Embed Size (px)
Citation preview
Canine vasculature: A study of a,j- adrenoceptors and heart failure
by
Sally Anne Argyle M.V.B. M.R.C.V.S. Cert S.A.C.
A thesis submitted for the degree of Doctor of Philosophy
from
The Division of Neuroscience and Biomedical systems, Institute
of Biomedical & Life Sciences and the Department of Veterinary
Clinical Studies, University of Glasgow. Glasgow, G12 8QQ.
© S.A. Argyle 1998

ProQuest Number: 13815585
All rights reserved
INFORMATION TO ALL USERS The quality of this reproduction is dependent upon the quality of the copy submitted.
In the unlikely event that the author did not send a com p le te manuscript and there are missing pages, these will be noted. Also, if material had to be removed,
a note will indicate the deletion.
uestProQuest 13815585
Published by ProQuest LLC(2018). Copyright of the Dissertation is held by the Author.
All rights reserved.This work is protected against unauthorized copying under Title 17, United States C ode
Microform Edition © ProQuest LLC.
ProQuest LLC.789 East Eisenhower Parkway
P.O. Box 1346 Ann Arbor, Ml 48106- 1346

GUiSGOW UNIVERSITY UERAKY
— jama*.GLASGOWu n iv er sitylibrary
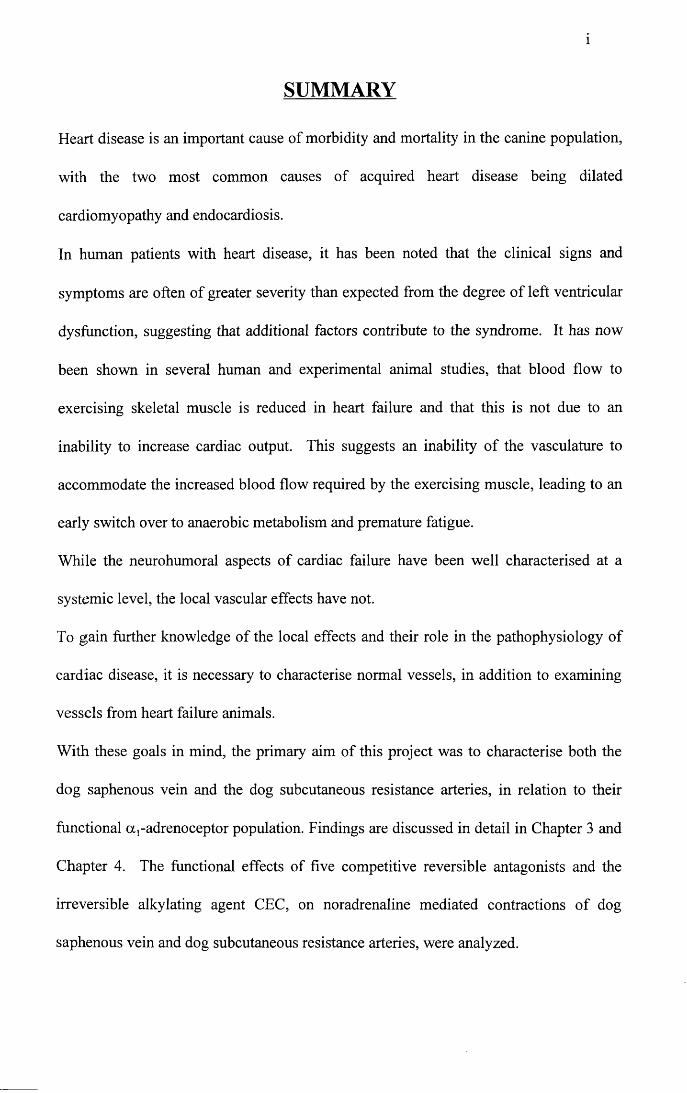
SUMMARY
Heart disease is an important cause of morbidity and mortality in the canine population,
with the two most common causes of acquired heart disease being dilated
cardiomyopathy and endocardiosis.
In human patients with heart disease, it has been noted that the clinical signs and
symptoms are often of greater severity than expected from the degree of left ventricular
dysfunction, suggesting that additional factors contribute to the syndrome. It has now
been shown in several human and experimental animal studies, that blood flow to
exercising skeletal muscle is reduced in heart failure and that this is not due to an
inability to increase cardiac output. This suggests an inability of the vasculature to
accommodate the increased blood flow required by the exercising muscle, leading to an
early switch over to anaerobic metabolism and premature fatigue.
While the neurohumoral aspects of cardiac failure have been well characterised at a
systemic level, the local vascular effects have not.
To gain further knowledge of the local effects and their role in the pathophysiology of
cardiac disease, it is necessary to characterise normal vessels, in addition to examining
vessels from heart failure animals.
With these goals in mind, the primary aim of this project was to characterise both the
dog saphenous vein and the dog subcutaneous resistance arteries, in relation to their
functional a,-adrenoceptor population. Findings are discussed in detail in Chapter 3 and
Chapter 4. The functional effects of five competitive reversible antagonists and the
irreversible alkylating agent CEC, on noradrenaline mediated contractions of dog
saphenous vein and dog subcutaneous resistance arteries, were analyzed.
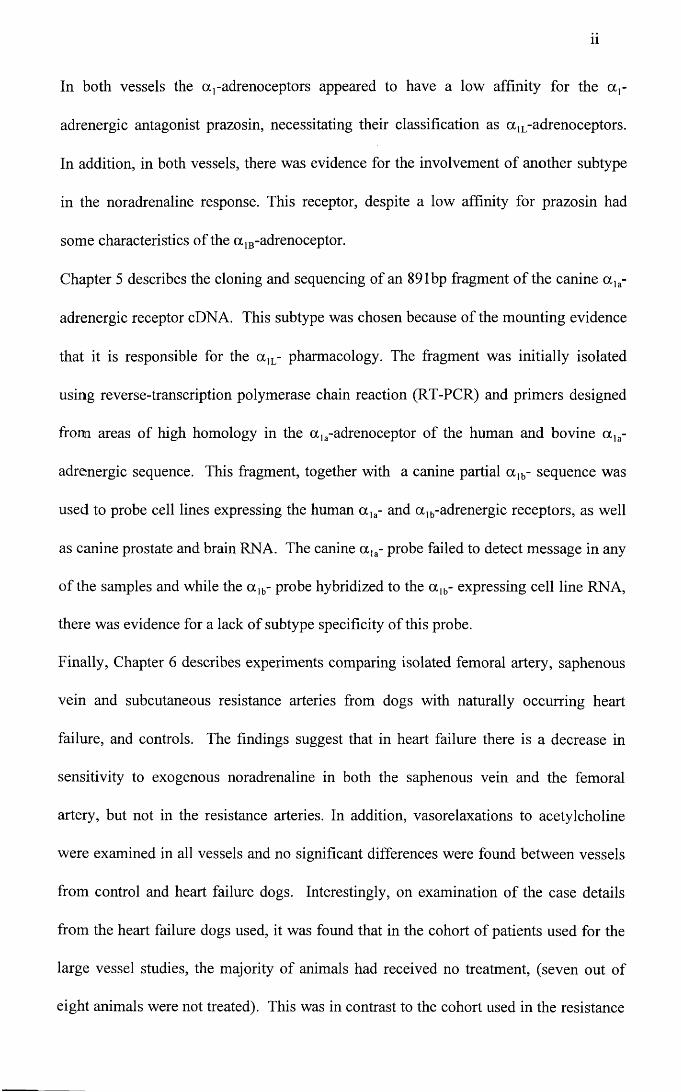
In both vessels the a,-adrenoceptors appeared to have a low affinity for the a,-
adrenergic antagonist prazosin, necessitating their classification as a 1L-adrenoceptors.
In addition, in both vessels, there was evidence for the involvement of another subtype
in the noradrenaline response. This receptor, despite a low affinity for prazosin had
some characteristics of the a 1B-adrenoceptor.
Chapter 5 describes the cloning and sequencing of an 891 bp fragment of the canine a la-
adrenergic receptor cDNA. This subtype was chosen because of the mounting evidence
that it is responsible for the a 1L- pharmacology. The fragment was initially isolated
using reverse-transcription polymerase chain reaction (RT-PCR) and primers designed
from areas of high homology in the a la-adrenoceptor of the human and bovine a la-
adrenergic sequence. This fragment, together with a canine partial a ]b- sequence was
used to probe cell lines expressing the human a ]a- and a ,b-adrenergic receptors, as well
as canine prostate and brain RNA. The canine a la- probe failed to detect message in any
of the samples and while the a ]b- probe hybridized to the a ]b- expressing cell line RNA,
there was evidence for a lack of subtype specificity of this probe.
Finally, Chapter 6 describes experiments comparing isolated femoral artery, saphenous
vein and subcutaneous resistance arteries from dogs with naturally occurring heart
failure, and controls. The findings suggest that in heart failure there is a decrease in
sensitivity to exogenous noradrenaline in both the saphenous vein and the femoral
artery, but not in the resistance arteries. In addition, vasorelaxations to acetylcholine
were examined in all vessels and no significant differences were found between vessels
from control and heart failure dogs. Interestingly, on examination of the case details
from the heart failure dogs used, it was found that in the cohort of patients used for the
large vessel studies, the majority of animals had received no treatment, (seven out of
eight animals were not treated). This was in contrast to the cohort used in the resistance

artery group, where four out of five animals had received treatment for their cardiac
disease. The relevance of this and possible effects are discussed in this chapter.
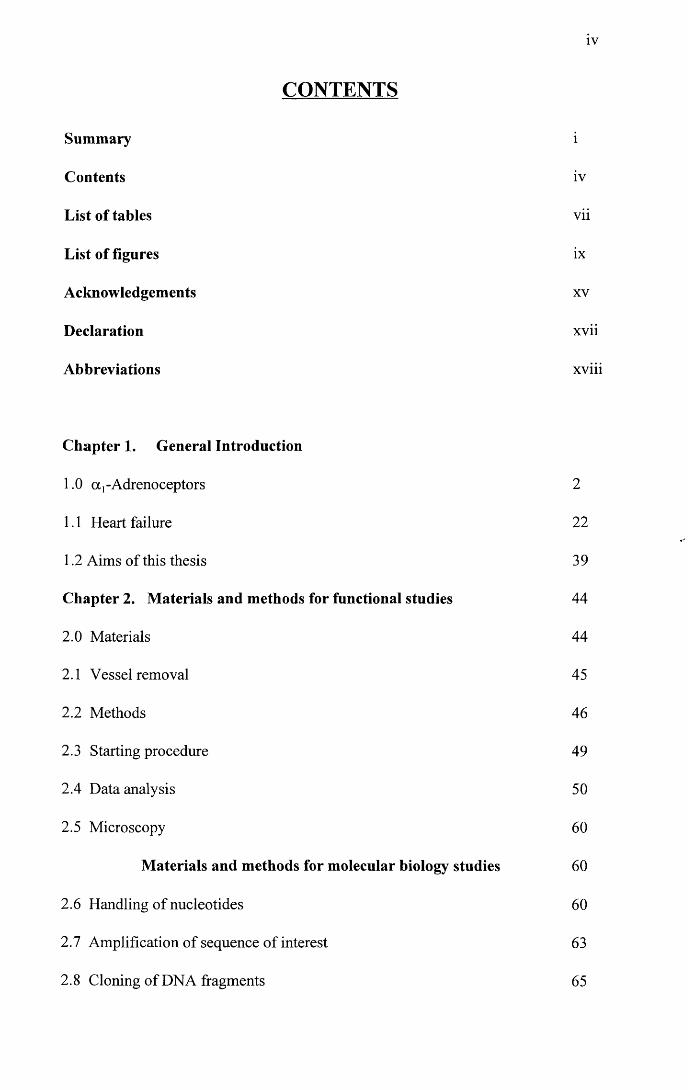
CONTENTS
Summary i
Contents iv
List of tables vii
List of figures ix
Acknowledgements xv
Declaration xvii
Abbreviations xviii
Chapter 1. General Introduction
1.0 a,-Adrenoceptors 2
1.1 Heart failure 22
1.2 Aims of this thesis 39
Chapter 2. Materials and methods for functional studies 44
2.0 Materials 44
2.1 Vessel removal 45
2.2 Methods 46
2.3 Starting procedure 49
2.4 Data analysis 50
2.5 Microscopy 60
Materials and methods for molecular biology studies 60
2.6 Handling of nucleotides 60
2.7 Amplification of sequence of interest 63
2.8 Cloning of DNA fragments 65
V
2.9 Plasmid isolation 69
2.10 Restriction digests 69
2.11 S equencing 7 0
2.12 Northern analysis 71
Chapter 3. Functional classification of oq-adrenoceptors mediating
contraction to exogenous noradrenaline in dog saphenous vein
3.0 Abstract 76
3.1 Methods 77
3.2 Results 79
3.3 Discussion 116
Chapter 4. Functional classification of a,-adrenoceptors mediating
contraction of canine subcutaneous resistance arteries to exogenous
noradrenaline
4.0 Abstract 127
4.1 Methods 128
4.2 Results 130
4.3 Discussion 156
Chapter 5. Cloning and sequencing of the canine a la-adrenoceptor
5.0 Abstract 163
5.1 Results 164
5.2 Discussion 186
vi
Chapter 6. Functional characteristics of the dog saphenous vein, dog
femoral artery and dog subcutaneous resistance artery, and the effects
of naturally occurring heart failure on these characteristics
6.0 Abstract 194
6.1 Method 195
6.2 Results 197
6.3 Discussion 229
Chapter 7. General discussion 244
Appendices 258
References 264
vii
Figure
Chapter 3
3.1
3.2
3.3
3.4
3.5
Chapter 4
4.1
4.2
4.3
4.4
Chapter 6
6.1
List of Tables
Title
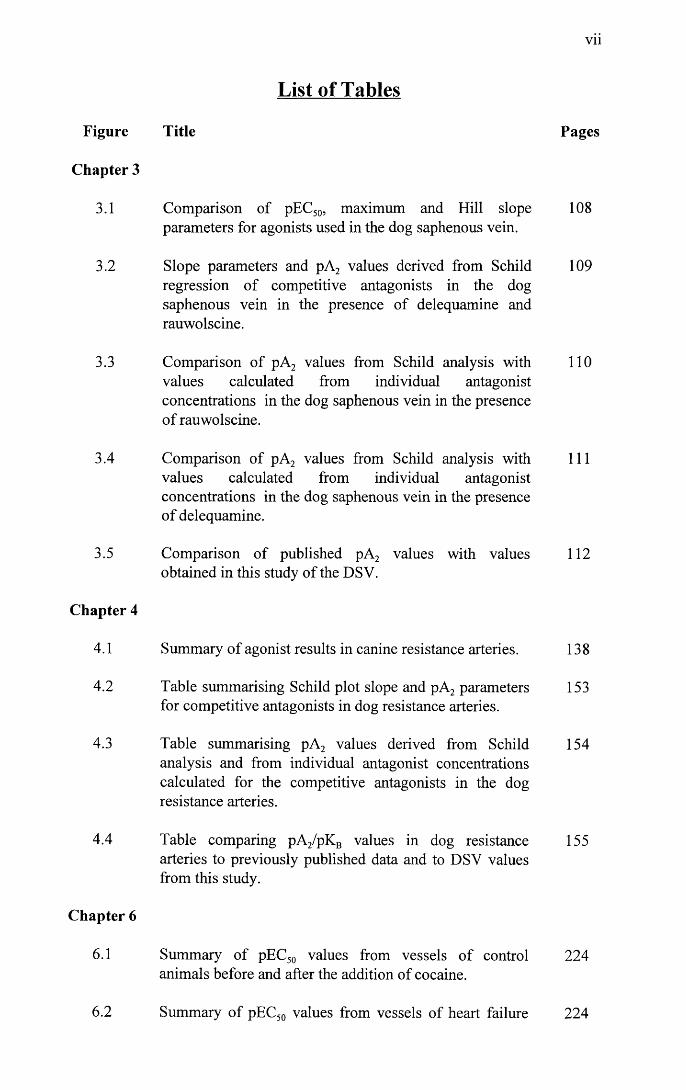
Comparison of pEC50, maximum and Hill slope parameters for agonists used in the dog saphenous vein.
Slope parameters and pA2 values derived from Schild regression of competitive antagonists in the dog saphenous vein in the presence of delequamine and rauwolscine.
Comparison of pA2 values from Schild analysis with values calculated from individual antagonist concentrations in the dog saphenous vein in the presence of rauwolscine.
Comparison of pA2 values from Schild analysis with values calculated from individual antagonist concentrations in the dog saphenous vein in the presence of delequamine.
Comparison of published pA2 values with values obtained in this study of the DSV.
Summary of agonist results in canine resistance arteries.
Table summarising Schild plot slope and pA2 parameters for competitive antagonists in dog resistance arteries.
Table summarising pA2 values derived from Schild analysis and from individual antagonist concentrations calculated for the competitive antagonists in the dog resistance arteries.
Table comparing pA2/pKB values in dog resistance arteries to previously published data and to DSY values from this study.
Summary of pEC50 values from vessels of control animals before and after the addition of cocaine.
Pages
108
109
110
111
112
138
153
154
155
224
6.2 Summary of pEC50 values from vessels of heart failure 224
viii
dogs before and after the addition of cocaine.
6.3 Synopsis of heart failure cases used in the femoral arteryand saphenous vein experiments.
6.4 Synopsis of heart failure cases used in the subcutaneousresistance artery experiments.
225
226
ix
Pag<
16
19
26
27
56
58
59
66
81
82
90
91
92
List of Figures
Title
Chart summarising the classification of the a]-adrenoceptors.
Schematic diagram of the proposed structure of an a,- adrenoceptor.
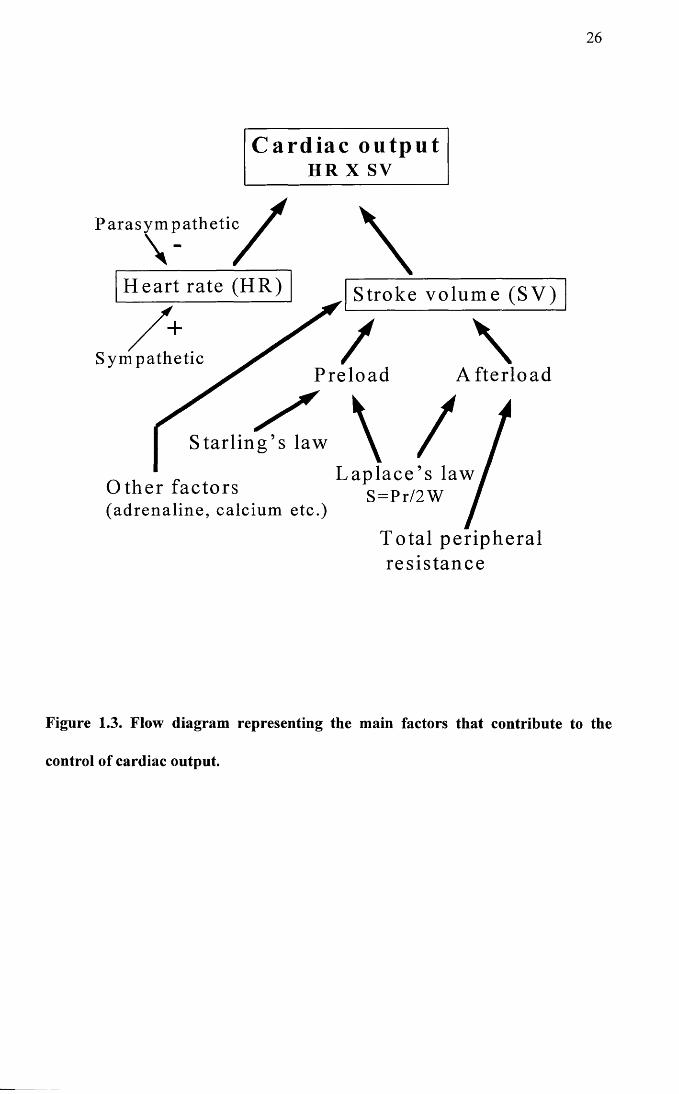
Flow diagram representing the main factors that contribute to the control of cardiac output.
The heart failure cascade.
Anatomical location of the femoral artery and the saphenous vein.
Schematic representation of a Mulvany Halpem wire myograph.
Schematic representation of an organ bath.
Diagram of the pCR® 2.1 plasmid.
Mean concentration response curve data for the agonist profiles in the dog saphenous vein.
Agonist profile for a single experiment demonstrating the two site fit for the UK14304 curve in dog saphenous vein.
Graph illustrating the effect of either lpM rauwolscine or 0.1 pM delequamine on NA concentration response curves in DSV.
Graph showing data from a single experiment in the DSV, comparing the effect of 0.1 pM delequamine and lpM rauwolscine on a response curve to phenylephrine.
Graph showing data from a single experiment in the DSV, comparing the effect of 0.1 pM delequamine and lpM delequamine on a response curve to UK 14304.
X
3.6
3.7
3.8
3.9
3.10
3.11
3.12
3.13
3.14
3.15
3.16
3.17
3.18
3.19
3.20
3.21
Mean time control concentration response curves for dog 93 saphenous vein.
Mean concentration response data for prazosin in DSV in the 94 presence of rauwolscine.
Mean concentration response data for prazosin in DSV in the 95 presence of delequamine.
Mean concentration response data for BMY 7378 in DSV in 96 the presence of rauwolscine.
Mean concentration response data for BMY 7378 in DSV in 97 the presence of delequamine.
Mean concentration response data for WB4101 in DSV in the 98 presence of rauwolscine.
Mean concentration response data for WB4101 in DSV in the 99 presence of delequamine.
Mean response data for HV723 in DSV in the presence of 100 rauwolscine.
Mean concentration response data for HV723 in DSV in the 101 presence of delequamine.
Mean concentration response data for 5 methylurapidil (5 102MeU) in DSV in the presence of rauwolscine.
Mean concentration response data for 5 methylurapidil (5 103MeU) in DSV in the presence of delequamine.
Mean concentration response data for 5 methylurapidil (5 104MeU) in DSV in the presence of delequamine showing the two site curves only for lpM 5MeU.
Schild plots for prazosin, WB4101 and HV723 in the dog 105 saphenous vein in the presence of rauwolscine.
Schild plots for prazosin, BMY 7378, WB4101 and HV723 106in the dog saphenous vein in the presence of delequamine.
Schild plot for 5 methylurapidil in the dog saphenous vein in 107 the presence of delequamine.
Mean concentration response curves in the DSV, to 114 noradrenaline in the presence of CEC and rauwolscine.
xi
3.22
Chapter 4
4.1
4.2
4.3
4.4
4.5
4.6
4.7
4.8
4.9
4.10
4.11
4.12
4.13
Mean concentration response curves in the DSV, to 115 noradrenaline in the presence of CEC and delequamine.
Time control concentration response curves to noradrenaline 132 in canine resistance arteries.
Graphs illustrating individual experiments in dog resistance 133 arteries fitted to a one site model.
Increasing concentrations of prazosin versus noradrenaline 134 from a single dog resistance artery fitted to the one site model.
Increasing concentrations of WB 4101 versus noradrenaline 135from a single dog resistance artery.
Agonist profile for canine resistance arteries. 137
Mean CRC data for noradrenaline in the presence of prazosin 142in canine resistance arteries.
Mean CRC data for noradrenaline in the presence of BMY 1437378 in canine resistance arteries.
Mean CRC data for noradrenaline in the presence of WB 1444101 in canine resistance arteries.
Mean CRC data for noradrenaline in the presence of HV 723 145in canine resistance arteries.
Mean CRC data for noradrenaline in the presence of 5 146Methylurapidil in canine resistance arteries.
Schild plot for prazosin versus noradrenaline in canine 147resistance arteries.
Schild plot for WB 4101 versus noradrenaline in canine 148resistance arteries.
Schild plot for HV 723 versus noradrenaline in canine 149resistance arteries.
4.14
4.15
Chapter 5
5.1
5.2
5.3
5.4
5.5
5.6
5.7
5.8
5.9
5.10
5.11
Chapter 6
6.1
xii
Schild plot for 5 methylurapidil versus noradrenaline in 150 canine resistance arteries.
Mean CRC curve data for chloroethylclonidine in canine 152 resistance arteries.
Theoretical two dimensional representation of an a r 168adrenoceptor.
Representative gel showing PCR product with high 169homology to titin.
The three primers used to amplify the canine a ]a-sequence, 170 lined up with the sequences from the bovine and human expand the canine a ]b- sequence.
Representative gel showing the PCR product corresponding 171 to the canine a ]a-adrenoceptor partial sequence.
Photograph of gel showing the three colonies containing the 173 a la- insert.
Primers used for sequencing from the clone and for direct 176 PCR sequencing.
Nucleotide sequence of the canine a la- clone together with 178 the predicted amino acid sequence.
Comparison of predicted amino acid sequence from the 179 canine, bovine and human a la- adrenoceptors.
Photograph of gel showing colonies containing the a lb- 183 insert.
Northern blot of human a ]a- and a lb- expressing cell line 184 RNA, hybridized to the a ]b-, and ribosomal probes.
Northern blot of canine RNA hybridized to the a lb- and 185 GAPDH probes.
Concentration response curve data to noradrenaline in the 199 dog saphenous vein from control animals.
6.2 Concentration response curve data to noradrenaline in the 200
xiii
6.3
6.4
6.5
6.6
6.7
6.8
6.9
6.10
6.11
6.12
6.13
6.14
6.15
6.16
6.17
dog saphenous vein from heart failure animals.
Concentration response curve data to noradrenaline in saphenous vein rings from control and heart failure animals.
Concentration response curve data to noradrenaline in saphenous vein rings from control and heart failure animals after the addition of lpM cocaine.
Concentration response curve data to acetylcholine from control and heart failure dogs.
Saphenous vein immunohistochemistry.
Concentration response curve data to noradrenaline in the dog femoral artery from control animals.
Concentration response curve data to noradrenaline in the dog femoral artery from heart failure animals.
Concentration response curve data to noradrenaline in the dog femoral artery from control and heart failure animals.
Concentration response curve data to noradrenaline in the dog femoral artery from control and heart failure animals after the addition of 1 pM cocaine.
Concentration response curve data to acetylcholine from control and heart failure dogs in the femoral artery.
Femoral artery immunohistochemistry.
Mean time control data for dog subcutaneous resistance arteries.
Graphs illustrating mean concentration response curve data from subcutaneous resistance arteries of control dogs.
Graphs illustrating mean concentration response curve data from subcutaneous resistance arteries of heart failure dogs.
Mean concentration response curve data comparing control and heart failure dogs.
Mean concentration response curve data for acetylcholine in subcutaneous resistance arteries from control and heart failure dogs.
201
202
203
204
208
209
210
211
212
213
217
218
219
220
221
xiv
6.18
6.19
6.20
Dog subcutaneous resistance artery histology and 222 immunohi stochemi stry.
Individual concentration response curves from femoral artery 227 rings of heart failure dogs.
Individual concentration response curves from subcutaneous 228resistance arteries in the presence of L- NAME (from heart failure dogs).

XV
ACKNOWLEDGEMENTS
I would like to extend my profound gratitude to Professor Ian McGrath for his
continued support, enthusiasm and guidance over the last three years. I couldn’t have
wished for a better supervisor. I would also like to thank him for his advice and
constructive criticism in the preparation of this manuscript.
I owe a large debt of gratitude to both Professor Max Murray and Professor Henry
Dargie. Their initial and continued support and inspiration made this project possible. I
would also like to thank Professor Dargie for providing a large proportion of the
funding for this project.
A very big thank you to all the following.
The vascular group both past and present, for making the last three years both an
excellent learning experience and also a very enjoyable one. In particular, I would like
to extend my thanks to Joyce Macmillan, Karen Smith and Janet MacKenzie.
Dr Howard Prentice, for his advice and the use of his laboratory facilities, also Yvonne
Alexander, Andy Wylie, Simon McCartin, Gillian Queen, Karen Jess and Robert
Heeley, for their time, patience and supervision.
The Clinical and Pathology departments of Glasgow Veterinary School, in particular Dr
Chris Little. The heart failure study was only possible due to their cooperation
regarding the supply of clinical case material. Thanks also to Chris for helping me to
get the project off the ground.
Dr Ian Montgomery for the preparation of the histology and immunohistochemistry
sections .
Glasgow University and the Clinical Studies Trust Fund (Petsavers) for their financial
support in the funding of this project.

Last but by no means least, thank you to my friends and family. In particular, thanks to
my husband David who has had a great deal to put up with for the last three years and
especially the last three months. Without his support none of this would have been
possible.
xvii
DECLARATION
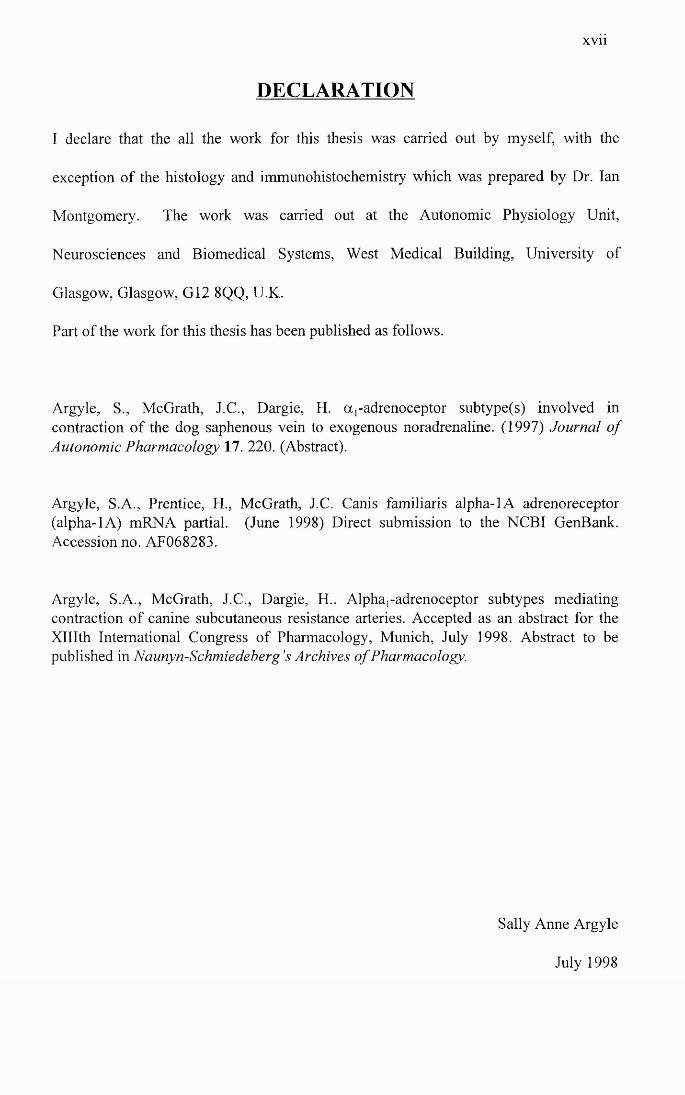
I declare that the all the work for this thesis was carried out by myself, with the
exception of the histology and immunohistochemistry which was prepared by Dr. Ian
Montgomery. The work was carried out at the Autonomic Physiology Unit,
Neurosciences and Biomedical Systems, West Medical Building, University of
Glasgow, Glasgow, G12 8QQ, U.K.
Part of the work for this thesis has been published as follows.
Argyle, S., McGrath, J.C., Dargie, H. a,-adrenoceptor subtype(s) involved in contraction of the dog saphenous vein to exogenous noradrenaline. (1997) Journal o f Autonomic Pharmacology 17. 220. (Abstract).
Argyle, S.A., Prentice, H., McGrath, J.C. Canis familiaris alpha-lA adrenoreceptor (alpha-1 A) mRNA partial. (June 1998) Direct submission to the NCBI GenBank. Accession no. AF068283.
Argyle, S.A., McGrath, J.C., Dargie, H.. Alpha,-adrenoceptor subtypes mediating contraction of canine subcutaneous resistance arteries. Accepted as an abstract for the XHIth International Congress of Pharmacology, Munich, July 1998. Abstract to be published in Naunyn-Schmiedeberg’s Archives o f Pharmacology.
Sally Anne Argyle
July 1998

Abbreviations
ACEI Angiotensin converting enzyme inhibitorAch AcetylcholineAI Angiotensin IAll Angiotensin IICa2+ calciumcAMP adenosine 3’-5’-cyclic monophosphatecDNA single stranded DNACEC chloroethylclonidinecGMP guanosine 3’-5’-cyclic monophosphateCRC concentration response curve°C degrees centrigradeC 0 2 carbon dioxideDNA deoxyribonucleic acidDSCRA dog subcutaneous resistance arteryDSV dog saphenous veinEDRF endothelium-derived relaxing factorEDHF endothelium-derived hyperpolarizing factorG protein GTP-dependent regulatory proteinsGTP guanosine triphosphateHR heart rateI (1,4,5)P3 inositol (1,4,5) trisphosphateKC1 potassium chlorideKS Krebs’ solutionL-NAME N“-Nitro-L-Arginine Methyl ester hydrochloride1, ml, pi litre, millilitre, microlitreMgCl2 Magnesium chloridemRNA messenger RNAM (mM, pM, nM, pM, fM.) Molar (moles per litre; millimolar, micromolar,
nanomolar, picomolar, femtomolar)mnths monthsNA noradrenalineo2 oxygenO.D. optical densityPE phenylephrinePIP2 phosphatidylinositol (4,5) bisphosphateRAAS renin angiotensin aldosterone systemRNA ribonucleic acidSV stroke volumes.e. mean standard error of the meanTaq polymerase Thermus aquaticus DNA polymeraseTPR total peripheral resistancepm micrometreyrs years

xix
This thesis is dedicated to David and Blythe who have been my inspiration
1
CHAPTER 1
General introduction
1.0 dj-Adrenoceptors
1.0.1 Historical perspective
1.0.2 o^-adrenoceptor subtypes
1.0.3 Structure and genomic organization of the a,-adrenoceptors
1.0.4 Signal transduction
1.1 Heart failure
1.1.1 Definition
1.1.2 Aetiology
1.1.3 Pathophysiology
1.1.4 Neurohumoral systems
1.1.5 Treatment of cardiac failure
1.1.6 Role of the peripheral vasculature in heart failure
1.2 Aims of this thesis
2
1.0 aj-ADRENOCEPTORS
1.0.1 Historical perspective
Oliver and Schaffer (1895) showed that adrenal gland extract increased blood pressure
when administered in vivo, thereby introducing the concept of the adrenoceptor system.
Subsequent to this it was thought that the reason for variation in effects brought about
by adrenotropic receptors (in some cases depressor and in others pressor), was due to the
release of different endogenous catecholamines called sympathins, (sympathin I for
inhibitory and sympathin E for excitatory), each one causing a different effect at the
same receptor, (Cannon and Rosenbleuth, 1933).
This theory became obsolete when Ahlquist (1948) used five different catecholamines
on eight different systems, in order to examine their rank order of potency for
contraction and relaxation responses. Rank orders differed between pressor and
depressor responses, suggesting that the receptors involved in each of these activities
were in fact different. He named these two types of receptors a and p, with a- receptors
being involved in excitatory responses, with the exception of the gut, and P- receptors
being responsible for inhibitory responses, with the exception of the myocardium.
Ahlquist’s theory was later confirmed with the advent of a P-adrenoceptor antagonist
(Moran and Perkins, 1958; Powell and Slater, 1958). Until this time only an a-
adrenoceptor antagonist had been available.
Langer (1974) then discovered the existence of pre-junctional a-adrenoceptors which
modulated the release of endogenous noradrenaline. These receptors differed
pharmacologically from post-junctional receptors. An example of this was demonstrated
by the relative potency of phenoxybenzamine at both sites. Phenoxybenzamine was 30
times more potent at post-junctional adrenoceptors. Due to these differences he decided
3
to classify the pre-junctional receptors as a 2-, and the post-junctional as a r
adrenoceptors, based on anatomical and pharmacological properties.
In 1979, Drew and Whiting found that hypertension induced by the administration of
phenylephrine, was more readily antagonized by prazosin, than hypertension induced by
noradrenaline. Conversely, yohimbine antagonized the effects of noradrenaline to a
greater extent This was one of several papers showing evidence of post-junctional a 2-
adrenoceptors (Timmermans et al. 1979; Docherty et al. 1979). From this time onward
a ,- and a 2-adrenoceptors were classified purely on pharmacological properties (Starke
and Langer, 1979; Berthelsen and Pettinger, 1977). The presence of post-junctional a 2-
as well as a r adrenoceptors, which mediate vascular smooth muscle contraction, is now
well documented in a variety of vessels (Simonsen et al. 1997; Elliott, 1997; Wright et
al. 1995; Nielsen et al. 1989), including the dog saphenous vein (MacLennan et al.
1997; De Mey and Vanhoutte, 1981).
1.0.2 a 1-adrenergic subtypes
Role of the a ,-adrenoceptors and relevance of multiple subtypes
The a,-adrenoceptors are mediators of the sympathetic nervous system and as such,
these receptors interact with the endogenous ligands noradrenaline and adrenaline. Due
to this interaction and because of their wide distribution, these receptors have many
important functions.
Receptors on vascular smooth muscle and in myocardium have a key role in the control
of peripheral resistance and myocardial contractility (Minneman and Esbenshade, 1994;
Minneman, 1988; Graham et al. 1996). Not only do these receptors have an important
physiological role, but they have been implicated in certain pathological processes.
Alterations in both the a r and a 2-adrenoceptor population on vascular smooth muscle
4
have been reported in heart failure (Forster and Armstrong, 1990; Forster et al. 1989;
Stassen et al. 1997a; Stassen et al. 1997b). More recently, certain subtypes have been
implicated in myocardial and smooth muscle hypertrophy (Xin et al. 1997; Milano et al.
1994a; Yamazaki et al. 1997; Milano et al. 1994b), as well as being involved in the
phenomenon of ischaemic preconditioning of the myocardium (Kariya et al. 1997; Li et
al. 1997). Their role in the dynamic component of benign prostatic hypertrophy has
been well documented (Chappie, 1997; Hieble and Ruffolo, 1996). The importance of
a ,- adrenoceptors is also reflected in the fact that currently they are targets for the drug
treatment of a variety of conditions such as hypertension, benign prostatic hypertrophy,
nasal congestion and angina pectoris (Hieble and Ruffolo, 1996; Minneman et al. 1993).
It is clear from this, that an understanding of the contribution of individual subtypes to
both physiological and pathological processes, will not only extend our knowledge of
the pathways involved, but will open up the possibility for the development of subtype
selective antagonists and agonists, which can be used more effectively and with fewer
side effects.
The evidence supporting the existence of more than one subtype of a } -adrenoceptor
began to surface in the early 1980s. Since then the evolving sub-classification of these
receptors has followed a tortuous and often confusing path.
Evidence based on agonist studies
The initial proposal for the sub-classification of these receptors into two populations
came from agonist studies. Ruffolo et al (1977), made the initial observation that the
imidazoline agonists and the phenethylamine agonists seemed to either have different
modes of action at the same receptor population, or they acted on different types of a,-
adrenoceptor, since if desensitization was induced with an agonist from one group, the
5
tissue was not subsequently desensitized to agonist from the other group, but responses
were reduced if a different agonist from within the same group were used. Godfraind et
al (1982), while working on rat thoracic aorta, showed that the responses to the
phenethylamine agonists were relatively less sensitive to calcium channel blockers when
compared to the imidazolines. Further evidence for heterogeneity of the a r
adrenoceptor population came from work on a variety of tissues, the responses of which,
on the basis of antagonist profiles, were a,-mediated, but which showed different
responses to different classes of agonists. For example, in the rat anoccocygeus muscle,
phenethylamine agonists produced a dose response curve with a definite shoulder, with
the lower component of the curve demonstrating a phasic response. In comparison,
imidazoline agonists, produced a monophasic concentration response curve in the same
tissue, and the response was also phasic except at the highest concentrations of agonist.
This led McGrath (1982) to suggest that the adrenoceptors mediating these responses be
classified as a la- and a ]b-. In this classification, the phenethylamine agonists activated
both the subtypes, thus accounting for the biphasic response, whereas the imidazoline
agonists activated only the a ]a- subtype which were contributing to the lower phasic part
of the phenethylamine concentration response curve. In addition, it was thought that the
two proposed subtypes could be further distinguished by their second messenger
activation pathways, with the a la- utilizing extracellular calcium and the a lb- utilizing
intracellular calcium. Usage of this classification scheme did not continue mainly due
to the failure to identify antagonists which could distinguish the two subtypes.
Evidence from radioligand binding and functional experiments
Throughout the course of this introduction, native receptors will be referred to with
uppercase letters and recombinant receptors will be referred to with lowercase letters, as
6
recommended by the committee for the nomenclature of a,-adrenoceptors (Hieble et al.
1995).
In the case of functional and radioligand binding studies, receptors are classified with
the use of selective antagonists. In the case of radioligand binding, the receptors are
labelled using a radioactive drug, which is then competed off the receptor using a non
radioactive competitive congener (Starke, 1981). In functional studies the concentration
of the antagonist which causes the concentration response curve to shift to the right by a
factor of two is the antagonist’s receptor dissociation constant (pA2), and if two
receptors are the same, then a given antagonist should have the same pA2 value at both
sites (Flavahan and Vanhoutte, 1986a). A more detailed description of the derivation of
pA2 values is given in the materials and methods section of this thesis.
Morrow et al (1985) and Morrow and Creese (1986) showed evidence for receptor
heterogeneity in rat brain. They found that the antagonists WB4101 and phentolamine
competed for [3H] prazosin labelled sites with high and low affinities, suggesting that
the prazosin was labelling a heterogeneous population of receptors. The high affinity
sites were termed a 1A-, while the low affinity sites were termed a )B-.
In 1987, Han and colleagues published a number of papers which followed on from this.
A Nature publication (Han et al. 1987a), also distinguished subtypes based on the
affinity for WB4101 at rat hippocampus, vas deferens, liver and spleen. Their results
showed that in rat liver and spleen, the affinity for WB 4101 was low and the pattern of
antagonism monophasic, suggesting the presence of only the a 1B- subtype. In contrast,
both the vas deferens and the hippocampus displayed biphasic inhibition curves for WB
4101, suggesting the presence of both the a 1A- and the a 1B- subtypes. From this study
they also concluded that the contraction induced by the a 1B-adrenoceptor was
independent of extracellular calcium while that induced by the a ]A-adrenoceptor relied
7
on the opening of dihydropyridone sensitive calcium channels. Interestingly this tied in
with the proposed classification of McGrath (1982). However, by the authors’ own
admission, the ability to distinguish the two subtypes, by sensitivity to calcium channel
blockers, while possible for the tissues which they examined, did not hold true for all
tissues and thus while the division based on differing affinity for WB 4101 gained
credence, the source of calcium as a subtype distinguishing feature, did not. In fact, in a
later publication (Han et al. 1990), it was demonstrated from cells in culture that both
a ]A- and a 1B- adrenergic receptors could stimulate inositol phosphate accumulation to a
similar extent and it has since been shown that all the cloned receptors can induce the
accumulation of inositol phosphate (Cotecchia et al. 1995; Schwinn et al. 1991; Theroux
et al. 1996; Minneman and Esbenshade, 1994).
Han et al (1987b), went on to use both the alkylating agent chloroethylclonidine (CEC)
and WB4101. In this instance, they found that again there were high and low affinity
sites in rat brain for WB4101 competition against [125I] BE 2254 binding, and that CEC
seemed to inactivate only the low affinity WB4101 sites, although quantitatively the
number of sites inactivated by CEC compared to the low affinity WB4101 sites did not
correlate well. In a paper the following year they showed that this discrepancy was
probably due to incomplete access of the CEC to sensitive sites, since when the
experimental conditions were altered and the CEC inactivation carried out in hypotonic
as opposed to isotonic solution, the proportion of sites inactivated increased and was
more compatible with the proportion of WB4101 low affinity sites(Minneman et al.
1988).
In the late 1980s the advent of further subtype selective antagonists lent support to the
proposed a 1A- and a ]B- classification. In particular, both a urapidil derivative, 5
methylurapidil and a 1,4-dihydropyridine, niguldipine, were found to be selective for
the a 1A- subtype (Graziadei et al. 1989; Hanft and Gross, 1989; Gross et al. 1988), with
5 methylurapidil having an «70 fold selectivity for the a 1A- subtype as opposed to only a
20-30 fold selectivity exhibited by WB 4101 in radioligand binding experiments (Hanft
and Gross, 1989).
Evidence from molecular studies
Although the a IA- and a 1B- classification had met with a certain amount of scepticism
and uncertainty, the existence of these subtypes, in addition to a third, ( a ID-), was
confirmed from 1988 onwards with the successive cloning and sequencing of these
receptors, and their identification as different gene products (Smiley et al. 1998). Due,
in the beginning, to a limited number of subtype-selective antagonists, there was some
confusion as to the identity of the cloned receptors in relation to their native
counterparts. The following paragraphs aim to summarise the sequence of events
without, hopefully, causing too much additional confusion.
The first of these receptors to be cloned, sequenced and expressed was the hamster a ]b-
(Cotecchia et al. 1988). This was isolated from DDT|MF-2 cells, which are a hamster
derived smooth muscle cell line. When this 2Kb cDNA clone was expressed in COS-7
cells, it was shown to have a low affinity for WB 4101 and phentolamine, and to be
associated with the accumulation of inositol phosphate. From these findings and based
on the information from functional and radioligand binding studies already discussed
above, it was decided that this clone represented the hamster a 1B- adrenergic receptor.
A second receptor was identified by the same group and the results published the
following year (Schwinn et al. 1990). This time a clone was derived from a bovine
brain cDNA library using a probe derived from the hamster a lb- adrenoceptor. This
receptor was « 70% homologous to the hamster a ]b- sequence, supporting the fact that
this was an a r adrenoceptor. The new clone was mapped to a different human
chromosome to the hamster a lb- and when this clone was expressed in COS-7 cells,
unlike the a ]b-, it showed a 10 fold higher affinity for the antagonists WB 4101 and
phentolamine, together with a high affinity for the agonist oxymetazoline. Although
this profile supported the classification of this receptor as an a la-, the sensitivity of the
receptor to CEC, (generally associated with the a lb-), together with an inability to detect
expression of mRNA in rat tissues described as possessing a 1A- adrenoceptors from
binding studies, led the authors to believe that this was a novel adrenoceptor not
identified from radioligand or functional studies, and it was named the a lc-adrenoceptor.
A third clone was identified from a rat cerebral cortex library (Lomasney et al. 1991).
Due to the high affinity of this clone for WB 4101 and a distribution in rat tissues
corresponding to the native a 1A-adrenoceptor from radioligand binding studies, it was
assumed that this clone represented the a 1A-adrenoceptor. At roughly the same time
another group had identified an a,-adrenoceptor using solution-phase library screening
of a rat brain library (Perez et al. 1991). This clone did not convincingly fall into either
the a 1A- or a 1B- classification, since despite a high affinity for WB 4101, the affinity for
5 methylurapidil and niguldipine was much lower than at a 1A- adrenoceptors and the
sensitivity to CEC was lower than expected at a 1B- adrenoceptors. Based on this
evidence, the clone was considered to be a novel a,-adrenoceptor and was named the
a ld-. It soon became clear that the a ]d- was identical in sequence to the a la clone
(Lomasney et al. 1991), with the exception of two codons, and that these were in fact
encoding for the same receptor, generally now accepted to be the a ]d- (Minneman and
Esbenshade, 1994).
10
At this point it seemed that while the cloned a ]b- corresponded to and encoded for the
native a 1B-, the cloned a ]d- had no functionally defined counterpart, the native a ]A- had
no cloned counterpart and the cloned a ]c- had no functional counterpart.
Despite this all was not lost. From about 1994 onwards it became generally accepted
that the cloned a lc- should be renamed the a la- and that this cloned receptor
corresponded to and encoded for the native a ]A-adrenoceptor (Hieble et al. 1995).
Evidence for this came from a number of observations. It was demonstrated that
alterations in the experimental conditions under which sensitivity to CEC was
examined, could influence the results, and subsequently sensitivities approximately 20%
lower than expected were derived for the human and bovine a lc- clones (Schwinn et al.
1995). A decrease in the sensitivity to CEC was also seen in the rat homologue (Laz et
al. 1994). Another study reported a higher sensitivity to niguldipine in the rat
homologue of the receptor compared to the bovine clone (Forray et al. 1994a), and with
the use of more sensitive techniques such as RNase protection assays and in situ
hybridization studies, the mRNA for this subtype had a wider tissue distribution than
originally shown with Northern analysis (Price et al. 1994; Price et al. 1993). In
addition, a functional study of the a,-adrenoceptors mediating smooth muscle
contraction, in the isolated perfused kidney of the rat, showed a high degree of
correlation in the functional potency of the antagonists used with the affinity of the
same ligands for the cloned a ]c- receptor (Blue et al. 1995). This type of correlation was
mirrored in a number of other studies, for example, Testa et al (1995), Ford et al (1994)
and Faure et al (1994a).
With the advent of the a ]D- selective ligand BMY 7378 (Goetz et al. 1995), it became
apparent that the cloned a ld-adrenoceptor did have a functional counterpart. Since then
it has been identified as playing a role in a variety of tissue types including rat renal
11
artery (VillalobosMolina et al. 1997), rat aorta (Kenny et al. 1995), rat aorta and iliac
artery (Piascik et al. 1995) and rat myocardium, aorta, vas deferens and spleen (Deng et
al. 1996).
In summary therefore, there are currently three native subtypes of aj-adrenoceptor,
namely a 1A-, a ]B- and a 1D-. These would appear to correspond to, and be encoded by,
the three cloned a!-adrenoceptors namely, the a ]a-, a lb- and a ld- . The term a lc- is no
longer to be used. To date one or more of the three cloned receptors have been
identified in a variety of species including human, rat, murine, bovine and rabbit. With
particular relevance to this thesis, as far as I am aware the only canine sequence
currently known is a partial sequence for the canine a lb-adrenoceptor (Libert et al.
1989).
From functional, radioligand or mRNA expression studies, although often more than
one subtype is expressed or appears to have a functional role, frequently a particular
subtype seems to predominate in a particular tissue. Some examples are listed. The
a 1A-adrenoceptor has been identified in rat resistance arteries (Kong et al. 1994; Ibarra
et al. 1997), rat renal artery (Piascik et al. 1997; VillalobosMolina et al. 1997), vas
deferens (Moriyama et al. 1997; Burt et al. 1995), rat renal vascular bed (Blue et al.
1995) and rabbit ear artery (Fagura et al. 1997), from functional studies. Expression of
the a la- subtype mRNA has been demonstrated in human heart, liver, cerebellum and
cerebral cortex (Faure et al. 1995; Hirasawa et al. 1995; Price et al. 1994), rat, monkey
and human bladder and prostate (Nasu et al. 1996; Walden et al. 1997) and rabbit and
guinea pig liver (GarciaSainz et al. 1995). The a 1B- subtype has been demonstrated in
rat mesenteric resistance artery (Piascik et al. 1997), rat spleen (Burt et al. 1995) and
rabbit cutaneous resistance arteries (Smith et al. 1997) from functional studies.
Expression of the a ]b- subtype has been identified in human spleen, kidney and fetal
12
brain (Price et al. 1994), rat liver (GarciaSainz et al. 1995; Faure et al. 1995) and rat
pineal (Sugden et al. 1996). As already mentioned the a ]D- subtype has been identified
in rat aorta and rat iliac artery (Fagura et al. 1997; Kenny et al. 1995; Piascik et al. 1995;
Deng et al. 1996) from functional studies. Expression studies have identified the a ld-
subtype in human aorta and cerebral cortex (Price et al. 1994), rabbit aorta, prostate, vas
deferens and cerebral cortex (Suzuki et al. 1997) and guinea pig liver (Faure et al.
1995).
It is important to highlight at this point, that in functional studies, the classical oc]A-
adrenoceptor subtype would appear to only have been identified in rat tissues. By
classical a 1A-, I mean a functional receptor with a high affinity for prazosin (>9), as well
as a high affinity for the a ]A- subtype-selective ligands. The relevance of this becomes
clear in the next section, where the a ]L-adrenoceptor is discussed. Although in the
previous paragraph I mentioned that the rabbit ear artery a,-adrenoceptor was classified
as a 1A-, it is interesting to note that values for the affinity of prazosin were not quoted
in this study (Fagura et al. 1997).
oc1L-adrenoceptor pharmacology
While the sub-classification of the a,-adrenoceptors into a 1A-, a 1B-, and a 1D- was being
resolved, an additional purely functional classification was coming to light.
A characteristic of all the subtypes mentioned so far, is that in radioligand binding and
functional experiments, these receptors all have a high affinity for the a,- ligand
prazosin.
From examination of functional experiments, it became clear that there was a
considerable spread in the pA2 values for prazosin at a ,-adrenoceptors (Drew, 1985).
The variability in the potency of this antagonist was taken as evidence for receptor
13
heterogeneity. This was supported by a study of rabbit pulmonary artery which showed
that prazosin antagonised the agonist clonidine in a non-competitive way, revealing both
a high and a low affinity site (Hoick et al.l 983). Flavahan and Vanhoutte (1986a)
reviewed the literature and suggested that receptors could be classified as a 1H- if the
affinities for prazosin and yohimbine were greater than 9 and 6.4 respectively, and oc1L-
if the affinities for prazosin and yohimbine were less than 9 and 6.2 respectively.
Muramatsu et al (1990b) evolved this suggested classification scheme, and based on
functional experiments using prazosin, HV 723, WB 4101, yohimbine, phentolamine
and CEC on a selection of blood vessels, they divided the a,-adrenoceptors into three
groups. The a ]H-receptors had a high affinity for prazosin (pA2 > 9.5), that was greater
than the affinity for either HV 723 or WB 4101, and they were sensitive to CEC. The
a 1L- adrenoceptors had a similar pA2 value for prazosin and HV 723 and the affinity for
prazosin was generally <9. The a ]N-adrenoceptors had a low affinity for prazosin
(pA2<9) and a higher affinity for HV 723 (pA2>9). Both the a 1L- and the a ]N-
adrenoceptors were insensitive to CEC. Other ligands which appear to distinguish the
low affinity prazosin sites by having a low affinity at these receptors relative to that for
the a 1A-adrenoceptor are, RS-17053 (Leonardi et al. 1997; Testa et al. 1997; Marshall et
al. 1996; Ford et al. 1996a), SNAP 5089 and REC 15/2627 (Testa et al. 1997; Leonardi
et al. 1997).
It was unclear as to how this classification scheme could be reconciled with the a 1A-,
a 1B- and a 1D- classification, which was evolving in parallel and whose subtypes could
not be distinguished by prazosin. Oshita et al (1992) suggested that the a 1A-, a ]B- and
a 1D- were subtypes of the a 1H- receptors, but this still meant that there was no cloned
counterpart for the prazosin insensitive receptors (a ]L/N-).
14
Although the identity of the gene encoding the oc]L-adrenoceptor is still not completely
clear, there is now some convincing evidence that the a 1A-adrenoceptor is responsible
for the a 1L- pharmacology. This idea initially came from experiments looking at the
human a la-adrenoceptor expressed in cell lines (Ford et al. 1997a; Ford et al. 1996a).
Radioligand binding experiments revealed a profile typical of the classical a ]A-
pharmacology, with a high affinity for prazosin, WB 4101, 5 methylurapidil,
niguldipine and RS-17053. When these results were compared to experiments
measuring inositol phosphate accumulation, it was shown that the pA2 values for these
antagonists fell, and values were more typical of those seen at the a ]L-adrenoceptor in
functional studies. The fall in the pA2 values could not be explained by an overall
lowering of the values, since affinity estimates for tamsulosin, indoramin and REC
15/2739 remained high and comparable to radioligand binding values. In addition,
similar experiments carried out using the a lb- and oc)d- cloned subtypes did not exhibit
such changes in affinity estimates between the two types of experiment. It was also
shown that if the conditions of radioligand binding were altered and whole cells rather
than membranes used, together with a change in the media, results from radioligand
binding at the cloned a la- could be altered to more closely mirror the a 1L-adrenoceptor
pharmacology (Williams et al. 1996).
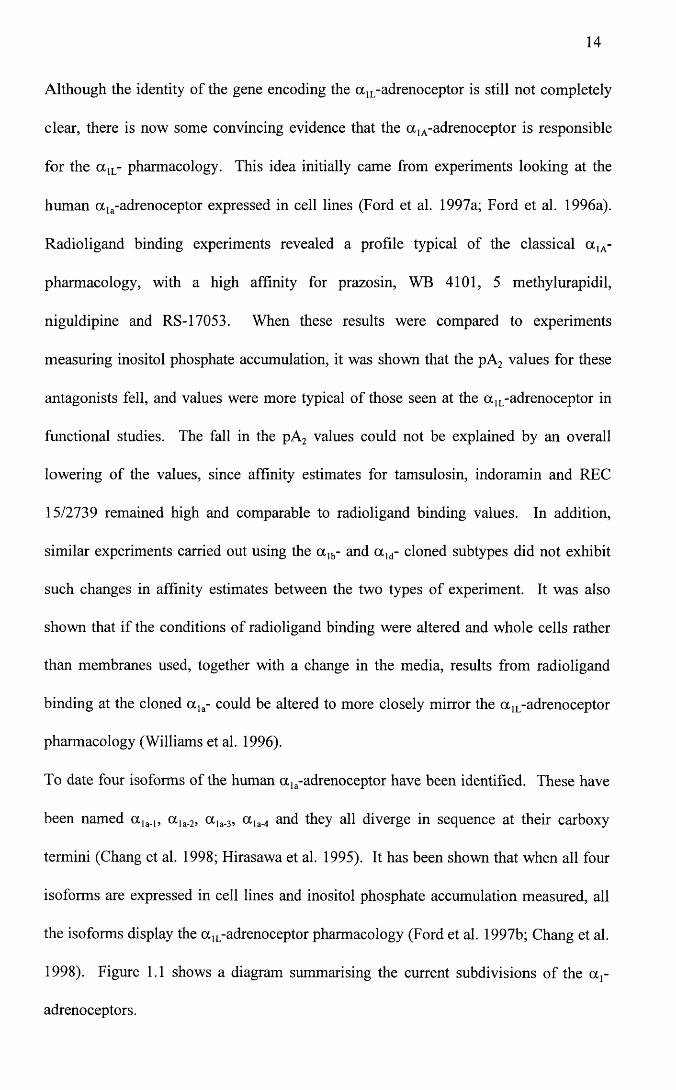
To date four isoforms of the human a la-adrenoceptor have been identified. These have
been named a ,^ , a la_2, a la_3, a ]a_4 and they all diverge in sequence at their carboxy
termini (Chang et al. 1998; Hirasawa et al. 1995). It has been shown that when all four
isoforms are expressed in cell lines and inositol phosphate accumulation measured, all
the isoforms display the a 1L-adrenoceptor pharmacology (Ford et al. 1997b; Chang et al.
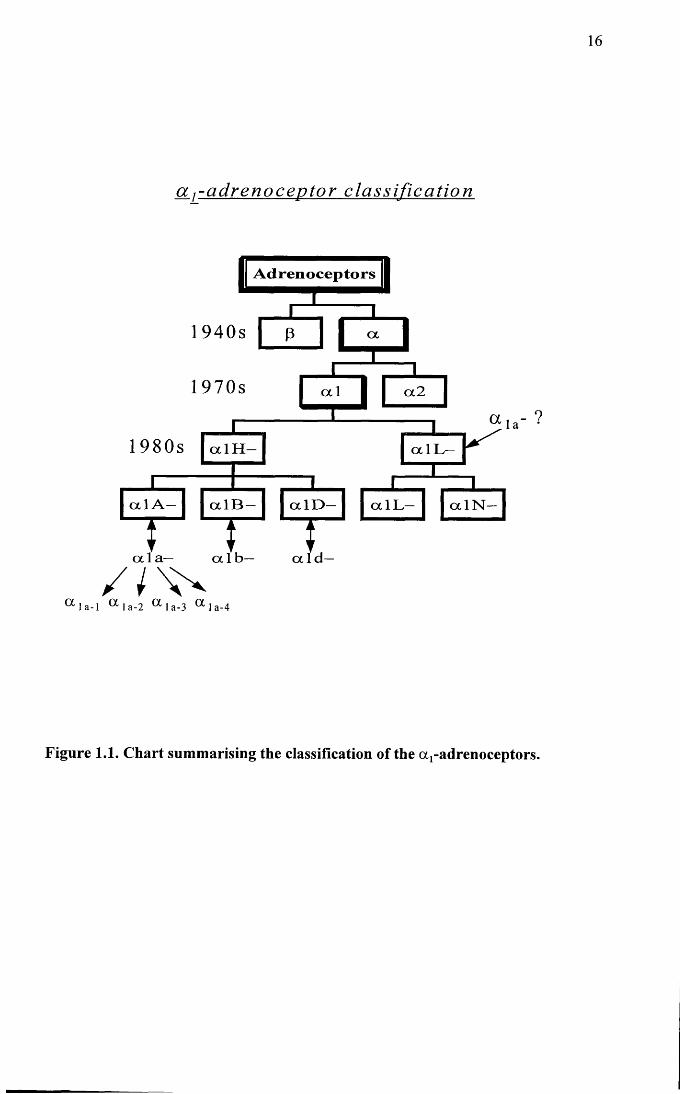
1998). Figure 1.1 shows a diagram summarising the current subdivisions of the oq-
adrenoceptors.

15
The a ]L-adrenoceptor is mainly associated with mediating noradrenaline induced
contraction of the lower urinary tract tissue of man (Muramatsu et al. 1995; Muramatsu
et al. 1994; Ford et al. 1996a) and animals, including the dog (Leonardi et al. 1997;
Testa et al. 1997), and the rabbit (Leonardi et al. 1997; Shannon Kava et al. 1998;
Deplanne and Galzin, 1996). In addition, a pharmacological profile consistent with this
subtype has been identified in a variety of blood vessels including, rabbit cutaneous
resistance arteries (Smith et al. 1997), rat small mesenteric artery (Van der Graaf et al.
1996a), dog saphenous vein, mesenteric vein and artery (Muramatsu et al. 1995), and
rabbit thoracic aorta (Muramatsu et al. 1990a).
a j - a d r e n o c e p t o r c l a s s i f i c a t i o n
A d r e n o c e p t o r s
1940s
1970s ocl
1980s
cx Ib ex l a — ocld—
cxlB — oclL—c x l D -ocl A — ocl N —
cxlH — oclL—
oc2
a l a - l a 1 a-2 a l a - 3 a 1 a-4
Figure 1.1. Chart summarising the classification of the a r adrenoceptors.
17
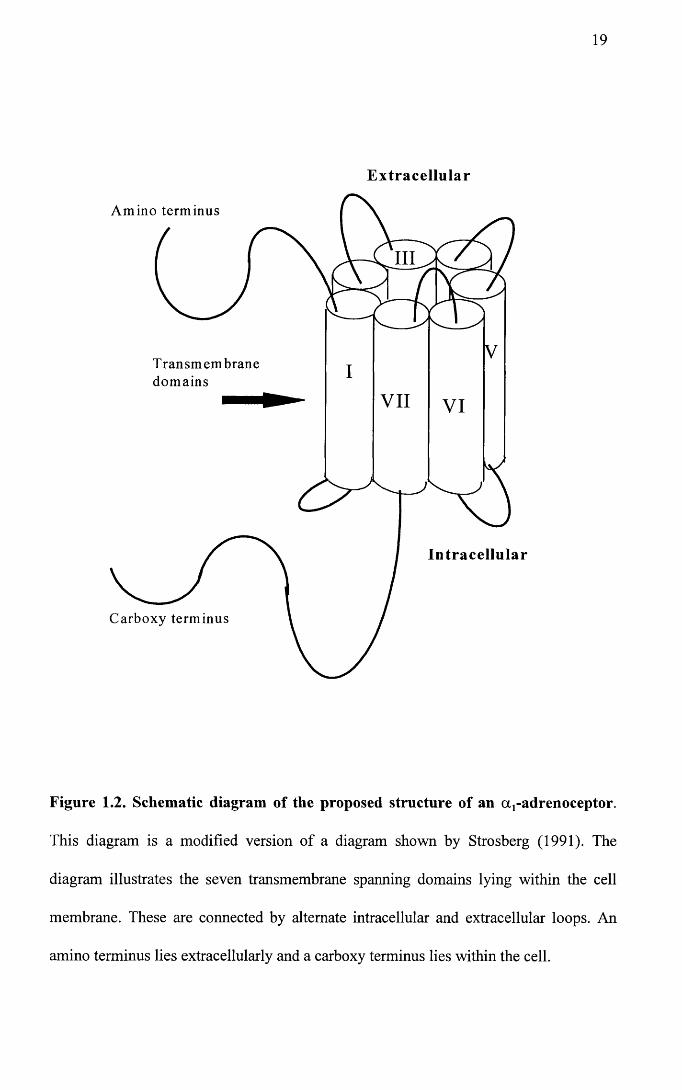
1.0.3 Structure and genomic organization of the a ,-adrenoceptors
a!-adrenoceptors are part of a larger family of cell receptors that are coupled to guanine
nucleotide regulatory proteins (G proteins) (Gilman, 1986). Hydropathicity analysis of
the cloned receptors has shown a similarity to rhodopsin and bacteriorhodopsin and
indicates a putative structure consisting of a single polypeptide chain ranging in length
from 429-561 amino acid residues, comprising seven transmembrane spanning domains
interspersed with alternate hydrophilic intra and extracellular loops, an extracellular
amino terminus and a cytoplasmic carboxy terminus (Graham et al. 1996; Schwinn et al.
1990; Cotecchia et al. 1988). A theoretical diagram of this is illustrated in Figure 1.2.
The exact three dimensional structure and orientation of the a,-adrenoceptors is still
being resolved.
Homology between the subtypes is highest in the transmembrane spanning domains
with homology in the order of 65-75% at the amino acid level when the subtypes are
compared (Cotecchia et al. 1995). Homologies are even higher between species for a
particular subtype as can be seen from sequence comparisons in Chapter 6, where for
example it is shown that homology between the a la-adrenoceptor sequences for different
species is in the order of « 90% .
The different subtypes are encoded by different genes with the a lb- being located on
human chromosome 5 and the a ]a- being located on human chromosome 8 (Smiley et al.
1998; Schwinn et al. 1990). Unlike most of the other G protein coupled receptors, the
a!-adrenoceptors have a single large intron located at the end of the putative VI
transmembrane spanning domain (Cotecchia et al. 1995; Perez et al. 1994; Ramarao et
al. 1992). A recent study also examined the genomic organization of the exon cassettes
encoding the four isoforms of the human a la-adrenoceptor (a la_„ a la_2, ot]a_3, a la,4). In
this study, workers were unable to locate the exon encoding for the <x]a_2 isoform but
18
showed that the exon for the a la_, isoform lay beside the VII transmembrane domain
region with no intron gap, the a ]a_4 isoform lay 1.4Kb downstream and the a ]a_3 exon lay
approximately another 7Kb downstream (Chang et al. 1998).
A number of studies using mutated and chimeric a,-adrenoceptors have been able to
identify regions of the receptor responsible for G protein interactions, homologous
desensitization and ligand binding.
Zhao et al (1996) found that three residues lying side by side on the extracellular loop of
the fifth transmembrane spanning domain could alter the antagonist affinity of WB 4101
and phentolamine. Therefore if these sites on an a ]b-adrenoceptor were mutated to the
residues found in the a ]a-adrenoceptor, this changed the antagonist profile from oc]b- to
a la- in relation to WB 4101 and phentolamine. If the residues were mutated back the
antagonist affinity could be reversed back to that for the a lb-.
Lattion et al (1994), using truncated forms of the a lb-adrenergic receptor, demonstrated
that the carboxy terminal portion of the receptor was important in phosphorylation and
homologous desensitization. Taking things a step further, (Diviani et al. 1997) it was
shown that in fact 21 amino acids in the carboxy terminal portion of the receptor
contained the phosphorylation sites associated with desensitization.
Using a chimeric receptor (p2-/oclb-), it was shown that the third intracellular loop of the
a,-adrenoceptor was important in the coupling of the receptor to the G protein. Further
analysis revealed that 27 residues contained in the amino end of the third intracellular
loop were sufficient to allow G protein coupling (Cotecchia et al. 1992). In addition,
the same group were able to demonstrate that point mutations in the carboxy end of the
third intracellular loop could produce constitutively active receptors (Kjelsberg et al.
1992).
19
Extracellular
Amino terminus
III
Transmembranedomains
VII VI
Intracellular
Carboxy terminus
Figure 1.2. Schematic diagram of the proposed structure of an aj-adrenoceptor.
This diagram is a modified version of a diagram shown by Strosberg (1991). The
diagram illustrates the seven transmembrane spanning domains lying within the cell
membrane. These are connected by alternate intracellular and extracellular loops. An
amino terminus lies extracellularly and a carboxy terminus lies within the cell.
20
1.0.4 Signal transduction
As already discussed above, it was previously thought that the a ]A- and a 1B- subtypes of
adrenoceptor could be distinguished on the basis of their signal transduction
mechanisms, with the a 1B- subtype depending on intracellular calcium and the a 1A-
depending on extracellular calcium (Han et al. 1987a; McGrath, 1982). It has since
been demonstrated that due to exceptions to the rule, this was not a reliable
differentiating feature.
Although the pathways leading to an increase in intracellular calcium concentration are
still not clear, it is generally accepted that a,-adrenoceptors couple to G proteins usually
of the pertussis toxin-insensitive family. G proteins are heterotrimeric structures made
up of a , (3 and y subunits. The a subunits are divided into several families. Examples of
some of these families are, and G0, which are pertussis toxin-sensitive, Gs which are
pertussis toxin-insensitive, G]2 about which little is known and Gq which are pertussis
toxin-insensitive. The Gq family is the one which is associated with a,-adrenoceptor
mediated phosphatidylinositol metabolism and the family comprises Gaq, Gall, GaU and
Ga]6 (Wu et al. 1992, Guarino et al. 1996). Coupling to the G protein leads to activation
of a membrane phospholipid, generally phospholipase C, which in turn catalyzes the
breakdown of phosphatidylinositol-4,5-bisphosphate (PIP2), releasing diacylglycerol
and Ins (1,4,5) P3. Ins (1,4,5) P3 induces the release of calcium from intracellular stores.
Diacylglycerol activates Protein Kinase C which phosphorylates a number of
intracellular proteins including calcium channels (Minneman and Esbenshade, 1994;
Minneman, 1988).
A number of studies have aimed to identify differences in signal transduction pathways
utilized by different subtypes of a r-adrenoceptor, but again, if differences exist, they
remain to be fully elucidated. Since the cloning of the a r subtypes, expression of the
21
receptors in cell lines has allowed the study of a particular subtype in isolation.
Interpretation of the findings of these types of studies should, however, be treated with
caution. Generally in transfection studies, the level of receptor expression is extremely
high. Under these conditions, the amount of G protein and second messengers become
limiting to the response. Under such circumstances, receptors may couple to and
activate G proteins and second messenger systems that the native receptors would not.
This can lead to errors in conclusions regarding signalling pathways and ligand
affinities (Kenakin, 1997; Minneman and Esbenshade, 1994).
Bearing this in mind, from transfection studies it would seem that all the cloned
receptors can induce inositol phosphate accumulation (Cotecchia et al. 1995; Schwinn et
al. 1991; Theroux et al. 1996; Minneman and Esbenshade, 1994), although the a ]a-
adrenoceptor seems to couple to phospholipase C with the greatest affinity (Theroux et
al. 1996; Schwinn et al. 1991). These differences could be explained by the different
subtypes interacting with different G proteins. Wu et al (1992), showed that all three
subtypes of cloned receptor could couple to both Gaq and Gall. In contrast only a la- and
a lb- coupled to Gal4, and only a lb- coupled to Ga]6.
While the above Gq family proteins are all pertussis toxin-insensitive, there is also
eviden;e that aj-adrenoceptors do interact with pertussis toxin-sensitive G proteins.
Boonei and DeMey (1990), demonstrated that the contractile responses of o^-agonists
in the :at mesenteric resistance artery were abolished by treatment with pertussis toxin
and Gurdal et al (1997), were able to demonstrate that in rat aorta, although part of the
phenylephrine mediated response was pertussis toxin-insensitive and associated with
Gaq, a proportion of the response was sensitive to the application of pertussis toxin, and
seemed to be associated with an interaction of the a ]B-adrenergic receptor with the
pertussis toxin-sensitive Gao.
22
As well as activation of phospholipase C, a,-adrenoceptors can activate phospholipase
D and phospholipase A2 (Balbao and Insel, 1998; Graham et al. 1996). In addition, the
a ,- adrenoceptors can increase intracellular cAMP (Chang et al. 1998; Schwinn et al.
1991; Cotecchia et al. 1990). This latter effect has been most studied in the ot]b-
adrenoceptor and it would seem that in transfected cells, this receptor can couple to Gs
(Horie et al. 1995).
It has recently been shown that the a ]d-adrenoceptor can induce smooth muscle cell
hypertrophy through activation of the mitogen-activated protein kinase (MAP kinase)
cascade (Xin et al. 1997), which has been identified as an important pathway involved
in regulating the growth and differentiation of cells. As this study examined native
receptors in smooth muscle cells, the pathway allowing activation of the MAP kinase
cascade is likely to be a real event. Another study using neonatal myocytes showed that
both a r and P- adrenoceptors were involved in MAP kinase and raf-1 kinase activation
and that the action of both receptor types appeared to be synergistic (Yamazaki et al.
1997).
1.1 Heart Failure
1.1.1 Definition
The aim of the body is to maintain cardiac output, which is defined as the volume of
blood pumped out of the ventricles per minute. When for some reason the body fails to
circulate enough blood to meet the metabolic demands of the body or the blood backs
up within the venous or capillary bed, this is termed heart failure (Hamlin, 1988). The
main factors controlling cardiac output are outlined in Figure 1.3.
23
1.1.2 Aetiology
Causes of heart failure may be primarily cardiac or vascular and aetiologies differ with
the species involved. In man the main causes of heart failure are hypertension and
coronary artery disease. In the domestic canine population there are two main causes of
acquired cardiac disease, namely endocardiosis and idiopathic dilated cardiomyopathy.
Endocardiosis
This is the most common acquired cardiac disease in the canine population. One study
suggested that 58% of dogs over the age of 9 years had evidence of severe valvular
disease at postmortem (Whitney, 1974). Endocardiosis of the atrioventricular valves is
the most common finding with the mitral valve being affected in about 60% of cases.
Involvement of both mitral and tricuspid valves is found frequently but involvement of
the tricuspid valve alone is much less likely. In general smaller breeds of dog are more
commonly affected and males are 1.5 times more likely than females to develop the
condition (Keene, 1988). The condition has also been reported in pigs (Guarda et al.
1993; Castagnaro et al. 1997).
The aetiology is still not understood. Certainly some breeds have a much higher
incidence, for example the cavalier King Charles Spaniel (Haggstrom et al. 1992),
suggesting a genetic component to the condition.
Grossly the valves become thickened and irregular in outline and this is thought to be
due to defective or degenerative alterations in the collagen or glycosaminoglycan
content of the valve leaflets. In effect the atrioventricular valve becomes leaky so that
during ventricular systole, blood jets back into the atria instead of being ejected out into
the aorta and pulmonary artery. Stroke volume is therefore reduced (Keene, 1988).
24
Dilated cardiomyopathy
The aetiology of dilated cardiomyopathy is also unknown. This is the most common
myocardial disease of dogs. The mean age of affected animals is 4-6 years. Male
animals and especially the “giant breeds” are more commonly affected (Tidholm and
Jonsson, 1997). Common breeds involved are Great Danes, Wolfhounds, Dobermann
Pinschers, Boxers, Springer Spaniels and Cocker Spaniels. On postmortem the heart is
large and dilated. There may be concurrent endocardiosis but even if the valve leaflets
are normal there has often been valvular regurgitation due to dilation of the valve
annulus. Focal endocardial fibrosis is often present and histologically there is
myocardial cellular degeneration (Tidholm and Jonsson, 1997; Tidholm, 1996; Cobb,
1992).
A number of less common conditions can also cause acquired cardiac disease in dogs
such as, endocarditis, cardiac tamponade, intracardiac neoplasia and hypertrophic
cardiomyopathy (although this latter condition is prevalent in the feline population (Luis
Fuentes, 1992)).
Congenital cardiac anomalies can also precipitate the syndrome of cardiac failure and
occur not uncommonly in the canine population. Some examples of these would be
pulmonic stenosis, aortic stenosis, ventricular septal defects, atrioventricular valve
dysplasias and patent ductus arteriosis (Olivier, 1988).
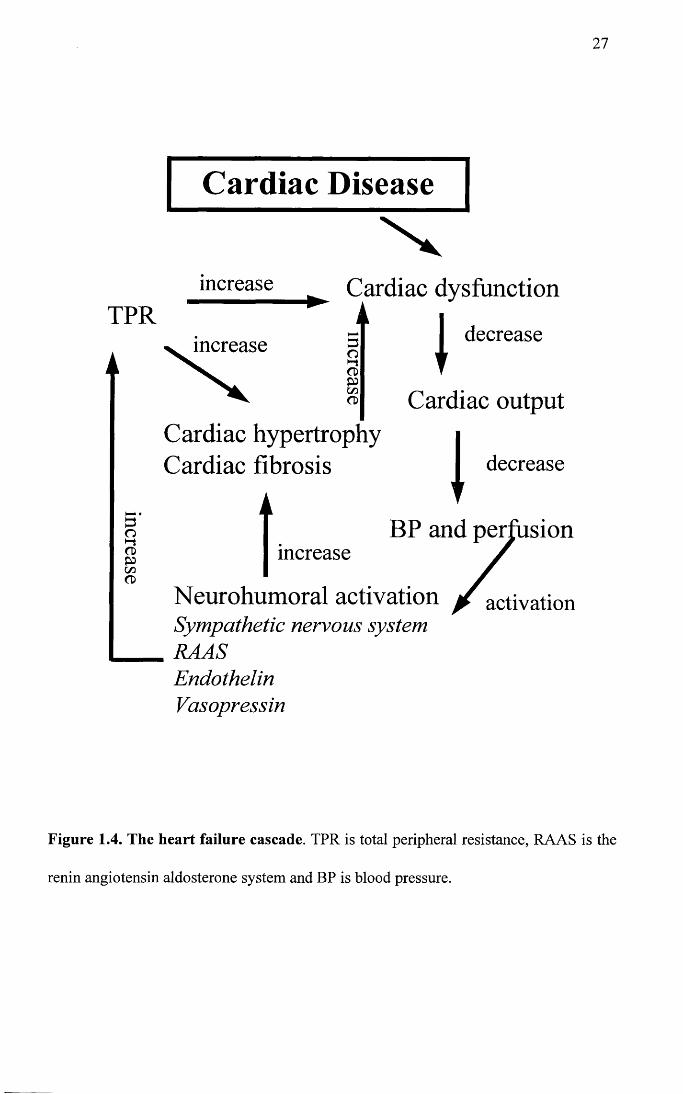
1.1.3 Pathophysiology of heart failure
In respect of the pathophysiology, the sequence of events resulting in the syndrome of
cardiac failure are similar irrespective of the initiating cause.
When there is a fall in the cardiac output, this causes a fall in blood pressure, since
blood pressure is the sum of cardiac output times total peripheral resistance (Levick,
25
1992). The body aims to maintain the blood pressure through a number of reflex arcs
which involve baroreceptors, cardiopulmonary receptors, arterial chemoreceptors and
muscle receptors. These receptors send messages to the nucleus tractus solitarus in the
brain. This in turn leads to neurohumoral activation. In the short term these
mechanisms may well be beneficial to the body, but in the longer term they can actually
contribute to and worsen the syndrome of heart failure (Francis et al. 1984). Figure 1.3
summarises the factors which influence cardiac output and Figure 1.4 summarises the
factors involved in the genesis of heart failure. In Figure 1.3, Starling’s law describes
the phenomenon whereby, within certain limits, an increase in preload (end diastolic
volume), causes an increase in stroke volume. The relationship is not linear, since
above a certain limit, further increases in preload are associated with a plateau and then
a decline in stroke volume (Levick, 1992). Laplace’s law S=Pr/2W, links the
dimensions of the ventricle to wall stress. The main determinant of afterload (the force
against which the ventricle contracts), is the total peripheral resistance and this is
directly proportional to wall stress on the ventricle. However, chamber dimensions will
also have an effect on wall stress and the force of contraction of the ventricle. In the
equation S = Pr/2W, S is the wall stress or afterload, P is the pressure, r is the chamber
radius and W is the wall thickness. From this it can be seen that in dilated
cardiomyopathy for example, where the chamber is dilated and the wall is thin, S will be
bigger leading to increased wall stress and a reduction in force production. (Hamlin,
1988).
26
C a r d i a c o u t p u th r x sv
P arasym p athet icv /H ear t rate (HR)
r
S y m p a th e t ic
Stroke vo lume (SV)
\Preload After load
Sta r l ing’s law_ t r L a p l a c e ’s lawOther factors S=Pr/2W(adrenal ine , ca lc ium etc.)
Total per iphera l res is tance
Figure 1.3. Flow diagram representing the main factors that contribute to the
control of cardiac output.
increase
27
TPR
A
Cardiac Disease
increase
increase
Cardiac dysfunctioni i
decreaseE3oCDPcnCD Cardiac output
Cardiac hypertrophy Cardiac fibrosis I decrease
BP and perfusionincrease
Neurohumoral activationSympathetic nervous systemRAASEndothelinVasopressin
/ activactivation
Figure 1.4. The heart failure cascade. TPR is total peripheral resistance, RAAS is the
renin angiotensin aldosterone system and BP is blood pressure.
28
1.1.4 Neurohumoral systems
Neurohumoral activation comprises several important components. These include, the
sympathetic nervous system, the renin angiotensin aldosterone system, endothelin,
vasopressin and the natriuretic peptides.
Sympathetic nervous system
Activation of the sympathetic nervous system occurs very early in the course of disease
and elevation in circulating catecholamines has been well documented. (Francis et al.
1984; Grassi et al. 1995; Hasking et al. 1986; Leimbach et al. 1986; Cohn et al. 1984;
Thomas and Marks, 1978). Increased sympathetic activity leads to increases in heart
rate through p-adrenoceptors in the myocardium and peripheral vasoconstriction
primarily through a ,- but also a 2-adrenoceptors in vascular smooth muscle. The exact
mechanism of elevated circulating catecholamines has been the subject of some debate.
Several papers suggested that the increased levels are simply due to increased release
from the nerve terminal and the adrenal gland (Meredith et al. 1993; Hasking et al.
1986). However, more recent publications suggest, not only that an increased release of
catecholamine is involved, but also that there appears to be an impairment in the
reuptake of noradrenaline by nerve terminals in the myocardium (Bohm et al. 1995;
Beau and Saffitz, 1994), which contributes to local elevation and leads to spillover into
the plasma.
The overall effect of sympathetic activation is to increase heart rate, force of contraction
and increase total peripheral resistance. While in the short term these effects may be
beneficial in maintaining the blood pressure, in the longer term they are almost certainly
detrimental (Francis et al. 1984). An obvious adverse effect is the increased total
peripheral resistance which increases the afterload on the myocardium. This in turn
increases myocardial wall stress which is directly proportional to myocardial oxygen
consumption. In addition, it now seems clear that a ] -adrenoceptors can mediate
vascular smooth muscle and myocyte growth and hypertrophy (Xin et al. 1997; Milano
et al. 1994; Yamazaki et al. 1997; Milano et al. 1994). This will also contribute to the
raised peripheral resistance and to ventricular remodelling. The ventricular remodelling
is characterised by lengthening of the myocytes, slippage of the myocytes and
interstitial growth. The net effect of all these changes is to alter the shape and lower the
efficiency of the ventricle thereby having a deleterious effect on the patient (Cohn,
1995).
In fact, it has been shown that plasma levels of noradrenaline have an inverse
relationship to prognosis, i.e. the higher the levels of circulating catecholamines, the
poorer the prognosis for the patient (Cohn et al. 1984).
Another feature of increased sympathetic activity is a decrease in p-adrenoceptor
sensitivity and receptor number, due to homologous desensitization and downregulation
of these receptors. The effects can be seen in the myocardium and vascular smooth
muscle. In the canine pacing induced model of heart failure it has been shown that there
is a decrease in density of p-adrenoceptors in the myocardium, but this effect can be
reversed on cessation of pacing (Larosa et al. 1993). Decreased P-adrenoceptor density
can also be demonstrated in human myocardium from heart failure patients (Bristow et
al. 1982; Bristow et al. 1986). Downregulation of peripheral vascular p-adrenoceptor
function has also been demonstrated in dogs with pacing induced heart failure (Kiuchi et
al. 1993). There would also appear to be a role for alteration in the G protein
composition of cells contributing to the decreased p-adrenoceptor function. This can be
demonstrated by a decrease in G(s) (stimulatory), without alteration in G(i) (inhibitory)
content (Vatner et al. 1996; Lai et al. 1996).
30
Renin angiotensin aldosterone system (RAAS)
Renin is released from the juxtaglomerular apparatus in the kidney. The release of
renin is triggered by a fall in local perfusion and sympathetic activity. Renin converts
angiotensinogen into angiotensin I. Angiotensin I is in turn converted to angiotensin II
by angiotensin converting enzyme (ACE) (Levick, 1992). Originally this conversion
was thought to occur primarily in the lung, but it now seems clear that ACE activity is
more widely distributed throughout the endothelium in the vascular system and that
local renin release from tissues other than the kidney plays an important role
(Timmermans et al. 1993; Diet et al. 1996). Angiotensin II has numerous effects. It
causes the release of aldosterone from the adrenal gland which in turn is responsible for
the retention of sodium and water (Hall, 1986). It has also been shown that chronic
administration of aldosterone can induce a reduction in baroreceptor sensitivity in dogs
(Wang, 1994), a phenomenon which is well described in heart failure (Dibnerdunlap and
Thames, 1992; Wang et al. 1996). Angiotensin II is a potent vasoconstrictor by direct
activity on AT, receptors on the vascular smooth muscle (Timmermans et al. 1993).
Angiotensin II also modulates a ,-adrenoceptor function and has been shown to enhance
noradrenergic neurotransmission (Minatoguchi and Majewski, 1994; Cox et al. 1996),
as well as increasing the transcription and expression of a,-adrenoceptors in vascular
smooth muscle (Hu et al. 1995). Conversely, the use of angiotensin converting enzyme
inhibitors has been shown to decrease a, -adrenoceptor sensitivity in human vessels
(Kimura et al. 1997). ACE enhances the breakdown of the vasodilator bradykinin,
thereby having an indirect vasoconstrictor effect (Warren and Loi, 1995). Activation of
the RAAS is associated with elevations in levels of endothelin (Clavell et al. 1996) and
angiotensin II has been shown to have a direct depressant effect on myocytes which
appears to be mediated through the AT, receptor. The growth effects of angiotensin II
31
have been well documented and angiotensin II can promote hypertrophy of cardiac
myocytes through actions mediated primarily through ATj receptors (Booz and Baker,
1996), as well as hypertrophic (Berk et al. 1989; Geistefer et al. 1988), and hyperplastic
(Dubey et al. 1992), responses in vascular smooth muscle.
Endothelin
Endothelin is a 21-amino acid peptide, and was first described in 1988 (Yanagisawa et
al. 1988). It is synthesized by the endothelium. Three endothelins have been described
but endothelin-1 is the most important. The actions of endothelin are mediated by ETA
and ETb receptors (Cannan et al. 1996). ETA receptors are located on vascular smooth
muscle where they mediate vasoconstriction and ETB receptors are located on the
endothelium where they mediate vasodilation. ETB receptors have also been localized
to smooth muscle where they can mediate vasoconstriction (Rubanyi and Polokoff,
1994).
Endothelin can also mediate hypertrophic and mitogenic responses (Gwathmey and
Paige, 1994; Booz and Baker, 1996). Levels of endothelin are elevated during cardiac
failure in both experimental models (Margulies et al. 1990), and in human heart failure
patients (Stewart et al. 1992). During experimental heart failure the inotropic response
to endothelin is enhanced (Li and Rouleau, 1996), as is coronary artery contraction
(Cannan et al. 1996). The pulmonary circulation is thought to be important in the
clearance of endothelin, and ETB receptors may be especially important in this role
(Dupuis et al. 1996).
There are numerous interactions with endothelin and the other factors involved in
neurohumoral activation. For example, in experimental heart failure the RAAS appears
to increase the levels of endothelin (Clavell et al. 1996), atrial natriuretic peptide
32
decreases the release of endothelin-1 secretion (Wada et al. 1996), and a r adrenoceptors
may be involved in the activity of endothelin (Todorov et al. 1995).
Vasopressin
Vasopressin is released from the posterior pituitary gland and has antidiuretic actions as
well as being a powerful vasoconstrictor (Levick, 1992). During heart failure levels of
this hormone are elevated (Francis et al. 1984).
Natriuretic peptides
There are three natriuretic peptides, atrial natriuretic peptide (ANP), brain natriuretic
peptide (BNP) and C-type natriuretic peptide (CNP) (Winaver et al. 1995). Levels of
BNP and ANP are elevated in heart failure.
Atrial nariuretic peptide is produced by atrial myocytes in response to stretch (Brenner
et al. 1990). ANP is also produced by ventricular myocyctes, but only when ventricular
hypertrophy is present (Lee et al. 1988). Levels of ANP are elevated during heart failure
and have been shown to correlate positively with mortality in patients with cardiac
disease (Swedberg et al. 1990). ANP induces diuresis and vasodilation (Swedberg et al.
1990). It also decreases the activity of the RAAS (Fett et al. 1993), endothelin-1
production (Wada et al. 1996) and, it can modulate the release of vasopressin (Winaver
et al. 1995). ANP has also been shown to have anti-growth and anti-proliferative effects
on vascular smooth muscle cells (Winaver et al. 1995).
BNP is also elevated in cardiac disease and is produced predominantly by ventricular
myocytes (Yasue et al. 1994). There is evidence that BNP is a superior marker of
ventricular dysfunction compared to ANP (Yamamoto et al. 1996).
33
1.1.5 Treatment of cardiac failure
The mainstays of treatment of cardiac disease in the canine population comprise the use
of diuretics, vasodilators and cardiac glycosides.
Diuretics are used in an attempt to control the congestion seen in heart failure which is
most often exhibited as pulmonary oedema. Frusemide is the diuretic of choice. This is
a high ceiling loop diuretic which reduces the resorption of sodium and chloride in the
loop of Henle (Kittleson, 1988). Often if the diuresis induced by frusemide is
insufficient then it may be combined with another class of diuretic such as
spironolactone. This latter drug is a potassium sparing diuretic and has been shown to
be effective in the management of human patients refractory to frusemide alone
(Vanvliet et al. 1993).
Digoxin is a cardiac glycoside which is used frequently in canine heart failure. It has a
variety of actions which include positive inotropy, resetting of the baroreceptor reflex,
reduction in the release of renin from the juxtaglomerular apparatus and vagomimetic
activity, for example, slowing of conduction through the atrioventricular junction
(Kittleson, 1988). One of the main indications of digoxin is in the management of atrial
fibrillation. This dysrhythmia is commonly found in dogs with atrial enlargement often
associated with the common cardiac diseases such as dilated cardiomyopathy and
endocardiosis. In this case, digoxin helps to slow down the ventricular response to the
atrial fibrillation (Keene, 1996).
One of the most successful treatments in recent years has been the angiotensin
converting enzyme inhibitors (ACEI). These drugs prevent the formation of angiotensin
II from angiotensin I, by inhibiting the angiotensin converting enzyme. This results in a
blockade of the effects of both ACE and angiotensin II which have been described in the
section titled renin angiotensin aldosterone system. They are now used extensively in
34
the management of heart disease in the human population. An increasing number of
studies has shown that these drugs have significant benefits and increase longevity,
quality of life and haemodynamic parameters both in the human population
(CONSENSUS trial study group, 1987) and in the canine population (Woodfield et al.
1995; Hamlin et al. 1996; The IMPROVE study group, 1995).
1.1.6 The role of the vasculature in heart failure
For several decades it has been clear that exercise intolerance is an important component
of cardiac disease. Not only this, but the degree of exercise intolerance exhibited by
patients is often disproportionate to their degree of left ventricular dysfunction (Francis
et al. 1984). This has led to the belief that there must be an additional factor
contributing to the syndrome in addition to the myocardial dysfunction itself. One
theory is that there is an alteration in skeletal muscle metabolism, preventing the
exercising muscle from working efficiently (Coats, 1996).
The other factor which is considered to be important and which is relevant in this study,
is that there is an alteration in the peripheral vasculature which contributes to increased
total peripheral resistance and prevents normal dilation of the vasculature, which would
normally increase blood flow to the exercising skeletal muscle. Indeed, a number of
studies both on human patients and animal models of disease have confirmed that blood
flow to exercising skeletal muscle is reduced in heart failure (Zelis et al. 1969; Musch
and Terrell, 1992; Higgins et al. 1972). Wilson et al (1984), found a reduction in limb
blood flow and an increased 0 2 extraction, together with early lactate production, in
heart failure patients when compared to normal controls. LeJemtel et al (1986)
described similar findings, but this time compared single and two limb exercise. In
normal patients, cardiac output reached a maximum and oxygen uptake reached a
35
plateau during two limb exercise. In contrast, during single limb exercise, maximal
cardiac output was not achieved prior to fatigue, although vascular flow was greater in
the limb during single leg exercise compared to two limb exercise. In the heart failure
group, patients had a reduced limb blood flow and did not show an increased blood flow
to the limb when only single leg exercise was performed, suggesting an impaired blood
flow. Taking things a step further, Jondeau et al (1995), demonstrated that normal
patients asked to perform leg exercise to exhaustion achieved maximal cardiac output,
and oxygen consumption reached a plateau. In contrast, heart failure patients did not
achieve maximal cardiac output during leg exercise, since additional arm exercise in the
failure group induced a further increase in their cardiac output. This suggested that
blood flow to the lower limb and not cardiac output was the limiting factor for the heart
failure patients.
This led to an increasing interest in the peripheral vasculature, both in relation to
characterisation of normal vessels and in relation to the identification of alterations in
the heart failure state.
To date a number of studies have looked at the vasculature in vivo and in vitro. Results
have often been conflicting but findings fall into two main categories. 1. Alteration in
vasorelaxation. 2. Alteration in smooth muscle contraction.
Vasorelaxation
Two important pathways are involved in mediation of vascular smooth muscle
relaxation, namely pathways involving the formation of guanosine 3’-5’-cyclic
monophosphate (cGMP) or those involving adenosine 3’-5’-cyclic monophosphate
(cAMP), (Vanhoutte, 1996; Nasa et al. 1996). The three main relaxing factors released
from the endothelium are nitric oxide, prostacyclin and endothelium-derived
36
hyperpolarizing factor (EDHF). The release of these factors from the endothelium can
be triggered by a number of substances. Acetylcholine, for example, induces the release
of nitric oxide and also EDHF (Vanhoutte, 1996). Nitric oxide is also released under
basal conditions and release can be triggered due to shear stress on the vascular wall
(Hayoz et al. 1993). Adenosine can also stimulate or inhibit the formation of cAMP
depending on the subtype of receptor involved. This substance is released from cells by
facilitated diffusion and also from the degradation of released ATP. It has been shown
that mice lacking the adenosine A2a receptor demonstrate hypertension, suggesting that
the action of adenosine at this receptor subtype is important in mediating a degree of
basal vasorelaxation (Ledent et al. 1997).
A growing number of human and animal studies have now demonstrated alterations in
relaxation responses in vessels from heart failure patients and animals.
A consistent finding is that acetylcholine mediated, endothelium-dependent relaxation
responses, are attenuated in heart failure. This has been demonstrated in forearm blood
flow studies (FBF) in human heart failure patients (Katz et al. 1992; Drexler et al. 1992;
Kubo et al. 1991; Hirooka et al. 1994), in isolated resistance sized gluteal arteries from
heart failure patients (Angus et al. 1993), in the femoral artery and coronary arteries of
dogs with experimentally induced heart failure (Wang et al. 1994; Kaiser et al. 1989),
and in rats with experimentally induced heart failure, both in isolated vessels and in
intact hindquarter resistance vessels (Nasa et al. 1996; Drexler and Wenyan, 1992).
This finding is unlikely to be due to an inability of the vascular smooth muscle to relax
to the nitric oxide released from the endothelium, since most studies have shown, that
unlike the relaxation to acetylcholine, the relaxation to sodium nitroprusside or
nitroglycerine, which are endothelium-independent vasorelaxing agents, using the
cGMP pathway, is not attenuated in heart failure, both in vivo, (Drexler et al. 1992;
37
Drexler and Wenyan, 1992; Wang et al. 1994; Kaiser et al. 1989; Hirooka et al. 1994),
and in isolated vessels, (Nasa et al. 1996; Angus et al. 1993). It therefore seems more
likely that the endothelium is defective in heart failure. Interestingly, from the point of
view of this study, one group failed to show alteration in acetylcholine induced
vasorelaxation, where isolated dorsal pedal artery and saphenous vein segments from
dogs with experimentally induced heart failure were examined, (Forster et al. 1989).
Several studies have also reported a reduced cAMP mediated vasodilation in heart
failure. For example, Mathew et al (1993), examined isolated canine pulmonary arteries
from dogs with experimental heart failure and showed, that while vasorelaxations to
acetylcholine and bradykinin were comparable to controls (cGMP mediated),
vasorelaxations to isoproterenol, arachidonic acid and prostacyclin, were all attenuated
in the failure group (cAMP mediated). Nasa et al (1996), also demonstrated a reduction
in isoproterenol mediated vasorelaxation in thoracic artery and pulmonary artery in rats
with experimental heart failure.
Results regarding alterations in basal nitric oxide production in heart failure are less
conclusive. Some workers report no change in basal nitric oxide production, as
estimated by vasoconstrictor response to nitric oxide synthase inhibitors (Drexler and
Wenyan, 1992; Kubo et al. 1994). In contrast, Eisner et al (1991), found that there was
a decreased vasoconstrictor response to NG-nitro-L-arginine (NNA) in dogs with
experimental heart failure, suggestive of reduced basal nitric oxide and Teerlink et al
(1994), found that the enhanced response of intact isolated aortic rings from rats with
heart failure was due to a reduced basal nitric oxide production in the heart failure
versus the control animals. Finally, several studies report evidence for enhanced nitric
oxide production in heart failure, the three studies cited all being in human heart failure
patients (Drexler et al. 1992; Habib and Oakley, 1994; Winlaw et al. 1994).
38
Vasoconstrictor responses
Fewer studies have examined agonist responses in heart failure and the results from
these studies are inconsistent. Obviously factors such as the species, the stage and
severity of disease, the blood vessels examined, the experimental design and drug
treatment will all have an influence and can contribute to the findings for individual
studies.
A number of studies by Forster et al, have demonstrated an enhanced sensitivity and
maximal response to noradrenaline in isolated dorsal pedal artery and saphenous vein
segments from pacing induced heart failure dogs when compared to controls (Forster et
al. 1989; Forster and Armstrong, 1990). On further examination, it appeared that the
response to a,-agonists was enhanced while response to a 2-agonists was decreased.
Stassen et al (1997a; 1997b) also found an increased sensitivity to phenylephrine in
isolated vessels from rats with experimental heart failure, although maximal response
was reduced. The difference appeared to be related to calcium influx and not to protein
kinase C or the IP3 mediated release of intracellular calcium. Teerlink et al (1994), in
endothelium denuded aortic rings from heart failure rats, found a reduction in maximal
response to both noradrenaline and potassium chloride. This was similar to findings of
Angus et al (1993), who also found a reduction in maximal response in gluteal
resistance arteries from human heart failure patients, when a variety of agonists were
used including noradrenaline, angiotensin I and angiotensin II.
In vivo studies have been similarly conflicting with Feng et al (1994), demonstrating
reduced responses to both a r and a 2-adrenoceptor agonists in forearm blood flow
studies. Meanwhile, Indolfi et al (1994), also in forearm blood flow studies in human
patients, reported no change in a ,- and a 2- adrenoceptor agonist responses. Kubo et al
(1989), showed a similar response to the a 2-antagonist yohimbine in control and heart
39
failure patients in forearm blood flow studies also supportive of the finding that there
was no alteration in the a 2-adrenoceptor population.
1.2 Aims of this thesis
As outlined in the introduction, the resistance artery component of the peripheral
vasculature plays an important role in maintenance of total peripheral resistance. There
is now convincing evidence that vascular alterations contribute to the syndrome of heart
failure, but as yet the exact mechanisms involved have not been fully elucidated. It is a
prerequisite that before pathophysiological changes can be characterised, the “normal”
characteristics of in this case, blood vessels, must be understood. On this basis, this
thesis has three main aims.
1. Since a,-adrenoceptors are important mediators of vascular smooth muscle
contraction, the primary aim of this project was to characterise the dog saphenous vein
and subcutaneous resistance arteries, in relation to a!-adrenoceptors mediating
contraction to exogenous noradrenaline. The dog saphenous vein has been used in
pharmacological studies before, therefore some characterisitics of this vessel were
already known. In contrast, to my knowledge, isolated canine subcutaneous resistance
arteries have not been studied.
2. In addition to functional characterisation of the a,-adrenoceptors, another aim of this
project was to clone and sequence the canine a ]a- adrenoceptor. This subtype was
selected because of the mounting evidence from the literature that the a la- subtype is
responsible for the a ]L- adrenoceptor pharmacology. This latter subtype appears to play
a functional role in both of the vessels that were examined.

40
3. Although studies on isolated vessels from experimental models of heart failure have
been conducted, studies using isolated vessels from dogs with naturally occurring heart
failure have not been carried out. For this reason, segments of femoral artery,
saphenous vein, and subcutaneous resistance arteries were collected from clinical heart
failure cases which were euthanased because of their heart disease. Experiments were
designed to identify alterations in vasoconstriction and vasorelaxation responses
between control and heart failure animals, taking into account the aetiology of the heart
failure and treatment if any.
41
CHAPTER 2
Material and methods for functional studies
2.0 Materials
2.0.1 Solutions
2.0.2 Drugs
2.0.3 Animals used
2.1 Vessel removal
2.1.1 Saphenous vein removal
2.1.2 Femoral artery removal
2.1.3 Subcutaneous resistance artery removal
2.2 Methods
2.2.1 Mulvany Halpern wire myograph
2.2.2 Organ bath apparatus
2.2.3 Normalisation procedure
2.3 Starting procedure
2.4 Data analysis
2.4.1 Analysis of agonist concentration response curves
2.4.2 One site model
2.4.3 Two site model
2.4.4 Analysis of antagonist studies
2.4.5 Analysis of relaxation studies
2.5 Microscopy
Materials and methods for molecular biology studies
2.6 Handling of nucleotides
2.6.1 RNA isolation
2.6.2 RNA and DNA quantitation
2.6.3 Agarose gel electrophoresis
2.6.4 Isolation of DNA from agarose gels
2.6.5 Ethanol precipitation
2.7 Amplification of sequence of interest
2.7.1 cDNA synthesis
2.7.2 Polymerase chain reaction
2.7.3 Primers
2.8 Cloning of DNA fragments
2.8.1 LB plates and LB broth
2.8.2 Ligations
2.8.3 Transformations
2.8.4 Analysis of colonies
2.9 Plasmid isolation
2.10 Restriction digests
2.11 Sequencing
2.11.1 Cycle sequencing
2.11.2 Sequencing gel
2.12 Northern analysis
43
2.12.1 Solutions used
2.12.2 Formaldehyde gels
2.12.3 Sample preparation
2.12.4 Blotting procedure
2.12.5 Preparation of probes
2.12.6 Hybridization
2.12.7 Washing of membranes
44
MATERIALS AND METHODS FOR FUNCTIONAL STUDIES
2.0 Materials
2.0.1 Solutions
Krebs-Henseleit solution (KS) was of the following composition (mM): NaCl 112, KC1
5.9, MgCl2 1.2, CaCl2 2, NaHC03 25, NaHP04 1.2 and glucose 11.5. Na2EDTA
0.023mM was also included in the KS solution at all times to prevent degradative
oxidation of noradrenaline.
For the antagonist studies, in both the saphenous vein and subcutaneous resistance
arteries, certain drugs were included in the KS solution. This modified KS was termed
blockers Krebs’ (BKS) and had an identical composition as Krebs’ solution but in
addition, cocaine (3pM) (Aboud et al. 1993), corticosteroid (30pM) (Blue et al. 1995)
and propranolol (lpM ) (Forster, 1996) were added to block neuronal uptake, non
neuronal uptake and (3-adrenoceptors respectively.
Potassium Chloride solution (KPSS), was a 125mM potassium chloride solution which
had the same composition as KS except that the NaCl was replaced with KC1.
2.0.2 Drugs
The following compounds were used:
(R) A-61603 (Abbott laboratories); (-)-noradrenaline bitartrate (Sigma); delequamine
(RS-15385-197, Roche Bioscience formerly Syntex, gift of Dr. Whiting); rauwolscine
(Roth); WB4101 (2-(2,6-dimethoxyphenoxyethyl)aminomethyl-1,4-benzodioxane
hydrochloride), Research Biochemicals International); HV723 (a-ethyl-3,4,5-
trimethoxy-a-3-((2-(2-methoxyphenoxy)ethyl))-amino)propyl)benzeneacetonitrile
fumarate, a gift from I. Muramatsu; 5 methylurapidil (Research Biochemical
45
International); chloroethylclonidine (Research Biochemicals International); prazosin
HC1 (Pfizer); cocaine HC1 (MacCarthy’s); propranolol HC1 (Sigma); corticosterone-2
acetate (Sigma); BMY 7378 (dihydrochloride 8-[2-[4-(2-Methoxyphenyl)-l-
piperozynl] ethyl] - 8 -azaspiro [4.5] decone-7,9-dione, Research B iochemicals
International); (-)- phenylephrine HC1 (Sigma); UK-14304 (Research Biochemicals
International); L-NAME (N“-Nitro-L-Arginine Methyl ester hydrochloride, Sigma);
Acetylcholine Chloride (Sigma).
All drugs were made up daily from salts in deionised water, with the exception of
noradrenaline which was initially dissolved in 23 pM Na^DTA. Further dilutions were
then made using deionised water.
2.0.3 Animals used
Dogs were euthanased at the local dog and cat home using pentobarbitone sodium
(Euthatal 200mg/ml Rhone Merieux) at a dose of 150mg/Kg bodyweight, administered
by intravenous injection. Dogs of all breeds, ages, sexes and weights were utilised.
Animals were given a clinical examination in order to exclude any with obvious clinical
abnormalities. For the heart failure study, animals used were those diagnosed and
treated at Glasgow University Veterinary School. These animals were euthanased
because of failure to respond to treatment or because of worsening of their disease.
2.1 Vessel Removal
2.1.1 Saphenous vein removal
Vessels were removed immediately after euthanasia by careful dissection, ensuring as
little connective tissue remained attached to the vessel as was possible. The
46
intermediate section of the lateral saphenous vein was consistently removed each time
(Figure 2.1). Vessels were then placed in ice cold KS and used within 24 hours.
2.1.2 Femoral artery removal
The artery was dissected from the femoral triangle. This is located anatomically at the
proximal medial aspect of the hindlimb and is bounded by the sartorius muscle cranially
and the pectineus and adductor muscles laterally. The medial femoral fascia and
adipose tissue were dissected to reveal the femoral artery and vein running together with
the artery in a cranial location (Figure 2.1). After removal the artery was treated in an
identical fashion to the saphenous vein.
2.1.3 Subcutaneous resistance artery removal
A patch of skin overlying the gluteal muscles was removed and placed directly into ice
cold KS. This was transported back to the laboratory and resistance sized arteries were
removed with the aid of a dissecting microscope. As for the larger vessels, resistance
vessels were used within 24 hours of removal.
2.2 METHODS
2.2.1 Mulvanv Halpern wire myograph
Functional experiments of resistance arteries were carried out using a four chamber
Mulvany Halpern wire myograph (J.P. Trading. Aarhus, Denmark.) (Mulvany and
Halpem, 1976).
Resistance arteries were cut into approximately 2mm lengths and mounted between two
40pm wires. One wire was attached to a fixed head while the other was attached to a
head which in turn was connected to a force transducer. The force transducer was in
47
turn connected to a Linseis (TYP 2066) four channel pen recorder to allow recordings of
force production (Figure 2.2).
2.2.2 Organ bath apparatus
Functional experiments of the saphenous vein (S.V.) and femoral artery (F.A.) were
performed in 10ml organ baths. Vessels were cut into 5mm ring sections and mounted
between two wires both 0.35mm in diameter. One wire was fixed to a perspex post
while the other was suspended by cotton thread and attached to a Grass FT03 force
transducer and micrometer (Figure 2.3.). Measurements were recorded on a Linseis
(TYP 7208) eight channel pen recorder. Vessels were bathed in Krebs’ solution (K.S.)
and maintained at 37°C. KS was bubbled with 95%02/5%CO2 at all times.
2.2.3 Normalisation procedure
The process of normalisation was first described by Mulvany and Halpern (1977), for
small resistance sized arteries and since then has become an accepted procedure when
studying resistance arteries using the Mulvany Halpern wire myograph.
The basis of the normalisation procedure is the generation of a circumference/tension
relationship for each vessel, which when fitted to an exponential equation, allows the
calculation of the diameter at which the vessel should be set in order to be equivalent to
a given transmural pressure if that vessel were relaxed. Generally for resistance arteries,
vessels are set at 0.9 of L I00 which means 90% of the diameter due to a transmural
pressure of lOOmmHg.
The actual procedure is carried out by starting with the wires suspending the vessel
touching and putting the vessel through a number of stretches at one minute intervals.
Each time the vessel is stretched, the micrometer reading is recorded together with the
48
force at the end of the minute interval. This allows calculation of the vessel
circumference by this:
L = (ti + 2) d + 2f EQUATION 1.
where L is the circumference, d the diameter of the wires and f the distance between the
two wires.
Tension produced by the vessel is calculated by this:
T = F/2g EQUATION 2.
where F = the force produced in mN, g is the length of the vessel and tension is defined
as the circumferential wall force per unit length.
In this study the resistance arteries were normalised to 0.9 of L I00 as described. The
same procedure was adapted for the saphenous vein and femoral artery in a similar way
to Angus et al (1986). The main reason for this decision was the wide variety of dogs
involved in the study, leading to considerable variation in the size of vessels being used.
It therefore seemed more desirable to adopt a procedure which would take vessel length
and diameter into consideration rather than simply setting vessels at a given resting
tension. In addition, looking at the literature there seemed to be a wide range of optimal
resting tensions given for these particular vessels. For example Constantine et al (1982)
quote a value of 0.6g for saphenous vein compared to a value of 3g given by Guan et al
(1990). In the case of the saphenous vein the vessel was set at 0.9 of L20 which means
90% of the diameter if the transmural pressure were 20mmHg. This was a more
appropriate pressure for a vein (Levick, 1992). The same setting was also used for the
49
femoral artery. While in vivo pressures in this artery would be considerably higher, it
was not possible to achieve the force required to normalise these arteries to 0.9 of L I00
and this method still took into account variations in vessel dimensions and vessels
produced consistently good reproducible contractions.
All calculations were performed using a computer iterative fitting technique where the
computer then gives the micrometer setting in order to achieve 0.9 of L20 or L I00 and
calculates the equivalent transmural pressure at this setting using the Laplace
relationship, assuming that the vessel wall is sufficiently thin for the relationship to
apply and that the curvature caused by the wires has no effect. The Laplace equation is
as follows:
P = 2tiT/L. EQUATION 3.
2.3 Starting procedure used prior to all protocols
After mounting in KS solution all vessels were allowed to equilibrate for a thirty minute
period. Vessels were then normalised and again allowed a further thirty minute rest
period. After normalisation, vessels were washed several times and if BKS solution was
required for the experiment it would replace the KS from this point onwards. A siting
concentration of noradrenaline (10pM) was added to the bath. When the contraction
had reached a plateau, vessels were washed back down to baseline. Twenty minutes
later the KS was replaced by a 125mM KC1 solution. As before when the contraction
reached a plateau, vessels were washed down to baseline. The KC1 contraction was
50
repeated ten minutes later. This routine made up the starting protocol for all
experiments, as it was found that subsequent to this protocol, there was good
reproducibility of up to four concentration response curves for all vessels.
After a further thirty minutes the protocol would start. Concentration response curves
were constructed in a cumulative manner using half log increments. All responses were
allowed to plateau before the next concentration of agonist was added to the bath.
Details of the specific protocols used are discussed in the relevant sections.
2.4 Data analysis
2.4.1 Analysis of agonist concentration response curves
Responses to agonists were calculated as active effective pressure (KPa) and these
responses were expressed as such, or as a percentage of maximum of the first curve for
that particular ring unless otherwise stated.
All concentration response curve (CRC) data for individual experiments was curve
fitted using the computer software GraphPad Prism 2.01 (Institute for Scientific
Information, San Diego, California, U.S.A.). Where data could not be fitted to the
models described below, data was analyzed on Microsoft excel spreadsheets and pEC50
values derived by interpolation, not from a model. The mean of the raw data was
calculated and data presented as mean ± standard error of the mean (s.e.mean). This
was then graphed in logarithmic space.
2.4.2 One Site model
The interaction between a ligand and a receptor is governed by the Law of Mass Action
(Clark, 1937). The relationship between the ligand concentration and the ligand
51
receptor complex is rectangular hyperbolic when plotted in arithmetic space, and
sigmoidal when plotted in logarithmic space. Concentration response curves when
plotted in a similar fashion follow the same pattern, leading to the conclusion that tissue
response must be a linear function of receptor occupancy (Clark, 1937). Since the
concentration response curve conforms to a sigmoid it can be defined by a logistic
equation which generally takes the form of the Hill equation used by GraphPad software
and given in the equation below.
a . [A]nHE = _______________
[A]50nH+ [A]nH
Where E is the response, a is the maximal response, [A] is the agonist concentration,
nH is the midpoint slope and [A]50 is the concentration of agonist required to generate
50% of a , (Roberts et al. 1996; Black et al. 1985).
This allowed the derivation of a number of parameters for each curve namely, upper
asymptote, Hill slope (midpoint slope) and pEC50 (negative log of [A]50) values.
Curves could then be compared by performing Students’ t test (two groups), or one way
analysis of variance (ANOVA) (more than two groups), comparing these parameters. In
all cases P < 0.05 was taken as indicating a significant difference. In the case of
ANOVA a Bonferroni post test allowing multiple comparisons was employed to
determine the origin of any significant differences (Wallenstein et al. 1980).
For illustrative purposes, mean curves were generated by meaning the curve fit
parameters from individual experiments and generating a curve upon which the raw
mean data ± s.e.mean could be superimposed.
52
Judgment of how well the data fitted the equations used in the curve fitting procedure
was determined in a number of ways. Simply looking at the graphs and how well the
data seemed to fit the curve played a large part. In addition to this, the program
provided a number of parameters which were also taken into consideration. These were
as follows.
(1). The Sum-of-Squares which is the sum of the vertical distances of the points from
the curve and is expressed in the same units as the Y values.
(2). R2 value which represents the goodness of fit. This is the fraction of the variability
in the Y values which can be explained by the equation. Therefore if R2 is 0 then the
line fits the data no better than a horizontal line going through the mean Y values. If R2
is equal to 1.0 then there is no scatter and all the data points lie exactly on the line.
(3) Runs test. This measures the number of runs which is a cluster of data points lying
above or below the line. If the number of runs is lower than the program expects then
this suggests that the fit is not good.
(4). 95% confidence intervals for the parameters defined by the curve fit (upper
asymptote, EC50 and Hill slope). If the intervals are very wide this again may suggest
that the fit is not good.
2.4.3 Two site model
In some instances the data did not appear to fit the one site model as judged by the
points discussed above. In this case the data was fitted to a two site model described by
the following equation:
E = al/(l+10((LogEC501-x),nH1))+a2/(l+10(LogEC502-X)*nH2))
53
where X is the logarithm of the agonist concentration, E is the response, nH is the
midpoint slope and a is the upper asymptote. Numbers 1 and 2 denote the two sites.
The two site model was first described by Furchgott (1981), and further developed by
Lemoine and Kaumann (1983) and Kenakin (1992). Dr Gillian Watt (James Black
Institute), kindly assisted in the programming of the GraphPad Prism software with the
two site model (personal communication). In order to assess which model fitted best
(the one site Hill equation or the two site described above) an F test was performed.
Simply comparing the Sum-of Squares for the two equations can be misleading. The
more complex equation, because it has more parameters, will tend to appear as a better
fit (Van der Graaf et al. 1996b). What the F test does, is to compare the relative increase
in the Sum-of-Squares to the relative increase in the degrees of freedom when going
from the complex (two site), to the simple (one site), model. If the complex model is
the better fit, the relative increase in the Sum-of-Squares will be greater than the relative
increase in the degrees of freedom. Alternatively, if the more simple model is correct,
the relative increase in both parameters would be about equal. GraphPad automatically
performs this test when asked to fit two equations simultaneously.
2.4.4 Analysis of antagonist studies
The aim of antagonist studies is to derive a value that is a measure of the potency of a
particular antagonist. The two values used are pA2 and pKB values. The derivation of
these is described shortly. In general, if two receptors are the same they should have the
same pA2 or pKB values for a given antagonist regardless of the tissue or the agonist
used (Kenakin, 1982).
For the antagonist studies, potency of the competitive antagonists used was calculated
by performing Schild regression (Arunlakshana and Schild, 1959). A range of
54
concentrations was employed for each antagonist used. DR values were then calculated
for individual experiments. The DR is the dose ratio and is the ratio of the EC50 in the
presence and absence of the antagonist. The EC50 values used for the Schild analysis
were derived from the curve fitting procedure for individual experiments. In the cases
where curve fitting was not applicable then EC50 values were derived by interpolation
from Microsoft Excel spreadsheets.
The log (DR-1) was then plotted against the concentration of antagonist (log [B]) and
linear regression performed through the points. Certain requirements must be fulfilled
for Schild analysis to be a realistic measure of antagonist potency, namely the
measurements must be made under equilibrium conditions, a range of antagonist
concentrations must be used and the shift in the concentration response curves caused
by increasing concentrations of the antagonist must produce parallel rightward
displacements with no significant decrease in the upper asymptotes (Kenakin, 1992;
Kenakin et al. 1992; Arunlakshana and Schild, 1959). Where the linear regression line
intercepts the X axis is termed the pA2 value. This is the concentration of antagonist
that causes a two fold shift in the pEC50 of the agonist CRC. If the slope of the linear
regression line is not significantly different from unity, then the pA2 value is a good
measure of antagonist potency and will be close to the pKB. A pKB value is defined as
the antagonist equilibrium dissociation constant (Roberts et al. 1996; Furchgott, 1981).
It can be calculated from a single antagonist concentration using the Schild equation
(Jenkinson, 1991; Kenakin, 1982; Arunlakshana and Schild, 1959).
log (DR-1) = log[B] + log Kb
This calculation assumes a slope of 1.
55
If Schild regression under equilibrium conditions, produces a slope not significantly
different from unity, this suggests a competitive interaction with a single receptor
population and it is reasonable to derive a pKB value from a single concentration. If the
Schild regression slope is significantly different from unity, then if pKB values are
calculated from each of the concentrations used, generally there is a significant
difference in the pKB values over the range of concentrations and thus it can be seen that
calculation based on a single concentration would be unreliable. This finding suggests a
non-competitive interaction possibly indicating a non-homogeneous population of
receptors. In summary, the pA2 value is derived from the Schild plot where the slope is
not constrained. The pKB value is derived from the Schild equation and assumes a slope
of unity.
2.4.5 Analysis of relaxation studies
As for the agonist studies data was converted into active effective pressure and this in
turn was expressed as a percentage relaxation.
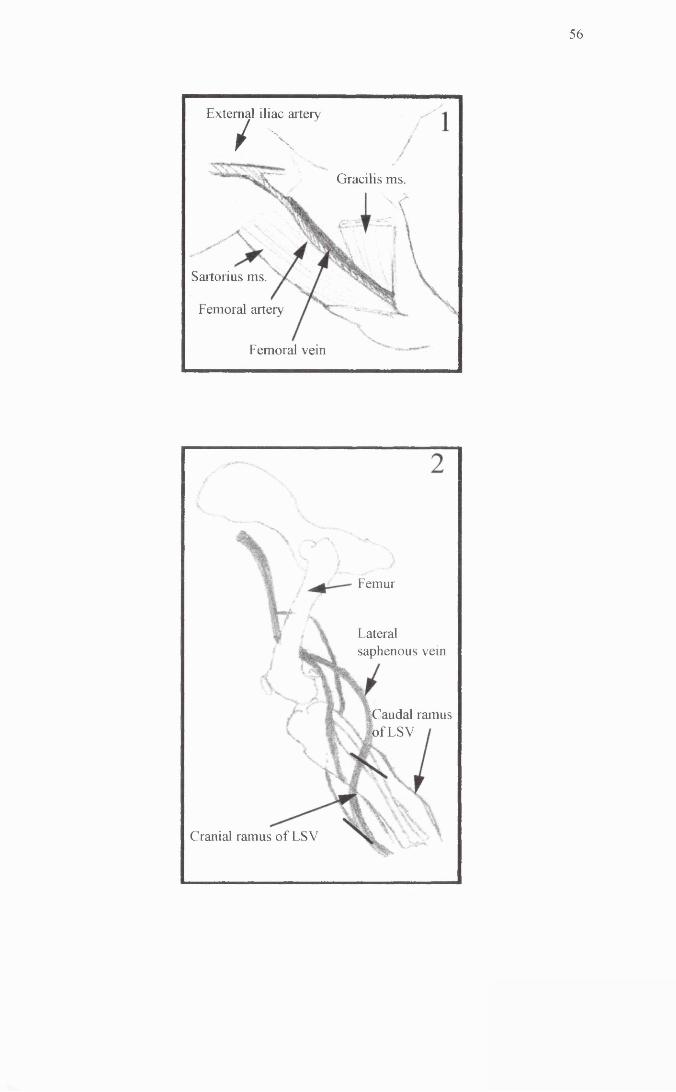
56
Gracilis ms
External iliac artery
/ \
Sartorius ms.
Femoral artery
Femoral vein
^Caudal of LSV
Femur
Lateralsaphenous vein
ramus
Cranial ramus of LSV
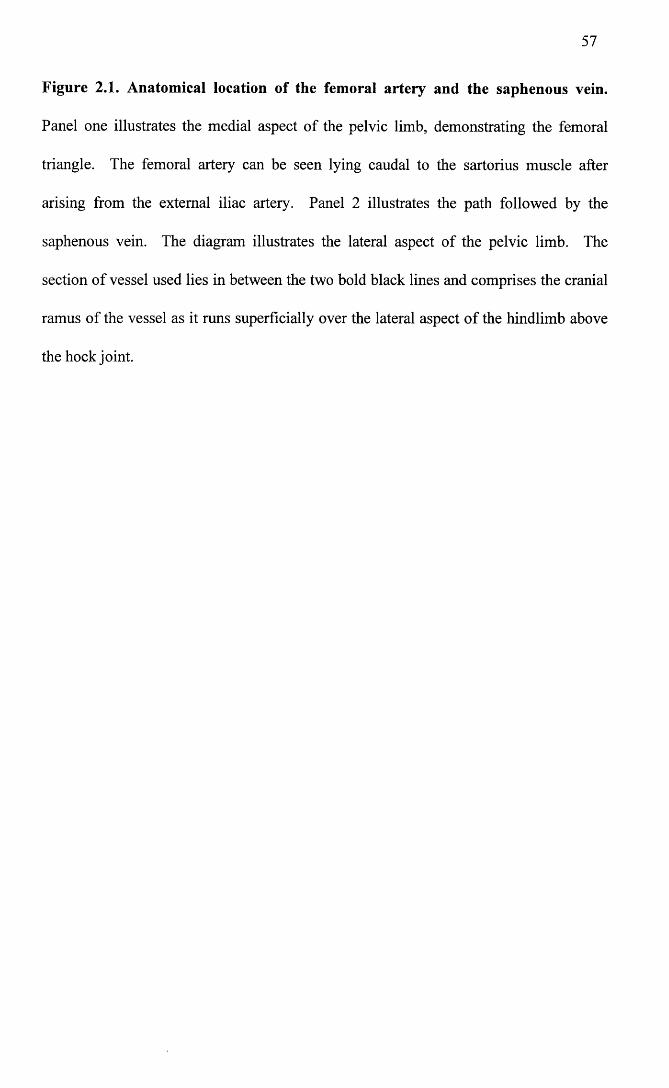
Figure 2.1. Anatomical location of the femoral artery and the saphenous vein.
Panel one illustrates the medial aspect of the pelvic limb, demonstrating the femoral
triangle. The femoral artery can be seen lying caudal to the sartorius muscle after
arising from the external iliac artery. Panel 2 illustrates the path followed by the
saphenous vein. The diagram illustrates the lateral aspect of the pelvic limb. The
section of vessel used lies in between the two bold black lines and comprises the cranial
ramus of the vessel as it runs superficially over the lateral aspect of the hindlimb above
the hock joint.
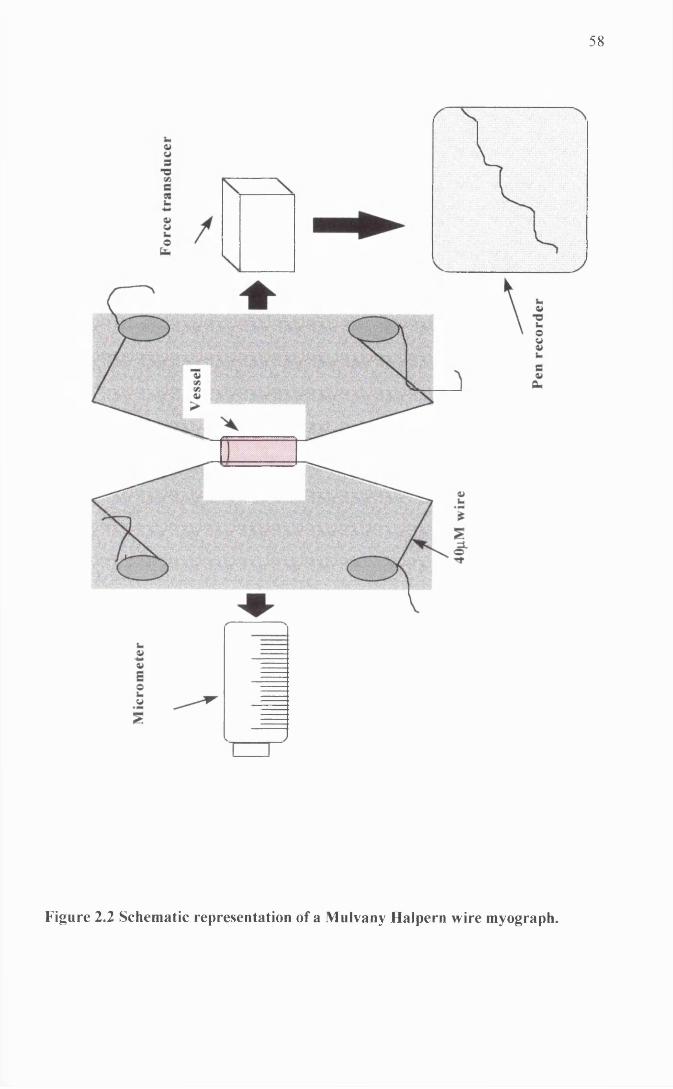
58
Ht?
Figure 2.2 Schematic representation of a Mulvany Halpern wire myograph.
mic
rom
eter
59
Figure 2.3. Schematic representation of an organ bath.
60
2.5 Microscopy
Specimens of saphenous vein, femoral artery and subcutaneous resistance artery, which
had been fixed for 24 hours in 10% neutral buffered formalin and dehydrated with
graded alcohol, were embedded in paraffin wax. Sections, cut at 5pm using a Leitz
1212 rotary microtome, and mounted on poly-l-lysine (Sigma) coated slides were dried
for 12-18 hours at 36°C. The dried sections were then stained by Haemalum and Eosin,
or immunocytochemically for the presence of neuropeptide Y and tyrosine hydroxylase.
A Zeiss Axiophot microscope was used to examine the stained sections and Kodak
Ektachrome 64 used for colour photography. Details of the staining techniques can be
found in Appendix 1. All microscopy was performed by Dr. I. Montgomery.
MATERIALS AND METHODS FOR MOLECULAR BIOLOGY
STUDIES
2.6 Handling of nucleotides
2.6.1 RNA Isolation
All glassware and solutions used in the handling of RNA were pre-treated with a 0.1%
v/v solution of diethylamine pyrocarbonate (DEPC), to destroy RNAses and minimize
degradation of RNA. The solutions and glassware were then autoclaved to remove
traces of DEPC.
Gloves were worn at all times and all pipette tips and polypropylene tubes were
autoclaved to minimize exposure of RNA to RNAses.
61
Tissue was collected immediately after euthanasia and snap frozen in liquid nitrogen.
RNA isolation was carried out using RNAzolB (Biogenesis Ltd.) according to the
manufacturer’s instructions.
Briefly, frozen tissue was added to RNAzol B (2mls per lOOmg of tissue) and
homogenised using a polytron homogeniser. Homogenate was then transferred to a
sterile eppendorf. In the case of cells in culture, culture media was removed and 1ml of
RNAzolB added per 106 cells. Lysate was then transferred to a sterile eppendorf.
0.1 mis of chloroform was added to the homogenate/lysate and tubes were shaken
vigorously for 15 seconds before being placed on ice for 5 minutes. Tubes were then
centrifuged at 12000g, for 15 minutes at 4°C.
The upper aqueous phase was removed to a fresh tube and an equal volume of
isopropanol added. Tubes were incubated on ice for 15 minutes and then centrifuged at
12000g for 15 minutes at 4°C.
Supernatant was carefully removed and the RNA pellet washed in 800pl of 75% ethanol
by vortexing and subsequent centrifugation at 7800g for 8 minutes at 4°C. Ethanol was
carefully removed and the pellet allowed to air dry for several minutes before being
resuspended in DEPC-treated water or TE buffer (lOmM Tris pH 8.0, ImM
ethylenediamine tetracetic acid), made with DEPC-treated water.
Aliquots of RNA were removed for quantitation by spectrophotometry as described
below. Aliquots of samples were also separated electrophoretically using agarose gel
electrophoresis allowing visualisation of the 28S and 18S ribosomal bands indicative of
good quality RNA (Dolnick and Pink, 1983). RNA was stored at -70°C until required.
62
2.6.2 RNA and DNA quantitation
RNA was diluted in DEPC-treated water or TE buffer made with DEPC-treated water.
Usually a 1:500 dilution was used. The optical density was then measured at 260nm
and 280nm. An RNA concentration of 40p.g/ml has an absorbance at 260nm of 1.
Therefore the concentration is 40 X O.D. 260nm X dilution factor = pg/ml. The quality
of the RNA sample as regards degradation and protein contamination was determined
by estimating the 260 : 280nm ratio. Pure RNA has a ratio of 2.0. (Sambrook et al.
1989; Chomczynski and Sacchi, 1987). In the case of DNA, the sample was again
diluted in TE buffer or water and the optical density measured. A concentration of
50pg/ml gives a 260nm absorbance of 1. Pure DNA has a 260 : 280nm ratio of 1.8
(Sambrook et al. 1989).
2.6.3 Agarose gel electrophoresis
Unless otherwise stated 1% agarose gels were used. In general, the percentage agarose
used will depend on the molecular weight of the fragments being separated. Small
fragments (< 400bp) would require a higher percentage gel whereas larger fragments, (>
3Kb) would require a lower percentage gel. Agarose was dissolved in 0.5X TBE buffer
and the gels were also run in this buffer at between 50 - lOOVolts. 1 X TBE buffer is
made up of 89mM Tris (pH 8.0), 89mM Boric acid and 2mM EDTA. Ethidium
bromide (0.5pg/ml) was used to stain gels in order to visualise the DNA on a UV
transilluminator. 1Kb size markers from Gibco-BRL were used at all times and samples
were loaded with one tenth volume of 10X loading buffer (0.25% bromophenol blue and
40% v/v glycerol in water).
63
2.6.4 Isolation of DNA from agarose gels
Bands were cut out of agarose gels taking as little excess agarose as possible. Supelco
GenElute™ spin columns or Supelco GenElute™ spin columns minus ethidium
bromide, from Sigma, were used according to the manufacturer’s instructions. The
eluted DNA was either used directly or ethanol precipitated and resuspended in the
appropriate buffer prior to use.
2.6.5 Ethanol precipitation
RNA and DNA were precipitated by the addition of one tenth the volume of 3M sodium
acetate (pH 5.4) and 2 volumes of 100 % ethanol. Samples were then stored at -20°C
for 30 minutes followed by centrifugation at 12,000g for 30 minutes at 4°C. The pellet
was then washed in 70% ethanol by vortexing and subsequent centrifugation at 12,000g
for 5 minutes. The ethanol was then removed and the pellet allowed to air dry for
several minutes (on ice if RNA) before being resuspended in an appropriate volume of
water or TE buffer.
2.7 Amplification of sequence of interest
2.7.1 cDNA synthesis
First strand cDNA synthesis from RNA was made using the Pharmacia Biotech First-
Strand cDNA synthesis kit according to the manufacturer’s instmctions.
Briefly, 5pg of total RNA in a 20 j l x 1 volume is denatured at 65°C for 10 minutes and
then chilled on ice. This is then added to a reaction mix containing the Moloney Murine
Leukaemia virus-reverse transcriptase enzyme, bovine serum albumin (0.08 mg/ml),
dATP (1.8 mM), dCTP (1.8mM), dGTP (1.8mM) and dTTP (1.8mM), DTT solution (15
mM) and one of a choice of primers. In this study either a random hexadeoxynucleotide
64
primer (0.2pg) or a gene specific primer (20pm) was used. The final volume of the
reaction was 33pi. This was incubated at 37°C for one hour. The cDNA was then used
immediately for polymerase chain reaction or stored at -70°C until required.
2.7.2 Polymerase chain reaction
Experiments were carried out using a Hybaid “omnigene” thermal cycler.
Unless otherwise stated the reaction was carried out in a 50pl volume using the
following: IX PCR buffer (Gibco-BRL), 10pm of each primer, 200pM of each dATP,
dTTP, dCTP, dGTP, 1.5mM MgCl2, 5pl of cDNA from cDNA synthesis 33jul reaction
and 0.5pi of Taq Polymerase enzyme (5 units/pl Gibco-BRL). This was made up to
50pl with sterile deionised water. For each primer set used, negative controls were run
in parallel. These contained identical ingredients except that the cDNA template was
replaced with sterile water.
Unless otherwise stated, the cycle programme used was as follows: 95°C for 3 minutes
followed by 30 cycles comprising denaturation (95°C for 30 seconds), annealing (48°C
for 30 seconds) and extension (72°C for 30 seconds). This was followed by a 5 minute
extension period at 72°C.
At the end of the reaction aliquots of the PCR reactions were electrophoresed on 1%
agarose gels as described in section 2.5.3, to allow visualisation of the PCR products.
2.7.3 Primers
With the exception of the primers included in the cDNA synthesis kit and the human
GAPDH primer (Glyceraldehyde-3-phosphate dehydrogenase, Clontech) used as a
control for the polymerase chain reaction, all primers were custom made by Cruachem
and on arrival resuspended in sterile water to give 200mM stock solutions. These were
65
stored at -20°C until required, when they were further diluted for either polymerase
chain reaction or sequencing.
2.8 Cloning of DNA fragments
Cloning of PCR products was carried out using Invitrogen’s Original TA Cloning® Kit
according to the manufacturer’s instructions. This relies on the fact that Taq polymerase
adds a single deoxyadenosine to the 3’ end of PCR products. The vector used in the kit
has 3’ deoxythymidine overhangs which allows the PCR product to ligate into the
vector. Figure 2.4 represents the pCR® 2.1 plasmid used in the kit.
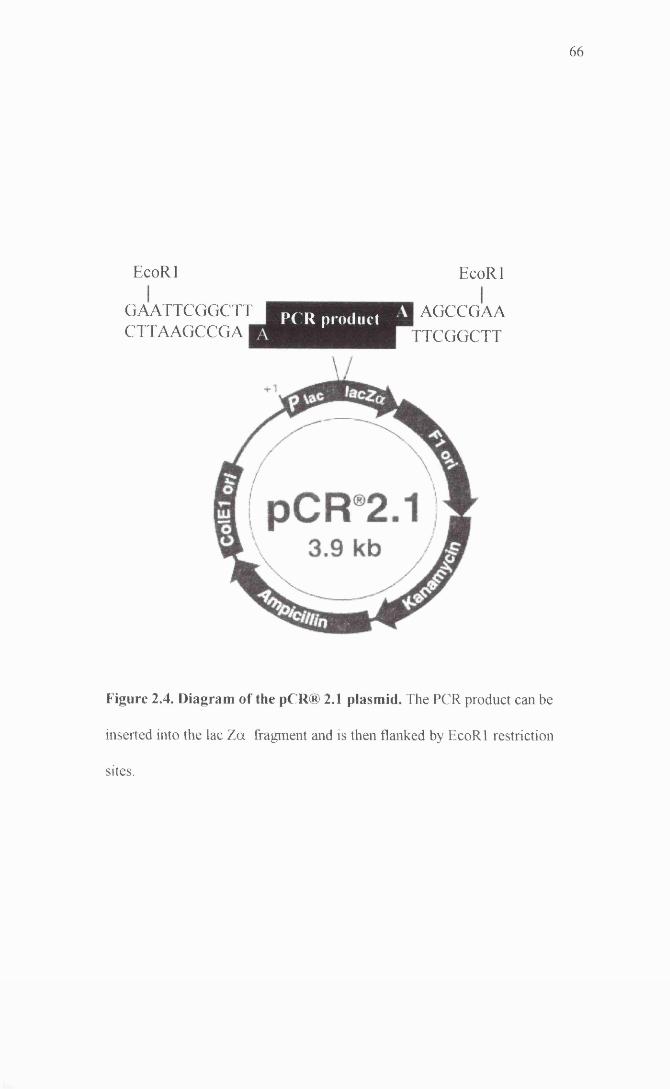
6 6
EcoRl EcoRl
GAATTCGGCTT CTTAAGCCGA
PCR product AGCCGAATTCGGCTT
Figure 2.4. Diagram of the pCR® 2.1 plasmid. The PCR product can be
inserted into the lac Z a fragment and is then flanked by EcoR 1 restriction
sites.
67
2.8.1 LB (Luria-Bertanif plates and LB broth
LB broth was made using the following ingredients. 1% w/v bacto-tryptone; 0.5% w/v
bacto-yeast extract; 1% NaCl; 1.5% w/v bacto-agar. 950mls of deionised water was
added and the pH adjusted to 7.0. The mixture was then made up to a final volume of
1 litre, autoclaved and subsequently stored at room temperature until required. LB plates
were prepared using the same recipe except that 15g/l of agar was added prior to
autoclaving. The LB agar was cooled and ampicillin added to a concentration of
50pg/ml. Agar was then poured into 100mm plates and allowed to set. These plates
were then used for the growth of bacteria containing plasmids carrying an ampicillin
resistance gene. Plates were streaked with bacteria using an inoculating loop which was
sterilised by flaming and cooling.
2.8.2 Ligations
A ligation reaction was set up using the following: 3-5pl of fresh PCR product (if kept
too long the A overhangs can be degraded), 1 jul of 10X ligation buffer, 2pl of pCR®2.1
vector (50ng), lp l of T4 DNA ligase, made up to a total volume of lOpl. This was
incubated overnight at 14°C.
2.8.3 Transformations
LB plates containing 50pg/ml of ampicillin were spread with 40p.l of 40mg/ml of X-gal
(5-bromo-4-chloro-3-indolyl-P-D-galactoside) dissolved in dimethylformamide, and
allowed to dry.
Meanwhile the ligation mixture was centrifuged and stored on ice. One vial of INVaF’
competent cells was carefully thawed on ice and 2pl of 0.5M P-Mercaptoethanol gently
stirred into the cells with the pipette tip. 2pl of ligation mix was also stirred into the
68
thawed cells and the mixture then incubated for 30 minutes on ice. Cells were then
heat-shocked at 42°C for 30 seconds and placed back on ice. 250pl of SOC media was
added to each vial of cells and placed in a horizontal shaker at 37°C for 1 hour at
225rpm. Two previously prepared LB plates, streaked with X-gal, were used per
transformation. One plate was spread with 50pl of the transformation mix while the
other was spread with 200pil of the same transformation mix. Plates were left at room
temperature for 15 minutes, then inverted and placed in an incubator overnight at 37°C.
The following morning plates were removed from the incubator and placed in the cold
room (4°C) for several hours after which colonies were selected for further growth and
analysis.
2.8.4 Analysis of colonies
The pCR®2.1 vector contains the lac promoter and the lacZa cDNA which produces 0-
galactosidase and in the presence of X-gal, will give blue colonies. If the insert has
been succesfully cloned into the plasmid, this will disrupt the lacZa cDNA and the
colonies will be white.
Between 15 and 20 colonies were selected from each transformation. Each colony was
inoculated into 3mls of LB broth containing 50pg/ml of ampicillin and grown up
overnight at 37°C in a horizontal shaker at 225rpm. Plasmids were then isolated and
restriction digested to screen for the presence of the insert.
Colonies which did contain plasmid with the desired insert were re-plated and stored in
the cold room for up to 3 months. Glycerol stock solutions were also made and stored
at -70°C.
69
2.9 Plasmid isolation
Plasmids were purified using the Wizard® Plus SV Minipreps DNA purification system
from Promega.
2mls of bacterial culture were centrifuged at 10,000g for 1 minute to pellet the bacterial
cells. Cells were then resuspended in 250pl of cell resuspension solution (50mM Tris-
HC1 and lOmM EDTA). 250pl of cell lysis solution was then added (0.2M NaOH and
1%SDS) and mixed by inversion. 5 minutes later 10pl of Alkaline protease solution
was added and again mixed by inversion. 350pl of neutralisation solution was added
(4.09M guanidine hydrochloride; 0.759M potassium acetate; 2.12M glacial acetic acid;
pH 4.2.) and again mixed by inversion.
The lysate was then centrifuged at 14,000g for 10 minutes at room temperature. Clear
lysate was then transferred by decanting into a spin column and centrifuged at 14,000g
for 1 minute at room temperature. The column was then washed twice with column
wash solution (60mM potassium acetate, lOmM Tris-HCl, pH 7.5; 60%ethanol) by
spinning the wash through the column in the centrifuge.
The DNA was then eluted using lOOpl of nuclease-free water. Aliquots of the plasmid
prep could be used for restriction digest and the rest of the prep was stored at -20°C.
2.10 Restriction digests
Restriction digests were carried out using Gibco-BRL restriction enzymes in
conjunction with the appropriate reaction buffer. Digests were usually carried out in
20pl volumes using about lpg of DNA, 2pl of 10X reaction buffer and 5-10 units of
70
enzyme. Samples were mixed and incubated at 37°C for one hour. Amounts were
scaled up for larger volume digests.
2.11 Sequencing
2.11.1 Cycle sequencing
Sequencing was performed using the Thermo Sequenase cycle sequencing kit from
Amersham incorporating 33P labelled dideoxynucleotides. A reaction mix was set up
containing 2pl reaction buffer, 50-500ng of DNA, 2pm of primer and 8 units of thermo
sequenase DNA polymerase. The reaction was made up to a final volume of 20pl with
sterile water. Four termination reactions were set up for each sample containing 2pl of
termination master mix and 0.5pl of each labelled ddNTP. 4.5pl of the reaction mix
was added to each of the termination mixes and these were subjected to 30 cycles of
95°C for 30 seconds, 55°C for 30 seconds and 72°C for 1 minute. 4pl of stop solution
was then added to terminate the reaction.
2.11.2 Sequencing gel
A 6% acrylamide gel was used of the following composition. For lOOmls of gel
solution, 19:1 acrylamide : bis-acrylamide 20mls, 42g of Urea, lOmls of 10X glycerol-
tolerant gel buffer made up to lOOmls with water. Before pouring, 1ml of 10%
ammonium persulphate was added together with 25pl of TEMED (N, N, N ’, N ’-
tetramethylethylenediamine). The glycerol-tolerant gel buffer (TTE buffer) was made
up as follows. For 20X buffer, 216g Tris base, 72g Taurine, 4g Na^DTA* 2H20 made
up to 1 litre in water.
Gels were cast in vertical Bio-Rad sequencing gel kits, run in IX TTE buffer and the
temperature maintained at 50°C.
71
Once run, gels were transferred onto 3MM Whatman paper, covered in Saran wrap and
dried on a vacuum operated gel drier. Once dry, gels were exposed overnight to
radiographic film and subsequently film was developed on an X -OGRAPH Compact
X2 film developer.
2.12 Northern analysis
2.12.1 Solutions used for northern analysis
DEPC-treated water: 50pl DEPC per 500mls of water, left for 12 hours and then
autoclaved.
20 X SSC: 3M NaCl, 0.3M Na3 citrate. DEPC treated and autoclaved.
10 X MOPS buffer: 0.2M 3-[N-Morpholino]-propane-sulphonic acid, 0.05M Na
acetate pH 7.0, 0.01M Na^DTA. Made up with DEPC-treated water and filter
sterilised. Stored at 4°C in a light-proof bottle.
100 X Denhardt’s solution: 2% w/v bovine serum albumin, 2%w/v Ficoll™, 2% w/v
polyvinylpyrolidone (PVP). Filter sterilised and stored at -20°C.
10% SDS: 10% w/v lauryl sulfate sodium salt made up with DEPC-treated water.
2.12.2 Formaldehyde gels
A 1% denaturing agarose gel was used. This was made by dissolving 3g of agarose in
219mls of DEPC-treated water and 30mls of 10 X MOPS. Once the agarose had
dissolved the solution was cooled to 50°C and 51mls of 37% formaldehyde added. The
gel was then immediately poured into a horizontal Bio-Rad gel casting kit. All this was
performed in a fume hood to avoid inhalation of formaldehyde fumes. The gel was
allowed to set for one hour. Gels were mn in 1 X MOPS buffer at 100 Volts.
72
2.12.3 Sample preparation
20jj,g of total RNA was ethanol precipitated and resuspended in 6 j l x 1 of DEPC-treated
water. The RNA was then added to a solution containing 12.5pi of deionised
formamide, 2.5pl of 10 X MOPS and 4pl of 37% formaldehyde. RNA was then heated
to 65°C for several minutes and chilled on ice. 2.5pl of loading buffer was added (50%
v/v glycerol and 0.1 mg/ml bromophenol blue), and samples loaded into the gel.
Formamide was deionised using Bio-Rad analytical grade mixed bed resin AG 501-XB
(D) resin 20-50 mesh. lOOmls of formamide was added to the resin in the fume hood
and stirred for one hour. The blue resin turned yellow once the process was complete.
The formamide was then filtered twice through Whatman Nol paper, aliquoted and
stored frozen until required.
2.12.4 Blotting procedure
Once the gel had been run, the ladder and any excess gel was trimmed. The ladder was
stained with ethidium bromide and photographed with a fluorescent ruler to allow
subsequent judging of RNA species sizes.
A thick glass plate was placed on a stand and covered with 3 MM Whatman paper which
dipped on all four sides into a tray containing 10 X SSC solution. The gel was inverted
and placed directly on top of the paper. Hybond-N+ membrane (Amersham), was cut to
fit the gel exactly and placed gently on top of the gel. A plastic pipette was gently
rolled over the membrane to remove any air bubbles. Three layers of 3MM Whatman
paper were placed over the membrane and finally several layers of paper towel were
placed over this. Old radiographic film was placed around the gel to prevent the
capillary action bypassing the gel itself. A weight of approximately 800g was placed on
top of the paper towels ensuring even weight distribution, and the blot was left
73
overnight. The following morning the membrane was carefully peeled off the gel and
fixed in an ultraviolet stratalinker. Membranes were wrapped in Saran wrap and stored
in the fridge until required.
2.12.5 Preparation of probes
cDNA probes were labelled with [a-32P] dCTP using Ready-To-Go® DNA labeling
beads from Pharmacia Biotech. The principals of the labelling procedure are based on
the use of random oligodeoxyribonucleotides which anneal to the DNA template. The
Klenow fragment enzyme then allows incorporation of dNTPS which are present
including the radiolabelled dCTP. Briefly, 25-50ng of linearized DNA dissolved in TE
buffer, made up to a volume of 45 j l x 1 with water and denatured at 95°C for 5 minutes.
The DNA was then added to the tube containing the bead along with 5 pi of [a-32P]
dCTP (3000Ci/mmol). The reaction tube was then incubated at 37°C for 30 minutes.
Following this, the probe was run through a Nick™ column (Pharmacia Biotech),
which is a sephadex column containing sephadex® G-50 DNA grade. This removed
unincorporated isotope. Labelled DNA was then eluted from the column in TE buffer
and was ready for use.
Oligonucleotide probes were end-labelled with [y-32P] ATP. 200ng of oligonucleotide
were made up to 6pl in water. The following were then added to the tube: 1 pi of 10X
Kinase buffer (Promega); lp l of T4 polynucleotide kinase (Promega); 2pl of [y
32P]ATP. The tube was then incubated at 37°C for 30-60 minutes. The reaction was
stopped by the addition of lpl of 0.2M EDTA. The following were then added in order
to precipitate the labelled probe: 170pl of water; transfer RNA ( lp l of lOmg/ml
solution); 20pl of 3M sodium acetate, pH 5.7; 600pl of 100% ethanol. The tube was
74
placed on dry ice for 2 minutes followed by a 5 minute spin at 12,000g. The ethanol
was removed and the pellet resuspended in 20 p,l of TE buffer. lOpl was used for each
hybridization.
All isotope handling was carried out with the use of protective screens, and everything
carefully monitored for 32P contamination.
2.12.6 Hybridization
Blots were placed inside hybridization tubes and prehybridization solution added. The
tube was then placed in a revolving incubator at 65°C for one hour. The
prehybridization solution was made up as follows: 2.5mls 20 X SSC, 0.5mls 100X
Denhardt’s, 0.5mls 10% SDS, 0.02mls salmon sperm DNA (heat denatured at 95°C first
and then placed on ice) and 6.48mls of water.
After one hour the labelled probe was added to the prehybridization buffer and the blot
hybridized overnight at 65°C.
2.12.7 Washing of membranes
Membranes were washed in 2 X SSC/ 0.1%SDS for 10 minutes at 65°C. This wash was
repeated. If the blot was still hot then it was washed in 1 X SSC/ 0.1%SDS for 10
minutes at 65°C. A final high stringency wash of 0.1 X SSC / 0.1% SDS for 10 minutes
at 65°C may be used, but is only recommended if the probe is specific and not for
related sequences.
Membranes were then wrapped in Saran-wrap and exposed to radiographic film for 12
hours to one week (depending on the strength of the signal) at -70°C. Film was
developed on an X -OGRAPH Compact X2 film developer.
75
CHAPTER 3
Functional classification o f aj-adrenoceptors mediating
contraction to exogenous noradrenaline in the dog saphenous
vein
3.0 Abstract
3.1 Methods
3.1.1 Agonists profiles
3.1.2 Antagonist studies
3.2 Results
3.2.1 Agonist profile
3.2.2 Competitive antagonists
3.2.3 Non-competitive antagonists
3.3 Discussion
3.0 Abstract
The aim of this study was to functionally classify the subtype(s) of a,-adrenoceptor
mediating contraction of the dog saphenous vein to exogenous noradrenaline.
Agonist profiles to noradrenaline, phenylephrine, (R) A-61603 and UK14304 confirmed
the presence of post-junctional a ,- and a 2- adrenoceptors, with a rank order of potency
of (R) A-61603 > noradrenaline > UK14304 > phenylephrine.
To assess antagonism of the a r mediated responses, the reversible competitive
antagonists prazosin, WB 4101, HV 723, BMY 7378 and 5 methylurapidil were used in
the presence of an a 2-antagonist (either lpM rauwolscine or 0.1 pM delequamine). The
low potency of prazosin and HV723 suggested the presence of the a ]L-adrenoceptor
subtype. The non-competitive nature of 5 methylurapidil and BMY 7378, and the
baseline contraction and rightward shift in the concentration response curves in the
presence of the highest concentration of the irreversible antagonist chloroethylclonidine,
are highly suggestive of the presence of a second receptor subtype. Despite the low
affinity for prazosin, the additional receptor subtype most closely resembles the a 1D-
adrenoceptor.
77
3.1 Methods
5mm sections of saphenous vein were set up in 10ml organ baths, normalised and the
starting protocol completed, as described in the materials and methods section of this
thesis. After normalisation vessels were maintained in blockers Krebs’ solution. The
experimental protocols employed in this section fell into two categories outlined below.
All comparisons were made using one way analysis of variance (ANOVA), followed by
a Bonferroni post test, unless stated otherwise. A P value < 0.05 was deemed
statistically significant unless stated otherwise.
3.1.1 Agonist profiles
An agonist profile was performed in order to ascertain the contribution of both a r and
a 2-adrenoceptors in mediating contraction in this vessel. Hence, noradrenaline was used
since it is the endogenous agonist and will act via both a r and a 2-adrenoceptors,
phenylephrine was used as an aj-agonist and UK 14304 was used as an a 2-agonist. In
addition the Abbott compound was used since it is an a 1A-selective agonist which has a
potency of a 1A->a]B->a]D-, (Knepper et al. 1995). Vessels were allowed a forty minute
recovery period after the starting protocol (section 2.3 materials and methods) and
between subsequent concentration response curves. Cumulative concentration response
curves were then constmcted to the following agonists, using half log increments.
Noradrenaline (NA) and phenylephrine (PE), starting at a concentration of InM and
increasing up to a maximum of ImM if required. (R) A-61603 (Abbott compound)
starting with a concentration of 0.3nM and increasing up to a concentration of 30pM if
required. UK14304 starting with a concentration of InM and increasing up to a
concentration of 0.1 pM if required. Adequate time was allowed between additions of
agonist for the previous response to have reached a plateau. Three concentration
78
response curves (CRC) were carried out on each ring using a different agonist each time.
Results were expressed as a percentage of the response to the lOpM siting concentration
of noradrenaline, and plotted in logarithmic space. Experiments were curve fitted using
GraphPad prism software and fitted to a one site model unless otherwise stated as
described in section 2.4 of materials and methods.
3.1.2 Antagonist studies
Four to seven saphenous vein rings were set up in parallel. For each experiment one
ring was designated as a time control and no antagonist used. Each other ring was
assigned one of five competitive reversible antagonists, or the irreversible alkylating
agent chloroethylclonidine (CEC). In addition to the blocking agents already present in
the blockers Krebs’ solution, either 0.1 pM of the a 2-adrenoceptor antagonist RS-15385-
197 (delequamine), or 1 pM of the a 2-antagonist rauwolscine, were present in the baths
at all times. An initial cumulative control CRC to noradrenaline was performed in each
ring. After this, vessels were washed until they returned to baseline and a concentration
of antagonist added to the bath. A forty minute period for equilibration was allowed
before a second CRC to noradrenaline was performed. Up to four curves, but more
often two, were performed on each ring, each time using an increasing concentration of
the antagonist that had been assigned to that ring. Experiments where there was a
significant change in the maximum, pEC50 or Hill slope of the time control curve, were
excluded from the study. Comparisons of these parameters were made using one way
ANOVA followed by a Bonferroni post test. Time control data is shown in Figure 3.6.
The antagonists used according to this protocol were prazosin, 5 methylurapidil,
BMY7378, WB4101 and HV723. Analysis of antagonist action was performed by
Schild analysis (pA2) as described in the materials and methods section 2.4 of this
79
thesis. Estimation of antagonist affinity was also calculated using single antagonist
concentrations again as described in section 2.4.
The protocol used for CEC was different. After the control curve, a concentration of
CEC was added to the bath and left for one hour. The vessel was then washed ten times
over a forty minute period. A second curve to NA was then performed, (Williams and
Clarke, 1995; O'Rourke et al. 1995). Due to the irreversible nature of this antagonist
only one concentration of CEC was used on each ring.
3.2 Results
All results are given as mean ± s.e. mean and n = the number of experiments unless
otherwise stated.
3.2.1 Agonist profile
Values were derived from at least six different animals. Experiments were performed in
the absence of an a 2-adrenoceptor antagonist. All the agonists used in this study caused
concentration-dependent increases in tension of the dog saphenous vein. The pEC50
values of the agonists used were as follows: NA 6.7 ± 0.08, n = 7; PE 5.94 ± 0.07, n =
11; Abbott compound 7.57 ± 0.50, n = 6; UK14304 6.35 ± 0.28, n = 5. This resulted in
a rank order of potency of Abbott > NA > UK14304 > PE, with the Abbott compound
being 7.39X more potent than NA, 42.8X more potent than PE and 16X more potent
than UK14304. The results are summarised in Table 3.1. All curves fitted to the one
site model (Figure 3.1) with the exception of a single UK14304 experiment, which fitted
better to the two site model of receptor activation (Figure 3.2). This two site curve was
not included in the calculation of agonist potency. One way ANOVA revealed a
significant difference in the maximum values for the agonists used. A Bonferroni post

80
test showed that this was due to the maximum achieved by UK14304 being significantly
lower than the other three agonists used. In fact, the upper asymptote for UK14304 was
approximately 50% of that for the other agonists. There was also a significant
difference in the Hill slope parameters for the different agonists, most noticeably due to
the shallowness of the curves to UK14304.
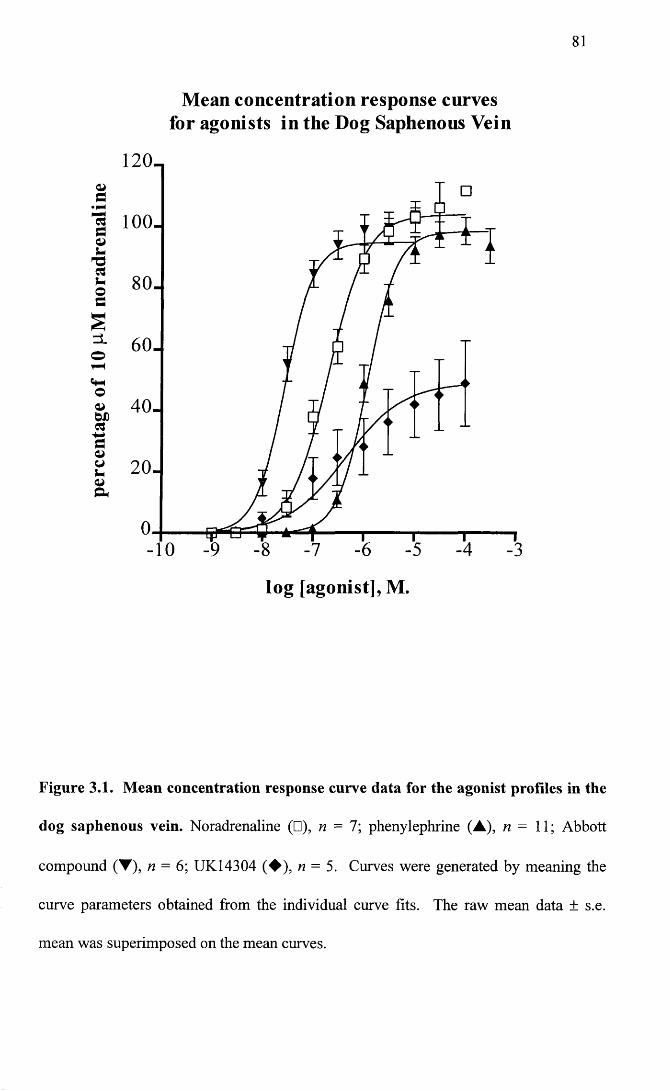
81
Mean concentration response curves for agonists in the Dog Saphenous Vein
120-
1 100.
80-
60-
40-
-10
log [agonist], M.
Figure 3.1. Mean concentration response curve data for the agonist profiles in the
dog saphenous vein. Noradrenaline (□), n = 7; phenylephrine (A), n = 11; Abbott
compound (T), n = 6; UK14304 (♦ ) , n = 5. Curves were generated by meaning the
curve parameters obtained from the individual curve fits. The raw mean data ± s.e.
mean was superimposed on the mean curves.
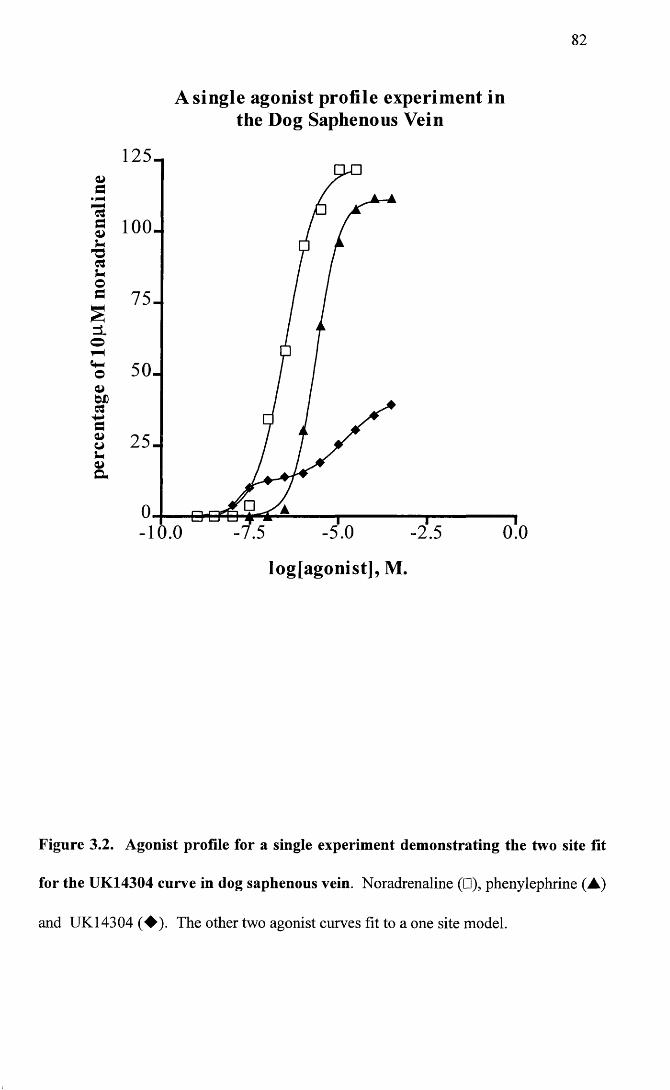
perc
enta
ge
of 10
pM
nora
dren
alin
e
82
A single agonist profile experiment in the Dog Saphenous Vein
125-
100.
75.
50-
25-
-5.0- 10.0 -7.5 -2.5 0.0
logjagonist], M.
Figure 3.2. Agonist profile for a single experiment demonstrating the two site fit
for the UK14304 curve in dog saphenous vein. Noradrenaline (□), phenylephrine (A)
and UK14304 (♦ ) . The other two agonist curves fit to a one site model.
83
3.2.2 Competitive antagonists
A range of five competitive reversible antagonists was used. Values were derived from
experiments carried out using at least four different animals. pA2 values were derived as
described in materials and methods in Chapter 2. The first set of antagonist studies was
conducted in the presence of lpM of the putative a 2-antagonist rauwolscine. The same
experiments were then repeated in the presence of 0.1 pM of the a 2-antagonist
delequamine. The reasons for repeating the experiments in the presence of delequamine
are explained as follows.
The presence of a 2-adrenoceptors necessitated the use of an a 2-antagonist.
Unfortunately there is no satisfactory irreversible blocking agent for these receptors.
Phenoxybenzamine is an irreversible antagonist at a-adrenoceptors. It has been used
successfully to isolate a 2-adrenoceptors in a mixed population of a r and a 2-
adrenoceptors in both the rabbit saphenous vein (Daly et al. 1988b) and the dog
saphenous vein (MacLennan et al. 1997). However, in the rabbit saphenous vein it was
not possible to satisfactorily isolate the a]-adrenoceptor population using receptor
protection with prazosin (Daly et al. 1988b), and in the dog saphenous vein,
phenoxybenzamine selectively blocked the a,-adrenoceptor population in the absence of
receptor protection (Constantine et al. 1982), tying in with the findings of Dubovich and
Langer (1974), that phenoxybenzamine has a much higher affinity for a ,- versus a 2-
adrenoceptors. The only other option was to use a selective reversible a 2-adrenoceptor
antagonist. Initially, the putative a 2- antagonist rauwolscine (lpM ) was used, based on
a study by Leech and Faber (1996), who used this antagonist for the same purpose. In
another study, when used in rabbit blood vessels, it appeared to be a 2-selective up to a
concentration of 2.5pM (Daly et al. 1988a). However, on analysis of the data, the
profound effect that this antagonist had on the concentration response curves to
noradrenaline (Figure 3.3), suggested the possibility that rauwolscine was also affecting
the a !-adrenoceptor population. Fishing experiments were then performed using 0.1 pM
of the a 2-antagonist RS-15385-197 (delequamine) for comparison (Figure 3.3). This
latter antagonist is thought to be highly a 2-selective, and up to a concentration of lOpM
has been reported to have no effect on a,-adrenoceptor agonist curves in the DSV
(Brown et al. 1993). The present study showed that lpM rauwolscine shifted the CRC
of phenylephrine to the right and suppressed the maximum, unlike 0.1 pM delequamine
which had no effect (Figure 3.4). On the other hand, delequamine at concentrations of
both 0.1 pM and lpM, shifted the concentration response curve of the a 2-agonist UK
14304, as can be seen in Figure 3.5. Incidentally, in this particular experiment as in one
other, UK 14304 concentration response curves fitted to the two site model. The
addition of delequamine seemed to shift only the lower part of the curve which, as
previously mentioned, may indicate that UK 14304 is acting at the a!-adrenoceptor
population also, and that while the lower part of the curve is a 2-mediated, the upper part
of the curve may be a]-mediated. This finding was not addressed in the present study
but it would be of interest to investigate this further.
Observations of the effect of rauwolscine were in agreement with a paper by Daniel et al
(1996), which suggested that rauwolscine antagonized an unusual subtype of a r
adrenoceptor in the DSV when phenylephrine was the agonist. At this point, all the
antagonist studies were repeated in the presence of 0.1 pM delequamine. This was done
in order to prevent the problem outlined by Kenakin (1982), of “frame shifting” pA2
values derived when an antagonist has been used that also affects the population of
interest in addition to the population of receptors which the experimenter wishes to
exclude.
85
Mean concentration response curve data for the antagonists used both in the presence of
rauwolscine and delequamine are shown in Figures 3.7 to 3.17. Schild regressions are
shown in Figures 3.18 to 3.19. Table 3.2 summarises slope and pA2 values for the
competitive antagonists. The pA2 values calculated from individual antagonist
concentrations in the presence of rauwolscine or delequamine are listed in Tables 3.3
and 3.4 respectively. Each antagonist is discussed separately giving results in the
presence of rauwolscine first and then comparing this to results in the presence of
delequamine.
The a r antagonist prazosin, was used at concentrations of InM, lOnM and 0.1 pM (n = 4
for each concentration). In the presence of rauwolscine, increasing concentrations of the
antagonist caused parallel rightward displacements of the concentration response curves
to noradrenaline, with no significant alteration in maximum values (P of .05). One way
ANOVA of the Hill slopes showed a significant difference (P of 0.0059), with a
Bonferroni post test revealing that this was due to a decrease in the slope in the presence
of 0.1 pM prazosin. pEC50 values in the presence of prazosin were also significantly
different from controls (P< 0.0001), but from the post test this was due only to the
highest concentration of the antagonist. Schild regression yielded a pA2 value of 7.36,
with a slope significantly different from negative unity (-0.8 to -0.30, 95% confidence
intervals (C.I.)). When pA2 values were calculated for each antagonist concentration,
they were found to be significantly different due to a higher value with the InM
concentration of prazosin. A pA2 value of 7.35 ± 0.03 (n = 4) was obtained with 0.1 pM
piazosin.
In contrast, in the presence of delequamine, prazosin, while also causing concentration-
dependent rightward shifts in the concentration response curves, caused no significant
change in either the maximum or Hill slope parameters (P of 0.17 and 0.10
86
respectively). pEC50 values were significantly changed (P<0.0001), this time due to
both the lOnM and 0.1 pM concentrations of prazosin. Schild regression yielded a
higher pA2 value of 8.31, with a slope not significantly different from negative unity (-
1.01 to -0.64, 95% C.I.). pA2 values calculated from single antagonist concentrations
were not significantly different over the range of antagonist used and a pA2 value of
8.09 ± 0.07 (n = 4) was calculated in the presence of 0.1 pM prazosin.
The a ]D- selective antagonist, BMY 7378 was used at concentrations of InM, lOnM and
0.1 pM (n = 4 for each concentration). In the presence of rauwolscine, none of the
concentrations used caused a significant change in the pEC50, or Hill slopes of the
curves to NA (P of 0.25 and 0.40 respectively). Maximum values were significantly
altered (P of 0.045). Although not large, the difference was due to a reduction in the
maximum in the presence of 0.1 pM BMY 7378. As none of the concentrations of
antagonist caused a significant shift in the concentration response curves and the effect
was not concentration-dependent (Figure 3.9), a meaningful Schild regression was not
possible, since the regression line would have been almost horizontal. PA2 values
calculated from each antagonist concentration were significantly different, with a value
of 6.54 ± 0.17 ( n = 4) in the presence of 0.1 pM BMY 7378. This suggested that the
interaction was not competitive.
Results in the presence of delequamine were similar. This time maximum values as
well as pEC50, and Hill slopes were not significantly different (P of 0.15, 0.19 and 0.75
respectively). When Schild regression was performed, a slope significantly different
from negative unity was obtained (-0.52 to -0.09, 95% C.I.) with an X axis intercept of
7.2 (pA2). Again, pA2 values calculated from single antagonist concentrations were
significantly different. A pA2 of 7.04 ± 0.12 (n = 4) was calculated from 0.1 pM BMY
7378.
87
The a ]A/D-selective antagonist WB4101 was used at concentrations of InM, lOnM and
0.1 pM (n = 4-5 for each concentration). In the presence of rauwolscine, WB 4101
produced parallel dextral displacements of the NA concentration response curves, with
no significant alterations in maximum or Hill slope values (P of 0.12 and 0.28
respectively). pEC50 values were significantly different (PO.OOOl), but from the post
test this appeared to be due only to the highest concentration of the antagonist. Schild
regression yielded a pA2 value of 8.06 and a slope not significantly different from
negative unity (-1 to -0.23, 95% C.I). PA2 values calculated for lOnM and 0.1 pM WB
4101 were not significantly different as judged by a t test. The InM concentration was
not included since only one pA2 value was obtained. This was due to negative values
being derived from the other three experiments because of the low potency of WB 4101
at this concentration. A pA2 value of 7.7 ±0.11 (n = 4), was derived from 0.1 pM WB
4101.
In the presence of delequamine, WB 4101 also produced parallel rightward
displacements of the concentration response curves to NA, with the exception of the
highest concentration used. This concentration of WB4101 caused a significant
decrease in the maximum value and a significant lowering of the Hill slope parameter (P
of 0.0012 and 0.0006 respectively). This time both lOnM and 0.1 pM WB 4101
contributed to the significant change in the pEC50 values (P < 0.0001). Schild regression
analysis gave a slope not significantly different from negative unity (-1.22 to -0.57, 95%
C.I.) and a higher pA2 value of 8.86. pA2 values calculated over the range of antagonist
concentrations used were not significantly different and a pA2 value calculated using the
intermediate concentration of WB4101, which caused no slope or maximum value
change, yielded a value of 8.88 ± 0.15 ( n = 4).
HV723 was used at concentrations of InM, lOnM and 0.1 pM (n = 4-5 for each
concentration). In the presence of rauwolscine, increasing concentrations of the
antagonist caused parallel rightward displacements in the concentration response curves
to NA, with no significant change in maximum or Hill slope parameters (P of 0.41 and
0.82 respectively). Both lOnM and 0.1 pM HV 723 contributed to the significant change
in the pEC50 values (P< 0.0001). Schild regression yielded a pA2 value of 8.16 with a
slope not significantly different from negative unity (-1.15 to -0.35, 95% C.I). pA2
values were not significantly different over the range of antagonist concentrations and
0.1 pM HV 723 gave a pA2 value of 7.8 ± 0.02 (n = 4).
In the presence of delequamine, HV 723 in increasing concentrations caused rightward
shifts in the concentration response curves to noradrenaline with no significant
alteration in maximum values (P of 0.35). There was however a significant lowering in
the Hill slope parameter for all concentrations of the antagonist used ( P < 0.0001).
Schild regression for this antagonist yielded a slope not significantly different from
negative unity (-1.18 to -0.66, 95% C.I.), and a higher pA2 value of 8.98. pA2 values
were not significantly different over the range of antagonist concentrations used and a
pA2 estimation from the highest concentration of antagonist gave a value of 8.77 ± 0.25
(* = 4).
The a 1A-selective antagonist, 5 methylurapidil, was used at concentrations of lOnM,
0.1 pM and lpM (n = 4-1 for each concentration used). In the presence of rauwolscine,
increasing concentrations of 5 methylurapidil caused no significant alterations in either
the maximum, Hill slope or pEC50 parameters (P of 0.15, 0.82 and 0.05 respectively).
Schild regression, as for BMY 7378, in the presence of rauwolscine, was not possible
because of the lack of effect of the antagonist. A pA2 of 6.00 ± 0.77 was derived from
lpM 5 methylurapidil.
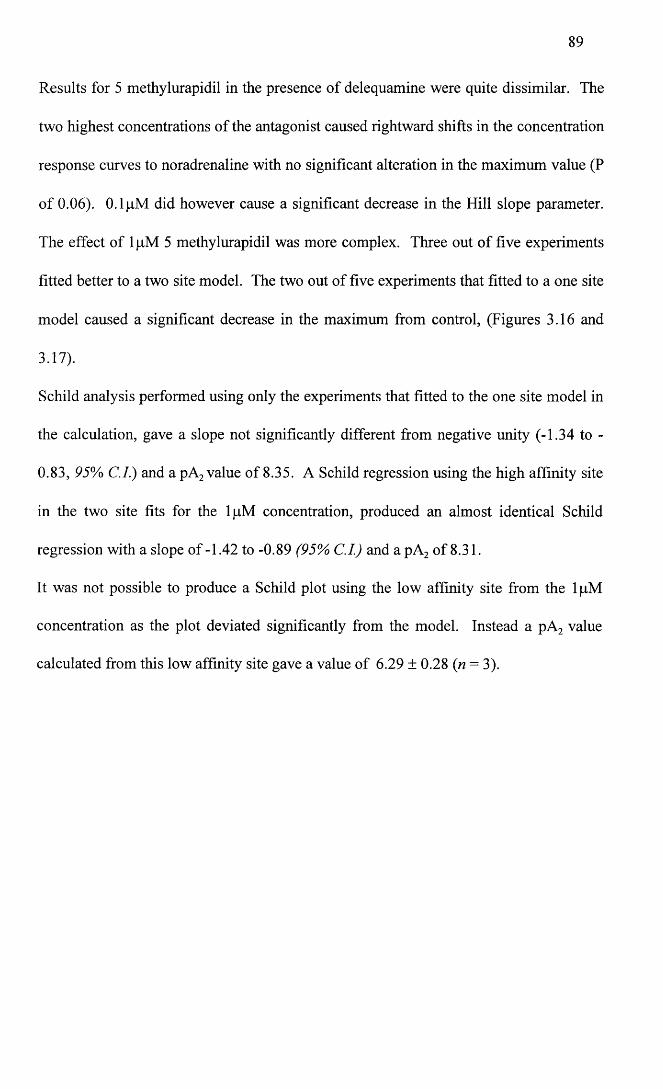
89
Results for 5 methylurapidil in the presence of delequamine were quite dissimilar. The
two highest concentrations of the antagonist caused rightward shifts in the concentration
response curves to noradrenaline with no significant alteration in the maximum value (P
of 0.06). 0.1 pM did however cause a significant decrease in the Hill slope parameter.
The effect of 1 pM 5 methylurapidil was more complex. Three out of five experiments
fitted better to a two site model. The two out of five experiments that fitted to a one site
model caused a significant decrease in the maximum from control, (Figures 3.16 and
3.17).
Schild analysis performed using only the experiments that fitted to the one site model in
the calculation, gave a slope not significantly different from negative unity (-1.34 to -
0.83, 95% C.I.) and a pA2 value of 8.35. A Schild regression using the high affinity site
in the two site fits for the lpM concentration, produced an almost identical Schild
regression with a slope o f -1.42 to -0.89 (95% C.I.) and apA 2 of 8.31.
It was not possible to produce a Schild plot using the low affinity site from the lpM
concentration as the plot deviated significantly from the model. Instead a pA2 value
calculated from this low affinity site gave a value of 6.29 ± 0.28 (n = 3).
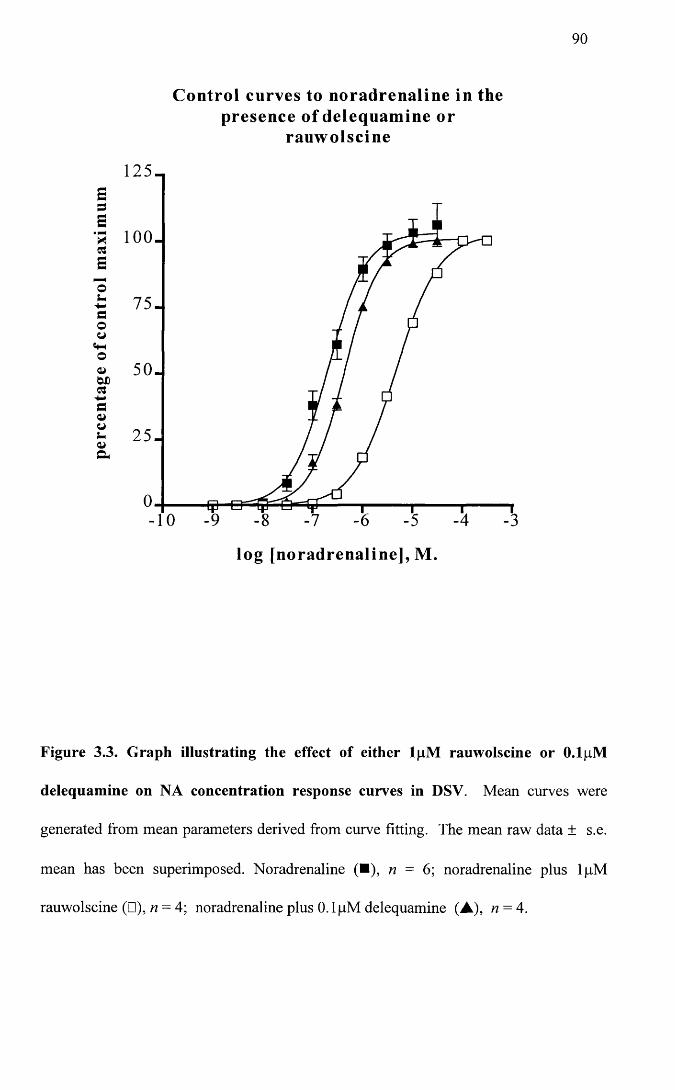
90
Control curves to noradrenaline in the presence of delequamine or
rauwolscine
75.
50.
log [noradrenaline], M.
Figure 3.3. Graph illustrating the effect of either lpM rauwolscine or O.lpM
delequamine on NA concentration response curves in DSV. Mean curves were
generated from mean parameters derived from curve fitting. The mean raw data ± s.e.
mean has been superimposed. Noradrenaline (■), n = 6; noradrenaline plus lpM
rauwolscine (□),« = 4; noradrenaline plus 0.1 pM delequamine (A), n = 4.
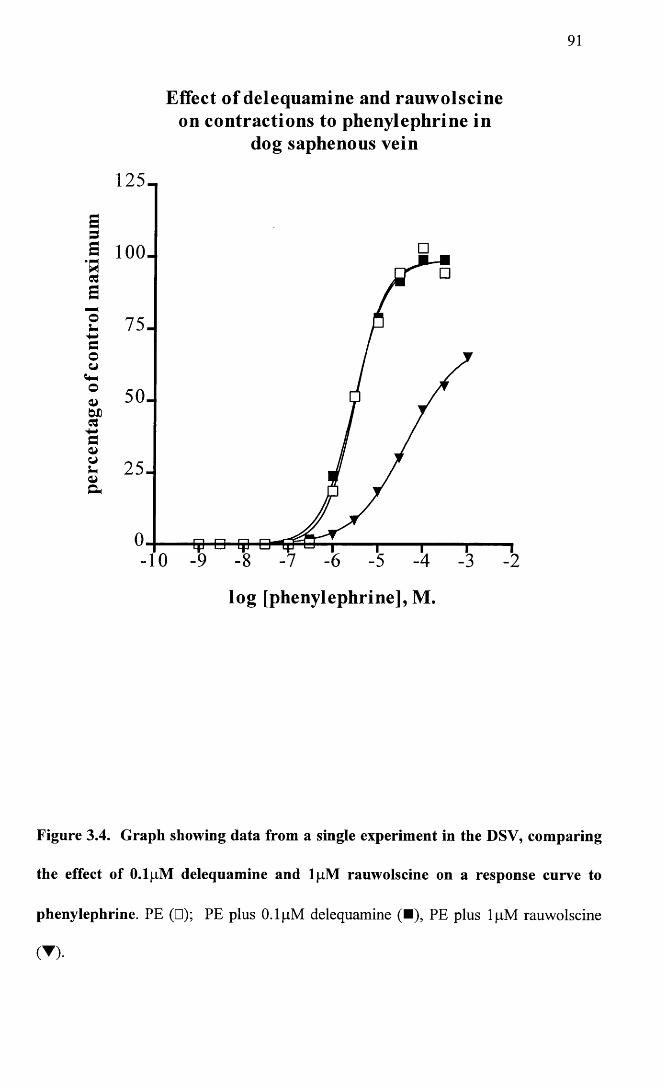
91
Effect of delequamine and rauwolscine on contractions to phenylephrine in
dog saphenous vein
125-
S 100.
75.
50.W)
25.
-10
log [phenylephrine], M.
Figure 3.4. Graph showing data from a single experiment in the DSV, comparing
the effect of O.lpM delequamine and lpM rauwolscine on a response curve to
phenylephrine. PE (□); PE plus 0.1 pM delequamine (■), PE plus lpM rauwolscine
(▼)•
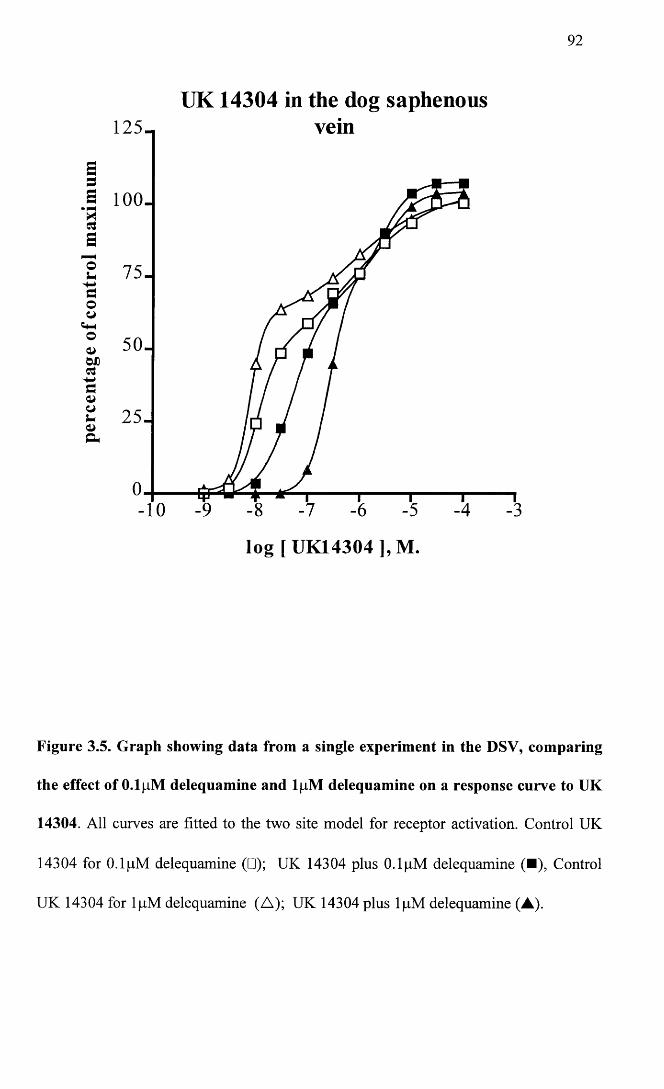
92
UK 14304 in the dog saphenousvein
S= 5S 100.Clao 75-
50-
25-
-10
log [U K 14304],M .
Figure 3.5. Graph showing data from a single experiment in the DSV, comparing
the effect of O.lpM delequamine and lpM delequamine on a response curve to UK
14304. All curves are fitted to the two site model for receptor activation. Control UK
14304 for O.lpM delequamine (□); UK 14304 plus 0.1 pM delequamine (■), Control
UK 14304 for lpM delequamine (A); UK 14304 plus lpM delequamine (A).
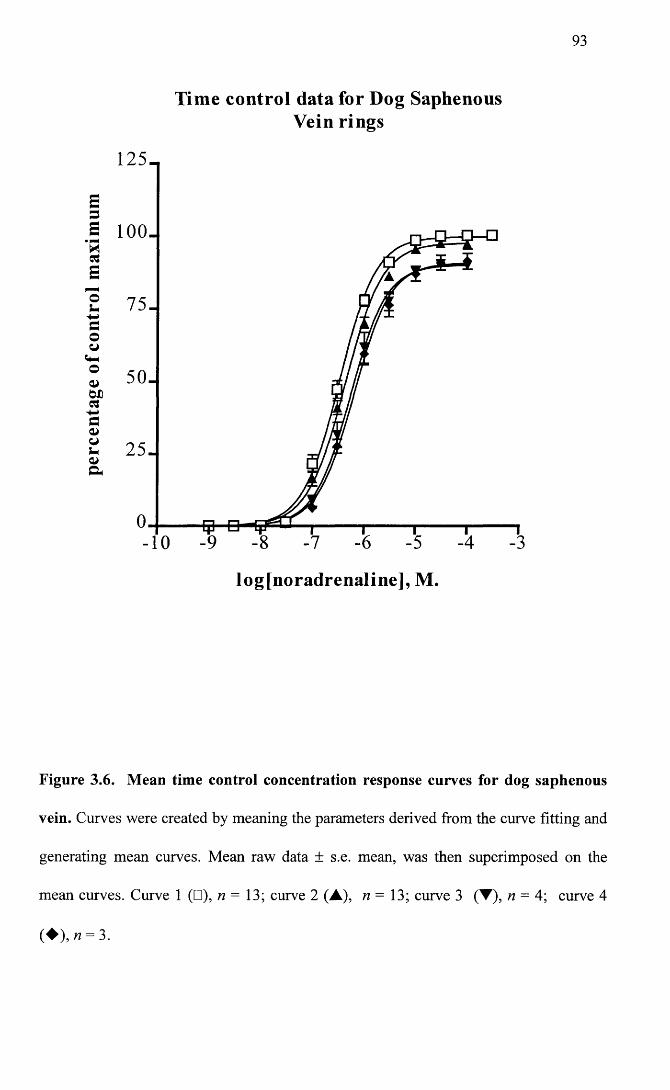
93
Time control data for Dog Saphenous Vein rings
125-
ou 75-aoCJ
o 50-
25-
-10
log[noradrenaline], M.
Figure 3.6. Mean time control concentration response curves for dog saphenous
vein. Curves were created by meaning the parameters derived from the curve fitting and
generating mean curves. Mean raw data ± s.e. mean, was then superimposed on the
mean curves. Curve 1 (□), n = 13; curve 2 (A), n = 13; curve 3 (T), n = 4; curve 4
( ♦ ) ,« = 3.
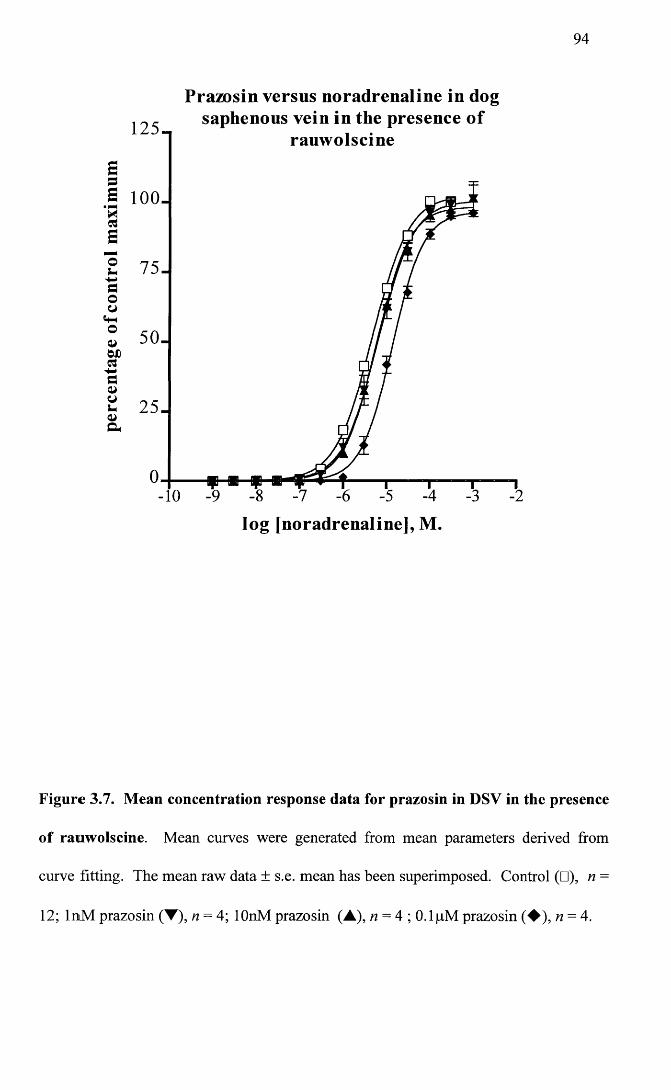
94
Prazosin versus noradrenaline in dogsaphenous vein in the presence o f
rauwolscine125-
S 100-
75-
50-©D
25-
-10
log [noradrenaline], M.
Figure 3.7. Mean concentration response data for prazosin in DSV in the presence
of rauwolscine. Mean curves were generated from mean parameters derived from
curve fitting. The mean raw data ± s.e. mean has been superimposed. Control (□), n =
12; InM prazosin (▼), n = 4; lOnM prazosin (A), n = 4 ; O.lpM prazosin (♦ ) , n — 4.
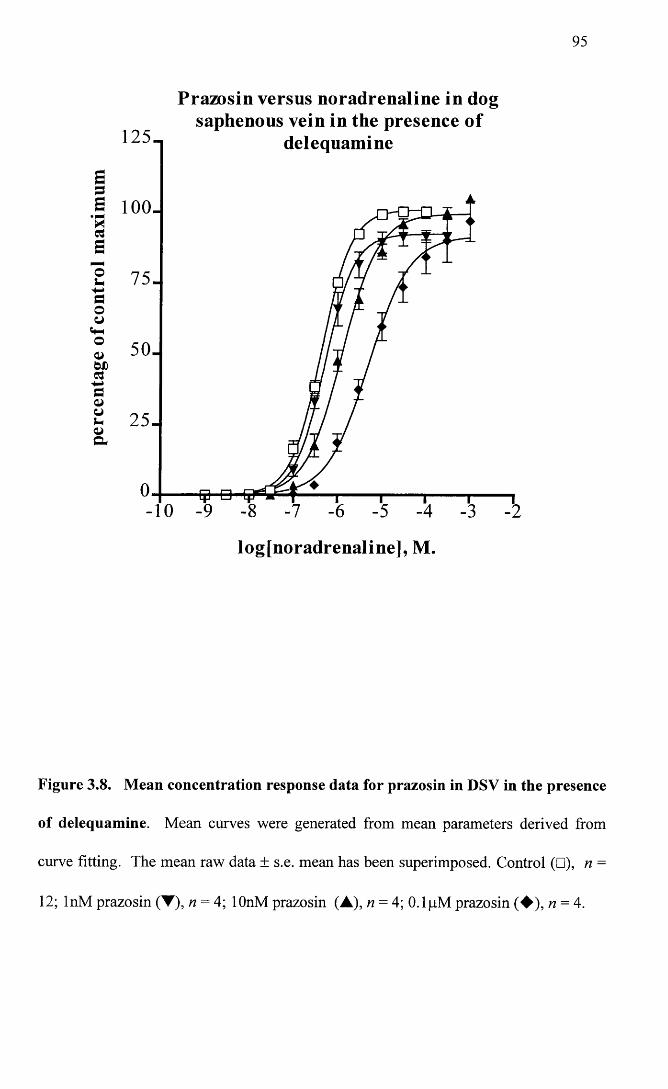
95
Prazosin versus noradrenaline in dogsaphenous vein in the presence of
delequamine125-
S 100-
75-
25-
-10
log[noradrenaline], M.
Figure 3.8. Mean concentration response data for prazosin in DSV in the presence
of delequamine. Mean curves were generated from mean parameters derived from
curve fitting. The mean raw data ± s.e. mean has been superimposed. Control (□), n =
12; InM prazosin (T), n = 4; lOnM prazosin (A), n = 4; O.lpM prazosin (♦ ) , n = 4.
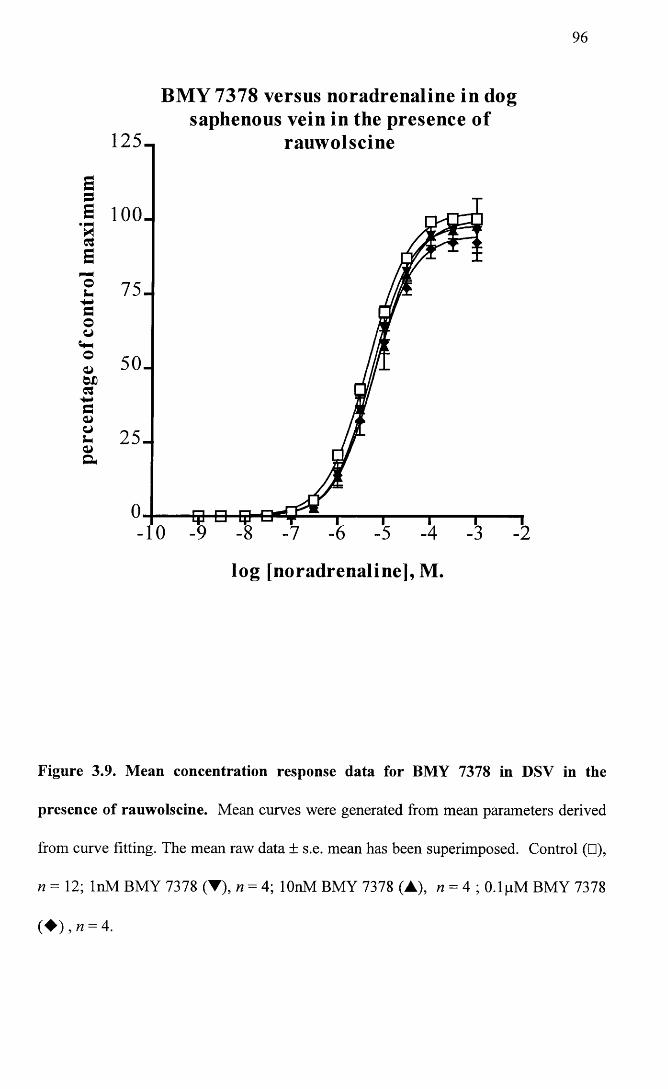
96
BM Y 7378 versus noradrenaline in dogsaphenous vein in the presence of
125- rauwolscine
S 100.
50-
25.
log [noradrenaline], M.
Figure 3.9. Mean concentration response data for BMY 7378 in DSV in the
presence of rauwolscine. Mean curves were generated from mean parameters derived
from curve fitting. The mean raw data ± s.e. mean has been superimposed. Control (□),
n = 12; InM BMY 7378 (T), n = 4; lOnM BMY 7378 (A), n = 4 ; O.lpM BMY 7378
( ♦ M = 4.
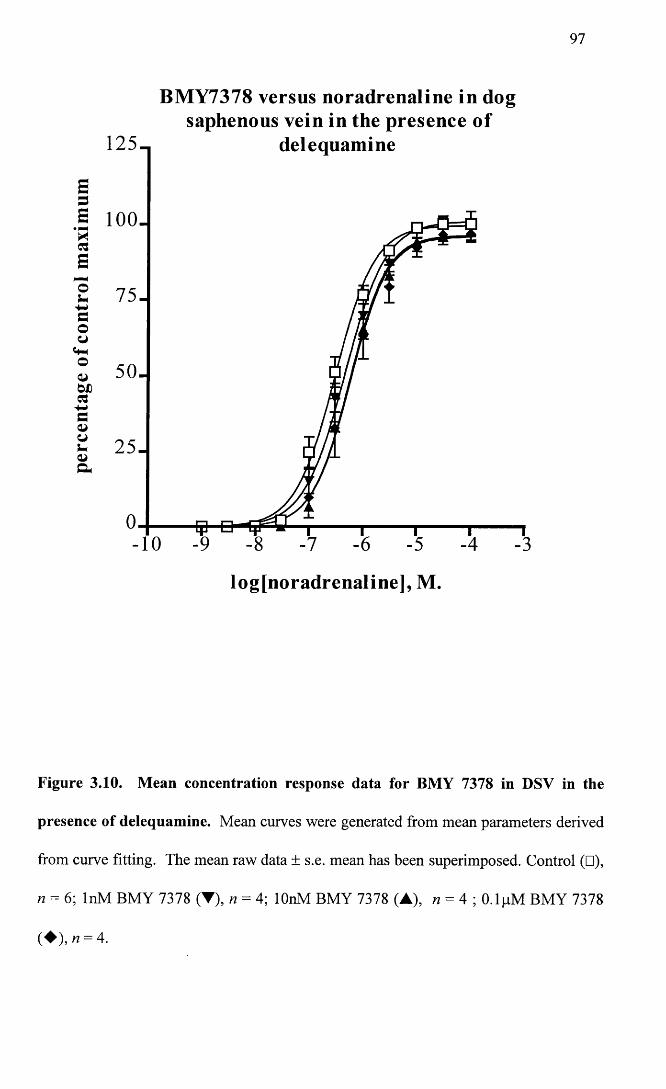
97
BM Y7378 versus noradrenaline in dogsaphenous vein in the presence o f
delequamine
a 100.
log[noradrenaline], M.
Figure 3.10. Mean concentration response data for BMY 7378 in DSV in the
presence of delequamine. Mean curves were generated from mean parameters derived
from curve fitting. The mean raw data ± s.e. mean has been superimposed. Control (□),
« = 6; InM BMY 7378 (▼), n = 4; lOnM BMY 7378 (A), n = 4 ; O.lpM BMY 7378
( ♦ ) ,« = 4.
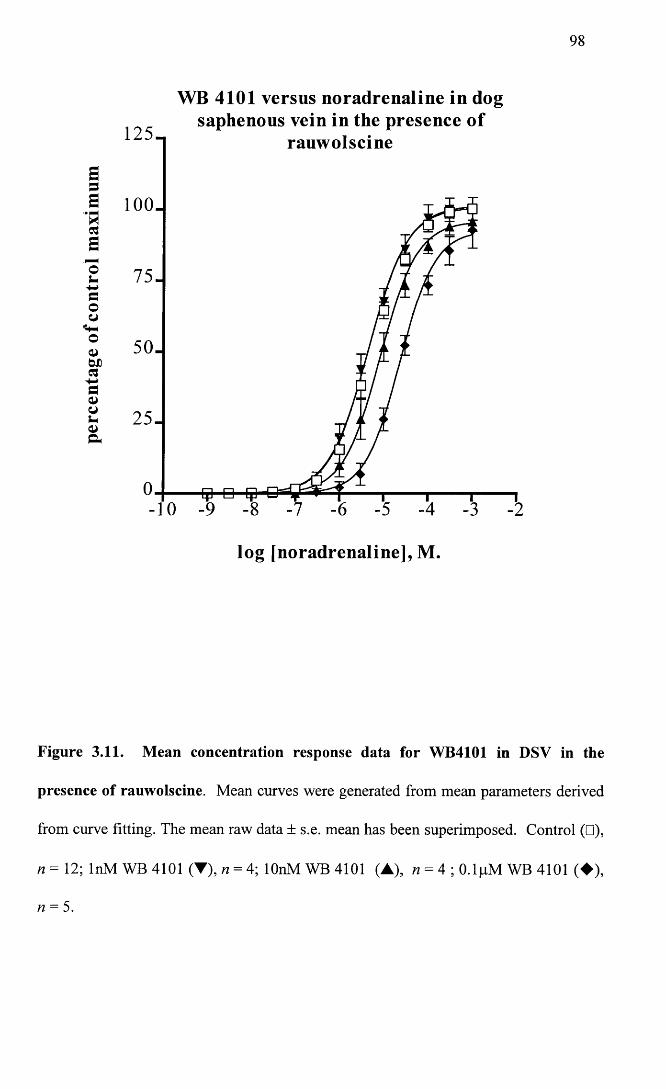
98
WB 4101 versus noradrenaline in dogsaphenous vein in the presence of
rauwolscine
Ssa loo.
a
2 75-
50.QiWDa
25.
-10
log [noradrenaline], M.
Figure 3.11. Mean concentration response data for WB4101 in DSV in the
presence of rauwolscine. Mean curves were generated from mean parameters derived
from curve fitting. The mean raw data ± s.e. mean has been superimposed. Control (□),
n = 12; InM WB 4101 (▼), n = 4; lOnM WB 4101 (A), n = 4 ; O.lpM WB 4101 (♦ ) ,
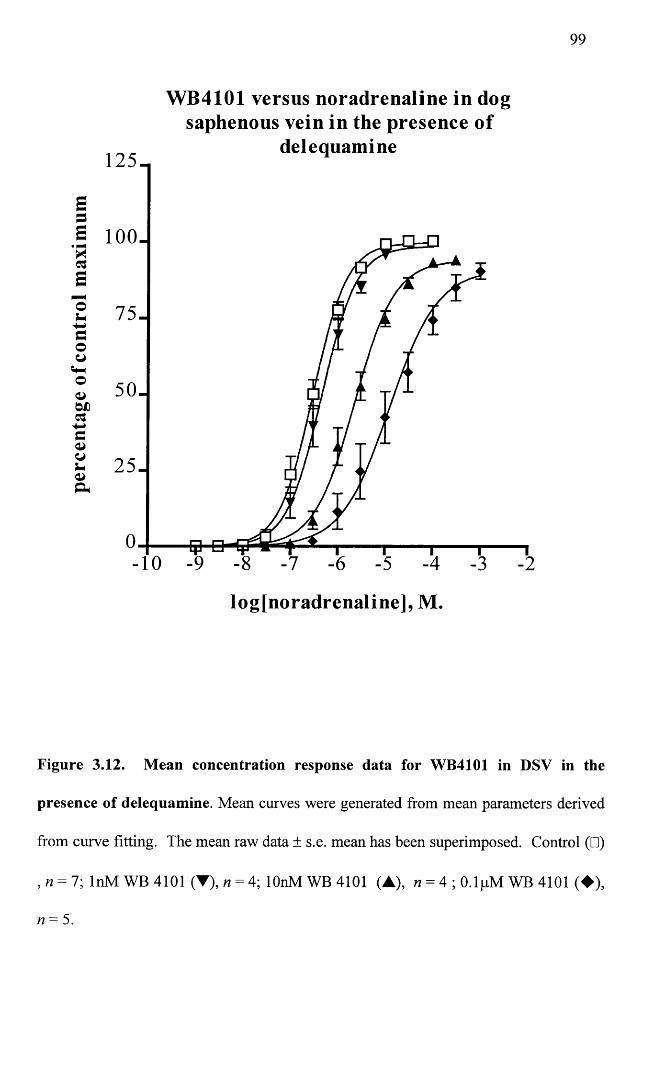
99
W B4101 versus noradrenaline in dogsaphenous vein in the presence o f
delequamine125-
a 100.
75-
50-
25-
-10
log[noradrenaline], M.
Figure 3.12. Mean concentration response data for WB4101 in DSV in the
presence of delequamine. Mean curves were generated from mean parameters derived
from curve fitting. The mean raw data ± s.e. mean has been superimposed. Control (□)
, n = 7; InM WB 4101 (▼), n = 4; lOnM WB 4101 (A), n = 4 ; O.lpM WB 4101 (♦ ) ,
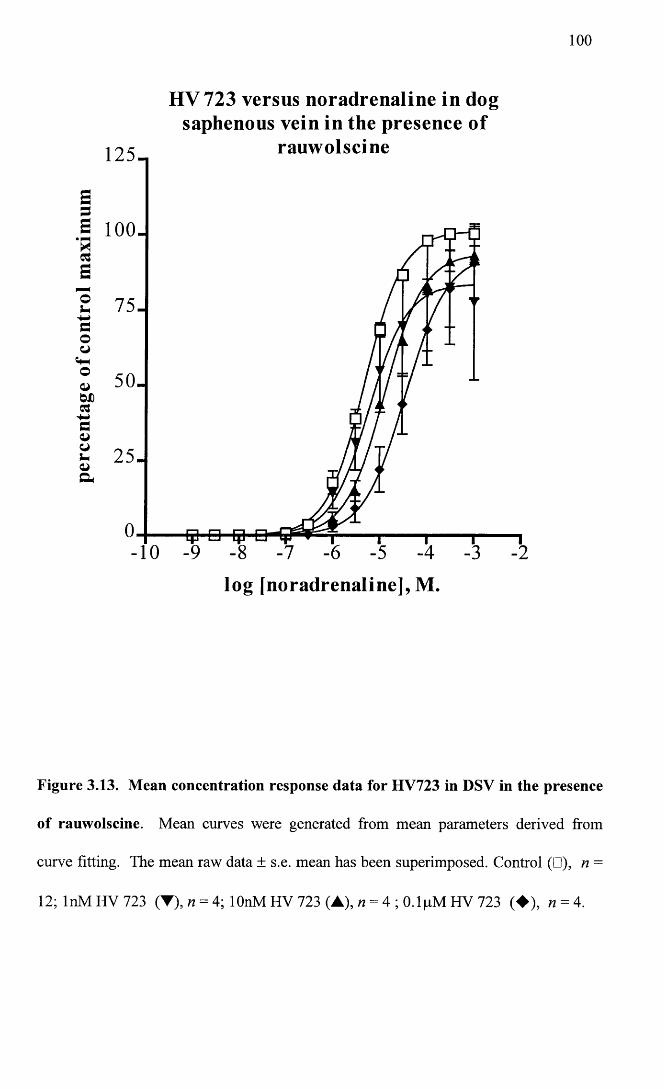
100
HV 723 versus noradrenaline in dogsaphenous vein in the presence o f
rauwolscine125-
a ioo-
75-
50-
25-
log [noradrenaline], M.
Figure 3.13. Mean concentration response data for HV723 in DSV in the presence
of rauwolscine. Mean curves were generated from mean parameters derived from
curve fitting. The mean raw data ± s.e. mean has been superimposed. Control (□), n =
12; InM HV 723 (▼), n = 4; lOnM HV 723 (A), n = 4 ; O.lpM HV 723 (♦ ) , n = 4.
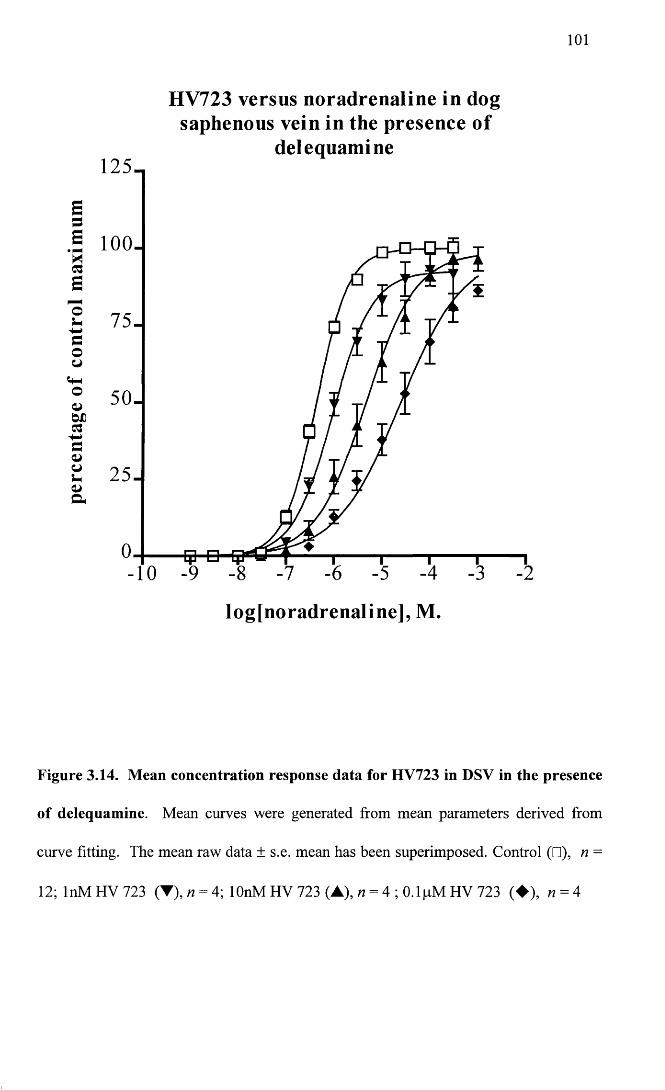
101
S3E'H3
o
3oCJ
oa->wd3+■»3ajot-a>&
125-,
HV723 versus noradrenaline in dog saphenous vein in the presence o f
delequam ine
-10 -9 -8 -7 -6 -5
log[noradrenaline], M.
Figure 3.14. Mean concentration response data for HV723 in DSV in the presence
of delequamine. Mean curves were generated from mean parameters derived from
curve fitting. The mean raw data ± s.e. mean has been superimposed. Control (□), n =
12; InM HV 723 (T), n = 4; lOnM HV 723 (A), n = 4; O.ljaM HV 723 (♦ ) , n = 4
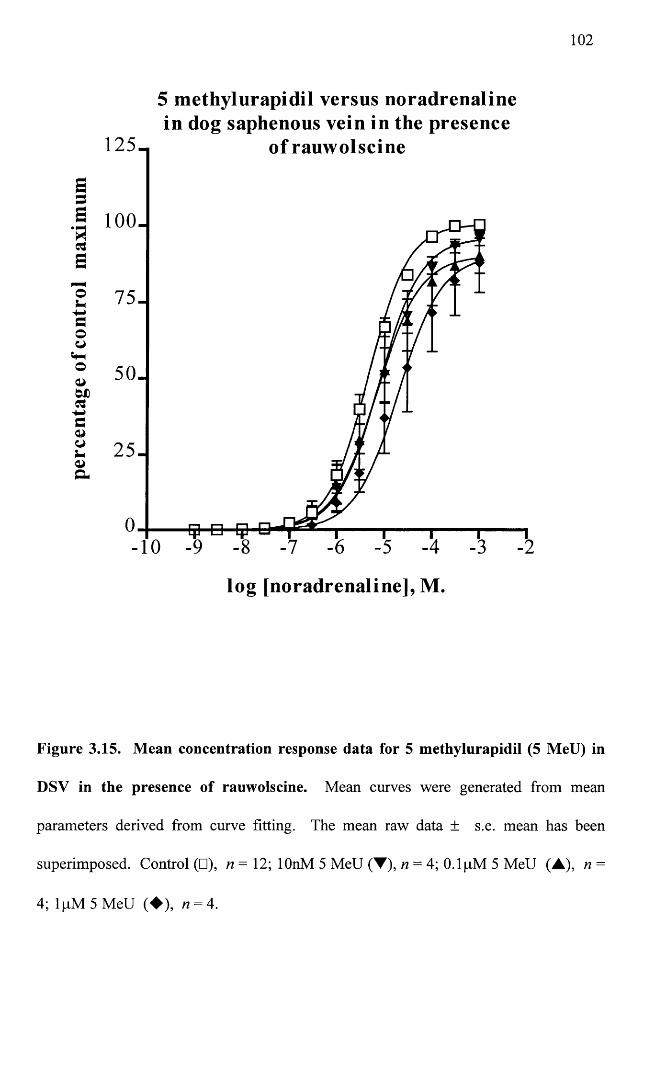
102
5 m ethylurapidil versus noradrenalinein dog saphenous vein in the presence
125- o f rauw olscine
.§ 100.
75-
50.
25 .
-10
log [noradrenaline], M.
Figure 3.15. Mean concentration response data for 5 methylurapidil (5 MeU) in
DSV in the presence of rauwolscine. Mean curves were generated from mean
parameters derived from curve fitting. The mean raw data ± s.e. mean has been
superimposed. Control (□), n= 12; lOnM 5 MeU (▼), n = 4; O.lpM 5 MeU (A), n =
4; 1 pM 5 MeU (♦ ) , n = 4.
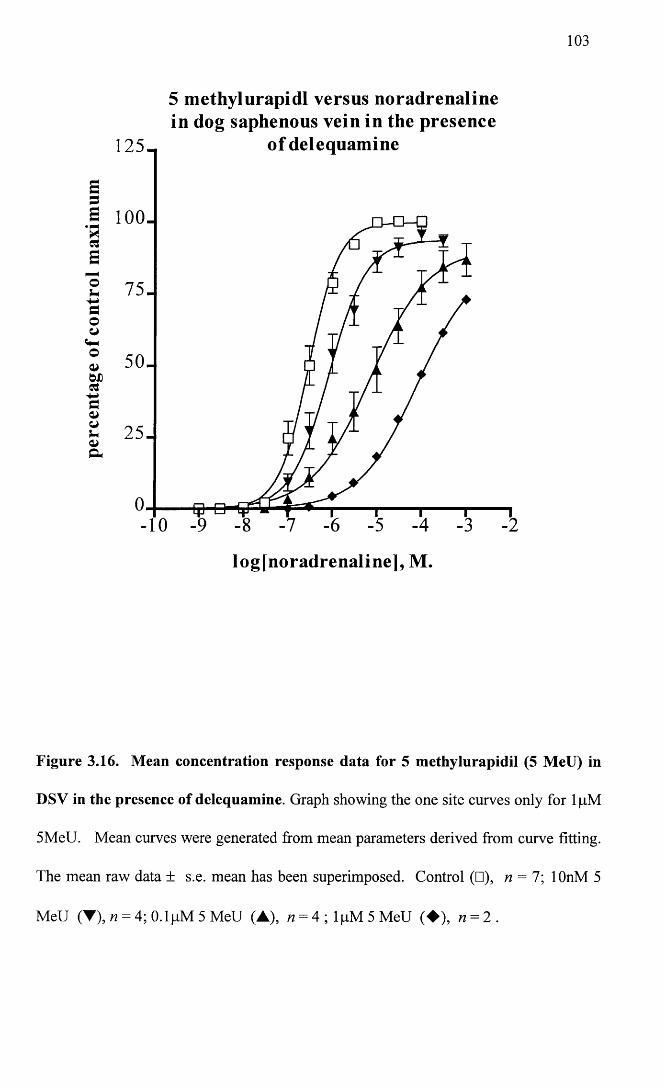
103
5 methylurapidl versus noradrenalinein dog saphenous vein in the presence
of delequamine
S 100-
75-
50-
25-
V-10
logjnoradrenaline], M.
Figure 3.16. Mean concentration response data for 5 methylurapidil (5 MeU) in
DSV in the presence of delequamine. Graph showing the one site curves only for lpM
5MeU. Mean curves were generated from mean parameters derived from curve fitting.
The mean raw data ± s.e. mean has been superimposed. Control (□), w = 7; lOnM 5
MeU (T), n = 4; O.lpM 5 MeU (A), « = 4 ; l p M 5 M e U (♦ ) , « = 2 .
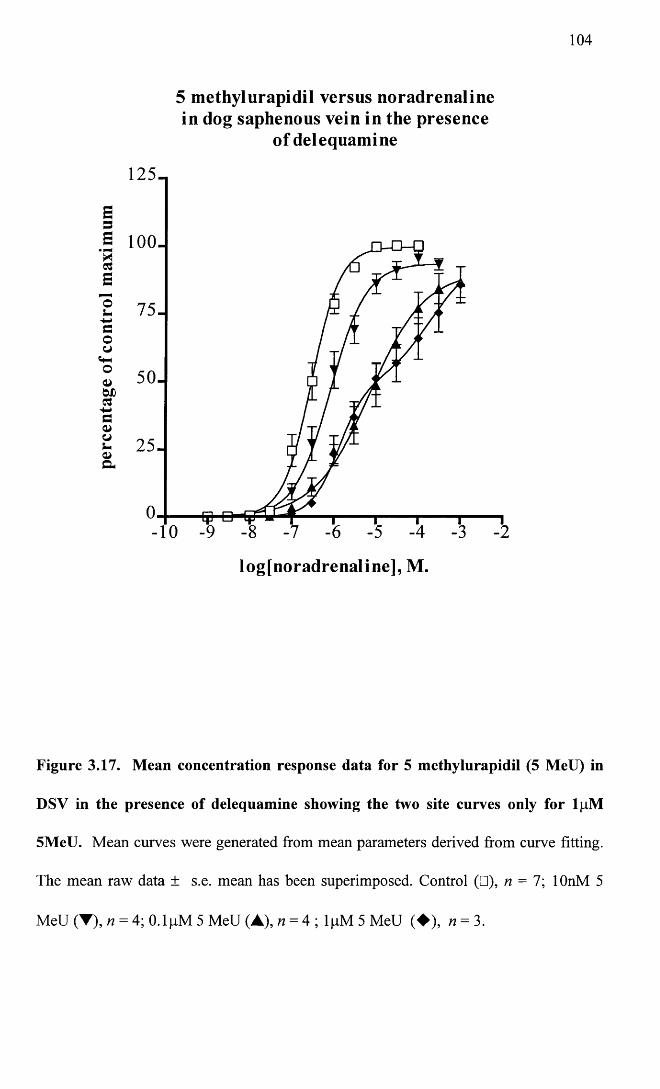
104
5 methylurapidil versus noradrenaline in dog saphenous vein in the presence
of delequamine
125-,
a loo.
75-
50-
a
-10
log[noradrenaline], M.
Figure 3.17. Mean concentration response data for 5 methylurapidil (5 MeU) in
DSV in the presence of delequamine showing the two site curves only for lpM
5MeU. Mean curves were generated from mean parameters derived from curve fitting.
The mean raw data ± s.e. mean has been superimposed. Control (□), n = l \ lOnM 5
MeU (▼), n = 4; 0.1 pM 5 MeU (A), n = 4; lpM 5 MeU (♦ ) , n = 3.
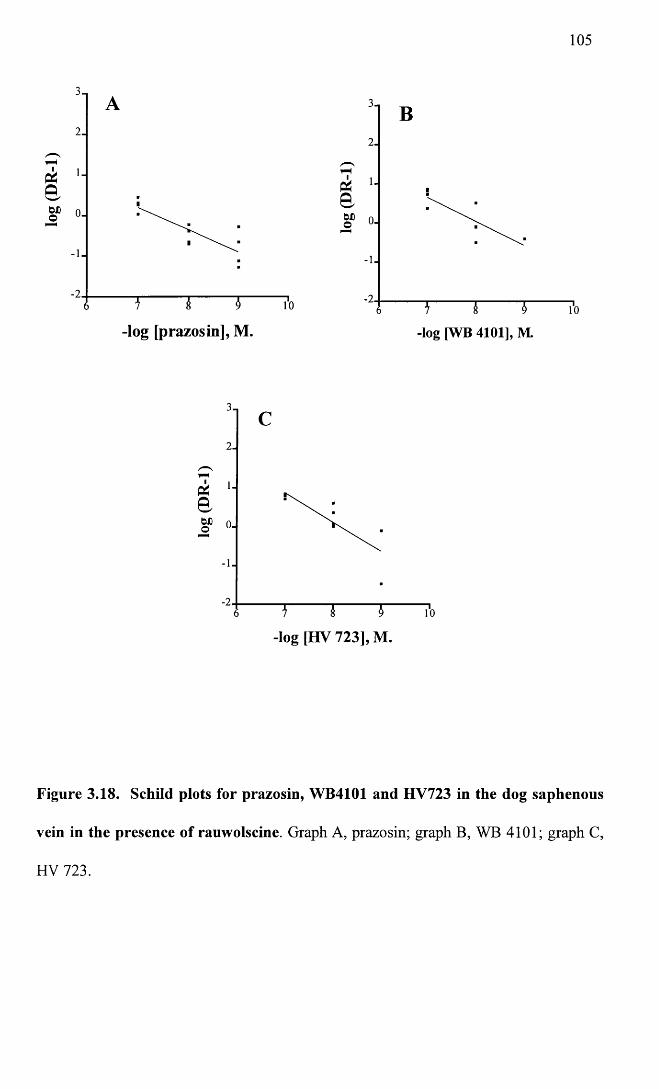
log
(DR
-1)
105
-log [prazosin], M. -log [WB 4101], M.
AafcDo
-log [HV 723], M.
Figure 3.18. Schild plots for prazosin, WB4101 and HV723 in the dog saphenous
vein in the presence of rauwolscine. Graph A, prazosin; graph B, WB 4101; graph C,
HV 723.
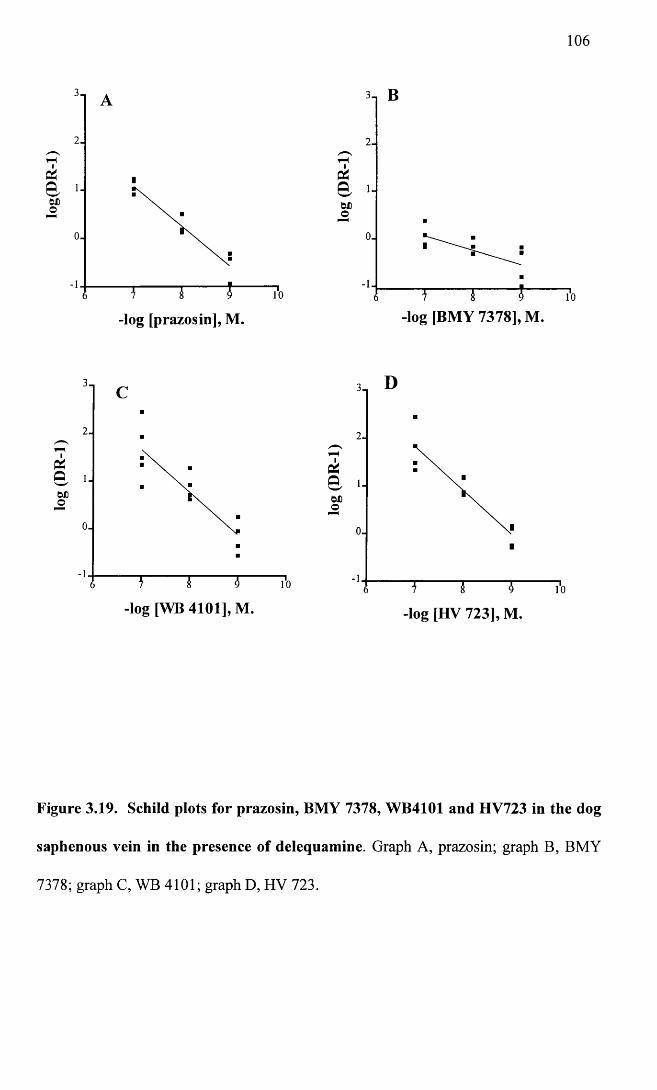
106
-log [prazosin], M. -log [BMY 7378], M.
IP40,6JjO
IP4Q
-log [WB 4101], M. _log [h y 723], M.
Figure 3.19. Schild plots for prazosin, BMY 7378, WB4101 and HV723 in the dog
saphenous vein in the presence of delequamine. Graph A, prazosin; graph B, BMY
7378; graph C, WB 4101; graph D, HV 723.
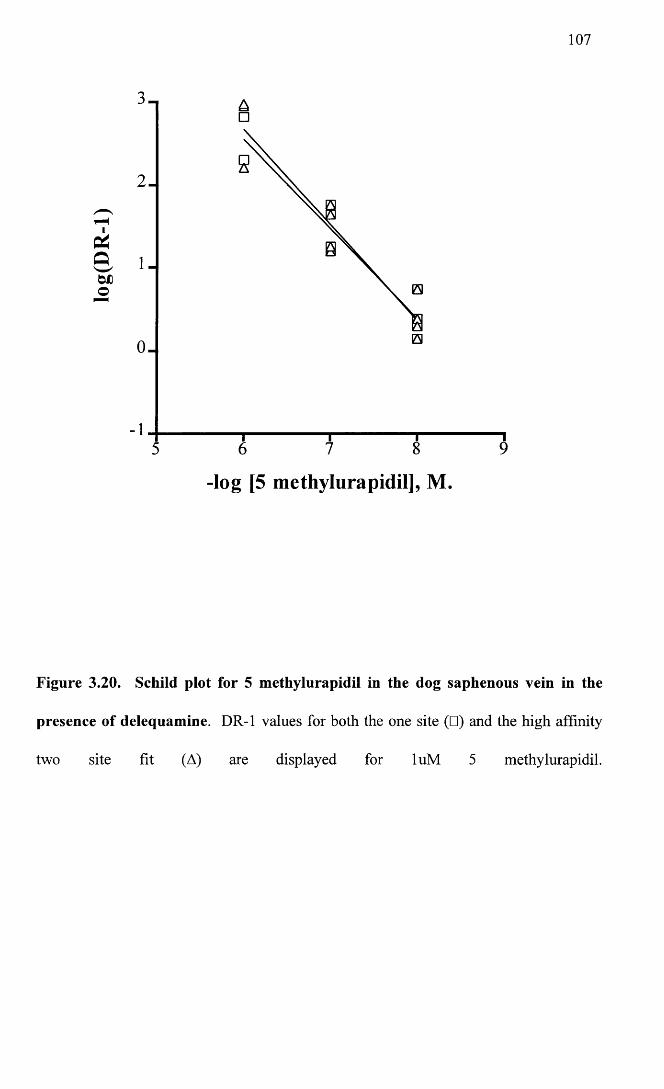
107
2 -
-log [5 methylurapidil], M.
Figure 3.20. Schild plot for 5 methylurapidil in the dog saphenous vein in the
presence of delequamine. DR-1 values for both the one site (□) and the high affinity
two site fit (A) are displayed for luM 5 methylurapidil.
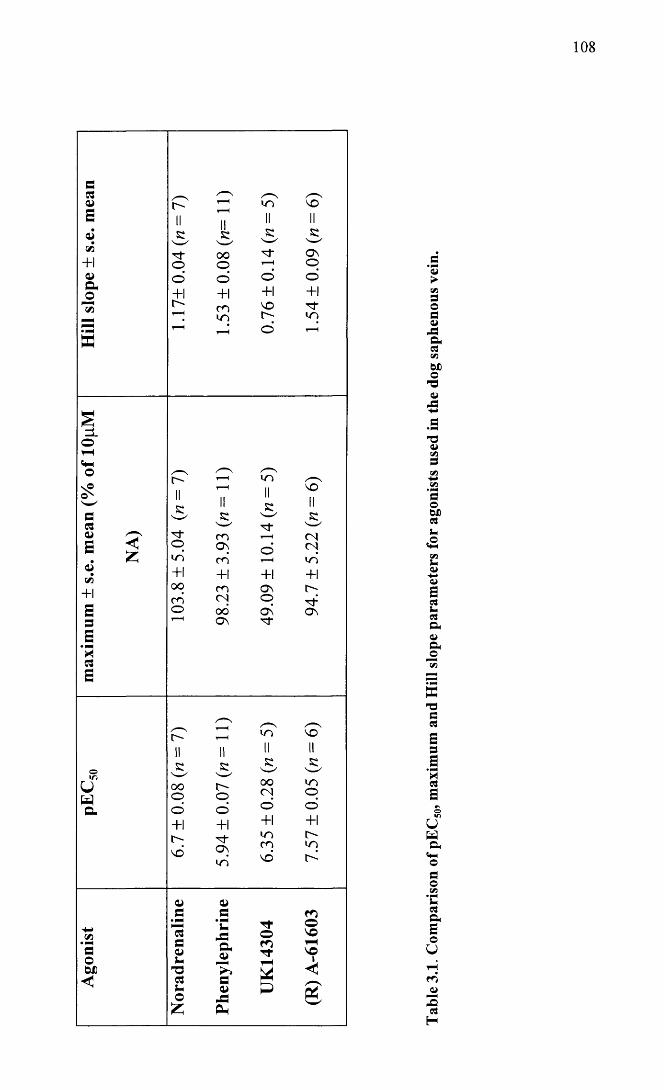
108
>V 0 O 0 4JAa0VIbx>o-0<uA
'V<uV0VI•P+0ObX)0u
zVI
a>
B0U0aa>Oho
w-000
a0a
'30a
uwa<f-lo0OVi• PMU0aao
U
r̂ i- -20
H
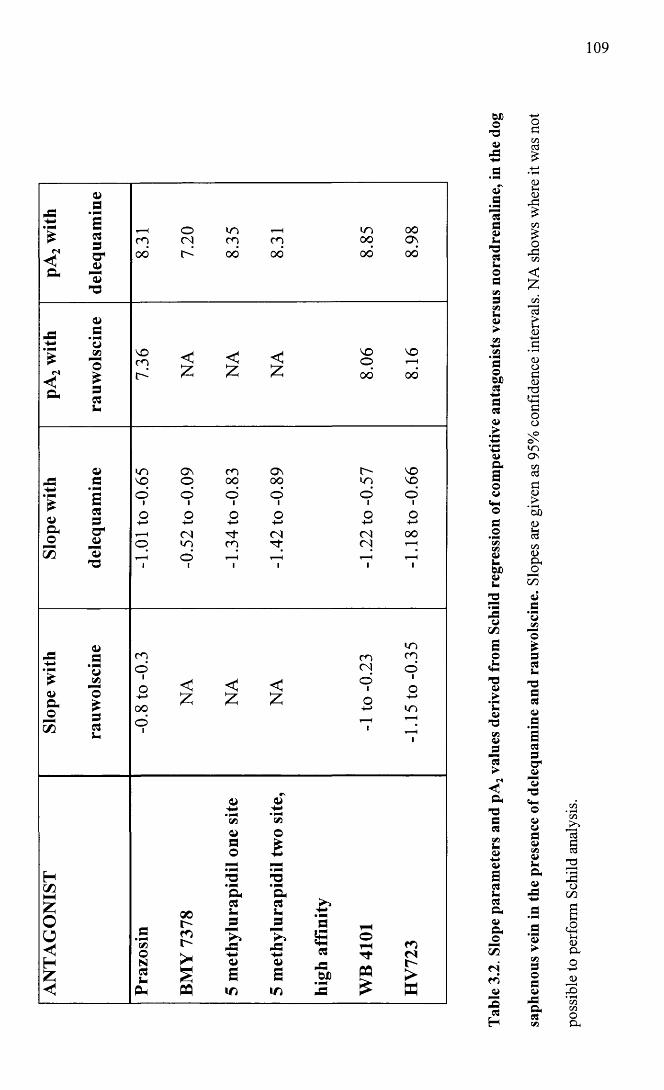
109
<N<Q-
3• p*333
—13T3
O m 00p <N p p 00 Osoo 00 00 00 00
-C
£fSa
*3cn'o£33J-
VO < < < voo VO
£ £ z 00 00
<WaJ3
OE• mmE33a*a>
13T3
vn ov m ov vovo o oo oo lO voo1 o1 oi oi o1 oio o o o o o'(-> +-> 4-> s-> +-> +->r- < <N (N (N oop in p p CN 1—Ho >—3 i—H 1—H *—!
£ jsoao
55
HC/5HH£oo<<H£
a>t3’3t/3o£335-
mo m<Ninpoio < < C o1 1o+->00o1
£ z 0 +->H1in1—H r-H
50oN3i-
3h
00l>m
PQ
o’(»a>3o
a3!-
J3-E0>3
IT)
<Ds-»• PNCMo£a3
J3
a>3in
3(33
p3OX)
TTP P£
r>nr->B
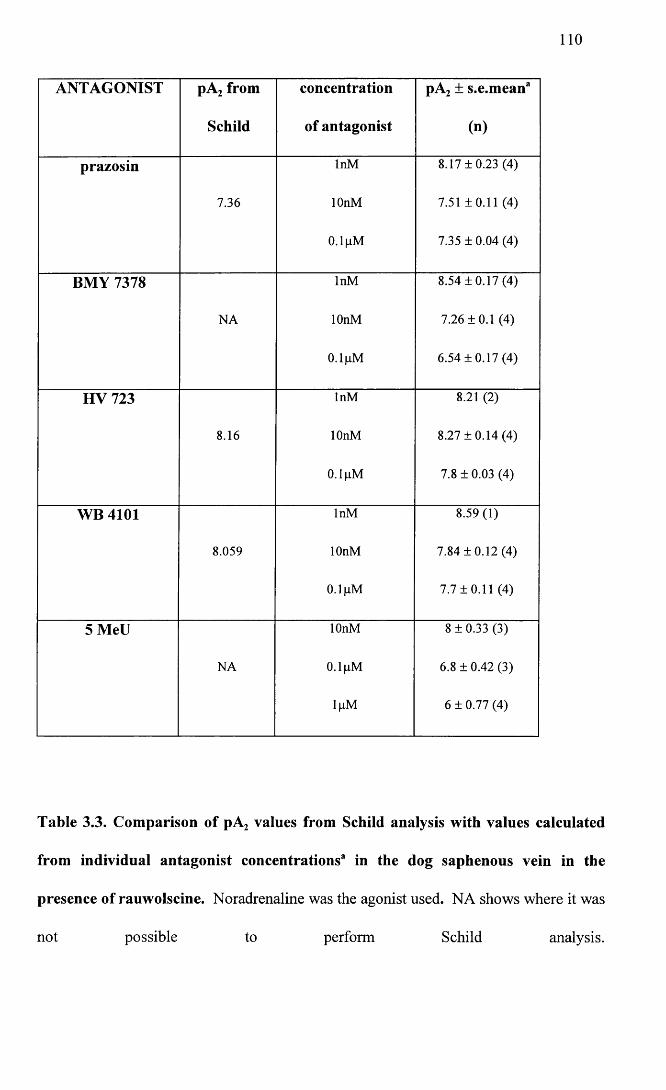
110
ANTAGONIST pA2 from concentration pA2 ± s.e.mean'
Schild of antagonist (n)
prazosin InM 8.17 + 0.23 (4)
7.36 lOnM 7.51 ±0.11 (4)
0.1 pM 7.35 ± 0.04 (4)
BMY 7378 InM 8.54 ±0.17 (4)
NA lOnM 7.26 ±0.1 (4)
0.1 pM 6.54 ±0.17 (4)
HV 723 InM 8.21 (2)
8.16 lOnM 8.27 ±0.14 (4)
0.1 pM 7.8 ± 0.03 (4)
WB 4101 InM 8.59(1)
8.059 lOnM 7.84 ±0.12 (4)
0.1 pM 7.7 ±0.11 (4)
5 MeU lOnM 8 ± 0.33 (3)
NA 0.1 pM 6.8 ± 0.42 (3)
lpM 6 ± 0.77 (4)
Table 3.3. Comparison of pA2 values from Schild analysis with values calculated
from individual antagonist concentrations3 in the dog saphenous vein in the
presence of rauwolscine. Noradrenaline was the agonist used. NA shows where it was
not possible to perform Schild analysis.
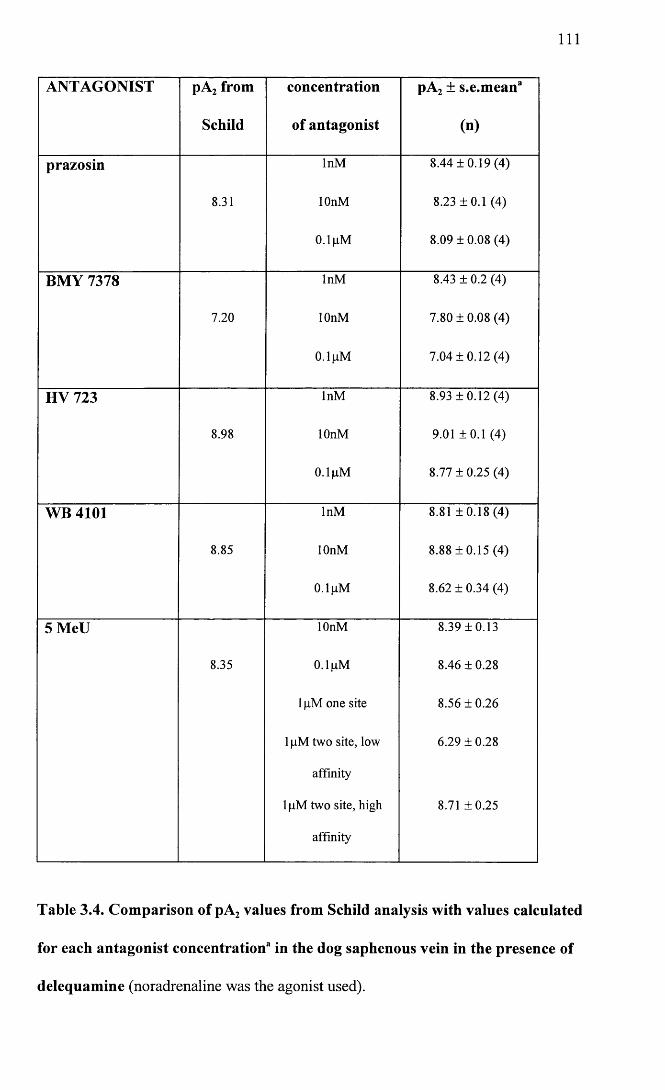
I l l
ANTAGONIST pA2 from
Schild
concentration
of antagonist
pA2 ± s.e.mean3
(n)
prazosin
8.31
InM
lOnM
0.1 gM
8.44 ±0.19 (4)
8.23 ±0.1 (4)
8.09 ± 0.08 (4)
BMY 7378 InM 8.43 ± 0.2 (4)
7.20 lOnM 7.80 ± 0.08 (4)
0.1 gM 7.04 ± 0 .12 (4)
HV 723 InM 8.93 ± 0 .1 2 (4 )
8.98 lOnM 9.01 ±0.1 (4)
0.1 gM 8.77 ± 0.25 (4)
WB 4101 InM 8.81 ± 0 .1 8 (4 )
8.85 lOnM 8.88 ±0.15 (4)
0.1 gM 8.62 ± 0.34 (4)
5 MeU lOnM 8.39 ±0.13
8.35 0.1 gM 8.46 ± 0.28
1 gM one site 8.56 ±0.26
1 gM two site, low 6.29 ±0.28
affinity
1 gM two site, high 8.71 ±0.25
affinity
Table 3.4. Comparison of pA2 values from Schild analysis with values calculated
for each antagonist concentration3 in the dog saphenous vein in the presence of
delequamine (noradrenaline was the agonist used).
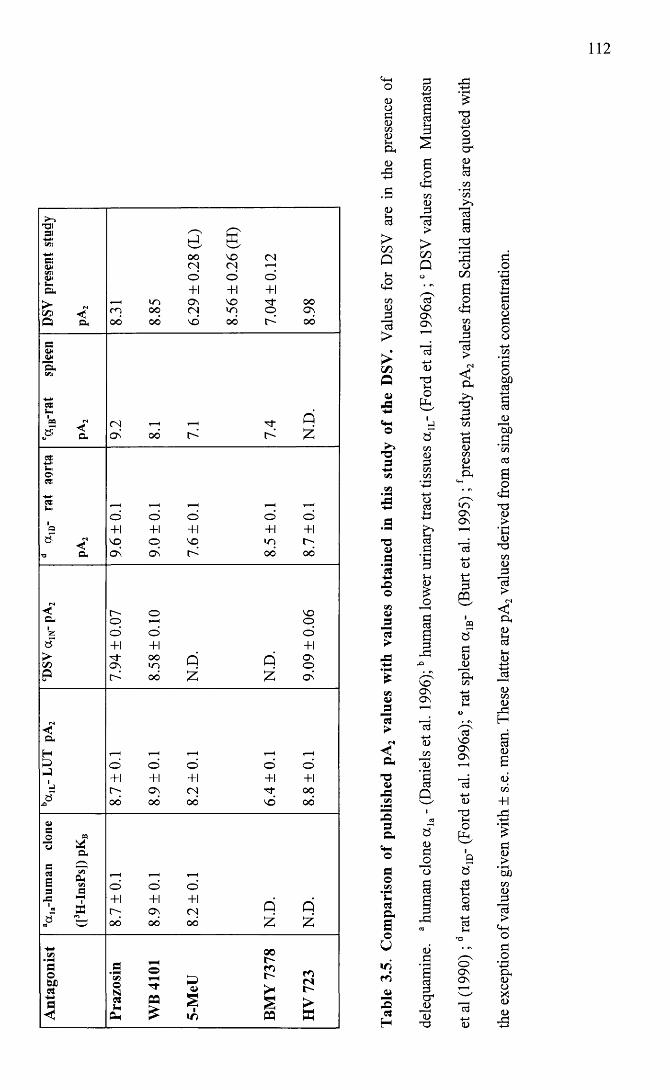
112
-UI31-***</»SIow<zna*!_a.>czs -< Ql D- 8.
31
8.85
6.29
± 0.2
8 (L
)
8.56
± 0.2
6 (H
)
7.04
±0.1
2
8.98
s:aw—■5,cm
0*Lw1C E Q f S
P a 9.2
8.1
7.1
7.4
N.D
.
~u,07S-wOSL..1Q»
■0 Q. 9.6
±0.1
9.0
±0.1
7.6
±0.1
8.5
±0.1
8.7
±0.1
r«i<a.1z<3>V5Q 7.9
4 ±
0.07
8.58
±0.1
0
N.D
.
N.D
.
9.09
± 0.
06
N<D-H&J'hJSA 8.7
±0
.1
8.9
±0.1
8.2
±0.1
6.4
±0.1
8.8
±0.1
a>a0 « ■§ * CLe —C £E v).s ^'« MB f2_ «8 8.7
±0
.1
8.9
±0.1
8.2
±0.1
N.D
.
N.D
.
Ant
agon
ist
Praz
osin
WB
4101
5-M
eU
BMY
7378
HV
723
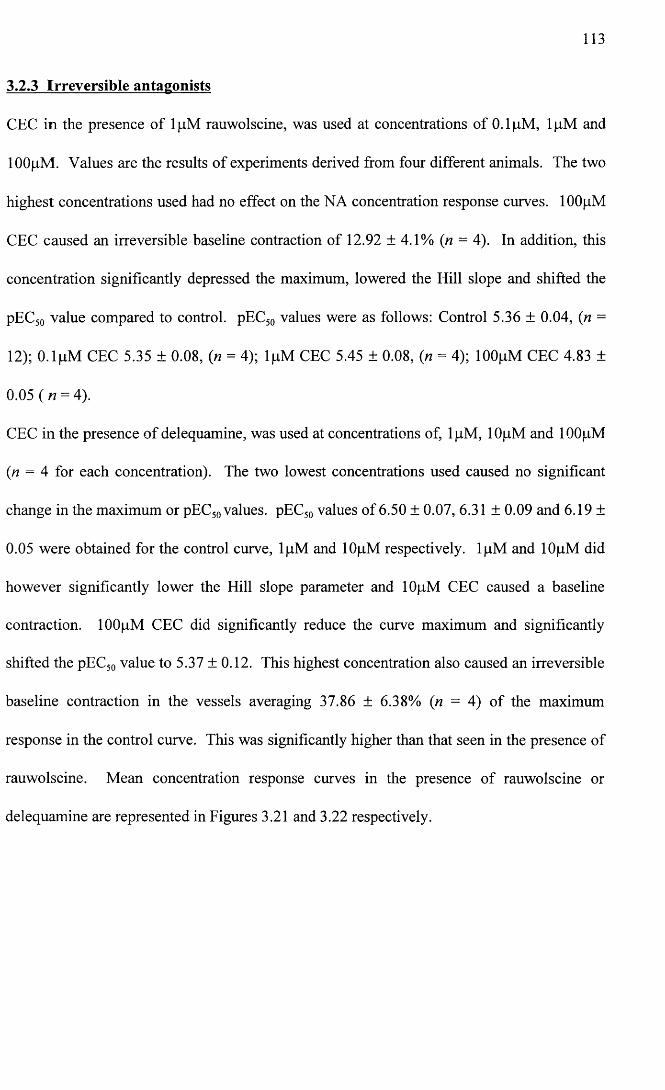
113
3.2.3 Irreversible antagonists
CEC in the presence of lpM rauwolscine, was used at concentrations of 0.1 pM, lpM and
lOOpM. Values are the results of experiments derived from four different animals. The two
highest concentrations used had no effect on the NA concentration response curves. lOOpM
CEC caused an irreversible baseline contraction of 12.92 ±4.1 % (n = 4). In addition, this
concentration significantly depressed the maximum, lowered the Hill slope and shifted the
pEC50 value compared to control. pEC50 values were as follows: Control 5.36 ± 0.04, (n =
12); 0.1 pM CEC 5.35 ± 0.08, (n = 4); lpM CEC 5.45 ± 0.08, {n = 4); lOOpM CEC 4.83 ±
0.05 ( n = 4).
CEC in the presence of delequamine, was used at concentrations of, lpM, lOpM and lOOpM
(n = 4 for each concentration). The two lowest concentrations used caused no significant
change in the maximum or pEC50 values. pEC50 values of 6.50 ± 0.07, 6.31 ± 0.09 and 6.19 ±
0.05 were obtained for the control curve, lpM and lOpM respectively. lpM and lOpM did
however significantly lower the Hill slope parameter and lOpM CEC caused a baseline
contraction. lOOpM CEC did significantly reduce the curve maximum and significantly
shifted the pEC50 value to 5.37 ±0.12. This highest concentration also caused an irreversible
baseline contraction in the vessels averaging 37.86 ± 6.38% (n = 4) of the maximum
response in the control curve. This was significantly higher than that seen in the presence of
rauwolscine. Mean concentration response curves in the presence of rauwolscine or
delequamine are represented in Figures 3.21 and 3.22 respectively.
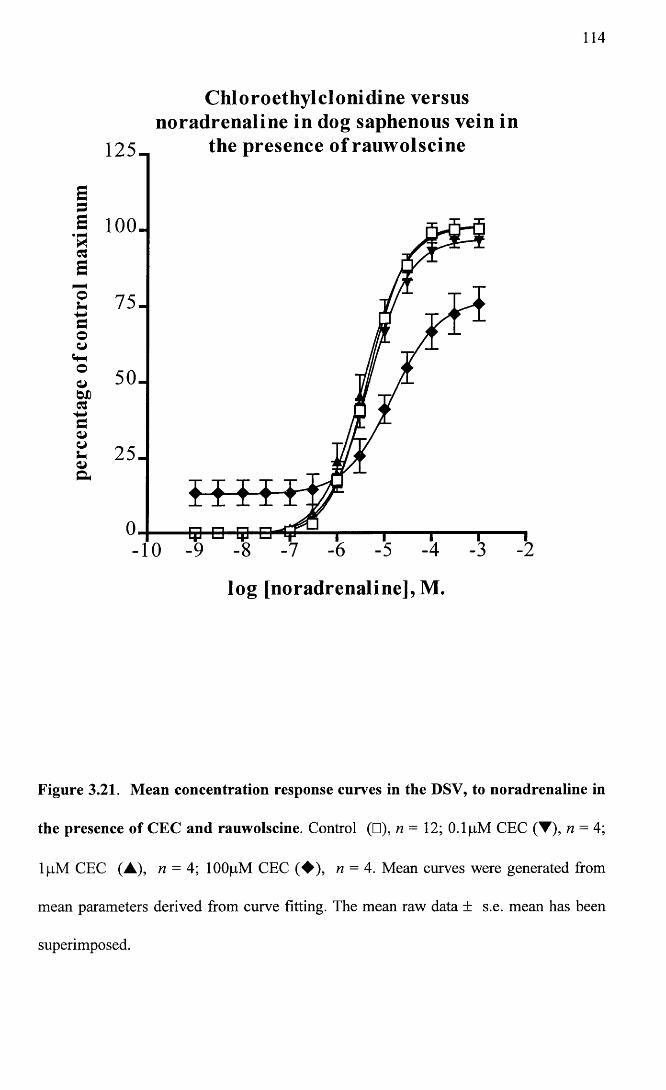
114
C hloroethylclonidine versusnoradrenaline in dog saphenous vein in
the presence o f rauw olscine
5
a 100.H
Eo+-»couo 5 0 .
log [noradrenaline], M.
Figure 3.21. Mean concentration response curves in the DSV, to noradrenaline in
the presence of CEC and rauwolscine. Control (□), n= 12; 0.1 pM CEC (▼), n = 4;
lpM CEC (A), n = 4; lOOpM CEC (♦ ) , n = 4. Mean curves were generated from
mean parameters derived from curve fitting. The mean raw data ± s.e. mean has been
superimposed.
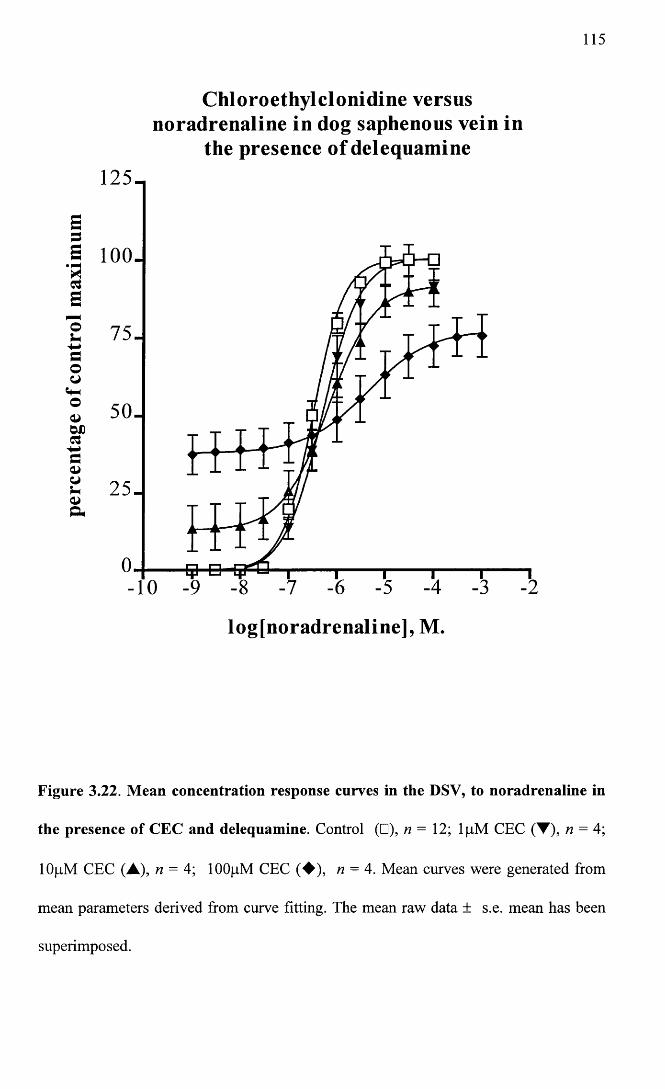
115
C hloroethylclon id ine versus noradrenaline in dog saphenous vein in
the presence o f delequam ine125-,
Sa 100.Rcsa©5-aooo 50.
25 .
-10
log[noradrenaline], M.
Figure 3.22. Mean concentration response curves in the DSV, to noradrenaline in
the presence of CEC and delequamine. Control (□), n — 12; lpM CEC (T), n — 4;
lOpM CEC (A), n = 4; lOOpM CEC (♦ ) , n = 4. Mean curves were generated from
mean parameters derived from curve fitting. The mean raw data ± s.e. mean has been
superimposed.
116
3.3 Discussion
The dog saphenous vein (DSV) has been used extensively in a wide variety of vascular
research studies and thus within certain limits it has been well characterised. This made
it a good choice of vessel for this study.
It is now well accepted that the DSV has both a r and a 2- post-junctional adrenoceptors,
which mediate contraction to exogenous noradrenaline. Evidence for this first came
from in vivo studies by Drew and Whiting (1979). Later a number of studies looked at
isolated rings of vein and compared responses to a number of agonists and antagonists
(Flavahan and Vanhoutte, 1986b; Alabaster et al. 1985; Flavahan et al. 1984;
Constantine et al. 1982; Sullivan and Drew, 1980; De Mey and Vanhoutte, 1981).
These studies found that exogenous noradrenaline activated post-junctional a ,- and a 2-
adrenoceptors and that the lower half of the curve was predominantly a 2- mediated
while the upper portion of the curve was primarily a ,- mediated. In general, all these
studies found that the aj-agonist phenylephrine was less potent than noradrenaline,
while there was some variation seen between studies in the rank order of the a 2-agonists
used. De Mey and Vanhoutte (1981) used the a 2-agonist clonidine and found it only
slightly less potent than noradrenaline. In contrast, Alabaster at al (1985) found the a 2-
agonist they chose (UK14304) to be more potent than either noradrenaline or
phenylephrine.
In agreement with the studies mentioned above, I also found noradrenaline to be more
potent than phenylephrine. The a 2-agonist UK14304 was of intermediate potency to
phenylephrine and noradrenaline, being more potent than the former and less potent
than the latter. As for the other studies cited, phenylephrine and noradrenaline were full
agonists in this tissue, while UK14304 only achieved about 50% of the response
produced by these two agonists. Another interesting finding was the significant
117
difference in the Hill slope parameters between agonists. A Bonferroni post test showed
that this was due to the shallowness of the UK14304 curve. The phenylephrine curve
was also significantly steeper than the noradrenaline curve. This has previously been
observed by Guimaraes and Paiva (1987). The steepness of the curves to both the
Abbott compound and phenylephrine may indicate that these agonists are more likely to
be activating a single population of receptors as opposed to either noradrenaline or UK
14304 (Table 3.1), since shallower curves can be due to an interaction of the agonist
with more than one receptor population.
In addition to the agonists already mentioned, the Abbott compound (R) A-61603 was
used. A-61603 was developed a number of years ago, but only since the recent
discovery of a,-adrenoceptor subtypes, has its potential as a subtype-selective agonist
come to light.
Most currently available information on this substance has been published in a paper by
Knepper (1995). Sensitivity (EC50 values) of this agonist was compared in a variety of
tissue types (native subtypes) and cell lines, transfected with the three cloned oq-
subtypes ( a la-, a ]b- and a ld-). Included in the tissues selected were rat vas deferens and
canine prostate. Although in the paper these were both classified as having a ]A-
adrenoceptors, these tissues have both been described elsewhere in the literature as
containing a 1L-adrenoceptors (Muramatsu et al. 1995). This is relevant to the vessels
used in this study because of their low affinity to prazosin which is discussed later.
Knepper shows A-61603 to be 35-150 fold more potent at a 1A-adrenoceptors compared
to either oc1B- or a ]D-.
Comparisons were also made between A-61603 and different agonists at the three native
subtypes. At canine prostate strips A-61603 was 165 fold more potent than
phenylephrine and 128 fold more potent than noradrenaline. At the a ]B-adrenoceptor in
118
rat spleen, A-61603 was 40 fold more potent than phenylephrine. In contrast, at a 1D-
adrenoceptor sites in rat aorta, the compound was less potent than phenylephrine. It
should however be noted, that in the present study, the R-enantiomer rather than the
racemic mix was used. The R-enantiomer appears to confer potency to the compound.
Knepper also quotes figures for (R) A-61603 at the canine prostate, showing a 590 fold
greater potency than phenylephrine and a 460 fold greater potency than noradrenaline.
These figures are considerably higher than those obtained in this study. Unfortunately,
no values are available for (R) A-61603 at the other oq-subtypes.
To summarise the results of the agonist studies, the rank order of potency of the agonists
used would support the presence of both post-junctional cq- and a 2-adrenoceptors
(Wright et al. 1995). The Abbott compound was the most potent of the agonists used.
This would support the view that the oq ̂ -adrenoceptor is involved. Its relative
potency in relation to phenylephrine, while much lower when compared to Knepper’s
study, for a ]AyL- adrenoceptors, could be explained by the coexistence of another
receptor subtype where the compound does not show the same order of magnitude in the
increased sensitivity over phenylephrine. The discrepancies between studies, of the
potency of UK14304 compared to noradrenaline could be due to the relative proportion
of a ,- and a 2- adrenoceptors. It has been demonstrated that the density of a 2-
adrenoceptors increases from the distal to the proximal portion of the DSV (Guimaraes
and Nunes, 1990; Guimaraes et al. 1991; Pereira et al. 1991). According to the
diagrams drawn by Guimaraes and Nunes (1990), the section of DSV used in this study
was intermediate. In many of the other studies the exact region of vein used is not clear,
thus anatomical location of the segment of vessel used may explain some of the
variations seen between studies.
119
Although not addressed in this study, it is worth mentioning, that it has been suggested
that in some vessels, UK 14304 may act as an agonist at a,-adrenoceptors (Nagadeh et
al. 1994). This could explain the two site fit seen for UK 14304 in several of the DSV
rings (Figures 3.2 and 3.4.) and the shallowness of the Hill slopes seen in this study
(Table 3.1).
In addition to agonists, a selection of aj -adrenoceptor antagonists was used in order to
functionally classify the subtype of a,-adrenoceptor responsible for contraction of this
vessel to exogenous noradrenaline. The current concepts and nomenclature for
classification of a j-adrenoceptors have already been discussed in the introduction in
Chapter 1. The a j-antagonist prazosin, was used in addition to the following putative
subtype-selective antagonists: The a 1A-selective 5 methylurapidil (Hanft and Gross,
1989; Graziadei et al. 1989; Gross et al. 1989; Gross et al. 1988); the a ,D-selective
BMY 7378 (Goetz et al. 1995); HV 723 to distinguish a ]L- and a ]N- (Oshita et al. 1988;
Muramatsu et al. 1995); the a,^-selective WB 4101 (Kenny et al. 1995; Morrow and
Creese, 1986). In addition, the irreversible alkylating agent CEC was used to determine
the presence of a 1B-adrenoceptors (Michel et al. 1993; Gross et al. 1989; Minneman et
al. 1988; Minneman, 1988; Han et al. 1987b).
A number of studies have already tried to classify a,-adrenoceptors in the DSV. From
functional studies the one common finding has been the low affinity for prazosin (pKB
or pA2 values less than 9), (Alabaster et al. 1985; Sullivan and Drew, 1980; De Mey and
Vanhoutte, 1981; Guimaraes and Nunes, 1990; Flavahan and Vanhoutte, 1986b;
Flavahan et al. 1984). Beyond this, the subtype(s) involved are still unresolved.
Guimaraes et al (1991), suggested that there was more than one subtype, with the
proximal part of the vessel being a ]A- due to the high potency of WB4101, and distally
a ]B-, because WB4101 was less potent in this region but the effect of the agonist
120
phenylephrine was greater. Hicks et al (1991) concluded on the presence of the a 1A- in
the DSV, again based on the high affinity to WB4101. They also felt that there was an
additional subtype because of the non-competitive action of some of the antagonists on
contractions to phenylephrine. Although it has been suggested that phenylephrine,
especially at high agonist concentrations, may mediate its action through ot2-
adrenoceptors in the DSV and human vessels (Hair et al. 1988; Hicks et al. 1991;
Guimaraes et al. 1987), the relative insensitivity of phenylephrine contractions to
calcium channel blockers compared to the a 2-agonist BHT 920 and the lower potency of
rauwolscine against phenylephrine induced contractions compared to other a 2-
adrenoceptor agonists, has been used to argue that this is unlikely. The lack of effect of
the selective a 2-antagonist delequamine, on contractions to phenylephrine in this study
would support this latter view.
Daniel et al (1996) also found a high potency for WB4101 (pKB 8.3), but because of the
low affinity for 5 methylurapidil (pKB 6.2), concluded that this indicated the presence of
an a 1D- rather than an a 1A- receptor subtype. Both these antagonists seemed to act
competitively. However, only a narrow concentration range was explored. Potency of
prazosin was also low and varied depending on the concentration used from a pKB of
6.69 to 7.76. It was concluded that the subtype involved was similar to the a 1D-, but
was atypical, because the sites seemed to be somewhat sensitive to CEC and
rauwolscine.
Findings from this study are summarised in Tables 3.2 to 3.4 and were somewhat
interesting when comparisons were made between experiments carried out in the
presence of rauwolscine with those conducted in the presence of delequamine. In
general, there appeared to be a lowering of antagonist affinities when rauwolscine rather
than delequamine was used (as already mentioned, Kenakin (1982) describes this effect
when an antagonist interferes with the receptor population being studied). In addition to
this, the antagonists most dramatically affected by the use of one or other a 2-antagonist
were prazosin, 5 methylurapidil and WB 4101. Prazosin in the presence of rauwolscine
had a very low affinity and Schild regression was suggestive of a non-competitive
interaction due to a slope significantly different from negative unity. In contrast, the
interaction became competitive and the affinity much higher when delequamine was
used. It is not clear as to why the interaction should have been non-competitive with
rauwolscine, but this is possibly just a reflection of the very low affinity of this ligand
for the receptors remaining unaffected by rauwolscine. What is clear, is that
rauwolscine is interacting at prazosin sensitive sites in DSV. 5 methylurapidil also had
a very low affinity in the presence of rauwolscine. When delequamine was used, 5
methylurapidil became much more potent and the highest concentration used appeared
to unmask a high and a low affinity site. Interestingly, the low affinity site yielded a
pA2 of 6.29 ± 0.28 which was similar to a pA2 obtained with the same concentration in
the presence of rauwolscine (6.00 ± 0.77). This would seem to suggest that
rauwolscine, in addition to interacting with prazosin sensitive sites, also interacts with
high affinity sites identified by 5 methylurapidil, but not with 5 methylurapidil low
affinity sites in the DSV. Finally, WB 4101 in the presence of rauwolscine, had a low
potency and fulfilled the criteria for a competitive interaction. In the presence of
delequamine, the interaction was not strictly competitive due to a decrease in maximum
with the highest concentration of antagonist. To summarise, rauwolscine would appear
to interact with a j-adrenoceptors which are prazosin-sensitive, 5 methylurapidil-
sensitive and WB 4101 - sensitive.
Focusing solely on results obtained in the presence of delequamine, prazosin interacted
in a competitive fashion with a low affinity (pA2 of 8.31) as seen in other studies. The
122
interaction with HV723 was not strictly competitive as the antagonist altered the slope
of the concentration response curves. However, Schild analysis produced a pA2 of 8.98.
From these two antagonists alone, the subtype of adrenoceptor could be classified
according to Muramatsu’s scheme (Muramatsu et al. 1990b; Muramatsu et al. 1995) as
an oc,L-. The interaction with WB4101 was not strictly competitive as the highest
concentration caused a decrease in the maximum value. PA2 values calculated from
individual antagonist concentrations ranged from 8.81 ± 0.18 with the lowest
concentration, to 8.62 ± 0.34 with the highest concentration but were not significantly
different across the range of antagonist concentrations used. The lower figure was
comparable to data from Muramatsu et al (1990b) (pA2 8.58 ± 0.10) and the higher
value similar to a pA2 of 8.9 ±0.1 from human lower urinary tract classified as ot]L-
(Ford et al. 1996b).
The a 1D-antagonist BMY 7378 (Goetz et al. 1995) interacted non-competitively. A pA2
value calculated from the lowest concentration used was 8.43 ± 0.2. This could support
the presence of the a ]D-adrenoceptor since in rat aorta, now generally accepted to
possess this subtype, values of 8.9 ± 0.1 have been obtained (Goetz et al. 1995). With
increasing concentrations of this antagonist the pA2 values fell significantly giving a pA2
of 7.04 ±0.12 with the antagonist concentration of 0.1 pM, which would be more in
line with the affinity of this antagonist at either the a 1A- or a ]B-adrenoceptor.
Finally, 5 methylurapidil had the most complex effect in this vessel. The interaction
was non-competitive. Experiments using the highest concentration either caused a
decrease in the maximum and fitted to a one site model, or fitted to a two site model.
PA2 values calculated from individual concentrations were not significantly different
with the exception of the low affinity site identified with 1 pM 5MeU. Interestingly the
123
pA2 value of 6.29 ± 0.28 from this low affinity site was similar to the low affinity
obtained in the DSV by Daniel et al. (1996).
Interpretation of the results from CEC was also complicated as this antagonist, at the
highest concentrations used, caused an irreversible baseline contraction in the presence
of rauwolscine and delequamine. CEC normally has been considered as an irreversible
antagonist which has some affinity for all subtypes of a j-adrenoceptor but most strongly
irreversibly alkylates the a 1B- subtype (Muramatsu et al. 1995; Schwinn et al. 1995;
Forray et al. 1994a; Perez et al. 1991) and has least effect on the a ]A- and a 1L- subtypes.
It has also been suggested that in the rat aorta, CEC acts as an agonist at a 2-
adrenoceptors, although in this case no direct contractile action of CEC is seen
(Docherty and O’Rourke, 1997; O'Rourke et al. 1995). The contraction caused by CEC
in the DSV has been well documented. Nunes and Guimaraes (1993) thought that this
action was mediated by a 2-adrenoceptors because of the sensitivity of this action to
rauwolscine. Low et al (1994) also studied this effect of CEC on the DSV. They too
found that CEC acted through rauwolscine sensitive sites and to a lesser extent prazosin
sensitive sites. Nunes and Mota (1994) showed that this action was mediated via a
protein kinase C-dependent mechanism which would fit in with the findings of Low et
al (1994) where rauwolscine blocked the release of internal stores of calcium and
calcium influx induced by CEC. These latter findings were therefore interpreted as
suggesting that the rauwolscine sensitive sites involved in the baseline contraction seen
with CEC were oq- rather than a 2-adrenoceptors, a conclusion that ties in well with the
findings from the present study and that of Daniel (1996). The sensitivity of CEC’s
baseline contraction to rauwolscine is also supported in part by findings in the present
study. When the antagonist studies were performed in the presence of lpM
rauwolscine, a baseline contraction of 12.92 ± 4.09% (n = 4) was observed. This was
124
significantly lower when compared to a baseline contraction of 37.86 ± 6.38% (n = 4),
seen when delequamine was the a 2-antagonist used. This suggests that in effect,
rauwolscine is protecting the receptor sites that contribute to the CEC induced
contraction in this vessel. Only the highest concentration of CEC (lOOpM) caused a
significant shift in the pEC50 value and a decrease in the maximum of the NA CRC.
From the literature, interpretation of our findings with CEC is difficult because of the
subjectivity involved and the wide variety of protocols used. My feeling is that the
interaction of CEC with this vessel is two fold. The baseline contraction seems, in part
at least, to be caused by rauwolscine sensitive a]-adrenoceptors. Looking at the
difference in the competitive antagonists when either rauwolscine or delequamine was
used, these rauwolscine sensitive sites are a 1A- or a ]L- like receptors. Secondly, the shift
to the right with depression of the maximum seen with the highest concentration of CEC
would support the presence of a 1B-, or a 1D-adrenoceptors.
To summarise, the findings from this study confirm the presence of a r and a 2-
adrenoceptors. The Abbott compound was the most potent of the agonists used.
Although the Abbott compound’s relative potency was lower than that stated for a ]A-
\ a ]L-adrenoceptors in Knepper’s study (1995), the possible existence of a heterogeneous
population of a,-adrenoceptors, which may include the a ]A-\aiL- adrenoceptor subtype,
could account for a lowering of the potency of this agonist.
The potencies of prazosin and HV723 were compatible with the presence of the a ]L-
subtype. The potencies of WB4101 and 5 methylurapidil were also comparable to
values obtained at tissues thought to possess both the oc]L-subtype and the a ]A- subtype
(Table 3.5). In a number of vessels, lpM 5 methylurapidil seemed to uncover a low and
a high affinity site. This together with the sensitivity to CEC and the non-competitive
interaction of BMY 7378, may indicate the presence of a second a,- subtype. The
125
additional subtype has similarities to the a 1D-adrenoceptor due to the relatively high
affinity of InM BMY 7378 and due to the sensitivity to lOOpM CEC.
It therefore seems fairly clear that the a ]L-adrenoceptor is involved in vascular smooth
muscle contraction of this vessel. The results are also convincing with regards
involvement of an additional subtype. Due to the low affinity of prazosin and since
currently there are no further subdivisions of the a 1L-subtype, while it can be said that
the additional subtype has some characteristics of the a 1D-adrenoceptor, at present it can
not be satisfactorily classified. Since all the antagonist studies were performed in the
presence of noradrenaline it would be of value to repeat these experiments using the
subtype selective agonist (R) A-61603 in an attempt to obtain pA2 values for these
antagonists at a pure receptor population.
126
CHAPTER 4
Functional classification of ocj-adrenoceptors
contraction of canine subcutaneous resistance
exogenous noradrenaline
4.0. Abstract
4.1 Methods
4.1.1 Agonist studies
4.1.2 Competitive antagonists
4.1.3 Non-competitive antagonists
4.2 Results
4.2.1 Agonist profile
4.2.2 Competitive antagonists
4.2.3 Non-competitive antagonists
mediating
arteries to
4.3. Discussion
127
4.0 Abstract
The aim of this study was to functionally classify the subtype(s) of a j-adrenoceptor
mediating contraction of dog resistance arteries to exogenous noradrenaline.
Agonist profiles to noradrenaline, phenylephrine, (R) A-61603 and UK143 04, suggested
that the responses were predominantly mediated by a population of post-junctional a,-
adrenoceptors.
The reversible competitive antagonists prazosin, WB 4101, HV 723, BMY 7378 and 5
methylurapidil were used. As for the DSV, the low potency of prazosin and HV723
suggested the presence of the a 1L- adrenoceptor subtype.
The actions of chloroethylclonidine in the resistance arteries, were dissimilar to those in
the dog saphenous vein, in that the baseline contraction caused by chloroethylclonidine
was not a consistent feature in resistance vessels. However, the highest concentration
used, although causing no significant shift in the pEC50 value compared to control, did
cause a decrease in the maximum.
The sensitivity to lOOpM chloroethylclonidine, together with significant decreases in
the upper asymptotes of concentration response curve data, in the presence of all
competitive antagonists, with the exception of BMY 7378, may indicate the presence of
additional a!-adrenoceptor subtypes. The degree of sensitivity to CEC could support the
involvement of an a 1B- or an a ]D-like receptor. The declining pA2 values for BMY
7378, seen with increasing antagonist concentration, would further support the
involvement of the a ]D-adrenoceptor. However, the low potency of prazosin, within the
current classification scheme, makes it impossible to classify additional subtypes
involved in the response.
128
4.1 Methods
Canine subcutaneous resistance arteries, approximately 2mm in length and 255 ± 7 pm
in diameter (n = 89) were dissected and mounted in Mulvany Halpem wire myographs
and normalised to 0.9 of L I00 as described in materials and methods, section 2.2.3.
After normalisation, vessels were maintained in blockers Krebs’ solution for the rest of
the experiment. Following the normalisation procedure, vessels were allowed a forty
minute equilibration period, followed by the starting protocol as outlined in materials
and methods section 2.3. Agonist profiles and antagonist studies were performed in
these vessels as for the dog saphenous vein, n = the number of experiments unless
otherwise stated.
4.1.1 Agonist studies
Three consecutive concentration response curves (CRC), each to a different agonist,
were performed on each ring. The agonists used were noradrenaline (NA),
phenylephrine (PE) and either (R) A-61603 or UK143 04. A forty minute recovery
period was allowed between each concentration response curve. Cumulative
concentration response curves were performed using half log increments with the
following concentration ranges: Noradrenaline (NA) and phenylephrine (PE), starting
at a concentration of InM and increasing up to a maximum of ImM if required. (R) A-
61603 (Abbott compound) starting with a concentration of 0.3nM and increasing up to a
concentration of 30pM if required. UK14304 starting with a concentration of InM and
increasing up to a concentration of 0.1 pM if required. Responses were allowed to reach
a plateau before subsequent concentrations of agonist were added to the bath.
Responses were expressed as a percentage of the lOpM NA siting concentration and
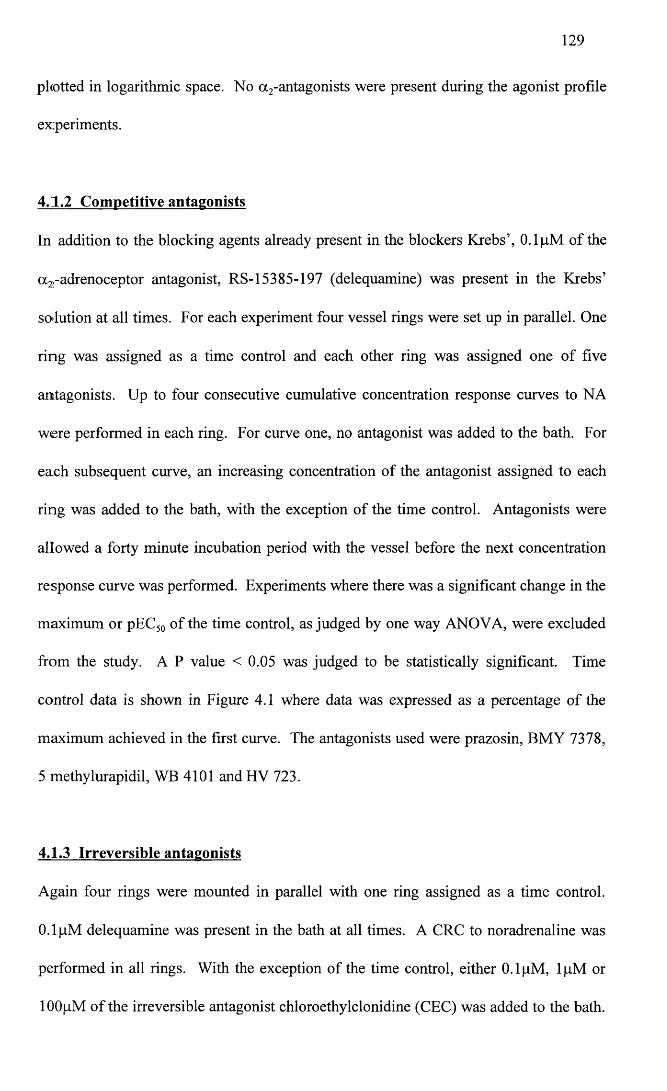
129
photted in logarithmic space. No a 2-antagonists were present during the agonist profile
experiments.
4.1.2 Competitive antagonists
In addition to the blocking agents already present in the blockers Krebs’, 0.1 pM of the
a^-adrenoceptor antagonist, RS-15385-197 (delequamine) was present in the Krebs’
solution at all times. For each experiment four vessel rings were set up in parallel. One
ring was assigned as a time control and each other ring was assigned one of five
antagonists. Up to four consecutive cumulative concentration response curves to NA
were performed in each ring. For curve one, no antagonist was added to the bath. For
each subsequent curve, an increasing concentration of the antagonist assigned to each
ring was added to the bath, with the exception of the time control. Antagonists were
allowed a forty minute incubation period with the vessel before the next concentration
response curve was performed. Experiments where there was a significant change in the
maximum or pEC50 of the time control, as judged by one way ANOVA, were excluded
from the study. A P value < 0.05 was judged to be statistically significant. Time
control data is shown in Figure 4.1 where data was expressed as a percentage of the
maximum achieved in the first curve. The antagonists used were prazosin, BMY 7378,
5 methylurapidil, WB 4101 and HV 723.
4.1.3 Irreversible antagonists
Again four rings were mounted in parallel with one ring assigned as a time control.
0.1 pM delequamine was present in the bath at all times. A CRC to noradrenaline was
performed in all rings. With the exception of the time control, either 0.1 pM, lpM or
lOOpM of the irreversible antagonist chloroethylclonidine (CEC) was added to the bath.
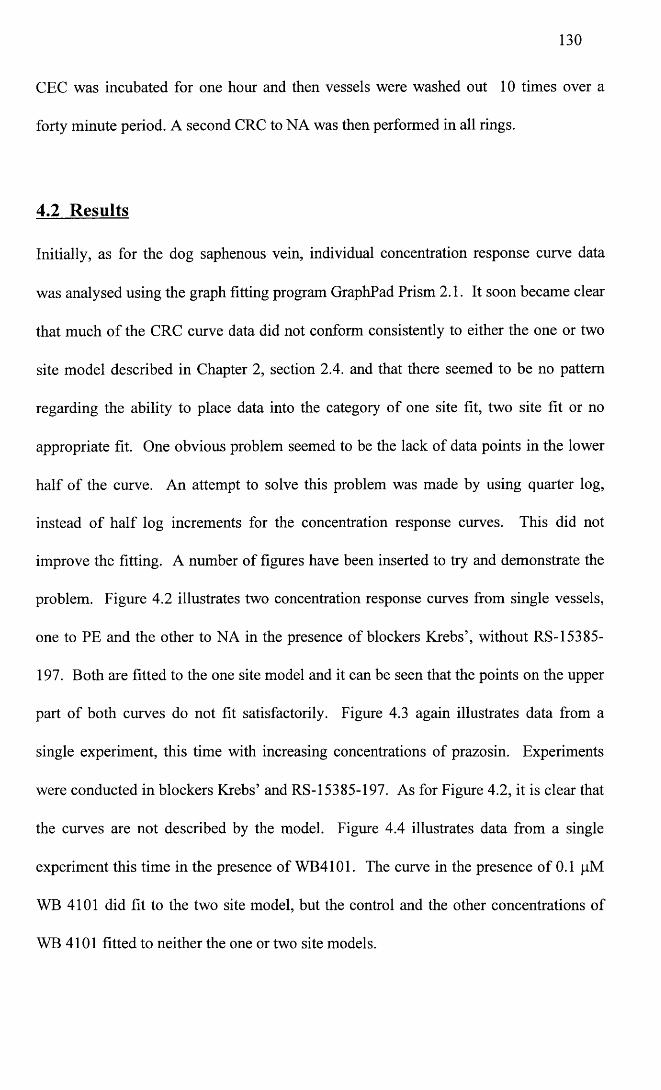
130
CEC was incubated for one hour and then vessels were washed out 10 times over a
forty minute period. A second CRC to NA was then performed in all rings.
4.2 Results
Initially, as for the dog saphenous vein, individual concentration response curve data
was analysed using the graph fitting program GraphPad Prism 2.1. It soon became clear
that much of the CRC curve data did not conform consistently to either the one or two
site model described in Chapter 2, section 2.4. and that there seemed to be no pattern
regarding the ability to place data into the category of one site fit, two site fit or no
appropriate fit. One obvious problem seemed to be the lack of data points in the lower
half of the curve. An attempt to solve this problem was made by using quarter log,
instead of half log increments for the concentration response curves. This did not
improve the fitting. A number of figures have been inserted to try and demonstrate the
problem. Figure 4.2 illustrates two concentration response curves from single vessels,
one to PE and the other to NA in the presence of blockers Krebs’, without RS-15385-
197. Both are fitted to the one site model and it can be seen that the points on the upper
part of both curves do not fit satisfactorily. Figure 4.3 again illustrates data from a
single experiment, this time with increasing concentrations of prazosin. Experiments
were conducted in blockers Krebs’ and RS-15385-197. As for Figure 4.2, it is clear that
the curves are not described by the model. Figure 4.4 illustrates data from a single
experiment this time in the presence of WB4101. The curve in the presence of 0.1 pM
WB 4101 did fit to the two site model, but the control and the other concentrations of
WB 4101 fitted to neither the one or two site models.

131
Data was therefore analysed on Microsoft Excel spreadsheets and the pEC50 values
derived by interpolation rather than curve fitting. The result of this was, that while it
was possible to obtain maximum and pEC50 data for each experiment, it was not
possible to assess midpoint slope parameters.
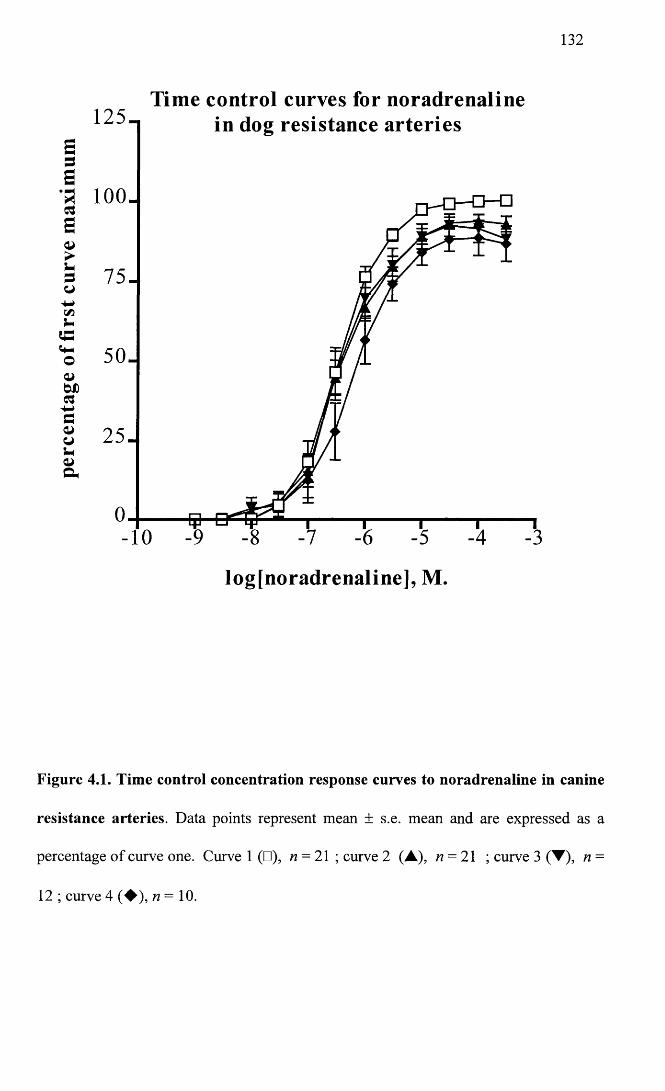
132
Tim e control curves for noradrenaline1 2 5 -
SBa 100.as
so
in dog resistance arteries
-10
log[noradrenaline], M.
Figure 4.1. Time control concentration response curves to noradrenaline in canine
resistance arteries. Data points represent mean ± s.e. mean and are expressed as a
percentage of curve one. Curve 1 (□), n = 21 ; curve 2 (A), n = 21 ; curve 3 (▼), n =
12 ; curve 4 (♦ ) , « = 10.
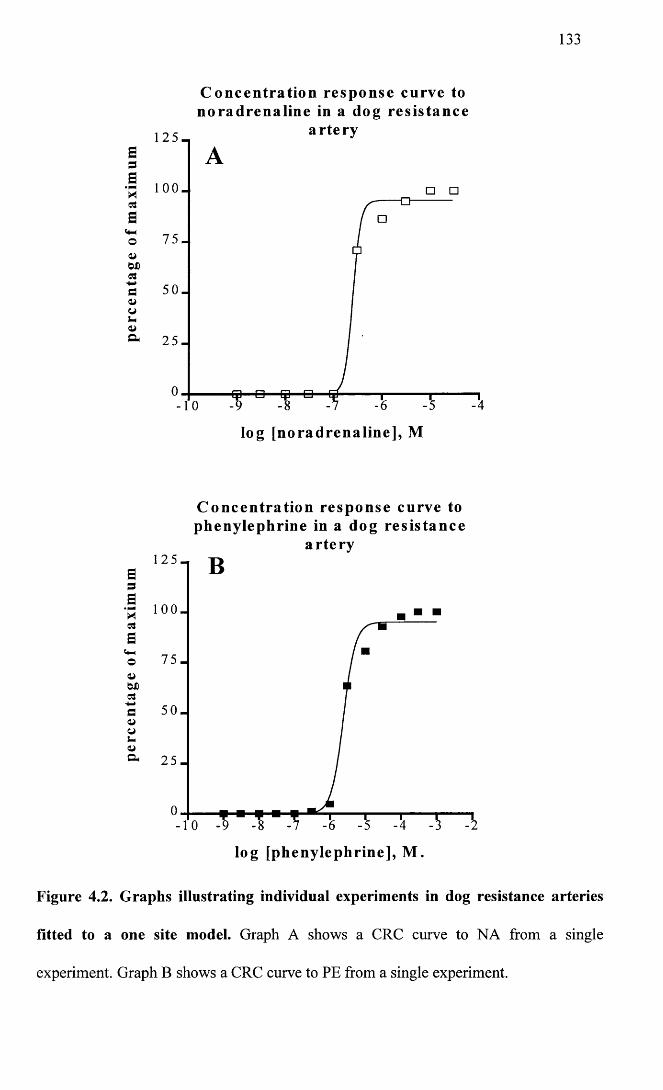
133
1 2 5 -
5 1 0 0 -
3aaoo>WD03
do>ui-lo>o-
7 5 -
5 0 -
2 5 -
C on cen tration resp on se curve to noradrenaline in a dog resistan ce
artery
- 1 0 -9 -8 -7 -6 -5
log [noradrenaline], M
C on cen tration resp on se curve to phenylephrine in a dog resistan ce
artery
adB■a ioo_|a
<4-4
o 7 5 -
bX)03
■4-4p 5 0 -
wS-& 2 5 -
log [phenylephrine], M .
Figure 4.2. Graphs illustrating individual experiments in dog resistance arteries
fitted to a one site model. Graph A shows a CRC curve to NA from a single
experiment. Graph B shows a CRC curve to PE from a single experiment.
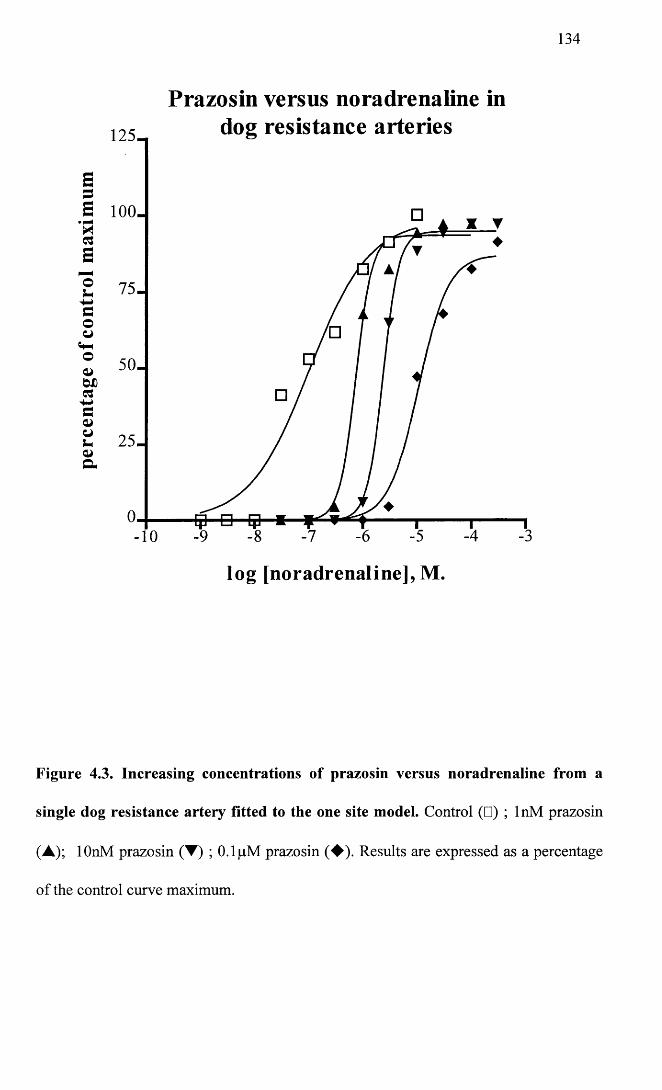
134
Prazosin versus noradrenaline indog resistance arteries1 2 5 -
75-
50-
2 5 -
-10
log [noradrenaline], M.
Figure 4.3. Increasing concentrations of prazosin versus noradrenaline from a
single dog resistance artery fitted to the one site model. Control (□) ; InM prazosin
(A); lOnM prazosin (▼) ; 0.1 pM prazosin (♦ ) . Results are expressed as a percentage
of the control curve maximum.
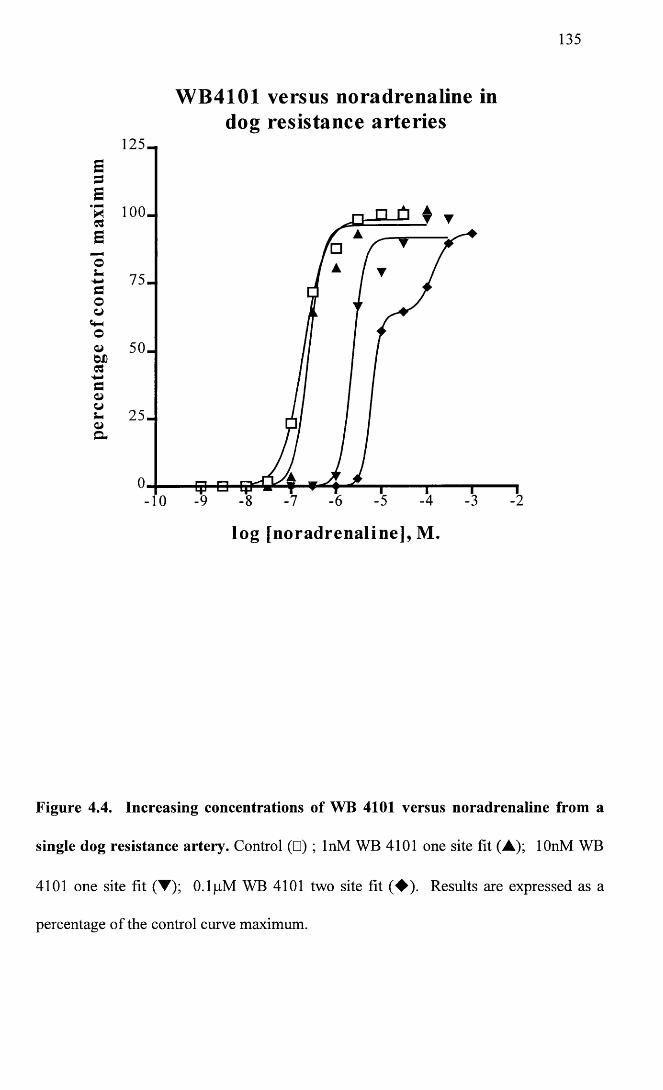
135
W B 4101 versus noradrenaline indog resistance arteries
125-E3E‘H 1 0 0 -C3Eos-s-»Couo
50-
-10
log [noradrenaline], M.
Figure 4.4. Increasing concentrations of WB 4101 versus noradrenaline from a
single dog resistance artery. Control (□) ; InM WB 4101 one site fit (A); lOnM WB
4101 one site fit (▼); 0.1 pM WB 4101 two site fit (♦ ) . Results are expressed as a
percentage of the control curve maximum.
136
4.2.1 Agonist profile
Data for each agonist was derived from at least six different animals with the exception
of UK14304 where four were used. Results are expressed as a percentage of the lOpM
siting concentration of noradrenaline. PE, NA and the Abbott compound caused
concentration-dependent increases in tension in the resistance arteries. The response to
UK14304 was variable, with one vessel not responding to this agonist at all. This latter
point should be noted since the results from UK 14304 are derived only from the other
three vessels which responded within the range of agonist concentrations used. The
pEC50 values of the agonists used were as follows: Noradrenaline 6.46 ± 0.1, n = 8;
phenylephrine 5.83 ± 0.09, n = 10; Abbott 7.88 ± 0.11, n = 6 ; UK 14304 7.29 ± 0.22,
n = 3. This gave a rank order of potency of Abbott > UK 14304 > NA > PE, with the
Abbott compound being 27X more potent than NA and 112X more potent than PE. One
way ANOVA of the maximum values from individual experiments showed that they
were significantly different (P< 0.0001). A Bonferroni post test showed that the
difference was due to the maximum for UK14304 being significantly lower (42.33 ±
11.3%). In other words, NA, PE and the Abbott compound acted as full agonists, while
UK 14304 was only a partial agonist. Results for the agonist studies are summarised in
Figure 4.5 and Table 4.1.
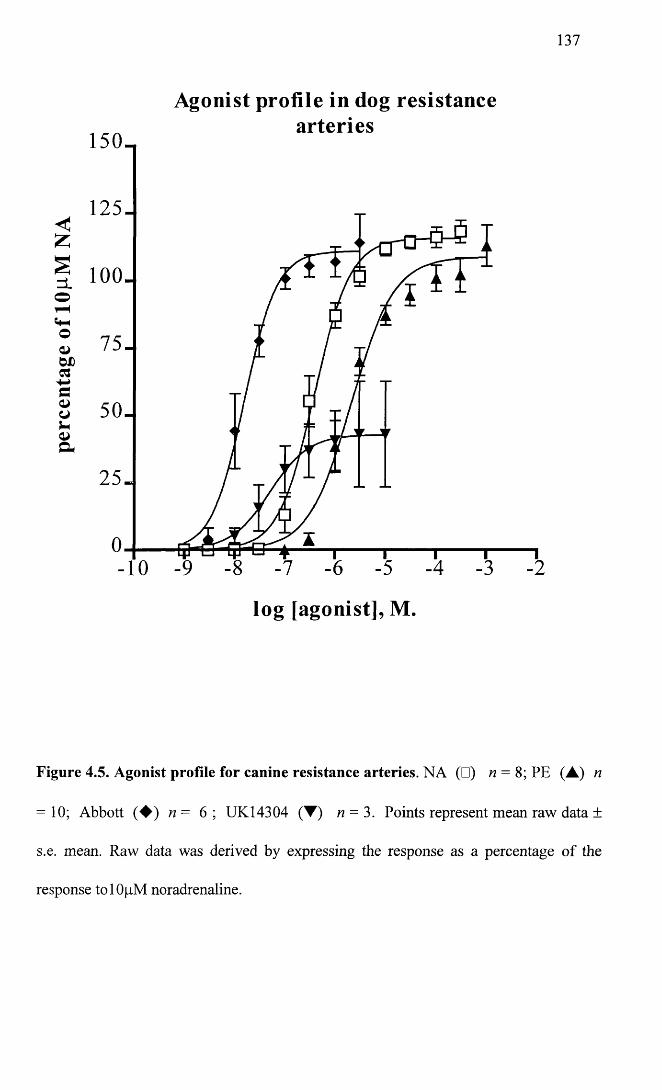
137
Agonist profile in dog resistancearteries
150_
125-<Z
| 100-O ▼H
001 W)CG
7 5 -
5 0 -
2 5 -
-10
log [agonist], M.
Figure 4.5. Agonist profile for canine resistance arteries. NA (□) n = 8; PE (A) n
= 10; Abbott ( ♦ ) n= 6 ; UK14304 (T ) n = 3. Points represent mean raw data ±
s.e. mean. Raw data was derived by expressing the response as a percentage of the
response tolOpM noradrenaline.
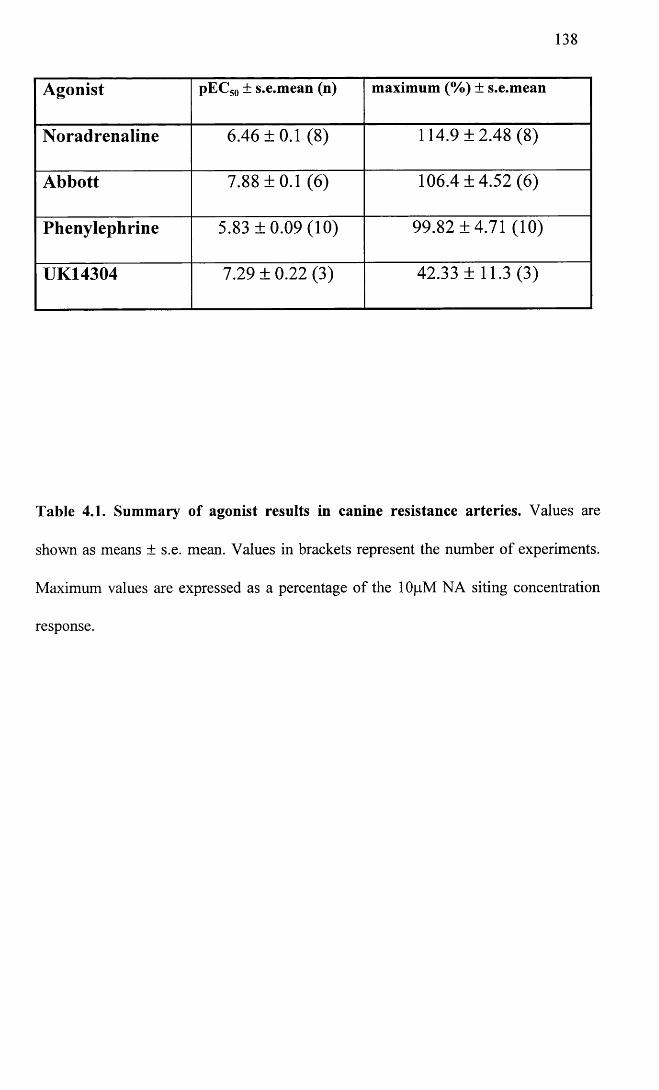
138
Agonist pEC50 ± s.e.mean (n) maximum (%) ± s.e.mean
Noradrenaline 6.46 ±0.1 (8) 114.9 ±2.48 (8)
Abbott 7.88 ±0.1 (6) 106.4 ±4.52 (6)
Phenylephrine 5.83 ±0.09 (10) 99.82 ±4.71 (10)
UK14304 7.29 ± 0.22 (3) 42.33 ±11.3 (3)
Table 4.1. Summary of agonist results in canine resistance arteries. Values are
shown as means ± s.e. mean. Values in brackets represent the number of experiments.
Maximum values are expressed as a percentage of the 1 OpM NA siting concentration
response.
139
4.2.2 Competitive antagonists
Graphs illustrating the mean CRC data for the antagonists below are shown in Figures
4.6 to 4.10. Schild regressions are illustrated in Figures 4.11 to 4.14. Tables 4.2 and
4.3 summarise Schild regression parameters and pA2 values.
The a,-adrenoceptor antagonist prazosin, was used at concentrations of InM, lOnM and
0.1 pM. Values for each concentration were derived from 6-8 different animals. This
antagonist caused a concentration-dependent dextral shift in the noradrenaline
concentration response curves. One way ANOVA showed that the pEC50 values were
significantly different (P of 0.0005), while a Bonferroni post test showed that this was
due only to the highest concentration of antagonist used. Maximum values were also
(just) significantly different (P of 0.0419). The post test again showed that this was due
to a significant decrease in the maximum only for the highest concentration of
antagonist used. Schild regression yielded a slope not significantly different from
negative unity and a pA2 value of 8.36. pA2 values calculated from single
concentrations were not significantly different over the range of antagonist
concentrations used. The pA2 value calculated from the intermediate concentration was
8.21 ±0.24 (w = 8).
The a ]D-selective antagonist BMY 7378, was used at concentrations of InM, lOnM and
0.1 pM. Values were derived from 4-5 animals for each concentration. Increasing
concentrations caused only marginal shifting of the concentration response curves to
NA with no significant changes occurring in either the pEC50 or maximum values (P of
0.99 and 0.22 respectively). Due to the lack of effect of BMY 7378, many of the DR-1
values derived from the lowest concentration used were negative, not allowing log (DR-
1) values to be derived for the Schild plot, and when Schild analysis was performed
with the points obtained, the slope was significantly different from negative unity. PA2
140
values derived over the range of antagonist concentrations used were significantly
different, with a decline in the pA2 value seen with increasing antagonist concentrations,
supporting the findings from the Schild analysis. A pA2 value derived from the highest
concentration of antagonist used yielded a value of 6.51 ± 0.47 (n = 4).
The ot1A/D- selective antagonist WB 4101 was used at concentrations of InM, lOnM and
0.1 pM. Values for each concentration were derived from 5-6 animals. Increasing
concentrations of antagonist caused concentration-dependent dextral shifts in the
concentration response curves to NA. Maximum values were significantly different (P
of 0.0018) and a post test showed that this was due to a significant decrease only in the
highest concentration of antagonist used. pEC50 values were significantly different (P of
<0.0001). A post test showed that this was due to a significant shift in the curves for
lOnM and 0.1 pM but not InM concentrations of antagonist. Schild regression yielded a
slope not significantly different from negative unity, and a pA2 value of 8.42. pA2
values calculated for the three different antagonist concentrations were not significantly
different and a pA2 value of 8.82 ± 0.19 (n = 6) was derived from the lOnM
concentration of WB 4101.
The antagonist HV 723, was used at concentrations of InM, lOnM and lpM. Values
were derived from 6-9 animals. The antagonist caused a concentration-dependent
rightward displacement of the NA concentration response curves with a significant
difference in the pEC50 values (P<0.0001). A post test showed that this difference was
due to the two highest concentrations of antagonist only. Maximum values were also
significantly different (P of 0.0051). This was due to a decrease in the maximum in the
presence of 0.1 pM HV 723 only. Schild regression produced a slope not significantly
different from negative unity and a pA2 value of 8.81. pA2 values calculated for the
141
three concentrations used were not significantly different and a pA2 value of 8.86 ± 0.29
(n = 9), was derived from the lOnM concentration of HV 723.
The a 1A-selective antagonist 5 methylurapidil (5 MeU), was used at concentrations of
lOnM, 0.1 pM and lpM. Values were derived from 7-9 animals for each concentration.
There was a concentration-dependent rightward displacement of the noradrenaline
concentration response curves with a significant difference in the pEC50 values (P of <
0.0001) due to the two highest concentrations of antagonist used. Maximum values
were also significantly different (P of < 0.0001), again due to a significant depression in
the maximum in the presence of lpM 5MeU. Schild regression yielded a slope not
significantly different from negative unity and a pA2 value of 8.08. pA2 values
calculated from each concentration used were not significantly different and a pA2 value
of 8.01 ±0.18 (t? = 9) was calculated from 0.1 pM 5 methylurapidil.
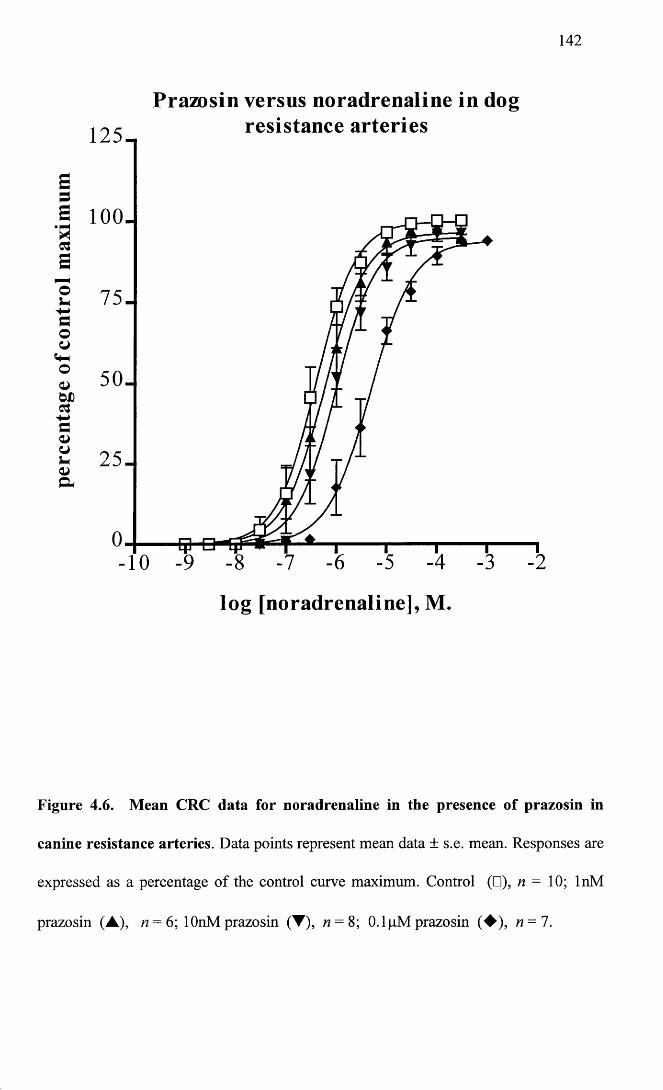
142
Prazosin versus noradrenaline in dogresistan ce arter ies
a loo.
lo g [noradrenaline], M.
Figure 4.6. Mean CRC data for noradrenaline in the presence of prazosin in
canine resistance arteries. Data points represent mean data ± s.e. mean. Responses are
expressed as a percentage of the control curve maximum. Control (□), n = 10; InM
prazosin (A), n = 6; lOnM prazosin (T), n = 8; O.lpM prazosin (♦ ) , n — 1.
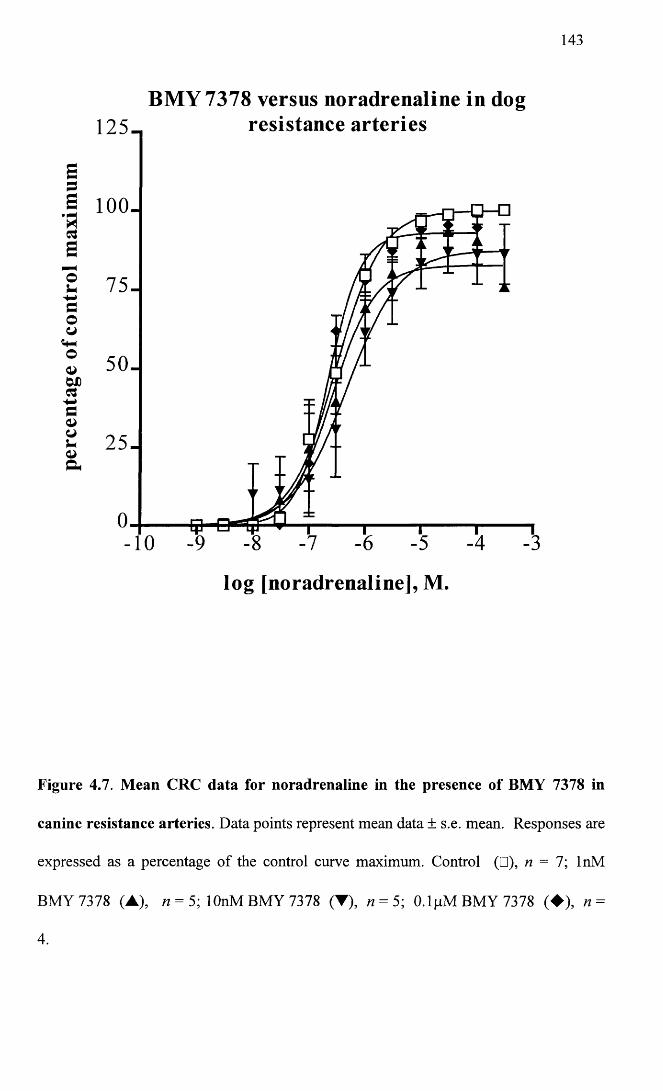
143
BMY 7378 versus noradrenaline in dogresistance arteries125_
a loo-
7 5 -
5 0 .
2 5 -
-10
log [noradrenaline], M.
Figure 4.7. Mean CRC data for noradrenaline in the presence of BMY 7378 in
canine resistance arteries. Data points represent mean data ± s.e. mean. Responses are
expressed as a percentage of the control curve maximum. Control (□), n = 7; InM
BMY 7378 (A), n = 5; lOnM BMY 7378 (T), n = 5; 0.1 pM BMY 7378 (♦ ) , n =
4.
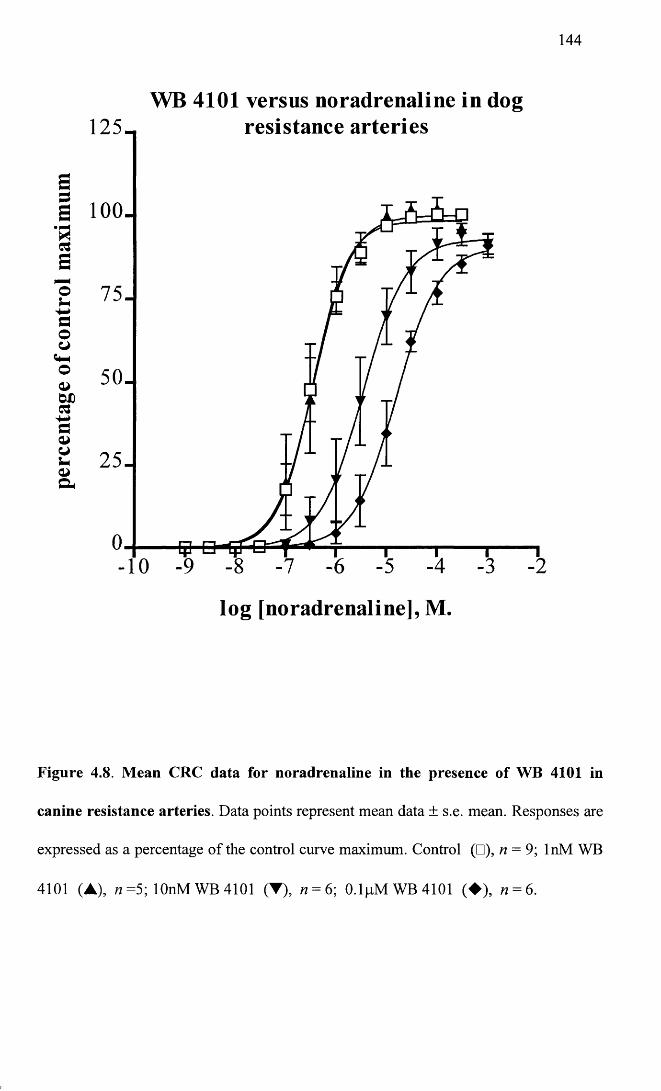
144
WB 4101 versus noradrenaline in dogresistance arteries1 2 5 -
S1 100-C3a
2 7 5 -f iO
© 50-
2 5 -
-10
log [noradrenaline], M.
Figure 4.8. Mean CRC data for noradrenaline in the presence of WB 4101 in
canine resistance arteries. Data points represent mean data ± s.e. mean. Responses are
expressed as a percentage of the control curve maximum. Control (□), n = 9; InM WB
4101 (A), n =5; lOnM WB 4101 (T), 12 = 6; 0.1pMWB4101 (♦ ) , n = 6.
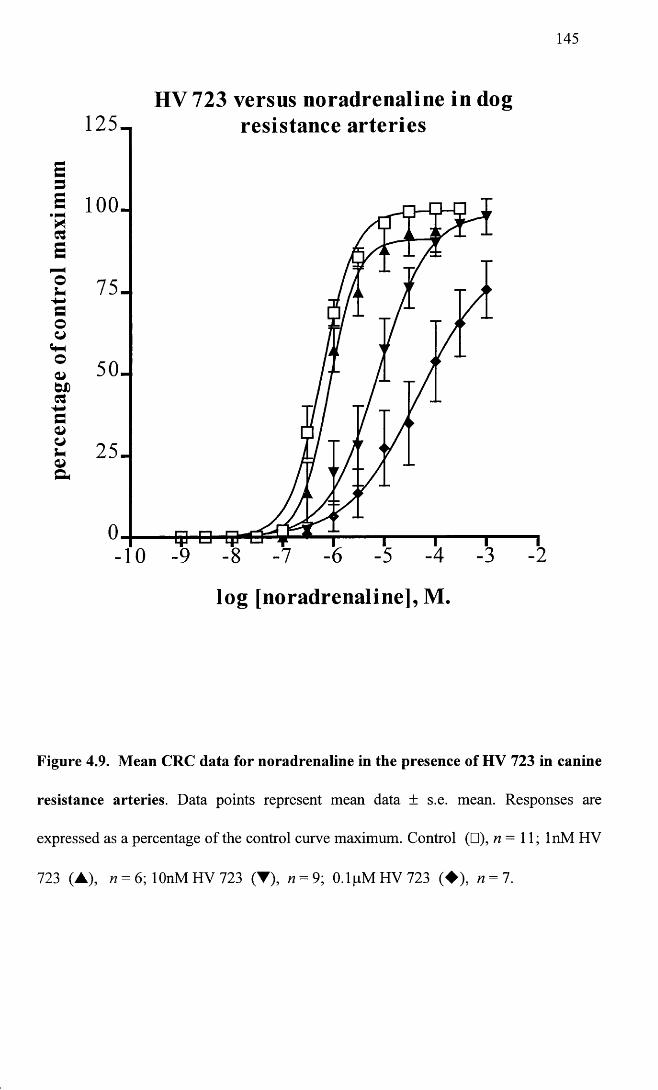
145
HV 723 versus noradrenaline in dogresistance arteries
a io o -
5 0 -
log [noradrenaline], M
Figure 4.9. Mean CRC data for noradrenaline in the presence of HV 723 in canine
resistance arteries. Data points represent mean data ± s.e. mean. Responses are
expressed as a percentage of the control curve maximum. Control (□), n = 11; InM HV
723 (A), n = 6; lOnM HV 723 (▼), n = 9; 0.1pMHV723 (♦ ) , n = 7.
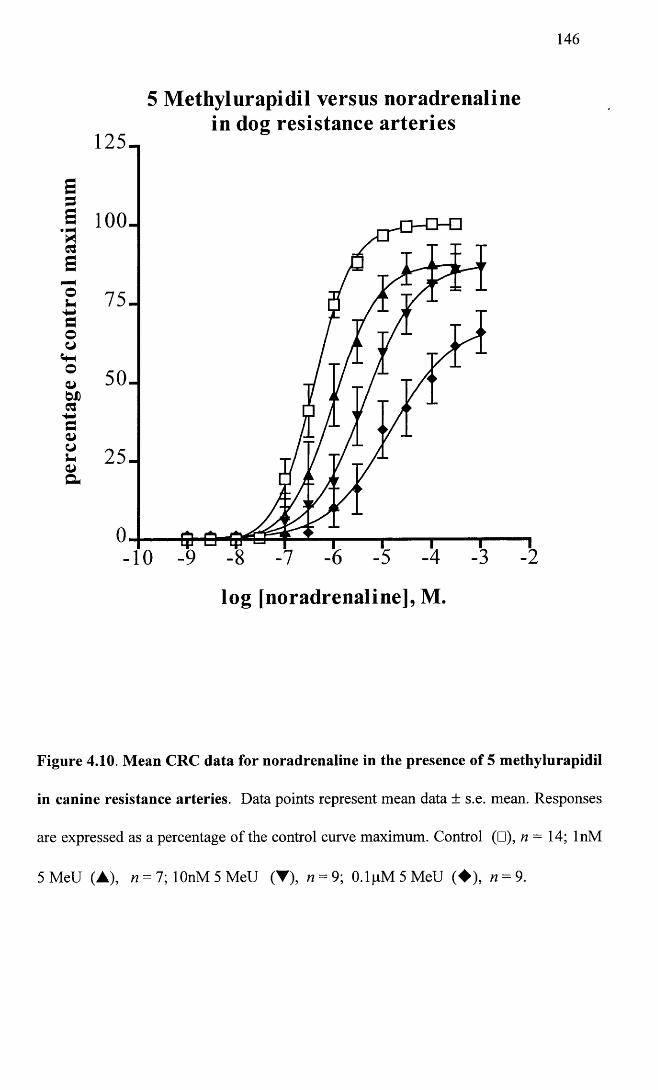
146
5 Methylurapidil versus noradrenalinein dog resistance arteries
1 2 5 -
a loo .
7 5 -
50-
2 5 -
4 ►
log [noradrenaline], M.
Figure 4.10. Mean CRC data for noradrenaline in the presence of 5 methylurapidil
in canine resistance arteries. Data points represent mean data ± s.e. mean. Responses
are expressed as a percentage of the control curve maximum. Control (□), n - 14; InM
5 MeU (A), n = l\ lOnM 5 MeU (▼), n = 9; 0.1pM 5M eU (♦ ) , n = 9.
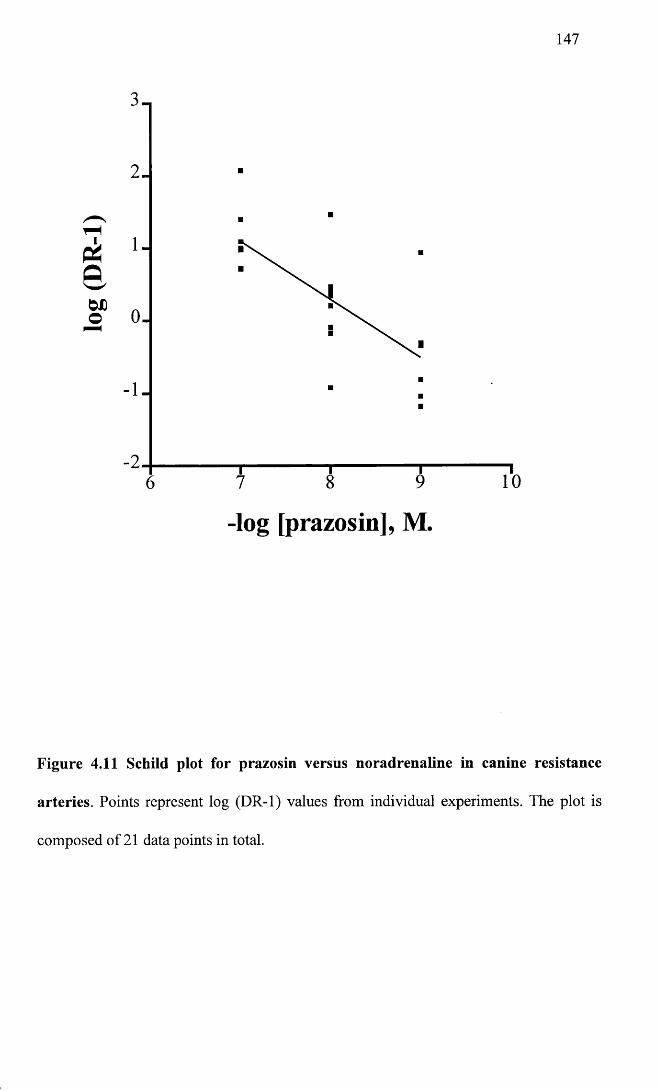
log
(DR
-1)
147
0 .
-log [prazosin], M
Figure 4.11 Schild plot for prazosin versus noradrenaline in canine resistance
arteries. Points represent log (DR-1) values from individual experiments. The plot is
composed of 21 data points in total.
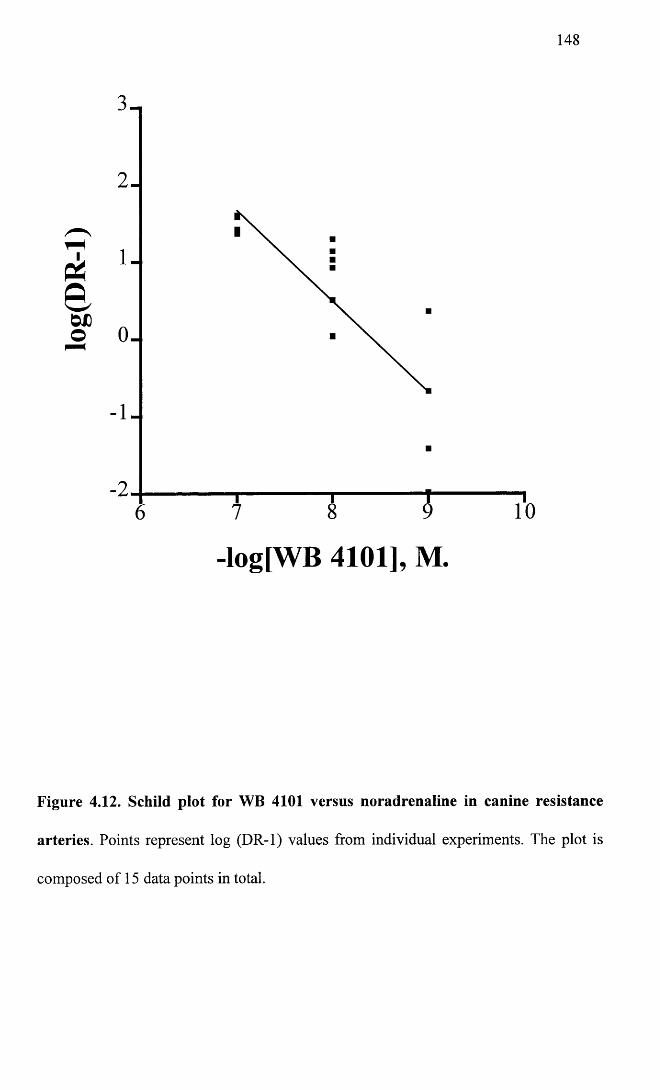
log(
DR
-l)148
1
1
-log[WB 4101], M
Figure 4.12. Schild plot for WB 4101 versus noradrenaline in canine resistance
arteries. Points represent log (DR-1) values from individual experiments. The plot is
composed of 15 data points in total.
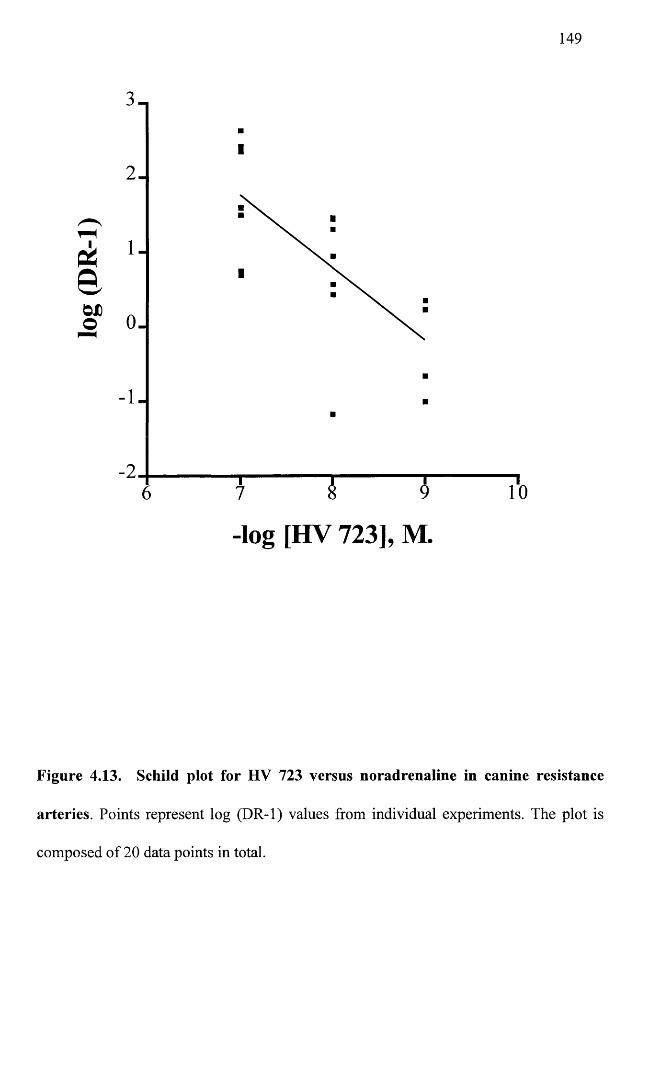
log
(DR
-1)
149
2
-log [HV 723], M
Figure 4.13. Schild plot for HV 723 versus noradrenaline in canine resistance
arteries. Points represent log (DR-1) values from individual experiments. The plot is
composed of 20 data points in total.
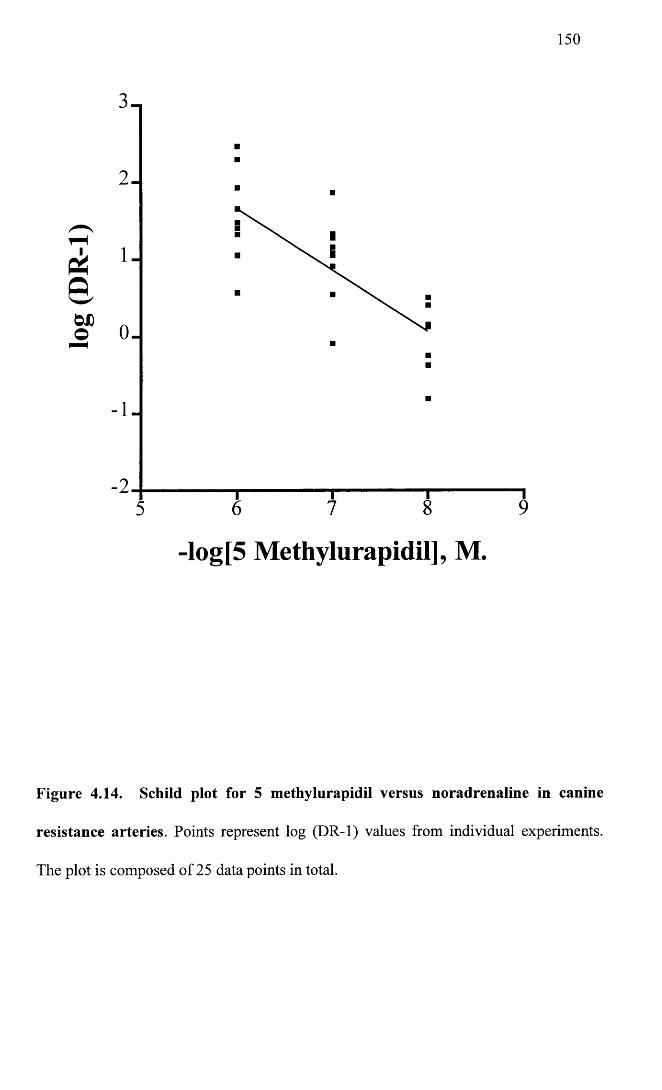
log
(DR
-1)
150
2 .
-log[5 Methylurapidil], M.
Figure 4.14. Schild plot for 5 methylurapidil versus noradrenaline in canine
resistance arteries. Points represent log (DR-1) values from individual experiments.
The plot is composed of 25 data points in total.
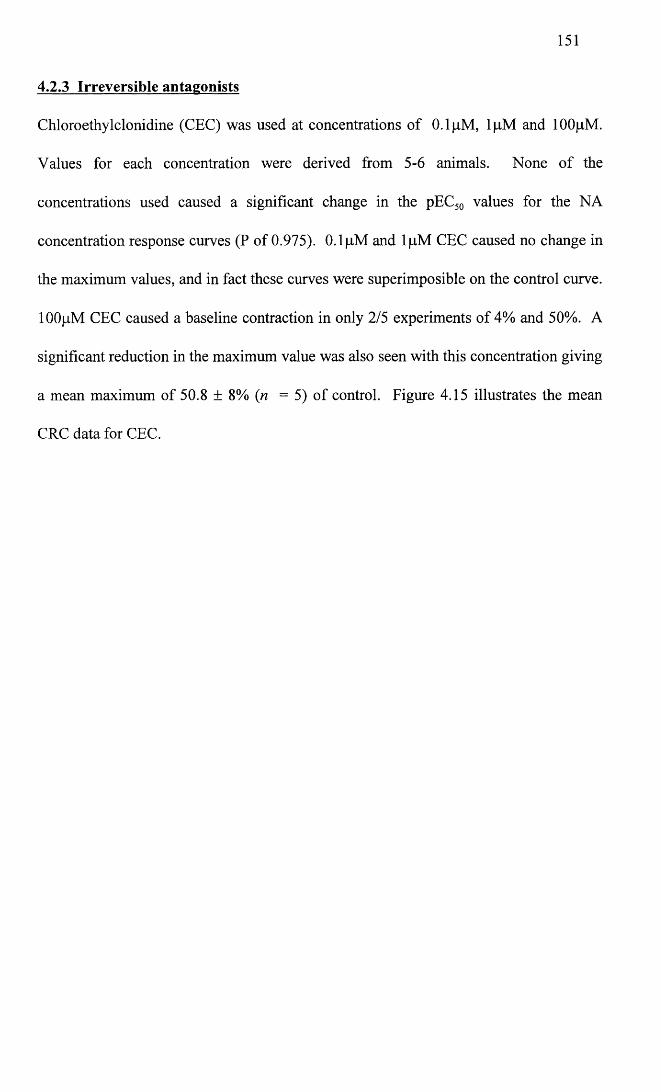
151
4.2.3 Irreversible antagonists
Chloroethylclonidine (CEC) was used at concentrations of 0.1 pM, lpM and 100pM.
Values for each concentration were derived from 5-6 animals. None of the
concentrations used caused a significant change in the pEC50 values for the NA
concentration response curves (P of 0.975). 0.1 pM and lpM CEC caused no change in
the maximum values, and in fact these curves were superimposible on the control curve.
lOOpM CEC caused a baseline contraction in only 2/5 experiments of 4% and 50%. A
significant reduction in the maximum value was also seen with this concentration giving
a mean maximum of 50.8 ± 8% (n = 5) of control. Figure 4.15 illustrates the mean
CRC data for CEC.
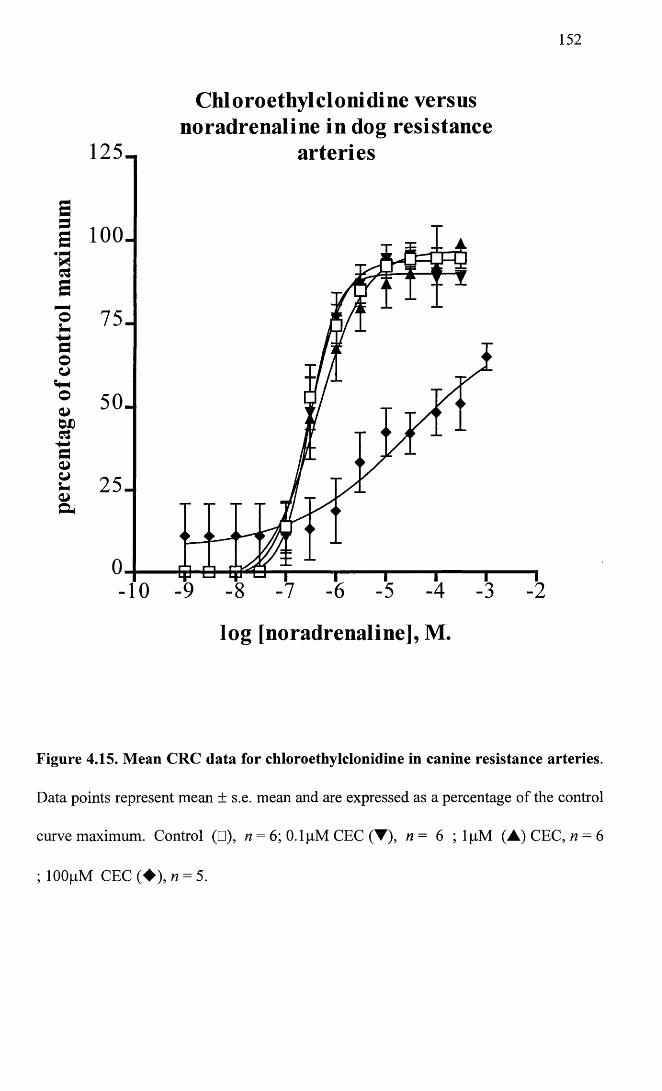
152
Chloroethylclonidine versusnoradrenaline in dog resistance
1 2 5 - arteries
Sa 100-
s7 5 -o
uaooo 5 0-
4-*c
c .2 5 -
o
log [noradrenaline], M.
Figure 4.15. Mean CRC data for chloroethylclonidine in canine resistance arteries.
Data points represent mean ± s.e. mean and are expressed as a percentage of the control
curve maximum. Control (□), n = 6; 0.1 pM CEC (▼), n = 6 ; lpM (A) CEC, n = 6
; lOOpM CEC (♦ ) , n = 5.
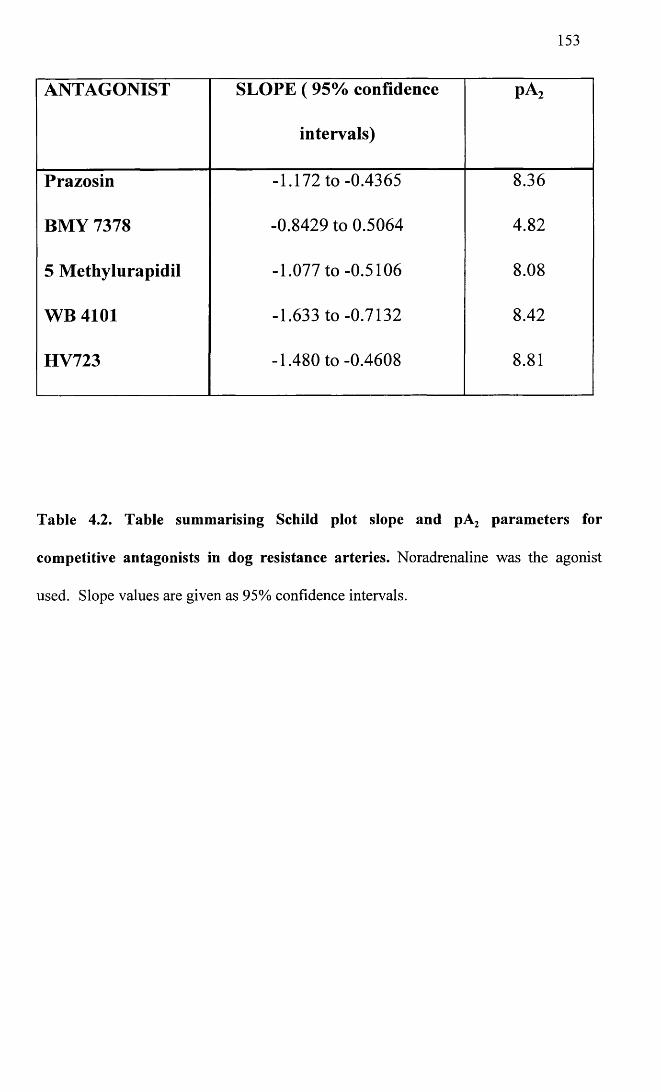
153
ANTAGONIST SLOPE ( 95% confidence
intervals)
pA2
Prazosin -1.172 to -0.4365 8.36
BMY 7378 -0.8429 to 0.5064 4.82
5 Methylurapidil -1.077 to -0.5106 8.08
WB 4101 -1.633 to -0.7132 8.42
HV723 -1.480 to -0.4608 8.81
Table 4.2. Table summarising Schild plot slope and pA2 parameters for
competitive antagonists in dog resistance arteries. Noradrenaline was the agonist
used. Slope values are given as 95% confidence intervals.
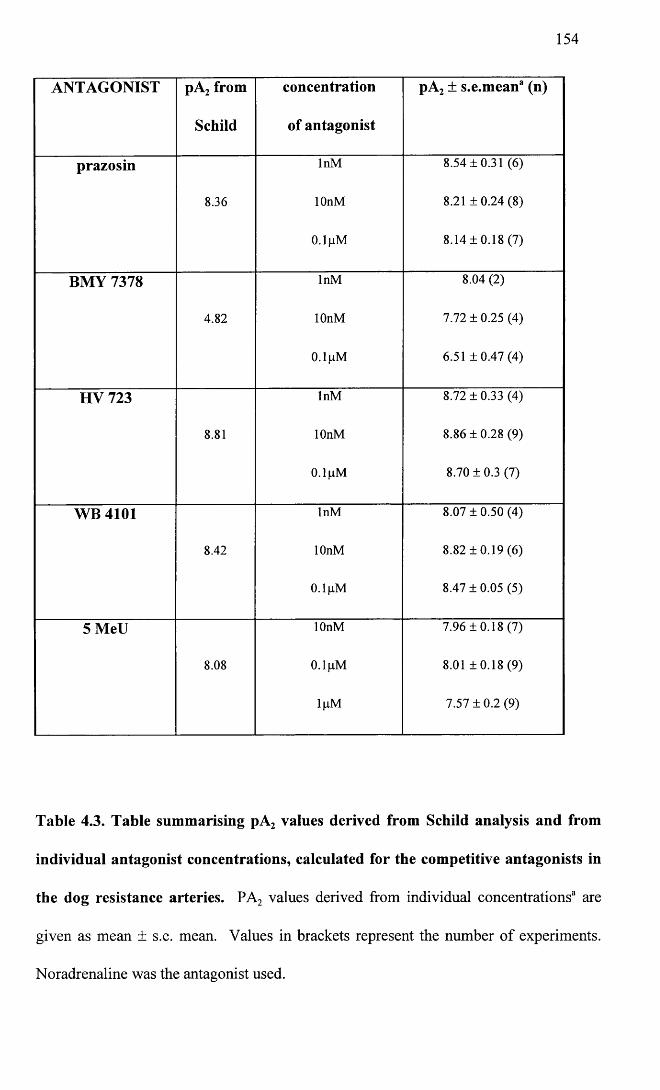
154
ANTAGONIST pA2 from
Schild
concentration
of antagonist
pA2 ± s.e.mean3 (n)
prazosin InM 8.54 ±0.31 (6)
8.36 lOnM 8.21 ±0 .24 (8)
0.1 pM 8.14 ±0.18 (7)
BMY 7378 InM 8.04 (2)
4.82 lOnM 7.72 ± 0.25 (4)
0.1 pM 6.51 ± 0 .4 7 (4 )
HV 723 InM 8.72 ± 0.33 (4)
8.81 lOnM 8.86 ±0.28 (9)
0.1 gM 8.70 ± 0.3 (7)
WB 4101 InM 8.07 ± 0.50 (4)
8.42 lOnM 8.82 ±0 .19 (6)
0.1 (iM 8.47 ± 0.05 (5)
5 MeU lOnM 7.96 ±0.18 (7)
8.08 0.1 pM 8.01 ± 0 .1 8 (9 )
\ \ iM 7.57 ±0 .2 (9)
Table 4.3. Table summarising pA2 values derived from Schild analysis and from
individual antagonist concentrations, calculated for the competitive antagonists in
the dog resistance arteries. PA2 values derived from individual concentrations3 are
given as mean ± s.e. mean. Values in brackets represent the number of experiments.
Noradrenaline was the antagonist used.
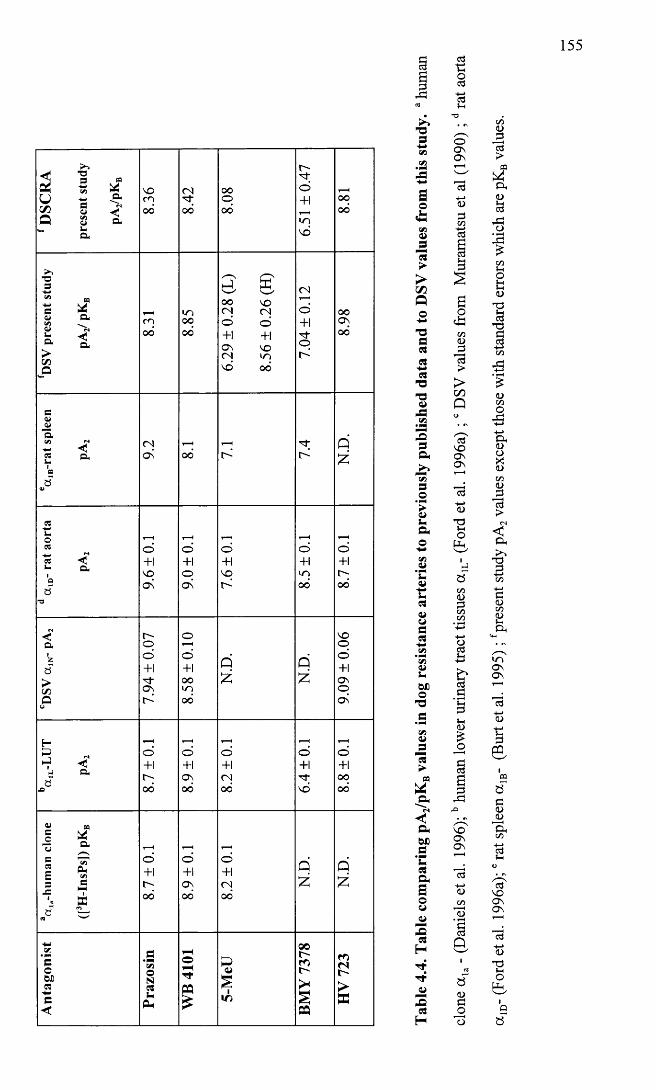
155
3 f i22 Sft s &
a
8.36
8.42 00
ooo
6.51
±0.
47
8.81
T33* P3 ^<u o*<*>CJ M *- -<! a D. >CO
-P
8.31
8.85
6.29
± 0.2
8 (L
)
8.56
± 0.2
6 (H
)
7.04
±0.
12
8.98
3<u—"a1*1 r» -M •<3 Q, L>1aaV
9.2
00
VL
N.D
.
3La033 •< L. Q,1aa■a
9.6
±0.1
9.0
±0.1
7.6
±0.1
8.5
±0.1
8.7
±0.1
<aiza>C/3OU 7.9
4 ±
0.07
8.58
±0.
10
N.D
.
N.D
.
9.09
± 0.
06
H3►J Q.a
X) 8.7
±0.1
8.9
±0.1
8.2
±0.1 ©
+1©+1oooo
« CO
§ £ - ^s ^ 2 &<E e 3 ®J= i
S3a “ « ^
8.7
±0.
1
8.9
±0.1
8.2
±0.
1
N.D
.
N.D
.
Ant
agon
ist
Praz
osin
WB
4101
5-M
eU
BMY
7378
HV
723
156
4.3 Discussion
Resistance arteries, because of their small size, and the relation of vessel radius to
resistance to blood flow, (inversely related to the radius to the fourth power, according
to Poiseuille’s law (Levick, 1992)), play the most important role in regulation of total
peripheral resistance. Despite the importance of resistance arteries, few studies have
looked at these vessels in relation to adrenoceptor subtype and instead the majority of
studies have focused on the large conduit vessels. One of the main reasons for this has
been the comparatively recent advent of techniques such as perfusion and wire
myography, allowing the study of isolated resistance sized vessels.
To my knowledge, at the time of writing this thesis, no studies have been published,
examining a]-adrenoceptors in canine peripheral resistance arteries and therefore
comparisons can only be made with studies from other species and large vessel studies.
From the literature, a {-adrenoceptors would seem to be the predominant receptor type
involved in vascular smooth muscle contraction of resistance arteries to noradrenaline,
although a 2-adrenoceptors have also been implicated. Studies by Nielsen et al (1989),
Parkinson and Hughes (1995) and Stephens et al (1992), all involving human resistance
sized arteries, confirm the presence of both a,- and a 2- post-junctional adrenoceptors.
Leech and Faber (1996) also found evidence for both a,- and a 2-adrenoceptors in rat
cremaster resistance artery. In contrast, Macmillan et al (1994) found a very low
sensitivity for the a 2-agonist UK14304, compared to phenylephrine, in rabbit
subcutaneous resistance arteries, suggesting that a 2-adrenoceptors are not involved in
vascular smooth muscle contraction of this vessel.
In this study, the rank order of agonist potency was Abbott > UK14304 > NA > PE.
Despite UK14304 appearing quite potent in this ranking, it should be noted that one out
of the four vessels examined, failed to respond to this agonist, thus in reality UK 14304
157
was relatively less potent in this vessel than in the DSV, where it was more potent than
phenylephrine. This would suggest that although there may be some a 2-adrenoceptor
function, aj-adrenoceptors are the main mediators of the response in this vessel. This
conclusion would be supported by work in porcine vascular tissues (Wright et al. 1995),
comparing agonist potencies to binding and antagonist studies, where relative potencies
of NA, PE and UK14304 were correlated with the relative binding distribution of a r
and a 2- adrenoceptors. In addition, it has also been reported in the literature that in
certain vessels, UK 14304 may act as a partial agonist at a!-adrenoceptors (Nagadeh et
al. 1994). To rule this out in canine vessels, it would be of value to examine the effect
of a.]-antagonists on the contractile responses to UK 14304. Despite this, to avoid
complications which may arise from the activation of putative a 2-adrenoceptors, the a 2-
antagonist delequamine was present at all times during the antagonist studies. The
reasons for the use of delequamine, as opposed to the use of rauwolscine, have been
discussed in Chapter 3.
As for the DSV, (R) A-61603 was the most potent of the agonists used (this is discussed
in Chapter 3). In the case of the dog resistance artery, (R) A-61603 was 112X more
potent than PE compared to only 43X more potent in the DSV. Although this does not
completely support the presence of an a 1A-adrenoceptor subtype, (Knepper’s paper
(Knepper et al. 1995) quotes a 590 fold greater potency using the R- enantiomer of A-
61603 in canine prostatic strips), it would be unreasonable to rule out the presence of
this subtype based on a single previous study, as for example the presence of more than
one subtype may alter the sensitivity to the agonist. In summary, the agonist profile
would suggest that a,-adrenoceptors predominantly mediate contraction to
noradrenaline in dog resistance artery, although there may be some a 2-adrenoceptor
158
function. The relative potency of the Abbott compound may suggest the presence of the
a 1A- subtype.
For all the competitive antagonists used, with the exception of BMY 7378, the highest
antagonist concentration caused a significant decrease in the maximum, from the control
curve. It could be assumed that this was a time-dependent change but the factors which
support this being a true finding are as follows:
1. Time control curves were run in parallel with all experiments and maximums, as
judged by one way ANOVA were not significantly different;
2. Although up to four consecutive curves were performed in some vessels, in the
majority of experiments only two or three concentration response curves were
performed, and for WB 4101, 5 methylurapidil and HV 723, experiments were
performed using only the highest concentration of the antagonists (i.e. only two CRC
curves were performed in total), specifically to exclude a time-dependent phenomenon.
3. Concentration response curves, in the presence of BMY 7378, showed no significant
alterations in upper asymptotes over the range of antagonist concentrations used.
Concentration response curve data therefore, from WB 4101, HV 723 and 5
methylurapidil was not supportive of a strictly competitive interaction, as all three
antagonists displayed insurmountable antagonism at the highest concentration. The
significant difference for prazosin was marginal with P just less than 0.05 which was not
as convincing of a non-competitive interaction.
Despite the fact that not all the concentration response curves strictly fulfilled the
criteria for Schild analysis (i.e. parallel rightward displacements with no decrease in the
upper asymptote), Schild regression and pA2 value estimates from individual
concentrations were performed for all antagonists and are summarised in Tables 4.3 and
4.4. With the exception of BMY 7378, all slope 95% confidence intervals encompassed
159
negative unity and none of the pA2 values calculated for individual concentrations were
significantly different over the range of antagonist concentrations studied. It would
seem therefore, that while CRC data may suggest non-competitive interactions with
some of the antagonists, this was not identified by subsequent Schild analysis. pA2
values for prazosin and HV 723 are similar to those obtained in the DSV and would
support the presence of the a ]L- receptor subtype. (Muramatsu et al. 1995; Muramatsu et
al. 1990b). All the pA2 values are shown in Table 4.4 where they can be compared to
the results from the DSV in this study and different subtypes from other studies. It can
clearly be seen that values are similar to the DSV and that both of these compare most
closely with the a ]a- clone and the a 1L- of lower urinary tract.
The actions of chloroethylclonidine were dissimilar in some respects, to the effects of
this antagonist in the DSV. The main difference was that only 2/5 dog resistance artery
vessels developed a baseline contraction to lOOpM CEC, whereas the baseline
contraction was a consistent finding in all the DSV rings. In Chapter 3, it was discussed
that a population of rauwolscine-sensitive receptors contributed to the baseline
contraction to CEC seen in the DSV. In addition, these rauwolscine-sensitive receptors
appeared to be a!-adrenoceptors, which were a 1A/L- like, in that they were sensitive to 5
methylurapidil, WB 4101 and relatively sensitive to prazosin, although the affinity for
the latter antagonist was still < 9.
lOOpM CEC caused a significant decrease in the maximum in both vessels, but only a
significant shift in the pEC50 in the DSV. Due to the decrease in maximum it would not
be possible to rule out the presence of a 1B-adrenoceptors.
Comparing the findings of the present study with those of other studies which have
examined resistance arteries, it would appear that the rat mesenteric resistance artery has
received most attention. Van der Graaf (1996a) found similar results in this vessel to
160
results from this study and concluded on the presence of the a 1L-adrenoceptor. Smith
and McGrath also investigated rat mesenteric resistance artery and concluded on the
presence of the a ]A- subtype and /or the a ]B- subtype. Interestingly, this study found
that the affinity for prazosin significantly decreased from 5 to 52 weeks of age so that at
52 weeks the receptors could have been classified as a 1L- on the basis of affinity for
prazosin and HV 723 (Smith and McGrath, 1996). A study by Simonsen et al (1997) in
horse penile resistance arteries also found that prazosin had a low affinity (pA2 8.03 ±
0.09) and rabbit subcutaneous resistance arteries, (Smith et al. 1997) have been shown
to have a low affinity prazosin site classified as a ]L-, but in addition seem to possess a
high affinity prazosin site most closely resembling the cx1B-adrenoceptor.
To summarise, the antagonist findings support the presence of an a ]A- or a 1L-
adrenoceptor. Due to the low affinity for prazosin, within the current classification
scheme, this would strictly be referred to as an a ]L-adrenceptor. If in the DSV, the
baseline contraction caused by CEC is genuinely contributed to by the receptors that
also appeared to be a 1L- adrenoceptors in this vessel, then although on the basis of the
antagonist affinities, the receptors in both vessels would be classified as the same
subtype, the lack of ability to consistently cause a contraction in the presence of CEC,
could suggest that the receptors in the dog subcutaneous resistance arteries are somehow
different to those in the DSV.
The insurmountable nature of the antagonism to the highest concentrations of 5
methylurapidil, HV 723 and WB 4101, provide some evidence for the presence of more
than one a j-adrenoceptor subtype. If another subtype were present it could be similar to
the a 1B-, because of the depression in maximum seen with CEC. There is also some
evidence supporting the role of the a ]D-, since the interaction with BMY 7378 was not
strictly competitive, evidenced by the declining pA2 values seen with increasing
concentrations of the antagonist. A pA2 of 8.04 derived in the presence of InM BMY
7378 would be supportive of involvement of the a 1D- subtype. The sensitivity to CEC
could also be accounted for by the presence of the a ]D-adrenoceptor since this subtype is
reported to have an intermediate susceptibility to alkylinization by this compound
(Michel et al. 1993).
Any other subtype which is involved must also have a low affinity for prazosin. At this
time no satisfactory classification scheme exists for the discrimination of low affinity
prazosin sites other than their division into a 1L- or a 1N- (Muramatsu et al. 1995),
However, evidence from this study, in both the DSV and the subcutaneous resistance
arteries suggests that a further subdivision of a,-adrenoceptors with a low affinity for
prazosin must exist.
162
CHAPTER 5
Cloning and sequencing of the canine a la-adrenoceptor
5.0 Abstract
5.1 Results
5.1.1 RT-PCR
5.1.2 Cloning
5.1.3 Sequencing
5.1.4 Sequence analysis
5.1.5 Northern blotting
5.2 Discussion
163
5.0 Abstract
The aim of this study was to amplify the canine a ]a-adrenoceptor cDNA from dog tissue
RNA, using reverse-transcription polymerase chain reaction (RT-PCR), and primers
based on areas of high homology between a la-adrenoceptors from human and bovine
published sequences. Although it was not possible to amplify the full length coding
region, an 891 bp fragment was amplified, which encoded the putative amino terminus
through to the sixth transmembrane spanning domain of the receptor. This sequence
was found to be over 90% homologous to published human and bovine a la- sequences.
The sequence was submitted directly to the GenBank and given Accession No
AF068283.
A clone encoding part of the canine a lb-adrenoceptor, together with the a ]a- clone from
this study, were used to probe two cell lines each over-expressing either the human a ]a-
or a lb- adrenoceptor. With equal loading of RNA from both cell lines, the a lb- probe,
while showing some cross-reactivity, produced a much stronger signal with the a ]b- cell
line. In contrast, the a la- probe showed no reactivity with either cell line. Northern
analysis was repeated using RNA extracted from canine prostate and brain tissue. The
a lb- probe identified message in both tissues, but again the a la- probe did not identify
transcripts. Several possibilities exist that could explain the failure of the a ]a- probe to
identify transcripts. These are discussed in section 5.2.
164
5.1 Results
All materials and methods have been discussed in the materials and methods.
5.1.1 RT-PCR
In order to amplify the canine oc]a-adrenoceptor, a number of primers were designed
based on areas of high homology existing between the human and bovine published
sequences.
Figure 5.1 is a schematic diagram representing the proposed structure of the a ,-
adrenoceptor. The picture illustrates the presence of the seven putative transmembrane
spanning domains and the amino and carboxy termini of the receptor.
The primer design proved particularly problematic and in fact, three different sets of
primers were tested before a product of the right size and sequence was obtained.
Initially, a selection of oligonucleotide primers were designed, based on the human a ,3-
adrenoceptor sequence. Three isoforms had been described for this subtype (Hirasawa
et al. 1995), each one diverging in the sequence of the putative carboxy terminus. The
isoforms are named a 1A_,, a 1A_2 and a 1A„3. Primers were designed such that the
upstream (sense or 5’) primer was common to all isoforms and overlapped the start
codon (ATG). A different downstream (antisense or 3’) primer was designed for each
of the three different isoforms, each one overlapping the stop codon for that particular
isoform. In addition, a downstream primer common to all three isoforms was designed.
The primers were as follows: Upstream primer, 5’ gaccatggtgtttctctc 3’ (bases 433-450
(Hirasawa et al. 1995)); a ]A_, downstream primer 5’ ctagacttcctccccgttc 3’ (bases 1383-
1401 (Hirasawa et al. 1995)); a ]A_2 downstream primer 5’ caggcagatcatgaggtc 3’ (bases
1927-1940 (Hirasawa et al. 1995)); a 1A_3 downstream primer 5’ gctggcttcatgtcatgg
165
3’(bases 1716-1733 (Hirasawa et al. 1995)); Common downstream primer 5’
ctgtggtacaggaggattg 3’ (bases 1682-1700 of a 1A_3 (Hirasawa et al. 1995)).
Dog tissue was collected immediately after euthanasia, snap frozen, and stored in liquid
nitrogen until required. Total RNA was isolated using the RNazolB method as
described in materials and methods. cDNA was synthesised from total RNA (as
described in materials and methods), from dog brain and heart using both the random
hexamer primers and oligo(dt) primers. Polymerase chain reactions were set up using
the following: IX PCR buffer, 10pm of each primer, 200pM of each dNTP (dATP,
dTTP, dCTP, dGTP), 3mM MgCl2, 5pi of cDNA and 2.5 units of Taq polymerase. The
reaction was made up to 50pl with distilled autoclaved water in 0.5ml polypropylene
tubes. The conditions used for the PCR were, 95°C for 45 seconds (denaturation), 55°C
for 45 seconds (annealing), 72°C for 3 minutes (extension) for a total of 35 cycles. This
was followed by a 10 minute extension period at 72°C. The upstream primer was used
in conjunction with one of each of the downstream primers giving rise to four primer
pairs in total. The primer pair consisting of the upstream primer and the a 1A_3
downstream primer, produced a band of the expected size («1.3Kb), when used with
cDNA made from dog heart generated with random hexamer primers (Figure 5.2).
Unfortunately, when this was subsequently sequenced, it was found to have little
similarity to any of the published a,-adrenoceptor sequences, but was highly
homologous to a myocardial structural protein called titin.
A second set of primers was then designed, again based on both the human otla-
sequence and the bovine a ]a- sequence. These were as follows: a ]a- upstream primer 5’
ggaccatggtgtttctctccggaaatgc 3’, corresponding to bases 92-119 of the bovine clone
(Schwinn et al. 1990) and bases 432-459 of the human isoform 3 clone (Hirasawa et al.
1995), where there was 100% homology between the two species; a ]a- bovine
166
downstream primer 5’ cctttagacttcctccccattttcactgaggg 3’ corresponding to bases 1469-
1500 of the bovine clone (Schwinn et al. 1990); a ]a- human downstream primer 5’
ctagacttcctccccgttctcactgaggg 3’ corresponding to bases 1373-1401 of the human clone
(Hirasawa et al. 1995). On this occasion no products were produced with any
combination of the primer pairs. During this time annealing temperature was varied
between 50°C and 60°C, the length of each step in the cycle was altered between 45 and
60 seconds, between 10 and 50pm of primer was used and a variety of tissue cDNAs
were used including, canine heart, brain and prostate and human prostate.
A slightly different approach was then adopted. This time a primer was designed for the
synthesis of cDNA. 20pm of this was used in place of the random hexamer or oligo(dt)
primer. The sequence of this primer was 5’ atggggttgatgcagctgtt 3’. In addition a new
downstream primer was used in conjunction with the previous a la- upstream primer.
The sequence of the downstream primer was 5’ acccaatgggcatcactaaga 3’. The
sequence of the three primers and the bases that they correspond to from published
sequences is shown in Figure 5.3. The new primer combination did produce a band of
the expected size (891 base pairs), when used with cDNA made from dog prostate RNA,
where the cDNA had been synthesised using the gene-specific primer. Figure 5.4 shows
a photograph of a representative PCR reaction, which has been run out on a 1% agarose
gel and stained with ethidium bromide to visualize the DNA. Optimum concentrations
of the components of the PCR reaction were as follows: 2 0 0 jliM of each dNTP ; IX
PCR buffer; 1.5mM MgCl2; 10pm of each primer; 2.5U Taq polymerase; 5pl of cDNA
from a 33 pi reaction.
Optimum PCR cycle conditions were, a denaturation step for 3 minutes at 95°C,
followed by 30 cycles of denaturation (95°C for 30 seconds), annealing (48°C for 30
167
seconds) and extension (72°C for 30 seconds). The process was concluded with a final
5 minute extension at 72°C. Samples were then stored at -20°C until required.
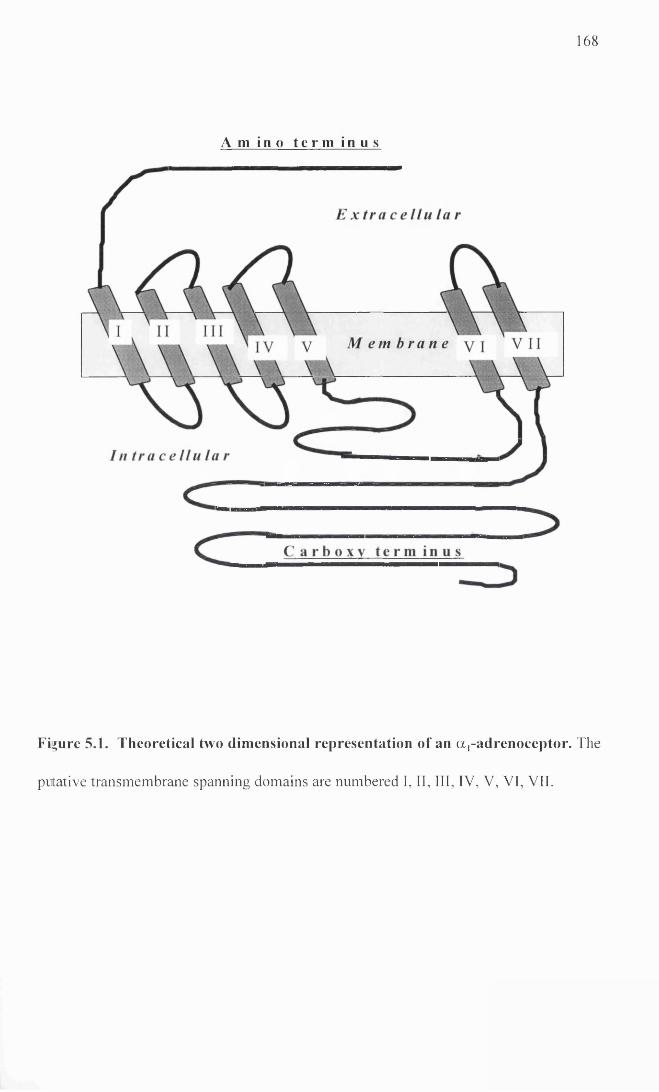
1 6 8
A m i n o t e r m i n u s
Figure 5.1. Theoretical two dimensional representation of an a,-adrenoceptor. The
putative transmembrane spanning domains are numbered I, II, III, IV, V, VI, VII.
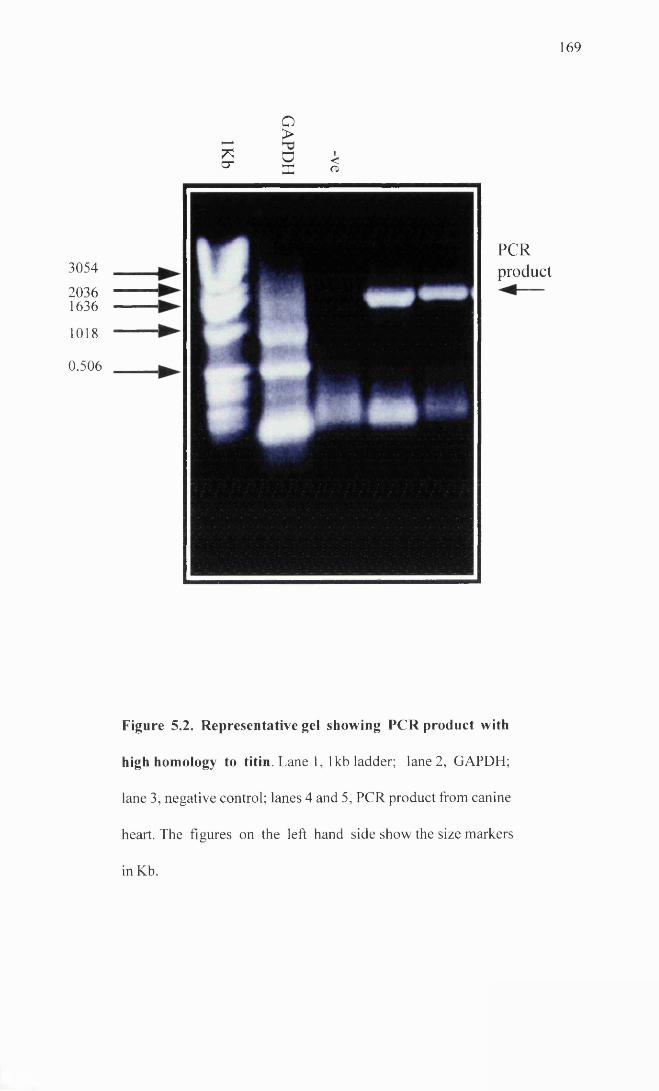
1 6 9
*cr
O>DX
<o>
3054
20361636
1018
0.506
PCRproduct
Figure 5.2. Representative gel showing PCR product with
high homology to titin. Lane 1, 1 kb ladder; lane 2, GAPDH;
lane 3, negative control; lanes 4 and 5, PCR product from canine
heart. The figures on the left hand side show the size markers
in Kb.
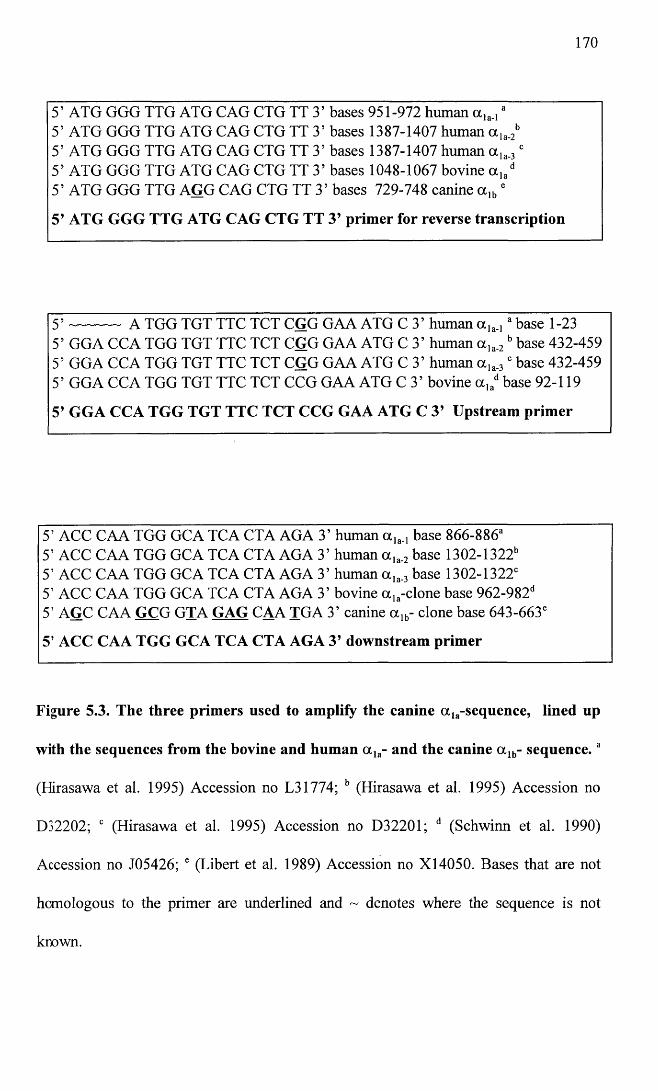
170
5’ ATG GGG TTG ATG CAG CTG TT 3’ bases 951-972 human a,,., *5’ ATG GGG TTG ATG CAG CTG TT 3’ bases 1387-1407 human a la.2b 5’ ATG GGG TTG ATG CAG CTG TT 3’ bases 1387-1407 human a ,a.3 c 5’ ATG GGG TTG ATG CAG CTG TT 3’ bases 1048-1067 bovine a ,ad 5’ ATG GGG TTG AGG CAG CTG TT 3’ bases 729-748 canine a ,„ '
5’ ATG GGG TTG ATG CAG CTG TT 3’ primer for reverse transcription
5 ’ ---------- a TGG TGT TTC TCT CGG GAA ATG C 3’ human a ,„ ,3 base 1-235’ GGA CCA TGG TGT TTC TCT CGG GAA ATG C 3’ human a la.2 b base 432-459 5’ GGA CCA TGG TGT TTC TCT CGG GAA ATG C 3’ human a la.3' base 432-459 5’ GGA CCA TGG TGT TTC TCT CCG GAA ATG C 3’ bovine a lad base 92-119
5’ GGA CCA TGG TGT TTC TCT CCG GAA ATG C 3’ Upstream primer
5’ ACC CAA TGG GCA TCA CTA AGA 3’ human base 866-886“5’ ACC CAA TGG GCA TCA CTA AGA 3’ human a ,a.2 base 1302-1322b 5’ ACC CAA TGG GCA TCA CTA AGA 3’ human a ,a.3 base 1302-1322'5’ ACC CAA TGG GCA TCA CTA AGA 3’ bovine a la-clone base 962-982d 5’ AGC CAA GCG GJA GAG CAA TGA 3’ canine a ]b- clone base 643-663'
5’ ACC CAA TGG GCA TCA CTA AGA 3’ downstream primer
Figure 5.3. The three primers used to amplify the canine a la-sequence, lined up
with the sequences from the bovine and human a la- and the canine a lb- sequence.a
(Hirasawa et al. 1995) Accession no L31774; b (Hirasawa et al. 1995) Accession no
D32202; c (Hirasawa et al. 1995) Accession no D32201; d (Schwinn et al. 1990)
Accession no J05426; e (Libert et al. 1989) Accession no X14050. Bases that are not
homologous to the primer are underlined and ~ denotes where the sequence is not
known.
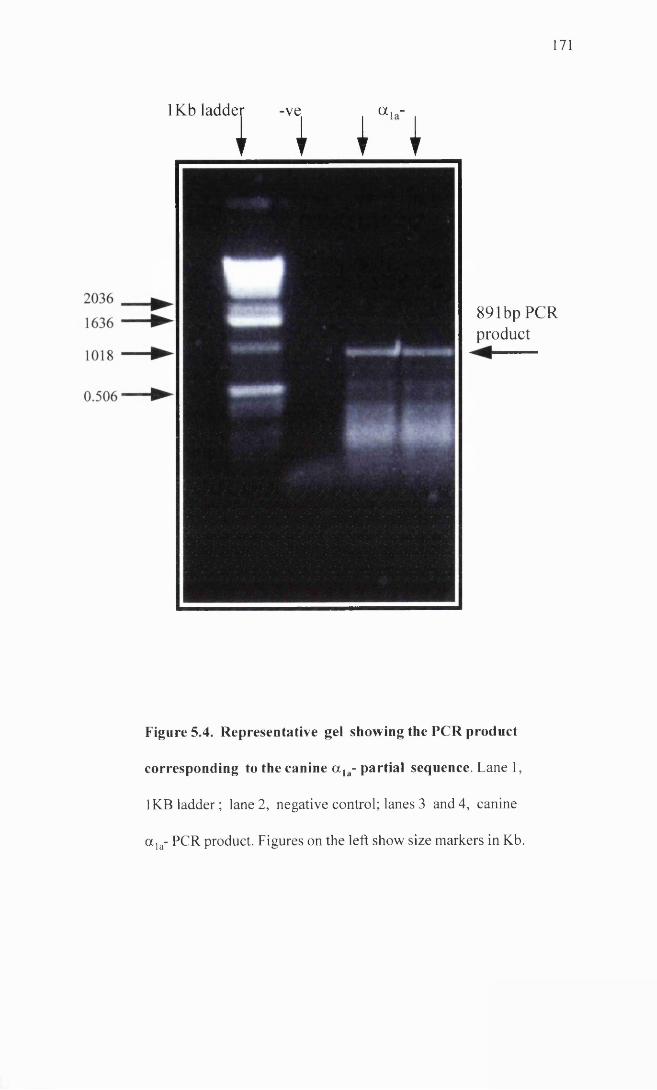
171
1Kb ladder -ve . a , -
1 I I I
891 bp PCR product
Figure 5.4. Representative gel showing the PCR product
corresponding to the canine a , a- partial sequence. Lane 1,
1 KB ladder; lane 2, negative control; lanes 3 and 4, canine
a la- PCR product. Figures on the left show size markers in Kb.
172
5.1.2 Cloning
The PCR product was cloned using Invitrogen’s Original TA Cloning® Kit as described
in the materials and methods. Ligations were carried out using fresh PCR product to
prevent loss of the A’ overhangs which enable the product to insert into the plasmid.
Thirty white colonies were selected from the transformation and grown up overnight in
3ml volumes of LB broth. Wizard® Plus SV Minipreps DNA purification system from
Promega, was used to purify the plasmids from the cultures grown.
Minipreps were digested using the restriction enzyme EcoRl, as this site flanks the
insertion site in the Invitrogen plasmid (pCR® 2.1). Digests were run out on a 1%
agarose gel. Figure 5.5 shows a photograph of the gel identifying three of the selected
colonies containing an insert of the correct size. The positive colonies were re-plated on
ampicillin-containing agarose plates and stored at 4°C. In addition, the remainder of the
cultures from the positive colonies were placed in vials containing 40% glycerol and 2%
peptone, and stored at -70°C. The purified plasmid DNA from the three colonies was
then used for sequencing.
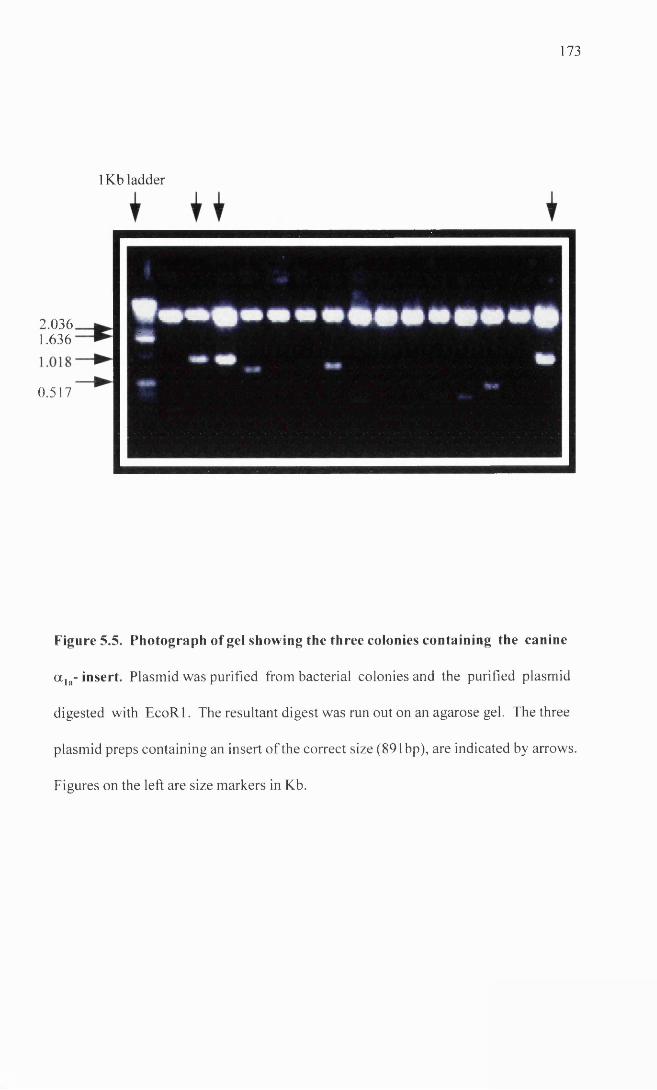
1 7 3
1Kb ladder
0.517
2.0361.636 m
Figure 5.5. Photograph of gel showing the three colonies containing the canine
a la- insert. Plasmid was purified from bacterial colonies and the purified plasmid
digested with EcoRl. The resultant digest was run out on an agarose gel. The three
plasmid preps containing an insert of the correct size (891 bp), are indicated by arrows
Figures on the left are size markers in Kb.
174
5.1.3 Sequencing
The miniprep DNA, corresponding to one of the positive colonies, was sequenced using
the Thermo Sequenase cycle sequencing kit from Amersham, incorporating 33P labelled
dideoxynucleotides as described in the materials and methods. 5pi of miniprep DNA
was used in the sequencing reactions, which was equivalent to approximately 500ng of
DNA. For the first sequencing reaction, the M l3 reverse primer from Invitrogen was
used (5’caggaaacagctatgac 3’). This primer is homologous to the pCR®2.1 plasmid
sequence upstream of the insert and allowed the sequence to be read from the plasmid
into the insert. For the subsequent sequencing reactions, primers were custom made
(Figure 5.6). Conditions for sequencing were as follows: Denaturation (95°C for 30
seconds), annealing (55°C for 30 seconds), extension (72°C for 30 seconds), for a total
of 40 cycles. Reactions were run on a 6% polyacrylamide gel, exposed to radiographic
film and developed as described in materials and methods .
The entire 891 bases of the upstream strand of the insert were sequenced. In addition, in
order to obtain a consensus sequence, direct sequencing of PCR products was performed
for both strands. This was done by excising the PCR product from an agarose gel and
spinning the block of agarose through a Supelco GenElute™ spin column, as described
in materials and methods. The DNA, when recovered was ethanol precipitated and
resuspended in lOpl of TE buffer. For sequencing, the entire lOpl was used for a single
reaction. This meant that several different PCR reactions were required to sequence the
full length of the product. For the first reaction, the upstream and downstream primers
that had been used for the RT-PCR were employed (Figure 5.3). Subsequent to this,
custom primers were designed based on the sequence obtained from the previous
sequencing, (Figure 5.6). The sequence of the clone was identical to the sequence
obtained from the PCR sequencing, with the exception of a single base, where the clone

175
contained a guanine residue instead of an adenosine residue at base number 272
counting from the beginning of the ATG start codon. This was found to alter the amino
acid encoded in this region from a tyrosine, in the case of the clone, to a cystine. At this
point, another two clones were sequenced in this region and also found to have an
adenosine residue, therefore adenosine was considered the consensus base and was used
when determining the predicted amino acid sequence of the clone.
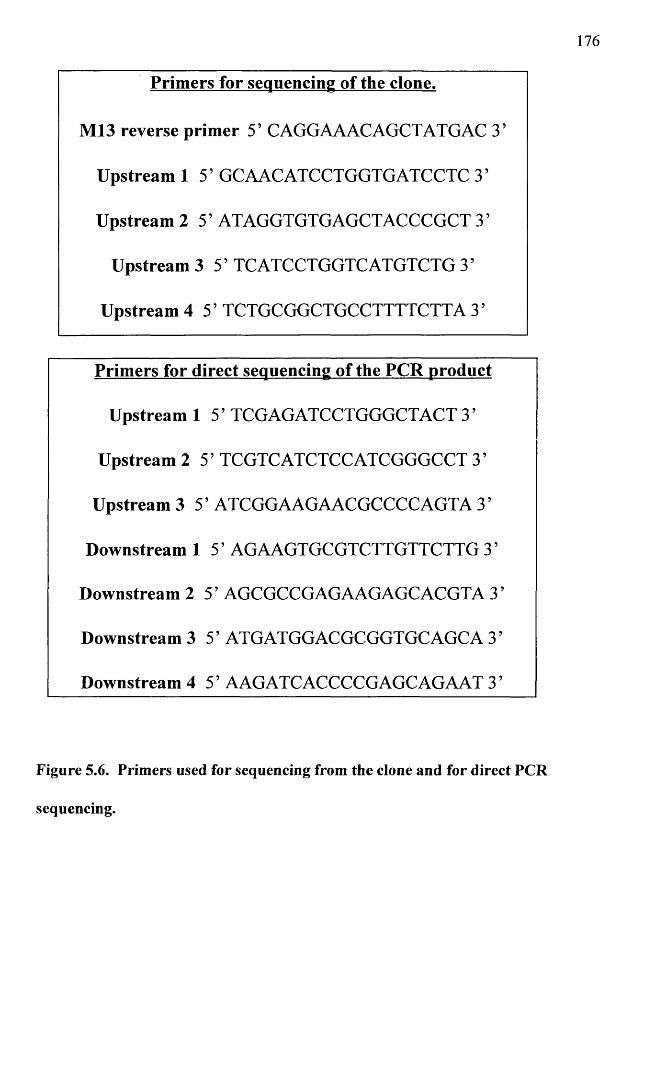
176
Primers for sequencing of the clone.
M13 reverse primer 5’ CAGGAAACAGCTATGAC 3’
Upstream 1 5’ GCAACATCCTGGTGATCCTC 35
Upstream 2 5’ ATAGGTGTGAGCTACCCGCT 3’
Upstream 3 5’ TCATCCTGGTC ATGTCTG 3 ’
Upstream 4 5’ TCTGCGGCTGCCTTTTCTTA 3’
Primers for direct sequencing of the PCR product
Upstream 1 5’ TCGAGATCCTGGGCTACT 3 ’
Upstream 2 5’ TCGTCATCTCCATCGGGCCT 3’
Upstream 3 5’ ATCGGAAGAACGCCCCAGTA 35
Downstream 1 5’ AGAAGTGCGTCTTGTTCTTG 3’
Downstream 2 5’ AGCGCCGAGAAGAGCACGTA 3’
Downstream 3 5’ ATGATGGACGCGGTGCAGCA 3’
Downstream 4 5’ AAGATCACCCCGAGCAGAAT 3 ’
Figure 5.6. Primers used for sequencing from the clone and for direct PCR
sequencing.
177
5.1.4 Sequence analysis
The nucleotide and predicted amino acid sequence of the clone are given in Figure 5.7.
Sequence analysis was carried out using the University of Wisconsin Genetics
Computer Group (G.C.G.) sequence analysis software programmes.
Using the BESTFIT programme (which employs the local homology algorithm of Smith
and Waterman (1981)), it was determined that the canine clone had the following
homologies at the nucleotide level with existing clones: 93% homology to the bovine
a la- clone (Schwinn et al. 1990), accession number J05426; 93% homology to the three
isoforms of the human a ]a- clone (Hirasawa et al. 1995); 93% homology to a novel
fourth human a la- clone (Chang et al. 1998), accession number AFO13261; 78%
homology to the human a lb- clone (Ramarao et al. 1992), accession number L31773;
85% homology to the canine partial a lb- sequence (Libert et al. 1989), accession number
X I4050; 81% homology to the human and rat a ]d- clones (Schwinn et al. 1995),
accession numbers L31772 and L31771. Figure 5.8 illustrates the amino acid sequence
of the clone determined in this study and compares it to the amino acid sequence of both
the bovine and human a la-adrenoceptor sequences.
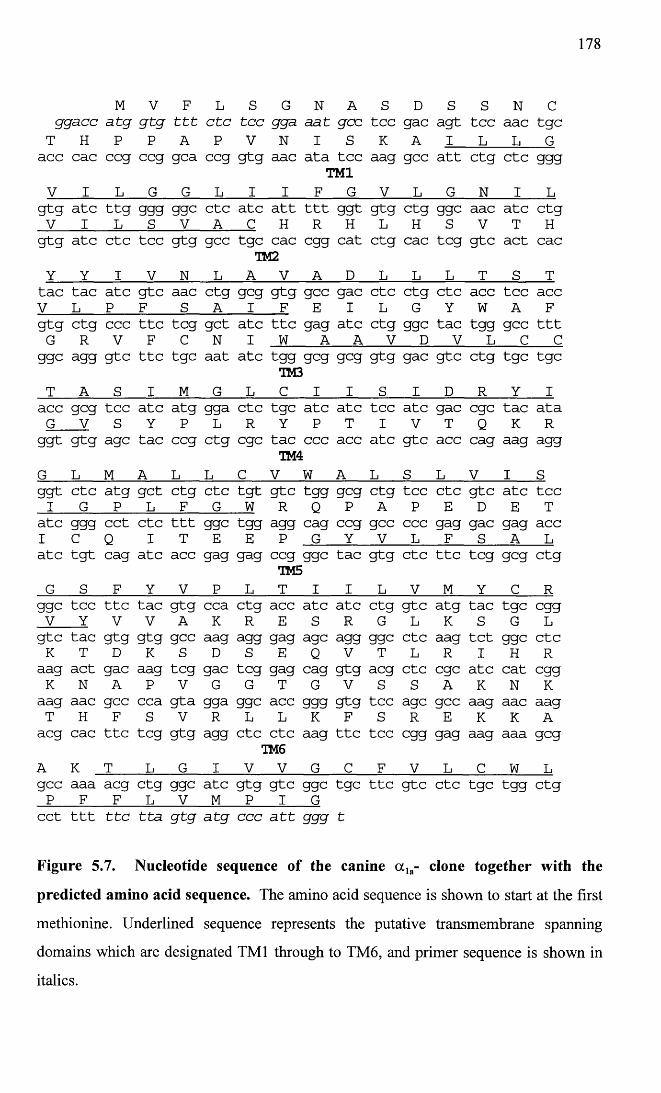
178
M V F L S G N A s D s S N cgga.cc a tg g tg t t t e tc tcc 993- aat gee tee gac agt tcc aac tgcT H P P A p V N I s K A I L L Gacc cac ccg ccg gca ccg gtg aac ata tcc aag gcc att ctg etc gggTM1V I L G G L i I F G V L G N I Lgtg ate ttg ggg ggc etc ate att ttt ggt gtg ctg ggc aac ate CtgV I L s V A C H R H L H s V T Hgtg ate etc tcc gtg gcc tgc cac egg cat ctg cac teg gtc act cac
TM2Y Y I V N L A V A D L L L T S Ttac tac ate gtc aac ctg geg gtg gee gac etc ctg etc acc tcc accV L P F S A i F E I L G Y W A Fgtg ctg ccc ttc teg get ate ttc gag ate ctg ggc tac tgg gcc tttG R V F C N I w A A V D V L C Cggc agg gtc ttc tgc aat ate tgg geg geg gtg gac gtc ctg tgc tgc
TM3T A s I M G L C 1 I s I D R Y Iacc geg tcc ate atg gga etc tgc ate ate tee ate gac ege tac ataG V S Y P L R Y P T I V T Q K Rggt gtg age tac ccg ctg ege tac ccc acc ate gtc acc cag aag aggTM4G L M A L L C V W A L S L V I sggt etc atg get ctg etc tgt gtc tgg geg ctg tcc etc gtc ate tcci G P L F G W R Q p A P E D E Tate ggg cct etc ttt ggc tgg agg cag ccg gee ccc gag gac gag accI c Q I T E E p G Y V L F S A Late tgt cag ate acc gag gag ccg ggc tac gtg etc ttc teg geg ctg
TM5G s F Y V p L T I I L V M Y c Rggc tec ttc tac gtg cca ctg acc ate ate ctg gtc atg tac tgc eggV Y V V A K R E S R G L K S G Lgtc tac gtg gtg gcc aag agg gag age agg ggc etc aag tct ggc etcK T D K S D s E Q V T L R I H Raag act gac aag teg gac teg gag cag gtg acg etc ege ate cat eggK N A P V G G T G V S S A K N Kaag aac gcc cca gta gga ggc acc ggg gtg tcc age gee aag aac aagT H F S V R L L K F S R E K K Aacg cac ttc teg gtg agg etc etc aag ttc tcc egg gag aag aaa gegTM6A K T L G I V V G C F V L C W Lgcc aaa acg ctg ggc ate gtg gtc ggc tgc ttc gtc etc tgc tgg ctgP F F L V M p I Gcct ttt t t c t ta g tg a tg ccc a t t ggg t
Figure 5.7. Nucleotide sequence of the canine a la- clone together with the
predicted amino acid sequence. The amino acid sequence is shown to start at the first
methionine. Underlined sequence represents the putative transmembrane spanning
domains which are designated TM1 through to TM6, and primer sequence is shown in
italics.
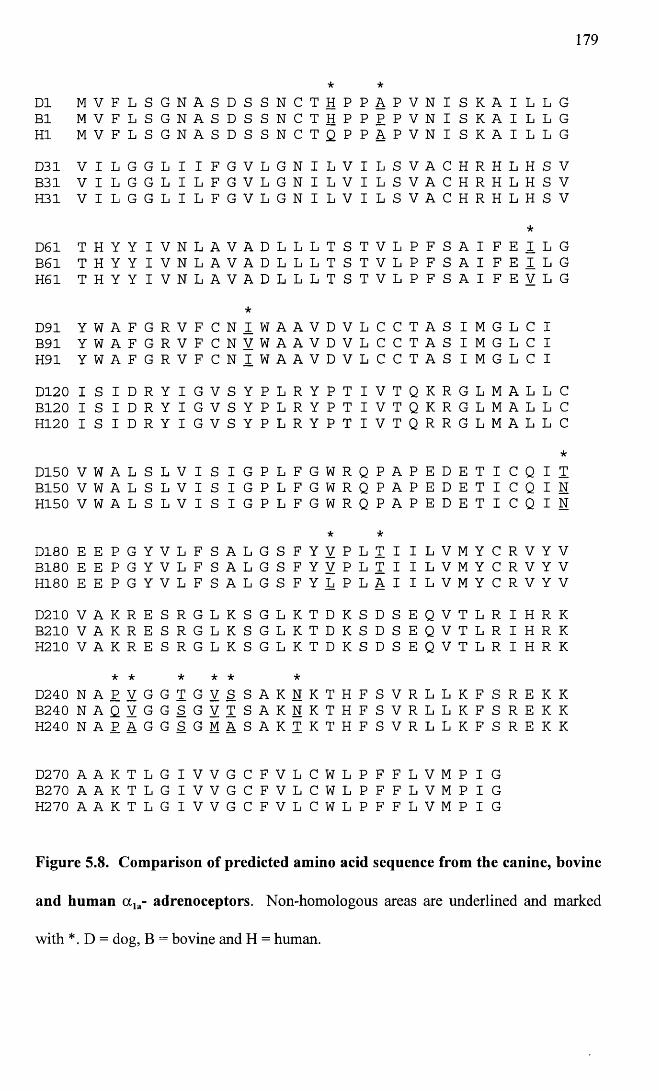
179
D1 M V F L S G N A S D S S N C T*H P P
*A P V N I s K A I L L G
B1 M V F L S G N A S D S S N C T H P P P P V N I s K A I L L GHI M V F L S G N A S D S S N C T Q P P A P V N I s K A I L L GD31 V I L G G L I I F G V L G N I L V I L S V A C H R H L H S VB31 V I L G G L I L F G V L G N I L V I L S V A c H R H L H S VH31 V I L G G L I L F G V L G N I L V I L S V A c H R H L H S V
*
D61 T H Y Y I V N L A V A D L L L T S T V L p F S A I F E I L GB61 T H Y Y I V N L A V A D L L L T S T V L p F S A I F E I L GH61 T H Y Y I V N L A V A D L L L T S T V L p F S A I F E V L G
D91 Y W A F G R V F C N*I W A A V D V L C C T A S I M G L C I
B91 Y W A F G R V F C N V W A A V D V L C C T A S I M G L c IH91 Y W A F G R V F C N I W A A V D V L C C T A S I M G L c ID120 I S I D R Y I G V S Y P L R Y P T I V T Q K R G L M A L L CB120 I S I D R Y I G V S Y P L R Y P T I V T Q K R G L M A L L CH120 I S I D R Y I G V S Y P L R Y P T I V T Q R R G L M A L L C
D150 V W A L S L V I S I G P L F G W R Q P A P E D E T I C Q I*TB150 V W A L S L V I S I G P L F G W R Q P A P E D E T I C Q I N
H150 V W A L S L V I S I G P L F G W R Q P A P E D E T I C Q I N
D180 E E P G Y V L F S A L G S F Y*V P L
*T I I L V M Y C R V Y V
B180 E E P G Y V L F S A L G S F Y V P L T I I L V M Y C R V Y VH180 E E P G Y V L F S A L G S F Y L P L A I I L V M Y c R V Y VD210 V A K R E S R G L K S G L K T D K S D S E Q V T L R I H R KB210 V A K R E S R G L K S G L K T D K S D S E Q V T L R I H R KH210 V A K R E S R G L K S G L K T D K S D s E Q V T L R I H R K
* * * * * *D240 N A P V G G T G V S S A K N K T H F S V R L L K F S R E K KB240 N A Q V G G S G V T S A K N K T H F S V R L L K F s R E K KH240 N A P A G G S G M A S A K T K T H F S V R L L K F s R E K K
D270 A A K T L G I V V G C F V L C W L P F F L V M P I GB270 A A K T L G I V V G C F V L C W L P F F L V M P I GH270 A A K T L G I V V G C F V L C W L P F F L V M P I G
Figure 5.8. Comparison of predicted amino acid sequence from the canine, bovine
and human a la- adrenoceptors. Non-homologous areas are underlined and marked
with *. D = dog, B = bovine and H = human.
180
5.1.5 Northern blotting
Two probes were generated for Northern analysis. The first was termed the a la- probe
and this was the partial canine a la-adrenoceptor sequence (Figure 5.7) that had been
cloned and sequenced in this study (891 bp). The second probe was termed the a lb-
probe. This was kindly donated by Libert et al (1989), and comprised a clone encoding
a partial sequence for the canine a lb-adrenoceptor (accession number X I4050). This
clone was received as a 1.8Kb fragment inserted into the EcoRl restriction site of the
pBlueskript SK+ plasmid (2958bp plasmid from Stratagene). On receipt, INVaF’
competent cells from the TA cloning kit, were transformed with the pBlueskript SK+
plasmid. Twelve colonies were selected and grown up in 3ml volumes of LB broth
overnight. Plasmid DNA was purified from the colonies using the Wizard® Plus SV
Minipreps DNA purification system from Promega. 8 pi of each miniprep was digested
with EcoRl and run out on a 1% agarose gel. All of the colonies contained the insert
(Figure 5.9). The inserts were excised from the gel and the DNA purified from the
agarose using Supelco GenElute™ spin column minus ethidium bromide. Plasmid
containing the a la- clone was also digested with EcoRl, and the insert band purified in
the same way.
Total RNA was prepared from two cell lines of rat-1 fibroblasts, each stably expressing
either the human a ]a-adrenoceptor or the human a lb-adrenoceptor, (accession numbers
L31774 and L31773 respectively), at high levels. These cells were kindly donated by
Dr Janet MacKenzie. From radioligand binding experiments using [3H]-prazosin, she
had shown a Bmax of 912 ± 38 fmol mg"1 protein and a Kd of 0.477 ± 0.1 InM for the a la-
cell line, and a Bmax of 954 ± 55 fmol mg'1 protein and a Kd of 0.433 ±0.14 nM for the
a ]b- cell line (all values represent mean ± s.e. mean). Bmax is the maximum density of
binding sites and Kd is the equilibrium dissociation constant.
181
20pg of RNA from each cell line was run on a formaldehyde gel and subsequently
transferred to a Hybond-N+ membrane (Amersham), as described in the materials and
methods. The a ]b- probe was random labelled with [a-32P] dCTP using Ready-To-Go®
DNA labeling beads from Pharmacia Biotech, using «50ng of the probe DNA. This was
hybridized overnight with the membrane. The following morning, the membrane was
washed at low stringency using two washes with 2X SSC/0.1% SDS. The membrane
was then exposed to radiographic film for 24 hours and Figure 5.10 illustrates the
hybridization of the probe. The probe had hybridized to both cell lines to a single size
RNA species of » 5 Kb. The intensity of labelling was much stronger for the a lb- cell
line.
The filter was then stripped by placing the membrane in boiling 0.1% SDS. The
hybridization was repeated using the a la- probe labelled in the same way as the a lb-
probe. The filter was again washed at low stringency, but this time no hybridization of
the probe was seen despite exposure to film for 72 hours. In order to assess loading of
the RNA, an 18S human ribosomal 49mer oligonucleotide probe corresponding to bases
364 to 413, was end-labelled with [y-32P] ATP as described in materials and methods.
The sequence of the probe was 5’ cgtggtcaccatggtaggcacggcgactaccatcgaaagttgatagggc
3’. This probe was hybridized overnight and washed the following morning at high
stringency using two washes of 2X SSC/0.1%SDS, one wash of 1XSSC/0.1% SDS and
one wash of 0.1XSSC/0.1%SDS. The filter was exposed to radiographic film for 6
hours and the resultant hybridization pattern is shown in Figure 5.10. This indicated
that there was equal loading of RNA from both cell lines and therefore, that the a ]b-
probe hybridized more strongly to the a lb- expressing cell line rather than the a ]a- cell
line, although some cross-reactivity was demonstrated.
A second membrane was prepared, this time using 20pg of RNA from both dog brain
and dog prostate. Again the a ]a- probe did not hybridize to either lane. Figure 5.11
shows the results after a 72 hour exposure, when the a ]b- probe was used. In this case,
the blots were washed to moderate stringency using two washes of 2X SSC/0.1%SDS
and one wash of 1XSSC/0.1% SDS. The a lb- probe hybridized to both lanes but with
greater intensity for the dog prostate RNA. This time two different size transcripts of
«5Kb and «3Kb, were seen on the film. The membrane was stripped using boiling
0.1%SDS, and this time a GAPDH cDNA was random-labelled and hybridized
overnight to assess loading of RNA. Results of a 72 hour exposure are illustrated in
Figure 5.11. In this case, the general intensity of the hybridization is low but the band
for the dog prostate does appear stronger which may account for the increased intensity
of labelling seen with the a ]b- probe at the prostate tissue.
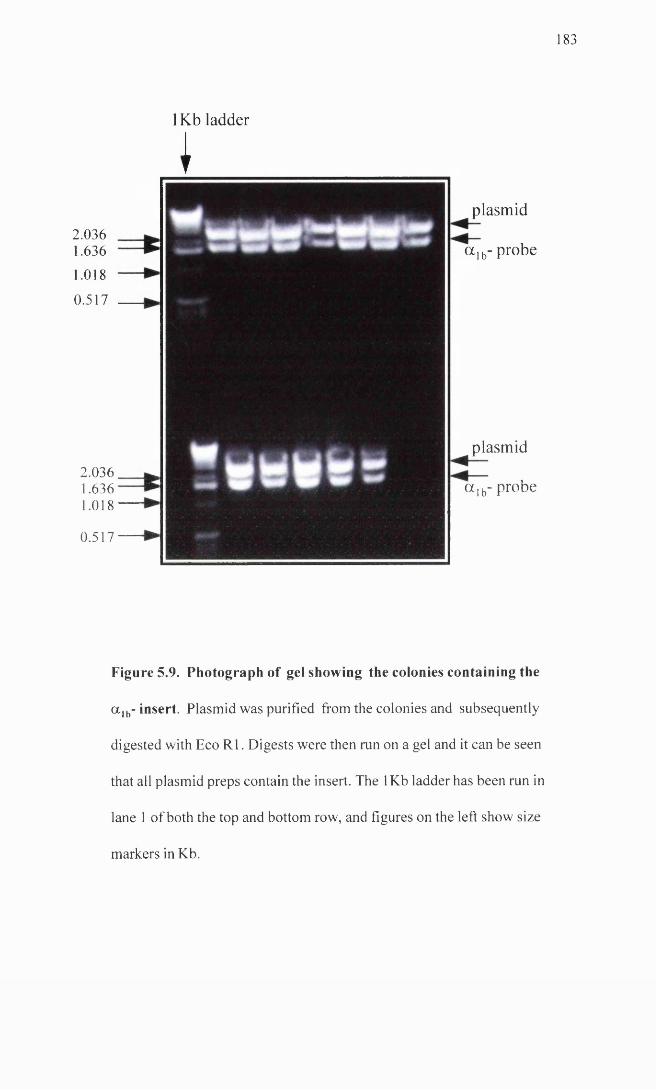
1 8 3
1Kb ladder
2.0361.636
1.018
0.517
2.0361.6361.018
0.517
I
plasmid
a lb- probe
plasmid
a lb- probe
Figure 5.9. Photograph of gel showing the colonies containing the
a lb- insert. Plasmid was purified from the colonies and subsequently
digested with Eco R1. Digests were then run on a gel and it can be seen
that all plasmid preps contain the insert. The 1Kb ladder has been run in
lane 1 of both the top and bottom row, and figures on the left show size
markers in Kb.
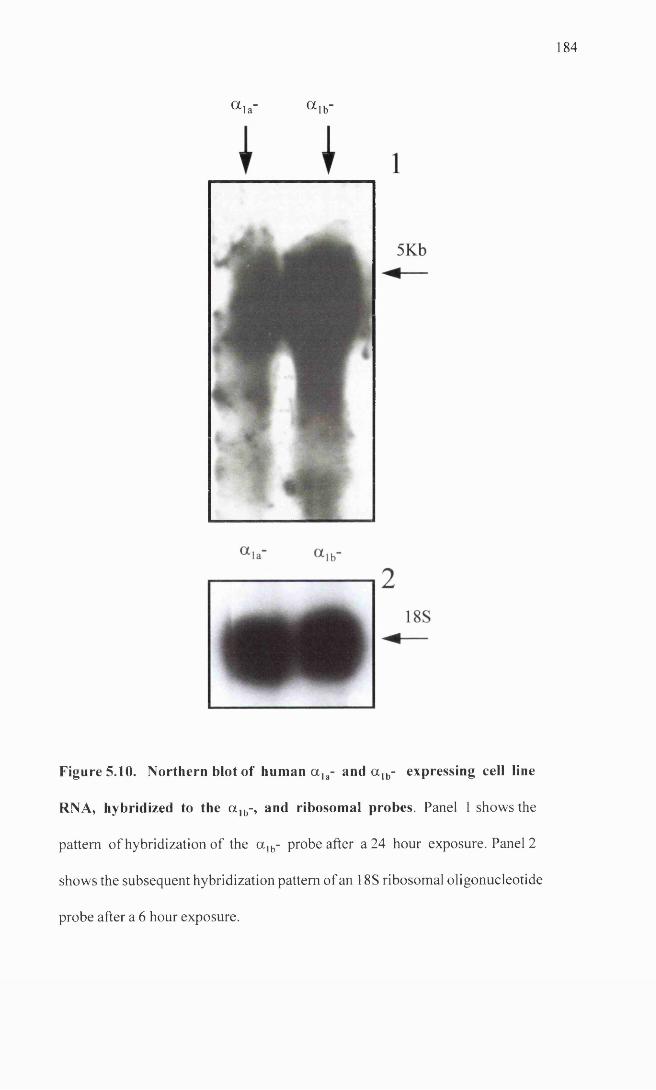
1 8 4
a i a " a i b "
Figure 5.10. Northern blot of human a la- and a lb- expressing cell line
RNA, hybridized to the a lb-, and ribosomal probes. Panel 1 shows the
pattern of hybridization of the a lb- probe after a 24 hour exposure. Panel 2
shows the subsequent hybridization pattern of an 18S ribosomal oligonucleotide
probe after a 6 hour exposure.
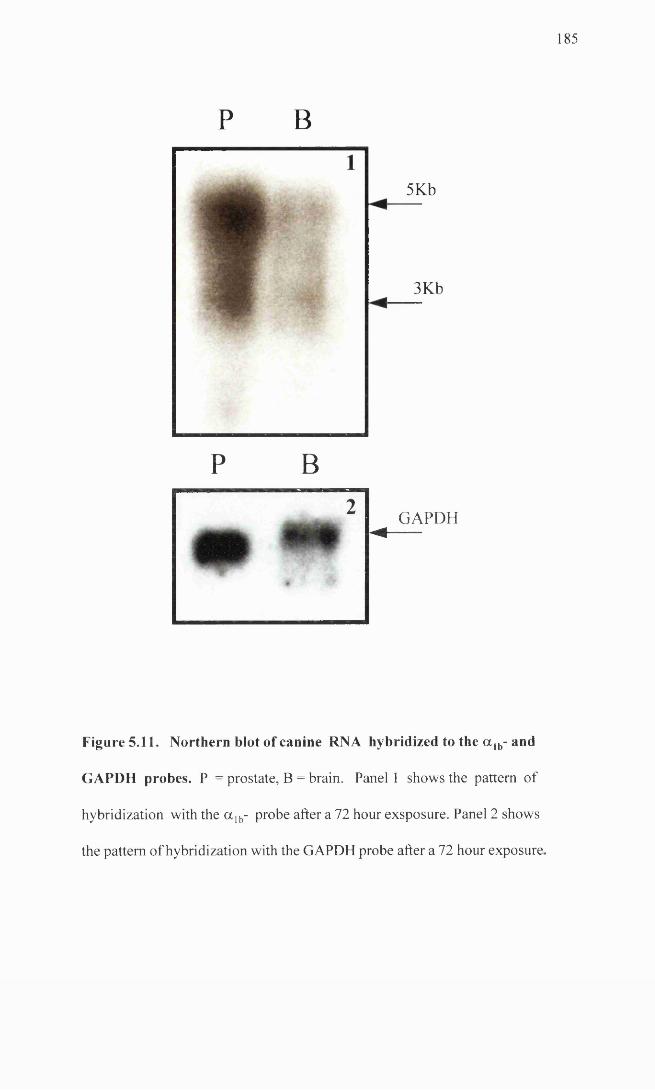
1 8 5
5Kb-------
3Kb
GAPDH M ------
Figure 5.11. Northern blot of canine RNA hybridized to the a lb- and
GAPDH probes. P = prostate, B = brain. Panel 1 shows the pattern of
hybridization with the a lb- probe after a 72 hour exsposure. Panel 2 shows
the pattern of hybridization with the GAPDH probe after a 72 hour exposure.
P B
P B2
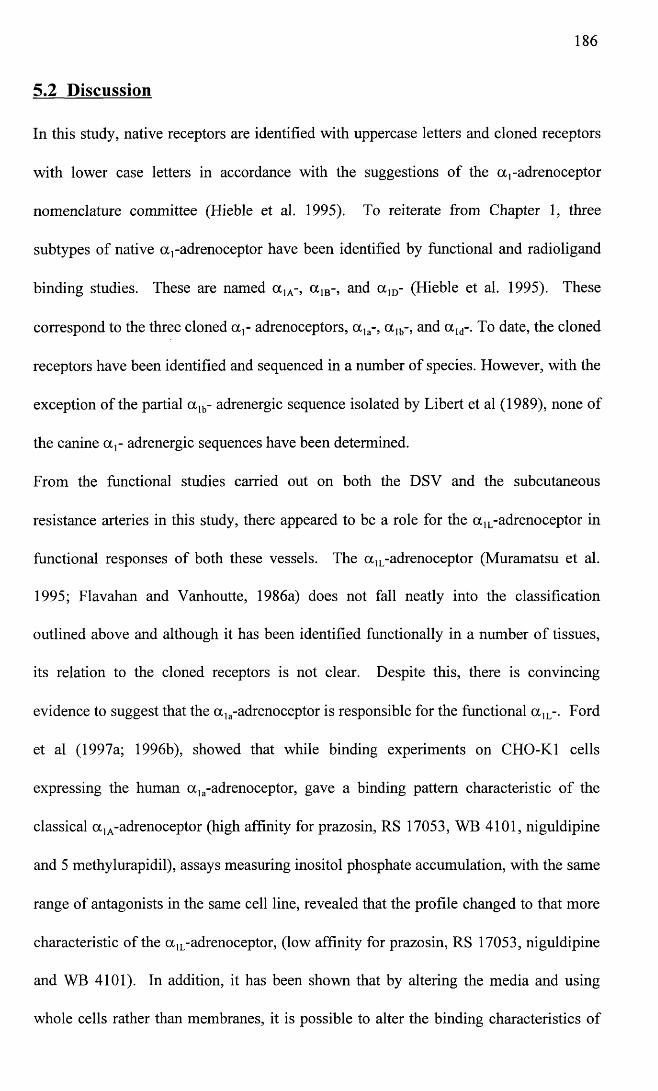
186
5.2 Discussion
In this study, native receptors are identified with uppercase letters and cloned receptors
with lower case letters in accordance with the suggestions of the a,-adrenoceptor
nomenclature committee (Hieble et al. 1995). To reiterate from Chapter 1, three
subtypes of native a } -adrenoceptor have been identified by functional and radioligand
binding studies. These are named a ]A-, a ]B-, and a ]D- (Hieble et al. 1995). These
correspond to the three cloned a,- adrenoceptors, a la-, a ]b-, and a ld-. To date, the cloned
receptors have been identified and sequenced in a number of species. However, with the
exception of the partial a lb- adrenergic sequence isolated by Libert et al (1989), none of
the canine a r adrenergic sequences have been determined.
From the functional studies carried out on both the DSV and the subcutaneous
resistance arteries in this study, there appeared to be a role for the a ]L-adrenoceptor in
functional responses of both these vessels. The a 1L-adrenoceptor (Muramatsu et al.
1995; Flavahan and Vanhoutte, 1986a) does not fall neatly into the classification
outlined above and although it has been identified functionally in a number of tissues,
its relation to the cloned receptors is not clear. Despite this, there is convincing
evidence to suggest that the a la-adrenoceptor is responsible for the functional a 1L-. Ford
et al (1997a; 1996b), showed that while binding experiments on CHO-K1 cells
expressing the human a la-adrenoceptor, gave a binding pattern characteristic of the
classical a 1A-adrenoceptor (high affinity for prazosin, RS 17053, WB 4101, niguldipine
and 5 methylurapidil), assays measuring inositol phosphate accumulation, with the same
range of antagonists in the same cell line, revealed that the profile changed to that more
characteristic of the a 1L-adrenoceptor, (low affinity for prazosin, RS 17053, niguldipine
and WB 4101). In addition, it has been shown that by altering the media and using
whole cells rather than membranes, it is possible to alter the binding characteristics of
187
CH0-K1 cells expressing the human a la-adrenoceptor, to give a profile more closely
resembling that seen for functional studies at the so called a 1L-adrenoceptor (Williams et
al. 1996). This alteration could not simply be explained by a lowering of all values
since the effect was not seen with other subtypes of a,-adrenoceptors and only certain
antagonists showed lower values under the changed conditions. In addition, a novel
fourth isoform of the human a la-adrenoceptor (a ]A_4), has recently been identified
(Chang et al. 1998). This isoform together with the other three isoforms previously
described, (Hirasawa et al. 1995), have been transfected into cell lines. When antagonist
experiments were carried out measuring inositol phosphate accumulation, all isoforms
displayed the a 1L-adrenoceptor profile, with a low affinity for prazosin, RS-17053 and
WB 4101 (Ford et al. 1997b; Chang et al. 1998).
With this in mind and with the results of the functional experiments, it seemed logical to
investigate expression and functional characteristics of the canine a 1A-adrenoceptor in
more detail. The first step was to identify and determine the sequence of this receptor
from canine tissue.
The sequence homology, even at the nucleotide level, is very highly conserved among
the a,-adrenoceptor subtypes for different species (Graham et al. 1996). Based on this
fact, it seemed reasonable to attempt to amplify the a ]A-adrenoceptor from canine tissue
cDNA, using primers based on human and bovine sequences.
Unfortunately, when primers were designed to amplify the entire coding region for the
receptor, a product corresponding to an adrenergic receptor sequence was not obtained.
The reason for this is not clear but several possibilities exist.
1. The fact that the initial primer sets amplified titin, and the second set of primers failed
to amplify anything, may indicate very low levels of expression or complex secondary
structures preventing primer annealing and extension. With the second sets of primers,
188
in addition to altering many of the parameters such as cycle number, time and
temperature as already detailed, reactions were carried out in the presence of varying
concentrations of dimethylsulphoxide (DMSO), which should have helped to disrupt
secondary structures if present (personal communication from Dr Robert Heeley).
2. Hirasawa et al (1995) and Chang et al (1998) have identified isoforms of the human
a la-adrenergic receptor. These isoforms are identical apart from their carboxy termini,
where the sequence diverges. If a similar situation exists for the canine receptor, then
this could have contributed to the failure to amplify the entire sequence and may explain
the fact that it was possible to amplify a partial sequence, once a new downstream
primer had been designed, which corresponded to an area within the putative VI
transmembrane spanning domain, rather than one where the downstream primer lay
within the carboxy terminal region.
3. Another reason for failure to amplify the full length clone may have been in the
primer design. In polymerase chain reactions the most important aspect contributing to
the success of the reaction is the design and choice of the primers. In the design of
primers for this study, several recommendations were followed (Sharrocks, 1994).
Primers were designed from areas of high homology, length of the primers was kept
between 18 and 30 bases, the AT to GC ratio was kept roughly 1:1 to maintain a similar
melting temperature (Tm) for all the primers and where possible, primers were designed
such that there was a “GC clamp” on the 3’ end of the primer. In addition, all primers
were checked for the absence of self homology and homology with their downstream
counterpart, using a primer checking programme.
When the partial receptor was sequenced it was found to be over 90% homologous, at
the nucleotide level, to the human and bovine a la-adrenergic sequences, compared to
only approximately 70-80% homologous to either published a ]b- or a ld- adrenergic
189
receptor sequences. This provided strong evidence that the sequence amplified did
represent the canine a la-adrenergic receptor.
Rat-1 fibroblasts stably expressing the human a ]a- and a ]b-adrenergic receptors were
available, and because of the high interspecies homology between the subtypes of
adrenergic receptor, it was decided to use these cell lines to test the suitability of the ot]a-
clone and the a lb- clone, as probes for the identification and quantification of these two
subtypes in tissue, since the cell lines could act as positive and negative controls.
Unfortunately, the a la-probe failed to hybridize to either cell line and also failed to
hybridize to RNA prepared from canine prostate and canine brain, despite the fact that
the clone had originated from RNA prepared from canine prostatic tissue. On the other
hand, the a lb- probe hybridized to both canine prostatic and brain tissue. However,
despite the fact that hybridization was markedly greater at the a ]b- cell line versus the
a la- cell line, the fact that the probe did hybridize to the a la- cell line would indicate that
this probe is not subtype specific.
Some possible explanations for the failure of the a la- probe to identify transcripts are:
1. Northern blotting has been used to examine expression of a,-adrenoceptor subtypes
in other studies (Stewart et al. 1994; Schwinn et al. 1991; McGehee et al. 1990;
Lomasney et al. 1991; Laz et al. 1994; Deng and Cornett, 1998; Alonzo-Llamazares et
al. 1995; Beaulieu et al. 1997). Despite this, the levels of expression of these receptors
is known to be low. Graham et al (1996) and Schwinn et al (1990), failed to identify
a 1A- expression in tissues with functional a ]A- characteristics using the same technique.
More sensitive methods are available and have been used, such as RNAse protection
assays (Nasu et al. 1996; Moriyama et al. 1997; Price et al. 1994) and competitive RT-
PCR (Chang et al. 1998; Faure et al. 1995). Even the use of polyA+ enriched mRNA
190
rather than total RNA may be useful. Although these techniques were out with the
scope of this study, they may be investigated in the future.
2. From verbal communication with Dr Janet MacKenzie, problems were encountered
with the rat-1 fibroblast cell lines as regards loss of expression of the adrenergic
receptors, subsequent to the Northern blotting experiments. If the levels of expression
in the cell lines had been falling this may have explained the inability of the a la- probe
to identify transcripts in the RNA from these cells.
3. The a la- probe itself may have been the problem. Lack of homology would be the
most likely reason for a probe to fail to work. This is an unlikely explanation in this
case due to the homology of > 90% between the probe sequence and the human otla-
sequence.
4. Expression of the a la-adrenoceptor may be very low in the canine tissues that were
used for the Northern analysis. Prostate was used because this was the tissue from
which the clone was derived and from binding and functional studies, the canine
prostate has been characterised as having primarily either a 1A- or a ]L-adrenergic
receptors (Testa et al. 1997; Knepper et al. 1995; Goetz et al. 1994). Brain was also
included since human brain tissue has been shown to have a 1A-adrenoceptors (Price et
al. 1994; Faure et al. 1995; Hirasawa et al. 1995), and while species differences do exist
in distribution of receptor subtypes, often there are similarities.
In the case of the a ]b- probe, in the cell lines the probe only identified a single size of
mRNA transcript («5Kb), whereas in the canine tissue the probe hybridized to two
different sized mRNAs, namely a band «5Kb and a second band ~3Kb. Different sizes
of mRNA transcripts for a 5-adrenoceptors have been reported previously. In a study by
Beaulieu et al (1997), four transcript sizes were observed for the a 1D-adrenergic receptor
191
in hamster hearts and Stewart et al (1994) identified three transcript sizes for the ot]A-
adrenoceptor in rat heart and brain.
Libert et al (1989) used the same canine a ]b- probe that was used in this study, in a
variety of canine tissues. They observed a tissue specific variation in the size of the
transcripts identified with two transcripts of 4.8 and 2.6Kb in canine lung, two
transcripts of 4.1 and 2.6Kb in canine heart and only a single transcript of 4.8Kb in
canine stomach. As suggested by Libert et al, in the paper cited, and as already
suggested in this discussion, this pattern may be due to lack of subtype specificity of the
probe and thus, the probe may be identifying the presence of more than one subtype in
the canine tissues. This could explain why only a single band was seen in the cell lines
where only a single subtype is being expressed. Another explanation is, that it has been
shown that in the 5’ untranslated region of the a 1B-adrenoceptor, there are a number of
translation initiation sites. In addition, an intron in the 5’ untranslated region of the rat
a ]b-adrenergic receptor also gives rise to alternative splicing (Jones et al. 1997; Graham
et al. 1996). This would give rise to a 1B- transcripts of varying size.
In conclusion, from this study, part of the canine a la- adrenergic receptor has been
identified and sequenced. The homology to both the human and bovine a la-adrenergic
receptors is high (> 90%). Using Northern analysis, this probe was unsuccessful in
identifying expression of a 1A-adrenergic receptor transcripts. The most likely
explanation for this is probably due to low expression levels and lack of sensitivity of
the technique. While hybridization with the a lb- probe was achieved, the subtype
selectivity of this probe was unconvincing due to cross-reactivity with the a ]a- cell line.
With high homology even between different subtypes this will always be a potential
problem.
192
For the future it will be desirable to isolate the full receptor. The partial sequence may
be used as a probe to screen a canine cDNA library. Using this method it will be
interesting to see if isoforms of this receptor exist as they do for the human a la-. In
addition, a more sensitive method of detection will be adopted to examine tissue
expression of the subtypes, such as semi-quantitative RT-PCR or RNase protection.
The former may be particularly useful where small amounts of tissue (particularly blood
vessels) are being used. With the full length sequence information it will be possible to
generate more subtype-selective primers and probes in an attempt eliminate the problem
of non-subtype selectivity.
193
CHAPTER 6
Functional characteristics of dog saphenous vein, dog femoral
artery and dog subcutaneous resistance artery, and the effects
o f naturally occurring heart failure on these characteristics
6.0 Abstract
6.1 Method
6.1.1 Saphenous vein and femoral artery
6.1.2 Subcutaneous resistance arteries
6.1.3 Histology and immunohistochemistry
6.2 Results
6.2.1 Saphenous vein
6.2.2 Femoral artery
6.2.3 Subcutaneous resistance arteries
6.3 Discussion
194
6.0 Abstract
The objective of this study was to carry out a preliminary investigation into the
functional characteristics of several isolated blood vessels from control and heart failure
dogs. The literature concerning changes occurring in heart failure is conflicting
probably due to species variation, drug treatment in some of the human studies and
variation in the severity and duration of the heart failure.
To my knowledge, this is the first study to have examined isolated blood vessels from
dogs with naturally occurring heart failure. The main findings of this study were as
follows. There was a decreased sensitivity to noradrenaline in both the saphenous vein
and femoral artery, but not the subcutaneous resistance artery, in heart failure animals.
There was a significant increase in maximal response to potassium chloride in femoral
arteries and resistance arteries from failure animals, while the maximal response to
noradrenaline was only significantly greater in the femoral artery. There was no
impairment of acetylcholine mediated relaxations in heart failure in any of the vessels
studied, and neuronal reuptake of noradrenaline was most marked in the saphenous vein
where it was not impaired in heart failure.
195
6.1 Methods
6.1.1 Saphenous vein (PSV) and femoral artery (FA)
5mm sections of vessel were taken from control and heart failure animals, mounted in
10ml organ baths, normalised and the starting protocol completed as described in
materials and methods. Vessels were maintained in Krebs’ solution and no blocking
agents used unless otherwise stated.
Two rings were mounted from each vessel. After a forty minute equilibration period, a
cumulative concentration response curve to noradrenaline was performed in all rings,
starting with a concentration of InM and increasing up to a concentration of ImM if
required. Once a maximal contraction had been achieved, vessels were washed until
they returned to baseline. At this point lpM of the uptake-1 blocking agent cocaine,
was added to the bath of one of the rings. Forty minutes later a second concentration
response curve to noradrenaline was performed in this ring. The second ring was also
allowed a forty minute recovery period. Subsequent to this, the vessel was
precontracted with lpM noradrenaline. Once the contraction had reached a steady state,
a cumulative concentration response curve was performed to acetylcholine using a
concentration range of InM to lOpM acetylcholine.
6.1.2 Subcutaneous resistance arteries (PSCRA!
Sections of resistance artery approximately 2mm in length and approximately 260 ±11
microns in diameter (n = 40), were mounted in Mulvany Halpem wire myographs,
normalised to 0.9 of L I00 and the starting protocol completed as described in the
materials and methods. From this time on vessels were maintained in Krebs’ solution
and no blocking agents used unless stated otherwise. Four vessels were set up in
parallel from each animal. An initial concentration response curve to noradrenaline was
196
performed in all vessels starting with a concentration of InM and increasing up to a
concentration of ImM if required. Once a maximal contraction had been achieved,
vessels were washed until they returned to baseline. At this point, vessel one was
assigned as a time control, lfiM cocaine was added to the bath of vessel two, lOOpM L-
NAME (N“-Nitro-L-Arginine Methyl ester hydrochloride) was added to the bath of
vessel three, and a combination of lpM cocaine and lOOpM L-NAME was added to the
bath of vessel four. After a forty minute period a second concentration response curve
to noradrenaline was performed. Vessels were again washed until baseline was reached.
Finally, forty minutes after the second curve, the time control and the cocaine assigned
vessel were precontracted with lpM noradrenaline and once a steady state had been
attained, a concentration response curve to acetylcholine was performed as for the DSV
and FA.
In the DSV and the FA, concentration response curves to noradrenaline were curve
fitted using GraphPad Prism as described in Chapter 2, allowing the derivation of
maximum, pEC50 and Hill slope parameters from the curve fitting. Results were
expressed as a percentage of the first concentration response curve maximum.
As discussed in Chapter 4, DSCRA were not amenable to curve fitting and therefore all
data were analysed on Microsoft Excel spreadsheets and parameters derived by
interpolation. Results were again expressed as a percentage of the first curve maximum.
Concentration response curves to acetylcholine for all vessels were analysed on
Microsoft Excel spreadsheets and pEC10, pEC25 and pEC50 values derived from
interpolation. Results were expressed as a percentage of the contraction to lpM
noradrenaline.
197
All parameters were compared using paired or unpaired Students t test. A P< 0.05 was
taken to be statistically significant and n = the number of experiments unless otherwise
stated.
6.1.3 Histology and Immunohistochemistrv
In order to assess the sympathetic innervation of the vessels being studied,
immunohistochemistry was performed using anti-neuropeptide Y (NPY) and anti
tyrosine hydroxylase antibodies. The materials and methods for this are given in section
2.5 of materials and methods.
6.2 Results
6.2.1 Saphenous Vein
Values were derived from eight control animals and seven heart failure animals. Firstly,
in the control group, noradrenaline caused a concentration-dependent increase in tone
with a pEC50 of 5.93 ± 0.07 (n = 8). In the presence of lpM cocaine, there was a left
shift and a lowering of the maximum of the concentration response curve (Figure 6.1).
This resulted in a significant shift in the pEC50 value ( P of < 0.001) to 6.35 ± 0.07 (n =
8) and a significant decrease in the maximum ( P of 0.0025) from 102.6 ± 0.56% to
87.56 ± 3.4%. Hill slope parameters did not alter significantly (0.94 ± 0.03, n = 8 with
and without cocaine).
In the case of the heart failure group, a mean pEC50 value of 5.69 ± 0.12 (n = 7) was
obtained for noradrenaline. As in the control group, cocaine caused a left shift in the
concentration response curve, giving a mean pEC50 of 6.03 ± 0.12 (n = 7) which was
significantly different ( P of 0.015). From the mean graphs (Figure 6.2), there also
appeared to be a depression in the maximum, but this was not statistically significant.
198
When the control and heart failure group were compared, the curves from the failure
group appeared to be shifted to the right when compared to the controls (Figure 6.3).
Curves were compared at the pEC10, pEC25, pEC50 and pEC75 values. The difference
between the two groups was only significant at the pEC10 and pEC25 levels (P of 0.03
and 0.04 respectively). When the two groups were again compared after the addition of
cocaine (Figure 6.4), their relative relationship had not changed except that the
difference between the two groups was now only significant at the pEC]0 value and no
longer significant at the pEC25 value (P of 0.049 and 0.068 respectively).
Maximum responses to noradrenaline and 125mM potassium chloride were not
significantly different between the two groups (P of 0.473 and 0.598 respectively).
Responses to acetylcholine were quite variable in both groups but overall acetylcholine
only induced slight relaxations in the saphenous vein, with tone on maximal relaxation
still comprising 69.9 ± 10.5 % (n = 7) of the tone produced by lpM noradrenaline in the
control group and 71.3 ± 11.4 % (n = 6) in the failure group. These were not
significantly different. The two groups were also compared at the pEC10 value and
again there was no significant difference. Due to the poor response to acetylcholine in
this vessel, pEC25 and pEC50 values could not be derived for the majority of vessels.
Graphs for acetylcholine concentration response curves are shown in Figure 6.5.
Cross sections of the saphenous vein were stained for the presence of the noradrenergic
co-transmitter, neuropeptide Y (NPY), and the enzyme tyrosine hydroxylase (TH),
which is involved in the enzymatic synthesis of noradrenaline from tyrosine. From the
panels in Figure 6.6, it can be seen that the staining for NPY and TH is abundant and
extends right into the media of the vessel. This indicates that the saphenous vein has a
rich sympathetic innervation.
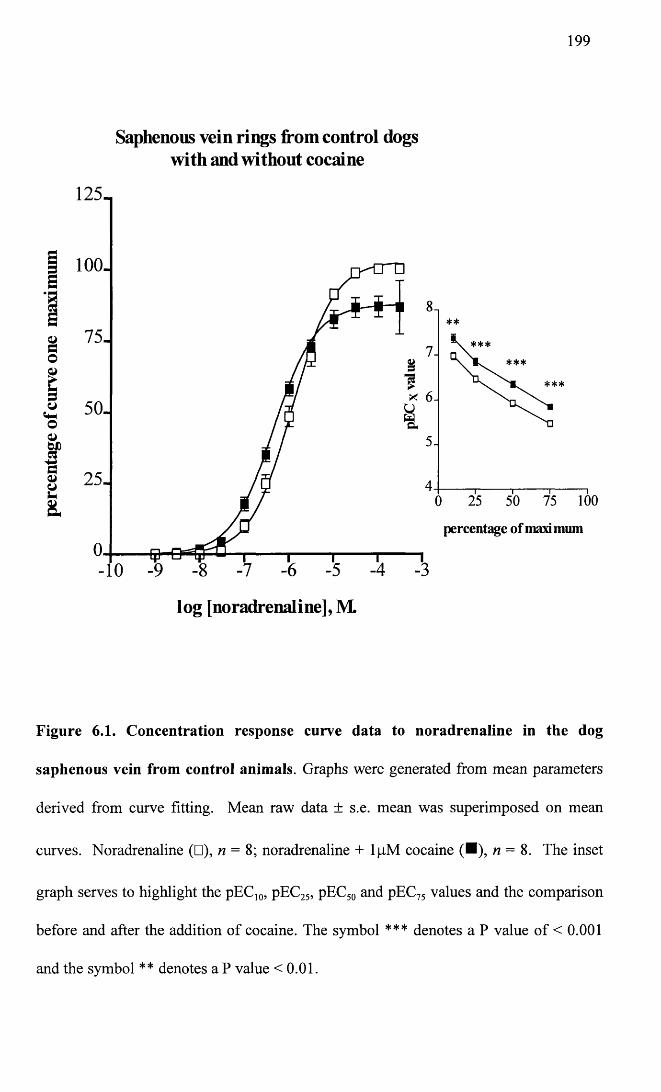
199
Saphenous vein rings from control dogs with and without cocaine
100-s75-§o
&
* 50-o0>sp§ 25-U8. 100
percentage of maxi mum
log [noradrenaline], M.
Figure 6.1. Concentration response curve data to noradrenaline in the dog
saphenous vein from control animals. Graphs were generated from mean parameters
derived from curve fitting. Mean raw data ± s.e. mean was superimposed on mean
curves. Noradrenaline (□), n = 8; noradrenaline + lpM cocaine (■), n = 8. The inset
graph serves to highlight the pEC10, pEC25, pEC50 and pEC75 values and the comparison
before and after the addition of cocaine. The symbol *** denotes a P value of < 0.001
and the symbol ** denotes a P value <0.01.
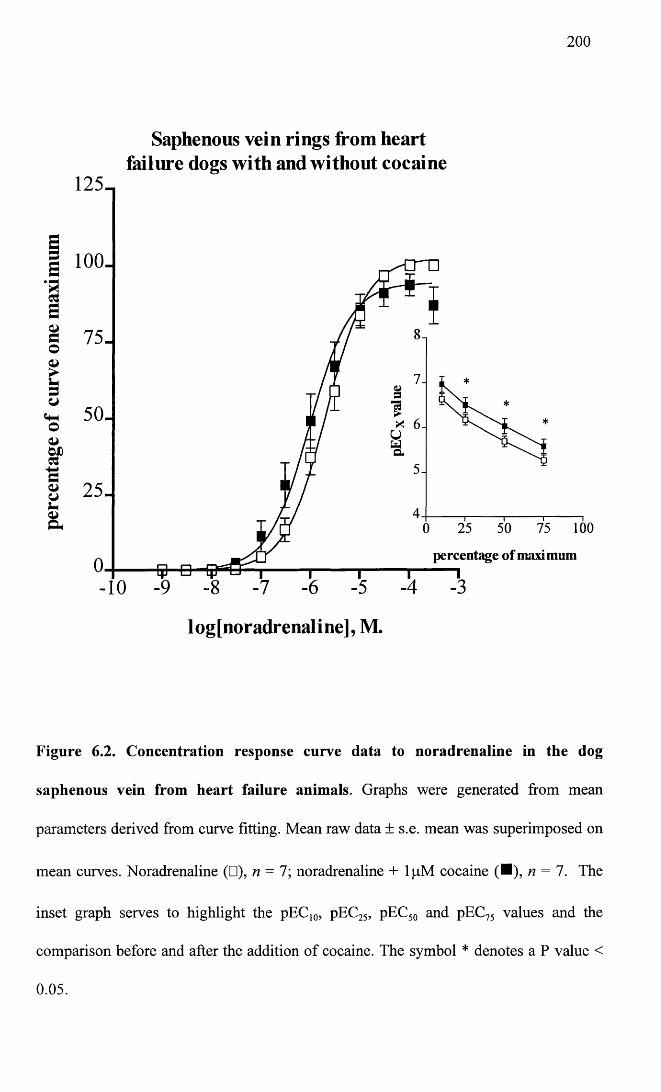
200
Saphenous vein rings from heart failure dogs with and without cocaine
125-,
i 100J
■asa ©
o50.o
CJOD
S3
100
percentage of maximum
logfnoradrenaline], M.
Figure 6.2. Concentration response curve data to noradrenaline in the dog
saphenous vein from heart failure animals. Graphs were generated from mean
parameters derived from curve fitting. Mean raw data ± s.e. mean was superimposed on
mean curves. Noradrenaline (□), n = l; noradrenaline + lpM cocaine (■), n — 1. The
inset graph serves to highlight the pEC]0, pEC25, pEC50 and pEC75 values and the
comparison before and after the addition of cocaine. The symbol * denotes a P value <
0.05.
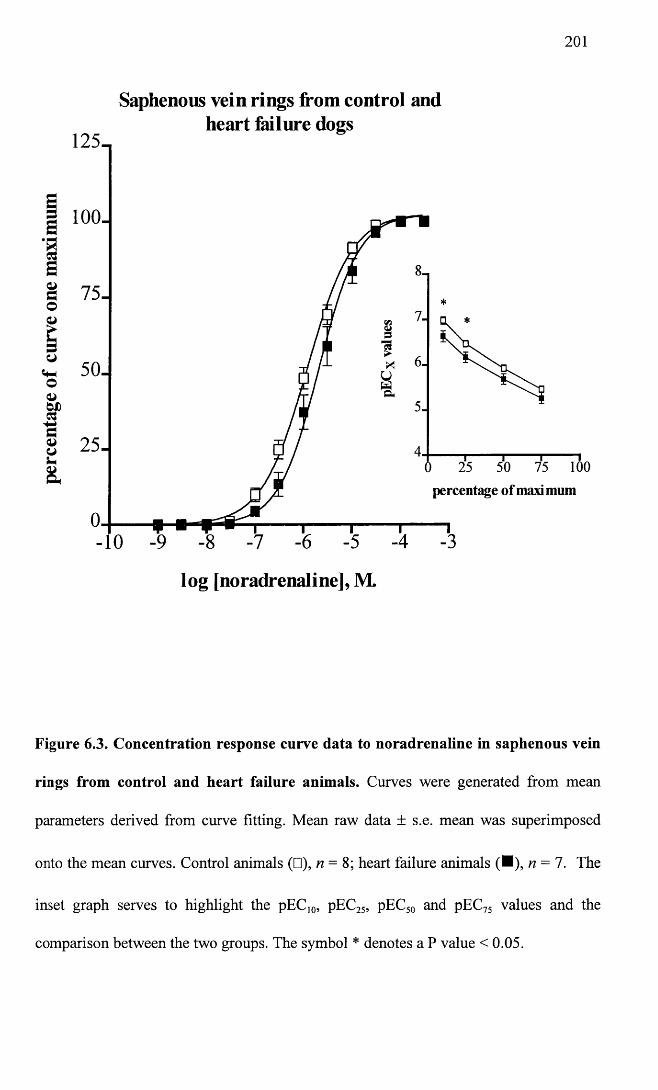
201
Saphenous vein rings from control andheart Mlure dogs
125-
100.S
E3 75-O
cQJO 25-&
percentage of maxi mum
-10
log [noradrenaline], M.
Figure 6.3. Concentration response curve data to noradrenaline in saphenous vein
rings from control and heart failure animals. Curves were generated from mean
parameters derived from curve fitting. Mean raw data ± s.e. mean was superimposed
onto the mean curves. Control animals (□), n = 8; heart failure animals (■), n = 7. The
inset graph serves to highlight the pEC10, pEC25, pEC50 and pEC75 values and the
comparison between the two groups. The symbol * denotes a P value < 0.05.
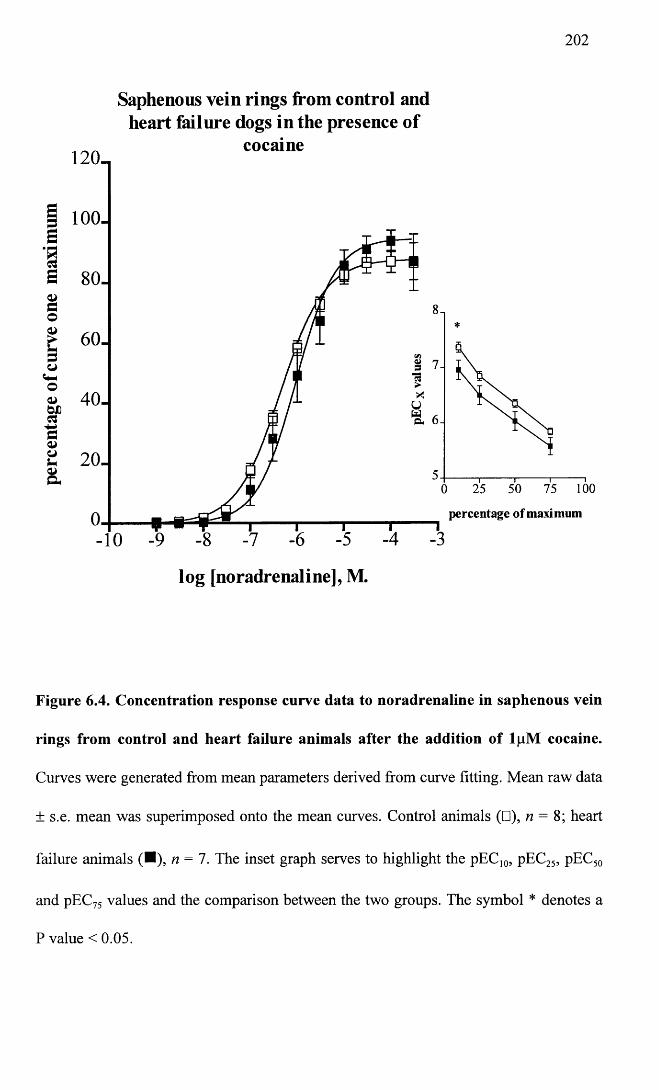
202
Saphenous vein rings from control and heart failure dogs in the presence of
cocaine120-,
g 100- S
£ 80.dO£ 60-o
Sr 4 0 -bX&ao
100
percentage of maximum
log [noradrenaline], M.
Figure 6.4. Concentration response curve data to noradrenaline in saphenous vein
rings from control and heart failure animals after the addition of lpM cocaine.
Curves were generated from mean parameters derived from curve fitting. Mean raw data
± s.e. mean was superimposed onto the mean curves. Control animals (□), n = 8; heart
failure animals (■), n = 7. The inset graph serves to highlight the pEC]0, pEC25, pEC50
and pEC75 values and the comparison between the two groups. The symbol * denotes a
P value < 0.05.
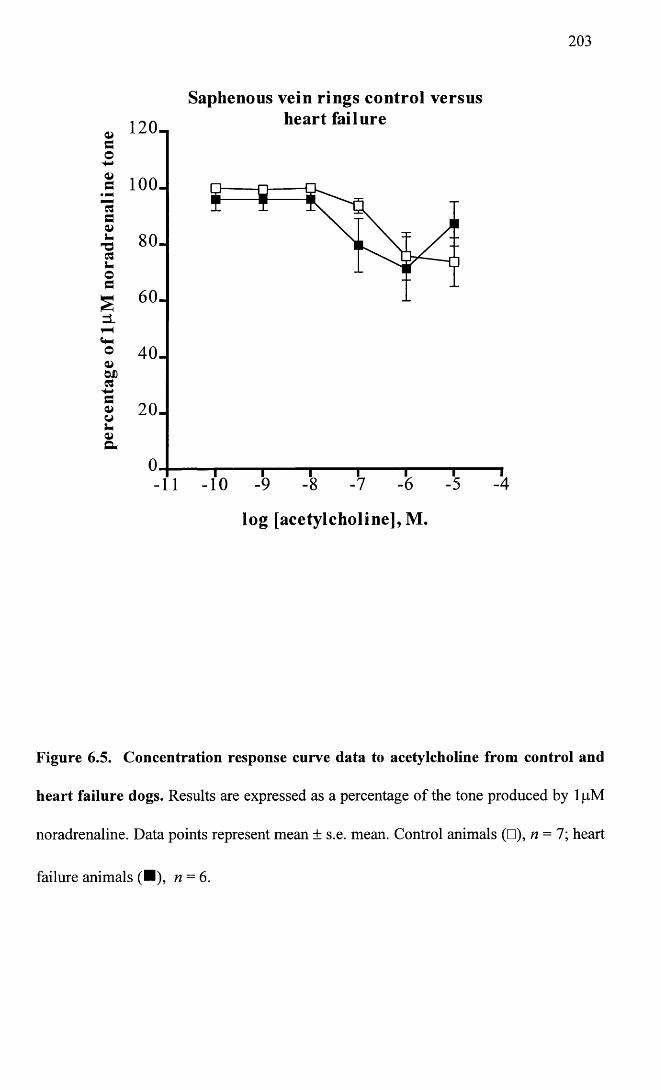
203
Saphenous vein rings control versusheart failure120 -
a 100.
80 .
40 .
20 .
-10
log [acetylcholine], M.
Figure 6.5. Concentration response curve data to acetylcholine from control and
heart failure dogs. Results are expressed as a percentage of the tone produced by 1 pM
noradrenaline. Data points represent mean ± s.e. mean. Control animals (□), n = l \ heart
failure animals (■), n = 6.
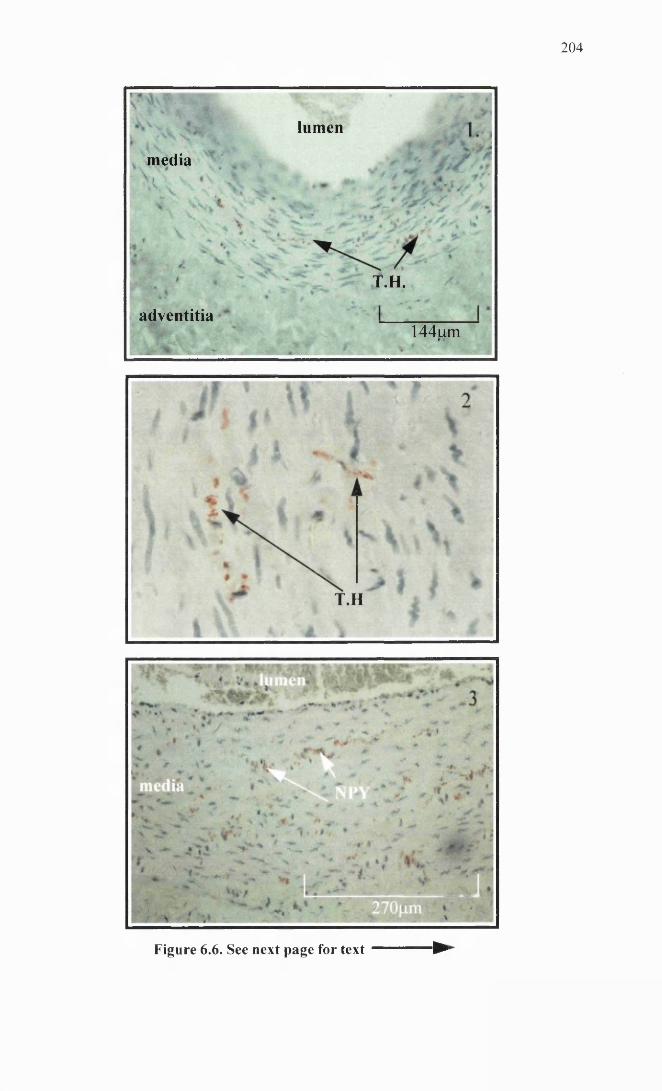
2 0 4
lumen
media
T.H.
adventitia144jLim
T.H
Figure 6.6. See next page for text ►
Figure 6.6. Saphenous vein immunohistochemistry. Panel 1 shows a cross section of
the saphenous vein, showing areas of tyrosine hydroxylase (TH) staining seen as red.
Panel 2 also shows tyrosine hydroxylase staining but under higher magnification . The
area shown in this section comprises the media of the vessel. Panel 3 shows a cross
sectional area of the saphenous vein showing areas containing NPY, again seen as areas
of red staining which occur right throughout the media of the vessel. These panels
illustrate that the saphenous vein is richly innervated. The distribution of nerves in this
vessel is also unusual in that generally innervation only extends as far as the
adventitial/medial border.
206
6.2.2 Femoral artery
Values were derived from eight control and seven heart failure animals.
In the femoral artery from the control group, the mean pEC50 for the noradrenaline
concentration response curves was 6.05 ± 0.07 (n = 10). After the addition of lpM
cocaine the concentration response curve shifted to the right with a pEC50 of 5.82 ± 0.04
(n= 10) and there was a reduction in the maximum from 100.4 ± 0.3 % to 82.94 ± 4.35
% ( n = 10). Both parameters were significantly different before, versus after the addition
of cocaine, with P values of 0.02 and 0.003 for pEC50 and maximum values respectively.
Mean Hill slope values before and after the addition of cocaine were also significantly
different (P of 0.0001), with a Hill slope of 1.02 ± 0.03 without cocaine and 1.28 ± 0.02
with cocaine (n = 10). Mean data are illustrated in Figure 6.7.
In the heart failure group, noradrenaline caused contraction of the femoral artery with a
pEC50 value of 5.54 ±0.13 ( n = 8). The addition of lpM cocaine had no significant
effect on the maximum, pEC50 or Hill slope of the noradrenaline curve (Figure 6.8).
When a comparison was made of the noradrenaline CRC data between the control and
heart failure groups, the curve from the heart failure animals appeared to be noticeably
shifted to the right. The difference between the two curves was significant at the level
of the pEC10, pEC25, pEC50 and pEC75 values with P values in all cases of 0.002. When
active effective pressures were compared for maximal response to both noradrenaline
and 125mM potassium chloride, these were found to be significantly different in both
groups (P of 0.0042 and < 0.001 respectively), with the following values: Maximum
noradrenaline response in the control group of 3.64 ± 0.31 KPa, (n =10); maximum
noradrenaline response in the failure group of 5.11 ± 0.35 KPa, ( n = 8); maximum
potassium chloride response in the control group of 2.18 ± 0.26 KPa, (n = 10);
maximum potassium chloride response in the failure group of 4.46 ± 0.25 KPa, (n = 8).
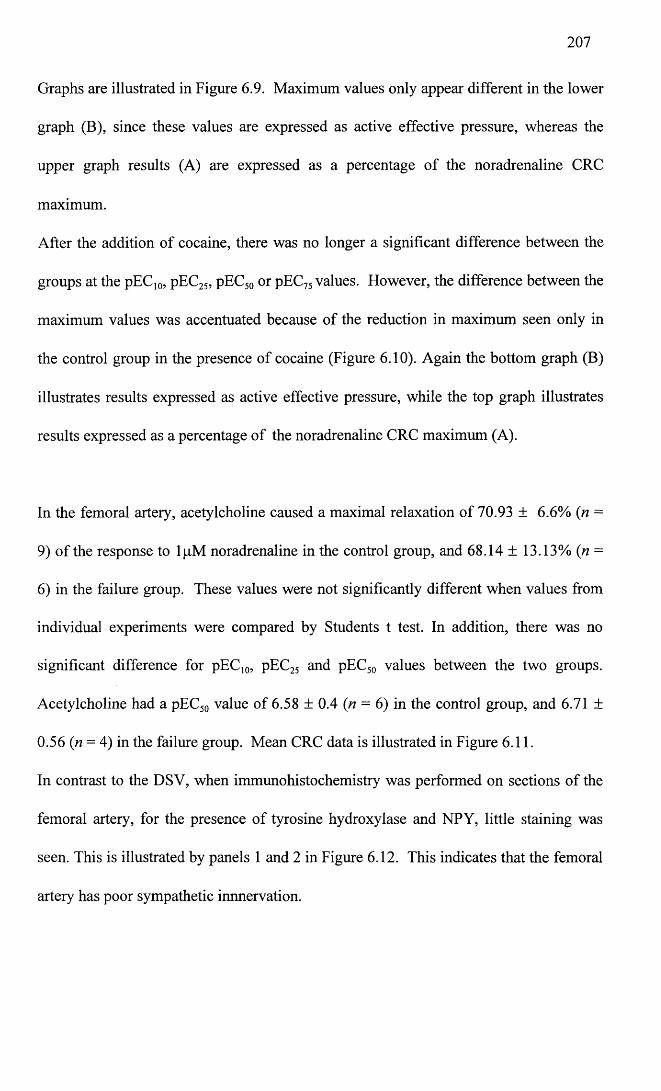
207
Graphs are illustrated in Figure 6.9. Maximum values only appear different in the lower
graph (B), since these values are expressed as active effective pressure, whereas the
upper graph results (A) are expressed as a percentage of the noradrenaline CRC
maximum.
After the addition of cocaine, there was no longer a significant difference between the
groups at the pEC10, pEC25, pEC50 or pEC75 values. However, the difference between the
maximum values was accentuated because of the reduction in maximum seen only in
the control group in the presence of cocaine (Figure 6.10). Again the bottom graph (B)
illustrates results expressed as active effective pressure, while the top graph illustrates
results expressed as a percentage of the noradrenaline CRC maximum (A).
In the femoral artery, acetylcholine caused a maximal relaxation of 70.93 ± 6.6% (n =
9) of the response to lpM noradrenaline in the control group, and 68.14 ± 13.13% (n =
6) in the failure group. These values were not significantly different when values from
individual experiments were compared by Students t test. In addition, there was no
significant difference for pEC10, pEC25 and pEC50 values between the two groups.
Acetylcholine had a pEC50 value of 6.58 ± 0.4 (n = 6) in the control group, and 6.71 ±
0.56 (n = 4) in the failure group. Mean CRC data is illustrated in Figure 6.11.
In contrast to the DSV, when immunohistochemistry was performed on sections of the
femoral artery, for the presence of tyrosine hydroxylase and NPY, little staining was
seen. This is illustrated by panels 1 and 2 in Figure 6.12. This indicates that the femoral
artery has poor sympathetic innnervation.
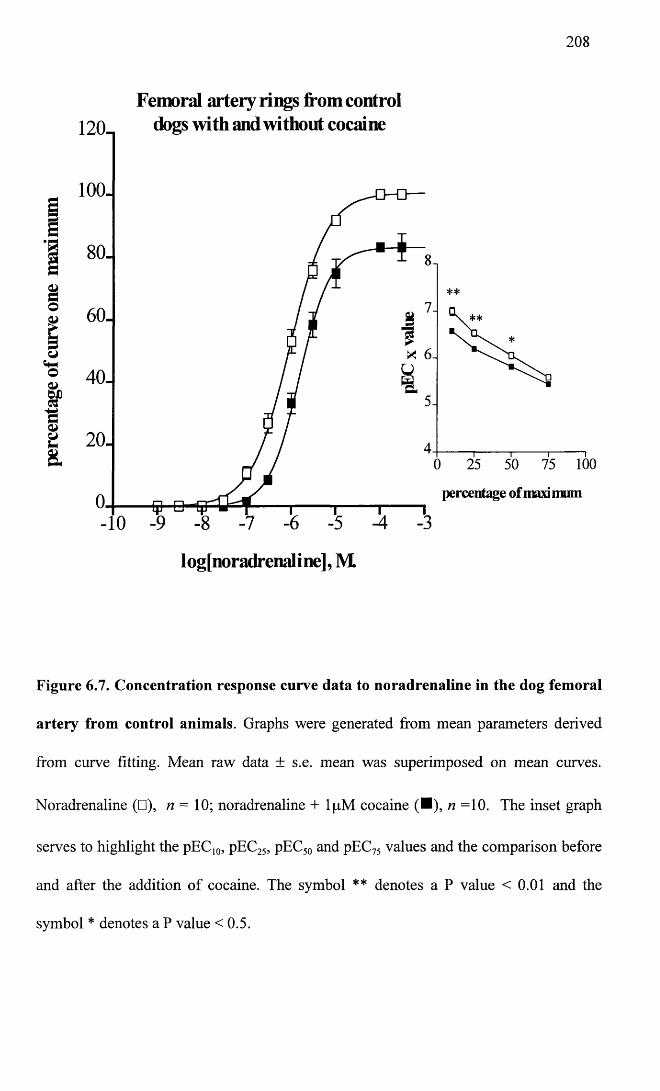
208
Femoral artery rings from controldogs with and without cocaine120.
100.
s80.
&S 60.
o«t-lo<u 40-
&a 20- & 100
percentage of maxi mum
I ogjnoradrenal i ne], M
Figure 6.7. Concentration response curve data to noradrenaline in the dog femoral
artery from control animals. Graphs were generated from mean parameters derived
from curve fitting. Mean raw data ± s.e. mean was superimposed on mean curves.
Noradrenaline (□), n — 10; noradrenaline + lpM cocaine (■), n =10. The inset graph
serves to highlight the pEC10, pEC25, pEC50 and pEC75 values and the comparison before
and after the addition of cocaine. The symbol ** denotes a P value < 0.01 and the
symbol * denotes a P value <0.5.
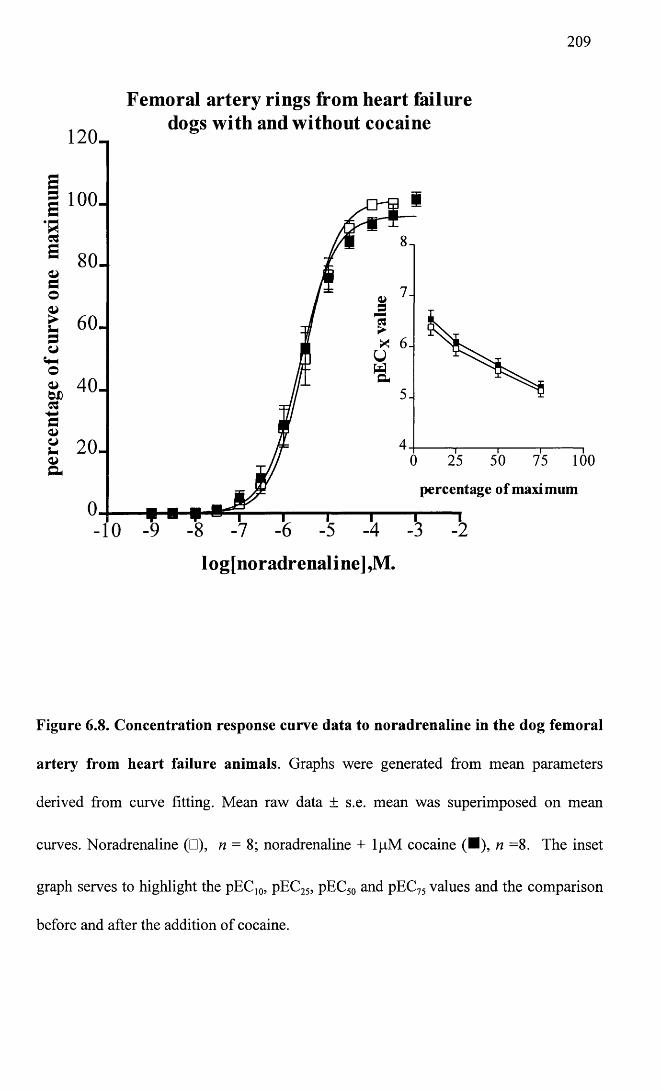
209
Femoral artery rings from heart failuredogs with and without cocaine
120_
5 100-
80-
60-
40-
20 -100
percentage of maxi mum
log[noradrenaline],M.
Figure 6.8. Concentration response curve data to noradrenaline in the dog femoral
artery from heart failure animals. Graphs were generated from mean parameters
derived from curve fitting. Mean raw data ± s.e. mean was superimposed on mean
curves. Noradrenaline (□), n = 8; noradrenaline + lpM cocaine (■), n =8. The inset
graph serves to highlight the pEC10, pEC25, pEC50 and pEC75 values and the comparison
before and after the addition of cocaine.
210
Femoral artery rings from control and heart failure dogsE
s 1 2 0 -a1 100.
a° 80- v
5 60 .o4>S’ 40 . a<vuS 2 0 -a
7 -
25
percentage of maximum
75
log[noradrenaline], M.
s 5-tflV)V U& 4 -V >o
l o g [ n o r a d r e n a l i n e ] , M .
Figure 6.9. Concentration response curve data to noradrenaline in the dog femoral
artery from control and heart failure animals. Graphs were generated from mean
parameters derived from curve fitting. Mean raw data ± s.e. mean was superimposed on
mean curves. Control animals (□), n = 10; heart failure animals (■), n =8. In graph A,
the inset graph serves to highlight the pEC]0, pEC25, pEC50 and pEC75 values and the
comparison between the two groups. The symbol ** denotes a P value <0.01. Graph B
shows the same CRC data expressed as active effective pressure (KPa).
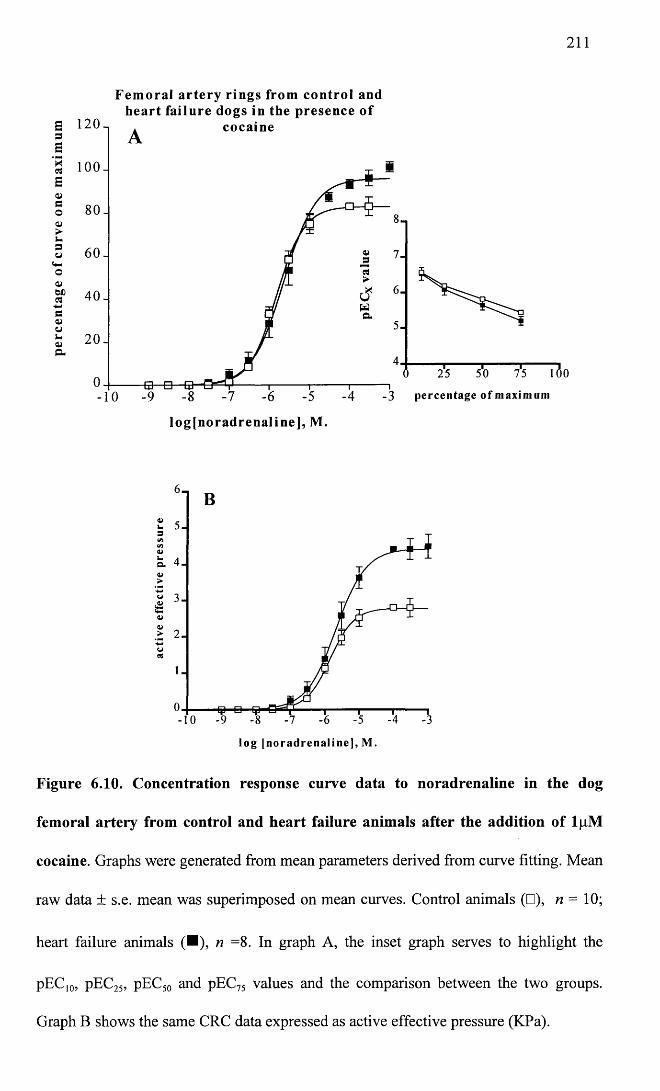
211
Femoral artery rings from control and heart failure dogs in the presence of
£ 120 3 £’§ 1 0 0 - B
o 80-<U
g 60.
cocaine
8
7
640-a<UuV-atCu
52 0 -
4
3 percentage o f max imum
log[noradrenaline], M.
uQ->
CJV>
l og [noradrena l ine ] , M.
Figure 6.10. Concentration response curve data to noradrenaline in the dog
femoral artery from control and heart failure animals after the addition of lpM
cocaine. Graphs were generated from mean parameters derived from curve fitting. Mean
raw data ± s.e. mean was superimposed on mean curves. Control animals (□), n — 10;
heart failure animals (■), n =8. In graph A, the inset graph serves to highlight the
pEC]0, pEC25, pEC50 and pEC75 values and the comparison between the two groups.
Graph B shows the same CRC data expressed as active effective pressure (KPa).
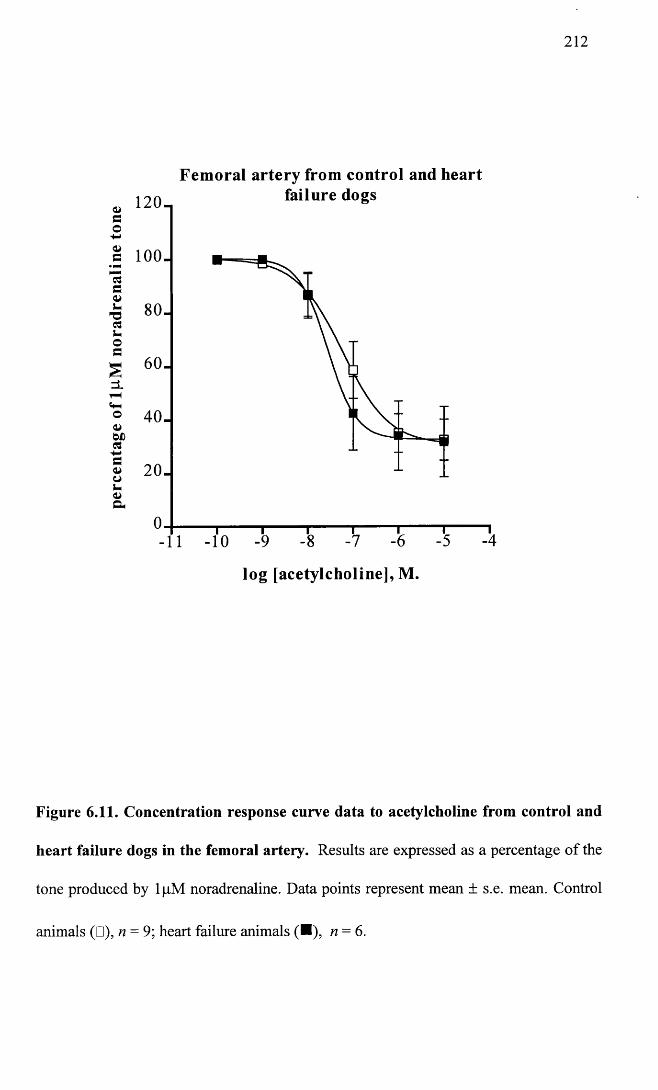
212
4>eo-4-»<ua
’cSaOU
7303S-oc
a>WD03Ca>ot*4>a
1 2 0 -
100 -
80-
60-
40 -
20 -
Fem oral artery from control and heart failure dogs
-111 “10
— I---------- 1----------- 1---------1—-9 -8 -7 -6
log [acetylcholine], M.
T-5 -4
Figure 6.11. Concentration response curve data to acetylcholine from control and
heart failure dogs in the femoral artery. Results are expressed as a percentage of the
tone produced by lpM noradrenaline. Data points represent mean ± s.e. mean. Control
animals (□), n = 9; heart failure animals (■), n = 6.
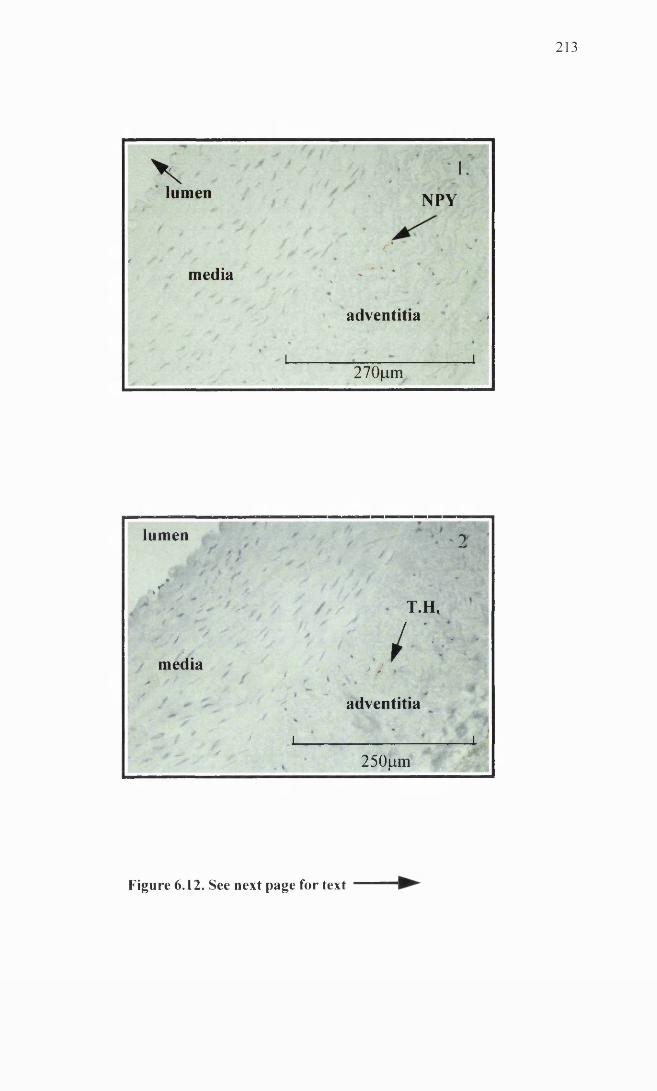
2 1 3
Vlumen
' 1./ j t 9 '
NPY
/ _ /' /* V
*media - * , * * *
\ ‘ „ f
t -
adventitia <% ♦ i i
• a- *270fim
lumen ■ 2* : * ?
• / ̂ f > ̂ /r % T ' J
S T.H.
* / J / '•• • *media r
» 1 * / 1A / ' *
/adventitia
" l 0 f f * / * i i■-> — s * 250^im
Figure 6.12. See next page for text
214
Figure 6.12. Femoral artery immunohistochemistry. Both NPY and tyrosine
hydroxylase appear as areas of red staining. Panel 1 shows scant red staining for NPY
in a cross section of femoral artery. Panel 2 also demonstrates the low level of staining
for tyrosine hydroxylase (TH). In both panel 1 and 2, any staining for either NPY or
TH is limited to the adventitia of the vessel.
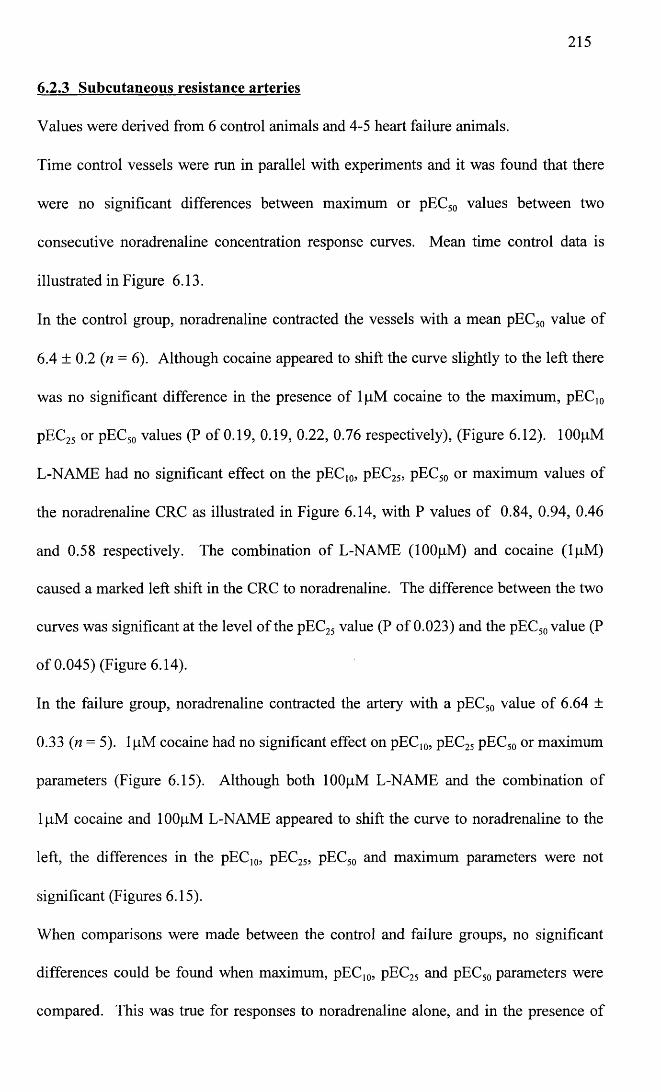
215
6.2.3 Subcutaneous resistance arteries
Values were derived from 6 control animals and 4-5 heart failure animals.
Time control vessels were run in parallel with experiments and it was found that there
were no significant differences between maximum or pEC50 values between two
consecutive noradrenaline concentration response curves. Mean time control data is
illustrated in Figure 6.13.
In the control group, noradrenaline contracted the vessels with a mean pEC50 value of
6.4 ± 0.2 (n = 6). Although cocaine appeared to shift the curve slightly to the left there
was no significant difference in the presence of ljiM cocaine to the maximum, pEC10
pEC25 or pEC50 values (P of 0.19, 0.19, 0.22, 0.76 respectively), (Figure 6.12). lOOpM
L-NAME had no significant effect on the pEC10, pEC25, pEC50 or maximum values of
the noradrenaline CRC as illustrated in Figure 6.14, with P values of 0.84, 0.94, 0.46
and 0.58 respectively. The combination of L-NAME (IOOjjM) and cocaine (lpM )
caused a marked left shift in the CRC to noradrenaline. The difference between the two
curves was significant at the level of the pEC25 value (P of 0.023) and the pEC50 value (P
of 0.045) (Figure 6.14).
In the failure group, noradrenaline contracted the artery with a pEC50 value of 6.64 ±
0.33 (n = 5). 1 |aM cocaine had no significant effect on pEC10, pEC25 pEC50 or maximum
parameters (Figure 6.15). Although both lOOpM L-NAME and the combination of
lpM cocaine and lOOpM L-NAME appeared to shift the curve to noradrenaline to the
left, the differences in the pEC10, pEC25, pEC50 and maximum parameters were not
significant (Figures 6.15).
When comparisons were made between the control and failure groups, no significant
differences could be found when maximum, pEC10, pEC25 and pEC50 parameters were
compared. This was true for responses to noradrenaline alone, and in the presence of
216
IjllM cocaine, lOOpM L-NAME and both cocaine and L-NAME (Figure 6.16).
However, when responses to 125mM KC1 were compared, it was found that the
maximal response in the heart failure group was significantly higher than that in the
control group with a maximal response in the failure group of 28.49 ± 2.45KPa (n =14)
compared to 16.81 ± 1.8KPa (n = 24), in the control group (P<0.004).
Responses to acetylcholine were variable. The maximum relaxation in the control
group was 43.39 ± 10.66% (n = 11) and in the failure group 75.59 ± 11.79% (n = 6). A
pEC50 value of 6.32 ± 0.3 (n = 6), was obtained for the control group and a pEC50 value
of 6.77 ± 0.22 ( n = 5 ) for the failure group. Data from the control and failure animals
is illustrated graphically in Figure 6.17. Although it appears that the failure animals
showed an increased relaxation, when individual values were compared by t test, no
significant difference was found between maximum values (P of 0.07). In addition no
significant differences were found between the pEC10, pEC25 and pEC50 values (P values
of 0.79, 0.69 and 0.29 respectively).
Subcutaneous resistance arteries appeared to be well innervated as can be seen from the
NPY staining of a whole-mounted vessel in Figure 6.18. The nerves form an intricate
lace work like pattern over the entire surface of the vessel.
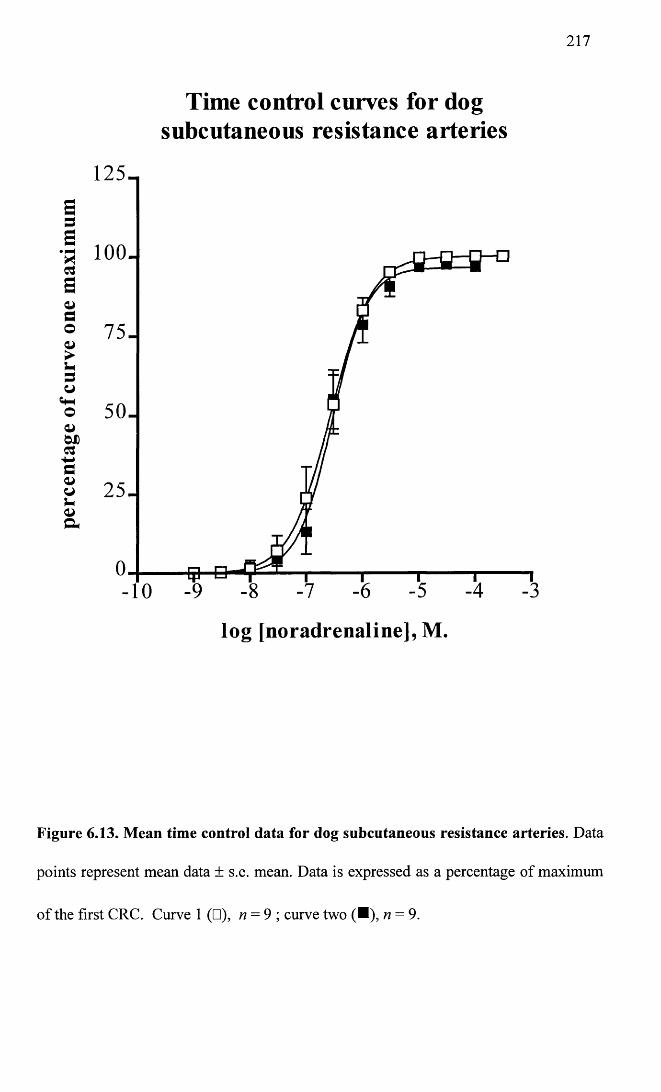
perc
enta
ge
of cu
rve
one
max
imum
217
Time control curves for dog subcutaneous resistance arteries
100.
-10
lo g [noradrenaline], M.
Figure 6.13. Mean time control data for dog subcutaneous resistance arteries. Data
points represent mean data ± s.e. mean. Data is expressed as a percentage of maximum
of the first CRC. Curve 1 (□), n = 9 ; curve two (■), n = 9.
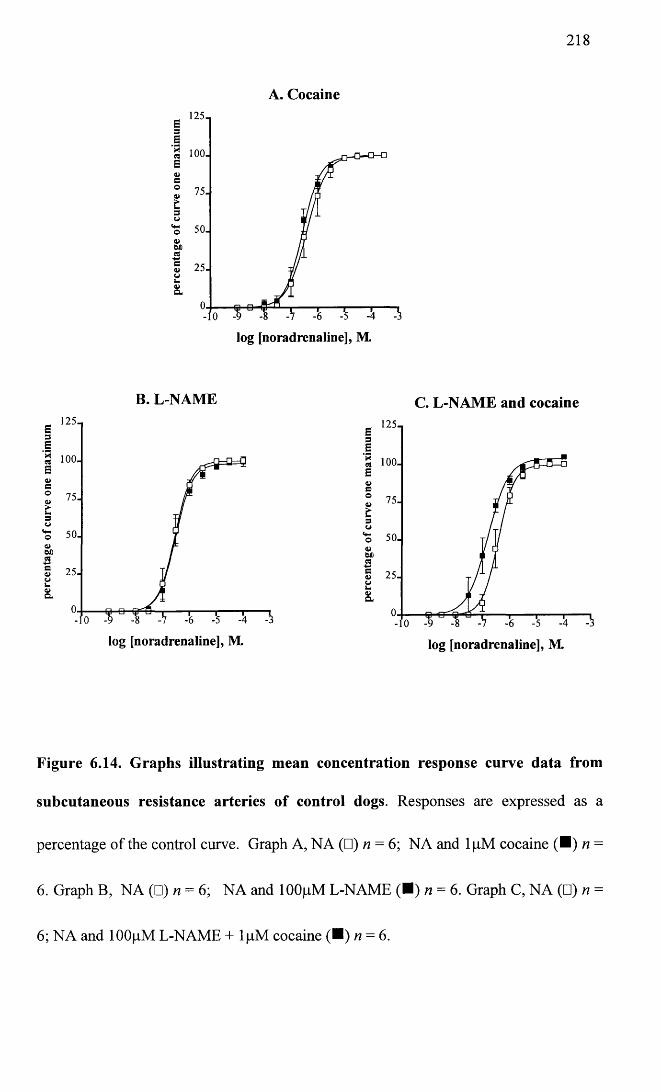
218
A. Cocaine125-E3e
'§ 100. E<ys° 75.4,t3o
‘s 50.
g 25.L.&
log [noradrenaline], M.
B. L-NAME C. L-NAME and cocaine125-E3
E■aec
100.
Q 75.a>>•L.3O*5 50.OX)ag 25. o u O)C L
E ' 2 5 13E’5 100. Ee oa>£3
50.
g 25.k*a>a.
log [noradrenaline], M. log [noradrenaline], M.
Figure 6.14. Graphs illustrating mean concentration response curve data from
subcutaneous resistance arteries of control dogs. Responses are expressed as a
percentage of the control curve. Graph A, NA (□) n = 6; NA and lpM cocaine (■ ) n =
6. Graph B, NA (□) n = 6; NA and lOOpM L-NAME (■) n = 6. Graph C, NA (□) h =
6; NA and lOOpM L-NAME + lpM cocaine (■ ) n = 6.
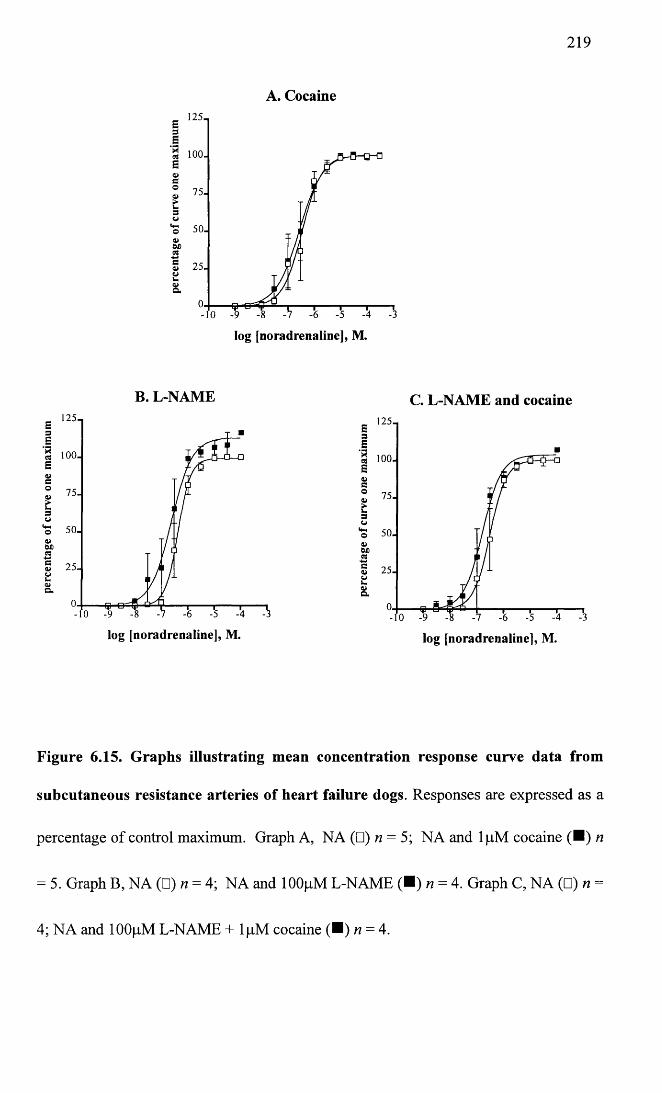
219
A. Cocaine
log [noradrenaline], M.
B. L-NAME C. L-NAME and cocaine125-
Cp i-9 -8 -7 -<
log [noradrenaline], M.
■ ,25i3e'3 100. s4>©s3
75.
o<*-!o4>OX)CS§ 25.La
§L- 10
log [noradrenaline], M.
Figure 6.15. Graphs illustrating mean concentration response curve data from
subcutaneous resistance arteries of heart failure dogs. Responses are expressed as a
percentage of control maximum. Graph A, NA (□) n = 5; NA and lpM cocaine (■ ) n
= 5. Graph B, NA (□) n = 4; NA and lOOpM L-NAME (■) n = 4. Graph C, NA (□) n =
4; NA and lOOfiM L-NAME + lpM cocaine (■ ) n = 4.
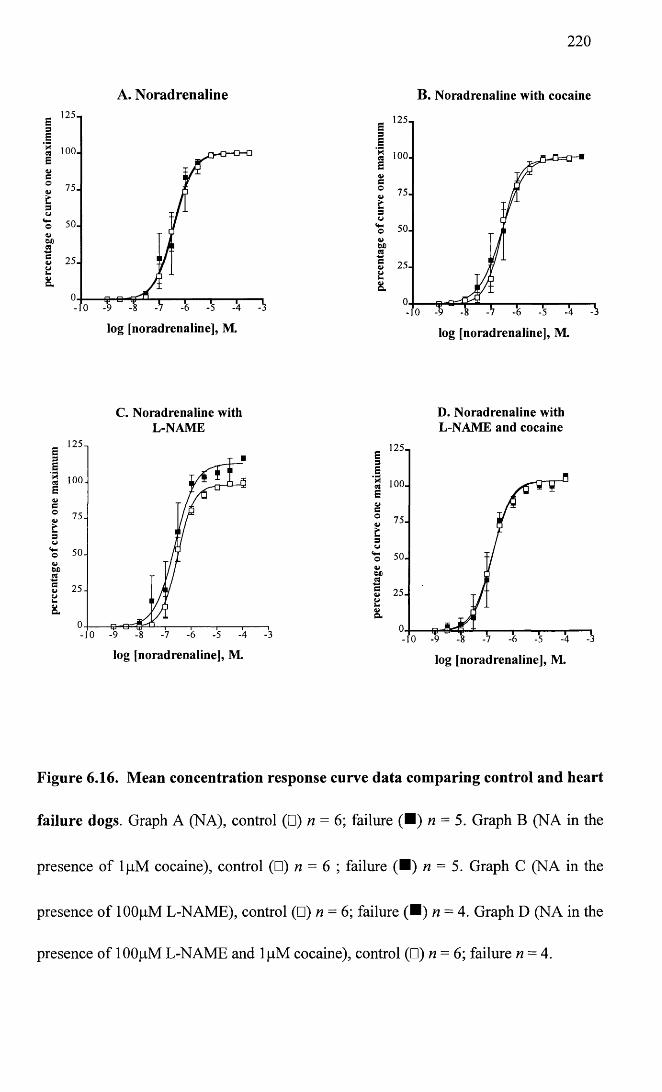
2 2 0
A. Noradrenaline
6 l2511| 100. EVC©
tsCJ‘S 50.
75.
S 25.oL .
8.
log [noradrenaline], M.
C. Noradrenaline with L-NAME
Ei£ loo . BC° 75-
3w50-
S 25-u8
log [noradrenaline], M
B. Noradrenaline with cocaine
■ 1251 3si ioo. Ba>c° 75.&s
‘S 50. w 6X)M25.
log [noradrenaline], M.
D. Noradrenaline with L-NAME and cocaine
E ,2 5 13E1 ioo. B4>c° 75-
3V‘S 50.
log [noradrenaline], M.
Figure 6.16. Mean concentration response curve data comparing control and heart
failure dogs. Graph A (NA), control (□) n = 6; failure (■ ) n = 5. Graph B (NA in the
presence of lpM cocaine), control (□) n = 6 ; failure (■ ) n = 5. Graph C (NA in the
presence of lOOpM L-NAME), control (□) n = 6; failure (■ ) n = 4. Graph D (NA in the
presence of 100pM L-NAME and lpM cocaine), control (□) n = 6; failure n = 4.
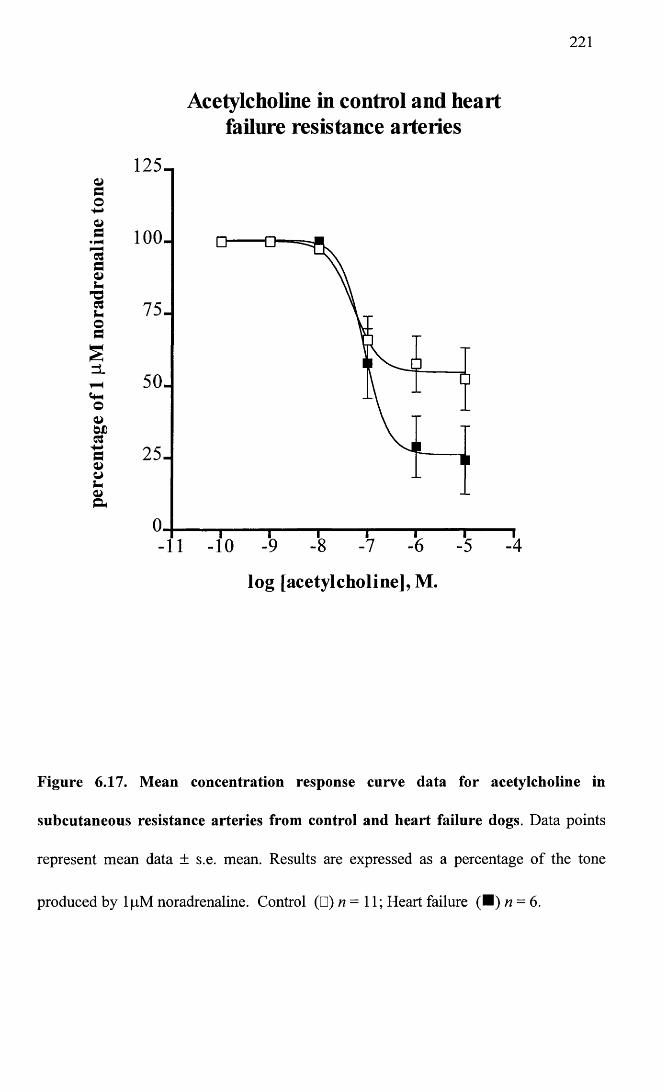
221
Acetylcholine in control and heartfailure resistance arteries
Vdo
d• pH
*ddsh
'■ododszL
CfHOa>bDds-»da>os-o&
125-.
100.
75-
50-
25-
-10
lo g [a c e ty lc h o lin e ] , M .
Figure 6.17. Mean concentration response curve data for acetylcholine in
subcutaneous resistance arteries from control and heart failure dogs. Data points
represent mean data ± s.e. mean. Results are expressed as a percentage of the tone
produced by lpM noradrenaline. Control (□) n = 11; Heart failure (■ ) n = 6.
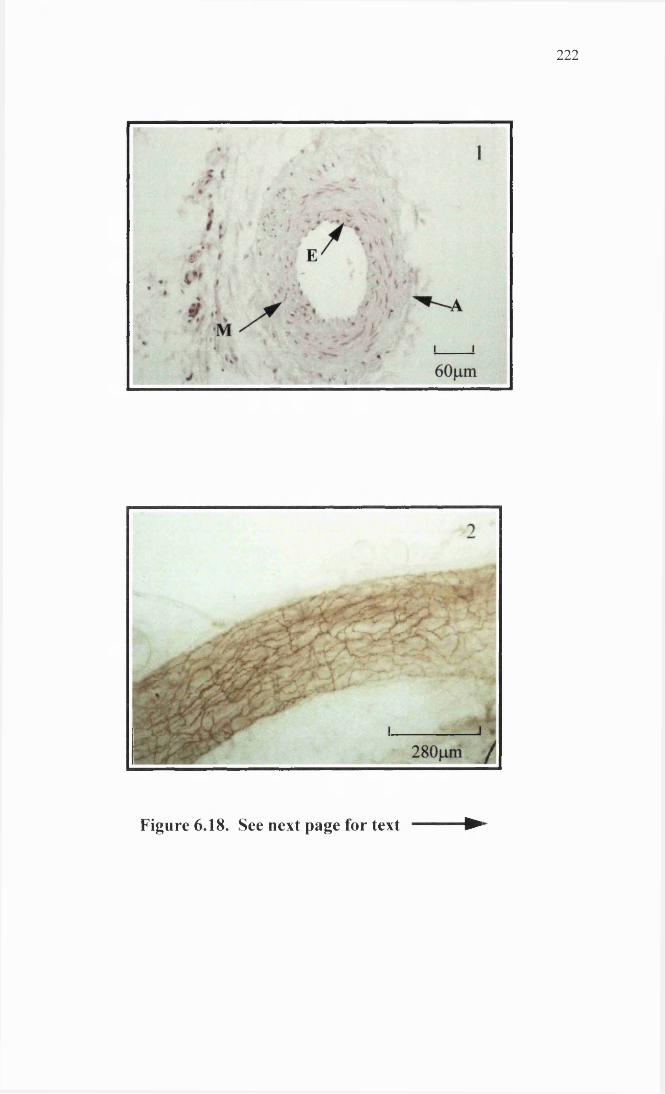
2 2 2
Figure 6.18. See next page for text ►
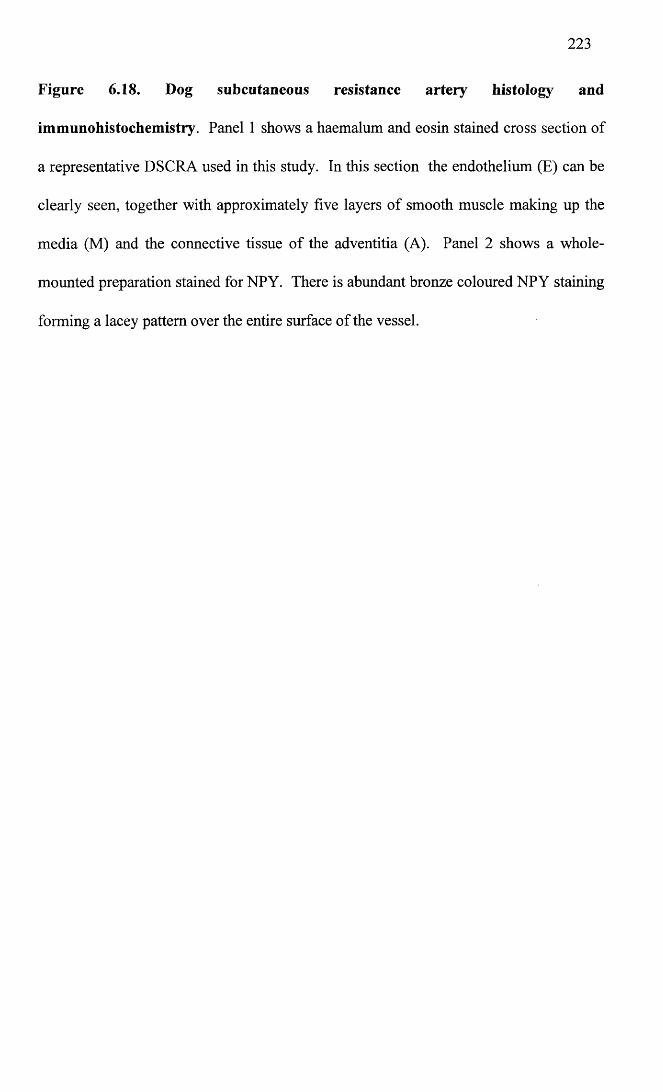
Figure 6.18. Dog subcutaneous resistance artery histology and
immunohistochemistry. Panel 1 shows a haemalum and eosin stained cross section of
a representative DSCRA used in this study. In this section the endothelium (E) can be
clearly seen, together with approximately five layers of smooth muscle making up the
media (M) and the connective tissue of the adventitia (A). Panel 2 shows a whole-
mounted preparation stained for NPY. There is abundant bronze coloured NPY staining
forming a lacey pattern over the entire surface of the vessel.
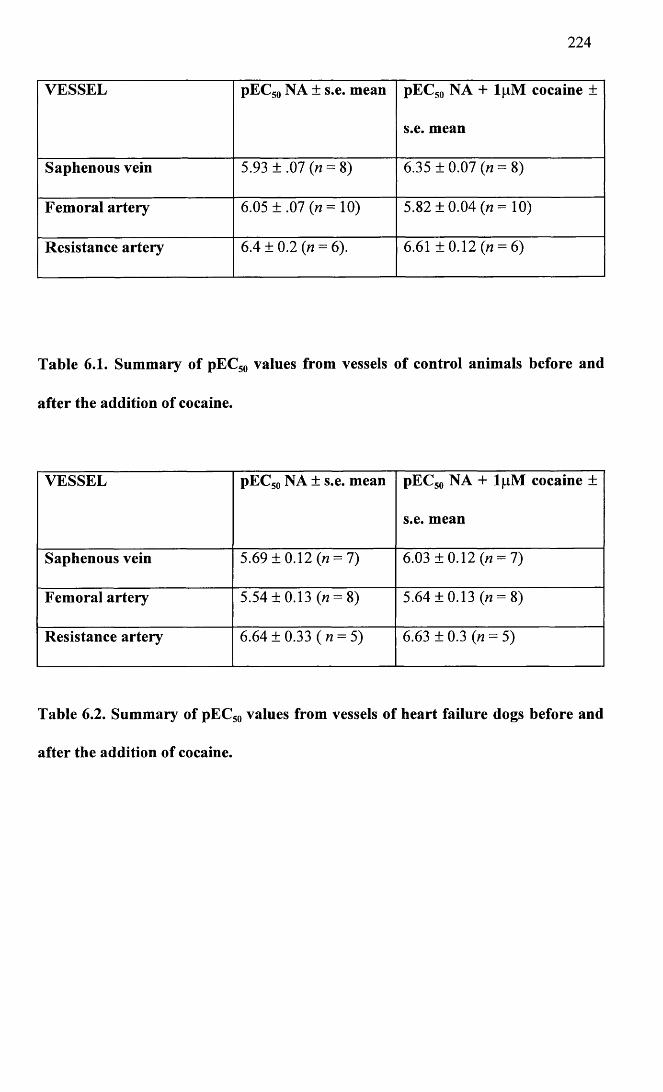
224
VESSEL pEC50 NA ± s.e. mean pEC50 NA + lpM cocaine ±
s.e. mean
Saphenous vein 5.93 ±.07 0 = 8) 6.35 ± 0.07 (n = 8)
Femoral artery 6.05 ±.07 (n= 10) 5.82 ±0.04 («= 10)
Resistance artery 6.4 ± 0.2 (n = 6). 6.61 ± 0.12 (n = 6)
Table 6.1. Summary of pEC50 values from vessels of control animals before and
after the addition of cocaine.
VESSEL pEC50 NA ± s.e. mean pEC50 NA + l|nM cocaine ±
s.e. mean
Saphenous vein 5.69 ±0.12 0 = 7) 6.03 ±0.12 0 = 7)
Femoral artery 5.54 ±0.13 0 = 8) 5.64 ±0.13 0 = 8)
Resistance artery 6.64 ± 0.33 (« = 5) 6.63 ± 0.3 O = 5)
Table 6.2. Summary of pEC50 values from vessels of heart failure dogs before and
after the addition of cocaine.
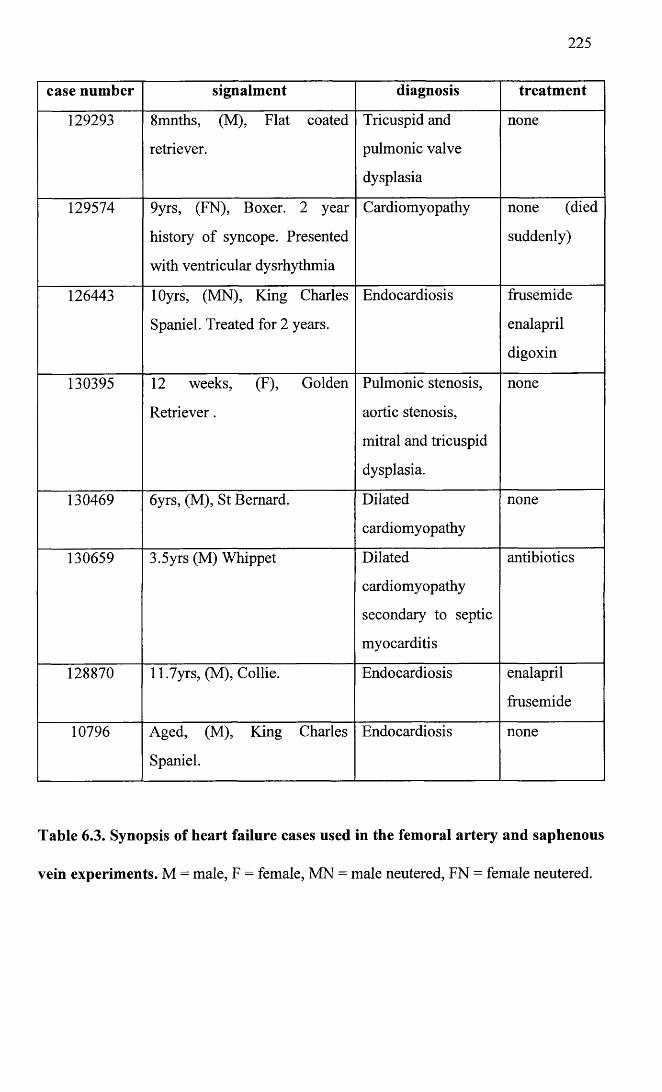
225
case number signalment diagnosis treatment
129293 8mnths, (M), Flat coated
retriever.
Tricuspid and
pulmonic valve
dysplasia
none
129574 9yrs, (FN), Boxer. 2 year
history of syncope. Presented
with ventricular dysrhythmia
Cardiomyopathy none (died
suddenly)
126443 lOyrs, (MN), King Charles
Spaniel. Treated for 2 years.
Endocardiosis frusemide
enalapril
digoxin
130395 12 weeks, (F), Golden
Retriever.
Pulmonic stenosis,
aortic stenosis,
mitral and tricuspid
dysplasia.
none
130469 6yrs, (M), St Bernard. Dilated
cardiomyopathy
none
130659 3.5yrs (M) Whippet Dilated
cardiomyopathy
secondary to septic
myocarditis
antibiotics
128870 11.7yrs, (M), Collie. Endocardiosis enalapril
frusemide
10796 Aged, (M), King Charles
Spaniel.
Endocardiosis none
Table 6.3. Synopsis of heart failure cases used in the femoral artery and saphenous
vein experiments. M = male, F = female, MN = male neutered, FN = female neutered.
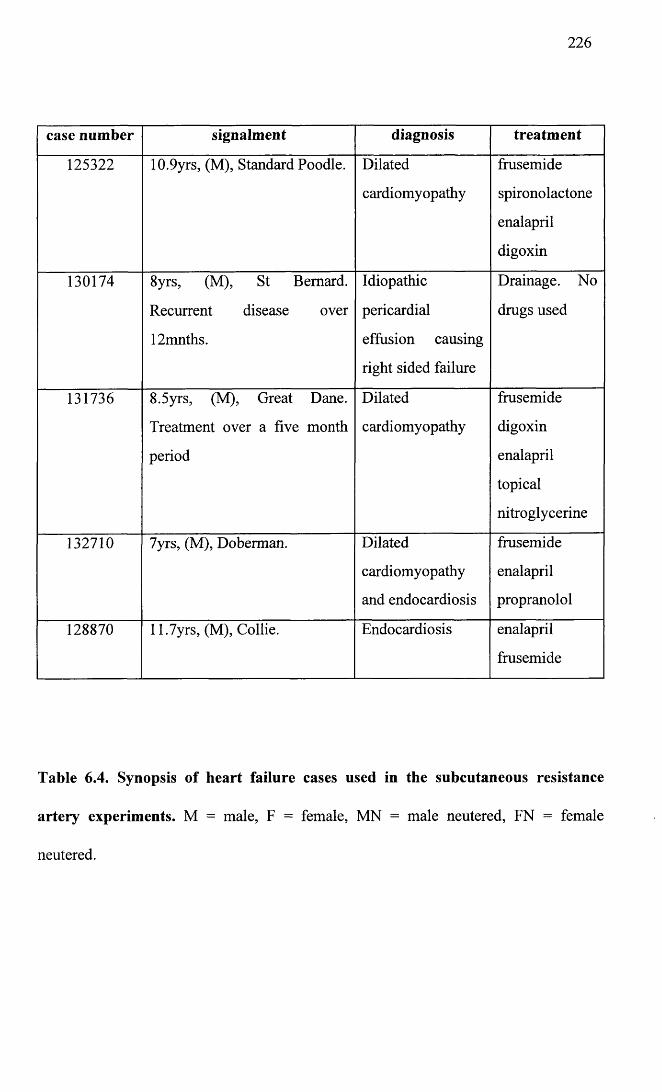
226
case number signalment diagnosis treatment
125322 10.9yrs, (M), Standard Poodle. Dilated
cardiomyopathy
frusemide
spironolactone
enalapril
digoxin
130174 8yrs, (M), St Bernard.
Recurrent disease over
12mnths.
Idiopathic
pericardial
effusion causing
right sided failure
Drainage. No
drugs used
131736 8.5yrs, (M), Great Dane.
Treatment over a five month
period
Dilated
cardiomyopathy
frusemide
digoxin
enalapril
topical
nitroglycerine
132710 7yrs, (M), Doberman. Dilated
cardiomyopathy
and endocardiosis
frusemide
enalapril
propranolol
128870 11.7yrs, (M), Collie. Endocardiosis enalapril
frusemide
Table 6.4. Synopsis of heart failure cases used in the subcutaneous resistance
artery experiments. M = male, F = female, MN = male neutered, FN = female
neutered.
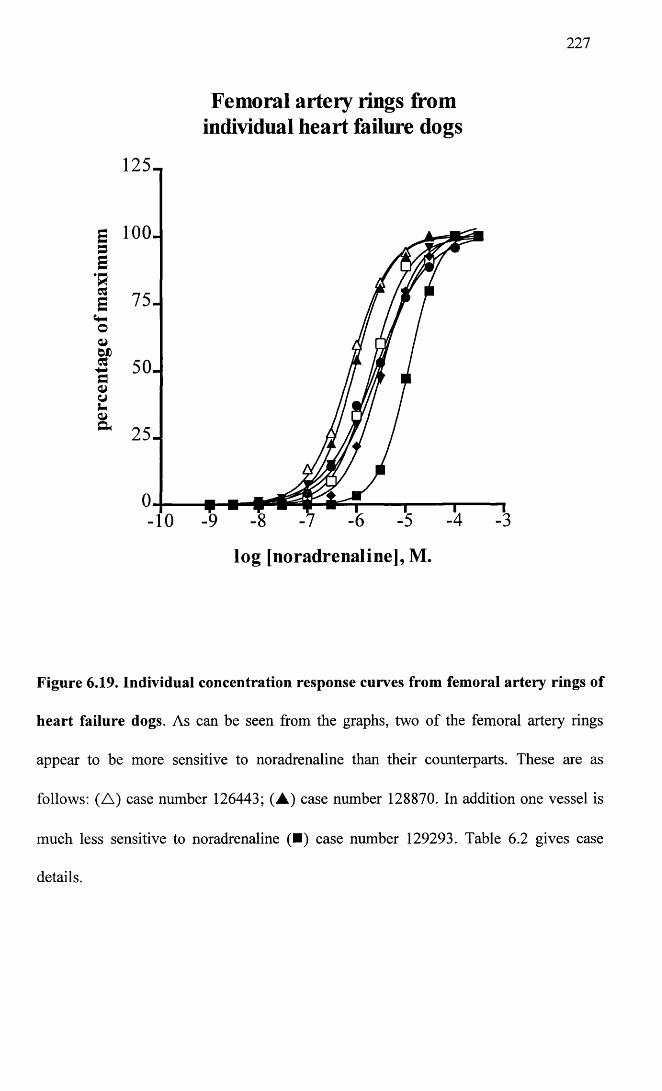
227
Femoral artery rings from individual heart failure dogs
125-
g 100. s E
•R1 7 5 .oWD* 50-
25-
-10
log [noradrenaline], M.
Figure 6.19. Individual concentration response curves from femoral artery rings of
heart failure dogs. As can be seen from the graphs, two of the femoral artery rings
appear to be more sensitive to noradrenaline than their counterparts. These are as
follows: (A ) case number 126443; (A ) case number 128870. In addition one vessel is
much less sensitive to noradrenaline (■) case number 129293. Table 6.2 gives case
details.
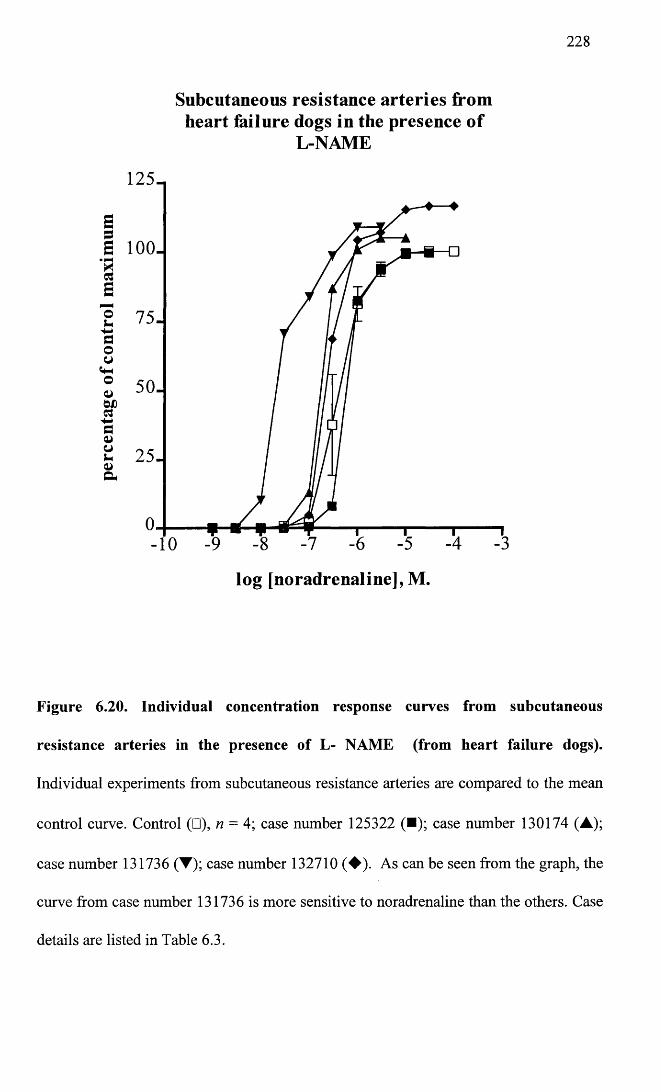
228
Subcutaneous resistance arteries from heart failure dogs in the presence o f
L-NAME
125-
25-
-10
log [noradrenaline], M.
Figure 6.20. Individual concentration response curves from subcutaneous
resistance arteries in the presence of L- NAME (from heart failure dogs).
Individual experiments from subcutaneous resistance arteries are compared to the mean
control curve. Control (□), n = 4; case number 125322 (■); case number 130174 (A);
case number 131736 (▼); case number 132710 (♦ ) . As can be seen from the graph, the
curve from case number 131736 is more sensitive to noradrenaline than the others. Case
details are listed in Table 6.3.
229
6.3 Discussion
Heart failure and the importance of the vasculature in the pathophysiology of this
condition has been discussed in the introduction in Chapter one, together with the
relevance of cardiac disease in the canine population and the main aetiologies and
treatment options currently available.
To date, a number of studies have examined the effects of congestive cardiac failure in
isolated vessels from the dog and also vessels in the intact animal (Mathew et al. 1993;
LeTran and Forster, 1997; Ianuzzo et al. 1996; Forster et al. 1989; Forster and
Armstrong, 1990; Forster et al. 1991; Forster, 1995; Larosa et al. 1994; Forster et al.
1994; Forster and Campbell, 1993; Forster, 1996; Forster, 1995; Kaiser et al. 1989;
Eisner et al. 1991; Kiuchi et al. 1993; Katz, 1995). All these studies used animals
whose heart failure had been induced experimentally, with the pacing induced model
being the most used and best characterised (Armstrong et al. 1986). In this study,
vessels were harvested from animals in the canine population who had developed
naturally occurring heart failure and who were seen at Glasgow University Veterinary
hospital referral clinic. Animals had been referred to the hospital because of heart
disease. On referral dogs were examined by a Veterinary cardiologist and underwent an
examination consisting of clinical examination, thoracic radiography,
electrocardiography and in most cases, diagnostic echocardiography and post mortem
examination. This meant that each case had a definitive diagnosis of a specific cardiac
disease. Ideally control animals should have been subjected to a similar clinical
investigation to that of their heart failure counterparts. This unfortunately was not a
feasible option. Control animals were however given a clinical examination. In the
majority of cardiac diseases seen in the canine population, clinical examination will
reveal some abnormality such as a murmur, poor pulses, reduced capillary refill time,
230
cough and inspiratory crackles on auscultation of the lung field, increased heart rate,
jugular distension and or pulsation and abdominal distension. Animals exhibiting any
of these signs were not included as controls.
Vessels were taken from dogs with heart failure, who were euthanased at their owner’s
request, because the cardiac disease had progressed and was no longer responsive to
treatment, or because there was no appropriate treatment available and in one case due
to the aggressive nature of the dog which prevented examination and administration of
treatment. Tables 6.3 and 6.4, summarise the heart failure cases used in this study,
giving information on the diagnosis and treatment if any. Several points need to be
borne in mind when interpreting findings and making comparisons with the literature.
Obviously in comparison with experimental models of heart failure, there is a non
uniformity in the aetiology of failure, breed of animal, age of animal, treatment and
duration of the condition.
Responses to the catecholamine, noradrenaline and the endothelium-dependent
vasodilator, acetylcholine were compared in control and heart failure groups. In
addition, the effect of the agents cocaine and L-NAME were also examined. The
rationale for using these latter two agents is discussed below.
Increased sympathetic activity is well documented as playing a part in the
pathophysiology of cardiac failure (Leimbach et al. 1986; Grassi et al. 1995; Hasking et
al. 1986; Cohn et al. 1984; Thomas and Marks, 1978). The assumption that increased
plasma noradrenaline may simply be due to increased release from sympathetic nerve
terminals may not necessarily be true. Noradrenaline in the neuroeffector junction is
taken up by the nerve terminal (termed uptake-1) and by non-neuronal tissue (uptake-2).
Uptake-1 is the most important and specific of the two uptake processes. Cocaine
blocks uptake-1, thereby effectively increasing the amount of noradrenaline in the
231
neuroeffector junction. In the myocardium several studies have identified a decrease in
noradrenaline uptake which contributes to the increased sympathetic stimulation of the
post-junctional adrenoceptors (Liang et al. 1989; Himura et al. 1993; Beau and Saffitz,
1994; Eisenhofer et al. 1996). Cocaine was therefore employed in this study to see if
this phenomenon also played a role in the peripheral sympathetic nerve terminals.
Furchgott and Zawadzki (1980) first highlighted the requirement of an intact vascular
endothelium in order for acetylcholine to mediate vasorelaxation. Palmer et al (1987)
identified the endothelium-derived relaxing factor released by the acetylcholine to be
nitric oxide. Nitric oxide is released under both basal conditions and upon stimulation
(Vanhoutte and Shimokawa, 1989). L-NAME is an inhibitor of nitric oxide synthase,
the enzyme responsible for nitric oxide formation. The aim of using L-NAME in this
study was to compare basal release of nitric oxide in control and heart failure animals.
Conduit vessels (Saphenous vein and femoral artery)
In the saphenous vein segments from control animals, sensitivity to noradrenaline
before and after the addition of cocaine was comparable to values from the literature
(Flavahan and Vanhoutte, 1986b; Alabaster et al. 1985; De Mey and Vanhoutte, 1981).
1 pM cocaine significantly enhanced the sensitivity of the saphenous vein and decreased
the maximal response. As is clear from Figure 6.6, the saphenous vein is well
innervated, indicated by abundant staining for both tyrosine hydroxylase and NPY. The
distribution of the innervation in this vessel was also interesting in that the nerves
appeared to penetrate the wall of the vessel right up to the intimal layer rather than being
limited to the adventitial/medial border. It is therefore logical that in this vessel
cocaine would have the effect of increasing the sensitivity to noradrenaline, especially at
low concentrations of the agonist. Similarly, the shift seen with cocaine in the controls
232
was still present in saphenous vein segments taken from heart failure animals. The shift
in both groups was comparable, as when the differences in pEC10, pEC25, pEC50 and
pEC75 values seen before and after cocaine, were compared by t test for both groups,
there were no significant differences (P of 0.73, 0.41, 0.32 and 0.54 respectively). This
would suggest that uptake-1 is not impaired in heart failure in the saphenous vein.
In control animals, the femoral artery was more sensitive to noradrenaline than the
saphenous vein (pEC50 6.05 ± 0.07 (n = 10)). This is in agreement with DeMey and
Vanhoutte (1981), but in contrast to Forster and Armstrong (1990) who found the
saphenous vein to be most sensitive to noradrenaline.
In contrast to the saphenous vein, the canine femoral artery is poorly innervated. This
can clearly be seen in Figure 6.12, where staining with tyrosine hydroxylase and NPY is
sparse and limited to the adventitia of the vessel. It would be logical therefore, to expect
little effect from cocaine in this vessel. In the failure group this is certainly the case,
with no significant differences in any of the parameters after the addition of lpM
cocaine. Surprisingly, in the control group, the same dose of cocaine caused a marked
decrease in sensitivity and maximal response of the femoral artery rings. Cocaine does
have local anaesthetic properties and therefore slows the rate of depolarisation by
affecting sodium channels. It is also reported to have a depressant effect on smooth
muscle contraction in a variety of smooth muscle types, for example intestinal and
bronchial smooth muscle (Catterall and Mackie, 1996). It would appear for whatever
reason, that the control vessels are more sensitive than the failure vessels to the
depressant effects of cocaine. Interestingly in the study by Forster and Armstrong
(1990), a reuptake blocker (desipramine lpM) was used at all times in the Krebs’
solution. Desipramine, pharmacologically, is a different class of drug to cocaine, being
a tricyclic antidepressant (Baldessarini, 1996). It would however be interesting to see if
233
desipramine also has a depressant effect on the femoral artery, as this may explain the
lower sensitivity to noradrenaline in Forster and Armstrong’s study compared to this
one.
In both the saphenous vein and femoral artery there was a rightward shift in the
concentration response curves to noradrenaline in the heart failure animals compared to
controls. This would indicate that in heart failure both femoral artery and saphenous
vein become less sensitive to noradrenaline. The difference in the femoral artery was
more marked with a significant difference existing between all parameters, whereas in
the saphenous vein only the parameters compared in the lower part of the curve were
significantly different. Working on the basis that some of the symptoms of heart failure
are due to reduced blood flow to exercising muscle (Chapter 1), then it would be
expected that vessels would be more sensitive to agonists. What may be important in
this study is that the animals used would have been in end stage heart failure and it is
perfectly possible that the decreased sensitivity is only a feature of severe disease.
In addition, when active effective pressures were compared for maximal response to
noradrenaline and to 125mM KC1, values for the heart failure group were significantly
higher for the femoral artery only. No difference was observed in the saphenous vein.
This latter finding is probably the most important. Since the femoral artery is the main
vessel supplying arterial blood to the hindlimb and hence to the skeletal muscle mass in
this limb, it is possible that enhanced maximal contractile force exhibited by this vessel
in the heart failure animals, plays a role in limiting blood supply to this region. This
would tie in with the concept of reduced blood flow to exercising muscle being
important in the pathophysiology of heart failure.
In the presence of cocaine the relationship between the two groups for the saphenous
vein remained the same. Due to the disparate activity of cocaine in the femoral artery,
234
after the addition of cocaine, there was no longer a significant difference in the
sensitivity of the two groups. Hence, it would seem that cocaine distinguishes between
control and heart failure femoral artery rings. The reasons for this are not immediately
clear and require further investigation.
In the saphenous vein, acetylcholine-induced vasorelaxation was poor and no significant
difference was seen in heart failure. Acetylcholine-induced relaxations can be mediated
by both nitric oxide and endothelium-derived hyperpolarizing factor (Vanhoutte, 1996),
and these would not seem to be an important feature in the saphenous vein. Poor
responses to vasorelaxing agents have been reported previously in this vessel (Hicks et
al. 1991; Nunes and Mota, 1994; Forster and Armstrong, 1990).
Relaxations to acetylcholine in the femoral artery were much more marked with
maximal relaxations of 70.9 ± 6.6% ( n = 9) in controls and 68.1 ± 13.1% (n = 6) in the
failure group. As for the saphenous vein, there was no significant difference in the
response to acetylcholine between the control and failure animals. Numerous studies in
both humans (Drexler et al. 1992; Ramsey et al. 1995; Katz et al. 1992; Hirooka et al.
1994) and animal models (Kaiser et al. 1989; Wang et al. 1994; Drexler and Wenyan,
1992; Kiuchi et al. 1993; Nasa et al. 1996; Mathew et al. 1993) have shown a reduction
in acetylcholine induced vasorelaxation in a variety of vessels. However, in support of
this study Forster et al (1990; 1989) found no differences in dorsal pedal artery or
saphenous vein relaxations to acetylcholine before versus after heart failure in the dog
pacing induced model, and Mathew et al (1993), found no differences in acetylcholine
mediated relaxations in pulmonary arteries from dogs with pacing induced heart failure.
235
Subcutaneous resistance arteries
In the dog subcutaneous resistance arteries, noradrenaline contracted the vessels with a
pEC50 of 6.4 ± 0.2 (n = 6). Hence, the resistance vessels were more sensitive to
noradrenaline than either the saphenous vein or femoral artery (Table 6.1). Although
the DSCRA appears to be well innervated, cocaine had less effect than in the DSV. In
the presence of cocaine, in both the control and failure group, the noradrenaline curve is
marginally shifted to the left and the maximum decreased. However, none of the
differences reach statistical significance in either group, suggesting that neuronal uptake
of noradrenaline does not play a large role in the control of local levels of noradrenaline
in the resistance vessels.
In control animals, L-NAME had no significant effect on the noradrenaline
concentration response curve, indicating that basal release of nitric oxide does not seem
to be a dominant feature in these vessels. In contrast, in the failure group, L-NAME
seemed to shift the noradrenaline response curve to the left. The difference in the two
curves did not reach statistical significance, but the findings suggested that basal release
of nitric oxide may have been elevated in the heart failure animals in this study.
Increased levels of basal nitric oxide in human patients has also been suggested (Drexler
et al. 1992; Habib and Oakley, 1994; Winlaw et al. 1994). However, when the
individual curves from the heart failure dogs, in the presence of L-NAME, were plotted
against the mean control curve, it was clear that one curve was much more sensitive
than the others (Figure 6.20). This curve is from case number 131736. From Table 6.4,
it can be seen that this is the only dog in the cohort which was receiving nitroglycerine
ointment. This drug induces the formation of nitric oxide which can then act directly on
the vascular smooth muscle. While this should not be a surprising finding, it is
236
exhilarating to observe that the drug would appear to be having the desired effect, at
least in this animal.
In the control animals when cocaine and L-NAME were combined, there was a
significant shift in the concentration response curve to the left indicating a significant
increase in sensitivity in the presence of the combined drugs which was not seen with
either substance on its own, indicating a synergistic effect. In contrast, in the heart
failure group, the combination of the two drugs had no greater effect than L-NAME
used in isolation. The numbers of heart failure animals are too low to draw any concrete
conclusions from this difference, due to the variability in responses in the heart failure
cohort exemplified in Figure 6.20. It could be hypothesised that the synergistic effect in
the control situation may be caused by small increases in local noradrenaline, caused by
the presence of cocaine, which in turn may stimulate the production of basal nitric oxide
so that an effect with L-NAME is only seen when the two drugs are combined.
Noradrenaline has been shown to stimulate nitric oxide production in the isolated
mesentery of the rat (Yamamoto et al. 1994), and the desensitization to methoxamine
seen in the rat mesentery would appear to be associated with nitric oxide production
(Kamata and Makino, 1997).
When comparisons were made between the control and heart failure group, there was no
alteration in sensitivity or maximal response to noradrenaline on its own or in the
presence of cocaine, L-NAME, or cocaine and L-NAME combined. In contrast,
maximal response to 125mM potassium chloride was significantly elevated in the
failure group. Again as for the femoral artery, this is an important finding and may play
a role in limiting blood flow.
Responses to acetylcholine, as for the larger vessels were not significantly different
between the two groups.
237
It is well established that increased total peripheral resistance is a feature of congestive
heart failure (Parmley, 1985), so that while it seems reasonable that maximal responses
in the femoral artery are enhanced, it is somewhat surprising to find that there seemed to
be a decrease rather than an increase in agonist sensitivity in saphenous vein and
femoral artery from heart failure animals. Also surprising, was the finding that there was
no alteration in sensitivity of the resistance arteries, since these vessels are the most
important in the control of total peripheral resistance.
Desensitization and homologous downregulation of p-adrenoceptors in heart failure, has
now been well documented in the myocardium and would also appear to occur in the
peripheral vasculature, (Kiuchi et al. 1993; Bristow et al. 1982; Bristow et al. 1986).
For the P-adrenoceptors, desensitization is due to stimulation with catecholamines, is
associated with phosphorylation of the receptor, and is mediated by protein kinase A
and a specific p-adrenergic receptor kinase. Desensitization of the receptor is followed
by downregulation which is characterised by a loss of binding sites (Morris et al. 1991).
In the case of a,-adrenoceptors, desensitization of the response on exposure to
catecholamines is also well documented and has been best characterised for the a lb-
adrenergic receptor, where it has been shown that phosphorylation of sites in the
carboxy terminus are involved (Diviani et al. 1997; Lattion et al. 1994). In contrast, loss
of receptor number would not appear to occur (Seasholtz et al. 1997a; Seasholtz et al.
1997b). Counterbalancing this are the findings that angiotensin II increases
transcription of a r adrenergic mRNA in vascular smooth muscle cells (Hu et al. 1995),
and that adrenaline can also increase a,-adrenergic receptor expression mediated
through p2-adrenergic receptors (Morris et al. 1991).
The net effect of these interactions is unclear and will probably vary from one situation
to the next.
238
A number of other studies have examined agonist sensitivity in heart failure in a variety
of vessels and species. Results have been conflicting. The most logical comparison to
make would be with the dog pacing induced model. Forster et al (1987), in contrast to
this study, found increases in sensitivity to noradrenaline in both dog saphenous vein
and dorsal pedal artery. In agreement with this study they also found increases in
maximal tension in the artery after heart failure, but they also saw increases in tension in
the saphenous vein. As already mentioned, their study used desipramine. If
desipramine had the same effect as cocaine in the present study, then the contrasting
effect of the drug on control versus heart failure artery could account for the apparent
increasing sensitivity seen in the dorsal pedal artery. In addition, in a subsequent study
by the same group, they were no longer able to demonstrate differences in the dorsal
pedal artery (Forster, 1995), although findings for the saphenous vein were consistent
with the previous report (Forster et al. 1987). In a separate study by the same group
(Forster and Armstrong, 1990), a ,- and a 2- agonists were examined and the study
showed that there was an enhanced responsiveness to a r agonists, but that the response
to a 2- agonists was diminished in heart failure. Depression of vascular a 2-adrenoceptor
function has also been shown in rat vasculature following heart failure (Feng et al.
1996). Saphenous vein does have post-junctional a 2-adrenoceptors (Drew and Whiting,
1979), which are thought to contribute mainly to the lower part of the noradrenaline
curve (Flavahan and Vanhoutte, 1986b; Alabaster et al. 1985; Flavahan et al. 1984;
Constantine et al. 1982; Sullivan and Drew, 1980; De Mey and Vanhoutte, 1981). This
may explain findings for the saphenous vein in the present study, where the difference
between the failure and control group was only significant for the lower part of the
concentration response curve. In support of findings for both vessels, an in vivo study
examining dorsal hand vein blood flow in human patients with congestive cardiac
239
failure (Feng et al. 1994), showed a decreased responsiveness to both phenylephrine and
clonidine in severe cardiac failure, suggesting decreased responsiveness involving both
a r and a 2-adrenoceptors. Slightly different findings again were reported by Angus et al
(1993). In human resistance arteries taken from gluteal biopsies, no differences were
found in sensitivity to a variety of agonists, but for all the agonists used there was a
significant decrease in maximal response in the failure versus the control patients. The
agonists used were noradrenaline, angiotensin I and angiotensin II, suggesting that the
effect was not solely due to alterations involving the a-adrenoceptors. Two recent
studies by Stassen et al (1997a; 1997b), examined resistance arteries and thoracic aorta
from rats with experimentally induced heart failure. In contrast to the present study,
they found an increased sensitivity to the agonist phenylephrine but a decreased
maximal response in heart failure in the resistance arteries. The difference appeared to
be associated with calcium influx induced by phenylephrine but not potassium chloride.
There was also some suggestion of increased a,-adrenoceptor density after heart failure,
although when this was normalised for DNA content the difference was not significant.
To confound matters further, Kaiser et al (1989) in an in vivo study found no alteration
in response to noradrenaline in femoral arteries of dogs with pacing induced heart
failure.
Several possible reasons exist for the discrepancies between studies.
(1) The stage and severity of the cardiac failure. In this study the majority of animals
had severe cardiac disease often of several years duration and in most cases were
euthanased because of their disease. This contrasts with the experimental models where
rapid pacing may have only been of 4-5 weeks duration prior to vessel isolation (Forster
and Armstrong, 1990).
240
(2). The use of drug therapy. In the case of the experimental animal models, treatment
has generally not been used. In contrast, patients in the human studies may be on a
variety of drug treatments. Interestingly in this study, of the cohort of eight animals
with heart failure who were used in the femoral artery and saphenous vein experiments,
only two were on treatment with drugs (Table 6.3). Another one was treated with
antibiotic, but this would not be expected to alter vascular reactivity. If individual
concentration response curves for the heart failure animals are graphed, there are no
particular outliers in the saphenous vein experiments (not shown). In the femoral artery
experiments this is not the case. Two of the animals seem to have curves which are
shifted to the left compared to the others. It may be significant that these two were the
only animals receiving treatment in the group (Figure 6.19). When this observation is
considered along with the fact that 4/5 of the cohort used for study of the resistance
arteries in failure, were on treatment and did not show alterations in sensitivity to
noradrenaline, it should be considered that treatment may mask changes in the reactivity
of vessels. Obviously at this stage this is only a preliminary observation. Increased
numbers of heart failure animals are required, such that the heart failure group can be
further subdivided on the basis of aetiology and treatment modality.
(3). Experimental populations tend to be more uniform with regard to age and breed.
The studies carried out on experimental dogs state the use of adult dogs but do not
elaborate on this. In this study because of the source of the control population, accurate
ages were not available for these animals. It would be reasonable to say however, that
there was a fairly even distribution of age bands among the control group. In contrast, in
the heart failure cohort, with the exception of two dogs < 1 year of age and a 3.5 year
old whippet, all the dogs would be considered old. A number of studies have examined
changes in noradrenaline sensitivity and endothelial function with age (Haidet et al.
241
1995; Toda and Miyazaki, 1987; Shimizu and Toda, 1986; Kaiser and Ptu, 1992; Vila et
al. 1997; Carvajal et al. 1995; Tabemero and Vila, 1995; Gurdal et al. 1995). On
examining the literature, the main observation is that alterations depend very much on
the species and the blood vessel studied. Gurdal et al (1995) and Carvajal (1995), both
report a decrease in sensitivity to noradrenaline in rat aorta with age, which could
explain the findings of this study. In contrast, two in vivo studies of beagle hindlimb
blood flow did not identify changes in either vasorelaxant or vasoconstrictor activity in
the femoral artery (Kaiser and Ptu, 1992; Haidet et al. 1995), but vasoconstriction in
isolated beagle coronary arteries showed enhanced vasoconstriction to catecholamines
(Toda and Miyazaki, 1987). These latter three studies, because they relate to canine
vasculature, are probably more relevant. They would support the argument that the
decreased sensitivity seen in the conduit vessels in heart failure, from this study, is not
age related, although the increased maximal response observed in the femoral artery
from failure animals may be.
To summarise the findings of this study. In the heart failure animals there is a decreased
sensitivity to noradrenaline in both femoral artery and saphenous vein but not in the
subcutaneous resistance artery. The difference is most marked in the femoral artery
where in addition, maximal responses to both noradrenaline and 125mM KC1 are
increased. Since maximal response is increased to both noradrenaline and KC1, this is
unlikely to be solely an adrenergic-mediated phenomenon, but may involve a general
enhancement of vasoconstriction. The reason for the enhancement of only the
potassium mediated response in the resistance arteries is not clear. In the large vessels
the alteration in sensitivity to noradrenaline could be due to endothelial modulation of
the response. Inducible nitric oxide and/or endothelium-derived hyperpolarizing factor
(EDHF) are unlikely to play a role because of the similarity in response to acetylcholine
242
in the two groups of animals, although in the future it would be interesting to look at the
relative contribution of EDHF, if any, in the acetylcholine mediated response, and if
there is a contribution, to examine if the relative contribution of EDHF and nitric oxide
change in the disease state. Differences in basal nitric oxide production or adenosine
3’,5’-cyclic monophosphate (cAMP) vasorelaxant pathways could be responsible.
Alternatively, the alterations may be due to changes in adrenergic receptor density and
number (although you may expect to see a decrease in maximal response if this was the
case), or in the efficiency of receptor coupling and signal transduction.
Finally, the alteration may be a more general alteration in contractile ability of vascular
smooth muscle, in which case alterations with other non-adrenergic agonists would be
expected.
There was no alteration in sensitivity to noradrenaline in the resistance arteries.
Masking of alterations due to treatment must be considered. Although it appears as if
there may be differences in basal nitric oxide production in the resistance artery vessels
between control and failure animals, this was mainly due to a single animal who had
been treated with nitroglycerine ointment. This requires further elucidation with
increased numbers of animals.
Future studies require increased numbers of animals, making it possible to divide heart
failure animals into groups depending on aetiology and treatment modalities. A logical
progression would be to determine if the apparent decreased sensitivity in heart failure
in the large vessels is agonist-dependent and therefore, to look at other agonists such as
vasopressin, angiotensin and endothelin. Although the aj-adrenoceptor population may
not solely be involved in the changes seen, on the bases of studies such as those carried
out by Stassen et al (1997a; 1997b), where there appears to be an increase in a r
adrenoceptor density and alterations in aj-mediated calcium influx, it would be of

243
interest to focus on the aj-adrenoceptor population in relation to a,-adrenoceptor
subtypes, receptor density and levels of receptor expression at the mRNA level.

CHAPTER 7
General discussion
245
There are several reasons for studying receptors. These are, the understanding of
normal physiological processes, the understanding of pathophysiological processes, the
understanding of how drugs currently in use work and the development of new more
effective drugs.
The reasons for examining the canine a r adrenoceptors include all these categories, but
in particular, the long term aim, from my perspective, is to understand
pathophysiological changes, especially in heart failure and to aid in the development of
new drug treatments for this and other conditions. With regard to the potential for drug
development, it is often difficult to identify possibilities until the groundwork has been
covered. However if, for example, the oq-adrenoceptor subtypes involved in a variety of
vascular beds can be identified, then it may be possible to use subtype-selective a ,-
adrenoceptor antagonists which will selectively enhance blood flow to a particular
region, without having a significant effect on, say for example, systemic blood pressure.
Results from the studies on functional classification of the a,-adrenoceptors, mediating
vascular smooth muscle contraction in the saphenous vein and the subcutaneous
resistance arteries, exemplify the limitations and problems encountered with a ,-
adrenoceptor classification at present.
One obvious problem in the saphenous vein, is the coexistence of an a 2-adrenoceptor
population. In an ideal situation an irreversible a 2-antagonist should be used to exclude
this population of receptors from the analysis. No such antagonist is available, although
unsuccessful attempts have been made using phenoxybenzamine, which has a much
higher affinity for a r rather than a 2-adrenoceptors (Daly et al. 1988b; Dubovich and
Langer, 1974; Constantine et al. 1982). The only other option is to use a reversible
antagonist. The limitations of this are, that once equilibrium has been achieved, the
246
antagonist can freely dissociate and reassociate with the receptors. This is potentially
problematic especially at high agonist concentrations, where the agonist may break
through the a 2-antagonist effect, leading to an underestimation of the a,-antagonist’s
potency. In addition, when an irreversible antagonist such as CEC is being used, this
antagonist is inevitably going to access some of the a 2-adrenoceptor population as the
reversible antagonist dissociates from the receptors.
The lack of reliable subtype-selective antagonists is also the cause of considerable
frustration. This is best illustrated by the lack of antagonists which have a high affinity
for the a 1B-adrenoceptor subtype and can distinguish it from both a ]A- and a ]D-.
Chloroethylclonidine is one of the few antagonists currently available, but it is far from
ideal for several reasons. In addition to its antagonist effects, it also acts as an agonist.
This has been demonstrated in this study and others, by the contraction seen in the DSV
(Nunes and Mota, 1994; Low et al. 1994; Nunes and Guimaraes, 1993). O’Rourke et al
(1995), also suggested that CEC acted as an agonist at adrenoceptors in the rat aorta.
Although CEC alkylates a 1B-adrenergic receptors preferentially, it will bind to the other
receptor subtypes (Michel et al. 1993), and the degree of alkylation is often influenced
by experimental conditions and the species involved. In a recent study, using flow
cytometry and confocal imaging techniques, it was shown that in cell lines expressing
either the a ]a- or a lb- adrenoceptors, that the a lb-adrenoceptors localised on the cell
membrane, whereas a ]a-adrenoceptors seemed to predominantly localise internally
(Hirasawa et al. 1997). If this is really the case, then this may explain why the
hydrophilic CEC preferentially alkylates the a ]B- subtype, since access to these sites
would be greater. This also means that as exposure time increases, or for example
membranes are used rather than whole cells in binding experiments, CEC will gain
access to and inactivate other receptor subtypes, explaining the influence of
247
experimental conditions. Some of the confusion caused by the unreliability of CEC can
be seen by the difficulties which were encountered in the classification of the adrenergic
receptor cloned by Schwinn et al, (1990). This receptor was initially classified as the
ot]c-, since although the antagonist profile was similar to that for the native a JA-, it
appeared more sensitive to CEC than would have been expected for an a ,A- adrenergic
receptor. It was only later, when the rat homologue of the receptor was shown to have a
lower sensitivity to CEC (Laz et al. 1994), that it became apparent that the comparative
sensitivity of the bovine clone was due to a species variation (Forray et al. 1994a), and
that in fact the bovine clone represented the a 1A- adrenergic receptor.
The current classification scheme also imposes limitations. In both the vessels
examined in this study, the affinity for prazosin was low (pA2 < 9). This is indicative of
the a 1L- subtype, which encompasses the a 1L- and ot]N- subdivisions distinguished by
HV 723 (Muramatsu et al. 1995). These receptors with low affinity for prazosin are
considered to be insensitive to CEC.
However, in both cases there was evidence from the pattern of interaction of the other
antagonists used, that more than one subtype was involved in the responses of the
saphenous vein and the resistance arteries. In the saphenous vein this was based on the
antagonist profile of 5 methylurapidil, which at the highest concentration used seemed
to distinguish a low and a high affinity site, and the non-competitive interaction of
BMY 7378. In the case of the resistance arteries, evidence for the involvement of more
than one subtype came from the reduction in upper asymptote seen with some of the
antagonists used, in addition to the non-competitive interaction of BMY 7378 based on
Schild analysis.
248
Although the pitfalls associated with the use of CEC have been highlighted, both vessels
seemed to display a certain amount of sensitivity to this antagonist, which would lend
support to the evidence for a heterogeneous population of receptors.
These findings have given rise to two main issues. Firstly, although the a ]L-
adrenoceptor has been demonstrated in both vessels, based on response to CEC, there
would appear to be some differences in this subtype when the two vessel types are
compared. Secondly, if additional receptors are involved, since they too have a low
affinity for prazosin, how are they to be classified ?.
In the saphenous vein it was concluded that rauwolscine could interact with a population
of a,-adrenoceptors, which also contributed to the baseline contraction caused by CEC.
This population of adrenoceptors seemed to correspond to the a 1L- subtype already
mentioned. In the subcutaneous resistance arteries, the antagonist profile also
necessitated classification of the receptors as a 1L-, although the baseline contraction to
CEC was only seen in two of the vessels used. Three reasons could exist for this
difference.
1. The a,-adrenoceptors in the two vessels, although both classified as a ]L- are in fact
different, supporting the suggestion that further subdivision within the low affinity
prazosin sites does exist. If the a ]L-adrenoceptor is in fact a conformational variation of
the a ]A-, then it would not be terribly surprising that there would be more than one
conformational variant, leading to functional alterations in the receptor with regard to
antagonist profiles.
2. The conclusion as regards the receptors responsible for the contraction to CEC in the
DSV are wrong.
249
3. Despite the use of delequamine, the a 2-adrenoceptor population in the DSV may have
interfered with the antagonist profile in this vessel and could be the explanation for the
evidence of involvement of other receptor subtypes in this vessel.
The a 2-adrenoceptor in the DSV has previously been classified as the a 2A- subtype
(MacLennan et al. 1997). It could be argued that the potency of some of the antagonists
used in this study would be consistent with their activity at the a 2-adrenoceptors. For
example, the affinity for 5 methylurapidil, in the presence of delequamine, at the low
affinity site in the DSV (pA2 6.29 ± 0.28), and its affinity in the presence of rauwolscine
at the highest concentration used (pA2 6.00 ± 0.77), could be consistent with an action at
a 2-adrenoceptors, since a pA2 potency range of 4 to 6 has been given for this antagonist
at a 2-adrenoceptors (Wilson et al. 1991). In addition, it has been shown that CEC can
inactivate the a 2A- and a 2C- adrenoceptors as well as the a 1B- (Michel et al. 1993).
Evidence which would support the theory that the subtypes identified were all of the cq-
adrenoceptor type would be the affinity of the other antagonists. Firstly, in the DSV,
prazosin in the presence of delequamine acted in a competitive manner, with a pA2
value of 8.31. This is much higher than would be expected at the a 2A-adrenoceptors,
since of the three a 2-subtypes, prazosin has the lowest affinity at the a 2A-, and a pKB
value of 5.19 has been obtained for this antagonist at the a 2-adrenoceptors in the DSV
(MacLennan et al. 1997). Also, in the same study, a pKB value of 7.42 was obtained for
WB 4101, at a 2-adrenoceptors in this vessel. This is lower than the value of 8.85
obtained in this study, and although there may be considerable overlap in the potency
ranges for this antagonist at both a,- and a 2- adrenoceptors, a pA2 value of 8.85, falls
within the potency range at a,-adrenoceptors of 8-10, given by Wilson et al (1991).
In conclusion, in the DSV, there is evidence for the involvement of more than one
receptor subtype. One of the subtypes involved seems to have all the characteristics of
250
the a 1L-adrenoceptor when compared with the literature. The other subtype or subtypes
involved also have a low affinity for prazosin and are sensitive to CEC. At this time,
the possibility that the coexisting population of a 2-adrenoceptors has contributed to
these findings cannot be excluded. In the resistance arteries, prazosin also has a low
affinity. Again there is evidence for the involvement of more than one subtype of
receptor and again there is a degree of sensitivity to CEC. Unlike the DSV, a 2-
adrenoceptors would appear to have little part to play in functional responses,
supporting the existence of further divisions of the low affinity prazosin receptors in this
vessel.
The discussion so far raises questions regarding the usefulness of functional studies in
a,-adrenoceptor classification, especially in this case, where it seems to be difficult to
reach a satisfactory conclusion.
The answer lies in the reasons for wishing to establish the subtypes involved in the first
place. Radioligand binding studies or molecular studies examining expression of
receptor subtypes, may give more satisfactory and clear cut answers, but when the long
term aim is to understand possible pathophysiological alterations in the a r
adrenoceptors mediating the functional response of a vessel, and to develop antagonists
that will affect this functional response, then other methods of study may bear little
relation to the functional reality. Examples of the importance of functional studies can
be taken from the literature. As already discussed, benign prostatic hypertrophy (BPH)
is an important disease in the human and canine population. In man, the a,-
adrenoceptors play an important role in the dynamic component of urinary tract
obstruction (Hieble and Ruffolo, 1996). Although non-selective aj-antagonists, such as
prazosin, are effective, the hunt has been on going to develop a subtype-selective
antagonist that will have fewer systemic side effects. If only radioligand binding studies
251
and molecular studies on prostatic tissue were taken into consideration, it would seem
clear from binding, that the subtype of a,-adrenoceptor in the prostate is the a ]A-
(Goetz et al. 1994). This would be supported by expression levels of mRNA, where
although all three cloned subtypes are expressed, expression of the a ]a- subtype is
highest (Moriyama et al. 1996; Nasu et al. 1996; Faure et al. 1994b). However, from
functional studies, this is not quite the case, and indeed the a ]L-adrenoceptor seems to be
important in mediating contraction in prostatic tissue from a number of species
(Shannon Kava et al. 1998; Deplanne and Galzin, 1996; Leonardi et al. 1997; Testa et
al. 1997; Ford et al. 1996a; Kenny et al. 1996). Therefore, based solely on binding
studies, a 1A- selective antagonists such as, RS 17053, SNAP 5089 and Rec 15/2627,
would be expected to be effective in the treatment of BPH. In fact, all these antagonists
distinguish the a 1A-adrenoceptor from the a 1L- due to the fact that they have a lower
affinity at the latter subtype in functional studies (Leonardi et al. 1997).
Although I have underlined the importance of the functional approach in studying the
a,-adrenoceptors, the molecular approach has proved an important and valuable tool
and encompasses a plethora of techniques and approaches.
The cloning and sequencing of the receptor subtypes, although initially confusing, did
help in clarifying the idea that subtypes do exist and that they are the result of different
gene products. The expression of individual subtypes in cell lines has provided insights
into the structure function relationships of these G protein coupled receptors, although
the assumption that receptors expressed at high levels in cell lines behave in a similar
fashion to native receptors must be treated with caution. In particular, the use of mutant
and truncated forms of receptor have identified regions of the receptor important in
ligand binding, G protein coupling and phosphorylation/desensitization.
252
With knowledge of the sequence of the specific subtypes, it has been possible to use
techniques to identify the levels of expression of the three cloned subtypes in tissues
(Price et al. 1994; Nasu et al. 1996; Piascik et al. 1994) and monitor alterations in levels
of expression in disease states (Beaulieu et al. 1997).
In Chapter 5, I describe the isolation of a partial sequence of the canine ocla-
adrenoceptor. The reasons for this have been discussed, but to reiterate, were due to the
findings of the functional studies demonstrating involvement of the a ]L-adrenoceptor.
Due to recent evidence suggesting the a ]a-adrenoceptor as being responsible for the
functional a 1L-, it seemed logical to isolate this subtype first. Although the full length
receptor was not isolated, the fragment which has been cloned and sequenced, can now
be used as a probe to screen a cDNA library. This should allow the full length receptor
to be identified and it will be interesting to see if, like the human a la-adrenoceptor
(Chang et al. 1998), isoforms of the canine a la-adrenoceptor exist. With knowledge of
the sequence of the receptor, it will be possible to use a variety of techniques to measure
levels of expression in canine tissues, including blood vessels. As has been
demonstrated in Chapter 5, and from other studies (Schwinn et al. 1990), Northern
blotting is not ideal. One reason for this may be the relatively low level of expression of
the adrenergic transcripts, which could have contributed to the failure of the canine a ,,,-
probe to identify transcripts in this study (Graham et al. 1996). Other more sensitive
techniques such as PCR, semi-quantitative PCR and RNAse protection assays have
already been used successfully in other studies, and the sensitivity of techniques such as
PCR would enable examination of relatively small amounts of tissue, such as the blood
vessels used in this study.
It would also be of interest to express the full length receptor in cell lines and examine
the antagonist profile in relation to inositol phosphate accumulation, to see if, like the
253
human, the canine a la-adrenoceptor can exhibit the a 1L- profile (Ford et al. 1997b; Ford
etal. 1996b).
More recently, subtype-specific antibodies have been used to measure levels of
expressed receptor protein on the cell surface using flow cytometry (Hirasawa et al.
1998). This will allow the relationship between not only expression of mRNA and
function to be made, but also allow exploration of the relationship between mRNA
expression, expression of the receptor on the cell surface and functional contribution of
the expressed receptor. The use of flow cytometry in this way is exciting in that it
allows the localisation of the receptors on different cell types by the use of cell type
specific antibodies in conjunction with the a,-adrenoceptor specific antibody. This is
not possible with radioligand binding. In a recent study (Piascik et al. 1997), it was
shown, again using an a ]B-adrenoceptor antibody, that receptor protein was expressed in
a variety of blood vessels which had previously been shown to express the a 1B- subtype
at the mRNA level. When functional studies were carried out on these blood vessels, it
appeared that the a 1B-adrenergic receptor did not have a functional role in mediating
contraction of all the vessels in which it was expressed. This raises the question as
regards the role of receptors expressed in this way, that do not appear to partake in a
functional role. Of course, as already described in the introduction, a,-adrenoceptors
would seem to be involved in other functions apart from vascular smooth muscle
contraction. Their role in mediating cell hypertrophy is the source of current research
interest (Xin et al. 1997) and possibly certain subtypes may play a more important role
in mediating these effects, than others.
A recent novel approach to the study of the adrenoceptors has been the use of antisense
oligonucleotides (Gonzalez-Cabrera et al. 1998; Piascik et al. 1997). Antisense
technology is treated with a degree of well deserved scepticism and it could be imagined
254
from the high degree of homology seen between the a,-adrenoceptor subtypes, that
generation of subtype-selective antisense oligonucleotides would be problematic.
Despite this, a publication by Piascik et al (1997), describes the use of antisense
oligonucleotides for each of the three cloned a ,-adrenoceptors, where the
oligonucleotide targets the translation initiation site for the receptor. The antisense
oligonucleotides did seem to have the effect of blocking the required subtype and
findings were backed up by functional and antibody studies on a variety of vessels.
Although the concept of the use of antisense oligonucleotides as therapeutic tools is a
long way off, these may well prove useful as an additional means of targeting individual
subtypes or removing additional receptor populations, for example a coexisting
population of a 2-adrenoceptors such as occurs in the DSV, enabling analysis of the
remaining a,-adrenoceptor population. Information could also be obtained on
parameters such as turn over time of receptors, i.e. the length of time between blocking
expression of the mRNA and the loss of receptor on the cell surface. Some information
on this has already been shown, (Gonzalez-Cabrera et al. 1998) with the use of an a ]B-
antisense oligonucleotide in DDT, MF2 cells, where the density of receptors was
reduced by 28% within 24 hours, as ascertained by radioligand binding.
As already mentioned, one of the problems associated with the study of receptors in
native tissues has been the presence of multiple receptor subtypes, making dissection of
the effects created by a single subtype difficult. One way of overcoming this has been
the expression of individual recombinant receptors in cell lines. This too creates
potential problems as the cell line may often not contain the same intracellular
signalling materials as the native tissue. One potential way around this is the current
development of lines of transgenic knockout mice, which are lacking a particular
255
subtype (Smiley et al. 1998). a ]B- knockout mice are currently being studied by other
workers in this laboratory.
In Chapter 6 I have discussed experiments comparing vessels from control and heart
failure dogs. The main findings from these experiments were, that in heart failure in the
saphenous vein and femoral artery, there appeared to be a reduction in sensitivity to
exogenous noradrenaline. In addition, there was no reduction in acetylcholine mediated
relaxation. In the resistance arteries there was no change in noradrenaline sensitivity or
acetylcholine mediated relaxation, although it was hypothesised that treatment in the
cohort of heart failure animals used for the resistance artery studies (4/5 on treatment),
may have contributed to this finding. Another important finding was that in the femoral
artery, maximal responses to both noradrenaline and potassium chloride were
significantly greater in the vessels from heart failure animals, while in the resistance
arteries the maximal response to potassium chloride only, was significantly enhanced in
the vessels from the heart failure cohort.
The main limitation to this part of the study was the supply of clinical material.
Nevertheless, the findings from the conduit vessels are convincing and provide a good
basis for future work.
A logical progression would be to examine the effect of endothelial denudation on the
reduction in sensitivity to noradrenaline seen in heart failure, and also to establish if the
alteration in sensitivity is observed with other types of agonist such as angiotensin,
endothelin and vasopressin.
It would also be valuable to examine the a,-adrenoceptor population in more detail in
heart failure animals, especially if a,-adrenoceptors appear to be contributing to the
alteration in sensitivity to noradrenaline identified in the femoral artery and saphenous
vein. It is possible that there could be changes in receptor number, receptor subtype or
256
receptor coupling and signal transduction. Reports from the literature in humans and
experimental models of heart failure are inconclusive reporting both increases, (Forster
et al. 1989; Forster and Armstrong, 1990; Stassen et al. 1997a; Stassen et al. 1997b),
decreases, (Feng et al. 1994) or no change (Indolfi et al. 1994; Kubo et al. 1989) in the
responsiveness of a ,- and a 2-adrenoceptors.
Further studies would take the form of experiments designed to address each of these
possibilities. Functional and radioligand binding experiments would help to address the
issues of receptor number and receptor subtype. In addition, vessels from some of the
heart failure animals already used have been stored in liquid nitrogen for the purpose of
examining expression of the a,-adrenergic subtypes once the full length receptors have
been identified and the technique established in control tissue.
In addition to a more detailed look at the a,-adrenoceptor population, it would be of
value to examine the role of the endothelium more closely.
Although no differences were found in any of the vessels to acetylcholine mediated
relaxations, it would be of interest to look at the relative roles of nitric oxide and
endothelium-derived hyperpolarizing factor in this response, as it is now clear that both
of these can be released by acetylcholine, depending on the vessels examined
(Vanhoutte, 1996).
It would also be of interest to examine cAMP-mediated vasorelaxations, for example
prostacyclin mediated vasorelaxation, since one study has demonstrated impairment of
cAMP-mediated vasorelaxations in canine pulmonary arteries from experimental heart
failure dogs, despite no alteration in the cGMP-mediated vasorelaxations (Mathew et al.
1993).
257
Finally, with increased numbers of clinical cases, it will be possible to subdivide the
heart failure animals into groups based on aetiology and treatment, to see if any of these
parameters influence findings.
To summarise, functional classification of the canine vascular a,-adrenoceptors has
provided a useful and revealing insight into the complexities of receptor classification,
and while answering some question, it has raised others. Although not complete, good
progress has been made towards isolation of the full length canine a 1a-adrenoceptor,
which will allow expression of this subtype to be studied in canine tissues. Both the
functional and molecular approach can then be used to make a comparison between
control dogs and animals with naturally occurring heart failure, since it has already been
established that in both the saphenous vein and femoral artery there appears to be a loss
of sensitivity to noradrenaline.
This ground work and the questions it raises, together with the exciting possibilities
arising from novel approaches such as the use of subtype-specific antibodies and
antisense oligonucleotides, ensures a bright and exciting future in this area of research.

Appendix I
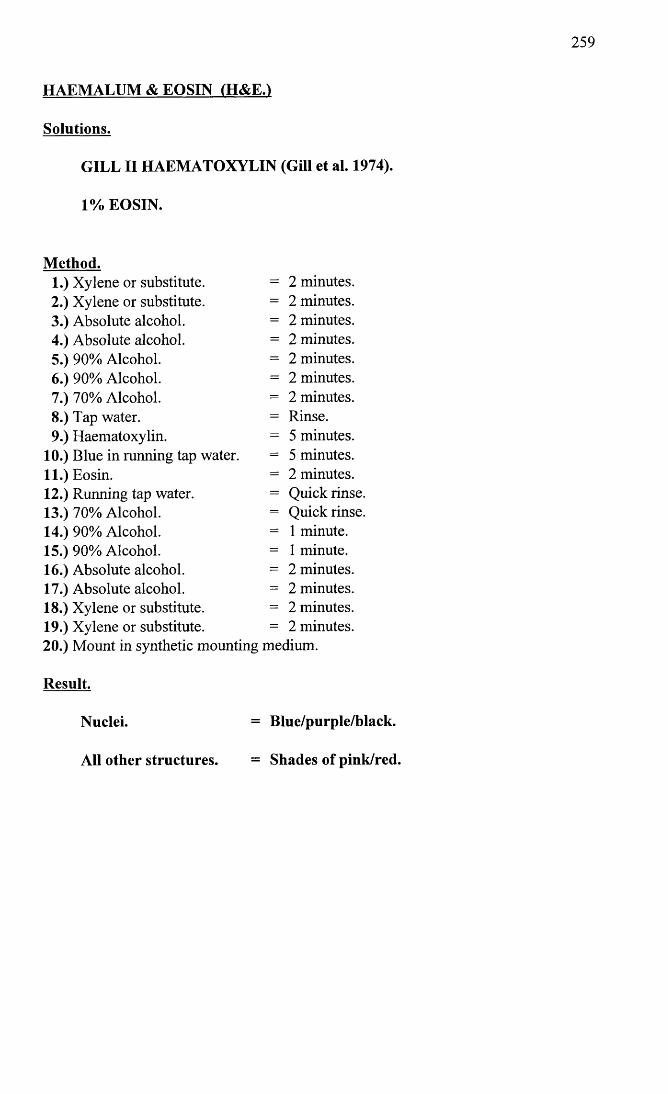
259
HAEMALUM & EOSIN (H&E.)
Solutions.
GILL IIHAEMATOXYLIN (Gill et al. 1974).
1% EOSIN.
Method.1. Xylene or substitute. = 2 minutes.2. Xylene or substitute. = 2 minutes.3. Absolute alcohol. = 2 minutes.4. Absolute alcohol. = 2 minutes.5. 90% Alcohol. = 2 minutes.6. 90% Alcohol. = 2 minutes.7. 70% Alcohol. = 2 minutes.8. Tap water. - Rinse.9. Haematoxylin. - 5 minutes.
10. Blue in running tap water. = 5 minutes.11. Eosin. = 2 minutes.12. Running tap water. — Quick rinse.13. 70% Alcohol. = Quick rinse.14. 90% Alcohol. = 1 minute.15. 90% Alcohol. = 1 minute.16. Absolute alcohol. = 2 minutes.17. Absolute alcohol. - 2 minutes.18. Xylene or substitute. = 2 minutes.19. Xylene or substitute. - 2 minutes.20. Mount in synthetic mounting medium.
Result.
Nuclei. = Blue/purple/black.
All other structures. = Shades of pink/red.
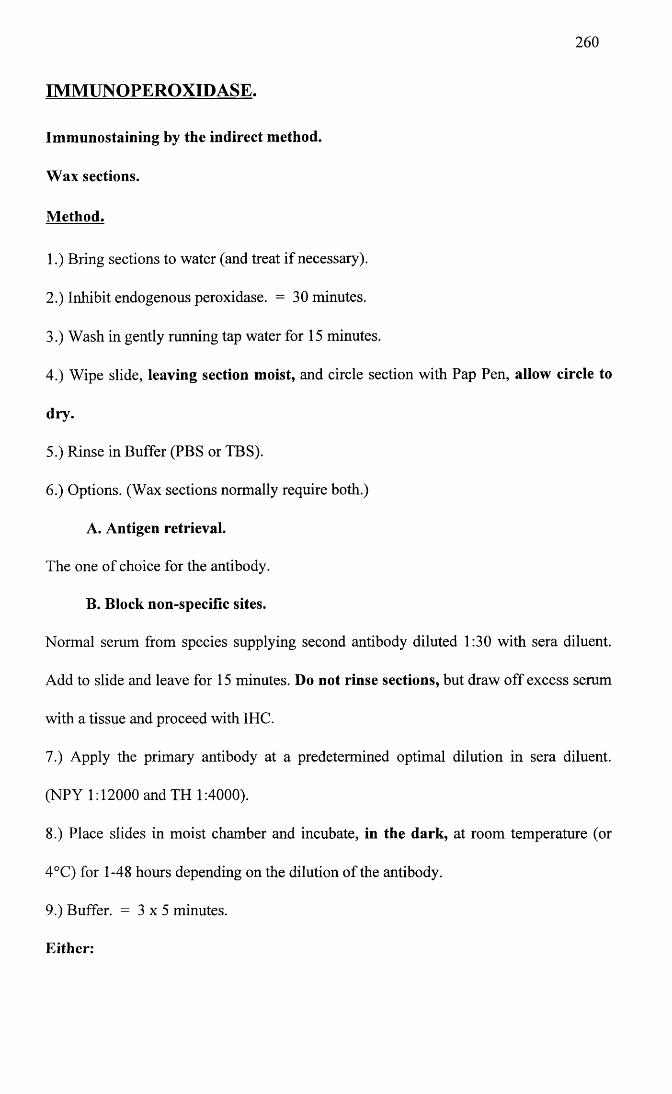
260
IMMUNOPEROXIDASE.
Immunostaining by the indirect method.
Wax sections.
Method.
1.) Bring sections to water (and treat if necessary).
2.) Inhibit endogenous peroxidase. = 30 minutes.
3.) Wash in gently running tap water for 15 minutes.
4.) Wipe slide, leaving section moist, and circle section with Pap Pen, allow circle to
dry.
5.) Rinse in Buffer (PBS or TBS).
6.) Options. (Wax sections normally require both.)
A. Antigen retrieval.
The one of choice for the antibody.
B. Block non-specific sites.
Normal serum from species supplying second antibody diluted 1:30 with sera diluent.
Add to slide and leave for 15 minutes. Do not rinse sections, but draw off excess serum
with a tissue and proceed with IHC.
7.) Apply the primary antibody at a predetermined optimal dilution in sera diluent.
(NPY 1:12000 and TH 1:4000).
8.) Place slides in moist chamber and incubate, in the dark, at room temperature (or
4°C) for 1-48 hours depending on the dilution of the antibody.
9.) Buffer. = 3 x 5 minutes.
Either:
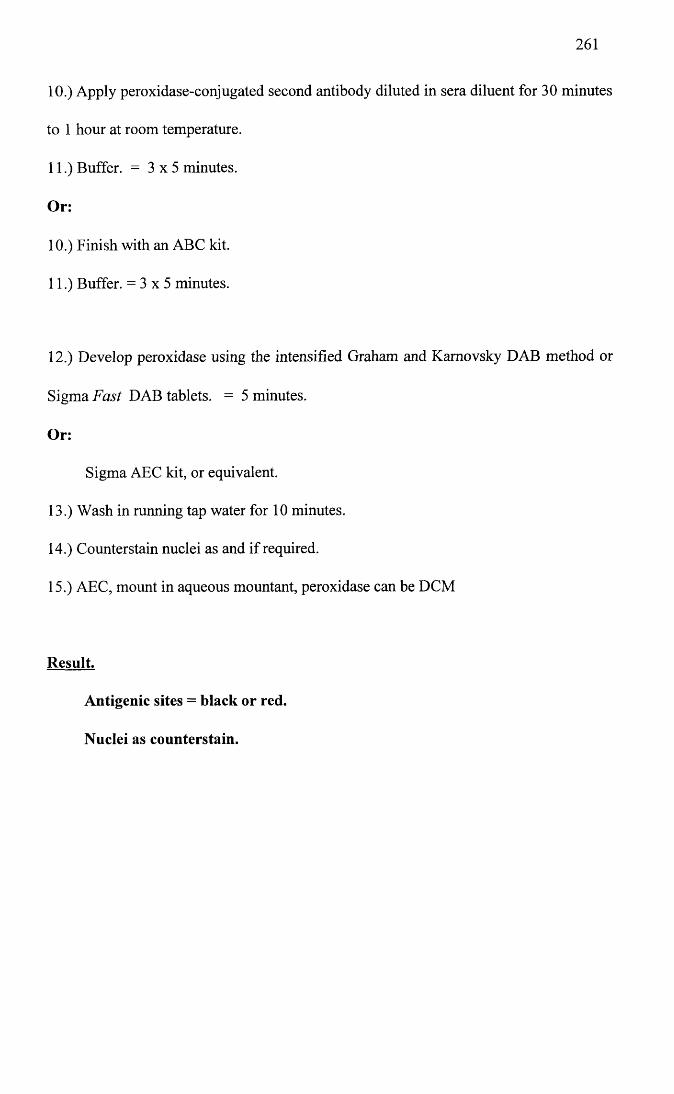
261
10.) Apply peroxidase-conjugated second antibody diluted in sera diluent for 30 minutes
to 1 hour at room temperature.
11.) Buffer. = 3 x 5 minutes.
Or:
10.) Finish with an ABC kit.
11.) Buffer. = 3 x 5 minutes.
12.) Develop peroxidase using the intensified Graham and Kamovsky DAB method or
Sigma Fast DAB tablets. = 5 minutes.
Or:
Sigma AEC kit, or equivalent.
13.) Wash in running tap water for 10 minutes.
14.) Counterstain nuclei as and if required.
15.) AEC, mount in aqueous mountant, peroxidase can be DCM
Result.
Antigenic sites = black or red.
Nuclei as counterstain.
262
IMMUNOPEROXIDASE.
Immunostaining by the indirect method.
Whole mounts.
Method.
Ian Montogomery uses needle dishes for this method.
1.) Fixation as sections.
2.) PBS/TBS + 0.2% Triton X-100. = 2 x 20 minutes. Use for all buffer rinses.
3.) Inhibit endogenous peroxidase. = 30 minutes.
4.) Wash in tap water for 15 minutes with several changes.
5.) Options. (Normally both)
A. Antigen retrieval.
The one of choice for the antibody. These specimens normally require a little longer.
B. Block non-specific sites.
Normal serum from species supplying second antibody diluted 1:30 with sera diluent.
Add to specimen and leave for 30 minutes. Do not rinse specimens and proceed with
IHC.
6.) Incubate in the primary antibody, at a predetermined optimal dilution in sera diluent,
overnight at room temperature (or 4°C) in the dark. (NPY 1:12000, TH 1:4000)
7.) Buffer. = 3 x 20 minutes.
Either:
8.) Apply peroxidase-conjugated second antibody diluted in sera diluent for 30 minutes
to 1 hour at room temperature.
9.) Buffer. = 3 x 5 minutes.
Or:
263
8.) Finish with an ABC kit.
9.) Buffer. = 3 x 5 minutes.
10.) Develop peroxidase using the intensified Graham and Kamovsky DAB method or
Sigma Fast DAB tablets. = 5 minutes.
Or:
Sigma AEC kit, or equivalent.
11.) Wash in several changes of tap water for 10 minutes.
12.) Counterstain nuclei as and if required.
13.) AEC, mount in aqueous mountant, peroxidase can be DCM
Result.
Antigenic sites, black or red.
Nuclei as counterstain.
264
REFERENCES
Aboud, R., Shafii, M. and Docherty, J.R. (1993) Investigation of the subtypes of a r adrenoceptor mediating contractions of rat aorta, vas deferens and spleen. Br. J. Pharmacol. 109, 80-87.
Ahlquist, R.P. (1948) A study of the adrenotropic receptors. Am. J. Physiol. 153, 586- 600.
Alabaster, V.A., Keir, R.F. and Peters, C.P. (1985) Comparison of activity of alpha- adrenoceptor agonists and antagonists in the dog and rabbit saphenous vein. Naunyn- Schmiedeberg's Arch Pharmacol 330, 33-36.
Alonzo-Llamazares, A., Zamanillo, D., Casanova, E., Ovalle, S. and Chinchetru, M.A. (1995) Molecular cloning of a ld- adrenergic receptor and tissue distribution of the three a j-adrenergic subtypes in mouse. Journal o f Neurochemistry 65, 2387-2392.
Angus, J.A., Cocks, T.M. and Satoh, K. (1986) a 2-Adrenoceptors and endothelium- dependent relaxation in canine large arteries. Br. J. Pharmacol. 88, 767-777.
Angus, J.A., Ferrier, C.P., Sudhir, K., Kaye, D.M. and Jennings, G.L. (1993) Impaired contraction and relaxation in skin resistance arteries from patients with congestive heart failure. Cardiovascular Research 27, 204-210.
Armstrong, P.W., Stopps, T.P., Ford, S.E. and De Bold, A.J. (1986) Rapid ventricular pacing in the dog; pathophysiologic studies of heart failure. Circulation 74, 1075-1084.
Arunlakshana, O. and Schild, H.O. (1959) Some quantitative uses of drug antagonists. Br. J. Pharmacol. 14, 48-58.
Balbao, M.A. and Insel, P.A. (1998) Stimulation of phospholipase D via ct]-adrenergic receptors in Madin-Darby canine kidney cells is independent of PKCa and -8 activation. Molecular Pharmacology 53, 221-227.
Baldessarini, R.J. (1996) Drugs and the treatment of psychiatric disorders. In: Hardman, J.G., Limbird, L.E., Molinoff, P.B., Ruddon, R.W. and Goodman Gilman, A. (Eds.) Goodman & Gilman’s The Pharmacological Basis o f Therapeutics, 9th edn. pp. 431- 459. McGraw-Hill]
Beau, S.L. and Saffitz, J.E. (1994) Transmural heterogeneity of norepinephrine uptake in failing human hearts. J. Am. Coll. Cardiol. 23, 579-585.
Beaulieu, M., BrakierGingras, L. and Bouvier, M. (1997) Upregulation of alpha(la)- and alpha(lb)-adrenergic receptor mRNAs in the heart of cardiomyopathic hamsters. Journal O f Molecular And Cellular Cardiology 29, 111-119.
Berk, B.C., Vekshtein, V., Gordon, H.M. and Tsuda, T. (1989) Angiotensin II- stimulated protein synthesis in cultured rat aortic smooth muscle cells. Hypertension 62, 749-756.
265
Berthelsen, S. and Pettinger, W.A. (1977) A functional basis for the classification of a- adrenergic receptors. Life Sciences 21, 595-606.
Black, J.W., Leff, P. and Shankley, N.P. (1985) Pharmacological analysis of the pentagastrin-tiotidine interaction in the mouse isolated stomach. Br. J. Pharmacol. 86, 589-599.
Blue, D.R.J., Bonhaus, D.W., Ford, A.P.W., Pflster, J.R., Sharif, N.A., Shieh, I.A., Vimont, R.L., Williams, T.J. and Clarke, D.E. (1995) Functional evidence equating the pharmacologically-defined a ,A- and cloned a 1c-adrenoceptor: Studies in the isolated perfused kidney of the rat. Br. J. Pharmacol. 115, 283-294.
Bohm, M., La Rosse, K., Schwinger, R. and Erdmann, E. (1995) Evidence for reduction of norepinephrine uptake sites in the failing human heart. J. Am. Coll. Cardiol. 25, 146- 153.
Boonen, H.C.M. and De Mey, J. (1990) G-proteins are involved in contractile responses of isolated mesenteric resistance arteries to agonists. Naunyn-Schmiedeberg's Archives o f Pharmacology 342, 462-468.
Booz, G.W. and Baker, K.M. (1996) Role of type 1 and type 2 angiotensin receptors in angiotensin II-induced cardiomyocyte hypertrophy. Hypertension 28, 635-640.
Brenner, B.M., Ballermann, B.J., Gunning, M.E. and Zeidel, M.L. (1990) Diverse biological actions of atrial natriuretic peptide. Physiol. Rev. 70, 665-699.
Bristow, M.R., Ginsburg, R., Minobe, W., Cubbicciotti, R.S., Sageman, W.S., Lurie, K., Billingham, M.E., Harrison, D.C. and Stinson, E.B. (1982) Decreased catecholamine sensitivity and p-adrenergic-receptor density in failing human hearts. The New England Journal o f Medicine 307, 205-211.
Bristow, M.R., Ginsburg, R., Umans, V., Fowler, M., Minobe, W., Rasmussen, R., Zera, P., Menlove, R., Shah, P., Jamieson, S. and Stinson, E.B. (1986) pr and p2-adrenergic- receptor subpopulations in nonfailing and failing human ventricular myocardium: Coupling of both receptor subtypes to muscle contraction and selective pr-receptor down-regulation in heart failure. Circ. Res. 59, 297-309.
Brown, C.M., MacKinnon, A.C., Redfem, W.S., Hicks, P.E., Kilpatrick, A.T., Small,C., Ramcharan, M., Clague, R.U., Clark, R.D., MacFarlane, C.B. and Spedding, M. (1993) The pharmacology of RS-15385-197, a potent and selective oc2-adrenoceptor antagonist. Br. J. Pharmacol. 108, 516-525.
Burt, R.P., Chappie, C.R. and Marshall, I. (1995) Evidence for a functional a 1A- (a lc-) adrenoceptor mediating contraction of the rat epididymal vas deferens and an a ]B- adrenoceptor mediating contraction of the rat spleen. Br. J. Pharmacol. 115, 467-475.
266
Caiman, C.R., Burnett, J.C. and Lerman, A. (1996) Enhanced coronary vasoconstriction to endothelin-b-receptor activation in experimental congestive-heart-failure. Circulation 93, 646-651.
Cannon, W.B. and Rosenbleuth, A. (1933) Studies on conditions of activity in endocrine organs. Sympathin E and sympathin I. Am. J. Physiol 104, 557-574.
Carvajal, A., Velasco, A., Arias, L.H.M. and Maroto, M. (1995) Age-related-changes in contractile responses to noradrenaline in isolated blood-vessels from rat and rabbit. Journal o f Autonomic Pharmacology 15, 321-326.
Castagnaro, M., Amedeo, S., Bertolotto, A., Manzardo, E., Riccio, A. and Guarda, F. (1997) Morphological and biochemical investigations of mitral valve endocardiosis in pigs. Research In Veterinary Science 62, 121-125.
Catterall, W. and Mackie, K. (1996) Local anesthetics. In: Hardman, J.G., Limbird, L.E., Molinoff, P.B., Ruddon, R.W. and Goodman Gilman, A. (Eds.) Goodman & Gilman's The Pharmacological Basis o f Therapeutics, 9th edn. pp. 331-348. McGraw- Hill]
Chang, D.J., Chang, T.K., Yamanishi, S.S., Rick Salazar, F.H., Kosaka, A.H., Khare, R., Bhakta, S., Jasper, J.R., Shieh, I., Lesnick, J.D., Ford, A.P.D.W., Daniels, D.V., Eglen, R.M., Clarke, D.E., Bach, C. and Chan, H.W. (1998) Molecular cloning, genomic characterization and expression of novel human a ,A-adrenoceptor isoforms. FEBS letts 422, 279-283.
Chappie, C.R. (1997) Alpha-blocker update: Prostate-selective blockade. Current Opinion in Urology 7, 8-14.
Chomczynski, P. and Sacchi, N. (1987) Single-step method of RNA isolation by acid guanidinium thiocyanate-phenol-chloroform extraction. Anal. Biochem. 162, 156-159.
Clark, A.J. (1937) General Pharmacology. In: Clark, A.J. (Ed.) Hejfter's Hanbuch der Experimentallen Pharmakologie, Erganzungswerk. Volume 4. pp. 1-223. Berlin: Springer-Verlag]
Clavell, A.L., Mattingly, M.T., Stevens, T.L., Nir, A., Wright, R.S., Aarhus, L.L., Heublein, D.M. and Burnett Jr, J.C. (1996) Angiotensin converting enzyme inhibition modulates endogenous endothelin in chronic canine thoracic inferior vena caval constriction. J. Clin. Invest. 97, 1286-1292.
Coats, A.J.S. (1996) The "Muscle Hypothesis" of chronic heart failure. Journal O f Molecular And Cellular Cardiology 28, 2255-2262.
Cobb, M.A. (1992) Idiopathic dilated cardiomyopathy: Advances in aetiology, pathogenesis and management. J. Small. Anim. Pract. 33, 113-118.
Cohn, J.N., Levine, T.B., Olivari, M.T., Garberg, V., Lura, D., Francis, G.S., Simon,A.B. and Rector, T. (1984) Plasma norepinephrine as a guide to prognosis in patients
267
with chronic congestive heart failure. The New England Journal o f Medicine 311, 819- 823.
Cohn, J.N. (1995) Critical review of heart failure - the role of left ventricular remodeling in the therapeutic response. Clinical Cardiology 18, 4-12.
CONSENSUS trial study group (1987) Effects of enalapril on mortality in severe congestive heart failure. Results of the cooperative north Scandinavian enalapril survival study. The New England Journal o f Medicine 316, 1429-1435.
Constantine, J.W., Lebel, W. and Archer, R. (1982) Functional postsynaptic a 2-but not a j-adrenoceptors in the dog saphenous vein exposed to phenoxybenzamine. Eur. J. Pharm. 85, 325-329.
Cotecchia, S., Schwinn, D.A., Randall, R.R., Lefkowitz, R.J., Caron, M.G. and Kobilka,B.K. (1988) Molecular cloning and expression of the cDNA for the hamster a r adrenergic receptor. Proc. Natl. Acad. Sci. USA 85, 7159-7163.
Cotecchia, S., Kobilka, B.K., Daniel, K.W., Nolan, R.D., Lapetina, E.Y., Caron, M.G., Lefkowitz, R.J. and Regan, J.W. (1990) Multiple second messenger pathways of a- adrenergic receptor subtypes expressed in eukaryotic cells. Journal O f Biological Chemistry 265, 63-69.
Cotecchia, S., Ostrowski, J., Kjelsberg, M.A., Caron, M.G. and Lefkowitz, R.J. (1992) Discrete amino acid sequences of the a,-adrenergic receptor determine the selectivity of coupling to phosphatidylinositol hydrolysis. The Journal o f Biological Chemistry 267, 1633-1639.
Cotecchia, S., Lattion, A.L., Diviani, D. and Cavalli, A. (1995) Regulation of signal- transducing polypetides. Biochemical Society Transactions 23, 121-125.
Cox, S.L., Story, D.F. and Ziogas, J. (1996) Angiotensin II receptors involved in the enhancement of noradrenergic transmission in the caudal artery of the spontaneously hypertensive rat. Br. J. Pharmacol. 119, 965-975.
Daly, C.J., McGrath, J.C. and Wilson, V.G. (1988a) An examination of the postjunctional a-adrenoceptor subtypes for (-) -noradrenaline in several isolated blood vessels from the rabbit. Br. J. Pharmacol. 95, 473-484.
Daly, C.J., Dunn, W.R., McGrath, J.C. and Wilson, V.G. (1988b) An attempt at selective protection from phenoxybenzamine of postjunctional a-adrenoceptor subtypes mediating contractions to noradrenaline in the rabbit isolated saphenous vein. Br. J. Pharmacol. 95, 501-511.
Daniel, E.E., Low, A.M., Gaspar, V., Lu-Chao, H., Green, J., Akrong, J., Deurksen, S., Soyka, C., Chen, C.K., Boyd, J. and Kwan, C.Y. (1996) Unusual a-adrenoceptor subtype in canine saphenous vein: Comparison to mesenteric vein. Br. J. Pharmacol. 117, 1535-1543.
268
Daniels, D.Y., Gever, J.R., Meloy, T.D., Chang, D.J., Kosaka, A.H., Clarke, D.E. and Ford, A.P.D.W. (1996) Functional pharmacological characteristics of human, rat and rabbit cloned a 1A-adrenoceptors expressed in Chinese hamster ovary (CHO-K1) cells. Br. J. Pharmacol. 119, 360P(Abstract)
De Mey, J. and Vanhoutte, P.M. (1981) Uneven distribution of postjunctional alpha,- and alpha2-like adrenoceptors in the canine arterial and venous smooth muscle. Circ. Res. 48, 875-884.
Deng, C.L. and Cornett, L.E. (1998) Regulation of a lb-adrenergic receptor gene expression in rat liver cell lines. Biochimica Et Biophysica Acta 1219, 669-676.
Deng, X.F., Chemtob, S. and Varma, D.R. (1996) Characterization of a 1D-adrenoceptor subtype in rat myocardium, aorta and other tissues. Br. J. Pharmacol 119, 269-276.
Deplanne, V. and Galzin, A.M. (1996) Functional characterization of alpha-1- adrenoceptor subtypes in the prostatic urethra and trigone of male rabbit. J. Pharm. Exp. Ther. 278, 527-534.
Dibnerdunlap, M.E. and Thames, M.D. (1992) Control of sympathetic-nerve activity by vagal mechanoreflexes is blunted in heart-failure. Circulation 86, 1929-1934.
Diet, F., Pratt, R.E., Berry, G.J., Momose, N., Gibbons, G. and Dzau, V.J. (1996) Increased accumulation of tissue ACE in human atherosclerotic coronary artery disease. Circulation 94, 2756-2767.
Diviani, D., Lattion, A.L. and Cotecchia, S. (1997) Characterization of the phosphorylation sites involved in G protein-coupled receptor kinase- and protein kinase C-mediated desensitization of the a ]B-adrenergic receptor. The Journal o f Biological Chemistry 272,28712-28719.
Docherty, J.R., MacDonald, A. and McGrath, J.C. (1979) Further subclassification of a- adrenoceptors in the cardiovascular system, vas deferens and annococcygeus of the rat. Br. J. Pharmacol. 67, 421P-422P.
Docherty, J.R. and O’Rourke, M. (1997) The alpha-adrenoceptor-mediated actions of chloroethylclonidine. General Pharmacology 28, 197-201.
Dolnick, B.J. and Pink, J.J. (1983) 5-Fluoracin modulation of (DHFR) /dihydrofolate reductase RNA levels in methotrexate-resistant KB cells. Journal O f Biological Chemistry 258, 13299-13306.
Drew, G.M. (1985) What do antagonists tell us about a-adrenoceptors? Clinical Science 68(Suppl 10), 15s-19s.
Drew, G.M. and Whiting, S.B. (1979) Evidence for two distinct types of postsynaptic a- adrenoceptor in vascular smooth muscle in vivo. Br. J. Pharmacol. 67, 207-215.
269
Drexler, H., Hayoz, D., Munzel, T., Homig, B., Just, H., Brunner, H. and Zelis, R. (1992) Endothelial function in chronic congestive heart failure. Am. J. Cardiol 69, 1596-1601.
Drexler, H. and Wenyan, L. (1992) Endothelial dysfunction of hindquarter resistance vessels in experimental heart failure. American Journal O f Physiology-Heart And Circulatory Physiology 262, 1640-1645.
Dubey, R., Roy, A. and Overbeck, H.W. (1992) Culture of renal arteriolar smooth muscle cells. Mitogenic responses to angiotensin II. Circ. Res. 71, 1143-1152.
Dubovich, M.L. and Langer, S.Z. (1974) Negative feed-back regulation of noradrenaline release by nerve stimulation in the perfused cat's spleen: differences in potency of phenoxybenzamine in blocking the pre-and postsynaptic adrenergic receptors. J. Physiol 237, 505-519.
Dupuis, J., Goresky, C.A. and Fournier, A. (1996) Pulmonary clearance of circulating endothelin-1 in dogs in vivo: Exclusive role of ET(B) receptors. Journal o f Applied Physiology 81, 1510-1515.
Eisenhofer, G., Friberg, P., Rundqvist, B., Quyyumi, A., Lambert, G., Kaye, D., Kopin, I., Goldstein, D. and Esler, M. (1996) Cardiac sympathetic nerve function in congestive heart failure. Circulation 93, 1667-1676.
Elliott, J. (1997) Alpha-adrenoceptors in equine digital veins: Evidence for the presence of both alpha(l) and alpha(2)-receptors mediating vasoconstriction. Journal O f Veterinary Pharmacology And Therapeutics 20, 308-317.
Eisner, D., Muntze, A., Kromer, E.P. and Riegger, G.A.J. (1991) Systemic vasoconstriction induced by inhibition of nitric oxide synthesis is attenuated in conscious dogs with heart failure. Cardiovascular Research 25, 438-440.
Fagura, M.S., Lydford, S.J. and Dougall, I.G. (1997) Pharmacological classification of alphal-adrenoceptors mediating contractions of rabbit isolated ear artery: Comparison with rat isolated thoracic aorta. Br. J. Pharmacol. 120, 247-258.
Faure, C., Pimoule, C., Arbilla, S., Langer, S.Z. and Graham, D. (1994a) Expression of alphal-adrenoceptor subtypes in rat tissues: Implications for alphal-adrenoceptor classification. European Journal o f Pharmacology - Molecular Pharmacology Section 268, 141-149.
Faure, C., Pimoule, C., Vallancien, G., Langer, S.Z. and Graham, D. (1994b) Identification of alphal-adrenoceptor subtypes present in the human prostate. Life Sciences 54, 1595-1605.
Faure, C., Gouhier, C., Langer, S.Z. and Graham, D. (1995) Quantification of alphal- adrenoceptor subtypes in human tissues by competitive RT-PCR analysis. Biochemical and Biophysical Research Communications 213, 935-943.
270
Feng, Q., Bergdahl, A., Lu, X., Sun, X., Edvinsson, L. and Hedner, T. (1996) Vascular alpha2-adrenoceptor function is decreased in rats with congestive heart failure. Cardiovascular Research 31, 577-584.
Feng, Q., Callow, I. and Arnold, M. (1994) Alpha-1 and alpha-2 adrenoceptor responsiveness in heart failure patients with severe or mild to moderate left ventricular dysfunction. Circulation 90 no4 part 2 .1 491 (Abstract)
Fett, D.L., Cavero, P.G. and Burnett, J.C. (1993) Low-dose atrial-natriuretic-factor and furosemide in experimental acute congestive-heart-failure. Journal O f The American Society O f Nephrology 4, 162-167.
Flavahan, N.A., Rimele, T.J., Cooke, J.P. and Vanhoutte, P.M. (1984) Characterization of postjunctional alpha-1 and alpha-2 adrenoceptors activated by exogenous or nerve- released norepinephrine in the canine saphenous vein. The Journal o f Pharmacology and Experimental Therapeutics 230 3, 699-705.
Flavahan, N.A. and Vanhoutte, P.M. (1986a) a r Adrenoeptor subclassification in vascular smooth muscle. TIPS September, 347-349.
Flavahan, N.A. and Vanhoutte, P.M. (1986b) Alpha-1 and alpha-2 adrenoceptor response coupling in canine saphenous and femoral veins. J. Pharm. Exp. Ther. 238 no 1, 131-138.
Ford, A.P.D.W., Arredondo, N.F., Blue, D.R., Jnr, Bonhaus, D.W., Jasper, J., Shannon Kava, M., Lesnick, J., Pfister, J.R., Amy Shieh, I., Vimont, R.L., Williams, T.J., McNeal, J.E., Stamey, T.A. and Clarke, D.E. (1996a) RS-17053 (N-[2-(2- Cyclopropylmethoxyphenoxy)ethyl]-5-chloro-a, a-dimethyl-1 //-indole-3 -ethanamine hydrochloride), a selective a 1A_adrenoceptor antagonist, displays low affinity for functional a,-adrenoceptors in human prostate: Implications for adrenoceptor classification. Molecular Pharmacology 49, 209-215.
Ford, A.P.D.W., Daniels, D.V., Chang, D.J., Diaz, M.R., Gever, J.R., Jasper, J.R., Lesnick, J.D. and Clarke, D.E. (1996b) The putative a ]L- receptor (AR): A distinct pharmacological state of the a ]A-adrenoceptor. Br. J. Pharmacol. 118, 29P(Abstract)
Ford, A.P.D.W., Daniels, D.V., Chang, D.J., Gever, J.R., Jasper, J.R., Lesnick, J.D. and Clarke, D.E. (1997a) Pharmacological pleiotropism of the human recombinant alpha(la)-adrenoceptor: Implications for alpha(l)-adrenoceptor classification. Br. J. Pharmacol. 121, 1127-1135.
Ford, A.P.D.W., Daniels, D.V., Gever, J.R., Jasper, J.R., Lesnick, J.D., Meloy, T.D., Clarke, D.E. and Chang, D.J. (1997b) Human cloned a ]A-adrenoceptor (AR) isoforms display a ]L-AR pharmacological profiles in functional studies. The Pharmacologist 39, 3 9( Abstract)
Ford, A.P.W., Williams, T.J., Blue, D. and Clarke, D.E. (1994) a 1-Adrenoceptor classification: Sharpening Occam's razor. TIPS 15, 167-170.
271
Forray, C., Bard, J.A., Laz, T.M., Smith, K.E., Vaysse, P.J.J., Weinshank, R.L., Gluchowski, C. and Branchek, T.A. (1994a) Comparison of the pharmacological properties of the cloned bovine , human, and rat a lc-adrenergic receptors. Faseb Journal 8, A353
Forray, C., Bard, J.A., Wetzel, J.M., Chiu, G., Shapiro, E., Tang, R., Lepor, H., Hartig, P.R., Weinshank, R.L., Branchek, T. and Gluchowski, C. (1994b) The a r adrenergic receptor that mediates smooth muscle contraction in human prostate has the pharmacological properties of the cloned human a ]c subtype. Molecular Pharmacology 45, 703-708.
Forster, C., Carter, S.L. and Armstrong, P.W. (1987) In vitro a-agonist activity in canine blood vessels following experimental heart failure. Clin. Invest. Med. 5, B53
Forster, C., Carter, S.L. and Armstrong, P.W. (1989) a r Adrenoceptor activity in arterial smooth muscle following congestive heart failure. Canadian Journal O f Physiology And Pharmacology 67, 110-115.
Forster, C., Wanes, D. and Ann strong, P.W. (1991) Novel vascular effects of isoprenaline following pacing-induced heart failure in the dog. Eur. J. Pharm. 200, 251- 257.
Forster, C., Naik, G. and Armstrong, P.W. (1994) Noradrenaline biosynthesis and metabolism during development and recovery from pacing-induced heart failure in the dog. Canadian Journal O f Physiology And Pharmacology 72, 45-49.
Forster, C. (1995) Inhibition of vascular contractions to alpha-adrenoceptor agonists by polymyxin-b - impact of heart-failure state. Eur. J. Pharm. 283, 241-250.
Forster, C. (1996) Interaction of 5-methyl-urapidil with alpha(l)-adrenoceptors in canine blood vessels: Impact of pacing-induced heart failure. Eur. J. Pharm. 318, 55-63.
Forster, C. and Armstrong, P.W. (1990) Pacing-induced heart failure in the dog: Evaluation of peripheral vascular a-adrenoceptor subtypes. Journal O f Cardiovascular Pharmacology 16, 708-718.
Forster, C. and Campbell, P.M. (1993) Nifedipine inhibits responses to alpha- adrenoceptor stimulation in canine blood vessels: Impact of heart failure. Eur. J. Pharm. 242,119-128.
Francis, G.S., Goldsmith, S.R., Levine, T.B., Olivari, M.T. and Cohn, J.N. (1984) The neurohumoral axis in congestive heart failure. Ann. Int. Med. 101, 370-377.
Furchgott, R.F. (1981) Adrenergic and dopaminergic peripheral receptors. Proceedings o f the 4th Meeting on Adrenergic Mechanisms, Porto, Portugal 10-29. (Abstract)
Furchgott, R.F. and Zawadzki, J.V. (1980) The obligatory role of endothelial cells in the relaxation of arterial smooth muscle by acetylcholine. Nature 288, 374-376.
272
GarciaSainz, J.A., Romero-Avila, M., Villalobos-Molina, R. and Minneman, K. (1995) a,-Adrenoceptor subtype selectivity of tamsulosin: Studies using livers from different species. European Journal o f Pharmacology - Molecular Pharmacology Section 289, 1- 7.
Geistefer, A.A.T., Peach, M.J. and Owens, G.K. (1988) Angiotensin II induces hypertrophy, not hyperplasia of cultured rat aortic smooth muscle cells. Circ. Res. 62, 749-756.
Gill, G.W., Frost, J.K. and Miller, K.A. (1974) A new formula for a half-oxidised hematoxylin that neither overstains not requires differentiation. Acta Cytol. 18, 300-311.
Gilman, A.G. (1986) Receptor-regulated G proteins. Trends in Neurosciences 9, 460- 463.
Godfraind, T., Miller, R.C. and Socrates-Lima, J. (1982) Selective a r and a 2- adrenoceptor agonist-induced contractions and 45Ca2+ fluxes in the rat isolated aorta. Br. J. Pharmacol. 77, 597-604.
Goetz, A.S., Lutz, M.W., Rimele, T.J. and Saussy, D.L. (1994) Characterization of alpha-1-adrenoceptor subtypes in human and canine prostate membranes. J. Pharm. Exp. Ther. 271, 1228-1233.
Goetz, A.S., King, H.K., Ward, S.D.C., True, T.A., Rimele, T.J. and Saussy, D.L. (1995) BMY7378 is a selective antagonist of the D subtype of a x-adrenoceptors. Eur. J. Pharm. 272, R5-R6.
Gonzalez-Cabrera, P.J., Iversen, P.L., Liu, M.F., Scofield, M.A. and Jeffries, W.B. (1998) Selective inhibition of the a ]B-adrenergic receptor expression and function using a phosphorothioate antisense oligodeoxynucleotide. Molecular Pharmacology 53, 1034- 1039.
Graham, R.M., Perez, D., Hwa, J. and Piascik, M. (1996) a r Adrenergic receptor subtypes molecular structure, function , and signaling. Circ. Res. 78, 737-749.
Grassi, G., Seravalle, G., Cattaneo, B.M., Lanfranchi, A., Vailati, S., Giannattasio, C., Del Bo, A., Sala, C., Bolla, G., Pozzi, M. and Mancia, G. (1995) Sympathetic activation and loss of reflex sympathetic control in mild congestive heart failure. Circulation 92, 3206-3211.
Graziadei, I., Zemig, G., Boer, R. and Glossman, H. (1989) Stereoselective binding of niguldipine enantiomers to a ]A-adrenoceptors labeled with [3H]5-methyl-urapidil. European Journal o f Pharmacology - Molecular Pharmacology Section 172, 329-337.
Gross, G., Hanft, G. and Rugevics, C. (1988) 5-Methyl-urapidil discriminates between subtypes of the alphal-adrenoceptor. Eur. J. Pharm. 151, 333-335.
Gross, G., Hanft, G. and Mehdom, H. (1989) Demonstration of a ]A- and a 1B- adrenoceptor binding sites in human brain tissue. Eur. J. Pharm. 169, 325-328.
273
Guan, Y., Kwan, C. and Daniel, E. (1990) Evidence against the role of ocj-adrenoceptor reserve in buffering the inhibitory effect of nifedipine on the contractility of canine vascular smooth muscle. Caw. J. Physiol. Pharmacol. 68, 1346-1350.
Guarda, F., Griglio, B. and Rossignoli, M. (1993) Malformations of the heart and endocardiosis in pigs. Deutsche Tierarztliche Wochenschrift 100, 443-445.
Guarino, R. D., Perez, D. M. and Piascik, M. T. (1996) Recent advances in the molecular pharmacology of the a r adrenergic receptors. Cell Signal. 8 323-333.
Guimaraes, S., Paiva, M.Q. and Moura, D. (1987) Alpha2-adrenoceptor-mediated responses to so-called selective alph^-adrenoceptor agonists after partial blockade of alpha!-adrenoceptors. Naunyn-Schmiedeberg’s Arch Pharmacol 335, 397-402.
Guimaraes, S., Moura, D., Nunes, J.P., Vaz-da Silva, M.J. and Guimaraes, J.T. (1991) Alphaj- and alpha2-adrenoceptors at different levels of the canine saphenous vein. J. Neural. Transm. [Suppl] 34, 163-169.
Guimaraes, S. and Nunes, J.P. (1990) The effectiveness of a 2-adrenoceptor activation increases from the distal to the proximal part of the veins in canine limbs. Br. J. Pharmacol. 11, 387-393.
Guimaraes, S. and Paiva, M.Q. (1987) Postsynaptic a-adrenoceptor reserve and the shift of the concentration-response curves to the right, as caused by the irreversible a- adrenoceptor antagonist phenoxybenzamine. Br. J. Pharmacol. 92, 505-512.
Gurdal, H., Cai, G.P. and Johnson, M.D. (1995) Alpha(l)-adrenoceptor responsiveness in the aging aorta. Eur. J. Pharm. 274, 117-123.
Gurdal, H., Seasholtz, T.M., Wang, H., Brown, R.D., Johnson, M.D. and Friedman, E. (1997) Role of Gaq or Gao proteins in a,-adrenoceptor subtype-mediated responses in Fischer 344 rat aorta. Molecular Pharmacology 52, 1064-1070.
Gwathmey, J.K. and Paige, J.A. (1994) Endothelin and vasoactive peptides: New cardiovascular mediators. Journal O f Veterinary Pharmacology And Therapeutics 17, 420-425.
Habib, F. and Oakley, C. (1994) Enhanced basal nitric oxide production in heart failure: Another failed counter-regulatory vasodilator mechanism? Lancet 344, 371-373.
Haggstrom, J., Hannson, K., Kvart, C. and Swenson, L. (1992) Chronic valvular disease in the cavalier King Charles Spaniel in Sweden. Veterinary record 131, 549-553.
Haidet, G.C., Wennberg, P.W. and Rector, T.S. (1995) Aging and vasoreactivity - in- vivo responses in the beagle hindlimb. American Journal O f Physiology-Heart And Circulatory Physiology 37, H 92-H 99.
274
Hair, W.M., Hughes, A.D. and Sever, P.S. (1988) Phenylephrine: is it a selective a r adrenoceptor agonist. Br. J. Pharmacol. 95, 860P(Abstract)
Hall, J.E. (1986) Control of sodium excretion by angiotensin II: intrarenal mechanisms and blood pressure regulation. American Journal o f Physiology - Regulatory Integrative and Comparative Physiology 250, R960-R972.
Hamlin, R.L. (1988) Pathophysiology of heart failure. In: Fox, P.R. (Ed.) Canine and feline cardiology, pp. 159-170. New York: Churchill Livingstone]
Hamlin, R.L., Benitz, A.M., Ericsson, G.F., Cifelli, S. and Daurio, C.P. (1996) Effects of enalapril on exercise tolerance and longevity in dogs with heart-failure produced by iatrogenic mitral regurgitation. Journal O f Veterinary Internal Medicine 10, 85-87.
Han, C., Abel, P.W. and Minneman, K.P. (1987a) alphal-Adrenoceptor subtypes linked to different mechanisms for increasing intracellular Ca2+ in smooth muscle. Nature 329, 333-335.
Han, C., Abel, P.W. and Minneman, K.P. (1987b) Heterogeneity of alphal-adrenergic receptors revealed by chloroethylclonidine. Molecular Pharmacology 32, 505-510.
Han, C., Wilson, K.M. and Minneman, K.P. (1990) alphal-Adrenergic receptor subtypes and formation of inositol phosphates in dispersed hepatocytes and renal cells. Molecular Pharmacology 37, 903-910.
Hanft, G. and Gross, G. (1989) Subclassification of a,-adrenoceptor recognition sites by urapidil derivatives and other selective antagonists. Br. J. Pharmacol. 97, 691-700.
Hasking, G., Esler, M., Jennings, G., Burton, D., Johns, J. and Komer, P. (1986) Norepinephrine spillover to plasma in patients with congestive heart failure: evidence of increased overall and cardiorenal sympathetic nervous activity. Circulation 73 no 4. 615-621.
Hayoz, D., Drexler, H., Munzel, T., Homig, B., Zeiher, A., Just, H., Brunner, H. and Zelis, R. (1993) Flow-mediated arterial dilation is abnormal in congestive heart failure. Circulation 87 SuppI VII, VII-92-VII-96.
Hicks, P.E., Barras, M., Herman, G., Mauduit, P., Armstrong, M. and Rossignol, B. (1991) -Adrenoceptor subtypes in dog saphenous vein that mediate contraction and inositol phosphate production. Br. J. Pharmacol. 102, 151-161.
Hieble, J.P., Bylund, D.B., Clarke, D.E., Eikenburg, D.C., Langer, S.Z., Lefkowitz, R.J., Minneman, K.P. and Ruffolo, R.R., Jr. (1995) International Union of Pharmacology X. Recommendation for nomenclature of a,-adrenoceptors: Consensus update.Pharmacological Reviews 47 2, 267-270.
Hieble, J.P. and Ruffolo, R.R., Jr. (1996) Pharmacotherapy of benign prostatic hypertrophy with alphal-adrenoceptor antagonists. Pharmacology Communications 8, 251-256.
275
Higgins, C.B., Vatner, S.F., Franklin, D. and Braunwald, E. (1972) Effects of experimentally produced heart failure on the peripheral vascular response to severe exercise in conscious dogs. Circ. Res. 31, 186-194.
Himura, Y., Felten, S.Y., Kashiki, M., Lewandowski, T.J., Delehanty, J.M. and Liang C, S. (1993) Cardiac noradrenergic nerve terminal abnormalities in dogs with experimental congestive heart failure. Circulation 88, 1299-1309.
Hirasawa, A., Shibata, K., Horie, K., Takei, Y., Obika, K., Tanaka, T., Muramoto, N., Takagaki, K., Yano, J. and Tsujimoto, G. (1995) Cloning, functional expression and tissue distribution of human a ]c-adrenoceptor splice variants. FEBS letts 363, 256-260.
Hirasawa, A., Sugawara, T., Awaji, T., Tsumaya, K., Ito, H. and Tsujimoto, G. (1997) Subtype-specific differences in subcellular localization of alpha(l)- adrenoceptors: chloroethylclonidine preferentially alkylates the accessible cell surface alpha(l)- adrenoceptors irrespective of the subtype. Molecular Pharmacology 52, 764-770.
Hirasawa, A., Awaji, T., Sugawara, T., Tsujimoto, A. and Tsujimoto, G. (1998) Differential mechanism for the cell surface sorting and agonist-promoted internalization of the a 1B-subtype. Br. J. Pharmacol. 124, 55-62.
Hirooka, Y., Imaizumi, T., Tagawa, T., Shiramoto, M., Endo, T., Ando, S. and Takeshita, A. (1994) Effects of L-arginine on impaired acetylcholine-induced and ischaemic vasodilation of the forearm in patients with heart failure. Circulation 90, 658- 668 .
Hoick, M. I., Jones, C. H. M. and Haeusler, G. (1983) Differential interactions of clonidine and methoxamine with the postsynaptic alphal-adrenoceptor of rabbit main pulmonary artery. J. Cardiovasc. Pharmacol., 5, 240-248.
Horie, K., Itoh, H. and Tsujimoto, G. (1995) Hamster a 1B-adrenergic receptor directly activates Gs in the transfected hamster ovary cells. Molecular Pharmacology 48, 392- 400.
Hu, Z., Shi, X., Okazaki, M. and Hoffman, B.B. (1995) Angiotensin II induces transcription and expression of a,-adrenergic receptors in vascular smooth muscle cells. American Journal o f Physiology - Heart and Circulatory Physiology 37, H1006-H1014.
Ianuzzo, C.D., Ianuzzo, S.E., Chalfoun, N., Feild, M., Locke, M., Fernandez, J. and Chiu, R.C.J. (1996) Cardiomyoplasty - comparison of latissimus-dorsi muscles of 3 large mammals with that of human. Journal O f Cardiac Surgery 11, 30-36.
Ibarra, M., Terron, J.A., LopezGuerrero, J.J. and VillalobosMolina, R. (1997) Evidence for an age-dependent functional expression of alpha(lD)-adrenoceptors in the rat vasculature. Eur. J. Pharm. 322, 221-224.
Indolfi, C., Maione, A.G., Volpe, M., Rapacciuolo, A., Esposito, G., Ceravolo, R., Rendina, V., Condorelli, M. and Chiariello, M. (1994) Forearm vascular responsiveness
276
to alpha(l)-adrenoceptor and alpha(2)-adrenoceptor stimulation in patients with congestive-heart- failure. Circulation 90, 17-22.
Jenkinson, D.H. (1991) How we describe competitive antagonists: three questions of usage. Trends In Pharmacological Sciences 12, 53-54.
Jondeau, G., Katz, S.D., Goldberger, M., McCarthy, M., Bourdarias, J.P. and LeJemtel, T.H. (1995) Active skeletal muscle mass and cardiopulmonary reserve. Failure to attain peak aerobic capacity during maximal bicycle exercise in patients with severe congestive heart failure. Circulation 86, 1351-1356.
Jones, S.M., Deng, C.L., MacLeod, V. and Cornett, L.E. (1997) Evidence for alternative splicing in hepatic a 1B-adrenergic receptor gene expression. Journal o f Receptor and Signal Transduction Research 17, 815-832.
Kaiser, L., Spickard, R.C. and Bari Olivier, N. (1989) Heart failure depresses endothelium-dependent responses in canine femoral artery. American Journal o f Physiology - Heart and Circulatory Physiology 256, H962-H967.
Kaiser, L. and Ptu, S. (1992) Effects of increasing age on vascular responses of the in vivo femoral artery of adult beagles. Gerontology 38, 121-126.
Kamata, K. and Makino, A. (1997) A comparative study on the rat aorta and mesenteric arterial bed of the possible role of nitric oxide in the desensitization of the vasoconstrictor response to an alpha(l)-adrenoceptor agonist. Br. J. Pharmacol. 120, 1221-1228.
Kariya, T., Minatoguchi, S., Ohno, T., Yamashita, K., Uno, Y., Arai, M., Koshiji, M., Fujiwara, T. and Fujiwara, H. (1997) Infarct size-reducing effect of ischaemic preconditioning is related to alpha(lb)-adrenoceptors but not to alpha(la)-adrenoceptors in rabbits. Journal O f Cardiovascular Pharmacology 30, 437-445.
Katz, S., Biasucci, L., Sabba, C., Strom, J., Galvao, M., Solomon, S., Nikolic, S., Forman, R. and LeJementel, T. (1992) Impaired endothelium-mediated vasodilation in the peripheral vasculature of patients with congestive heart failure. J. Am. Coll. Cardiol. 19,918-925.
Katz, S.D. (1995) The role of endothelium-derived vasoactive substances in the pathophysiology of exercise intolerance in patients with congestive heart failure. Progress in Cardiovascular Diseases XXXVIII, 23-50.
Keene, B.W. (1988) Chronic valvular disease in the dog. In: Fox, P.R. (Ed.) Canine and feline cardiology, pp. 409-418. New York: Churchill Livingstone]
Keene, B.W. (1996) Management of canine dilated cardiomyopathy. Canine Practice 21,27-31.
277
Kenakin, T. (1997) Differences between natural and recombinant G protein-coupled receptor systems with varying receptor/G protein stoichiometry. Trends In Pharmacological Sciences 18, 447-491.
Kenakin, T.P. (1982) The Schild regression in the process of receptor classification. Can. J. Physiol. Pharmacol. 60, 249-265.
Kenakin, T.P. (1992) Tissue response as a functional discriminator of receptor heterogeneity: Effects of mixed receptor populations on Schild regressions. Molecular Pharmacology 41, 699-707.
Kenakin, T.P., Bond, R.A. and Bonner, T.I. (1992) II. Definition of pharmacological receptors. Pharmacological Reviews 44, 351-362.
Kenny, B.A., Chalmers, D.H., Philpott, P.C. and Naylor, A.M. (1995) Characterization of an a ID-adrenoceptor mediating the contractile response of the rat aorta to noradrenaline. Br. J. Pharmacol. 115, 981-986.
Kenny, B.A., Miller, A.M., Williamson, I.J.R., Oconnell, J., Chalmers, D.H. and Naylor, A.M. (1996) Evaluation of the pharmacological selectivity profile of alpha-1- adrenoceptor antagonists at prostatic alpha-1-adrenoceptors -binding, functional and in- vivo studies. Br. J. Pharmacol. 118, 871-878.
Kimura, M., Ohasahi, K., Umemura, K., Kosuge, K., Nishimoto, M. and Nakashima, M.(1997) Angiotensin converting enzyme inhibitor attenuates alpha-adrenoceptor sensitivity in human vessel. J. Am. Coll. Cardiol. 29 no.2, 91897 (Abstract)
Kittleson, M.D. (1988) Management of heart failure: concepts, therapeutic strategies, and drug pharmacology. In: Fox, P.R. (Ed.) Canine and feline cardiology, pp. 171-204. New York: Churchill Livingstone]
Kiuchi, K., Sato, N., Shannon, R.P., Vatner, D.E., Morgan, K. and Vatner, S.F. (1993) Depressed beta-adrenergic receptor- and endothelium-mediated vasodilation in conscious dogs with heart failure. Circ. Res. 73, 1013-1023.
Kjelsberg, M.A., Cotecchia, S., Ostrowski, J., Caron, M.G. and Lefkowitz, R.L. (1992) Constitutive activation of the a 1B-adrenergic receptor by all amino acid substitutions at a single site. The Journal o f Biological Chemistry 267, 1430-1433.
Knepper, S.M., Buckner, S.A., Brune, M.E., DeBemardis, J.F., Meyer, M.D. and Hancock, A. A. (1995) A-61603, a potent alphal-adrenergic receptor agonist, selective for the alphal A receptor subtype. J. Pharmacol. Exp. Ther. 274, 97-103.
Kong, J.Q., Taylor, D.A. and Fleming, W.W. (1994) Functional distribution and role of alpha-1-adrenoceptor subtypes in the mesenteric vasculature of the rat. J. Pharm. Exp. Ther. 268, 1153-1159.
278
Kubo, S., Rector, T., Bank, A., Raij, L., Kraemar, M., Tadros, P., Beardslee, M. and Garr, M. (1994) Lack of contribution of nitric oxide to basal vasomotor tone in heart failure. Am. J. Cardiol. 74, 1133-1136.
Kubo, S.H., Rector, T.S., Heifetz, S.M. and Cohn, J.N. (1989) a 2-receptor-mediated vasoconstriction in patients with congestive heart failure. Circulation 80, 1660-1667.
Kubo, S.H., Rector, T.S., Bank, A.J., Williams, R.E. and Heifetz, S.M. (1991) Endothelium-dependent vasodilation is attenuated in patients with heart failure. Circulation 84, 1589-1596.
Lai, L.P., Suematsu, M., Elam, H. and Liang, C.S. (1996) Differential changes of myocardial beta-adrenoceptor subtypes and G- proteins in dogs with right-sided congestive heart failure. Eur. J. Pharm. 309, 201-208.
Langer, S.Z. (1974) Presynaptic regulation of catecholamine release. Biochem. Pharmacol. 23, 1793-1800.
Larosa, G., Armstrong, P.W. and Forster, C. (1994) Endothelium-dependent relaxations in canine coronary arteries, are enhanced in early heart failure and persist in recovery. Canadian Journal O f Physiology And Pharmacology 72, 1148-1154.
Larosa, G.L., Armstrong, P.W., Seeman, P. and Forster, C. (1993) Beta adrenoceptor recovery after heart-failure in the dog. Cardiovascular Research 27, 489-493.
Lattion, A.L., Diviani, D. and Cotecchia, S. (1994) Truncation of the receptor carboxyl- terminus impairs agonist-dependent phosphorylation and desensitization of the alpha(lb)-adrenergic receptor. Journal O f Biological Chemistry 269, 22887-22893.
Laz, T.M., Forray, C., Smith, K.E., Vaysse, P.J.J., Branchek, T.A. and Weinshank, R.L.(1994) The rat homologue of the bovine a ]c-adrenergic receptor shows the pharmacological properties of the classical a 1A subtype. Molecular Pharmacology 46, 414-422.
Ledent, C., Vaugeois, J., Schiffmann, S.N., Pedrazzini, T., Yacoubi, M. E., Vanderhaeghen, J., Costentin, J., Heath, J. K., Vassart, G. and Parmentier, M. (1997) Aggressiveness, hypoalgesia and high blood pressure in mice lacking the adenosine A2a receptor. Nature 388, 674-678.
Lee, R.T., Bloch, K.D., Pfeffer, J.M., Pfeffer, M.A., Neer, E.J. and Seidman, C.E. (1988) Atrial natriuretic gene expression in ventricles of rats with spontaneous biventricular hypertrophy. J. Clin. Invest. 81, 431-434.
Leech, C.J. and Faber, J.E. (1996) Different a-adrenoceptor subtypes mediate constriction of arterioles and venules. Am. J. Physiol. 270, H710-H722.
Leimbach, W.N., Gunnar Wallin, B., Victor, R.G., Aylward, P.E., Sundolf, G. and Mark, A.L. (1986) Direct evidence from intraneuronal recordings for increased central sympathetic outflow in patients with heart failure. Circulation 73, 913-919.
279
LeJemtel, T.H., Maskin, C.S., Lucido, D. and Chadwick, B.J. (1986) Failure to augment maximal limb blood flow in response to one-leg versus two-leg exercise in patients with severe heart failure. Circulation 74, 245-251.
Lemoine, H. and Kaumann, A.J. (1983) A model for the interaction of competitive antagonists with two receptor- subtypes characterised by a Schild-plot with apparent slope unity. Naunyn-Schmiedeberg's Archives o f Pharmacology 322, 111-120.
Leonardi, A., Hieble, J.P., Guameri, L., Naselsky, D.P., Poggesi, E., Sironi, G., Sulpizio, A.C. and Testa, R. (1997) Pharmacological characterization of the uroselective alpha-1 antagonist Rec 15/2739 (SB 216469): Role of the alpha-1L adrenoceptor in tissue selectivity, part I. The Journal o f Pharmacology and Experimental Therapeutics 281, 1272-1283.
LeTran, Y. and Forster, C. (1997) Chloroethylclonidine and alpha-adrenoceptor agonist interaction in blood vessels following heart failure. Eur. J. Pharm. 336, 177-185.
Levick, J.R. (1992) An introduction to cardiovascular physiology, Oxford: Butterworth- Heinemann Ltd.
Li, K., He, H., Li, C., Sirois, P. and Rouleau, J.L. (1997) Myocardial alpha(l)- adrenoceptor: inotropic effect and physiologic and pathologic implications. Life Sciences 60, 1305-1318.
Li, K. and Rouleau, J.L. (1996) Altered responsiveness to endothelin-1 of myocardium from pacing-induced heart-failure model in the dog. Cardiovascular Drugs And Therapy 10, 107-112.
Liang, C.S., Fan, T., Sullebarger, J.T. and Sakamoto, S. (1989) Decreased adrenergic neuronal uptake activity in experimental right heart failure: a chamber-specific contributor to p-adrenoceptor down-regulation. J. Clin. Invest. 84, 1267-1275.
Libert, F., Parmentier, M., Lefort, A., Dinsart, C., Van Sande, J., Maenhaut, C., Simons, M., Dumont, J.E. and Vassart, G. (1989) Selective amplification and cloning of four new members of the G protein-coupled receptor family. Science 244, 569-572.
Lomasney, J.W., Cotecchia, S., Lorenz, W., Leung, W., Schwinn, D., Yang-Feng, T., Brownstein, M., Lefkowitz, R. and Caron, M. (1991) Molecular cloning and expression of the cDNA for the a 1A-adrenergic receptor. Journal O f Biological Chemistry 266, 6365-6369.
Low, A.M., Bowdish, T.R., Prashad, T.R. and Gaspar, V. (1994) Interactions of chloroethylclonidine with rauwolscine- and prazosin-sensitive adrenoceptors in the dog saphenous vein. Br. J. Pharmacol. 113, 1263-1268.
Luis Fuentes, V. (1992) Feline heart disease: An update. J. Small. Anim. Pract. 33, 130- 137.
280
MacLennan, S.J., Luong, L.A., Jasper, J.R., To, Z.P. and Eglen, R.M. (1997) Characterization of alpha(2)-adrenoceptors mediating contraction of dog saphenous vein: identity with the human alpha(2a) subtype. Br. J. Pharmacol. 121, 1721-1729.
Macmillan, J.M., Daly, C.J. and McGrath, J.C. (1994) The innervation and ct- adrenoceptor profile of rabbit isolated dorsal cutaneous and sub-cutaneous resistance arteries. Journal O f Vascular Research 31, 30(Abstract)
Margulies, K.B., Hildebrand, F.L., Lerman, A., Perella, M.A. and Burnett, J.C. (1990) Increased endothelin in experimental heart failure. Circulation 82, 2226-2230.
Marshall, I., Burt, R.P., Green, G.M., Hussain, M.B. and Chappie, C.R. (1996) Different subtypes of alpha(la)-adrenoceptor mediating contraction of rat epididymal vas deferens, rat hepatic portal vein and human prostate distinguished by the antagonist RS17053. Br. J. Pharmacol. 119, 407-415.
Mathew, R., Wang, J., Gewitz, M.H., Hintze, T.H. and Wolin, M.S. (1993) Congestive heart failure alters receptor-dependent cAMP-mediated relaxation of canine pulmonary arteries. Circulation 87, 1722-1728.
McGehee, R.E., Rossby, S.P. and Cornett, L.E. (1990) Detection by northern analysis of a,-adrenergic receptor gene transcripts in rat heart. Mol. Cell. Endocrinol. 74, 1-9.
McGrath, J.C. (1982) Evidence for more than one type of post-junctional a- adrenoceptor. Biochem. Pharmacol. 31, 467-484.
Meredith, I., Eisenhofer, G., Lambert, G., Dewar, E., Jennings, G. and Esler, M. (1993) Cardiac sympathetic nervous activity in congestive heart failure. Evidence for increased neuronal norepinephrine release and preserved neuronal uptake. Circulation 88, 136- 145.
Michel, M.C., Kerker, J., Branchek, T.A. and Forray, C. (1993) Selective irreversible binding of chloroethylclonidine at alpha(l)-adrenoceptor and alpha(2)-adrenoceptor subtypes. Molecular Pharmacology 44, 1165-1170.
Milano, C.A., Allen, L.F., Dolber, P.C. and Lefkowitz, R.J. (1994a) Ventricular hypertrophy in transgenic mice with cardiac specific overexpression of a wild-type or mutant alpha(l)-adrenergic receptor. Circulation 90, 304
Milano, C.A., Dolber, P.C., Rockman, H.A., Bond, R.A., Venable, M.E., Allen, L.F. and Lefkowitz, R.J. (1994b) Myocardial expression of a constitutively active alpha(lb)- adrenergic receptor in transgenic mice induces cardiac-hypertrophy. Proceedings O f The National Academy O f Sciences O f The United States O f America 91, 10109-10113.
Minatoguchi, S. and Majewski, H. (1994) Modulation of norepinephrine release in adriamycin-induced heart failure in rabbits: Role of presynaptic a 2-adrenoceptors and presynaptic angiotensin II receptors. Journal O f Cardiovascular Pharmacology 23, 438- 445.
281
Minneman, K. and Esbenshade, T. (1994) a r Adrenergic receptor subtypes. Annu. Rev. Pharmacol. Toxicol. 34, 117-133.
Minneman, K.P. (1988) a r Adrenergic receptor subtypes, inositol phosphates, and sources of cell Ca2+. Pharmacological Reviews 40 no2, 87-119.
Minneman, K.P., Han, C. and Abel, P.W. (1988) Comparison of a r adrenergic receptor subtypes distinguished by chloroethylclonidine and WB4101. J. Pharm. Exp. Ther. 33, 509-514.
Minneman, K.P., Esbenshade, T.A. and Zhong, H. (1993) Cross-talk between receptors and intracellular second messenger systems. Biochemical Society Transactions 21, 1109-1114.
Moran, N.C. and Perkins, M.E. (1958) Adrenergic blockade of the mammalian heart by a dichloro analogue of isoproterenol. J. Pharm. Exp. Ther. 124, 223-237.
Moriyama, N., Kurimoto, S., Horie, S., Nasu, K., Tanaka, T., Yano, K., Hirano, H., Tsujimoto, G. and Kawabe, K. (1996) Detection of alpha(l)-adrenoceptor subtypes in human hypertrophied prostate by in-situ hybridization. Histochemical Journal 28, 283- 288.
Moriyama, N., Nasu, K., Takeuchi, T., Akiyama, K., Murata, S., Nishimatsu, H., Yano, J., Tsujimoto, G. and Kawabe, K. (1997) Quantification and distribution of alpha(l)- adrenoceptor subtype mRNAs in human vas deferens: comparison with those of epididymal and pelvic portions. Br. J. Pharmacol. 122, 1009-1014.
Morris, G., Hadcock, J.R. and Malbon, C.C. (1991) Cross-regulation between G- protein-coupled receptors. The Journal o f Biological Chemistry 4, 2233-2238.
Morrow, A.L., Battaglia, G., Norman, A.B. and Creese, I. (1985) Identification of subtypes of [3H]prazosin-labelled a] receptor binding sites in rat brain. Eur. J. Pharm. 109, 285-287.
Morrow, A.L. and Creese, I. (1986) Characterization of a,-adrenergic receptor subtypes in rat brain: A reevaluation of [3H]WB4104 and [3H]prazosin binding. Molecular Pharmacology 29, 321-330.
Mulvany, M.J. and Halpem, W. (1976) Mechanical properties of vascular smooth muscle cells in situ. Nature 260, 617-619.
Mulvany, M.J. and Halpem, W. (1977) Contractile properties of small arterial resistance vessels in spontaneously hypertensive and normotensive rats. Circ. Res. 41, 19-26.
Muramatsu, I., Kigoshi, S. and Oshita, M. (1990a) Two distinct a!-adrenoceptor subtypes involved in noradrenaline contraction of the rabbit thoracic aorta. Br. J. Pharmacol. 101, 662-666.
282
Muramatsu, I., Ohmura, T., Kigoshi, S., Hashimoto, S. and Oshita, M. (1990b) Pharmacological subclassification of a,-adrenoceptors in vascular smooth muscle. Br. J. Pharmacol. 99, 197-201.
Muramatsu, I., Oshita, M., Ohmura, T., Kigoshi, S., Akion, H., Gobara, M. and Okada, K. (1994) Pharmacological characterization of a!-adrenoceptor subtypes in the human prostate: functional and binding studies. Br. J. Urol 74, 572-578.
Muramatsu, I., Ohmura, T., Hashimoto, S. and Oshita, M. (1995) Functional subclassification of vascular a,-adrenoceptors. Pharmacology Communications 6 Nos. 1-3, 23-28.
Musch, T.I. and Terrell, J.A. (1992) Skeletal muscle blood flow abnormalities in rats with a chronic myocardial infarction: rest and exercise. American Journal o f Physiology - Heart and Circulatory Physiology 262, H411-H419.
Nagadeh, M.M., Templeton, A.G.B. and McGrath, J.C. (1994) Rat isolated common carotid artery: Analysis of a,-adrenoceptor partial agonism by UK 14304. Br. J. Pharmacol. 113, 99P(Abstract)
Nasa, Y., Toyoshima, H., Ohaku, H., Hashizume, Y., Sanbe, A. and Takeo, S. (1996) Impairment of cGMP- and cAMP-mediated vasorelaxations in rats with chronic heart failure. American Journal o f Physiology - Heart and Circulatory Physiology 271, H2228-H2237.
Nasu, K., Moriyama, N., Kawabe, K., Tsujimoto, G., Murai, M., Tanaka, T. and Yano, J. (1996) Quantification and distribution of a 1-adrenoceptor subtype mRNAs in human prostate: comparison of benign hypertrophied tissue and non-hypertrophied tissue. Br. J. Pharmacol. 119, 797-803.
Nielsen, H., Thom, S., Hughes, A., Martin, G., Mulvany, M. and Sever, P. (1989) Postjunctional a 2-adrenoceptors mediate vasoconstriction in human subcutaneous resistance vessels. Br. J. Pharmacol. 97, 829-834.
Nunes, J.P. and Guimaraes, S. (1993) Chloroethylclonidine irreversibly activates postjunctional alpha2-adrenoceptors in the dog saphenous vein. Naunyn-Schmiedeberg’s Arch Pharmacol 348, 264-268.
Nunes, J.P. and Mota, A. (1994) Evidence that chloroethylclonidine can contract the dog saphenous vein via a Protein Kinase C-dependant mechanism. Arch. int. Pharmacodyn. 327, 142-151.
O'Rourke, M., Kearns, S. and Docherty, J.R. (1995) Investigation of the actions of chloroethylclonidine in rat aorta. Br. J. Pharmacol. 115, 1399-1406.
Oliver, G. and Schaffer, E.A. (1895) The physiological effects of extracts from suprarenal capsules. J. Physiol 18, 230-237.
283
Olivier, N.B. (1988) Congenital heart disease in dogs. In: Fox, P.R. (Ed.) Canine and feline cardiology, pp. 357-389. New York: Churchill Livingstone]
Oshita, M., Iwanaga, Y., Hashimoto, S., Morikawa, K. and Muramatsu, I. (1988) Pharmacological studies on the selectivity of HV-723, a new alpha-1 adrenoceptor antagonist. Jpn. J. Pharmacol., 47, 229-235.
Oshita, M., Takita, M., Kigoshi, S. and Muramatsu, I. (1992) oCj-adrenoceptor subtypes in rabbit thoracic aorta. Jpn. J. Pharmacol., 58, 276P
Palmer, R.M.J., Ferrige, A.G. and Moncada, S. (1987) Nitric oxide release accounts for the biological activity of endothelium-derived relaxing factor. Nature 327, 524-526.
Parkinson, N. and Hughes, A. (1995) The mechanism of action of a 2-adrenoceptors in human isolated subcutaneous resistance arteries. Br. J. Pharmacol. 115, 1463-1468.
Parmley, W.W. (1985) Pathophysiology of congestive heart failure. Am. J. Cardiol. 55, 9A-14A.
Pereira, O., Moura, D., Nunes, P., Vaz-da Silva, M.J. and Guimaraes, S. (1991) Involvement of a r and a 2-adrenoceptors in the responses of the proximal and distal segments of the canine saphenous vein to exogenous and endogenous noradrenaline. Naunyn-Schmiedeberg's Arch Pharmacol 343, 616-622.
Perez, D.M., Piascik, M.T. and Graham, R.M. (1991) Solution-phase library screening for the identification of rare clones: Isolation of an a )D-adrenergic receptor cDNA. Molecular Pharmacology 40, 876-883.
Perez, D.M., Piascik, M.T., Malik, N., Gaivin, R. and Graham, R.M. (1994) Cloning expression and tissue distribution of the rat homolog of the bovine a lc-adrenergic receptor provide evidence for its classification as the a 1A- subtype. Molecular Pharmacology 46, 823-831.
Piascik, M.T., Smith, M.S., Soltis, E.E. and Perez, D.M. (1994) Identification of the mRNA for the novel a 1D-adrenoceptor and two other a,-adrenoceptors in vascular smooth muscle. Molecular Pharmacology 46, 30-40.
Piascik, M.T., Guarino, R.D., Smith, M.S., Soltis, E.E., Saussy Jr, D.L. and Perez, D.M.(1995) The specific contribution of the novel alpha-ID adrenoceptor to the contraction of vascular smooth muscle. J. Pharm. Exp. Ther. 275, 1583-1589.
Piascik, M.T., Hrometz, S.L., Edelmann, S.E., Guarino, R.D., Hadley, R.W. and Brown, R.D. (1997) Immunocytochemical localization of the alpha-lb adrenergic receptor and the contribution of this and the other subtypes to vascular smooth muscle contraction: analysis with selective ligands and antisense oligonucleotides. J. Pharm. Exp. Ther. 283, 854-868.
Powell, C.E. and Slater, I.H. (1958) Blocking of inhibitory adrenergic receptors by a dichloro analogue of isoproterenol. J. Pharm. Exp. Ther. 122, 480-488.
284
Price, D.T., Schwinn, D.A., Lomasney, J.W., Allen, L.F., Caron, M.G. and Lefkowitz, R.J. (1993) Identification, quantification, and localization of mRNA for three distinct alpha 1-adrenergic receptor subtypes in human prostate. Journal o f Urology 150, 546- 551.
Price, D.T., Lefkowitz, R.J., Caron, M.G., Berkowitz, D. and Schwinn, D.A. (1994) Localization of mRNA for three distinct a,-adrenergic receptor subtypes in human tissues - implications for human a- adrenergic physiology. Molecular Pharmacology 45, 171-175.
Ramarao, C.S., Kincade Denker, J.M., Perez, D.M., Gaivin, R.J., Riek, R.P. and Graham, R.M. (1992) Genomic organization and expression of the human a 1B- adrenergic receptor. Journal O f Biological Chemistry 267, 21936-21945.
Ramsey, M.W., Goodfellow, J., Jones, C.J.H., Luddington, L.A., Lewis, M.J. and Henderson, A.H. (1995) Endothelial control of arterial distensibility is impaired in chronic heart failure. Circulation 92, 3212-3219.
Roberts, S.P., Harper, E.A., Watt, G.F., Gerskowitch, V.P., Hull, R.A.D., Shankley, N.P. and Black, J.W. (1996) Analysis of the variation in the action of L-365,260 at CCKB/gastrin receptors in the rat, guinea-pig and mouse isolated gastric tissue assays. Br. J. Pharmacol. 118, 1779-1789.
Rubanyi, G.M. and Polokoff, M.A. (1994) Endothelins: molecular biology, biochemistry, pharmacology, physiology, and pathophysiology. Pharmacological Reviews 325-415.
Ruffolo, R.R., Jr., Turowski, B.S. and Patil, P.N. (1977) Lack of cross-desensitization between structurally dissimilar a-adrenoceptor agonists. Journal o f Pharmacy and Pharmacology 29, 378-380.
Sambrook, J., Fritsch, E.F. and Maniatis, T. (1989) Molecular Cloning. A laboratory manual, Second edn. U.S.A. Cold Spring Harbor laboratory Press.
Schwinn, D.A., Lomasney, J.W., Lorenz, W., Szklut, P.J., Fremeau, R.T.J., Yang-Feng, T.L., Caron, M.G., Lefkowitz, R.J. and Cotecchia, S. (1990) Molecular cloning and expression of the cDNA for a novel a,-adrenergic receptor subtype. Journal O f Biological Chemistry 265, 8183-8189.
Schwinn, D.A., Page, S.O., Middleton, J.P., Lorenz, W., Liggett, S.B., Yamamoto, K., Lapetina, E.G., Caron, M.G., Lefkowitz, R.J. and Cotecchia, S. (1991) The a ]c- adrenergic receptor: Characterization of signal transduction pathways and mammalian tissue heterogeneity. Molecular Pharmacology 40, 619-626.
Schwinn, D.A., Johnston, G.I., Page, S.O., Mosley, M.J., Wilson, K.H., Worman, N.P., Campbell, S., Fidock, M.D., Furness, L.M., Parry-Smith, D.J., Peter, B. and Bailey,D.S. (1995) Cloning and pharmacological characterization of human alpha~\
285
adrenergic receptors: Sequence corrections and direct comparison with other species homologues. J. Pharm. Exp. Ther. 272, 134-142.
Seasholtz, T.M., Gurdal, H., Wang, H.Y., Cai, G.P., Johnson, M.D. and Friedman, E. (1997a) Heterologous desensitization of the rat tail artery contraction and inositol phosphate accumulation after in vitro exposure to phenylephrine is mediated by decreased levels of Gaq and Gai. J. Pharm. Exp. Ther. 283, 925-931.
Seasholtz, T.M., Gurdal, H., Wang, H.Y., Johnson, M.D. and Friedman, E. (1997b) Desensitization of norepinephrine receptor function is associated with G protein uncoupling in the rat aorta. American Journal O f Physiology-Heart And Circulatory Physiology 42, H279-H285.
Shannon Kava, M., Blue, D.R., Jnr, Vimont, R.L., Clarke, D.E. and Ford, A.P.D.W.(1998) a 1L-Adrenoceptor mediation of smooth muscle contraction in rabbit bladder neck: a model for lower urinary tissues in man. Br. J. Pharmacol. 123, 1359-1366.
Sharrocks, A.D. (1994) The design of primers for PCR. In: Griffin, H.G. and Griffin, A.M. (Eds.) PCR Technology Current Innovations, pp. 5-13. Boca Raton: CRC press inc.]
Shimizu, I. and Toda, N. (1986) Alterations with age of the response to vasodilator agents in isolated mesenteric arteries of the beagle. Br. J. Pharmacol. 89, 769-778.
Simonsen, U., Prieto, D., Hernandez, M., DeTejada, I.S. and GarciaSacristan, A. (1997) Adrenoceptor-mediated regulation of the contractility in horse penile resistance arteries. Journal O f Vascular Research 34, 90-102.
Smiley, R.M., Kwatra, M.M. and Schwinn, D., A. (1998) New developments in cardiovascular adrenergic receptor pharmacology: Molecular mechanisms and clinical relevance. Journal o f Cardiothoracic and Vascular Anesthesia 12, 80-95.
Smith, K.M., Macmillan, J. and McGrath, J.C. (1997) Investigation of a]-adrenoceptor subtypes mediating vasoconstriction in rabbit cutaneous resistance arteries. Br. J. Pharmacol. 122, 825-832.
Smith, K.M. and McGrath, J.C. (1996) Investigation of developmental changes in alpha(l)-adrenoceptor subtypes in rat mesenteric resistance arteries. Br. J. Pharmacol. 119, P340
Smith, T.M. and Waterman, M.S. (1981) Comparison of biosequences. Advances in applied mathematics 2, 482-489.
Starke, K. (1981) a-Adrenoceptor subclassification. Rev. Physiol. Biochem. Pharmacol. 88, 199-236.
Starke, K. and Langer, S.Z. (1979) A note on terminology of presynaptic receptors. In: Langer, S.Z., Starke, K. and Dubocovich, M.L. (Eds.) Presynaptic receptors, pp. 1-3. Oxford: Pergamon Press]
286
Stassen, F.R.M., Willemsen, M.J.J.M.F., Janssen, G.M.J. and DeMey, J.G.R. (1997a) alphal-Adrenoceptor subtypes in rat aorta and mesenteric small arteries are preserved during left ventricular dysfunction post-myocardial infarction. Cardiovascular Research 33, 706-713.
Stassen, F.R.M., Willemsen, M.J.J.M.F., Janssen, G.M.J., Fazzi, G.E., Schiffers, P.M.H., Smits, J.F.M. and DeMey, J.G.R. (1997b) Reduced responsiveness of rat mesenteric resistance artery smooth muscle to phenylephrine and calcium following myocardial infarction. Br. J. Pharmacol. 120, 1505-1512.
Stephens, N., Bund, S.J., Faragher, E.B. and Heagerty, A.M. (1992) Neurotransmission in human resistance arteries: contribution of a,- and a 2-adrenoceptors but not P2- purinoceptors. Journal O f Vascular Research 29, 347-352.
Stewart, A.F.R., Rokosh, D.G., Bailey, B.A., Kams, L.R., Chang, K.C., Long, C.S., Kariya, K. and Simpson, P.C. (1994) Cloning of the rat a lc-adrenergic receptor from cardiac myocytes. Circ. Res. 75, 796-802.
Stewart, D.J., Cemacek, P., Costello, K.B. and Rouleau, J.L. (1992) Elevated endothelin-1 in heart-failure and loss of normal response to postural change. Circulation 85,510-517.
Strosberg, A.D. (1991) Structure/function relationship of proteins belonging to the family of receptors coupled to GTP-binding proteins. European Journal o f Biochemistry 196, 1-10.
Sugden, D., Anwar, N. and Klein, D.C. (1996) Rat pineal a 1-adrenoceptor subtypes: studies using radioligand binding and reverse transcription-polymerase chain reaction analysis. Br. J. Pharmacol. 118, 1246-1252.
Sullivan, A.T. and Drew, G.M. (1980) Pharmacological characterisation of pre- and postsynaptic a-adrenoceptors in dog saphenous vein. Naunyn-Schmiedeberg’s Arch Pharmacol 314, 249-258.
Suzuki, F., Miyamoto, S., Takita, M., Oshita, M., Watanabe, Y., Kakizuka, A., Narumiya, S., Taniguchi, T. and Muramatsu, I. (1997) Cloning, functional expression and tissue distribution of rabbit alpha(ld)-adrenoceptor. Biochimica Et Biophysica Acta- Biomembranes 1323, 6-11.
Swedberg, K., Eneroth, P., Kjekshus, J. and Wilhelmsen, L. (1990) Hormones regulating cardiovascular function in patients with severe congestive heart failure and their relation to mortality. Circulation 82, 1730-1736.
Tabemero, A. and Vila, E. (1995) Effect of age on noradrenaline responses in rat tail artery and aorta - role of endothelium. Journal o f Autonomic Pharmacology 15, 327- 333.
287
Teerlink, J.R., Gray, G.A., Clozel, M. and Clozel, J. (1994) Increased vascular responsiveness to norepinephrine in rats with heart failure is endothelium dependent. Circulation 89, 393-401.
Testa, R., Taddei, C., Poggesi, E., Destefani, C., Cotecchia, S., Hieble, J.P., Sulpizio, A.C., Naselsky, D., Bergsma, D., Ellis, C., Swift, A., Ganguly, S., Ruffolo RR Jr and Leonardi, A. (1995) Rec 15/2739 (SB 216469): A novel prostate selective alphal- adrenoceptor antagonist. Pharmacology Communications 6, 79-86.
Testa, R., Guameri, L., Angelico, P., Poggesi, E., Taddei, C., Sironi, G., Colombo, D., Sulpizio, A.C., Naselsky, D.P., Hieble, J.P. and Leonardi, A. (1997) Pharmacological characterization of the uroselective alpha-1 antagonist rec 15/2739 (SB 216469): role of the alpha-1L adrenoceptor in tissue selectivity part II. J. Pharm. Exp. Ther. 281, 1284- 1293.
The IMPROVE study group (1995) Acute and short-term haemodynamic, echocardiographic, and clinical effects of enalapril maleate in dogs with naturally aquired heart failure: results of the invasive multicenter PROspective veterinary evaluation of enalapril study. Journal O f Veterinary Internal Medicine 9, 234-242.
Theroux, T.L., Esbenshade, T.A., Peavy, R.D. and Minneman, K.P. (1996) Coupling efficiencies of human a,-adrenergic receptor subtypes: Titration of receptor density and responsiveness with inducible and repressible expression vectors. Molecular Pharmacology 50, 1376-1387.
Thomas, J.A. and Marks, B.H. (1978) Plasma norepinephrine in congestive heart failure. Am. J. Cardiol. 41, 233-243.
Tidholm, A. and Jonsson, L. (1997) A retrospective study of canine dilated cardiomyopathy (189 cases). Journal O f The American Animal Hospital Association 33, 544-550.
Tidholm, A.E.M. (1996) Canine dilated cardiomyopathy: a study of 189 cases in 38 breeds. Veterinary Quarterly 18, S34-S35.
Timmermans, P.B.M.W.M., Kwa, H.Y. and Van Zwieten, P.A. (1979) Possible subdivision of postsynaptic alpha-adrenoceptors mediating pressor responses in the pithed rat. Naunyn-Schmie deb ergs Archives O f Pharmacology 310, 189-196.
Timmermans, P.B.M.W.M., Wong, P.C., Chiu, A.T., Herblin, W.F., Benfield, P., Carini, D.J., Lee, R.J., Wexler, R., Saye, J.A.M. and Smith, R.D. (1993) Angiotensin II receptors and angiotensin II receptor antagonists. Pharmacological Reviews 45, 205- 251.
Toda, N. and Miyazaki, M. (1987) Senescent beagle coronary arteries in response to catecholamines and adrenergic nerve stimulation. Journal o f Gerontology 42, 210-218.
288
Todorov, S., Petkov, O., Nikolov, R. and Zamfirova, R. (1995) Involvement of ca2+ and alpha(l)-adrenoceptors in endothelin-1 effects on the tone and electrically-evoked contractions of rabbit ear central artery. Methods And Findings In Experimental And Clinical Pharmacology 17, 391-395.
Van der Graaf, P.H., Shankley, N.P. and Black, J.W. (1996a) Analysis of the effects of a j-adrenoceptor antagonists on the noradrenaline-mediated contraction of rat small mesenteric artery. Br. J. Pharmacol. 118, 1308-1316.
Van der Graaf, P.H., Shankley, N.P. and Black, J.W. (1996b) Analysis of the activity of a,-adrenoceptor antagonists in rat aorta. Br. J. Pharmacol. 118, 299-310.
Vanhoutte, P.M. (1996) Endothelium-dependent responses in congestive heart failure. Journal O f Molecular And Cellular Cardiology 28, 2233-2240.
Vanhoutte, P.M. and Shimokawa, H. (1989) Endothelium-derived relaxing factor and coronary vasospasm. Circulation 80, 1 -9.
Vanvliet, A.A., Donker, A.J.M., Nauta, J.J.P. and Verheugt, F.W.A. (1993) Spironolactone in congestive-heart-failure refractory to high-dose loop diuretic and low- dose angiotensin-converting enzyme-inhibitor. Am J Cardiol 71, A 21-A 28.
Vatner, D.E., Sato, N., Ishikawa, Y., Kiuchi, K., Shannon, R.P. and Vatner, S.F. (1996) p-Adrenoceptor desensitization during the development of canine pacing-induced heart failure. Clinical And Experimental Pharmacology And Physiology 23, 688-692.
Vila, E., Vivas, N.M., Tabemero, A., Giraldo, J. and Arribas, S.M. (1997) Alpha(l)- adrenoceptor vasoconstriction in the tail artery during ageing. Br. J. Pharmacol. 121, 1017-1023.
VillalobosMolina, R., LopezGuerrero, J.J. and Ibarra, M. (1997) alpha(lD)- and alpha(lA)-adrenoceptors mediate contraction in rat renal artery. Eur. J. Pharm. 322, 225-227.
Wada, A., Tsutamoto, T., Maeda, Y., Kanamori, T., Matsuda, Y. and Kinoshita, M.(1996) Endogenous atrial natriuretic peptide inhibits endothelin-1 secretion in dogs with severe congestive heart failure. American Journal o f Physiology - Heart and Circulatory Physiology 270, HI 819-H1824.
Walden, P.D., Durkin, M.M., Lepor, H., Wetzel, J.M., Gluchowski, C. and Gustafson,E.L. (1997) Localization of mRNA and receptor binding sites for the alpha(la)- adrenoceptor subtype in the rat, monkey and human urinary bladder and prostate. Journal o f Urology 157, 1032-1038.
Wallenstein, S., Zucker, C.L. and Fleiss, J.L. (1980) Some statistical methods useful in circulation research. Circ. Res. 47, 1-9.
Wang, J., Seyedi, N., Xu, X., Wolin, M.S. and Hintze, T.H. (1994) Defective endothelium -mediated control of coronary circulation in conscious dogs after heart
289
failure. American Journal o f Physiology - Heart and Circulatory Physiology 266, H670- H680.
Wang, W. (1994) Chronic administration of aldosterone depresses baroreceptor reflex function in the dog. Hypertension 24, 571-575.
Wang, W., Han, H.Y. and Zucker, I.H. (1996) Depressed baroreflex in heart-failure is not due to structural-change in carotid-sinus nerve-fibers. Journal O f The Autonomic Nervous System 57, 101-108.
Warren, J.B. and Loi, R.K. (1995) Captopril increases skin micro vascular blood flow, nitric oxide and prostaglandins. Faseb Journal 9, 411-418.
Whitney, J.C. (1974) Observations on the effect of age on the severity of heart valve lesions in the dog. J. Small Anim. Pract. 15, 511-522.
Williams, T.J., Clarke, D.E. and Ford, A.P.D.W. (1996) Whole-cell radioligand binding assay reveals alpha(ll)-adrenoceptor (ar) antagonist profile for the human cloned alpha(la)-ar in Chinese hamster ovary (cho-kl) cells. Br, J. Pharmacol. 119, P359
Williams, T.J. and Clarke, D.E. (1995) Characterization of a,-adrenoceptors mediating vasoconstriction to noradrenaline and nerve stimulation in the isolated perfused mesentery of rat. Br. J. Pharmacol. 114, 531-536.
Wilson, J.R., Martin, J.L., Schwartz, D. and Ferraro, N. (1984) Exercise intolerance in patients with chronic heart failure: role of impaired nutritive flow to skeletal muscle. Circulation 69, 1079-1087.
Wilson, V.G., Brown, C.M. and McGrath, J.C. (1991) Are there more than two types of a-adrenoceptor involved in physiological responses? Experimental Physiology 76, 317- 346.
Winaver, J., Hoffman, A. and Haramati, A. (1995) Does the heart's hormone, ANP, help in congestive heart failure? News in Physiological Sciences 10, 247-253.
Winlaw, D., Smythe, G., Keogh, A., Schyvens, C., Spratt, P. and MacDonald, P. (1994) Increased nitric oxide production in heart failure. Lancet 344, 373-374.
Woodfield, J.A., Bauer, T.G., Ettinger, S.J., Lusk, R.H., Lunney, J., Brayley, K.A., Feldman, D.G., Spelman, L., Saunders, T.G., Fox, P.R., Stamoulis, M.E., Lesser, M., Edwards, N.J., Peck, E.A., Kelly, M.J., Darke, P.G.G., Little, C.J.L., Straus, J.H., Crawford, M.A., Creighton, S.R., Ogrady, M.R., Larue, M.J., Prueter, J.C., Carothers, M.A., Dougherty, J.F., Harpster, N.K., Cain, T.P., Knight, D.H., Soderberg, S.F., Moses, B.L., Snyder, P.S., Henik, R.A., Gaber, C.E., Benitz, A.M., Longhofer, S.L., Cifelli, S., Jernigan, A., Trimboli, W., Batty, A. and Ericsson, G.F. (1995) Controlled clinical-evaluation of enalapril in dogs with heart-failure - results of the cooperative veterinary enalapril study-group. Journal O f Veterinary Internal Medicine 9, 243-252.
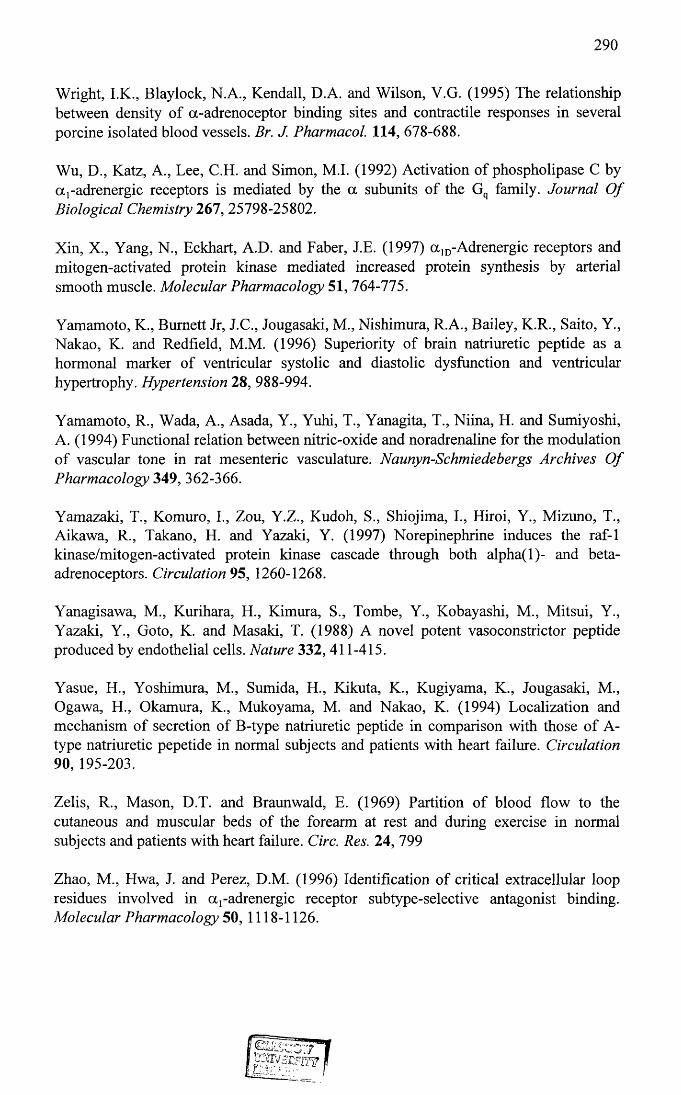
290
Wright, I.K., Blaylock, N.A., Kendall, D.A. and Wilson, V.G. (1995) The relationship between density of a-adrenoceptor binding sites and contractile responses in several porcine isolated blood vessels. Br. J. Pharmacol. 114, 678-688.
Wu, D., Katz, A., Lee, C.H. and Simon, M.I. (1992) Activation of phospholipase C by a,-adrenergic receptors is mediated by the a subunits of the Gq family. Journal O f Biological Chemistry 267, 25798-25802.
Xin, X., Yang, N., Eckhart, A.D. and Faber, J.E. (1997) a ]D-Adrenergic receptors and mitogen-activated protein kinase mediated increased protein synthesis by arterial smooth muscle. Molecular Pharmacology 51, 764-775.
Yamamoto, K., Burnett Jr, J.C., Jougasaki, M., Nishimura, R.A., Bailey, K.R., Saito, Y., Nakao, K. and Redfield, M.M. (1996) Superiority of brain natriuretic peptide as a hormonal marker of ventricular systolic and diastolic dysfunction and ventricular hypertrophy. Hypertension 28, 988-994.
Yamamoto, R., Wada, A., Asada, Y., Yuhi, T., Yanagita, T., Niina, H. and Sumiyoshi, A. (1994) Functional relation between nitric-oxide and noradrenaline for the modulation of vascular tone in rat mesenteric vasculature. Naunyn-Schmiedebergs Archives O f Pharmacology 349, 362-366.
Yamazaki, T., Komuro, I., Zou, Y.Z., Kudoh, S., Shiojima, I., Hiroi, Y., Mizuno, T., Aikawa, R., Takano, H. and Yazaki, Y. (1997) Norepinephrine induces the raf-1 kinase/mitogen-activated protein kinase cascade through both alpha(l)- and beta- adrenoceptors. Circulation 95, 1260-1268.
Yanagisawa, M., Kurihara, H., Kimura, S., Tombe, Y., Kobayashi, M., Mitsui, Y., Yazaki, Y., Goto, K. and Masaki, T. (1988) A novel potent vasoconstrictor peptide produced by endothelial cells. Nature 332, 411-415.
Yasue, H., Yoshimura, M., Sumida, H., Kikuta, K., Kugiyama, K., Jougasaki, M., Ogawa, El., Okamura, K., Mukoyama, M. and Nakao, K. (1994) Localization and mechanism of secretion of B-type natriuretic peptide in comparison with those of A- type natriuretic pepetide in normal subjects and patients with heart failure. Circulation 90, 195-203.
Zelis, R., Mason, D.T. and Braunwald, E. (1969) Partition of blood flow to the cutaneous and muscular beds of the forearm at rest and during exercise in normal subjects and patients with heart failure. Circ. Res. 24, 799
Zhao, M., Hwa, J. and Perez, D.M. (1996) Identification of critical extracellular loop residues involved in a j-adrenergic receptor subtype-selective antagonist binding. Molecular Pharmacology 50, 1118-1126.


