Embed Size (px)
Citation preview
Applied Catalysis B: Environmental 22 (1999) 249–259
A study of anatase–supported Mn oxide as catalystsfor 2-propanol oxidation
Jose Manuel Gallardo-Amoresa,b,∗, Tiziana Armarolib, Gianguido Ramisb,Elisabetta Finocchiob, Guido Buscab
a Departamento de Quimica Inorganica, Universidad Complutense, Ciudad Universitaria, E-28040 Madrid, Spainb Dipartimento di Ingegneria Chimica e di Processo “G.B.Bonino”, Università di Genova, P.le J.F. Kennedy, I-16129 Genova, Italy
Received 24 December 1998; received in revised form 23 January 1999; accepted 14 February 1999
Abstract
Several samples of TiO2 (anatase)-supported Mn oxideXMn–TiO2 (with X= 0.5, 1.0, 1.5 and 2.0, the theoretical monolayerfractions) have been prepared by a wet impregnation method and characterised by conventional techniques. Mn oxide was foundto be well dispersed on the support surface as Mn3+species, while part of it is stabilised into the TiO2 bulk as Mn4+species.This cation seem to hinder the support sintering and to favour the anatase to rutile phase transition at higher temperatures.Mn oxides supported on TiO2 are stable and retain medium-high surface area in the 600–900 K range. They are less activethan pure Mn oxides in the isopropanol oxidation but, above 600 K, allow complete oxidation of isopropanol to CO2 only.FT–IR studies and the GC–MS analysis of some intermediate products allow us to confirm the 2-propanol total oxidationoccurs through the previously proposed 2-propoxide/acetate/formate surface pathway. ©1999 Elsevier Science B.V. All rightsreserved.
Keywords:Wet impregnation method; Anatase–supported Mn
1. Introduction
Manganese oxides, like Mn3O4 [1], Mn2O3 [2,3]and MnO2 [4] are known to exhibit high activityin hydrocarbon and VOC total oxidation catalysis,producing CO2 at total reactant conversion. How-ever, we also found that, even in excess of oxygen,Mn3O4 also allows high yields (>90%) in the partialoxy–dehydrogenation of 2-propanol to acetone [5].
Supporting of metal oxides over oxide carrierscan result in an enhancement of the activity in ox-idation. For example when vanadia is supported onTiO2–anatase, it is more active both in different kinds
∗ Corresponding author.
of hydrocarbon selective oxidation [6,7] and in the se-lective catalytic reduction of NOx by ammonia (SCRreaction) [8]. Moreover, TiO2 anatase is stable inSO2 containing atmospheres, like many waste gases.For these reasons it seemed useful to us to look atTiO2–anatase supported manganese oxides, poten-tially of interest in the field of selective oxidation aswell as SCR catalysis. The Mn–Ti mixed oxide sys-tem received little attention in the catalysis literature[9–12].
The present study reports the characterisation of cat-alysts produced by impregnation of a TiO2 commer-cial support with a Mn salt, followed by calcination.We investigated the nature of the Mn oxide speciesso formed at the surface, the thermal stability of the
0926-3373/99/$ – see front matter ©1999 Elsevier Science B.V. All rights reserved.PII: S0926-3373(99)00055-7

250 J.M. Gallardo-Amores et al. / Applied Catalysis B: Environmental 22 (1999) 249–259
MnOx–anatase catalysts obtained and the behaviourand the mechanism of the isopropanol oxidation reac-tion occurring on the surface.
2. Experimental
TiO2 anatase was a commercial product kindlysupplied by Tioxide (Eurotitania, 129 m2/g). Thecatalysts samples have been prepared by a wet im-pregnation method, adding a neutral aqueous solutioncontaining the required amounts of salt precursorMn(CH3–COO)2·2H2O to TiO2, in order to cover theTiO2 support surface with 0.5, 1.0, 1.5 and 2.0 mono-layer fractions; then stirring continuously at 373 Kuntil total evaporation. Later, all samples were driedat 423 K for 3 h and calcined at 773 K the same time.They will be denoted hereinafter asXMn–TiO2 (withX= 0.5, 1.0, 1.5 and 2.0, the theoretical monolayerfractions). To calculate the theoretical support surfacecoverage by a single MnOx unit we took into accountthe drop in surface area of the pure support uponcalcination at 773 K (down to 69 m2/g) and the di-mensions of the unit cell ofa-Mn2O3–bixbyite [3,13].The cation density on the faces of the cubic unit cellof this structure is one cation per 11 Å2. To take intoconsideration that in the bixbyite structure every facecation is bridged by oxygen atoms, while when MnOx
is supported on an oxide carrier, oxygens do not nec-essarily bridge every Mn cation couples, we took as areference a little higher value, 15 Å2, per MnOx unit.The virtual loadings are 7.3, 5.6, 3.6 and 1.8 wt.% Mnper 100 g of support for 2, 1.5, 1 and 0.5 Mn.
For comparison catalytic experiments have alsobeen done with a pure Mn oxide Mn3O4 (24 m2/g).
The XRD spectra have been recorded on a SiemensD-500 diffractometer (Cu Ka radiation, Ni filter;35 kV, 35 mA). Cell parameters have been calculatedby a dedicated least square software.
The FT–IR spectra have been recorded using aNicolet Magna 750 Fourier Transform instrument. Forthe region 4000–400 cm–1 a KBr beam splitter hasbeen used with a DTGS detector. For the FIR region(600–50 cm–1) a ‘solid substrate’ beam splitter anda DTGS polyethylene detector have been used. KBrpressed disks (IR region) or polyethylene presseddisks (FIR region) were used.
The FT–IR spectra of adsorbed isopropanol overthe samples were carried out using self-supportingpressed disks of the pure catalyst powders, previouslypre-treated in air in the IR cell at 673 K for 2 h andoutgassed at 673 K for 30 min. Isopropanol was pur-chased from Carlo Erba (Milano, Italy).
The FT–Raman have been recorded by a BruckerRFS100 Instrument, with and Nd-YAG Laser(1064 nm), using 30 mW laser power 2000 scans and4 cm–1 resolution.
The UV–Vis spectra have been performed witha JASCO V-570 spectrophotometer in the region200–2500 nm using pressed disks of the samples anda polymer as a reference.
DTA–TG experiments were performed in air, witha Setaram TGA 92–12 apparatus, from room tem-perature to 1273 K, with heating and cooling rate of10 K min–1.
Catalytic tests were carried out at atmosphericpressure in a continuos flow tubular glass reactor.Variable amounts of catalysts calculated to have thesame exposed total surface area (8 m2) were loadedin form of fine powder (60–70 mesh) mechanicallymixed with an adequate amount of inert, low surfacearea material (quartz) to avoid preferential gas flowpaths and hot spots in the catalytic bed. The totalflow was 300 ml/min and the feed composition wasabout 2% of isopropanol in oxygen containing he-lium. Isopropanol/oxygen molar ratio in the feed was1:5, i.e. there is more oxygen than stoichiometric forcombustion of isopropanol to CO2 + H2O. The spacevelocity is in the range 10 – 3 gipa/gcat/h or, taking inaccount that the volume of the catalytic bed reactorincluding the quartz particles is 0.3 cm3, the GHSVis 1200 Volipa/Volcat/h.
The reactants and the reaction products were anal-ysed using two on-line gas chromatographs (HP5890), working in different analysis conditions in or-der to have a better resolution of inorganic and organicspecies. MS–GC product analysis was performedusing a HP 1800D GCD Plus system instrument.
3. Results and discussions
3.1. Surface area trend
The BET surface areas measurements show thatthe impregnation/calcination procedure gives rise to a

J.M. Gallardo-Amores et al. / Applied Catalysis B: Environmental 22 (1999) 249–259 251
Table 1Cell parameters, crystal size and some specific surface areas for the samples prepared after calcination at 773 K and at 1243 Ka
Samples PhaseD (Å) a (Å) b (Å) c (Å) V (Å3) S (m2/g) Phase D (Å) a= b(Å) c (Å) V(Å3)
773 K 1243 K
TiO2 A 101 3.782 (4) 3.782 (4) 9.525 (12) 136.369 R 311 4.614 (4) 2.970(4) 63.2
B 136 5.452 (11) 9.207 (40) 5.147 (63) 258.40.5Mn–TiO2 A 82 3.787 (6) 3.787 (6) 9.524 (30) 136.6
72 R 310 4.616 (4) 2.971(5) 63.3B 113 5.462 (11) 9.159 (41) 5.160 (12) 258.1
1.0Mn–TiO2 A 85 3.782 (6) 3.782 (6) 9.494 (23) 135.8R 311 4.620 (6) 2.973(6) 63.5
79B 107 5.444 (10) 9.192 (68) 5.150 (22) 257.7 P – 5.174 (9) 14.304(30) 331.6
1.5Mn–TiO2 A 87 3.784 (2) 3.784 (2) 9.472 (11) 135.6R 311 4.614 (4) 2.970(4) 63.2
82B 102 5.435 (3) 9.131 (2) 5.134 (4) 254.8 P – 5.162 (6) 14.421(40) 332.8
2.0Mn–TiO2 A 85 3.772 (7) 3.772 (7) 9.467 (28) 134.7 R 311 4.608 (3) 2.968(3) 63.085
B 101 5.419 (13) 9.167 (25) 5.128 (9) 254.7 P – 5.161 (8) 14.289(36) 329.6
a A: anatase; B: brookite; R: rutile; P: pyrophanite.
severe drop of the surface area of the support (Table1) which has, as received, a surface area of 129 m2/g.However, this drop is lower than that undergone bythe pure support upon simple calcination at the sametemperature. Additionally, this effect is the lower, thehigher the Mn loading. This suggests that impregna-tion with Mn somehow inhibits the sintering of theTiO2 support.
3.2. Structural and thermal stability studies
The XRD patterns of the samples calcined at 773 Kare shown in Fig. 1. All samples are constituted bytwo phases well identified, anatase (ICDD file No.21–1272) and brookite (ICDD file No. 29–1360).Diffraction peaks are broad for both phases and theirintensities decrease slightly by increasing Mn content.These features indicate they are materials with a lowdegree of crystallinity. Although this support fromTioxide presents analogous features to others studiedby us, anatase : brookite ratio is notably higher inthis case being calculated to be approximately above84 : 16, with the method reported in [14]. No peaksof Mn oxides are found even for the sample havingtwo complete theoretical Mn oxide monolayers. Thecrystal sizes calculated with the Scherrer’s formula[15] applied to the width of the main reflections of
Fig. 1. XRD patterns of the powders after calcination at 773 K:(a) TiO2, (b) 0.5Mn–TiO2, (c) 1.0Mn–TiO2, (d) 1.5Mn–TiO2, (e)2.0Mn–TiO2.
both anatase and brookite (Table 1) decreases whenMn is added. This agrees with the surface area trend,which increases by increasing Mn loading. In Table1 the unit cell parameters and volumes are reportedfor both phases. A small decrease of both unit cellparameters and volume is evident. Although this vari-ation likely lies into the measurement error limits, itscontinuity allows us to suppose that Mn entered tosome extent the anatase and the brookite structures.In fact it is well known that MnO2 and TiO2 are

252 J.M. Gallardo-Amores et al. / Applied Catalysis B: Environmental 22 (1999) 249–259
Fig. 2. DTA curves of the powders after calcination at 773 K:(a) TiO2, (b) 0.5Mn–TiO2, (c) 1.0Mn–TiO2, (d) 1.5Mn–TiO2, (e)2.0Mn–TiO2.
mutually soluble at least in the thermodynamicallystable rutile polymorph, and that the dissolution ofMnO2 into TiO2–rutile gives rise to a contraction ofthe unit cell [16]. This is in line with the observedsurface area and crystal size effects.
The DTA analyses of samples are compared in Fig.2 and TG data are listed in Table 2. For Mn-freesample, the DTA curve in 673–1273 K range showsat least three exothermic features. The first one, ev-ident as a shoulder below 973 K, is likely related toanatase sintering [17] without apparently associatedloss weight, the second one at 985 K is not present insamples with minor brookite content and so it couldbe associated with brookite→rutile phase transition,and finally, the third net peak at 1046 K is attributedto anatase-to-rutile phase transition [18]. When man-ganese is added to the support, two differences areobserved in the DTA curves: (i) the three exother-mic peaks lose resolution, giving rise to a single peakshifted to lower temperatures, (ii) a new endothermicpeak appears near 1203 K in all cases whose intensityincreases by increasing Mn content. The simultane-ously recorded TG curves show that the exothermicpeak is associated to a small but well detectable weight
Fig. 3. XRD patterns of the powders after a DTA–TG cycleuntil 1273 K: (a) TiO2, (b) 0.5Mn–TiO2, (c) 1.0Mn–TiO2, (d)1.5Mn–TiO2, (e) 2.0Mn–TiO2.
gain, while the successive endothermic peak is asso-ciated to a weight loss in the TG analysis, only whenMn is present. The XRD analyses of the powders afterthe DTA runs (Fig. 3 and Table 1) show the presenceof two phases, TiO2–rutile (ICDD file No. 34–180)and pyrophanite (MnTiO3, ICDD file No. 29–902).
These data can be interpreted in the following way:Mn oxide, likely in part dissolved into TiO2, favours
the phase transition of both anatase and brookite torutile and, during these phenomena, part of the sur-face species further enter the structure giving rise to a(Mn,Ti)O2 solid solution with weight gain by oxida-tion:
Mn2O3 + 12O2 → 2MnO2
Later, part of the (Mn,Ti)O2 rutile-type solid solutionconverts into pyrophanite with loss of oxygen:
MnO2 + TiO2 → MnTiO3 + 12O2
This reaction has already been reported [16] and agreeswith state diagram data [19].
3.3. Spectroscopic characterisation
3.3.1. Skeletal FT–IR and FT–Raman StudiesThe skeletal IR and FIR spectra of samples after
calcination at 773 K are compared in Fig. 4. The spec-trum of TiO2 presents two main complex absorptionbands with individual maxima at 590, 530, 472, 430,330, 280 and 270 cm–1 together a broad absorption

J.M. Gallardo-Amores et al. / Applied Catalysis B: Environmental 22 (1999) 249–259 253
Table 2TG data for all samples after calcination at 773 K
Samples T(K) Experimental weight Virtual weight Experimental weight Virtual weightgains (%) gains (%) losses (%) losses (%)
TiO2 775–975 – – 0.09 –975–1270 – – 0.21 –
0.5Mn–TiO2 775–965 – – 0.37 –965–1035 0.10 0.09 – –1035–1270 – – 0.37 0.29
1.0Mn–TiO2 695–910 – – 0.25 –910–1020 0.13 0.17 – –1020–1270 – – 0.65 0.52
1.5Mn–TiO2 750–965 – – 0.37 –965–1010 0.18 0.25 – –1010–1270 – – 0.85 0.76
2.0Mn–TiO2 750–965 – – 0.54 –965–1015 0.19 0.33 – –1015–1270 – – 1.04 0.99
Fig. 4. FT–IR and FT–FIR spectra of the samples after calcina-tion at 773 K: (a) TiO2, (b) 0.5Mn–TiO2, (c) 1.0Mn–TiO2, (d)1.5Mn–TiO2, (e) 2.0Mn–TiO2, (f) Mn3O4, (g) Mn2O3.
in the 800–600 cm–1 region. This spectrum is typicalof TiO2–anatase containing traces of brookite, as dis-cussed previously [20]. The position and intensities ofthe absorptions do not vary significantly when Mn isadded. No traces are found of Mn3O4 (hausmannite)
or a and Mn2O3 (bixbyite), as evident by comparisonwith their IR spectra (Fig. 4f, g).
In Fig. 5 FT–Raman spectra for all samples are re-ported. The spectrum of the Mn-free sample (Fig. 5a)presents typical peaks of anatase at 645, 522, 390, 198and 144 cm–1 as well as those of brookite phase at592, 543, 465, 365, 312, 290 and 225 cm–1 as reportedfor similar samples[20–22]. When Mn is added, theintensity of these peaks falls strongly down. This phe-nomenon is much stronger here than for coprecipitatedMn–Ti oxides, investigated previously [12], wherethe drop in intensity of the anatase Raman peaks ismuch less evident at the same Mn–Ti composition.This supports the idea that this phenomenon is a sur-face phenomenon, similar to that already shown forsupported V2O5–TiO2 [23],V2O5–WO3–TiO2 [24],MoO3–TiO2 and CuO–TiO2 [20] and SiO2–TiO2[14]. This phenomenon has been previously attributedto the increased absorption of the exciting light fromthe sample as well as to the increased structural dis-order at the sample surface. In any case, also with thisvery sensitive technique, no evidence of Mn oxidephases can be obtained.
3.3.2. DR–UV–Vis studiesThe UV–Vis spectra for TiO2 and different
Mn-impregnated TiO2 samples are shown in Fig. 6.For the Mn-free sample (Fig. 6a), the spectrum is char-acterised by an absorption band split into two maximanear 245 and 315 nm with a well defined absorption

254 J.M. Gallardo-Amores et al. / Applied Catalysis B: Environmental 22 (1999) 249–259
Fig. 5. FT–Raman spectra of the samples after calcination at 773 K: (a) TiO2, (b) 0.5Mn–TiO2, (c) 1.0Mn–TiO2, (d) 1.5Mn–TiO2, (e)2.0Mn–TiO2.
Fig. 6. UV–Vis spectra of the samples after calcination at 773 K:(a) TiO2, (b) 0.5Mn–TiO2, (c) 1.0Mn–TiO2, (d) 1.5Mn–TiO2, (e)2.0Mn–TiO2.
edge at 390 nm. These features agree with typicalTiO2–anatase spectra reported elsewhere [12,25] andare related to O2–→Ti4+ charge-transfer transitions.When Mn is added, new absorptions appear in the
region 400–450 nm, near 585 nm, and, at higher cov-erages, a third weak one near 740 nm (Fig. 6b-c).According to previous studies concerning coprecipi-tated Mn–Ti oxides [12] and MnO2–TiO2 rutile-typesolid solutions [16,26], the absorption just above theanatase edge (400–450 nm) can be due to Mn4+ mi-grated into the TiO2 framework, in agreement withXRD data. The components at 585 and 740 nm arereasonably due to crystal field d→d transitions ofoctahedral Mn3+ on the TiO2 surface [27–30].
These materials do not present absorption in regionabove 800 nm, in contrast to those prepared by copre-cipitation [12] so indicating that there is no segrega-tion of bulk Mn oxides.
3.4. Studies on 2-propanol oxidation
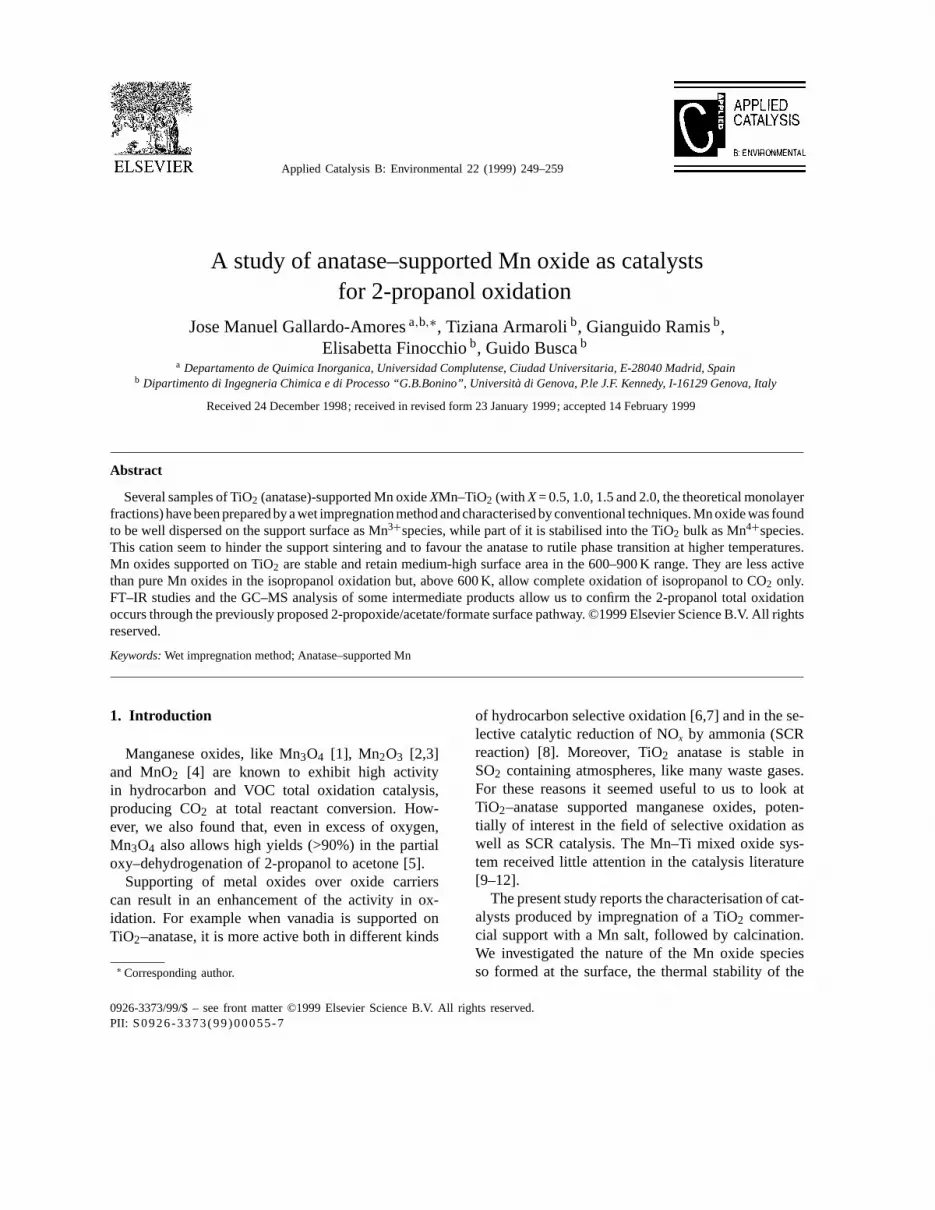
3.4.1. Catalytic activity in the flow reactorThe steady state conversions of 2-propanol over all
samples in the oxidation at different temperatures arecompared in Fig. 7. Isopropanol conversion is ob-servable already at 375 K and is total near 525 K onthe pure manganese oxide, Mn3O4. At this tempera-ture, on the best Mn–TiO2 catalyst 2-propanol con-version is only a 50% in the same conditions. Overall Mn–TiO2 catalysts conversion approaches to be
J.M. Gallardo-Amores et al. / Applied Catalysis B: Environmental 22 (1999) 249–259 255
Fig. 7. Comparison of isopropanol conversions as a function ofreaction temperature for the Mn3O4 and Mn–TiO2 samples.
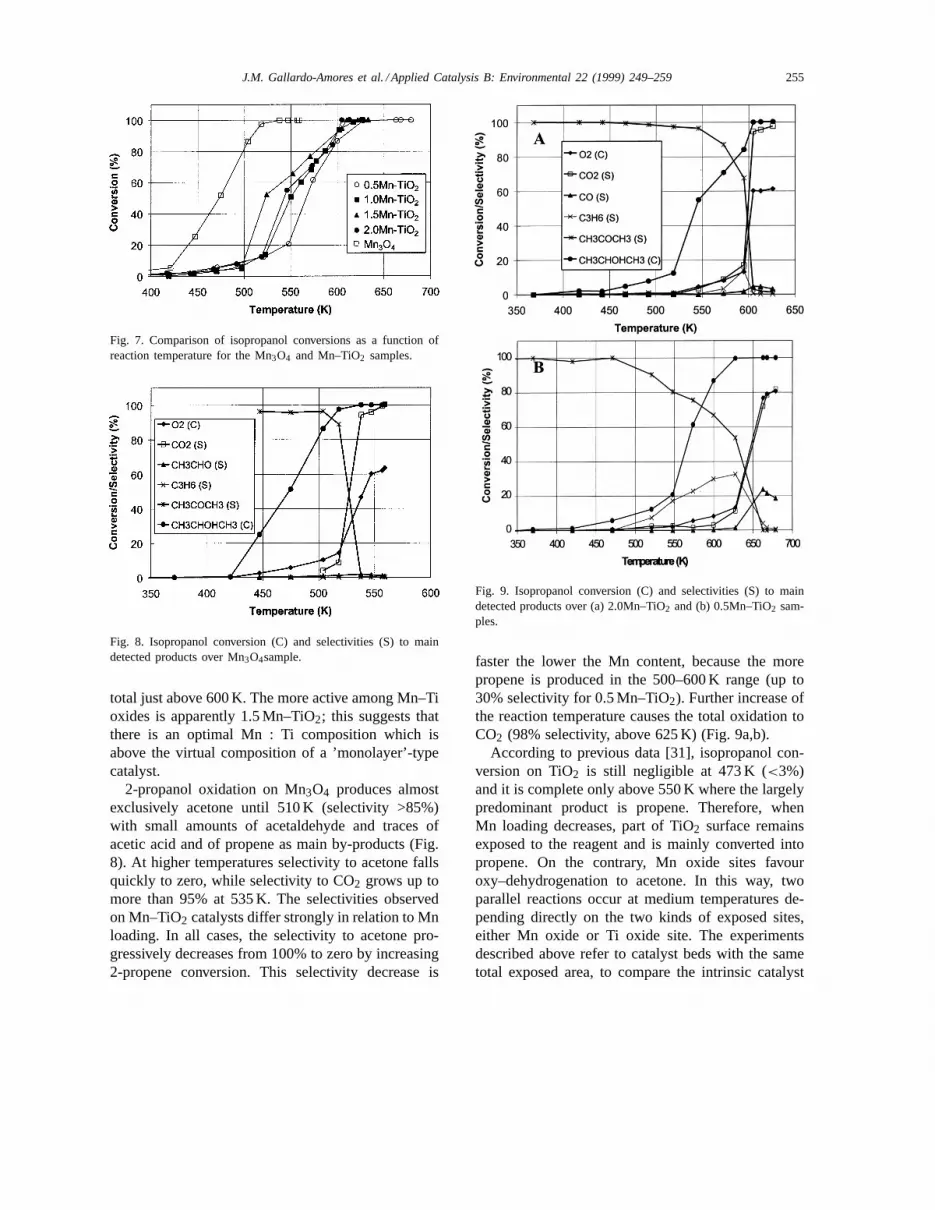
Fig. 8. Isopropanol conversion (C) and selectivities (S) to maindetected products over Mn3O4sample.
total just above 600 K. The more active among Mn–Tioxides is apparently 1.5 Mn–TiO2; this suggests thatthere is an optimal Mn : Ti composition which isabove the virtual composition of a ’monolayer’-typecatalyst.
2-propanol oxidation on Mn3O4 produces almostexclusively acetone until 510 K (selectivity >85%)with small amounts of acetaldehyde and traces ofacetic acid and of propene as main by-products (Fig.8). At higher temperatures selectivity to acetone fallsquickly to zero, while selectivity to CO2 grows up tomore than 95% at 535 K. The selectivities observedon Mn–TiO2 catalysts differ strongly in relation to Mnloading. In all cases, the selectivity to acetone pro-gressively decreases from 100% to zero by increasing2-propene conversion. This selectivity decrease is
Fig. 9. Isopropanol conversion (C) and selectivities (S) to maindetected products over (a) 2.0Mn–TiO2 and (b) 0.5Mn–TiO2 sam-ples.
faster the lower the Mn content, because the morepropene is produced in the 500–600 K range (up to30% selectivity for 0.5 Mn–TiO2). Further increase ofthe reaction temperature causes the total oxidation toCO2 (98% selectivity, above 625 K) (Fig. 9a,b).
According to previous data [31], isopropanol con-version on TiO2 is still negligible at 473 K (<3%)and it is complete only above 550 K where the largelypredominant product is propene. Therefore, whenMn loading decreases, part of TiO2 surface remainsexposed to the reagent and is mainly converted intopropene. On the contrary, Mn oxide sites favouroxy–dehydrogenation to acetone. In this way, twoparallel reactions occur at medium temperatures de-pending directly on the two kinds of exposed sites,either Mn oxide or Ti oxide site. The experimentsdescribed above refer to catalyst beds with the sametotal exposed area, to compare the intrinsic catalyst

256 J.M. Gallardo-Amores et al. / Applied Catalysis B: Environmental 22 (1999) 249–259
Fig. 10. FT–IR spectra of species arising from isopropanol in-teraction over 2.00 Mn–TiO2 sample upon heating at: (a) roomtemperature, (b) 373 K, (c) 423 K, (d) 473 K, (e) 523 K, (f) 573 Kand (g) 673 K.
activity. Having Mn–Ti samples definitely higher spe-cific area (65–85 m2g–1) than Mn3O4 (24 m2g–1), weworked with a definitely larger bed for Mn3O4. Thedifferences of catalytic activity of unsupported andsupported Mn oxides per unit weight or volume isdefinitely less pronounced.
3.4.2. FT–IR study of isopropanol adsorption andoxidation
The spectra of surface species arising from iso-propanol interaction over the 2.0 Mn–TiO2 sampleare compared in Fig. 10. At room temperature, theadsorption of isopropanol gives rise to a spectrumconstituted by bands situated at 1466, 1380 (doublet),1332, 1300 (broad and weak), 1165 and 1127 cm–1.The broad absorption at 1300 cm–1disappears quicklyupon heating at 373 K. According to the litera-ture [32–34], the features resisting heating at 373 Kare attributed to asymmetric and symmetric CH3deformations (1466, 1380 cm–1), CH deformation(1332 cm–1), and C–C and C–O stretchings (1165and 1127 cm–1), respectively, of isopropoxy-species.The broad band near 1300 cm–1 is due to the C–O–Hdeformation of coordinatively adsorbed isopropanol,easily desorbed. The bands due to isopropoxy-speciesdecrease progressively in intensity down to disappearcompletely at 573 K. In parallel, new sharp bands arefound in the 473–523 K range at 1682 (nC=O) and1244 (nasyC–C–C) cm–1, associated with adsorbed
Fig. 11. FT–IR spectra of gas-phase species arising from iso-propanol interaction over 2.00Mn–TiO2 sample upon heating at:(a) 373 K, (b) 443 K, (c) 473 K, (d) 523 K, (e) 573 K, (f) 623 K and(g) 673 K (the spectrum of isopropanol gas has been subtracted).
acetone [33]. Additionally, two absorptions grow byincreasing temperatures near 1585 and 1465 cm–1
related to acetate species [33] while an absorptionpersists near 1380 cm–1, likely evidence of formatespecies. After heating at 523 K the bands of carboxy-lates (mainly acetates) are still evident at 1560 and1455 cm–1. The spectra in the CH stretching regionagrees with the picture described above.
In the same conditions, the IR spectra of the gasphase species have also been recorded (Fig. 11). Thebands due to 2-propanol vapour decrease in intensityprogressively upon heating, while bands due to ace-tone vapour (1738 cm–1, C=O stretching) is observedstarting from 440 K, grow up to 523 K and later de-crease in intensity. Gaseous propene (912 cm–1, CH2wagging) starts to be detectable from 473 K and alsofirst grows and later drops, while finally the bandsdue to CO2 (2340 and 667 cm–1) become predomi-nant above 673 K. The comparison of the surface andgas-phase spectra suggest that 2-propoxide groups areprecursors for both gas-phase propene and gas-phaseand surface acetone, while CO2 is likely the productof total oxidation of acetone through acetate and for-mate species. This picture agrees with the mechanismpreviously proposed to occur on Mn3O4 [5]. The spec-tra obtained with the other Mn–TiO2 samples differfrom those discussed here only for the relative intensi-ties and the stability temperature ranges of the surfacespecies, which are the same in all cases.

J.M. Gallardo-Amores et al. / Applied Catalysis B: Environmental 22 (1999) 249–259 257
Fig. 12. MS–CG chromatogram of products from isopropanol oxidation over 2.00Mn–TiO2 at 573 K
3.4.3. MS–GC analyses of by-products ofisopropanol oxidation
As already said, GC analysis of the products flow-ing out of the reactor upon isopropanol oxidationexperiments show the reactants isopropanol and oxy-gen, and acetone, propene, CO2 and traces of COand acetaldehyde as the main products. However,very small additional peaks could be observed inthe Gas-chromatograms. To have further informationon the reaction mechanism, we repeated some ex-periments with GC–MS analysis of the products. Atlow conversion three peaks are observed at retentiontimes higher that those of the above products, about11.5, 12.4 and 15.6 min over VOC–HP capillary col-umn. In Fig. 12, the MS–GC chromatogram of thereaction products obtained over 2.0 Mn–TiO2 sam-ple at 575 K is shown above 10 min retention time.The mass spectra of the respective species are alsoshown in the figure. They are automatically identi-fied as isopropyl-formate (11.5 min retention time),di-isopropyl ether (12.4 min) and isopropyl acetate(15.6 min). These species disappear at higher reactantconversions.
The detection of these species can be related to thedetection by FT–IR of formates, isopropoxides and
acetate groups at the catalyst surface. It seems likelythat the reactant 2-propanol, when still present in bigamounts, scavenges these surface species and trapsthem as ethers or esters. So, these data are taken asan evidence of the role of isopropoxides, acetates andformates in the isopropanol oxidation mechanism, seeScheme 1.
4. Conclusions
The main conclusions found in this study can besummarised as follows:
Mn–Ti oxides prepared by impregnation of abrookite-containing anatase support are composed bywell dispersed Mn oxides at the surface and also byMnO2 partially entered the TiO2 bulk. No traces ofMn oxides as separate phases can be found also whenthe Mn oxide amount is double that needed to coverthe titania surface with a theoretical ‘monolayer’.
Impregnated Mn oxide seems to hinder the anatasesintering while it favours anatase-to-rutile phase tran-sition.
Electronic spectra suggest the existence of Mn4+ inthe bulk TiO2 and the predominance of Mn3+ at thesurface.

258 J.M. Gallardo-Amores et al. / Applied Catalysis B: Environmental 22 (1999) 249–259
Scheme 1. Reaction pathway for 2-propanol and acetone oxidation on Mn3O4.
Mn oxides supported on TiO2 are intrinsically lessactive than pure Mn oxides in the isopropanol oxida-tion, and are also less selective to acetone at uncom-plete conversion. Accordingly, samples with Mn load-ing under the monolayer, present an enhanced selec-tivity to propene, attributed to the uncovered supportsurface.
However, the higher Mn-content samples appear tobe quite stable medium-high surface area materials inthe 600–900 K range, giving rise, in this temperaturerange, to complete oxidation of isopropanol to CO2only. FT–IR studies and the GC–MS analysis of someintermediate products allow to confirm that 2-propanoltotal oxidation occurs through the previously proposed2-propoxide/acetate/formate surface pathway.
The lower catalytic activity of Mn–TiO2 sampleswith respect to unsupported Mn3O4(measured per unitsurface area) is attributed to the dissolution of theMnn+ active sites by TiO2.
Acknowledgements
Part of this work has been supported by NATO(CRG–960316). JMGA acknowledges MEC for a FPIgrant.
References
[1] M. Baldi, E. Finocchio, G. Busca, Appl. Catal. B: Environ.16 (1998) 43.
[2] J.E. Germain, R. Perez, Bull. Soc. Chim. France (1972) 541and 2042.
[3] M. Baldi, V. Sanchez Escribano, J.M. Gallardo Amores, F.Milella, G. Busca, Appl. Catal. B: Environ. 17 (1998) L 175.
[4] C. Lahousse, A. Bernier, A. Gaigneaux, P. Ruiz, P. Grange,B. Delmon, in: R.K. Grasselli et al. (Eds.), Proc. 3rd World
Congress on Oxidation Catalysis, Elsevier, Amsterdam, 1997,p. 777.
[5] M. Baldi, F. Milella, G. Ramis, V. Sanchez Escribano, G.Busca, Appl. Catal. A: General 166 (1998) 75.
[6] I.E. Wachs. R.Y. Saleh, S.S. Chan, C. Chersic, Chemtech.(1985) 756.
[7] B. Grzybowska-Swierkosz, F. Trifirò, J.C. Vedrine, Vanadiacatalysts for selective oxidation of hydrocarbons, Vanadiacatalysts for selective oxidation of hydrocarbons and theirderivatives, Appl. Catal. A: General 157 (1997) 1–426.
[8] G. Busca, L. Lietti, G. Ramis, F. Berti, Appl. Catal. B:Environ. 18 (1998) 1.
[9] M.A. Baltanas, A.B. Stiles, J.R. Katzer, Proc. 8th Congresson Catalysis V (1984) 311.
[10] A. Wollner, F. Lange, H. Schmelz, H. Knözinger, Appl. Catal.A General 94 (1993) 181.
[11] J.M. Gallardo Amores, V. Sanchez Escribano, G. Ramis, G.Busca, Appl. Catal. B: Environ. 13 (1997) 45.
[12] F. Milella, J.M. Gallardo-Amores, M. Baldi, G. Busca, J.Mater. Chem. 8 (1998) 2525.
[13] B.G. Hyde, S. Andersson, Inorganic Crystal Structures, 1sted., Wiley Intersience, New York, 1989.
[14] L. Yi, G. Ramis, G. Busca, L. Lorenzelli, J. Mater. Chem. 4(1994) 1755.
[15] A.R. West, Solid State Chemistry and its Applications, 1sted., New York, 1989.
[16] M. Valigi, C. Cimino, J. Solid State Chem. 12 (1975) 135.[17] F. Gruy, M. Pijolat, J. Am. Ceram. Soc. 75 (1992) 657.[18] J.M. Gallardo Amores, V. Sanchez Escribano, G. Busca, J.
Mater. Chem. 5 (1995) 1245.[19] I.E. Grey, C. Li, A. F: Reid, J. Solid State Chem. 17 (1976)
343.[20] G. Busca, G. Ramis, J.M. Gallardo Amores, V. Sánchez
Escribano, P. Piaggio, J. Chem. Soc., Faraday Trans. 90 (1994)3181.
[21] T. Osaka, F. Uzumi, Y. Fujiki, J. Raman Spectrosc. 7 (1978)321.
[22] Lj. D. Arsov, C. Kormann, W. Plieth, Lj. D. Arsov, J. RamanSpectrosc. 22 (1991) 573.
[23] G.C. Bond, J. Perez Zurita, S. Flamerz, P.J. Gellings, H.Borch, J.G. Van Ommen, B.J. Kip, Appl. Catal. 22 (1986)361.
[24] L.J. Alemany, L. Lietti, N. Ferlazzo, P. Forzatti, G. Busca,E. Giamello, F. Bregani, J. Catal. 155 (1995) 117.

J.M. Gallardo-Amores et al. / Applied Catalysis B: Environmental 22 (1999) 249–259 259
[25] J.M. Gallardo-Amores, V. Sánchez-Escribano, G. Busca, V.Lorenzelli, J. Mater. Chem. 4 (1994) 965.
[26] D. Cordischi, M. Valigi, D. Gazzoli, V. Indovina, J. SolidState Chem. 15 (1975) 82.
[27] J.R. Akrige, J.H. Kennedy, J. Solid State Chem. 29 (1979) 63.[28] M. Leglet, M. Bizi, C.K. Jorgensen, J. Solid State Chem. 86
(1990) 82.[29] V.S. Stubican, C. Greskovich, Geochimica et Cosmochimica
Acta 39 (1975) 875.[30] F. Lavalille, D. Gourier, A.M. Lejus, D. Vivien, J. Solid State
Chem. 49 (1983) 180.
[31] G. Busca, V. Sanchez Escribano, P. Forzatti, L. Lietti, G.Ramis, in: V. Cortes Corberan, S. Vic Bellon (Eds.), NewDevelopments in Selective Oxidation,Elsevier, Amsterdam,(1994) p. 777.
[32] P.F. Rossi, G. Busca, V. Lorenzelli, O. Saur, J.C. Lavalley,Lagmuir 3 (1987) 52.
[33] V. Sanchez Escribano, G. Busca, V. Lorenzelli, J. Phys. Chem.95 (1991) 5541.
[34] E. Finocchio, G. Busca, V. Lorenzelli, V. Sanchez-Escribano,J. Chem. Soc. Trans. 92 (1996) 1587.


