Embed Size (px)
Citation preview
com
ment
reviews
reports
deposited research
refereed researchinteractio
nsinfo
rmatio
n
Open Access2004Parisiet al.Volume 5, Issue 6, Article R40ResearchA survey of ovary-, testis-, and soma-biased gene expression in Drosophila melanogaster adultsMichael Parisi*, Rachel Nuttall†, Pamela Edwards*, James Minor†, Daniel Naiman‡, Jining Lü*, Michael Doctolero†, Marina Vainer†, Cathy Chan†, James Malley§, Scott Eastman† and Brian Oliver*
Addresses: *Laboratory of Cellular and Developmental Biology, National Institute of Diabetes and Digestive and Kidney Diseases, National Institutes of Health, Department of Health and Human Services, Bethesda, MD 20892, USA. †Incyte Genomics, Palo Alto, CA 94304, USA. ‡Department of Mathematical Sciences, Johns Hopkins University, Baltimore, MD 21218, USA. §Center for Information Technology, National Institutes of Health, Department of Health and Human Services, Bethesda, MD 20892, USA.
Correspondence: Michael Parisi. E-mail: [email protected]
© 2004 Parisi et al.; licensee BioMed Central Ltd. This is an Open Access article: verbatim copying and redistribution of this article are permitted in all media for any purpose, provided this notice is preserved along with the article's original URL.
Abstract
Background: Sexual dimorphism results in the formation of two types of individuals withspecialized reproductive roles and is most evident in the germ cells and gonads.
Results: We have undertaken a global analysis of transcription between the sexes using a 31,464element FlyGEM microarray to determine what fraction of the genome shows sex-biasedexpression, what tissues express these genes, the predicted functions of these genes, and wherethese genes map onto the genome. Females and males (both with and without gonads), dissectedtestis and ovary, females and males with genetically ablated germlines, and sex-transformed flieswere sampled.
Conclusions: Using any of a number of criteria, we find extensive sex-biased expression in adults.The majority of cases of sex differential gene expression are attributable to the germ cells. Thereis also a large class of genes with soma-biased expression. There is little germline-biased expressionindicating that nearly all genes with germline expression also show sex-bias. Monte Carlosimulations show that some genes with sex-biased expression are non-randomly distributed in thegenome.
BackgroundSexual dimorphism varies enormously from the morphologi-cally indistinct yeast mating types, to extreme differences thatcan lead to the misclassification of males and females as dis-tinct species. While the Drosophila sexes show relativelymodest sexually dimorphic somatic body plans there is strik-ing sexual dimorphism in the germline [1]. Indeed, it is diffi-cult to imagine cell types that differ more than eggs and
sperm. During the last century a handful of genes involved inthe regulation of somatic (for example, Sex-lethal [2], trans-former [3], transformer-2 [4], doublesex [5], intersex [6])and germline sexual identity (for example, ovo [7], sans fille[8], ovarian tumor [9], and stand still [10]) have been identi-fied, but we know very little about the effector genes that actu-ally result in a sexually dimorphic state. Major terminal genesin the current models of somatic and germline sex
Published: 1 June 2004
Genome Biology 2004, 5:R40
Received: 4 February 2004Revised: 8 April 2004Accepted: 12 May 2004
The electronic version of this article is the complete one and can be found online at http://genomebiology.com/2004/5/6/R40
Genome Biology 2004, 5:R40
R40.2 Genome Biology 2004, Volume 5, Issue 6, Article R40 Parisi et al. http://genomebiology.com/2004/5/6/R40
determination are a transcription factor (doublesex) and anRNA binding protein (Sex-lethal) [11,12]. These moleculesmust orchestrate a cascade of effector functions that result insexually dimorphic gametes and the somatic support func-tions required for their union at fertilization.
Whilst we know relatively little about how germline sexualidentity is determined in Drosophila, the downstream proc-ess of oogenesis has been well studied. Egg production occursin the ovary [13]; each ovary consists of a cluster of 16-20ovarioles where the assembly line-like production of germlineand somatic cell units (egg chambers) progresses along thelength of the ovariole. The germline component of each eggchamber contains the differentiated products of a singlegermline stem cell division. The differentiating stem celldaughter undergoes four rounds of incomplete cytokinesis toproduce an interconnected 16-cell cyst surrounded by asomatic follicular epithelium.
One of these 16 germline cells becomes the oocyte and theremaining 15 cells develop into supporting nurse cells. The16-germline cells within cysts are connected by an intercellu-lar network facilitating the active transport of macromole-cules from the nurse cells into the growing oocyte. Thesecomponents include basic cellular machinery such as ribos-omes, and a vast assortment of proteins and RNA species thatsupport early embryonic development. For example, the dor-sal/ventral and anterior/posterior axes of the future embryoare laid down during oogenesis [14]. The somatic follicularepithelium surrounding each egg chamber is an importantsource of structural proteins, such as yolk and egg shell pro-teins, that become incorporated into the oocyte, as well aspatterning information. Most of the yolk proteins are pro-duced distantly in non-gonadal fat body tissue [15]. Thus,while much of the egg is constructed by the cells of the eggchamber, there is significant contribution from distantorgans. Finally, additional somatic functions in the femalereproductive tract and female mating behaviors are requiredfor productive gamete function [16]. A global analysis of geneexpression in adult females therefore captures the genesrequired for all of the stages of oogenesis from stem cell toearly embryo.
Analogously, the Drosophila testis contains developing gam-etes, from the stem cells at the apical tip of the testis to fullyfunctional sperm [17]. As in the ovary, the germline stem celldivision in the testis produces cysts of 16 primary spermato-cytes. However, in males all these primary spermatocytesundergo meiosis resulting in a cyst of 64 spermatids. Eachspermatid then follows an elaborate differentiation programof cytoskeletal and nuclear rearrangements to form a maturesperm cell. These changes are quite remarkable. For example,sperm chromatin is nearly crystalline and the nucleuschanges from a round structure to a highly elongated andslightly hooked shape. Cytoskeletal rearrangement is equallydramatic. The round spermatid forms a flagellar axoneme
that is nearly half the length of the adult. Mitochondrial dif-ferentiation in the axoneme is also striking. Individual mito-chondria fuse into two large and interleaved structuresextending along the length of the flagellum. Thus, while thestructure of a sperm cell might suggest a simplistic develop-mental program for spermatogenesis (DNA and a motor),shedding the features that characterize virtually all other cellsin the body (such as packing DNA into nucleosomes) is anenormous reengineering feat. As is the case in females, themale reproductive tract and male behavior are required forfertility [18]. Therefore a global analysis of gene expression inadult males captures the genes required for all of the stages ofspermatogenesis from stem cell to the fertilized egg.
Not surprisingly, both genetic and classic molecular studiesindicate that spermatogenesis and oogenesis are complexevents requiring extensive and often sex-specifically deployedinformation [13,17]. More recently, global gene expressionstudies using printed cDNAs, expressed sequence tags(ESTs), and full transcriptome microarrays have revealedextensive overall sex differential expression [19-24], withgene expression in the germline and gonads being particu-larly striking [19,20,24]. Here we report gene expression pro-files as a function of sexual dimorphism and sexdetermination in Drosophila as analyzed using a platformincluding 93% of predicted genes from version 1.0 of the Dro-sophila genome [25] and 75% of release 3.1. This articleincludes the dataset from Parisi et al. [24] on gene expressionin adults, augmented with additional microarray experimentsto further track the source of sexually dimorphic expression.
There are many stories embedded in the expression datareported here. We touch on only a few to illustrate the valueof the dataset. The most significant aspect of the survey wereport here is the creation of a dataset that can be mined byother researchers interested in gametogenesis and sexualdimorphism. To that end, genes showing differential expres-sion have been organized into easy to browse tables thatinclude internet links to FlyBase [26,27], the compendium ofgenome information for Drosophila. We have also depositedall the data at the Gene Expression Omnibus [28,29] so thatthose interested in large-scale reanalysis can easily downloadthe entire dataset.
ResultsExperimental designWe used a series of experiments to delimit germline andsomatic sex-biased expression. By comparing flies with andwithout a germline we can identify genes with germline-dependent expression bias [21,23]. While most genes show-ing germline-dependent expression are expressed within thegermline cells, this class also includes somatically-expressedgenes induced or de-repressed by the presence of germ cells.Progeny of homozygous tudor1 mothers have no germline andare useful in differentiating somatic and germline-biased
Genome Biology 2004, 5:R40
http://genomebiology.com/2004/5/6/R40 Genome Biology 2004, Volume 5, Issue 6, Article R40 Parisi et al. R40.3
com
ment
reviews
reports
refereed researchdepo
sited researchinteractio
nsinfo
rmatio
n
expression [30]. Another measure of germline contributionwas obtained by dissection. The gonad samples provide ameasure of gene expression in the germline and somatic com-ponents of the gonad. Whilst the gonads clearly contain bothtissues, the vast majority of the mRNA is derived from thegermline cells. Indeed, we were unable to collect sufficient
mRNA (600 ng of polyA+) from dissected germline-lessgonads to perform a single microarray experiment. Finally,wildtype Drosophila males are XY and females are XX. Wereversed the sex of XX flies from female to male using muta-tions in tra2 and dsx [31]. These sex transformed flies haverudimentary testes with very few germline cells [32] and arethus phenotypically similar, although less extreme, than themale progeny of tudor1 mothers [1]. By performing replicatemicroarray experiments on these diverse samples we obtain arobust picture of sexually dimorphic gene expression in thegermline and soma.
Pairs of mRNA samples (Figure 1) labeled using Cy3 or Cy5labeled nonomers were applied to Incyte Fly Gene ExpressionMicroarrays (FlyGEM) and the Cy3 and Cy5 channel intensityvalues were extracted for study as previously reported [33].The microarray was designed against release 1 of the Dro-sophila genome and has been updated to release 3.1. Thereare many changes in the annotation and future changes arealso likely. As a result some of the microarray elements nolonger correspond to officially recognized genes (althoughsome detect transcripts) and some transcripts are now recog-nized by multiple element species. Therefore we use theexpression from the 14,611 DNA element species pairs corre-sponding to Drosophila transcripts (there are at least two ofeach printed on the array plus many control elements for atotal of 31,464) as a metric for 'genes'. Using element speciesrather than gene names assures that the dataset can beupdated as gene models change in the ongoing annotationeffort.
In order to characterize a gene as showing biased expressionin a particular tissue or sex, one is forced to use arbitrary sta-tistical or magnitude cut-offs. In our replicated heterotypichybridizations we used both a conservative measure to cap-ture the highest confidence data and noisier, but more inclu-sive, clustering methods. We express sex-biased and tissue-biased gene expression in terms of percent of the genome fordidactic purposes only, as these numbers depend greatly onthe arbitrary cut-off. For gene lists, see the extensive set oftables and links to FlyBase in the Additional data files.
Expression analyzed by ratioWe have used conservative calls on competitive pairwiseexperiments at two-fold. An extensive set of homotypichybridization experiments (mean r2 of 0.754, and a standarddeviation of 0.097) has shown that the 99.5% tolerance inter-val for measurements on the FlyGEMs is <1.5-fold, and unlikethe case with some array platforms the particular elementsequence does not contribute significantly to variance [33].Therefore, this global statistic can be applied to individualelements. Outliers are very effectively dealt with by replicates(Figure 2). In heterotypic hybridizations reported here, only0.01% of the elements (representing 0-6 in each comparison)showed two-fold differences that fail to correlate with theexperimental variables in question. Briefly, replication
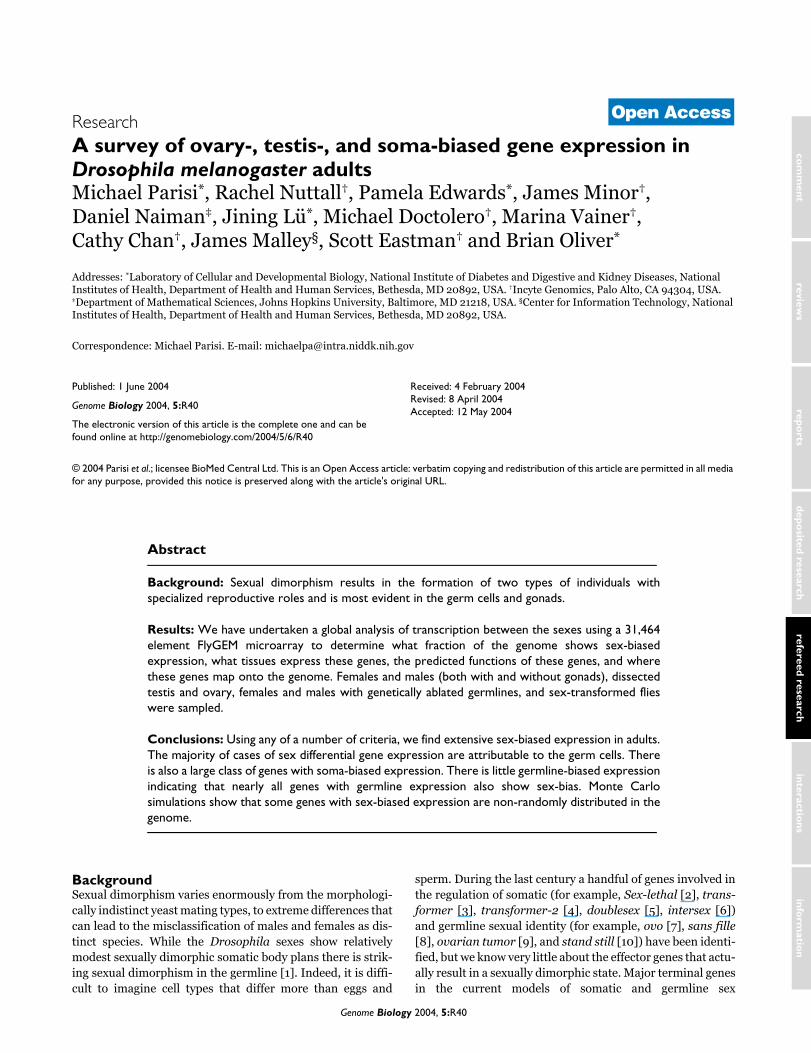
Microarray experimental designFigure 1Microarray experimental design. Sex biased gene expression data was derived from 44 microarray hybridizations testing 15 conditions. All experimental conditions included at least one biological replicate and most also include dye-flip hybridizations for additional replicates. Abbreviated genotypes of the samples are shown in light ellipses with the total number of replicated hybridizations in dark circles between the two samples. Full genotypes of the flies used are as follows: X/Y;tra2- males are w67c/BsY;tra2B/Df(2R)trix, X/X;tra2- sex transformed males are w67c/+;tra2B/Df(2R)trix, X/X;dsxD/dsx- males are (+/+; dsxM+R45/dsxswe. 'tud' males and females are the progeny of homozygous tud1 bw1 sp1 females mated to tud1
bw1 sp1/CyO males and themselves are genotypically tud1 bw1 sp1
homozygotes. Females and males are whole adult y1 w67c flies. Ovary, testis and no gonad samples are also derived from y1 w67c flies.
X/Y;tra2−males
Ovaries
X/X;tra2−males
Females
'tud'females
'tud'males
Females,no gonads
Males,no gonads
Testes
Males
X/X;dsxD/dsx−
Males
4
4
4
4 24
4
4
2
2 2 22
2
2
Genome Biology 2004, 5:R40
R40.4 Genome Biology 2004, Volume 5, Issue 6, Article R40 Parisi et al. http://genomebiology.com/2004/5/6/R40
effectively eliminates false positives for tissue-biased expres-sion in theory and practice.
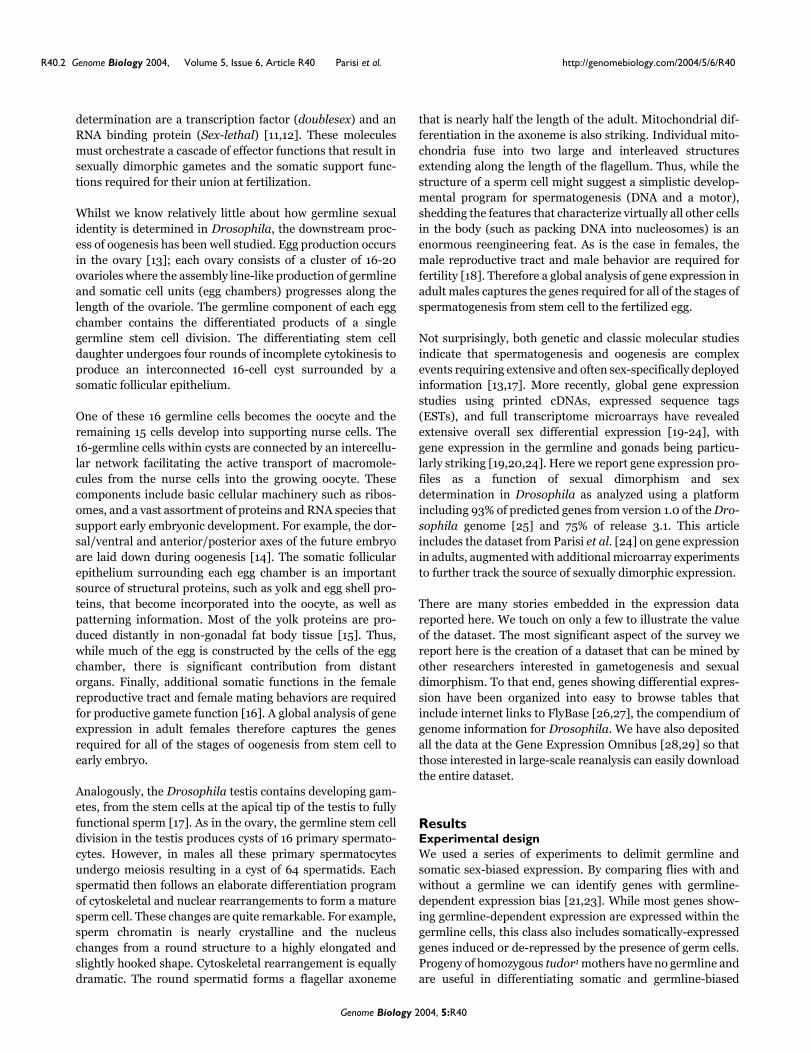
In comparisons of whole adult females and males, 17% of theelement species reporting in all experiments showed a greaterthan two-fold sex-biased hybridization intensity (Figure 2a).Female-biased hybridization intensity was less extensive(6%) than male-biased hybridization intensity (11%). A seriesof experiments suggest that most sex-biased hybridizationintensity is due to the germline (Figure 2; see also tables in theAdditional data). We found that 1.5% of array element speciesshow sex-biased hybridization in experiments using probes
derived from flies with no germ cells (Figure 2b). This distri-bution was asymmetric, with greater numbers of element spe-cies showing high hybridization to male samples (0.9%) thanto female samples (0.4%). Similarly, when male or femalecarcasses were compared, 3% of the element species showedsex-biased hybridization (Figure 2c). The greater degree ofsex-biased hybridization observed in the carcass samples mayreflect strain differences, which can be substantial [21,23], orgermline-dependent expression in the soma. We are cur-rently scrutinizing these possibilities with additional arrayexperiments using flies of identical genotypes, with and with-out germlines. Briefly, these data indicate that relatively little
Sex-biased differential expression in DrosophilaFigure 2Sex-biased differential expression in Drosophila. Scatter plots show global expression in Drosophila testing different sex and tissue conditions. Data are pairwise comparisons of natural log (Ln) Cy3/Cy5 signal ratios averaged from dye flipped and biological replicate experiments. Black color indicates expression ratios that fall within a two-fold cutoff. Microarray element species greater than two-fold are color coded as indicated on each scatter plot. Yellow points indicate 2-fold differences that fail to correspond to the expression variables analyzed. The number of element species included in each pairwise comparison that met stringency conditions are indicated in parentheses. (a) y1 w67c males versus y1 w67c females (n = 10,688); (b) male versus female progeny of homozygous tud1 bw1 sp1 females (n = 12,836); (c)y1 w67c males, no gonads versus y1 w67 female, no gonads (n = 9,778); (d)y1 w67c testis versus y1 w67c ovary (n = 11,338); (e) y1 w67c testis versus y1 w67c y1 w67c male, no gonads (n = 12,461); (f) y1 w67c ovary versus y1 w67c female, no gonads (n = 11,223).
MaleFemale
Male no gonadsFemale no gonads
OvaryFemale no gonads
TestisMale no gonads
TestisOvary
'tud' Male'tud' Female
-10
1-1 0 1
−5 −4 −3 −2 −1 1 2 3 4 5
−5
−4
−3
−2
−1
1
2
3
4
5
−5 −4 −3 −2 −1 1 2 3 4 5
−5
−4
−3
−2
−1
1
2
3
4
5
−5 −4 −3 −2 −1 1 2 3 4 5
−5
−4
−3
−2
−1
1
2
3
4
5
−5 −4 −3 −2 −1 1 2 3 4 5
−5
−4
−3
−2
−1
1
2
3
4
5
−5 −4 −3 −2 −1 1 2 3 4 5
−5
−4
−3
−2
−1
1
2
3
4
5
−5 −4 −3 −2 −1 1 2 3 4 5
−5
−4
−3
−2
−1
1
2
3
4
5
00 1
01
-1 0 1
-1-1
01
0 1
-1
01
0 1
-1-1
01
0 1
-1
(a) (b) (c)
(d) (e) (f)
Replicates 1 and 2
Rep
licat
es 3
and
4R
eplic
ates
3 a
nd 4
Rep
licat
es 3
and
4
Rep
licat
e 2
Rep
licat
e 2
Rep
licat
es 3
and
4
Replicates 1 and 2 Replicates 1 and 2Replicate 1
Replicate 1 Replicates 1 and 2
Genome Biology 2004, 5:R40
http://genomebiology.com/2004/5/6/R40 Genome Biology 2004, Volume 5, Issue 6, Article R40 Parisi et al. R40.5
com
ment
reviews
reports
refereed researchdepo
sited researchinteractio
nsinfo
rmatio
n
of the sex-biased expression in whole flies is attributable tothe soma.
While the contribution of the germline to sexually dimorphicgene expression can be approximated by examining the frac-tion of the sex-biased expression in whole wildtype fliesminus the sex-biased expression in the soma, a more directmeasurement is obtained by hybridizing mRNA from dis-sected gonads. As we show below, this substantially concen-trates the mRNAs from germline cells and increases the depthof the observed expression profile. Ovary and testis samplesexhibit the highest degree of sex-biased hybridization in ourexperiments (Figure 2d). A total of 29% of element speciesexhibit ovary-biased or testis-biased hybridization. This is incontrast to 14-16% of element species deduced to show ovaryor testis-biased hybridization by subtracting the somatic sex-biased genes from the list of element species exhibiting sex-biased hybridization in whole adults. The expression profile isdistinctly asymmetric with nearly twice as many element spe-cies showing greater than two-fold hybridization to testissamples (18%) versus ovary samples (11%). Additionally,there were far more element species showing a large magni-tude of testis-biased hybridization. For example, 2% of ele-ment species showed >20-fold hybridization intensity in thetestis channel, while <<1% of element species showed a simi-lar magnitude in the ovary channel (n = 4). These data indi-cate that the cells of the testis deploy a larger battery ofspecific genes than those of the ovary. Additionally, these dataconfirm that the most sexually dimorphic tissues, the gonads,show the most distinct gene expression profiles.
A priori, one might expect that the soma would be quite dif-ferent from the germline, but to what extent is this due to theexpression of germline-specific or soma-specific gene batter-ies? To address this question, we have also examined germ-line versus somatic expression within a given sex. As expectedwe observed a high degree of testis-biased hybridization incompetitive hybridizations with samples from either maleswith no or few germline cells (males from tudor1 mothers, andfemales transformed somatically into males; not shown) orfrom males with gonads removed (Figure 2e). A total of 14%of element species hybridize preferentially to labeled testissamples, supporting the idea that the gene batteries deployedin a testis-biased manner are extensive. Additionally, theseexperiments reveal a high degree of soma-biased hybridiza-tion - 10% of element species are preferentially hybridized tosamples from males with the gonads removed (Figure 2e).
Somewhat surprisingly, comparing females with or withoutgermlines did not show the same pattern of soma versusgermline hybridization that was evident in the males. Ovary-biased hybridization was modest (4%) in experiments meas-uring hybridization of samples from ovary versus samplesfrom females with the ovaries removed (Figure 2f). In con-trast, soma-biased hybridization was extensive (12%) as wasthe case when examining male soma and germline (Figure
2e). Thus, unlike what is seen in males, the asymmetry inthese ratio plots favors the soma. This suggests that most ofthe genes expressed in the female soma are also expressed inthe ovary and that many genes are expressed specifically inthe female soma. The soma is distinguished from the germ-line by a high degree of soma-biased gene expression.
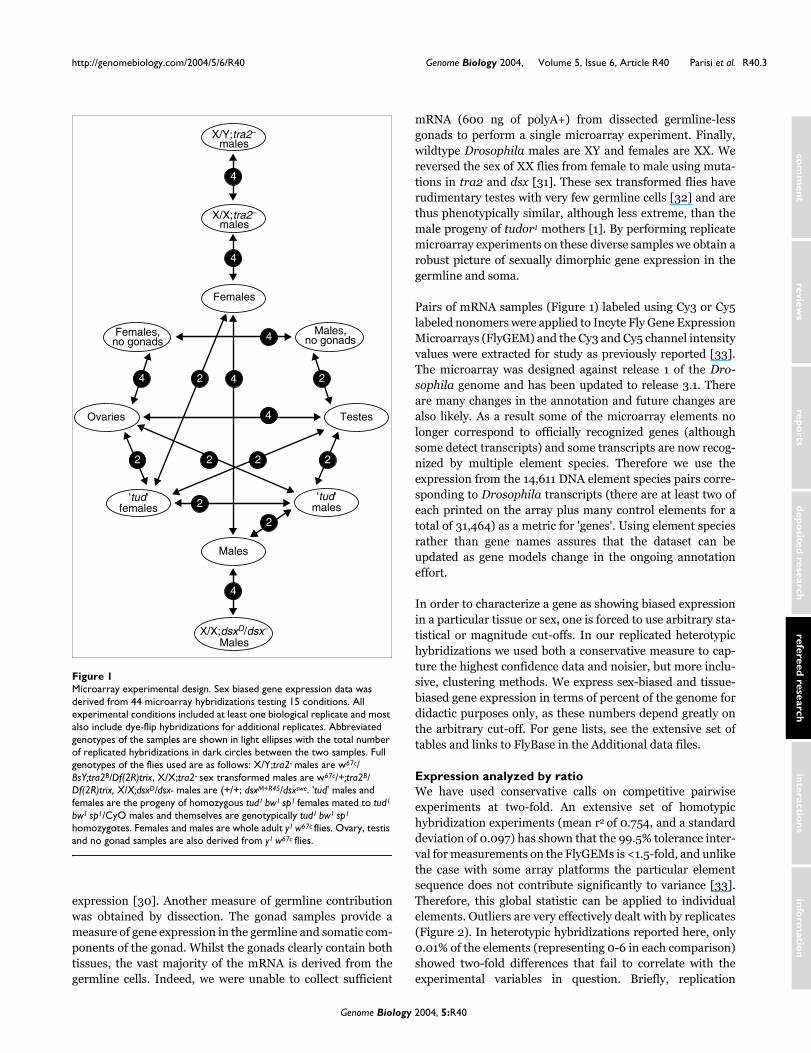
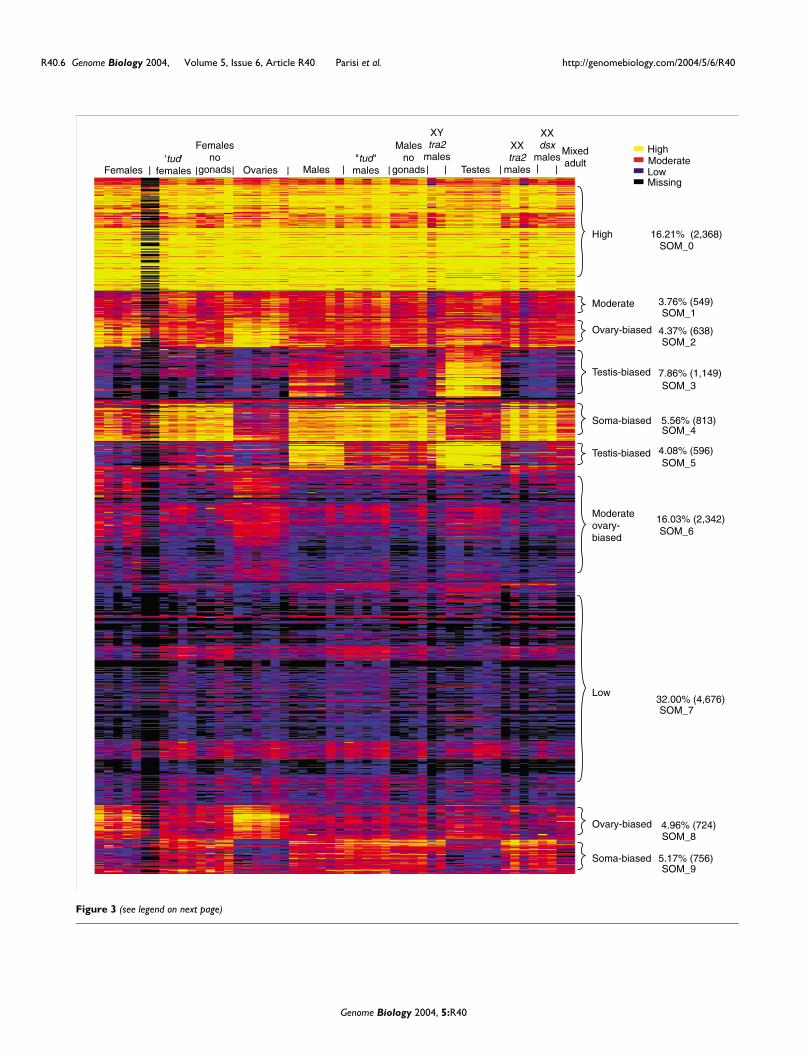
Expression analyzed by intensityAn overview of all sex-biased gene expression is provided byexamining a self-organized heat map of the cross-normalizedintensities from each of the hybridizations (Figure 3). Thisalso provides an independent method for building gene lists.As expected from the pairwise comparisons, the prominentclusters in this map highlight groups of element speciesexhibiting testis-biased (12%), ovary-biased (9%), and soma-biased (11%) hybridization. The clusters of element speciesshowing testis-biased hybridization are most dramatic, bothin terms of the number showing sex-bias and in terms of thedegree of hybridization bias. This global overview shows verylittle overt sex-biased expression in the soma, and very littlegermline-biased expression. In agreement with the scatter-plot analysis, the heat map indicates that the main batteriesof differentially expressed genes distinguish the soma fromthe germline, and the female germline from the male germ-line. Again, the lack of an overt class of genes showing germ-line-biased expression indicates that the male and femalegermlines have very little in common, other than the absenceof expression from a large class of genes that appear to havesoma-biased function.
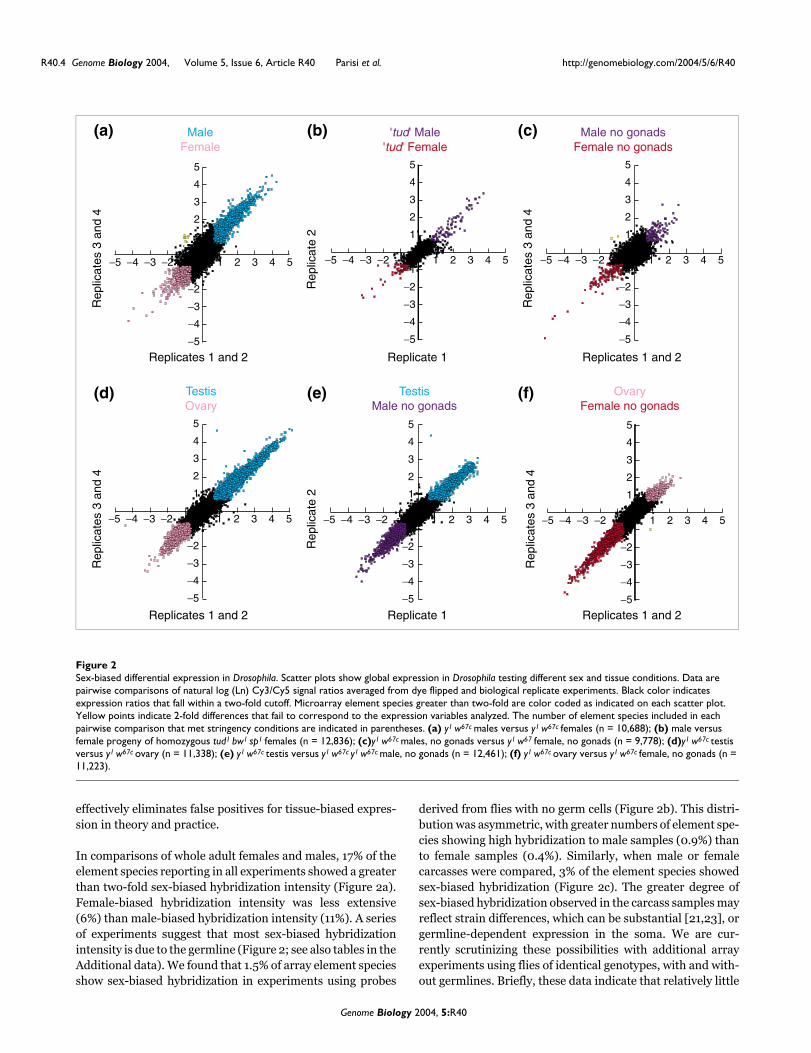
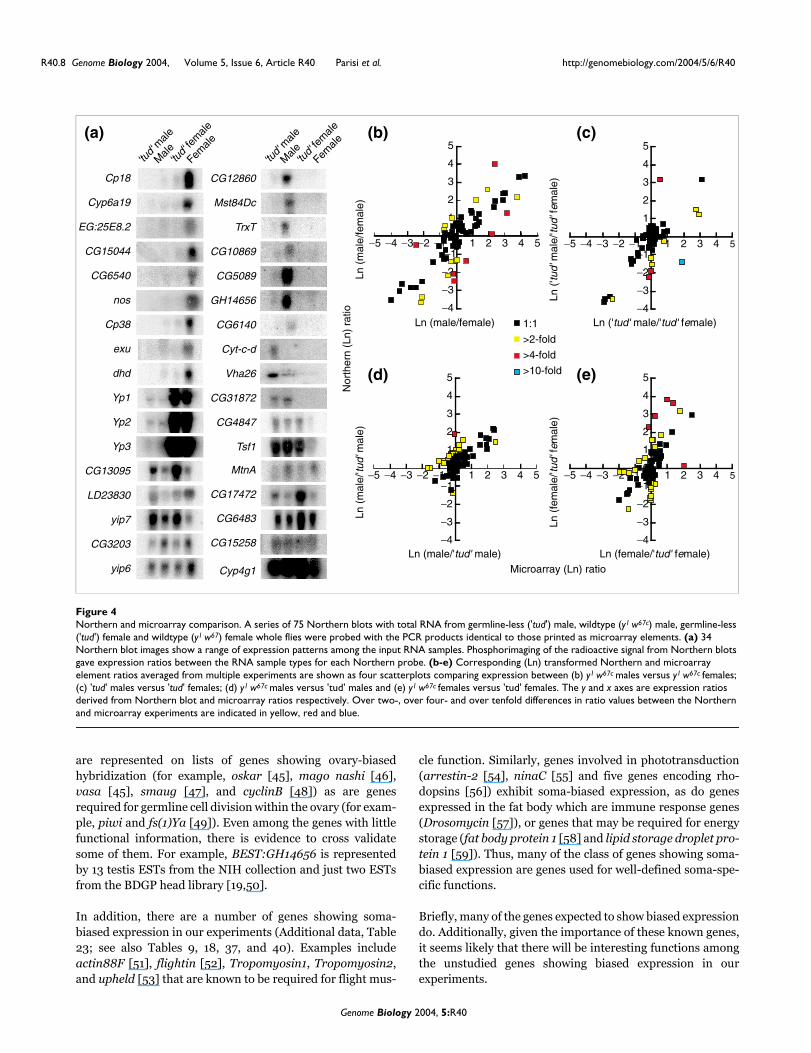
Cross-validation of expression by Northern blottingIt is standard practice to confirm the expression of genes ofinterest based on microarray data by RT-PCR or Northernblotting, although this is not practical when thousands ofgenes show biased expression. Additionally, this confirma-tion is usually restricted to genes showing differentialexpression, and therefore does not allow for a good estimateof sex-biased gene expression missed in the FlyGEM experi-ments. We selected 75 element species from the FlyGEMexperiments, across the range of observed intensities and sex-biases, for Northern blotting experiments on adult males andfemales with and without germlines (Figure 4a). Signal inten-sities from each lane on the Northerns were measured foreach experiment and then used to calculate differentialexpression ratios among the four sample lanes in a fashionanalogous to pairwise microarray comparisons (absoluteintensities correlated very poorly, indicating that the tech-niques have different signal and noise characteristics eventhough the same amplicons were used). Plotting the ratiosfrom Northerns versus microarrays demonstrates consistentrelative measurement of RNA between the two experimentalsystems (Figure 4b,c,d,e). The majority of the data points fallalong the diagonal for wildtype males and females. In theother comparisons, both the microarray and Northern ratiostend to cluster near the origin (a ratio of 1 is 0 in log space)due to lower sex-biased expression in the germlineless flies of
Genome Biology 2004, 5:R40
R40.6 Genome Biology 2004, Volume 5, Issue 6, Article R40 Parisi et al. http://genomebiology.com/2004/5/6/R40
Figure 3 (see legend on next page)
Females'tud'
females
Femalesno
gonads Ovaries Males"tud"
males
Malesno
gonads Testes
XYtra2
malesXXtra2
males
XXdsx
malesMixedadult
High
Moderate
Ovary-biased
Testis-biased
Soma-biased
Testis-biased
Ovary-biased
Soma-biased
Low
5.17% (756)
16.21% (2,368)
3.76% (549)
7.86% (1,149)
5.56% (813)
4.08% (596)
16.03% (2,342)
32.00% (4,676)
4.96% (724)
4.37% (638)
Moderateovary-biased
HighModerateLowMissing
SOM_0
SOM_1
SOM_2
SOM_3
SOM_4
SOM_5
SOM_6
SOM_7
SOM_8
SOM_9
Genome Biology 2004, 5:R40
http://genomebiology.com/2004/5/6/R40 Genome Biology 2004, Volume 5, Issue 6, Article R40 Parisi et al. R40.7
com
ment
reviews
reports
refereed researchdepo
sited researchinteractio
nsinfo
rmatio
n
tudor1 mothers. Thus, ratios determined by Northern blottingand FlyGEM compare favorably.
Cross-validation of expression with the developmental time courseComparing array results across platforms can cross-validate alarger fraction of the genome. Confidence is heightened forelement species showing biased expression on two platforms[34]. A Drosophila developmental profile including malesand females with and without a germline has also been per-formed on a cDNA array platform (GEO accession GPL218)[20]. This array is less complete than the FlyGEM and isbiased against testis gene expression as no clones from testiscDNA libraries were included in the platform. Thus, overallestimates of sex-biased gene expression are expected to varybetween the platforms. However, FlyGEM element speciesdesigned against the genes represented by cDNA insertsshould correlate if both platforms are performing as expected.We extracted data from 2,536 GPL218 elements also presenton the FlyGEM platform for comparative analysis.
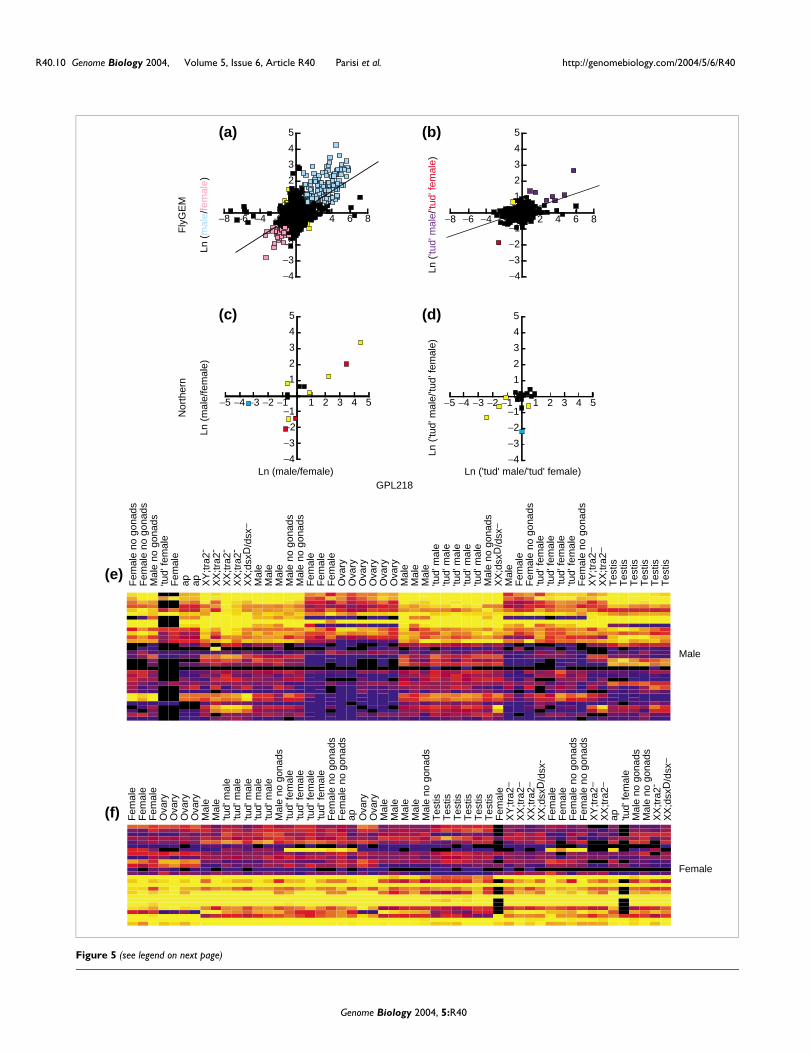
The correlation between male/female hybridization ratioswas quite good (Figure 5a,b). The trend lines clearly demon-strate that elements showing sex-biased expression on oneplatform show similar sex-biased expression on the other ifone applies a greater than two-fold cut-off to these ratios. Theonly clearly artifactual result from this comparison is thepresence of a substantial number of elements reporting sex-bias only in Arbeitman et al. [20]. This may be due to cross-hybridization as a result of low sequence complexity andrepeats in the cDNA inserts - a common problem with cDNAarrays [35]. Nevertheless, this comparison clearly cross-vali-dates the expression profiles for a substantial set of genes.Indeed, the r2 for male/female ratios across platforms is0.447, which is similar to the correlation observed betweenreplicate hybridizations within the time course dataset (r2 =0.334 +/- 0.114).
We then tested whether expression ratios from our Northernanalysis correlated to ratios derived from Arbeitman et al.[20]. We have Northern data in 16/2,536 elements commonto both platforms. The male versus female and 'tud' male ver-sus 'tud' female ratios were plotted (Figure 5c,d). The Arbeit-man et al. [20] data to Northern (Figure 5c,d) and FlyGEM toNorthern (Figure 4b,c) correlation was similar.
The Arbeitman et al. [20] data has been recently re-evaluatedin a more statistically rigorous manner to extract the high
confidence data from the moderately reproducible primarydata [36]. The specific aim of this re-evaluation was to iden-tify genes with sex-specific expression patterns. If the set ofcDNA amplicons that most reliably hybridize to female ormale samples can also be used to categorize female and malesamples of differing genotype from another lab, then confi-dence in that list of genes is augmented. We therefore took alist of gene identifiers from this more recent study, extractedour corresponding data, and generated a cluster map of sam-ples (Figure 5e,5f). This small subset of elements was suffi-cient for the unsupervised classification of whole females andmales, despite disparate genetic backgrounds. Tissues werealso appropriately juxtaposed on the sample tree. Collec-tively, the scatterplot and heat map comparisons indicate thatFlyGEM and Arbeitman et al. [36] data are in broad agree-ment and suggests that a full meta-analysis of Drosophilaexpression data from multiple platforms will be fruitful.
Well-characterized genes are correctly scoredGenes known to have sex-biased expression or functionshould be present in the appropriate ovary-, testis-, or soma-biased lists. We have mapped the FlyGEM element species tothe current release of the Drosophila genome and generateda large set of lists with links to Flybase gene report pages (seeAdditional data). Following these links leads to more links(for example, literature, additional array data, yeast two-hybrid maps) and following these trails lends further confi-dence in the array data. For example, on lists of element spe-cies showing ovary-bias (Table 21 in Additional data; see alsoTables 5, 15, 17, 30, 24, 36, and 38), we find six that representchorion proteins (Cp15, Cp16, Cp18, Cp19, Cp36, and Cp38).Chorion proteins are components of the egg shell, and areknown to be highly over-expressed in the ovary [37,38]. Sim-ilarly, structural components of sperm such as beta-tubulin85D [39], tektin-A [40] and don juan [41] are foundon testis-biased lists (Additional data, Table 22; see alsoTables 6, 7, 9, 31, 33, and 39). A number of other genes show-ing biased hybridization are known to be required for femaleor male fertility. These include alpha-tubulin67C, which isrepresented by over 20 female sterile alleles [42] and dead-head, which is represented by four female sterile alleles and asingle lethal allele [43]. Genes represented by male sterilealleles (for example, boule [34] and fuzzy onions [44]) arefound on testis-biased lists. The boule gene is also required inmammalian spermatogenesis [34], highlighting the potentialutility of this dataset for those interested in spermatogenesisin mammals. Genes known to encode products requiredmaternally for germline formation in the resulting embryo
Heat diagram of intensitiesFigure 3 (see previous page)Heat diagram of intensities. Self organizing maps (SOMs) were used to generate an image of clustered intensity data from 26 pairwise experiments. The individual channels from these experiments are parsed out and arranged by tissue type as indicated in the top row text. The normalized intensities are indicated as high expression (yellow), moderate (red), low (blue) and missing value (below background; black). The diagram represents averaged data from the duplicated elements within each microarray. Brackets show ten SOM clusters with the tissue type and percentage of the total number of microarray elements in the right text column.
Genome Biology 2004, 5:R40
R40.8 Genome Biology 2004, Volume 5, Issue 6, Article R40 Parisi et al. http://genomebiology.com/2004/5/6/R40
are represented on lists of genes showing ovary-biasedhybridization (for example, oskar [45], mago nashi [46],vasa [45], smaug [47], and cyclinB [48]) as are genesrequired for germline cell division within the ovary (for exam-ple, piwi and fs(1)Ya [49]). Even among the genes with littlefunctional information, there is evidence to cross validatesome of them. For example, BEST:GH14656 is representedby 13 testis ESTs from the NIH collection and just two ESTsfrom the BDGP head library [19,50].
In addition, there are a number of genes showing soma-biased expression in our experiments (Additional data, Table23; see also Tables 9, 18, 37, and 40). Examples includeactin88F [51], flightin [52], Tropomyosin1, Tropomyosin2,and upheld [53] that are known to be required for flight mus-
cle function. Similarly, genes involved in phototransduction(arrestin-2 [54], ninaC [55] and five genes encoding rho-dopsins [56]) exhibit soma-biased expression, as do genesexpressed in the fat body which are immune response genes(Drosomycin [57]), or genes that may be required for energystorage (fat body protein 1 [58] and lipid storage droplet pro-tein 1 [59]). Thus, many of the class of genes showing soma-biased expression are genes used for well-defined soma-spe-cific functions.
Briefly, many of the genes expected to show biased expressiondo. Additionally, given the importance of these known genes,it seems likely that there will be interesting functions amongthe unstudied genes showing biased expression in ourexperiments.
Northern and microarray comparisonFigure 4Northern and microarray comparison. A series of 75 Northern blots with total RNA from germline-less ('tud') male, wildtype (y1 w67c) male, germline-less ('tud') female and wildtype (y1 w67) female whole flies were probed with the PCR products identical to those printed as microarray elements. (a) 34 Northern blot images show a range of expression patterns among the input RNA samples. Phosphorimaging of the radioactive signal from Northern blots gave expression ratios between the RNA sample types for each Northern probe. (b-e) Corresponding (Ln) transformed Northern and microarray element ratios averaged from multiple experiments are shown as four scatterplots comparing expression between (b) y1 w67c males versus y1 w67c females; (c) 'tud' males versus 'tud' females; (d) y1 w67c males versus 'tud' males and (e) y1 w67c females versus 'tud' females. The y and x axes are expression ratios derived from Northern blot and microarray ratios respectively. Over two-, over four- and over tenfold differences in ratio values between the Northern and microarray experiments are indicated in yellow, red and blue.
'tud'
male
Female
Male
'tud'
fem
ale
−5 −4 −3 −2 −1 0 1 2 3 4 5
−4
−3
−2
−1
0
1
2
3
4
5
−5 −4 −3 −2 −1 0 1 2 3 4 5
−4
−3
−2
−1
0
1
2
3
4
5
−5 −4 −3 −2 −1 0 1 2 3 4 5
−4
−3
−2
−1
0
1
2
3
4
5
−5 −4 −3 −2 -1 0 1 2 3 4 5
−4
−3
−2
−1
0
1
2
3
4
5
Ln (male/'tud' male)
Ln (male/female)
Ln (
mal
e/fe
mal
e)Ln
(m
ale/
'tud'
mal
e)
Ln (female/'tud' female)Ln
(fe
mal
e/'tu
d' fe
mal
e)
Ln ('tud' male/'tud' female)
Ln (
'tud'
mal
e/'tu
d' fe
mal
e)
Microarray (Ln) ratio
Nor
ther
n (L
n) r
atio
1:1
>2-fold
>4-fold
>10-fold
'tud'
male
Female
Male
'tud'
fem
ale
Cyp6a19
Yp2
yip7
CG3203
dhd
Cp18
exu
LD23830
Cp38
Yp1
CG13095
nos
Yp3
CG15044
CG6540
yip6
EG:25E8.2
CG4847
CG6140
TrxT
CG6483
Tsf1
CG12860
CG15258
CG10869
CG5089
GH14656
Cyt-c-d
Vha26
CG31872
Cyp4g1
Mst84Dc
MtnA
CG17472
(d) (e)
(b)(a) (c)
Genome Biology 2004, 5:R40
http://genomebiology.com/2004/5/6/R40 Genome Biology 2004, Volume 5, Issue 6, Article R40 Parisi et al. R40.9
com
ment
reviews
reports
refereed researchdepo
sited researchinteractio
nsinfo
rmatio
n
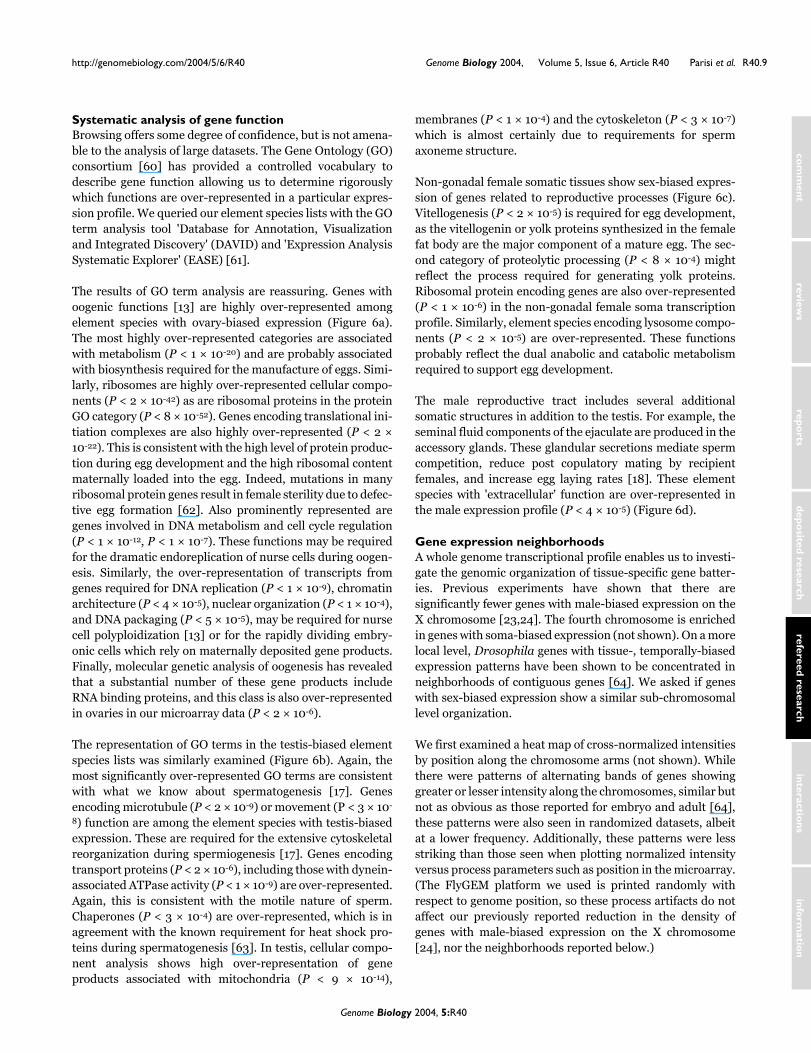
Systematic analysis of gene functionBrowsing offers some degree of confidence, but is not amena-ble to the analysis of large datasets. The Gene Ontology (GO)consortium [60] has provided a controlled vocabulary todescribe gene function allowing us to determine rigorouslywhich functions are over-represented in a particular expres-sion profile. We queried our element species lists with the GOterm analysis tool 'Database for Annotation, Visualizationand Integrated Discovery' (DAVID) and 'Expression AnalysisSystematic Explorer' (EASE) [61].
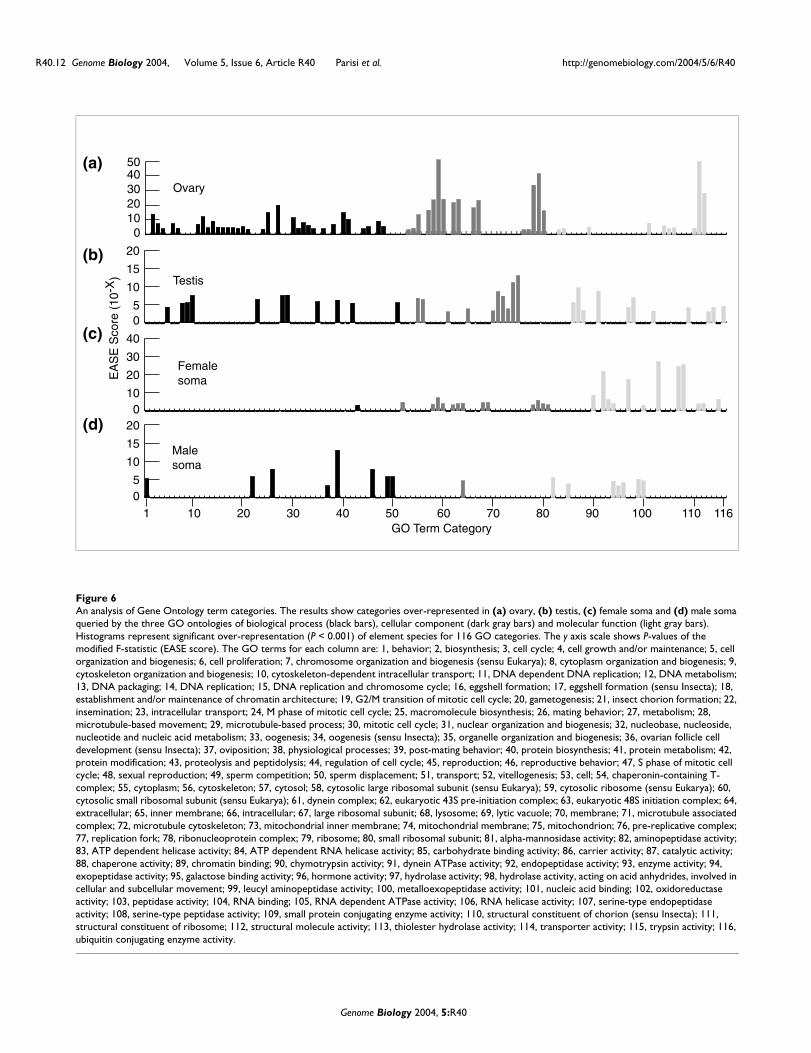
The results of GO term analysis are reassuring. Genes withoogenic functions [13] are highly over-represented amongelement species with ovary-biased expression (Figure 6a).The most highly over-represented categories are associatedwith metabolism (P < 1 × 10-20) and are probably associatedwith biosynthesis required for the manufacture of eggs. Simi-larly, ribosomes are highly over-represented cellular compo-nents (P < 2 × 10-42) as are ribosomal proteins in the proteinGO category (P < 8 × 10-52). Genes encoding translational ini-tiation complexes are also highly over-represented (P < 2 ×10-22). This is consistent with the high level of protein produc-tion during egg development and the high ribosomal contentmaternally loaded into the egg. Indeed, mutations in manyribosomal protein genes result in female sterility due to defec-tive egg formation [62]. Also prominently represented aregenes involved in DNA metabolism and cell cycle regulation(P < 1 × 10-12, P < 1 × 10⁻⁷). These functions may be requiredfor the dramatic endoreplication of nurse cells during oogen-esis. Similarly, the over-representation of transcripts fromgenes required for DNA replication (P < 1 × 10⁻⁹), chromatinarchitecture (P < 4 × 10⁻⁵), nuclear organization (P < 1 × 10⁻⁴),and DNA packaging (P < 5 × 10⁻⁵), may be required for nursecell polyploidization [13] or for the rapidly dividing embry-onic cells which rely on maternally deposited gene products.Finally, molecular genetic analysis of oogenesis has revealedthat a substantial number of these gene products includeRNA binding proteins, and this class is also over-representedin ovaries in our microarray data (P < 2 × 10⁻⁶).
The representation of GO terms in the testis-biased elementspecies lists was similarly examined (Figure 6b). Again, themost significantly over-represented GO terms are consistentwith what we know about spermatogenesis [17]. Genesencoding microtubule (P < 2 × 10⁻⁹) or movement (P < 3 × 10-
8) function are among the element species with testis-biasedexpression. These are required for the extensive cytoskeletalreorganization during spermiogenesis [17]. Genes encodingtransport proteins (P < 2 × 10⁻⁶), including those with dynein-associated ATPase activity (P < 1 × 10⁻⁹) are over-represented.Again, this is consistent with the motile nature of sperm.Chaperones (P < 3 × 10⁻⁴) are over-represented, which is inagreement with the known requirement for heat shock pro-teins during spermatogenesis [63]. In testis, cellular compo-nent analysis shows high over-representation of geneproducts associated with mitochondria (P < 9 × 10-14),
membranes (P < 1 × 10⁻⁴) and the cytoskeleton (P < 3 × 10⁻⁷)which is almost certainly due to requirements for spermaxoneme structure.
Non-gonadal female somatic tissues show sex-biased expres-sion of genes related to reproductive processes (Figure 6c).Vitellogenesis (P < 2 × 10⁻⁵) is required for egg development,as the vitellogenin or yolk proteins synthesized in the femalefat body are the major component of a mature egg. The sec-ond category of proteolytic processing (P < 8 × 10⁻⁴) mightreflect the process required for generating yolk proteins.Ribosomal protein encoding genes are also over-represented(P < 1 × 10⁻⁶) in the non-gonadal female soma transcriptionprofile. Similarly, element species encoding lysosome compo-nents (P < 2 × 10⁻⁵) are over-represented. These functionsprobably reflect the dual anabolic and catabolic metabolismrequired to support egg development.
The male reproductive tract includes several additionalsomatic structures in addition to the testis. For example, theseminal fluid components of the ejaculate are produced in theaccessory glands. These glandular secretions mediate spermcompetition, reduce post copulatory mating by recipientfemales, and increase egg laying rates [18]. These elementspecies with 'extracellular' function are over-represented inthe male expression profile (P < 4 × 10⁻⁵) (Figure 6d).
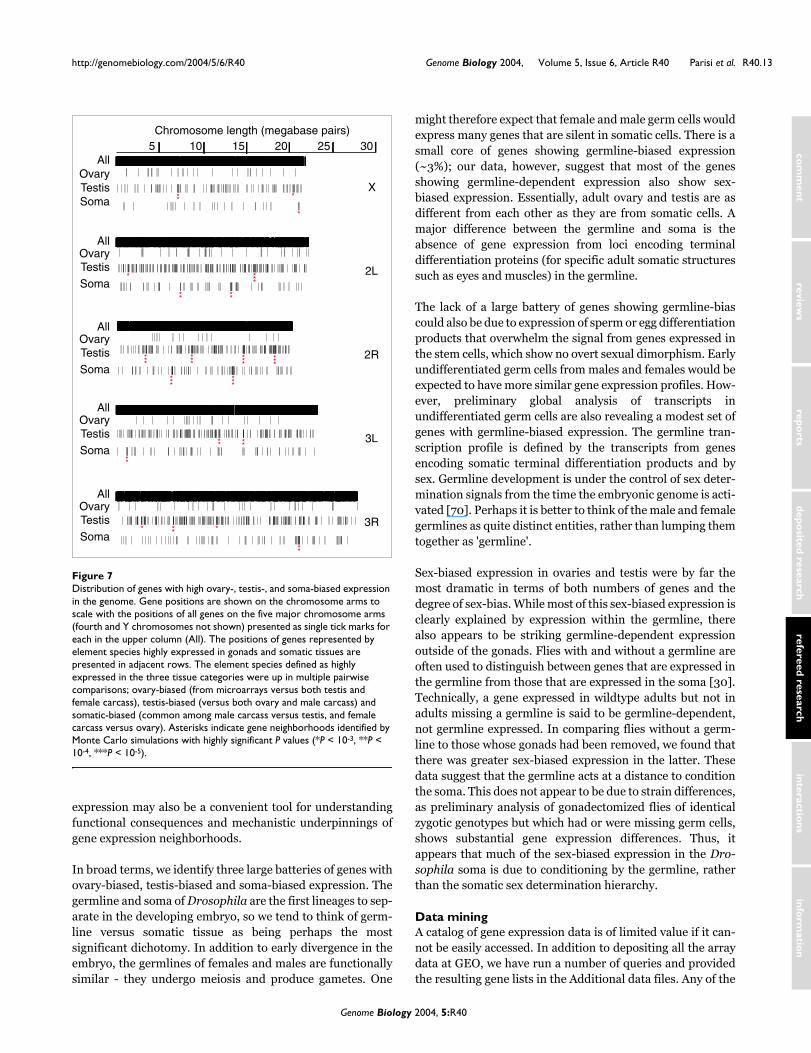
Gene expression neighborhoodsA whole genome transcriptional profile enables us to investi-gate the genomic organization of tissue-specific gene batter-ies. Previous experiments have shown that there aresignificantly fewer genes with male-biased expression on theX chromosome [23,24]. The fourth chromosome is enrichedin genes with soma-biased expression (not shown). On a morelocal level, Drosophila genes with tissue-, temporally-biasedexpression patterns have been shown to be concentrated inneighborhoods of contiguous genes [64]. We asked if geneswith sex-biased expression show a similar sub-chromosomallevel organization.
We first examined a heat map of cross-normalized intensitiesby position along the chromosome arms (not shown). Whilethere were patterns of alternating bands of genes showinggreater or lesser intensity along the chromosomes, similar butnot as obvious as those reported for embryo and adult [64],these patterns were also seen in randomized datasets, albeitat a lower frequency. Additionally, these patterns were lessstriking than those seen when plotting normalized intensityversus process parameters such as position in the microarray.(The FlyGEM platform we used is printed randomly withrespect to genome position, so these process artifacts do notaffect our previously reported reduction in the density ofgenes with male-biased expression on the X chromosome[24], nor the neighborhoods reported below.)
Genome Biology 2004, 5:R40
R40.10 Genome Biology 2004, Volume 5, Issue 6, Article R40 Parisi et al. http://genomebiology.com/2004/5/6/R40
Figure 5 (see legend on next page)
Nor
ther
n
GPL218
Fly
GE
M
(a) (b)
(c) (d)
Female
Male
(e)
(f)
Fem
ale
no g
onad
s F
emal
e no
gon
ads
Mal
e no
gon
ads
'tud
' fem
ale
Fem
ale
ap
ap
XY
;tra2
- X
X;tr
a2-
XX
;tra2
- X
X;tr
a2-
XX
;dsx
D/d
sx−
Mal
e M
ale
Mal
e M
ale
no g
onad
s
Mal
e no
gon
ads
Fem
ale
Fem
ale
Fem
ale
Ova
ry
Ova
ry
Ova
ry
Ova
ry
Ova
ry
Ova
ry
Mal
e M
ale
Mal
e 't
ud' m
ale
'tud
' mal
e 't
ud' m
ale
'tud
' mal
e 't
ud' m
ale
Mal
e no
gon
ads
XX
;dsx
D/d
sx−
Mal
e F
emal
e F
emal
e no
gon
ads
'tud
' fem
ale
'tud
' fem
ale
'tud
' fem
ale
'tud
' fem
ale
Fem
ale
no g
onad
s X
Y;tr
a2−
XX
;tra2
− T
estis
T
estis
T
estis
T
estis
T
estis
T
estis
Fem
ale
Fem
ale
F
emal
e
Ova
ry
Ova
ry
Ova
ry
Ova
ry
Mal
e M
ale
'tud
' mal
e 't
ud' m
ale
'tud
' mal
e 't
ud' m
ale
'tud
' mal
e M
ale
no g
onad
s 't
ud' f
emal
e 't
ud' f
emal
e 't
ud' f
emal
e 't
ud' f
emal
e F
emal
e no
gon
ads
Fem
ale
no g
onad
s a
p O
vary
O
vary
M
ale
Mal
e M
ale
Mal
e
Mal
e no
gon
ads
Tes
tis
Tes
tis
Tes
tis
Tes
tis
Tes
tis
Tes
tis F
emal
e X
Y;tr
a2−
XX
;tra2
− X
X;tr
a2−
XX
;dsx
D/d
sx-
Fem
ale
Fem
ale
Fem
ale
no g
onad
s F
emal
e no
gon
ads
XY
;tra2
− X
X;tr
a2−
ap
'tud
' fem
ale
Mal
e no
gon
ads
Mal
e no
gon
ads
XX
;tra2
- X
X;d
sxD
/dsx
−
−5 −4 −3 −2 −1 1 2 3 4 5
−4
−3
−2
−1
1
2
3
4
5
−5 −4 −3 −2 −1 1 2 3 4 5
−4
−3
−2
−1
0
1
2
3
4
5
−8 −6 −4 -2 0 2 4 6 8
−4
−3
−2
−1
0
1
2
3
4
5
−8 −6 −4 -2 0 2 4 6 8
−4
−3
-2
-1
0
1
2
3
4
5
Ln (
mal
e/fe
mal
e)Ln
(m
ale/
fem
ale)
Ln (male/female) Ln ('tud' male/'tud' female)
Ln (
'tud'
mal
e/'tu
d' fe
mal
e)Ln
('tu
d' m
ale/
'tud'
fem
ale)
Genome Biology 2004, 5:R40
http://genomebiology.com/2004/5/6/R40 Genome Biology 2004, Volume 5, Issue 6, Article R40 Parisi et al. R40.11
com
ment
reviews
reports
refereed researchdepo
sited researchinteractio
nsinfo
rmatio
n
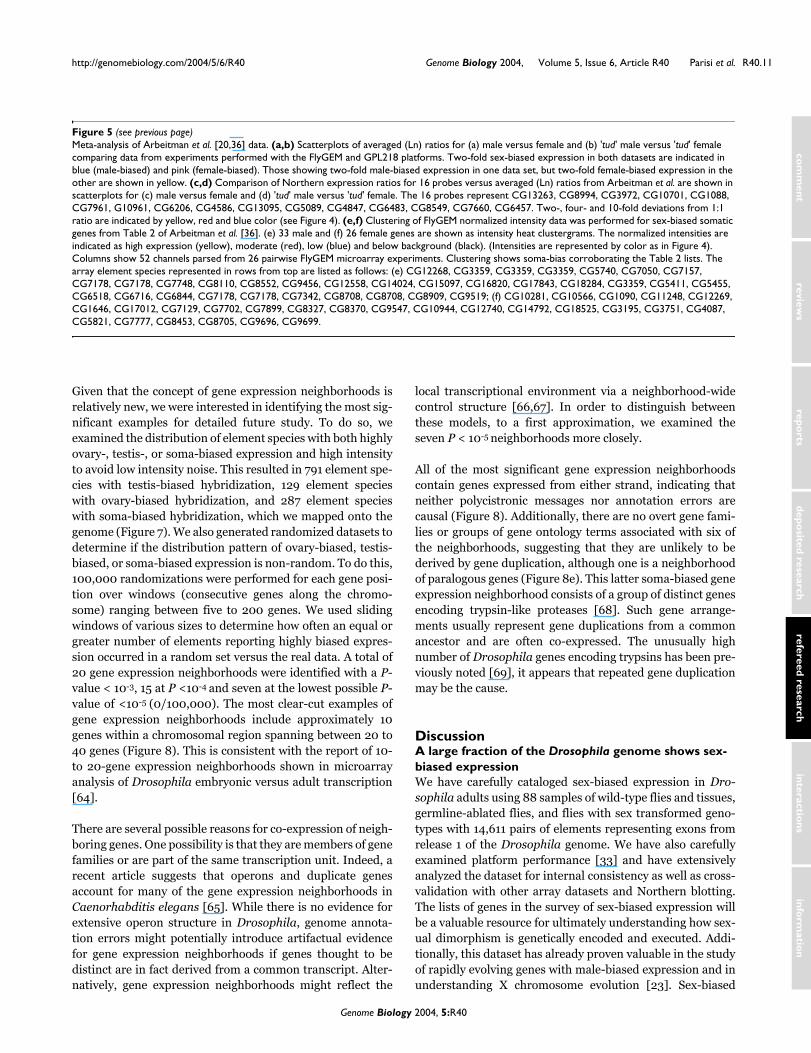
Given that the concept of gene expression neighborhoods isrelatively new, we were interested in identifying the most sig-nificant examples for detailed future study. To do so, weexamined the distribution of element species with both highlyovary-, testis-, or soma-biased expression and high intensityto avoid low intensity noise. This resulted in 791 element spe-cies with testis-biased hybridization, 129 element specieswith ovary-biased hybridization, and 287 element specieswith soma-biased hybridization, which we mapped onto thegenome (Figure 7). We also generated randomized datasets todetermine if the distribution pattern of ovary-biased, testis-biased, or soma-biased expression is non-random. To do this,100,000 randomizations were performed for each gene posi-tion over windows (consecutive genes along the chromo-some) ranging between five to 200 genes. We used slidingwindows of various sizes to determine how often an equal orgreater number of elements reporting highly biased expres-sion occurred in a random set versus the real data. A total of20 gene expression neighborhoods were identified with a P-value < 10-3, 15 at P <10-4 and seven at the lowest possible P-value of <10-5 (0/100,000). The most clear-cut examples ofgene expression neighborhoods include approximately 10genes within a chromosomal region spanning between 20 to40 genes (Figure 8). This is consistent with the report of 10-to 20-gene expression neighborhoods shown in microarrayanalysis of Drosophila embryonic versus adult transcription[64].
There are several possible reasons for co-expression of neigh-boring genes. One possibility is that they are members of genefamilies or are part of the same transcription unit. Indeed, arecent article suggests that operons and duplicate genesaccount for many of the gene expression neighborhoods inCaenorhabditis elegans [65]. While there is no evidence forextensive operon structure in Drosophila, genome annota-tion errors might potentially introduce artifactual evidencefor gene expression neighborhoods if genes thought to bedistinct are in fact derived from a common transcript. Alter-natively, gene expression neighborhoods might reflect the
local transcriptional environment via a neighborhood-widecontrol structure [66,67]. In order to distinguish betweenthese models, to a first approximation, we examined theseven P < 10-5 neighborhoods more closely.
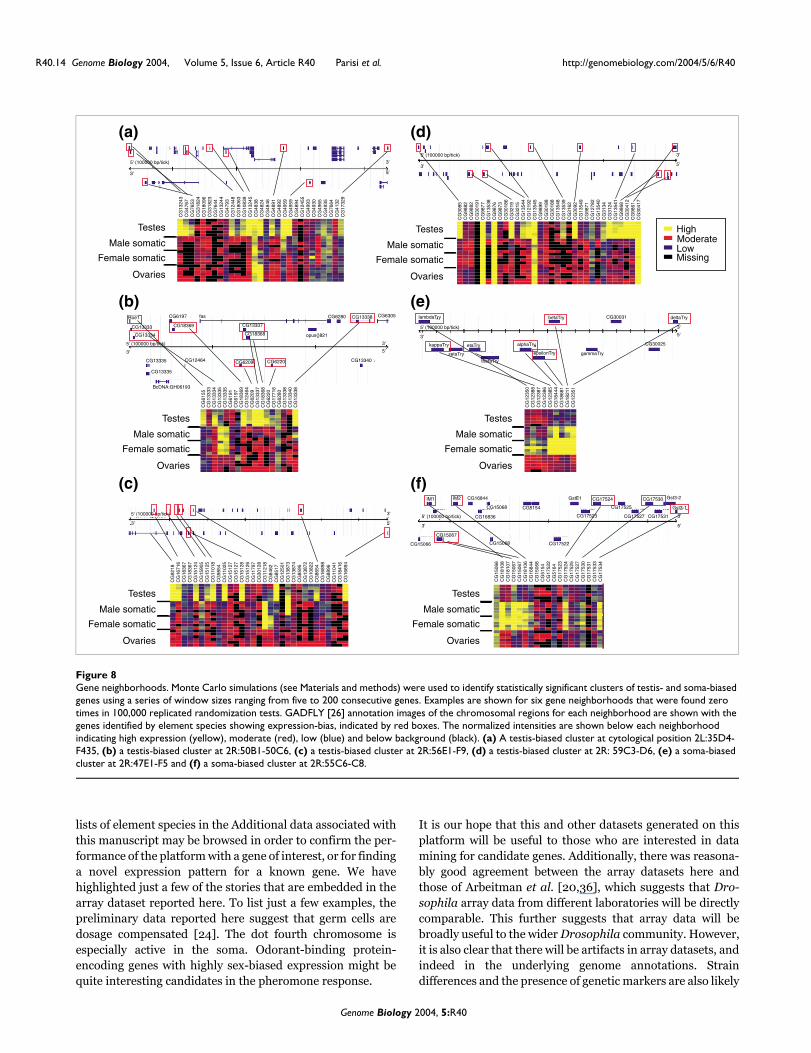
All of the most significant gene expression neighborhoodscontain genes expressed from either strand, indicating thatneither polycistronic messages nor annotation errors arecausal (Figure 8). Additionally, there are no overt gene fami-lies or groups of gene ontology terms associated with six ofthe neighborhoods, suggesting that they are unlikely to bederived by gene duplication, although one is a neighborhoodof paralogous genes (Figure 8e). This latter soma-biased geneexpression neighborhood consists of a group of distinct genesencoding trypsin-like proteases [68]. Such gene arrange-ments usually represent gene duplications from a commonancestor and are often co-expressed. The unusually highnumber of Drosophila genes encoding trypsins has been pre-viously noted [69], it appears that repeated gene duplicationmay be the cause.
DiscussionA large fraction of the Drosophila genome shows sex-biased expressionWe have carefully cataloged sex-biased expression in Dro-sophila adults using 88 samples of wild-type flies and tissues,germline-ablated flies, and flies with sex transformed geno-types with 14,611 pairs of elements representing exons fromrelease 1 of the Drosophila genome. We have also carefullyexamined platform performance [33] and have extensivelyanalyzed the dataset for internal consistency as well as cross-validation with other array datasets and Northern blotting.The lists of genes in the survey of sex-biased expression willbe a valuable resource for ultimately understanding how sex-ual dimorphism is genetically encoded and executed. Addi-tionally, this dataset has already proven valuable in the studyof rapidly evolving genes with male-biased expression and inunderstanding X chromosome evolution [23]. Sex-biased
Meta-analysis of Arbeitman et al [20,36] dataFigure 5 (see previous page)Meta-analysis of Arbeitman et al. [20,36] data. (a,b) Scatterplots of averaged (Ln) ratios for (a) male versus female and (b) 'tud' male versus 'tud' female comparing data from experiments performed with the FlyGEM and GPL218 platforms. Two-fold sex-biased expression in both datasets are indicated in blue (male-biased) and pink (female-biased). Those showing two-fold male-biased expression in one data set, but two-fold female-biased expression in the other are shown in yellow. (c,d) Comparison of Northern expression ratios for 16 probes versus averaged (Ln) ratios from Arbeitman et al. are shown in scatterplots for (c) male versus female and (d) 'tud' male versus 'tud' female. The 16 probes represent CG13263, CG8994, CG3972, CG10701, CG1088, CG7961, G10961, CG6206, CG4586, CG13095, CG5089, CG4847, CG6483, CG8549, CG7660, CG6457. Two-, four- and 10-fold deviations from 1:1 ratio are indicated by yellow, red and blue color (see Figure 4). (e,f) Clustering of FlyGEM normalized intensity data was performed for sex-biased somatic genes from Table 2 of Arbeitman et al. [36]. (e) 33 male and (f) 26 female genes are shown as intensity heat clustergrams. The normalized intensities are indicated as high expression (yellow), moderate (red), low (blue) and below background (black). (Intensities are represented by color as in Figure 4). Columns show 52 channels parsed from 26 pairwise FlyGEM microarray experiments. Clustering shows soma-bias corroborating the Table 2 lists. The array element species represented in rows from top are listed as follows: (e) CG12268, CG3359, CG3359, CG3359, CG5740, CG7050, CG7157, CG7178, CG7178, CG7748, CG8110, CG8552, CG9456, CG12558, CG14024, CG15097, CG16820, CG17843, CG18284, CG3359, CG5411, CG5455, CG6518, CG6716, CG6844, CG7178, CG7178, CG7342, CG8708, CG8708, CG8909, CG9519; (f) CG10281, CG10566, CG1090, CG11248, CG12269, CG1646, CG17012, CG7129, CG7702, CG7899, CG8327, CG8370, CG9547, CG10944, CG12740, CG14792, CG18525, CG3195, CG3751, CG4087, CG5821, CG7777, CG8453, CG8705, CG9696, CG9699.
Genome Biology 2004, 5:R40
R40.12 Genome Biology 2004, Volume 5, Issue 6, Article R40 Parisi et al. http://genomebiology.com/2004/5/6/R40
An analysis of Gene Ontology term categoriesFigure 6An analysis of Gene Ontology term categories. The results show categories over-represented in (a) ovary, (b) testis, (c) female soma and (d) male soma queried by the three GO ontologies of biological process (black bars), cellular component (dark gray bars) and molecular function (light gray bars). Histograms represent significant over-representation (P < 0.001) of element species for 116 GO categories. The y axis scale shows P-values of the modified F-statistic (EASE score). The GO terms for each column are: 1, behavior; 2, biosynthesis; 3, cell cycle; 4, cell growth and/or maintenance; 5, cell organization and biogenesis; 6, cell proliferation; 7, chromosome organization and biogenesis (sensu Eukarya); 8, cytoplasm organization and biogenesis; 9, cytoskeleton organization and biogenesis; 10, cytoskeleton-dependent intracellular transport; 11, DNA dependent DNA replication; 12, DNA metabolism; 13, DNA packaging; 14, DNA replication; 15, DNA replication and chromosome cycle; 16, eggshell formation; 17, eggshell formation (sensu Insecta); 18, establishment and/or maintenance of chromatin architecture; 19, G2/M transition of mitotic cell cycle; 20, gametogenesis; 21, insect chorion formation; 22, insemination; 23, intracellular transport; 24, M phase of mitotic cell cycle; 25, macromolecule biosynthesis; 26, mating behavior; 27, metabolism; 28, microtubule-based movement; 29, microtubule-based process; 30, mitotic cell cycle; 31, nuclear organization and biogenesis; 32, nucleobase, nucleoside, nucleotide and nucleic acid metabolism; 33, oogenesis; 34, oogenesis (sensu Insecta); 35, organelle organization and biogenesis; 36, ovarian follicle cell development (sensu Insecta); 37, oviposition; 38, physiological processes; 39, post-mating behavior; 40, protein biosynthesis; 41, protein metabolism; 42, protein modification; 43, proteolysis and peptidolysis; 44, regulation of cell cycle; 45, reproduction; 46, reproductive behavior; 47, S phase of mitotic cell cycle; 48, sexual reproduction; 49, sperm competition; 50, sperm displacement; 51, transport; 52, vitellogenesis; 53, cell; 54, chaperonin-containing T-complex; 55, cytoplasm; 56, cytoskeleton; 57, cytosol; 58, cytosolic large ribosomal subunit (sensu Eukarya); 59, cytosolic ribosome (sensu Eukarya); 60, cytosolic small ribosomal subunit (sensu Eukarya); 61, dynein complex; 62, eukaryotic 43S pre-initiation complex; 63, eukaryotic 48S initiation complex; 64, extracellular; 65, inner membrane; 66, intracellular; 67, large ribosomal subunit; 68, lysosome; 69, lytic vacuole; 70, membrane; 71, microtubule associated complex; 72, microtubule cytoskeleton; 73, mitochondrial inner membrane; 74, mitochondrial membrane; 75, mitochondrion; 76, pre-replicative complex; 77, replication fork; 78, ribonucleoprotein complex; 79, ribosome; 80, small ribosomal subunit; 81, alpha-mannosidase activity; 82, aminopeptidase activity; 83, ATP dependent helicase activity; 84, ATP dependent RNA helicase activity; 85, carbohydrate binding activity; 86, carrier activity; 87, catalytic activity; 88, chaperone activity; 89, chromatin binding; 90, chymotrypsin activity; 91, dynein ATPase activity; 92, endopeptidase activity; 93, enzyme activity; 94, exopeptidase activity; 95, galactose binding activity; 96, hormone activity; 97, hydrolase activity; 98, hydrolase activity, acting on acid anhydrides, involved in cellular and subcellular movement; 99, leucyl aminopeptidase activity; 100, metalloexopeptidase activity; 101, nucleic acid binding; 102, oxidoreductase activity; 103, peptidase activity; 104, RNA binding; 105, RNA dependent ATPase activity; 106, RNA helicase activity; 107, serine-type endopeptidase activity; 108, serine-type peptidase activity; 109, small protein conjugating enzyme activity; 110, structural constituent of chorion (sensu Insecta); 111, structural constituent of ribosome; 112, structural molecule activity; 113, thiolester hydrolase activity; 114, transporter activity; 115, trypsin activity; 116, ubiquitin conjugating enzyme activity.
05
10
15
20
010
20
30
40
05
10
15
20
01020304050
Ovary
Testis
Female soma
Male soma
1 10 20 30 40 50 60 70 110 1161009080GO Term Category
EA
SE
Sco
re (
10-X
)
(a)
(b)
(c)
(d)
Genome Biology 2004, 5:R40
http://genomebiology.com/2004/5/6/R40 Genome Biology 2004, Volume 5, Issue 6, Article R40 Parisi et al. R40.13
com
ment
reviews
reports
refereed researchdepo
sited researchinteractio
nsinfo
rmatio
n
expression may also be a convenient tool for understandingfunctional consequences and mechanistic underpinnings ofgene expression neighborhoods.
In broad terms, we identify three large batteries of genes withovary-biased, testis-biased and soma-biased expression. Thegermline and soma of Drosophila are the first lineages to sep-arate in the developing embryo, so we tend to think of germ-line versus somatic tissue as being perhaps the mostsignificant dichotomy. In addition to early divergence in theembryo, the germlines of females and males are functionallysimilar - they undergo meiosis and produce gametes. One
might therefore expect that female and male germ cells wouldexpress many genes that are silent in somatic cells. There is asmall core of genes showing germline-biased expression(~3%); our data, however, suggest that most of the genesshowing germline-dependent expression also show sex-biased expression. Essentially, adult ovary and testis are asdifferent from each other as they are from somatic cells. Amajor difference between the germline and soma is theabsence of gene expression from loci encoding terminaldifferentiation proteins (for specific adult somatic structuressuch as eyes and muscles) in the germline.
The lack of a large battery of genes showing germline-biascould also be due to expression of sperm or egg differentiationproducts that overwhelm the signal from genes expressed inthe stem cells, which show no overt sexual dimorphism. Earlyundifferentiated germ cells from males and females would beexpected to have more similar gene expression profiles. How-ever, preliminary global analysis of transcripts inundifferentiated germ cells are also revealing a modest set ofgenes with germline-biased expression. The germline tran-scription profile is defined by the transcripts from genesencoding somatic terminal differentiation products and bysex. Germline development is under the control of sex deter-mination signals from the time the embryonic genome is acti-vated [70]. Perhaps it is better to think of the male and femalegermlines as quite distinct entities, rather than lumping themtogether as 'germline'.
Sex-biased expression in ovaries and testis were by far themost dramatic in terms of both numbers of genes and thedegree of sex-bias. While most of this sex-biased expression isclearly explained by expression within the germline, therealso appears to be striking germline-dependent expressionoutside of the gonads. Flies with and without a germline areoften used to distinguish between genes that are expressed inthe germline from those that are expressed in the soma [30].Technically, a gene expressed in wildtype adults but not inadults missing a germline is said to be germline-dependent,not germline expressed. In comparing flies without a germ-line to those whose gonads had been removed, we found thatthere was greater sex-biased expression in the latter. Thesedata suggest that the germline acts at a distance to conditionthe soma. This does not appear to be due to strain differences,as preliminary analysis of gonadectomized flies of identicalzygotic genotypes but which had or were missing germ cells,shows substantial gene expression differences. Thus, itappears that much of the sex-biased expression in the Dro-sophila soma is due to conditioning by the germline, ratherthan the somatic sex determination hierarchy.
Data miningA catalog of gene expression data is of limited value if it can-not be easily accessed. In addition to depositing all the arraydata at GEO, we have run a number of queries and providedthe resulting gene lists in the Additional data files. Any of the
Distribution of genes with high ovary-, testis-, and soma-biased expression in the genomeFigure 7Distribution of genes with high ovary-, testis-, and soma-biased expression in the genome. Gene positions are shown on the chromosome arms to scale with the positions of all genes on the five major chromosome arms (fourth and Y chromosomes not shown) presented as single tick marks for each in the upper column (All). The positions of genes represented by element species highly expressed in gonads and somatic tissues are presented in adjacent rows. The element species defined as highly expressed in the three tissue categories were up in multiple pairwise comparisons; ovary-biased (from microarrays versus both testis and female carcass), testis-biased (versus both ovary and male carcass) and somatic-biased (common among male carcass versus testis, and female carcass versus ovary). Asterisks indicate gene neighborhoods identified by Monte Carlo simulations with highly significant P values (*P < 10-3, **P < 10-4, ***P < 10-5).
0
** *
*
*
*
X
2L
3R
3L
2R
**
***
*** *********
***
**
**
**
**
**
**
***
*
5 10 15 20 25 30Chromosome length (megabase pairs)
OvaryTestisSoma
All
OvaryTestis
Soma
All
OvaryTestis
Soma
All
OvaryTestis
Soma
All
OvaryTestis
Soma
All
Genome Biology 2004, 5:R40
R40.14 Genome Biology 2004, Volume 5, Issue 6, Article R40 Parisi et al. http://genomebiology.com/2004/5/6/R40
lists of element species in the Additional data associated withthis manuscript may be browsed in order to confirm the per-formance of the platform with a gene of interest, or for findinga novel expression pattern for a known gene. We havehighlighted just a few of the stories that are embedded in thearray dataset reported here. To list just a few examples, thepreliminary data reported here suggest that germ cells aredosage compensated [24]. The dot fourth chromosome isespecially active in the soma. Odorant-binding protein-encoding genes with highly sex-biased expression might bequite interesting candidates in the pheromone response.
It is our hope that this and other datasets generated on thisplatform will be useful to those who are interested in datamining for candidate genes. Additionally, there was reasona-bly good agreement between the array datasets here andthose of Arbeitman et al. [20,36], which suggests that Dro-sophila array data from different laboratories will be directlycomparable. This further suggests that array data will bebroadly useful to the wider Drosophila community. However,it is also clear that there will be artifacts in array datasets, andindeed in the underlying genome annotations. Straindifferences and the presence of genetic markers are also likely
Gene neighborhoodsFigure 8Gene neighborhoods. Monte Carlo simulations (see Materials and methods) were used to identify statistically significant clusters of testis- and soma-biased genes using a series of window sizes ranging from five to 200 consecutive genes. Examples are shown for six gene neighborhoods that were found zero times in 100,000 replicated randomization tests. GADFLY [26] annotation images of the chromosomal regions for each neighborhood are shown with the genes identified by element species showing expression-bias, indicated by red boxes. The normalized intensities are shown below each neighborhood indicating high expression (yellow), moderate (red), low (blue) and below background (black). (a) A testis-biased cluster at cytological position 2L:35D4-F435, (b) a testis-biased cluster at 2R:50B1-50C6, (c) a testis-biased cluster at 2R:56E1-F9, (d) a testis-biased cluster at 2R: 59C3-D6, (e) a soma-biased cluster at 2R:47E1-F5 and (f) a soma-biased cluster at 2R:55C6-C8.
CG
1324
3C
G47
67C
G76
53C
G31
824
CG
1809
6C
G31
823
CG
7644
CG
1324
4C
G47
93C
G12
448
CG
1806
3C
G10
839
CG
1324
5C
G48
38C
G48
24C
G48
46C
G48
91C
G48
92C
G49
59C
G49
59C
G48
94C
G12
455
CG
4993
CG
4930
CG
4965
CG
4935
CG
7664
CG
4132
CG
1732
9
CG
6155
CG
1333
3C
G13
334
CG
1333
5C
G13
335
CG
6191
CG
6197
CG
1836
9C
G12
464
CG
6209
CG
1333
7C
G18
368
CG
6220
CG
1771
6C
G62
80C
G13
338
CG
1334
0C
G13
338
CG
9218
CG
1671
6C
G18
367
CG
1836
7C
G15
124
CG
1590
5C
G15
125
CG
1101
8C
G98
54C
G11
025
CG
1512
7C
G15
127
CG
1512
8C
G15
126
CG
1179
7C
G30
128
CG
1121
8C
G84
62C
G85
17C
G12
501
CG
1387
3C
G13
874
CG
8595
CG
1387
2C
G10
822
CG
8654
CG
1689
8C
G88
96C
G11
041
CG
1841
6C
G16
894
CG
3085
CG
9882
CG
9882
CG
3019
1C
G98
77C
G13
538
CG
9876
CG
9873
CG
3018
6C
G32
19C
G32
15C
G13
544
CG
1219
2C
G13
545
CG
9899
CG
3018
8C
G30
188
CG
1354
8C
G13
539
CG
3162
CG
3092
CG
1354
9C
G98
71C
G12
782
CG
1354
0C
G31
34C
G31
24C
G13
541
CG
9868
CG
3041
2C
G98
61C
G30
417
CG
1235
0C
G12
388
CG
1238
7C
G12
386
CG
1238
5C
G18
444
CG
1868
1C
G18
211
CG
1235
1
CG
1506
6C
G18
108
CG
1810
7C
G15
067
CG
1506
7C
G18
106
CG
1684
4C
G15
068
CG
5154
CG
1752
2C
G51
64C
G17
523
CG
1752
4C
G17
525
CG
1752
7C
G17
530
CG
1753
1C
G17
533
CG
1753
4
HighModerateLowMissing
(a) (d)
(b)
(c)
(e)
(f)
Roe1
CG13333
CG13334
5' (100000 bp/tick)
5'3'
3'
5' (100000 bp/tick)
5'3'
3'
5' (100000 bp/tick)
5'3'
3'
5' (100000 bp/tick)
5'3'
3'
5' (100000 bp/tick)
5'3'
3'
5' (100000 bp/tick)
5'3'
3'
CG6197
CG18369
CG13335 CG13340
CG13335
BcDNA:GH06193
CG13337
CG18368
fas
CG6209 CG6220
opus{}821
CG6280 CG13338 CG6305
CG12464
lambdaTry betaTry
kappaTry
zetaTry
etaTry
thetaTry
alphaTry
epsilonTry
CG30031
gammaTry
CG30025
deltaTry
IM1 IM2
CG15066
CG15067
CG16844
CG16836
CG15068
CG15068
CG5154
CG17522
GstE1 Gst3-2
Gst3-1
CG17523
CG17524
CG17525
CG17530
CG17527 CG17531
Testes
Male somatic
Female somatic
Ovaries
Testes
Male somatic
Female somatic
Ovaries
Testes
Male somatic
Female somatic
Ovaries
Testes
Male somatic
Female somatic
Ovaries
Testes
Male somatic
Female somatic
Ovaries
Testes
Male somatic
Female somatic
Ovaries
Genome Biology 2004, 5:R40
http://genomebiology.com/2004/5/6/R40 Genome Biology 2004, Volume 5, Issue 6, Article R40 Parisi et al. R40.15
com
ment
reviews
reports
refereed researchdepo
sited researchinteractio
nsinfo
rmatio
n
to confound results; array data should be viewed with thisfirmly in mind.
Materials and methodsAnimals and treatmentsWe used standard Drosophila techniques throughout. Flieswere grown at 25 ± 0.5°C on GIF or PB media (KD Scientific,Columbia, MD, USA) and aged 5-7 days prior to use. Mostalleles and transgenes have been previously described andcan be found, with references, at FlyBase [26]. Flies wildtypefor sex were of the genotype y1 w67c. To study the contributionof the body as a whole and the gonads, flies were dissectedand snap frozen as described [19]. To study the germline-dependent gene expression profiles, samples were preparedfrom the progeny of homozygous tud1 bw1 sp1 females. Flieswere dissected to confirm germline loss (tudor1 is not fullypenetrant for germlineless-ness, only individuals withatrophic gonads were retained) as above. This sham dissec-tion also facilitates comparisons to gonadectomized samples.The effects of somatic sex determination mutants on sex-biased gene expression included examining sex-transformedflies using doublesex (+/+; dsxM+R45/dsxswe) and transformer2 (w67c/+;tra2B/Df(2R)trix) mutants. Sibling w67c/BsY;tra2B/Df(2R)trix were used in a direct comparison forone group of experiments.
Microarray hybridizationAn extensive platform description is available [71] and at theGene Expression Omnibus website [29] under accessionnumber GPL20. RNA isolation, labeling, and hybridizationhave been previously described [71].
Microarray intensity quantificationHybridized slides were read on a GenePix 4000 A to generateTIFF images which were imported into GemTools (IncyteGenomics, Palo Alto, CA, USA) for spot finding. Data was nor-malized and corrected in Array Qualifier (Novation Bio-sciences, Palo Alto, CA, USA). Intensities <2.5-fold abovelocal background were discarded. Raw intensity data and cor-rected data from Array Qualifier were loaded into an Accessdatabase and analyzed in Excel (Microsoft, Redmond, WA,USA). The GEO data accessions for these hybridizations are:GSM2456, GSM2458, GSM2460, GSM2462, GSM2464,GSM2466, GSM16542, GSM16554, GSM16556, GSM16569,GSM16570, GSM16572, GSM16574, GSM16576, GSM16578,GSM16580, GSM2457, GSM2459, GSM2461, GSM2463,GSM2465, GSM2467, GSM16650, GSM16555, GSM16571,GSM16573, GSM16575, GSM16577, GSM16579, GSM16581,GSM16582, GSM16584, GSM15686, GSM16588, GSM16593,GSM16613, GSM16614, GSM16615, GSM16619, GSM16583,GSM16585, GSM16587, GSM16589, GSM16609.
Analysis of ratiosFor analysis of ratios, the Cy3:Cy5 signal for each element wasaveraged over biological replicate experiments and dye flips
and then averaged from duplicate elements. Elements failingto return a ratio value from duplicates were excluded.Boolean queries were run to generate gene lists of particularinterest (for example, high in ovary and female, and low in allothers). For analysis by intensity, array channels were cross-normalized in Array Qualifier.
For array to array comparisons, the GPL218 platform tableand 40 sample datasets representing 20 biologically repli-cated adult stages were downloaded from the GEO website.For comparison to the GPL20 data, Log2 VALUE data (ratioof experiment to reference sample) from eight sample setsrepresenting four biological replicates for five day adult Can-ton S or 'tud' males and females (GEO accessions GSM3551,GSM3552, GSM3518, GSM3519, GSM3531, GSM3532,GSM3537, GSM3538) were converted to Ln values. The ratiosfrom each biological replicate pair were averaged and theseexperiment/reference sample ratios were then rearrangedinto male/female and 'tud' male/'tud' female ratios for paral-lel platform comparison. A total of 2,536 overlapping ele-ments between GPL20 and GPL218 were selected based onFlybase IDs and plotted against the GPL20 counterpart (sam-ple accession: GSM2456, GSM2458, GSM2457, GSM2459,GSM16582, GSM16583) or Northern ratios.
ClusteringTo analyze sex-biased gene expression as normalized intensi-ties among multiple microarray experiments, heat diagramswere generated by the Cluster 3.0 for Mac OSX program [72]formatted for OSX by Michiel deHoon [73]. A normalized setof signal intensity data was prepared for Cluster by averagingduplicate spots (the two duplicate features within an array)from 26 cross normalized microarray experiments. The sam-ple columns were fixed, while genes were clustered. A selforganizing map (SOM) was made using default parameters(10 clusters). The resulting SOM file was then used to performk-means clustering. The output file was visualized withJavaTreeview (adapted by Alok Saldanha at Stanford Univer-sity) [74].
A similar heat diagram was processed for analyzing the geneneighborhoods using this normalized dataset. A Treeview-generated image of the normalized intensities was madeusing an input data file that sorted the data for each gene byposition along the chromosome. Data was sorted first bychromosome arm and then by distance along the chromo-some using the first nucleotide of the microarray elementamplimer as the positional reference relative to theannotation.
To produce the array to array comparison heat map, normal-ized intensity data from the FlyGEM platform was extractedfor gene identifiers from Arbeitman et al., Table 2 [36]. Heatmaps were performed by k-means clustering of 26 female and33 male soma-biased element species. Both genes and sam-ples were clustered.
Genome Biology 2004, 5:R40
R40.16 Genome Biology 2004, Volume 5, Issue 6, Article R40 Parisi et al. http://genomebiology.com/2004/5/6/R40
GO term analysisAnalysis of gene function was done using the vocabulary ofthe Gene Ontology Consortium [75] and applying it to thepairwise expression ratio gene lists processed through thebioinformatics tools DAVID and EASE [76] (search per-formed November, 2003). The LocusLink identifiers for allmicroarray features showing greater than two-fold differen-tial expression ratios were loaded into the DAVID website andsearch parameters set to include all available categories fromthe three GO ontologies (biological process, cellular compo-nent and molecular function). A statistical measure of therepresentation of all GO categories was done with the EASEbioinformatics tool. The statistical probability for representa-tion of genes within a given category relative to the totalnumber of genes with GO function terms (EASE score) wascalculated for each category using the Drosophila-specificdatabase as a background filter. Drosophila features with GOterm categories with EASE scores of P < 0.001 were reported.
Monte CarloTo test if genes with sex-biased expression are non-randomlydistributed into neighborhoods, we performed 100,000 sim-ulations per window. The input data are stringently selectedlists of genes that are differentially expressed in ovaries(ovary versus testis or females, no gonads), testis (testis ver-sus ovary or males, no gonads) and somatic tissue (femaleand male, no gonads versus their respective gonads). Themicroarray data elements include those shown to be greaterthan three standard deviations above the mean local back-ground in one channel while the signal from the other chan-nel was within background levels. These lists are binary. Thechromosomal locations for all genes were mapped on thegenomic scaffolds from version 3.1 of the Drosophila genomeannotation using the first nucleotide position from thesequence of each microarray element. Redundant elementswere then removed based on their primer sequences to mini-mize spurious clustering.
To control for non-random distribution of gene models onchromosomes, we made use of gene order rather than exactchromosomal position. This is addressed using a nonpara-metric permutation test approach [77]. Because there is amultiple testing issue [78], a large number of dependent tests(since the windows are allowed to overlap) are performed,one for every gene window, so the measures of significancehave to be calculated to account for the number of testsperformed.
We determined a significance level to associate with the testof clustering in a given window as follows. In the given win-dow (w) we determine the number (n) of sex-biased genes. Aseries of 100,000 Monte Carlo iterations are carried out inwhich the sex-biased genes and the non-differentiallyexpressed genes are shuffled among the gene positions andthe relative frequency of at least n sex-biased genes occurringin some window of the same size as w on the chromosome is
determined. Thus, our empirical P-value can be interpretedas the probability of such a degree of clustering occurring inat least some window of the size by chance alone.
Northern versus microarrayA subset of 75 element species were chosen as probes forNorthern blotting on Hybond-N+ membranes (Amersham,Piscataway, NJ, USA) essentially as described in [79]. Probeswere selected to cover the full range of absolute intensitiesand male/female differential expression revealed in microar-ray experiments. Blotted mRNAs were from flies wildtypewith respect to sex and germline (y1 w67c) or from flies with nogermline (progeny of homozygous tudor1 mothers). Thesesame genotypes were used for labeling reactions in microar-ray experiments. Amplicon probes were made using the sameprimer pairs used in microarray construction and werelabeled using Redi-prime II (Amersham). Northerns werehybridized at 42° in UltraHyb (Ambion, Houston, TX, USA)in 15 ml conical tubes in a bacterial shaker. Blots were imageson a Storm 860 phosphorimager and quantified using Image-Quant (Molecular Dynamics, Sunnyvale, CA, USA). A total of73 Northerns were successful (passing visual inspection andshowing bands above background, see Figure 4a). Whileabsolute intensities between microarrays and Northernsshowed poor correlation (not shown), which is perhapsexpected for different assays with different efficiencies, therelative measures showed very good correlation.
Additional data filesThe following additional data files are available: a zip file con-taining 42 Excel tables (Additional data file 1) and an rtf filedetailing the contents of the tables (Additional data file 2).Additional data file 1A zip file containing 42 Excel tablesA zip file containing 42 Excel tablesClick here for additional data fileAdditional data file 2An rtf file detailing the contents of the tablesAn rtf file detailing the contents of the tablesClick here for additional data file
AcknowledgmentsWe thank the Bloomington Stock Center for providing stocks. We alsothank Dr. Margaret Cam, Dr. Thomas Brody, the Genome Biology refereesand members of the Oliver lab for critical reading of the manuscript, andBruce Baker for providing an advance copy of Arbeitman et al. [36].
References1. Oliver B: Genetic control of germline sexual dimorphism in
Drosophila. Int Rev Cytol 2002, 219:1-60.2. Cline TW: Two closely linked mutations in Drosophila mela-
nogaster that are lethal to opposite sexes and interact withdaughterless. Genetics 1978, 90:683-698.
3. McKeown M, Belote JM, Boggs RT: Ectopic expression of thefemale transformer gene product leads to female differenti-ation of chromosomally male Drosophila. Cell 1988,53:887-895.
4. Belote JM, Baker BS: Sex determination in Drosophila mela-nogaster: analysis of transformer-2, a sex-transforming locus.Proc Natl Acad Sci USA 1982, 79:1568-1572.
5. Burtis KC, Baker BS: Drosophila doublesex gene controlssomatic sexual differentiation by producing alternativelyspliced mRNAs encoding related sex-specific polypeptides.Cell 1989, 56:997-1010.
6. Chase BA, Baker BS: A genetic analysis of intersex, a gene reg-ulating sexual differentiation in Drosophila melanogasterfemales. Genetics 1995, 139:1649-1661.
7. Oliver B, Singer J, Laget V, Pennetta G, Pauli D: Function of Dro-
Genome Biology 2004, 5:R40
http://genomebiology.com/2004/5/6/R40 Genome Biology 2004, Volume 5, Issue 6, Article R40 Parisi et al. R40.17
com
ment
reviews
reports
refereed researchdepo
sited researchinteractio
nsinfo
rmatio
n
sophila ovo+ in germ-line sex determination depends on X-chromosome number. Development 1994, 120:3185-3195.
8. Oliver B, Kim YJ, Baker BS: Sex-lethal, master and slave: a hier-archy of germ-line sex determination in Drosophila. Develop-ment 1993, 119:897-908.
9. Pauli D, Oliver B, Mahowald AP: The role of the ovarian tumorlocus in Drosophila melanogaster germ line sexdetermination. Development 1993, 119:123-134.
10. Pennetta G, Pauli D: stand still, a Drosophila gene involved inthe female germline for proper survival, sex determinationand differentiation. Genetics 1997, 145:975-987.
11. Baker BS, Wolfner MF: A molecular analysis of doublesex, abifunctional gene that controls both male and female sexualdifferentiation in Drosophila melanogaster. Genes Dev 1988,2:477-489.
12. Inoue K, Hoshijima K, Sakamoto H, Shimura Y: Binding of the Dro-sophila sex-lethal gene product to the alternative splice siteof transformer primary transcript. Nature 1990, 344:461-463.
13. Spradling AC: Developmental genetics of oogenesis. In TheDevelopment of Drosophila Edited by: Bate M, Martinez-Arias A. ColdSpring Harbor Laboratory Press; 1993:1-70.
14. Riechmann V, Ephrussi A: Axis formation during Drosophila oog-enesis. Curr Opin Genet Dev 2001, 11:374-383.
15. Gelti-Douka H, Gingeras TR, Kambysellis MP: Yolk proteins inDrosophila: identification and site of synthesis. J Exp Zool 1974,187:167-172.
16. Bloch Qazi MC, Heifetz Y, Wolfner MF: The developmentsbetween gametogenesis and fertilization: ovulation andfemale sperm storage in Drosophila melanogaster. Dev Biol2003, 256:195-211.
17. Fuller MT: Spermatogenesis. In The Development of DrosophilaEdited by: Bate M, Martinez-Arias A. Cold Sping Harbor LaboratoryPress; 1993:71-148.
18. Wolfner MF: Tokens of love: functions and regulation of Dro-sophila male accessory gland products. Insect Biochem Mol Biol1997, 27:179-192.
19. Andrews J, Bouffard GG, Cheadle C, Lu J, Becker KG, Oliver B: Genediscovery using computational and microarray analysis oftranscription in the Drosophila melanogaster testis. Genome Res2000, 10:2030-2043.
20. Arbeitman MN, Furlong EEM, Imam F, Johnson E, Null BH, Baker BS,Krasnow MA, Scott MP, Davis RW, White KP: Gene expressionduring the life cycle of Drosophila melanogaster. Science 2002,297:2270-2275.
21. Jin W, Riley RM, Wolfinger RD, White KP, Passador-Gurgel G, Gib-son G: The contributions of sex, genotype and age to tran-scriptional variance in Drosophila melanogaster. Nat Genet2001, 29:389-395.
22. Meiklejohn CD, Parsch J, Ranz JM, Hartl DL: Rapid evolution ofmale-biased gene expression in Drosophila. Proc Natl Acad SciUSA 2003, 100:9894-9899.
23. Ranz JM, Castillo-Davis CI, Meiklejohn CD, Hartl DL: Sex-depend-ent gene expression and evolution of the Drosophila tran-scriptome. Science 2003, 300:1742-1745.
24. Parisi M, Nuttall R, Naiman D, Bouffard G, Malley J, Andrews J, East-man S, Oliver B: Paucity of genes on the Drosophila X chromo-some showing male-biased expression. Science 2003,299:697-700.
25. Adams MD, Celniker SE, Holt RA, Evans CA, Gocayne JD, Amanati-des PG, Scherer SE, Li PW, Hoskins RA, Galle RF, et al.: Thegenome sequence of Drosophila melanogaster. Science 2000,287:2185-2195.
26. Flybase, a Database of the Drosophila Genome [http://flybase.bio.indiana.edu]
27. FlyBase: The FlyBase database of the Drosophila GenomeProjects and community literature. Nucleic Acids Res 1999,27:85-88.
28. NCBI GEO, Gene Expression Omnibus [http://www.ncbi.nlm.nih.gov/geo/]
29. Edgar R, Domrachev M, Lash AE: Gene Expression Omnibus:NCBI gene expression and hybridization array datarepository. Nucleic Acids Res 2002, 30:207-210.
30. Schupbach T, Wieschaus E: Germline autonomy of maternal-effect mutations altering the embryonic body pattern of Dro-sophila. Dev Biol 1986, 113:443-448.
31. Baker BS, Ridge KA: Sex and the single cell. I. On the action ofmajor loci affecting sex determination in Drosophilamelanogaster. Genetics 1980, 94:383-423.
32. Nöthiger R, Jonglez M, Leuthold M, Meier-Gerschwiler P, Weber T:Sex determination in the germ line of Drosophila depends ongenetic signals and inductive somatic factors. Development1989, 107:505-518.
33. Johnston R, Wang B, Nuttall R, Doctolero M, Edwards P, Lu J, VainerM, Yue H, Wang X, Minor J, et al.: FlyGEM, a full transcriptomearray platform for the Drosophila community. Genome Biol2004, 5:R19.
34. Xu EY, Lee DF, Klebes A, Turek PJ, Kornberg TB, Reijo Pera RA:Human BOULE gene rescues meiotic defects in infertileflies. Hum Mol Genet 2003, 12:169-175.
35. Yue H, Eastman PS, Wang BB, Minor J, Doctolero MH, Nuttall RL,Stack R, Becker JW, Montgomery JR, Vainer M, Johnston R: An eval-uation of the performance of cDNA microarrays for detect-ing changes in global mRNA expression. Nucleic Acids Res 2001,29:E41-41.
36. Arbeitman MN, Fleming AA, Siegal ML, Null BH, Baker BS: Agenomic analysis of Drosophila somatic sexual differentiationand its regulation. Development 2004, 131:2007-2021.
37. DiBenedetto AJ, Lakich DM, Kruger WD, Belote JM, Baker BS, Wolf-ner MF: Sequences expressed sex-specifically in Drosophilamelanogaster adults. Dev Biol 1987, 119:242-251.
38. Orr-Weaver TL: Drosophila chorion genes: cracking the egg-shell's secrets. Bioessays 1991, 13:97-105.
39. Raff EC: Genetics of microtubule systems. J Cell Biol 1984,99:1-10.
40. Pisano C, Bonaccorsi S, Gatti M: The kl-3 loop of the Y chromo-some of Drosophila melanogaster binds a tektin-like protein.Genetics 1993, 133:569-579.
41. Santel A, Blumer N, Kampfer M, Renkawitz-Pohl R: Flagellar mito-chondrial association of the male-specific Don Juan proteinin Drosophila spermatozoa. J Cell Sci 1998, 111:3299-3309.
42. Matthies HJ, Messina LG, Namba R, Greer KJ, Walker MY, Hawley RS:Mutations in the alpha-tubulin 67C gene specifically impairachiasmate segregation in Drosophila melanogaster. J Cell Biol1999, 147:1137-1144.
43. Salz HK, Flickinger TW, Mittendorf E, Pellicena-Palle A, Petschek JP,Albrecht EB: The Drosophila maternal effect locus deadheadencodes a thioredoxin homolog required for female meiosisand early embryonic development. Genetics 1994,136:1075-1086.
44. Hwa JJ, Hiller MA, Fuller MT, Santel A: Differential expression ofthe Drosophila mitofusin genes fuzzy onions (fzo) and dmfn.Mech Dev 2002, 116:213-216.
45. Johnstone O, Lasko P: Translational regulation and RNA local-ization in Drosophila oocytes and embryos. Annu Rev Genet2001, 35:365-406.
46. Mohr SE, Dillon ST, Boswell RE: The RNA-binding proteinTsunagi interacts with Mago Nashi to establish polarity andlocalize oskar mRNA during Drosophila oogenesis. Genes Dev2001, 15:2886-2899.
47. Nelson MR, Leidal AM, Smibert CA: Drosophila Cup is an eIF4E-binding protein that functions in Smaug-mediated transla-tional repression. EMBO J 2004, 23:150-159.
48. Dalby B, Glover DM: Discrete sequence elements control pos-terior pole accumulation and translational repression ofmaternal cyclin B RNA in Drosophila. EMBO J 1993,12:1219-1227.
49. Deng W, Lin H: Asymmetric germ cell division and oocytedetermination during Drosophila oogenesis. Int Rev Cytol 2001,203:93-138.
50. Stapleton M, Carlson J, Brokstein P, Yu C, Champe M, George R,Guarin H, Kronmiller B, Pacleb J, Park S, et al.: A Drosophila full-length cDNA resource. Genome Biol 2002, 3:research0080-0080.8.
51. Nongthomba U, Pasalodos-Sanchez S, Clark S, Clayton JD, SparrowJC: Expression and function of the Drosophila ACT88F actinisoform is not restricted to the indirect flight muscles. J Mus-cle Res Cell Motil 2001, 22:111-119.
52. Ayer G, Vigoreaux JO: Flightin is a myosin rod binding protein.Cell Biochem Biophys 2003, 38:41-54.
53. Fyrberg E, Fyrberg CC, Beall C, Saville DL: Drosophila mela-nogaster troponin-T mutations engender three distinctsyndromes of myofibrillar abnormalities. J Mol Biol 1990,216:657-675.
54. Pierce KL, Lefkowitz RJ: Classical and new roles of beta-arrestins in the regulation of G-protein-coupled receptors.Nat Rev Neurosci 2001, 2:727-733.
55. Walsh T, Walsh V, Vreugde S, Hertzano R, Shahin H, Haika S, Lee MK,
Genome Biology 2004, 5:R40
R40.18 Genome Biology 2004, Volume 5, Issue 6, Article R40 Parisi et al. http://genomebiology.com/2004/5/6/R40
Kanaan M, King MC, Avraham KB: From flies' eyes to our ears:mutations in a human class III myosin cause progressive non-syndromic hearing loss DFNB30. Proc Natl Acad Sci USA 2002,99:7518-7523.
56. Montell C: Visual transduction in Drosophila. Annu Rev Cell DevBiol 1999, 15:231-268.
57. Ferrandon D, Jung AC, Criqui M, Lemaitre B, Uttenweiler-Joseph S,Michaut L, Reichhart J, Hoffmann JA: A drosomycin-GFP reportertransgene reveals a local immune response in Drosophilathat is not dependent on the Toll pathway. EMBO J 1998,17:1217-1227.
58. Antoniewski C, Laval M, Dahan A, Lepesant JA: The ecdysoneresponse enhancer of the Fbp1 gene of Drosophila mela-nogaster is a direct target for the EcR/USP nuclear receptor.Mol Cell Biol 1994, 14:4465-4474.
59. Miura S, Gan JW, Brzostowski J, Parisi MJ, Schultz CJ, Londos C,Oliver B, Kimmel AR: Functional conservation for lipid storagedroplet association among Perilipin, ADRP, and TIP47(PAT)-related proteins in mammals, Drosophila, andDictyostelium. J Biol Chem 2002, 277:32253-32257.
60. Ashburner M, Ball CA, Blake JA, Botstein D, Butler H, Cherry JM,Davis AP, Dolinski K, Dwight SS, Eppig JT, et al.: Gene Ontology:tool for the unification of biology. Nat Genet 2000, 25:25-29.
61. Dennis G JR, Sherman BT, Hosack DA, Yang J, Gao W, Lane HC,Lempicki RA: DAVID: Database for Annotation, Visualization,and Integrated Discovery. Genome Biol 2003, 4:R60.
62. Saboe-Larssen S, Lyamouri M, Merriam J, Oksvold MP, LambertssonA: Ribosomal protein insufficiency and the minute syndromein Drosophila: a dose-response relationship. Genetics 1998,148:1215-1224.
63. Yue L, Karr TL, Nathan DF, Swift H, Srinivasan S, Lindquist S:Genetic analysis of viable Hsp90 alleles reveals a critical rolein Drosophila spermatogenesis. Genetics 1999, 151:1065-1079.
64. Spellman PT, Rubin GM: Evidence for large domains of similarlyexpressed genes in the Drosophila genome. J Biol 2002, 1:5.
65. Lercher MJ, Blumenthal T, Hurst LD: Coexpression of neighbor-ing genes in Caenorhabditis elegans is mostly due to operonsand duplicate genes. Genome Res 2003, 13:238-243.
66. Roy P, Stuart J, Lund J, Kim S: Chromosomal clustering of mus-cle-expressed genes in Caenorhabditis elegans. Nature 2002,418:975-979.
67. Oliver B, Parisi M, Clark D: Gene expression neighborhoods. JBiol 2002, 1:4.
68. Davis C, Riddell D, Higgins M, Holden J, White B: A gene family inDrosophila melanogaster coding for trypsin-like enzymes. NuclAcids Res 1985, 13:6605-6619.
69. Ross J, Jiang H, Kanost MR, Wang Y: Serine proteases and theirhomologs in the Drosophila melanogaster genome: an initialanalysis of sequence conservation and phylogeneticrelationships. Gene 2003, 304:117-131.
70. Williamson A, Lehmann R: Germ cell development in Dro-sophila. Annu Rev Cell Dev Biol 1996, 12:365-391.
71. Johnson R, Nuttall R, Doctolero M, Edwards P, Lü J, Wang B, VainerM, Yue H, Wang X, Minor J, et al.: FlyGEM, a full transcriptomearray platform for the Drosophila community. Genome Biol2004, 5:R19.
72. Eisen MB, Spellman PT, Brown PO, Botstein D: Cluster analysisand display of genome-wide expression patterns. Proc NatlAcad Sci USA 1998, 95:14863-14868.
73. Software, Cluster 3.0 (for Win, Mac and Linus) [http://bonsai.ims.u-tokyo.ac.jp/~mdehoon/software/cluster/software.htm]
74. Java Treeview [http://genome-www.stanford.edu/~alok/TreeView]75. Gene Ontology Consortium [http://www.geneontology.org/]76. DAVID, Database for Annotation, Visualization and Inte-
grated Discovery [http://apps1.niaid.nih.gov/david/upload.asp]77. Good PI: Resampling Methods: A Practical Guide to Resampling Methods
for Testing Hypotheses New York: Springer-Verlag; 2000. 78. Hsu J: Multiple Comparisons: Theory and Methods Boca Raton: CRC
Press; 1996. 79. Sambrook J, Fritsch EF, Maniatis T: Molecular Cloning: A Laboratory
Manual 2nd edition. Cold Spring Harbor: Cold Spring Harbor LabPress; 1989.
Genome Biology 2004, 5:R40


