Embed Size (px)
Citation preview

Journal of Global Strategic Management | 16 | 2014, December
26
A SUSTAINABLE GROWTH RATE METRIC
BASED ON R&D EXPERIENCE FOR
GOVERNMENT R&D ORGANIZATIONS *Kadir Alpaslan DEMİR
**İhsan Burak TOLGA *Gebze Institude of Technology; Turkey
**Software Engineer, Turkey
ABSTRACT
Government research and development (R&D) are different from other type of organizations in various
aspects. One main difference lies in the performance management of these organizations. Many other types of
organizations measure performance using concepts such as profitability, market share, return on investments
(ROI) etc. These measures do not explain the motivations of government R&D organizations because the goals
of these organizations are quite different. The main goals of government R&D organizations include
conducting basic scientific research that private sector avoids, providing expertise on various disciplines to
other government organizations, conducting classified government research, developing industry standards
etc. In this paper, we identify a set of metrics that can be used for performance management in government
R&D organizations. An organization is able to manage and monitor the expertise accumulated using the
identified metrics. While these metrics are developed mainly for government R&D organizations, they may
also be used by other types of organizations.
Keywords: R&D Organizations, Performance Management, Organization Metrics, Talent management,
Personnel turnover, Experience, R&D
INTRODUCTION
Today, research and development (R&D) is an important function in many corporations and companies. R&D
departments in companies help the organization to develop new and better products and as a result help the
business grow. Hence R&D performance is an important concern and naturally, there are metrics developed to
measure R&D performance (Hartmann, et.al.,2006) and its effect on company profitability (Tubbs, 2007) and
business success. For example, Mudambi and Swift report that “R&D expenditure volatility is positively related
to firm growth.” (Mudambi, and Swift, 2011).In addition to R&D departments in private businesses, there are
also governmental agencies that conduct R&D activities. These R&D research agencies serve a different
purpose and consequently they have different goals. TUBITAK in Turkey and NASA in USA are examples of
such government R&D institutions. As emphasized earlier, the goals of these organizations are quite different
from their counterparts in private sector. For example, the vision of NASA as stated in their website (NASA,
2014) is “to reach for new heights and reveal the unknown so that what we do and learn will benefit all
humankind”. The Scientific and Technological Research Council of Turkey (TUBITAK) is one of the most
important government-funded R&D organizations in Turkey. The mission and vision of TUBITAK is clearly
stated in the organization’s website (TUBITAK, 2014): “TUBITAK is responsible for promoting, developing,
organizing, conducting and coordinating research and development in line with national targets and priorities.
TUBITAK acts as an advisory agency to the Turkish Government on science and research issues, and is the
secretariat of the Supreme Council for Science and Technology (SCST), the highest S&T policy making body
in Turkey. Setting its vision as to be an innovative, guiding, participating and cooperating institution in the
fields of science and technology, which serves for improvement of the life standards of our society and
sustainable development of our country, TUBITAK not only supports innovation, academic and industrial R&D
studies but also in line with national priorities develops scientific and technological policies and manages
R&D institutes, carrying on research, technology and development studies.” Financial objectives are an
important part of any private sector organization’s set of objectives. However, as the mission and vision
statement of NASA and TUBITAK clearly indicate, financial objectives are not among the main concerns of
these types of institutions. Therefore, performance management systems commonly used in private sector will
only have limited use. To better manage R&D organizations we need metrics that are more relevant to R&D

Journal of Global Strategic Management | 16 | 2014, December
27
activities. This study aims to develop a metric for government R&D institutions to aid them in identifying a
sustainable growth rate. This in turn will help managers implement better growth strategies. In a detailed
technical MITRE report on performance management at research and development (R&D) organizations, it is
stated that measuring performance and track the outcome of R&D activities in advance are difficult (MITRE,
2009). Governmental R&D organizations have been seeking valid and sensible metrics to develop their further
strategies. The reason behind why traditional metrics and cost models cannot be applied when it comes to
evaluating personnel performance, especially in governmental R&D organizations is that it is always too late
when the result data (i.e. customer satisfaction rating, end product profit / research investment ratio) are
provided and even beyond it, it is a difficult activity to measure the true returns of research investments.
Projects which have a short developing span and successfully put into service lead to make people think that
other research programs and projects that have relatively longer development periods are not cost-efficient.
Whereas, these so-called “low-hanging fruits” (Harman, Wayne and Robin Staton, 2006) do not exist, their
short development spans are illusions which are actually base on decades-long researches and become efficient
products at a time which usually cannot be expected in before. As mentioned above, to track most promising
projects and provide information out of the performance evaluation systems, we need quantifiable metrics to
measure personnel performance, which is one of their key component of R&D projects.
Personnel experience has been one of the key factors in calculating expected software costs. “Constructive Cost
Model”, COCOMO (Boehm, Clark, Horowitz, Madachy, Shelby, Westland, 1995), has personnel experience
related cost drivers since its initial version, Basic COCOMO. These cost drivers are included in this most
widely-adapted software cost estimation model as “Application Experience”, “Platform Experience” and
“Language and Toolset Experience”, which have polynomial effect on the overall estimation.
In this study, our goal is to identify and develop a set of metrics that can be used for performance management
in government R&D organizations. The most important metric developed in this study is “Sustainable Growth
Rate
(SGR)” metric. Sustainable growth rate is a commonly used and well-known metric in private sector. However,
this metric is currently defined with a financial point of view, which serves its purpose in the business world.
In this research, we redefine this metric in a way that is relevant and useful to government R&D organizations.
As a result, an organization is able to manage and monitor the experience accumulated using the identified
metrics. Furthermore, they are able to assess the growth rate of the organization. While these metrics are
developed mainly for government R&D organizations, they may also be used by other types of organizations.
To explain the concepts introduced, we developed a case study to explain how the metrics are produced and
used.
The rest of the paper is organized as follows. In the second section, we provide a short literature review on the
topic. The metrics used in the study is explained in the third section. In the next section, a case study is
examined to show the use of metrics. The conclusions drawn are listed in the fifth section and the paper ends
with limitations and opportunities for future research.
LITERATURE REVIEW
There are a lot of metrics that are used in performance management of R&D in companies and organizations.
According to a study conducted by Goldense, Schwartz, and James, the top five R&D metrics in use today are
R&D spending as a percent of sales, total patents filed/pending/awarded, total R&D headcount, number of
products/projects in active development, and first year sales of new products (Goldense, Schwartz, and James,
2005). Metrics commonly used by commercial industry include:
Table 1. Metrics Commonly Used in Commercial Industry
Net Business Value (Npv) Budget Variance Cost
Return On Investment (Roi) Quality Measurements Schedule
Total Cost Of Ownership (Tco) Risk Organizational Flexibility
Discounted Cash Flow Alignment With Corp. Strategies Intellectual Property Factors
Market Lifecycle Factors Fit With Existing Product Portfolio Market Share

Journal of Global Strategic Management | 16 | 2014, December
28
The reason behind the wide spectrum of metrics in use with R&D metrics unlike traditional short-term financial
metrics seems to be the fact that R&D projects are unique compared to other corporate spending projects. There
are also metrics that are used in measuring R&D performance (Kostoff, 2005) A very detailed report that
investigates performance management issues in government R&D organizations is the MITRE’s report
(MITRE, 2009). A comprehensive list of metrics that can be used for this purpose is provided in Table 2.
MITRE report (MITRE, 2009) mentions about The Army Research Laboratory related to their performance
measurement approach by highlighting the questions ARL asks, “What information does the stakeholder really
want to know from a performance evaluation system, beyond what the ultimate outcomes and impacts of the
research will be?” And these questions mainly focus on to get answers for these three questions (MITRE,
2009):
Is this work relevant? Does anyone care about the effort given to reach a target or goal no matter how
distant or difficult it is?
Is the program productive? Is this program/project working toward its goal or, to be pessimistic, delivering
a product to its customer in a timely manner?
Is the work of the highest quality? Can we backup the claim to be world-class research organization which
is doing a world-class work?
With relate to answering the third question above; ARL also has a Technical Assessment Group (TAB) which
is basically a peer review board consisting of 15 top-class engineers and scientists. The job this assembling is
(1) to monitor / review the scientific and technical quality of ARL’s program, (2) to assess the current state of
ARL’s current facilities and equipment, and (3) to evaluate the preparedness of technical ARL staff. (MITRE,
2009) Their final evaluation reports are received by the senior management in U.S. Army and the Department
of Defense (DoD) each year. Developed by Dr. Edwards B. Roberts from MIT’s Sloan School of Management,
ARL applies a stakeholder evaluation model in which three stakeholder groups are defined: (1) development
and manufacturing groups directly dependent on search results, (2) customers purchasing company’s final
products and deliverables, (3) senior management of the company. (MITRE, 2009) Besides these two areas of
measures, ARL also a variety of performance measures like maintenance backlog, workforce diversity,
procurement cycle-time and papers published / patents received.
According to same study conducted by MITRE, The Office of Naval Research which defines and sponsors
R&D in support of current and future U.S. Navy and Marine Corps requirements, makes its funding decisions
in the presence of uncertainty which resides in required capabilities, performance requirements and the
feasibility of a technology or R&D approach. ONR has adapted The RAND Corporation’s PortMan R&D
decision framework to support its R&D decision-making. This framework computes the expected value of an
R&D project as the product of three factors: (1) value to the military of the capability sought through R&D,
(2) the extent to which the performance potential matches the level required to achieve the capability, and (3)
the project’s transition probability. And not expectedly, PortMan does not rely on the expected value as a point
solution, but it rather includes an estimate of uncertainty and their estimated direction over time. The evaluation
is based on the best current information and tracking over time.

Journal of Global Strategic Management | 16 | 2014, December
29
Table 2. Metrics for R&D Performance Measurement (MITRE,2009) Organizational Workforce
Number of proposals submitted and endorsed Number of graduates/post graduates in programs
Number of new research agreements that leverage industry, academic,
and/or other governmental and international partners/fiscal year (FY) Number of National Research Council (NRC) Fellows/FY
Amount of special appropriations designated for research/FY Science and engineering attrition rates - total, by discipline, by training
Number of cooperative research and development agreements (CRADAs) Workforce diversity
Vision process for new starts Growth in employment of program participants
Amount of funds leveraged Number of training students
Number and types of accreditation maintained at the organization Percent of employees that complete specified training/FY
Compliance with specified requirements Number of student hires
Percent of DIACAP compliance Percent of military reenlistment goals met
Percent of buildings that receive "green" rating on installation report Percent of licensed professionals maintaining prescribed credentials
Number of work-related accidents Percent of employees that completed training
Number of days for civilian recruitment actions to complete local approval Percent of military completing mandatory military education
Percent of divisions using a particular model Percent of military completing acquisition training
Space requirements for all divisions captured and reconciled with
availability Percent of military completing training
Development and prioritization of top 10 unfunded requirements (UFRs) Percent of civilian supervisors completing advanced leadership training
Reduction in dollar amount of lost accountable property Number of patents, publications, and citations
Percent completion of monthly hand receipt inventory Activity
Number of funded scientists and engineers Number of licensing agreements issues for intellectual property
Outcome Number of peer-reviewed publications (full articles or book chapters)
Percent that accomplish the objectives of the research proposals Number of awards
Number of developmental products funded by contributions from other
organizations/FY Percent of research proposals scored in the top 1/3 for scientific merit
Condition of technical base Number of conferences, exhibits, and associations at which program
presents or exhibits
Acquisition funding applied Technical assistance to industry
Technology transition agreements Production of algorithms
Number of technologies transitioned Customer assessments
Number of past transitions Impact
Increase in outside resources that support command-approved objectives Pillar alignment/alignment
Number of firms created Capability gap coverage
Licensing revenues War-fighting capabilities achieved
Maintenance backlog Progress toward goals
Procurement cycle-time Continued relevance to war-fighting capabilities
Value Cost avoided
ROI Lives saved
TRL Enhanced health/safety
Cost Improved system capability
Costs avoided New capabilities enabled
Potential payoff System improvements
Programmatic Reduced manning
Budget request and budget appropriated Percent that meet advanced development milestones
Schedule Product area directorate needs addressed
Execution rates for obligation versus disbursement within 5% variance Cost of risk reduction/cost of consequence
Science and engineering demographics
According to the study of Harman, Wayne and Robin Staton; the S&T metrics was a topic of interest in 2004,
as the U.S. Naval Sea System Command restructuring plan was released to public and navy management tried
to identify cost-savings investments. The plan was a reaction to the Navy’s inquiry about the value of its $2
billion per year investment in S&T. (MITRE, 2009) The conclusion of the study states that the level of S&T
needed to support the Navy has no correlation with number of ships in the inventory or number of personnel.
There were, in the history, some extraordinary successful projects, “low hanging fruit in S&T” as they put it
and they also think it as a myth. The biggest example of this is the Silver Fox, an unmanned aerial vehicle
(UAV) which was developed and put into action in less than sixty days and it was perceived as a great success
story. Yet they had missed the point that the researches related to UAVs go back even until 1918. For the same
subject, another instance is the thermobaric bomb which was developed and got in service in less than six
months again. But in fact, this fast pace was a result of thirty year-long research in explosive chemistry.

Journal of Global Strategic Management | 16 | 2014, December
30
Therefore, Dahlgren Division states in their report (Harman, Wayne and Robin Staton, 2006) that there is no
“overnight” success, and in-house S&T has great value to the U.S. Navy. This study team also asserted that
S&T metrics can be defined and collected in response to specific questions. (MITRE, 2009) Harman, Wayne
and Robin Staton’s study has some bulleted points that summarizes the overall work and their perception
towards in-house S&T: (Harman, Wayne, Robin Staton, 2006)
Be careful what you measure. What you measure is what you will get. Metrics can be defined and collected
in response to specific questions, but you tend to get what you choose to measure.
Technical competition requires technical tasking.
The immediate ROI for Navy S&T is its contribution to the quality and development of “our people (who)
will determine our future success” or failure.
Transitions and speed-of -transition are not significant measures of S&T performance. They may be better
measures of how well the entire RDT&E acquisition process is working.
A better measure of S&T is how well is Navy S&T addressing current and future Navy needs, and how
prepared the current workforce is to address those needs.
The size of the Navy S&T budget and in-house workforce should be determined by what you want it to do,
i.e. what Navy capabilities need to be enabled.
As another point in conclusion; the reports says that ROI for S&T could not be quantified in fiscal terms -or in
any periodic time gap- due to long delay and uncertainty between the start of S&T effort and the time this new
technology is put into service as a Navy system, which could be decades later. Thus, Navy does not obtain
financial benefit increase for a successful S&T investment, unlike industry.
In their study (MITRE, 2009), another attention getting point is a practice adopted by the S&T Directorate of
the U.S. Department of Homeland Security (DHS), of which function is the nation’s homeland security
research, development, test evaluation management for S&T. By following this practice, the Directorate
allocates 10% of its S&T funding to higher-risk innovation that carries a very small chance to be successful in
which case it will bring game-changing technologies and systems in one-to-five year, much faster that
conventional development like the most programs. And within this 10% portion, 10% again is spent to real-
high-risk efforts which often fail to be successful but always carry a chance to succeed and have great impact.
In most cases that they fail, they enable the researchers and its members to have a greater understanding to
improve subsequent basic and applied research efforts to lead breakthrough and abilities beyond of today’s.
50% of the overall S&T’s funding is allocated to lower-risk projects to ensure satisfying customer-defined
needs, which also brings a balance and mitigates high-risk portion of expenditures. (Science and Technology
for a Safer Nation, US Department of Homeland Security, 2007)
THEORETICAL FRAMEWORK
In this section, the metrics used and developed in this study will be explained in detail. Having experienced
researchers and engineers is key for achieving a high performing R&D organization. Therefore in this study,
our focus is measuring personnel experience and how to maintain a certain level of experience and expertise
in the R&D organization. A list of metrics developed for this study is as follows:
R&D experience of an R&D staff
An R&D staff is an employee who is tasked with R&D related work in the organization. A scientist, a research
engineer or research assistant can be one of the R&D staff. This is one of the key metric within the scope of
this study. As noted earlier, for R&D organizations and especially for government-funded R&D organizations,
the R&D experience accumulated within the organization is crucial for the performance of the organization.
This type of organizations mainly build up expertise through R&D experience. Therefore, the number of years
spent in the R&D activities for a research staff becomes a core metric. This metric can be measured in years or
months.

Journal of Global Strategic Management | 16 | 2014, December
31
Total R&D experience of the organization/department
This metric is calculated by summing up all the research staff’s R&D experience in terms of years. When this
metric is high, it simply means that the organization is quite experienced. The scope may be an organization
or a specific department within the organization. Again this metric may be defined in years or months.
Sustainable Growth Rate (SGR)
This is a commonly used metric in strategic management. This metric is used in business world to assess a
company’s growth rate and generally formulated in financial terms. Since financial objectives may not be a
priority for R&D organizations, we use the concept in a quite different way. In this study, we redefine the term
for the R&D organizations. For an R&D organization, experienced research staff is one of the main assets.
Therefore, sustaining experience is one of the main concerns of any R&D organization. Another main concern
is the work load or in other terms the project load. As a result, how these two metrics grow over time helps to
identify whether the R&D organizations has a sustainable growth rate or not. The sustainable growth rate is
calculated with the following formula:
The sustainable growth rate (SGR) is calculated by dividing the rate of current R&D experience (CE) to future
R&D experience (FE) to the rate of current workload (CL) to future workload (FL). The future is defined by
the period to be analyzed. It can be a year, 5 years, 10 years, or any time period that makes sense for the
analysis.
At this point, we have a basic assumption that the current work load is sufficiently handled with the current
workforce. If the SGR is equal to 1 or greater than 1, we can simply state that the growth is sustainable. If the
SGR is smaller than 1, then the conclusion will be that the organization will not have a sustainable growth and
there will be problems in completing projects therefore meeting long-term objectives. Calculation of SGR helps
the executives to strategically manage the human resources of the R&D organization.
Sustainable Growth Rate (SGR) Conclusion
Sustainable Growth Rate (SGR) > 1 Sustainable Growth
Sustainable Growth Rate (SGR) = 1 Optimal Growth
Sustainable Growth Rate (SGR) < 1 Unsustainable Growth
Current Workload (CW)
This is a self-explanatory metric. It is a measure of the R&D organizations’ workload. Workload can be defined
depending on the focus of measurement activities. In our study, we use project load to measure our workload.
However, it is important to note that the workload of an R&D organization may consist of other activities
unrelated to project related activities in the traditional sense. These activities may include certification,
international or national standard development, providing expertise and consultancy to other agencies,
investigation of accidents and mishaps. On the other hand, it is also possible to treat these activities as projects.
Some NATO and international R&D organizations start all of these activities under a project charter and treat
these activities as a project.
Future Workload (FW)
The future workload may be derived from the future plans if the organization have such plans at hand. In case,
there are no future plans or future is unclear for the organization, it is possible to estimate the workload based
on statistics derived from past project load. This is the estimation of workload at a determined future date. The

Journal of Global Strategic Management | 16 | 2014, December
32
future date may be a year, 2 years, 5 years or 10 years later. The future workload may be estimated with the
following formula:
In the formula, FW is the future workload and CW is the current workload. Expected yearly workload change
(EYWC) is the expected percent of change in the workload. It may be positive or negative. Expected yearly
workload change is calculated from statistics based on historical data. NY is the number of years.
Project Load
This is the number of projects or required project effort. The project load is naturally derived from contracts in
place or the long-term organizational goals detailed in the strategic plans of the R&D organization.
Current R&D Experience
Current R&D experience may be calculated for an organization, for a department, or for a project. How to
calculate this metric is explained previously under the section titled total R&D experience in terms of years.
Future R&D Experience
This is the estimation of the R&D experience of the organization or the department for a future date. It is
calculated with the following formula:
In the formula, FE is the future R&D experience and CE is the current R&D experience. Expected yearly R&D
experience change (EYEC) is the expected percent of experience in the organization or in the department. It
may be positive or negative. It is calculated from statistics based on historical data. NY is the number of years
CASE STUDY
To illustrate the use of metrics detailed in the previous section, we developed a case study based on a fictitious
government R&D organization. We especially use a fictitious organization since we do not want to reveal a
classified strategic HRM aspect of a government R&D organization. Furthermore, a fictitious organization is
quite sufficient for our purposes which is simply to explain the use of metrics. This organization consists of
government employees mainly subject to government HRM regulations. This is important as we know that
government HRM regulations are quite different from the HRM practices in the private sector. For example,
in Turkey, it is not easy to get a job in the government. The salaries are far from being competitive while
bonuses are unlikely. It is also far more difficult to let a government employee go. Simply, there are very
limited tools for managers in the government organizations to hire, fire and motivate staff. It is important to
note that we keep the case study simple to ease the understanding of the concepts introduced. The name of our
fictitious R&D organization is “Technology Research Institute”. The institute consists of 3 departments: A
systems engineering research department, a software development research department, an electronics
engineering research department. The systems engineering department consists of 8 research engineers. The
software development research department has 10 research engineers. Finally, the electronics engineering
research department employs 10 research engineers. Figure 1 depicts the departmental structure of the R&D
organization. The R&D experience of each research engineer is presented in Table 3. At the end of the table,
the total and average R&D experience of each department is also calculated.

Journal of Global Strategic Management | 16 | 2014, December
33
Fig 1. An R&D Organization with 3 Research Departments
To keep the case study as simple as possible, let’s focus on only one of the departments in the R&D
organization. Let’s build up a case for a future scenario of personnel attrition at systems engineering research
department. The assumptions of the scenario are (1) every year a random research engineer is lost due to
retirement or moving to another job (2) a recent engineering graduate with zero experience is hired (3) the
number of personnel stays the same. In table 4, a simulation of personnel turnover for a ten year period is
presented. Table 5 shows the number of projects (project load) in the long-term plans of the systems
engineering research department for the same 10 year period.
Table 3. R&D Experience of Research Engineers (Res. Engr.) in Research Departments
Systems Engineering Research Department Software Development Research
Department Electronics Engineering Research Department
Name
R&D
Experience
(Years)
Name
R&D
Experience
(Years)
Name
R&D
Experience
(Years)
Systems Res. Engr.1 25 Software Res. Engr. 1 19 Electronics Res. Engr. 1 20
Systems Res. Engr. 2 17 Software Res. Engr. 2 13 Electronics Res. Engr. 2 18
Systems Res. Engr. 3 11 Software Res. Engr. 3 12 Electronics Res. Engr. 3 16
Systems Res. Engr. 4 10 Software Res. Engr. 4 12 Electronics Res. Engr. 4 14
Systems Res. Engr. 5 9 Software Res. Engr. 5 11 Electronics Res. Engr. 5 10
Systems Res. Engr. 6 7 Software Res. Engr. 6 5 Electronics Res. Engr. 6 8
Systems Res. Engr. 7 5 Software Res. Engr. 7 4 Electronics Res. Engr. 7 7
Systems Res. Engr. 8 4 Software Res. Engr. 8 3 Electronics Res. Engr. 8 7
Software Res. Engr. 9 1 Electronics Res. Engr. 9 5
Software Res. Engr. 10 0 Electronics Res. Engr. 10 3
Total R&D Experience of Sys.
Eng. Res. Dept. 88
Total R&D Experience of
Sw. Dev. Res. Dept. 80
Total R&D Experience of
Electronics Eng. Res. Dept. 108
Table 4. A Sample Future Scenario of Systems Engineering Research Departments
Systems Engineering Research
Department 2014 2015 2016 2017 2018 2019 2020 2021 2022 2023 2024
Systems Research Engineer 1 25 0 1 2 3 4 5 6 0 1 2
Systems Research Engineer 2 17 18 19 20 21 22 23 0 1 2 3
Systems Research Engineer 3 11 12 13 14 0 1 2 3 4 5 6
Systems Research Engineer 4 10 11 0 1 2 3 4 5 6 0 1
Systems Research Engineer 5 9 10 11 12 13 0 1 2 3 4 5
Systems Research Engineer 6 7 8 9 0 1 2 3 4 5 6 7
Systems Research Engineer 7 5 6 7 8 9 10 0 1 2 3 0
Systems Research Engineer 8 4 5 6 7 8 9 10 11 12 13 14
Total R&D Experience of Systems
Eng. Res. Dept. (Years) 88 70 66 64 57 51 48 32 33 34 38
Journal of Global Strategic Management | 16 | 2014, December
34
Table 5. Number of Projects in Plan for Systems Engineering Research Departments for a 10 Year Period
Systems Engineering Research
Department
2014 2015 2016 2017 2018 2019 2020 2021 2022 2023 2024
Number of Projects in Plan 7 7 8 9 9 10 12 13 14 15 15
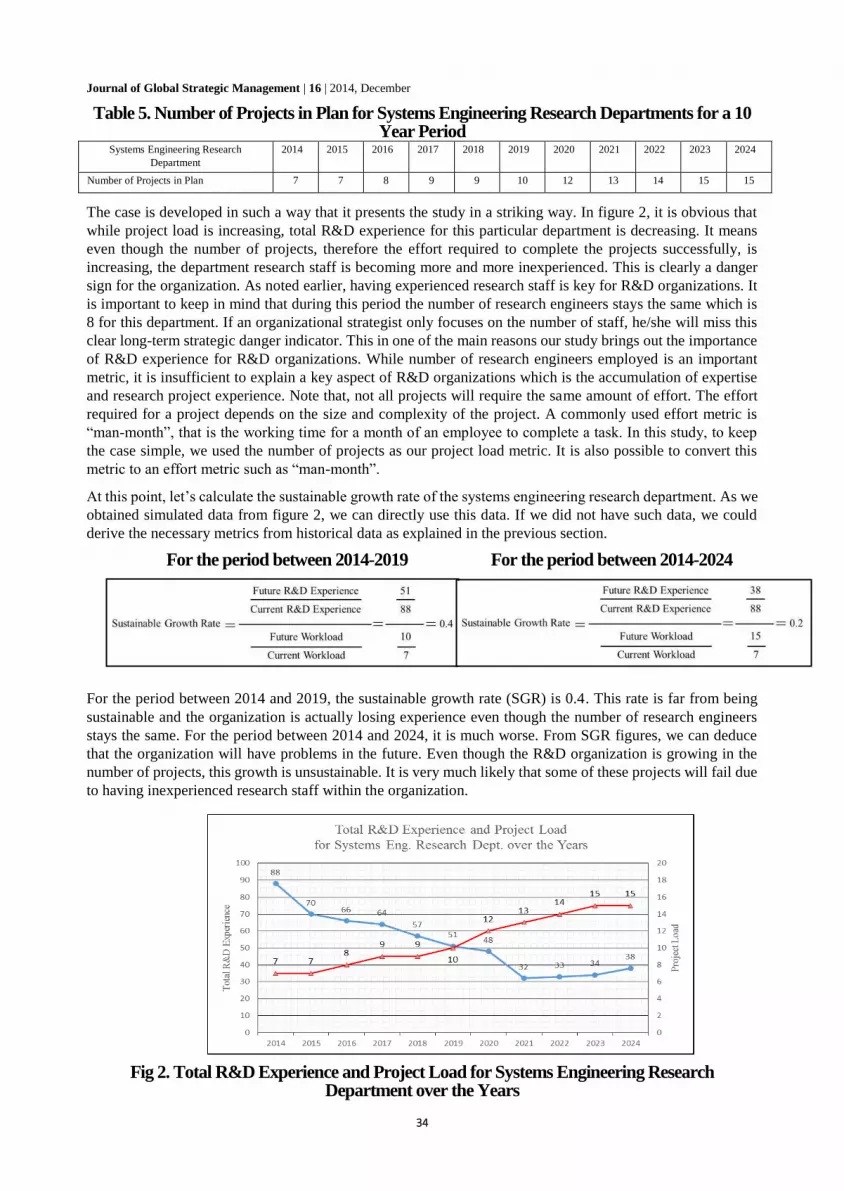
The case is developed in such a way that it presents the study in a striking way. In figure 2, it is obvious that
while project load is increasing, total R&D experience for this particular department is decreasing. It means
even though the number of projects, therefore the effort required to complete the projects successfully, is
increasing, the department research staff is becoming more and more inexperienced. This is clearly a danger
sign for the organization. As noted earlier, having experienced research staff is key for R&D organizations. It
is important to keep in mind that during this period the number of research engineers stays the same which is
8 for this department. If an organizational strategist only focuses on the number of staff, he/she will miss this
clear long-term strategic danger indicator. This in one of the main reasons our study brings out the importance
of R&D experience for R&D organizations. While number of research engineers employed is an important
metric, it is insufficient to explain a key aspect of R&D organizations which is the accumulation of expertise
and research project experience. Note that, not all projects will require the same amount of effort. The effort
required for a project depends on the size and complexity of the project. A commonly used effort metric is
“man-month”, that is the working time for a month of an employee to complete a task. In this study, to keep
the case simple, we used the number of projects as our project load metric. It is also possible to convert this
metric to an effort metric such as “man-month”.
At this point, let’s calculate the sustainable growth rate of the systems engineering research department. As we
obtained simulated data from figure 2, we can directly use this data. If we did not have such data, we could
derive the necessary metrics from historical data as explained in the previous section.
For the period between 2014-2019 For the period between 2014-2024
For the period between 2014 and 2019, the sustainable growth rate (SGR) is 0.4. This rate is far from being
sustainable and the organization is actually losing experience even though the number of research engineers
stays the same. For the period between 2014 and 2024, it is much worse. From SGR figures, we can deduce
that the organization will have problems in the future. Even though the R&D organization is growing in the
number of projects, this growth is unsustainable. It is very much likely that some of these projects will fail due
to having inexperienced research staff within the organization.
Fig 2. Total R&D Experience and Project Load for Systems Engineering Research
Department over the Years

Journal of Global Strategic Management | 16 | 2014, December
35
CONCLUSION
Peter Drucker points out the importance of knowledge workers in today’s society. A knowledge worker
produces knowledge, ideas, and information (Drucker, 2006). The core of knowledge creating organizations
such as R&D organizations, is the employees (Barutcugil, 2004) in other words knowledge workers. When
these knowledge workers are experienced, they are more likely to produce effective results that is achieving
success in R&D projects. Having experienced employees are essential for many types of organizations but it
is crucial for R&D organizations. Research and development activities are long-term activities accumulating
knowledge through experiences. Therefore, to achieve success in R&D projects, experience is one of the
essential keys.
Government R&D organizations are different from R&D departments within companies or corporations. These
differences lie in the motivation of the organizations. In simple terms, to make profit is one of the main
objectives of private R&D companies or R&D departments within companies. The government R&D
organizations are generally tasked with research studies or R&D activities or R&D projects that cannot be
directly linked to the objective of making profit. They are sometimes tasked with basic science research projects
that serve as a precursor to research studies leading to practical results. Most companies do not have enough
resources or capital to take on such basic science research. Therefore, governments task government-funded
R&D organizations with strategic research beneficial to the mankind, country, private sector, etc. NASA in
USA and TUBITAK in Turkey are such governmentfunded R&D organizations. As a result, since government
R&D organizations have different motivations and organizational goals, they require a different set of
performance measures. Most of the current strategic management literature focuses on the performance
measures relevant to private-funded R&D organizations. In this study, we attempt to fill a portion of this gap
in the literature and propose a set of performance measures leading to the development of a sustainable growth
rate metric. Maintaining a sustainable growth rate (SGR) is important for any type of organization. Not being
able to implement a healthy growth strategy may result in the dissolution of the organization. Therefore, the
managers should closely monitor the SGR of the organization and take necessary precautions if the SGR is
low. This can only be achieved by having an acceptable and relevant SGR measurement system. As pointed
out earlier, since having experienced researchers is strategic for an R&D organization, it is inevitable that the
SGR measurement system rely on the key concept of experience measurement.
In this study, our contribution to the body of knowledge is the development of a simple sustainable growth rate
metric for government R&D organizations. To illustrate the concepts introduced, we developed a case study.
Step by step, we explained how the metric can be calculated with examples. The case study is prepared in such
a way that even though the number of researchers in an R&D department stays the same, the growth rate is not
sustainable. This provides a clear focus on the importance of experience in the formulation of sustainable
growth rate. The developed sustainable growth rate metric can be used by government funded R&D
organizations to monitor the growth rate of the organization. Furthermore, with the help of this metric, the
managers are able to have a tool to strategically manage their organizations and establish a sustainable HRM
program.
LIMITATIONS AND OPPORTUNITIES FOR FUTURE RESEARCH
In this study, it is possible to have a real case study. However, to illustrate the concepts introduced, a fictitious
case study is quite sufficient. In addition, building a real case study from a government R&D organization may
reveal sensitive data of the organization. In this study, we avoid that. Future work includes the development of
a method to strategically align the desired SGR to organizational goals. Another key concept used in the
development of SGR is the workload. The workload is actually a derivative of organizational goals. Therefore,
while one aspect of SGR is related to HRM, the other aspect is related to strategic management and setting
realistic organizational goals.
ACKNOWLEDGEMENTS AND DISCLAIMERS
The views and conclusions contained herein are those of the authors and should not be interpreted as necessarily
representing the official policies or endorsements, either expressed or implied, of any affiliated organization or
government.

Journal of Global Strategic Management | 16 | 2014, December
36
REFERENCES
Barutcugil, I., Stratejik İnsan Kaynakları Yönetimi – Strategic Human Resource Management, Kariyer
Publishing, Istanbul, March 2004, p 19.
Boehm, B. W., Clark, B., Horowitz, E., Madachy, R., Selby, R., & Westland, C. (1995). An overview of the
COCOMO 2.0 software cost model. In Software Technology Conference (p. 21).
Drucker, P. F., (2006). The Effective Executive, HarperCollins publishing, New York. NY, 2006.
Goldense, B. L., Schwartz, A. R., and James, R. J., (2005). As more companies use more R&D metrics, the
“top five” metrics remain the same, according to research study, PDMA Visions, Jan 2005, Vol. XXIX, No. 1.
Harman, Wayne, and Robin Staton, (2006). Science and Technology Metrics and Other Thoughts, TR, Naval
Surface Warfare Center, Dahlgren, Virginia, July 2006.
Hartmann, G. C., Myers, M.B. and Rosenbloom, R. S.,(2006). Planning your firm's R&D investment,
Research-Technology Management, Vol 49 No. 2, pp. 25-36, 2006.
Higgins, Robert (1977). How much growth can a firm afford, Financial Management 6 (3) p. 7-16.
Jyoti, Banwet, D. K., and Deshmukh, S. G., (2006). Balanced scorecard for performance evaluation of R&D
organization: A conceptual model, Journal pf Scientific and Industrial Research, Vol. 65, Nov. 2006, pp. 879-
886
Kostoff, R. N. (2005). Science and technology metrics. Defense Technical Information Center, 2005.
MITRE (2009). Performance Management at R&D organizations, MITRE Technical Report, MTR 090189.
Mudambi, R., & Swift, T. (2011). Proactive R&D management and firm growth: a punctuated equilibrium
model. Research Policy, Vol. 40 No. 3, pp. 429-440.
Nappinnai, M. V., and Premavathy, N., (2013). Employee Attrition and Retention in a Global Competitive
Scenario, International Journal of Research in Business Management (IMPACT: IJRBM), Vol. 1, Issue 6, Nov
2013, 11-14 NASA, 2014. www.nasa.gov, last accessed on 28 October 2014.
Tubbs, M., (2007). The relationship between R&D and company performance. Research-Technology
Management, Vol. 50, No.6 pp 23-30, 2007. TUBITAK, 2014. www.tubitak.gov.tr, last accessed on 28
October 2014.
Ülgen, H., and Mirze, S.K., (2013). İşletmelerde Stratejşk Yönetim,6th Ed.,Beta Publications, Istanbul 2013.


