Embed Size (px)
Citation preview
A Thesis
entitled
Auxetic Spinal Implants: Consideration of Negative Poisson’s Ratio in the Design of an
Artificial Intervertebral Disc
By
Carrie E. Baker
Submitted to the Graduate Faculty as partial fulfillment of the
requirements for the Master of Science Degree in Bioengineering
__________________________________________
Lesley M. Berhan, Ph.D., Committee Chair
__________________________________________
Vijay K. Goel, Ph.D., Committee Member
__________________________________________
Patricia A. Relue, Ph.D., Committee Member
__________________________________________
Dr. Patricia R. Komuniecki, Dean
College of Graduate Studies
The University of Toledo
May 2011

Copyright 2011, Carrie E. Baker
This document is copyrighted material. Under copyright law, no parts of this document
may be reproduced without the expressed permission of the author.
iii
An Abstract of
Auxetic Spinal Implants: Consideration of Negative Poisson’s Ratio in the Design of an
Artificial Intervertebral Disc
By
Carrie E. Baker
Submitted to the Graduate Faculty as partial fulfillment of the requirements
for the Master of Science Degree in Bioengineering
The University of Toledo
May 2011
Fusion is a common surgery performed to treat those with chronic, severe, low back
pain. Currently fusion is being done by replacing the removed disc with an implanted
intervertebral cage and bone graft with posterior fixation devices to provide stability until
the fusion process has completed. The fusion process limits the range of motion of the
spine in the section where fusion has taken place and also generally does not help to
reduce pain that is associated with the degenerated disc. This study examined the
possibility of using a negative Poisson’s ratio artificial intervertebral disc to replace discs
that are degenerating. The hypothesis is that replacing the damaged disc with a negative
Poisson’s ratio artificial spinal disc implant will allow for the same range of motion that
the natural intervertebral disc allows and additionally will prevent interference with
surrounding nerves due to the lack of bulging exhibited by a negative Poisson’s ratio
material when compressed.
iv
The initial portion of this study focused on finite element analysis of the L4-L5
motion segment to determine if the stresses, range of motion, and displacement of the
intervertebral disc were affected by changing the Poisson’s ratio of the disc. The study
focused on examining seven possible movements that can take place in the spine;
extension, flexion, left and right lateral bending, left and right axial rotation, and pure
compression. Each of these analyses was completed using several Poisson’s ratios for the
intervertebral disc; the initial model had a Poisson’s ratio of 0.45 for the annulus fibrosus
and 0.4999 for the nucleus pulposus. For all additional analyses the annulus fibrosus and
the nucleus pulposus had the same Poisson’s ratio and were examined for Poisson’s ratios
of; 0.4999, 0.3, -0.3, and -0.999. These analyses had results that indicate that a negative
Poisson’s ratio artificial intervertebral disc will undergo similar stress and range of
motion as a natural intervertebral disc, but will additionally have a negative displacement
as compared to a bulging effect that can be observed in a positive Poisson’s ratio.
However, at some point in the range between -0.3 and -0.999 the beneficially properties
are lost.
The second portion of this study focused on compressing medium density
polyurethane foam to create foam with a negative Poisson’s ratio. The compression
process was achieved through heating the foam while under tri-axial compression.
Additionally the microstructures of the original uncompressed foam and the compressed
foam were examined through the use of scanning electron microscopy (SEM) and
microCT. A small sample of the three dimensional (3D) microstructures of both the
original uncompressed foam and the compressed foam were printed using rapid

v
prototyping, otherwise known as 3D printing. The long term goal of this work is to
fabricate an auxetic spinal implant prototype.
For my mother, Toni. Even when Alzheimer’s has taken your memories, I will remember
for us both. You have inspired and motivated me in ways you will never know, and for
that I thank you.
“A mother will hold her child’s hand for a short time, but their heart forever.” -
Anonymous
vii
Acknowledgements
First and foremost, I would like to thank my advisor Dr. Lesley Berhan for all of her
guidance throughout my graduate career. Her mentorship has been outstanding and has
pushed to learn more than I thought possible. Additional thanks to my committee
members, Dr. Vijay Goel and Dr. Patricia Relue for their help in making the most of my
research project and their insight. A special thank you to the entire Bioengineering
department faculty and staff who always made me feel welcomed and for all of their
support. Wiona Porath, you deserve so much credit for all the work you do and you have
truly inspired me. To John, Tim, and Randy in the MIME machine shop, this project
would not have been possible without your skills. The three of you deserve more thanks
than you receive.
A second set of thank you's needs to go out to all of my family and friends who have
supported me unconditionally throughout my life and have always understood my crazy
schedule. My father, mother, and sister have always been there no matter the
circumstances and I would not be half the person I am today without each of them. To
my friends, your ability to make me laugh at the toughest times and to give me a break
when it was needed have allowed me to keep my sanity during this time in my life. To
Elaine “Ana” Korenich, your ability to keep me motivated and on task played a large part
of this process. A very special thank you to you, because without you I would be stuck at
square one.
viii
Contents
Abstract .......................................................................................................................................... iii
Acknowledgements ........................................................................................................................ vii
Contents ........................................................................................................................................ viii
List of Figures ................................................................................................................................. xi
Chapter 1 Introduction .................................................................................................................... 1
1.1 Spine Anatomy................................................................................................................. 1
1.2 Disc Degeneration ............................................................................................................ 3
1.3 Artificial Disc Replacement ............................................................................................. 4
1.4 Negative Poisson’s Ratio Materials ................................................................................. 5
1.5 Purpose of this Study ....................................................................................................... 6
Chapter 2 Literature Review .......................................................................................................... 8
2.1 Low Back Pain ................................................................................................................. 8
2.2 Disc Degeneration .......................................................................................................... 10
2.3 Fusion ............................................................................................................................. 12
2.3.1 Laminectomy ......................................................................................................... 13
2.3.2 Laminotomy ........................................................................................................... 13
2.3.3 Posterolateral Fusion .............................................................................................. 13
ix
2.3.4 Posterior Lumbar Interbody Fusion ....................................................................... 13
2.3.5 Anterior Lumbar Interbody Fusion ........................................................................ 14
2.3.6 Transforaminal Lumbar Interbody Fusion ............................................................. 14
2.3.7 Extreme Lateral Interbody Fusion ......................................................................... 14
2.4 Nucleus Arthroplasty ..................................................................................................... 14
2.5 Total Disc Replacement ................................................................................................. 15
2.6 Negative Poisson’s Ratio ............................................................................................... 17
2.7 Negative Poisson’s Ratio Foams ................................................................................... 20
Chapter 3 Finite Element Study of L4-L5 Motion Segment ......................................................... 23
3.1 Materials and Methods ................................................................................................... 23
3.1.1 Model ..................................................................................................................... 23
3.1.2 Motions .................................................................................................................. 24
3.1.3 Loads ...................................................................................................................... 24
3.1.4 Intervertebral Disc Properties ................................................................................ 24
3.2 Results and Discussion .................................................................................................. 25
3.2.1 Visual Comparison of Deformed and Undeformed Models .................................. 25
3.2.2 Range of Motion .................................................................................................... 40
3.2.3 Intervertebral Disc Stress ....................................................................................... 43
3.2.4 Displacement of Intervertebral Disc ...................................................................... 48
3.3 Conclusions ................................................................................................................ 53
x
Chapter 4 Compression of Polyurethane Foam ........................................................................... 54
4.1 Materials and Methods ....................................................................................................... 54
4.1.1 Cutting of Foam ..................................................................................................... 54
4.1.2 Compression Chamber ........................................................................................... 55
4.1.3 Compression Process ............................................................................................. 56
4.1.4 Characterization of Foam ....................................................................................... 57
4.1.4.1 Scanning Electron Microscopy Analysis ........................................................... 57
4.1.4.2 MicroCT ............................................................................................................. 57
4.1.4.3 Three Dimensional Printing ............................................................................... 57
4.2 Results and Discussion .................................................................................................. 58
4.2.1 Foam Compression ................................................................................................ 58
4.2.2 Scanning Electron Microscopy .............................................................................. 59
4.2.3 MicroCT ................................................................................................................. 60
4.2.4 Three Dimensional Printing ................................................................................... 62
4.3 Conclusions .................................................................................................................... 64
Chapter 5 ...................................................................................................................................... 65
References ..................................................................................................................................... 67
xi
List of Figures
Figure 1-1: Lateral View of Spinal Column .................................................................................... 2
Figure 1-2: Axial View of Intervertebral Disc ................................................................................. 2
Figure 2-1: Common Disc Problems ............................................................................................... 9
Figure 2-2: The Charité Artificial Disc and the Pro-Disc L artificial disc .................................... 15
Figure 2-3: Compression Properties of Non-auxetic versus Auxetic Materials ............................. 17
Figure 2-4: Comparison of Conventional Honeycomb to Re-entrant Honeycomb ....................... 18
Figure 2-5: Rotating Squares Structure .......................................................................................... 19
Figure 2-6: Theoretical Liquid Crystalline Polymer undeformed and deformed........................... 19
Figure 2-7: Artificial Disc Design Proposed by Martz et al. ......................................................... 20
Figure 2-8: Idealized Re-entrant unit cell produced by symmetrical collapse of a 24-sided
polyhedron with cubic symmetry ................................................................................................... 21
Figure 2-9: Scanning Electron Micrographs of Uncompressed and Compressed foams ............... 22
Figure 3-1: Example of the Finite Element Model ........................................................................ 24
Figure 3-2 : Compression with the Original Model Properties ...................................................... 26
Figure 3-3: Compression with a Poisson’s ratio of -0.3 ................................................................ 27
Figure 3-4: Compression with a Poisson’s ratio of -0.999 ............................................................ 27
Figure 3-5: Extension with the Original Model Properties ............................................................ 28
Figure 3-6: Extension with a Poisson's ratio of -0.3 ...................................................................... 29
Figure 3-7: Extension with a Poisson’s ratio of -0.999 .................................................................. 29
Figure 3-8: Flexion with the Original Model Properties ................................................................ 30
xii
Figure 3-9: Flexion with a Poisson’s ratio of -0.3 ......................................................................... 31
Figure 3-10: Flexion with a Poisson’s ratio of -0.999 ................................................................... 31
Figure 3-11: Left Lateral Bending with the Original Model Properties ........................................ 32
Figure 3-12: Left Lateral Bending with a Poisson’s ratio of -0.3 .................................................. 33
Figure 3-13: Left Lateral Bending with a Poisson’s ratio of -0.999 .............................................. 33
Figure 3-14: Right Lateral Bending with the Original Model Properties ...................................... 34
Figure 3-15: Right Lateral Bending with a Poisson’s ratio of -0.3 ................................................ 35
Figure 3-16: Right Lateral Bending with a Poisson’s ratio of -0.999 ............................................ 35
Figure 3-17: Left Axial Rotation with the Original Model Properties ........................................... 36
Figure 3-18: Left Axial Rotation with a Poisson’s ratio of -0.3 .................................................... 37
Figure 3-19: Left Axial Rotation with a Poisson’s ratio of -0.999 ................................................ 37
Figure 3-20: Right Axial Rotation with the Original Model Properties ........................................ 38
Figure 3-21: Right Axial Rotation with a Poisson’s ratio of -0.3 .................................................. 39
Figure 3-22: Right Axial Rotation with a Poisson’s ratio of -0.999 .............................................. 39
Figure 3-23: Range of Motion in Flexion for Various Poisson's Ratios ........................................ 40
Figure 3-24: Range of Motion in Flexion for Various Poisson's Ratios ........................................ 41
Figure 3-25: Range of Motion in Left Lateral Bending for Various Poisson's Ratios ................... 41
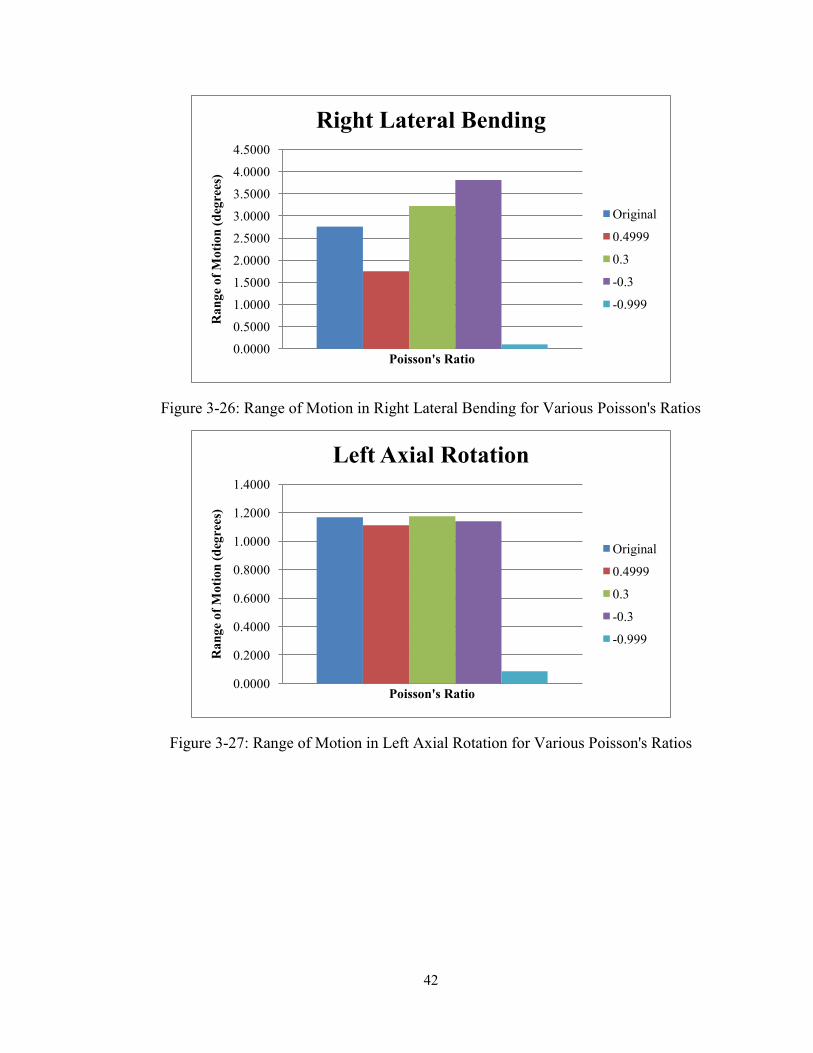
Figure 3-26: Range of Motion in Right Lateral Bending for Various Poisson's Ratios................. 42
Figure 3-27: Range of Motion in Left Axial Rotation for Various Poisson's Ratios ..................... 42
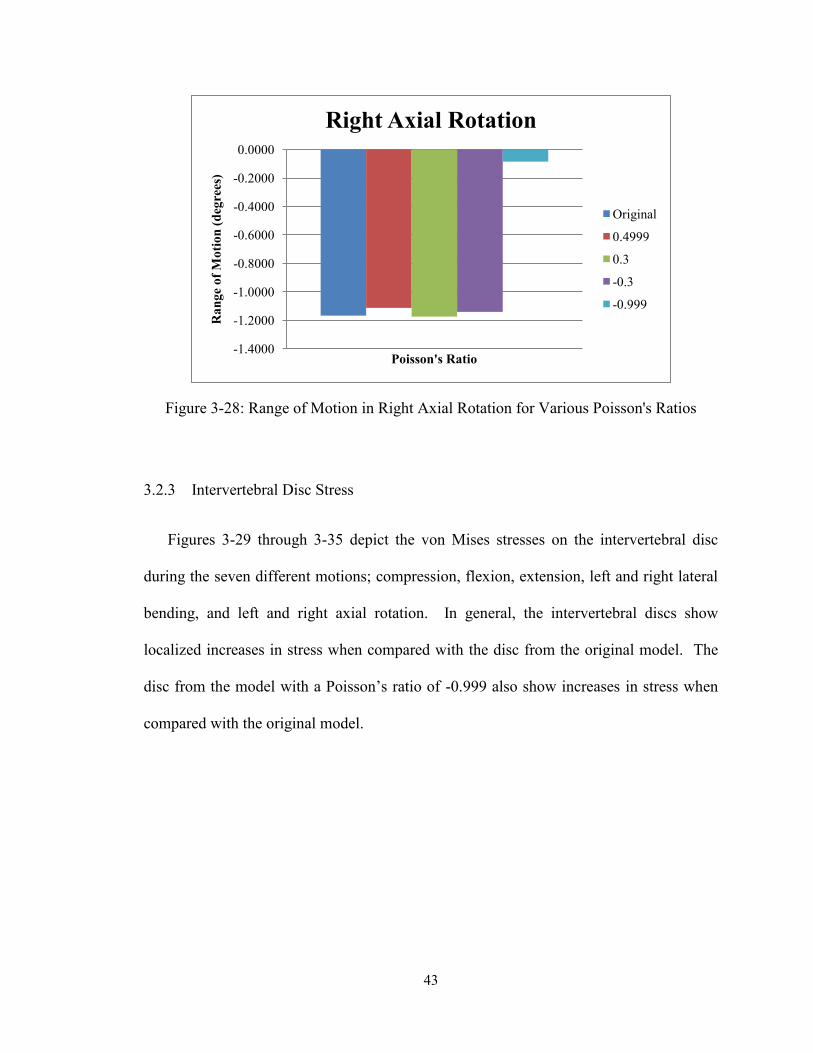
Figure 3-28: Range of Motion in Right Axial Rotation for Various Poisson's Ratios ................... 43
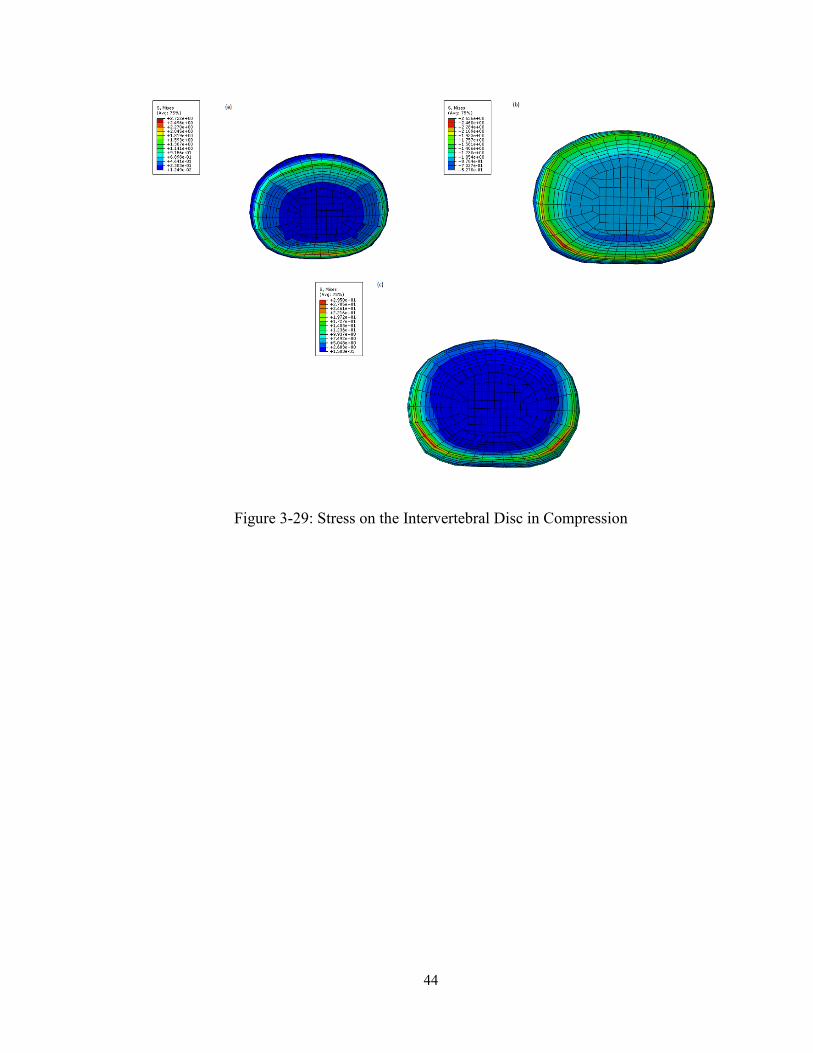
Figure 3-29: Stress on the Intervertebral Disc in Compression ..................................................... 44
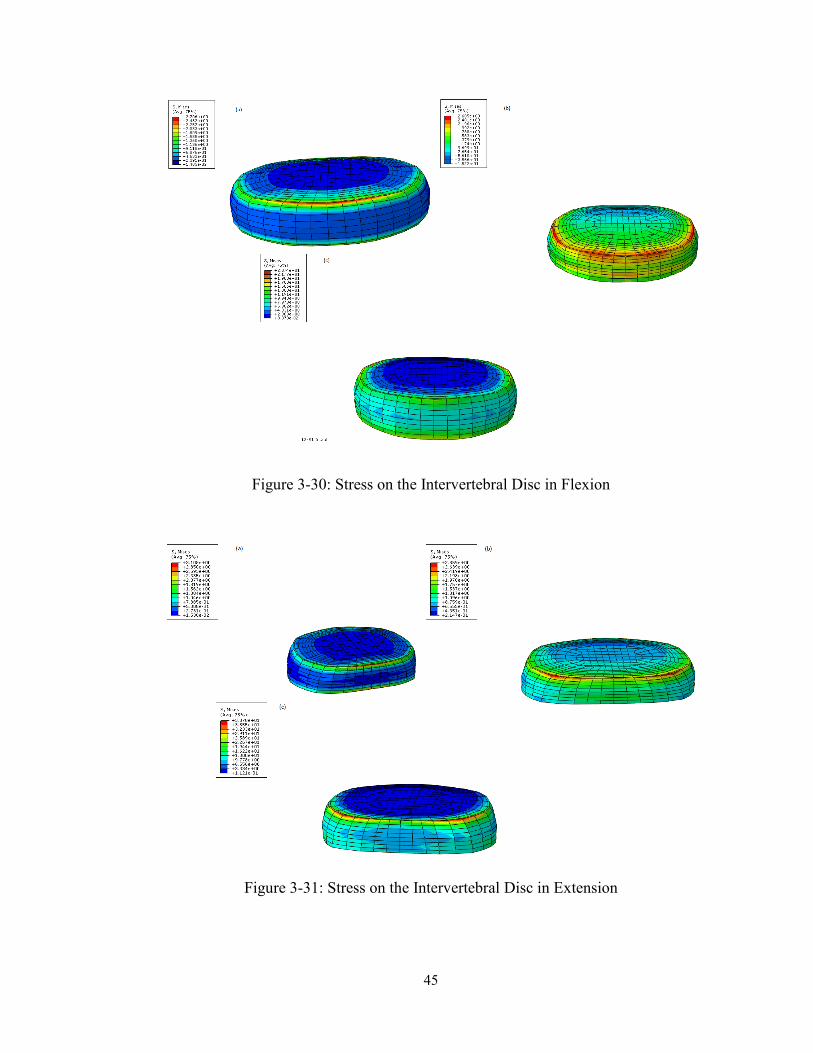
Figure 3-30: Stress on the Intervertebral Disc in Flexion .............................................................. 45
Figure 3-31: Stress on the Intervertebral Disc in Extension .......................................................... 45
xiii
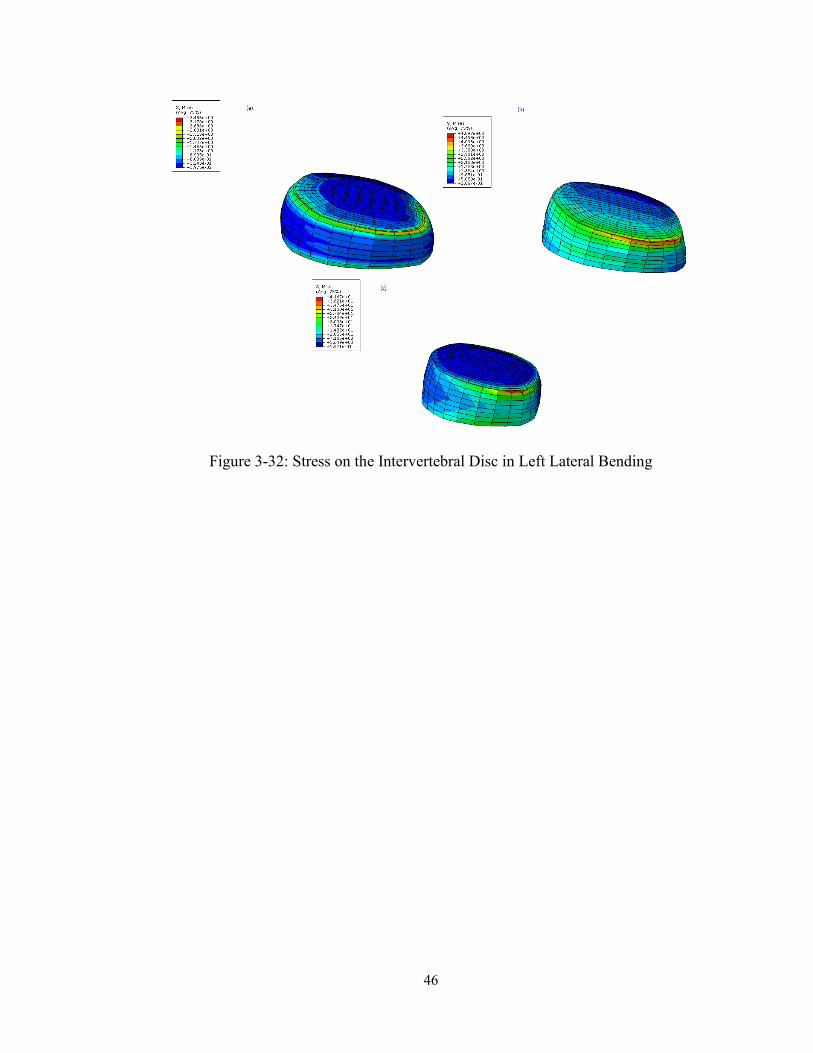
Figure 3-32: Stress on the Intervertebral Disc in Left Lateral Bending ......................................... 46
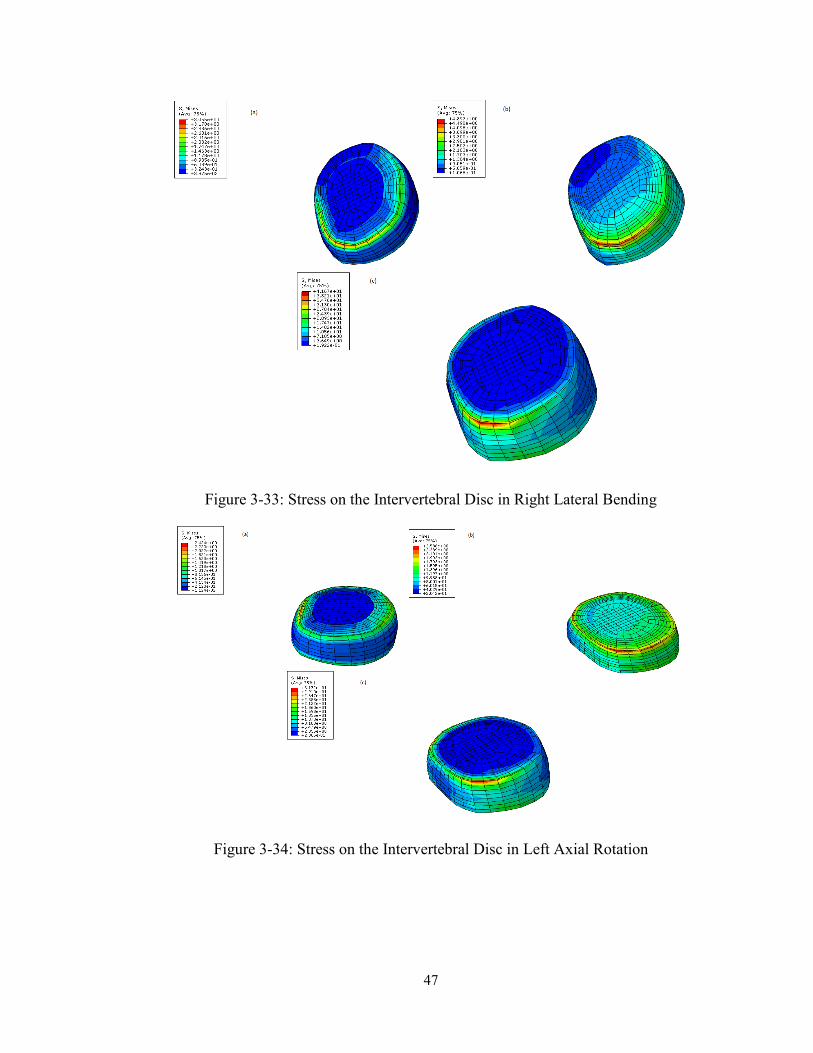
Figure 3-33: Stress on the Intervertebral Disc in Right Lateral Bending ...................................... 47
Figure 3-34: Stress on the Intervertebral Disc in Left Axial Rotation ........................................... 47
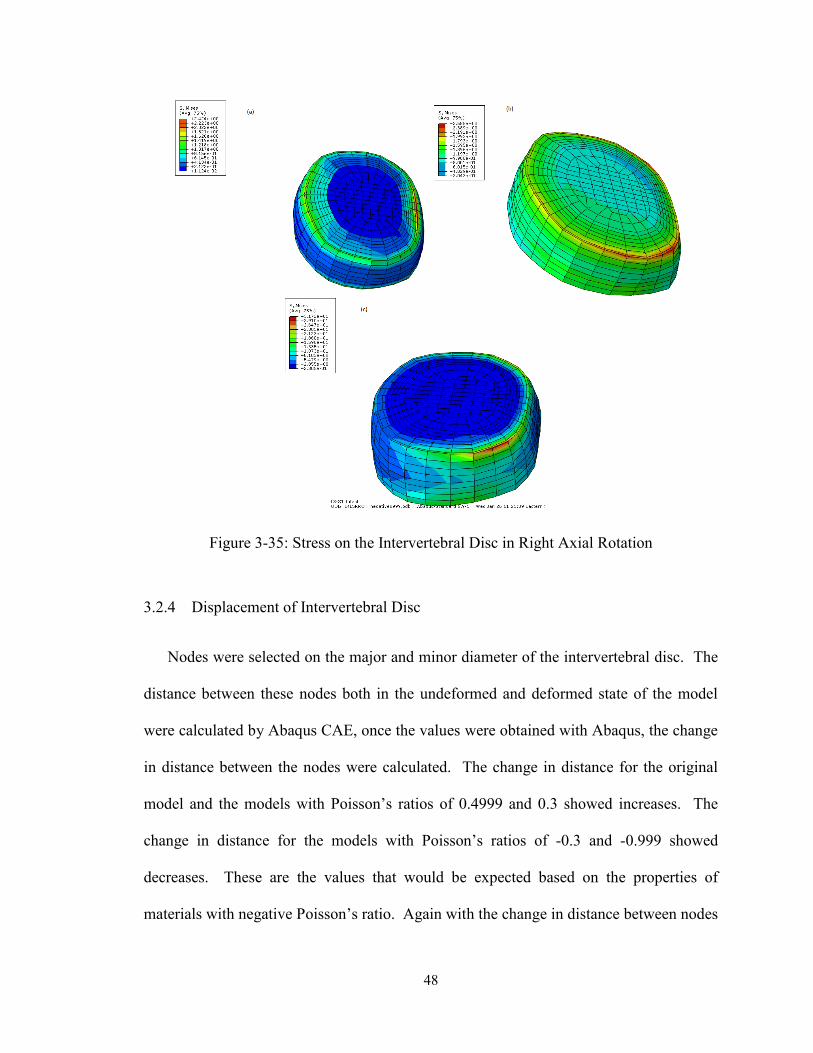
Figure 3-35: Stress on the Intervertebral Disc in Right Axial Rotation ......................................... 48
Figure 3-36: Displacement Compression ....................................................................................... 49
Figure 3-37: Displacement Flexion ............................................................................................... 50
Figure 3-38: Displacement Extension ............................................................................................ 50
Figure 3-39: Displacement Left Lateral Bending .......................................................................... 51
Figure 3-40: Displacement Right Lateral Bending ........................................................................ 51
Figure 3-41: Displacement Left Axial Rotation ............................................................................ 52
Figure 3-42: Displacement Right Axial Rotation .......................................................................... 52
Figure 4-1: Process of Cutting Foam ............................................................................................. 54
Figure 4-2: Compression Chamber ................................................................................................ 55
Figure 4-3: Compression chamber, Uncompressed foam, and Compressed foam ........................ 56
Figure 4-4: Unexpanded compressed foam and Expanded compressed foam ............................... 58
Figure 4-5: SEM images of Uncompressed Polyurethane Foam ................................................... 59
Figure 4-6: SEM images of Compressed Polyurethane Foam Samples ........................................ 60
Figure 4-7: MicroCT Scan of Uncompressed Foam ...................................................................... 61
Figure 4-8: MicroCT Scan of Compressed Foam .......................................................................... 62
Figure 4-9: 3D Printing of the Uncompressed Foam Microstructure ............................................ 63
Figure 4-10: 3D Printing of the Compressed Foam Microstructure .............................................. 63
1
Chapter 1
Introduction
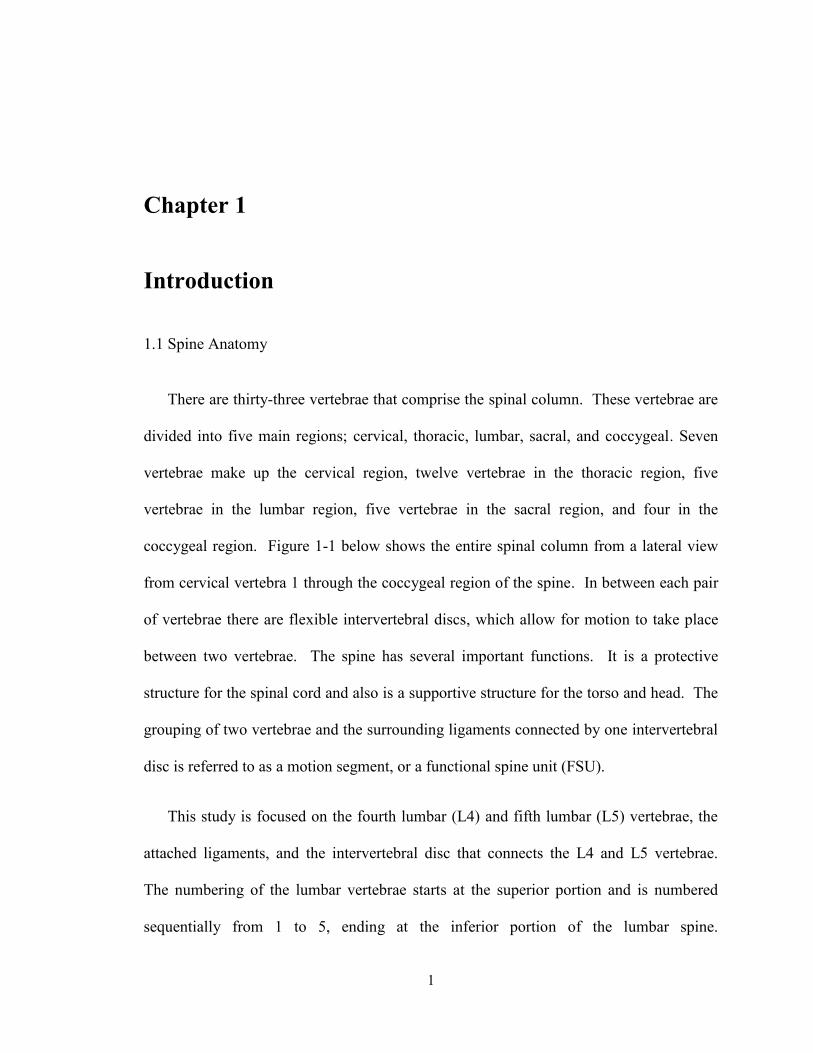
1.1 Spine Anatomy
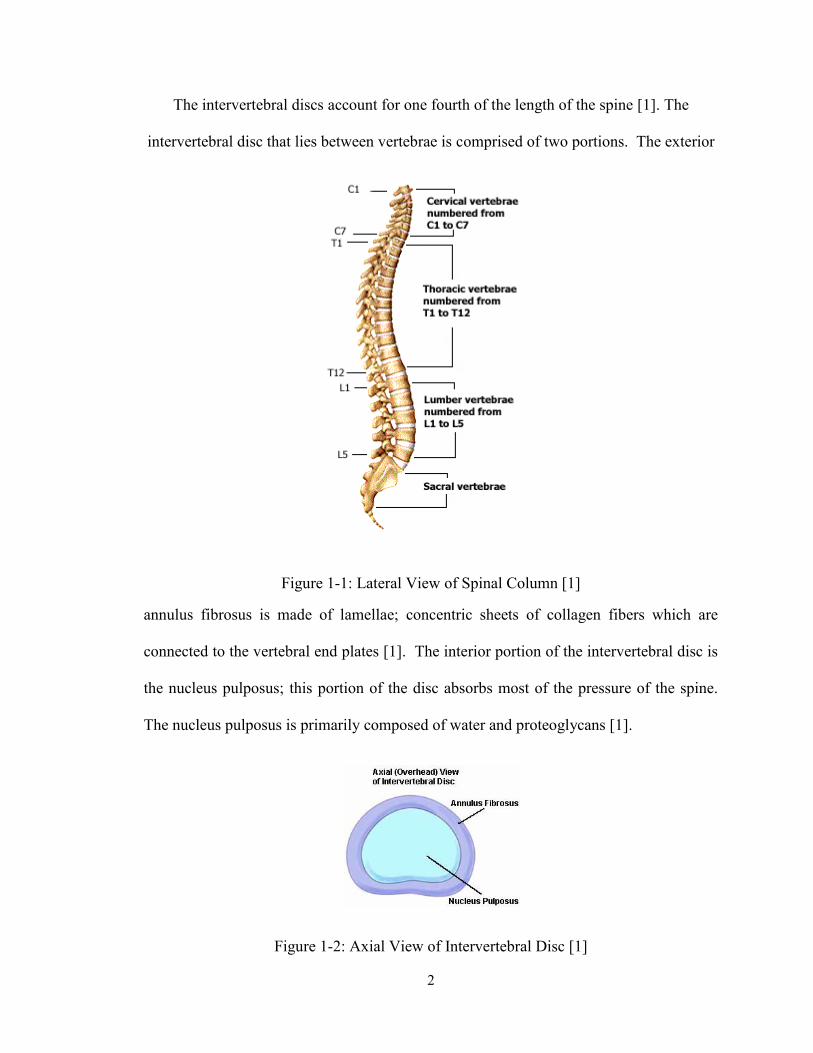
There are thirty-three vertebrae that comprise the spinal column. These vertebrae are
divided into five main regions; cervical, thoracic, lumbar, sacral, and coccygeal. Seven
vertebrae make up the cervical region, twelve vertebrae in the thoracic region, five
vertebrae in the lumbar region, five vertebrae in the sacral region, and four in the
coccygeal region. Figure 1-1 below shows the entire spinal column from a lateral view
from cervical vertebra 1 through the coccygeal region of the spine. In between each pair
of vertebrae there are flexible intervertebral discs, which allow for motion to take place
between two vertebrae. The spine has several important functions. It is a protective
structure for the spinal cord and also is a supportive structure for the torso and head. The
grouping of two vertebrae and the surrounding ligaments connected by one intervertebral
disc is referred to as a motion segment, or a functional spine unit (FSU).
This study is focused on the fourth lumbar (L4) and fifth lumbar (L5) vertebrae, the
attached ligaments, and the intervertebral disc that connects the L4 and L5 vertebrae.
The numbering of the lumbar vertebrae starts at the superior portion and is numbered
sequentially from 1 to 5, ending at the inferior portion of the lumbar spine.
2
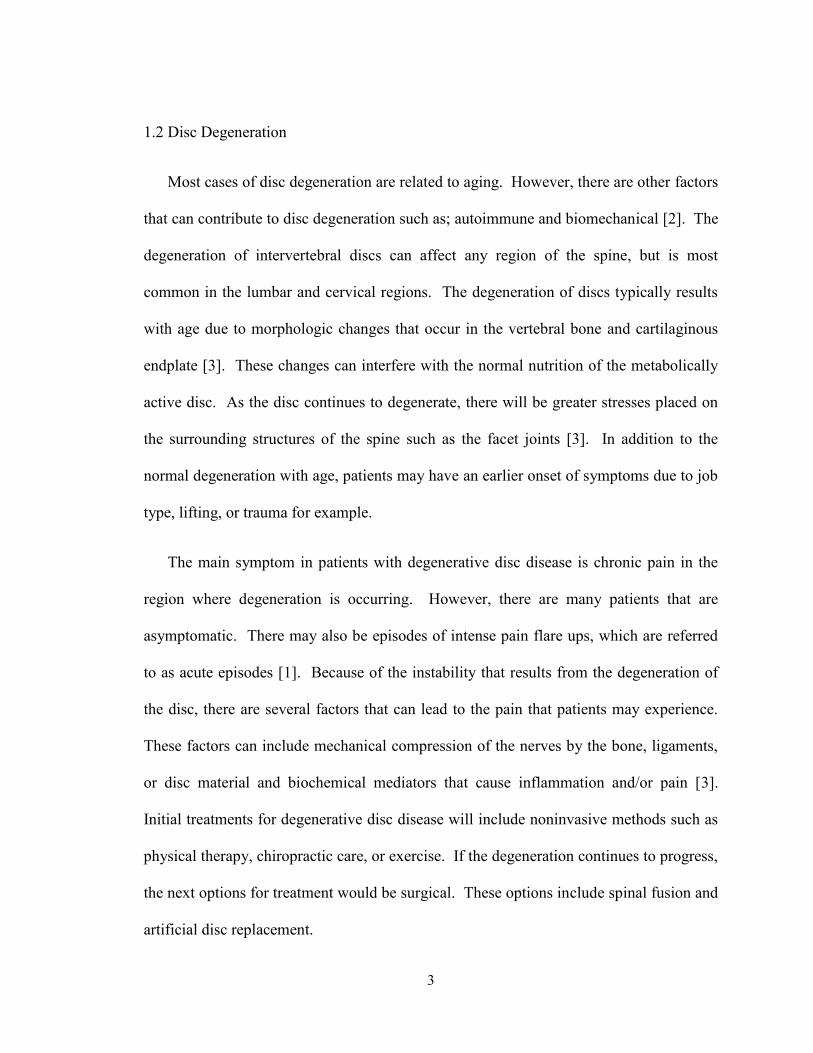
The intervertebral discs account for one fourth of the length of the spine [1]. The
intervertebral disc that lies between vertebrae is comprised of two portions. The exterior
Figure 1-1: Lateral View of Spinal Column [1]
annulus fibrosus is made of lamellae; concentric sheets of collagen fibers which are
connected to the vertebral end plates [1]. The interior portion of the intervertebral disc is
the nucleus pulposus; this portion of the disc absorbs most of the pressure of the spine.
The nucleus pulposus is primarily composed of water and proteoglycans [1].
Figure 1-2: Axial View of Intervertebral Disc [1]
3
1.2 Disc Degeneration
Most cases of disc degeneration are related to aging. However, there are other factors
that can contribute to disc degeneration such as; autoimmune and biomechanical [2]. The
degeneration of intervertebral discs can affect any region of the spine, but is most
common in the lumbar and cervical regions. The degeneration of discs typically results
with age due to morphologic changes that occur in the vertebral bone and cartilaginous
endplate [3]. These changes can interfere with the normal nutrition of the metabolically
active disc. As the disc continues to degenerate, there will be greater stresses placed on
the surrounding structures of the spine such as the facet joints [3]. In addition to the
normal degeneration with age, patients may have an earlier onset of symptoms due to job
type, lifting, or trauma for example.
The main symptom in patients with degenerative disc disease is chronic pain in the
region where degeneration is occurring. However, there are many patients that are
asymptomatic. There may also be episodes of intense pain flare ups, which are referred
to as acute episodes [1]. Because of the instability that results from the degeneration of
the disc, there are several factors that can lead to the pain that patients may experience.
These factors can include mechanical compression of the nerves by the bone, ligaments,
or disc material and biochemical mediators that cause inflammation and/or pain [3].
Initial treatments for degenerative disc disease will include noninvasive methods such as
physical therapy, chiropractic care, or exercise. If the degeneration continues to progress,
the next options for treatment would be surgical. These options include spinal fusion and
artificial disc replacement.
4
1.3 Artificial Disc Replacement
For years, the treatment of choice for degenerative disc disease that has not responded
to conservative treatments has been spinal fusion. In spinal fusion, the diseased disc is
removed and either autologous or allograft bone grafts are implanted, often along with
interbody cages, pedicle screws, and rods, to create a bony fusion between the vertebrae
[4]. While patients can benefit from the fusion of spinal vertebrae, there are still many
who do not show an improvement in symptoms after the bone fusion. In addition, the
purpose of fusion is to limit motion in the diseased portion of the spine. This limiting of
motion in turn causes neighboring segments of the spine to have increases in stress and
motion [4].
On October 26, 2004, the FDA approved an artificial disc for the treatment of
degenerative disc disease at L4 to S1 [5]. There are currently two FDA approved total
disc replacements; the Charité™ total disc replacement and the Prodisc®-L total disc
replacement [6]. The ideal advantage to total disc replacement verses spinal fusion
would be the preservation of motion in the spine. Using the artificial disc will also
restore stability and maintain disc height without causing adjacent segment disease [4].
The two total artificial discs that are approved for use in the United States by the FDA
both consist of two metal endplates and a plastic inlay that fits between the two endplates.
The endplates can then slide over the plastic inlay to allow for motion. In 2010 Depuy
ceased manufacturing of the Charité artificial disc in favor of an improved version called
the In Motion artificial disc. The new version keeps many of Charité’s features while
incorporating some minor modifications to allow for easier implant insertion [7]. These
metal on metal or metal on plastic models over time can experience wear due to the
5
motion. This wear can cause irritation in the body. An implant that is one continuous
piece would in theory prevent this wear, however most materials experience bulge in the
transverse direction when compressed in the axial direction. This bulge can interfere
with surrounding nerves and cause further pain issues. However, there is a class of
materials known as negative Poisson’s ratio materials that when compressed, contract in
the transverse direction. It is this property that seems to make an artificial intervertebral
disc made of a negative Poisson’s ratio material an attractive candidate as a total disc
replacement.
1.4 Negative Poisson’s Ratio Materials
The Poisson’s ratio of a material is defined as the ratio of the lateral strain to the
longitudinal strain for a material undergoing tension in the longitudinal direction [8]. For
a homogeneous, isotropic structure,
x
y
xyv
Equation 1-1: Poisson’s Ratio
Where εx is the strain applied in the x direction and εy is the resultant tensile strain in
the y direction, which is transverse with respect to the x direction [9]. For isotropic
materials, vxy = vyx = v and the range of the Poisson’s ratio lies between -1≤ v ≤ 0.5,
anisotropic materials may have Poisson’s ratios that lie outside of this range. Negative
Poisson’s ratio materials, or auxetic materials, will undergo longitudinal and lateral
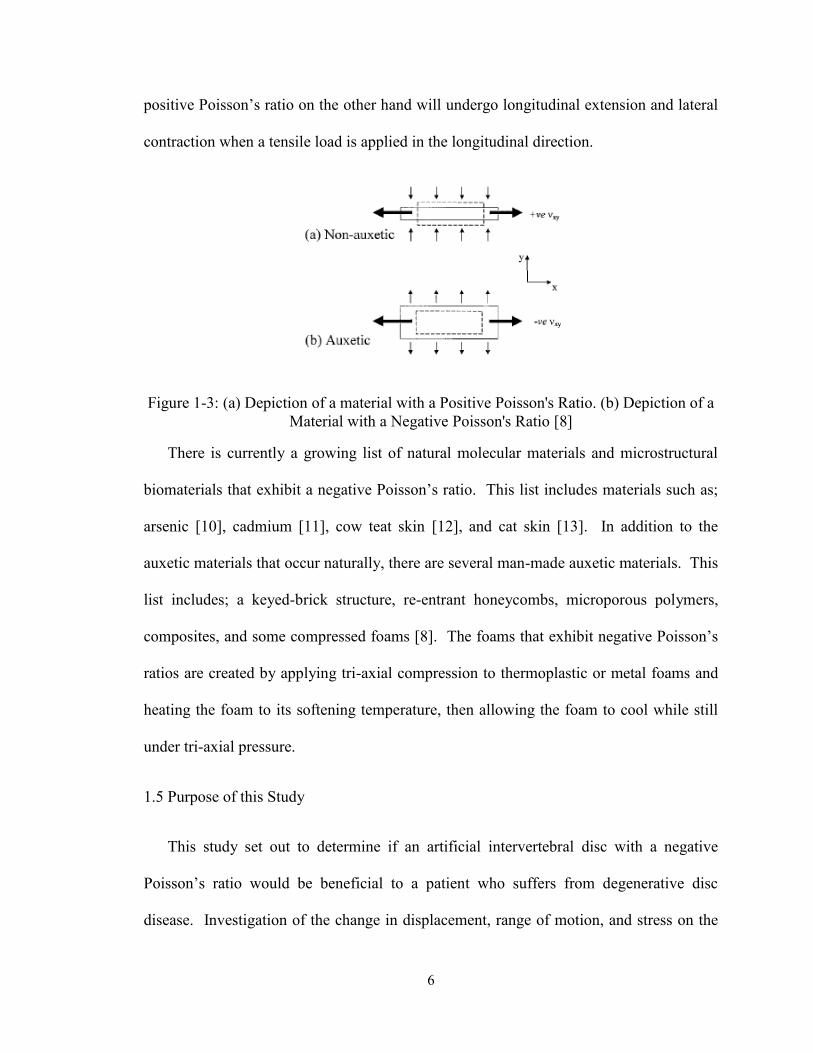
extension when a tensile load is applied in the longitudinal direction. Materials with a
6
positive Poisson’s ratio on the other hand will undergo longitudinal extension and lateral
contraction when a tensile load is applied in the longitudinal direction.
Figure 1-3: (a) Depiction of a material with a Positive Poisson's Ratio. (b) Depiction of a
Material with a Negative Poisson's Ratio [8]
There is currently a growing list of natural molecular materials and microstructural
biomaterials that exhibit a negative Poisson’s ratio. This list includes materials such as;
arsenic [10], cadmium [11], cow teat skin [12], and cat skin [13]. In addition to the
auxetic materials that occur naturally, there are several man-made auxetic materials. This
list includes; a keyed-brick structure, re-entrant honeycombs, microporous polymers,
composites, and some compressed foams [8]. The foams that exhibit negative Poisson’s
ratios are created by applying tri-axial compression to thermoplastic or metal foams and
heating the foam to its softening temperature, then allowing the foam to cool while still
under tri-axial pressure.
1.5 Purpose of this Study
This study set out to determine if an artificial intervertebral disc with a negative
Poisson’s ratio would be beneficial to a patient who suffers from degenerative disc
disease. Investigation of the change in displacement, range of motion, and stress on the
7
intervertebral disc were performed using finite element study of the L4-L5 motion
segment. When a negative Poisson’s ratio material is longitudinally compressed, the
material will also compress in the transverse direction. This unique property would
prevent bulging that could result if an artificial intervertebral disc was designed using a
positive Poisson’s ratio material. Bulging could result in interference with the nerves
surrounding the spinal column and cause the patient additional pain. The objective of
this study was to determine if polyurethane foam could be compressed to yield a negative
Poisson’s ratio foam. The compressed foam was characterized through scanning electron
microscopy, microCT, and three dimensional printing of the microstructure of the foam.
8
Chapter 2
Literature Review
This section will review literature related to low back pain and disc degeneration.
There will be a discussion of the various pathologies that contribute to degenerative disc
disease. In addition, the surgical treatment options of spinal fusion and total disc
replacement will be covered. Finally, a review will be done on negative Poisson’s ratio
materials with special attention paid to negative Poisson’s ratio foams.
2.1 Low Back Pain
Not only does low back pain have physical effects on patients, but it can also results
in socioeconomic problems for the patient as well [14]. The total costs of low back pain
in the United States exceed $100 billion per year [15]. The costs that can be associated
with low back pain include; health care, missed work, and disability. Each year, the
fewer than 5% of the patients who have an episode of low back pain account for 75% of
the total costs [15]. Not only does the low back pain affect the patient, but it also has an
impact on the family and employer of the patient. Low back pain can be characterized by
specific pathologies such as; hernia, infection, inflammation, osteoporosis, rheumatoid
arthritis, or fracture [14]. Low back pain can also occur without indication of what is the
cause, or non-specific low back pain. The most important symptoms of non-specific low
9
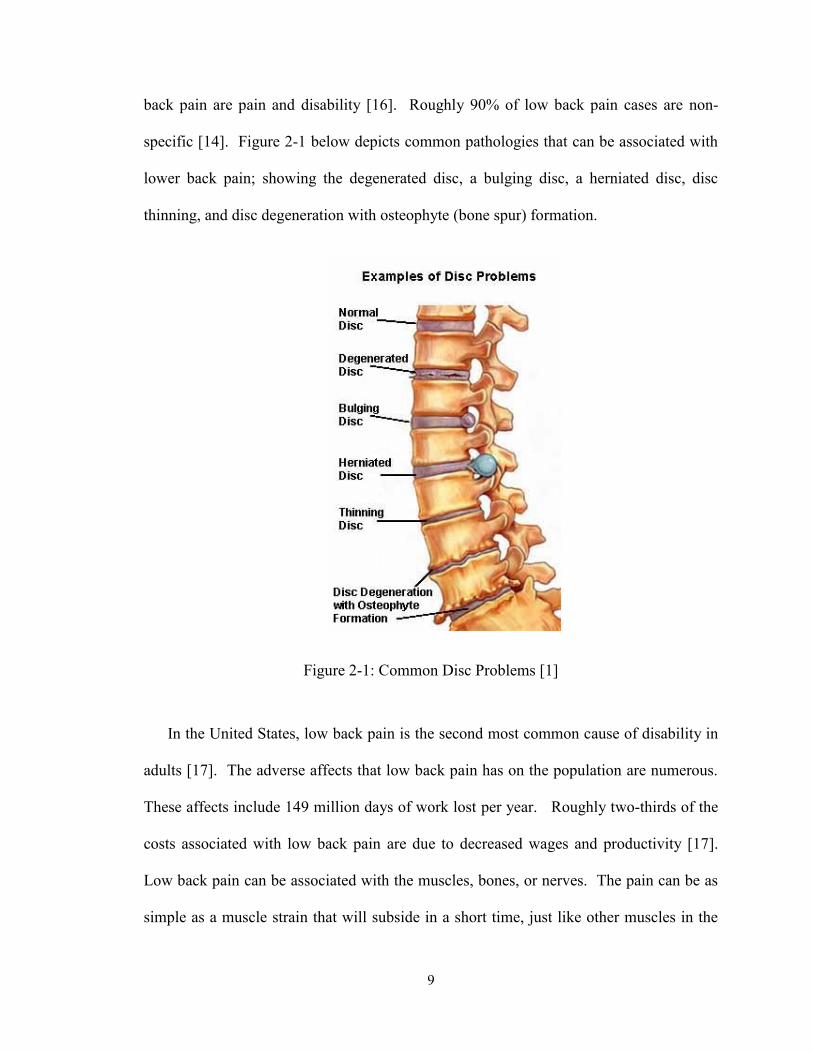
back pain are pain and disability [16]. Roughly 90% of low back pain cases are non-
specific [14]. Figure 2-1 below depicts common pathologies that can be associated with
lower back pain; showing the degenerated disc, a bulging disc, a herniated disc, disc
thinning, and disc degeneration with osteophyte (bone spur) formation.
Figure 2-1: Common Disc Problems [1]
In the United States, low back pain is the second most common cause of disability in
adults [17]. The adverse affects that low back pain has on the population are numerous.
These affects include 149 million days of work lost per year. Roughly two-thirds of the
costs associated with low back pain are due to decreased wages and productivity [17].
Low back pain can be associated with the muscles, bones, or nerves. The pain can be as
simple as a muscle strain that will subside in a short time, just like other muscles in the
10
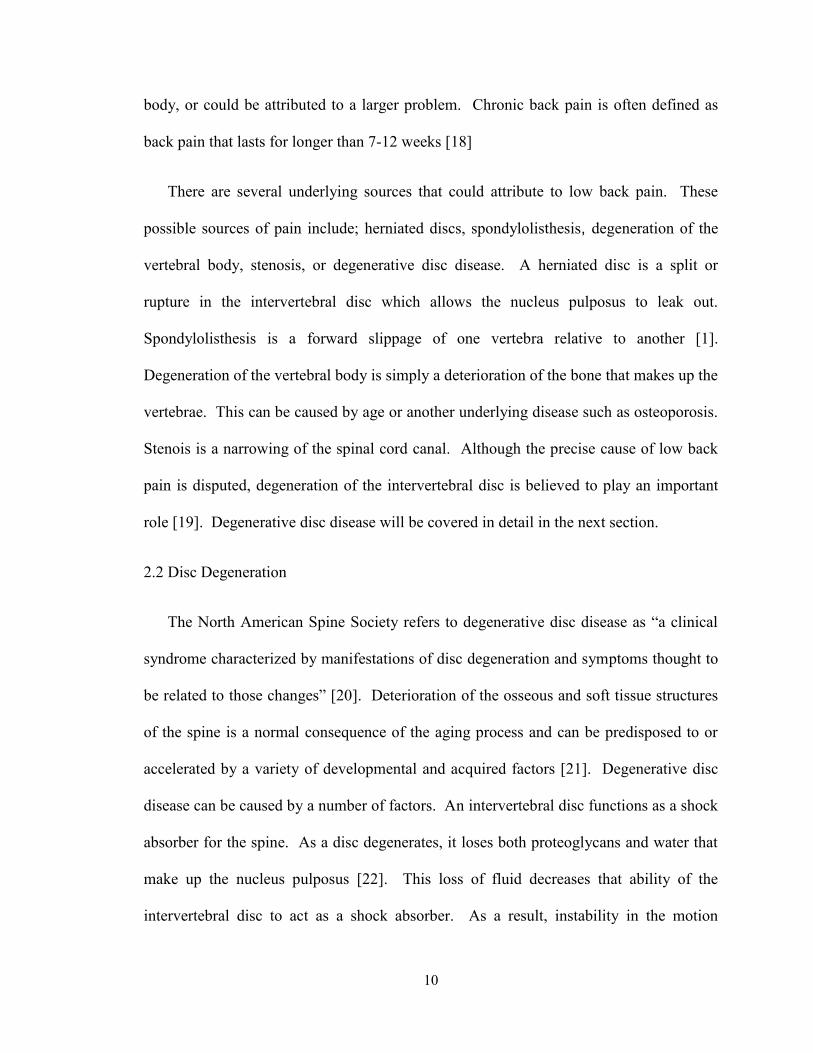
body, or could be attributed to a larger problem. Chronic back pain is often defined as
back pain that lasts for longer than 7-12 weeks [18]
There are several underlying sources that could attribute to low back pain. These
possible sources of pain include; herniated discs, spondylolisthesis, degeneration of the
vertebral body, stenosis, or degenerative disc disease. A herniated disc is a split or
rupture in the intervertebral disc which allows the nucleus pulposus to leak out.
Spondylolisthesis is a forward slippage of one vertebra relative to another [1].
Degeneration of the vertebral body is simply a deterioration of the bone that makes up the
vertebrae. This can be caused by age or another underlying disease such as osteoporosis.
Stenois is a narrowing of the spinal cord canal. Although the precise cause of low back
pain is disputed, degeneration of the intervertebral disc is believed to play an important
role [19]. Degenerative disc disease will be covered in detail in the next section.
2.2 Disc Degeneration
The North American Spine Society refers to degenerative disc disease as “a clinical
syndrome characterized by manifestations of disc degeneration and symptoms thought to
be related to those changes” [20]. Deterioration of the osseous and soft tissue structures
of the spine is a normal consequence of the aging process and can be predisposed to or
accelerated by a variety of developmental and acquired factors [21]. Degenerative disc
disease can be caused by a number of factors. An intervertebral disc functions as a shock
absorber for the spine. As a disc degenerates, it loses both proteoglycans and water that
make up the nucleus pulposus [22]. This loss of fluid decreases that ability of the
intervertebral disc to act as a shock absorber. As a result, instability in the motion
11
segment occurs because the disc has lost some of its stiffness. Most patients with
degeneration of the disc have some degree of abnormal spinal flexibility, but further
investigation into the relationship between kinematics and flexibility need to be
performed [22].
As the disc degenerates, it leads to changes in the surrounding anatomy as well. The
disc will lose height, causing the facet joints into malalignment [23]. In addition to the
increased forces of the facet joints, a degenerating disc and fact changes will likely have
an effect on the posterior ligaments. As the disc degenerates, it leads to a vicious cycle
which can include degenerative disc disease, facet arthrosis, ligamentous and capsular
hypertrophy, spine instability, and lumbar stenosis [23].
Disc degeneration occurs in three stages; dysfunctional, instability, and stabilization.
The dysfunctional stage is characterized by circumferential fissuring or tearing of the
outer annulus fibrosus [24]. This stage of disc degeneration is accompanied by acute
episodes of low back pain or phases where the back “goes out”. In the instability stage,
intervertebral disc changes occur as the result of multiple annular tears and delamination
of the layers. This results in vertebral segment instability [24]. The instability will result
in further decline in proteoglycans and water loss. The final stage, stabilization, is
characterized by further resorption of the nucleus pulposus which leads to more
intervertebral disc space narrowing, fibrosis, endplate irregularities, and osteophyte
formation [24].
12
2.3 Fusion
There are several options for the treatment of low back pain and degenerative disc
disease. Initial treatments will be of the conservative approach, such as physical therapy.
If these options fail to treat the pain, surgical options will then be investigated. If the
main cause of pain is compression on the nerve root, a decompression surgery can be
done. Techniques commonly used in decompression surgeries include laminectomy and
laminotomy. If compression on the nerve root is not causing the patient’s pain, a spinal
fusion may be performed. In spinal fusion, the damaged intervertebral disc would be
removed and then an interbody cage and bone grafts would be placed in between the
vertebrae in order to promote bone growth that would fuse the adjacent vertebrae
together. There are several surgical techniques that can be used in order to fuse the
vertebrae. These techniques include; posterolateral fusion, anterior lumbar interbody
fusion, posterior lumbar interbody fusion, transforaminal lumbar interbody fusion, and
extreme lateral interbody fusion. A brief description of the above mentioned procedures
will follow in upcoming sections.
Spinal fusion should eliminate motion at the instrumented segment [25]. A major
problem with fusion is that the elimination of motion in one segment will lead to
increases in loading in the adjacent segments. As the loads in adjacent segments
increase, this can lead to increases in degeneration in those adjacent segments [25]. A
study by Ghiselli et al. found that 59 of 215 patients had degeneration adjacent to their
fusion site that would require additional surgical procedures. The study also predicts that
over time 16.5% of patients who have had fusion surgery will have degeneration at the
adjacent level that will require surgery after five years, and after ten years that percentage
13
will be 36.1% [26]. In a second study, Lehmann et al. found that in patients that had
undergone fusion at L3 or lower, there was significant instability above the fusion level
in 15 of 33 patients in a long-term follow-up study [27].
2.3.1 Laminectomy
Laminectomy is a surgery to remove the lamina, or the back part of the vertebra that
covers your spinal canal. The goal of laminectomy is to relieve pressure on the spinal
column caused by stenois by enlarging the spinal canal [28].
2.3.2 Laminotomy
A laminotomy is a procedure that can be used to remove the ligamentum flavum.
Spinal stenosis has been attributed to this ligament located in the spinal canal [29]. The
goal of a laminotomy is also to relieve pressure on the spinal column.
2.3.3 Posterolateral Fusion
Posterolateral fusion is a process that aims to create stability in the affected spine
segment through a posterior entry surgery. In a posterolateral fusion, the damaged
intervertebral disc material is not removed, but a bone graft is attached between the
transverse processes to encourage growth across the vertebrae [30].
2.3.4 Posterior Lumbar Interbody Fusion
As with posterolateral fusion, posterior lumbar interbody fusion is a surgery that aims
to return stability to the affected spinal region through a posterior entry surgery. In
posterior lumbar interbody fusion, the damaged intervertebral disc is removed, and bone
grafts are placed to promote growth between the vertebrae [30].
14
2.3.5 Anterior Lumbar Interbody Fusion
For an anterior lumbar interbody fusion, the vertebrae are fused after the removal of
the affected intervertebral disc and replaced with bone grafts to promote growth. Unlike
the posterior lumbar interbody fusion, the anterior surgery is performed through and
incision in the abdomen as opposed to the back [31].
2.3.6 Transforaminal Lumbar Interbody Fusion
Transforaminal lumbar interbody fusion is also an open back surgery during which
the intervertebral disc is removed and replaced with bone grafts. This surgery differs
from posterior lumbar interbody fusion in that the disc is removed from the sides of the
vertebrae as opposed to the back [32].
2.3.7 Extreme Lateral Interbody Fusion
Extreme lateral interbody fusion is a minimally invasive surgical approach that fuses
the affected vertebrae with a side approach surgery that avoids that major back and
abdominal muscles [7]. Again this surgery removes the affected intervertebral disc and
replaces it with bone grafts to promote growth between the vertebrae.
2.4 Nucleus Arthroplasty
Currently, the FDA considers the term nucleus arthroplasty as a term that applies to
any device that replaces the nucleus pulposus while preserving the surrounding annulus
fibrosus [33]. This option differs from total disc replacement which will be discussed
later in that only the inner portion, nucleus, of the disc is removed. With total disc
replacement the entire disc is removed and an implant is placed to preserve disc height
15
and motion. As of 2006, there were several companies that had nucleus arthroplasty
devices in FDA investigational device exemption (IDE) studies. These companies
included Spine Wave, Inc., Raymedica, LLC, Disc Dynamics, Inc., and Pioneer Surgical
Technology [33].
2.5 Total Disc Replacement
Due to increases in adjacent segment loading that are seen in spinal fusions, it was
important to move to the next frontier in surgical options for treatment of intervertebral
disc degeneration. Total disc replacement has increased in popularity as an alternative
for lumbar fusion [34]. Total disc replacement aims to completely remove the damaged
intervertebral disc and replace the disc with an artificial disc which will still allow for
motion in that segment of the spine as opposed to spinal fusion which would eliminate
the motion of the segment. It is the goal of total disc replacement to maintain the disc
height, reduce pain associated with the diseased area, not increase loading in the adjacent
segments of the spine, and in turn prevent deterioration of the adjacent segments because
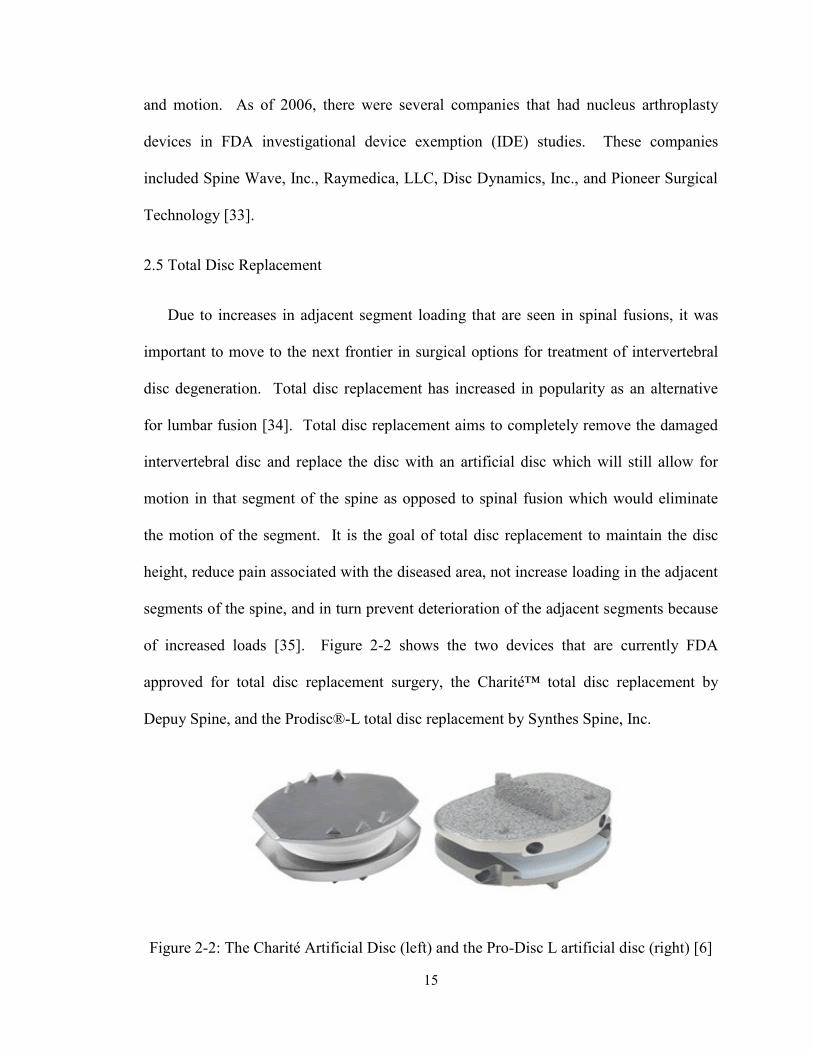
of increased loads [35]. Figure 2-2 shows the two devices that are currently FDA
approved for total disc replacement surgery, the Charité™ total disc replacement by
Depuy Spine, and the Prodisc®-L total disc replacement by Synthes Spine, Inc.
Figure 2-2: The Charité Artificial Disc (left) and the Pro-Disc L artificial disc (right) [6]
16
A study performed by Cinotti et al. reported on 46 patients who underwent total disc
replacement with Charité disc prosthesis. Follow-up was performed between 2-5 years
after surgery, 63% of the patients reported satisfactory results [36]. O’Leary et al.
performed a study that found that the Charité total disc replacement restored near normal
quantity of flexion-extension range of motion under constant preload, however the
quality of segmental motion differed from the intact case over the flexion-extension range
[37]. In another study, performed by Tropiano et al., 64 patients who underwent lumbar
total disc replacement with the Pro-Disc prosthesis were followed up with a mean of 8.7
years after surgery, 55 patients, or 86%, participated in the follow-up. The authors
reported significant improvement in back pain and disability. Thirty-three patients
reported excellent results, eight had good results, and 14 had poor results [38]. A study
performed by Tumialán et al. found that patients in the military who underwent total disc
replacement experienced results comparable to spinal fusion, but that the total disc
replacement patients were able to return to active duty at a faster rate than patients who
underwent the spinal fusion process [39].
Disc arthroplasty devices are classified by their articulating surfaces as either metal-
on-metal or metal-on-plastic. In order for a total disc replacement to be performed, the
patient must have intact ligaments and integrity of the facet joints. It is also important for
the vertebral bodies with intact end plates and good bone quality to be present [40].
During the FDA investigational device exemption (IDE) clinical trials, patients were
randomly selected to undergo either total disc replacement or spinal fusion with titanium
interbody cage. The patients involved in the FDA IDE trials who underwent artificial
disc replacement experienced shorter recovery periods, with shorter hospital stays, and
17
faster pain relief. All of which resulted in higher patient satisfaction, when compared
with the patients who underwent spinal fusion [4].
2.6 Negative Poisson’s Ratio
Negative Poisson’s ratio materials have many tasks for which they can be used. An
auxetic form of polytetrafluoroethylene (PTFE) has been used to manufacture prosthetic
arteries [41, 42]. Due to the nature of auxetic materials, they should have improved
fracture toughness, shear modulus, hardness, sound absorbing properties, and impact
resistance when compared with positive Poisson’s ratio materials with the same Young’s
modulus. For any material, the Poisson’s ratio is related to the geometry and deformation
mechanisms of its microstructure. Therefore, the design of auxetic materials at any
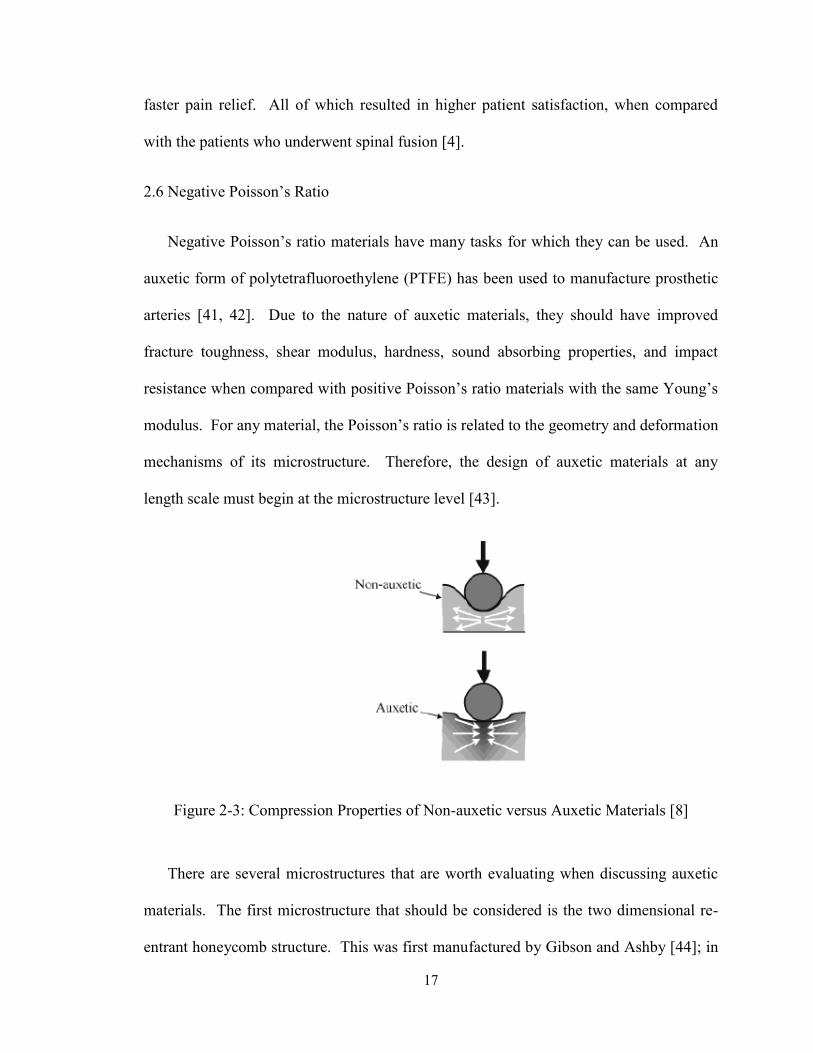
length scale must begin at the microstructure level [43].
Figure 2-3: Compression Properties of Non-auxetic versus Auxetic Materials [8]
There are several microstructures that are worth evaluating when discussing auxetic
materials. The first microstructure that should be considered is the two dimensional re-
entrant honeycomb structure. This was first manufactured by Gibson and Ashby [44]; in
18
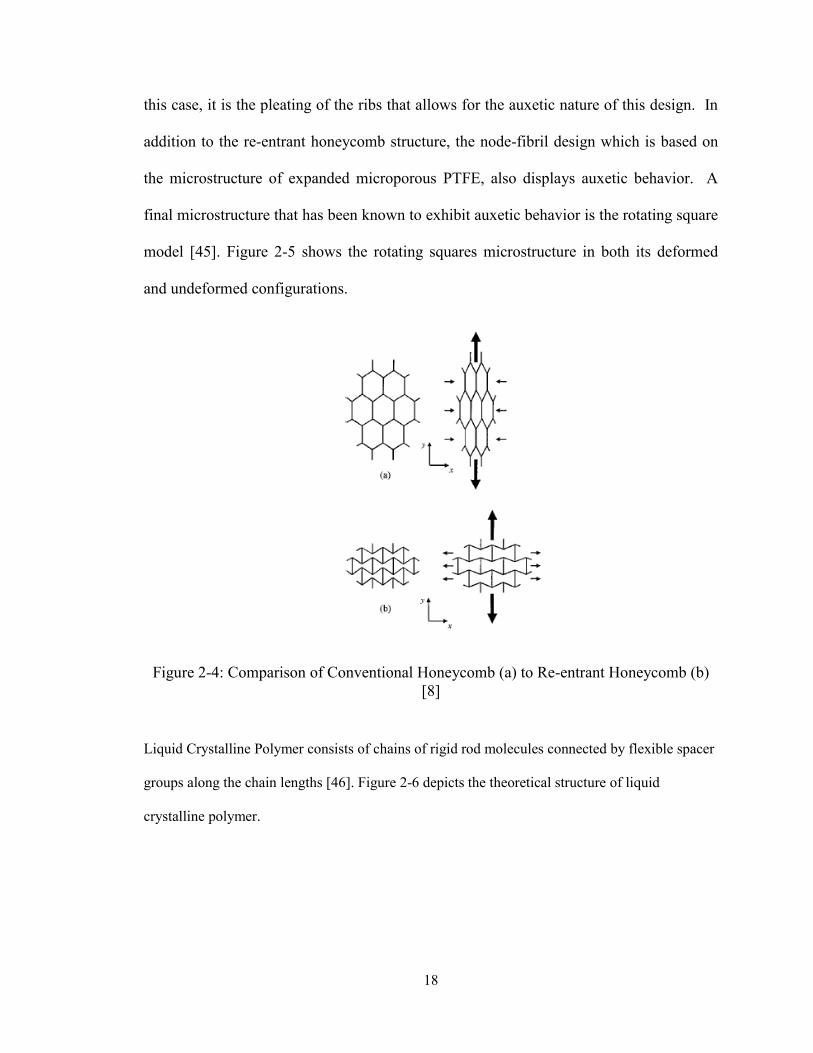
this case, it is the pleating of the ribs that allows for the auxetic nature of this design. In
addition to the re-entrant honeycomb structure, the node-fibril design which is based on
the microstructure of expanded microporous PTFE, also displays auxetic behavior. A
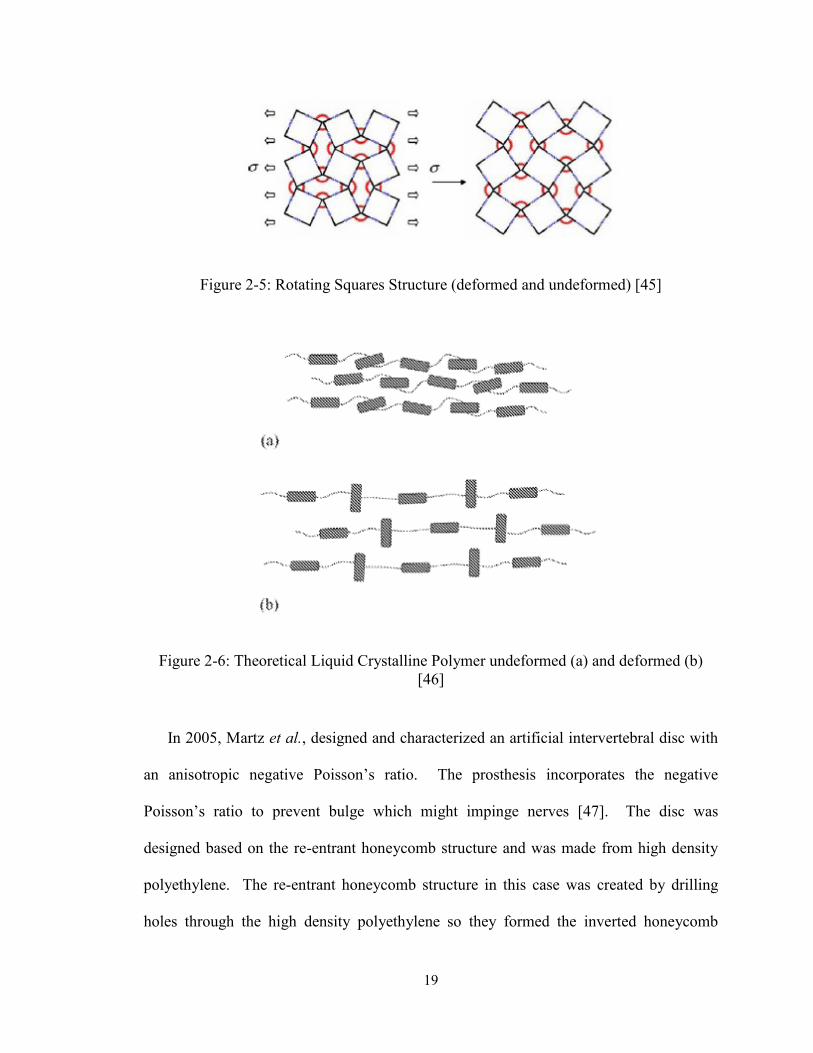
final microstructure that has been known to exhibit auxetic behavior is the rotating square
model [45]. Figure 2-5 shows the rotating squares microstructure in both its deformed
and undeformed configurations.
Figure 2-4: Comparison of Conventional Honeycomb (a) to Re-entrant Honeycomb (b)
[8]
Liquid Crystalline Polymer consists of chains of rigid rod molecules connected by flexible spacer
groups along the chain lengths [46]. Figure 2-6 depicts the theoretical structure of liquid
crystalline polymer.
19
Figure 2-5: Rotating Squares Structure (deformed and undeformed) [45]
Figure 2-6: Theoretical Liquid Crystalline Polymer undeformed (a) and deformed (b)
[46]
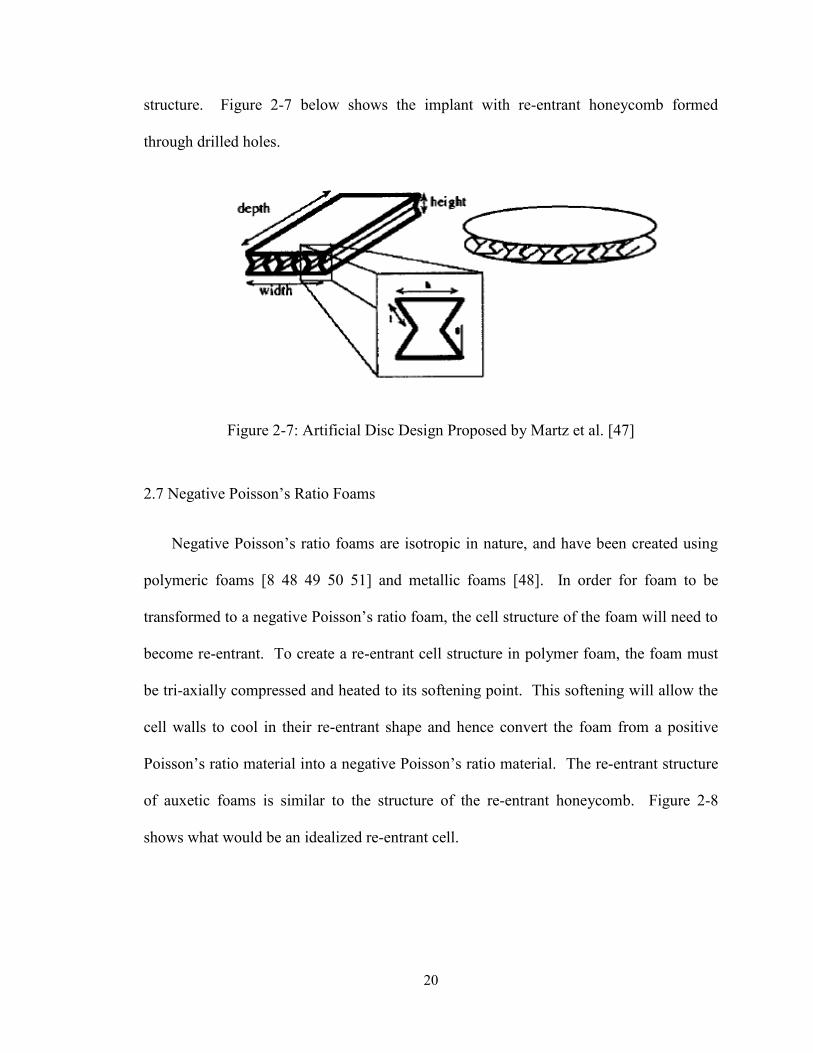
In 2005, Martz et al., designed and characterized an artificial intervertebral disc with
an anisotropic negative Poisson’s ratio. The prosthesis incorporates the negative
Poisson’s ratio to prevent bulge which might impinge nerves [47]. The disc was
designed based on the re-entrant honeycomb structure and was made from high density
polyethylene. The re-entrant honeycomb structure in this case was created by drilling
holes through the high density polyethylene so they formed the inverted honeycomb
20
structure. Figure 2-7 below shows the implant with re-entrant honeycomb formed
through drilled holes.
Figure 2-7: Artificial Disc Design Proposed by Martz et al. [47]
2.7 Negative Poisson’s Ratio Foams
Negative Poisson’s ratio foams are isotropic in nature, and have been created using
polymeric foams [8 48 49 50 51] and metallic foams [48]. In order for foam to be
transformed to a negative Poisson’s ratio foam, the cell structure of the foam will need to
become re-entrant. To create a re-entrant cell structure in polymer foam, the foam must
be tri-axially compressed and heated to its softening point. This softening will allow the
cell walls to cool in their re-entrant shape and hence convert the foam from a positive
Poisson’s ratio material into a negative Poisson’s ratio material. The re-entrant structure
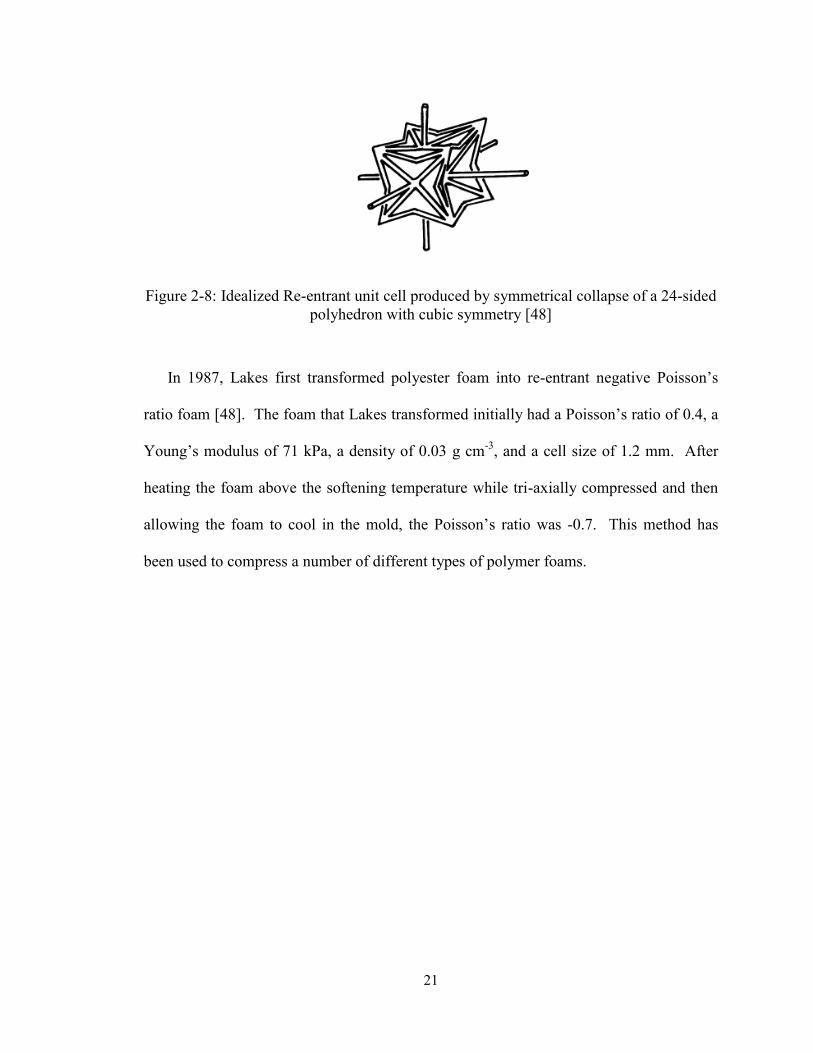
of auxetic foams is similar to the structure of the re-entrant honeycomb. Figure 2-8
shows what would be an idealized re-entrant cell.
21
Figure 2-8: Idealized Re-entrant unit cell produced by symmetrical collapse of a 24-sided
polyhedron with cubic symmetry [48]
In 1987, Lakes first transformed polyester foam into re-entrant negative Poisson’s
ratio foam [48]. The foam that Lakes transformed initially had a Poisson’s ratio of 0.4, a
Young’s modulus of 71 kPa, a density of 0.03 g cm-3
, and a cell size of 1.2 mm. After
heating the foam above the softening temperature while tri-axially compressed and then
allowing the foam to cool in the mold, the Poisson’s ratio was -0.7. This method has
been used to compress a number of different types of polymer foams.
22
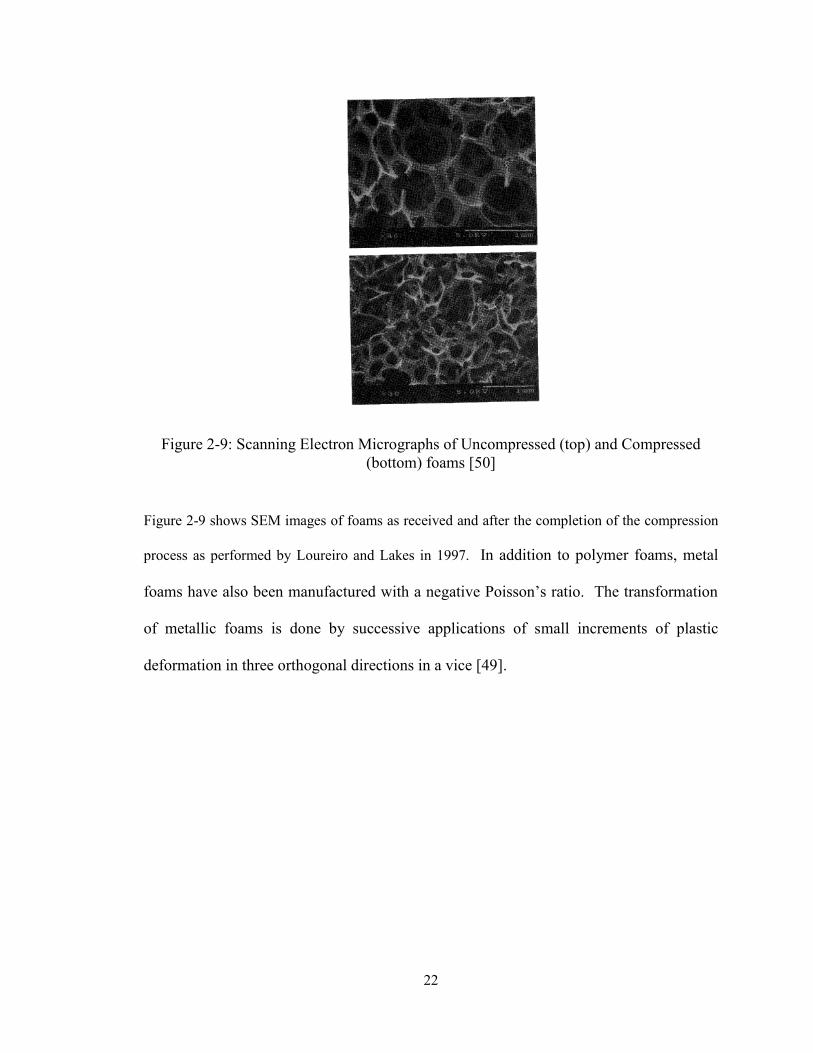
Figure 2-9: Scanning Electron Micrographs of Uncompressed (top) and Compressed
(bottom) foams [50]
Figure 2-9 shows SEM images of foams as received and after the completion of the compression
process as performed by Loureiro and Lakes in 1997. In addition to polymer foams, metal
foams have also been manufactured with a negative Poisson’s ratio. The transformation
of metallic foams is done by successive applications of small increments of plastic
deformation in three orthogonal directions in a vice [49].
23
Chapter 3
Finite Element Study of L4-L5 Motion Segment
3.1 Materials and Methods
This portion of the study was a finite element analysis (FEA) of the L4-L5 motion
segment within Abaqus CAE.
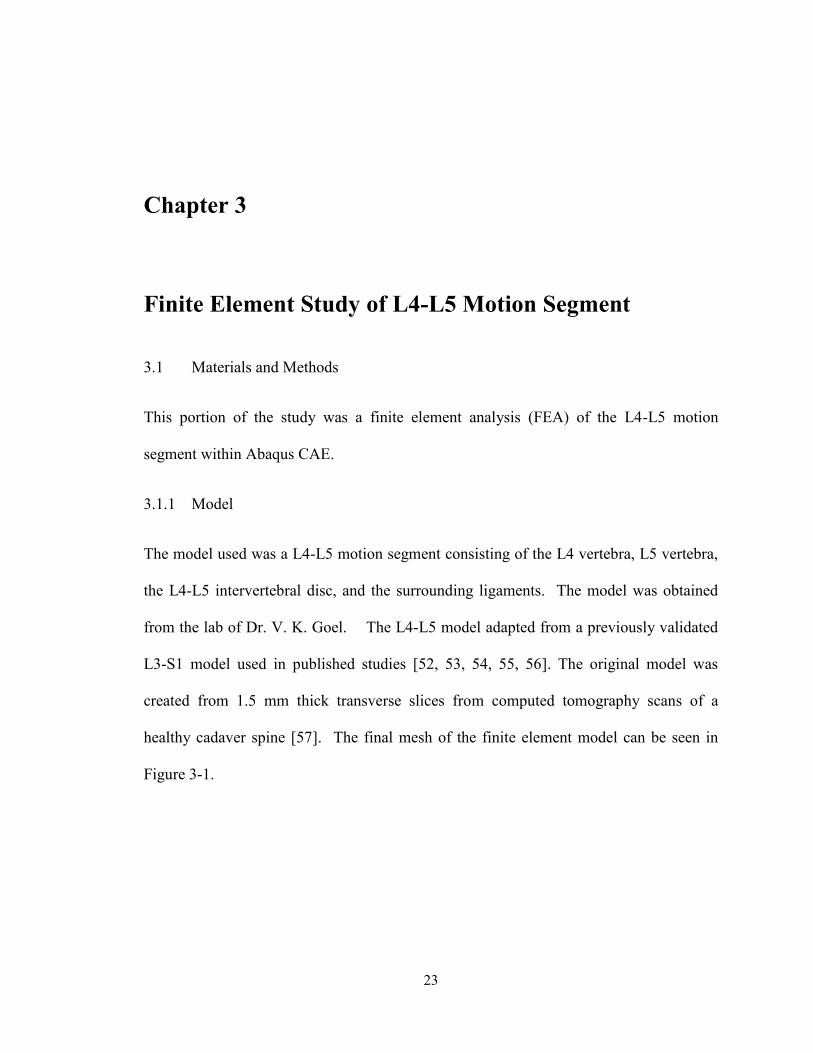
3.1.1 Model
The model used was a L4-L5 motion segment consisting of the L4 vertebra, L5 vertebra,
the L4-L5 intervertebral disc, and the surrounding ligaments. The model was obtained
from the lab of Dr. V. K. Goel. The L4-L5 model adapted from a previously validated
L3-S1 model used in published studies [52, 53, 54, 55, 56]. The original model was
created from 1.5 mm thick transverse slices from computed tomography scans of a
healthy cadaver spine [57]. The final mesh of the finite element model can be seen in
Figure 3-1.
24
Figure 3-1: Example of the Finite Element Model
3.1.2 Motions
The model was run under several different scenarios in order to create all of the
possible motions of the intact spine in the human body. These motions include; pure
compression, flexion, extension, right lateral bending, left lateral bending, right axial
rotation, and left axial rotation.
3.1.3 Loads
The pure compression model was a load of 600 N applied in the downward axial
direction. All other loads consisted of the same pure compression load of 600 N applied
in the downward axial direction followed by a 7.5 Nm moment applied in the appropriate
direction to obtain the desired motion.
3.1.4 Intervertebral Disc Properties
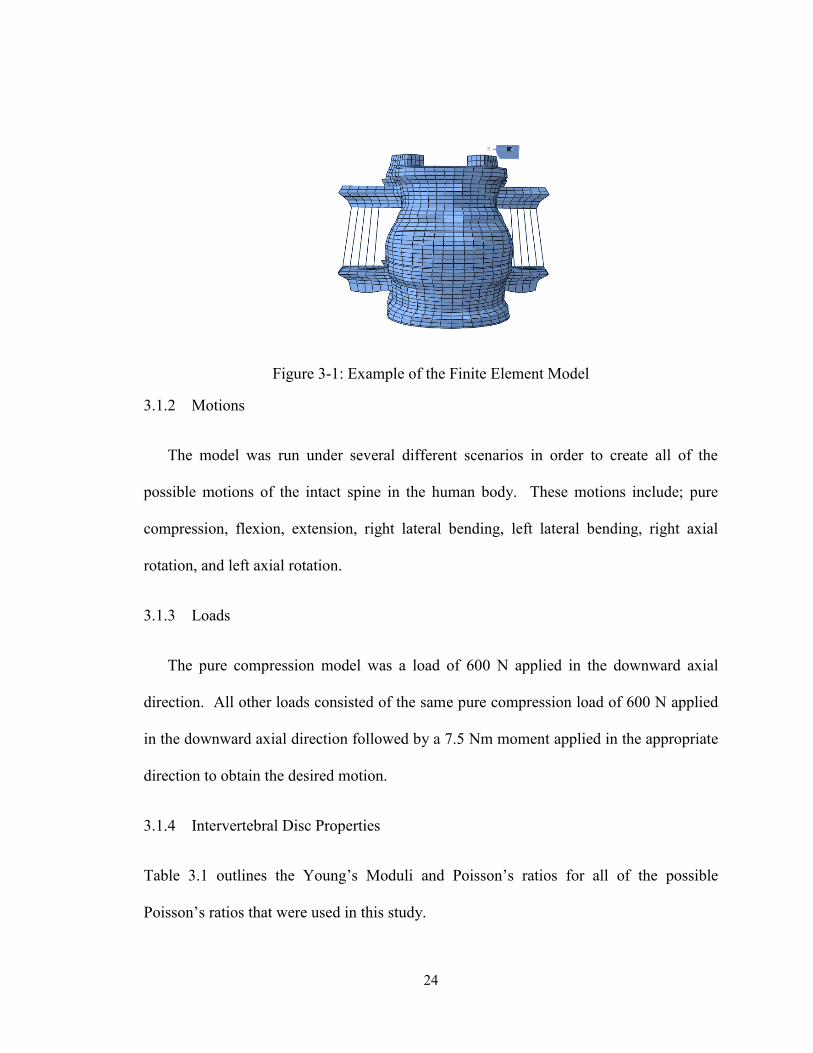
Table 3.1 outlines the Young’s Moduli and Poisson’s ratios for all of the possible
Poisson’s ratios that were used in this study.
25
Table 3.1: Young’s Moduli and Poisson’s Ratios used in Study
Young’s Modulus (MPa) Poisson’s Ratio
Original
Annulus Fibrosus 4.2 0.45
Nucleus Pulposus 1 0.4999
0.4999
Annulus Fibrosus 4.2 0.4999
Nucleus Pulposus 4.2 0.4999
0.3
Annulus Fibrosus 4.2 0.3
Nucleus Pulposus 4.2 0.3
-0.3
Annulus Fibrosus 4.2 -0.3
Nucleus Pulposus 4.2 -0.3
-0.999
Annulus Fibrosus 4.2 -0.999
Nucleus Pulposus 4.2 -0.999
3.2 Results and Discussion
After the finite element models were run; the range of motion, the stress on the
intervertebral disc, and the displacement between nodes on the intervertebral disc were
investigated in order to determine if there would be a benefit to using an artificial
intervertebral disc when compared with the native intervertebral disc or with a positive
Poisson’s ratio artificial intervertebral disc.
3.2.1 Visual Comparison of Deformed and Undeformed Models
The deformed and undeformed shapes of the L4-L5 motion segment can be seen in
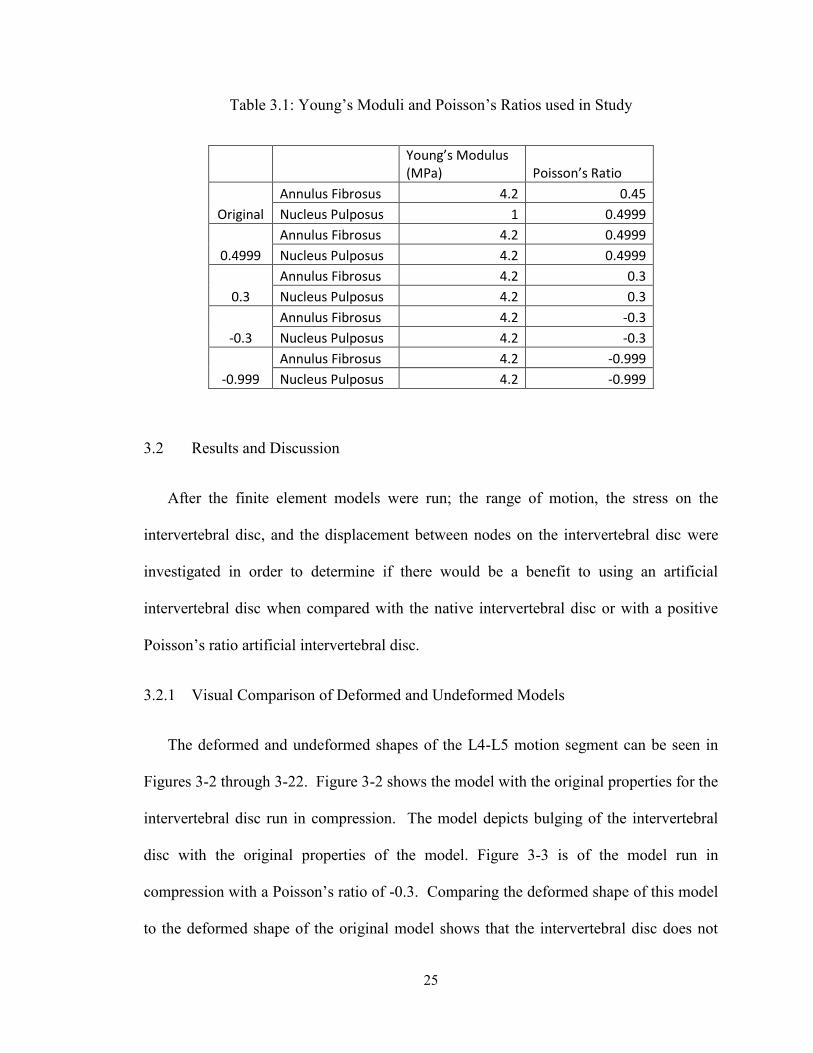
Figures 3-2 through 3-22. Figure 3-2 shows the model with the original properties for the
intervertebral disc run in compression. The model depicts bulging of the intervertebral
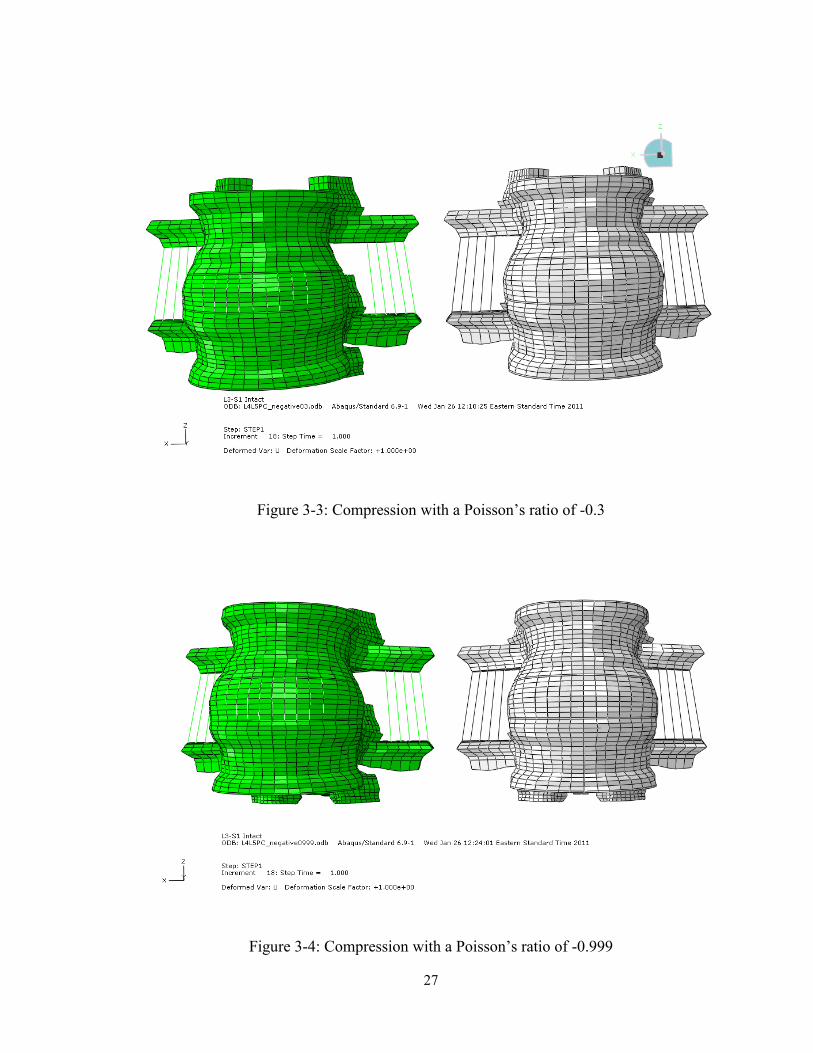
disc with the original properties of the model. Figure 3-3 is of the model run in
compression with a Poisson’s ratio of -0.3. Comparing the deformed shape of this model
to the deformed shape of the original model shows that the intervertebral disc does not
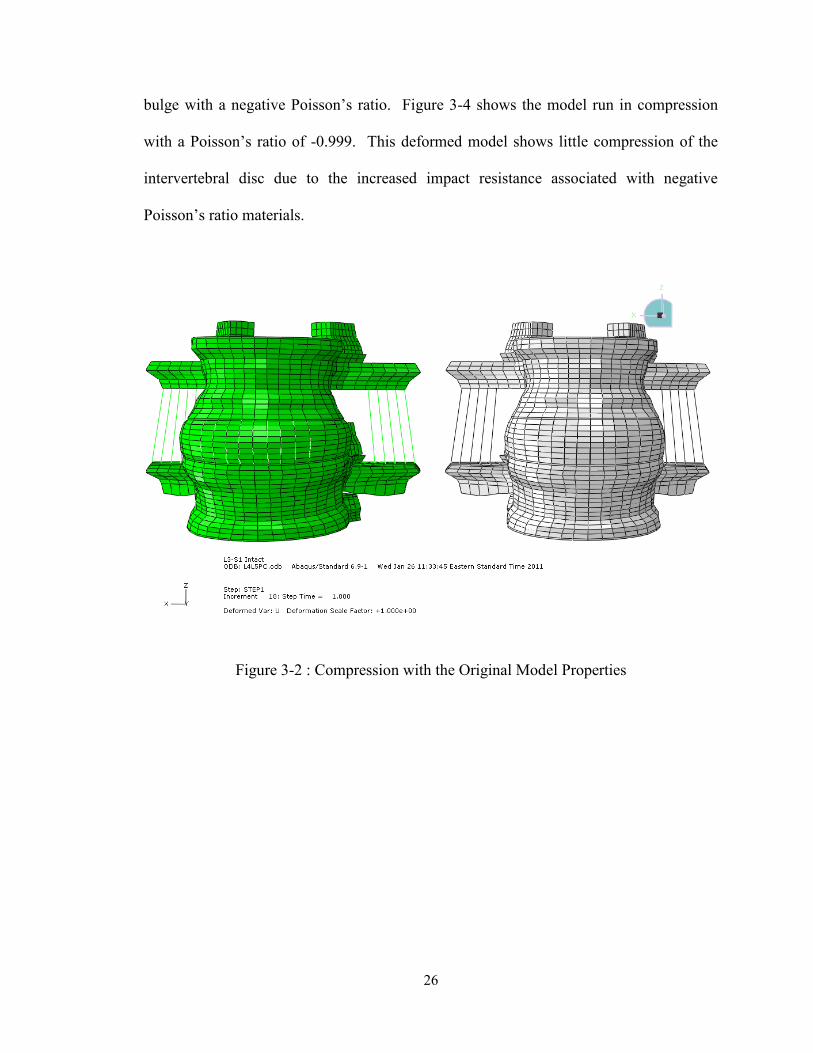
26
bulge with a negative Poisson’s ratio. Figure 3-4 shows the model run in compression
with a Poisson’s ratio of -0.999. This deformed model shows little compression of the
intervertebral disc due to the increased impact resistance associated with negative
Poisson’s ratio materials.
Figure 3-2 : Compression with the Original Model Properties
27
Figure 3-3: Compression with a Poisson’s ratio of -0.3
Figure 3-4: Compression with a Poisson’s ratio of -0.999
28
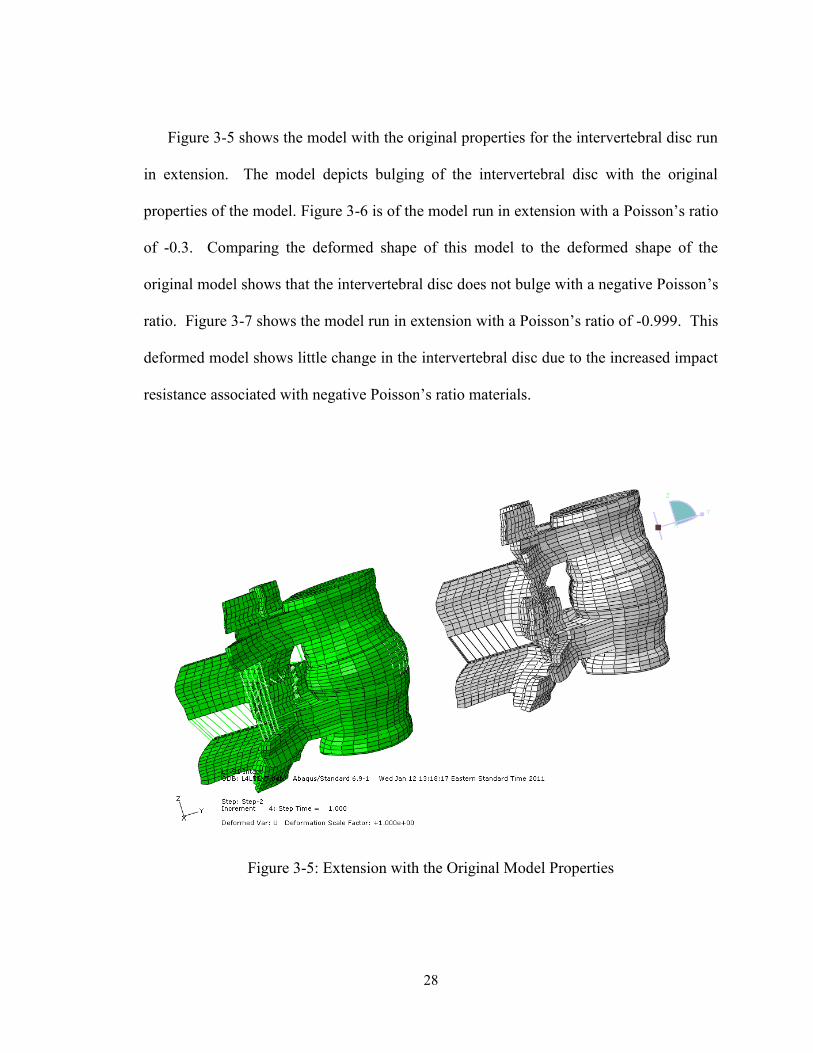
Figure 3-5 shows the model with the original properties for the intervertebral disc run
in extension. The model depicts bulging of the intervertebral disc with the original
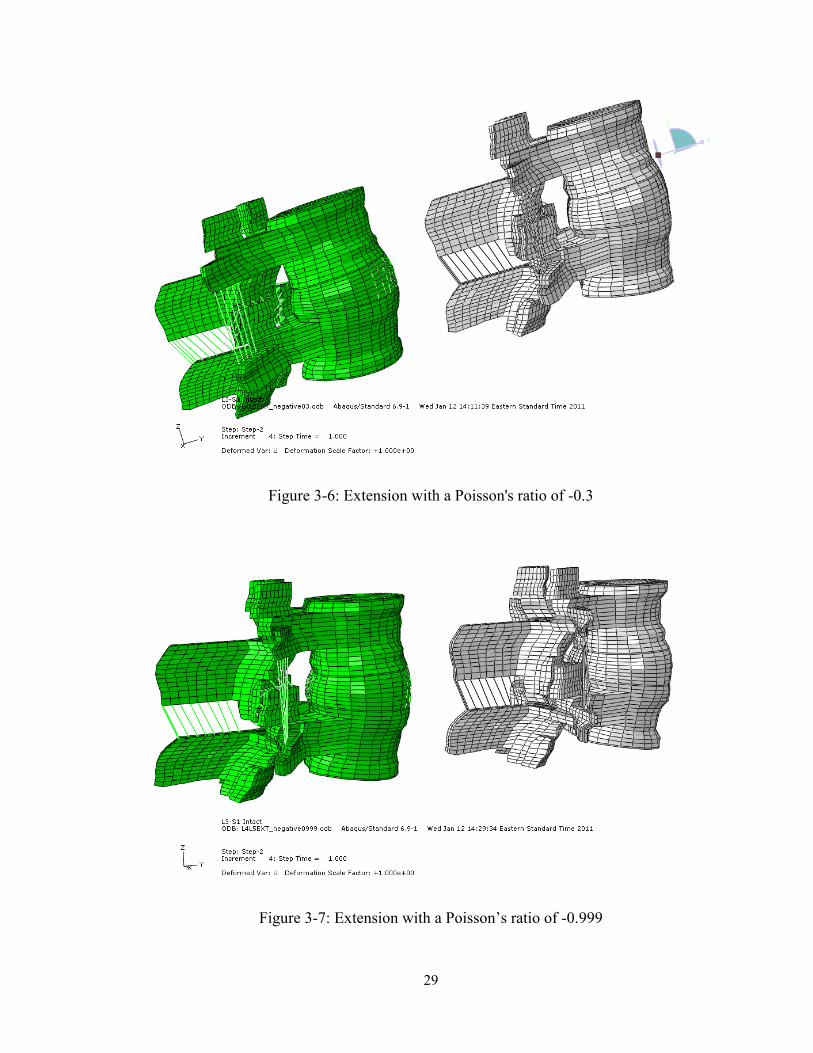
properties of the model. Figure 3-6 is of the model run in extension with a Poisson’s ratio
of -0.3. Comparing the deformed shape of this model to the deformed shape of the
original model shows that the intervertebral disc does not bulge with a negative Poisson’s
ratio. Figure 3-7 shows the model run in extension with a Poisson’s ratio of -0.999. This
deformed model shows little change in the intervertebral disc due to the increased impact
resistance associated with negative Poisson’s ratio materials.
Figure 3-5: Extension with the Original Model Properties
29
Figure 3-6: Extension with a Poisson's ratio of -0.3
Figure 3-7: Extension with a Poisson’s ratio of -0.999
30
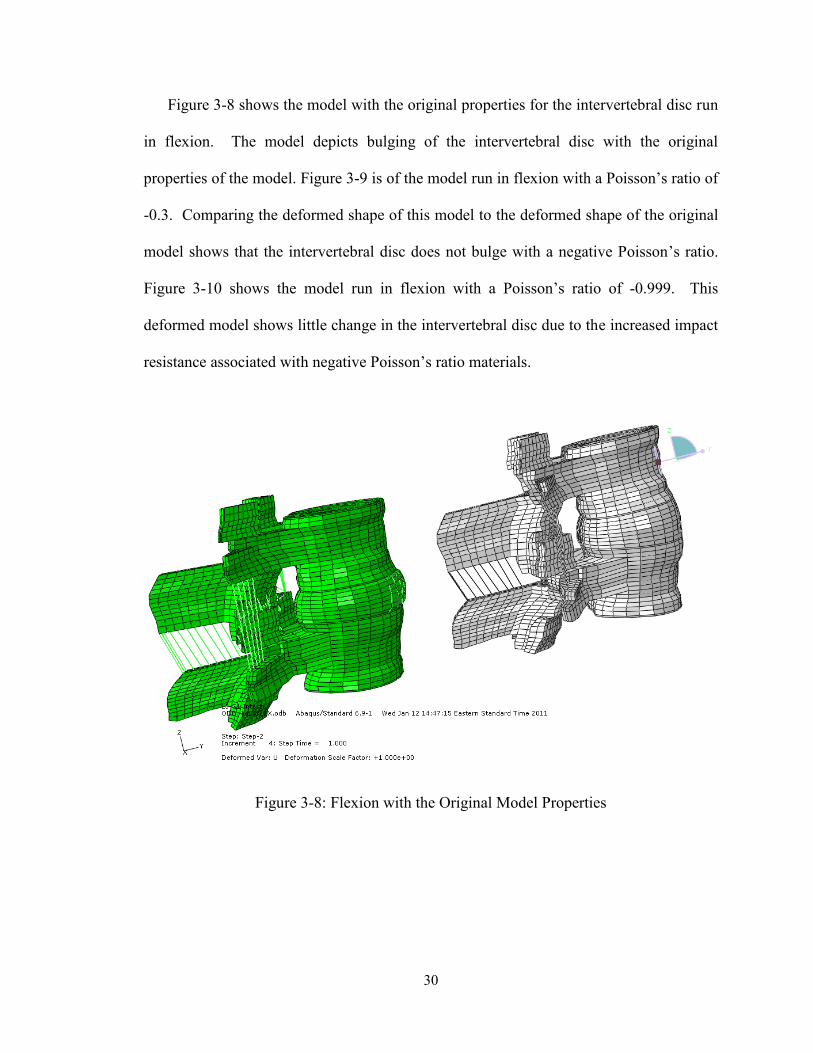
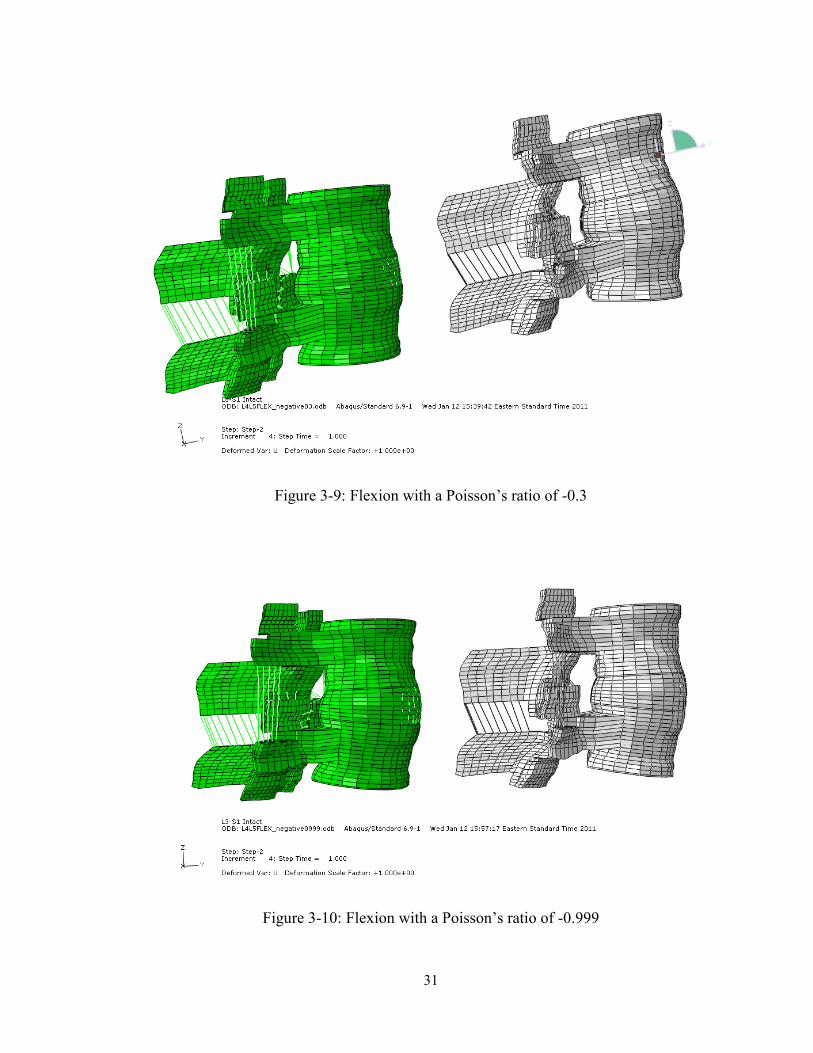
Figure 3-8 shows the model with the original properties for the intervertebral disc run
in flexion. The model depicts bulging of the intervertebral disc with the original
properties of the model. Figure 3-9 is of the model run in flexion with a Poisson’s ratio of
-0.3. Comparing the deformed shape of this model to the deformed shape of the original
model shows that the intervertebral disc does not bulge with a negative Poisson’s ratio.
Figure 3-10 shows the model run in flexion with a Poisson’s ratio of -0.999. This
deformed model shows little change in the intervertebral disc due to the increased impact
resistance associated with negative Poisson’s ratio materials.
Figure 3-8: Flexion with the Original Model Properties
31
Figure 3-9: Flexion with a Poisson’s ratio of -0.3
Figure 3-10: Flexion with a Poisson’s ratio of -0.999
32
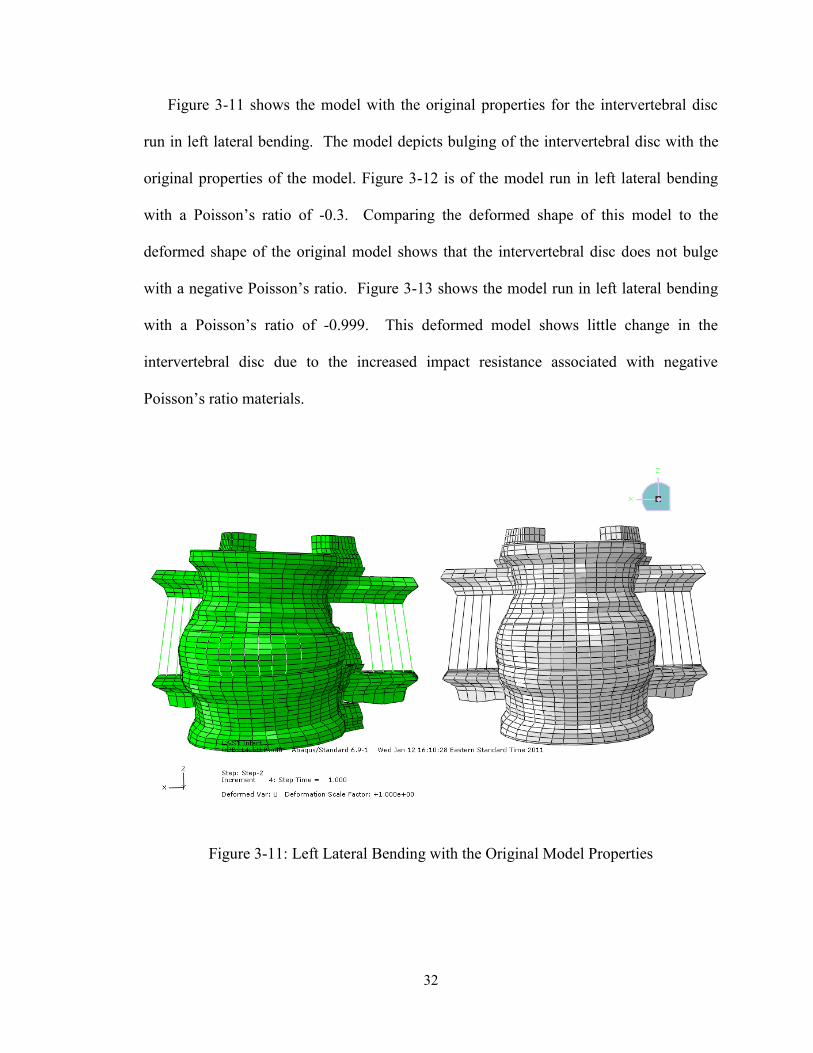
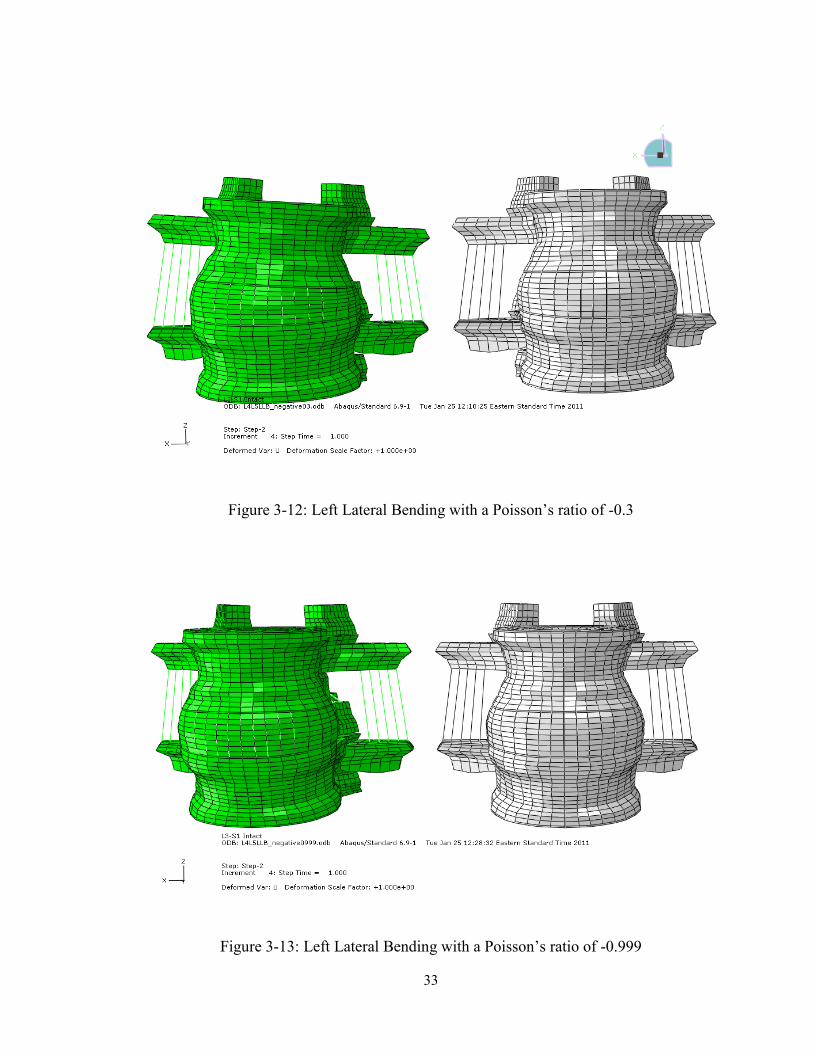
Figure 3-11 shows the model with the original properties for the intervertebral disc
run in left lateral bending. The model depicts bulging of the intervertebral disc with the
original properties of the model. Figure 3-12 is of the model run in left lateral bending
with a Poisson’s ratio of -0.3. Comparing the deformed shape of this model to the
deformed shape of the original model shows that the intervertebral disc does not bulge
with a negative Poisson’s ratio. Figure 3-13 shows the model run in left lateral bending
with a Poisson’s ratio of -0.999. This deformed model shows little change in the
intervertebral disc due to the increased impact resistance associated with negative
Poisson’s ratio materials.
Figure 3-11: Left Lateral Bending with the Original Model Properties
33
Figure 3-12: Left Lateral Bending with a Poisson’s ratio of -0.3
Figure 3-13: Left Lateral Bending with a Poisson’s ratio of -0.999
34
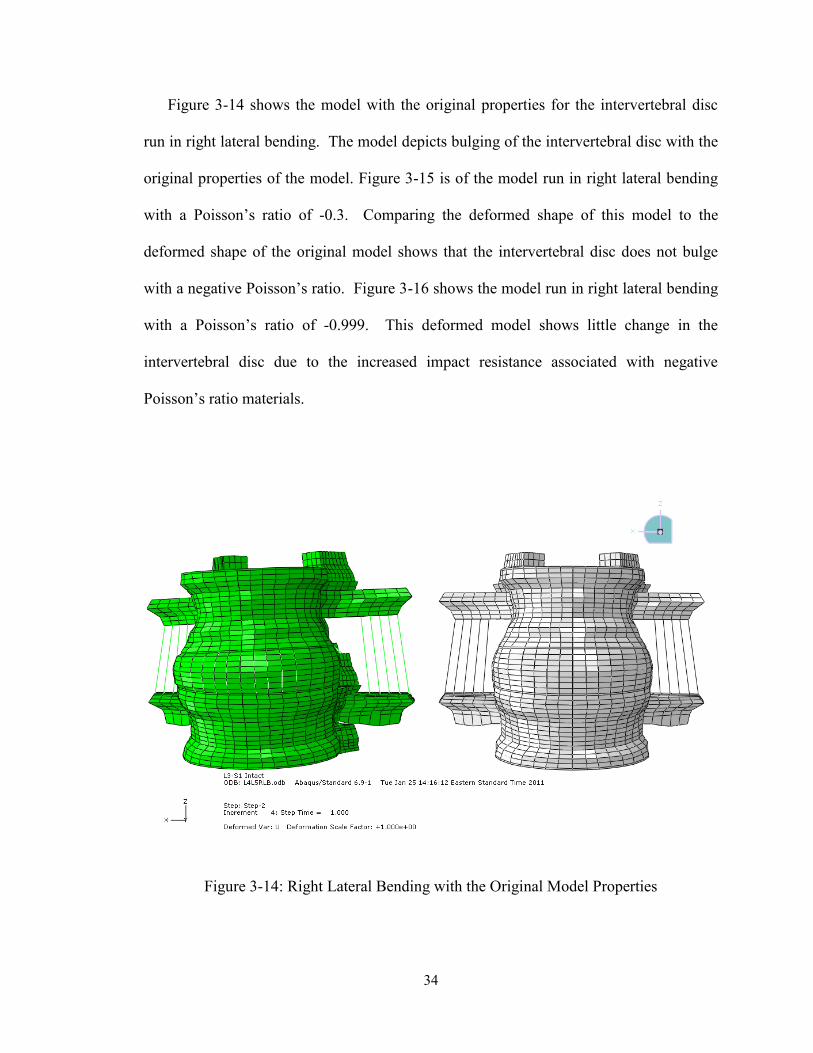
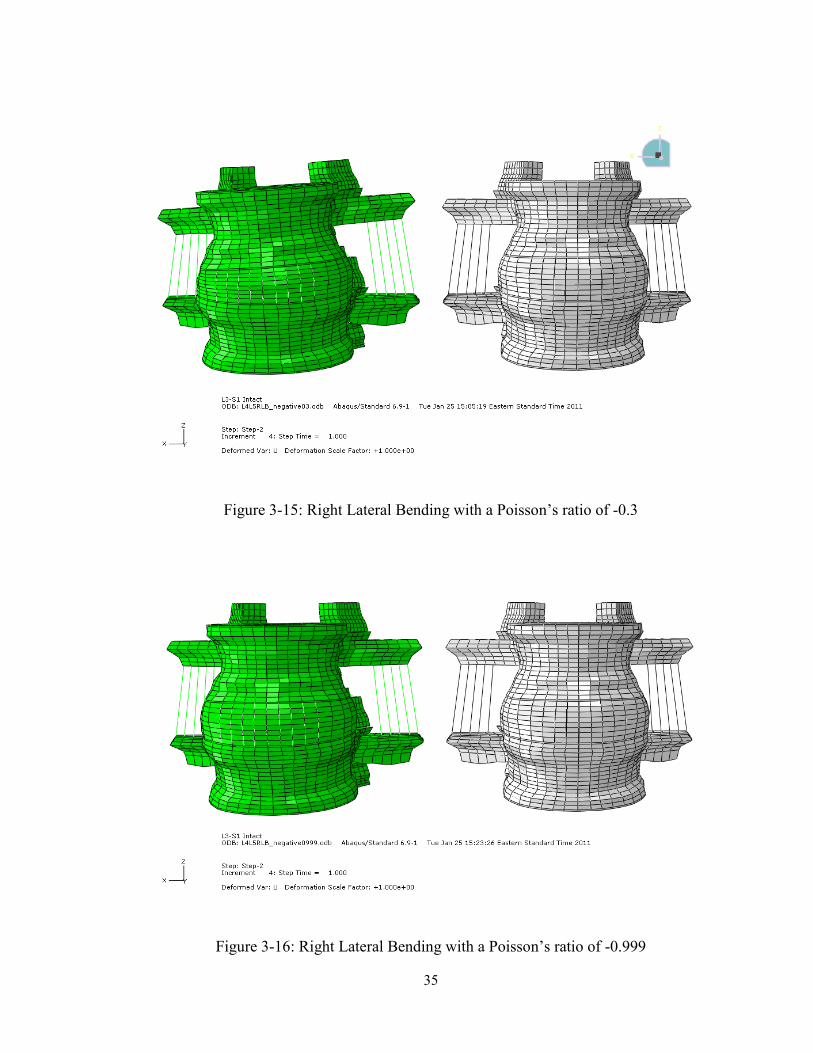
Figure 3-14 shows the model with the original properties for the intervertebral disc
run in right lateral bending. The model depicts bulging of the intervertebral disc with the
original properties of the model. Figure 3-15 is of the model run in right lateral bending
with a Poisson’s ratio of -0.3. Comparing the deformed shape of this model to the
deformed shape of the original model shows that the intervertebral disc does not bulge
with a negative Poisson’s ratio. Figure 3-16 shows the model run in right lateral bending
with a Poisson’s ratio of -0.999. This deformed model shows little change in the
intervertebral disc due to the increased impact resistance associated with negative
Poisson’s ratio materials.
Figure 3-14: Right Lateral Bending with the Original Model Properties
35
Figure 3-15: Right Lateral Bending with a Poisson’s ratio of -0.3
Figure 3-16: Right Lateral Bending with a Poisson’s ratio of -0.999
36
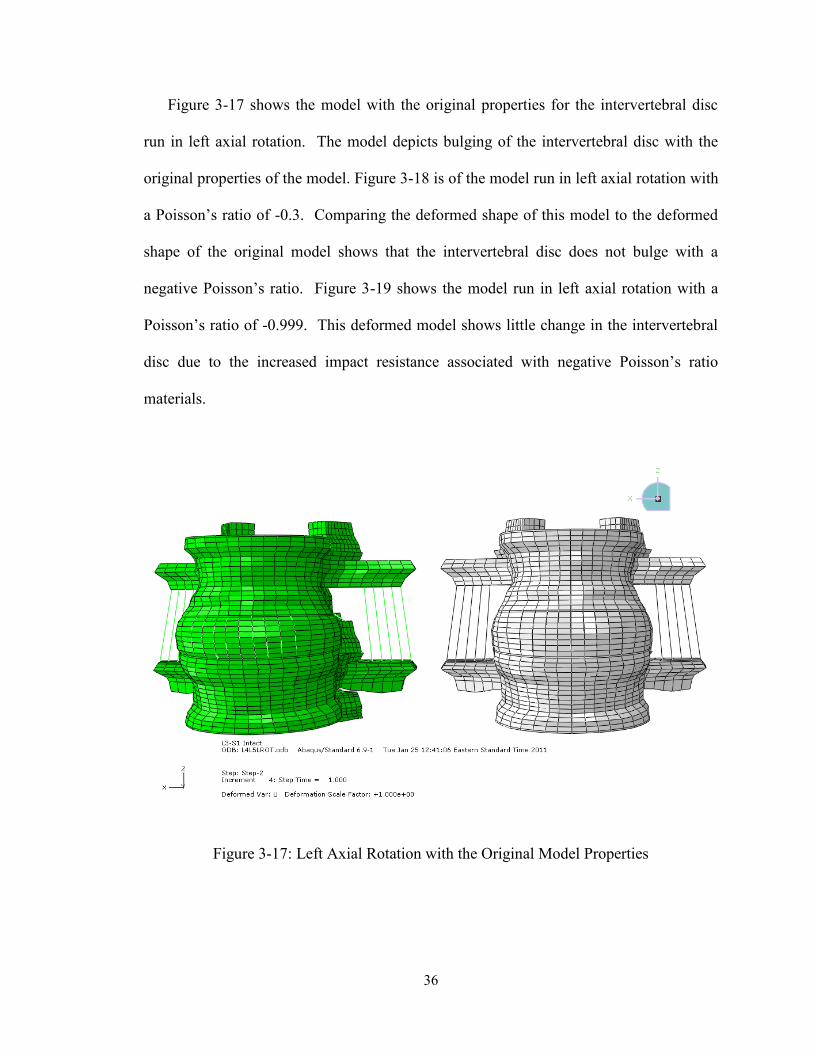
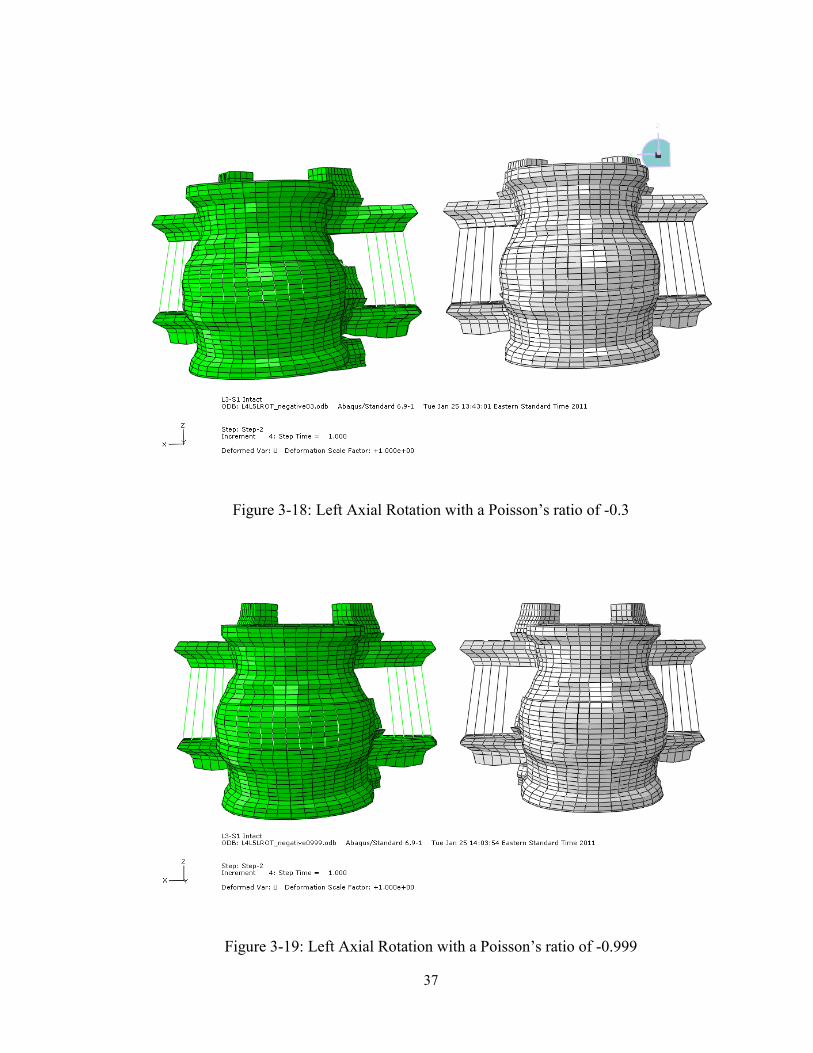
Figure 3-17 shows the model with the original properties for the intervertebral disc
run in left axial rotation. The model depicts bulging of the intervertebral disc with the
original properties of the model. Figure 3-18 is of the model run in left axial rotation with
a Poisson’s ratio of -0.3. Comparing the deformed shape of this model to the deformed
shape of the original model shows that the intervertebral disc does not bulge with a
negative Poisson’s ratio. Figure 3-19 shows the model run in left axial rotation with a
Poisson’s ratio of -0.999. This deformed model shows little change in the intervertebral
disc due to the increased impact resistance associated with negative Poisson’s ratio
materials.
Figure 3-17: Left Axial Rotation with the Original Model Properties
37
Figure 3-18: Left Axial Rotation with a Poisson’s ratio of -0.3
Figure 3-19: Left Axial Rotation with a Poisson’s ratio of -0.999
38
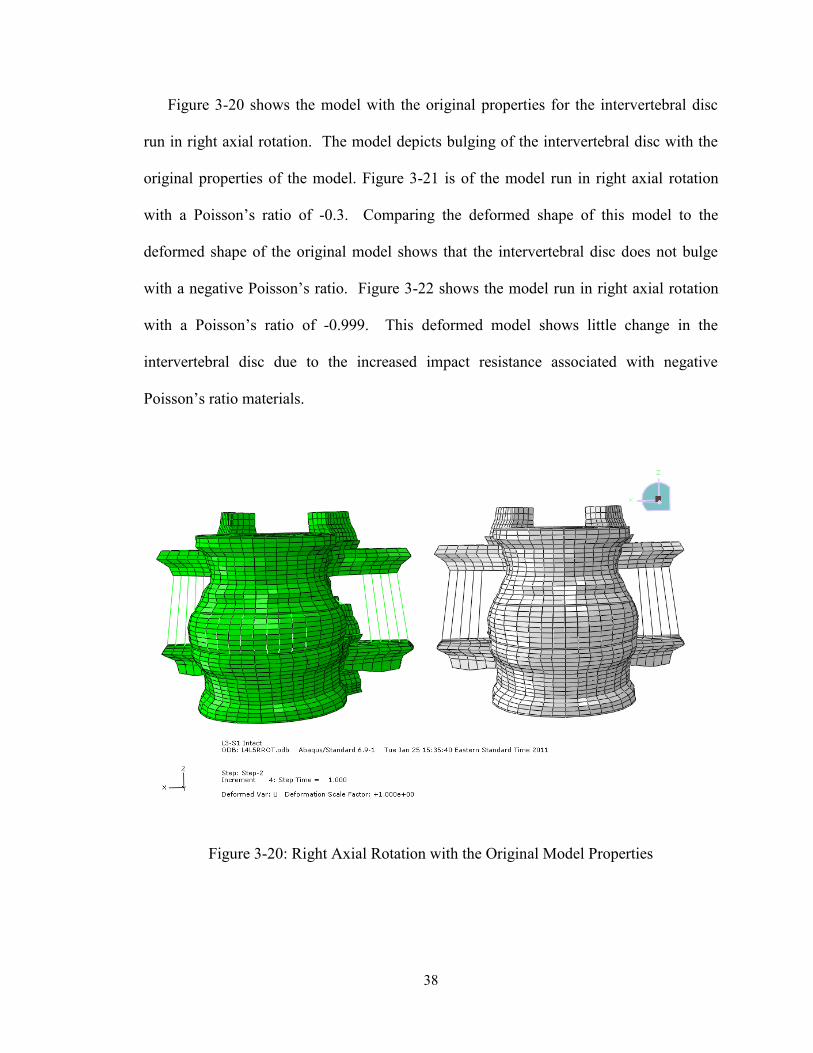
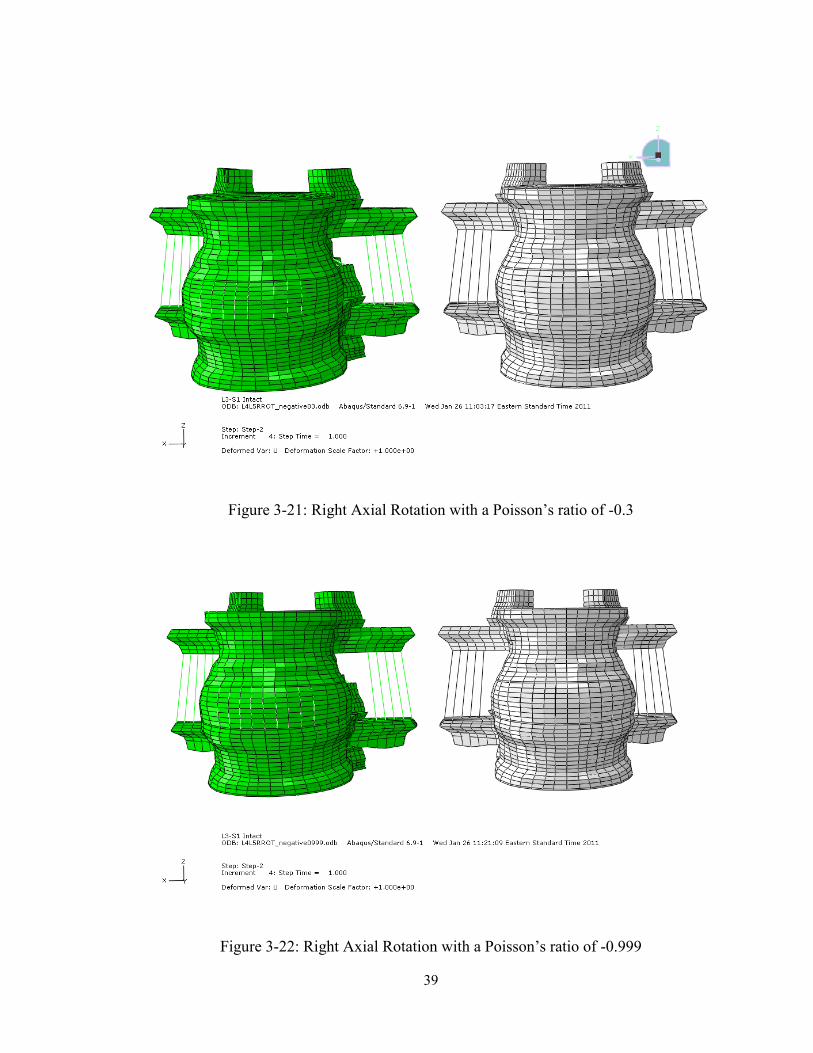
Figure 3-20 shows the model with the original properties for the intervertebral disc
run in right axial rotation. The model depicts bulging of the intervertebral disc with the
original properties of the model. Figure 3-21 is of the model run in right axial rotation
with a Poisson’s ratio of -0.3. Comparing the deformed shape of this model to the
deformed shape of the original model shows that the intervertebral disc does not bulge
with a negative Poisson’s ratio. Figure 3-22 shows the model run in right axial rotation
with a Poisson’s ratio of -0.999. This deformed model shows little change in the
intervertebral disc due to the increased impact resistance associated with negative
Poisson’s ratio materials.
Figure 3-20: Right Axial Rotation with the Original Model Properties
39
Figure 3-21: Right Axial Rotation with a Poisson’s ratio of -0.3
Figure 3-22: Right Axial Rotation with a Poisson’s ratio of -0.999
40
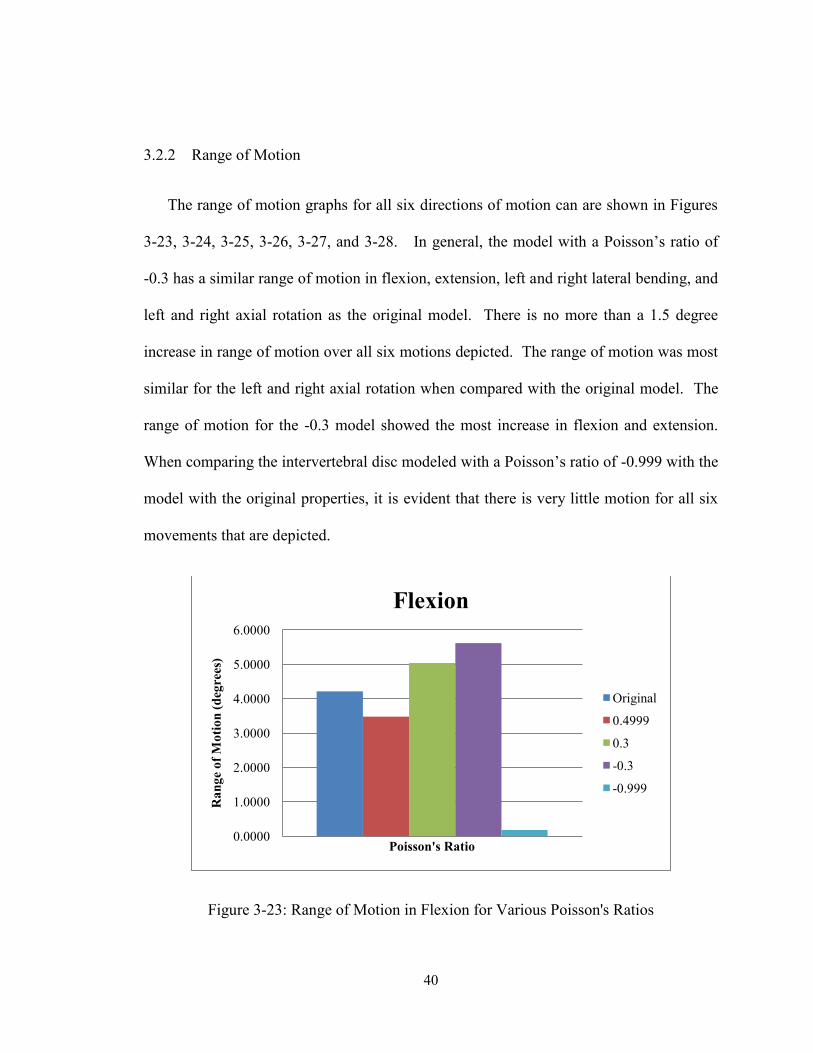
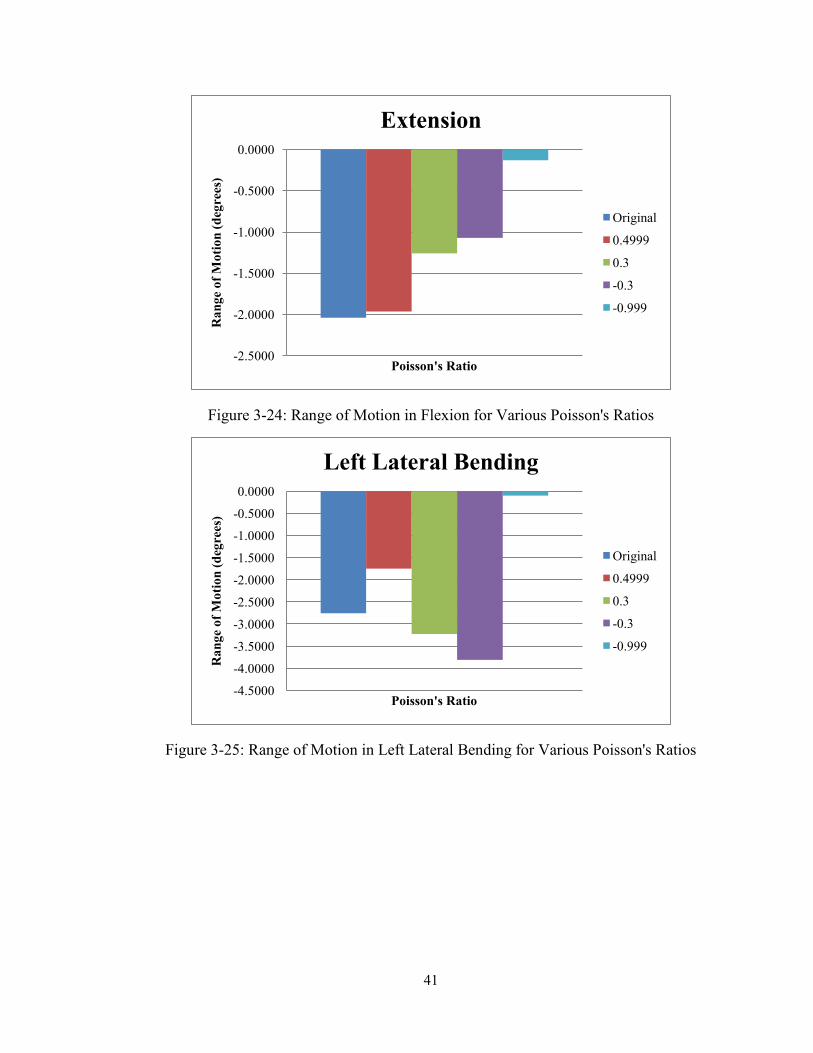
3.2.2 Range of Motion
The range of motion graphs for all six directions of motion can are shown in Figures
3-23, 3-24, 3-25, 3-26, 3-27, and 3-28. In general, the model with a Poisson’s ratio of
-0.3 has a similar range of motion in flexion, extension, left and right lateral bending, and
left and right axial rotation as the original model. There is no more than a 1.5 degree
increase in range of motion over all six motions depicted. The range of motion was most
similar for the left and right axial rotation when compared with the original model. The
range of motion for the -0.3 model showed the most increase in flexion and extension.
When comparing the intervertebral disc modeled with a Poisson’s ratio of -0.999 with the
model with the original properties, it is evident that there is very little motion for all six
movements that are depicted.
Figure 3-23: Range of Motion in Flexion for Various Poisson's Ratios
0.0000
1.0000
2.0000
3.0000
4.0000
5.0000
6.0000
Ra
ng
e o
f M
oti
on
(d
egre
es)
Poisson's Ratio
Flexion
Original
0.4999
0.3
-0.3
-0.999
41
Figure 3-24: Range of Motion in Flexion for Various Poisson's Ratios
Figure 3-25: Range of Motion in Left Lateral Bending for Various Poisson's Ratios
-2.5000
-2.0000
-1.5000
-1.0000
-0.5000
0.0000
Ra
ng
e o
f M
oti
on
(d
egre
es)
Poisson's Ratio
Extension
Original
0.4999
0.3
-0.3
-0.999
-4.5000
-4.0000
-3.5000
-3.0000
-2.5000
-2.0000
-1.5000
-1.0000
-0.5000
0.0000
Ra
ng
e o
f M
oti
on
(d
egre
es)
Poisson's Ratio
Left Lateral Bending
Original
0.4999
0.3
-0.3
-0.999
42
Figure 3-26: Range of Motion in Right Lateral Bending for Various Poisson's Ratios
Figure 3-27: Range of Motion in Left Axial Rotation for Various Poisson's Ratios
0.0000
0.5000
1.0000
1.5000
2.0000
2.5000
3.0000
3.5000
4.0000
4.5000
Ra
ng
e o
f M
oti
on
(d
egre
es)
Poisson's Ratio
Right Lateral Bending
Original
0.4999
0.3
-0.3
-0.999
0.0000
0.2000
0.4000
0.6000
0.8000
1.0000
1.2000
1.4000
Ra
ng
e o
f M
oti
on
(d
egre
es)
Poisson's Ratio
Left Axial Rotation
Original
0.4999
0.3
-0.3
-0.999
43
Figure 3-28: Range of Motion in Right Axial Rotation for Various Poisson's Ratios
3.2.3 Intervertebral Disc Stress
Figures 3-29 through 3-35 depict the von Mises stresses on the intervertebral disc
during the seven different motions; compression, flexion, extension, left and right lateral
bending, and left and right axial rotation. In general, the intervertebral discs show
localized increases in stress when compared with the disc from the original model. The
disc from the model with a Poisson’s ratio of -0.999 also show increases in stress when
compared with the original model.
-1.4000
-1.2000
-1.0000
-0.8000
-0.6000
-0.4000
-0.2000
0.0000
Ra
ng
e o
f M
oti
on
(d
egre
es)
Poisson's Ratio
Right Axial Rotation
Original
0.4999
0.3
-0.3
-0.999
44
Figure 3-29: Stress on the Intervertebral Disc in Compression
45
Figure 3-30: Stress on the Intervertebral Disc in Flexion
Figure 3-31: Stress on the Intervertebral Disc in Extension
46
Figure 3-32: Stress on the Intervertebral Disc in Left Lateral Bending
47
Figure 3-33: Stress on the Intervertebral Disc in Right Lateral Bending
Figure 3-34: Stress on the Intervertebral Disc in Left Axial Rotation
48
Figure 3-35: Stress on the Intervertebral Disc in Right Axial Rotation
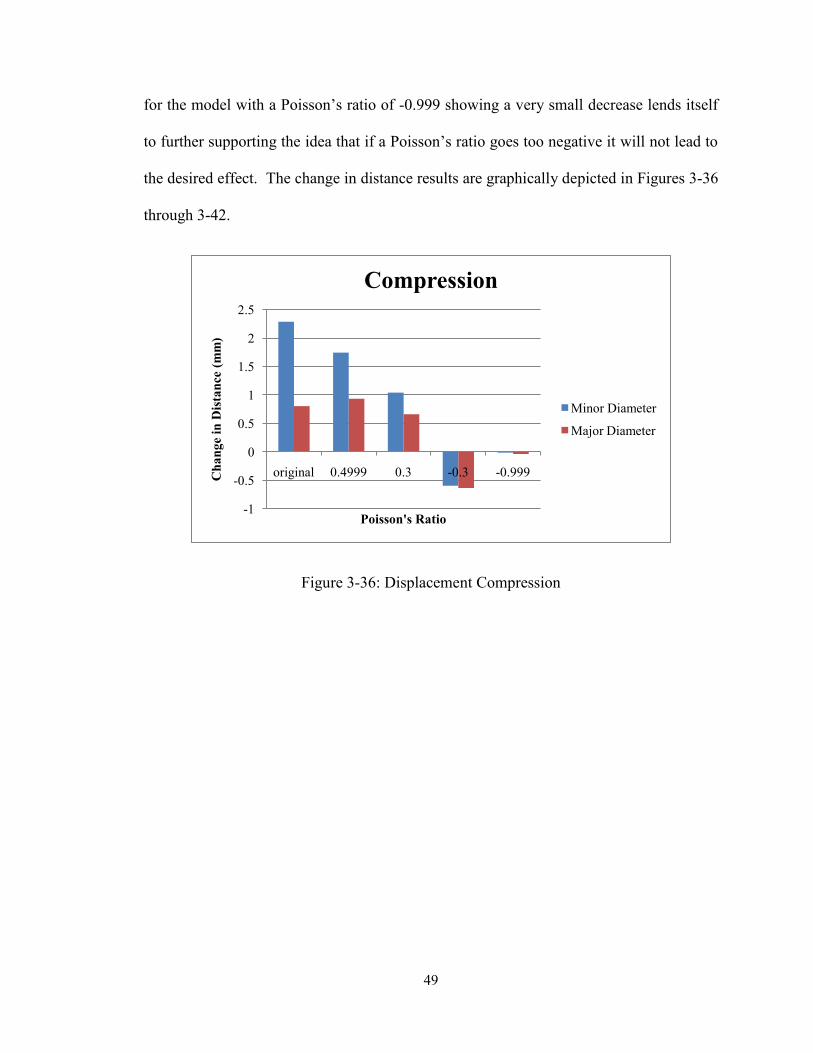
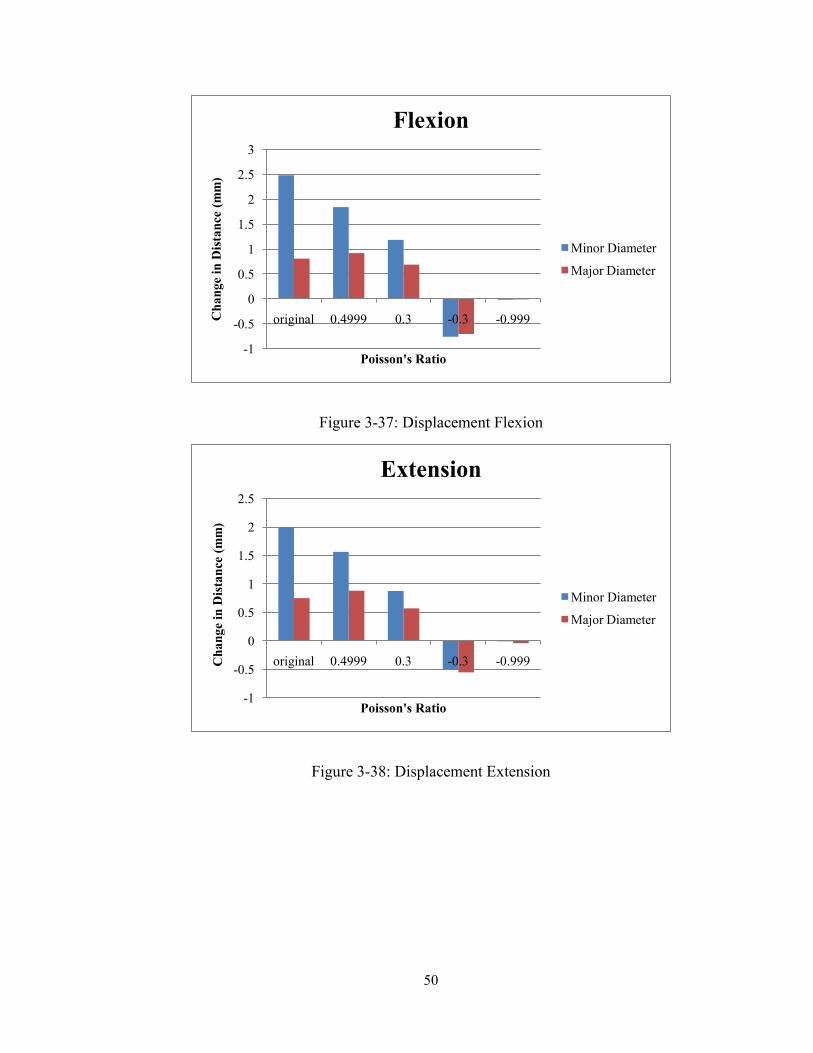
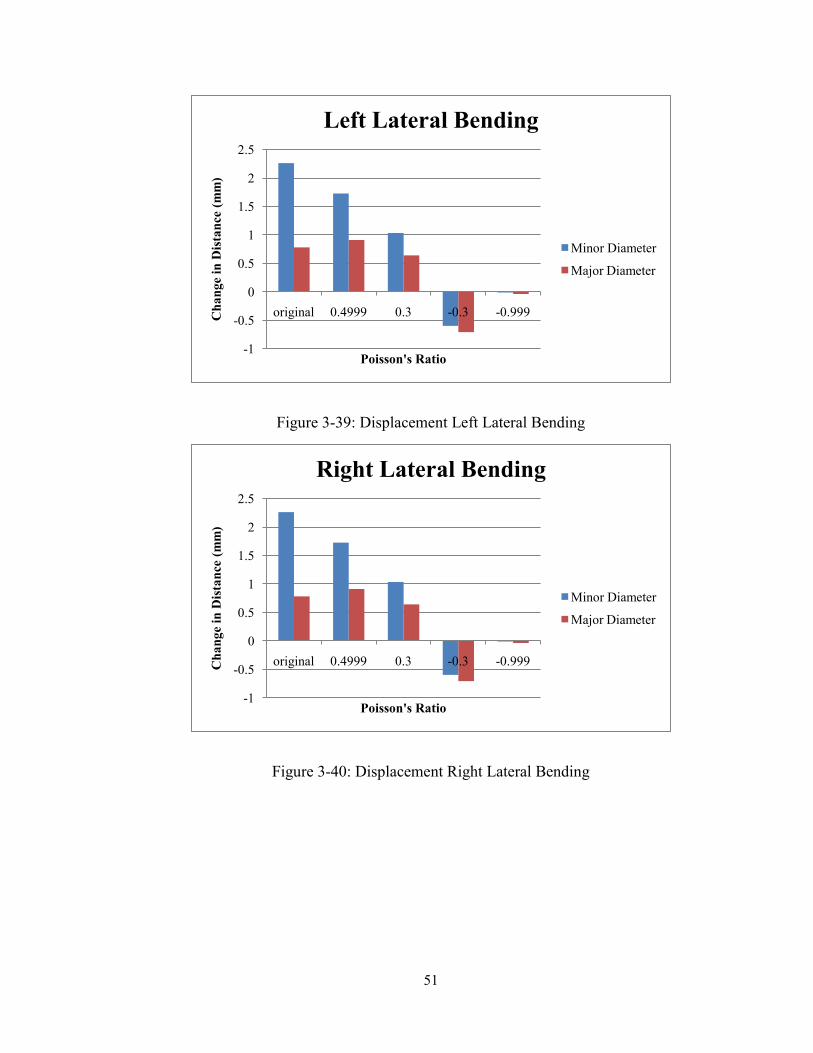
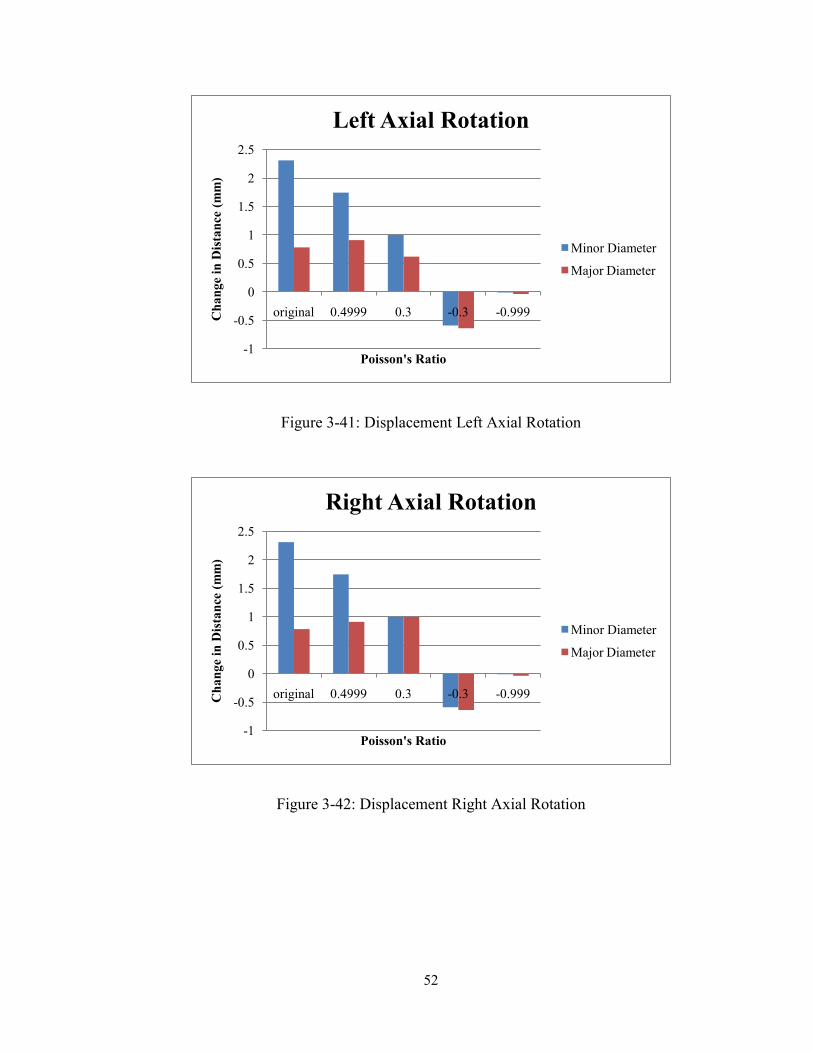
3.2.4 Displacement of Intervertebral Disc
Nodes were selected on the major and minor diameter of the intervertebral disc. The
distance between these nodes both in the undeformed and deformed state of the model
were calculated by Abaqus CAE, once the values were obtained with Abaqus, the change
in distance between the nodes were calculated. The change in distance for the original
model and the models with Poisson’s ratios of 0.4999 and 0.3 showed increases. The
change in distance for the models with Poisson’s ratios of -0.3 and -0.999 showed
decreases. These are the values that would be expected based on the properties of
materials with negative Poisson’s ratio. Again with the change in distance between nodes
49
for the model with a Poisson’s ratio of -0.999 showing a very small decrease lends itself
to further supporting the idea that if a Poisson’s ratio goes too negative it will not lead to
the desired effect. The change in distance results are graphically depicted in Figures 3-36
through 3-42.
Figure 3-36: Displacement Compression
-1
-0.5
0
0.5
1
1.5
2
2.5
original 0.4999 0.3 -0.3 -0.999Ch
an
ge
in D
ista
nce
(m
m)
Poisson's Ratio
Compression
Minor Diameter
Major Diameter
50
Figure 3-37: Displacement Flexion
Figure 3-38: Displacement Extension
-1
-0.5
0
0.5
1
1.5
2
2.5
3
original 0.4999 0.3 -0.3 -0.999Ch
an
ge
in D
ista
nce
(m
m)
Poisson's Ratio
Flexion
Minor Diameter
Major Diameter
-1
-0.5
0
0.5
1
1.5
2
2.5
original 0.4999 0.3 -0.3 -0.999Ch
an
ge
in D
ista
nce
(m
m)
Poisson's Ratio
Extension
Minor Diameter
Major Diameter
51
Figure 3-39: Displacement Left Lateral Bending
Figure 3-40: Displacement Right Lateral Bending
-1
-0.5
0
0.5
1
1.5
2
2.5
original 0.4999 0.3 -0.3 -0.999Ch
an
ge
in D
ista
nce
(m
m)
Poisson's Ratio
Left Lateral Bending
Minor Diameter
Major Diameter
-1
-0.5
0
0.5
1
1.5
2
2.5
original 0.4999 0.3 -0.3 -0.999Ch
an
ge
in D
ista
nce
(m
m)
Poisson's Ratio
Right Lateral Bending
Minor Diameter
Major Diameter
52
Figure 3-41: Displacement Left Axial Rotation
Figure 3-42: Displacement Right Axial Rotation
-1
-0.5
0
0.5
1
1.5
2
2.5
original 0.4999 0.3 -0.3 -0.999Ch
an
ge
in D
ista
nce
(m
m)
Poisson's Ratio
Left Axial Rotation
Minor Diameter
Major Diameter
-1
-0.5
0
0.5
1
1.5
2
2.5
original 0.4999 0.3 -0.3 -0.999Ch
an
ge
in D
ista
nce
(m
m)
Poisson's Ratio
Right Axial Rotation
Minor Diameter
Major Diameter
53
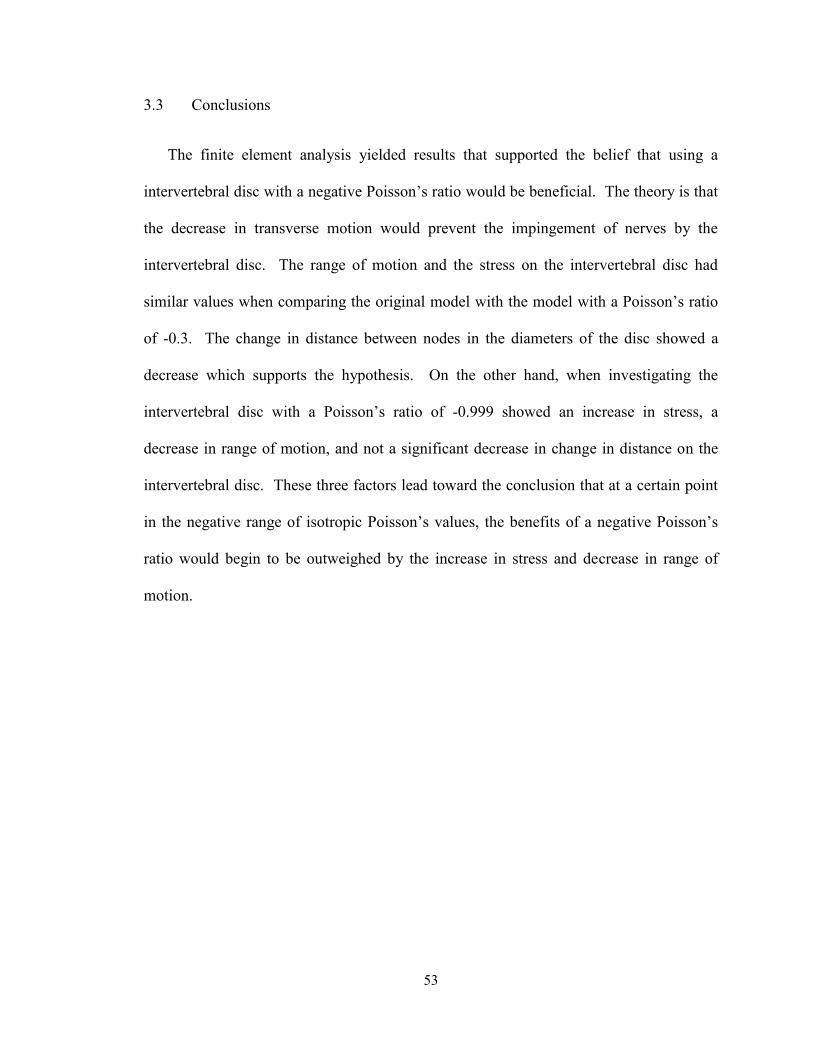
3.3 Conclusions
The finite element analysis yielded results that supported the belief that using a
intervertebral disc with a negative Poisson’s ratio would be beneficial. The theory is that
the decrease in transverse motion would prevent the impingement of nerves by the
intervertebral disc. The range of motion and the stress on the intervertebral disc had
similar values when comparing the original model with the model with a Poisson’s ratio
of -0.3. The change in distance between nodes in the diameters of the disc showed a
decrease which supports the hypothesis. On the other hand, when investigating the
intervertebral disc with a Poisson’s ratio of -0.999 showed an increase in stress, a
decrease in range of motion, and not a significant decrease in change in distance on the
intervertebral disc. These three factors lead toward the conclusion that at a certain point
in the negative range of isotropic Poisson’s values, the benefits of a negative Poisson’s
ratio would begin to be outweighed by the increase in stress and decrease in range of
motion.
54
Chapter 4
Compression of Polyurethane Foam
4.1 Materials and Methods
4.1.1 Cutting of Foam
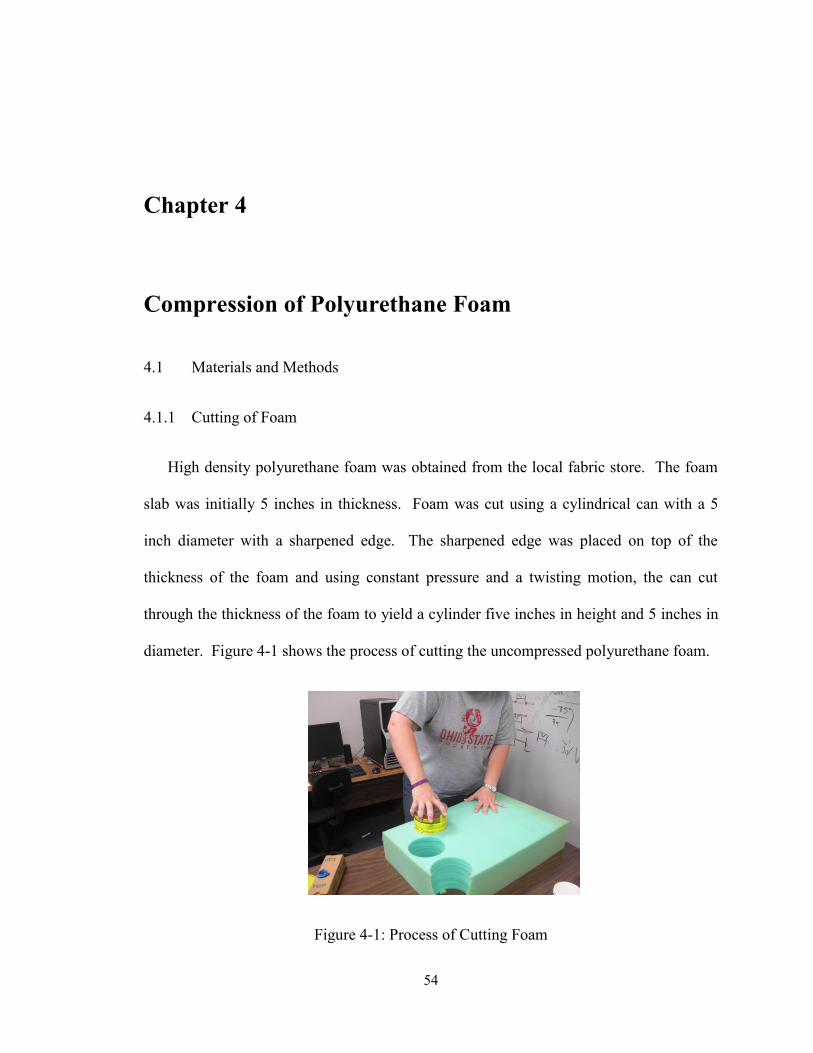
High density polyurethane foam was obtained from the local fabric store. The foam
slab was initially 5 inches in thickness. Foam was cut using a cylindrical can with a 5
inch diameter with a sharpened edge. The sharpened edge was placed on top of the
thickness of the foam and using constant pressure and a twisting motion, the can cut
through the thickness of the foam to yield a cylinder five inches in height and 5 inches in
diameter. Figure 4-1 shows the process of cutting the uncompressed polyurethane foam.
Figure 4-1: Process of Cutting Foam
55
4.1.2 Compression Chamber
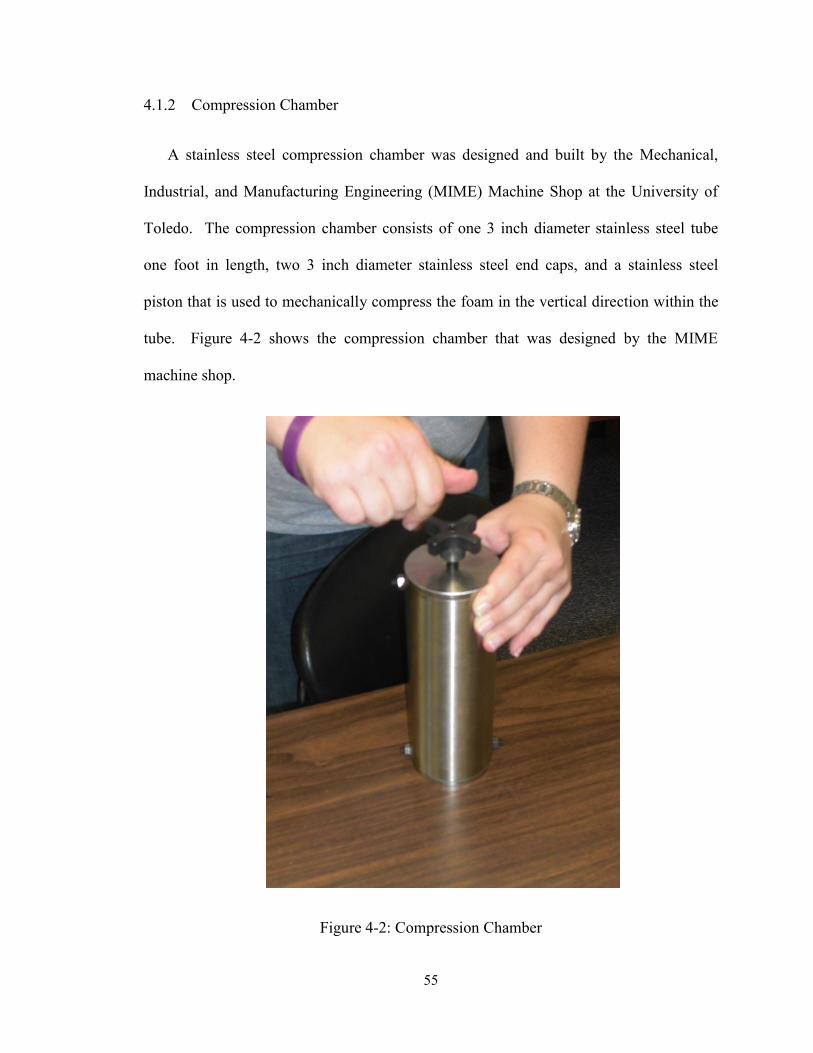
A stainless steel compression chamber was designed and built by the Mechanical,
Industrial, and Manufacturing Engineering (MIME) Machine Shop at the University of
Toledo. The compression chamber consists of one 3 inch diameter stainless steel tube
one foot in length, two 3 inch diameter stainless steel end caps, and a stainless steel
piston that is used to mechanically compress the foam in the vertical direction within the
tube. Figure 4-2 shows the compression chamber that was designed by the MIME
machine shop.
Figure 4-2: Compression Chamber
56
4.1.3 Compression Process
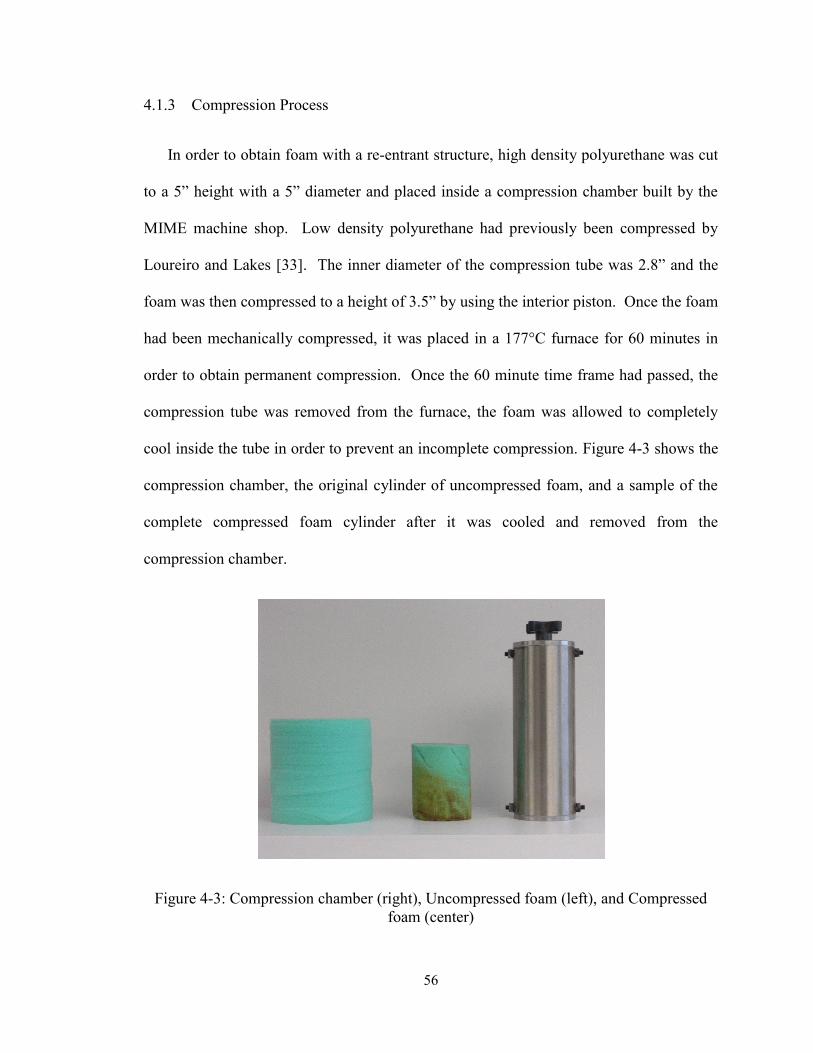
In order to obtain foam with a re-entrant structure, high density polyurethane was cut
to a 5” height with a 5” diameter and placed inside a compression chamber built by the
MIME machine shop. Low density polyurethane had previously been compressed by
Loureiro and Lakes [33]. The inner diameter of the compression tube was 2.8” and the
foam was then compressed to a height of 3.5” by using the interior piston. Once the foam
had been mechanically compressed, it was placed in a 177°C furnace for 60 minutes in
order to obtain permanent compression. Once the 60 minute time frame had passed, the
compression tube was removed from the furnace, the foam was allowed to completely
cool inside the tube in order to prevent an incomplete compression. Figure 4-3 shows the
compression chamber, the original cylinder of uncompressed foam, and a sample of the
complete compressed foam cylinder after it was cooled and removed from the
compression chamber.
Figure 4-3: Compression chamber (right), Uncompressed foam (left), and Compressed
foam (center)
57
4.1.4 Characterization of Foam
4.1.4.1 Scanning Electron Microscopy Analysis
Both the original uncompressed foam and the compressed foam were characterized
by scanning electron microscopy (SEM) using a Hitachi S-4800 UHR SEM. An
accelerating voltage of 3 kV was used to capture the images. Prior to analysis all the
samples were sputter coated with gold using a Cressington 108 auto coater (Ted Pella
Inc., Redding, CA).
4.1.4.2 MicroCT
MicroCT images of the microstructure of the foam were obtained using an uCT 35,
made by Scanco Medical AG in Switzerland. All software which we use is supplied by
the same company. Foam samples were 8x8x16 mm prisms scanned at 6 micrometer
resolution and using isometric voxel. The scan length was 3 mm (500 slices), the number
of samples was 4096, the number of projections was 1023, and sample time
(integration) was 500 ms. X-ray tube energy was 70 kV and intensity was 114 micro A.
Obtained images were viewed in Solidworks in order to determine continuity of the foam
microstructure before three dimensional printing was completed.
4.1.4.3 Three Dimensional Printing
MicroCT images were converted to files for use with a three dimensional printer or
rapid prototype machine, the stratasys FDM3000. 1x1x1 millimeter samples were scaled
up to 1x1x1 inch samples and both the compressed and uncompressed foam
microstructures were printed.
58
4.2 Results and Discussion
4.2.1 Foam Compression
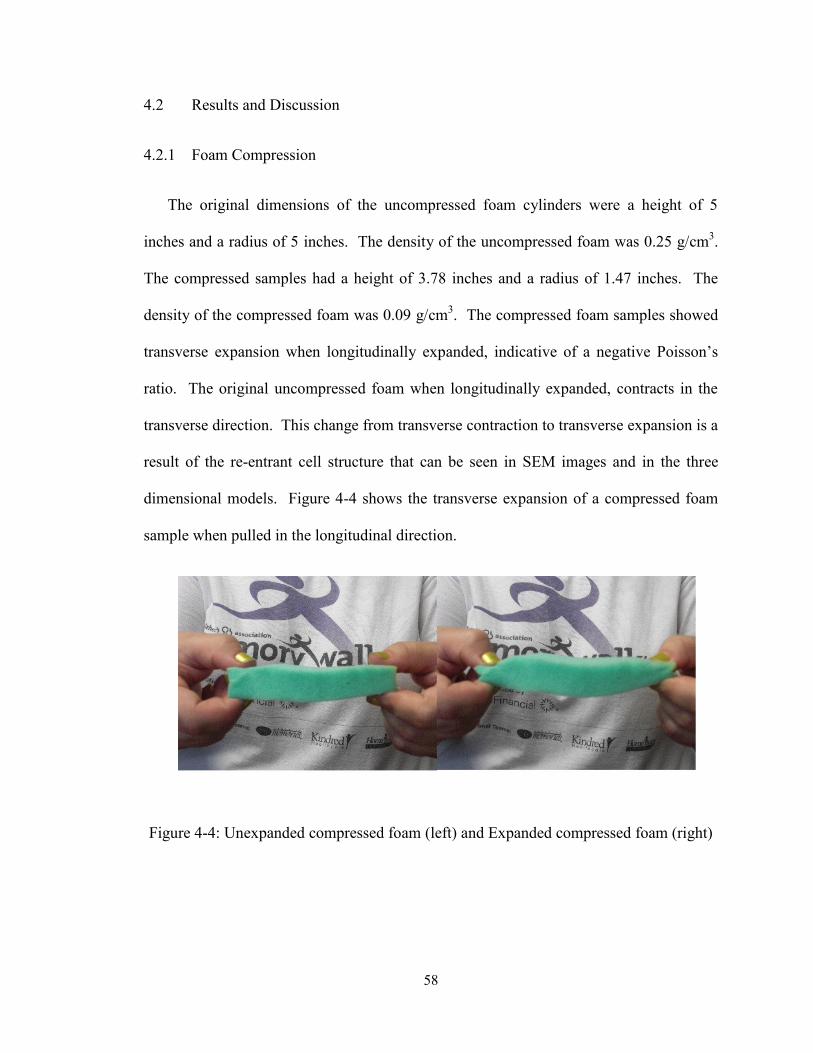
The original dimensions of the uncompressed foam cylinders were a height of 5
inches and a radius of 5 inches. The density of the uncompressed foam was 0.25 g/cm3.
The compressed samples had a height of 3.78 inches and a radius of 1.47 inches. The
density of the compressed foam was 0.09 g/cm3. The compressed foam samples showed
transverse expansion when longitudinally expanded, indicative of a negative Poisson’s
ratio. The original uncompressed foam when longitudinally expanded, contracts in the
transverse direction. This change from transverse contraction to transverse expansion is a
result of the re-entrant cell structure that can be seen in SEM images and in the three
dimensional models. Figure 4-4 shows the transverse expansion of a compressed foam
sample when pulled in the longitudinal direction.
Figure 4-4: Unexpanded compressed foam (left) and Expanded compressed foam (right)
59
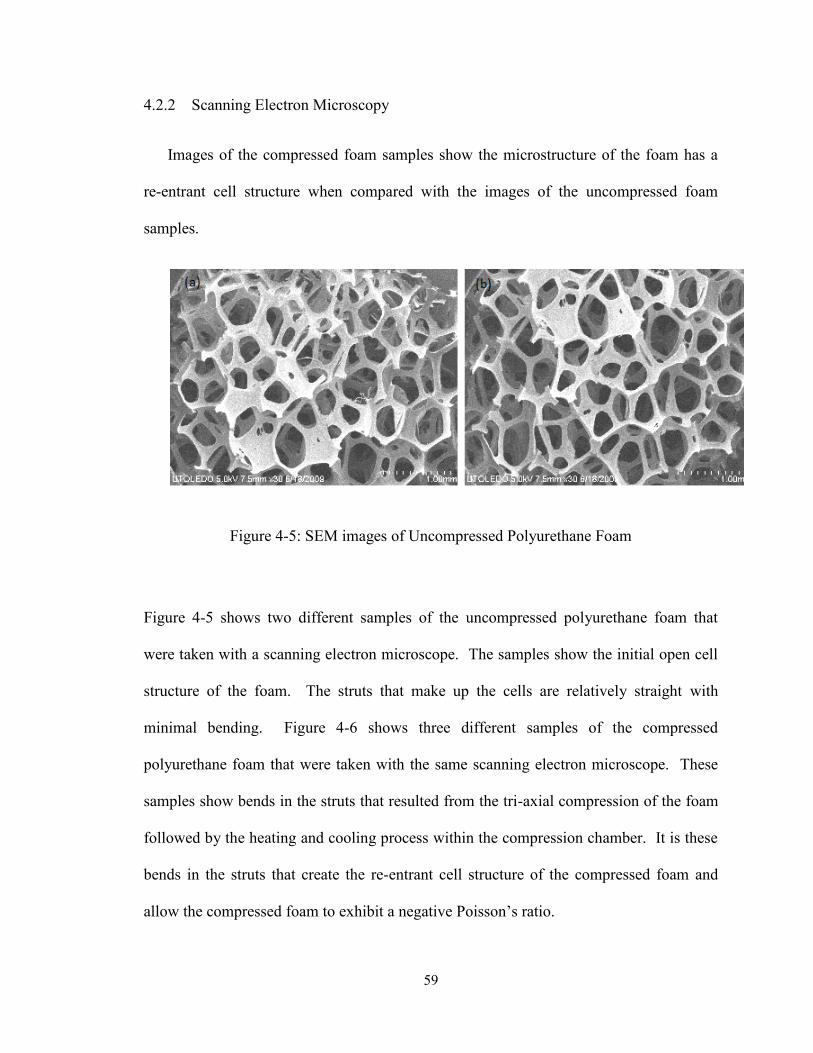
4.2.2 Scanning Electron Microscopy
Images of the compressed foam samples show the microstructure of the foam has a
re-entrant cell structure when compared with the images of the uncompressed foam
samples.
Figure 4-5: SEM images of Uncompressed Polyurethane Foam
Figure 4-5 shows two different samples of the uncompressed polyurethane foam that
were taken with a scanning electron microscope. The samples show the initial open cell
structure of the foam. The struts that make up the cells are relatively straight with
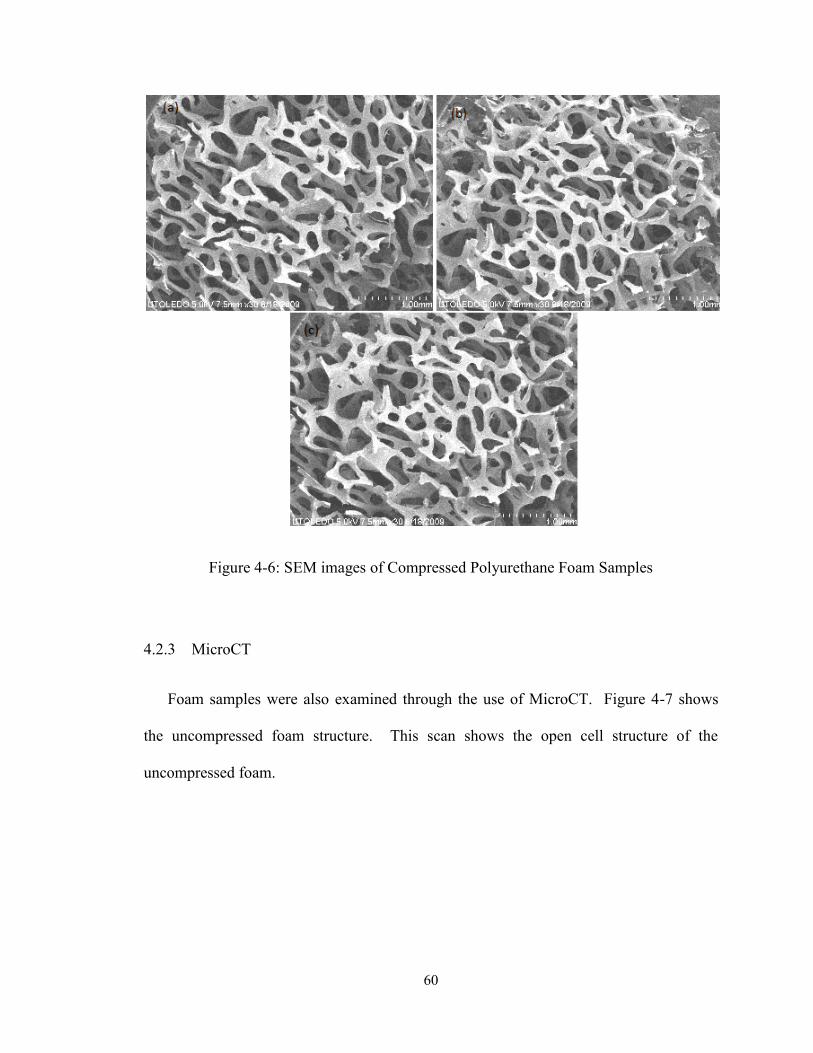
minimal bending. Figure 4-6 shows three different samples of the compressed
polyurethane foam that were taken with the same scanning electron microscope. These
samples show bends in the struts that resulted from the tri-axial compression of the foam
followed by the heating and cooling process within the compression chamber. It is these
bends in the struts that create the re-entrant cell structure of the compressed foam and
allow the compressed foam to exhibit a negative Poisson’s ratio.
60
Figure 4-6: SEM images of Compressed Polyurethane Foam Samples
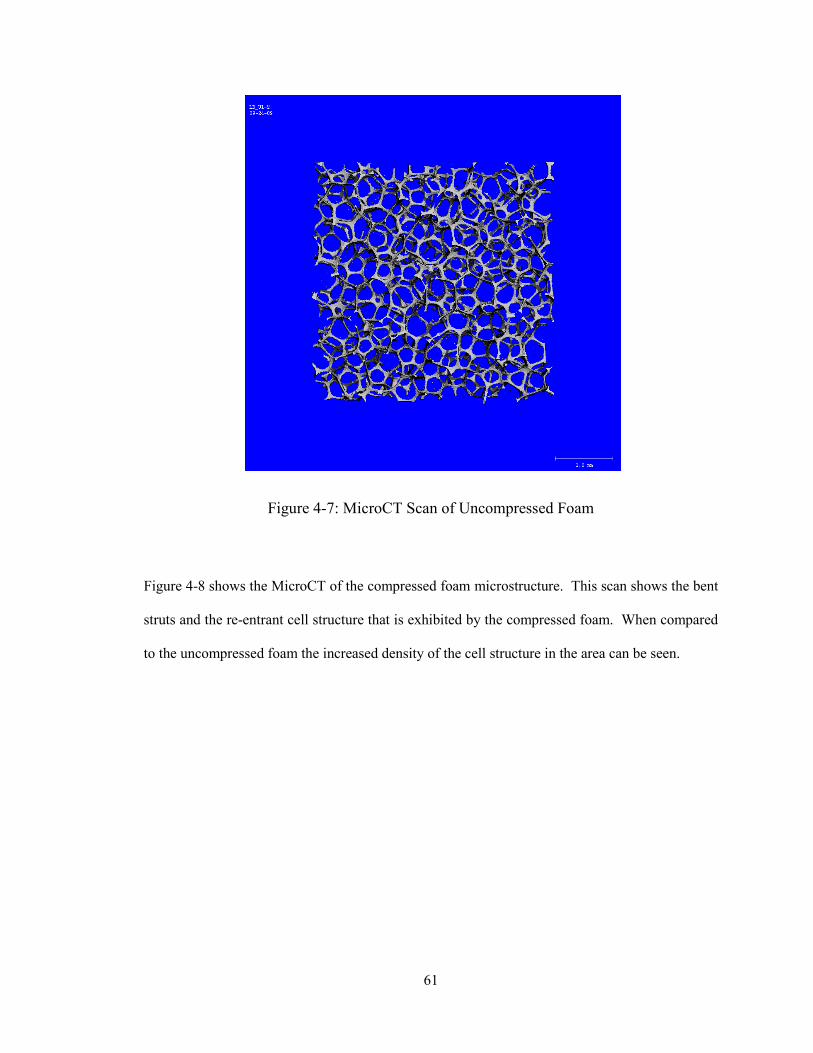
4.2.3 MicroCT
Foam samples were also examined through the use of MicroCT. Figure 4-7 shows
the uncompressed foam structure. This scan shows the open cell structure of the
uncompressed foam.
61
Figure 4-7: MicroCT Scan of Uncompressed Foam
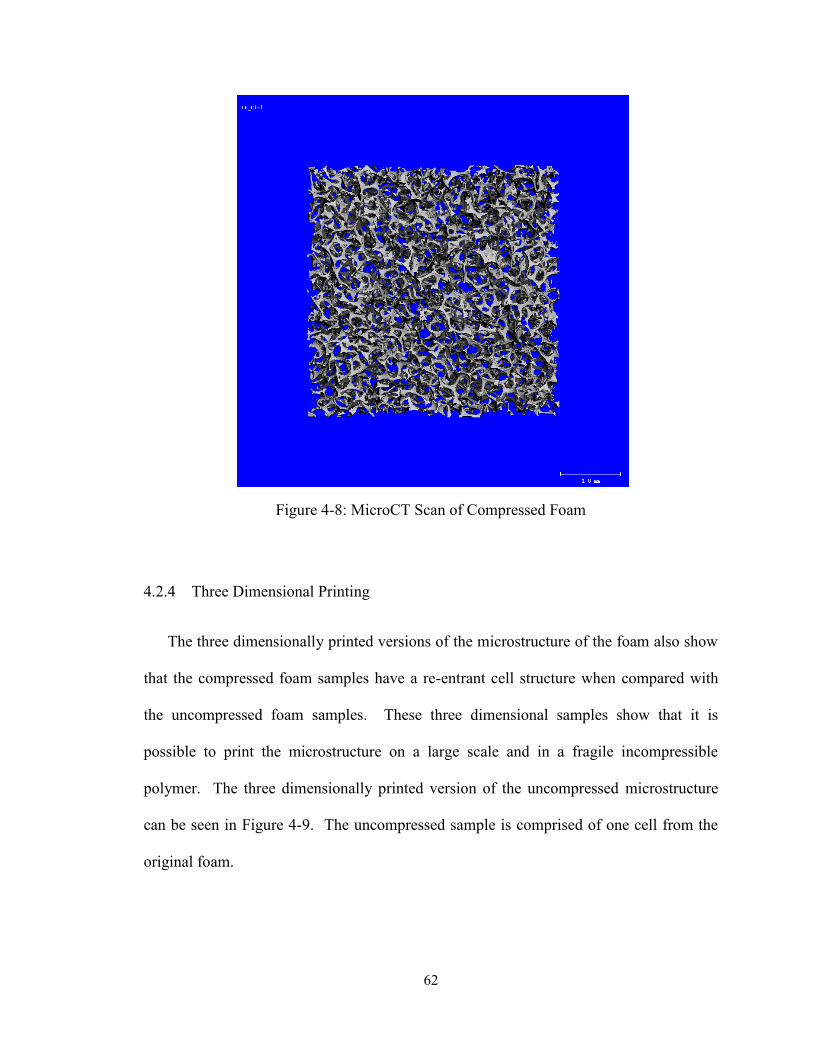
Figure 4-8 shows the MicroCT of the compressed foam microstructure. This scan shows the bent
struts and the re-entrant cell structure that is exhibited by the compressed foam. When compared
to the uncompressed foam the increased density of the cell structure in the area can be seen.
62
Figure 4-8: MicroCT Scan of Compressed Foam
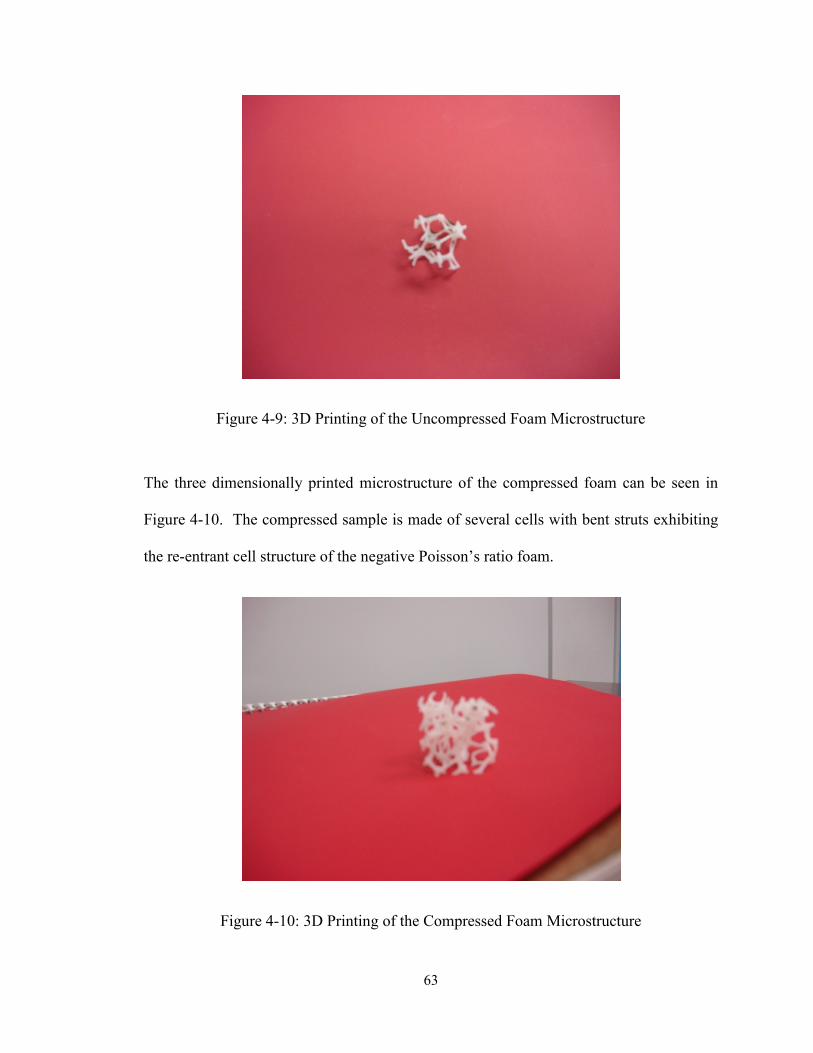
4.2.4 Three Dimensional Printing
The three dimensionally printed versions of the microstructure of the foam also show
that the compressed foam samples have a re-entrant cell structure when compared with
the uncompressed foam samples. These three dimensional samples show that it is
possible to print the microstructure on a large scale and in a fragile incompressible
polymer. The three dimensionally printed version of the uncompressed microstructure
can be seen in Figure 4-9. The uncompressed sample is comprised of one cell from the
original foam.
63
Figure 4-9: 3D Printing of the Uncompressed Foam Microstructure
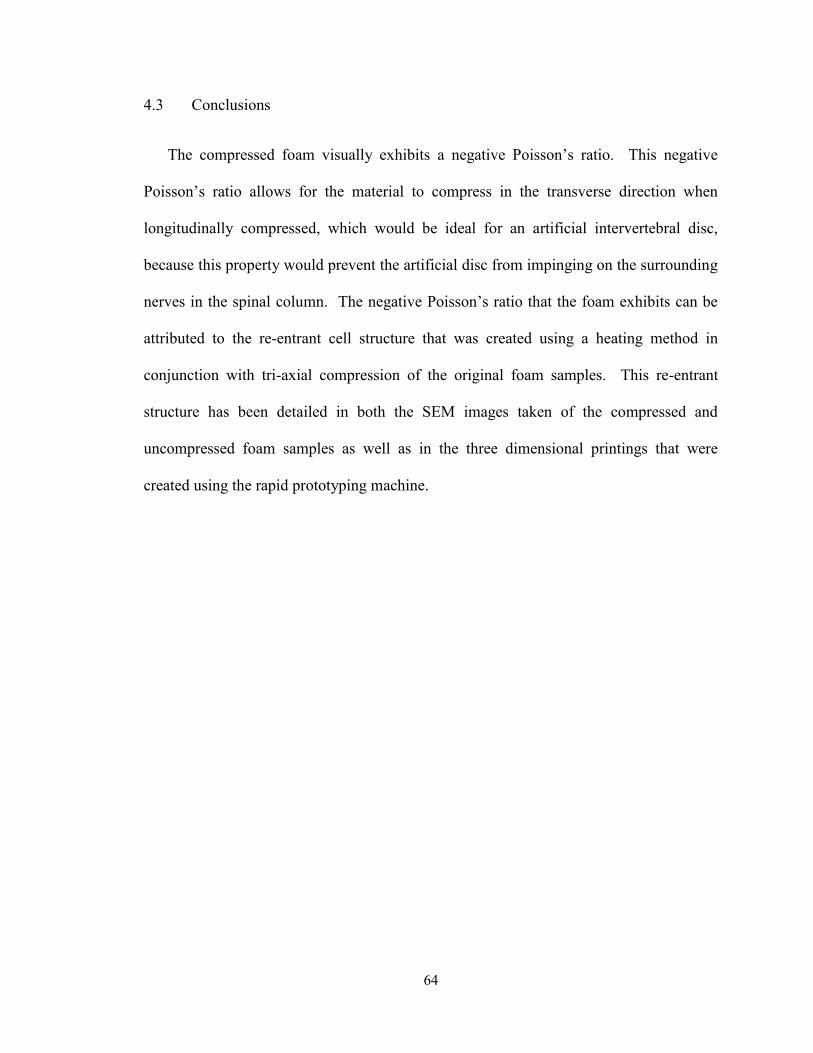
The three dimensionally printed microstructure of the compressed foam can be seen in
Figure 4-10. The compressed sample is made of several cells with bent struts exhibiting
the re-entrant cell structure of the negative Poisson’s ratio foam.
Figure 4-10: 3D Printing of the Compressed Foam Microstructure
64
4.3 Conclusions
The compressed foam visually exhibits a negative Poisson’s ratio. This negative
Poisson’s ratio allows for the material to compress in the transverse direction when
longitudinally compressed, which would be ideal for an artificial intervertebral disc,
because this property would prevent the artificial disc from impinging on the surrounding
nerves in the spinal column. The negative Poisson’s ratio that the foam exhibits can be
attributed to the re-entrant cell structure that was created using a heating method in
conjunction with tri-axial compression of the original foam samples. This re-entrant
structure has been detailed in both the SEM images taken of the compressed and
uncompressed foam samples as well as in the three dimensional printings that were
created using the rapid prototyping machine.
65
Chapter 5
Concluding Remarks
The objectives that were set forth with this study were met by completing a finite
element study on the effects of Poisson’s ratio of the intervertebral disc on the range of
motion, stress, and change in distance between nodes on the intervertebral disc was
completed. In addition, compression of polyurethane foam.
The first portion of this study concentrated on a finite element study of the Poisson’s
ratio of the intervertebral disc. This study concluded that there would be benefits to using
an artificial disc with a negative Poisson’s ratio. Further finite element studies will need
to be performed when a complete artificial disc with a negative Poisson’s ratio is
designed, replacing the native disc with the artificial disc within the model. In order to
have a completed artificial disc it will again be essential to obtain a three dimensionally
printed sample that is not rigid and also for movements similar to the native intervertebral
disc. Once a disc is printed, the Poisson’s ratio of that disc will need to be calculated in
order to determine if the microstructure determines the functioning of the samples. The
artificial three dimensionally negative Poisson’s ratio disc will also need to have a
fixation method to secure the intervertebral disc between the vertebrae. Once an implant
has been manufactured, in vitro testing can be completed to determine how the implant
responds to different circumstances.
66
The uncompressed and compressed foam samples were characterized through several
methods such as; scanning electron microscopy, microCT, and three dimensional
printing. The microstructure of the compressed foam samples visually exhibited a re-
entrant cell structure which lends itself to a negative Poisson’s ratio material. In addition
to the microstructure showing a re-entrant cell structure, the foam could be manually
stretched in the longitudinal direction and would show expansion in the transverse
direction. Additional testing of these compressed foam samples needs to be performed to
determine the precise Poisson’s ratio of the samples. Further three dimensional printing
of the microstructure should be completed in order to obtain samples that have been
printed in a less rigid material. This will involve further investigation to find a suitable
material and a rapid prototyping machine that can print the detailed microstructure to
scale.
67
References
1. www. spineuniverse.com. [Online] [Cited: March 1, 2011.] www.spineuniverse.com.
2. Parizel, P. M., et al. Degenerative Disc Disease. Medical Radiology. Part 4, 2007.
3. Modic, M. T., Ross, J. S. Lumbar Degenerative Disk Disease. Radiology. 2007, Vol. 245, 1.
4. Holm, R.,Bakewell, S. Artificial disc replacement --Evolutionary treatment for degenerative
disc disease. AORN journal. 2005, Vol. 82, 2.
5. Cunningham, B. W., et al. Biomechanical evalution oftotal disc replacement arthroplasty: An
in vitro hman cadaveric model. Spine. 2003, Vol. 28.
6. www.fda.gov. [Online] [Cited: March 9, 2011.] www.fda.gov.
7. http://www.spine-health.com/news/20100413/depuy-spine-stops-production-charite-artificial-
disc. [Online]
8. Evans, K. E., Alderson, A. Auxetic Materials: Functional Materials and Structures from
Lateral Thinking! Advanced Materials. 2000, Vol. 12, 9.
9. Martz, E. O., et al. Re-Entrant Transformation Methods in Closed Cell Foams. Cellular
Polymers. 1996, Vol. 15.
10. Gunton, D.J., Saunders, G. A. The Young's modulus and Poisson's ratio of arsenic,
antimony and bismuth. Journal of Material Science. 1972, Vol. 7, 9.
68
11. Li, Y. The anisotropic behavior of Poisson's ratio, Young's modulus, and shear modulus in
hexagonal materials. physica status solidi (a). 1976, Vol. 38, 1.
12. Lees, C. Vincent, J. F., Hillerton, J. E. Poisson's Ratio in Skin. Biomed Material Eng. 1991,
Vol. 1, 1.
13. Veronda, D. R., Westmann, R. A. Mechanical characterization of skin—Finite
deformations. Journal Biomechanics. 1970, Vol. 3, 1.
14. van Tulder, M., Koes, B., Bombardier, C. Low back pain. Best Practice & Research
Clinical Rheumatology. 2002, Vol. 16, 5.
15. Katz, J.N. Lumbar Disc Disorders and Low-Back Pain: Socioeconomic Factors and
Consequences. The Journal of Bone and Joint Surgery. 2006, Vol. 88.
16. Koes, B.W., van Tulder, M.W., Thomas, S. Diagnosis and treatment of low back pain.
BMJ. 2006, Vol. 332.
17. Freburger, J. K., et al. The Rising Prevalence of Chronic Low Back Pain. Arch Intern Med.
2009, Vol. 169, 3.
18. Andersson, G.B.J. Epidemiological features of chronic low-back pain. Lancet. 1999, Vol.
354.
19. Norcross, J.P., et al. An in vivo model of degenerative disc disease. Journal of Orthopaedic
Research. 2003, Vol. 21.
20. Milette, P. C. Degenerative Disc Disease. Rivista di Neuroradiologia. 2003, Vol. 16.
69
21. Modic, M. Degenerative disc disease and back pain. Magnetic resonance imaging clinics in
North America. 1999, Vol. 7, 3.
22. Tanaka, N., et al. The relationship between disc degeneration and flexibility of the lumbar
spine. The Spine Journal. 2001, 1.
23. Modic, M. T., et al. Imaging of Degenerative Disk Disease. Radiology. 1988, 168.
24. Silber, J.S., et al. How the disc degnerates.
25. Adams, M. A., et al. The Biomechanics of Back Pain. London : Elsevier, 2006.
26. Ghiselli, G. et al. Adjacent Segment Degeneration in the Lumbar Spine. The Journal of Bone
and Joint Surgery. 2004, Vols. 86-A, 7.
27. Lehmann, T. R., et al. Long-Term Follow-up of Lower Lumbar Fusion Patients. Spine.
1987, Vol. 12, 2.
28. [Online] www.mayoclinic.com.
29. [Online] www.spinalfusionalternative.com.
30. [Online] www.laserspineinstitute.com.
31. [Online] www.back.com.
32. [Online] www.cedars-sinai.edu.
33. Stiegman, G. A. III,. Chapter 3: Nucleus Arthroplasty Technology from the U.S. regulatory
viewpoint.
70
34. van den Eerenbeemt, K.D.,et al. Total disc replacement surgery for symptomatic
degenerative lumbar disc disease: a systematic review of literature. Eur Spine Journal. 2010, Vol.
19.
35. Berg, S., et al. Total disc replacement compared to lumbar fusion: a randomised controlled
trial with 2-year follow-up. Eur Spine Journal. 2009, Vol. 18.
36. Cinotti, G., David, T., Postacchini, F. Results of disc prosthesis after a minimium follow-up
period of two years. Spine. 1996, Vol. 21.
37. O'Leary, P., et al. Response of Charite total disc replacement under physiologic loads:
prosthesis component motion patterns. The Spine Journal. 2005, Vol. 5.
38. Tropiano, P., et al. Lumbar totaldisc replacement. Seven to eleven year follow-up. Journal
Bone Joint Surgery. 2005, Vol. 87A.
39. Tumialan, L.M., et al. Arthroplasty in the military: a preliminary experience with ProDisc-C
and ProDisc-L. Neurosurgery Focus. 2010, Vol. 28, 5.
40. Fekete, T. F., Porchet, F. Overview of disc arthroplasty--past, present and future. Acta
Neurochir. 2010, Vol. 152.
41. Caddock, B.D., Evans, K.E. Microporous materials with negative Poisson's ratios: I.
Microstructure and mechanical properties. J. Phys. D: Appl Phys. 1989, Vol. 22.
42. —. Negative Poisson's ratios and strain-dependent mechanical properties in arterial
prostheses. Biomaterials. 1995, Vol. 16.
71
43. Tatlier, M., Berhan, L. Modelling the negative Poisson's ratio of compressed fused fibre
networks. Physica Status Solidi b. 2009, Vol. 246, 9.
44. Gibson, L.J., Ashby, M.F. Cellular Solids. New York : Pergamon Press, 1988.
45. Attard, D., et al. On the properties of auxetic roatating stretching squares. Physica status
solidi b. 2009, Vol. 246, 9.
46. Alderson, A., Alderson,K.L. Auxetic Materials. Proceedings of the Institution of Mechanical
Engineers. Part G, Journal of aerospace engineering. 2007, Vol. 221, G4.
47. Martz, E. O., et al. Design of an Artificial Intervertebral Disc Exhibiting a Negative
Poisson's ratio. Cellular Polymers. 2005, Vol. 24, 3.
48. Lakes, R. S. Foam Structures with a Negative Poisson's Ratio. Science. 1987, Vol. 235.
49. Friis, E.A., Lakes, R.S., Park, J.B. Negative Poisson's ratio polymeric and metallic foams.
Journal of Material Science. 1988, Vol. 23.
50. Loureiro, M., Lakes, R.S,. Scale-up of transformation of negative Poisson's ratio foam;
Slabs. Cellular Polymers. 1997, Vol. 16, 5.
51. Brandel, B., Lakes, R.S. Negative Poisson's ratio polyethylene foams. Journal of Material
Science. 2001, Vol. 36.
52. Goel, V., et al. Interlaminar Shear Stresses and Laminae Separation in a Disc: Finite Element
Analysis of the L3-L4 Motion Segment Subjected to Axial Compressive Loads. Spine. 1995, Vol.
20, 6.
72
53. Goel, V., Pope, M. Biomechanics of Fusion and Stabilization. Spine. 1995, Vol. 20, 245.
54. Goel, V., et al. Effects of Rigidity of an Internal Fixation Device. Spine. 1991, Vol. 16,
Supplement 3.
55. Grauer, J., et al. Biomechanics of two-level Charite artificial disc placement in comparison
to fusion plus single-level disc placement combination. The Spine Journal. 2006, Vol. 6.
56. Ivanov, A., et al. The Effect of Removing the Lateral Part of the Pars Interarticularis on
Stress Distribution atthe Neural Arch in Lumbar Foraminal Microdecompression at L3-L4 and
L4-L5- Anatomic and Finite Element Investigations. Spine. 2007, Vol. 32, 22.
57. Kong, W., Goel, V., Gilbertson, L. Prediction of Biomechanical Parameters in the Lumbar
Spine During Static Sagittal Plane Lifting. Journal of Biomechanical Engineering. 1998, 120.


