Embed Size (px)
Citation preview
POLYMER COATING OF AN OPTIMIZED NANO LIPID CARRIER SYSTEM OF
HARPAGOPHYTUM PROCUMBENS EXTRACT FOR ORAL DELIVERY
Somaya Saleh Almajdoub
3515576
A thesis submitted in partial fulfilment of the requirements for the degree
M.Pharm (Pharmaceutics)
In
School of Pharmacy at the University of the Western Cape
Cape Town
Supervisor: Dr. A. Dube.
Co-supervisor: Dr. N. Ebrahim.
2017
I
ABSTRACT
Harpagophytum procumbens is a traditional medicinal plant widely used in South African
traditional healthcare to treat a range of ailments like degenerative rheumatoid arthritis,
osteoarthritis, tendonitis, kidney inflammation, heart disease, dyspepsia and loss of appetite.
Analgesic and anti-inflammatory effects of Harpagophytum procumbens has been reported to
decrease due to stomach acidity. In addition, dried plant extract is water soluble and has poor
lipid solubility severely limiting its ability to pass across lipid-rich biological membranes. To
overcome this, plant extract was incorporated into a nano lipid alginate coated bead.
Harpagophytum procumbens freeze dried aqueous extract was prepared and the active
principle harpagoside was identified by mass spectrometry (MS). A simple, linear, accurate
and precise UHPLC method was developed for quantitative determination of the bioactive
harpagoside. Harpagophytum procumbens was encapsulated in lipid vesicles (liposomes and
phytosomes) by using a dry film hydration technique and characterized for particle size,
polydispersity index and encapsulation efficiency.
Statistical response surface methodology (RSM) experimental design was used for lipid
vesicles formulation optimization. The effects of formulation parameters (input factors)
phosphatidylcholine ratio, cholesterol ratio and type of the lipid vesicle on output factors
particle size, polydispersity index and percentage entrapment efficiency was investigated.
Experimental design was statistically validated by ANOVA and suitable model for each
output factor was selected based on non-significant lack of fit p-value and R2 values. The
design matrix showed that particle size of lipid vesicles enhanced as phosphatidylcholine and
cholesterol content increases. The particle size of lipid vesicles was in a range of 382.6 to
608.7 nm for liposomes for phytosome was in a range of 207.8 to 596.4 nm. The design
matrix also showed that polydispersity index decreases as phosphatidylcholine and
cholesterol concentration increases which reflects complete complexion. Phosphatidylcholine
had a more positive effect on encapsulation efficacy than cholesterol. High cholesterol
content generally decreased percentage encapsulation.
Once the desirability function was included for formulation optimization, the optimized
formulation was phosphatidylcholine 80 %, cholesterol 5 % and type of lipid vesicle was
http://etd.uwc.ac.za/
II
phytosomes. The predicted values of these vesicles was, particle size 531.29 nm, poly
disparity index 0.23 and percentage encapsulation efficiency 31 % and a desirability of
0.77. The optimized formulation was verified in 4 replicates and the results were similar to
the predicted results.
The zeta potential of the optimized formulation was outside the recommended range. Hence,
stearic acid was added to the optimized H. procumbens phytosomes formulation as a surface
charge inducer. The zeta potential was significantly (p ˂ 0.05) improved when stearic acid
was added to the optimized formulation from −8.3 ± 0.72 to –30.6 ± 0.80 mV.
Scanning electron microscopy confirmed the formation of the phospholipid vesicles upon
hydration of thin lipid film. FTIR analysis indicated the interaction of plant extract to the
polar end of the phosphatidylcholine through formation of strong hydrogen bonding between
the hydroxyl group of phospholipid and extract phytoconstituents.
The phytosomes showed instability in simulated gastric SGF (pH 1.2), demonstrated by
increase in the particle size, polydispersity index and a reduction in zeta potential after 4
hours of incubation.
H. procumbens phytosomes was encapsulated in alginate beads in order to protect
phytosomes integrity. This was performed to overcome degradation of the plant extract in an
acidic environment. Alginate coated H. procumbens phytosomes were successfully prepared
by inotropic gelation technique by using sodium alginate and calcium chloride as a cross-
linking agent. Alginate coated H. procumbens phytosomes formulations at 2 % sodium
alginate and 4% calcium chloride was found to be the best parameter values.
The alginate-coated H. procumbens phytosomes exhibited high swelling rate in simulated
intestinal fluid (SIF) pH 7.4 (92 %), while the swelling rate was lower in gastric simulated
fluid (SGF) pH 1.2 (19 %), this is a desirable result. The alginate-coated H. procumbens
phytosomes in acidic media (SGF) showed no release over the 4 hours and no signs of bead
disruption.
The in vitro release study showed that phytosomes and alginate-coated H. procumbens
phytosomes entered a slow-release phase and delayed the harpagoside release, compared to
conventional freeze dried plant extract. H. procumbens phytosomes demonstrated Fickian
diffusion release mechanism of harpagoside and its release from alginate-coated H.
http://etd.uwc.ac.za/
III
procumbens phytosomes was predominantly by both diffusion drug release and anomalous
transport (swelling controlled drug release).
At lower temperature conditions, i.e. 4-8 °C, the phytosomes showed fairly high retention of
active in the vesicles over 30 days with only 8.82 % leak. As for alginate coated H.
procumbens phytosomes, alginate beads exhibited satisfactory stability under all exposed
temperatures; however, they showed negligible leaking at the end of 30 days at 37 °C.
Overall, water soluble phytoconstituents of freeze dried H. procumbens extract can be
converted to alginate coated phytosomes complexes. This can be considered a promising
vehicle for control delivery of H. procumbens extract as it minimizes release in simulated
gastric environment and breakdown in simulated intestinal environment which could lead to
increased availability of phytosomes for small intestine absorption.
http://etd.uwc.ac.za/
IV
KEY WORDS
Harpagophytum procumbens, harpagoside, anti-inflammatory, lipid-based drug delivery
systems (LBDDS), liposomes, phytosomes, response surface methodology (RSM), alginate
beads, simulated gastric fluid (SGF) and simulated intestinal fluid (SIF).
http://etd.uwc.ac.za/
V
DECLARATION
I declare that ―Polymer coating of an optimized nano lipid carrier system of Harpagophytum
procumbens extract for oral delivery‖ is my own work, that has not been submitted before for
any degree or examination at this or any other University, and that all sources I have used or
quoted have been indicated and acknowledged by means of complete references.
Somaya October 2017.
Signed: UWC, Bellville.
http://etd.uwc.ac.za/
VI
TABLE OF CONTENTS
ABSTRACT........................................................................................................................................ I
KEYWORDS.....................................................................................................................................IV
DECLARATION................................................................................................................................V
TABLE OF CONTENTS..................................................................................................................VI
LIST OF FIGURES.........................................................................................................................XIV
LIST OF TABLES...........................................................................................................................XIX
LIST OF ABBREVIATIONS....................................................................................................... XXII
DEDICATION............................................................................................................................. XX IV
ACKNOWLEDGEMNTS............................................................................................................. XXV
CHAPTER 1 INTRODUCTION ........................................................................................................ 1
1.1 Background and Problem Definition ............................................................................................. 1
1.2 Aim and objectives of the study ..................................................................................................... 4
CHAPTER 2 LITERATURE REVIEW ............................................................................................ 5
2.1 Background .................................................................................................................................... 5
2.2 Harpagophytum procumbens .......................................................................................................... 5
2.2.1 Description .............................................................................................................................. 5
2.2.2 Geographical distribution and habitat: ................................................................................... .7
2.2.3 Phytochemistry: Main and active constituents ....................................................................... .7
2.2.4 Clinical usefulness .................................................................................................................. .8
2.2.5 Pharmacological effect as anti-inflammatory .......................................................................... 8
2.2.6 Dosage forms………………………………………………..……..…………………...……9
2.3 Intestinal absorption ................................................................................................................... ..10
http://etd.uwc.ac.za/
VII
2.3.1 Simulated Gastric Fluid (SGF)………………………………………………..….………..11
2.3.2 Simulated Intestinal Fluid (SIF)………………………………………..……...…..….……11
2.4 Nanotechnology ........................................................................................................................... 12
2.5 Lipid-based drug delivery systems: ............................................................................................. 12
2.5.1 Types of lipid based systems…………………………….…………………….………..…..13
2.5.2 Liposomes……..…………………………………………………….……………….…….13
2.5.2.1 Preparation of liposomes…………………..……..……..……..…..…………....……14
2.5.2.1.1 Thin-film hydration method……….………...……...……….……………….14
2.5.2.2 Types of liposomes………………….………..………….…………….………..……15
2.5.3 Phytosomes ............................................................................................................................ 20
2.5.3.1 Difference between liposome and phytosome…………………………….………….16
2.5.3.2 Preparation of phytosomes……………………………………….……………...……17
2.5.4 Structural components of lipid based drug delivery systems……………….…………..…..17
2.5.4.1 Phospholipids……………………………………………………………....…….……17
2.5.4.1.1 Phosphatidylcholine (PC)………………………………………..…………….19
2.5.4.1.2 Lecithin………………………………………………………..……………….19
2.5.4.2 Cholesterol…………………………………………………………..…….….…......…20
2.5.4.3 Stearic acid………………………………………….………………..………..….....…20
2.5.5 Characterization of liposomes and phytosomes: .................................................................... 21
2.6 Alginate coating ........................................................................................................................... 27
2.6.1 Alginate hydrogel beads preparation .................................................................................... 30
http://etd.uwc.ac.za/
VIII
2.6.1.1 Ionic cross-linking…………………....…………………………………….…………26
2.6.1.2 Covalent cross-linking……………………………….………………....…………….26
2.6.1.3 Thermal gelation…………………………………….…………………..………..…..26
2.6.2 Physicochemical characterization of alginate hydrogels beads. ............................................ 31
2.6.3 Biomedical applications of Alginate beads .......................................................................... 29
2.7 Response surface methodology .................................................................................................... 34
2.7.1 Definition of terms in RSM .................................................................................................... 35
2.7.2 Process for RSM application ................................................................................................. 36
CHAPTER 3 METHODOLOGY .................................................................................................... 33
3.1 Preparation of freeze dried H.procumbens plant extract ............................................................... 33
3.2 Identification of Harpagoside biomarker in plant extract ............................................................. 33
3.2.1 LC/MS..................................................................................................................................... 33
3.2.1.1 Instrumentation……………………………...…………..…………………...………..33
3.2.1.2 Method……………………………………..………..…….………………..………....34
3.2.2 UHPLC……………………….…………........…………………….………………….…....34
3.2.2.1 Development and validation of an UHPLC method for harpagoside assay…….…..…34
3.2.2.2 Instrumentation………………………..……………………..….….….…....…...….…34
3.2.2.3 Chromatographic conditions….…………………………………..……….….….……34
3.2.2.4 Preparation of pure standard harpagoside stock solution……………….……..............35
3.2.2.5 Preparation of mobile phase…………………………………………………..….........35
3.2.2.6 Key parameters of the analytical method validation…………..….…………..…….....35
3.3 Quantitative determination of harpagoside constituent in H.procumbens plant extract……....38
3.4 Lipid vesicles (liposomes and phytosomes) preparation……………………………………….. 38
http://etd.uwc.ac.za/
IX
3.4.1 Preparation of 0.1 M potassium phosphate buffer pH 7.4 at 25°C…………………..……..38
3.4.2 Liposome preparation……………………………………………………………………...38
3.4.3 Phytosomes preparation ………………………………………………..……...……..…... 39
3.5 Physicochemical characterization of H.procumbens liposomes and phyttosomes……….……..40
3.5.1 Visualization of lipid vesicles by optical microscopy ........................................................... 40
3.5.2 Mean particle size and polydispersity index (PDI) determination ....................................... 40
3.5.3 Zeta potential determination ................................................................................................. 41
3.5.4 Percentage encapsulationt efficiency…………………………………………………........41
3.6 Preliminary study for determination of nano lipid vesicles formulation parameters…….….…..43
3.6.1 Investigating the effect of lipid type on percentage encapsulation efficiency ........................ 43
3.6.2 Investigating the optimal sonication time for vesicle disruption ............................................ 43
3.6.3 Investigation of the influence of lipid vesicle size reduction process on the percentage
encapsulation efficiency…….………………………………………………………………...44
3.6.4 Finding the appropriate plant extract ratio for appropriate percentage encapsulation
efficiency…………..…………...…………………...…………………………………..…….44
3.7 RSM optimization process of nano lipid vesicles formulation by design of experiments ........... 44
3.7.1 Generating experimental matrix ............................................................................................ 45
3.7.2 Lipid vesicle characterization of RSM generated experiments ............................................. 46
3.7.3 RSM Data analysis and evaluation of the fitted response surface models ............................ 46
3.7.4 Formulation optimization using desirability function ........................................................... 47
3.7.5 Validation of optimized condition ......................................................................................... 48
3.8 Characterization of selected optimized RSM formulation ........................................................... 48
3.8.1 Particle size and polydispersity index .................................................................................... 48
http://etd.uwc.ac.za/
X
3.8.2 Zeta Potential Analysis ........................................................................................................... 48
3.8.3 Surface Morphology .............................................................................................................. 48
3.8.4 Apparent solubility study ........................................................................................................ 48
3.8.5 FTIR spectroscopy ................................................................................................................. 49
3.8.6 Stability in simulated gastric fluid (SGF) pH 1.2 .................................................................. 49
3.8.6.1 Preparation of simulated GI media ................................................................................ 49
3.8.6.2 Method ........................................................................................................................... 50
3.9 Phytosome - alginate system………………………………………………….…………..….….50
3.9.1 Preparation of the alginate coated H.procumbens phytosomes ............................................ 50
3.9.2 Process variables and optimization....................................................................................... 52
3.9.3 Characterization of alginate coated H.procumbens phytosomes .......................................... 53
3.9.3.1 Particle size measurements .......................................................................................... 53
3.9.3.2 Percentage encapsulation efficiency determination…………..……………………...53
3.9.3.3 Alginate coated H. procumbens phytosomes erosion study………...………….……54
3.9.3.4 Moephology and surface assessment of selected alginate coated H. procumbens
phytosomes…………………………………………………………………….….54
3.9.3.5 Phytosomes- polymer compatibility study …………………..…..……………..……54
3.9.3.6 Swelling index ............................................................................................................. 55
3.9.3.7 Invitro drug release in GIT fluids……………………………………………...…….55
3.9.3.8 Release profile determination ...................................................................................... 56
3.9.3.9 Mechanism of release ............ ………………………………………………………. 56
http://etd.uwc.ac.za/
XI
3.9.3.10 Effect of storage temperature on H. procumbens phytosomes and alginate coated
phytosomes…………………………………….…………………………………...57
3.10 Statistical analysis of data .......................................................................................................... 58
CHAPTER 4 RESULTS AND DISCUSSION ............................................................................... 59
4.1 H. procumbens plant extract preparation ..................................................................................... 59
4.2 Identification of harpagoside biomarker in H.procumbens plant extract ..................................... 59
4.2.1 LC/MS. ................................................................................................................................... 59
4.2.2 UHPLC ................................................................................................................................ ...61
4.2.2.1 Development and validation of an UHPLC method for harpagoside assay……..……63
4.2.2.2 Validation UHPLC method of harpagoside…………………………………..…….…65
4.3 Quantitative determination of harpagoside constituent in plant extract…………….……..……72
4.4 Lipid vesicles (liposomes/ phytosomes) preparation and characterization……………….….…72
4.5 Preliminary study for determination of nano lipid vesicles formulation parameters……….…...72
4.5.1 Investigating the effect of lipid type on percentage encapsulation efficiency…...………….73
4.5.2 Investigating the optimal sonication time for vesicle disruption………………………….74
4.5.3 Investigating the influence of the lipid vesicle size reduction method on percentage
encapsulation efficiency……………………….………………………………………...….74
4.5.4 Finding the appropriate plant extract ratio for appropriate percentage encapsulation
efficiency………………………………………………………………………………76
4.6 Response Surface Methodology (RSM) optimization process of nano lipid vesicles
formulation…………………………………………………………………..…………………...77
4.6.1 Design of experiments ............................................................................................................. 77
4.6.2 Generating experimental matrix…………………………………………….……………….77
http://etd.uwc.ac.za/
XII
4.6.3 Lipid vesicle characterization of RSM generated experiments………………..……………78
4.6.4 Analysis of RSM data and evaluation of the fitted output factor surface models…….…….79
4.6.5 Effect of input factor on output factor Y1PS (particle size)……………………….……..… 84
4.6.6 Effect of input factors on output factor Y2PDI (polydispersity index)…….………….…...87
4.6.7 Effect of input factors on percentage encapsulation efficiency Y3%EE (percentage
encapsulation efficiency)…………………………………………………………...….89
4.6.8 Formulation optimization using desirability function………………..……………….…….91
4.6.9 Verification of optimized condition…………………………………..………………...…..91
4.7 Characterization of selected optimized RSM formulation ........................................................... 92
4.7.1 Particle size and polydispersity index………………………………….…………………....92
4.7.2 Zeta Potential Analysis………………………………………………….……………….....93
4.7.3 Scanning Electron Microscopy (SEM) ………………………..………………………...…96
4.7.4 Solubility…………………………..…………………………………….…………..…..…97
4.7.5 FTIR study………………………………………………………………….………………98
4.7.6 Stability in simulated gastric fluid (SGF) pH 1.2…………………………..………..……101
4.8 Phytosome - alginate system ..................................................................................................... 104
4.8.1 Preparation of the alginate coated H.procumbens phytosomes ....................................... 104
4.8.2 Process variables and process optimization ..................................................................... 105
4.9 Characterization of alginate coated H.procumbens phytosomes ............................................. 105
4.9.1 Particle size measurment…………………………………………………………………..105
http://etd.uwc.ac.za/
XIII
4.9.2 Percentage encapsulation efficiency of alginate coated H. procumbens phytosomes…….106
4.9.3 Alginate coated H. procumbens phytosomes erosion study…………..………..…………108
4.9.4 Shape and surface assessment of selected alginate coated H. procumbens phytosomes
…………………………………………………………………..…………………………110
4.9.5 Phytosomes- polymer compatibility study……………………………………………..…110
4.9.6 Swelling index …………………………….………………………………..……………113
4.9.7 Ivitro release study in GIT fluids………………………………………..………………...114
4.9.8 Release profile determination………………..………………………………………...….115
4.9.9 Mechanism of release………..………………………………………………………….....116
4.9.10 Storage stability study ………..……………….…………………………………………..119
CHAPTER 5 CONCLUSION AND RECOMMENDATIONS……………………………..….124
REFERENCES ………………..…………………………..…………….……..…………. ……….127
http://etd.uwc.ac.za/
XIV
LIST OF FIGURES
Figure 2-1: H. procumbens with flower, fruit (seed capsule) and bluish green
leaves…………………………………………………………………………
……………………………………………………...
6
Figure 2-2: H. procumbens with secondary tubers……………………………………... 6
Figure 2-3: Geographical distribution of H. procumbens (region 1)..................………..
7
Figure 2-4 : Varying pH in the gastrointestinal tract ………………………….………….
10
Figure 2-5: Classification of lipid based drug delivery system…………………..……… 13
Figure 2-6: Liposomes manufacturing steps with some modification…………………… 15
Figure 2-7: Classification of liposomes based on the lamellarity and size………………. 15
Figure 2-8: Difference between phytosome and liposome. …………………………...… 16
Figure 2-9: A diagram showing a phospholipid molecule with two fatty acids and a
modified phosphate group attached to a glycerol bachbone…………..….…. 18
Figure 2-10: Illustration of the basic elements of a lipid, with the arrangement into the
lipid bilayer structure…………………………………….…………...…… 18
Figure 2-11: General structure of cholesterol…………………………………...………… 20
Figure 2-12: Mechanism of drug release ……............................................................……. 23
Figure 2-13: Chemical structure of repeated units of alginate: D-mannuronic acid (M)
andL-guluronicacid (G)……………………………………….………...…. 24
Figure 2-14: Schematic crosslink between alginate and the calcium cations resulting in
―egg box model" calcium cross-linked junctions…………............................. 25
Figure 2-15: Schematic representation of alginate beads fabrication process………….….
27
Figure 2-16: Schematic representation of two mechanisms for drug release from a
particle embedded in a hydrogel bead……………………………………… 29
Figure 3-1 : General lipid vesicles preparation steps………………………………...…… 40
http://etd.uwc.ac.za/
XV
Figure 3-2: Preparation of alginate coated H.procumbens phytosomes beads by
ionotropicgelation method………………....................................................... 52
Figure 4-1: Full scan MS spectrum of pure standard harpagoside in positive ion mode
showing [M+Na]+ Ion of harpagoside at m/z 517…………………………… 60
Figure 4-2: Full scan MS spectrum of plant extract in positive ion mode showing
[M+Na]+ Ion of harpagoside at m/z 517………………………………….… 60
Figure 4-3: Full scan MS spectrum of pure standard harpagoside in negative ion mode
showing [M+HCOO]- Ion of harpagoside at m/z 539.23…………………… 61
Figure 4-4: Full scan MS spectrum of plant extract in negative ion mode showing
[M+HCOO]- Ion of harpagoside at at m/z 539.23………………………….. 61
Figure 4-5-1: Harpagoside chromatogram in plant extractbefore spiking…………………. 62
Figure 4-5-2 : Harpagoside chromatogram in plant extract after spiking…………………... 62
Figure 4-6 : Spectra for pure standard harpagoside peak at 278nm indicating
harpagoside identity and no co elution with harpagoside from other plant
extract components…..…………………………………….......…………… 63
Figure 4-7: UHPLC chromatogram of pure harpagoside. Mobile phase (methanol:
water; (60:40v/v)…………………………………….………………………. 63
Figure 4-8 : UHPLC chromatogram of harpagoside in H.procumbens plant extract…...... 64
Figure 4-9 : Identical spectra (bottom) acquired across the harpagoside peak in plant
extract (top) indicate a pure peak of harpagoside ……………….……..…. 64
Figure 4-10-1: Mobile phase component (methanol) chromatogram……………………..…. 65
Figure 4-10-2: Mobile phase component (deionized water) chromatogram……………….... 65
Figure 4-11-1: UHPLC chromatogram of pure standard non-degraded harpagoside……….. 66
Figure 4-11-2: UHPLC chromatogram of the forced degradation harpagoside sample in
NaOH………………………………………………………………………... 66
Figure 4-12-1 : Linearity plot of harpagoside dissolvedin methanol……………...…………. 67
Figure 4-12-2: Linearity plot of harpagoside dissolved in phosphate buffer solution, pH 7.4
pH 7.4……....
68
http://etd.uwc.ac.za/
XVI
Figure 4-13 : Microscopic images oflipid vesicles………………………………………… 72
Figure 4-14 : Histogram illustrating lipid type on percentage encapsulation efficiency…... 73
Figure 4-15 : Sonication time for disrupt of lipid vesicles to release maximum amount of
loaded drug…………………………………………………………….…… 74
Figure 4-16 : Effect of variation in plant extract content on the percentage encapsulation
efficiency of lipid vesicle formulations prepared with constant lipid phase
content …………………………………………………………….………..
………………………………………………………………………...
76
Figure 4-17 : Illustration of particle size of two randomly selected formulations
of according to RSM………………………………………………………… 79
Figure 4-18-1 : Normal plot of residuals (a), normal probability plot of actual and predicted
values (b) of particle size……………………………………………………. 83
Figure 4-18-2 : Normal plot of residuals (a), normal probability plot of actual and predicted
values (b) of polydispersity index…………………………………..……….. 83
Figure 4-18-3 : Normal plot of residuals (a), normal probability plot of actual and predicted
values (b) of percentage encapsulation efficiency……………….………….. 84
Figure 4-19-1: Three-dimensional (3D) surface plot showing the effect of
phosphatidylcholine and cholesterol content on particle size……………….. 86
Figure 4-19-2 : Three-dimensional (3D) surface plot showing the effect of
phosphatidylcholine and cholesterol content on polydispersity index (PDI)... 88
Figure 4-19-3: Three-dimensional (3D) surface plot showing the effect of
phosphatidylcholine and cholesterol content on percentage encapsulation
efficiency.......................................................................................................... 90
Figure 4-20 : Desirability ramp for theoptimization process optimization………….…….. 91
Figure 4-21 : Observed values of optimized formula (particle size, polydispersity index
and percentage encapsulation efficiency) in comparison with proposed
optimizedformulation of RSM……………………………………………….
92
Figure 4-22 : Particle size for final optimizedphytosomes formulation…………..……….. 93
Figure 4-23 : Incorporation of stearic acid as charge inducer significantly.......................... 95
http://etd.uwc.ac.za/
XVII
Figure 4-24: Zeta potential of empty phytosomes (blue peak), loaded H. procumbens
phytosomes (red peak), loaded H. procumbens phytosomes including stearic
acid (green peak)……………………………………………………………. 96
Figure 4-25: Representive SEM micrograph of optimized H.procumbens phytosomes at
two different magnifications………..…………………………………..…… 97
Figure 4-26 : Represents the apparent solubility of H.procumbens extract and phytosomes
in water and n- octanol………………………………………………………. 98
Figure 4-27 : FTIR spectra of (A) empty phytosomes, (B) H.procumbens plant extract
and (C) H.procumbens loaded phytosomes………………………………… 100
Figure 4-28-1 : Particle size of empty and loaded H.procumbens phytosomes against
simulated gastric fluid (SGF) (mean±sd, n=2)………………………..…… 101
Figure 4-28-2: Polydispersity index of empty and loaded H.procumbens phytosomes
against simulated gastric fluid (SGF) (mean±sd, n=2)…………………….. 102
Figure 4-28-3: Zeta potential of empty and loaded H.procumbens phytosomes against
simulated gastric fluid ………………………………………………..…….. 103
Figure 4-28-4 : Harpagoside release from H. procumbens phytosomes in simulated gastric
fluid (SGF)……………….. ……………..……………………………..…… 104
Figure 4-29 : Dry and freshly prepared alginate coated H.procumbens phytosomes……… 105
Figure 4-30 : Alginate coated H.procumbens phytosomes particle size as a function of
different alginate and calcium chloride concentrations………………..……. 106
Figure 4-31: Alginate coated H.procumbens phytosomes percentage encapsulation
efficiency at different alginate and calcium chloride concentrations …….… 107
Figure 4-32 : Erosion and release from alginate coated H.procumbens phytosomes at
different sodium concentrations; (A) 2% calcium chloride (B) 4% calcium
chloride as cross linking solution ……………………………….…………. 108
Figure 4-33 : Erosion of alginate coated H.procumbens phytosomes in PBS 7.4 at
different sodium alginate concentrations formulation and 4% CaCl2………. 109
http://etd.uwc.ac.za/
XVIII
Figure 4-34-1: Spherical shape of dry and freshly prepared alginate coated H.procumbens
phytosomes………………………………………………..…………………
………..
110
Figure 4-34-2: SEM micrograph of surface microstructure of the dried alginate
coated H.procumbens phytosomes………………………………….……….. 110
Figure 4-35: FTIR spectra of sodium alginate, empty alginate coated phytosomes,
H.procumbens phytosomes and alginate coated H.procumbens
phytosomes………………………………………………………………….. 111
Figure 4-36 : Swelling index of alginate coated H.procumbens phytosomes in
simulated gastric fluid (SGF) and simulated intestinal fluid (SIF)………...... 113
Figure 4-37 : Release profile of H.procumbens phytosomes in simulated gastric fluid
(SGF) and simulated intestinal fluid (SIF)…………………………………... 114
Figure 4-38 : Intact alginate coated H.procumbens phytosomes in SGF and eroded
alginate coated H.procumbens phytosomes in SIF…………………...…….. 115
Figure 4-39 : In vitro release profile of coated and un coated H.procumbens phytosomes
and freeze dried plant extract in phosphate buffer solution (pH 7.4)…….… 116
Figure 4-40 1- : Release kinetics of phytosomes……………………………………………… 118
Figure 4-40-2: Release kinetics of alginate beads…………………………………………… 119
Figure 4-41 : Physical stability of optimized H.procumbens phytosomes formulation at 3
different temperatures……………………………………………………..… 120
Figure 4-42: Instability of H.procumbens phytosomes at 37 °C…………………………... 122
Figure 4-43 : Particle size stability of optimized alginate coated H.procumbens
phytosomes formulation at 3 different temperatures………….…………… 123
http://etd.uwc.ac.za/
XIX
LIST OF TABLES
Table 2-1: Standard zeta potential values and their related stability behaviour………..... 23
Table 3.1: Lipid vesicles formulations with diversity in lipid type……………………... 44
Table 3.2: Lipid vesicle formulations prepared with constant lipid phase content and
variation in plant extract content ……………………………….………….. 45
Table 3.3: The upper and lower levels of input factors set for optimization process…… 46
Table 3.4: Generated experimental matrix by RSM optimal design……………..……... 47
Table 3.5: Desirability specifications of numerical optimization for H.procumbens
nano formulation………………………………………………..………….... 48
Table 3.6: Composition of alginate coated H.procumbens phytosomes formulations….. 54
Table 4.1: Intra-day precision (repeatability) ……………….………………………….. 68
Table 4.2: Intermediate precision …………………………………………..…………... 69
Table 4.3: Percentage recovery of the harpagoside …………………..………………… 70
Table 4.4: Method robustness …………………………..………………...……..……… 71
Table 4.5: System suitability ………………………………………...…………………. 71
Table 4.6: Influence vesicles sizing down method on the percentage encapsulation
efficiency…………………………………………………………………….
….
75
Table 4.7: Experimental matrix of RSM optimal design……………………..……….… 78
Table 4.8: Estimation of regression model, fit summary of the output factors Y1PS,
Y2PDI and Y3%EE, respectively………………………………………………
80
Table 4.9: Statistical parameters obtained from the ANOVA for the selected
regression model of Y1PS generated from RSM software………………… 81
http://etd.uwc.ac.za/
XX
Table 4.10: Statistical parameters obtained from the ANOVA for the selected regression
model for Y2PDI generated from RSM……………………………………..
software……………………………….
81
Table 4.11: Statistical parameters obtained from the ANOVA for the selected regression
model for Y3%EE generated from RSM software……………………………. 82
Table 4.12: Particle size of liposomes and phytosomes formulation (extracted from table
4.7)……………………………………………………………………………
85
Table 4.13: Polydispersity index of liposomes and phytosomes formulation (extracted
from table 4.7)………………………………………………………………..
87
Table 4.14: Percentage encapsulation efficiency of liposomes and phytosomes
formulations (extracted from table 4.7)……………………………………… 89
Table 4.15: Zeta potential results of proposed formulation by RSM ………………..…...
94
Table 4.16: Regression coefficient (R2) and release exponent (n) values of different
H.procumbens formulations………………………..………………………... 117
Table 4.17: Exponent 𝑛 of the power law and drug release mechanism from phytosome
delivery systems……………………………………………………………... 118
http://etd.uwc.ac.za/
XXII
LIST OF ABBREVATIONS
abbervation Full name
H. procumbens Harpagophytum procumben.
PC Phosphotydylcholine.
Lec Lecithin.
Chol Cholesterol.
PBS Phosphate buffer solution.
UHPLC Ultra high performance liquid chromatography.
LC-MS Liquid chromatography-mass spectrometry.
PS Particle size.
ZP Zeta potential.
PDI Polydispersity index.
% EE Percentage encapsulation efficiency.
SEM Scanning electron microscope.
SGF Simulated gastrointestinal fluid.
SIF Simulated intestinal fluid.
RSM Response surface methodology.
ANOVA Analysis of variance.
Mg/ml Milligram/ mililiter.
Nm Nanometer.
mV Millivolts .
http://etd.uwc.ac.za/
XXIII
µm Micrometer.
Cm-1
Centimeter -1
(reciprocal centimeters).
(R2) Correlation coefficient.
M/Z Mass-to-charge ratio.
% RSD Percentage relative standard deviation.
min Minutes
http://etd.uwc.ac.za/
XXIV
DEDICATION
For my parents (get well soon daddy).
For my family.
http://etd.uwc.ac.za/
XXV
ACKNOWLEDGEMENTS
First and foremost, praise and thanks must be given to God (ALLAH), the creator and the
guardian, for giving me the opportunity to undertake such a momentous task for giving me
the courage, patience, strength and the knowledge to get through to the end.
Especially thank for the following people:
My supervisor, Dr. Dube, my Co-supervisor Dr. Ebrahim, for their help, support and
guidance in completing this research project. This would not be possible without you.
Profe M. Mayer, I sincerely thank you for welcoming me into the biotechnology department.
Your welcoming attitude will forever be appreciated. Dr. M. Drah, I wish to express my
sincere appreciation for his support and the valuable advice given throughout the study. I
truly value and appreciate your contribution to this thesis.
Mr. R. Baboo for his editing service. Mr. M. Y. Kippe for his help with LC/MS and UHPLC
analysis throughout this research, Thank you for all the help in the analytical laboratory and
always being there for me your wisdom and understanding will always be remembered.
Mr. S. Dyantyi and Mrs. E. Kuhn; Many thanks for all your assistance. My writing coach S.
Omoruyi and My statistician M. Mulubwa your help, advice are truly appreciated.
My dearest friends Hanan, Reem, Souad, Jean, Tendai, Myolisi and pharmaceutics
colleagues, for your kindness and always listening and, support. Your friendship has given
me strength and added so much positive energy to my life. Thank you for your wise,
inspirational advice and unfaltering encouragement. To school of pharmacy staff members,
for their encouragement.
Special thanks to my parents, whose never-ending love, encouragement, wisdom, motivation,
support and confidence in me have enabled me to acquire this achievement. I wish to thank
my sister and my brothers for their love, support and encouragement.
And finally but most importantly thanks to my dear husband and my little boy and girl for all
the motivation, continuing support and the understanding during the time that I was busy with
this research. This meant a lot to me. Your love, wisdom, encouragement, kindness and calm
http://etd.uwc.ac.za/
XXVI
temperament has given me the strength to complete this thesis even when times were tough.
Your wisdom and understanding will always be remembered.
Thank you for all the help with completing this research project. This research would be
impossible to complete without all of you.
http://etd.uwc.ac.za/
5
Chapter 1
Introduction
1.1 Background and Problem Definition
Medicinal plants are commonly used in South African traditional healthcare to treat a range
of ailments (Clarkson et al., 2004). According to recent estimates by the World Health
Organisation (WHO), more than 3.5 billion people in the developing world rely on plants as
components of their primary health care (Xego et al., 2016).
South Africa is a country with a strong history of traditional healing which hosts around
30,000 plant species of which 3000 species are used therapeutically. Around 80% of the
South African population use traditional medicines for their primary health care needs
(Street, 2012). The reliance on traditional medicine of such a large portion of the population
can be attributed to a number of factors; relatively good accessibility to the plants,
affordability and extensive local knowledge and expertise amongst the communities (Street et
al., 2008).
One of the phytopharmaceuticals that exert anti-inflammatory effects is Harpagophytum
procumbens (Pedaliaceae). Extracts of this herbal drug have become the focus of research as
a potential therapeutic agent in the treatment of arthritis and pain due to its favourable side
effects profile compared to synthetic alternatives. Moreover, non-steroidal anti-inflammatory
drugs (NSAIDs) are often associated with serious adverse effects in long-term use, such as
gastric ulceration, hepatic toxicity, and haemorrhage (Tan et al., 2016).
Harpagophytum procumbens, also known as Devil‘s Claw, is an herbaceous plant species
that has high medicinal value in southern Africa (Lim et al., 2014). This plant grows mainly
in Namibia, Botswana, Zimbabwe and South Africa. The secondary tubers of H. procumbens
are effective in the treatment of degenerative rheumatoid arthritis, osteoarthritis, tendonitis,
kidney inflammation (Mncwangi et al., 2012). Therefore, H. procumbens has been
increasingly considered an alternative to non-steroidal anti-inflammatory drugs (Ludwig-
Müller et al., 2008.). Harpagoside is believed to be a main bioactive compound of H.
procumbens related to the anti-inflammatory efficacy of this plant (Kim et al., 2015).
http://etd.uwc.ac.za/
6
H. procumbens has been claimed to possess inhibition potential of inducible nitric oxide
(NO), inflammatory cytokines (IL-6, IL-1𝛽) and tumour necrosis factor-alpha (TNF-𝛼), and
prostaglandine-2 (PGE2), direct inhibition of cyclooxygenase-2 (COX-2) enzyme as well as
prevention of arachidonic acid metabolism and eicosanoid biosynthesis, leading to COX-2
inhibition and reducing inflammation (Gyurkovska et al., 2011; Akhtar et al., 2012; Ebrahim
et al., 2011; Sheu et al., 2015).
H. procumbens was mainly administered as one of the following: an infusion, decoction,
tincture, powder, and extract. While infusions and decoctions are the most central traditional
methods of preparation, the main active principles in the plant are prone to hydrolysis (Street
et al., 2012). It has been proposed that stomach digestion influences the pharmacological
activity of H. procumbens (Hostanska et al., 2014; Soulimani et al., 1994) resulting in
reduced activity when administered orally (Catelan et al., 2006). This may be due to acid
hydrolysis or denaturing of the active principles as they pass through the stomach (Soulimani
et al., 1994; Mncwangi et al., 2012).
Encapsulation of plant extract in lipid based drug delivery systems might be a good solution
for protecting the plant material and obtaining the required properties. The bioavailability and
absorption of water soluble phytoconstituents is erratic due either to their large molecular size
which cannot be absorbed by passive diffusion, or to their poor lipid solubility in the
gastrointestinal tract. This severely limits their ability to cross the lipid-rich biological
membranes, resulting in poor bioavailability (Bhattacharya et al., 2009; Udapurkar et al.,
2016). This could be overcome by a novel drug delivery system (NDDS); that converts the
water‐soluble plant extract molecules into a lipid‐compatible molecular complex.
Nanotechnology may be applied to NDDS that enables a weight reduction of drug particles
accompanied by an increase in stability and improved functionality. Various approaches such
as liposomes, niosomes, and phytosomes, are used for the enhancement of bioavailability
(Abhinav et al., 2016). These systems have various advantages over the traditional
formulations such as improved solubility & bioavailability, controlled drug delivery,
protection of plant actives from degradation (Sharma et al., 2016).
Liposomes and phytosomes are microscopic vesicles consisting of phospholipid bilayers and
are utilized for hydrophilic and lipophilic drugs (Udapurkar et al., 2016). The basic difference
between liposomes and phytosomes is that, in the former, the active biomaterial is dissolved
http://etd.uwc.ac.za/
7
in the internal pocket or it floats in the layer membrane, whereas in phytosomes the active is
anchored through chemical bonds to the polar phospholipids heads and becomes an integral
part of the membrane, while no bonds are formed in liposomes (Rawat et al., 2012).
Phytosomal technology has been effectively used to enhance the bioavailability, solubility,
prolong the duration of action, reduce side effects and increase therapeutic effect of many
popular plant extracts. Some of the phytoconstituents incorporated in phytosomes include
extracts of Ginkgo biloba, grape seed, milk thistle (Sharma, 2014, Saraf, 2010) and in
liposomes include colchicine, silymarin, and rosemary essential oil (Mathur, 2013, Kiaee et
al., 2016).
Following oral administration, the lipid component of the lipid based drug delivery system
(liposomes and phytosomes) may be subjected to hydrolysis in the presence of acidic pH and
eliminate the encapsulated plant materials and lose their function as a carrier. Hence, to
overcome this, a possible solution is to coat the lipid vesicles with pH sensitive polymer
matrices. This serves to protect the lipid vesicles from the influence of acidic environment
and promote their breakdown in the intestinal medium for increased absorption of the intact
liposome or phytosomes.
Alginate is a polysaccharide found in brown algae, composed mainly by linear polymers of β-
(1-4)-D-mannuronic (M) and α-L-gluronic (G) acids, which are different in terms of their
proportions and linear arrangements (Xu et al., 2017). Alginate, a pH sensitive polymer
stable at acidic pH but unstable in alkaline medium (intestinal environment) (Abbas et al.,
2017), have been proven to protect compounds from hostile environments, such as low pH
and enzymes in the stomach. It enhances the stability of drug delivery in the stomach and
achieves controlled release in the intestine (Liu et al., 2017). Sodium alginate is a suitable
carrier matrix because it is biodegradable, biocompatible and nontoxic orally (Devi et al.,
2010) and has been used as a gastro-resistant carrier in simulated gastric fluid (Smith et al.,
2010; Cerciello et al., 2016).
Inspired by this knowledge we aimed to design a novel delivery system based on alginate
hydrogel micro beads containing Harpagophytum procumbens extract loaded lipid vesicles
(liposomes) to enhance the stability in the acidic region of the gastro-intestinal tract for
improved intact delivery and release of liposomes in the small intestinal environment.
http://etd.uwc.ac.za/
8
1.2 Aim and objectives of the study
The aim of the study is to develop an optimized lipo/phytosomal carrier system consisting of
Harpagophytum procumbens coated with alginate for protection from gastric digestion. To
achieve the aim the following objectives were set:
Development and validation of a rapid, simple and reliable UHPLC method for
identification and quantification of harpagoside in Harpagophytum procumbens crude
plant extract.
Preparation of liposomes and phytosomes formulations containing Harpagophytum
procumbens plant extract.
Optimization studies of liposomes and phytosomes formulation parameters using
response surface methodology (RSM).
Physio-chemical characterization of prepared liposomes and phytosomes.
Formulation and development of an alginate coating method for phytosomal
formulation encapsulation.
To perform in vitro stability of the optimized nano lipid vesicles and alginate coated
beads in simulated gastric and intestinal medium.
Determine the mechanism of release of harpagoside from phytosomes and alginate
coated phytosomes.
Determine the stability of harpagoside in phytosomes and alginate coated phytosomes
at various temperatures over time.
http://etd.uwc.ac.za/
9
Chapter 2
Literature review
2.1 Background
For a very long time, herbal medicine has a topic of global importance, making an impact on
both world health and international trade. Medicinal plants continue to play a central role in
the healthcare system of large proportions of the world‘s population (Akerele, 1988). This is
particularly true in developing countries, where herbal medicine has a long and uninterrupted
history of use. Recognition and development of the medicinal and economic benefits of these
plants are on the increase in both developing and industrialized nations (WHO, 1998).
The WHO estimates that up to 80 percent of people still rely on herbal remedies for their
health care (Mahomoodally, 2013). Several factors are responsible for this, namely, the high
cost of drugs, drug resistance which often lead to treatment failure and expensive treatment of
some chronic diseases which the general populace cannot afford (Afolayan et al., 2004). In
Africa, traditional healers and remedies made from plants play an important role in the health
of millions of people. There are an estimated 200 000 indigenous traditional healers in South
Africa and up to 80 % of South Africans consult these healers, usually in addition to using
modern biomedical services (Xego et al., 2016). It is estimated that over 3000 species of
South African plants are used regularly in traditional medicine and around 38 species are
being exploited commercially which include Harpagophytum procumbens (Kuete, 2013).
2.2 Harpagophytum procumbens
2.2.1 Description
Harpagophytum procumbens (H.procumbens) is a perennial herb belonging to the
pedaliaceae family commonly known as Devil‘s Claw. Other common names include grapple
plant, wood spider, and harpago. The vernacular name, Devil‘s Claw is derived from the fact
that the fruits of the plant are covered in small claw-like protrusions. Similarly, its herbal
name Harpagophytum translates from the Greek ‗harpago‘, which means ‗a grappling hook‘
http://etd.uwc.ac.za/
10
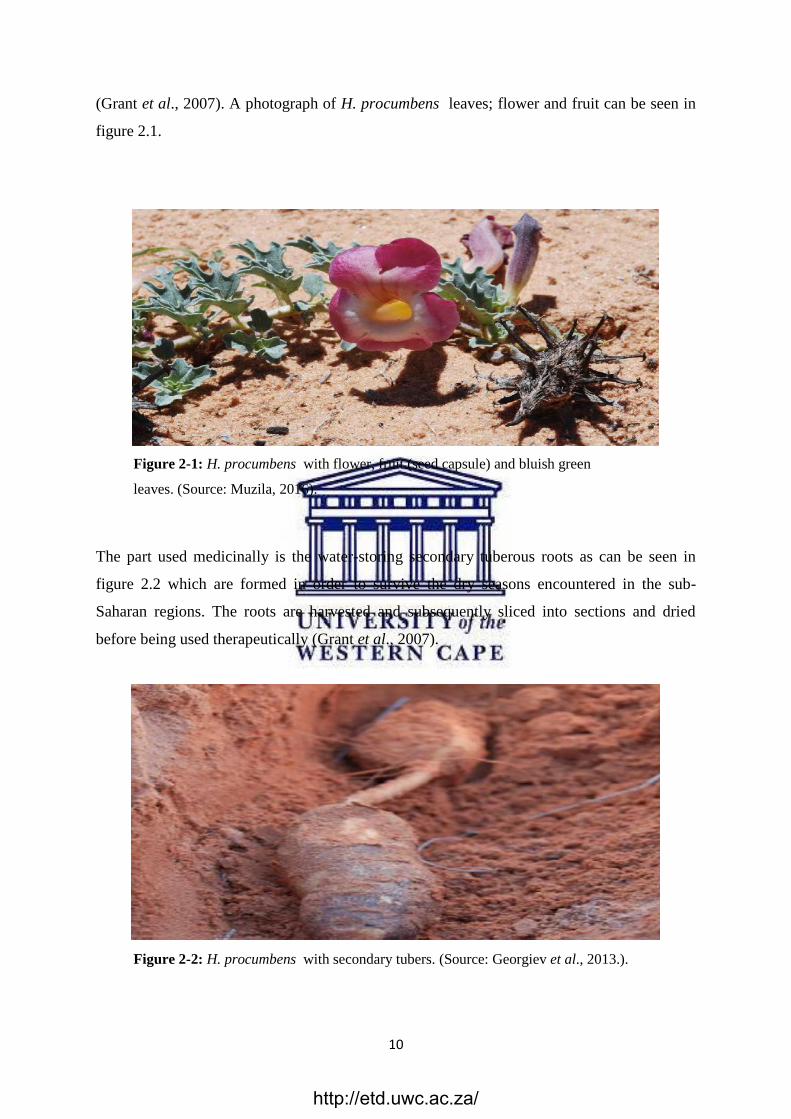
(Grant et al., 2007). A photograph of H. procumbens leaves; flower and fruit can be seen in
figure 2.1.
Figure 2-1: H. procumbens with flower, fruit (seed capsule) and bluish green
leaves. (Source: Muzila, 2016).
The part used medicinally is the water-storing secondary tuberous roots as can be seen in
figure 2.2 which are formed in order to survive the dry seasons encountered in the sub-
Saharan regions. The roots are harvested and subsequently sliced into sections and dried
before being used therapeutically (Grant et al., 2007).
Figure 2-2: H. procumbens with secondary tubers. (Source: Georgiev et al., 2013.).
http://etd.uwc.ac.za/
11
H. procumbens plant tubers have been used by the native population of southern Africa for
treating a number of ailments, including fever, diabetes, diarrhoea and blood diseases (Van
Wyk et al., 2011). More recently, extracts of the secondary roots of the species have been
found to be effective in the treatment of degenerative rheumatoid arthritis, osteoarthritis,
tendonitis, kidney inflammation and heart disease (Georgiev et al., 2010). Therefore H.
procumbens has been increasingly considered an alternative to non-steroidal anti-
inflammatory drugs (Georgiev et al., 2010).
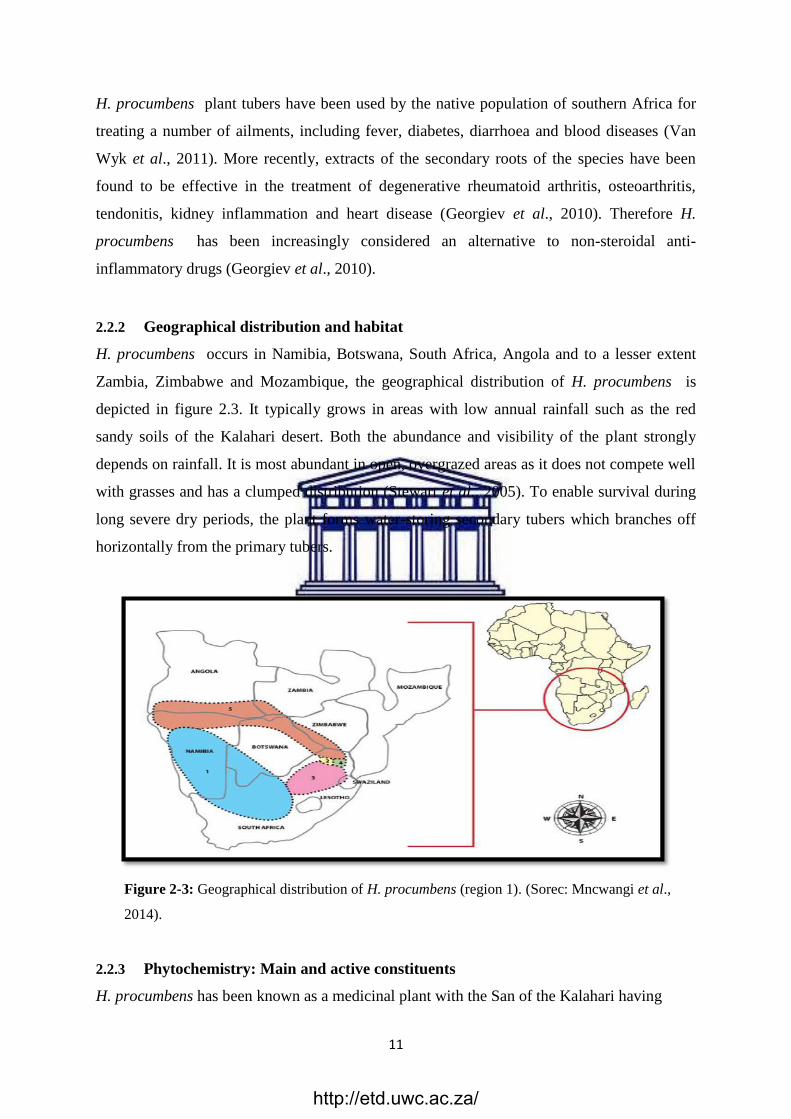
2.2.2 Geographical distribution and habitat
H. procumbens occurs in Namibia, Botswana, South Africa, Angola and to a lesser extent
Zambia, Zimbabwe and Mozambique, the geographical distribution of H. procumbens is
depicted in figure 2.3. It typically grows in areas with low annual rainfall such as the red
sandy soils of the Kalahari desert. Both the abundance and visibility of the plant strongly
depends on rainfall. It is most abundant in open, overgrazed areas as it does not compete well
with grasses and has a clumped distribution (Stewart et al., 2005). To enable survival during
long severe dry periods, the plant forms water-storing secondary tubers which branches off
horizontally from the primary tubers.
Figure 2-3: Geographical distribution of H. procumbens (region 1). (Sorec: Mncwangi et al.,
2014).
2.2.3 Phytochemistry: Main and active constituents
H. procumbens has been known as a medicinal plant with the San of the Kalahari having
http://etd.uwc.ac.za/
12
used it first, many generations ago. The major chemical constituents of Harpagophytum are
iridoid glycosides (primarily harpagoside, harpagide, and procumbide), sugars (mainly the
tetrasaccharide, stachyose), triterpenoids (oleanolic and ursolic acid), phytosterols (primarily
beta-sitosterol), aromatic acids (caffeic, cinnamic, and chlorogenic acids), and flavonoids
such as luteolin and kaempferol (Akhtar et al., 2012). However, the main pharmacological
activity of H. procumbens extracts is attributed to harpagoside, and its content is used to
standardize commercial H. procumbens products, which should contain at least 1.2 % of the
compound. Iridoid glycosides are believed to act synergistically or antagonistically in
modulating the enzymes responsible for inflammation. However, most official monograph
specifications are based on harpagoside content alone (Viljoen et al., 2012).
2.2.4 Clinical usefulness
The European Scientific Cooperative on Phytotherapy (ESCOP) monograph ESCOP
recommends the use of Devil's claw for symptomatic treatment of painful osteoarthritis, relief
of low back pain, loss of appetite, and dyspepsia (Babili et al., 2012). It has also been used as
a folk remedy for the relief of arthritis, lumbago, and muscular pain and has anti-rheumatic
and anti-inflammatory properties (Naidoo et al., 2014). It has been shown to exhibit a variety
of biological activities and used as pharmaceutical products for the treatment of inflammatory
ailments, rheumatoid arthritis, and osteoarthritis (Chrubasik et al., 2007). Several clinical and
animal studies have demonstrated the efficacy of H. procumbens in rheumatic diseases, in
addition to its analgesic properties (Andersen et al., 2004). Several investigations have also
found that extracts have good anti-inflammatory and analgesic activities in carrageenan-
induced acute inflammation (Dimitrova et al., 2013).
A standardized extract of H. procumhens has been shown to alleviate rheumatic pain
(Chrubasik et al., 2000). Preparations are also used in the treatment of osteoarthritis (OA)
(Saanders et al., 2011; Chrubasik et al., 2007). A recent study by Gyourkovska, et al. (2011)
reported anti-inflammatory action by several fractions as well as pure compounds of this
extract.
2.2.5 Pharmacological effect as anti-inflammatory
H. procumbens has anti-inflammatory effects (Viljoen et al., 2012) through a variety of
mechanisms for inflammation. The main mechanism is by inhibiting the release of different
pro-inflammatory mediators. A review of clinical trials utilizing its preparations for the
http://etd.uwc.ac.za/
13
treatment of inflammatory disorders shows that extracts from tubers of H. procumbens also
inhibit different pro-inflammatory mediators; suppressed the release of TNF-α (tumor
necrosis factor gene), IL-6 and IL-8 (interleukins genes expression), in LPS-stimulated
monocytic THP-1 cells at non-cytotoxic concentrations, thereby inhibiting inflammation (50-
250 μg/ml) (Hostanska et al., 2014). Extracts tested on isolated murine macrophages, has
shown strong anti-inflammatory properties related to nitric oxide (NO) and cytokine (TNF-a
and IL-6) release as well as COX-1 and COX-2 inhibition expression by macrophages
(Gyurkovska et al., 2011). Ebrahim and Eubel, (2011) demonstrated direct inhibition of
COX-2 enzyme by H. procumbens extract and its active components namely, harpagoside
and harpagide.
2.2.6 Dosage forms
H. procumbens was first administered as an infusion but currently it is almost exclusively
supplied as an ethanol tincture or as a dry extract in tablet or capsule form (Grant et al.,
2007). However, the dried extract is generally more acceptable than the solution form, but it
may also have further disadvantages. For instance, the dried extract powder may not have
uniform particle size, adequate flow characteristics and might be hygroscopic. Further, it has
been proposed that stomach digestion influences the pharmacological activity of H.
procumbens. Some studies have indicated that the analgesic and anti-inflammatory effects of
H. procumbens are decreased by the acidity of stomach due to acid hydrolysis or denaturing
of the active principles (Bone et al., 2013; Soulimani et al., 1994). Catelan et al. reported
that the intraperitoneal administration of H. procumbens extracts administered to rats 30 min
prior to carrageenan injection exerted inhibitory effects on the acute inflammatory response.
More importantly, they observed it was ineffective to reduce the intensity of inflammatory
response when administered orally (Catelan et al., 2006).
The delivery of plant/herbal therapeutic molecules is problematic due to poor solubility, poor
permeability, low bioavailability, instability in biological milieu and extensive first pass
metabolism. These limitations of herbal drugs can be overcome by attaching or encapsulating
them with suitable nanomaterials. The nanomaterials can significantly enhance the
pharmacokinetics and therapeutic index of plant drugs. Targeted delivery and combination
therapy can drastically improve the performance of herbal drugs (Kumari et al., 2012).
http://etd.uwc.ac.za/
14
2.3 Intestinal absorption
The most desirable route of administration for therapeutic agents is oral; as it avoids pain and
risk of infection associated with parenteral administration and thereby increases patient
compliance. However most of the orally administered drugs display low systemic availability
and diminished efficacy (Gavhane et al., 2012). As for the drug absorption after oral
administration, the gastrointestinal (GI) transit of a drug is an important factor to determine
the drug absorption (Kimura et al., 2002). The luminal environment is complex, and drug
absorption may be affected by several physiological factors, including volume and viscosity
of the gastrointestinal fluids, the pH and buffer capacity of these fluids. These can vary
greatly in different regions of the gastrointestinal (GI) tract (Fadda et al., 2010). One
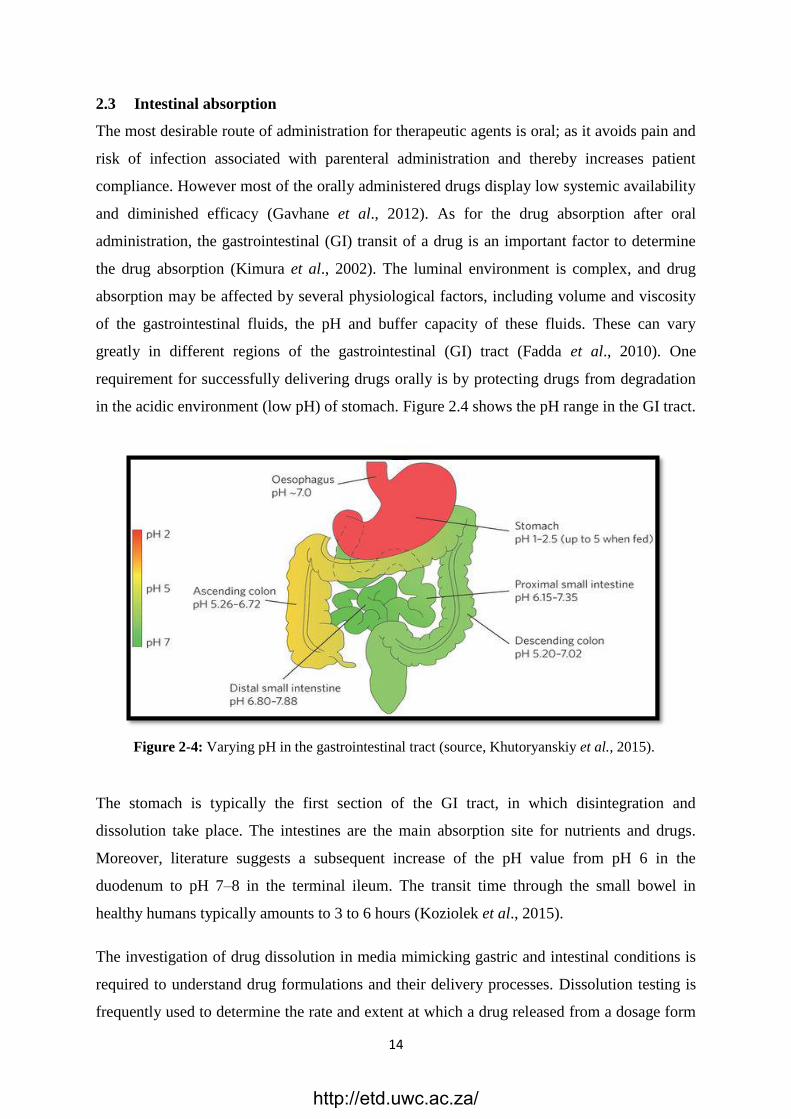
requirement for successfully delivering drugs orally is by protecting drugs from degradation
in the acidic environment (low pH) of stomach. Figure 2.4 shows the pH range in the GI tract.
Figure 2-4: Varying pH in the gastrointestinal tract (source, Khutoryanskiy et al., 2015).
The stomach is typically the first section of the GI tract, in which disintegration and
dissolution take place. The intestines are the main absorption site for nutrients and drugs.
Moreover, literature suggests a subsequent increase of the pH value from pH 6 in the
duodenum to pH 7–8 in the terminal ileum. The transit time through the small bowel in
healthy humans typically amounts to 3 to 6 hours (Koziolek et al., 2015).
The investigation of drug dissolution in media mimicking gastric and intestinal conditions is
required to understand drug formulations and their delivery processes. Dissolution testing is
frequently used to determine the rate and extent at which a drug released from a dosage form
http://etd.uwc.ac.za/
15
and it plays many important roles throughout drug product development (Fang et al., 2010).
Drug dissolution in the physiological environment of the GI tract is the primary step in the
oral absorption process from a pharmaceutical dosage form.
During drug dosage form development it is essential to investigate factors which influence
absorption especially after oral administration (Dressman et al., 2000). Simulation of
gastrointestinal conditions is essential to adequately predict the in vivo performance of drug
formulations. In vitro dissolution tests should mimic a drug performance in a human proximal
gastrointestinal tract (GIT). To establish reliable in vitro testing it is important that artificial
environments simulate physiological conditions as closely as possible. The level of the
simulation is dependent on many factors related to equipment and simulated medium
(Gruberova et al., 2017).
2.3.1 Simulated Gastric Fluid (SGF)
SGF is a traditional medium to simulate gastric conditions. This synthetic fluid will mimic
the effect of the gastric juice in the stomach on a particular drug. This medium contains
hydrochloric acid and sodium chloride and water, and has a pH of 1.2. Drugs made for
dissolution and disintegration in the small intestine must not disintegrate or dissolve in the in
the Simulated Gastric Fluid (SGF). On the other hand, drugs designed to act in the stomach
will dissolve in this synthetic solution of Simulated Gastric Fluid (SGF) (Klein, 2010).
2.3.2 Simulated Intestinal Fluid (SIF)
SIF is an artificial dissolution medium form of intestinal solution for the simulation of small
intestinal (SI) conditions. It is used to predict the in vivo behaviour of drug formulations
when administered orally (Klein, 2010). The extent to which the analysed pharmaceutical
dissolves and releases it actives in the simulated intestinal is a good indicator of how the
pharmaceutical will be available for absorption into the system from the villi in the intestine.
Simulated gastric fluid (SGF) and simulated intestinal fluid (SIF) are widely used media in
dissolution tests in the pharmaceutical industry to mimic the natural environment in which
the dosage forms will be administered and to evaluate the predictive capability of a
dissolution test. More commonly SGF and SIF media are prepared and utilized in dissolution
tests without enzymes (Medina et al., 2017).
http://etd.uwc.ac.za/
16
2.4 Nanotechnology
Nanotechnology is defined as the intentional design, characterization, production and
application of materials, structures, devices, and systems by controlling their size and shape
in the nanoscale range (Solano-Umaña et al., 2015). Nanotechnology plays a central role in
the recent technological advances in the areas of disease diagnosis, drug design and drug
delivery and could overcome challenges such as drug toxicity, sustaining the release of drugs
in the body and improving bioavailability. Drugs, which are water insoluble and unstable in
the biological environment, may be delivered properly with nanotechnology. Nanostructures
can protect drugs from hydrolytic and enzymatic degradation (Caban et al., 2014). They also
prevent drugs from first-pass metabolism and increase the blood residence time. They can
penetrate tissues efficiently due to their reduced size. In addition, drugs which are produced
at nanoscale may pass biological barriers (Caban et al., 2014). Nanostructures exhibit unique
physicochemical and biological properties (e.g., an enhanced reactive area as well as an
ability to cross cell and tissue barriers) due to their small sizes, which make them a
favourable material for biomedical applications (Abhinav et al., 2016). Various approaches
such as liposomes, niosomes, nanoemulsions, phytosome etc., are used for the enhancement
of bioavailability (Abhinav et al., 2016).
2.5 Lipid-based drug delivery systems
Lipid based drug delivery systems (LDDS) consists of a diverse group of formulations, each
consisting of varying functional and structural properties that are amenable to modifications
achieved by varying the composition of lipid excipients and other additives. Generally, most
lipid drug delivery systems used as drug carriers have high stability, high carrier capacity,
feasible for incorporating into both hydrophilic and hydrophobic substances and variable
routes of administration, including oral, topical, parenteral and pulmonary routes (Chime et
al., 2013).
Lipids have gained much interest as carriers for the delivery of drugs with poor water
solubility (Pouton, 2006). The availability of novel lipid excipients with acceptable
regulatory and safety profiles coupled with their ability to enhance oral bioavailability has
helped in the development of lipid based formulations as a means for drug delivery
Lipid-based formulations, in many cases may reduce or eliminate the influence of food on the
absorption of these drugs (Shrestha et al., 2014). Despite this, marketed oral drug products
http://etd.uwc.ac.za/
17
employing lipid-based formulations are currently outnumbered 25 to 1 by conventional
formulations (Shrestha et al., 2014).
Lipid-based formulations can be applied to influence the absorption of active ingredients
through different mechanisms, such as modifying the release of active ingredients, improving
their bioavailability and stability, changing the composition and character of the intestinal
environment, stimulating the lymphatic transport of active ingredients, and interact with
enterocyte-based transport processes and reducing unwanted drug side effects (Fricker et al.,
2010).
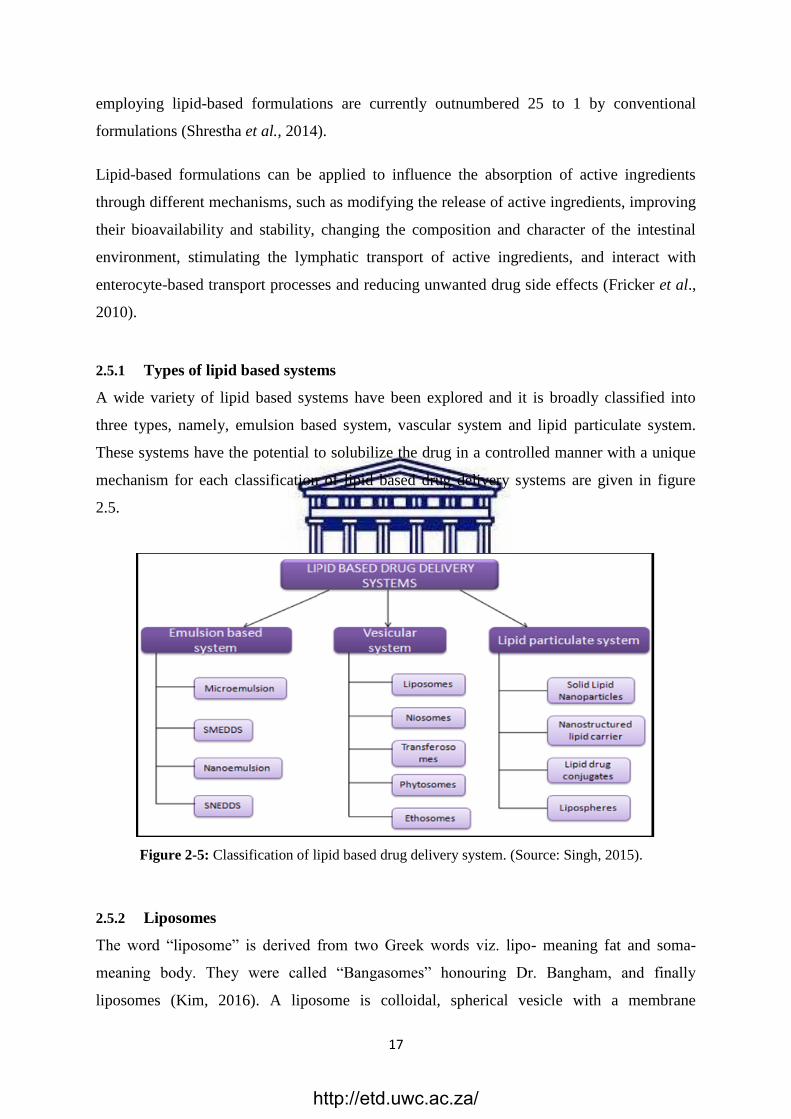
2.5.1 Types of lipid based systems
A wide variety of lipid based systems have been explored and it is broadly classified into
three types, namely, emulsion based system, vascular system and lipid particulate system.
These systems have the potential to solubilize the drug in a controlled manner with a unique
mechanism for each classification of lipid based drug delivery systems are given in figure
2.5.
Figure 2-5: Classification of lipid based drug delivery system. (Source: Singh, 2015).
2.5.2 Liposomes
The word ―liposome‖ is derived from two Greek words viz. lipo- meaning fat and soma-
meaning body. They were called ―Bangasomes‖ honouring Dr. Bangham, and finally
liposomes (Kim, 2016). A liposome is colloidal, spherical vesicle with a membrane
http://etd.uwc.ac.za/
18
composed of a phospholipid bilayer used to deliver drug or genetic material into a cell.
Liposomes were first produced in England in 1961 by Alec D. Bangham, who found that
phospholipids combined with water immediately and formed a sphere because one end of
each molecule is hydrophilic, while the opposite end is hydrophobic. Water soluble
medications added to the water were trapped inside the aggregation of hydrophobic ends
while fat-soluble medications were incorporated into the phospholipid layer (Shailesh et al.,
2009).
Liposomes are the most common and well-investigated nanocarriers for targeted drug
delivery. They have improved therapies for a range of biomedical applications by stabilizing
therapeutic compounds, overcoming obstacles to cellular and tissue uptake, and improving
biodistribution of compounds to target sites in vivo (Ding et al., 2006; Hua et al., 2013).
As a drug delivery system, liposomes offer several advantages including biocompatibility,
biodegradability, low toxicity, capacity for self-assembly, ability to trap both hydrophilic and
lipophilic drugs, and a wide range of physicochemical and biophysical properties that can be
modified to control their biological characteristics (Akbarzadeh et al., 2013).
2.5.2.1 Preparation of liposomes
There are several methods for the preparation of liposomes: thin film hydration method, ether
injection method, reverse phase evaporation method, lyophilization method. The type of
preparation method influences the properties of liposomes, including their shape, size,
stability and drug loading efficiency (Akhtar, 2014).
2.5.2.1.1 Thin-film hydration method
One of the most widely used techniques for liposome manufacturing is the thin-film
hydration or Bangham method. Briefly, as represented in figure 2.6, this method involves
dissolving the lipids in an organic solvent, evaporation of the solvent under reduced pressure
to produce a thin film of lipids, and the hydration of the obtained lipid film in aqueous media.
The drug to be entrapped can be included in the aqueous media (for hydrophilic drugs) or in
the lipid film (for lipophilic drugs). However, this method produces large and
nonhomogeneous multi lamellar vesciles (MLVs) that require sonication or extrusion
processes to produce homogeneous small unilamelar vesicles (ULVs) (Bozzuto et al., 2015).
http://etd.uwc.ac.za/
19
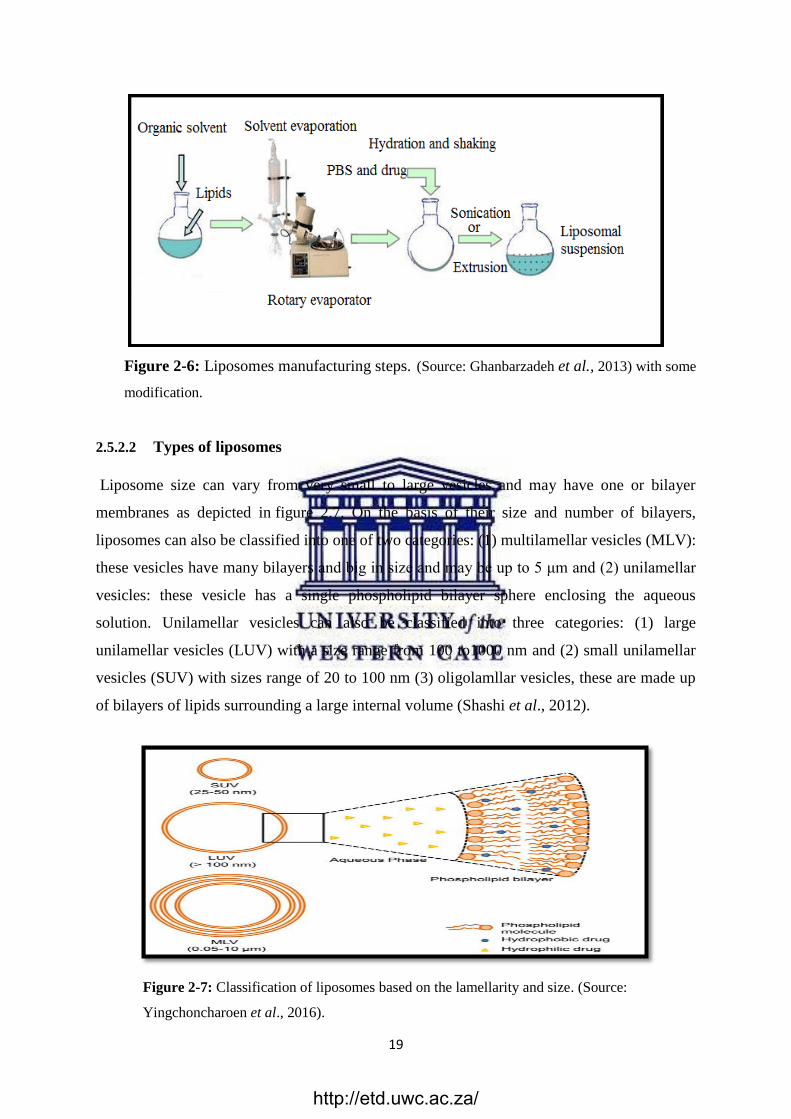
Figure 2-6: Liposomes manufacturing steps. (Source: Ghanbarzadeh et al., 2013) with some
modification.
2.5.2.2 Types of liposomes
Liposome size can vary from very small to large vesicles and may have one or bilayer
membranes as depicted in figure 2.7. On the basis of their size and number of bilayers,
liposomes can also be classified into one of two categories: (1) multilamellar vesicles (MLV):
these vesicles have many bilayers and big in size and may be up to 5 μm and (2) unilamellar
vesicles: these vesicle has a single phospholipid bilayer sphere enclosing the aqueous
solution. Unilamellar vesicles can also be classified into three categories: (1) large
unilamellar vesicles (LUV) with a size range from 100 to1000 nm and (2) small unilamellar
vesicles (SUV) with sizes range of 20 to 100 nm (3) oligolamllar vesicles, these are made up
of bilayers of lipids surrounding a large internal volume (Shashi et al., 2012).
Figure 2-7: Classification of liposomes based on the lamellarity and size. (Source:
Yingchoncharoen et al., 2016).
http://etd.uwc.ac.za/
20
2.5.3 Phytosomes
The term phyto means plant while some means cell-like (Sharma et al., 2016). Phytosome
structures contain the active ingredients of the herb surrounded by the phospholipids.
Phytosomes are advanced forms of herbal products that are better absorbed, utilized, and as a
result produce better results than conventional herbal extracts (Shelke, 2012). Phytosomes
protect valuable component of herbal extracts from destruction by digestive secretion,
demonstrates better absorption which produces better bioavailability and improved
pharmacological parameters than conventional herbal extracts (Pawar et al., 2015). In
phytosomes, the complex of phospholipids and water soluble active plant components
involve chemical bond formation and therefore becomes more stable (Nayyer et al., 2015).
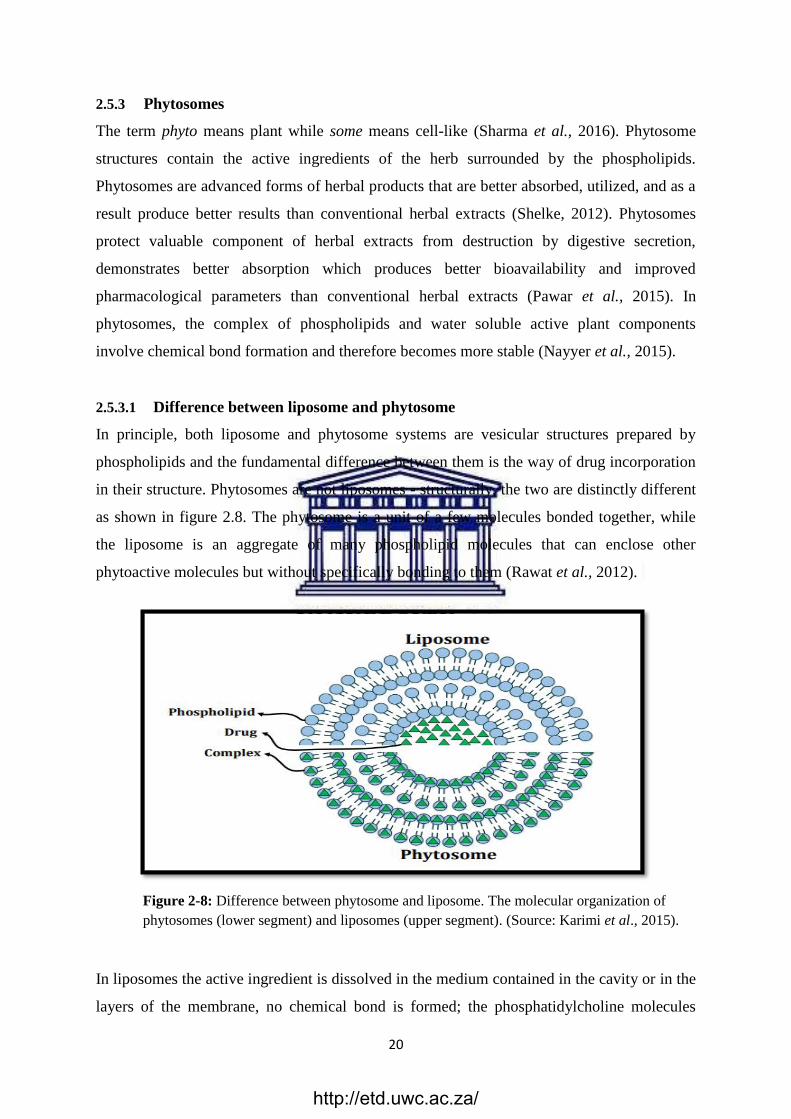
2.5.3.1 Difference between liposome and phytosome
In principle, both liposome and phytosome systems are vesicular structures prepared by
phospholipids and the fundamental difference between them is the way of drug incorporation
in their structure. Phytosomes are not liposomes - structurally, the two are distinctly different
as shown in figure 2.8. The phytosome is a unit of a few molecules bonded together, while
the liposome is an aggregate of many phospholipid molecules that can enclose other
phytoactive molecules but without specifically bonding to them (Rawat et al., 2012).
Figure 2-8: Difference between phytosome and liposome. The molecular organization of
phytosomes (lower segment) and liposomes (upper segment). (Source: Karimi et al., 2015).
In liposomes the active ingredient is dissolved in the medium contained in the cavity or in the
layers of the membrane, no chemical bond is formed; the phosphatidylcholine molecules
http://etd.uwc.ac.za/
21
collectively surround the water-soluble substance (Rawat et al., 2012). There may be
hundreds or even thousands of phosphatidylcholine molecules surrounding the water-soluble
compound. In contrast, with the phytosome it is an integral part of the membrane, being the
molecules anchored through chemical bonds to the polar head of the phospholipid. The
phosphatidylcholine and the individual plant components actually a 1:1 or a 2:1 complex
depending on the substance. Unlike liposome, chemical bonds are formed between
phosphatidylcholine molecule and phytoconstituent, so the phytosomes show better stability
profile (Rani et al., 2007).
2.5.3.2 Preparation of phytosomes
Phytosomes are formulated by the processes in which the standardized extract of active
ingredient are bound to phospholipid like phosphatidylcholine (PC),
phosphatidylethanolamin or phosphatidylserine through a polar end (Amit et al., 2013).
Phytosomes are prepared by one of the following methods: anti-solvent precipitation
technique, rotary evaporation technique, solvent evaporation technique, ether injection
technique (Udapurkar et al. 2016).
In recent years, a variety of phospholipid-related formulations (phytosomes and liposomes)
have been reported to increase the bioavailability of poor lipid soluble extracts by increasing
the absorption in gastrointestinal tract. Phytosome has been effectively used to enhance the
bioavailability of many popular herbal extracts or active molecules as Silybin, Ginseng,
Grape seed, Curcumin and olive oil (Prasad et al., 2016; Dewan et al., 2016). Liposome has
been effectively used to enhance the bioavailability of many popular herbal extracts or active
molecules as Artemisia, Catechin, Querectine and Myrtus communis (Thapa et al., 2013;
Sharma, 2014).
2.5.4 Structural components of lipid based drug delivery systems
There are a number of the structural and non-structural components of lipid based
formulations. The major structural components of lipid based drug delivery system are:
2.5.4.1 Phospholipids
Phospholipids are amphiphilic molecules, consisting of hydrophobic tails and a hydrophilic
head. The hydrophilic head contains the negatively charged phosphate group, and may
contain other polar groups. The hydrophobic tail usually consists of long fatty acid
http://etd.uwc.ac.za/
22
hydrocarbon chains (Suriyakala et al., 2014). When placed in water, they form various
structures depending on their specific properties. Mostly, they form micelles or are organized
as lipid bilayers with the hydrophobic tails lined up against one another and the hydrophilic
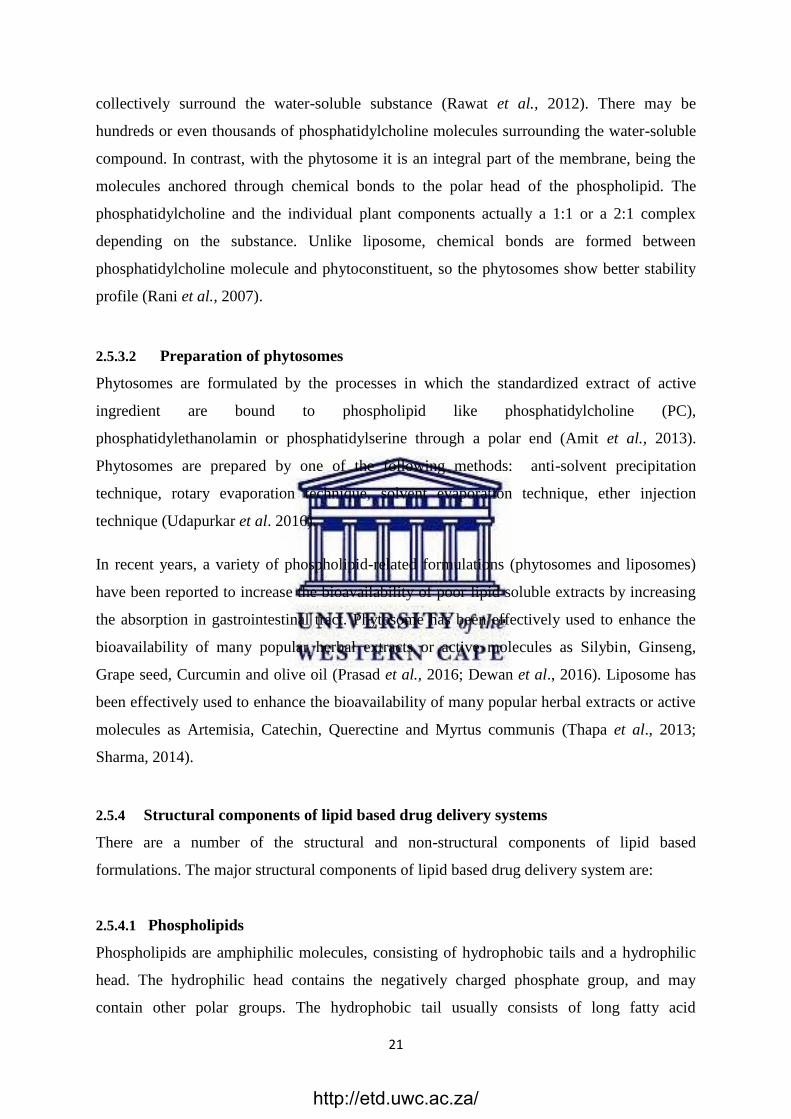
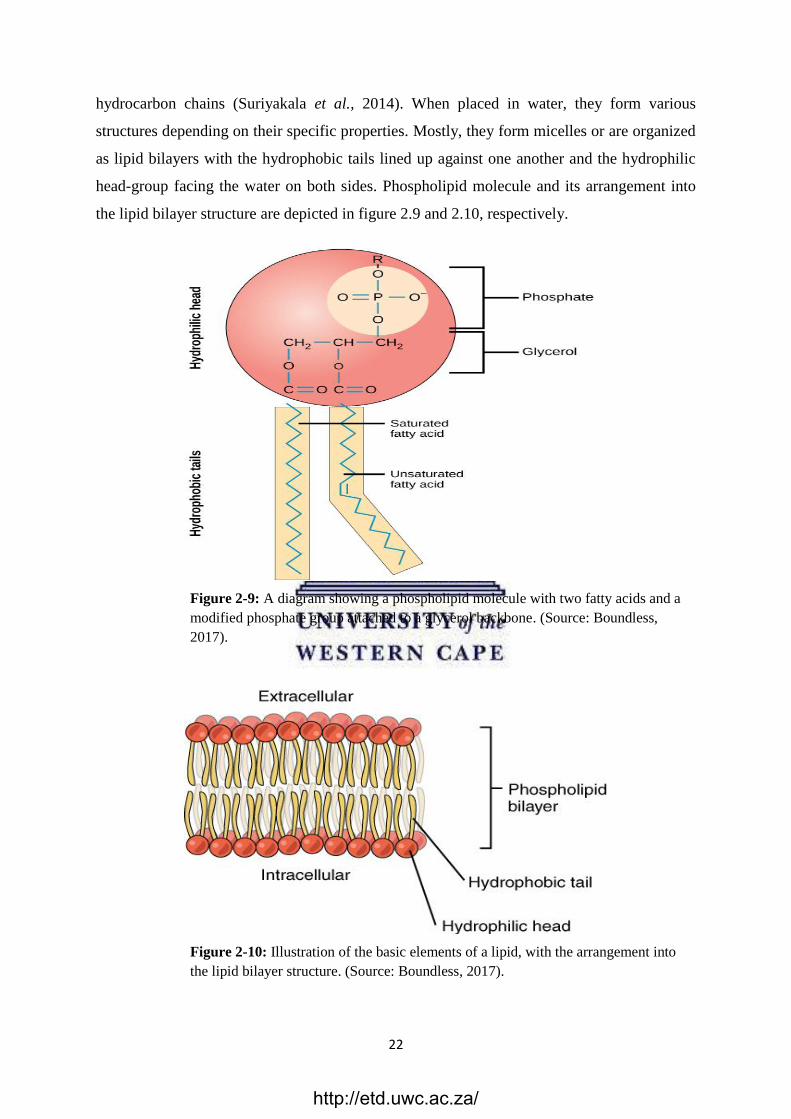
head-group facing the water on both sides. Phospholipid molecule and its arrangement into
the lipid bilayer structure are depicted in figure 2.9 and 2.10, respectively.
Figure 2-9: A diagram showing a phospholipid molecule with two fatty acids and a
modified phosphate group attached to a glycerol backbone. (Source: Boundless,
2017).
Figure 2-10: Illustration of the basic elements of a lipid, with the arrangement into
the lipid bilayer structure. (Source: Boundless, 2017).
http://etd.uwc.ac.za/
23
Glycerol containing phospholipids are most commonly used component of liposome
formulation and represent more than 50 % of weight of lipid in biological membranes. These
are derived from phosphatidic acid. The back bone of the molecule is the phosphoric ester of
glycerol (Anwekar et al., 2011). One of the OH groups of phosphoric acid may be further
esterified to a wide range of organic alcohols including glycerol, choline, ethanolamine,
serine and inositol. Examples of phospholipids are phosphatidylcholine (PC), phosphatidyl
ethanolamine (PE), phosphatidyl serine (PS), phosphatidyl inositol (PI), and phosphatidyl
glycerol (PG) for stable liposomes, saturated fatly acids are used. Unsaturated fatty acids are
not used generally (Anwekar et al., 2011).
2.5.4.1.1 Phosphatidylcholine (PC)
The commonly used lipid phase substances for producing liposomes and phytosomes are
phospholipids from soy, and mainly phosphatidylcholine (PC) (Choubey, 2011). Soybean
phosphatidylcholine (SPC) has been clinically available for several decades due to its
biocompatibility, biodegradability, metabolic activity, and low toxicity compared to its
synthetic alternatives. These abundant characteristics make SPC an attractive candidate for
production of pharmaceutical dosage forms (Hou et al., 2012).
Phosphatidylcholine is miscible in both water and lipid environment and well absorbed when
taken orally. It has two polar and non-polar portions where, the polar head of PC, choline,
interacts with phytoconstituents by creation of an H-band between phosphatidylcholine‘s
phosphate group and hydroxyl group of phytoconstituents. Due to the chemical bond between
the H-band of PC and phytoconstituents, phytosomes show better physical stability which
enhances absorption of hydrophilic polar phytoconstituents resulted in enhanced
bioavailability and greater therapeutic benefits (Bhattacharya, 2009).
2.5.4.1.2 Lecithin
Lecithin (phosphatidylcholine) is a generic term which is used to designate a yellow
brownish fatty substance present in animal or plant tissue composed of phospholipids,
phosphoric acid, triglyceride, glycolipids, etc. Lecithin is extracted from sources such as soya
beans, eggs, milk, marine sources, rapeseed, cottonseed and sunflower chemically by using
hexane, ethanol, etc. Lecithin has emulsification and lubricant properties (Tiwari, 2013).
http://etd.uwc.ac.za/
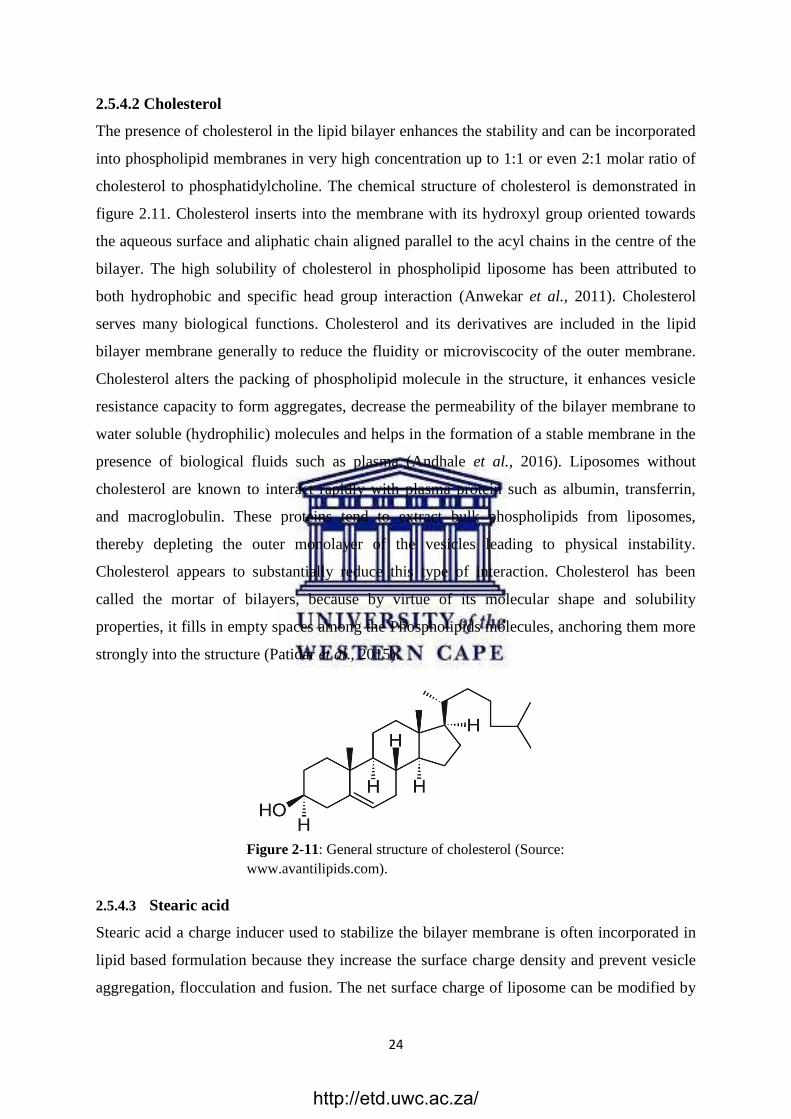
24
2.5.4.2 Cholesterol
The presence of cholesterol in the lipid bilayer enhances the stability and can be incorporated
into phospholipid membranes in very high concentration up to 1:1 or even 2:1 molar ratio of
cholesterol to phosphatidylcholine. The chemical structure of cholesterol is demonstrated in
figure 2.11. Cholesterol inserts into the membrane with its hydroxyl group oriented towards
the aqueous surface and aliphatic chain aligned parallel to the acyl chains in the centre of the
bilayer. The high solubility of cholesterol in phospholipid liposome has been attributed to
both hydrophobic and specific head group interaction (Anwekar et al., 2011). Cholesterol
serves many biological functions. Cholesterol and its derivatives are included in the lipid
bilayer membrane generally to reduce the fluidity or microviscocity of the outer membrane.
Cholesterol alters the packing of phospholipid molecule in the structure, it enhances vesicle
resistance capacity to form aggregates, decrease the permeability of the bilayer membrane to
water soluble (hydrophilic) molecules and helps in the formation of a stable membrane in the
presence of biological fluids such as plasma (Andhale et al., 2016). Liposomes without
cholesterol are known to interact rapidly with plasma protein such as albumin, transferrin,
and macroglobulin. These proteins tend to extract bulk phospholipids from liposomes,
thereby depleting the outer monolayer of the vesicles leading to physical instability.
Cholesterol appears to substantially reduce this type of interaction. Cholesterol has been
called the mortar of bilayers, because by virtue of its molecular shape and solubility
properties, it fills in empty spaces among the Phospholipids molecules, anchoring them more
strongly into the structure (Patidar et al., 2015).
Figure 2-11: General structure of cholesterol (Source:
www.avantilipids.com).
2.5.4.3 Stearic acid
Stearic acid a charge inducer used to stabilize the bilayer membrane is often incorporated in
lipid based formulation because they increase the surface charge density and prevent vesicle
aggregation, flocculation and fusion. The net surface charge of liposome can be modified by
http://etd.uwc.ac.za/
25
the incorporation of charge inducers such as stearic acid and other compounds such as
stearylamine, cetylpyridinium chloride, sodium de oxycholate, phosphatidic acid and
dicethylphosphate (Nimmathota, 2016; Junyaprasert et al., 2008; Khan et al., 2017;
Thulasiramaraju et al., 2012).
An appropriate selection of lipid vehicles, formulation strategies and rational delivery system
design can lead to the success of lipid based drug delivery systems (Kalepu et al., 2013).
2.5.5 Characterization of liposomes and phytosomes
The behaviour of phytosomes in both physical and biological systems is governed by factors
such as size, membrane permeability, percentage entrapped, chemical composition as well as
the quantity and purity of the starting materials. Therefore, the phytosomes are characterized
for physical attributes i.e. shape, size, its distribution, percentage drug capture, percentage
drug release and chemical composition (Jain et al., 2010). In order to assess the liposome and
phytosomes to obtain quantitative measures that allow comparison between different lipid
vesicles formulations, various parameters can be examined.
1) Morphology: The shape of lipid vesicles can be seen using Transmission and
Scanning Electron Microscopy (TEM) and techniques (Ravi et al., 2015; Dewan et al., 2016).
2) Particle size and size distribution: The improved drug bioavailability of
nanoparticles is attributed to the fact that particles in the nano-size range are efficient in
crossing permeability barriers (Pandey et al., 2005). The size of the vesicle governs the in
vivo fate of lipid vesicles, because it determines the fraction cleared by the reticulo-
endithelial system (RES) (Sharma et al., 2016). Several techniques are available for assessing
submicrometer size and polydispersity index which include microscopy techniques, size
exclusion chromatography (SEC), field-flow fractionation and static or dynamic light
scattering (Laouini et al., 2012).
3) Zeta Potential: The zeta potential (ZP) indicates the overall charge a particle
acquired in a specific medium. Stability of nanodispersion during storage can be predicted
from the zeta potential value. The zeta potential indicates the degree of repulsion between
close and similarly charged particles in the dispersion. High zeta potential indicates highly
charged particles. Generally, high zeta potential (negative or positive) prevents aggregation
http://etd.uwc.ac.za/
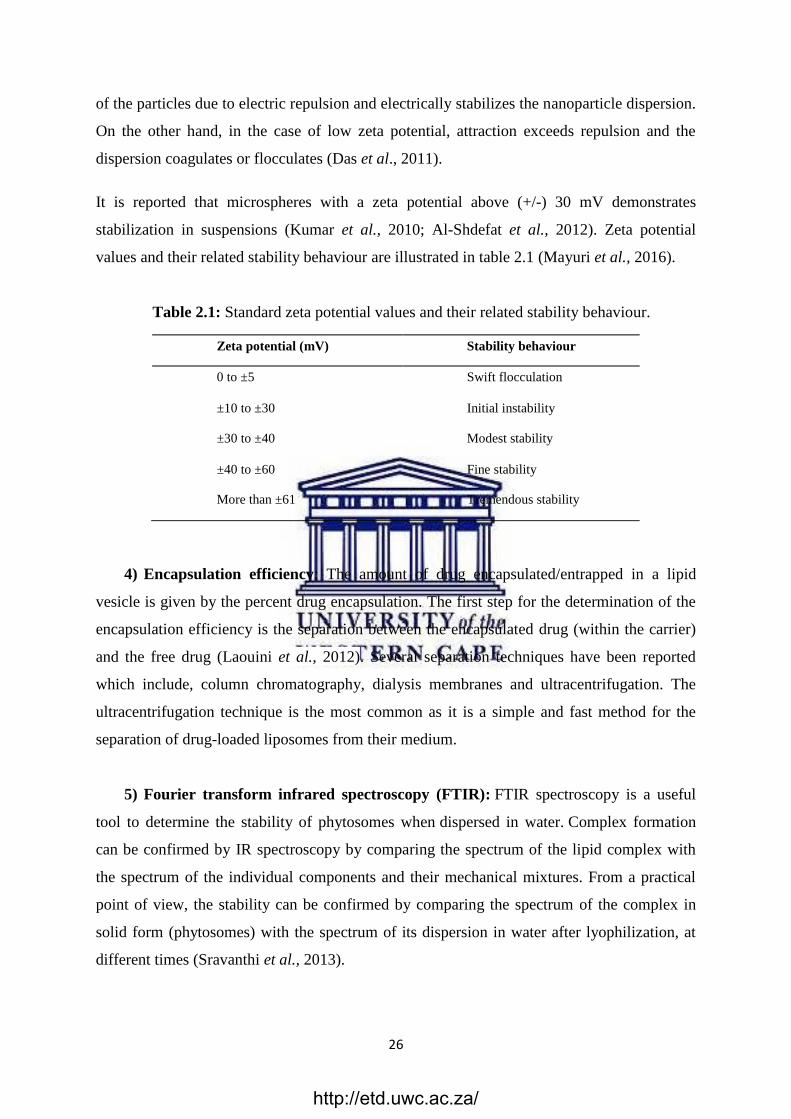
26
of the particles due to electric repulsion and electrically stabilizes the nanoparticle dispersion.
On the other hand, in the case of low zeta potential, attraction exceeds repulsion and the
dispersion coagulates or flocculates (Das et al., 2011).
It is reported that microspheres with a zeta potential above (+/-) 30 mV demonstrates
stabilization in suspensions (Kumar et al., 2010; Al-Shdefat et al., 2012). Zeta potential
values and their related stability behaviour are illustrated in table 2.1 (Mayuri et al., 2016).
Table 2.1: Standard zeta potential values and their related stability behaviour.
Zeta potential (mV) Stability behaviour
0 to ±5 Swift flocculation
±10 to ±30 Initial instability
±30 to ±40 Modest stability
±40 to ±60 Fine stability
More than ±61 Tremendous stability
4) Encapsulation efficiency: The amount of drug encapsulated/entrapped in a lipid
vesicle is given by the percent drug encapsulation. The first step for the determination of the
encapsulation efficiency is the separation between the encapsulated drug (within the carrier)
and the free drug (Laouini et al., 2012). Several separation techniques have been reported
which include, column chromatography, dialysis membranes and ultracentrifugation. The
ultracentrifugation technique is the most common as it is a simple and fast method for the
separation of drug-loaded liposomes from their medium.
5) Fourier transform infrared spectroscopy (FTIR): FTIR spectroscopy is a useful
tool to determine the stability of phytosomes when dispersed in water. Complex formation
can be confirmed by IR spectroscopy by comparing the spectrum of the lipid complex with
the spectrum of the individual components and their mechanical mixtures. From a practical
point of view, the stability can be confirmed by comparing the spectrum of the complex in
solid form (phytosomes) with the spectrum of its dispersion in water after lyophilization, at
different times (Sravanthi et al., 2013).
http://etd.uwc.ac.za/
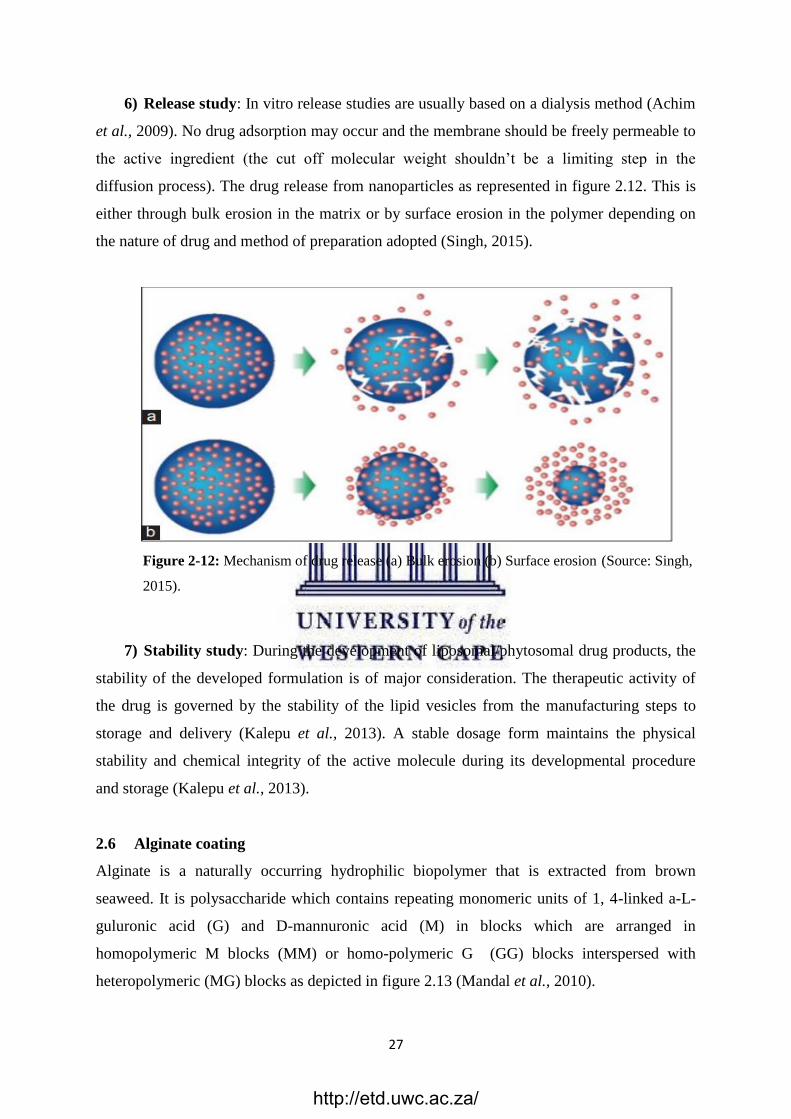
27
6) Release study: In vitro release studies are usually based on a dialysis method (Achim
et al., 2009). No drug adsorption may occur and the membrane should be freely permeable to
the active ingredient (the cut off molecular weight shouldn‘t be a limiting step in the
diffusion process). The drug release from nanoparticles as represented in figure 2.12. This is
either through bulk erosion in the matrix or by surface erosion in the polymer depending on
the nature of drug and method of preparation adopted (Singh, 2015).
Figure 2-12: Mechanism of drug release (a) Bulk erosion (b) Surface erosion (Source: Singh,
2015).
7) Stability study: During the development of liposomal/phytosomal drug products, the
stability of the developed formulation is of major consideration. The therapeutic activity of
the drug is governed by the stability of the lipid vesicles from the manufacturing steps to
storage and delivery (Kalepu et al., 2013). A stable dosage form maintains the physical
stability and chemical integrity of the active molecule during its developmental procedure
and storage (Kalepu et al., 2013).
2.6 Alginate coating
Alginate is a naturally occurring hydrophilic biopolymer that is extracted from brown
seaweed. It is polysaccharide which contains repeating monomeric units of 1, 4-linked a-L-
guluronic acid (G) and D-mannuronic acid (M) in blocks which are arranged in
homopolymeric M blocks (MM) or homo-polymeric G (GG) blocks interspersed with
heteropolymeric (MG) blocks as depicted in figure 2.13 (Mandal et al., 2010).
http://etd.uwc.ac.za/
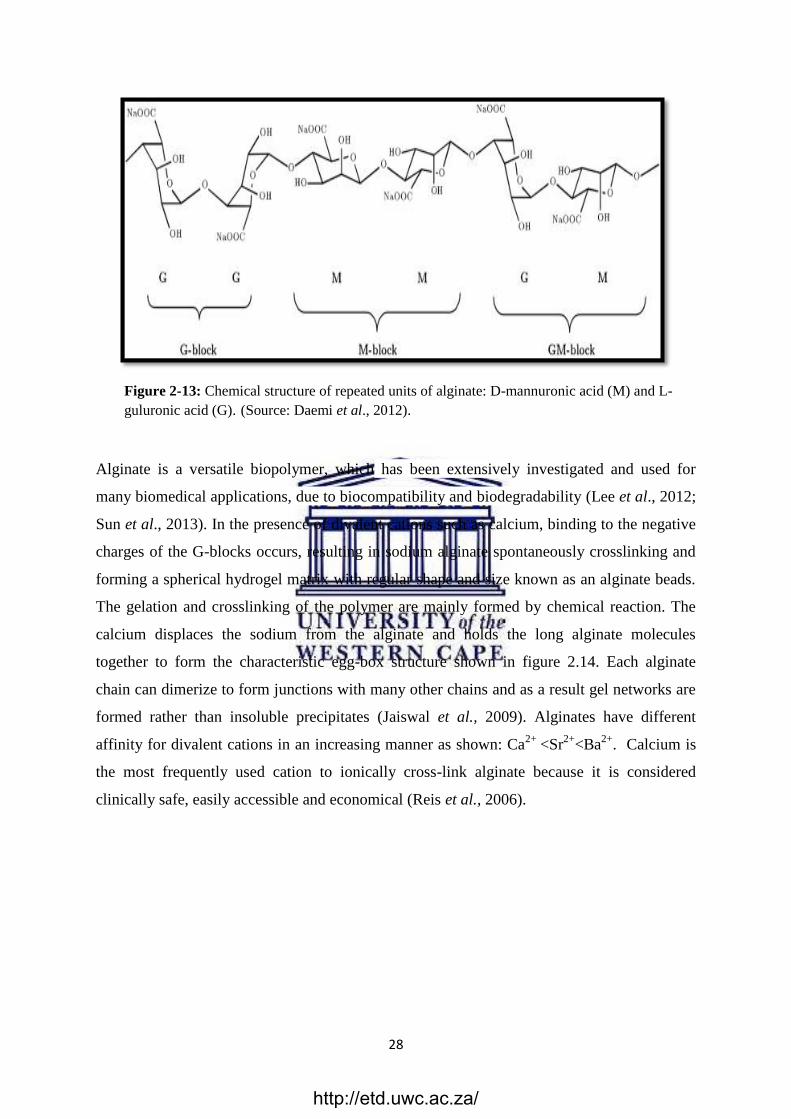
28
Figure 2-13: Chemical structure of repeated units of alginate: D-mannuronic acid (M) and L-
guluronic acid (G). (Source: Daemi et al., 2012).
Alginate is a versatile biopolymer, which has been extensively investigated and used for
many biomedical applications, due to biocompatibility and biodegradability (Lee et al., 2012;
Sun et al., 2013). In the presence of divalent cations such as calcium, binding to the negative
charges of the G-blocks occurs, resulting in sodium alginate spontaneously crosslinking and
forming a spherical hydrogel matrix with regular shape and size known as an alginate beads.
The gelation and crosslinking of the polymer are mainly formed by chemical reaction. The
calcium displaces the sodium from the alginate and holds the long alginate molecules
together to form the characteristic egg-box structure shown in figure 2.14. Each alginate
chain can dimerize to form junctions with many other chains and as a result gel networks are
formed rather than insoluble precipitates (Jaiswal et al., 2009). Alginates have different
affinity for divalent cations in an increasing manner as shown: Ca2+
<Sr2+
<Ba2+
. Calcium is
the most frequently used cation to ionically cross-link alginate because it is considered
clinically safe, easily accessible and economical (Reis et al., 2006).
http://etd.uwc.ac.za/
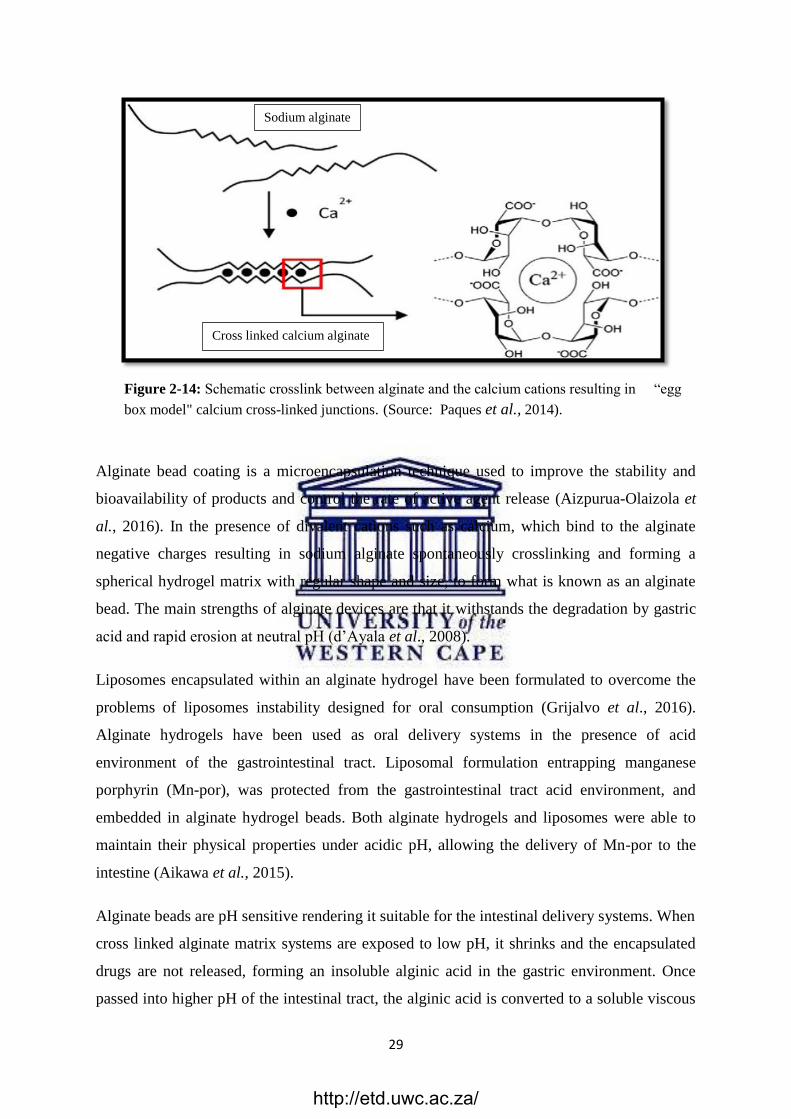
29
Figure 2-14: Schematic crosslink between alginate and the calcium cations resulting in ―egg
box model" calcium cross-linked junctions. (Source: Paques et al., 2014).
Alginate bead coating is a microencapsulation technique used to improve the stability and
bioavailability of products and control the rate of active agent release (Aizpurua-Olaizola et
al., 2016). In the presence of divalent cations such as calcium, which bind to the alginate
negative charges resulting in sodium alginate spontaneously crosslinking and forming a
spherical hydrogel matrix with regular shape and size, to form what is known as an alginate
bead. The main strengths of alginate devices are that it withstands the degradation by gastric
acid and rapid erosion at neutral pH (d‘Ayala et al., 2008).
Liposomes encapsulated within an alginate hydrogel have been formulated to overcome the
problems of liposomes instability designed for oral consumption (Grijalvo et al., 2016).
Alginate hydrogels have been used as oral delivery systems in the presence of acid
environment of the gastrointestinal tract. Liposomal formulation entrapping manganese
porphyrin (Mn-por), was protected from the gastrointestinal tract acid environment, and
embedded in alginate hydrogel beads. Both alginate hydrogels and liposomes were able to
maintain their physical properties under acidic pH, allowing the delivery of Mn-por to the
intestine (Aikawa et al., 2015).
Alginate beads are pH sensitive rendering it suitable for the intestinal delivery systems. When
cross linked alginate matrix systems are exposed to low pH, it shrinks and the encapsulated
drugs are not released, forming an insoluble alginic acid in the gastric environment. Once
passed into higher pH of the intestinal tract, the alginic acid is converted to a soluble viscous
Sodium alginate
Cross linked calcium alginate
http://etd.uwc.ac.za/
30
layer which results in faster degradation and release of molecules. This pH dependent
behaviour of alginate can be exploited to customize release profiles (Wang et al., 2013;
Mittal et al., 2016).
2.6.1 Alginate hydrogel beads preparation
Alginate hydrogels beads can be prepared by various cross-linking approaches, including:
2.6.1.1 Ionic cross-linking
The most common methods used to fabricate alginate gel beads employ external soluble ionic
cross-linking agents, such as divalent cations (i.e. Ca2+
). When a droplet of aqueous sodium
alginate dripping from a needle tip and enters a CaCl2 bath, Ca2+
ions diffuse into the alginate
rich droplet faster than the rate of diffusion of alginate molecules. This results in conversion
of the alginate droplets to gel beads, kinetically entrapping the originally dispersed material
in the alginate solution. The gelation and crosslinking of the polymers are mainly achieved by
exchange of sodium ions from the guluronic acids with divalent cations, and the stacking of
these guluronic groups to form the characteristic egg-box structure as represented in figure
2.15 (Lee et al., 2012; Sun et al.,2013).
2.6.1.2 Covalent cross-linking
Covalently cross-linked hydrogels can be prepared from chemically modified alginates; a
covalently cross-linked hydrogel is chemically stable and can provide different modes of
stress relaxation. However, covalent cross-linking reagents may be toxic, and the unreacted
chemicals may need to be removed from the gels. By covalently conjugating methacrylate
groups onto the alginate backbone, covalently cross-linked hydrogels can be prepared in the
presence of a photo initiator and UV light (Lee et al., 2012; Sun et al.,2013).
2.6.1.3 Thermal gelation
Thermo-sensitive hydrogels have been widely investigated in many drug delivery
applications, due to their adjustable swelling properties in response to temperature changes,
leading to on demand modulation of drug release from the gels (Lee et al., 2012; Sun et
al.,2013).
http://etd.uwc.ac.za/
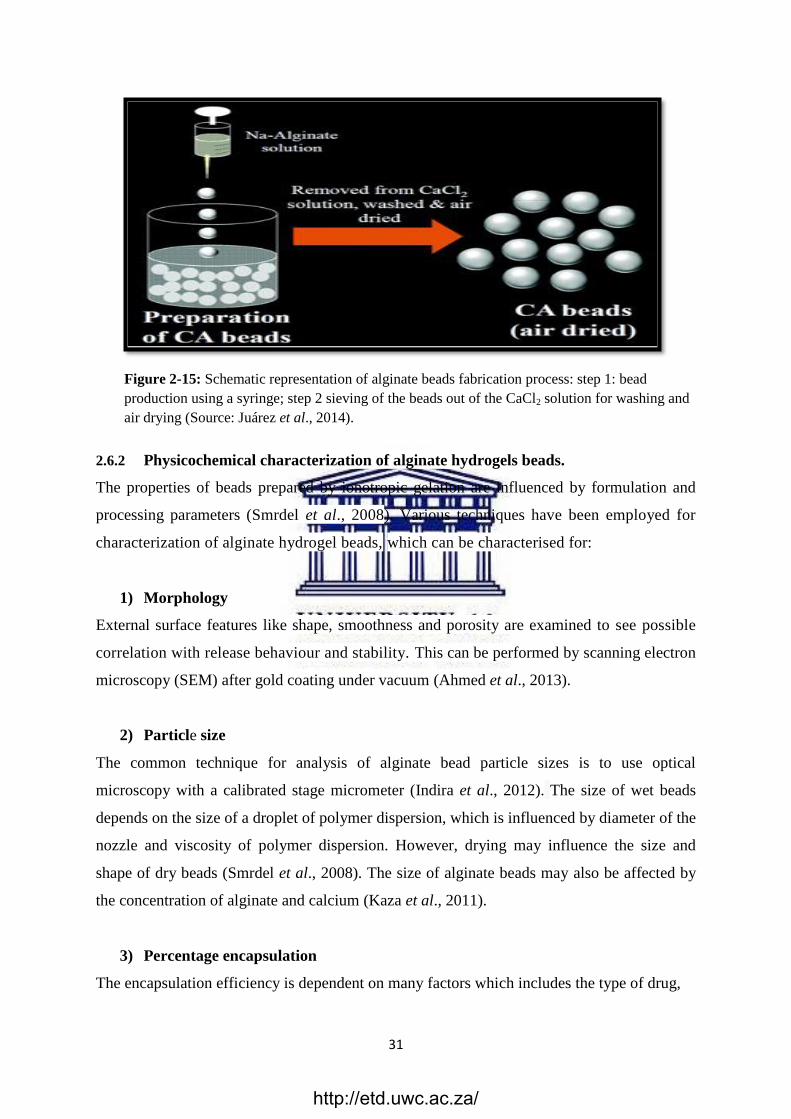
31
Figure 2-15: Schematic representation of alginate beads fabrication process: step 1: bead
production using a syringe; step 2 sieving of the beads out of the CaCl2 solution for washing and
air drying (Source: Juárez et al., 2014).
2.6.2 Physicochemical characterization of alginate hydrogels beads.
The properties of beads prepared by ionotropic gelation are influenced by formulation and
processing parameters (Smrdel et al., 2008). Various techniques have been employed for
characterization of alginate hydrogel beads, which can be characterised for:
1) Morphology
External surface features like shape, smoothness and porosity are examined to see possible
correlation with release behaviour and stability. This can be performed by scanning electron
microscopy (SEM) after gold coating under vacuum (Ahmed et al., 2013).
2) Particle size
The common technique for analysis of alginate bead particle sizes is to use optical
microscopy with a calibrated stage micrometer (Indira et al., 2012). The size of wet beads
depends on the size of a droplet of polymer dispersion, which is influenced by diameter of the
nozzle and viscosity of polymer dispersion. However, drying may influence the size and
shape of dry beads (Smrdel et al., 2008). The size of alginate beads may also be affected by
the concentration of alginate and calcium (Kaza et al., 2011).
3) Percentage encapsulation
The encapsulation efficiency is dependent on many factors which includes the type of drug,
http://etd.uwc.ac.za/
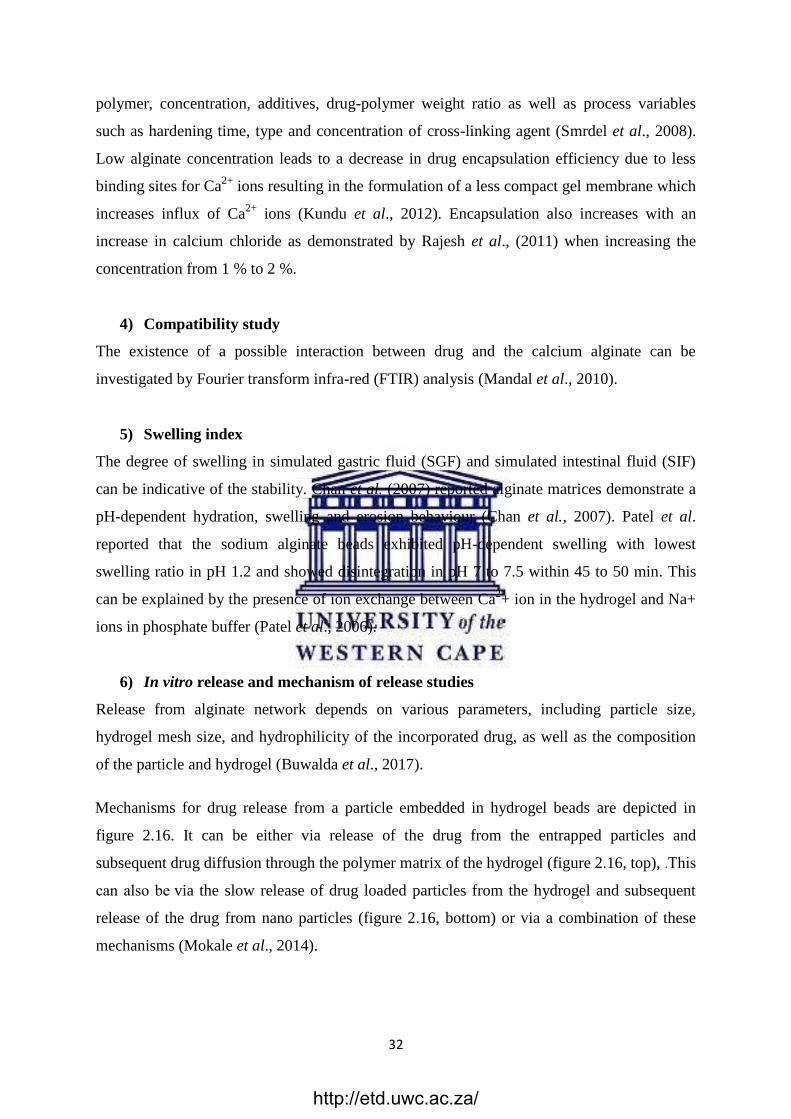
32
polymer, concentration, additives, drug-polymer weight ratio as well as process variables
such as hardening time, type and concentration of cross-linking agent (Smrdel et al., 2008).
Low alginate concentration leads to a decrease in drug encapsulation efficiency due to less
binding sites for Ca2+
ions resulting in the formulation of a less compact gel membrane which
increases influx of Ca2+
ions (Kundu et al., 2012). Encapsulation also increases with an
increase in calcium chloride as demonstrated by Rajesh et al., (2011) when increasing the
concentration from 1 % to 2 %.
4) Compatibility study
The existence of a possible interaction between drug and the calcium alginate can be
investigated by Fourier transform infra-red (FTIR) analysis (Mandal et al., 2010).
5) Swelling index
The degree of swelling in simulated gastric fluid (SGF) and simulated intestinal fluid (SIF)
can be indicative of the stability. Chan et al. (2007) reported alginate matrices demonstrate a
pH-dependent hydration, swelling and erosion behaviour (Chan et al., 2007). Patel et al.
reported that the sodium alginate beads exhibited pH-dependent swelling with lowest
swelling ratio in pH 1.2 and showed disintegration in pH 7 to 7.5 within 45 to 50 min. This
can be explained by the presence of ion exchange between Ca2+ ion in the hydrogel and Na+
ions in phosphate buffer (Patel et al., 2006).
6) In vitro release and mechanism of release studies
Release from alginate network depends on various parameters, including particle size,
hydrogel mesh size, and hydrophilicity of the incorporated drug, as well as the composition
of the particle and hydrogel (Buwalda et al., 2017).
Mechanisms for drug release from a particle embedded in hydrogel beads are depicted in
figure 2.16. It can be either via release of the drug from the entrapped particles and
subsequent drug diffusion through the polymer matrix of the hydrogel (figure 2.16, top), .This
can also be via the slow release of drug loaded particles from the hydrogel and subsequent
release of the drug from nano particles (figure 2.16, bottom) or via a combination of these
mechanisms (Mokale et al., 2014).
http://etd.uwc.ac.za/
33
Figure 2-16: Schematic representation of two mechanisms for drug release from a particle
embedded in a bead: (top) release of the drug from the entrapped particles and subsequent
drugdiffusion through the polymer matrix of the hydrogel; (bottom) release of drug entrapped
particles from the beads and subsequent release of the drug from the nano particles. (Source,
Mokale et al., 2014).
The release of active compounds from matrix beads is pH dependant as reported by Sizery et
al. (Suzery et al., 2017) Their study demonstrated that alginate beads prevented phycocyanin
release in simulated gastric fluid medium (acidic environment). Hence, after 2 hours of
incubation, there was no release of phycocyanin in the simulated gastric fluid medium but it
released rapidly in the simulated intestinal fluid medium. It has been reported that the release
of drug from alginate gel beads is due to diffusion through the swollen matrix and relaxation
of the polymer at pH 1.2 to 4.5 and due to the diffusion and erosion mechanism at pH 7–7.5
(Takka et al., 1998).
2.6.3 Biomedical applications of Alginate beads
Calcium alginate gel beads have been developed as a unique vehicle for drug delivery and
successfully used as a matrix for the entrapment and/or delivery of biological agents. Various
categories of drugs and biomolecular chemicals have been encapsulated. These include
nonsteroidal anti-inflammatory drugs, enzymes, peptides/proteins, and acid labile drugs
(Nimase et al., 2010; Babu et al., 2007). Alginate has been widely used in a variety of
biomedical applications, including cell encapsulation, cell transplantation tissue engineering
and drug delivery (Baniasadi et al., 2015). Alginate beads have been used to encapsulate
other delivery systems including microspheres and liposomes (Gombotz et al., 2012). It has
http://etd.uwc.ac.za/
34
also been used for stability improvement of various compounds and oral bioavailability issues
(Sankalia et al., 2005; Bhushan et al., 2015; Lin et al., 2016; Davidov-Pardo et al., 2014). In
addition, alginate has been used as gastro resistant carrier (El-Sherbiny et al., 2011; Cerciello
et al., 2016; Smith et al., 2010; Aikawa et al., 2015).
Alginate-liposome systems have been used for release profile modification (Dhoot et al.,
2003; Nagpal et al., 2012). Combinations of liposomes and alginate have been investigated in
order to modify the release of drugs from such phospholipid vehicles and to stabilize the
products (Tønnesen et al., 2002). The release of nicardipine HCl was extended by employing
calcium alginate gel beads (Takka et al., 1998) and liposome-loaded calcium alginate
microspheres have also rendered controlled release properties to resveratrol (Balanč et al.,
2016).
2.7 Response surface methodology
The design of experiments is a structured, organized method used to determine the
relationship between the factors affecting a process and the output of that process (Shaji et
al., 2016). In the development of any pharmaceutical product an important issue is to design
a formulation with optimized quality in a short time period and minimum number of trials.
Among diversity of DOE techniques, Response Surface Methodology (RSM) is the most
frequently used optimization technique for designing and optimization of different
pharmaceutical formulations, which requires minimum experimentation. Thus, it is less time-
consuming and cost-effective compared to conventional methods of formulating dosage
forms (Mishra et al., 2016).
The response surface methodology (RSM) is a collection of mathematical and statistical
techniques useful for modelling and analysis of problems, in which an output variables of
interest is influenced by several input variables and the objective is to simultaneously
optimize the levels of these output variables to attain the best system performance. The
design based on fit of a polynomial equation to the experimental data for empirical model
building. An experiment is a series of tests, called runs, in which changes are made in the
input variables in order to identify the reasons for changes in the output response
(Ashengroph et al., 2013). It is a useful tool for studying the influence of experimental
parameters by varying them simultaneously and for determining experimental factor
settings and assesses the relationship between experimental and observed results to find the
http://etd.uwc.ac.za/
35
optimum conditions for a reaction using a limited number of experiment runs to obtain
statistically acceptable results (Khajeh, 2012).
RSM has several advantages compared to the classical experimental or optimization methods
in which one variable at a time technique is used. Firstly, RSM trims down the number of
experimental runs that are necessary to establish a mathematical trend in the experimental
design region allow to determining the optimum level of experimental factors required for a
given response, RSM offers a large amount of information from a small number of
experiments. Secondly, in RSM it is possible to observe the interaction effect of the
independent parameters on the response. The model equation easily clarifies these effects for
binary combination of the independent parameters. In addition, the empirical model that
related the response to the independent variables is used to obtain information about the
process. With respect to these, it can be said that RSM is a useful tool for the optimization of
chemical and biochemical process (Singh et al., 2014; Ghanbarzadeh et al., 2014).
Recently, RSM has been extensively applied for the optimization of multiple variables in
many bioprocesses and showed satisfactory results; it has been used for optimization of lipid
vesicles formulation (Soema et al., 2015; Wang et al., 2014).
2.7.1 Definition of terms in RSM
There are some important terms which describes the response surface methodology to a
greater extent, which include the following: (1) Experimental domain is the experimental
field that must be investigated. It is the minimum and maximum limits of the experimental
variables studied. (2) Experimental design is a specific set of experiments defined by a matrix
composed by the different level combinations of the variables studied. (3) Input variables are
experimental variables that can be changed independently of each other. Typical independent
variables comprise the pH, temperature, reagent concentration etc. (4) Levels of a variable are
different values of a variable at which the experiments must be carried out. (5) Responses or
output variables are the measured values of the results from experiments. Typical responses
are the analytical signal (absorbance, intensity, etc.). (6) Residual is the difference between
the calculated and experimental result for a determinate set of conditions. A good
mathematical model fitted to experimental data must present low residuals values (Bhan,
2017).
http://etd.uwc.ac.za/
36
2.7.2 Process for RSM application
Steps invlved in the application of the response surface methodology as an optimization
technique include: Selection of input and output factors of major effects on the system;
choice of the experimental design and performing the experiments according to the selected
matrix; measurement of output variables and mathematic–statistical treatment of the obtained
experimental data through a polynomial function fit; Evaluation of the model fit; Verification
of the necessity and possibility of performing a displacement in direction to the optimal
region; and Obtaining the optimum values for each studied variable (Bezerra et al., 2008;
Shivakumar et al., 2007).
http://etd.uwc.ac.za/
33
Chapter 3
Methodology
3.1 Preparation of freeze dried H. procumbens plant extract
H. procumbens coarse powder was purchased from (Warren Chem, South Africa). Five
hundred grams of plant powder was macerated in 2000 ml distilled water in a 2500 ml glass
container and tightly closed to prevent water evaporation. The container was agitated in a
shaker (Labcon, USA) at 40 oC for 6 hours, followed by separation of the macerate using a
porcelain funnel. This was filtered using Whatman no. 1 filter paper and centrifuged with a
(Beckman Coulter, USA) centrifuge for 30 min at 10, 000 rpm. The resultant supernatant was
carefully removed and collected. The supernatant was transferred into aliquots of 500 ml
round bottom flasks and sealed. The flasks were carefully filled with liquid nitrogen until
completely frozen. The containers were connected to a freeze dryer (Virtis ®, UK) and dried
under low pressure. The macerate was freeze dried for 2 days and 18 hours. The final
powdered product was carefully collected and stored in air tight containers, in a freezer
(Mahomed et al., 2006).
3.2 Identification of harpagoside biomarker in plant extract
3.2.1 LC/MS
Liquid chromatography/mass spectrometry (LC/MS) analysis method was used as it offers a
good combination of sensitivity and selectivity (Lei et al., 2011). Prepared freeze dried plant
extract contains many active ingredients and harpagoside was used as marker compound
(Mncwangi et al., 2014; Karioti et al., 2011). LC/MS was used to identify the marker
compounds (harpagoside) in the plant extract via exact mass of the compound.
3.2.1.1 Instrumentation
For identification purposes, spectrometric analysis was carried out on reconstituted freeze
dried plant extract in distilled water solution recorded mass spectrum was compared to
reference standard compounds of harpagoside in methanol using single quadrupole mass
spectrometry (Perkin Elmer SQ 300 MS. USA) equipped with electrospray ionisation (ESI)
source with operated mode at a voltage of 50,000 V.
http://etd.uwc.ac.za/
34
3.2.1.2 Method
Direct Infusion Electrospray Ionization (DI-ESI- (+) method was used. Reference standard of
harpagoside and plant extract sample solutions were filtered through 0.2 syringe filter
(solution A). Solution A was added to 50 % aqueous methanol (MS grade, Merck, South
Africa) as diluent containing 0.1 % formic acid, which enhances sample ionization, (solution
B). Fifteen microliters of solution B were directly infused into the ESI chamber of the SQ
300 mass spectrometer using the on-board syringe pump at the rate of 15 µl/min and the ions
were detected in positive and negative modes, i.e. ESI-MS (+/-), scan spectra from 100 to
2000 m/z was used. The mass spectra were collected and analysed using the Chromera®
manager V 3.4.4.5945 software. The harpagoside qualitative peak in the plant extract was
therefore correlated to the MS spectrum of the reference standard compound.
3.2.2 UHPLC
The biomarker compound was further identified by the spiking method using UHPLC. Pre-
analysed plant extract samples were spiked with definite concentration of standard
harpagoside and injected into the UHPLC. The subsequent peaks height was measured and
compared i.e. before after spiking.
3.2.2.1 Development and validation of an UHPLC method for harpagoside
An isocratic HPLC method adapted from (Babili et al., 2012) with slight modification was
utilized.
3.2.2.2 Instrumentation
Ultra-high performance liquid chromatography (Perkin Elmer, USA) was equipped with a
programmable Flexar FX-15 auto sampler, a UHPLC pump model FX-15, and a Flexar PDA
plus detector model FX-15 and Flexar solvent manager 3-CH degasser was used. The data
were recorded using Chromera®
Manager software version 3.4.4.5945.
3.2.2.3 Chromatographic Conditions
The following chromatographic conditions were used with a Kinetex150 x 4.6 mm, 5 um C-
18 column: Flow rate: l ml /min, injection volume: 10 µl, wavelength: 278 nm, column
temperature: 25 °C, auto sampler tray temperature: 4 °C, run time: 5 min, diluent: mobile
phase 60:40% v/v methanol HPLC-grade methanol (Sigma Aldrich, South Africa) and
deionized water (18 MΩ·cm) was obtained by water filtration system (O purity, SA),
http://etd.uwc.ac.za/
35
acidified with 0.1 % formic acid formic acid (Merck, South Africa),. Elution mode: isocratic,
detector: UV/ PDA plus.
3.2.2.4 Preparation of pure standard harpagoside stock solution
One milligram of pure standard harpagoside purchased from (Sigma Aldrich, South Africa)
was accurately weighed using semi micron electronic balance (Shimadzu, Japan) and
transferred to a 1ml volumetric flask. This was dissolved in 1 ml of methanol, vortexed for 30
seconds using vortex mixer (Benchmark, Taiwan) and the solution filtered through 0.25 μm
syringe filter (KimLab, India) prior to performing HPLC analysis.
3. 2. 2. 5 Preparation of mobile phase
Filtered and degassed mobile phase consisting of solvent A: deionized water acidified with
0.1 % formic acid and solvent B: methanol at the selected ratios was utilized. All solvents
were filtered through filter apparatus (Millipore ®, USA) using 0.25 µm membrane filter
(Millipore, Ireland).
3.2.2.6 Key parameters of the analytical method validation
The UHPLC method was validated to assure the method appropriateness for the quantitative
analysis of harpagoside marker compound in plant extract. The validation method met the
International Conference on Harmonization guidelines (ICH, 2005). The following analytical
parameters were used: a) Specificity b) Linearity. c) Accuracy. d) Precision (repeatability,
intermediate precision). e) Sensitivity. g) Robustness. h) System suitability.
a) Specificity
It is the ability to detect the analyte uniquely in the presence of other components (ICH,
2005). Specificity was evaluated by means of analysis of the mobile phase, (Methanol:
Water) by injection to determine if there was any interference with harpagoside elution.
Specificity was confirmed by the base hydrolysis test by force degrading the test sample in an
alkaline medium. One millilitre of sodium hydroxide solution (0.1 M) ( B & M Scientific,
SA) was added to 9 ml of harpagoside solution, vortexed to disperse the sodium hydroxide
solution uniformly in the test sample and allowed to stand for 24 hours, then analysed
(Bhimavarapu et al., 2011).
http://etd.uwc.ac.za/
36
b) Linearity
Linearity of an analytical procedure is its ability (within a given range) to obtain test results
which are directly proportional to the concentration of analyte in the sample (ICH, 2005).
Linearity was evaluated by linear regression analysis method using a calibration graph. The
calibration curve was obtained by plotting the peak area versus injected analyte concentration
from six different duplicate concentrations ranging from 0.125(100 %), 0.0625(50 %)
0.03125(25 %), 0.01562(12.5 %), 0.00781(6.25 %), 0.003905(1.56 %) and 0.00195(3.125 %)
mg/ml. These were prepared from a standard harpagoside stock solution. The correlation
coefficient, y-intercept and slope of the regression line were calculated.
c) Precision
The precision of an analytical procedure expresses the closeness of agreement between
results obtained from multiple samplings of the same homogeneous samples under prescribed
conditions (ICH, 2005). Precision of the developed method was studied under the headings of
repeatability (intra-day precision) and intermediate precision (inter-day precision). The
repeatability was assured by six replicates of 0.125 mg/ml of harpagoside standard solution.
The intermediate precision was evaluated by analysing three replicates of harpagoside
standard solution at three concentration levels (0.125, 0.0625, 0.03125 mg/ml), on three
different days. The average, standard deviation and relative standard deviation (coefficient of
variation) of the replicates were calculated for each type of precision from the peak area of
harpagoside.
d) Accuracy
The accuracy of an analytical procedure expresses the closeness of the test results obtained by
the method and the value found (ICH, 2005). The accuracy was assessed by determining the
percentage recovery of the known amount of standard harpagoside at six replicates of the
level 0.01562 mg/ml and then the individual and mean percentage recovery were calculated
using the following formula:
Recovery (%) = (m measured / m calculated) × 100. Eq 1.
Where m measured is the harpagoside amount measured and m measured is the calculated
amount of harpagoside obtained from the calibration curve (Babili et al., 2012).
http://etd.uwc.ac.za/
37
e) Sensitivity
Limit of Quantitation is the lowest amount of analyte in a sample which can be quantitatively
determined with suitable precision and accuracy. Limit of detection is the lowest amount of
analyte in a sample which can be detected but not necessarily quantitated as an exact value
(ICH, 2005).
Limit of Detection (LOD) and Limit of Quantitation (LOQ) were determined using the
calibration curve method. The LOD and LOQ of the assay method were evaluated based on
the standard deviation of the response and the slope by using linearity data of serial dilutions
of harpagoside stock solutions. The values of the slope and the standard deviation of the y-
intercepts of the regression line were used to calculate the LOD and LOD of the proposed
method and were calculated using the following equations:
LOQ = 10 ×
S . Eq 2.
LOD = 3.3 ×
S . Eq 3.
Where = the standard deviation of the response.
S = the slope of the calibration curve.
The slope S was estimated from the harpagoside calibration curve. The standard deviation of
y-intercepts of regression line was used as the standard deviation.
f) Robustness
Robustness of an analytical procedure is a measure of its capacity to remain unaffected by
small, but deliberate variations in method parameters (ICH, 2005). It was evaluated by
applying the developed method while introducing variations, wavelength was altered to (± 2),
column temperature was changed to (± 2 °C) units from set value, and the effect of these
variations was recorded.
http://etd.uwc.ac.za/
38
g) System suitability
The purpose of the system suitability test is to ensure that the complete testing system is
adequate for the intended analysis. For system suitability, six replicates of (0.125 mg/ml)
pure standard harpagoside were injected into UHPLC and column performance factors
namely; theoretical plate count, tailing factors, resolution, and retention time were
determined.
3.3 Quantitative determination of harpagoside constituent in H. procumbens plant
extract
The concentration of harpagoside in the freeze dried plant crude extract was determined by
applying the validated UHPLC method on a reconstituted solution of freeze dried plant
extract in distilled water. The obtained peak area was interpolated to concentration utilizing
the generated calibration curve. The experiment was repeated three times and results
presented as microgram per milligrams of dry weight ± standard deviation.
3.4 Lipid vesicles (liposomes and phytosomes) preparation
3.4.1 Preparation of 0.1 M potassium phosphate buffer pH 7.4 at 25 °C
1M K2HPO4 at 174.18 g mol-1
= 87.09 g per 1 L.
1M KH2PO4 at 136.09 g mol-1
= 68.045 g per 1 L.
Added 80.2 ml of K2HPO4 to 19.8 ml of KH2PO4, dilute the combined 1M solutions to 1
litre distilled water (Cold spring harbor protocols).
3.4.2 Liposome preparation
Conventional lipid thin film hydration technique as described by Sha et al., (2012) with slight
modifications was used. The liposomes synthesis method consisted of three steps:
Step-1: Drying the lipid phase
The lipid phase components, i.e., L-a Soy phosphatidylcholine (PC) (> 95 % purity) (Avanti
® polar lipids.Inc. USA) and cholesterol (≥ 99 %) (Sigma Aldrich, USA) were weighed using
an analytical balance (Mettler, USA) and dissolved in 2 ml chloroform (Merck.SA); Once the
lipids were thoroughly mixed in the organic solvent , the mixture was transferred to a round-
bottom flask and attached to a rotary evaporator (Buchi-RII Rotavapor, Switzerland) attached
to a vacuum pump (Buchi V-700, Switzerland). The round-bottom flask was immersed in a
http://etd.uwc.ac.za/
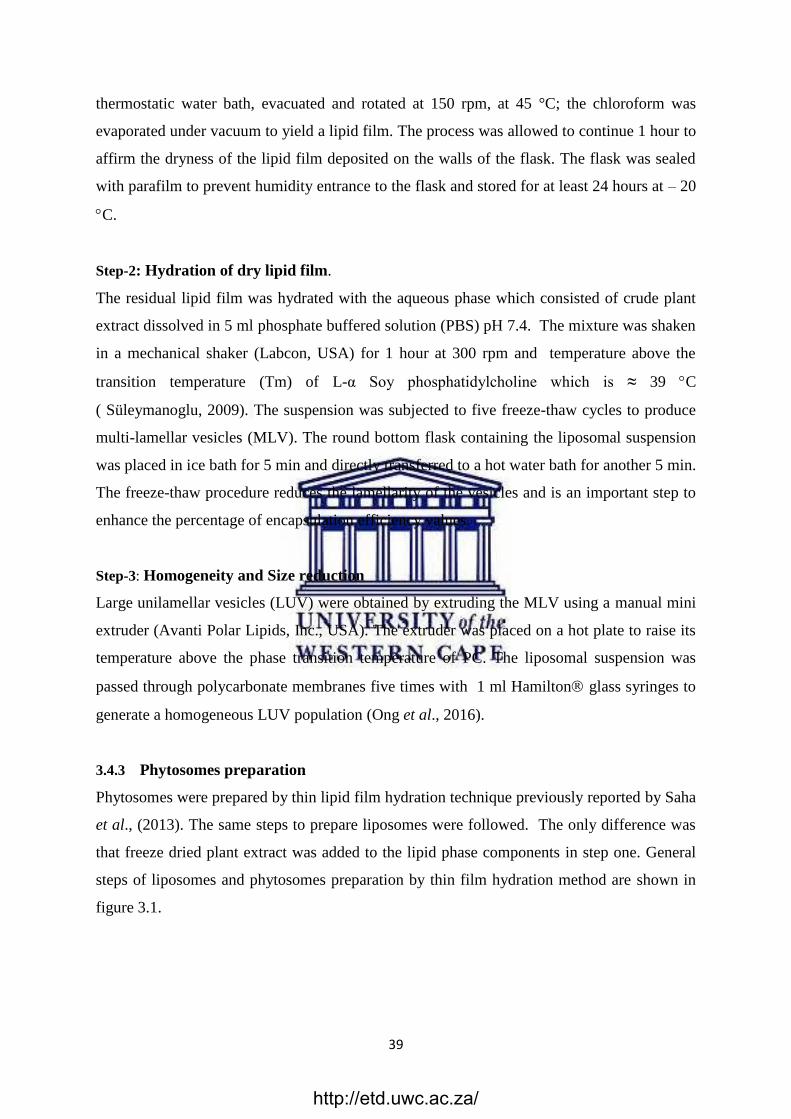
39
thermostatic water bath, evacuated and rotated at 150 rpm, at 45 °C; the chloroform was
evaporated under vacuum to yield a lipid film. The process was allowed to continue 1 hour to
affirm the dryness of the lipid film deposited on the walls of the flask. The flask was sealed
with parafilm to prevent humidity entrance to the flask and stored for at least 24 hours at – 20
C.
Step-2: Hydration of dry lipid film.
The residual lipid film was hydrated with the aqueous phase which consisted of crude plant
extract dissolved in 5 ml phosphate buffered solution (PBS) pH 7.4. The mixture was shaken
in a mechanical shaker (Labcon, USA) for 1 hour at 300 rpm and temperature above the
transition temperature (Tm) of L-α Soy phosphatidylcholine which is ≈ 39 C
( Süleymanoglu, 2009). The suspension was subjected to five freeze-thaw cycles to produce
multi-lamellar vesicles (MLV). The round bottom flask containing the liposomal suspension
was placed in ice bath for 5 min and directly transferred to a hot water bath for another 5 min.
The freeze-thaw procedure reduces the lamellarity of the vesicles and is an important step to
enhance the percentage of encapsulation efficiency values.
Step-3: Homogeneity and Size reduction
Large unilamellar vesicles (LUV) were obtained by extruding the MLV using a manual mini
extruder (Avanti Polar Lipids, Inc., USA). The extruder was placed on a hot plate to raise its
temperature above the phase transition temperature of PC. The liposomal suspension was
passed through polycarbonate membranes five times with 1 ml Hamilton glass syringes to
generate a homogeneous LUV population (Ong et al., 2016).
3.4.3 Phytosomes preparation
Phytosomes were prepared by thin lipid film hydration technique previously reported by Saha
et al., (2013). The same steps to prepare liposomes were followed. The only difference was
that freeze dried plant extract was added to the lipid phase components in step one. General
steps of liposomes and phytosomes preparation by thin film hydration method are shown in
figure 3.1.
http://etd.uwc.ac.za/
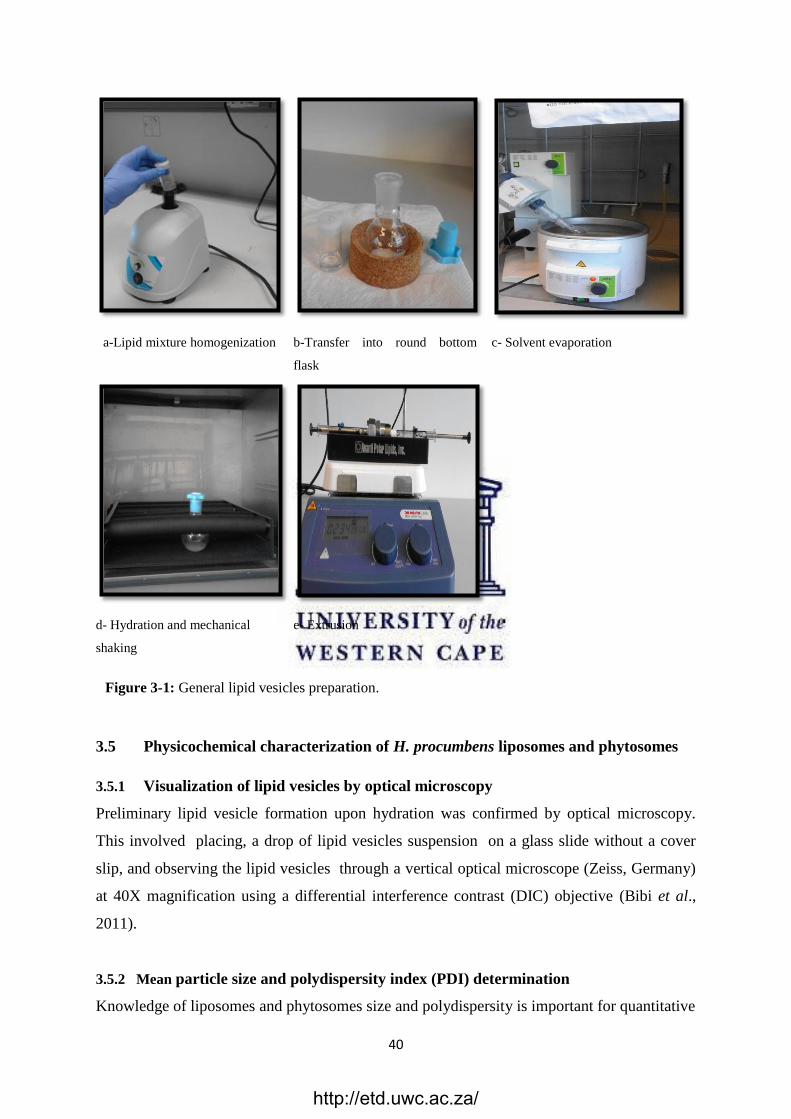
40
a-Lipid mixture homogenization b-Transfer into round bottom
flask
c- Solvent evaporation
d- Hydration and mechanical
shaking
e- Extrusion
Figure 3-1 : General lipid vesicles preparation.
3.5 Physicochemical characterization of H. procumbens liposomes and phytosomes
3.5.1 Visualization of lipid vesicles by optical microscopy
Preliminary lipid vesicle formation upon hydration was confirmed by optical microscopy.
This involved placing, a drop of lipid vesicles suspension on a glass slide without a cover
slip, and observing the lipid vesicles through a vertical optical microscope (Zeiss, Germany)
at 40X magnification using a differential interference contrast (DIC) objective (Bibi et al.,
2011).
3.5.2 Mean particle size and polydispersity index (PDI) determination
Knowledge of liposomes and phytosomes size and polydispersity is important for quantitative
http://etd.uwc.ac.za/
41
interpretation of results. Particle size is determined by dynamic light scattering based on the
principle of the random Brownian motion of particles in a liquid is faster for small particles
than for large particles.
The mean particle size (z-average diameter) of the liposomes and phytosomes was
determined. To measure the level of homogeneity of particle sizes of the liposomes and
phytosomes, the mean particle size (z-average diameter) and polydispersity index (PDI) was
measured using photon correlation spectroscopy (PCS) using a Nano ZS 90 Zetasizer
(Malvern Instruments Ltd., U.K.) with the 4 mW He–Ne laser operating at a wavelength of
633 nm, temperature of 25 °C and a 90 o scattering angle. One millilitre of phytosomal or
liposomal suspension was loaded into a zeta-potential measurement capillary cell (DTS
1070), the capillary cells were thoroughly rinsed with deionized water before filling to avoid
any contamination. Three independent measurements for ten cycles were performed for each
sample. The z-average diameter and the polydispersity index of the liposomes were
automatically generated by the instrument using cumulant analysis with software loaded the
instrument.
3.5.3 Zeta potential determination
The zeta potential is a function of the surface charge of the suspension or dispersion (Demir
et al., 2014). The charge present on the surface of colloid particles was measured using the
Smoluchowski‘s equation from the electrophoretic mobility of liposomes and phytosomes.
The same instrument was used for this as for particle size measurement i.e. Zetasizer Nano
ZS 90 at 25 °C with a voltage of 4 mV. The samples were analysed at 25 ºC at an angle of
173 to the laser beam. The intensity-weighted mean value was measured and the average of
three measurements taken.
The measurement was conducted after filling 1 ml of each liposomal and phytosomal
dispersion into the zeta-potential measurement capillary cell (DTS 1070), the capillary cells
were thoroughly rinsed with deionized water before filling with liposomes or phytosomes
solution to avoid any contamination. Three independent measurements for ten cycles were
performed for each sample (Saoji et al., 2016).
3.5.4 Percentage entrapment efficiency
Encapsulation efficiency (% EE) was evaluated by determining the content of plant extract
encapsulated (using harpagoside as the marker) into the liposomes and phytosomes. This
http://etd.uwc.ac.za/
42
involved two steps (Begum et al., 2012).
Step one: Harpagoside starting concentration determination
In case of liposomes, the starting concentration was determined by using a 1ml sample from
the aqueous phase which consisted of plant aqueous solution dissolved in phosphate buffer
before hydration, filtered through 0.45 µm nylon syringe filters (kimLab, India) with the
sample analysed by UHPLC. In the case of phytosomes, because the crude extract is
integrated in the thin film formation process, the phytosomes had to be disrupted for
harpagoside detection. One millilitre of ethanol (Merck .SA) was added to 1 ml phytosomal
suspension and sonicated for 3 min to break the phytosomes using a probe tip sonicator
(Bandelin Sonoplus, Germany). This was followed by centrifugation using an ultra-centrifuge
(Eppendorf 5417 R, Germany) at 10, 000 rpm for 5 min at 4 °C and filtration through 0.45
µm syringe filter. The sample was analysed using UHPLC.
Step 2: Encapsulated harpagoside concentration determination
a- Lipid vesicles purification: interference of free harpagoside with encapsulated
harpagoside detection was avoided by a separation technique. 1ml of H. procumbens
loaded liposomes or phytosomes dispersion was transferred via pipette to a 2 ml
eppendorf tube and centrifuged using an ultra-centrifuge, at speed of 10,000 rpm for 1
hour at 4 °C in order to separate unloaded harpagoside by the formation of
supernatant and a pellet. The formed pellet which comprised the liposome or
phytosomes was double washed with PBS, where 1 ml PBS was added to the pellet
and vortexed for 20 seconds to disperse the vesicles and dissolve the free harpagoside
in the PBS and centrifuged again at the same speed and time.
b- Pellet lysing and content analysis: after washing steps, 1 ml ethanol was added to
the pellet to lyse the lipid vesicle to liberate the entrapped harpagoside. This mixture
was sonicated by using a probe tip sonicator. The sonicator tip was inserted in the
eppendorf tube and sonicated for 3 min at high intensity. The mixture was centrifuged
and filtered using a 0.45 um filter; the entrapped harpagoside was determined by
UHPLC. The percentage encapsulation efficiency (% EE) was expressed as the
percentage of the encapsulated harpagoside concentration to the total, as follows:
http://etd.uwc.ac.za/
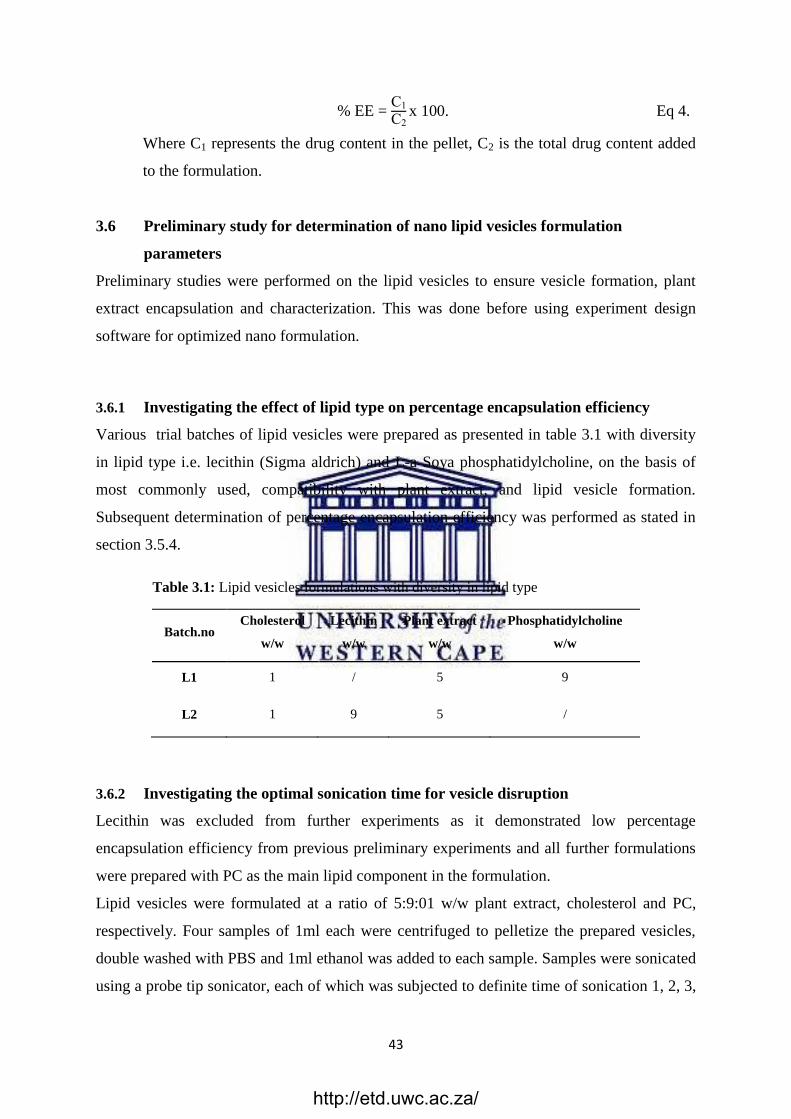
43
% EE = C1
C2 x 100. Eq 4.
Where C1 represents the drug content in the pellet, C2 is the total drug content added
to the formulation.
3.6 Preliminary study for determination of nano lipid vesicles formulation
parameters
Preliminary studies were performed on the lipid vesicles to ensure vesicle formation, plant
extract encapsulation and characterization. This was done before using experiment design
software for optimized nano formulation.
3.6.1 Investigating the effect of lipid type on percentage encapsulation efficiency
Various trial batches of lipid vesicles were prepared as presented in table 3.1 with diversity
in lipid type i.e. lecithin (Sigma aldrich) and L-a Soya phosphatidylcholine, on the basis of
most commonly used, compatibility with plant extract, and lipid vesicle formation.
Subsequent determination of percentage encapsulation efficiency was performed as stated in
section 3.5.4.
Table 3.1: Lipid vesicles formulations with diversity in lipid type
Batch.no Cholesterol
w/w
Lecithin
w/w
Plant extract
w/w
Phosphatidylcholine
w/w
L1 1 / 5 9
L2 1 9 5 /
3.6.2 Investigating the optimal sonication time for vesicle disruption
Lecithin was excluded from further experiments as it demonstrated low percentage
encapsulation efficiency from previous preliminary experiments and all further formulations
were prepared with PC as the main lipid component in the formulation.
Lipid vesicles were formulated at a ratio of 5:9:01 w/w plant extract, cholesterol and PC,
respectively. Four samples of 1ml each were centrifuged to pelletize the prepared vesicles,
double washed with PBS and 1ml ethanol was added to each sample. Samples were sonicated
using a probe tip sonicator, each of which was subjected to definite time of sonication 1, 2, 3,
http://etd.uwc.ac.za/
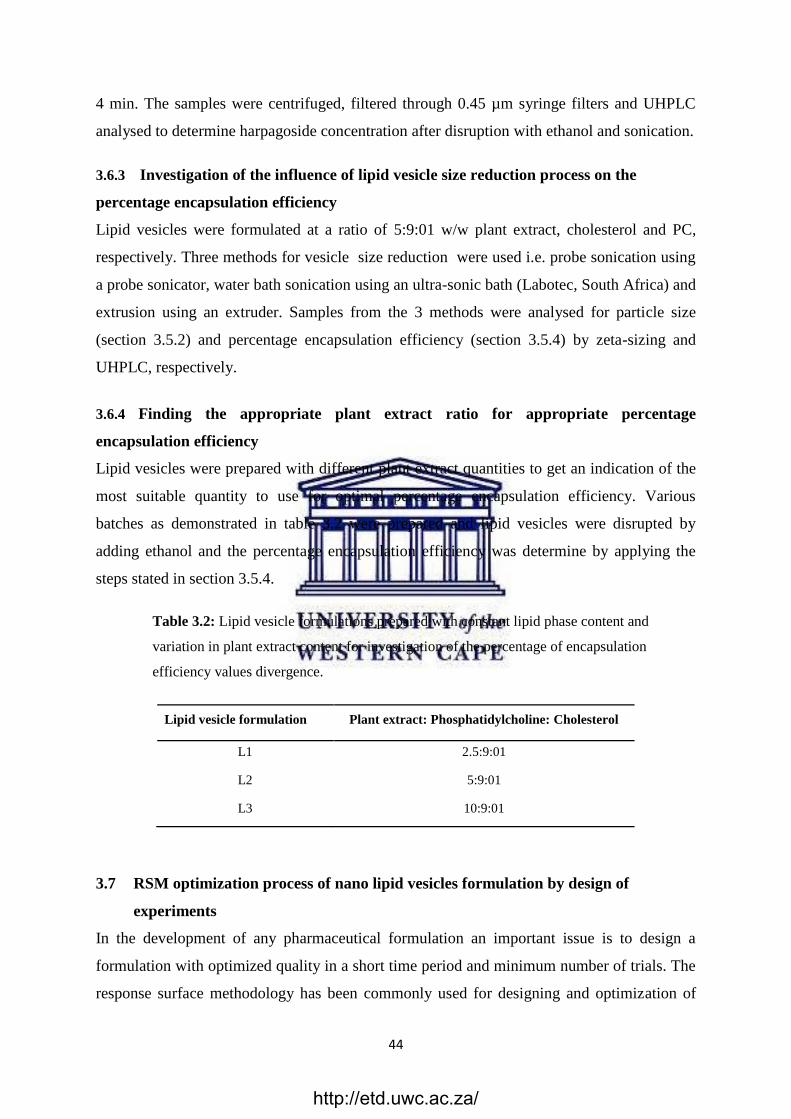
44
4 min. The samples were centrifuged, filtered through 0.45 µm syringe filters and UHPLC
analysed to determine harpagoside concentration after disruption with ethanol and sonication.
3.6.3 Investigation of the influence of lipid vesicle size reduction process on the
percentage encapsulation efficiency
Lipid vesicles were formulated at a ratio of 5:9:01 w/w plant extract, cholesterol and PC,
respectively. Three methods for vesicle size reduction were used i.e. probe sonication using
a probe sonicator, water bath sonication using an ultra-sonic bath (Labotec, South Africa) and
extrusion using an extruder. Samples from the 3 methods were analysed for particle size
(section 3.5.2) and percentage encapsulation efficiency (section 3.5.4) by zeta-sizing and
UHPLC, respectively.
3.6.4 Finding the appropriate plant extract ratio for appropriate percentage
encapsulation efficiency
Lipid vesicles were prepared with different plant extract quantities to get an indication of the
most suitable quantity to use for optimal percentage encapsulation efficiency. Various
batches as demonstrated in table 3.2 were prepared and lipid vesicles were disrupted by
adding ethanol and the percentage encapsulation efficiency was determine by applying the
steps stated in section 3.5.4.
Table 3.2: Lipid vesicle formulations prepared with constant lipid phase content and
variation in plant extract content for investigation of the percentage of encapsulation
efficiency values divergence.
Lipid vesicle formulation Plant extract: Phosphatidylcholine: Cholesterol
L1 2.5:9:01
L2 5:9:01
L3 10:9:01
3.7 RSM optimization process of nano lipid vesicles formulation by design of
experiments
In the development of any pharmaceutical formulation an important issue is to design a
formulation with optimized quality in a short time period and minimum number of trials. The
response surface methodology has been commonly used for designing and optimization of
http://etd.uwc.ac.za/
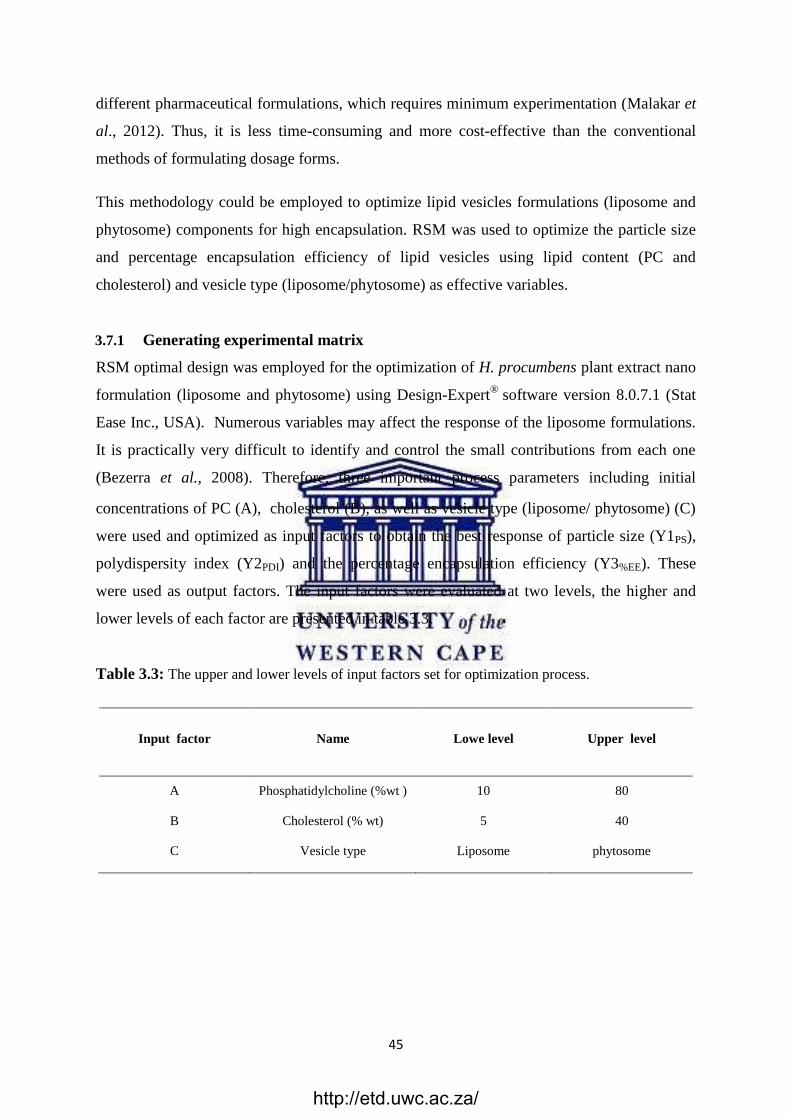
45
different pharmaceutical formulations, which requires minimum experimentation (Malakar et
al., 2012). Thus, it is less time-consuming and more cost-effective than the conventional
methods of formulating dosage forms.
This methodology could be employed to optimize lipid vesicles formulations (liposome and
phytosome) components for high encapsulation. RSM was used to optimize the particle size
and percentage encapsulation efficiency of lipid vesicles using lipid content (PC and
cholesterol) and vesicle type (liposome/phytosome) as effective variables.
3.7.1 Generating experimental matrix
RSM optimal design was employed for the optimization of H. procumbens plant extract nano
formulation (liposome and phytosome) using Design-Expert®
software version 8.0.7.1 (Stat
Ease Inc., USA). Numerous variables may affect the response of the liposome formulations.
It is practically very difficult to identify and control the small contributions from each one
Bezerra et al., 2008). Therefore, three important process parameters including initial (
concentrations of PC (A), cholesterol (B), as well as vesicle type (liposome/ phytosome) (C)
were used and optimized as input factors to obtain the best response of particle size (Y1PS),
polydispersity index (Y2PDI) and the percentage encapsulation efficiency (Y3%EE). These
were used as output factors. The input factors were evaluated at two levels, the higher and
lower levels of each factor are presented in table 3.3.
Table 3.3: The upper and lower levels of input factors set for optimization process.
Input factor Name Lowe level Upper level
A Phosphatidylcholine (%wt ) 10 80
B Cholesterol (% wt) 5 40
C Vesicle type Liposome phytosome
http://etd.uwc.ac.za/
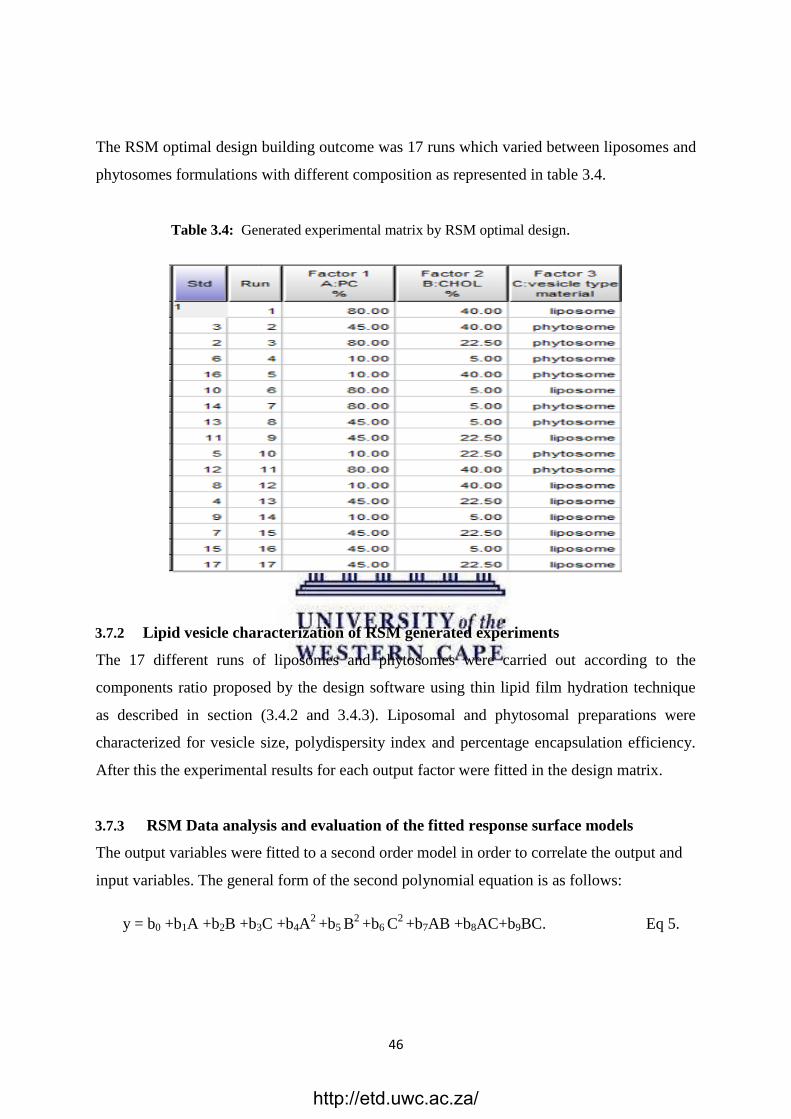
46
The RSM optimal design building outcome was 17 runs which varied between liposomes and
phytosomes formulations with different composition as represented in table 3.4.
Table 3.4: Generated experimental matrix by RSM optimal design.
3.7.2 Lipid vesicle characterization of RSM generated experiments
The 17 different runs of liposomes and phytosomes were carried out according to the
components ratio proposed by the design software using thin lipid film hydration technique
as described in section (3.4.2 and 3.4.3). Liposomal and phytosomal preparations were
characterized for vesicle size, polydispersity index and percentage encapsulation efficiency.
After this the experimental results for each output factor were fitted in the design matrix.
3.7.3 RSM Data analysis and evaluation of the fitted response surface models
The output variables were fitted to a second order model in order to correlate the output and
input variables. The general form of the second polynomial equation is as follows:
y = b0 +b1A +b2B +b3C +b4A2
+b5 B2
+b6 C2 +b7AB +b8AC+b9BC. Eq 5.
http://etd.uwc.ac.za/
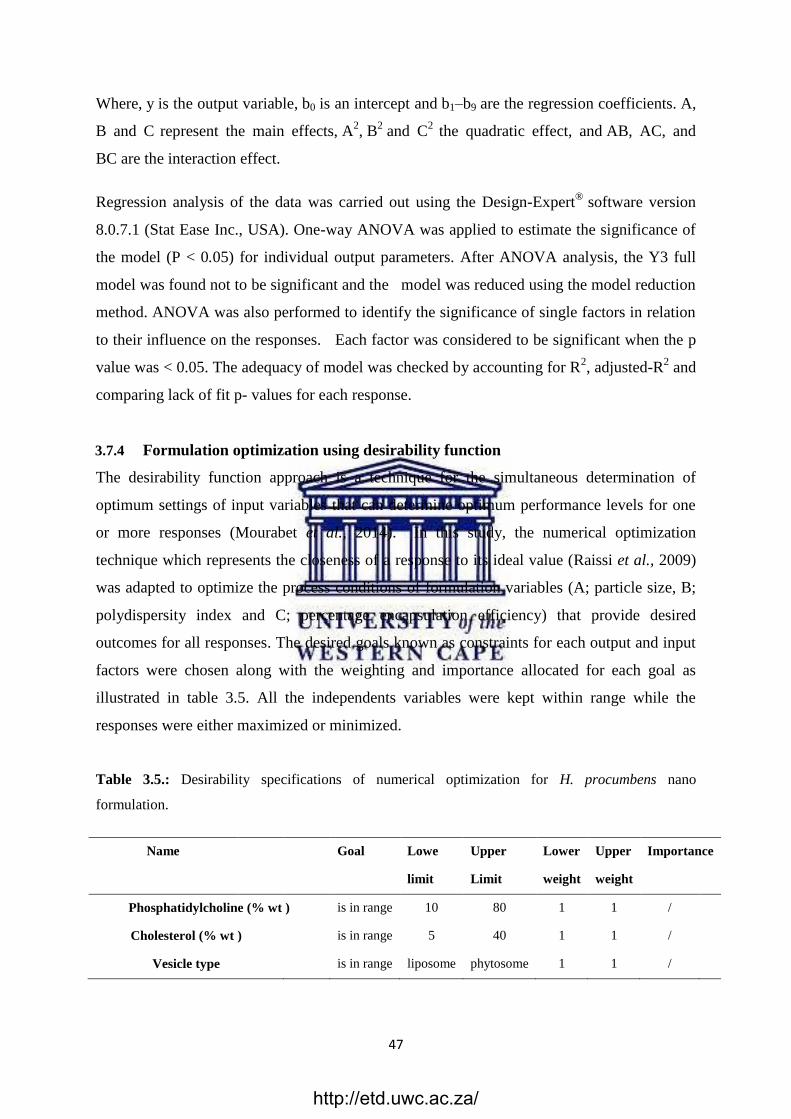
47
Where, y is the output variable, b0 is an intercept and b1–b9 are the regression coefficients. A,
B and C represent the main effects, A2, B
2 and C
2 the quadratic effect, and AB, AC, and
BC are the interaction effect.
Regression analysis of the data was carried out using the Design-Expert®
software version
8.0.7.1 (Stat Ease Inc., USA). One-way ANOVA was applied to estimate the significance of
the model (P < 0.05) for individual output parameters. After ANOVA analysis, the Y3 full
model was found not to be significant and the model was reduced using the model reduction
method. ANOVA was also performed to identify the significance of single factors in relation
to their influence on the responses. Each factor was considered to be significant when the p
value was < 0.05. The adequacy of model was checked by accounting for R2, adjusted-R
2 and
comparing lack of fit p- values for each response.
3.7.4 Formulation optimization using desirability function
The desirability function approach is a technique for the simultaneous determination of
optimum settings of input variables that can determine optimum performance levels for one
or more responses (Mourabet et al., 2014). In this study, the numerical optimization
technique which represents the closeness of a response to its ideal value (Raissi et al., 2009)
was adapted to optimize the process conditions of formulation variables (A; particle size, B;
polydispersity index and C; percentage encapsulation efficiency) that provide desired
outcomes for all responses. The desired goals known as constraints for each output and input
factors were chosen along with the weighting and importance allocated for each goal as
illustrated in table 3.5. All the independents variables were kept within range while the
responses were either maximized or minimized.
Table 3.5.: Desirability specifications of numerical optimization for H. procumbens nano
formulation.
Name
Goal Lowe Upper Lower Upper Importance
limit Limit weight weight
Phosphatidylcholine (% wt ) is in range 10 80 1 1 /
Cholesterol (% wt )
is in range 5 40 1 1 /
Vesicle type
is in range liposome phytosome 1 1 /
http://etd.uwc.ac.za/
48
Vesicle size (nm)
minimize 207.8 608.7 1 1 **
Polydispersity index
minimize 0.18 0.593 1 1 **
Percentage encapsulation efficiency (%) maximize 2 31.25 1 1 ****
3.7.5 Validation of optimized condition
The optimum values of the selected formulation and its predicted output factors values were
verified experimentally. Four replicates of the optimized phytosomes formulation were
produced and the output factor values (particle size, polydispersity index, and percentage
encapsulation efficiency) were experimentally determined. The model predicted values were
compared with actual ones obtained from experimentation and the percentage error was
calculated by using the following formula (Ghanbarzadeh et al., 2013):
% Error = Predicted - observed
Observed × 100 Eq 6.
3.8 Characterization of selected optimized RSM formulation
3.8.1 Particle size and polydispersity index
The optimized RSM phytosomes formulation was characterized for mean particle size and
polydispersity index using the Zetasizer Malvern instrument as per method in section 3.5.2.
3.8.2 Zeta Potential Analysis
The optimized RSM phytosomes formulation was also characterized for zeta potential
although it was not one of the output factors as per method in section 3.5.3.
3.8.3 Surface Morphology
The Scanning Electron Microscope (SEM) was utilized to study the external morphology of
the phytosomes produced from the optimized formulation. Approximately 5μL of the
phytosomal suspension was placed on double-sided carbon conductive adhesive tape fixed on
SEM aluminium stubs. The samples were allowed to dry at room temperature. The
phytosomes were then sputter-coated with a thin layer of gold in vacuum for 30 seconds at 20
mA using a coating unit (Emitech K550X, England) to make it electrically conductive. The
http://etd.uwc.ac.za/
49
surface morphology of the coated samples was viewed and photographed using an Auriga
HR-SEM F50 scanning electron microscope (Zeiss, Germany) (El-Gazayerly et al., 2014).
3.8.4 Apparent solubility study
To determine the change in solubility due to complexion, a protocol reported by Tan et al.,
(2012) was followed. Solubility characteristics of H. procumbens extract and prepared H.
procumbens phytosomes were determined by adding excess of the samples to 6 ml of water
and n-octanol in a sealed glass container at room temperature. The liquids were shaken for 24
hours and centrifuged at 4000 rpm for 10 min. The supernatant was filtered through a 0.45
μm syringe filter, and analysed using UHPLC.
3.8.5 FTIR spectroscopy
To study the possible interactions between plant extract and phospholipids, IR spectrums of
freeze dried H. procumbens plant extract, empty phytosomes, loaded H. procumbens
phytosomes, were recorded in range of 4000 – 650 cm-1
using a Fourier transform infrared
spectrometer (Perkin-Elmer Spectrum-400, USA) equipped with a diamond attenuated total
reflectance (ATR) accessories with a diamond crystal.
After fresh preparation of the phytosomal suspensions (empty and loaded), the residual
moisture in the samples was removed by subjecting the samples to vacuum drying using a
vacuum oven before obtaining any spectra (Niive, lasec, South Africa). A small quantity of
the sample was placed on the crystal, pressure applied and scanned at 2 cm⁻1/sec 4 times at a
resolution of 4 cm⁻1/sec, the obtained IR spectra were interpreted for functional groups at
their respective wave number (cm-1
). The analysis of the spectra was done using spectrum
software version 6.3.5.
3.8.6 Stability in simulated gastric fluid (SGF) pH 1.2
The selected optimized H. procumbens phytosomes formulation was evaluated for in vitro
physicochemical stability after exposure to simulated gastric fluid (SGF; pH 1.2) by
monitoring the physicochemical properties (particle size, polydispersity index, and zeta
potential) of the prepared phytosomes and compared with the initial values and physical
changes (aggregation and precipitation) that were seen with H. procumbens phytosomes.
http://etd.uwc.ac.za/
50
3.8.6.1 Preparation of simulated GI media
Simulated intestinal fluid and gastric fluid as media were used to conduct the stability study
as per WHO (WHO, 2012) guidelines. The simulated gastric fluid (SGF) was prepared by
dissolving 2.0 g of sodium chloride in 7.0 mL of hydrochloric acid (420 g/l) and made up to
1000 ml with water. SLS (0.1 %) was added as surfactant to simulate the gastric conditions.
This test solution had a pH of 1.2.
3.8.6.2 Method
Physical changes of H. procumbens phytosomes in simulated GI media and the possible
corresponding correlation of these changes with the phytosomes stability was investigated.
The method reported by Freag et al., (2013) was used with some modifications. H.
procumbens phytosomes were prepared and purified by the centrifugation technique as stated
in section (3.5.4, step 2 a). One millilitre of the phytosomal formulation was added to 2 ml
SGF at pH 1.2 in 10 ml glass vials tightly closed with plastic caps. The vials were incubated
for 2 hours.The samples were thereafter mildly agitated at 75 rpm on a digital multi-position
magnetic stirrer (VELP Scientifica, Europe), and heated at 37 °C in the circulating
thermostatic bath (Julabo5B, Germany). Empty phytosomes were prepared following the
same steps and exposed to SGF. This served as the control.
At two hour intervals, samples of empty and loaded phytosomes were assessed for the
physicochemical properties such as particle size, zeta potential as well as polydispersity index
and harpagoside content in the medium, using the Zetasizer and UHPLC. Experiments were
performed in duplicate.
3.9 Phytosomes in alginate system
One of the key features of an oral delivery system for H. procumbens phytosomes should be
the ability to transit through stomach with minimal impact from the adverse gastric
environment.
3.9.1 Preparation of the alginate coated H. procumbens phytosomes
The alginate coated H. procumbens phytosomes were prepared using the inotropic gelation
technique by the syringe method as reported by Bansal et al., (2016) with slight
modifications, in attempt to increase the H. procumbens phytosomes stability in the gastric
environment.
http://etd.uwc.ac.za/
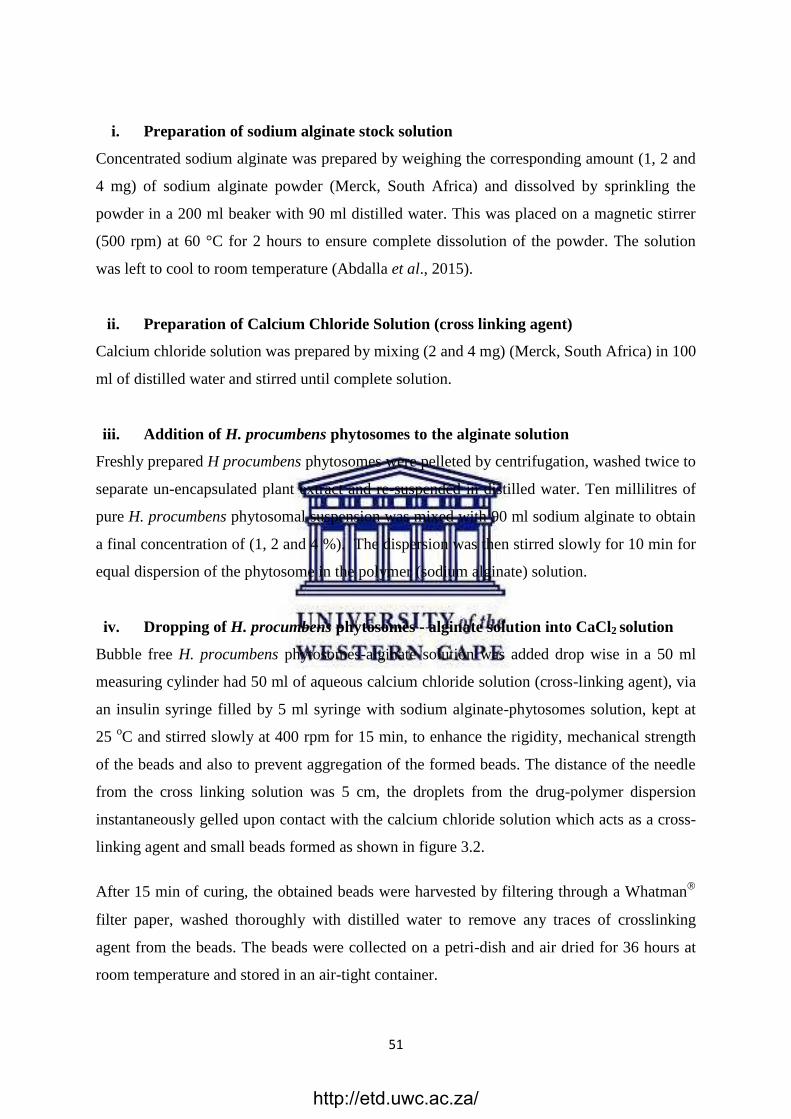
51
i. Preparation of sodium alginate stock solution
Concentrated sodium alginate was prepared by weighing the corresponding amount (1, 2 and
4 mg) of sodium alginate powder (Merck, South Africa) and dissolved by sprinkling the
powder in a 200 ml beaker with 90 ml distilled water. This was placed on a magnetic stirrer
(500 rpm) at 60 °C for 2 hours to ensure complete dissolution of the powder. The solution
was left to cool to room temperature (Abdalla et al., 2015).
ii. Preparation of Calcium Chloride Solution (cross linking agent)
Calcium chloride solution was prepared by mixing (2 and 4 mg) (Merck, South Africa) in 100
ml of distilled water and stirred until complete solution.
iii. Addition of H. procumbens phytosomes to the alginate solution
Freshly prepared H procumbens phytosomes were pelleted by centrifugation, washed twice to
separate un-encapsulated plant extract and re-suspended in distilled water. Ten millilitres of
pure H. procumbens phytosomal suspension was mixed with 90 ml sodium alginate to obtain
a final concentration of (1, 2 and 4 %). The dispersion was then stirred slowly for 10 min for
equal dispersion of the phytosome in the polymer (sodium alginate) solution.
iv. Dropping of H. procumbens phytosomes - alginate solution into CaCl2 solution
Bubble free H. procumbens phytosomes-alginate solution was added drop wise in a 50 ml
measuring cylinder had 50 ml of aqueous calcium chloride solution (cross-linking agent), via
an insulin syringe filled by 5 ml syringe with sodium alginate-phytosomes solution, kept at
25 oC and stirred slowly at 400 rpm for 15 min, to enhance the rigidity, mechanical strength
of the beads and also to prevent aggregation of the formed beads. The distance of the needle
from the cross linking solution was 5 cm, the droplets from the drug-polymer dispersion
instantaneously gelled upon contact with the calcium chloride solution which acts as a cross-
linking agent and small beads formed as shown in figure 3.2.
After 15 min of curing, the obtained beads were harvested by filtering through a Whatman
filter paper, washed thoroughly with distilled water to remove any traces of crosslinking
agent from the beads. The beads were collected on a petri-dish and air dried for 36 hours at
room temperature and stored in an air-tight container.
http://etd.uwc.ac.za/
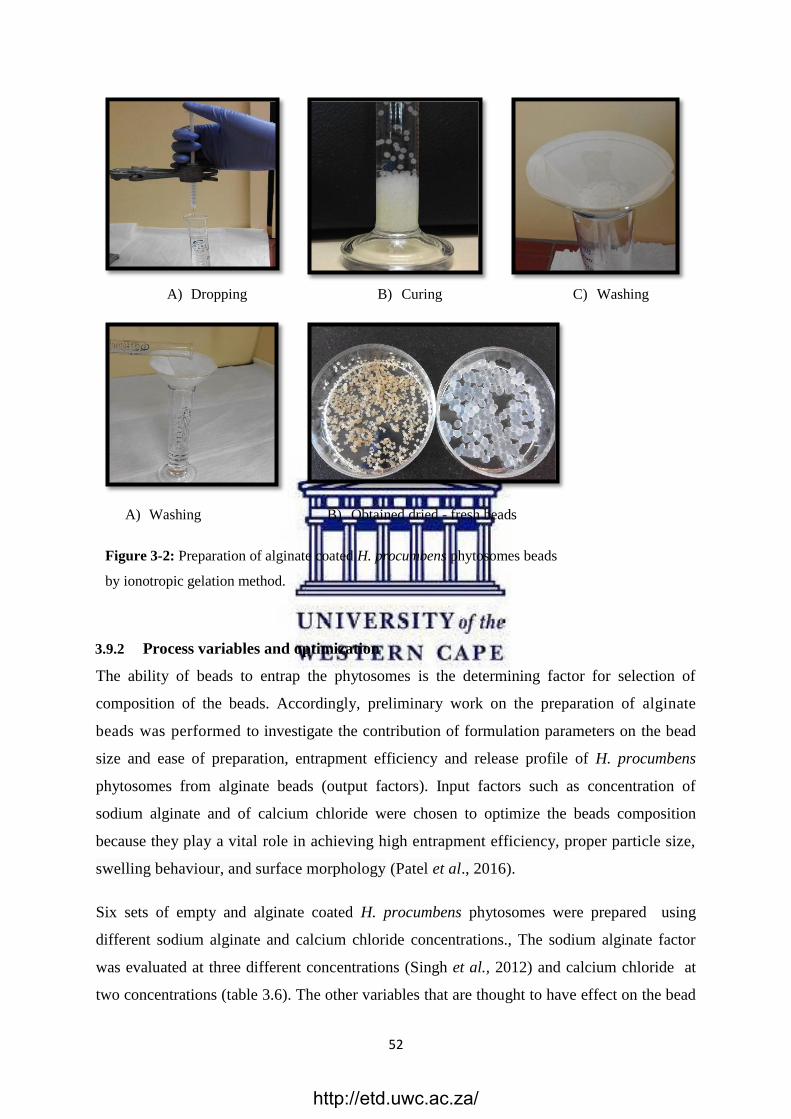
52
A) Dropping B) Curing C) Washing
A) Washing B) Obtained dried - fresh beads
Figure 3-2: Preparation of alginate coated H. procumbens phytosomes beads
by ionotropic gelation method.
3.9.2 Process variables and optimization
The ability of beads to entrap the phytosomes is the determining factor for selection of
composition of the beads. Accordingly, preliminary work on the preparation of alginate
beads was performed to investigate the contribution of formulation parameters on the bead
size and ease of preparation, entrapment efficiency and release profile of H. procumbens
phytosomes from alginate beads (output factors). Input factors such as concentration of
sodium alginate and of calcium chloride were chosen to optimize the beads composition
because they play a vital role in achieving high entrapment efficiency, proper particle size,
swelling behaviour, and surface morphology (Patel et al., 2016).
Six sets of empty and alginate coated H. procumbens phytosomes were prepared using
different sodium alginate and calcium chloride concentrations., The sodium alginate factor
was evaluated at three different concentrations (Singh et al., 2012) and calcium chloride at
two concentrations (table 3.6). The other variables that are thought to have effect on the bead
http://etd.uwc.ac.za/
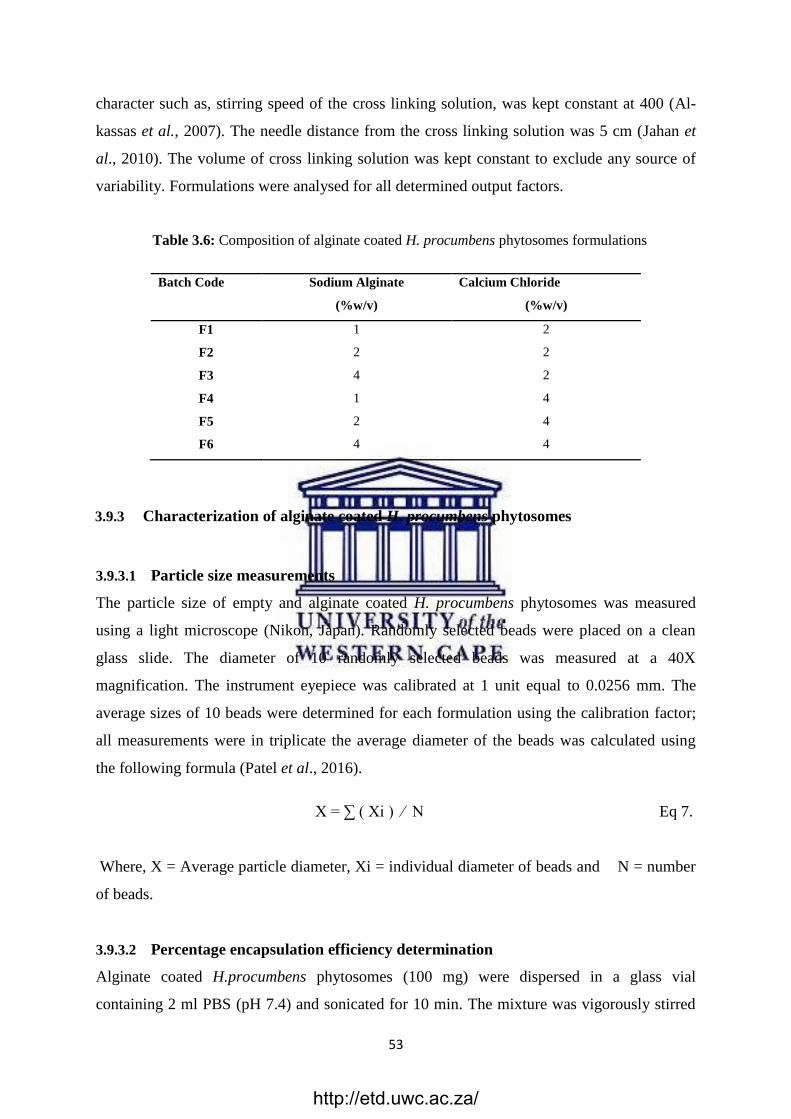
53
character such as, stirring speed of the cross linking solution, was kept constant at 400 (Al-
kassas et al., 2007). The needle distance from the cross linking solution was 5 cm (Jahan et
al., 2010). The volume of cross linking solution was kept constant to exclude any source of
variability. Formulations were analysed for all determined output factors.
Table 3.6: Composition of alginate coated H. procumbens phytosomes formulations
Batch Code
Sodium Alginate
(%w/v)
Calcium Chloride
(%w/v)
F1 1 2
F2 2 2
F3 4 2
F4 1 4
F5 2 4
F6 4 4
3.9.3 Characterization of alginate coated H. procumbens phytosomes
3.9.3.1 Particle size measurements
The particle size of empty and alginate coated H. procumbens phytosomes was measured
using a light microscope (Nikon, Japan). Randomly selected beads were placed on a clean
glass slide. The diameter of 10 randomly selected beads was measured at a 40X
magnification. The instrument eyepiece was calibrated at 1 unit equal to 0.0256 mm. The
average sizes of 10 beads were determined for each formulation using the calibration factor;
all measurements were in triplicate the average diameter of the beads was calculated using
the following formula (Patel et al., 2016).
X = ∑ ( Xi ) ∕ N Eq 7.
Where, X = Average particle diameter, Xi = individual diameter of beads and N = number
of beads.
3.9.3.2 Percentage encapsulation efficiency determination
Alginate coated H.procumbens phytosomes (100 mg) were dispersed in a glass vial
containing 2 ml PBS (pH 7.4) and sonicated for 10 min. The mixture was vigorously stirred
http://etd.uwc.ac.za/
54
at 1000 rpm for 4 hours with a magnetic stirrer to break down the alginate coating (Nayak et
al., 2011). One ml of ethanol was added and the mixture was probe sonicated for 3 min to
lyse the H. procumbens phytosomes liberated from lysed alginate beads. The mixture was
centrifuged for 5 min, filtered through 0.45 µm syringe filter and analyzed using UHPLC.
Observations were recorded in triplicate and the beads percentage encapsulation efficiency
was calculated using following formula (Kassem et al., 2012):
Percentage encapsulation efficiency = Entrapped drug
Initial drug 100 Eq 8.
3.9.3.3 Alginate coated H. procumbens phytosomes erosion study
An erosin study was performed to determine how alginate and calcium chloride concentration
affects the time needed for alginate beads to swell, disintegrate and release their encapsulated
phytosomes. Equal amounts of dried alginate beads were dispersed in glass vials containing
phosphate buffer solution pH 7.4 in equal volumes and placed in multi positions of a
magnetic stirrer water bath at 37 oC and 100 rpm for 2 hours. Alginate coated H. procumbens
phytosomes integrity was visual inspected and released plant extract was detected by UHPLC
at time interval of 1, 2, 4, 6 & 8 hours.
3.9.3.4 Morphology and surface assessment of selected alginate coated H. procumbens
phytosomes
Morphological examination of the surface of the dried alginate coated H. procumbens
phytosomes was carried out using a scanning electron microscope. Randomly selected beads
were placed on double-sided copper conductive tape fixed on aluminium stubs. The beads
were then sputter-coated with a thin layer of gold in a vacuum for at 20 mA using a coating
unit to make it electrically conductive and was analyzed with a SEM instrument.
3.9.3.5 Phytosomes- polymer compatibility study
H. procumbens phytosomes- alginate polymer interactions in the formulation were studied by
the use of the Fourier Transform Infrared (FTIR) spectrometer. Empty and loaded alginate
beads (alginate–coated H. procumbens phytosome) were prepared and air dried. H.
procumbens phytosomes were prepared and dried in a vacuum oven at room temperature.
http://etd.uwc.ac.za/
55
The samples were put on the small diamond crystal and pressure was applied by ATR
accessory and scanned 4 times at 2 cm⁻1/sec at a resolution of 4 cm⁻1/sec within the wave
number range of 4000 cm-1-650 cm-1. Drug polymer interaction was studied by comparing
the IR spectra of H. procumbens phytosomes and empty alginate beads with H. procumbens
phytosomes loaded alginate beads. The analysis of the spectra conducted used spectrum
software version 6.3.5.
3.9.3.6 Swelling index study
This study was conducted to estimate the percentage swelling of the alginate beads. This is
responsible for leaching of the phytosomes into the gastric and intestinal fluids. The beads
swelling extent in the dissolution medium was determined by following described methods
by Patel et al., (2016; Nayak et al., (2011). The extent of swelling was measured in terms of
% weight gain by beads. The swelling behaviour of dried beads in gastric and intestinal
simulated fluids (SGF; pH 1.2, SIF; pH 7.4) was tested. Simulated gastric fluid prepared as
prescribed in section (3.8.6.1), simulated intestinal fluid (SIF) was prepared as per WHO
(WHO, 2012); 6.8 g of potassium dihydrogen phosphate was dissolved in 250 ml of water
and 190 ml sodium hydroxide (0.2 mol/l) and 400 ml water. The resulting solution was
adjusted with sodium hydroxide (0.2 mol/l) to a pH of 7.5 ± 0.1 and diluted with sufficient
water up to 1000 ml.
In this test 3.4 mg of optimized alginate–coated H. procumbens phytosomes formulation was
transferred to a glass vial containing GSF. The samples were stirred at 60 rpm speed in a
multi stirrer water bath and allowed to swell for 2 hours at 37 ± 0.5 °C in simulating the
gastric medium. The same experiment was repeated in SIF. At the end of 2 hours, the beads
were withdrawn, placed on tissue paper to remove moisture adhering to the surface and
immediately weighed. The swelling behaviour of beads was expressed as the ratio of initial
weight of beads to the final weight of swollen beads as a function of time.
The % weight gain by the beads (swelling index) was calculated by the following formula:
Swelling index (SI) = [{Wt – W0}/ W0] x 100. Eq 9.
Where, Wt = Mass of swollen beads at time t and W0= Mass of dry beads at t = 0.
http://etd.uwc.ac.za/
56
3.9.3.7 Invitro drug release in GIT fluids
The release study was performed at different pH (SGF; 1.2, SIF; 7.4), simulating transition of
beads in GIT; the media of pH 1.2 was representing the gastric condition pH 7.4 was
representing the intestinal condition.
Accurately weighed 10 mg of alginate coated H. procumbens phytosomes was dispersed in a
10 ml glass vial containing 2 ml simulated intestinal fluid (SIF) and placed in a multi stirrer
water bath its temperature was adjusted to 37 oC and 200 rpm. The experiment was conducted
for 8 hours. One vial was used for each time point. (1, 2, 4, 6, and 8 hours). At the
determined time interval the vial was removed from the water bath and the solution was
transferred by pipette to eppendorf tubes. This was centrifuged for 30 min at 14,000 rpm. The
supernatant was filtered through 0.45 µm syringe filter and UHPLC was used for the analysis
to quantify the harpagoside released from alginate coated H. procumbens phytosomes. The
experiment was repeated using simulated gastric fluid (SGF) as release medium for 4 hours,
The experiments were done in duplicate (Shazly et al., 2008) with slight modification.
3.9.3.8 Release profile determination
The drug release study was performed by using the dispersion method reported by Shazly et
al., (2008) with slight changes on selected optimized H. procumbens phytosomes
formulation, alginate coated H. procumbens phytosomes formulation and freeze dried extract
to compare the release pattern in PBS pH 7.4 as release medium. Five mg of freeze dried H.
procumbens extract was placed in 10 ml glass vials containing 2 ml release medium. These
were placed in a circulating thermostatic water bath on digital multi-position magnetic stirrer.
The temperature was set at 37 C and stirring speed of 200 rpm for 8 hours. A different vial
was used for each time interval. After the specific time interval, a vial was removed; the
solution filtered, and analyzed using UHPLC, to quantify harpagoside concentration in the
release medium. Experiments were performed in duplicate. The same steps were applied for
the H. procumbens phytosomes and alginate coated phytosomes, but firstly the phytosomes
were purified by centrifugation as mentioned in section (3.5.4) to prevent un-encapsulated
harpagoside from being present in the release medium and influencing the result. The purified
phytosomes were re-suspended in PBS and used to conduct the release study.
http://etd.uwc.ac.za/
57
3.9.3.9 Mechanism of rlease
The analysis of the mechanism of drug release from the pharmaceutical dosage form is an
important process. In order to understand the mechanism and kinetics of drug release,
the drug release data of the in-vitro study was fitted to various kinetic equations such
as zero-order, first-order, Higuchi and the Korsmeyer and Peppas equation (Mello et al.,
2011) The DDSolver 1.0 software was used for the linear regression analysis. It features 40
models that can be used to directly calculate the parameters and the appropriateness of each
model. Correlation coefficient correlation values were calculated for the linear curves
obtained with regression analysis. The value of the release exponent (n) of the Korsmeyer–
Peppas equation was determined and used to indicate different release mechanisms. The
highest values of regression coefficient (R2) were selected as the best fit model. The
equations used for calculating the release kinetics are as follows:
Zero Order model: F=k0*t Eq.10
Where F denotes fraction of drug released up to time t, ko is the zero-order rate constant
expressed in units of concentration/time, t is the time in hours.
First Order model: F=100*[1-n (-kf*t)] Eq.11
Where kf is the constant of mathematical model.
Higuchi’smodel F=kH*t1/2
Eq.12
Where kH is the constant reflecting the design variable of the system.
Korsmeyer-Peppas model: F=kK-P*t^n Eq.13
Where kK-P is the rate constant and n is the release exponent.
3.9.3.10 Effect of storage temperature on H. procumbens phytosomes and alginate coated
phytosomes.
Phytosomes were stored for 30 days at 4-8 °C (refrigerated temperature), 25 °C, and 37 °C.
Freshly prepared phytosomes were purified to separate of non-entrapped harpagoside by
centrifugation method. Purified phytosome formulations were placed in glass vials, tightly
sealed and parafilmed. Sample aliquots were withdrawn periodically at 1, 7, 14, 30 days.
Particle size, polydispersity index, zeta potential and harpagoside leakage analysis were
evaluated using a zetasizer and UHPLC as the method described by Muppidi et al., (2012).
http://etd.uwc.ac.za/
58
For leakage analysis samples were centrifuged and the supernatant was injected into UHPLC
to detect and quantify the harpagoside leaked from phytosomes.
For alginate coated H. procumbens phytosomes, the method reported by Kashid et al., (2016)
was used with slight modifications. These were also tested for stability. A 50mg of dried
alginate coated H. procumbens phytosomes were transferred to air tight containers,
parafilmed and stored at 4-8 °C, 25 °C and 37 °C for 30 days. At predetermined time of 1, 7,
14, 30 days samples were analysed for particle size to check for possible changes in the bead
size due to temperature variation. The samples were tested for harpagoside leakage. Samples
were transferred to 2 ml tubes; 1ml ethanol was added and stirred slowly for 10 min. The
ethanol was added to dissolve any phytosomes which may have migrated from the alginate
core to the shell. Ethanol does not affect the alginate bead integrity.
3.10 Statistical analysis of data
All results were expressed as mean values ± standard deviation (SD). The results were
evaluated and analyzed statistically with the GraphPad InStat® software (version 6, Graph
Pad Software San Diego, California, USA). Analysis of variance (ANOVA) was used to
assess regression analysis R2 (correlation coefficient) and linear regression to measure
linearity. Data was analyzed for one and two way analysis of variance (ANOVA). One-way
ANOVA analysis was followed by the Tukey‘s multiple comparison test. A probability factor
of less than 0.05 (P < 0.05) was considered to represent statistically significant difference,
whereas P < 0.001 was considered extremely significant.
Design-Expert®, version 8.0.7.1 software (Stat-ease Inc., USA) was used for performing
experimental design, polynomial fitting and ANOVA results.
DDsolver software for model fitting for release study data and evaluation of release kinetics
was obtained according to exponent release value.
http://etd.uwc.ac.za/
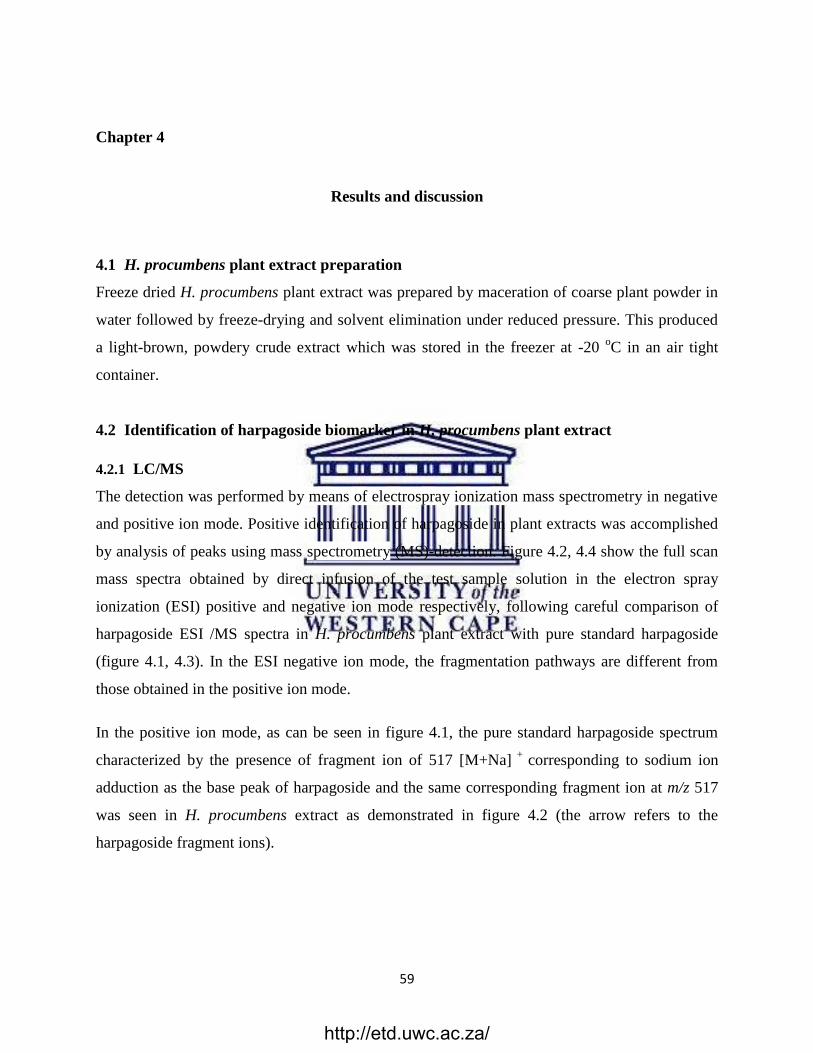
59
Chapter 4
Results and discussion
4.1 H. procumbens plant extract preparation
Freeze dried H. procumbens plant extract was prepared by maceration of coarse plant powder in
water followed by freeze-drying and solvent elimination under reduced pressure. This produced
a light-brown, powdery crude extract which was stored in the freezer at -20 oC in an air tight
container.
4.2 Identification of harpagoside biomarker in H. procumbens plant extract
4.2.1 LC/MS
The detection was performed by means of electrospray ionization mass spectrometry in negative
and positive ion mode. Positive identification of harpagoside in plant extracts was accomplished
by analysis of peaks using mass spectrometry (MS)-detection. Figure 4.2, 4.4 show the full scan
mass spectra obtained by direct infusion of the test sample solution in the electron spray
ionization (ESI) positive and negative ion mode respectively, following careful comparison of
harpagoside ESI /MS spectra in H. procumbens plant extract with pure standard harpagoside
(figure 4.1, 4.3). In the ESI negative ion mode, the fragmentation pathways are different from
those obtained in the positive ion mode.
In the positive ion mode, as can be seen in figure 4.1, the pure standard harpagoside spectrum
characterized by the presence of fragment ion of 517 [M+Na] +
corresponding to sodium ion
adduction as the base peak of harpagoside and the same corresponding fragment ion at m/z 517
was seen in H. procumbens extract as demonstrated in figure 4.2 (the arrow refers to the
harpagoside fragment ions).
http://etd.uwc.ac.za/
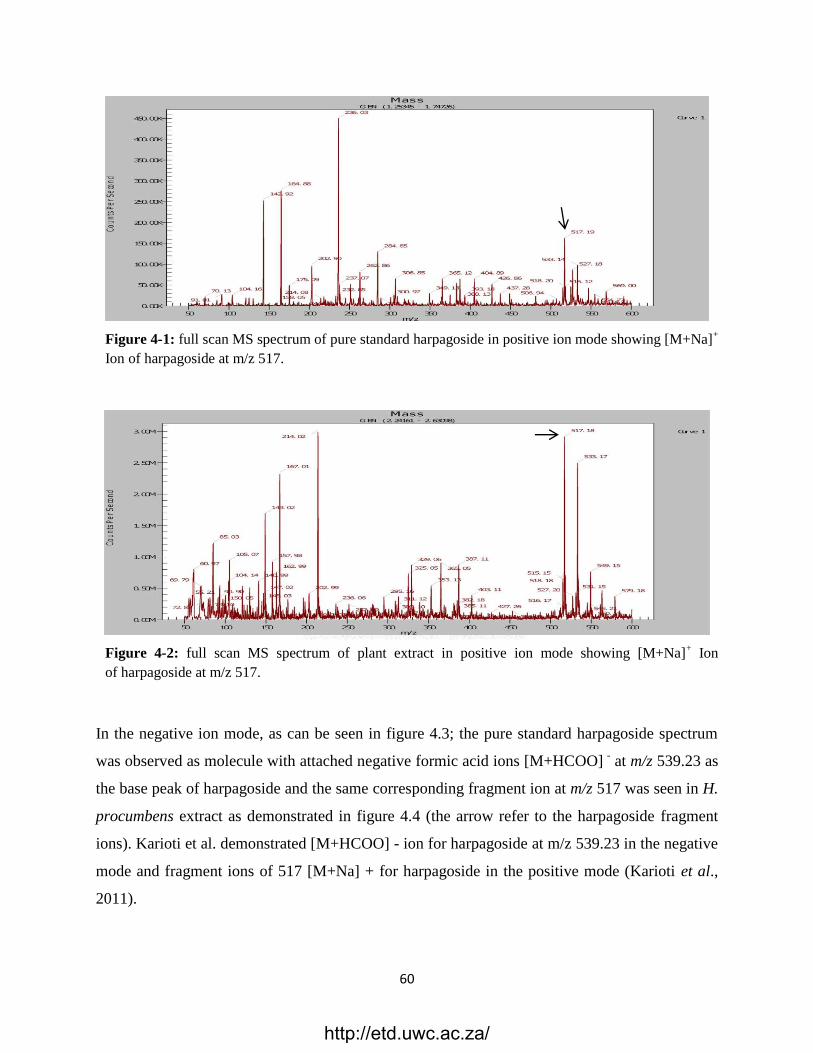
60
Figure 4-1: full scan MS spectrum of pure standard harpagoside in positive ion mode showing [M+Na]+
Ion of harpagoside at m/z 517.
Figure 4-2: full scan MS spectrum of plant extract in positive ion mode showing [M+Na]+ Ion
of harpagoside at m/z 517.
In the negative ion mode, as can be seen in figure 4.3; the pure standard harpagoside spectrum
was observed as molecule with attached negative formic acid ions [M+HCOO] - at m/z 539.23 as
the base peak of harpagoside and the same corresponding fragment ion at m/z 517 was seen in H.
procumbens extract as demonstrated in figure 4.4 (the arrow refer to the harpagoside fragment
ions). Karioti et al. demonstrated [M+HCOO] - ion for harpagoside at m/z 539.23 in the negative
mode and fragment ions of 517 [M+Na] + for harpagoside in the positive mode (Karioti et al.,
2011).
http://etd.uwc.ac.za/
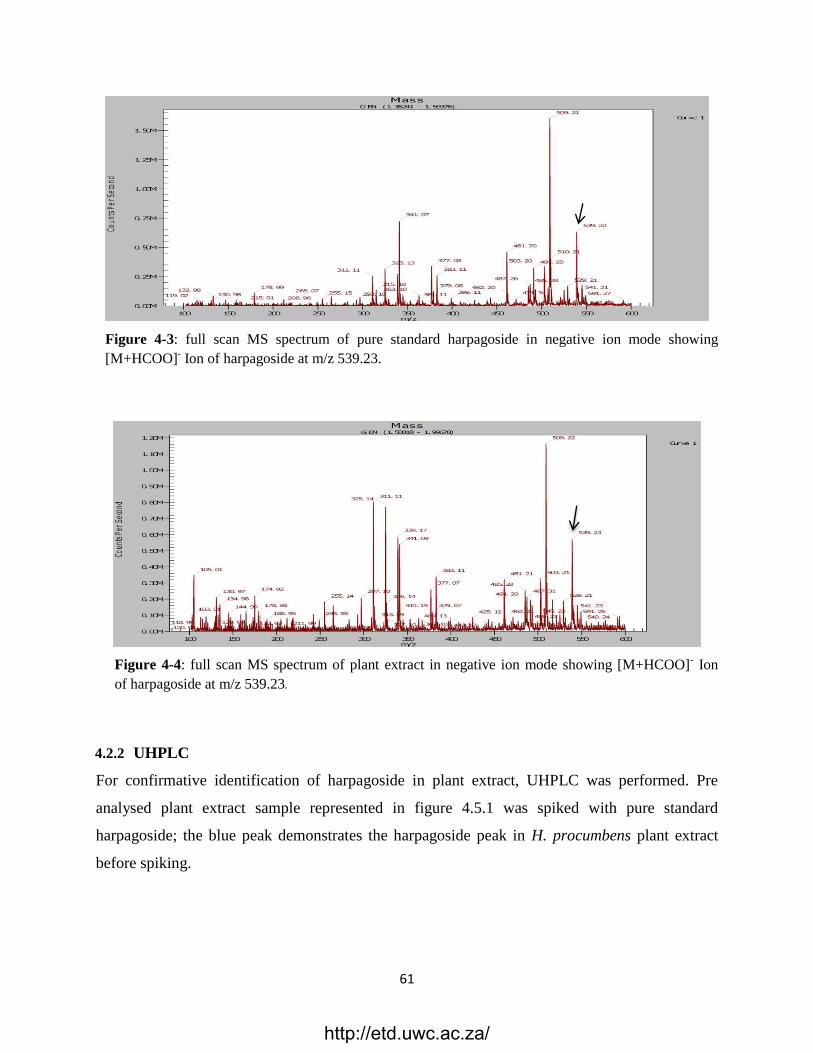
61
Figure 4-3: full scan MS spectrum of pure standard harpagoside in negative ion mode showing
[M+HCOO] - Ion of harpagoside at m/z 539.23.
Figure 4-4: full scan MS spectrum of plant extract in negative ion mode showing [M+HCOO]- Ion
of harpagoside at m/z 539.23.
4.2.2 UHPLC
For confirmative identification of harpagoside in plant extract, UHPLC was performed. Pre
analysed plant extract sample represented in figure 4.5.1 was spiked with pure standard
harpagoside; the blue peak demonstrates the harpagoside peak in H. procumbens plant extract
before spiking.
http://etd.uwc.ac.za/
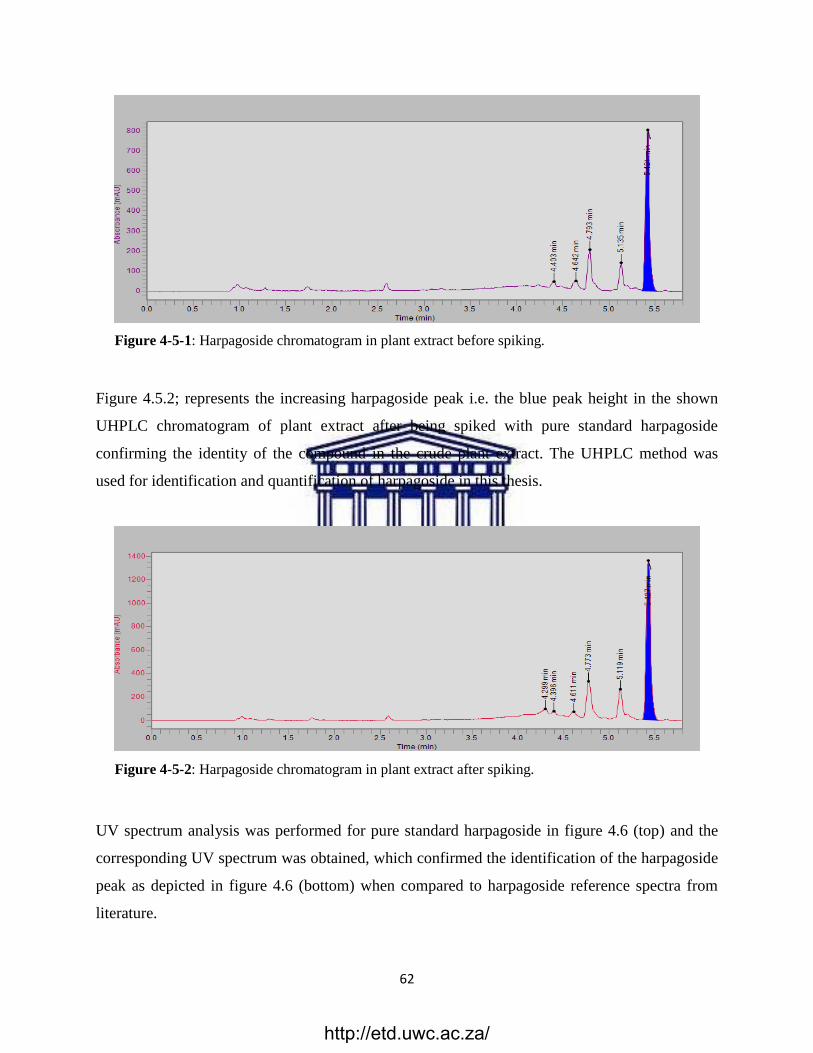
62
Figure 4-5-1: Harpagoside chromatogram in plant extract before spiking.
Figure 4.5.2; represents the increasing harpagoside peak i.e. the blue peak height in the shown
UHPLC chromatogram of plant extract after being spiked with pure standard harpagoside
confirming the identity of the compound in the crude plant extract. The UHPLC method was
used for identification and quantification of harpagoside in this thesis.
Figure 4-5-2 : Harpagoside chromatogram in plant extract after spiking.
UV spectrum analysis was performed for pure standard harpagoside in figure 4.6 (top) and the
corresponding UV spectrum was obtained, which confirmed the identification of the harpagoside
peak as depicted in figure 4.6 (bottom) when compared to harpagoside reference spectra from
literature.
http://etd.uwc.ac.za/
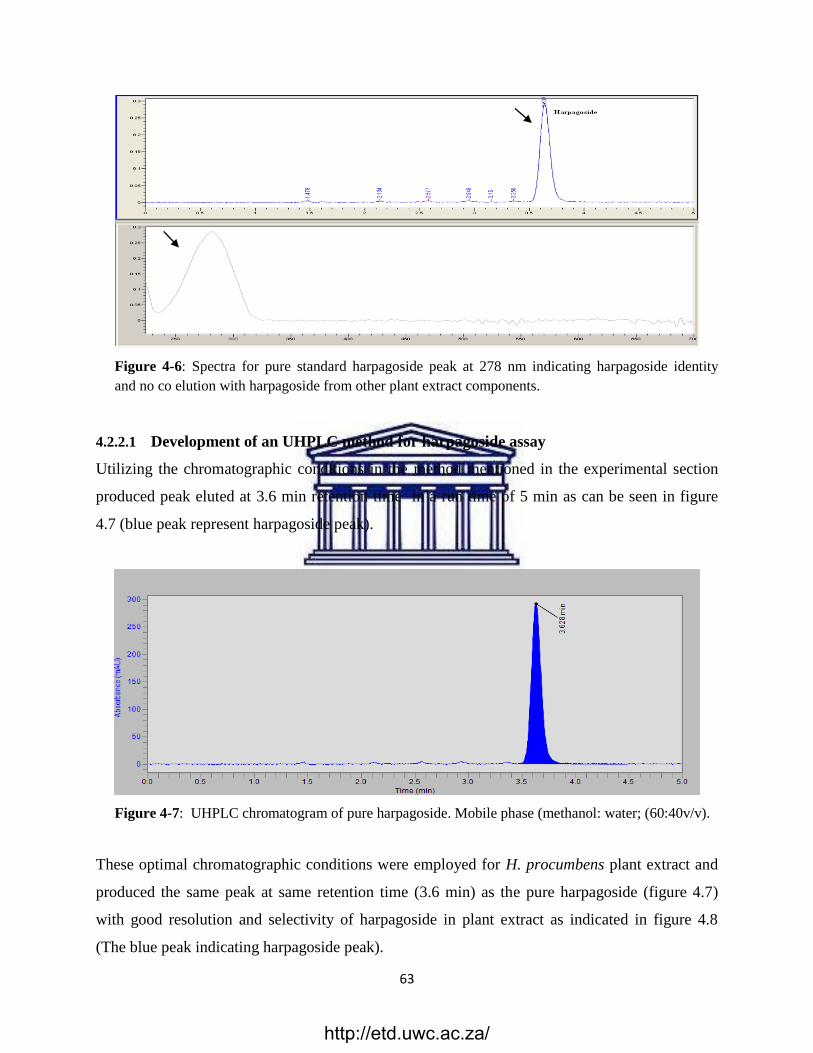
63
Figure 4-6 : Spectra for pure standard harpagoside peak at 278 nm indicating harpagoside identity
and no co elution with harpagoside from other plant extract components.
4.2.2.1 Development of an UHPLC method for harpagoside assay
Utilizing the chromatographic conditions in the method mentioned in the experimental section
produced peak eluted at 3.6 min retention time in a run time of 5 min as can be seen in figure
4.7 (blue peak represent harpagoside peak).
Figure 4-7: UHPLC chromatogram of pure harpagoside. Mobile phase (methanol: water; (60:40v/v).
These optimal chromatographic conditions were employed for H. procumbens plant extract and
produced the same peak at same retention time (3.6 min) as the pure harpagoside (figure 4.7)
with good resolution and selectivity of harpagoside in plant extract as indicated in figure 4.8
(The blue peak indicating harpagoside peak).
http://etd.uwc.ac.za/
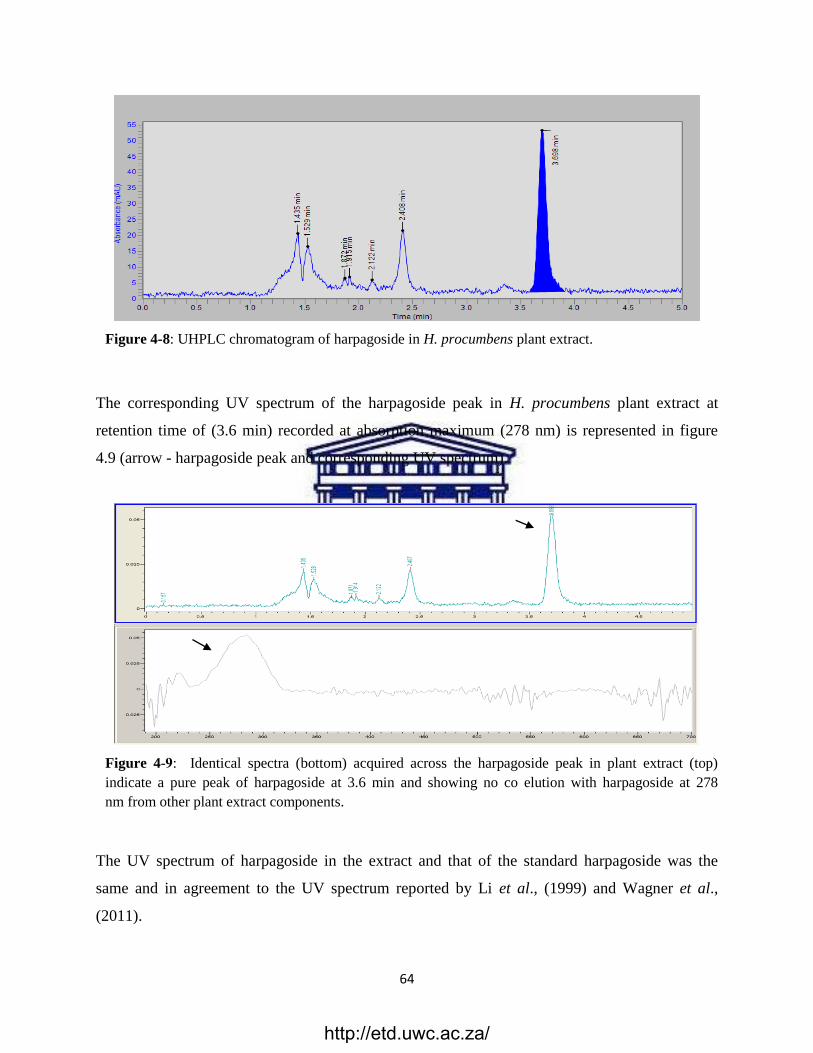
64
Figure 4-8 : UHPLC chromatogram of harpagoside in H. procumbens plant extract.
The corresponding UV spectrum of the harpagoside peak in H. procumbens plant extract at
retention time of (3.6 min) recorded at absorption maximum (278 nm) is represented in figure
4.9 (arrow - harpagoside peak and corresponding UV spectrum).
Figure 4-9: Identical spectra (bottom) acquired across the harpagoside peak in plant extract (top)
indicate a pure peak of harpagoside at 3.6 min and showing no co elution with harpagoside at 278
nm from other plant extract components.
The UV spectrum of harpagoside in the extract and that of the standard harpagoside was the
same and in agreement to the UV spectrum reported by Li et al., (1999) and Wagner et al.,
(2011).
http://etd.uwc.ac.za/
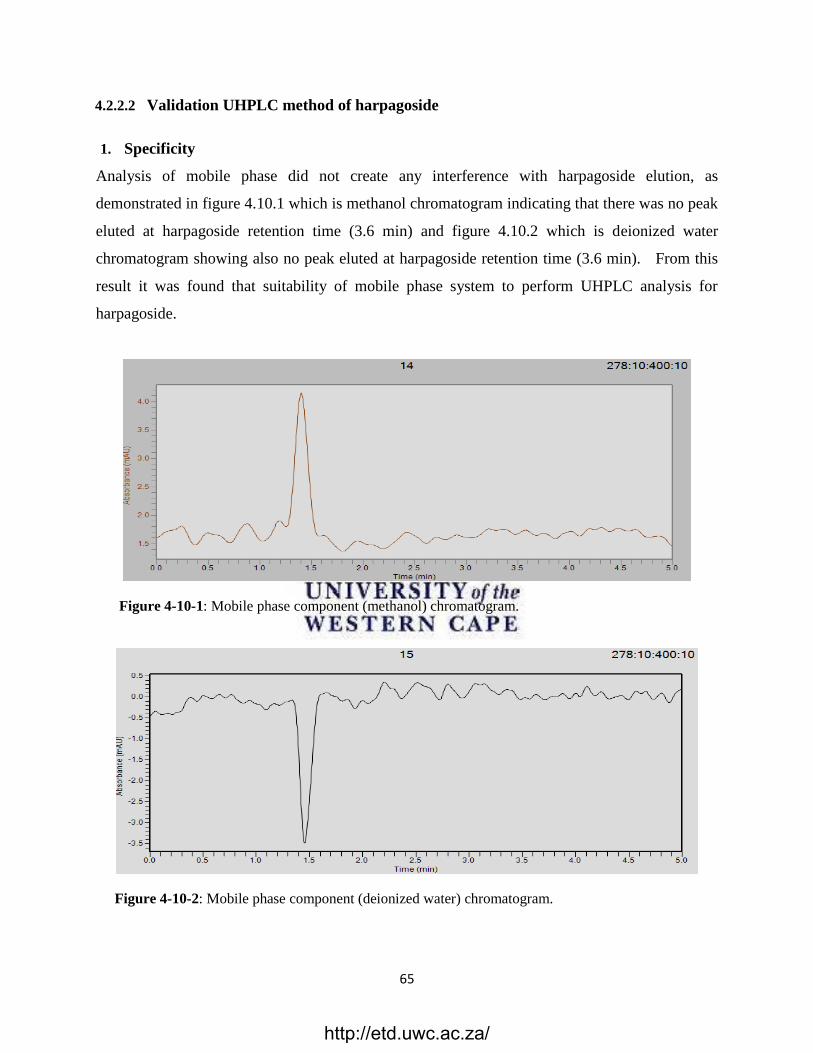
65
4.2.2.2 Validation UHPLC method of harpagoside
1. Specificity
Analysis of mobile phase did not create any interference with harpagoside elution, as
demonstrated in figure 4.10.1 which is methanol chromatogram indicating that there was no peak
eluted at harpagoside retention time (3.6 min) and figure 4.10.2 which is deionized water
chromatogram showing also no peak eluted at harpagoside retention time (3.6 min). From this
result it was found that suitability of mobile phase system to perform UHPLC analysis for
harpagoside.
Figure 4-10-1: Mobile phase component (methanol) chromatogram.
Figure 4-10-2: Mobile phase component (deionized water) chromatogram.
http://etd.uwc.ac.za/
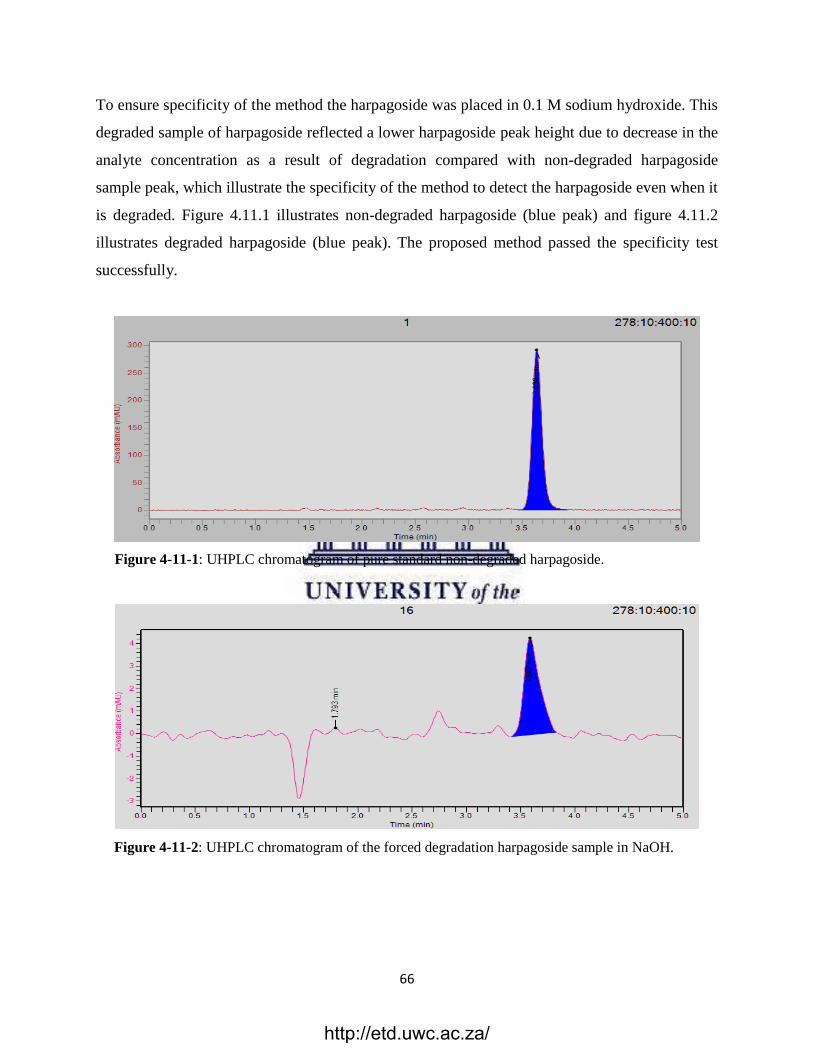
66
To ensure specificity of the method the harpagoside was placed in 0.1 M sodium hydroxide. This
degraded sample of harpagoside reflected a lower harpagoside peak height due to decrease in the
analyte concentration as a result of degradation compared with non-degraded harpagoside
sample peak, which illustrate the specificity of the method to detect the harpagoside even when it
is degraded. Figure 4.11.1 illustrates non-degraded harpagoside (blue peak) and figure 4.11.2
illustrates degraded harpagoside (blue peak). The proposed method passed the specificity test
successfully.
Figure 4-11-1: UHPLC chromatogram of pure standard non-degraded harpagoside.
Figure 4-11-2: UHPLC chromatogram of the forced degradation harpagoside sample in NaOH.
http://etd.uwc.ac.za/
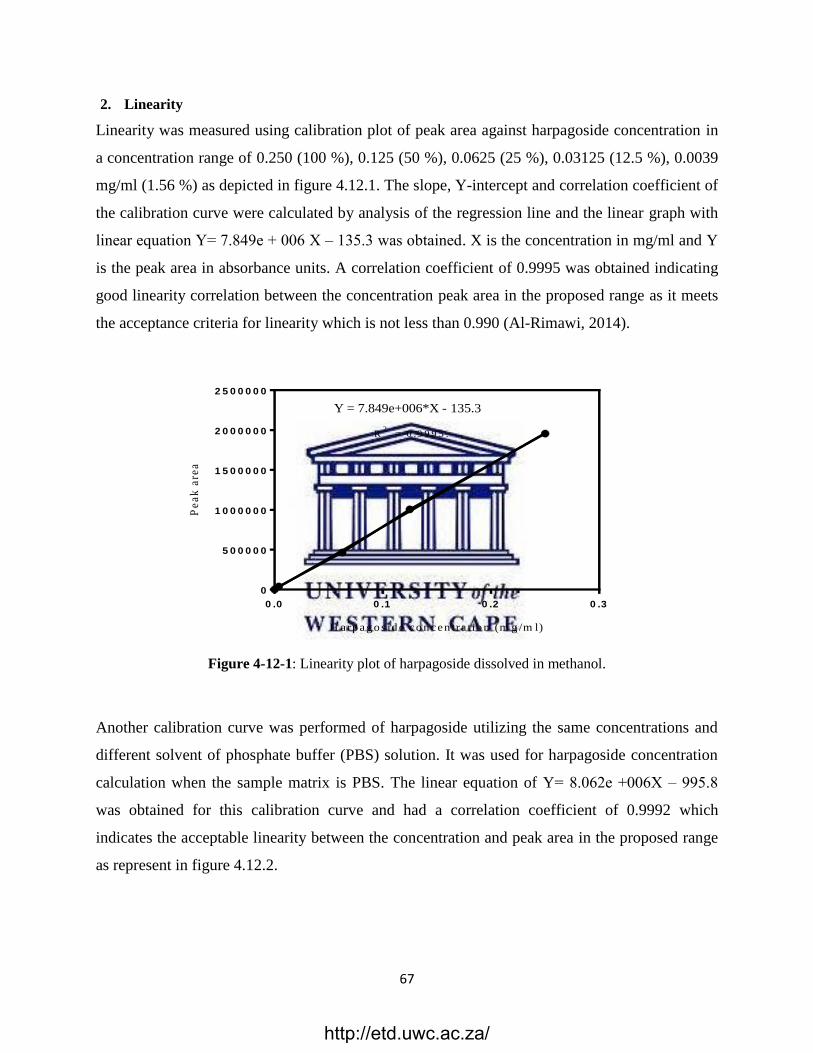
67
2. Linearity
Linearity was measured using calibration plot of peak area against harpagoside concentration in
a concentration range of 0.250 (100 %), 0.125 (50 %), 0.0625 (25 %), 0.03125 (12.5 %), 0.0039
mg/ml (1.56 %) as depicted in figure 4.12.1. The slope, Y-intercept and correlation coefficient of
the calibration curve were calculated by analysis of the regression line and the linear graph with
linear equation Y= 7.849e + 006 X ‒ 135.3 was obtained. X is the concentration in mg/ml and Y
is the peak area in absorbance units. A correlation coefficient of 0.9995 was obtained indicating
good linearity correlation between the concentration peak area in the proposed range as it meets
the acceptance criteria for linearity which is not less than 0.990 (Al-Rimawi, 2014).
H arp a go s id e co n cen tra tio n (m g /m l)
Pe
ak
are
a
0 .0 0 .1 0 .2 0 .3
0
5 0 0 0 0 0
1 0 0 0 0 0 0
1 5 0 0 0 0 0
2 0 0 0 0 0 0
2 5 0 0 0 0 0
Y = 7.849e+006*X - 135.3
R2 = 0 .9 9 9 5 .
Figure 4-12-1 : Linearity plot of harpagoside dissolved in methanol.
Another calibration curve was performed of harpagoside utilizing the same concentrations and
different solvent of phosphate buffer (PBS) solution. It was used for harpagoside concentration
calculation when the sample matrix is PBS. The linear equation of Y= 8.062e +006X ‒ 995.8
was obtained for this calibration curve and had a correlation coefficient of 0.9992 which
indicates the acceptable linearity between the concentration and peak area in the proposed range
as represent in figure 4.12.2.
http://etd.uwc.ac.za/
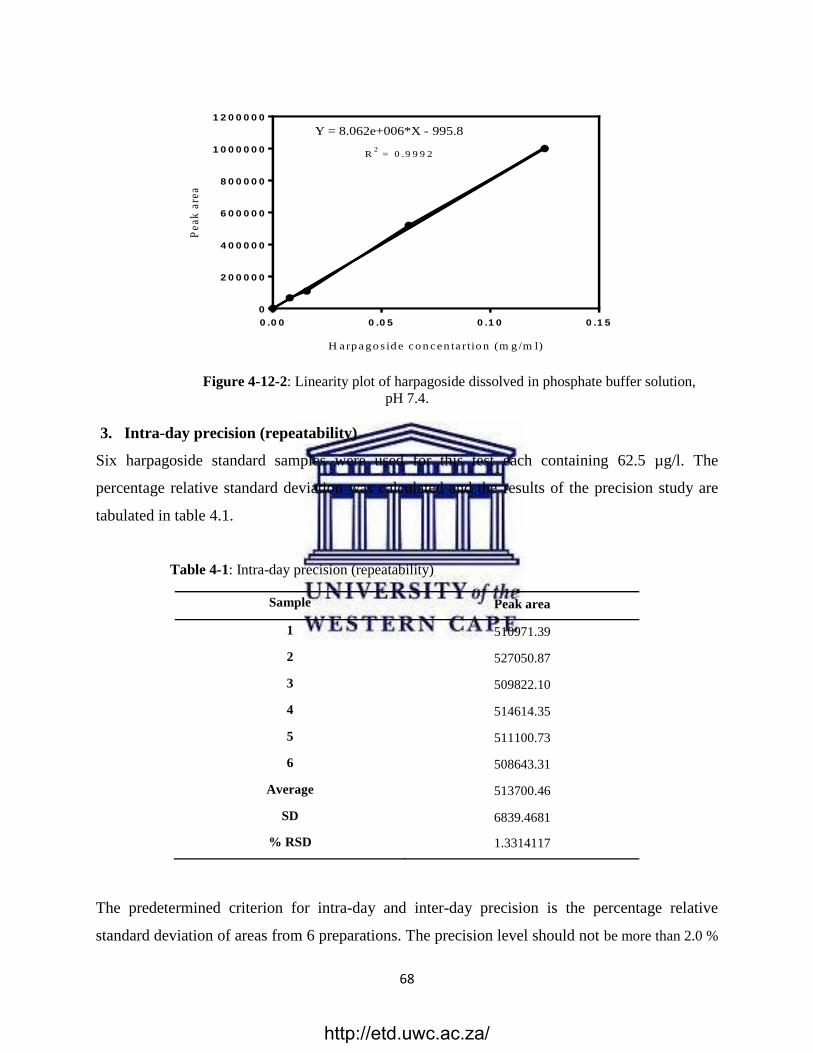
68
H arp a go s id e co n cen ta rtio n (m g /m l)
Pe
ak
are
a
0 .0 0 0 .0 5 0 .1 0 0 .1 5
0
2 0 0 0 0 0
4 0 0 0 0 0
6 0 0 0 0 0
8 0 0 0 0 0
1 0 0 0 0 0 0
1 2 0 0 0 0 0
R2 = 0 .9 9 9 2
Y = 8.062e+006*X - 995.8
Figure 4-12-2: Linearity plot of harpagoside dissolved in phosphate buffer solution,
pH 7.4.
3. Intra-day precision (repeatability)
Six harpagoside standard samples were used for this test each containing 62.5 µg/l. The
percentage relative standard deviation was calculated and the results of the precision study are
tabulated in table 4.1.
Table 4-1: Intra-day precision (repeatability)
Sample Peak area
1 510971.39
2 527050.87
3 509822.10
4 514614.35
5 511100.73
6 508643.31
Average 513700.46
SD 6839.4681
% RSD 1.3314117
The predetermined criterion for intra-day and inter-day precision is the percentage relative
standard deviation of areas from 6 preparations. The precision level should not be more than 2.0 %
http://etd.uwc.ac.za/
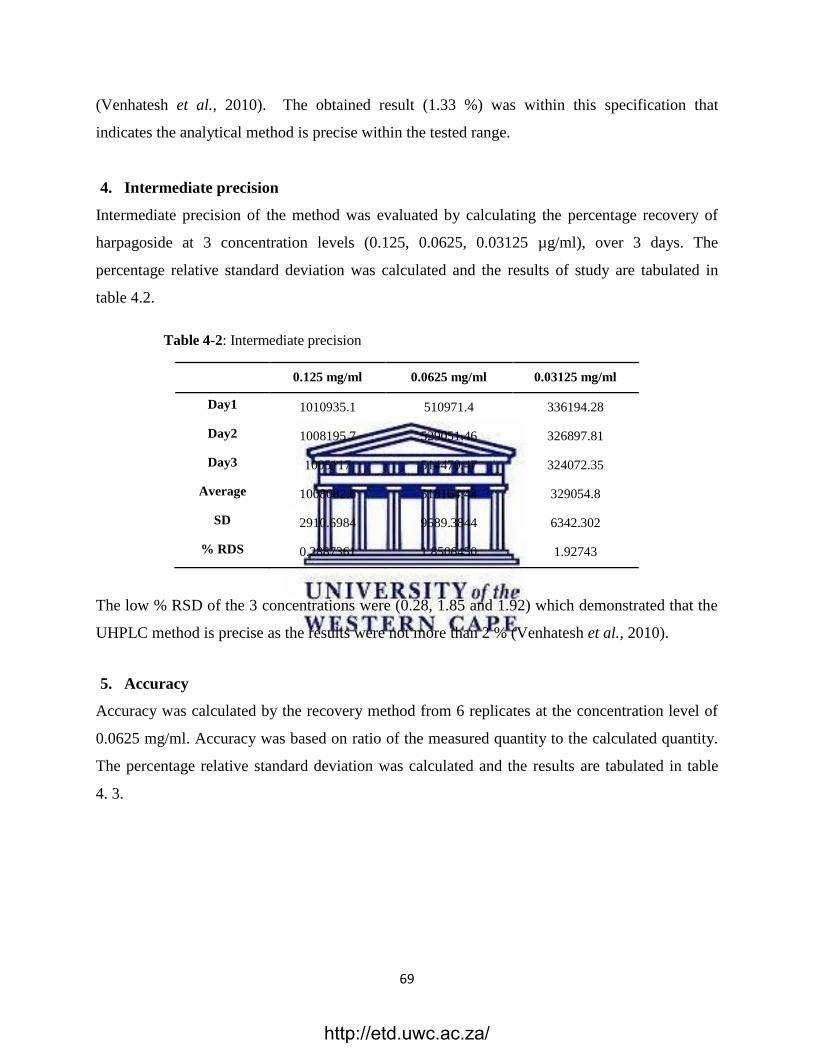
69
(Venhatesh et al., 2010). The obtained result (1.33 %) was within this specification that
indicates the analytical method is precise within the tested range.
4. Intermediate precision
Intermediate precision of the method was evaluated by calculating the percentage recovery of
harpagoside at 3 concentration levels (0.125, 0.0625, 0.03125 µg/ml), over 3 days. The
percentage relative standard deviation was calculated and the results of study are tabulated in
table 4.2.
Table 4-2: Intermediate precision
0.125 mg/ml 0.0625 mg/ml 0.03125 mg/ml
Day1 1010935.1 510971.4 336194.28
Day2 1008195.7 529051.46 326897.81
Day3 1005117 514470.47 324072.35
Average 1008082.6 518164.44 329054.8
SD 2910.6984 9589.3844 6342.302
% RDS 0.2887361 1.8506450 1.92743
The low % RSD of the 3 concentrations were (0.28, 1.85 and 1.92) which demonstrated that the
UHPLC method is precise as the results were not more than 2 % (Venhatesh et al., 2010).
5. Accuracy
Accuracy was calculated by the recovery method from 6 replicates at the concentration level of
0.0625 mg/ml. Accuracy was based on ratio of the measured quantity to the calculated quantity.
The percentage relative standard deviation was calculated and the results are tabulated in table
4. 3.
http://etd.uwc.ac.za/
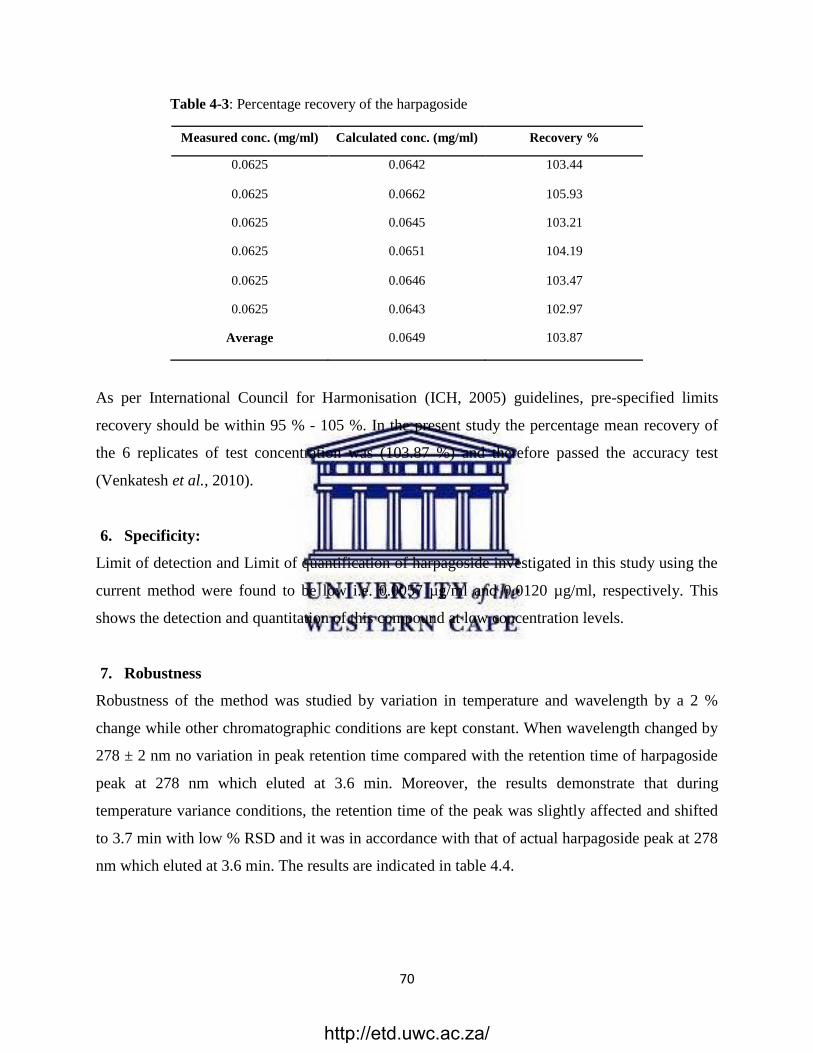
70
Table 4-3: Percentage recovery of the harpagoside
Measured conc. (mg/ml) Calculated conc. (mg/ml) Recovery %
0.0625 0.0642 103.44
0.0625 0.0662 105.93
0.0625 0.0645 103.21
0.0625 0.0651 104.19
0.0625 0.0646 103.47
0.0625 0.0643 102.97
Average 0.0649 103.87
As per International Council for Harmonisation (ICH, 2005) guidelines, pre-specified limits
recovery should be within 95 % - 105 %. In the present study the percentage mean recovery of
the 6 replicates of test concentration was (103.87 %) and therefore passed the accuracy test
(Venkatesh et al., 2010).
6. Specificity:
Limit of detection and Limit of quantification of harpagoside investigated in this study using the
current method were found to be low i.e. 0.0057 µg/ml and 0.0120 µg/ml, respectively. This
shows the detection and quantitation of this compound at low concentration levels.
7. Robustness
Robustness of the method was studied by variation in temperature and wavelength by a 2 %
change while other chromatographic conditions are kept constant. When wavelength changed by
278 ± 2 nm no variation in peak retention time compared with the retention time of harpagoside
peak at 278 nm which eluted at 3.6 min. Moreover, the results demonstrate that during
temperature variance conditions, the retention time of the peak was slightly affected and shifted
to 3.7 min with low % RSD and it was in accordance with that of actual harpagoside peak at 278
nm which eluted at 3.6 min. The results are indicated in table 4.4.
http://etd.uwc.ac.za/
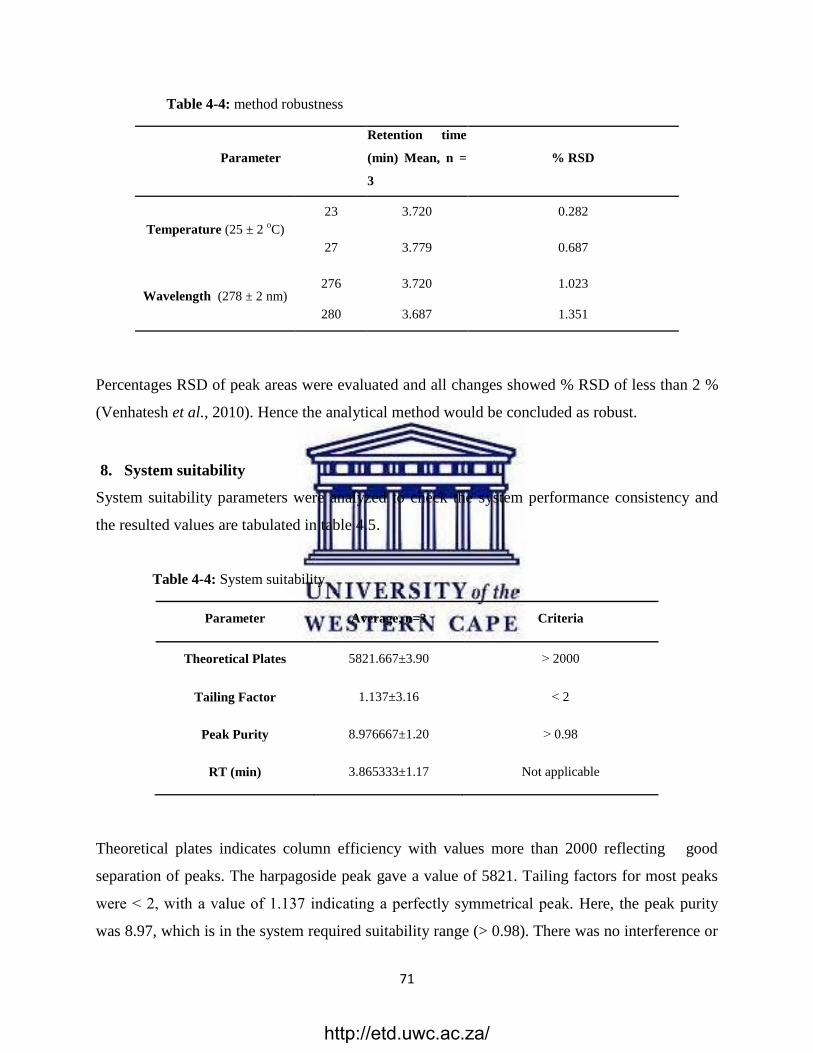
71
Table 4-4: method robustness
Parameter
Retention time
(min) Mean, n =
3
% RSD
Temperature (25 ± 2 oC)
23 3.720 0.282
27 3.779 0.687
Wavelength (278 ± 2 nm) 276 3.720 1.023
280 3.687 1.351
Percentages RSD of peak areas were evaluated and all changes showed % RSD of less than 2 %
(Venhatesh et al., 2010). Hence the analytical method would be concluded as robust.
8. System suitability
System suitability parameters were analyzed to check the system performance consistency and
the resulted values are tabulated in table 4.5.
Table 4-4: System suitability
Parameter Average, n=3 Criteria
Theoretical Plates 5821.667±3.90 ˃ 2000
Tailing Factor 1.137±3.16 ˂ 2
Peak Purity 8.976667±1.20 ˃ 0.98
RT (min) 3.865333±1.17 Not applicable
Theoretical plates indicates column efficiency with values more than 2000 reflecting good
separation of peaks. The harpagoside peak gave a value of 5821. Tailing factors for most peaks
were ˂ 2, with a value of 1.137 indicating a perfectly symmetrical peak. Here, the peak purity
was 8.97, which is in the system required suitability range (> 0.98). There was no interference or
http://etd.uwc.ac.za/
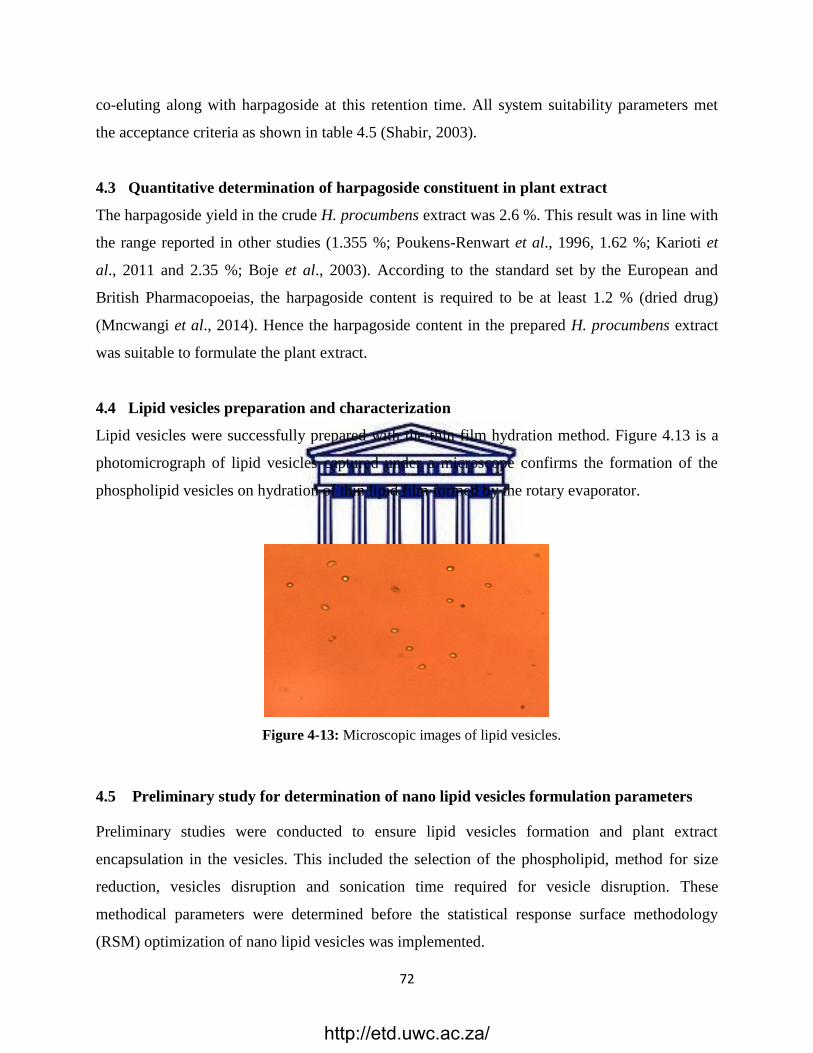
72
co-eluting along with harpagoside at this retention time. All system suitability parameters met
the acceptance criteria as shown in table 4.5 (Shabir, 2003).
4.3 Quantitative determination of harpagoside constituent in plant extract
The harpagoside yield in the crude H. procumbens extract was 2.6 %. This result was in line with
the range reported in other studies (1.355 %; Poukens-Renwart et al., 1996, 1.62 %; Karioti et
al., 2011 and 2.35 %; Boje et al., 2003). According to the standard set by the European and
British Pharmacopoeias, the harpagoside content is required to be at least 1.2 % (dried drug)
(Mncwangi et al., 2014). Hence the harpagoside content in the prepared H. procumbens extract
was suitable to formulate the plant extract.
4.4 Lipid vesicles preparation and characterization
Lipid vesicles were successfully prepared with the thin film hydration method. Figure 4.13 is a
photomicrograph of lipid vesicles captured under a microscope confirms the formation of the
phospholipid vesicles on hydration of thin lipid film formed by the rotary evaporator.
Figure 4-13 : Microscopic images of lipid vesicles.
4.5 Preliminary study for determination of nano lipid vesicles formulation parameters
Preliminary studies were conducted to ensure lipid vesicles formation and plant extract
encapsulation in the vesicles. This included the selection of the phospholipid, method for size
reduction, vesicles disruption and sonication time required for vesicle disruption. These
methodical parameters were determined before the statistical response surface methodology
(RSM) optimization of nano lipid vesicles was implemented.
http://etd.uwc.ac.za/
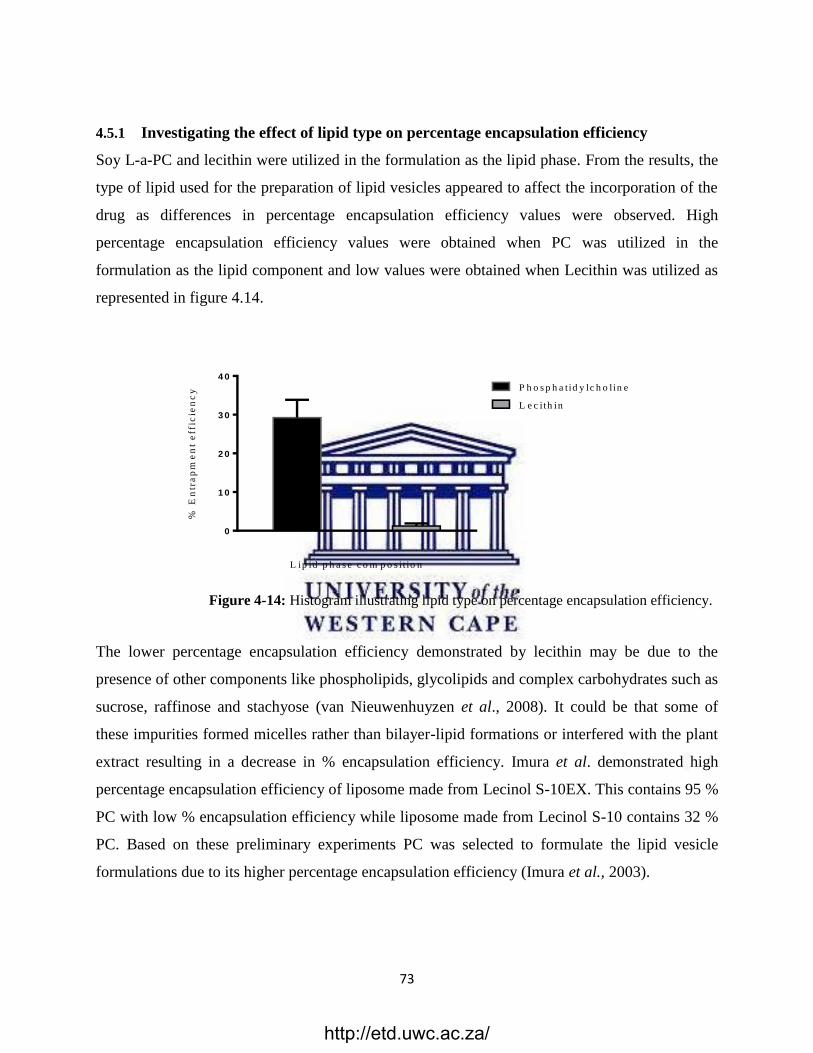
73
4.5.1 Investigating the effect of lipid type on percentage encapsulation efficiency
Soy L-a-PC and lecithin were utilized in the formulation as the lipid phase. From the results, the
type of lipid used for the preparation of lipid vesicles appeared to affect the incorporation of the
drug as differences in percentage encapsulation efficiency values were observed. High
percentage encapsulation efficiency values were obtained when PC was utilized in the
formulation as the lipid component and low values were obtained when Lecithin was utilized as
represented in figure 4.14.
Figure 4-14 : Histogram illustrating lipid type on percentage encapsulation efficiency.
The lower percentage encapsulation efficiency demonstrated by lecithin may be due to the
presence of other components like phospholipids, glycolipids and complex carbohydrates such as
sucrose, raffinose and stachyose (van Nieuwenhuyzen et al., 2008). It could be that some of
these impurities formed micelles rather than bilayer-lipid formations or interfered with the plant
extract resulting in a decrease in % encapsulation efficiency. Imura et al. demonstrated high
percentage encapsulation efficiency of liposome made from Lecinol S-10EX. This contains 95 %
PC with low % encapsulation efficiency while liposome made from Lecinol S-10 contains 32 %
PC. Based on these preliminary experiments PC was selected to formulate the lipid vesicle
formulations due to its higher percentage encapsulation efficiency (Imura et al., 2003).
L ip id p h a s e c o m p o s it io n
% E
ntr
ap
me
nt
eff
icie
nc
y
0
1 0
2 0
3 0
4 0
P h o s p h a tid y lc h o lin e
L e c ith in
http://etd.uwc.ac.za/
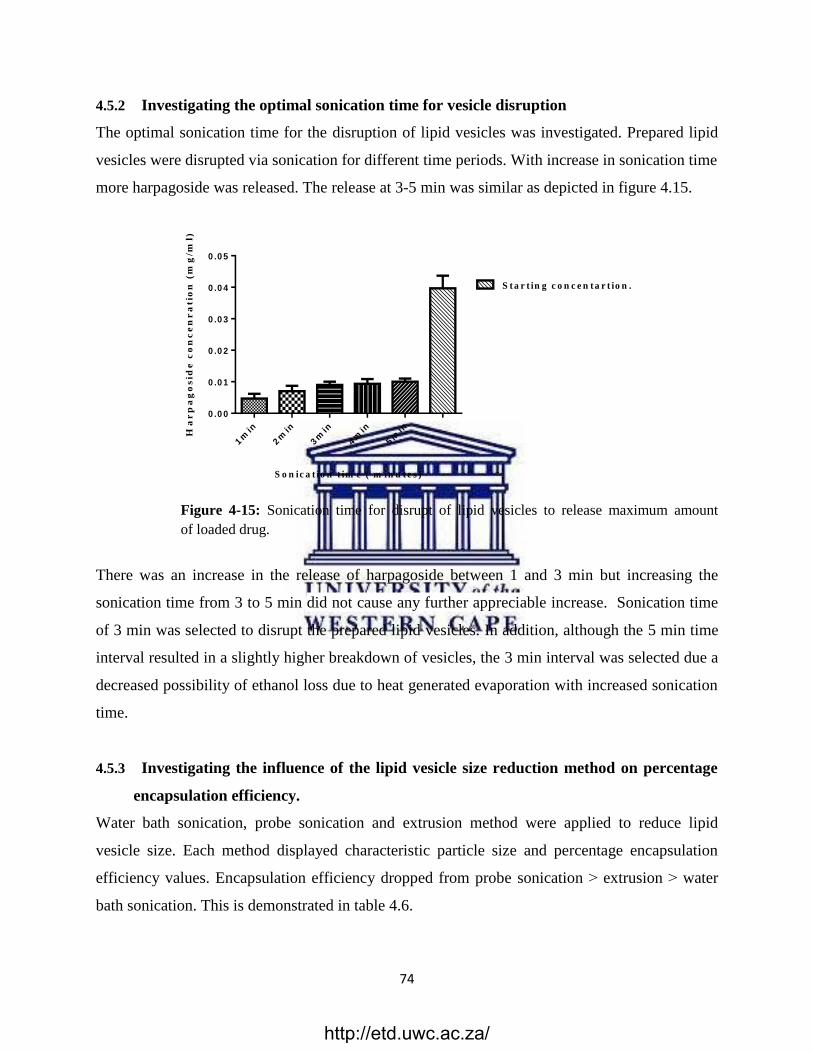
74
4.5.2 Investigating the optimal sonication time for vesicle disruption
The optimal sonication time for the disruption of lipid vesicles was investigated. Prepared lipid
vesicles were disrupted via sonication for different time periods. With increase in sonication time
more harpagoside was released. The release at 3-5 min was similar as depicted in figure 4.15.
Figure 4-15 : Sonication time for disrupt of lipid vesicles to release maximum amount
of loaded drug.
There was an increase in the release of harpagoside between 1 and 3 min but increasing the
sonication time from 3 to 5 min did not cause any further appreciable increase. Sonication time
of 3 min was selected to disrupt the prepared lipid vesicles. In addition, although the 5 min time
interval resulted in a slightly higher breakdown of vesicles, the 3 min interval was selected due a
decreased possibility of ethanol loss due to heat generated evaporation with increased sonication
time.
4.5.3 Investigating the influence of the lipid vesicle size reduction method on percentage
encapsulation efficiency.
Water bath sonication, probe sonication and extrusion method were applied to reduce lipid
vesicle size. Each method displayed characteristic particle size and percentage encapsulation
efficiency values. Encapsulation efficiency dropped from probe sonication ˃ extrusion ˃ water
bath sonication. This is demonstrated in table 4.6.
1m
in
2m
in
3m
in
4m
in
5m
in
0 .0 0
0 .0 1
0 .0 2
0 .0 3
0 .0 4
0 .0 5
S o n ic a t io n t im e ( m in u t e s )
Ha
rp
ag
os
ide
co
nc
en
ra
tio
n (
mg
/ml)
S t a r t in g c o n c e n t a r t io n .
http://etd.uwc.ac.za/
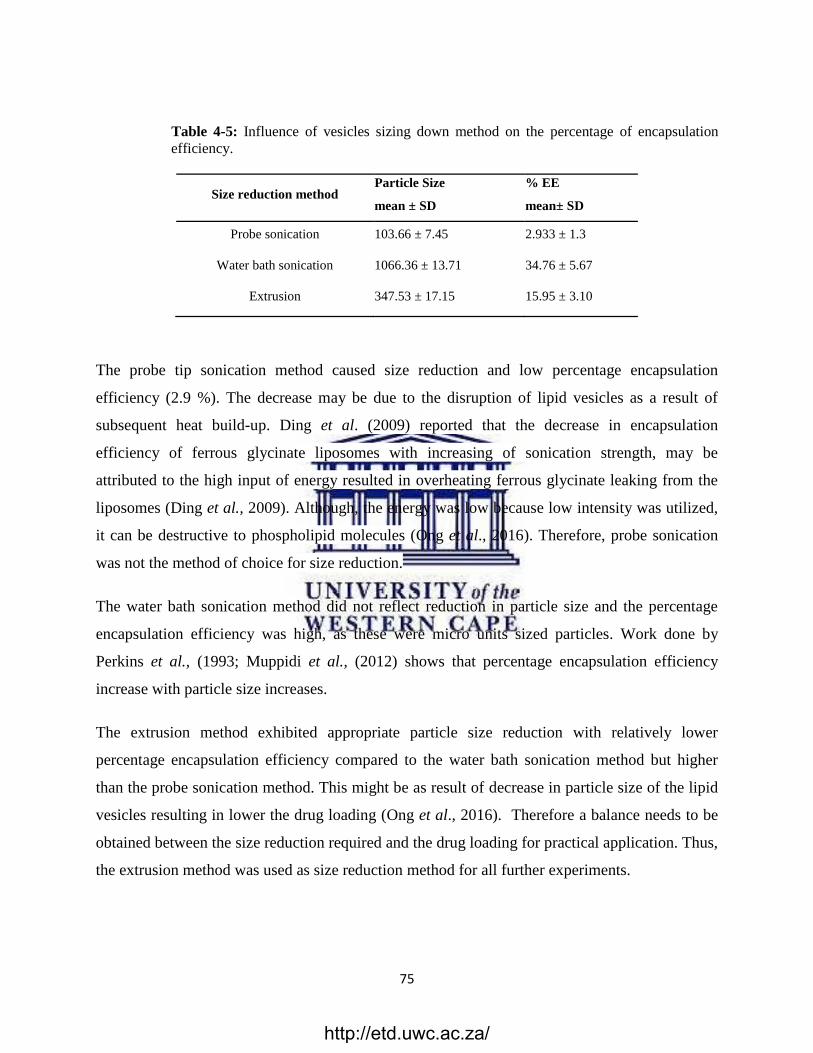
75
Table 4-5: Influence of vesicles sizing down method on the percentage of encapsulation
efficiency.
Size reduction method Particle Size
mean ± SD
% EE
mean± SD
Probe sonication 103.66 ± 7.45 2.933 ± 1.3
Water bath sonication 1066.36 ± 13.71 34.76 ± 5.67
Extrusion 347.53 ± 17.15 15.95 ± 3.10
The probe tip sonication method caused size reduction and low percentage encapsulation
efficiency (2.9 %). The decrease may be due to the disruption of lipid vesicles as a result of
subsequent heat build-up. Ding et al. (2009) reported that the decrease in encapsulation
efficiency of ferrous glycinate liposomes with increasing of sonication strength, may be
attributed to the high input of energy resulted in overheating ferrous glycinate leaking from the
liposomes (Ding et al., 2009). Although, the energy was low because low intensity was utilized,
it can be destructive to phospholipid molecules (Ong et al., 2016). Therefore, probe sonication
was not the method of choice for size reduction.
The water bath sonication method did not reflect reduction in particle size and the percentage
encapsulation efficiency was high, as these were micro units sized particles. Work done by
Perkins et al., (1993; Muppidi et al., (2012) shows that percentage encapsulation efficiency
increase with particle size increases.
The extrusion method exhibited appropriate particle size reduction with relatively lower
percentage encapsulation efficiency compared to the water bath sonication method but higher
than the probe sonication method. This might be as result of decrease in particle size of the lipid
vesicles resulting in lower the drug loading (Ong et al., 2016). Therefore a balance needs to be
obtained between the size reduction required and the drug loading for practical application. Thus,
the extrusion method was used as size reduction method for all further experiments.
http://etd.uwc.ac.za/
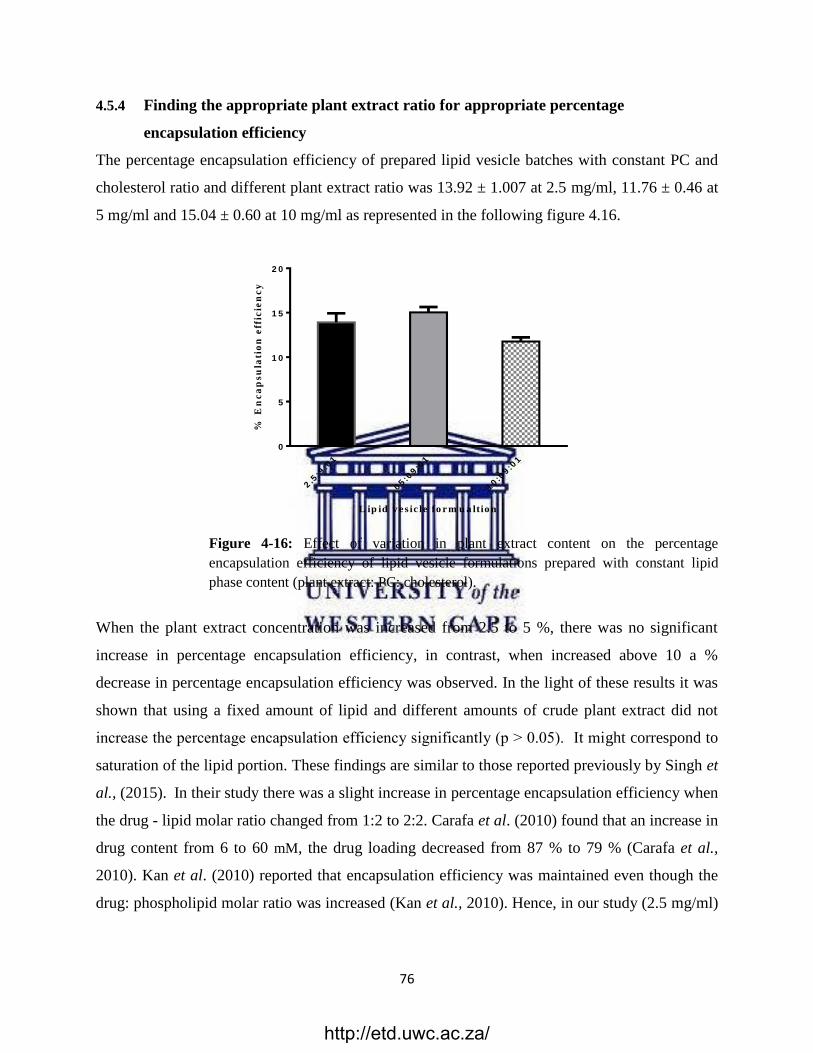
76
4.5.4 Finding the appropriate plant extract ratio for appropriate percentage
encapsulation efficiency
The percentage encapsulation efficiency of prepared lipid vesicle batches with constant PC and
cholesterol ratio and different plant extract ratio was 13.92 ± 1.007 at 2.5 mg/ml, 11.76 ± 0.46 at
5 mg/ml and 15.04 ± 0.60 at 10 mg/ml as represented in the following figure 4.16.
L ip id v e s ic le fo r m u a ltio n
% E
nc
ap
su
lati
on
eff
icie
nc
y
2.5
:9:0
1
05:0
9:0
1
10:0
9:0
1
0
5
1 0
1 5
2 0
Figure 4-16 : Effect of variation in plant extract content on the percentage
encapsulation efficiency of lipid vesicle formulations prepared with constant lipid
phase content (plant extract: PC: cholesterol).
When the plant extract concentration was increased from 2.5 to 5 %, there was no significant
increase in percentage encapsulation efficiency, in contrast, when increased above 10 a %
decrease in percentage encapsulation efficiency was observed. In the light of these results it was
shown that using a fixed amount of lipid and different amounts of crude plant extract did not
increase the percentage encapsulation efficiency significantly (p ˃ 0.05). It might correspond to
saturation of the lipid portion. These findings are similar to those reported previously by Singh et
al., (2015). In their study there was a slight increase in percentage encapsulation efficiency when
the drug - lipid molar ratio changed from 1:2 to 2:2. Carafa et al. (2010) found that an increase in
drug content from 6 to 60 mM, the drug loading decreased from 87 % to 79 % (Carafa et al.,
2010). Kan et al. (2010) reported that encapsulation efficiency was maintained even though the
drug: phospholipid molar ratio was increased (Kan et al., 2010). Hence, in our study (2.5 mg/ml)
http://etd.uwc.ac.za/
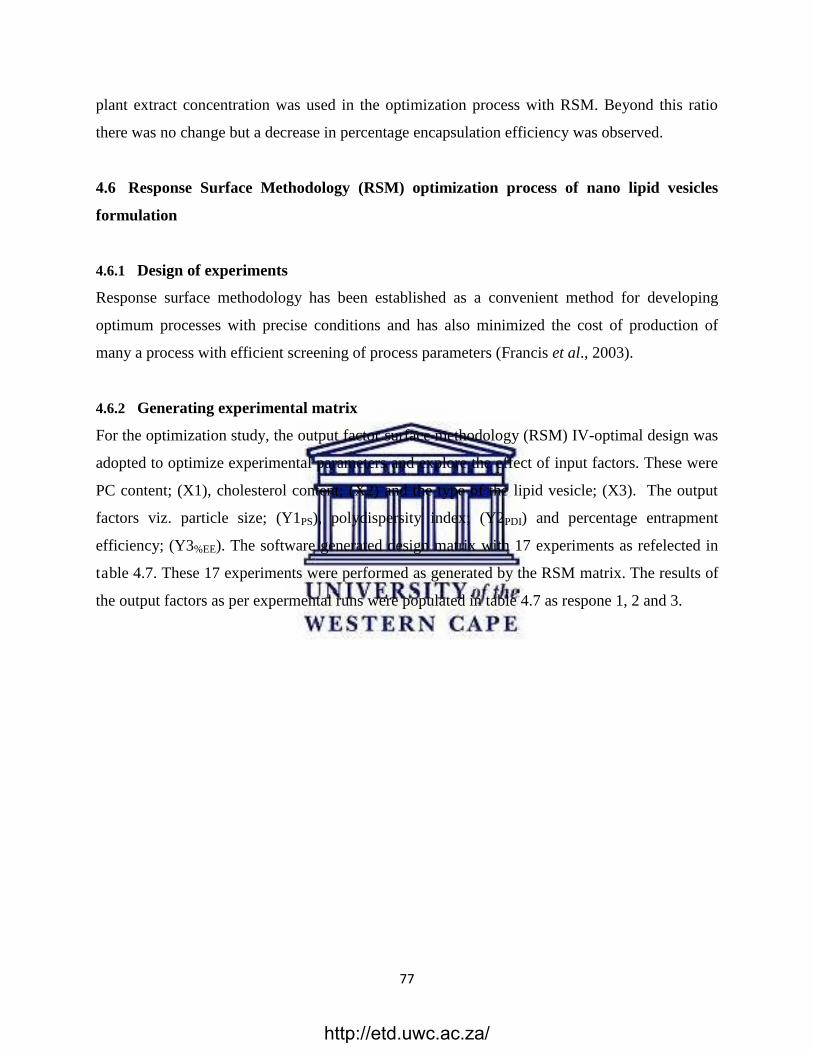
77
plant extract concentration was used in the optimization process with RSM. Beyond this ratio
there was no change but a decrease in percentage encapsulation efficiency was observed.
4.6 Response Surface Methodology (RSM) optimization process of nano lipid vesicles
formulation
4.6.1 Design of experiments
Response surface methodology has been established as a convenient method for developing
optimum processes with precise conditions and has also minimized the cost of production of
many a process with efficient screening of process parameters (Francis et al., 2003).
4.6.2 Generating experimental matrix
For the optimization study, the output factor surface methodology (RSM) IV-optimal design was
adopted to optimize experimental parameters and explore the effect of input factors. These were
PC content; (X1), cholesterol content; (X2) and the type of the lipid vesicle; (X3). The output
factors viz. particle size; (Y1PS), polydispersity index; (Y2PDI) and percentage entrapment
efficiency; (Y3%EE). The software generated design matrix with 17 experiments as refelected in
table 4.7. These 17 experiments were performed as generated by the RSM matrix. The results of
the output factors as per expermental runs were populated in table 4.7 as respone 1, 2 and 3.
http://etd.uwc.ac.za/
78
Table 4 -6: Experimental matrix of RSM optimal design.
4.6.3 Lipid vesicle characterization of RSM generated experiments
The generated design matrix consisted of 17 experiments with different composition varied for
liposome and phytosomes formulations. Particle size, polydispersity index and percentage
encapsulation efficiency were measured and the results are depicted in table 4.7. The size range
obtained varied between 208 nm and 609 nm. The polydispersity index values of the
formulations were between 0.18 and 0.593 revealing that the particle polydispersity index was
homogeneous in some formulations and hererogeneous in some. The percentage encapsulation
efficiency of the lipid vesicles formulations was calculated and within the range of 2 % - 31.25
%. Phytosomes, prepared with the same formulation as the liposomes demonstrated lower
particle size and higher percentage encapsulation efficiency compared with liposomes, this can
be seen when experiment 1, 12, 14 (liposomes formulations) were compared to 11, 5, 4,
(phytosomes formulations) respectively. The variation in output values is believed to be due to
variation in formulation composition. The following figure 4.17 shows the particle size and
polydispersity index curve of two randomly selected formulations from those proposed by RSM.
http://etd.uwc.ac.za/
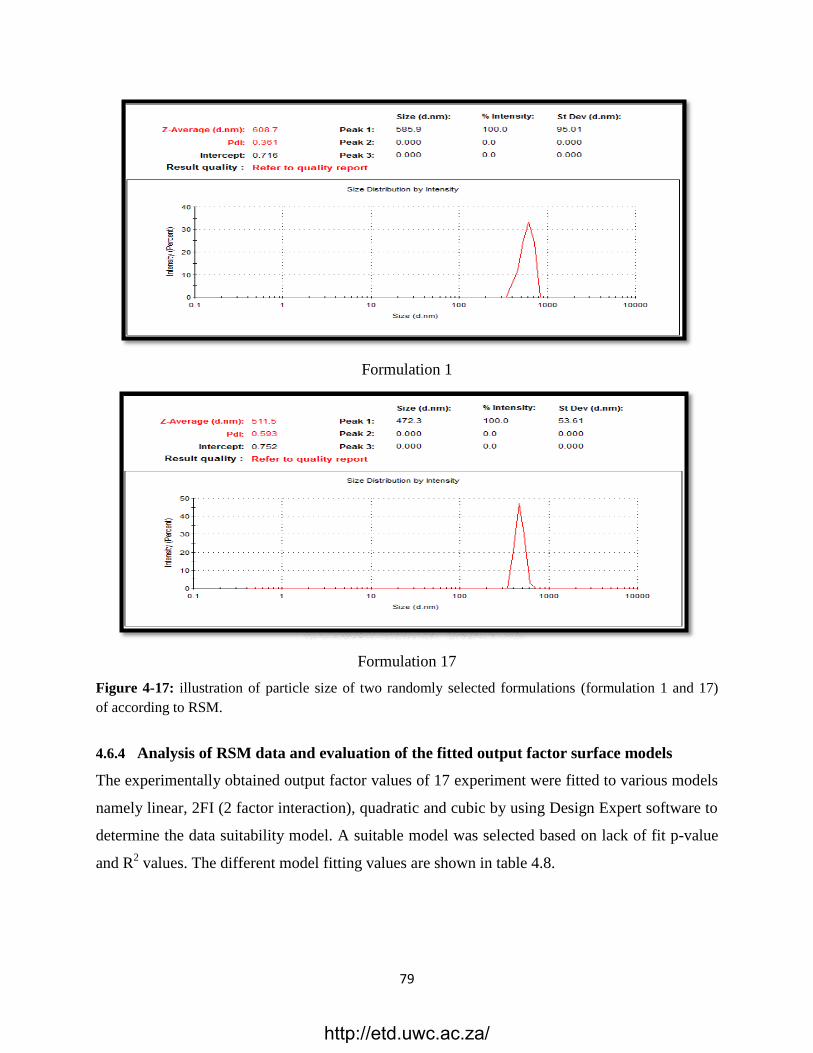
79
Formulation 1
Formulation 17
Figure 4-17 : illustration of particle size of two randomly selected formulations (formulation 1 and 17)
of according to RSM.
4.6.4 Analysis of RSM data and evaluation of the fitted output factor surface models
The experimentally obtained output factor values of 17 experiment were fitted to various models
namely linear, 2FI (2 factor interaction), quadratic and cubic by using Design Expert software to
determine the data suitability model. A suitable model was selected based on lack of fit p-value
and R2 values. The different model fitting values are shown in table 4.8.
http://etd.uwc.ac.za/
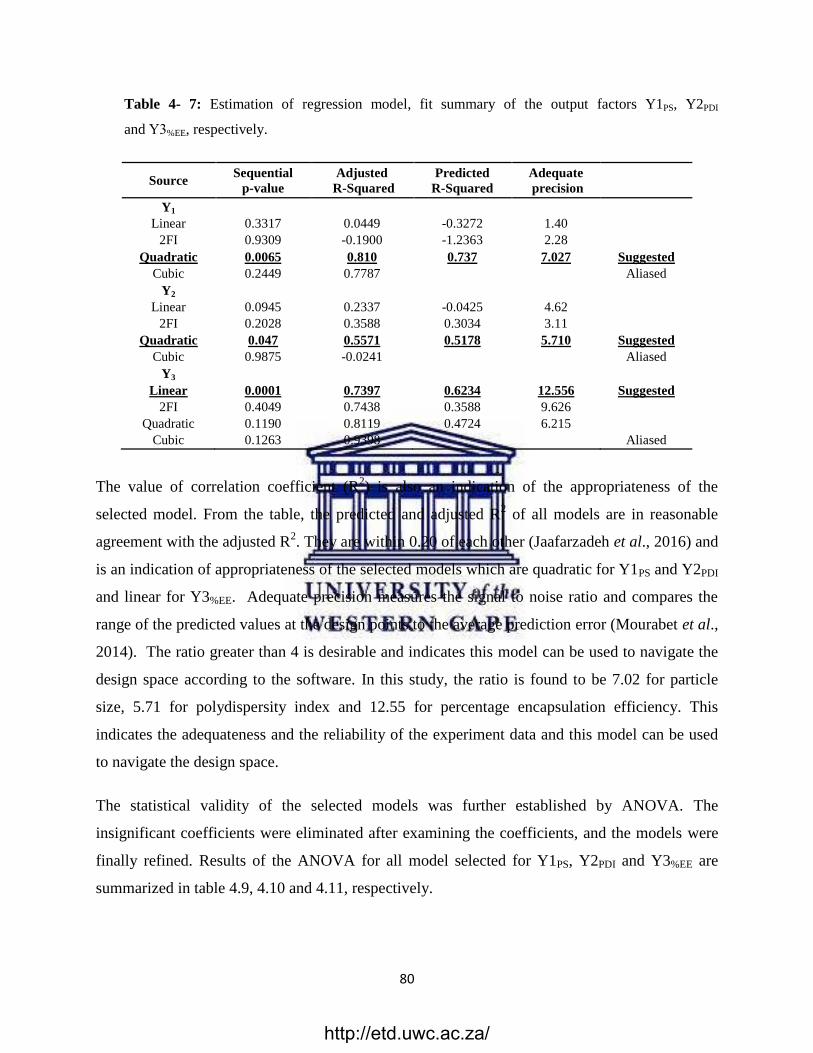
80
Table 4- 7: Estimation of regression model, fit summary of the output factors Y1PS, Y2PDI
and Y3%EE, respectively.
Source Sequential
p-value Adjusted
R-Squared Predicted
R-Squared Adequate
precision
Y1 Linear 0.3317 0.0449 -0.3272 1.40
2FI 0.9309 -0.1900 -1.2363 2.28
Quadratic 0.0065 0.810 0.737 7.027 Suggested Cubic 0.2449 0.7787 Aliased
Y2
Linear 0.0945 0.2337 -0.0425 4.62 2FI 0.2028 0.3588 0.3034 3.11
Quadratic 0.047 0.5571 0.5178 5.710 Suggested Cubic 0.9875 -0.0241 Aliased
Y3
Linear 0.0001 0.7397 0.6234 12.556 Suggested 2FI 0.4049 0.7438 0.3588 9.626
Quadratic 0.1190 0.8119 0.4724 6.215 Cubic 0.1263 0.9398 Aliased
The value of correlation coefficient (R2) is also an indication of the appropriateness of the
selected model. From the table, the predicted and adjusted R2 of all models are in reasonable
agreement with the adjusted R2. They are within 0.20 of each other (Jaafarzadeh et al., 2016) and
is an indication of appropriateness of the selected models which are quadratic for Y1PS and Y2PDI
and linear for Y3%EE. Adequate precision measures the signal to noise ratio and compares the
range of the predicted values at the design points to the average prediction error (Mourabet et al.,
2014). The ratio greater than 4 is desirable and indicates this model can be used to navigate the
design space according to the software. In this study, the ratio is found to be 7.02 for particle
size, 5.71 for polydispersity index and 12.55 for percentage encapsulation efficiency. This
indicates the adequateness and the reliability of the experiment data and this model can be used
to navigate the design space.
The statistical validity of the selected models was further established by ANOVA. The
insignificant coefficients were eliminated after examining the coefficients, and the models were
finally refined. Results of the ANOVA for all model selected for Y1PS, Y2PDI and Y3%EE are
summarized in table 4.9, 4.10 and 4.11, respectively.
http://etd.uwc.ac.za/
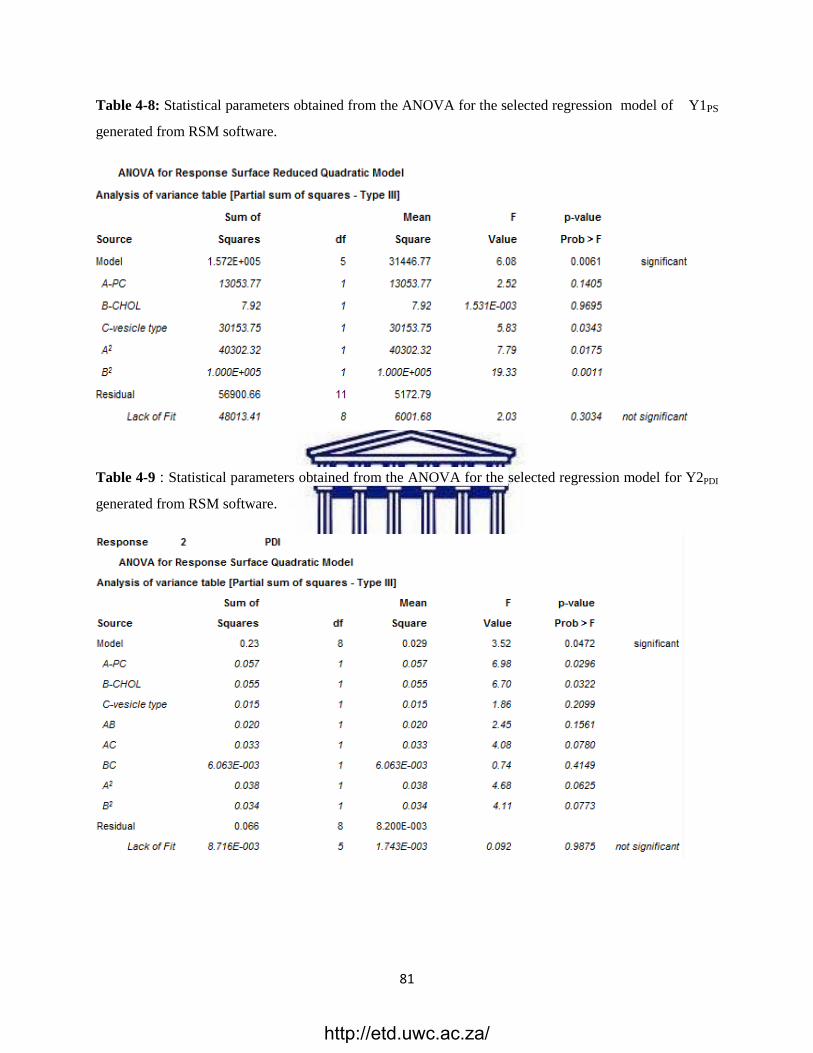
81
Table 4-8: Statistical parameters obtained from the ANOVA for the selected regression model of Y1PS
generated from RSM software.
Table 4-9 : Statistical parameters obtained from the ANOVA for the selected regression model for Y2PDI
generated from RSM software.
http://etd.uwc.ac.za/
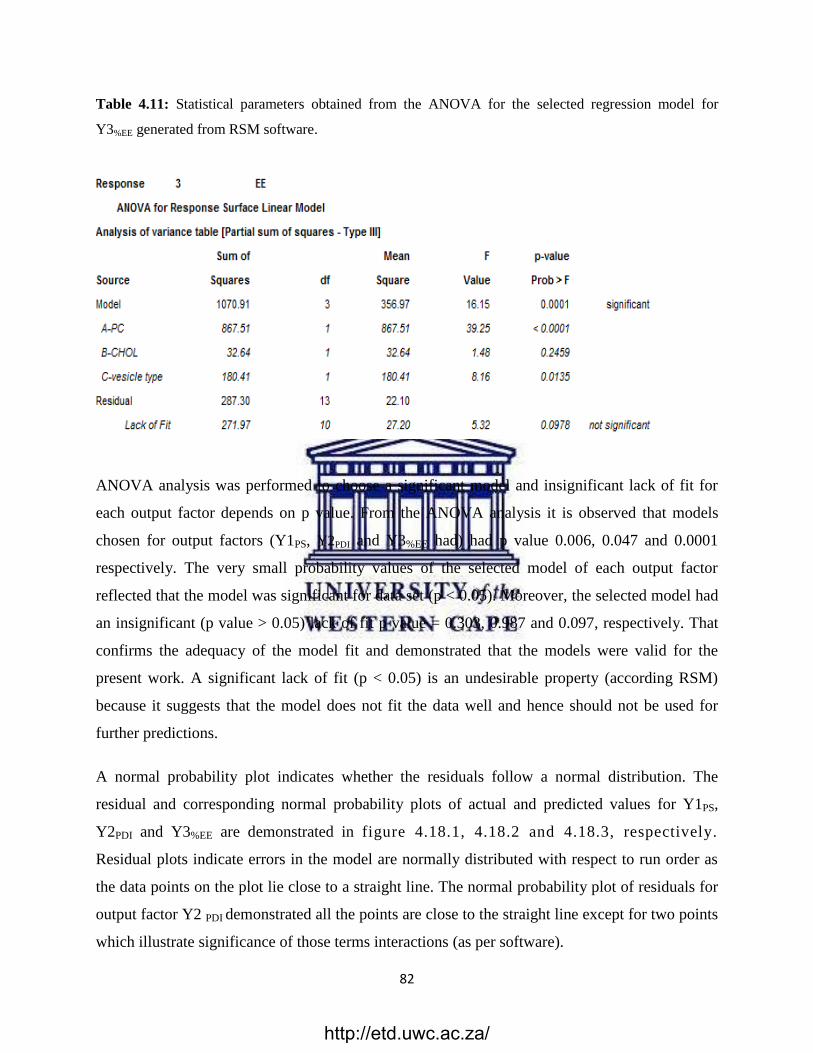
82
Table 4.11: Statistical parameters obtained from the ANOVA for the selected regression model for
Y3%EE generated from RSM software.
ANOVA analysis was performed to choose a significant model and insignificant lack of fit for
each output factor depends on p value. From the ANOVA analysis it is observed that models
chosen for output factors (Y1PS, Y2PDI and Y3%EE had) had p value 0.006, 0.047 and 0.0001
respectively. The very small probability values of the selected model of each output factor
reflected that the model was significant for data set (p < 0.05). Moreover, the selected model had
an insignificant (p value > 0.05) lack of fit p value = 0.303, 0.987 and 0.097, respectively. That
confirms the adequacy of the model fit and demonstrated that the models were valid for the
present work. A significant lack of fit (p < 0.05) is an undesirable property (according RSM)
because it suggests that the model does not fit the data well and hence should not be used for
further predictions.
A normal probability plot indicates whether the residuals follow a normal distribution. The
residual and corresponding normal probability plots of actual and predicted values for Y1PS,
Y2PDI and Y3%EE are demonstrated in figure 4.18.1, 4.18.2 and 4.18.3, respectively .
Residual plots indicate errors in the model are normally distributed with respect to run order as
the data points on the plot lie close to a straight line. The normal probability plot of residuals for
output factor Y2 PDI demonstrated all the points are close to the straight line except for two points
which illustrate significance of those terms interactions (as per software).
http://etd.uwc.ac.za/
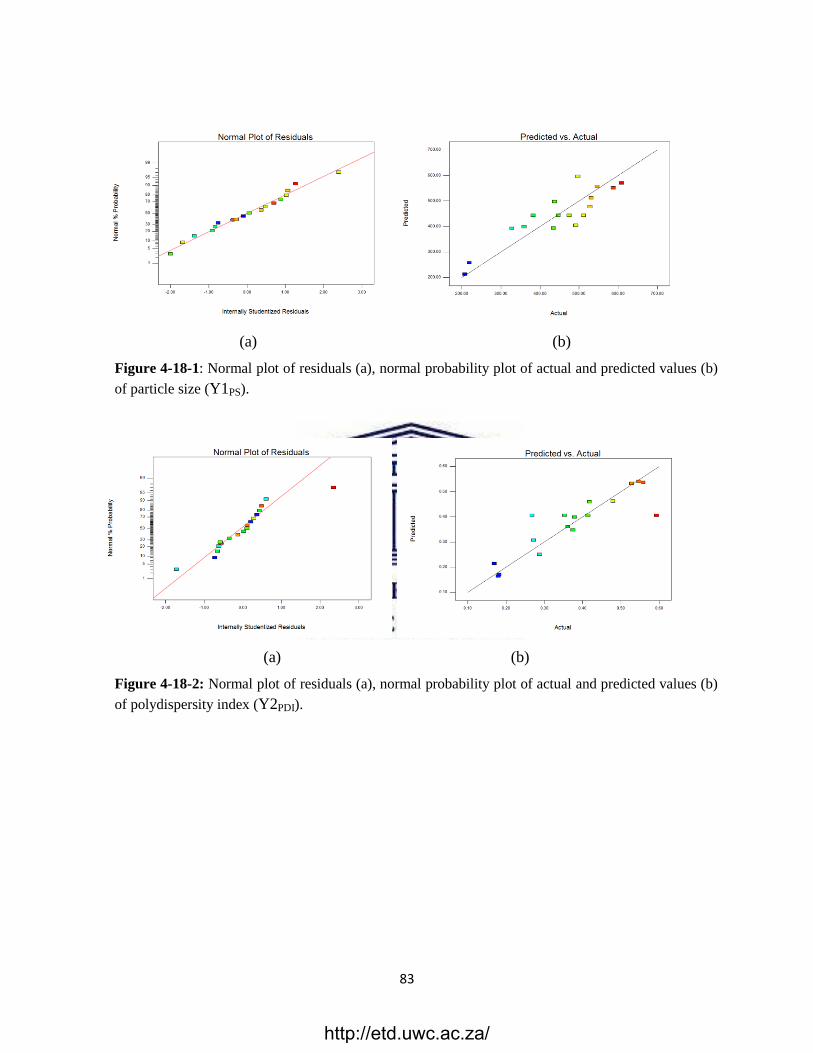
83
(a) (b)
Figure 4-18-1 : Normal plot of residuals (a), normal probability plot of actual and predicted values (b)
of particle size (Y1PS).
(a) (b)
Figure 4-18-2 : Normal plot of residuals (a), normal probability plot of actual and predicted values (b)
of polydispersity index (Y2PDI).
http://etd.uwc.ac.za/
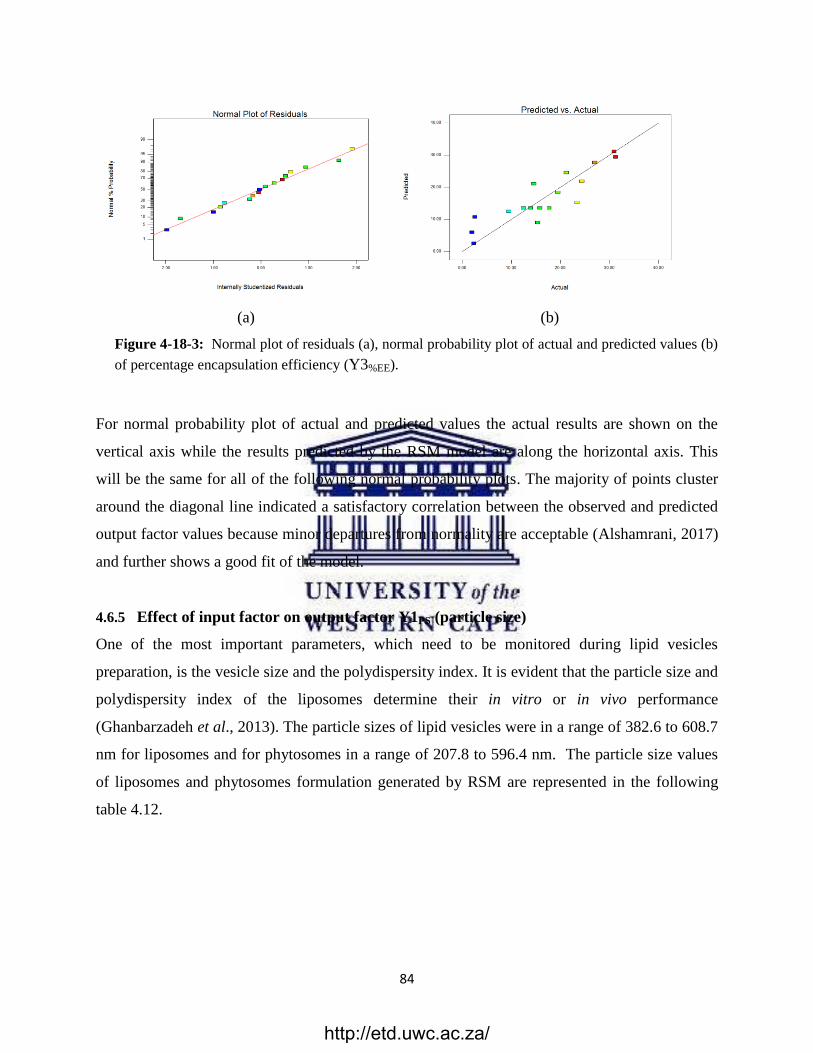
84
(a) (b)
Figure 4-18-3 : Normal plot of residuals (a), normal probability plot of actual and predicted values (b)
of percentage encapsulation efficiency (Y3%EE).
For normal probability plot of actual and predicted values the actual results are shown on the
vertical axis while the results predicted by the RSM model are along the horizontal axis. This
will be the same for all of the following normal probability plots. The majority of points cluster
around the diagonal line indicated a satisfactory correlation between the observed and predicted
output factor values because minor departures from normality are acceptable (Alshamrani, 2017)
and further shows a good fit of the model.
4.6.5 Effect of input factor on output factor Y1PS (particle size)
One of the most important parameters, which need to be monitored during lipid vesicles
preparation, is the vesicle size and the polydispersity index. It is evident that the particle size and
polydispersity index of the liposomes determine their in vitro or in vivo performance
(Ghanbarzadeh et al., 2013). The particle sizes of lipid vesicles were in a range of 382.6 to 608.7
nm for liposomes and for phytosomes in a range of 207.8 to 596.4 nm. The particle size values
of liposomes and phytosomes formulation generated by RSM are represented in the following
table 4.12.
http://etd.uwc.ac.za/
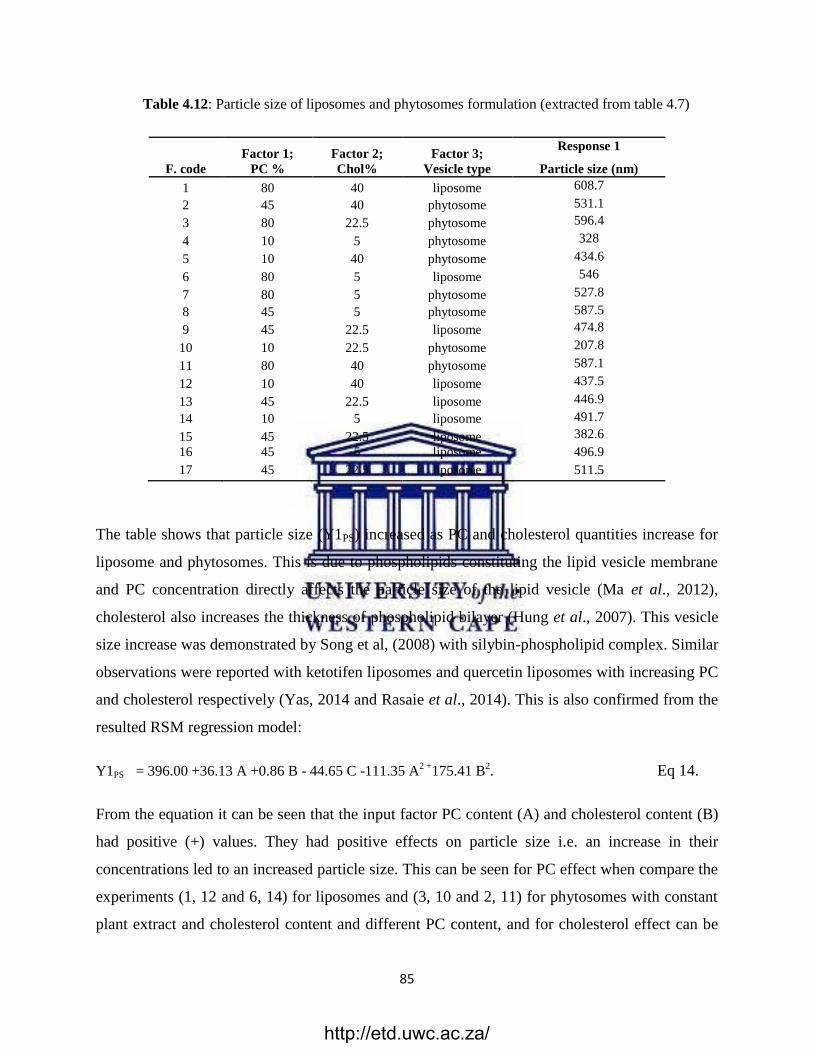
85
Table 4.12: Particle size of liposomes and phytosomes formulation (extracted from table 4.7)
F. code
Factor 1;
PC %
Factor 2;
Chol%
Factor 3;
Vesicle type
Response 1
Particle size (nm)
1 80 40 liposome 608.7
2 45 40 phytosome 531.1
3 80 22.5 phytosome 596.4
4 10 5 phytosome 328
5 10 40 phytosome 434.6
6 80 5 liposome 546
7 80 5 phytosome 527.8
8 45 5 phytosome 587.5
9 45 22.5 liposome 474.8
10 10 22.5 phytosome 207.8
11 80 40 phytosome 587.1
12 10 40 liposome 437.5
13 45 22.5 liposome 446.9
14 10 5 liposome 491.7
15 45 22.5 liposome 382.6
16 45 5 liposome 496.9
17 45 22.5 liposome 511.5
The table shows that particle size (Y1PS) increased as PC and cholesterol quantities increase for
liposome and phytosomes. This is due to phospholipids constituting the lipid vesicle membrane
and PC concentration directly affects the particle size of the lipid vesicle (Ma et al., 2012),
cholesterol also increases the thickness of phospholipid bilayer (Hung et al., 2007). This vesicle
size increase was demonstrated by Song et al, (2008) with silybin-phospholipid complex. Similar
observations were reported with ketotifen liposomes and quercetin liposomes with increasing PC
and cholesterol respectively (Yas, 2014 and Rasaie et al., 2014). This is also confirmed from the
resulted RSM regression model:
Y1PS = 396.00 +36.13 A +0.86 B - 44.65 C -111.35 A2 +
175.41 B2. Eq 14.
From the equation it can be seen that the input factor PC content (A) and cholesterol content (B)
had positive (+) values. They had positive effects on particle size i.e. an increase in their
concentrations led to an increased particle size. This can be seen for PC effect when compare the
experiments (1, 12 and 6, 14) for liposomes and (3, 10 and 2, 11) for phytosomes with constant
plant extract and cholesterol content and different PC content, and for cholesterol effect can be
http://etd.uwc.ac.za/
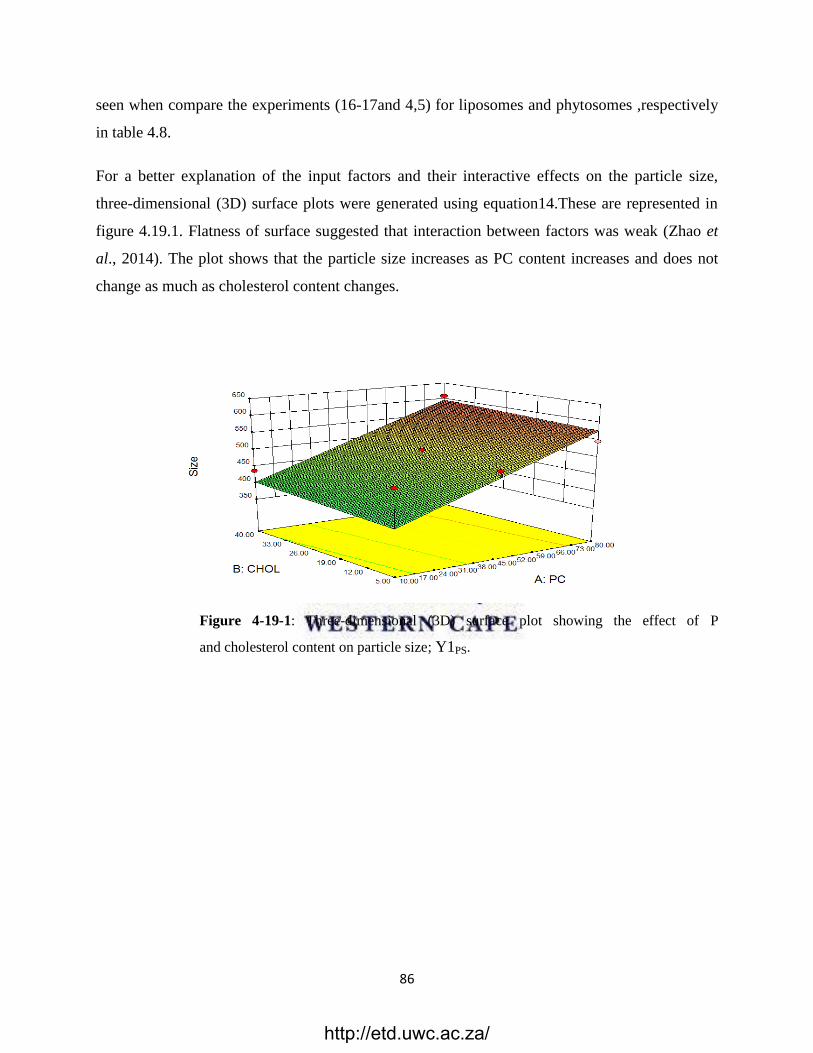
86
seen when compare the experiments (16-17and 4,5) for liposomes and phytosomes ,respectively
in table 4.8.
For a better explanation of the input factors and their interactive effects on the particle size,
three-dimensional (3D) surface plots were generated using equation14.These are represented in
figure 4.19.1. Flatness of surface suggested that interaction between factors was weak (Zhao et
al., 2014). The plot shows that the particle size increases as PC content increases and does not
change as much as cholesterol content changes.
Figure 4-19-1: Three-dimensional (3D) surface plot showing the effect of P
and cholesterol content on particle size; Y1PS.
http://etd.uwc.ac.za/
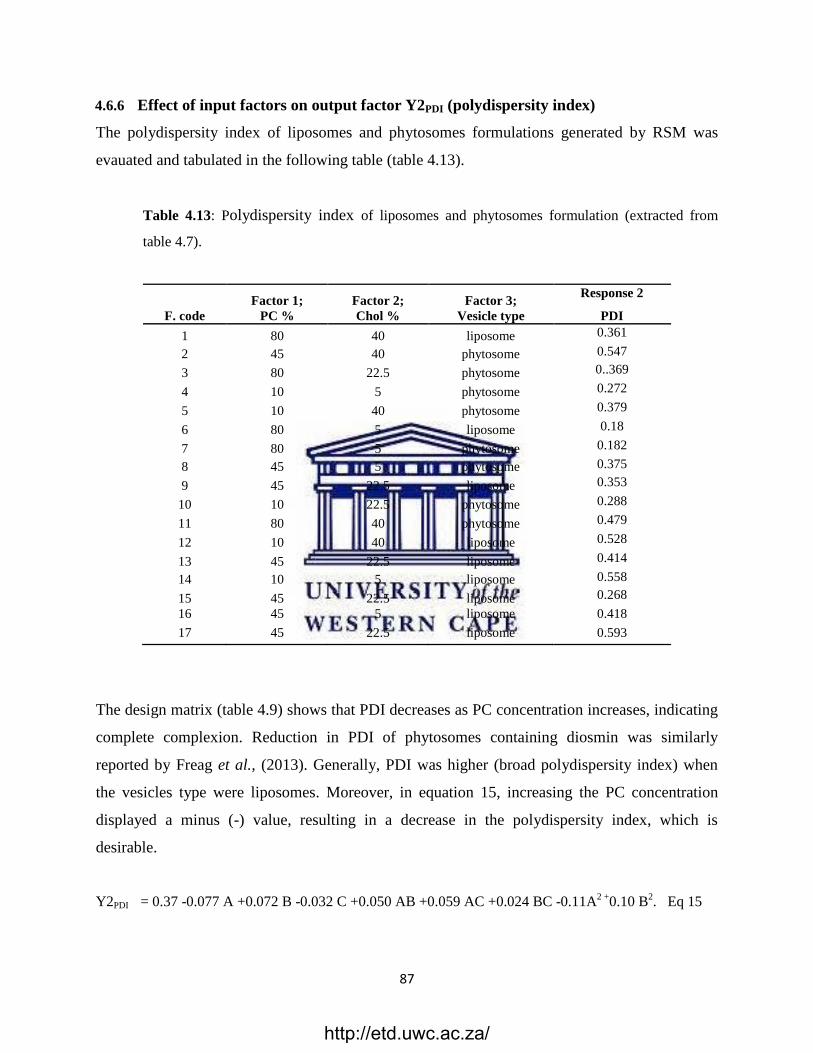
87
4.6.6 Effect of input factors on output factor Y2PDI (polydispersity index)
The polydispersity index of liposomes and phytosomes formulations generated by RSM was
evauated and tabulated in the following table (table 4.13).
Table 4.13: Polydispersity index of liposomes and phytosomes formulation (extracted from
table 4.7).
F. code
Factor 1;
PC %
Factor 2;
Chol %
Factor 3;
Vesicle type
Response 2
PDI
1 80 40 liposome 0.361
2 45 40 phytosome 0.547
3 80 22.5 phytosome 0..369
4 10 5 phytosome 0.272
5 10 40 phytosome 0.379
6 80 5 liposome 0.18
7 80 5 phytosome 0.182
8 45 5 phytosome 0.375
9 45 22.5 liposome 0.353
10 10 22.5 phytosome 0.288
11 80 40 phytosome 0.479
12 10 40 liposome 0.528
13 45 22.5 liposome 0.414
14 10 5 liposome 0.558
15 45 22.5 liposome 0.268
16 45 5 liposome 0.418
17 45 22.5 liposome 0.593
The design matrix (table 4.9) shows that PDI decreases as PC concentration increases, indicating
complete complexion. Reduction in PDI of phytosomes containing diosmin was similarly
reported by Freag et al., (2013). Generally, PDI was higher (broad polydispersity index) when
the vesicles type were liposomes. Moreover, in equation 15, increasing the PC concentration
displayed a minus (-) value, resulting in a decrease in the polydispersity index, which is
desirable.
Y2PDI = 0.37 -0.077 A +0.072 B -0.032 C +0.050 AB +0.059 AC +0.024 BC -0.11A2 +
0.10 B2. Eq 15
http://etd.uwc.ac.za/
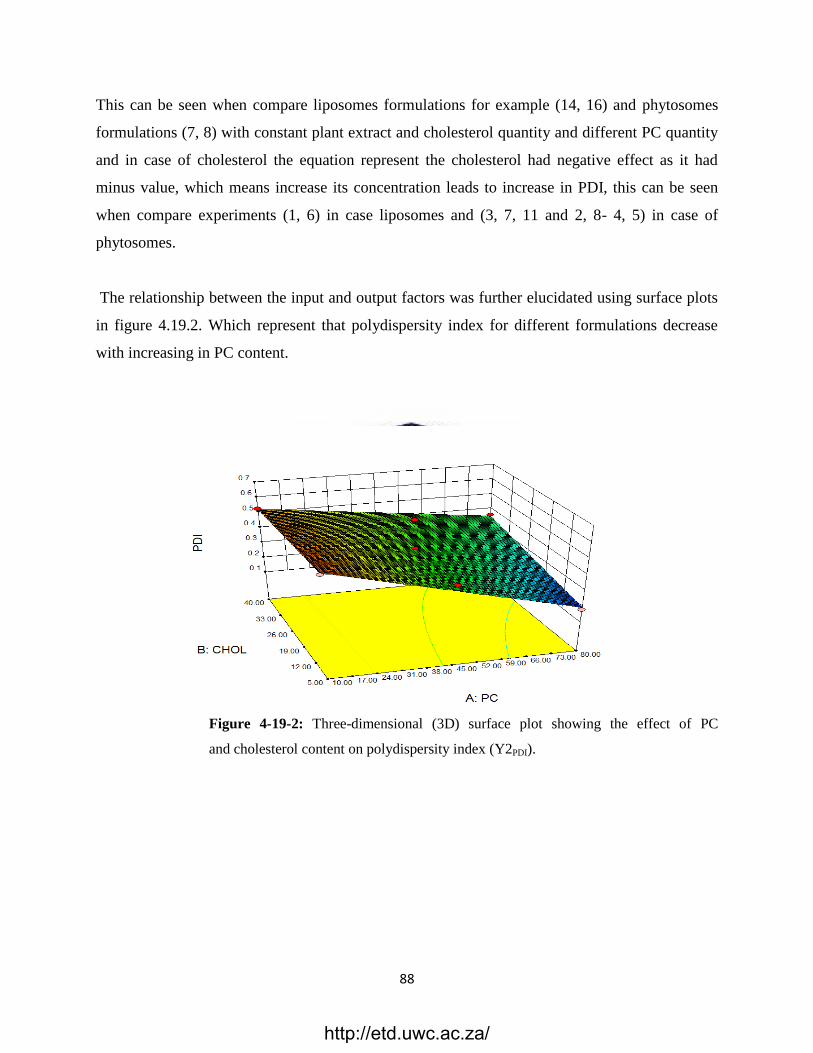
88
This can be seen when compare liposomes formulations for example (14, 16) and phytosomes
formulations (7, 8) with constant plant extract and cholesterol quantity and different PC quantity
and in case of cholesterol the equation represent the cholesterol had negative effect as it had
minus value, which means increase its concentration leads to increase in PDI, this can be seen
when compare experiments (1, 6) in case liposomes and (3, 7, 11 and 2, 8- 4, 5) in case of
phytosomes.
The relationship between the input and output factors was further elucidated using surface plots
in figure 4.19.2. Which represent that polydispersity index for different formulations decrease
with increasing in PC content.
Figure 4-19-2 : Three-dimensional (3D) surface plot showing the effect of PC
and cholesterol content on polydispersity index (Y2PDI).
http://etd.uwc.ac.za/
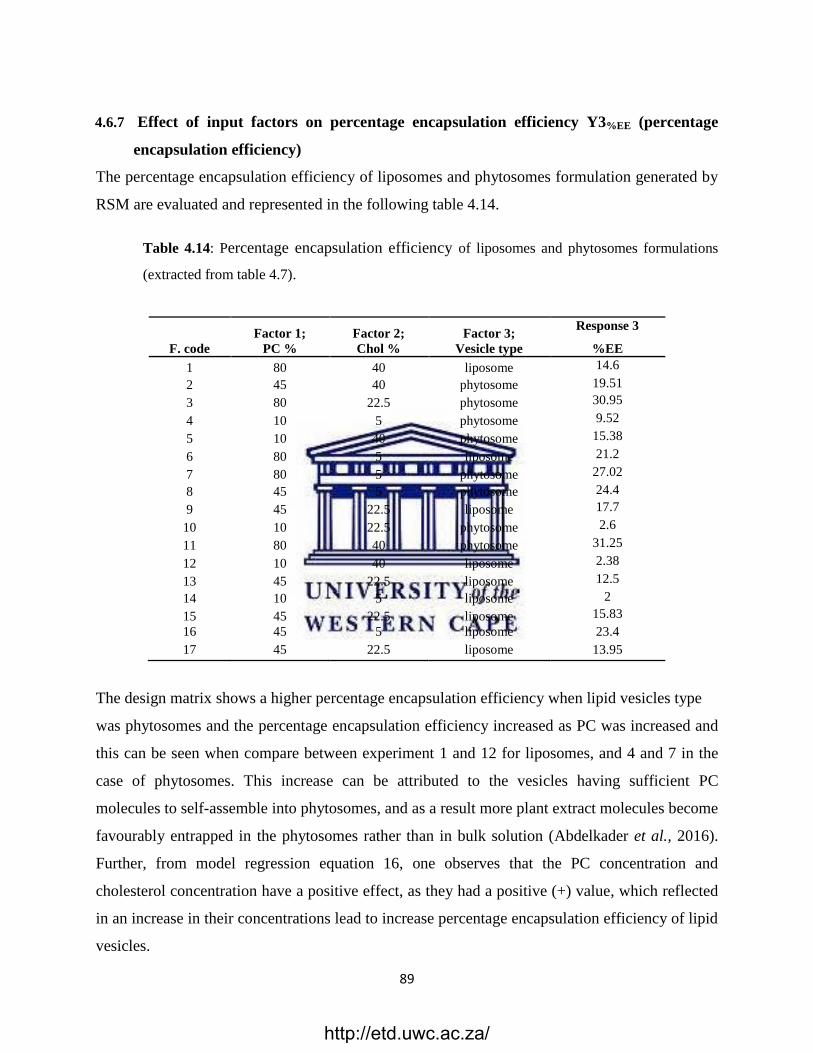
89
4.6.7 Effect of input factors on percentage encapsulation efficiency Y3%EE (percentage
encapsulation efficiency)
The percentage encapsulation efficiency of liposomes and phytosomes formulation generated by
RSM are evaluated and represented in the following table 4.14.
Table 4.14: Percentage encapsulation efficiency of liposomes and phytosomes formulations
(extracted from table 4.7).
F. code
Factor 1;
PC %
Factor 2;
Chol %
Factor 3;
Vesicle type
Response 3
%EE
1 80 40 liposome 14.6
2 45 40 phytosome 19.51
3 80 22.5 phytosome 30.95
4 10 5 phytosome 9.52
5 10 40 phytosome 15.38
6 80 5 liposome 21.2
7 80 5 phytosome 27.02
8 45 5 phytosome 24.4
9 45 22.5 liposome 17.7
10 10 22.5 phytosome 2.6
11 80 40 phytosome 31.25
12 10 40 liposome 2.38
13 45 22.5 liposome 12.5
14 10 5 liposome 2
15 45 22.5 liposome 15.83
16 45 5 liposome 23.4
17 45 22.5 liposome 13.95
The design matrix shows a higher percentage encapsulation efficiency when lipid vesicles type
was phytosomes and the percentage encapsulation efficiency increased as PC was increased and
this can be seen when compare between experiment 1 and 12 for liposomes, and 4 and 7 in the
case of phytosomes. This increase can be attributed to the vesicles having sufficient PC
molecules to self-assemble into phytosomes, and as a result more plant extract molecules become
favourably entrapped in the phytosomes rather than in bulk solution (Abdelkader et al., 2016).
Further, from model regression equation 16, one observes that the PC concentration and
cholesterol concentration have a positive effect, as they had a positive (+) value, which reflected
in an increase in their concentrations lead to increase percentage encapsulation efficiency of lipid
vesicles.
http://etd.uwc.ac.za/
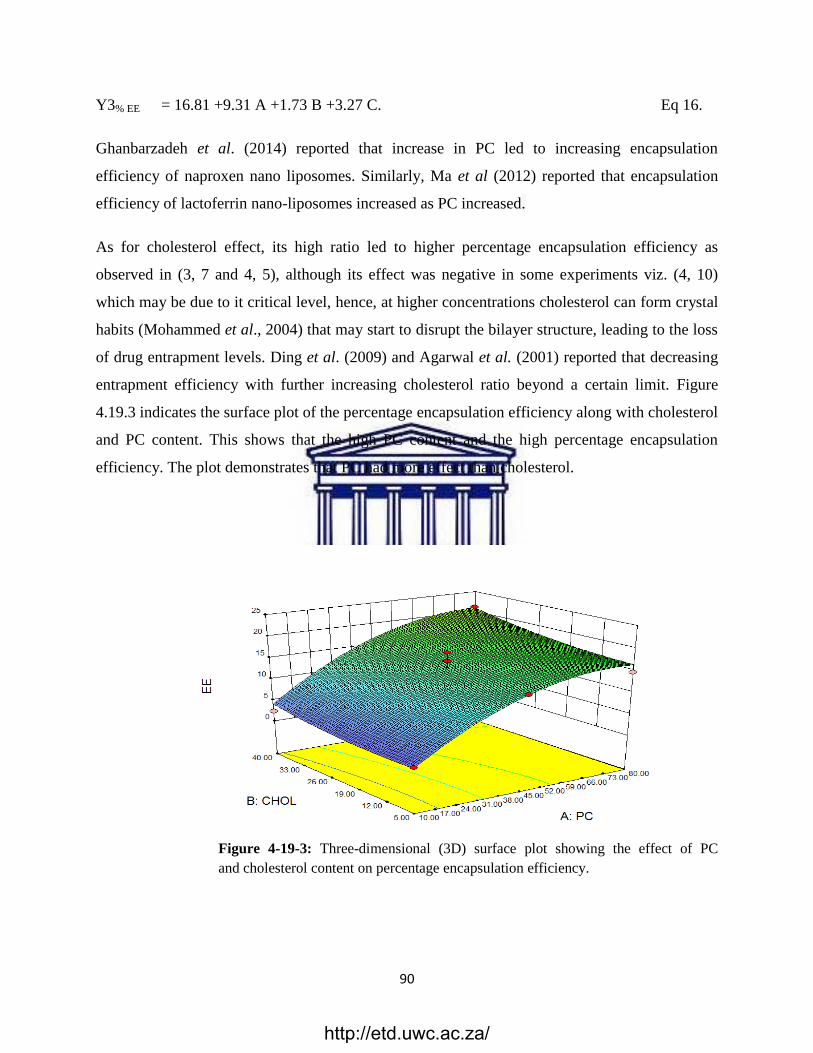
90
Y3% EE = 16.81 +9.31 A +1.73 B +3.27 C. Eq 16.
Ghanbarzadeh et al. (2014) reported that increase in PC led to increasing encapsulation
efficiency of naproxen nano liposomes. Similarly, Ma et al (2012) reported that encapsulation
efficiency of lactoferrin nano-liposomes increased as PC increased.
As for cholesterol effect, its high ratio led to higher percentage encapsulation efficiency as
observed in (3, 7 and 4, 5), although its effect was negative in some experiments viz. (4, 10)
which may be due to it critical level, hence, at higher concentrations cholesterol can form crystal
habits (Mohammed et al., 2004) that may start to disrupt the bilayer structure, leading to the loss
of drug entrapment levels. Ding et al. (2009) and Agarwal et al. (2001) reported that decreasing
entrapment efficiency with further increasing cholesterol ratio beyond a certain limit. Figure
4.19.3 indicates the surface plot of the percentage encapsulation efficiency along with cholesterol
and PC content. This shows that the high PC content and the high percentage encapsulation
efficiency. The plot demonstrates that PC had more effect than cholesterol.
Figure 4-19-3: Three-dimensional (3D) surface plot showing the effect of PC
and cholesterol content on percentage encapsulation efficiency.
http://etd.uwc.ac.za/
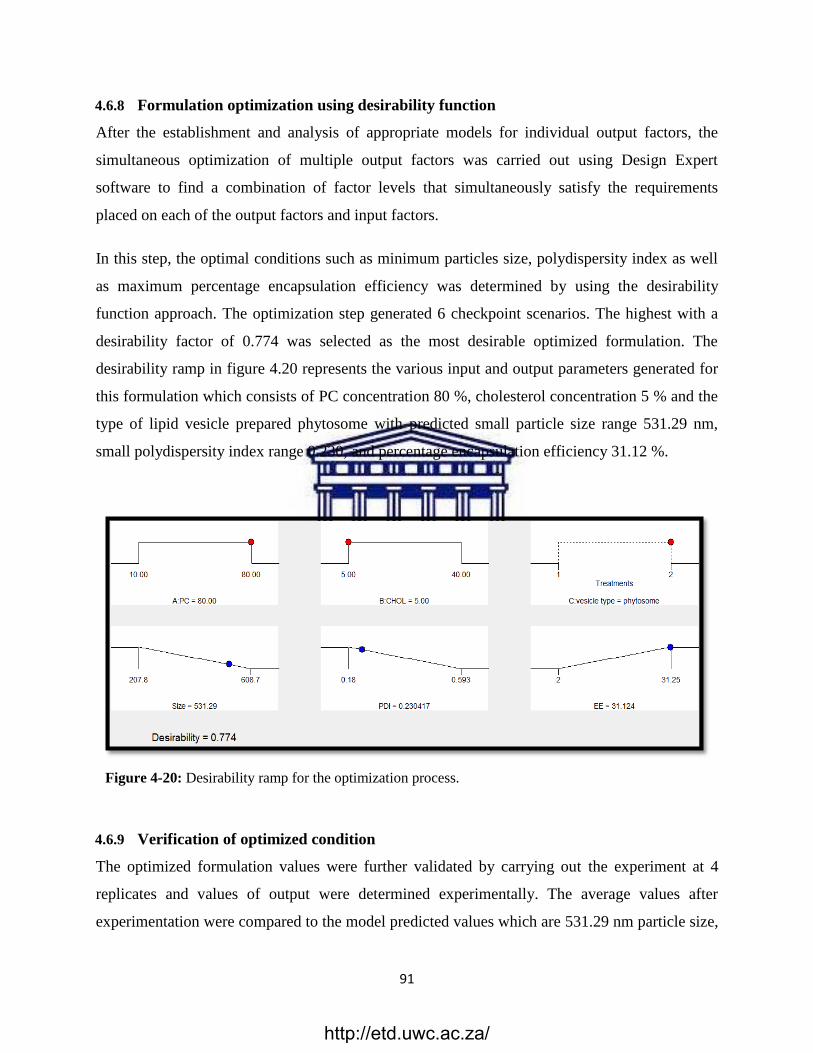
91
4.6.8 Formulation optimization using desirability function
After the establishment and analysis of appropriate models for individual output factors, the
simultaneous optimization of multiple output factors was carried out using Design Expert
software to find a combination of factor levels that simultaneously satisfy the requirements
placed on each of the output factors and input factors.
In this step, the optimal conditions such as minimum particles size, polydispersity index as well
as maximum percentage encapsulation efficiency was determined by using the desirability
function approach. The optimization step generated 6 checkpoint scenarios. The highest with a
desirability factor of 0.774 was selected as the most desirable optimized formulation. The
desirability ramp in figure 4.20 represents the various input and output parameters generated for
this formulation which consists of PC concentration 80 %, cholesterol concentration 5 % and the
type of lipid vesicle prepared phytosome with predicted small particle size range 531.29 nm,
small polydispersity index range 0.230, and percentage encapsulation efficiency 31.12 %.
Figure 4-20 : Desirability ramp for the optimization process.
4.6.9 Verification of optimized condition
The optimized formulation values were further validated by carrying out the experiment at 4
replicates and values of output were determined experimentally. The average values after
experimentation were compared to the model predicted values which are 531.29 nm particle size,
http://etd.uwc.ac.za/
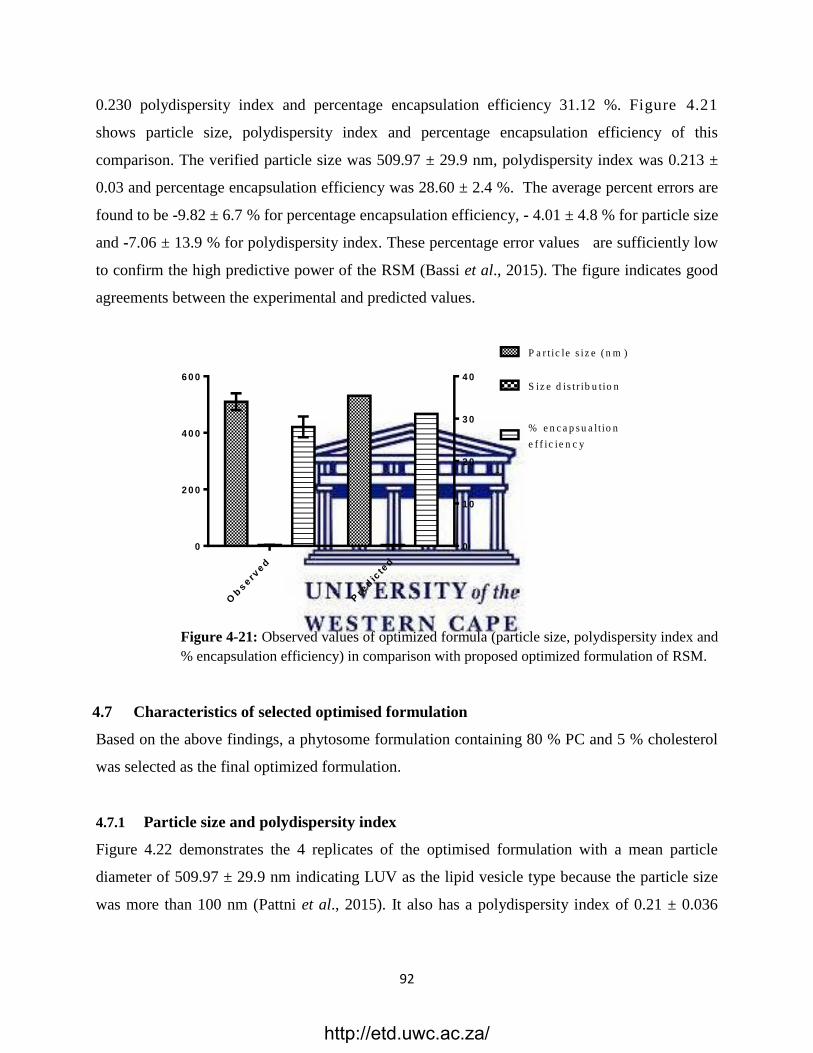
92
0.230 polydispersity index and percentage encapsulation efficiency 31.12 %. Figure 4.21
shows particle size, polydispersity index and percentage encapsulation efficiency of this
comparison. The verified particle size was 509.97 ± 29.9 nm, polydispersity index was 0.213 ±
0.03 and percentage encapsulation efficiency was 28.60 ± 2.4 %. The average percent errors are
found to be -9.82 ± 6.7 % for percentage encapsulation efficiency, - 4.01 ± 4.8 % for particle size
and -7.06 ± 13.9 % for polydispersity index. These percentage error values are sufficiently low
to confirm the high predictive power of the RSM (Bassi et al., 2015). The figure indicates good
agreements between the experimental and predicted values.
Ob
serv
ed
Pre
dic
ted
0
2 0 0
4 0 0
6 0 0
0
1 0
2 0
3 0
4 0
P a r t ic le s iz e ( n m )
S iz e d is t r ib u tio n
% e n c a p s u a lt io n
e f f ic ie n c y
Figure 4-21 : Observed values of optimized formula (particle size, polydispersity index and
% encapsulation efficiency) in comparison with proposed optimized formulation of RSM.
4.7 Characteristics of selected optimised formulation
Based on the above findings, a phytosome formulation containing 80 % PC and 5 % cholesterol
was selected as the final optimized formulation.
4.7.1 Particle size and polydispersity index
Figure 4.22 demonstrates the 4 replicates of the optimised formulation with a mean particle
diameter of 509.97 ± 29.9 nm indicating LUV as the lipid vesicle type because the particle size
was more than 100 nm (Pattni et al., 2015). It also has a polydispersity index of 0.21 ± 0.036
http://etd.uwc.ac.za/
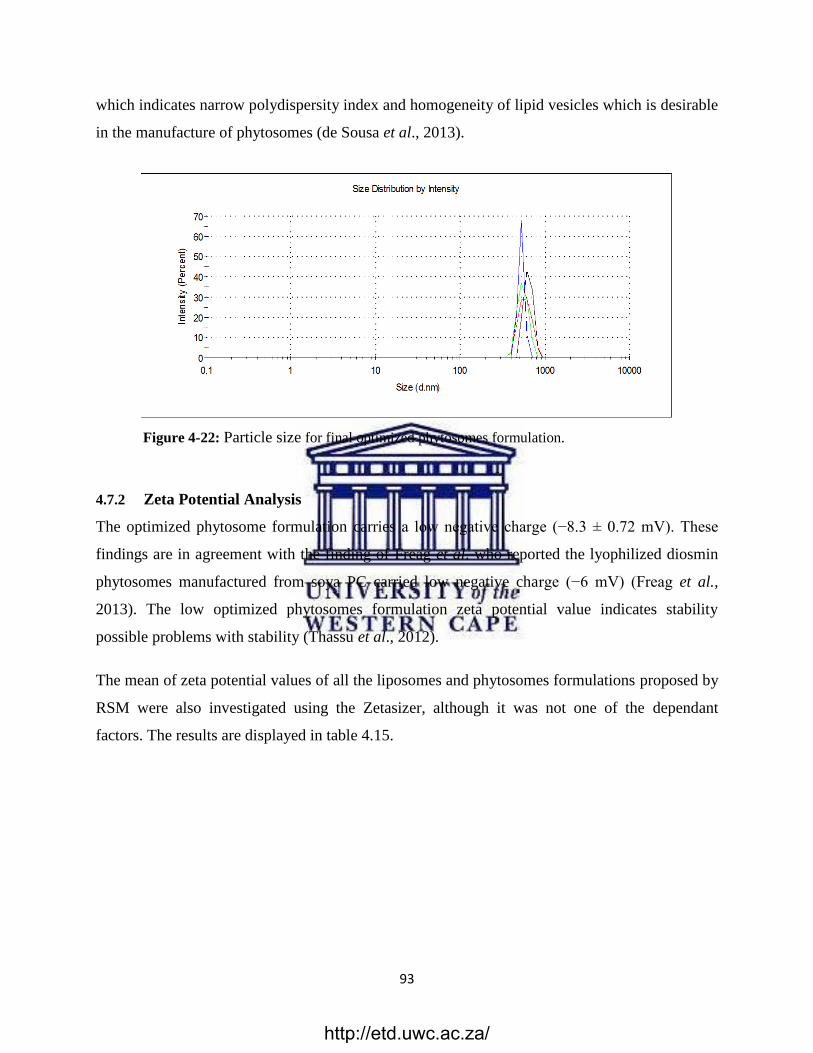
93
which indicates narrow polydispersity index and homogeneity of lipid vesicles which is desirable
in the manufacture of phytosomes (de Sousa et al., 2013).
Figure 4-22 : Particle size for final optimized phytosomes formulation.
4.7.2 Zeta Potential Analysis
The optimized phytosome formulation carries a low negative charge (−8.3 ± 0.72 mV). These
findings are in agreement with the finding of Freag et al. who reported the lyophilized diosmin
phytosomes manufactured from soya PC carried low negative charge (−6 mV) (Freag et al.,
2013). The low optimized phytosomes formulation zeta potential value indicates stability
possible problems with stability (Thassu et al., 2012).
The mean of zeta potential values of all the liposomes and phytosomes formulations proposed by
RSM were also investigated using the Zetasizer, although it was not one of the dependant
factors. The results are displayed in table 4.15.
http://etd.uwc.ac.za/
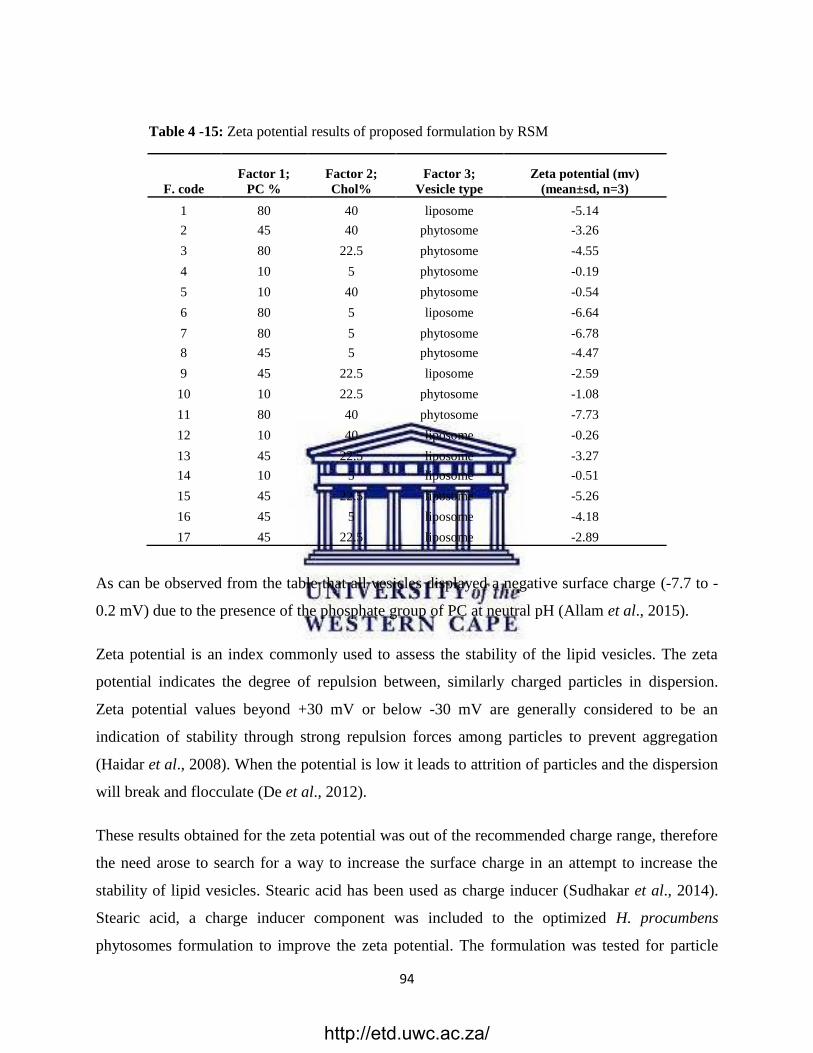
94
Table 4 -15: Zeta potential results of proposed formulation by RSM
F. code
Factor 1;
PC %
Factor 2;
Chol%
Factor 3;
Vesicle type
Zeta potential (mv)
(mean±sd, n=3)
1 80 40 liposome -5.14
2 45 40 phytosome -3.26
3 80 22.5 phytosome -4.55
4 10 5 phytosome -0.19
5 10 40 phytosome -0.54
6 80 5 liposome -6.64
7 80 5 phytosome -6.78
8 45 5 phytosome -4.47
9 45 22.5 liposome -2.59
10 10 22.5 phytosome -1.08
11 80 40 phytosome -7.73
12 10 40 liposome -0.26
13 45 22.5 liposome -3.27
14 10 5 liposome -0.51
15 45 22.5 liposome -5.26
16 45 5 liposome -4.18
17 45 22.5 liposome -2.89
As can be observed from the table that all vesicles displayed a negative surface charge (-7.7 to -
0.2 mV) due to the presence of the phosphate group of PC at neutral pH (Allam et al., 2015).
Zeta potential is an index commonly used to assess the stability of the lipid vesicles. The zeta
potential indicates the degree of repulsion between, similarly charged particles in dispersion.
Zeta potential values beyond +30 mV or below -30 mV are generally considered to be an
indication of stability through strong repulsion forces among particles to prevent aggregation
(Haidar et al., 2008). When the potential is low it leads to attrition of particles and the dispersion
will break and flocculate (De et al., 2012).
These results obtained for the zeta potential was out of the recommended charge range, therefore
the need arose to search for a way to increase the surface charge in an attempt to increase the
stability of lipid vesicles. Stearic acid has been used as charge inducer (Sudhakar et al., 2014).
Stearic acid, a charge inducer component was included to the optimized H. procumbens
phytosomes formulation to improve the zeta potential. The formulation was tested for particle
http://etd.uwc.ac.za/
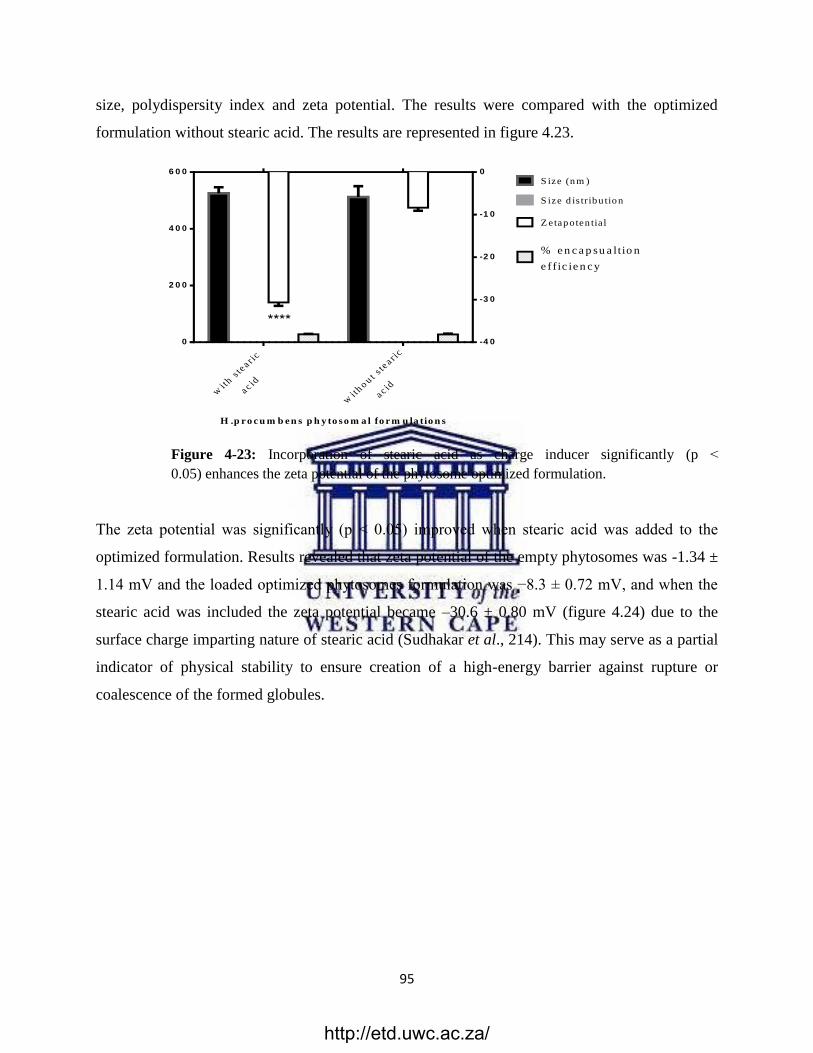
95
size, polydispersity index and zeta potential. The results were compared with the optimized
formulation without stearic acid. The results are represented in figure 4.23.
Figure 4-23 : Incorporation of stearic acid as charge inducer significantly (p ˂
0.05) enhances the zeta potential of the phytosome optimized formulation.
The zeta potential was significantly (p ˂ 0.05) improved when stearic acid was added to the
optimized formulation. Results revealed that zeta potential of the empty phytosomes was -1.34 ±
1.14 mV and the loaded optimized phytosomes formulation was −8.3 ± 0.72 mV, and when the
stearic acid was included the zeta potential became –30.6 ± 0.80 mV (figure 4.24) due to the
surface charge imparting nature of stearic acid (Sudhakar et al., 214). This may serve as a partial
indicator of physical stability to ensure creation of a high-energy barrier against rupture or
coalescence of the formed globules.
H .p r o c u m b e n s p h y to so m a l fo r m u la tio n s
wit
h ste
a r ic
a c id
wit
h o u t s te
a r ic
a c id
0
2 0 0
4 0 0
6 0 0
-4 0
-3 0
-2 0
-1 0
0
S ize (nm )
S ize d is tr ibu tion
Z etapoten tial
% e n c a p su a lt io n
e ff ic ie n c y
****
http://etd.uwc.ac.za/
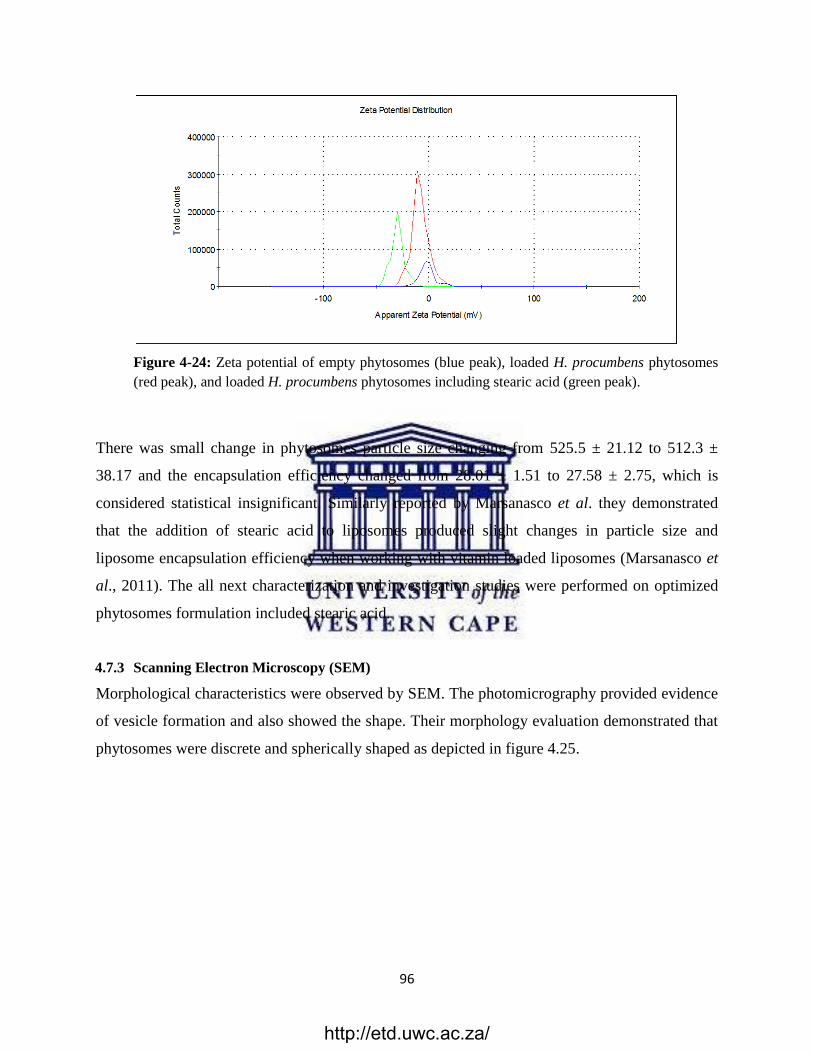
96
Figure 4-24: Zeta potential of empty phytosomes (blue peak), loaded H. procumbens phytosomes
(red peak), and loaded H. procumbens phytosomes including stearic acid (green peak).
There was small change in phytosomes particle size changing from 525.5 ± 21.12 to 512.3 ±
38.17 and the encapsulation efficiency changed from 28.01 ± 1.51 to 27.58 ± 2.75, which is
considered statistical insignificant. Similarly reported by Marsanasco et al. they demonstrated
that the addition of stearic acid to liposomes produced slight changes in particle size and
liposome encapsulation efficiency when working with vitamin loaded liposomes (Marsanasco et
al., 2011). The all next characterization and investigation studies were performed on optimized
phytosomes formulation included stearic acid.
4.7.3 Scanning Electron Microscopy (SEM)
Morphological characteristics were observed by SEM. The photomicrography provided evidence
of vesicle formation and also showed the shape. Their morphology evaluation demonstrated that
phytosomes were discrete and spherically shaped as depicted in figure 4.25.
http://etd.uwc.ac.za/
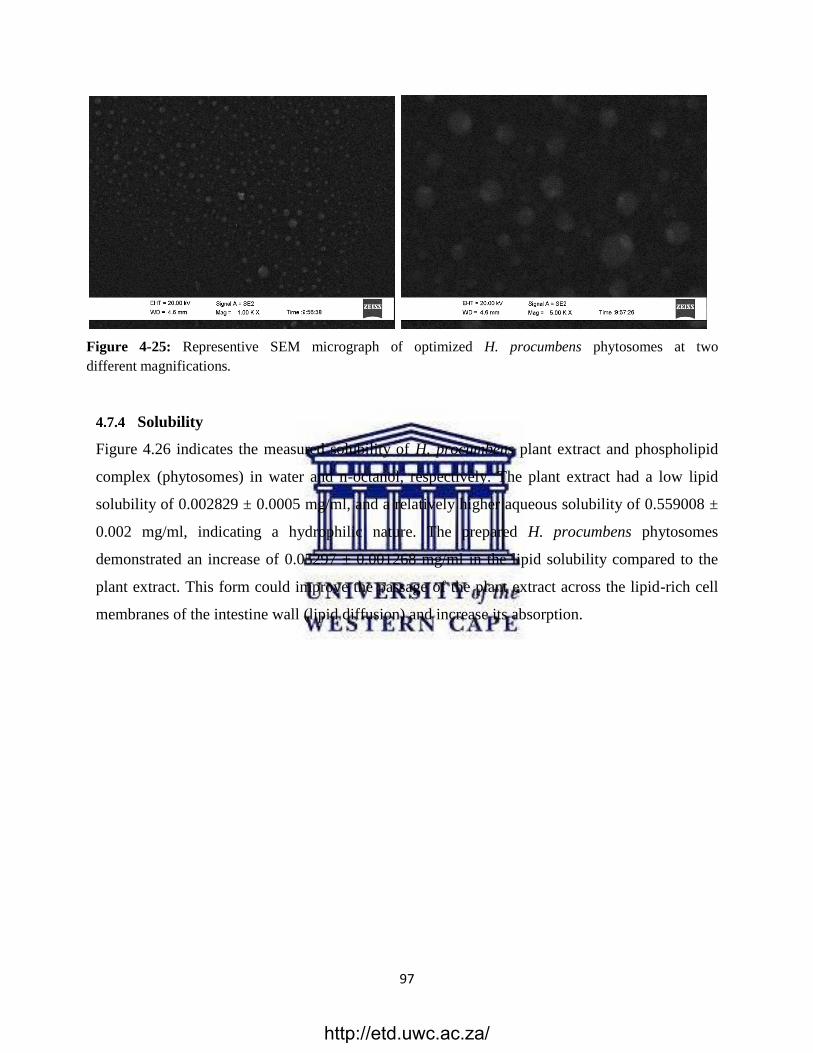
97
Figure 4-25: Representive SEM micrograph of optimized H. procumbens phytosomes at two
different magnifications.
4.7.4 Solubility
Figure 4.26 indicates the measured solubility of H. procumbens plant extract and phospholipid
complex (phytosomes) in water and n-octanol, respectively. The plant extract had a low lipid
solubility of 0.002829 ± 0.0005 mg/ml, and a relatively higher aqueous solubility of 0.559008 ±
0.002 mg/ml, indicating a hydrophilic nature. The prepared H. procumbens phytosomes
demonstrated an increase of 0.05297 ± 0.001268 mg/ml in the lipid solubility compared to the
plant extract. This form could improve the passage of the plant extract across the lipid-rich cell
membranes of the intestine wall (lipid diffusion) and increase its absorption.
http://etd.uwc.ac.za/
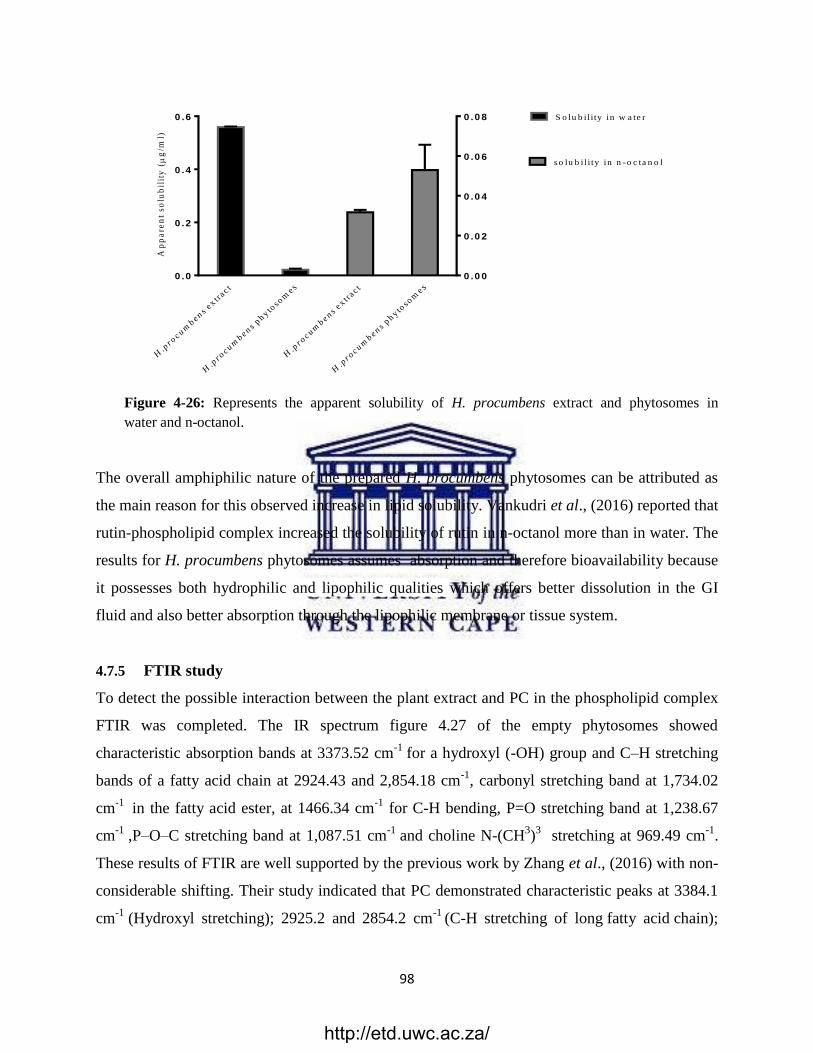
98
Figure 4-26 : Represents the apparent solubility of H. procumbens extract and phytosomes in
water and n-octanol.
The overall amphiphilic nature of the prepared H. procumbens phytosomes can be attributed as
the main reason for this observed increase in lipid solubility. Vankudri et al., (2016) reported that
rutin-phospholipid complex increased the solubility of rutin in n-octanol more than in water. The
results for H. procumbens phytosomes assumes absorption and therefore bioavailability because
it possesses both hydrophilic and lipophilic qualities which offers better dissolution in the GI
fluid and also better absorption through the lipophilic membrane or tissue system.
4.7.5 FTIR study
To detect the possible interaction between the plant extract and PC in the phospholipid complex
FTIR was completed. The IR spectrum figure 4.27 of the empty phytosomes showed
characteristic absorption bands at 3373.52 cm-1
for a hydroxyl (-OH) group and C–H stretching
bands of a fatty acid chain at 2924.43 and 2,854.18 cm-1
, carbonyl stretching band at 1,734.02
cm-1
in the fatty acid ester, at 1466.34 cm-1
for C-H bending, P=O stretching band at 1,238.67
cm-1
,P–O–C stretching band at 1,087.51 cm-1
and choline N-(CH3)3 stretching at 969.49 cm
-1.
These results of FTIR are well supported by the previous work by Zhang et al., (2016) with non-
considerable shifting. Their study indicated that PC demonstrated characteristic peaks at 3384.1
cm-1
(Hydroxyl stretching); 2925.2 and 2854.2 cm-1
(C-H stretching of long fatty acid chain);
Ap
pa
ren
t s
olu
bil
ity
(
g/m
l)
H.p
ro c umb en s
e x tra c t
H.p
ro c umb en s p
h y tosom
e s
H.p
ro c umb en s e
x tra c t
H.p
ro c umb en s p
h y tosom
e s 0 .0
0 .2
0 .4
0 .6
0 .0 0
0 .0 2
0 .0 4
0 .0 6
0 .0 8 S o lu b il ity in w a te r
s o lu b il i ty in n -o c ta n o l
http://etd.uwc.ac.za/
99
1736.4 cm-1
(carbonyl stretching of the fatty acid ester);1466.1 cm-1
(C-H bending); 1242.9 cm-
1 (P = O stretching band); 1090.0 cm
-1 (P-O-C stretching) and 968.4 cm
-1 (N
+(CH3)3 stretching.
The H. procumbens extract exhibited a characteristic band at 3293.83 cm-1
for a hydroxyl (-OH)
group and at 2926.43 cm-1
(for C-H stretching) and 1627.82 cm-1
. This indicates the presence of a
carbonyl (C=O) group and 1346.36 cm-1
for (C-H bending) and 991.68 for (C-O group).
The FT-IR spectrum of the complex (phytosomes), showed significant changes. The absorption
peak of hydroxyl (O–H) stretching of empty phytosomes shifted to lower wave number at
3352.62 cm-1
in complex. This could indicate the interaction of plant extract to polar end of the
PC through formation of strong hydrogen bonding between hydroxyl groups of phospholipid and
extract phytoconstituents in phytosomes (Vankudri et al., 2016; Singh et al., 2013). Shifting of
the P=O absorption band of PC molecule to lower frequency (1235.92 cm-1) further indicates
the sensitivity of these vibrations to the formation of H-bonds (Süleymanoglu, 2009)
http://etd.uwc.ac.za/
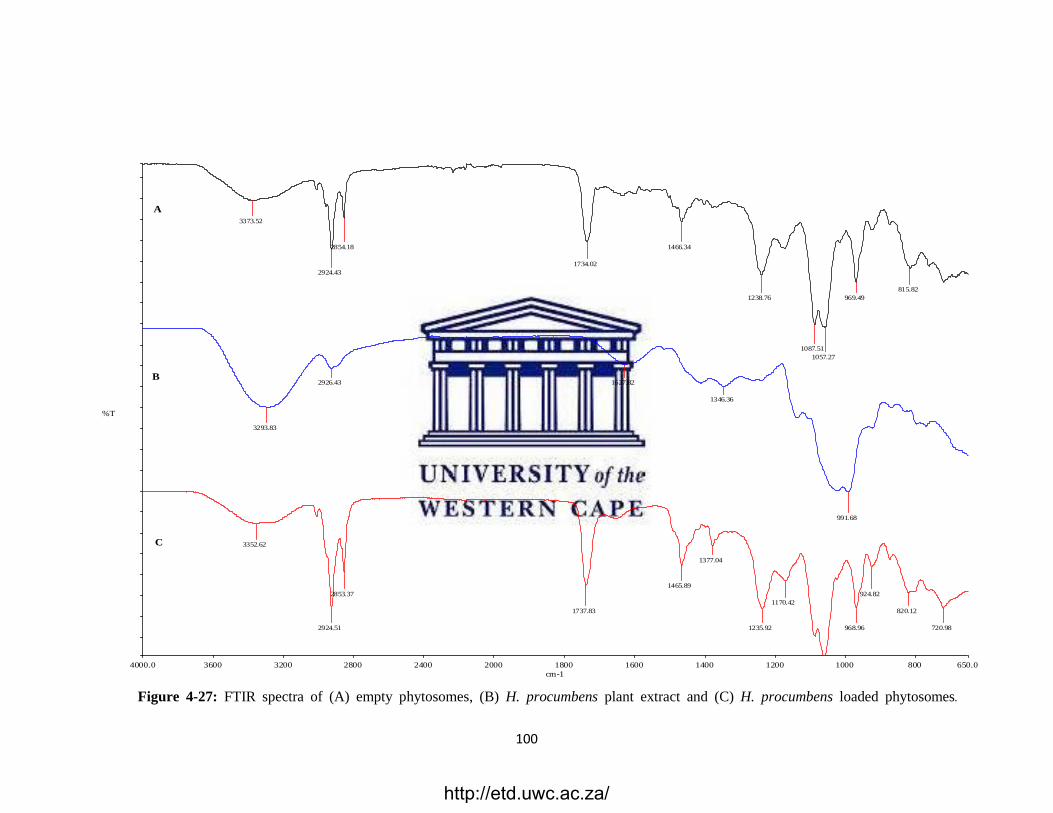
100
Figure 4-27 : FTIR spectra of (A) empty phytosomes, (B) H. procumbens plant extract and (C) H. procumbens loaded phytosomes.
4000.0 3600 3200 2800 2400 2000 1800 1600 1400 1200 1000 800 650.0
cm-1
%T
A
B
C
3373.52
2924.43
2854.18
1734.02
1466.34
1238.76
1087.51
1057.27
969.49
815.82
3293.83
2926.43 1627.82
1346.36
991.68
3352.62
2924.51
2853.37
1737.83
1465.89
1377.04
1235.92
1170.42
968.96
924.82
820.12
720.98
http://etd.uwc.ac.za/
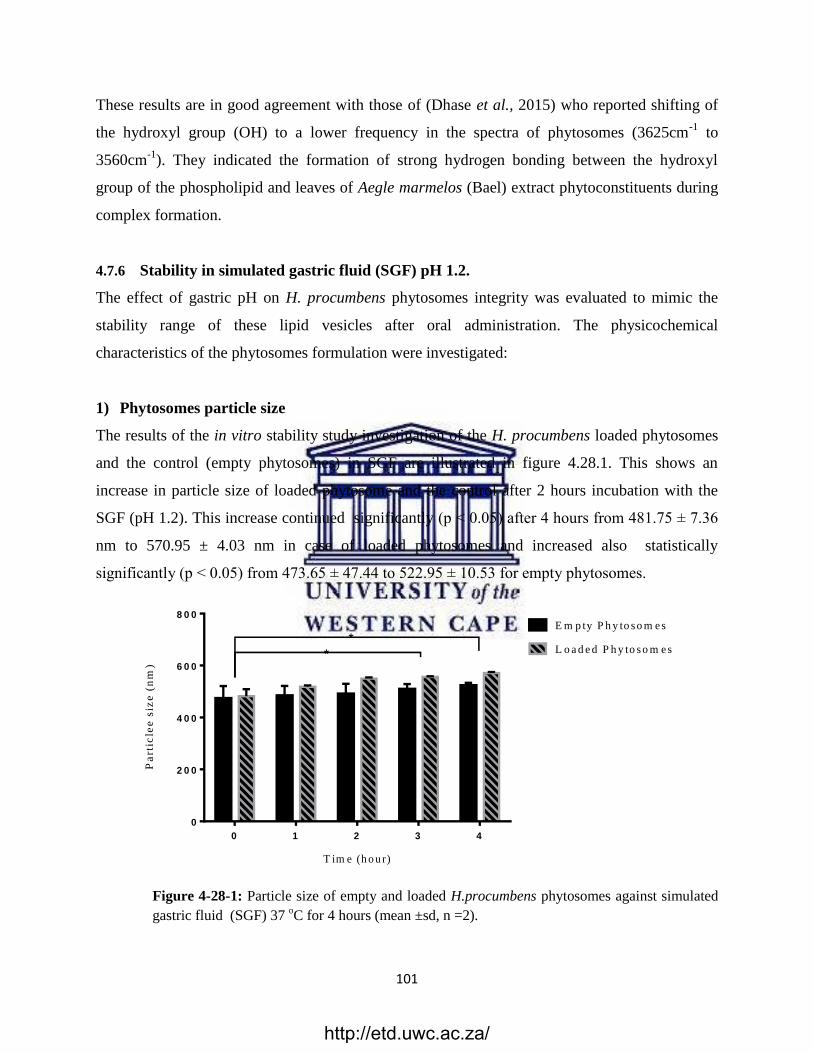
101
These results are in good agreement with those of (Dhase et al., 2015) who reported shifting of
the hydroxyl group (OH) to a lower frequency in the spectra of phytosomes (3625cm-1
to
3560cm-1
). They indicated the formation of strong hydrogen bonding between the hydroxyl
group of the phospholipid and leaves of Aegle marmelos (Bael) extract phytoconstituents during
complex formation.
4.7.6 Stability in simulated gastric fluid (SGF) pH 1.2.
The effect of gastric pH on H. procumbens phytosomes integrity was evaluated to mimic the
stability range of these lipid vesicles after oral administration. The physicochemical
characteristics of the phytosomes formulation were investigated:
1) Phytosomes particle size
The results of the in vitro stability study investigation of the H. procumbens loaded phytosomes
and the control (empty phytosomes) in SGF are illustrated in figure 4.28.1. This shows an
increase in particle size of loaded phytosome and the control after 2 hours incubation with the
SGF (pH 1.2). This increase continued significantly (p ˂ 0.05) after 4 hours from 481.75 ± 7.36
nm to 570.95 ± 4.03 nm in case of loaded phytosomes and increased also statistically
significantly (p ˂ 0.05) from 473.65 ± 47.44 to 522.95 ± 10.53 for empty phytosomes.
T im e (h o ur)
Pa
rtic
lee
siz
e (
nm
)
0 1 2 3 4
0
2 0 0
4 0 0
6 0 0
8 0 0E m p ty P h y to s o m e s
L o a d e d P h y to s o m e s**
Figure 4-28-1 : Particle size of empty and loaded H.procumbens phytosomes against simulated
gastric fluid (SGF) 37 oC for 4 hours (mean ±sd, n =2).
http://etd.uwc.ac.za/
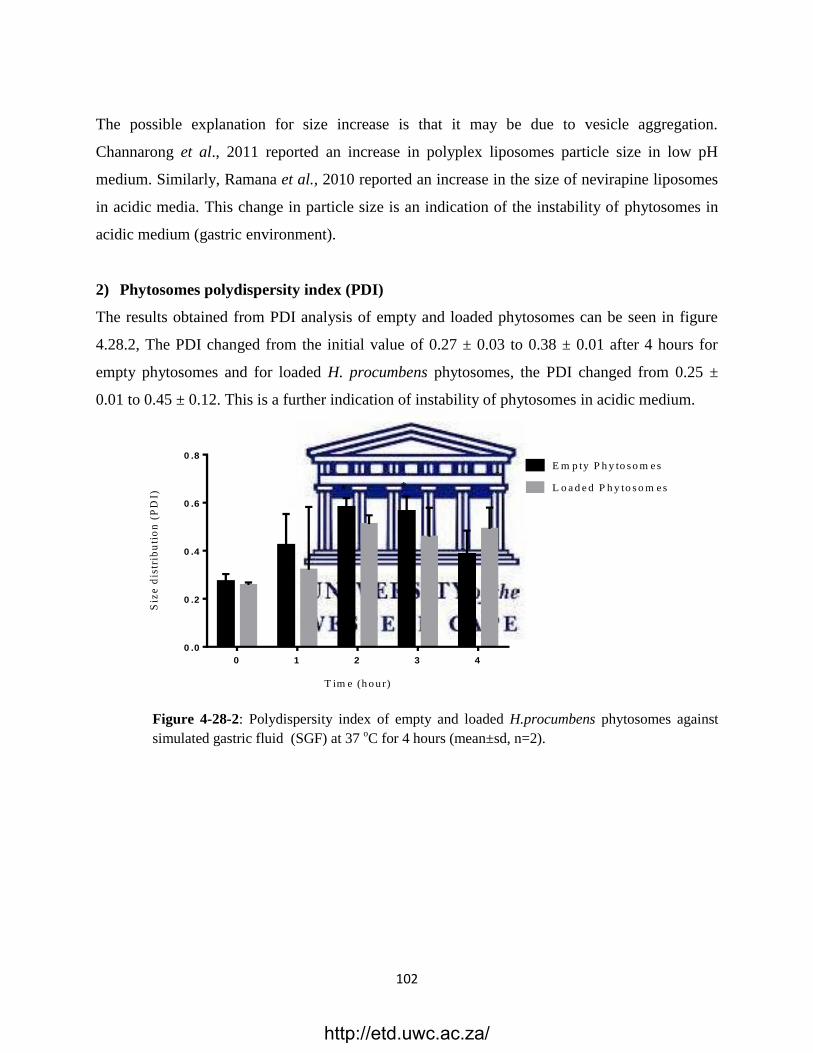
102
The possible explanation for size increase is that it may be due to vesicle aggregation.
Channarong et al., 2011 reported an increase in polyplex liposomes particle size in low pH
medium. Similarly, Ramana et al., 2010 reported an increase in the size of nevirapine liposomes
in acidic media. This change in particle size is an indication of the instability of phytosomes in
acidic medium (gastric environment).
2) Phytosomes polydispersity index (PDI)
The results obtained from PDI analysis of empty and loaded phytosomes can be seen in figure
4.28.2, The PDI changed from the initial value of 0.27 ± 0.03 to 0.38 ± 0.01 after 4 hours for
empty phytosomes and for loaded H. procumbens phytosomes, the PDI changed from 0.25 ±
0.01 to 0.45 ± 0.12. This is a further indication of instability of phytosomes in acidic medium.
T im e (h o ur)
Siz
e d
istr
ibu
tio
n (
PD
I)
0 1 2 3 4
0 .0
0 .2
0 .4
0 .6
0 .8E m p ty P h y to s o m e s
L o a d e d P h y to s o m e s**
Figure 4-28-2: Polydispersity index of empty and loaded H.procumbens phytosomes against
simulated gastric fluid (SGF) at 37 oC for 4 hours (mean±sd, n=2).
http://etd.uwc.ac.za/
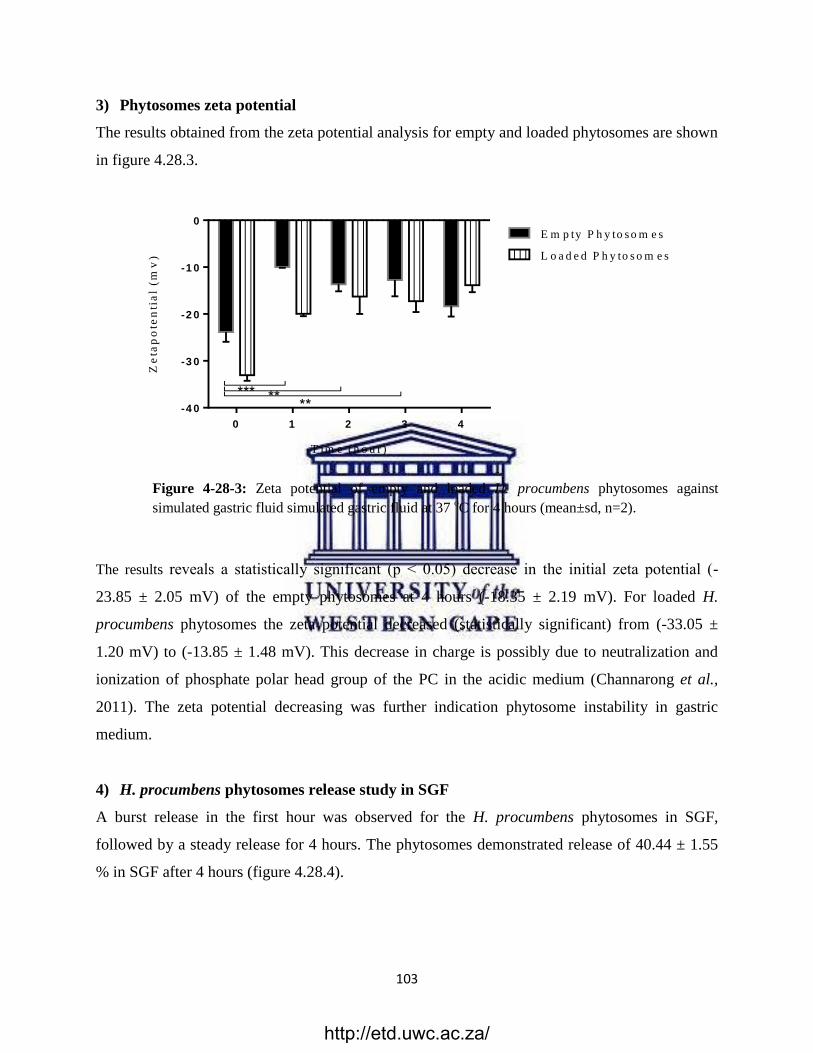
103
3) Phytosomes zeta potential
The results obtained from the zeta potential analysis for empty and loaded phytosomes are shown
in figure 4.28.3.
T im e (h o u r )
Ze
tap
ote
nti
al
(mv
)
0 1 2 3 4
-4 0
-3 0
-2 0
-1 0
0
E m p ty P h y to s o m e s
L o a d e d P h y to s o m e s
*** ** **
Figure 4-28-3: Zeta potential of empty and loaded H. procumbens phytosomes against
simulated gastric fluid simulated gastric fluid at 37 oC for 4 hours (mean±sd, n=2).
The results reveals a statistically significant (p ˂ 0.05) decrease in the initial zeta potential (-
23.85 ± 2.05 mV) of the empty phytosomes at 4 hours (-18.35 ± 2.19 mV). For loaded H.
procumbens phytosomes the zeta potential decreased (statistically significant) from (-33.05 ±
1.20 mV) to (-13.85 ± 1.48 mV). This decrease in charge is possibly due to neutralization and
ionization of phosphate polar head group of the PC in the acidic medium (Channarong et al.,
2011). The zeta potential decreasing was further indication phytosome instability in gastric
medium.
4) H. procumbens phytosomes release study in SGF
A burst release in the first hour was observed for the H. procumbens phytosomes in SGF,
followed by a steady release for 4 hours. The phytosomes demonstrated release of 40.44 ± 1.55
% in SGF after 4 hours (figure 4.28.4).
http://etd.uwc.ac.za/
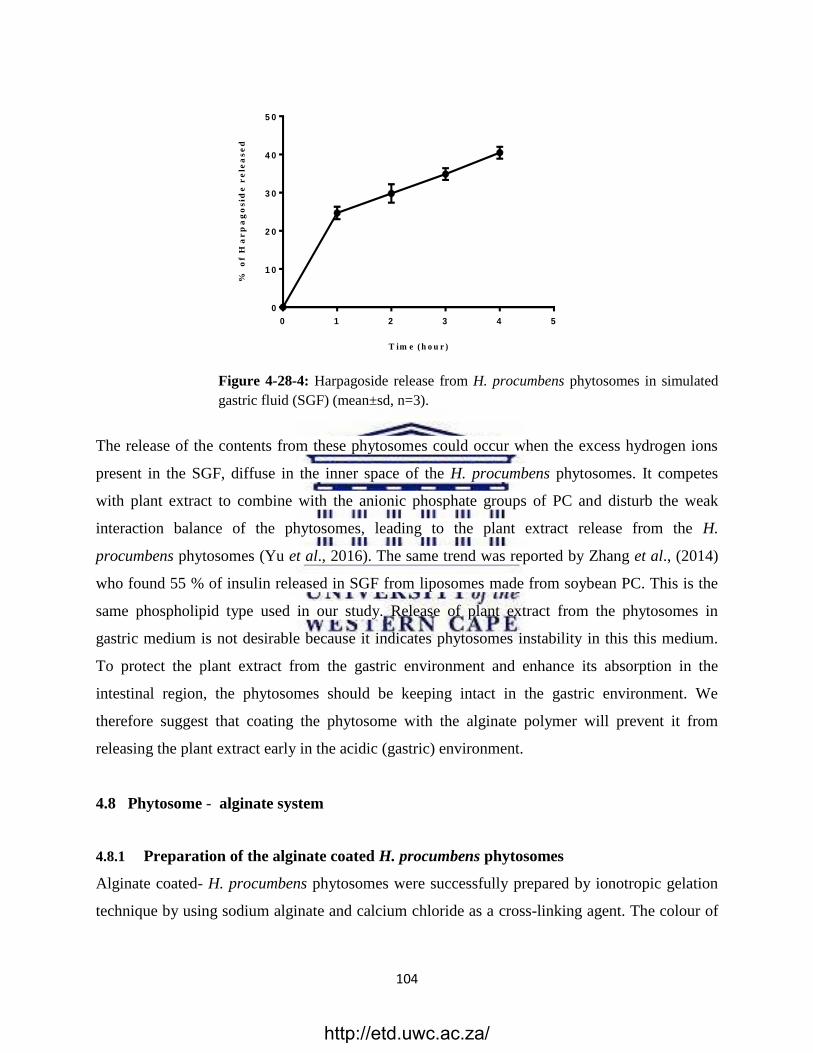
104
T im e ( h o u r )
% o
f H
ar
pa
go
sid
e r
ele
as
ed
0 1 2 3 4 5
0
1 0
2 0
3 0
4 0
5 0
Figure 4-28-4 : Harpagoside release from H. procumbens phytosomes in simulated
gastric fluid (SGF) (mean±sd, n=3).
The release of the contents from these phytosomes could occur when the excess hydrogen ions
present in the SGF, diffuse in the inner space of the H. procumbens phytosomes. It competes
with plant extract to combine with the anionic phosphate groups of PC and disturb the weak
interaction balance of the phytosomes, leading to the plant extract release from the H.
procumbens phytosomes (Yu et al., 2016). The same trend was reported by Zhang et al., (2014)
who found 55 % of insulin released in SGF from liposomes made from soybean PC. This is the
same phospholipid type used in our study. Release of plant extract from the phytosomes in
gastric medium is not desirable because it indicates phytosomes instability in this this medium.
To protect the plant extract from the gastric environment and enhance its absorption in the
intestinal region, the phytosomes should be keeping intact in the gastric environment. We
therefore suggest that coating the phytosome with the alginate polymer will prevent it from
releasing the plant extract early in the acidic (gastric) environment.
4.8 Phytosome - alginate system
4.8.1 Preparation of the alginate coated H. procumbens phytosomes
Alginate coated- H. procumbens phytosomes were successfully prepared by ionotropic gelation
technique by using sodium alginate and calcium chloride as a cross-linking agent. The colour of
http://etd.uwc.ac.za/
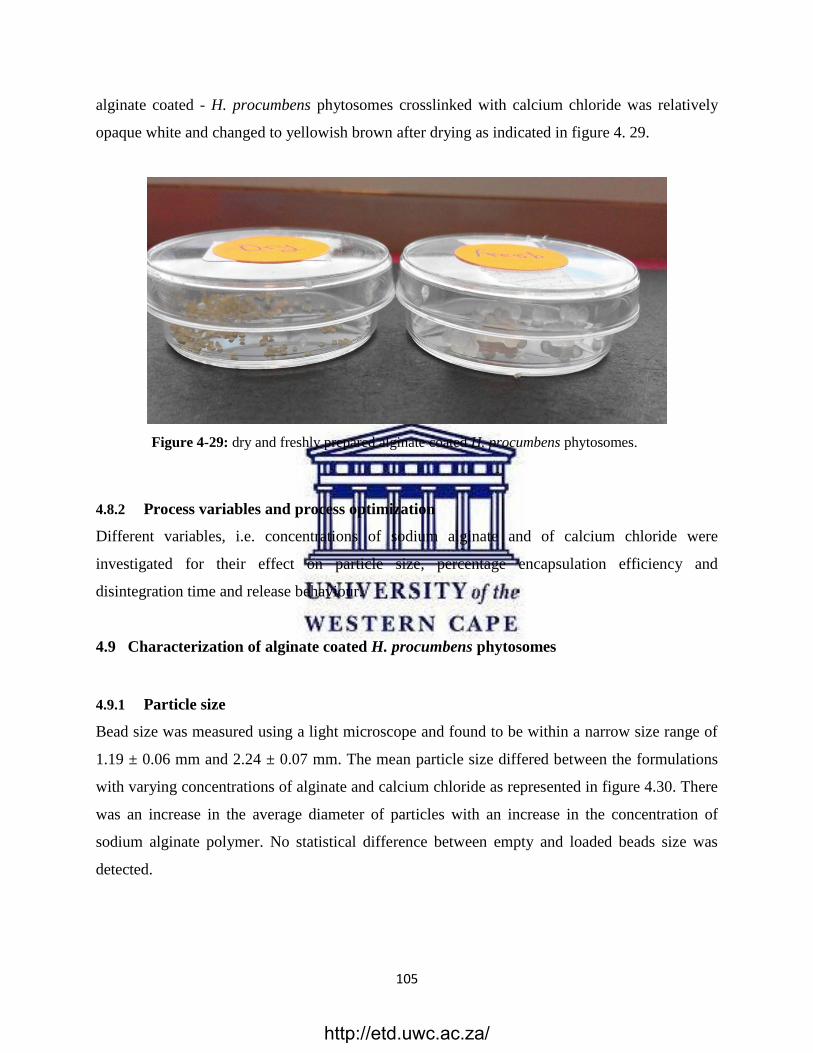
105
alginate coated - H. procumbens phytosomes crosslinked with calcium chloride was relatively
opaque white and changed to yellowish brown after drying as indicated in figure 4. 29.
Figure 4-29 : dry and freshly prepared alginate coated H. procumbens phytosomes.
4.8.2 Process variables and process optimization
Different variables, i.e. concentrations of sodium alginate and of calcium chloride were
investigated for their effect on particle size, percentage encapsulation efficiency and
disintegration time and release behaviour.
4.9 Characterization of alginate coated H. procumbens phytosomes
4.9.1 Particle size
Bead size was measured using a light microscope and found to be within a narrow size range of
1.19 ± 0.06 mm and 2.24 ± 0.07 mm. The mean particle size differed between the formulations
with varying concentrations of alginate and calcium chloride as represented in figure 4.30. There
was an increase in the average diameter of particles with an increase in the concentration of
sodium alginate polymer. No statistical difference between empty and loaded beads size was
detected.
http://etd.uwc.ac.za/
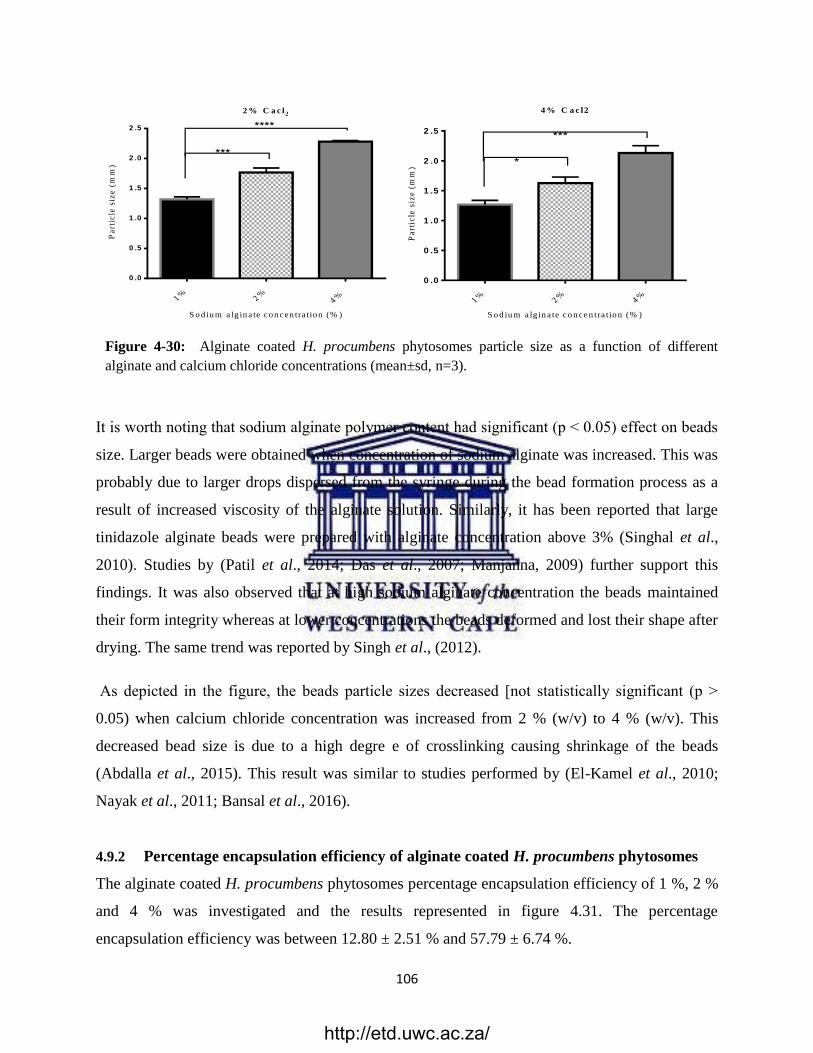
106
Figure 4-30 : Alginate coated H. procumbens phytosomes particle size as a function of different
alginate and calcium chloride concentrations (mean±sd, n=3).
It is worth noting that sodium alginate polymer content had significant (p ˂ 0.05) effect on beads
size. Larger beads were obtained when concentration of sodium alginate was increased. This was
probably due to larger drops dispersed from the syringe during the bead formation process as a
result of increased viscosity of the alginate solution. Similarly, it has been reported that large
tinidazole alginate beads were prepared with alginate concentration above 3% (Singhal et al.,
2010). Studies by (Patil et al., 2014; Das et al., 2007; Manjanna, 2009) further support this
findings. It was also observed that at high sodium alginate concentration the beads maintained
their form integrity whereas at lower concentrations the beads deformed and lost their shape after
drying. The same trend was reported by Singh et al., (2012).
As depicted in the figure, the beads particle sizes decreased [not statistically significant (p ˃
0.05) when calcium chloride concentration was increased from 2 % (w/v) to 4 % (w/v). This
decreased bead size is due to a high degre e of crosslinking causing shrinkage of the beads
(Abdalla et al., 2015). This result was similar to studies performed by (El-Kamel et al., 2010;
Nayak et al., 2011; Bansal et al., 2016).
4.9.2 Percentage encapsulation efficiency of alginate coated H. procumbens phytosomes
The alginate coated H. procumbens phytosomes percentage encapsulation efficiency of 1 %, 2 %
and 4 % was investigated and the results represented in figure 4.31. The percentage
encapsulation efficiency was between 12.80 ± 2.51 % and 57.79 ± 6.74 %.
2 % C a c l2
S o d iu m a lg in a te co n cen tra tion (% )
Pa
rtic
le s
ize
(m
m)
1%
2%
4%
0 .0
0 .5
1 .0
1 .5
2 .0
2 .5
***
****4 % C a c l2
S o d iu m a lg in a te co n cen tra tion (% )
Pa
rtic
le s
ize
(m
m)
1 %
2%
4%
0 .0
0 .5
1 .0
1 .5
2 .0
2 .5
*
***
http://etd.uwc.ac.za/
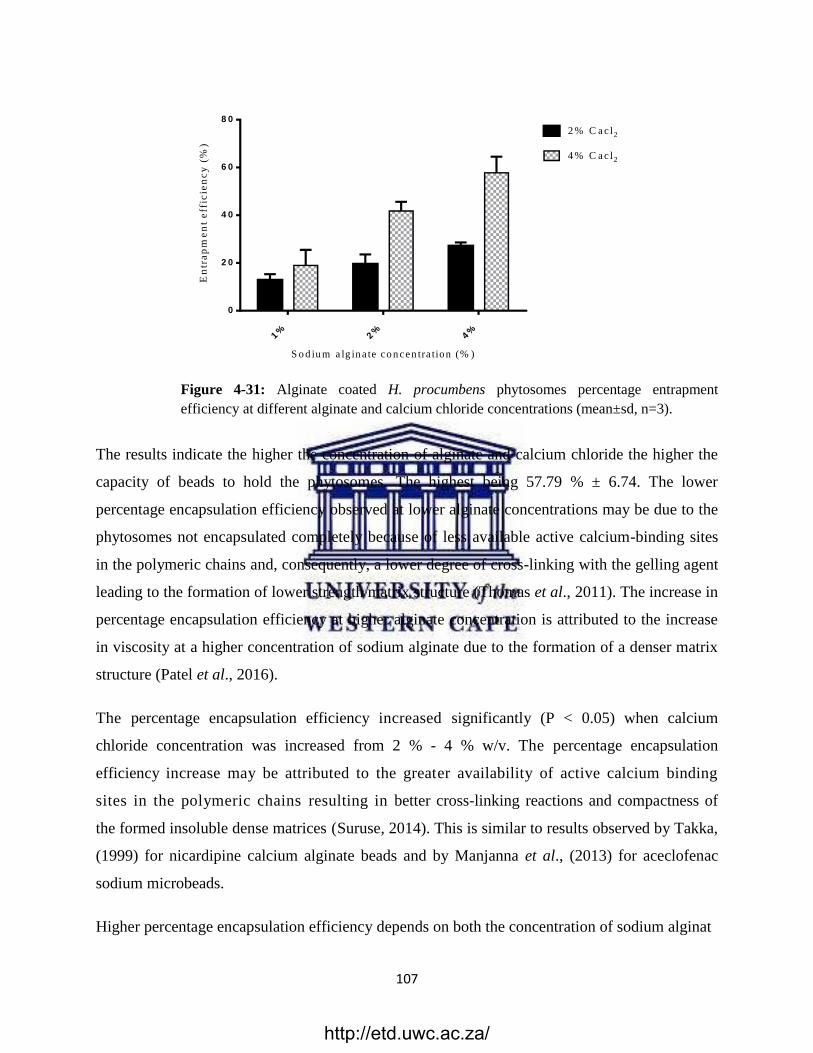
107
Figure 4-31: Alginate coated H. procumbens phytosomes percentage entrapment
efficiency at different alginate and calcium chloride concentrations (mean±sd, n=3).
The results indicate the higher the concentration of alginate and calcium chloride the higher the
capacity of beads to hold the phytosomes. The highest being 57.79 % ± 6.74. The lower
percentage encapsulation efficiency observed at lower alginate concentrations may be due to the
phytosomes not encapsulated completely because of less available active calcium-binding sites
in the polymeric chains and, consequently, a lower degree of cross-linking with the gelling agent
leading to the formation of lower strength matrix structure (Thomas et al., 2011). The increase in
percentage encapsulation efficiency at higher alginate concentration is attributed to the increase
in viscosity at a higher concentration of sodium alginate due to the formation of a denser matrix
structure (Patel et al., 2016).
The percentage encapsulation efficiency increased significantly (P < 0.05) when calcium
chloride concentration was increased from 2 % - 4 % w/v. The percentage encapsulation
efficiency increase may be attributed to the greater availability of active calcium binding
sites in the polymeric chains resulting in better cross-linking reactions and compactness of
the formed insoluble dense matrices (Suruse, 2014). This is similar to results observed by Takka,
(1999) for nicardipine calcium alginate beads and by Manjanna et al., (2013) for aceclofenac
sodium microbeads.
Higher percentage encapsulation efficiency depends on both the concentration of sodium alginat
S o d iu m a lg in a te co n cen tra tion (% )
En
tra
pm
en
t e
ffic
ien
cy
(%
)
1%
2%
4%
0
2 0
4 0
6 0
8 0
2 % C a c l2
4 % C a c l2
http://etd.uwc.ac.za/
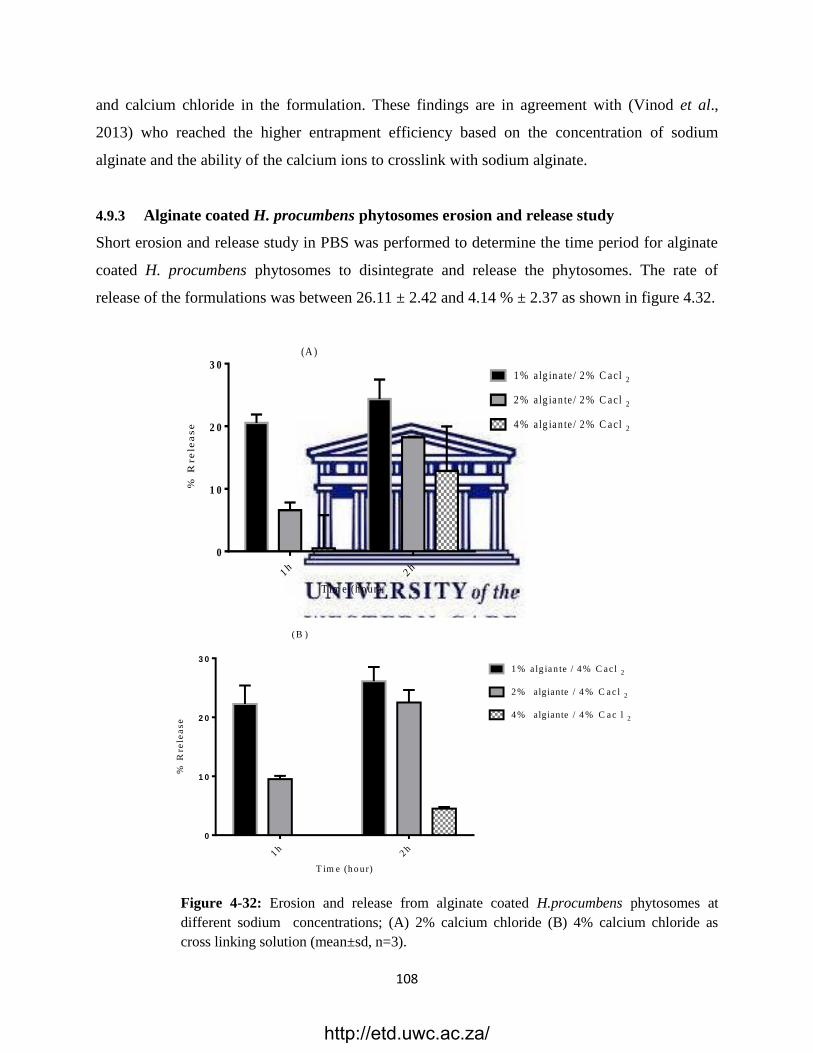
108
and calcium chloride in the formulation. These findings are in agreement with (Vinod et al.,
2013) who reached the higher entrapment efficiency based on the concentration of sodium
alginate and the ability of the calcium ions to crosslink with sodium alginate.
4.9.3 Alginate coated H. procumbens phytosomes erosion and release study
Short erosion and release study in PBS was performed to determine the time period for alginate
coated H. procumbens phytosomes to disintegrate and release the phytosomes. The rate of
release of the formulations was between 26.11 ± 2.42 and 4.14 % ± 2.37 as shown in figure 4.32.
T im e (h o ur)
% R
re
lea
se
1h
2h
0
1 0
2 0
3 01 % alg in a te / 2 % C acl 2
2 % alg ian te / 2 % C acl 2
4 % alg ian te / 2 % C acl 2
(A )
T im e (h o ur)
% R
rele
ase
1h
2h
0
1 0
2 0
3 0
1 % a lg ian te / 4 % C acl 2
2% algiante / 4 % C a c l 2
4% algiante / 4 % C a c l 2
( B )
Figure 4-32 : Erosion and release from alginate coated H.procumbens phytosomes at
different sodium concentrations; (A) 2% calcium chloride (B) 4% calcium chloride as
cross linking solution (mean±sd, n=3).
http://etd.uwc.ac.za/
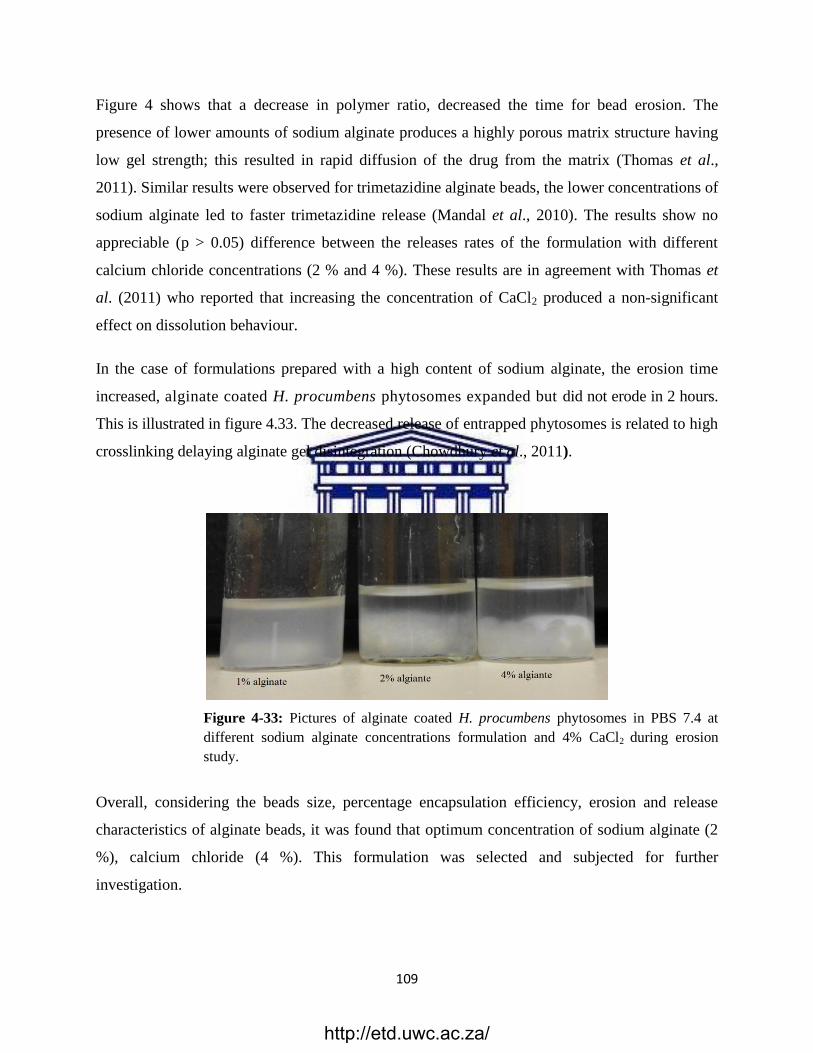
109
Figure 4 shows that a decrease in polymer ratio, decreased the time for bead erosion. The
presence of lower amounts of sodium alginate produces a highly porous matrix structure having
low gel strength; this resulted in rapid diffusion of the drug from the matrix (Thomas et al.,
2011). Similar results were observed for trimetazidine alginate beads, the lower concentrations of
sodium alginate led to faster trimetazidine release (Mandal et al., 2010). The results show no
appreciable (p > 0.05) difference between the releases rates of the formulation with different
calcium chloride concentrations (2 % and 4 %). These results are in agreement with Thomas et
al. (2011) who reported that increasing the concentration of CaCl2 produced a non-significant
effect on dissolution behaviour.
In the case of formulations prepared with a high content of sodium alginate, the erosion time
increased, alginate coated H. procumbens phytosomes expanded but did not erode in 2 hours.
This is illustrated in figure 4.33. The decreased release of entrapped phytosomes is related to high
crosslinking delaying alginate gel disintegration (Chowdhury et al., 2011).
Figure 4-33 : Pictures of alginate coated H. procumbens phytosomes in PBS 7.4 at
different sodium alginate concentrations formulation and 4% CaCl2 during erosion
study.
Overall, considering the beads size, percentage encapsulation efficiency, erosion and release
characteristics of alginate beads, it was found that optimum concentration of sodium alginate (2
%), calcium chloride (4 %). This formulation was selected and subjected for further
investigation.
http://etd.uwc.ac.za/
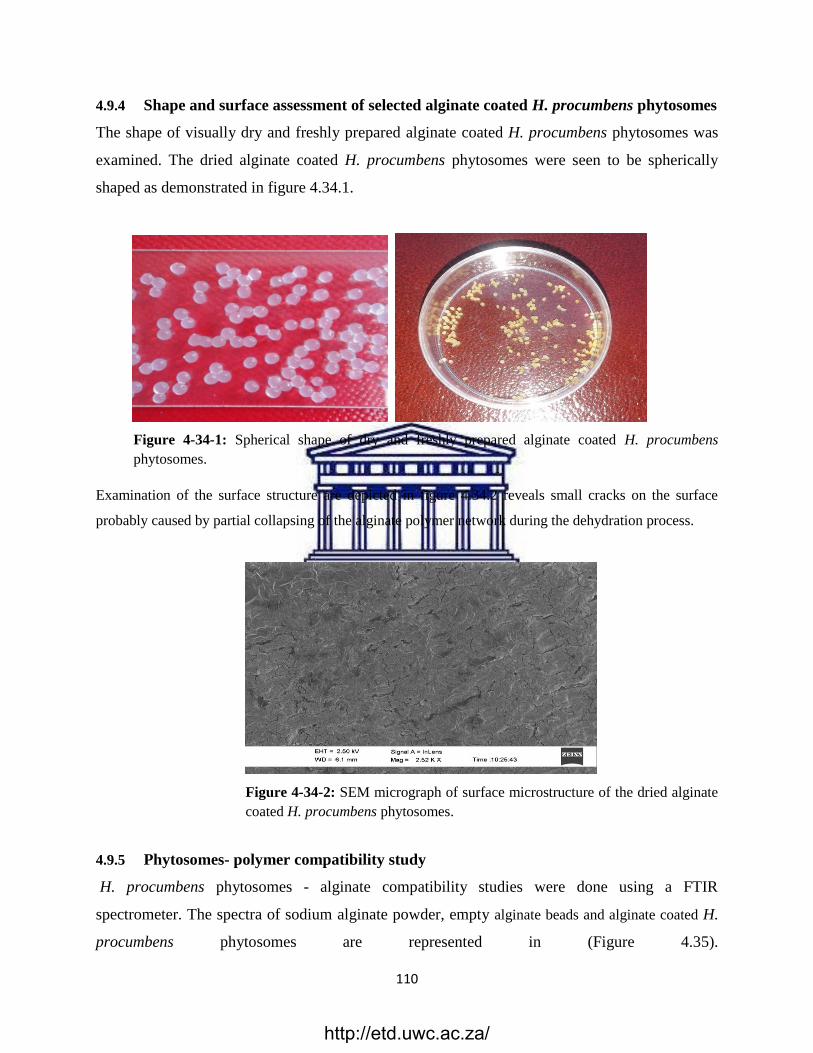
110
4.9.4 Shape and surface assessment of selected alginate coated H. procumbens phytosomes
The shape of visually dry and freshly prepared alginate coated H. procumbens phytosomes was
examined. The dried alginate coated H. procumbens phytosomes were seen to be spherically
shaped as demonstrated in figure 4.34.1.
Figure 4-34-1: Spherical shape of dry and freshly prepared alginate coated H. procumbens
phytosomes.
Examination of the surface structure are depicted in figure 4.34.2 reveals small cracks on the surface
probably caused by partial collapsing of the alginate polymer network during the dehydration process.
Figure 4-34-2: SEM micrograph of surface microstructure of the dried alginate
coated H. procumbens phytosomes.
4.9.5 Phytosomes- polymer compatibility study
H. procumbens phytosomes - alginate compatibility studies were done using a FTIR
spectrometer. The spectra of sodium alginate powder, empty alginate beads and alginate coated H.
procumbens phytosomes are represented in (Figure 4.35).
http://etd.uwc.ac.za/
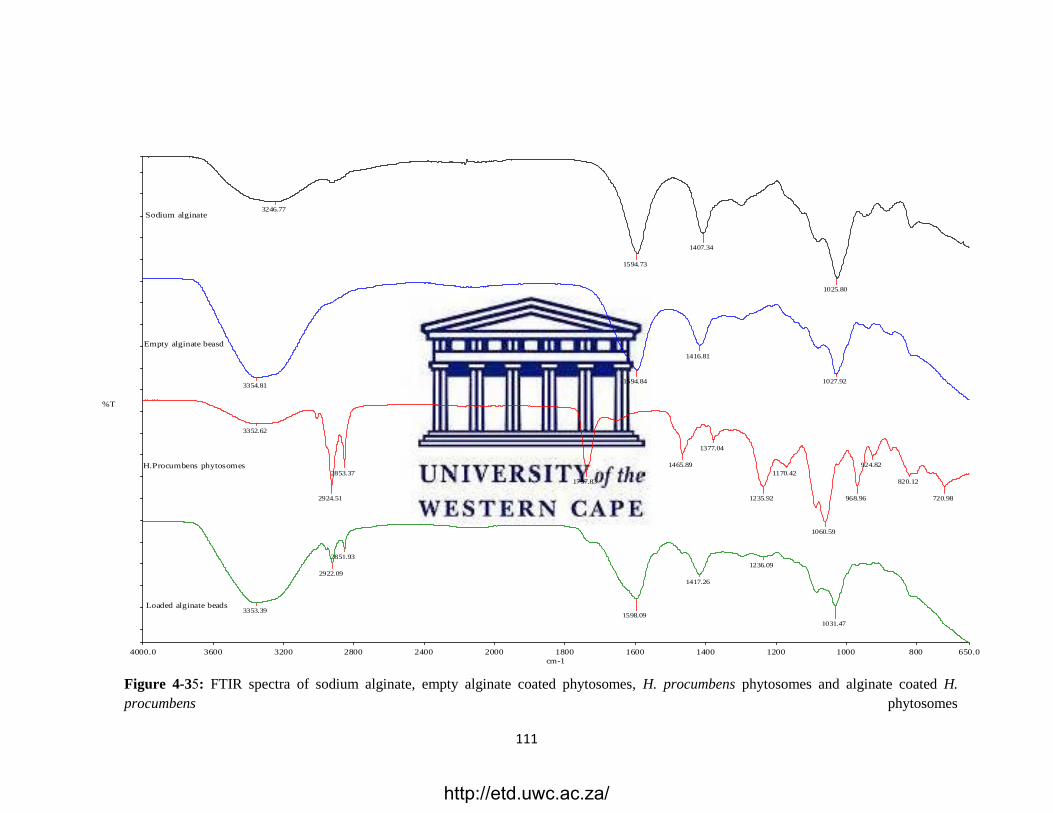
111
Figure 4-35: FTIR spectra of sodium alginate, empty alginate coated phytosomes, H. procumbens phytosomes and alginate coated H.
procumbens phytosomes
4000.0 3600 3200 2800 2400 2000 1800 1600 1400 1200 1000 800 650.0
cm-1
%T
Sodium alginate
Empty alginate beasd
H.Procumbens phytosomes
Loaded alginate beads
3246.77
1594.73
1407.34
1025.80
3354.811594.84
1416.81
1027.92
3352.62
2924.51
2853.37
1737.83
1465.89
1377.04
1235.92
1170.42
1060.59
968.96
924.82
820.12
720.98
3353.39
2922.09
2851.93
1598.09
1417.26
1236.09
1031.47
http://etd.uwc.ac.za/
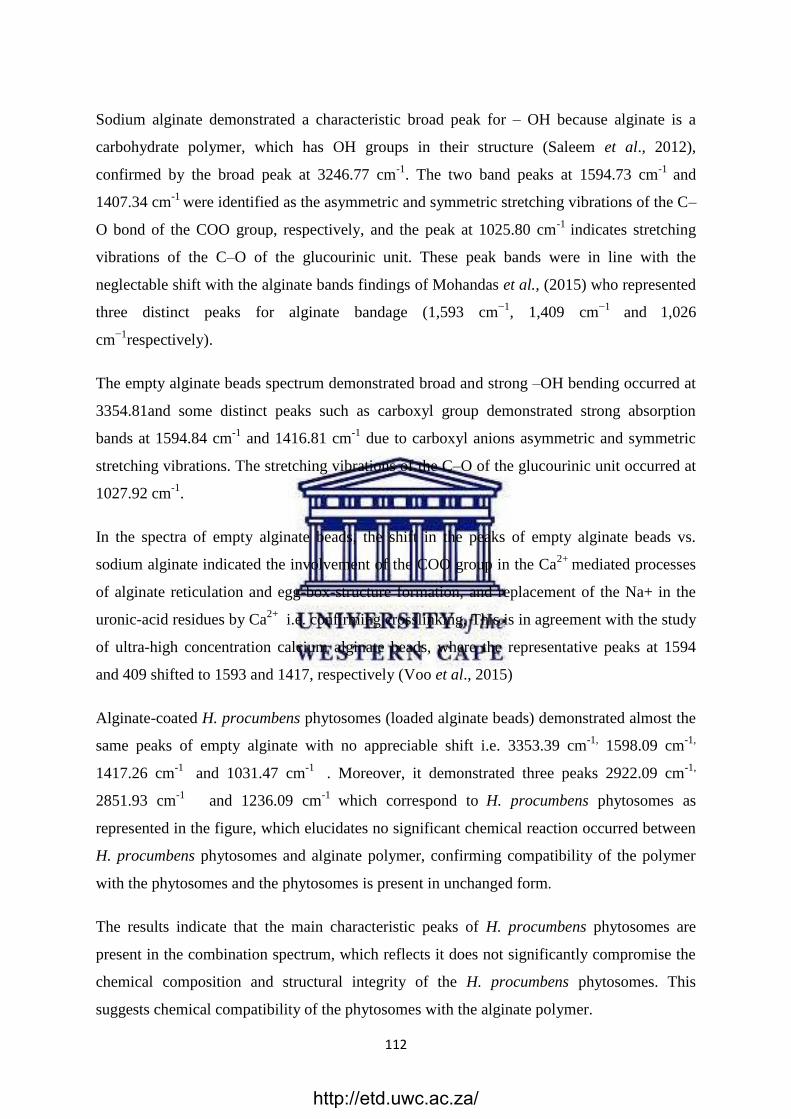
112
Sodium alginate demonstrated a characteristic broad peak for – OH because alginate is a
carbohydrate polymer, which has OH groups in their structure (Saleem et al., 2012),
confirmed by the broad peak at 3246.77 cm-1
. The two band peaks at 1594.73 cm-1
and
1407.34 cm-1
were identified as the asymmetric and symmetric stretching vibrations of the C–
O bond of the COO group, respectively, and the peak at 1025.80 cm-1
indicates stretching
vibrations of the C–O of the glucourinic unit. These peak bands were in line with the
neglectable shift with the alginate bands findings of Mohandas et al., (2015) who represented
three distinct peaks for alginate bandage (1,593 cm−1
, 1,409 cm−1
and
1,026
cm−1
respectively).
The empty alginate beads spectrum demonstrated broad and strong –OH bending occurred at
3354.81and some distinct peaks such as carboxyl group demonstrated strong absorption
bands at 1594.84 cm-1
and 1416.81 cm-1
due to carboxyl anions asymmetric and symmetric
stretching vibrations. The stretching vibrations of the C–O of the glucourinic unit occurred at
1027.92 cm-1
.
In the spectra of empty alginate beads, the shift in the peaks of empty alginate beads vs.
sodium alginate indicated the involvement of the COO group in the Ca2+
mediated processes
of alginate reticulation and egg-box-structure formation, and replacement of the Na+ in the
uronic-acid residues by Ca2+
i.e. confirming crosslinking. This is in agreement with the study
of ultra-high concentration calcium alginate beads, where the representative peaks at 1594
and 409 shifted to 1593 and 1417, respectively (Voo et al., 2015)
Alginate-coated H. procumbens phytosomes (loaded alginate beads) demonstrated almost the
same peaks of empty alginate with no appreciable shift i.e. 3353.39 cm-1,
1598.09 cm-1,
1417.26 cm-1
and 1031.47 cm-1
. Moreover, it demonstrated three peaks 2922.09 cm-1,
2851.93 cm-1
and 1236.09 cm-1
which correspond to H. procumbens phytosomes as
represented in the figure, which elucidates no significant chemical reaction occurred between
H. procumbens phytosomes and alginate polymer, confirming compatibility of the polymer
with the phytosomes and the phytosomes is present in unchanged form.
The results indicate that the main characteristic peaks of H. procumbens phytosomes are
present in the combination spectrum, which reflects it does not significantly compromise the
chemical composition and structural integrity of the H. procumbens phytosomes. This
suggests chemical compatibility of the phytosomes with the alginate polymer.
http://etd.uwc.ac.za/
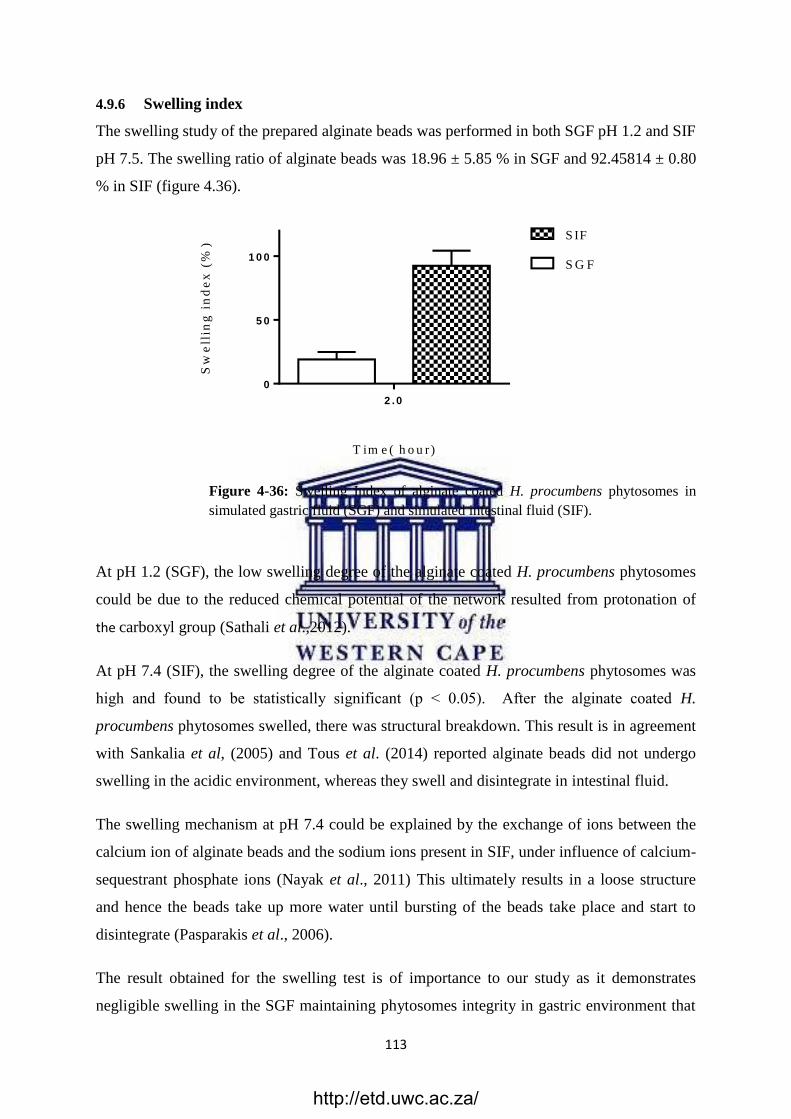
113
4.9.6 Swelling index
The swelling study of the prepared alginate beads was performed in both SGF pH 1.2 and SIF
pH 7.5. The swelling ratio of alginate beads was 18.96 ± 5.85 % in SGF and 92.45814 ± 0.80
% in SIF (figure 4.36).
Figure 4-36 : Swelling Index of alginate coated H. procumbens phytosomes in
simulated gastric fluid (SGF) and simulated intestinal fluid (SIF).
At pH 1.2 (SGF), the low swelling degree of the alginate coated H. procumbens phytosomes
could be due to the reduced chemical potential of the network resulted from protonation of
the carboxyl group (Sathali et al.,2012).
At pH 7.4 (SIF), the swelling degree of the alginate coated H. procumbens phytosomes was
high and found to be statistically significant (p ˂ 0.05). After the alginate coated H.
procumbens phytosomes swelled, there was structural breakdown. This result is in agreement
with Sankalia et al, (2005) and Tous et al. (2014) reported alginate beads did not undergo
swelling in the acidic environment, whereas they swell and disintegrate in intestinal fluid.
The swelling mechanism at pH 7.4 could be explained by the exchange of ions between the
calcium ion of alginate beads and the sodium ions present in SIF, under influence of calcium-
sequestrant phosphate ions (Nayak et al., 2011) This ultimately results in a loose structure
and hence the beads take up more water until bursting of the beads take place and start to
disintegrate (Pasparakis et al., 2006).
The result obtained for the swelling test is of importance to our study as it demonstrates
negligible swelling in the SGF maintaining phytosomes integrity in gastric environment that
T im e ( h o u r )
Sw
ell
ing
in
de
x (
%)
2 .0
0
5 0
1 0 0S G F
S IF
http://etd.uwc.ac.za/
114
could affect and deform the phytosomes that entrap and protect the H. procumbens plant
extract. Further, swelling takes place in the intestinal environment which increases
phytosome release from alginate matrix which could phytosomal intestinal absorption.
4.9.7 Release study in GIT fluids
Release study of harpagoside from phytosome-alginate beads was performed in SGF and SIF
environments. The release profiles are shown in figure 4.37.
Figure 4-37 : Release profile of H. procumbens phytosomes in simulated gastric fluid
(SGF) and simulated intestinal fluid (SIF).
The drug release from the alginate beads is dependent on the penetration of the dissolution
medium into the beads, swelling and dissolution of the alginate matrix, followed by the
dissolution of the drug subsequent to leaching through the swollen matrix (Mandal et al.,
2010; Patel et al., 2016).
In case of SGF, the alginate beads demonstrated no release at 4 hours and there was no sign
of bead disruption and it maintained shape even after 4 hours as depicted in figure 4.38. The
absence of the release the compounds from alginate beads could be related the low swelling
ability (Shi et al., 2006). Similar finding was reported by Tous et al, (2014) who indicated
that beads kept their intact form for up to 4 h in acidic pH; with no change in sphericity and
low % release (4 %) of sodium diclofenac from sodium diclofenac loaded sodium alginate
beads was observed in simulated gastric fluid (Saha et al.,2013).
T im e (h o ur)
% R
ele
ase
0 2 4 6 8 1 0
0
2 0
4 0
6 0
8 0
1 0 0% r e le a s e d in S IF
% r e le a s e d in S G F
http://etd.uwc.ac.za/
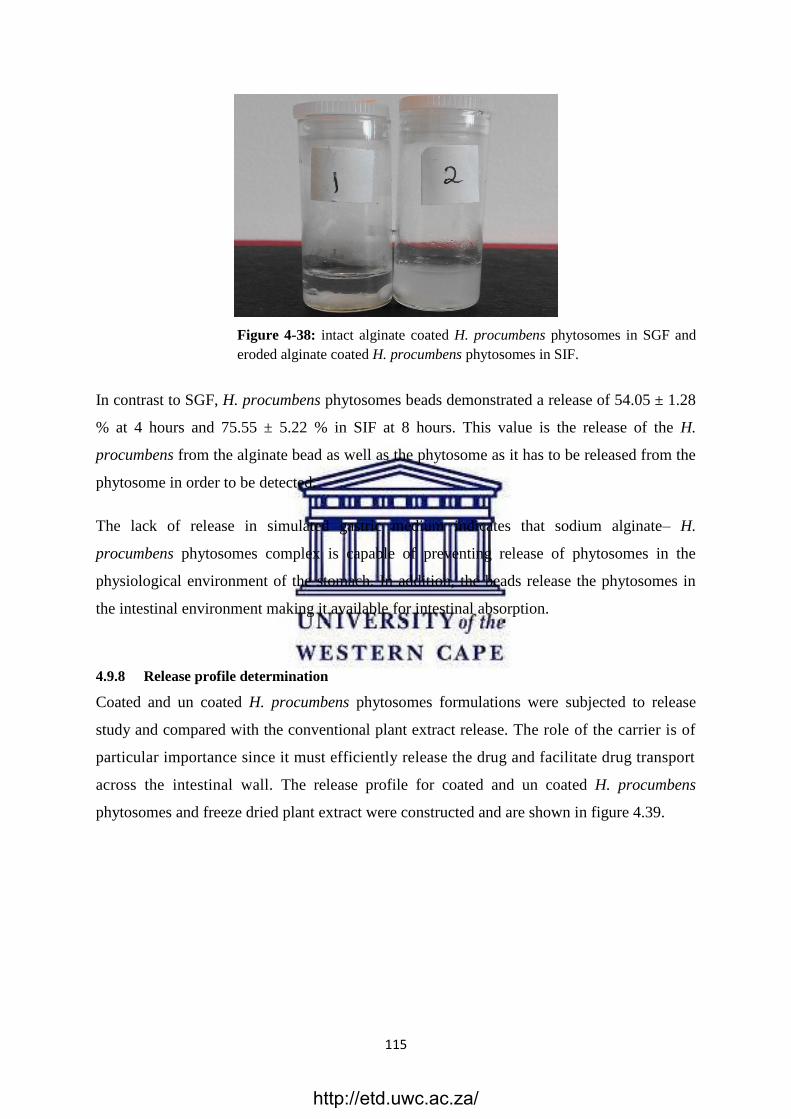
115
Figure 4-38 : intact alginate coated H. procumbens phytosomes in SGF and
eroded alginate coated H. procumbens phytosomes in SIF.
In contrast to SGF, H. procumbens phytosomes beads demonstrated a release of 54.05 ± 1.28
% at 4 hours and 75.55 ± 5.22 % in SIF at 8 hours. This value is the release of the H.
procumbens from the alginate bead as well as the phytosome as it has to be released from the
phytosome in order to be detected.
The lack of release in simulated gastric medium indicates that sodium alginate– H.
procumbens phytosomes complex is capable of preventing release of phytosomes in the
physiological environment of the stomach. In addition, the beads release the phytosomes in
the intestinal environment making it available for intestinal absorption.
4.9.8 Release profile determination
Coated and un coated H. procumbens phytosomes formulations were subjected to release
study and compared with the conventional plant extract release. The role of the carrier is of
particular importance since it must efficiently release the drug and facilitate drug transport
across the intestinal wall. The release profile for coated and un coated H. procumbens
phytosomes and freeze dried plant extract were constructed and are shown in figure 4.39.
http://etd.uwc.ac.za/
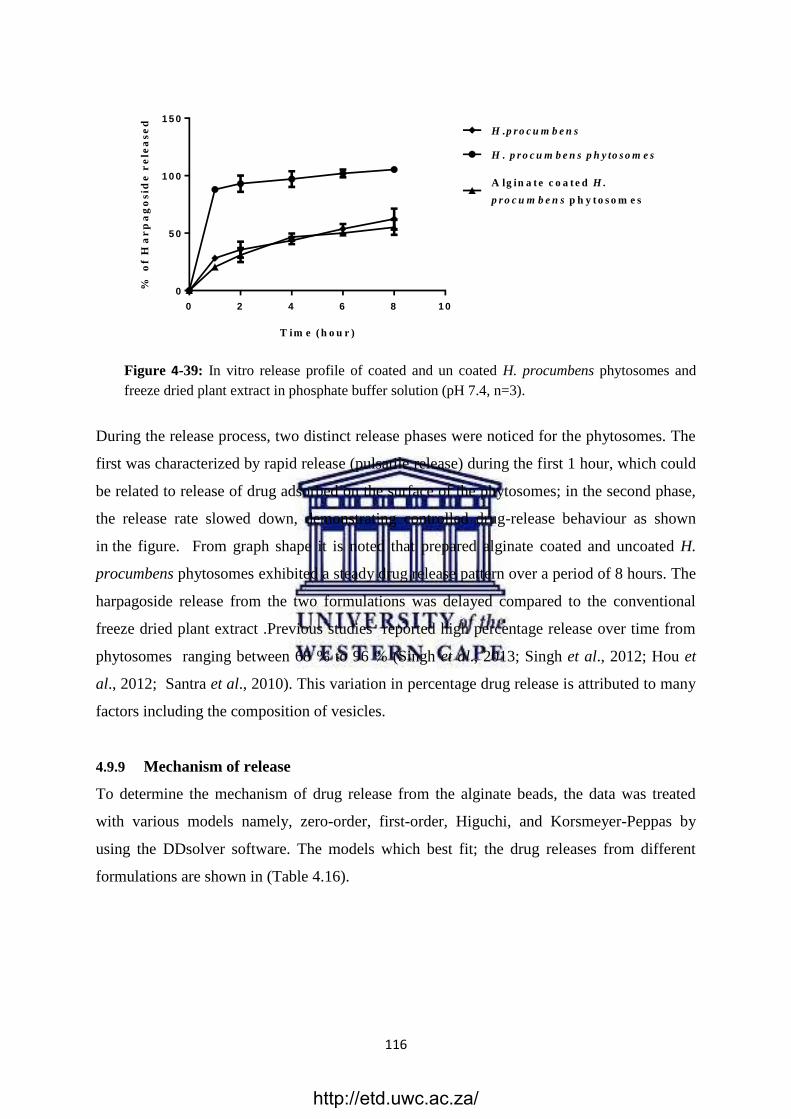
116
T im e ( h o u r )
% o
f H
ar
pa
go
sid
e r
ele
as
ed
0 2 4 6 8 1 0
0
5 0
1 0 0
1 5 0
H .p r o c u m b e n s
H . p r o c u m b e n s p h y to s o m e s
A lg in a t e c o a t e d H .
p r o c u m b e n s p h y t o s o m e s
Figure 4-39 : In vitro release profile of coated and un coated H. procumbens phytosomes and
freeze dried plant extract in phosphate buffer solution (pH 7.4, n=3).
During the release process, two distinct release phases were noticed for the phytosomes. The
first was characterized by rapid release (pulsatile release) during the first 1 hour, which could
be related to release of drug adsorbed on the surface of the phytosomes; in the second phase,
the release rate slowed down, demonstrating controlled drug-release behaviour as shown
in the figure. From graph shape it is noted that prepared alginate coated and uncoated H.
procumbens phytosomes exhibited a steady drug release pattern over a period of 8 hours. The
harpagoside release from the two formulations was delayed compared to the conventional
freeze dried plant extract .Previous studies reported high percentage release over time from
phytosomes ranging between 68 % to 96 % (Singh et al., 2013; Singh et al., 2012; Hou et
al., 2012; Santra et al., 2010). This variation in percentage drug release is attributed to many
factors including the composition of vesicles.
4.9.9 Mechanism of release
To determine the mechanism of drug release from the alginate beads, the data was treated
with various models namely, zero-order, first-order, Higuchi, and Korsmeyer-Peppas by
using the DDsolver software. The models which best fit; the drug releases from different
formulations are shown in (Table 4.16).
http://etd.uwc.ac.za/
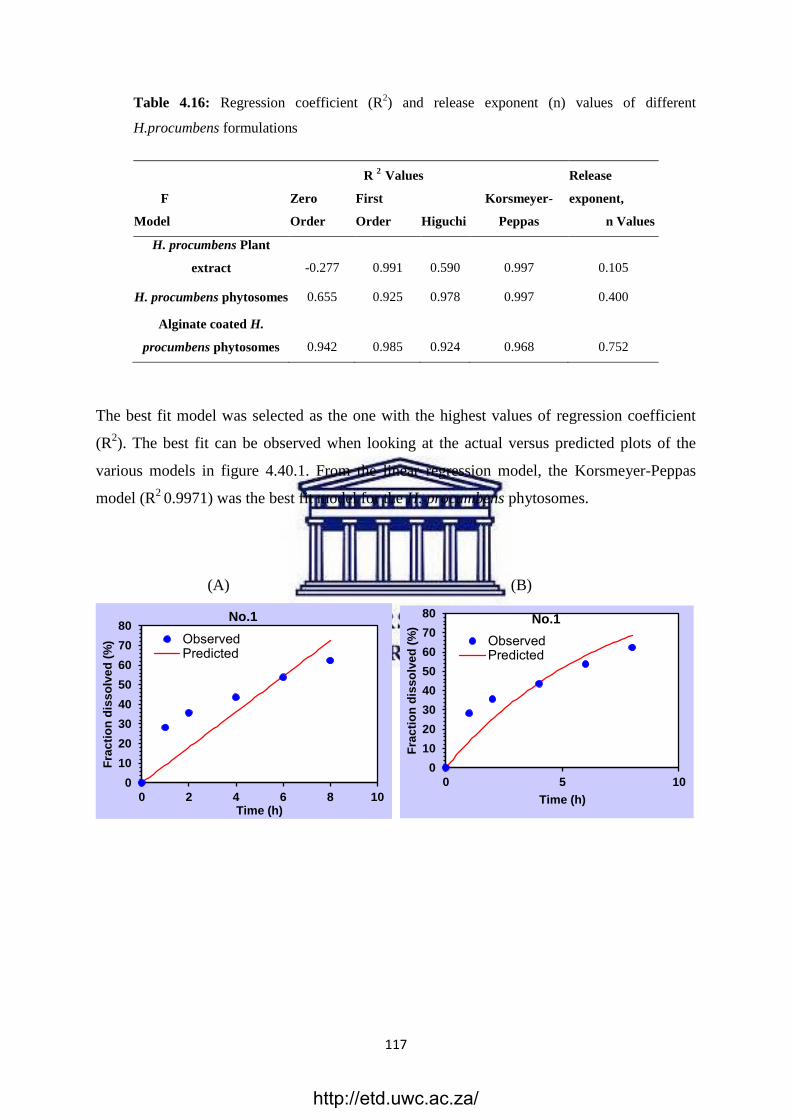
117
Table 4.16: Regression coefficient (R2) and release exponent (n) values of different
H.procumbens formulations
R 2
Values Release
exponent,
n Values
F
Model
Zero
Order
First
Order Higuchi
Korsmeyer-
Peppas
H. procumbens Plant
extract -0.277 0.991 0.590 0.997 0.105
H. procumbens phytosomes 0.655 0.925 0.978 0.997 0.400
Alginate coated H.
procumbens phytosomes 0.942 0.985 0.924 0.968 0.752
The best fit model was selected as the one with the highest values of regression coefficient
(R2). The best fit can be observed when looking at the actual versus predicted plots of the
various models in figure 4.40.1. From the linear regression model, the Korsmeyer-Peppas
model (R2
0.9971) was the best fit model for the H. procumbens phytosomes.
(A) (B)
0
10
20
30
40
50
60
70
80
0 2 4 6 8 10
Fra
cti
on
dis
so
lve
d (
%)
Time (h)
No.1
ObservedPredicted
0
10
20
30
40
50
60
70
80
0 5 10
Fra
cti
on
dis
so
lve
d (
%)
Time (h)
No.1
ObservedPredicted
http://etd.uwc.ac.za/
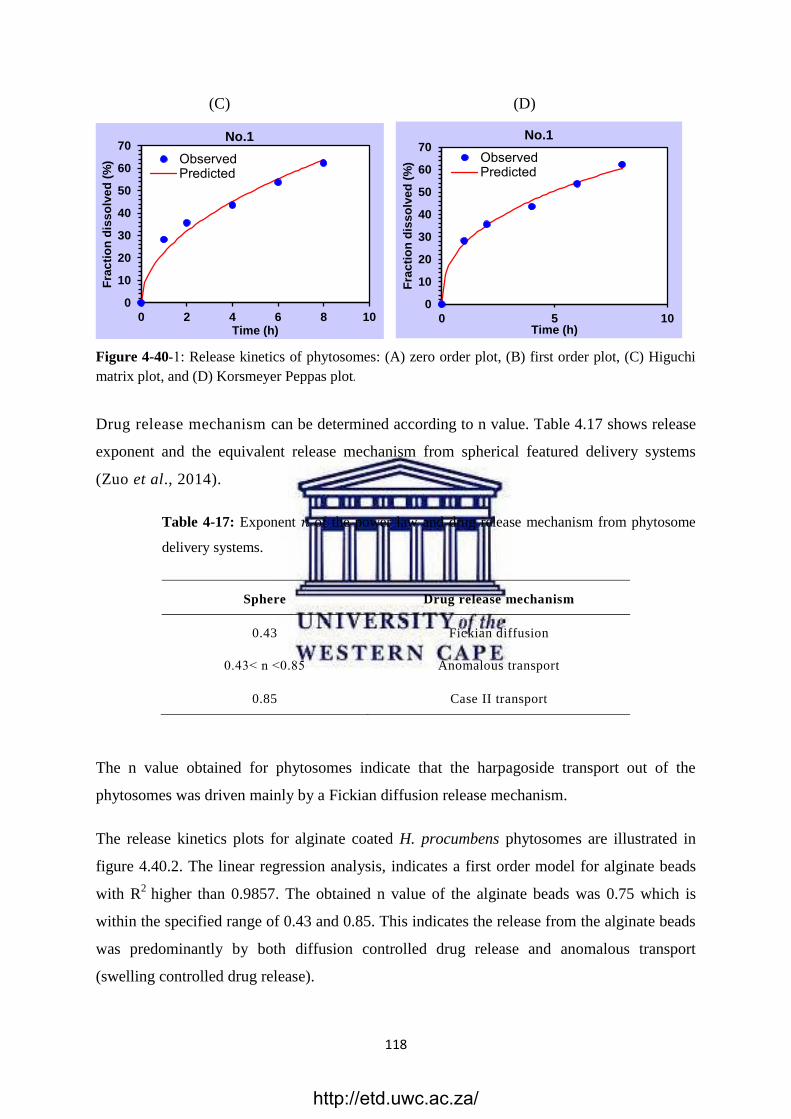
118
(C) (D)
Figure 4-40 1- : Release kinetics of phytosomes: (A) zero order plot, (B) first order plot, (C) Higuchi
matrix plot, and (D) Korsmeyer Peppas plot.
Drug release mechanism can be determined according to n value. Table 4.17 shows release
exponent and the equivalent release mechanism from spherical featured delivery systems
(Zuo et al., 2014).
Table 4-17: Exponent 𝑛 of the power law and drug release mechanism from phytosome
delivery systems.
Sphere Drug release mechanism
0.43 Fickian diffusion
0.43˂ n ˂0.85 Anomalous transport
0.85 Case II transport
The n value obtained for phytosomes indicate that the harpagoside transport out of the
phytosomes was driven mainly by a Fickian diffusion release mechanism.
The release kinetics plots for alginate coated H. procumbens phytosomes are illustrated in
figure 4.40.2. The linear regression analysis, indicates a first order model for alginate beads
with R2
higher than 0.9857. The obtained n value of the alginate beads was 0.75 which is
within the specified range of 0.43 and 0.85. This indicates the release from the alginate beads
was predominantly by both diffusion controlled drug release and anomalous transport
(swelling controlled drug release).
0
10
20
30
40
50
60
70
0 2 4 6 8 10
Fra
cti
on
dis
so
lve
d (
%)
Time (h)
No.1
ObservedPredicted
0
10
20
30
40
50
60
70
0 5 10
Fra
cti
on
dis
so
lve
d (
%)
Time (h)
No.1
ObservedPredicted
http://etd.uwc.ac.za/
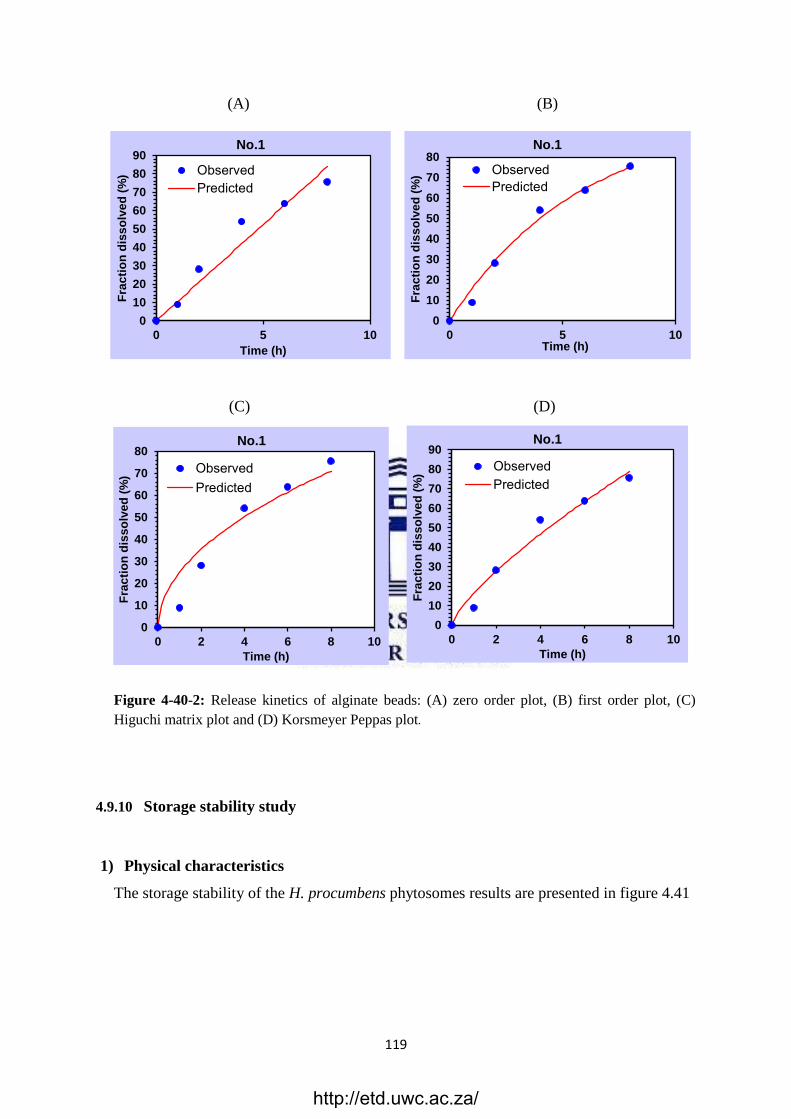
119
(A) (B)
(C) (D)
Figure 4-40-2: Release kinetics of alginate beads: (A) zero order plot, (B) first order plot, (C)
Higuchi matrix plot and (D) Korsmeyer Peppas plot.
4.9.10 Storage stability study
1) Physical characteristics
The storage stability of the H. procumbens phytosomes results are presented in figure 4.41
0
10
20
30
40
50
60
70
80
0 5 10
Fra
cti
on
dis
so
lve
d (
%)
Time (h)
No.1
ObservedPredicted
0
10
20
30
40
50
60
70
80
90
0 5 10
Fra
cti
on
dis
so
lve
d (
%)
Time (h)
No.1
ObservedPredicted
0
10
20
30
40
50
60
70
80
0 2 4 6 8 10
Fra
cti
on
dis
so
lve
d (
%)
Time (h)
No.1
ObservedPredicted
0
10
20
30
40
50
60
70
80
90
0 2 4 6 8 10
Fra
cti
on
dis
so
lve
d (
%)
Time (h)
No.1
ObservedPredicted
http://etd.uwc.ac.za/
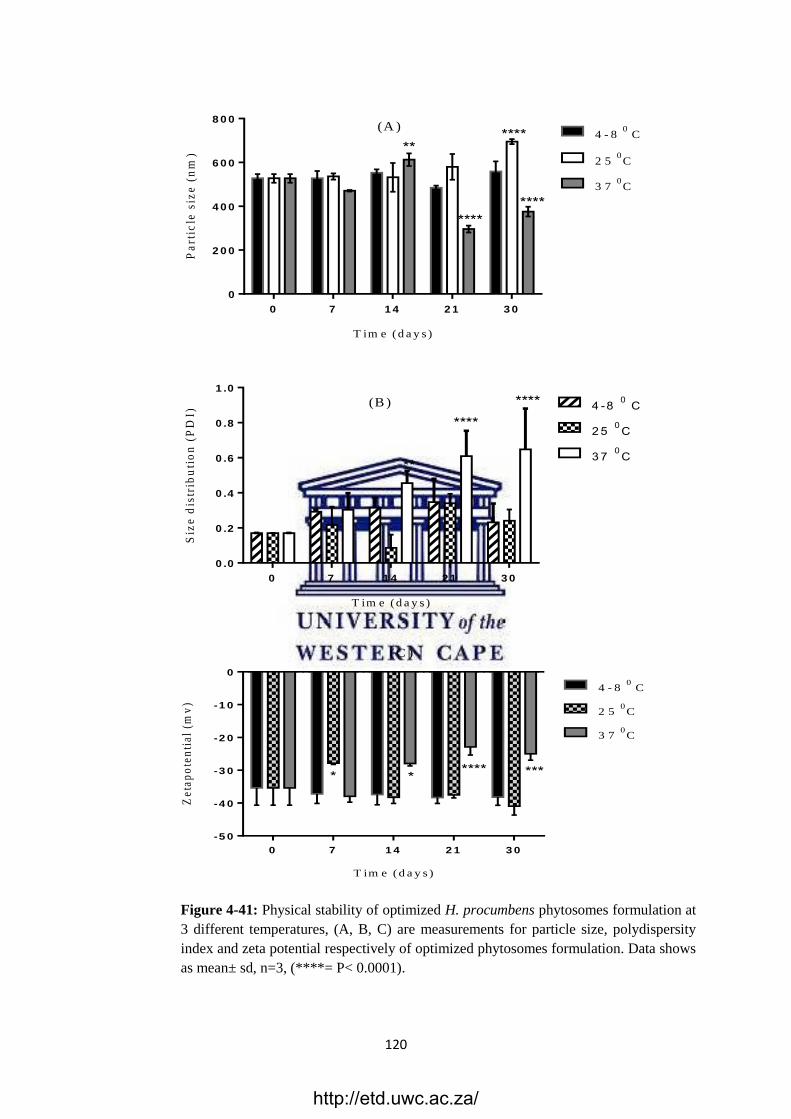
120
Figure 4-41 : Physical stability of optimized H. procumbens phytosomes formulation at
3 different temperatures, (A, B, C) are measurements for particle size, polydispersity
index and zeta potential respectively of optimized phytosomes formulation. Data shows
as mean± sd, n=3, (****= P< 0.0001).
T im e (d a y s )
Pa
rtic
le s
ize
(n
m)
0 7 1 4 2 1 3 0
0
2 0 0
4 0 0
6 0 0
8 0 0
4 - 80
C
2 50C
3 70C
****
********
**(A )
T im e (d a y s )
Siz
e d
istr
ibu
tio
n (
PD
I)
0 7 1 4 2 1 3 0
0 .0
0 .2
0 .4
0 .6
0 .8
1 .0
4 -8 0 C
2 5 0 C
3 7 0 C
********
**
(B )
T im e (d a y s )
Ze
tap
ote
nti
al
(mv
)
0 7 1 4 2 1 3 0
-5 0
-4 0
-3 0
-2 0
-1 0
0
4 - 80
C
2 50C
3 70C
* * *******
(C )
http://etd.uwc.ac.za/
121
At 4-8 oC small variation in size was observed for the H. procumbens phytosomes over the
tested period with a smallest size at 0 day and the largest size at 30 days (p ˃ 0.05) with sizes
of 527.3 ± 19.7 – 558.7 ± 46.5 nm respectively. The zeta potential values (-35.4 ± 5.26 to -
38.16 ± 2.51 mV) of the phytosome remained relatively stable when exposed at a
temperature 4-8 oC, This implies that the prepared phytosomal formulation retained their
initial charge and thus tendency for aggregation and flocculation was reduced, indicating that
the prepared phytosomal formulation was more stable under refrigeration.
At 25 oC, there was a statistically significant (p ˂ 0.05) increase in particle size at the end of
30 days, it changed from 527.3 ± 19.7 to 695.06 ± 11.32 nm. No significant change was
observed for PDI (0.17 ± 0.001– 0.24 ± 0.065) and zeta potential (-35.4 ± 5.26 – - 40.9 ± 2.70
mV).
At 37 oC all batches displayed a statistically significant (p ˂ 0.05) decrease in particle size
(527.3 ± 19.7 – 375.5 ± 22.12), zeta potential (-35.4 ± 5.26 – -25 ± 1.93) and increase in PDI
(0.17 ± 0.001 – 0.64 ± 0.23). The size reduction and PDI increase is most likely an indication
of phytosomal breakdown.
The preferred storage conditions would be 4-8 oC as an increase in storage temperature
contributed to instability of the H. procumbens phytosomal suspension.
Alginate coated H. procumbens phytosomes were also subjected to storage stability for 30
days at different temperatures and were tested for particle size changes. Results demonstrated
that alginate coated H. procumbens phytosomes exhibited consistent size at all three
temperatures for the 30 days period; this indicates that the alginate coated phytosomes are not
stable to some extent and are not affected by temperature. The formulation only exhibited not
appreciated significant increase in particle size at the end of 30 days at 37 oC.
2) Leakage
Leakage is a crucial characteristic for the evaluation of drug delivery systems. H. procumbens
phytosomes and alginate coated H. procumbens loaded phytosomes formulations were tested
for harpagoside leakage over a 30 day period at 4 – 8 °C, 25 °C and 37 °C. Results are shown
in figure 4.41.
http://etd.uwc.ac.za/
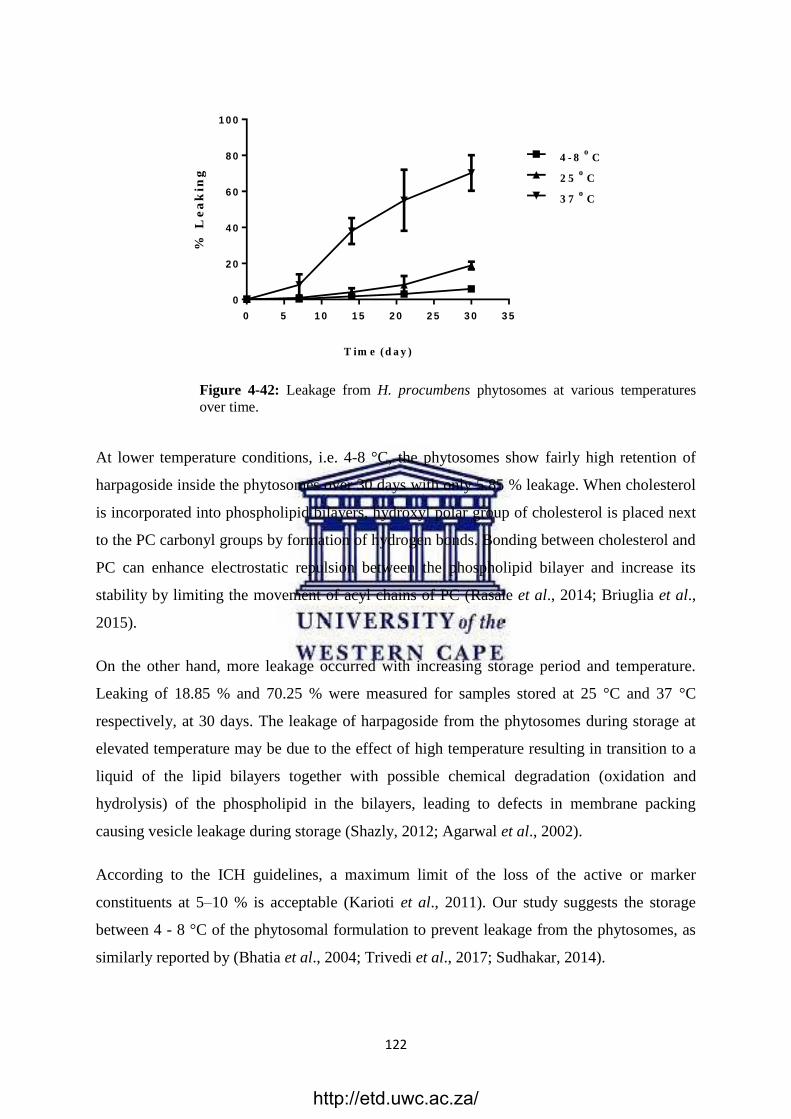
122
0 5 1 0 1 5 2 0 2 5 3 0 3 5
0
2 0
4 0
6 0
8 0
1 0 0
2 5o
C
3 7o
C
4 - 8o
C
T im e (d a y )
% L
ea
kin
g
Figure 4-42: Leakage from H. procumbens phytosomes at various temperatures
over time.
At lower temperature conditions, i.e. 4-8 °C, the phytosomes show fairly high retention of
harpagoside inside the phytosomes over 30 days with only 5.85 % leakage. When cholesterol
is incorporated into phospholipid bilayers, hydroxyl polar group of cholesterol is placed next
to the PC carbonyl groups by formation of hydrogen bonds. Bonding between cholesterol and
PC can enhance electrostatic repulsion between the phospholipid bilayer and increase its
stability by limiting the movement of acyl chains of PC (Rasaie et al., 2014; Briuglia et al.,
2015).
On the other hand, more leakage occurred with increasing storage period and temperature.
Leaking of 18.85 % and 70.25 % were measured for samples stored at 25 °C and 37 °C
respectively, at 30 days. The leakage of harpagoside from the phytosomes during storage at
elevated temperature may be due to the effect of high temperature resulting in transition to a
liquid of the lipid bilayers together with possible chemical degradation (oxidation and
hydrolysis) of the phospholipid in the bilayers, leading to defects in membrane packing
causing vesicle leakage during storage (Shazly, 2012; Agarwal et al., 2002).
According to the ICH guidelines, a maximum limit of the loss of the active or marker
constituents at 5–10 % is acceptable (Karioti et al., 2011). Our study suggests the storage
between 4 - 8 °C of the phytosomal formulation to prevent leakage from the phytosomes, as
similarly reported by (Bhatia et al., 2004; Trivedi et al., 2017; Sudhakar, 2014).
http://etd.uwc.ac.za/
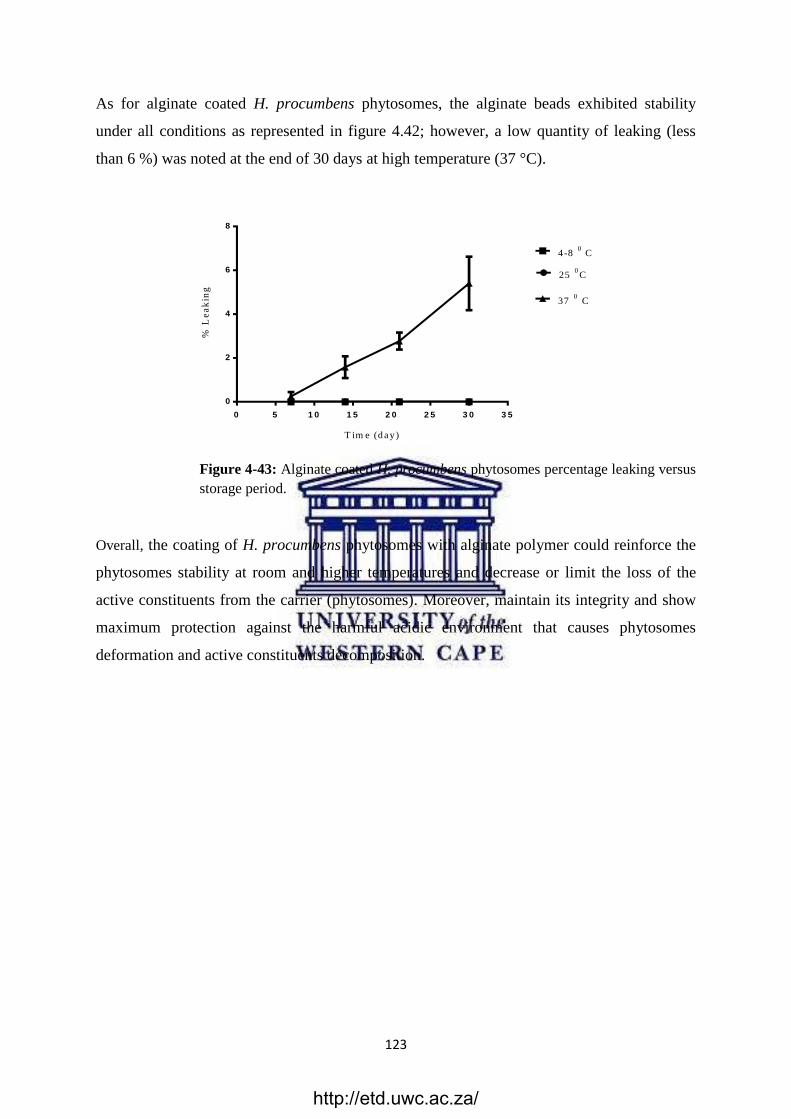
123
As for alginate coated H. procumbens phytosomes, the alginate beads exhibited stability
under all conditions as represented in figure 4.42; however, a low quantity of leaking (less
than 6 %) was noted at the end of 30 days at high temperature (37 °C).
Figure 4-43: Alginate coated H. procumbens phytosomes percentage leaking versus
storage period.
Overall, the coating of H. procumbens phytosomes with alginate polymer could reinforce the
phytosomes stability at room and higher temperatures and decrease or limit the loss of the
active constituents from the carrier (phytosomes). Moreover, maintain its integrity and show
maximum protection against the harmful acidic environment that causes phytosomes
deformation and active constituents decomposition.
T im e (d ay )
% L
ea
kin
g
0 5 1 0 1 5 2 0 2 5 3 0 3 5
0
2
4
6
8
250C
4-80
C
370 C
http://etd.uwc.ac.za/
124
Chapter 5
Conclusion and Recommendations
To recap:
The aim of the study was to develop an optimized liposomal/phytosomal carrier system
consisting of Harpagophytum procumbens coated with alginate for protection from gastric
medium digestion.
To achieve the aim, the following objectives were set:
Development and validation of a rapid, simple and reliable UHPLC method for
identification and quantification of harpagoside in Harpagophytum procumbens crude
plant extract.
Preparation of liposomes and phytosomes formulations containing Harpagophytum
procumbens plant extract.
Optimization studies of liposomes and phytosomes formulation parameters using
response surface methodology (RSM).
Physio-chemical characterization of prepared liposomes and phytosomes.
Formulation and development of an alginate coating method for phytosomal
formulation encapsulation.
To perform in vitro stability of the optimized nano lipid vesicles and alginate coated
beads in simulated gastric and intestinal medium.
Determine the mechanism of release of harpagoside from phytosomes and alginate
coated phytosomes.
Determine the stability of harpagoside in phytosomes and alginate coated phytosomes
at various temperatures over time.
A simple, accurate, linear, precise and robust UHPLC method for the determination of
harpagoside in aqueous plant extract was successfully applied. Harpagophytum procumbens
extract was complexed with phosphatidylcholine (PC) to form liposomes and phytosomes.
RSM was successfully used as a mathematical tool to provide a prediction model for the
response to various inputs factors. The predicted RSM values and experimental values were
http://etd.uwc.ac.za/
125
closely matched. The optimum preparation conditions were PC 80 %, cholesterol 5 % and the
lipid vesicle being a phytosomes. It was observed that PC and cholesterol affect the
entrapment efficiency and lipid vesicles size. PC and cholesterol increased the entrapment
efficiency, although, PC had a more positive effect on encapsulation efficacy than
cholesterol. High cholesterol content generally decreased percentage encapsulation. The
particle size of lipid vesicles enhanced as phosphatidylcholine and cholesterol content
increases.
The addition of stearic acid to the optimized phytosomal formulation increased the stability
by improving zeta potential to a suitable value of 30.6 ± 0.80 mV.
The ionotropic gelation technique was successfully used for preparation of Harpagophytum
procumbens phytosomes beads using sodium alginate and calcium chloride as a cross linking
solution. Parameters such as polymer concentration and calcium chloride concentration
played a noticeable role in achieving high entrapment efficiency, particle size and swelling
behaviour. In addition, the particle size, zeta potential and leakage rate were the important
indicators to evaluate phytosomes stability. The phytosomes showed instability in simulated
gastric SGF (pH 1.2), demonstrated by the increase in the particle size, PDI and a reduction
in zeta potential after 4 hours of incubation.
The present study has shown that alginate coated Harpagophytum procumbens phytosomes
could be used to protect phytosomes from the gastric environment. They are suitable as a
possible gastro retentive dosage form, as they have a rigid structure that resist biodegradation
in gastric pH (simulated gastric fluid) but exhibit complete biodegradation in phosphate
buffer pH 7.4 (simulated intestinal fluid) which could lead to increased availability of intact
phytosomes for small intestine absorption.
It is recommended that intestinal absorption studies employing phospholipid vesicle-based
permeation assays (PVPA) be used to determine uptake of Harpagophytum procumbens
loaded phytosomes and in vivo bio-distribution of these loaded phytosomes. It would thus be
of interest to continue developing selected formulations as well as introduce new elements
into the formulations to achieve more desirable incorporation and retention of plant extract in
phytosomes and Harpagophytum procumbens in alginate beads. It is also recommended that
stearic acid be included as an input factor in the RSM software to further optimize the
http://etd.uwc.ac.za/
126
formulation. In addition, this model including the RSM component could be used as a
precursor to test other medicinal plants for increased intestinal phytosomal delivery.
http://etd.uwc.ac.za/
127
References
Abbas, G., Hanif, M., & Khan, M. A. (2017). pH responsive alginate polymeric rafts for
controlled drug release by using box behnken response surface design. Designed
Monomers and Polymers, 20(1), 1-9.
Abdalla, K. F., Kamoun, E. A., & El Maghraby, G. M. (2015). Optimization of the
entrapment efficiency and release of ambroxol hydrochloride alginate beads. Journal of
Applied Pharmaceutical Science. 5 (04), 013-019.
Abdelkader, H., Longman, M. R., Alany, R. G., & Pierscionek, B. (2016). Phytosome-
hyaluronic acid systems for ocular delivery of L-carnosine. International Journal of
Nanomedicine, 2016(11), 2815-2827.
Abhinav, M., Neha, J., Anne, G., & Bharti, V. (2016). Role of novel drug delivery systems in
bioavailability enhancement: At a glance. International Journal of Drug Delivery
Technology, 6(1), 7-26.
Achim, M., Precup, C., Gonganaunitu, D., Barbu-Tudoran, L., Porfire, A. S., Scurtu, R.,
Ciuce, C. (2009). Thermosensitive liposomes containing doxorubicin. Preparation and in
vitro evaluation. Farmacia, 57(6), 703-710.
Afolayan, A., & Adebola, P. (2004). In vitro propagation: A biotechnological tool capable of
solving the problem of medicinal plants decimation in South Africa. African Journal of
Biotechnology, 3(12), 683-687.
Agarwal, R., & Katare, O. (2002). Miconazole nitrate–loaded topical liposomes.
Pharmaceutical Technology, 26(11), 48-60.
Agarwal, R., Katare, O. P., & Vyas, S. P. (2001). Preparation and in vitro evaluation of
liposomal/niosomal delivery systems for antipsoriatic drug dithranol. International
Journal of Pharmaceutics, 228(1), 43-52.
http://etd.uwc.ac.za/
128
Ahmed, M. M., El-Rasoul, S. A., Auda, S. H., & Ibrahim, M. A. (2013).
Emulsification/internal gelation as a method for preparation of diclofenac sodium–
sodium alginate microparticles. Saudi Pharmaceutical Journal, 21(1), 61-69.
Aikawa, T., Ito, S., Shinohara, M., Kaneko, M., Kondo, T., & Yuasa, M. (2015). A drug
formulation using an alginate hydrogel matrix for efficient oral delivery of the
manganese porphyrin-based superoxide dismutase mimic. Biomaterials Science, 3(6),
861-869.
Aizpurua-Olaizola, O., Navarro, P., Vallejo, A., Olivares, M., Etxebarria, N., & Usobiaga, A.
(2016). Microencapsulation and storage stability of polyphenols from vitis vinifera grape
wastes. Food Chemistry, 190, 614–621.
Akbarzadeh, A., Rezaei-Sadabady, R., Davaran, S., Joo, S. W., Zarghami, N., Hanifehpour,
Y., Samiei, M., Kouhi, .M & Nejati-Koshki, K. (2013). Liposome: classification,
preparation, and applications. Nanoscale Research Letters, 1(8), 1-9.
Akerele, O. (1988). Medicinal plants and primary health care: An agenda for
action. Fitoterapia, 59(5), 355-363.
Akhtar, N. (2014). Vesicles: A recently developed novel carrier for enhanced topical drug
delivery. Current Drug Delivery, 11(1), 87-97.
Akhtar, N., & Haqqi, T. M. (2012). Current nutraceuticals in the management of
osteoarthritis: A review. Therapeutic Advances in Musculoskeletal Disease, 4(3), 181-
207.
Al-Kassas, R. S., Al-Gohary, O. M., & Al-Faadhel, M. M. (2007). Controlling of systemic
absorption of gliclazide through incorporation into alginate beads. International Journal
of Pharmaceutics, 341(1), 230-237.
Allam, A. N., Komeil, I. A., & Abdallah, O. Y. (2015). Curcumin phytosomal softgel
formulation: Development, optimization and physicochemical characterization. Acta
Pharmaceutica, 65(3), 285-297.
http://etd.uwc.ac.za/
129
Al-Rimawi, F. (2014). Development and validation of HPLC-UV method for determination
of bovine serum albumin and myoglobin proteins. International Research Journal of
Pure & Applied Chemistry, 4(6), 585-593.
Alshamrani, O. S. (2017). Construction cost prediction model for conventional and
sustainable college buildings in North America. Journal of Taibah University for
Science, 11(2), 315-323.
Al-Shdefat, R., Yassin, A. E. B., Anwer, K., & Alsarra, I. (2012). Preparation and
characterization of biodegradable paclitaxel loaded chitosan microparticles. Digest
Journal of Nanomaterials and Biostructures, 7(3), 1139-1147.
Amit, P., Tanwar, Y., Rakesh, S., & Poojan, P. (2013). Phytosome: Phytolipid drug delivery
system for improving bioavailability of herbal drug. Journal of Pharmaceutical Science
and Bioscientific, 3(2), 51-57.
Andersen, M. L., Santos, E. H., Maria de Lourdes, V Seabra, da Silva, A. A., & Tufik, S.
(2004). Evaluation of acute and chronic treatments with Harpagophytum procumbens on
Freund‘s adjuvant-induced arthritis in rats. Journal of Ethnopharmacology, 91(2), 325-
330.
Andhale, V. A., Patil, P. R., Dhas, A. U., Chauhan, P. D., & Desai, S. V. (2016). Liposome:
an emerging tool in drug carrier system. International Journal of Pharmacy &
Technology. 8(1), 10982-11011.
Anwekar, H., Patel, S., & Singhai, A. K. (2011). Liposomes as drug carriers. International
Journal of Pharmacy and Life Sciences. 2(7), 945-951.
Ashengroph, M., Nahvi, I., & Amini, J. (2013). Application of taguchi design and response
surface methodology for improving conversion of isoeugenol into vanillin by
resting cells of psychrobacter sp. CSW4. Iranian Journal of Pharmaceutical
Research, 12(3), 411-421.
Babili, F. E., Fouraste, I., Rougaignon, C., Moulis, C., & Chatelain, C. (2012). Anatomical
study of secondary tuberized roots of Harpagophytum procumbens DC and
http://etd.uwc.ac.za/
130
quantification of harpagoside by high-performance liquid chromatography
method. Pharmacognosy Magazine, 8(30), 175-180.
Babu, V. R., Sairam, M., Hosamani, K. M., & Aminabhavi, T. M. (2007). Preparation of
sodium alginate–methylcellulose blend microspheres for controlled release of
nifedipine. Carbohydrate Polymers, 69(2), 241-250.
Balanč, B., Trifković, K., Đorđević, V., Marković, S., Pjanović, R., Nedović, V., Bugarski,
B. (2016). Novel resveratrol delivery systems based on alginate-sucrose and alginate-
chitosan microbeads containing liposomes. Food Hydrocolloids, 61, 832-842.
Baniasadi, M., & Minary-Jolandan, M. (2015). Alginate-collagen fibril composite
hydrogel. Materials, 8(2), 799-814.
Bansal, D., Gulbake, A., Tiwari, J., & Jain, S. K. (2016). Development of liposomes
entrapped in alginate beads for the treatment of colorectal cancer. International Journal
of Biological Macromolecules, 82, 687-695.
Bassi, P., & Kaur, G. (2015). Polymeric films as a promising carrier for bioadhesive drug
delivery: Development, characterization and optimization. Saudi Pharmaceutical
Journal, 25(1), 32-43.
Begum, M., Sudhakar, M., & Abbulu, K. (2012). Flurbiprofen-loaded stealth liposomes:
Studies on the development, characterization, pharmacokinetics, and
biodistribution. Journal of Young Pharmacists, 4(4), 209-219.
Bezerra, M. A., Santelli, R. E., Oliveira, E. P., Villar, L. S., & Escaleira, L. A. (2008).
Response surface methodology (RSM) as a tool for optimization in analytical
chemistry. Talanta, 76(5), 965-977.
Bhan, M. (2017). Response surface methodology: An important tool in optimization.
International Journal of Advanced Research and Development, 2(1), 38-40.
Bhatia, A., Kumar, R., & Katare, O. P. (2004). Tamoxifen in topical liposomes:
Development, characterization and in-vitro evaluation. Journal of Pharmacy &
Pharmaceutical Sciences, 7(2), 252-259.
http://etd.uwc.ac.za/
131
Bhattacharya, S., & Ghosh, A. (2009). Phytosomes: The emerging technology for
enhancement of bioavailability of botanicals and nutraceuticals. The Internet Journal of
Aesthetic and Antiaging Medicine, 2(1), 141-153.
Bhimavarapu, R., Chitra, K. P., Meda, H., Kanikanti, D., Anne, M., & Gowthami, N. (2011).
Forced degradation study of paracetamol in tablet formulation using RP-HPLC. Bulletin
of Pharmaceutical Research, 1(3), 13-17.
Bhushan, B., Pal, A., & Jain, V. (2015). Improved enzyme catalytic characteristics upon
glutaraldehyde cross-linking of alginate entrapped xylanase isolated from aspergillus
flavus MTCC 9390. Enzyme Research, 2015, 1-9.
Bibi, S., Kaur, R., Henriksen-Lacey, M., McNeil, S. E., Wilkhu, J., Lattmann, E.,
Christensenb, D., Mohammed, A, R., Perrie, Y. (2011). Microscopy imaging of
liposomes: From coverslips to environmental SEM. International Journal of
Pharmaceutics, 417(1), 138-150.
Boje, K., Lechtenberg, M., & Nahrstedt, A. (2003). New and known iridoid-and
phenylethanoid glycosides from Harpagophytum procumbens and their in vitro
inhibition of human leukocyte elastase. Planta Medica, 69(09), 820-825.
Bone, K., & Mills, S. Y. (2013). Principles and practice of phytotherapy: Modern herbal
medicine. London, U.K. Elsevier Health Sciences.
Boundless ―Biological Macromolecules‖. Boundless Biology. [Accessed June, 2017].
https://www.boundless.com/biology/textbooks/boundless-biology-textbook/biological-
macromolecules-3/lipids-55/phospholipids-300-11433/.
Bozzuto, G., & Molinari, A. (2015). Liposomes as nanomedical devices. International
Journal of Nanomedicine, 10, 975-999.
Briuglia, M., Rotella, C., McFarlane, A., & Lamprou, D. A. (2015). Influence of cholesterol
on liposome stability and on in vitro drug release. Drug Delivery and Translational
Research, 5(3), 231-242.
http://etd.uwc.ac.za/
132
Buwalda, S. J., Vermonden, T., & Hennink, W. E. (2017). Hydrogels for therapeutic delivery:
Current developments and future directions. Biomacromolecules, 18(2), 316-330.
Caban, S., Aytekin, E., Sahin, A., & Capan, Y. (2014). Nanosystems for drug delivery. OA
Drug Design and Delivery, 18(2), 1-7.
Carafa, M., Marianecci, C., Marzio, L. D., Caro, V. D., Giandalia, G., Giannola, L. I.,
Santucci, E. (2010). Potential dopamine prodrug-loaded liposomes: Preparation,
characterization, and in vitro stability studies. Journal of Liposome Research, 20(3),
250-257.
Catelan, S.C., Belentani, R.M., Marques, L.C., Silva, E.R., Silva, M.A., Caparroz-Assef,
S.M., Cuman, R.K.N., Bersani-Amado, C.A. (2006). The role of adrenal corticosteroids
in the anti-inflammatory effect of the whole extract of Harpagophytum procumbens in
rats, Phytomedicine, 13(6), 446-451.
Cerciello, A., Auriemma, G., Morello, S., Aquino, R. P., Del Gaudio, P., & Russo, P. (2016).
Prednisolone delivery platforms: Capsules and beads combination for a right timing
therapy. PloS One, 11(7), 1-14.
Chan, L. W., Ching, A. L., Liew, C. V., & Heng, P. W. S. (2007). Mechanistic study on
hydration and drug release behaviour of sodium alginate compacts. Drug Development
and Industrial Pharmacy, 33(6), 667-676.
Channarong, S., Chaicumpa, W., Sinchaipanid, N., & Mitrevej, A. (2011). Development and
evaluation of chitosan-coated liposomes for oral DNA vaccine: The improvement of
Peyer‘s patch targeting using a polyplex-loaded liposomes. American Association of
Pharmaceutical Scientists, Pharmscitech, 12(1), 192-200.
Chime, S. A., & Onyishi, I. V. (2013). Lipid-based drug delivery systems (LDDS): Recent
advances and applications of lipids in drug delivery. African Journal of Pharmacy and
Pharmacology, 7(48), 3034-3059.
Choubey, A. (2011). Phytosome-A novel approach for herbal drug delivery. International
Journal of Pharmaceutical Sciences and Research, 2(4), 807-815.
http://etd.uwc.ac.za/
133
Chowdhury, J. A., Jahan, S. T., Morshed, M. M., Mallick, J., Nath, A. K., Uddin, M. Z.,
Dutta. M., Islam, M. K., Kawsar, M. H. (2011). Development and evaluation of
diclofenac sodium loaded alginate cross-linking beads. Bangladesh Pharmaceutical
Journal, 14(1), 41-48.
Chrubasik, J. E., Roufogalis, B. D., & Chrubasik, S. (2007). Evidence of effectiveness of
herbal antiinflammatory drugs in the treatment of painful osteoarthritis and chronic low
back pain. Phytotherapy Research, 21(7), 675-683.
Chrubasik, S., Sporer, F., Dillmann-Marschner, R., Friedmann, A., & Wink, M. (2000).
Physicochemical properties of harpagoside and its in vitro release from Harpagophytum
procumbens extract tablets. Phytomedicine, 6(6), 469-473.
Clarkson, C., Maharaj, V. J., Crouch, N. R., Grace, O. M., Pillay, P., Matsabisa, M. G.,
Bhagwandin, N., Smith, P. J., Folb, I. P. (2004). In vitro antiplasmodial activity of
medicinal plants native to or naturalised in South Africa. Journal of
Ethnopharmacology, 92(2), 177-191.
Cold Spring Harbor Protocols by Cold Spring Harbor Laboratory Press:
http://cshprotocols.cshlp.org/site/recipes/nav_p.dtl [accessed Jun, 2015].
d‘Ayala, G. G., Malinconico, M., & Laurienzo, P. (2008). Marine derived polysaccharides for
biomedical applications: Chemical modification approaches. Molecules, 13(9), 2069-
2106.
Daemi, H., & Barikani, M. (2012). Synthesis and characterization of calcium alginate
nanoparticles, sodium homopolymannuronate salt and its calcium nanoparticles. Scientia
Iranica, 19(6), 2023-2028.
Das, M. K., & Senapati, P. C. (2007). Evaluation of furosemide-loaded alginate microspheres
prepared by ionotropic external gelation technique. Acta Poloniae Pharmaceutica -Drug
Research, 64(3), 253-262.
Das, S., & Chaudhury, A. (2011). Recent advances in lipid nanoparticle formulations with
solid matrix for oral drug delivery. American Association of Pharmaceutical Scientists,
PharmSciTech, 12(1), 62-76.
http://etd.uwc.ac.za/
134
Davidov-Pardo, G., & McClements, D. J. (2014). Resveratrol encapsulation: Designing
delivery systems to overcome solubility, stability and bioavailability issues. Trends in
Food Science & Technology, 38(2), 88-103.
De Sousa Lobato, K. B., Paese, K., Forgearini, J. C., Guterres, S. S., Jablonski, A., & de
Oliveira Rios, A. (2013). Characterisation and stability evaluation of bixin
nanocapsules. Food Chemistry, 141(4), 3906-3912.
De, A., & Venkatesh, D. N. (2012). Design and evaluation of liposomal delivery system for
L-asparaginese. Journal of Applied Pharmaceutical Science, 2 (8), 112-117.
Demir, B., Barlas, F. B., Guler, E., Gumus, P. Z., Can, M., Yavuz, M., Coskunol, H., Timur,
S. (2014). Gold nanoparticle loaded phytosomal systems: Synthesis, characterization and
in vitro investigations. RSC Advances, 4(65), 34687-34695.
Devi, N. K. D., Chandana, M., Sindhura, A., Ratnavali, G., & Kavitha, R. (2010).
Comparative evaluation of alginate beads prepared by ionotropic gelation
technique. Pharmacophore, 1(3), 196-213.
Dewan, N., Dasgupta, D., Pandit, S., & Ahmed, P. (2016). Review on-herbosomes, a new
arena for drug delivery. Journal of Pharmacognosy and Phytochemistry, 5(4), 104- 108.
Dhase, A. S., Saboo, S. S. (2015). Preparation and evaluation of phytosomes containing
methanolic extract of leaves of aegle marmelos (bael). International Journal of
PharmTech Research, 8(6), 231-240.
Dhoot, N. O., & Wheatley, M. A. (2003). Microencapsulated liposomes in controlled drug
delivery: Strategies to modulate drug release and eliminate the burst effect. Journal of
Pharmaceutical Sciences, 92(3), 679-689.
Dimitrova, P., Georgiev, M., Khan, M., & Ivanovska, N. (2013). Evaluation of verbascum
species and harpagoside in models of acute and chronic inflammation. Open Life
Sciences, 8(2), 186-194.
http://etd.uwc.ac.za/
135
Ding, B. S., Dziubla, T., Shuvaev, V. V., Muro, S., & Muzykantov, V. R. (2006). Advanced
drug delivery systems that target the vascular endothelium. Molecular
Interventions, 6(2), 98-112.
Ding, B., Xia, S., Hayat, K., & Zhang, X. (2009). Preparation and pH stability of ferrous
glycinate liposomes. Journal of Agricultural and Food Chemistry, 57(7), 2938-2944.
Dressman, J. B., & Reppas, C. (2000). In vitro–in vivo correlations for lipophilic, poorly
water-soluble drugs. European journal of pharmaceutical sciences, 11, 73-80.
Ebrahim, N., & Uebel, R. (2011). Direct inhibition of cyclooxygenase-2 enzyme by an
extract of harpagophytum procumbens, harpagoside and harpagide. African Journal of
Pharmacy and Pharmacology. 5(20), 2209-2212.
El-Gazayerly, O., Makhlouf, A., Soelm, A., & Mohmoud, M. (2014). Antioxidant and
hepatoprotective effects of silymarin phytosomes compared to milk thistle extract in
CCl4 induced hepatotoxicity in rats. Journal of Microencapsulation, 31(1), 23-30.
El-Kamel, A., Al-Gohary, O., & Hosny, E. (2003). Alginate-diltiazem hydrochloride beads:
Optimization of formulation factors, in vitro and in vivo availability. Journal of
Microencapsulation, 20(2), 211-225.
El-Sherbiny, I. M., Abdel-Mogib, M., Dawidar, A. M., Elsayed, A., & Smyth, H. D. (2011).
Biodegradable pH-responsive alginate-poly (lactic-co-glycolic acid) nano/micro
hydrogel matrices for oral delivery of silymarin. Carbohydrate Polymers, 83(3), 1345-
1354.
Fadda, H. M., Sousa, T., Carlsson, A. S., Abrahamsson, B., Williams, J. G., Kumar, D., &
Basit, A. W. (2010). Drug solubility in luminal fluids from different regions of the small
and large intestine of humans. Molecular Pharmaceutics, 7(5), 1527-1532.
Fang, J. B., Robertson, V. K., Rawat, A., Flick, T., Tang, Z. J., Cauchon, N. S., & McElvain,
J. S. (2010). Development and application of a biorelevant dissolution method using USP
apparatus 4 in early phase formulation development. Molecular Pharmaceutics, 7(5),
1466-1477.
http://etd.uwc.ac.za/
136
Francis, F., Sabu, A., Nampoothiri, K. M., Ramachandran, S., Ghosh, S., Szakacs, G.,
Pandey, A. (2003). Use of response surface methodology for optimizing process
parameters for the production of α-amylase by aspergillus oryzae. Biochemical
Engineering Journal, 15(2), 107-115.
Freag, M. S., Elnaggar, Y. S., & Abdallah, O. Y. (2013). Lyophilized phytosomal
nanocarriers as platforms for enhanced diosmin delivery: Optimization and ex vivo
permeation. International Journal of Nanomedicine, 8, 2385-2397.
Fricker, G., Kromp, T., Wendel, A., Blume, A., Zirkel, J., Rebmann, H., Setzer, C., Quinkert,
R., Martin, F., Müller-Goymann, C. (2010). Phospholipids and lipid-based formulations
in oral drug delivery. Pharmaceutical Research, 27(8), 1469-1486.
Gavhane, Y. N., & Yadav, A. V. (2012). Loss of orally administered drugs in GI tract. Saudi
Pharmaceutical Journal, 20(4), 331-344.
Georgiev, M. I., Ivanovska, N., Alipieva, K., Dimitrova, P., & Verpoorte, R. (2013).
Harpagoside: From Kalahari Desert to pharmacy shelf. Phytochemistry, 92, 8-15.
Georgiev, M., Alipieva, K., & Denev, P. (2010). Antioxidant activity and bioactive
constituents of the aerial parts of Harpagophytum procumbens plants. Biotechnology &
Biotechnological Equipment, 24(1), 438-443.
Ghanbarzadeh, S., & Arami, S. (2013). Enhanced transdermal delivery of diclofenac sodium
via conventional liposomes, ethosomes, and transfersomes. BioMed Research
International, 2013, 1-7.
Ghanbarzadeh, S., Khorrami, A., & Arami, S. (2014). Preparation of optimized naproxen
nano liposomes using response surface methodology. Journal of Pharmaceutical
Investigation, 44(1), 33-39.
Ghanbarzadeh, S., Valizadeh, H., & Zakeri-Milani, P. (2013). Application of response
surface methodology in development of sirolimus liposomes prepared by thin film
hydration technique. BioImpacts, 3(2), 75-81.
http://etd.uwc.ac.za/
137
Gombotz, W. R., & Wee, S. F. (2012). Protein release from alginate matrices. Advanced
Drug Delivery Reviews, 64, 194-205.
Grant, L., McBean, D., Fyfe, L., & Warnock, A. (2007). A review of the biological and
potential therapeutic actions of Harpagophytum procumbens. Phytotherapy
Research, 21(3), 199-209.
Grijalvo, S., Mayr, J., Eritja, R., & Díaz, D. D. (2016). Biodegradable liposome-encapsulated
hydrogels for biomedical applications: A marriage of convenience. Biomaterials
Science, 4(4), 555-574.
Gruberova, L., & Kratochvil, B. (2017). Biorelevant dissolution of candesartan
cilexetil. ADMET and DMPK, 5(1), 39-46.
Gyurkovska, V., Alipieva, K., Maciuk, A., Dimitrova, P., Ivanovska, N., Haas, C., Bley, T.,
Georgiev, M. (2011). Anti-inflammatory activity of Devil‘s claw in vitro systems and
their active constituents. Food Chemistry, 125(1), 171-178.
Haidar, Z. S., Hamdy, R. C., & Tabrizian, M. (2008). Protein release kinetics for core–shell
hybrid nanoparticles based on the layer-by-layer assembly of alginate and chitosan on
liposomes. Biomaterials, 29(9), 1207-1215.
Hostanska, K., Melzer, J., Rostock, M., Suter, A., & Saller, R. (2014). Alteration of anti‐
inflammatory activity of Harpagophytum procumbens (devil's claw) extract after
external metabolic activation with S9 mix. Journal of Pharmacy and
Pharmacology, 66(11), 1606-1614.
Hou, Z., Li, Y., Huang, Y., Zhou, C., Lin, J., Wang, Y., Cui, F., Zhou, S., Jia, M., Ye, S.,
Zhang, Q. (2012). Phytosomes loaded with mitomycin C–soybean phosphatidylcholine
complex developed for drug delivery. Molecular Pharmaceutics, 10(1), 90-101.
https://avantilipids.com/. [Accessed October, 2016].
Hua, S., & Wu, S. Y. (2013). The use of lipid-based nanocarriers for targeted pain
therapies. Frontiers in Pharmacology, 4, (143), 1-7.
http://etd.uwc.ac.za/
138
Hung, W., Lee, M., Chen, F., & Huang, H. W. (2007). The condensing effect of cholesterol
in lipid bilayers. Biophysical Journal, 92(11), 3960-3967.
ICH Harmonised Tripartite Guideline Q2 (R1). (2005): Validation of analytical procedures:
Text and methodology.
Imura, T., Otake, K., Hashimoto, S., Gotoh, T., Yuasa, M., Yokoyama, S., Sakai, H.,
Rathman, J. F., Abe, M. (2003). Preparation and physicochemical properties of various
soybean lecithin liposomes using supercritical reverse phase evaporation
method. Colloids and Surfaces B: Biointerfaces, 27(2), 133-140.
Indira, M. Y., & Ch, R. (2012). Design and evaluation of multi-unit floating alginate beads of
famotidine. International Journal of Pharmacy and Industrial Research, 2 (3), 344-353.
Jaafarzadeh, N., Omidinasab, M., & Ghanbari, F. (2016). Combined electrocoagulation and
UV-based sulfate radical oxidation processes for treatment of pulp and paper
wastewater. Process Safety and Environmental Protection, 102, 462-472.
Jahan, S. T., Sadat, S. M. A., Islam, M. S., Jalil, R., & Chowdhury, J. A. (2010). Effect of
various excipients on theophylline-loaded alginate beads prepared by ionic cross linking
technique. Dhaka University Journal of Pharmaceutical Sciences, 9(1), 15-22.
Jain, N., Gupta, B. P., Thakur, N., Jain, R., Banweer, J., Jain, D. K Jain, S. (2010).
Phytosome: A novel drug delivery system for herbal medicine. International Journal of
Pharmaceutical Sciences and Drug Research, 2(4), 224-228.
Jaiswal, D., Bhattacharya, A., Yadav, I. K., Singh, H. P., Chandra, D., & Jain, D. (2009).
Formulation and evaluation of oil entrapped floating alginate beads of ranitidine
hydrochloride. International Journal of Pharmacy and Pharmaceutical Sciences, 1(3),
128-140.
Juárez, G. A. P., Spasojevic, M., Faas, M. M., & de Vos, P. (2014). Immunological and
technical considerations in application of alginate-based microencapsulation
systems. Frontiers in Bioengineering and Biotechnology, 2(26), 1-15.
http://etd.uwc.ac.za/
139
Junyaprasert, V. B., Teeranachaideekul, V., & Supaperm, T. (2008). Effect of charged and
non-ionic membrane additives on physicochemical properties and stability of
niosomes. Aaps Pharmscitech, 9(3), 851- 859.
Kalepu, S., Manthina, M., & Padavala, V. (2013). Oral lipid-based drug delivery systems–an
overview. Acta Pharmaceutica Sinica B, 3(6), 361-372.
Kalepu, S., Sunilkumar, K., Betha, S., & Mohanvarma, M. (2013). Liposomal drug delivery
system—a comprehensive review. International Journal of Drug Delivery
Research, 5(4), 62-75.
Kan, P., Tsao, C. W., Wang, A. J., Su, W. C., & Liang, H. F. (2010). A liposomal
formulation able to incorporate a high content of Paclitaxel and exert promising
anticancer effect. Journal of Drug Delivery, 2011. 1-9.
Karimi, N., Ghanbarzadeh, B., Hamishehkar, H., Keivani, F., Pezeshki, A., & Gholian, M. M.
(2015). Phytosome and liposome: The beneficial encapsulation systems in drug delivery
and food application. Applied Food Biotechnology, 2(3), 17-27.
Karioti, A., Fani, E., Vincieri, F. F., & Bilia, A. R. (2011). Analysis and stability of the
constituents of curcuma longa and Harpagophytum procumbens tinctures by HPLC-
DAD and HPLC–ESI-MS. Journal of Pharmaceutical and Biomedical Analysis, 55(3),
479-486.
Kashid, P., Doijad, R., Shete, A., Sajane, S., & Bhagat, A. (2016). Studies on rebamipide
loaded gastroretentive alginate based mucoadhesive beads: Formulation & in-vitro, in-
vivo evaluation. Pharmaceutical Methods, 7(2), 132-138.
Kassem, M. A., El Assal, M., & Al-Badrawy, A. (2012). Preparation and evaluation of
certain hydrophilic drug-loaded microspheres. International Research Journal of
Pharmaceuticals, 2(4), 82-90.
Kaza, R., Pravallika, P., Reddy, T. V., & Naga Priya, K. R. (2011). Formulation and
evaluation of controlled release microspheres of acyclovir sodium. International Journal
of Innovative Pharmaceutical Research, 2(1), 98-101.
http://etd.uwc.ac.za/
140
Khajeh, M. (2012). Multivariate optimization of microwave-assisted digestion of copper and
zinc from powder milk. Journal of the Brazilian Chemical Society, 23(9), 1704-1711.
Khan R. and Irchhaiya. R. (2017). An overview on niosomes as efficient drug carriers.
International Journal of Pharma and Bio Sciences, 8(2), 106 -116.
Kiaee, G., Javar, H. A., Kiaee, B., & Kiaei, S. (2016). Preparation and characterization of
liposome containing minoxidil and rosemary essential oil. Journal of in Silico & in Vitro
Pharmacology, 2(3), 1-4.
Kim, J. (2016). Liposomal drug delivery system. Journal of Pharmaceutical
Investigation, 46(4), 387-392.
Kim, T. K., & Park, K. S. (2015). Inhibitory effects of harpagoside on TNF-α-induced pro-
inflammatory adipokine expression through PPAR-γ activation in 3T3-L1
adipocytes. Cytokine, 76(2), 368-374.
Kimura, T., & Higaki, K. (2002). Gastrointestinal transit and drug absorption. Biological and
Pharmaceutical Bulletin, 25(2), 149-164.
Klein, S. (2010). The use of biorelevant dissolution media to forecast the in vivo performance
of a drug. The AAPS journal, 12(3), 397-406.
Koziolek, M., Grimm, M., Becker, D., Iordanov, V., Zou, H., Shimizu, J., Wanke, C.,
Garbacz, G., & Weitschies, W. (2015). Investigation of pH and temperature profiles in
the GI tract of fasted human subjects using the Intellicap® system. Journal of
Pharmaceutical Sciences, 104(9), 2855-2863.
Kuete, V. (2013). Medicinal plant research in Africa: Pharmacology and chemistry. Newnes.
Kumar, A., Badde, S., Kamble, R., & Pokharkar, V. B. (2010). Development and
characterization of liposomal drug delivery system for nimesulide. International Journal
of Pharmacy and Pharmaceutical Sciences, 2(4), 87-89.
Kumari, A., Kumar, V., & Yadav, S. (2012). Nanotechnology: A tool to enhance therapeutic
values of natural plant products. Trends in Medical Research, 7(2), 34-42.
http://etd.uwc.ac.za/
141
Kundu, A., & Datta, S. (2012). Formulation and characterization of alginate microbeads of
norfloxacin by ionotropic gelation. International Journal of Advances in Pharmacy,
Biology and Chemistry 1(3), 266-270.
Laouini, A., Jaafar-Maalej, C., Limayem-Blouza, I., Sfar, S., Charcosset, C., & Fessi, H.
(2012). Preparation, characterization and applications of liposomes: State of the
art. Journal of Colloid Science and Biotechnology, 1(2), 147-168.
Lee, K. Y., & Mooney, D. J. (2012). Alginate: Properties and biomedical
applications. Progress in Polymer Science, 37(1), 106-126.
Lei, Z., Huhman, D. V., & Sumner, L. W. (2011). Mass spectrometry strategies in
metabolomics. The Journal of Biological Chemistry, 286(29), 25435-25442.
Li, J., Wang, X., Zhang, T., Wang, C., Huang, Z., Luo, X., Deng, Y. (2015). A review on
phospholipids and their main applications in drug delivery systems. Asian Journal of
Pharmaceutical Sciences, 10(2), 81-98.
Li, Y., Zou, C., & Liu, H. (1999). Determination of harpagide and harpagoside
inScrophularia ningpoensis by capillary electrophoresis. Chromatographia, 50(5), 358-
362.
Lim, D. W., Kim, J. G., Han, D., & Kim, Y. T. (2014). Analgesic effect of Harpagophytum
procumbens on postoperative and neuropathic pain in rats. Molecules, 19(1), 1060-1068.
Lin, S., Chen, Y., Chen, R., Chen, L., Ho, H., Tsung, Y., Sheu, M., Liu, D. (2016). Improving
the stability of astaxanthin by microencapsulation in calcium alginate beads. PloS
One, 11(4), 1-10.
Liu, L., Yao, W., Rao, Y., Lu, X., & Gao, J. (2017). PH-responsive carriers for oral drug
delivery: Challenges and opportunities of current platforms. Drug Delivery, 24(1), 569-
581.
Ludwig-Müller, J., Georgiev, M., & Bley, T. (2008). Metabolite and hormonal status of hairy
root cultures of devil's claw (Harpagophytum procumbens) in flasks and in a bubble
column bioreactor. Process Biochemistry, 43(1), 15-23.
http://etd.uwc.ac.za/
142
Ma, J., Guan, R., Ri, C., Liu, M., Ye, X., & Jiang, J. (2012). Response surface methodology
for the optimization of lactoferrin nano-liposomes. Advance Journal of Food Science
and Technology, 4(5), 249-256.
Mahomed, I. M., & Ojewole, J. A. (2006). Anticonvulsant activity of Harpagophytum
procumbens DC [pedaliaceae] secondary root aqueous extract in mice. Brain Research
Bulletin, 69(1), 57-62.
Mahomoodally, M. F. (2013). Traditional medicines in Africa: An appraisal of ten potent
African medicinal plants. Evidence-Based Complementary and Alternative Medicine:
ECAM, 2013, 1-14.
Malakar, J., Nayak, A. K., & Goswami, S. (2012). Use of response surface methodology in
the formulation and optimization of bisoprolol fumarate matrix tablets for sustained drug
release. International Scholarly Research Network, Pharmaceutics, 2012, 1-10.
Mandal, B., Alexander, K., & Riga, A. (2010). Evaluation of the drug-polymer interaction in
calcium alginate beads containing diflunisal. Die Pharmazie-an International Journal of
Pharmaceutical Sciences, 65(2), 106-109.
Mandal, S., Kumar, S. S., Krishnamoorthy, B., & Basu, S. K. (2010). Development and
evaluation of calcium alginate beads prepared by sequential and simultaneous
methods. Brazilian Journal of Pharmaceutical Sciences, 46(4), 785-793.
Manjanna, K., Kumar, P., & Shivakumar, B. (2009). Effect of manufacturing conditions on
physico-chemical characteristics and drug release profiles of aceclofenac sodium
microbeads. Drug Invention Today, 1(2), 98-107.
Manjanna, K., Rajesh, K., & Shivakumar, B. (2013). Formulation and optimization of natural
polysaccharide hydrogel microbeads of aceclofenac sodium for oral controlled drug
delivery. American Journal of Medical Sciences and Medicine, 1(1), 5-17.
Marsanasco, M., Márquez, A. L., Wagner, J. R., Alonso, S. d. V., & Chiaramoni, N. S.
(2011). Liposomes as vehicles for vitamins E and C: An alternative to fortify orange
juice and offer vitamin C protection after heat treatment. Food Research
International, 44(9), 3039-3046.
http://etd.uwc.ac.za/
143
Mathur, M. (2013). Approaches for improving the pharmacological and pharmacokinetics
properties of herbal drugs. International Research Journal of Pharmaceutical and
Applied Sciences, 3(4), 40-50.
Mayuri, K., Chinnala, K., M. (2016) .Preparation, Optimization and evaluation of liposomes
encapsulating diclofenac sodium and charge inducers to enhance stability using lipid
hydration method. International Journal of Pharmacy and Pharmaceutical Research,
6(3), 180-191.
Medina, J.R., Hernandez, J., Hurtado, M. (2017). In vitro release studies of carbamazepine
tablets and benzoyl metronidazole suspensions using the flow-through cell apparatus and
simulated gastrointestinal fluids. International Journal of Applied Pharmaceutics, 9(4),
54-60.
Mello, V. A. d., & Ricci-Júnior, E. (2011). Encapsulation of naproxen in nanostructured
system: Structural characterization and in vitro release studies. Química Nova, 34(6),
933-939.
Mishra, B., Reddy, K.H., Manikanta, A., Anand, A,. Raju, M.S.K. (2016) Formulation and
Optimization of Clarithromycin Loaded with Pullulan Acetate Microsphere for
Sustained Release by Response Surface Methodology. International Journal of Drug
Development and Research, 8(3): 011-015.
Mittal, H., Ray, S. S., & Okamoto, M. (2016). Recent progress on the design and applications
of Polysaccharide‐Based graft copolymer hydrogels as adsorbents for wastewater
purification. Macromolecular Materials and Engineering, 301(5), 496-522.
Mncwangi, N. P., Viljoen, A. M., Zhao, J., Vermaak, I., Chen, W., & Khan, I. (2014). What
the devil is in your phytomedicine? Exploring species substitution in Harpagophytum
through chemometric modeling of 1 H-NMR and UHPLC-MS datasets.
Phytochemistry, 106, 104-115.
Mncwangi, N., Chen, W., Vermaak, I., Viljoen, A. M., & Gericke, N. (2012). Devil's Claw—
A review of the ethnobotany, phytochemistry and biological activity of Harpagophytum
procumbens. Journal of Ethnopharmacology, 143(3), 755-771.
http://etd.uwc.ac.za/
144
Mncwangi, N., Vermaak, I., & Viljoen, A. M. (2014). Mid-infrared spectroscopy and short
wave infrared hyperspectral imaging—A novel approach in the qualitative assessment of
Harpagophytum procumbens and H. zeyheri (devil's claw). Phytochemistry Letters, 7,
143-149.
Mohammed, A., Weston, N., Coombes, A., Fitzgerald, M., & Perrie, Y. (2004). Liposome
formulation of poorly water soluble drugs: Optimisation of drug loading and ESEM
analysis of stability. International Journal of Pharmaceutics, 285(1), 23-34.
Mohandas, A., Sudheesh, P. T., Raja, B., Lakshmanan, V. K., & Jayakumar, R. (2015).
Exploration of alginate hydrogel/nano zinc oxide composite bandages for infected
wounds. International Journal of Nanomedicine, 10(1), 53-66.
Mokale, V., Jitendra, N., Yogesh, S., & Gokul, K. (2014). Chitosan reinforced alginate
controlled release beads of losartan potassium: Design, formulation and in vitro
evaluation. Journal of Pharmaceutical Investigation, 44(4), 243-252.
Mondal, S., & Sarkar, M. (2011). Membrane fusion induced by small molecules and
ions. Journal of Lipids, 2011, 1-14.
Mourabet, M., El Rhilassi, A., El Boujaady, H., Bennani-Ziatni, M., & Taitai, A. (2014). Use
of response surface methodology for optimization of fluoride adsorption in an aqueous
solution by brushite. Arabian Journal of Chemistry, 10, 3292–3302.
Muppidi, K., Pumerantz, A. S., Wang, J., & Betageri, G. (2012). Development and stability
studies of novel liposomal vancomycin formulations. International Scholarly Research
Network Pharmaceutics, 2012, 1-8.
Muzila, M. (2016). Genetic, Morphological and Chemical Variation in the Genus
Harpagophytum, (Doctoral dissertation), Swedish University of Agricultural Sciences.
Nagpal, M., Maheshwari, D., Rakha, P., Dureja, H., Goyal, S., & Dhingra, G. (2012).
Formulation development and evaluation of alginate microspheres of ibuprofen. Journal
of Young Pharmacists, 4(1), 13-16.
http://etd.uwc.ac.za/
145
Naidoo, Y., Heneidak, S., Bhatt, A., Kasim, N., & Naidoo, G. (2014). Morphology,
histochemistry, and ultrastructure of foliar mucilage-producing trichomes of
harpagophytum procumbens (pedaliaceae). Turkish Journal of Botany, 38(1), 60-67.
Nayak, A., Khatua, S., Hasnain, M., & Sen, K. (2011). Development of diclofenac sodium-
loaded alginate-PVP K 30 microbeads using central composite design. DARU Journal of
Faculty of Pharmacy, Tehran University of Medical Sciences, 19(5), 356-366.
Nimase, P. K., & Vidyasagar, G. (2010). Preparation and evaluation of floating calsium
alginate beads of clarithromycin. Der Pharmacia Sinica, 1(1), 29-35.
Nimmathota, M. (2016). Colloidal dispersions (liposomes and ethosomes) for skin drug
delivery and their role on rheumatoid arthritis. Asian Journal of Pharmaceutics, 10(3),
208-221.
Ong, S. G. M., Chitneni, M., Lee, K. S., Ming, L. C., & Yuen, K. H. (2016). Evaluation of
extrusion technique for nanosizing liposomes. Pharmaceutics, 8(4), 1-12.
Pandey, R., Ahmad, Z., Sharma, S., & Khuller, G. (2005). Nano-encapsulation of azole
antifungals: Potential applications to improve oral drug delivery. International Journal
of Pharmaceutics, 301(1), 268-276.
Paques, J. P., van der Linden, E., van Rijn, C. J., & Sagis, L. M. (2014). Preparation methods
of alginate nanoparticles. Advances in Colloid and Interface Science, 209, 163-171.
Patel, N., Lalwani, D., Gollmer, S., Injeti, E., Sari, Y., & Nesamony, J. (2016). Development
and evaluation of a calcium alginate based oral ceftriaxone sodium
formulation. Progress in Biomaterials, 5(2), 117-133.
Patel, Y. L., Sher, P., & Pawar, A. P. (2006). The effect of drug concentration and curing
time on processing and properties of calcium alginate beads containing metronidazole by
response surface methodology. AAPS Pharmscitech, 7(4), 24-30.
Patidar, A., Birla, D., PurviJaveri, M. C., & Sharma, V. (2015). Liposome: New strategy in
drug delivery. International journal of pharmacy & life sciences. 6(7), 4615-4619.
http://etd.uwc.ac.za/
146
Patil, J., Mandave, S., & Jadhav, S. (2014). Ionotropicaly crosslinked and chitosan reinforced
losartan potassium loaded complex alginate beads: Design, characterization and
evaluation. Malaya Journal of Biosciences, 1(3), 126-133.
Pattni, B. S., Chupin, V. V., & Torchilin, V. P. (2015). New developments in liposomal drug
delivery. Chemical Reviews, 115(19), 10938-10966.
Pawar, H. A., & Bhangale, B. D. (2015). Phytosome as a novel biomedicine: A
microencapsulated drug delivery system. Journal of Bioanalysis & Biomedicine, 7(1), 6-
12.
Perkins, W., Minchey, S., Ahl, P., & Janoff, A. (1993). The determination of liposome
captured volume. Chemistry and Physics of Lipids, 64(1-3), 197-217.
Pincet, F., Cribier, S., & Perez, E. (1999). Bilayers of neutral lipids bear a small but
significant charge. The European Physical Journal B-Condensed Matter and Complex
Systems, 11(1), 127-130.
Poukens-Renwart, P., Tits, M., & Angenot, L. (1996). Quantitative densitometric evaluation
of harpagoside in the secondary roots of Harpagophytum procumbens DC. Journal of
Planar Chromatography-Modern TLC, 9(3), 199-202.
Pouton, C. W. (2006). Formulation of poorly water-soluble drugs for oral administration:
Physicochemical and physiological issues and the lipid formulation classification
system. European Journal of Pharmaceutical Sciences, 29(3), 278-287.
Prasad, B.S., Bhatia, S., & Singh, S. (2016). Phytosome: Phytoconstituent based lipid
delivered drug delivery system. Journal of Chemical and Pharmaceutical Research,
8(5), 664-670.
Raissi, S., & Farsani, R. (2009). Statistical process optimization through multi-response
surface methodology. World Academy of Science, Engineering and Technology, 51(46),
267-271.
http://etd.uwc.ac.za/
147
Ramana, L. N., Sethuraman, S., Ranga, U., & Krishnan, U. M. (2010). Development of a
liposomal nanodelivery system for nevirapine. Journal of Biomedical Science, 17(57), 1-
9.
Rani, B., Vandana, N. M., & Arora, S. (2007). Phytosomes: Potential carriers for herbal
drugs. International Journal of Research and Reviews in Pharmacy and Applied
science, 2(3), 566-577.
Rasaie, S., Ghanbarzadeh, S., Mohammadi, M., & Hamishehkar, H. (2014). Nano
phytosomes of quercetin: A promising formulation for fortification of food products with
antioxidants. Pharmaceutical Sciences, 20(3), 96-101.
Ravi, G. S., Chandur, V., Shabaraya, A.R., Sanjay, K. (2015). Phytosomes: An advanced
herbal drug delivery system. International Journal of Pharmaceutical Research and
Bioscience, 4(3), 415-432.
Rawat, S., & Motwani, S. (2012). Phytosomal drug delivery systems. International Journal
of Research and Development in Pharmacy and Life Sciences, 1(3), 143-150.
Reis, C. P., Neufeld, R. J., Vilela, S., Ribeiro, A. J., & Veiga, F. (2006). Review and current
status of emulsion/dispersion technology using an internal gelation process for the
design of alginate particles. Journal of Microencapsulation, 23(3), 245-257.
Saha, S., Sarma, A., Saikia, P., & Chakrabarty, T. (2013). Phytosome: A brief
overview. Scholars Academic Journal of Pharmacy, 2(1), 12-20.
Saleem, M., Kotadia, D. R., & Kulkarni, R. V. (2012). Effect of formulation variables on
dissolution of water-soluble drug from polyelectrolyte complex beads. Dissolution
Technologies, 19, 21-28.
Sanders, M., & Grundmann, O. (2011). The use of glucosamine, devil's claw
(harpagophytum procumbens), and acupuncture as complementary and alternative
treatments for osteoarthritis. Alternative Medicine Review, 16(3), 228.
Sankalia, M. G., Mashru, R. C., Sankalia, J. M., & Sutariya, V. B. (2005). Papain entrapment
in alginate beads for stability improvement and site-specific delivery: Physicochemical
http://etd.uwc.ac.za/
148
characterization and factorial optimization using neural network modeling. AAPS
Pharmscitech, 6(2), 209-222.
Santra K, Rudra A, Mukherjee B. (2010). Development and physicochemical, and in vitro
evaluation of dexamethasone containing liposomes. International Journal of Biomedical
and Pharmaceutical Sciences, 4(1), 43-47.
Saoji, S. D., Raut, N. A., Dhore, P. W., Borkar, C. D., Popielarczyk, M., & Dave, V. S.
(2016). Preparation and evaluation of phospholipid-based complex of standardized
centella extract (SCE) for the enhanced delivery of phytoconstituents. The Journal of the
American Association of Pharmaceutical Scientists, 18(1), 102-114.
Saraf, S. (2010). Applications of novel drug delivery system for herbal
formulations. Fitoterapia, 81(7), 680-689.
Sathali, A., & Varun, J. (2012). Formulation, development and in vitro evaluation of
candesartan cilexetil mucoadhesive microbeads. International Journal of Current
Pharmaceutical Research, 4(3), 109-118.
Sha, X., Guo, J., Chen, Y., & Fang, X. (2012). Effect of phospholipid composition on
pharmacokinetics and biodistribution of epirubicin liposomes. Journal of Liposome
Research, 22(1), 80-88.
Shabir, G. A. (2003). Validation of high-performance liquid chromatography methods for
pharmaceutical analysis: Understanding the differences and similarities between
validation requirements of the US Food and Drug Administration, the US Pharmacopeia
and the International Conference on Harmonization. Journal of chromatography
A, 987(1), 57-66.
Shailesh, S., Neelam, S., & Sandeep, K. (2009). Liposomes: A review. Journal of Pharmacy
Research. 2(7), 1163-1167.
Shaji, J., & Shah, A. (2016). Optimization of tenoxicam loaded niosomes using quadratic
design. International Journal of Current Pharmaceutical Research. 8(1), 62-67.
http://etd.uwc.ac.za/
149
Sharma, A. K., Keservani, R. K., & Kesharwani, R. K. (2016). Biosimilars: Concept and
regulation. In Keservani, R., K., Sharma, A., K., Kesharwani, R., K. Novel Approaches
for Drug Delivery, 171-188. DOI: 10.4018/978-1-5225-0751-2.ch007.
Sharma, M. (2014). Applications of nanotechnology based dosage forms for delivery of
herbal drugs. Research and Reviews: Journal of Pharmaceutics and
Nanotechnology, 2(1), 23-30.
Sharma, P., Verma, S., & Misri, P. (2016). Global need for novel herbal drug
formulations. International Journal of Pharmacognosy and Phytochemical
Research, 8(9), 1535-1544.
Shashi, K., Satinder, K., & Bharat, P. (2012). A complete review on:
Liposomes. International Research Journal of Pharmacy, 3(7), 10-16.
Shazly, G. A. G. (2012). Design and evaluation of sustained released liposomal preparations
containing adenosine monophosphate. Digest Journal of Nanomaterials and
Biostructures, 7(4), 1679-1687.
Shazly, G., Nawroth, T., & Langguth, P. (2008). Comparison of dialysis and dispersion
methods for in vitro release determination of drugs from multilamellar
liposomes. Dissolution Technologies, 15(2), 7-10.
Shelke, S. S. (2012). Phytosomes-A new herbal drug delivery system. International Journal
of Research in Pharmaceutical and Biomedical Sciences, 3(4), 1710-1715.
Sheu, S., Hong, Y., Sun, J., Liu, M., Chen, C., & Ke, C. (2015). Radix scrophulariae extracts
(harpagoside) suppresses hypoxia-induced microglial activation and neurotoxicity. BMC
Complementary and Alternative Medicine, 15(1), 1-9.
Shi, J., Alves, N. M., & Mano, J. F. (2006). Drug release of pH/Temperature‐Responsive
calcium Alginate/Poly (N‐isopropylacrylamide) Semi‐IPN beads. Macromolecular
Bioscience, 6(5), 358-363.
http://etd.uwc.ac.za/
150
Shivakumar, H., Patel, P., Desai, B., Ashok, P., & Arulmozhi, S. (2007). Design and
statistical optimization of glipizide loaded lipospheres using response surface
methodology. Acta Pharmaceutica, 57(3), 269-285.
Shrestha, H., Bala, R., & Arora, S. (2014). Lipid-based drug delivery systems. Journal of
Pharmaceutics, 2014, 1-10.
Singh, D. (2015). Application of novel drug delivery system in enhancing the therapeutic
potential of phytoconstituents. Asian Journal of Pharmaceutics, 9(4), 1-12.
Singh, D., Rawat, M., Semalty, A., & Semalty, M. (2012). Emodin–phospholipid
complex. Journal of Thermal Analysis and Calorimetry, 108(1), 289-298.
Singh, D., Rawat, M., Semalty, A., & Semalty, M. (2013). Chrysophanol–phospholipid
complex. Journal of Thermal Analysis and Calorimetry, 111(3), 2069-2077.
Singh, G., Pai, R. S., & Devi, V. K. (2012). Response surface methodology and process
optimization of sustained release pellets using taguchi orthogonal array design and
central composite design. Journal of Advanced Pharmaceutical Technology &
Research, 3(1), 30-40.
Singh, R. P., & Narke, R. (2015). Preparation and evaluation of phytosome of
lawsone. International Journal of Pharmaceutical Sciences and Research, 6(12), 5217-
5226.
Singh, S., Gogoi, B. K., & Bezbaruah, R. L. (2012). Calcium alginate as a support material
for immobilization of L-amino acid oxidase isolated from aspergillus fumigatus. IIOAB
Journal, 3(5), 7-11.
Singhal, P., Tomar, A., Goel, K., Pandey, M., & Saraf, S. A. (2010). Preparation and
evaluation of stomach-specific ion tropically emulsion gelled alginate beads of
tinidazole. Der Pharmacia Lettre, 2(6), 272-282.
Smith, A. M., Jaime-Fonseca, M. R., Grover, L. M., & Bakalis, S. (2010). Alginate-loaded
liposomes can protect encapsulated alkaline phosphatase functionality when exposed to
gastric pH. Journal of Agricultural and Food Chemistry, 58(8), 4719-4724.
http://etd.uwc.ac.za/
151
Smrdel, P., Bogataj, M., & Mrhar, A. (2008). The influence of selected parameters on the size
and shape of alginate beads prepared by ionotropic gelation. Scientia
Pharmaceutica, 76(1), 77-90.
Soema, P. C., Willems, G., Jiskoot, W., Amorij, J., & Kersten, G. F. (2015). Predicting the
influence of liposomal lipid composition on liposome size, zeta potential and liposome-
induced dendritic cell maturation using a design of experiments approach. European
Journal of Pharmaceutics and Biopharmaceutics, 94, 427-435.
Solano-Umaña, V., Vega-Baudrit, J. R., & González-Paz, R. (2015). The new field of the
nanomedicine. International Journal of Applied Science and Technology, 5(1), 79- 88.
Song, Y., Zhuang, J., Guo, J., Xiao, Y., & Ping, Q. (2008). Preparation and properties of a
silybin-phospholipid complex. Die Pharmazie- an International Journal of
Pharmaceutical Sciences, 63(1), 35-42.
Soulimani, R., Younos, C., Mortier, F., & Derrieu, C. (1994). The role of stomachal digestion
on the pharmacological activity of plant extracts, using as an example extracts of
Harpagophytum procumbens. Canadian Journal of Physiology and Pharmacology,
72(12), 1532-1536.
Sravanthi, M., & Krishna, J. S. (2013). Phytosomes: A novel drug delivery for herbal
extracts. International Journal of Pharmaceutical Sciences and Research, 4(3), 949-959.
Stewart, K. M., & Cole, D. (2005). The commercial harvest of devil's claw (Harpagophytum
spp.) in southern Africa: The devil's in the details. Journal of
Ethnopharmacology, 100(3), 225-236.
Street, R., & Prinsloo, G. (2012). Commercially important medicinal plants of South Africa:
A review. Journal of Chemistry, 2013, 1-16.
Street, R., Stirk, W., & Van Staden, J. (2008). South African traditional medicinal plant
trade-challenges in regulating quality, safety and efficacy. Journal of
Ethnopharmacology, 119(3), 705-710.
http://etd.uwc.ac.za/
152
Sudhakar, B., Ravi Varma, J., & Ramana Murthy, K. (2014). Formulation, characterization
and ex vivo studies of terbinafine HCl liposomes for cutaneous delivery. Current Drug
Delivery, 11(4), 521-530.
Süleymanoglu, E. (2009). The use of IR spectroscopy after rehydration to follow ternary
lipoplex formation and design as a metal-based DNA nanopharmaceuticals. Prilozi, 1,
61-80.
Sun, J., & Tan, H. (2013). Alginate-based biomaterials for regenerative medicine
applications. Materials, 6(4), 1285-1309.
Suriyakala, P.C., Satheesh, B.N., Senthil, R.D., Prabakaran, L. (2014). Phospholipids as
versatile polymer in drug delivery systems. International Journal of Pharmacy and
Pharmaceutical Sciences, 6(1), 8-11.
Suruse, P. (2014). Development of microcapsules of glimepiride using fenugreek seed
extract. International Journal of Pharmaceutical and Phytopharmacological
Research, 3(3), 212-215.
Suzery, M., Setyawan, D., Majid, D., & Sutanto, H. (2017). Encapsulation of phycocyanin-
alginate for high stability and antioxidant activity. IOP Conference Series: Earth and
Environmental Science, 55(1), 1-8.
Takka S, A. F. (1999). Calcium alginate microparticles for oral administration: II effect of
formulation factors on drug release and drug entrapment efficiency. Journal of
Microencapsulation, 16(3), 291-301.
Takka, S., Ocak, Ö. H., & Acartürk, F. (1998). Formulation and investigation of nicardipine
HCl–alginate gel beads with factorial design-based studies. European Journal of
Pharmaceutical Sciences, 6(3), 241-246.
Tan, B. H., & Ong, C. E. (2016). The use of natural remedies to treat
osteoarthritis. Tang, 6(1), 1-9.
http://etd.uwc.ac.za/
153
Tan, Q., Liu, S., Chen, X., Wu, M., Wang, H., Yin, H., He, D., Xiong, H., Zhang, J. (2012).
Design and evaluation of a novel evodiamine-phospholipid complex for improved oral
bioavailability. AAPS Pharmscitech, 13(2), 534-547.
Thapa, R. K., Khan, G. M., Parajuli-Baral, K., & Thapa, P. (2013). Herbal medicine
incorporated nanoparticles: Advancements in herbal treatment. Asian Journal of
Biomedical and Pharmaceutical Sciences, 3(24), 7- 14.
Thassu, D., & Chader, G. J. (2012). Ocular drug delivery systems: Barriers and application of
nanoparticulate systems. CRC Press. DOI: 10.1201/B12950.
Thomas, L. M., & Khalil, Y. I. (2011). Preparation and evaluation of atenolol floating beads
as a controlled delivery system. Iraqi Journal of Pharmaceutical Sciences, 20(1), 70-80.
Thulasiramaraju, T., Babu, A., Arunachalam, A., Prathap, M., Srikanth, S., & Sivaiah, P.
(2012). Liposome: A novel drug delivery system. International Journal of
Biopharmacuties, 3(1): 5-16.
Tiwari, G. (2013). Preparation and Characterization of ketoconazole encapsulated liposome
and ethosome: A Comparative study, (Doctoral dissertation). National institute of
technology, Rourkela. India.
Tønnesen, H. H., & Karlsen, J. (2002). Alginate in drug delivery systems. Drug Development
and Industrial Pharmacy, 28(6), 621-630.
Tous, S., Fathy, M., Fetih, G., & Gad, S. F. (2014). Preparation and evaluation of ketoprofen-
loaded calcium alginate beads. International Journal of PharmTech Research, 6(3),
1100-1112.
Trivedi R.V., Taksande J. B., Awandekar N. B., Umekar M. J. (2017). Effect of lipid
composition on liposomal formulation of pramipexole. World Journal of Pharmaceutical
Research, 6(1), 1073-1089.
Udapurkar, P., Bhusnure, O., Kamble, S., & Biyani, K. (2016). Phyto-phospholipid complex
vesicles for phytoconstituents and herbal extracts: A promising drug delivery system.
International Journal of Herbalmedicine; 4(5) 14-20.
http://etd.uwc.ac.za/
154
Van Nieuwenhuyzen, W., & Tomás, M. C. (2008). Update on vegetable lecithin and
phospholipid technologies. European Journal of Lipid Science and Technology, 110(5),
472-486.
Van Wyk, B. E. (2011). The potential of South African plants in the development of new
medicinal products. South African Journal of Botany, 77(4), 812-829.
Vankudri, R., Habbu, P., Hiremath, M., Patil, B., & Savant, C. (2016). Preparation and
therapeutic evaluation of rutin-phospholipid complex for antidiabetic activity. Journal of
Applied Pharmaceutical Science, 6(1), 90-101.
Venkatesh, S., Kumar, M. B., Ramachandran, S., & Sameer, G. N. (2010). HPLC method
development, validation and its application to stability studies of chlorpromazine
hydrochloride tablets. International Research Dournal of Pharmacy, 1(1) 225-232.
Viljoen, A., Mncwangi, N., & Vermaak, I. (2012). Anti-inflammatory iridoids of botanical
origin. Current Medicinal Chemistry, 19(14), 2104-2127.
Vinod, M., Jitendra, N., Gayatri, K., & Gokul, K. (2013). Formulation and development of
diltiazem hydrochloride sustained release alginate beads by ionotropic external gelation
technique. Advances in Pharmacology and Pharmacy, 1(3), 139-143.
Voo, W., Lee, B., Idris, A., Islam, A., Tey, B., & Chan, E. (2015). Production of ultra-high
concentration calcium alginate beads with prolonged dissolution profile. RSC
Advances, 5(46), 36687-36695.
Wagner, H., Bauer, R., Melchart, D., Xiao, P. G., & Staudinger, A. (2011). Chromatographic
fingerprint analysis of herbal medicines: Thin-layer and high performance liquid
chromatography of Chinese drugs. Berlin, Germany: Springer Science & Business
Media. DOI: 10.1007/978-3-7091-0763-8.
Wang, H., Liu, M., & Du, S. (2014). Optimization of madecassoside liposomes using
response surface methodology and evaluation of its stability. International Journal of
Pharmaceutics, 473(1), 280-285.
http://etd.uwc.ac.za/
155
Wang, W., Waterhouse, G. I., & Sun-Waterhouse, D. (2013). Co-extrusion encapsulation of
canola oil with alginate: Effect of quercetin addition to oil core and pectin addition to
alginate shell on oil stability. Food Research International, 54(1), 837-851.
World Health Organization. (1998). Regulatory situation of herbal medicines: A worldwide
review.
World health organization. (2012). The international pharmacopoeia. Geneva; world health
organization, Dept. of essential medicines and pharmaceutical policies.
Xego, S., Kambizi, L., & Nchu, F. (2016). Threatened medicinal plants of South Africa: Case
of the family hyacinthaceae. African Journal of Traditional, Complementary and
Alternative Medicines, 13(3), 169-180.
Xu, F., Dong, F., Wang, P., Cao, H. Y., Li, C. Y., Li, P. Y., Pang, X. H., Zhang, Y.Z., Chen,
X .L. (2017). Novel molecular insights into the catalytic mechanism of marine bacterial
alginate lyase AlyGC from polysaccharide lyase family 6. The Journal of Biological
Chemistry, 292(11), 4457-4468.
Yas, A. (2014). Development and optimization of liposomal ketotifen fumarate dry powder
using response surface methodology. International Journal of Pharmaceutical Sciences
and Research, 5(6), 2264-2278.
Yingchoncharoen, P., Kalinowski, D. S., & Richardson, D. R. (2016). Lipid-based drug
delivery systems in cancer therapy: What is available and what is yet to
come. Pharmacological Reviews, 68(3), 701-787.
Yu, F., Li, Y., Chen, Q., He, Y., Wang, H., Yang, L., Guo, S., Meng, Z., Cui, J., Xue, M.,
Chen, X. (2016). Monodisperse microparticles loaded with the self-assembled berberine-
phospholipid complex-based phytosomes for improving oral bioavailability and
enhancing hypoglycemic efficiency. European Journal of Pharmaceutics and
Biopharmaceutics, 103, 136-148.
Zhang, X., Qi, J., Lu, Y., He, W., Li, X., & Wu, W. (2014). Biotinylated liposomes as
potential carriers for the oral delivery of insulin. Nanomedicine: Nanotechnology,
Biology and Medicine, 10(1), 167-176.
http://etd.uwc.ac.za/
156
Zhang, Z., Zhang, R., Zou, L., & McClements, D. J. (2016). Protein encapsulation in alginate
hydrogel beads: Effect of pH on microgel stability, protein retention and protein
release. Food Hydrocolloids, 58, 308-315.
Zhao, L., Su, C., Zhu, B., & Jia, Y. (2014). Development and optimization of insulin-chitosan
nanoparticles. Tropical Journal of Pharmaceutical Research, 13(1), 3-8.
Zuo, J., Gao, Y., Bou-Chacra, N., & Lobenberg, R. (2014). Evaluation of the DDSolver
software applications. BioMed Research International, 2014, 1-9.
http://etd.uwc.ac.za/


