Embed Size (px)
Citation preview

A unifying principle underlying the extracellular field potential spectralresponses in the human cortex
Ella Podvalny,1,2 Niv Noy,1,2 Michal Harel,1 Stephan Bickel,3,4 Gal Chechik,2 Charles E. Schroeder,5,6
Ashesh D. Mehta,4 Misha Tsodyks,1 and Rafael Malach1
1Department of Neurobiology, Weizmann Institute of Science, Rehovot, Israel; 2Gonda Multidisciplinary Brain ResearchCenter, Bar Ilan University, Ramat Gan, Israel; 3Department of Neuroscience, Albert Einstein College of Medicine, Bronx,New York; 4Department of Neurosurgery, Hofstra North Shore LIJ School of Medicine and Feinstein Institute for MedicalResearch, Manhasset, New York; 5Cognitive Neuroscience and Schizophrenia Program, Nathan Kline Institute, Orangeburg,New York; and 6Department of Psychiatry, Columbia College of Physicians and Surgeons, New York, New York
Submitted 24 November 2014; accepted in final form 6 April 2015
Podvalny E, Noy N, Harel M, Bickel S, Chechik G, SchroederCE, Mehta AD, Tsodyks M, Malach R. A unifying principleunderlying the extracellular field potential spectral responses in thehuman cortex. J Neurophysiol 114: 505–519, 2015. First publishedApril 8, 2015; doi:10.1152/jn.00943.2014.—Electrophysiologicalmass potentials show complex spectral changes upon neuronal acti-vation. However, it is unknown to what extent these complex band-limited changes are interrelated or, alternatively, reflect separateneuronal processes. To address this question, intracranial electrocor-ticograms (ECoG) responses were recorded in patients engaged invisuomotor tasks. We found that in the 10- to 100-Hz frequency rangethere was a significant reduction in the exponent � of the 1/f�
component of the spectrum associated with neuronal activation. In aminority of electrodes showing particularly high activations the ex-ponent reduction was associated with specific band-limited powermodulations: emergence of a high gamma (80–100 Hz) and a de-crease in the alpha (9–12 Hz) peaks. Importantly, the peaks’ heightwas correlated with the 1/f� exponent on activation. Control simula-tion ruled out the possibility that the change in 1/f� exponent was aconsequence of the analysis procedure. These results reveal a newglobal, cross-frequency (10–100 Hz) neuronal process reflected in asignificant reduction of the power spectrum slope of the ECoG signal.
ECoG; electrophysiology; power spectrum; 1/f; narrow-band gamma
A MAJOR ADVANCE in our understanding of human corticalfunction has been obtained through invasive recordings, con-ducted for clinical purposes in epilepsy patients (e.g., Mukameland Fried 2011). The more common method applied in suchdiagnostic procedure has been electrocorticogram (ECoG) re-cordings, which are mass potentials, obtained from smallelectrodes placed directly on the cortical surface. In parallelwith extensive research in nonhuman primates, it has beenestablished that the frequency content of such electrophysio-logical signals is modulated by mental states and behavior(Buzsáki and Draguhn 2004; Fries et al. 2001; Gray and Singer1989; Henrie and Shapley 2005). A large body of research hasbeen focused on attempts to characterize the functional rolesthat specific frequency bands play in cortical processing (Buz-saki 2006).
Previous ECoG studies revealed a stimulus-related broad-band power increase in the frequency range of 40–150 Hzduring visual, motor, and auditory tasks (Crone et al. 2001;
Fisch et al. 2009; Lachaux et al. 2000; Miller et al. 2009; Niret al. 2007; Ossandón et al. 2012; Privman et al. 2007). At thelow frequencies, power decreases (also termed event-relateddesynchronization, ERD) were reported during sensory activa-tion (Berger 1929; Chatrian 1976; Pfurtscheller and Aranibar1977; Ramot et al. 2012). A clear association between thebroadband gamma increase and neuronal firing on the one hand(Manning et al. 2009; Mukamel et al. 2005; Nir et al. 2007) andthe ERD on the other has been reported (Crone et al. 1998b;Mukamel et al. 2005; Ramot et al. 2012).
In parallel, numerous studies have demonstrated that theLFP and ECoG signals span a broad range of frequencies thatfollow a 1/f� function, where the power is inversely propor-tional to frequency, f, with a scaling exponent � (Dehghani etal. 2010; Freeman and Zhai 2009; He et al. 2010; Henrie andShapley 2005; Manning et al. 2009; Miller et al. 2009; Milsteinet al. 2009; Nir et al. 2008; Pritchard 1992). Although thispower to frequency “power law” relation is ubiquitous inneuronal activity, its function and origin are still unclear (Baket al. 1987; Bédard and Destexhe 2009; He 2014). The 1/f�
component was often considered either as noise or attributed tothe frequency-dependent filtering properties of the extracellularmedium (Bédard et al. 2004). More recently, the frequency-dependent filtering hypothesis was ruled out (Logothetis et al.2007) and the 1/f� spectrum was suggested to be related toneural activity (El Boustani et al. 2009; He et al. 2010; Nir etal. 2008). While these findings begin to reveal the full extent ofspectral responses in neural populations, the relation betweendifferent spectral components remains unclear.
Consequently, our aim in this study was to search forpossible relationship between the different ECoG spectral char-acteristics: the broadband 1/f� component and the band-limited“bumps” appearing on top of the broadband component. Tothat end, we separated these components of the spectrumand analyzed them independently. Our results reveal aglobal reduction in the exponent of the 1/f� componentspanning a wide frequency range (10 –100 Hz). In a minorityof electrodes showing particularly high responsivity, wefound also modulations in band-limited peaks appearing ontop of the 1/f� component in the alpha and gamma range.The peaks’ height was correlated to the exponent �, thussuggesting a link between broadband and band-limited spec-tral phenomena.
Address for reprint requests and other correspondence: R. Malach, Dept. ofNeurobiology, Weizmann Institute of Science, Rehovot 76100, Israel (e-mail:[email protected]).
J Neurophysiol 114: 505–519, 2015.First published April 8, 2015; doi:10.1152/jn.00943.2014.
5050022-3077/15 Copyright © 2015 the American Physiological Societywww.jn.org

MATERIALS AND METHODS
Subjects and Data Collection
Six subjects participated in the present study [4 women, 27.5 � 3.9yr old (mean � SE), see Table 1 for details] with pharmacologicallyintractable epilepsy, monitored for presurgical evaluation. The record-ings were conducted at the patients’ quiet bedside. Stimuli werepresented via a standard LCD screen and keyboard responses wererecorded. The data were collected in Long Island Jewish MedicalCenter, New York, and Columbia University Medical Center, NewYork. All patients provided fully informed written consent accordingto the US National Institutes of Health guidelines, as monitored by thelocal institutional review boards, which approved the study protocol.Each patient was implanted with 104–126 intracranial electrodes for5–10 days. The electrodes were arranged in subdural grids, strips,and/or depth arrays (Integra Lifesciences). In the subdural grids andstrips, each recording site was 2 mm in diameter with 1 cm separation,whereas in the depth electrodes each recording site was 1 mm indiameter with 0.5 cm separation. The location and number of elec-trodes were based solely on clinical criteria. The signals were filteredelectronically between 0.5–500 Hz or 0.1 Hz–1 kHz and sampled at arate of 1 kHz or 2 kHz, respectively (XLTEK EMU 128 LTMSystem). A strip electrode screwed into the frontal bone near thebregma was used as common mode ground and reference. Stimulus-triggered electrical pulses were recorded along with the electrophys-iological data for precise synchronization of the stimuli with theneural responses.
Electrode Localization
Computed tomography (CT) scans following electrode implanta-tion were coregistered to the preoperative MRI using iPlan Stereotaxysoftware (BrainLAB) to determine electrode positions. The three-dimensional brain image thus mounted with electrode locations wasnormalized to Talairach coordinates (Talairach and Tournoux 1988)and rendered in BrainVoyager software in two dimensions as asurface mesh, enabling precise localization of the electrodes both withrelation to the subject’s anatomical MRI scan and in standard coor-dinate space. For joint presentation of all participants’ electrodes,locations were projected onto a cortical reconstruction of a healthysubject from a previous study. Given the large number of electrodesand in order to facilitate the data presentation, we subdivided theelectrodes into groups based on rough anatomical considerations (seeFig. 9, bottom). It should be emphasized that these subdivisions wereapproximate since no independent functional delineation based onfMRI was available in these patients. Each electrode was attributed toone of seven regions: low visual, high visual, parietal, auditory,somatosensory, motor, and frontal. Low visual regions included early,retinotopic visual areas, that are at low order in the visual hierarchy,while high visual refers to downstream, category-selective corticalregions that are at high levels in the visual hierarchy (Fig. 9, bottom).
Visuomotor Task
Pictures of faces of both sexes (Minear and Park 2004) werepresented followed by a delay interval of 1.5- to 4-s duration termi-nated by an auditory cue (beep sound). Upon hearing the cue, patientswere instructed to press a button to indicate whether the precedingpicture was of a man or a woman. Baseline time window for each trialis defined as 500 ms before visual stimulus onset and activation timeis 150 until 650 ms after stimulus onset, excluding the triggerexecution period.
Object Recognition Task
The patients viewed gray scale digital photographs of faces, man-made tools, buildings, and geometric patterns, which were superim-posed with a small white fixation dot. The images were presented for250 ms in pseudorandom order at a rate of 1 Hz, while the patientsperformed a 1-back memory task (i.e., pressing a mouse button eachtime a specific image repeated twice in a row). Stimulus repetitionswere infrequent (�10% of the trials) and were mainly used to keep thepatient alert.
Data Analysis
All data analyses were performed using custom-written MATLAB(R2014b) programs (Mathworks).
Preprocessing
Each electrode was rereferenced by subtraction of the averagedsignal of all the electrodes, thus discarding nonneuronal contributions(Privman et al. 2007). The 60-Hz frequency line noise and itsharmonics were removed with Butterworth bandstop filter (MAT-LAB, butter). Loose electrodes were identified by spectrograms andwere removed (up to 5 electrodes per patient). The patients did notexperience epileptic seizures during the recordings; however, anadditional preprocessing stage was completed and the trials whichwere suspected to be contaminated by interictal epileptic discharges(IEDs) were removed and the data reanalyzed (see Table 3). Inaddition, we defined pathological channels by using IED detectionalgorithm (Janca et al. 2014), which was shown to be more objectiveand superior to human detection. The algorithm adaptively modelsstatistical distributions of signal envelopes and enables discriminationof signals containing IEDs from signals with background activity.Irrespectively to task-defined trials, the electrodes that showed IEDsrate higher than algorithm’s false positive rate of 8.5 IEDs/min (theIED detected by algorithm but not by human reader) were defined aspathological (n � 64, of 720 total) (for details and code, see Janca etal. 2014).
Spectral Analysis
Power spectral density (Praw) was estimated by multitaper method(Thomson 1982). To achieve spectral resolution similar to CGSA (seebelow), each time interval, T seconds length, was divided to twononoverlapping windows. We used orthogonal Slepian tapers (n � 5,T/2 length) to minimize spectral power leakage. The tapers weregenerated with discrete prolate spheroidal sequences function (dpss,MATLAB). The signal was zero mean and projected onto each taper,padded with zeros to T length (Thomson 1982) and the discreteFourier transform (�) was computed by FFT algorithm (MATLAB)and multiplied by its conjugate to produce the power spectrum. Foreach trial, the power spectrum was averaged over two nonoverlappingwindows and tapers. The spectral resolution achieved was 1/T: 2 Hzfor 0.5-s intervals and 1 Hz for 1-s intervals.
Table 1. Clinical information of the patients
PatientID Sex Age Handedness
SeizureLocalization
ImplantedHemisphere
No. ofUsable
ElectrodesSamplingRate, Hz
CL Female 22 R Left O L 126 2,000DC Female 35 R Left F-T Bilateral 126 2,000EK Female 22 L Left T L 112 1,000RS Male 21 R Right F-T R 126 2,000TD Female 21 R Right O R 104 1,000WS Male 44 R Left F-P L 126 2,000
R and L are right and left, respectively; O, F, T, and P are occipital, frontal,temporal, and parietal, respectively.
506 A UNIFYING PRINCIPLE FOR SPECTRAL RESPONSES
J Neurophysiol • doi:10.1152/jn.00943.2014 • www.jn.org

1/f� Component Extraction
We used coarse-graining spectral analysis (CGSA) by Yamamotoand Hughson to extract the 1/f� components of the spectrum (He et al.2010; Yamamoto and Hughson 1993). Briefly, the method is based onthe scale-invariance property of 1/f� signal: it will retain its powerwhen rescaled in time and cross-correlated with the original, nonres-caled time course. In contrast, rescaling in time of harmonic compo-nents causes a complete loss of spectral power when cross-correlatedwith the original.
To obtain the 1/f� component we used the following algorithm.1) Cross-spectrum Sxx2
was computed between the signal whereeach second sample was taken, x2 (contracted in time by factor of 2
and resulted in T/2 length), and the raw signal x1: Sxx2� � �x1� � �x2��. The
procedure was conducted for odd and even samples, which were usedfor cross-spectrum with first and second x1 halves. The signal con-traction constrained the spectral resolution to 2 Hz for 500-ms inter-vals.
2) Cross-spectrum Sxx1⁄2was computed between the signal where
each sample was duplicated x1/2 (dilated in time by factor of 2) and the
raw signal x1: Sxx1⁄2� � �x1� � �x1⁄2��
3)Corrected 1/f� power was computed as P1⁄f � ��Sxx2�·�Sxx1⁄2
�.The rescaling in time in both directions 1 and 2 is necessary to
correct for arbitrary chosen rescaling factor of 2 (see Yamamoto andHughson 1993 for details). All the time series components wereprojected first on the Slepian tapers and cross/auto spectrum resultswere averaged over tapers (similarly to the raw power spectrumestimation).
Permutation Test
The samples from two sets were randomly divided into two newsets regardless of their labels; the mean difference between two setswas computed across k � 1,000 permutations. The P value wasestimated as the probability of the mean difference computed onrandom groups to differ from the original groups.
Raw Power Modulation
The significance of the raw power stimuli-induced modulation wasassessed by a random permutation test for the power values in eachfrequency bin (2 Hz width) defined by spectral analysis in a range of10–100 Hz (alpha � 0.05, Bonferroni corrected for number of bins).
1/f� Component Linear Model
The linear model for 1/f� component of each trial was estimated byiteratively reweighting the least squares with the bisquare weightingfunction (MATLAB, robustfit), and the exponent � was extracted. Thefraction of variance explained was computed as [1 � (varerr/vartot)],where varerr is the variance of linear model errors and vartot is the totalvariance. The difference between 1/f scaling exponents during acti-vation and baseline, �base � �act, is termed “rotation.” Significancelevels of rotation for each electrode were assessed by a paired t-test (�� 0.05, Bonferroni corrected). Intersection frequency is the frequencyvalue of the intersection point between the 1/f� functions fitted duringvisual activation and baseline. For each electrode we computed theestimation of the probability density function (PDF) of intersectionfrequency distribution; its peak value represented the intersectionfrequency of the electrode. The PDF was estimated by kernel smooth-ing using normal kernel function (MATLAB, ksdensity) in the rangeof 0–1,000 Hz frequencies.
Band-Limited Peak Detection
The peaks were selected on the remaining power components afterthe 1/f� component removal (Praw � P1/f), averaged over trials and
satisfying the following conditions: 1) being a local maximum, and 2)the power was significantly modulated by stimulus (permutation test,see Raw Power Modulation above).
Synthetic Peaks
For each trial for electrodes with significant gamma peak we founda maximal point in the gamma range. A mixture of 7 sine waves wasgenerated with the same central frequency and amplitude as of themaximal point. This mixture was added to baseline time course andspectral analysis was applied. The synthetic �30-Hz wide peaksappeared in the raw power spectrum (see Fig. 8) comparable to peaksin activation trials. Similar analysis was done for electrodes withsignificant alpha peaks, which decreased upon activation. A sine wavewith the same frequency of alpha peak in baseline and amplitudeequal to difference between alpha peak in baseline and activation wasadded to activation trials.
RESULTS
ECoG signals were recorded from six patients implantedwith 104–126 electrodes for clinical purposes, 720 in total(Table 1). Patients performed two tasks: a visuomotor task andan object recognition task. The visuomotor task included abrief presentation of faces of both sexes for 250 ms, followedby a blank interval presented for a random duration (1.5–4 s),terminated by an auditory cue (Fig. 1A). The participants wereinstructed to focus on the fixation cross and identify the sex ofa face by pressing a button following the auditory cue. Theanatomical distribution of electrode sites detected by postimplantation CT and MRI scans (see MATERIALS AND METHODS)covered a substantial cortical territory (Fig. 1B). Finally, toexpand the analysis to additional visual categories, we used thedata from a one-back object recognition memory experimentwhere images of faces, patterns, houses, and man-made objectswere presented (see MATERIALS AND METHODS).
To examine spectral changes associated with the visualresponse in the visuomotor task, we analyzed separately twotime windows: a baseline period extending 500 ms prior to thevisual stimulus presentation, and an activation period lastingfrom 150 ms until 650 ms after the stimulus onset, consistentwith known response latencies to faces and to reduce adapta-tion effects (Fisch et al. 2009) (see Fig. 1C). The intertrialperiod was not constant, thus reducing expectation effectsduring the baseline time window. The onset of higher fre-quency activity in single trials and the event-related potential(ERP) onset both correspond to the activation window onset(Fig. 1C).
Spectral Components: 1/f� and Band-Limited Peaks
Conventional spectral analysis included spectrograms show-ing relative power changes over time, averaged over trials(Fig. 2A, first column). Typical visual responses showed anincrease in power across a broad range of high frequencies,compatible with previous findings (Fisch et al. 2009). Theaverage relative power of the activation time window normal-ized by baseline (Fig. 2A, second column) showed a high-frequency spectral peak. The relative power, however, is show-ing only a partial picture of spectral response, and it is notclear what transformation was applied to the baseline thatleads to the activation spectrum. Therefore, a more compre-hensive view of the broadband power modulation can beobtained by visual inspection of the raw power spectrum
507A UNIFYING PRINCIPLE FOR SPECTRAL RESPONSES
J Neurophysiol • doi:10.1152/jn.00943.2014 • www.jn.org

during the baseline vs. activation (Fig. 2A, third column).Comparing these raw power spectra revealed three consis-tent phenomena, which will be quantitatively described inthe next sections:
1) 1/f� spectrum. The raw power spectrum could be approx-imated by a straight line on a double-logarithmic scale in abroad frequencies range (10–100 Hz) following previous find-ings (Dehghani et al. 2010; He et al. 2010; He 2014; Miller etal. 2009; Milstein et al. 2009).
2) � reduction upon activation. The slope of the approxi-mated power-spectrum line was smaller on activation. Wedescribe this broadband phenomenon as counter-clockwise“rotation” of the log-log activation spectrum relative tobaseline.
3) Band-limited peak modulations. An increase in band-limited power, superimposed on the 1/f� spectrum, appeared asa peak centered around frequencies of 80–120 Hz, particularlyduring the activation condition.
Figure 2C illustrates these three characteristics of the ECoGspectral response.
Separation Between the 1/f� Spectral Component and theBand-Limited Peaks
In order to quantitatively analyze the broadband activitychanges, we first separated the 1/f� component from the band-limited peaks superimposed on it. To extract the 1/f� in a robustmanner, we used the coarse graining spectral analysis (CGSA)introduced by Yamamoto and Hughson (Yamamoto and Hugh-
Fig. 1. Experimental setup. A: the sequence of a visuomotorparadigm: an image of a face was presented for 250 ms,followed by a random-time (1.5–4 s) blank interval followed byan auditory cue. The task was to identify the sex of a face, bypressing a button on auditory cue. Eighty-eight trials werepresented to each patient. B: recording sites locations (redpoints) were obtained from CT and MRI scans of each subject,superimposed on a single subject cortical reconstruction forgroup analysis (see MATERIALS AND METHODS). C: baseline andactivation ECoG signals were selected from the recorded timecourse (baseline: 500 ms prior stimulus onset; activation: 150–650 ms after stimulus onset). The raw data from 5 single trialsare shown (thin lines) and the event-related potential (ERP) isshown below in a thick line, averaged over 88 trials recordedfrom one electrode.
508 A UNIFYING PRINCIPLE FOR SPECTRAL RESPONSES
J Neurophysiol • doi:10.1152/jn.00943.2014 • www.jn.org
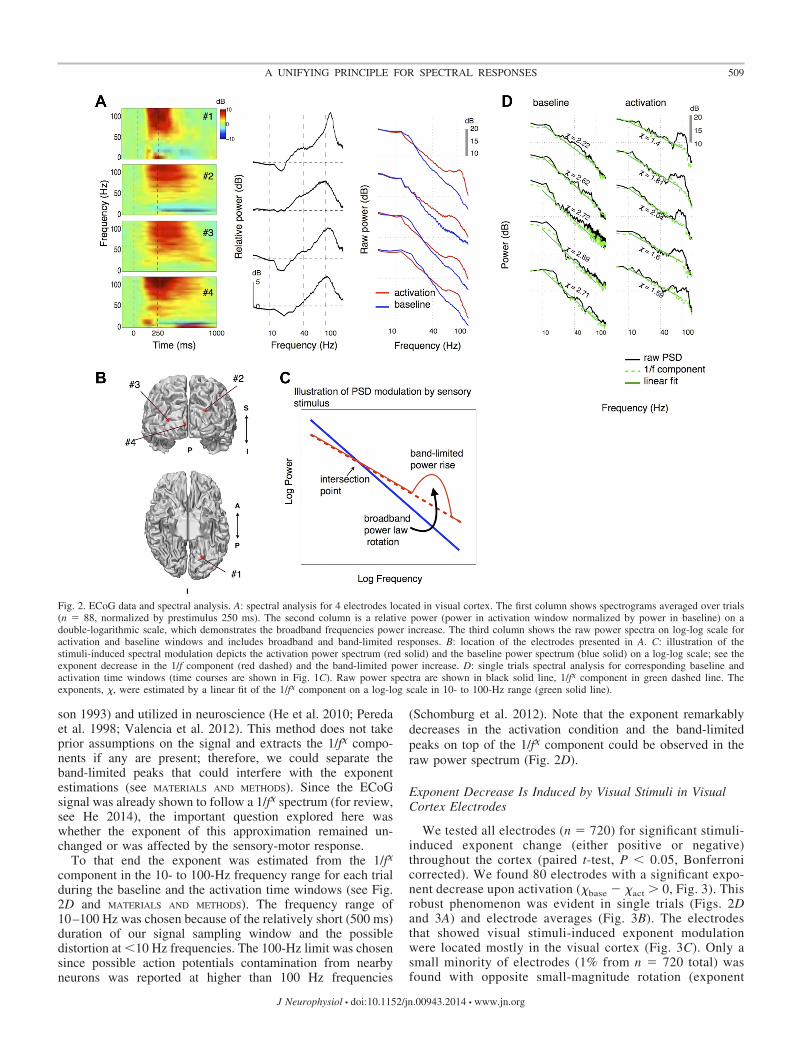
son 1993) and utilized in neuroscience (He et al. 2010; Peredaet al. 1998; Valencia et al. 2012). This method does not takeprior assumptions on the signal and extracts the 1/f� compo-nents if any are present; therefore, we could separate theband-limited peaks that could interfere with the exponentestimations (see MATERIALS AND METHODS). Since the ECoGsignal was already shown to follow a 1/f� spectrum (for review,see He 2014), the important question explored here waswhether the exponent of this approximation remained un-changed or was affected by the sensory-motor response.
To that end the exponent was estimated from the 1/f�
component in the 10- to 100-Hz frequency range for each trialduring the baseline and the activation time windows (see Fig.2D and MATERIALS AND METHODS). The frequency range of10–100 Hz was chosen because of the relatively short (500 ms)duration of our signal sampling window and the possibledistortion at �10 Hz frequencies. The 100-Hz limit was chosensince possible action potentials contamination from nearbyneurons was reported at higher than 100 Hz frequencies
(Schomburg et al. 2012). Note that the exponent remarkablydecreases in the activation condition and the band-limitedpeaks on top of the 1/f� component could be observed in theraw power spectrum (Fig. 2D).
Exponent Decrease Is Induced by Visual Stimuli in VisualCortex Electrodes
We tested all electrodes (n � 720) for significant stimuli-induced exponent change (either positive or negative)throughout the cortex (paired t-test, P � 0.05, Bonferronicorrected). We found 80 electrodes with a significant expo-nent decrease upon activation (�base � �act � 0, Fig. 3). Thisrobust phenomenon was evident in single trials (Figs. 2Dand 3A) and electrode averages (Fig. 3B). The electrodesthat showed visual stimuli-induced exponent modulationwere located mostly in the visual cortex (Fig. 3C). Only asmall minority of electrodes (1% from n � 720 total) wasfound with opposite small-magnitude rotation (exponent
Fig. 2. ECoG data and spectral analysis. A: spectral analysis for 4 electrodes located in visual cortex. The first column shows spectrograms averaged over trials(n � 88, normalized by prestimulus 250 ms). The second column is a relative power (power in activation window normalized by power in baseline) on adouble-logarithmic scale, which demonstrates the broadband frequencies power increase. The third column shows the raw power spectra on log-log scale foractivation and baseline windows and includes broadband and band-limited responses. B: location of the electrodes presented in A. C: illustration of thestimuli-induced spectral modulation depicts the activation power spectrum (red solid) and the baseline power spectrum (blue solid) on a log-log scale; see theexponent decrease in the 1/f component (red dashed) and the band-limited power increase. D: single trials spectral analysis for corresponding baseline andactivation time windows (time courses are shown in Fig. 1C). Raw power spectra are shown in black solid line, 1/f� component in green dashed line. Theexponents, �, were estimated by a linear fit of the 1/f� component on a log-log scale in 10- to 100-Hz range (green solid line).
509A UNIFYING PRINCIPLE FOR SPECTRAL RESPONSES
J Neurophysiol • doi:10.1152/jn.00943.2014 • www.jn.org

Fig. 3. 1/f� exponents are modulated by visual stimulus. A: 1/f� components for 9 example trials for one electrode with significant exponent modulation shownat 10- to 100-Hz frequency range (red � activation, blue � baseline, black dashed line � linear fit). B: example of 1/f� component averaged over trials for 3electrodes (88 trials) and all the trials average for electrodes with significant exponent decrease (n � 80). Different intersection points are possible (see arrows).The difference between the baseline and activation exponents are shown in insets. C: bar plot of percentage of electrodes with significant exponent decrease (n �80) in each brain area relative to all electrodes implanted in that area. The highest percentage of electrodes with significant rotation was in low-visual areas. D:distribution of intersection frequencies (28.3 � 17.4 Hz, � � �). E: distribution of raw power modulation above and below the intersection frequency (IF). Thepower at higher frequencies than intersection point is increasing relative to baseline (1.1 � 1.5 dB, P � 10�8) while the power below is decreasing (�0.8 � 1.3 dB,P � 10�5). F: mean relative power in 10- to 30-Hz range (top panel) and 40- to 100-Hz range vs. the intersection frequency. The higher was the intersectionfrequency, the bigger was the deviation from baseline (reduction) in low frequencies, while the opposite was true for the high frequencies, where the increasedpower was diminished at high intersection frequencies. G: rotation estimated in long (1 s) vs. short (0.5) intervals for all electrodes (gray). Significant positiverotation was found in 57 electrodes for both interval lengths (paired t-test, P � 0.05, Bonferroni corrected).
510 A UNIFYING PRINCIPLE FOR SPECTRAL RESPONSES
J Neurophysiol • doi:10.1152/jn.00943.2014 • www.jn.org

increase, Table 2). In Fig. 3B it is evident that the intersec-tion point between the baseline and activation 1/f� compo-nent, which indicates the frequency where the power re-mained constant during visual activation, could vary be-tween electrodes.
Furthermore, as is shown in Fig. 3F, there was a consistentrelationship between activation level (reflected in gammapower increase) and the location of the intersection point. Morespecifically, with higher gamma the frequency of the intersec-tion point shifted to lower values. The full distribution ofintersection frequencies was skewed toward the low frequen-cies (28.3 � 17.4 Hz, � � �, Fig. 3D); therefore as a result ofthe exponent decrease, the power above the intersection fre-quency increased, while the power below decreased uponactivation (Fig. 3E). The values of exponents averaged overtrials were in the range of 1.6 –3.2, consistent with thevalues previously reported in ECoG studies (He at al. 2010;Miller et al. 2009). The exponent decrease was found in allpatients and the average number of electrodes per patientwas 13.4 � 6.4 electrodes (� � �, n � 6). The differencesin number of electrodes were expected because of thedifferent electrodes coverage, which was determined solelyby clinical needs.
To verify possible spectral analysis edge effects, wetested the exponent modulation using only 1st- and 2nd-order symmetrical tapers. Of 80 electrodes with significantpositive rotation that were found with 5 tapers, 76 were alsosignificant using 2 tapers (paired t-test, P � 0.05, Bonfer-roni corrected for number of electrodes, n � 720). Only 2electrodes were significant with 2 tapers but not 5. Next, we
tested the stability of exponent modulation for longer timewindows. In this case we reduce the edges differencesbetween activation and baseline trials, but also add a non-active period into the activation window. Therefore, whentaking longer intervals, we expect the result to be affectednot just by the activation window edge, but also by the shortduration (�400 ms) of the responses. The baseline andactivation windows were defined at 1 s length. Only baselinetrials uninterrupted by motor response to previous stimuluswere taken into account and only activation windows unin-terrupted by the auditory cue. While the rotation magnitudein the 1-s intervals was smaller for most significant elec-trodes (Fig. 3G) we found significant positive rotation in 57of 80 electrodes tested on 500-ms intervals (paired t-test,P � 0.05, Bonferroni corrected).
We also examined all electrodes with a significant rawpower modulation in any frequency in the range of 10–100 Hz(n � 293, see MATERIALS AND METHODS). We found a significantaverage exponent decrease over this population [Fig. 4A,paired t-test, �base � �act � 0.1 � 0.17 (� � �), P � 10�20].Examining the goodness of linear model (explained variance)of the 1/f� component showed remarkable levels of 96.5 �1.2% and 96.4 � 1.3% (� � �) for activation and baseline,respectively (Fig. 4B and MATERIALS AND METHODS). The histo-gram of frequencies with significant raw power increases anddecreases over the entire population of electrodes (Fig. 4C,permutation test, see MATERIALS AND METHODS) reveals that thefrequency which showed the minimal change in power uponactivation centered around �35 Hz (arrow).
Table 2. Average responses
Effect on Activation VIS VIS Face VIS Pattern VIS House VIS Object AUD MOT
1/f componentNo. of electrodes, �
decrease 80 56 17 47 36 48 79No. of electrodes, �
increase 10 0 0 1 0 1 4Rotation �base � �act 0.31 � 0.1 0.38 � 0.2 0.52 � 0.2 0.48 � 0.2 0.45 � 0.1 0.25 � 0.1 0.1 � 0.16Intersection
frequency, Hz 28.3 � 17.4 27.7 � 13.2 28.4 � 9.9 26.3 � 10.6 29.3 � 12.9 42.4 � 20.1 59.3 � 25.7Main location Low visual Low visual Low visual Low visual Low visual Motor Auditory Motor
Somatosensory
GammaNo. of electrodes
with peak 42 23 21 29 23 6 6Peak power 0.82 � 1.02 0.78 � 0.66 1.02 � 0.72 0.79 � 0.57 0.78 � 0.46 ND NDPeak frequency, Hz 87.5 � 11.7 83.2 � 9.7 75.6 � 13.7 80.4 � 13.9 79 � 15.6 ND NDMain location Low visual Low visual Low visual Low visual Low visual ND ND�act peak corr coeff �0.38, P � 0.012 �0.61, P � 0.003 Not
significant�0.39, P � 0.05 �0.66, P � 10�3 ND ND
AlphaNo. of electrodes
peak decrease 72 40 5 23 22 58 57No. of electrodes
peak increase 3 1 0 4 1 2 3Peak power on
activation 40.2 � 50.4 20.2 � 19.5 ND 13 � 11.4 31.6 � 37.9 29.1 � 25.3 27.9 � 22.5Peak frequency, Hz 11.7 � 0.9 11.3 � 1.2 ND 10.8 � 1.6 10.7 � 1.7 11.8 � 0.9 11.9 � 0.3Main location Low visual Low visual ND Low visual Low visual Motor
SomatosensoryMotor
Somatosensory�act peak corr coeff 0.51, P � 10�5 0.62, P � 10�4 ND Not significant 0.60, P � 0.005 0.65, P � 10�7 0.3, P � 0.05
Values are means � SD. VIS, visual responses to faces in visuomotor experiment and categories in object recognition (face, patterns, houses, and objects);AUD, responses to auditory cue; MOT, responses to button press; ND, not enough responsive electrode available, n � 6.
511A UNIFYING PRINCIPLE FOR SPECTRAL RESPONSES
J Neurophysiol • doi:10.1152/jn.00943.2014 • www.jn.org
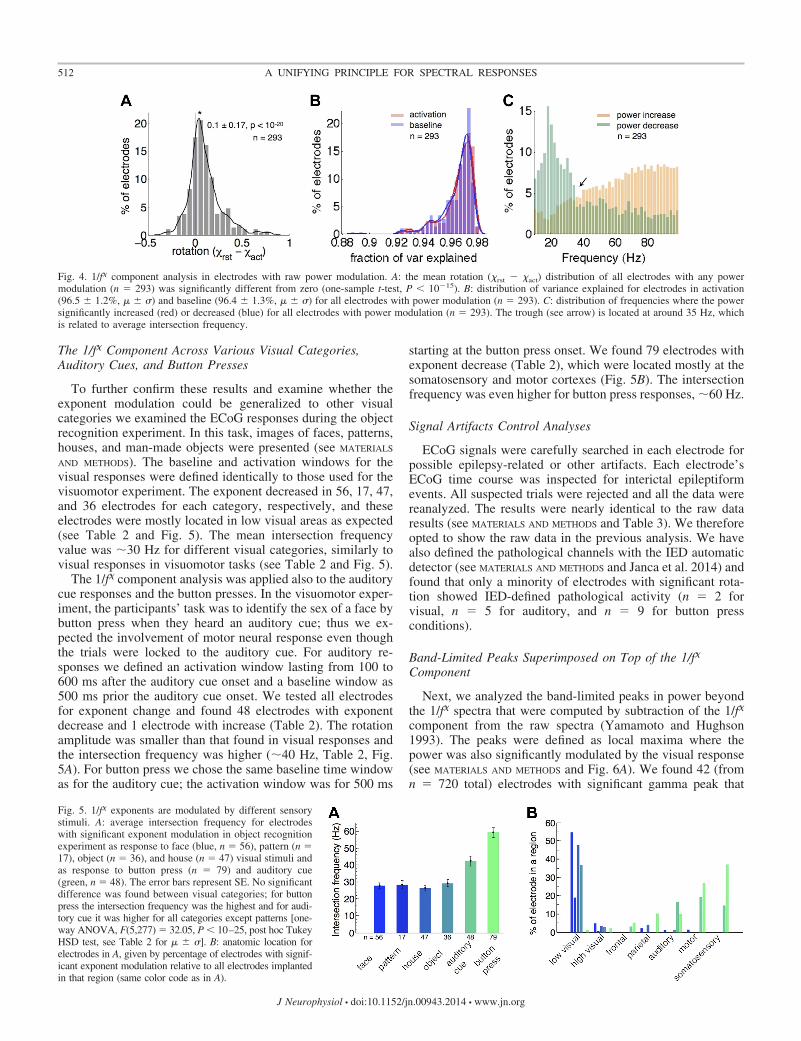
The 1/f� Component Across Various Visual Categories,Auditory Cues, and Button Presses
To further confirm these results and examine whether theexponent modulation could be generalized to other visualcategories we examined the ECoG responses during the objectrecognition experiment. In this task, images of faces, patterns,houses, and man-made objects were presented (see MATERIALS
AND METHODS). The baseline and activation windows for thevisual responses were defined identically to those used for thevisuomotor experiment. The exponent decreased in 56, 17, 47,and 36 electrodes for each category, respectively, and theseelectrodes were mostly located in low visual areas as expected(see Table 2 and Fig. 5). The mean intersection frequencyvalue was �30 Hz for different visual categories, similarly tovisual responses in visuomotor tasks (see Table 2 and Fig. 5).
The 1/f� component analysis was applied also to the auditorycue responses and the button presses. In the visuomotor exper-iment, the participants’ task was to identify the sex of a face bybutton press when they heard an auditory cue; thus we ex-pected the involvement of motor neural response even thoughthe trials were locked to the auditory cue. For auditory re-sponses we defined an activation window lasting from 100 to600 ms after the auditory cue onset and a baseline window as500 ms prior the auditory cue onset. We tested all electrodesfor exponent change and found 48 electrodes with exponentdecrease and 1 electrode with increase (Table 2). The rotationamplitude was smaller than that found in visual responses andthe intersection frequency was higher (�40 Hz, Table 2, Fig.5A). For button press we chose the same baseline time windowas for the auditory cue; the activation window was for 500 ms
starting at the button press onset. We found 79 electrodes withexponent decrease (Table 2), which were located mostly at thesomatosensory and motor cortexes (Fig. 5B). The intersectionfrequency was even higher for button press responses, �60 Hz.
Signal Artifacts Control Analyses
ECoG signals were carefully searched in each electrode forpossible epilepsy-related or other artifacts. Each electrode’sECoG time course was inspected for interictal epileptiformevents. All suspected trials were rejected and all the data werereanalyzed. The results were nearly identical to the raw dataresults (see MATERIALS AND METHODS and Table 3). We thereforeopted to show the raw data in the previous analysis. We havealso defined the pathological channels with the IED automaticdetector (see MATERIALS AND METHODS and Janca et al. 2014) andfound that only a minority of electrodes with significant rota-tion showed IED-defined pathological activity (n � 2 forvisual, n � 5 for auditory, and n � 9 for button pressconditions).
Band-Limited Peaks Superimposed on Top of the 1/f�
Component
Next, we analyzed the band-limited peaks in power beyondthe 1/f� spectra that were computed by subtraction of the 1/f�
component from the raw spectra (Yamamoto and Hughson1993). The peaks were defined as local maxima where thepower was also significantly modulated by the visual response(see MATERIALS AND METHODS and Fig. 6A). We found 42 (fromn � 720 total) electrodes with significant gamma peak that
Fig. 4. 1/f� component analysis in electrodes with raw power modulation. A: the mean rotation (�rst � �act) distribution of all electrodes with any powermodulation (n � 293) was significantly different from zero (one-sample t-test, P � 10�15). B: distribution of variance explained for electrodes in activation(96.5 � 1.2%, � � �) and baseline (96.4 � 1.3%, � � �) for all electrodes with power modulation (n � 293). C: distribution of frequencies where the powersignificantly increased (red) or decreased (blue) for all electrodes with power modulation (n � 293). The trough (see arrow) is located at around 35 Hz, whichis related to average intersection frequency.
Fig. 5. 1/f� exponents are modulated by different sensorystimuli. A: average intersection frequency for electrodeswith significant exponent modulation in object recognitionexperiment as response to face (blue, n � 56), pattern (n �17), object (n � 36), and house (n � 47) visual stimuli andas response to button press (n � 79) and auditory cue(green, n � 48). The error bars represent SE. No significantdifference was found between visual categories; for buttonpress the intersection frequency was the highest and for audi-tory cue it was higher for all categories except patterns [one-way ANOVA, F(5,277) � 32.05, P � 10–25, post hoc TukeyHSD test, see Table 2 for � � �]. B: anatomic location forelectrodes in A, given by percentage of electrodes with signif-icant exponent modulation relative to all electrodes implantedin that region (same color code as in A).
512 A UNIFYING PRINCIPLE FOR SPECTRAL RESPONSES
J Neurophysiol • doi:10.1152/jn.00943.2014 • www.jn.org

centered around 90 Hz [87.5 � 11.7 Hz (� � �), Fig. 6A,inset].
The height of the gamma peak in these electrodes wassignificantly correlated to the average relative power in thegamma range (Fig. 6B). In contrast, the correlation betweenpeak height and peak frequency was not significant, which iscomparable to a recent study in monkeys (Jia et al. 2013). Asexpected, due to the correlation between relative gamma powerand gamma peak, the electrodes with gamma peaks werelocated mostly in the visual cortex (Fig. 6D). We found also 72electrodes with significant decrease in the alpha peak [11.7 �0.9 Hz (� � �)] upon activation (Table 2); the differencebetween alpha peaks in baseline and activation conditions wascorrelated to relative power in alpha range (Fig. 6C). Theseelectrodes were located mostly in low-order visual areas (Fig.6E). The gamma peaks were found in 7 � 7.3 electrodes andalpha peaks in 12 � 6.4 electrodes per patient (� � �, n � 6).The differences in number of electrodes were expected becauseof the different electrodes coverage, which was determinedsolely by clinical needs.
Similar results were found for the different categories in theobject recognition experiment, except the “patterns” condition(see MATERIALS AND METHODS) where only 5 electrodes hadalpha peak decrease (Table 2 and Fig. 7). The electrodes with
alpha and gamma peaks were located mostly in the visualcortex. In the responses for auditory cue and button presses, wefound 57 and 58 electrodes with significant modulation of thealpha peaks beyond the 1/f� component (Table 2) but only 6electrodes with a significant gamma peak. Most electrodes witha significant modulation of the gamma peak or the alpha peakwere located at the auditory, somatosensory, and motor cor-texes, as expected (Table 2).
Control Analyses for Potential Band-Limited Peak Artifacts
It could be argued that the reduction we found in the 1/f�
exponent was merely a consequence of the emergence of theband-limited gamma peaks during activation. If this were thecase, the 1/f� component would be contaminated by the strongband-limited gamma increase during activation, leading toapparent reduction in exponent levels. One argument againstthis possibility relates to the goodness of fit for baseline andactivation 1/f� components. Distortion of the activation 1/f�
component induced by the band-limited power changes shouldbe expected in the range of 60–100 Hz, leading to reduced fit,if there were a substantial “leakage” from the band-limitedbumps onto the linear 1/f� component. We examined theelectrodes for a difference in goodness of fit between baseline
Table 3. Average responses after epileptic artifacts rejection
Effect on Activation VIS VIS Face VIS Pattern VIS House VIS Object AUD MOT
1/f componentNo. of electrodes, positive rotation 74 56 15 46 36 42 75No. of electrodes, negative rotation 9 0 0 1 0 2 3Rotation �base � �act 0.33 � 0.15 0.38 � 0.2 0.52 � 0.2 0.48 � 0.2 0.45 � 0.1 0.26 � 0.1 0.33 � 0.18Intersection frequency, Hz 28.2 � 18.8 27.7 � 13.2 29.1 � 10.4 26.2 � 10.7 29.3 � 12.9 43.7 � 15.7 60.3 � 26.1Main location Low visual Low visual Low visual Low visual Low visual Motor auditory Motor somatosensory
Values are means � SD. VIS, visual responses to faces in visuomotor experiment and categories in object recognition; AUD, responses to auditory cue; MOT,responses to button press.
Fig. 6. Band-limited power was modulated during visual response. A: the residual power after 1/f� component removal is shown for 5 electrodes averaged overtrials, for baseline (blue) and activation (red) conditions. The band-limited peaks are visible in the alpha and the gamma range, and their frequency value is shown.Distribution of peak frequencies in the gamma range is shown in inset. B: mean relative gamma power and band-limited peak heights were correlated. C: meanrelative alpha power and difference between alpha band-limited peaks heights in baseline and activation were correlated. D: bar plot of percentage of electrodeswith a band-limited gamma peak in each brain area relative to all electrodes implanted in that area. The highest percentage of electrodes is located in low-visualareas. E: bar plot of percentage of electrodes with a decreased band-limited alpha peak in each brain area relative to all electrodes implanted in that area. Thehighest percentage of electrodes is located in low-visual areas.
513A UNIFYING PRINCIPLE FOR SPECTRAL RESPONSES
J Neurophysiol • doi:10.1152/jn.00943.2014 • www.jn.org

and activation trials specifically in the range of 60–100 Hz,where the harmonic amplitude changes occurred. We foundonly 6 electrodes with a significant fit difference betweenbaseline and activation (permutation test, P � 0.05, Bonferronicorrected for number of tested electrodes, n � 720). Thegoodness of fit was better in activation condition in 1 electrode.The goodness of fit was better in baseline condition in 5electrodes, but only one of these electrodes showed a signifi-cant gamma peak and rotation.
A second argument against the possibility that the exponentchange was a consequence of the band-limited peaks modula-
tions is the finding that a significant exponent change wasobserved even in electrodes showing no such changes. Wefound electrodes that showed a significant rotation but nogamma peaks (n � 41) and a significant rotation but nosignificant alpha peak decrease (n � 50).
Finally, a simulation was conducted specifically aimed atruling out the possibility of slope contamination by the gammapeaks as follows. Based on the power spectra during baselinederived from all electrodes with a significant gamma peak androtation (n � 39), a “synthetic” sensory-driven power spectrasimulation was generated. This simulated power spectra wasconstructed by adding a mixture of sine waves simulating thegamma “bumps” to baseline time course obtained in the no-stimulus condition (see Fig. 8 and MATERIALS AND METHODS).The location of this synthetic peak was at a similar frequencyand with the same amplitude as the maximal point in harmonicpower found in the activation trials. Having generated thus anECoG power spectrum function with band-limited power dis-tortions similar to the sensory responses, we ran our analysison this simulated “chimera” signal (see Fig. 8A). We definedsynthetic rotation as the difference between the exponents of thebaseline 1/f� component and the one generated by the syntheticpower spectrum. Had the gamma peak caused the rotation, thesynthetic rotation should have been similar to the actually mea-sured one. In contrast, we found that the synthetic rotation wasdrastically smaller than the real one. Thus, while the meansynthetic rotation was 0.06 � 0.04 (� � �, n � 39), the realrotation measured was 6.8-fold larger (0.40 � 0.16, � � �,n � 39). The difference was highly significant in the vastmajority (95%) of electrodes (paired t-test, � � 0.05, Bonfer-roni corrected, n � 39). Figure 8B depicts a scatterplot show-ing the measured exponent rotation derived from the trueactivated spectra (y-axis) vs. the exponent derived from thesynthetic “bump” simulation described above (x-axis). Similaranalysis was done for electrodes that showed both a significantdecrease in alpha peak and a significant rotation (n � 30). Thesynthetic rotation was 0.09 � 0.06 (� � �, n � 30), signifi-cantly lower than real measured rotation 0.35 � 0.18 (� � �,
Fig. 7. Band-limited power modulation in object-recognition experiment. A:gamma peak frequency was �80 Hz for different visual categories: face (n �23), pattern (n � 21), house (n � 29), and object (n � 23); error bars for SE.No significant difference was found between categories [one-way ANOVA,F(3,102) � 1.58, P � 0.19, see Table 2 for � � �]. B: anatomic location ofelectrodes with emerged gamma peak given by percent of electrodes withsignificant gamma peak relative to all electrodes implanted in that area. Mostelectrodes were located at low visual areas. C: same as B but for electrodeswith significant alpha peak decrease.
Fig. 8. Band-limited peaks in the gamma range did not affect the rotation. A:example of raw spectra for single trials of measured data, baseline (blue) andactivation (red). Raw spectra for synthetic trials, which include the syntheticharmonic peak that was added to baseline time course, is shown in orange. Thelinear model of the 1/f component appears in dashed colored lines. B:scatterplot of measured vs. synthetic rotation, with dashed unitary line. Mea-sured rotation (� � 0.4) was computed as the difference in the baseline andactivation exponents, averaged over trials. Synthetic rotation (� � 0.06) is thedifference between exponents in baseline and synthetic trials. The exponentswere extracted from the 1/f component as described in MATERIALS AND
METHODS.
514 A UNIFYING PRINCIPLE FOR SPECTRAL RESPONSES
J Neurophysiol • doi:10.1152/jn.00943.2014 • www.jn.org

n � 30) in 27 of the 30 electrodes (90%, paired t-test, � �0.05, Bonferroni corrected).
1/f� Exponent and Band-Limited Peak Height
Comparing the main components of spectral responses—exponents, band-limited gamma, and alpha peak heights—revealed a significant correlation. The agreement was alsoevident in the substantial overlap of the spatial locations ofthe electrodes showing each of these parameter’s changes(Fig. 9A). We found negative correlation between the gammapeak height and the exponent during activation (r � �0.38,P � 0.02) (Fig. 9B) and similar correlation was found in theobject recognition experiment for faces, houses, and objects,but not patterns (Table 2). We found a positive correlationbetween the alpha peak height and the exponent (r � 0.51, P �10�5) and a similar correlation for the object recognition
experiment except for the responses to houses (Table 2). Forauditory responses and button presses we found a correlationbetween alpha peak height and the activation exponent value,comparable to the correlation we found in visual responses(Table 2), but we did not have a sufficient number of gammapeaks for similar analysis (n � 6). The distributions of theexponents in electrodes with significant alpha and gammapeaks were significantly different (Fig. 9D), where gammapeaks occurred in electrodes with lower exponents on activa-tion.
Next we compared the exponent change in the population ofelectrodes that had significant exponent change but did notshow a significant gamma peak with those that did. Our resultsshow a significant difference in the rotation value (�base � �act)of the two populations: 0.17 � 0.13 (n � 46) vs. 0.3 � 0.2(n � 34) (2-sample t-test, P � 0.005), respectively. The
Fig. 9. Band-limited peaks and broadband power relation. A: inflated map of the cortex with the electrodes colored by rotation magnitude (�rst � �act), and gammaand alpha band-limited peaks heights. B: gamma band-limited peak height was significantly correlated to the exponent during activation. C: alpha band-limitedpeak height was significantly correlated to the exponent during activation. D: the distributions of exponents of activation window for electrodes with emergedgamma peak (2.05 � 0.2, � � �) and electrodes with reduced alpha peaks (2.5 � 0.3, � � �) were significantly different (2-sample t-test, P � 10�13).
515A UNIFYING PRINCIPLE FOR SPECTRAL RESPONSES
J Neurophysiol • doi:10.1152/jn.00943.2014 • www.jn.org

exponents on activation were lower for electrodes with gammapeaks (2.1 � 0.3, n � 34) than in electrodes with no significantpeak (2.5 � 0.3, n � 46) (2-sample t-test, P � 10�7). Thus thegamma peaks occurred only in electrodes with largest rotationand lowest exponent on activation.
DISCUSSION
Our analysis of ECoG signals reveals that the complexdynamics of mass neuronal activation is reflected in two maineffects: first, a reduction in the 1/f� exponent in the broad rangeof frequencies of 10–100 Hz (rotation); and second, modula-tion of band-limited power peaks, i.e., emergence of a peak inhigh gamma and decrease of the alpha peak amplitude. Theband-limited peaks’ heights were correlated with the exponenton activation, where the significant gamma peaks emerged inelectrodes with lower exponents and higher rotation. Theseeffects were found across the cortex and in responses to variousvisual categories, auditory and motor activity.
To the best of our knowledge, this is the first study to reporta reduction in 1/f� exponent as a consistent signature ofneuronal activity in ECoG recordings. We found such expo-nent change across different cortical areas and tasks. Further-more, a major advantage of this phenomenon is its dependenceon a broad range of frequencies, suggesting it may serve as areliable and sensitive means to assess neuronal activations inLFP and ECoG recordings.
It could be argued that the exponent reduction we observedwas merely an artifact of the specific analysis employed, i.e.,the approximation to a 1/f function may have suffered fromdistortions imposed by the high, band-limited gamma peaksthat emerge in the activated electrodes. Three results argueagainst this trivial account. First, if our 1/f estimation proce-dure were inadequate in the face of the gamma peak distor-tions, we would expect a reduction in the fit of the estimate ofthe undistorted baseline, compared with the distorted, activestate. Only one electrode with both rotation and band-limitedgamma peak showed better goodness of fit during baseline thanin the activation condition in the range of 60–100 Hz. Second,imposing severe distortions, of similar magnitude both in thegamma peaks generated as well as alpha peak decreases uponactivation, in simulated data failed to reproduce the magnitudeof exponent changes that could explain the measured rotations(Fig. 8). Finally, significant exponent changes were observedalso in electrodes in which no significant gamma distortion wasobserved (n � 41) and similarly, significant rotation wasobserved in electrodes in the absence of a significant alphapeak decrease (n � 50), further confirming that the exponentchange was not a direct consequence of the gamma bumps. Theresults were stable also for the first two symmetrical tapersanalysis and for longer intervals of 1 s, thus arguing against amajor role for edge effects. Thus we can safely conclude thatthe exponent reduction is a separate cortical phenomenon thatis correlated, but not a direct outcome of the analysis procedureof the band-limited gamma peaks.
Two previous studies examined the possibility of an expo-nent shift in the ECoG power spectrum during a motor task inpatients; however, in contrast to our findings, these studiesreported a constant exponent in the 10- to 100-Hz frequencyrange (He et al. 2010; Miller et al. 2009). The difference maybe due to examining power spectra averages, which may not
reflect accurately the power spectra of single trials
�log�i�1N 1� f xi �i�1
N log�1� f xi��. Alternatively, the differ-ence may be due to longer sampling durations. These differencessuggest that the exponent modulation reported here might be ashort-lived phenomenon that is compatible with the short timewindow needed for most neuronal computations (tens to hundredsof milliseconds). He et al. found an exponent decrease in ultra-lowfrequencies of the spectrum (�0.01 Hz), which was induced bybutton presses tasks. Unfortunately, our experiments did not allowsuch long time scales. An additional study tested the modulationin exponents of intracellular recordings in cat’s visual cortex invivo (El Boustani et al. 2009). The authors found that the expo-nent was not constant, but was modulated by the statistics of thepresented visual stimuli. We confirm this finding in human extra-cellular neural population activity and extend it to motor andauditory modalities.
What could be the underlying electrophysiological processesthat lead to the observed exponent decrease? Attempting torelate the observed changes to cortical organization, it shouldbe noted that the cortex contains a rich connectivity pattern;thus the spiking activity of groups of neurons is not indepen-dent—instead, it is correlated on a range of time scales (Decoet al. 2011; Smith and Kohn 2008). A plausible source of the1/f� spectrum might be a distribution of these timescales. Wefound that the exponent decreases during sensory and motorresponses, reflecting a shift of power towards higher frequen-cies. This phenomenon could appear when pairwise cross-correlations occur on shorter time scales during neuronal acti-vation, thus generating faster fluctuations (Abeles 1991; Abe-les et al. 1995; Bair et al. 2001; de la Rocha et al. 2007;Gutnisky and Dragoi 2008; Ostojic et al. 2009; Tan et al.2014). Furthermore, attentional effects, which are likely to begenerated during the visual activation period, have been shownto reduce the amplitude of slow fluctuations in neuronal firing(Churchland et al. 2010). Such effect may be reflected inbroadband low frequencies and thus further enhance the expo-nent reduction observed in the power spectra during the visualactivation period.
Another possibility could relate the power spectrum to theshape of synaptic potentials. Our analysis suggests that thesynaptic potential rise and decay time constants would beshorter upon cortical activation. This process is expected due tothe higher membrane conductance levels that are associatedwith high levels of postsynaptic excitations during neuronalactivations (Mitchell and Silver 2003) that will lead to fastermembrane potential fluctuations. However, the exact shape ofthe synaptic potential and its time constants distribution in thehuman cortex are unknown; therefore its relationship to thepower spectrum of population signals remains to be studied.
Miller et al. proposed a model that explains the changes inECoG signals upon activation as a uniform broadband increasein power spanning all frequency bands, which is concurrentlysculpted by a band-limited reduction in power at the alpha-betarange (Miller et al. 2009). The latter effect has been considereda separate mechanism, similarly to the alpha block or theevoked response desynchronization (Crone et al. 1998a) phe-nomenon. Compatible with this model, our data indeed show adecrease in alpha-beta power concurrently with the gammapower increase. However, we show that in parallel to thesefrequency-specific changes there was a more uniform effect,
516 A UNIFYING PRINCIPLE FOR SPECTRAL RESPONSES
J Neurophysiol • doi:10.1152/jn.00943.2014 • www.jn.org

i.e., the exponent change that spanned from the alpha to thegamma bands.
The exponent modulation phenomenon was consistent overmodalities; however, the intersection points of the “rotation,”i.e., the frequencies in which no power change was observedupon stimulation which constitute the transition between thetask-driven increases and decreases in power, were different:�30 Hz for visual responses and �40 Hz and �60 Hz forauditory and motor, respectively (Fig. 5A, Table 2). Theintersection frequency was also inversely related to the in-crease in gamma power. The intersection point relation tomotor behavior was reported by Miller et al. (Miller et al.2008); however, this phenomenon was hypothesized to origi-nate in uniform power spectrum increase (constant exponent)and separate low-frequencies filtering. Our findings suggestthat the phenomenon of alpha block is not a separate mecha-nism, but rather one component in a process that consists alsoof a rotation of the 1/f� component or the entire 10- to 100-Hzspectrum, leading to a reduction in power below the intersec-tion frequency and increased power above it (Fig. 3, E and F).Under this formulation, the larger spatial spread of the ERDphenomena compared with the gamma increase (Crone et al.1998b) may be explained by the larger anatomical spread(including spreading across the skull boundary) of low fre-quencies compared with the localized nature of high-frequencygamma oscillations. Such differential anatomical spread islikely due to higher signal phase cancellations (due to, e.g.,small temporal jitter in signal conduction times) that areexpected to occur at high but not at low frequencies overdistance. However, more studies are needed to clarify the basisof such differences in spatial spread.
The second task-driven phenomenon we describe is anincrease in band-limited power (“peaks”) at a high gammafrequency range and the decrease of a peak in low (alpha)frequencies. Our results are in agreement with previous find-ings of narrow band gamma increases to the extent that we see,particularly under high exponent changes, a band-limited in-crease in power (see Figs. 2 and 6). However, in our data,recorded from human cortex, the frequency of this band-limited peak centered around higher gamma frequencies, i.e.,80–100 Hz rather than the 35–85 Hz typically found inmonkey and cat studies (Eckhorn et al. 1988; Gray and Singer1989; Henrie and Shapley 2005). Recently it was proposed,based on recordings in nonhuman primates, that moving fromthe anesthetized to the awake state causes a shift in the gammapeaks to higher frequencies (Xing et al. 2012), which maypartially account for our observed discrepancy. The source ofthe observed band-limited gamma power increase is not clear.In our analysis it was specific to the cases where the exponentreduction was particularly high. The effect may reflect a sort of“resonance” or synchronization of neurons, comparable tonarrow band 40-Hz synchronization (Fries et al. 2001), butshifted to higher frequencies in the human cortex. However, analternative explanation is spectral leakage of actual spikingactivity, which has been shown to contain frequencies in thehigh gamma range (Scheffer-Teixeira et al. 2013; Schomburget al. 2012). Finally, a simple network mechanism that couldgenerate a gamma peak effect was proposed in a recent study(Xing et al. 2012) demonstrating that gamma peaks could bewell simulated by a simple recurrent excitatory-inhibitory net-
work, implementing essentially a filter that integrates randomnoise inputs.
Our results reveal a significant correlation between theexponent reduction and the increase in harmonic peak ampli-tude during the active state. Since, as described above, boththese phenomena appear to depend on the level of neuronalactivation, the link between the harmonic peak and the expo-nent change may simply be derived from this common sourcedriving both phenomena. For example, in the modeling work ofXing et al. (Xing et al. 2012) the amplitude of the gammaharmonic peaks strongly depended on the level of inputs to thesimulated network. In parallel, higher activity leads to reducedslow fluctuations (Churchland et al. 2010), generating a con-current reduction in power spectrum exponent. However, sincethe precise mechanisms that underlie these two phenomena arenot fully clarified yet, the source of the link between themremains to be fully elucidated as well.
In our study, we demonstrate a neuronal response thatunifies the power modulations across different frequencybands. However, it is important to emphasize that such unifor-mity does not necessarily rule out the possibility of frequency-specific information transfer as well. For example, Belitski andcolleagues examined LFP power spectra recorded from theprimary visual cortex of anesthetized macaques (Belitski et al.2008) and found that the presentation of naturalistic colormovies elicited power modulations that conveyed complemen-tary information about the stimuli in low and high frequencies.In our model, the regulation of frequency bands is mediated byan intersection point and an exponent, which can vary ondifferent stimuli and in different electrodes.
It is important to emphasize that our analysis does not ruleout the possibility that alternative, more complex, power spec-trum function may actually fit the ECoG data better. However,the exponent change provides a straightforward fit to the dataand may prove to be a sensitive new means for detectingneuronal activations in ECoG and LFP responses. Furthermore,the correlation found between the changes in exponent and theamplitude of the band-limited peaks suggests the possibility offurther functional links between these seemingly separate ex-pressions of neuronal activation.
ACKNOWLEDGMENTS
We thank Prof. M. Abeles for helpful discussions and comments on themanuscript. We thank Dr. M. Ramot for reviewing the manuscript and helpingus to improve it. We thank the participants for volunteering to take part in thestudy.
GRANTS
This work was funded by the EU FP7 VERE, ICORE program (ISF 51/11),HBP flagship grants, and the Helen and Martin Kimmel Award to R. Malach.
DISCLOSURES
No conflicts of interest, financial or otherwise, are declared by the author(s).
AUTHOR CONTRIBUTIONS
Author contributions: E.P., N.N., C.E.S., A.D.M., M.T., and R.M. concep-tion and design of research; E.P. and M.H. analyzed data; E.P., G.C., A.D.M.,M.T., and R.M. interpreted results of experiments; E.P. prepared figures; E.P.and R.M. drafted manuscript; E.P., N.N., M.H., G.C., C.E.S., A.D.M., M.T.,and R.M. edited and revised manuscript; E.P., N.N., S.B., G.C., C.E.S.,
517A UNIFYING PRINCIPLE FOR SPECTRAL RESPONSES
J Neurophysiol • doi:10.1152/jn.00943.2014 • www.jn.org

A.D.M., M.T., and R.M. approved final version of manuscript; S.B. andA.D.M. performed experiments.
REFERENCES
Abeles M, Bergman H, Gat I, Meilijson I, Seidemann E, Tishby N, VaadiaE. Cortical activity flips among quasi-stationary states. Proc Natl Acad SciUSA 92: 8616–8620, 1995.
Abeles M. Corticonics: Neural Circuits of the Cerebral Cortex. New York:Cambridge University Press, 1991.
Bair W, Zohary E, Newsome WT. Correlated firing in macaque visual areaMT: time scales and relationship to behavior. J Neurosci 21: 1676–1697,2001.
Bak P, Tang C, Wiesenfeld K. Self-organized criticality: an explanation of 1/fnoise. Phys Rev Lett 59: 381–384, 1987.
Bédard C, Destexhe A. Macroscopic models of local field potentials and theapparent 1/f noise in brain activity. Biophys J 96: 2589–2603, 2009.
Bédard C, Kröger H, Destexhe A. Modeling extracellular field potentials andthe frequency-filtering properties of extracellular space. Biophys J 86:1829–1842, 2004.
Belitski A, Gretton A, Magri C, Murayama Y, Montemurro a M, Logo-thetis NK, Panzeri S. Low-frequency local field potentials and spikes inprimary visual cortex convey independent visual information. J Neurosci 28:5696–5709, 2008.
Berger H. Ueber das Elektrenkephalogramm des Menschen. Arch PsychiatrNervenkr 87: 527–570, 1929.
El Boustani S, Marre O, Béhuret S, Baudot P, Yger P, Bal T, Destexhe A,Frégnac Y. Network-state modulation of power-law frequency-scaling invisual cortical neurons. PLoS Comput Biol 5: e1000519, 2009.
Buzsáki G, Draguhn A. Neuronal oscillations in cortical networks. Science304: 1926–1929, 2004.
Buzsaki G. Rhythms of the Brain. New York: Oxford University Press, 2006.Chatrian GE. The mu rhythm. In: Handbook of Electroencephalography
Clinical Neurophysiology: The EEG in the Waking Adult, edited by Rey-mond A. Amsterdam, The Netherlands: Elsevier, 1976. p. 46–69.
Churchland MM, Yu BM, Cunningham JP, Sugrue LP, Cohen MR,Corrado GS, Newsome WT, Clark AM, Hosseini P, Scott BB, BradleyDC, Smith a M, Kohn A, Movshon JA, Armstrong KM, Moore T,Chang SW, Snyder LH, Lisberger SG, Priebe NJ, Finn IM, Ferster D,Ryu SI, Santhanam G, Sahani M, Shenoy KV. Stimulus onset quenchesneural variability: a widespread cortical phenomenon. Nat Neurosci 13:369–78, 2010.
Crone NE, Boatman D, Gordon B, Hao L. Induced electrocorticographicgamma activity during auditory perception. Clin Neurophysiol 112: 565–582, 2001.
Crone NE, Miglioretti DL, Gordon B, Lesser RP. Functional mapping ofhuman sensorimotor cortex with electrocorticographic spectral analysis. II.Event-related synchronization in the gamma band. Brain 121: 2301–2315,1998a.
Crone NE, Miglioretti DL, Gordon B, Sieracki JM, Wilson MT, UematsuS, Lesser RP. Functional mapping of human sensorimotor cortex withelectrocorticographic spectral analysis. I. Alpha and beta event-relateddesynchronization. Brain 121: 2271–2299, 1998b.
Deco G, Jirsa VK, McIntosh AR. Emerging concepts for the dynamicalorganization of resting-state activity in the brain. Nat Rev Neurosci 12:43–56, 2011.
Dehghani N, Bédard C, Cash SS, Halgren E, Destexhe A. Comparativepower spectral analysis of simultaneous elecroencephalographic and mag-netoencephalographic recordings in humans suggests non-resistive extracel-lular media. J Comput Neurosci 29: 405–421, 2010.
De la Rocha J, Doiron B, Shea-Brown E, Josic K, Reyes A. Correlationbetween neural spike trains increases with firing rate. Nature 448: 802–806,2007.
Eckhorn R, Bauer R, Jordan W, Brosch M, Kruse W, Munk M, ReitboeckHJ. Coherent oscillations: A mechanism of feature linking in the visualcortex? Biol Cybern 60: 121–130, 1988.
Fisch L, Privman E, Ramot M, Harel M, Nir Y, Kipervasser S, AndelmanF, Neufeld MY, Kramer U, Fried I, Malach R. Neural “ignition”:enhanced activation linked to perceptual awareness in human ventral streamvisual cortex. Neuron 64: 562–574, 2009.
Freeman WJ, Zhai J. Simulated power spectral density (PSD) of backgroundelectrocorticogram (ECoG). Cogn Neurodyn 3: 97–103, 2009.
Fries P, Reynolds JH, Rorie AE, Desimone R. Modulation of oscillatoryneuronal synchronization by selective visual attention. Science 291: 1560–1563, 2001.
Gray CM, Singer W. Stimulus-specific neuronal oscillations in orientationcolumns of cat visual cortex. Proc Natl Acad Sci USA 86: 1698–1702, 1989.
Gutnisky DA, Dragoi V. Adaptive coding of visual information in neuralpopulations. Nature 452: 220–224, 2008.
He BJ, Zempel JM, Snyder AZ, Raichle ME. The temporal structures andfunctional significance of scale-free brain activity. Neuron 66: 353–369,2010.
He BJ. Scale-free brain activity: past, present, and future. Trends Cogn Sci 18:480–487, 2014.
Henrie JA, Shapley RM. LFP power spectra in V1 cortex: the graded effectof stimulus contrast. J Neurophysiol 94: 479–490, 2005.
Janca R, Jezdik P, Cmejla R, Tomasek M, Worrell G, Stead M, WagenaarJ, Jefferys JR, Krsek P, Komarek V, Jiruska P, Marusic P. Detection ofinterictal epileptiform discharges using signal envelope distribution model-ling: application to epileptic and nonepileptic intracranial recordings. BrainTopogr 28: 172–183, 2015.
Jia X, Xing D, Kohn A. No consistent relationship between gamma power andpeak frequency in macaque primary visual cortex. J Neurosci 33: 17–25,2013.
Lachaux JP, Rodriguez E, Martinerie J, Adam C, Hasboun D, Varela FJ.A quantitative study of gamma-band activity in human intracranial record-ings triggered by visual stimuli. Eur J Neurosci 12: 2608–2622, 2000.
Logothetis NK, Kayser C, Oeltermann A. In vivo measurement of corticalimpedance spectrum in monkeys: implications for signal propagation. Neu-ron 55: 809–823, 2007.
Manning JR, Jacobs J, Fried I, Kahana MJ. Broadband shifts in local fieldpotential power spectra are correlated with single-neuron spiking in humans.J Neurosci 29: 13613–13620, 2009.
Miller KJ, Shenoy P, Nijs Den M, Sorensen LB, Rao RPN, Ojemann JG.Features in movement classification. IEEE Trans Biomed Eng 55: 1634–1637, 2008.
Miller KJ, Sorensen LB, Ojemann JG, den Nijs M. Power-law scaling in thebrain surface electric potential. PLoS Comput Biol 5: e1000609, 2009.
Milstein J, Mormann F, Fried I, Koch C. Neuronal shot noise and Brownian1/f2 behavior in the local field potential. PLoS One 4: e4338, 2009.
Minear M, Park D. A lifespan database of adult facial stimuli. Behav ResMethods Instruments Comput 36: 630–633, 2004.
Mitchell SJ, Silver RA. Shunting inhibition modulates neuronal gain duringsynaptic excitation. Neuron 38: 433–445, 2003.
Mukamel R, Fried I. Human intracranial recordings and cognitive neurosci-ence. Annu Rev Psychol 63: 511–537, 2011.
Mukamel R, Gelbard H, Arieli A, Hasson U, Fried I, Malach R. Couplingbetween neuronal firing, field potentials, and FMRI in human auditorycortex. Science 309: 951–954, 2005.
Nir Y, Fisch L, Mukamel R, Gelbard-Sagiv H, Arieli A, Fried I, MalachR. Coupling between neuronal firing rate, gamma LFP, and BOLD fMRI isrelated to interneuronal correlations. Curr Biol 17: 1275–1285, 2007.
Nir Y, Mukamel R, Dinstein I, Privman E, Harel M, Fisch L, Gelbard-Sagiv H, Kipervasser S, Andelman F, Neufeld MY, Kramer U, Arieli A,Fried I, Malach R. Interhemispheric correlations of slow spontaneousneuronal fluctuations revealed in human sensory cortex. Nat Neurosci 11:1100–1108, 2008.
Ossandón T, Vidal JR, Ciumas C, Jerbi K, Hamamé CM, Dalal SS,Bertrand O, Minotti L, Kahane P, Lachaux JP. Efficient “pop-out” visualsearch elicits sustained broadband activity in the dorsal attention network.J Neurosci 32: 3414–3421, 2012.
Ostojic S, Brunel N, Hakim V. How connectivity, background activity, andsynaptic properties shape the cross-correlation between spike trains. JNeurosci 29: 10234–10253, 2009.
Pereda E, Gamundi A, Rial R, González J. Non-linear behaviour of humanEEG: fractal exponent versus correlation dimension in awake and sleepstages. Neurosci Lett 250: 91–94, 1998.
Pfurtscheller G, Aranibar A. Event-related cortical desynchronization de-tected by power measurements of scalp EEG. Electroencephalogr ClinNeurophysiol 42: 817–826, 1977.
Pritchard WS. The brain in fractal time: 1/f-like power spectrum scaling ofthe human electroencephalogram. Int J Neurosci 66: 119–129, 1992.
Privman E, Nir Y, Kramer U, Kipervasser S, Andelman F, Neufeld MY,Mukamel R, Yeshurun Y, Fried I, Malach R. Enhanced category tuning
518 A UNIFYING PRINCIPLE FOR SPECTRAL RESPONSES
J Neurophysiol • doi:10.1152/jn.00943.2014 • www.jn.org

revealed by intracranial electroencephalograms in high-order human visualareas. J Neurosci 27: 6234–6242, 2007.
Ramot M, Fisch L, Harel M, Kipervasser S, Andelman F, Neufeld MY,Kramer U, Fried I, Malach R. A widely distributed spectral signatureof task-negative electrocorticography responses revealed during a visuo-motor task in the human cortex. J Neurosci 32: 10458 –10469,2012.
Scheffer-Teixeira R, Belchior H, Leão RN, Ribeiro S, Tort ABL. Onhigh-frequency field oscillations (�100 Hz) and the spectral leakage ofspiking activity. J Neurosci 33: 1535–1539, 2013.
Schomburg EW, Anastassiou CA, Buzsáki G, Koch C. The spiking com-ponent of oscillatory extracellular potentials in the rat hippocampus. JNeurosci 32: 11798–11811, 2012.
Smith MA, Kohn A. Spatial and temporal scales of neuronal correlation inprimary visual cortex. J Neurosci 28: 12591–12603, 2008.
Talairach J, Tournoux P. Co-Planar Stereotaxic Atlas of the Human Brain.New York: Thieme Medical Publishers, 1988.
Tan AYY, Chen Y, Scholl B, Seidemann E, Priebe NJ. Sensory stimulationshifts visual cortex from synchronous to asynchronous states. Nature 509:226–229, 2014.
Thomson DJ. Spectrum estimation and harmonic analysis. Proc IEEE 70:1055–1096, 1982.
Valencia M, López-Azcárate J, Nicolás MJ, Alegre M, Artieda J. Dopa-minergic modulation of the spectral characteristics in the rat brain oscilla-tory activity. Chaos, Solitons Fractals 45: 619–628, 2012.
Xing D, Shen Y, Burns S, Yeh CI, Shapley R, Li W. Stochastic generationof gamma-band activity in primary visual cortex of awake and anesthetizedmonkeys. J Neurosci 32: 13873–13880a, 2012.
Yamamoto Y, Hughson RL. Extracting fractal components from time series.Phys D 68: 250–264, 1993.
519A UNIFYING PRINCIPLE FOR SPECTRAL RESPONSES
J Neurophysiol • doi:10.1152/jn.00943.2014 • www.jn.org


