Embed Size (px)
Citation preview
arX
iv:1
106.
1812
v1 [
phys
ics.
ins-
det]
9 J
un 2
011
A Xenon Gas Purity Monitor for EXO
A. Dobia, C. Halla, S. Herrinb, A. Odianb, C.Y. Prescottb, P.C. Rowsonb,N. Ackermanb, B. Aharminc, M. Augerd, P.S. Barbeaue, K. Barrye,
C. Benitez-Medinaf, M. Breidenbachb, S. Cookf, I. Countse, T. Danielsg,R. DeVoee, M.J. Dolinskie, K. Donatoc, W. Fairbank Jr.f, J. Farinec,
G. Girouxd, R. Gornead, K. Grahamh, G. Grattae, M. Greene,C. Hagemannh, K. Hallf, D. Hallmanc, C. Hargroveh, A. Karelini,
L.J. Kaufmanj, A. Kuchenkovi, K. Kumarg, J. Laceyh, D.S. Leonardk,F. LePorte, D. Mackayb, R. MacLellanl, B. Mongf, M. Montero Dıeze,
A.R. Mullere, R. Neilsone, E. Ninerl, K. O’Sullivane, A. Piepkel, A. Pocarg,K. Pushkinl, E. Rollinh, D. Sinclairm, S. Slutskya, V. Stekhanovi,
K. Twelkere, N. Voskaniana, J.-L. Vuilleumierd, U. Wichoskic, J. Wodinb,L. Yangb, Y.-R. Yena
aPhysics Department, University of Maryland, College Park MD, USAbSLAC National Accelerator Laboratory, Menlo Park CA, USA
cPhysics Department, Laurentian University, Sudbury ON, CanadadLHEP, Physikalisches Institut, University of Bern, Bern, Switzerland
ePhysics Department, Stanford University, Stanford CA, USAfPhysics Department, Colorado State University, Fort Collins CO, USAgPhysics Department, University of Massachusetts, Amherst MA, USA
hPhysics Department, Carleton University, Ottawa, CanadaiInstitute for Theoretical and Experimental Physics, Moscow, Russia
jPhysics Department, Indiana University, Bloomington IN, USAkPhysics Department, University of Seoul, Seoul, Korea
lDept. of Physics and Astronomy,University of Alabama, Tuscaloosa AL,USAmPhysics Department, Carleton University, Ottawa and TRIUMF, Vancouver, Canada
Abstract
We discuss the design, operation, and calibration of two versions of a xenongas purity monitor (GPM) developed for the EXO double beta decay pro-gram. The devices are sensitive to concentrations of oxygen well below 1 ppbat an ambient gas pressure of one atmosphere or more. The theory of opera-tion of the GPM is discussed along with the interactions of oxygen and otherimpurities with the GPM’s tungsten filament. Lab tests and experiences incommissioning the EXO-200 double beta decay experiment are described.
Preprint submitted to Elsevier June 10, 2011
These devices can also be used on other noble gases.
Key words:
xenon, electronegative ion, purification, tungsten oxide, argon, space charge
1. Introduction
The EXO collaboration is developing and executing a series of experi-ments to search for the neutrinoless double beta decay of 136Xe. The firstsuch experiment, known as EXO-200, is currently taking data at the WIPPfacility near Carlsbad, New Mexico, and planning for a next generation ex-periment is underway. The EXO-200 detector is a liquid xenon TPC, whilethe successor experiments may be based on liquid or gas technology. One ofthe primary technical challenges for these detectors is the need to reduce theconcentration of electronegative impurities to less than one-part-per-billion,in order to limit the attenuation of charge and light to acceptable levels.
The first step towards controlling the concentration of impurities is tohave a simple, robust, and sensitive method to detect those impurities inthe gas. We describe here a simple device that we have developed for thispurpose which is capable of operating continuously in the EXO xenon gashandling system for the duration of the experiment. We refer to the deviceas a gas purity monitor (GPM), and it is capable of detecting oxygen atconcentrations less than one part-per-billion over a wide range of ambientgas pressures. We have operated GPMs below one atmosphere and abovethree. It is sensitive to other electronegative impurities at comparable levels.We have installed GPMs at three critical locations in the EXO-200 xenongas system, and they have proved useful during the commissioning phase ofthe experiment. The information provided by the GPMs is complementaryto other techniques that we use to detect impurities, including occasionalmass spectroscopic measurements of the xenon gas, and measurements of theelectron lifetime in the liquid xenon. Most importantly, the GPMs provide ahighly sensitive and continuous measurement of the xenon gas purity in realtime. In this article we describe the design, operation, and calibration of theGPMs. Our other purity monitoring techniques will be described elsewhere.
A tungsten filament immersed in the xenon gas of interest is heated to ahigh temperature where thermionic emission occurs. A bias voltage placedon the filament allows the emission current to be collected on an anode andmeasured. In tests performed in our lab with several prototype GPMs, we
2

find that pure xenon gas samples give a relatively large emission current,while impure samples give a negligible current. This demonstrates that thedevice is sensitive to the impurity concentration in the gas.
At least two physical mechanisms may be responsible for the dependenceof the anode current on the gas purity. First, the observed emission currentis influenced by space charge build-up around the filament. This currenthas two components: the primary electron current created directly by thefilament and a secondary current due to negatively charged impurity speciessuch as O−
2 which form through electron capture reactions. The electroncurrent, typically microamperes in the devices described, dominates. Theion current, because of the very low velocities of the ions involved, is negligi-bly small, typically nanoamperes. The ions, however, influence the electroncurrent through space charge effects.
Secondly, impure gas oxidizes the filament, which reduces the emissioncurrent by changing the work function of the tungsten surface. Both of thesemechanisms lead to high emission currents at high purity, and low emissioncurrents in low purity.
In general, we expect that both mechanisms are at work at the same time,but they can be distinguished from each other based on the GPM behaviorthat is observed. For example, the signature of the oxidation mechanism isthat the emission current decays in a constant-purity gas sample. In this casethe time rate of change of the current is the appropriate figure of merit forthe purity analysis, while the absolute magnitude of the current indicates thepast history of the filament. For the space charge mechanisms, the absolutecurrent is the best measure of the instantaneous purity. Rapid changes ofpurity, such as can happen in experimental apparatus under use, can beseen in the space charge mode. The oxidation mode can be used to identifyspecies, even those that are not electronegative such as N2. The relativeimportance of the two mechanisms is determined primarily by the filamenttemperature and bias voltage.
The organization of this paper is the following: We first discuss spacecharge limited currents in xenon. Then we describe a GPM we constructedin cylindrical geometry and a series of measurements and experiments per-formed with it. Next we discuss a second GPM, the “Omega” style, con-structed for the purpose of studying oxidizing effects on the tungsten filamentand its use as a purity monitor. A series of measurements with the “Omega”style GPM is described. Finally, experiences using the cylindrical GPM forcommissioning EXO-200 at WIPP are discussed.
3

2. Space Charge limited currents in noble gas filled diodes
2.1. Space Charge current limits in pure xenon
Space charge phenomena have been studied for many years in numeroussituations involving electric currents, electrostatic potentials, and conductingmedia including vacuum, gases, liquids, and solids. In steady state condi-tions, space charge limited currents can be understood using electrostaticprinciples and appropriate boundary conditions.
Consider the case of a vacuum diode consisting of a cylinder of lengthL, radius b with a tungsten filament on its axis of radius a. The filament(cathode) is heated by a current to a temperature T, while a voltage +V isapplied to the outer wall (anode). Electrons emitted at the surface of thetungsten filament will flow to the anode. The anode current that is collecteddepends on the temperature T of the filament and the voltage V, as well as thegeometry. At low temperature, the current is determined by the thermionicemission from the tungsten. But at high enough temperatures, the currentreaches a saturation value set by space charge considerations. This situationwas first described by Child and Langmuir and the current-voltage relation isknown as the Child’s (or Child-Langmuir) Law which predicts a well-knownV3/2 dependence for the space charge limited current.
Now consider the case where the diode is filled with a noble gas suchas xenon at pressures of ∼ 1 bar. What determines the magnitude of thiscurrent? When the GPM has been filled with xenon gas, the electron carrierswill travel to the anode with a much lower velocity than for the vacuum case.Following the philosophy of Child’s Law, we replace the electron velocity witha value v0 (well measured for xenon gas [1]).
The space charge limited current can be readily calculated. Starting with∇ · E = ρ/ǫ0, j = ρv◦er, and the boundary condition E = 0 at the cathode,the current is given by
Jelectron =2πǫ0v0V L
b− a− a ln(b/a)(1)
The current is linear in V, so the GPM has an effective resistance given byReff = (b− a− a ln(b/a))/ (2πǫ0v0L). Reff has a value of approximately 2Mohms for the cylindrical GPM described in this report.
We have measured the current that flows in the cylindrical GPM describedin the next section in this report for values of the applied voltage V, andcompared them to the expected current from the formula above. Figure 1
4

volts0 50 100 150 200 250 300 350 400
mic
roam
ps
0
50
100
150
200
250GPM I vs V
Figure 1: Current versus bias voltage for the cylindrical GPM described in Section 3, filledwith pure xenon as measured (black points) and predicted for space charge (red curve)using equation (1) and published values of the electron drift velocity.
shows this comparison. The data fall slightly above the predicted values,possibly due to the finite length of the filament and associated end effects.
2.2. Space Charge currents in the limit of ion current only
The presence of electronegative impurities, such as O2, affect the flow ofcurrent by capturing electrons and becoming charged. The drift velocity ofthe negatively charged impurities is given by vi = µE, where µ is the ionmobility. Since typical ion drift velocities are several orders of magnitudebelow that of electrons, captured electrons contribute a very small amountto the total anode current. In the limit of very impure gas where all electronsare captured near the filament and the current is purely negative ions, theresulting current can be estimated by replacing v0 with vi = µE in the spacecharge equations, giving
Jion =2πǫ0µV
2L
(√b2 − a2 − a tan−1(
√b2 − a2/a))2
(2)
which is no longer linear in the voltage, and typically falls in the nanoampererange.
5

2.3. Suppression of space charge limited currents by negative ions
The electron, by being captured on an electronegative impurity, continuesto contribute to the space charge, but effectively disappears from the overallcurrent at the anode. These negative ions remain for a long time (fractionsof a second) before reaching the anode. The ion cloud around the filamentbuilds up because of the low clearing velocity, hence long clearing times. Theelectron current is suppressed. As the electron velocity is almost constant asa function of the electric field, by lowering the applied voltage V, the effect ofthe ion cloud can be increased. The sensitivity of the GPM to small amountsof impurities stems from the low velocities of the ions, thus “amplifying” theion concentration.
It is easy to observe effects of negative ions on the anode current. Thefilament current is initially off. When it is turned on, the anode current hasa dramatic time dependence depending on the amount of impurities in thegas.
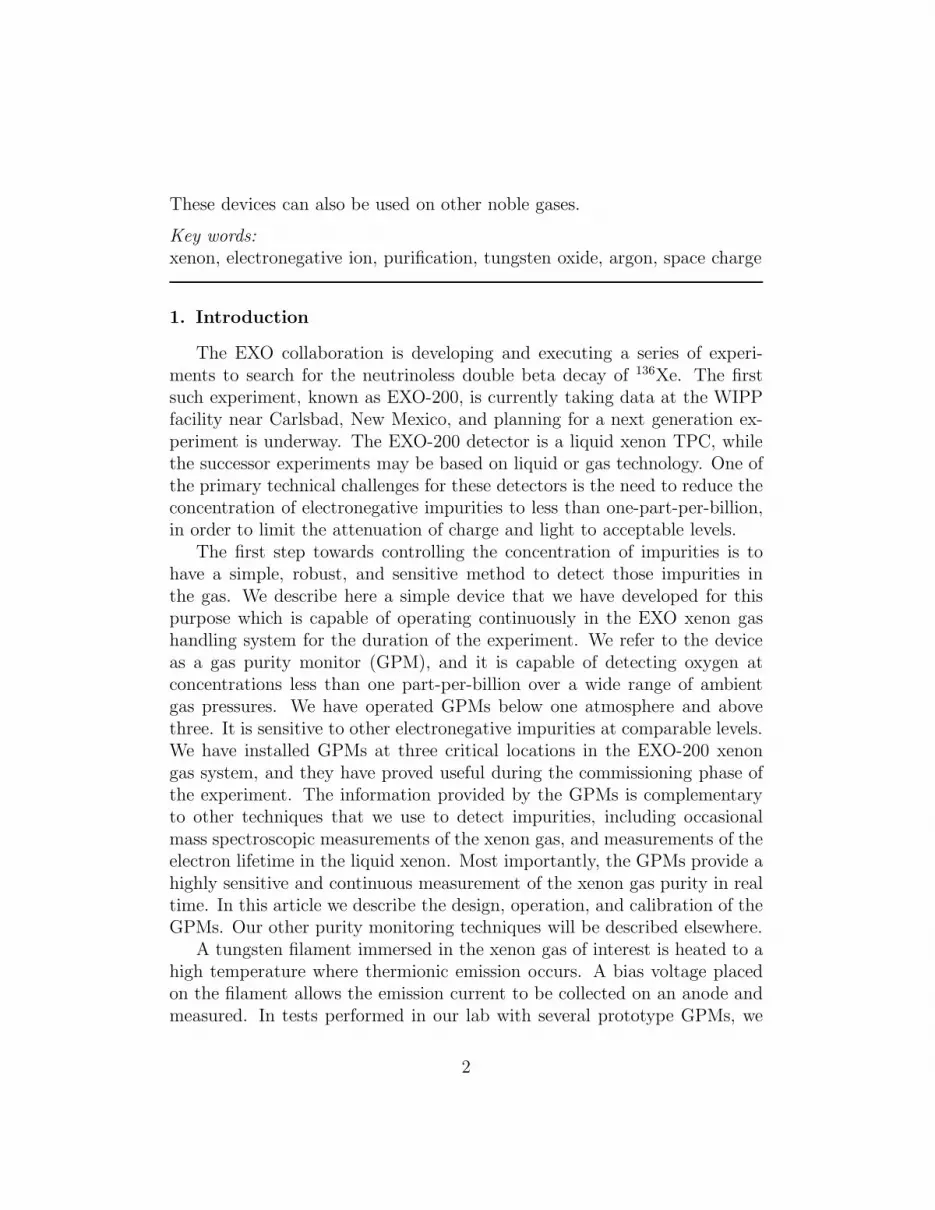
Figure 2 shows scope traces of the anode current for two cases, purexenon and xenon with impurities added, as the filament is turned on for 50seconds. For pure xenon the current builds up in a fraction of a second toa constant value, and remains there until the filament current goes away.For impure xenon, the current rises initially to the value for pure xenon,then decreases rapidly in the next few seconds. The ion cloud grows, andthe current declines as the ion cloud influences the current through its spacecharge. Figure 2 shows scope traces of the anode current for these two cases.For impure xenon the scope trace has a leading spike when the filament isturned on, a clear sign of the presence of impurities. Steady state conditionssettle in after a few seconds. The scope serves as a simple real-time monitorfor impurities, simply by looking at scope traces of the anode current as thefilament is turned on.
Relating the measured anode current to the amount of impurity in thexenon gas is a primary goal of interest. Surely they are not linearly related,but what is the relationship? In the Appendix we discuss the space chargelimited currents in the case where we have electronegative impurities presentand suppressed anode currents. We show that, under reasonable assump-tions, the density of the neutral impurity component, M◦, is related to thenormalized GPM anode current S by
M◦ = k1− S
S(3)
6
seconds-10 0 10 20 30 40 50 60
S
0
0.2
0.4
0.6
0.8
1
1.2
impure xenon
pure xenon
Figure 2: Scope traces of the GPM anode current, plotted as S, the ratio of currentsnormalized to those for pure xenon, when the filament is turned on for 50 seconds. Thefirst (in black) shows pure xenon; the second (in red) shows the response initially equalto pure xenon, but then suppression as an ion cloud builds up in the xenon containingelectronegative impurities. Variations in operation conditions render the precision of pure-xenon normalization to about 10%.
where S = J/J0 and J0 is the current for pure xenon, and
k ≈ 2ev◦µV
αb2(4)
where e is the charge of the electron, µ the mobility of the negative ion, andα is related to the probability for an electron attaching to a M◦ molecule,converting to an M− ion.
Since α is an unknown quantity, to assign an absolute value to M◦, thescale needs to be fixed by calibration. Calibration of the GPM would consistof one or more measurements of a known impure sample. Measurement of Son a sample of known concentrationM◦ sets the scale for all values of S. Thismethod was used for calibration with a sample of O2 as described in Section3.3. Of course, this calibration would apply to this one species of impurity,and only when other global parameters such as pressure, temperature, biasvoltage, etc. are held fixed.
7

The important information here is the (1−S)/S relationship between themeasured S and the impurity concentration M◦. This relation has simpleinterpretations. As the electron current is suppressed (and therefore its spacecharge is suppressed) by a factor of S, the ion space charge, M−, replaces themissing electrons by a factor (1 − S), and M◦ is proportional to M−. The1/S term arises because the rate of production of M− is proportional to theelectron current. The constant k has the value of M◦ for which S = 0.5.
Using the relation vi = µV/b, the coefficient k can be written
k ≈ 2ev◦viαb
.
Low ion velocity, for a given normalized GPM current S, leads to a smallerM◦ value. This shows why it is important to use low bias voltages, giving lowion velocities, to reach high sensitivity to M◦. Conversely, low probabilitycoefficients α lead to insensitivity to M◦.
3. The Cylindrical GPMOperation in Space Charge Limited Mode
The cylindrical GPM is shown in Figure 3. The filament in the cylindricalGPM is a 200 micron diameter tungsten wire, and its length is 13 cm. Thebody is constructed of vacuum components available from a catalog, whilethe internal parts are machined in our shops. The xenon gas flows throughthe device and across the filament during operations.
We heat the filament by applying a voltage, regulated by current, acrossthe two feedthroughs. The temperature of the filament can be determinedfrom the resistivity from published tables or by using the following empiricalformula: [T/T0]
1.19 = [R/R0], where T is the final temperature, T0 is roomtemperature and R and R0 the resistances, both measured in degrees Kelvin.The 13 cm long filament in the cylindrical GPM operates in these studiesat 4.0 A at 10.5 V and a temperature of 2150 K. A simplified schematic isshown in Figure 4.
The ON/OFF status of the filament current is controlled by a computer.It is normally OFF, and cycled ON for a period of 15 seconds (or longerif desired) and the GPM anode current sampled during this period afterwaiting for ≥ 5 seconds to allow the anode currents to settle. The cycles canbe repeated as often or as infrequently as desired.
8

Figure 3: A cylindrical GPM consisting of 2-3/4 inch conflat vacuum components and a13 cm long tungsten filament centered by posts and held by set screws. The filament isheld under constant tension by a 40 gm weight at the lower end free to slide vertically.This design requires the GPM to be mounted vertically as shown. This is the design usedto study space charge limited currents in this report. Three units are in operation asmonitors for EXO-200 at WIPP.
9

Figure 4: Left: diagram of the two GPM geometries (Cylindrical and Omega). Right:simplified GPM electrical circuit. The filament is heated by applying 10 volts for 4 amperesin the case of the Cylindrical GPM for operating in the space charge limited mode, or 2 to5 volts for 4-8 amperes (depending on the filament resistance and the desired temperature)for the Omega GPM. The anode current flowing due to a bias voltage of -18 V is measured.The stainless steel plumbing is used as the collection anode. A computer drives the solidstate relay to turn the filament current ON.
3.1. Tests on electronegative impurities
The GPM was installed in the laboratory in a closed loop xenon systemthat included a circulating pump, a purifier (which is a heated zirconiumgetter1), a liquid lifetime monitor, a pressure gauge, a flow meter, and testvolume on a valved side port that allowed for injection of known impuritiesinto the gas stream. A simplified diagram of the lab system is shown inFigure 5. Not shown in the diagram, but important to the use, are thesupply bottles, vacuum pumps, and a cryogenic system.
Initial tests were done with several different gas samples, including O2,H2O vapor, air, and HFE70002. Figure 6 shows the response to water vapor,at a pressure of 20 µm Hg from the test volume. At t = 0, a valve wasopened and the water vapor was allowed to mix with the room temperaturexenon as it flowed past the test volume. The GPM immediately droppedto very low current, a typical response. The current remained suppressedfor many hours of circulation. Other gas samples showed similar effects on
1SAES Pure Gas Inc. Model PS3-MT3-R2HFE7000 (formula CF3CF2CF2OCH3) is a heat transfer fluid manufactured by the
3M company and used in the EXO-200 cryostat.
10

Figure 5: A simplified diagram of the lab test system consisting of a GPM, a liquid xenonpurity monitor (XPM), a pump, a purifier, a flow meter, and a pressure gauge. Thissystem was built as a prototype for EXO-200.
the GPM current. In the next sections we discuss correlations with electronlifetimes in liquid xenon and calibration of the GPM using O2, a knownelectronegative substance, because it is a gas, unlike water vapor, at liquidxenon temperatures.
3.2. Correlation with liquid xenon lifetimes
The underlying motivation for monitoring the xenon purity in the gasphase is to assist in the purifying of the EXO-200 TPC’s liquid xenon dur-ing commissioning and data collection operations. The EXO-200 systemat WIPP pumps the xenon around a loop, going from the liquid phase inthe TPC, through a heater and into the gas phase, through the pump, thenthrough a purifier before re-liquefying and returning to the TPC. The GPMs,three in all, monitor the gas purity at three points in this loop (see Figure22).
The test setup at our lab was built as a prototype of the WIPP setup, sohas many features in common. We have used it to study the correlation ofthe GPM signal with the electron drift lifetimes in the xenon liquid in thisclosed loop test system in the lab. The liquid xenon purity monitor (XPM)is patterned after the ICARUS design [2].
The test consisted of injections of O2 at a pressure of 20 µm Hg, asmeasured by a thermocouple gauge, from a test volume of ∼ 140 cm3 into
11

hours-10 -5 0 5 10 15 20 25 30
S
0
0.1
0.2
0.3
0.4
0.5
0.6
0.7
0.8
0.9
1
O2
Inject H
Figure 6: GPM response to injection of water vapor into the test system
the gas phase. The xenon was then allowed to circulate with the pump on,but with the purifier bypassed, at a rate of ∼ 1.5 SLPM (standard liters perminute). Mixing was allowed to occur over the next several hours. The rateof flow around the system was such that a full volume change took about 3hours. During this period, we monitored the GPM current and the electronlifetimes. The fall in the GPM current, initially rapid, stabilized after severalhours, corresponding to full mixing of the O2 with the xenon. Both the GPMresponse and the electron lifetime responses show a minimum around 5 hoursinto the test, and clearly are rising by 10 hours. The only hot element in thissystem is the filament, pulsed ON for 25 seconds to sample the GPM currentevery 5 minutes. After 24.3 hours, the bypass at the purifier was closed, andthe inline valves at the input and output of the purifier opened, so that theflow passed through the purifier. Purity and lifetimes begin to improve evenwhile the purifier is bypassed, but accelerate when it is in the loop. Figure7 shows the GPM signal and xenon lifetimes, overlayed, for 30 hours of thistest.
12

hours-10 -5 0 5 10 15 20 25 30
S
0
0.2
0.4
0.6
0.8
1
1.2
GPM Normalized
XPM Lifetimes
s)µlif
etim
e (
0
500
1000
1500
2000
2500
3000
Figure 7: Correlation plot of the GPM signal (S) and the electron lifetime in liquid xenonupon injection of O2
3.3. Calibration
As an example of how to calibrate the GPM, we have used the same dataas shown in Figure 7. For the calibration the electron lifetime monitor wasfull of liquid xenon, approximately 0.6 liters. Initially to clean the xenon, thesystem had circulated the gas for a considerable time with the purifier ON,until the GPM read full current (S = 1). Oxygen was injected at t = 0. Thefall in the GPM current, initially rapid, stabilized after several hours at avalue of∼ 0.018, corresponding to full mixing of the O2 with the xenon. Aftera period of ∼ 10 hours, the GPM current began a slow rise. At 24.3 hours,the purifier bypass was closed and the purifier became operative. The GPMcurrent continued to rise until the test was terminated at 95 hours, reaching anormalized GPM reading of S = 0.8. The normalized GPM response duringthis test is shown in Figure 8 (the same as shown in Figure 7, but extendingout to 100 hours).
For calibration purposes, we know the amount of O2 injected into thesystem. It was 11 ± 1 ppb if uniformly mixed with xenon. As discussed inSection 4 of this report, O2 can be adsorbed by the walls and the tungstenfilament quickly, so the amount in the xenon can be somewhat lower. The
13

hours0 20 40 60 80 100
S
0
0.2
0.4
0.6
0.8
1
1.2
1.4
GPM normalized added2Xenon with O
Oxygen injected
purifier turned ON
Figure 8: GPM normalized response, S, during the injection and subsequent purificationof oxygen
lifetime measurement in the liquid xenon can be converted to a concentrationusing measured rate constants for O2 in liquid xenon [3]. At 5 hours into thisrun, the lifetime measured was 40 µsec, corresponding to 7.5 ±1 ppb of O2.
Assuming the O2 was fully and uniformly mixed, the O2 concentrationof 7.5 ppb O2 gave a GPM reading of 0.018 at 5 hours. Using the relationM◦ = k(1− S)/S we find that k = 1.4 × 10⁻¹⁰. At the end of the test withthe GPM at 0.8, the O2 concentration was estimated to be M◦ = .35×10−10
(35 parts per trillion). Figure 9 shows the estimated O2 concentration basedon this calibration technique and the GPM model described in the Appendix,for the duration of this test.
In general, calibration may not be easy. Residual species in our xenoncarrier gas, such as hydrogen, nitrogen, oxygen, carbon monoxide, carbondioxide, nitric oxide and so on, have varying tendencies to adsorb onto sur-faces in the apparatus, affinities that also depend on the precise material andsurface quality of the surfaces available. In particular, nonvolatile impurities,most notably water, will not mix well. They prefer to attach to surfaces orfreeze out, so calibration of a nonvolatile impurity by injection of a knownamount into the gas stream, using the technique described here, would likely
14

hours0 20 40 60 80 100
con
cent
ratio
n (p
pb)
2O
-410
-310
-210
-110
1
10
210
concentration2O
Figure 9: Estimated O2 concentrations based on the GPM calibration and model describedin the text and the Appendix
result in an overestimate of the concentration in the gas. Monitoring and pu-rifying water vapor in a cryogenic system such as EXO-200 can be a difficultproblem.
3.4. Dependence on Pressure
The linear relationship between GPM current and bias voltage V dis-cussed in Section 2 is based on assuming a constant electron drift velocity v◦.The data, as seen in Figure 1, show some deviation from linearity. The non-linearity arises primarily due to non-constant v◦ as V changes. The velocityis determined well by experiment and is expected to scale with E/P [1]. Thuswe would expect the GPM current would depend both on the bias voltage Vand the gas pressure P . This dependence is easily measured by varying thesystem pressure, recording the GPM current, and fitting the data to a curve.Figure 10 shows the resulting data and fit over a pressure range of 600 to2300 torr.
A simple power law fits the data well. For the cylindrical GPM in thisreport, we fit with Jfit = α1 + α2/P + α3/P
2 , P in torr, and find α1 =−4.4279, α2 = 16982, and α3 = −4.4003×10⁶ for the pressure range 600-2300
15

pressure (torr)600 800 1000 1200 1400 1600 1800 2000 2200 2400
amps
)µ
GP
M c
urre
nt (
0
2
4
6
8
10
12
14GPM current vs Pressure
Figure 10: Cylindrical GPM current versus pressure for pure xenon at a bias voltage of-18 V. The curve is a simple fit discussed in the text.
torr for a bias voltage of -18 V. This fit applies to the cylindrical GPM only.(The Omega GPM described later in this report has significantly differentgeometry and would not be expected to follow this curve.)
To account for pressure variations in the course of monitoring the gaspurity, it is necessary to measure P , compute Jfit, and to calculate a nor-malized GPM parameter S = J/Jfit. An appropriate pressure gauge mustbe located in close proximity to the GPM so that the pressure correctionscan be made.
4. The Omega GPM Operation in Oxidation Mode
The Omega GPM has been used to study the effects of impurities onthe tungsten filament and as a purity monitor as well. The simplicity ofthe device shown in Figure 11 is appealing. All parts can be obtained fromcatalogs. On the other hand, it lacks the symmetry of the cylindrical device,so comparison of performance cannot be compared quantitatively to analyticcalculations. Its behavior in the presence of impurities must be measured inexperiments in the lab. We have done that for several situations, described
16

Figure 11: An “Omega” style GPM consisting of 2-3/4 conflat vacuum components, atungsten filament attached to two posts, and a feedthrough on one side. This design hasbeen used to study oxidation effects on the tungsten filament. It can also serve as a puritymonitor as described in the text.
next in this section.
4.1. Demonstration Experiment
We now describe how the GPM can be used to measure gas purity whenthe oxidation mechanism is dominant. The behavior of the GPM under theseconditions is illustrated in Figure 12. In this experiment, 0.3 SLPM of xenongas contaminated with O2 and N2 passes through the Omega-style GPM at1050 torr, and we measure the absolute concentrations of the two impurityspecies downstream of the GPM with the coldtrap/RGA technique[4]. Wefind that before the GPM filament is heated the xenon contains 3.8 ppb of O2
and 40 ppb of N2. At t = 0, we heat the GPM filament to 1600 K, and theGPM signal rises to S = 0.9 and begins to fall linearly. Since the purity ofthe xenon entering the device remains constant, we infer that the oxidationmechanism dominates the emission current value for these conditions. Thisis confirmed by the coldtrap/RGA measurements downstream of the GPM,where we see the O2 concentration begin to fall (indicating that oxygen isbeing removed by the hot filament), while the N2 level remains constant.
Since the GPM signal (S) is falling, it is necessary to reset the devicebefore the emission current reaches zero. At t = 11 minutes, we degas thefilament by heating it to 2150 K for one minute. During this time, the
17

−5 0 5 10 15 200
1
2
3
4
5
Time (min)
Con
cent
ratio
n (p
pb)
0
0.2
0.4
0.6
0.8
1
Nor
mal
ized
GP
M S
igna
l
GPM
O2
N2/10
Filament On1590K
Flash for 45sec 2150K
Figure 12: A demonstration of GPM operation in oxidation mode. In this experiment,xenon gas containing O2 and N2 flows through the GPM at a flow rate of 0.3 SLPM.Downstream of the GPM we measure the absolute concentration of O2 and N2 with thecoldtrap/RGA technique[4]. The GPM filament is turned off until t = 0, at which timewe heat it to 1600 K. The normalized GPM signal (S) immediately rises to 0.9 and beginsto fall linearly. At t = 11 minutes we degas the filament for 45 seconds, which resetsthe GPM signal to 0.9. For this particular GPM device and operating conditions, S = 1corresponds to 400 nA of emission current. See text for further details.
18

GPM current drops to zero, which we interpret as evidence that the fila-ment is ejecting impurities from its surface at this elevated temperature, andthus becomes space charge limited. In fact, we see the O2 concentrationdownstream of the GPM increase during and after the degassing process asexpected. At t = 12 minutes, we return the filament to 1600 K, and we findthat the GPM signal has returned to 0.9 and is falling linearly as before.We infer from this experiment that the degassing process removes O2 fromthe filament surface, which returns the work function of the tungsten to itsoriginal value, after which it begins to oxidize again. Under these conditions,we take the time rate change of the GPM signal (dS/dt) as the appropriatefigure of merit for the gas purity.
It is important to note that the GPM is actually removing impuritiesfrom the gas stream while it measures the gas purity, as shown in Figure 12.In fact, this cleaning effect was observed as early as 1912 by Langmuir [5, 6].This local purification effect is most pronounced when the GPM is operatedin static xenon, and in this case the xenon within the GPM itself becomespurified as O2 is consumed by the tungsten filament and deposited as WO3.Also, the buildup of other gases such as H2, CO and CH4 in the device canlead to a false purity measurement if the xenon gas is static. The presence ofany of these gases increases the electron velocity causing the emission currentto rise [7]. When the gas flow rate is a few SLPM or larger, however, theGPM purification effect is small.
4.2. Calibration of the decay rate vs O2 concentration.
We calibrate the GPM purity measurement in the oxidation mode bymeasuring the decay rate dS/dt for a variety of gas samples of varying im-purity concentrations. As before, the absolute impurity concentration of thexenon gas is determined by the coldtrap/RGA method. This technique wasitself calibrated by mixing purified xenon with known amounts of O2 and N2
[4].An example experiment is shown in Figure 13. We start with highly
purified xenon produced by the purifier, giving a GPM signal of S = 1 and nosignal decay. The pressure in the GPM is maintained at 1050 ± 30 Torr, andthe flow rate is maintained at 4.9 ± 0.1 SLPM. At t = 0, we bypass the gasflow around the purifier, and the O2 concentration rises to 5.4 ppb. The GPMsignal begins to fall. (Note that in these experiments, the RGA/coldtrap isarranged to measure the absolute purity of the gas entering the GPM, ratherthan the output purity as shown in Figure 12.) We measure the decay rate
19

−5 0 5 10 150
1
2
3
4
5
6
Time (min)
Con
cent
ratio
n (p
pb)
0
0.25
0.5
0.75
1
1.25
1.5
Nor
mal
ized
GP
M S
igna
lO2
GPM
Figure 13: A calibration of the GPM signal decay rate. In this experiment we measurethe absolute concentration of oxygen entering the GPM with the coldtrap/RGA. Prior tot = 0 the gas entering the GPM has been purified, and the normalized GPM signal is S= 1. At t = 0 we bypass the purifier, and the GPM signal falls. The RGA measures theO2 concentration to be 5.4 ppb. We degas the filament three times at t = 3, 6, and 9minutes and repeat the decay rate measurement. At t = 13 minutes we begin to purifythe incoming gas again, and the GPM signal rises as the O2 concentration goes to zero.See text for additional details.
dS/dt and then degas the filament. We repeat the process twice, and we findthat the decay rate is repeatable to within 5%.
At t = 13 minutes, we return the xenon gas system to purify mode, andthe O2 concentration entering the GPM returns to zero. We then observe thatthe GPM signal quickly rises to 0.7 and rises slowly thereafter. The risingGPM signal could be interpreted both as evidence for the improving purity,and also as further evidence that the filament is cleaning its own surface byejecting O2, even at the lower temperature of 1600 K. Calculations of O2
oxidation and ejection rates are described in Section 4.7.We measured the decay rate dS/dt for a variety of O2 impurity concentra-
tions, as shown in Figure 14. As expected, the signal decay rate is correlatedwith the true O2 concentration over three orders of magnitude, indicatingthe usefulness of the device as a purity monitor.
4.3. Reset of the filament by degassing
In a second experiment, we prepared a xenon gas sample contaminatedwith 180 ppb of O2. Again we start with highly purified xenon produced by
20

Figure 14: The normalized GPM signal decay rate (dS/dt) as a function of the absolute O2
concentration of the incoming gas. High decay rates correspond to high O2 concentrations,as expected.
the purifier and a GPM signal of S = 1. At t = 0 we bypass the purifier, andthe GPM signal quickly drops to zero. At t = 2 minutes we return the systemto purify mode, and the GPM signal begins to rise slowly, again indicatingthat the filament is slowly cleaning its surface by ejecting oxygen. At t = 4minutes we degas the filament at 2150 K, after which the signal quicklyreturns to S = 1, indicating a complete reset of the filament properties. Wenote that the S = 1 signal in highly purified xenon is quite reproducible,once the filament has been properly degassed.
4.4. Effect of operating at higher filament temperature
As the degassing experiment illustrates, impurities are being ejected fromthe filament surface even at the normal operating temperature of 1600 K.Therefore we expect that operating the GPM at elevated filament temper-atures would increase the rate of impurity ejection, resulting in a cleanerfilament surface and less GPM signal decay. We have confirmed this effectby varying the filament temperature in a series of experiment with identicalgas purity. We find that by increasing the filament temperature from 1750 Kto 1990 K we reduce the GPM signal decay rate by a factor of eight, as shownin Figure 15. This gives further evidence that the GPM emission current isdetermined primarily by the condition of the filament surface. In light ofthese results, we can view the degassing process as a limiting case of normal
21

−2 0 2 4 60
35
70
105
140
175
210
Time (min)
Con
cent
ratio
n (p
pb)
0
0.2
0.4
0.6
0.8
1
Nor
mal
ized
GP
M S
igna
lO2
GPM
Figure 15: The effect of degassing on the GPM signal. Prior to t = 0 the gas enteringthe GPM is purified, and the normalized GPM signal is S = 1. At t = 0, we bypass thepurifier, and the O2 concentration rises to 180 ppb, while the GPM signal quickly dropsto zero. At t = 2 minutes we begin to purifier the gas again, and the O2 concentrationdrops to zero. The GPM signal recovers slowly until t = 4 minutes, when we degas thefilament for 45 seconds by heating it to 2150 K. After degassing the GPM signal returnsto S = 1.
GPM operation, where the GPM filament temperature is high enough thatthe relevant impurities are no longer able to bond to the filament surface.Measurements of surface interactions between O2 and N2 indicate that thisshould occur at 2000-2100 K, as discussed below in Section 5.
4.5. Absorption of O2 on stainless steel
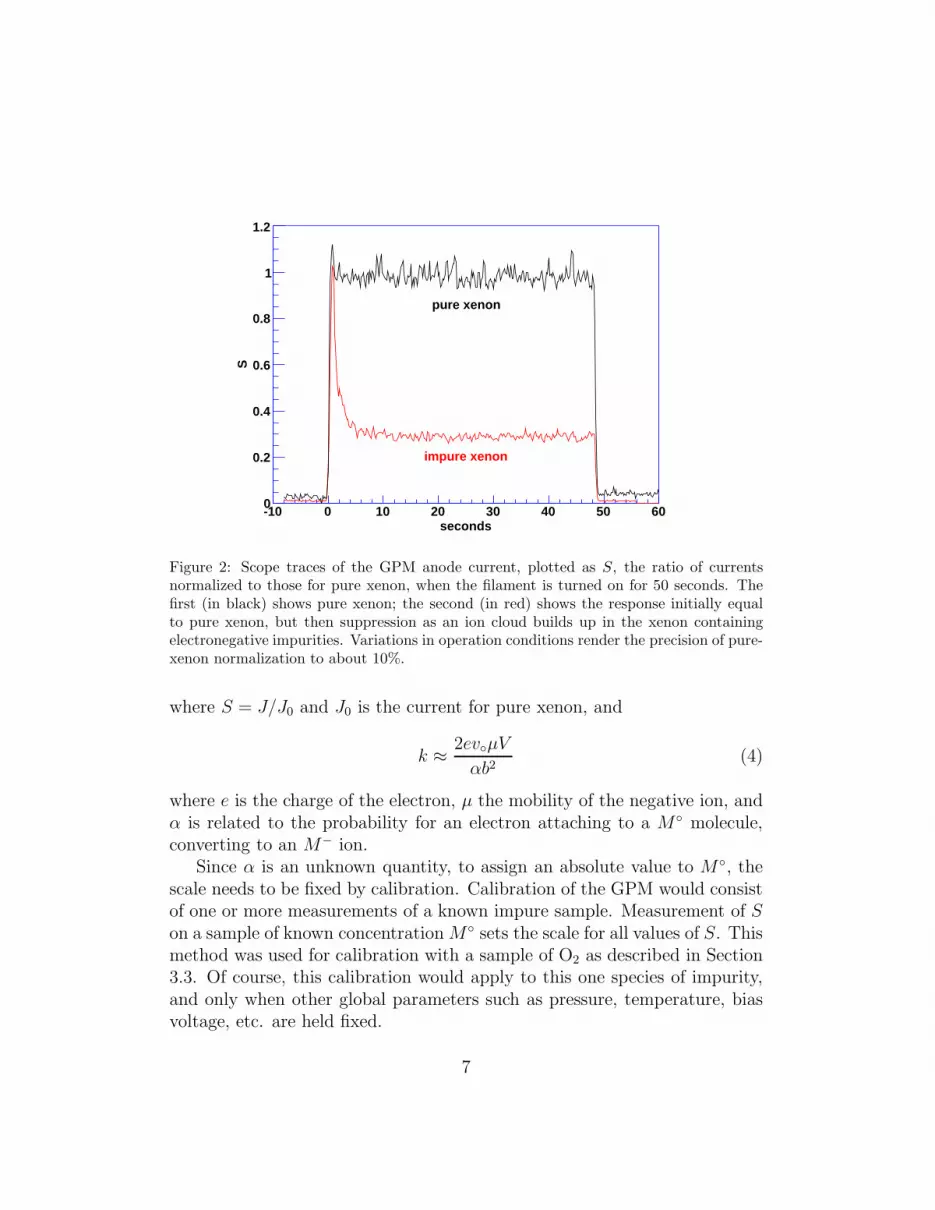
In a third oxidation-mode experiment with 2.8 ppb of O2, we find evidencefor O2 adsorption on the stainless steel plumbing upstream of the GPM. Asshown in Figure 16, we again start with purified xenon and a GPM signalof S = 1. At t = 0 we bypass the purifier, and the GPM signal decays asusual. However, the decay rate is slow at first, and becomes faster after afew minutes. A similar effect is seen in xenon gas samples with 0.25 and 0.3ppb O2. At t = 6 minutes we degas the filament and subsequently reproducethe faster decay rate. We infer from the slow initial decay rate that the O2
impurities take several minutes to reach the GPM, although the gas flow rateis large enough to carry them to the GPM very quickly. This indicates thatthe impurities are temporarily removed from the gas by the interior surface ofthe stainless steel plumbing between the purifier and the GPM. This surface
22
−5 0 5 10 150
0.5
1
1.5
2
2.5
3
Time (min)
Con
cent
ratio
n (p
pb)
0
0.2
0.4
0.6
0.8
1
Nor
mal
ized
GP
M S
igna
l
O2
GPM
Figure 16: Evidence of absorption of O2 on the stainless steel plumbing. Prior to t = 0purified gas is entering the GPM, and the normalized GPM signal is S = 1. At t = 0 thepurifier is bypassed, and the O2 concentration rises to 2.8 ppb. The GPM signal dropsabruptly to S = 0.9, and then falls slowly. By t = 5 minutes, the GPM signal is decayingmore quickly. We interpret the slow decay as evidence that O2 is being removed from thegas stream by the stainless steel plumbing upstream of the purifier. At t = 6 minutes, thefilament is degassed, resetting to GPM signal to S = 1, but the signal continues to fallsharply in the presence of the O2. At t = 10 minutes, we remove the O2 from the inputgas using the purifier, and the GPM signal begins to rise and level off at S = 0.6. Onemore degassing of the filament, at t = 13 minutes, results in the GPM signal returning toS = 1.
has been purged by pure xenon gas for a significant period of time beforethe introduction of the O2. Once the surface becomes saturated with theimpurity, then the O2 begins to reach the downstream GPM.
4.6. GPM signal overshoot
As shown in Figures 13 and 16, after degassing the filament the GPMsignal sometimes temporarily overshoots the ideal value of S = 1. The originof this effect is not clear, but we observe this behavior most commonly inhighly purified xenon gas. For example, our 180 ppb data, shown in Figure 10,indicates virtually no overshoot at all. It is possible that the GPM filamentis putting out small amount of a gas such as CO or CH4 that is not stronglyelectronegative, causing the electron drift velocity to increase [7], resultingin elevated currents. In any case, the overshoot is temporary, and it does notaffect the subsequent measurement of the decay rate of the signal.
23

4.7. Discussion of oxidation
In the absence of space charge, the thermionic current density emittedfrom a heated tungsten surface is given by Richardson’s law: I ∼ T 2e−Φ/kT ,where Φ is the work function of the filament surface. The work functions oftungsten and tungsten oxide have been measured to be 4.5 eV and 5.59-5.7eV respectively [8, 9]. These values imply that a fully oxidized filament willsuffer a reduction factor of 1000 to 6000 in thermionic emission compared toa pure tungsten surface.
Degassing the filament at 2150 K for 45 seconds rapidly removes oxygenfrom the surface and restores the work function of the filament. At 1600 Kmainly W2O6 is ejected from the filament’s oxidized surface at a relativelylow rate [10, 11]. At 2150 K single oxygen along with WO2 is ejected at 100×and 10× the rate of evaporation at 1600 K, respectively [10, 11]. Once thefilament’s surface has oxidized its work function will not recover until theoxide layer has been desorbed.
Some basic considerations allow us to infer the rates of oxygen captureand ejection from the filament surface in 1050 torr of xenon at 1600 K. InFigure 12, xenon containing 3.8 ppb of O2 flows at 0.3 SLPM across the GPMfilament. This corresponds to 1.25 × 10¹⁴ O2 molecules per minute. Whenthe filament is heated, the O2 concentration at the GPM outlet is reduced by58%, indicating an O2 capture rate of 7.3 × 10¹³ molecules per minute. Onthe other hand, we estimate that our filament has about 5 × 10¹⁴ tungstenatoms on its surface, and the observed emission current decay rate indicatesthat the filament surface will fully oxidize in 50 minutes. This corresponds toa net surface coverage rate of 6.7× 10¹² molecules per minute. Since the netcoverage rate is observed to be much smaller than the O2 capture rate, weinfer that the difference is due to ejection of tungsten oxide (predominantlyWO3 andW2O6 [10]) from the filament surface at a rate of 6.6×10¹³ moleculesper minute in 1050 torr of xenon. Other studies of tungsten filaments invacuum find ejection rates which are four times larger than this[10].
4.8. Formation of tungsten-oxide powder in the GPM
A major concern with burning a tungsten filament in impure gas is theformation of byproducts such as tungsten oxide. This substance is continuallyemitted from the GPM filament during operations, and it could travel withthe gas stream and contaminate the rest of the apparatus unless it is removedwith a particulate filter. Secondly, if the oxygen concentration is as high as
24

10−6, then the resulting tungsten oxide can quickly cover the conflat flangeand short the GPM filament leads.
The color of the tungsten oxide is indicative of the concentration of theO2 in which it was formed. For 10 ppb, the color is grey-white, for 100 ppbit is blue-white, and for 1 ppm it is black. At 10−4 the color is yellow, andthe filament will burn out within a few minutes. The blue-white powderfound inside the GPM was analyzed using X ray crystallography, and itscomposition was found to be 90% WO3, 8% WO2 and 2% W18O49. Thenon-stoichiometric defects are responsible for the color of the tungsten-oxidecrystal. These observations are consistent with results reported by othergroups while growing thin tungsten oxide films in oxygenated environmentsusing argon sputtering [12, 13, 14].
During the study, both the blue and the black tungsten oxide causedelectrical shorts in the GPM. The white powder formed at low O2 concen-trations is amorphous and might not be conductive [14]. In order to stop thetungsten oxide powder from spreading through the system and potentiallycontaminating the detector, particulate filters (Mott filters) must be used atthe output of the device. Without Mott filters we have observed the tungstenoxide powder traverse several meters in our plumbing. The diameter of theblue tungsten oxide particulates is as small as 10 nm [13]. The majority ofthe tungsten oxide particles observed in the plumbing after oxidization testsare on the order of several microns. [section 4.8]
Figure 17 show SEM images of the filament after burning in 1 ppm O2
and one that was used in purified xenon. The device was used with pressuresof 1350 Torr. Figure 18 shows electrodes coated with tungsten oxide.
5. GPM response to N2
The xenon gas samples used in our GPM calibration experiments con-tained some N2 contamination, so we investigated the effect of nitrogen onthe performance and behavior of the device. First, we note that our demon-stration experiment, shown in Figure 12, indicates that N2 is not removedfrom the gas when the GPM filament is heated. Secondly, we prepared asample of xenon containing significant N2 and less than 0.1 ppb of O2.
The GPM signal under these conditions is S = 1, and does not changewhen switching from bypass mode (N2 contamination of 20 ppb) to purifymode (N2 < 1 ppb). We conclude that the presence of nitrogen has little
25

Figure 17: Left: Filament after burning in static xenon initially containing 1ppm O2 for150 hours. The evaporation pattern is visible. Right: Filament after being used for 2months with purified xenon (0.1ppb) O2. After burning in xenon the filament is morebrittle. The tungsten re-crystallizes in a granular structure with the grains ranging inradius from 4 to 20 microns in diameter.
Figure 18: Tungsten oxide formed in 1350 torr of static xenon in a 0.58 L volume with100 ppb oxygen
26

effect on the GPM signal. This result is not surprising, because at tempera-tures above 1000K N2 adsorption onto tungsten ceases and N2 does not bondto a tungsten surface [15].
The GPM results presented above indicate that the device is not sensi-tive to the presence of N2 in the xenon gas. This shortcoming is acceptablein most situations because N2 presents less of a problem to TPC operationthan does O2 due to its much smaller electron capture cross section3. Nev-ertheless, xenon which is contaminated with O2 usually contains even higherconcentrations of N2, due to its larger presence in air. Therefore it wouldbe useful to have a complementary technique for observing N2 as a meansof inferring the presence of O2. Secondly, noble gas purifiers such as thezirconium getters used by EXO have ten times less capacity for absorbing N2
than O2. Therefore the presence of significant N2 in the xenon gas systemcould be an indication that the purifier is more than 10% exhausted.
N2 impurities cannot be detected with the GPM at 1600 K because ni-trogen desorbs rapidly from the filament between 1000-2300 K [15, 17]. Inprinciple, N2 could be detected by increasing the filament temperature to2300 K, where another phase of tungsten nitride begins to form[15]. Underthese conditions, we would expect the GPM signal to decay as N2 is ad-sorbed on he filament. In practice, however, we find that our GPM emissioncurrent becomes space charge limited under these conditions, and is thenindependent of the work function.
At room temperature, however, a pure tungsten filament will adsorbenough N2 to cover a surface layer[15]. Tungsten nitride is expected to causethe emission current to suffer a factor of 50 reduction at 1600 K due to theincreased surface work function [18]. H2O, H2, and other hydrocarbon im-purities are also expected to adsorb at room temperature [19, 20]. Thereforewe performed a series of experiments to attempt to observe N2 absorption onthe surface of the GPM filament at room temperature. In these experimentswe left the GPM filament off while immersed in a static xenon gas sampleovernight. When using a xenon gas sample containing 1 × 10⁻⁹ g/g of N2,the GPM signal rises to S = 0.8 within 3 seconds after heating to 1600 K.In other xenon samples containing 10 × 10−9 g/g and 20 × 10−9 g/g of N2,however, the rise time of the signal is 16 seconds and 22 seconds, respectively,
3Nitrogen electron capture rates ∼ 800 times smaller than oxygen have beenreported[16].
27

0 5 10 15 20 25 30 350
0.2
0.4
0.6
0.8
1
Time (seconds)
Nor
mal
ized
GP
M S
igna
l
Pure Xe10ppb N
220ppb N
2
Figure 19: An experiment to observe adsorption of N2 and other gases on the GPMfilament at room temperature. The GPM filament is left at room temperature immersedin the gas of interest for 12 hours. At t = 0 we turn on the filament, and the emissioncurrent rises as N2 is ejected from the surface and the work function decreases. The risetime could be used to infer the quantity of these impurities in the gas. See text for furtherdetails.
as shown in Figure 19. The longer rise times observed in these datasets areconsistent with the presence of a layer of N2 adsorbed on the filament surface,which would temporarily reduce the tungsten work function until the surfaceis cleaned of this impurity. It should be noted, however, the observed effectcould be due to some other impurity such as a hydrocarbon, which wouldalso desorb rapidly at 1600 K. Nevertheless, this effect could be useful fordetecting impurity species which are less electronegative than O2.
For the cylindrical GPM, it is difficult to observe any effect of nitrogencontamination up to the ∼ 1 ppm level. However, for nitrogen contaminatedxenon, while GPM current is constant in time for the default 4.0 A setting, adecay with time of the GPM response is observed for lower filament currents.A test was performed in which a fixed dosage of 1 ppm nitrogen was added tothe gas flow, and the GPM response decay time was observed as a function ofthe GPM filament current4. The filament current setting was varied between3.0 A and 4.0 A. The GPM current decay rate was observed to fall to zero as
4Note that in these experiments, the nitrogen dosed into the system was controlledat the <10% level for all data points, but the nitrogen content of the gas flow was notindependently measured.
28

filament temperature (K)1750 1800 1850 1900 1950 2000
S d
ecre
ase/
hr
0
0.005
0.01
0.015
0.02
0.025
0.03
0.035
0.04
0.045
Figure 20: Decay rates of the cylindrical GPM current versus filament temperature fromNitrogen impurities. The solid line is a linear fit to the data.
the 4.0 A setting was approached. We have used the known tungsten ther-mal resistivity coefficients, and the observed power supply voltage at eachfilament current setting, to deduce the filament temperature at each filamentcurrent setting. Figure 20 shows the decay time data as a function of fila-ment temperature. The GPM current decay rate falls to zero at a filamenttemperature of about 2000 ± 50 K, corresponding to a filament current of ∼3.6 A. This behavior suggests that at a characteristic temperature, nitrogenis completely desorbed from the tungsten filament surface. The tempera-ture observed here corresponds closely to values for nitrogen desorption fromtungsten in the literature [21].
6. Tests with Argon
It is reasonable to extend these principles and studies to other noble gases.We have only done this, briefly, with argon. Neon and helium have not beenstudied. The test with argon was a simple one, namely to purify a sampleof ultra-high-purity (UHP) argon in our system, circulating it through thepurifier. UHP grade argon from a commercial supplier comes with specifi-cations on certain impurity levels. Our sample had the following limits onimpurities: < 1 ppm O2; < 0.5 ppm H2O; < 1 ppm CO; < 1 ppm CO2;and < 5 ppm N2. For comparison we have a comparable test on UHP gradexenon. The specifications on purity for the xenon sample are essentially the
29
hours0 50 100 150 200 250 300
S
0
0.5
1
1.5
2
2.5
UHP Argon
UHP Xenon
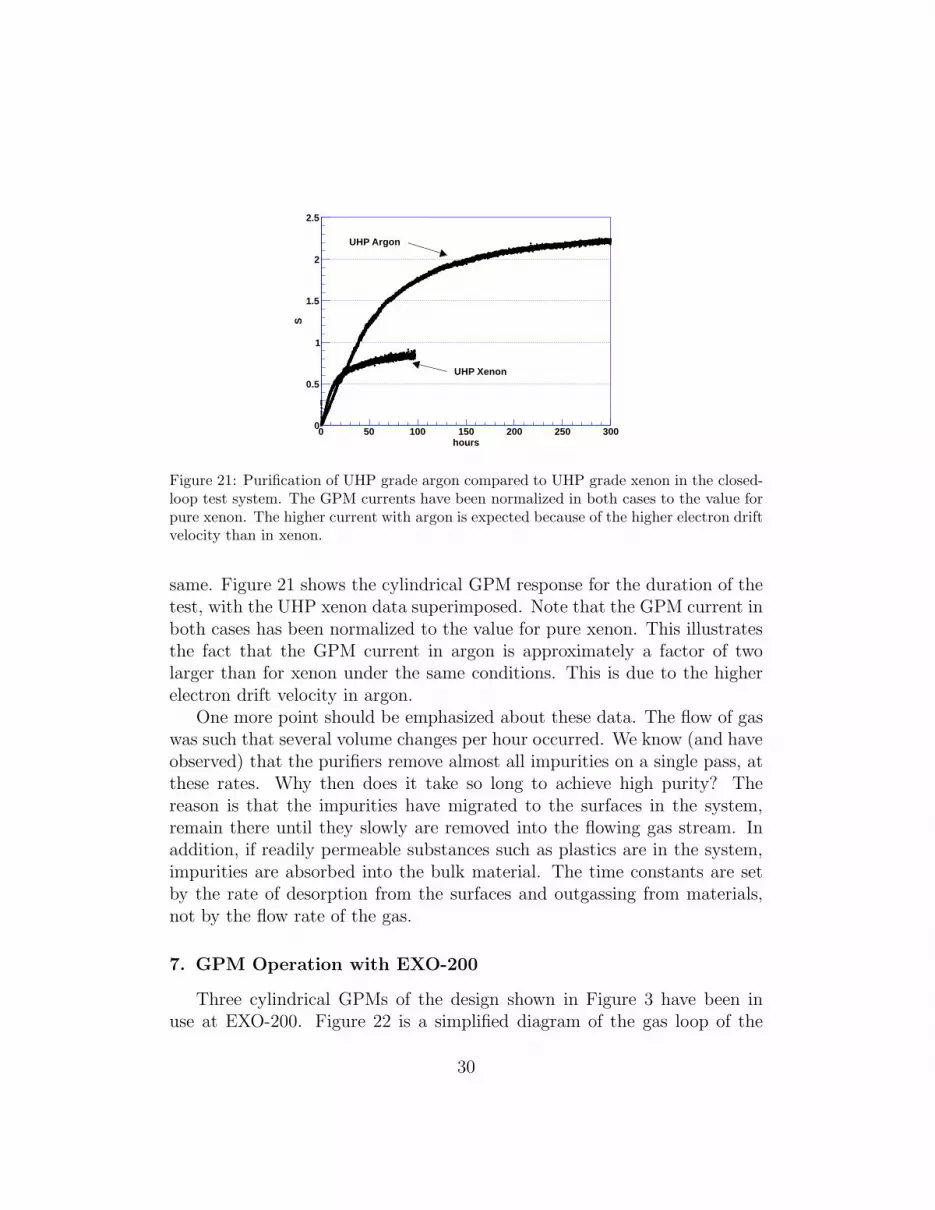
Figure 21: Purification of UHP grade argon compared to UHP grade xenon in the closed-loop test system. The GPM currents have been normalized in both cases to the value forpure xenon. The higher current with argon is expected because of the higher electron driftvelocity than in xenon.
same. Figure 21 shows the cylindrical GPM response for the duration of thetest, with the UHP xenon data superimposed. Note that the GPM current inboth cases has been normalized to the value for pure xenon. This illustratesthe fact that the GPM current in argon is approximately a factor of twolarger than for xenon under the same conditions. This is due to the higherelectron drift velocity in argon.
One more point should be emphasized about these data. The flow of gaswas such that several volume changes per hour occurred. We know (and haveobserved) that the purifiers remove almost all impurities on a single pass, atthese rates. Why then does it take so long to achieve high purity? Thereason is that the impurities have migrated to the surfaces in the system,remain there until they slowly are removed into the flowing gas stream. Inaddition, if readily permeable substances such as plastics are in the system,impurities are absorbed into the bulk material. The time constants are setby the rate of desorption from the surfaces and outgassing from materials,not by the flow rate of the gas.
7. GPM Operation with EXO-200
Three cylindrical GPMs of the design shown in Figure 3 have been inuse at EXO-200. Figure 22 is a simplified diagram of the gas loop of the
30

Figure 22: A simplified diagram of the gas loop for EXO-200. Three GPMs monitor thepurity of the gas as it circulates. In close proximity of each is a pressure gauge. The manualvalves associated with the GPMs and the purifier allow for bypassing these componentswhen desired. Two computer driven valves on the inlet (feed) and outlet (bleed) allow forcontrol of the system pressure to stringent tolerances.
system. The pump creates a flow up to 20 SLPM. This flow passes firstthrough a flow meter, then through GPM-1 before the purifier5. GPM-2 islocated immediately after the purifier and monitors the health of the purifier.GPM-3 is located in the output leg of the TPC, and monitors the purity ofthe xenon after passing through the TPC. The condenser and heater are usedwhen the TPC has liquid xenon in it; otherwise they are passive when theTPC has only xenon gas in it. The system has operated reliably in bothstates during commissioning of EXO-200.
7.1. Practical considerations for using a GPM
There are practical considerations involved in using a GPM to monitor thepurity of the gas. As shown in Figure 2, the response time to electronegativeimpurities is several seconds. The rate at which one can monitor a gasstream can be as short as a few seconds, or as infrequently as conditionsrequire. During tests in the lab we typically sample the gas purity onceevery 5 minutes. For EXO-200 at WIPP, the sample rate has varied fromonce every 20 minutes to once every few hours, depending on circumstances
5SAES Pure Gas, Inc. Model PS4-MT3-R; two in parallel
31

at the time.The GPM is very sensitive to impurity concentrations and the act of
sampling the purity can disturb the reading. Impurities reside on all surfaces,including the GPM walls. When the filament is on, ∼40 W of power istransferred to the gas flow by convection and conduction, while at the sametime the local surfaces are radiatively heated. The rising temperature causesimpurities to evolve into the local gas, distorting the readings. To mitigatethis problem, we keep the sample duration as short as possible: around 10-15seconds. Also we have enclosed the GPMs in heater jackets which maintaina steady GPM body temperature of ∼ 100 deg C, to reduce these transientheating effects.
As discussed in Section 4, oxidation or similar effects can occur at thesurface of the filament. This can result in filament burnout and the needfor replacement. We have replaced the filaments on several occasions in thelab and at WIPP. To facilitate the filament replacement, the GPMs have 3valves attached, one for the input side, one for the output side, and a bypassvalve. In addition, the bottom “tee” shown in Figure 3 is actually a “cross”in the EXO-200 GPMs at WIPP. The extra port provided by the cross hasa copper pinch off tube mounted on it. It is the port used for pumping outthe GPM for a vacuum bakeout following a filament replacement.
To minimize the damage to the filaments, The control system stretchesout the time between samples when the normalized signal S, falls below 0.1.
7.2. Dependence on the flow rates
During operations of the EXO-200 cylindrical GPMs in space-charge lim-ited mode at WIPP, it was observed that high flow conditions affected theobserved GPM currents. Initially, the observations showed reduced GPMcurrent in purified xenon as the gas flow rate was increased. It was subse-quently also seen that high flow conditions led to elevated GPM currents inimpure xenon gas.
We studied the effect of gas flow rates on the cylindrical GPM perfor-mance in our lab setup. Figure 23 shows how normalized GPM current isaffected by the flow rates up to ∼ 2.4 SLPM in purified xenon. The effectat the flow rates we achieve in the lab is generally smaller than observed atWIPP (our EXO-200 pump can deliver up to 20 SLPM ).
We have considered three possible flow-dependent mechanisms :
1. Flow- and impedance-dependent pressure drops between the GPM itself
32

flow (slpm)0 0.5 1 1.5 2 2.5
S
1
1.05
1.1
1.15
1.2
1.25
Figure 23: The normalized cylindrical GPM current (S) is plotted as a function of flowrate in purified xenon. Our normal operating point in the lab is ∼1.5 SLPM. At WIPP,the flow rate is higher.
and the nearby pressure transducer used to make the pressure depen-dent normalization of the GPM current. Depending on the location ofthe pressure transducer, this can cause a positive or negative shift inthe normalized GPM current.
2. Flow-dependent convective cooling of the GPM filament. This effectmight change electron emission or impurity desorption from the fila-ment.
3. Flow-dependent displacement or removal of the slow-moving negativelycharged impurity ions. Ion velocities in the xenon are nominally around10 cm/s for typical ion mobilities ∼ 1 V cm−2sec−1; this compares with∼ 15 cm/s flow rates at 10 SLPM in the GPM. This effect is expectedto increase the observed GPM current.
Effect 1 must be carefully evaluated in any GPM setup, but as it turns outneither at EXO-200 nor in our lab is this effect sufficiently large to explain theobserved GPM shifts, typically by at least one order of magnitude. Effect 2 isobserved (Figure 24), where we have deduced the filament temperature fromthe observed filament resistance and the known thermal resistivity curve fortungsten (2150K is taken the absolute reference point at lowest flow). Weare unable to evaluate at this time if these small temperature reductions are
33

flow (slpm)0 0.5 1 1.5 2 2.5
T (
K)
∆
-45
-40
-35
-30
-25
-20
-15
-10
-5
0
5
Figure 24: Filament cooling as a function of flow rate in purified xenon. Temperature isdetermined from the observed filament resistance.
causative. The final Effect 3, whereby impurity ions are swept out of theGPM gas, has not yet been studied in the lab.
Because of the flow effects on the GPM currents, the flow rates should bekept low. In our lab, the flow rate is typically 1.5 SLPM. We also avoid usingthe GPMs in static xenon because the build-up of gases such as H2, CH4,and CO can lead to false purity measurements. At WIPP, since our pumpis capable of higher speeds, we usually run the GPMs with bypass valves inparallel open to reduce the flow through the GPMs themselves, and generallyavoid maximum flow operation.
7.3. Examples
We illustrate the use of the GPMs during commissioning of EXO-200 atWIPP with the example of a 11 day period of flowing xenon gas through theTPC for the purpose of cleaning it, as the TPC contains significant metallicsurface area as well as outgassing plastic parts (teflon, kapton, and acrylic).The gas-phase loop of the EXO-200 system shown in Figure 22 consists of(i) a circulation pump which at this time was creating a flow of ∼ 10 SLPM, followed by (ii) GPM-1, followed in turn by (iii) two purifiers in parallel,then (iv) GPM-2, (v) the TPC, and (vi) GPM-3. After GPM-3 the gasreturns to the input side of the pump. The xenon was sampled continuouslyby GPM-3 situated in the output of the TPC. Figure 25 shows its response.Initially, the monitor current is suppressed, indicating rather poor purity.
34

The signal grows steadily over the next 11 days, reaching a good value ofS ∼ 0.9. The GPM cannot distinguish the species of impurity, nor can wedetermine its concentration. Subsequent analysis of gas samples, however,indicated presence of trace amounts of H2O and isopropanol (which was usedfor cleaning parts).
A second example of the use of the GPMs during commissioning of EXO-200 at WIPP comes from a 4-hour period when xenon gas was circulating inthe system and the TPC had no liquid in it. Figure 26 captures a typicalperiod of monitoring, chosen here because a “feed” event occurs during thisperiod. A feed cycle is simply an injection of a small amount of xenon fromstorage bottles to maintain the TPC pressure within a tightly defined narrowband. The gas from the storage bottles, however, also contains some smallimpurity component.
The feed of xenon is introduced into the loop after the pump and beforeGPM1. Figure 26 shows this occurring a little before 4 hours. The responsesof two GPMs are shown. GPM-1 shows a drop in S, the normalized signal,due to impurities in the feed gas. Although the feed event lasts only seconds,the GPM-1 takes ∼ 2 hours to recover. The slow response is due to impuritiesaccumulating on the walls and surfaces in the vicinity of GPM1. The flowingxenon slowly picks up the impurities and carries them through the purifiers.GPM2, situated after the purifiers, however shows no change. The purifiershave removed all of the impurities from the xenon passing through. Fromthese data we learn; (i) that the feed stock from the storage bottles is impure;(ii) the purifiers are functioning well.
These examples show the use of the GPMs at WIPP. They serve well asonline monitors of the health of the gas loop in the EXO-200 system.
8. Conclusion
We have constructed and characterized two types of gas purity monitorswhich are capable of detecting common impurities in a xenon gas streamwith high sensitivity. We have deployed three of these devices in the xenongas handling system of the EXO-200 experiment, and they have provided gaspurity information during the commissioning phase of the experiment. Mostimportantly, the GPMs can be operated continuously without disturbingdetector operations, giving instant and remotely accessible information aboutthe xenon gas purity at all times.
35

days0 2 4 6 8 10 12 14
S
0
0.2
0.4
0.6
0.8
1
1.2GPM3 Record
Figure 25: A 11-day period of monitoring the xenon purity in the EXO-200 system atWIPP. Xenon gas flows continuously at ∼10 SLPM for the purpose of cleaning the TPC.The GPM at the output of the TPC initially reports a low value for S, around 0.1, thatrises to ∼ 0.95.
hours0 1 2 3 4 5 6 7 8
S
0
0.1
0.2
0.3
0.4
0.5
0.6
0.7
0.8
0.9
1
GPM-1
GPM-2
Figure 26: A 4-hour period of monitoring the xenon purity in the EXO-200 system atWIPP. The injection of a small amount of gas from supply bottles indicates some impurityaccompanies the gas, as shown by the response of GPM-1. The gas flows through thepurifiers and through GPM-2, which shows no response, indicating that the purifier isoperating effectively.
36

Acknowledgments EXO is supported by the Department of Energy and theNational Science Foundation in the United States, NSERC in Canada, FNSin Switzerland and the Ministry for Science and Education of the RussianFederation in Russia. The SLAC National Accelerator Laboratory operatesunder Department of Energy contract number DE-AC02-76SF00515.
A. A model relating the space charge limited current and the im-
purity concentration in cylindrical geometry
In Section 2.3 we wrote that, under reasonable assumptions, the densityof the neutral impurity component, M◦, is related to the normalized GPManode current S by
M◦ = k1− S
S
where S = J/J0 and J0 is the current for pure xenon, and
k ≈ 2ev◦µV
αb2
where e is the charge of the electron, and α is related to the probability foran electron attaching to a M◦ molecule, converting to an M− ion.
To derive this relationship requires cylindrical symmetry, so would notnecessarily apply to the Omega GPM design. We make some very reasonablesimplifying assumptions. They are:
i) Steady state current flow has been established. This occurs in the labtests several seconds after the filament current has been turned on.
ii) The filament temperature is high enough so that the electron current isnot emission limited.
iii) The ion current can be neglected. The ratio Jion/Jelectron from (1) and(2) in Section 2 is ≈ µV/veb ≈ vi/velectron. For µ ≈ 1V cm−2 s−1, and abias voltage of 18 V, this ratio is ≈ 10−4.
iv) The electron velocity is constant. This is a good assumption in thissituation because the electric field is nearly constant for r ≫ a at avalue V/b.
37
v) Negative ions are formed by capturing electrons from the current flow.We assume this process is proportional to the density of neutral impu-rities M◦ and the density ne(r) of electrons. This assumption can beexpressed as
M−(r) = α ne M◦ per second per unit of volume
where α is a “probability coefficient”, M− is the rate of formation ofnegative ions per unit volume, ne is the electron density, and M◦ is theimpurity density. The parameter α is a constant in the analysis here,but in the lab its value likely will depend on the species of impurity, thepressure, the gas temperature, and possibly other factors. These globalparameters must be held fixed for the relationship between M◦ and Sto hold.
vi) Steady state ion distribution is established when the number of ionsflowing to the anode equals the number of ions formed in the volume.This can be expressed in a mass flow equation. Define a vector for theflow of ions: −→
M = M−vier
where M− is a (scalar) density of negative ions moving with radial ve-locity vi in the direction er. Steady state conditions occur when:
∇ · −→M = α ne M◦.
The density of electrons is given by
ne =J
2πrv◦e
so integration gives M− = αJM◦/ 2πev◦vi = αJM◦b/ 2πev◦µV , a con-stant independent of r. It scales linearly in α and M◦ and inversely withvi.
We can now solve for the current-voltage relation using the same spacecharge analysis we used in deriving (1) and (2) in Section 2,
∇ · E =ρeǫ◦
+M−
ǫ◦
38

With the boundary conditions Φ = 0 and dΦ/dr = 0 at r = a and Φ = Vat r = b, we get
V =J(b− a− a ln b/a)
2πǫ◦v◦+
M−((b2 − a2)/2− a2 ln(b/a)
2ǫ◦= c1J + c2M
◦J
where c1 ≈ b/ 2πǫ◦v◦ and c2 ≈ αb3/ 4πǫ◦ev◦µV . Inverting, we have
J =V
c1 + c2M◦
and J◦ (J at M◦ = 0) =V
c1.
Defining the normalized GPM current as S = J/J◦ , then
S =1
1 + c2/c1 M◦
or
M◦ =c1c2
1− S
S(5)
with
c1/c2 ≈2ev◦µV
αb2(6)
References
[1] J. L. Pack, R. E. Voshall, A. V. Phelps, Drift velocities of slow electronsin krypton, xenon, deuterium, carbon monoxide, carbon dioxide, watervapor, nitrous oxide, and ammonia, Phys. Rev. 127 (1962) 2084–2089.
[2] P. Benetti, et al., A simple and effective purifier for liquid xenon, NuclearInstruments and Methods in Physics Research Section A: Accelerators,Spectrometers, Detectors and Associated Equipment 329 (1993) 361 –364.
[3] G. Bakale, U. Sowada, W. F. Schmidt, Effect of an electric field onelectron attachment to sulfur hexafluoride, nitrous oxide, and molecularoxygen in liquid argon and xenon, The Journal of Physical Chemistry80 (1976) 2556–2559.
39

[4] D. Leonard, et al., A simple high-sensitivity technique for purity anal-ysis of xenon gas, Nuclear Instruments and Methods in Physics Re-search Section A: Accelerators, Spectrometers, Detectors and AssociatedEquipment 621 (2010) 678 – 684.
[5] I. Langmuir, The effect of space charge and residual gases on thermioniccurrents in high vacuum, Phys. Rev. 2 (1913) 450–486.
[6] I. Langmuir, The constitution and fundamental properties of solids andliquids. Part I. Solids., Journal of the American Chemical Society 38(1916) 2221–2295.
[7] T. Berghofer, J. Blumer, J. R. Horandel, A measurement of drift veloc-ities of electrons in xenon-methane mixtures, Nuclear Instruments andMethods in Physics Research Section A: Accelerators, Spectrometers,Detectors and Associated Equipment 525 (2004) 544 – 552.
[8] G. Vida, et al., Characterization of tungsten surfaces by simultane-ous work function and secondary electron emission measurements, Mi-croscopy and Microanalysis 9 (2003) 337–342.
[9] M. Gillet, et al., Growth, structure and electrical properties of tungstenoxide nanorods, The European Physical Journal D - Atomic, Molecular,Optical and Plasma Physics 34 (2005) 291–294. 10.1140/epjd/e2005-00161-2.
[10] J. C. Batty, R. E. Stickney, Quasiequilibrium treatment of gas–solidreactions. I. Evaporation rates of volatile species formed in the reactionof O2 with W, Mo, and C, The Journal of Chemical Physics 51 (1969)4475–4484.
[11] J. Batty, R. Stickney, Quasiequilibrium treatment of gas-solid reactions.III. Rate of volatilization of tungsten by high-temperature oxidation,Oxidation of Metals 3 (1971) 331–355. 10.1007/BF00614627.
[12] R. Sato, N. Kawamura, H. Tokumaru, The coloration of tungsten-oxidefilm by oxygen deficiency and its mechanism, Applied Surface Science254 (2008) 7676 – 7678. 9th International Conference on AtomicallyControlled Surfaces, Interfaces and Nanostructures 2007 (ASCIN-9).
40

[13] M. Kurumada, et al., Structure of WO3 ultrafine particles and theircharacteristic solid states, Journal of Crystal Growth 275 (2005) e1673– e1678. Proceedings of the 14th International Conference on CrystalGrowth and the 12th International Conference on Vapor Growth andEpitaxy.
[14] K. Miyake, et al., Physical and electrochemichromic properties of RFsputtered tungsten oxide films, Journal of Applied Physics 54 (1983)5256–5261.
[15] T. Oguri, Chemisorption of nitrogen on tungsten, Journal of the Phys-ical Society of Japan 18 (1963) 1280–1294.
[16] S. D. Biller, et al., Effects of oxygen and nitrogen on drifting electronsin a liquid argon TPC, Nuclear Instruments and Methods in PhysicsResearch Section A: Accelerators, Spectrometers, Detectors and Asso-ciated Equipment 276 (1989) 144 – 150.
[17] J. A. Becker, C. D. Hartman, Field emission microscope and flash fil-ament techniques for the study of structure and adsorption on metalsurfaces, The Journal of Physical Chemistry 57 (1953) 153–159.
[18] C.-F. Huang, B.-Y. Tsui, C.-H. Lu, Thermal stability and electricalcharacteristics of tungsten nitride gates in metal–oxide–semiconductordevices, Japanese Journal of Applied Physics 47 (2008) 872–878.
[19] B. D. Barford, R. R. Rye, Adsorption of ethylene and hydrogen ontungsten single crystals: Flash desorption, adsorption kinetics, and workfunction changes, The Journal of Chemical Physics 60 (1974) 1046–1056.
[20] R. Shigeishi, The adsorption of methane on tungsten (100) and (111),Surface Science 72 (1978) 61 – 76.
[21] G. Ehrlich, T. W. Hickmott, Adsorption spectrum of nitrogen on tung-sten, Nature 177 (1956) 1045–1046.
41