Embed Size (px)
Citation preview

The correlation of skeletal and molecular data: concordance of cranial, dental, mitochondrial DNA, and Y-Chromosome DNA
*Brianne Herrera, BA, Department of Anthropology, Texas State University, San Marcos
Tsunehiko Hanihara, PhD, Department of Anatomy and Biological Anthropology, Saga Medical School
Kanya Godde, PhD, School of Natural Sciences, School of Social Sciences, Humanities, and Arts, University of California, Merced; Department of Anthropology, University of Tennessee, Knoxville

Goals – Correspondence of Biological Data•Investigate why different patterns emerge
from different biological data▫Cranial, dental, and molecular data
•Peopling of the New World

Population N Location Source
Aleutian 137
Unalaska, St. George, St. Paul, Bering Island, Akutan, False Pass, King Cove, Nelson Lagoon, Sand Point Zlojutro 2006
Alaskan - Yakut 150 The Western and Southwestern region of Alaska Davis et al. 2011
Alaskan - Inupiat 151
The Northwestern coast and the North Slope Borough region of Alaska Davis et al. 2011
Greenland - Inuit 70
Inuit males from six different location in Greenland (Nanortalik, Nuuk, Ilulissat, Uummannaq, Upernavik, and Ittoqqortoormiit) Bosch et al. 2003
Greenland 272
Aasiaat (23), Llulissat (29), Kangaatsiaq (3), Maniitsoq (34), Nanortalik (25), Narsaq (16), Nuuk (50), Paamiut (12), Qaanaaq (6), Qaqortoq (12), Qasigiannguit (1), Sisimiut (16), Tasiilaq (41), Upernavik (2) and Uummannaq (2)
Hallenberg et al. 2009
Y-Chromosome Data
Population N Location Source
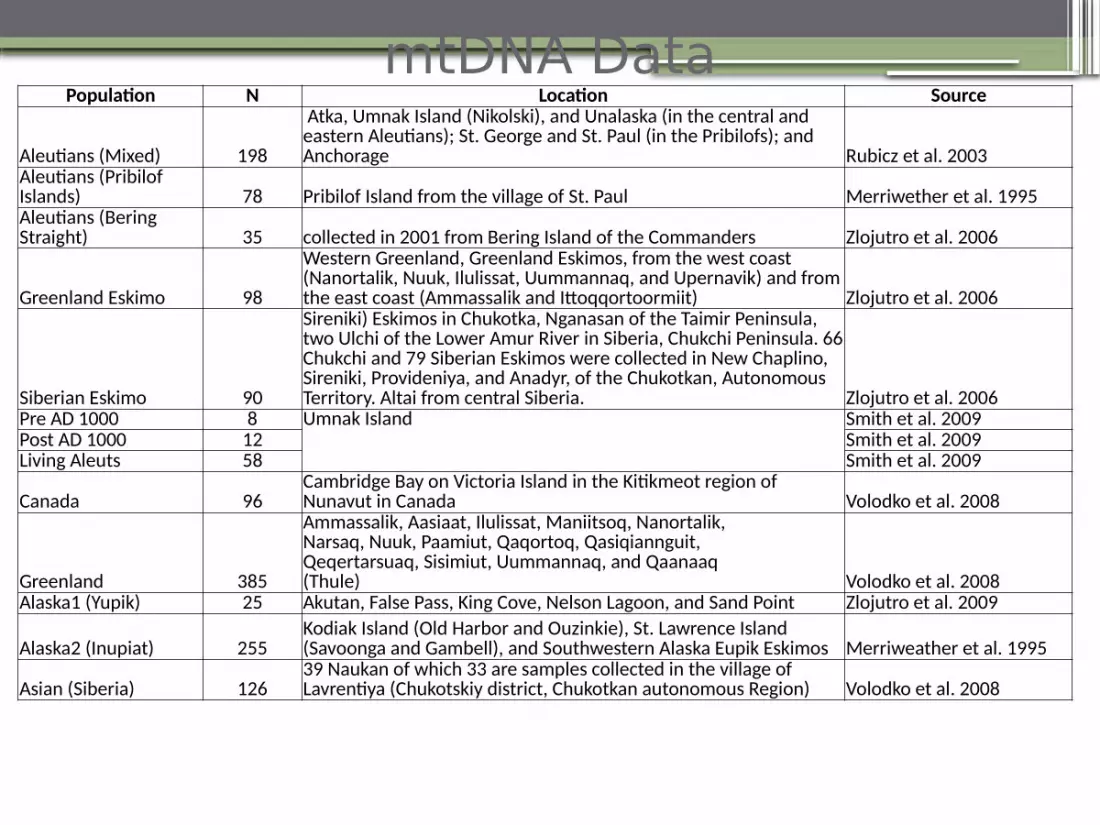
Aleutians (Mixed) 198
Atka, Umnak Island (Nikolski), and Unalaska (in the central and eastern Aleutians); St. George and St. Paul (in the Pribilofs); and Anchorage Rubicz et al. 2003
Aleutians (Pribilof Islands) 78 Pribilof Island from the village of St. Paul Merriwether et al. 1995Aleutians (Bering Straight) 35 collected in 2001 from Bering Island of the Commanders Zlojutro et al. 2006
Greenland Eskimo 98
Western Greenland, Greenland Eskimos, from the west coast (Nanortalik, Nuuk, Ilulissat, Uummannaq, and Upernavik) and from the east coast (Ammassalik and Ittoqqortoormiit) Zlojutro et al. 2006
Siberian Eskimo 90
Sireniki) Eskimos in Chukotka, Nganasan of the Taimir Peninsula, two Ulchi of the Lower Amur River in Siberia, Chukchi Peninsula. 66 Chukchi and 79 Siberian Eskimos were collected in New Chaplino, Sireniki, Provideniya, and Anadyr, of the Chukotkan, Autonomous Territory. Altai from central Siberia. Zlojutro et al. 2006
Pre AD 1000 8 Umnak Island Smith et al. 2009Post AD 1000 12 Smith et al. 2009Living Aleuts 58 Smith et al. 2009
Canada 96Cambridge Bay on Victoria Island in the Kitikmeot region of Nunavut in Canada Volodko et al. 2008
Greenland 385
Ammassalik, Aasiaat, Ilulissat, Maniitsoq, Nanortalik,Narsaq, Nuuk, Paamiut, Qaqortoq, Qasiqiannguit,Qeqertarsuaq, Sisimiut, Uummannaq, and Qaanaaq(Thule) Volodko et al. 2008
Alaska1 (Yupik) 25 Akutan, False Pass, King Cove, Nelson Lagoon, and Sand Point Zlojutro et al. 2009
Alaska2 (Inupiat) 255Kodiak Island (Old Harbor and Ouzinkie), St. Lawrence Island (Savoonga and Gambell), and Southwestern Alaska Eupik Eskimos Merriweather et al. 1995
Asian (Siberia) 12639 Naukan of which 33 are samples collected in the village of Lavrentiya (Chukotskiy district, Chukotkan autonomous Region) Volodko et al. 2008
mtDNA Data

Population N Location Source
Alaska1 135 & 146
Alaskan Eskimos (Yup'ik) from: Togiak; Mumtrak; Tanunak; Bethel; Hooper Bay; Iliamna Lake; Yukon; Kwichak; Nushagak and Kuskokwim River Basin; St Lawrence Island Hanihara
Alaska2 107
Alaskan Eskimos (Inupiat) from: Seward Peninsula; Shishmaref; Wales; Postolik; Nome; Little Diomede Island; Point Hope Hanihara
Alaska3 81 & 125Alaska Eskimos from Point Barrow; Utkiavik; Nixerak (near Barrow): Northernmost part of Alaska / NMNH; SI Hanihara
Siberia 23 & 21Port Providence; Plover Bay; Puoten; Indian Point / NE Siberia / Eskimo / NMNH; AMNH Hanihara
Canadian 30 & 28
Pond's Inlet; Sculpin Island; Labrador; Manico Point; Southampton Island Cumberland Golf; Buffin Island / Canadian Eskimos Hanihara
Greenland 112 & 115Smith Sound; Port Foulke; Western District; Nuussuaq; Ikertok Fiord; North Star Bay; Saunders Island / Greenland Eskimos Hanihara
Aleut1 102Amaknak, Unalaska, Unga, Umnak, Wislow, and Shiplock Islands / Fox Islands of Aleutian Island chain / AMNH; NMNH Hanihara
Aleut2 71 & 60Aleutian Island: Samalga Island Quad; Kagamil Island / NMNH; SI Hanihara
Aleut3 13Kanaga, Amlia, Adak, and Atka Islands; Andreanof Islands of Aleutian Island chain / NMNH; SI Hanihara
Aleut4 18 &29Amchitka and Kiska Islands; Rat Islands of Aleutian Island chain / NMNH; SI Hanihara
Aleut6 16 & 20 Aleutian Island Chain / locality unknown Hanihara
Cranial Metric and Nonmetric Data

Dental - MetricPopulation N Location Source
Alaska 66Nunivak Island; Bering Sea / Alaska Eskimos
Hanihara
Greenland 58
Smith Sound, Port Foulke; Disco Island; Upernatic; Wolstenholme Sound / Greenland Eskimos
Hanihara
Aleutian 78
Unalaska, Unga, Umnak, Shiplock, Amaknak, Kagamil, Kanaga, Amlia, Adak, Atka, Amchitka, Kiska, Attu, Agatu Islands / Aleutian Islands
Hanihara
Dental - NonmetricPopulation N Location Source
Alaska 80
Alaska Eskimos from Point Barrow; Seward Peninsula; Kialegak; St Lawrence Island and Southern Alaska
Hanihara
Greenland 54
Ikertok Fiord; Smith Sound; Port Foulke; Mugsuak Peninsula; Disco Island; Wolstenbolme Sound; Upernavic; Sepulchre; Issungvak / Greenland Hanihara
Aleutian 76 Aleutian Island Chain Hanihara
Dental Metric and Nonmetric Data

Background - Populations•Aleutians•Alaskan Eskimo•Greenland Eskimo•Canadian Eskimo•Siberian Eskimo

Map created with Google Earth (2013)

Methods•Cranial metrics and nonmetrics•mtDNA and y-chromosome DNA•Dental metrics and nonmetrics
•Had matched and unmatched data

Methods•Found R and kinship matrices•Mantel Test•Procrustes
▫Graphed eigenvectors produced by Procrustes analysis
•Correlation matrices

MantelP values
Matching
Cranial metric and nonmetric0.0813
Dental metric and nonmetric0.4715
Not Matching
Cranial metric and nonmetric 0.0097
Dental metric and nonmetric 1.0000
mtDNA and metric 0.0689
mtDNA and nonmetric 0.0642
Y-chromosome and metric 0.4865
Y-chromosome and nonmetric 0.0500
mtDNA and Y-chromosome DNA 0.3527

Correlation MatricesMetric Nonmetric mtDNA
Metric 1 0.5344 0.7089
Nonmetric 0.5344 1 0.4185
mtDNA 0.7089 0.4185 1
Correlation matrix of matching cranial metric and nonmetric with mtDNA

Correlation Matrices Metric Nonmetric Y-chromosome
Metric 1 0.4947 0.4202
Nonmetric 0.4947 1 0.9681
Y-chromosome 0.4202 0.9681 1
Correlation matrix of matching metric and nonmetric with y-chromosome DNA

Correlation Matrices Metric Nonmetric mtDNA
Metric 1 0.822 0.7633
Nonmetric 0.822 1 0.6991
mtDNA 0.7633 0.6991 1
Correlation matrix of non-matching metric and nonmetric with mtDNA

Correlation Matrices Metric Nonmetric Y-chromosome
Metric 1 0.8972 0.6931
Nonmetric 0.8972 1 0.8629
Y-chromosome 0.6931 0.8629 1
Correlation matrix of non-matching metric and nonmetric with y-chromosome DNA

Graph of procrustes analysis using matching metric and nonmetric data, with mtDNA
Procrustes
X – mtDNAΔ – metricO - nonmetric
Aleut 1
Aleut 4
Alaska 2
Alaska 1
Aleut 6
Canada
Aleut 2Aleut 3
Asia
Greenland
second component of
average eigenvector
first component of average eigenvector

Graph of procrustes analysis using non-matching metric and nonmetric data, with mtDNA
Procrustes
X – mtDNAΔ – metricO - nonmetric
Alaska 2
Alaska 1
Greenland
Aleut 1
Aleut 2
Aleut 4
second component of
average eigenvector
first component of average eigenvector

Graph of procrustes analysis using matching metric and nonmetric data, with y-chromosome
Procrustes
X – y chromosomeΔ – metricO - nonmetric
Alaska 1
Alaska 2
Aleut 1
Greenland
Asia
first component of average eigenvector
second component of
average eigenvector

Graph of procrustes analysis using non-matching metric and nonmetric data, with y-chromosome
Procrustes
X – y chromosomeΔ – metricO - nonmetric
Alaska 2
Alaska 1
Greenland
Aleut 1
second component of
average eigenvector
first component of average eigenvector

Conclusions•Procrustes shows high levels of
correlations•Nonmetric and y-chromosome DNA shows
higher correlations than metric and y-chromosome DNA
•Metric and mtDNA correlation was much stronger than nonmetric and mtDNA
•Possible sex bias

References•Bosch E, Calafell F, Rosser ZH, Norby S, Lynnerup N, Hurles ME, and Jobling MA. 2003. High level of
male-biased Scandinavian admixture in Greenlandic Inuit shown by y-chromosomal analysis. Hum Genet 112:353-363.
•Davis C, Ge J, Chidambaram A, King J, Turnbough K, Collins M, Dym O, Chakraborty R, Eisenberg AJ, and Budowle B. 2011. Y-str loci diversity in native Alaskan populations. Int J Legal Med 125:559-563.
•Hallenberg C, Tomas C, Simonson B, and Morling N. 2009. Y-chromosome STR haplotypes in males from Greenland. Forensic Sci Int 3:e145-e146.
•Merriwether DA, Rothhammer F, and Ferrell RE. 1995. Distribution of the four founding lineage haplotypes in Native Americans suggests a single wave migration for the New World. Am J Phys Anthropol 98:411-430.
•Rubicz R, Schurr TG, and Crawford MH. 2003. Mitochondrial DNA variation and the origin of the Aleuts. Hum Bio 75(6):809-835.
•Volodko NV, Starikovskaya EB, Mazunin IO, Eltsov NP, Naidenko PV, Wallace DC, and Sukernik RI. 2008. Mitochondrial genome diversity in Arctic Siberians with particular reference to the evolutionary history of Beringia and Pleistocenic peopling of the Americas. Am J Hum Genet 82:1084-1100.
•Zlojutro M, Rubicz R, Devor EJ, Spitsyn VA, Makarov SV, Wilson K, and Crawford MH. 2006. Genetic structure of the Aleuts and circumpolar populations based on mitochondrial DNA sequences: a synthesis. Am J Phys Anthropol 129:446-464.
•Zlojutro M, Rubicz R, and Crawford MH. 2009. Mitochondrial DNA and y-chromosome variation in five eastern Aleut communities: evidence for genetic substructure in the Aleut population. Ann Hum Genet 36(5):511-526.


