Embed Size (px)
Citation preview
Research of JST Investments | @JSTInvestments | www.jstinvestments.com
About the company
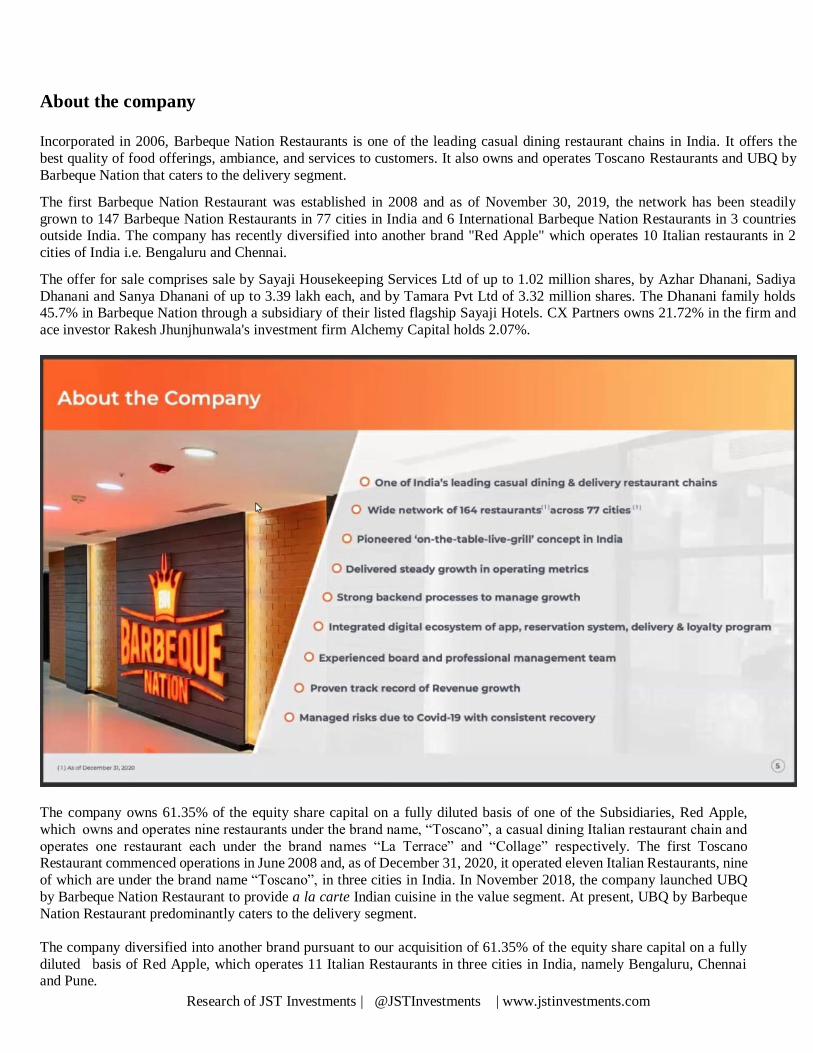
Incorporated in 2006, Barbeque Nation Restaurants is one of the leading casual dining restaurant chains in India. It offers the
best quality of food offerings, ambiance, and services to customers. It also owns and operates Toscano Restaurants and UBQ by
Barbeque Nation that caters to the delivery segment.
The first Barbeque Nation Restaurant was established in 2008 and as of November 30, 2019, the network has been steadily
grown to 147 Barbeque Nation Restaurants in 77 cities in India and 6 International Barbeque Nation Restaurants in 3 countries outside India. The company has recently diversified into another brand "Red Apple" which operates 10 Italian restaurants in 2
cities of India i.e. Bengaluru and Chennai.
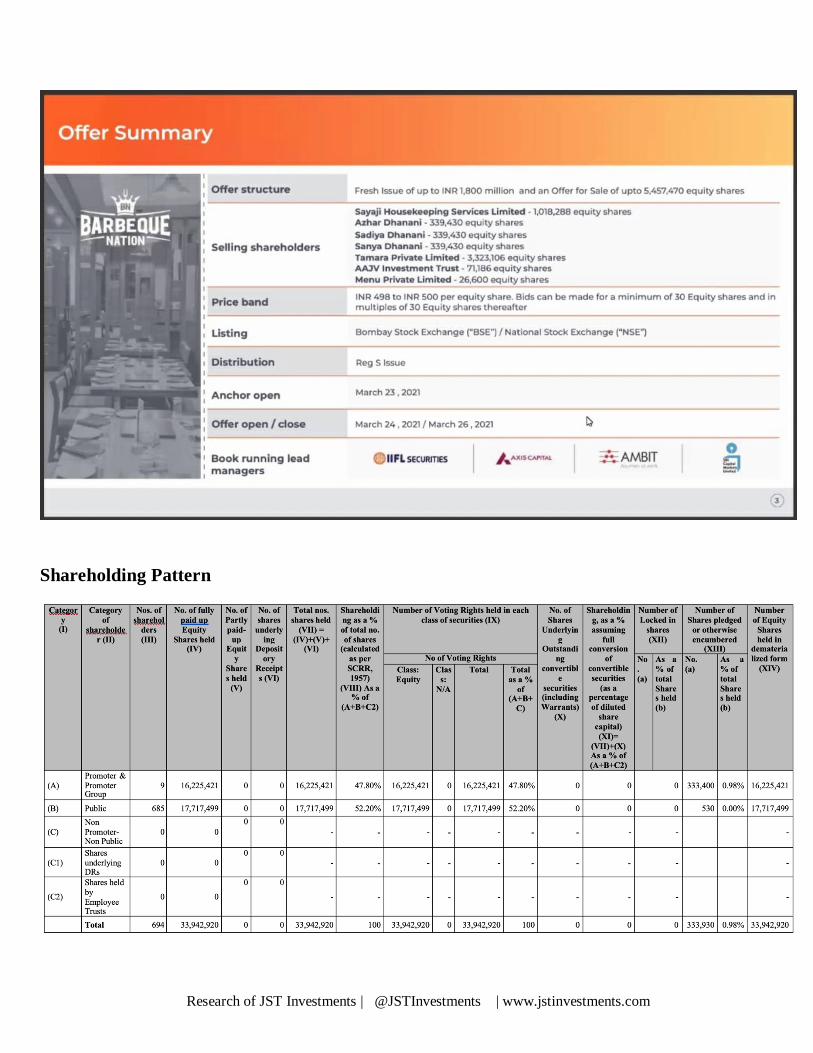
The offer for sale comprises sale by Sayaji Housekeeping Services Ltd of up to 1.02 million shares, by Azhar Dhanani, Sadiya
Dhanani and Sanya Dhanani of up to 3.39 lakh each, and by Tamara Pvt Ltd of 3.32 million shares. The Dhanani family holds 45.7% in Barbeque Nation through a subsidiary of their listed flagship Sayaji Hotels. CX Partners owns 21.72% in the firm and
ace investor Rakesh Jhunjhunwala's investment firm Alchemy Capital holds 2.07%.
The company owns 61.35% of the equity share capital on a fully diluted basis of one of the Subsidiaries, Red Apple,
which owns and operates nine restaurants under the brand name, “Toscano”, a casual dining Italian restaurant chain and
operates one restaurant each under the brand names “La Terrace” and “Collage” respectively. The first Toscano Restaurant commenced operations in June 2008 and, as of December 31, 2020, it operated eleven Italian Restaurants, nine
of which are under the brand name “Toscano”, in three cities in India. In November 2018, the company launched UBQ
by Barbeque Nation Restaurant to provide a la carte Indian cuisine in the value segment. At present, UBQ by Barbeque
Nation Restaurant predominantly caters to the delivery segment.
The company diversified into another brand pursuant to our acquisition of 61.35% of the equity share capital on a fully
diluted basis of Red Apple, which operates 11 Italian Restaurants in three cities in India, namely Bengaluru, Chennai and Pune.
Research of JST Investments | @JSTInvestments | www.jstinvestments.com
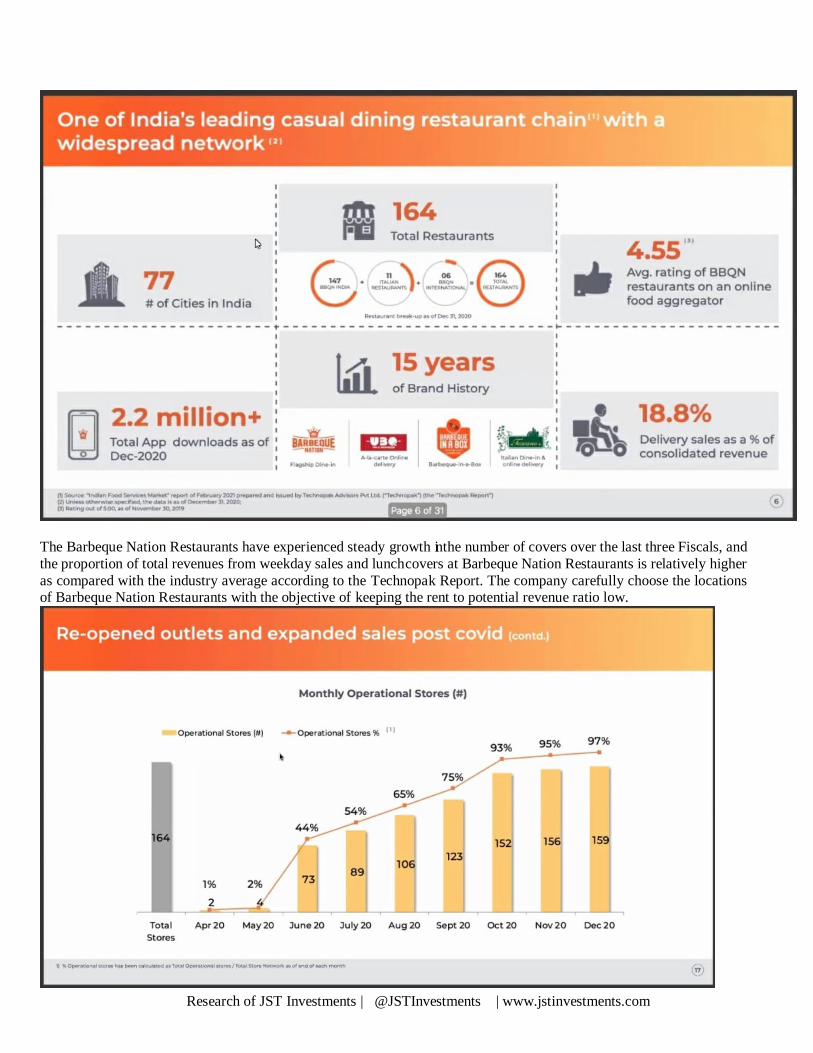
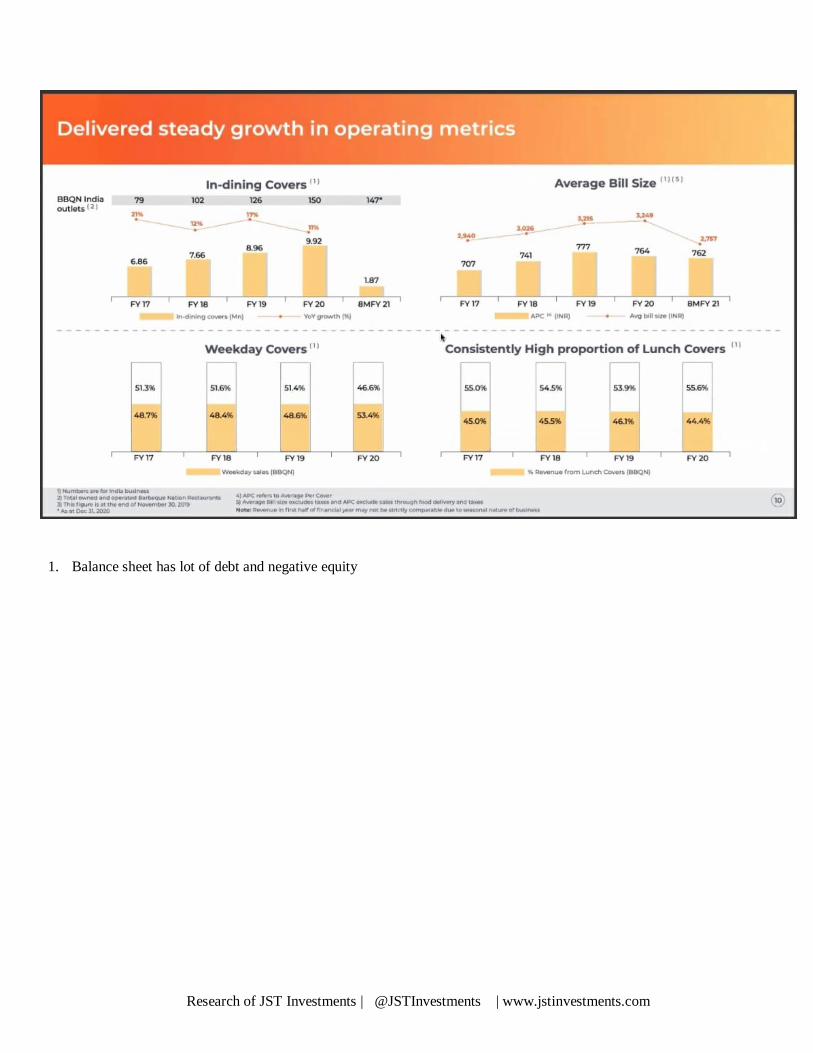
The Barbeque Nation Restaurants have experienced steady growth in the number of covers over the last three Fiscals, and
the proportion of total revenues from weekday sales and lunch covers at Barbeque Nation Restaurants is relatively higher
as compared with the industry average according to the Technopak Report. The company carefully choose the locations of Barbeque Nation Restaurants with the objective of keeping the rent to potential revenue ratio low.
Research of JST Investments | @JSTInvestments | www.jstinvestments.com
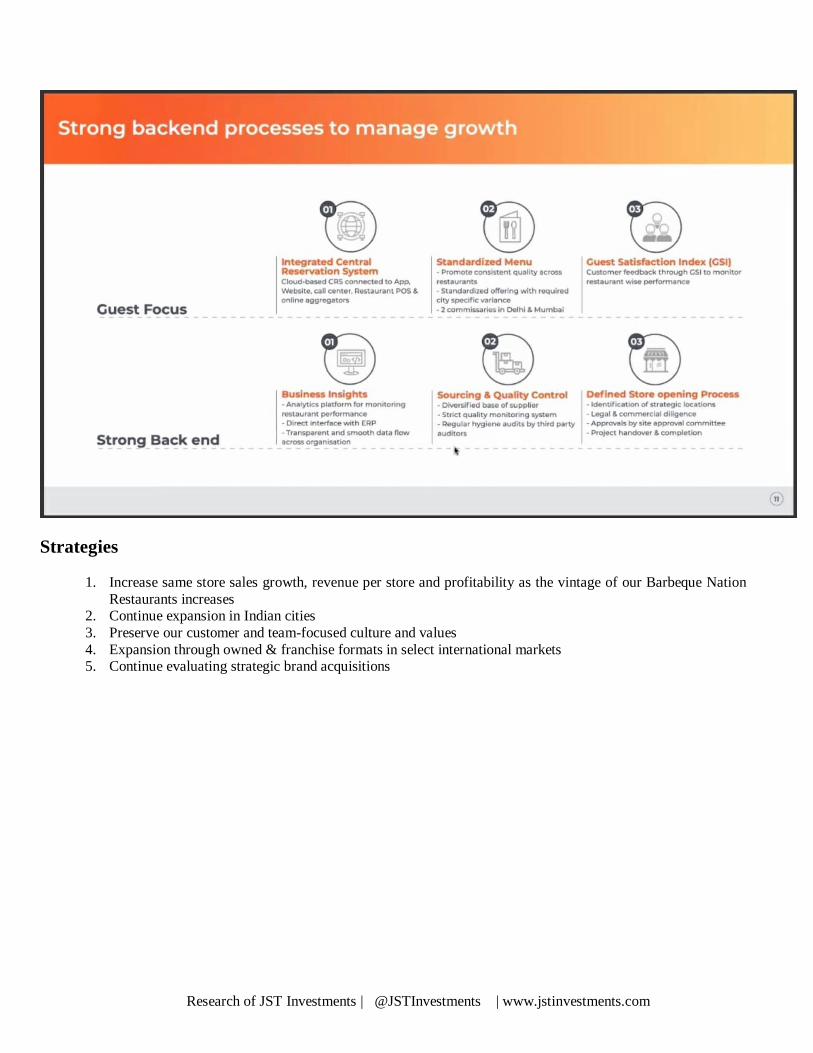
The Company places a strong emphasis on customer reviews and feedback and the Barbeque Nation Restaurants use in-
house call centre to obtain customer feedback for Barbeque Nation Restaurants in accordance with internally devised
and managed Guest Satisfaction Index (“GSI”). The Barbeque Nation Restaurants use two cloud-based systems: the Central Reservation System (“CRS”) and the Central Feedback System (“CFS”). The company also accepts reservations
for Barbeque Nation Restaurants through revamped smartphone application ‘BBQ App’, Facebook chat messenger,
chat-bot and other reservation platforms.
The Company was ranked amongst the top 10 retail companies to work for by Great Place to Work Institute in 2020 in
collaboration with the Retailers Association of India and was ranked number 7 amongst India’s best companies to work
for in 2020 by the Great Place to Work Institute in collaboration with Economic Times.
The company promoters include Kayum Dhanani, Raoof Dhanani, Sayaji Hotels, Sayaji Housekeeing Services and Suchitra Dhanani. The registrar of the issue is LinkinTime. IIFL Securities, Axis Capital, Ambit Capital and SBI Capital are the lead
managers to the issue. The company will utilise the proceeds of the issue to repay outstanding borrowing. As of September 2019,
the net debt of the company was at ₹166.28 crore.
Research of JST Investments | @JSTInvestments | www.jstinvestments.com
Business Model
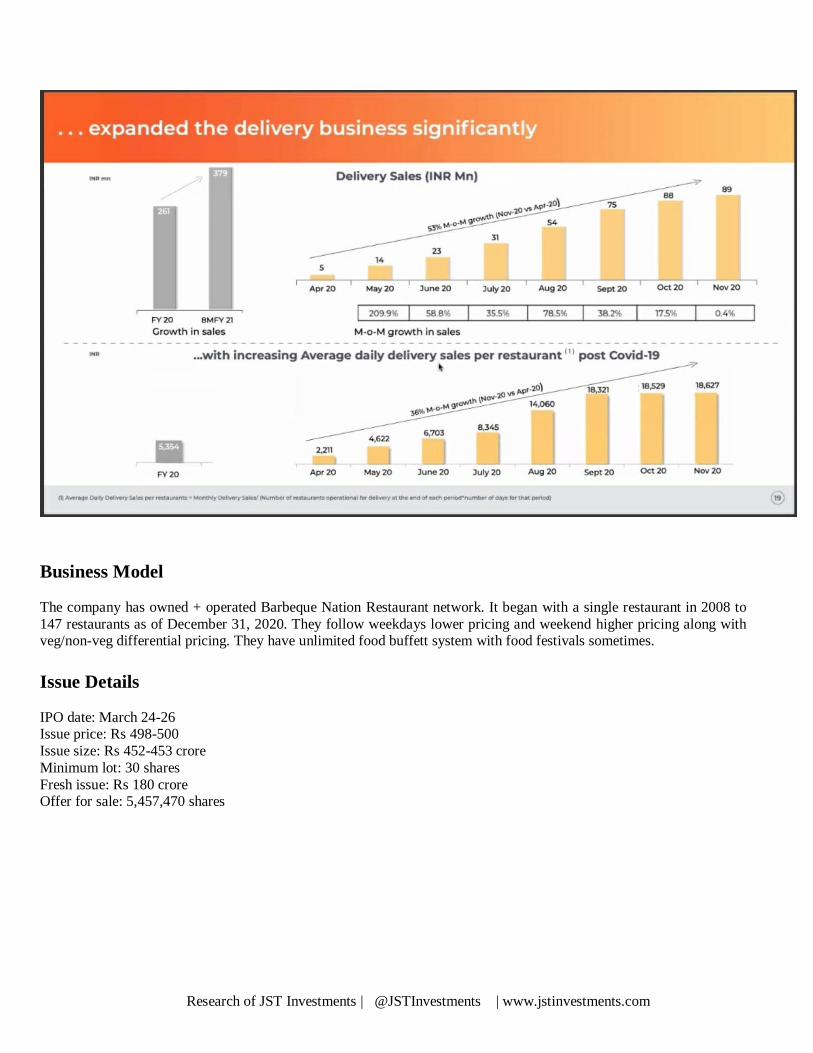
The company has owned + operated Barbeque Nation Restaurant network. It began with a single restaurant in 2008 to
147 restaurants as of December 31, 2020. They follow weekdays lower pricing and weekend higher pricing along with veg/non-veg differential pricing. They have unlimited food buffett system with food festivals sometimes.
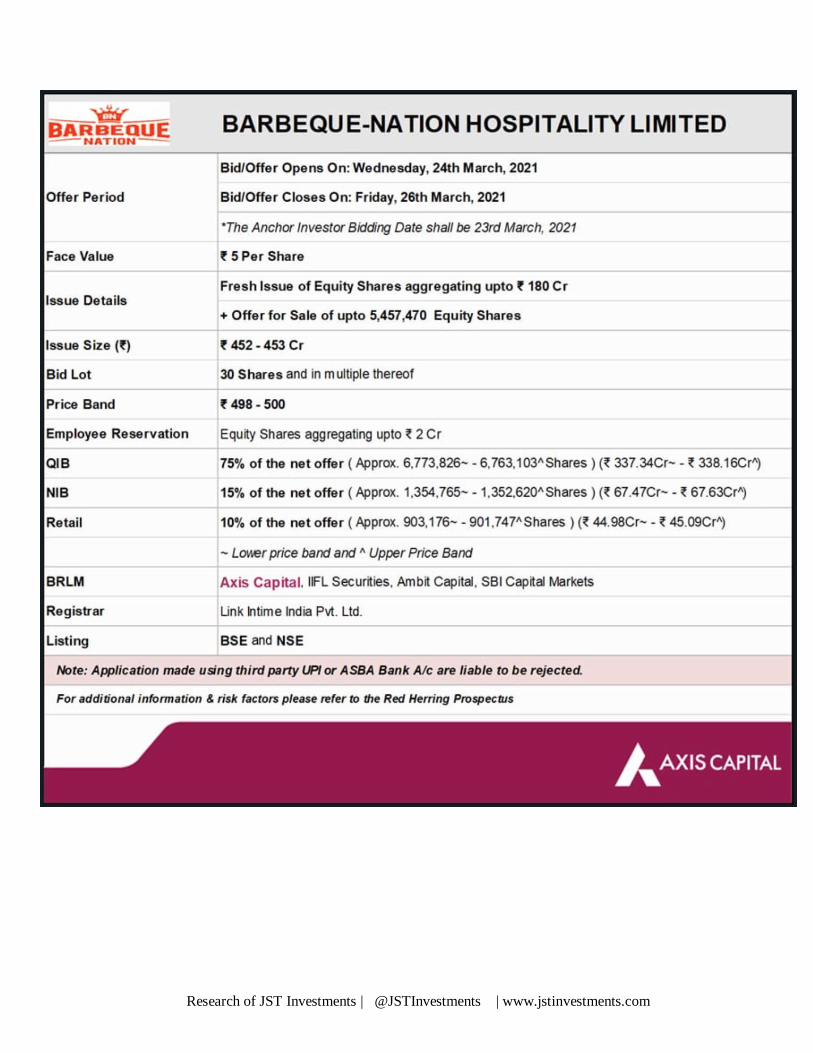
Issue Details
IPO date: March 24-26 Issue price: Rs 498-500
Issue size: Rs 452-453 crore
Minimum lot: 30 shares
Fresh issue: Rs 180 crore Offer for sale: 5,457,470 shares
Research of JST Investments | @JSTInvestments | www.jstinvestments.com
Research of JST Investments | @JSTInvestments | www.jstinvestments.com
Shareholding Pattern
Research of JST Investments | @JSTInvestments | www.jstinvestments.com
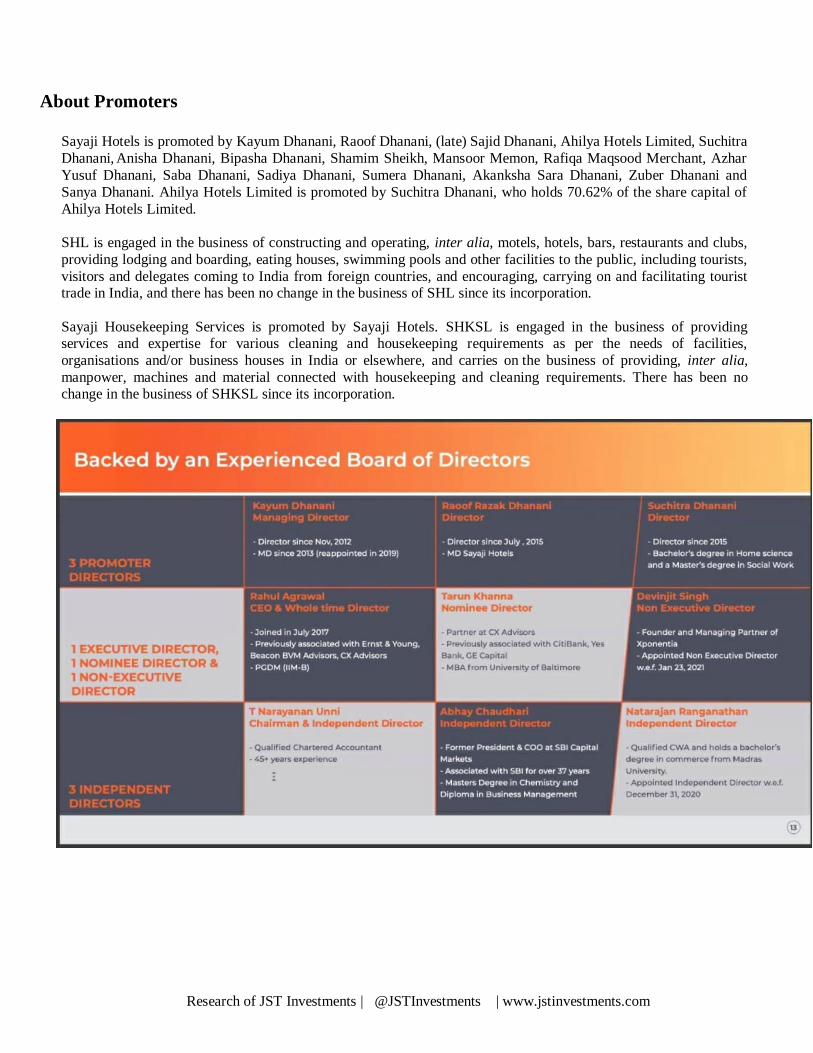
About Promoters
Sayaji Hotels is promoted by Kayum Dhanani, Raoof Dhanani, (late) Sajid Dhanani, Ahilya Hotels Limited, Suchitra
Dhanani, Anisha Dhanani, Bipasha Dhanani, Shamim Sheikh, Mansoor Memon, Rafiqa Maqsood Merchant, Azhar
Yusuf Dhanani, Saba Dhanani, Sadiya Dhanani, Sumera Dhanani, Akanksha Sara Dhanani, Zuber Dhanani and
Sanya Dhanani. Ahilya Hotels Limited is promoted by Suchitra Dhanani, who holds 70.62% of the share capital of
Ahilya Hotels Limited.
SHL is engaged in the business of constructing and operating, inter alia, motels, hotels, bars, restaurants and clubs,
providing lodging and boarding, eating houses, swimming pools and other facilities to the public, including tourists,
visitors and delegates coming to India from foreign countries, and encouraging, carrying on and facilitating tourist trade in India, and there has been no change in the business of SHL since its incorporation.
Sayaji Housekeeping Services is promoted by Sayaji Hotels. SHKSL is engaged in the business of providing services and expertise for various cleaning and housekeeping requirements as per the needs of facilities,
organisations and/or business houses in India or elsewhere, and carries on the business of providing, inter alia,
manpower, machines and material connected with housekeeping and cleaning requirements. There has been no change in the business of SHKSL since its incorporation.
Research of JST Investments | @JSTInvestments | www.jstinvestments.com
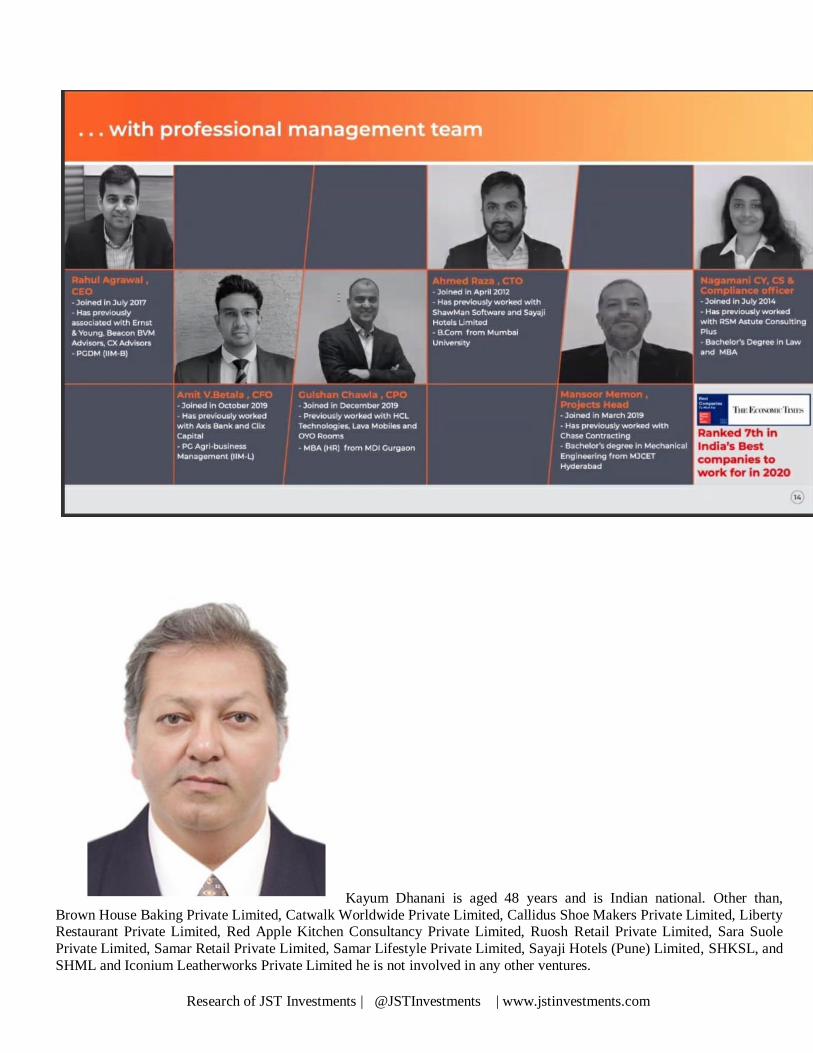
Kayum Dhanani is aged 48 years and is Indian national. Other than,
Brown House Baking Private Limited, Catwalk Worldwide Private Limited, Callidus Shoe Makers Private Limited, Liberty Restaurant Private Limited, Red Apple Kitchen Consultancy Private Limited, Ruosh Retail Private Limited, Sara Suole
Private Limited, Samar Retail Private Limited, Samar Lifestyle Private Limited, Sayaji Hotels (Pune) Limited, SHKSL, and
SHML and Iconium Leatherworks Private Limited he is not involved in any other ventures.

Research of JST Investments | @JSTInvestments | www.jstinvestments.com
Raoof Dhanani is aged 57 years and is Indian national too. Other than, Alisha Agrophos Private Limited, Aries Hotels Private Limited, Catwalk Worldwide Private Limited, Kshipra Restaurants
Private Limited, Malwa Hospitality Private Limited, Prinite Hospitality Private Limited, Saba Reality Private Limited,
SHKSL, SHL, SHML, Sayaji Hotels (Pune) Limited, Sayaji Hotels (Vadodara) Limited, Super Civiltech Private Limited and
Red Apple Kitchen Consultancy Private Limited, he is not involved in any other ventures.
Suchitra Dhanani is aged 56 years and an Indian national. Other than, Ahilya
Hotels Limited, Aries Hotels Private Limited, Alter Vegan Foods Private Limited, Malwa Hospitality Private Limited, Rama
Buildcare Private Limited, SHKSL, SHL, SHML, Sayaji Hotels (Pune) Limited and Sayaji Hotels (Vadodara) Limited, she is not involved in any other ventures.
Research of JST Investments | @JSTInvestments | www.jstinvestments.com
Questions to the Management
1. Reason behind Johnny Rockets exit
American cuisine customized to Indian palate. There were partnership differences. They exited as they thought that was
not the way to be built. They were also not willing to take it forward, so they parted ways. They invested a very small
amount in the business, and instead of infusing more, they thought of exiting.
2. Reason behind steep price band when the company did a private placement in January at Rs 252/share and also that
the financials are very weak- negative networth, PAT and low sales.
The liquidity of the company was tight since we had losses in the first 6 months last year. We discussed with our merchant
bankers and investors given the current situation and hence the lower price band. Raised capital for survival, that was
necessary that time. (Not really confidence inspiring answer)
3. What kind of capex are you looking at?
We have 70% of our restaurants in metro cities and 30% in tier 1-2 markets. We will maintain this going forward, for 2-3
years. We believe that we have low penetration in metro markets and so we want to focus in both these markets first.
Strengths
1. Diversified offerings for both vegetarians and non-vegetarians
2. Experience promoters and managers team
3. Steady growth in covers and consistent APC with a relatively high proportion of revenues from weekday sales and lunch covers
4. Attractive offerings based on constant menu innovation
Research of JST Investments | @JSTInvestments | www.jstinvestments.com
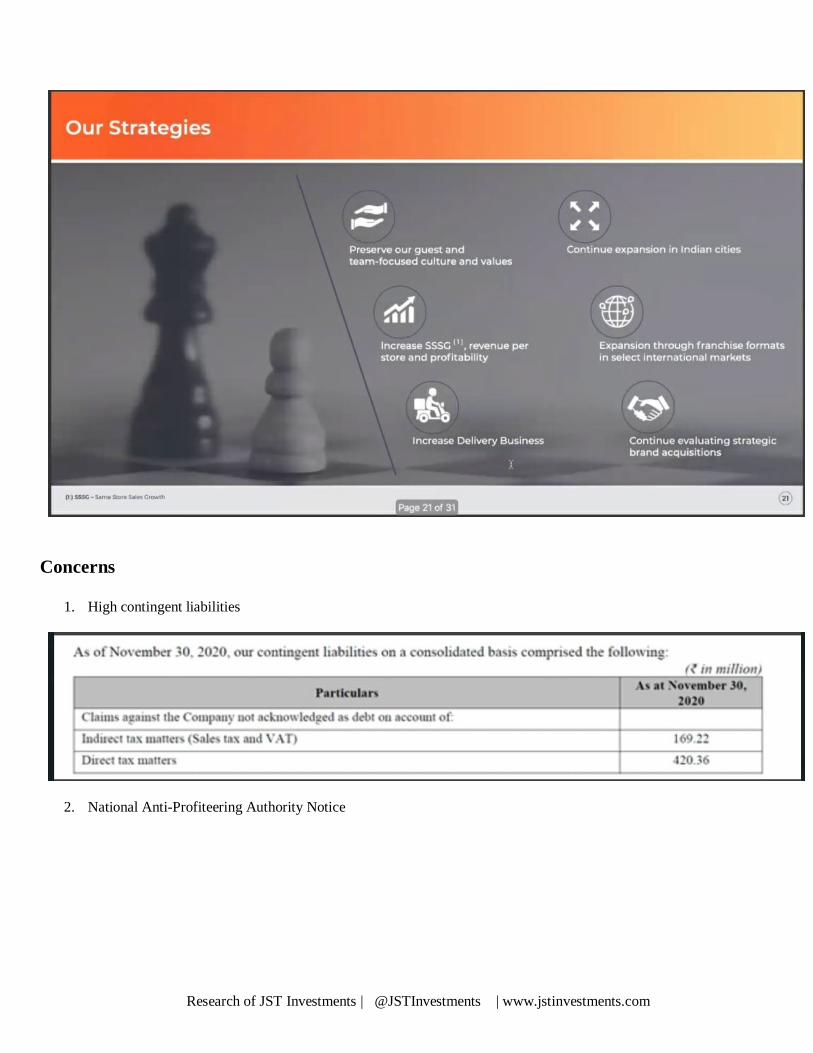
Strategies
1. Increase same store sales growth, revenue per store and profitability as the vintage of our Barbeque Nation
Restaurants increases 2. Continue expansion in Indian cities
3. Preserve our customer and team-focused culture and values
4. Expansion through owned & franchise formats in select international markets 5. Continue evaluating strategic brand acquisitions
Research of JST Investments | @JSTInvestments | www.jstinvestments.com
Concerns
1. High contingent liabilities
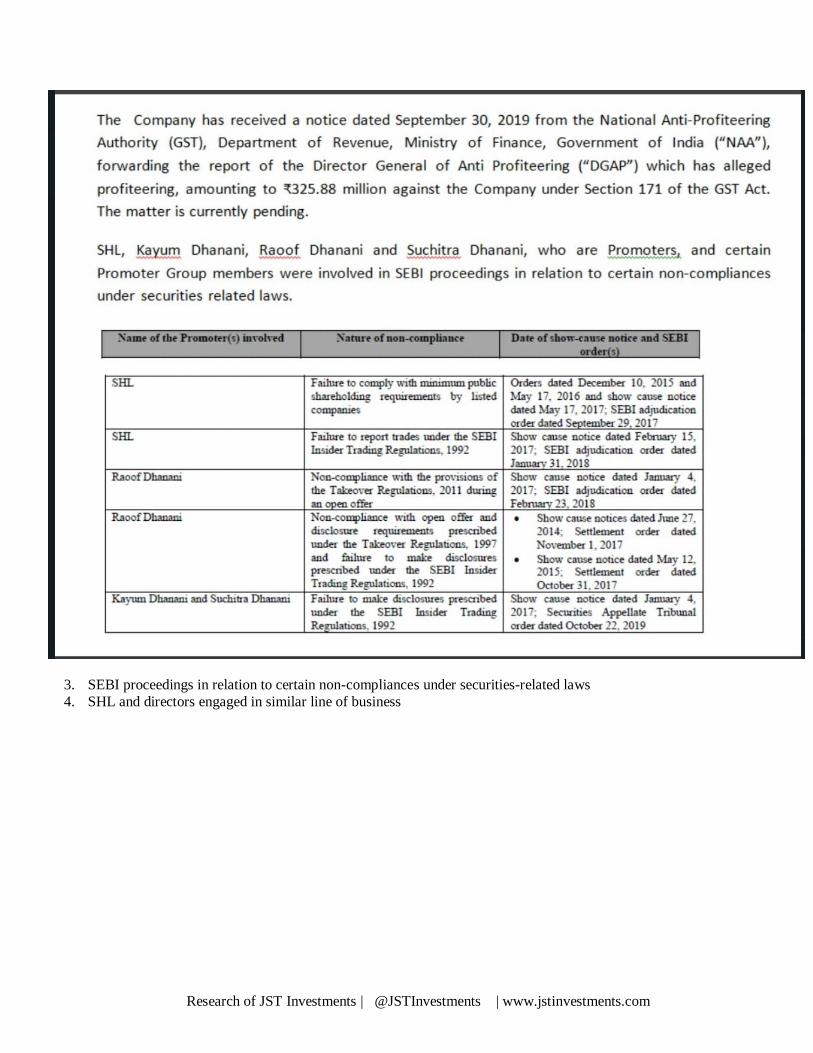
2. National Anti-Profiteering Authority Notice
Research of JST Investments | @JSTInvestments | www.jstinvestments.com
3. SEBI proceedings in relation to certain non-compliances under securities-related laws
4. SHL and directors engaged in similar line of business
Research of JST Investments | @JSTInvestments | www.jstinvestments.com
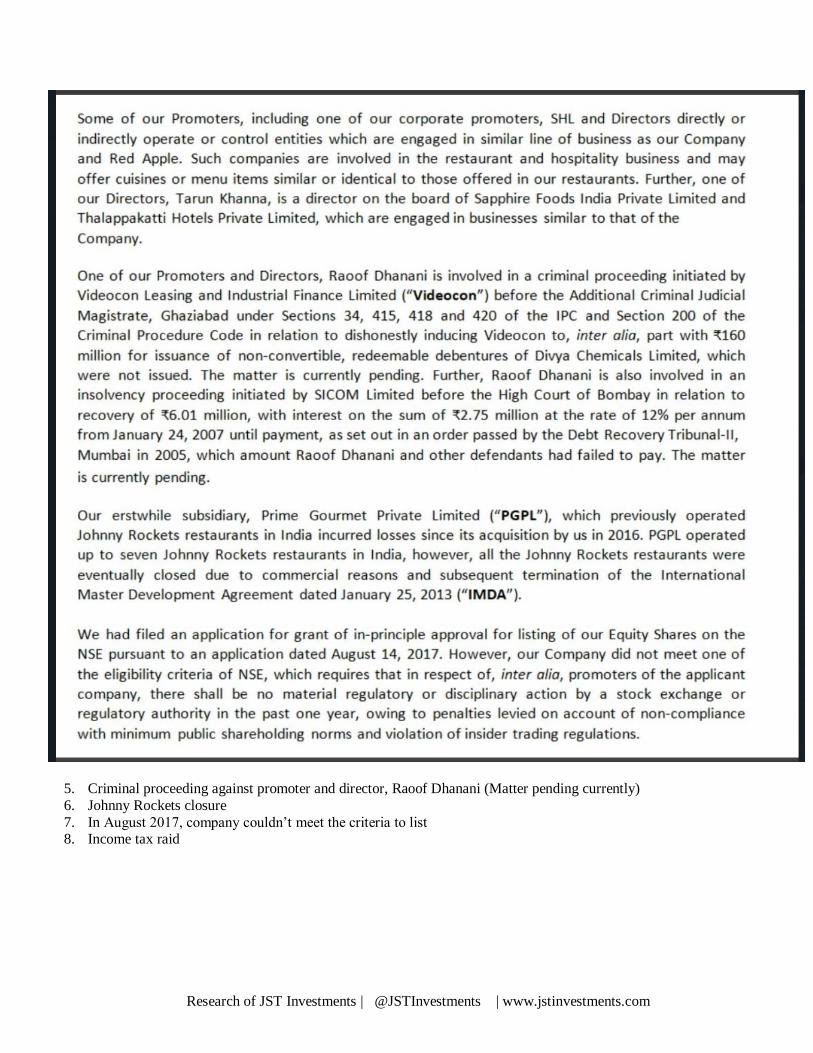
5. Criminal proceeding against promoter and director, Raoof Dhanani (Matter pending currently)
6. Johnny Rockets closure
7. In August 2017, company couldn’t meet the criteria to list 8. Income tax raid
Research of JST Investments | @JSTInvestments | www.jstinvestments.com
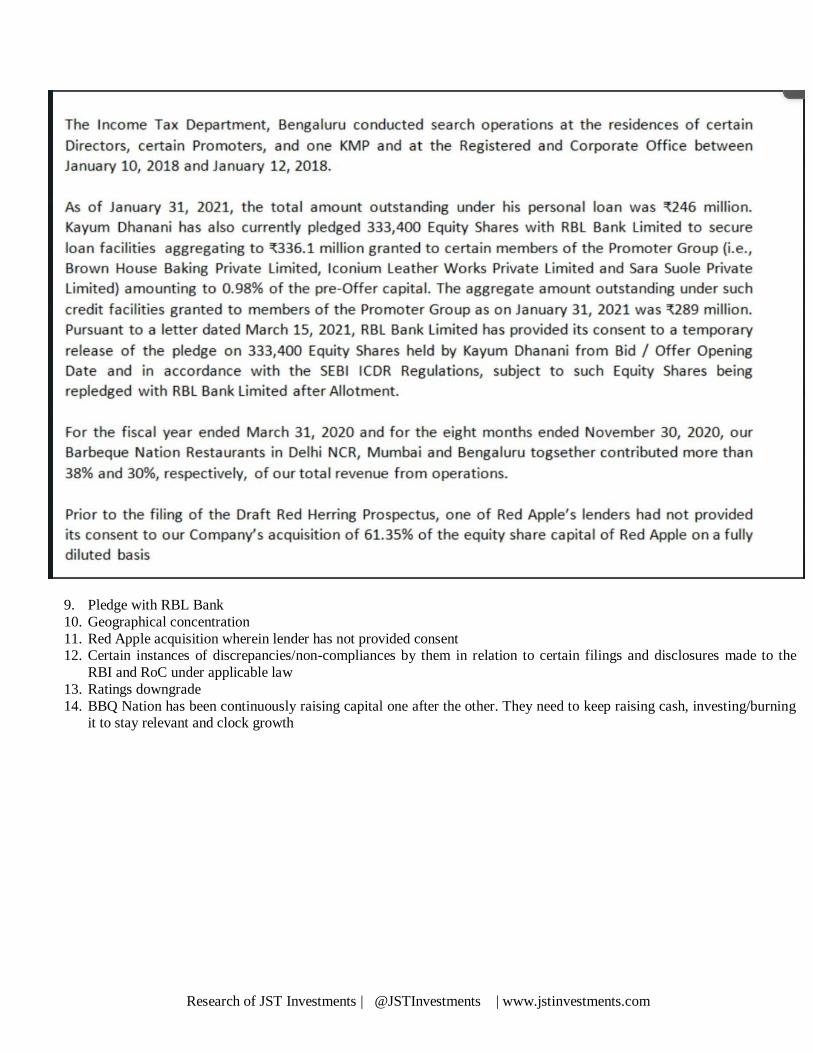
9. Pledge with RBL Bank
10. Geographical concentration
11. Red Apple acquisition wherein lender has not provided consent 12. Certain instances of discrepancies/non-compliances by them in relation to certain filings and disclosures made to the
RBI and RoC under applicable law
13. Ratings downgrade
14. BBQ Nation has been continuously raising capital one after the other. They need to keep raising cash, investing/burning it to stay relevant and clock growth
Research of JST Investments | @JSTInvestments | www.jstinvestments.com
Research of JST Investments | @JSTInvestments | www.jstinvestments.com
Financials Snapshot
Research of JST Investments | @JSTInvestments | www.jstinvestments.com
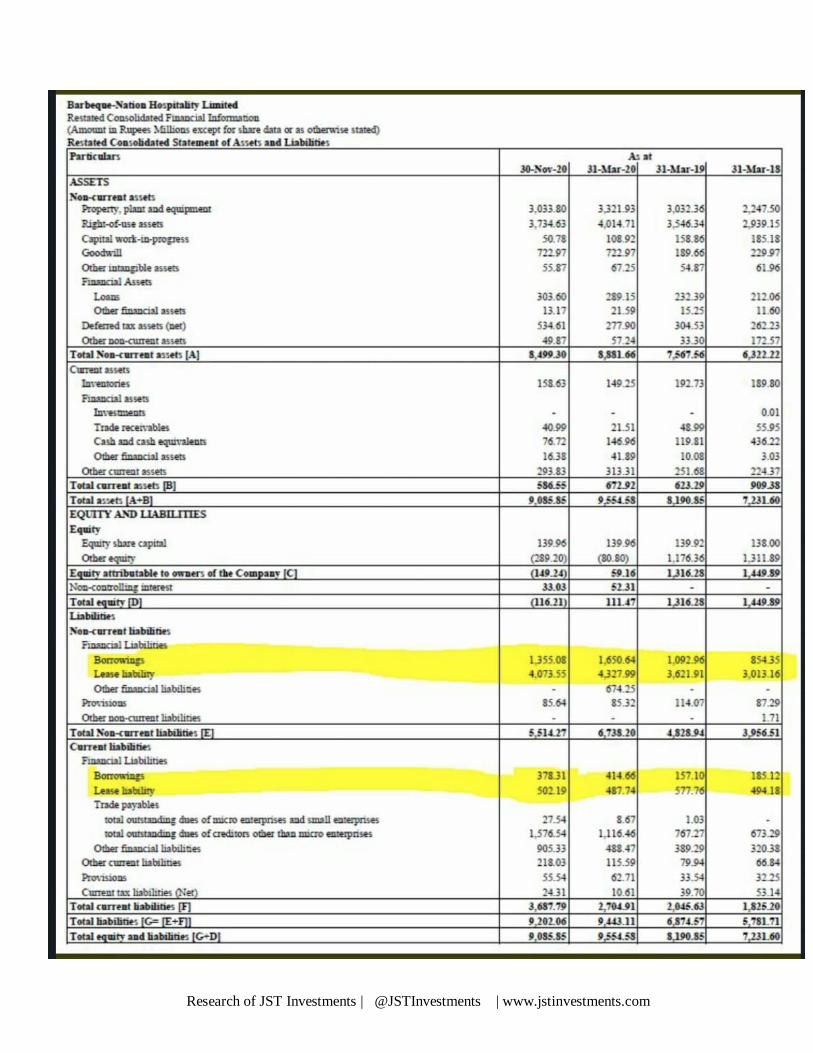
1. Balance sheet has lot of debt and negative equity
Research of JST Investments | @JSTInvestments | www.jstinvestments.com
Research of JST Investments | @JSTInvestments | www.jstinvestments.com
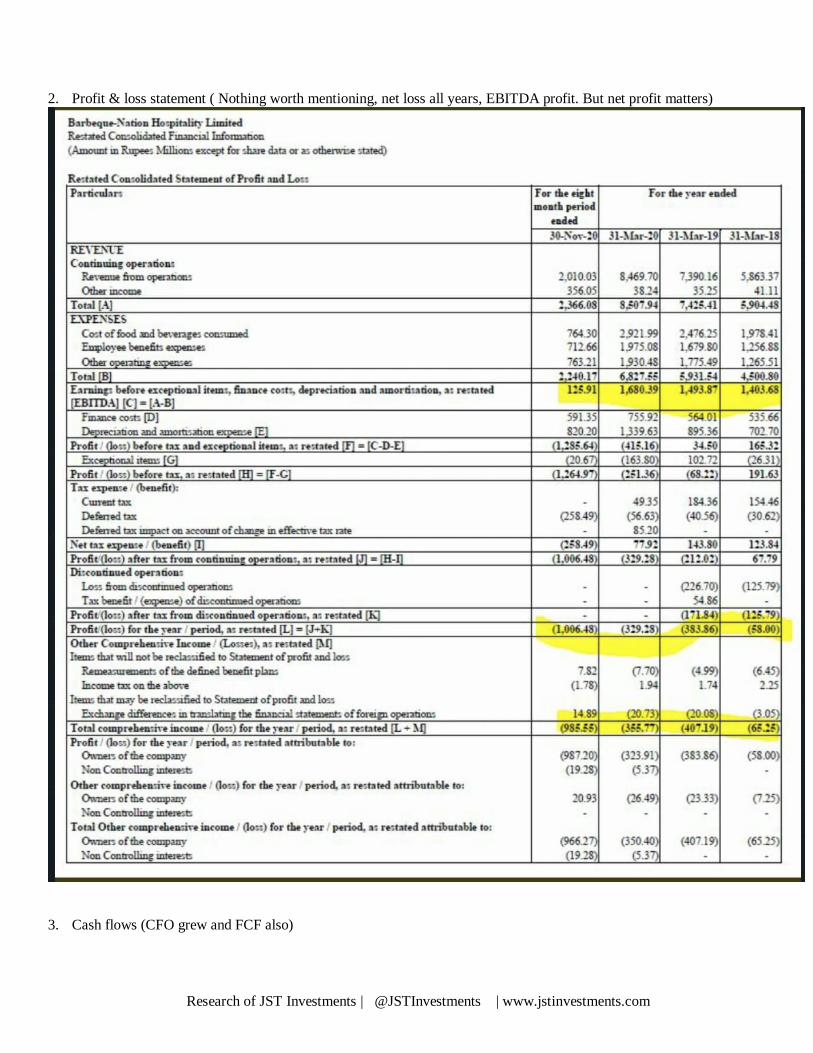
2. Profit & loss statement ( Nothing worth mentioning, net loss all years, EBITDA profit. But net profit matters)
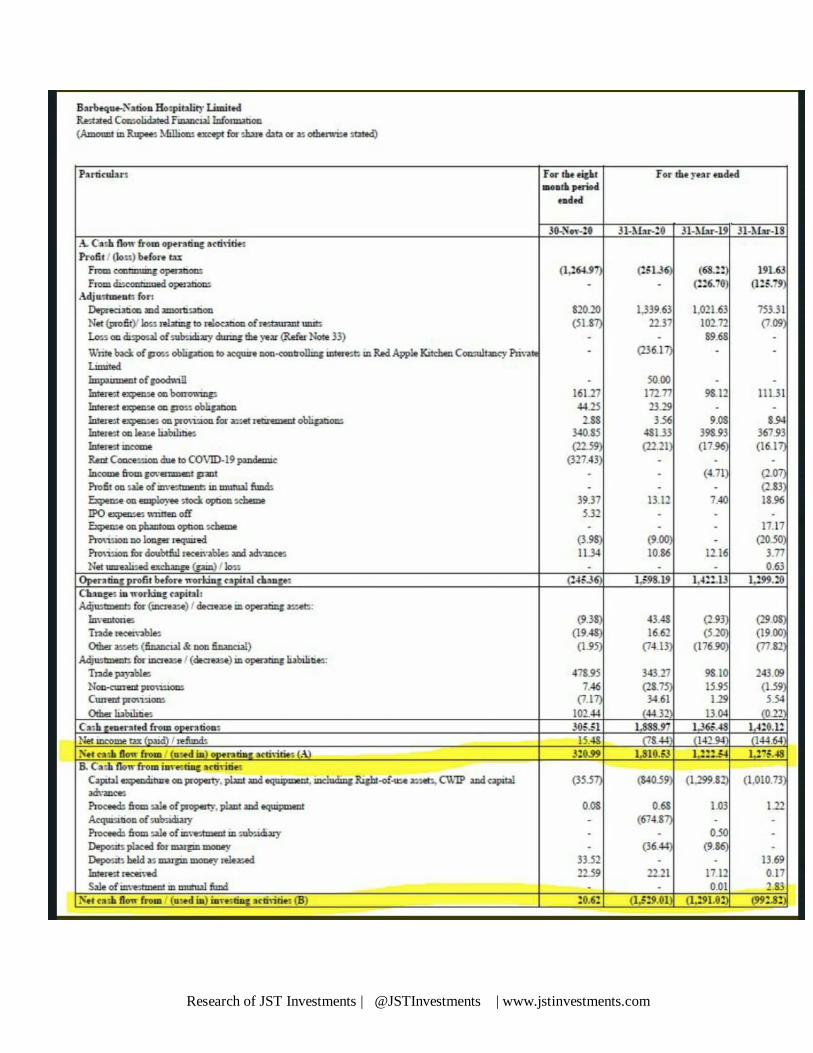
3. Cash flows (CFO grew and FCF also)
Research of JST Investments | @JSTInvestments | www.jstinvestments.com
Research of JST Investments | @JSTInvestments | www.jstinvestments.com
Valuation & Conclusion
The kind of format that they operate in (Barbeque) is quite different. But, we see BBQ has been continuously raising capital
one after the other and that tells us that they need to keep raising cash, investing/burning it to stay relevant, and clock growth.
The restaurant business is very tough as Preferences change rapidly and a new player can very well hyper-scale.(Look at cloud kitchens + Rebel foods who opened 1000 restaurants in 24 months). The moat is not there for the restaurant business.
The company is loss-making for all the periods that they have reported their numbers for along with high debt. The company also allotted shares to Jubilant 2 months back at Rs 252 and is bringing the IPO now at Rs 500. The company justified this by
saying they raised capital for survival and hence price was lower which is not really confidence inspiring.
The second wave of corona concerns, local lockdowns, and more restrictions coupled with the cut-throat competition of the restaurant business make us wary of this IPO. We have an ‘Avoid’ rating on this IPO.
Outstanding Litigations
1. Amit Rai Sood, a landlord had filed a suit against the Company for eviction, recovery of possession, arrears in rent and
mesne profits before the District Judge (Commercial Court), South-East District, Saket District Court, New Delhi. The Saket District Court passed an order dated September 1, 2020 directing the Company to deposit a sum of Rs 3.15
million before the Court within fifteen days from the date of the order. Aggrieved by the order, the Company filed an
appeal before the High Court of Delhi. The High Court of Delhi vide order dated November 24, 2020, referred the dispute between the parties before the Delhi High Court Mediation and Conciliation Centre. The Company has since
vacated the premises, and on January 22, 2021, the parties entered into a settlement agreement by which the Company
agreed to pay Amit Rai Sood a total amount of Rs 3.92 million (by adjusting the security deposit and paying an additional sum
of ₹0.95 million) which provides for full and final settlement of Amit Rai Sood’s claims. 2. In relation to the Company’s restaurant at Lokhandwala, Mumbai, after the termination of the Business Conducting
Agreement dated November 24, 2011, Rajesh Chowdhury, the owner of AHRL, refused to return the furniture, fixtures
and service equipment of the Company in the premises formerly used by the Company. In addition to this, it came to the attention that the restaurant premises had been refurbished and the outlet had been renamed as “India BBQ Co. By Chef
Harpal Singh Chokhi”. The Company has filed two complaints dated October 16, 2020 and October 24, 2020
respectively, before the Amboli Police Station for taking necessary action against Rajesh Chaudhary, the owner and Harpal Singh Chokhi for using the Company’s properties in an unauthorised manner. The matter is currently pending.
3. The Company had received a notice dated April 27, 2016 from the Office of the Joint Director of Health Services,
Kamrup Metropolitan District, Uzanbazar, Guwahati forwarding the report of the Food Analyst to the Government of
Assam pertaining to the paneer sample collected from our Barbeque Nation Restaurant located at Guwahati. The report of the Food Analyst opined about the non-conformity of the paneer sample with the prescribed standards under the Food
Safety and Standards (Food Products Standards and Additives) Regulations, 2011 and was therefore sub-standard in
terms of the requirements prescribed under these Regulations. The Company has filed a reply dated June 7, 2016 with the Designated Officer, Food Safety, Kamrup Metropolitan District, Guwahati submitting the justification that the paneer
sample taken for testing was not meant for human consumption and was a sample received from a vendor for quality
check. Subsequently, there has been no communication from the Designated Officer in this regard. 4. The Company received a notice dated October 30, 2017 from the Pune Municipal Corporation (“PMC”) under Section
478(1) of the Maharashtra Municipal Corporation Act, 1949 in relation to the restaurant at Deccan Mall, Pune, directing
removal of an alleged unauthorised construction on the terrace. The Company filed a reply to the notice on November 7,
2017 requesting PMC to cancel the notice and grant an opportunity to regularize the construction. The Company then filed an application before the Civil Judge Junior Division, PMC Court, Pune challenging the said notice and seeking a
permanent injunction restraining PMC from acting as per the notice. On November 24, 2017, the PMC Court passed an
order directing both parties to maintain status-quo subject to the Company depositing the penalty amount in the court till the next date. On February 15, 2021, the PMC Court passed an order rejecting the application filed by the Company. On
February 26. 2021, the Company filed an appeal against the order of the PMC Court. The matter is currently pending.
Research of JST Investments | @JSTInvestments | www.jstinvestments.com
5. The Income Tax Department, Bengaluru conducted search operations at the residences of certain Directors, certain
Promoters, and one KMP and at the Registered and Corporate Office between January 10, 2018 and January 12, 2018.
Pursuant to such search operations, the Company had received certain notices from the Office of the Assistant Commissioner of Income Tax, Bengaluru (“ACIT”) on February 5, 2019 under section 153A of the IT Act, directing
the Company to prepare correct returns of total income for the assessment years 2012-13 till 2017-18. The Company
had filed returns in response to the notices for these assessment years. Thereafter, the Company received further
notices from the ACIT under Section 142(1) of the IT Act on July 19, 2019, directing the Company to furnish certain accounts and documents. Subsequently, assessment proceedings were initiated against the Company. Pursuant to this,
assessment orders were passed by the Deputy Commissioner of Income Tax, Bengaluru on December 30, 2019 for each
of the assessment years, with tax demands aggregating to Rs150.03 million. Separately, in respect of assessment year 2018-19, an order was passed by the ACIT on December 31, 2019 under Section 143(3) of the IT Act with a tax
demand amounting to Rs 2.84 million. The Company has filed appeals against these orders before the Commissioner of
Income-tax (Appeals). Consequent to these orders, penalty proceedings have been initiated against the Company on December 31, 2019, on grounds such as concealment of income, misreporting of income and furnishing inaccurate
particulars of income in relation to certain assessment years. Additionally, in relation to the order passed for the
assessment year 2012-2013, the Joint Commissioner of Income-tax (OSD) passed an order on June 9, 2020, rectifying
the demand payable for the assessment year 2012-13 to Rs 114. The Company has since paid the revised demand in relation to assessment year 2012-13.
6. The Company had received a notice dated September 30, 2019 from the National Anti-Profiteering Authority (GST),
Department of Revenue, Ministry of Finance, Government of India (“NAA”) forwarding the report of the Director General of Anti-Profiteering (“DGAP”) dated September 4, 2019, which has alleged profiteering, amounting to Rs
325.88 million against the Company under Section 171 of the GST Act. The matter was initiated to investigate whether
GST reduction benefit from 18% to 5% was passed on to the end customer. The period for which such investigation
was carried out was from November 15, 2017 to March 31, 2019. The notice issued by the NAA directs the Company to show cause as to why the report should not be accepted and the liability for profiteering should not be determined.
The Company appeared before the NAA for hearings on various dates and has made its written submissions to the NAA
on November 14, 2019, December 2, 2019, and February 15, 2020. The NAA passed an interim order in the matter on May 20, 2020 stating that the report of the DGAP could not be accepted and directed the DGAP to submit a fresh
report after conducting further investigation, and also recompute the profiteered amount, which investigation should be
completed within a period of three months from the date of this order. Pursuant to the order of the NAA, the DGAP issued various notices to the Company, seeking information or documents in relation to the alleged profiteering. The
Company has filed a writ petition before the High Court of Karnataka challenging the order of the NAA dated May 20,
2020. On July 15, 2020, the High Court of Karnataka granted interim relief to the Company and granted a stay of the
order passed by the NAA for a period of eight weeks, which interim stay was extended till further orders on August 12, 2020. On September 10, 2020, the NAA has filed a transfer petition before the Supreme Court of India, for transfer of
the writ petition to the Delhi High Court. In December 2020, the respondents filed their statement of objections to the
writ petition filed by the Company before the High Court of Karnataka. The matter is currently pending. 7. The Company along with some of the Directors received two notices from the Food Safety Officer, Food and Drug
Administration, Nagpur dated January 7, 2020. One of the notices pertains to the noodles sample and the other notice
pertains to a paneer sample taken for testing from the Barbeque Nation Restaurant at Nagpur on May 29, 2019. The notices state that the samples collected were not as per the prescribed standards. The Company has filed reply to both
notices on October 27, 2020. The matters are currently pending.
8. On August 5, 2020, the Company received a notice from the Department of Registration and Stamps, Government of
Maharashtra, Pune directing the Company to pay deficit stamp duty of Rs 1.62 million along with a penalty of 2% per month from the date of execution of the agreement in relation to a leave and license agreement for its restaurant at Pune.
On October 8, 2020, the Company has filed a response with the Joint Sub Registrar-In-Charge (Class - 2), Haveli No.
3, Hadaspur, Pune stating that the duty paid on the document is correct and sufficient, and that there is no deficit duty as claimed in the notice. The matter is currently pending.
9. On September 25, 2020, our Company received a notice from the Office of the Joint District Registrar Grade- 1 and
Stamp Collector, Pune City, Pune (“District Registrar”) directing the Company to pay deficit stamp duty of ₹1.00
million in relation to a lease deed. The Company has filed a response dated December 22, 2020 with the Office of the District Registrar stating that it has paid the stamp duty as per the calculation by the owner of the property during
registration and also requested for details of deficit payable by the Company as per the calculations done by the
Research of JST Investments | @JSTInvestments | www.jstinvestments.com
authority. The matter is currently pending.
10. The Company had received a notice dated November 27, 2020 from the Assistant Food Controller & Food Safety
Designated Officer, Krishna District, Machilipatnam forwarding the report of the Food Analyst, State Food Laboratory, Hyderabad, pertaining to the coloured sugar sprinkles sample collected from our Barbeque Nation Restaurant located at
Vijaywada. The report of the Food Analyst stated that sugar sprinkles sample were not in conformity with the
standards prescribed under the Food Safety and Standards (Packaging and Labelling) Regulations, 2011. The Company
has filed a reply dated December 23, 2020 with the Assistant Food Controller & Food Safety Designated Officer, Krishna District, Machilipatnam submitting that upon being notified by Assistant Food Controller & Food Safety
Designated Officer, Krishna District, Machilipatnam, the remaining packets of the product have been discarded and
their usage have been discontinued. The matter is currently pending. 11. The Company has received a notice from the Municipal Corporation, Ghaziabad on December 31, 2020 alleging that
the Barbeque Nation Restaurant in Ghaziabad was not in compliance with Section 31A of the Air (Prevention and
Control of Pollution) Act, 1981 for use of coal which was banned by the National Green Tribunal. The Company has filed a response with the Nagar Nigam Health Officer, Ghaziabad, on January 4, 2021, clarifying that coal is not used
at the restaurant, and instead wood charcoal is used, which is permitted. The matter is currently pending.
12. The Company received a notice from the Deputy Commissioner (License), Navi Mumbai Municipal Corporation dated
January 5, 2021 in relation to the Barbeque Nation restaurant at Vashi, Navi Mumbai relating to the alleged use of solid fuels / kerosene, which is prohibited in terms of the license. The Company has filed a response with the Deputy
Commissioner (License) on January 11, 2021, clarifying that prohibited solid fuels or kerosene are not used at the
restaurant, and instead, wood charcoal is used, which is permitted. The matter is currently pending. 13. The Company received a notice dated January 27, 2021 from the Directorate of Enforcement, Vigilance and Disaster
Management, Greater Hyderabad Municipal Corporation directing the Company to pay an amount of ₹0.1 million
within three days of receipt of the notice for the violation of advertisement rules. The matter is currently pending.
14. The Company received summons dated January 22, 2021 from the Employee’s Provident Fund Organisation, Karnataka, imposing a penalty of Rs 2.46 million along with interest amounting to ₹1.18 million in relation to an alleged delay in
payment of contributions for the months July 2019 and March 2020. The Company was issued a notice on January 27,
2021 directing the Company to appear for an inquiry and present its case in the proceedings. Subsequently, the Company also received another summons from the Employee’s Provident Fund Organisation, Karnataka in relation to
alleged delay in contribution for the months April 2020 till December 2020, imposing a penalty of Rs 3.72 million
along with interest amounting to Rs 2.44 million. The Company has filed responses to both the summons by letters dated January 29, 2021 and February 15, 2021 in these proceedings stating that the Company had promptly remitted the
provident fund contributions for the above-mentioned periods and requested the Regional Provident Fund
Commissioner to waive the interest and damages levied for the delays. By an order dated February 17, 2021, the
Assessing Officer stated that there was no provision for waiver of the interest but noted that the contentions with respect to waiver of damages will be considered before passing the final order. The Company has remitted the interest
amounts of Rs 1.18 million and Rs 2.44 million on February 19, 2021. The matter is currently pending.
15. The Company was issued a notice by the Senior Labour Inspector, Labour Department, Government of Karnataka dated January 22, 2021 relating to certain violation and non-compliances observed under certain labour laws, during an
inspection of our Registered and Corporate Office on January 22, 2021. The Company submitted a reply to the Senior
Labour Inspector on March 10, 2021, stating that the all the registers and records under the concerned acts were being maintained by the Company and requested to close the matter. The matter is currently pending.
Internal Risks:
1. As of December 31, 2020, the company had 147 Barbeque Nation Restaurants (including opened, temporarily closed
and under construction outlets), six International Barbeque Nation Restaurants and 11 Italian Restaurants of which nine are operated under the brand name “Toscano” and one each under the brand names “La Terrace” and “Collage”,
respectively, of which 9 were operational, often with limited operations or limitations on capacity for dine-in guests,
depending on local regulations. The company’s financial results were materially and adversely affected as a direct
consequence of COVID-19. It incurred consolidated losses after taxes as restated of Rs 1,006.48 million for the eight-month period ended November 30, 2020 and the networth became negative as at November 30, 2020. The trade
payables have also increased as at November 30, 2020 compared with the fiscal years ended 2019 and 2020.
Further, while the company cannot currently estimate the duration or future negative impact of the COVID-19 pandemic
Research of JST Investments | @JSTInvestments | www.jstinvestments.com
on our business or on the Indian or global economy, it expects the negative effects to continue into the fourth quarter of
Fiscal 2021 and beyond and for such further period that COVID-19 persists. Similarly, it cannot predict the effects the
COVID-19 pandemic will have on the restaurant industry as a whole or the share of customer traffic to the restaurants compared to other restaurants or outlets. In addition, there can be no assurance that the COVID-19 crisis will not cause
the Indian or global macroeconomic environment to worsen.
2. The company leverages the large third-party delivery aggregators that have their own mobile applications and delivery
fleets and have integrated the customer base with certain delivery aggregators. However, the activities of delivery aggregators have increased competition with other restaurant brands and new food service platforms, such as cloud
kitchens, which do not offer in-restaurant services and only serve food through third party delivery aggregators,
requiring less capital expenditure to offer food services. If food delivery through third party delivery aggregators continues to increase, it is possible that footfalls in the restaurants could decrease, especially in light of the COVID-19
pandemic, unless they adapt the business model to account for this change in consumer preference. The company
currently depends on third party delivery aggregators for a substantial portion of our food delivery services and that could increase in the future, especially as a result of the impact of COVID-19 and. the resulting growth in delivery. It is
possible that the negotiating leverage of third party delivery aggregators with respect to the agreements with them could
increase as their businesses grow, which means the company may have to pay higher fees for their services or may have
difficulty extending or renewing our agreements with them on commercially acceptable terms, or at all, in the future, especially if they fail to sufficiently develop their own food delivery services or find alternative means to serve the
increasing number of customers who choose to order their food online or through mobile applications. In addition, in
order to increase their market share, certain delivery aggregators offer significant discounts for their services and as their businesses mature, they may choose or be required to raise their fees, which could adversely impact the fees the
company pays for their services.
3. The Company has received a notice dated September 30, 2019 from the National Anti-Profiteering Authority (GST),
Department of Revenue, Ministry of Finance, Government of India (“NAA”), forwarding the report of the Director General of Anti Profiteering (“DGAP”) which has alleged profiteering, amounting to Rs 325.88 million against the
Company under Section 171 of the GST Act. The matter was initiated to investigate whether GST reduction benefit
from 18% to 5% was passed by the Company on to the end consumer. The period for which such investigation was carried out was from November 15, 2017 to March 31, 2019. The notice issued by the NAA directs the Company to
show cause as to why the report should not be accepted and the liability for profiteering should not be determined. The
Company appeared before the NAA for hearings on various dates and has made its written submissions to the NAA on November 14, 2019, December 2, 2019, and February 15, 2020. The NAA passed an interim order in the matter on May
20, 2020 stating that the report of the DGAP could not be accepted and directed the DGAP to submit a fresh report after
conducting further investigation, and also recompute the profiteered amount, which investigation should be completed
within a period of three months from the date of this order. Pursuant to the order of the NAA, the DGAP issued various notices to the Company, seeking information or documents in relation to the alleged profiteering. The Company has
filed a writ petition before the High Court of Karnataka challenging the order of the NAA dated May 20, 2020. On July
15, 2020, the High Court of Karnataka granted interim relief to the Company and granted a stay of the order passed by the NAA for a period of eight weeks, which interim stay was extended till further orders on August 12, 2020. On
September 10, 2020, the NAA has filed a transfer petition before the Supreme Court of India, for transfer of the writ
petition to the Delhi High Court. In December 2020, the respondents filed their statement of objections to the writ petition filed by the Company before the High Court of Karnataka. The matter is currently pending.
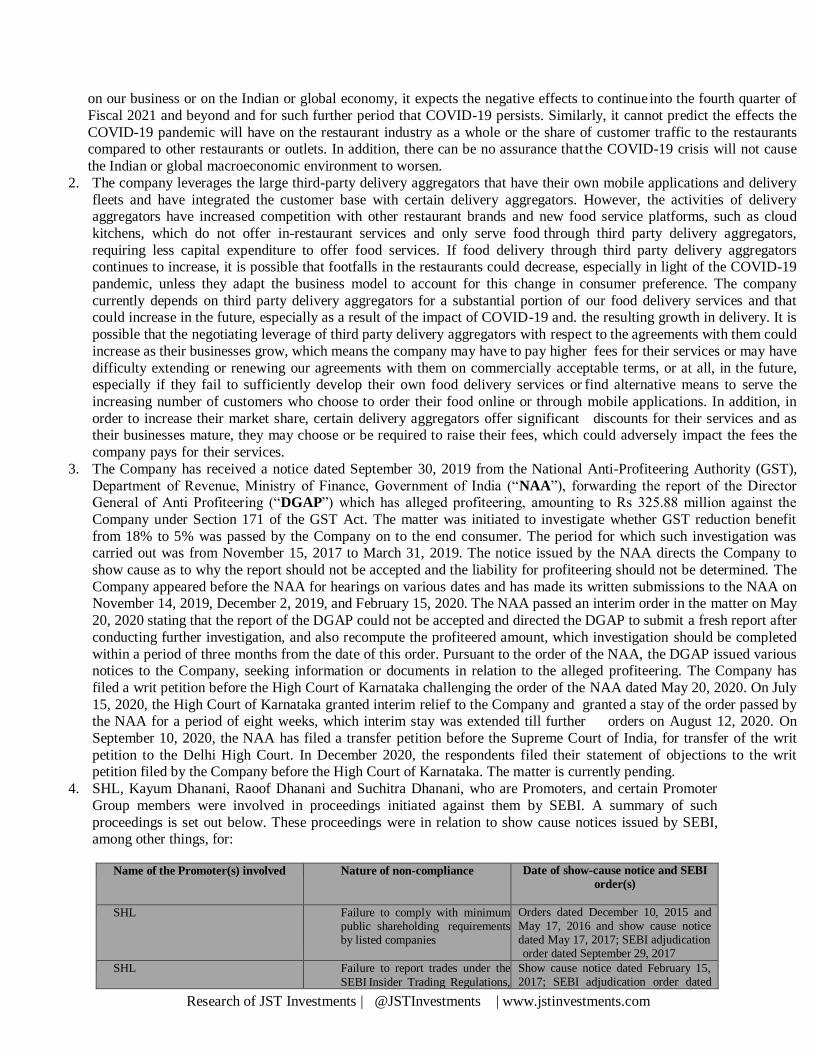
4. SHL, Kayum Dhanani, Raoof Dhanani and Suchitra Dhanani, who are Promoters, and certain Promoter
Group members were involved in proceedings initiated against them by SEBI. A summary of such
proceedings is set out below. These proceedings were in relation to show cause notices issued by SEBI, among other things, for:
Name of the Promoter(s) involved Nature of non-compliance Date of show-cause notice and SEBI
order(s)
SHL Failure to comply with minimum public shareholding requirements by listed companies
Orders dated December 10, 2015 and May 17, 2016 and show cause notice dated May 17, 2017; SEBI adjudication order dated September 29, 2017
SHL Failure to report trades under the
SEBI Insider Trading Regulations,
Show cause notice dated February 15, 2017; SEBI adjudication order dated
Research of JST Investments | @JSTInvestments | www.jstinvestments.com
1992 January 31, 2018
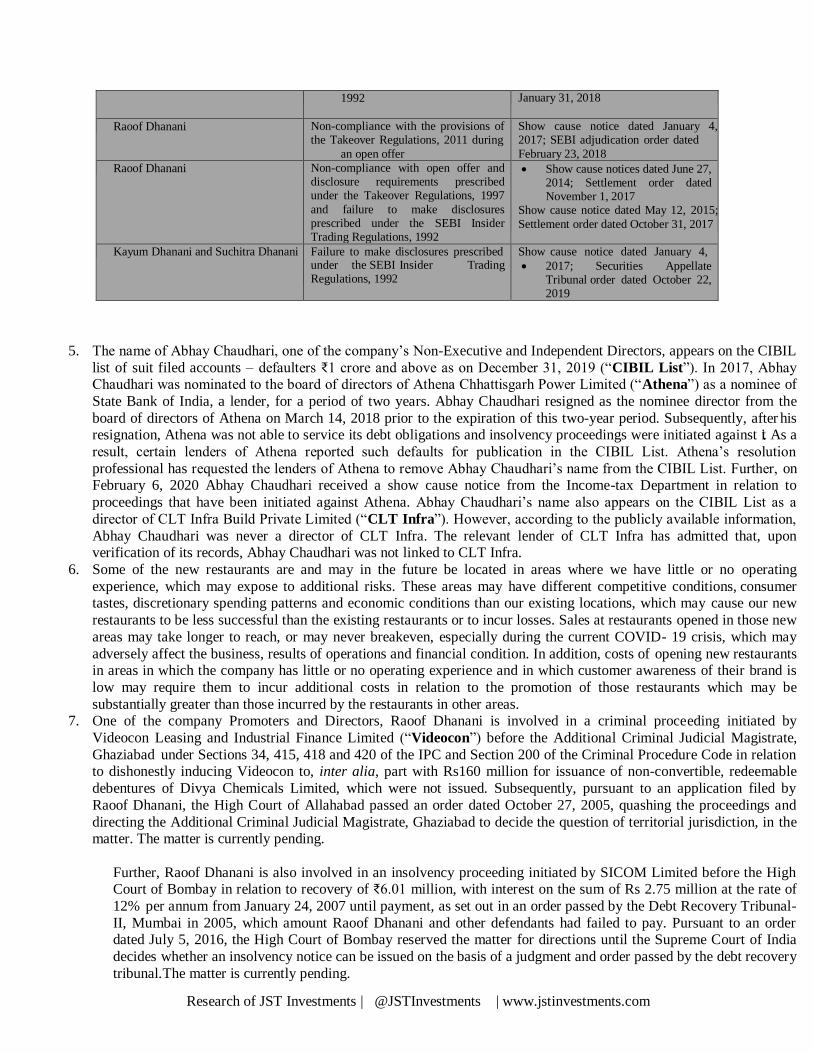
Raoof Dhanani Non-compliance with the provisions of the Takeover Regulations, 2011 during
an open offer
Show cause notice dated January 4, 2017; SEBI adjudication order dated
February 23, 2018
Raoof Dhanani Non-compliance with open offer and disclosure requirements prescribed under the Takeover Regulations, 1997
and failure to make disclosures prescribed under the SEBI Insider Trading Regulations, 1992
Show cause notices dated June 27, 2014; Settlement order dated November 1, 2017
Show cause notice dated May 12, 2015;
Settlement order dated October 31, 2017
Kayum Dhanani and Suchitra Dhanani Failure to make disclosures prescribed under the SEBI Insider Trading Regulations, 1992
Show cause notice dated January 4,
2017; Securities Appellate Tribunal order dated October 22, 2019
5. The name of Abhay Chaudhari, one of the company’s Non-Executive and Independent Directors, appears on the CIBIL
list of suit filed accounts – defaulters ₹1 crore and above as on December 31, 2019 (“CIBIL List”). In 2017, Abhay Chaudhari was nominated to the board of directors of Athena Chhattisgarh Power Limited (“Athena”) as a nominee of
State Bank of India, a lender, for a period of two years. Abhay Chaudhari resigned as the nominee director from the
board of directors of Athena on March 14, 2018 prior to the expiration of this two-year period. Subsequently, after his resignation, Athena was not able to service its debt obligations and insolvency proceedings were initiated against it. As a
result, certain lenders of Athena reported such defaults for publication in the CIBIL List. Athena’s resolution
professional has requested the lenders of Athena to remove Abhay Chaudhari’s name from the CIBIL List. Further, on February 6, 2020 Abhay Chaudhari received a show cause notice from the Income-tax Department in relation to
proceedings that have been initiated against Athena. Abhay Chaudhari’s name also appears on the CIBIL List as a
director of CLT Infra Build Private Limited (“CLT Infra”). However, according to the publicly available information,
Abhay Chaudhari was never a director of CLT Infra. The relevant lender of CLT Infra has admitted that, upon verification of its records, Abhay Chaudhari was not linked to CLT Infra.
6. Some of the new restaurants are and may in the future be located in areas where we have little or no operating
experience, which may expose to additional risks. These areas may have different competitive conditions, consumer tastes, discretionary spending patterns and economic conditions than our existing locations, which may cause our new
restaurants to be less successful than the existing restaurants or to incur losses. Sales at restaurants opened in those new
areas may take longer to reach, or may never breakeven, especially during the current COVID- 19 crisis, which may
adversely affect the business, results of operations and financial condition. In addition, costs of opening new restaurants in areas in which the company has little or no operating experience and in which customer awareness of their brand is
low may require them to incur additional costs in relation to the promotion of those restaurants which may be
substantially greater than those incurred by the restaurants in other areas. 7. One of the company Promoters and Directors, Raoof Dhanani is involved in a criminal proceeding initiated by
Videocon Leasing and Industrial Finance Limited (“Videocon”) before the Additional Criminal Judicial Magistrate,
Ghaziabad under Sections 34, 415, 418 and 420 of the IPC and Section 200 of the Criminal Procedure Code in relation to dishonestly inducing Videocon to, inter alia, part with Rs160 million for issuance of non-convertible, redeemable
debentures of Divya Chemicals Limited, which were not issued. Subsequently, pursuant to an application filed by
Raoof Dhanani, the High Court of Allahabad passed an order dated October 27, 2005, quashing the proceedings and
directing the Additional Criminal Judicial Magistrate, Ghaziabad to decide the question of territorial jurisdiction, in the matter. The matter is currently pending.
Further, Raoof Dhanani is also involved in an insolvency proceeding initiated by SICOM Limited before the High Court of Bombay in relation to recovery of ₹6.01 million, with interest on the sum of Rs 2.75 million at the rate of
12% per annum from January 24, 2007 until payment, as set out in an order passed by the Debt Recovery Tribunal-
II, Mumbai in 2005, which amount Raoof Dhanani and other defendants had failed to pay. Pursuant to an order dated July 5, 2016, the High Court of Bombay reserved the matter for directions until the Supreme Court of India
decides whether an insolvency notice can be issued on the basis of a judgment and order passed by the debt recovery
tribunal. The matter is currently pending.
Research of JST Investments | @JSTInvestments | www.jstinvestments.com
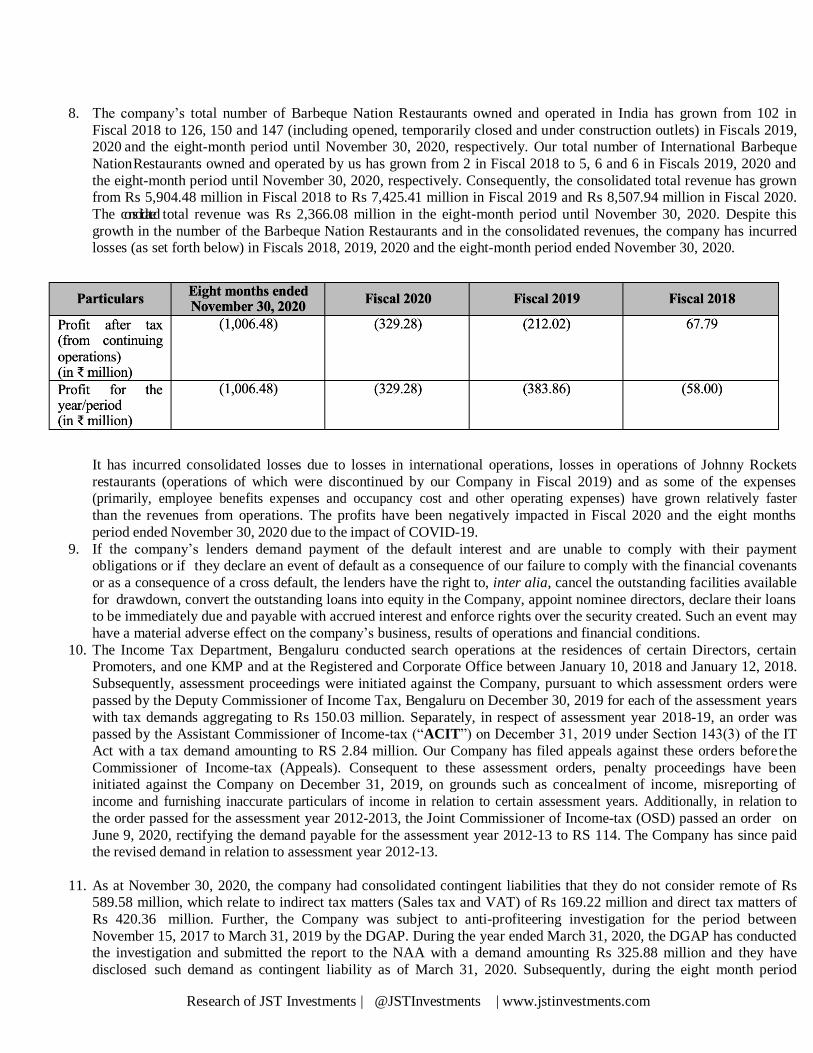
8. The company’s total number of Barbeque Nation Restaurants owned and operated in India has grown from 102 in
Fiscal 2018 to 126, 150 and 147 (including opened, temporarily closed and under construction outlets) in Fiscals 2019, 2020 and the eight-month period until November 30, 2020, respectively. Our total number of International Barbeque
Nation Restaurants owned and operated by us has grown from 2 in Fiscal 2018 to 5, 6 and 6 in Fiscals 2019, 2020 and
the eight-month period until November 30, 2020, respectively. Consequently, the consolidated total revenue has grown from Rs 5,904.48 million in Fiscal 2018 to Rs 7,425.41 million in Fiscal 2019 and Rs 8,507.94 million in Fiscal 2020.
The consolidated total revenue was Rs 2,366.08 million in the eight-month period until November 30, 2020. Despite this
growth in the number of the Barbeque Nation Restaurants and in the consolidated revenues, the company has incurred losses (as set forth below) in Fiscals 2018, 2019, 2020 and the eight-month period ended November 30, 2020.
It has incurred consolidated losses due to losses in international operations, losses in operations of Johnny Rockets
restaurants (operations of which were discontinued by our Company in Fiscal 2019) and as some of the expenses (primarily, employee benefits expenses and occupancy cost and other operating expenses) have grown relatively faster
than the revenues from operations. The profits have been negatively impacted in Fiscal 2020 and the eight months
period ended November 30, 2020 due to the impact of COVID-19.
9. If the company’s lenders demand payment of the default interest and are unable to comply with their payment obligations or if they declare an event of default as a consequence of our failure to comply with the financial covenants
or as a consequence of a cross default, the lenders have the right to, inter alia, cancel the outstanding facilities available
for drawdown, convert the outstanding loans into equity in the Company, appoint nominee directors, declare their loans to be immediately due and payable with accrued interest and enforce rights over the security created. Such an event may
have a material adverse effect on the company’s business, results of operations and financial conditions.
10. The Income Tax Department, Bengaluru conducted search operations at the residences of certain Directors, certain Promoters, and one KMP and at the Registered and Corporate Office between January 10, 2018 and January 12, 2018.
Subsequently, assessment proceedings were initiated against the Company, pursuant to which assessment orders were
passed by the Deputy Commissioner of Income Tax, Bengaluru on December 30, 2019 for each of the assessment years
with tax demands aggregating to Rs 150.03 million. Separately, in respect of assessment year 2018-19, an order was passed by the Assistant Commissioner of Income-tax (“ACIT”) on December 31, 2019 under Section 143(3) of the IT
Act with a tax demand amounting to RS 2.84 million. Our Company has filed appeals against these orders before the
Commissioner of Income-tax (Appeals). Consequent to these assessment orders, penalty proceedings have been initiated against the Company on December 31, 2019, on grounds such as concealment of income, misreporting of
income and furnishing inaccurate particulars of income in relation to certain assessment years. Additionally, in relation to
the order passed for the assessment year 2012-2013, the Joint Commissioner of Income-tax (OSD) passed an order on
June 9, 2020, rectifying the demand payable for the assessment year 2012-13 to RS 114. The Company has since paid the revised demand in relation to assessment year 2012-13.
11. As at November 30, 2020, the company had consolidated contingent liabilities that they do not consider remote of Rs 589.58 million, which relate to indirect tax matters (Sales tax and VAT) of Rs 169.22 million and direct tax matters of
Rs 420.36 million. Further, the Company was subject to anti-profiteering investigation for the period between
November 15, 2017 to March 31, 2019 by the DGAP. During the year ended March 31, 2020, the DGAP has conducted the investigation and submitted the report to the NAA with a demand amounting Rs 325.88 million and they have
disclosed such demand as contingent liability as of March 31, 2020. Subsequently, during the eight month period
Research of JST Investments | @JSTInvestments | www.jstinvestments.com
ended November 30, 2020, NAA has examined this report and ruled that methodology adopted by DGAP while arriving
at the demand is incorrect and directed to conduct further investigation. Accordingly, the demand of Rs 325.88 million
has been excluded from contingent liability as of November 30, 2020 as the investigation is under process.
12. Kayum Dhanani has agreed to secure a personal loan of Rs 400 million with a pledge over substantially all of the Equity
Shares held by him, which shall be created upon the expiry of a period of one year from the date of lock-in of the pre-
Offer share capital of the Company. A failure by Kayum Dhanani to comply with his payment obligations or the occurrence of an event of default or any event of acceleration will entitle the lender to, inter alia, recall or accelerate
repayment of the loan, declare Kayum Dhanani as a defaulter and/or enforce the security provided. In such
circumstances, Kayum Dhanani may be required to liquidate a portion of his assets to comply with his payment obligations. As of January 31, 2021, the total amount outstanding under his personal loan was Rs 246 million. Kayum
Dhanani has also currently pledged 333,400 Equity Shares with RBL Bank Limited to secure loan facilities aggregating
to Rs 336.1 million granted to certain members of the Promoter Group (i.e., Brown House Baking Private Limited, Iconium Leather Works Private Limited and Sara Suole Private Limited) amounting to 0.98% of the pre- Offer capital.
The aggregate amount outstanding under such credit facilities granted to members of the Promoter Group as on January
31, 2021 was Rs 289 million. Pursuant to a letter dated March 15, 2021, RBL Bank Limited has provided its consent to
a temporary release of the pledge on 333,400 Equity Shares held by Kayum Dhanani from Bid / Offer Opening Date and in accordance with the SEBI ICDR Regulations, subject to such Equity Shares being re- pledged with RBL Bank
Limited after Allotment.
13. All of the company’s business operations are conducted on premises leased or licensed from various third parties. They may also enter into such transactions with new third parties in the future. Further, the lease deeds in respect of certain of
our Barbeque Nation Restaurants and Italian Restaurants have expired and, whilst the Barbeque Nation Restaurants
and the Italian Restaurants continue to operate at the relevant premises, discussions to renew such lease deeds are
currently ongoing. Further, the Registered and Corporate office in Bengaluru is located on premises leased to us by Liberty Restaurent Private Limited, one of the Group Entities, for a period of 51 months with effect from August 1,
2020. The registered office of Red Apple is also leased to them by Liberty Restaurent Private Limited for a period of 51
months with effect from August 1, 2020. In the event that we are unable to renew our lease or our landlord loses ownership or lease rights to this property, the company may be required to vacate the current premises and make
alternative arrangements for our registered and corporate office. There can be no assurance that the new arrangements
will be on commercially acceptable terms. The company generally enters into long-term lease agreements or license agreements that have an initial term that typically ranges from a period of five to 19 years for the Barbeque Nation
Restaurants and International Barbeque Nation Restaurants, and three to 15 for our Toscano Restaurants. Some of these
lease/license agreements also grant them the right of renewal upon expiration of the current term. In some of the
lease/license agreements the company may terminate the arrangement by giving prior notice ranging between three and six months. Further, some of the leases/licenses in India include a lock- in period ranging between one to five years,
during which period they cannot terminate the lease, except on the occurrence of a limited number of specified events.
14. The company does not have an in-house transportation facility and they rely on third party transportation and other logistic facilities at every stage of the business activity including for procurement of products from the vendors and for
transportation from the distribution centres to various restaurants. For this purpose, they hire services of transportation
companies. However, they have not entered into any definitive agreements with any third-party transport service providers and engage them on a needs basis. Additionally, availability of transportation solutions in the markets they
operate in is typically fragmented. The company rarely enters into written documentation in relation to the
transportation services they hire which poses various additional risks including the inability to claim insurance.
15. The company has applied for registration of several trademarks, which are currently pending before the concerned authorities in India and abroad. With respect to applications made for registration of trademarks, some of the trademark
applications are objected by other parties. Further the company have filed oppositions to trademark applications filed by
certain third parties. In respect of one of the Subsidiaries, Red Apple, an application made by it for the registration of the trademark ‘CAFE TOSCANO’ was refused. The protective steps that it took to protect its intellectual property rights,
including registrations under trademark laws, confidentiality provisions and contractual arrangements, may be
inadequate to deter misappropriation. of the company’s intellectual property. There can be no assurance that they will be
able to protect their intellectual property rights in the future, including by successfully renewing the intellectual property rights that they own. The trademark applications filed by the Company in Egypt has been refused and the
applications filed by the Company in Thailand have been abandoned. In relation to the applications in Malaysia, the
Research of JST Investments | @JSTInvestments | www.jstinvestments.com
trademarks registry has agreed to waive the objections previously raised and has provisionally accepted the trademark
applications, subject to certain conditions. The company may be unable to detect the unauthorised use of, or take
appropriate steps to enforce, the intellectual property rights in India or abroad. 16. The company depends on third-party distributors and suppliers for such deliveries, and therefore, are subject to the risk
that shortages or interruptions in supply, caused by factors such as adverse weather conditions, unanticipated demand,
changes in governmental regulation and recalls of food products, could adversely affect the availability, quality and cost
of ingredients. If the quality of the suppliers’ ingredients declines, the company may not be able to obtain replacements for such ingredients on commercially agreeable terms or at all in the open market. If the food quality declines due to the
inferior quality of ingredients or due to interruptions in the flow of ingredients and similar factors, guest traffic may
decline and negatively affect the results. 17. For the fiscal year ended March 31, 2020 and for the eight months ended November 30, 2020, the Barbeque Nation
Restaurants in Delhi NCR, Mumbai and Bengaluru together contributed more than 38% and 30%, respectively, of the
total revenue from operations. The company may continue to open more restaurants in these cities. The concentration of the revenues from operations generated from these areas heightens the exposure to adverse developments related to
competition, as well as economic, political, demographic and other changes, which may adversely affect the business
prospects, financial conditions and results of operations.
18. Red Apple became the Subsidiary with effect from December 31, 2019. In January 2020 and February 2020, the Company acquired 61.35% of equity share capital (on a fully diluted basis) of Red Apple. Under a certain loan facility of
Rs 5.00 million granted to Red Apple by one of its lenders, Red Apple required the consent of this lender in connection with,
inter alia, the acquisition of its equity shares and the consequent change of control. Prior to filing the Draft Red Herring Prospectus, Red Apple did not obtain the consent for the acquisition by the Company of 61.35% of its equity share
capital (on a fully diluted basis) from this lender. Failure to obtain such a consent could result in the issuance of an event
of default notice and the acceleration of all amounts payable under the relevant financing arrangements. Any acceleration
of the amounts outstanding under facilities granted to Red Apple will need to be immediately refinanced by Red Apple or repaid with the assistance of a capital infusion from the Company.
19. The note in the financial statements describes the impact of the COVID-19 pandemic on the Company’s
operations and the fact that its current liabilities exceeded its current assets by Rs. 2,735.05 million as of November 30, 2020 on a standalone basis and Rs. 3,101.24 million on a consolidated basis, but the
financial statements having been prepared on a going concern basis considering the mitigation plans of the
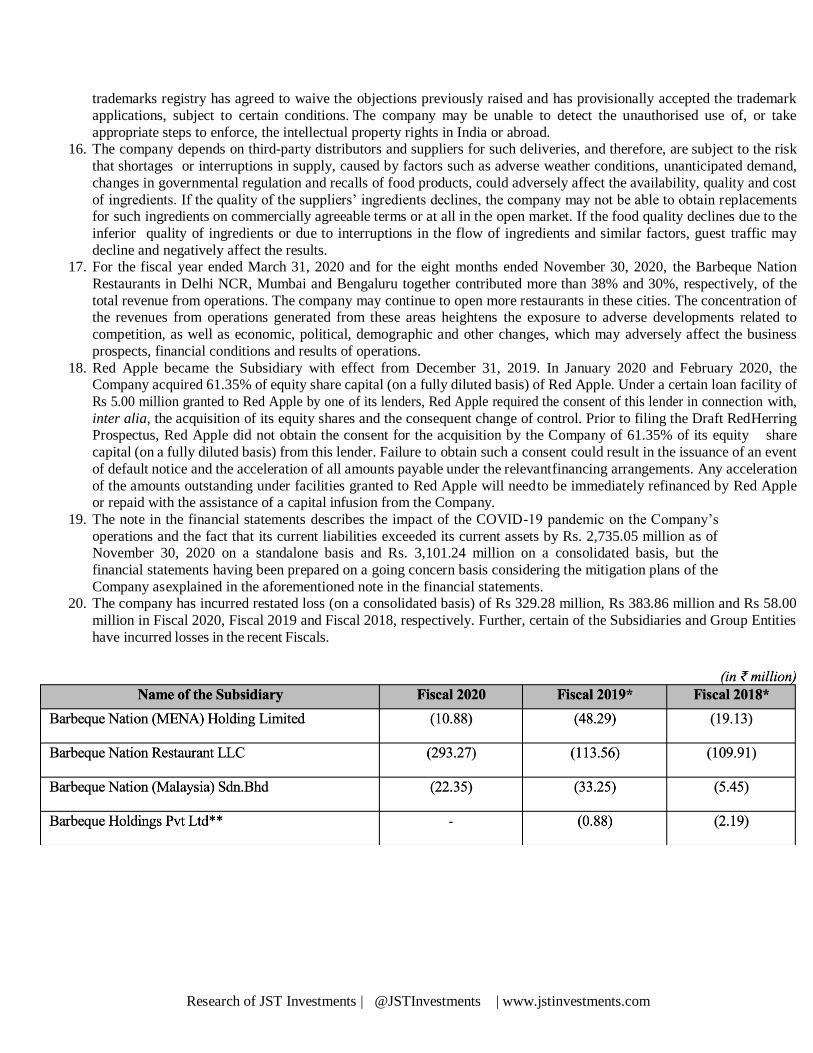
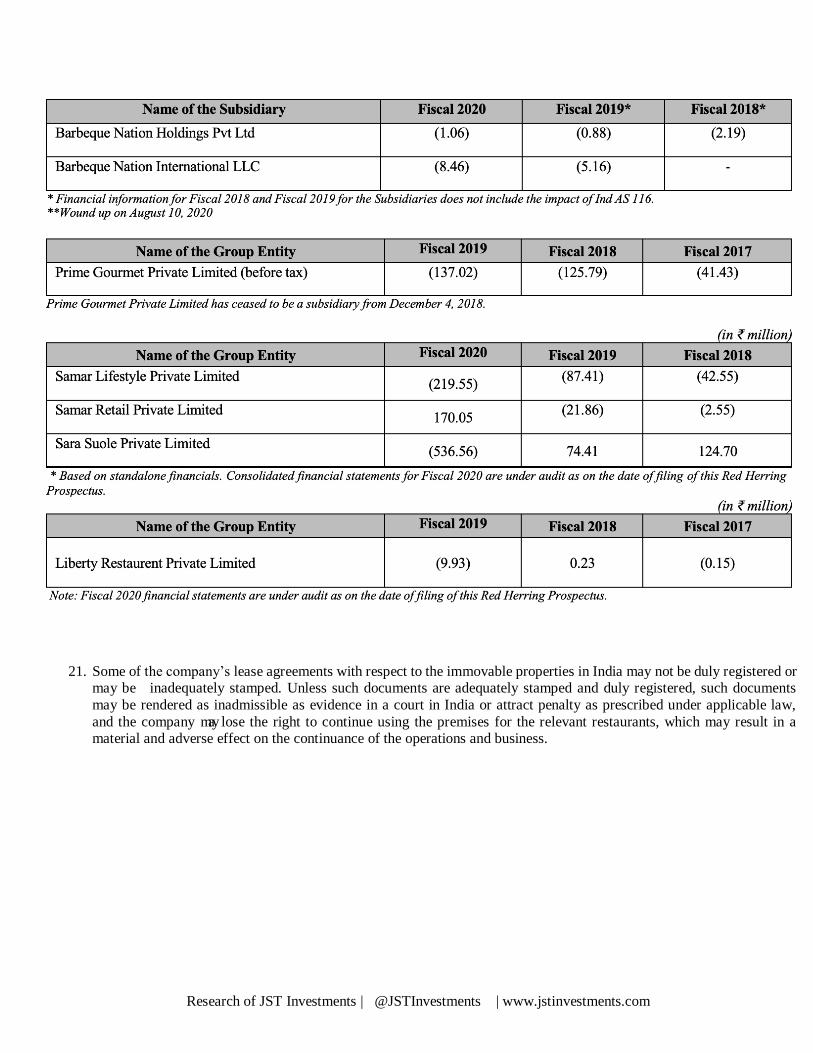
Company as explained in the aforementioned note in the financial statements. 20. The company has incurred restated loss (on a consolidated basis) of Rs 329.28 million, Rs 383.86 million and Rs 58.00
million in Fiscal 2020, Fiscal 2019 and Fiscal 2018, respectively. Further, certain of the Subsidiaries and Group Entities
have incurred losses in the recent Fiscals.
Research of JST Investments | @JSTInvestments | www.jstinvestments.com
21. Some of the company’s lease agreements with respect to the immovable properties in India may not be duly registered or may be inadequately stamped. Unless such documents are adequately stamped and duly registered, such documents
may be rendered as inadmissible as evidence in a court in India or attract penalty as prescribed under applicable law,
and the company may lose the right to continue using the premises for the relevant restaurants, which may result in a material and adverse effect on the continuance of the operations and business.
Research of JST Investments | @JSTInvestments | www.jstinvestments.com
22. The company occupies some of the premises used for the restaurants in India by way of a license, which only
provides them a right to use the property, and unlike a lease, not a possessory interest. A license may be
terminated by the owner of the premises at any time, subject to remedies for breach of contract by the licensee and subject to certain exceptions. A license may also not be enforceable against any transferee of the
premises. If any of the licensors decides to terminate the license for premises used by the company for their
restaurants or transfers such premises, they may lose the right to continue using the premises for the relevant
restaurants, which may result in a material and adverse effect on the continuance of the operations and business of the Company. The company may incur significant costs in relocating the restaurants and the
investments in developing and marketing such restaurants may be lost.
23. While the company has obtained a significant number of approvals, licenses, registrations, certificates and permits from the relevant authorities, the company are yet to receive or apply for several approvals, licenses,
registrations and permits. The company cannot assure that they will apply for and receive these approvals and
clearances in time or at all. There can be no assurance that the relevant authority will issue an approval or renew expired approvals within the applicable time period or issue them at all. Any delay in receipt or non-receipt
of such approvals, licenses, registrations and permits could result in cost and time overrun or which could
adversely affect the related operations.
24. As of January 31, 2021, the company had a consolidated debt of Rs 1,431.20 million. It has entered into agreements for short- term and long-term loans and other borrowings. Some of these agreements contain
requirements to maintain certain security margins, financial ratios and contain restrictive covenants relating
to issuance of new shares, changes in capital structure, making material changes to constitutional documents, implementing any expansion scheme, incurring further indebtedness, encumbrances on, or disposal of assets,
paying dividends and making investments over certain thresholds. There can be no assurance that the
company will be able to comply with these financial or other covenants, or that they will be able to obtain
the consents necessary to proceed with the actions which they believe are necessary to operate and grow their business.
25. The use of electronic payment methods and collection of other personal information exposes the company to
an increased risk of privacy and security breaches as well as other risks. It may experience security breaches in which payment related data and personal information may be stolen. Although they use secure private
networks to transmit confidential information, third parties may have the technology or know-how to breach
the security of the customer information transmitted in connection with credit and debit card sales, and the security measures and those of technology suppliers may not effectively prohibit others from obtaining improper
access to this information. If a person is able to circumvent the company’s security measures or otherwise gain
access to the confidential information that they collect, the customer may be able to destroy or steal valuable
information or otherwise disrupt the operations. The company may become subject to claims for purportedly fraudulent transactions arising out of the actual or alleged theft of credit or debit card information or other
confidential information and may also be subject to lawsuits or other proceedings relating to these types of
incidents. 26. The company periodically make significant, fixed capital improvements to their facilities. They may also
invest in additional power supply infrastructure at the locations or other significant, fixed capital
improvements, but any such investments generally become the property of the landlord after the expiration of the lease/ license. The cost of such capital improvements has gone up in recent times. Moreover, the
company’s growth strategy primarily focuses on company owned and operated restaurants, which entail a
higher capital commitment. As such, it may be unable to recover investments while upgrading the locations
at the termination of a lease/ license, such as investments in power supply infrastructure. 27. There has been an inadvertent delay in reporting (i) certain transfers of Equity Shares made by the company’s
Promoter, Kayum Dhanani to certain third parties, who are categorized as public shareholders of the
Company; and (ii) creation of pledge in favour of RBL Bank Limited, to the Company, and consequently by the Company to the Stock Exchanges. The Company has received a letter dated January 29, 2021 from SEBI in
respect of such transactions undertaken by Kayum Dhanani. SEBI, in this letter, pointed out that although the
Company made the requisite declarations in respect of such transactions, there was a delay in making such
disclosures. SEBI went on to state that such delay in compliance was viewed seriously and the Company was warned and advised to be cautious and ensure compliance with all applicable provisions of the SEBI rules
and regulations. There have also been certain instances of discrepancies / non-compliances by the Company
Research of JST Investments | @JSTInvestments | www.jstinvestments.com
in relation to certain filings and disclosures made to the RBI and the RoC under applicable law, such as
delays in filing of relevant forms with the RoC and non-compliance with applicable provisions of company
law by our Company, including in relation to inadvertently filing a return of allotment with the RoC for a preferential allotment of equity shares by the Company for cash consideration, when the allotment was for
consideration other than cash and filing of a return of allotment with the RoC stating that the issuance was for
premium, when the issuance was made at par value. While the Company has filed a rectification application
for the incorrect return of allotment, they cannot assure that no penalty will be imposed on the Company for the said lapse.
Further, the Company does not have share transfer forms in relation to transfer of 4,999 equity shares each by
Suchitra Dhanani and (late) Sajid Dhanani to SHL on April 1, 2007, and are unable to ascertain instances of contravention of, or non-compliance with, applicable laws and regulations with respect to the said transfers.
Additionally, the company does not have past records of their erstwhile subsidiary Favorite Restaurants
Private Limited, which has merged with the Company. Any penalty applicable on the Company for defaults of Favorite Restaurants Private Limited may adversely affect the cash flows and results of operations of the
Company.
28. The company’s risk management policies and procedures designed to prevent the occurrence of, or mitigate,
risks such as food wastage, unaccounted cover discounts and incorrect or unapproved discounted billing may not be adequate or effective. It can provide no assurance that the IT systems, policies and procedures and
personnel will always be effective or that they will always be successful in monitoring or evaluating the
compliance risks to which we are or may be exposed. Non-compliance with applicable regulations could lead to reduced customers using the products and services.
29. The company’s funding requirements are based on management estimates and current business plans and
have not been appraised by any bank or financial institution. The deployment of the Net Proceeds will be at
the discretion of the Board. It also is yet to identify the exact location of the new restaurants or enter into agreements for purchase or lease of property for these restaurants. The company has relied on past expenditure
in setting up restaurants for the purposes of estimating utilisation of the Net Proceeds in the future. While the
company has obtained the quotations from various vendors in relation to such purchase of fit outs and construction related items for the restaurants it plans to set-up, most of these quotations are valid for a certain
period of time and may be subject to revisions, and other commercial and technical factors.
30. The rating committee of ICRA in a letter dated August 31, 2020 revised the long-term ratings of the Company to BBB+ from A-. The rating committee also revised the Company’s short-term ratings to A2 from
A2+. According to ICRA, their outlook on the long-term rating continues to be ‘negative’. The company’s
credit rating could have been downgraded due to various factors, including factors which may be outside
their control. Any future downgrade of the credit ratings may increase interest rates for refinancing the borrowings, which would increase the cost of borrowings, and may have an adverse effect on the future
issuances of debt and the company’s ability to borrow on a competitive basis.
31. The Company has declared and paid dividends for Fiscals 2018 and 2019. However, no dividend was paid for Fiscal 2020. Any dividends to be declared and paid in the future are required to be recommended by the
company’s Board of Directors and approved by its Shareholders, at their discretion, subject to the provisions
of the Articles of Association and applicable law, including the Companies Act. The Company’s ability to pay dividends in the future will depend upon our future results of operations, financial condition, cash flows,
sufficient profitability, working capital requirements and capital expenditure requirements. The company
cannot assure you that they will generate sufficient revenues to cover operating expenses and, as such, pay
dividends to the Company’s shareholders in future consistent with the past practices, or at all. 32. Post listing, the company’s Promoters will continue to exercise significant influence over us through their
shareholding. In accordance with the Articles of Association and applicable laws and regulations, the
Promoters will have the ability to exercise, directly or indirectly, a significant influence over the business. Further, one of the Promoters and Managing Director, Kayum Dhanani has executed a binding share transfer
agreement, pursuant to which, PPL and AAJVIT, at their discretion, may transfer between zero to 600,000
Equity Shares to him, thereby further increasing his shareholding and the shareholding of the company’s
Promoters. 33. The company has entered into transactions with several related parties, and will likely enter in the future as
well.
Research of JST Investments | @JSTInvestments | www.jstinvestments.com
34. The Offer includes an offer for sale of up to 5,457,470 Equity Shares by the Selling Shareholders, which
includes one of the corporate Promoters and members of the Promoter Group. The proceeds from the Offer
will be paid to the Selling Shareholders, in proportion of the respective portion of their Offered Shares, and will not receive any such proceeds. The company’s Promoter and the Promoter Group members being part of
the Selling Shareholders will receive such proceeds from the Offer for Sale.
Research of JST Investments | @JSTInvestments | www.jstinvestments.com
Industry Overview
India’s GDP Growth
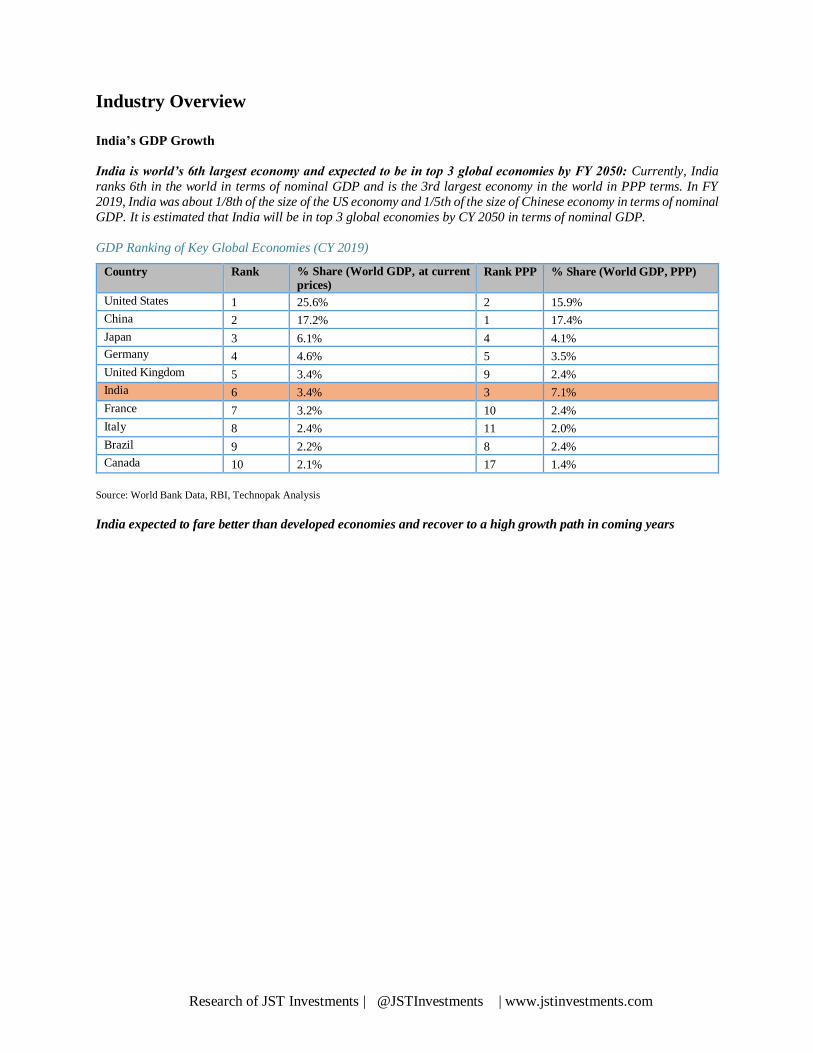
India is world’s 6th largest economy and expected to be in top 3 global economies by FY 2050: Currently, India
ranks 6th in the world in terms of nominal GDP and is the 3rd largest economy in the world in PPP terms. In FY
2019, India was about 1/8th of the size of the US economy and 1/5th of the size of Chinese economy in terms of nominal
GDP. It is estimated that India will be in top 3 global economies by CY 2050 in terms of nominal GDP.
GDP Ranking of Key Global Economies (CY 2019)
Country Rank % Share (World GDP, at current
prices) Rank PPP % Share (World GDP, PPP)
United States 1 25.6% 2 15.9%
China 2 17.2% 1 17.4%
Japan 3 6.1% 4 4.1%
Germany 4 4.6% 5 3.5%
United Kingdom 5 3.4% 9 2.4%
India 6 3.4% 3 7.1%
France 7 3.2% 10 2.4%
Italy 8 2.4% 11 2.0%
Brazil 9 2.2% 8 2.4%
Canada 10 2.1% 17 1.4%
Source: World Bank Data, RBI, Technopak Analysis
India expected to fare better than developed economies and recover to a high growth path in coming years
Research of JST Investments | @JSTInvestments | www.jstinvestments.com
848 1,662
2,279
2,928
462 %
3,968
544
10.7
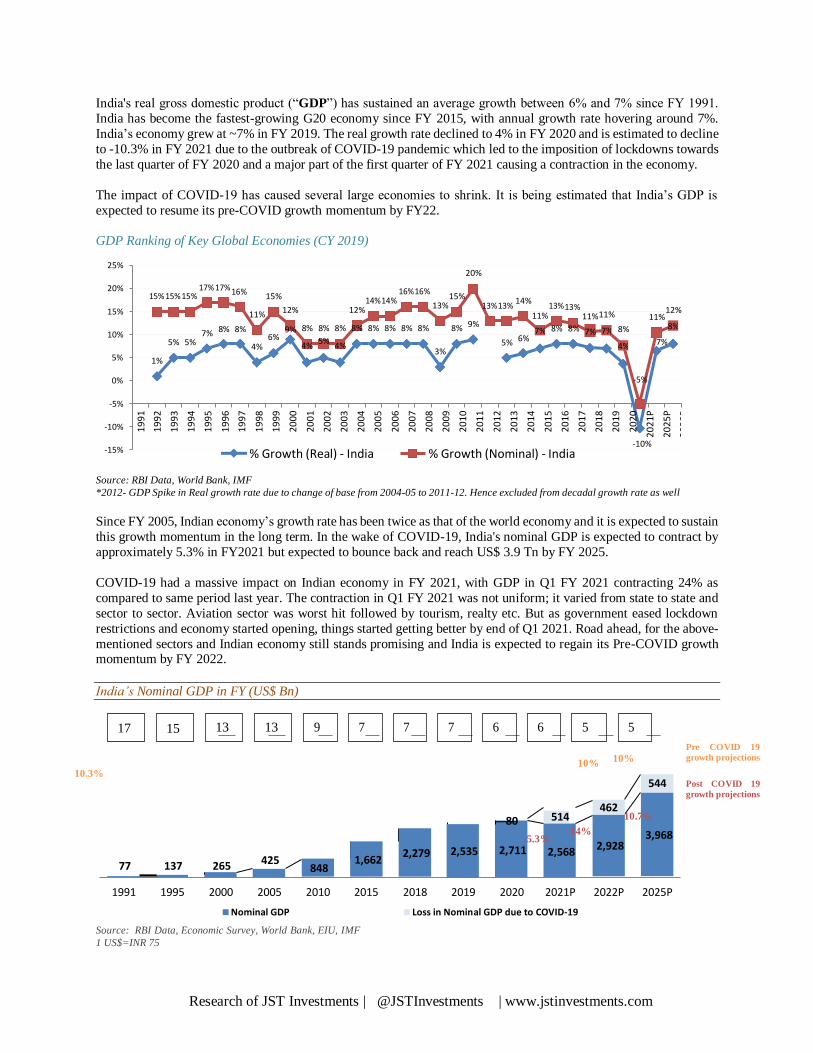
India's real gross domestic product (“GDP”) has sustained an average growth between 6% and 7% since FY 1991.
India has become the fastest-growing G20 economy since FY 2015, with annual growth rate hovering around 7%.
India’s economy grew at ~7% in FY 2019. The real growth rate declined to 4% in FY 2020 and is estimated to decline
to -10.3% in FY 2021 due to the outbreak of COVID-19 pandemic which led to the imposition of lockdowns towards
the last quarter of FY 2020 and a major part of the first quarter of FY 2021 causing a contraction in the economy.
The impact of COVID-19 has caused several large economies to shrink. It is being estimated that India’s GDP is
expected to resume its pre-COVID growth momentum by FY22.
GDP Ranking of Key Global Economies (CY 2019)
25%
20%
15%
10%
5%
0%
-5%
-10%
-15%
Source: RBI Data, World Bank, IMF
*2012- GDP Spike in Real growth rate due to change of base from 2004-05 to 2011-12. Hence excluded from decadal growth rate as well
Since FY 2005, Indian economy’s growth rate has been twice as that of the world economy and it is expected to sustain
this growth momentum in the long term. In the wake of COVID-19, India's nominal GDP is expected to contract by
approximately 5.3% in FY2021 but expected to bounce back and reach US$ 3.9 Tn by FY 2025.
COVID-19 had a massive impact on Indian economy in FY 2021, with GDP in Q1 FY 2021 contracting 24% as
compared to same period last year. The contraction in Q1 FY 2021 was not uniform; it varied from state to state and
sector to sector. Aviation sector was worst hit followed by tourism, realty etc. But as government eased lockdown
restrictions and economy started opening, things started getting better by end of Q1 2021. Road ahead, for the above-
mentioned sectors and Indian economy still stands promising and India is expected to regain its Pre-COVID growth momentum by FY 2022.
India’s Nominal GDP in FY (US$ Bn)
10.3%
10% 10%
Pre COVID 19
growth projections
Post COVID 19
growth projections
1991 1995 2000 2005 2010 2015 2018 2019 2020 2021P 2022P 2025P
Nominal GDP Loss in Nominal GDP due to COVID-19
Source: RBI Data, Economic Survey, World Bank, EIU, IMF
1 US$=INR 75
17 15 13 13 9 7 7 7 6 6 5 5
80 514
-5.3% 14%
2,711
77 137 265 425 2,568
2,535
20%
15%
15% 14%
11% 12% 12% 13% 11% 11% 11% 12%
11%
7% 8% 8% 9% 8% 8% 8% 8% 8% 8% 8% 8% 8% 9%
5% 5% 6%
4% 4% 5%
4% 5% 6% 8% 8% 7% 8%
7% 3%
1%
-5%
-10% % Growth (Real) - India % Growth (Nominal) - India
7% 7%
4%
8%
19
91
19
92
19
93
19
94
19
95
19
96
19
97
19
98
19
99
20
00
20
01
20
02
20
03
20
04
20
05
20
06
20
07
20
08
20
09
20
10
20
11
20
12
20
13
20
14
20
15
20
16
20
17
20
18
20
19
20
20
20
21
P
20
25
P
20
30
P
Research of JST Investments | @JSTInvestments | www.jstinvestments.com
%
2,222
305
White boxes at the top refer to India’s GDP rank on a global basis
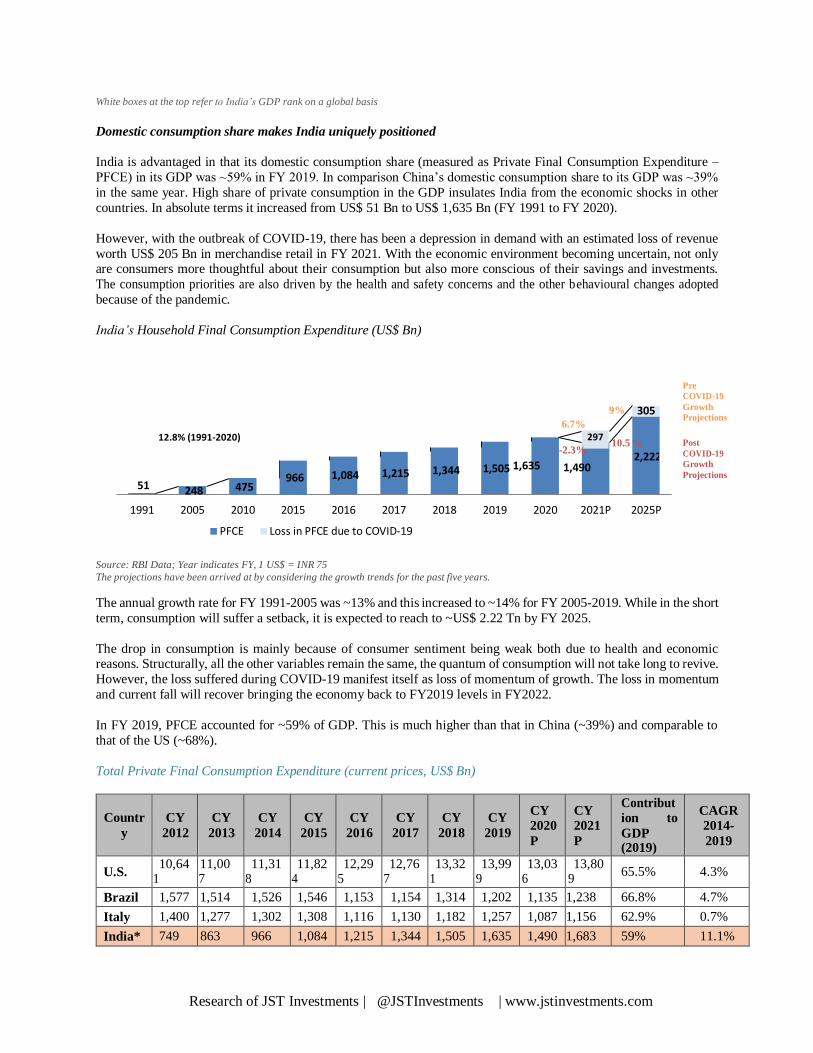
Domestic consumption share makes India uniquely positioned
India is advantaged in that its domestic consumption share (measured as Private Final Consumption Expenditure –
PFCE) in its GDP was ~59% in FY 2019. In comparison China’s domestic consumption share to its GDP was ~39%
in the same year. High share of private consumption in the GDP insulates India from the economic shocks in other
countries. In absolute terms it increased from US$ 51 Bn to US$ 1,635 Bn (FY 1991 to FY 2020).
However, with the outbreak of COVID-19, there has been a depression in demand with an estimated loss of revenue
worth US$ 205 Bn in merchandise retail in FY 2021. With the economic environment becoming uncertain, not only are consumers more thoughtful about their consumption but also more conscious of their savings and investments.
The consumption priorities are also driven by the health and safety concerns and the other behavioural changes adopted
because of the pandemic.
India’s Household Final Consumption Expenditure (US$ Bn)
9%
6.7%
Pre
COVID-19
Growth
Projections
12.8% (1991-2020)
51 248
1,084 1,215 1,344 1,505
297 10.5
-2.3%
1,635 1,490
Post
COVID-19
Growth
Projections
1991 2005 2010 2015 2016 2017 2018 2019 2020 2021P 2025P
PFCE Loss in PFCE due to COVID-19
Source: RBI Data; Year indicates FY, 1 US$ = INR 75
The projections have been arrived at by considering the growth trends for the past five years.
The annual growth rate for FY 1991-2005 was ~13% and this increased to ~14% for FY 2005-2019. While in the short
term, consumption will suffer a setback, it is expected to reach to ~US$ 2.22 Tn by FY 2025.
The drop in consumption is mainly because of consumer sentiment being weak both due to health and economic reasons. Structurally, all the other variables remain the same, the quantum of consumption will not take long to revive.
However, the loss suffered during COVID-19 manifest itself as loss of momentum of growth. The loss in momentum
and current fall will recover bringing the economy back to FY2019 levels in FY2022.
In FY 2019, PFCE accounted for ~59% of GDP. This is much higher than that in China (~39%) and comparable to
that of the US (~68%).
Total Private Final Consumption Expenditure (current prices, US$ Bn)
Countr
y
CY
2012
CY
2013
CY
2014
CY
2015
CY
2016
CY
2017
CY
2018
CY
2019
CY
2020
P
CY
2021
P
Contribut
ion to
GDP (2019)
CAGR
2014-
2019
U.S. 10,64
1 11,00 7
11,31 8
11,82 4
12,29 5
12,76 7
13,32 1
13,99 9
13,03 6
13,80 9
65.5% 4.3%
Brazil 1,577 1,514 1,526 1,546 1,153 1,154 1,314 1,202 1,135 1,238 66.8% 4.7%
Italy 1,400 1,277 1,302 1,308 1,116 1,130 1,182 1,257 1,087 1,156 62.9% 0.7%
India* 749 863 966 1,084 1,215 1,344 1,505 1,635 1,490 1,683 59% 11.1%
475 966
Research of JST Investments | @JSTInvestments | www.jstinvestments.com
Indone
sia 495 518 519 509 495 539 582 594 577 662 54.0% 2.7%
Malays
ia 143 156 167 177 160 163 174 206 189 213 51.4% 4.2%
France 1,573 1,469 1,536 1,549 1,318 1,340 1,396 1,497 1,303 1,430 55.4% 0.5%
Germa
ny 2,079 1,976 2,076 2,115 1,809 1,853 1,952 2,058 1,917 1,958 54.1% 0.2%
Thaila
nd 196 211 220 213 205 206 222 246 227 234 49.3% 2.3%
China 2,732 3,145 3,548 3,948 4,271 4,416 4,698 5,263 5,152 5,980 36.8% 8.2% Source: World Bank, RBI, Technopak Research & Analysis
2021P: The projections have been arrived at by considering impact of COVID-19 *For India, CY 2020P means FY 2021P
1US$ = INR 75
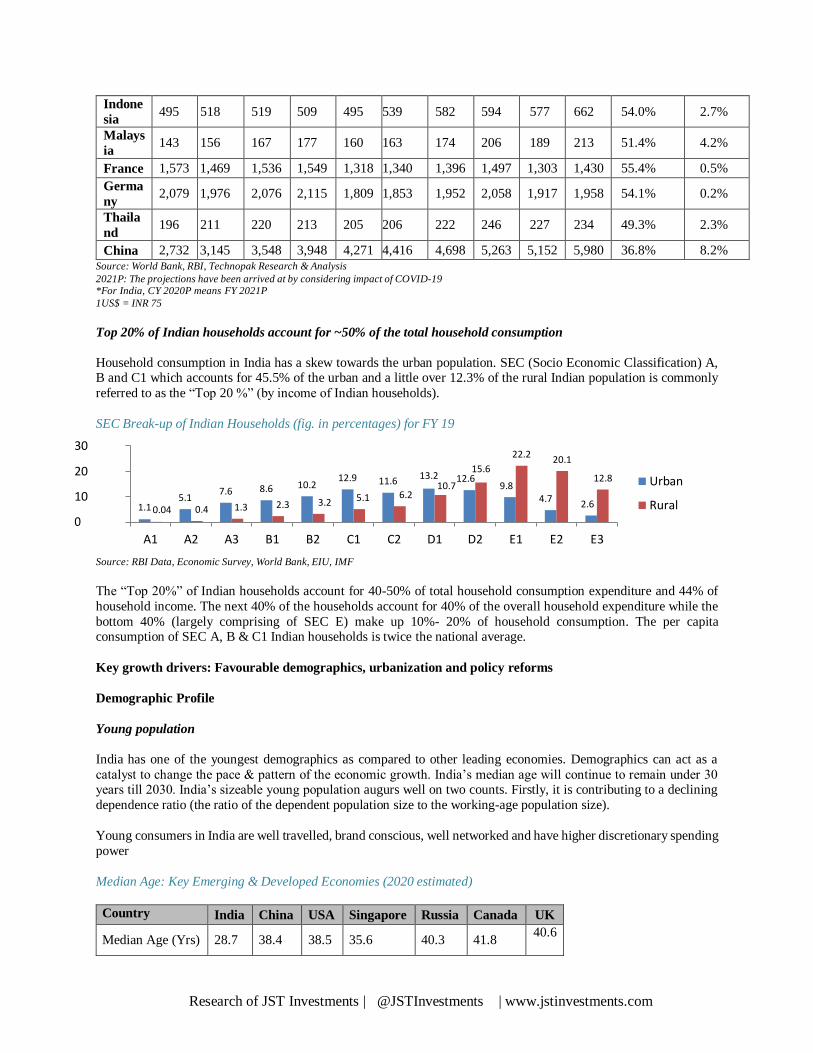
Top 20% of Indian households account for ~50% of the total household consumption
Household consumption in India has a skew towards the urban population. SEC (Socio Economic Classification) A, B and C1 which accounts for 45.5% of the urban and a little over 12.3% of the rural Indian population is commonly
referred to as the “Top 20 %” (by income of Indian households).
SEC Break-up of Indian Households (fig. in percentages) for FY 19
30
20
10
0
Urban
Rural
A1 A2 A3 B1 B2 C1 C2 D1 D2 E1 E2 E3
Source: RBI Data, Economic Survey, World Bank, EIU, IMF
The “Top 20%” of Indian households account for 40-50% of total household consumption expenditure and 44% of
household income. The next 40% of the households account for 40% of the overall household expenditure while the
bottom 40% (largely comprising of SEC E) make up 10%- 20% of household consumption. The per capita consumption of SEC A, B & C1 Indian households is twice the national average.
Key growth drivers: Favourable demographics, urbanization and policy reforms
Demographic Profile
Young population
India has one of the youngest demographics as compared to other leading economies. Demographics can act as a
catalyst to change the pace & pattern of the economic growth. India’s median age will continue to remain under 30 years till 2030. India’s sizeable young population augurs well on two counts. Firstly, it is contributing to a declining
dependence ratio (the ratio of the dependent population size to the working-age population size).
Young consumers in India are well travelled, brand conscious, well networked and have higher discretionary spending
power
Median Age: Key Emerging & Developed Economies (2020 estimated)
Country India China USA Singapore Russia Canada UK
Median Age (Yrs) 28.7 38.4 38.5 35.6 40.3 41.8 40.6
22.2 20.1
12.9 8.6 10.2 11.6
13.2 10.7
15.6 12.6
9.8 12.8
5.1 7.6
5.1 6.2 4.7 1.1 0.04 0.4 1.3 2.3 3.2 2.6
Research of JST Investments | @JSTInvestments | www.jstinvestments.com
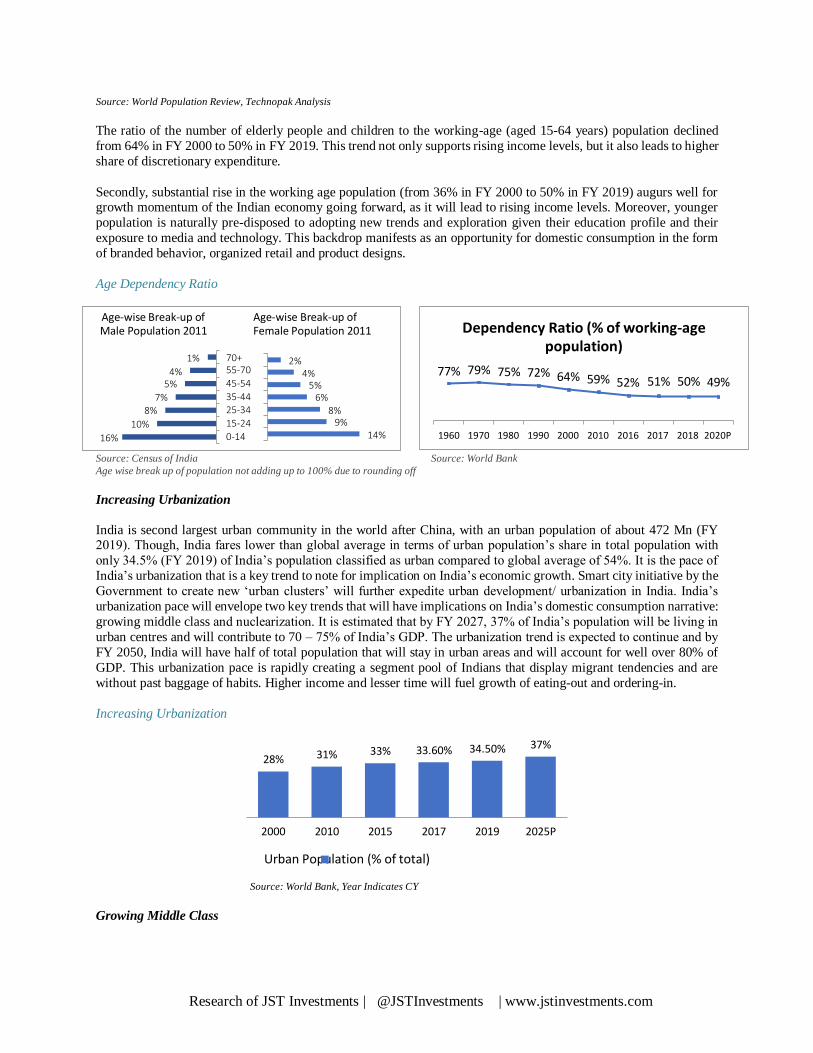
Age-wise Break-up of Male Population 2011
Age-wise Break-up of Female Population 2011
1%
4% 5%
7% 8%
10%
70+ 55-70
45-54
35-44 25-34
15-24
0-14
2% 4%
5% 6%
8% 9%
16% 14%
Dependency Ratio (% of working-age population)
77% 79% 75% 72% 64% 59% 52%
51% 50% 49%
1960 1970 1980 1990 2000 2010 2016 2017 2018 2020P
28% 31% 33% 33.60% 34.50% 37%
Source: World Population Review, Technopak Analysis
The ratio of the number of elderly people and children to the working-age (aged 15-64 years) population declined
from 64% in FY 2000 to 50% in FY 2019. This trend not only supports rising income levels, but it also leads to higher
share of discretionary expenditure.
Secondly, substantial rise in the working age population (from 36% in FY 2000 to 50% in FY 2019) augurs well for growth momentum of the Indian economy going forward, as it will lead to rising income levels. Moreover, younger
population is naturally pre-disposed to adopting new trends and exploration given their education profile and their
exposure to media and technology. This backdrop manifests as an opportunity for domestic consumption in the form
of branded behavior, organized retail and product designs.
Age Dependency Ratio
Source: Census of India Source: World Bank
Age wise break up of population not adding up to 100% due to rounding off
Increasing Urbanization
India is second largest urban community in the world after China, with an urban population of about 472 Mn (FY 2019). Though, India fares lower than global average in terms of urban population’s share in total population with
only 34.5% (FY 2019) of India’s population classified as urban compared to global average of 54%. It is the pace of
India’s urbanization that is a key trend to note for implication on India’s economic growth. Smart city initiative by the
Government to create new ‘urban clusters’ will further expedite urban development/ urbanization in India. India’s
urbanization pace will envelope two key trends that will have implications on India’s domestic consumption narrative:
growing middle class and nuclearization. It is estimated that by FY 2027, 37% of India’s population will be living in
urban centres and will contribute to 70 – 75% of India’s GDP. The urbanization trend is expected to continue and by
FY 2050, India will have half of total population that will stay in urban areas and will account for well over 80% of
GDP. This urbanization pace is rapidly creating a segment pool of Indians that display migrant tendencies and are
without past baggage of habits. Higher income and lesser time will fuel growth of eating-out and ordering-in.
Increasing Urbanization
2000 2010 2015 2017 2019 2025P
Urban Population (% of total)
Source: World Bank, Year Indicates CY
Growing Middle Class
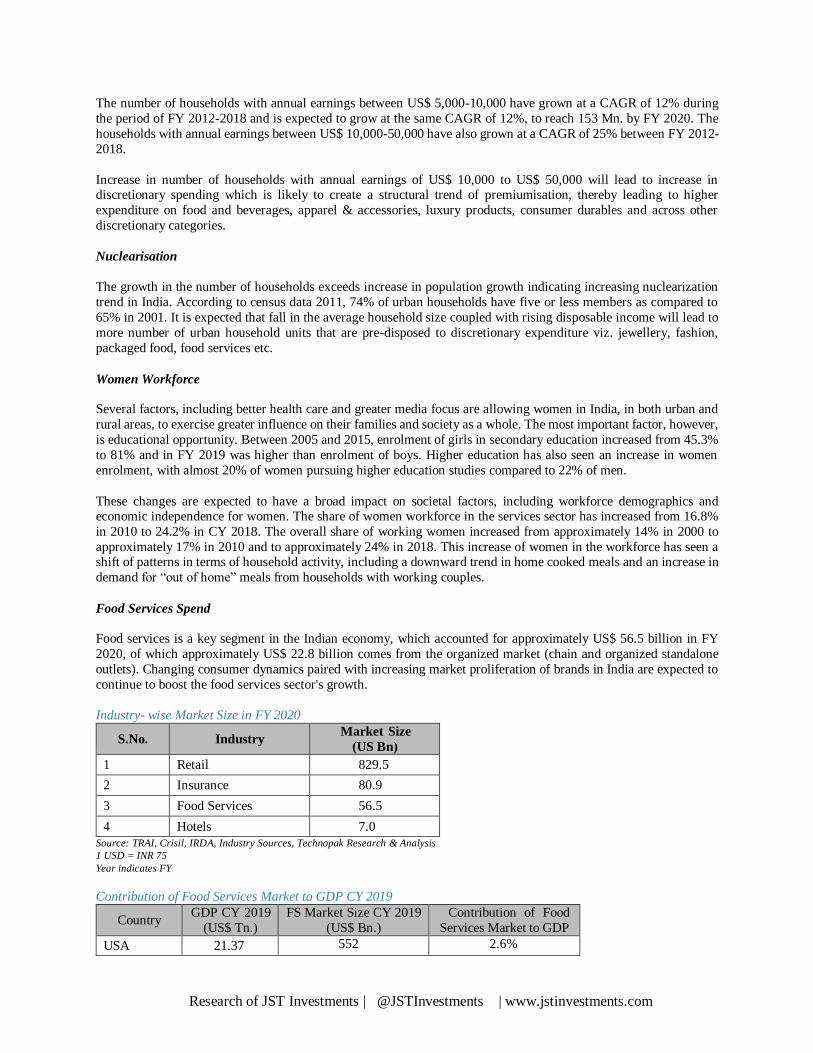
Research of JST Investments | @JSTInvestments | www.jstinvestments.com
The number of households with annual earnings between US$ 5,000-10,000 have grown at a CAGR of 12% during
the period of FY 2012-2018 and is expected to grow at the same CAGR of 12%, to reach 153 Mn. by FY 2020. The
households with annual earnings between US$ 10,000-50,000 have also grown at a CAGR of 25% between FY 2012-
2018.
Increase in number of households with annual earnings of US$ 10,000 to US$ 50,000 will lead to increase in discretionary spending which is likely to create a structural trend of premiumisation, thereby leading to higher
expenditure on food and beverages, apparel & accessories, luxury products, consumer durables and across other
discretionary categories.
Nuclearisation
The growth in the number of households exceeds increase in population growth indicating increasing nuclearization
trend in India. According to census data 2011, 74% of urban households have five or less members as compared to
65% in 2001. It is expected that fall in the average household size coupled with rising disposable income will lead to
more number of urban household units that are pre-disposed to discretionary expenditure viz. jewellery, fashion,
packaged food, food services etc.
Women Workforce
Several factors, including better health care and greater media focus are allowing women in India, in both urban and
rural areas, to exercise greater influence on their families and society as a whole. The most important factor, however,
is educational opportunity. Between 2005 and 2015, enrolment of girls in secondary education increased from 45.3%
to 81% and in FY 2019 was higher than enrolment of boys. Higher education has also seen an increase in women
enrolment, with almost 20% of women pursuing higher education studies compared to 22% of men.
These changes are expected to have a broad impact on societal factors, including workforce demographics and economic independence for women. The share of women workforce in the services sector has increased from 16.8%
in 2010 to 24.2% in CY 2018. The overall share of working women increased from approximately 14% in 2000 to
approximately 17% in 2010 and to approximately 24% in 2018. This increase of women in the workforce has seen a shift of patterns in terms of household activity, including a downward trend in home cooked meals and an increase in
demand for “out of home” meals from households with working couples.
Food Services Spend
Food services is a key segment in the Indian economy, which accounted for approximately US$ 56.5 billion in FY
2020, of which approximately US$ 22.8 billion comes from the organized market (chain and organized standalone
outlets). Changing consumer dynamics paired with increasing market proliferation of brands in India are expected to
continue to boost the food services sector's growth.
Industry- wise Market Size in FY 2020
S.No. Industry Market Size
(US Bn)
1 Retail 829.5
2 Insurance 80.9
3 Food Services 56.5
4 Hotels 7.0
Source: TRAI, Crisil, IRDA, Industry Sources, Technopak Research & Analysis
1 USD = INR 75
Year indicates FY
Contribution of Food Services Market to GDP CY 2019
Country GDP CY 2019
(US$ Tn.)
FS Market Size CY 2019
(US$ Bn.)
Contribution of Food
Services Market to GDP
USA 21.37 552 2.6%
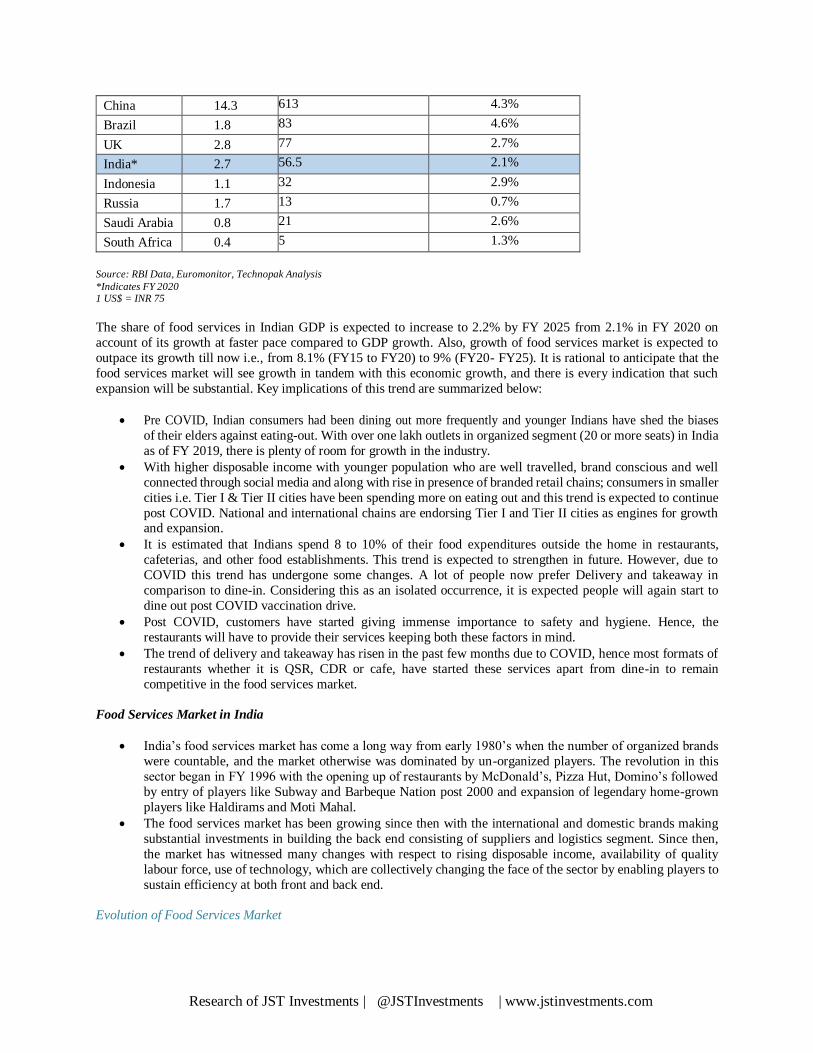
Research of JST Investments | @JSTInvestments | www.jstinvestments.com
China 14.3 613 4.3%
Brazil 1.8 83 4.6%
UK 2.8 77 2.7%
India* 2.7 56.5 2.1%
Indonesia 1.1 32 2.9%
Russia 1.7 13 0.7%
Saudi Arabia 0.8 21 2.6%
South Africa 0.4 5 1.3%
Source: RBI Data, Euromonitor, Technopak Analysis
*Indicates FY 2020 1 US$ = INR 75
The share of food services in Indian GDP is expected to increase to 2.2% by FY 2025 from 2.1% in FY 2020 on
account of its growth at faster pace compared to GDP growth. Also, growth of food services market is expected to
outpace its growth till now i.e., from 8.1% (FY15 to FY20) to 9% (FY20- FY25). It is rational to anticipate that the
food services market will see growth in tandem with this economic growth, and there is every indication that such
expansion will be substantial. Key implications of this trend are summarized below:
Pre COVID, Indian consumers had been dining out more frequently and younger Indians have shed the biases
of their elders against eating-out. With over one lakh outlets in organized segment (20 or more seats) in India
as of FY 2019, there is plenty of room for growth in the industry.
With higher disposable income with younger population who are well travelled, brand conscious and well
connected through social media and along with rise in presence of branded retail chains; consumers in smaller
cities i.e. Tier I & Tier II cities have been spending more on eating out and this trend is expected to continue
post COVID. National and international chains are endorsing Tier I and Tier II cities as engines for growth and expansion.
It is estimated that Indians spend 8 to 10% of their food expenditures outside the home in restaurants,
cafeterias, and other food establishments. This trend is expected to strengthen in future. However, due to
COVID this trend has undergone some changes. A lot of people now prefer Delivery and takeaway in
comparison to dine-in. Considering this as an isolated occurrence, it is expected people will again start to
dine out post COVID vaccination drive.
Post COVID, customers have started giving immense importance to safety and hygiene. Hence, the
restaurants will have to provide their services keeping both these factors in mind.
The trend of delivery and takeaway has risen in the past few months due to COVID, hence most formats of
restaurants whether it is QSR, CDR or cafe, have started these services apart from dine-in to remain
competitive in the food services market.
Food Services Market in India
India’s food services market has come a long way from early 1980’s when the number of organized brands
were countable, and the market otherwise was dominated by un-organized players. The revolution in this
sector began in FY 1996 with the opening up of restaurants by McDonald’s, Pizza Hut, Domino’s followed
by entry of players like Subway and Barbeque Nation post 2000 and expansion of legendary home-grown
players like Haldirams and Moti Mahal.
The food services market has been growing since then with the international and domestic brands making
substantial investments in building the back end consisting of suppliers and logistics segment. Since then,
the market has witnessed many changes with respect to rising disposable income, availability of quality
labour force, use of technology, which are collectively changing the face of the sector by enabling players to
sustain efficiency at both front and back end.
Evolution of Food Services Market
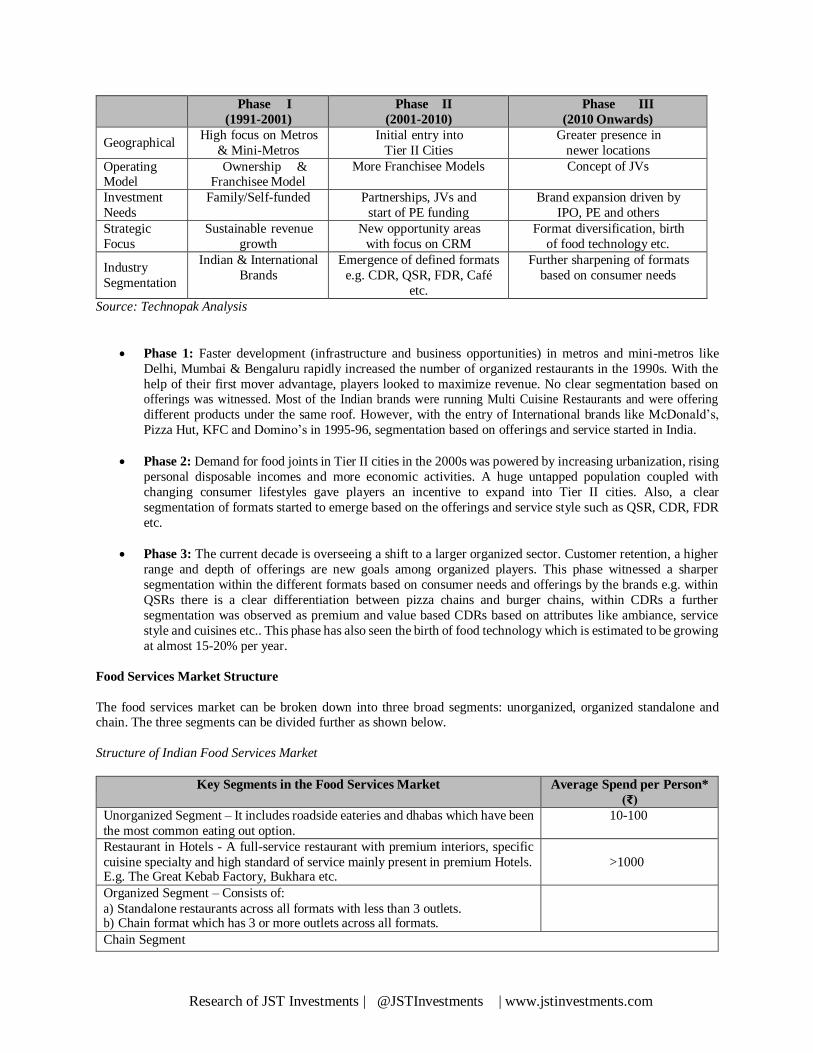
Research of JST Investments | @JSTInvestments | www.jstinvestments.com
Phase I
(1991-2001)
Phase II
(2001-2010)
Phase III
(2010 Onwards)
Geographical High focus on Metros
& Mini-Metros
Initial entry into
Tier II Cities
Greater presence in
newer locations
Operating Model
Ownership & Franchisee Model
More Franchisee Models Concept of JVs
Investment
Needs
Family/Self-funded Partnerships, JVs and
start of PE funding
Brand expansion driven by
IPO, PE and others
Strategic
Focus
Sustainable revenue
growth
New opportunity areas
with focus on CRM
Format diversification, birth
of food technology etc.
Industry
Segmentation
Indian & International
Brands
Emergence of defined formats
e.g. CDR, QSR, FDR, Café
etc.
Further sharpening of formats
based on consumer needs
Source: Technopak Analysis
Phase 1: Faster development (infrastructure and business opportunities) in metros and mini-metros like
Delhi, Mumbai & Bengaluru rapidly increased the number of organized restaurants in the 1990s. With the
help of their first mover advantage, players looked to maximize revenue. No clear segmentation based on offerings was witnessed. Most of the Indian brands were running Multi Cuisine Restaurants and were offering
different products under the same roof. However, with the entry of International brands like McDonald’s,
Pizza Hut, KFC and Domino’s in 1995-96, segmentation based on offerings and service started in India.
Phase 2: Demand for food joints in Tier II cities in the 2000s was powered by increasing urbanization, rising
personal disposable incomes and more economic activities. A huge untapped population coupled with
changing consumer lifestyles gave players an incentive to expand into Tier II cities. Also, a clear
segmentation of formats started to emerge based on the offerings and service style such as QSR, CDR, FDR
etc.
Phase 3: The current decade is overseeing a shift to a larger organized sector. Customer retention, a higher
range and depth of offerings are new goals among organized players. This phase witnessed a sharper
segmentation within the different formats based on consumer needs and offerings by the brands e.g. within
QSRs there is a clear differentiation between pizza chains and burger chains, within CDRs a further
segmentation was observed as premium and value based CDRs based on attributes like ambiance, service
style and cuisines etc.. This phase has also seen the birth of food technology which is estimated to be growing
at almost 15-20% per year.
Food Services Market Structure
The food services market can be broken down into three broad segments: unorganized, organized standalone and chain. The three segments can be divided further as shown below.
Structure of Indian Food Services Market
Key Segments in the Food Services Market Average Spend per Person*
(₹)
Unorganized Segment – It includes roadside eateries and dhabas which have been
the most common eating out option.
10-100
Restaurant in Hotels - A full-service restaurant with premium interiors, specific
cuisine specialty and high standard of service mainly present in premium Hotels. E.g. The Great Kebab Factory, Bukhara etc.
>1000
Organized Segment – Consists of:
a) Standalone restaurants across all formats with less than 3 outlets. b) Chain format which has 3 or more outlets across all formats.
Chain Segment
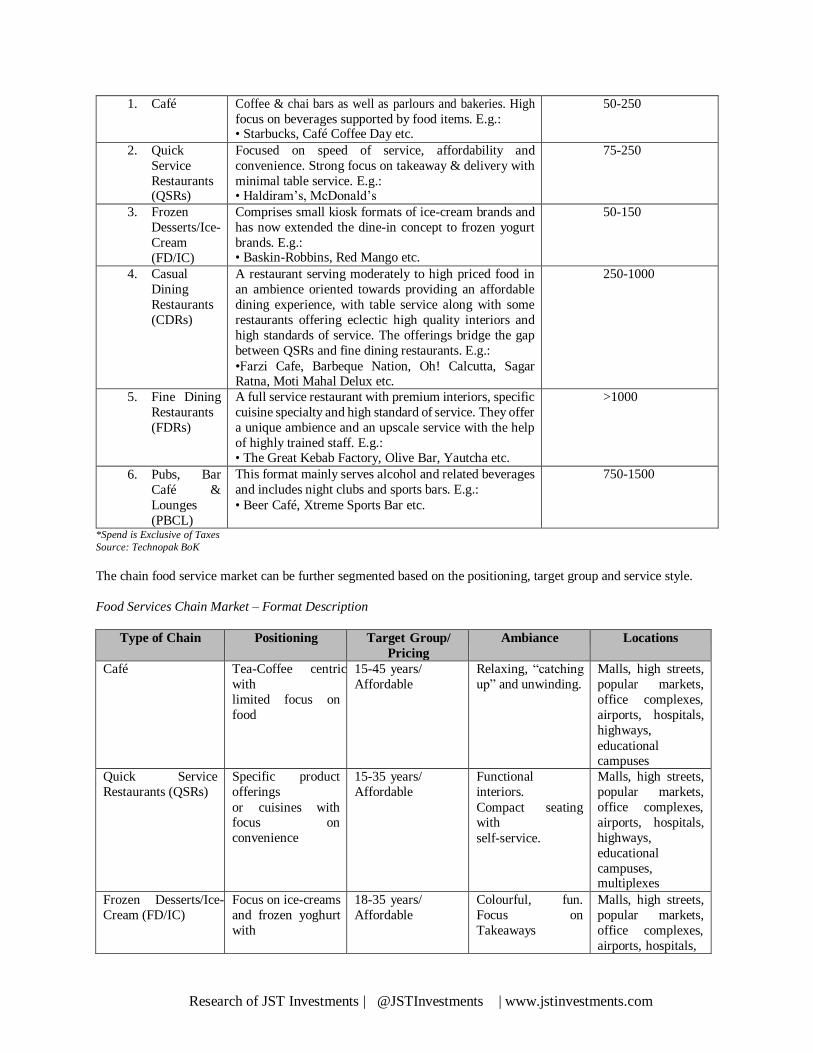
Research of JST Investments | @JSTInvestments | www.jstinvestments.com
1. Café Coffee & chai bars as well as parlours and bakeries. High
focus on beverages supported by food items. E.g.: • Starbucks, Café Coffee Day etc.
50-250
2. Quick
Service
Restaurants (QSRs)
Focused on speed of service, affordability and
convenience. Strong focus on takeaway & delivery with
minimal table service. E.g.: • Haldiram’s, McDonald’s
75-250
3. Frozen
Desserts/Ice-
Cream
(FD/IC)
Comprises small kiosk formats of ice-cream brands and
has now extended the dine-in concept to frozen yogurt
brands. E.g.: • Baskin-Robbins, Red Mango etc.
50-150
4. Casual
Dining
Restaurants
(CDRs)
A restaurant serving moderately to high priced food in
an ambience oriented towards providing an affordable
dining experience, with table service along with some
restaurants offering eclectic high quality interiors and
high standards of service. The offerings bridge the gap
between QSRs and fine dining restaurants. E.g.:
•Farzi Cafe, Barbeque Nation, Oh! Calcutta, Sagar Ratna, Moti Mahal Delux etc.
250-1000
5. Fine Dining
Restaurants
(FDRs)
A full service restaurant with premium interiors, specific
cuisine specialty and high standard of service. They offer
a unique ambience and an upscale service with the help
of highly trained staff. E.g.: • The Great Kebab Factory, Olive Bar, Yautcha etc.
>1000
6. Pubs, Bar
Café &
Lounges
(PBCL)
This format mainly serves alcohol and related beverages
and includes night clubs and sports bars. E.g.:
• Beer Café, Xtreme Sports Bar etc.
750-1500
*Spend is Exclusive of Taxes
Source: Technopak BoK
The chain food service market can be further segmented based on the positioning, target group and service style.
Food Services Chain Market – Format Description
Type of Chain Positioning Target Group/
Pricing
Ambiance Locations
Café Tea-Coffee centric
with
limited focus on
food
15-45 years/
Affordable
Relaxing, “catching
up” and unwinding.
Malls, high streets,
popular markets,
office complexes,
airports, hospitals,
highways,
educational campuses
Quick Service
Restaurants (QSRs)
Specific product
offerings
or cuisines with focus on
convenience
15-35 years/
Affordable
Functional
interiors.
Compact seating with
self-service.
Malls, high streets,
popular markets,
office complexes,
airports, hospitals,
highways,
educational
campuses, multiplexes
Frozen Desserts/Ice-
Cream (FD/IC)
Focus on ice-creams
and frozen yoghurt
with
18-35 years/
Affordable
Colourful, fun.
Focus on
Takeaways
Malls, high streets,
popular markets,
office complexes,
airports, hospitals,
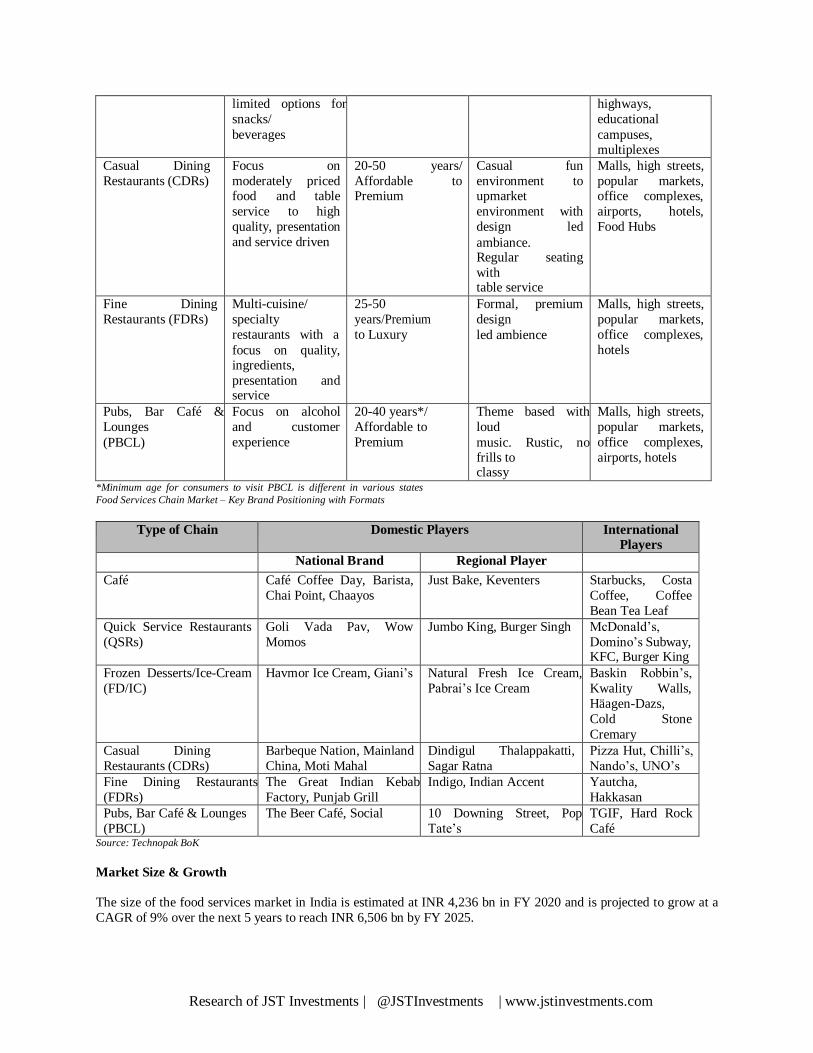
Research of JST Investments | @JSTInvestments | www.jstinvestments.com
limited options for
snacks/
beverages
highways,
educational
campuses, multiplexes
Casual Dining
Restaurants (CDRs)
Focus on
moderately priced food and table
service to high
quality, presentation
and service driven
20-50 years/
Affordable to Premium
Casual fun
environment to upmarket
environment with
design led
ambiance. Regular seating
with table service
Malls, high streets,
popular markets, office complexes,
airports, hotels,
Food Hubs
Fine Dining
Restaurants (FDRs)
Multi-cuisine/
specialty
restaurants with a
focus on quality, ingredients,
presentation and service
25-50
years/Premium
to Luxury
Formal, premium
design
led ambience
Malls, high streets,
popular markets,
office complexes,
hotels
Pubs, Bar Café &
Lounges
(PBCL)
Focus on alcohol
and customer
experience
20-40 years*/
Affordable to
Premium
Theme based with
loud
music. Rustic, no frills to classy
Malls, high streets,
popular markets,
office complexes,
airports, hotels
*Minimum age for consumers to visit PBCL is different in various states
Food Services Chain Market – Key Brand Positioning with Formats
Type of Chain Domestic Players International
Players National Brand Regional Player
Café Café Coffee Day, Barista,
Chai Point, Chaayos
Just Bake, Keventers Starbucks, Costa
Coffee, Coffee
Bean Tea Leaf
Quick Service Restaurants
(QSRs)
Goli Vada Pav, Wow
Momos
Jumbo King, Burger Singh McDonald’s,
Domino’s Subway, KFC, Burger King
Frozen Desserts/Ice-Cream
(FD/IC)
Havmor Ice Cream, Giani’s Natural Fresh Ice Cream,
Pabrai’s Ice Cream
Baskin Robbin’s,
Kwality Walls,
Häagen-Dazs,
Cold Stone
Cremary
Casual Dining
Restaurants (CDRs)
Barbeque Nation, Mainland
China, Moti Mahal
Dindigul Thalappakatti,
Sagar Ratna
Pizza Hut, Chilli’s,
Nando’s, UNO’s
Fine Dining Restaurants
(FDRs)
The Great Indian Kebab
Factory, Punjab Grill
Indigo, Indian Accent Yautcha,
Hakkasan
Pubs, Bar Café & Lounges
(PBCL)
The Beer Café, Social 10 Downing Street, Pop
Tate’s
TGIF, Hard Rock
Café Source: Technopak BoK
Market Size & Growth
The size of the food services market in India is estimated at INR 4,236 bn in FY 2020 and is projected to grow at a
CAGR of 9% over the next 5 years to reach INR 6,506 bn by FY 2025.
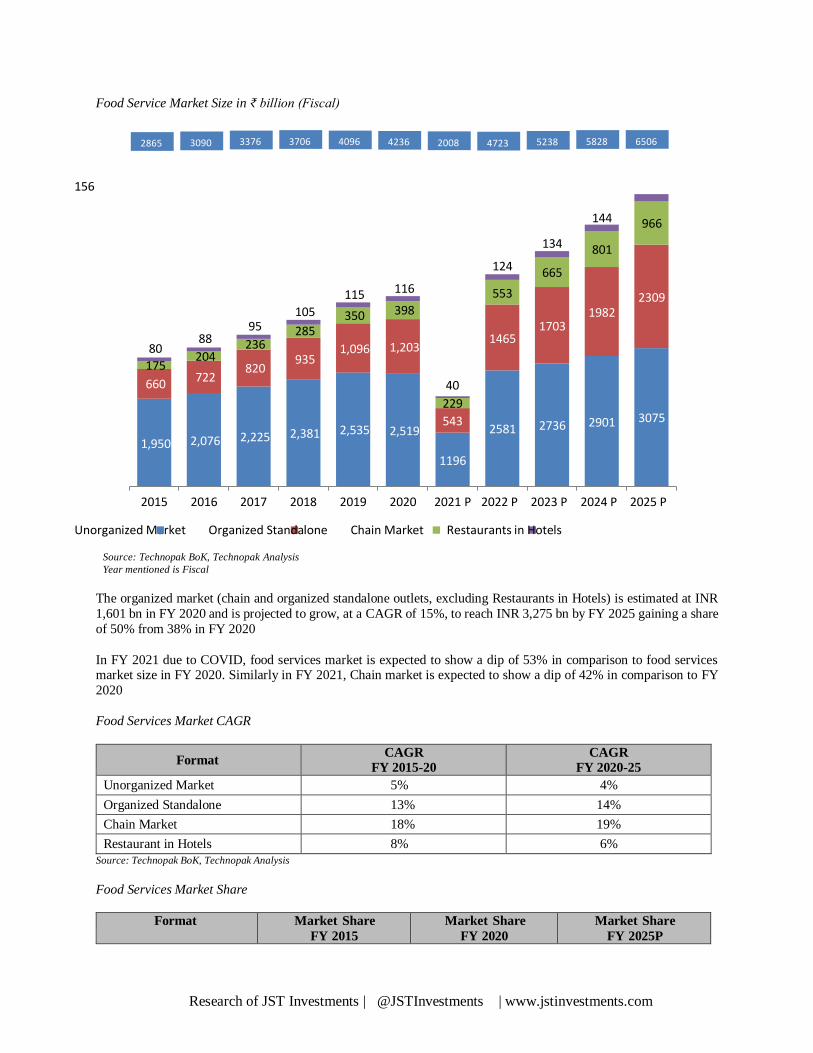
Research of JST Investments | @JSTInvestments | www.jstinvestments.com
2865 3090 3376 3706 4096 4236 2008 4723 5238 5828 6506
Food Service Market Size in ₹ billion (Fiscal)
156
2015 2016 2017 2018 2019 2020 2021 P 2022 P 2023 P 2024 P 2025 P
Unorganized Market Organized Standalone Chain Market Restaurants in Hotels
Source: Technopak BoK, Technopak Analysis
Year mentioned is Fiscal
The organized market (chain and organized standalone outlets, excluding Restaurants in Hotels) is estimated at INR
1,601 bn in FY 2020 and is projected to grow, at a CAGR of 15%, to reach INR 3,275 bn by FY 2025 gaining a share
of 50% from 38% in FY 2020
In FY 2021 due to COVID, food services market is expected to show a dip of 53% in comparison to food services market size in FY 2020. Similarly in FY 2021, Chain market is expected to show a dip of 42% in comparison to FY
2020
Food Services Market CAGR
Format CAGR
FY 2015-20
CAGR
FY 2020-25
Unorganized Market 5% 4%
Organized Standalone 13% 14%
Chain Market 18% 19%
Restaurant in Hotels 8% 6%
Source: Technopak BoK, Technopak Analysis
Food Services Market Share
Format Market Share
FY 2015
Market Share
FY 2020
Market Share
FY 2025P
144 966
134 801 124 665
116
398
553
80
175
660
88
204
722
95
236
820
105
285
115
350
2309 1982
1703
1,203 1465
935 1,096
40
229
2,535 2,519 543
2581 2736 2901 3075
1,950 2,076 2,225 2,381
1196
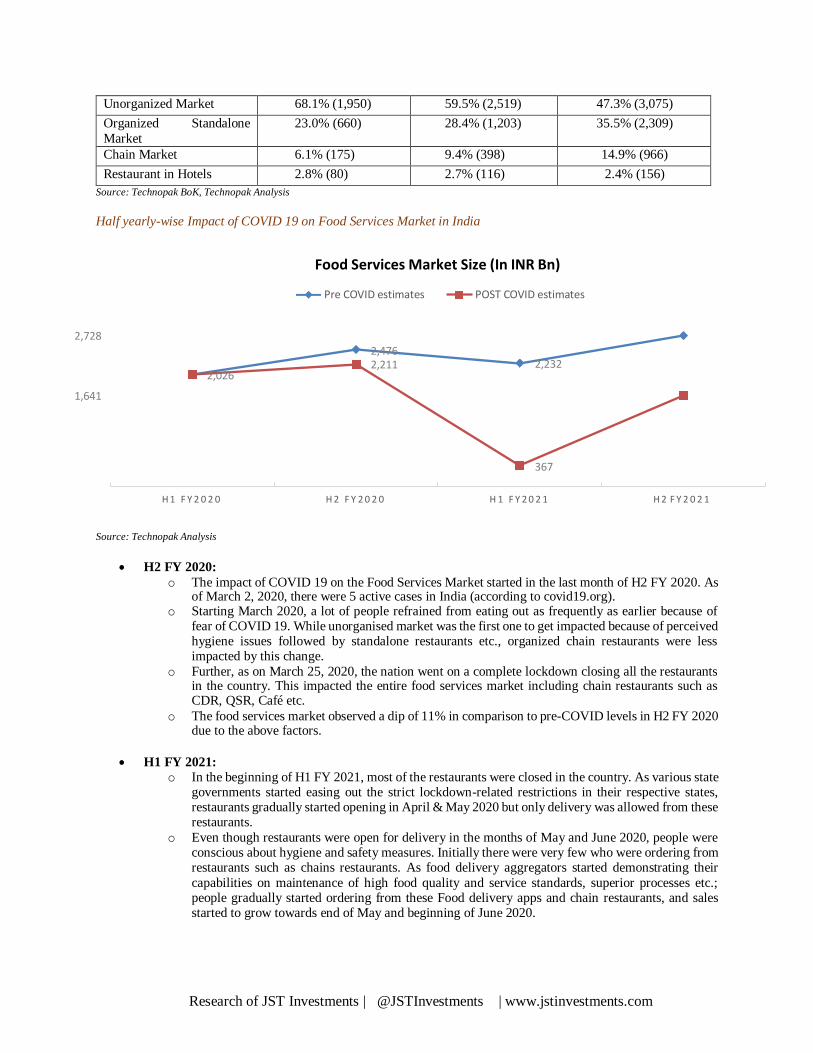
Research of JST Investments | @JSTInvestments | www.jstinvestments.com
Unorganized Market 68.1% (1,950) 59.5% (2,519) 47.3% (3,075)
Organized Standalone
Market
23.0% (660) 28.4% (1,203) 35.5% (2,309)
Chain Market 6.1% (175) 9.4% (398) 14.9% (966)
Restaurant in Hotels 2.8% (80) 2.7% (116) 2.4% (156)
Source: Technopak BoK, Technopak Analysis
Half yearly-wise Impact of COVID 19 on Food Services Market in India
Food Services Market Size (In INR Bn)
Pre COVID estimates POST COVID estimates
2,728
1,641
H 1 F Y 2 0 2 0 H 2 F Y 2 0 2 0 H 1 F Y 2 0 2 1 H 2 F Y 2 0 2 1
Source: Technopak Analysis
H2 FY 2020:
o The impact of COVID 19 on the Food Services Market started in the last month of H2 FY 2020. As of March 2, 2020, there were 5 active cases in India (according to covid19.org).
o Starting March 2020, a lot of people refrained from eating out as frequently as earlier because of fear of COVID 19. While unorganised market was the first one to get impacted because of perceived hygiene issues followed by standalone restaurants etc., organized chain restaurants were less impacted by this change.
o Further, as on March 25, 2020, the nation went on a complete lockdown closing all the restaurants in the country. This impacted the entire food services market including chain restaurants such as CDR, QSR, Café etc.
o The food services market observed a dip of 11% in comparison to pre-COVID levels in H2 FY 2020 due to the above factors.
H1 FY 2021:
o In the beginning of H1 FY 2021, most of the restaurants were closed in the country. As various state governments started easing out the strict lockdown-related restrictions in their respective states, restaurants gradually started opening in April & May 2020 but only delivery was allowed from these restaurants.
o Even though restaurants were open for delivery in the months of May and June 2020, people were conscious about hygiene and safety measures. Initially there were very few who were ordering from restaurants such as chains restaurants. As food delivery aggregators started demonstrating their
capabilities on maintenance of high food quality and service standards, superior processes etc.; people gradually started ordering from these Food delivery apps and chain restaurants, and sales started to grow towards end of May and beginning of June 2020.
2,476 2,211 2,232
2,026
367
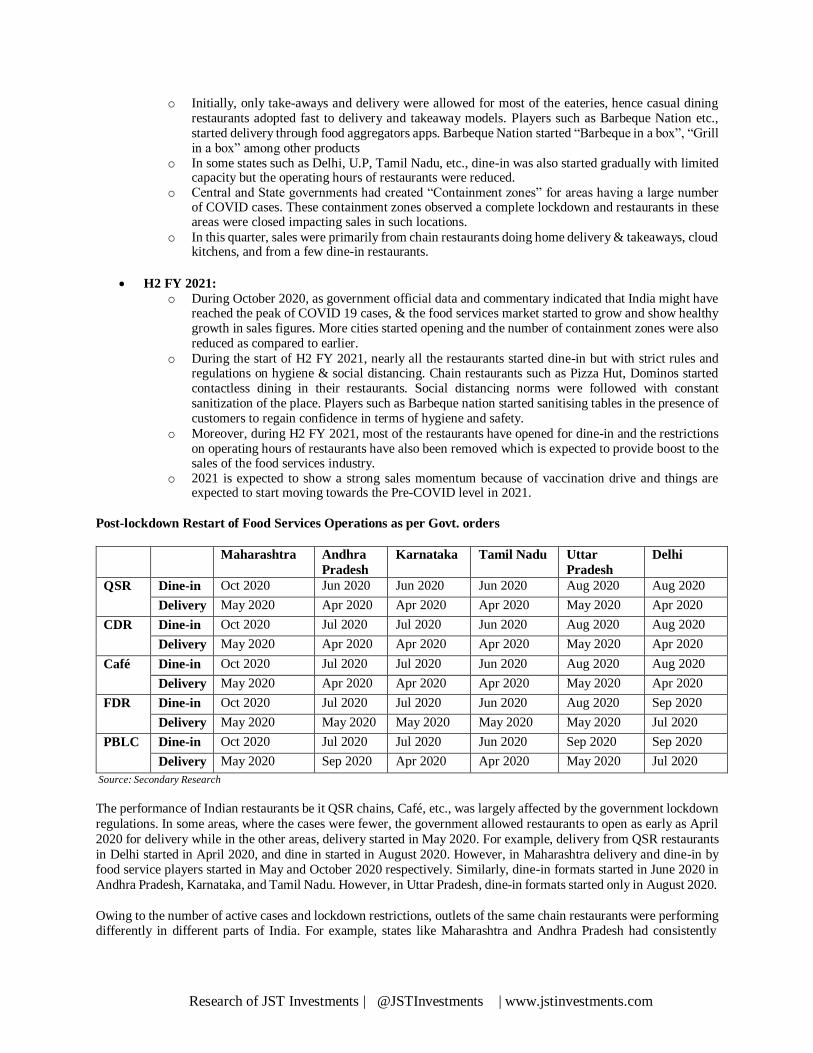
Research of JST Investments | @JSTInvestments | www.jstinvestments.com
o Initially, only take-aways and delivery were allowed for most of the eateries, hence casual dining restaurants adopted fast to delivery and takeaway models. Players such as Barbeque Nation etc., started delivery through food aggregators apps. Barbeque Nation started “Barbeque in a box”, “Grill in a box” among other products
o In some states such as Delhi, U.P, Tamil Nadu, etc., dine-in was also started gradually with limited capacity but the operating hours of restaurants were reduced.
o Central and State governments had created “Containment zones” for areas having a large number of COVID cases. These containment zones observed a complete lockdown and restaurants in these areas were closed impacting sales in such locations.
o In this quarter, sales were primarily from chain restaurants doing home delivery & takeaways, cloud kitchens, and from a few dine-in restaurants.
H2 FY 2021:
o During October 2020, as government official data and commentary indicated that India might have reached the peak of COVID 19 cases, & the food services market started to grow and show healthy growth in sales figures. More cities started opening and the number of containment zones were also reduced as compared to earlier.
o During the start of H2 FY 2021, nearly all the restaurants started dine-in but with strict rules and regulations on hygiene & social distancing. Chain restaurants such as Pizza Hut, Dominos started contactless dining in their restaurants. Social distancing norms were followed with constant sanitization of the place. Players such as Barbeque nation started sanitising tables in the presence of customers to regain confidence in terms of hygiene and safety.
o Moreover, during H2 FY 2021, most of the restaurants have opened for dine-in and the restrictions on operating hours of restaurants have also been removed which is expected to provide boost to the sales of the food services industry.
o 2021 is expected to show a strong sales momentum because of vaccination drive and things are expected to start moving towards the Pre-COVID level in 2021.
Post-lockdown Restart of Food Services Operations as per Govt. orders
Maharashtra Andhra
Pradesh
Karnataka Tamil Nadu Uttar
Pradesh
Delhi
QSR Dine-in Oct 2020 Jun 2020 Jun 2020 Jun 2020 Aug 2020 Aug 2020
Delivery May 2020 Apr 2020 Apr 2020 Apr 2020 May 2020 Apr 2020
CDR Dine-in Oct 2020 Jul 2020 Jul 2020 Jun 2020 Aug 2020 Aug 2020
Delivery May 2020 Apr 2020 Apr 2020 Apr 2020 May 2020 Apr 2020
Café Dine-in Oct 2020 Jul 2020 Jul 2020 Jun 2020 Aug 2020 Aug 2020
Delivery May 2020 Apr 2020 Apr 2020 Apr 2020 May 2020 Apr 2020
FDR Dine-in Oct 2020 Jul 2020 Jul 2020 Jun 2020 Aug 2020 Sep 2020
Delivery May 2020 May 2020 May 2020 May 2020 May 2020 Jul 2020
PBLC Dine-in Oct 2020 Jul 2020 Jul 2020 Jun 2020 Sep 2020 Sep 2020
Delivery May 2020 Sep 2020 Apr 2020 Apr 2020 May 2020 Jul 2020
Source: Secondary Research
The performance of Indian restaurants be it QSR chains, Café, etc., was largely affected by the government lockdown
regulations. In some areas, where the cases were fewer, the government allowed restaurants to open as early as April
2020 for delivery while in the other areas, delivery started in May 2020. For example, delivery from QSR restaurants
in Delhi started in April 2020, and dine in started in August 2020. However, in Maharashtra delivery and dine-in by food service players started in May and October 2020 respectively. Similarly, dine-in formats started in June 2020 in
Andhra Pradesh, Karnataka, and Tamil Nadu. However, in Uttar Pradesh, dine-in formats started only in August 2020.
Owing to the number of active cases and lockdown restrictions, outlets of the same chain restaurants were performing differently in different parts of India. For example, states like Maharashtra and Andhra Pradesh had consistently
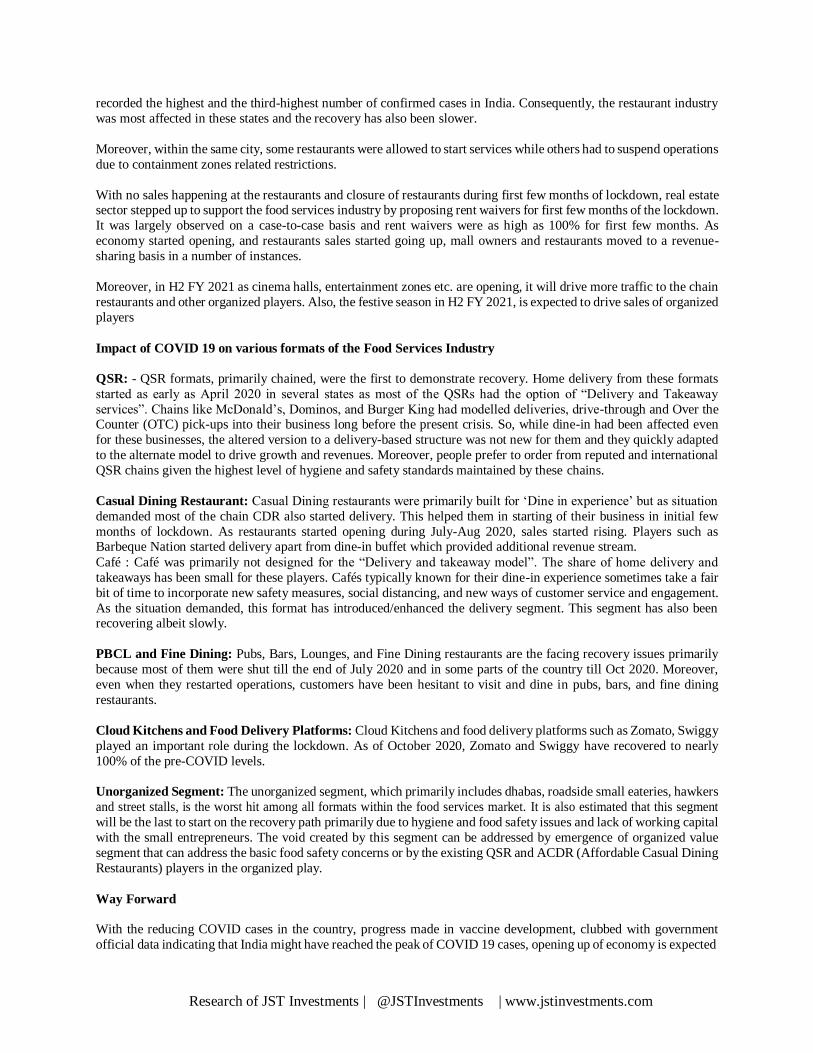
Research of JST Investments | @JSTInvestments | www.jstinvestments.com
recorded the highest and the third-highest number of confirmed cases in India. Consequently, the restaurant industry
was most affected in these states and the recovery has also been slower.
Moreover, within the same city, some restaurants were allowed to start services while others had to suspend operations
due to containment zones related restrictions.
With no sales happening at the restaurants and closure of restaurants during first few months of lockdown, real estate sector stepped up to support the food services industry by proposing rent waivers for first few months of the lockdown.
It was largely observed on a case-to-case basis and rent waivers were as high as 100% for first few months. As
economy started opening, and restaurants sales started going up, mall owners and restaurants moved to a revenue-
sharing basis in a number of instances.
Moreover, in H2 FY 2021 as cinema halls, entertainment zones etc. are opening, it will drive more traffic to the chain
restaurants and other organized players. Also, the festive season in H2 FY 2021, is expected to drive sales of organized
players
Impact of COVID 19 on various formats of the Food Services Industry
QSR: - QSR formats, primarily chained, were the first to demonstrate recovery. Home delivery from these formats
started as early as April 2020 in several states as most of the QSRs had the option of “Delivery and Takeaway
services”. Chains like McDonald’s, Dominos, and Burger King had modelled deliveries, drive-through and Over the Counter (OTC) pick-ups into their business long before the present crisis. So, while dine-in had been affected even
for these businesses, the altered version to a delivery-based structure was not new for them and they quickly adapted
to the alternate model to drive growth and revenues. Moreover, people prefer to order from reputed and international
QSR chains given the highest level of hygiene and safety standards maintained by these chains.
Casual Dining Restaurant: Casual Dining restaurants were primarily built for ‘Dine in experience’ but as situation
demanded most of the chain CDR also started delivery. This helped them in starting of their business in initial few
months of lockdown. As restaurants started opening during July-Aug 2020, sales started rising. Players such as Barbeque Nation started delivery apart from dine-in buffet which provided additional revenue stream.
Café : Café was primarily not designed for the “Delivery and takeaway model”. The share of home delivery and
takeaways has been small for these players. Cafés typically known for their dine-in experience sometimes take a fair
bit of time to incorporate new safety measures, social distancing, and new ways of customer service and engagement.
As the situation demanded, this format has introduced/enhanced the delivery segment. This segment has also been recovering albeit slowly.
PBCL and Fine Dining: Pubs, Bars, Lounges, and Fine Dining restaurants are the facing recovery issues primarily
because most of them were shut till the end of July 2020 and in some parts of the country till Oct 2020. Moreover,
even when they restarted operations, customers have been hesitant to visit and dine in pubs, bars, and fine dining
restaurants.
Cloud Kitchens and Food Delivery Platforms: Cloud Kitchens and food delivery platforms such as Zomato, Swiggy
played an important role during the lockdown. As of October 2020, Zomato and Swiggy have recovered to nearly
100% of the pre-COVID levels.
Unorganized Segment: The unorganized segment, which primarily includes dhabas, roadside small eateries, hawkers
and street stalls, is the worst hit among all formats within the food services market. It is also estimated that this segment
will be the last to start on the recovery path primarily due to hygiene and food safety issues and lack of working capital
with the small entrepreneurs. The void created by this segment can be addressed by emergence of organized value
segment that can address the basic food safety concerns or by the existing QSR and ACDR (Affordable Casual Dining
Restaurants) players in the organized play.
Way Forward
With the reducing COVID cases in the country, progress made in vaccine development, clubbed with government
official data indicating that India might have reached the peak of COVID 19 cases, opening up of economy is expected
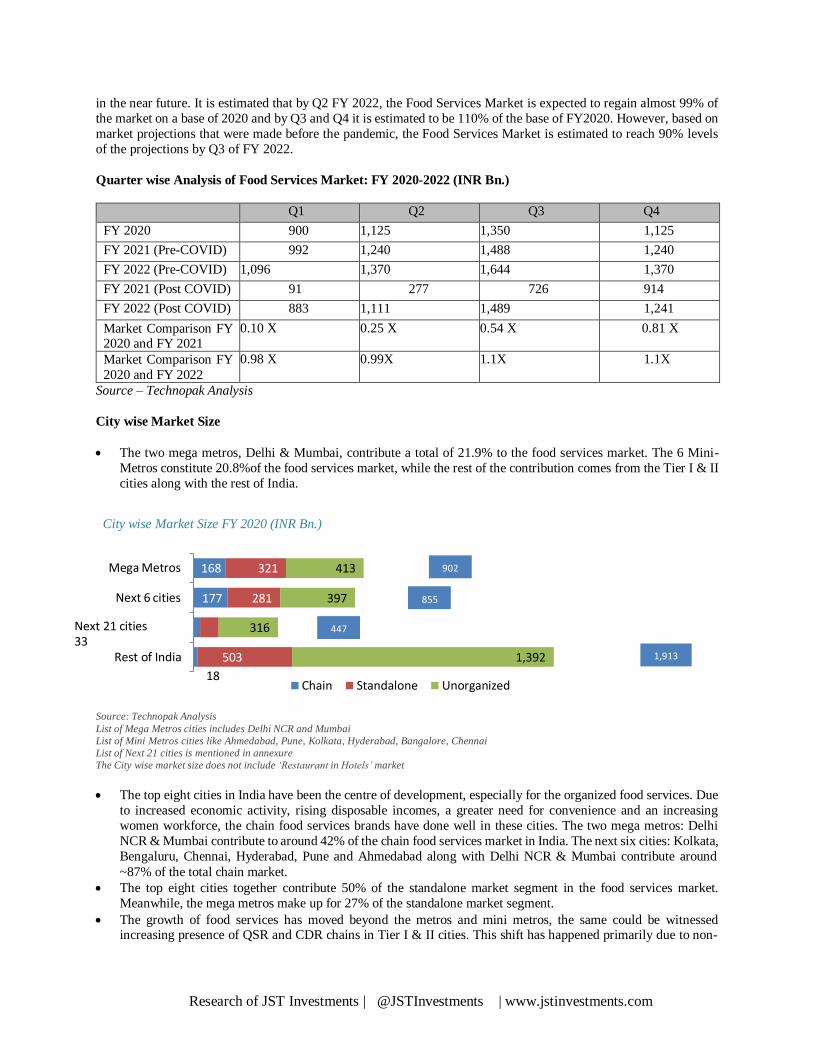
Research of JST Investments | @JSTInvestments | www.jstinvestments.com
in the near future. It is estimated that by Q2 FY 2022, the Food Services Market is expected to regain almost 99% of
the market on a base of 2020 and by Q3 and Q4 it is estimated to be 110% of the base of FY2020. However, based on
market projections that were made before the pandemic, the Food Services Market is estimated to reach 90% levels
of the projections by Q3 of FY 2022.
Quarter wise Analysis of Food Services Market: FY 2020-2022 (INR Bn.)
Q1 Q2 Q3 Q4
FY 2020 900 1,125 1,350 1,125
FY 2021 (Pre-COVID) 992 1,240 1,488 1,240
FY 2022 (Pre-COVID) 1,096 1,370 1,644 1,370
FY 2021 (Post COVID) 91 277 726 914
FY 2022 (Post COVID) 883 1,111 1,489 1,241
Market Comparison FY 2020 and FY 2021
0.10 X 0.25 X 0.54 X 0.81 X
Market Comparison FY
2020 and FY 2022
0.98 X 0.99X 1.1X 1.1X
Source – Technopak Analysis
City wise Market Size
The two mega metros, Delhi & Mumbai, contribute a total of 21.9% to the food services market. The 6 Mini-
Metros constitute 20.8%of the food services market, while the rest of the contribution comes from the Tier I & II
cities along with the rest of India.
City wise Market Size FY 2020 (INR Bn.)
Mega Metros
168
321
413
902
Next 6 cities 177 281 397 855
Next 21 cities 98 33
Rest of India
18
316
503
447
Chain Standalone Unorganized
1,392
Source: Technopak Analysis
List of Mega Metros cities includes Delhi NCR and Mumbai
List of Mini Metros cities like Ahmedabad, Pune, Kolkata, Hyderabad, Bangalore, Chennai
List of Next 21 cities is mentioned in annexure
The City wise market size does not include ‘Restaurant in Hotels’ market
The top eight cities in India have been the centre of development, especially for the organized food services. Due
to increased economic activity, rising disposable incomes, a greater need for convenience and an increasing
women workforce, the chain food services brands have done well in these cities. The two mega metros: Delhi
NCR & Mumbai contribute to around 42% of the chain food services market in India. The next six cities: Kolkata,
Bengaluru, Chennai, Hyderabad, Pune and Ahmedabad along with Delhi NCR & Mumbai contribute around
~87% of the total chain market.
The top eight cities together contribute 50% of the standalone market segment in the food services market.
Meanwhile, the mega metros make up for 27% of the standalone market segment.
The growth of food services has moved beyond the metros and mini metros, the same could be witnessed increasing presence of QSR and CDR chains in Tier I & II cities. This shift has happened primarily due to non-
1,913
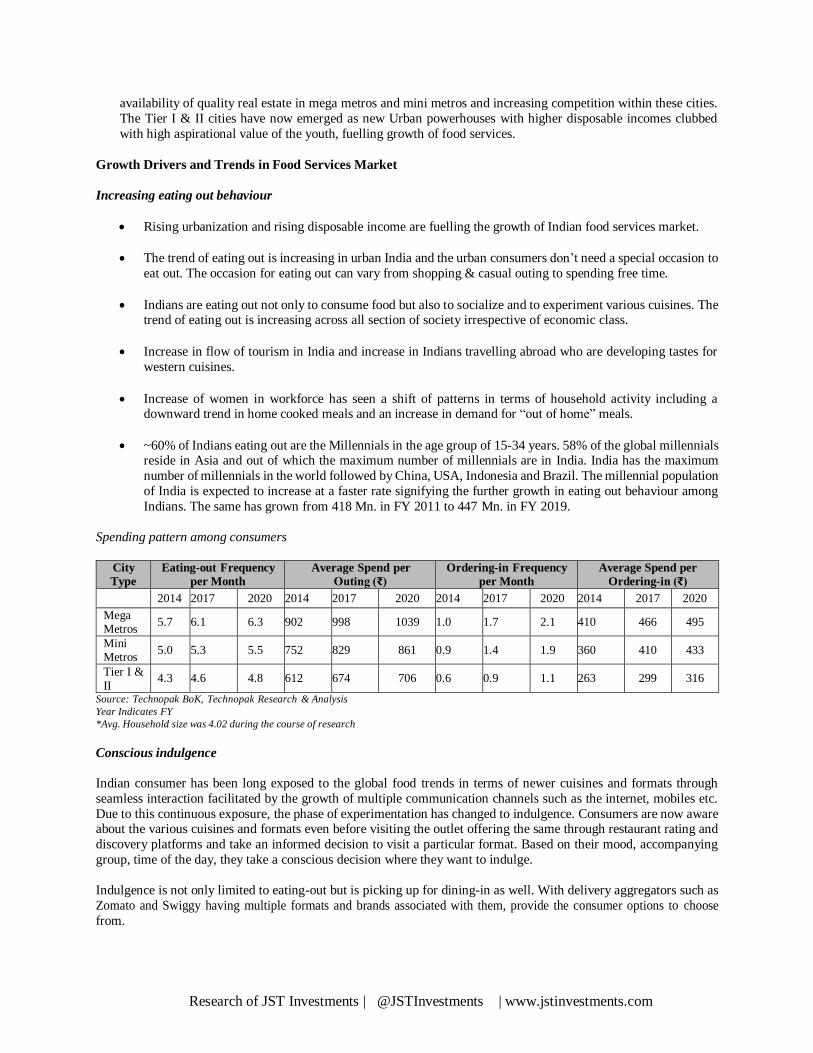
Research of JST Investments | @JSTInvestments | www.jstinvestments.com
availability of quality real estate in mega metros and mini metros and increasing competition within these cities.
The Tier I & II cities have now emerged as new Urban powerhouses with higher disposable incomes clubbed
with high aspirational value of the youth, fuelling growth of food services.
Growth Drivers and Trends in Food Services Market
Increasing eating out behaviour
Rising urbanization and rising disposable income are fuelling the growth of Indian food services market.
The trend of eating out is increasing in urban India and the urban consumers don’t need a special occasion to
eat out. The occasion for eating out can vary from shopping & casual outing to spending free time.
Indians are eating out not only to consume food but also to socialize and to experiment various cuisines. The trend of eating out is increasing across all section of society irrespective of economic class.
Increase in flow of tourism in India and increase in Indians travelling abroad who are developing tastes for
western cuisines.
Increase of women in workforce has seen a shift of patterns in terms of household activity including a downward trend in home cooked meals and an increase in demand for “out of home” meals.
~60% of Indians eating out are the Millennials in the age group of 15-34 years. 58% of the global millennials reside in Asia and out of which the maximum number of millennials are in India. India has the maximum
number of millennials in the world followed by China, USA, Indonesia and Brazil. The millennial population
of India is expected to increase at a faster rate signifying the further growth in eating out behaviour among
Indians. The same has grown from 418 Mn. in FY 2011 to 447 Mn. in FY 2019.
Spending pattern among consumers
City
Type
Eating-out Frequency
per Month
Average Spend per
Outing (₹)
Ordering-in Frequency
per Month
Average Spend per
Ordering-in (₹)
2014 2017 2020 2014 2017 2020 2014 2017 2020 2014 2017 2020
Mega Metros
5.7 6.1 6.3 902 998 1039 1.0 1.7 2.1 410 466 495
Mini Metros
5.0 5.3 5.5 752 829 861 0.9 1.4 1.9 360 410 433
Tier I &
II 4.3 4.6 4.8 612 674 706 0.6 0.9 1.1 263 299 316
Source: Technopak BoK, Technopak Research & Analysis
Year Indicates FY
*Avg. Household size was 4.02 during the course of research
Conscious indulgence
Indian consumer has been long exposed to the global food trends in terms of newer cuisines and formats through
seamless interaction facilitated by the growth of multiple communication channels such as the internet, mobiles etc.
Due to this continuous exposure, the phase of experimentation has changed to indulgence. Consumers are now aware about the various cuisines and formats even before visiting the outlet offering the same through restaurant rating and
discovery platforms and take an informed decision to visit a particular format. Based on their mood, accompanying
group, time of the day, they take a conscious decision where they want to indulge.
Indulgence is not only limited to eating-out but is picking up for dining-in as well. With delivery aggregators such as
Zomato and Swiggy having multiple formats and brands associated with them, provide the consumer options to choose
from.
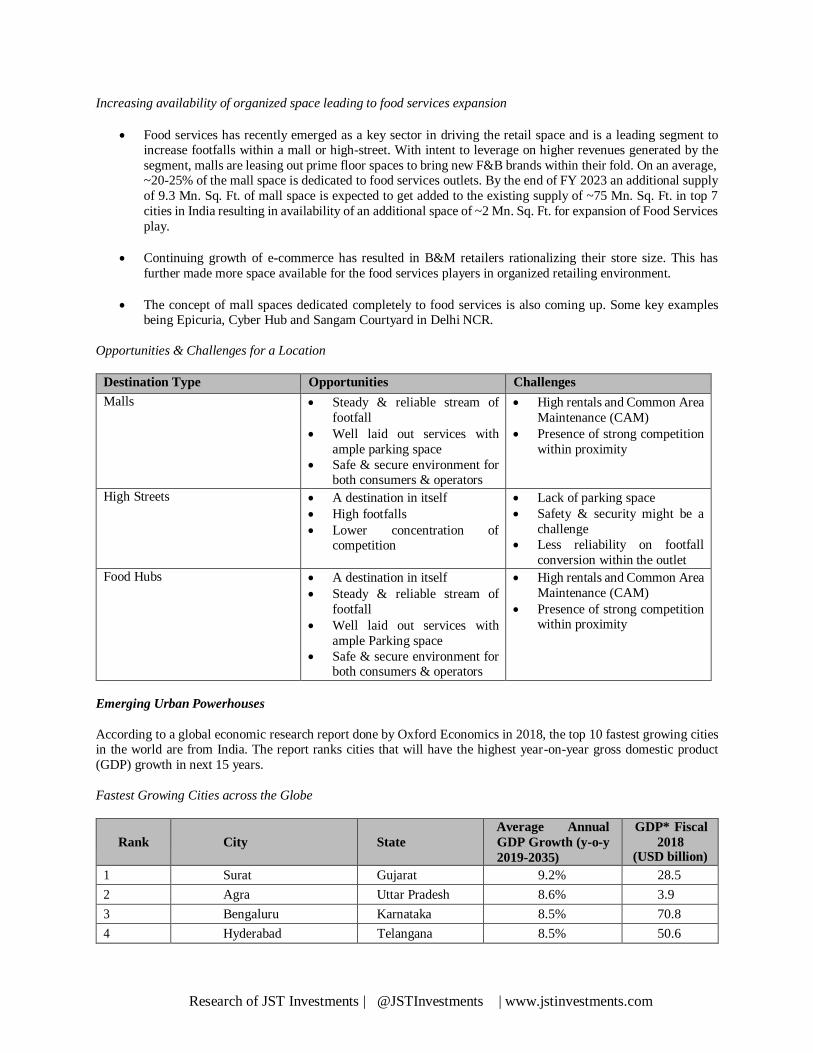
Research of JST Investments | @JSTInvestments | www.jstinvestments.com
Increasing availability of organized space leading to food services expansion
Food services has recently emerged as a key sector in driving the retail space and is a leading segment to increase footfalls within a mall or high-street. With intent to leverage on higher revenues generated by the
segment, malls are leasing out prime floor spaces to bring new F&B brands within their fold. On an average, ~20-25% of the mall space is dedicated to food services outlets. By the end of FY 2023 an additional supply
of 9.3 Mn. Sq. Ft. of mall space is expected to get added to the existing supply of ~75 Mn. Sq. Ft. in top 7
cities in India resulting in availability of an additional space of ~2 Mn. Sq. Ft. for expansion of Food Services
play.
Continuing growth of e-commerce has resulted in B&M retailers rationalizing their store size. This has
further made more space available for the food services players in organized retailing environment.
The concept of mall spaces dedicated completely to food services is also coming up. Some key examples being Epicuria, Cyber Hub and Sangam Courtyard in Delhi NCR.
Opportunities & Challenges for a Location
Destination Type Opportunities Challenges
Malls Steady & reliable stream of
footfall
Well laid out services with
ample parking space
Safe & secure environment for both consumers & operators
High rentals and Common Area
Maintenance (CAM)
Presence of strong competition
within proximity
High Streets A destination in itself
High footfalls
Lower concentration of competition
Lack of parking space
Safety & security might be a
challenge
Less reliability on footfall
conversion within the outlet
Food Hubs A destination in itself
Steady & reliable stream of
footfall
Well laid out services with
ample Parking space
Safe & secure environment for both consumers & operators
High rentals and Common Area
Maintenance (CAM)
Presence of strong competition within proximity
Emerging Urban Powerhouses
According to a global economic research report done by Oxford Economics in 2018, the top 10 fastest growing cities in the world are from India. The report ranks cities that will have the highest year-on-year gross domestic product
(GDP) growth in next 15 years.
Fastest Growing Cities across the Globe
Rank
City
State
Average Annual
GDP Growth (y-o-y
2019-2035)
GDP* Fiscal
2018 (USD billion)
1 Surat Gujarat 9.2% 28.5
2 Agra Uttar Pradesh 8.6% 3.9
3 Bengaluru Karnataka 8.5% 70.8
4 Hyderabad Telangana 8.5% 50.6
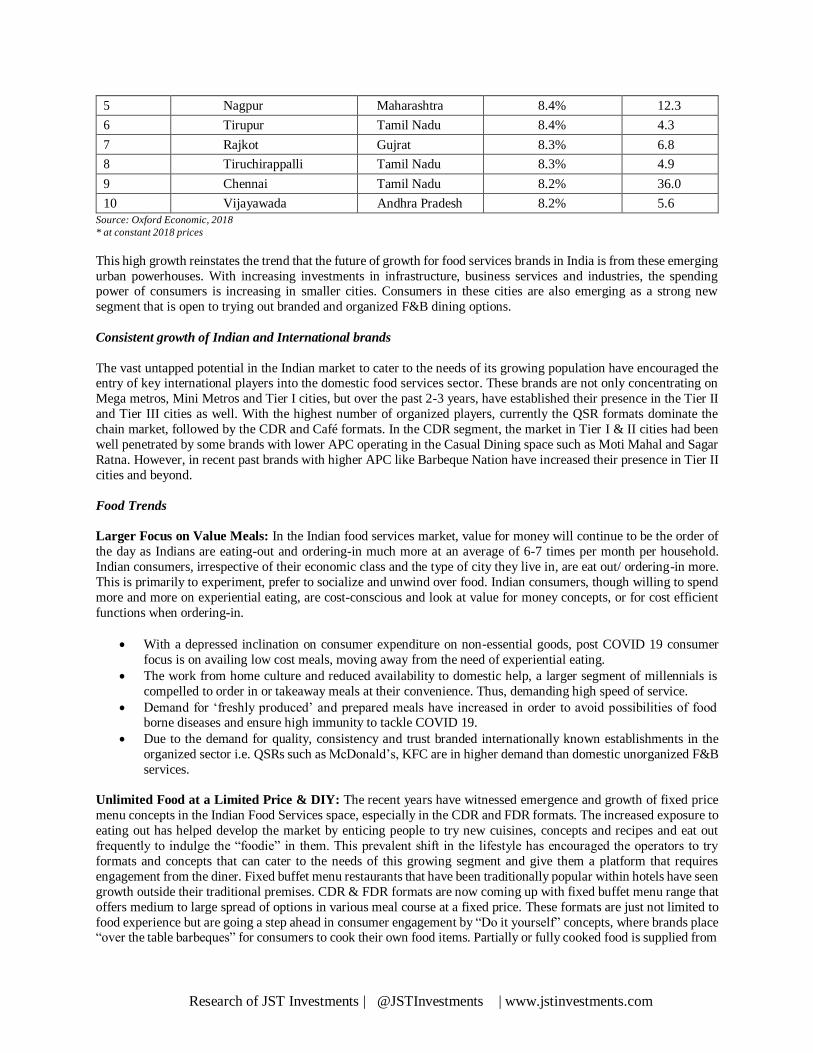
Research of JST Investments | @JSTInvestments | www.jstinvestments.com
5 Nagpur Maharashtra 8.4% 12.3
6 Tirupur Tamil Nadu 8.4% 4.3
7 Rajkot Gujrat 8.3% 6.8
8 Tiruchirappalli Tamil Nadu 8.3% 4.9
9 Chennai Tamil Nadu 8.2% 36.0
10 Vijayawada Andhra Pradesh 8.2% 5.6
Source: Oxford Economic, 2018
* at constant 2018 prices
This high growth reinstates the trend that the future of growth for food services brands in India is from these emerging
urban powerhouses. With increasing investments in infrastructure, business services and industries, the spending power of consumers is increasing in smaller cities. Consumers in these cities are also emerging as a strong new
segment that is open to trying out branded and organized F&B dining options.
Consistent growth of Indian and International brands
The vast untapped potential in the Indian market to cater to the needs of its growing population have encouraged the entry of key international players into the domestic food services sector. These brands are not only concentrating on
Mega metros, Mini Metros and Tier I cities, but over the past 2-3 years, have established their presence in the Tier II
and Tier III cities as well. With the highest number of organized players, currently the QSR formats dominate the
chain market, followed by the CDR and Café formats. In the CDR segment, the market in Tier I & II cities had been
well penetrated by some brands with lower APC operating in the Casual Dining space such as Moti Mahal and Sagar
Ratna. However, in recent past brands with higher APC like Barbeque Nation have increased their presence in Tier II
cities and beyond.
Food Trends
Larger Focus on Value Meals: In the Indian food services market, value for money will continue to be the order of
the day as Indians are eating-out and ordering-in much more at an average of 6-7 times per month per household.
Indian consumers, irrespective of their economic class and the type of city they live in, are eat out/ ordering-in more.
This is primarily to experiment, prefer to socialize and unwind over food. Indian consumers, though willing to spend
more and more on experiential eating, are cost-conscious and look at value for money concepts, or for cost efficient
functions when ordering-in.
With a depressed inclination on consumer expenditure on non-essential goods, post COVID 19 consumer
focus is on availing low cost meals, moving away from the need of experiential eating.
The work from home culture and reduced availability to domestic help, a larger segment of millennials is
compelled to order in or takeaway meals at their convenience. Thus, demanding high speed of service.
Demand for ‘freshly produced’ and prepared meals have increased in order to avoid possibilities of food borne diseases and ensure high immunity to tackle COVID 19.
Due to the demand for quality, consistency and trust branded internationally known establishments in the
organized sector i.e. QSRs such as McDonald’s, KFC are in higher demand than domestic unorganized F&B
services.
Unlimited Food at a Limited Price & DIY: The recent years have witnessed emergence and growth of fixed price
menu concepts in the Indian Food Services space, especially in the CDR and FDR formats. The increased exposure to
eating out has helped develop the market by enticing people to try new cuisines, concepts and recipes and eat out
frequently to indulge the “foodie” in them. This prevalent shift in the lifestyle has encouraged the operators to try
formats and concepts that can cater to the needs of this growing segment and give them a platform that requires
engagement from the diner. Fixed buffet menu restaurants that have been traditionally popular within hotels have seen
growth outside their traditional premises. CDR & FDR formats are now coming up with fixed buffet menu range that
offers medium to large spread of options in various meal course at a fixed price. These formats are just not limited to
food experience but are going a step ahead in consumer engagement by “Do it yourself” concepts, where brands place “over the table barbeques” for consumers to cook their own food items. Partially or fully cooked food is supplied from
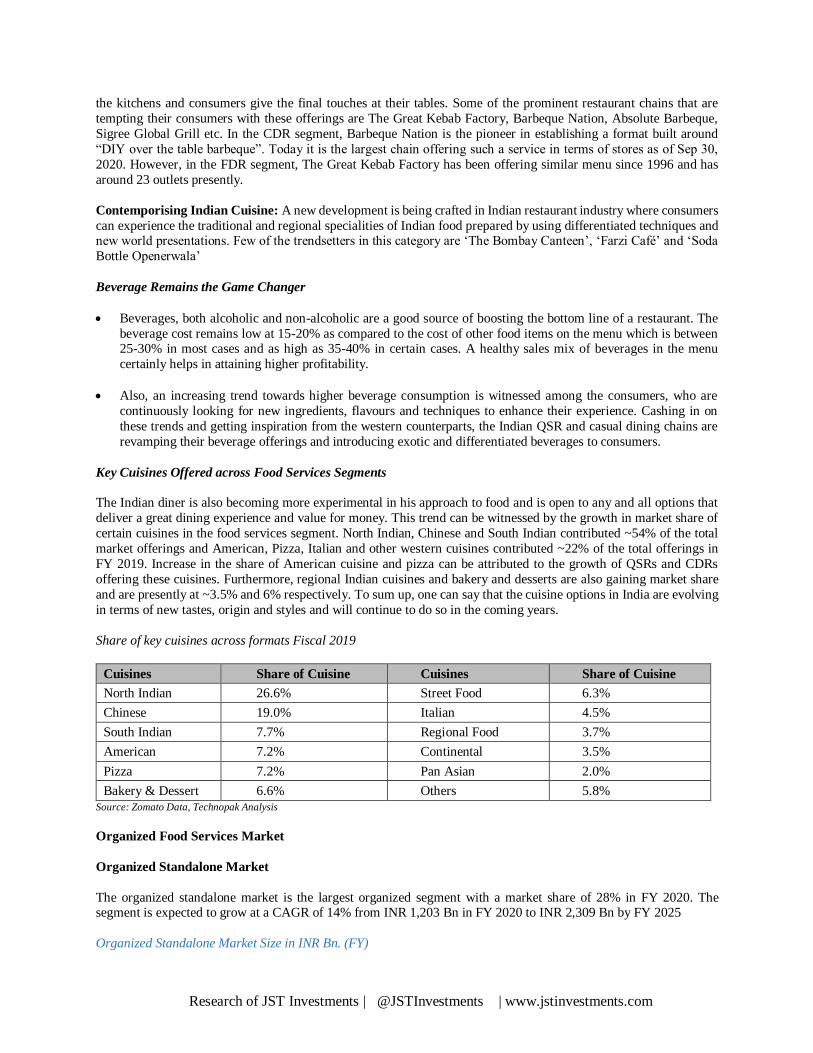
Research of JST Investments | @JSTInvestments | www.jstinvestments.com
the kitchens and consumers give the final touches at their tables. Some of the prominent restaurant chains that are
tempting their consumers with these offerings are The Great Kebab Factory, Barbeque Nation, Absolute Barbeque,
Sigree Global Grill etc. In the CDR segment, Barbeque Nation is the pioneer in establishing a format built around
“DIY over the table barbeque”. Today it is the largest chain offering such a service in terms of stores as of Sep 30,
2020. However, in the FDR segment, The Great Kebab Factory has been offering similar menu since 1996 and has
around 23 outlets presently.
Contemporising Indian Cuisine: A new development is being crafted in Indian restaurant industry where consumers
can experience the traditional and regional specialities of Indian food prepared by using differentiated techniques and new world presentations. Few of the trendsetters in this category are ‘The Bombay Canteen’, ‘Farzi Café’ and ‘Soda
Bottle Openerwala’
Beverage Remains the Game Changer
Beverages, both alcoholic and non-alcoholic are a good source of boosting the bottom line of a restaurant. The
beverage cost remains low at 15-20% as compared to the cost of other food items on the menu which is between 25-30% in most cases and as high as 35-40% in certain cases. A healthy sales mix of beverages in the menu
certainly helps in attaining higher profitability.
Also, an increasing trend towards higher beverage consumption is witnessed among the consumers, who are
continuously looking for new ingredients, flavours and techniques to enhance their experience. Cashing in on
these trends and getting inspiration from the western counterparts, the Indian QSR and casual dining chains are
revamping their beverage offerings and introducing exotic and differentiated beverages to consumers.
Key Cuisines Offered across Food Services Segments
The Indian diner is also becoming more experimental in his approach to food and is open to any and all options that
deliver a great dining experience and value for money. This trend can be witnessed by the growth in market share of
certain cuisines in the food services segment. North Indian, Chinese and South Indian contributed ~54% of the total
market offerings and American, Pizza, Italian and other western cuisines contributed ~22% of the total offerings in
FY 2019. Increase in the share of American cuisine and pizza can be attributed to the growth of QSRs and CDRs
offering these cuisines. Furthermore, regional Indian cuisines and bakery and desserts are also gaining market share
and are presently at ~3.5% and 6% respectively. To sum up, one can say that the cuisine options in India are evolving
in terms of new tastes, origin and styles and will continue to do so in the coming years.
Share of key cuisines across formats Fiscal 2019
Cuisines Share of Cuisine Cuisines Share of Cuisine
North Indian 26.6% Street Food 6.3%
Chinese 19.0% Italian 4.5%
South Indian 7.7% Regional Food 3.7%
American 7.2% Continental 3.5%
Pizza 7.2% Pan Asian 2.0%
Bakery & Dessert 6.6% Others 5.8%
Source: Zomato Data, Technopak Analysis
Organized Food Services Market
Organized Standalone Market
The organized standalone market is the largest organized segment with a market share of 28% in FY 2020. The segment is expected to grow at a CAGR of 14% from INR 1,203 Bn in FY 2020 to INR 2,309 Bn by FY 2025
Organized Standalone Market Size in INR Bn. (FY)
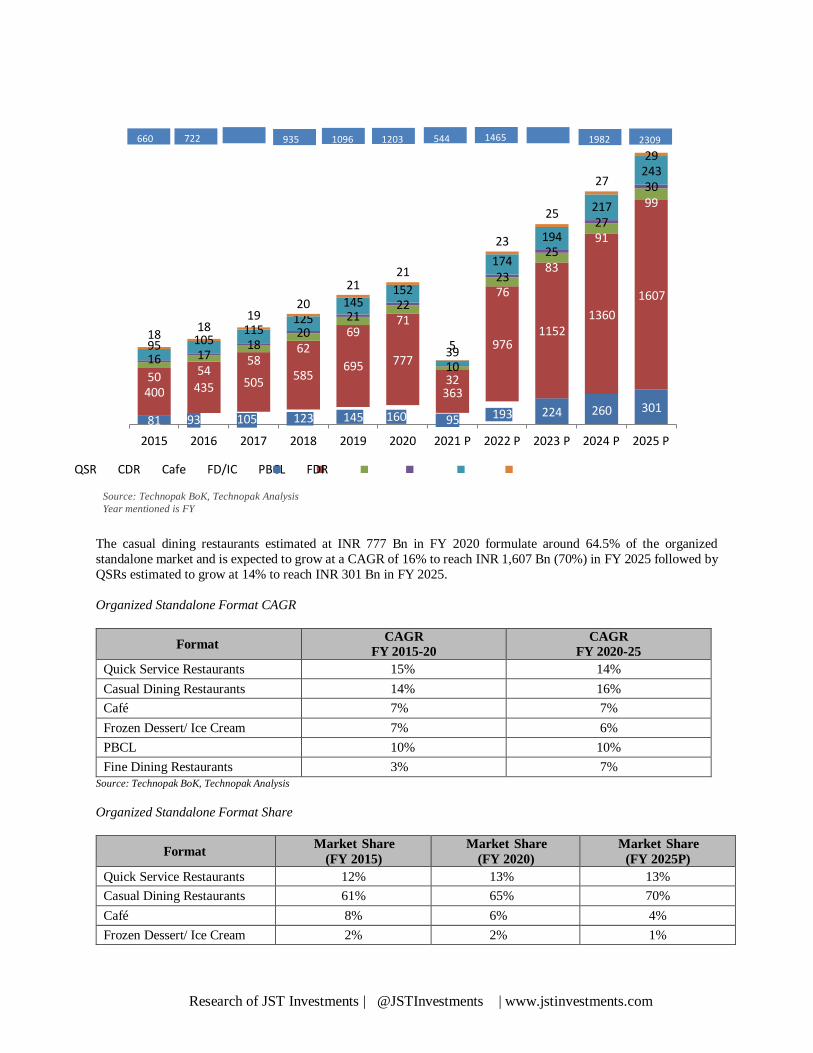
Research of JST Investments | @JSTInvestments | www.jstinvestments.com
18 105 17 54
435
19 115 18 58
505
20 62
585
125
21 69
695
145 22 71
777
152 23 76
976
174
2015 2016 2017 2018 2019 2020 2021 P 2022 P 2023 P 2024 P 2025 P
QSR CDR Cafe FD/IC PBCL FDR
Source: Technopak BoK, Technopak Analysis
Year mentioned is FY
The casual dining restaurants estimated at INR 777 Bn in FY 2020 formulate around 64.5% of the organized
standalone market and is expected to grow at a CAGR of 16% to reach INR 1,607 Bn (70%) in FY 2025 followed by
QSRs estimated to grow at 14% to reach INR 301 Bn in FY 2025.
Organized Standalone Format CAGR
Format CAGR
FY 2015-20
CAGR
FY 2020-25
Quick Service Restaurants 15% 14%
Casual Dining Restaurants 14% 16%
Café 7% 7%
Frozen Dessert/ Ice Cream 7% 6%
PBCL 10% 10%
Fine Dining Restaurants 3% 7%
Source: Technopak BoK, Technopak Analysis
Organized Standalone Format Share
Format Market Share
(FY 2015)
Market Share
(FY 2020)
Market Share
(FY 2025P)
Quick Service Restaurants 12% 13% 13%
Casual Dining Restaurants 61% 65% 70%
Café 8% 6% 4%
Frozen Dessert/ Ice Cream 2% 2% 1%
660 722 935 1465 1982 1096 1203 544 2309
27
25
23
21
194 25 83
217 27 91
29 243 30 99
21
20 1607
1360
18 95 16
50 400
1152
39 10 32
363
81 93 105 123 145 160 95 193 224 260 301
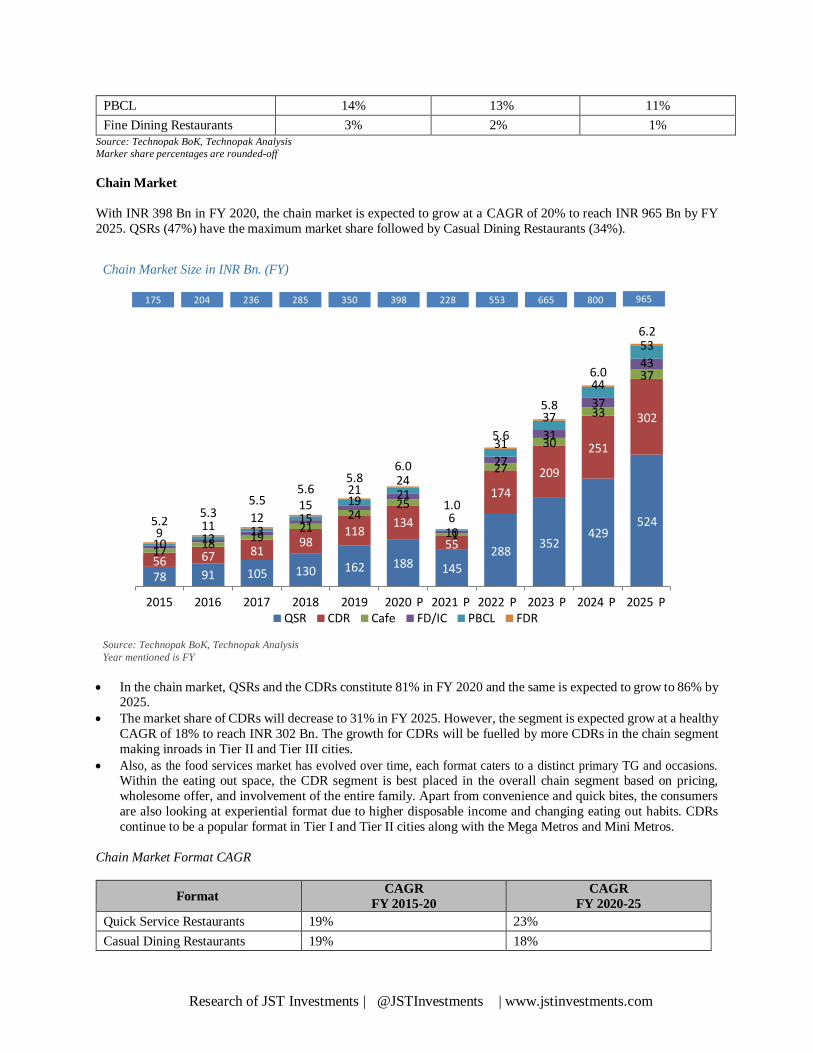
Research of JST Investments | @JSTInvestments | www.jstinvestments.com
175 204 236 285 350 398 228 553 665 800 965
6.2 53
6.0 44
43 37
5.8 37
37 33 302
5.6 31
31 30 251
5.2
5.3 11
5.5
12
5.6 15 15
5.8 21 19 24
118
6.0 24
209
25
134
21 174 1.0
524
10 12 13
17
21 98
429
56 78
18 67
91
19 81
105
55
145
288 352
130 162 188
27 27
PBCL 14% 13% 11%
Fine Dining Restaurants 3% 2% 1%
Source: Technopak BoK, Technopak Analysis
Marker share percentages are rounded-off
Chain Market
With INR 398 Bn in FY 2020, the chain market is expected to grow at a CAGR of 20% to reach INR 965 Bn by FY
2025. QSRs (47%) have the maximum market share followed by Casual Dining Restaurants (34%).
Chain Market Size in INR Bn. (FY)
2015 2016 2017 2018 2019 2020 P 2021 P 2022 P 2023 P 2024 P 2025 P QSR CDR Cafe FD/IC PBCL FDR
Source: Technopak BoK, Technopak Analysis
Year mentioned is FY
In the chain market, QSRs and the CDRs constitute 81% in FY 2020 and the same is expected to grow to 86% by 2025.
The market share of CDRs will decrease to 31% in FY 2025. However, the segment is expected grow at a healthy
CAGR of 18% to reach INR 302 Bn. The growth for CDRs will be fuelled by more CDRs in the chain segment
making inroads in Tier II and Tier III cities.
Also, as the food services market has evolved over time, each format caters to a distinct primary TG and occasions. Within the eating out space, the CDR segment is best placed in the overall chain segment based on pricing,
wholesome offer, and involvement of the entire family. Apart from convenience and quick bites, the consumers
are also looking at experiential format due to higher disposable income and changing eating out habits. CDRs
continue to be a popular format in Tier I and Tier II cities along with the Mega Metros and Mini Metros.
Chain Market Format CAGR
Format CAGR
FY 2015-20
CAGR
FY 2020-25
Quick Service Restaurants 19% 23%
Casual Dining Restaurants 19% 18%
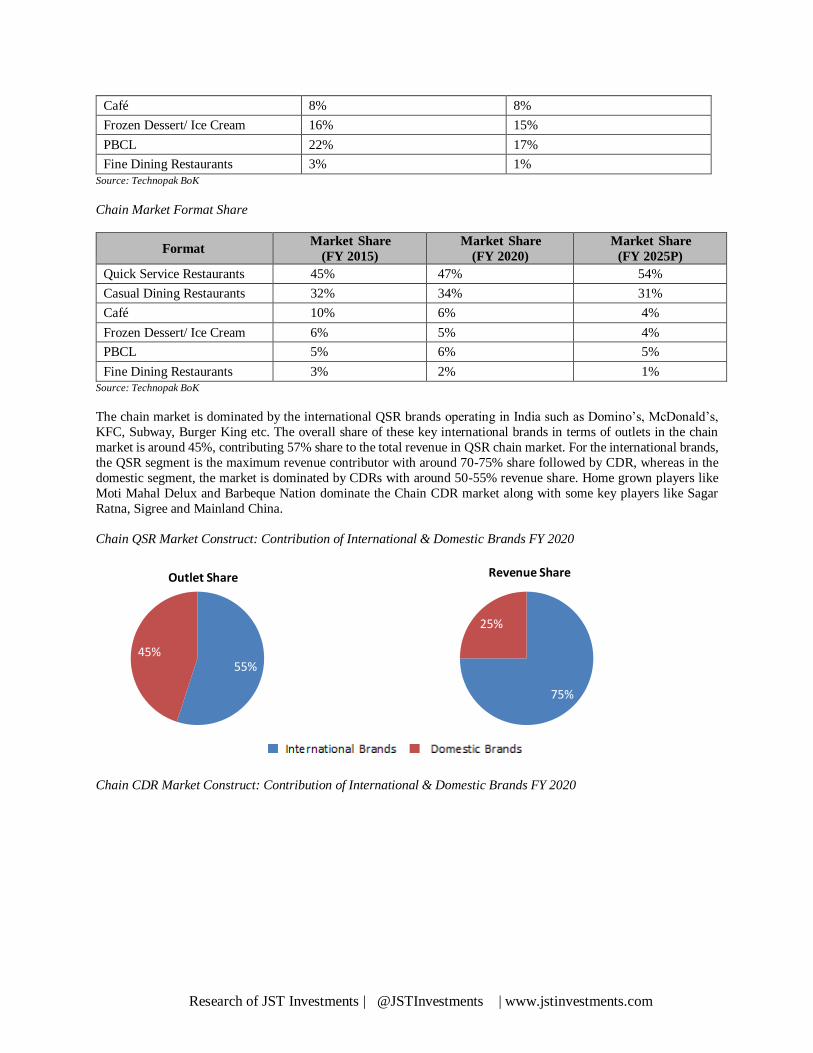
Research of JST Investments | @JSTInvestments | www.jstinvestments.com
Café 8% 8%
Frozen Dessert/ Ice Cream 16% 15%
PBCL 22% 17%
Fine Dining Restaurants 3% 1%
Source: Technopak BoK
Chain Market Format Share
Format Market Share
(FY 2015)
Market Share
(FY 2020)
Market Share
(FY 2025P)
Quick Service Restaurants 45% 47% 54%
Casual Dining Restaurants 32% 34% 31%
Café 10% 6% 4%
Frozen Dessert/ Ice Cream 6% 5% 4%
PBCL 5% 6% 5%
Fine Dining Restaurants 3% 2% 1%
Source: Technopak BoK
The chain market is dominated by the international QSR brands operating in India such as Domino’s, McDonald’s,
KFC, Subway, Burger King etc. The overall share of these key international brands in terms of outlets in the chain
market is around 45%, contributing 57% share to the total revenue in QSR chain market. For the international brands,
the QSR segment is the maximum revenue contributor with around 70-75% share followed by CDR, whereas in the
domestic segment, the market is dominated by CDRs with around 50-55% revenue share. Home grown players like
Moti Mahal Delux and Barbeque Nation dominate the Chain CDR market along with some key players like Sagar
Ratna, Sigree and Mainland China.
Chain QSR Market Construct: Contribution of International & Domestic Brands FY 2020
Outlet Share Revenue Share
Chain CDR Market Construct: Contribution of International & Domestic Brands FY 2020
45% 55%
25%
75%
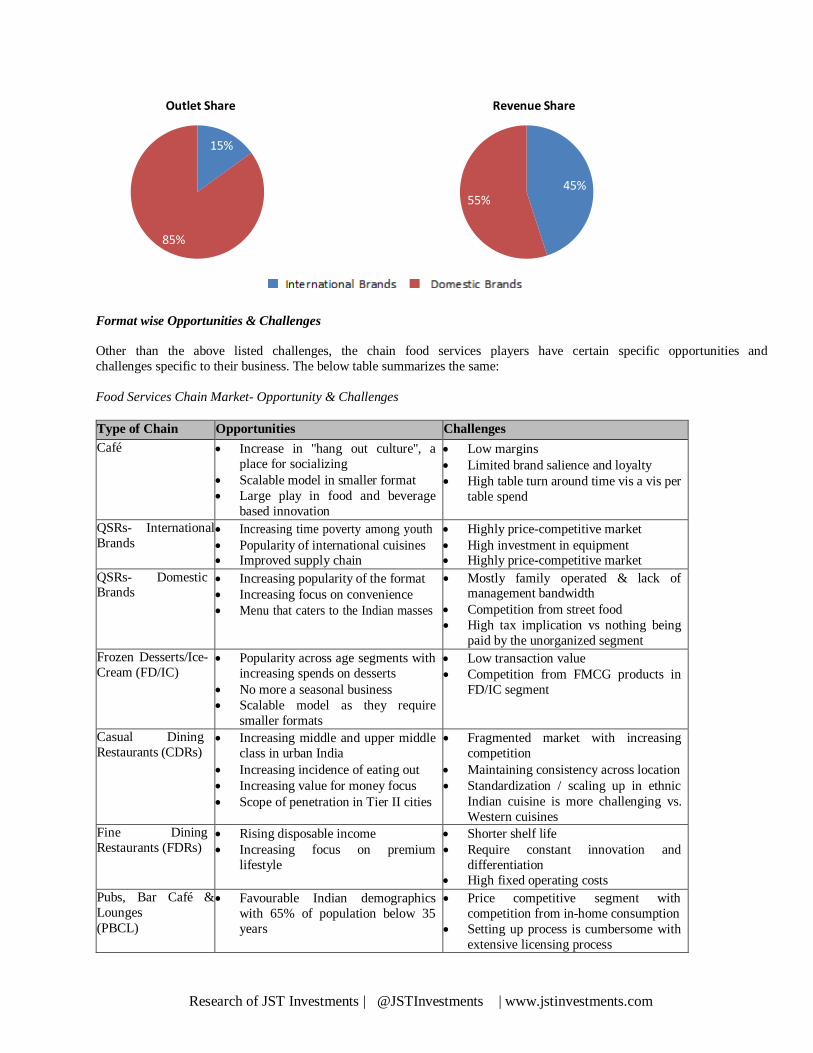
Research of JST Investments | @JSTInvestments | www.jstinvestments.com
15%
85%
45% 55%
Outlet Share Revenue Share
Format wise Opportunities & Challenges
Other than the above listed challenges, the chain food services players have certain specific opportunities and
challenges specific to their business. The below table summarizes the same:
Food Services Chain Market- Opportunity & Challenges
Type of Chain Opportunities Challenges
Café Increase in ''hang out culture'', a
place for socializing
Scalable model in smaller format
Large play in food and beverage
based innovation
Low margins
Limited brand salience and loyalty
High table turn around time vis a vis per
table spend
QSRs- International
Brands Increasing time poverty among youth
Popularity of international cuisines Improved supply chain
Highly price-competitive market
High investment in equipment Highly price-competitive market
QSRs- Domestic Brands
Increasing popularity of the format
Increasing focus on convenience
Menu that caters to the Indian masses
Mostly family operated & lack of management bandwidth
Competition from street food
High tax implication vs nothing being
paid by the unorganized segment
Frozen Desserts/Ice-
Cream (FD/IC) Popularity across age segments with
increasing spends on desserts
No more a seasonal business
Scalable model as they require
smaller formats
Low transaction value
Competition from FMCG products in
FD/IC segment
Casual Dining
Restaurants (CDRs) Increasing middle and upper middle
class in urban India
Increasing incidence of eating out
Increasing value for money focus
Scope of penetration in Tier II cities
Fragmented market with increasing
competition
Maintaining consistency across location
Standardization / scaling up in ethnic
Indian cuisine is more challenging vs.
Western cuisines
Fine Dining
Restaurants (FDRs) Rising disposable income
Increasing focus on premium
lifestyle
Shorter shelf life
Require constant innovation and
differentiation
High fixed operating costs
Pubs, Bar Café &
Lounges
(PBCL)
Favourable Indian demographics
with 65% of population below 35
years
Price competitive segment with
competition from in-home consumption
Setting up process is cumbersome with
extensive licensing process
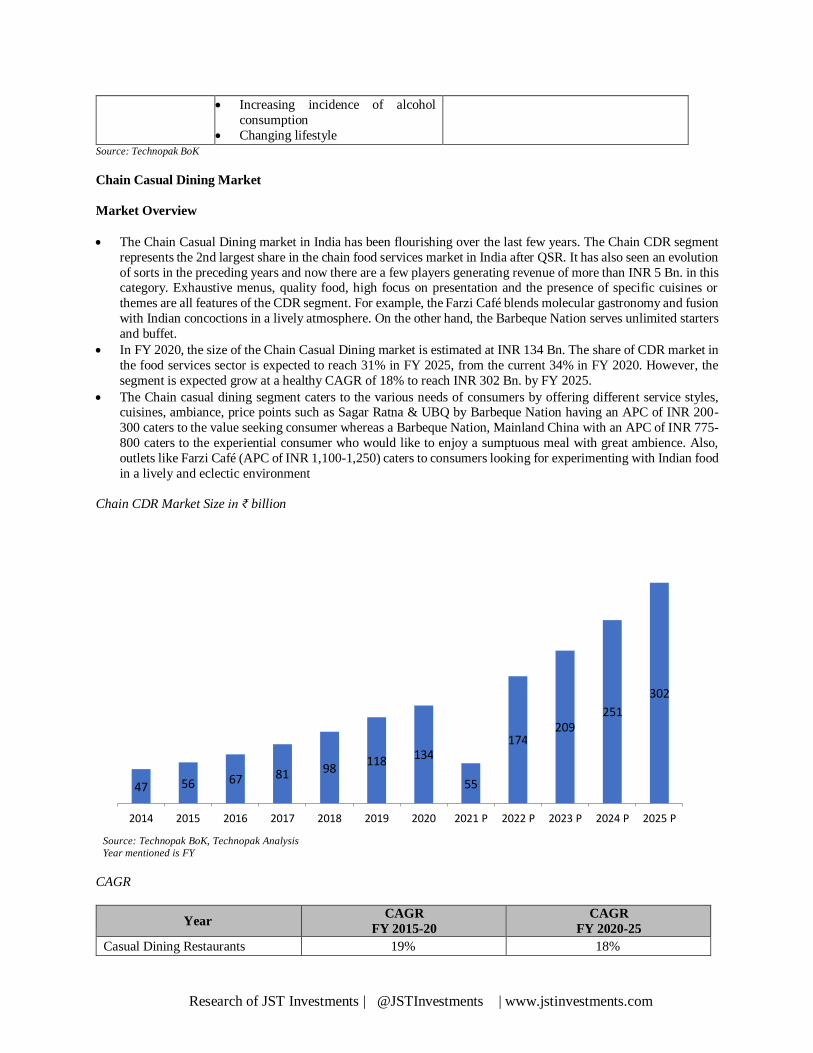
Research of JST Investments | @JSTInvestments | www.jstinvestments.com
47
56
67
81
98
118
134
55
174
209
251
302
Increasing incidence of alcohol
consumption
Changing lifestyle
Source: Technopak BoK
Chain Casual Dining Market
Market Overview
The Chain Casual Dining market in India has been flourishing over the last few years. The Chain CDR segment
represents the 2nd largest share in the chain food services market in India after QSR. It has also seen an evolution
of sorts in the preceding years and now there are a few players generating revenue of more than INR 5 Bn. in this category. Exhaustive menus, quality food, high focus on presentation and the presence of specific cuisines or
themes are all features of the CDR segment. For example, the Farzi Café blends molecular gastronomy and fusion
with Indian concoctions in a lively atmosphere. On the other hand, the Barbeque Nation serves unlimited starters
and buffet.
In FY 2020, the size of the Chain Casual Dining market is estimated at INR 134 Bn. The share of CDR market in
the food services sector is expected to reach 31% in FY 2025, from the current 34% in FY 2020. However, the
segment is expected grow at a healthy CAGR of 18% to reach INR 302 Bn. by FY 2025.
The Chain casual dining segment caters to the various needs of consumers by offering different service styles, cuisines, ambiance, price points such as Sagar Ratna & UBQ by Barbeque Nation having an APC of INR 200-
300 caters to the value seeking consumer whereas a Barbeque Nation, Mainland China with an APC of INR 775-
800 caters to the experiential consumer who would like to enjoy a sumptuous meal with great ambience. Also,
outlets like Farzi Café (APC of INR 1,100-1,250) caters to consumers looking for experimenting with Indian food
in a lively and eclectic environment
Chain CDR Market Size in ₹ billion
2014 2015 2016 2017 2018 2019 2020 2021 P 2022 P 2023 P 2024 P 2025 P
Source: Technopak BoK, Technopak Analysis
Year mentioned is FY
CAGR
Year CAGR
FY 2015-20
CAGR
FY 2020-25
Casual Dining Restaurants 19% 18%
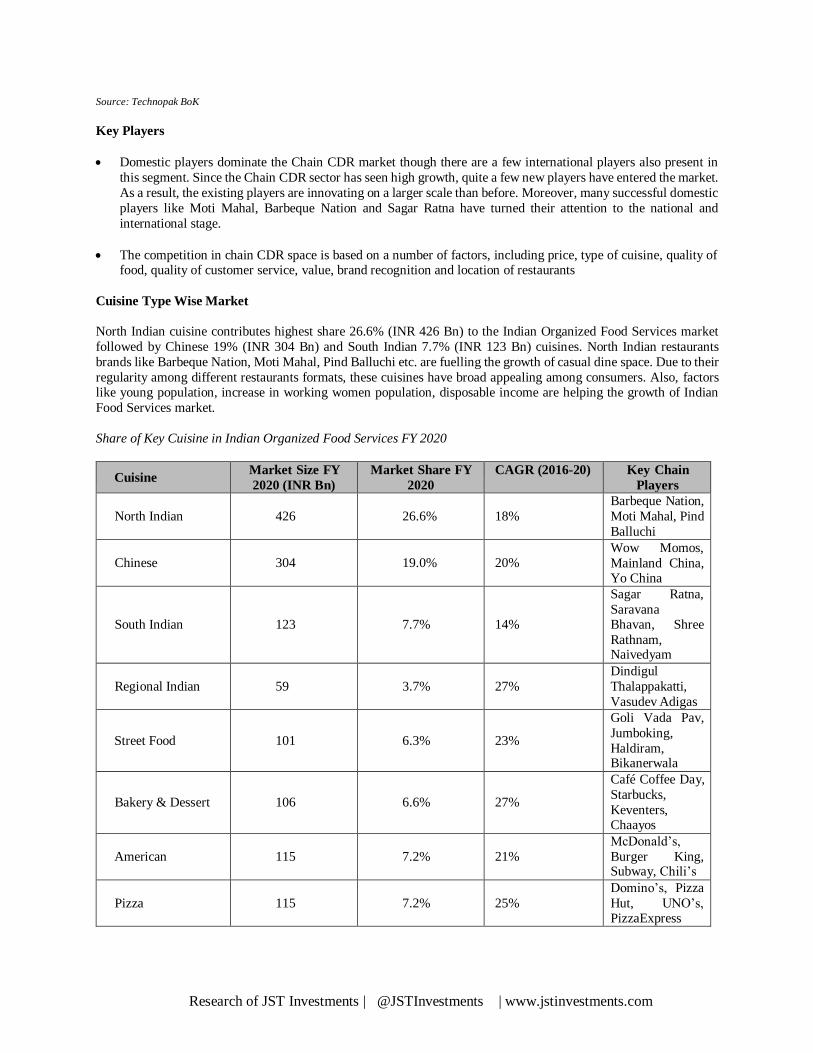
Research of JST Investments | @JSTInvestments | www.jstinvestments.com
Source: Technopak BoK
Key Players
Domestic players dominate the Chain CDR market though there are a few international players also present in
this segment. Since the Chain CDR sector has seen high growth, quite a few new players have entered the market.
As a result, the existing players are innovating on a larger scale than before. Moreover, many successful domestic
players like Moti Mahal, Barbeque Nation and Sagar Ratna have turned their attention to the national and
international stage.
The competition in chain CDR space is based on a number of factors, including price, type of cuisine, quality of food, quality of customer service, value, brand recognition and location of restaurants
Cuisine Type Wise Market
North Indian cuisine contributes highest share 26.6% (INR 426 Bn) to the Indian Organized Food Services market
followed by Chinese 19% (INR 304 Bn) and South Indian 7.7% (INR 123 Bn) cuisines. North Indian restaurants
brands like Barbeque Nation, Moti Mahal, Pind Balluchi etc. are fuelling the growth of casual dine space. Due to their
regularity among different restaurants formats, these cuisines have broad appealing among consumers. Also, factors like young population, increase in working women population, disposable income are helping the growth of Indian
Food Services market.
Share of Key Cuisine in Indian Organized Food Services FY 2020
Cuisine Market Size FY
2020 (INR Bn)
Market Share FY
2020
CAGR (2016-20) Key Chain
Players
North Indian
426
26.6%
18%
Barbeque Nation,
Moti Mahal, Pind
Balluchi
Chinese
304
19.0%
20% Wow Momos,
Mainland China, Yo China
South Indian
123
7.7%
14%
Sagar Ratna,
Saravana Bhavan, Shree
Rathnam, Naivedyam
Regional Indian
59
3.7%
27%
Dindigul
Thalappakatti,
Vasudev Adigas
Street Food
101
6.3%
23%
Goli Vada Pav,
Jumboking,
Haldiram, Bikanerwala
Bakery & Dessert
106
6.6%
27%
Café Coffee Day,
Starbucks,
Keventers, Chaayos
American
115
7.2%
21%
McDonald’s,
Burger King, Subway, Chili’s
Pizza
115
7.2%
25%
Domino’s, Pizza
Hut, UNO’s, PizzaExpress
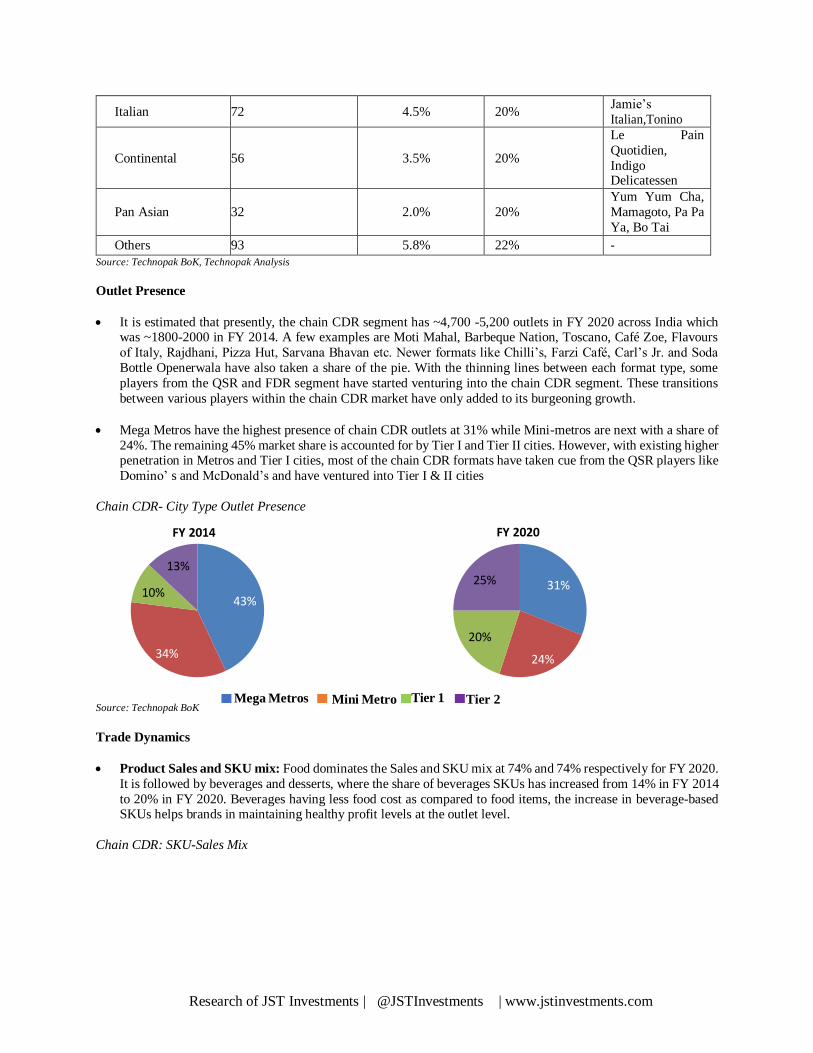
Research of JST Investments | @JSTInvestments | www.jstinvestments.com
Italian 72 4.5% 20% Jamie’s
Italian,Tonino
Continental
56
3.5%
20%
Le Pain
Quotidien,
Indigo Delicatessen
Pan Asian
32
2.0%
20%
Yum Yum Cha,
Mamagoto, Pa Pa
Ya, Bo Tai
Others 93 5.8% 22% -
Source: Technopak BoK, Technopak Analysis
Outlet Presence
It is estimated that presently, the chain CDR segment has ~4,700 -5,200 outlets in FY 2020 across India which was ~1800-2000 in FY 2014. A few examples are Moti Mahal, Barbeque Nation, Toscano, Café Zoe, Flavours
of Italy, Rajdhani, Pizza Hut, Sarvana Bhavan etc. Newer formats like Chilli’s, Farzi Café, Carl’s Jr. and Soda
Bottle Openerwala have also taken a share of the pie. With the thinning lines between each format type, some
players from the QSR and FDR segment have started venturing into the chain CDR segment. These transitions
between various players within the chain CDR market have only added to its burgeoning growth.
Mega Metros have the highest presence of chain CDR outlets at 31% while Mini-metros are next with a share of
24%. The remaining 45% market share is accounted for by Tier I and Tier II cities. However, with existing higher penetration in Metros and Tier I cities, most of the chain CDR formats have taken cue from the QSR players like
Domino’ s and McDonald’s and have ventured into Tier I & II cities
Chain CDR- City Type Outlet Presence
FY 2014
FY 2020
Source: Technopak BoK
Mega Metros Mini Metro Tier 1 Tier 2
Trade Dynamics
Product Sales and SKU mix: Food dominates the Sales and SKU mix at 74% and 74% respectively for FY 2020.
It is followed by beverages and desserts, where the share of beverages SKUs has increased from 14% in FY 2014
to 20% in FY 2020. Beverages having less food cost as compared to food items, the increase in beverage-based SKUs helps brands in maintaining healthy profit levels at the outlet level.
Chain CDR: SKU-Sales Mix
13%
10% 43%
34%
25% 31%
20%
24%
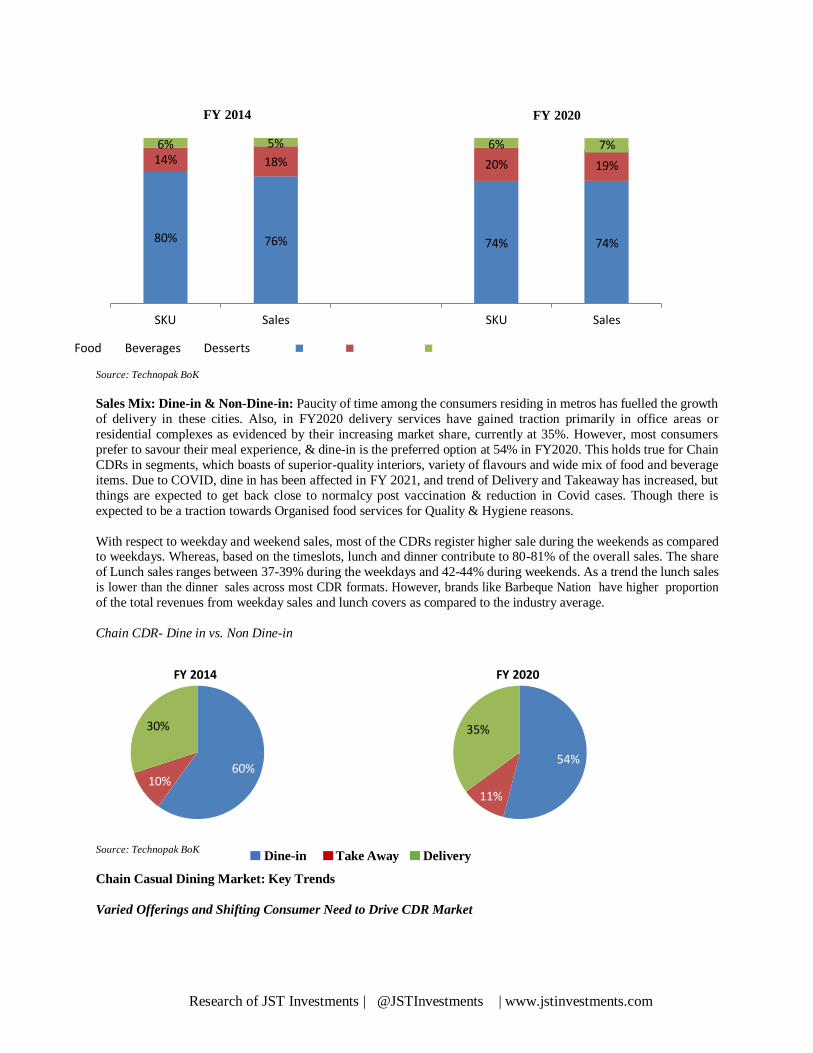
Research of JST Investments | @JSTInvestments | www.jstinvestments.com
6% 14%
5%
18%
6%
20%
7%
19%
80% 76% 74% 74%
30%
60% 10%
35%
54%
11%
FY 2014 FY 2020
SKU Sales SKU Sales
Food Beverages Desserts
Source: Technopak BoK
Sales Mix: Dine-in & Non-Dine-in: Paucity of time among the consumers residing in metros has fuelled the growth
of delivery in these cities. Also, in FY2020 delivery services have gained traction primarily in office areas or
residential complexes as evidenced by their increasing market share, currently at 35%. However, most consumers
prefer to savour their meal experience, & dine-in is the preferred option at 54% in FY2020. This holds true for Chain
CDRs in segments, which boasts of superior-quality interiors, variety of flavours and wide mix of food and beverage
items. Due to COVID, dine in has been affected in FY 2021, and trend of Delivery and Takeaway has increased, but
things are expected to get back close to normalcy post vaccination & reduction in Covid cases. Though there is
expected to be a traction towards Organised food services for Quality & Hygiene reasons.
With respect to weekday and weekend sales, most of the CDRs register higher sale during the weekends as compared to weekdays. Whereas, based on the timeslots, lunch and dinner contribute to 80-81% of the overall sales. The share
of Lunch sales ranges between 37-39% during the weekdays and 42-44% during weekends. As a trend the lunch sales
is lower than the dinner sales across most CDR formats. However, brands like Barbeque Nation have higher proportion
of the total revenues from weekday sales and lunch covers as compared to the industry average.
Chain CDR- Dine in vs. Non Dine-in
FY 2014 FY 2020
Source: Technopak BoK Dine-in Take Away Delivery
Chain Casual Dining Market: Key Trends
Varied Offerings and Shifting Consumer Need to Drive CDR Market
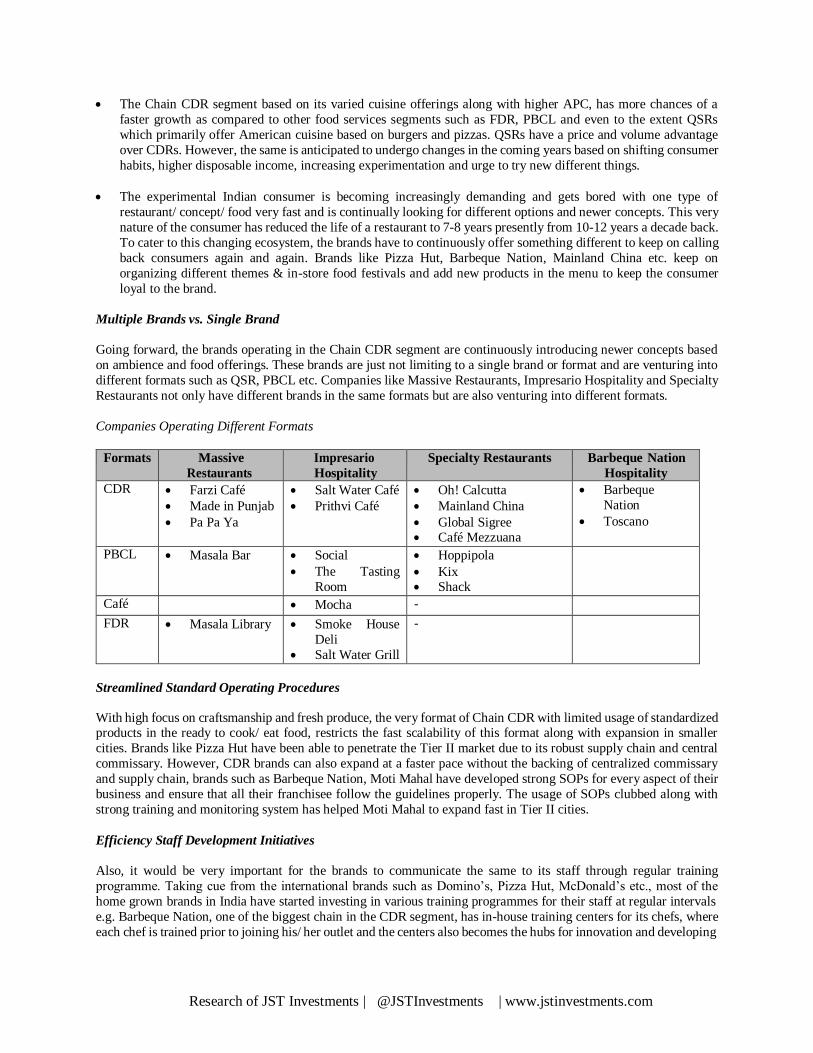
Research of JST Investments | @JSTInvestments | www.jstinvestments.com
The Chain CDR segment based on its varied cuisine offerings along with higher APC, has more chances of a
faster growth as compared to other food services segments such as FDR, PBCL and even to the extent QSRs
which primarily offer American cuisine based on burgers and pizzas. QSRs have a price and volume advantage
over CDRs. However, the same is anticipated to undergo changes in the coming years based on shifting consumer
habits, higher disposable income, increasing experimentation and urge to try new different things.
The experimental Indian consumer is becoming increasingly demanding and gets bored with one type of
restaurant/ concept/ food very fast and is continually looking for different options and newer concepts. This very
nature of the consumer has reduced the life of a restaurant to 7-8 years presently from 10-12 years a decade back.
To cater to this changing ecosystem, the brands have to continuously offer something different to keep on calling
back consumers again and again. Brands like Pizza Hut, Barbeque Nation, Mainland China etc. keep on
organizing different themes & in-store food festivals and add new products in the menu to keep the consumer
loyal to the brand.
Multiple Brands vs. Single Brand
Going forward, the brands operating in the Chain CDR segment are continuously introducing newer concepts based
on ambience and food offerings. These brands are just not limiting to a single brand or format and are venturing into
different formats such as QSR, PBCL etc. Companies like Massive Restaurants, Impresario Hospitality and Specialty
Restaurants not only have different brands in the same formats but are also venturing into different formats.
Companies Operating Different Formats
Formats Massive
Restaurants
Impresario
Hospitality
Specialty Restaurants Barbeque Nation
Hospitality
CDR Farzi Café
Made in Punjab
Pa Pa Ya
Salt Water Café
Prithvi Café
Oh! Calcutta
Mainland China
Global Sigree Café Mezzuana
Barbeque
Nation
Toscano
PBCL Masala Bar Social
The Tasting
Room
Hoppipola
Kix Shack
Café Mocha -
FDR Masala Library Smoke House
Deli
Salt Water Grill
-
Streamlined Standard Operating Procedures
With high focus on craftsmanship and fresh produce, the very format of Chain CDR with limited usage of standardized products in the ready to cook/ eat food, restricts the fast scalability of this format along with expansion in smaller
cities. Brands like Pizza Hut have been able to penetrate the Tier II market due to its robust supply chain and central
commissary. However, CDR brands can also expand at a faster pace without the backing of centralized commissary
and supply chain, brands such as Barbeque Nation, Moti Mahal have developed strong SOPs for every aspect of their
business and ensure that all their franchisee follow the guidelines properly. The usage of SOPs clubbed along with
strong training and monitoring system has helped Moti Mahal to expand fast in Tier II cities.
Efficiency Staff Development Initiatives
Also, it would be very important for the brands to communicate the same to its staff through regular training
programme. Taking cue from the international brands such as Domino’s, Pizza Hut, McDonald’s etc., most of the
home grown brands in India have started investing in various training programmes for their staff at regular intervals
e.g. Barbeque Nation, one of the biggest chain in the CDR segment, has in-house training centers for its chefs, where
each chef is trained prior to joining his/ her outlet and the centers also becomes the hubs for innovation and developing
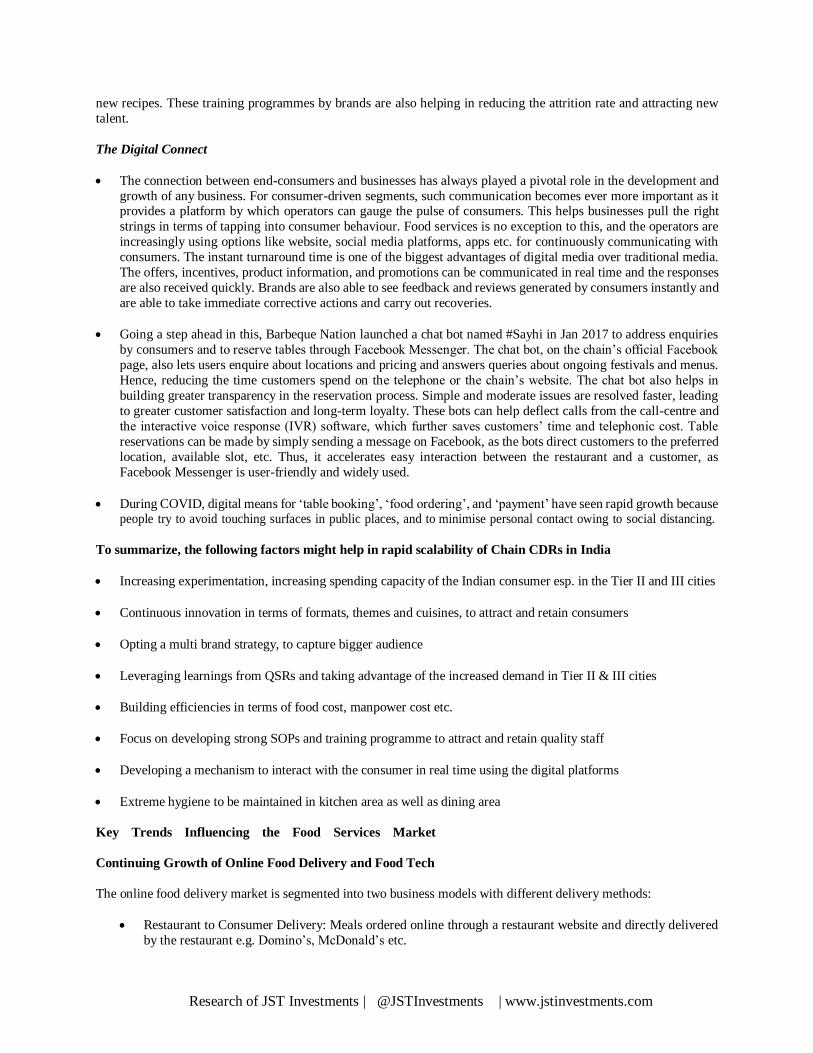
Research of JST Investments | @JSTInvestments | www.jstinvestments.com
new recipes. These training programmes by brands are also helping in reducing the attrition rate and attracting new
talent.
The Digital Connect
The connection between end-consumers and businesses has always played a pivotal role in the development and
growth of any business. For consumer-driven segments, such communication becomes ever more important as it provides a platform by which operators can gauge the pulse of consumers. This helps businesses pull the right
strings in terms of tapping into consumer behaviour. Food services is no exception to this, and the operators are
increasingly using options like website, social media platforms, apps etc. for continuously communicating with
consumers. The instant turnaround time is one of the biggest advantages of digital media over traditional media.
The offers, incentives, product information, and promotions can be communicated in real time and the responses
are also received quickly. Brands are also able to see feedback and reviews generated by consumers instantly and
are able to take immediate corrective actions and carry out recoveries.
Going a step ahead in this, Barbeque Nation launched a chat bot named #Sayhi in Jan 2017 to address enquiries
by consumers and to reserve tables through Facebook Messenger. The chat bot, on the chain’s official Facebook
page, also lets users enquire about locations and pricing and answers queries about ongoing festivals and menus.
Hence, reducing the time customers spend on the telephone or the chain’s website. The chat bot also helps in
building greater transparency in the reservation process. Simple and moderate issues are resolved faster, leading
to greater customer satisfaction and long-term loyalty. These bots can help deflect calls from the call-centre and
the interactive voice response (IVR) software, which further saves customers’ time and telephonic cost. Table
reservations can be made by simply sending a message on Facebook, as the bots direct customers to the preferred
location, available slot, etc. Thus, it accelerates easy interaction between the restaurant and a customer, as
Facebook Messenger is user-friendly and widely used.
During COVID, digital means for ‘table booking’, ‘food ordering’, and ‘payment’ have seen rapid growth because people try to avoid touching surfaces in public places, and to minimise personal contact owing to social distancing.
To summarize, the following factors might help in rapid scalability of Chain CDRs in India
Increasing experimentation, increasing spending capacity of the Indian consumer esp. in the Tier II and III cities
Continuous innovation in terms of formats, themes and cuisines, to attract and retain consumers
Opting a multi brand strategy, to capture bigger audience
Leveraging learnings from QSRs and taking advantage of the increased demand in Tier II & III cities
Building efficiencies in terms of food cost, manpower cost etc.
Focus on developing strong SOPs and training programme to attract and retain quality staff
Developing a mechanism to interact with the consumer in real time using the digital platforms
Extreme hygiene to be maintained in kitchen area as well as dining area
Key Trends Influencing the Food Services Market
Continuing Growth of Online Food Delivery and Food Tech
The online food delivery market is segmented into two business models with different delivery methods:
Restaurant to Consumer Delivery: Meals ordered online through a restaurant website and directly delivered
by the restaurant e.g. Domino’s, McDonald’s etc.
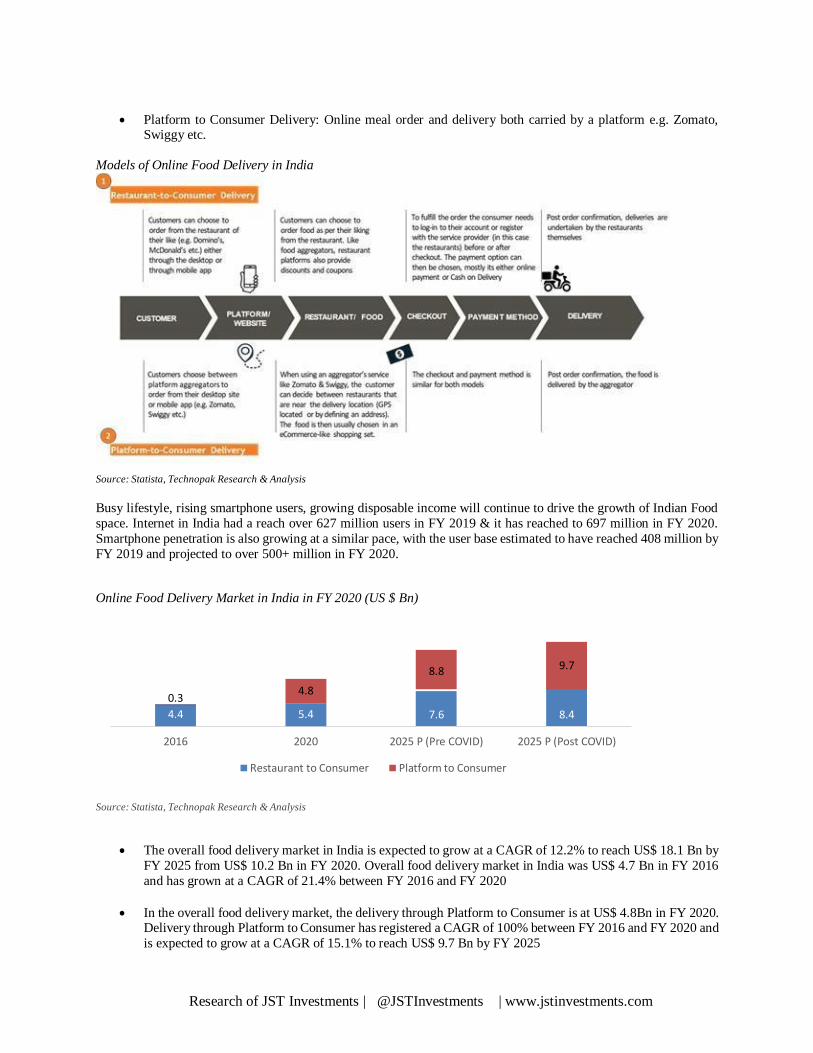
Research of JST Investments | @JSTInvestments | www.jstinvestments.com
0.3
5.4 4.4 8.4 7.6
4.8
8.8
9.7
Platform to Consumer Delivery: Online meal order and delivery both carried by a platform e.g. Zomato, Swiggy etc.
Models of Online Food Delivery in India
Source: Statista, Technopak Research & Analysis
Busy lifestyle, rising smartphone users, growing disposable income will continue to drive the growth of Indian Food
space. Internet in India had a reach over 627 million users in FY 2019 & it has reached to 697 million in FY 2020.
Smartphone penetration is also growing at a similar pace, with the user base estimated to have reached 408 million by
FY 2019 and projected to over 500+ million in FY 2020.
Online Food Delivery Market in India in FY 2020 (US $ Bn)
2016 2020 2025 P (Pre COVID) 2025 P (Post COVID)
Restaurant to Consumer Platform to Consumer
Source: Statista, Technopak Research & Analysis
The overall food delivery market in India is expected to grow at a CAGR of 12.2% to reach US$ 18.1 Bn by
FY 2025 from US$ 10.2 Bn in FY 2020. Overall food delivery market in India was US$ 4.7 Bn in FY 2016
and has grown at a CAGR of 21.4% between FY 2016 and FY 2020
In the overall food delivery market, the delivery through Platform to Consumer is at US$ 4.8Bn in FY 2020. Delivery through Platform to Consumer has registered a CAGR of 100% between FY 2016 and FY 2020 and
is expected to grow at a CAGR of 15.1% to reach US$ 9.7 Bn by FY 2025
Research of JST Investments | @JSTInvestments | www.jstinvestments.com
The delivery through Restaurant to Consumer is at US$ 5.4 Bn in FY 2020. Delivery through Restaurant to Consumer has registered a CAGR of 5% between FY 2016 and FY 2020 and is expected to grow at a CAGR
of 9.2% to reach US$ 8.4 Bn by FY 2025
Pre COVID, the growth of “Platform to Consumer” between 2020 and 2025 was estimated to be 13% but
due to COVID, the projected growth rate has increased to 15.1%. This is primarily due to people’s preference
for delivery over dine-in during COVID time
Similarly, pre COVID, the growth of “Restaurant to Consumer” between FY 2020 - FY 2025 was estimated
to be 7% but due to COVID now it has increased to 9.2%. The primary reason for this increased growth is
due to increased focus of the restaurants on hygienic and safe delivery. The restaurants have taken a lot of
initiatives to ensure safe delivery, which motivated a lot of consumers to order directly from restaurants websites / app
Growing user base of smartphone in India is allowing online food delivery platforms to capture market by
offerings a wide range of food products. The rise of digital technology is shaping the online delivery market
in India which is further helping the restaurants to improve their topline.
Technology has impacted all aspects of food services market and is not just limited to Platform to Consumer delivery formats. It has also led to the emergence to new business models, such as restaurant discovery platforms, cloud–based
kitchens that support home cooks and online table reservation.
Food Discovery/Restaurant Search: Earlier food enthusiasts had to wait for annual food guides and eating out
directories of restaurants. These publications had expert reviews, opinions, and vital information to dine in the city. Now, these directories, expert reviews and opinions are made available by food discovery or restaurant
search players on just a few clicks, a feat attained by food discovery players.
Post COVID, role of food discovery/restaurant search is expected to grow. People have now become extremely
cautious about the safety and hygiene of the restaurants, and try to find reviews regarding restaurant hygiene
before visiting. Role of influencers has also increased now on food discovery apps, as people now take their
consideration regarding hygiene and safety norms being followed in the restaurants.
Table Reservation: Of late it has become common for Casual & fine dining restaurants to offer table reservations
to their clients. In fact, this service has become an integral part of a restaurant’s operation. With this service, outlets can estimate demand more accurately and improve on sourcing & staffing and can manage costs more
efficiently. It is beneficial to a customer as reservation will guarantee one’s table at the time and place planned,
and likely to receive better service at the outlet as details like time of arrival, no of persons etc. will be shared
with the outlet in advance.
During the initial months of lockdown, as the restaurants were closed, hence there were no table reservations.
Apps/websites offering table reservation features had to lay off staff to save cash and survive the pandemic. These
apps also started coming with innovative ideas to have cash flow during lockdown, for example EazyDiner
launched pre-paid dining vouchers which could be redeemed anytime until Dec 2020, this was an initiative of
Eazydiner to support closed restaurants.
Once the lockdown restrictions were eased and restaurants started opening up, number of table reservations started increasing, & Table reservation apps such as Dineout and EazyDiner started recording an increase in table
reservations. This is helping both the restaurants and consumers in the following ways:
o As customers reserve table in advance, restaurants plan accordingly for the number of walk-ins at a particular
time, and are able to maintain the social distancing norms. App/websites providing table reservations are expected to grow in coming future
o On the other hand, as consumers have reserved the table, they expect restaurants to be prepared for them in terms of hygiene, sanitization and social distancing
Research of JST Investments | @JSTInvestments | www.jstinvestments.com
Restaurant technology platform Dineout, collaborated with an AI based firm to help the partner restaurants in maintaining social distancing. Also, Dineout aims to provide live feed of kitchens to customers with the help of
AI.
Cloud Kitchens: Cloud kitchens are emerging as alternative channel for food delivery. In 2015, the food tech
space went through a period of disruption. Due to significant rise in the awareness of healthy eating among consumers, the healthy food offerings-based restaurants are gaining traction among consumers. Urban markets
are expected to see a continuing emphasis on health and wellness. Indeed, as consumer health-awareness becomes
more sophisticated, especially amongst younger demographics, brands targeting health issues are expected to
become more refined, focusing on particular conditions and nutritional requirements. Given the high rental and
capex required for dine-in restaurants, the space for delivery-only kitchens is bound to increase, which can give
better quality meals at more affordable prices to customers – all in the convenience of customers’ homes and
offices. Due to time scarcity, Time, speed and convenience are going to matter more than ever and that is going
to lead to the growth of delivery-only kitchen models. Some of the players who are into cloud kitchens are Faasos,
FreshMenu, Biryani by Kilo etc.
Due to accelerating internet and smartphone penetration in India, online food delivery market is witnessing an
explosive growth over last 3-4 years which is further fuelling the growth of cloud kitchens. The kitchen-only format model has certainly removed the pressure from the bottom line due to lower rentals, manpower cost and
reduced cost of utilities. However, due to lack of physical presence, these brands have lower brand recall and
have floating loyalty based on discounts provided against established brands such as Domino’s, McDonald’s etc.
which command strong consumer loyalty, have top of the mind recall and well accepted product categories. Going
forward, kitchen-only brands will be able to disrupt the market if they have strong and loyal consumer base and
are able to create a brand that is scalable and well accepted across consumers in different cities.
During initial months of lockdown, when only delivery from restaurants was allowed, cloud kitchen played an important role in providing safe and hygienic food to customers at home. During the pandemic, when number of
restaurants were closing permanently, cloud kitchens were showing sales growth even during Q2 2020. Cloud
kitchens capable of providing both the hygiene and delivery are expected to grow Post COVID also.
Few other technology trends are as below:
Data analysis to improve management and the customer experience
Leveraging tools like mobile apps, messaging and social media to provide customers with a more targeted and
customized virtual experience
Allowing customers to take care of their bill expense and tip through their app
Using point of sales tablets to take orders which intercommunicate flawlessly and right away to kitchen display screens through cloud system
Brands are furnishing their restaurants with self-order kiosk, digital menu board, free Wi-Fi and wireless chargers
COVID Impact on Ordering & Delivery
COVID has caused the CDR & QSR chains to move to digital platforms for ordering food. Several chain restaurants
already had apps and websites for online food ordering, and those who earlier did not have apps/websites, have
launched new apps/websites in the last few months.
Moreover, most of these brands have started dine-in through digitization/app to develop contactless dining. Now
customers have an option of ordering and making payment through app only.
Brands are noticing the major traffic of online ordering coming through their mobile application. The demand for online delivery is significantly driven by food aggregator platforms like Zomato, Swiggy, etc. These aggregators offer
deep discounts and offers to increase the order density. This has helped the restaurants in increasing their reach and
has positively impacted the sales. However, the discounts offered by the aggregators are putting pressure on the overall
profitability of these restaurants.
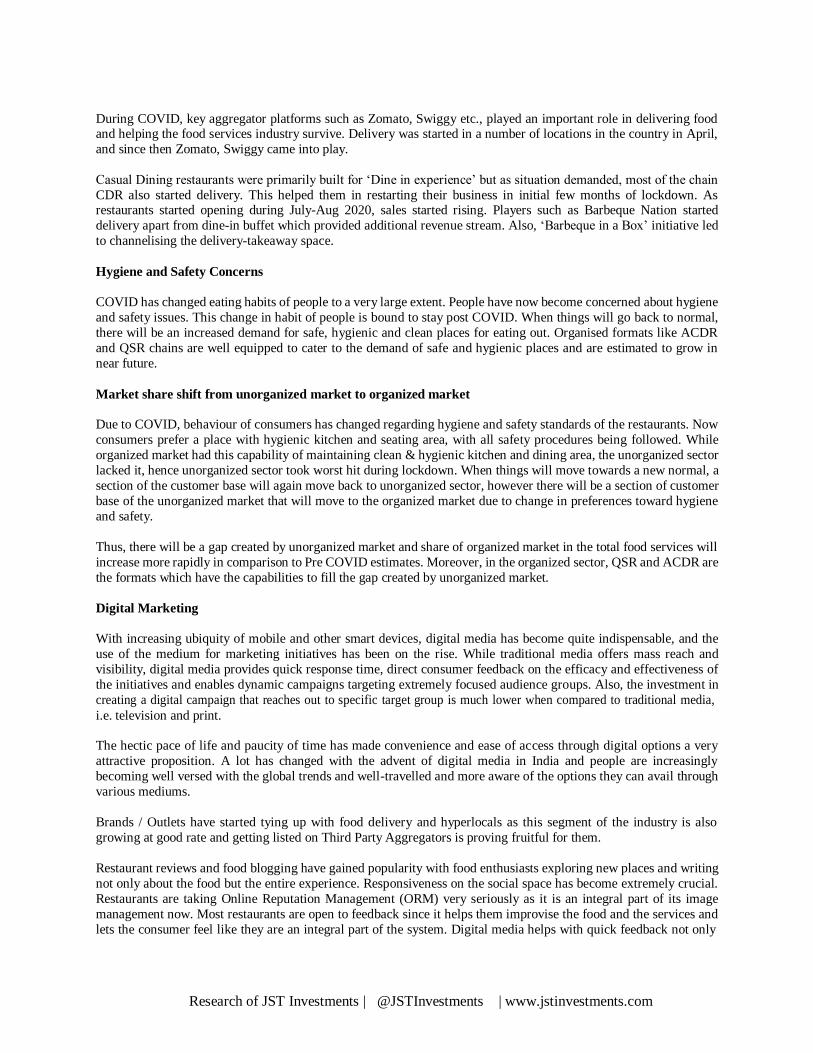
Research of JST Investments | @JSTInvestments | www.jstinvestments.com
During COVID, key aggregator platforms such as Zomato, Swiggy etc., played an important role in delivering food and helping the food services industry survive. Delivery was started in a number of locations in the country in April,
and since then Zomato, Swiggy came into play.
Casual Dining restaurants were primarily built for ‘Dine in experience’ but as situation demanded, most of the chain
CDR also started delivery. This helped them in restarting their business in initial few months of lockdown. As restaurants started opening during July-Aug 2020, sales started rising. Players such as Barbeque Nation started
delivery apart from dine-in buffet which provided additional revenue stream. Also, ‘Barbeque in a Box’ initiative led
to channelising the delivery-takeaway space.
Hygiene and Safety Concerns
COVID has changed eating habits of people to a very large extent. People have now become concerned about hygiene
and safety issues. This change in habit of people is bound to stay post COVID. When things will go back to normal,
there will be an increased demand for safe, hygienic and clean places for eating out. Organised formats like ACDR
and QSR chains are well equipped to cater to the demand of safe and hygienic places and are estimated to grow in
near future.
Market share shift from unorganized market to organized market
Due to COVID, behaviour of consumers has changed regarding hygiene and safety standards of the restaurants. Now
consumers prefer a place with hygienic kitchen and seating area, with all safety procedures being followed. While
organized market had this capability of maintaining clean & hygienic kitchen and dining area, the unorganized sector
lacked it, hence unorganized sector took worst hit during lockdown. When things will move towards a new normal, a
section of the customer base will again move back to unorganized sector, however there will be a section of customer
base of the unorganized market that will move to the organized market due to change in preferences toward hygiene
and safety.
Thus, there will be a gap created by unorganized market and share of organized market in the total food services will
increase more rapidly in comparison to Pre COVID estimates. Moreover, in the organized sector, QSR and ACDR are
the formats which have the capabilities to fill the gap created by unorganized market.
Digital Marketing
With increasing ubiquity of mobile and other smart devices, digital media has become quite indispensable, and the
use of the medium for marketing initiatives has been on the rise. While traditional media offers mass reach and
visibility, digital media provides quick response time, direct consumer feedback on the efficacy and effectiveness of
the initiatives and enables dynamic campaigns targeting extremely focused audience groups. Also, the investment in
creating a digital campaign that reaches out to specific target group is much lower when compared to traditional media,
i.e. television and print.
The hectic pace of life and paucity of time has made convenience and ease of access through digital options a very
attractive proposition. A lot has changed with the advent of digital media in India and people are increasingly
becoming well versed with the global trends and well-travelled and more aware of the options they can avail through
various mediums.
Brands / Outlets have started tying up with food delivery and hyperlocals as this segment of the industry is also
growing at good rate and getting listed on Third Party Aggregators is proving fruitful for them.
Restaurant reviews and food blogging have gained popularity with food enthusiasts exploring new places and writing
not only about the food but the entire experience. Responsiveness on the social space has become extremely crucial.
Restaurants are taking Online Reputation Management (ORM) very seriously as it is an integral part of its image
management now. Most restaurants are open to feedback since it helps them improvise the food and the services and
lets the consumer feel like they are an integral part of the system. Digital media helps with quick feedback not only
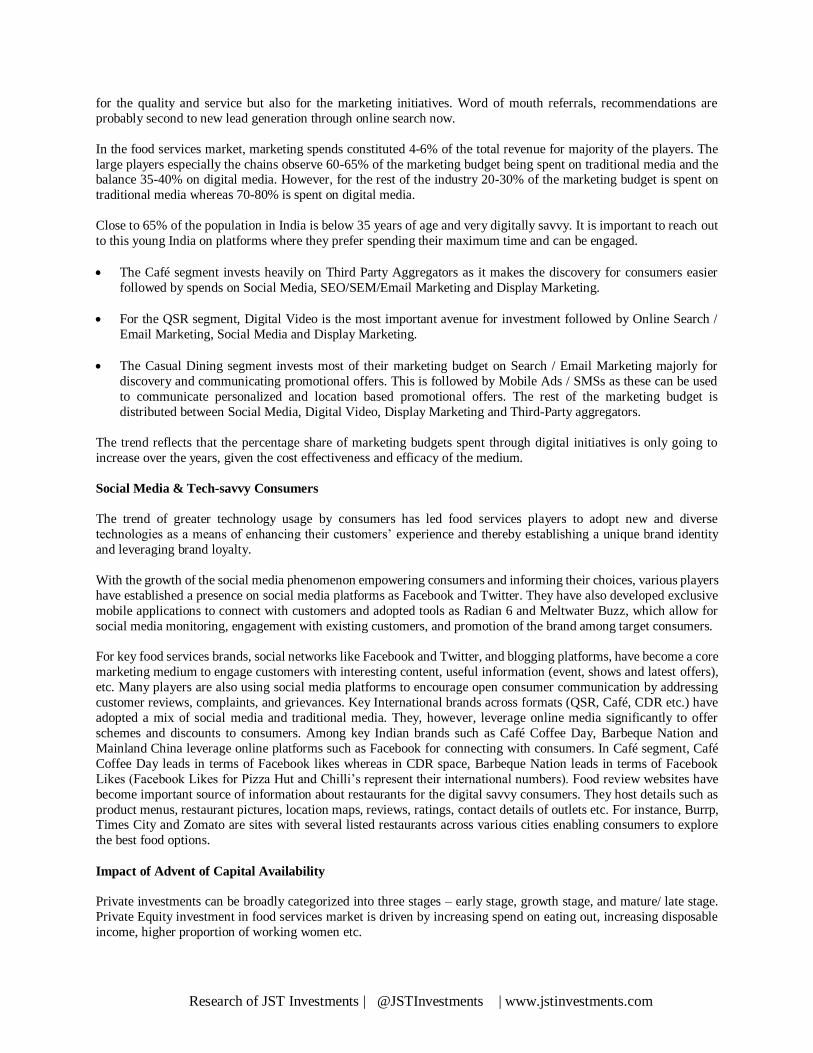
Research of JST Investments | @JSTInvestments | www.jstinvestments.com
for the quality and service but also for the marketing initiatives. Word of mouth referrals, recommendations are
probably second to new lead generation through online search now.
In the food services market, marketing spends constituted 4-6% of the total revenue for majority of the players. The
large players especially the chains observe 60-65% of the marketing budget being spent on traditional media and the balance 35-40% on digital media. However, for the rest of the industry 20-30% of the marketing budget is spent on
traditional media whereas 70-80% is spent on digital media.
Close to 65% of the population in India is below 35 years of age and very digitally savvy. It is important to reach out
to this young India on platforms where they prefer spending their maximum time and can be engaged.
The Café segment invests heavily on Third Party Aggregators as it makes the discovery for consumers easier
followed by spends on Social Media, SEO/SEM/Email Marketing and Display Marketing.
For the QSR segment, Digital Video is the most important avenue for investment followed by Online Search /
Email Marketing, Social Media and Display Marketing.
The Casual Dining segment invests most of their marketing budget on Search / Email Marketing majorly for
discovery and communicating promotional offers. This is followed by Mobile Ads / SMSs as these can be used
to communicate personalized and location based promotional offers. The rest of the marketing budget is
distributed between Social Media, Digital Video, Display Marketing and Third-Party aggregators.
The trend reflects that the percentage share of marketing budgets spent through digital initiatives is only going to
increase over the years, given the cost effectiveness and efficacy of the medium.
Social Media & Tech-savvy Consumers
The trend of greater technology usage by consumers has led food services players to adopt new and diverse
technologies as a means of enhancing their customers’ experience and thereby establishing a unique brand identity
and leveraging brand loyalty.
With the growth of the social media phenomenon empowering consumers and informing their choices, various players
have established a presence on social media platforms as Facebook and Twitter. They have also developed exclusive
mobile applications to connect with customers and adopted tools as Radian 6 and Meltwater Buzz, which allow for
social media monitoring, engagement with existing customers, and promotion of the brand among target consumers.
For key food services brands, social networks like Facebook and Twitter, and blogging platforms, have become a core
marketing medium to engage customers with interesting content, useful information (event, shows and latest offers),
etc. Many players are also using social media platforms to encourage open consumer communication by addressing
customer reviews, complaints, and grievances. Key International brands across formats (QSR, Café, CDR etc.) have
adopted a mix of social media and traditional media. They, however, leverage online media significantly to offer
schemes and discounts to consumers. Among key Indian brands such as Café Coffee Day, Barbeque Nation and
Mainland China leverage online platforms such as Facebook for connecting with consumers. In Café segment, Café
Coffee Day leads in terms of Facebook likes whereas in CDR space, Barbeque Nation leads in terms of Facebook
Likes (Facebook Likes for Pizza Hut and Chilli’s represent their international numbers). Food review websites have
become important source of information about restaurants for the digital savvy consumers. They host details such as
product menus, restaurant pictures, location maps, reviews, ratings, contact details of outlets etc. For instance, Burrp, Times City and Zomato are sites with several listed restaurants across various cities enabling consumers to explore
the best food options.
Impact of Advent of Capital Availability
Private investments can be broadly categorized into three stages – early stage, growth stage, and mature/ late stage.
Private Equity investment in food services market is driven by increasing spend on eating out, increasing disposable
income, higher proportion of working women etc.
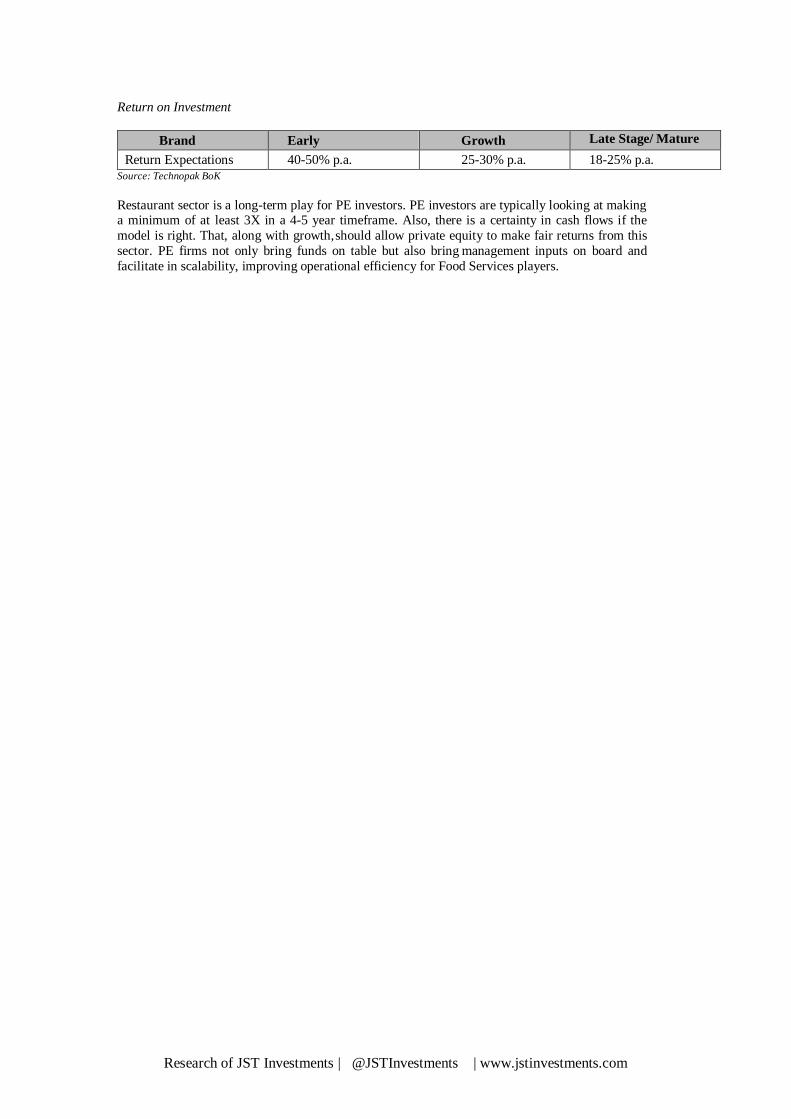
Research of JST Investments | @JSTInvestments | www.jstinvestments.com
Return on Investment
Brand Early Growth Late Stage/ Mature
Return Expectations 40-50% p.a. 25-30% p.a. 18-25% p.a.
Source: Technopak BoK
Restaurant sector is a long-term play for PE investors. PE investors are typically looking at making a minimum of at least 3X in a 4-5 year timeframe. Also, there is a certainty in cash flows if the
model is right. That, along with growth, should allow private equity to make fair returns from this
sector. PE firms not only bring funds on table but also bring management inputs on board and
facilitate in scalability, improving operational efficiency for Food Services players.


