Embed Size (px)
Citation preview

Deep-Sea Research II 49 (2002) 1297–1322
Abyssal circulation in the Somali Basin
M. Denglera,*, D. Quadfaselb, F. Schotta, J. Fischera
a Institut f .ur Meereskunde an der Universit .at Kiel, D .usternbrooker Weg 20, 24105 Kiel, GermanybNiels Bohr Institutet for Astronomi, Fysik og Geofysik, K�benhavns Universitet, Juliane Maries Vej 30, 2100 Copenhagen, Denmark
Accepted 20 September 2001
Abstract
The bottom and deep circulation in the Somali Basin are investigated on the basis of hydrographic and direct velocity
profiles from three shipboard surveys carried out during the southwest monsoon in 1995 and of velocity time series from
the WOCE mooring array ICM7. The inflow of bottom water into the Somali Basin through the Amirante Passage
drives a thermohaline circulation, which may be modulated by the monsoon wind forcing. Details of the abyssal
circulation have been discussed controversially. Deep velocity records from the mooring array in the northern Somali
Basin are dominated by fluctuations with periods of 30–50 days and amplitudes above 5 cm s�1: Despite this strongvariability annual record averages indicate the existence of a deep western boundary current (DWBC) below 3000 m at
the base of the continental slope south of Socotra Island as part of a cyclonic bottom circulation. The southwestward
DWBC transport off Socotra Island is estimated to 271:3 Sv: The bottom and deep water exchange between the
Somali and Arabian Basin north of 71N is estimated from two cross-basin geostrophic velocity sections referenced by
vertically averaged LADCP currents. For the bottom water, an eastward transport into the Arabian Basin of
1:470:5 Sv and 2:170:6 Sv was determined in June and August, respectively, while for the deep-water layer above3500 m eastward transports of 3:672:3 Sv in June and 4:072:4 Sv in August were obtained. r 2002 Elsevier Science
Ltd. All rights reserved.
1. Introduction
The Indian Ocean is bounded to the north byland at subtropical latitudes. There is a netbuoyancy flux into the Indian Ocean north of121S (Zhang and Talley, 1998), inhibiting theformation of deep water. The deep water in thenorthern abyssal basins is thus supplied fromthe south.
Dense abyssal waters from Antarctica charac-terized by low temperatures, low salinities, andhigh oxygen contents spread northward along thewestern and eastern margins of the Indian Ocean.The eastern inflow ventilates the Australian andcentral Indian Basins, while the western branchsupplies the Mascarene, Somali and ArabianBasins. Here, Circumpolar Deep Water (CDW)enters the Madagascar Basin through the discor-dance zones in the Southwestern Indian Ridge(Warren, 1978). As a deep western boundarycurrent (DWBC), it flows northward into theMascarene Basin and enters the Somali Basin viathe 4600 m deep Amirante Passage (Fig. 1).
*Corresponding author. Tel.: +49-431-600-4107; fax: +49-
431-600-4102.
E-mail address: [email protected] (M. Dengler).
0967-0645/02/$ - see front matter r 2002 Elsevier Science Ltd. All rights reserved.
PII: S 0 9 6 7 - 0 6 4 5 ( 0 1 ) 0 0 1 6 7 - 9

The first direct evidence of rapid northwardbottom flow through the Amirante Passage camefrom an analysis of the microtopography andregional sediment distribution based on contin-uous seismic-reflection profiles and echograms(Johnson and Damuth, 1979). The northwardtransport of CDW through the passage is nowfairly well established. On the basis of threeWOCE sections and three pre-WOCE sectionsJohnson et al. (1998) estimated an inflow into theSomali Basin of 1.0–1:7 Sv (1 Sv ¼ 1� 106 m3 s�1)below 4000 m depth, in agreement with previousestimates by Fieux and Swallow (1988).The Somali Basin is bounded to the south by the
Mascarene Plateau and the Central Indian Ridge,to the west by the African continent and to the eastby the Carlsberg Ridge (Fig. 1). The Owenfracture zone, a gap in the Carlsberg Ridge near111N; 571E; with a depth of 3800 m (Wyrtki, 1971)
connects the Somali Basin with the Arabian Basin.Bottom water from the Somali Basin crosses thissill and ventilates the deep Arabian Basin. Theaverage transport of the throughflow below3000 m depth was estimated to about 2 Sv; witha seasonal modulation of the same magnitude(Johnson et al., 1991b; Quadfasel et al., 1997). TheCDW entering through the Amirante Passagebelow 3800 m thus has to upwell in the SomaliBasin to continue its path into the Arabian Basin.A passage at depth 3500–4000 m also exists at thesoutheastern tip of the Arabian Basin near 61S inthe Chargos-Laccadive ridge (Fig. 1), connectingthe Arabian Basin to the Central Indian Basin(Fischer et al., 1982). To date, an exchange of deepwater through this passage has not been docu-mented.Above the bottom water, deep water chara-
cterized by high salinities, high-silicate and
Fig. 1. Bathymetric features and names in the western Indian Ocean (B. is basin, R. is ridge P. is plateau. Filled contours are 4000 m
(light gray), 3000, 2000, 1000 and 200 m depths.
M. Dengler et al. / Deep-Sea Research II 49 (2002) 1297–13221298

low-oxygen contents is found in the depth rangebetween about 2000 and 3500 m (Warren, 1993).This water mass is often referred to as the IndianOcean Deep Water (IDW) (e.g., Warren andJohnson, 1992; Toole and Warren, 1993). IDW iscomposed of upwelled CDW and water massesfrom intermediate depths in the Arabian Sea andperhaps the Bay of Bengal (e.g., Warren andJohnson, 1992; Warren, 1993).A southward movement of IDW south of
the equator at subtropical latitudes has beenobserved by several authors (e.g., Warren, 1981b;Spencer et al., 1982; Toole and Warren, 1993).Results from a recent global inverse modelsuggest 773 Sv of IDW to flow southwardacross 181S (Sloyan and Rintoul, 2001). In theAmirante passage, Johnson et al. (1998) foundIDW flowing southward above the northward-flowing CDW. The estimated transport resulted in4–8 Sv; much larger than the inflow into theSomali Basin. Given that IDW is transformedCDW returning south, the authors suggested awestward flow of upwelled CDW in the deepeastern basins of the Indian Ocean north of theAmirante Passage in depths unconstrained bytopography.To account for the different abyssal water mass
characteristics and their induced circulationschemes, we will follow Warren and Johnson(1992) by using ‘‘bottom water’’ to describe thelayer below 3500 m depths and ‘‘deep water’’ forthe layer between 2000 and 3500 m depthsthroughout this paper. ‘‘Abyssal’’ refers to bothdeep and bottom layer.The abyssal circulation in the Somali Basin itself
has been discussed controversially. The firstinferences of a circulation pattern were made byWarren et al. (1966). Maps of salinity on potentialtemperature surfaces from 130 Nansen bottlestations collected during the southwest monsoonperiod in August and September 1964 revealed aband of fresh deep water along the continentalslope of Somalia. An eastward extension of thisband was found at about 101N: Warren et al.(1966) interpreted this feature as a deep westernboundary current crossing the equator and leadingto an anticylonic circulation pattern in the north-ern Somali Basin.
On the contrary, geostrophic calculations basedon data from April 1984 by Fieux et al. (1986)suggested a cyclonic abyssal circulation. Theydetermined a southward deep boundary currentat the continental slope of Somalia north of theequator with velocities of up to 22 cm s�1 and awestward transport of 3:6 Sv at the base of thenorthern continental slope south of Socotra Islandbetween 2000 and 5000 m depths. In the deep-water layer, higher salinities were found farther tothe south at the western boundary than in theinterior of the northern part of the basin. No clearpattern was identifiable in the bottom water.A possible linkage of the deep circulation to
the monsoon was suggested by Schott et al.(1989) based on a current meter record from theequator at a depth of 3000 m during 1985/86. Thecurrents showed strong seasonality parallel to thecoast in phase with the surface current withnortheastward mean flow of 10 cm s�1 duringJune to September and 7 cm s�1 southwestwardflow during November to February. Records atintermediate depths showed little (1000 and1500 m) or no ð2000 mÞ seasonality. The distribu-tion of salinity in the deep water in October 1986was comparable to the observations from Fieuxet al. (1986) in 1984.Two repeat CTD sections at the height of
subsequent monsoon periods in the Somali Basinat 41S; on the equator and at about 81N showedonly small seasonal differences in the geostrophiccirculation of the bottom water (Johnson et al.,1991a). At 41S the shoaling of the water propertyisopleths towards the continental slope suggestedthe presence of a DWBC. Geostrophic estimatesbelow about 3800 m yielded a northward CDWtransport of 3:9 Sv during January 1987 and 4:6 Svin the same direction during July 1987. Due to lackof guidance from the tracer field, no geostrophictransports were computed for the northern sec-tions. Yet, geostrophic shears within 11 of theequator suggested that the bottom water turnseastward there. The presence of a large mass ofcold water in the interior of the basin east of theChain Ridge (Fig. 1) further suggested an east-ward flow at the equator, with some waterbranching northward into the interior of thenorthern Somali Basin.
M. Dengler et al. / Deep-Sea Research II 49 (2002) 1297–1322 1299

Johnson et al. (1991a) showed the observedbottom circulation to be consistent with thedynamical framework of the deep-mean circula-tion by Stommel and Arons (1960). Under theassumptions of a flat bottom basin of 4000 mdepth with realistic geometry and uniform upwel-ling, a northward boundary current is predicted toabout 41N: North of this latitude, potentialvorticity conservation leads to a weak cyclonicinterior flow that feeds a southward DWBC(Fig. 2).In this model, a substantial eastward current
along the equator is not reproduced. Johnson et al.(1991a) argued that elevated diapycnal eddydiffusivities at the equator could account for largerupwelling rates, which in turn justifies the east-ward spreading of CDW. However, estimates ofabyssal eddy diffusivities within 11 of the equatorin the Indian Ocean have not revealed elevatedlevels (Dengler and Quadfasel, 2002). An averageeddy diffusivity in the order of Kr ¼ 2�10�5 m2 s�1 was found in the depth range between500 and 2000 m:Recently, Beal et al. (2000) observed a temporal
reversal of the bottom circulation in the northernSomali Basin based on two sets of lowered ADCPand hydrographic measurements along 81N: InJune 1995, a southward DWBC with a transport
of 5 Sv was observed, in September the flow wasnorthward with a transport of 2:6 Sv: The deepzonal density gradient across the interior of thebasin also changed between the two occupations,implying a cyclonic circulation in June and ananti-cyclonic circulation in September. Apart fromconsidering elevated eddy activity the authorssuggested a strong barotropic component to theGreat Whirl in September to cause the flowreversal in the bottom waters.As part of the German contribution to the
World Ocean Circulation Experiment (WOCE), ameasurement program was carried out in theIndian Ocean Special Survey Area 2 (ISS2),located in the western Arabian Sea. The programconsisted of three cruises between March 1995 andAugust 1995 (Fig. 3a) and a mooring array ICM7deployed in the Somali Basin from April 1995 toOctober 1996 (Fig. 3b). In this paper, the bottomand deep circulations and their variability arediscussed on the basis of the above data sets.
2. Data
On cruise M32, R/V Meteor completed threesurveys in the Somali and Arabian Basin, pre-dominately on repeated cruise tracks. The first leg
Fig. 2. Schematic illustration of the bottom circulation as predicted from the Stommel and Arons (1960) concept. The transport of the
DWBC relative to a unit source is shown on the left. The schematic flow of the bottom water is shown on the right, with the basin
outline being the 3800 m isobath used by Johnson et al. (1991a). The cyclonic recirculation of bottom water in the northern part is
shaded (adapted from Johnson et al., 1991a).
M. Dengler et al. / Deep-Sea Research II 49 (2002) 1297–13221300

M32/1 was conducted during the transition fromNE to SW-monsoon between March 26 and April25, while two subsequent cruises, leg M32/4 andleg M32/6, were carried out in the early stage andfully developed SW-monsoon from June 8 to July10 and from August 17 to September 19,respectively. In addition to the hydrographicsurveys, an array consisting of 12 current metermoorings was deployed and nine Pegasus trans-ponder pairs were installed during M32/1. Un-fortunately, during all three cruises the vesselcould not enter the Somali exclusive economiczone (EEZ) due to unresolved clearance situations.Hydrographic sections therefore were conductedoutside the EEZ (Fig. 3a) and most of themoorings were set following the EEZ’s boundaryfrom 71N to the continental shelf of Socotra Island(Fig. 3b).Subsets of these observations were presented in
several earlier publications. Quadfasel et al. (1997)determined the deep-water exchange through theOwens Fracture Zone on the basis of the deephydrographic data. Schott et al. (1997) analyzedthe summer monsoon response in the upper
1000 m using direct velocity measurements andhydrographic data. Apart from a monsoon re-sponse of the Great Whirl reaching to 1000 mdepth, they found the Somali Current and theGreat Whirl to be decoupled from the ArabianSea. Instead, communication occurred predomi-nately through the Passage between Socotra Islandand the African continent. Most recently Schottand Fischer (2000) discussed the winter monsooncirculation of the northern Arabian Sea and theSomali Current using the moored current observa-tions.The shipboard observations on all three cruises
consisted of conductivity–temperature–depth dis-solved oxygen (CTD-O2) measurements and directcurrent measurements by a shipboard acousticcurrent Doppler profiler (ADCP), a loweredADCP and a Pegasus profiler. CTD data werecollected with a Neil Brown Mark III system,which was, along with the oxygen sensor, attachedto a rosette with 21 Niskin bottles. Three bottleshad to be left out to make room for the loweredADCP (LADCP). The accuracy of the CTD-O2measurements meets the WOCE requirements set
Fig. 3. (a) Locations of deep CTD casts collected in the Somali Basin during the three R=VMeteor cruises. Bottom bathymetry (Smith
and Sandwell, 1997) shading increases from 5000 m (white) by 500 m to 3000 m then by 1000 m: (b) Position of moorings (K10–K21)and Pegasus transponder pairs (P1–P6) in the northern Somali Basin.
M. Dengler et al. / Deep-Sea Research II 49 (2002) 1297–1322 1301

in Joyce and Corry (1991). After calibration, theoverall accuracy of salinity in deeper waters wasbetter than 0.002 for all three cruises. Laboratorycalibration of the temperature sensor prior to andafter the cruises showed its accuracy to be within0:002 K: Oxygen was measured with a Beckmansensor and calibrated using the O2 values from thewater samples determined by the Winkler method.Accuracy after calibration was better than3:05 mmol kg�1: LADCP measurements were car-ried out using a RDI narrow-band 153 kHzADCP (NBADCP), except in the first week ofcruise M32/1, when a broad-band ADCP(BBADCP) was in use. The BBADCP failed tomeasure currents below 2000 m and was thereforereplaced after station 28 (Schott et al., 1996). Thedata were processed using a method similar to thatdescribed in Fischer and Visbeck (1993). Onemodification included an interpolation of flaggedbins when velocity data were available in preceed-ing and subsequent bins, leading to a moreaccurate determination of the velocity integratedover time.Shipboard ADCP data also were collected with
a RDI narrow-band 153 kHz ADCP. R/V Meteor
was equipped with an Ashtech 3D-GPS receiver,which substantially improved the data qualitybecause a heading-dependent error of the Gyrocompass could be corrected. For data processing,the CODAS3 software (Firing, 1991) was used.High-quality data were collected in the upper350 m of the water column.Two meridional repeat sections were occupied in
the Somali Basin. The western section ran from31S; 501E to Socotra Island, thereby sampling thecenter of the northern Somali Basin (Fig. 3a). Thefull section was completed during M32/4 andM32/6 only. The eastern meridional section along57:51E between 31S and the Carlsberg Ridge wascompleted on all three cruises. Although stationspacing was 30 nm or less on both sections, deepprofiles were only collected every second or thirdstation in some parts.The mooring array WOCE ICM7 was deployed
in April 1995 (M32/1) and retrieved with achartered vessel in October 1996. The 11 mooringshad a total of 57 Aanderaa rotor current meters(RCMs) and 7 self-contained ADCPs. The array
was made up of three elements. Two moorings(K10 and K11) were set up to monitor currents inthe about 1000 m deep Socotra Passage (Fig. 3b).The results are reported in Schott et al. (1997) andSchott and Fischer (2000). A boundary currentarray (K12–K16) was deployed perpendicular tothe isobaths of the continental slope south ofSocotra Island. All moorings in the deeper waterwere equipped with RCMs at 2000 m; butadditionally six instruments were placed at deeperlevels to observe a possible boundary current atthe northern continental slope. Finally, a triangu-lar setup was chosen (K17–K21) in the centralSomali Basin to resolve planetary wave propaga-tion. This included a mooring close to the ChainRidge (K20) with an instrument at 4000 m depths.The upper layer velocity records have beendescribed by Schott and Fischer (2000). Here, thediscussion focuses on the records from deeper than2000 m:Altogether, nine sets of Pegasus profiles were
obtained during the three cruises. Pegasus is a freefalling profiler that measures horizontal velocity(Spain et al., 1981). Six transponder pairs weredeployed in the northern part of the Somali Basin.Their positions were chosen to interleave with themooring array line (Fig. 3b). The remaining threewere positioned along 571E at 11N; the equatorand 11S: The survey technique described by Sendet al. (1996) was used for determining thetransponder locations. The dropsonde wasadjusted to have downward velocities of about0:85 m s�1 and upward velocities of 0:5 m s�1: Therecorded travel times were converted to distancesusing a sound speed profile from a simultaneouslymeasured CTD profile at the same position. Afterde-spiking, horizontal velocities were calculatedand low-pass filtered with a 50 m cut-off wave-length to remove small scale instrumental noise.Send (1994) found the absolute error of thePegasus velocities after filtering to be less than0:02 m s�1:The above described variety of different direct
current observations at similar positions made itpossible to quantify uncertainties inherent in thedifferent instruments by an inter-comparisonstudy. It is presented in detail in Appendix A. Insummary, the RCM and Pegasus velocities agreed
M. Dengler et al. / Deep-Sea Research II 49 (2002) 1297–13221302

to within 1:5 cm s�1; but the LADCP data showedlarger uncertainties with the 95% confidence being9 cm s�1 and a bias of 0:4 cm s�1 in both velocitycomponents. We will refrain from a description ofthe abyssal circulation on their basis. However,depth-averaged Pegasus and LADCP velocitiescompared well having a standard deviation of only0:81 cm s�1: In Section 3.2, these measurementswill be used to reference geostrophic currents.
3. Observations
3.1. Bottom and deep water masses
Circumpolar Deep Water enters the SomaliBasin via the Amirante Passage, having potentialtemperatures between 0:81Cpyp1:11C; salinitieslower than 34.725 and dissolved oxygen valueshigher than 175 mmol kg�1 (Johnson et al., 1998).This water occupies the Somali Basin at depthsgreater than 4000 m (Figs. 4 and 5). However, forreasons mentioned below, we will distinguishbetween bottom and deep water, i.e. CDW andIDW, below and above the 3500 m isobaththroughout this presentation.The coldest, least saline and most oxygen rich
bottom water is found below 4900 m depth southof the equator in the western section (Fig. 4) inagreement with a southern entry point of CDW.At our southern section end minimum potentialtemperatures were just below 0:91C and salinitiesless than 34.716. Johnson et al. (1998) reportedmaximum northward transport in the AmirantePassage at temperatures between 0:81C and 0:91C:Pre-WOCE hydrographic measurements (Fieuxet al., 1986; Barton and Hill, 1989) confirm thepresence of water with temperatures of 0:81C atabout 4700 m and colder water in the AmirantePassage. The absence of the cold water in ourmeasurements suggests significant warming of theinflow water through vertical mixing south of 31S:This is consistent with temperature observations inthe bottom water within the Amirante Passage,which increased by 0:041C over a meridionaldistance of 100 km (Johnson et al., 1998).Between the equator and about 51N in the
western section (Fig. 4), near-bottom temperatures
and salinities gradually increase. Meridional gra-dients of the bottom water mass properties arelargest in the vicinity of topographic featuresbetween 21N and 41N: As indicated in Fig. 3a,the varying bathymetry is due to the widercontinental slope off Somalia crossing the section.At this latitude, a northward spreading of CDWnear the bottom is further constricted by the ChainRidge to the east. However, TOPEX/POSEIDONand ship depth sounding derived bathymetry fromSmith and Sandwell (1997) (Fig. 3a) indicateseveral gaps with maximum depths larger than5000 m between the continental slope and theChain Ridge through which the bottom water canspread northward.North of 51N; the western section runs
central through the northern Somali Basin. Hor-izontal near bottom property distributions areroughly constant and minimum temperatures of0:961C and salinities of 34.718 are observed. Apatch of colder, less saline and oxygen-rich waterat the foot of the continental slope of Socotra isvisible in the data from June 1995 (Fig. 4).However, this patch was not observed during theother two cruises and is thus not a persistentfeature.In the eastern part of the basin along 57:51E
minimum temperatures and salinities just below11C and 34.72 were measured close to the bottom(Fig. 5). Maximum depths in this part of the basinhardly exceed 4600 m; which appears to be tooshallow to permit the spreading of dense CDW.Some deep gaps in the sea floor close to theCarlsberg ridge are seen in the Hydrosweepbathymetric data plotted in Fig. 5. No CTDmeasurements are available from inside these gaps.There are two possible explanations for the
observed property distributions in the CDW. Thelack of cold CDW north of 51N may be due to thelonger route the water takes to reach the northernpart of the basin. This is in agreement with theStommel and Arons (1960) framework, whichpredicts a weak cyclonic bottom circulation inthe northern Somali Basin (Fig. 2). Anotherpossibility is that north of the equator enhancedvertical mixing in the abyss leads to a differentvertical advection–vertical diffusion balance inthe deep water, thereby altering the property
M. Dengler et al. / Deep-Sea Research II 49 (2002) 1297–1322 1303

Fig. 4. Distribution of potential temperature ð1C), salinity (PSS-78) and dissolved oxygen ðm mol kg�1Þ along the western section(Fig. 3) during June 1995 (M32/4).
M. Dengler et al. / Deep-Sea Research II 49 (2002) 1297–13221304

distribution. Some suggestions for the latter ideawill be discussed in Section 4.Above the CDW to 2000 m; the deep water is
characterized by the higher salinities and loweroxygen values of the Indian Deep Water. Theimbalance of volume transport in the AmirantePassage reported by Johnson et al. (1998) requiresa westward advection of IDW north of theAmirante Passage, which has to pass through thewestern section. They determined a southwardflow in the Amirante Passage between the iso-therms 1:41Cpyp1:91C; located at 3500 and2400 m; respectively, having salinities between
34.73 and 34.745. Dissolved oxygen was between150 and 170 mmol kg�1 (Fig. 6).In the deep-water layer above about 3500 m;
there is a pronounced meridional gradient insalinity and oxygen content (Fig. 4). At constantdepths, salinity increases towards the northwhereas oxygen decreases. In the northern partof the section, mesoscale displacements of theisotherms are seen. Here, the y–S characteristics(Fig. 6) show a continuous linear relation in thebottom and deep water, whereas a change in slopeat y ¼ 1:41C is visible in the profiles from southof the equator, becoming more distinct as the
Fig. 5. Distribution of potential temperature and salinity along the eastern section during June 1995.
M. Dengler et al. / Deep-Sea Research II 49 (2002) 1297–1322 1305
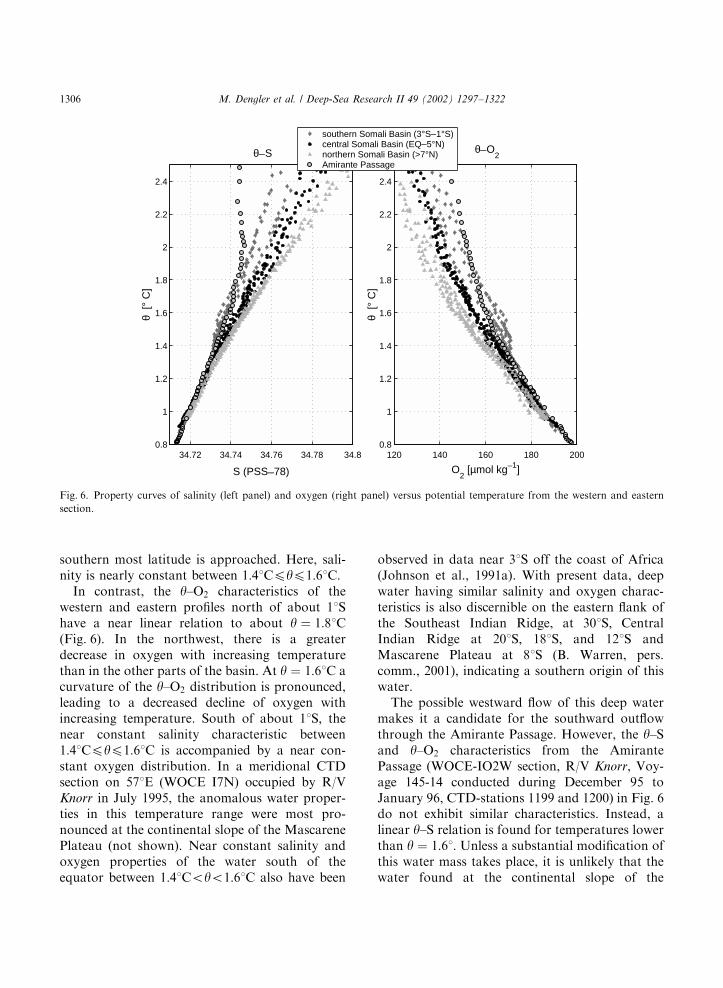
southern most latitude is approached. Here, sali-nity is nearly constant between 1:41Cpyp1:61C:In contrast, the y–O2 characteristics of the
western and eastern profiles north of about 11Shave a near linear relation to about y ¼ 1:81C(Fig. 6). In the northwest, there is a greaterdecrease in oxygen with increasing temperaturethan in the other parts of the basin. At y ¼ 1:61C acurvature of the y–O2 distribution is pronounced,leading to a decreased decline of oxygen withincreasing temperature. South of about 11S; thenear constant salinity characteristic between1:41Cpyp1:61C is accompanied by a near con-stant oxygen distribution. In a meridional CTDsection on 571E (WOCE I7N) occupied by R/VKnorr in July 1995, the anomalous water proper-ties in this temperature range were most pro-nounced at the continental slope of the MascarenePlateau (not shown). Near constant salinity andoxygen properties of the water south of theequator between 1:41Coyo1:61C also have been
observed in data near 31S off the coast of Africa(Johnson et al., 1991a). With present data, deepwater having similar salinity and oxygen charac-teristics is also discernible on the eastern flank ofthe Southeast Indian Ridge, at 301S; CentralIndian Ridge at 201S; 181S; and 121S andMascarene Plateau at 81S (B. Warren, pers.comm., 2001), indicating a southern origin of thiswater.The possible westward flow of this deep water
makes it a candidate for the southward outflowthrough the Amirante Passage. However, the y–Sand y–O2 characteristics from the AmirantePassage (WOCE-IO2W section, R/V Knorr, Voy-age 145-14 conducted during December 95 toJanuary 96, CTD-stations 1199 and 1200) in Fig. 6do not exhibit similar characteristics. Instead, alinear y–S relation is found for temperatures lowerthan y ¼ 1:61: Unless a substantial modification ofthis water mass takes place, it is unlikely that thewater found at the continental slope of the
34.72 34.74 34.76 34.78 34.80.8
1
1.2
1.4
1.6
1.8
2
2.2
2.4
θ [°
C]
S (PSS_78)
θ_S
120 140 160 180 2000.8
1
1.2
1.4
1.6
1.8
2
2.2
2.4
θ[°
C]
O2
[µmol kg_1]
θ_O2
southern Somali Basin (3°S_1°S)central Somali Basin (EQ_5°N) northern Somali Basin (>7°N) Amirante Passage
Fig. 6. Property curves of salinity (left panel) and oxygen (right panel) versus potential temperature from the western and eastern
section.
M. Dengler et al. / Deep-Sea Research II 49 (2002) 1297–13221306

Mascarene Plateau and near 31S off the coast ofAfrica participates in the southward flow throughthe Amirante Passage.
3.2. Velocities and geostrophic transports
3.2.1. Direct velocity measurements
Deep profiles of horizontal velocity using aPegasus drop sonde were collected in the northernSomali Basin and within 11 of the equator duringall three R/V Meteor cruises. To describe thebottom circulation in the northern Somali Basin,vertical averages of horizontal velocity werecalculated between 3500 m depth and the bottom.Between April and August, the bottom circula-
tion north of 91N tends to become more easterly(Fig. 7). Velocities above 5 cm s�1 are observed,but a clear and consistent circulation pattern doesnot really evolve. Beal et al. (2000) found acyclonic bottom circulation in June 1995 and areversed bottom circulation in September 1995below 3800 m: Our observations contrast theirresults. The velocities from the June section,recorded within a week of the observationsreported by Beal et al. (2000), rather suggest ananticyclonic circulation and there is no indicationof a flow reversal between the surveys from Juneand August. Beal et al. (2000) suggest a strongbarotropic component of the Great Whirl to causethe flow reversal in the bottom water. However,during the M32/4 section occupation from June 16to June 20, the Great Whirl was not pronounced.Bottom velocities within 11 of the equator show
a strong eastward flow between 3500 m and the
bottom in April, in particular at and to the southof the equator (Fig. 8). In June, there was no clearcirculation pattern while in August the flow hadreversed relative to April and southeastwardvelocities of about 3 cm s�1 were observed.Although the horizontal and temporal resolu-
tion of the direct velocity measurements is limitedat the equator, it is fair to say that they do notshow a stationary eastward current as suggestedby Johnson et al. (1991a). Instead, we find time-dependent currents at the equator with a reversalof flow direction between occupations. Luyten(1982) analyzed four deep current-meter timeseries (3600 m) moored at the equator and at1:51N between 511E and 571E from May toDecember in 1978. The velocity time series weredominated by fluctuations having periods longerthan 50 days. On average, Luyten (1982) foundnortheastward flow of about 1 cm s�1 over thedeployment time span of nearly 8 months.
3.2.2. Geostrophic velocities
To investigate the abyssal flow in the northernSomali Basin, the geostrophic velocity fields andtransports between 71N and the continental shelfof Socotra was determined. In the south thesection was terminated at the Chain Ridge(Fig. 3a) and is therefore closed to the east belowthe sill depths of the Owen Fracture zone. Pastinvestigators have had difficulties when referencinggeostrophy in the northern Somali Basin. Fieuxand Swallow (1988) found extremely large abyssalgeostrophic velocities of 23 cm s�1 using a zerovelocity surface at 2000 m depth. Due to eddy
Fig. 7. Bottom velocity vectors, averaged from 3500 m depth to bottom, from Pegasus profiles in the northern Somali Basin.
M. Dengler et al. / Deep-Sea Research II 49 (2002) 1297–1322 1307

noise, Johnson et al. (1991a) refrained fromestimating geostrophic transport in the northernpart of the basin.On two of the three R/VMeteor cruises LADCP
current profiles were measured at each stationusing a NBADCP. The good agreement betweenthe barotropic, i.e. depth-averaged velocities mea-sured by the Pegasus drop sonde, and thebarotropic velocities of the NBADCP describedin Appendix A encouraged us to use the latter forreferencing the geostrophic velocities. However,the depth averaged LADCP velocities containcurrent components that are not accounted for inthe geostrophic approximation, especially tidalcurrents, Ekman and cyclostrophic componentsas well as a possible velocity bias. These have to beremoved prior to referencing. The procedure tothis and an error estimate is briefly described inAppendix B.The results are shown in Fig. 9. In general, the
deep geostrophic velocity field is dominated bybaroclinic motion of decreasing horizontal scaletoward the continental shelf. Going northwardfrom 101N; there are several reversals in flowdirection below 1500 m depths. These featureswere also seen in the LADCP profiles and aretherefore not artificially arising from dense CTDstation spacing. Furthermore, they are consistentwith the Pegasus measurements presented inFig. 7.Overall, the flow field south of 101N in August
appears to be less structured compared to June.Below 1000 m to the bottom, eastward flow was
found between 81N and 101N and westward flowfurther to the south. However, this picture mayonly result from the large gap in station spacingbetween 7:51N and 91N: The upper water columnin August is dominated by the presence of theGreat Whirl. Its vertical rotation axis was locatedat 101N and a substantial part of the eastwardrecirculation took place on the shelf of Socotra,not included in these sections. One peculiar featureis the lack of vertical shear of geostrophicvelocities between station 88 and 89 at theeastward flowing flank of the Great Whirl. In theJune section, strong eastward flow with velocitiesexceeding 30 cm s�1 was present between 1000 and1500 m near 101N: Velocity time series from1000 m at K15 indicate that these large eastwardvelocities persisted between mid-June to mid-August, while westward velocities of the samemagnitude were observed throughout October.
3.2.3. Geostrophic transport estimates
Cumulative geostrophic transports were calcu-lated by averaging the geostrophic transportsections on neutral density surfaces and integrat-ing them vertically upward (Fig. 10). In the deeppart of the water column, bottom wedges weretreated by least-square-fitting temperature andsalinity to the bottom triangle (Wunsch, 1996, p.220). No adequate procedure was found to treatthe deep reaching wedges at the continental shelfof Socotra above 2000 m; which were thusneglected. Furthermore the southernmost station
Fig. 8. Bottom velocity vectors from Pegasus profiles from the eastern section averaged between 3500 m and the bottom.
M. Dengler et al. / Deep-Sea Research II 49 (2002) 1297–13221308

Fig. 9. Geostrophic velocities in the northern Somali Basin from ship sections (Fig. 3a) during June (upper panel), and August (lower
panel). Positive velocities are eastward. Thick contours represent neutral density surfaces in kg m�3: Filled bathymetry is taken from aHydrosweep echo sounder data recorded during the cruises. Velocities are referenced by vertically averaged ADCP currents (see text
for details). Dashed lines indicate area used for DWBC transport estimates. The numbers along the tops mark the positions of CTD
stations, while pluses mark mid-points between stations.
M. Dengler et al. / Deep-Sea Research II 49 (2002) 1297–1322 1309
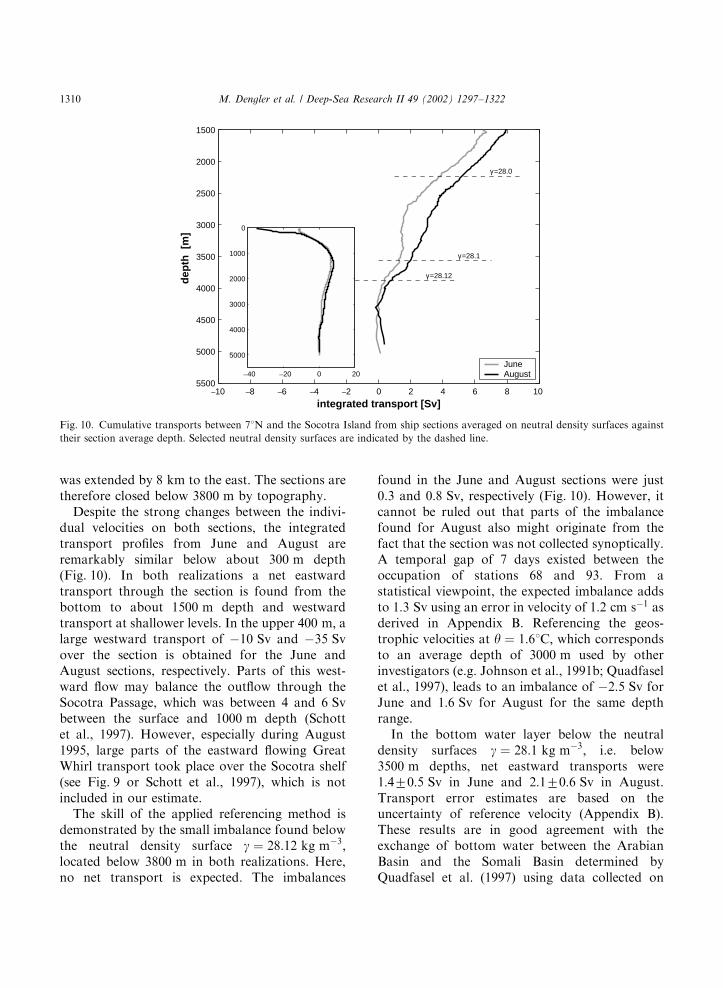
was extended by 8 km to the east. The sections aretherefore closed below 3800 m by topography.Despite the strong changes between the indivi-
dual velocities on both sections, the integratedtransport profiles from June and August areremarkably similar below about 300 m depth(Fig. 10). In both realizations a net eastwardtransport through the section is found from thebottom to about 1500 m depth and westwardtransport at shallower levels. In the upper 400 m; alarge westward transport of �10 Sv and �35 Svover the section is obtained for the June andAugust sections, respectively. Parts of this west-ward flow may balance the outflow through theSocotra Passage, which was between 4 and 6 Svbetween the surface and 1000 m depth (Schottet al., 1997). However, especially during August1995, large parts of the eastward flowing GreatWhirl transport took place over the Socotra shelf(see Fig. 9 or Schott et al., 1997), which is notincluded in our estimate.The skill of the applied referencing method is
demonstrated by the small imbalance found belowthe neutral density surface g ¼ 28:12 kg m�3;located below 3800 m in both realizations. Here,no net transport is expected. The imbalances
found in the June and August sections were just0.3 and 0:8 Sv; respectively (Fig. 10). However, itcannot be ruled out that parts of the imbalancefound for August also might originate from thefact that the section was not collected synoptically.A temporal gap of 7 days existed between theoccupation of stations 68 and 93. From astatistical viewpoint, the expected imbalance addsto 1:3 Sv using an error in velocity of 1:2 cm s�1 asderived in Appendix B. Referencing the geos-trophic velocities at y ¼ 1:61C; which correspondsto an average depth of 3000 m used by otherinvestigators (e.g. Johnson et al., 1991b; Quadfaselet al., 1997), leads to an imbalance of �2:5 Sv forJune and 1:6 Sv for August for the same depthrange.In the bottom water layer below the neutral
density surfaces g ¼ 28:1 kg m�3; i.e. below3500 m depths, net eastward transports were1:470:5 Sv in June and 2:170:6 Sv in August.Transport error estimates are based on theuncertainty of reference velocity (Appendix B).These results are in good agreement with theexchange of bottom water between the ArabianBasin and the Somali Basin determined byQuadfasel et al. (1997) using data collected on
_10 _8 _6 _4 _2 0 2 4 6 8 10
1500
2000
2500
3000
3500
4000
4500
5000
5500
γ=28.12
γ=28.1
γ=28.0
integrated transport [Sv]
dep
th [
m]
June August _40 _20 0 20
0
1000
2000
3000
4000
5000
Fig. 10. Cumulative transports between 71N and the Socotra Island from ship sections averaged on neutral density surfaces against
their section average depth. Selected neutral density surfaces are indicated by the dashed line.
M. Dengler et al. / Deep-Sea Research II 49 (2002) 1297–13221310

the same cruises east of the Owens Fracture zone.Both integrated transport profiles in Fig. 10 showthe largest transport gradients in the column from3500 to about 3800 m; just above the sill depth ofthe Owen Fracture zone.The deep water column between 2000 and
3500 m is represented between the neutral densitysurfaces g ¼ 28:00 kg m�3 and 28:1 kg m�3: Here,an eastward transport of 3:672:3 Sv in June andof 4:072:4 Sv in August is obtained. The results ofthese two realizations therefore disagree with thehypothesis of westward flow of IDW in thenorthern Somali Basin, which may eventuallyparticipate in the outflow of deep water throughthe Amirante Passage found by Johnson et al.(1998).
3.3. Moored array current observations
The WOCE ICM7 array contained seven rotorcurrent meters moored at depths larger than2000 m: The time series of six of these observationsare shown as current vectors in Fig. 11. The
seventh RCM moored at K15 in 4200 m lost itsrotor 7 months after deployment and will not beconsidered.The most prominent feature common to all time
series is the energetic intra-seasonal variability.The amplitudes of the fluctuations can exceed10 cm s�1; but are usually about 5 cm s�1: Thevariance-preserving frequency spectrum calculatedfrom the deep velocity records shows a pro-nounced maximum at the 30- to 50-day periodband (Fig. 12), representing the dominant timescale of the fluctuations. They are present also inthe shallower records (not shown) and theirbaroclinic character is indicated by reversals ofphase between the shallow and deep records.Meridional variance of the fluctuations exceedszonal variance.These intra-seasonal fluctuations are also re-
ported from TOPEX/POSEIDON altimetry datafrom the northwest Indian Ocean, in the regionfrom 51N and 111N and from off the coast ofSomalia to about 601E (Eigenheer, 1997; Brandtet al., 2002). They have maximum amplitudes
1.Apr 1.Jul 1.Oct 1.Jan 1.Apr 1.Jul 1.Oct1995 1996
N
E10 cm/s
3000m3000mK13
4000m4000mK14
3500m3500mK15
4000m4000mK16
4500m4500mK16
4000m4000mK20
Fig. 11. Vector time series of 40-h averaged deep velocity measurements in the northern Somali Basin. Barotropic tidal currents were
subtracted prior to averaging.
M. Dengler et al. / Deep-Sea Research II 49 (2002) 1297–1322 1311

during the southwest monsoon period and showwestward phase propagation. Strong intra-seaso-nal current variability dominated by meridionalfluctuations with periods between 30 and 50 daysin the same area was found by Sengupta et al.(2001) in the data from a modular ocean modelsetup for the Indian Ocean north of 301S: Aninteresting result here is that the current fluctua-tions were also present in a model run forced withseasonal wind (periods 90 days or greater) only.This indicates that the fluctuations are generatedby the instability of the large-scale circulationrather than forced directly by the wind. A detaileddescription of the observed 30- to 50-day fluctua-tions will be presented in a separate paper.The large amplitude 30- to 50-day fluctuations
in the velocity field of the abyssal Somali Basinmay account for the drastic changes found in thePegasus and geostrophic velocities as well asexplain the variability found in previous investiga-tions (Johnson et al., 1991a; Beal et al., 2000).However, especially the deep time series at K14and to a lesser extend K13 indicate a predominantcurrent direction, which will be discussed below.
Furthermore, the velocity time series providemeans to investigate the seasonal cycle.
3.3.1. Average velocities and transports
Significant average southwestward velocitieswere found at K13 and K14, amounting to 1.3and 2:1 cm s�1; respectively (Table 1). Progressivevector diagrams of the velocity records in Fig. 13show a drift past the RCMs of 1100 km at K14 in4000 m depth and 850 km at K13 in 3000 m depthduring the deployment time span. At K15 and K16only marginally significant mean flows wereobserved. However, the drift past these locationsexhibits circular movement that is less pronouncedin the drift of the northern records. No significantaverage velocity was found at K20. Velocityvariance is oriented along topography at K13and K14. At K15 and K16, velocity varianceellipses are zonally oriented and the variancegenerally increases. An exception is the record in4000 m depth at K16, where velocities are gen-erally lower than those of surrounding records.The average bottom circulation in the northern
Somali Basin is thus cyclonic, with a boundary
10_4
10_3
10_2
10_1
10_5
10_4
10_3
frequency ν [cph]
Φu
⋅ν [
m2 s2
]
95%
365d 183d 50d 30d f_1
Fig. 12. Variance-preserving frequency spectra of horizontal velocity calculated from the six deep records from below 3000 m depth
from the northern Somali Basin.
M. Dengler et al. / Deep-Sea Research II 49 (2002) 1297–13221312

current in the northwest corner Fig. 14. Here, onthe continental slope of Socotra, the flow issouthwestward and follows the topography. High-est speeds are seen at the foot of the continentalslope, but about 1100 m above the bottom at K13the mean flow is not significantly different fromzero. These characteristics are typical for a deepwestern boundary current (e.g., Warren, 1981a).Even though there is only a limited number of
deep time series covering the average south-westward flow close to the continental slope ofSocotra, an estimate of the DWBC transport isattempted. The boundary current is assumed toencompass the area north of the position of K15and below 3000 m depth (see Fig. 14). Any use ofinterpolation schemes is unwarranted due to thelimited data resolution. Instead, the area is simplylinear distributed, assigning 40% of the total toeach of the records at K13 and K14 and 20% tothe record at K15.As expected, the resulting time series of DWBC
transport shown in Fig. 15 is dominated by 30- to50-day fluctuations. For short periods of a fewdays, maximum southwestward transports of14 Sv and northeastward transports of 10 Sv areobtained, showing the influence of the Rossbywaves. On the basis of the crude assumptionsabove, an annual average transport and a standarddeviation of the average of 2:071:3 Sv in south-westward direction is obtained. The standarddeviation of the transport is 3:7 Sv:To partially verify the assumptions for the
moored transport calculations, the geostrophic
transports were calculated from the June andAugust sections over the same horizontal distancebelow the neutral density surface g ¼28:075 kg m�3; enveloping the same area as usedfor the transport time series (see Fig. 9). In Juneand August, a southwestward transport of�0:7870:53 Sv and of 0:5270:67 Sv were ob-tained, respectively (Fig. 15). The average mooringtransport estimates during the time of the sectionoccupations were 0:17 Sv in June and 0:40 Sv inAugust, both in southwestward direction. Themooring estimate in June is slightly above thegeostrophic estimate, but within the uncertaintiesdiscussed. In summary, the results of bothmethods are in general agreement, giving someconfidence in the mooring transport estimates.
3.3.2. Seasonal cycle
Previous investigators have suggested a mon-soon response in the abyss of the northern SomaliBasin. The velocity time series from the ICM7array provide means to investigate the depthpenetration of the response to the seasonal forcingof the monsoon winds in the northern SomaliBasin. Amplitude and phase of the seasonal signalwere determined by fitting an annual harmonicalong-shore current component of the time seriesusing minimum variance criteria. Although asingle amplitude and phase of an annual harmonicdetermined from a 18-month record is notstatistically significant when the described varianceof the signal is low, the results presented in Fig. 16
Table 1
Running annual averages of the mean flow in maximum flow direction ( %u), their standard deviation sð %uÞ estimated by dividing thestandard deviation of the velocity records by the square root of the degrees of freedom and average flow directions of the deep
velocities times series
Mooring no. Depth (m) %u7sð %uÞ Direction Degrees of freedom sðuÞ ðcm s�1Þðcm s�1Þ of mean flow ð1Þ
K13 3000 1:3170:90 265 15 3.47a
K14 4000 2:0571:11 225 15 4.32
K15 3500 1:2071:12 201 19 4.91
K16 4000 0:5770:53 78 16 2.11
K16 4500 1:3171:08 38 17 4.43
K20 4000 0:3871:14 30 14 4.27
aThe standard deviations in the direction of the average flow is indicated by sðuÞ: Tidal currents were removed prior to averaging.
M. Dengler et al. / Deep-Sea Research II 49 (2002) 1297–1322 1313

show consistent horizontal and vertical patternsalong the section.The seasonal cycle is most pronounced in the
upper 200 m of the water column, where ampli-tudes exceed 40 cm s�1: Two maxima with a 1801phase relationship occur between 71N–91N and101N–111N; representing the contribution of theGreat Whirl. Here, the annual signal contributesto more than 30% to the total variance of the timeseries. However, the northward propagation of theGreat Whirl in 1995 and its early instability inSeptember 1996 (Wirth et al., 2002) will reduce theamplitude and described variance of the seasonalsignal locally.
There is a strong decrease of amplitude andcontained variance of the annual signal withdepth. At about 400 m; the amplitude drops offto below 5 cm s�1: In the interior northernSomali Basin between 71N and 101N; amplitudesof less than 1 cm s�1 are found below about1500 m: Described variance is below 5% forthis part of the water column, indicating thatthe abyssal circulation in the interior SomaliBasin is only marginally affected by the seasonalwind forcing. Instead, variance is dominated bythe 30–50 day Rossby waves. These results do notconfirm the hypothesis of Beal et al. (2000) whosuggested a strong barotropic component of the
_1500 _1000 _500 0 500
_1000
_500
0
500
1000
k13 3000m
zon
al d
ista
nce
[km
]
_1500 _1000 _500 0 500
_1000
_ 500
0
500
1000
k14 4000m
_1500 _1000 _500 0 500_1000
_500
0
500
1000
k15 3500m
zon
al d
ista
nce
[km
]
meridional distance [km]
_1500 _1000 _500 0 500_1000
_500
0
500
1000
k16 4000mk16 4500m
meridional distance [km]
end
start
end
start
end
start
end
start
end
Fig. 13. Progressive vectors diagrams of the deep velocity records in the northern Somali Basin.
M. Dengler et al. / Deep-Sea Research II 49 (2002) 1297–13221314

1 cm/s
48oO 50oO 52oO 54oO 56oO
6oN
8oN
10oN
12oN
Fig. 14. Vectors of the average velocities calculated from the time series below 3000 m from the northern Somali Basin.
1.Apr 1.Jul 1.Oct 1.Jan 1.Apr 1.Jul 1.Oct_10
_8
_6
_4
_2
0
2
4
6
8
10
12
14
sou
thw
estw
ard
tra
nsp
ort
[S
v]
1995 1996
moorings geostrophic
Fig. 15. Transport calculated from the moored time series (solid line) and geostrophic transports from the June and August cruise.
Dashed line indicates annual average transport.
M. Dengler et al. / Deep-Sea Research II 49 (2002) 1297–1322 1315

Great Whirl to cause a reversal in the bottomcirculation.However, amplitudes and contained variances
increase towards the continental shelf. The ampli-tude of the annual signal at K13 increases from1:6 cm s�1 at 700 m depths to 9:4 cm s�1 at1000 m depths. At 2000 m; an amplitude of10:5 cm s�1 was determined. Described varianceat 1000 and 2000 m is 16% and 38%, respectively.Furthermore, the phase relationship of the deepamplitude maximum is reversed to the annualsignal found in the upper water column. Whereasmaximum northeastward velocities in the upper
ocean are observed in September, maximumsouthwestward velocities are found at 1000 and2000 m: At 3000 m; amplitude is again stronglyreduced and amounts to less than 2 cm s�1:The strong baroclinic response of the seasonal
cycle close to the northwest boundary may beexplained by the reflection of long Rossby wavesof annual period. Brandt et al. (2002) showed thatfirst and second vertical mode long annual Rossbywaves propagate westward across the southernArabian Sea. They are radiated from the westernside of the Indian subcontinent and are continu-ously forced by the action of the wind curl field
Fig. 16. Results from annual harmonic analysis. Upper panel displays amplitude of annual harmonic in cm s�1: The lower panel showsdescribed variance in % (contoured). Phase in months of the year are indicated by small numbers. Dashed lines indicate area used for
DWBC transport estimates.
M. Dengler et al. / Deep-Sea Research II 49 (2002) 1297–13221316

over the central Arabian Sea. In TOPEX/POSEI-DON altimetry data, these waves are mostpronounced between 61 and 101N and can betraced all the way to the coast of Somalia. At thenorthwest boundary, they will reflect into shortRossby waves and off equatorial coastal Kelvinwaves, retaining the vertical mode of the incidentwave. The short Rossby waves are generated tobalance the cross-shore mass flux (e.g., Liu et al.,1999). Due to frictional effects, they will decayquickly away from the shelf and will not affect theinterior of the Somali Basin as suggested inFig. 16. Thus, they act only to redistribute massalong the boundary.
4. Summary and concluding remarks
The structure and dynamics of the abyssalcirculation in the Somali Basin is explored on thebasis of CTD and direct velocity measurementsfrom shipboard surveys carried out during threestages of the SW monsoon in 1995 and deepvelocity records from the WOCE mooring arrayICM7 deployed in the northern Somali Basinbetween April 1995 and October 1996. To accountfor the Circumpolar Deep Water and the IndianDeep Water as two different abyssal water massesin the Somali Basin and their linked circulation,we discriminate between the bottom water below3500 m depths and the deep water in the layerbetween 2000 and 3500 m depths.Bottom water having a transport of 1.0–1:7 Sv
enters the Somalia Basin via the Amirante Passage(Johnson et al., 1998). Property distribution alonga meridional section in the western Somali Basinshow the lack of dense CDW in the northernSomali Basin north of 51N: Largest meridionalgradients in the property distributions are foundbetween 21N and 41N: However, a stationaryeastward bottom current along the equator wasnot confirmed by direct velocity observations.Instead, time dependent currents with flow rever-sals between April and August are observed.The most pronounced signals in the deep
velocity records from the northern Somali Basinwere baroclinic intra-seasonal fluctuations withperiods of 30–50 days. Amplitudes associated with
the fluctuations were above 5 cm s�1: Despite thelarge variability, statistically significant averagesouthwestward velocities following the orientationof topography of 1:3 cm s�1 at 111N and2:0 cm s�1 at 10:61N were determined from thedeep records close to the continental shelf ofSocotra, suggesting the presence of a weakDWBC. At a distance of 100 km away from thecontinental slope, a cyclonic recirculation wasindicated. The annual average DWBC transport,calculated from the velocity time series below3000 m north of 10:21N was estimated to be271:3 Sv in southwestward direction. Temporalvariability in the DWBC transport is large,predominately due to the 30- to 50-day fluctua-tions. The average southwestward DWBC trans-port must be balanced by northeastward flow inthe interior of the northern Somali Basin.This circulation is in general agreement with the
circulation of the Stommel–Arons model for thenorthern Somali Basin derived by Johnson et al.(1991a) (Fig. 2), which predicts a cyclonic deepwestern boundary circulation for the northernSomali Basin. The model assumptions of a uni-form upwelling in the Somali Basin leads to a weaksouthwest boundary-current transport south ofSocotra Island. In contrast to this hypothesis, theaverage transport estimated from the observationsexceeds the inflow into the Somali Basin.The cross-basin exchange of bottom and deep
water between the Somali and the Arabian Basinnorth of 71N was determined from geostrophiccalculations referenced by vertically averagedLADCP currents. In the bottom water layer,eastward transports into the Arabian Basin of1:470:5 Sv in June and 2:170:6 Sv in Augustwere obtained. A large fraction of these transportswere determined in depths just above the silldepths of the Owen fracture zone. Despite thestrong variability, horizontally integrated trans-port profiles were remarkably similar, indicatingthat the eastward transport of bottom water intothe Arabian Basin may only be marginally affectedby the 30- to 50-day fluctuations. The transportestimates basically agree with the exchange ofbottom water through the Owen fracture zonedetermined by Quadfasel et al. (1997) who foundan eastward transport of 2:3 Sv in June and 1:2 Sv
M. Dengler et al. / Deep-Sea Research II 49 (2002) 1297–1322 1317

in August from data collected in the Arabian Basinon the same two cruises.The bottom water circulation in the Somali
Basin on the basis of the above results issummarized as follows. In order to sustain thecyclonic DWBC circulation cell in the northernSomali Basin, a large fraction of the bottom waterinflow into the Somali Basin spreads northwardacross the equator. North of 71N it leaves theSomali Basin at a depths above 3800 m andventilates the abyss of the Arabian Basin. Thiscirculation scheme contrasts the inferred bottomwater circulation by Johnson et al. (1991a).However, elevated levels of diapycnal mixing inthe abyssal northern Somali Basin can account forthe observed meridional gradients in the propertydistribution and justify an increased northwardtransport of bottom water into the northernSomali Basin. In a separate paper we will showthat elevated eddy diffusivities are indeed found inthe abyss of the northern Somali Basin.In the deep-water layer, eastward transports
of 3:672:3 Sv in June and 4:072:4 Sv in August1995 were determined from the cross-basin sec-tions north of 71N: South of this latitude,transports could not be determined due to thelack of referencing. However, the southwardexport of IDW through the Amirante Passagebetween 4 and 8 Sv determined by Johnson et al.(1998) implies a westward transport of deep waterbetween the Mascarene Plateau and 71N of about8–10 Sv:Between the continental slope of the Mascarene
Plateau and about 11N; a distinct deep water masswas found in the potential temperature rangebetween 1:41Cpyp1:61C having a near-constantdistribution of salinity and O2: A possibility forpart of its origin is a mid-depths western boundarycurrent flowing northward along the eastern sideof the Central Indian Ridge and the MascarenePlateau (B. Warren, pers. comm., 2001). Similarwater properties in the same temperature rangealso have been observed by Johnson et al. (1991a)near 31S off the coast of Africa, suggesting apossible westward advection of this water, perhapsas a westward jet south of the equator. How thisanomalous deep water leaves the Somali Basinremains unclear. However, it would need to be
substantially modified to participate in thesouthward flow through the Amirante Passage,since water with similar y–S and y–O2 character-istics is absent in the Passage. Additional evidenceof westward flow of deep water south of theequator is reported by Warren and Johnson (2002)from farther to the east. They determined west-ward transports of 2.2 and 6:7 Sv throughpassages in the Ninetyeast Ridge at 51S and101S; respectively.Finally, an analysis of a seasonal cycle in the
moored time series indicates that the abyssalcirculation in the interior northern Somali Basinis only marginally affected by the seasonal windforcing. Amplitudes and explained variances in thecurrent records of less than 1 cm s�1; and less than5% respectively were found for the seasonal cyclebelow 1500 m: This suggests that the reversinginterior bottom circulation in the northern SomaliBasin reported by Beal et al. (2000) was probablydue to higher frequency variability. However,amplitudes of the seasonal cycle of 10 cm s�1 werefound between 1000 and 2000 m depths at thenorthern continental slope south of SocotraIsland. It is possible, that this increase wasassociated with the arrival of the annual Rossbywaves described by Brandt et al. (2002).
Acknowledgements
We thank the captains and crews of the R/VMeteor and GMMOS Discovery for their helpduring deployment and retrieval of the mooredarray and the shipboard measurements, as well asC. Meinke, U. Papenburg, H. W .ullner, U. Dr-.ubbisch and A. Welsch for technical assistanceduring the field work. The routines for theharmonic tidal analysis were kindly made availableby H. Mofjeld, PMEL and the CTD data from theAmirante Passage by G. Johnson, PMEL. Wethank Bruce Warren for constructive criticismsthat significantly helped to improve the manu-script. This study was supported by the DeutschenForschungsgemeinschaft (R/V Meteor) and theBundesminister f .ur Bildung und Forschung(WOCE).
M. Dengler et al. / Deep-Sea Research II 49 (2002) 1297–13221318

Appendix A
Due to the diversity of direct current observa-tions at similar positions, an inter-comparison wasperformed to quantify uncertainties inherent in thedifferent instruments. Velocity data from themoored RCMs, the Pegasus drop sonde and theNBADCP are compared.Comparisons were performed from velocity
measurements within a 25 m depth interval and asampling time that did not differ by more than 2 h:Sanford (1991) showed the horizontal coherencewavelength of the abyssal internal wavefield to bein the order of 15–20 km for mid-latitude internalwaves. To avoid the influence of negativelycorrelated internal waves, horizontal velocitycomparisons were further restricted to instrumentpositions less than 10 km apart. Also, RCMvelocities smaller than the rotor threshold of2 cm s�1 were excluded in the comparisons.The velocity differences between RCM measure-
ments from moorings and Pegasus measurementsshowed a standard deviation of 1:5 cm s�1
(Table 2). Considering the 2-h averaging intervalof the RCM’s, this difference cannot be distin-guished from variability of the internal wavefield.No bias was found between the Pegasus and RCMvelocities. The standard deviation of the velocitydifferences determined between RCM andNBADCP measurements was 4:8 cm s�1: A linearfit to the velocity differences of both componentsshowed the absolute RCM velocities to be largerby 14% and an offset of 0:4 cm s�1: At eachtransponder location, a LADCP profile wascollected after the Pegasus dropsonde waslaunched. The dropsonde was deployed about15 min prior to the rosette and surfaced not later
than 30 min after the end of the CTD cast.Velocity differences between the near simulta-neously collected profiles of the two platformshad a standard deviation of 4:6 cm s�1; similar tothe RCM–LADCP comparison. A linear regres-sion showed the Pegasus velocities to be larger by11% and again an offset of 0:4 cm s�1: Theseresults did not change, when linear regressionswere calculated for zonal and meridional velocityonly.The large standard deviation found in the
LADCP comparisons implies that the NBADCPvelocities have a 95% confidence level of about9 cm s�1: In both comparisons, the absolutevelocities of RCMs and the Pegasus were morethan 10% larger than velocities measured by theLADCP, which is due to the inherent smoothing inLADCP processing and the fact that ADCPmeasures an average velocity over the specifiedbin length, which was 16 m for the data used here.The results of both linear regressions exhibited anoffset of þ0:4 cm s�1; implying a NBADCP bias inboth velocity components. No statistically signifi-cant dependence of the offset to temperature,pressure or backscatter strength could be found.Possible explanations of this bias is a displacedacoustic signal frequency or a dislocated Janusconfiguration. Velocity data from the BBADCPwas not considered in the comparison.A comparison between the LADCP and Pegasus
data also was performed from the full-depthaveraged velocity profiles. Here, barotropic tidalcurrents (see Appendix B) were removed toaccount for the different sampling times. Differ-ences of the depths-averaged velocities showed astandard deviation of only 0:81 cm s�1: The goodquality of the depth-averaged LADCP data has
Table 2
Summary of the velocity comparisons
Comparison n sðDuÞ sðDvÞ D %u D%v Least square fit
ðcm s�1Þ ðcm s�1Þ ðcm s�1Þ ðcm s�1Þ
UPEG–URCM 18 1.57 1.30 �0:1670:37 0:1970:31 FURCM–ULADCP 29 4.32 4.84 0:4970:84 0:5970:94 0:14URCM þ 0:4UPEG–ULADCP 5841 4.62 4.64 0:4270:06 0:3770:06 0:11UPEG þ 0:4a
an is the number of compared values, sðDUÞ the standard deviation of velocity differences, D %U the average velocity difference.
M. Dengler et al. / Deep-Sea Research II 49 (2002) 1297–1322 1319

been discussed by Fischer and Visbeck (1993) andFiring (1998). In Section 3.2, these measurementsare be used to reference geostrophic currents.However, due to the large uncertainties inbaroclinic LADCP velocities, we refrain from adescription of the abyssal circulation on theirbasis.
Appendix B
Vertically averaged LADCP velocities containcurrent components that are not accounted for inthe geostrophic approximation. The appendixbriefly describes the treatment used in this studyto remove those current components and providesan error estimate.Before the vertically averaged LADCP (%vLADCP)
data were used to reference geostrophic velocities(vref ), three velocity components of the LADCPwere estimated and removed. Those were thebarotropic tidal currents (vtide), the ageostrophiccurrent components (vageo) as Ekman, inertial andcyclostrophic currents and a velocity bias (vbias),determined in Appendix A.
vref ¼ %vLADCP � vtide � vageo � vbias ðB:1Þ
To avoid a degradation of the velocity measure-ments by barotropic tidal currents, the harmonic
constants of 15 tidal constituents were calculatedfrom each mooring. In a first step, five major tidalconstituents were calculated by harmonic analysisfor each time series using 29 day segments. Theresults were used to infer 10 minor constituents onthe basis of the tidal potential. To determine thebarotropic tidal flow, the Fourier coefficients werefinally projected on the barotropic and first threebaroclinic vertical modes. The results for the M2
and the K1 are shown in Fig. 17. M2 major axisamplitude is less than 2 cm s�1 in the centralSomali Basin. However, strong barotropic tidalcurrents with amplitudes of more than 13 cm s�1
are present in the Socotra Passage.Due to the use of 29-day segments, 16 individual
determinations for each tidal constituent at eachtime series were to be obtained, allowing a errorestimate. On average, the M2 constituent tidalcurrents showed a mean standard deviation of0:23 cm s�1 for the zonal and 0:28 cm s�1 for themeridional velocity, implying a standard error ofless than 0:1 cm s�1 for each determination. Thestandard deviation of phase estimates was alsosmall, less than 101: However, tidal constituentswith velocities smaller than 0:2 cm s�1; e.g., the O1constituent, could not be resolved properly,because of large standard deviation of phase.Here, this velocity is taken as the error in the tidalvelocity estimates.
Fig. 17. Tidal currents of the M2 constituent (left) and K1 constituent (right).
M. Dengler et al. / Deep-Sea Research II 49 (2002) 1297–13221320

The contributions of (vageo) were estimated forthe upper water column, where they are presumedto be largest, only. Except for Ekman and inertialcurrents, cyclostrophic current contributions areparticularly large within the Great Whirl (Fischeret al., 1996). For the determination of theageostrophic current component, the differencebetween cross-track ADCP velocities, averagedbetween two CTD stations and the geostrophicvelocities were used. Following Fischer et al.(1996), only the baroclinic flow field was takeninto account. Both velocity shears were referencedat 350 m depths. Particularly large ageostrophiccomponents were determined during the Augustcruise, where the SW-monsoon and the GreatWhirl were fully developed. Here, an absolutesection average of 30 cm s�1 was calculated for thedepth range between 50 and 100 m: However, dueto the fact that large ageostrophic velocities arelimited to a small depth interval in the upper watercolumn, their contributions to the depth-averagevelocities are small. The error in determining theageostrophic contribution is estimated on the basisof the error of the ADCP velocity data, which wasdetermined to be about 3 cm s�1 when averagedbetween stations. The overall contribution to theerror for reference velocity was 0:15 cm s�1 forstation depths larger 3500 m:The largest error contribution to reference
velocity originates from the inaccuracy of themeasurement of depth-average velocity by theLADCP. Except for the LADCP bias, two majorerror sources are the inaccuracy of GPS positionfixes and data gaps in the sampling due to bottominterference (e.g., Firing, 1998). Due to a durationof the LADCP casts of about 4 h; the root meansquare uncertainty of GPS position fixes leads toan uncertainty in the depth averaged LADCPvelocities of 0:6 cm s�1: On average, 23 of the 8 sensembles averages were unreliable due to bottominterference, which adds an additional uncertaintyof 0:2 cm s�1 when assuming a rosette velocity of10 cm s�1: A possible LADCP compass error wasinvestigated by comparing the LADCP velocitycomponents with the Pegasus measurements, butno significant deviation was be found.In summary, the different error contributions to
the reference velocity lead to a total root mean
square error of 1:2 cm s�1; which is predominatelydue to GPS inaccuracy. Other error sources notincluded in this estimate, e.g., errors due to thelimited horizontal resolution of the LADCPmeasurements or ocean interior ageostrophicmotion are believed to be small for the area ofinterest. In fact as is shown in Section 3.2.3 theestimated reference velocity error is somewhatlarger as suggested by the geostrophic transportcalculations.
References
Barton, E.D., Hill, A.E., 1989. Abyssal flow through the
Amirante Trench (western Indian Ocean). Deep-Sea
Research 36, 1121–1126.
Beal, L.M., Molinari, R.L., Robbins, P.E., Chereskin, T.K.,
2000. Reversing bottom circulation in the Somali Basin.
Geophysical Research Letters 27, 2565–2568.
Brandt, P., Stramma, L., Schott, F., Fischer, J., Dengler, M.,
Quadfasel, D., 2002. Annual Rossby waves in the Arabian
Sea from TOPEX/POSEIDON altimeter and in situ data.
Deep-Sea Research II 49, 1197–1210.
Dengler, M., Quadfasel, D., 2002. Equatorial deep jets and
abyssal mixing in the Indian Ocean. Journal of Physical
Oceanography, in press.
Eigenheer, A., 1997. .Uber den Einflu� von niederfrequentenWellen auf die Monsunzirkulation im Indischen Ozean.
Ph.D. Thesis, FB Geowissenschaften der Universit.at Ham-
burg, 106 Seiten.
Fieux, M., Schott, F., Swallow, J.C., 1986. Deep boundary
currents in the western Indian Ocean revisited. Deep-Sea
Research 33, 415–426.
Fieux, M., Swallow, J.C., 1988. Flow of deep water into the
Somali Basin. Deep-Sea Research 35, 303–309.
Firing, E., 1991. Acoustic Doppler current profiling measure-
ments and navigation. Tech. rep., WHPO Publication 91-1,
WOCE Report 68=91:Firing, E., 1998. Lowered ADCP development and use in
WOCE. Intern. WOCE Newsletter 30, 10–14.
Fischer, J., Schott, F., Stramma, L., 1996. Currents and
transports of the Great Whirl-Socotra Gyre system during
the summer monsoon August 1993. Journal of Geophysical
Research 101 (C2), 3573–3587.
Fischer, J., Visbeck, M., 1993. Deep velocity profiling with self-
contained ADCPs. Journal of Atmospheric and Oceanic
Technology 10, 764–773.
Fischer, R.L., Jantsch, M.Z., Comer, R.L., 1982. General
bathymetric chart of the oceans (GEPCO), map 5.09.
Canadian Hydrographic Service, Ottawa.
Johnson, D.A., Damuth, J.E., 1979. Deep thermohaline flow
and current-controlled sedimentation in the Amirante
Passage: Western Indian Ocean. Marine Geology 33, 1–44.
M. Dengler et al. / Deep-Sea Research II 49 (2002) 1297–1322 1321

Johnson, G.C., Musgrave, D.L., Warren, B.A., Ffield, A.,
Olson, D.B., 1998. Flow of bottom and deep water in the
Amirante Passage and Mascarene Basin. Journal of
Geophysical Research 103, 30973–30984.
Johnson, G.C., Warren, B.A., Olson, D.B., 1991a. Flow of
bottom water in the Somali Basin. Deep-Sea Research 38,
637–652.
Johnson, G.C., Warren, B.A., Olson, D.B., 1991b. A deep
boundary current in the Arabian Sea. Deep-Sea Research
38, 653–661.
Joyce, T., Corry, C., 1991. Requirements for WOCE hydro-
graphic programme data reporting. Tech. rep., WHPO
Publication 90-1, Rev. 2, WOCE Report 67=91: 144pp.Liu, Z., Wu, L., Bayler, E., 1999. Rossby wave-coastal Kelvin
wave interaction in the extratropics. Part I: Low-frequency
adjustment in a closed basin. Journal of Physical Oceano-
graphy 29, 2382–2404.
Luyten, J.R., 1982. Equatorial current measurements, I.
moored observations. Journal of Marine Research 40,
19–41.
Quadfasel, D., Fischer, J., Schott, F., Stramma, L., 1997. Deep
water exchange through the Owens Fracture Zone in the
Arabian Sea. Geophysical Research Letters 24, 2805–2808.
Sanford, T.B., 1991. Spatial structures of thermocline and
abyssal waves. In: M .uller, P., Henderson, D. (Eds.),
Dynamics of Oceanic Internal Gravity Waves. ’Aha
Huliko’a Hawaiian Winter Workshop. University of Hawaii
at Manoa, pp. 109–142.
Schott, F., Fischer, J., 2000. Winter monsoon circulation of the
northern Arabian Sea and Somali Current. Journal of
Geophysical Research 105, 6359–6376.
Schott, F., Fischer, J., Garternicht, U., Quadfasel, D., 1997.
Summer monsoon response of the northern Somali Current,
1995. Geophysical Research Letters 24, 2565–2568.
Schott, F., Pollehne, F., Quadfasel, D., Stramma, L., Wiesner,
M., Zeitzschel, B., 1996. Arabian Sea 1995. Cruise No. 32,
23 March–19 December 1995. Meteor Berichte 95-6, 163 pp.
Schott, F., Swallow, J.C., Fieux, M., 1989. Deep currents
underneath the equatorial Somali Current. Deep-Sea
Research 36 (8), 1191–1199.
Send, U., 1994. Accuracy of velocity profile measurements:
Effect of tropical and midlatitude internal waves. Journal of
Geophysical Research 99 (C8), 16 229–16 236.
Send, U., Visbeck, M., Krahmann, G., 1996. Aspects of
acoustic transponder surveys and acoustic navigation. IEEE
Oceans 96, 1631–1642.
Sengupta, D., Senan, R., Goswami, B.N., 2001. Origin of
intraseasonal variability of circulation in the tropical central
Indian Ocean. Geophysical Research Letters 28,
1267–1270.
Sloyan, B.M., Rintoul, S.R., 2001. The Southern Ocean limb of
the global deep overturning circulation. Journal of Physical
Oceanography 31, 143–173.
Smith, W.H.F., Sandwell, D.T., 1997. Global sea floor
topography from satellite altimetry and ship depth sound-
ings. Science 2775, 1956–1962.
Spain, P.F., Dorson, D.L., Rossby, H., 1981. Pegasus: A
simple, acoustically tracked velocity profiler. Deep-Sea
Research 28, 1553–1567.
Spencer, D., Broeker, W.S., Craig, H., Weiss, R.F., 1982.
Sections and profiles. In: GEOSECS Indian Ocean Expedi-
tion, Vol. 6, National Science Foundation, Washington,
DC, 140 pp.
Stommel, H., Arons, A.B., 1960. On the abyssal circulation of
the world ocean-I. Stationary planetary flow patterns on a
sphere. Deep-Sea Research 6, 140–154.
Toole, J.M., Warren, B.A., 1993. A hydrographic section across
the subtropical south Indian Ocean. Deep-Sea Research I
40, 1973–2019.
Warren, B.A., 1978. Bottom water transport through the
Southwest Indian Ridge. Deep-Sea Research 13, 315–321.
Warren, B.A., 1981a. Deep circulation to the World Ocean. In:
Warren, B.A., Wunsch, C. (Eds.), Evolution of Physical
Oceanography. The MIT Press, Cambridge, MA, pp. 6–41.
Warren, B.A., 1981b. Transindian hydrographic section at Lat.
181S: Property distributions and circulation in the South
Indian Ocean. Deep-Sea Research 28, 759–788.
Warren, B.A., 1993. Circulation of north Indian deep water in
the Arabian Sea. In: Desai, B.N. (Ed.), Oceanography in the
Indian Ocean. A.A. Balkema, Rotterdam, pp. 575–582.
Warren, B.A., Johnson, G.C., 1992. Deep currents in the
Arabian Sea. Marine Geology 104, 279–288.
Warren, B.A., Johnson, G.C., 2002. The overflows across the
Ninetyeast Ridge. Deep-Sea Research II 49, 1423–1439.
Warren, B.A., Stommel, H., Swallow, J.C., 1966. Water masses
and patterns of flow in the Somali Basin during the
southwest monsoon of 1964. Deep-Sea Research 13,
825–860.
Wirth, A., Willebrand, J., Schott, F., 2002. Variability of the
Great-Whirl from observations and models. Deep-Sea
Research II 49, 1279–1295.
Wunsch, C., 1996. The Ocean Circulation Inverse Problem
Cambridge University Press, Cambridge 422pp.
Wyrtki, K., 1971. Oceanic Atlas of the International Indian
Ocean Expedition National Science Foundation Washing-
ton, DC 531 pp.
Zhang, H.M., Talley, L.D., 1998. Heat and buoyancy budgets
and mixing rates in the upper thermocline of the Indian and
global Oceans. Journal of Physical Oceanography 28,
1961–1978.
M. Dengler et al. / Deep-Sea Research II 49 (2002) 1297–13221322


