Embed Size (px)
Citation preview
The Dissertation Committee for Rubén Mario Salas Pereira certifies that this is the approved version of the following dissertation:
Accelerated Corrosion Testing, Evaluation and Durability Design
of Bonded Post-Tensioned Concrete Tendons
Committee:
John E. Breen, Supervisor Michael E. Kreger James O. Jirsa Harovel G. Wheat Kevin J. Folliard

Accelerated Corrosion Testing, Evaluation and Durability Design
of Bonded Post-Tensioned Concrete Tendons
by
Rubén Mario Salas Pereira, Lic, M.S.E.
Dissertation
Presented to the Faculty of the Graduate School of
The University of Texas at Austin
in Partial Fulfillment
of the Requirements
for the Degree of
Doctor of Philosophy
The University of Texas at Austin
August 2003

To Seidy
and
to my parents

iv
Acknowledgements
I wish to express my deepest and sincere appreciation to Dr. John E. Breen
for his encouragement and support in beginning these studies, and for his constant
and inspiring guidance. It has been my distinct pleasure and proud privilege to
have him as my supervising professor. I will treasure his advice and his lessons
forever.
My sincere thanks are to all the committee members of this dissertation,
Dr. Michael Kreger, Dr. James Jirsa, Dr. Harovel Wheat, and Dr. Kevin Folliard
for their invaluable suggestions and constructive criticisms.
I would like to thank the graduate students that worked on TxDOT Project
1405 before I started, especially Jeff West and Andrea Schokker for their fine
work that represents an important portion of this dissertation. I also wish to thank
Andrea Kotys for her hard work, especially in the beam portion of the research
project.
I wish to acknowledge the assistance of the administrative and technical
staff of Ferguson Structural Engineering Laboratory especially Regina Forward,
Hortensia Peoples, Mary Jo Moore, Blake Stasney and Mike Bell.
My sincere thanks are to the graduate and undergraduate students that
worked with me during the project, especially to Juan José, Felipe, Art, Chris and
Jeff.

v
The experimental investigation presented in this dissertation was
sponsored by the Texas Department of Transportation. The financial support
received in this regard is gratefully acknowledged.
I wish to express my appreciation to the Universidad de Costa Rica,
especially to the Department of Civil Engineering for providing support which
enabled me to pursue these graduate studies.
My sincere thanks are to my colleagues in Franz Sauter & Asociados S.A.,
especially to Mr. Franz Sauter for his support and guidance.
Many thanks to my friends in Austin for their support and help.
I would like to thank Doña Rosario, Alex, and the rest of my wife’s family
for their constant support.
Special thanks to my parents, Padre and Madre, for their love and support
throughout the years. They have taught me with their example the joy of learning
and the pursuit of excellence. With their drive and perseverance, maintaining the
highest values, they inspire me to allow all my dreams to come true.
Special thanks to my brothers and sisters; I am following in your
footsteps. Thanks also to the rest of my family, including my nephew Roberto
for his technical assistance and support during my defense.
I would like especially to thank my wife Seidy, for all the help that she
gave me during the course of this dissertation, but especially for her love, her
patience, her tolerance… Flaquita: I love you.
Finally, I thank God for all. Ruben M. Salas
July, 2003

vi
Accelerated Corrosion Testing, Evaluation and Durability Design
of Bonded Post-Tensioned Concrete Tendons
Publication No. ______________
Rubén Mario Salas Pereira, Ph.D.
The University of Texas at Austin, 2003
Supervisor: John E. Breen
In the last few years, the effectiveness of cement grout in galvanized or
polyethylene ducts, the most widely used corrosion protection system for
multistrand bonded post-tensioned concrete tendons, has been under debate, due
to significant tendon corrosion damage, several reported failures of individual
tendons as well as a few collapses of non-typical structures. While experience in
the USA has been generally good, some foreign experience has been less than
satisfactory.
This dissertation is part of a comprehensive research program started in
1993, which has the objectives to examine the use of post-tensioning in bridge
substructures, identify durability concerns and existing technology, develop and
carry out an experimental testing program, and conclude with durability design
guidelines.

vii
Three experimental programs were developed: A long term macrocell
corrosion test series, to investigate corrosion protection for internal tendons in
precast segmental construction; a long term beam corrosion test series, to examine
the effects of post-tensioning on corrosion protection as affected by crack width;
and, a long term column corrosion test series, to examine corrosion protection in
vertical elements.
Preliminary design guidelines were developed previously in the overall
study by the initial researchers, after an extensive literature review.
This dissertation scope includes continuation of exposure testing of the
macrocell, beam and column specimens, performing comprehensive autopsies of
selected specimens and updating the durability design guidelines based on the
exposure testing and autopsy results.
After autopsies were performed, overall findings indicate negative
durability effects due to the use of mixed reinforcement, small concrete covers,
galvanized steel ducts, and industry standard or heat-shrink galvanized duct
splices. The width of cracks was shown to have a direct negative effect on
specimen performance. Grout voids were found to be detrimental to the
durability of both galvanized ducts and strand. Relying on epoxy and galvanized
bar coatings was also found inappropriate because of local attack. On the other
hand, very positive effects were found with the use of high performance concrete,
high post-tensioning levels, plastic ducts, and sound epoxy filling at the joints.

viii
Table of Contents
LIST OF TABLES ........................................................................................... xxiv
LIST OF FIGURES .......................................................................................xxviii
CHAPTER 1: INTRODUCTION ........................................................................ 1
1.1 Background ............................................................................................. 1
1.2 Research Objectives and Scope............................................................... 6 1.2.1 Project Statement ............................................................................... 6 1.2.2 Project Objectives .............................................................................. 7 1.2.3 Project Scope...................................................................................... 8 1.2.4 Dissertation Scope............................................................................ 13
CHAPTER 2: INTERNAL BONDED POST-TENSIONING SYSTEMS..... 15
2.1 Prestressed Concrete ............................................................................. 15 2.1.1 Historical Development ................................................................... 15 2.1.2 Basic Definitions.............................................................................. 17 2.1.3 Advantages and Disadvantages of Internal and External Post-
Tensioning........................................................................................ 19 2.1.4 Mixed Post-Tensioning .................................................................... 20 2.1.5 Applications of Bonded Post-Tensioning ........................................ 22 2.1.6 Partial Post-Tensioning .................................................................... 25
2.2 Durability of Bonded Post-Tensioned Concrete Structures .................. 26 2.2.1 Problems Encountered Around the World: The Ghent Workshop ... 27 2.2.2 Experience in United States ............................................................. 29
2.3 Factors Affecting the Durability of Bonded Post-Tensioned Concrete Structures ............................................................................. 37
2.3.1 Exposure Conditions ........................................................................ 37 2.3.1.1 Coastal Exposure ...................................................................... 37

ix
2.3.1.2 Freezing Exposure .................................................................... 38 2.3.1.3 Aggressive Soils ...................................................................... 39
2.3.2 Concrete Durability.......................................................................... 39 2.3.2.1 Sulfate Attack ........................................................................... 39 2.3.2.2 Freezing and Thawing Damage................................................ 40 2.3.2.3 Alkali-Aggregate Reaction ....................................................... 40 2.3.2.4 Carbonation .............................................................................. 40 2.3.2.5 Cracking.................................................................................... 41
2.3.3 Grouts for Post-Tensioning .............................................................. 42 2.3.3.1 Voids and Bleed Water............................................................. 43 2.3.3.2 Grout Cracking ......................................................................... 44
2.3.4 Corrosion of Steel Components in Post-Tensioning System ........... 44 2.3.4.1 Corrosion Fundamentals........................................................... 45 2.3.4.1.1 Passivity........................................................................ 46 2.3.4.1.2 Corrosion of Steel in Concrete ..................................... 46 2.3.4.1.3 Half-Cell Potential Measurements ............................... 47 2.3.4.2 Chloride Induced Corrosion ..................................................... 48 2.3.4.2.1 Uniform Corrosion ...................................................... 51 2.3.4.2.2 Pitting Corrosion ......................................................... 51 2.3.4.3 Hydrogen Embrittlement and Stress Corrosion Cracking ....... 52 2.3.4.4 Steel Geometry and Crevice Corrosion ................................... 53
2.3.5 Anchorage Sealing ........................................................................... 54 2.3.6 Precast Segmental Construction-Joint Performance ........................ 54
2.4 Corrosion Protection of Bonded Post-Tensioned Concrete Structures . 55 2.4.1 Structural Form ................................................................................ 58
2.4.1.1 Drainage.................................................................................... 58 2.4.1.2 Joints ......................................................................................... 58 2.4.1.3 Splashing .................................................................................. 58 2.4.1.4 Geometry .................................................................................. 59

x
2.4.2 Structural Design Details ................................................................. 59 2.4.2.1 Cracking.................................................................................... 59 2.4.2.2 Reinforcement Details .............................................................. 59
2.4.3 Surface Treatments........................................................................... 59 2.4.4 Concrete as Corrosion Protection..................................................... 60
2.4.4.1 Concrete Permeability .............................................................. 60 2.4.4.2 Cover Thickness ....................................................................... 60 2.4.4.3 Corrosion Inhibitors.................................................................. 61
2.4.5 High Performance Grouts ................................................................ 61 2.4.6 Ducts for Post-Tensioning................................................................ 62 2.4.7 Coatings on Prestressing Steel ......................................................... 64
2.4.7.1 Metallically Coated Prestressing Steels.................................... 64 2.4.7.2 Non Metallically Coatings for Prestressing Steels .................. 64
2.4.8 Prestressing Steel-Other Prestressing Materials............................... 65 2.4.9 Anchorage Protection....................................................................... 65 2.4.10 Encapsulated and Electrically Isolated Systems............................. 68 2.4.11 Precast Segmental Construction-Joint Detail ................................. 68 2.4.12 Temporary Corrosion Protection.................................................... 69 2.4.13 Inspection Practices ........................................................................ 69 2.4.14 Monitoring...................................................................................... 69
CHAPTER 3: MACROCELL CORROSION TEST....................................... 71
3.1 Experimental Program........................................................................... 72 3.1.1 Test Specimen .................................................................................. 73 3.1.2 Variables .......................................................................................... 76
3.1.2.1 Joint Type ................................................................................. 76 3.1.2.2 Duct Type ................................................................................. 78 3.1.2.3 Joint Precompression................................................................ 78 3.1.2.4 Grout Type................................................................................ 78

xi
3.1.2.5 Specimen Types........................................................................ 78 3.1.3 Materials........................................................................................... 80 3.1.4 Measurements During Exposure Testing ......................................... 81
3.1.4.1 Macrocell Corrosion Current Measurements ........................... 81 3.1.4.2 Half-Cell Potential Readings .................................................... 82
3.2 Exposure Test Results ........................................................................... 85 3.2.1 Macrocell Corrosion Current Results............................................... 85 3.2.2 Half-Cell Potential Readings............................................................ 90 3.2.3 Specimen Performance Reproducibility Based on Half-Cell
Potentials .......................................................................................... 93 3.2.4 Analysis and Discussion of Exposure Test Results ......................... 95
3.2.4.1 Time to Initiation of Corrosion................................................. 95 3.2.4.2 General Behavior Over Exposure Time ................................... 98 3.2.4.2.1 Macrocell Current......................................................... 98 3.2.4.2.2 Half-Cell Potentials ...................................................... 99 3.2.4.3 Corrosion Rate or Severity ..................................................... 100 3.2.4.3.1 Weighted Average Corrosion Current........................ 100 3.2.4.3.2 Corrosion Current Density ......................................... 101 3.2.4.3.3 Metal Loss .................................................................. 103 3.2.4.3.4 Discussion: Corrosion Rate Calculations .................. 104
3.3 Forensic Examination.......................................................................... 108 3.3.1 Procedure........................................................................................ 109
3.3.1.1 Specimen Condition at End of Testing................................... 109 3.3.1.2 Concrete Powder Samples for Chloride Analysis .................. 109 3.3.1.2.1 Location A .................................................................. 111 3.3.1.2.2 Location B .................................................................. 111 3.3.1.2.3 Location C .................................................................. 111 3.3.1.3 Longitudinal Saw Cuts ........................................................... 112 3.3.1.4 Expose and Remove Duct and Strand .................................... 112
xii
3.3.1.5 Grout Samples for Chloride Analysis..................................... 113 3.3.1.6 Expose and Remove Mild Steel.............................................. 113 3.3.1.7 Examine Joint Condition ....................................................... 114
3.3.2 Autopsy Program ........................................................................... 115 3.3.3 Evaluation and Rating of Corrosion Found During Forensic
Examination ................................................................................... 116 3.3.3.1 Prestressing Strand ................................................................ 117 3.3.3.2 Mild Steel Reinforcing .......................................................... 119 3.3.3.3 Galvanized Steel Duct ........................................................... 121
3.3.4 Forensic Examination Results........................................................ 123 3.3.4.1 Detailed Visual Inspection...................................................... 123 3.3.4.1.1 Specimen DJ-S-L-NG 2 (Dry Joint, Steel Duct, Low
Precompresion , Normal Grout) ................................................. 123 3.3.4.1.2 Specimen DJ-S-M-NG 2 (Dry Joint, Steel Duct,
Medium Precompresion , Normal Grout) ................................. 125 3.3.4.1.3 Specimen DJ-S-H-NG 2 (Dry Joint, Steel Duct,
High Precompresion , Normal Grout) ........................................ 127 3.3.4.1.4 Specimen DJ-P-L-NG 2 (Dry Joint, Plastic Duct,
Low Precompresion , Normal Grout)......................................... 129 3.3.4.1.5 Specimen DJ-P-M-NG 2 (Dry Joint, Plastic Duct,
Medium Precompresion , Normal Grout) .................................. 131 3.3.4.1.6 Specimen DJ-S-L-CI 2 (Dry Joint, Plastic Duct, Low
Precompresion , Corrosion Inhibitor in Grout) .......................... 132 3.3.4.1.7 Specimen DJ-S-M-CI 2 (Dry Joint, Plastic Duct,
Medium Precompresion , Corrosion Inhibitor in Grout) ........... 134 3.3.4.1.8 Specimen SE-S-L-NG 1 (Epoxy Joint, Steel Duct,
Low Precompresion , Normal Grout)......................................... 136 3.3.4.1.9 Specimen SE-S-M-NG 1 (Epoxy Joint, Steel Duct,
Medium Precompresion , Normal Grout) .................................. 138 3.3.4.1.10 Specimen SE-S-H-NG 1 (Epoxy Joint, Steel Duct,
High Precompresion , Normal Grout) ........................................ 140 3.3.4.1.11 Specimen SE-P-L-NG 1 (Epoxy Joint, Plastic Duct,
Low Precompresion , Normal Grout)......................................... 141

xiii
3.3.4.1.12 Specimen SE-P-M-NG 1 (Epoxy Joint, Plastic Duct, Medium Precompresion , Normal Grout)......................... 143
3.3.4.1.13 Specimen SE-S-L-CI 1 (Epoxy Joint, Steel Duct, Low Precompresion , Corrosion Inhibitor in Grout).................. 144
3.3.4.1.14 Specimen SE-S-M-CI 1 (Epoxy Joint, Steel Duct, Medium Precompresion , Corrosion Inhibitor in Grout) ........... 146
3.3.4.1.15 Specimen SE-S-H-CI 1 (Epoxy Joint, Steel Duct, High Precompresion , Corrosion Inhibitor in Grout) ................. 148
3.3.4.1.16 Specimen SE-S-L-SF 1 (Epoxy Joint, Steel Duct, Low Precompresion , Silica Fume added to Grout) ................... 149
3.3.4.1.17 Specimen EG-S-L-NG 1 (Epoxy Joint with Gasket, Steel Duct, Low Precompresion , Normal Grout)...................... 151
3.3.4.1.18 Specimen EG-S-M-NG 1 (Epoxy Joint with Gasket, Steel Duct, Medium Precompresion , Normal Grout) .. 153
3.3.4.1.19 Specimen EG-S-H-NG 1 (Epoxy Joint with Gasket, Steel Duct, High Precompresion , Normal Grout) ..................... 155
3.3.4.2 Corrosion Rating Summary .................................................... 157 3.3.4.3 Chloride Analysis ................................................................... 161
3.4 Analysis and Discussion of Results .................................................... 173 3.4.1 Overall Performance ...................................................................... 173 3.4.2 Effect of Joint Type........................................................................ 177
3.4.2.1 Galvanized Steel Duct Corrosion ........................................... 177 3.4.2.2 Prestressing Strand Corrosion ................................................ 178 3.4.2.3 Mild Steel Reinforcement Corrosion...................................... 179 3.4.2.4 Chloride Penetration ............................................................... 179 3.4.2.5 Grouting.................................................................................. 180
3.4.3 Effect of Duct Type........................................................................ 180 3.4.3.1 Duct Corrosion ....................................................................... 180 3.4.3.2 Prestressing Strand Corrosion ................................................ 181 3.4.3.3 Reversed Macrocell ................................................................ 182
3.4.4 Effect of Joint Precompression ...................................................... 182

xiv
3.4.4.1 Strand and Mild Steel Corrosion ............................................ 182 3.4.4.2 Duct Corrosion ....................................................................... 183
3.4.5 Effect of Grout Type ...................................................................... 185 3.4.6 Grout Voids.................................................................................... 188 3.4.7 Reversed Corrosion Macrocell....................................................... 190 3.4.8 Test Measurements......................................................................... 191
3.4.8.1 Comparisson Between Half-Cell Potentials and Macrocell Corrosion Current....................................................................... 191
3.4.8.2 Comparisson Between Macrocell Corrosion Current and Forensic Examination................................................................. 193
3.5 Summary and Conclusions from Macrocell Corrosion Tests ............. 195 3.5.1 Overall Performance ...................................................................... 196 3.5.2 Assessing Corrosion Activity Using Half-Cell Potential
Measurements ................................................................................ 197 3.5.3 Segmental Joints............................................................................. 198 3.5.4 Ducts for Internal Post-Tensioning ................................................ 199 3.5.5 Joint Precompression ..................................................................... 200 3.5.6 Grout for Bonded Post-Tensioning ................................................ 201
3.6 Measures for Implementation from Macrocell Results....................... 202
CHAPTER 4: LARGE SCALE BEAM CORROSION TESTS ................... 205
4.1 Research Objectives ............................................................................ 206
4.2 Experimental Program......................................................................... 206 4.2.1 Test Specimen ................................................................................ 208
4.2.1.1 Specimen Description............................................................. 208 4.2.1.2 Specimen Design .................................................................... 210 4.2.1.2.1 Levels of Prestress...................................................... 210 4.2.1.2.2 Design Loading .......................................................... 210 4.2.1.2.3 Section Reinforcement ............................................... 212

xv
4.2.1.2.4 Analysis of Section Behavior ..................................... 214 4.2.2 Variables ........................................................................................ 216
4.2.2.1 Control Variables.................................................................... 216 4.2.2.2 Phase I Variables .................................................................... 217
4.2.2.2.1 Levels of Prestressing, Loading and Cracking ............ 217 4.2.2.2.2 Duct Splices for Galvanized Steel Duct ...................... 218 4.2.2.2.3 High Performance Fly Ash Grout................................ 219
4.2.2.3 Phase II Variables ................................................................... 219 4.2.2.3.1 Concrete Type.............................................................. 219 4.2.2.3.2 Prestressing Strand Types............................................ 220 4.2.2.3.3 Duct Type and End Anchorage Protection .................. 221 4.2.2.3.4 High Performance Antibleed Grout and Poor
Grouting Procedures........................................................... 221 4.2.3 Specimen Types ............................................................................. 222 4.2.4 Materials......................................................................................... 224 4.2.5 Experimental Set-Up...................................................................... 226 4.2.6 Specimen Fabrication..................................................................... 228 4.2.7 Specimen Loading.......................................................................... 230 4.2.8 Block Specimen ............................................................................. 231 4.2.9 Beam Dripper System .................................................................... 231
4.3 Measurements During Exposure Testing ............................................ 232 4.3.1 Visual Inspection............................................................................ 232 4.3.2 Crack Width Measurements ........................................................... 232 4.3.3 Half-Cell Readings......................................................................... 233 4.3.4 Corrosion Rate Readings................................................................ 235 4.3.5 Chloride Penetration Measurements .............................................. 241 4.3.6 Limited Autopsy............................................................................. 244
4.4 Exposure Test Results ........................................................................ 244 4.4.1 Crack Width Measurements .......................................................... 244

xvi
4.4.1.1 Crack Widths During Initial Loading............................. 245 4.4.1.2 Crack Widths at the End of Testing for Autopsy
Beams................................................................................. 249 4.4.2 Half-Cell Potential Readings.......................................................... 253
4.4.2.1 Phase I Beam Specimens ................................................ 254 4.4.2.2 Phase II Beam Specimens............................................... 263
4.4.3 Corrosion Rate Measurements ...................................................... 271 4.4.3.1 Phase I Beam Measurements .......................................... 271 4.4.3.2 Phase II Beam Measurements......................................... 277
4.4.4 Chloride Content Analysis ............................................................. 278 4.4.4.1 Phase I Concrete Block Specimens ................................ 279 4.4.4.2 Phase II Concrete Block Specimens ............................... 281 4.4.4.3 Phase I Autopsy Beam Specimens ................................. 283 4.4.4.4 Phase II Autopsy Beam Specimens ................................ 288
4.5 Forensic Examination.......................................................................... 293 4.5.1 Autopsy Procedure ......................................................................... 293
4.5.1.1 Specimen Selection for Forensic Examination....................... 293 4.5.1.2 Specimen Condition at End of Testing.................................. 297 4.5.1.3 Crack Measurements .............................................................. 297 4.5.1.4 Concrete Powder Samples for Chloride Analysis .................. 297 4.5.1.5 Saw Cuts and Concrete Removal ........................................... 297 4.5.1.5.1 Full Autopsies............................................................. 297 4.5.1.5.2 Partial Autopsies......................................................... 300 4.5.1.6 Exposure and Removal of Ducts ............................................ 300 4.5.1.7 Splice Condition Examination................................................ 300 4.5.1.8 Duct Opening and Grout Condition Examination .................. 301 4.5.1.9 Grout Samples for Chloride Analysis..................................... 301 4.5.1.10 Grout Removal and Strand Exposure ................................... 301 4.5.1.11 Mild Steel Exposure and Removal ....................................... 301

xvii
4.5.2 Evaluation and Corrosion Rating System Used During Forensic Examination ................................................................................... 302
4.5.2.1 Mild Steel Reinforcement....................................................... 303 4.5.2.2 Galvanized Steel Duct/Duct Splice ........................................ 305 4.5.2.3 Prestressing Strand ................................................................. 307 4.5.2.4 Duct Splices............................................................................ 309 4.5.2.5 Grout ....................................................................................... 309
4.5.3 Forensic Examination Results for Phase I Beams.......................... 309 4.5.3.1 Beam Specimen 1.1 – Non-PS, Unloaded.............................. 309 4.5.3.2 Beam Specimen 1.3 – Non-PS, Constant Service Load ......... 312 4.5.3.3 Beam Specimen 2.3 – 2/3 PS, Service Load .......................... 314 4.5.3.4 Beam Specimen 2.11 – 2/3 PS, Service Load, Fly
Ash Gout .................................................................................... 320 4.5.3.5 Beam Specimen 3.1 – 100% U PS, Unloaded........................ 325 4.5.3.6 Beam Specimen 3.2 – 100% U PS, Service Load .................. 330 4.5.3.7 Beam Specimen 3.3 – 100% U PS, Overload......................... 335 4.5.3.8 Beam Specimen 4.2 – 100% S PS, Service Load................... 340
4.5.4 Forensic Examination Results for Phase II Beams ........................ 345 4.5.4.1 Beam Specimen 1.5 – Non-PS, Fly Ash Concrete ................. 345 4.5.4.2 Beam Specimen 1.6 – Non-PS, High Performance
Concrete ..................................................................................... 348 4.5.4.3 Beam Specimen 2.5 – 2/3 PS, Fly Ash Concrete ................... 351 4.5.4.4 Beam Specimen 2.6 – 2/3 PS, High Performance Concrete... 356 4.5.4.5 Beam Specimen 3.6 – 100% U PS, Fly Ash Concrete ........... 361 4.5.4.6 Beam Specimen 3.7 – 100% U PS, High Performance
Concrete ..................................................................................... 366 4.5.5 Corrosion Rating Summary............................................................ 371
4.5.5.1 Stirrup Corrosion Ratings....................................................... 371 4.5.5.2 Rebar Corrosion Ratings ....................................................... 373 4.5.5.3 Galvanized Steel Duct Ratings ............................................... 375

xviii
4.5.5.4 Prestressing Strand Ratings .................................................... 377
4.6 Analysis and Discussion of Results .................................................... 378 4.6.1 Overal Performance ....................................................................... 378 4.6.2 Effect of Cracking .......................................................................... 385
4.6.2.1 Crack Density ......................................................................... 385 4.6.2.2 Crack Width............................................................................ 391 4.6.2.3 Longitudinal Cracking............................................................ 396 4.6.2.4 Loading Levels ....................................................................... 396 4.6.2.5 Prestressing Levels ................................................................. 397
4.6.3 Effect of Concrete Type ................................................................ 397 4.6.4 Effect of Splice Type ..................................................................... 398 4.6.5 Effect of Splice Damage ................................................................ 399 4.6.6 Effect of Grout Type ...................................................................... 399 4.6.7 Special Autopsy Findings .............................................................. 399 4.6.8 Exposure Testing Measurements versus Forensic Examination
Results ............................................................................................ 400 4.6.8.1 Half-Cell Potential Readings versus Forensic Examination
Results ........................................................................................ 402 4.6.9 Corrosion Rate Measurements versus Forensic Examination
Results ............................................................................................ 409 4.6.10 Chloride Penetration versus Forensic Examination Results......... 414 4.6.11 Final Full Autopsies ..................................................................... 421
4.7 Summary and Conclusions.................................................................. 422 4.7.1 Overall Performance ...................................................................... 422 4.7.2 Load/Prestress Level versus Corrosion. The Effect of Cracking... 424 4.7.3 Fly Ash in Concrete ....................................................................... 425 4.7.4 Duct Splices for Galvanized Steel Duct......................................... 425 4.7.5 High Performance Fly Ash Grouts................................................. 426 4.7.6 Exposure Testing Results ............................................................... 427

xix
4.8 Recommendations for Future Testing ................................................. 428
4.9 Implementation of Results ................................................................... 428
CHAPTER 5: LARGE SCALE COLUMN CORROSION TEST ............... 431
5.1 Background and Objectives ................................................................ 431
5.2 Experimental Program......................................................................... 434 5.2.1 Test Specimen ................................................................................ 434
5.2.1.1 Design Loading....................................................................... 434 5.2.1.2 Reinforced Concrete Design................................................... 436 5.2.1.3 Post-Tensioned Column Design ............................................. 437
5.2.2 Variables ........................................................................................ 439 5.2.2.1 Control Variables.................................................................... 439 5.2.2.2 Column to Foundation Connection......................................... 440 5.2.2.3 Loading................................................................................... 440 5.2.2.4 Concrete Type......................................................................... 441 5.2.2.5 Post-Tensioning Ducts............................................................ 441 5.2.2.6 Prestressing Bar Coating ........................................................ 442
5.2.3 Specimen Types ............................................................................. 442 5.2.4 Materials......................................................................................... 443 5.2.5 Experimental Set up ....................................................................... 446
5.2.5.1 Exposure Conditions............................................................... 447 5.2.5.2 Specimen Location ................................................................. 448
5.2.6 Specimen Fabrication..................................................................... 449 5.2.7 Specimen Loading.......................................................................... 452 5.2.8 Measurements During Exposure Testing ....................................... 453
5.2.8.1 Half-Cell Potential Readings .................................................. 453 5.2.8.2 Chloride Penetration ............................................................... 454
5.3 Exposure Test Results ......................................................................... 455 5.3.1 Half Cell Potential Readings.......................................................... 455

xx
5.3.2 Chloride Content in Concrete......................................................... 467 5.3.3 Prediction of Specimen Performance Using Half-Cell Potential
Data ................................................................................................ 474
5.4 Forensic Examination.......................................................................... 474 5.4.1 Procedure........................................................................................ 474
5.4.1.1 Specimen Condition at End of Testing................................... 474 5.4.1.2 Foundation Saw Cuts.............................................................. 475 5.4.1.3 Concrete Removal .................................................................. 475
5.4.2 Autopsy Program ........................................................................... 476 5.4.3 Evaluation and Corrosion Rating Used During Forensic
Examination ................................................................................... 477 5.4.3.1 Mild Steel Reinforcement (Spirals, Longitudinal Steel and
Dowels) ...................................................................................... 477 5.4.3.2 Post-Tensioning Ducts............................................................ 480 5.4.3.3 Post-Tensioning Bars.............................................................. 482
5.4.4 Forensic Examination Results........................................................ 483 5.4.4.1 Detail Visual Inspection ......................................................... 483
5.4.4.1.1 Specimen NJ-TC-N (No Dowel, Class C Concrete, No Load) ............................................................................ 484
5.4.4.1.2 Specimen DJ-TC-N (Doweled Joint, Class C Concrete, No Load) ............................................................ 485
5.4.4.1.3 Specimen DJ-FA-S (Doweled Joint, Fly Ash Concrete, Service Load)..................................................... 487
5.4.4.1.4 Specimen DJ-TC-S (Doweled Joint, Class C Concrete, Service Load)..................................................... 489
5.4.4.1.5 Specimen NJ-TC-S (No Dowel, Class C Concrete, Service Load) ..................................................................... 491
5.4.4.1.6 Specimen PT-TC-N-PD (Post-Tensioned, Class C Concrete, No Load, Plastic Duct) ...................................... 492
5.4.4.1.7 Specimen PT-TC-S-PD (Post-Tensioned, Class C Concrete, Service Load, Plastic Duct) ............................... 496

xxi
5.4.4.1.8 Specimen PT-FA-S-PD (Post-Tensioned, Fly Ash Concrete, Service Load, Plastic Duct) ............................... 498
5.4.4.1.9 Specimen PT-TC-S-EB (Post-Tensioned, Class C Concrete, Service Load, Epoxy-Coated PT Bar) ............... 500
5.4.4.1.10 Specimen PT-TC-S-GB (Post-Tensioned, Class C Concrete, Service Load, Galvanized PT Bar) .................... 502
5.4.4.2 Corrosion Rating Summary .................................................... 504 5.4.4.3 Chloride Content in Grout ...................................................... 518
5.5 Analysis and Discussion of Results .................................................... 522 5.5.1 Overall Performance ...................................................................... 522 5.5.2 Comparison Between Half-Cell Potentials and Corrosion Ratings527 5.5.3 Effect of Loading ........................................................................... 528 5.5.4 Effect of Trickle Saltwater ............................................................. 528 5.5.5 Effect of Joint Type........................................................................ 529 5.5.6 Effect of Concrete Type ................................................................ 529 5.5.7 Effect of Duct Type........................................................................ 530 5.5.8 Effect of Post-Tentioning Bar Coatings......................................... 530
5.6 Summary and Conclusions.................................................................. 531 5.6.1 Post-Tensioning to Improve Corrosion Protection ....................... 531 5.6.2 Fly Ash as Partial Cement Replacement in Concrete .................... 532 5.6.3 Plastic Ducts for Post-Tensioning.................................................. 532 5.6.4 Post-Tensioning Bar Coatings........................................................ 533
5.7 Implementation of Results .................................................................. 534
CHAPTER 6: DURABILITY DESIGN GUIDELINES TO REDUCE CORROSION RISK ................................................................................ 535
6.1 Measures for Implementation from Macrocell Corrosion Tests ......... 535
6.2 Measures for Implementation from Beam Corrosion Tests ................ 536
6.3 Measures for Implementation from Column Corrosion Tests ............ 538

xxii
CHAPTER 7: SUMMARY AND CONCLUSIONS....................................... 541
7.1 Summary and Conclusions from Macrocell Corrosion Tests ............. 543 7.1.1 Overall Performance ...................................................................... 543 7.1.2 Assessing Corrosion Activity Using Half-Cell Potential
Measurements ................................................................................ 544 7.1.3 Segmental Joints............................................................................. 545 7.1.4 Ducts for Internal Post-Tensioning ................................................ 546 7.1.5 Joint Precompression ..................................................................... 547 7.1.6 Grout for Bonded Post-Tensioning ................................................ 548
7.2 Summary and Conclusions from Beam Corrosion Tests .................... 549 7.2.1 Overall Performance ...................................................................... 549 7.2.2 Load/Prestress Level versus Corrosion. The Effect of Cracking... 551 7.2.3 Fly Ash in Concrete ....................................................................... 552 7.2.4 Duct Splices for Galvanized Steel Duct......................................... 553 7.2.5 High Performance Fly Ash Grouts................................................. 553 7.2.6 Exposure Testing Results ............................................................... 554
7.3 Summary and Conclusions from Column Corrosion Tests................. 555 7.3.1 Post-Tensioning to Improve Corrosion Protection ....................... 556 7.3.2 Fly Ash as Partial Cement Replacement in Concrete .................... 556 7.3.3 Plastic Ducts for Post-Tensioning.................................................. 557 7.3.4 Post-Tensioning Bar Coatings........................................................ 557
7.4 Major Overall Conclusions ................................................................. 558
7.5 Reccomended Changes and Procedures .............................................. 561
7.6 Directions for Future Research ........................................................... 562
xxiii
APPENDIX A: MACROCELL CORROSION TESTS SUPPLEMENTARY MATERIAL ......................................................... 563
A.1 Corrosion Current Plots....................................................................... 563
A.2 Half-Cell Plots..................................................................................... 570
A.3 Specimen Performance Reproducibility.............................................. 577
APPENDIX B: BEAM CORROSION TESTS SUPPLEMENTARY MATERIAL .............................................................................................. 585
B.1 Detail Beam Construction Drawings................................................... 585
B.2 Surface Crack Patterns and Widths Prior to Autopsy ......................... 595
B.3 Half-Cell Potentials (Line Graphs) ..................................................... 602
B.4 Half-Cell Potentials (Contour Maps) .................................................. 610
B.5 Half-Cell Potentials (Outliers) ............................................................ 611
B.6 Corrosion Rate Readins....................................................................... 612
B.7 Block Chloride Penetration Graphs..................................................... 615
B.8 Beam Chloride Penetration Graphs..................................................... 618
APPENDIX C: COLUMN CORROSION TESTS SUPPLEMENTARY MATERIAL .............................................................................................. 625
C.1 Half-Cell Potential Plots...................................................................... 625
C.2 Concrete Chloride Content Plots......................................................... 634
REFERENCES .................................................................................................. 643
VITA ............................................................................................................. 663

xxiv
List of Tables
Table 1.1 Major Project Tasks and Contributions of Graduate Students ............ 12 Table 2.1 Key Developments in Prestressed Concrete History ........................... 15 Table 2.2 Basic Definitions (adapted from2.4) .................................................... 18 Table 2.3 Advantages and Disadvantages of Internal and External Post-
Tensioning (adapted from references 2.2 and 2.7) ........................................ 20 Table 2.4 Common Reference Electrode Potentials versus SHE ......................... 48 Table 3.1 Specimen Notation ............................................................................... 79 Table 3.2 Specimen Types and Variables.............................................................. 79 Table 3.3 Material Details ................................................................................... 80 Table 3.4 Interpretation of Half-Cell Potentials for Uncoated
Reinforcing Steel ............................................................................................ 84 Table 3.5 Corrosion Current Results Based on Corrosion Activity and
Polarity ........................................................................................................... 87 Table 3.6 Half-Cell Potential Results (Based on ASTM C876, see Table 3.4) .... 91 Table 3.7 Time to Initiation of Corrosion for Specimens Autopsied at Eight
Years of Exposure ........................................................................................... 97 Table 3.8 General Macrocell Current Results ..................................................... 99 Table 3.9 General Half-Cell Potential Results .................................................. 100 Table 3.10 Corrosion Severity Based on Current Density ................................. 102 Table 3.11 Calculated Weighted Average Current, Current Density and Metal
Loss for Active Specimen after Eight Years of Exposure ............................. 104 Table 3.12 Specimens Selected for Forensic Examination ................................ 116 Table 3.13 Evaluation and Rating System for Corrosion Found on
Prestressing Strand ...................................................................................... 119 Table 3.14 Evaluation and Rating System for Corrosion Found on Mild
Steel Bars ...................................................................................................... 120 Table 3.15 Evaluation and Rating System for Corrosion Found on Post-
Tensioning Duct ........................................................................................... 122 Table 3.16 Corrosion Ratings for Specimens Autopsied after 4.4 Years of
Exposure ....................................................................................................... 158

xxv
Table 3.17 Corrosion Ratings for Specimens Autopsied after 8 Years of Exposure ....................................................................................................... 159
Table 3.18 Effect of Grout Type – Strand Corrosion Ratings ............................ 187 Table 4.1 Summary of Section Details ............................................................... 213 Table 4.2 Control Variables (Adapted from Reference 4.2) ............................... 216 Table 4.3 Planned Crack Widths, Prestress Amounts and Loading .................. 218 Table 4.4 Beam Specimen Types and Variables ................................................ 222 Table 4.5 Construction Material Details: Phase I Beam Specimens ................. 225 Table 4.6 Common Reference Electrode Potentials versus SHE ........................ 234 Table 4.7 Interpretation of Half-Cell Potentials for Uncoated Reinforcing
Steel, Based on ASTM C876-91 .................................................................... 235 Table 4.8 PR Monitor Corrosion Severity Based on Current Density................ 240 Table 4.9 Highest Half-Cell Potential Reading at 1594 Days (End of Testing)
for Phase I Autopsy Beams............................................................................ 261 Table 4.10 Time to Initiation of Corrosion for Phase II Autopsy Beams............ 269 Table 4.11 Phase I Autopsy Beam Corrosion Current Density Measurements .. 275 Table 4.12 Phase II Autopsy Beam Corrosion Current Density Measurements. 278 Table 4.13 Phase I Ponded Block Chloride Penetration Measurements............ 281 Table 4.14 Phase II Ponded Block Chloride Penetration Measurements........... 283 Table 4.15 Phase I Autopsy Beam Chloride Penetration Measurements ........... 286 Table 4.16 Phase II Autopsy Beam Chloride Penetration Measurements.......... 291 Table 4.17 Phase I Beams Selected for Forensic Examination ......................... 295 Table 4.18 Phase II Beams Selected for Forensic Examination ......................... 296 Table 4.19 Evaluation and Rating System for Corrosion Found on Mild
Steel Bars....................................................................................................... 305 Table 4.20 Evaluation and Rating System for Corrosion Found on Galvanized
Steel Duct/Duct Splice................................................................................... 307 Table 4.21 Evaluation and Rating System for Corrosion Found on
Prestressing Strand ....................................................................................... 308 Table 4.22 Summary of Forensic Examination Corrosion Rating Results ......... 384 Table 4.23 Summary of Exposure Test Results ................................................... 401

xxvi
Table 4.24 Main Variables to be Analized During Final (Future) Autopsy of Beam Specimens ............................................................................................ 421
Table 5.1 Calculated Column Forces for Prototype Substructure (unfactored) .................................................................................................. 435
Table 5.2 Long-Term Prestress Losses .............................................................. 439 Table 5.3 Control Variables Based on TxDOT prectice .................................... 439 Table 5.4 Specimen Notation ............................................................................. 442 Table 5.5 Column Specimen Types and Variables ............................................. 443 Table 5.6 Column Construction Material Details .............................................. 443 Table 5.7 TxDOT Class C Concrete Cylinder Strengths ................................... 445 Table 5.8 Fly Ash (35%) Concrete Cylinder Strengths ...................................... 445 Table 5.9 Interpretation of Half-Cell Potentials for Uncoated
Reinforcing Steel .......................................................................................... 453 Table 5.10 Non-prestressed Column Average Half-Cell Readings Summary ... 464 Table 5.11 Post-Tensioned Column Average Half-Cell Readings Summary ..... 464 Table 5.12 Evaluation and Rating System for Corrosion Found on Mild
Steel Bars ...................................................................................................... 480 Table 5.13 Evaluation and Rating System for Corrosion Found on Post-
Tensioning Duct ........................................................................................... 481 Table 5.14 Specimen Notation ........................................................................... 504 Table 5.15 Maximun Spiral Corrosion Rating in any Two-Inch Increment for
All Specimens .............................................................................................. 515 Table 5.16 Total Spiral Corrosion Rating for All Specimens ........................... 516 Table 5.17 Maximun Rebar Corrosion Rating in any Two-Inch Increment for
All Specimens ............................................................................................... 506 Table 5.18 Total Rebar Corrosion Rating for All Specimens ............................ 506 Table 5.19 Maximun Dowel Corrosion Rating in any Two-Inch Increment for
All Specimens ............................................................................................... 507 Table 5.20 Total Dowel Corrosion Rating for All Specimen ............................. 507 Table 5.21 Maximun Duct Corrosion Rating in any Two-Inch Increment for
All Specimens ............................................................................................... 508 Table 5.22 Total Duct Corrosion Rating for All Specimen................................. 508

xxvii
Table 5.23 Maximun PT-Bar Corrosion Rating in any Two-Inch Increment for All Specimens ............................................................................................... 509
Table 5.24 Total PT-Bar Corrosion Rating for All Specimen............................. 509 Table B.1 Half-Cell Outliners-Phase I Beams .................................................... 611 Table B.2 Half-Cell Outliners-Phase II Beams................................................... 611
xxviii
List of Figures
Figure 1.1 Project TxDot 0-1405 Scope, Researchers and Technical Reports .... 11 Figure 1.2 Project TxDot 0-1405 (1993-2006) and Dissertation (2000-2003)
Schedule ....................................................................................................... 14 Figure 2.1 Post-Tensioning Anchorage Details (from T.Y.Lin, and N.H.
Burns, 1981)................................................................................................. 19 Figure 2.2 Typical Balance and Cantilever Segment ......................................... 23 Figure 2.3 Vertical Post-Tensioning of the High-Level Approach Piers of the
sunshine Skyway Bridge, Florida ................................................................ 23 Figure 2.4 Post-Tensioning in (a) Hammerhead Piers, (b) Cantilever Piers,
and (c) Straddle Bents .................................................................................. 24 Figure 2.5 Plan View of Slipped Tendon at Deviation Saddle. Niles Channel
Bridge .......................................................................................................... 31 Figure 2.6 Advanced Corrosion of Strands within Anchorage. Niles Channel
Bridge .......................................................................................................... 31 Figure 2.7 The Mid-Bay Bridge. Florida ............................................................. 32 Figure 2.8 Failure of Tendon 28-6 on the Mid-Bay Bridge ................................. 32 Figure 2.9 Failure of Tendon 57-1 on the Mid-Bay Bridge –At Expansion
Joint Diaphragm- ........................................................................................ 33 Figure 2.10 The Sunshine Skyway Bridge, Tampa, Florida ................................ 33 Figure 2.11 Tendon Corrosion inside the Sunshine Skyway Bridge Piers ........... 34 Figure 2.12 Passive-Active Behavior in Steel ...................................................... 46 Figure 2.13 Corrosion of Steel in Concrete ......................................................... 47 Figure 2.14 The Self-Propagating Process of Pitting Corrosion ........................ 51 Figure 2.15 Multilayer Corrosion Protection for Bonded Post-Tensioned
Systems ........................................................................................................ 55 Figure 2.16 Hazard Scenarios ............................................................................. 57 Figure 2.17 Multi-Layer Corrosion Protection for Buried Post-Tensioning
Anchorages .................................................................................................. 67 Figure 2.18 Member End Details for Anchorage Corrosion Protection ............. 67 Figure 3.1 Macrocell Specimen Details ............................................................... 74

xxix
Figure 3.2 Anode and Cathode Bar Details ......................................................... 75 Figure 3.3 Gasket Details .................................................................................... 77 Figure 3.4 Macrocell Corrosion Current Measurement ...................................... 82 Figure 3.5 Half-Cell Potential Readings ............................................................. 83 Figure 3.6 Macrocell Corrosion Current: Dry, Epoxy and Epoxy with Gasket
Joint, Steel Duct, High Precompression and Normal Grout ...................... 88 Figure 3.7 Macrocell Corrosion Current: Dry, Epoxy Joint, Steel and Plastic
Duct, Low Precompression and Normal Grout .......................................... 88 Figure 3.8 Macrocell Corrosion Current: Dry Joint, Steel Duct, Low, Medium
and High Precompression and Normal Grout ............................................ 89 Figure 3.9 Macrocell Corrosion Current: Epoxy Joint, Steel Duct, Medium
Precompresion and Different Grouts (Normal and Corrosion Inhibitor Added) ......................................................................................................... 89
Figure 3.10 Half-Cell Potentials: Dry, Epoxy and Epoxy with Gasket Joints, Steel Duct, High Precompression and Normal Grout ................................ 91
Figure 3.11 Half-Cell Potentials: Dry and Epoxy Joint, Plastic and Steel Duct, Low Precompression, and Normal Grout ......................................... 92
Figure 3.12 Half-Cell Potentials: Dry and Epoxy Joint,Steel Duct, Low, Medium and High Precompression, and Normal Grout ............................. 92
Figure 3.13 Half-Cell Potentials: Epoxy Joint, Plastic and Steel Duct, Medium Precompression, and Different Grouts (Normal and Corrosion Inhibitor Added .......................................................................................... 93
Figure 3.14 Half-Cell Potentials for Duplicated Specimen with Dry Joint, High Precompression and Normal Grout .................................................... 94
Figure 3.15 Half-Cell Potentials for Duplicated Specimen with Dry Joint, Plastic Duct, Medium Precompression and Normal Grout ......................... 94
Figure 3.16 Half-Cell Potentials for Duplicated Specimen with Epoxy Joint, Steel Duct, High Precompression and Normal Grout ................................. 95
Figure 3.17 Calculated Weighted Average Corrosion Current for Active Specimens after Eight Years of Exposure .................................................. 106
Figure 3.18 Calculated Corrosion Current Densities for Active Specimens after Eight Years of Exposure .................................................................... 107
Figure 3.19 Calculated Metal Loss for Active Specimens after Eight Years of Exposure..................................................................................................... 107

xxx
Figure 3.20 Specimen Labeling Scheme ............................................................. 109 Figure 3.21 Chloride Sample Locations ............................................................. 110 Figure 3.22 Longitudinal Saw Cuts .................................................................... 112 Figure 3.23 Specimen Opened to Expose Duct/Strand ....................................... 113 Figure 3.24 Specimen Opened to Expose Mild Steel Bars.................................. 114 Figure 3.25 Examining Epoxy Joint Condition................................................... 115 Figure 3.26 Intervals for Corrosion Ratings on Prestressing Strand................. 118 Figure 3.27 Intervals for Corrosion Ratings on Mild Steel Bars........................ 121 Figure 3.28 Intervals for Corrosion Ratings on Galvanized Duct ..................... 122 Figure 3.29 Concrete, Duct, Strand and Bar Condition for Specimen
DJ-S-L-NG-2 .............................................................................................. 125 Figure 3.30 Concrete, Duct, Strand and Bar Condition for Specimen
DJ-S-M-NG-2............................................................................................. 127 Figure 3.31 Concrete, Duct, Strand and Bar Condition for Specimen
DJ-S-H-NG-2 ............................................................................................. 128 Figure 3.32 Concrete, Duct, Strand and Bar Condition for Specimen
DJ-P-L-NG-2.............................................................................................. 130 Figure 3.33 Concrete, Duct, Strand and Bar Condition for Specimen
DJ-P-M-NG-2 ............................................................................................ 132 Figure 3.34 Concrete, Duct, Strand and Bar Condition for Specimen
DJ-S-L-CI-2................................................................................................ 133 Figure 3.35 Concrete, Duct, Strand and Bar Condition for Specimen
DJ-S-M-CI-2 .............................................................................................. 135 Figure 3.36 Concrete, Duct, Strand and Bar Condition for Specimen
SE-S-L-NG-1 .............................................................................................. 137 Figure 3.37 Concrete, Duct, Strand and Bar Condition for Specimen
SE-S-M-NG-1 ............................................................................................. 139 Figure 3.38 Concrete, Duct, Strand and Bar Condition for Specimen
SE-S-H-NG-1.............................................................................................. 141 Figure 3.39 Concrete, Duct, Strand and Bar Condition for Specimen
SE-P-L-NG-1.............................................................................................. 142 Figure 3.40 Concrete, Duct, Strand and Bar Condition for Specimen
SE-P-M-NG-1............................................................................................. 144

xxxi
Figure 3.41 Concrete, Duct, Strand and Bar Condition for Specimen SE-S-L-CI-1................................................................................................ 145
Figure 3.42 Concrete, Duct, Strand and Bar Condition for Specimen SE-S-M-CI-1............................................................................................... 147
Figure 3.43 Incompletely Filled Epoxy Joint (SE-S-M-CI-1) ............................. 147 Figure 3.44 Concrete, Duct, Strand and Bar Condition for Specimen
SE-S-H-CI-1 ............................................................................................... 149 Figure 3.45 Concrete, Duct, Strand and Bar Condition for Specimen
SE-S-L-SF-1 ............................................................................................... 151 Figure 3.46 Concrete, Duct, Strand and Bar Condition for Specimen
EG-S-L-NG-1 ............................................................................................. 152 Figure 3.47 Incomplete Epoxy Coverage in Epoxy/Gasket Joint
(EG-S-M-NG-1).......................................................................................... 154 Figure 3.48 Concrete, Duct, Strand and Bar Condition for Specimen
EG-S-M-NG-1 ............................................................................................ 154 Figure 3.49 Incomplete Epoxy Coverage in Epoxy/Gasket Joint
(EG-S-H-NG-1) .......................................................................................... 156 Figure 3.50 Concrete, Duct, Strand and Bar Condition for Specimen
EG-S-H-NG-1............................................................................................. 156 Figure 3.51 Strand Corrosion Ratings for All Specimens .................................. 160 Figure 3.52 Mild Steel Bar Corrosion Ratings for All Specimens...................... 160 Figure 3.53 Duct Corrosion Ratings for All Specimens ..................................... 161 Figure 3.54 Concrete Chloride Ion Profiles for Specimens DJ-S-I-NG-2.......... 164 Figure 3.55 Concrete Chloride Ion Profiles for Specimens DJ-S-M-NG-2........ 164 Figure 3.56 Concrete Chloride Ion Profiles for Specimens DJ-S-H-NG-2 ........ 165 Figure 3.57 Concrete Chloride Ion Profiles for Specimens DJ-P-L-NG-2 ........ 165 Figure 3.58 Concrete Chloride Ion Profiles for Specimens DJ-S-L-CI-2 .......... 166 Figure 3.59 Concrete Chloride Ion Profiles for Specimens DJ-S-M-CI-2 ......... 166 Figure 3.60 Concrete Chloride Ion Profiles for Specimens DJ-S-L-NG-1......... 167 Figure 3.61 Concrete Chloride Ion Profiles for Specimens DJ-S-M-NG-1........ 167 Figure 3.62 Concrete Chloride Ion Profiles for Specimens SE-S-H-NG-1 ........ 168 Figure 3.63 Concrete Chloride Ion Profiles for Specimens EG-S-L-NG-1 ........ 168

xxxii
Figure 3.64 Acid Soluble Chloride Content at 0.5 in. Depth ............................. 169 Figure 3.65 Acid Soluble Chloride Content at 1.25 in. Depth............................ 169 Figure 3.66 Acid Soluble Chloride Content at 3 in. Depth................................. 170 Figure 3.67 Acid Soluble Chloride Content at 4.75 in. Depth –Bar Level-........ 170 Figure 3.68 Measured Chloride Contents in Post-Tensioning Grout after
about Eight Years of Exposure................................................................... 172 Figure 3.69 Comparison of Corrosion Ratings for Prestressing Strand (after
Four Years and Five Months, and Eight Years of Exposure Testing) ....... 174 Figure 3.70 Top View of the Effect of a Faulty Epoxy Joint (SE-S-M-CI-1)
Compared to a Sound Epoxy Joint (SE-S-L-CI-1) ..................................... 175 Figure 3.71 Total Corrosion Rating Ordered According to Performance (after
Four Years and Five Months of Exposure) ................................................ 176 Figure 3.72 Total Corrosion Rating Ordered According to Performance (after
Eight Years of Exposure) ........................................................................... 176 Figure 3.73 Galvanized Steel Duct Corrosion: Effect of Joint Type ................. 178 Figure 3.74 Effect of Joint Precompression on Duct Corrosion (after Eight
Years of Exposure Testing) ........................................................................ 184 Figure 3.75 Effect of Joint Precompression on Duct Corrosion (after Four
Years of Expsure Testing) .......................................................................... 185 Figure 3.76 Effect of Grout Type – Strand Corrosion Rating ........................... 187 Figure 3.77 Typical Grout Voids ....................................................................... 188 Figure 3.78 Hole in Duct Corresponding to Grout Void (Specimen DJ-S-M-
NG-2) (from Autopsy at Eight Years of Exposure Testing)........................ 189 Figure 3.79 Hole in Duct Corresponding to Grout Void (Specimen DJ-S-M-
NG-1) (from Autopsy at Four an a Half Years of Exposure Testing) ........ 189 Figure 3.80 Mechanism for Development of Reversed Macrocell in Dry Joint
Specimens or in Poor Epoxy Joint Specimens .......................................... 191 Figure 3.81 Comparison Between Corrosion Current and Half-Cell Potential
Readings..................................................................................................... 192 Figure 3.82 Comparison of Corrosion Rating and Metal Loss for
Prestressing Strand .................................................................................... 194 Figure 3.83 Comparison of Corrosion Rating and Metal Loss for Mild Steel
Bars ............................................................................................................ 194

xxxiii
Figure 4.1 Linear Rectangular Beam Specimens (on Top of Reaction Beams) ....................................................................................................... 208
Figure 4.2 Specimen Dimensions ...................................................................... 209 Figure 4.3 100%S PS Section Tendon Profile and Allowable Limits ............... 212 Figure 4.4 Section Reinforcement Details ........................................................ 213 Figure 4.5 Moment Curvature Behavior for All Sections with Class C
Concrete .................................................................................................... 215 Figure 4.6 Applied Moment-Estimated Crack Width Behavior for All Sections
with Class C Concrete................................................................................ 215 Figure 4.7 Duct Splices ...................................................................................... 219 Figure 4.8 Locations of Intentional Damage to Epoxy-Coated Strand ............. 220 Figure 4.9 VSLAB+System................................................................................. 221 Figure 4.10 Phase I Beam Specimens ................................................................ 223 Figure 4.11 Phase II Beam Specimens............................................................... 224 Figure 4.12 Test Setup ....................................................................................... 227 Figure 4.13 Beam Test Setup at North End of Ferguson Laboratory................ 227 Figure 4.14 Reinforcing Cage, End Detail for PT Beam, and Formwork ......... 228 Figure 4.15 Staged Post-Tensioning Sequence.................................................. 229 Figure 4.16 Beam Loading System .................................................................... 230 Figure 4.17 Concrete Blocks for Beam Chloride Analysis ................................ 231 Figure 4.18 Beam End Dripper System ............................................................. 232 Figure 4.19 Crack Width Measurement Locations ............................................ 233 Figure 4.20 Grid for Half-Cell Potential Readings Non-prestressed Beams
and Half-Cell Reading Locations for otherBeams..................................... 234 Figure 4.21 Polarization Resistance Apparatus (Schematic) ............................ 238 Figure 4.22 3LP Equipment and Setup .............................................................. 241 Figure 4.23 Non-PS and 2/3 PS Beam Concrete Sample Locations (Adapted
from Reference 4.5) .................................................................................... 243 Figure 4.24 100%U PS (and 100%S PS) Beam Concrete Sample Locations
(Adapted from Reference 4.5) .................................................................... 243 Figure 4.25 Phase I Beam Specimens Crack Patterns....................................... 246

xxxiv
Figure 4.26 Calculated Cracking Behavior ....................................................... 247 Figure 4.27 Measured Maximum Crack Widths ................................................ 248 Figure 4.28 Non-PS Section-Crack Patterns and Measurements...................... 249 Figure 4.29 2/3 PS Section-Crack Patterns and Measurements........................ 250 Figure 4.30 100%U PS Section-Crack Patterns and Measurements................. 250 Figure 4.31 Crack Widths-Phase I Beams ......................................................... 252 Figure 4.32 Crack Widths-Phase II Beams........................................................ 252 Figure 4.33 Half-Cell Potential Readings for Phase I Autopsy Beams ............. 255 Figure 4.34 Half-Cell Potential Readings for Non-PS Specimens in Phase I
Autopsy Beams ........................................................................................... 256 Figure 4.35 Half-Cell Potential Readings for 2/3 PS Specimens in Phase I
Autopsy Beams ........................................................................................... 257 Figure 4.36 Half-Cell Potential Readings for 100%U PS Specimens in
Phase I Autopsy Beams .............................................................................. 258 Figure 4.37 Half-Cell Potential Readings for Unloaded Specimens in Phase
I Autopsy Beams......................................................................................... 259 Figure 4.38 Half-Cell Potential Readings for Service Load Specimens in
Phase I Autopsy Beams .............................................................................. 260 Figure 4.39 Greatest Negative Half-Cell Potential Readings at 1594 Days
(End of Testing) for Phase I Autopsy Beams ............................................. 261 Figure 4.40 Half-Cell Potential Contour Maps at 1594 Days for Phase I
Autopsy Beams ........................................................................................... 262 Figure 4.41 Half-Cell Potential Readings for Phase II Autopsy Beams........... 263 Figure 4.42 Half-Cell Potential Readings for Non-PS Specimens inPhase II
Autopsy Beams ........................................................................................... 264 Figure 4.43 Half-Cell Potential Readings for 2/3 PS Specimens in Phase II
Autopsy Beams ........................................................................................... 265 Figure 4.44 Half-Cell Potential Readings for 100%U PS Specimens in Phase
II Autopsy Beams....................................................................................... 266 Figure 4.45 Half-Cell Potential Readings for Fly Ash Concrete Specimens in
Phase II Autopsy Beams............................................................................ 267 Figure 4.46 Half-Cell Potential Readings for High Performance Concrete
Specimens in Phase II Autopsy Beams...................................................... 268

xxxv
Figure 4.47 Greatest Negative Half-Cell Potential Readings at 1235 Days (End of Testing) for Phase II Autopsy Beams ........................................... 268
Figure 4.48 Half-Cell Potential Contour Maps at 1235 Days for All Phase II Beams ......................................................................................................... 270
Figure 4.49 Maximum Corrosion Rate Readings Using PR Monitor for Phase I Autopsy Beams........................................................................................ 273
Figure 4.50 Maximum Corrosion Rate Readings Using 3LP r for Phase I Autopsy Beams ........................................................................................... 274
Figure 4.51 Comparison of Corrosion Rate Measurement Equipment ............ 276 Figure 4.52 Corrosion Rate Readings Using 3LP r for Phase II Autopsy
Beams ......................................................................................................... 277 Figure 4.53 Acid-Soluble Chloride Content for Phase I Ponded Block
Specimens................................................................................................... 280 Figure 4.54 Acid-Soluble Chloride Content for Phase II Ponded Block
Specimens................................................................................................... 282 Figure 4.55 Beam and Block Chloride Penetration at 1594 Days for Phase I-
Ponded Region on Beamss ......................................................................... 284 Figure 4.56 Beam and Block Chloride Penetration at 1594 Days for Phase I-
Unponded Region on Beamss..................................................................... 285 Figure 4.57 Acid-Soluble Chloride Content at Bar and Top-of-Duct Level for
Phase I Beams ............................................................................................ 287 Figure 4.58 Beam and Block Chloride Penetration at 1235 Days for Phase II-
Ponded Region on Beams........................................................................... 289 Figure 4.59 Beam and Block Chloride Penetration at 1235 Days for Phase II-
Unponded Region on Beams ...................................................................... 290 Figure 4.60 Acid-Soluble Chloride Content at Bar and Top-of-Duct Level for
Phase II Beams........................................................................................... 292 Figure 4.61 Selected Beams for Forensic Examination..................................... 296 Figure 4.62 Beam Section Removed for Investigation....................................... 298 Figure 4.63 Concrete Saw Used in Autopsy ...................................................... 299 Figure 4.64 Concrete Removal to Expose Duct and Mild Steel......................... 299 Figure 4.65 Partial Autopsied Beam.................................................................. 300 Figure 4.66 Mild Steel Reinforcement Cage...................................................... 302

xxxvi
Figure 4.67 Intervals for Corrosion Rating on Mild Steel................................. 303 Figure 4.68 Intervals for Corrosion Rating on Galvanized Steel Duct/Splice .. 306 Figure 4.69 Specimen 1.1-Condition Prior to Autopsy...................................... 310 Figure 4.70 Specimen 1.1-Mild Steel Bar and Stirrup....................................... 311 Figure 4.71 Specimen 1.1-Crack Pattern and Specimen Corrosion Rating
Graphs........................................................................................................ 312 Figure 4.72 Specimen 1.3-Condition Prior to Autopsy...................................... 313 Figure 4.73 Specimen 1.3-Mild Steel Bar and Stirrup....................................... 313 Figure 4.74 Specimen 1.3- Crack Pattern and Specimen Corrosion Rating
Graphs........................................................................................................ 314 Figure 4.75 Specimen 2.3- Condition Prior to Autopsy..................................... 315 Figure 4.76 Specimen 2.3- Duct Splices ............................................................ 317 Figure 4.77 Specimen 2.3- Reinforcing Elements.............................................. 318 Figure 4.78 Specimen 2.3- Crack Pattern and Specimen Corrosion Rating
Graphs........................................................................................................ 319 Figure 4.79 Specimen 2.11- Condition Prior to Autopsy................................... 320 Figure 4.80 Specimen 2.11- Duct Splices .......................................................... 322 Figure 4.81 Specimen 2.11- Reinforcing Elements............................................ 323 Figure 4.82 Specimen 2.11- Crack Pattern and Specimen Corrosion Rating
Graphs........................................................................................................ 324 Figure 4.83 Specimen 3.1- Condition Prior to Autopsy..................................... 325 Figure 4.84 Specimen 3.1- Duct Splices ............................................................ 327 Figure 4.85 Specimen 3.1- Reinforcing Elements.............................................. 328 Figure 4.86 Specimen 3.1- Crack Pattern and Specimen Corrosion Rating
Graphs........................................................................................................ 329 Figure 4.87 Specimen 3.2- Condition Prior to Autopsy..................................... 330 Figure 4.88 Specimen 3.2- Grouted Duct .......................................................... 332 Figure 4.89 Specimen 3.2- Duct Splices ............................................................ 332 Figure 4.90 Specimen 3.2- Reinforcing Elements.............................................. 333 Figure 4.91 Specimen 3.2- Crack Pattern and Specimen Corrosion Rating
Graphs........................................................................................................ 334

xxxvii
Figure 4.92 Specimen 3.3- Condition Prior to Autopsy..................................... 335 Figure 4.93 Specimen 3.3- North Duct Splices .................................................. 337 Figure 4.94 Specimen 3.3- Reinforcing Elements.............................................. 338 Figure 4.95 Specimen 3.3- Crack Pattern and Specimen Corrosion Rating
Graphs........................................................................................................ 339 Figure 4.96 Specimen 4.2- Condition Prior to Autopsy..................................... 340 Figure 4.97 Specimen 4.2- Duct Splices ............................................................ 342 Figure 4.98 Specimen 4.2- Reinforcing Elements.............................................. 343 Figure 4.99 Specimen 4.2- Crack Pattern and Specimen Corrosion Rating
Graphs........................................................................................................ 344 Figure 4.100 Specimen 1.5- Condition Prior to Autopsy................................... 345 Figure 4.101 Specimen 1.5-Mild Steel Bar and Stirrup..................................... 346 Figure 4.102 Specimen 1.5- Crack Pattern and Specimen Corrosion Rating
Graphs........................................................................................................ 347 Figure 4.103 Specimen 1.6- Condition Prior to Autopsy................................... 348 Figure 4.104 Specimen 1.6-Mild Steel Bar and Stirrup..................................... 349 Figure 4.105 Specimen 1.6- Crack Pattern and Specimen Corrosion Rating
Graphs........................................................................................................ 350 Figure 4.106 Specimen 2.5- Condition Prior to Autopsy................................... 351 Figure 4.107 Specimen 2.5- Duct Splices .......................................................... 353 Figure 4.108 Specimen 2.5- Reinforcing Elements............................................ 354 Figure 4.109 Specimen 2.5- Crack Pattern and Specimen Corrosion Rating
Graphs........................................................................................................ 355 Figure 4.110 Specimen 2.6- Condition Prior to Autopsy................................... 356 Figure 4.111 Specimen 2.6- Duct Splices .......................................................... 358 Figure 4.112 Specimen 2.6- Reinforcing Elements............................................ 359 Figure 4.113 Specimen 2.6- Crack Pattern and Specimen Corrosion Rating
Graphs........................................................................................................ 360 Figure 4.114 Specimen 3.6- Condition Prior to Autopsy................................... 361 Figure 4.115 Specimen 3.6- Duct Splices .......................................................... 363 Figure 4.116 Specimen 3.6- Reinforcing Elements............................................ 364

xxxviii
Figure 4.117 Specimen 3.6- Crack Pattern and Specimen Corrosion Rating Graphs........................................................................................................ 365
Figure 4.118 Specimen 3.7- Condition Prior to Autopsy................................... 366 Figure 4.119 Specimen 3.7- Duct Splices .......................................................... 368 Figure 4.120 Specimen 3.7- Reinforcing Elements............................................ 369 Figure 4.121 Specimen 3.7- Crack Pattern and Specimen Corrosion Rating
Graphs........................................................................................................ 370 Figure 4.122 Generalized Stirrup Corrosion Ratings ....................................... 372 Figure 4.123 Localized Stirrup Corrosion Ratings ........................................... 373 Figure 4.124 Generalized Bar Corrosion Ratings............................................. 374 Figure 4.125 Localized Bar Corrosion Ratings................................................. 374 Figure 4.126 Generalized Duct Corrosion Ratings ........................................... 376 Figure 4.127 Localized Duct Corrosion Ratings ............................................... 376 Figure 4.128 Generalized Strand Corrosion Ratings ........................................ 377 Figure 4.129 Localized Strand Corrosion Ratings ............................................ 378 Figure 4.130 Generalized Stirrup Corrosion Ratings for Phase I Autopsy
Beams Ordered According to Performance............................................... 379 Figure 4.131 Generalized Stirrup Corrosion Ratings for Phase II Autopsy
Beams Ordered According to Performance............................................... 380 Figure 4.132 Generalized Rebar Corrosion Ratings for Phase I Autopsy
Beams Ordered According to Performance............................................... 380 Figure 4.133 Generalized Rebar Corrosion Ratings for Phase II Autopsy
Beams Ordered According to Performance............................................... 381 Figure 4.134 Generalized Corrosion Ratings for Phase I Autopsy Beams
Ordered According to Performance........................................................... 382 Figure 4.135 Generalized Corrosion Ratings for Phase II Autopsy Beams
Ordered According to Performance........................................................... 383 Figure 4.136 Effect of Crack Density on Stirrup and Rebar Corrosion for
Phase I Autopsy Beams .............................................................................. 387 Figure 4.137 Effect of Crack Density on Duct and Strand Corrosion for
Phase I Autopsy Beams ............................................................................. 388 Figure 4.138 Effect of Crack Density on Stirrup and Ribar Corrosion for
Phase II Autopsy Beams............................................................................. 389

xxxix
Figure 4.139 Effect of Crack Density on Duct and Strand Corrosion for Phase II Autopsy Beams............................................................................. 390
Figure 4.140 Localized Stirrup and Rebar Corrosion Rating versus Maximum Crack Width for Phase I Autopsy Specimens............................................ 392
Figure 4.141 Localized Duct and Strand Corrosion Rating versus Maximum Crack Width for Phase I Autopsy Specimens............................................ 393
Figure 4.142 Localized Stirrup and Rebar Corrosion Rating versus Maximum Crack Width for Phase II Autopsy Specimens........................................... 394
Figure 4.143 Localized Duct and Strand Corrosion Rating versus Maximum Crack Width for Phase II Autopsy Specimens........................................... 395
Figure 4.144 Duct Splice Performance.............................................................. 398 Figure 4.145 Effect of Grout Cracking .............................................................. 400 Figure 4.146 Bleed Water Void and Duct Corrosion ........................................ 400 Figure 4.147 Half-Cell Potential at 1594 Days (End of Testing) for Phase I
Autopsy Beams ........................................................................................... 402 Figure 4.148 Time to Initiation of Corrosion for Phase I Autopsy Beams ........ 402 Figure 4.149 Half-Cell Potential at 1594 Days (End of Testing) for Phase II
Autopsy Beams ........................................................................................... 403 Figure 4.150 Time to Initiation of Corrosion for Phase II Autopsy Beams....... 403 Figure 4.151 Half-Cell Readings at the End of Testing vs. Stirrup and Rebar
Corrosion Ratings for Phase I Autopsy Specimens.................................... 405 Figure 4.152 Half-Cell Readings at the End of Testing vs. Duct and Strand
Corrosion Ratings for Phase I Autopsy Specimens ................................... 406 Figure 4.153 Half-Cell Readings at the End of Testing vs. Stirrup and Rebar
Corrosion Ratings for Phase II Autopsy Specimens .................................. 407 Figure 4.154 Half-Cell Readings at the End of Testing vs. Duct and Strand
Corrosion Ratings for Phase II Autopsy Specimens .................................. 408 Figure 4.155 Final Corrosion Rate Measurements Using 3LP Equipment for
Phase I Autopsy Beams .............................................................................. 409 Figure 4.156 Final Corrosion Rate Measurements Using 3LP Equipment for
Phase II Autopsy Beams............................................................................ 409 Figure 4.157 Corrosion Rate Measurements (using 3LP Equipment) after 47
Months of Exposure vs. Stirrup and Rebar Corrosion Ratings for Phase I Autopsy Specimens ....................................................................... 410

xl
Figure 4.158 Corrosion Rate Measurements (using 3LP Equipment) after 47 Months of Exposure vs. Duct and Strand Corrosion Ratings for Phase I Autopsy Specimens ....................................................................... 411
Figure 4.159 Corrosion Rate Measurements (using 3LP Equipment) after 35 Months of Exposure vs. Stirrup and Rebar Corrosion Ratings for Phase II Autopsy Specimens ...................................................................... 412
Figure 4.160 Corrosion Rate Measurements (using 3LP Equipment) after 35 Months of Exposure vs. Duct and Strand Corrosion Ratings for Phase II Autopsy Specimens ...................................................................... 413
Figure 4.161 Beam Chloride Content at Bar Level-3 in. Offset for Phase I Autopsy Beams ........................................................................................... 414
Figure 4.162 Beam Chloride Content at Bar Level-18 in. Offset for Phase I Autopsy Beams ........................................................................................... 415
Figure 4.163 Beam Chloride Content at Bar Level-3 in. Offset for Phase II Autopsy Beams ........................................................................................... 416
Figure 4.164 Beam Chloride Content at Bar Level-18 in. Offset for Phase II Autopsy Beams ........................................................................................... 416
Figure 4.165 Acid-Soluble Chloride Content vs. Stirrup and Rebar Corrosion Ratings for Phase I Autopsy Specimens ..................................................... 417
Figure 4.166 Acid-Soluble Chloride Content vs. Duct and Strand Corrosion Ratings for Phase I Autopsy Specimens ..................................................... 418
Figure 4.167 Acid-Soluble Chloride Content vs. Stirrup and Rebar Corrosion Ratings for Phase II Autopsy Specimens.................................................... 419
Figure 4.168 Acid-Soluble Chloride Content vs. Duct and Strand Corrosion Ratings for Phase I Autopsy Specimens ..................................................... 420
Figure 5.1 Exposure of Partially Sumerged Column in Sea Water .................. 432 Figure 5.2 Typical Corrosion Damage in Bridge Substructures ....................... 432 Figure 5.3 Prototype Multicolumn Substructure .............................................. 435 Figure 5.4 Reinforced Concrete Column Section Details ................................. 436 Figure 5.5 Column Interaction Diagrams ......................................................... 437 Figure 5.6 Post-Tensioned Column Section Details ......................................... 438 Figure 5.7 Column-Fundation Joint Configurations ......................................... 440 Figure 5.8 Comparison of Ducts Types for Tensioning ..................................... 441

xli
Figure 5.9 Comparison of Prestressing Bar Coatings....................................... 442 Figure 5.10 Column Corrosion Test Setup-Schematic....................................... 446 Figure 5.11 Column Corrosion Test Setup ........................................................ 447 Figure 5.12 Column Dripper System ................................................................. 448 Figure 5.13 Specimen Location Specimen Details............................................. 448 Figure 5.14 Foundation Reinforcement ............................................................ 449 Figure 5.15 Column Construction ..................................................................... 449 Figure 5.16 Column Post-Tensioning Details.................................................... 450 Figure 5.17 Column Post-Tensioning ............................................................... 451 Figure 5.18 Inlet and Vent for Grouting ............................................................ 451 Figure 5.19 Loading System............................................................................... 452 Figure 5.20 Column Loading Forces ................................................................. 452 Figure 5.21 Numbering and Locations for Half-Cell Potential Measurements
and Chloride Samples (Adapted from Ref. 1 and 2) .................................. 454 Figure 5.22 All Half-Cell Potential Readings: Column NJ-TC-N ..................... 457 Figure 5.23 All Half-Cell Potential Readings: Column DJ-TC-N..................... 458 Figure 5.24 All Half-Cell Potential Readings: Column PT-TC-N-PD-Rebar ... 458 Figure 5.25 All Half-Cell Potential Readings: Column PT-TC-N-PD-PT
Bars ............................................................................................................ 459 Figure 5.26 Average Half-Cell Potential Readings at Column Base (Level 1):
Non Ptrestressed Columns ......................................................................... 459 Figure 5.27 Average Half-Cell Potential Readings at Column Mid-Height
(Level 3): Non Ptrestressed Columns ........................................................ 460 Figure 5.28 Average Half-Cell Potential Readings at Top Column (Level 5):
Non Ptrestressed Columns ......................................................................... 460 Figure 5.29 Average Half-Cell Potential Readings at Column Base (Level 1):
PT Columns-Rebar..................................................................................... 461 Figure 5.30 Average Half-Cell Potential Readings at Column Mid-Height
(Level 3): PT Columns-Rebar .................................................................... 461 Figure 5.31 Average Half-Cell Potential Readings at Top Column (Level 5):
PT Column-Rebars..................................................................................... 462

xlii
Figure 5.32 Average Half-Cell Potential Readings at Column Base (Level 1): PT Columns-PT Bars ................................................................................. 462
Figure 5.33 Average Half-Cell Potential Readings at Column Mid-Height (Level 3): PT Columns-PT Bars................................................................. 463
Figure 5.34 Average Half-Cell Potential Readings at Top Column (Level 5): PT Columns-PT Bars ................................................................................. 463
Figure 5.35 Effect of Diffusion Controlled Cathodic Polarization (Lack of Oxygen) on Corrosion Potential and Current ........................................... 466
Figure 5.36 Concrete Chloride Penetration for Column NJ-TC-N in Non –Dripper Side at End of Testing................................................................... 469
Figure 5.37 Concrete Chloride Penetration for Column NJ-TC-N in Dripper Side at End of Testing ................................................................................ 469
Figure 5.38 Concrete Chloride Penetration for Column PT-TC-N-PD in Non –Dripper Side at End of Testing................................................................. 470
Figure 5.39 Concrete Chloride Penetration for Column PT-TC-N-PD in Dripper Side at End of Testing................................................................... 470
Figure 5.40 Concrete Chloride Penetration at 0.5 inches for All Columns in Non –Dripper Side at End of Testing......................................................... 471
Figure 5.41 Concrete Chloride Penetration at 1.0 inches for All Columns in Non –Dripper Side at End of Testing......................................................... 471
Figure 5.42 Concrete Chloride Penetration at 2.0 inches for All Columns in Non –Dripper Side at End of Testing......................................................... 472
Figure 5.43 Concrete Chloride Penetration at 0.5 inches for All Columns in Dripper Side at End of Testing................................................................... 472
Figure 5.44 Concrete Chloride Penetration at 1.0 inches for All Columns in Dripper Side at End of Testing................................................................... 473
Figure 5.45 Concrete Chloride Penetration at 2.0 inches for All Columns in Dripper Side at End of Testing................................................................... 473
Figure 5.46 Saw Cutting of Column Foundation............................................... 475 Figure 5.47 Concrete Removal and Reinforcement Dismantling ...................... 476 Figure 5.48 Intervals for Corrosion Ratings on (A) Dowels, (B) Mild Steel
Longitudinal Bars, and (C) Spiral ............................................................. 478 Figure 5.49 Intervals for Corrosion Ratings on PT Ducts ................................ 481 Figure 5.50 Intervals for Corrosion Ratings on PT Bars .................................. 482

xliii
Figure 5.51 Specimen Condition at the End of Testing ..................................... 483 Figure 5.52 Condition of Specimen NJ-TC-N at the End of Testing.................. 484 Figure 5.53 Reinforcement Condition for Specimen NJ-TC-N .......................... 485 Figure 5.54 Condition of Specimen DJ-TC-N at the End of Testing ................. 486 Figure 5.55 Reinforcement Condition for Specimen DJ-TC-N.......................... 487 Figure 5.56 Condition of Specimen DJ-FA-S at the End of Testing .................. 488 Figure 5.57 Reinforcement Condition for Specimen DJ-FA-S........................... 489 Figure 5.58 Condition of Specimen DJ-TC-S at the End of Testing .................. 490 Figure 5.59: Reinforcement Condition for Specimen DJ-TC-S .......................... 490 Figure 5.60 Condition of Specimen NJ-TC-S at the End of Testing .................. 491 Figure 5.61 Reinforcement Condition for Specimen NJ-TC-S........................... 492 Figure 5.62 Condition of Specimen PT-TC-N-PD at the End of Testing........... 493 Figure 5.63 Reinforcement Condition for Specimen PT-TC-N-PD ................... 493 Figure 5.64 PT Bar Top Anchorage Condition for Specimen PT-TC-N-PD ..... 494 Figure 5.65 Reinforcement Condition for Specimen PT-TC-N-PD ................... 495 Figure 5.66 Condition of Specimen PT-TC-S-PD at the End of Testing ........... 496 Figure 5.67 Reinforcement Condition for Specimen PT-TC-S-PD.................... 497 Figure 5.68 Duct and PT Bar Condition for Specimen PT-TC-S-PD................ 497 Figure 5.69 Condition of Specimen PT-FA-S-PD at the End of Testing ........... 498 Figure 5.70 Reinforcement Condition for Specimen PT-FA-S-PD.................... 499 Figure 5.71 Duct and PT Bar Condition for Specimen PT-FA-S-PD................ 499 Figure 5.72 Condition of Specimen PT-TC-S-EB at the End of Testing............ 500 Figure 5.73 Reinforcement Condition for Specimen PT-TC-S-EB .................... 501 Figure 5.74 Duct and PT Bar Condition for Specimen PT-TC-S-EB ................ 501 Figure 5.75 Condition of Specimen PT-TC-S-GB at the End of Testing ........... 502 Figure 5.76 Reinforcement Condition for Specimen PT-TC-S-GB.................... 503 Figure 5.77 Reinforcement Condition for Specimen PT-TC-S-GB.................... 503 Figure 5.78 Maximum Spiral Corrosion Rating in Any Two-Inch Increment
for All Specimens........................................................................................ 510

xliv
Figure 5.79 Total Spiral Corrosion Rating for All Specimens ......................... 510 Figure 5.80 Maximum Rebar Corrosion Rating in Any Two-Inch Increment
for All Specimens........................................................................................ 511 Figure 5.81 Total Rebar Corrosion Rating for All Specimens ......................... 511 Figure 5.82 Maximum Dowel Corrosion Rating in Any Two-Inch Increment
for All Specimens........................................................................................ 512 Figure 5.83 Total Dowel Corrosion Rating for All Specimens......................... 512 Figure 5.84 Maximum Duct Corrosion Rating in Any Two-Inch Increment for
All Specimens ............................................................................................. 513 Figure 5.85 Total Duct Corrosion Rating for All Specimens ........................... 513 Figure 5.86 Maximum PT Bar Corrosion Rating in Any Two-Inch Increment
for All Specimens........................................................................................ 514 Figure 5.87 Total PT Bar Corrosion Rating for All Specimens........................ 514 Figure 5.88 Grout Chloride Penetration for Column PT-TC-N-PD at End of
Testing ........................................................................................................ 519 Figure 5.89 Grout Chloride Penetration for Column PT-TC-S-PD at End of
Testing ........................................................................................................ 520 Figure 5.90 Grout Chloride Penetration for Column PT-FA-S-PD at End of
Testing ........................................................................................................ 520 Figure 5.91 Grout Chloride Penetration for Column PT-TC-S-EB at End of
Testing ........................................................................................................ 521 Figure 5.92 Grout Chloride Penetration for Column PT-TC-S-GB at End of
Testing ........................................................................................................ 521 Figure 5.93 Typical Corrosion and Section Loss Found on Dowels at the
Column-Foundation Interface.................................................................... 523 Figure 5.94 Duct Corrosion Found Inside Rubber Gasket................................ 523 Figure 5.95 Total Spiral Corrosion Rating Ordered According to
Performance............................................................................................... 525 Figure 5.96 Total Rebar Corrosion Rating Ordered According to
Performance............................................................................................... 525 Figure 5.97 Total Dowel Corrosion Rating Ordered According to
Performance............................................................................................... 526

xlv
Figure 5.98 Total PT Bar Corrosion Rating Ordered According to Performance............................................................................................... 527
Figure A.1 Macrocell Corrosion Current:Dry, Epoxy and Epoxy with Gasket Joint, Steel Duct, Low Precompression and Normal Grout....................... 563
Figure A.2 Macrocell Corrosion Current:Dry, Epoxy and Epoxy with Gasket Joint, Steel Duct, Medium Precompression and Normal Grout ............... 564
Figure A.3 Macrocell Corrosion Current:Dry, Epoxy Joint, Steel Duct, Low Precompression and Corrosion Inhibitor in Grout ................................... 564
Figure A.4 Macrocell Corrosion Current:Dry, Epoxy Joint, Steel Duct, Medium Precompression and Corrosion Inhibitor in Grout .................... 565
Figure A.5 Macrocell Corrosion Current:Epoxy Joint, Steel and Plastic Duct, Medium Precompression, and Normal Grout ........................................... 565
Figure A.6 Macrocell Corrosion Current: Epoxy Joint, Steel Duct, Low, Medium and High Precompression, and Normal Grout ........................... 566
Figure A.7 Macrocell Corrosion Current:Epoxy with Gasket Joint, Steel Duct, Low, Medium and High Precompression, and Normal Grout ......... 566
Figure A.8 Macrocell Corrosion Current:Dry Joint, Steel Duct, Low and Medium Precompression, and Corrosion Inhibitor in Grout ................... 567
Figure A.9 Macrocell Corrosion Current:Epoxy Joint, Steel Duct, Low, Medium and High Precompression, and Corrosion Inhibitor in Grout .... 567
Figure A.10 Macrocell Corrosion Current:Dry Joint, Steel Duct, Low, Precompression, and Different Grouts (Normal and with Corrosion Inhibitor Added) ......................................................................................... 568
Figure A.11 Macrocell Corrosion Current:Dry Joint, Steel Duct, Medium Precompression, and Different Grouts (Normal and with Corrosion Inhibitor Added) ......................................................................................... 568
Figure A.12 Macrocell Corrosion Current:Epoxy Joint, Steel Duct, Low Precompression, and Different Grouts (Normal, Corrosion Inhibitor Silica Fume) ............................................................................................... 569
Figure A.13 Macrocell Corrosion Current:Epoxy Joint, Steel Duct, High Precompression, and Different Grouts (Normal and with Corrosion Inhibitor Added) ......................................................................................... 569
Figure A.14 Half-Cell Potentials:Dry, Epoxy and Epoxy with Gasket Joints, Steel Duct, Low Precompression, and Normal Grout................................ 570

xlvi
Figure A.15 Half-Cell Potentials:Dry, Epoxy and Epoxy with Gasket Joints, Steel Duct, Medium Precompression, and Normal Grout ......................... 571
Figure A.16 Half-Cell Potentials:Dry and Epoxy Joint, Steel Duct, Low Precompression, and Corrosion Inhibitor in Grout .................................. 571
Figure A.17 Half-Cell Potentials:Dry and Epoxy Joint, Steel Duct, Medium Precompression, and Corrosion Inhibitor in Grout .................................. 572
Figure A.18 Half-Cell Potentials:Dry and Epoxy Joint, Steel and Plastic Duct, Medium Precompression, and Normal Grout .................................. 572
Figure A.19 Half-Cell Potentials:Epoxy Joint, Steel Duct, Low, Medium and High Precompression, and Normal Grout ................................................. 573
Figure A.20 Half-Cell Potentials: Epoxy Joint with Gasket, Steel Duct, Low, Medium and High Precompression, and Normal Grout ............................ 573
Figure A.21 Half-Cell Potentials:Dry Joint, Steel Duct, Low and Medium Precompression, and Corrosion Inhibitor in Grout .................................. 574
Figure A.22 Half-Cell Potentials:Epoxy Joint, Steel Duct, Low, Medium and High Precompression, and Corrosion Inhibitor in Grout ......................... 574
Figure A.23 Half-Cell Potentials:Dry Joint, Steel Duct,Low Precompression, Normal Grout and Grout with Corrosion Inhibitor Added........................ 575
Figure A.24 Half-Cell Potentials:Dry Joint, Steel Duct, Medium Precompression, and Different Grouts (Normal and Corrosion Inhibitor Added) ........................................................................................................ 575
Figure A.25 Half-Cell Potentials:Epoxy Joint, Steel Duct, Low Precompression, and Different Grouts (Normal, Silica Fume and Corrosion Inhibitor Added)........................................................................ 576
Figure A.26 Half-Cell Potentials:Epoxy Joint, Steel Duct, High Precompression, and Different Grouts (Normal and Corrosion Inhibitor Added) ........................................................................................................ 576
Figure A.27 Half-Cell Potentials for Duplicated Specimens with Dry Joint, Steel Duct, Low Precompression, and Normal Grout............................... 577
Figure A.28 Half-Cell Potentials for Duplicated Specimens with Dry Joint, Steel Duct, Medium Precompression, and Normal Grout ........................ 577
Figure A.29 Half-Cell Potentials for Duplicated Specimens with Dry Joint, Plasticl Duct, Low Precompression, and Normal Grout .......................... 578

xlvii
Figure A.30 Half-Cell Potentials for Duplicated Specimens with Dry Joint, Steel Duct, Low Precompression, and Grout with Corrosion Inhibitor Added.......................................................................................................... 578
Figure A.31 Half-Cell Potentials for Duplicated Specimens with Dry Joint, Steel Duct, Medium Precompression, and Grout with Corrosion Inhibitor Added .......................................................................................... 579
Figure A.32 Half-Cell Potentials for Duplicated Specimens with Epoxy Joint, Steel Duct, Low Precompression, and Normal Grout................................ 579
Figure A.33 Half-Cell Potentials for Duplicated Specimens with Epoxy Joint, Steel Duct, Medium Precompression, and Normal Grout ........................ 580
Figure A.34 Half-Cell Potentials for Duplicated Specimens with Epoxy Joint, Plastic Duct, Low Precompression, and Normal Grout ........................... 580
Figure A.35 Half-Cell Potentials for Duplicated Specimens with Epoxy Joint, Plastic Duct, Medium Precompression, and Normal Grout ..................... 581
Figure A.36 Half-Cell Potentials for Duplicated Specimens with Epoxy Joint, Steel Duct, Low Precompression, and Grout with Corrosion Inhibitor Added ......................................................................................................... 581
Figure A.37 Half-Cell Potentials for Duplicated Specimens with Epoxy Joint, Steel Duct, Medium Precompression, and Grout with Corrosion Inhibitor Added ......................................................................................... 582
Figure A.38 Half-Cell Potentials for Duplicated Specimens with Epoxy Joint, Steel Duct, High Precompression, and Grout with Corrosion Inhibitor Added ......................................................................................................... 582
Figure A.39 Half-Cell Potentials for Duplicated Specimens with Epoxy Joint, Steel Duct, Low Precompression, and Grout with Silica Fume Added .... 583
Figure A.40 Half-Cell Potentials for Duplicated Specimens with Epoxy Joint with Gasket, Steel Duct, Low Precompression, and Normal Grout ......... 583
Figure A.41 Half-Cell Potentials for Duplicated Specimens with Epoxy Joint with Gasket, Steel Duct, Medium Precompression, and Normal Grout . 584
Figure A.42 Half-Cell Potentials for Duplicated Specimens with Epoxy Joint with Gasket, Steel Duct,High Precompression, and Normal Grout ........ 584
Figure B.1 Sheet 0: Drawing List ..................................................................... 585 Figure B.2 Sheet S1: Non-PS Section ................................................................ 586 Figure B.3 Sheet S2: Non PS Stirrup Layout ..................................................... 586 Figure B.4 Sheet S3: 100%S PS Section ............................................................ 587

xlviii
Figure B.5 Sheet S4: 100%S PS Stirrup Layout ................................................ 587 Figure B.6 Sheet S5: 100%S Anchorage Zone................................................... 588 Figure B.7 Sheet S6: 100%S End Detail............................................................ 588 Figure B.8 Sheet S7: 100%U PS Section ........................................................... 589 Figure B.9 Sheet S8: 100%U Stirrup Layout ..................................................... 589 Figure B.10 Sheet S9: 100%U Anchorage Zone................................................ 590 Figure B.11 Sheet S10: 100%U End Details ..................................................... 590 Figure B.12 Sheet S11: 100%S End Details ...................................................... 591 Figure B.13 Sheet S12: 2/3 PS Stirrup Layout.................................................. 591 Figure B.14 Sheet S13: 2/3 PS Anchorage Zone .............................................. 592 Figure B.15 Sheet S14: 2/3 PS End Detail........................................................ 592 Figure B.16 Sheet S15: Reaction Beam Section ................................................ 593 Figure B.17 Sheet S16: 2/3 PS Reaction Beam Stirrup Layout ........................ 593 Figure B.18 Sheet D1: Bar Details .................................................................... 594 Figure B.19 Sheet D2: Anchorage Hardware.................................................... 594 Figure B.20: Sheet D3: Post-Tensioning Duct and Splice Details ..................... 595 Figure B.21 Final Crack Pattern and Measurements-Beam 1.3 ....................... 596 Figure B.22 Final Crack Pattern and Measurements-Beam 2.3 ....................... 596 Figure B.23 Final Crack Pattern and Measurements-Beam 2.11 ..................... 597 Figure B.24 Final Crack Pattern and Measurements-Beam 3.2 ....................... 597 Figure B.25 Final Crack Pattern and Measurements-Beam 3.3 ....................... 598 Figure B.26 Final Crack Pattern and Measurements-Beam 4.2 ....................... 598 Figure B.27 Final Crack Pattern and Measurements-Beam 1.5 ....................... 599 Figure B.28 Final Crack Pattern and Measurements-Beam 1.6 ....................... 599 Figure B.29 Final Crack Pattern and Measurements-Beam 2.5 ....................... 600 Figure B.30 Final Crack Pattern and Measurements-Beam 2.6 ....................... 600 Figure B.31 Final Crack Pattern and Measurements-Beam 3.6 ....................... 601 Figure B.32 Final Crack Pattern and Measurements-Beam 3.7 ....................... 601 Figure B.33 Half-Cell Potential Readings for All Phase I Beams...................... 602

xlix
Figure B.34 Half-Cell Potential Readings for All Non-PS Phase I Beams ........ 602 Figure B.35 Half-Cell Potential Readings for All 2/3 PS Phase I Beams .......... 603 Figure B.36 Half-Cell Potential Readings for All 100%U PS Phase I Beams ... 603 Figure B.37 Half-Cell Potential Readings for All 100%S PS Phase I Beams .... 604 Figure B.38 Half-Cell Potential Readings for All Unloaded Phase I Beams ..... 604 Figure B.39 Half-Cell Potential Readings for All 100% Service Load Phase I
Beams ......................................................................................................... 605 Figure B.40 Half-Cell Potential Readings for All Overloaded Phase I Beams.. 605 Figure B.41 Half-Cell Potential Readings for All Phase II Beams .................... 606 Figure B.42 Half-Cell Potential Readings for All 2/3 PS Phase II Beams......... 606 Figure B.43 Half-Cell Potential Readings for All Fly Ash Concrete Phase II
Beams ......................................................................................................... 607 Figure B.44 Half-Cell Potential Readings for All High Performance Concrete
Phase II Beams........................................................................................... 607 Figure B.45 Half-Cell Potential Readings for All Varying Strand Type Phase
II Beams ..................................................................................................... 608 Figure B.46 Half-Cell Potential Readings for All Varying Grout Type Phase II
Beams ......................................................................................................... 608 Figure B.47 Half-Cell Potential Readings for All Varying Duct Type Phase II
Beams ......................................................................................................... 609 Figure B.48 Contour Maps of Half- Cell Potential Readings at 498 Days ....... 610 Figure B.49 Phase I Beams-Measured Corrosion Rates (Seven Month
Exposure Duration-PR Monitor Equipment ) ............................................ 612 Figure B.50 Phase I Beams-Measured Corrosion Rates (Twelve Month
Exposure Duration-3LP Equipment ) ........................................................ 612 Figure B.51 Phase I Beams-Measured Corrosion Rates (Fifteen Month
Exposure Duration-PR Monitor Equipment ) ............................................ 613 Figure B.52 Phase I Beams-Measured Corrosion Rates (Fifteen Month
Exposure Duration-3LP Equipment ) ........................................................ 613 Figure B.53 Phase I Beams-Measured Corrosion Rates (47 Month Exposure
Duration-3LP Equipment ) ........................................................................ 614 Figure B.54 Phase II Beams-Measured Corrosion Rates (35 Month Exposure
Duration-3LP Equipment ) ........................................................................ 614

l
Figure B.55 Block Chloride Penetration at 7 Months (Phase I Ponded Block Specimens) ................................................................................................. 615
Figure B.56 Block Chloride Penetration at 14 Months (Phase I Ponded Block Specimens) ................................................................................................. 615
Figure B.57 Block Chloride Penetration at 41 Months (Phase I Ponded Block Specimens) ................................................................................................. 616
Figure B.58 Block Chloride Penetration at 54 Months (Phase I Ponded Block Specimens) ................................................................................................. 616
Figure B.59 Block Chloride Penetration at 29 Months (Phase II Ponded Block Specimens) ................................................................................................. 617
Figure B.60 Block Chloride Penetration at 42 Months (Phase II Ponded Block Specimens) ...................................................................................... 617
Figure B.61 Chloride Penetration at 54 Months-Beam 1.1 ............................... 618 Figure B.62 Chloride Penetration at 54 Months-Beam 1.3 ............................... 618 Figure B.63 Chloride Penetration at 54 Months-Beam 2.3 ............................... 619 Figure B.64 Chloride Penetration at 54 Months-Beam 2.11 ............................. 619 Figure B.65 Chloride Penetration at 54 Months-Beam 3.1 ............................... 620 Figure B.66 Chloride Penetration at 54 Months-Beam 3.2 ............................... 620 Figure B.67 Chloride Penetration at 54 Months-Beam 3.3 ............................... 621 Figure B.68 Chloride Penetration at 54 Months-Beam 4.2 ............................... 621 Figure B.69 Chloride Penetration at 54 Months-Beam 1.5 ............................... 622 Figure B.70 Chloride Penetration at 54 Months-Beam 1.6 ............................... 622 Figure B.71 Chloride Penetration at 42 Months-Beam 2.5 ............................... 623 Figure B.72 Chloride Penetration at 42 Months-Beam 2.6 ............................... 623 Figure B.73 Chloride Penetration at 42 Months-Beam 3.6 ............................... 624 Figure B.74 Chloride Penetration at 42 Months-Beam 3.7 ............................... 624 Figure C.1 All Half-Cell Potential Readings for Column NJ-TC-S .................. 625 Figure C.2 All Half-Cell Potential Readings for Column DJ-TC-S ................. 626 Figure C.3 All Half-Cell Potential Readings for Column PT-TC-S-PD-Rebar. 626 Figure C.4 All Half-Cell Potential Readings for Column PT-TC-S-PD-PT
Bars ............................................................................................................ 627

li
Figure C.5 All Half-Cell Potential Readings for Column PT-FA-S-PD- Rebar ......................................................................................................... 627
Figure C.6 All Half-Cell Potential Readings for Column PT-FA-S-PD-PT Bars ........................................................................................................... 628
Figure C.7 All Half-Cell Potential Readings for Column PT-TC-S-EB- Rebar 628 Figure C.8 All Half-Cell Potential Readings for Column PT-TC-S-EB-PT
Bars ........................................................................................................... 629 Figure C.9 All Half-Cell Potential Readings for Column PT-TC-S-GB-
Rebar ......................................................................................................... 629 Figure C.10 All Half-Cell Potential Readings for Column PT-TC-S-GB-PT
Bars ........................................................................................................... 630 Figure C.11 Average Half-Cell Potential Readings for Column NJ-TC-N ...... 630 Figure C.12 Averagel Half-Cell Potential Readings for Column DJ-TC-N ...... 631 Figure C.13 Average Half-Cell Potential Readings for Column DJ-FA-S ....... 631 Figure C.14 Average Half-Cell Potential Readings for Column DJ-TC-S ....... 632 Figure C.15 Average Half-Cell Potential Readings for Column NJ-TC-S ....... 632 Figure C.16 Average Half-Cell Potential Readings for Column PT-TC-N-PD-
Rebar ......................................................................................................... 633 Figure C.17 Average Half-Cell Potential Readings for Column PT-TC-N-PD-
PT Bars ...................................................................................................... 633 Figure C.18 Concrete Chloride Penetration for Column DJ-TC-N in Non-
Dripper Side at End of Testing .................................................................. 634 Figure C.19 Concrete Chloride Penetration for Column DJ-TC-N in Dripper
Side at End of Testing ............................................................................... 635 Figure C.20 Concrete Chloride Penetration for Column DJ-FA-S in Non-
Dripper Side at End of Testing .................................................................. 635 Figure C.21 Concrete Chloride Penetration for Column DJ-FA-S in Dripper
Side at End of Testing ............................................................................... 636 Figure C.22 Concrete Chloride Penetration for Column DJ-TC-S in Non-
Dripper Side at End of Testing .................................................................. 636 Figure C.23 Concrete Chloride Penetration for Column DJ-TC-S in Dripper
Side at End of Testing ............................................................................... 637

lii
Figure C.24 Concrete Chloride Penetration for Column NJ-TC-S in Non-Dripper Side at End of Testing .................................................................. 637
Figure C.25 Concrete Chloride Penetration for Column NJ-TC-S in Dripper Side at End of Testing ............................................................................... 638
Figure C.26 Concrete Chloride Penetration for Column PT-TC-S-PD in Non-Dripper Side at End of Testing .......................................................... 638
Figure C.27 Concrete Chloride Penetration for Column PT-TC-S-PD in Dripper Side at End of Testing .................................................................. 639
Figure C.28 Concrete Chloride Penetration for Column PT-FA-S-PD in Non-Dripper Side at End of Testing .......................................................... 639
Figure C.29 Concrete Chloride Penetration for Column PT-FA-S-PD in Dripper Side at End of Testing .................................................................. 640
Figure C.30 Concrete Chloride Penetration for Column PT-TC-S-EB in Non-Dripper Side at End of Testing .......................................................... 640
Figure C.31 Concrete Chloride Penetration for Column PT-TC-S-EB in Dripper Side at End of Testing .................................................................. 641
Figure C.32 Concrete Chloride Penetration for Column PT-TC-S-GB in Non-Dripper Side at End of Testing .......................................................... 641
Figure C.33 Concrete Chloride Penetration for Column PT-TC-S-GB in Dripper Side at End of Testing .................................................................. 642
1
CHAPTER 1 Introduction
1.1 BACKGROUND
In the last few years, the effectiveness of cement grout in galvanized or
polyethylene ducts, the most widely used corrosion protection system for internal
and external multistrand post-tensioning for bridge superstructures has been under
debate, due to significant tendon corrosion damages, several reported failures of
individual tendons as well as a few collapses of non-typical structures.1.1-1.5 While
experience in the USA has been generally good,1.6 some foreign experience has
been less than satisfactory. A moratorium was established in the U.K. in 1992 for
internal bonded post-tensioned structures (due to bridge failures including the
well known collapse of the Ynys-y-Gwas Bridge in Wales), and is still in effect
for “internal, grouted tendons with discontinuous (poorly sealed) ducts”.1.2,1.7
Germany has expressed a preference for the use of external prestressing.1.8-1.9 The
French Authorities have gone in the opposite direction considering the idea of
forbidding external tendons injected with cement grouts1.10. Japan has expressed a
preference for the use of fully external tendons using transparent sheath with
grouting.1.4 These are only a few examples of the general concern and show the
need for comprehensive studies regarding the corrosion protection of bonded
post-tensioning systems.
Recognizing the extent of the problem, in November 2001, engineers from
many countries gathered at Ghent University,1.11 Belgium, under the sponsorship
of fib (federation internationale du béton) and IABSE (International Association
for Bridge and Structural Engineering), to review the problems encountered and
to discuss the available solutions. Other congresses and seminars have followed,

2
including the October 2002, first fib Congress “Concrete Structures in the 21st
Century,” in Osaka, Japan. However, many aspects still remain under discussion.
In United States, the very limited problems with tendon corrosion in
precast segmental bridges1.6, 1.12-1.17 include one external tendon failure found in
1999 in the Niles Channel Bridge, two tendon failures and eleven corroded
tendons discovered during the year 2000 at the Mid-Bay Bridge, and, corroded
and failed vertical tendons discovered in the same year in precast segmental
columns of the high level approaches of the Sunshine Skyway Bridge. All of
these bridges are located in the State of Florida. Additionally, grouting
deficiencies were found in 2001 in the Sidney Lanier cable-stayed bridge in
Georgia and in the Boston Central Artery bridges. No significant tendon
corrosion problems have been reported in the states of California (with 3800 post-
tensioned bridges), Georgia, Texas and Virginia, as reported by the American
Segmental Bridge Association. 1.18
The general concern after the unfortunate experiences world wide has lead
many transportation agencies and technical societies to produce “emergency”
documents and technical reports. These state of the art reports and specification
documents are the response to knowledge and expertise to date, with regard to
new material requirements, construction practices and monitoring techniques.
However, it is clear, that more research is needed to reinforce or even to disprove
some of these theories, since to date there is not a clear agreement on a consistent
set of durability design, construction and monitoring guidelines. Some of the
mentioned “emergency” documents include:
- The Concrete Society (1996), “Durable Bonded Post-Tensioned Concrete
Bridges,” The Concrete Society Technical Report TR47, United Kingdom,
1996.1.22 Second edition to be published shortly as reported by Prof. G.
Somerville.1.23

3
- FIP (1996),“Corrosion protection of Prestressing Steels,” Fédération
Internationale de la Précontrainte (FIP), London, 1996.1.24
- fib (2000), “Corrugated Plastic Ducts for Internal Bonded Post-
Tensioning,” Fédération Internationale du béton (fib) Technical Report
Bulletin No. 7, Lausanne, Switzerland, January, 2000.1.25
- fib (2000), “Grouting of tendons in prestressed concrete,” Fédération
Internationale du béton (fib) Technical Report Bulletin No. 20, Lausanne,
Switzerland, July, 2000.1.26
- JPCEA (2001), “Manual for Maintenance of Prestressed Concrete
Bridges,” Japan, November 2000. As referenced in Hamada1.27 and
Kitazono.1.28
- ASBI (2001), “Interim Statement on Grouting Practices,” Phoenix,
Arizona, U.S.A., December 2000.1.20
- JSCE (2001), “Standard Specification for Maintenance of Concrete
Structures,” Japan, January 2001. As referenced by Hamada1.27 and
Kitazono.1.28
- PTI (2001), “Guide Specification for Grouting of Post-Tensioned
Structures,” Phoenix, Arizona, U.S.A. February 2001, First edition.1.19
- ASBI (2002), “2002 Grouting Certification Training Manual,” Phoenix,
Arizona, U.S.A., 2002.1.21
- FLDOT (2002), “New Directions for Florida Post-Tensioned Bridges,”
Tallahassee, Florida, U.S.A., February 2002.1.16
- VSL (2002), “Grouting of Post-Tensioning Tendons,” VSL International
Ltd. Lyssach, Switzerland, May 2002.1.23
- Swiss Federal Roads Authority and the Swiss Federal Railways
(2001), “Measures for providing durability of post-tensioning tendons in
bridges,” 1.29

4
Corrosion protection for bonded internal tendons can be very effective.
Within the elements, internal tendons can be well protected by the multilayer
protection system; including a sound design taking away the surface water,
surface treatments, high quality concrete, plastic or galvanized duct, sound
cement grout, coatings and other internal barriers in the prestressing steel and
good anchorage protection measures (for example, encapsulated systems).
However, potential weak links exist, among others, when the high strength
concrete has high permeability (due to mix design and construction or due to
service/exposure conditions), and when the concrete has cracking (due to
shrinkage or service loading). Additional weak links occur when ducts are not
adequately spliced or adequately protected by impermeable concrete and so are
prone to severe corrosion. In addition, voids, bleed water and cracks can be
present in the Portland cement grout. Finally, the prestressing steel may not be
adequately protected and handled during construction, including inadequate or
total lack of temporary protection techniques.
One of the major problems that agencies face today is the difficulty of
providing good monitoring and inspection techniques for bonded post-tensioned
structures. Condition surveys are often limited to visual inspections for signs of
cracking, spalling and rust staining. This limited technique can often overlook
the deterioration of prestressing steel and fail to detect the potential for very
severe and sudden collapses, as demonstrated in the Ynys-y-Gwas Bridge
failure.1.2 Therefore, as stated by West1.30 “…there is fear that figures reporting
the incidence of corrosion in prestressed structures based on limited or visual
inspections may be unconservative and produce a false sense of security.” The
same could happen even when using advanced techniques as borescopy, since in
this case the analysis is limited to specific areas in selected bridge elements.

5
Grout voids or even corrosion of prestressing steel in many areas of the bridge
element may still be overlooked.
As stated by Ganz1.31 the design of the corrosion protection systems
should take into account that most parts of the tendons are not accessible during
the design life, and that in general individual components or the entire tendons,
are not replaceable. Even if special details are provided to allow replaceability of
the tendons during the design life, the replacement should be carried out only in
“emergency” situations.
Stable grout mixes and better grouting procedures are now being
implemented, in part after the important findings of Schockker et al.1.32 at the Phil
M. Ferguson Structural Engineering Laboratory (FSEL) at the University of
Texas at Austin, in 1999. The American Segmental Bridge Institute (ASBI) in
2001 launched the Grouting Certification Training Program, which was first held
in August 2001, at FSEL. This training program has been adopted by various
Transportation Agencies throughout the United States as a requirement for
grouting supervisors and inspectors.1.18 Additionally, the Post-Tensioning
Institute Committee on Grouting Specification, published in February 2001 the
“Specification for Grouting of Post-Tensioned Structures.”1.19 The use of this
guide and the new and better inspection procedures are expected to yield more
durable structures.
Besides high performance grouts and better grouting practices, plastic
ducts either polyethylene (PE) or polypropylene (PP) are being implemented as
reported by fib technical report on “Corrugated Plastic Ducts for Internal Bonded-
Post-Tensioning”.1.25 Yet, many durability aspects of bonded internal post-
tensioning systems require further research and analysis.

6
1.2 RESEARCH OBJECTIVES AND SCOPE
1.2.1 Project Statement
The research presented in this dissertation is part of the University of
Texas at Austin, Center for Transportation Research Project 0-1405: “Durability
Design of Post-Tensioned Bridge Substructure Elements.” The research is being
performed at the Phil M. Ferguson Structural Engineering Laboratory and is
sponsored by the Texas Department of Transportation and Federal Highway
Administration. The title of Project 0-1405 involves two main aspects:
• Durability of Bridge Substructures, and
• Post-Tensioned Bridge Substructures.
The substructure emphasis is in response to the deteriorating condition of
bridge substructures in some areas of Texas. While considerable research and
design effort has been given to bridge deck design to prevent corrosion damage,
substructures had historically been more overlooked. Often superstructure
drainage details result in substructures having a high exposure to aggressive
agents such as, deicing salts, also substructures are often in direct contact with salt
water and damaging soils.
The second aspect of the research is post-tensioned substructures.
Relatively few post-tensioned substructures have been used in the past. There are
many possible applications in bridge substructures where post-tensioning can
provide structural and economical benefits, and can possibly improve durability.
Post-tensioning is now being used in Texas bridge substructures, and it is
reasonable to expect the use of post-tensioning to increase in the future as
precasting of substructure components becomes more prevalent and as foundation
sizes increase. This is expected, even though some problems have been

7
encountered in post-tensioned bridges throughout the world as mentioned
previously.
The problem that bridge engineers face is that there are few
comprehensive durability design guidelines for post-tensioned concrete structures.
Durability design guidelines should provide information on how to identify
possible durability problems, how to improve durability using post-tensioning,
and how to ensure that the post-tensioning system does not introduce new
durability problems.
1.2.2 Project Objectives
The overall research objectives for TXDOT Project 0-1405 are as follows:
1. To examine the use of post-tensioning in bridge substructures,
2. To identify durability concerns for bridge substructures in Texas,
3. To identify existing technology to ensure durability or improve
durability,
4. To develop experimental testing programs to evaluate protection
measures for improving the durability of post-tensioned bridge
substructures, and
5. To develop durability design guidelines and recommendations for
post-tensioned bridge substructures.
A review of literature has indicated that while a few problems have been
encountered in some bridges in Europe, Japan, and the U.S.A., damage has been
limited to a very small percentage of post-tensioned bridges. In general, post-
tensioning systems have been successfully used in bridge designs. However, as
these bridges age and increase in cumulative exposure, more problems are being

8
noted. New practices and materials are required to guarantee the safety and design
life of these structures.
The initial literature review performed by West 1.33 identified a substantial
amount of relevant information that could be applied to the durability of post-
tensioned bridge substructures. This existing information allowed the scope of
the experimental portion of the project to be narrowed. The final objective
represents the culmination of the project. All of the research findings are to be
compiled into the practical format of comprehensive durability design guidelines.
1.2.3 Project Scope
The subject of durability is extremely broad, and as a result a broad scope
of research was developed for TXDOT Project 0-1405. Based on the project
proposal and an initial review of relevant literature performed by West1.33, the
project scope and necessary work plan were defined. The main components of
TXDOT Project 0-1405 are:
1. Extensive Literature Review
2. Survey of Existing Bridge Substructures Inspection Reports
(BRINSAP)
3. Long-Term Corrosion Tests with Large-Scale Post-Tensioned Beam
and Column Elements
4. Investigation of Corrosion Protection (near joints) for Internal
Prestressing Tendons in Precast Segmental Bridges
5. Development of Improved Grouts for Post-Tensioning
6. Development of recommendations and design guidelines for durable
bonded post-tensioned bridge substructures

9
Components 1 and 2 (literature review and survey of Brinsap report) were
performed initially by West1.33, Schokker1.34, Koester1.35 and Larosche1.36 and
findings up to 1998 were published in references 1.33 and 1.34. The literature
review process was continued by the author and is updated in this dissertation.
Component 3 was divided into Large Scale Column Corrosion Tests and
Large Scale Beam Corrosion Tests. The column tests were started by Larosche1.36
and West. 1.33 Column exposure testing began in July 1996. The beam tests were
implemented in two phases: the first phase was implemented by West, 1.33 and
exposure testing began in December 1997. The second phase was implemented by
Schokker, 1.34 and exposure testing begun in December 1998. Comprehensive
autopsies of around half of these specimens, at the end of their exposure testing
period were performed by Kotys1.37 and the author and are reported in this
dissertation.
Component 4 (corrosion protection at joints of segmental bridges) was
developed and implemented by Vignos1.38 under TxDOT Project 0-1264. This
testing program was transferred to TxDOT Project 0-1405 in 1995 for long-term
testing. Although this aspect of the research was developed under Project 0-1264
to address corrosion concerns for precast segmental bridge superstructures, the
concepts and variables are equally applicable to precast segmental substructures,
and the testing program fits well within the scope of Project 0-1405. Half of the
macrocell laboratory specimens were autopsied at four and a half years of
exposure testing by West.1.33 Final autopsies of the remaining specimens were
performed by Kotys1.37 and the author, and findings are reported in this
dissertation.
Component 5 (Development of Improved Grouts for Post-Tensioning) was
developed and implemented by Schokker1.34 based on previous work published by
Hamilton1.39 and Koester1.35. The accelerated corrosion testing was performed

10
and conclusions were drawn and published.1.32,1.34 Under this portion of the
research, high-performance grouts for bonded post-tensioning were developed
through a series of fresh property tests, accelerated corrosion tests, and large-scale
field trials. These grouts have become widely used in practice.
Component 6 (Development of recommendations and design guidelines
for durable bonded post-tensioned bridge substructures) refers to the most
important implementation directed aspect of the research program. Interim
design guidelines were developed and published by West and Schokker1.40 based
on research results up to 1999. Updated Guidelines based on final autopsy results
from the macrocell, column and beam tests are included in this dissertation.
The project scope is outlined in Figure 1.1. This figure shows the
cooperative effort performed by all graduate research assistants during the length
of the project. In Figure 1.1 the years in brackets show the actual or expected
publication dates for each Technical Report, published under TxDOT Project 0-
1405. A more detailed description of the involvement of each graduate research
assistant is shown in Table 1.1.

11
Figure 1.1. TxDOT Project 0-1405 Scope, Researchers and
Technical Reports
Literature Review
-West,
Koester,Larosche, Schokker
SalasKotys
-1405-1 (1999)1405-8 (2003)
Long Term Exposure Tests (corrosion)
--
West, SchokkerLarosche
-1405-3 (1999)
Segmental Joint MacrocellSpecimen
Corrosion Tests-
West,VignosSalas, Kotys
-1405-4 (1999)1405-6 (2002)1405-7 (2003)
Evaluation ofImproved Grouts
for Post-Tensioning
(Fresh properties and corrosion
protection)
SchokkerKoester
-1405-2 (1999)
Beams-
SalasKotys
-1405-8 (2003)
Columns -
Salas
-1405-8 (2003)
Investigating Corrosion Protection Systems
Design Guidelines: West, Schokker (Interim Conclusions), 1405-5 (1999)-
Salas, 1405-9 (2003)

12
Table 1.1 Major Project Tasks and Contributions of Graduate Students
Project Task
Wes
t (R
ef.
1.33
)
Scho
kker
(R
ef. 1
.34)
Koe
ster
(R
ef. 1
.35)
Lar
osch
e (R
ef. 1
.36)
Vig
nos
(Ref
. 1.3
8)
Kot
ys
(Ref
. 1.3
7)
Sala
s (a
utho
r)
Literature Review X X X X X
Identification of Substructure PT Applications X X
Identification of Protection Variables X X
Survey of Existing Structures X
Testing Program Design
Long Term Beam Exposure Tests
Long Term Column Exposure Tests
Segmental Macrocell Corrosion Tests
Evaluation of Improved Grouts for PT
X
X
X
X
X
X
Fabrication of Test Specimens
Long Term Beam Exposure Tests
Long Term Column Exposure Tests
Segmental Macrocell Corrosion Tests
Evaluation of Improved Grouts for PT
X
X
X
X
X
X
X
Initial Exposure Testing
Long Term Beam Exposure Tests
Long Term Column Exposure Tests
Segmental Macrocell Corrosion Tests
Evaluation of Improved Grouts for PT
X
X
X
X
X
X
X
X
Limited Specimen Autopsies
Long Term Beam Exposure Tests
Long Term Column Exposure Tests
Segmental Macrocell Corrosion Tests
X
X
X
Continuation of Exposure Testing
Long Term Beam Exposure Tests
Long Term Column Exposure Tests
Segmental Macrocell Corrosion Tests
X
X
X
X
X
Final Autopsies
Long Term Beam Exposure Tests
Long Term Column Corrosion Tests
Segmental Macrocell Corrosion Tests
X
X
X
X
X
Continuation of Exposure Testing
Long Term Beam Exposure Tests
X
X
Preliminary Design Guidelines X X
Design Guidelines update X

13
1.2.4 Dissertation Scope
The author’s involvement in Project 0-1405 started in August 2000, after
exposure testing had begun in Components 3 and 4 above. This dissertation’s
scope includes the following:
1. Continuation of exposure testing of the remaining macrocell
specimens,
2. Continuation of exposure testing of all beam and column specimens,
3. Performance of comprehensive autopsies of the remaining macrocell
specimens, after eight years of aggressive exposure,
4. Performance of comprehensive autopsies and examinations of
approximately half of Phase 1 and Phase 2 beams, after four and a half
years, and three and a half years of exposure testing, respectively,
5. Performance of comprehensive autopsies and examinations of all
column specimens after six and a half years of exposure testing, and
6. Updating of durability design guidelines based on exposure testing and
autopsy results.
Figure 1.2 shows the project and dissertation (shaded area) schedule. As
shown in this figure, approximately half of the beams from the large scale tests
will undergo continuous exposure testing beyond the year 2003. The latter was
decided after final macrocell corrosion tests results indicated longer exposure
times to be desirable, as explained in detail in Chapter 4.
In Chapter 2 an overview of the history of bonded post-tensioning
Systems and Structures is given, the main post-tensioning concepts, advantages,
disadvantages, and durability aspects are summarized, and general background on
durability protection techniques used to date is given. In Chapter 3, the

14
Segmental Macrocell Corrosion Test program and findings are explained. The
Long-Term Beam Corrosion Test results are presented in Chapter 4. In Chapter 5
the Long-Term Column Corrosion Test results are summarized. In Chapter 6 the
update on the Durability Design Guidelines based on the Interim Design
Guidelines published previously under Project 0-14051.40 (as revised after the
autopsy results of this series were analyzed) are presented. In Chapter 7 the
program is summarized and conclusions on the Corrosion Testing, Evaluation and
Durability Design of Bonded Post-Tensioned Tendons are presented.
Figure 1.2. Project TxDOT 0-1405 (1993-2006) and
Dissertation (2000-2003) Schedule

15
CHAPTER 2 Internal Bonded Post-Tensioning Systems
2.1 PRESTRESSED CONCRETE
2.1.1 Historical Development
Key events in the history of prestressed concrete structures started at the
end of the 19th Century, with the concept of imposing preservice stresses on
hardened concrete. However, the most important event in the development of this
technique was recorded in 1933, when E. Freyssinet demonstrated the advantage
of using higher strength concrete and high strength steel to minimize losses.
Table 2.1 summarizes the key events as reported by Schupack.2.1
Table 2.1 Key Developments in Prestressed Concrete History2.1
Year Author / researcher Description
1888 P.H.Jackson Concept of imposing preservice stresses on hardened concrete.
1907 M. Koenen Identify losses due to classic shortening.
1908 G.R. Steiner Recognized losses due to shrinkage.
1928 F.Dischinger Loss of prestress compensated by retensioning.
1933 E.Freyssinet Demonstrated advantage of using higher strength concrete and high
strength steel to minimize losses.
1939 K.Wettstein
E.Hoyer
Used high strength piano wire.
1943 J.M.Crom Used high tensile drawn wire for tanks and pipe.
1944 G.Magnel Identified the relaxation losses of work-hardened steels under
constant strain.
1950 Reported by W.O. Everling. Use of stress relieved wire 240 ksi (1.65 GPa) and strand 250 ksi
(1.72 GPa) to provide user friendly steel.
1963 T.Cahill Developed low-relaxation steel reducing loss from about 12 to 2.5%.

16
After these events, no other dramatic new concepts were reported through
the end of the 20th Century, but continuous development has occurred and
prestressing steel usage has been significantly increasing since the 1960’s
After the second world war, as reported by Godart,2.2 countries like France
experienced the construction euphoria of widespread infrastructure reconstruction,
during a period marked by cement and steel shortage. French viaducts were
reconstructed with simply supported spans made up of prestressed beams, known
as VIPP (Viaducts a travées Indépendantes a Poutres Précontraintes: Viaducts
with simply supported spans made of prestressed beams). After an investigation
by Trouillet in the year 2000 as reported by Godart, 2.2 fifteen out of a total of 720
VIPP built before 1966, had been demolished because of tendon corrosion.
In the USA, according to the National Bridge Inventory Database2.3, there
are approximately 600,000 bridges, of which half were built between 1950 and
1994. Based on Federal Highway Administration (FHWA) data reported by
Yunovich, 2.3 approximately 18.5% of the total are prestressed concrete bridges.
These include both post-tensioned and pretensioned technology.
The beginning of post-tensioned concrete bridges in the US started in
Madison County, Tennessee, 2.4 where a concrete highway bridge was built and
opened to traffic on October 28,1950. The bridge consisted of three-spans with a
total length of 81 feet, using precast concrete blocks with mortar joints. This
bridge was shortly followed by the Walnut Lane Bridge in Philadelphia,
completed in the fall of 1950 and opened to traffic in February 1951. The
construction of the Walnut Lane Bridge started in 1949, and therefore the
beginning of post-tensioning in the US is often associated with this bridge. Three
segmental I-girder bridges were constructed in western New York in 1950 and
1951. 2.5 By the end of 1952, there were prestressed concrete bridges in eight
states and this grew to 17 states in 1954. By the year 1985, there were more than

17
60,000 prestressed concrete bridges in the United States.2.4 The majority of these
bridges used pretensioned units. The first precast post-tensioned segmental box
girder bridge was the John F.Kennedy Memorial Causeway, built in 1971 in the
coast of Texas. The Pine Valley Creek Bridge, built in the coastal mountains near
San Diego, California in 1974 was the first U.S. cast-in place balanced cantilever
bridge.2.5
In 1999, the use of bonded post-tensioning steel in bridges and earthwork
comprised 22 percent (about 29,000 tons) of the total post-tensioning steel
tonnage used in the US. Other uses include buildings, slabs-on-ground and
miscellaneous.2.5
2.1.2 Basic Definitions
The current research refers to bonded internal post-tensioning systems. In
general, prestressed concrete can be pretensioned or post-tensioned, depending on
when the prestressing steel is tensioned. Table 2.2 gives the basic definitions and
main differences among the different prestressing techniques.
In bridge post-tensioning applications, prestressing steels often consist of a
bundle (tendon) of 7-wire prestressing strands of very high strength steel that are
run through the ducts previously placed into the concrete element before casting.
The end anchorage includes wedges to hold the tendons that run through an
anchor head with tapered holes. Figure 2.1 shows a typical anchorage system.
The wedges contain teeth that bite into the strand, and this makes corrosion
protection of the end anchorage area critical. 2.6 Once the prestressing steel has
been stressed to the desired level and adequately anchored, the ducts can be
injected with cement grout, in which case the system is referred as bonded. In
this case, the grout develops bond between the steel tendon and the duct and
surrounding concrete and acts as a corrosion barrier.

18
Table 2.2 Basic Definitions (Adapted from 2.4)
Term Definition
Prestressed
Concrete
Technique of tensioning the steel reinforcement in a reinforced concrete
structures so as to place the concrete in a state of compression to counteract
the tensile stresses resulting from service loads. Prestressed concrete may
be pretensioned or post-tensioned, depending on when the prestressing
steel is tensioned.
Pretensioned
Concrete
Pretensioned concrete is made by stressing the steel (normally wires or
strand) between fixed points, usually the ends of a rigid casting bed, and
then casting concrete around the steel. After the concrete has gained
sufficient strength, the strands are released from their original anchorage,
thereby applying compressive stress to the concrete.
Post-Tensioned
Concrete
In post-tensioned concrete, the tendons are tensioned after the concrete has
gained strength. This can be done by using tendons that have been encased
in sheathing during manufacture. These covered tendons are cast in the
concrete. Alternatively, ducts are cast in the concrete, normally using
metal sheathing, through which the tendons are later threaded. When the
concrete has achieved a predetermined strength, the tendons are stressed
and anchored. Post-tensioned construction can be classified as bonded or
unbonded.
Unbonded
construction.
In unbonded construction, the tendons transfer stress to the structure only
at the anchorages. Except for external tendons, unbonded construction is
very rarely used in highway bridges because of the severity of the service
environment and the uncontrolled crack width and reduction in capacity at
the ultimate limit state.
Bonded
construction
In bonded construction, grout is injected to fill the void between the tendon
and the duct. This not only protects the tendon against corrosion but also
increases the ultimate strength capacity of the component.
Internal Tendons Tendons that are embedded in a member.
External
Tendons
Tendons most frequently used in cellular sections and must be unbonded or
partially bonded at intermediate deviators.

19
Figure 2.1 Post-Tensioning Anchorage Details (from T.Y. Lin, and N.H. Burns, 1981) 2.6
2.1.3 Advantages and Disadvantages of Internal and External Post-
Tensioning
Prestressed concrete benefits include improved crack control (higher
cracking moment, fewer cracks, smaller crack widths), reduced reinforcement
congestion, continuity of reinforcement and efficient use of high strength steel
and concrete. Additionally, post-tensioning will allow for a quick and efficient
joining of precast elements and continuity between existing components and
additions.2.6
Post-tensioning systems can be internal and external. Table 2.3 shows a
comparison of these systems in terms of their advantages and disadvantages.

20
Table 2.3 Advantages and Disadvantages of Internal and External Post-Tensioning (Adapted from References 2.2 and 2.7)
Advantages Disadvantages
Internal Post-
Tensioning
- allow for possible reanchoring of the
strands, losing only locally the prestress
force in the event of failure of a section
- tendons can follow well the moment
diagram
- low production costs
- system reserves available
- concentration of vent hoses at the road
surface (can be avoided)
- design experience necessary
- high requirements to quality, especially
during grouting
- grout characteristics are critical
- expensive maintenance
- very difficult to investigate and impossible
to replace
External Post-
Tensioning
- webs free of tendons
- low weight
- high quality
- no vent hoses
- tendons with high level-corrosion
protection
- restressable
- strengthenable
- theoretically replaceable
- more easy to investigate
- can be damaged
- exposed to atmospheric influences
- reserve is missing due to no bond
- full loading action on the anchorage
- critical assembly operations
- more expensive construction and
demolition
- more sensitive to fire
- more easily attackable by vandals
- with any failure the prestressing force
disappears over the overall length of the
tendon
- the buckling and whipping generated by a
sudden rupture create risks for the
inspection staff and for the other tendons
- design experience necessary
2.1.4 Mixed Post-Tensioning
There has been world wide debate with respect to the use of either
internal or external post-tensioning. After analyzing the advantages and
disadvantages for each system, it appears obvious that in many cases the solution
would be in the intermediate area. As noted by Jungwirth and Gehlen2.7 a “mixed
construction,” which is use of a combination of internal and external tendons in a

21
section, is considered to have many advantages. These include among others:
different loading cases during the construction and demolition phase can be
handled more easily with internal post-tensioning tendons; residual load bearing
capacity in case of failure of external tendons (for example: in case of fire or
earthquakes); possibility of a subsequent strengthening with external tendons;
and , better ductility with internal tendons in case of earthquakes.
After considering some decisions in Germany, Virlogeux 2.8 stated in 1999
that “… stopping internal prestressing, or limiting its application by some
recommendations issued to protect against some exceptional problems, could
create difficulties everywhere, especially when coming from Germany, which has
the very well-deserved reputation of its use of prestressing. It would be against
the facts: hundreds of thousands of structures have been built in prestressed
concrete on the five continents, with very few problems.”
Chaussin2.9 stated in Ghent that “…it is a good thing, whenever it is
possible, not to put all one’s eggs in one basket and to combine internal and
external tendons.” He recommends that in internally prestressed members, a
particular attention must be given to anchorage areas. The risk could be
counteracted by placing in these zones enough non-prestressed mild reinforcing
steel to withstand the action effects susceptible to occur even if cracks appear. In
that case, crack formation would constitute an evident sign of distress for an
experienced eye and the structure manager would have enough time to take
appropriate actions. In externally prestressed structures, structures would have to
be designed so the failure of one tendon does not seriously impair the proper
functioning of the structure. The broken tendon should be easily inspected and
replaced. In this type of structure, it is advisable to incorporate, during the
design phase, the potential for additional external tendons (anchor and deviation
points) for strengthening purposes, either to respond to changes in service

22
conditions or to compensate the loss of part of the existing prestressing or to
counteract an unexpected behavior of the structural concrete. It is understood
that the additional cost of such measures if they are included in the design phase,
would be a small fraction of the cost of installing them later during the structure’s
service life.
2.1.5 Applications of Bonded Post-Tensioning
Bonded post-tensioning is currently used in many bridge and building
applications. In bridge applications, bonded post-tensioning is used in:
• Precast segmental balanced cantilever construction (cantilever tendons and
continuity tendons) See Figure 2.2.
• Precast segmental span-by-span construction
• Post-tensioned AASHTO, bulb-T, and spliced girders
• Cast-in Place segmental balanced cantilever construction
• Cast-in-place bridges on falsework
• Transverse post-tensioning of superstructures (transverse top slab post-
tensioning, transverse post-tensioning in diaphragms, vertical post-tensioning
in diaphragms, transverse post-tensioning in deviator ribs of precast segments,
vertical post-tensioning bars in webs,
• Post-tensioning of substructures, see Figure 2.3 and Figure 2.4 (hammerhead
piers, straddle bents, cantilever piers, precast box piers, precast I-section pier
columns, transverse confinement tendons at tops of piers)

23
Figure 2.2 Typical Balanced Cantilever Segment 2.10
Figure 2.3 Vertical Post-Tensioning of the High-Level Approach Piers of the Sunshine Skyway Bridge, Florida 2.10

24
Figure 2.4 Post-Tensioning in (a) Hammerhead Piers, (b) Cantilever Piers, and (c) Straddle Bents 2.10
(a) (b)
(c)

25
A detailed description of the above applications is included in Volume 1,
Chapter 2, of the document “New Directions for Florida Post-Tensioned Bridges,”
published in 2002 by the Florida Department of Transportation. 2.10
2.1.6 Mixed Reinforcement
AASHTO LRFD (Load and Resistance Factor Design) Bridge
specification explicitly recognized the use of partial prestressing,2.11 as referenced in 2.12
an unfortunate term. There are several conflicting definitions for partial
prestressing in use in practice. It may refer to the level of stresses and what degree
of tensile stress is permitted in the precompressed tensile zone under service load.
AASHTO is using the term partial prestressed structures to refer to structural
concrete members with a combination of high strength prestressing steel and non-
prestressed mild steel reinforcement. Internationally the preferred term for this
use is ‘mixed reinforcement’ a combination of active reinforcement (stressed in
construction) and passive reinforcement (stressed by subsequent load condition).
This more correct terminology will be used in this study. The relative amounts of
prestressing steel and reinforcing bars may vary, and the level of prestress in the
prestressing steel may be altered to suit specific design requirements. In most
cases, members with mixed reinforcement are expected to crack under service
load conditions (flexural cracks due to applied loads).2.12
As stated by West,2.12 in the past practice in the United States prestressed
concrete elements have always been required to meet the classic definition of full
prestressing at service load levels where concrete stresses are kept within
allowable limits and members are generally assumed to be uncracked (no flexural
cracks due to applied loading). The design requirements for prestressed concrete
were distinctly separate from those for reinforced concrete (non-prestressed)
members, and are located in different chapters or sections of the codes. The fully

26
prestressed condition may not always lead to an optimum design. The limitation
of concrete tensile stresses to below cracking can lead to large prestress
requirements, resulting in very conservative design, excessive creep deflections
(camber) and the requirement for staged prestressing as construction progresses.
Some relief was given by allowing some levels of tensile stress in the
precompressed tensile zones at service load levels.
Mixed reinforcement can provide a desirable design alternative to
reinforced concrete and fully prestressed designs in many types of structures,
including bridge substructures. The opposition to mixed reinforcement designs
and the reluctance to recognize higher allowable tensile stresses at service level in
design codes has primarily been related to concerns for increased cracking and its
effect on corrosion. Mixed reinforcement structures will generally have more
cracks than comparable fully prestressed structures but lesser cracking than non-
prestressed structures. No explicit crack width limitations are placed on non-
prestressed members. Due to the widely accepted notion that prestressing steel is
more susceptible to corrosion, and that the consequences of corrosion in
prestressed elements are more severe than in reinforced concrete, many engineers
have felt that the benefits of mixed reinforced are outweighed by the increased
corrosion risk. Little or no research has been performed to assess the effect of
mixed reinforcement on corrosion. 2.12
2.2 DURABILITY OF BONDED POST-TENSIONED CONCRETE STRUCTURES
As referenced by Kuesel 2.13, Hardy-Cross said that “The first requirement
for a beautiful bridge is that it must stand up long enough for us to look at it.”
Kuesel continue saying that “…We should endeavor to design bridges that will be
functional, enduring and – yes – beautiful. …. Design codes should require
consideration of endurability – inspectability, maintainability, reliability and

27
resistance to water, corrosion, temperature cycles and neglect. …we should not
be debating how much further we can reduce safety margins (for loads and
strength), but rather how much we should increase safety margins (for wear and
corrosion). … All around us we see the results of neglect of long-term problems,
and yet we persist in concentrating our attention on short-term design. Least first
cost is a short –term objective. Long useful life is a long term objective. We
need them both.”
Godart 2.2 indicates that “…Design defects are … mainly linked to
construction defects or unsuitable techniques or to the use of low durability
materials. The two principal construction defects responsible for corrosion are
poor waterproofing and incomplete grouting of the prestressing ducts. In addition
to these defects there is poor sealing of end anchorages, deck anchorages and
transverse anchorages.”
2.2.1 Problems Encountered Around the World: The Ghent Workshop
In November 2001, engineers from many countries gathered at Ghent
University, under the sponsorship of fib and IABSE, to discuss the “Durability of
Post-Tensioning Tendons.” The findings are contain in the fib-IABSE Technical
Report, Bulletin 15.2.14 The problems reported from different countries lead to
similar findings. Zivanovic et al. 2.15 succinctly summarized the conference
findings with respect to the inventory and condition of post-tensioning bridges as
follows:
a) Design Defects:
• Lack of waterproofing;
• Lack of sealing behind tendon anchorages;

28
• Construction resulting in a large number of unprepared
construction joints, which could give rise to cracking due to
restrained shrinkage;
• Use of unprotected transverse tendons in grooves in the deck;
• Use of sheaths made from bitumen-coated Kraft paper wrapped
around the tendons which made grouting impossible;
• Low ratio of rebar/total steel, as low as zero for longitudinal
construction joints along the length of the deck between the beams
and slabs;
• Large numbers of tendons per span in older structures with deck
anchorages increasing the number of points of possible water
ingress;
• Use between 1950 and 1970 of prestressing steel which was
susceptible to stress corrosion which gave rise to the possibility of
brittle fracture;
• Lack of provision for drainage
• Leaking expansion joints;
• Insufficient concrete cover over the reinforcement, resulting in
corrosion of the reinforcement and spalling of the concrete giving
easier access to the prestressing tendons for aggressive agents.
b) Construction defects
The main defects leading to corrosion are poor waterproofing,
incomplete grouting of the prestressing ducts and poor sealing of end
anchorages.
Although concrete has generally performed well in older structures,
there may be areas where poor workmanship has given rise to
honeycombing or shrinkage cracking. The most common location are

29
the soffits of flanges where concreting has been made difficult by the
congestion of ducts or where there has not been proper compaction,
resulting in large areas where spalling may allow aggressive agents to
penetrate.2.15
During the workshop, Godart2.2 also mentioned that “…When …external
tendons…are in a wet atmosphere, generally due to bad construction details (lack
of ventilation, absence of waterproofing, non tight inspection access…), wire
failures caused by corrosion occur and the durability of the tendons is lowered.”
From Japan, Mutsuyoshi2.16 reported that internal post-tensioned concrete
structures with cement grouting have been forbidden by the Japan Highway
Public Corporation, because bad quality of grouting after construction has been
found in many bridges. Now, almost all new prestressed concrete structures are
being constructed using fully external tendons using transparent sheath with
grouting.
2.2.2 Experience in United States
Out of the total number of bridges in the USA, approximately 20% are
prestressed concrete bridges; only 3% of these were classified, in 1998, as
structural deficient (bridges that can no longer sustain the loads for which they
were designed).2.3
A comprehensive survey performed in 1999 by the American Segmental
Bridge Institute (ASBI), found that concrete segmental bridges were performing
well with time. Based on inspection reports using Federal Highway
Administration (FHWA) guidelines, all segmental bridges were rated as “fair” or
better. Of the 131 bridges, 99 percent had superstructure ratings of “satisfactory”
or better, 79 percent had superstructure ratings of “good” or better, and 31 percent
had superstructure ratings of “very good” or better.2.17

30
The first segmental bridge constructed in the US, in 1971, the John F.
Kennedy Memorial Causeway near Corpus Christi, Texas, was inspected
extensively in a Federal Highway Administration study in 1988, and no
indications of distress or corrosion of the prestressing tendons were found.2.12
This bridge was constructed using match-cast epoxy joints, as required by
designers, considering the hot, humid, seawater environment of the Gulf of
Mexico.
Recently, some tendon failures and corrosion related problems have come
to light, especially in the state of Florida.2.5,2.10 In 1999, one of the external
tendons in the Niles Channel Bridge built in 1983, failed due to corrosion at an
expansion joint. A 9-inch movement of the tendon through one of the deviation
saddles was noticed first. When the tendon was removed for replacement, a void
in the grout and heavy pitting in the prestressing strands inside the anchor head
were found. (See Figures 2.5 and 2.6). In 2000, eleven tendons out of a total of
846 were replaced in the Mid-Bay Bridge built in 1993. Ten of the eleven
tendons that were replaced were located at expansion joints. (See Figures 2.7, 2.8
and 2.9) Also, in 2000, several corroded tendons were discovered in segmental
piers of the Sunshine Skyway Bridge, built in 1986, where the corrosion resulted
from seawater in ducts, permeable concrete anchorage protection at the top of
piers and splitting of polyethylene ducts.2.5 (See Figures 2.10 and 2.11)

31
Figure 2.5 Plan View of Slipped Tendon at Deviation Saddle
Niles Channel Bridge 2.10
Figure 2.6 Advanced Corrosion of Strands within Anchorage
Niles Channel Bridge 2.10

32
Figure 2.7 The Mid-Bay Bridge, Florida 2.10
Figure 2.8 Failure of Tendon 28-6 on the
Mid-Bay Bridge 2.10

33
Figure 2.9 Failure of Tendon 57-1 on the Mid-Bay Bridge- At Expansion Joint Diaphragm- 2.10
Figure 2.10 The Sunshine Skyway Bridge, Tampa, Florida 2.10

34
Figure 2.11 Tendon Corrosion inside the Sunshine Skyway Bridge Piers (Refer to Figure 2.3) 2.10
In addition to the above, inspections in Florida bridges have revealed a
large number of bleed water voids at anchorages, partially grouted tendons and
ungrouted tendons, the same type of problems that were found in the Sidney
Lanier Cable Stayed Bridge in Georgia and in the Boston Central Artery
bridges.2.5
Freyermuth 2.5 has indicated that the major portion of the bridge tendon
corrosion problems that have been observed in the U.S. have been identified with
the following:2.5
1. An aggressive environment (northeast U.S. and Florida)
2. Areas with a low volume of post-tensioned construction
3. Contractors with no experience or expertise in post-tensioned
construction
4. Grossly inadequate construction supervision

35
5. Design details without adequate provision for corrosion protection
of tendons
6. Failures to respond to or correct construction problems
In particular, after analyzing the problems encountered in bridges located
in the state of Florida, it appears that the tendon corrosion problems were due to:
1. Voids associated with accumulation of bleed water at tendons
anchorages
2. Recharge of ungrouted tendon anchorages with salt water or
surface drainage during construction.
3. Leakage through end anchorage protection details
4. Quality of the grout installation and grout materials
5. Splitting of polyethylene ducts
6. Deficiencies in implementation and inspection of grouting
procedures.
The findings in Florida have lead to some immediate recommendations,
with respect to the use of bonded post-tensioning systems:2.18
1. No precast concrete hollow column section should be specified
below the waterline.
2. No PT tendons should be located in columns below the highest
water splash zone elevation.
3. Grouting operation for vertical tendons should be carefully
planned, tested and monitored. Stage and vacuum grouting should
be specified in the upper section of tendons in combination with a
pressurized sealed PT system and zero bleed grout.

36
4. Provide multiple levels of protection at anchorages, including
permanent grout cap, epoxy material pour-back and polymer
coating over the pour-back.
5. The impact of construction methods on the corrosion vulnerability
of PT system should be thoroughly analyzed and designed for,
especially for critical elements in aggressive corrosive
environments.
6. PT redundancy system or practical replacement capabilities should
be incorporated.
7. Corrosion detection methods should be included during the
construction and service life of the structure.
After these important findings in Florida, many states are performing
comprehensive investigations of their post-tensioned bridges, to determine the
extent of the problem. These include among others the states of Texas, California,
Virginia, and Georgia. 2.19
In spite of the above, and as mentioned by Freyermuth,2.5 the durability
performance of prestressed and segmental post-tensioned bridges has been
superior to all other types of construction. Recent improvements in grouting
materials technology (ant-bleed –thixotropic - grouts), and training programs for
grouting supervisors and inspectors are expected to yield significant results,
reducing the incidence of corrosion problems in grouted tendons.

37
2.3 FACTORS AFFECTING THE DURABILITY OF BONDED POST-TENSIONED
CONCRETE STRUCTURES
2.3.1 Exposure Conditions
There are four general environments where concrete structure durability
may be a concern: coastal exposure, freezing exposure, and aggressive soils.
These exposures may occur singly or in combination.
West2.12 summarized and compiled information on these exposure
conditions as follows:
2.3.1.1 Coastal Exposure
Coastal exposures are one of the most severe environments for concrete
structures. This is particularly true for structural components located directly in
the seawater, as in the case of bridge substructures. Seawater contains dissolved
salts which affect the durability of concrete. The most prevalent salts in order of
quantity are sodium, magnesium and potassium chlorides and magnesium,
calcium and potassium sulfates. These salts provide sources of chlorides and
sulfates which can lead to corrosion of reinforcement and sulfate attack on
concrete. To a lesser extent, these salts also provide a source of alkalis which
may lead to expansive alkali-aggregate reactions if reactive aggregates are
present. There are four main exposure zones for a structure in a coastal exposure:
atmospheric zone, splash zone, tidal zone and submerged zone.2.12
Corrosion of steel reinforcement requires oxygen and thus generally
occurs only in zones which experience some amount of drying. Also, corrosion
rates are highest when humidity is in the 90-95% range. The greatest risk of
corrosion occurs in the splash and atmospheric zones for these reasons. Corrosion
in the tidal zone is normally limited due to the shorter drying periods and slower

38
rate of oxygen diffusion through saturated concrete. The submerged zone of
concrete has a low risk of corrosion due to lack of oxygen. 2.12
Frost damage is most severe in concrete that is saturated, and therefore
concrete within the tidal zone or immediately above the high tide level may
experience the most significant damage. Freeze-thaw damage rarely occurs below
the low tide level since the seawater would also have to freeze. 2.12
Sulfate attack occurs primarily in zones where the concrete is submerged
for some period, allowing greater sulfate concentrations. The greatest risk of
sulfate attack normally occurs in the tidal zone and submerged zone. The same
holds true for alkali-aggregate reactions due to alkalis in the seawater. 2.12
The temperature range to which a structure is subjected also affects
durability. Increases in temperature have an accelerating effect on many chemical
reactions, including corrosion. The general rule of thumb is that a temperature
increase of 10 degrees Celsius doubles the rate of reaction. Traditionally,
seawater environments in cold climates, such as the North Sea, were viewed as
the most severe exposure for structures. More recently, the accelerating effects of
high temperatures have been recognized as equally or possible more severe than
the combination of freezing temperatures and corrosive environments. 2.12
2.3.1.2 Freezing Exposure
Environments where structures may be exposed to freezing temperatures
may lead to freeze-thaw damage of concrete. A secondary effect is that the use of
deicing chemicals in freezing exposures can exacerbate freeze-thaw damage and
may lead to corrosion of steel reinforcement if the deicing agents contain
chlorides. 2.12
The severity of freeze-thaw damage of concrete is a function of the
presence of moisture in the concrete and the number of times the moisture freezes
39
and thaws. Frost damage worsens when repeated cycles of freezing and thawing
occur. Thus a moderate winter climate which experiences many freeze-thaw
cycles can cause more frost damage than a severe winter climate that remains
below freezing for long periods. 2.12
2.3.1.3 Aggressive Soils
Chemical attack on concrete in the form of sulfate attack or alkali-
aggregate reactions may occur in soils containing sulfates or alkalis. The
presence of these aggressive agents must be accompanied by moisture for attack
to occur (assuming the concrete is susceptible to either form of attack). Moisture
provides the transport mechanism for sulfates and alkalis to penetrate concrete,
and is also necessary for the deleterious reactions to occur.2.12
2.3.2 Concrete Durability
Concrete is typically the first level of protection for the reinforcement.
Extensive research has been performed on the many subject areas pertaining to
concrete durability.2.6 Several aspects related to concrete durability are discussed
in this section, but a detailed literature review on the subject can be found in
West. 2.12
2.3.2.1 Sulfate Attack
Sulfate attack is a fairly intricate process that causes cracking of the
concrete. Sulfates react to the C3A in concrete to form ettringite. The ettringite
occupies a much larger volume in the concrete that then causes cracking due to
expansive stresses. Sulfate attack can be controlled by utilizing cements with low
C3A contents, such as Type V cements. Pozzolan addition has also been found to
be helpful in preventing sulfate attack. (from various references in Schokker) 2.6

40
2.3.2.2 Freezing and Thawing Damage
Saturated or nearly saturated concrete can be susceptible to freeze-thaw
damage due to the expansion of water during freezing. Fortunately, this problem
can be avoided by the addition of an air-entraining admixture. (from various
references in Schokker) 2.6
2.3.2.3 Alkali-Aggregate Reaction
Alkali-aggregate reactions are chemical reactions between alkalis and
certain types of aggregates. The reactions may be alkali-silica or alkali-carbonate,
depending on the type of aggregate. The alkali-silica reactions produce an alkali-
silica gel that possesses expansive properties and can lead to cracking and
deterioration of the concrete. The reaction of alkalis with carbonate aggregates is
referred to as the dedolomitazation of the aggregate. The alkali-carbonate
reaction products are prone to swelling in a manner similar to clays. 2.12
2.3.2.4 Carbonation
Carbonation of concrete occurs when atmospheric carbon dioxide
penetrates the concrete. In the presence of moisture, carbon dioxide will react
with calcium hydroxide in the concrete to produce calcium carbonate.
The formation of calcium carbonate reduces the pH of the concrete to as
low as 8, where the passive film is no longer stable allowing corrosion to begin.
The process of carbonation is slow in good quality concrete. The rate of
carbon dioxide penetration is a function of the square-root of the exposure time.
Factors affecting the rate of carbonation include the concrete permeability,
cracking, the moisture content of the concrete and relative humidity. The
presence of cracks will allow the carbonation front to reach the steel rapidly (a
local scale). This may contribute to the formation of macrocell corrosion at the

41
crack. Carbonation will not occur in concrete that is saturated or very dry. The
rate of carbonation is highest for relative humidity of 50% to 70%.
Carbonation may be slowed by specifying concrete with low permeability.
Options include the use of low water-cement reactions, use of superplasticizers to
reduce water demand, and the use of mineral admixtures. Compaction and proper
curing are needed to ensure low permeability. Concrete surface treatments or
sealers may slow penetration of carbon dioxide. (from various references in West) 2.12
2.3.2.5 Cracking
The effect of cracking on the corrosion of reinforcing or prestressing steel
is controversial. One viewpoint is that cracks reduce the service life of structures
by permitting rapid penetration of carbonation and by providing a means of access
of chloride ions, moisture, and oxygen to the reinforcing steel. Thus, cracks
accelerate the onset of corrosion. 2.20
The other viewpoint is that while cracks accelerate the onset of corrosion,
that corrosion is localized. With time, chlorides and water penetrate even
uncracked concrete and initiate more widespread corrosion. Consequently, after a
few years of service for concrete with moderate to high permeability there is little
difference between the amount of corrosion in cracked and uncracked concrete.2.20
With respect to cracking, Qing Li.2.21 concluded that “…Load-induced
cracking does affect the corrosion initiation of the reinforcement in structural
concrete, … From the test results, it is almost certain that the corrosion initiates
at the cracked sections of reinforced concrete structural members. How this
localized corrosion propagates, leading to further longitudinal surface cracking,
delamination, debonding , and the ultimate capacity reduction in terms of strength
and stiffness of the structure, is of consequential importance to structures in

42
marine environment, where an ample supply of saltwater and oxygen is available.
In particular, cyclic tides and/or waves pump saltwater in and out of the cracks,
significantly exacerbating structural capacity deterioration. This intricate
phenomenon has not been examined thoroughly thus far and needs considerable
attention from the research community.”
An in-depth analysis of cracking and corrosion is included in reference
2.12.
2.3.3 Grouts for Post-Tensioning
As summarized in West,2.12 cement grout bonds the post-tensioning
tendon to the surrounding concrete and provides corrosion protection for the
tendon. Corrosion protection is in the form of a barrier to moisture and chloride
penetration, and the presence of an alkaline environment for the tendon.
An optimum grout for post-tensioning combines desirable fresh properties
with good corrosion protection. The fresh properties of the grout influence how
well the grout fills the duct. The corrosion protection provided by the grout is
rendered less effective if the duct is only partially or intermittently filled with
grout. The presence of voids or discontinuous grouting may also permit
movement of moisture and chlorides along the length of the tendon. Important
grout fresh properties include: fluidity, bleed resistance, volume change, set time.
The fresh properties of grout can be controlled through water-cement
ratio, the use of chemical and mineral admixtures, and by the type of cement.
Admixtures include the use of anti-bleed agents sometimes referred to as
thixotropic admixtures. This class of admixture gives the grout gel-like properties
to minimize bleeding, while permitting the grout to become fluid when agitated
(mixed, pumped, etc.).

43
Grouting techniques are critical. As reported by Hamada, et al.2.22, at the
Ghent Workshop, “ …it has been found in Japan … that serious deterioration has
occurred in prestressed bridges due to insufficient grouting.”
2.3.3.1 Voids and Bleed Water
Voids can be formed in the post-tensioning duct from incomplete
grouting, trapped air pockets, or from the evaporation of bleed water pockets.
Top quality grout is of little benefit if poor grouting procedures result in large
void formations, which provide no protection to the strand and no transfer of
bond. Proper venting of the post-tensioning duct is critical for complete grouting.
The void between the tendon and the post-tensioining duct is a very complex
space. For instance, a parabolic shaped duct with a tensioned tendon may have a
number of small voids of varying shapes and sizes, and very stiff grout may not
fill the interstices 2.23 as referenced in 2.6
Bleed lenses form as a result of the separation of water from the cement.
This sedimentation process is accentuated by the addition of seven –wire strand,
which acts as a “water-transport mechanism.” 2.24 as referenced in 2.6 The spaces within
the individual twisted wires that form the strand are large enough to allow easy
passage of water but not cement. Ducts with vertical rises will typically cause
more bleed due to the increased pressure within the grout column. Intermediate
bleed water lenses may form in tall vertical ducts, leaving a void through the
cross-section of the duct exposing the tendon. Even in parabolic draped ducts,
any bleed water will tend to gather near the highest intermediate points, leaving
voids in the duct. 2.6
Grouts containing anti-bleed admixture, or thixotropic grouts, can be bleed
resistant even when used in ducts with large vertical rises. 2.4 as referenced in 2.6 These

44
grouts are able to retain their water even under high pressures and can eliminate
significant void formation when proper grouting procedures are followed. 2.6
From the Florida experience, Pielstick2.26 reported that “…the corrosion
[of prestressing steel] resulted from the absence of grout due to accumulated bleed
water at the anchorages leaving voids. The bleed water was either reabsorbed into
the grout or evaporated. It appears that additional corrosion resulted when these
voids were recharged with water and air leaking through at the anchorages.
….Multiple voids were …found near the anchorages which were then filled with
grout by the vacuum injection method. This vacuum injection method removes as
much air as possible and measures the air volume, then replaces the measured air
volume with grout.”
2.3.3.2 Grout Cracking
Grouts are injected after the concrete elements have been post-tensioned,
and therefore there is no compression force in the hardened grout, making the
grout matrix vulnerable to cracking.
The effect of grout cracking on prestressing steel corrosion has not
received enough attention by researchers. Hamilton2.27 reported after his series of
accelerated corrosion tests, that “…the outline of the crack…is in line with the
most intense area of corrosion. Away from the crack location the intensity of the
pitting corrosion decreases. In some areas a greenish-white corrosion was noted
which was still moist when the grout was removed. Usually within a day the
corrosion product would dry and the remaining deposit would be red or black.”
2.3.4 Corrosion of Steel Components in Post-Tensioning Systems
Corrosion of prestressing steel is generally of greater concern than
corrosion of passive mild steel reinforcement because of the possibility that
corrosion may cause a local reduction in cross section and failure of the steel.
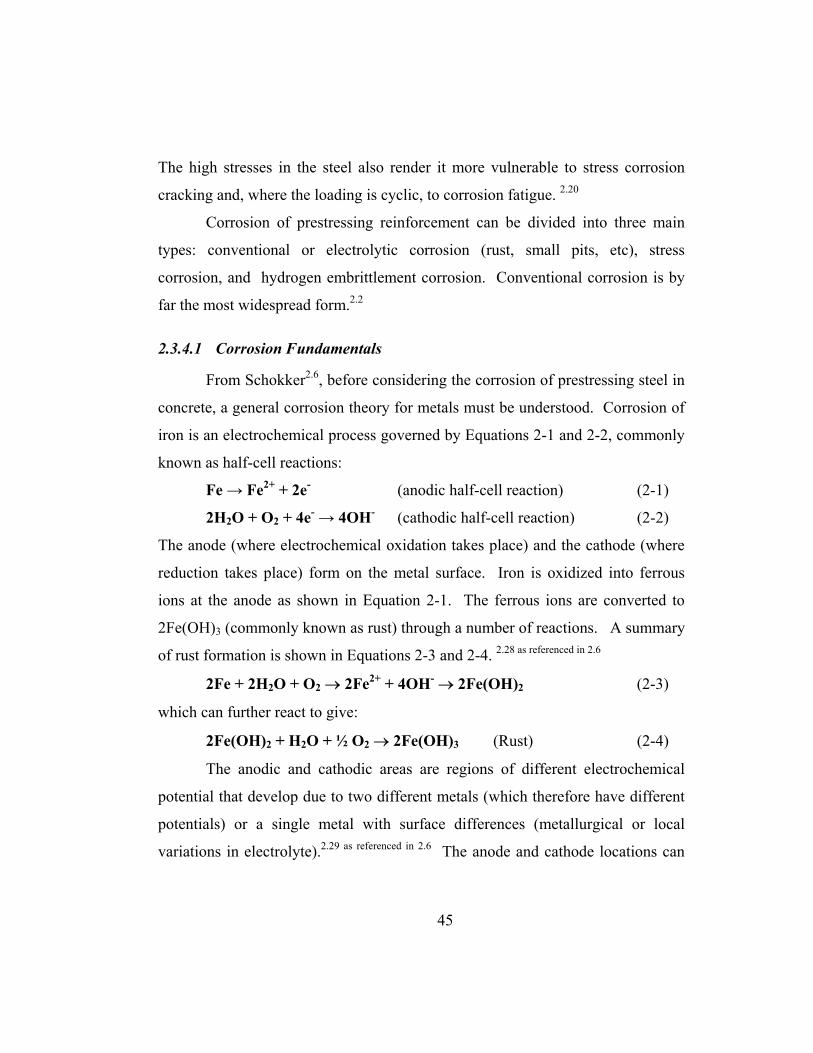
45
The high stresses in the steel also render it more vulnerable to stress corrosion
cracking and, where the loading is cyclic, to corrosion fatigue. 2.20
Corrosion of prestressing reinforcement can be divided into three main
types: conventional or electrolytic corrosion (rust, small pits, etc), stress
corrosion, and hydrogen embrittlement corrosion. Conventional corrosion is by
far the most widespread form.2.2
2.3.4.1 Corrosion Fundamentals
From Schokker2.6, before considering the corrosion of prestressing steel in
concrete, a general corrosion theory for metals must be understood. Corrosion of
iron is an electrochemical process governed by Equations 2-1 and 2-2, commonly
known as half-cell reactions:
Fe → Fe2+ + 2e- (anodic half-cell reaction) (2-1)
2H2O + O2 + 4e- → 4OH- (cathodic half-cell reaction) (2-2)
The anode (where electrochemical oxidation takes place) and the cathode (where
reduction takes place) form on the metal surface. Iron is oxidized into ferrous
ions at the anode as shown in Equation 2-1. The ferrous ions are converted to
2Fe(OH)3 (commonly known as rust) through a number of reactions. A summary
of rust formation is shown in Equations 2-3 and 2-4. 2.28 as referenced in 2.6
2Fe + 2H2O + O2 → 2Fe2+ + 4OH- → 2Fe(OH)2 (2-3)
which can further react to give:
2Fe(OH)2 + H2O + ½ O2 → 2Fe(OH)3 (Rust) (2-4)
The anodic and cathodic areas are regions of different electrochemical
potential that develop due to two different metals (which therefore have different
potentials) or a single metal with surface differences (metallurgical or local
variations in electrolyte).2.29 as referenced in 2.6 The anode and cathode locations can

46
change often and have an irregular pattern leading to a somewhat uniform
corrosion or the locations can be more fixed and localized.
2.3.4.1.1 Passivity
Steel is an active-passive metal, and therefore its corrosion rate depends on
potential as shown in Figure 2.12. Under typical conditions, steel in concrete is in
a passive state and a passive protective film is found on the steel surface.
Chlorides (and lowered pH) in the surrounding concrete have been shown to
cause a breakdown of the passive film at potentials that should be well within the
passive region2.30 as referenced in 2.6.
Figure 2.12 Passive-Active Behavior in Steel 2.6
2.3.4.1.2 Corrosion of Steel in Concrete
In the case of corrosion of steel in concrete, the anodes and cathodes are
formed on the steel surface with the cement paste pore solution acting as an
electrolyte. Figure 2.13 shows the basic corrosion process for steel in concrete.
corrosion rate
elec
trode
pot
entia
l
t r anspas s ive
pas s ive
act ive

47
The rust product occupies a much larger volume than the products that go into its
formation which can cause splitting tensile stresses in the concrete.2.6
Figure 2.13 Corrosion of Steel in Concrete2.6
2.3.4.1.3 Half-Cell Potential Measurements
Electrical potential measurements are useful to monitor the corrosion of
the steel embedded in the concrete. Electrical half-cell potential measurements
are often used for this purpose. Because it is impossible to measure the absolute
value of a half-cell potential, measurements must be made of two half-cell
potentials with one used as a reference potential value. For convenience, the
hydrogen half-cell reaction at standard state is arbitrarily defined as having a
potential value of +0. Potentials may be reported in terms of the primary
reference electrode, known as the Standard Hydrogen Electrode (SHE) or directly
in terms of the secondary reference electrode used during half-cell potential
Fe2+
OH-
H2O O2
e-
Anode
Cathode Cathode
e-
OH-
H2O O2
Rust
CONCRETE
STEEL

48
measurements. For half-cell potentials measured in concrete specimens, common
secondary reference electrodes include the Copper-Copper Sulfate Electrode
(CSE) and the Saturated Calomel Electrode (SCE). Table 2.4 gives the potential
versus SHE for these reference electrodes.2.28 as referenced in 2.6 Half-cell potentials
throughout this document will be reported as millivolts versus SCE. In order to
change these values to compare with results from the other common reference
electrode, CSE, simply add +77 millivolts to the values.2.6
Table 2.4: Common Reference Electrode Potentials versus SHE Half-Cell Reaction Potential
(V vs. SHE) Copper-Copper Sulfate
(CSE) CuSO4 + 2e- = Cu + SO42- +0.318
Saturated Calomel Electrode (SCE) Hg2Cl2 + 2e- = 2Hg + 2Cl- +0.241
Standard Hydrogen Electrode (SHE) 2H + 2e- = H2 +0.000
2.3.4.2 Chloride Induced Corosion
“Chloride attack has been found to be the severest factor in Japan and
many prestressed concrete bridges have been found deteriorated due to this
factor. Thus, it is supposed that chloride attack will be the most important factor
in future durability of prestressed concrete bridges in Japan.” 2.16
“…The literature investigation revealed that almost all deterioration
cases were caused by chloride induced corrosion.” 2.22
Chloride induced corrosion is the most common form of corrosion in
reinforced concrete. This type of corrosion can be relatively quick and can
localize to cause significant reductions in cross-sectional area. The rust product
causes cracking and spalling as well as unsightly staining at the concrete surface.

49
The role of chlorides in depassivation has been much debated. The general
consensus is that once the level of chlorides in the concrete at the steel exceeds a
certain limit, the passive film either breaks down or is no longer able to protect
the steel from corrosion. In general terms, the role of chlorides in depassivation
may take one or a combination of the following forms:2.12
chloride ions may disperse the passive film.
chloride ions may make the film permeable to Fe2+ ions allowing
the anodic reaction to occur even when the passive film is present.
chloride ions may penetrate the passive film and anodic reactions
with Cl- acting as a catalyst may occur.
chloride ions may reduce the pH, making the passive film unstable.
Chloride thresholds for corrosion are controversial because corrosion is
dependent on so many variables:2.29 as referenced in 2.6
proportioning of concrete
type and specific area of cement
water-cement ratio
sulfate content
curing conditions, age, environment
carbonation
temperature and relative humidity
condition of reinforcement
Chlorides may be present in the concrete from any of the concrete
constituents. They may also penetrate the concrete from external sources, mostly
commonly de-icing chemicals, which combine with the melted snow or ice and
often run down the surface of the superstructure and substructure elements; and,
seawater, from immersion or salt-water spray. 2.12, 2.6

50
Three different analytical values have been used to designate the chloride
content of fresh concrete, hardened concrete, or any of the concrete mixture
ingredients: (a) total, (b) acid-soluble, and (c) water-soluble.2.20 Work at Federal
Highway Administration Laboratories and after field bridge deck studies in
California and New York, demonstrated that for hardened concrete subject to
externally applied chlorides, the corrosion threshold was 0.2 percent acid-soluble
chlorides per weight of cement 2.20 (around 0.6 to 0.9 kg of Cl-/m3 or 1.5 lb/yd3).
A detailed discussion on chloride threshold values is included in reference 2.12,
pages 39-41.
To define the service life of a structure, based on chloride exposure, two
concepts need to be defined. The initiation period (time to the onset of corrosion),
and the propagation period.
The initiation period ti defines the time it takes for chlorides to penetrate
the concrete cover and accumulate at the location of the embedded steel in a
sufficient quantity to break down the protective passive layer on the steel,
initiating an active state of corrosion. The length of this period is a function of
the concrete quality, depth of cover, exposure conditions (including the level of
chloride at the surface and the temperature of the environment), and the threshold
chloride concentration required to initiate corrosion. A simple approach used to
predict the initiation period is to assume that ionic diffusion is the mechanism of
chloride transport and to solve Fick’s second law of diffusion. 2.31
The propagation period tp defines the time necessary for sufficient
corrosion to occur to cause an unacceptable level of damage to the concrete
structure or element under consideration. The length of this period depends not
only on the rate of the corrosion process, but also on the definition of
“unacceptable damage.” This level of damage will vary depending on the
requirements of the owner and the nature of the structure. 2.31
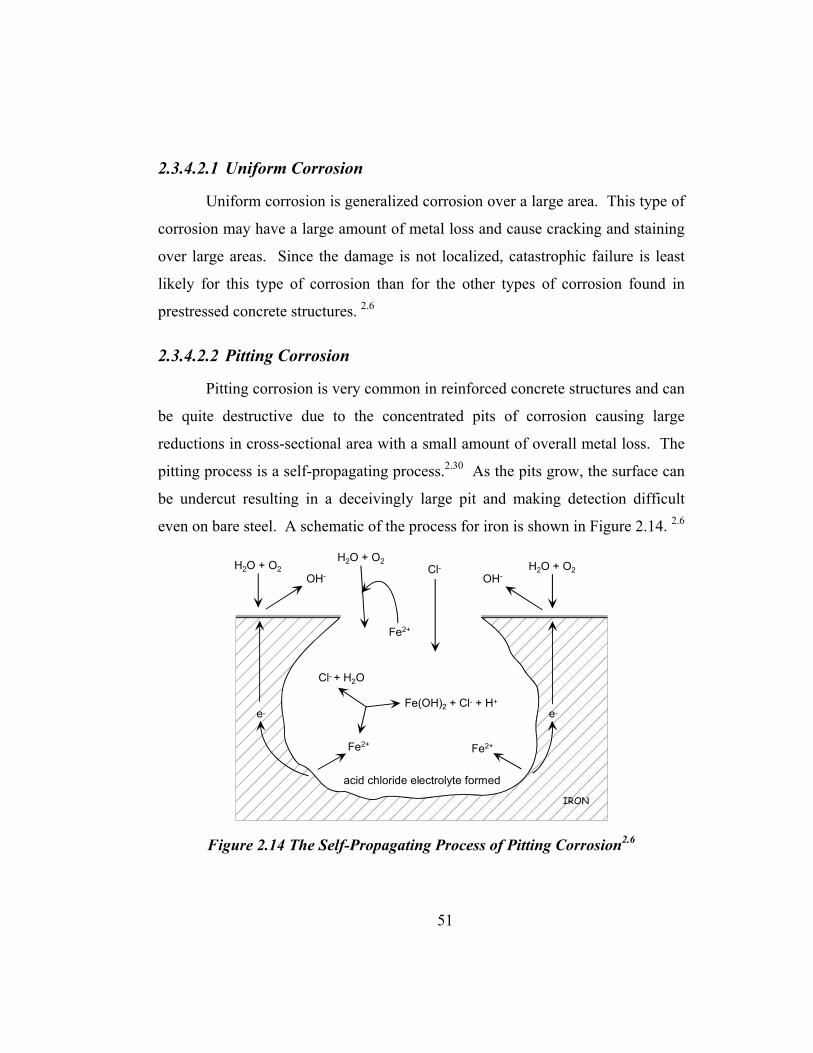
51
2.3.4.2.1 Uniform Corrosion
Uniform corrosion is generalized corrosion over a large area. This type of
corrosion may have a large amount of metal loss and cause cracking and staining
over large areas. Since the damage is not localized, catastrophic failure is least
likely for this type of corrosion than for the other types of corrosion found in
prestressed concrete structures. 2.6
2.3.4.2.2 Pitting Corrosion
Pitting corrosion is very common in reinforced concrete structures and can
be quite destructive due to the concentrated pits of corrosion causing large
reductions in cross-sectional area with a small amount of overall metal loss. The
pitting process is a self-propagating process.2.30 As the pits grow, the surface can
be undercut resulting in a deceivingly large pit and making detection difficult
even on bare steel. A schematic of the process for iron is shown in Figure 2.14. 2.6
Figure 2.14 The Self-Propagating Process of Pitting Corrosion2.6
IRON
Fe2+
OH-
e-
H2O + O2
Cl- + H2O
Fe(OH)2 + Cl- + H+
e-
H2O + O2OH-
Fe2+
acid chloride electrolyte formed
Cl- H2O + O2
Fe2+

52
2.3.4.3 Hydrogen Embrittlement and Stress Corrosion Cracking
“…there are countries who do not permit the use of galvanized duct
because of the fear that galvanizing could cause hydrogen embrittlement of the
prestressing steel. Even though widely used there is no evidence known to the
author [Ganz] where the use of galvanized duct would have caused damage to
tendons made of cold drawn wire and 7-wire strand.” 2.32
“….its prestressing [of the Saint-Cloud Viaduct] is completely internal to
the concrete. ….it was strengthened in 1979 by an additional external
prestressing which is deviated in a vertical plane…In 1998, one of the additional
tendons which were in the Northern side cell and which had a 300 m length broke
in its middle…the prestressing wires were sensitive to the stress corrosion, and
the majority of wires presented this type of cracking.” 2.2
As described by Schokker, 2.6 the combination of tensile stress and a
corrosive environment can cause susceptibility in steel to certain types of
environmentally induced cracking. The types of environmentally induced
cracking most often associated with prestressing steel are stress-corrosion
cracking and hydrogen embrittlement. Both types of corrosion may lead to brittle
failures with minimal metal loss in the affected area. The most dangerous aspect
of hydrogen embrittlement and stress-corrosion cracking failures is the potential
for structural collapse without warning.
Jones2.28 as referenced in 2.6 defines stress corrosion cracking (SCC) as brittle
failure of an alloy in a corrosive environment at relatively low tensile stress.
Hydrogen embrittlement (HE) is defined as brittle fracture caused by the
absorption of atomic hydrogen into a metal alloy.
Schupack and Suarez2.33 as referenced in 2.6 performed a survey in 1982 to
investigate corrosion incidents in prestressed structures during the previous five
years. The study indicated a small number of incidents with only 1/5 of these

53
reported as possible SCC / HE brittle failures. Most of these incidents were found
in unbonded post-tensioned construction. The failures reported were within an
isolated area in the structure and were not catastrophic collapses.
Stress corrosion cracking and hydrogen embrittlement both cause brittle
fractures in a corrosive environment under tensile stress, but one difference is
their behavior in the presence of cathodic protection. Cathodic protection can
suppress stress corrosion cracking, but tends to enhance hydrogen
embrittlement.2.34, 2.28 as referenced in 2.6 For this reason, cathodic protection can be
problematic for prestressed structures.
The effect of galvanizing on hydrogen embrittlement of prestressing wire is
a topic of concern. The zinc coating on the galvanized wire reacts with the
alkaline Portland cement in fresh concrete or grout and evolves hydrogen:2.35 as
referenced in 2.6
Ca(OH)2 + Zn + 2H2O = Ca(Zn(OH)4) + H2 (2-5)
A study by Yamaoka, Hideyoshi and Kurachi2.35 as referenced in 2.6 found indications
that galvanization of prestressing steel helps protect the steel from hydrogen
embrittlement.
2.3.4.4 Steel Geometry and Crevice Corrosion
As stated by Schokker, 2.6 the cross-section of prestressing strand makes it
more susceptible to corrosion than traditional steel reinforcement. The strand is
made up of a twisted bundle of seven individual wires, which give it a higher ratio
of surface area to total cross-sectional area than we would find for a solid bar with
the same diameter as the strand. The contact between the wires can also cause
corrosion at the interfaces (crevice corrosion).
The geometric constraints of the crevice enhance the formation of chloride
ion concentration cells. Once corrosion has initiated, it progresses similar to

54
pitting corrosion. Due to the geometry of the crevice, Fe2+ ions can not disperse
easily, and chloride ions are drawn into the crevice by the positive charge
accumulation. The process becomes autocatalytic as the presence of chloride
ions leads to formation of hydrochloric acid (HCl) and higher corrosion rates
develop. 2.12
2.3.5 Anchorage Sealing
Anchorage corrosion may lead to cracking and spalling of the concrete in
the vicinity and even failure of the anchorage. Corrosion of the anchorage and
strand stubs may also allow moisture entry into the duct and subsequent tendon
corrosion. Not all multistrand post-tensioning systems include an end cap.
Anchorages are commonly recessed in a pocket at the end or edge of the concrete
element. Corrosion protection for the anchorage normally consists of filling the
anchorage recess or pocket with mortar or concrete. The location of the
anchorage within the structure can also play a role in the onset of corrosion and
corrosion development. In many structures, the anchorages are located at the ends
of structural elements below expansion joints, or at exterior member ends or slab
edges. These locations are prone to concentrated exposure with moisture and
chlorides, and often lead to severe anchorage corrosion damage. 2.12
2.3.6 Precast Segmental Construction – Joint Performance
Dry joints or poorly sealed segmental joints have been shown to be
extremely detrimental to the durability of post-tensioned structures, either with
internal2.36,2.37 or external post-tensioning.2.10 Experiences in the United
Kingdom2.36,2.37 led to the ban in 1992 on the use of internal bonded post-
tensioned structures with discontinuous (poorly sealed) ducts.

55
2.4 CORROSION PROTECTION OF BONDED POST-TENSIONED CONCRETE
STRUCTURES
“…The objective of the corrosion protection must be to achieve a design
life of the tendons which is comparable to that of the structure in which they are
placed.” 2.38
“Without exceptions, and regardless of cost, improvements in grouting
practice and improvements in the quality of global tendon corrosion protection
details, must be implemented to provide full assurance of the long-term durability
(100+ years) of post-tensioning tendons.” 2.19
Corrosion protection of bonded post-tensioned concrete structures can be
achieved by the careful design of the multilayer protection system. As shown in
Figure 2.15, protection measures include surface treatments on the concrete, the
concrete itself, the duct, the grout and strand or bar coatings such as epoxy or
galvanizing. Post-tensioning also provides the opportunity to electrically isolate
the prestressing system from the rest of the structure.
Figure 2.15 Multilayer Corrosion Protection For Bonded Post-Tensioned Systems2.12
duct
coated strand
grout
moisture, chlorides, CO2
concrete
surface treatment

56
As described by Matt2.39 weak links could exist in every layer. In the first
layer, water can penetrate through defective or inadequate design of non-
structural elements such as waterproofing membranes, drainage systems, etc. and
reach the concrete structure. In a second layer, water can be transported through
the concrete cover by diffusion and capillary absorption. The rate is determined
by the quality of the concrete (thickness, permeability, cracks, honey-combing,
etc.) The third barrier/layer consists of the corrosion protection system of the
post-tensioning tendons themselves. It can be impaired by open grouting vents,
leaking ducts, cracked and porous pocket concrete as well as grout voids, etc. In
the fourth layer the longitudinal water transport in an inclined tendon has to be
considered in case the grouting may not be perfect. In the fifth layer, the
prestressing steel can also corrode at locations remote from the point of ingress.
Figure 2.16 shows the possible hazard scenarios in a typical box girder segment.
To ensure better corrosion protection of prestressing steel, Schupack2.40
indicates that the following should be considered, particularly if the environment
of use is aggressive or control of construction is doubtful:
- Designs should minimize concrete cracking, particularly in aggressive
environments;
- High-quality, low – permeability concrete;
- Construction techniques should ensure specified concrete cover to all
reinforcement;
- Tough plastic sheaths for post-tensioning;
- Improved grouting methods and materials (that is, nonbleeding grout);
- Use of electrically isolated tendons;
- New tough polymer coatings for strands and bars;
- Stainless steel-clad wires and bars;
- Stainless steel (now more than 10 times as expensive as A 416 strands);

57
- Low-carbon alloy bars with good stress-corrosion-cracking resistance;
- A more inherently corrosion-resistant steel; and, - High-strength bars with subtle90
- deformations that can replace strand.
Figure 2.16 Hazard Scenarios2.39

58
2.4.1 Structural Form
A detailed description of corrosion protection variables is included in
West2.12. A summary of the most important aspects are included here as a
reference.
2.4.1.1 Drainage
Since the most common cause of reinforcement corrosion is moisture-
borne chlorides, whether as seawater or de-icing chemicals, adequate drainage is a
critical factor in the selection of structural form. Adequate superstructure
drainage must be provided, and must ensure chloride –laden water does not come
in contact with the substructure. 2.12 Use of impermeable deck sealants or
membranes should be considered.
2.4.1.2 Joints
A common source of substructure corrosion problems is moisture and
chlorides dripping onto substructure components through leaking deck joints.
Proper joint design and maintenance is required when severe conditions are
encountered. 2.12
2.4.1.3 Splashing
Substructure components adjacent to roadways where de-icing chemicals
are used can be prone to corrosion damage due to splashing. Increasing the
distance between the roadway and substructure may increase initial construction
costs, but may reduce long term costs by avoiding this type of corrosion
damage.2.12

59
2.4.1.4 Geometry
Other aspects of the structural geometry can influence durability.
Decreasing the exposed surface by an efficient design and increasing concrete
cover to safe limits can decrease the corrosion potential.
2.4.2 Structural Design Details
2.4.2.1 Cracking
Concrete cracking provides easy access for moisture and chlorides to
reach the reinforcement. Although the significance of cracking on corrosion is
often debated, cracking should be avoided or minimized where possible. 2.12
2.4.2.2 Reinforcement Detailing
Reinforcement detailing not only affects cracking in the structure, it also
can influence construction. Congested reinforcement details make concrete
placement difficult and can lead to poor compaction and voids. 2.12
2.4.3 Surface Treatments
Concrete surface treatments work to improve corrosion protection by
preventing moisture and chlorides from entering the concrete. Surface treatments
include waterproof membranes and surface polymer impregnation. In the latter,
the exposed surface of the concrete is impregnated with polymer that fills the
voids and cracks in the concrete, providing a barrier with very low permeability.
Various overlays may be used to provide a low permeability barrier over existing
concrete. Options include polymer concrete overlays, latex-modified concrete
overlays and overlays with low permeability Portland cement concrete.2.12

60
2.4.4 Concrete as Corrosion Protection
Concrete acts as a physical barrier to moisture and chlorides, and provides
the alkaline environment necessary for formation of the passive film on the
surface of steel. 2.12
2.4.4.1 Concrete Permeability
The permeability of concrete controls the rate at which moisture, oxygen
and carbon dioxide penetrates the concrete. Because the penetration of moisture
provides the transport mechanism for chlorides and other aggressive substances,
lowering the concrete permeability increases the length of time before aggressive
agents reach the steel, and thus improves corrosion protection. The permeability
of concrete is affected by four general factors:2.41 and 2.42 as referenced in 2.12 pore
structure of the cement paste, aggregate, voids in the concrete, and, cracking of
the concrete.
A detailed description of each factor is included in Reference 2.12. The
discussion includes the used and effects of low water/cementitios material ratio
and the use of supplementary cementitious materials.
High Performance Concrete (HCP) as used in the text, refers to low
permeability concrete with improved strength f’c=10000 psi, w/c = 0.29, 25%
replacement by fly ash, and superplasticizer to reach a slump of 8 inches.
2.4.4.2 Cover Thickness
The thickness of concrete cover over the reinforcement plays a significant
role in corrosion protection. Increased clear cover provides improved protection
for the steel, particularly if low permeability concrete is used. The penetration of
chlorides over time can be approximated by a square-root time law.2.43 as referenced in
2.12 This means if the concrete cover thickness is doubled, it will take

61
approximately four times as long for chlorides to penetrate to the depth of the
reinforcement.2.12
2.4.4.3 Corrosion Inhibitors
Many types of corrosion inhibitors are on the market today. They are
intended to slow the corrosion process of steel in concrete without adversely
affecting other properties and are typically included as an admixture in the fresh
concrete. Corrosion inhibitors can be divided into three basic types by the method
in which they slow the corrosion process:244 and 245 as referenced in 2.6
Anodic Inhibitors (Passive System)
Anodic inhibitors react with the steel to form a protective film, and proper
dosage depends on the amount of chlorides penetrating the concrete. If the
amount of chlorides is too high for the dosage of corrosion inhibitor, then all of
the anodic sites are not eliminated and corrosion continues at a rate greater or
equal to that of untreated concrete. The popular corrosion inhibitor, Calcium
Nitrite, is an anodic inhibitor.
Cathodic Inhibitors (Active System)
Cathodic inhibitors form a barrier around the cathodic site to reduce
chloride ingress. These inhibitors tend to be less efficient than anodic inhibitors.
Silica fume is an example of a cathodic inhibitor.
Mixed Inhibitors (Passive-Active System)
Mixed inhibitors combine the inhibiting traits of both the anodic and
cathodic type inhibitors.
2.4.5 High Performance Grouts
As West2.12 has stated, the selection of suitable grout proportions and
admixtures requires careful consideration of the grout fresh properties and

62
corrosion protection. The effects of various admixtures and grout proportions on
fresh properties and corrosion protection have been studied by several
researchers. 2.27,2.46 Schokker2.6 performed an extensive research study to develop
two optimized grouts for post-tensioned. The study was part of the research
project related to this dissertation.
Additional information on mix proportioning and guide specifications for
grouts for post-tensioning is provided by the PTI “Guide Specification for
Grouting of Post-Tensioned Structures,” 2.47 the fib report “Grouting of Tendons
in Prestressed Concrete,” 2.48 and the VSL report “Grouting of Post-Tensioning
Tendons,”2.49
As a response for the need of better grout mixes, new prepacked grouts are
available with thixotropic properties. One of these grouts is in the form of a
plastic gel when at rest, and is instantly fluidized when it is shaken. This grout
uses a w/c = 0.35, and two liquid additives: a stabilizer that retards hydration of
the cement and fluidizes it, and also reduces shrinkage; and, a set activator that
also acts as a thixotropic agent.2.50
In an effort to provide a more consistent grout material, the Florida
Department of Transportation is requiring that pre-bagged resistant grouts be
used. The ASBI and PTI have recommended anti-bleed or low bleed grouts
meeting a series of performance requirements. These grouts reduce the size and
number of voids due to bleed water, but anchorages should still be probed or
visually inspected when the grout has set.2.26
2.4.6 Ducts for Post-Tensioning
Typically galvanized corrugated metal ducts have been used in Post-
Tensioning applications. However, as a consequence of the corrosion concern,
specific corrugated plastic duct systems for bonded post-tensioning have been

63
introduced on the market, since the 1990’s. 2.38 To date, it is not considered
necessary that plastic ducting is always required to provide an extra barrier. 2.53
Plastic duct systems, when combined with suitable accessories such as
connection details and anchorage caps, provide a complete encapsulation of the
post-tensioning tendon. Considering that not all plastic ducts are suitable for post-
tensioning applications, fib has taken the initiative some years ago, and has
prepared a technical report for the testing and approval of plastic duct systems for
use in post-tensioning.2.51
To avoid excessive wobble of the tendons, excessive friction losses
during stressing, and leakage of grout during injection, more “robust” ducts of
durable polyethylene are being introduced. 2.51,2.32
Some of these plastic duct systems have now been used with excellent
experience. Plastic duct systems had been specified exclusively in the UK since
1996, and are now being specified also in Florida, and in Switzerland for the
general application in aggressive environment. Experience has shown that plastic
ducts made of polypropylene (PP) perform better in warm climates than those
made of polyethylene. It has also been found that the plastic ducts need to be
protected from large local transverse loads at supports near the tendon profile high
points by the provision of sufficiently rigid half shells. 2.38
Changes in the material requirements for the High-Density Polyethylene
(HDPE) duct systems have been suggested for all external post-tensioning
systems. Robust plastic ducts have been recommended for internal tendons
meeting the requirements of the fib Technical Report2.51 as referenced in the PTI
Guide Specification for Grouting of Post-Tensioned Structures2.47. 2.26

64
2.4.7 Coatings on Prestressing Steel
2.4.7.1 Metallically coated prestressing steels
As indicated by Ganz 2.38 zinc coated prestressing steel is rarely used for
post-tensioning. Zinc provides a sacrificial protection of the prestressing steel.
The durability of the protection by zinc depends primarily on the consumption
rate of zinc in the actual environment, and the available thickness of the zinc
layer. Zinc coating is relatively insensitive to local damage and the prestressing
steel remains protected even if the zinc coating is locally damaged. Galvanized
prestressing steels have been standardized in the French standard NF A35035. It
is understood that a European standard and a ISO standard are being prepared on
galvanized prestressing steels.
2.4.7.2 Non Metallic Coatings for Prestressing Steels
From Ganz, 2.38 the most commonly used non-metallic coating is epoxy
resin. Experience has shown that epoxy coated strand needs to have the
interstices between wires completely filled with epoxy to avoid migration of
water / humidity along the strand. 2.38 Further issues in ongoing discussions are
on the effect of local defects in the coating in an aggressive environment such as
under chloride attack. It has been reported that local defects may lead to
accelerated pitting corrosion at these locations. The thickness of coating needs to
be carefully controlled for reliable anchorage by wedges. 2.32
Other non-metallic coatings have been developed including resins with
delayed curing (After-Bond), tar epoxy resins, and others. However, experience
is still limited for applications in pretensioning and post-tensioning. 2.38
While there is no dispute that epoxy coating will extend the time to
corrosion damage, compared with uncoated steel, the long-term performance
remains somewhat uncertain. Not all the factors affecting corrosion performance

65
are understood, and there are many examples of good performance, as well as
examples of premature corrosion damage. The dominant factors affecting
performance are the number and size of defects in the coating and the long-term
adhesion of the coating to the steel.2.54
2.4.8 Prestressing Steel – Other Prestressing Materials
Fiber-reinforcement polymer (FRP), stainless steel, stainless-clad steel,
and MMFX steel bars comprise the new generation of concrete reinforcing
materials being used for durable construction. 2.55
With respect to FRP reinforcement, Clemena states that: “…Until we
learn more …, I would consider the corrosion –resistant metallic reinforcing bar
the superior reinforcing material, for at least the next decade.” 2.56
Ganz 2.38 states that: “…It has been proposed to replace prestressing steels
with non-corrosive fiber reinforced plastic materials. It is the author’s [Ganz]
opinion that these materials still have to go through a long development until they
can provide performance and reliability for post-tensioning applications
comparable with well protected prestressing steel.
Gaubinger2.57 states that: “…a common use [of CFRP tendons] is presently
prevented by two main facts: high costs of manufacturing and the development of
a suitable anchorage.
2.4.9 Anchorage Protection
As described by West2.12, “the post-tensioning anchorages and end stubs
of the strands must be carefully protected. Although anchorage corrosion may
lead to failure of the anchorage, bond between the tendon and concrete will
prevent a complete loss of prestress Multistrand anchorage systems may be fitted
with a sealed end cap to protect strand ends. The cap is grouted or filled with
corrosion inhibiting grease. Not all multistrand post-tensioning systems include

66
an end cap. Anchorages are commonly recessed in a pocket at the end or edge of
the concrete element. Corrosion protection for the anchorage normally consists of
filling the anchorage recess or pocket with mortar or concrete. Common practice
is to coat the anchorage and pocket surfaces with an epoxy bonding agent prior to
filling the anchorage pocket with a non-shrink mortar.
The location of the anchorage within the structure can also play a
role in corrosion protection and corrosion damage. In many structures, the
anchorages are located at the ends of structural elements below expansion joints,
or at exterior member ends or slab edges. The location of post-tensioning
anchorages is often dictated by the method of construction. In instances where
the anchorage can not be located away from a possible source of aggressive
agents, the anchorage must be detailed to provide multiple layers of corrosion
protection. The Concrete Society (U.K.) Technical Report No. 47 on bonded
post-tensioned bridges2.37 as referenced in 2.12 provides suggestions for anchorage
protection details. The report discusses two approaches for anchorage protection.
The first is to provide an anchorage that is not encased in mortar or concrete after
stressing. Exposed anchorage hardware is protected by end caps and waterproof
membrane, and has the advantage that the anchorage can be readily inspected for
corrosion damage. The second approach provides a higher level of corrosion
protection at the expense of inspectability by recessing the anchorage in a filled
pocket. Details of multilevel corrosion protection for this form of buried
anchorage are shown in Figure 2.17. The details of the member end can also be
designed to minimize contact with moisture and chlorides draining through
expansion joints, as shown in Figure 2.18. The member end is detailed to prevent
water from dripping onto the anchorage region. An abutment gallery is provided
to allow inspectors to gain access to the anchorage.”

67
Figure 2.17 -Multi-Layer Corrosion Protection for Buried
Post-Tensioning Anchorages 2.37 as referenced in 2.12
Figure 2.18 - Member End Details for Anchorage
Corrosion Protection2.37 as referenced in 2.12

68
2.4.10 Encapsulated and Electrically Isolated Systems
In a Electrically Isolated Tendon (EIT), the prestressing steel is entirely
isolated not only by a robust plastic duct, but also at the anchorages. In this way,
the EIT system is used to protect tendons from the effects of stray currents which
could cause hydrogen embrittlement and pitting corrosion to the prestressing
steel. 2.38, 2.58
Up to now, about 100 bridges have successfully been constructed using
robust plastic ducts of which in over 20 bridges electrically isolated tendons have
been installed. 2.58
2.4.11 Precast Segmental Construction – Joint Detail
As stated by Moreton2.52 “The U.K. “moratorium” is still in effect for
“internal, grouted tendons with discontinuous (poorly sealed) ducts. This is
broadly interpreted (or misinterpreted) to mean that only external tendons are
allowed for precast segmental construction in the United Kingdom. This is not
so. The concern of the Highways Agency is for the integrity of the ducts through
the precast joints – that they should be completely sealed – and they require this
via a performance specification.”
Most countries consider epoxy resin to provide sufficient protection to
post-tensioning tendons crossing joints between precast segments. However, the
UK has specified full encapsulation for the tendons by plastic in these joints.2.32
In response to this problem, a new commercial coupler device is now
available to connect plastic prestressing ducts used with match-cast joints in
precast segmental construction.250 The new coupler is suppose to yield good
results in precast segmental construction. However, testing is still required. To
this respect, Raiss2.59 has stated that: " Pending further experience with this
system, it may be prudent to assume that some percentage of the internal tendons

69
is lost (say 5-10%).” However, this could be still unconservative until new
research is done.
2.4.12 Temporary Corrosion Protection
Without further protection measures, grouting should be done within one
to about 4 weeks in aggressive and benign climatic conditions, respectively. If
grouting needs to be delayed beyond the above proposed intervals, particular
methods need to be provided for post-tensioning tendons. 2.38
While the use of Rust-Ban 310 is still under investigation (by EMPA –
Swiss Federal Laboratory for Materials and Testing and ASTRA – Swiss Federal
Highways Administration) it seems that it provides good temporary protection.
The solution is applied at the factory of the strand supplier and sufficient time
needs to be permitted to let the solution dry on the tendon.2.60
In case unprotected tendons were installed and grouting cannot be
achieved within the accepted time frame, the tendons can be protected by blowing
dry air through the duct. 2.60
2.4.13 Inspection Practices
The American Segmental Bridge Institute (ASBI) has developed a three-
day training program for the Certification of grouting technicians. This program
has been developed to train the Inspectors in theory and field procedures to
achieve a properly grouted structures. 2.19 The training manual contain updated
and detail information on grouting materials, procedures and specifications.
2.4.14 Monitoring
Various techniques are being used to monitor the condition of existing
post-tensioned bridges. However, they are not totally satisfactory, all of them
having some limitations.2.15

70
Some non-destructive testing (NDT) and methods that could be used
include:2.15
- georadar
- potential mapping
- impact-echo
- remanent magnetism
- radiography
- reflectometry
- ultrasonic
- acoustic
In addition, the use of electrically isolated tendons have proved
successful.2.15

71
CHAPTER 3 Macrocell Corrosion Tests
Post-tensioned segmental bridge design and construction has recently
received much attention, due to a few reported tendon failures and the collapse of
a few small bridges (see Section 2.2). Still, it has been shown that the durability
performance of segmental post-tensioned bridges has been superior to all other
types of construction. 3.1
Recognizing that post-tensioned segmental construction has many
advantages with respect to other bridge systems, it is clear that more research is
needed to identify weak links, and counteract their negative effects. Structures
should safely achieve their design service life and allow for safe monitoring and
inspecting.
One of the most important aspects to be studied refers to segment joint
sealing and waterproofing. Current guide specifications3.2 require the use of
match-cast epoxy joints whenever internal tendons are used. Epoxy joints were
introduced to enhance force transfer across the segmental joint and to seal the
joint against moisture ingress. Epoxy joints have been recognized as an absolute
requirement for durability when internal tendons are used.
Plastic ducts have also been recognized as the preferred material for post-
tensioning, when structures are exposed to very severe environment, as was
described in Section 2.3.
As outlined in Chapter 1, an experimental research study using Macrocell
Corrosion Tests was initiated in 1993 at the Ferguson Structural Engineering
Laboratory. The main purpose of the study was to investigate the corrosion
protection of internal tendons at segmental joints. As part of the program, half of

72
the laboratory specimens were autopsied in 1999, and were reported by West.3.3
This chapter documents the final results, after the second half of the specimens
were autopsied by the author after eight years of very aggressive exposure.
3.1 EXPERIMENTAL PROGRAM
The test method used in this series was originally developed and
implemented by Rene Vignos3.4 and later reported by West3.3. It is repeated with
minor changes herein. The basic objectives for development of the testing
program were as follows:
• The test method should provide meaningful comparisons in a reasonable amount of time.
• The test method should accommodate the desired variables in a realistic manner.
• The test method should allow measurement of both macrocell and microcell corrosion.
• The test method should be as standardized as possible to allow comparisons with past and future testing, and provide reproducible results.
Vignos patterned the test method after ASTM G109 - “Standard Test
Method for Determining the Effects of Chemical Admixtures on the Corrosion of
Embedded Steel Reinforcement in Concrete Exposed to Chloride
Environments.”3.5 The standard macrocell corrosion specimens were modified to
examine prestressing tendons in grouted ducts and simulate segmental joints. A
full description of the development of the testing program and details of the
experiment setup are provided in Reference 3.4. A summary of the general
characteristics of the test specimens, variables and measurements is included in
the following sections. Exposure testing was initiated by Vignos in August 1993.
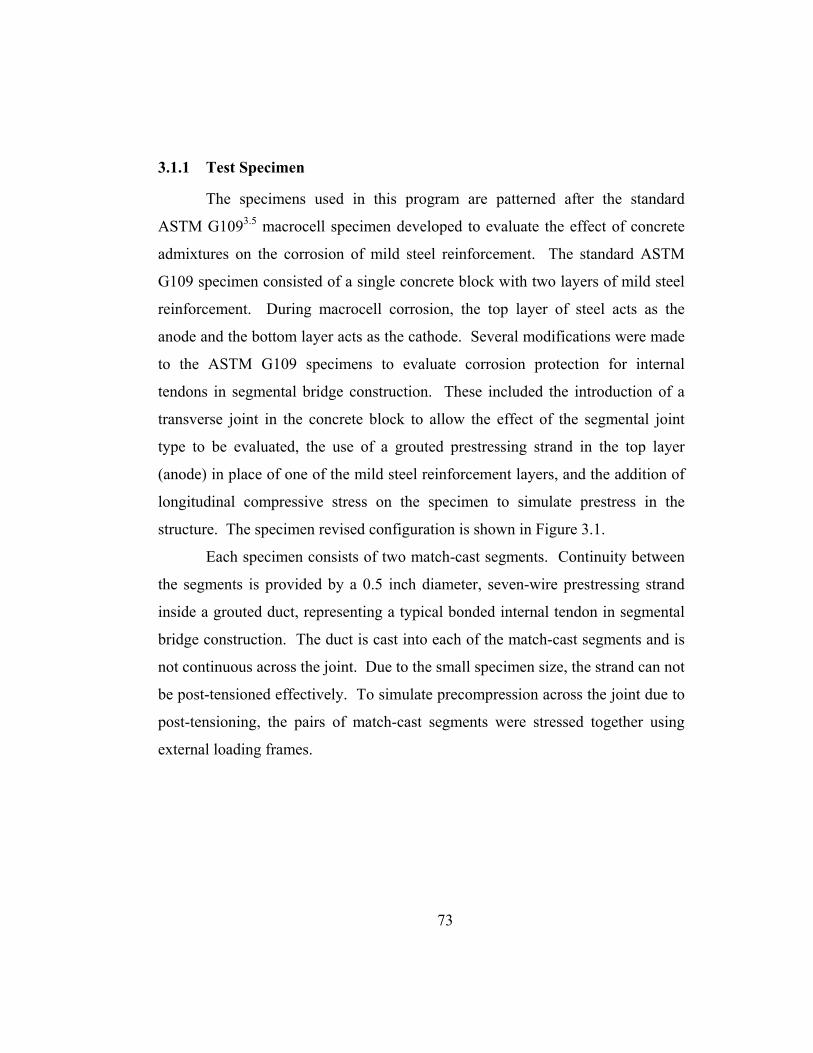
73
3.1.1 Test Specimen
The specimens used in this program are patterned after the standard
ASTM G1093.5 macrocell specimen developed to evaluate the effect of concrete
admixtures on the corrosion of mild steel reinforcement. The standard ASTM
G109 specimen consisted of a single concrete block with two layers of mild steel
reinforcement. During macrocell corrosion, the top layer of steel acts as the
anode and the bottom layer acts as the cathode. Several modifications were made
to the ASTM G109 specimens to evaluate corrosion protection for internal
tendons in segmental bridge construction. These included the introduction of a
transverse joint in the concrete block to allow the effect of the segmental joint
type to be evaluated, the use of a grouted prestressing strand in the top layer
(anode) in place of one of the mild steel reinforcement layers, and the addition of
longitudinal compressive stress on the specimen to simulate prestress in the
structure. The specimen revised configuration is shown in Figure 3.1.
Each specimen consists of two match-cast segments. Continuity between
the segments is provided by a 0.5 inch diameter, seven-wire prestressing strand
inside a grouted duct, representing a typical bonded internal tendon in segmental
bridge construction. The duct is cast into each of the match-cast segments and is
not continuous across the joint. Due to the small specimen size, the strand can not
be post-tensioned effectively. To simulate precompression across the joint due to
post-tensioning, the pairs of match-cast segments were stressed together using
external loading frames.

74
6 in.
5/8 in. to ¾ in. cover
1 in. 4.5 in.
3 in.
3 in.
Duct:1 3/16 in. O.D. steel 1 5/16 in. O.D. plastic
R
ductgrout
plexiglass dam
3.5% NaCl solution
7-wire prestress
(0.5 in. dia.)
2 - #4 bars 0.5 in. dia.
concretesegment
match cast segmental joint
gasket (when applicable)
100 Ohms
5 in.
12 in. ¼ in. end cover
End View
Longitudinal Section
Figure 3.1 Macrocell Specimen Details 3.8
Similar to ASTM G109, two 0.5 in. (#4) mild steel bars were used as the
cathode. These bars would represent non-prestressed reinforcement within the

75
segment. The use of two bars increases the ratio of cathode area to anode area,
accelerating macrocell corrosion. The cathode bars were discontinuous across the
transverse joint, consistent with precast segmental construction. The end cover
for the cathode bars at the segmental joint was 0.25 in. Following ASTM G109,
the exposed length of the anode and cathode were limited to 5 in. by painting the
strand and the mild steel bars with epoxy paint as shown in Figure 3.2.
Electrical contact must exist between the anode and cathode for macrocell
corrosion to develop. This contact is achieved in the test specimen by wiring the
protruding ends of the anode and cathode steel together, as shown in Figure 3.1.
Zinc ground clamps are used to connect the wire to the steel. A 100-Ohm resistor
is placed in the wire connection between the anode and cathode, as shown in Fig.
3.1, to allow assessment of the corrosion current by measuring the voltage drop
across the resistor (Icorr = Vmeas/R).
Figure 3.2 Anode and Cathode Bar Details 3.8
exposed epoxy paint
1 in.
exposed
epoxy paint
Strand Detail (Anode)
Bar Detail (Cathode)
5 in.
1 in. 2.5 in.
0.5 in. dia. 7-wire strand
0.5 in. (#4) bar
5 in. 6 in.
5 in.

76
Exposure conditions for the specimens consist of a 4-week cycle of 2
weeks dry and 2 weeks wet. During the wet period of the cycle, a portion of the
top surface of the specimen is ponded with 3.5% NaCl solution, as shown in
Figure 3.1. At the end of the wet period, the NaCl solution is removed from the
Plexiglas dam using a wet/dry vacuum.
The specimen was chosen as an extreme aggressive environment to
indicate relative effects of variables and is not representative of actual exposure
and cover conditions.
3.1.2 Variables
A broad scope of protection variables was selected for investigation in this
program. These variables cover four components of precast concrete segmental
bridges related to corrosion of internal tendons. Included are; joint type, duct
type, joint precompression and grout type.
3.1.2.1 Joint Type
Precast segmental joints are either dry or wet. Wet joints include mortar
joints, concrete joints but most frequently epoxy joints. Dry joints and epoxy
joints require match casting, and are the most common segmental joints used in
North America. When match-cast epoxy joints are used, the entire face of the
segment is coated with a thin layer of epoxy immediately before each segment is
placed in the bridge. The segments are held in firm contact with temporary post-
tensioning while the epoxy cures and the prestressing tendons are placed and
stressed. In some situations, a small gasket is used around each duct opening to
prevent epoxy from entering the duct when the segment is placed and initially
stressed. If a gasket is not used, the duct is swabbed out immediately after initial
stressing to prevent epoxy from blocking the duct.

77
To address typical North American practice, dry joints and epoxy joints,
with and without gaskets, were selected for investigation in this testing program.
All joint types were match-cast. The AASHTO Guide Specification for
Segmental Bridges3.6 does not permit the use of dry joints with internal tendons.
However, dry joints were included as a worst case scenario for comparison
purposes. At the time of initiation of the study, influential designers were
requesting that they be allowed to use internal tendons with dry joints. It was
agreed that the dry joint specimens be included to document actual behavior.
The epoxy-jointed specimens were assembled according to the standard
practice. Both match cast faces were coated with epoxy and the segments were
pushed together. The joint was precompressed at 50 psi for 48 hours after which
the specimens were unloaded and re-loaded to the desired level of precompression
(see Section 3.1.2.3). In the epoxy/gasket joint, a foam gasket was glued to the
face of one segment around the duct opening prior to application of the epoxy.
Details of the foam gasket are shown in Figure 3.3. In the epoxy joint without a
gasket, the duct was swabbed out immediately after stressing to prevent the epoxy
from blocking the duct.
Figure 3.3 Gasket Details 3.8
foam gasket:¼ in. thick &¼ in. wide
duct opening

78
3.1.2.2 Duct Type
Two duct types were investigated; standard galvanized steel duct and
plastic duct. Due to size limitations, PVC pipe was used for the plastic duct.
3.1.2.3 Joint Precompression
The joint precompression refers to the level of prestress provided by the
internal and/or external tendons in the bridge. Three levels of precompression
were selected; 5 psi, 50 psi and psif'3 c . The lowest level of 5 psi could represent
the level of precompression encountered in a precast segmental column under self
weight. The precompression of 50 psi is based on the AASHTO Guide
Specifications.3.6 The highest precompression value of psif'3 c . corresponds to
190 psi for this testing program.
3.1.2.4 Grout Type
Three cement grout types were selected for evaluation; normal grout (plain
cement grout, no admixtures, w/c = 0.40), grout with silica fume (13% cement
replacement by weight, w/c = 0.32, superplasticizer added) and grout with a
commercial calcium nitrite corrosion inhibitor (w/c = 0.40). Grout mix
proportions are provided in Section 3.1.3.
3.1.2.5 Specimen Types
A total of nineteen specimen types were selected to address all of the
variables. Each specimen type was duplicated for a total of thirty-eight
specimens. The notation used in the specimen designations is described in Table
3.1. Details of the specimen types and corresponding designations are listed in
Table 3.2.

79
Table 3.1 Specimen Notation
Joint Type Duct Type Joint Precompression Grout type DJ: Dry Joint L: Low, 5 psi NG: Normal Grout
S: Galvanized Steel SF: Silica Fume Added
SE: Standard Epoxy M: Medium, 50 psi
EG:Epoxy with Gasket P: Plastic
H: High, 190 psi (3√f’c) CI: Corrosion Inhibitor Example: DJ – S – L – NG
Table 3.2 Specimen Types and Variables 3.8
Specimen Duct Joint Grout No. Name Type Precompression Type
Dry Joints: 1,2 DJ-S-L-NG Steel 5 psi Normal 7,8 DJ-S-M-NG Steel 50 psi Normal 11,12 DJ-S-H-NG Steel 190 psi Normal 31,32 DJ-P-L-NG Plastic 5 psi Normal 33,34 DJ-P-M-NG Plastic 50 psi Normal 3,4 DJ-S-L-CI Steel 5 psi Corrosion Inhibitor 9,10 DJ-S-M-CI Steel 50 psi Corrosion Inhibitor
Standard Epoxy Joints:
15,16 SE-S-L-NG Steel 5 psi Normal 21,22 SE-S-M-NG Steel 50 psi Normal 27,28 SE-S-H-NG Steel 190 psi Normal 35,36 SE-P-L-NG Plastic 5 psi Normal 37,38 SE-P-M-NG Plastic 50 psi Normal 17,18 SE-S-L-CI Steel 5 psi Corrosion Inhibitor 23,24 SE-S-M-CI Steel 50 psi Corrosion Inhibitor 29,30 SE-S-H-CI Steel 190 psi Corrosion Inhibitor 19,20 SE-S-L-SF Steel 5 psi Silica Fume
Epoxy/Gasket Joints:
5,6 EG-S-L-NG Steel 5 psi Normal 25,26 EG-S-M-NG Steel 50 psi Normal 13,14 EG-S-H-NG Steel 190 psi Normal

80
3.1.3 Materials
Details of the materials used in this testing program are summarized in
Table 3.3. All materials and proportions were selected to match segmental bridge
usage as closely as possible. Concrete was batched using a six cubic foot mixer in
the laboratory. Grouts were batched in five gallon buckets using a paddle mixer
mounted to a drill press. Complete details of specimen construction are provided
in Reference 3.4.
Table 3.3 Material Details 3.8
Item Description
Segment Concrete • w/c = 0.44, f’c =5000 psi • batch proportions: Coarse Aggregate 383 lb (3/4 in. max.)
Fine Aggregate 300 lb
Type I/II Cement 150 lb
Water 66 lb
• cylinder strengths: 7-day 4493 psi 28-day 5145 psi
Normal Grout • w/c = 0.40 • batch proportions: Type I/II Cement 28.8 lb
Water 11.6 lb Corrosion Inhibitor
Grout
• w/c = 0.40 • corrosion inhibitor: calcium nitrite • batch proportions: Type I/II Cement 28.8 lb
Water 11.6 lb Corrosion Inhibitor 187 ml
Silica Fume Grout • w/c = 0.32 • silica fume: Sikacrete 950DP • superplasticizer: WRDA-19 • batch proportions: Type I/II Cement 21.7 lb
Water 8.0 lb Silica Fume 3.26 lb Superplasticizer 88.5 ml
Prestressing Strand • 0.5 in. diameter seven wire strand • Grade 270 (270 ksi), low relaxation
Mild Steel Reinforcement
• 0.5 in. diameter bars (#4) • ASTM A615, Grade 60 (60 ksi)
Steel Duct • Corrugated, semi-rigid, galvanized steel duct for post-tensioning • 1-3/16 in. outside diameter
Plastic Duct • ASTM D1785 PVC pipe • 1-5/16 in. outside diameter, 1 in. inside diameter
Segment Epoxy • B-73 Mid-Range two-part span epoxy

81
3.1.4 Measurements during Exposure Testing
Two forms of regular measurements were taken to evaluate macrocell and
microcell corrosion in the test specimens. Macrocell corrosion current can be
measured directly as described in Section 3.1.1. In addition, the probability of
macrocell corrosion can be estimated using half-cell potential measurements.
Microcell corrosion cannot be measured directly. However, significant half-cell
potential readings in the absence of measured macrocell corrosion current would
indicate a high probability for microcell corrosion.
3.1.4.1 Macrocell Corrosion Current Measurements
The nature of the macrocell specimen allows direct measurement of the
macrocell corrosion current. Macrocell corrosion currents provide three forms of
information:
• The time at which corrosion began can be determined from regular measurements during testing.
• Corrosion rate or severity can be calculated from corrosion current measurements.
• The polarity of the corrosion current indicates which steel is corroding (prestressing strand or mild steel reinforcing bars).
The corrosion current is determined by measuring the voltage drop across
a resistor placed between the anode and cathode steel, as shown in Figure 3.4.
The corrosion current, Icorr, is calculated dividing the measured voltage drop by
the known resistance (Ohm’s Law). Each specimen is connected to a data
acquisition system, allowing voltages (currents) for all specimens to be measured
simultaneously. Corrosion currents are measured at one week intervals.

82
Figure 3.4 Macrocell Corrosion Current Measurement 3.8
During corrosion, the electrons liberated at the anode travel through the
electrical connection provided by the wire and resistor to the cathode. Since
current moves in the direction opposite to electron flow, the current in the
macrocell flows from the cathode to the anode. With the leads of the voltage
measuring device attached as indicated in Figure 3.4, the measured voltage across
the resistor will have a positive polarity if the anodic reaction is occurring on the
prestressing strand. Thus, the polarity of the measured voltage allows the
direction of the electron flow to be determined, indicating whether or not the
expected corrosion cell has developed.
3.1.4.2 Half-Cell Potential Readings
Half-cell potential readings also provide three forms of information
regarding the condition of the specimen:
• The magnitude of half-cell potential readings indicate the probability of corrosion at a given location.
• The time at which corrosion initiation occurred can be determined from regular potential readings taken during testing.
• Significant half-cell potentials in the absence of macrocell corrosion currents suggest the occurrence of microcell corrosion.
R 10 0 Ohms
An od e (s tr a nd)
Cat ho de ( bars)
-
+
V
Icorr = V R

83
Half-cell potential readings were taken every two weeks at the start of the
wet period and the start of the dry period. All measurements are performed
according to ASTM C8763.7 using a saturated calomel electrode (SCE). Three
half-cell potential measurements are made manually on each specimen, as shown
in Figure 3.5. One measurement is taken with the Plexiglas dam filled with NaCl
solution and the electrode immersed in the solution. Two measurements are taken
directly on the surface of each segment with the dam empty. The surface of the
concrete is damp for these readings. In all cases, electrical contact between the
anode and cathode is interrupted to ensure that the half-cell potential reading is
for the strand only.
Figure 3.5 Half-Cell Potential Readings 3.8
The numerical significance of the half-cell potential readings is shown in
Table 3.4, as defined by ASTM C876. This standard was developed for half-cell
potential readings of uncoated reinforcing steel in concrete, and therefore the
values reported in Table 3.4 may not necessarily be appropriate for grouted
prestressing strand in concrete. In general, half-cell potential readings are not an
effective method for monitoring corrosion activity in bonded post-tensioned
structures. In structures with galvanized steel ducts, the prestressing tendon will
+ -+ -
R
electricalcontactinterrupted R
electricalcontactinterrupted
concretesurfacedamp
SCE Electrode
NaCl solution
voltmeter voltmeter

84
be in contact with the duct in most cases and half-cell potentials taken on the
prestressing tendon may in fact reflect the potential of the zinc on the galvanized
steel duct. Because the potential of the zinc will be more negative than that of the
tendon, this contact could lead to erroneous results and conclusions. In situations
where the tendon is completely encapsulated in an impervious plastic duct system,
half-cell potentials are not possible since the duct will act as a barrier to the ion
flow necessary for half-cell potential readings.
In spite of these issues, half-cell potential readings were used effectively
in the macrocell corrosion specimens in this testing program for two reasons.
First, in all cases the prestressing tendon is not in contact with the galvanized
duct. Second, for both galvanized ducts and plastic ducts the discontinuity in the
duct at the segmental joint should allow ion movement and measurement of half-
cell potentials. However, it is still possible that the presence of the duct, whether
galvanized steel duct or plastic, may affect the magnitude of the half-cell
potentials. Thus, it is important to consider both the magnitude and variation of
the measured potentials over time.
Table 3.4 Interpretation of Half-Cell Potentials for Uncoated
Reinforcing Steel 3.7
Measured Potential (vs SCE) Probability of Corrosion
More positive than –130 mV less than 10% probability of corrosion
Between -130 mV and –280 mV corrosion activity uncertain
More negative than –280 mV greater than 90% probability of corrosion
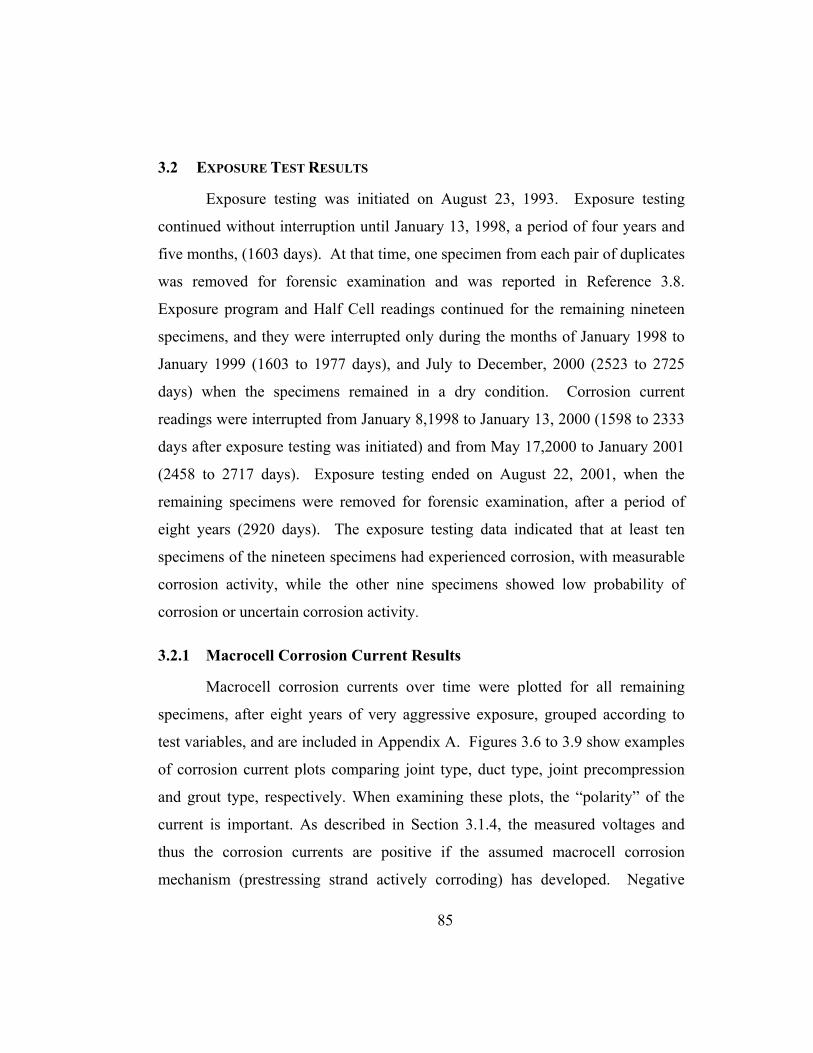
85
3.2 EXPOSURE TEST RESULTS
Exposure testing was initiated on August 23, 1993. Exposure testing
continued without interruption until January 13, 1998, a period of four years and
five months, (1603 days). At that time, one specimen from each pair of duplicates
was removed for forensic examination and was reported in Reference 3.8.
Exposure program and Half Cell readings continued for the remaining nineteen
specimens, and they were interrupted only during the months of January 1998 to
January 1999 (1603 to 1977 days), and July to December, 2000 (2523 to 2725
days) when the specimens remained in a dry condition. Corrosion current
readings were interrupted from January 8,1998 to January 13, 2000 (1598 to 2333
days after exposure testing was initiated) and from May 17,2000 to January 2001
(2458 to 2717 days). Exposure testing ended on August 22, 2001, when the
remaining specimens were removed for forensic examination, after a period of
eight years (2920 days). The exposure testing data indicated that at least ten
specimens of the nineteen specimens had experienced corrosion, with measurable
corrosion activity, while the other nine specimens showed low probability of
corrosion or uncertain corrosion activity.
3.2.1 Macrocell Corrosion Current Results
Macrocell corrosion currents over time were plotted for all remaining
specimens, after eight years of very aggressive exposure, grouped according to
test variables, and are included in Appendix A. Figures 3.6 to 3.9 show examples
of corrosion current plots comparing joint type, duct type, joint precompression
and grout type, respectively. When examining these plots, the “polarity” of the
current is important. As described in Section 3.1.4, the measured voltages and
thus the corrosion currents are positive if the assumed macrocell corrosion
mechanism (prestressing strand actively corroding) has developed. Negative

86
corrosion currents indicate that a reversed corrosion cell has developed. That is,
the prestressing strand is acting as the cathode, while the mild steel reinforcement
bars are actively corroding.
Macrocell corrosion current plots for all dry joint specimens show active
corrosion. Specimens DJ-S-L-NG-2, DJ-S-L-CI-2 and DJ-S-M-NG-2 show strand
corrosion, while the remaining four specimens show reversed macrocell
corrosion.
Seven out of nine epoxy joint specimens show stable corrosion currents
close to zero, which suggests that the steel in these specimens had low or no
corrosion. Only two epoxy joint specimens show a clear initiation of corrosion:
specimen SE-S-M-CI-1 with strand corrosion, and specimen SE-S-H-CI-1 with
reversed macrocell corrosion.
Epoxy Joint specimens with gaskets show a random behavior, with no
corrosion, reversed macrocell corrosion and strand corrosion, in specimens EG-
S-M-NG-1, EG-S-L-NG-1 and EG-S-H-NG-1, respectively. Table 3.5 shows the
general results according to corrosion current activity and polarity.
Out of the 484 corrosion current data points for each specimen over 2902
days of exposure testing, a very few were considered outliers. These values
clearly separated from the trend in an unpredictable and/or out of scale manner.
They were clearly isolated from the rest of the data set. These data points would
disproportionately affect the later calculations with regard to the time to initiation
of corrosion, weighted average corrosion current, corrosion current density, and
metal loss. A thorough examination of the data was made, finding outliers in the
following specimens (number of outlier data in brackets): DJ-S-L-NG-2 (3), DJ-
S-H-NG-2 (2),SE-S-L-NG-1 (5), SE-P-L-NG-1 (1), SE-S-M-CI-1(27), SE-S-M-
NG-1 (4), and EG-S-H-NG-1 (14). These values were probably the product of

87
lost or bad connection between the strand and the cable system. These few outlier
values have been excluded from Figures 3.6 to 3.9 and Figures A.1 to A.13.
In addition to the above, corrosion current data for specimen DJ-P-M-NG-
2 was collected up to January 8, 1998, (1598 days after exposure testing was
initiated). After this date, data values for this specimen were not consistent or
coherent, and therefore, are not considered reliable.
Table 3.5 Corrosion Current Results Based on Corrosion Activity and Polarity
Zero currents (no
corrosion)
Strand corrosion
activity
Reversed macrocell
corrosion
SE-P-L-NG-1 DJ-S-L-CI-2 DJ-S-M-CI-2 SE-S-L-CI-1 DJ-S-L-NG-2 DJ-P-M-NG-2 SE-S-L-SF-1 DJ-S-M-NG-2 DJ-P-L-NG-2 SE-S-L-NG-1 SE-S-M-CI-1 DJ-S-H-NG-2 SE-S-M-NG-1 ---------------- SE-S-H-CI-1 SE-P-M-NG-1 ----------------- EG-S-L-NG-1 SE-S-H-NG-1 ----------------- ----------------- EG-S-M-NG-1 ----------------- ----------------- EG-S-H-NG-1 ---------------- ----------------

88
Figure 3.6 Macrocell Corrosion Current: Dry, Epoxy and Epoxy with Gasket Joint, Steel Duct, High Precompresion and Normal Grout
Figure 3.7 Macrocell Corrosion Current: Dry and Epoxy Joint, Steel and
Plastic Duct, Low Precompresion and Normal Grout
-0.080-0.070-0.060-0.050-0.040-0.030-0.020-0.0100.0000.0100.0200.0300.0400.0500.0600.0700.080
0 250 500 750 1000 1250 1500 1750 2000 2250 2500 2750 3000
Time (days)
"DJ-S-H-NG-2, Dry Joint""SE-S-H-NG-1, Epoxy Joint""EG-S-H-NG-1, Epoxy Joint with Gasket"
Note: Negative current indicatesmacrocell corrosion is reversed.(i.e. bottom steel is corroding)
-0.080-0.070-0.060-0.050-0.040-0.030-0.020-0.0100.0000.0100.0200.0300.0400.0500.0600.0700.080
0 250 500 750 1000 1250 1500 1750 2000 2250 2500 2750 3000
Time (days)
DJ-S-L-NG-2; Dry Joint, Steel DuctDJ-P-L-NG-2; Dry Joint, Plastic DuctSE-S-L-NG-1; Epoxy Joint, Steel DuctSE-P-L-NG-1; Epoxy Joint, Plastic Duct
Note: Negative current indicatesmacrocell corrosion is reversed.(i.e. bottom steel is corroding)

89
Figure 3.8 Macrocell Corrosion Current: Dry Joint, Steel Duct, Low,
Medium and High Precompression and Normal Grout
Figure 3.9 Macrocell Corrosion Current: Epoxy Joint, Steel Duct, Medium
Precompresion and Different Grouts (Normal and Corrosion Inhibitor Added)
-0.080-0.070-0.060-0.050-0.040-0.030-0.020-0.0100.0000.0100.0200.0300.0400.0500.0600.0700.080
0 250 500 750 1000 1250 1500 1750 2000 2250 2500 2750 3000
Time (days)
DJ-S-L-NG-2, Low PrecompressionDJ-S-M-NG-2, Medium PrecompressionDJ-S-H-NG-2, High Precompression
Note: Negative current indicatesmacrocell corrosion is reversed.(i.e. bottom steel is corroding)
-0.080-0.070-0.060-0.050-0.040-0.030-0.020-0.0100.0000.0100.0200.0300.0400.0500.0600.0700.080
0 250 500 750 1000 1250 1500 1750 2000 2250 2500 2750 3000
Time (days)
SE-S-M-NG-1, Normal GroutSE-S-M-CI-1, Corrosion Inhibitor
Note: Negative current indicatesmacrocell corrosion is reversed.(i.e. bottom steel is corroding)
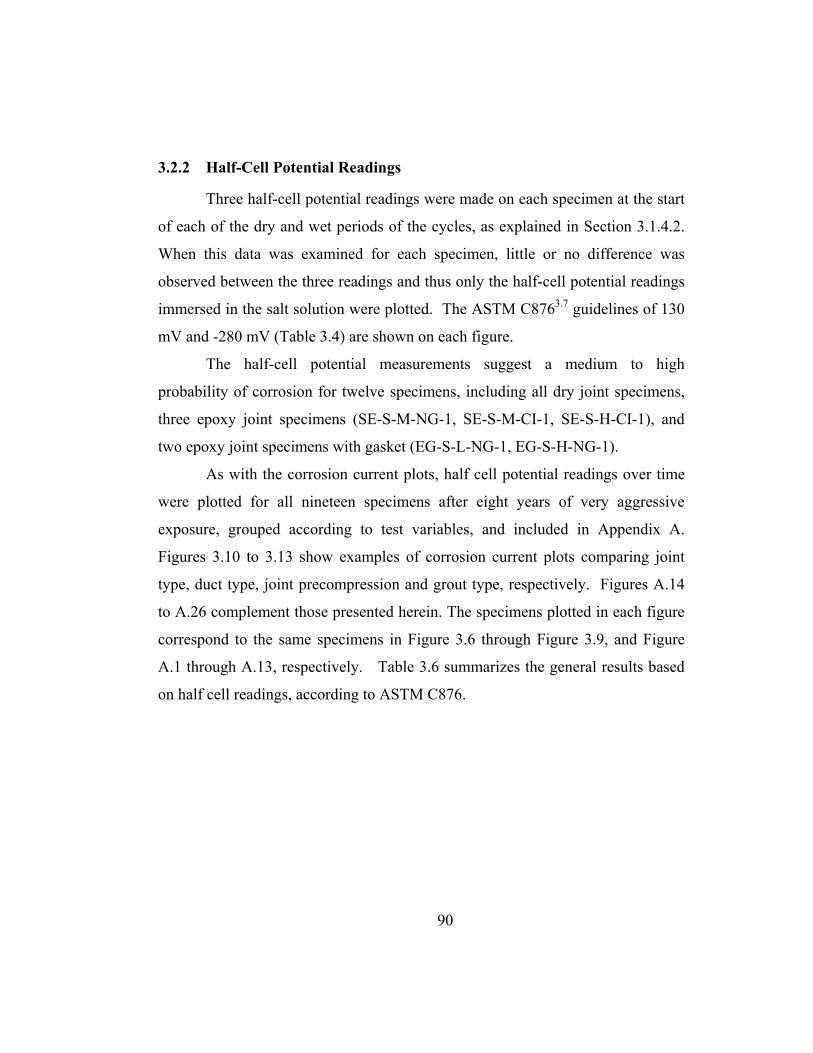
90
3.2.2 Half-Cell Potential Readings
Three half-cell potential readings were made on each specimen at the start
of each of the dry and wet periods of the cycles, as explained in Section 3.1.4.2.
When this data was examined for each specimen, little or no difference was
observed between the three readings and thus only the half-cell potential readings
immersed in the salt solution were plotted. The ASTM C8763.7 guidelines of 130
mV and -280 mV (Table 3.4) are shown on each figure.
The half-cell potential measurements suggest a medium to high
probability of corrosion for twelve specimens, including all dry joint specimens,
three epoxy joint specimens (SE-S-M-NG-1, SE-S-M-CI-1, SE-S-H-CI-1), and
two epoxy joint specimens with gasket (EG-S-L-NG-1, EG-S-H-NG-1).
As with the corrosion current plots, half cell potential readings over time
were plotted for all nineteen specimens after eight years of very aggressive
exposure, grouped according to test variables, and included in Appendix A.
Figures 3.10 to 3.13 show examples of corrosion current plots comparing joint
type, duct type, joint precompression and grout type, respectively. Figures A.14
to A.26 complement those presented herein. The specimens plotted in each figure
correspond to the same specimens in Figure 3.6 through Figure 3.9, and Figure
A.1 through A.13, respectively. Table 3.6 summarizes the general results based
on half cell readings, according to ASTM C876.

91
Table 3.6 Half Cell Potential Results (Based on ASTM C8763.7, See Table 3.4)
Less than 10% probability of corrosion
Between 10% to 90% probability of corrosion
More than 90% probability of corrosion
SE-P-L-NG-1 DJ-S-M-CI-2 DJ-S-L-NG-2 SE-S-L-CI-1 SE-S-M-NG-1 DJ-S-M-NG-2 SE-S-L-SF-1 EG-S-L-NG-1 DJ-S-H-NG-2 SE-S-L-NG-1 EG-S-H-NG-1 DJ-S-L-CI-2 SE-P-M-NG-1 ----------------- DJ-P-L-NG-2 SE-S-H-NG-1 ----------------- DJ-P-M-NG-2 EG-S-M-NG-1 ----------------- SE-S-M-CI-1
Figure 3.10 Half-Cell Potentials: Dry, Epoxy and Epoxy with Gasket Joints, Steel Duct, High Precompresion and Normal Grout
-800
-700
-600
-500
-400
-300
-200
-100
0
100
0 250 500 750 1000 1250 1500 1750 2000 2250 2500 2750 3000
Time (days)
DJ-S-H-NG-2, Dry Joint
SE-S-H-NG-1, Epoxy Joint
EG-S-H-NG-1, Epoxy Joint with Gasket
< 10% probabilityof corrosion
> 90% probabilityof corrosion

92
Figure 3.11 Half-Cell Potentials: Dry and Epoxy Joint, Plastic and Steel Duct, Low Precompression, and Normal Grout
Figure 3.12 Half-Cell Potentials: Dry Joint, Steel Duct, Low, Medium and High Precompression, and Normal Grout
-800
-700
-600
-500
-400
-300
-200
-100
0
100
0 250 500 750 1000 1250 1500 1750 2000 2250 2500 2750 3000
Time (days)
DJ-S-L-NG-2; Dry Joint, Steel DuctDJ-P-L-NG-2; Dry Joint, Plastic DuctSE-S-L-NG-1; Epoxy Joint, Steel DuctSE-P-L-NG-1; Epoxy Joint, Plastic Duct
< 10% probabilityof corrosion
> 90% probabilityof corrosion
-800
-700
-600
-500
-400
-300
-200
-100
0
100
0 250 500 750 1000 1250 1500 1750 2000 2250 2500 2750 3000
Time (days)
DJ-S-L-NG-2, Low PrecompressionDJ-S-M-NG-2, Medium PrecompressionDJ-S-H-NG-2, High Precompression
< 10% probabilityof corrosion
> 90% probabilityof corrosion

93
Figure 3.13 Half-Cell Potentials: Epoxy Joint, Steel Duct, Medium
Precompression, and Different Grouts (Normal, and Corrosion Inhibitor Added)
3.2.3 Specimen Performance Reproducibility based on Half-Cell Potentials.
Half-Cell potentials were plotted for all nineteen specimens autopsied at
eight years of very aggressive exposure with respect to their duplicates, autopsied
at four and a half years. As it is observed in Figures 3.14, 3.15 and 3.16 for
specimens DJ-S-H-NG, DJ-P-M-NG and SE-S-H-NG, respectively, a very good
correlation existed among duplicated specimens, up to four and a half years of
testing. These results confirmed that duplicated modified ASTM G109 macrocell
specimens could be used at different dates of testing and be compared to obtain
reliable partial and final results. Half- Cell potential plots for specimens not
shown herein are included in Appendix A, Figures A.27 to A.42.
-800
-700
-600
-500
-400
-300
-200
-100
0
100
0 250 500 750 1000 1250 1500 1750 2000 2250 2500 2750 3000
Time (days)
SE-S-M-NG-1, Normal GroutSE-S-M-CI-1, Corrosion Inhibitor
< 10% probabilityof corrosion
> 90% probabilityof corrosion

94
Figure 3.14 Half-Cell Potentials for Duplicated Specimens with Dry Joint, Steel Duct, High Precompression and Normal Grout
Figure 3.15 Half-Cell Potentials for Duplicated Specimens with Dry Joint, Plastic Duct, Medium Precompression and Normal Grout
-800
-700
-600
-500
-400
-300
-200
-100
0
100
0 250 500 750 1000 1250 1500 1750 2000 2250 2500 2750 3000
Time (days)
Hal
f-cel
l Pot
entia
l (m
V)
DJ-P-M-NG-1DJ-P-M-NG-2
< 10% probabilityof corrosion
> 90% probabilityof corrosion
-800
-700
-600
-500
-400
-300
-200
-100
0
100
0 250 500 750 1000 1250 1500 1750 2000 2250 2500 2750 3000
Time (days)
Hal
f-cel
l Pot
entia
l (m
V)
DJ-S-H-NG-1DJ-S-H-NG-2
< 10% probabilityof corrosion
> 90% probabilityof corrosion

95
Figure 3.16 Half-Cell Potentials for Duplicated Specimens with Epoxy Joint, Steel Duct, High Precompression and Normal Grout
3.2.4 Analysis and Discussion of Exposure Test Results
3.2.4.1 Time to Initiation of Corrosion
The relative length of exposure before corrosion initiation is detected may
be used to compare the effectiveness of corrosion protection variables. For the
purposes of this research program, the initiation of corrosion is defined as:
a) a sudden and significant increase (in the order of 0.003 mA and above)
in measured corrosion current, and/or
b) half-cell potential measurements more negative than -280 mV, and/or
c) a sudden and significant change (in the order of -100 mV) more
negative in half-cell potential
Criterion (a) is evaluated by examining the plots of macrocell corrosion
current over time for a significant increase in corrosion current. Criteria (b) is
-800
-700
-600
-500
-400
-300
-200
-100
0
100
0 250 500 750 1000 1250 1500 1750 2000 2250 2500 2750 3000
Time (days)
Hal
f-cel
l Pot
entia
l (m
V)
SE-S-H-NG-1SE-S-H-NG-2
< 10% probabilityof corrosion
> 90% probabilityof corrosion

96
based on the guidelines of ASTM C876,3.7as described in Section 3.1.4.2.
However, the non-typical details of the macrocell specimens in this program may
affect the reliability of the ASTM C876 guidelines, and corrosion may occur at
potentials less negative than -280 mV. For this reason, Criterion (c) is included,
where plots of half-cell potential over time are examined for a more negative
significant change.
Based on corrosion current readings, ten specimens displayed some
amount of increased corrosion activity or an initiation of corrosion, as described
in Section 3.2.1, and shown in Figures 3.6 through Figure 3.9, and Figures A.1
through Figure A.13. Half Cell potential readings include two additional
specimens, for a total of twelve specimens showing increased corrosion activity,
as described in Section 3.2.2, and shown in Figures 3.10 through 3.11, and
Figures A.14 through A. 26. Using these plots and the above definitions for
corrosion initiation, the approximate time to the initiation of corrosion for these
specimens are listed in Table 3.7. The initiation of corrosion based on macrocell
corrosion current was very clear for all specimens. The time to corrosion based
on half-cell potentials was estimated using Criterion (b) for most specimens. In
some cases, it was apparent that Criterion (c) better indicated the onset of
corrosion. Examples include specimen DJ-S-M-CI-2, DJ-S-H-NG-2, DJ-P-M-
NG-2, EG-S-L-NG-1, and EG-S-H-NG-1,
From Table 3.7, it is observed that most specimens show a good
correlation between times to corrosion initiation based on macrocell current and
half-cell potential. However, four specimens show different corrosion initiation
times, these are: DJ-S-M-CI-2, SE-S-M-CI-1, SE-S-H-CI-1, EG-S-L-NG-1. For
these specimens, Half Cell corrosion initiation dates correspond to the period
when Corrosion Current readings were interrupted (period defined between 1598
days to 2333 days after exposure testing was initiated), as was indicated
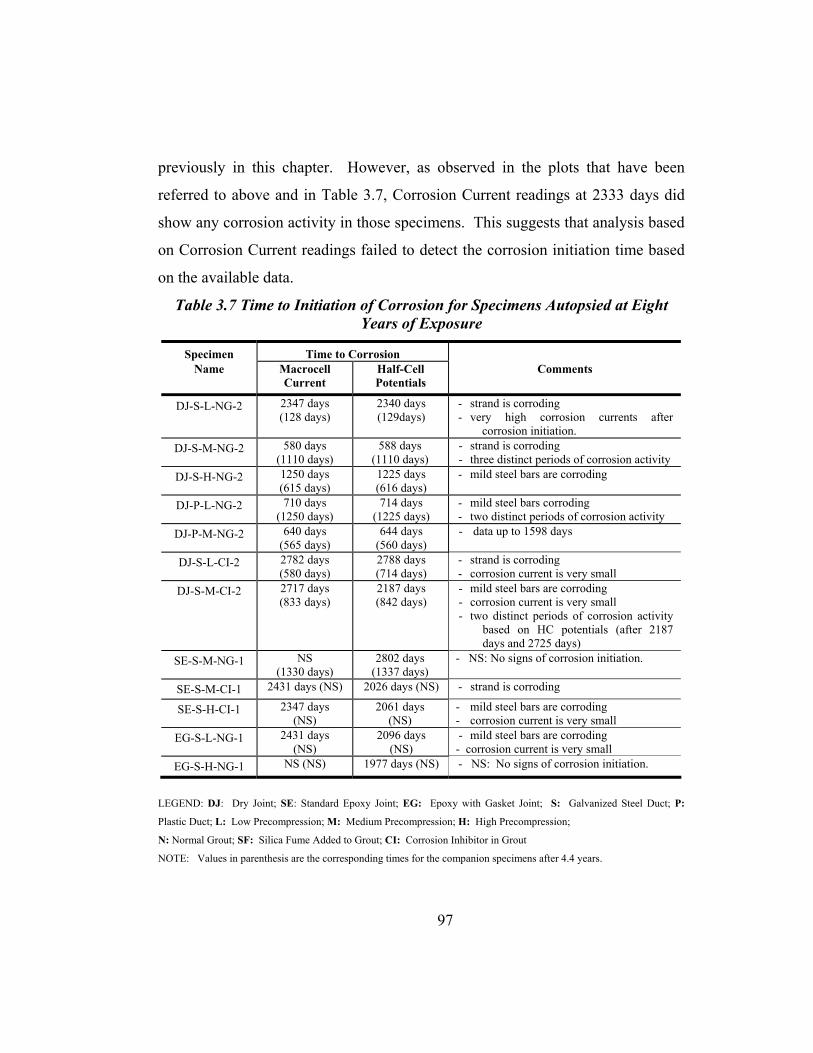
97
previously in this chapter. However, as observed in the plots that have been
referred to above and in Table 3.7, Corrosion Current readings at 2333 days did
show any corrosion activity in those specimens. This suggests that analysis based
on Corrosion Current readings failed to detect the corrosion initiation time based
on the available data.
Table 3.7 Time to Initiation of Corrosion for Specimens Autopsied at Eight Years of Exposure
Specimen Time to Corrosion Name Macrocell
Current Half-Cell Potentials
Comments
DJ-S-L-NG-2 2347 days (128 days)
2340 days (129days)
- strand is corroding - very high corrosion currents after
corrosion initiation. DJ-S-M-NG-2 580 days
(1110 days) 588 days
(1110 days) - strand is corroding - three distinct periods of corrosion activity
DJ-S-H-NG-2 1250 days (615 days)
1225 days (616 days)
- mild steel bars are corroding
DJ-P-L-NG-2 710 days (1250 days)
714 days (1225 days)
- mild steel bars corroding - two distinct periods of corrosion activity
DJ-P-M-NG-2 640 days (565 days)
644 days (560 days)
- data up to 1598 days
DJ-S-L-CI-2 2782 days (580 days)
2788 days (714 days)
- strand is corroding - corrosion current is very small
DJ-S-M-CI-2 2717 days (833 days)
2187 days (842 days)
- mild steel bars are corroding - corrosion current is very small - two distinct periods of corrosion activity
based on HC potentials (after 2187 days and 2725 days)
SE-S-M-NG-1 NS (1330 days)
2802 days (1337 days)
- NS: No signs of corrosion initiation.
SE-S-M-CI-1 2431 days (NS) 2026 days (NS) - strand is corroding
SE-S-H-CI-1 2347 days (NS)
2061 days (NS)
- mild steel bars are corroding - corrosion current is very small
EG-S-L-NG-1 2431 days (NS)
2096 days (NS)
- mild steel bars are corroding - corrosion current is very small
EG-S-H-NG-1 NS (NS) 1977 days (NS) - NS: No signs of corrosion initiation.
LEGEND: DJ: Dry Joint; SE: Standard Epoxy Joint; EG: Epoxy with Gasket Joint; S: Galvanized Steel Duct; P:
Plastic Duct; L: Low Precompression; M: Medium Precompression; H: High Precompression;
N: Normal Grout; SF: Silica Fume Added to Grout; CI: Corrosion Inhibitor in Grout
NOTE: Values in parenthesis are the corresponding times for the companion specimens after 4.4 years.

98
The length of time to corrosion for each of the twelve specimens showing
activity do not suggest any trend between time to corrosion and levels of
precompression, although conceptually, higher precompression may be expected
to limit moisture and chloride ion penetration at the joint.
The presence of a corrosion inhibitor in grout appears to positively affect
the time to corrosion, when comparing specimens DJ-S-L-NG-2 and DJ-S-M-NG-
2 with specimens DJ-S-L-CI-2 and DJ-S-M-CI-2, respectively. However, this
trend is contradicted when comparing specimen SE-S-M-NG-1 with specimen
SE-S-M-CI-1.
Epoxy Joint specimen, SE-S-M-NG-1, shows a longer time for corrosion
initiation when compared to Dry Joint specimen, DJ-S-M-NG-2. However, this
trend is contradicted when comparing specimens SE-S-M-CI-1 and DJ-S-M-CI-2.
After carefully analyzing the reasons for the above contradictions with
respect to the expected trends and results, it is deducted that this is due to the poor
performance shown for specimen SE-S-M-CI-1. This conclusion suggests that an
additional variable may be affecting this specimen, which is not fully understood
based on nondestructive evaluations (Macrocell Currents and Half Cell
Potentials). Total autopsy of this specimen is expected to reveal the cause.
3.2.4.2 General Behavior Over Exposure Time
3.2.4.2.1 Macrocell Current
Table 3.8 summarizes the general test results from Macrocell Current
plots, when main test variables are compared after eight years of aggressive
exposure.

99
Table 3.8 General Macrocell Current Results
Main Variable Reference Plots General Results
Joint Type Figure 3.6 and Figures A.1, A.2, A.3, A.4
SE specimens show lower corrosion currents than EG specimens. EG specimens show less corrosion currents than DJ specimens. Exception: SE-S-M-CI-1.
Duct Type Figure 3.7 and Figure A.5
DJ specimens with plastic duct clearly show lower corrosion currents (with reversed macrocell behavior) than DJ specimens with steel duct (active strand corrosion).
Joint Precompression
Figure 3.8 and Figures A.6, A.7, A.8, A.9
No clear trend is shown with respect to joint precompression.
Grout Type Figure 3.9 and Figures A.10, A.11, A.12,
A.13
Specimens with CI show in general less corrosion currents than NG specimens, with reversed macrocell behavior in most cases. Exception: SE-S-M-CI-1.
DJ: Dry Joint; SE: Epoxy Joint; EG: Epoxy Joint with Gasket; CI: Corrosion Inhibitor; NG: Normal Grout
3.2.4.2.2 Half-Cell Potentials
Table 3.9 summarizes the general test results from Half-Cell Potential
Plots, when main test variables are compared after eight years of aggressive
exposure.

100
Table 3.9 General Half-Cell Potential Results
Main Variable Reference Plots General Results
Joint Type Figure 3.5 and Figures A.14, A.15, A.16,
A.17
Epoxy Joint and Epoxy Joint with Gasket specimens show lower probability of strand corrosion than Dry Joint specimens. Exception: SE-S-M-CI-1.
Duct Type Figure 3.6 and Figure A.18
Dry Joint and Epoxy Joint specimens with plastic duct (discontinuous at the joint) show lower probability of strand corrosion than similar specimens with steel duct.
Joint Precompression
Figure 3.7 and Figures A.19, A.20, A.21,
A.22
Dry Joint specimen data indicate lower probability of strand corrosion with increasing levels of precompression. This trend is not observed in Epoxy Joint specimens due to behavior of specimen SE-S-M-CI-1. No clear trend is shown in Epoxy Joint with Gasket specimens with respect to joint precompression.
Grout Type Figure 3.8 and Figures A.23, A.24, A.25,
A.26
Dry Joint specimens with Corrosion Inhibitor show lower probability of strand corrosion with respect to specimens with Normal Grout. The contrary is found in Epoxy Joint specimens where higher probability of strand corrosion is shown in specimens with Corrosion Inhibitor than those with Normal Grout, these include specimen SE-S-M-CI-1 and specimen SE-S-H-CI-1.
3.2.4.3 Corrosion Rate or Severity
Corrosion severity is commonly evaluated in three ways using measured
macrocell corrosion currents: weighted average corrosion current, corrosion
current density and metal loss.
3.2.4.3.1 Weighted Average Corrosion Current
The weighted average corrosion current over the duration of testing, Iwa,
was computed using the following expression:
n1,iTTI
Ii
iaiwa ==
∑∑ Eq. 3.1

101
where,
Iai = average current in time interval i
Ti = duration of time interval i
n = number of measurements
The effect of different time intervals between readings requires a weighted
average. Table 3.12 gives weighted averages for the active specimens. ASTM
G1093.5 defines failure as an average corrosion current of 10 µA (0.010 mA). All
specimens except specimen DJ-S-L-NG-2 are below this value.
3.2.4.3.2 Corrosion Current Density
The corrosion current density is the amount of corrosion current per unit
surface area of the anode, calculated as the weighted average corrosion current
divided by the total anode surface area.
)/( 2
surf
wa cmAAI
DensityCurrentCorrosion µ= Eq. 3.2
The anode surface area (Asurf) is taken as the total (nominal) surface area
of the anode bar, assuming that corrosion is occurring over the entire exposed
length of the anode. For this testing program, the non-typical macrocell
specimens make estimation of the anode surface area very difficult. If the strand
is the anodic site, the total surface area is computed as the sum of the surface
areas of each of the seven wires of the strand. The presence of the duct and
segmental joint raise further questions as to whether corrosion will occur over the
exposed length of strand. For specimens in which the corrosion macrocell is
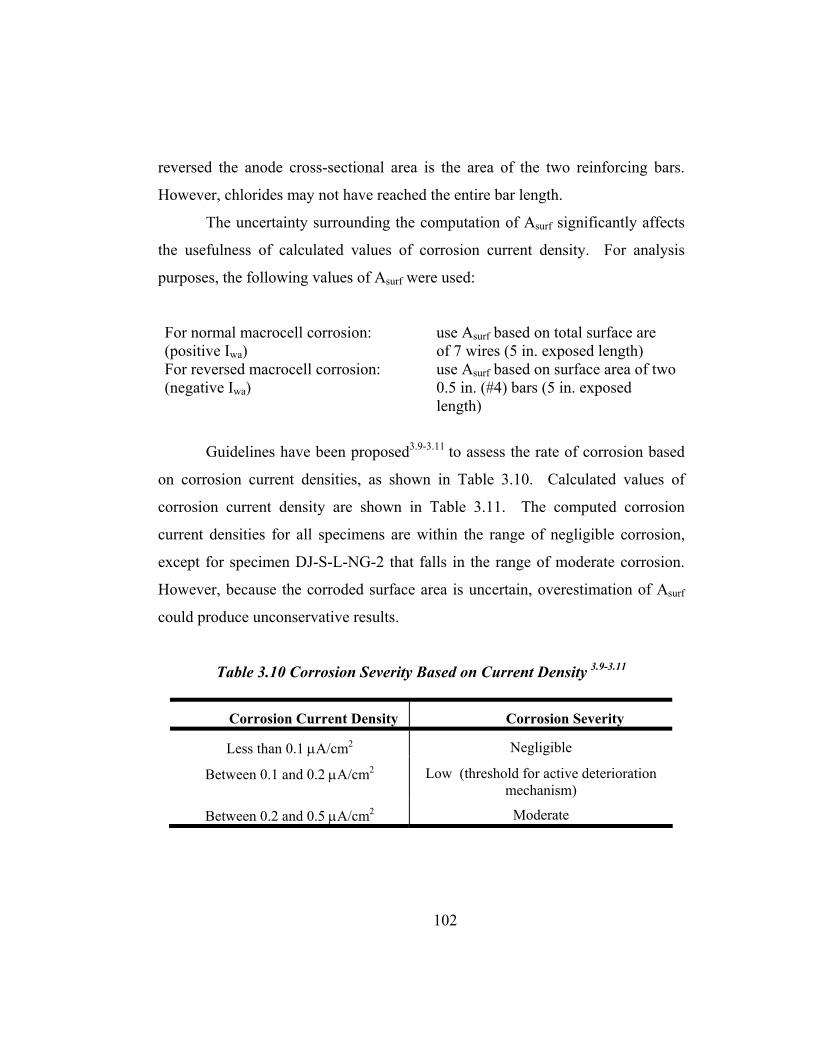
102
reversed the anode cross-sectional area is the area of the two reinforcing bars.
However, chlorides may not have reached the entire bar length.
The uncertainty surrounding the computation of Asurf significantly affects
the usefulness of calculated values of corrosion current density. For analysis
purposes, the following values of Asurf were used:
For normal macrocell corrosion: (positive Iwa)
use Asurf based on total surface are of 7 wires (5 in. exposed length)
For reversed macrocell corrosion: (negative Iwa)
use Asurf based on surface area of two 0.5 in. (#4) bars (5 in. exposed length)
Guidelines have been proposed3.9-3.11 to assess the rate of corrosion based
on corrosion current densities, as shown in Table 3.10. Calculated values of
corrosion current density are shown in Table 3.11. The computed corrosion
current densities for all specimens are within the range of negligible corrosion,
except for specimen DJ-S-L-NG-2 that falls in the range of moderate corrosion.
However, because the corroded surface area is uncertain, overestimation of Asurf
could produce unconservative results.
Table 3.10 Corrosion Severity Based on Current Density 3.9-3.11
Corrosion Current Density Corrosion Severity
Less than 0.1 µA/cm2 Negligible
Between 0.1 and 0.2 µA/cm2 Low (threshold for active deterioration mechanism)
Between 0.2 and 0.5 µA/cm2 Moderate

103
3.2.4.3.3 Metal Loss
The amount of steel “consumed” by macrocell corrosion is directly related
to the total amount of electrical charge, or number of electrons, exchanged
between the anode and cathode. One amp of corrosion current consumes 1.04
grams of steel (iron) per hour.3.12 The total amount of current passed, or charge
flux, is computed by numerically integrating the macrocell corrosion current data
over the duration of exposure. Although an absolute measurement of corrosion
severity is difficult to obtain using metal loss (charge flux), a relative comparison
of corrosion severity between specimens is possible. Calculated values of metal
loss are listed in Table 3.11.
As mentioned in Section 3.3.3.1, ASTM G1093.5 defines failure as an
average macrocell corrosion current over the duration of testing of more than 10
µA. For an average corrosion current of 10 µA and the exposure duration of eight
years, a metal loss of 729 milligrams (10-5 Amp. x 1.04 g/hour x 70080 h x
1000mg/g) would be expected. Only specimen DJ-S-L-NG-2 is above this value.
Slightly below are specimens DJ-P-L-NG-2 and DJ-S-H-NG-2 with mild steel
metal loss close to 465 mg corresponding to a weighted average corrosion current
of approximately 6.4 µA; and, below are specimens DJ-S-M-NG-2 and SE-S-M-
CI-1 with strand metal loss close to 190 mg corresponding to a weighted average
corrosion current of approximately 2.6 µA. The other macrocell specimens are
below 1 µA, with only very minor corrosion activity.

104
Table 3.11 Calculated Weighted Average Current, Current Density and Metal Loss for Active Specimens after Eight Years of Exposure
Specimen Weighted Average Corrosion Current
Corrosion Current Density
Metal Loss
No. Name (µAmps) (µA/cm2) (mg)
DJ-S-L-NG-2 29.417 0.253 2135 DJ-S-M-NG-2 2.572 0.022 187 DJ-S-H-NG-2 -6.392 0.064 464 DJ-S-L-CI-2 0.068 0.001 5 DJ-S-M-CI-2 -0.422 0.004 31 DJ-P-L-NG-2 -6.475 0.065 470 SE-S-M-CI-1 2.664 0.023 193 SE-S-H-CI-1 -0.266 0.003 19 EG-S-L-NG-1 -0.211 0.002 15
Note: Negative average corrosion current indicates mild steel bars are corroding. Specimen DJ-P-M-NG-2 due has been excluded. See discussion in Section 3.2.1.
3.2.4.3.4 Discussion: Corrosion Rate Calculations
The corrosion rate calculations for weighted average corrosion current,
corrosion current density, and metal loss indicate that the corrosion activity is
important for specimen DJ-S-L-NG-2, and moderately important for specimens
DJ-S-M-NG-2, DJ-S-H-NG-2, DJ-P-L-NG and SE-S-M-CI-1. For all other
specimens corrosion activity is considerably lower than what would be defined as
failure.
The calculated corrosion rates using the three different methods are plotted
in Figure 3.17 through Figure 3.19 where the relative performance of the nine
specimens included in Table 3.11 is the same for all three cases. All three
corrosion rate calculations are related to the charge flux or the number of
electrons exchanged between the anode and cathode. The charge flux is
calculated by integrating the corrosion current over time:

105
)Coulombs()n,1i(TIdtIFluxeargCh iaicorr =≡= ∑∫ Eq. 3.3
where, Icorr = instantaneous corrosion current
Iai = average current in time interval i
Ti = duration of time interval i
n = number of measurements
The calculation of charge flux appears in the computation of weighted
average corrosion current, current density and metal loss:
)mg(gmg1000
hrampg04.1
sec3600hr1
dtILossMetal
)cm/amps(A1
t
dtI
AIDensityCurrent
)amps(TTI
t
dtII,Current.AvgWeighted
corr
2
surfd
corr
surf
wa
i
iai
d
corrwa
×
−××=
×≡=
≡=
∫
∫
∑∑∫
where, td = duration of testing
Asurf = corroded surface area
In general, any one of the three forms of corrosion rate calculations would
be appropriate for comparing the performance of the protection variables.
Calculated metal loss will be used for discussion purposes in the remainder of this
document.
The corrosion rate calculations provide a means for relative comparison of
corrosion activity in the different specimens. However, it is difficult to use the
calculated corrosion rates to obtain an absolute measure of corrosion severity.
Corrosion current density can be used for this purpose if the area over which
corrosion is occurring is known. The non-typical details of the segmental
macrocells make estimation of the corroded surface area uncertain at best, and
thus the use of corrosion current density to assign a corrosion severity using Table
3.10 is questionable for this testing program.

106
The effect of the different variables (other than joint type) is not clear
based on the calculated corrosion rates (Figures 3.17 through Figure 3.19).
However, data suggests that a higher level of precompression or protection to the
strand (in the case of plastic ducts or corrosion inhibitor in grout), somewhat
produces a higher tendency of reversed macrocell behavior, which may relate to
lower strand corrosion.
Figure 3.17 Calculated Weighted Average Corrosion Current for Active Specimens after Eight Years of Exposure
29.417
2.572
0.068
2.664
6.392
0.422
6.475
0.266 0.2110
5
10
15
20
25
30
35
DJ-
S-L
-NG
-2
DJ-
S-M
-NG
-2
DJ-
S-H
-NG
-2
DJ-
S-L
-CI-
2
DJ-
S-M
-CI-
2
DJ-
P-L
-NG
-2
SE
-S-M
-CI-
1
SE
-S-H
-CI-
1
EG
-S-L
-NG
-1
Strand Corroding
Bars Corroding

107
3.18 Calculated Corrosion Current Densities for Active Specimens after Eight Years of Exposure
Figure 3.19 Calculated Metal loss for Active Specimens after Eight Years of Exposure
0.253
0.022
0.001
0.023
0.064
0.004
0.065
0.003 0.0020
0.05
0.1
0.15
0.2
0.25
0.3
DJ-
S-L
-NG
-2
DJ-
S-M
-NG
-2
DJ-
S-H
-NG
-2
DJ-
S-L
-CI-
2
DJ-
S-M
-CI-
2
DJ-
P-L
-NG
-2
SE
-S-M
-CI-
1
SE
-S-H
-CI-
1
EG
-S-L
-NG
-1
Strand Corroding
Bars Corroding
2135
187
5
193
464
31
470
19 150
500
1000
1500
2000
2500
DJ-
S-L
-NG
-2
DJ-
S-M
-NG
-2
DJ-
S-H
-NG
-2
DJ-
S-L
-CI-
2
DJ-
S-M
-CI-
2
DJ-
P-L
-NG
-2
SE
-S-M
-CI-
1
SE
-S-H
-CI-
1
EG
-S-L
-NG
-1Strand Corroding
Bars Corroding
108
3.3 FORENSIC EXAMINATION
After 2920 days of exposure (taking place over eight years), the remaining
19 specimens out of the initial 38 were removed from testing for forensic
examination or autopsy. The previous 19 specimens had been autopsied three and
a half years before, at 1603 days of exposure. The objectives of the forensic
examinations are as follows:
1. Obtain visual evaluation of corrosion damage on duct, strand and mild
steel reinforcement.
2. Obtain visual evaluation of joint condition
3. Determine chloride ion penetration at locations adjacent to and away
from the segmental joint.
4. Examine mechanisms of corrosion in segmental macrocell corrosion
specimens
The notation scheme shown in Figure 3.20 was assigned for record
keeping purposes. “Clamp end” refers to the end of the specimen where ground
clamps were attached to complete the macrocell circuit. Segment B was cast first.
Segment A was match –cast against Segment B. All specimens were numbered on
Side C at the clamp end. This marking ensured that the orientation of all
specimens was known throughout the forensic examination process. The notation
scheme will be referred to throughout this chapter.
The following sections 3.3.1 through 3.3.3 have been repeated from
Reference 3.8, with only minor changes, as they refer to the same procedure
followed in the first autopsy, at four years and five months of aggressive
exposure.

109
Figure 3.20 Specimen Labeling Scheme 3.8
3.3.1 Procedure
3.3.1.1 Specimen Condition at End of Testing
The exterior surfaces of each specimen were examined for cracking and
rust staining upon removal from testing. Duct ends were examined for grout
voids and rust stains. The joint perimeter was examined for visible salt stains,
joint epoxy and grout.
3.3.1.2 Concrete Powder Samples for Chloride Analysis
One of the objectives of the forensic examination was to determine the
influence of the three joint types on the penetration of moisture and chlorides. It
was expected that chloride contents could be higher in the vicinity of the joint,
particularly for dry joint specimens. To examine the influence of joint type on
chloride penetration, concrete powder samples were collected at multiple depths
Top View
End AClamp EndEnd B
Side D
Side C
Side C View
22End AClamp End
End B
SpecimenNumber
Segment B Segment A

110
and locations to determine chloride ion profiles adjacent to the joint and away
from the joint. Sample locations are shown in Figure 3.21. Concrete powder
samples were collected using a rotary hammer and following a procedure based
on AASHTO T 260-94.3.13 Two 1.5 g samples were collected at each depth.
Samples were analyzed for acid soluble chlorides using a specific ion probe (CL
Test System by James Instruments).
Figure 3.21 Chloride Sample Locations 3.8
extent of ponded area
Chloride Sample Depthsat A and C
5/4 in. 3 in.
4 ¾ in. ¾ in.
1.5 in.
Plan View
A
1 1/8 in.
B3/8 in. diam. C
4 in. 2 in
0.5 in.
¾ in.
0.5 in.
¼ in. dia.
Chloride Sample Depths at B
5/4 in.
3 in.
4 ¾ in. ¾ in.
¼ in. ½ in.
1 ¾ in.
¼ in ½ in.
up to

111
3.3.1.2.1 Location A
Samples at A were taken at a distance of 2 in. from the segmental joint
using a 3/8 in. diameter drill bit. Two holes were drilled at each depth to later
average the chloride content results. The first sample was taken on the top
surface of the specimen. Initially, the holes were drilled to a depth of 0.25 in.
The holes and bit were then cleaned, and the holes were drilled an additional
depth of 0.5 in. An average depth of 0.5 in. was assumed for this sample. The
remaining three samples at location A were obtained by drilling into the sides of
the specimen. One hole was drilled into each side of the specimen at the desired
depths. The holes were drilled to an initial depth of 0.75 in. so that the collected
sample will be from concrete directly below the ponded area. Following cleaning,
the holes were drilled an additional 0.5 to 0.75 in. to obtain the sample amount
(total depth up to 1.5 in.).
3.3.1.2.2 Location B
Samples at B were collected at a distance of 0.5 in. from the segmental
joint. Due to the close proximity of the joint, a smaller bit size of 0.25 in. was
used for these samples. The procedure for obtaining the powder samples at
location B was similar to that at location A with some minor modifications due to
the smaller drill bit size. Four holes were required for the two samples on the top
surface of the specimen, and the holes for the other samples were drilled slightly
deeper (up to 1.75 in.) to obtain the necessary sample amount.
3.3.1.2.3 Location C
Samples at C were taken at a distance of 4 in. from the segmental joint.
The procedure for collecting samples at C is identical to that for samples at A.

112
3.3.1.3 Longitudinal Saw Cuts
Four longitudinal saw cuts were made on each specimen to facilitate
removal of the duct/strand unit and mild steel bars. Saw cuts were made to a
depth of 1.5 in. at the level of the tendon and bars, as shown in Figure 3.22.
These cuts are referred to as the strand cut line and bar cut line respectively. The
specimen remained intact after cutting, but was easily opened using a hammer and
chisel. Saw cuts were performed using a high torque circular saw fitted with a
diamond dry-cut concrete blade as shown in Figure 3.23. Some cracked samples
needed to be wrapped with duct tape to permit cutting of the specimen.
Figure 3.22 Longitudinal Saw Cuts 3.8
3.3.1.4 Expose and Remove Duct and Strand
The duct was exposed by opening the specimen at the strand cut line, as
shown in Figure 3.23. The duct and strand were then removed from the concrete
as one unit. The concrete surrounding the duct was examined for voids, cracks,
rust staining, salt collection and damage. After thorough examination, the duct
was cut open by making two longitudinal cuts along the sides of the duct/strand
strand cut line
A
B
1 ¼ in. 1.5 in.
Chloride sample locations
bar cut line
C
1.5 in.
1 ¼ in.

113
unit using a small air-driven grinder. The grout was examined for voids and
cracks and indications of moisture and chloride ingress. If desired, grout samples
were taken from the grout for chloride analysis at this time (see Section 3.3.1.5).
The grout was then carefully removed, exposing the strand for examination. The
extent and severity of corrosion on both the strand and duct was rated according
to the corrosion rating scheme described in Section 3.3.3.
Figure 3.23 Specimen Opened to Expose Duct/Strand 3.8
3.3.1.5 Grout Samples for Chloride Analysis
Grout samples were collected from selected specimens for chloride
analysis. Samples were carefully removed from the strand at the location of the
joint and at a distance of 2 in. from the joint. The grout pieces were crushed
between two steel plates and ground into powder using a mortar and pestle. Grout
powder samples were analyzed for acid soluble chlorides using a specific ion
probe (CL Test System by James Instruments).
3.3.1.6 Expose and Remove Mild Steel
The mild steel bars were exposed by opening the specimen at the bar cut
line, as shown in Figure 3.24. The bars were then removed from the concrete for
examination. The extent and severity of corrosion on the bars was rated

114
according to the corrosion rating scheme described in Section 4.3.2. The concrete
surrounding the bars was examined for voids, rust staining, salt collection and any
damage.
Figure 3.24 Specimen Opened to Expose Mild Steel Bars 3.8
3.3.1.7 Examine Joint Condition
In the dry joint specimens, the specimen readily separated into its two
segments after the duct/strand unit was removed (Section 3.3.1.4). This
separation allowed the condition of the joint face to be examined directly for
cracking, rust staining, evidence of moisture and chloride penetration and general
soundness of the joint.
The intention of the epoxy joint is to bond the two segments together. As
a result, it was not possible to examine the joint in the same manner as the dry
joint specimens. An indication of the epoxy joint condition was obtained by
examining several sections through the joint, as shown in Figure 3.25. The saw
cuts at the strand line and bar line (Section 3.3.1.3) revealed the epoxy joint
condition at sections 1 and 3 in Figure 3.25. An addition longitudinal saw cut was
made at the mid-height of the specimen to obtain a third section through the joint

115
(Joint Section 2 in the figure). The joint was also examined around the perimeter
of the specimen. The joint sections were examined for indications of voids in the
epoxy or the presence of moisture, salt or corrosion products.
Mid-Heightsaw cut line
Top View:Joint Section 1
Section throughSaw Cut:Joint Section 2
Bottom View:Joint Section 3examine epoxy joint
Figure 3.25 Examining Epoxy Joint Condition 3.8
3.3.2 Autopsy Program
The remaining specimen from each duplicate pair of specimen types, was
finally prepared for forensic examination.
Chloride samples were collected from ten of the nineteen specimens
autopsied, in order to coincide with the specimen pair that was analyzed
previously. The ten specimens were selected out of the nineteen to provide a
representative sample and address the major variables expected to influence
chloride penetration. The mid-height cut for epoxy-jointed specimens was
performed on six of the twelve specimens with epoxy joints. Specimens selected
were standard epoxy joints and epoxy/gasket joints at each of the three levels of
joint precompression. Details of the nineteen specimens selected for autopsy are
listed in Table 3.12.

116
Table 3.12 Specimens Selected for Forensic Examination
Specimen Time to Corrosion
Corrosion Location
Chloride Samples
Mid-Height Cut
DJ-S-L-NG-2 2347 days Strand A, B, C n/a DJ-S-M-NG-2 580 days Strand A, B n/a DJ-S-H-NG-2 1250 days Bars A, B n/a DJ-P-L-NG-2 710 days Bars A, B n/a DJ-P-M-NG-2 640 days Bars None n/a DJ-S-L-CI-2 2782 days Strand A, B n/a DJ-S-M-CI-2 2717 days Bars A, B n/a SE-S-L-NG-1 n/a n/a A, B, C Yes SE-S-M-NG-1 n/a n/a A, B Yes SE-S-H-NG-1 n/a n/a A, B Yes SE-P-L-NG-1 n/a n/a None No SE-P-M-NG-1 n/a n/a None No SE-S-L-CI-1 n/a n/a None No SE-S-M-CI-1 2431 days Strand None No SE-S-H-CI-1 2347 days Bars None No SE-S-L-SF-1 n/a n/a None No
EG-S-L-NG-1 2347 days Bars A, B Yes EG-S-M-NG-1 n/a n/a None Yes EG-S-H-NG-1 n/a n/a None Yes
3.3.3 Evaluation and Rating of Corrosion Found During Forensic
Examination
A generalized evaluation and rating system was developed to quantify the
severity and extent of corrosion damage in the test specimens. The procedure is
presented in a universal form with the intention of applying the same rating
system to other situations. The length of strand, mild steel reinforcement or
galvanized steel duct was subdivided into eight increments. At each increment,
the steel was examined and a rating was assigned to describe the corrosion

117
severity within that increment. The ratings for the eight increments were summed
to give a total corrosion rating for the element that could be compared for
different specimens. By assigning a corrosion severity at eight locations, both the
extent and severity of corrosion is considered.
The corrosion severity ratings are described below. The rating system is
essentially the same for prestressing strand, mild steel reinforcement and
galvanized duct, with some modifications to reflect unique corrosion aspects of
each type of steel. In general, the evaluation system doubles the severity rating
for each category of increasing corrosion damage.
3.3.3.1 Prestressing Strand
The strand was examined at eight intervals, as indicated in Figure 3.26.
The interval sizes have been adjusted to provide four intervals in the unpainted
region of the strand, and two intervals in each of the painted regions at both ends.
Corrosion ratings were assigned to indicate the severity of corrosion on the outer
six wires of the strand and on the center wire (after de-stranding) at each interval
to address the possibility of different corrosion activity on the strand exterior and
interstices between wires. The corrosion rating system for prestressing strand is
described in Table 3.13. The total strand corrosion rating was calculated as
follows:
∑=
+×=8
1ii,centerii,outer RnRRatingCorrosionStrand Eq. 3.4
where, Router,i = outer wires corrosion rating, interval i
ni = number of corroded outer wires, interval i
Rcenter,i= center wire corrosion rating, interval i
i = interval, 1 to 8

118
Figure 3.26 Intervals for Corrosion Ratings on Prestressing Strand
The corrosion rating system for prestressing strand was adapted from
Poston3.14 and Hamilton.3.15 The use of a cleaning pad to assess corrosion severity
was proposed by Sason3.16 for classifying the degree of rusting on prestressing
strand for new construction. The recommended cleaning pad is a 3M Scotch Brite
Cleaning Pad. The pad is held by hand and rubbed longitudinally along the strand
axis with a pressure similar to that used when cleaning pots and pans. The
classification of pitting severity was based on tensile tests performed on corroded
prestressing strand.3.17 The tests were used to assign a reduced tensile capacity of
97% GUTS to pitting damage at the level of P1. Moderate pitting (P2) was
assigned a capacity of 90% GUTS, and severe pitting (P3) 77% GUTS. In
general, the presence of any pitting visible to the unaided eye is deemed cause for
rejection in new construction.3.16

119
Table 3.13 Evaluation and Rating System for Corrosion Found on Prestressing Strand 3.8
Code Meaning Description Rating
NC No Corrosion No evidence of corrosion. 0
D Discoloration No evidence of corrosion, but some discoloration from original color.
1
L Light Surface corrosion on less than one half of the interval, no pitting. Surface corrosion can be removed using cleaning pad.
2
M Moderate Surface corrosion on more than one half of the interval, no pitting. and/or Corrosion can not be completely removed using cleaning pad.
4
P1 Mild Pitting Broad shallow pits with a maximum pit depth not greater than 0.02 in.
8
P2 Moderate Pitting Pitting where the maximum pit depth ranged between 0.02 and 0.04 in.
16
P3 Severe Pitting Pitting where the maximum pit depth is greater than 0.04 in.
32
3.3.3.2 Mild Steel Reinforcement
The mild steel reinforcing bars were examined at eight intervals, as
indicated in Figure 3.27 The interval sizes have been adjusted to provide four
intervals in the unpainted region of the bars, and two intervals in the painted
regions at both ends. Corrosion ratings were assigned to indicate the severity of
corrosion on the top and bottom surfaces of each bar to reflect the possibility of
different corrosion severity and extent. The corrosion rating system is described
in Table 3.14. The total bar corrosion rating was calculated as follows:
∑=
+++=8
1ii,Bot2Bari,Top2Bari,Bot1Bari,Top1Bar RRRRRatingCorrosionBar Eq. 3.5

120
where, RBar1Top,i = Bar 1, top surface corrosion rating, interval i
RBar1Bot,i = Bar 1, bottom surface corrosion rating,
interval i
RBar2Top,i = Bar 2, top surface corrosion rating, interval i
RBar2Bot,i = Bar 2, bottom surface corrosion rating,
interval i
i = interval, 1 to 8
Table 3.14 Evaluation and Rating System for Corrosion Found on Mild Steel Bars 3.8
Code Meaning Description Rating
NC No Corrosion No evidence of corrosion 0
D Discoloration No evidence of corrosion, but some discoloration from original color
1
L Light Surface corrosion on less than one half of the interval, no pitting. Surface corrosion can be removed using cleaning pad.
2
M Moderate Surface corrosion on more than one half of the interval, no pitting. and/or Corrosion can not be completely removed using cleaning pad.
4
P Pitting Pits visible to unaided eye. 8
AR Area Reduction Measurable reduction in bar cross-sectional area due to corrosion
R2
R = Estimated cross-sectional area reduction in percent
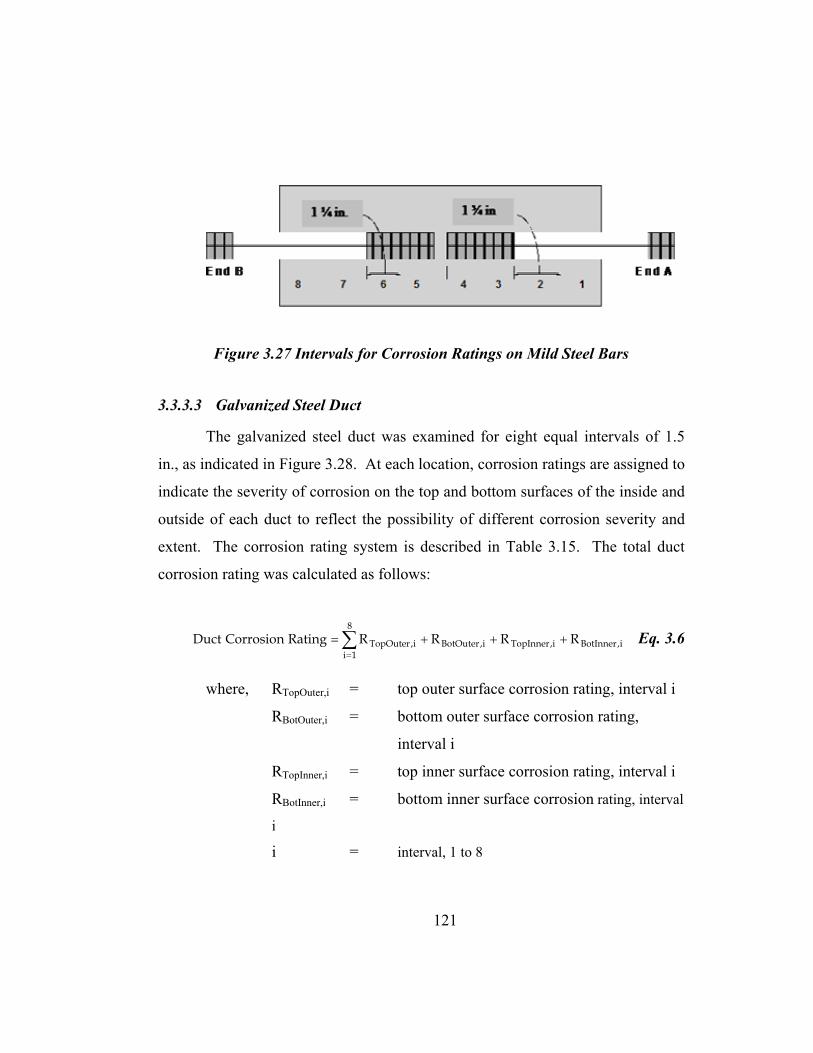
121
Figure 3.27 Intervals for Corrosion Ratings on Mild Steel Bars
3.3.3.3 Galvanized Steel Duct
The galvanized steel duct was examined for eight equal intervals of 1.5
in., as indicated in Figure 3.28. At each location, corrosion ratings are assigned to
indicate the severity of corrosion on the top and bottom surfaces of the inside and
outside of each duct to reflect the possibility of different corrosion severity and
extent. The corrosion rating system is described in Table 3.15. The total duct
corrosion rating was calculated as follows:
∑=
+++=8
1ii,BotInneri,TopInneri,BotOuteri,TopOuter RRRRRatingCorrosionDuct Eq. 3.6
where, RTopOuter,i = top outer surface corrosion rating, interval i
RBotOuter,i = bottom outer surface corrosion rating,
interval i
RTopInner,i = top inner surface corrosion rating, interval i
RBotInner,i = bottom inner surface corrosion rating, interval
i
i = interval, 1 to 8

122
12345678
Figure 3.28 Intervals for Corrosion Ratings on Galvanized Duct 3.8
Table 3.15 Evaluation and Rating System for Corrosion Found on Post-tensioning Duct 3.8
Code Meaning Description Rating
NC No Corrosion No evidence of corrosion 0
D Discoloration No evidence of corrosion, but some discoloration from original color
1
L Light Surface corrosion on less than one half of the interval, no pitting.
2
M Moderate Surface corrosion on more than one half of the interval, no pitting.
4
S Severe Corrosion completely covers the interval. and/or Presence of pitting.
8
H Hole Through Duct Hole corroded through duct.
Used in conjunction with ratings D, L, M and S.
32 + Ah
Ah = Area of hole(s) in mm2

123
3.3.4 Forensic Examination Results
3.3.4.1 Detailed Visual Inspection
A brief summary of the forensic examination results after eight years
exposure is provided for each specimen in the following sections. The previous
rating results from the autopsy performed at four years and five months are
included in the individual tables, for comparison. The detailed description for the
previous autopsy results is included in Reference 3.8.
3.3.4.1.1 Specimen DJ-S-L-NG-2 (Dry Joint, Steel Duct, Low Precompression, Normal Grout)
Duct corrosion produced a crack in the
top of the concrete specimen extending its
whole length, as shown in Figure 3.29. The
crack had a maximum top width of 0.12 in.,
and extended the full depth of cover to the
duct, and was clearly visible when the specimen was opened at the strand cut line.
Rust staining was visible around the crack.
A 0.020 in. maximum width crack was also evident in the side, at the level
of the strand. Also, at one end of the specimen, three cracks were found
extending from the duct perimeter to the outer limits of the specimen,
corresponding to the cracks described above, in the top, and side directions. No
cracks were found in the bottom of the specimen, below the location of the mild
steel bars.
More than 50% of the duct had been consumed by corrosion, leaving a
build up of corrosion products around the surface of the grout. Corrosion
Corrosion Rating:
Specimen (1) (2)
4.4 yrs 8 yrs Strand 26 612 Bars 12 54 Duct 528 15779

124
products were mixed with a white powder (that was analyzed with X-Ray
Diffraction and was found to be Zinc Oxide and Zinc Hydroxide). At the
remaining areas of the duct metal, severe uniform corrosion and pitting was
found, as shown in Figure 3.29. The duct corrosion rating for this specimen was
the maximum of all specimens examined.
Three shallow voids of around 0.016 in.2 each, were found in the grout
surface, when extracting the remaining duct material. The voids appear to have
resulted from insufficient grout fluidity rather than due to trapped air or bleed
water collection. The grout was also cracked in the top, corresponding with the
crack observed in the concrete cover.
The strand showed one of the highest corrosion rates when compared to
the other 18 specimens. Uniform corrosion and pitting extended the complete
length of the strand, including those sections where the epoxy paint had peeled
off, which represented more than 50% of the painted area.
The mild steel showed moderate corrosion away from the joint, in the
vicinity of the epoxy paint area, as shown in Figure 3.29. Additionally, light to
moderate corrosion was found under the epoxy paint and in all those areas where
the epoxy had peeled off, which represented around 15% to 20% of the epoxy
area in the bars.
The match-cast dry joint was intact with no voids or cracks. Some grout
infiltrated the joint during grouting. The entire face of the joint was covered with
a white residue that may be salt or leaching.

125
Specimen condition prior to autopsy Duct (Top view) [Side view in detail]
Strand Mild Steel Bars
Figure 3.29 Concrete, Duct, Strand and Bar Condition for
Specimen DJ-S-L-NG-2
3.3.4.1.2 Specimen DJ-S-M-NG-2 (Dry Joint, Steel Duct, Medium Precompression, Normal Grout)
Duct corrosion produced a 0.040 in.
max. width crack at the top of the specimen,
extending the whole length as shown in Figure
3.30. No cracks were found in the sides or
bottom of the specimen.
Corrosion Rating:
Specimen (1) (2) 4.4 yrs 8 yrs
Strand 43 780 Bars 12 44 Duct 325 3054
126
The crack extended the complete concrete cover depth, having a max
width at the strand cut line of 0.080 in.
The duct was severely corroded at the top, with maximum corrosion
occurring around the joint section and also at approximately 60 mm, on both
sides, from the joint location. Corrosion products accumulated in thin layers.
White powder was found in the duct, mixed with steel corrosion products, and
was observed specially in the half duct below. Underneath the duct, a black
stain of about 0.039 in.2 against the concrete surface was found, with moisture.
Within a few minutes, this black stain rapidly changed color to a lighter dark rust
color, after the duct was removed from the concrete and moisture was lost.
The most severe corrosion found in the duct corresponded to a large void
in the grout of about 0.40 in.2. The grout was covered with corrosion products
from the duct metal.
The strand had moderate to severe corrosion in the top areas, where the
epoxy paint had peeled off; and light corrosion in the exposed steel areas. On
the bottom of the strand, moderate to severe corrosion was found at the epoxy
paint areas, and very severe corrosion and pitting in the exposed steel area. The
strand corrosion rating was the highest when compared to the other specimens.
Discoloration and light to moderate corrosion was found in the reinforcing
bars, mainly underneath the epoxy paint, as shown in Figure 3.30. The epoxy
paint seemed to have retained moisture, forcing the paint to peel off and triggering
corrosion. Few small voids were found in the concrete surface underneath the
reinforcing bars.
The entire face of the dry joint was covered with a white residue that may
be salt or leaching.

127
Specimen condition prior to autopsy Duct (Top view)
Strand Mild Steel Bars
Figure 3.30 Concrete, Duct, Strand and Bar Condition for
Specimen DJ-S-M-NG-2
3.3.4.1.3 Specimen DJ-S-H-NG-2 (Dry Joint, Steel Duct, High Precompression, Normal Grout)
A 0.040 in. maximum width crack was
evident at the top of the specimen, with a length
of about 7 in., centered with respect to the joint
location as shown in Figure 3.31. At the bottom
of the specimen, there was another crack,
extending one half of the specimen, with a maximum crack width in the order of
0.080 in. No cracks were visible in the sides of the specimen.
Corrosion Rating:
Specimen (1) (2) 4.4 yrs 8 yrs
Strand 38 137 Bars 60 606 Duct 64 361

128
Severe uniform corrosion and pitting was found on the top and bottom of
the galvanized steel duct, around the joint. Additionally, a black stain with
moisture was found at approximately 2.35 in. from the joint in the top of the duct
in Segment B. One hole of around 0.17 in.2 was located in the duct at the joint
and a 0.09 in.2 hole was at approximately 1.2 in. from the joint, at the top of the
duct in Segment A, corresponding to the location of a void in the grout. White
stains (powder) and discoloration of the duct was evident in the bottom of the duct
in Segments A and B.
Specimen condition prior to autopsy Duct (Bottom view)
Strand Mild Steel Bars
Figure 3.31 Concrete, Duct, Strand and Bar Condition for
Specimen DJ-S-H-NG-2

129
Moderate to severe corrosion was found on the strand in Segment A, in the
areas where the epoxy had peeled off. Light to moderate corrosion was found on
the unpainted areas.
Mild steel was severely corroded, with extensive pitting and severe
volume decrease due to corrosion products, in Segment B. The bar corrosion
produced a crack in the concrete cover in the bottom of the specimen. Mild steel
in Segment A was only lightly corroded and discolored, especially in the areas
where the epoxy paint had peeled off. See Figure 3.31. The mild steel corrosion
rating was the highest when compared to the other specimens.
White dust covered the dry joint.
3.3.4.1.4 Specimen DJ-P-L-NG-2 (Dry Joint, Plastic Duct, Low Precompression, Normal Grout)
Corrosion in the reinforcing bars produced a
0.040 in. maximum width crack in Segment B, in
the bottom of the specimen as shown in Figure 3.32.
No cracks were found in the top or sides of the
specimen.
White dust, corresponding to leaching or salt, was found in the inside
surface of the concrete, at the duct/strand cut line, around the silicone holding the
grouting ducts to the plastic duct. Also white dust was found at the joint section
at the level of the plastic duct, where silicone was used to seal the duct joint.
A very deep void centered at 2 in. from the joint, in Segment A, was found
in the top of the grout. Also shallow voids were found in the top of the grout at
approximately 3 in. from the joint, in Segment B.
Light corrosion was found on the strand.
Corrosion Rating:
Specimen (1) (2)
4.4 yrs 8 yrs Strand 6 116 Bars 17 201 Duct 0 0

130
The mild steel had very severe corrosion and pitting in the exposed areas
in Segment B, at the top and bottom of the bars. Severe corrosion and pitting
was also observed in the same segment, in the areas where the epoxy paint had
peeled off. The build-up of corrosion products was severe, causing the concrete
cover to crack. At the adjoining segment, moderate corrosion was found at the
bars, close to the joint section.
The dry joint was intact, with a white residue in the entire joint.
Specimen condition prior to autopsy Specimen condition prior to autopsy (Top view) (Bottom view of Segment B)
Duct and grout condition Mild Steel Bars
Figure 3.32 Concrete, Duct, Strand and Bar Condition for Specimen DJ-P-L-NG-2

131
3.3.4.1.5 Specimen DJ-P-M-NG-2 (Dry Joint, Plastic Duct, Medium Precompression, Normal Grout)
Mild steel corrosion was responsible for a
0.020 in. maximum width crack at the bottom of
the specimen in Segment A as shown in Figure
3.33. No cracks were visible at the top and sides
of the specimen.
White residue was found in the inside
concrete surface, at the duct/strand cut line, between the silicone used at the joint
section and sides of the plastic duct and in the connection of the grouting duct and
the plastic duct.
The dry joint was clean, with no signs of crystals or corrosion stains;
however, little concrete discoloration was observed in the joint concrete surface in
the top of the duct/strand level.
The plastic duct was intact, with no signs of damage.
Minor discoloration was observed at the outer wires of the strand, in the
exposed surface area close to the joint section. The areas where the epoxy paint
had peeled off, at both sides of the strand in Segments A and B, had light
corrosion.
Moderate to severe corrosion was observed in the mild steel bars of
Segment A, in the exposed areas close to the joint section. Additionally, light to
moderate corrosion was found were the epoxy paint had peeled off. In
Segment B, light corrosion was found were the epoxy paint had peeled off, and no
corrosion was observed in the exposed steel areas, closer to the joint.
A few small voids (approx. 0.012 in.2) were found in the grout surface,
close to the joint section. Salt crystals were found inside the voids, in the interior
concrete surface.
Corrosion Rating:
Specimen (1) (2)
4.4 yrs 8 yrs Strand 9 80 Bars 24 77 Duct 0 0

132
Specimen condition prior to autopsy Duct (Bottom view, Segment A)
Strand Mild Steel Bars
Figure 3.33 Concrete, Duct, Strand and Bar Condition for
Specimen DJ-P-M-NG-2
3.3.4.1.6 Specimen DJ-S-L-CI-2 (Dry Joint, Plastic Duct, Low Precompression, Corrosion Inhibitor in Grout)
The top of the specimen had a 0.010 in. maximum width crack, extending
a length of 4.75 in., centered in the specimen as shown in Figure 3.34. No cracks
or signs of corrosion were observed in the sides or bottom of the specimen.

133
The galvanized steel duct had severe
corrosion on the top surface, close to the joint
section. The duct was consumed in
approximately 0.72 in.2 at the joint section and
had another hole in the top on Segment A,
within 0.75 in. to 2 in. from the dry joint. The
duct also showed areas with white stains or products in the bottom sections
against the concrete and in the top sections against the concrete around the
grouting duct locations.
Specimen condition prior to autopsy Duct (Top view)
Strand Mild Steel Bars
Figure 3.34 Concrete, Duct, Strand and Bar Condition for
Specimen DJ-S-L-CI-2
Corrosion Rating:
Specimen (1) (2)
4.4 yrs 8 yrs Strand 114 86 Bars 4 22 Duct 42 674

134
Duct corrosion produced a 0.010 in. crack in the concrete cover.
Some small 0.015-0.030 in.2 voids were observed in the top of the grout,
underneath the galvanized steel duct. Salt crystals were found inside of the voids.
Minor discoloration and light corrosion was observed at the prestressing
strand. Light corrosion was found on the exposed areas of the mild steel bars,
next to the joint section in Segment B and at 20 mm from the joint section on
Segment A. Light to moderate surface corrosion was observed were the epoxy
paint had peeled off. The dry joint was clean, except for white stains – salt
crystals or leaching – around the duct area.
3.3.4.1.7 Specimen DJ-S-M-CI-2 (Dry Joint, Plastic Duct, Medium Precompression, Corrosion Inhibitor in Grout)
A fine crack, 0.020 in. maximum width and
6 in. length, was visible in the top of the specimen,
centered with respect to the dry joint section, as
shown in Figure 3.35. No cracks or signs of
corrosion were found at the sides or the bottom of
the specimen.
At the duct/strand cut line, the concrete had several bubble holes under the
duct, but there were no corrosion products inside the holes.
Moderate to severe corrosion was found in the galvanized steel duct,
mixed with white deposits, corresponding to Zinc Oxide and Zinc Hydroxide, as
examined by X-Ray Diffraction. The duct in Segment B had a small hole of
approximately 0.030 in.2, corresponding to a void in grout. Corrosion action was
also responsible for a hole of an approximate area of 0.40 in.2 next to the joint
section. The white residue was present in the top of the duct around the areas
where the grouting vents were attached. At 0.6 in. from the joint in the bottom of
Corrosion Rating:
Specimen (1) (2)
4.4 yrs 8 yrs Strand 24 54 Bars 20 27 Duct 151 346

135
the duct in Segment B, there was a black spot of corrosion products with
moisture.
Condition prior to autopsy Duct (Top view)
Strand Mild Steel Bars
Figure 3.35 Concrete, Duct, Strand and Bar Condition for Specimen DJ-S-M-CI-2
The grout had large voids across the top and bottom, with salt crystals
deposited inside.
Discoloration was observed on the strand and corrosion was negligible.
The mild steel bars had moderate corrosion in the unpainted area of
Segment B. Discoloration was observed under the epoxy paint. In Segment A,
light to moderate corrosion was found in the unpainted area of the bars close to
the dry joint.

136
3.3.4.1.8 Specimen SE-S-L-NG-1 (Epoxy Joint, Steel Duct, Low Precompression, Normal Grout)
A hairline crack of about 3.5 in. in
length was located in the top of the specimen,
inside the ponded region, extending mainly in
Segment B as shown in Figure 3.36. No
cracks or corrosion stains were found in the
sides or bottom of the specimen.
The duct halves did not meet at the joint, leaving a gap of approximately
0.12 in.
Severe corrosion covered most of the top of the duct in Segment B, as
seen in Figure 3.36, and half the top of the duct in Segment A, extending from the
joint face. Corrosion in Segment B produced a horizontal crack in the duct of
approximately 1.5 in. that lead to another vertical crack of about 0.75 in. in length
with a hole of 0.015 in2. The bottom of the duct was covered mostly with a white
residue (white powder) with only a few areas of light to moderate corrosion near
the joint section.
A large void of an approximate length of 4 in. and width of 0.75 in. was
found in the top of the duct, extending 2.5 in. into Segment B and 1.5 in. into
Segment A. Another void of approximately 0.039 in.2 was found in the top of the
grout in Segment B, with duct corrosion products inside.
Corrosion Rating:
Specimen (2) (1)
4.4 yrs 8 yrs Strand 22 64 Bars 6 26 Duct 13 167

137
Specimen condition prior to autopsy Duct (Top view) [Side view in detail]
Strand Mild Steel Bars
Figure 3.36 Concrete, Duct, Strand and Bar Condition for Specimen SE-S-L-NG-1
Light to moderate corrosion was found on the strand in one of the outer
wires, where the epoxy paint had peeled off, at 3 in. from the joint. The other
outer wires had discoloration in the unpainted areas and light surface corrosion in
the areas were the epoxy paint had peeled off. The inner wire had light corrosion
in its entire length.

138
The mild steel bars showed discoloration in the unpainted areas and light
corrosion in the few areas where the epoxy paint had peeled off, as shown in
Figure 3.36.
3.3.4.1.9 Specimen SE-S-M-NG-1 (Epoxy Joint, Steel Duct, Medium Precompression, Normal Grout)
The top of the specimen had a crack
with an approximate maximum width of 0.016
in., extending a length of 6.3 in., centered with
the joint as shown in Figure 3.37. No cracks
were found on the sides or bottom of the
specimen.
The epoxy at the joint did not cover the entire face. There were small
holes in the epoxy in the top surface of the specimen. Epoxy bond on the lower
part of the bar cut line broke along the joint.
At the duct/strand cut line, severe corrosion was found on the top of the
galvanized steel duct, as shown on Figure 3.37. Corrosion produced several
small holes through the duct in Segment B. In Segment A, one large longitudinal
hole of about 0.55 in.2 was centered at approximately 23.6 in. from the joint.
White powder was impregnated to the duct metal in various locations, especially
in the bottom of the duct in Segment A and in the top of duct in Segments A and
B, around the grout vent locations, as shown in Figure 3.37.
Moderate to severe corrosion was found on one of the outer wires of the
strand of the unpainted section, in Segment B. The center wire has also
moderately corroded at the same place. Light to moderate corrosion was found on
the rest of the wires in that segment. Light corrosion and discoloration was
found under the epoxy paint.
Corrosion Rating:
Specimen (2) (1)
4.4 yrs 8 yrs Strand 2 119 Bars 16 41 Duct 61 732

139
Specimen condition prior to autopsy Duct (Top view)
Strand Mild Steel Bars
Figure 3.37 Concrete, Duct, Strand and Bar Condition for Specimen SE-S-M-NG-1
Large amounts of corrosion were found on one of the bars in Segment B,
under the epoxy paint, close to Face B. Severe corrosion was found on all areas
were the epoxy paint had peeled off, being more severe and concentrated than
seen on other specimens. Severe corrosion was found on the same bar, on
Segment B, starting where the epoxy coating ends, and extending approximately
0.6 in.

140
3.3.4.1.10 Specimen SE-S-H-NG-1 (Epoxy Joint, Steel Duct, High Precompression, Normal Grout)
The specimen had a hairline crack in the
top, with a length of 4.3 in., as seen in Figure
3.38. No cracks were found in the sides or
bottom of the specimen.
The top of the galvanized metal duct had
severe corrosion in two thirds of the total length of Segment B and one third of
the length in Segment A, extending from the joint section. The most severe
corrosion on both sides was found at approximately 2 in. from the joint.
Corrosion products in the duct were dark (black). Two holes, one of 0.18
in.2 and another of 0.016 in.2 were found centered at 2 in. from the joint in
Segment B. The voids did not correspond to a large deep void in the grout located
by the joint in the top of the grout in Segment A. White powder was found in the
metal duct around the grout vent locations and by the joint section in the top of
the duct in Segment A.
The strand had light corrosion in the areas were the epoxy paint had
peeled off. In the unpainted areas, the outer wires were only discolored. The
inner wire had light corrosion in its entire length.
Mild steel bars had discoloration in the unpainted areas and light corrosion
where the epoxy paint had peeled off.
Corrosion Rating:
Specimen (2) (1)
4.4 yrs 8 yrs Strand 3 88 Bars 0 29 Duct 8 268

141
Specimen condition prior to autopsy Duct (Top view)
Strand Mild Steel Bars
Figure 3.38 Concrete, Duct, Strand and Bar Condition for Specimen SE-S-H-NG-1
3.3.4.1.11 Specimen SE-P-L-NG-1 (Epoxy Joint, Plastic Duct, Low Precompression, Normal Grout)
No cracks were found in the top, sides
or bottom of the specimen.
The plastic duct was intact, with no
signs of damage.
The top of the hardened grout had a
large void in Segment A beginning 1 in. from
Corrosion Rating:
Specimen (2) (1)
4.4 yrs 8 yrs Strand 5 80 Bars 0 0 Duct 0 0

142
the joint section and extending 1.4 in. The void was clean without salt deposits.
In the Segment B side, the grout had a smaller void 0.8 in. from the joint
extending 0.8 in. vertically with an approximate width of 0.080 in. At the joint
location there was a small circular void of 0.20 in. in diameter. The grout was
smooth in the bottom surface.
Light corrosion was found at the sides of the strand, closer to Faces A and
B, suggesting that some water may have seeped from the ends. Around the joint
and under the ponded region the outer wires of the strand were in excellent
condition. The inner wire had light corrosion. Minor discoloration was found on
the areas where the epoxy had peeled off.
Specimen condition prior to autopsy Duct (Top view)
Strand Mild Steel Bars
Figure 3.39 Concrete, Duct, Strand and Bar Condition for Specimen SE-P-L-NG-1

143
No corrosion was found on the mild steel bars.
The epoxy segmental joint was intact around its perimeter, with no signs
of moisture, salt or rust penetration at the strand and bar cut lines.
3.3.4.1.12 Specimen SE-P-M-NG-1 (Epoxy Joint, Plastic Duct, Medium Precompression, Normal Grout)
No cracks were found on the top, sides
or bottom of the specimen as shown in Figure
3.40.
The plastic duct was intact, without any
signs of deterioration.
Several large voids were found on the
top surface of the grout. In most cases, the
voids were less than 0.16 in. deep. The voids
appear to have resulted from insufficient grout fluidity.
Discoloration and very light corrosion was found on the outer wires of the
prestressing strand in the unpainted area. The inner wire showed light corrosion.
In the areas with epoxy coating, the strand showed light corrosion, where the
paint had peeled off.
Light corrosion occurred in the mild steel bars under the epoxy coating.
No corrosion was found in the unpainted areas.
Corrosion Rating:
Specimen (2) (1)
4.4 yrs 8 yrs Strand 5 88 Bars 0 18 Duct 0 0

144
Specimen condition prior to autopsy Duct (Top view)
Strand Mild Steel Bars
Figure 3.40 Concrete, Duct, Strand and Bar Condition for Specimen SE-P-M-NG-1
3.3.4.1.13 Specimen SE-S-L-CI-1 (Epoxy Joint, Steel Duct, Low Precompression, Corrosion Inhibitor in Grout)
No cracks were found on the top, sides or
bottom of the specimen as shown in Figure 3.41.
Severe corrosion was found on the top of
the galvanized metal duct in Segment B,
extending half of the segment from the joint
section, and with the most severe corrosion at
Corrosion Rating:
Specimen (2) (1)
4.4 yrs 8 yrs Strand 24 95 Bars 0 28 Duct 85 126

145
1.75 in. from the joint. Also, moderate to severe corrosion was found on the top
of the metal duct in Segment A, centered at 1.75 in. from the joint, as shown in
Figure 3.41. White residue (powder) was found mixed with the dark corrosion
products. The bottom of the duct showed no signs of corrosion products either
in the form of dark or white residues.
Specimen condition prior to autopsy Duct (Top view)
Strand Mild Steel Bars
Figure 3.41 Concrete, Duct, Strand and Bar Condition for Specimen SE-S-L-CI-1
Eleven small voids were found on the top of the grout surface, one of
approximately 0.05 in.2 was deep enough to expose the strand. The voids appear
to have resulted from insufficient grout fluidity.

146
Corrosion in the strand was very light in the unpainted areas and light in
the areas where the epoxy paint had peeled off. The inner wire was more
corroded than the outer wires, having light to moderate corrosion in its entire
length.
3.3.4.1.14 Specimen SE-S-M-CI-1 (Epoxy Joint, Steel Duct, Medium Precompression, Corrosion Inhibitor in Grout)
The specimen had cracks in the top
with a maximum width of 0.040 in. and
extending a length of 7 in., centered in the
ponded region as shown in Figure 3.42. No
cracks were found in the sides and bottom
of the specimen.
The galvanized metal duct was severely corroded in its entirety. Holes
accounted for 2.85 in.2. The duct was practically consumed in the center section,
under the ponded region. The sides had severe corrosion.
The strand showed very severe corrosion in the uncoated areas, especially
on the bottom. Under the epoxy, the corrosion was severe and was worse in the
top of the strand. The center wire had moderate to severe corrosion in its entirety.
The mild steel bars had only discoloration in the uncoated areas and light
corrosion in the coated areas where the epoxy had peeled off.
The match-cast epoxy joint was incompletely filled in the top of the strand
cut line, allowing water to penetrate to the duct. The joint had corrosion stains
from the duct location up to the top of the specimen as shown in Figure 3.43.
Corrosion Rating:
Specimen (2) (1) 4.4 yrs 8 yrs Strand 2 308 Bars 0 29 Duct 114 2445

147
Specimen condition prior to autopsy Duct
(Top view) Strand Mild Steel Bars
Figure 3.42 Concrete, Duct, Strand and Bar Condition for Specimen SE-S-M-CI-1
Figure 3.43 Incompletely filled Epoxy Joint (SE-S-M-CI-1)

148
3.3.4.1.15 Specimen SE-S-H-CI-1 (Epoxy Joint, Steel Duct, High Precompression, Corrosion Inhibitor in Grout)
The bottom of the specimen had one
0.010 in. maximum width crack extending two
thirds of Segment B, from Face B, as shown in
Figure 3.44. No cracks were found on the top
and sides of the specimen.
After making the strand cut, the epoxy
segmental joint came apart easily.
At the duct cut line, severe corrosion was found on the top of the duct in
Segment A, centered at 1.75 in. from the joint section, as shown in Figure 3.44.
Moderate corrosion and a heavy accumulation of white residue was found on the
top of the duct, also centered at 1.75 in. from the epoxy segmental joint. No
corrosion was found in the bottom of the duct.
Severe corrosion and pitting, and severe section loss, was found in the
mild steel bars in Segment B, in the coated and uncoated areas. Light to
moderate corrosion was found in the mild steel bars in the Segment A.
Strand corrosion was light in the outer wires with epoxy coat. In the
uncoated areas, the wires showed only discoloration. The inner wire had light
corrosion in its entirety.
Corrosion Rating:
Specimen (2) (1)
4.4 yrs 8 yrs Strand 3 78 Bars 1 132 Duct 10 44

149
Specimen condition prior to autopsy Duct (Bottom view)
Strand Mild Steel Bars
Figure 3.44 Concrete, Duct, Strand and Bar Condition for Specimen SE-S-H-CI-1
3.3.4.1.16 Specimen SE-S-L-SF-1 (Epoxy Joint, Steel Duct, Low Precompression, Silica Fume added to Grout)
The concrete specimen had a crack in the top, with an approximately
maximum width of 0.02 in. No cracks were visible in the sides or bottom of the
specimen as shown in Figure 3.45.

150
The epoxy segmental joint separated
easily after unloading the specimen, indicating
lack of adequate bonding with the concrete
surface. However, corrosion stains were found
on the surface.
Severe corrosion was found in the top of
the duct, between the location of the grout vents. The most severe corrosion was
centered at 1.75 in. from the epoxy joint towards Face B. Centered at this
location, a large hole of approximately 0.62 in.2 was found. Another small hole
of approximately 0.0023 in.2 was found in Segment A next to the joint section and
another of similar size at 1.20 in. from the joint. Moderate to light corrosion,
mixed with white residue, was found in the bottom of the duct, mainly in Segment
B, and centered at 1.20 in. from the joint.
The concrete surface against the bottom of the galvanized metal duct had
several small round shallow voids.
The grout had a very porous structure, with many micro voids.
The strand had discoloration in the uncoated areas and light corrosion in
the outer epoxy coated wires. The inner wire had light corrosion with a small area
of moderate corrosion.
No corrosion was found on the mild steel bars in the uncoated areas.
Discoloration and light corrosion was found in few areas where the epoxy coating
had peeled off.
Corrosion Rating:
Specimen (2) (1)
4.4 yrs 8 yrs Strand 3 88 Bars 1 13 Duct 10 591

151
Specimen condition prior to autopsy Duct (Top view)
Strand Mild Steel Bars
Figure 3.45 Concrete, Duct, Strand and Bar Condition for Specimen SE-S-L-SF-1
3.3.4.1.17 Specimen EG-S-L-NG-1 (Epoxy Joint with Gasket, Steel Duct, Low Precompression, Normal Grout)
Corrosion in the galvanized metal
duct produced a 0.020 in. maximum
width longitudinal crack in the top of the
specimen, 5.5 in. in length, and two
additional hairline cracks of 1.2 in. and 2
Corrosion Rating:
Specimen (2) (1) 4.4 yrs 8 yrs Strand 2 88 Bars 0 25 Duct 54 1096

152
in. respectively in the top of Segment B at the border of the ponded region and
extending to the sides, as shown in Figure 3.46. No cracks were found in the
sides or bottom of the specimen.
Specimen condition prior to autopsy Duct
(Top view)
Strand Mild Steel Bars
Figure 3.46 Concrete, Duct, Strand and Bar Condition for Specimen EG-S-L-NG-1
The epoxy segmental joint was intact with no signs of moisture, salt or
rust penetration. Examination of three sections through the joint showed it to be
completely filled with epoxy and free from voids or cracks.
Severe corrosion was found in the top and bottom of the duct in segment
B, and in half of the length in the top of the duct in Segment A, starting from the
joint section. The heaviest corrosion was found at 1.75 in. from the joint in

153
Segment B and at 1.40 in. from the joint in Segment A, corresponding to the holes
found on each side of 1.33 in2 and 0.030 in.2, respectively. The corrosion
products included black spots with moisture. No voids were found on the grout.
The outer wires of the strand had discoloration in the uncoated areas and
light corrosion in those areas where the epoxy coating had peeled off. The inner
wire had light corrosion in its entirety. Inside the duct, the strand was positioned
at the bottom on Segment B and on the side on Segment A.
Discoloration was found on the mild steel bars in the unpainted area, and
discoloration and light corrosion were the epoxy had peeled off. There was a
small area of approximately 0.12 in.2 with moderate corrosion in the vicinity of
Face B.
3.3.4.1.18 Specimen EG-S-M-NG-1 (Epoxy Joint with Gasket, Steel Duct, Medium Precompression, Normal Grout)
A 0.010 in. maximum width crack was at
the top of the concrete specimen, extending 3 in.
from the epoxy segmental joint towards face A as
shown in Figure 3.48. No cracks or corrosion
signs were found on the sides or bottom of the
specimen.
The top portion of the specimen above the strand cut line separated at the
joint during autopsy. The gasket appears to have prevented complete bonding of
the segments. Around the gasket there were signs of moisture, salt and rust stains.
The incomplete epoxy coverage is shown in Figure 3.47.
Severe corrosion was found on the top of the duct, mainly in Segment A,
as shown in Figure 3.48. The corrosion products were black, dark green and
typical dark orange, mixed with white residue. The most severe corrosion was
Corrosion Rating:
Specimen (2) (1)
4.4 yrs 8 yrs Strand 23 90 Bars 0 31 Duct 237 198

154
centered at 1.6 in. from the joint towards Face A. Centered at this point there
were three small holes of 0.040 in.2 each in the duct. Corrosion products were in
the form of flakes or very thin layers.
Figure 3.47 Incomplete Epoxy Coverage in Epoxy/Gasket Joint (EG-S-M-NG-1)
Specimen condition prior to autopsy Duct (Top view)
Strand Mild Steel Bars
Figure 3.48 Concrete, Duct, Strand and Bar Condition for Specimen EG-S-M-NG-1

155
Discoloration was found on the outer wires of the strand, in the unpainted
(uncoated) region. Light corrosion was found on the areas where the epoxy had
peeled off. The inner wire had light corrosion.
Mild steel bars had minor discoloration under the ponded region (uncoated
areas) and light corrosion in those areas where the epoxy coating had peeled off.
3.3.4.1.19 Specimen EG-S-H-NG-1 (Epoxy Join with Gasket, Steel Duct, High Precompression, Normal Grout)
No cracks were found on the top, sides or
bottom of the specimen as shown in Figure 3.50.
Similar to specimen EG-S-M-NG-1, the
side and bottom perimeter of the joint were intact
and appeared to be filled with epoxy, but thin
voids were visible at the joint on the top surface of
the specimen. Sections through the joint at the mid-height and bar and strand cut
lines showed it to be completely filled with epoxy and free from voids or cracks.
However, the gasket again appears to have prevented complete bonding of the
segments immediately above the duct opening. Salt penetration and rust stains
were visible on the joint as shown in Figure 3.49. Similar results were obtained
during autopsy performed at four and a half years of exposure, to the duplicate
specimens EG-S-M-NG-2 and EG-S-H-NG-23.8.
The top of the duct had severe corrosion in Segments A and B, centered in
each side at 1.60 in. from the epoxy joint with gasket, as shown in Figure 3.50.
Holes in Segment A had 0.016 mm2, same as the holes in Segment B.
Corrosion products were very dark in color and there was one dark green spot
close to the hole in Segment B. The duct bottom had light to moderate corrosion
Corrosion Rating:
Specimen (2) (1)
4.4 yrs 8 yrs Strand 16 84 Bars 1 34 Duct 78 131

156
extending a few millimeters from the joint section at each side, as seen in Figure
3.50. White residue was present around all the corroded areas.
Figure 3.49 Incomplete Epoxy Coverage in Epoxy/Gasket Joint (EG-S-H-NG-1)
Specimen condition prior to autopsy Duct (Top view)
Strand Mild Steel Bars
Figure 3.50 Concrete, Duct, Strand and Bar Condition for Specimen EG-S-H-NG-1

157
The strand had only discoloration in the unpainted section – for the outer
and inner wires-, and light corrosion where the epoxy coating had peeled off.
Mild steel bars had discoloration and light corrosion in the unpainted areas
and light corrosion where the epoxy coating had peeled off.
3.3.4.2 Corrosion Rating Summary
Strand, bar and duct corrosion ratings for all specimens are listed in Tables
3.17 and 3.18, and plotted in Figure 3.51 through Figure 3.53. Results from the
autopsy performed at four and a half years of testing are included as a reference.
Average, standard deviation and median values are listed at the bottom of the
tables.
In order to put the corrosion ratings in perspective, a “Threshold of
Concern” was assigned at the corrosion rating of 50 for the strands, bars and
ducts. This threshold is used to indicate corrosion related deterioration deemed
severe enough to warrant concern. In general, corrosion ratings greater than 50
corresponded to pitting corrosion for strands and bars, and holes in the galvanized
steel duct caused by corrosion.
After four years and five months of exposure (Table 3.16), Specimen DJ-
S-L-CI-1 had the most severe strand corrosion, with a strand corrosion rating of
114 compared to the average of 19.5 and median of 12. This was the only
specimen with a strand corrosion rating greater than 50. Specimen DJ-S-H-NG-1
had the most severe mild steel reinforcement corrosion with a rating of 60
compared to the average of 9.1 and median of 1. This specimen was the only one
with a bar corrosion rating greater than 50. Specimen DJ-S-L-NG-1 had the worst
duct corrosion with a rating of 528 compared to the average of 122.9 and median
of 79. In each case, the specimen with the largest corrosion rating was several
times higher than the average and median values.

158
After eight years of aggressive exposure (Table 3.17), specimen DJ-S-M-
NG-2 had the most severe strand corrosion with a corrosion rating of 780,
followed by Specimen DJ-S-L-NG-2 with a corrosion rating of 612, both
compared to the average of 164.8 and the median of 88. All specimens had strand
corrosion ratings higher than the value of 50 that was chosen as the threshold of
concern. Specimen SE-S-M-CI-1, in spite of being an epoxy jointed specimen,
had high duct, strand and mild steel corrosion ratings of 305, 132 and 2445,
respectively, when compared to the median values of 88, 29 and 268. Autopsy
results for this specimen showed inadequate epoxy filling at the joint.
Table 3.16 Corrosion Ratings for Specimens Autopsied after 4.4 Years
of Exposure3.8
Specimen Name Strand Corrosion Rating
Bars Duct
DJ-S-L-NG-1 26 12 528 DJ-S-M-NG-1 43 12 325 DJ-S-H-NG-1 38 60 64 DJ-P-L-NG-1 6 17 0 DJ-P-M-NG-1 9 24 0 DJ-S-L-CI-1 114 4 42 DJ-S-M-CI-1 24 20 151 SE-S-L-NG-2 13 6 22 SE-S-M-NG-2 2 16 61 SE-S-H-NG-2 3 0 8 SE-P-L-NG-2 5 0 0 SE-P-M-NG-2 6 0 0 SE-S-L-CI-2 24 0 85 SE-S-M-CI-2 2 0 114 SE-S-H-CI-2 3 1 10 SE-S-L-SF-2 12 0 12 EG-S-L-NG-2 2 0 54 EG-S-M-NG-2 23 0 237 EG-S-H-NG-2 16 1 78
Average 19.5 9.1 94.3 Std. Dev. 25.3 14.3 132.6 Median 12 1 54

159
Specimen DJ-S-H-NG-2 had the most severe mild steel corrosion, with a
corrosion rating of 606, followed by specimen DJ-P-L-NG-2, with a corrosion
rating of 201. The average value and median values for mild steel corrosion were
75.6 and 29, respectively. Fourteen specimens out of the nineteen specimens had
negligible bar corrosion, below the value of 50. Specimen DJ-S-L-NG-2 had the
worst duct corrosion, with a corrosion rating of 15779 compared to the average
value of 1369.1 and the median of 268. This specimen was followed by
specimens DJ-S-M-NG-2 and SE-S-M-CI-1, with duct corrosion ratings of 3054
and 2445 respectively. These values show that duct corrosion was extremely
severe in a number of specimens, which is in agreement with the extremely large
destruction of galvanized duct observed during the autopsy process and reported
in Section 3.3.4.
Table 3.17 Corrosion Ratings for Specimens Autopsied after 8 Years of Exposure
Specimen Name Strand Corrosion Rating
Bars Duct
DJ-S-L-NG-2 612 54 15,779 DJ-S-M-NG-2 780 44 3,054 DJ-S-H-NG-2 137 606 361 DJ-P-L-NG-2 116 201 0 DJ-P-M-NG-2 80 77 0 DJ-S-L-CI-2 86 22 674 DJ-S-M-CI-2 54 27 346 SE-S-L-NG-1 64 26 167 SE-S-M-NG-1 119 41 732 SE-S-H-NG-1 88 29 268 SE-P-L-NG-1 80 0 0 SE-P-M-NG-1 88 18 0 SE-S-L-CI-1 95 28 126 SE-S-M-CI-1 305 29 2,445 SE-S-H-CI-1 78 132 44 SE-S-L-SF-1 88 13 591 EG-S-L-NG-1 88 25 1,096 EG-S-M-NG-1 90 31 198 EG-S-H-NG-1 84 34 131
Average 164.8 75.6 1369.1 Std. Dev. 196.4 136.7 3587.3 Median 88 29 268

160
Figure 3.51 Strand Corrosion Ratings for All Specimens
Figure 3.52 Mild Steel Bar Corrosion Ratings for All Specimens
61
2
78
0
13
7
11
6
80 86 1
19
88
80 88
30
5
78 88
88
26 38
6 9 24
13
2 3 5 6 24
2 3 12
2 23
16
64 8
4
90
54 9
5
43
11
4
0
200
400
600
800
1000
DJ-
S-L
-NG
DJ-
S-M
-NG
DJ-
S-H
-NG
DJ-
P-L
-NG
DJ-
P-M
-NG
DJ-
S-L
-CI
DJ-
S-M
-CI
SE
-S-L
-NG
SE
-S-M
-NG
SE
-S-H
-NG
SE
-P-L
-NG
SE
-P-M
-NG
SE
-S-L
-CI
SE
-S-M
-CI
SE
-S-H
-CI
SE
-S-L
-SF
EG
-S-L
-NG
EG
-S-M
-NG
EG
-S-H
-NG
Co
rro
sio
n R
ati
ng Strand (8 years)
Strand (4.4 years)
Threshold ofConcernRating = 50
Dry Joints Epoxy Joints Epoxy & Gasket
54
44
60
6
20
1
77
22 26 41
29
0
18 28 29
13
2
13 25 31 34
12
12
60
17
4 20
6 0 0 0 0 1 1
27
24
0 000
16
0
100
200
300
400
500
600
700
DJ
-S-L
-NG
DJ
-S-M
-NG
DJ
-S-H
-NG
DJ
-P-L
-NG
DJ
-P-M
-NG
DJ
-S-L
-CI
DJ
-S-M
-CI
SE
-S-L
-NG
SE
-S-M
-NG
SE
-S-H
-NG
SE
-P-L
-NG
SE
-P-M
-NG
SE
-S-L
-CI
SE
-S-M
-CI
SE
-S-H
-CI
SE
-S-L
-SF
EG
-S-L
-NG
EG
-S-M
-NG
EG
-S-H
-NG
Co
rro
sio
n R
ati
ng
Bar (8 years)
Bar (4.4 years)
Threshold ofConcernRating = 50
Dry Joints Epoxy Joints Epoxy & Gasket

161
Figure 3.53 Duct Corrosion Ratings for All Specimens
3.3.4.3 Chloride Analysis
Concrete powder samples were collected from six dry joint specimens and
four epoxy joint specimens for chloride analysis, following the procedure
described in Section 3.3.1.2. In addition, samples were collected from the grout
in these specimens for chloride analysis. Concrete chloride ion profiles for these
10 specimens are shown in Figure 3.54 through Figure 3.63. Values plotted in the
figures are acid soluble chloride levels, expressed as a percentage of concrete
weight. The chloride threshold for corrosion is indicated in the figures at 0.033%.
This value, intended as a guide only, is based on the widely accepted chloride
threshold value of 0.2% of the weight of cement.3.18 The same data has been
rearranged in Figure 3.64 through Figure 3.67, to better compare the specimen
chloride levels at the same depths. Data for specimen DJ-S-L-NG-2, at 0.5 in.
15,7
79
3,05
4
0 0
674
732
268
0 0
2,44
5
591 1,
096
198
13152
8
325
64 0 0 151
22 8 0 0 54
44126
167
346
361
78
237
12
10
114
8561420
2000
4000
6000
8000
10000
12000
14000
16000
18000
DJ
-S-L
-NG
DJ
-S-M
-NG
DJ
-S-H
-NG
DJ
-P-L
-NG
DJ
-P-M
-NG
DJ
-S-L
-CI
DJ
-S-M
-CI
SE
-S-L
-NG
SE
-S-M
-NG
SE
-S-H
-NG
SE
-P-L
-NG
SE
-P-M
-NG
SE
-S-L
-CI
SE
-S-M
-CI
SE
-S-H
-CI
SE
-S-L
-SF
EG
-S-L
-NG
EG
-S-M
-NG
EG
-S-H
-NG
Co
rro
sio
n R
ati
ng
Duct (8 years)
Duct (4.4 years)Threshold of ConcernRating = 50
Dry Joints Epoxy Joints Epoxy & Gasket

162
from the joint, is not shown in the above mentioned figures, since the advanced
cracking in the specimen did not allowed for the extraction of representative
samples at the various depths.
Chloride Content analysis shows that in general under the area where the
ponded region was located, there is a significant decrease in the level of chlorides
with increasing depths, being more considerable in all four epoxy joint specimens
analyzed, including the epoxy joint specimen with gasket.
Dry joint specimens showed significantly higher chloride contents
adjacent to the joint in comparison to measurements away from the joint. This
trend was also observed in the epoxy joint specimens but at a much lower scale,
especially at higher depths.
Dry Joint specimens in the proximity of the joint showed chloride contents
well above the corrosion threshold, over the depth of the specimen. At 2 in. from
the joint, also under the ponded region, these specimens showed very high
chloride contents, except for specimen DJ-S-L-CI-2 that showed low contents
below the level of 3 in. At 4.25 in. from the joint, away from the ponded region,
the dry joint specimen DJ-S-L-NG-2, showed very high corrosion levels at all
depths.
Epoxy joint specimens showed a different pattern with respect to dry joint
specimens. Under the ponded region these specimens showed very high chloride
levels above the strand level, but below this depth, chloride levels were below the
threshold value. Away from the joint, at 4.25 in., the chloride levels were
negligible in specimen SE-S-L-NG-1, at all four depths analyzed.
The epoxy joint specimen with gasket, EG-S-L-NG-1, showed a very
similar pattern in the proximity of the joint, as those epoxy joint specimens
without gasket. However, at 2 in. away from the joint this specimen still showed

163
high chloride contents at a depth of 3 in., although below this depth the chloride
content decreased considerably.
In general, no distinct trend was observed in all specimens with respect to
different levels of precompression.
The chloride profile for specimens DJ-S-H-NG-2, DJ-P-L-NG-2, DJ-S-M-
CI-2, and SE-S-H-NG-1 exhibit a discontinuity in the measurements at 2 in.
away from the joint, as shown in Figures 3.55 through 3.57, 3.59 and 3.62.
Chloride measurements decrease at mid-height of the specimen, and increase at
the level of the mild steel bars. This discontinuity is also observed in specimen
DJ-S-L-CI-2 adjacent to the joint, as shown in Figure 3.62. After careful analysis
of the possible reasons for this behavior, it was found that saltwater leakage from
the ponded area ran down the exterior of the specimens to the bottom where it
must have entered the concrete. For the epoxy joint specimen, the top surface and
sides are sealed with epoxy according to ASTM G1093.5 requirements, while the
bottom is not. This mechanism is common in bridges, and the epoxy sealant on
the top and sides would amplify the effect leading to increased chloride levels
near the bottom surface. In dry joint specimens, the saltwater also penetrates the
joint and deposits in the bottom area.

164
Figure 3.54 Concrete Chloride Ion Profiles for Specimen DJ-S-l-NG-2
Figure 3.55 Concrete Chloride Ion Profiles for Specimen DJ-S-M-NG-2
0
1
2
3
4
5
6
0.00 0.05 0.10 0.15 0.20 0.25 0.30 0.35 0.40
Acid Soluble Chloride Content(% by weight of concrete)
0.5 in. from joint
2 in. from joint
Chloride threshold for corrosion(TxDOT Class Cconcrete
Level of bars
Level of strand
0
1
2
3
4
5
6
0.00 0.05 0.10 0.15 0.20 0.25 0.30 0.35 0.40
Acid Soluble Chloride Content(% by weight of concrete)
2 in. from joint
4.25 in. from joint
Chloride threshold for corrosion(TxDOT Class Cconcrete
Level of bars
Level of strand

165
Figure 3.56 Concrete Chloride Ion Profiles for Specimen DJ-S-H-NG-2
Figure 3.57 Concrete Chloride Ion Profiles for Specimen DJ-P-L-NG-2
0
1
2
3
4
5
6
0.00 0.05 0.10 0.15 0.20 0.25 0.30 0.35 0.40
Acid Soluble Chloride Content(% by weight of concrete)
0.5 in. from joint
2 in. from joint
Chloride threshold for corrosion(TxDOT Class Cconcrete
Level of bars
Level of strand
0
1
2
3
4
5
6
0.00 0.05 0.10 0.15 0.20 0.25 0.30 0.35 0.40
Acid Soluble Chloride Content(% by weight of concrete)
0.5 in. from joint
2 in. from joint
Chloride threshold for corrosion(TxDOT Class Cconcrete
Level of bars
Level of strand
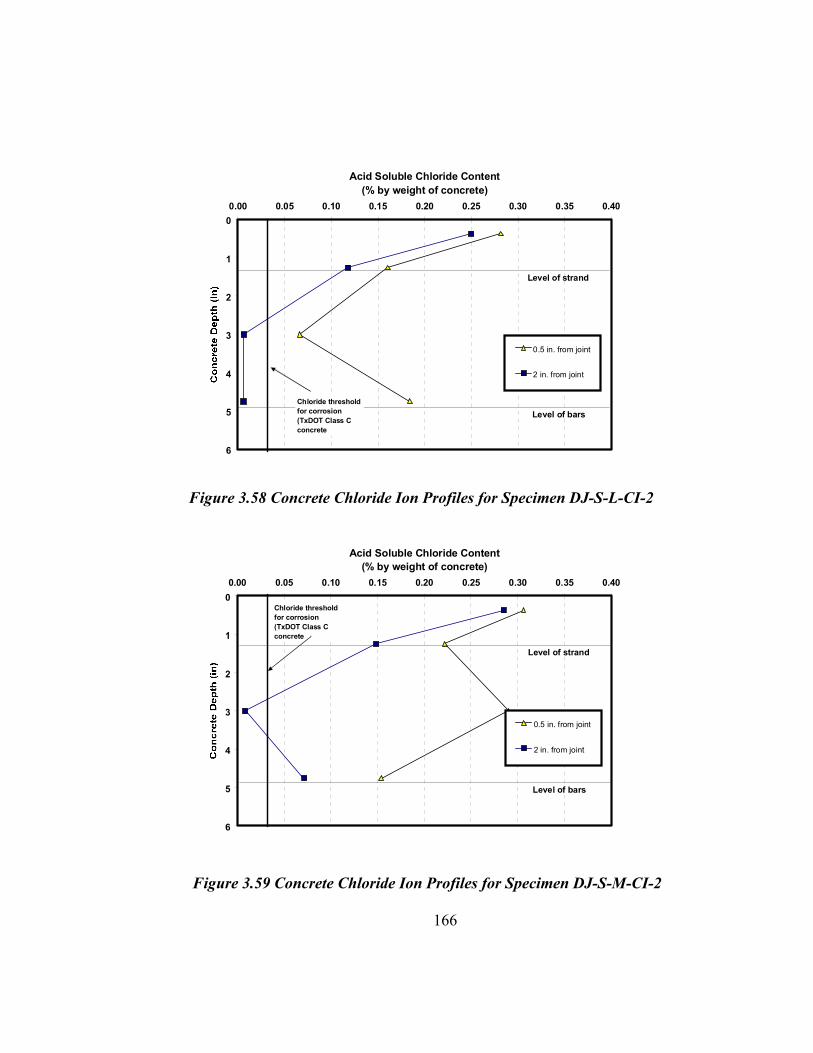
166
Figure 3.58 Concrete Chloride Ion Profiles for Specimen DJ-S-L-CI-2
Figure 3.59 Concrete Chloride Ion Profiles for Specimen DJ-S-M-CI-2
0
1
2
3
4
5
6
0.00 0.05 0.10 0.15 0.20 0.25 0.30 0.35 0.40
Acid Soluble Chloride Content(% by weight of concrete)
0.5 in. from joint
2 in. from joint
Chloride threshold for corrosion(TxDOT Class Cconcrete
Level of bars
Level of strand
0
1
2
3
4
5
6
0.00 0.05 0.10 0.15 0.20 0.25 0.30 0.35 0.40
Acid Soluble Chloride Content(% by weight of concrete)
0.5 in. from joint
2 in. from joint
Chloride threshold for corrosion(TxDOT Class Cconcrete
Level of bars
Level of strand
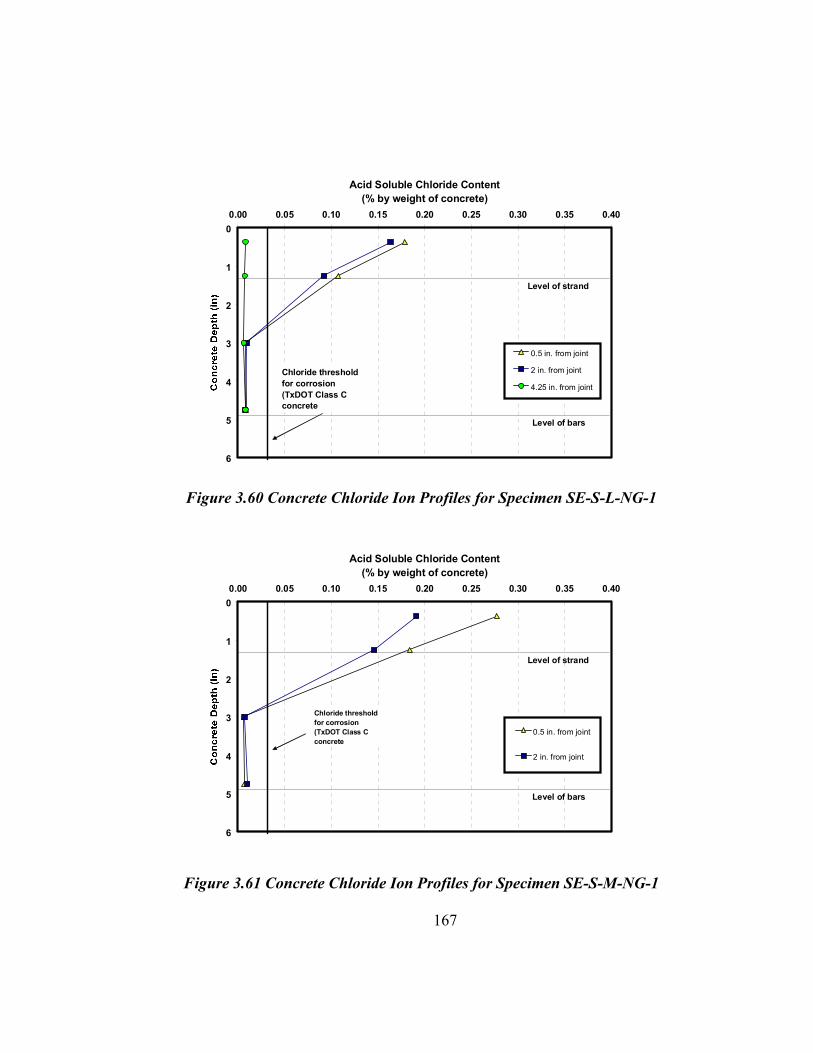
167
Figure 3.60 Concrete Chloride Ion Profiles for Specimen SE-S-L-NG-1
Figure 3.61 Concrete Chloride Ion Profiles for Specimen SE-S-M-NG-1
0
1
2
3
4
5
6
0.00 0.05 0.10 0.15 0.20 0.25 0.30 0.35 0.40
Acid Soluble Chloride Content(% by weight of concrete)
0.5 in. from joint
2 in. from joint
4.25 in. from joint
Chloride threshold for corrosion(TxDOT Class Cconcrete
Level of bars
Level of strand
0
1
2
3
4
5
6
0.00 0.05 0.10 0.15 0.20 0.25 0.30 0.35 0.40
Acid Soluble Chloride Content(% by weight of concrete)
0.5 in. from joint
2 in. from joint
Chloride threshold for corrosion(TxDOT Class Cconcrete
Level of bars
Level of strand

168
Figure 3.62 Concrete Chloride Ion Profiles for Specimen SE-S-H-NG-1
Figure 3.63 Concrete Chloride Ion Profiles for Specimen EG-S-L-NG-1
0
1
2
3
4
5
6
0.00 0.05 0.10 0.15 0.20 0.25 0.30 0.35 0.40
Acid Soluble Chloride Content(% by weight of concrete)
0.5 in. from joint
2 in. from joint
Chloride threshold for corrosion(TxDOT Class Cconcrete
Level of bars
Level of strand
0
1
2
3
4
5
6
0.00 0.05 0.10 0.15 0.20 0.25 0.30 0.35 0.40
Acid Soluble Chloride Content(% by weight of concrete)
0.5 in. from joint
2 in. from joint
Chloride threshold for corrosion(TxDOT Class Cconcrete
Level of bars
Level of strand
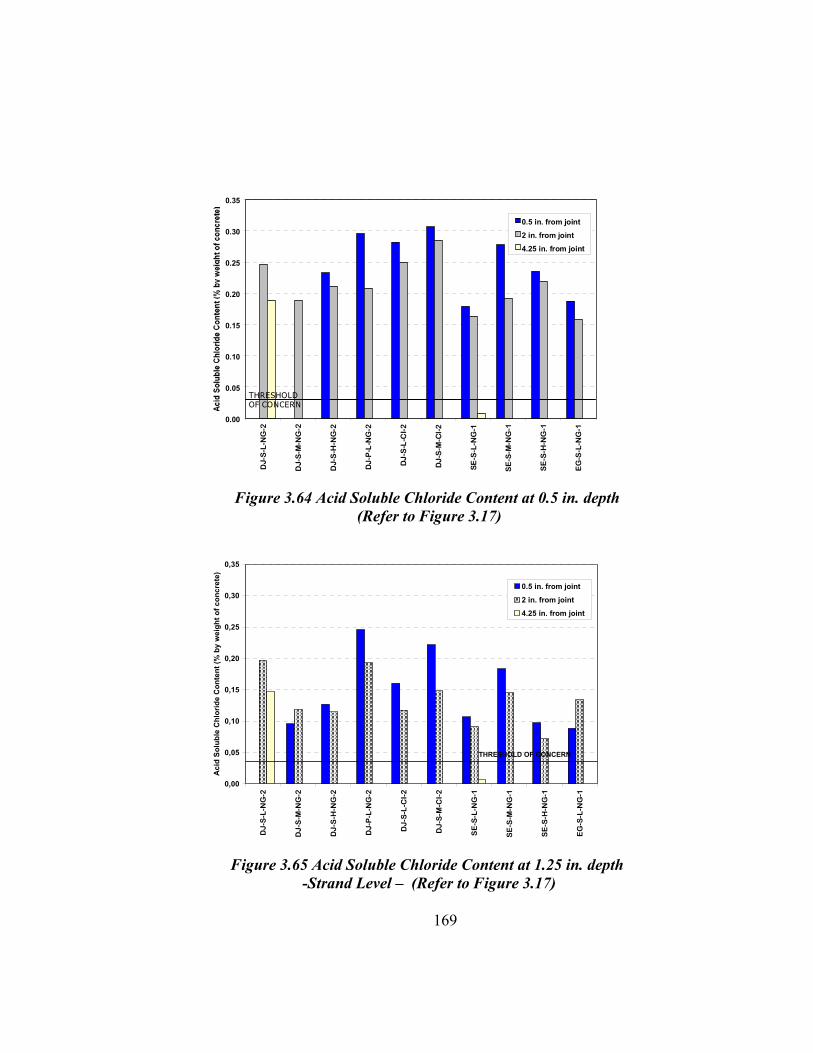
169
Figure 3.64 Acid Soluble Chloride Content at 0.5 in. depth (Refer to Figure 3.17)
Figure 3.65 Acid Soluble Chloride Content at 1.25 in. depth -Strand Level – (Refer to Figure 3.17)
0.00
0.05
0.10
0.15
0.20
0.25
0.30
0.35
DJ-
S-L
-NG
-2
DJ-
S-M
-NG
-2
DJ-
S-H
-NG
-2
DJ
-P-L
-NG
-2
DJ
-S-L
-CI-
2
DJ
-S-M
-CI-
2
SE
-S-L
-NG
-1
SE
-S-M
-NG
-1
SE
-S-H
-NG
-1
EG
-S-L
-NG
-1
0.5 in. from joint
2 in. from joint
4.25 in. from joint
THRESHOLD OF CONCERN
0,00
0,05
0,10
0,15
0,20
0,25
0,30
0,35
DJ-
S-L
-NG
-2
DJ-
S-M
-NG
-2
DJ
-S-H
-NG
-2
DJ-
P-L
-NG
-2
DJ-
S-L
-CI-
2
DJ-
S-M
-CI-
2
SE
-S-L
-NG
-1
SE
-S-M
-NG
-1
SE
-S-H
-NG
-1
EG
-S-L
-NG
-1
Aci
d So
lubl
e C
hlor
ide
Con
tent
(% b
y w
eigh
t of c
oncr
ete)
0.5 in. from joint
2 in. from joint
4.25 in. from joint
THRESHOLD OF CONCERN

170
Figure 3.66 Acid Soluble Chloride Content at 3 in. depth (Refer to Figure 3.17)
Figure 3.67 Acid Soluble Chloride Content at 4.75 in. depth - Bar Level – (Refer to Figure 3.17)
0.00
0.05
0.10
0.15
0.20
0.25
0.30
0.35
DJ-
S-L
-NG
-2
DJ-
S-M
-NG
-2
DJ-
S-H
-NG
-2
DJ
-P-L
-NG
-2
DJ
-S-L
-CI-
2
DJ
-S-M
-CI-
2
SE
-S-L
-NG
-1
SE
-S-M
-NG
-1
SE
-S-H
-NG
-1
EG
-S-L
-NG
-1
0.5 in. from joint
2 in. from joint
4.25 in. from joint
THRESHOLD OF CONCERN
0,00
0,05
0,10
0,15
0,20
0,25
0,30
0,35
DJ-
S-L
-NG
-2
DJ-
S-M
-NG
-2
DJ-
S-H
-NG
-2
DJ-
P-L
-NG
-2
DJ-
S-L
-CI-
2
DJ-
S-M
-CI-
2
SE
-S-L
-NG
-1
SE
-S-M
-NG
-1
SE
-S-H
-NG
-1
EG
-S-L
-NG
-1
Aci
d So
lubl
e C
hlor
ide
Con
tent
(% b
y w
eigh
t of c
oncr
ete)
0.5 in. from joint
2 in. from joint
4.25 in. from joint
THRESHOLD OF CONCERN
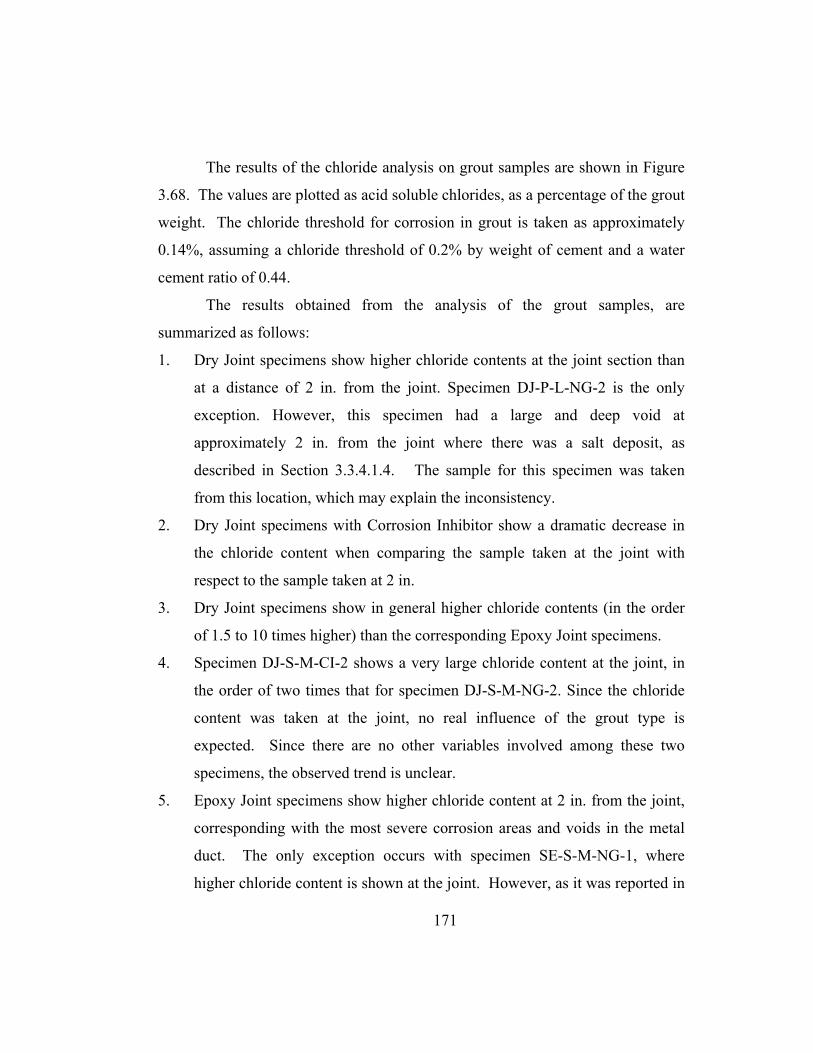
171
The results of the chloride analysis on grout samples are shown in Figure
3.68. The values are plotted as acid soluble chlorides, as a percentage of the grout
weight. The chloride threshold for corrosion in grout is taken as approximately
0.14%, assuming a chloride threshold of 0.2% by weight of cement and a water
cement ratio of 0.44.
The results obtained from the analysis of the grout samples, are
summarized as follows:
1. Dry Joint specimens show higher chloride contents at the joint section than
at a distance of 2 in. from the joint. Specimen DJ-P-L-NG-2 is the only
exception. However, this specimen had a large and deep void at
approximately 2 in. from the joint where there was a salt deposit, as
described in Section 3.3.4.1.4. The sample for this specimen was taken
from this location, which may explain the inconsistency.
2. Dry Joint specimens with Corrosion Inhibitor show a dramatic decrease in
the chloride content when comparing the sample taken at the joint with
respect to the sample taken at 2 in.
3. Dry Joint specimens show in general higher chloride contents (in the order
of 1.5 to 10 times higher) than the corresponding Epoxy Joint specimens.
4. Specimen DJ-S-M-CI-2 shows a very large chloride content at the joint, in
the order of two times that for specimen DJ-S-M-NG-2. Since the chloride
content was taken at the joint, no real influence of the grout type is
expected. Since there are no other variables involved among these two
specimens, the observed trend is unclear.
5. Epoxy Joint specimens show higher chloride content at 2 in. from the joint,
corresponding with the most severe corrosion areas and voids in the metal
duct. The only exception occurs with specimen SE-S-M-NG-1, where
higher chloride content is shown at the joint. However, as it was reported in

172
Section 3.3.4.1.9, the epoxy in this specimen did not cover the entire face of
the joint, leaving small gaps, which may have allowed saltwater to penetrate
the joint.
6. Dry joint specimens with Steel Duct, and Normal Grout, show a distinct
trend with respect to the level of precompression, having less chloride
content with higher levels of precompression. The same trend is observed
with Epoxy Joint specimens with Steel Duct, Normal Grout and Low and
High Levels of Precompression. The only two exceptions are, specimen DJ-
S-M-CI-2, which has higher chloride content than specimen DJ-S-L-CI-2;
and, specimen SE-S-M-NG-1, which has higher chloride content than the
other Epoxy Joint specimens. The last case is explained following the
same reasoning as in 5. above.
Figure 3.68 Measured Chloride Contents in Post-tensioning Grout after about Eight Years of Exposure
Acid Soluble Chloride Content(% by weight of grout)
0.0 0.1 0.2 0.3 0.4 0.5 0.6 0.7
DJ-S-L-NG-2
DJ-S-M-NG-2
DJ-S-H-NG-2
DJ-P-L-NG-2
DJ-S-L-CI-2
DJ-S-M-CI-2
SE-S-L-NG-1
SE-S-M-NG-1
SE-S-H-NG-1
EG-S-L-NG-1
At jointAt 50 mm from joint
Corrosion Threshold 0.14%

173
3.4 ANALYSIS AND DISCUSSION OF RESULTS
After two forensic examinations, at four and a half years and at eight years
of very aggressive exposure, the effect of all variables involved in this testing
program can be analyzed and compared. Findings and conclusions after the
autopsy at four and a half years were described in detail in Reference 3.8. This
chapter includes the results after eight years of exposure, comparing them to
results from the first forensic examination when appropriate.
3.4.1 Overall Performance
The use of a specimen based on ASTM G1093.5 in this testing program,
modified to examine prestressing tendons in grouted ducts and to simulate
segmental ducts, was found to be an excellent method for analyzing relative
specimen performance and for evaluating the adequacy of corrosion protection
variables. After eight years of aggressive exposure all specimens have shown
strand and mild steel corrosion. The galvanized steel ducts were severely
damaged.
The relative performance of the specimens in this testing program was
studied by looking at the corrosion ratings for the prestressing strands, ordered
from lowest to highest. Figure 3.69 shows the results at four and a half years and
at eight years of exposure. As can be observed, important changes have occurred
between the two autopsy dates. Major of these is the dramatic increase in strand
corrosion between the two dates.
While at four and a half years specimen DJ-S-L-CI-1 had the highest
strand corrosion rating, suggesting a very poor performance of the Corrosion
Inhibitor added to the grout, the duplicated specimen DJ-S-L-CI-2 autopsied after
eight years of exposure had a relatively good performance. Specimen SE-S-M-
CI-1 was the only corrosion inhibitor specimen showing a very high strand

174
corrosion rating after eight years. However, this specimen also had a faulty epoxy
filling at the joint as illustrated in Figure 3.70. These results suggest that the
corrosion inhibitor had a positive effect in limiting the corrosion rate after the
onset of corrosion had started.
At the end of eight years of exposure all prestressing strands had
experienced a corrosion rating above the value of 50, chosen as the threshold of
concern. At four and a half years, only one specimen had exceeded that value.
Figure 3.69 Comparison of Corrosion Ratings for Prestressing Strand (after Four Years and Five Months, and Eight Years of Exposure Testing)
0 100 200 300 400 500 600 700 800
DJ-S-M-CI
SE-S-L-NG
SE-S-H-CI
SE-P-L-NG
DJ-P-M-NG
EG-S-H-NG
DJ-S-L-CI
EG-S-L-NG
SE-S-H-NG
SE-P-M-NG
SE-S-L-SF
EG-S-M-NG
SE-S-L-CI
DJ-P-L-NG
SE-S-M-NG
DJ-S-H-NG
SE-S-M-CI
DJ-S-L-NG
DJ-S-M-NG
Strand Corrosion Index
Strand Corrosion Rating after eightyears of exposure
Strand Corrosion Rating after four anda half years of exposure

175
Figure 3.70 Top View of the Effect of a Faulty Epoxy Joint (SE-S-M-CI-1) Compared to a Sound Epoxy Joint (SE-S-L-CI-1)
The overall performance of the specimens is better compared by
considering the total corrosion rating, obtained by summing the ratings for the
strand, bars and duct, as shown in Figure 3.71 and Figure 3.72. Comparison
between these two figures showed overall corrosion increased dramatically for
most specimens between four and a half years and eight years of exposure. After
eight years, the best performance was shown in the plastic duct specimens, while
the dry joint specimens with steel ducts and normal grout showed the worst
performance. The poor performance observed for specimen SE-S-M-CI-1 clearly
shows the detrimental effect of faulty epoxy filling at the joint.

176
Figure 3.71 Total Corrosion Rating Ordered According to Performance (after Four Years and Five Months of Exposure)
Figure 3.72 Total Corrosion Rating Ordered According to Performance (after Eight Years of Exposure)
0 3,00 0 6,00 0 9,0 00 12,000 15,000
SE-P-L-NG -1SE-P-M -NG -1SE-S-H -NG -1
SE-S-H-CI-1D J-P-L-NG -2S E-S-L-SF-1
D J-P-M -NG -2SE-S-L-NG -1EG-S-L-NG -1SE-S-M -NG -1EG-S-H -NG -1
SE-S-L-CI-1SE-S -M -CI-1DJ-S-L-CI-2
D J-S-H -NG -2D J-S -M -CI-2
EG-S-M -NG -1D J-S-M -NG -2D J-S-L-NG -2
Total C orrosion Rating
StrandBarsDuct
Strand Bars Duct Total
SE-P-L-NG-1 5 0 0 5SE-P-M-NG-1 6 0 0 6SE-S-H-NG-1 3 0 8 11SE-S-H-CI-1 3 1 10 14DJ-P-L-NG-2 6 17 0 23SE-S-L-SF-1 12 0 12 24DJ-P-M-NG-2 9 24 0 33SE-S-L-NG-1 13 6 22 41EG-S-L-NG-1 2 0 54 56SE-S-M-NG-1 2 16 61 79EG-S-H-NG-1 16 1 78 95SE-S-L-CI-1 24 0 85 109SE-S-M-CI-1 2 0 114 116DJ-S-L-CI-2 114 4 42 160DJ-S-H-NG-2 38 60 64 162DJ-S-M-CI-2 24 20 151 195EG-S-M-NG-1 23 0 237 260DJ-S-M-NG-2 43 12 325 380DJ-S-L-NG-2 26 12 528 566
0 3,000 6,000 9,000 12,000 15,000
SE-P-L-NG-1SE-P-M-NG-1DJ-P-M-NG-2
SE-S-L-CI-1EG-S-H-NG-1
SE-S-H-CI-1SE-S-L-NG-1DJ-P-L-NG-2
EG-S-M-NG-1SE-S-H-NG-1DJ-S-M-CI-2SE-S-L-SF-1DJ-S-L-CI-2
SE-S-M-NG-1DJ-S-H-NG-2EG-S-L-NG-1SE-S-M-CI-1
DJ-S-M-NG-2DJ-S-L-NG-2
Total Corosion Rating
StrandBarsDuct
Strand Bars Duct Total
SE-P-L-NG-1 80 0 0 80SE-P-M-NG-1 88 18 0 106DJ-P-M-NG-2 80 77 0 157SE-S-L-CI-1 95 28 126 249EG-S-H-NG-1 84 34 131 249SE-S-H-CI-1 78 132 44 254SE-S-L-NG-1 64 26 167 257DJ-P-L-NG-2 116 201 0 317EG-S-M-NG-1 90 31 198 319SE-S-H-NG-1 88 29 268 385DJ-S-M-CI-2 54 27 346 427SE-S-L-SF-1 88 13 591 692DJ-S-L-CI-2 86 22 674 782SE-S-M-NG-1 119 41 732 892DJ-S-H-NG-2 137 606 361 1,104EG-S-L-NG-1 88 25 1,096 1,209SE-S-M-CI-1 308 29 2,445 2,782DJ-S-M-NG-2 780 44 3,054 3,878DJ-S-L-NG-2 612 54 15,779 16,445
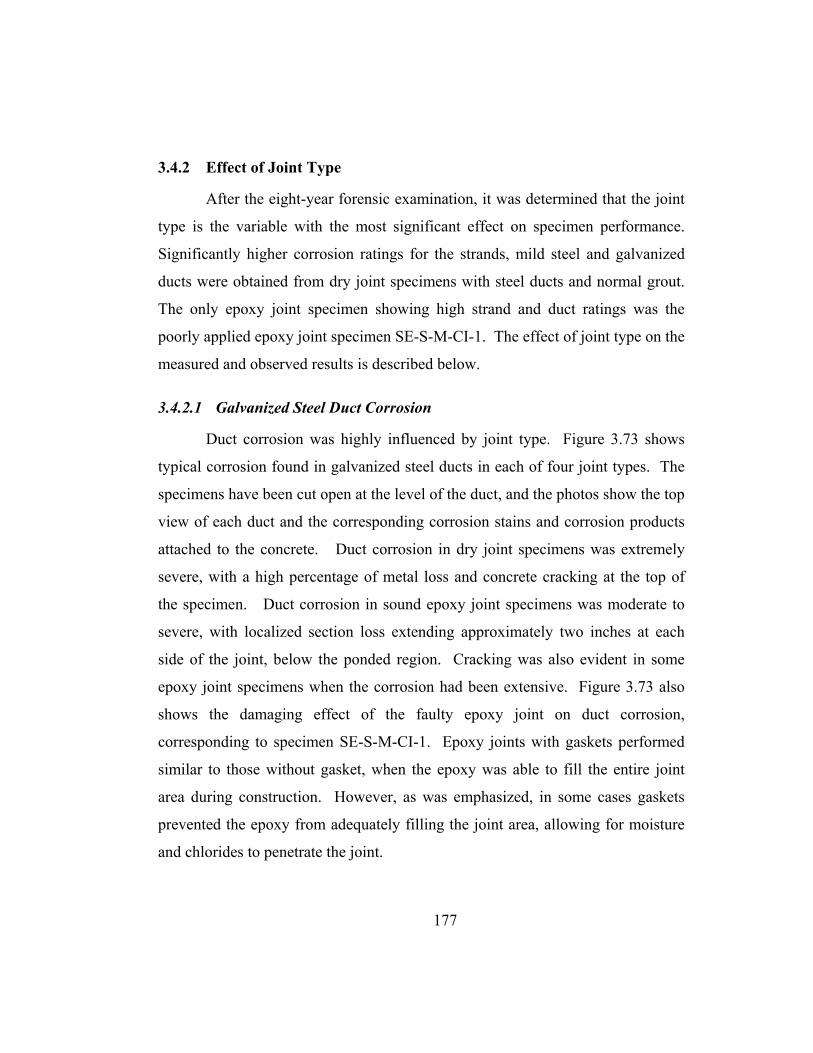
177
3.4.2 Effect of Joint Type
After the eight-year forensic examination, it was determined that the joint
type is the variable with the most significant effect on specimen performance.
Significantly higher corrosion ratings for the strands, mild steel and galvanized
ducts were obtained from dry joint specimens with steel ducts and normal grout.
The only epoxy joint specimen showing high strand and duct ratings was the
poorly applied epoxy joint specimen SE-S-M-CI-1. The effect of joint type on the
measured and observed results is described below.
3.4.2.1 Galvanized Steel Duct Corrosion
Duct corrosion was highly influenced by joint type. Figure 3.73 shows
typical corrosion found in galvanized steel ducts in each of four joint types. The
specimens have been cut open at the level of the duct, and the photos show the top
view of each duct and the corresponding corrosion stains and corrosion products
attached to the concrete. Duct corrosion in dry joint specimens was extremely
severe, with a high percentage of metal loss and concrete cracking at the top of
the specimen. Duct corrosion in sound epoxy joint specimens was moderate to
severe, with localized section loss extending approximately two inches at each
side of the joint, below the ponded region. Cracking was also evident in some
epoxy joint specimens when the corrosion had been extensive. Figure 3.73 also
shows the damaging effect of the faulty epoxy joint on duct corrosion,
corresponding to specimen SE-S-M-CI-1. Epoxy joints with gaskets performed
similar to those without gasket, when the epoxy was able to fill the entire joint
area during construction. However, as was emphasized, in some cases gaskets
prevented the epoxy from adequately filling the joint area, allowing for moisture
and chlorides to penetrate the joint.
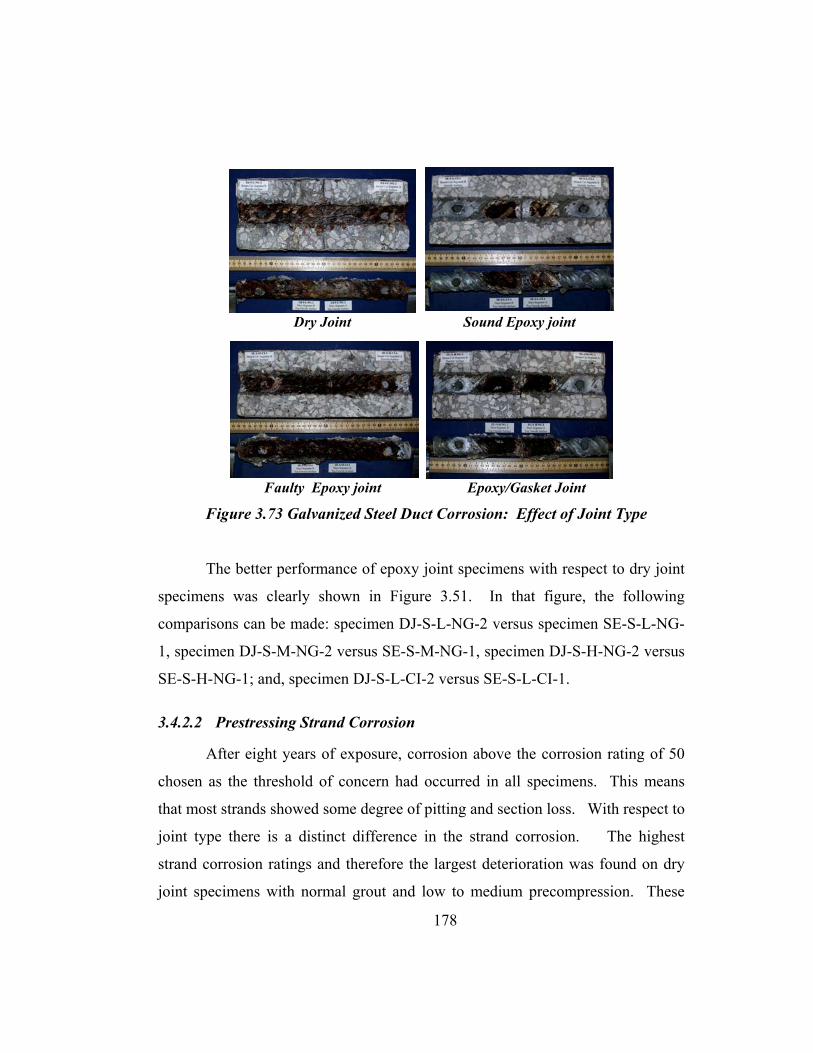
178
Dry Joint Sound Epoxy joint
Faulty Epoxy joint Epoxy/Gasket Joint
Figure 3.73 Galvanized Steel Duct Corrosion: Effect of Joint Type
The better performance of epoxy joint specimens with respect to dry joint
specimens was clearly shown in Figure 3.51. In that figure, the following
comparisons can be made: specimen DJ-S-L-NG-2 versus specimen SE-S-L-NG-
1, specimen DJ-S-M-NG-2 versus SE-S-M-NG-1, specimen DJ-S-H-NG-2 versus
SE-S-H-NG-1; and, specimen DJ-S-L-CI-2 versus SE-S-L-CI-1.
3.4.2.2 Prestressing Strand Corrosion
After eight years of exposure, corrosion above the corrosion rating of 50
chosen as the threshold of concern had occurred in all specimens. This means
that most strands showed some degree of pitting and section loss. With respect to
joint type there is a distinct difference in the strand corrosion. The highest
strand corrosion ratings and therefore the largest deterioration was found on dry
joint specimens with normal grout and low to medium precompression. These

179
specimens show very severe strand section loss. The corresponding epoxy joint
specimens, with the same duct, precompression force and grout type, showed
strand corrosion ratings on the order of eight to ten times smaller. Other dry
joint specimens, either with plastic ducts or with corrosion inhibitor added to the
grout showed similar results to the corresponding epoxy joint specimens. The
only difference was observed in the faulty epoxy joint specimen SE-S-M-CI-1,
which showed a much higher strand corrosion rating than the corresponding dry
joint specimen. In this case, the faulty epoxy joint produced misleading results.
3.4.2.3 Mild Steel Reinforcement Corrosion
Four dry joint specimens (DJ-S-L-NG-2, DJ-S-H-NG-2, DJ-P-L-NG-2
and DJ-P-M-NG-2) and one epoxy joint specimen (SE-S-H-CI-1) showed mild
steel corrosion ratings above the threshold value of 50, where there was pitting
corrosion and section loss. The largest mild steel bar deterioration was observed
in specimen DJ-S-H-NG-2, whose bar corrosion rating was more than 20 times
higher than the corresponding epoxy joint specimen, with same variables. In
general, dry joint specimens showed larger bar deterioration than epoxy joint
specimens, except for specimens with improved grouts, where the results were
practically the same in all cases. Epoxy joint specimens with gaskets showed
very similar results to those without gaskets in all three cases studied.
3.4.2.4 Chloride Penetration
Measured acid soluble chloride contents in the concrete adjacent to and at
two inches from the joint were always higher for all dry joint specimens. They
were in all cases above the threshold value of 0.033% of concrete weight. These
dry joint specimens showed very high chloride contents across the entire face of
the concrete adjacent to the joint, but lower chloride contents two inches inside.

180
Salt deposits were observed on the interior of the ducts in the dry joint specimens,
clearly indicating that moisture and chlorides had penetrated through the joint.
Epoxy joint specimens had a very similar low chloride content at 0.5 in.
and at 2 in. from the joint, suggesting a good performance of the joint. Below the
depth of 3 in. (mid-height between the strand and mild steel bars) all epoxy joint
specimens without gaskets showed negligible chloride contents. However, the
faulty epoxy joint specimen SE-S-M-CI-1 had much higher chloride values for
the reasons described previously.
Epoxy joint specimen with gasket EG-S-L-NG-1, showed a very similar
pattern in the proximity of the joint as the epoxy joint specimens without gasket.
However, at two inches away from the joint this specimen showed high chloride
contents at a depth of three inches.
3.4.2.5 Grouting
Grout leaked into the joint region in two of the seven dry joint specimens
autopsied at eight years of exposure. During the autopsy at four and a half years,
five out of seven dry joint specimens were found with grout leakage through the
joint. The extent of the leaks in both autopsies ranged from very minor around
the duct opening to almost 80% of the joint face covered with grout. No leakage
was found in the standard epoxy joint and epoxy/gasket joint specimens.
3.4.3 Effect of Duct Type
3.4.3.1 Duct Corrosion
Galvanized steel duct corrosion was severe in all seven dry joint
specimens, producing longitudinal cracks in the top of the concrete specimen
ranging from 0.010 in. to 0.12 in. in width. Dry joint specimens with normal
grout and low to medium precompression showed very high steel duct

181
consumption by corrosion, up to 50% of the total duct area. The six epoxy joint
specimens with steel ducts showed cracks in the top of the concrete specimens in
all cases, but smaller than those in dry joint specimens, ranging from hairline
cracks up to 0.020 in. cracks. The only exception was specimen SE-S-L-CI-1
with no concrete cracking. Specimen SE-S-M-CI-1 showed very severe duct
corrosion, similar to specimen DJ-S-M-NG-1, due to the incomplete filling of the
match-cast epoxy joint as explained in Section 4.4.1.14 and shown in Figure 3.70.
In addition, two out of three Epoxy Joint specimens with gaskets and steel ducts,
showed top cracks of 0.010 in. and 0.020 in. in width.
Plastic ducts performed extremely well in all four specimens tested. The
two dry joint specimens with plastic ducts showed bottom cracks, below the mild
steel, of 0.020 in. and 0.040 in. in width, while the two epoxy joint specimens
with plastic ducts did not show any concrete cracking.
As was explained in Reference 3.8, the concrete cover in these specimens
was substantially thinner than would be allowed by specifications. This condition
contributed to the severe galvanized duct corrosion in such a short period of time.
However, the test results indicate the potential corrosion problems when using
galvanized ducts in aggressive exposures. The relative performance of the
galvanized and plastic ducts should not be affected by the thin cover. Plastic
ducts performed extremely well in spite of the thin cover.
3.4.3.2 Prestressing Strand Corrosion
Strand corrosion ratings for dry joint specimens with steel ducts, normal
grout and low to medium precompression showed much higher values, in the
order of six to nine times, with respect to strand corrosion ratings in specimens
with plastic ducts. This trend was not clearly shown in epoxy joint specimens,
where strand ratings were much lower overall and were all in the same range.

182
Strand corrosion with plastic ducts ranged from no corrosion to light
corrosion. In galvanized steel ducts, strand corrosion ranged from no corrosion to
very severe uniform corrosion and pitting.
3.4.3.3 Reversed Macrocell
Dry Joint specimens with plastic ducts (DJ-P-L-NG-2 and DJ-P-M-NG-2)
showed reversed macrocell behavior, while the corresponding specimens with
steel duct (DJ-S-L-NG-2 and DJ-S-M-NG-2) showed strand corrosion activity, as
it was indicated in Table 3.5. These results were confirmed after forensic
examination where it was found that the mild steel bars in these plastic duct
specimens were corroding as the primary corrosion area.
Corrosion currents did not indicate corrosion activity for epoxy joint
specimens with either plastic ducts or steel ducts, except for specimens SE-S-M-
CI-1 and SE-S-H-CI-1.
The results of dry joint specimens clearly show the superiority of plastic
ducts in improving strand corrosion protection.
3.4.4 Effect of Joint Precompression
3.4.4.1 Strand and Mild Steel Corrosion
The results with regard to strand and mild steel corrosion did not show any
distinct trend with respect to the three levels of joint precompression used in the
testing program. The isolated result for dry joint specimen DJ-S-H-NG-2 with
respect to specimens DJ-S-L-NG-2 and DJ-S-M-NG-2 in Figure 3.51 and Figure
3.52, indicates that at very high levels of precompression there is an increased
level of protection of the strand and mild steel bars. This result is not clearly
shown for epoxy joint specimens with and without gaskets.

183
3.4.4.2 Duct Corrosion
Galvanized steel duct corrosion in dry joint specimens shows a clear trend
with respect to the level of precompression. Figure 3.53 compares similar
specimens where joint precompression is the only variable (DJ-S-L-NG-2, DJ-S-
M-NG-2 and DJ-S-H-NG-2). For these specimens, a higher level of
precompression (or prestress) results in significant corrosion rating reduction, and
therefore, it improves significantly the duct corrosion protection. The same trend
was observed during the autopsy performed at four and a half years of exposure,
with the duplicate specimens.3.8
The improved duct corrosion protection with higher levels of
precompression is also observed when comparing dry joint specimens with
corrosion inhibitor added to the grout and when comparing epoxy joint specimens
with gaskets.
Duct corrosion levels in epoxy joint specimens do not show any distinct
trend with respect to the level of precompression.
Similar results are obtained from the use of a crack rating, defined as the
length of the crack in the top of the concrete specimen multiplied by the
maximum crack width. This seems a valid comparison since the concrete and
clear cover are the same for all specimens. Crack ratings for all autopsied
specimens with steel ducts have been plotted along with duct corrosion ratings in
Figure 3.74. From these results, it can be seen that crack ratings are generally
proportional to duct corrosion ratings.

184
Figure 3.74. Effect of Joint Precompression on Duct Corrosion
(after Eight Years of Exposure Testing)
Proportionality between crack ratings and duct corrosion ratings shown in
Figure 3.74 after eight years of exposure, was more evident than after four and a
half years of exposure as shown in Figure 3.75.
0
2000
4000
6000
8000
10000
12000
14000
16000
DJ-
S-L
-NG
-2
DJ-
S-M
-NG
-2
DJ-
S-H
-NG
-2
DJ-
S-L
-CI-
2
DJ-
S-M
-CI-
2
SE
-S-L
-NG
-1
SE
-S-M
-NG
-1
SE
-S-H
-NG
-1
SE
-S-L
-CI-
1
SE
-S-M
-CI-
1
SE
-S-H
-CI-
1
SE
-S-L
-SF-
1
EG
-S-L
-NG
-1
EG
-S-M
-NG
-1
EG
-S-H
-NG
-1
0
20
40
60
80
100
120
140
160
Duct Corrosion Rating
Crack Rating

185
Figure 3.75 Effect of Joint Precompression on Duct Corrosion
(after Four Years of Exposure Testing)3.8
3.4.5 Effect of Grout Type
To examine the effect of grout type on strand corrosion severity, similar
specimens with grout type as the only variable were grouped as shown in Table
3.18 and Figure 3.76. From these, a clear trend is observed from dry joint
specimens with and without corrosion inhibitor. Specimens with Corrosion
Inhibitor (Calcium Nitrite) added to the grout showed very low strand corrosion
ratings when compared to those with normal grout. This trend was also observed
from the results based on Macrocell currents and Half-Cell potentials, as included
in Table 3.8 and Table 3.9, respectively.
0
100
200
300
400
500
600
DJ-
S-L
-NG
-1
DJ-
S-M
-NG
-1
DJ-
S-H
-NG
-1
DJ -
S-L-
CI -1
DJ-
S-M
-CI -1
SE-
S-L-
NG
-2
SE-
S-M
-NG
-2
SE-
S-H
-NG
-2
SE-S
-L-C
I -2
SE-S
-M-C
I -2
SE-S
-H-C
I -2
EG
-S-L
-NG
-2
EG-S
-M-N
G-2
EG-S
-H-N
G-2
Duc
t Cor
rosi
on R
atin
g
0
10
20
30
40
50
60
Cra
ck R
atin
g(le
ngth
x m
axim
um w
idth
)
Duct Corrosion RatingCrack Rating

186
Standard Epoxy Joint specimens had much lower corrosion values so that
they did not show a distinct trend with the use of normal grout, corrosion
inhibitor, silica fume, and low precompression. For these specimens light to
moderate corrosion was found, without pitting. Similar results were obtained for
standard epoxy joint specimens with high precompression. In this case there was
light to negligible corrosion and discoloration. The only exception was found with
specimen SE-S-M-CI-1 due to the faulty epoxy joint.
The above results suggest that calcium nitrite corrosion inhibitor was not
detrimental with respect to the rate of corrosion. It may even be concluded that it
was somewhat effective in counteracting the negative effects of chlorides in
strand corrosion. These results contradict the earlier conclusions reached after
four and a half years of exposure testing. However, as reported3.8 these
conclusions were based on very limited data available. They also contradict
results obtained by Koester3.19 who reported research performing anodic
polarization tests on grouted prestressing strands to investigate the corrosion
protection provided by various cement grouts. Koester concluded that calcium
nitrite significantly reduced the time to corrosion in comparison to plain grout,
and had no effect on corrosion rate after the initiation of corrosion. The calcium
nitrite dosage used in that series was adjusted to account for the higher cement
content in the grout, a factor that was not adjusted in the series reported herein.

187
Table 3.18 Effect of Grout Type – Strand Corrosion Ratings
Specimen Strand Corrosion Rating Comments DJ-S-L-NG-2 612 Uniform corrosion extending
complete length of strand and pitting.
DJ-S-L-CI-2 86 Light to moderate corrosion. DJ-S-M-NG-2 780 Severe corrosion and pitting DJ-S-M-CI-2 54 Light to negligible corrosion.
Strand discoloration. SE-S-L-NG-1 64 Light to moderate corrosion SE-S-L-CI-1 95 Light to moderate corrosion SE-S-L-SF-1 88 Light to moderate corrosion
SE-S-M-NG-1 119 Moderate to severe corrosion. SE-S-M-CI-1 305 Moderate to severe corrosion. SE-S-H-NG-1 88 Light to negligible corrosion.
Strand discoloration. SE-S-H-CI-1 78 Light to negligible corrosion.
Strand discoloration.
Figure 3.76 Effect of Grout Type – Strand Corrosion Rating
0
100
200
300
400
500
600
700
800
900
DJ-
S-L
-NG
-2
DJ-
S-L
-CI-2
DJ-
S-M
-NG
-2
DJ-
S-M
-CI-2
SE-
S-L-
NG
-1
SE-S
-L-C
I-1
SE-S
-L-S
F-1
SE-
S-M
-NG
-1
SE-
S-M
-CI-1
SE-
S-H
-NG
-1
SE-S
-H-C
I-1
Str
and
corr
osio
n ra
ting
Normal grout
Corrosion Inhibitor added
Silica Fume added
Faulty epoxy joint

188
3.4.6 Grout Voids
Grout voids were found in seventeen out of the nineteen specimens
autopsied at eight years of exposure. In nine specimens the shape of the voids
suggests that they resulted from lack of grout fluidity. In the remaining
specimens the voids may be attributed to entrapped air, bleed water or incomplete
filling. Typical voids are shown in Figure 3.77.
Void Caused by Entrapped Air, Bleed Water or Incomplete Filling (from Reference 3.8)
Voids Caused by Lack of Grout Fluidity
Figure 3.77 Typical Grout Voids
In eleven cases the duct was corroded at the top of a grout void in different
degrees as shown in Figure 3.78 for specimen DJ-S-M-NG-2. Similar findings
were obtained in two specimens during the first autopsy at four an a half years, as
shown in Figure 3.79. The new findings reinforced the conclusion that the
presence of a void in the grout may lead to more severe corrosion of the
galvanized steel duct and define the area for a premature onset of corrosion.

189
Figure 3.78 Hole in Duct Corresponding to Grout Void (Specimen DJ-S-M-NG-2) (from Autopsy at Eight Years of Exposure Testing)
Figure 3.79 Hole in Duct Corresponding to Grout Void (Specimen DJ-S-M-NG-1) (from Autopsy at Four an a Half Years of Exposure Testing)15
Grout

190
3.4.7 Reversed Corrosion Macrocell
As shown in Table 3.5, six of the nineteen specimens were found to have
reverse macrocell corrosion. This means that the mild steel bars were corroding
(anodic reaction), instead of the prestressing strand. Four of these specimens
were dry joint specimens, while the other two were specimens SE-S-M-CI-1 and
EG-S-L-NG-1, both with epoxy joints. Specimen SE-S-M-CI-1 as discussed
previously, had a very poor epoxy filling of the joint, which allowed water and
chlorides to penetrate the joint. Specimen EG-S-L-NG-1 was found to have a
sound epoxy joint.
As mentioned previously in reference 3.8, the development of a reversed
macrocell in typical macrocell specimens is unlikely and is not addressed by
ASTM G109.3.5 The development of the reversed corrosion macrocell in this
testing program was considered to be attributed to the transverse segmental joint.
The use of a dry joint is particularly severe, as indicated by the experimental data.
A possible mechanism is shown in Figure 3.80. The dry joint allows easy
penetration of chlorides to the bottom layer of steel. The small end cover for the
bottom bars, 0.25 in., provides little protection from lateral migration of the
chlorides. The steel becomes quickly depassivated while the prestressing steel
benefits from the additional protection provided by the grout and duct. It is
assumed that the added protection is primarily due to the extra thickness of the
grout over the strand in comparison to the end cover of the bars. Although the
duct is discontinuous at the joint, it may also contribute to corrosion protection.
These conditions are conducive to the formation of a reversed corrosion
macrocell.

191
Figure 3.80 Mechanism for Development of Reversed Macrocell in Dry Joint Specimens or in Poor Epoxy Joint Specimens 3.8
The occurrence of a reversed macrocell was not clearly confirmed by
forensic examination. Only specimens DJ-S-H-NG-2 and DJ-P-L-NG-2 show a
distinct behavior with very high mild steel corrosion and low prestressing strand
corrosion. However, specimens DJ-P-M-NG-2 and SE-S-H-CI-1 showed high
mild steel and strand corrosion ratings at the same time. Specimens DJ-S-M-CI-
2 and EG-S-L-NG-1 showed low corrosion in both mild steel and strand.
Chloride profiles (where available) indicated chloride levels in excess of the
corrosion threshold in all specimens, except in specimens EG-S-L-NG-1.
3.4.8 Test Measurements
3.4.8.1 Comparison Between Half-Cell Potentials and Macrocell Corrosion Current
Similar results were obtained using Half – Cell Potentials and Macrocell
Corrosion Currents when assessing strand corrosion in all macrocell specimens,
as reported in Sections 3.1.4.1 and 3.1.4.2. Table 3.7 showed that most specimens
had a good correlation between times to corrosion initiation, and Table 3.8 and
Table 3.9 showed that conclusions with respect to the four main variables in the
groutedprestressingstrand
mild steelbars
NaClsolution
Cl-dry jointprovidespathway forchlorides toreach bars
Cl-
strand "protected" byduct & grout

192
testing program were basically the same. However, these methods were not able
to detect corrosion in seven specimens in the case of Half-Cell Potentials, and
nine specimens in the case of Corrosion Currents, all of which were found to have
some degree of strand corrosion during forensic examination.
Figure 3.81 shows the comparison between Corrosion Currents and Half
Cell Potentials for specimen DJ-S-M-NG-2 and specimen SE-S-M-CI-1. As can
be observed, Half-Cell potentials (above 90% probability of corrosion as per
ASTM C8763.7) showed very good correlation with corrosion currents, with
regard to the onset of corrosion and corrosion activity.
Figure 3.81 Comparison Between Corrosion Current and Half-Cell Potential Readings
-0.010
0.000
0.010
0.020
0.030
0.040
0.050
0 250 500 750 1000 1250 1500 1750 2000 2250 2500 2750 3000
Time (days)
-0.0100.0000.0100.0200.0300.0400.0500.0600.0700.0800.0900.100
0 250 500 750 1000 1250 1500 1750 2000 2250 2500 2750 3000
Time (days)
-1000
-800
-600
-400
-200
0
200
400
0 250 500 750 1000 1250 1500 1750 2000 2250 2500 2750 3000
Time (days)
< 10% probabilityof corrosion
> 90% probabilityof corrosion
-1000
-800
-600
-400
-200
0
200
400
0 250 500 750 1000 1250 1500 1750 2000 2250 2500 2750 3000
Time (days)
< 10% probabilityof corrosion
> 90% probabilityof corrosion

193
Based on the above, half-cell potentials can readily be taken in in-service
concrete structures to detect the onset of corrosion, while the corrosion current cannot be
measured directly. However, it must be noted the particular conditions of in-service
structures may differ considerably from those in the experimental specimens, which may
affect the reliability of the readings. The prestressing strand in this testing program was
not in contact with the metal duct. Thus, in typical situations half –cell potentials taken
on the prestressing tendon may in fact reflect the very negative potential of the zinc on
the galvanized steel duct, leading to erroneous conclusions. In the experimental
specimens, it is possible that the discontinuity in the duct at the segmental joint facilitated
ion flow through the grout, allowing half-cell potential readings from the prestressing
strands to be taken.
3.4.8.2 Comparison Between Macrocell Corrosion Current and Forensic Examination
Metal loss values calculated in Section 3.2.4.3.3. and summarized in Table
3.11 were compared against the strand corrosion ratings presented in Section
3.3.4.2 and summarized in Table 3.17. Figures 3.82 and 3.83 show the results.
As can be observed in these figures, there are many discrepancies. Computed
metal loss calculations based on current measurements did not show major strand
corrosion activity in many of the specimens, contrary to what was found during
forensic examination. In addition, specimens with maximum values of calculated
metal loss do not correspond to specimens with the maximum corrosion ratings
observed.
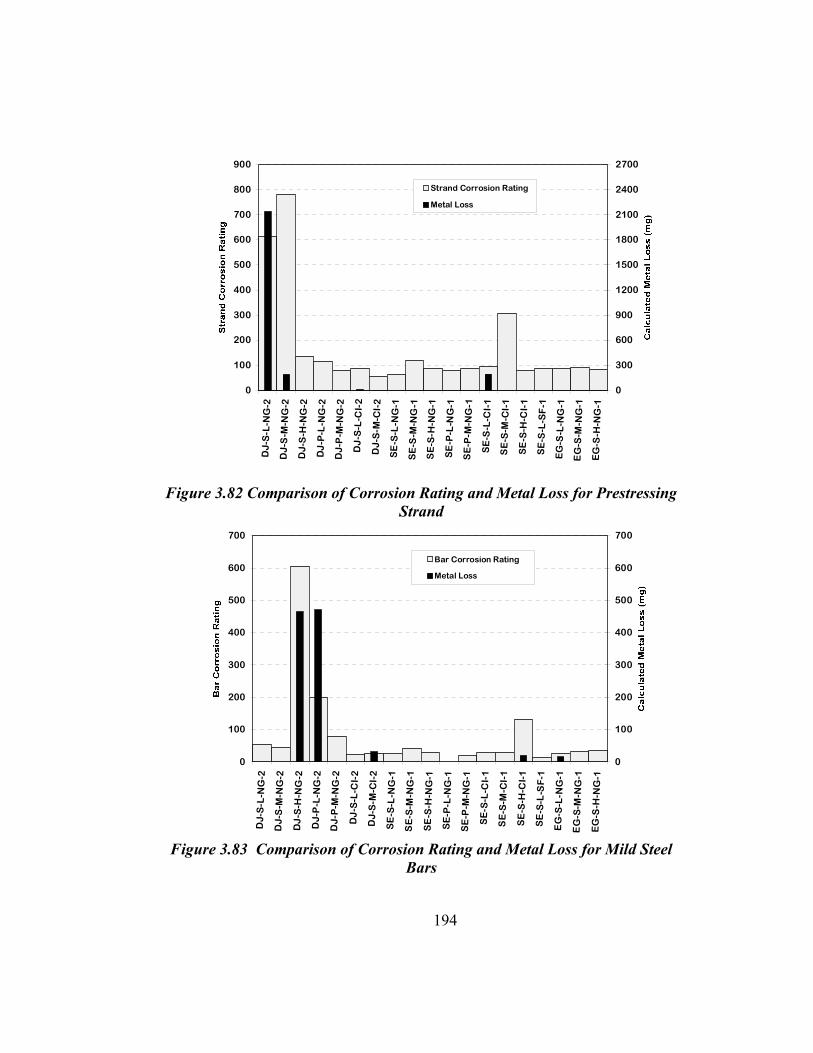
194
Figure 3.82 Comparison of Corrosion Rating and Metal Loss for Prestressing
Strand
Figure 3.83 Comparison of Corrosion Rating and Metal Loss for Mild Steel Bars
0
100
200
300
400
500
600
700
800
900
DJ-
S-L
-NG
-2
DJ-
S-M
-NG
-2
DJ -
S-H
-NG
-2
DJ
-P-L
-NG
-2
DJ-
P-M
-NG
-2
DJ
-S-L
-CI-
2
DJ -
S-M
-CI -
2
SE
-S-L
-NG
-1
SE
-S-M
-NG
-1
SE
-S-H
-NG
-1
SE
-P-L
-NG
-1
SE
-P-M
-NG
-1
SE
-S-L
-CI-
1
SE
-S-M
-CI -
1
SE
-S-H
-CI-
1
SE
-S-L
-SF
-1
EG
-S-L
-NG
-1
EG
-S-M
-NG
-1
EG
-S-H
-NG
-1
0
300
600
900
1200
1500
1800
2100
2400
2700
Strand Corrosion Rating
Metal Loss
0
100
200
300
400
500
600
700
DJ-
S-L
-NG
-2
DJ -
S-M
-NG
-2
DJ
-S-H
-NG
-2
DJ -
P-L
-NG
-2
DJ-
P-M
-NG
-2
DJ
-S-L
-CI-
2
DJ-
S-M
-CI-
2
SE
-S-L
-NG
-1
SE
-S-M
-NG
-1
SE
-S-H
-NG
-1
SE
-P-L
-NG
-1
SE
-P-M
-NG
-1
SE
-S-L
-CI-
1
SE
-S-M
-CI-
1
SE
-S-H
-CI -
1
SE
-S-L
-SF
-1
EG
-S-L
-NG
-1
EG
-S-M
-NG
-1
EG
-S-H
-NG
-1
0
100
200
300
400
500
600
700
Bar Corrosion Rating
Metal Loss

195
The above results comparing computed metal loss based on macrocell
corrosion currents with the actual corrosion rating noted from the forensic
examination results are similar to those obtained at four and a half years of
exposure, and the same conclusions apply:
1. Some strand corrosion may be due to microcell corrosion activity or
low corrosion currents that were not detected during exposure testing
measurements.
2. The calculated metal loss procedure misses the fact that both layers of
steel are corroding at the same time. Macrocell corrosion current
would correctly indicate if either the mild steel bars or the prestressing
strands were experiencing the more severe corrosion activity, but the
other would be overlooked. The charge flux calculated from
macrocell corrosion current would underestimate the actual corrosion
severity or metal loss.
3. Since the driving force for macrocell corrosion is the potential
difference between the two layers of steel (resulting from variations in
chloride and moisture concentrations), this may disappear during a
long-term test. The advanced moisture and chloride penetration may
occur before corrosion can be initiated on the steel. This phenomenon
may indicate an important limitation of the use of the metal loss
calculation procedure in analyzing dry joint segmental construction
with macrocell specimens.
3.5 SUMMARY AND CONCLUSIONS FROM MACROCELL CORROSION TESTS
Thirty eight macrocell specimens were used to investigate the corrosion
protection of internal tendons at segmental joints. Half of the specimens were
autopsied after around four and a half years of highly aggressive exposure and

196
preliminary conclusions were reported.3.8 The variables analyzed during the
testing program included: joint type (dry or epoxy), duct type (galvanized steel or
plastic), grout type (3 grouts with differing additives) and level of joint
compression (3 different levels). The second half of the specimens was autopsied
with over eight years of very aggressive exposure. Numerous conclusions can be
drawn.
3.5.1 Overall Performance
• Superiority of plastic ducts was evident. Specimens with plastic duct had the
best overall performance (quantified in terms of strand, mild steel and duct
corrosion).
• Thin epoxy joints provided substantially improved corrosion protection when
compared to dry joints. Incompletely filled epoxy joint performance was very
similar to that of a dry joint.
• All galvanized steel duct specimens showed some degree of duct corrosion,
from moderate uniform corrosion up to severe duct destruction.
• Post-tensioning strands were corroded in all specimens, from light uniform
corrosion to moderate pitting.
• Mild steel bars were corroded in seventeen out of the nineteen specimens.
One third of those had from moderate corrosion to severe pitting.
• In many instances, the epoxy coverage, provided on the strand and mild steel
bars to limit the exposed length of the anode and cathode, failed to provide
complete corrosion protection to these areas. Epoxy paint peeled off in many
instances allowing for moisture and chloride ingress. Corrosion under the
epoxy paint was in many cases comparable to the corrosion condition in the
exposed lengths. Among other effects, this affected the current density
calculations.

197
• Metal loss calculations based on current density calculations failed to indicate
the amount of corrosion in the specimens.
3.5.2 Assessing Corrosion Activity Using Half-Cell Potential Measurements
Half-Cell Potentials were taken at two week intervals at the start of the
wet period and at the start of the dry period. All measurements were performed
according to ASTM C8763.7 using a saturated calomel electrode (SCE). In all
cases the prestressing tendon was not in contact with the galvanized duct, and it
was considered that the segmental joint allowed for ion movement. However,
while HC-Potentials in dry joint specimens had good correlation with forensic
examination results, they failed to detect corrosion activity in six out of nine
epoxy joint specimens, and in one epoxy joint specimen with gasket.
With respect to testing variables, the following conclusions are drawn
based on Half-Cell Potential Data:
• Epoxy joint specimens showed lower probability of strand corrosion than dry
joint specimens.
• Macrocell specimens with plastic ducts (discontinuous) at the joint showed
lower probability of strand corrosion than similar specimens with galvanized
steel ducts.
• Dry joint specimen data indicated less probability of strand corrosion with
increasing levels of joint precompression. This trend was not clearly shown in
epoxy joint specimens.
• Dry Joint specimens with Corrosion Inhibitor (Calcium Nitrite) showed lower
probability of strand corrosion with respect to specimens with Normal Grout.
198
3.5.3 Segmental Joints
To address typical North American practice, dry joints and epoxy joints,
with and without gaskets, were selected for investigation in this testing program.
All joint types were match-cast. The AASHTO Guide Specifications for
Segmental Bridges3.6 does not permit the use of dry joints with internal tendons.
However, dry joints were included as a worst case scenario for comparison
purposes. The thin epoxy-jointed specimens were assembled according to the
standard practice. In the epoxy/gasket joint, a foam gasket was glued to the face
of one segment around the duct opening prior to application of the epoxy.
Forensic examination after eight years of exposure included: seven specimens
with dry joints, nine specimens with epoxy joints and three specimens with epoxy
joints with gasket. The conclusions are as follows:
• All galvanized steel ducts and prestressing strands in the nineteen specimens
showed some degree of corrosion. The higher corrosion ratings were obtained
from dry joint specimens with galvanized steel ducts and normal grout.
Ducts in these specimens were extremely corroded, with corrosion centered at
the joint, and with concrete cracking in the top of the specimen. In general,
dry joint specimens showed increased chloride penetration and increased
corrosion of galvanized steel duct, prestressing strand and mild steel
reinforcement. These results show that dry joints do not provide adequate
corrosion protection for internal tendons in aggressive environments.
• Sound epoxy joint specimens with galvanized steel ducts showed moderate to
very severe duct corrosion centered away from the joint. Clear cover for
specimens was small (five eights to three quarters of an inch), significantly
lower than would be allowed by specifications. However, the test results
indicate the potential corrosion problems when using galvanized ducts in

199
aggressive environments if chlorides penetrate the concrete cover away from
the epoxy joint.
• Thin epoxy joints provided substantially improved corrosion protection when
compared to dry joints. However, test results showed that poor epoxy filling
at the joint is extremely detrimental to the performance of the duct, the
prestressing strand and the mild steel reinforcement. Incompletely filled
epoxy joint performance was very similar to that of a dry joint.
• Corrosion of mild steel in some epoxy joint specimens was found to be the
result of an external source of moisture and chlorides rather than from
penetration at the epoxy joint or through the concrete. This conclusion was
reinforced with chloride levels measured at the joint and away from the joint.
These findings reinforce the need to provide adequate clear cover over the
ends of longitudinal bars in the segments, even if external post-tensioning is
used.
• In some cases, the use of gaskets in epoxy jointed specimens prevented
complete epoxy coverage of the joint. This condition could worsen under
field conditions.
3.5.4 Ducts for Internal Post-Tensioning
Two duct types were investigated; standard galvanized steel duct and
plastic duct. Due to size limitations, PVC pipe was used for the plastic duct.
Test results indicated:
• Galvanized steel duct was corroded in all specimens. Severe corrosion and
large duct destruction was observed in dry joint specimens. Such corrosion
was often centered on the dry joint. Epoxy joint specimens showed moderate
to severe duct corrosion. The corrosion was often centered away from the
joint.

200
• Superiority of plastic ducts was evident. Strand encased in plastic ducts
showed only light corrosion and discoloration. Specimens with plastic duct
had the best overall performance (quantified in terms of strand, mild steel and
duct corrosion).
• Concrete cover in specimens was lower than allowed by specifications.
However, test results indicate that these are potential corrosion problems
when using galvanized steel ducts in aggressive exposures if chlorides
penetrate the cover. Plastic ducts performed well in spite of the small cover.
3.5.5 Joint Precompression
Due to the small specimen size, the strand could not be post-tensioned
effectively. To simulate precompression across the joint due to post-tensioning,
the pairs of match –cast segments were stressed together using external loading
frames. Three levels of precompression were selected; 5 psi, 50 psi and 3√f’c psi.
The lowest level of 5 psi could represent the level of precompression encountered
in a precast segmental column under self weight. The precompression of 50 psi is
based on AASHTO Guide Specifications.3.6 The highest precompression value
corresponded to 190 psi for this testing program. Eight out of the nineteen
specimens (at eight years of exposure) had low precompression, seven medium
precompression and four high precompression. Conclusions are as follows:
• Test results did not show a clear trend with respect to joint precompression
when analyzing time to corrosion initiation and rate of corrosion in
prestressing strands and mild steel bars. An isolated result for dry joint
specimens with galvanized steel ducts and normal grout showed that at very
high levels of precompression, there is an increased level of strand and mild
steel protection. This result is not clearly shown for epoxy joint specimens
with and without gasket.

201
• Galvanized steel duct corrosion in dry joint specimens also showed better
performance with a higher level of precompression. However again, this
result is not clearly shown in epoxy joint specimens. Precompression level is
much important in dry joint specimens.
3.5.6 Grouts for Bonded Post-Tensioning
Three cement grout types were selected for evaluation; normal grout (plain
cement grout, no admixtures, w/c = 0.40), grout with silica fume (13% cement
replacement by weight, w/c = 0.32, superplasticizer added) and grout with a
commercial calcium nitrite corrosion inhibitor (w/c = 0.40). The dosage of
corrosion inhibitor used in this testing program was the same dosage normally
used for concrete (aprox. 20 liters/m3 concrete). The Calcium Nitrite dosage was
not adjusted to account for the higher cement content in grout. The testing
program for the nineteen remaining specimens at eight years of exposure included
thirteen specimens with normal grout, five with corrosion inhibitor and one with
silica fume. Conclusions are as follows:
• Dry joint Specimens with Corrosion Inhibitor (Calcium Nitrite) added to the
grout showed a lower strand corrosion rating (less strand corrosion severity) at
eight years of exposure, than specimens with normal grout (in the order of
seven times smaller). This trend was not clearly shown in epoxy joint
specimens. This result contradicts those obtained at four and a half years of
exposure where the most severe corrosion of the prestressing tendon was
found where calcium nitrite corrosion inhibitor was used.
• Epoxy joint specimens with silica fume, corrosion inhibitor and normal grout
had very similar performances. No clear distinction was evident.

202
• Grout voids, due to entrapped air, bleed water, incomplete grout filling or lack
of grout fluidity were detrimental not only to the prestressing strand, but also
to the galvanized steel duct.
3.6 MEASURES FOR IMPLEMENTATION FROM MACROCELL RESULTS
Macrocell test results generated the following findings for immediate
implementation to improve corrosion protection for precast segmental
construction.
Joint Type
• Epoxy joints should always be used with internal prestressing tendons.
• Dry joints should be avoided with external prestressing tendons in
aggressive exposures, to protect segment mild steel reinforcement at
joints and to block entry of chlorides that might be transported to
locations of flaws in external tendon sheaths or anchors.
• Stringent inspection and construction practices must be exercised to
guarantee good epoxy filling at the joints and complete grouting.
• Gaskets in epoxy joints should be avoided since there is a potential for
incomplete epoxy coverage of the joint. Preferred practice with epoxy
joints is to utilize a thorough swabbing of tendon ducts immediately
after initial segment placement and stressing to seal the duct edges at
the joint. Tightness of the joint should be checked by air pressure
testing. Carefully coupled ducts are an alternative as long as a positive
seal is obtained.

203
Duct type
• Plastic ducts for post-tensioning should be used in all situations where
aggressive exposure may occur.
Grout type
• Calcium Nitrite Corrosion inhibitor added to the grout had little effect
on the onset of corrosion but did seem to enhance long-term strand
corrosion protection.

204
(Page left blank intentionally)
205
CHAPTER 4 Large Scale Beam Corrosion Tests
The use of post-tensioning in flexural members can provide many
advantages, as described in Chapter 2. The improvement in crack control and the
precompression applied to the concrete suggest that moisture and chloride
penetration would be reduced, impacting positively on durability. However,
when post-tensioning systems are used, new durability concerns arise, since new
hardware is incorporated within the elements.
The durability concern increases when mixed reinforcement (i.e., a
combination of non-prestressed and prestressed reinforcement as the main
flexural tension element) is used. Mixed reinforcement has received much
attention in the last few years, since fully prestressed members may not always
lead to an optimum design, from a strength and economic perspective.4.1, 4.2 The
limitation of concrete tensile stresses in fully prestressed members below
cracking, can lead to large prestress requirements, resulting in very
unconservative designs, excessive creep deflections and the requirement for stage
prestressing as construction progresses. Mixed reinforcement may increase
ductility in comparison to fully prestressed members, have less congestion than
reinforced concrete elements, reduce creep and excessive camber, produce a more
efficient design, and the reinforcement can be tailored to control deflections,
cracking, and cracking moment.4.2 Also, from recent research in Europe, it seems
that a better fatigue resistance is also attained. However, all these benefits could
be outweighed by the increased corrosion risk, since concrete is likely to crack
under service load levels.

206
The large scale flexural elements in this research study are being used to
evaluate the relative performance of several flexural concrete member protection
variables, including:
1) different levels of prestress and load, producing different crack
widths and patterns
2) different post-tensioning hardware: duct types, duct splices,
strand types and anchorage systems
3) different concrete and grout mixes
4) different grout injection procedures
The beam research portion of the durability study concludes with
recommendations for materials and implementation measures.
4.1 RESEARCH OBJECTIVES
The Large Scale Beam Corrosion Test program utilizes large-scale linear
flexural elements, under long-term exposure testing. It has the following
objectives:
1) Determination of the effect of post-tensioning on durability
(corrosion protection) through crack control, and
2) Evaluation of the relative performance of a broad scope of
corrosion protection variables for multistrand postensioning
systems.
4.2 EXPERIMENTAL PROGRAM
Beam specimen exposure testing includes combination of structural
loading with aggressive exposure, by means of cyclic wetting and drying with a
3.5% NaCl solution to promote accelerated corrosion. The effect of prestressing
levels is investigated for a range of systems, from nonprestressed (reinforced
concrete) to partially prestressed (mixed reinforcement) to fully prestressed.

207
Variables in the research program include the influence of crack width, type of
concrete (normal and high performance concrete – refer to Section 2.4.4.1),
prestressing strand coatings, duct splices, high performance grout, and
encapsulated post-tensioning systems.
Two phases were implemented as part of the experimental program.
Phase I was developed to investigate the influence of prestressing levels,
cracking, high performance grout and post-tensioning duct splices. This phase
was designed and implemented by West.4.2 Phase II was developed to investigate
high performance concrete (refer to Section 2.4.4.1), high performance grout,
prestressing strand coatings and an encapsulated post-tensioning system. This
phase was implemented by Schokker.4.3 Both researchers, West and Schokker,
built series of beam specimens and initiated exposure testing in the early part of
the experimental program. Both phases used the same overall beam specimen
design and loading.
Sections 4.2 through 4.3 include a summary of the work done by West and
Schokker. For a detailed description of their experimental program and
description of measurements during exposure testing, refer to References 4.2 and
4.3. CTR Research Report 1405-34.4 also contains a detailed summary of West’s
and Schokker’s work.
Sections 4.4 through 4.10 include all exposure testing results and final
autopsy results, conclusions and recommendations for the selected specimens.
Exposure testing was performed as a cooperative effort by West and Schokker in
the first stages, and Kotys 4.5 and the author in the final stages of the specimens
selected for full autopsy. Full autopsies were performed by Kotys and the author.
Approximately half of the specimens remain under exposure at the end of this
reporting period, for future autopsy. These sections were written jointly between

208
Kotys and the author and were first published in Kotys’ thesis. The sections are
included here with few changes.
4.2.1 Test Specimen
4.2.1.1 Specimen Description
The specimens used in this experimental program are not patterned after a
prototype structure. Linear rectangular flexural elements, as shown in Figure 4.1,
were chosen for the following reasons:
• results can be applied to bent cap and beam elements directly and
some results may be qualitatively applied to other elements such as
pile caps.
• all desired variables can be readily incorporated into design
• ease of construction, handling and placement
• simplicity of controlling and maintaining loading
Figure 4.1 Linear Rectangular Beam Specimens (on Top of Reaction Beams)

209
The beams subjected to combined structural loading are tested outside the
Ferguson Structural Engineering Laboratory and are exposed to cyclic wetting
and drying with a 3.5% NaCl solution to provide and highly aggressive corrosive
environment.
Specimen dimensions and details were selected to provide concrete
covers, reinforcement sizes, post-tensioning hardware and crack widths of a
similar order of magnitude as in practical applications, with consideration for
handling and loading of the specimens. Prestressed specimens used a minimum
of two tendons (multistrand) to represent applications typical of post-tensioned
bridges.
The Type E multistrand anchorage hardware manufactured by VSL
Corporation was selected because it is available in tendon configurations with as
few as three strands. The 18” x 24” concrete section, accommodating up to eight
strands in two tendons, was chosen to provide the most flexibility in the design of
mixed reinforced sections. For practical reasons, a nominal beam length of 15
feet was chosen. Specimen dimensions are shown in Figure 4.2.
Figure 4.2 Specimen Dimensions
15’ 2”
Cross Section
18” x 24”
PondedSaltwater
Loading Loading
4.5’ 4.5’ 4.5’Reactions
Specimen
15’ 2”
Cross Section
18” x 24”
PondedSaltwater
Loading Loading
4.5’ 4.5’ 4.5’Reactions
Specimen

210
4.2.1.2 Specimen Design
4.2.1.2.1 Levels of Prestress
To examine a broad range of prestressing, section reinforcement was
proportioned for the following prestressing levels:
• non-prestressed (Non-PS)
• mixed reinforcement with nominal prestress amount between 50% and
75% of total tensile force (2/3 PS). See definition in Section 2.1.6.
• 100% prestressed based on ultimate (nominal) strength (100 %U PS)
• 100% prestressed based on service load/allowable stress design
(100%S PS)
The amount of prestress in percent, is defined as the tensile force
component provided by prestressing steel at the nominal flexural capacity of the
section. Only 100%S PS specimens would not be expected to crack under service
loading. The selected specimen dimensions and requirement for two tendons
dictated the use of 8 strands for the 100%S PS section, 6 strands for the 100%U
PS section, and 4 strands for the 2/3 PS (mixed reinforcement) section.
4.2.1.2.2 Design Loading
Reinforcement was proportioned based on the total allowable service load
moment (dead load plus live load) computed for the 100%S PS section.
Assuming a ratio of dead load to live load of 1.5, the calculated permissible total
service load moment was used to compute the dead and live load moments. The
factored moment was then computed and used to proportion the reinforcement for
the non-prestressed sections as well as the mixed reinforcement and the 100%U
PS post-tensioned sections.

211
The 100%S PS section was design to meet the stress limits according to
Clause 5.9.4 of AASHTO LRFD4.6(Clause 18.4 of ACI 3184.7). The sections with
eight post-tensioning strands in two tendons were analyzed with the following
assumptions:
• Gross section properties, elastic stresses
• f’c = 5 ksi
• Aps = eight 12.7 mm (0.5 in.) 7-wire prestressing strands, fpu = 270 ksi
• fpi = 0.65fpu
• Long term losses = 15% (fpe = 0.55fpu)
• Maximum tendon eccentricity, e = 8 in. based on clear cover to duct of 2.5
in.
• Computation of the total allowable moment assumed that the governing
stress in the concrete (tensile or compressive) is at least 75% of the
corresponding allowable value. (i.e., either 0.75fcallow ≤ fcmax ≤ fcallow or
0.75ftallow ≤ ftmax ≤ ftallow)
• Self weight of the beam could be neglected (self weight is very small in
comparison to applied forces)
The section was analyzed for stresses in the concrete immediately after
prestress transfer and under maximum applied loading. Calculated stresses and
moments are included in Reference 4.2. The service load moment, with
ft = 0.75ftallow governing, was calculated as 2750 k-in. To meet stress limits at the
member ends a draped profile was chosen for the tendons. Figure 4.3 shows the
tendon profile and the allowable limits for the steel center of gravity (cgs).

212
Figure 4.3 100%S PS Section Tendon Profile and Allowable Limits 4.3
Based on the calculated service load moment, the dead and live load
moments, factored moments and nominal moments were calculated as follows:
Mservice = 2750 k-in. (based on 100%S PS section)
MD/ML = 1.5 (assumed)
Therefore,
MD = 1650 k-in.
ML = 1100 k-in.
Mfactored = 4180 k-in.
Mnominal = 4650 k-in. (for φ = 0.9)
4.2.1.2.3 Section Reinforcement
The required nominal flexural capacity, Mn, was used for the strength design of
the remaining sections. The 100%U PS section required the use of six strands.
Mixed reinforced sections (50% to 75% prestress) required the use of four
strands, for an effective prestress level of 66.7% (2/3 PS). Reference 4.2
-300
-200
-100
0
100
200
3000 1375 2750 4125
Tend
on E
ccen
tric
ity (
mm
)
Distance Along Beam (mm)
Ti = 958 kN (8 strands @ 0.65 fpu)e = 200 mm @ c.l.
allowable limits for cgsindicated by shaded area
tendon profile(cgs)
-4
-8
-12
4
8
12
tendon profile (cgs)
(in.)
54 (1375)
108 (2750)
162 (4125)
in. (mm)

213
describes in detail the procedure followed to select the appropriate amounts of
reinforcement, based on AASHTO LRFD (1998) and ACI 318-95. Figure 4.4
shows the final reinforcement details for each section. Detailed construction
drawings, from Reference 4.2, have been included in Appendix B. Table 4.1
includes a summary of Section Details.
Figure 4.4 Section Reinforcement Details 4.2
Table 4.1 Summary of Section Details 4.4
5935 k-in2 #30.56 fpu8 – 0-.5 in.100%S PS
4685 k-in2 #30.6 fpu6 – 0.5 in.100%U PS
4750 k-in4 #4 and 4 #30.6 fpu4 – 0.5 in. 2/3 PS
4685 k-in6 #6 and 2 #4n/aNoneNon-PS
Nominal Capacity
Mild Steel Bars(tension)
Effective Prestress(after losses)
Prestressing StrandsSection
5935 k-in2 #30.56 fpu8 – 0-.5 in.100%S PS
4685 k-in2 #30.6 fpu6 – 0.5 in.100%U PS
4750 k-in4 #4 and 4 #30.6 fpu4 – 0.5 in. 2/3 PS
4685 k-in6 #6 and 2 #4n/aNoneNon-PS
Nominal Capacity
Mild Steel Bars(tension)
Effective Prestress(after losses)
Prestressing StrandsSection
0.55 fpu
Compression Steel:2 - #5's (15.9 mm dia.)
Tension Steel:6 - #6's (19 mm dia.) and2 - #4's (12.7 mm dia.)
Compression Steel:2 - #5's (15.9 mm dia.)
Tension Steel:4 - #3's (9.5 mm dia.) and4 - #4's (12.7 mm dia.)
Prestressing Steel:4 - 12.7 mm dia. strands
Compression Steel:2 - #5's (15.9 mm dia.)
Tension Steel:2 - #3's (9.5 mm dia.)(not required by design)
Prestressing Steel:6 - 12.7 mm dia. strands
Compression Steel:2 - #5's (15.9 mm dia.)
Tension Steel:2 - #3's (9.5 mm dia.)(not required by design)
Prestressing Steel:8 - 12.7 mm dia. strands
Non-Prestressed 2/3 Prestressed
100% PrestressedStrength Design
100% PrestressedAllowable Stress Design
Compression Steel2-#5’s Tension Steel:6 - #6’s and2 - #4’s
Compression Steel2-#5’s Tension Steel:4 - #3’s and4 - #4’sPrestressing Steel:4- 0.5in. dia. strands
Compression Steel2-#5’s Tension Steel:2 - #3’s and(not required by design)Prestressing Steel:6- 0.5in. dia. strands
Compression Steel2-#5’s Tension Steel:2 - #3’s and(not required by design)Prestressing Steel:8 - 0.5in. dia. strands
2.38 in. 3.93 in.
1.84 in.
2.25 in. 1.5 in.
5.4 in.
10.05 in.
2.19 in.
5.4 in.
2.19 in.
5.4 in.
Compression Steel:2 - #5's (15.9 mm dia.)
Tension Steel:6 - #6's (19 mm dia.) and2 - #4's (12.7 mm dia.)
Compression Steel:2 - #5's (15.9 mm dia.)
Tension Steel:4 - #3's (9.5 mm dia.) and4 - #4's (12.7 mm dia.)
Prestressing Steel:4 - 12.7 mm dia. strands
Compression Steel:2 - #5's (15.9 mm dia.)
Tension Steel:2 - #3's (9.5 mm dia.)(not required by design)
Prestressing Steel:6 - 12.7 mm dia. strands
Compression Steel:2 - #5's (15.9 mm dia.)
Tension Steel:2 - #3's (9.5 mm dia.)(not required by design)
Prestressing Steel:8 - 12.7 mm dia. strands
Non-Prestressed 2/3 Prestressed
100% PrestressedStrength Design
100% PrestressedAllowable Stress Design
Compression Steel2-#5’s Tension Steel:6 - #6’s and2 - #4’s
Compression Steel2-#5’s Tension Steel:4 - #3’s and4 - #4’sPrestressing Steel:4- 0.5in. dia. strands
Compression Steel2-#5’s Tension Steel:2 - #3’s and(not required by design)Prestressing Steel:6- 0.5in. dia. strands
Compression Steel2-#5’s Tension Steel:2 - #3’s and(not required by design)Prestressing Steel:8 - 0.5in. dia. strands
Compression Steel:2 - #5's (15.9 mm dia.)
Tension Steel:6 - #6's (19 mm dia.) and2 - #4's (12.7 mm dia.)
Compression Steel:2 - #5's (15.9 mm dia.)
Tension Steel:4 - #3's (9.5 mm dia.) and4 - #4's (12.7 mm dia.)
Prestressing Steel:4 - 12.7 mm dia. strands
Compression Steel:2 - #5's (15.9 mm dia.)
Tension Steel:2 - #3's (9.5 mm dia.)(not required by design)
Prestressing Steel:6 - 12.7 mm dia. strands
Compression Steel:2 - #5's (15.9 mm dia.)
Tension Steel:2 - #3's (9.5 mm dia.)(not required by design)
Prestressing Steel:8 - 12.7 mm dia. strands
Non-Prestressed 2/3 Prestressed
100% PrestressedStrength Design
100% PrestressedAllowable Stress Design
Compression Steel2-#5’s Tension Steel:6 - #6’s and2 - #4’s
Compression Steel2-#5’s Tension Steel:4 - #3’s and4 - #4’sPrestressing Steel:4- 0.5in. dia. strands
Compression Steel2-#5’s Tension Steel:2 - #3’s and(not required by design)Prestressing Steel:6- 0.5in. dia. strands
Compression Steel2-#5’s Tension Steel:2 - #3’s and(not required by design)Prestressing Steel:8 - 0.5in. dia. strands
2.38 in. 3.93 in.
1.84 in.
2.25 in. 1.5 in.
5.4 in.
10.05 in.
2.19 in.
5.4 in.
2.19 in.
5.4 in.

214
Shear reinforcement was proportioned for the shear force corresponding to
the development of the nominal flexural capacity of the sections.
Anchorage zone design and reinforcement was provided following Breen
et al. recommendations. 4.8 Spirals used in the anchorage zone were based on the
guidelines provided by the hardware supplier. Details are included in Reference
4.2.
The post-tensioning system was draped with slope changes at third points.
This profile was required to control stresses in the 100%S PS specimens and to
ensure electrical contact among strands, since contact may influence corrosion
behavior.
Type E anchorage system from VSL Corporation was used in all post-
tensioned beams. 100%S PS Section used the Type E-4 with four strand capacity
per tendon. 100%U PS and 2/3 PS used Type E-3 anchorage system with three
strand capacity per tendon. Anchorage and grout tube details are shown in the
Appendix B drawings.
4.2.1.2.4 Analysis of Section Behavior
Each section was analyzed to determine its moment curvature behavior
and applied moment vs. crack width behavior. Surface crack widths were
predicted using recommendations by Armstrong et al. 4.1 with the Gergely-Lutz
expression. Details of these calculations are included in Reference 4.2. Figure
4.5 and Figure 4.6 show the computed moment-curvature and moment-crack
width curves for the control Class C concrete. Full details on Section Behavior
are included in Reference 4.2, including long-term behavior.

215
Figure 4.5 Moment Curvature Behavior for All Sections with Class C Concrete4.2
Figure 4.6 Applied Moment- Estimated Crack Width Behavior for All Sections with Class C Concrete 4.2
0
100
200
300
400
500
600
700
-0.01 0.00 0.01 0.02 0.03 0.04 0.05Curvature x 1000 (rad./mm)
0
885
1770
2655
3540
4425
5310
6195-0.3 0.0 0.3 0.5 0.8 1.0 1.3
Curvature x 1000 (rad./in.)
Non-PS2/3 PS100%U100%S
0.0
0.1
0.2
0.3
0.4
100 150 200 250 300 350 400Applied Moment (kN-m)
0.000
0.004
0.008
0.012
0.016885 1770 2655 3540
Applied Moment (k-in.)
Non-PS2/3 PS100%U100%S
Service LoadMoment Non-PS
2/3 PS 100%U PS 100%S PS

216
A long-term prestress loss (creep, shrinkage, relaxation) of 4.7% was
calculated for the 100%S PS section. Prestress force losses of 5% and 4.3% were
calculated for the 100%U PS and 2/3 PS sections, respectively, after four years of
sustained loading, since these sections were cracked prior to and during sustained
loading.
4.2.2 Variables
Beam Specimens were implemented in two phases, around a year apart.
Phase I specimens included the following variables: level of prestress and crack
width, one specimen with high performance grout, and the evaluation of duct
splices. Phase II specimens include different concrete types, prestressing strand
coatings and post-tensioning hardware protection, in addition to duct splice
evaluation.
4.2.2.1 Control Variables
Typical TxDOT practice was considered to define the values of the
variables for the control or reference specimens, as described in Table 4.2.
Table 4.2 Control Variables (Adapted from Reference 4.2)
Variable Description
Concrete Based on TxDOT Specification Item 421 TxDOT Class C concrete for bridge substructures Maximum w/c ratio = 0.533 (actual w/c will be closer to 0.45 based on slump requirements) Type I cement Slump = 4 in. Maximum coarse aggregate size = ¾ in. Retarder, Rheocrete 300 R Entrained air admixture 2 in. clear cover to main steel
Cement Grout Based on TxDOT Specification Item 426.3.4a w/c ratio = 0.44 Type I cement Expanding admixture, Intraplast – N
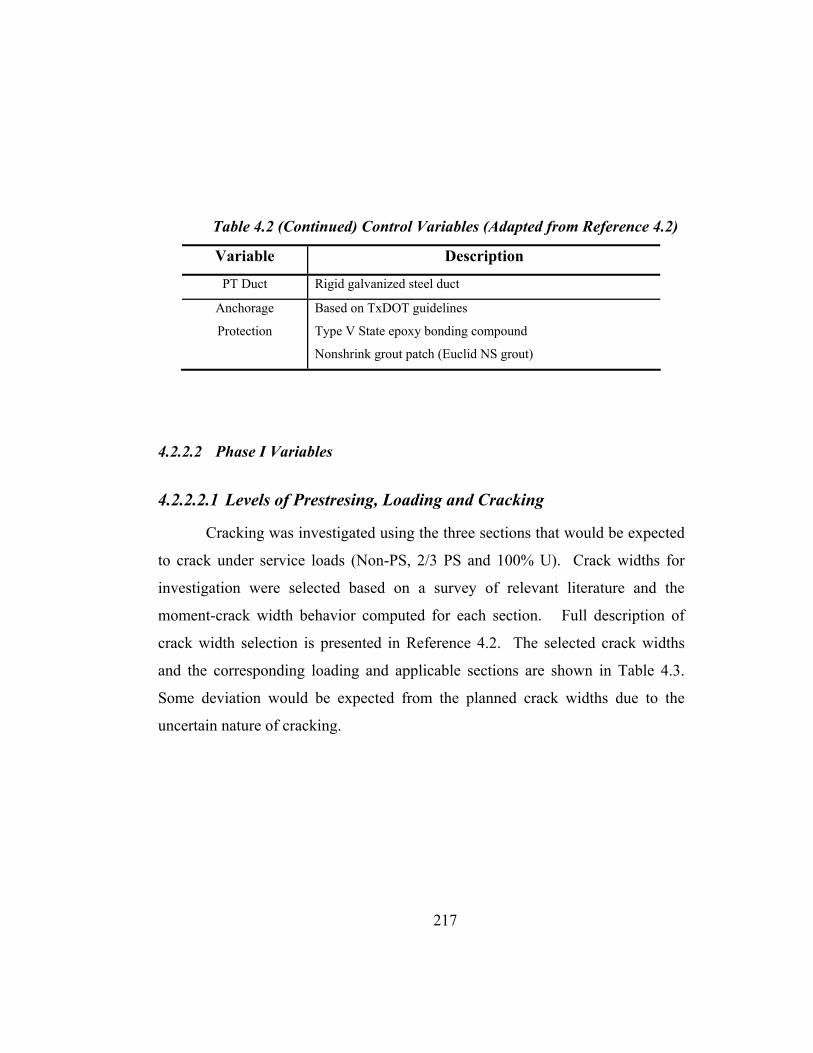
217
Table 4.2 (Continued) Control Variables (Adapted from Reference 4.2)
Variable Description
PT Duct Rigid galvanized steel duct
Anchorage
Protection
Based on TxDOT guidelines
Type V State epoxy bonding compound
Nonshrink grout patch (Euclid NS grout)
4.2.2.2 Phase I Variables
4.2.2.2.1 Levels of Prestresing, Loading and Cracking
Cracking was investigated using the three sections that would be expected
to crack under service loads (Non-PS, 2/3 PS and 100% U). Crack widths for
investigation were selected based on a survey of relevant literature and the
moment-crack width behavior computed for each section. Full description of
crack width selection is presented in Reference 4.2. The selected crack widths
and the corresponding loading and applicable sections are shown in Table 4.3.
Some deviation would be expected from the planned crack widths due to the
uncertain nature of cracking.

218
Table 4.3 Planned Crack Widths, Prestress Amounts and Loading 4.2
Loading Case Crack Widths
Applicable Sections
Loading
uncracked 100%S PS service load 1.) Constant Service Load 0.1 mm
(0.004 in.) 100%U PS service load
0.2 mm
(0.008 in.)
2/3 PS
service load
0.3 mm
(0.012 in.)
Non-PS
service load
2.) Very Small Crack
0.05 mm
(0.002 in.)
2/3 PS & 100%U PS
as needed and hold
3.) Unloaded Uncracked Non-PS & 100%U PS None
4.) Overload & Return to Service
as measured Non-PS, 2/3 PS & 100%U PS
up to 1.33 x service load, then return to service load
4.2.2.2.2 Duct Splices for Galvanized Steel Duct
Two duct splices were studied: standard industry splice (IS) and heat
shrink splice (HS). The first consisted of a 1 ft length of oversized duct with the
ends drapped with duct tape. The second consisted of an 8 in. length of heat
shrink tubing (original diameter of the tubing was 4 in.). Splice damages were
also studied consisting of poor or incomplete duct taping on IS splices, and a 1 in.
cut made in the HS tubing in the middle section. Figure 4.7 shows both duct
splices used.
The following comparisons were studied:
1) Industry standard versus heat shrink
2) Industry standard versus unspliced

219
3) Effect of damage for industry standard and heat shrink splices.
Figure 4.7 Duct Splices 4.2
4.2.2.2.3 High Performance Fly Ash Grout
Fly ash grout was used in one beam specimen, with the following
characteristics: w/c = 0.35, 30% cement replacement by weigh with Fly Ash,
superplasticizer (4 milliliters per kilogram of cementitious material for fluidity).
4.2.2.3 Phase II Variables
4.2.2.3.1 Concrete Type
Two different concrete mixes were selected for comparison: TxDOT
Class C Concrete with 25% Fly Ash and High Performance Concrete (refer to
Section 2.4.4.1).
Fly Ash was used due to its increasing use in concrete. For this
experimental program, fly ash Class F was used due to availability from local
ready-mix suppliers. For the fly ash mix, the water cement ratio was 0.44 with
25% cement replacement by weight with fly ash, and no other significant changes
to the standard Class C Concrete mix.
ducttape heat shrink tubing
Industry Standard Splice Heat Shrink Splice

220
The high performance concrete mix selected had improved strength (f’c =
10000 psi) and durability. The mix contained 25% cement replacement by fly ash
(w/c = 0.29) with superplasticizer added on site to reach a slump of about 8
inches. Full details of the mix designs are included in Reference 4.3.
4.2.2.3.2 Prestressing strand types
Two types of prestressing strands, besides the normal uncoated strands,
were chosen for comparison: epoxy-coated and galvanized. The strands were 0.5
in. diameter, 270 ksi, stress relieved.
The effect of damages to the epoxy coating was also studied. Figure 4.8
shows the location of intentional damage in one of the tendons. Damages
consisted of ¼” x ¼” squares of epoxy removed at five selected locations.
Damage locations were selected to coincide with likely crack locations and bends
in the parabolic duct profile. In these areas, durability may be affected by
chlorides penetrating the small gaps that may occur between the overlapping
metal. One strand in the damaged tendon was repaired with an epoxy patch
repair kit and the other strand was left damaged.
Figure 4.8 Locations of Intentional Damage to Epoxy-Coated Strand 4.3
CL
Damaged Tendon
Undamaged Tendon
Damage Location
CL
NaCl

221
4.2.2.3.3 Duct Type and End Anchorage Protection
Polyethylene plastic ducts were used to compare with galvanized steel
ducts. The VSLAB+TM system shown in Figure 4.9 was used, with an oval duct
due to size limitations, to accommodate two strands. The system also allowed
investigation of the end anchorage protection, since it provides an encapsulated
system. The system is basically air and water tight.
The original intention was to evaluate an electrically isolated system, but
such a system was not commercially available at the time of casting.
Figure 4.9 VSLAB+TM System4.3
4.2.2.3.4 High Performance Antibleed Grout and Poor Grouting
Procedures
Under this project, antibleed grouts were studied by Schokker 4.3 and one
mix was chosen for investigation in Phase II beams. The grout had a w/c ratio of
0.33 with 2% cement weight of antibleed admixture. The duct profile used in the

222
beams had only a small vertical rise, so bleed would not be a significant problem.
The antibleed grout was chosen to compare its corrosion protection properties
with the fly ash grout and TxDOT standard grout.
Poor grouting procedures were also investigated. One specimen was
chosen, injecting grout with the standard method in one duct and using poor
grouting procedures in the other duct (see Section 4.2.6).
4.2.3 Specimen Types
Twenty seven specimens were constructed in two phases. Phase I
included sixteen specimens and Phase II had eleven specimens. Table 4.4 shows
the specimen types and variables on each phase. Figures 4.10 and 4.11 show the
description and labeling of all beam specimens, showing the location of the duct
splices.
Table 4.4 Beam Specimen Types and Variables 4.2
M a i n S e c t i o n T y p e V a r i a b l e N o n - P S 2 / 3 P S 1 0 0 % U 1 0 0 % S
U n l o a d e d 1 .1 3 .1
V e r y S m a l l C r a c k 2 .1 3 .2
C o n s t a n t S e r v i c e L o a d 1 .2 2 .2 3 .3 4 .1
C o n s t a n t S e r v i c e L o a d ( d u p l i c a t e ) 1 .3 2 .3 3 .4 4 .2
O v e r l o a d a n d R e t u r n t o S e r v ic e 1 .4 2 .4 3 .5
Phas
e I
H i g h P e r f o r m a n c e F l y A s h G r o u t 2 .1 1
S t a n d a r d C o n c r e t e w i t h 2 5 % F l y A s h 1 .5 2 .5 3 .6
H i g h P e r f o r m a n c e F l y A s h C o n c r e t e 1 .6 2 .6 3 .7
E p o x y C o a t e d S t r a n d s 2 .7
G a lv a n i z e d S t r a n d s 2 .8
P o o r G r o u t i n g P r o c e d u r e s 2 .9
H i g h P e r f o r m a n c e A n t i - B l e e d G r o u t 2 .1 0
Phas
e II
E n c a p s u la t e d S y s t e m w / P l a s t i c D u c t 2 .1 2

223
Figure 4.10 Phase I Beam Specimens 4.2
SPLICE DESCRIPTIONS:IS - Industry StandardHS - Heat ShrinkNS - No SpliceISD - Industry Standard w/ DamageHSD - Heat Shrink w/ Damage
ISHS
Beam 2.1: Very Small Crack
ISNS
ISHS
ISHS
ISHS
Beam 2.2: Service Load (cracked)
Beam 2.3: Service Load (cracked)
Beam 2.4: Overload & Return to Service
Beam 2.11: Service (Fly Ash Grout)
ISDHSD
2/3 Prestressed Beams
ISHS
Beam 3.1: Unloaded
ISNS
ISHS
ISHS
Beam 3.3: Service Load (cracked)
Beam 3.4: Service Load (cracked)
Beam 3.5: Overload & Return to Service
ISDHSD
ISHS
Beam 3.2: Very Small Crack
ISNS
ISHS
Beam 4.1: Service Load (uncracked)
Beam 4.2: Service Load (uncracked)
ISDHSD
100%S Prestressed Beams
100%U Prestressed BeamsBeam 1.1: Unloaded
Beam 1.2: Service Load (cracked)
Beam 1.3: Service Load (cracked)
Beam 1.4: Overload & Return to Service
Non-Prestressed Beams

224
Figure 4.11 Phase II Beam Specimens 4.3
4.2.4 Materials
Construction Materials for Phase I specimens are shown in Table 4.5.
Phase II specimens used the same materials as in Phase I with the additions
described previously in Section 4.2.2.3.
Splice Descriptions:IS - Industry StandardHS - Heat Shrink
Beam 1.5: Fly Ash Concrete
Beam 1.6: High Performance Concrete
Non-Prestressed Beams
ISHS
Beam 2.5: Fly Ash Concrete
Beam 2.6: High Performance Concrete
Beam 2.7: Epoxy Coated Strand
Beam 2.8: Galvanized Strand
ISIS
ISHS
2/3 Prestressed Beams
Beam 2.9: Poor Grouting Procedures
Beam 2.10: Anti-Bleed Grout
Beam 2.12: Enc. System / Plastic Duct
ISHS
ISIS
ISHS
Beam 3.6: Fly Ash Concrete
ISHS
Beam 3.7: High Performance Concrete
100%U Prestressed Beams
ISHS
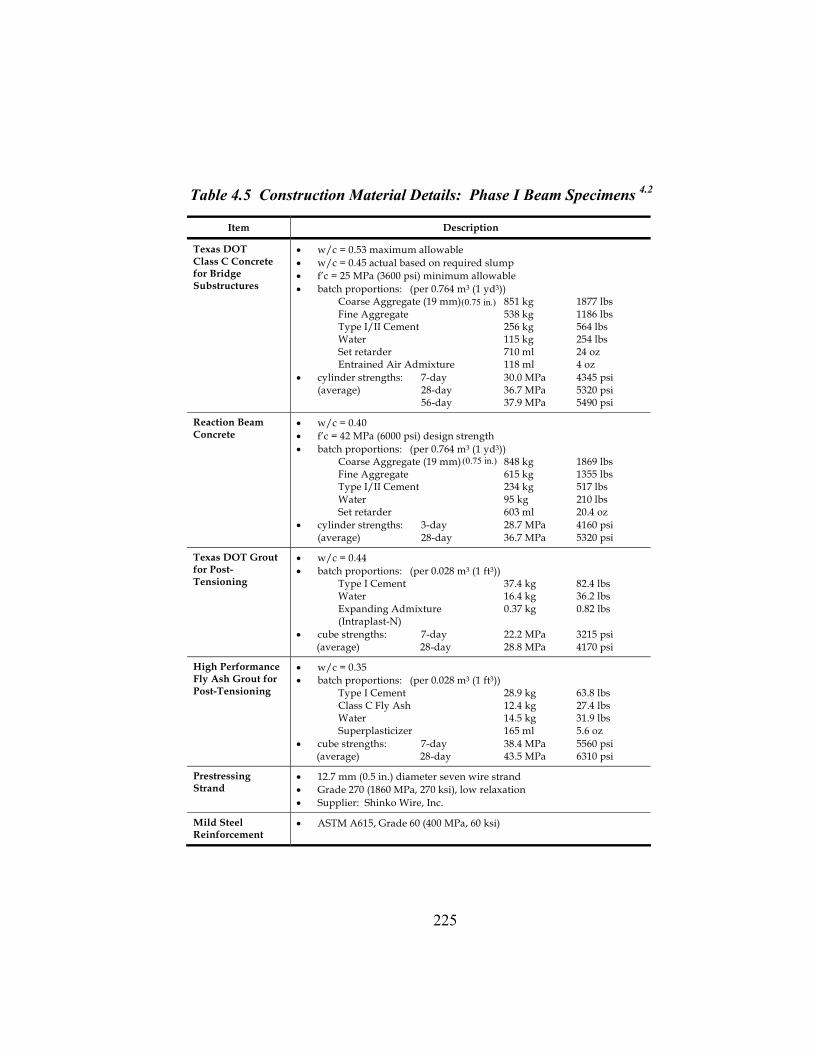
225
Table 4.5 Construction Material Details: Phase I Beam Specimens 4.2
Item Description
Texas DOT Class C Concrete for Bridge Substructures
• w/c = 0.53 maximum allowable • w/c = 0.45 actual based on required slump • f’c = 25 MPa (3600 psi) minimum allowable • batch proportions: (per 0.764 m3 (1 yd3)) Coarse Aggregate (19 mm) 851 kg 1877 lbs Fine Aggregate 538 kg 1186 lbs Type I/II Cement 256 kg 564 lbs Water 115 kg 254 lbs Set retarder 710 ml 24 oz Entrained Air Admixture 118 ml 4 oz • cylinder strengths: 7-day 30.0 MPa 4345 psi (average) 28-day 36.7 MPa 5320 psi 56-day 37.9 MPa 5490 psi
Reaction Beam Concrete
• w/c = 0.40 • f’c = 42 MPa (6000 psi) design strength • batch proportions: (per 0.764 m3 (1 yd3)) Coarse Aggregate (19 mm) 848 kg 1869 lbs Fine Aggregate 615 kg 1355 lbs Type I/II Cement 234 kg 517 lbs Water 95 kg 210 lbs Set retarder 603 ml 20.4 oz • cylinder strengths: 3-day 28.7 MPa 4160 psi (average) 28-day 36.7 MPa 5320 psi
Texas DOT Grout for Post-Tensioning
• w/c = 0.44 • batch proportions: (per 0.028 m3 (1 ft3)) Type I Cement 37.4 kg 82.4 lbs Water 16.4 kg 36.2 lbs Expanding Admixture 0.37 kg 0.82 lbs (Intraplast-N) • cube strengths: 7-day 22.2 MPa 3215 psi (average) 28-day 28.8 MPa 4170 psi
High Performance Fly Ash Grout for Post-Tensioning
• w/c = 0.35 • batch proportions: (per 0.028 m3 (1 ft3)) Type I Cement 28.9 kg 63.8 lbs Class C Fly Ash 12.4 kg 27.4 lbs Water 14.5 kg 31.9 lbs Superplasticizer 165 ml 5.6 oz • cube strengths: 7-day 38.4 MPa 5560 psi (average) 28-day 43.5 MPa 6310 psi
Prestressing Strand
• 12.7 mm (0.5 in.) diameter seven wire strand • Grade 270 (1860 MPa, 270 ksi), low relaxation • Supplier: Shinko Wire, Inc.
Mild Steel Reinforcement
• ASTM A615, Grade 60 (400 MPa, 60 ksi)
(0.75 in.)
(0.75 in.)
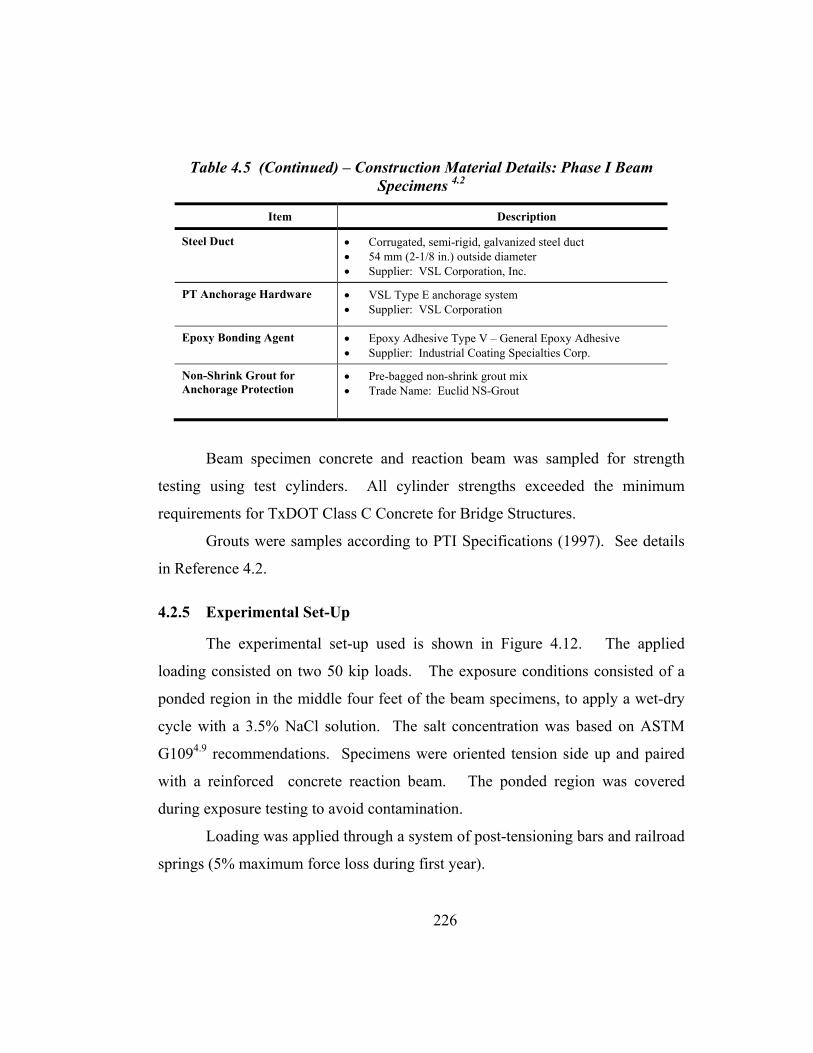
226
Table 4.5 (Continued) – Construction Material Details: Phase I Beam Specimens 4.2
Item Description
Steel Duct • Corrugated, semi-rigid, galvanized steel duct • 54 mm (2-1/8 in.) outside diameter • Supplier: VSL Corporation, Inc.
PT Anchorage Hardware • VSL Type E anchorage system • Supplier: VSL Corporation
Epoxy Bonding Agent • Epoxy Adhesive Type V – General Epoxy Adhesive • Supplier: Industrial Coating Specialties Corp.
Non-Shrink Grout for Anchorage Protection
• Pre-bagged non-shrink grout mix • Trade Name: Euclid NS-Grout
Beam specimen concrete and reaction beam was sampled for strength
testing using test cylinders. All cylinder strengths exceeded the minimum
requirements for TxDOT Class C Concrete for Bridge Structures.
Grouts were samples according to PTI Specifications (1997). See details
in Reference 4.2.
4.2.5 Experimental Set-Up
The experimental set-up used is shown in Figure 4.12. The applied
loading consisted on two 50 kip loads. The exposure conditions consisted of a
ponded region in the middle four feet of the beam specimens, to apply a wet-dry
cycle with a 3.5% NaCl solution. The salt concentration was based on ASTM
G1094.9 recommendations. Specimens were oriented tension side up and paired
with a reinforced concrete reaction beam. The ponded region was covered
during exposure testing to avoid contamination.
Loading was applied through a system of post-tensioning bars and railroad
springs (5% maximum force loss during first year).

227
Figure 4.12 Test Setup 4.2
Specimens were located in the paved area at the North end of the Ferguson
Structural Engineering Laboratory, as shown in Figure 4.13.
Figure 4.13. Beam Test Setup at North End of Ferguson Laboratory 4.2
Specimen
ReactionBeam
1.37 m(4.5 ft)
1.37 m(4.5 ft)
1.37 m(4.5 ft)
Cross Section:457 x 610 mm(18 x 24 in.)
Ponded SaltSolution
4.62 m (15' 2")TubeSection
ChannelSection
16 mm PT Bar(5/8 in.)
Spring
4.5 ft 4.5 ft 4.5 ft4.5 ft
15’ 2”
5/8 in. PT Bar Cross Section18 x 24 in.
Specimen
ReactionBeam
1.37 m(4.5 ft)
1.37 m(4.5 ft)
1.37 m(4.5 ft)
Cross Section:457 x 610 mm(18 x 24 in.)
Ponded SaltSolution
4.62 m (15' 2")TubeSection
ChannelSection
16 mm PT Bar(5/8 in.)
Spring
4.5 ft 4.5 ft 4.5 ft4.5 ft
15’ 2”
5/8 in. PT Bar Cross Section18 x 24 in.

228
4.2.6 Specimen Fabrication
All specimens were constructed at the Ferguson Structural Engineering
Laboratory. Full description of the construction process is included in References
4.2 and 4.3. Figure 4.14 shows details of the construction process.
Figure 4.14. Reinforcing Cage, End Detail for PT Beam, and Formwork4.2,4.3

229
Post-Tensioning losses due to elastic shortening, friction and anchorage
seating were considered in the design of each section type. Post-tensioning was
applied in stages as shown in Figure 4.15. Several pull off tests were performed
to determine necessary power seating forces to limit seating losses to tolerable
levels.
Figure 4.15 Staged Post-Tensioning Sequence 4.2
Special wedges were used with the epoxy coated strands. These wedges
were larger than standard wedges and proper anchor heads were fabricated to
accommodate the wedges.
Grouting was performed following Post-Tensioning Institute
recommendations. Vents were provided toward the end of the intermediate rise in
the duct. Beam 2.9 had one tendon poorly grouted to compare against good
practice procedures. As explain in Reference 4.3, for this tendon, the pump was
turned off twice during pumping to allow possible pockets of air in the line. The
pump was left off for approximately 10 minutes at one point during grouting to
allow the grout already pumped into the tendon to reach a different consistency
Stage 1:Tendon 1to 1/3 Tj
1/3 Tj
Stage 2:Tendon 2to 2/3 Tj
2/3 Tj
Stage 3:Tendon 1from 1/3Tjto Tj
Tj Tj
Stage 4:Tendon 2from 2/3Tjto Tj

230
than that of the grout in the pumping chamber that was continuously agitated.
The far end grout tube was closed at the first appearance of grout instead of
letting the grout flow to reach a continuous stream.
Anchorages were protected by filling the anchorage pockets with a
nonshrink grout.
4.2.7 Specimen Loading
The specimens were loaded using two 120 kip hydraulic rams, one at each
end of the beam. Figure 4.16 shows the loading hardware. The force in the post-
tensioning bars was locked in by tightening the nuts. Load was maintained
during exposure testing with the use of two railroad springs at each end. Loading
was readjusted periodically to overcome losses. Detailed description of specimen
load history is included in Reference 4.2.
Figure 4.16 Beam Loading System
Spreaderbeam
120 kip Ram
nut
Railroadsprings
Spreaderbeam
120 kip Ram
nut
Railroadsprings
Spreaderbeam
120 kip Ram
nut
Railroadsprings
120 kip Ram
nut
Railroadsprings

231
4.2.8 Block specimens
Concrete blocks were fabricated and cast simultaneously as the beam
specimens, to monitor chloride penetration on beams during exposure testing.
The use of these blocks avoids drilling in the test area of the actual beams to
extract the powder samples for chloride analysis. Concrete block dimensions
were 12 x 12 x 6 in., and were based on the AASHTO T 259-80
recommendations4.10 for evaluating chloride ion permeability of concrete. Two
blocks were cast during each pour, and were termed control block and ponded
block. Each ponded block was fitted with a plexiglass ponded region that was
filled with a 3.5% NaCl solution following the same exposure schedule as for the
beam specimens. The control blocks were used to indicate the base level of
chlorides in the concrete. Concrete blocks are shown in Figure 4.17
Figure 4.17 Concrete Blocks for Beam Chloride Analysis 4.2
4.2.9 Beam Dripper System
Three specimens were selected to evaluate the effect of saltwater dripping
in the anchorage area, at the top of the nonshrink grout: Specimen 2.7 (epoxy-
coated strand), Specimen 2.9 (poorly grouted) and Specimen 2.12 (encapsulated
system / plastic duct). The trickle saltwater system is shown in Figure 4.18.

232
Figure 4.18 Beam End Dripper System 4.3
4.3 MEASUREMENTS DURING EXPOSURE TESTING
In an attempt to monitor the corrosion activity of the specimens during
exposure testing, multiple non-destructive methods were used. All these methods
have advantages and limitations that became more evident after full autopsies had
been performed. Non-destructive methods used in this series included: visual
inspection, crack width measurements, half-cell potential readings, corrosion rate
measurements and chloride penetration measurements.
4.3.1 Visual Inspection
During exposure testing, specimens were examined for any signs of
distress, including changes in cracking, rust stains, and spalling.
4.3.2 Crack Width Measurements
Surface cracks were measured using a crack microscope and a crack
comparator, where each crack crossed each one of the five reference lines drawn
on the beam top (tension) side, as indicated in Figure 4.19.

233
Figure 4.19 Crack Width Measurement Locations 4.2
Cracks were measured after loading the specimens, at the beginning of
exposure testing; and, at the end of testing for the selected specimens,
immediately prior to full autopsies.
4.3.3 Half-Cell Readings
Half-cell potential measurements can provide two types of information:
• Probability of corrosion at a given location.
• Time for corrosion initiation.
Half-cell (HC) potentials were measured against a Saturated Calomel
Electrode (SCE) at the end of the wet cycle. Therefore, throughout this
document, HC potentials are reported as millivolts versus SCE. Other common
reference electrodes and the potential of these electrodes versus the Standard
Hydrogen Electrode (SHE) are shown in Table 4.6. A detailed description of the
theory behind Half-Cell measurements is included in Reference 4.11. Also,
References 4.2 and 4.3 include a description of half-cell potential theory
pertaining to this research program.
Half-Cell potential measurements require the use of a reference electrode,
voltmeter and electrical connection to the reinforcement. Ground clamps were
used to attach a wire to the prestressing tendons before capping the anchorages. In
addition, two ground wires were attached to the reinforcement cage, where
5 reference lines,75 mm (3 in.) spacing
crack location
center of loadapplication

234
electrical continuity was found on the reinforcing cage, ducts and prestressing
ducts.
Table 4.6 Common Reference Electrode Potentials versus SHE4.11
HC potential measurements were taken every four weeks, and were based
on ASTM C876 4.12 guidelines. A grid was defined in the top of the specimens to
serve as a guide for the readings. The grid spacing is 6 inches along the length of
the beam. Figure 4.20 shows the example for non-prestressed beams and
reading locations for other specimens.
Figure 4.20 Grid for Half-Cell Potential Readings Non-Prestressed Beams and Half-Cell Reading Locations for other beams 4.2
Reference Electrode Half-Cell Reaction Potential (V vs. SHE)
Copper-Copper Sulfate (CSE) CuSO4 + 2e- = Cu + SO4
2- +0.318
Saturated Calomel Electrode (SCE) Hg2Cl2 = 2e- = 2Hg + 2Cl- +0.241
Standard Hydrogen Electrode (SHE) 2H + 2e- = H2 +0.000
Ponded Area
Grid at 150 mm spacing (6 in.)
Non PS 2/3 PS 100% U PS 100% S PS

235
Table 4.7 shows the numerical significance of HC Potential readings.
These values are reported for uncoated reinforcing steel and therefore they may
not necessarily be appropriate for post-tensioned concrete. When galvanized
steel ducts are used, half-cell potentials may reflect the potential of the zinc on the
galvanized steel duct, which could lead to erroneous conclusions.
Table 4.7 Interpretation of Half-Cell Potentials for Uncoated Reinforcing Steel, Based on ASTM C876-91 4.2
During the first months of exposure testing, HC readings were taken before the
saltwater solution was removed from the ponded area. It was later found that
more accurate readings were obtained when taking the readings immediately after
removal of the solution. Outside the ponded area, a wetting solution was used
according to ASTM standards.
4.3.4 Corrosion Rate Readings
Full description of Corrosion Rate theory is included in Reference 4.2.
The following description is an extract from that reference.
Polarization resistance is a useful technique for measuring instantaneous
corrosion rates under laboratory and field conditions. Polarization measurements
are rapid, highly sensitive, non-destructive and can be performed repeatedly. The
theory states that within a small range of overvoltage (+/- 10 to 15 mV from the
free corrosion potential), there is a linear relationship between applied current and
electrode potential. The slope of the curve of ∆E versus ∆Iapplied at the origin is
Measured Potential (vs SCE) Probability of Corrosion
more positive than –130 mV less than 10% probability of corrosion
Between -130 mV and –280 mV corrosion activity uncertain
more negative than –280 mV greater than 90% probability of corrosion

236
defined as the polarization resistance, Rp. The polarization resistance is inversely
proportional to corrosion current, which in turn is directly proportional to
corrosion rate. The computed corrosion rate can be compared to established
guidelines to relate corrosion rate to corrosion damage. This method for
corrosion rate measurements is often referred to as linear polarization or the
polarization resistance method.4.2
The instantaneous corrosion current is related to the polarization resistance
by the Stern-Geary equation shown below.4.13,4.14
( ) pca
cacorr R
13.2
i ×β+β
ββ= Eq. 4.1
where
icorr = corrosion current, mA
βa = anodic Tafel constant, mV
βc = cathodic Tafel constant, mV
Rp = polarization resistance, Ohms
The rate of corrosion in terms of corrosion current density, i, can be
calculated by dividing the corrosion current, icorr, by the area of polarized steel,
Ap.
p
corr
Aii = Eq. 4.2
where
icorr = corrosion current, mA
Ap = area of polarized steel, cm2
i = corrosion current density, mA/cm2

237
The computed corrosion rate, in terms of corrosion current density, can be
compared to the established guidelines to relate corrosion rate to corrosion
damage.
The polarization resistance, Rp, can be measured using several different
techniques.4.14,4.15 The two most common methods used for reinforced concrete
are the three electrode procedure, and electrochemical impedance spectroscopy
(sometimes referred to as AC impedance). Each method has advantages and
disadvantages.4.15 The three electrode method is most common due to its
simplicity and low equipment cost.
The basic components of the equipment for the three electrode method are
shown in Figure 4.21. The working electrode is the steel reinforcement for which
the corrosion rate is to be measured. The counter electrode is used to apply the
polarizing current to the steel. The reference electrode measures the free
corrosion potential of the working electrode and the change in potential of the
working electrode due to the applied current from the counter electrode. The
process of measuring the polarization resistance begins with measuring the free
corrosion potential or open-circuit potential of the tested area of steel
reinforcement (working electrode). The working electrode is then polarized in
uniform increments from the free corrosion potential and the associated current is
measured. The polarization resistance is taken as the slope of the curve when ∆E
versus ∆Iapplied is plotted. This relationship is normally linear for a range of up to
+/- 10 mV from the free corrosion potential.4.13 When corrosion activity is low,
small changes in applied current will produce a large change in potential and the
polarization resistance will be large. When corrosion activity is high, large
changes in applied current are needed to produce the desired potential increment,
resulting in a low polarization resistance.

238
Figure 4.21 Polarization Resistance Apparatus (Schematic) 4.2
Errors in Corosion Rate measurements based on Polarization Resistance
include: Ohmic Electrolyte Resistance, uncertain polarized area, uncertain Tafel
constants, use in prestressed concrete, erratic or very small polarization resistance.
A detailed description of each source of error is included in Reference 4.2.
At the beginning of this experimental program there was no published
work on using polarization resistance to monitor corrosion rates in pretensioned
or post-tensioned concrete. Some of the factors listed above may have a
significant influence on the usefulness of the technique in prestressed concrete. In
spite of these potential limitations, it was decided to use polarization resistance as
an evaluation method in this testing program since qualitative information and
comparisons may still be possible. Relative corrosion rate measurements can
provide an indication of relative corrosion rates between specimens with different
variables. For example, the relative effectiveness of different corrosion protection
measures may be evaluated by comparing corrosion rates with those from
“control” specimens. Also, regular measurements may indicate the onset of
corrosion through increases in corrosion rate.
This program used two different types of equipment to take corrosion rate
measurements: the CORRTEST PR-Monitor Model IN-4500 and the 3LP
WE CE RE
-322 mV
0.288 mAPotentialCurrent
WE - Working ElectrodeCE - Counter ElectrodeRE - Reference Electrode
polarizingsignal

239
Equipment. Both types of equipment use the three-electrode technique. Two
corrosion rate measurements were taken on each beam, one at midspan and one at
a 1 ft. (305 mm) offset from midspan. The polarization resistance technique
requires a direct electrical connection to the steel for which the corrosion rate is
being measured. This connection was provided by the ground wires attached to
the mild steel reinforcement and prestressing tendons during construction.
Corrosion rate measurements require the concrete to be initially dry. A wetting
solution is used to moisten the concrete surface immediately prior to testing.
The PR-Monitor device uses a portable computer to control the corrosion
rate measurement process. The PR-Monitor compensates for the concrete
resistance and has a guard electrode to confine the polarization signal. The
default polarization scan uses six steps of 5 mV, starting at -15 mV from the free
corrosion potential and ending at +15 mV. The starting and ending potentials and
voltage increment may be adjusted by the user in situations where the solution
resistance is large in comparison to the polarization resistance. The increased
potential range for the polarization scan can improve the accuracy of the
measured polarization resistance when the solution resistance is high. At the end
of the polarization scan, the concrete resistance or solution resistance is measured
using AC impedance. A high frequency, low voltage AC signal is used to isolate
the solution resistance. The computer performs a linear regression analysis on the
polarization scan data and computes the total resistance, Rtot, as the slope of ∆E
versus ∆Iapplied. The solution resistance, Rs, is subtracted from the total resistance
to obtain the polarization resistance, Rp as shown below.
Rp = Rtot - Rs Eq. 4.3
The corrosion current is calculated assuming a proportionality constant, B,
of 26 mV, a typical value for actively corroding steel reinforcement in
concrete.4.16

240
pcorr R
Bi = Eq. 4.4
where,
( )ca
ca
3.2B
β+βββ
= Eq. 4.5
When all measurements and calculations are complete, the computer
displays the free corrosion potential, polarization resistance, concrete resistance
and corrosion rate in mils per year. This information and the polarization scan
data are also written to an output file. The corrosion rate can be converted to
current density by dividing the corrosion rate in mils per year by 0.4568.4.17 The
corrosion current density can also be calculated using the measured polarization
resistance and assumed polarized area. (See Equations 4.1 and 4.2) The corrosion
severity is assigned based on the ranges listed in Table 4.8.
Table 4.8 PR Monitor Corrosion Severity Based on Current Density 4.17
Corrosion Current Density (µA/cm2) Corrosion Severity
Less than 0.1
Between 0.1 and 0.5
Between 0.5 and 1.0
Greater than 1.0
Passive
Low
Moderate
High
The 3LP Equipment was developed by Kenneth C. Clear, Inc., USA. A
photograph of the equipment and setup is shown in Figure 4.22. The 3LP device
is manually operated, and polarization scan data are recorded by hand. The
counter electrode is rectangular and current confinement is not provided. The
equipment measures the half-cell potential of the reinforcement (working
electrode) and the applied polarization current. The polarization scan uses three
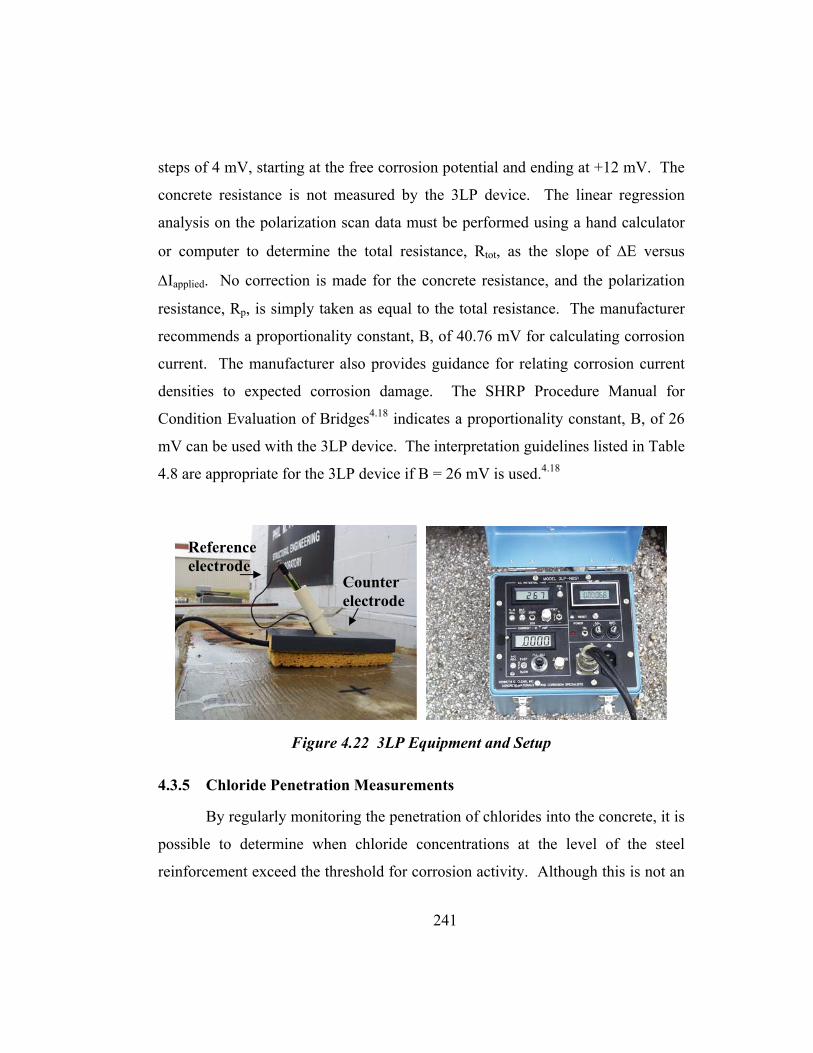
241
steps of 4 mV, starting at the free corrosion potential and ending at +12 mV. The
concrete resistance is not measured by the 3LP device. The linear regression
analysis on the polarization scan data must be performed using a hand calculator
or computer to determine the total resistance, Rtot, as the slope of ∆E versus
∆Iapplied. No correction is made for the concrete resistance, and the polarization
resistance, Rp, is simply taken as equal to the total resistance. The manufacturer
recommends a proportionality constant, B, of 40.76 mV for calculating corrosion
current. The manufacturer also provides guidance for relating corrosion current
densities to expected corrosion damage. The SHRP Procedure Manual for
Condition Evaluation of Bridges4.18 indicates a proportionality constant, B, of 26
mV can be used with the 3LP device. The interpretation guidelines listed in Table
4.8 are appropriate for the 3LP device if B = 26 mV is used.4.18
Figure 4.22 3LP Equipment and Setup
4.3.5 Chloride Penetration Measurements
By regularly monitoring the penetration of chlorides into the concrete, it is
possible to determine when chloride concentrations at the level of the steel
reinforcement exceed the threshold for corrosion activity. Although this is not an
Reference electrode
Counter electrode

242
absolute measurement of corrosion activity, it can be used in conjunction with
other data to estimate whether corrosion initiation had occurred. 4.2
Chloride penetration is normally measured by collecting and testing
samples from the concrete at varied depths. The most common method for
obtaining samples is to use a rotary hammer (hammer drill). Holes are drilled in
the concrete to the desired depth and the powder is collected for analysis.
Samples were analyzed for acid-soluble chloride content using a specific ion
probe (CL Test System by James Instruments).4.2 Chloride sample and analysis
procedure were based on AASHTO T260-94.4.19
Two samples were taken periodically from each concrete block at three
depths: 0.5 in., 1 in., and 2 in. (bar level). The two powder samples per block
were combined to give a representative sample at each depth. Several acid-soluble
chloride tests were run and the results were averaged. Drill holes were filled with
epoxy.4.3
At the end of testing, concrete samples for chloride content analysis were
taken from beams scheduled for partial and full autopsy. Samples were taken at
four locations from the beam transverse centerline: 2 in., 18 in., 26 in., and 32 in.;
and, at three depths: 0.5 in., 1 in., and 2 in. In partial autopsy beams, 1.3 and 3.3
as described later, samples were not taken at the 2 in. depth so bars would not be
damaged. For 100%U PS and 100%S PS beams, two samples were taken at each
distance from the beam transverse centerline, since less reinforcement congestion
allowed for drilling at these locations. Samples were combined, analyzed and
results were averaged. Figures 4.23 and 4.24 shows the concrete sample
locations.

243
Figure 4.23 Non-PS and 2/3 PS Beam Concrete Sample Locations (Adapted from Reference 4.5)
Figure 4.24 100%U PS (and 100%S PS) Beam Concrete Sample Locations
(Adapted from Reference 4.5)
C.L.
C.L.Ponded Region
2”16”8”6”
Samples at depths of 0.5, 1.0 and 2.0 inches
C.L.
C.L.Ponded Region
2”16”8”6”
Samples at depths of 0.5, 1.0 and 2.0 inches
C.L.
C.L.Ponded Region
2”16”8”6”
Samples at depths of 0.5, 1.0 and 2.0 inches
C.L.
C.L.Ponded Region
2”16”8”6”
1.75”
1.75”
Samples at depths of 0.5, 1.0 and 2.0 inches
C.L.
C.L.Ponded Region
2”16”8”6”
1.75”
1.75”
Samples at depths of 0.5, 1.0 and 2.0 inches
C.L.
C.L.Ponded Region
2”16”8”6”
1.75”
1.75”
Samples at depths of 0.5, 1.0 and 2.0 inches

244
The above sample locations allow for investigation of the following
aspects:
• Vertical penetration of chlorides through concrete
• Horizontal propagation of chlorides through concrete
• Chloride content in ponded region versus non-ponded region
• Effect of surface cracking on chloride penetration.
4.3.6 Limited Autopsy
In order to correlate the half-cell potential readings with actual
reinforcement condition, a limited autopsy was performed after 15 months of
exposure testing by Schokker,4.3 in Phase I beams 1.3, 3.3 and 3.4. Detailed
description of limited autopsy procedure and findings are described in Reference
4.3
4.4 EXPOSURE TEST RESULTS
As described in Section 4.3, non-destructive testing to monitor corrosion
activity in the specimens included: crack width measurements, half-cell potential
readings, corrosion rate measurements, and chloride penetration and chloride
content analysis. Results obtained during the exposure testing period are
described herein.
4.4.1 Crack Width Measurements
Crack widths were measured at two dates: during initial loading and, at
the end of testing for the selected partial and full autopsy beams. Measurements
were taken using a microscope during initial loading and a crack comparator
immediately before autopsy.

245
4.4.1.1 Crack Widths During Initial Loading
Crack patterns on the tension and side faces of all Phase I beams are
shown in Figure 4.25. Load and reaction points are indicated in the figure.
Only cracked specimens at service loading are shown. The measured crack data
showed the following trends:4.2
• The number of cracks and extent of cracking was drastically reduced
as the level of prestress increased.
• The extent of cracking along the beam was well predicted by the
cracking moment for the three beam types. See Reference 4.2 for a
detailed description of crack prediction and theory.
• Cracks commonly occurred at stirrup locations.
• The maximum surface crack widths were reduced as the level of
prestress increased.

246
Figure 4.25 Phase I Beam Specimens Crack Patterns 4.2
Non-PS: Service Load
Non-PS: Service Load
Non-PS: 25% Overload (Sustained Service)
100%U PS: 25% Overload (Sustained Service)
100%U PS: 33% Overload (Sustained Service)
100%U PS: 25% Overload (Sustained Service)
2/3 PS: Very Small Crack (below Service)
2/3 PS: Service Load
2/3 PS: Service Load
2/3 PS: 25% Overload (Sustained Service)
2/3 PS: Service Load
1.2
1.3
1.4
3.3
3.4
3.5
2.1
2.2
2.3
2.4
2.11
Top surface (tension face)
Side face

247
A comparison of the expected crack width versus moment curve
for each of the three cracked section types is shown in Figure 4.26.
Figure 4.26 Calculated Cracking Behavior 4.3
Figure 4.27 shows the measured maximum crack widths versus moment
for each section type. The plots corresponding to the specimens with TxDOT
standard concrete and control variables show excellent agreement with the
estimated crack width values calculated prior to loading, using the Gergely-Lutz
method with modifications for post-tensioned sections.4.1 Plots of specimens with
high performance concrete, high performance grout and epoxy-coated strand
slightly deviated from the estimated crack width plots.4.3
0.0
0.1
0.2
0.3
0.4
100 150 200 250 300 350 400
Applied Moment (kN-m)
Surf
ace
Cra
ck W
idth
(m
m)
0.000
0.004
0.008
0.012
0.016885 1770 2655 3540
Applied Moment (k-in.)
Surf
ace
Cra
ck W
idth
(in
.)
Non-PS2/3 PS
100%U
Service LoadMoment

248
Figure 4.27 Measured Maximum Crack Widths 4.3
0.0000
0.0040
0.0080
0.0120
0.0160
0.0200
0 1000 2000 3000 4000
Surf
ace
Crac
k W
idth
(in)
1.2: Service Load1.3: Service Load1.4: Overload1.5: FA Concrete1.6: HP ConcreteCalculated
NO
N-PS SPEC
IME
NS
0.0000
0.0040
0.0080
0.0120
0.0160
0.0200
0 1000 2000 3000 4000
Surfa
ce C
rack
Wid
th (i
n)
2.1: Service Load2.2: Service Load2.3: Service Load2.4: Overload2.5: FA Concrete2.6: HP Concrete2.7: Epoxy Strand2.8: Galvanized Strand2.9: Service Load2.10:Anit -Bleed Grout2.11: FA Grout2.12: Plastic DuctCalculated
2/3 PS S
PECIMENS
0.0000
0.0040
0.0080
0.0120
0.0160
0.0200
0 1000 2000 3000 4000
Applied Moment (k-in)
Surfa
ce C
rack
Wid
th (i
n)
3.3:Overload3.4: Overload3.5: Overload3.6: FA Concrete3.7: HP ConcreteCalculated
100%U PS SPECIM
ENS
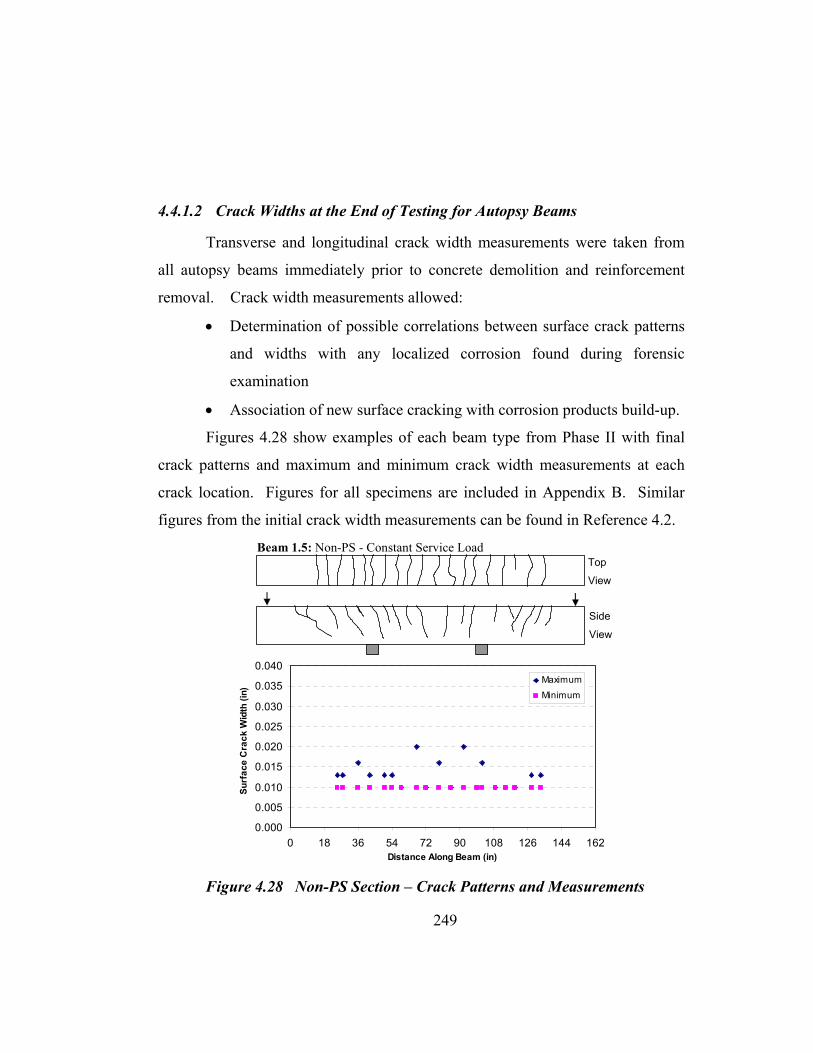
249
4.4.1.2 Crack Widths at the End of Testing for Autopsy Beams
Transverse and longitudinal crack width measurements were taken from
all autopsy beams immediately prior to concrete demolition and reinforcement
removal. Crack width measurements allowed:
• Determination of possible correlations between surface crack patterns
and widths with any localized corrosion found during forensic
examination
• Association of new surface cracking with corrosion products build-up.
Figures 4.28 show examples of each beam type from Phase II with final
crack patterns and maximum and minimum crack width measurements at each
crack location. Figures for all specimens are included in Appendix B. Similar
figures from the initial crack width measurements can be found in Reference 4.2.
Figure 4.28 Non-PS Section – Crack Patterns and Measurements
Beam 1.5: Non-PS - Constant Service Load
0.000
0.005
0.010
0.015
0.020
0.025
0.030
0.035
0.040
0 18 36 54 72 90 108 126 144 162Distance Along Beam (in)
Surf
ace
Cra
ck W
idth
(in)
Maximum
Minimum
Top
View
Side
View

250
Figure 4.29 2/3 PS Section – Crack Patterns and Measurements
Figure 4.30 100%U PS Section – Crack Patterns and Measurements
Beam 2.5: 2/3 PS - Constant Service Load
Beam 3.7: 100%U PS - Constant Service Load
0.000
0.005
0.010
0.015
0.020
0.025
0.030
0.035
0.040
0 18 36 54 72 90 108 126 144 162Distance Along Beam (in)
Surf
ace
Cra
ck W
idth
(in)
Maximum
Minimum
0,000
0,005
0,010
0,015
0,020
0,025
0,030
0,035
0,040
0 18 36 54 72 90 108 126 144 162Distance Along Beam (in)
Surf
ace
Cra
ck W
idth
(in)
Maximum
Minimum
Top
View
Side
View
Top
View
Side
View

251
It is observed that crack data did not exist for Specimen 3.2 and 4.2, since
they remained uncracked under service load levels. The cracking of these
specimens could be due to one of the previously mentioned reasons.
When comparing Figure 4.28 with Figure 4.27 for Specimen 1.5, it is
observed an increase in crack width from initial to final testing. The maximum
crack width for this specimen grew from 0.012 in. to 0.020 in. Similar
comparisons can be made for Specimens 2.5 and 3.7 from Figures 4.27, 4.29 and
4.30. The crack width for Specimen 2.5 grew from 0.007 in. to 0.020 in. (about
three times larger), while for Specimen 3.7 the maximum crack width grew from
0.010 in. to 0.016 in. Loading was kept constant during exposure period and
therefore, it is concluded that additional crack opening was due to a combination
of long term concrete deformations and, active reinforcement and duct corrosion.
Maximum measured crack widths and the average of the maximum crack
widths from each crack for Phase I specimens are shown in Figure 4.31. From
this figure, no difference is observed between the Non-PS and 2/3 PS beams, but
shows a small decrease in the 100% PS Beams. The average maximum crack
widths of the Phase I beams are almost identical, with Specimen 2.3 showing a
slightly larger average maximum crack width. A slight trend of decreasing
maximum crack width with increasing levels of prestress is observed.
Figure 4.32 shows the maximum measured crack width and the average of
the maximum crack width from each crack for Phase II beams. No distinct trends
are observed between the maximum crack widths and prestress levels, and
between maximum crack widths and concrete type. However, the average
maximum crack widths seem to show an increase with increasing prestress levels,
even when differences may be considered very small.

252
Figure 4.31 Crack Widths – Phase I Beams 4.5
Figure 4.32 Crack Widths – Phase II Beams 4.5
Wide longitudinal or splitting type cracks were found at the end of testing
in Specimens 1.3, 2.3 and 2.11. Section 4.6.2 includes a discussion on the
importance of these cracks and their relation with corrosion found after forensic
examination.
BEAM VARIABLE1.1 N PS, Uload1.3 N PS, Sload2.3 2/3 PS, Sload
2.11 2/3 PS, Sload, FA Grout
3.1 U PS, Uload3.2 U PS, Sload3.3 U PS, Oload4.2 S PS, Sload
0.01
33
0.01
65
0.01
32
0.01
30
0.01
03
0.01
300.02
00
0.02
00
0.02
00
0.01
30
0.01
30
0.01
30
-0.0050.0100.0150.0200.0250.0300.0350.0400.045
1.3 2.3 2.11 3.2 3.3 4.2
BEAM
Cra
ck W
idth
(in.
)
Avg. Max. Crack Width
Max. Crack Width
Non-PS 2/3 PS 100%U PS 100%S PS
BEAM VARIABLE
1.5 N PS, FA Conc.
1.6N PS,
HP Conc.
2.52/3 PS,
FA Conc.
2.6 2/3 PS, HP Conc.
3.6 U PS, FA Conc.
3.7U PS,
HP Conc.
0.01
30
0.01
17
0.01
36
0.01
27
0.01
45 0.02
05
0.02
00
0.01
60
0.02
00
0.01
60
0.01
60
0.04
0
-0.0050.0100.0150.0200.0250.0300.0350.0400.045
1.5 1.6 2.5 2.6 3.6 3.7
BEAM
Cra
ck W
idth
(in.
)
Avg. Max. Crack Width
Max. Crack Width
Non-PS 2/3 PS 100%U PS
0,01
30
0,01
17
0,01
36
0,01
27
0,01
45
0,01
450,02
00
0,01
60
0,02
00
0,01
60
0,01
60
0,01
60
-0,0050,0100,0150,0200,0250,0300,0350,0400,045
1,5 1,6 2,5 2,6 3,6 3,7
BEAM
Cra
ck W
idth
(in.
)
Avg. Max. Crack Width
Max. Crack Width
Non-PS 2/3 PS 100%U PS

253
4.4.2 Half-Cell Potential Readings
Half-Cell potential readings were taken once every four weeks at the end
of each wet cycle, as explain in Section 4.3.3. The graphs presented in this
section include readings from the beginning of the exposure testing period until
the exposure testing ceased for the specimens chosen for forensic examination,
corresponding to 1594 days for Phase I beams and 1235 days for Phase II beams.
Due to these significantly different exposure durations, no attempt was made to
compare data from both phases. Therefore, data from each phase will always be
presented separately.
Potential plots correspond to the highest value for a specimen on a given
reading date. Average half-cell potentials and greatest negative potentials
followed the same trend and therefore, only greatest negative potentials are
shown. ASTM guidelines, as indicated in Table 4.7, are shown on the figures as a
reference.
A seven month gap of half-cell plots can be observed on each graph. This
gap represents a period in which readings were not taken due to changeover in
personnel.
A negligible number of half-cell readings were found to not follow the
trend of the rest of the plot. These outliers were clearly identified. Due to their
significant deviation from the trend, it was decided to replace the reading with an
interpolation between the two adjacent readings. These outliers are considered to
be due to human error or to the unreliability of the equipment. Over the course of
exposure testing, complications commonly arose with the wiring system needed
to take the readings. Although measures were taken to correct these problems,
there was always some uncertainty of the accuracy of the readings. A description
of the eleven data points considered as outliers in Phase I and the five data points
in Phase II is included in Appendix B.

254
It is important to emphasize that half-cell potentials are only an indicator
of corrosion activity, and a correlation with corrosion rate cannot be made. The
ASTM C876 guidelines only indicate the probability of corrosion. Many factors
can influence measured half-cell potentials, including concrete cover thickness,
concrete resistivity, concrete moisture content, different metals and availability of
oxygen. In some cases, these factors can lead to very negative half-cell potentials
with little or no corrosion activity. For this reason it is important to consider the
variation of half-cell potential measurements over an extended period of time in
addition to the magnitude of the readings. 4.2
The onset of corrosion can be determined based on the following:
• A sudden and significant change (more negative) in half-cell potentials, or
• Half-cell potential measurements more negative than -280 mV vs SCE.
When it is concluded that there is a high probability that corrosion activity
is occurring within the member, it is difficult to determine which element
(stirrups, rebars, ducts or prestressing strands) is corroding, since they are all
electrically connected. This uncertainty can be resolved during forensic
examination. 4.5
4.4.2.1 Phase I Beam Specimens
Phase I beams started exposure testing in December 1997, and ended in
May 2002 for the autopsy specimens, after 1594 days of testing. Figure 4.33
shows a plot of Phase I autopsy beams. At the end of testing, all specimens,
except Specimen 3.1 (100%S PS, Unloaded), show high probability of corrosion
activity, above 90%. Figures 4.34 through Figure 4.38 show the autopsy
specimens separated according to the main variables. Half-cell potential plots for
all specimens in Phase I can be found in Appendix B.

255
Figure 4.33 Half-Cell Potential Readings for Phase I Autopsy Beams
Figure 4.34 shows half-cell readings for the Non-PS beams in Phase I.
The only variables on these specimens are the loading and cracking. The plot
shows a decrease in the corrosion activity when the beam is unloaded and
uncracked. The onset of corrosion shows also a significant difference, as would
be expected, with an earlier possible initiation date for the loaded and cracked
specimen. When analyzing this data, it has to be recognized that it is impractical
to assume any structural member to be completely unloaded. Nevertheless, the
negative effect of cracking is an important conclusion.
-900
-800
-700
-600
-500
-400
-300
-200
-100
0
100
200
0 200 400 600 800 1000 1200 1400 1600 1800Time (days)
Hal
f Cel
l Pot
entia
l (-m
V)
1.1: Unloaded 1.3: Service Load
2.3: Service Load 2.11:Service Load, FA Grout
3.1: Unloaded 3.2: Service Load
3.3: Overload 4.2: Service Load <10% Probability
>90%Probability

256
Figure 4.34 Half-Cell Potential Readings for Non-PS Specimens in Phase I Autopsy Beams
Figure 4.35 shows half-cell readings for mixed reinforcement beams in
Phase I. Both specimens are identical except for the grout type. Based on this
plot, it does not appear that the grout type has any effect on corrosion protection.
However, care must be exercised when analyzing these results since readings
could be reflecting the potential of the mild steel reinforcement and not the post-
tensioning strands. If this is the case, it is reasonable to find both specimens with
very similar potentials. The results will be confirmed after forensic examination.
-900
-800
-700
-600
-500
-400
-300
-200
-100
0
100
200
0 200 400 600 800 1000 1200 1400 1600 1800Time (days)
Hal
f Cel
l Pot
entia
l (-m
V)1.1: Unloaded, Uncracked1.3: Service Load, Cracked
<10% Probability
>90% Probability

257
Figure 4.35 Half-Cell Potential Readings for 2/3 PS Specimens in Phase I Autopsy Beams
Figure 4.36 shows half-cell readings for the 100%U PS beams in Phase I.
Variables include applied load and cracking. There is a distinct trend showing a
decrease in the performance of the specimens with increasing loading. The
unloaded specimen had half-cell readings in the uncertain range, between 10%
and 90% probability of corrosion, while loaded specimens exceeded the 90%
probability line. Again, an increase in corrosion protection is observed when the
specimen is uncracked through both time to initiation of corrosion and final
potential readings. It should be noted that while Specimen 3.2 was uncracked at
the beginning of testing, a fine crack at the end of testing was found on the
specimen surface. The effect of this crack will be clearly determined after
forensic examination.
-900
-800
-700
-600
-500
-400
-300
-200
-100
0
100
200
0 200 400 600 800 1000 1200 1400 1600 1800
Time (days)
Hal
f Cel
l Pot
entia
l (-m
V)2.3: Service Load2.11: Service Load, FA Grout
<10% Probability
>90% Probability
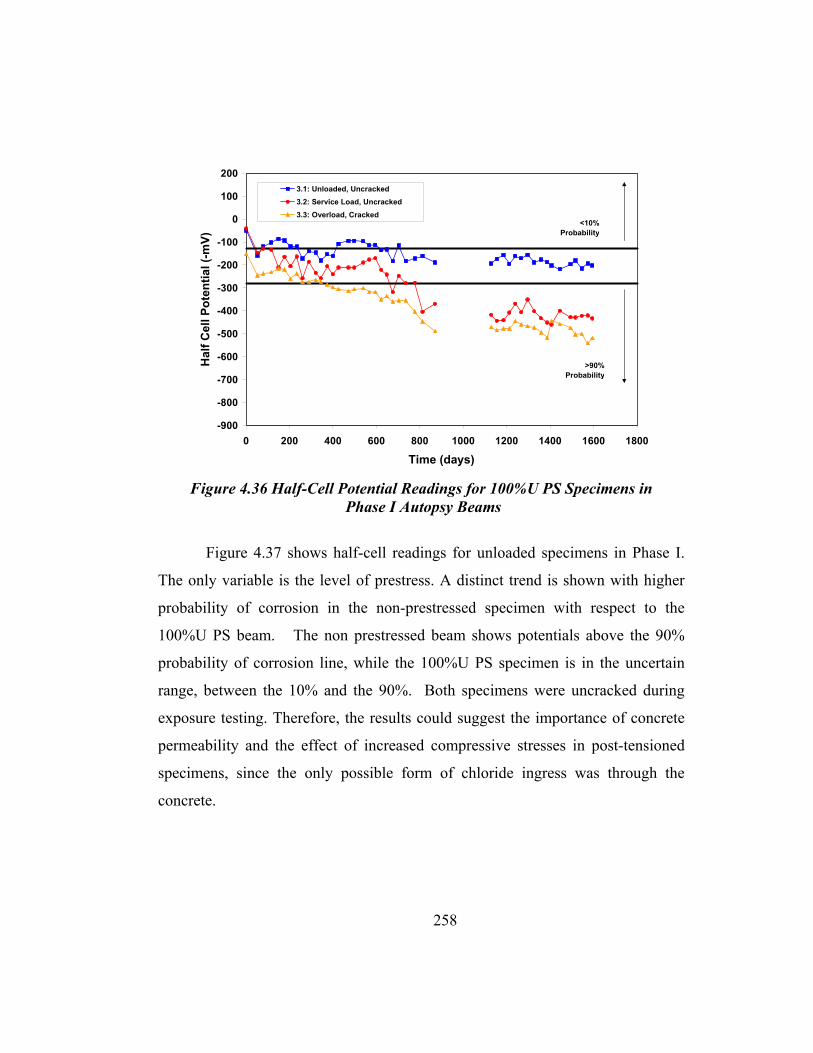
258
Figure 4.36 Half-Cell Potential Readings for 100%U PS Specimens in Phase I Autopsy Beams
Figure 4.37 shows half-cell readings for unloaded specimens in Phase I.
The only variable is the level of prestress. A distinct trend is shown with higher
probability of corrosion in the non-prestressed specimen with respect to the
100%U PS beam. The non prestressed beam shows potentials above the 90%
probability of corrosion line, while the 100%U PS specimen is in the uncertain
range, between the 10% and the 90%. Both specimens were uncracked during
exposure testing. Therefore, the results could suggest the importance of concrete
permeability and the effect of increased compressive stresses in post-tensioned
specimens, since the only possible form of chloride ingress was through the
concrete.
-900
-800
-700
-600
-500
-400
-300
-200
-100
0
100
200
0 200 400 600 800 1000 1200 1400 1600 1800
Time (days)
Hal
f Cel
l Pot
entia
l (-m
V)3.1: Unloaded, Uncracked3.2: Service Load, Uncracked3.3: Overload, Cracked
<10% Probability
>90%Probability

259
Figure 4.37 Half-Cell Potential Readings for Unloaded Specimens in Phase I Autopsy Beams
` Figure 4.38 shows half-cell potentials for beams subjected to service load
in Phase I. The only variable is the level of prestress. As in the previous case,
performance increases as the level of prestress increases. Mixed reinforced beams
show similar performance as Non-PS beams, with a distinct difference with
respect to 100% PS beams. Comparison among 100%U PS and 100%S PS shows
a slightly better performance of the 100%S PS. However, the difference is very
small to draw definite conclusions.
-900
-800
-700
-600
-500
-400
-300
-200
-100
0
100
200
0 200 400 600 800 1000 1200 1400 1600 1800
Time (days)
Hal
f Cel
l Pot
entia
l (-m
V)1.1: Non-PS3.1: 100%U PS
<10% Probability
>90% Probability

260
Figure 4.38 Half-Cell Potential Readings for Service Load Specimens in Phase I Autopsy Beams
Figure 4.39 shows the greatest negative half-cell potentials for all Phase I
autopsy beams at the final reading date, corresponding to 1594 days of exposure.
All specimens except Specimen 3.1 (100%U PS, Unloaded) show very negative
potential readings, exceeding the value of -280 mV representing the 90%
probability of corrosion. Non-prestressed and mixed reinforced (2/3 PS) beams
show slightly greater negative potentials at the end of testing than 100% PS
beams. Again, prestressing in the unloaded and uncracked Specimen 3.1 seems to
play the major role in delaying chloride penetration and corrosion activity, when
compared to Specimen 1.1.
Table 4.9 shows the time to initiation of corrosion activity for each Phase I
autopsy beam. The onset of corrosion activity is defined as the date when a
reading more negative than -280 mV is recorded, indicating a probability of
corrosion greater than 90%.
-900
-800
-700
-600
-500
-400
-300
-200
-100
0
100
200
0 200 400 600 800 1000 1200 1400 1600 1800
Time (days)
Hal
f Cel
l Pot
entia
l (m
V vs
SC
E)
1.3: Non-PS 2.3: 2/3 PS
2.11: 2/3 PS, FA Grout 3.2: 100%U PS
4.2: 100%S PS <10% Probability
>90% Probability

261
Figure 4.39 Greatest Negative Half-Cell Potential Reading at 1594 Days (End of Testing) for Phase I Autopsy Beams
Table 4.9 Time to Initiation of Corrosion for Phase I Autopsy Beams
Specimen Description Time to Corrosion
(days)
1.1 Non-PS, Unloaded 622
1.3 Non-PS, Service Load 52
2.3 2/3 PS, Service Load 52
2.11 2/3 PS, Service Load, Fly Ash Grout 116
3.1 100% U PS, Unloaded Never crosses threshold
3.2 100%U PS, Service Load 676
3.3 100% U PS Overload 373
4.1 100%S PS, Service Load 622
Figure 4.40 shows the half-cell potential contour maps for all Phase I
specimens after 1594 days of exposure testing. Contour maps for the same beam
specimens after 498 days are shown in Appendix B.
515
595 572535
202
433
518487
0
100
200
300
400
500
600
700
Beam1.1
Beam1.3
Beam2.3
Beam2.11
Beam3.1
Beam3.2
Beam3.3
Beam4.2
Half-
Cel
l Pot
entia
ls (-
mV
)
100%S100%U2/3 PSNon-PS
> 90% probability
< 10% probability

262
Figure 4.40 Half-Cell Potential Contour Maps at 1594 Days for
All Phase I Beams
< -580 VSCE -430 to -580 VSCE -280 to -430 VSCE -130 to -280 VSCE +20 to -130 VSCE
1.1 – Unloaded (uncracked) 2.11 – Service (cracked)
1.2 – Service (cracked) 3.1 – Unloaded (uncracked)
1.3 – Service (cracked) 3.2 – Service (uncracked)
1.4 – Overload (cracked) 3.3 – Overload (cracked)
2.1 – Very Small Cracks 3.4 – Overload (cracked)
2.2 – Service (cracked) 3.5 – Overload (cracked)
2.3 – Service (cracked) 4.1 – Service (uncracked)
2.4 – Overload (cracked) 4.2 – Service (uncracked)

263
After half-cell potential readings had been analyzed from the Phase I
specimen plots the following main conclusions are drawn:
• Probability of corrosion increases with increasing loading
• Probability of corrosion increases with increasing cracking
• Probability of corrosion decreases with increasing levels of prestress
• Performance of mixed reinforced (2/3 PS) specimens resemble more
that of Non-Prestressed specimens, as opposed to 100% PS specimens
• No distinct difference is observed between the performance of 100%U
PS and 100%S PS specimen.
4.4.2.2 Phase II Beam Specimens
Phase II beams started exposure testing in December 1998, and ended in
May 2002 for the autopsy specimens, after 1235 days of testing. Figure 4.41
shows a plot of Phase II autopsy beams. At the end of testing, all specimens,
show high probability of corrosion activity, above 90%.
Figure 4.41 Half-Cell Potential Readings for Phase II Autopsy Beams
-900
-800
-700
-600
-500
-400
-300
-200
-100
0
100
200
0 200 400 600 800 1000 1200 1400
Time (days)
Hal
f Cel
l Pot
entia
l (-m
V)
1.5: FA Concrete 1.6: HP Concrete
2.5: FA Concrete 2.6: HP Concrete
3.6: FA Concrete 3.7: HP Concrete<10%
Probability
>90% Probability

264
Figures 4.42 through Figure 4.46 show the autopsy specimens separated
according to the main variables. Half-cell potential plots for all specimens in
Phase II are included in Appendix B.
Figure 4.42 shows half-cell readings for the Non-PS beams in Phase II.
The only variable being compared for these specimens is the concrete type.
According to the time to initiation of corrosion and the potential readings
throughout the exposure testing period, it appears that high performance concrete
(as described in Section 2.4.4.1) performed better than the fly ash concrete.
However, both appear to merge to the same potential range.
Figure 4.42 Half-Cell Potential Readings for Non-PS Specimens in
Phase II Autopsy Beams
Figure 4.43 shows half-cell readings for the mixed reinforced beams (2/3 PS) in
Phase II. As in the previous case, all the variables are the same, with the
exception of concrete type. Based on the time to initiation of corrosion and
-900
-800
-700
-600
-500
-400
-300
-200
-100
0
100
200
0 200 400 600 800 1000 1200 1400Time (days)
Hal
f Cel
l Pot
entia
l (-m
V)
1.5: FA Concrete
1.6: HP Concrete<10%
Probability
>90% Probability

265
potential readings, the high performance concrete performed better than the fly
ash concrete. These results show the positive effect of less permeable concrete,
even when these specimens were cracked at service load levels.
Figure 4.43 Half-Cell Potential Readings for 2/3 PS Specimens in
Phase II Autopsy Beams
Figure 4.44 shows half-cell readings for the 100%U PS beams in Phase II.
The only variable being compared among these specimens is concrete type. The
plot shows that the fly ash performed slightly better than high performance
concrete as defined in Section 2.4.4.1, in contrast to the previous plots. However,
the half-cell potential difference between both curves is very small, and appears to
be merging to the same potential range.
-900
-800
-700
-600
-500
-400
-300
-200
-100
0
100
200
0 200 400 600 800 1000 1200 1400Time (days)
Hal
f Cel
l Pot
entia
l (-m
V)
2.5: FA Concrete
2.6: HP Concrete
<10% Probability
>90% Probability

266
Figure 4.44 Half-Cell Potential Readings for 100%U PS Specimens in Phase II Autopsy Beams
Figure 4.45 shows half-cell potential readings of the fly ash concrete
beams in Phase II. The three specimens differ only on the level of prestress. As
observed from the plot, based on the time to initiation of corrosion and the half-
cell potential values, the fully prestressed (100%U PS) beam performed better
than the Non-PS and 2/3 PS beams. Both the simple reinforced and the mixed
reinforced concrete specimens show the same corrosion initiation time, but the
potential of the mixed reinforced beam becomes slightly more negative over the
exposure period.
-900
-800
-700
-600
-500
-400
-300
-200
-100
0
100
200
0 200 400 600 800 1000 1200 1400
Time (days)
Hal
f Cel
l Pot
entia
l (-m
V)3.6: FA Concrete3.7: HP Concrete
<10% Probability
>90% Probability

267
Figure 4.45 Half-Cell Potential Readings for Fly Ash Concrete Specimens in Phase II Autopsy Beams
Figure 4.46 shows half-cell potentials for the high performance concrete
beams in Phase II. The only difference among the specimens is the level of
prestress. As can be observed, it appears that the 2/3 PS beam performed better
than both the 100%U PS and the Non-PS beams that performed very similar
throughout the testing period. However, the final potentials are very similar for
all three specimens.
When comparing Figures 4.45 and 4.46, it is observed that high
performance concrete specimens performed slightly better than fly ash specimens.
Both specimens have cement replacement by fly ash, but the high performance
concrete as defined in Section 2.4.4.1, had a lower water-cement ratio.
-900
-800
-700
-600
-500
-400
-300
-200
-100
0
100
200
0 200 400 600 800 1000 1200 1400
Time (days)
Hal
f Cel
l Pot
entia
l (-m
V)1.5: Non-PS2.5: 2/3 PS3.6: 100%U PS <10%
Probability
>90% Probability

268
Figure 4.46 Half-Cell Potential Readings for High Performance Concrete Specimens in Phase II Autopsy Beams
Figure 4.47 shows the greatest negative half-cell potentials for all Phase II
autopsy beams at the final reading date, corresponding to 1235 days of exposure.
Figure 4.47 Greatest Negative Half-Cell Potential Reading at 1235 Days
(End of Testing) for Phase II Autopsy Beams
-900
-800
-700
-600
-500
-400
-300
-200
-100
0
100
200
0 200 400 600 800 1000 1200 1400
Time (days)
Hal
f Cel
l Pot
entia
l (-m
V)1.6: Non-PS2.6: 2/3 PS3.7: 100%U PS
<10% Probability
>90% Probability
465
353
548
306345
395
0
100
200
300
400
500
600
700
Bea m 1.5
Be a m 1.6
Be a m 2.5
Be a m 2.6
Be a m 3.6
Be a m 3.7
Hal
f-Cel
l Pot
entia
ls (-
mV
)
100%U2/3 PSNon-PS
> 90% Probability
> 10% Probability

269
All specimens show very negative potentials and there is not a clear
distinction among the Non-PS, 2/3 PS and 100%U PS specimens. Specimen 2.5
(mixed reinforced, fly ash concrete) show a slightly higher potential at the final
date than the other specimens, but all were above the level of 90% probability of
corrosion.
Table 4.10 shows the time to initiation of corrosion activity for each Phase
II autopsy beam. The onset of corrosion activity is defined as the date when a
reading more negative than -280 mV is recorded, indicating a probability of
corrosion greater than 90%.
Table 4.10 Time to Initiation of Corrosion for Phase II Autopsy Beams
Specimen Description Time to
Corrosion (days)
1.5 Non-PS, Fly Ash Concrete, Service Load 15
1.6 Non-PS, High Performance (HP)
Concrete, Service Load
139
2.5 2/3 PS, Service Load, Fly Ash Concrete 14
2.6 2/3 PS, HP Concrete, Service Load 419
3.6 100% U PS, Unloaded, Fly Ash Concrete 263
3.7 100%U PS, HP Concrete, Service Load 41
Figure 4.48 shows the half-cell potential contours maps for all Phase II
specimens after 1235 days of exposure testing. Contour maps at 139 days of
testing are shown in Reference 4.4.

270
2 3 4 5 6 7 8 9 10 11 12 13
2 3 4 5 6 7 8 9 10 11 12
Figure 4.48 Half-Cell Potential Contour Maps at 1235 Days for All Phase II Beams
After half-cell potential readings had been analyzed from the Phase II
specimen plots the following main conclusions were drawn:
< -580 VSCE -430 to -580 VSCE -280 to -430 VSCE -130 to -280 VSCE +20 to -130 VSCE
1.5 – Service (cracked) 2.9 – Service (cracked)
1.6 – Service (cracked) 2.10 – Service (uncracked)
2.5 – Service (cracked) 2.12 – Service (uncracked)
2.6 – Service (cracked) 3.6 – Service (cracked)
2.7 – Service (cracked) 3.7 – Service (cracked)
2.8 – Service (cracked)

271
• Performance of mixed reinforced (2/3 PS) specimen is closer to that of
a non-prestressed specimen than to a fully prestressed specimen.
• High Performance concrete as defined in Section 2.4.4.1, appears to
perform slightly better than Class C concrete with cement replacement
by Fly Ash. However, the difference is not significant.
• Phase II series lacked a control specimen with Class C concrete
without fly ash. Therefore, the effect of fly ash concrete and high
performance concrete could not be directly evaluated against common
practice.
4.4.3 Corrosion Rate Measurements
The procedure and theory for the corrosion rate measurements is explained
in Section 4.3.4. Four measurements were taking up to the forensic examination
date. Two types of equipment were used: PR Monitor and 3LP. Phase I
specimen measurements were taken at seven, twelve, fifteen and forty-seven
months of exposure. Phase II specimen measurements were taken at 37 months
of exposure. Difficulties with the measurement equipment did not permit taking
of readings immediately prior to autopsy. The following discussion of corrosion
rate results was reported in Reference 4.5.
4.4.3.1 Phase I Beam Measurements
Corrosion rate measurements of all the Phase I beams were performed
after seven months of exposure testing using the PR Monitor equipment. Readings
were taken midway (one week) through the dry portion of the exposure cycle.
Corrosion rate measurements were performed after twelve months of exposure
testing using the 3LP equipment. Readings were taken on day five of the two
week dry portion of the exposure cycle. The next measurements were performed
after fifteen months of exposure testing using both the PR Monitor and 3LP

272
equipment. Readings were taken sixteen days after the start of the dry portion of
the exposure cycle (the dry period was extended beyond the normal two weeks
because work was being performed on the beams). The final successful corrosion
rate measurements of the Phase I beams were performed after 47 months of
exposure testing using the 3LP equipment.
As recommended in the SHRP Procedure Manual for Condition
Evaluation of Bridges,4.18 a proportionality constant, B, of 26 mV was used in the
calculation of the corrosion current when the 3LP equipment was used. This
assumption was made so the interpretation guidelines in Table 4.8 (shown on each
graph) could be used to rank the corrosion severity according to the
measurements.
Corrosion rate readings, in terms of corrosion current density, for the
Phase I autopsy beams are shown in Figures 4.49 and 4.50, and are listed in Table
4.11. Graphs of the corrosion rate readings of all the Phase I beams can be found
in Appendix B.
Figure 4.49 is a graph of the maximum corrosion rate readings taken of the
Phase I autopsy beams using the PR Monitor equipment. The graph shows a
consistent trend that the corrosion rate decreased over time. This does not make
practical sense. Therefore, further investigation of the corrosion rate readings will
be made after the forensic examination to determine the reliability of the use of
the PR Monitor equipment as a means of assessing corrosion rate. Through
comparison of the three 100%U PS beams, both sets of readings show that the
corrosion rate increases as the applied load, which corresponds to crack width
increases.

273
Figure 4.49 Maximum Corrosion Rate Readings Using PR Monitor for Phase I Autopsy Beams4.5
Figure 4.50 is a graph of all the maximum corrosion rate readings taken of
the Phase I autopsy beams using the 3LP equipment. The graph shows a
consistent trend that the corrosion rate increased over time, with the exception of
Specimen 3.1. Again, comparison of the 100%U PS sections show increasing
corrosion rates with increasing applied load. There is a significant increase from
Specimen 3.2 (uncracked) to Specimen 3.3 (cracked).
BEAM VARIABLE1.1 N PS, Uload1.3 N PS, Sload2.3 2/3 PS, Sload
2.11 2/3 PS, Sload, FA Grout
3.1 U PS, Uload3.2 U PS, Sload3.3 U PS, Oload4.2 S PS, Sload
0
4
8
12
16
20
24
28
32
1.1 1.3 2.3 2.11 3.1 3.2 3.3 4.2
Beam
Cor
rosi
on C
urre
nt D
ensi
ty
( µA
/cm2 )
PR Mon: 7 mon.PR Mon: 15 mon.
100%S100%U2/3 PSNon-PS
Current Density Severity < 0.1 Passive 0.1 to 0.5 Low 0.5 to 1.0 Moderate > 1.0 Severe

274
Figure 4.50 Maximum Corrosion Rate Readings Using 3LP for Phase I Autopsy Beams4.5
The corrosion severities determined in Table 4.11 are based on the last
corrosion rate readings taken with the PR Monitor equipment. All readings taken
with the 3LP equipment are extremely high, showing severe corrosion for all
measurements. This indicates that, although they can be used to make relative
comparisons and identify trends, readings using the 3LP are not reliable for
determining actual corrosion rates and severities. For this reason, the corrosion
severities assigned were based on the most recent reading taken with the PR
Monitor.
BEAM VARIABLE1.1 N PS, Uload1.3 N PS, Sload2.3 2/3 PS, Sload
2.11 2/3 PS, Sload, FA Grout
3.1 U PS, Uload3.2 U PS, Sload3.3 U PS, Oload4.2 S PS, Sload
0
4
8
12
16
20
24
28
32
1.1 1.3 2.3 2.11 3.1 3.2 3.3 4.2
Beam
Cor
rosi
on C
urre
nt D
ensi
ty
( µA
/cm2 )
3LP: 12 mon.3LP: 15 mon.3LP: 47 mon.
100%S100%U2/3 PSNon-PS
Current Density Severity < 0.1 Passive 0.1 to 0.5 Low 0.5 to 1.0 Moderate > 1.0 Severe
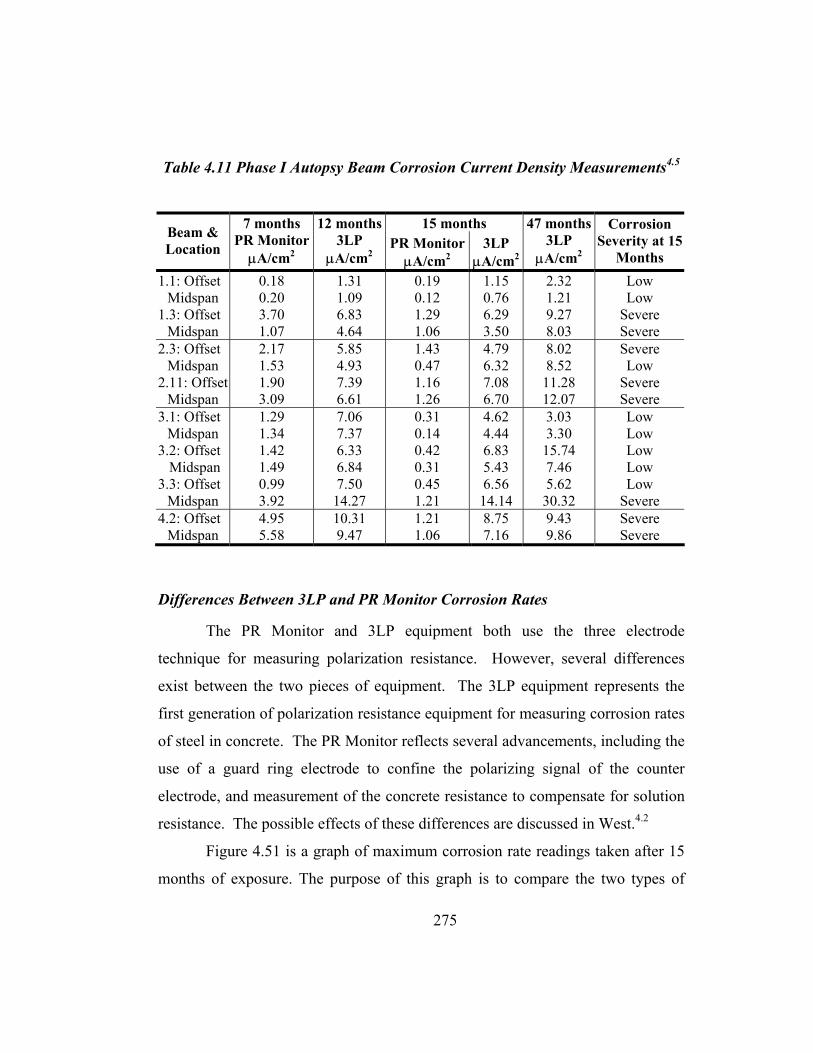
275
Table 4.11 Phase I Autopsy Beam Corrosion Current Density Measurements4.5
15 months Beam & Location
7 months PR Monitor µA/cm2
12 months3LP
µA/cm2 PR MonitorµA/cm2
3LP µA/cm2
47 months 3LP
µA/cm2
Corrosion Severity at 15
Months 1.1: Offset
Midspan 1.3: Offset
Midspan
0.18 0.20 3.70 1.07
1.31 1.09 6.83 4.64
0.19 0.12 1.29 1.06
1.15 0.76 6.29 3.50
2.32 1.21 9.27 8.03
Low Low
Severe Severe
2.3: Offset Midspan
2.11: Offset Midspan
2.17 1.53 1.90 3.09
5.85 4.93 7.39 6.61
1.43 0.47 1.16 1.26
4.79 6.32 7.08 6.70
8.02 8.52
11.28 12.07
Severe Low
Severe Severe
3.1: Offset Midspan
3.2: Offset Midspan
3.3: Offset Midspan
1.29 1.34 1.42 1.49 0.99 3.92
7.06 7.37 6.33 6.84 7.50
14.27
0.31 0.14 0.42 0.31 0.45 1.21
4.62 4.44 6.83 5.43 6.56 14.14
3.03 3.30
15.74 7.46 5.62
30.32
Low Low Low Low Low
Severe 4.2: Offset
Midspan 4.95 5.58
10.31 9.47
1.21 1.06
8.75 7.16
9.43 9.86
Severe Severe
Differences Between 3LP and PR Monitor Corrosion Rates
The PR Monitor and 3LP equipment both use the three electrode
technique for measuring polarization resistance. However, several differences
exist between the two pieces of equipment. The 3LP equipment represents the
first generation of polarization resistance equipment for measuring corrosion rates
of steel in concrete. The PR Monitor reflects several advancements, including the
use of a guard ring electrode to confine the polarizing signal of the counter
electrode, and measurement of the concrete resistance to compensate for solution
resistance. The possible effects of these differences are discussed in West.4.2
Figure 4.51 is a graph of maximum corrosion rate readings taken after 15
months of exposure. The purpose of this graph is to compare the two types of

276
equipment used for taking the readings over the duration of this experimental
program. The 3LP corrosion rates measured after fifteen months of testing are
significantly higher than the PR Monitor corrosion rates. Other research and field
experience with various devices for corrosion rate measurement have consistently
shown that the 3LP equipment indicates higher corrosion rates than other
devices.4.2 Although there is a large difference in the readings from the two types
of equipment, the trends in corrosion activity are similar. This suggests that the
large discrepancy in magnitude is likely due to inherent differences between the
two devices. Although the magnitude measured by the 3LP equipment may not be
reliable, it appears to be a good method for determining corrosion trends of
individual specimens and comparing these trends among multiple specimens.
Figure 4.51 Comparison of Corrosion Rate Measurement Equipment4.5
BEAM VARIABLE1.1 N PS, Uload1.3 N PS, Sload2.3 2/3 PS, Sload
2.11 2/3 PS, Sload, FA Grout
3.1 U PS, Uload3.2 U PS, Sload3.3 U PS, Oload4.2 S PS, Sload
0
4
8
12
16
20
24
28
32
1.1 1.3 2.3 2.11 3.1 3.2 3.3 4.2
Beam
Cor
rosi
on C
urre
nt D
ensi
ty
( µA
/cm2 )
PR Mon: 15 mon.3LP: 15 mon.
100%S100%U2/3 PSNon-PS
Current Density Severity < 0.1 Passive 0.1 to 0.5 Low 0.5 to 1.0 Moderate > 1.0 Severe

277
4.4.3.2 Phase II Beam Measurements
Only one successful set of corrosion rate readings was obtained for the
Phase II beams. They were performed after 35 months of exposure testing using
the 3LP equipment. As with the measurements of the Phase I beams, a
proportionality constant, B, of 26 mV was used in the corrosion current
calculations. Corrosion rate readings, in terms of corrosion current density, for the
Phase II autopsy beams are plotted in Figure 4.52 and listed in Table 4.12. A
graph of the corrosion rate readings for all Phase II beams can be found in
Appendix B.
Figure 4.52 shows higher corrosion rates in the 100%U PS than the 2/3 PS
beams for both concrete types. Specimen 3.7 is significantly higher than all the
other readings. The reason for this will be determined after the forensic
examination. The readings do not show a consistently better concrete type. Since
only one set of measurements was obtained, comparisons among readings over
time or between equipment cannot be made for the Phase II specimens.
Figure 4.52 Corrosion Rate Readings Using 3LP for Phase II Autopsy Beams4.5
BEAM VARIABLE
1.5 N PS, FA Conc.
1.6N PS,
HP Conc.
2.52/3 PS,
FA Conc.
2.62/3 PS,
HP Conc.
3.6U PS,
FA Conc.
3.7U PS,
HP Conc.
04
8
1216
20
2428
32
1.5
1.6
2.5
2.6
3.6
3.7
Beam
Cor
rosi
on C
urre
nt D
ensi
ty
( µA
/cm2 )
3LP: 35 mon.
100%U2/3 PSNon-PS
Current Density Severity < 0.1 Passive 0.1 to 0.5 Low 0.5 to 1.0 Moderate > 1.0 Severe

278
Because corrosion severities were only assigned according to readings
taken with the PR Monitor, and no readings of the Phase II beams were taken
using this equipment, corrosion severities could not be assigned to the Phase II
beams in Table 4.12.
Table 4.12 Phase II Autopsy Beam Corrosion Current Density Measurements4.5
Beam & Location 35 months
3LP µA/cm2
1.5: Offset Midspan
1.6: Offset Midspan
2.17 2.01 1.86 2.05
2.5: Offset Midspan
2.6: Offset Midspan
0.06 0.07 1.45 1.55
3.6: Offset Midspan
3.7: Offset Midspan
no reading 0.78 9.66 22.90
4.4.4 Chloride Content Analysis
Acid Soluble Chloride Analysis was performed as described in Section
4.3.5. Samples were taken at the following dates:
• From Phase I Concrete Blocks: Seven, fourteen, forty-one and fifty-
four months of exposure testing.
• From Phase II Concrete Blocks: Twenty-nine and forty-two months of
exposure testing.
• From Autopsy Beam Specimens: Immediately prior to forensic
examination.

279
Chloride Threshold value is indicated in the figures at 0.033%. This
value, intended as a guide only, is based on the widely accepted chloride
threshold value of 0.2% of the weight of cement.4.20
4.4.4.1 Phase I Concrete Block Specimens
All Phase I specimens were constructed with Standard TxDOT Class C
Concrete. However, concrete mixtures varied a little, which was the purpose of
casting and testing the different block specimens. Figure 4.53 shows the acid
soluble chloride content at different depths from the Phase I Ponded Block
Specimens, representing only autopsy beams. The same results are presented in
Table 4.13. Each block may have also represented non-autopsy beams, since
various specimens were casted from the same batch of concrete. Appendix B
includes the acid soluble chloride content graphs for all concrete blocks.
In addition to ponded blocks, control blocks were also constructed and
analyzed for chloride content. Concrete blocks were maintained without saltwater
ponding. As expected, control blocks showed negligible chloride content at all
depths.
From the chloride content graphs for Phase I concrete ponded blocks it is
concluded that:
• Chloride content decreases with depth.
• All the chloride contents at the bar level are below the threshold for
corrosion, except for Specimen 1.1 and 1.3 after 54 months.
• Although all specimens were made of TxDOT Class C Concrete (same
concrete mix), concrete in Beam 4.2 consistently shows the highest
permeability, and that used in Beams 2.3 and 2.11 consistently shows
the lowest permeability.

280
0
0.5
1
1.5
2
2.5
0.00 0.04 0.08 0.12 0.16 0.20 0.24 0.28 0.32
Acid-Soluble Chloride Content (% by weight of concrete)
Con
crete Dep
th (in.)
1.1, 1.32.3, 2.113.1, 3.2, 3.34.2
Bar LevelCl- threshold for corrosion
7 MONTHS
0
0.5
1
1.5
2
2.5
0.00 0.04 0.08 0.12 0.16 0.20 0.24 0.28 0.32
Con
cret
e Dep
th (i
n.)
1.1, 1.32.3, 2.113.1, 3.2, 3.34.2
Bar LevelCl- threshold for corrosion
14 MONTHS
0
0.5
1
1.5
2
2.5
0.00 0.04 0.08 0.12 0.16 0.20 0.24 0.28 0.32
Con
cret
e Dep
th (i
n.)
1.1, 1.32.3, 2.113.1, 3.2, 3.34.2
Bar LevelCl- threshold for corrosion
41 MONTHS
0
0.5
1
1.5
2
2.5
0.00 0.04 0.08 0.12 0.16 0.20 0.24 0.28 0.32
Con
cret
e Dep
th (i
n.)
1.1, 1.32.3, 2.113.1, 3.2, 3.34.2
Bar LevelCl- threshold for corrosion
54 MONTHS
Figure 4.53 Acid-Soluble Chloride Content for
Phase I Ponded Block Specimens4.5

281
Table 4.13 Phase I Ponded Block Chloride Penetration Measurements4.5
Acid Soluble Chloride Content (% by weight of concrete)
Beams Represented
Depth (inches)
7 months 14 months 41 months 54 months
1.1, 1.3 0.5 1.0 2.0
0.0000 0.0000 0.0000
0.0152 0.0000 0.0000
0.0774 0.0300 0.0112
0.1399 0.0982 0.0490
2.3, 2.11 0.5 1.0 2.0
0.0000 0.0000 0.0000
0.0086 0.0000 0.0000
0.0029 0.0027 0.0035
0.0862 0.0068 0.0031
3.1, 3.2, 3.3 0.5 1.0 2.0
0.0004 0.0000 0.0000
0.0013 0.0000 0.0000
0.1586 0.0417 0.0125
0.1303 0.0501 0.0039
4.2 0.5 1.0 2.0
0.0004 0.0001 0.0000
0.0440 0.0000 0.0000
0.1904 0.0994 0.0250
0.2149 0.1162 0.0048
4.4.4.2 Phase II Concrete Block Specimens
Figure 4.54 shows the acid soluble chloride content for Phase II Ponded
Block Specimens representing autopsy beams. The same information is presented
in Table 4.14. For these series, concrete type is the main variable. Again, as in
the previous case, control blocks show negligible chloride content at all depths.
Plots of the chloride content results for all the blocks can be found in Appendix B.
From these results it is found that:
• Acid-soluble chloride content progressively increases over time and
decreases with depth, as expected.
• All chloride contents at one-inch and two-inch (bar level) depths are
well below the threshold for corrosion and show little variation
between the concrete types.
• Results at 0.5 inches after 29 and 42 months of exposure confirm that
the high performance concrete was less permeable.

282
Figure 4.54 Acid-Soluble Chloride Content for
Phase II Ponded Block Specimens4.5
0
0.5
1
1.5
2
2.5
0.00 0.04 0.08 0.12 0.16 0.20 0.24 0.28 0.32
Acid Soluble Chloride Content (% by weight of concrete)
Con
cret
e D
epth
(in.
)
1.5, 2.5, 3.6: FA Concrete
1.6, 2.6, 3.7: HP Concrete
Bar LevelCl- thresholdfor corrosion
29 MONTHS
0
0.5
1
1.5
2
2.5
0.00 0.04 0.08 0.12 0.16 0.20 0.24 0.28 0.32
Con
cret
e D
epth
(in.
)
1.5, 2.5, 3.6: FA Concrete
1.6, 2.6, 3.7: HP Concrete
Bar LevelCl- thresholdfor corrosion
42 MONTHS

283
Table 4.14 Phase II Ponded Block Chloride Penetration Measurements4.5 Acid-Soluble Chloride Content
(% by weight of concrete) Beams
Represented Depths (inches)
29 months 42 months
1.5, 2.5, 3.6 0.5 1.0 2.0
0.1422 0.0072 0.0046
0.2359 0.0078 0.0017
1.6, 2.6, 3.7 0.5 1.0 2.0
0.0439 0.0151 0.0133
0.0846 0.0097 0.0025
4.4.4.3 Phase I Autopsy Beam Specimens
As described in Section 4.4.4.1, all Phase I beams were made of Standard
TxDOT Class C Concrete. Figure 4.55 shows the beam and block chloride
content plots at 1594 days (end of testing for autopsy beams), in the ponded
region. Block chloride content is shown again for comparison. As shown on
this graph, higher chloride content was found on the beams, in comparison to their
corresponding blocks. The reason for this difference could be the result of
cracking, which would allow ease of chloride ingress. This is clear in Specimen
1.3, since both concrete samples were taken at crack locations. The three-inch
offset samples for Specimens 2.11 and 4.2 were also taken at crack locations,
which would explain their high values at the bar level since the values from their
blocks is essentially zero.
Figure 4.56 shows similar data for those samples taken outside the ponded
region on the beams (at 27-inch and 32-inch offset). From this graph it is
observed that most measurements at the bar level at both locations are at or below
the threshold, with the exception of Specimen 1.3 whose 32-inch sample was
taken at a crack location. Generally, chloride levels at the one-inch depth of the
Non-PS and 2/3 PS beams are significantly higher at the 27-inch offset
(immediately outside the ponded region) in comparison with those from the 32-

284
inch offset. This is not observed in the 100% PS beam, which suggest that the
horizontal propagation of chlorides decreases with increasing levels of prestress.
Figure 4.55 Beam and Block Chloride Penetration at 1594 Days for
Phase I – Ponded Region on Beams4.5
0
0.5
1
1.5
2
2.5
0.00 0.05 0.10 0.15 0.20 0.25 0.30 0.35 0.40 0.45 0.50 0.55 0.60
Acid Soluble Chloride Content (% by weight of concrete)
Con
cret
e D
epth
(in.
)
1.11.32.32.113.13.23.34.2
Bar LevelCl- threshold for corrosion
BEAM 3" OFFSET
0
0.5
1
1.5
2
2.5
0.00 0.05 0.10 0.15 0.20 0.25 0.30 0.35 0.40 0.45 0.50 0.55 0.60
Con
cret
e D
epth
(in.
)
1.11.32.32.113.13.23.34.2
Bar LevelCl- threshold for corrosion
BEAM 18" OFFSET
0
0.5
1
1.5
2
2.5
0.00 0.05 0.10 0.15 0.20 0.25 0.30 0.35 0.40 0.45 0.50 0.55 0.60
Con
cret
e D
epth
(in.
)
1.1, 1.3
2.3, 2.11
3.1, 3.2, 3.34.2
Bar LevelCl- threshold for corrosion
BLOCKS: 54 MONTHS

285
Figure 4.56 Beam and Block Chloride Penetration at 1594 Days for Phase I – Unponded Region on Beams4.5
0
0.5
1
1.5
2
2.5
0.00 0.05 0.10 0.15 0.20 0.25 0.30 0.35 0.40 0.45 0.50 0.55 0.60
Acid Soluble Chloride Content (% by weight of concrete)
Con
cret
e D
epth
(in.
)
1.11.32.32.113.13.23.34.2
Bar LevelCl- threshold for corrosion
BEAM 27" OFFSET
0
0.5
1
1.5
2
2.5
0.00 0.05 0.10 0.15 0.20 0.25 0.30 0.35 0.40 0.45 0.50 0.55 0.60
Con
cret
e D
epth
(in.
)
1.1, 1.3
2.3, 2.11
3.1, 3.2, 3.34.2
Bar LevelCl- threshold for corrosion
BLOCKS: 54 MONTHS
0
0.5
1
1.5
2
2.5
0.00 0.05 0.10 0.15 0.20 0.25 0.30 0.35 0.40 0.45 0.50 0.55 0.60
Con
cret
e D
epth
(in.
)
1.11.32.32.113.13.23.34.2
Bar LevelCl- threshold for corrosion
BEAM 32" OFFSET

286
Table 4.15 shows the results in a tabular form, for all Phase I autopsy
beam acid-soluble chloride contents.
Table 4.15 Phase I Autopsy Beam Chloride Penetration Measurements4.5
Chloride Content (% by weight of concrete) Beam Depth (inches) 3” Offset 18” Offset 27” Offset 32” Offset
1.1 0.5 1.0 2.0
0.0774 0.0300 0.112
0.1399 0.0982 0.0490
0.0757 0.0199 0.0058
0.0448 0.0080 0.0064
1.3 0.5 1.0 2.0
0.1020 0.2695 0.5729
0.1901 0.3169 0.2216
0.2070 0.1447 0.0250
0.0250 0.0219 0.2496
2.3 0.5 1.0 2.0
0.2326 0.1765 0.1299
0.2326 0.1689 0.0820
0.2306 0.1025 0.0214
0.1836 0.0883 0.0296
2.11 0.5 1.0 2.0
0.3583 0.3173 0.2213
0.2352 0.1852 0.0890
0.2038 0.1735 0.0373
0.0277 0.0138 0.0157
3.1 0.5 1.0 2.0
0.2064 0.0965 0.0120
0.1547 0.0583 0.0150
0.1047 0.0082 0.0076
0.0307 0.0079 0.0154
3.2 0.5 1.0 2.0
0.2557 0.0712 0.0317
0.1626 0.0384 0.0079
0.1676 0.0355 0.0084
0.2258 0.0746 0.0116
3.3 0.5 1.0 2.0
0.3182 0.2641 0.1424
0.2581 0.1389 0.0169
0.1330 0.0171 0.0030
0.1445 0.0520 0.0031
4.2 0.5 1.0 2.0
0.3675 0.2668 0.0837
0.1583 0.0464 0.0084
0.0082 0.0097 0.0064
0.0064 0.0054 0.0050
Figure 4.57 shows the chloride content results at the bar and top-of-duct
level (at the two-inch depth from the concrete surface), after 1594 days of
exposure.

287
Figure 4.57 Acid-Soluble Chloride Content at Bar and Top-of-Duct Level for Phase I Beams 4.5
The following results are found:
• Chloride content in the ponded region is consistently higher at the bar
level than outside the ponded region.
• Unloaded and uncracked specimens (1.3 and 3.1) show very low
chloride contents at all locations.
• Measurements taken at crack locations give significantly larger
chloride content values, as in the case of Specimens 1.3 and 2.3 at the
three-inch offset.
• An increase in the level of prestress results in lower chloride contents
due to fewer cracks and higher compressive stresses in the concrete.
• Minimal difference is observed in the performance of the 100%S and
100%U PS beams. The larger value from the 100%U PS beam at the
three-inch offset location is due to the small crack at the sample
locations.
0.00 0.05 0.10 0.15 0.20 0.25 0.30 0.35 0.40 0.45 0.50 0.55 0.60
1.1
1.3
2.3
2.11
3.1
3.2
3.3
4.2
Beam
Spe
cim
en
Acid Soluble Chloride Content (% by weight of concrete)
3" offset18" offset27" offset32" offset
BEAM VARIABLE1.1 N PS, Uload1.3 N PS, Sload2.3 2/3 PS, Sload
2.11 2/3 PS, Sload, FA Grout
3.1 U PS, Uload3.2 U PS, Sload3.3 U PS, Oload4.2 S PS, Sload

288
4.4.4.4 Phase II Autopsy Beam Specimens
Concrete type is the only variable of interest when comparing Phase II
autopsy beams, since all were loaded at the service load level. Figure 4.58 shows
the beam and block chloride content plots at 1235 days (end of testing for autopsy
beams), in the ponded region. Block chloride content is shown again for
comparison. As can be observed, high performance concrete specimens
consistently shows as the superior concrete type in both the beam and block
specimens at 0.5 inch and one-inch depth. All samples from inside the ponded
region at the bar level show negligible chloride contents, implying that both types
of concrete are effective in limiting chloride penetration for this time period.
Figure 4.59 shows similar data for those samples taken outside the ponded
region on the beams (at 27-inch and 32-inch offset). From this graph it is
observed that most measurements taken outside the ponded region of the Phase II
specimens show negligible chloride contents. The only notable measurements
were found in the fly ash concrete specimens, supporting the above conclusion
that high performance concrete as defined in Section 2.4.4.1 appears to be
superior.
When comparing concrete block results with beam results, it is observed
that inside the ponded region, chloride contents from the blocks are
unconservative for beams 1.5 (Non-PS, Fly Ash Concrete) and 2.5 (2/3 PS, Fly
Ash Concrete), at the one-inch depth, but very approximate at all depths for
beams 1.6 (Non-PS, High Performance HP Concrete), 2.6 (2/3 PS, HP Concrete)
and 3.7 (100%U PS, HP Concrete). In general, actual chloride contents at the
two-inch depth were slightly higher than those measured from the concrete
blocks.
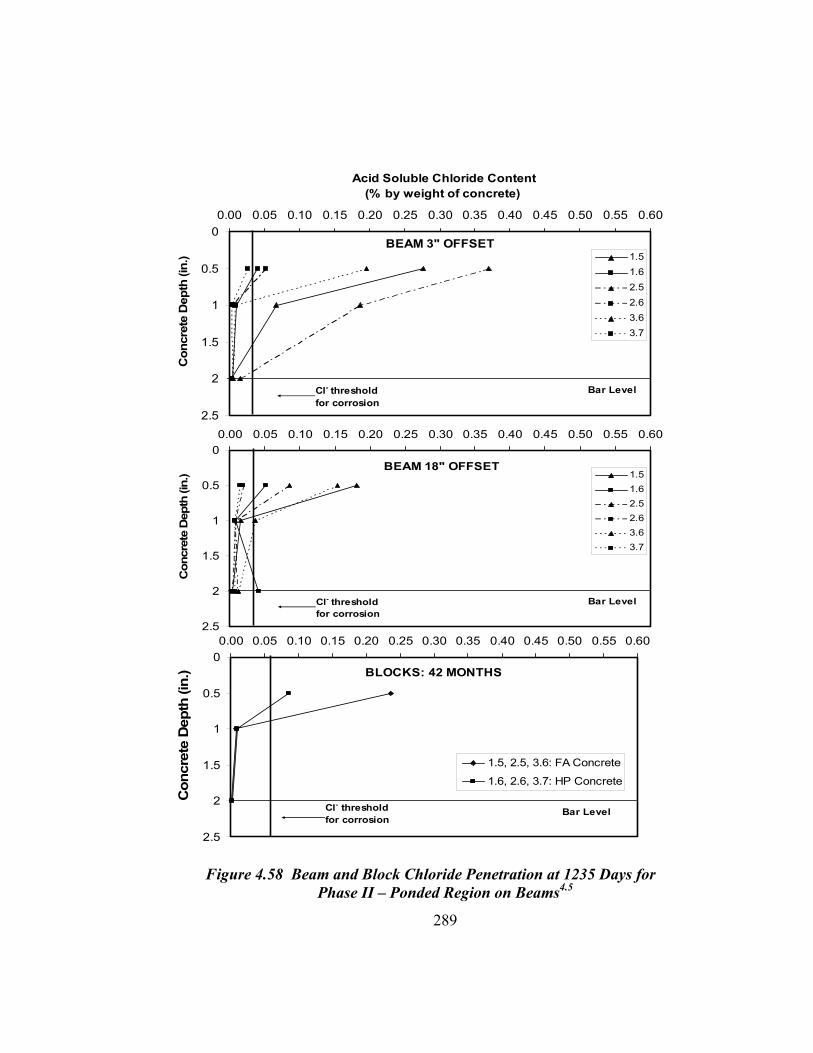
289
Figure 4.58 Beam and Block Chloride Penetration at 1235 Days for
Phase II – Ponded Region on Beams4.5
0
0.5
1
1.5
2
2.5
0.00 0.05 0.10 0.15 0.20 0.25 0.30 0.35 0.40 0.45 0.50 0.55 0.60
Acid Soluble Chloride Content (% by weight of concrete)
Con
cret
e D
epth
(in.
) 1.51.62.52.63.63.7
Bar LevelCl- threshold for corrosion
BEAM 3" OFFSET
0
0.5
1
1.5
2
2.5
0.00 0.05 0.10 0.15 0.20 0.25 0.30 0.35 0.40 0.45 0.50 0.55 0.60
Con
cret
e D
epth
(in.
) 1.51.62.52.63.63.7
Bar LevelCl- threshold for corrosion
BEAM 18" OFFSET
0
0.5
1
1.5
2
2.5
0.00 0.05 0.10 0.15 0.20 0.25 0.30 0.35 0.40 0.45 0.50 0.55 0.60
Con
cret
e D
epth
(in.
)
1.5, 2.5, 3.6: FA Concrete
1.6, 2.6, 3.7: HP Concrete
Bar LevelCl- thresholdfor corrosion
BLOCKS: 42 MONTHS

290
Figure 4.59 Beam and Block Chloride Penetration at 1235 Days for Phase II – Unponded Region on Beams4.5
0
0.5
1
1.5
2
2.5
0.00 0.05 0.10 0.15 0.20 0.25 0.30 0.35 0.40 0.45 0.50 0.55 0.60
Acid Soluble Chloride Content (% by weight of concrete)
Con
cret
e D
epth
(in.
) 1.51.62.52.63.63.7
Bar LevelCl- threshold for corrosion
BEAM 27" OFFSET
0
0.5
1
1.5
2
2.5
0.00 0.05 0.10 0.15 0.20 0.25 0.30 0.35 0.40 0.45 0.50 0.55 0.60
Con
cret
e D
epth
(in.
) 1.51.62.52.63.63.7
Bar LevelCl- threshold for corrosion
BEAM 32" OFFSET
0
0.5
1
1.5
2
2.5
0.00 0.05 0.10 0.15 0.20 0.25 0.30 0.35 0.40 0.45 0.50 0.55 0.60
Con
cret
e D
epth
(in.
)
1.5, 2.5, 3.6: FA Concrete
1.6, 2.6, 3.7: HP Concrete
Bar LevelCl- thresholdfor corrosion
BLOCKS: 42 MONTHS

291
Table 4.16 shows the results from Figures 4.58 and 4.59 in a tabular form,
for all Phase II autopsy beam acid-soluble chloride contents.
Table 4.16 Phase II Autopsy Beam Chloride Penetration Measurements4.5
Chloride Content (% by weight of concrete) Beam Depth (inches) 3” Offset 18” Offset 27” Offset 32” Offset
1.5 0.5 1.0 2.0
0.2770 0.0674 0.0034
0.1810 0.0163 0.0039
0.0076 0.0067 0.0021
0.0077 0.0043 0.0052
1.6 0.5 1.0 2.0
0.0410 0.0108 0.0046
0.0515 0.0082 0.0409
0.0019 0.0048 0.0111
00057 0.0076 0.0066
2.5 0.5 1.0 2.0
0.3700 0.1868 0.0156
0.0854 0.0077 0.0099
0.0250 0.0236 0.0109
0.0333 0.0039 0.0051
2.6 0.5 1.0 2.0
0.0525 0.0030
no reading
0.0196 0.0076 0.0033
0.0018 0.0015 0.0114
0.0029 0.0019 0.0021
3.6 0.5 1.0 2.0
0.1959 0.0081 0.0058
0.1540 0.0366 0.0120
0.0766 0.0381 0.0103
0.0652 0.0089 0.0070
3.7 0.5 1.0 2.0
0.0263 0.0035 0.0040
0.0144 0.0066 0.0064
0.0116 0.0057 0.0056
0.0045 0.0040 0.0051
Figure 4.60 shows the chloride content results at the bar and top-of-duct
level (at the two-inch depth from the concrete surface), after 1235 days of
exposure.

292
As observed from Figure 4.60, it is confirmed that acid-soluble chloride
contents at the bar and top-of-duct level of the Phase II beams are very low, with
respect to the chloride threshold value of 0.033%, meaning that the use of fly ash
concrete and high performance concrete are effective in minimizing the
penetration of chlorides through the concrete matrix.
Figure 4.60 Acid-Soluble Chloride Content at Bar and
Top-of-Duct Level for Phase II Beams 4.5
BEAM VARIABLE
1.5 N PS, FA Conc.
1.6 N PS, HP Conc.
2.52/3 PS,
FA Conc.
2.6 2/3 PS, HP Conc.
3.6U PS,
FA Conc.
3.7U PS,
HP Conc.
0.00 0.05 0.10 0.15 0.20 0.25 0.30 0.35 0.40 0.45 0.50 0.55 0.60
1.5
1.6
2.5
2.6
3.6
3.7
Beam
Spe
cim
en
Acid Soluble Chloride Content (% by weight of concrete)
3" offset18" offset27" offset32" offset

293
4.5 FORENSIC EXAMINATION
After four and a half years of exposure testing for Phase I Beam
Specimens and three and a half years for Phase II Beam Specimens, a detailed
visual inspection on the exterior condition was performed on all 27 specimens,
and exposure testing data were thoroughly analyzed. Based on this evaluation, it
was decided to perform a forensic examination that included full and partial
autopsies of approximately half of the beams. The forensic examination was
performed according to the program objectives, which relate to the evaluation of
the effect of post-tensioning on durability, and the evaluation of the relative
performance of a large number of corrosion protection variables including
prestress level and crack width, duct splices, grout type, concrete type, strand
type, duct type, and end anchorage protection.
Specific forensic examination objectives were as follows:
1. Obtain visual evaluation of the overall exterior condition of beam
specimens.
2. Determine chloride ion penetration through the concrete.
3. Obtain visual evaluation of corrosion damage on duct, duct splice,
strand and mild steel reinforcement.
4. Determine chloride ion content in the grout.
5. Determine most effective variables in corrosion protection.
4.5.1 Autopsy Procedure
4.5.1.1 Specimen Selection for Forensic Examination
Originally, all beam specimens were scheduled for full autopsy in May
2002. This date marked four and a half or three and a half years of exposure
testing for Phase I and Phase II beams, respectively. However, results from the
final segmental joint macrocell durability tests, as described in Chapter 3,

294
suggested that for a modest extension of the exposure testing program, it would be
possible to obtain increased benefit from the full-size durability specimens. Half
of the duplicated macrocell specimens were autopsied after four and a half years
of very aggressive exposure. The remaining duplicates were autopsied after eight
years of exposure. When the results from the longer exposure period were
compared with the preliminary conclusions reported after four years of exposure
testing, it was found that a number of significant changes had occurred. For
example, while no corrosion had been found after four and a half years in epoxy
jointed specimens, after eight years there was some corrosion (away from the
joint) in epoxy jointed specimens and there was corrosion at one epoxy joint that
was found to be incompletely filled with epoxy. More importantly, after eight
years there was extremely large destruction of galvanized duct and clear
indication of the superiority of the plastic duct, an aspect that was not so evident
after the first autopsy. If all exposure testing had been halted after four and a half
years in the macrocell series, a great deal of important information would have
been missed.
For the above reason, it was decided to select approximately half of the
beam specimens for autopsy in May 2002. Twelve out of the total of twenty
seven specimens in Phase I and Phase II were selected for full autopsy, while two
specimens were selected for partial autopsy. The remaining specimens were left
under continuous exposure testing for future autopsy. Tables 4.17 and 4.18, and
Figure 4.61 show the specimens selected for examination and the corresponding
test variables. The autopsy specimen selection was made based on visual
inspection, measurements taken during exposure testing and the necessity for
comparison of the test variables.
Specimens 1.1 and 3.1 were selected for partial autopsy, since they would
be needed for both the present and future autopsies because they were the only

295
uncracked and unloaded specimens. Thus, they served as control specimens for
comparison. Since these beams were not loaded or cracked, a portion of the
specimen could be removed while the remainder was returned to the exposure
testing. The partial autopsy consisted of exposing and removing half of the mild
steel/duct/strand section that was removed for each fully autopsied beam, leaving
the other half for continued exposure testing.
Table 4.17 Phase I Beams Selected for Forensic Examination
Spec
imen
Pres
tres
s
Leve
l
Cra
ckin
g (m
m)
App
lied
Load
Con
cret
e Ty
pe
Splic
e Ty
pe
Dam
age
to
Duc
t
Gro
ut ty
pe
Stra
nd
PT A
ncho
rage
1.1 Non-PS Uncracked Unloaded (1) -- -- -- -- --
1.3 Non-PS 0.3 Constant Service (1) -- -- -- -- --
2.3 2/3 PS 0.2 Constant Service (1) (2) (3) (4) (7) (8)
2.11 2/3 PS 0.2 Constant Service (1) (2) None Fly Ash (5) (7) (8)
3.1 100% U PS Uncracked Unloaded (1) (2) None (4) (7) (9)
3.2 100% U PS Uncracked Constant Service (1) (2) None (4) (7) (9)
3.3 100% U PS Cracked 124% - Return to
Service
(1) (6) None (4) (7) (9)
4.2 100% S PS Uncracked Constant Service (1) (2) (3) (4) (7) (10)
(1) TxDOT Class C (0.45 w/c, cement Type I, retarder, air entrainment agent) (2) Industry Standard (IS) and Heat Shrink (HS) (3) IS with damage and HS with damage (4) TxDOT Class C (0.44 w/c, cement Type I, expanding admixture) (5) 0.33 w/c, 30% Fly Ash replacement. (6) Industry Standard (IS) (7) 7-wire 0.5 in. low relaxation (270 ksi) strand (8) VSL Type E5-3 (with third strand opening unused) (9) VSL Type E5-3 (10) VSL Type E5-4

296
Table 4.18 Phase II Beams Selected for Forensic Examination
Spec
imen
Pres
tres
s
Leve
l
Cra
ckin
g (m
m)
App
lied
Load
Con
cret
e Ty
pe
Splic
e Ty
pe
Dam
age
to
Duc
t
Gro
ut ty
pe
Stra
nd
PT A
ncho
rage
1.5 Non-PS 0.3 Constant Service (11) -- -- -- -- --
1.6 Non-PS 0.3 Constant Service (12) -- -- -- -- --
2.5 2/3 PS 0.2 Constant Service (11) (13) None (14) (15) (16)
2.6 2/3 PS 0.2 Constant Service (12) (13) None (14) (15) (16)
3.6 100% U PS 0.1 Constant Service (11) (13) None (14) (15) (17)
3.7 100% U PS 0.1 Constant Service (12) (13) None (14) (15) (17)
(11) TxDOT Class C with Fly Ash (0.44 w/c, with 25% Class F Fly Ash) (12) High Performance (0.29 w/c, 25% Fly Ash, superplasticizer) (13) Industry Standard Splice (IS) and Heat Shrink Splice (HS) (14) TxDOT Class C (0.44 w/c, cement Type I, expanding admixture) (15) 7-wire 0.5 in. low relaxation (270 ksi) strand (16) VSL Type E5-3 (with third strand opening unused) (17) VSL Type E5-3
Figure 4.61 Selected Beams for Forensic Examination
Full autopsy Partial Autopsy Continue Testing

297
4.5.1.2 Specimen Condition at End of Testing
The appearance of the specimens can indicate corrosion activity. The
exterior surface of each beam specimen was examined for signs of additional
cracking, rust staining and concrete spalling.
4.5.1.3 Crack Measurements
One of the main objectives of the forensic examination was to determine
the influence of cracking on specimen performance and reinforcement corrosion
(onset of corrosion and propagation) due to chloride and moisture ingress. Crack
widths were measured at the beginning of exposure (after post-tensioning and first
loading) and at the end of exposure. The crack width measurement procedure
and the results are described in Section 4.3.2 and Section 4.4.1, respectively.
4.5.1.4 Concrete Powder Samples for Chloride Analysis
Concrete Powder Samples were collected from concrete block and beam
specimens to assess the chloride penetration. Powder samples were tested for
their acid soluble chloride content. The procedure for obtaining the samples is
explained in Section 4.3.5 and the results of the chloride analysis are given in
Section 4.4.4.
4.5.1.5 Saw Cuts and Concrete Removal
4.5.1.5.1 Full Autopsies
Analysis of duct, strand and mild steel was limited to a total length of 72
inches (42 inches from centerline to one side and 30 inches to the other side).
Figure 4.62 shows a diagram of the section removed for investigation. The section
included the entire 48-inch ponded region, and extended six inches outside the

298
ponded region on one side and 18 inches on the other side. It was decided that
this section would sufficiently provide the following information:
1. Reinforcement corrosion performance from the area in the ponded
region
2. Possible horizontal penetration of chlorides through the concrete from
the area immediately outside of the ponded region
3. A section of reinforcement not exposed to a corrosive environment for
comparison
Figure 4.62 Beam Section Removed for Investigation4.5
The concrete saw with a 27-inch circular blade shown in Figure 4.63 was
used to make all the cuts in the specimens. Two eight-inch deep vertical cuts
were made on the top of the beam, and a horizontal cut was made on each side of
the beam, below the duct line. These cuts separated the portion of the beam to be
analyzed from the rest of the specimen, allowing the area of interest to be
removed with a forklift.
Jack hammers and chipping hammers were used to carefully remove all
existing concrete around post-tensioning ducts and mild steel reinforcement, as
illustrated in Figure 4.64.
182”
24”
18”
Ponded Region48” x 16”
Vertical Top Cuts8” Deep
Horizontal Side Cuts72” Long
60”
182”182”
24”
18”
Ponded Region48” x 16”
Ponded Region48” x 16”
Vertical Top Cuts8” Deep
Vertical Top Cuts8” Deep
Horizontal Side Cuts72” Long
Horizontal Side Cuts72” Long
60”

299
Figure 4.63 Concrete Saw Used in Autopsy
Figure 4.64 Concrete Removal to Expose Duct and Mild Steel

300
4.5.1.5.2 Partial Autopsies
The partial autopsy procedure consisted of exposing and removing half of
the mild steel/duct/strand concrete section that was used for each fully autopsied
beam, leaving the other half for continued exposure testing. Figure 4.65 shows
one partial autopsied beam after the first half analysis portion has been removed,
and the beam had the cut section epoxied to seal the surface and returned to
exposure testing.
Figure 4.65 Partial Autopsied Beam
4.5.1.6 Exposure and Removal of Ducts
Metal or plastic duct was exposed after removing all concrete. The duct
and strand were then removed from the concrete as one unit. Immediately after
exposing the duct, the surface was examined for rust staining and color, salt
collection and damage.
4.5.1.7 Splice Condition Examination
Splices (Heat-Shrink or Industry Standard) were examined after removing
the duct/strand piece. Splices were thoroughly inspected for corrosion, salt
deposits, zinc corrosion products and rust staining.
C

301
4.5.1.8 Duct Opening and Grout Condition Examination
After external splice examination, splices were cut open in half
longitudinally, and the duct was also cut open by making two longitudinal cuts
along the sides of the duct/strand using a small air grinder. The grout was
examined for bleed water voids, incomplete duct filling and excessive porosity.
Grout was also examined for cracking and any indication of moisture and chloride
ingress. Since grout is injected after the stressing of post-tensioning steel,
hardened grout is susceptible to service cracking due to deflections and vibrations.
4.5.1.9 Grout Samples for Chloride Analysis
Grout Samples were collected from every duct at six-inch intervals over
the entire length of 72 in. The grout pieces were crushed between two steel
plates and ground into powder using a mortar and pestle. Powder samples were
analyzed for acid-soluble chlorides using a specific ion probe (CL Test System by
James Instrument).
4.5.1.10 Grout Removal and Strand Exposure
After the desired grout samples were removed, the remainder of the grout
was carefully removed, exposing the strand for examination. The extent and
severity of corrosion on both the strand and duct was rated according to the
corrosion rating scheme described in Section 4.5.2.
4.5.1.11 Mild Steel Exposure and Removal
The mild steel bars and stirrups were removed after ducts had been
removed, using the jackhammers and chipping hammers. Analysis of longitudinal
steel was limited to 72 in. corresponding to the same analysis length used for the
post-tensioning ducts and strands. Stirrups were analyzed only in the top portion
and two 3 in. legs at each side, as shown in Figure 4.66.

302
Figure 4.66 Mild Steel Reinforcement Cage
4.5.2 Evaluation and Corrosion Rating System Used During Forensic
Examination
After all steel elements were exposed and removed, they were thoroughly
examined and rated. The rating system selected for evaluation was the same used
for the Macrocell Corrosion Tests, as described in Section 3.3.3. The procedure
was created by West et al.4.21 in a universal form with the intention of applying
the same rating system to various situations. For the beam corrosion tests, the
length (72 inches) of longitudinal mild steel, duct and strand was subdivided into
36, two inch-intervals. At each interval, the steel was examined and a rating was
assigned to describe the corrosion severity within that interval. By assigning a
corrosion severity at 36 locations, both the extent and severity of corrosion are
determined.
As described in West et al.4.21 the rating system is essentially the same for
prestressing strand, mild steel reinforcement and galvanized duct, with some
modifications to reflect unique corrosion aspects of each type of steel. In general,
the evaluation system doubles the severity rating for each category of increasing
corrosion damage.

303
4.5.2.1 Mild Steel Reinforcement
The longitudinal mild steel was examined at 36, two inch intervals, as
indicated in Figure 4.67. Corrosion ratings were assigned to indicate for each
interval or segment, the corrosion severity on both the top and bottom bar
surfaces. The same procedure was applied to the stirrups, except the interval
division varied slightly. As with the longitudinal bars, the top portion of stirrups
was divided into 7 two-inch intervals. Due to the dimensions of the section
removed from each beam for forensic examination, there were 2 three-inch
sections (legs) from the sides of the stirrup to be analyzed. (see Figure 4.67) Each
three-inch leg was considered one interval, for a total of nine intervals per stirrup.
One rating was assigned to the inside and outside surfaces of each leg.
Figure 4.67 Intervals for Corrosion Rating on Mild Steel
The total bar corrosion rating was calculated as follows:
∑=
+=36
1
)(i
iBotiTopBar RRR Eq. 4.6
36 Intervals @ 2-inch spacings
LONGITUDINAL BAR
STIRRUP
7 Intervals @ 2-inch spacings
1 Interval3 inches(“leg”)
36 Intervals @ 2-inch spacings
LONGITUDINAL BAR
STIRRUP
7 Intervals @ 2-inch spacings
1 Interval3 inches(“leg”)

304
∑=
=m
nnBarRRatingCorrosionBarTotal
1 Eq. 4.7
where, RTop i = corrosion rating on top bar surface, interval i
RBot i = corrosion rating on bottom bar surface, interval i
RBar n = total bar corrosion rating, bar n
i = interval, 1 to 36
n = bar number, 1 to m
m = total number of bars on each specimen (2 or 8)
The corrosion rating system is described in Table 4.19. Each beam design
had a different number of mild steel bars (m), depending on the post-tensioning
level. The Non-PS beams had 6#6 and 2#4 bars as the tensile steel reinforcement
(m=8). The mixed reinforced beams (2/3 PS) had 4#3 and 4#4 bars (m=8). The
100% PS specimens, designed either with the strength design method or the
allowable stress design method, had 2#3 mild steel bars (m=2). These bars were
not required by design, but were included for construction purposes. The variation
in number of longitudinal bars is accounted for in the analysis of the data.
The stirrups were also rated using Table 4.19. However, a different
equation was used to calculate the total stirrup rating. As with the longitudinal
mild steel, the ratings for the top and bottom bar surface of each interval were
summed to give a total corrosion rating for the stirrup.
The total stirrup rating was calculated as follows:
∑=
+=9
1
)(i
iBotiTopStirrup RRR Eq.4.8
∑=
=6
1nnStirrupRRatingCorrosionStirrupTotal Eq. 4.9

305
where, RTop i = corrosion rating on top bar surface, interval i
RBot i = corrosion rating on bottom bar surface, interval i
RStirrup n = total stirrup corrosion rating, stirrup i
i = interval, 1 to 9
n = stirrup number, 1 to 6
Table 4.19 Evaluation and Rating System for Corrosion Found on Mild Steel Bars 4.2
Code Meaning Description Rating
NC No Corrosion No evidence of corrosion 0
D Discoloration No evidence of corrosion, but some discoloration from original color
1
L Light Surface corrosion on less than one half of the interval, no pitting. Surface corrosion can be removed using cleaning pad.
2
M Moderate Surface corrosion on more than one half of the interval, no pitting. and/or Corrosion can not be completely removed using cleaning pad.
4
P Pitting Pits visible to unaided eye. 8
AR Area Reduction Measurable reduction in bar cross-sectional area due to corrosion
R2
R = Estimated cross-sectional area reduction in percent
4.5.2.2 Galvanized Steel Duct/Duct Splice
The galvanized steel duct was examined at 36 two-inch intervals, and the
duct splices at 6 two-inch intervals as indicated in Figure 4.68. At each location,
a corrosion rating was assigned to indicate the severity of corrosion on the inside
and outside surfaces of the top and bottom of each duct.

306
Figure 4.68 Intervals for Corrosion Ratings on
Galvanized Steel Duct/Splice
The corrosion rating system for the galvanized steel ducts and duct splices
is described in Table 4.20.
The total duct corrosion rating was calculated as follows:
∑=
+++=36
1iiBotInneriTopInneriBotOuteriTopOuter RRRRRatingCorrosionDuct ,,,, Eq. 4.10
where, RTopOuter,i = top outer surface corrosion rating, interval i
RBotOuter,i = bottom outer surface corrosion rating,
interval i
RTopInner,i = top inner surface corrosion rating, interval i
RBotInner,i = bottom inner surface corrosion rating,
interval i
i = interval, 1 to 36
36 Intervals @ 2-inch spacings
6 Intervals @2-inch spacings
36 Intervals @ 2-inch spacings
6 Intervals @2-inch spacings

307
Table 4.20 Evaluation and Rating System for Corrosion Found on Galvanized Steel Duct /Duct Splice 4.2
Code Meaning Description Rating
NC No Corrosion No evidence of corrosion 0
D Discoloration No evidence of corrosion, but some discoloration from original color
1
L Light Surface corrosion on less than one half of the interval, no pitting.
2
M Moderate Surface corrosion on more than one half of the interval, no pitting.
4
S Severe Corrosion completely covers the interval. and/or Presence of pitting.
8
H Hole Through Duct Hole corroded through duct.
Used in conjunction with ratings D, L, M and S.
32 + Ah
Ah = Area of hole(s) in mm2
4.5.2.3 Prestressing Strand
The strands were examined at 36 two-inch intervals, like the longitudinal
mild steel bars. Corrosion ratings were assigned to indicate the severity of
corrosion on the outer six wires of the strand and on the center wire (after de-
stranding) at each interval. This was done to address the possibility of different
corrosion activity on the strand exterior and interstices between wires. The
corrosion rating system for prestressing strands is described in Table 4.21. The
total strand corrosion rating was calculated as follows:
∑=
+×=36
1,,
iiCenteriiOuter RnRRatingCorrosionStrand Eq. 4.11

308
where, Router,i = corrosion rating on outer wires, interval i
ni = number of corroded outer wires, interval i
Rcenter,i= corrosion rating on center wire, interval i
i = interval, 1 to 36
Table 4.21 Evaluation and Rating System for Corrosion Found on Prestressing Strand 4.2
Code Meaning Description Rating
NC No Corrosion No evidence of corrosion. 0
D Discoloration No evidence of corrosion, but some discoloration from original color.
1
L Light Surface corrosion on less than one half of the interval, no pitting. Surface corrosion can be removed using cleaning pad.
2
M Moderate Surface corrosion on more than one half of the interval, no pitting. and/or Corrosion can not be completely removed using cleaning pad.
4
P1 Mild Pitting Broad shallow pits with a maximum pit depth not greater than 0.02 in.
8
P2 Moderate Pitting Pitting where the maximum pit depth ranged between 0.02 and 0.04 in.
16
P3 Severe Pitting Pitting where the maximum pit depth is greater than 0.04 in.
32
As reported by West et al.4.21 the corrosion rating for prestressing strand
was adapted from Poston4.22 and Hamilton.4.23 The use of a cleaning pad to assess
corrosion severity was proposed by Sanson4.24 for classifying the degree of rusting
on prestressing strand for new construction. The recommended cleaning pad is a
3M Scotch Brite Cleaning Pad. The pad is held by hand and rubbed
longitudinally along the strand axis with a pressure similar to that used when
cleaning pots and pans. The classification of pitting severity was based on tensile
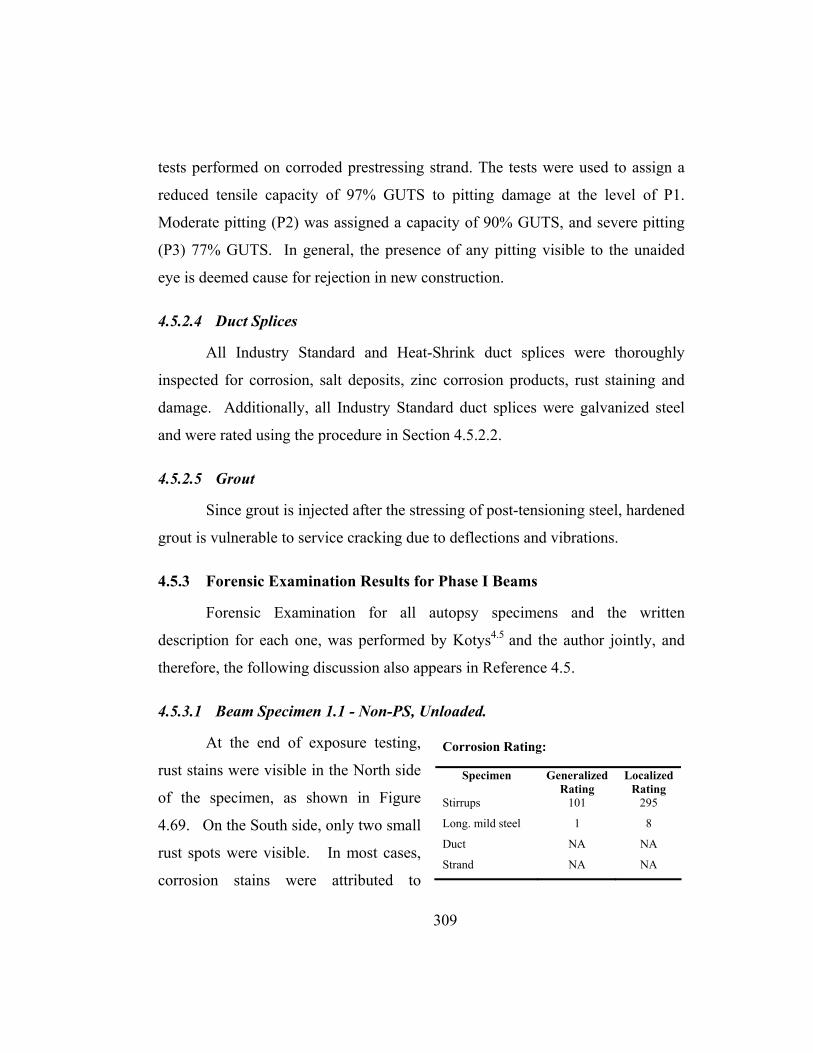
309
tests performed on corroded prestressing strand. The tests were used to assign a
reduced tensile capacity of 97% GUTS to pitting damage at the level of P1.
Moderate pitting (P2) was assigned a capacity of 90% GUTS, and severe pitting
(P3) 77% GUTS. In general, the presence of any pitting visible to the unaided
eye is deemed cause for rejection in new construction.
4.5.2.4 Duct Splices
All Industry Standard and Heat-Shrink duct splices were thoroughly
inspected for corrosion, salt deposits, zinc corrosion products, rust staining and
damage. Additionally, all Industry Standard duct splices were galvanized steel
and were rated using the procedure in Section 4.5.2.2.
4.5.2.5 Grout
Since grout is injected after the stressing of post-tensioning steel, hardened
grout is vulnerable to service cracking due to deflections and vibrations.
4.5.3 Forensic Examination Results for Phase I Beams
Forensic Examination for all autopsy specimens and the written
description for each one, was performed by Kotys4.5 and the author jointly, and
therefore, the following discussion also appears in Reference 4.5.
4.5.3.1 Beam Specimen 1.1 - Non-PS, Unloaded.
At the end of exposure testing,
rust stains were visible in the North side
of the specimen, as shown in Figure
4.69. On the South side, only two small
rust spots were visible. In most cases,
corrosion stains were attributed to
Corrosion Rating:
Specimen Generalized Rating
Localized Rating
Stirrups 101 295
Long. mild steel 1 8
Duct NA NA
Strand NA NA

310
corrosion of the bolster strips used to support the reinforcement during
construction. This was evident due to the concrete spalling around the “feet” of
many of the strips. The bolster strips were plastic tipped, but still corroded very
early during testing, as reported by West.4.2 The spots of rust were aligned and at
regular intervals.
Lateral (North) view Top view (from North side)
Figure 4.69 Specimen 1.1 - Condition Prior to Autopsy
A 0.03 in. maximum width crack extended from the Northeast corner of
the ponded region down the side of the beam a distance of 11 inches. Hairline
cracks were visible in the Northeast corner of the ponded region between the
corroded bolster tips.
This specimen was partially autopsied as explained in Section 4.5.1.1,
exposing and removing the mild steel bars only in a 42 inch length, west of the
beam centerline. The analysis length extended half of the ponded region (24
inches) and an additional foot and a half (18 inches) outside the ponded region.
After removing all mild steel bars in the autopsy region, severe corrosion
was found in three out of eight longitudinal bars. The corrosion was very
localized, at approximately 14 inches from the beam centerline. These localized
corrosion areas coincided with the rust stains found previously on the top of the
specimen in the Northeast corner of the ponded region. In Figure 4.70, the
measurement tape indicates the localized corrosion at 28 inches from the left end

311
of the mild steel bar. This locations corresponds to 14 inches from the beam
centerline.
Stirrups were placed at 12-inch spacings in all specimens. Therefore, four
stirrups were included in the partial autopsy region. After a detailed visual
inspection, severe localized corrosion was found in the stirrup located 14 inches
from the beam centerline. (The actual location of the center stirrup was two inches
from the beam centerline) The most severe corrosion was found in the north top
corner of the stirrup, as shown in Figure 4.70. The stirrups located at 26 and 38
inches from the beam centerline had moderate to light corrosion in the top section,
with no section loss. These stirrups were located outside the ponded region. The
center stirrup, located 2 inches from the beam centerline, had only minor
discoloration and light corrosion in localized areas.
Longitudinal bar Stirrup
Figure 4.70 Specimen 1.1 - Mild Steel Bar and Stirrup
Figure 4.71 shows the longitudinal bar and stirrup corrosion rating graphs.
Corrosion rating values for the east side of the beam were extrapolated from the
west side, due to the partial autopsy procedure. This was done to compare results
of the partial autopsy beams with those of the full autopsy beams. By doing so, it
was assumed that the bars and stirrups to the east side of the beam centerline
performed similarly to those west of the centerline.

312
Figure 4.71 Specimen 1.1. Crack Pattern and Specimen Corrosion Rating Graphs
4.5.3.2 Beam specimen 1.3 - Non-PS, Constant Service Load.
Specimen condition after testing
included nine transverse cracks in the
constant moment region (seven in the
ponded region), with a maximum
transverse crack width of 0.020 inches.
Longitudinal cracks were also visible at
4.5 inches from the sides of the beam, with a maximum crack width of 0.050 in.
Beam centerline
W E0.03in. Crack
Partial Autopsy Area Ponded region
21 29457
20457
290
2000
4000
6000
8000
4 16 28 40 52 64
Distance (in)
Stirr
up C
orro
sion
Rat
ing
Stirrups
Extrapolated data
0
5000
10000
15000
0 6 12 18 24 30 36 42 48 54 60 66 72
Dista n ce (in )
Rat
ing
Rebar
Beam centerline
W E0.03in. Crack
Partial Autopsy Area Ponded region
21 29457
20457
290
2000
4000
6000
8000
4 16 28 40 52 64
Distance (in)
Stirr
up C
orro
sion
Rat
ing
Stirrups
Extrapolated data
21 29457
20457
290
2000
4000
6000
8000
4 16 28 40 52 64
Distance (in)
Stirr
up C
orro
sion
Rat
ing
Stirrups
Extrapolated data
0
5000
10000
15000
0 6 12 18 24 30 36 42 48 54 60 66 72
Dista n ce (in )
Rat
ing
Rebar
Corrosion Rating:
Specimen Generalized Rating
Localized Rating
Stirrups 1231 770
Long. mild steel 91 261
Duct NA NA
Strand NA NA

313
Heavy rust stains and salt deposits were visible in the top of the cracks in
localized areas, as shown in Figure 4.72.
Lateral (South) view Top view (from South side)
Figure 4.72 Specimen 1.3. Condition Prior to Autopsy
Very severe corrosion, pitting and section loss were observed for all
longitudinal bars, corresponding with crack locations. All the stirrups were also
severely corroded, with large pits and section loss. Crack locations coincided
with the stirrup locations. Therefore, the stirrups were severely damaged,
especially under the ponded region. Figure 4.73 shows examples of the typical
longitudinal bar and stirrup corrosion in Specimen 1.3. Figure 4.74 shows the
crack pattern in the top of the specimen after exposure and the rebar and stirrup
corrosion ratings across the analyzed section.
Longitudinal Steel Stirrup
Figure 4.73 Specimen 1.3 Mild Steel Bar and Stirrup
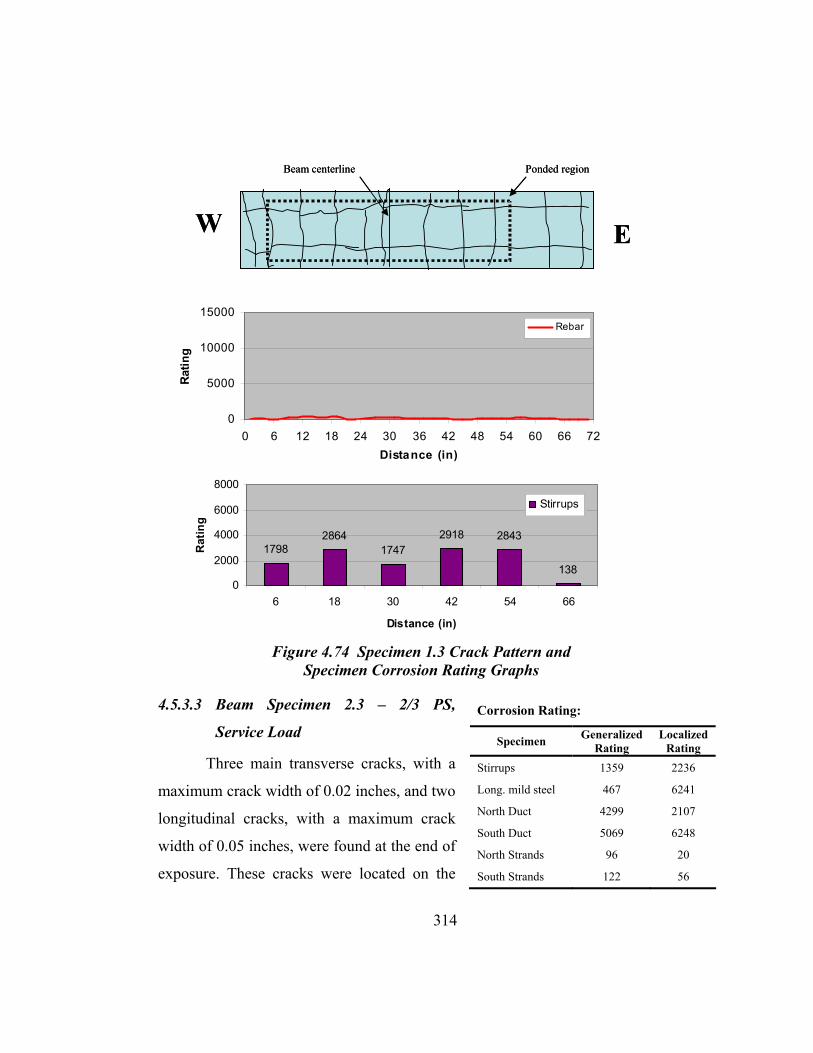
314
Figure 4.74 Specimen 1.3 Crack Pattern and Specimen Corrosion Rating Graphs
4.5.3.3 Beam Specimen 2.3 – 2/3 PS,
Service Load
Three main transverse cracks, with a
maximum crack width of 0.02 inches, and two
longitudinal cracks, with a maximum crack
width of 0.05 inches, were found at the end of
exposure. These cracks were located on the
EW
17982864
17472918 2843
1380
2000
4000
6000
8000
6 18 30 42 54 66
Distance (in)
Rat
ing
Stirrups
Ponded regionBeam centerline
0
5000
10000
15000
0 6 12 18 24 30 36 42 48 54 60 66 72Distance (in)
Ratin
g
Rebar
EW
17982864
17472918 2843
1380
2000
4000
6000
8000
6 18 30 42 54 66
Distance (in)
Rat
ing
Stirrups
Ponded regionBeam centerline
0
5000
10000
15000
0 6 12 18 24 30 36 42 48 54 60 66 72Distance (in)
Ratin
g
Rebar
Corrosion Rating:
Specimen Generalized Rating
Localized Rating
Stirrups 1359 2236
Long. mild steel 467 6241
North Duct
South Duct
4299
5069
2107
6248
North Strands
South Strands
96
122
20
56

315
top of the specimen in the ponded region. Salt deposits and large rust stains were
visible on the sides of the beam, as shown in Figure 4.75.
Very severe pitting and section loss was found on the mild steel bars in the
northeast corner of the ponded region. (See Figure 4.77) The corrosion was
located 24 inches from the beam centerline, which corresponded with the border
of the ponded region. The stirrups were also severely corroded, as seen in Figure
5.16. It was found that severely corroded stirrups coincided with crack locations.
(See graphs in Figure 4.78)
Lateral (South) View Top View (from South Side)
Figure 4.75 Specimen 2.3 – Condition Prior to Autopsy
Extremely severe corrosion and area loss, corresponding to crack
locations, was found in both post-tensioning ducts. (See Figure 4.77 and graphs in
Figure 4.78) Corrosion was aggravated at locations where large grout voids
existed, as shown in Figure 4.76. A large accumulation of corrosion products
from the ducts was found attached to the grout.
Moderate localized corrosion and pitting in a few wires was found on the
south strands. The north strands show only moderate to light uniform corrosion.
As with the mild steel bars, stirrups and ducts, localized corrosion in the strands
corresponded to crack locations in the ponded region.

316
The acid soluble chloride content in the grout reached a maximum value
of 0.3% by weight of grout inside the south duct, and 0.18% inside the north duct.
These values are much higher than the critical chloride threshold value of 0.033%
by weight of grout (corresponding to 0.2% by weight of cement). Chloride
samples were taken at 6-inch intervals within the forensic analysis length and
chloride content plots were obtained, as observed in Figure 4.78.
Beam specimen 2.3 had four duct splices. The north duct had two industry
standard splices, and the south duct had two heat-shrink splices. Figure 4.76
shows the condition of the duct splices at the end of exposure testing. Severe area
loss and extremely severe corrosion were found on the oversized piece of both
industry standard splices in the north duct. As shown in the photographs, moisture
was able to enter the sides of the splice at the duct tape locations. This accelerated
the corrosion by allowing corrosive attack from the inside of the splice as well as
the outside. Voids in the grout at the splice locations also aggravated the corrosion
in the galvanized steel pieces. The west duct splice on the north duct had been
intentionally damaged during construction. The role the damage played with
respect to the splice corrosion protection is not clear due to the effect of the other
contributing factors, such as splice locations, crack locations, moisture ingress
and chloride contents. The heat-shrink splices in the south duct also performed
poorly. As can be seen from Figure 4.76, the east heat-shrink splice trapped
moisture from the grout bleed water and accelerated the galvanized duct
deterioration. The west side splice was intentionally damaged during construction,
with a small cut (less than 1 inch) in the center. The generalized duct corrosion
under the splice and the uniform rust stains on the inside of the heat-shrink splice
indicate that the damage was not the main cause of duct corrosion. Nevertheless,
the damage is considered as one of the duct deterioration contributing factors.

317
Figure 4.76 Specimen 2.3 – Duct Splices

318
Figure 4.77 Specimen 2.3 – Reinforcing Elements
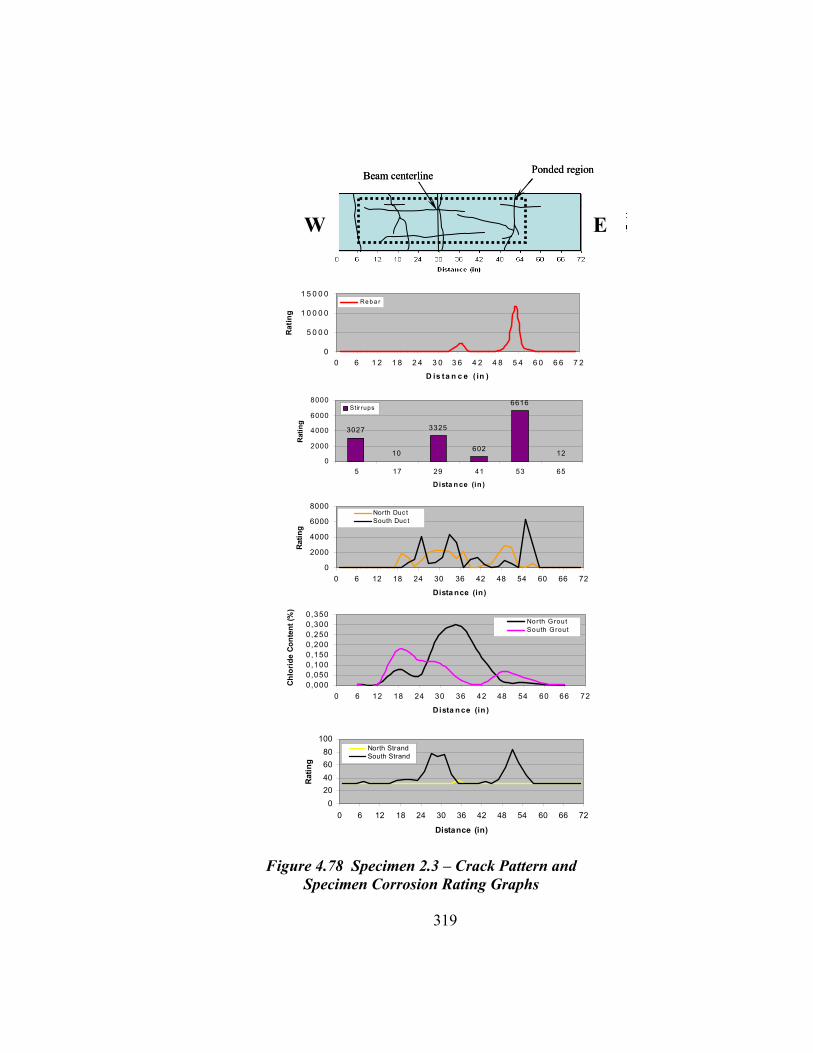
319
0
5 0 0 0
1 0 0 0 0
1 5 0 0 0
0 6 1 2 1 8 2 4 3 0 3 6 4 2 4 8 5 4 6 0 6 6 7 2
D is ta n c e ( in )
Rat
ing
Re b a r
3027
10
3325
602
6616
120
2000
4000
6000
8000
5 17 29 41 53 65
Dista n ce (in )
Rat
ing
Stir rups
0
2000
4000
6000
8000
0 6 12 18 24 30 36 42 48 54 60 66 72
Dista nce (in)
Rat
ing
North Duc tSouth Duc t
0,0000,0500,1000,1500,2000,2500,3000,350
0 6 12 18 24 30 36 42 48 54 60 66 72
Dista n ce (in )
Chlo
ride
Con
tent
(%)
North GroutSouth Grout
020406080
100
0 6 12 18 24 30 36 42 48 54 60 66 72
Distance (in)
Rat
ing
North StrandSouth Strand
EW
Beam centerline Ponded region
0
5 0 0 0
1 0 0 0 0
1 5 0 0 0
0 6 1 2 1 8 2 4 3 0 3 6 4 2 4 8 5 4 6 0 6 6 7 2
D is ta n c e ( in )
Rat
ing
Re b a r
3027
10
3325
602
6616
120
2000
4000
6000
8000
5 17 29 41 53 65
Dista n ce (in )
Rat
ing
Stir rups
0
2000
4000
6000
8000
0 6 12 18 24 30 36 42 48 54 60 66 72
Dista nce (in)
Ratin
g
North Duc tSouth Duc t
0,0000,0500,1000,1500,2000,2500,3000,350
0 6 12 18 24 30 36 42 48 54 60 66 72
Dista n ce (in )
Chlo
ride
Con
tent
(%)
North GroutSouth Grout
020406080
100
0 6 12 18 24 30 36 42 48 54 60 66 72
Distance (in)
Rat
ing
North StrandSouth Strand
EW
Beam centerline Ponded region
Figure 4.78 Specimen 2.3 – Crack Pattern and
Specimen Corrosion Rating Graphs

320
4.5.3.4 Beam Specimen 2.11 – 2/3 PS, Service Load, Fly Ash Grout
As shown in Figure 4.79, four
main transverse cracks and several small
longitudinal cracks were visible on the
top of Specimen 2.11 in the constant
moment region at the end of exposure. A
maximum transverse crack width of 0.03
inches was found in the southwest area
of the ponded region. The maximum
longitudinal crack width was also 0.030 in. Heavy rust stains were visible on the
top of the specimen in localized areas extending out of the cracks, as shown in
Figure 4.79. The additional rust stains corresponded to the location of the “legs”
of the bolster strips, used to support the reinforcement.
A full autopsy of Specimen 2.11 was performed, providing a total length
of 72 inches of the longitudinal bars, ducts, grout and strands and six stirrups to
be analyzed. Thirty inches of the analysis length extended to the west of the
centerline of the beam and the remaining 42 inches extended to the east.
Lateral (North) View Top View (from South Side)
Figure 4.79 Specimen 2.11 – Condition Prior to Autopsy
Corrosion Rating:
Specimen Generalized Rating
Localized Rating
Stirrups 1923 2978
Long. mild steel 476 7757
North Duct
South Duct
1504
1413
2440
1673
North Strands
South Strands
97
92
20
26

321
Very severe section loss and pitting was observed in all longitudinal mild
steel bars corresponding to all crack locations. (See Figure 4.81) The most severe
corrosion was found at the beam centerline crack. Similar results were found on
the stirrups, where the beam centerline stirrup had extensive corrosion and section
loss.
Figure 4.81 shows the severe corrosion and area loss found in the south
duct. Extensive duct deterioration was mostly located to the west of the centerline.
Zinc and steel corrosion products covered the remaining areas on the top of the
duct. The bottom of the duct was found to be in better condition, with some areas
of zinc and steel corrosion products. Corrosion on the north duct was less severe
than on the south duct. It was also found to have a few areas of severe localized
corrosion, section loss, and build up of zinc and steel corrosion products. The
corrosion on the north duct was significant at the centerline of the beam, under the
industry standard splice.
The south duct grout had several transverse cracks, with a maximum crack
width of 0.060 inches. This crack coincided with the location of the heavy duct
corrosion and area loss. Duct corrosion stains were found inside the grout cracks,
where moisture had traveled down from the grout surface. (See Figure 4.81) The
north duct grout had one large void due to bleed water that was 22 inches in
length and 0.013 inches deep. Corrosion products were found attached to the
grout in the void. This location corresponded with the splice location at the
centerline of the beam. Three transverse cracks, with a maximum crack width of
0.010 inches, were found on the east side of the grout. The cracks coincided with
the area where severe duct corrosion and duct area loss were found. The acid
soluble chloride content in the grout reached a maximum value of 0.31% by
weight of grout inside the north duct, and 0.033% inside the south duct. The
content in the north duct was from the sample taken at the centerline of the beam,

322
under the industry standard splice. It was much higher than the critical chloride
threshold value of 0.033% by weight of grout. Chloride samples were taken at 6-
inch intervals within the forensic analysis length and chloride content plots were
obtained, as observed in Figure 4.82.
Light to moderate corrosion was found on the outer wires of the strands in
both ducts, with the center wires presenting a slight increase in corrosion severity.
Specimen 2.11 had two duct splices. The north duct had an industry
standard splice, and the south duct had a heat-shrink splice. Both splices were
located at the centerline of the beam. Figure 4.80 shows the condition of the duct
splices at the end of exposure testing. The top of the north duct splice was found
to be severely deteriorated. The heat-shrink splice showed severe signs of rust
staining from the duct corrosion.
North Duct Splice South Duct Splice
Figure 4.80 Specimen 2.11 – Duct Splices

323
Figure 4.81 Specimen 2.11 – Reinforcing Elements
Longitudinal bar Stirrup North Duct South Duct North Duct Grout South Duct Grout North Strand South Strand

324
1 1 6 4
7 4 2 2
5 1 0 6
1 1 1 5
4 4 1 1
80
2 0 0 0
4 0 0 0
6 0 0 0
8 0 0 0
7 1 9 3 1 4 3 5 5 6 7
D ista n c e (in )
Ratin
g
S tir r u p s
0
5 0 0 0
1 0 0 0 0
1 5 0 0 0
0 6 1 2 1 8 2 4 3 0 3 6 4 2 4 8 5 4 6 0 6 6 7 2
D i sta n c e (i n )
Ratin
g
R e b a r
0
2000
4000
6000
8000
0 6 12 18 24 30 36 42 48 54 60 66 72
D ista n ce (in )
Rat
ing
No r th Du c t
S o u th Du c t
020406080
100
0 6 12 18 24 30 36 42 48 54 60 66 72
Distance (in)
Rat
ing
North StrandSouth Strand
Beam centerline
EW
Ponded region
0,0000,0500,1000,1500,2000,2500,3000,350
0 6 12 18 24 30 36 42 48 54 60 66 72
Dista nce (in)
Chlo
ride
Con
tent
(%)
North Grout
South Grout
Figure 4.82 Specimen 2.11 – Crack Pattern and Specimen Corrosion Rating Graphs
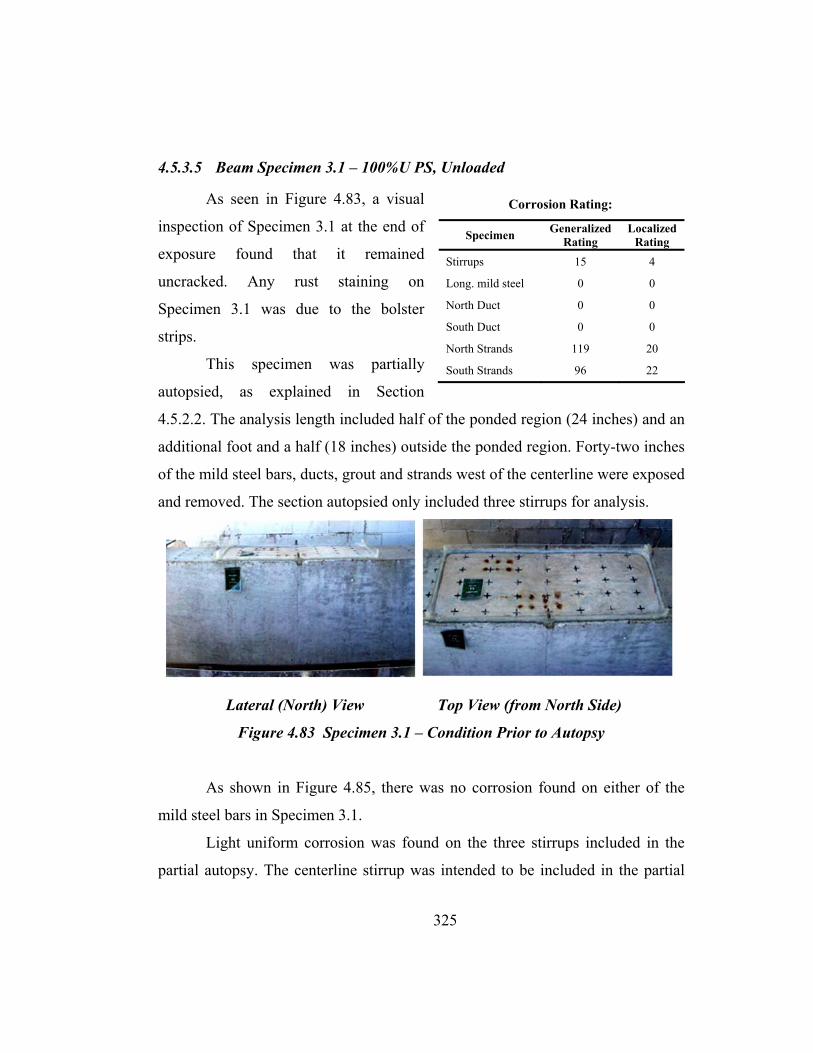
325
4.5.3.5 Beam Specimen 3.1 – 100%U PS, Unloaded
As seen in Figure 4.83, a visual
inspection of Specimen 3.1 at the end of
exposure found that it remained
uncracked. Any rust staining on
Specimen 3.1 was due to the bolster
strips.
This specimen was partially
autopsied, as explained in Section
4.5.2.2. The analysis length included half of the ponded region (24 inches) and an
additional foot and a half (18 inches) outside the ponded region. Forty-two inches
of the mild steel bars, ducts, grout and strands west of the centerline were exposed
and removed. The section autopsied only included three stirrups for analysis.
Lateral (North) View Top View (from North Side)
Figure 4.83 Specimen 3.1 – Condition Prior to Autopsy
As shown in Figure 4.85, there was no corrosion found on either of the
mild steel bars in Specimen 3.1.
Light uniform corrosion was found on the three stirrups included in the
partial autopsy. The centerline stirrup was intended to be included in the partial
Corrosion Rating:
Specimen Generalized Rating
Localized Rating
Stirrups 15 4
Long. mild steel 0 0
North Duct
South Duct
0
0
0
0
North Strands
South Strands
119
96
20
22

326
autopsy, but its actual location was outside of the section removed. This is why
there is no analysis or rating for the centerline stirrup
There were no signs of corrosion on either of the ducts.
The grout in the north and south ducts showed multiple small voids over
the entire length. Neither of the duct grouts had significantly large voids. The acid
soluble chloride content in the north duct grout was negligible. The chloride
content in the south duct grout was also negligible, except for the single
measurement of 0.021% by weight of grout. The sample yielding this value was
taken 36 inches to the west of the centerline. It was determined that this value was
due to an error in the equipment and considered an outlier. Chloride samples were
taken at 6-inch intervals within the forensic analysis length and chloride content
plots were obtained, as shown in Figure 4.86.
Moderate uniform corrosion was found on the strands in the north duct,
and light uniform corrosion was found on those located in the south duct. (See
Figure 4.85)
Specimen 3.1 had two duct splices. The south duct had an industry
standard splice and the north duct had a heat-shrink splice. Both splices were
located at the centerline of the beam. Therefore, only half of each splice was
included in the section autopsied. Figure 4.84 shows the condition of the duct
splices at the end of exposure testing. No signs of corrosion were found on either
splice.

327
North Duct Splice South Duct Splice
Figure 4.84 Specimen 3.1 – Duct Splices
Figure 4.86 shows the chloride content and corrosion rating graphs for
each reinforcing element. Corrosion rating values for the east side of the beam
were extrapolated from the west side, due to the partial autopsy procedure. This
was done to compare results of the partial autopsy beam with those of the full
autopsy beams. By doing so, it was assumed that the reinforcing elements to the
east side of the beam centerline performed similarly to those west of the
centerline.

328
Figure 4.85 Specimen 3.1 – Reinforcing Elements
Longitudinal bar Stirrup
North Duct South Duct North Duct Grout South Duct Grout North Strand South Strand

329
Partial Autopsy AreaBeam centerline
EW
Ponded region
No cracking
0
5 0 0 0
1 0 0 0 0
1 5 0 0 0
0 6 1 2 1 8 2 4 3 0 3 6 4 2 4 8 5 4 6 0 6 6 7 2
D i sta n c e (i n )
Ratin
g
R e b a r
2 5 2 1 2 8 2 8 2 10
2 0 0 0
4 0 0 0
6 0 0 0
8 0 0 0
6 1 8 3 0 4 2 5 4 6 6
D i sta n c e (i n )
Rat
ing
S tir r u p s
0
2 0 0 0
4 0 0 0
6 0 0 0
8 0 0 0
0 6 1 2 1 8 2 4 3 0 3 6 4 2 4 8 5 4 6 0 6 6 7 2
D i sta n c e ( i n )
Rat
ing
N o r th D u c tS o u th D u c t
0 , 0 0 00 , 0 5 00 , 1 0 00 , 1 5 00 , 2 0 00 , 2 5 00 , 3 0 00 , 3 5 0
0 6 1 2 1 8 2 4 3 0 3 6 4 2 4 8 5 4 6 0 6 6 7 2
D i sta n c e (i n )
Chlo
ride
Cont
ent (
%)
N o r th G r o u tS o u th G r o u t
0
2 0
4 0
6 0
8 0
1 0 0
0 6 1 2 1 8 2 4 3 0 3 6 4 2 4 8 5 4 6 0 6 6 7 2
D ista n c e (in )
Ratin
g
No r th S tr a n dS o u th S tr a n d
Partial Autopsy AreaBeam centerline
EW
Ponded region
No cracking
0
5 0 0 0
1 0 0 0 0
1 5 0 0 0
0 6 1 2 1 8 2 4 3 0 3 6 4 2 4 8 5 4 6 0 6 6 7 2
D i sta n c e (i n )
Ratin
g
R e b a r
2 5 2 1 2 8 2 8 2 10
2 0 0 0
4 0 0 0
6 0 0 0
8 0 0 0
6 1 8 3 0 4 2 5 4 6 6
D i sta n c e (in )
Ratin
g
S tir r u p s
0
2 0 0 0
4 0 0 0
6 0 0 0
8 0 0 0
0 6 1 2 1 8 2 4 3 0 3 6 4 2 4 8 5 4 6 0 6 6 7 2
D i sta n c e ( i n )
Ratin
g
N o r th D u c tS o u th D u c t
0 , 0 0 00 , 0 5 00 , 1 0 00 , 1 5 00 , 2 0 00 , 2 5 00 , 3 0 00 , 3 5 0
0 6 1 2 1 8 2 4 3 0 3 6 4 2 4 8 5 4 6 0 6 6 7 2
D i sta n c e (i n )
Chlo
ride
Cont
ent (
%)
N o r th G r o u tS o u th G r o u t
0
2 0
4 0
6 0
8 0
1 0 0
0 6 1 2 1 8 2 4 3 0 3 6 4 2 4 8 5 4 6 0 6 6 7 2
D ista n c e (in )
Ratin
g
No r th S tr a n dS o u th S tr a n d
Figure 4.86 Specimen 3.1 – Crack Pattern and Specimen Corrosion Rating Graphs

330
4.5.3.6 Beam Specimen 3.2 – 100%U PS, Service Load
A visual inspection found that
Specimen 3.2 had one transverse crack
(See Figure 4.87) across the top of the
beam at the end of exposure even though
this specimen was designed to remain
uncracked. The crack had a maximum
width of 0.01 inches and was located 12
inches to the west of the centerline of the
beam. This location was directly above a stirrup. As seen in Figure 4.87, any rust
staining was due to the bolster strips.
A full autopsy of Specimen 3.2 was performed, providing a total length of
72 inches of the longitudinal bars, ducts, grout and strands and six stirrups to be
analyzed. (See Figure 4.90) Forty-two inches of the analysis length extended to
the west of the centerline of the beam and the remaining 30 inches extended to the
east.
Lateral (North) View Top View (from South Side)
Figure 4.87 Specimen 3.2 – Condition Prior to Autopsy
Corrosion Rating:
Specimen Generalized Rating
Localized Rating
Stirrups 95 462
Long. mild steel 1 4
North Duct
South Duct
1
0
2
2
North Strands
South Strands
168
168
28
28

331
The only corrosion found on the mild steel bars was a small localized area
of light corrosion. It was located 10 inches to the east of the centerline.
Two localized areas of severe corrosion and area loss were found on the
stirrups. These areas were found on the stirrups located 13 and 25 inches to the
west of the centerline. The stirrup 13 inches to the west corresponds to the crack
described above. The remaining stirrups showed light uniform corrosion.
The only corrosion found on the north duct was located under the heat-
shrink splice at the centerline of the beam. It showed two very light spots of
corrosion. The south duct showed no signs of corrosion. (See Figure 4.90)
The grout in the north duct showed multiple small voids over the entire
length. The south duct grout had three large voids. A 14-inch long void was
located at the centerline, as shown in Figure 4.90. Two six-inch long voids were
found 24 inches to the east and to the west of the centerline. Figure 4.88 was
included to illustrate the good grouting quality of both ducts in Specimen 3.2. The
acid soluble chloride content in the north and south duct grout was negligible.
Chloride samples were taken at 6-inch intervals within the forensic analysis
length and chloride content plots were obtained, as shown in Figure 4.91.
Light uniform corrosion was found on all of the strands located in the
north and south ducts.

332
Figure 4.88 Specimen 3.2 – Grouted Duct
Specimen 3.2 had two duct splices. The south duct had an industry
standard splice and the north duct had a heat-shrink spice. Both splices were
located at the centerline of the beam. Figure 5.89 shows the condition of the duct
splices at the end of exposure. Both splices showed no signs of corrosion, with
only a minor salt stain on the industry standard splice.
North Duct Splice South Duct Splice
Figure 4.89 Specimen 3.2 – Duct Splices

333
Figure 4.90 Specimen 3.2 – Reinforcing Elements
Longitudinal bar Stirrup
North Duct South Duct
North Duct Grout South Duct Grout
North Strand South Strand
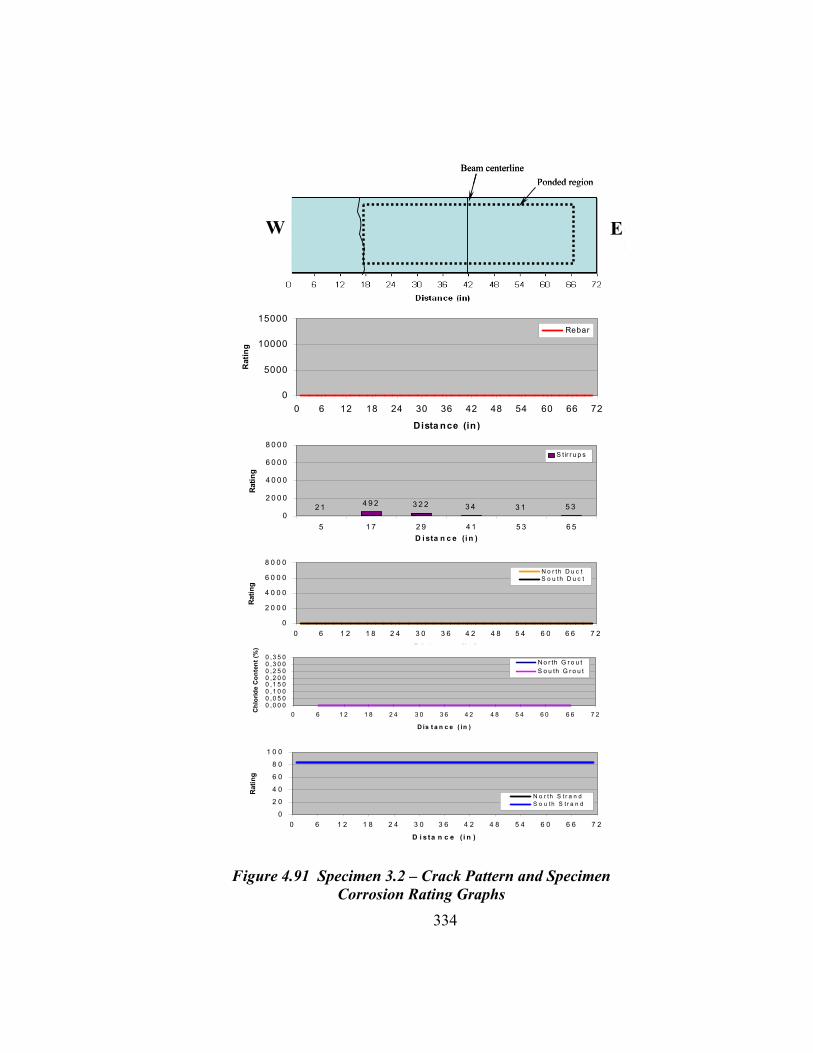
334
Beam centerline
EW
Ponded region
0
5000
10000
15000
0 6 12 18 24 30 36 42 48 54 60 66 72
Dista nce (in )
Rat
ing
Rebar
2 1 4 9 2 3 2 2 3 4 3 1 5 30
2 0 0 0
4 0 0 0
6 0 0 0
8 0 0 0
5 1 7 2 9 4 1 5 3 6 5D i sta n c e (i n )
Ratin
g
S tir r u p s
0
2 0 0 0
4 0 0 0
6 0 0 0
8 0 0 0
0 6 1 2 1 8 2 4 3 0 3 6 4 2 4 8 5 4 6 0 6 6 7 2
D i sta n c e ( i n )
Ratin
g
N o r th D u c tS o u th D u c t
0 ,0 0 00 ,0 5 00 ,1 0 00 ,1 5 00 ,2 0 00 ,2 5 00 ,3 0 00 ,3 5 0
0 6 1 2 1 8 2 4 3 0 3 6 4 2 4 8 5 4 6 0 6 6 7 2
D is t a n c e ( in )
Chl
orid
e C
onte
nt (%
)
N o r th G r o u tS o u th G r o u t
0
2 0
4 0
6 0
8 0
1 0 0
0 6 1 2 1 8 2 4 3 0 3 6 4 2 4 8 5 4 6 0 6 6 7 2
D i s ta n c e ( i n )
Rat
ing
N o r th S t r a n dS o u th S t r a n d
Figure 4.91 Specimen 3.2 – Crack Pattern and Specimen Corrosion Rating Graphs

335
4.5.3.7 Beam Specimen 3.3 – 100%U PS, Overload
As shown in Figure 4.92,
specimen 3.3 had three transverse cracks
across the top of the beam at the end of
exposure. The largest crack had a
maximum width of 0.013 inches and was
located at the centerline of the beam.
This location was directly above a
stirrup. The other two cracks had a
maximum width of 0.01 inches. They were located 24 inches to the east and west
of the centerline. Both of these cracks also coincided with stirrup locations. As
seen in Figure 4.92, there was minor rust staining around the cracks on the sides
of the beam. A majority of the rust spots on the top were from the bolster strips.
A full autopsy of Specimen 3.3 was performed, providing a total length of
72 inches of the longitudinal bars, ducts, grout, and strands and six stirrups to be
analyzed. Forty-two inches of the analysis length extended to the west of the
centerline of the beam and the remaining 30 inches extended to the east. (See
Figure 4.92)
Lateral (North) View Top View (from North Side)
Figure 4.92 Specimen 3.3 – Condition Prior to Autopsy
Corrosion Rating:
Specimen Generalized Rating
Localized Rating
Stirrups 423 867
Long. mild steel 36 294
North Duct
South Duct
429
220
924
685
North Strands
South Strands
161
118
64
32

336
Two areas with severe corrosion with area loss were found on one of the
mild steel bars. They coincided with the stirrups located at the centerline and 24
inches to the west.
Severe uniform corrosion and section loss was found on the three stirrups
located under the cracks described above. The remaining stirrups showed light
uniform corrosion.
Severe corrosion and area loss corresponding to the three crack locations
was found on the north duct. The south duct also showed signs of severe
corrosion and area loss at the centerline, and moderate corrosion under the other
two cracks. (See Figure 4.94) The remainder of the ducts showed no signs of
corrosion.
The grout in the north duct had two voids located at the centerline and 24
inches to the east. Corrosion products from the duct were found coinciding with
the three crack locations. Two voids were also present in the south duct grout.
They were located 30 inches to the west and 14 inches to the east of the
centerline. Neither of these voids coincided with any duct corrosion or crack
locations. Corrosion products from the south duct were found coinciding with
three crack locations. The acid soluble chloride content in the grout reached a
maximum value of 0.0423% by weight of grout inside the north duct at the
centerline. The maximum chloride content in the south duct grout was 0.0457%
by weight of grout. This sample was located 24 inches to the east of the
centerline, which is the same location as one of the cracks and severe duct
corrosion. These values are higher than the critical chloride threshold value of
0.033% by weight of grout. Chloride samples were taken at 6-inch intervals
within the forensic analysis length and chloride content plots were obtained, as
shown in Figure 4.95.

337
Moderate to severe uniform corrosion was found on all three prestressing
strands in the north duct. As shown in Figure 4.94, severe localized corrosion was
found 24 inches to the west of the centerline, which again coincides with a crack
location. Moderate to severe uniform corrosion was also found on all three
prestressing strands in the south duct.
Specimen 3.3 had one duct splice. It was an industry standard splice
located on the north duct at the centerline. Figure 4.93 shows the condition of the
duct splice at the end of exposure testing. The top of the north duct splice was
found to be severely corroded with significant section loss.
Figure 4.93 Specimen 3.3 – North Duct Splice

338
Figure 4.94 Specimen 3.3 – Reinforcing Elements
Longitudinal bar Stirrup North Duct South Duct
North Duct Grout South Duct Grout
North Strand South Strand

339
271098
9
2218
20858
0
2000
4000
6000
8000
7 19 31 43 55 67
Distance (in)
Stirrups
Beam centerline
EW
Ponded region
Previous limited autopsy area
0 , 0 0 00 , 0 5 00 , 1 0 00 , 1 5 00 , 2 0 00 , 2 5 00 , 3 0 00 , 3 5 0
0 6 1 2 1 8 2 4 3 0 3 6 4 2 4 8 5 4 6 0 6 6 7 2
D i s t a n c e ( i n )
Ch
lori
de
Co
nte
n
N o r t h G r o u t
S o u th G r o u t
02 04 06 08 0
1 0 0
0 6 1 2 1 8 2 4 3 0 3 6 4 2 4 8 5 4 6 0 6 6 7 2
D i sta n c e ( i n )
Rat
ing
N o r th S tr a n d
S o u th S t r a n d
0
5 0 0 0
1 0 0 0 0
1 5 0 0 0
0 6 1 2 1 8 2 4 3 0 3 6 4 2 4 8 5 4 6 0 6 6 7 2
D i s t a n c e ( i n )
Ra
tin
R e b a r
02000400060008000
0 6 12 18 24 30 36 42 48 54 60 66 72
Dista n ce (in )
Rat
ing
Nor th Duc tSouth Duc t
Figure 4.95 Specimen 3.3 – Crack Pattern and
Specimen Corrosion Rating Graphs
Rat
ing
Rat
ing
Chl
orid
e C
onte
nt (%
)R
atin
g

340
4.5.3.8 Beam Specimen 4.2 – 100%S PS, Service Load
As shown in Figure 4.96, a
visual inspection found that Specimen
4.2 had two transverse cracks across
the top of the beam at the end of
exposure. This specimen was designed
to remain uncracked. The first crack
had a maximum width of 0.013 inches
and was located one inch to the west of
the centerline of the beam. This location was directly above a stirrup. The second
crack had a maximum width of 0.01 inches. It was located 22 inches to the east of
the centerline, also above a stirrup. As seen in Figure 4.96, there was no rust
staining around the cracks. Any rust spots were again from the bolster strips.
A full autopsy of Specimen 4.2 was performed, providing a total length of
72 inches of the longitudinal bars, ducts, grout and strands and six stirrups to be
analyzed. Thirty inches of the analysis length extended to the west of the
centerline of the beam and the remaining 42 inches extended to the east. (See
Figure 4.99)
Lateral (South) View Top View (from East Side)
Figure 4.96 Specimen 4.2 – Condition Prior to Autopsy
Corrosion Rating:
Specimen Generalized Rating
Localized Rating
Stirrups 189 236
Long. mild steel 15 169
North Duct
South Duct
7
4
8
4
North Strands
South Strands
96
96
22
16

341
Signs of corrosion were only found on one of the mild steel bars. It was
severe localized corrosion with minor section loss at the centerline. (See Figure
4.98)
Severe localized corrosion and section loss were found on the two stirrups
located under the cracks described before. The remaining stirrups showed light
uniform corrosion with a few areas of moderate localized corrosion.
Severe corrosion corresponding to the maximum crack location at the
centerline was found on the north duct. The south duct showed signs of light to
moderate corrosion corresponding with the two cracks on the specimen. The
remainder of the ducts showed no signs of corrosion. (See Figure 4.98)
The grout in the north duct had a large void approximately 12 inches long.
It was located under the smaller crack to the east of the centerline. Corrosion
stains from the duct were found a few inches to the east of the centerline. As seen
in Figure 4.98, a large crack in the grout was also present at this location, showing
rust stains on the face of the crack. Two large voids were present in the south duct
grout. One began six inches to the west of the centerline, extending 18 inches.
(See Figure 4.98) The second void was 14 inches in length and began 20 inches to
the east. The acid soluble chloride content in the grout reached a maximum value
of 0.0023% by weight of grout inside the north and south ducts. This value is
much lower than the critical chloride threshold value of 0.033%. Chloride
samples were taken at 6-inch intervals within the forensic analysis length and
chloride content plots were obtained, as shown in Figure 4.99.
Light uniform corrosion was found on all of the strands located in the
north and south ducts.
Specimen 4.2 had four duct splices. The south duct had two industry
standard splices, one beginning 12 inches to the east of the centerline and the
other 12 inches to the west. The north duct had two heat-shrink splices at the same

342
locations. Figure 4.97 shows the condition of the duct splices at the end of
exposure testing. The only corrosion found on the industry standard splices was
very light and located on the end of the splice. Both heat-shrink splices showed no
signs of rust staining.
Figure 4.97 Specimen 4.2 – Duct Splices

343
Figure 4.98 Specimen 4.2 – Reinforcing Elements
Stirrup
Longitudinal bar
North Duct South Duct
North Duct South Duct Grout Grout
North Strand South Strand

344
Beam centerline
EW
Ponded region
0
5 0 0 0
1 0 0 0 0
1 5 0 0 0
0 6 1 2 1 8 2 4 3 0 3 6 4 2 4 8 5 4 6 0 6 6 7 2
D i sta n c e ( i n )
Ratin
g
R e b a r
3 2 2 56 7 8
91 1 4 8
10
2 0 0 0
4 0 0 0
6 0 0 0
8 0 0 0
4 1 6 2 8 4 0 5 2 6 4D ista n c e (in )
Ratin
g
S tir r u p s
0
2 0 0 0
4 0 0 0
6 0 0 0
8 0 0 0
0 6 1 2 1 8 2 4 3 0 3 6 4 2 4 8 5 4 6 0 6 6 7 2
D i sta n c e (i n )
Ratin
g
N o r th D u c tS o u th D u c t
0 , 0 0 00 , 0 5 00 , 1 0 00 , 1 5 00 , 2 0 00 , 2 5 00 , 3 0 00 , 3 5 0
0 6 1 2 1 8 2 4 3 0 3 6 4 2 4 8 5 4 6 0 6 6 7 2
D ista n c e (i n )
Chl
orid
e Co
nten
t (%
)
N o r th G r o u tS o u th G r o u t
020406080
100
0 6 12 18 24 30 36 42 48 54 60 66 72
Distance (in)
Rat
ing
North StrandSouth Strand
Beam centerline
EW
Ponded region
0
5 0 0 0
1 0 0 0 0
1 5 0 0 0
0 6 1 2 1 8 2 4 3 0 3 6 4 2 4 8 5 4 6 0 6 6 7 2
D i sta n c e ( i n )
Ratin
g
R e b a r
3 2 2 56 7 8
91 1 4 8
10
2 0 0 0
4 0 0 0
6 0 0 0
8 0 0 0
4 1 6 2 8 4 0 5 2 6 4D ista n c e (in )
Ratin
g
S tir r u p s
0
2 0 0 0
4 0 0 0
6 0 0 0
8 0 0 0
0 6 1 2 1 8 2 4 3 0 3 6 4 2 4 8 5 4 6 0 6 6 7 2
D i sta n c e (i n )
Ratin
g
N o r th D u c tS o u th D u c t
0 , 0 0 00 , 0 5 00 , 1 0 00 , 1 5 00 , 2 0 00 , 2 5 00 , 3 0 00 , 3 5 0
0 6 1 2 1 8 2 4 3 0 3 6 4 2 4 8 5 4 6 0 6 6 7 2
D ista n c e (i n )
Chl
orid
e Co
nten
t (%
)
N o r th G r o u tS o u th G r o u t
020406080
100
0 6 12 18 24 30 36 42 48 54 60 66 72
Distance (in)
Rat
ing
North StrandSouth Strand
Figure 4.99 Specimen 4.2 – Crack Pattern and Specimen Corrosion Rating Graphs

345
4.5.4 Forensic Examination Results for Phase II Beams
4.5.4.1 Beam Specimen 1.5 – Non-PS, Fly Ash Concrete
At the end of exposure,
Specimen 1.5 had a large number of
cracks on the top face and both sides.
(See Figure 4.100) A majority of the
cracks were confined to the constant
maximum moment region. There was a
large amount of rust staining,
corresponding to the cracks, on both
sides of the specimen. Rust stains did not surround the cracks located outside the
ponded region. Specimen 1.5 had a maximum crack width of 0.02 inches located
14 inches to the west and 11 inches to the east of the centerline.
Lateral (North) View Top View (from South Side)
Figure 4.100 Specimen 1.5 – Condition Prior to Autopsy
Corrosion Rating:
Specimen Generalized Rating
Localized Rating
Stirrups 224 296
Long. mild steel 6 8
North Duct
South Duct
NA
NA
NA
NA
North Strands
South Strands
NA
NA
NA
NA
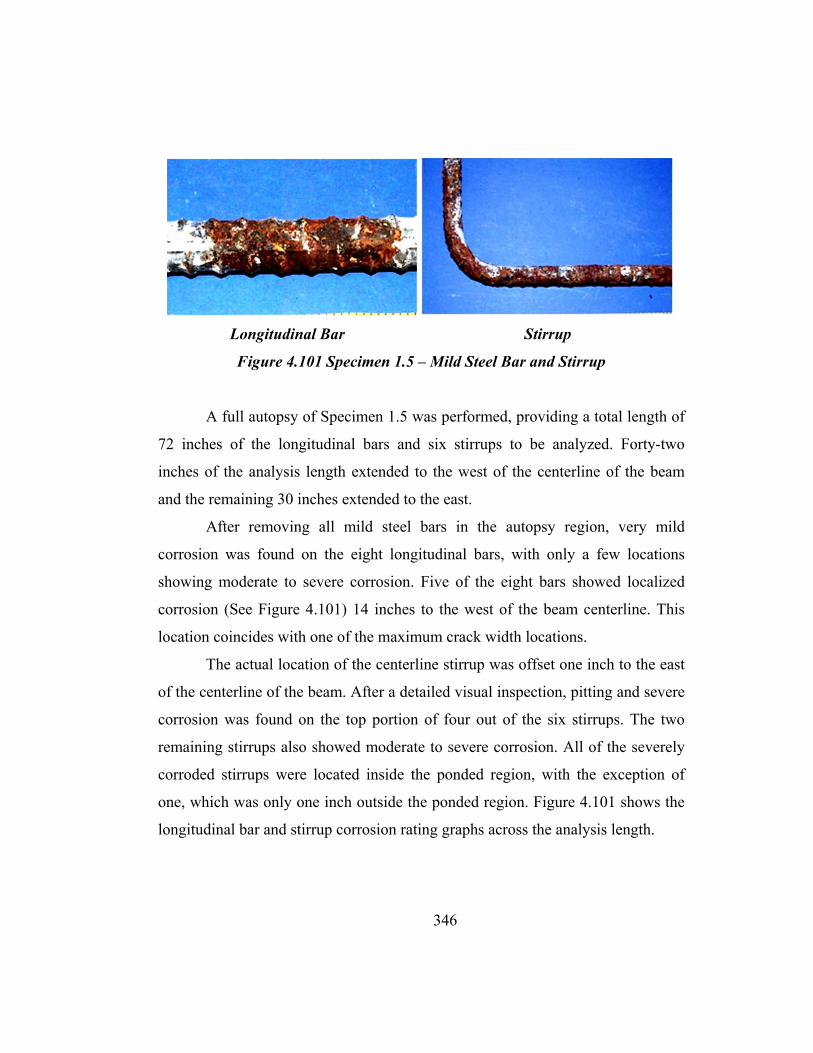
346
Longitudinal Bar Stirrup
Figure 4.101 Specimen 1.5 – Mild Steel Bar and Stirrup
A full autopsy of Specimen 1.5 was performed, providing a total length of
72 inches of the longitudinal bars and six stirrups to be analyzed. Forty-two
inches of the analysis length extended to the west of the centerline of the beam
and the remaining 30 inches extended to the east.
After removing all mild steel bars in the autopsy region, very mild
corrosion was found on the eight longitudinal bars, with only a few locations
showing moderate to severe corrosion. Five of the eight bars showed localized
corrosion (See Figure 4.101) 14 inches to the west of the beam centerline. This
location coincides with one of the maximum crack width locations.
The actual location of the centerline stirrup was offset one inch to the east
of the centerline of the beam. After a detailed visual inspection, pitting and severe
corrosion was found on the top portion of four out of the six stirrups. The two
remaining stirrups also showed moderate to severe corrosion. All of the severely
corroded stirrups were located inside the ponded region, with the exception of
one, which was only one inch outside the ponded region. Figure 4.101 shows the
longitudinal bar and stirrup corrosion rating graphs across the analysis length.

347
Beam centerline
EW
Ponded region
0
5 0 0 0
1 0 0 0 0
1 5 0 0 0
0 6 1 2 1 8 2 4 3 0 3 6 4 2 4 8 5 4 6 0 6 6 7 2
D ista n c e (in )
Ratin
g
Re b a r
88763 424 305 604
0
2000
4000
6000
8000
7 19 31 43 55
D ista n ce (in )
Rat
ing
Stir rups
Beam centerline
EW
Ponded region
0
5 0 0 0
1 0 0 0 0
1 5 0 0 0
0 6 1 2 1 8 2 4 3 0 3 6 4 2 4 8 5 4 6 0 6 6 7 2
D ista n c e (in )
Ratin
g
Re b a r
88763 424 305 604
0
2000
4000
6000
8000
7 19 31 43 55
D ista n ce (in )
Rat
ing
Stir rups
Figure 4.102 Specimen 1.5 – Crack Pattern and Specimen Corrosion Rating Graphs
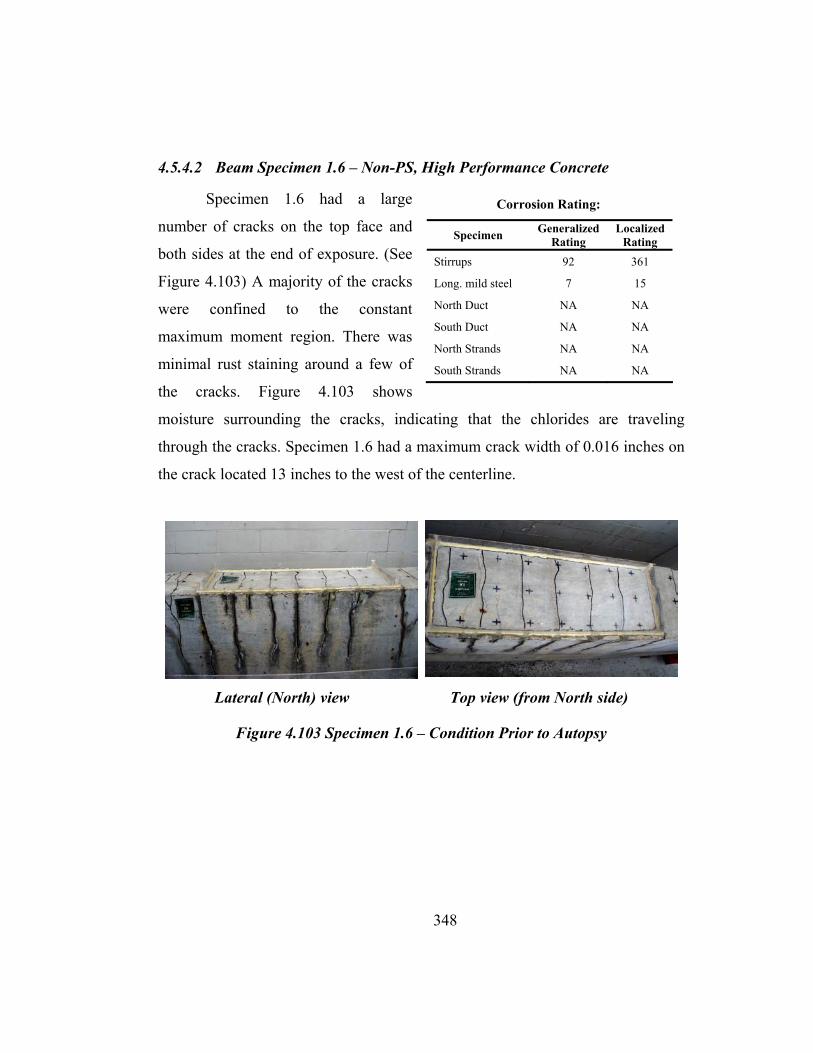
348
4.5.4.2 Beam Specimen 1.6 – Non-PS, High Performance Concrete
Specimen 1.6 had a large
number of cracks on the top face and
both sides at the end of exposure. (See
Figure 4.103) A majority of the cracks
were confined to the constant
maximum moment region. There was
minimal rust staining around a few of
the cracks. Figure 4.103 shows
moisture surrounding the cracks, indicating that the chlorides are traveling
through the cracks. Specimen 1.6 had a maximum crack width of 0.016 inches on
the crack located 13 inches to the west of the centerline.
Lateral (North) view Top view (from North side)
Figure 4.103 Specimen 1.6 – Condition Prior to Autopsy
Corrosion Rating:
Specimen Generalized Rating
Localized Rating
Stirrups 92 361
Long. mild steel 7 15
North Duct
South Duct
NA
NA
NA
NA
North Strands
South Strands
NA
NA
NA
NA

349
Longitudinal Bar Stirrup
Figure 4.104 Specimen 1.6 – Mild Steel Bar and Stirrup
A full autopsy of Specimen 1.6 was performed, providing a total length of
72 inches of the longitudinal bars, ducts, grout and strands and six stirrups to be
analyzed. Forty-two inches of the analysis length extended to the west of the
centerline of the beam and the remaining 30 inches extended to the east.
After removing all mild steel bars in the autopsy region, spots of moderate
to severe corrosion were found on all eight longitudinal bars. (See Figure 4.104)
The most severe corrosion was found on all the bars in the same location as the
maximum crack width. Other spots of corrosion on the bars were consistently
located in the same areas, all of which coincided with crack locations.

350
The actual location of the centerline stirrup was offset one inch to the west
of the centerline of the beam. After a detailed visual inspection, severe pitting and
section loss were found on the top portion of the stirrup located 23 inches to the
east of the centerline. Cracks were located two inches to each side of the stirrup.
Pitting was also found on the stirrup located 25 inches to the west of the
centerline, which was one inch from a crack. These two stirrups were included in
the ponded region. The remaining stirrup showed light corrosion. Figure 4.105
shows a plot of the longitudinal bar and stirrup corrosion ratings across the
analysis length.
Figure 4.105 Specimen 1.6 – Crack Pattern and Specimen Corrosion Rating Graphs
Beam centerline
EW
Ponded region
0
5 0 0 0
1 0 0 0 0
1 5 0 0 0
0 6 1 2 1 8 2 4 3 0 3 6 4 2 4 8 5 4 6 0 6 6 7 2
D ista n c e (in )
Rat
ing
Re b a r
80 47 56 50634
0
2000
4000
6000
8000
5 17 29 41 53D ista n ce (in )
Ratin
g
S tir rp us
Beam centerline
EW
Ponded region
0
5 0 0 0
1 0 0 0 0
1 5 0 0 0
0 6 1 2 1 8 2 4 3 0 3 6 4 2 4 8 5 4 6 0 6 6 7 2
D ista n c e (in )
Rat
ing
Re b a r
80 47 56 50634
0
2000
4000
6000
8000
5 17 29 41 53D ista n ce (in )
Ratin
g
S tir rp us
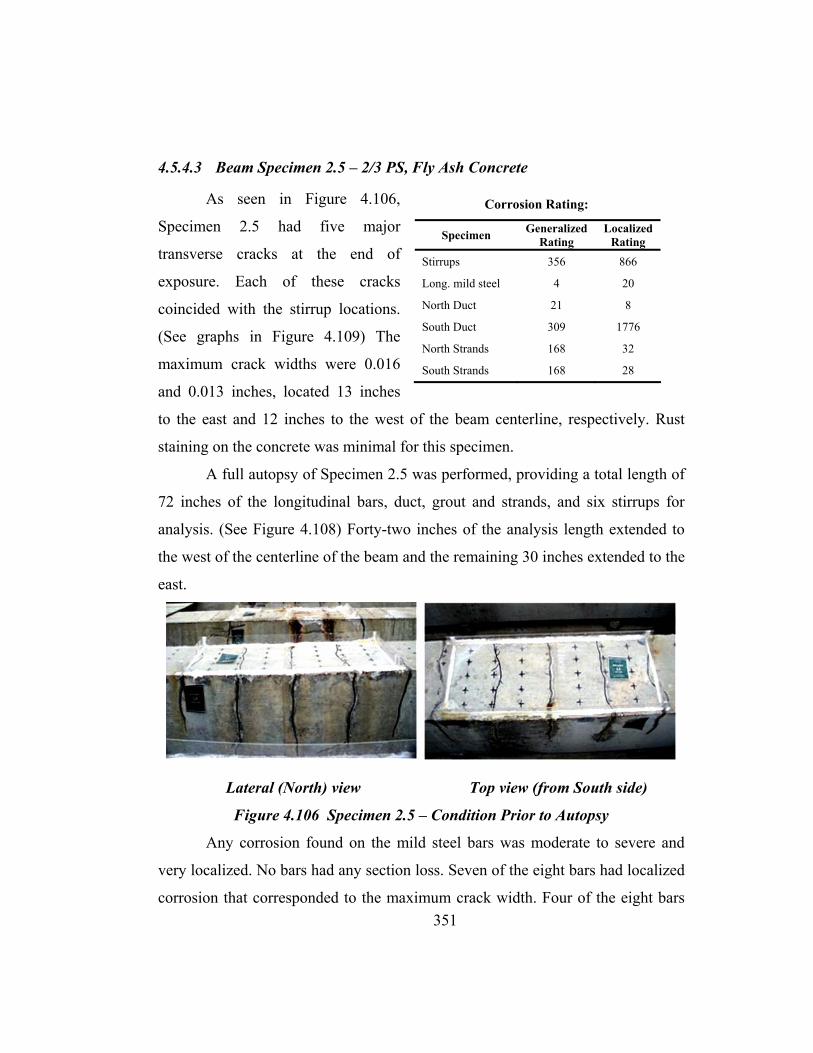
351
4.5.4.3 Beam Specimen 2.5 – 2/3 PS, Fly Ash Concrete
As seen in Figure 4.106,
Specimen 2.5 had five major
transverse cracks at the end of
exposure. Each of these cracks
coincided with the stirrup locations.
(See graphs in Figure 4.109) The
maximum crack widths were 0.016
and 0.013 inches, located 13 inches
to the east and 12 inches to the west of the beam centerline, respectively. Rust
staining on the concrete was minimal for this specimen.
A full autopsy of Specimen 2.5 was performed, providing a total length of
72 inches of the longitudinal bars, duct, grout and strands, and six stirrups for
analysis. (See Figure 4.108) Forty-two inches of the analysis length extended to
the west of the centerline of the beam and the remaining 30 inches extended to the
east.
Lateral (North) view Top view (from South side)
Figure 4.106 Specimen 2.5 – Condition Prior to Autopsy
Any corrosion found on the mild steel bars was moderate to severe and
very localized. No bars had any section loss. Seven of the eight bars had localized
corrosion that corresponded to the maximum crack width. Four of the eight bars
Corrosion Rating:
Specimen Generalized Rating
Localized Rating
Stirrups 356 866
Long. mild steel 4 20
North Duct
South Duct
21
309
8
1776
North Strands
South Strands
168
168
32
28

352
experienced moderate corrosion that corresponded to the second maximum crack
width of 0.013 inches. No corrosion was found anywhere on any of the bars,
except in these two previously described locations.
After a thorough visual inspection, severe uniform corrosion, pitting and
section loss were found covering the stirrups located under the largest crack and
at the centerline of the beam. The stirrup coinciding with the second largest crack
was completely covered with uniform corrosion and pitting. The stirrup 20 inches
to the east of the centerline did not show signs of uniform corrosion, but did have
one large area of severe corrosion and section loss. This stirrup was also located
beneath a crack. The remaining two stirrups showed few signs of corrosion.
Extremely severe corrosion and area loss, corresponding to the second
maximum crack location, were found on the south duct. (See Figure 4.108 and
graphs in Figure 4.109) Both ducts showed signs of light corrosion at the
centerline.
The grout in both ducts showed large voids in the top due to bleed water.
The void did not affect the north duct; however it appears to have contributed to
the consumption of the south duct. A large accumulation of corrosion products
from the south duct was found attached to the grout. (See Figure 4.108) The
corrosion rating of the south duct and the chloride content of the south duct are
significantly higher at the second maximum crack location. The acid soluble
chloride content in the grout reached a maximum value of 0.0036% by weight of
grout inside the south duct, and 0.0013% by weight of grout inside the north duct.
These values are much lower than the critical chloride threshold value of 0.033%
by weight of grout. Chloride samples were taken at 6-inch intervals within the
forensic analysis length and chloride content plots were obtained, as shown in
Figure 4.109.

353
Light uniform corrosion was found on all of the strands located in the
north and south ducts.
Specimen 2.5 had two duct splices. The south duct had an industry
standard splice, and the north duct had a heat-shrink splice. Both splices were
located at the centerline of the beam. Figure 4.107 shows the condition of the duct
splices at the end of exposure. Severe corrosion and minor section loss were
found on the center half of the top of the oversized piece of the industry standard
splice. The heat-shrink splice on the north duct showed signs of rust staining on
one side. This is due to the lack of sufficient adhesion between the steel duct and
splice, allowing moisture to be trapped under the splice.
Figure 4.107 Specimen 2.5 – Duct Splices

354
Figure 4.108 Specimen 2.5 – Reinforcing Elements
Longitudinal bar Stirrup
North Duct South Duct
North Duct Grout South Duct Grout
North Strand South Strand

355
Beam centerline
EW
Ponded region
0
5 0 0 0
1 0 0 0 0
1 5 0 0 0
0 6 1 2 1 8 2 4 3 0 3 6 4 2 4 8 5 4 6 0 6 6 7 2
D i sta n c e ( i n )
Ratin
g
R e b a r
3 3 3 7 1 8 98 5 3
2 0 9 4
3 4 90
2 0 0 0
4 0 0 0
6 0 0 0
8 0 0 0
4 1 6 2 8 4 0 5 2 6 4D ista n c e (in )
Rat
ing
S tir r u p s
0
2 0 0 0
4 0 0 0
6 0 0 0
8 0 0 0
0 6 1 2 1 8 2 4 3 0 3 6 4 2 4 8 5 4 6 0 6 6 7 2
D i sta n c e (i n )
Rat
ing
N o r th D u c tS o u th D u c t
0 , 0 0 00 , 0 5 00 , 1 0 00 , 1 5 00 , 2 0 00 , 2 5 00 , 3 0 00 , 3 5 0
0 6 1 2 1 8 2 4 3 0 3 6 4 2 4 8 5 4 6 0 6 6 7 2
D i sta n c e (i n )
Chl
orid
e C
onte
nt (%
)
N o r th G r o u t
S o u th G r o u t
0
2 0
4 0
6 0
8 0
1 0 0
0 6 1 2 1 8 2 4 3 0 3 6 4 2 4 8 5 4 6 0 6 6 7 2
D ista n c e (in )
Ratin
g
No r th S tr a n d
S o u th S tr a n d
Figure 4.109 Specimen 2.5 Crack Pattern and Specimen Corrosion Rating Graphs

356
4.5.4.4 Beam Specimen 2.6 – 2/3 PS, High Performance Concrete
Figure 4.110 shows Specimen
2.6 as having five major cracks at the
end of exposure. Each of these cracks
coincided with the stirrup locations.
(See graphs in Figure 4.113) The
maximum crack width was 0.016
inches, located 26 inches to the east
and 23 inches to the west of the beam
centerline. As seen in Figure 4.110, rust staining on the concrete was present
around a few of the cracks.
A full autopsy of Specimen 2.6 was performed, providing a total length of
72 inches of the longitudinal bars, duct, grout and strands, and six stirrups for
analysis. Forty-two inches of the analysis length extended to the west of the
centerline of the beam and the remaining 30 inches extended to the east. (See
Figure 4.112)
Lateral (North) view Top view (from South side)
Figure 4.110 Specimen 2.6 – Condition Prior to Autopsy
Corrosion Rating:
Specimen Generalized Rating
Localized Rating
Stirrups 41 88
Long. mild steel 7 190
North Duct
South Duct
2
10
4
34
North Strands
South Strands
95
96
16
16

357
The only corrosion found on the mild steel bars was confined to one bar. It
was severe corrosion with significant section loss. This area was located 22 inches
to the west of the centerline. It was found to be due to its contact with cross bars
that were present for construction purposes only.
The only significant corrosion found on the stirrups was present on those
located 14 and two inches to the west of the centerline. These two stirrups had
minor section loss in very localized areas. The remaining stirrups showed little
signs of corrosion.
Few signs of corrosion were found on both ducts in Specimen 2.6. One
area of localized corrosion was found 11 inches to the east of the centerline, as
shown in Figure 4.112. The only corrosion found on the south duct was at the
centerline, located under the industry standard splice. This area showed severe
corrosion with minor area loss.
The grout in both ducts showed large voids in the top due to bleed water.
The void in the north duct extended from about 22 to 32 inches west of the
centerline, as shown in Figure 4.112. This void did not appear to affect the
corrosion protection of the duct. The void in the south duct grout extended from
20 inches west of the centerline to 22 inches to the east, also pictured in Figure
4.112. It is likely that this void contributed to the corrosion of the south duct at the
centerline, as it trapped the bleed water under the duct. The acid soluble chloride
content in the grout reached a maximum value of 0.0016% by weight of grout
inside the north duct, and 0.005% inside the south duct. These values are much
lower than the critical chloride threshold value of 0.033% by weight of grout.
Chloride samples were taken at 6-inch intervals within the forensic analysis
length and chloride content plots were obtained, as shown in Figure 4.113.
Light uniform corrosion was found on all the strands located in the north
and south ducts.
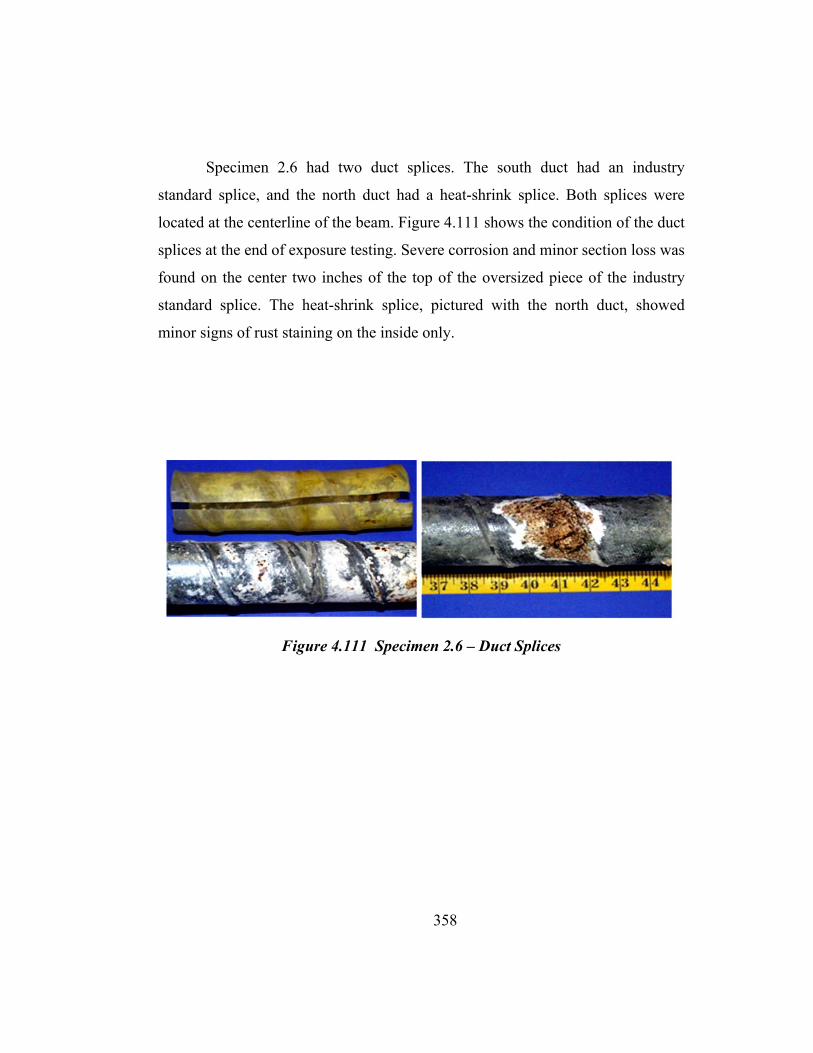
358
Specimen 2.6 had two duct splices. The south duct had an industry
standard splice, and the north duct had a heat-shrink splice. Both splices were
located at the centerline of the beam. Figure 4.111 shows the condition of the duct
splices at the end of exposure testing. Severe corrosion and minor section loss was
found on the center two inches of the top of the oversized piece of the industry
standard splice. The heat-shrink splice, pictured with the north duct, showed
minor signs of rust staining on the inside only.
Figure 4.111 Specimen 2.6 – Duct Splices

359
Figure 4.112 Specimen 2.6 – Reinforcing Elements
Longitudinal bar Stirrup North Duct South Duct North Duct Grout South Duct
Grout North Strand South Strand

360
Beam centerline
EW
Ponded region
0
5 0 0 0
1 0 0 0 0
1 5 0 0 0
0 6 1 2 1 8 2 4 3 0 3 6 4 2 4 8 5 4 6 0 6 6 7 2
D i sta n c e ( i n )
Ratin
g
R e b a r
4 5 4 2 1 2 4 5 8 5 80
2 0 0 0
4 0 0 0
6 0 0 0
8 0 0 0
4 1 6 2 8 4 0 5 2 6 4
D i sta n c e (i n )
Rat
ing
S tir r u p s
0
2 0 0 0
4 0 0 0
6 0 0 0
8 0 0 0
0 6 1 2 1 8 2 4 3 0 3 6 4 2 4 8 5 4 6 0 6 6 7 2
D i s t a n c e ( i n )
Ratin
g
N o r t h D u c tS o u t h D u c t
0 , 0 0 00 , 0 5 00 , 1 0 00 , 1 5 00 , 2 0 00 , 2 5 00 , 3 0 00 , 3 5 0
0 6 1 2 1 8 2 4 3 0 3 6 4 2 4 8 5 4 6 0 6 6 7 2
D i s t a n c e ( i n )
Chl
orid
e Co
nten
t (%
)
N o r t h G r o u tS o u t h G r o u t
020406080
100
0 6 12 18 24 30 36 42 48 54 60 66 72
Dista nce (in )
Ratin
g
North StrandSouth Strand
Beam centerline
EW
Ponded region
0
5 0 0 0
1 0 0 0 0
1 5 0 0 0
0 6 1 2 1 8 2 4 3 0 3 6 4 2 4 8 5 4 6 0 6 6 7 2
D i sta n c e ( i n )
Rat
ing
R e b a r
4 5 4 2 1 2 4 5 8 5 80
2 0 0 0
4 0 0 0
6 0 0 0
8 0 0 0
4 1 6 2 8 4 0 5 2 6 4
D i sta n c e (i n )
Rat
ing
S tir r u p s
0
2 0 0 0
4 0 0 0
6 0 0 0
8 0 0 0
0 6 1 2 1 8 2 4 3 0 3 6 4 2 4 8 5 4 6 0 6 6 7 2
D i s t a n c e ( i n )
Ratin
g
N o r t h D u c tS o u t h D u c t
0 , 0 0 00 , 0 5 00 , 1 0 00 , 1 5 00 , 2 0 00 , 2 5 00 , 3 0 00 , 3 5 0
0 6 1 2 1 8 2 4 3 0 3 6 4 2 4 8 5 4 6 0 6 6 7 2
D i s t a n c e ( i n )
Chl
orid
e Co
nten
t (%
)
N o r t h G r o u tS o u t h G r o u t
020406080
100
0 6 12 18 24 30 36 42 48 54 60 66 72
Dista nce (in )
Ratin
g
North StrandSouth Strand
Figure 4.113 Specimen 2.6 – Crack Pattern and Specimen Corrosion Rating Graphs

361
4.5.4.5 Beam Specimen 3.6 – 100%U PS, Fly Ash Concrete
Specimen 3.6 had only two
major transverse cracks across the
top of the beam, as shown in Figure
4.114 The location of both of these
cracks coincided with a stirrup. (See
Figure 4.117) The maximum crack
width was 0.016 inches, located 13
inches to the east. The second crack,
located 11 inches to the west of the centerline, had a maximum width of 0.013
inches. As shown in Figure 4.114, rust staining around the cracks was minimal. A
majority of the rust spots were again from the bolster strips.
A full autopsy of Specimen 3.6 was performed, providing a total length of
72 inches of the longitudinal bars, duct, grout and strands, and six stirrups for
analysis. (See Figure 4.116) Forty-two inches of the analysis length extended to
the west of the centerline of the beam and the remaining 30 inches extended to the
east.
Lateral (North) view Top view (from South side)
Figure 4.114 Specimen 3.6 – Condition Prior to Autopsy
Corrosion Rating:
Specimen Generalized Rating
Localized Rating
Stirrups 78 245
Long. mild steel 4 4
North Duct
South Duct
24
6
44
8
North Strands
South Strands
91
96
16
16

362
The only corrosion found on the two mild steel bars was light to moderate,
and coincided with the two cracks.
Uniform light to moderate corrosion was found on all the stirrups, except
the two located directly under the cracks. These stirrups were severely corroded in
many areas, with some section loss.
Corrosion in the north duct was found at the centerline and directly under
the larger crack. The centerline corrosion was a result of the industry standard
splice on the outside and the large void in the grout on the inside. There was
minor area loss at the location, which was due to the alignment with the larger
crack and the void in the grout. The only corrosion found on the south duct was
moderate to severe corrosion with no area loss, located under the larger crack.
(See Figure 4.116)
The grout in the north duct showed a large void in the top due to bleed
water. The void extended from the centerline across the entire east side. The
effect of the void in the corrosion of the duct is apparent in Figure 4.116. The
corrosion on the north duct and the corrosion products on the north grout are
confined to the area above the void. A few small voids were present on the south
duct grout, with the most significant one located 13 inches to the east of the
centerline. This location is again directly under the larger crack. The acid soluble
chloride content in the north duct grout reached a maximum value of 0.0022% by
weight of grout at the location under the larger crack. The grout in the south duct
reached 0.0021%. These values are much lower than the critical chloride
threshold value of 0.033% by weight of grout. Chloride samples were taken at 6-
inch intervals within the forensic analysis length and chloride content plots were
obtained, as shown in Figure 4.117.

363
Light uniform corrosion was found on all the strands located in the north
and south ducts.
Specimen 3.6 had two duct splices. The north duct had an industry
standard splice, and the south duct had a heat-shrink splice. Both splices were
located at the centerline of the beam. Figure 4.115 shows the condition of the duct
splices at the end of exposure. Minor corrosion and salt staining was found on the
center of the oversized piece of the industry standard splice. The heat-shrink
splice showed no signs of rust staining or corrosion.
Figure 4.115 Specimen 3.6 – Duct Splices

364
Figure 4.116 Specimen 3.6 – Reinforcing Elements
Longitudinal bar Stirrup North Duct South Duct North Duct Grout South Duct Grout North Strand South Strand

365
Beam centerline
EW
Ponded region
0
5 0 0 0
1 0 0 0 0
1 5 0 0 0
0 6 1 2 1 8 2 4 3 0 3 6 4 2 4 8 5 4 6 0 6 6 7 2
D i sta n c e ( i n )
Ratin
g
R e b a r
4 4 1 4 2 3 5 5 4 8 1 4 8 3 80
2 0 0 0
4 0 0 0
6 0 0 0
8 0 0 0
7 1 9 3 1 4 3 5 5 6 7
D ista n c e (i n )
Ratin
g
S tir r u p s
0
2 0 0 0
4 0 0 0
6 0 0 0
8 0 0 0
0 6 1 2 1 8 2 4 3 0 3 6 4 2 4 8 5 4 6 0 6 6 7 2
D i sta n c e (i n )
Ratin
g
N o r th D u c tS o u th D u c t
0 , 0 0 00 , 0 5 00 , 1 0 00 , 1 5 00 , 2 0 00 , 2 5 00 , 3 0 00 , 3 5 0
0 6 1 2 1 8 2 4 3 0 3 6 4 2 4 8 5 4 6 0 6 6 7 2
D i s ta n c e ( i n )
Chlo
ride
Con
tent
(%)
N o r t h G r o u tS o u th G r o u t
0
20
40
60
80
1 00
0 6 12 1 8 24 3 0 36 42 48 54 6 0 66 7 2
D ista n ce (in )
Ratin
g
No r th S tra ndS o u th S tra nd
Figure 4.117 Specimen 3.6 – Crack Pattern and Specimen Corrosion Rating Graphs

366
4.5.4.6 Beam Specimen 3.7 – 100%U PS, High Performance Concrete
Specimen 3.7 had four major
transverse cracks across the top of the
beam, two of which were located
outside the ponded region (See Figure
4.118) The maximum crack width was
0.04 inches, located outside the ponded
region at 26 inches to the west of the
centerline. The second largest crack,
located 13 inches to the east of the centerline, had a maximum width of 0.016
inches. As seen in Figure 4.118, rust staining around the cracks was present on the
sides of the beam.
A full autopsy of Specimen 3.7 was performed, providing a total length of
72 inches of the longitudinal bars, duct, grout and strands, and six stirrups for
analysis. (See Figure 4.120) Forty-two inches of the analysis length extended to
the west of the centerline of the beam and the remaining 30 inches extended to the
east.
Lateral (North) view Top view (from South side)
Figure 4.118 Specimen 3.7 – Condition Prior to Autopsy
Corrosion Rating:
Specimen Generalized Rating
Localized Rating
Stirrups 27 16
Long. mild steel 0 2
North Duct
South Duct
214
12
1164
20
North Strands
South Strands
168
168
28
28

367
No corrosion was found on the two mild steel bars in Specimen 3.7.
Moderate to severe uniform corrosion was found on the stirrups 10 inches
to the west and 14 inches to the east. Both of these stirrups were located directly
under cracks. The remaining stirrups showed light uniform corrosion.
A significant amount of area loss was found on the north duct, as shown in
Figure 4.120. This location was very close to a 0.013-inch crack. There was
severe corrosion and minor area loss at this same location on the south duct. (See
Figure 4.120) These were the only significant areas of corrosion found on the
ducts in Specimen 3.7.
The grout in the north duct showed a large void in the top due to bleed
water. The void extended from 30 inches west of the centerline to six inches west.
Corrosion products from the north duct at the location of area loss were found on
the grout. (See Figure 4.120) A few small voids were present on the south duct
grout, with the most significant one located under the location of minor area loss
in the south duct. The acid soluble chloride content in the north duct grout
reached a maximum value of 0.004% by weight of grout. A value of 0.0199% in
the south duct was found in the region of the duct area loss. These values are
much lower than the critical chloride threshold value of 0.033% by weight of
grout. Chloride samples were taken at 6-inch intervals within the forensic analysis
length and chloride content plots were obtained, as shown in Figure 4.121.
Light uniform corrosion was found on all the strands located in the north
and south ducts.

368
Specimen 3.7 had two duct splices. The north duct had an industry
standard splice, and the south duct had a heat-shrink splice. Both splices were
located at the centerline of the beam. Figure 4.119 shows the condition of the duct
splices at the end of exposure. The only corrosion found on the industry standard
splice was located under the duct tape. The heat-shrink splice showed no signs of
rust staining or corrosion.
Figure 4.119 Specimen 3.7 – Duct Splices

369
Figure 4.120 Specimen 3.7 – Reinforcing Elements
Longitudinal bar Stirrup North Duct South Duct North Duct Grout South Duct Grout North Strand South Strand

370
Beam centerline
EW
Ponded region
0
5 0 0 0
1 0 0 0 0
1 5 0 0 0
0 6 1 2 1 8 2 4 3 0 3 6 4 2 4 8 5 4 6 0 6 6 7 2
D i sta n c e (i n )
Rat
ing
R e b a r
9 2 2 5 2 3 4 1 3 2 2 50
2 0 0 0
4 0 0 0
6 0 0 0
8 0 0 0
8 2 0 3 2 4 4 5 6 6 8
D ista n c e (in )
Ratin
g
S tir r u p s
0
2 0 0 0
4 0 0 0
6 0 0 0
8 0 0 0
0 6 1 2 1 8 2 4 3 0 3 6 4 2 4 8 5 4 6 0 6 6 7 2
D i sta n c e (i n )
Ratin
g
N o r th Du c t
S o u th D u c t
0 ,0 0 00 ,0 5 00 ,1 0 00 ,1 5 00 ,2 0 00 ,2 5 00 ,3 0 00 ,3 5 0
0 6 1 2 1 8 2 4 3 0 3 6 4 2 4 8 5 4 6 0 6 6 7 2
Dis t a n c e ( in )
Chl
orid
e C
onte
nt (%
)
No r th G r o u t
S o u th G r o u t
020406080
100
0 6 12 18 24 30 36 42 48 54 60 66 72
Dista nce (in)
Ratin
g
North StrandSouth Strand
Beam centerline
EW
Ponded region
0
5 0 0 0
1 0 0 0 0
1 5 0 0 0
0 6 1 2 1 8 2 4 3 0 3 6 4 2 4 8 5 4 6 0 6 6 7 2
D i sta n c e (i n )
Rat
ing
R e b a r
9 2 2 5 2 3 4 1 3 2 2 50
2 0 0 0
4 0 0 0
6 0 0 0
8 0 0 0
8 2 0 3 2 4 4 5 6 6 8
D ista n c e (in )
Ratin
g
S tir r u p s
0
2 0 0 0
4 0 0 0
6 0 0 0
8 0 0 0
0 6 1 2 1 8 2 4 3 0 3 6 4 2 4 8 5 4 6 0 6 6 7 2
D i sta n c e (i n )
Ratin
g
No r th Du c t
S o u th Du c t
0 ,0 0 00 ,0 5 00 ,1 0 00 ,1 5 00 ,2 0 00 ,2 5 00 ,3 0 00 ,3 5 0
0 6 1 2 1 8 2 4 3 0 3 6 4 2 4 8 5 4 6 0 6 6 7 2
Dis t a n c e ( in )
Chl
orid
e C
onte
nt (%
)
No r th G r o u t
S o u th G r o u t
020406080
100
0 6 12 18 24 30 36 42 48 54 60 66 72
Dista nce (in)
Ratin
g
North StrandSouth Strand
Figure 4.121 Specimen 3.7 – Crack Pattern and Specimen Corrosion Rating Graphs
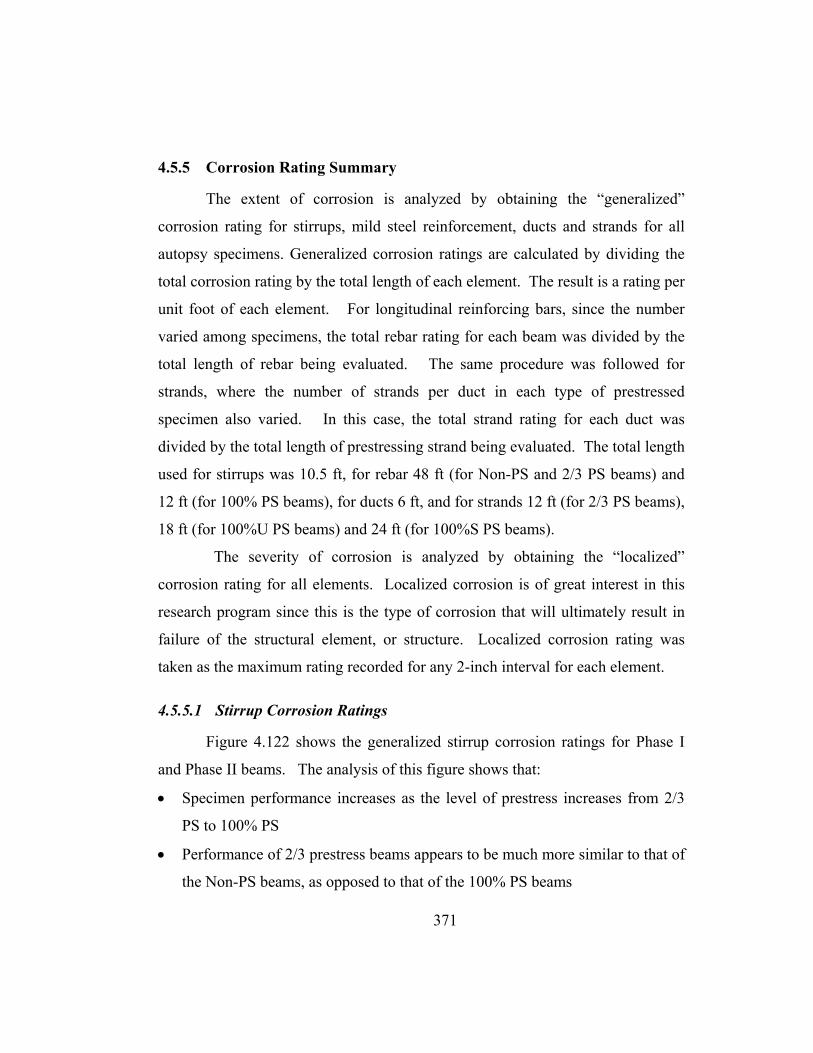
371
4.5.5 Corrosion Rating Summary
The extent of corrosion is analyzed by obtaining the “generalized”
corrosion rating for stirrups, mild steel reinforcement, ducts and strands for all
autopsy specimens. Generalized corrosion ratings are calculated by dividing the
total corrosion rating by the total length of each element. The result is a rating per
unit foot of each element. For longitudinal reinforcing bars, since the number
varied among specimens, the total rebar rating for each beam was divided by the
total length of rebar being evaluated. The same procedure was followed for
strands, where the number of strands per duct in each type of prestressed
specimen also varied. In this case, the total strand rating for each duct was
divided by the total length of prestressing strand being evaluated. The total length
used for stirrups was 10.5 ft, for rebar 48 ft (for Non-PS and 2/3 PS beams) and
12 ft (for 100% PS beams), for ducts 6 ft, and for strands 12 ft (for 2/3 PS beams),
18 ft (for 100%U PS beams) and 24 ft (for 100%S PS beams).
The severity of corrosion is analyzed by obtaining the “localized”
corrosion rating for all elements. Localized corrosion is of great interest in this
research program since this is the type of corrosion that will ultimately result in
failure of the structural element, or structure. Localized corrosion rating was
taken as the maximum rating recorded for any 2-inch interval for each element.
4.5.5.1 Stirrup Corrosion Ratings
Figure 4.122 shows the generalized stirrup corrosion ratings for Phase I
and Phase II beams. The analysis of this figure shows that:
• Specimen performance increases as the level of prestress increases from 2/3
PS to 100% PS
• Performance of 2/3 prestress beams appears to be much more similar to that of
the Non-PS beams, as opposed to that of the 100% PS beams

372
• Corrosion index increases as the loading, and thus transverse cracking
increases
• High performance concrete specimens, as defined in Section 2.4.4.1, perform
better than Class C Concrete specimens with Fly Ash
• Mixed reinforcing beams (2/3 PS) show the worst stirrup performance, even
when comparing with non prestressed beams.
Figure 4.122 Generalized Stirrup Corrosion Ratings
Figure 4.123 shows the localized stirrup corrosion ratings for all autopsy
beams. Similar trends as found from the generalized corrosion ratings. The
increase in corrosion rating as the crack width increases is more apparent as the
localized ratings significantly increase from Specimen 1.3 to Specimens 2.3 and
2.11. Also, the corrosion rating increase from Specimen 3.1 (uncracked -
unloaded) to Specimens 3.2 (service load) and 3.3 (overloaded) is significant.
101
1231 1359
1923
15 95423
189
0
500
1000
1500
2000
2500
1,1 1,3 2,3 2,11 3,1 3,2 3,3 4,2
Specimen
Ratin
g / f
t of S
tirru
p
Non-PS 2/3 PS 100%U PS 100%S PS
224 92356
41 78 270
500
1000
1500
2000
2500
1,5 1,6 2,5 2,6 3,6 3,7
Specimen
Rat
ing
/ ft o
f Stir
rup
Non-PS 2/3 PS 100%U PS
Phase I
Phase II
100%S PS, S. Load4.2
100%U PS, Overload3.3
100%U PS, S. Load3.2
100%U PS, Unloaded3.1
2/3 PS, S. Load, FA Grout2.11
2/3 PS, S. Load2.3
Non-PS, S. Load1.3
Non-PS, Unloaded1.1
Beam / Variable
100%S PS, S. Load4.2
100%U PS, Overload3.3
100%U PS, S. Load3.2
100%U PS, Unloaded3.1
2/3 PS, S. Load, FA Grout2.11
2/3 PS, S. Load2.3
Non-PS, S. Load1.3
Non-PS, Unloaded1.1
Beam / Variable
100%U PS, S. Load, HP Conc.
3.7
100%U PS, S. Load, FA Conc.
3.6
2/3 PS, S. Load, HP Conc.2.6
2/3 PS, S. Load, FA Conc.2.5
Non-PS, S. Load, HP Conc.1.6
Non-PS, S. Load, FA Conc.1.5
Beam / Variable
100%U PS, S. Load, HP Conc.
3.7
100%U PS, S. Load, FA Conc.
3.6
2/3 PS, S. Load, HP Conc.2.6
2/3 PS, S. Load, FA Conc.2.5
Non-PS, S. Load, HP Conc.1.6
Non-PS, S. Load, FA Conc.1.5
Beam / Variable
96
11721294
14 91
403180
1831
0
500
1000
1500
2000
1,1 1,3 2,3 2,11 3,1 3,2 3,3 4,2
Specimen
Ratin
g / f
t of S
tirru
p
Non-PS 2/3 PS 100%U PS 100%S PS
214 88339
39 74 260
500
1000
1500
2000
2500
1,5 1,6 2,5 2,6 3,6 3,7
Specimen
Ratin
g / f
t of S
tirru
p
Non-PS 2/3 PS 100%U PS
373
Figure 4.123 Localized Stirrup Corrosion Ratings
4.5.5.2 Rebar Corrosion Ratings
Figure 4.124 shows the generalized bar corrosion ratings for all autopsy
beams. The plots show that:
• Mixed reinforced beams (2/3 PS) show extremely poor performance when
compare with non prestressed and fully prestressed beams
• The negative effects of cracking clearly show when comparing non
prestressed beams 1.1 (unloaded, uncracked) and 1.3 (Service load, cracked)
• All ratings for Phase II beams are very low, which is possible due to the use of
fly ash concrete and high performance concrete. However, results cannot be
compared against Phase I beams since there is a one year exposure testing
difference.
Figure 4.125 shows the corresponding localized bar corrosion ratings. This
figure shows the same trends as in Figue 4.124.
Phase I
100%S PS, S. Load4.2
100%U PS, Overload3.3
100%U PS, S. Load3.2
100%U PS, Unloaded3.1
2/3 PS, S. Load, FA Grout2.11
2/3 PS, S. Load2.3
Non-PS, S. Load1.3
Non-PS, Unloaded1.1
Beam / Variable
100%S PS, S. Load4.2
100%U PS, Overload3.3
100%U PS, S. Load3.2
100%U PS, Unloaded3.1
2/3 PS, S. Load, FA Grout2.11
2/3 PS, S. Load2.3
Non-PS, S. Load1.3
Non-PS, Unloaded1.1
Beam / Variable
100%U PS, S. Load, HP Conc.
3.7
100%U PS, S. Load, FA Conc.
3.6
2/3 PS, S. Load, HP Conc.2.6
2/3 PS, S. Load, FA Conc.2.5
Non-PS, S. Load, HP Conc.1.6
Non-PS, S. Load, FA Conc.1.5
Beam / Variable
100%U PS, S. Load, HP Conc.
3.7
100%U PS, S. Load, FA Conc.
3.6
2/3 PS, S. Load, HP Conc.2.6
2/3 PS, S. Load, FA Conc.2.5
Non-PS, S. Load, HP Conc.1.6
Non-PS, S. Load, FA Conc.1.5
Beam / Variable
295770
2236
2978
4462
867
236
0500
100015002000250030003500
1,1 1,3 2,3 2,11 3,1 3,2 3,3 4,2
Specimen
Max
imum
Stir
rup
Ratin
g
Non-PS 2/3 PS 100%U PS 100%S PS
296 361866
88 24516
0500
100015002000250030003500
1,5 1,6 2,5 2,6 3,6 3,7
Specimen
Max
imum
Stir
rup
Rat
ing
Non-PS 2/3 PS 100%U PS
Phase II

374
Figure 4.124 Generalized Bar Corrosion Rating
Figure 4.125 Localized Bar Corrosion Ratings
100%S PS, S. Load4.2
100%U PS, Overload3.3
100%U PS, S. Load3.2
100%U PS, Unloaded3.1
2/3 PS, S. Load, FA Grout2.11
2/3 PS, S. Load2.3
Non-PS, S. Load1.3
Non-PS, Unloaded1.1
Beam / Variable
100%S PS, S. Load4.2
100%U PS, Overload3.3
100%U PS, S. Load3.2
100%U PS, Unloaded3.1
2/3 PS, S. Load, FA Grout2.11
2/3 PS, S. Load2.3
Non-PS, S. Load1.3
Non-PS, Unloaded1.1
Beam / Variable
100%U PS, S. Load, HP Conc.
3.7
100%U PS, S. Load, FA Conc.
3.6
2/3 PS, S. Load, HP Conc.2.6
2/3 PS, S. Load, FA Conc.2.5
Non-PS, S. Load, HP Conc.1.6
Non-PS, S. Load, FA Conc.1.5
Beam / Variable
100%U PS, S. Load, HP Conc.
3.7
100%U PS, S. Load, FA Conc.
3.6
2/3 PS, S. Load, HP Conc.2.6
2/3 PS, S. Load, FA Conc.2.5
Non-PS, S. Load, HP Conc.1.6
Non-PS, S. Load, FA Conc.1.5
Beam / Variable
1
91
467 476
0 136 15
0
100
200
300
400
500
1,1 1,3 2,3 2,11 3,1 3,2 3,3 4,2
Specimen
Ratin
g / f
t of R
ebar
Non-PS 2/3 PS 100%U PS 100%S PS
6 7 4 7 4 00
100
200
300
400
500
1,5 1,6 2,5 2,6 3,6 3,7
Specimen
Rat
ing
/ ft o
f Reb
ar
Non-PS 2/3 PS 100%U PS
Phase I
Phase II
100%S PS, S. Load4.2
100%U PS, Overload3.3
100%U PS, S. Load3.2
100%U PS, Unloaded3.1
2/3 PS, S. Load, FA Grout2.11
2/3 PS, S. Load2.3
Non-PS, S. Load1.3
Non-PS, Unloaded1.1
Beam / Variable
100%S PS, S. Load4.2
100%U PS, Overload3.3
100%U PS, S. Load3.2
100%U PS, Unloaded3.1
2/3 PS, S. Load, FA Grout2.11
2/3 PS, S. Load2.3
Non-PS, S. Load1.3
Non-PS, Unloaded1.1
Beam / Variable
100%U PS, S. Load, HP Conc.
3.7
100%U PS, S. Load, FA Conc.
3.6
2/3 PS, S. Load, HP Conc.2.6
2/3 PS, S. Load, FA Conc.2.5
Non-PS, S. Load, HP Conc.1.6
Non-PS, S. Load, FA Conc.1.5
Beam / Variable
100%U PS, S. Load, HP Conc.
3.7
100%U PS, S. Load, FA Conc.
3.6
2/3 PS, S. Load, HP Conc.2.6
2/3 PS, S. Load, FA Conc.2.5
Non-PS, S. Load, HP Conc.1.6
Non-PS, S. Load, FA Conc.1.5
Beam / Variable
8 261
6241
7757
0 4 294 1690
10002000300040005000600070008000
1,1 1,3 2,3 2,11 3,1 3,2 3,3 4,2
Specimen
Max
imum
Reb
ar R
atin
g
Non-PS 2/3 PS 100%U PS 100%S PS
Phase I
8 15 20 190 4 20
10002000300040005000600070008000
1,5 1,6 2,5 2,6 3,6 3,7
Specimen
Max
imum
Reb
ar R
atin
g
Non-PS 2/3 PS 100%U PS
Phase II
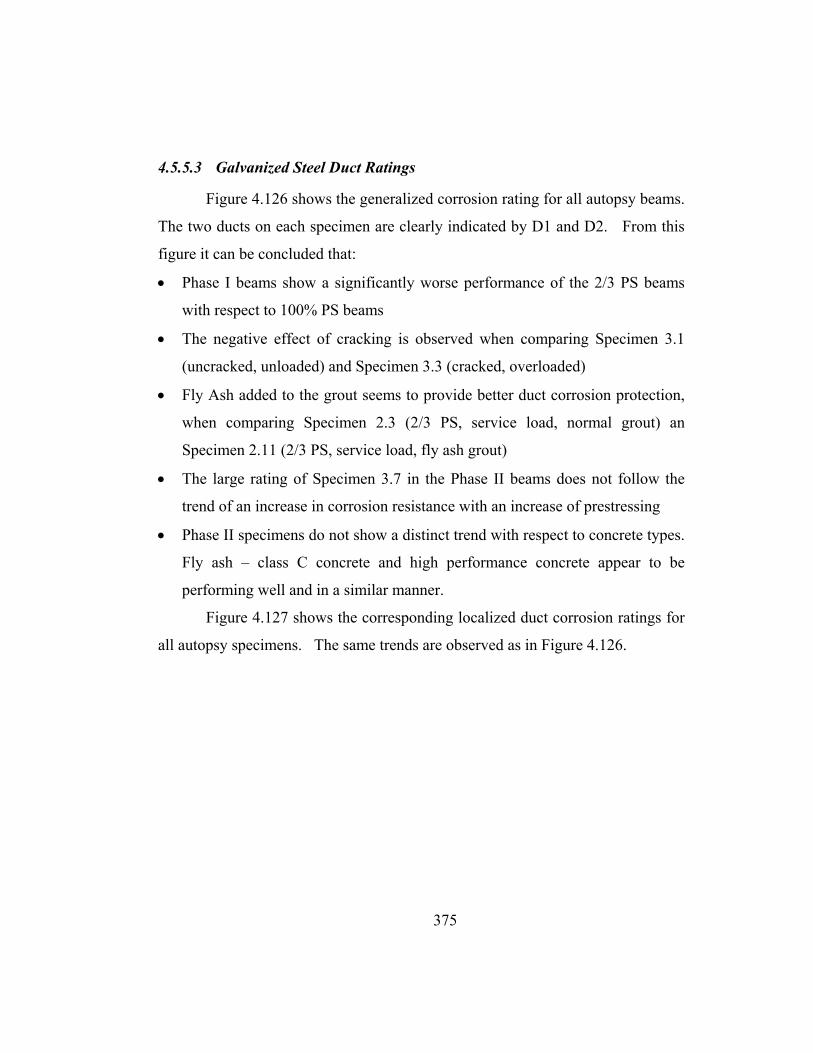
375
4.5.5.3 Galvanized Steel Duct Ratings
Figure 4.126 shows the generalized corrosion rating for all autopsy beams.
The two ducts on each specimen are clearly indicated by D1 and D2. From this
figure it can be concluded that:
• Phase I beams show a significantly worse performance of the 2/3 PS beams
with respect to 100% PS beams
• The negative effect of cracking is observed when comparing Specimen 3.1
(uncracked, unloaded) and Specimen 3.3 (cracked, overloaded)
• Fly Ash added to the grout seems to provide better duct corrosion protection,
when comparing Specimen 2.3 (2/3 PS, service load, normal grout) an
Specimen 2.11 (2/3 PS, service load, fly ash grout)
• The large rating of Specimen 3.7 in the Phase II beams does not follow the
trend of an increase in corrosion resistance with an increase of prestressing
• Phase II specimens do not show a distinct trend with respect to concrete types.
Fly ash – class C concrete and high performance concrete appear to be
performing well and in a similar manner.
Figure 4.127 shows the corresponding localized duct corrosion ratings for
all autopsy specimens. The same trends are observed as in Figure 4.126.

376
Figure 4.126 Generalized Duct Corrosion Ratings
Figure 4.127 Localized Duct Corrosion Ratings
100%S PS, S. Load4.2
100%U PS, Overload3.3
100%U PS, S. Load3.2
100%U PS, Unloaded3.1
2/3 PS, S. Load, FA Grout2.11
2/3 PS, S. Load2.3
Non-PS, S. Load1.3
Non-PS, Unloaded1.1
Beam / Variable
100%S PS, S. Load4.2
100%U PS, Overload3.3
100%U PS, S. Load3.2
100%U PS, Unloaded3.1
2/3 PS, S. Load, FA Grout2.11
2/3 PS, S. Load2.3
Non-PS, S. Load1.3
Non-PS, Unloaded1.1
Beam / Variable
100%U PS, S. Load, HP Conc.
3.7
100%U PS, S. Load, FA Conc.
3.6
2/3 PS, S. Load, HP Conc.2.6
2/3 PS, S. Load, FA Conc.2.5
Non-PS, S. Load, HP Conc.1.6
Non-PS, S. Load, FA Conc.1.5
Beam / Variable
100%U PS, S. Load, HP Conc.
3.7
100%U PS, S. Load, FA Conc.
3.6
2/3 PS, S. Load, HP Conc.2.6
2/3 PS, S. Load, FA Conc.2.5
Non-PS, S. Load, HP Conc.1.6
Non-PS, S. Load, FA Conc.1.5
Beam / Variable
Phase I
42995069
1504 1413
0 0 1 0429 220 7 4
0
1000
2000
3000
4000
5000
6000
2.3(D1)
2.3(D2)
2.11(D1)
2.11(D2)
3.1(D1)
3.1(D2)
3.2(D1)
3.2(D2)
3.3(D1)
3.3(D2)
4.2(D1)
4.2(D2)
Specimen
Ratin
g / f
t of D
uct
2/3 PS 100%U PS 100%S PS
21 309 2 10 24 6 214 120
1000
2000
3000
4000
5000
6000
2.5 (D1) 2.5 (D2) 2.6 (D1) 2.6 (D2) 3.6 (D1) 3.6 (D2) 3.7 (D1) 3.7 (D2)
Specimen
Ratin
g / f
t of D
uct
2/3 PS 100%U PS
Phase II
100%S PS, S. Load4.2
100%U PS, Overload3.3
100%U PS, S. Load3.2
100%U PS, Unloaded3.1
2/3 PS, S. Load, FA Grout2.11
2/3 PS, S. Load2.3
Non-PS, S. Load1.3
Non-PS, Unloaded1.1
Beam / Variable
100%S PS, S. Load4.2
100%U PS, Overload3.3
100%U PS, S. Load3.2
100%U PS, Unloaded3.1
2/3 PS, S. Load, FA Grout2.11
2/3 PS, S. Load2.3
Non-PS, S. Load1.3
Non-PS, Unloaded1.1
Beam / Variable
100%U PS, S. Load, HP Conc.
3.7
100%U PS, S. Load, FA Conc.
3.6
2/3 PS, S. Load, HP Conc.2.6
2/3 PS, S. Load, FA Conc.2.5
Non-PS, S. Load, HP Conc.1.6
Non-PS, S. Load, FA Conc.1.5
Beam / Variable
100%U PS, S. Load, HP Conc.
3.7
100%U PS, S. Load, FA Conc.
3.6
2/3 PS, S. Load, HP Conc.2.6
2/3 PS, S. Load, FA Conc.2.5
Non-PS, S. Load, HP Conc.1.6
Non-PS, S. Load, FA Conc.1.5
Beam / Variable
Phase I
2107 24401673
0 0 2 2924 685
8 4
6248
01000200030004000500060007000
2.3(D1)
2.3(D2)
2.11(D1)
2.11(D2)
3.1(D1)
3.1(D2)
3.2(D1)
3.2(D2)
3.3(D1)
3.3(D2)
4.2(D1)
4.2(D2)
Specimen
Max
imum
Duc
t Rat
ing
2/3 PS 100%U PS 100%S PS
8
1776
4 34 44 8
1164
200
1000
2000
30004000
5000
6000
7000
2.5 (D1) 2.5 (D2) 2.6 (D1) 2.6 (D2) 3.6 (D1) 3.6 (D2) 3.7 (D1) 3.7 (D2)
Specimen
Max
imum
Duc
t Rat
ing
2/3 PS 100%U PS
Phase II

377
4.5.5.4 Prestressing Strand Ratings
Figure 4.128 shows the generalized strand corrosion ratings for all autopsy
beams. Findings from this plot include:
• All strands appear to be performing similarly
• After visual inspection only minimal variation was found on the performance
of the strands. Therefore, it appears that specimens require more exposure
time to indicate differences and trends
• The difference between Specimen 2.3 (normal grout) and 2.11 (fly ash grout)
indicates that the addition of fly ash to the grout does not have a large effect
on the corrosion protection of the strand
Figure 4.128 Generalized Strand Corrosion Ratings
100%S PS, S. Load4.2
100%U PS, Overload3.3
100%U PS, S. Load3.2
100%U PS, Unloaded3.1
2/3 PS, S. Load, FA Grout2.11
2/3 PS, S. Load2.3
Non-PS, S. Load1.3
Non-PS, Unloaded1.1
Beam / Variable
100%S PS, S. Load4.2
100%U PS, Overload3.3
100%U PS, S. Load3.2
100%U PS, Unloaded3.1
2/3 PS, S. Load, FA Grout2.11
2/3 PS, S. Load2.3
Non-PS, S. Load1.3
Non-PS, Unloaded1.1
Beam / Variable
100%U PS, S. Load, HP Conc.
3.7
100%U PS, S. Load, FA Conc.
3.6
2/3 PS, S. Load, HP Conc.2.6
2/3 PS, S. Load, FA Conc.2.5
Non-PS, S. Load, HP Conc.1.6
Non-PS, S. Load, FA Conc.1.5
Beam / Variable
100%U PS, S. Load, HP Conc.
3.7
100%U PS, S. Load, FA Conc.
3.6
2/3 PS, S. Load, HP Conc.2.6
2/3 PS, S. Load, FA Conc.2.5
Non-PS, S. Load, HP Conc.1.6
Non-PS, S. Load, FA Conc.1.5
Beam / Variable
Phase I
96122
97 92119
96
168 168 161
11896 96
0
50
100
150
200
2.3(D1)
2.3(D2)
2.11(D1)
2.11(D2)
3.1(D1)
3.1(D2)
3.2(D1)
3.2(D2)
3.3(D1)
3.3(D2)
4.2(D1)
4.2(D2)
Specimen
Ratin
g / f
t of S
trand
2/3 PS 100%U PS 100%S PS
168 168
95 96 91 96
168 168
0
50
100
150
200
2.5(D1)
2.5(D2)
2.6(D1)
2.6(D2)
3.6(D1)
3.6(D2)
3.7(D1)
3.7(D2)
Specimen
Ratin
g / f
t of S
trand
2/3 PS 100%U PS
Phase II

378
Figure 4.129 shows the localized strand corrosion ratings. Phase II
beams show very similar results as those from Phase I. However, Specimens 2.3
(D1) and 3.3 (D1) show larger ratings, corresponding with crack locations.
Figure 4.129 Localized Strand Corrosion Ratings
4.6 ANALYSIS AND DISCUSSION OF RESULTS
After four and a half years of exposure for phase I beams and three and a
half years for phase II beams, the effect of many of the variables involved in this
testing program can be analyzed and compared.
4.6.1 Overall Performance
The use of the large scale beam specimen was found to be a very good
method for analyzing relative specimen performance and for evaluating the
adequacy of corrosion protection variables, especially when considering different
loading and prestressing levels.
100%S PS, S. Load4.2
100%U PS, Overload3.3
100%U PS, S. Load3.2
100%U PS, Unloaded3.1
2/3 PS, S. Load, FA Grout2.11
2/3 PS, S. Load2.3
Non-PS, S. Load1.3
Non-PS, Unloaded1.1
Beam / Variable
100%S PS, S. Load4.2
100%U PS, Overload3.3
100%U PS, S. Load3.2
100%U PS, Unloaded3.1
2/3 PS, S. Load, FA Grout2.11
2/3 PS, S. Load2.3
Non-PS, S. Load1.3
Non-PS, Unloaded1.1
Beam / Variable
100%U PS, S. Load, HP Conc.
3.7
100%U PS, S. Load, FA Conc.
3.6
2/3 PS, S. Load, HP Conc.2.6
2/3 PS, S. Load, FA Conc.2.5
Non-PS, S. Load, HP Conc.1.6
Non-PS, S. Load, FA Conc.1.5
Beam / Variable
100%U PS, S. Load, HP Conc.
3.7
100%U PS, S. Load, FA Conc.
3.6
2/3 PS, S. Load, HP Conc.2.6
2/3 PS, S. Load, FA Conc.2.5
Non-PS, S. Load, HP Conc.1.6
Non-PS, S. Load, FA Conc.1.5
Beam / Variable
Phase I
20
56
2026
20 2228 28 32
2216
64
010203040506070
2.3(D1)
2.3(D2)
2.11(D1)
2.11(D2)
3.1(D1)
3.1(D2)
3.2(D1)
3.2(D2)
3.3(D1)
3.3(D2)
4.2(D1)
4.2(D2)
Specimen
Maxim
um S
trand
Rat
ing
2/3 PS 100%U PS 100%S PS
3228
16 16 16 16
28 28
0
10
20
30
40
50
60
70
2.5 (D1) 2.5 (D2) 2.6 (D1) 2.6 (D2) 3.6 (D1) 3.6 (D2) 3.7 (D1) 3.7 (D2)
Specimen
Max
imum
Stra
nd R
atin
g
2/3 PS 100%U PS
Phase II

379
After four and a half years in Phase I beams distinct differences are shown
in stirrup, rebar and duct corrosion ratings among the autopsy specimens. Strand
corrosion was found to be somewhat similar in all specimens, and therefore, it
was clear the need for additional exposure testing for the remaining specimens.
Similar results were obtained from Phase II beams.
The relative performance of the specimens in this testing program was
studied by looking at the corrosion ratings for stirrups, rebar, ducts and strands,
ordered from highest to lowest. Figure 4.130 and Figure 4.131 show the
generalized stirrup corrosion ratings for phase I autopsy beams and phase II
autopsy beams, respectively. Figure 4.132 and Figure 4.133 show the
generalized rebar corrosion ratings for phase I and phase II, respectively. The
corrosion rating system used for stirrups and rebar was the same, but the
horizontal scale on the graphs is shown different to clearly indicate the relative
performance of the specimens with respect to the element under analysis.
Figure 4.130 Generalized Stirrup Corrosion Ratings for Phase I Autopsy Beams Ordered According to Performance
0 400 800 1200 1600 2000
2.11
2.3
1.3
3.3
4.2
1.1
3.1
3.2
Bea
m
Rating/ft
Stirrup
Increase in Corrosion Resistance
100%S PS, S. Load4.2
100%U PS, Overload3.3
100%U PS, S. Load3.2
100%U PS, Unloaded3.1
2/3 PS, S. Load, FA Grout2.11
2/3 PS, S. Load2.3
Non-PS, S. Load1.3
Non-PS, Unloaded1.1
Beam / Variable
100%S PS, S. Load4.2
100%U PS, Overload3.3
100%U PS, S. Load3.2
100%U PS, Unloaded3.1
2/3 PS, S. Load, FA Grout2.11
2/3 PS, S. Load2.3
Non-PS, S. Load1.3
Non-PS, Unloaded1.1
Beam / Variable
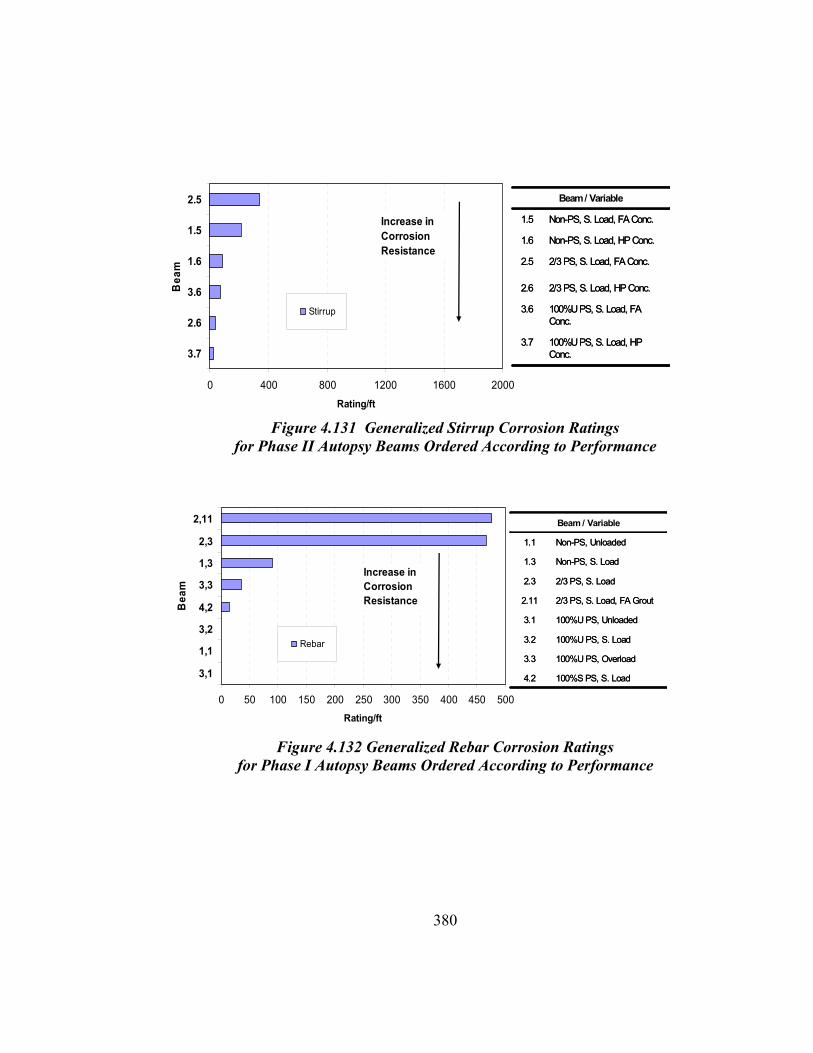
380
Figure 4.131 Generalized Stirrup Corrosion Ratings for Phase II Autopsy Beams Ordered According to Performance
Figure 4.132 Generalized Rebar Corrosion Ratings for Phase I Autopsy Beams Ordered According to Performance
0 400 800 1200 1600 2000
2.5
1.5
1.6
3.6
2.6
3.7
Bea
m
Rating/ft
Stirrup
Increase in Corrosion Resistance
100%U PS, S. Load, HP Conc.
3.7
100%U PS, S. Load, FA Conc.
3.6
2/3 PS, S. Load, HP Conc.2.6
2/3 PS, S. Load, FA Conc.2.5
Non-PS, S. Load, HP Conc.1.6
Non-PS, S. Load, FA Conc.1.5
Beam / Variable
100%U PS, S. Load, HP Conc.
3.7
100%U PS, S. Load, FA Conc.
3.6
2/3 PS, S. Load, HP Conc.2.6
2/3 PS, S. Load, FA Conc.2.5
Non-PS, S. Load, HP Conc.1.6
Non-PS, S. Load, FA Conc.1.5
Beam / Variable
0 50 100 150 200 250 300 350 400 450 500
2,11
2,3
1,3
3,3
4,2
3,2
1,1
3,1
Bea
m
Rating/ft
Rebar
Increase in Corrosion Resistance
100%S PS, S. Load4.2
100%U PS, Overload3.3
100%U PS, S. Load3.2
100%U PS, Unloaded3.1
2/3 PS, S. Load, FA Grout2.11
2/3 PS, S. Load2.3
Non-PS, S. Load1.3
Non-PS, Unloaded1.1
Beam / Variable
100%S PS, S. Load4.2
100%U PS, Overload3.3
100%U PS, S. Load3.2
100%U PS, Unloaded3.1
2/3 PS, S. Load, FA Grout2.11
2/3 PS, S. Load2.3
Non-PS, S. Load1.3
Non-PS, Unloaded1.1
Beam / Variable
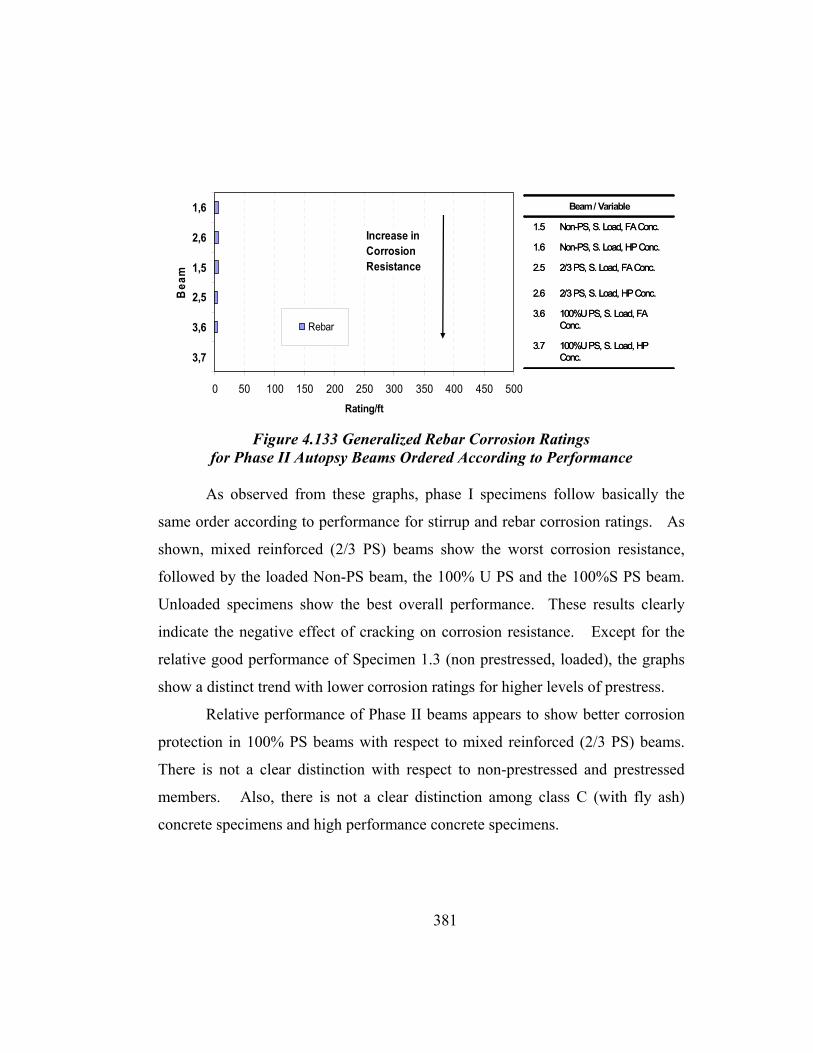
381
Figure 4.133 Generalized Rebar Corrosion Ratings for Phase II Autopsy Beams Ordered According to Performance
As observed from these graphs, phase I specimens follow basically the
same order according to performance for stirrup and rebar corrosion ratings. As
shown, mixed reinforced (2/3 PS) beams show the worst corrosion resistance,
followed by the loaded Non-PS beam, the 100% U PS and the 100%S PS beam.
Unloaded specimens show the best overall performance. These results clearly
indicate the negative effect of cracking on corrosion resistance. Except for the
relative good performance of Specimen 1.3 (non prestressed, loaded), the graphs
show a distinct trend with lower corrosion ratings for higher levels of prestress.
Relative performance of Phase II beams appears to show better corrosion
protection in 100% PS beams with respect to mixed reinforced (2/3 PS) beams.
There is not a clear distinction with respect to non-prestressed and prestressed
members. Also, there is not a clear distinction among class C (with fly ash)
concrete specimens and high performance concrete specimens.
0 50 100 150 200 250 300 350 400 450 500
1,6
2,6
1,5
2,5
3,6
3,7
Bea
m
Rating/ft
Rebar
Increase in Corrosion Resistance
100%U PS, S. Load, HP Conc.
3.7
100%U PS, S. Load, FA Conc.
3.6
2/3 PS, S. Load, HP Conc.2.6
2/3 PS, S. Load, FA Conc.2.5
Non-PS, S. Load, HP Conc.1.6
Non-PS, S. Load, FA Conc.1.5
Beam / Variable
100%U PS, S. Load, HP Conc.
3.7
100%U PS, S. Load, FA Conc.
3.6
2/3 PS, S. Load, HP Conc.2.6
2/3 PS, S. Load, FA Conc.2.5
Non-PS, S. Load, HP Conc.1.6
Non-PS, S. Load, FA Conc.1.5
Beam / Variable

382
The overall performance of the specimens is better compared by
considering the total corrosion rating, obtained by summing the ratings for the
rebar, duct and strand, as shown in Figure 4.134 and Figure 4.135.
Figure 4.134 Generalized Corrosion Ratings for Phase I Autopsy Beams Ordered According to Performance
As observed from Figure 4.134, it shows a clear trend with respect to the
level of prestress. As the level of prestress increases, the corrosion resistance
increases. In this graphs, it is observed that the strand rating is very similar for all
specimens, which suggest the need for a longer period of exposure testing, in
order to obtain more conclusive results with respect to strand corrosion.
Figure 4.134 also shows that galvanized duct corrosion is a major
problem, even when rebar and corrosion ratings cannot be compared because they
are the result of different rating systems.
The uncracked and unloaded Specimen 3.1 shows the overall best
performance as expected. This is a clear indication of the very negative effects of
0 1000 2000 3000 4000 5000 6000
2.3 (D2)
2.3 (D1)
2.11 (D1)
2.11 (D2)
3.3 (D1)
3.3 (D2)
3.2 (D1)
3.2 (D2)
3.1 (D1)
4.2 (D1)
4.2 (D2)
3.1 (D2)
Bea
m
Rating/ft
Rebar
Duct
Strand
Increase in Corrosion Resistance
100%S PS, S. Load4.2
100%U PS, Overload3.3
100%U PS, S. Load3.2
100%U PS, Unloaded3.1
2/3 PS, S. Load, FA Grout2.11
2/3 PS, S. Load2.3
Beam Variable
100%S PS, S. Load4.2
100%U PS, Overload3.3
100%U PS, S. Load3.2
100%U PS, Unloaded3.1
2/3 PS, S. Load, FA Grout2.11
2/3 PS, S. Load2.3
Beam Variable

383
cracking in the other specimens, and the positive effect of precompression force
in the concrete.
Figure 4.135 does not show a clear trend with respect to concrete type and
levels of prestress. By comparing Phase I and Phase II results, the need for longer
periods of exposure testing appears evident and may reflect the relative better
performance of specialty concretes (with fly ash) with respect to standard class C
concrete specimens. Care must be exercised when making this conclusion, since
phase II autopsy beams had around 23% less exposure time than phase I autopsy
beams.
Figure 4.135 Generalized Corrosion Ratings for Phase II Autopsy Beams
Ordered According to Performance
A summary table of results prepared by Kotys 4.5 is presented in Table
4.22. In this table, generalized and localized corrosion ratings from Section 4.5.5
are used to conclude on the relative performance of the testing variables.
0 1000 2000 3000 4000 5000 6000
2.5 (D2)
3.7 (D1)
2.5 (D1)
3.7 (D2)
3.6 (D1)
2.6 (D2)
3.6 (D2)
2.6 (D1)
Bea
m
Rating/ft
Rebar
Duct
Strand
Increase in Corrosion Resistance
100%U PS, S. Load, HP Conc.
3.7
100%U PS, S. Load,FA Conc.
3.6
2/3 PS, S. Load, HP Conc.2.6
2/3 PS, S. Load, FA Conc.2.5
Beam Variable
100%U PS, S. Load, HP Conc.
3.7
100%U PS, S. Load,FA Conc.
3.6
2/3 PS, S. Load, HP Conc.2.6
2/3 PS, S. Load, FA Conc.2.5
Beam Variable

384
Table 4.22 Summary of Forensic Examination Corrosion Rating Results4.5
Method of Comparison
Beams Compared
Variable Analyzed Result
Gen. Stirrup 1.3, 2.3, 3.2, 4.2 Prestress • Non and 2/3 PS much worse corrosion protection than 100%S and U PS
Loc. Stirrup 1.3, 2.3, 3.2, 4.2 Prestress • 2/3 PS is much worse corrosion protection than all others, including Non-PS
Gen. and Loc. Duct 2.3, 3.2, 4.2 Prestress • 2/3 PS the worst corrosion protection by a
significant amount Gen. and Loc.
Strand 2.3, 3.2, 4.2 Prestress • All corrosion protections about the same, with 100%U PS a little worse
Gen. Stirrup 1.5, 2.5, 3.6 1.6, 2.6, 3.7 Prestress
• 100%U PS consistently best corrosion protection • corrosion protection of Non and 2/3 PS similar, no
consistent superiority Gen. and Loc.
Bar 1.5, 2.5, 3.6 1.6, 2.6, 3.7 Prestress • 2/3 PS shows worst corrosion protection by a
significant amount Gen. and Loc.
Duct 2.5, 3.6 Prestress • 2/3 and 100%U PS corrosion protection similar, no consistent superior PS
Gen. and Loc. Strand 2.5, 3.6 Prestress • 2/3 and 100%U PS corrosion protection similar, no
consistent superior PS
Gen. Stirrup 1.1, 1.3 3.1, 3.2, 3.3 Load/Cracking
• Much worse corrosion protection when cracking is present
• Corrosion protection decreases as loading increases
Loc. Stirrup 1.1, 1.3 3.1, 3.2, 3.3 Load/Cracking
• Much worse corrosion protection when cracking is present
• Corrosion protection decreases as loading increases Gen. and Loc.
Bar 1.1, 1.3
3.1, 3.2, 3.3 Load/Cracking • Cracked beams show a little worse corrosion protection
Gen. and Loc. Duct 3.1, 3.2, 3.3 Load/Cracking • Much worse corrosion protection when cracking is
present
Gen. and Loc. Stirrup
1.5, 1.6 2.5, 2.6 3.6, 3.7
Concrete Type • HP concrete consistently better corrosion protection
Gen. and Loc. Bar
1.5, 1.6 2.5, 2.6 3.6, 3.7
Concrete Type• All similar corrosion protection and all low
ratings…both concretes provide good corrosion protection
Gen. and Loc. Duct
1.5, 1.6 2.5, 2.6 3.6, 3.7
Concrete Type • All corrosion protections similar, no consistent superior concrete
Gen. and Loc. Strand
1.5, 1.6 2.5, 2.6 3.6, 3.7
Concrete Type • All corrosion protections similar, no consistent superior concrete
Gen. Duct 2.3, 2.11 Grout Type • Fly ash grout shows much better corrosion protection
Gen. and Loc. Strand 2.3, 2.11 Grout Type • No difference in corrosion protection between grout
types

385
4.6.2 Effect of Cracking
Cracking effects were investigated using the three sections that would be
expected to crack under service loads (Non-PS, 2/3 PS and 100% U). In
addition, Specimen 4.2 (100%U PS) was found to be cracked at the end of the
exposure period, and therefore, it is included in the comparisons.
Specimens 1.3 (Non-PS), 2.3 (2/3 PS) and 2.11 (2/3 PS) developed
substantial longitudinal (splitting type) cracking during exposure. Non of the
other autopsied specimens evidenced longitudinal cracking. Since the
longitudinal cracks were very wide and could provided additional paths for
chloride penetration, they were considered in crack ratings.
4.6.2.1 Crack Density
Crack ratings for all autopsied specimens in Phase I have been plotted
along with stirrup, rebar, duct and strand generalized corrosion ratings, in Figure
4.136 and Figure 4.137. In a similar manner, crack ratings for all autopsied
specimens in Phase II have been plotted along with generalized corrosion ratings
in Figure 4.138 and Figure 4.139. Crack ratings are defined as indicated in
Equation 4.12.
( )∑=
=m
iilxwSpecimeneachforRatingCrack i
1 Eq. 4.12
where, wi = average crack width, for crack i
li = crack length at the end of testing, for crack i
m = number of longitudinal and transverse cracks on the specimen top surface, in the 72 inch-analysis length i = crack under consideration With the purpose of clearly showing the relationship between crack and
corrosion ratings Figure 4.136 through Figure 4.139 have been plotted

386
maintaining the same crack rating scale, and selecting the adequate generalized
corrosion rating scale depending on the level of corrosion found on each element.
For Phase II beams, the generalized corrosion rating scale for stirrups, rebar and
ducts has been changed to one fifth of that used in Phase I, since corrosion ratings
in Phase II beams were much smaller. The generalized corrosion rating scale for
Phase II beam strands was selected as half of that used in Phase I beams.
As observed from Figures 4.136 and 4.137, there seems to be a correlation
in Phase I beams between stirrup, rebar and duct corrosion ratings and crack
density (by means of a crack rating), with some deviations as in the case of rebar
corrosion of Specimen 1.3 in Figure 4.136, and, duct corrosion in Specimens 2.11
and 4.2 in Figure 4.137. The proportionality is not shown for the strands, which
do not show any distinct trend. It appears that the proportionality is better shown
on those elements closer to the top surface of the specimens, and therefore, those
receiving the effect of moisture and chlorides in a more direct means.
For Phase II autopsy beams, Figures 4.138 and 4.139 do not show any
distinct correlation. These beams constructed with high performance concrete or
fly ash concrete, had three years and a half of exposure testing at the time of
autopsy, as opposed to Phase I beams that had four years and a half. It is not clear
from these results if the non-proportionality observed is the result of the effect of
the different concrete types or the shorter exposure testing period. It is anticipated
that final autopsies of the remaining specimens in the beam series will yield more
conclusive results after several additional years of exposure testing.

387
Figure 4.136 Effect of Crack Density on Stirrup and Rebar Corrosion for Phase I Autopsy Beams
STIRRUPS
REBAR
0
400
800
1200
1600
2000
1.1 1.3 2.3 2.11 3.1 3.2 3.3 4.2
Gen
eral
ized
Stir
rup
Cor
rosi
on
Rat
ing
0
1
2
3
4
5
Cra
ck R
atin
g (le
ngth
x a
vera
ge w
idth
)
Stirrup CorrosionRating
Crack Rating
Non-PS 2/3 PS 100%U PS 100%S PS
Specimen
0
100
200
300
400
500
1.1 1.3 2.3 2.11 3.1 3.2 3.3 4.2
Gen
eral
ized
Bar
Cor
rosi
on R
atin
g
0
1
2
3
4
5
Cra
ck R
atin
g (le
ngth
x a
vera
ge w
idth
)
Bar CorrosionRating
Crack Rating
Non-PS 2/3 PS 100%U PS100%S
PSSpecimen

388
Figure 4.137 Effect of Crack Density on Duct and Strand Corrosion
for Phase I Autopsy Beams
DUCTS
STRANDS
0
1200
2400
3600
4800
6000
D1 D2 D1 D2 D1 D2 D1 D2 D1 D2 D1 D2
2.3 2.11 3.1 3.2 3.3 4.2
Gen
eral
ized
Duc
t Cor
rosi
on R
atin
g
0
1
2
3
4
5
Cra
ck R
atin
g (le
ngth
x a
vera
ge w
idth
) .
Duct CorrosionRating
Crack Rating
2/3 PS 100%U PS 100%S PS
Specimen
0
200
400
600
800
1000
D1 D2 D1 D2 D1 D2 D1 D2 D1 D2 D1 D2
2.3 2.11 3.1 3.2 3.3 4.2
Gen
eral
ized
Stra
nd C
orro
sion
Rat
ing
0
1
2
3
4
5
Cra
ck R
atin
g (le
ngth
x a
vera
ge w
idth
)
Strand CorrosionRatingCrack Rating
2/3 PS 100%U PS 100%S PS
Specimen

389
Figure 4.138 Effect of Crack Density on Stirrup and Rebar Corrosion for Phase II Autopsy Beams
STIRRUPS
REBAR
0
80
160
240
320
400
1.5 1.6 2.5 2.6 3.6 3.7
Gen
eral
ized
Stir
rup
Cor
rosi
on
Rat
ing
0
1
2
3
4
5
Cra
ck R
atin
g (le
ngth
x a
vera
ge w
idth
)
Stirrup CorrosionRating
Crack Rating
Non-PS 2/3 PS 100%U PS
Specimen
0
20
40
60
80
100
1.5 1.6 2.5 2.6 3.6 3.7
Gen
eral
ized
Bar
Cor
rosi
on R
atin
g
0
1
2
3
4
5
Cra
ck R
atin
g (le
ngth
x a
vera
ge w
idth
)
Bar CorrosionRating
Crack Rating
Non-PS 2/3 PS 100%U PS
Specimen

390
Figure 4.139 Effect of Crack Density on Duct and Strand Corrosion for Phase II Autopsy Beams
DUCTS
STRANDS
0
240
480
720
960
1200
D1 D2 D1 D2 D1 D2 D1 D2
2.5 2.6 3.6 3.7
Gen
eral
ized
Duc
t Cor
rosi
on R
atin
g
0
1
2
3
4
5
Cra
ck R
atin
g (le
ngth
x a
vera
ge w
idth
) .
Duct CorrosionRating
Crack Rating
Specimen
2/3 PS 100%U PS
0
100
200
300
400
500
D1 D2 D1 D2 D1 D2 D1 D2
2.5 2.6 3.6 3.7
Gen
eral
ized
Str
and
Cor
rosi
on R
atin
g
0
1
2
3
4
5
Cra
ck R
atin
g (le
ngth
x a
vera
ge w
idth
) .
StrandCorrosionRating
Crack Rating
2/3 PS 100%U PS
Specimen

391
4.6.2.2 Crack Width
In discussing crack width it is assumed that transverse cracks (formed
originally prior to exposure testing) are causes and longitudinal or splitting type
cracking formed after substantial exposure due to corrosion products are effects.
Thus, all correlations in this section are made with transverse crack widths only.
The effect of transverse crack width on stirrup, rebar, galvanized steel duct
and strand corrosion is illustrated on Figure 4.140 and Figure 4.141 for Phase I
beams, and on Figure 4.142 and Figure 4.143 for Phase II beams. In these
figures, the localized corrosion rating (maximum corrosion rating recorded for
any 2-inch interval for each element) is plotted versus the maximum transverse
crack width. The scale used for the corrosion rating (y scale) has been adjusted
for every element, to clearly show any proportionality among the variables. The
plots for Phase II beams use half of the corrosion rating scale in Phase I beam
plots, except for the strand rating that uses half of the scale.
As observed from Figure 4.140 there is a distinct trend among localized
corrosion rating and maximum crack width for post-tensioned specimens. Mixed
reinforced (2/3 PS) beams with wider cracks show higher stirrup, rebar and duct
corrosion ratings than 100% PS beams. The trend is not clearly observed for the
Non-PS beams nor for the strands However, from Section 4.5.5.4 it was shown
that strands were all performing similarly, with only minimal variations, and
therefore, it appears that specimens would require more exposure time to indicate
distinct performance differences.
The performance of Specimen 1.3, as observed from Figure 4.140, shows
a similar behavior to fully post-tensioned (100%U PS and 100%S PS beams).
This conclusion differs from the trend observed for mixed reinforced specimens
and from the expected results. The reason for this difference it is not apparent.
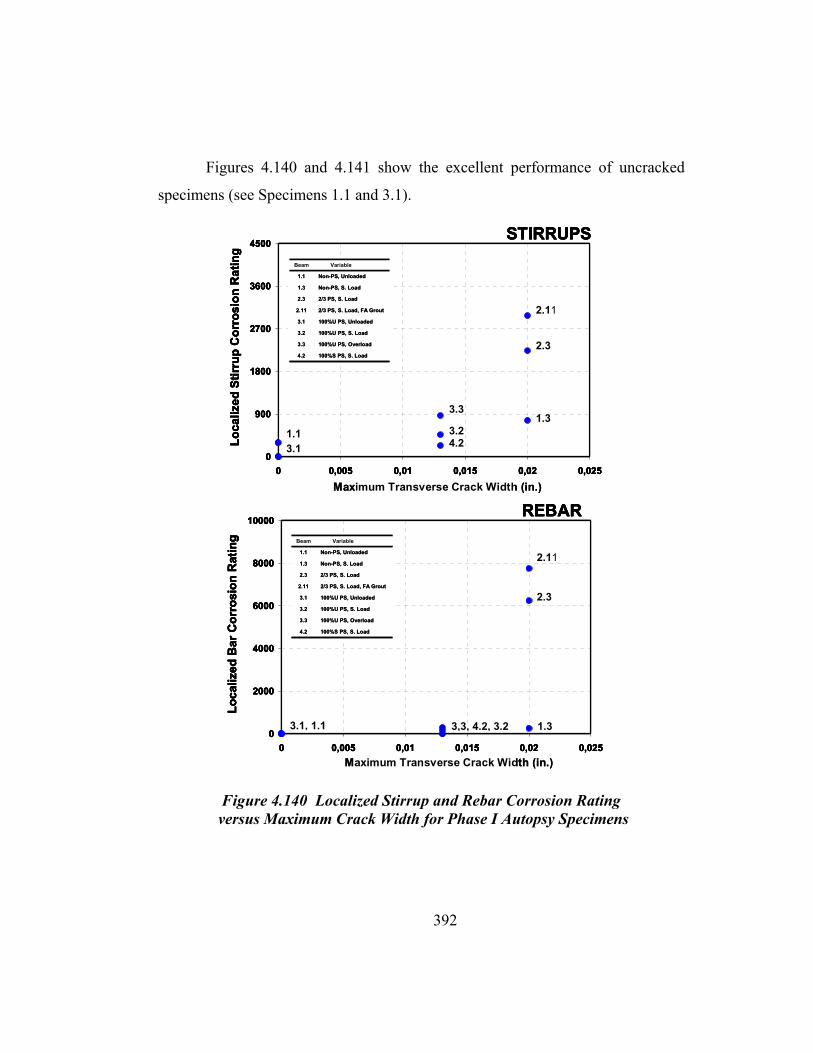
392
Figures 4.140 and 4.141 show the excellent performance of uncracked
specimens (see Specimens 1.1 and 3.1).
Figure 4.140 Localized Stirrup and Rebar Corrosion Rating versus Maximum Crack Width for Phase I Autopsy Specimens
0
900
1800
2700
3600
4500
0 0,005 0,01 0,015 0,02 0,025
Maximum Crack Width (in.)
Loca
lized
Stir
rup
Cor
rosi
on R
atin
g
2.11
2.3
1.33.3
3.24.23.1
1.1
0
2000
4000
6000
8000
10000
0 0,005 0,01 0,015 0,02 0,025
Maximum Crack Width (in.)
Loca
lized
Bar
Cor
rosi
on R
atin
g
2.11
2.3
1.33,3, 4.2, 3.23.1, 1.1
STIRRUPS
REBAR
100%S PS, S. Load4.2
100%U PS, Overload3.3
100%U PS, S. Load3.2
100%U PS, Unloaded3.1
2/3 PS, S. Load, FA Grout2.11
2/3 PS, S. Load2.3
Non-PS, S. Load1.3
Non-PS, Unloaded1.1
Beam Variable
100%S PS, S. Load4.2
100%U PS, Overload3.3
100%U PS, S. Load3.2
100%U PS, Unloaded3.1
2/3 PS, S. Load, FA Grout2.11
2/3 PS, S. Load2.3
Non-PS, S. Load1.3
Non-PS, Unloaded1.1
Beam Variable
100%S PS, S. Load4.2
100%U PS, Overload3.3
100%U PS, S. Load3.2
100%U PS, Unloaded3.1
2/3 PS, S. Load, FA Grout2.11
2/3 PS, S. Load2.3
Non-PS, S. Load1.3
Non-PS, Unloaded1.1
Beam Variable
100%S PS, S. Load4.2
100%U PS, Overload3.3
100%U PS, S. Load3.2
100%U PS, Unloaded3.1
2/3 PS, S. Load, FA Grout2.11
2/3 PS, S. Load2.3
Non-PS, S. Load1.3
Non-PS, Unloaded1.1
Beam Variable
Maximum Transverse Crack Width (in.)
Maximum Transverse Crack Width (in.)
0
900
1800
2700
3600
4500
0 0,005 0,01 0,015 0,02 0,025
Maximum Crack Width (in.)
Loca
lized
Stir
rup
Cor
rosi
on R
atin
g
2.11
2.3
1.33.3
3.24.23.1
1.1
0
2000
4000
6000
8000
10000
0 0,005 0,01 0,015 0,02 0,025
Maximum Crack Width (in.)
Loca
lized
Bar
Cor
rosi
on R
atin
g
2.11
2.3
1.33,3, 4.2, 3.23.1, 1.1
STIRRUPS
REBAR
100%S PS, S. Load4.2
100%U PS, Overload3.3
100%U PS, S. Load3.2
100%U PS, Unloaded3.1
2/3 PS, S. Load, FA Grout2.11
2/3 PS, S. Load2.3
Non-PS, S. Load1.3
Non-PS, Unloaded1.1
Beam Variable
100%S PS, S. Load4.2
100%U PS, Overload3.3
100%U PS, S. Load3.2
100%U PS, Unloaded3.1
2/3 PS, S. Load, FA Grout2.11
2/3 PS, S. Load2.3
Non-PS, S. Load1.3
Non-PS, Unloaded1.1
Beam Variable
100%S PS, S. Load4.2
100%U PS, Overload3.3
100%U PS, S. Load3.2
100%U PS, Unloaded3.1
2/3 PS, S. Load, FA Grout2.11
2/3 PS, S. Load2.3
Non-PS, S. Load1.3
Non-PS, Unloaded1.1
Beam Variable
100%S PS, S. Load4.2
100%U PS, Overload3.3
100%U PS, S. Load3.2
100%U PS, Unloaded3.1
2/3 PS, S. Load, FA Grout2.11
2/3 PS, S. Load2.3
Non-PS, S. Load1.3
Non-PS, Unloaded1.1
Beam Variable
0
900
1800
2700
3600
4500
0 0,005 0,01 0,015 0,02 0,025
Maximum Crack Width (in.)
Loca
lized
Stir
rup
Cor
rosi
on R
atin
g
2.11
2.3
1.33.3
3.24.23.1
1.1
0
2000
4000
6000
8000
10000
0 0,005 0,01 0,015 0,02 0,025
Maximum Crack Width (in.)
Loca
lized
Bar
Cor
rosi
on R
atin
g
2.11
2.3
1.33,3, 4.2, 3.23.1, 1.1
STIRRUPS
REBAR
0
900
1800
2700
3600
4500
0 0,005 0,01 0,015 0,02 0,025
Maximum Crack Width (in.)
Loca
lized
Stir
rup
Cor
rosi
on R
atin
g
2.11
2.3
1.33.3
3.24.23.1
1.1
0
2000
4000
6000
8000
10000
0 0,005 0,01 0,015 0,02 0,025
Maximum Crack Width (in.)
Loca
lized
Bar
Cor
rosi
on R
atin
g
2.11
2.3
1.33,3, 4.2, 3.23.1, 1.1
STIRRUPS
REBAR
100%S PS, S. Load4.2
100%U PS, Overload3.3
100%U PS, S. Load3.2
100%U PS, Unloaded3.1
2/3 PS, S. Load, FA Grout2.11
2/3 PS, S. Load2.3
Non-PS, S. Load1.3
Non-PS, Unloaded1.1
Beam Variable
100%S PS, S. Load4.2
100%U PS, Overload3.3
100%U PS, S. Load3.2
100%U PS, Unloaded3.1
2/3 PS, S. Load, FA Grout2.11
2/3 PS, S. Load2.3
Non-PS, S. Load1.3
Non-PS, Unloaded1.1
Beam Variable
100%S PS, S. Load4.2
100%U PS, Overload3.3
100%U PS, S. Load3.2
100%U PS, Unloaded3.1
2/3 PS, S. Load, FA Grout2.11
2/3 PS, S. Load2.3
Non-PS, S. Load1.3
Non-PS, Unloaded1.1
Beam Variable
100%S PS, S. Load4.2
100%U PS, Overload3.3
100%U PS, S. Load3.2
100%U PS, Unloaded3.1
2/3 PS, S. Load, FA Grout2.11
2/3 PS, S. Load2.3
Non-PS, S. Load1.3
Non-PS, Unloaded1.1
Beam Variable
Maximum Transverse Crack Width (in.)
Maximum Transverse Crack Width (in.)

393
Figure 4.141 Localized Duct and Strand Corrosion Rating
versus Maximum Crack Width for Phase I Autopsy Specimens
STRANDS
0
2000
4000
6000
8000
10000
0,000 0,005 0,010 0,015 0,020 0,025
Maximum Crack Width (in.)
Loca
lized
Duc
t Cor
rosi
on R
atin
g Duct 1
Duct 2
2.3
3.33.1 3.2,4.2
2.11
2.3
2.11
0
20
40
60
80
100
0,000 0,005 0,010 0,015 0,020 0,025Maximum Crack Width (in.)
Loca
lized
Str
and
Cor
rosi
on
Rat
ing
Strands inDuct 1Strands inDuct 2
2.11
2.33.3
4.23.1 2.3,2.114.2
3.23.3
DUCTS
100%S PS, S. Load4.2
100%U PS, Overload3.3
100%U PS, S. Load3.2
100%U PS, Unloaded3.1
2/3 PS, S. Load, FA Grout2.11
2/3 PS, S. Load2.3
Non-PS, S. Load1.3
Non-PS, Unloaded1.1
Beam Variable
100%S PS, S. Load4.2
100%U PS, Overload3.3
100%U PS, S. Load3.2
100%U PS, Unloaded3.1
2/3 PS, S. Load, FA Grout2.11
2/3 PS, S. Load2.3
Non-PS, S. Load1.3
Non-PS, Unloaded1.1
Beam Variable
100%S PS, S. Load4.2
100%U PS, Overload3.3
100%U PS, S. Load3.2
100%U PS, Unloaded3.1
2/3 PS, S. Load, FA Grout2.11
2/3 PS, S. Load2.3
Non-PS, S. Load1.3
Non-PS, Unloaded1.1
Beam Variable
100%S PS, S. Load4.2
100%U PS, Overload3.3
100%U PS, S. Load3.2
100%U PS, Unloaded3.1
2/3 PS, S. Load, FA Grout2.11
2/3 PS, S. Load2.3
Non-PS, S. Load1.3
Non-PS, Unloaded1.1
Beam Variable
Maximum Transverse Crack Width (in.)
Maximum Transverse Crack Width (in.)
STRANDS
0
2000
4000
6000
8000
10000
0,000 0,005 0,010 0,015 0,020 0,025
Maximum Crack Width (in.)
Loca
lized
Duc
t Cor
rosi
on R
atin
g Duct 1
Duct 2
2.3
3.33.1 3.2,4.2
2.11
2.3
2.11
0
20
40
60
80
100
0,000 0,005 0,010 0,015 0,020 0,025Maximum Crack Width (in.)
Loca
lized
Str
and
Cor
rosi
on
Rat
ing
Strands inDuct 1Strands inDuct 2
2.11
2.33.3
4.23.1 2.3,2.114.2
3.23.3
DUCTS
100%S PS, S. Load4.2
100%U PS, Overload3.3
100%U PS, S. Load3.2
100%U PS, Unloaded3.1
2/3 PS, S. Load, FA Grout2.11
2/3 PS, S. Load2.3
Non-PS, S. Load1.3
Non-PS, Unloaded1.1
Beam Variable
100%S PS, S. Load4.2
100%U PS, Overload3.3
100%U PS, S. Load3.2
100%U PS, Unloaded3.1
2/3 PS, S. Load, FA Grout2.11
2/3 PS, S. Load2.3
Non-PS, S. Load1.3
Non-PS, Unloaded1.1
Beam Variable
100%S PS, S. Load4.2
100%U PS, Overload3.3
100%U PS, S. Load3.2
100%U PS, Unloaded3.1
2/3 PS, S. Load, FA Grout2.11
2/3 PS, S. Load2.3
Non-PS, S. Load1.3
Non-PS, Unloaded1.1
Beam Variable
100%S PS, S. Load4.2
100%U PS, Overload3.3
100%U PS, S. Load3.2
100%U PS, Unloaded3.1
2/3 PS, S. Load, FA Grout2.11
2/3 PS, S. Load2.3
Non-PS, S. Load1.3
Non-PS, Unloaded1.1
Beam Variable
Maximum Transverse Crack Width (in.)
Maximum Transverse Crack Width (in.)

394
Figure 4.142 Localized Stirrup and Rebar Corrosion Rating versus Maximum Crack Width for Phase II Autopsy Specimens
0
150
300
450
600
750
900
0,000 0,005 0,010 0,015 0,020 0,025
Maximum Crack Width (in.)
Loca
lized
Stir
rup
Cor
rosi
on R
atin
g 2.5
1.53.6
1.6
2.63.7
0
500
1000
1500
2000
0,000 0,005 0,010 0,015 0,020 0,025
Maximum Crack Width (in.)
Loca
lized
Bar
Cor
rosi
on R
atin
g
1.5, 2.52.6
1.6 ,3.6, 3.7
STIRRUPS
REBAR
100%U PS, S. Load, HP Conc.
3.7
100%U PS, S. Load,FA Conc.
3.6
2/3 PS, S. Load, HP Conc.2.6
2/3 PS, S. Load, FA Conc.2.5
Non-PS, S. Load, HP Conc.1.6
Non-PS, S. Load, FA Conc.1.5
Beam Variable
100%U PS, S. Load, HP Conc.
3.7
100%U PS, S. Load,FA Conc.
3.6
2/3 PS, S. Load, HP Conc.2.6
2/3 PS, S. Load, FA Conc.2.5
Non-PS, S. Load, HP Conc.1.6
Non-PS, S. Load, FA Conc.1.5
Beam Variable
100%U PS, S. Load, HP Conc.
3.7
100%U PS, S. Load,FA Conc.
3.6
2/3 PS, S. Load, HP Conc.2.6
2/3 PS, S. Load, FA Conc.2.5
Non-PS, S. Load, HP Conc.1.6
Non-PS, S. Load, FA Conc.1.5
Beam Variable
100%U PS, S. Load, HP Conc.
3.7
100%U PS, S. Load,FA Conc.
3.6
2/3 PS, S. Load, HP Conc.2.6
2/3 PS, S. Load, FA Conc.2.5
Non-PS, S. Load, HP Conc.1.6
Non-PS, S. Load, FA Conc.1.5
Beam Variable
Maximum Transverse Crack Width (in.)
Maximum Transverse Crack Width (in.)
0
150
300
450
600
750
900
0,000 0,005 0,010 0,015 0,020 0,025
Maximum Crack Width (in.)
Loca
lized
Stir
rup
Cor
rosi
on R
atin
g 2.5
1.53.6
1.6
2.63.7
0
500
1000
1500
2000
0,000 0,005 0,010 0,015 0,020 0,025
Maximum Crack Width (in.)
Loca
lized
Bar
Cor
rosi
on R
atin
g
1.5, 2.52.6
1.6 ,3.6, 3.7
STIRRUPS
REBAR
100%U PS, S. Load, HP Conc.
3.7
100%U PS, S. Load,FA Conc.
3.6
2/3 PS, S. Load, HP Conc.2.6
2/3 PS, S. Load, FA Conc.2.5
Non-PS, S. Load, HP Conc.1.6
Non-PS, S. Load, FA Conc.1.5
Beam Variable
100%U PS, S. Load, HP Conc.
3.7
100%U PS, S. Load,FA Conc.
3.6
2/3 PS, S. Load, HP Conc.2.6
2/3 PS, S. Load, FA Conc.2.5
Non-PS, S. Load, HP Conc.1.6
Non-PS, S. Load, FA Conc.1.5
Beam Variable
100%U PS, S. Load, HP Conc.
3.7
100%U PS, S. Load,FA Conc.
3.6
2/3 PS, S. Load, HP Conc.2.6
2/3 PS, S. Load, FA Conc.2.5
Non-PS, S. Load, HP Conc.1.6
Non-PS, S. Load, FA Conc.1.5
Beam Variable
100%U PS, S. Load, HP Conc.
3.7
100%U PS, S. Load,FA Conc.
3.6
2/3 PS, S. Load, HP Conc.2.6
2/3 PS, S. Load, FA Conc.2.5
Non-PS, S. Load, HP Conc.1.6
Non-PS, S. Load, FA Conc.1.5
Beam Variable
0
150
300
450
600
750
900
0,000 0,005 0,010 0,015 0,020 0,025
Maximum Crack Width (in.)
Loca
lized
Stir
rup
Cor
rosi
on R
atin
g 2.5
1.53.6
1.6
2.63.7
0
500
1000
1500
2000
0,000 0,005 0,010 0,015 0,020 0,025
Maximum Crack Width (in.)
Loca
lized
Bar
Cor
rosi
on R
atin
g
1.5, 2.52.6
1.6 ,3.6, 3.7
STIRRUPS
REBAR
0
150
300
450
600
750
900
0,000 0,005 0,010 0,015 0,020 0,025
Maximum Crack Width (in.)
Loca
lized
Stir
rup
Cor
rosi
on R
atin
g 2.5
1.53.6
1.6
2.63.7
0
500
1000
1500
2000
0,000 0,005 0,010 0,015 0,020 0,025
Maximum Crack Width (in.)
Loca
lized
Bar
Cor
rosi
on R
atin
g
1.5, 2.52.6
1.6 ,3.6, 3.7
STIRRUPS
REBAR
100%U PS, S. Load, HP Conc.
3.7
100%U PS, S. Load,FA Conc.
3.6
2/3 PS, S. Load, HP Conc.2.6
2/3 PS, S. Load, FA Conc.2.5
Non-PS, S. Load, HP Conc.1.6
Non-PS, S. Load, FA Conc.1.5
Beam Variable
100%U PS, S. Load, HP Conc.
3.7
100%U PS, S. Load,FA Conc.
3.6
2/3 PS, S. Load, HP Conc.2.6
2/3 PS, S. Load, FA Conc.2.5
Non-PS, S. Load, HP Conc.1.6
Non-PS, S. Load, FA Conc.1.5
Beam Variable
100%U PS, S. Load, HP Conc.
3.7
100%U PS, S. Load,FA Conc.
3.6
2/3 PS, S. Load, HP Conc.2.6
2/3 PS, S. Load, FA Conc.2.5
Non-PS, S. Load, HP Conc.1.6
Non-PS, S. Load, FA Conc.1.5
Beam Variable
100%U PS, S. Load, HP Conc.
3.7
100%U PS, S. Load,FA Conc.
3.6
2/3 PS, S. Load, HP Conc.2.6
2/3 PS, S. Load, FA Conc.2.5
Non-PS, S. Load, HP Conc.1.6
Non-PS, S. Load, FA Conc.1.5
Beam Variable
Maximum Transverse Crack Width (in.)
Maximum Transverse Crack Width (in.)

395
Figure 4.143 Localized Duct and Strand Corrosion Rating versus Maximum Crack Width for Phase II Autopsy Specimens
0
1000
2000
3000
4000
5000
0,000 0,005 0,010 0,015 0,020 0,025
Maximum Crack Width (in.)
Loca
lized
Duc
t Cor
rosi
on R
atin
g Duct 1
Duct 2
2.5
2.5
3.7
2.6, 3.6, 3.7D2
0
10
20
30
40
50
0,000 0,005 0,010 0,015 0,020 0,025
Maximum Crack Width (in.)
Loca
lized
Str
and
Cor
rosi
on
Rat
ing
Strands inDuct 1Strands inDuct 2
2.53.7
2.6, 3.6
DUCTS
STRANDS
100%U PS, S. Load, HP Conc.
3.7
100%U PS, S. Load,FA Conc.
3.6
2/3 PS, S. Load, HP Conc.2.6
2/3 PS, S. Load, FA Conc.2.5
Non-PS, S. Load, HP Conc.1.6
Non-PS, S. Load, FA Conc.1.5
Beam Variable
100%U PS, S. Load, HP Conc.
3.7
100%U PS, S. Load,FA Conc.
3.6
2/3 PS, S. Load, HP Conc.2.6
2/3 PS, S. Load, FA Conc.2.5
Non-PS, S. Load, HP Conc.1.6
Non-PS, S. Load, FA Conc.1.5
Beam Variable
100%U PS, S. Load, HP Conc.
3.7
100%U PS, S. Load,FA Conc.
3.6
2/3 PS, S. Load, HP Conc.2.6
2/3 PS, S. Load, FA Conc.2.5
Non-PS, S. Load, HP Conc.1.6
Non-PS, S. Load, FA Conc.1.5
Beam Variable
100%U PS, S. Load, HP Conc.
3.7
100%U PS, S. Load,FA Conc.
3.6
2/3 PS, S. Load, HP Conc.2.6
2/3 PS, S. Load, FA Conc.2.5
Non-PS, S. Load, HP Conc.1.6
Non-PS, S. Load, FA Conc.1.5
Beam Variable
Maximum Transverse Crack Width (in.)
Maximum Transverse Crack Width (in.)
0
1000
2000
3000
4000
5000
0,000 0,005 0,010 0,015 0,020 0,025
Maximum Crack Width (in.)
Loca
lized
Duc
t Cor
rosi
on R
atin
g Duct 1
Duct 2
2.5
2.5
3.7
2.6, 3.6, 3.7D2
0
10
20
30
40
50
0,000 0,005 0,010 0,015 0,020 0,025
Maximum Crack Width (in.)
Loca
lized
Str
and
Cor
rosi
on
Rat
ing
Strands inDuct 1Strands inDuct 2
2.53.7
2.6, 3.6
DUCTS
STRANDS
100%U PS, S. Load, HP Conc.
3.7
100%U PS, S. Load,FA Conc.
3.6
2/3 PS, S. Load, HP Conc.2.6
2/3 PS, S. Load, FA Conc.2.5
Non-PS, S. Load, HP Conc.1.6
Non-PS, S. Load, FA Conc.1.5
Beam Variable
100%U PS, S. Load, HP Conc.
3.7
100%U PS, S. Load,FA Conc.
3.6
2/3 PS, S. Load, HP Conc.2.6
2/3 PS, S. Load, FA Conc.2.5
Non-PS, S. Load, HP Conc.1.6
Non-PS, S. Load, FA Conc.1.5
Beam Variable
100%U PS, S. Load, HP Conc.
3.7
100%U PS, S. Load,FA Conc.
3.6
2/3 PS, S. Load, HP Conc.2.6
2/3 PS, S. Load, FA Conc.2.5
Non-PS, S. Load, HP Conc.1.6
Non-PS, S. Load, FA Conc.1.5
Beam Variable
100%U PS, S. Load, HP Conc.
3.7
100%U PS, S. Load,FA Conc.
3.6
2/3 PS, S. Load, HP Conc.2.6
2/3 PS, S. Load, FA Conc.2.5
Non-PS, S. Load, HP Conc.1.6
Non-PS, S. Load, FA Conc.1.5
Beam Variable
0
1000
2000
3000
4000
5000
0,000 0,005 0,010 0,015 0,020 0,025
Maximum Crack Width (in.)
Loca
lized
Duc
t Cor
rosi
on R
atin
g Duct 1
Duct 2
2.5
2.5
3.7
2.6, 3.6, 3.7D2
0
10
20
30
40
50
0,000 0,005 0,010 0,015 0,020 0,025
Maximum Crack Width (in.)
Loca
lized
Str
and
Cor
rosi
on
Rat
ing
Strands inDuct 1Strands inDuct 2
2.53.7
2.6, 3.6
DUCTS
STRANDS
100%U PS, S. Load, HP Conc.
3.7
100%U PS, S. Load,FA Conc.
3.6
2/3 PS, S. Load, HP Conc.2.6
2/3 PS, S. Load, FA Conc.2.5
Non-PS, S. Load, HP Conc.1.6
Non-PS, S. Load, FA Conc.1.5
Beam Variable
100%U PS, S. Load, HP Conc.
3.7
100%U PS, S. Load,FA Conc.
3.6
2/3 PS, S. Load, HP Conc.2.6
2/3 PS, S. Load, FA Conc.2.5
Non-PS, S. Load, HP Conc.1.6
Non-PS, S. Load, FA Conc.1.5
Beam Variable
100%U PS, S. Load, HP Conc.
3.7
100%U PS, S. Load,FA Conc.
3.6
2/3 PS, S. Load, HP Conc.2.6
2/3 PS, S. Load, FA Conc.2.5
Non-PS, S. Load, HP Conc.1.6
Non-PS, S. Load, FA Conc.1.5
Beam Variable
100%U PS, S. Load, HP Conc.
3.7
100%U PS, S. Load,FA Conc.
3.6
2/3 PS, S. Load, HP Conc.2.6
2/3 PS, S. Load, FA Conc.2.5
Non-PS, S. Load, HP Conc.1.6
Non-PS, S. Load, FA Conc.1.5
Beam Variable
Maximum Transverse Crack Width (in.)
Maximum Transverse Crack Width (in.)

396
For Phase II specimens, Figure 4.142 and Figure 4.143 show a trend with
respect to stirrup, and strand corrosion, and maximum crack width for fly ash
concrete post-tensioned specimens. As the level of post-tensioning decreases,
cracking and corrosion rating increase. The trend is not clearly shown for rebar
corrosion and for high performance concrete specimens.
In spite of the few deviations observed from the general trends, the above
results confirm the negative effect of cracking and wide crack widths on corrosion
of steel and post-tensioning system reinforcement.
4.6.2.3 Longitudinal Cracking
Longitudinal or splitting type cracks were found at the end of testing in
Specimens 1.3, 2.3 and 2.11, corresponding with those specimens with the
maximum generalized stirrup, rebar and duct (in the case of post-tensioned
specimens) corrosion ratings, as shown in Figures 4.122, 4.124 and 4.126,
respectively. Longitudinal cracks are the result of very severe reinforcement or
duct corrosion occurring within the concrete member.
Longitudinal cracks for Specimen 1.3, 2.3 and 2.11 corresponded with the
location of the mild steel reinforcement, as shown in Figures 4.74, 4.78, 4.82,
referring to the reinforcement location in Figure 4.4. Longitudinal cracks in
Specimens 2.3 and 2.11 were also very close and along the location of the post-
tensioning galvanized ducts.
Without any other methods of externally monitoring the condition of the
concrete members, longitudinal or splitting cracks by themselves appear to be a
definite sign of very severe corrosion deem enough to generate concern.
4.6.2.4 Loading Levels
The effect of loading on reinforcement corrosion is clearly shown in
Figures 4.130 and 4.132 when comparing Specimens 1.1 and 1.3, and Specimens

397
3.2 and 3.3. Also, when comparing Specimens 3.2 and 3.3 in Figure 4.134. The
results are also shown in Figure 4.136 through Figure 4.143. The corrosion rating
(and therefore, corrosion extent and severity) increases when loading increases.
An increase in loading is associated with an increase in cracking.
4.6.2.5 Prestressing Levels
The effect of prestressing levels is shown in Figures 4.130 and 4.132 for
Phase I beam Specimens: 1.3, 2.3, 3.2 and 4.2. The corrosion severity decreases
with increasing prestressing levels. In particular, mixed reinforcing (2/3 PS)
beams show the worst corrosion protection and perform similar to loaded Non-PS
beams. An increase in prestressing level is associated with a decrease in crack
density and maximum crack widths.
4.6.3 Effect of Concrete Type
Concrete type effects are determined from Phase II beam specimens.
Figure 4.131 shows a distinct trend for stirrup corrosion, with higher corrosion
ratings for Class C concrete specimens with fly ash, in comparison to the high
performance concrete specimens. The opposite trend is shown in Figure 4.133
for rebar corrosion ratings, but in this case all ratings are very close to each other,
and therefore the trend is not clear. Figure 4.135 shows a better performance of
Specimen 2.6 (high performance concrete) when compared to Specimen 2.5
(Class C with Fly Ash concrete). However, the opposite results are obtained
when comparing Specimens 3.6 and 3.7. See definition of high performance
concrete used in Section 2.4.4.1.
It appears that concrete type will be better compared when the remaining
beams are left under continuous exposure for additional testing time.

398
4.6.4 Effect of Splice Type
Two splice types were tested: Industry Standard splice (IS) and Heat
Shrink splice (HS). Figure 4.144 shows both types of splices and the corrosion
and stains typically found. As observed, the industry standard splice allows
moisture to enter through the sides of the splice and get trapped between the duct
and the splice due to inefficiency of duct tape. This results in moisture and
chlorides attacking the splice from both sides.
The heat-shrink splice also allows moisture to enter through the sides and
get trapped due to insufficient adhesion between the splice and the duct. It also
traps bleed water from the grout.
Figure 4.144 Duct Splice Performance
Neither the IS nor the HS splice appears to be a satisfactory duct splice
with respect to corrosion protection of galvanized steel ducts.

399
4.6.5 Effect of Splice Damage
Since the basic undamaged splices were so ineffective, the intentional
damage on the duct splices does not show a direct correlation with the severity of
corrosion.
4.6.6 Effect of Grout Type
Strand corrosion ratings for Specimens 2.3 and 2.11 are all very low and
close in value and therefore, there is not a distinct trend with respect to grout type
(standard Class C versus fly ash grout). The remaining specimens in this testing
program are expected to yield more conclusive results with regard to the use of
different types of grout, including anti-bleed grout.
4.6.7 Special Autopsy Findings
Since grout is injected after post-tensioning of the element, it is
susceptible to cracking due to deflections from loading and vibrations. Cracking
in the grout may serve as direct paths for moisture and chlorides to the strands.
Figure 4.145 shows the grout condition found during forensic examination
for Specimen 2.11. As shown in this figure, moisture and corrosion stains
coming from the galvanized duct were present in many grout transverse slices.
At the time of forensic examination, it appeared that only a short time would have
been required for the moisture to get to the strand level. Similar finding were
also reported before by Hamilton. 4.26 However, this aspect in the multilayer
strand corrosion protection concept has not received enough attention to date.

400
Figure 4.145 Effect of Grout Cracking
Bleed water voids were also found inside the ducts on a few specimens,
even when they were supposed to have been grouted following correct
procedures. Figure 4.146 shows the negative effects of a bleed water void. It was
found that grout voids do not only affect the corrosion protection of the strands,
but they also appear to be detrimental to the duct.
Figure 4.146 Bleed Water Void and Duct Corrosion
4.6.8 Exposure Testing Measurements versus Forensic Examination Results
Table 4.23 shows the summary of exposure test results with respect to the
main test variables. This table can be compared to Table 4.22, which shows the
forensic examination results.
Beam 2.11 (2/3 Prestressed, High Performance (Fly Ash) grout,
Service Load)

401
Table 4.23 Summary of Exposure Test Results4.5
Method of Comparison
Beams Compared
Variable Analyzed Result
Half-Cell 1.1, 3.1 Prestress • 2/3 PS worse than 100%U PS
Half-Cell 1.3, 2.3, 3.2, 4.2 Prestress
• Increase in corrosion protection with increase in PS • 2/3 PS corrosion protection much more similar to
Non-PS than 100% PS • No significant difference between 100%U and
100%S PS
Half-Cell 1.5, 2.5, 3.6 Prestress • Increase in corrosion protection with increase in PS • 2/3 PS corrosion protection almost identical to Non-
PS
Half-Cell 1.6, 2.6, 3.7 Prestress • All levels of PS similar (due to very large crack in 100%U PS beam)
Corr. Rate 1.5, 2.5, 3.6 Prestress • Increase in corrosion protection with increase in PS
Cl- Content All Phase I Beams Prestress • Increase in horizontal chloride penetration with
decrease in PS • Increase in corrosion protection with increase in PS
Half-Cell 1.1, 1.3 Load/Cracking • Decrease in corrosion protection with increase in loading
Half-Cell 3.1, 3.2, 3.3 Load/Cracking
• Decrease in corrosion protection with increase in loading
• Significant decrease in corrosion protection with cracking present
Corr. Rate 3.1, 3.2, 3.3 Load/Cracking • Decrease in corrosion protection with increase in loading and cracking
Cl- Content 1.3, 2.11, 4.2 Load/Cracking • Significantly higher chloride content at bar level when samples taken at crack location
Half-Cell 1.5, 1.6 2.5, 2.6 Concrete Type • HP concrete corrosion protection better than FA
Half-Cell 3.6, 3.7 Concrete Type • FA concrete corrosion protection better than HP (this HP beam is the one with a very large crack)
Half-Cell All Phase II Beams Concrete Type • HP concrete corrosion protection better than FA
Corr. Rate 1.5, 1.6 2.5, 2.6 3.6, 3.7
Concrete Type • No significant difference in corrosion protection of HP and FA concrete
Cl- Content Blocks Concrete Type • HP concrete corrosion protection better than FA
Cl- Content 1.5, 1.6 2.5, 2.6 3.6, 3.7
Concrete Type• HP concrete better at preventing chloride penetration• Both concrete types minimize chloride penetration to
bar level
Half-Cell 2.3, 2.11 Grout Type • No difference in corrosion protection between normal and FA grout
Legend:
PHASE I BEAMS: 1.1 Non-PS, Unloaded; 1.3 Non-PS, S. Load; 2.3 2/3 PS, S.Load; 2.11 2/3 PS, S. Load;
3.1 100% U PS, Unloaded, 3.2 100% U PS, S. Load; 3.3 100% U PS, Overload; 4.2 100%S PS, S. Load
PHASE II BEAMS: 1.5 Non-PS, S. Load, FA Conc.; 1.6 Non-PS, S. Load, HP Conc.; 2.5 2/3 PS, S. Load, FA Conc.;
2.6 2/3 PS, S. Load, HP Conc.; 3.6 100%U PS, S. Load, FA Conc.; 3.7 100%U PS, S. Load, HP Conc.

402
4.6.8.1 Half-Cell Potential Readings versus Forensic Examination Results
Half-cell potential readings have been ordered according to specimen
performance in Figures 4.147 through Figure 4.150, including readings at the time
to initiation of corrosion and at the end of testing for all autopsied specimens.
Figure 4.147 Half-Cell Potential at 1594 Days (End of Testing) for Phase I Autopsy Beams
Figure 4.148 Time to Initiation of Corrosion for Phase I Autopsy Beams
0 100 200 300 400 500 600 700 800 900 1000
1.3
2.3
2.11
3.3
1.1
4.2
3.2
3.1
Beam
Half-Cell Potentials (-mV)
Increase in Corrosion Resistance
100%S PS, S. Load4.2
100%U PS, Overload3.3
100%U PS, S. Load3.2
100%U PS, Unloaded3.1
2/3 PS, S. Load, FA Grout2.11
2/3 PS, S. Load2.3
Non-PS, S. Load1.3
Non-PS, Unloaded1.1
Beam / Variable
100%S PS, S. Load4.2
100%U PS, Overload3.3
100%U PS, S. Load3.2
100%U PS, Unloaded3.1
2/3 PS, S. Load, FA Grout2.11
2/3 PS, S. Load2.3
Non-PS, S. Load1.3
Non-PS, Unloaded1.1
Beam / Variable
0 100 200 300 400 500 600 700 800 900 1000
1.3
2.3
2.11
3.3
1.1
4.2
3.2
3.1
Beam
Time to Corrosion (days)
Never crosses threshold
Increase in Corrosion Resistance
100%S PS, S. Load4.2
100%U PS, Overload3.3
100%U PS, S. Load3.2
100%U PS, Unloaded3.1
2/3 PS, S. Load, FA Grout2.11
2/3 PS, S. Load2.3
Non-PS, S. Load1.3
Non-PS, Unloaded1.1
Beam / Variable
100%S PS, S. Load4.2
100%U PS, Overload3.3
100%U PS, S. Load3.2
100%U PS, Unloaded3.1
2/3 PS, S. Load, FA Grout2.11
2/3 PS, S. Load2.3
Non-PS, S. Load1.3
Non-PS, Unloaded1.1
Beam / Variable

403
The half-cell potentials show an excellent inverse correlation in specimen
performance between the negative potential and the time to corrosion.
Figure 4.149 Half-Cell Potential at 1594 days (end of testing) for Phase II Autopsy Beams
Figure 4.150 Time to Initiation of Corrosion for Phase II Autopsy Beams
0 100 200 300 400 500 600 700 800 900 1000
1.5
2.5
3.7
1.6
3.6
2.6
Bea
m
Time to Corrosion (days)
Increase in Corrosion Resistance
100%U PS, S. Load, HP Conc.
3.7
100%U PS, S. Load, FA Conc.
3.6
2/3 PS, S. Load, HP Conc.2.6
2/3 PS, S. Load, FA Conc.2.5
Non-PS, S. Load, HP Conc.1.6
Non-PS, S. Load, FA Conc.1.5
Beam / Variable
100%U PS, S. Load, HP Conc.
3.7
100%U PS, S. Load, FA Conc.
3.6
2/3 PS, S. Load, HP Conc.2.6
2/3 PS, S. Load, FA Conc.2.5
Non-PS, S. Load, HP Conc.1.6
Non-PS, S. Load, FA Conc.1.5
Beam / Variable
0 100 200 300 400 500 600 700 800 900 1000
2.5
1.5
3.7
1.6
3.6
2.6
Beam
Half-Cell Potentials (-mV)
Increase in Corrosion Resistance
100%U PS, S. Load, HP Conc.
3.7
100%U PS, S. Load, FA Conc.
3.6
2/3 PS, S. Load, HP Conc.2.6
2/3 PS, S. Load, FA Conc.2.5
Non-PS, S. Load, HP Conc.1.6
Non-PS, S. Load, FA Conc.1.5
Beam / Variable
100%U PS, S. Load, HP Conc.
3.7
100%U PS, S. Load, FA Conc.
3.6
2/3 PS, S. Load, HP Conc.2.6
2/3 PS, S. Load, FA Conc.2.5
Non-PS, S. Load, HP Conc.1.6
Non-PS, S. Load, FA Conc.1.5
Beam / Variable

404
Half-cell potential readings at the end of testing versus forensic
examination results are directly compared in Figure 4.151 through Figure 4.154.
In these figures, the same scales used in Section 4.6.2 for stirrup, rebar, duct and
strand corrosion ratings have been maintained for consistency and clarity.
With the Phase I beams shown in Figure 4.151 and 4.152, it can be seen
that there is not a clear cut correlation between the half-cell readings and forensic
examination results. The loaded Non-PS and 2/3 PS beams (1.3, 2.3, 2.11) show
very fine correlation. However, the other specimens generally show quite poor
correlation. Some very high negative potential readings occurred in specimens
that evidenced very small amounts of actual corrosion (1.1, 3.1, 3.2).
With the Phase II beams, shown in Figures 4.153 and 4.154 there is little
relationship between the half-cell potential and the corrosion rating for most
specimens other than stirrups, but this is due to the actual corrosion ratings for
bars, ducts and strands being very low and close in values.

405
Figure 4.151 Half-Cell Readings at the End of Testing vs. Stirrup and Rebar Corrosion Ratings for Phase I Autopsy Specimens
0
400
800
1200
1600
2000
1.1 1.3 2.3 2.11 3.1 3.2 3.3 4.2
Gen
eral
ized
Stir
rup
Cor
rosi
on
Rat
ing
0
150
300
450
600
750
Gre
ates
t Neg
ativ
e H
alf-C
ell P
oten
tials
(-m
V) .
Stirrup CorrosionRatingHalf CellPotentials
Non-PS 2/3 PS 100%U PS 100%S PS
Specimen
0
100
200
300
400
500
1.1 1.3 2.3 2.11 3.1 3.2 3.3 4.2
Gen
eral
ized
Bar
Cor
rosi
on R
atin
g
0
150
300
450
600
750
Gre
ates
t Neg
ativ
e H
alf-
Cel
l Pot
entia
ls(-
mV)
Bar CorrosionRatingHalf CellPotentials
Non-PS 2/3 PS 100%U PS 100%S PS
Specimen
STIRRUPS
REBAR
0
400
800
1200
1600
2000
1.1 1.3 2.3 2.11 3.1 3.2 3.3 4.2
Gen
eral
ized
Stir
rup
Cor
rosi
on
Rat
ing
0
150
300
450
600
750
Gre
ates
t Neg
ativ
e H
alf-C
ell P
oten
tials
(-m
V) .
Stirrup CorrosionRatingHalf CellPotentials
Non-PS 2/3 PS 100%U PS 100%S PS
Specimen
0
100
200
300
400
500
1.1 1.3 2.3 2.11 3.1 3.2 3.3 4.2
Gen
eral
ized
Bar
Cor
rosi
on R
atin
g
0
150
300
450
600
750
Gre
ates
t Neg
ativ
e H
alf-
Cel
l Pot
entia
ls(-
mV)
Bar CorrosionRatingHalf CellPotentials
Non-PS 2/3 PS 100%U PS 100%S PS
Specimen
STIRRUPS
REBAR

406
Figure 4.152 Half-Cell Readings at the End of Testing vs.
Duct and Strand Corrosion Ratings for Phase I Autopsy Specimens
0
1200
2400
3600
4800
6000
D1 D2 D1 D2 D1 D2 D1 D2 D1 D2 D1 D2
Gen
eral
ized
Duc
t Cor
rosi
onR
atin
g
0
150
300
450
600
750
Gre
ates
t Neg
ativ
e H
alf-C
ell P
oten
tials
(-m
V) .
Duct CorrosionRatingHalf CellPotentials
2.3
100%U PS100%S
PSSpecimen
2.11 3.1 3.2 3.3 4.2
2/3 PS
0
200
400
600
800
1000
D1 D2 D1 D2 D1 D2 D1 D2 D1 D2 D1 D2
Gen
eral
ized
Str
and
Cor
rosi
on
Rat
ing
0
150
300
450
600
750
Gre
ates
t Neg
ativ
e H
alf-C
ell P
oten
tials
(-m
V) .
Strand CorrosionRatingHalf CellPotentials
2.3
100%U PS100%S
PSSpecimen
2.11 3.1 3.2 3.3 4.2
2/3 PS
DUCTS
STRANDS
0
1200
2400
3600
4800
6000
D1 D2 D1 D2 D1 D2 D1 D2 D1 D2 D1 D2
Gen
eral
ized
Duc
t Cor
rosi
onR
atin
g
0
150
300
450
600
750
Gre
ates
t Neg
ativ
e H
alf-C
ell P
oten
tials
(-m
V) .
Duct CorrosionRatingHalf CellPotentials
2.3
100%U PS100%S
PSSpecimen
2.11 3.1 3.2 3.3 4.2
2/3 PS
0
200
400
600
800
1000
D1 D2 D1 D2 D1 D2 D1 D2 D1 D2 D1 D2
Gen
eral
ized
Str
and
Cor
rosi
on
Rat
ing
0
150
300
450
600
750
Gre
ates
t Neg
ativ
e H
alf-C
ell P
oten
tials
(-m
V) .
Strand CorrosionRatingHalf CellPotentials
2.3
100%U PS100%S
PSSpecimen
2.11 3.1 3.2 3.3 4.2
2/3 PS
DUCTS
STRANDS

407
Figure 4.153 Half-Cell Readings at the End of Testing vs.
Stirrup and Rebar Corrosion Ratings for Phase II Autopsy Specimens
STIRRUPS
REBAR
0
80
160
240
320
400
1.5 1.6 2.5 2.6 3.6 3.7
Gen
eral
ized
Stir
rup
Cor
rosi
on
Rat
ing
0
150
300
450
600
750
Gre
ates
t Neg
ativ
e H
alf-C
ell P
oten
tials
(-m
V) .
StirrupCorrosion Rating
Half CellPotentials
Non-PS 2/3 PS 100%U PSSpecimen
0
20
40
60
80
100
1.5 1.6 2.5 2.6 3.6 3.7
Gen
eral
ized
Bar
Cor
rosi
on R
atin
g
0
150
300
450
600
750
Gre
ates
t Neg
ativ
e H
alf-
Cel
l Pot
entia
ls(-
mV)
Bar CorrosionRatingHalf CellPotentials
Non-PS 2/3 PS 100%U PSSpecimen

408
Figure 4.154 Half-Cell Readings at the End of Testing vs. Duct and Strand Corrosion Ratings for Phase II Autopsy Specimens
DUCTS
STRANDS
0
240
480
720
960
1200
D1 D2 D1 D2 D1 D2 D1 D2
Gen
eral
ized
Duc
t Cor
rosi
onR
atin
g
0
150
300
450
600
750
Gre
ates
t Neg
ativ
e H
alf-C
ell P
oten
tials
(-m
V) .
Duct CorrosionRatingHalf CellPotentials
2.5
Specimen
2.6 3.6
2/3 PS
3.7
100%U PS
100%U PS
0
100
200
300
400
500
D1 D2 D1 D2 D1 D2 D1 D2
Gen
eral
ized
Str
and
Cor
rosi
on
Rat
ing
0
150
300
450
600
750
Gre
ates
t Neg
ativ
e H
alf-C
ell P
oten
tials
(-m
V) .
Strand CorrosionRatingHalf CellPotentials
Specimen
2.5
Specimen
2.6 3.62/3 PS
3.7

409
4.6.9 Corrosion Rate Measurements versus Forensic Examination Results
Final corrosion rate measurements taken from Phase I and Phase II
autopsy beams are shown in Figure 4.155 and Figure 4.156, respectively, ordered
according to performance. As will be shown in Figures 4.157 through 4.160,
these corrosion rate indicators are highly misleading. For example, the worst
corrosion performance was generally Specimens 1.3, 2.3 and 2.11. These
specimens are not as critical in the corrosion rate measurements as more lightly
corroded specimens 3.2 and 3.3.
Figure 4.155 Final Corrosion Rate Measurements Using 3LP Equipment for Phase I Autopsy Beams
Figure 4.156 Final Corrosion Rate Measurements Using 3LP Equipment for Phase II Autopsy Beams
100%U PS, S. Load, HP Conc.
3.7
100%U PS, S. Load, FA Conc.
3.6
2/3 PS, S. Load, HP Conc.2.6
2/3 PS, S. Load, FA Conc.2.5
Non-PS, S. Load, HP Conc.1.6
Non-PS, S. Load, FA Conc.1.5
Beam / Variable
100%U PS, S. Load, HP Conc.
3.7
100%U PS, S. Load, FA Conc.
3.6
2/3 PS, S. Load, HP Conc.2.6
2/3 PS, S. Load, FA Conc.2.5
Non-PS, S. Load, HP Conc.1.6
Non-PS, S. Load, FA Conc.1.5
Beam / Variable
0 4 8 12 16 20 24 28 32
3.7
1.5
1.6
2.6
3.6
2.5
Beam
Corrosion Current Density (µA/cm2)
Increase in Corrosion Resistance
0 4 8 12 16 20 24 28 32
3.3
3.2
2.11
4.2
2.3
3.1
1.3
1.1
Beam
Corrosion Current Density (µA/cm2)
Increase in Corrosion Resistance
100% S PS, S . Load4.2
100% U PS, Overload3.3
100% U PS, S . Load3.2
100% U PS, Unloaded3.1
2/3 PS , S . Load, FA G rout2.11
2/3 PS , S . Load2.3
Non-PS, S . Load1.3
Non-PS, Unloaded1.1
Beam / Variable
100% S PS, S . Load4.2
100% U PS, Overload3.3
100% U PS, S . Load3.2
100% U PS, Unloaded3.1
2/3 PS , S . Load, FA G rout2.11
2/3 PS , S . Load2.3
Non-PS, S . Load1.3
Non-PS, Unloaded1.1
Beam / Variable

410
Corrosion rate measurements versus forensic examination results are directly compared in Figure 4.157 through Figure 4.160.
Figure 4.157 Corrosion Rate Measurements (using 3LP equipment) after 47 Months of Exposure vs. Stirrup and Rebar Corrosion Ratings for Phase I
Autopsy Specimens
0
100
200
300
400
500
1.1 1.3 2.3 2.11 3.1 3.2 3.3 4.2
Gen
eral
ized
Bar
Cor
rosi
on R
atin
g
0.00
7.00
14.00
21.00
28.00
35.00
Cor
rosi
on C
urre
nt D
ensi
ty ( µ
Α/c
m2 )
Bar CorrosionRating
Corrosion RateMeasurements
Non-PS 2/3 PS 100%U PS 100%S PS
Specimen
STIRRUPS
0
400
800
1200
1600
2000
1.1 1.3 2.3 2.11 3.1 3.2 3.3 4.2
Gen
eral
ized
Stir
rup
Cor
rosi
on R
atin
g
0.00
7.00
14.00
21.00
28.00
35.00
Cor
rosi
on C
urre
nt D
ensi
ty ( µ
Α/c
m2 )
StirrupCorrosionRatingCorrosion RateMeasurements
Non-PS 2/3 PS 100%U PS 100%S PS
Specimen REBAR
0
100
200
300
400
500
1.1 1.3 2.3 2.11 3.1 3.2 3.3 4.2
Gen
eral
ized
Bar
Cor
rosi
on R
atin
g
0.00
7.00
14.00
21.00
28.00
35.00
Cor
rosi
on C
urre
nt D
ensi
ty ( µ
Α/c
m2 )
Bar CorrosionRating
Corrosion RateMeasurements
Non-PS 2/3 PS 100%U PS 100%S PS
Specimen
STIRRUPS
0
400
800
1200
1600
2000
1.1 1.3 2.3 2.11 3.1 3.2 3.3 4.2
Gen
eral
ized
Stir
rup
Cor
rosi
on R
atin
g
0.00
7.00
14.00
21.00
28.00
35.00
Cor
rosi
on C
urre
nt D
ensi
ty ( µ
Α/c
m2 )
StirrupCorrosionRatingCorrosion RateMeasurements
Non-PS 2/3 PS 100%U PS 100%S PS
Specimen REBAR

411
Figure 4.158 Corrosion Rate Measurements (using 3LP equipment) after 47 Months of Exposure vs. Duct and Strand Corrosion Ratings for Phase I
Autopsy Specimens
DUCTS
STRANDS
0
200
400
600
800
1000
D1 D2 D1 D2 D1 D2 D1 D2 D1 D2 D1 D2
Gen
eral
ized
Stra
nd C
orro
sion
R
atin
g
0.00
7.00
14.00
21.00
28.00
35.00
Cor
rosi
on C
urre
nt D
ensi
ty ( µ
A/c
m2 )
Strand CorrosionRatingCorrosion RateMeasurements
2.3
100%U PS100%S
PSSpecimen
2.11 3.1 3.2 3.3 4.2
2/3 PS
0
1200
2400
3600
4800
6000
D1 D2 D1 D2 D1 D2 D1 D2 D1 D2 D1 D2
Gen
eral
ized
Duc
t Cor
rosi
onR
atin
g
0.00
7.00
14.00
21.00
28.00
35.00
Cor
rosi
on C
urre
nt D
ensi
ty ( µ
A/c
m2 )Duct CorrosionRatingCorrosion CurrentMeasurements
2.3
100%U PS100%S
PSSpecimen
2.11 3.1 3.2 3.3 4.2
2/3 PS

412
Figure 4.159 Corrosion Rate Measurements (using 3LP equipment) after 35 Months of Exposure vs.Stirrup and Rebar Corrosion Ratings for Phase II
Autopsy Specimens
0
20
40
60
80
100
1.5 1.6 2.5 2.6 3.6 3.7
Gen
eral
ized
Bar
Cor
rosi
on R
atin
g
0.00
7.00
14.00
21.00
28.00
35.00
Cor
rosi
on C
urre
nt D
ensi
ty ( µ
Α/c
m2 )
Bar CorrosionRating
Corrosion RateMeasurements
Non-PS 2/3 PS 100%U PSSpecimen
0
80
160
240
320
400
1.5 1.6 2.5 2.6 3.6 3.7
Gen
eral
ized
Stir
rup
Cor
rosi
on R
atin
g
0.00
7.00
14.00
21.00
28.00
35.00
Cor
rosi
on C
urre
nt D
ensi
ty ( µ
Α/c
m2 )
Stirrup CorrosionRating
Corrosion RateMeasurements
Non-PS 2/3 PS 100%U PSSpecimen
STIRRUPS
REBAR
0
20
40
60
80
100
1.5 1.6 2.5 2.6 3.6 3.7
Gen
eral
ized
Bar
Cor
rosi
on R
atin
g
0.00
7.00
14.00
21.00
28.00
35.00
Cor
rosi
on C
urre
nt D
ensi
ty ( µ
Α/c
m2 )
Bar CorrosionRating
Corrosion RateMeasurements
Non-PS 2/3 PS 100%U PSSpecimen
0
80
160
240
320
400
1.5 1.6 2.5 2.6 3.6 3.7
Gen
eral
ized
Stir
rup
Cor
rosi
on R
atin
g
0.00
7.00
14.00
21.00
28.00
35.00
Cor
rosi
on C
urre
nt D
ensi
ty ( µ
Α/c
m2 )
Stirrup CorrosionRating
Corrosion RateMeasurements
Non-PS 2/3 PS 100%U PSSpecimen
STIRRUPS
REBAR

413
Figure 4.160 Corrosion Rate Measurements (using 3LP equipment) after 35
Months of Exposure vs. Duct and Strand Corrosion Ratings for Phase II Autopsy Specimens
0
100
200
300
400
500
D1 D2 D1 D2 D1 D2 D1 D2
Gen
eral
ized
Str
and
Cor
rosi
on
Rat
ing
0.00
7.00
14.00
21.00
28.00
35.00
Cor
rosi
on C
urre
nt D
ensi
ty ( µ
A/c
m2 )Strand CorrosionRatingCorrosion RateMeasurements
100%U PS
2.5
Specimen
2.6 3.6
2/3 PS
3.7
0
240
480
720
960
1200
D1 D2 D1 D2 D1 D2 D1 D2
Gen
eral
ized
Duc
t Cor
rosi
onR
atin
g
0.00
7.00
14.00
21.00
28.00
35.00
Cor
rosi
on C
urre
nt D
ensi
ty ( µ
A/c
m2 )
Duct CorrosionRatingCorrosion CurrentMeasurements
100%U PS
2.5
Specimen
2.6 3.6
2/3 PS
3.7
DUCTS
STRANDS
0
100
200
300
400
500
D1 D2 D1 D2 D1 D2 D1 D2
Gen
eral
ized
Str
and
Cor
rosi
on
Rat
ing
0.00
7.00
14.00
21.00
28.00
35.00
Cor
rosi
on C
urre
nt D
ensi
ty ( µ
A/c
m2 )Strand CorrosionRatingCorrosion RateMeasurements
100%U PS
2.5
Specimen
2.6 3.6
2/3 PS
3.7
0
240
480
720
960
1200
D1 D2 D1 D2 D1 D2 D1 D2
Gen
eral
ized
Duc
t Cor
rosi
onR
atin
g
0.00
7.00
14.00
21.00
28.00
35.00
Cor
rosi
on C
urre
nt D
ensi
ty ( µ
A/c
m2 )
Duct CorrosionRatingCorrosion CurrentMeasurements
100%U PS
2.5
Specimen
2.6 3.6
2/3 PS
3.7
DUCTS
STRANDS

414
Figures 4.157 through Figure 4.160 show very poor or inexistent
correlation among corrosion rate readings and stirrup, rebar, duct and strand
corrosion ratings.
4.6.10 Chloride Penetration versus Forensic Examination Results
Chloride penetration plots for samples taken within the ponded region (3-
inch and 18-inch offset from centerline of beam), are shown in Figure 4.161 and
Figure 4.162 for Phase I beams. In these graphs, the chloride content for the
ponded blocks is compare to the chloride content for the beam specimens. As
shown in these figures, the negative effect of cracking is evidenced since the
ponded blocks were uncracked. While the chloride content in the beam
specimens is very high, except in the case of Specimen 1.1, the corresponding
chloride content in the ponded blocks is very low.
Figure 4.161 Beam Chloride Content at Bar Level – 3 in. Offset for Phase I Autopsy Beams
100%S PS, S. Load4.2
100%U PS, Overload3.3
100%U PS, S. Load3.2
100%U PS, Unloaded3.1
2/3 PS, S. Load, FA Grout2.11
2/3 PS, S. Load2.3
Non-PS, S. Load1.3
Non-PS, Unloaded1.1
Beam / Variable
100%S PS, S. Load4.2
100%U PS, Overload3.3
100%U PS, S. Load3.2
100%U PS, Unloaded3.1
2/3 PS, S. Load, FA Grout2.11
2/3 PS, S. Load2.3
Non-PS, S. Load1.3
Non-PS, Unloaded1.1
Beam / Variable
0.00 0.05 0.10 0.15 0.20 0.25 0.30 0.35 0.40 0.45 0.50 0.55 0.60
1.3
2.11
3.3
2.3
4.2
3.2
3.1
1.1
Beam
Chloride Content (% by weight of concrete)
Increase in Corrosion Resistance
Beam Specimens
Ponded Blocks
Threshold for corrosion

415
Figure 4.162 Beam Chloride Content at Bar Level – 18 in. Offset for Phase I Autopsy Beams
Figure 4.163 and Figure 4.164 show the chloride penetration results for
Phase II beams. Again, the chloride content for the blocks is shown. In this
case, chloride contents were in all cases below the threshold of concern.
However, it should be recognized that the chloride samples in the beams were
taken at the location shown (3 in. or 18 in. offset), and therefore, they may not
correspond to crack locations. Nevertheless, samples from the beam specimens
showed in general higher chloride contents than those from the ponded blocks,
which reflect again the negative effect of cracking on chloride penetration.
Figures 4.165 through Figure 4.168 show the comparison of acid-soluble
chloride content at the bar level taken at three inches from the beam centerline
versus stirrup, rebar, duct and strand corrosion ratings.
Overall, the chloride content measurements showed good correlation with
stirrup, rebar and stand corrosion ratings in Phase I specimens, except for
Specimen 1.3 that showed very high chloride content, and for Specimens 2.3 and
2.11 that showed lower chloride contents. However, chloride contents did not
correlate well with duct corrosion ratings in all specimens. For Phase II beams
there was no relationship between the chloride content at 3 in. offset and the
100%S PS, S. Load4.2
100%U PS, Overload3.3
100%U PS, S. Load3.2
100%U PS, Unloaded3.1
2/3 PS, S. Load, FA Grout2.11
2/3 PS, S. Load2.3
Non-PS, S. Load1.3
Non-PS, Unloaded1.1
Beam / Variable
100%S PS, S. Load4.2
100%U PS, Overload3.3
100%U PS, S. Load3.2
100%U PS, Unloaded3.1
2/3 PS, S. Load, FA Grout2.11
2/3 PS, S. Load2.3
Non-PS, S. Load1.3
Non-PS, Unloaded1.1
Beam / Variable
0.00 0.05 0.10 0.15 0.20 0.25 0.30 0.35 0.40 0.45 0.50 0.55 0.60
1.3
2.11
2.3
1.1
3.3
3.1
4.2
3.2
Beam
Chloride Content (% by weight of concrete)
Increase in Corrosion Resistance
Beam Specimens
Ponded Blocks
Threshold for corrosion

416
actual corrosion ratings for most specimens, but this was due to the chloride
contents for stirrups, bars, ducts and strands being very low. One of the reasons
for these low chloride values was that samples were taken at specific distances
from the beam centerline, and they may not have corresponded to crack locations.
Figure 4.163 Beam Chloride Content at Bar Level – 3 in. Offset for Phase II Autopsy Beams
Figure 4.164 Beam Chloride Content at Bar Level – 18 in. Offset for Phase II Autopsy Beams
100%U PS, S. Load, HP Conc.
3.7
100%U PS, S. Load, FA Conc.
3.6
2/3 PS, S. Load, HP Conc.2.6
2/3 PS, S. Load, FA Conc.2.5
Non-PS, S. Load, HP Conc.1.6
Non-PS, S. Load, FA Conc.1.5
Beam / Variable
100%U PS, S. Load, HP Conc.
3.7
100%U PS, S. Load, FA Conc.
3.6
2/3 PS, S. Load, HP Conc.2.6
2/3 PS, S. Load, FA Conc.2.5
Non-PS, S. Load, HP Conc.1.6
Non-PS, S. Load, FA Conc.1.5
Beam / Variable
0.00 0.05 0.10 0.15 0.20 0.25 0.30 0.35 0.40 0.45 0.50 0.55 0.60
2.5
3.6
1.6
3.7
1.5
2.6
Beam
Chloride Content (% by weight of concrete)
Increase in Corrosion Resistance
Beam Specimens
Ponded Blocks Threshold for corrosion
100%U PS, S. Load, HP Conc.
3.7
100%U PS, S. Load, FA Conc.
3.6
2/3 PS, S. Load, HP Conc.2.6
2/3 PS, S. Load, FA Conc.2.5
Non-PS, S. Load, HP Conc.1.6
Non-PS, S. Load, FA Conc.1.5
Beam / Variable
100%U PS, S. Load, HP Conc.
3.7
100%U PS, S. Load, FA Conc.
3.6
2/3 PS, S. Load, HP Conc.2.6
2/3 PS, S. Load, FA Conc.2.5
Non-PS, S. Load, HP Conc.1.6
Non-PS, S. Load, FA Conc.1.5
Beam / Variable
0.00 0.05 0.10 0.15 0.20 0.25 0.30 0.35 0.40 0.45 0.50 0.55 0.60
1.6
3.6
2.5
3.7
1.5
2.6
Bea
m
Chloride Content (% by weight of concrete)
Increase in Corrosion Resistance
Beam Specimens
Ponded Blocks Threshold for corrosion

417
Figure 4.165 Acid-Soluble Chloride Content versus vs. Stirrup and Rebar Corrosion Ratings for Phase I Autopsy Specimens
0
400
800
1200
1600
2000
1.1 1.3 2.3 2.11 3.1 3.2 3.3 4.2
Gen
eral
ized
Stir
rup
Cor
rosi
on R
atin
g
0
0.12
0.24
0.36
0.48
0.6
Chl
orid
e C
onte
nt a
t Bar
Lev
el -
3 in
ch
Offs
et (%
by
wei
ght o
f con
cret
e)Stirrup CorrosionRating
Chloride Contentat 3 in. offset
Non-PS 2/3 PS 100%U PS 100%S PS
Specimen
0
100
200
300
400
500
1.1 1.3 2.3 2.11 3.1 3.2 3.3 4.2
Gen
eral
ized
Bar
Cor
rosi
on R
atin
g
0
0.12
0.24
0.36
0.48
0.6
Chl
orid
e C
onte
nt a
t Bar
Lev
el -
3 in
ch
Offs
et (%
by
wei
ght o
f con
cret
e)
Bar CorrosionRating
ChlorideContent at 3 in.offset
Non-PS 2/3 PS 100%U PS 100%S PS
Specimen
STIRRUPS
REBAR
0
400
800
1200
1600
2000
1.1 1.3 2.3 2.11 3.1 3.2 3.3 4.2
Gen
eral
ized
Stir
rup
Cor
rosi
on R
atin
g
0
0.12
0.24
0.36
0.48
0.6
Chl
orid
e C
onte
nt a
t Bar
Lev
el -
3 in
ch
Offs
et (%
by
wei
ght o
f con
cret
e)Stirrup CorrosionRating
Chloride Contentat 3 in. offset
Non-PS 2/3 PS 100%U PS 100%S PS
Specimen
0
100
200
300
400
500
1.1 1.3 2.3 2.11 3.1 3.2 3.3 4.2
Gen
eral
ized
Bar
Cor
rosi
on R
atin
g
0
0.12
0.24
0.36
0.48
0.6
Chl
orid
e C
onte
nt a
t Bar
Lev
el -
3 in
ch
Offs
et (%
by
wei
ght o
f con
cret
e)
Bar CorrosionRating
ChlorideContent at 3 in.offset
Non-PS 2/3 PS 100%U PS 100%S PS
Specimen
STIRRUPS
REBAR

418
Figure 4.166 Acid-Soluble Chloride Content versus vs. Duct and Strand Corrosion Ratings for Phase I Autopsy Specimens
0
1200
2400
3600
4800
6000
D1 D2 D1 D2 D1 D2 D1 D2 D1 D2 D1 D2
Gen
eral
ized
Duc
t Cor
rosi
onR
atin
g
0
0.12
0.24
0.36
0.48
0.6
Chl
orid
e C
onte
nt a
t Bar
Lev
el -
3 in
ch
Offs
et (%
by
wei
ght o
f con
cret
e)
Duct CorrosionRatingChloride Contentat 3 in. offset
2.3
100%U PS100%S
PSSpecimen
2.11 3.1 3.2 3.3 4.2
2/3 PS
0
100
200
300
400
500
1.1 1.3 2.3 2.11 3.1 3.2 3.3 4.2
Gen
eral
ized
Bar
Cor
rosi
on R
atin
g
0
0.12
0.24
0.36
0.48
0.6
Chl
orid
e C
onte
nt a
t Bar
Lev
el -
3 in
ch
Offs
et (%
by
wei
ght o
f con
cret
e)
Bar CorrosionRating
ChlorideContent at 3 in.offset
Non-PS 2/3 PS 100%U PS 100%S PS
Specimen
DUCTS
STRANDS
0
1200
2400
3600
4800
6000
D1 D2 D1 D2 D1 D2 D1 D2 D1 D2 D1 D2
Gen
eral
ized
Duc
t Cor
rosi
onR
atin
g
0
0.12
0.24
0.36
0.48
0.6
Chl
orid
e C
onte
nt a
t Bar
Lev
el -
3 in
ch
Offs
et (%
by
wei
ght o
f con
cret
e)
Duct CorrosionRatingChloride Contentat 3 in. offset
2.3
100%U PS100%S
PSSpecimen
2.11 3.1 3.2 3.3 4.2
2/3 PS
0
100
200
300
400
500
1.1 1.3 2.3 2.11 3.1 3.2 3.3 4.2
Gen
eral
ized
Bar
Cor
rosi
on R
atin
g
0
0.12
0.24
0.36
0.48
0.6
Chl
orid
e C
onte
nt a
t Bar
Lev
el -
3 in
ch
Offs
et (%
by
wei
ght o
f con
cret
e)
Bar CorrosionRating
ChlorideContent at 3 in.offset
Non-PS 2/3 PS 100%U PS 100%S PS
Specimen
DUCTS
STRANDS

419
Figure 4.167 Acid-Soluble Chloride Content versus vs. Stitrup and Rebar
Corrosion Ratings for Phase II Autopsy Specimens
0
20
40
60
80
100
1.5 1.6 2.5 2.6 3.6 3.7
Gen
eral
ized
Bar
Cor
rosi
on R
atin
g
0
0.12
0.24
0.36
0.48
0.6
Chl
orid
e C
onte
nt a
t Bar
Lev
el -
3 in
ch
Offs
et (%
by
wei
ght o
f con
cret
e)
Bar CorrosionRating
ChlorideContent at 3 in.offset
Non-PS 2/3 PS 100%U PSSpecimen
STIRRUPS
REBAR
0
80
160
240
320
400
1.5 1.6 2.5 2.6 3.6 3.7
Gen
eral
ized
Stir
rup
Cor
rosi
on R
atin
g
0
0.12
0.24
0.36
0.48
0.6
Chl
orid
e C
onte
nt a
t Bar
Lev
el -
3 in
ch
Offs
et (%
by
wei
ght o
f con
cret
e)
Stirrup CorrosionRating
Chloride Contentat 3 in. offset
Non-PS 2/3 PS 100%U PSSpecimen
0
20
40
60
80
100
1.5 1.6 2.5 2.6 3.6 3.7
Gen
eral
ized
Bar
Cor
rosi
on R
atin
g
0
0.12
0.24
0.36
0.48
0.6
Chl
orid
e C
onte
nt a
t Bar
Lev
el -
3 in
ch
Offs
et (%
by
wei
ght o
f con
cret
e)
Bar CorrosionRating
ChlorideContent at 3 in.offset
Non-PS 2/3 PS 100%U PSSpecimen
STIRRUPS
REBAR
0
80
160
240
320
400
1.5 1.6 2.5 2.6 3.6 3.7
Gen
eral
ized
Stir
rup
Cor
rosi
on R
atin
g
0
0.12
0.24
0.36
0.48
0.6
Chl
orid
e C
onte
nt a
t Bar
Lev
el -
3 in
ch
Offs
et (%
by
wei
ght o
f con
cret
e)
Stirrup CorrosionRating
Chloride Contentat 3 in. offset
Non-PS 2/3 PS 100%U PSSpecimen

420
Figure 4.168 Acid-Soluble Chloride Content versus vs. Duct and Strand
Corrosion Ratings for Phase II Autopsy Specimens
0
240
480
720
960
1200
D1 D2 D1 D2 D1 D2 D1 D2
Gen
eral
ized
Duc
t Cor
rosi
onR
atin
g
0
0.12
0.24
0.36
0.48
0.6
Chl
orid
e C
onte
nt a
t Bar
Lev
el -
3 in
ch
Offs
et (%
by
wei
ght o
f con
cret
e)
Duct CorrosionRatingChloride Contentat 3 in. offset
100%U PS2.5
Specimen
2.6 3.62/3 PS
3.7
0
100
200
300
400
500
D1 D2 D1 D2 D1 D2 D1 D2
Gen
eral
ized
Str
and
Cor
rosi
on
Rat
ing
0
0.12
0.24
0.36
0.48
0.6
Chl
orid
e C
onte
nt a
t Bar
Lev
el -
3 in
ch
Offs
et (%
by
wei
ght o
f con
cret
e)
Strand CorrosionRatingChloride Contentat 3 in. offset
100%U PS2.5
Specimen
2.6 3.62/3 PS
3.7
DUCTS
STRANDS
0
240
480
720
960
1200
D1 D2 D1 D2 D1 D2 D1 D2
Gen
eral
ized
Duc
t Cor
rosi
onR
atin
g
0
0.12
0.24
0.36
0.48
0.6
Chl
orid
e C
onte
nt a
t Bar
Lev
el -
3 in
ch
Offs
et (%
by
wei
ght o
f con
cret
e)
Duct CorrosionRatingChloride Contentat 3 in. offset
100%U PS2.5
Specimen
2.6 3.62/3 PS
3.7
0
100
200
300
400
500
D1 D2 D1 D2 D1 D2 D1 D2
Gen
eral
ized
Str
and
Cor
rosi
on
Rat
ing
0
0.12
0.24
0.36
0.48
0.6
Chl
orid
e C
onte
nt a
t Bar
Lev
el -
3 in
ch
Offs
et (%
by
wei
ght o
f con
cret
e)
Strand CorrosionRatingChloride Contentat 3 in. offset
100%U PS2.5
Specimen
2.6 3.62/3 PS
3.7
DUCTS
STRANDS

421
4.6.11 Final Full Autopsies
Exposure testing will continue for nearly half of the laboratory specimens,
for several years, until signs of corrosion based on exposure testing results and
visual inspection, are deemed enough to decide on final autopsy. Table 4.24
shows the specimens to be compared and the main variables to be analyzed.
Table 4.24 Main Variables to be Analyzed During Final (Future) Autopsy of Beam Specimens
Beams to be compared Variable to be analyzed
1.1, 1.2, 1.4
3.1, 3.5 loading / cracking
1.4, 2.4, 3.5, 4.1
2.1, 4.1
1.2, 2.1, 4.1
1.1, 3.1
level of prestress / cracking
1.9, 2.12 Duct type
3.4; 3.4, 3.5 splice damage
3.4, 3.5; 2.2; 2.8; 2.9; 3.1 splice type
2.9, 2.10 grout type / poor grouting procedure
2.7, 2.8, 2.9 strand type / strand coating damage
2.7, 2.9, 212 anchorage system / encapsulated system

422
4.7 SUMMARY AND CONCLUSIONS
Twelve out of the twenty-seven large scale beam specimens were fully
autopsied to evaluate the effect of post-tensioning on durability and to evaluate
the relative performance of a large number of corrosion protection variables. Two
additional specimens were partially autopsied. Full autopsies for the remaining
specimens will be performed at a future date. Beams were fabricated in two
phases in order to begin exposure testing on a portion of the specimens while the
remaining specimens were being fabricated. In Phase I (16 beams), which started
exposure testing in December 1997, researchers investigated the effect of
prestress level and crack width and also included one of the high performance
grout specimens. In Phase II (11 beams), which started exposure testing in
December 1998, researchers investigated duct splices, grout type, concrete type,
strand type, duct type, and end anchorage protection. After the first full autopsy
performed at four and a half years for six Phase I beams, and three and a half
years for six Phase II beams, and partial autopsies performed to two Phase I
beams, preliminary conclusions were drawn.
4.7.1 Overall Performance
The variables selected for evaluation in this beam testing program fall into
four main categories: level of prestress and crack width, concrete type,
prestressing strand coatings and post-tensioning hardware protection. In addition,
different post-tensioning duct splices were also evaluated. After the initial
autopsies of the fourteen beams, the use of large scale beam specimens was found
to be a very good method for determining the effect of most of these variables.
Prestressing strand coatings and post-tensioned hardware protection will be
evaluated at a future date, since they are included in the remaining specimens

423
under exposure testing. Based on the autopsy performed to date, the following
conclusions are drawn:
• Galvanized duct performed poorly. No plastic duct was used in the
specimens of the first set of full autopsies.
• Bleed water voids were present in the ducts even after “good grouting
procedures.” Anti-bleed grout was not evaluated in the first set of full
autopsies, but it is included in one of the remaining specimens for future
autopsy.
• Voids from bleed water in grout were shown to be very detrimental to the
duct.
• A clear trend was found with respect to cracking and mild steel corrosion. As
cracking increased, stirrup and rebar corrosion increased. This trend was not
clearly shown on strands, since strand ratings were all very low and close in
value
• Mixed reinforcing (2/3 PS) beams showed the worst corrosion resistance. The
best performance was obtained from 100%S PS specimens, followed by
100%U PS specimens
• Phase I beam results showed that there was a reduced risk of corrosion
damage with increasing levels of prestress
• High performance concrete specimens (low permeability concrete, w/c=0.29),
appear to perform better than class C fly ash concrete specimens. However,
both appear to be effective in minimizing the chloride penetration through
concrete
• Industry standard duct splices as well as heat shrink duct splices do not seem
to provide adequate corrosion protection
• Duct splice damage did not show a direct correlation with the severity of
corrosion
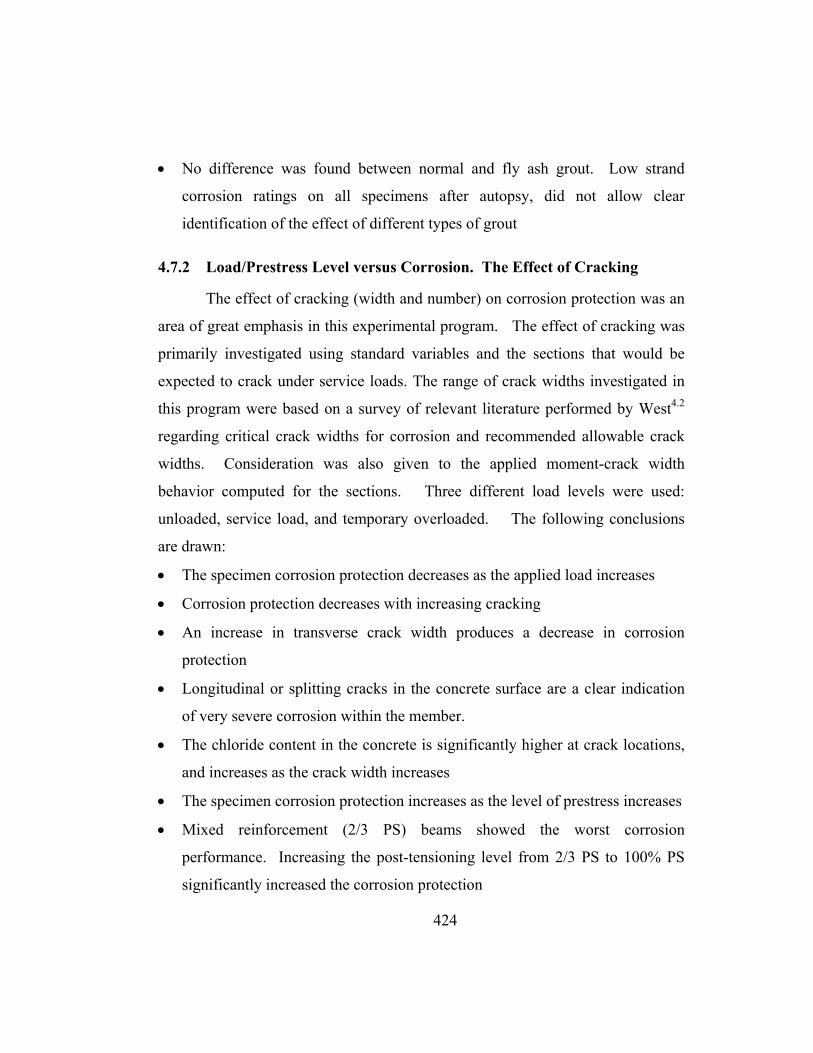
424
• No difference was found between normal and fly ash grout. Low strand
corrosion ratings on all specimens after autopsy, did not allow clear
identification of the effect of different types of grout
4.7.2 Load/Prestress Level versus Corrosion. The Effect of Cracking
The effect of cracking (width and number) on corrosion protection was an
area of great emphasis in this experimental program. The effect of cracking was
primarily investigated using standard variables and the sections that would be
expected to crack under service loads. The range of crack widths investigated in
this program were based on a survey of relevant literature performed by West4.2
regarding critical crack widths for corrosion and recommended allowable crack
widths. Consideration was also given to the applied moment-crack width
behavior computed for the sections. Three different load levels were used:
unloaded, service load, and temporary overloaded. The following conclusions
are drawn:
• The specimen corrosion protection decreases as the applied load increases
• Corrosion protection decreases with increasing cracking
• An increase in transverse crack width produces a decrease in corrosion
protection
• Longitudinal or splitting cracks in the concrete surface are a clear indication
of very severe corrosion within the member.
• The chloride content in the concrete is significantly higher at crack locations,
and increases as the crack width increases
• The specimen corrosion protection increases as the level of prestress increases
• Mixed reinforcement (2/3 PS) beams showed the worst corrosion
performance. Increasing the post-tensioning level from 2/3 PS to 100% PS
significantly increased the corrosion protection

425
• The corrosion protection of the 2/3 PS beam was much more similar to Non-
PS beams, as opposed to 100% PS Beams
• There was not a clear difference in the corrosion resistance among the fully
prestressed beams designed with the ultimate strength method as compared to
those designed with allowable stress method.
4.7.3 Fly Ash in Concrete
Concrete plays an important role in corrosion protection of steel
reinforcement. One of the objectives of this research program is to evaluate the
effectiveness of high performance concrete as a function of cracking. Three
different concrete mixes were selected for comparison. The reference mix was
the standard concrete: TxDOT Class C concrete. The alternates were a TxDOT
Class C concrete with 25% Class F Fly Ash and a High Performance Concrete
(0.29 w/c, 25% fly ash+superplasticizer). The following conclusions are drawn:
• Both the high performance concrete and the fly ash concrete beams showed
good corrosion protection by minimizing the chloride penetration through the
concrete
• The high performance concrete tends to show a slightly better corrosion
protection than the fly ash concrete, but the difference is not significant.
• No conclusions can be drawn on corrosion protection of the high performance
concrete and the fly ash concrete with respect to the standard TxDOT concrete
due to the unfortunate lack of directly comparable specimens at the time of the
first autopsy.
4.7.4 Duct Splices for Galvanized Steel Duct
In most practical applications, the post-tensioning ducts must be spliced at
some location. It was decided to compare industry standard (IS) splices to heat

426
shrink (HS) splices and unspliced duct. The effect of damaged splices was also
examined. The IS splice consisted of a 1 ft length of oversized duct placed over
the contact butt splice of the ducts. Concrete is prevented from entering the splice
by wrapping the ends with duct tape. The heat shrink splice consists of a 8 inch
length of heat shrink tubing placed over the contact butt splice of the ducts. The
original diameter of the heat shrink tubing was 4 inches. No mechanical
connection was made between the two ducts being connected. The conclusions
are as follows:
• The industry standard splice allowed moisture and chlorides to enter through
the sides of the splice and get trapped between the duct and the splice due to
inefficiency of duct tape.
• The heat-shrink splice also allowed moisture to enter through the sides and get
trapped due to insufficient adhesion between the splice and the duct. It also
traps bleed water from the grout.
• Damage inflicted on the duct splices did not show a direct correlation with the
severity of corrosion.
• Neither the industry standard splice nor the heat-shrink splice appears to be a
satisfactory duct splice for the corrosion protection of a galvanized steel duct.
4.7.5 High Performance Fly Ash Grouts
Two high performance grouts (a fly ash grout and an antibleed grout) were
selected for investigation, in comparison with TxDOT standard grout. The fly
ash grout specimen was autopsied, and results are reported herein. The antibleed
grout specimen will be autopsied at a future date. Antibleed grout had a water-
cement ratio of 0.33 with 2% cement weight of antibleed admixture. Based on the
information to date, the following conclusions are drawn:

427
• The fly ash grout aided in the corrosion protection of the galvanized steel
ducts
• The fly ash grout, in comparison to TxDOT standard grout, did not show an
increase in corrosion protection of the prestressing strand. This result may be
due to the strand ratings being very low and close in value. Several more
years of exposure testing may be required to yield more conclusive results
4.7.6 Exposure Testing Results
Half-cell potential readings were measured using a saturated calomel
reference electrode at the end of each wet cycle (once every four weeks). All
measurements were performed according to ASTM C876.4.12 In general, half-cell
potential readings are inadequate in determining the severity of corrosion activity,
but prove to be successful for relative comparison of specimens. The conclusions
are as follows:
• There is an exact correlation in specimen performance between the greatest
negative potential at the end of testing for autopsy beams and the time to
corrosion
• Both half cell potential readings and corrosion rating graphs show the loaded
Non-PS and 2/3 PS beams were the most corroded.
• Half-cell potential readings did not show a distinct correlation in high
performance and fly ash concrete specimens with the corresponding corrosion
ratings.
Corrosion rate measurements were taken four times during the exposure
duration. Two types of equipment were used in this experimental program: the
Pr Monitor and the 3LP. Measurements of the Phase I beams were taken after
seven, twelve, fifteen and forty-seven months of exposure. Measurements of the
Phase II beams were taken after 37 months of exposure. A final attempt to take
428
corrosion rate measurements of all beams was made immediately prior to the
forensic examination. This attempt was unsuccessful due to complications with
the 3LP equipment. Corrosion rate readings did not show good correlation with
forensic examination results. The presence of zinc in the galvanized steel ducts
may have played a role in the erroneous results.
Chloride content was found to be a useful method in determining the onset
of corrosion. However, there was not a direct relationship between the acid
soluble chloride content at the bar/duct level and the severity of corrosion at time
of autopsy.
4.8 RECOMMENDATIONS FOR FUTURE TESTING
The following recommendations are given for consideration in similar
experimental programs:
• A smaller concrete cover may be used to accelerate the time to initiation of
corrosion.
• Epoxy coated mild steel could be used to clearly separate and accelerate the
corrosion of the post-tensioning system.
• Connection wires used to take half-cell potential readings and corrosion rate
measurements should be protected against the outdoor environment, to avoid
possible deterioration and corrosion that would increase resistivity.
• Add more control specimens or examine fewer variables.
4.9 IMPLEMENTATION OF RESULTS
After final autopsies of twelve out of twenty-seven beam specimens and
partial autopsies of two beam specimens, research results generated the following
findings. Final autopsies of the remaining beam specimens will be more
conclusive for strand duct and grout types, and also for the use of encapsulated
anchorage systems.
429
Post-tensioning Ducts
• Galvanized ducts should not be used in aggressive exposures.
Level of Prestress
• Mixed reinforcement members should not be used in aggressive
exposures unless special provisions are made to effectively seal cracks
and concrete cover from exposure to chlorides.
• Fully prestressed members are recommended in aggressive
environments to delay moisture and chloride ingress.
• Post-tensioning systems need additional protection above the current
typical practice when in aggressive environments. In particular the use
of galvanized duct appears unwise. The use of plastic ducts and
encapsulated anchorage protection systems appear promising but while
plastic duct was clearly superior in the macrocell specimens the use in
the beam specimens cannot be conclusively evaluated until after final
autopsies of the remaining beam specimens.
Duct Splices for Galvanized Ducts
• Neither the standard industry practice of duct taped sleeves nor heat
shrink splices should be considered as watertight
• Better systems than industry standard or heat-shrink splices for
galvanized steel ducts should be investigated and developed if
galvanized duct continues to be used in non-aggressive environments.
High Performance Fly Ash Grout
• Standard Class C grout with fly ash is not recommended.
• The use of antibleed admixture appear promising but cannot be
conclusively evaluated until after final autopsies of the remaining
beam specimens.

430
Concrete type
• High Performance Concrete is recommended in aggressive
environments due to the significantly reduced permeability and crack
control. Fly ash (Class C) concrete may also be considered when the
environment is less aggressive.
Grouting Procedure
• Stringent grouting procedures should be enforced during construction.
Plastic Chairs
• Fully plastic chairs are recommended for use throughout the
substructure to eliminate corrosion damage. Chairs or bolster strips
that contain any steel should be avoided.

431
CHAPTER 5 Large Scale Column Corrosion Tests
Post-tensioned concrete piers or columns may be exposed to very severe
environments affecting their long-term durability. Two main exposure conditions
are of special interest: partially submerged structures in sea water and structures
exposed to deicing salts. The durability study of post-tensioned columns or
vertical concrete elements under these conditions have unique characteristics that
require different tests, than the macrocell and beam tests described in the previous
chapters. This chapter reports the procedures and results from long-term
corrosion tests of large scale column elements.
5.1 BACKGROUND AND OBJECTIVES
Columns or piers in sea water are exposed to a very severe environment.
This is especially the case for columns in the tidal zone (region between low and
high tides) with periodic wetting and drying. In addition, above the high tide
zone, the “wicking effect” (or capillary rise) may take place, which combined
with periodic splashing, provide the conditions for aggressive chloride exposure
(see Figure 5.1) and subsequent corrosion damage (see Figure 5.2).
Bridge piers on columns and like members in parking garages or other
structures, may be subject to deicing salts that are applied to roadways in cold (ice
and snow) environments. Depending on the ability of the drainage systems to
evacuate run off from the top slabs and decks, these chlorides combined with
water may trickle down the structures along the concrete faces, providing
unfavorable conditions of intermittent moisture and chlorides.

432
Figure 5.1 Exposure of Partially Submerged Column in Sea Water.
(a) Deicing Chemical Exposure (b) Coastal Saltwater Exposure “Attack from Above” “Attack from Below”
Figure 5.2 Typical Corrosion Damage in Bridge Substructures.5.1
AtmosphericZone
SplashZone
TidalZone
SubmergedZone
low tide
Wicking high tideeffect
AtmosphericZone
SplashZone
TidalZone
SubmergedZone
low tide
Wicking high tideeffect

433
In order to provide detailed observations to improve the durability design
of columns under these exposure conditions, a research study was started with the
dual intent to evaluate how to use post-tensioning to improve corrosion protection
and how to protect the post-tensioning systems from corrosion damage.
The column durability study was originally developed by West.5.1 The
specific objectives for this portion of the research were to investigate:
1. The effect of post-tensioning on concrete pier and column
durability (corrosion protection) through precompression of the
concrete and precompression of construction joints, and
2. The relative performance of various aspects of corrosion protection
for post-tensioning, including concrete type, duct type, post-
tensioning bar coatings and loading.
A total of ten large-scale column specimens were designed, constructed
and placed under exposure testing by West and Larosche.5.3 Exposure testing
began in July 1996 and was performed by West, Larosche and Schokker until
April 1999. Exposure testing was maintained by other graduate research
assistants until August 2000, when the author took over responsibility for the
exposure testing. Continued exposure testing was carried out until the author
performed full autopsies, which began in January 2003, after six and a half years
of accelerated exposure.
Test concept, variables, specimen types, materials, experimental set up,
construction and exposure testing details were reported by West et al.5.1, 5.3 In the
following discussion, Section 5.2 include a summary of the most important
aspects from West et al. report5.3. Sections 5.3 through 5.6 include the author’s
contribution to the research series with the final exposure testing results, autopsy
findings, conclusions and recommendations.

434
5.2 EXPERIMENTAL PROGRAM
5.2.1 Test Specimen
Test specimens are circular cast-in place columns. The columns were
patterned after standard Texas Department of Transportation (TxDOT)
multicolumn substructures (see Figure 5.3). The column dimensions and details
were selected such that covers, reinforcement sizes and post-tensioning hardware
were of similar order of magnitude as in practical applications, with consideration
for construction and loading of the specimens. A reduced nominal column
diameter of 18 in. and reduced height of 6 ft were selected for the actual test
specimens.
5.2.1.1 Design Loading
Typical bridge column reinforcement is based on minimum reinforcement
requirements, and the nominal capacity of the column is usually well in excess of
the design loading dictated by analysis of the bridge. Thus, it was decided to
obtain design loading for a typical TxDOT multicolumn bridge substructure (see
Figure 5.3), proportion the test specimen to meet minimum requirements and
compare the column capacity against the design loading. During testing, the
columns would be subjected to the design loading, which would provide a more
realistic representation of the typical case.
The prototype bridge substructure carried two lanes of traffic and one
shoulder. The bent was skewed to the roadway alignment at 45 degrees. The
superstructure consisted of five Type C precast, pretensioned bridge girders with a
75 ft span and a 8 in. thick cast-in-place concrete deck.
The three-column frame bent was analyzed using a plane frame analysis
program. AASHTO LRFD was used for design loading on the bridge.

435
Figure 5.3 Prototype Multicolumn Substructure.5.1
The bent cap was divided into several segments and the analysis was
performed to refine the end moments of inertia, either using the gross transformed
moment of inertia or elastic cracked section moment of inertia (positive or
negative bending). The frame was re-analyzed and the various combinations of
axial load and moment for the columns were determined. The calculated forces
for the outside columns are shown in Table 5.1. Loading on the substructure was
not symmetric due to the shoulder. The critical combination was taken at the top
of column 3, with the largest eccentricity.
Table 5.1 Calculated column forces for Prototype Substructure (unfactored).5.1
6.5 ft
16 ft
Bent Cap Section:33 x 36 in. deep
6 - #11 bars
4 - #11 bars
Column Section:30 in. diameter
8 - #8 bars
16 ft 16 ft 6.5 ft6.5 ft
16 ft
Bent Cap Section:Bent Cap Section:33 x 36 in. deep
6 - #11 bars
4 - #11 bars
Column Section:Column Section:30 in. diameter
8 - #8 bars
16 ft 16 ft 6.5 ft
Location Data Column 1 Column 3
Nmax 1781 kN (400.4 kips) 994 kN (223.4 kips)
Mmax 55.8 kN-m (494.4 k-in.) 74.6 kN-m (660.0 k-in.) Column
Base e = M/N 30.5 mm (1.2 in.) 76.2 mm (3.0 in.)
Nmax 1716 kN (385.7 kips) 928 kN (208.7 kips)
Mmax 144.8 kN-m (1281.6 k-in.) 118.0 kN-m (1044.0 k-in.) Column
Top e = M/N 83.8 mm (3.3 in.) 127 mm (5.0 in.)

436
The design loading from the prototype analysis was scaled for use with the
column specimens. Axial forces are scaled by the square of the ratio of column
diameters, following Equation 5.1. Bending moments are scaled by the cube of
the ratio of column diameters, following Equation 5.2.
kips275NDD
N prototype
2
prototype
specimenspecimen .=×
= Eq. 5.1
.inkip225MDD
M prototype
3
prototype
specimenspecimen =×
= Eq. 5.2
Assuming an average load factor of 1.5, the factored design forces are:
Nf = 112.6 kips, Mf = 338.6 kip in
5.2.1.2 Reinforced Concrete Design
The smallest circular column used by TxDOT is 18 in. diameter. This
column was selected as the nonprestressed or reinforced concrete design in the
research program. The reinforced concrete section is shown in Figure 5.4.
Figure 5.4 Reinforced Concrete Column Section Details.5.1
ir
Main Reinforcement:6 - #6 barsSp al:#3 at 6 in. pitchColumn Diameter: 18 in. Clear Cover to Spiral: 2 in.
ir
Main Reinforcement:6 - #6 barsSp al:#3 at 6 in. pitchColumn Diameter: 18 in. Clear Cover to Spiral: 2 in.
ir
Main Reinforcement:6 - #6 barsSp al:#3 at 6 in. pitchColumn Diameter: 18 in. Clear Cover to Spiral: 2 in.

437
The reinforced concrete (3600 psi) section was analyzed using a layer-by-
layer strain compatibility section analysis technique to produce axial force-
moment interaction diagrams, as shown in Figure 5.5. The factored resistance is
well in excess of the factored loading.
Figure 5.5 Column Interaction Diagrams5.1
The elastic decompression moment for the column was calculated for the
design service loading, and was equal to 169 kip in. The service load moment of
225 kip in. exceeded the decompression moment.
5.2.1.3 Post-Tensioned Column Design
The design of the post-tensioned columns kept the same mild steel
reinforcement (due to the need for confinement and concerns for creep) as the
reinforced column design, and added four threaded prestressing bars (bars are
often used instead of strands in columns). The four PT bars would provide
continuity between the column and foundation, effectively developing the flexural
capacity about more than one axis, and would increase the decompression
moment, which could improve durability at construction joints.
0
1000
2000
3000
4000
5000
0 50 100 150 200 250 300Moment (kN-m)
0
225
450
675
900
11250 443 885 1328 1770 2213 2655
Moment (k-in.)
RC Column, NominalRC Column, FactoredPT Column, NominalPT Column, Factorede = 76 mm (3 in.)
Factored Loads

438
A minimum effective prestress of 60% of ultimate (fpe =0.6 fpu) was used
for design and analysis purposes. The column section details are shown in Figure
5.6.
Figure 5.6 Post-Tensioned Column Section Details.5.1
The decompression moment was calculated as 406 kip in. which exceeded
the applied service moment of 225 kip in. by a considerable margin.
The post-tensioned column section was analyzed using the layer-by-layer
strain compatibility analysis technique. A detailed description of the procedure is
included in Reference 5.1. The calculated moment diagrams are also shown in
Figure 5.5. The lower nominal capacity of the post-tensioned columns illustrates
the effect of post-tensioning on the axial load carrying capacity of these elements.
However, even with this reduction, the factored resistance of the post-tensioned
columns far exceeded the factored loads.
Long-term prestress losses were calculated for periods of 500, 1000 and
1500 days, see details in Reference 5.1. Table 5.2 summarizes the results. Losses
are not uniform in the loaded case due to the eccentric loading. The calculated
losses indicate that with an initial prestress of 0.68 fpu the effective prestress in
the columns will meet or exceed the design value for an experiment duration
longer than 1500 days. The average initial prestress in the gross column section
was about 500 psi.
nfMain Rei orcement:6 - #6 bars4 – 5/8 in. PT barsfpe = 0.6fpu
Spiral:#3 at 6 in. pitch
2 in.Column Diameter: 18 in.Clear Cover to Spiral:
** Only PT bars provide continuity to foundation
nfMain Rei orcement:6 - #6 bars4 – 5/8 in. PT barsfpe = 0.6fpu
Spiral:#3 at 6 in. pitch
nfMain Rei orcement:6 - #6 bars4 – 5/8 in. PT barsfpe = 0.6fpu
Spiral:#3 at 6 in. pitch
nfMain Rei orcement:Main Rei orcement:6 - #6 bars4 – 5/8 in. PT barsfpe = 0.6fpu
Spiral:#3 at 6 in. pitch
2 in.Column Diameter: 18 in.Clear Cover to Spiral:
** Only PT bars provide continuity to foundation
2 in.Column Diameter: 18 in.Clear Cover to Spiral:
** Only PT bars provide continuity to foundation
Column Diameter: 18 in.Clear Cover to Spiral:
** Only PT bars provide continuity to foundation

439
Table 5.2 Long-Term Prestress Losses.5.1
5.2.2 Variables
Variables selected for exploration fall into five main categories: Column
to foundation joint, loading, concrete type, post-tensioning duct types and
prestressing bar coatings.
5.2.2.1 Control Variables
Standard variables based on typical current TxDOT practice were defined
to represent control cases. Table 5.3 summarizes the control variables used for
the research study.
Table 5.3 Control variables based on TxDOT practice. 5.1
Variable Typical mix or material used.
Concrete Based on TxDOT Specification Item 421, Tx DOT Class C concrete for
bridge substructures, Maximum w/c ratio = 0.533, Maximum coarse
aggregate size = 3/4 in., Retarder, Rheocrete 300-R, Entrained air
admixture, 2 in. clear cover to main steel.
Cement Grout Based on TxDOT Specification Item 426.3.4a
w/c ratio = 0.44
Type I cement
PT Duct Rigid galvanized steel duct.
Time Period Prestress Loss (days) ∆Fp1 ∆Fp2
Case 1: Loaded, fpi = 0.68fpu
500 10.7% 8.8% 1000 11.5% 9.6% 1500 11.9% 9.9%
Case 2: Unloaded, fpi = 0.68fpu 500 7.8% 7.8%
1000 8.4% 8.4% 1500 8.8% 8.8%
MFp1
Fp2

440
5.2.2.2 Column to Foundation Connection
The construction joint between the column and foundation presents a
possible weak link in corrosion protection since it represents a pre-formed crack
that could open under loading. This problem is aggravated by the potential
exposure conditions at the column foundation interface, since the cold joint could
be directly exposed to moisture and chlorides in coastal and deicing chemical
exposures. Selected configurations are shown in Figure 5.7. In this figure,
reinforcing cages (mild steel) consisting on 6#6 longitudinal bars and #3 bar
spiral at 6 in. pitch are shown. A two-inch cover was left at the base of the
column and the reinforcing cage. Only dowels or post-tensioned bars crossed the
joint.
Figure 5.7 Column-Foundation Joint Configurations.5.1
5.2.2.3 Loading Two loading conditions were considered: unloaded and service load. The
columns were subjected to the combined axial load and moment conditions
obtained from the prototype substructure analysis for the service load condition:
Nservice = 75.2 kips, Mservice = 225 kip in.
Doweled Joint Post-Tensioned Joint No Dowel
Column reinforcement
at joint
6 dowels:#6 bars
4 PT bars5/8“ diameter
coupler
bearing plateand nut
2 in. cover
rubber gasket
Doweled Joint Post-Tensioned Joint No Dowel
Column reinforcement
at joint
6 dowels:#6 bars
4 PT bars5/8“ diameter
coupler
bearing plateand nut
2 in. cover
rubber gasket

441
The unloaded case was included since it could represent a worse case
condition for allowing moisture and chloride penetration at the construction joint.
5.2.2.4 Concrete Type
TxDOT standard concrete mix was used in eight specimens. In two
columns, 35% of cement by volume (31% replacement by weight) was replaced
with fly ash (ASTM Class C), with no other significant changes to the concrete
mix.
5.2.2.5 Post-Tensioning Ducts
Impermeable plastic ducts are compared directly within individual
specimens to standard galvanized steel ducts, without duct splices, as shown in
Figure 5.8. Uncoated post-tensioning bars were used in columns where duct type
was evaluated.
Figure 5.8 Comparison of Ducts Types for Post-Tensioning.5.1
A rubber gasket was placed around the protruding PT-bars in the top of
the foundation to seal the dead ends of the ducts as shown in Figure 5.16. As it is
discussed in Section 5.5 it was a serious error in the specimen definition not to
splice ducts at this location.
galvanizedsteel
PT ducts
plasticPT ducts
Note: PT bars are uncoated
N

442
5.2.2.6 Prestressing Bar Coating
Two prestressing bar coatings are investigated: Epoxy coated (according
to ASTM A775-97) and zinc galvanized prestressing bars. The coated bars were
compared directly to uncoated bars within individual specimens (see Figure 5.9).
In both cases, anchorage hardware was either epoxy coated or galvanized. Nuts
and couplers are proportioned to limit damage in epoxy coating or zinc coating.
Figure 5.9 Comparison of Prestressing Bar Coatings.5.1
5.2.3 Specimen Types
Ten specimens were used to address all selected variables, using the
notation shown in Table 5.4. The complete experimental program is listed in
Table 5.5.
Table 5.4 Specimen Notation.5.1
Connection Type Loading Concrete type PT Protection
DJ: Doweled Joint PD: Plastic Duct
PT: Post-Tensioned
Joint
N: No
Load
TC: TxDOT Class C
EB: Epoxy-Coated PT Bar**
GB: Galvanized PT Bar** NJ: No dowel S:Service
Load
FA: 35% Fly Ash
Blank: Not applicable (i.e., no PT)
Example: PT-TC-S-PD
* plastic ducts used for bars 1 and 2, galvanized steel ducts used for bars 3 and 4
** epoxy-coated or galvanized bars used for bars 3 and 4, uncoated bars used for bars 1 and 2
uncoatedPT bars
galvanizedPT bars
orepoxy-coated
PT bars
Note: all ducts are galvanized steel
N

443
Table 5.5 Column Specimen Types and Variables.5.1
5.2.4 Materials
The materials used in the column corrosion tests are summarized in Table
5.6.
Table 5.6 Column Construction Material Details.5.1
Item Description
Column Concrete: Texas DOT Class C Concrete for Bridge Substructures
• w/c = 0.45 (based on slump, max. allowable w/c = 0.53) • f’c = 3600 psi minimum allowable • batch proportions: (per 1 yd3)
Coarse Aggregate (3/4 in.) 1877 lbs Fine Aggregate 1186 lbs Type I/II Cement 564 lbs Water 254 lbs Set retarder 24 oz Entrained Air Admixture 4 oz
• cylinder strengths: 7-day 4358 psi (average) 14-day 5250 psi 28-day 5284 psi
Specimen Foundation Connection
Concrete Type Loading PT Protection
1 DJ-TC-N Doweled Class C Unloaded n/a
2 PT-TC-N-PD Post-tensioned Class C Unloaded Plastic Duct
3 NJ-TC-N No Joint Class C Unloaded n/a
4 DJ-TC-S Doweled Class C Service n/a
5 PT-TC-S-PD Post-tensioned Class C Service Plastic Duct
6 NJ-TC-S No Joint Class C Service n/a
7 PT-TC-S-EB Post-tensioned Class C Service Epoxy-coated PT Bar
8 PT-TC-S-GB Post-tensioned Class C Service Galvanized PT Bar
9 DJ-FA-S Doweled 35% Fly Ash Service n/a
10 PT-FA-S-PD Post-tensioned 35% Fly Ash Service Plastic Duct
No dowel
No dowel

444
Table 5.6 (Continued) Column Construction Material Details.5.1
Item Description
Column Concrete: Texas DOT Class C Concrete with 31% Fly Ash by Weight
• w/(c +p) = 0.42 • f’c = 3600 psi minimum allowable • batch proportions: (per 1 yd3)
Coarse Aggregate (3/4 in.) 1855 lbs Fine Aggregate 1245 lbs Type I/II Cement 362 lbs Class C Fly Ash 162 lbs Water 220 lbs Set retarder 20.0 oz Entrained Air Admixture 3.5 oz
• cylinder strengths: 7-day 4447 psi (average) 28-day 6473 psi
Foundation Concrete Mix 1 (for RC Columns, Capitol Aggregates Mix 241)
• w/(c + p) = 0.39 • f’c = 8000 psi design strength • batch proportions: (per 1 yd3)
Coarse Aggregate (3/4 in.) 1790 lbs Fine Aggregate 1131 lbs Type I/II Cement 525 lbs Class C Fly Ash 225 lbs Water 295 lbs Set Retarder 22.5 oz
• avg. cylinder strengths: 28-day 6220 psi
Foundation Concrete Mix 2 (for PT Columns, Capitol Aggregates Mix 246)
• w/(c + p) = 0.25 • f’c = 14,000 psi design strength • batch proportions: (per 0.764 m3 (1 yd3))
Coarse Aggregate (0.5 in.) 1665 lbs Fine Aggregate 1371 lbs Type I/II Cement 714 lbs Class C Fly Ash 254 lbs Water 240 lbs Superplasticizer 160 oz
• cylinder strengths: 7-day 5102 psi (average) 14-day 7536 psi 28-day 8478 psi
TxDOT Grout for Post-Tensioning
• w/c = 0.44 • batch proportions: (per 1 ft3)
Type I Cement 82.4 lbs Water 36.2 lbs
Threaded Prestressing Bars • 5/8 in. diameter high strength threaded prestressing bar • Grade 157 (157 ksi) • Supplier: Dywidag Systems, Inc.
Mild Steel Reinforcement • ASTM A615, Grade 60 (60 ksi)

445
Table 5.6 (Continued) Column Construction Material Details.5.1
Item Description
Steel Duct • Corrugated, semi-rigid, galvanized steel duct • 1.575 in. outside diameter • Supplier: Dywidag Systems, Inc.
Plastic Duct • Corrugated, flexible plastic duct • 2 in. outside diameter • Supplier: Dywidag Systems, Inc.
Epoxy Bonding Agent • Sikadur 32 High-Mod - Epoxy Bonding Adhesive • Supplier: Sika
Cylinder compressive strengths are included in Tables 5.7 and 5.8.
Foundation concrete strengths did not reach their design values, but were deemed
sufficient. Grout for post-tensioning was not sampled for strength testing, as such
testing is not required by TxDOT specifications.
Table 5.7 TxDOT Class C Concrete Cylinder Strengths.5.1
Table 5.8 FlyAsh (35%) Concrete Cylinder Strengths.5.1
Column Average Cylinder Strength Numbers 7 Day 14 Day 28 Day
1, 3, 4, 6 33.0 MPa (4791 psi) 42.6 MPa (6177 psi) 42.0 MPa (6091 psi)
2, 5, 9, 10 27.0 MPa (3924 psi) 29.8 MPa (4324 psi) 30.9 MPa (4478 psi)
Averages 30.0 MPa (4358 psi) 36.2 MPa (5250 psi) 36.4 MPa (5284 psi)
Column Average Cylinder Strength Numbers 7 Day 14 Day 28 Day
7 35.2 MPa (5107 psi) 41.6 MPa (6028 psi) 46.2 MPa (6706 psi)
8 26.1 MPa (3788 psi) n/a 43.0 MPa (6240 psi)
Averages 30.7 MPa (4447 psi) n/a 44.6 MPa (6473 psi)

446
5.2.5 Experimental Setup
The experimental setup was designed to meet the following requirements:
• Provide a realistic simulated foundation for the column specimens
• Permit loading of the columns
• Accommodate exposure conditions consisting of salt water
continuously ponded around column base and regular application
of saltwater to one face of columns (dripper system)
The experimental setup is shown in Figures 5.10 and 5.11. The dripper
system is shown in Figure 5.12.
Figure 5.10 Column Corrosion Test Setup – Schematic.5.1
The dimensions of the reinforced concrete foundation (designed using a
strut and tie model) were 15.33 ft long, 36 in. wide and 18 in. high, with a 6 x 6
in. curb along the perimeter of the top surface to contain ponded saltwater.
Loading was applied on the columns using a stiffened loading plate on top of the
column and four-one inch threaded prestressing bars. The forces in the bars were
adjusted to apply the desired moment and axial force.
circular columnspecimen
tie-downbar
reinforced concretefoundation
pondedsaltwater
stiffenedloadingplate

447
Figure 5.11 Column Corrosion Test Setup.5.1
All foundation reinforcement was epoxy-coated to prolong the life of the
foundation. The top surface and curbs of the foundation were painted with
swimming pool paint to improve water –tightness of the ponded area. Details of
the foundation reinforcement and loading plates are included in Reference 5.1.
The loading system was treated as external prestressing in the column
calculations, and loading force losses were estimated for various time periods.
Loading force losses were small, 6.6% for post-tensioned columns and 3.6% for
reinforced concrete columns, in the period of 500 days from first loading. For this
reason, it was decided to simplify the loading system and not use springs,
readjusting periodically the loading forces on the columns.
5.2.5.1 Exposure Conditions
Exposure testing consisted of saltwater based on ASTM G109 (3.5% NaCl
in tap water), continuously ponded around the base of the columns to simulate a

448
coastal exposure. To simulate deicing salts dripping from the superstructure or
saltwater spray, a dripper system was placed on one face of each column, as
shown in Figure 5.12. Saltwater was pumped for a period of six to eight hours
every two weeks, controlling equal flow rates to each column.
Figure 5.12 Column Dripper Figure 5.13 Specimen Location System. 5.1 Specimen Details. 5.1
5.2.5.2 Specimen Location
The specimen location on two foundations is shown in Figure 5.13. The
mild steel bars and post-tensioning bars were numbered according to the scheme
shown. The curved arrows in the figure indicate the direction of applied moment
on each column. Columns without arrows were not loaded. The dripper was
located on the tension side for the loaded columns.
Rebar Locations PT Bar Locations
1
2
4
5
3
6
N
1
2
4
3
N
2 5 10 7 8
3 1 9 4 6ND D
D D
D
D D
D
D
D
PT-TC-N-PD PT-TC-S-PD PT-FA-S-PD PT-TC-S-EB PT-TC-S-GB
NJ-TC-N DJ-TC-N DJ-FA-S DJ-TC-S NJ-TC-S
D: Dripper location
Rebar Locations PT Bar Locations
1
2
4
5
3
6
N
1
2
4
3
N
2 5 10 7 8
3 1 9 4 6ND D
D D
D
D D
D
D
D
PT-TC-N-PD PT-TC-S-PD PT-FA-S-PD PT-TC-S-EB PT-TC-S-GB
NJ-TC-N DJ-TC-N DJ-FA-S DJ-TC-S NJ-TC-S
D: Dripper location

449
5.2.6 Specimen Fabrication
Column foundations were constructed inside the Ferguson Laboratory.
Once the foundations had been cast, column reinforcement and post-tensioning
hardware was assembled. Each foundation was then transported and placed in the
final location and the columns were cast in place, post-tensioned and loaded. A
detailed description of the construction process is included in Reference 5.3.
Photos of foundation and column fabrication are shown in Figures 5.14 and 5.15.
Top View End view
Figure 5.14 Foundation Reinforcement.5.2
Column Reinforcement on Foundation Pouring Column Concrete
Figure 5.15 Column Construction.5.2

450
As shown in Figure 5.16, short lengths of post-tensioning bar were cast
into the foundation to provide anchorage for the column post-tensioning bars.
Shallow, square pockets were formed around each bar to accommodate rubber
gaskets to seal the “dead end” of the post-tensioning ducts. The column post-
tensioning bars were coupled to the protruding bars prior to placement of the
ducts. Ground clamps were used to attach ground wires for measurements of
potentials to the post-tensioning bar ends prior to capping.
PT Bars Protruding from Foundation Gasket Around Post-Tensioning Bar
Reinforcement, Ducts and Grout Tubes Top of Column Prior to Capping
Figure 5.16 Column Post-Tensioning Details.5.2

451
Losses during stressing were negligible. The post-tensioning jacking
force, Fpj, was taken equal to the initial prestress force, Fpi (0.68fpuApbar=30 kips).
Each bar was post-tensioned individually, monitoring the post-tensioning force
during stressing with a load cell and by a pressure gauge on the hydraulic pump
(see Figure 5.17).
Grouting was done immediately after post-tensioning, all according to
TxDOT Specifications. Grouts were mixed in large buckets using a paddle mixer
mounted on a large hand held drill, and pumped immediately using an electric
grout pump, until a continuous flow of grout was exiting the vent. Figure 5.18
shows the inlet and vent for grouting.
Figure 5.17 Column Post-Tensioning.5.1 Figure 5.18 Inlet and Vent for
Grouting.5.1
An important caution was suggested by West et al.5.1 after grouting:
“..after the column grouting had been completed, the possibility of an error in the
post-tensioning grout came to light. It is possible that incorrectly labeled cement
barrels may have resulted in partial or complete cement replacement with Class F
grout tube
Foundation
groutpumped in
grout ventedthrough 6 mm(1/4") hole inbearing plate

452
fly ash. The amount of fly ash, if any, is not certain. If the fly ash content is high,
very little hydration will have occurred. The effect of this uncertainty on the
experimental results is not certain. Persons performing invasive inspections or
autopsies on the columns should be aware of the possibility of fly ash in the grout.
The most likely columns to contain fly ash grout are PT-TC-S-EB and PT-TC-S-
GB.”
5.2.7 Specimen Loading
Column loading was performed using the loading system shown in Figure
5.19. The applied forces are shown in Figure 5.20. A separate hydraulic pump
was used for each ram, and the forces T1 and T2 were applied simultaneously in
four increments of 22% and a final increment of 12%. Tie-down bar nuts were
tightened to refusal using a large wrench once the desired forces had been
attained.
Figure 5.19 Loading System.5.1 Figure 5.20 Column Loading Forces. 5.1
T1 T2
27 in.N
M
Nserv = 75 kipsMserv = 225 kip in.
Applied Forces:T1 = 45.9 kips
= 22.95 kips per bar
T2 = 29.2 kips= 14.6 kips per bar
2 tie-downbars
T1 T2
27 in.N
M
Nserv = 75 kipsMserv = 225 kip in.
Applied Forces:T1 = 45.9 kips
= 22.95 kips per bar
T2 = 29.2 kips= 14.6 kips per bar
2 tie-downbars

453
5.2.8 Measurements during Exposure Testing
Specimen monitoring during exposure testing included half-cell potential
measurements every four weeks, periodic visual inspection for signs of corrosion
and distress, and chloride samples taken occasionally to monitor chloride ingress
at various depths and heights.
5.2.8.1 Half-Cell Potential Readings
Half-Cell (HC) potentials were measured against a Saturated Calomel
Electrode (SCE), once a month, according to ASTM C876.5.4 The numerical
significance of the HC potential readings for normal reinforcing is shown in Table
5.9. The voltmeter was connected to the reinforcing cage using a wire that was
left attached to the reinforcing cage prior to concrete casting. Figure 5.21 shows
the reinforcement placement, and level numbering for HC readings. The readings
were taken on three out of six reinforcing bars (labeled 1, 3 and 6) and on all four
post-tensioning bars at three different heights (labeled levels 1, 3 and 5) in the
column.
Standard ASTM C876 was developed for uncoated reinforcement steel,
and therefore, the values reported in Table 5.9 may not necessarily be appropriate
for grouted prestressing bars (coated or uncoated) in concrete.
Table 5.9 Interpretation of Half Cell Potentials for
Uncoated Reinforcing Steel 5.4
Measured Potential (vs SCE) Probability of Corrosion
more positive than –130 mV less than 10% probability of corrosion
Between -130 mV and –280 mV corrosion activity uncertain
more negative than –280 mV greater than 90% probability of corrosion

454
5.2.8.2 Chloride Penetration
Chloride samples were taken periodically from specimens representing
each concrete type, joint type, and load level. Powder samples were taken at three
depths: 0.5 in, 1 in., and 2 in. The two-inch depth data represent the chloride
concentration at the bar level. The chloride samples are also taken at three
heights to investigate possible “wicking” effects: 3 in., 9 in., and 15 in., as shown
in Figure 5.21. The three-inch height represents the constantly submerged
concrete. Each sample is taken from two locations and the powder is combined to
give a representative sample.
Figure 5.21 Numbering and Locations for Half-Cell Potential Measurements
and Chloride Samples (adapted from ref. 1 and 2).
samples for
Level
Locations:y = 3 in.y =9 in.y =15 in.(measured from Column base)
4
5
3
2
1
Cl- testing
referenceelectrode
connection to reinforcement
voltmeter
Applied Axial Load
Applied Moment1
2
34
5
6
1
23
4N
samples for
Level
Locations:y = 3 in.y =9 in.y =15 in.(measured from Column base)
4
5
3
2
1
Cl- testing
referenceelectrode
connection to reinforcement
voltmeter
Applied Axial Load
Applied Moment1
2
34
5
6
1
23
4N
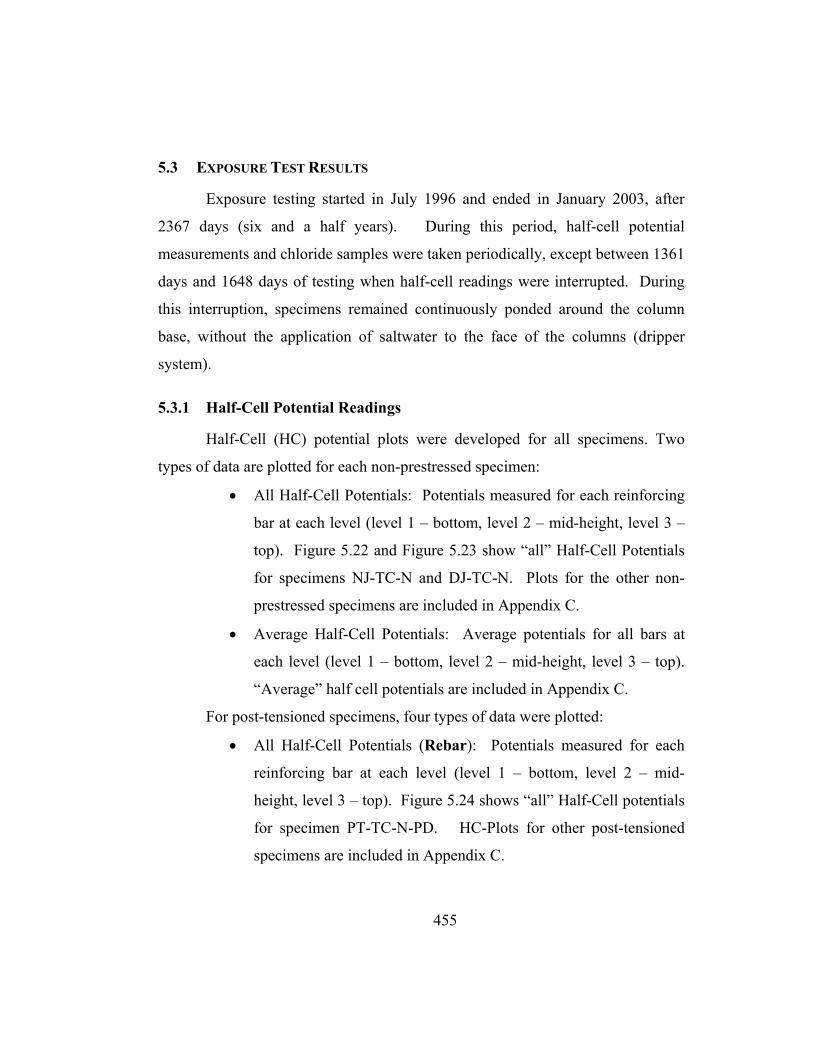
455
5.3 EXPOSURE TEST RESULTS
Exposure testing started in July 1996 and ended in January 2003, after
2367 days (six and a half years). During this period, half-cell potential
measurements and chloride samples were taken periodically, except between 1361
days and 1648 days of testing when half-cell readings were interrupted. During
this interruption, specimens remained continuously ponded around the column
base, without the application of saltwater to the face of the columns (dripper
system).
5.3.1 Half-Cell Potential Readings
Half-Cell (HC) potential plots were developed for all specimens. Two
types of data are plotted for each non-prestressed specimen:
• All Half-Cell Potentials: Potentials measured for each reinforcing
bar at each level (level 1 – bottom, level 2 – mid-height, level 3 –
top). Figure 5.22 and Figure 5.23 show “all” Half-Cell Potentials
for specimens NJ-TC-N and DJ-TC-N. Plots for the other non-
prestressed specimens are included in Appendix C.
• Average Half-Cell Potentials: Average potentials for all bars at
each level (level 1 – bottom, level 2 – mid-height, level 3 – top).
“Average” half cell potentials are included in Appendix C.
For post-tensioned specimens, four types of data were plotted:
• All Half-Cell Potentials (Rebar): Potentials measured for each
reinforcing bar at each level (level 1 – bottom, level 2 – mid-
height, level 3 – top). Figure 5.24 shows “all” Half-Cell potentials
for specimen PT-TC-N-PD. HC-Plots for other post-tensioned
specimens are included in Appendix C.

456
• Average Half-Cell Potentials (Rebar): Average potentials for all
reinforcing bars at each level (level 1 – bottom, level 2 – mid-
height, level 3 – top). See HC Potential plots in Appendix C.
• All Half-Cell Potentials (PT-Bars): Potentials measured for each
PT-Bar at each level (level 1 – bottom, level 2 – mid-height, level
3 – top). Figure 5.25 shows “all” Half-Cell Potentials for post-
tensioning bars in specimen PT-TC-N-PD. Plots for all other post-
tensioning specimens are included in Appendix C.
• Average Half-Cell Potentials (PT-Bars): Average potentials for
PT-Bars #1 and #2, and Average potentials for PT-Bars #3 and #4.
See plots in Appendix C.
Each post-tensioned specimen has two plain post-tensioning bars or ducts
and two bars or ducts that investigate a protection variable. For these reason,
average values were obtain in pairs (ducts #1 and #2, and ducts #3 and #4; or, PT-
bar #1 and #2, and PT-bar #3 and #4). Each variable is clearly separated for each
specimen in the plots.
Specimens are also compared relatively to each other on the same plot.
Three types of comparison plots were constructed:
• Average Half-Cell Potentials (Rebar) at Level 1, Level 3 and
Level 5 in Non-Prestressed Columns. See Figure 5.26 through
Figure 5.28.
• Average Half-Cell Potentials (Rebar) at Level 1, Level 3 and
Level 5 in Post-Tensioned Columns. See Figure 5.29 through
Figure 5.31.
• Average Half-Cell Potentials (PT Bars) (grouped in pairs #1,#2
and #3,#4), at Level 1, Level 3 and Level 5 in Post-Tensioned
Columns. See Figure 5.32 through Figure 5.34.

457
In these plots, ASTM C8765.4 corrosion threshold values are shown for
reference.
Table 5.10 shows a summary of the probability of corrosion for
reinforcing bars in non-prestressed columns, at levels 1, 2 and 3. In a similar
manner, Table 5.11 shows a summary of the probability of corrosion for
reinforcing bars and post-tensioned bars in PT-columns, at the same three levels
1, 3 and 5.
Figure 5.22 All Half-Cell Potential Readings: Column NJ-TC-N
-500
-400
-300
-200
-100
0
100
200
0 400 800 1200 1600 2000 2400
Time (days)
Hal
f-Cel
l Pot
entia
l (m
V)
Bar 1 Bot. Bar 1 Mid. Bar 1 TopBar 3 Bot. Bar 3 Mid. Bar 3 TopBar 5 Bot. Bar 5 Mid. Bar 5 Top
< 10% prob.of corrosion
> 90% prob.of corrosion

458
Figure 5.23 All Half-Cell Potential Readings: Column DJ-TC-N
Figure 5.24 All Half-Cell Potential Readings: Column PT-TC-N-PD – Rebar
-500
-400
-300
-200
-100
0
100
200
0 400 800 1200 1600 2000 2400
Time (days)
Hal
f-Cel
l Pot
entia
l (m
V)
Bar 1 Bot. Bar 1 Mid. Bar 1 TopBar 3 Bot. Bar 3 Mid. Bar 3 TopBar 5 Bot. Bar 5 Mid. Bar 5 Top
< 10% prob.of corrosion
> 90% prob.of corrosion
-500
-400
-300
-200
-100
0
100
200
0 400 800 1200 1600 2000 2400
Time (days)
Hal
f-Cel
l Pot
entia
l (m
V)
Bar 1 Bot. Bar 1 Mid. Bar 1 Top
Bar 3 Bot. Bar 3 Mid. Bar 3 Top
Bar 5 Bot. Bar 5 Mid. Bar 5 Top
< 10% probabilityof corrosion
> 90% probabilityof corrosion

459
Figure 5.25 All Half-Cell Potential Readings: Column PT-TC-N-PD – PT Bars
Figure 5.26 Average Half-Cell Potential Readings at Column Base (Level 1): Non-Prestressed Columns
-500
-400
-300
-200
-100
0
100
200
0 400 800 1200 1600 2000 2400
Time (days)
Hal
f-Cel
l Pot
entia
l (m
V)
NJ-TC-N DJ-TC-N
DJ-FA-S DJ-TC-S
NJ-TC-S
< 10% prob.of corrosion
> 90% prob.of corrosion
-500
-400
-300
-200
-100
0
100
200
0 400 800 1200 1600 2000 2400
Time (days)
Hal
f-Cel
l Pot
entia
l (m
V)
PT Bar 1 Bot. PT Bar 1 Mid. PT Bar 1 TopPT Bar 2 Bot. PT Bar 2 Mid. PT Bar 2 TopPT Bar 3 Bot. PT Bar 3 Mid. PT Bar 3 TopPT Bar 4 Bot. PT Bar 4 Mid. PT Bar 4 Top
< 10% prob.
> 90% prob.

460
Figure 5.27 Average Half-Cell Potential Readings at Column Mid-height (Level 3): Non-Prestressed Columns
Figure 5.28 Average Half-Cell Potential Readings at Top of Column (Level 5): Non-Prestressed Columns
-500
-400
-300
-200
-100
0
100
200
0 400 800 1200 1600 2000 2400
Time (days)
Hal
f-Cel
l Pot
entia
l (m
V)
NJ-TC-N DJ-TC-N
DJ-FA-S DJ-TC-S
NJ-TC-S
< 10% prob.of corrosion
> 90% prob.of corrosion
-500
-400
-300
-200
-100
0
100
200
0 400 800 1200 1600 2000 2400
Time (days)
Hal
f-Cel
l Pot
entia
l (m
V)
NJ-TC-N DJ-TC-N
DJ-FA-S DJ-TC-S
NJ-TC-S
< 10% prob.of corrosion
> 90% prob.of corrosion

461
Figure 5.29 Average Half-Cell Potential Readings at Column Base (Level 1): PT Columns – Rebar
Figure 5.30 Average Half-Cell Potential Readings at Column Mid-Height (Level 3): PT Columns – Rebar
-500
-400
-300
-200
-100
0
100
200
0 400 800 1200 1600 2000 2400
Time (days)
Hal
f-Cel
l Pot
entia
l (m
V)
PT-TC-N-PD PT-TC-S-PD
PT-FA-S-PD PT-TC-S-EB
PT-TC-S-GB
< 10% probability of corrosion
> 90% probabilityof corrosion
-500
-400
-300
-200
-100
0
100
200
0 400 800 1200 1600 2000 2400
Time (days)
Hal
f-Cel
l Pot
entia
l (m
V)
PT-TC-N-PD PT-TC-S-PD
PT-FA-S-PD PT-TC-S-EB
PT-TC-S-GB
< 10% probability of corrosion
> 90% probabilityof corrosion

462
Figure 5.31 Average Half-Cell Potential Readings at
Top of Column (Level 5): PT Columns – Rebar
Figure 5.32 Average Half-Cell Potential Readings at Column Base (Level 1): PT Columns – PT Bars
-500
-400
-300
-200
-100
0
100
200
0 400 800 1200 1600 2000 2400
Time (days)
Hal
f-Cel
l Pot
entia
l (m
V)
PT-TC-N-PD PT-TC-S-PD
PT-FA-S-PD PT-TC-S-EB
PT-TC-S-GB
< 10% probability of corrosion
> 90% probabilityof corrosion
-500
-400
-300
-200
-100
0
100
200
0 400 800 1200 1600 2000 2400
Time (days)
Hal
f-Cel
l Pot
entia
l (m
V)
PT-TC-N-PD (Bars 1,2 - Plastic Duct) PT-TC-N-PD (Bars 3,4 - Plain)PT-TC-S-PD (Bars 1,2 - Plastic Duct) PT-TC-S-PD (Bars 3,4 - Plain)PT-FA-S-PD (Bars 1,2 - Plastic Duct) PT-FA-S-PD (Bars 3,4 - Plain)PT-TC-S-EB (Bars 1,2 - Plain) PT-TC-S-EB (Bars 3,4 - Epoxy Bars)PT-TC-S-GB (Bars 1,2 - Plain) PT-TC-S-GB (Bars 3,4 -Galvanized Bars)
< 10% probability of corrosion
> 90% probabilityof corrosion

463
Figure 5.33 Average Half-Cell Potential Readings at Column Mid-Height (Level 3): PT Columns – PT Bars
Figure 5.34 Average Half-Cell Potential Readings at Top of Column (Level 5): PT Columns – PT Bars
-500
-400
-300
-200
-100
0
100
200
0 400 800 1200 1600 2000 2400
Time (days)
Hal
f-Cel
l Pot
entia
l (m
V)
PT-TC-N-PD (Bars 1,2 - Plastic Duct) PT-TC-N-PD (Bars 3,4 - Plain)PT-TC-S-PD (Bars 1,2 - Plastic Duct) PT-TC-S-PD (Bars 3,4 - Plain)PT-FA-S-PD (Bars 1,2 - Plastic Duct) PT-FA-S-PD (Bars 3,4 - Plain)PT-TC-S-EB (Bars 1,2 - Plain) PT-TC-S-EB (Bars 3,4 -Epoxy Bars)PT-TC-S-GB (Bars 1,2 - Plain) PT-TC-S-GB (Bars 3,4 - Galvanized Bars)
< 10% probability of corrosion
> 90% probabilityof corrosion
-500
-400
-300
-200
-100
0
100
200
0 400 800 1200 1600 2000 2400
Time (days)
Hal
f-Cel
l Pot
entia
l (m
V)
PT-TC-N-PD (Bars 1,2 - Plastic Duct) PT-TC-N-PD (Bars 3,4 - Plain)PT-TC-S-PD (Bars 1,2 - Plastic Duct) PT-TC-S-PD (Bars 3,4 - Plain)PT-FA-S-PD (Bars 1,2 - Plastic Duct) PT-FA-S-PD (Bars 3,4 - Plain)PT-TC-S-EB (Bars 1,2 -Plain) PT-TC-S-EB (Bars 3,4 - Epoxy Bars)PT-TC-S-GB (Bars 1,2 - Plain) PT-TC-S-GB (Bars 3,4 - Galvanized Bars)
< 10% probability of corrosion
> 90% probabilityof corrosion

464
Table 5.10 Nonprestressed Column Average Half-Cell Readings Summary
Table 5.11 Post-Tensioned Column Average Half-Cell Readings Summary.
Specimen Level Probability of Corrosion
5 uncertainNJ-TC-N 3 uncertain
1 uncertain5 low
DJ-TC-N 3 uncertain1 uncertain5 low
DJ-FA-S 3 low1 uncertain5 low
DJ-TC-S 3 low1 uncertain5 low
NJ-TC-S 3 uncertain1 high
Specimen Level Rebar PT Bars PT Bars(Plain) (Protected)
5 low low lowPT-TC-N-PD 3 low low low
1 high uncertain uncertain5 low low low
PT-TC-S-PD 3 uncertain low low1 uncertain uncertain uncertain5 low low low
PT-FA-S-PD 3 low low low1 uncertain uncertain uncertain5 low low low
PT-TC-S-EB 3 low uncertain low1 uncertain high uncertain5 low low low
PT-TC-S-GB 3 low low low1 uncertain uncertain uncertain
Reading

465
Analysis of the non-prestressed specimen plots, indicates that higher HC
potentials are observed at Level 1 corresponding to the continuously submerged
zone. In general, the HC potential at this level was in the range between -130 mV
and -280 mV (uncertain probability of corrosion as described in Table 5.9). The
only specimen showing higher average HC-potentials at this level was specimen
NJ-TC-S (No dowel - normal Type C concrete - service load), with readings more
negative than -400 mV (>90% probability region). At Level 3 (column mid-
height) three specimens showed potential values in the uncertain range (between
10% and 90% probability of corrosion): NJ-TC-N (No dowel – type C Concrete -
unloaded), DJ-TC-N (doweled – type C concrete - unloaded) and NJ-TC-S (No
dowel – type C concrete - service load). Specimens DJ-TC-S (doweled – Type C
concrete - service load) and DJ-FA-S (doweled – fly ash concrete - service load)
showed average potentials more positive than -130 mV, suggesting a very low
probability of corrosion (<10%). At Level 5 (top level) all specimens showed low
probability of corrosion, with slightly higher probability of corrosion in specimen
NJ-TC-N (No dowel – type C concrete, unloaded), which showed values in the
Low to Uncertain probability ranges (around -130 mV).
For post-tensioned specimens, a higher probability of rebar corrosion was
found at the bottom level (Level 1). At this level specimen PT-TC-N-PD (type C
concrete – unloaded – plastic ducts) showed the higher probability of corrosion,
with readings in the order of -300 mV. Other post-tensioning specimens showed
readings at Level 1 in the uncertain probability range, with readings between -130
mV and -280 mV. At levels 3 and 5, all post-tensioned specimens showed low
probability of rebar corrosion (values more positive than -130 mV), with a
slightly higher probability of corrosion at level 3 in specimen PT-TC-S-PD (type
C concrete – service load – plastic duct).

466
The probability of corrosion for post-tensioned bars at level 1 was found
in the uncertain probability range (between -130 mV and -280 mV) for all
specimens, except for specimen PT-T-S-EB (type C concrete – service load –
epoxy coated bars) that showed a high probability of corrosion (above 90%
probability) for the two non-protected PT-bars. At Levels 3 and 5, all specimens
showed low probability of corrosion (below 10%), except again for specimen PT-
TC-S-EB where a slightly higher probability of corrosion was found on the plain
(non protected) PT-bars.
Very negative Half-Cell potentials at the three inch level (Level 1) may
not be the result of very high corrosion rates or severity; therefore, the results
presented above must be evaluated with care. As explained by West,5.2 “…When
the oxygen supply is restricted, as in the case of submerged concrete, the rate of
cathodic reaction is reduced and the corroding system is said to be under diffusion
control. A system under diffusion control is illustrated by mixed potential theory
in Figure 5.35. Because the slope of the cathodic reaction becomes very steep,
the corrosion potential at equilibrium is very negative and the corrosion rate is
small. Thus, very negative half-cell potentials in submerged concrete should not
necessarily be interpreted as an indication of significant corrosion activity.”
Figure 5.35 Effect of Diffusion Controlled Cathodic Polarization (Lack of Oxygen) on Corrosion Potential and Current5.2
Pot
entia
l
Log(corrosion current)
Ean
Eca
icorr
Ecorr
Diffusion controlledcathodic reaction
Anodic reaction
Pot
entia
l
Log(corrosion current)
Ean
Eca
icorr
Ecorr
Cathodic reaction(not diffusion controlled)
Anodic reaction

467
Half-Cell potentials may also be misleading if absolute values at specific
dates are used, instead of trends or changes of these values over time.
Commonly, a well defined transition between stable readings to more negative
readings would define the onset of corrosion. Also, a continuing trend of more
negative readings could be the indication of corrosion activity. However, if half-
cell potential readings have been consistent with no significant deviations, this
may be the indication that corrosion is not occurring in the element under
consideration. With this concept, specimens NJ-TC-N, NJ-TC-S, PT-TC-N-PD
(Rebar and PT Bars), PT-FA-S-PD (PT Bars), and PT-TC-S-EB (Rebar) showed
some indication of corrosion activity over time; however, specimens DJ-TC-N,
DJ-TC-N, DJ-FA-S, DJ-TC-S, PT-TC-S-PD (Rebar and PT Bars), PT-FA-S-PD
(Rebar), PT-TC-S-EB (PT Bars), PT-TC-S-GB (Rebar and PT Bars), showed
steady potentials, and therefore uncertain corrosion activity.
5.3.2 Chloride Content in Concrete
Concrete chloride samples were taken directly from the column specimens
after 20 months, 32 months and 78 months (end of testing). Acid-soluble
chloride content results at 20 months and at 32 months were reported in reference
5.1. After 78 months (at the end of testing) powder samples were collected from
the column specimens at 3 inches, 9 inches and 15 inches from the base of the
specimens, on both the dripper and the non-dripper side. At each location,
samples were taken at three different depths: 0.5 inches, 1.0 inch and 2.0 inches.
Figure 5.36 and Figure 5.37 show chloride penetration plots for column
NJ-TC-N. Figure 5.38 and Figure 5.39 show chloride penetration plots for
column PT-TC-N-PD. Plots for other specimens are included in Appendix C.

468
The relative specimen performance with respect to chloride penetration is
compared in Figures 5.40 through 5.45. These plots have been constructed for all
specimens at each depth in all sample locations, for both the dripper and non-
dripper sides.
Chloride threshold value is indicated in the figures at 0.033%. This value,
intended as a guide only, is based on the widely accepted chloride threshold value
of 0.2% of the weight of cement.5.5
As can be observed from the figures, acid soluble chloride contents at a
height of 3 inches (submerged zone) and at 9 inches, are in most specimens well
in excess of the threshold value for corrosion. However, at 15 inches, most
specimens show low chloride contents, below the threshold value, at all depths.
Exceptions are fly ash specimens (DJ-FA-S and PT-FA-S-PD) that show chloride
contents below the threshold value at 9 inches on the non-dripper side (at all
depths), and on the dripper side (at 0.5 in. and 2 in.).
Typically, chloride contents at 2 in. depth are 20% to 80% lower than
those chloride contents at 1 in. depth, with few exceptions (NJ-TC-N dripper side,
DJ-TC-N non-dripper side, DJ-TC-S dripper side, PT-TC-S-PD non dripper side,
PT-TC-S-EB dripper side). Additionally, all post-tensioned specimens, and non-
prestressed specimens with fly ash concrete, show less chloride penetration than
non-prestressed specimens with normal Type C concrete.
From these results, the wicking effect or upward migration of chlorides in
the specimens is evident. Significant chloride contents were found at 9 inches
from the column base, and much lower contents were found at 15 inches,
suggesting that the chloride content is due to the wicking effect, and not to the
trickle water coming from above.

469
Figure 5.36 Concrete Chloride Penetration for Column NJ-TC-N in Non-Dripper Side at End of Testing
Figure 5.37 Concrete Chloride Penetration for Column NJ-TC-N in Dripper Side at End of Testing
0
4
8
12
16
0,00% 0,10% 0,20% 0,30% 0,40% 0,50% 0,60%Acid Soluble Chloride Content
(% by weight of concrete)
Hei
ght A
bove
Col
umn
Bas
e (i
n)
Depth = 0.5 inDepth = 1 in.Depth = 2 in.
water line
Foundation
Column
15"
9"
3"
Threshold
0
4
8
12
16
0,00% 0,10% 0,20% 0,30% 0,40% 0,50% 0,60%Acid Soluble Chloride Content
(% by weight of concrete)
Hei
ght A
bove
Col
umn
Bas
e (i
n)
Depth = 0.5 inDepth = 1 in.Depth = 2 in.
water line
Foundation
Column
15"
9"
3"
Threshold
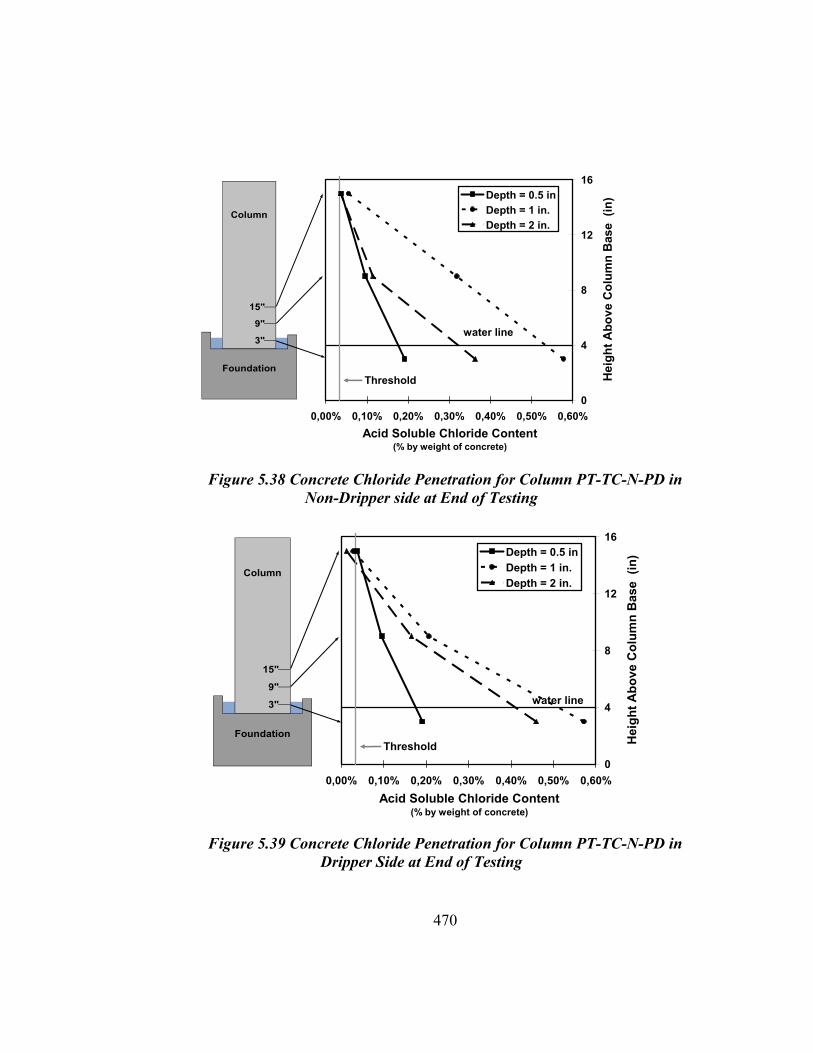
470
Figure 5.38 Concrete Chloride Penetration for Column PT-TC-N-PD in Non-Dripper side at End of Testing
Figure 5.39 Concrete Chloride Penetration for Column PT-TC-N-PD in Dripper Side at End of Testing
0
4
8
12
16
0,00% 0,10% 0,20% 0,30% 0,40% 0,50% 0,60%Acid Soluble Chloride Content
(% by weight of concrete)
Hei
ght A
bove
Col
umn
Bas
e (i
n)
Depth = 0.5 inDepth = 1 in.Depth = 2 in.
water line
Foundation
Column
15"
9"
3"
Threshold
0
4
8
12
16
0,00% 0,10% 0,20% 0,30% 0,40% 0,50% 0,60%Acid Soluble Chloride Content
(% by weight of concrete)
Hei
ght A
bove
Col
umn
Bas
e (i
n)
Depth = 0.5 inDepth = 1 in.Depth = 2 in.
water line
Foundation
Column
15"
9"
3"
Threshold
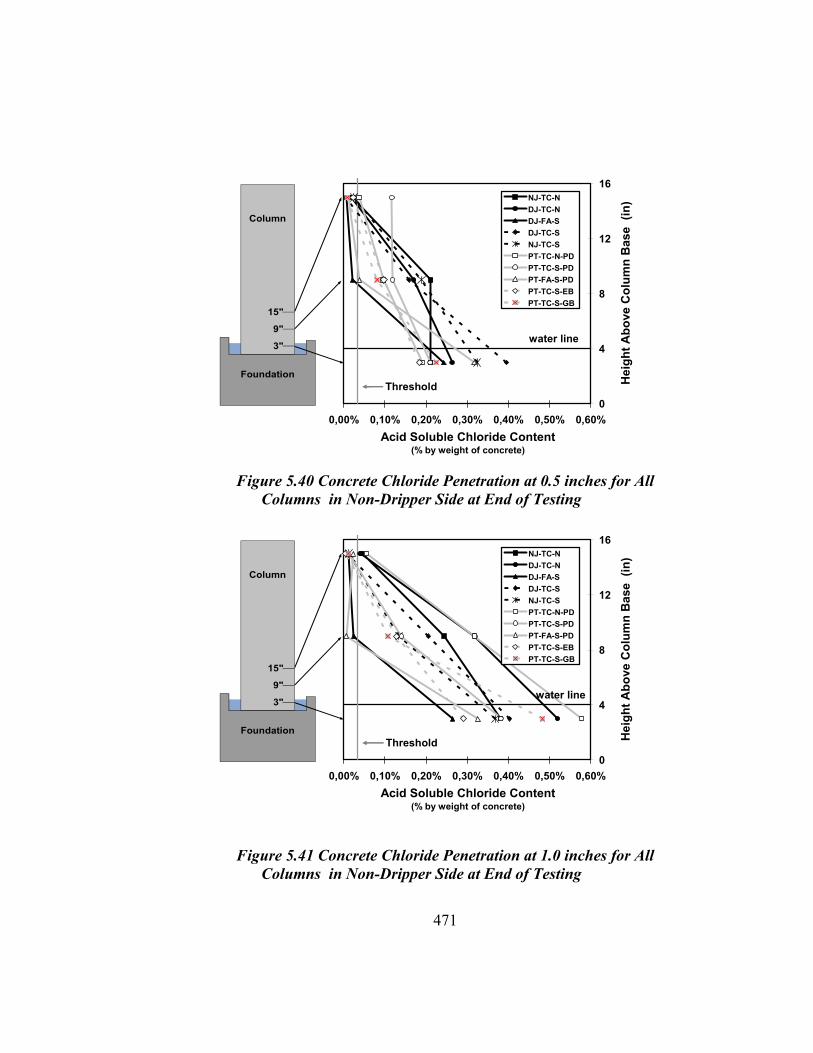
471
Figure 5.40 Concrete Chloride Penetration at 0.5 inches for All Columns in Non-Dripper Side at End of Testing
Figure 5.41 Concrete Chloride Penetration at 1.0 inches for All
Columns in Non-Dripper Side at End of Testing
0
4
8
12
16
0,00% 0,10% 0,20% 0,30% 0,40% 0,50% 0,60%Acid Soluble Chloride Content
(% by weight of concrete)
Hei
ght A
bove
Col
umn
Bas
e (i
n)
NJ-TC-NDJ-TC-NDJ-FA-SDJ-TC-SNJ-TC-SPT-TC-N-PDPT-TC-S-PDPT-FA-S-PDPT-TC-S-EBPT-TC-S-GB
water line
Foundation
Column
15"
9"
3"
Threshold
0
4
8
12
16
0,00% 0,10% 0,20% 0,30% 0,40% 0,50% 0,60%Acid Soluble Chloride Content
(% by weight of concrete)
Hei
ght A
bove
Col
umn
Bas
e (i
n)
NJ-TC-NDJ-TC-NDJ-FA-SDJ-TC-SNJ-TC-SPT-TC-N-PDPT-TC-S-PDPT-FA-S-PDPT-TC-S-EBPT-TC-S-GB
water line
Foundation
Column
15"
9"
3"
Threshold

472
Figure 5.42 Concrete Chloride Penetration at 2.0 inches for All Columns in Non-Dripper Side at End of Testing
Figure 5.43 Concrete Chloride Penetration at 0.5 inches for All Columns in Dripper Side at End of Testing
0
4
8
12
16
0,00% 0,10% 0,20% 0,30% 0,40% 0,50% 0,60%Acid Soluble Chloride Content
(% by weight of concrete)
Hei
ght A
bove
Col
umn
Bas
e (i
n)
NJ-TC-NDJ-TC-NDJ-FA-SDJ-TC-SNJ-TC-SPT-TC-N-PDPT-TC-S-PDPT-FA-S-PDPT-TC-S-EBPT-TC-S-GB
water line
Foundation
Column
15"
9"
3"
Threshold
0
4
8
12
16
0,00% 0,10% 0,20% 0,30% 0,40% 0,50% 0,60%Acid Soluble Chloride Content
(% by weight of concrete)
Hei
ght A
bove
Col
umn
Bas
e (i
n)
NJ-TC-NDJ-TC-NDJ-FA-SDJ-TC-SNJ-TC-SPT-TC-N-PDPT-TC-S-PDPT-FA-S-PDPT-TC-S-EBPT-TC-S-GB
water line
Foundation
Column
15"
9"
3"
Threshold

473
Figure 5.44 Concrete Chloride Penetration at 1.0 inches for All Columns in Dripper Side at End of Testing
Figure 5.45 Concrete Chloride Penetration at 2.0 inches for All Columns in Dripper Side at End of Testing
0
4
8
12
16
0,00% 0,10% 0,20% 0,30% 0,40% 0,50% 0,60%Acid Soluble Chloride Content
(% by weight of concrete)
Hei
ght A
bove
Col
umn
Bas
e (i
n)
NJ-TC-NDJ-TC-NDJ-FA-SDJ-TC-SNJ-TC-SPT-TC-N-PDPT-TC-S-PDPT-FA-S-PDPT-TC-S-EBPT-TC-S-GB
water line
Foundation
Column
15"
9"
3"
Threshold
0
4
8
12
16
0,00% 0,10% 0,20% 0,30% 0,40% 0,50% 0,60%Acid Soluble Chloride Content
(% by weight of concrete)
Hei
ght A
bove
Col
umn
Bas
e (i
n)
NJ-TC-NDJ-TC-NDJ-FA-SDJ-TC-SNJ-TC-SPT-TC-N-PDPT-TC-S-PDPT-FA-S-PDPT-TC-S-EBPT-TC-S-GB
water line
Foundation
Column
15"
9"
3"
Threshold

474
5.3.3 Prediction of specimen Performance using Half-Cell Potential Data
The higher probability of corrosion using half-cell potential readings was
found at the base of the column specimens. There was not a distinct trend with
respect to dripper and non – dripper sides. The poorest performance was found for
unloaded non-prestressed specimens and specimens with no-joint.
There was not a distinct trend between post-tensioned and non-prestressed
columns. Only specimen NJ-TC-S showed slightly higher probability of
corrosion than other specimens, when analyzing absolute values.
Only specimens NJ-TC-N, NJ-TC-S, PT-TC-N-PD (Rebar and PT Bars),
PT-FA-S-PD (PT Bars), and PT-TC-S-EB (Rebar) showed some indication of
corrosion activity over time, when analyzing trends over the total exposure
period.
There was not a distinct trend with respect to post-tensioned bars in plastic
ducts or galvanized ducts. Neither, was there any distinction between Galvanized
or Epoxy coated bars, compared to plain PT-Bars.
5.4 FORENSIC EXAMINATION
5.4.1 Procedure
5.4.1.1 Specimen Condition at End of Testing
Specimens were evaluated at the end of testing for signs of cracking or
distress and corrosion stains.

475
5.4.1.2 Foundation Saw Cuts
Prior to concrete removal, column specimens sharing the same foundation
were separated by saw cutting as shown in Figure 5.46. Due to special saw
cutting equipment requirements, saw cutting had to be contracted with an external
concrete demolition company.
Figure 5.46 Saw Cutting of Column Foundation.
5.4.1.3 Concrete Removal
Concrete in column specimens was carefully removed using pneumatic
equipment, as shown in Figure 5.47. Care was exercised to ensure total
exposure and removal of spiral and longitudinal mild steel reinforcement and
post-tensioning duct/PT bar systems. Reinforcement was immediately inspected
for any color changes due to drying of the corroded steel surfaces, if any.
Reinforcement cages were dismantled for careful reinforcement inspection and
rating.

476
Figure 5.47 Concrete Removal and Reinforcement Dismantling.
5.4.2 Autopsy Program
All specimens (ten in total) were autopsied at the end of six and a half
years of continuous exposure testing. After concrete was removed from each
column, mild steel reinforcement, post-tensioning ducts and high-strength post-
tensioning bars were carefully inspected and rated according to the corrosion

477
rating scheme explained in the following section. During autopsy, ducts were
cut open in half longitudinally, and grout samples were taken at different
locations to investigate chloride ingress to the post-tensioning bar level.
Anchorages and bar splices were also inspected for signs of corrosion in the areas
exposed to concrete and at the crevices, where steel pieces in the post-tensioning
system were in contact.
5.4.3 Evaluation and Corrosion Rating used during Forensic Examination
To maintain consistency in the corrosion ratings among the different series
in the durability project, the same generalized evaluation and rating system
previously used in the macrocell and beam corrosion tests, was used in the
column series with only minor changes due to the specific specimen
characteristics. The length of reinforcing bar, post-tensioning bar and post-
tensioning duct in the column was subdivided into 34 two-inch increments. In
addition, the post-tensioning bar length within the foundation was subdivided into
seven two-inch increments. Dowels were subdivided into 26 two-inch
increments and spirals were subdivided into 11 two-inch increments for every
spiral step in the column North side and 11 two-inch increments for every step in
the column South side. At each increment, the steel was examined and a rating
was assigned to describe the corrosion severity within that increment. The ratings
for all increments were summed to give a total corrosion rating for the element
that could be compared for different specimens. This method allowed evaluation
of corrosion extent and severity.
5.4.3.1 Mild Steel Reinforcement (Spirals, longitudinal Steel and dowels)
Mild steel reinforcement was examined at the intervals described above,
which is also illustrated in Figure 5.48.

478
Figure 5.48 Intervals for Corrosion Ratings on (A) dowels,
(B) mild steel longitudinal bars, and (C) spiral
Dowel distributionat joint
6 dowels:#6 bars
Column Joint
17 two-inch increments
6 two-inch increments
3 two-inch increments
Dowel distributionat joint
6 dowels:#6 bars
Column Joint
17 two-inch increments
6 two-inch increments
3 two-inch increments
Rebar location(no rebar at joint)
6 longitutinal# 6 bars:
Column Joint
34 two-inch increments
Rebar location(no rebar at joint)
6 longitutinal# 6 bars:
Column Joint
34 two-inch increments
Rebar location(no rebar at joint)
6 longitutinal# 6 bars:
Column Joint
34 two-inch increments
#3 spiral at6 in. pitch
Column Joint
286 two-inch increments
North
#3 spiral at6 in. pitch
Column Joint
286 two-inch increments
North
#3 spiral at6 in. pitch
Column Joint
286 two-inch increments
North (B)
(A)
(C)

479
Corrosion ratings were assigned to indicate corrosion severity for each
interval (considering top and bottom surfaces in the same corrosion rating). This
procedure differs from that used in the beam and macrocell corrosion series,
where the horizontal rebar top and bottom surfaces were rated separately.
However, it was found that one corrosion rating was enough to adequately
determine extent and severity of corrosion in these vertical bars. The total bar
corrosion rating was calculated as indicated in the following equations.
Mild steel longitudinal bars:
∑∑= =
=34
1iSegmentiBarj
6
1jRRatingCorrosionBar , Eq. 5.3
Mild steel dowels:
∑∑= =
=26
1iSegmentiDowelj
6
1jRRatingCorrosionDowel , Eq. 5.4
Spiral reinforcement:
Eq. 5.5
The reason for having distinctive totals for the North and South spiral
sides was intended to identify any difference in spiral corrosion condition
between the dripper and the non-dripper sides.
The corrosion rating system used is described in Table 5.12.
∑∑∑∑= == =
+=13
1iStepiSpiralSegmentjSourth
11
1j
13
1iStepiSpiralSegmentjNorth
11
1j
RRRatingCorrosionSpiral ,,

480
Table 5.12 Evaluation and Rating System for Corrosion Found on
Mild Steel Bars 5.6
Code Meaning Description Rating
NC No Corrosion No evidence of corrosion 0
D Discoloration No evidence of corrosion, but some discoloration from original color
1
L Light Surface corrosion on less than one half of the interval, no pitting. Surface corrosion can be removed using cleaning pad.
2
M Moderate Surface corrosion on more than one half of the interval, no pitting. and/or Corrosion can not be completely removed using cleaning pad.
4
P Pitting Pits visible to unaided eye. 8
AR Area Reduction Measurable reduction in bar cross-sectional area due to corrosion
R2
R = Estimated cross-sectional area reduction in percent.
5.4.3.2 Post-Tensioning Ducts
Post-Tensioning ducts were examined over 34 two-inch intervals, as
indicated in Figure 5.49. At each location, corrosion ratings are assigned to
indicate the severity of corrosion on the top and bottom surfaces of the inside and
outside of each duct to reflect the possibility of different corrosion severity and
extent. The corrosion rating system is described in Table 5.13. The total duct
corrosion rating was calculated as follows:
( )∑=
+++=34
1iiBotInneriTopInneriBotOuteriTopOuter RRRRRatingCorrosionDuct ,,,, Eq.5.6
where, RTopOuter,i = top outer surface corrosion rating, interval i
RBotOuter,i = bottom outer surface corrosion rating, interval i
RTopInner,i = top inner surface corrosion rating, interval i
RBotInner,i = bottom inner surface corrosion rating, interval i.

481
Figure 5.49 Intervals for Corrosion Ratings on PT Ducts
Table 5.13 Evaluation and Rating System for Corrosion Found on Post-Tensioning Duct 5.6
Code Meaning Description Rating
NC No Corrosion No evidence of corrosion 0
D Discoloration No evidence of corrosion, but some discoloration from original color
1
L Light Surface corrosion on less than one half of the interval, no pitting.
2
M Moderate Surface corrosion on more than one half of the interval, no pitting.
4
S Severe Corrosion completely covers the interval. and/or Presence of pitting.
8
H Hole Through Duct Hole corroded through duct.
Used in conjunction with ratings D, L, M and S.
32 + Ah
Ah = Area of hole(s) in mm2
Column joint
Duct location
34 two-inch increments
Rubber gaskets to seal dead end of PT ducts.
Column joint
Duct location
34 two-inch increments
Rubber gaskets to seal dead end of PT ducts.

482
5.4.3.3 Post-tensioning Bars
Post-tensioning bars were examined at 34 intervals inside the column
element and at seven two-inch increments in the short length of bar embedded in
the foundation with bearing plate and nut as shown in Figure 5.50.
Figure 5.50 Intervals for Corrosion Ratings on PT Bars
The total corrosion rating was calculated as follows:
∑∑∑∑= == =
+=7
1kkSegmentBarjPT
4
1j
34
1iiSegmentBarjPT
4
1jRRRatingCorrosionBarPT ,, Eq. 5.7
where, RPT Bar j, Segment i…= PT Bar j corrosion rating, interval i
(PT bar portion located inside column element).
RPT Bar j, Segment k…= PT Bar j Corrosion rating, interval k
(PT bar portion inside foundation).
4 PT bars5/8“ diameter
coupler
bearing plateand nut
Column joint
PT bar location
at joint
34 two-inch increments
seven two-inch increments
4 PT bars5/8“ diameter
coupler
bearing plateand nut
Column joint
PT bar location
at joint
34 two-inch increments
seven two-inch increments

483
The evaluation and rating system used for PT bars was the same system
used for mild steel bars, as shown in Table 5.12.
5.4.4 Forensic Examination Results
5.4.4.1 Detailed Visual Inspection
A brief summary of forensic examination results after six and a half years
of exposure is provided for each column specimen in the following sections. In
general, at the end of testing rust stains were only visible in the base of the
columns, in the bottom12 inches. No signs of cracking were observed in the
column surfaces. Figure 5.51 shows the condition of the specimens after
unloading and tie down bar cutting.
Tie down bars had uniform corrosion at the column base level, which
stained the foundation, but no severe pitting was observed on these high-strength
bars.
Figure 5.51 Specimen Condition at the End of Testing.

484
5.4.4.1.1 Specimen NJ-TC-N (No dowel, Class C Concrete, No load)
No signs of cracking were visible in the
column surfaces and no corrosion stains were present
at the column base, as observed in Figure 5.52.
Corrosion in the spiral was mostly
concentrated at the spiral base (first 18 inches). In
this region light corrosion was observed in a few
segments with only two two-inch segments in the
North side (dripper side) showing severe corrosion
and pitting. The rest of the spiral had some
discoloration from the original bar color with no
signs of corrosion. See Figure 5.53.
Figure 5.52 Condition of Specimen NJ-TC-N at the End of Testing
Reinforcing bars were in excellent condition. Only rebar #2 showed light
corrosion in one of the two inch segments as shown in Figure 5.53.
Corrosion Rating:
Specimen NJ-TC-N
Autopsy after 6.5 years
Spiral 532
Rebar 2
Dowel
Duct #1
Duct #2
Duct #3
Duct #4
PT-Bar
NA
NA
NA
NA
NA
NA

485
Figure 5.53 Reinforcement Condition for Specimen NJ-TC-N
5.4.4.1.2 Specimen DJ-TC-N (Doweled Joint, Class C Concrete, No
Load)
Only very few corrosion stains were
visible at the base of the column. The rest of the
specimen had no signs of cracking or corrosion
stains.
Spiral reinforcement had pitting in the
North side at the base of the column in the center
three two-inch segments, as shown in Figure
5.54. Light to moderate corrosion extended up to
a height of 14 inches from the column base, in
Complete Cage Spiral
Rebar #2
Corrosion Rating:
Specimen DJ-TC-N
Autopsy after 6.5 years
Spiral 595
Rebar 35
Dowel
Duct #1
Duct #2
Duct #3
Duct #4
PT-Bar
2704
NA
NA
NA
NA
NA

486
both the North and the South sides. In the dripper side, light corrosion was
concentrated in the center six inches of the total height of the spiral. In the non-
dripper side, only discoloration and few areas of light corrosion were visible in
the total spiral height.
Figure 5.54 Condition of Specimen DJ-TC-N at the End of Testing
The six reinforcing bars showed only light corrosion and discoloration in
the first eight inches from the column base. The rest of the bar lengths were in
excellent condition.
All six dowels showed severe corrosion and pitting at the column base
(column-foundation interface). As shown in Figure 5.55, area reduction in the
dowel bars was concentrated and severe, especially in Dowel #4 and Dowel #5.

487
Figure 5.55 Reinforcement Condition for Specimen DJ-TC-N
5.4.4.1.3 Specimen DJ-FA-S (Doweled Joint, Fly Ash Concrete,
Service Load)
The specimen surface had no signs of
corrosion stains or cracking. Concrete was in
excellent condition at the end of testing. See Figure
5.56.
Spiral reinforcement had moderate corrosion
in the North side (non-dripper side) at the four-inch
level from the column base. Light corrosion was
also concentrated in the spiral North side in the center
four two-inch segments from the four-inch height up
to a height of 30 inches.
Complete Cage Spiral
Rebar #3 Dowel #4
Corrosion Rating:
Specimen DJ-FA-S
Autopsy after 6.5 years
Spiral 360
Rebar 19
Dowel
Duct #1
Duct #2
Duct #3
Duct #4
PT-Bar
619
NA
NA
NA
NA
NA

488
Figure 5.56 Condition of Specimen DJ-FA-S at the End of Testing.
The rest of the spiral in the North and South sides had from light corrosion
to only discoloration.
Mild steel longitudinal reinforcement showed very few areas of light
corrosion. Rebar #2 had light corrosion between the heights of 36 to 52 inches
from the column base (with respect to the rebar analysis length of 68 inches).
This bar was located in the dripper side.
Dowels showed in general light to moderate corrosion in the two-inch
segment at the column base (joint location). Dowel #1 showed the heaviest
corrosion and area loss in this region, as shown in Figure 5.57.

489
Figure 5.57 Reinforcement Condition for Specimen DJ-FA-S
5.4.4.1.4 Specimen DJ-TC-S (Doweled Joint, Class C Concrete,
Service Load)
No signs of corrosion were observed in the
column surfaces at the end of testing. Concrete was
in excellent condition.
Spiral reinforcement showed very similar
corrosion ratings in the non-dripper and dripper
sides. Light to moderate corrosion was concentrated
in the first 22 inches from the column base; and, also
some areas of moderate corrosion were observed in
a few segments at the 46-inch and 53-inch levels.
Complete Cage Spiral
Rebar #1 Dowel #1
Corrosion Rating:
Specimen DJ-TC-S
Autopsy after 6.5 years
Spiral 458
Rebar 26
Dowel
Duct #1
Duct #2
Duct #3
Duct #4
PT-Bar
86
NA
NA
NA
NA
NA

490
Figure 5.58 Condition of Specimen DJ-TC-S at the End of Testing
Rebar corrosion in all cases was reduced to only light corrosion and bar
discoloration in the first six segments. Moderate corrosion was very localized as
observed in Rebar #3 in Figure 5.59.
Dowels showed light pitting and moderate corrosion in the vicinity of the
column joint. Section loss was not significant, as observed in Figure 5.59.
Figure 5.59 Reinforcement Condition for Specimen DJ-TC-S Rebar #3
Complete Cage Spiral
Dowel #3

491
5.4.4.1.5 Specimen NJ-TC-S (No dowel, Class C Concrete, Service
load)
No signs of cracking or spalling were
visible on the column surfaces. Rust stains
extended the first 5 inches, from the column base,
as shown in Figure 5.60. No other signs of
corrosion were visible in the specimen.
Extremely severe spiral corrosion was
mostly located at the base, in the North side
(Dripper side) in the first three spiral steps (see
Figure 5.61).
Rebar corrosion was concentrated in the
first four inches from the column base. Rebar #1
showed the most severe corrosion with light pitting, while the other bars only had
light to moderate corrosion . See Figure 5.61.
The specimen did not have dowels.
Figure 5.60 Condition of Specimen NJ-TC-S at the End of Testing
Corrosion Rating:
Specimen NJ-TC-S
Autopsy after 6.5 years
Spiral 10266
Rebar 32
Dowel
Duct #1
Duct #2
Duct #3
Duct #4
PT-Bar
NA
NA
NA
NA
NA
NA

492
Figure 5.61 Reinforcement Condition for Specimen NJ-TC-S
5.4.4.1.6 Specimen PT-TC-N-PD (Post-Tensioned, Class C Concrete,
No Load, Plastic Duct)
As shown in Figure 5.62, the concrete
surface was in excellent condition at the end of
testing. No signs of corrosion stains or cracking
were visible.
As shown in Figure 5.63, the spiral
reinforcement showed light to moderate uniform
corrosion in the first two steps (up to a height of
nine inches). From this level to the top of the
Rebar #1
Spiral Complete Cage
Corrosion Rating:
Specimen PT-TC-N-PD
Autopsy after 6.5 years
Spiral 351
Rebar 9
Dowel
Duct #1
Duct #2
Duct #3
Duct #4
PT-Bar
NA
Plastic
Plastic
276
4
673

493
spiral (corresponding to the top of the column), the reinforcement only showed
discoloration.
Figure 5.62 Condition of Specimen PT-TC-N-PD at the End of Testing
Figure 5.63 Reinforcement Condition for Specimen PT-TC-N-PD
Complete Cage
Rebar #1
Spiral

494
Rebar corrosion was negligible .
As shown in Figure 5.65, plastic ducts were in good condition with no
signs of damage. One galvanized steel duct (Duct #3) showed moderate
corrosion in the first 10 inches from the column base. This duct was located in
the dripper side. Severe corrosion was found on this duct in the first two inches, in
the area were the rubber gasket was located. Duct #4 in the non-dripper side
showed negligible corrosion at the base.
The anchorage plate in the top of the column, below the pour-back, was
found with moderate to severe corrosion, as shown in Figure 5.64. This finding
was typical for all Post-Tensioned specimens.
Post-tensioned bars showed severe corrosion and section loss at the
column-foundation joint section, as shown in Figure 5.65. PT bar localized
corrosion was observed in both post-tensioned bars in the dripper side, in both
plastic and galvanized steel duct.
Figure 5.64 PT Bar Top Anchorage Condition for Specimen PT-TC-N-PD

495
Figure 5.65 Reinforcement Condition for Specimen PT-TC-N-PD
Duct #1
PT Bar #2
PT Bar #1
Duct #2
Duct #3
PT Bar #3
Duct #4
PT Bar #4
At column joint

496
5.4.4.1.7 Specimen PT-TC-S-PD (Post-Tensioned, Class C Concrete,
Service Load, Plastic Duct)
As shown in Figure 5.66, no signs of
corrosion or cracking were present in the
concrete surfaces at the end of testing.
As shown in Figure 5.67, spiral
reinforcement was found in very good condition
at the end of testing. There was light corrosion
up to a level of 9 inches in both dripper and
non-dripper sides.
Rebar corrosion was negligible.
Figure 5.68 indicates that plastic ducts
were in good condition, while galvanized steel ducts showed substantial area loss
(approximately 260 mm2 for Duct #3 and 1400 m2 for Duct #4) in the first two
inches from the column base, behind the rubber gasket. Post-tensioned bars
showed moderate corrosion in the vicinity of the joint section and light to
negligible corrosion in the other areas.
Figure 5.66 Condition of Specimen PT-TC-S-PD at the End of Testing
Corrosion Rating:
Specimen PT-TC-S-PD
Autopsy after 6.5 years
Spiral 339
Rebar 3
Dowel
Duct #1
Duct #2
Duct #3
Duct #4
PT-Bar
NA
Plastic
Plastic
312
1461
146

497
Figure 5.67 Reinforcement Condition for Specimen PT-TC-S-PD
Figure 5.68 Duct and PT Bar Condition for Specimen PT-TC-S-PD
Complete Cage Spiral
Rebar #4
Duct #1 Duct #4
PT Bar #1
At column joint

498
5.4.4.1.8 Specimen PT-FA-S-PD (Post-Tensioned, Fly Ash Concrete,
Service Load, Plastic Duct)
The concrete surface was in excellent
condition at the end of testing as shown in Figure
5.69.
Figure 5.70 indicates that spiral
reinforcement showed light corrosion and
discoloration in approximately the first 23 inches
from the column base level. No distinction was
observed between the dripper and non-dripper
sides. Rebar reinforcement corrosion was
negligible.
Plastic ducts were in good condition and galvanized steel ducts showed
moderate to severe corrosion in the first two inches from the column base level, in
the rubber gasket location, as shown in Figure 5.71. Post-tensioned bars also
showed moderated corrosion concentrated around the column-foundation joint
section.
Figure 5.69 Condition of Specimen PT-FA-S-PD at the End of Testing
Corrosion Rating:
Specimen PT-FA-S-PD
Autopsy after 6.5 years
Spiral 337
Rebar 12
Dowel
Duct #1
Duct #2
Duct #3
Duct #4
PT-Bar
NA
Plastic
Plastic
12
12
95

499
Figure 5.70 Reinforcement Condition for Specimen PT-FA-S-PD.
Figure 5.71 Duct and PT Bar Condition for Specimen PT-FA-S-PD
Complete Cage Spiral
Rebar #6
Duct #1 PT Bar #2 and Duct #2
PT Bar #3 and Duct #3
Rubber Gasket
PT Bar Corrosion at column-foundation interface

500
5.4.4.1.9 Specimen PT-TC-S-EB (Post-Tensioned, Class C Concrete,
Service Load, Epoxy –Coated PT Bar)
Few corrosion stains were visible at the
end of testing in the base of the column, as shown
in Figure 5.72.
Figure 5.73 shows that spiral
reinforcement corrosion was limited to
discoloration in the whole spiral length and mild
steel longitudinal reinforcement had negligible
corrosion.
Figure 5.74 showed ducts had very severe
corrosion and extensive area loss in the first two to
three inches from the column base level, behind
the rubber gasket location.
Epoxy-coated post-tensioning bars (PT Bars #3 and #4) showed localized
corrosion at the column-foundation joint section. The other areas of bar were in
excellent condition. Regular black steel bars (PT Bars #1 and #2) had light to
moderate corrosion in the vicinity (+/- 10 inches) of the column base.
Figure 5.72 Condition of Specimen PT-TC-S-EB at the End of Testing
Corrosion Rating:
Specimen PT-TC-S-EB
Autopsy after 6.5 years
Spiral 291
Rebar 6
Dowel
Duct #1
Duct #2
Duct #3
Duct #4
PT-Bar #1,#2
PT-Bar #3,#4
NA
1740
16
2590
440
42
10

501
Figure 5.73 Reinforcement Condition for Specimen PT-TC-S-EB
Figure 5.74 Duct and PT Bar Condition for Specimen PT-TC-S-EB
Spiral Rebar #3
Duct #4
PT Bar #3
PT Bar #1

502
5.4.4.1.10 Specimen PT-TC-S-GB (Post-Tensioned, Class C Concrete,
Service Load, Galvanized PT
Bar)
Figure 5.75 showed that at the end of
testing, no cracking or other signs of distress
were observed.
Figure 5.76 indicates that the spiral
reinforcement in the dripper side had only light
corrosion at a level of three inches from the
column base, and light corrosion in the center
region from a height of 53 inches to 64 inches.
In the non-dripper side, no corrosion was found
in the spiral steel. No corrosion was found on
mild steel longitudinal reinforcement .
Figure 5.77 shows that ducts were corroded with extensive area loss in the
first two inches from the column base level, at the rubber gasket location.
Figure 5.75 Condition of Specimen PT-TC-S-GB at the End of Testing
Corrosion Rating:
Specimen PT-TC-S-GB
Autopsy after 6.5 years
Spiral 331
Rebar 0
Dowel
Duct #1
Duct #2
Duct #3
Duct #4
PT-Bar #1,#2
PT-Bar #3,#3
NA
2174
1810
2664
2665
39
21

503
Galvanized PT bars (PT Bars #3 and #4) showed localized corrosion and
pitting at the column base level. Black steel bars showed a more uniform
corrosion in the vicinity of the joint section (the region defined between 12 inches
at each side of the joint).
Figure 5.76 Reinforcement Condition for Specimen PT-TC-S-GB
Figure 5.77 Reinforcement Condition for Specimen PT-TC-S-GB
Complete Cage
Rebar #3
Spiral
Duct PT Bar #4

504
5.4.4.2 Corrosion Rating Summary
Spiral, longitudinal mild steel, dowel, duct and post-tensioning bar ratings
are listed in Tables 5.14 through 5.24, and plotted in Figure 5.78 through Figure
5.87. Average, standard deviation and median values are listed at the bottom of
the total corrosion tables. All these results correspond to the autopsy performed
at six and a half years of exposure testing.
Data is presented in two analysis scenarios:
• Maximum corrosion rating in any two-inch increment
• Total corrosion rating in the complete element, adding corrosion rating for all
increments
Specimen notation from Table 5.4 is repeated herein, in Table 5.14, to
assist the reader:
Table 5.14 Specimen Notation5.1
Connection Type Loading Concrete type PT Protection
DJ: Doweled Joint PD: Plastic Duct
PT: Post-Tensioned
Joint
N: No
Load
TC: TxDOT Class C
EB: Epoxy-Coated PT Bar**
GB: Galvanized PT Bar** NJ: No dowel S:Service
Load
FA: 35% Fly Ash
Blank: Not applicable (i.e., no PT)
Example: PT-TC-S-PD
* plastic ducts used for bars 1 and 2, galvanized steel ducts used for bars 3 and 4
** epoxy-coated or galvanized bars used for bars 3 and 4, uncoated bars used for bars 1 and 2

505
Table 5.15 Maximum Spiral Corrosion Rating in any two-inch increment for All Specimens
Table 5.16 Total Spiral Corrosion Rating for All Specimens
SpecimenName Dripper side Non-Dripper side Total
NJ-TC-N 322 210 532DJ-TC-N 367 228 595DJ-FA-S 175 185 360DJ-TC-S 216 242 458NJ-TC-S 10123 143 10266
PT-TC-N-PD 177 174 351PT-TC-S-PD 169 170 339PT-FA-S-PD 159 178 337PT-TC-S-EB 148 143 291PT-TC-S-GB 177 154 331
Average 1203.3 182.7 1386Std. Dev. 2974.1 32.5 2961.5Median 177 176 355.5
Total Spiral Corrosion Rating
SpecimenName Dripper side Non-Dripper side
NJ-TC-N 100 2DJ-TC-N 62 4DJ-FA-S 8 4DJ-TC-S 8 4NJ-TC-S 3470 1
PT-TC-N-PD 8 4PT-TC-S-PD 2 2PT-FA-S-PD 2 2PT-TC-S-EB 1 1PT-TC-S-GB 2 2
Maximum Spiral Corrosion Rating

506
Table 5.17 Maximum Rebar Corrosion Rating in any two-inch Increment for All Specimens.
Table 5.18 Total Rebar Corrosion Rating for All Specimens
SpecimenName Bar #1 Bar #2 Bar #3 Bar #4 Bar #5 Bar #6 Total
NJ-TC-N 0 2 0 0 0 0 2DJ-TC-N 3 7 4 8 9 4 35DJ-FA-S 4 13 0 0 2 0 19DJ-TC-S 9 2 9 3 0 3 26NJ-TC-S 16 10 0 0 0 6 32
PT-TC-N-PD 0 0 6 0 0 3 9PT-TC-S-PD 0 0 0 0 3 0 3PT-FA-S-PD 0 0 0 3 3 6 12PT-TC-S-EB 2 4 0 0 0 0 6PT-TC-S-GB 0 0 0 0 0 0 0
Average 3.4 3.8 1.9 1.4 1.7 2.2 14.4Std. Dev. 5.0 4.4 3.1 2.5 2.7 2.4 12.2Median 1 2 0 0 0 1.5 10.5
Total Rebar Corrosion Rating
SpecimenName
NJ-TC-N 2DJ-TC-N 2DJ-FA-S 1DJ-TC-S 2NJ-TC-S 8
PT-TC-N-PD 2PT-TC-S-PD 2PT-FA-S-PD 2PT-TC-S-EB 2PT-TC-S-GB 0
Maximum RebarCorrosion Rating

507
Table 5.19 Maximum Dowel Corrosion Rating in any two-inch Increment for All Specimens
Table 5.20 Total Dowel Corrosion Rating for All Specimens
SpecimenName Dowel #1 Dowel #2 Dowel #3 Dowel #4 Dowel #5 Dowel #6 Total
NJ-TC-N NA NA NA NA NA NA NADJ-TC-N 24 8 15 2284 365 8 2704DJ-FA-S 603 4 0 4 4 4 619DJ-TC-S 20 26 25 1 6 8 86NJ-TC-S NA NA NA NA NA NA NA
PT-TC-N-PD NA NA NA NA NA NA NAPT-TC-S-PD NA NA NA NA NA NA NAPT-FA-S-PD NA NA NA NA NA NA NAPT-TC-S-EB NA NA NA NA NA NA NAPT-TC-S-GB NA NA NA NA NA NA NA
Average 216 13 13 763 125 7 1136Std. Dev. 273.9 9.6 10.3 1075.5 169.7 1.9 1129.7Median 24 8 15 4 6 8 619
NA: NON APPLICABLE
Total Dowel Corrosion Rating
SpecimenName
NJ-TC-N NADJ-TC-N 2276DJ-FA-S 591DJ-TC-S 8NJ-TC-S NA
PT-TC-N-PD NAPT-TC-S-PD NAPT-FA-S-PD NAPT-TC-S-EB NAPT-TC-S-GB NA
NA: NON APPLICABLE
Maximum DowelCorrosion Rating

508
Table 5.21 Maximum Duct Corrosion Rating in any two-inch Increment for All Specimens
Table 5.22 Total Duct Corrosion Rating for All Specimens
SpecimenName Duct #1 Duct #2 Duct #3 Duct #4
NJ-TC-N NA NA NA NADJ-TC-N NA NA NA NADJ-FA-S NA NA NA NADJ-TC-S NA NA NA NANJ-TC-S NA NA NA NA
PT-TC-N-PD Plastic Plastic 276 4PT-TC-S-PD Plastic Plastic 312 1461PT-FA-S-PD Plastic Plastic 12 12PT-TC-S-EB 1740 16 2590 440PT-TC-S-GB 2174 1810 2664 2665
Average 1957 913 1171 916Std. Dev. 217.0 897.0 1193.7 1022.9Median 1957 913 312 440
NA: NON APPLICABLE
Total Duct Corrosion Rating
SpecimenName Duct #1 Duct #2 Duct #3 Duct #4
NJ-TC-N NA NA NA NADJ-TC-N NA NA NA NADJ-FA-S NA NA NA NADJ-TC-S NA NA NA NANJ-TC-S NA NA NA NA
PT-TC-N-PD Plastic Plastic 232 2PT-TC-S-PD Plastic Plastic 292 1446PT-FA-S-PD Plastic Plastic 8 8PT-TC-S-EB 1732 8 2582 432PT-TC-S-GB 2166 1802 2656 2657
NA: NON APPLICABLE
Maximum Duct Corrosion Rating

509
Table 5.23 Maximum PT-Bar Corrosion Rating in any two-inch Increment for All Specimens
Table 5.24 Total PT-Bar Corrosion Rating for All Specimens
SpecimenName Bar #1 Bar #2 Bar #3 Bar #4 Total
NJ-TC-N NA NA NA NA NADJ-TC-N NA NA NA NA NADJ-FA-S NA NA NA NA NADJ-TC-S NA NA NA NA NANJ-TC-S NA NA NA NA NA
PT-TC-N-PD 15 626 16 16 673PT-TC-S-PD 16 22 27 81 146PT-FA-S-PD 37 15 12 31 95PT-TC-S-EB 27 15 4 6 52PT-TC-S-GB 18 21 12 9 60
Average 23 140 14 29 205Std. Dev. 8.4 243.1 7.5 27.6 236.2Median 18 21 12 16 95
NA: NON APPLICABLE
Total PT-Bar Corrosion Rating
SpecimenName
NJ-TC-N NADJ-TC-N NADJ-FA-S NADJ-TC-S NANJ-TC-S NA
PT-TC-N-PD 608PT-TC-S-PD 4PT-FA-S-PD 4PT-TC-S-EB 4PT-TC-S-GB 4
NA: NON APPLICABLE
Corrosion RatingMaximum PT-Bar

510
Figure 5.78 Maximum Spiral Corrosion Rating in any two-inch Increment for All Specimens.
Figure 5.79 Total Spiral Corrosion Rating for All Specimens.
100
8 8
62
82 2 1 22 1
4 44
42 2 1 2
0
30
60
90
120
150
NJ-
TC-N
NJ-
TC-S
DJ-
FA-S
DJ-
TC-S
DJ-
TC-N
PT-T
C-N
-PD
PT-T
C-S
-PD
PT-F
A-S
-PD
PT-T
C-S
-EB
PT-T
C-S
-GB
Cor
rosi
on R
atin
gDripper side
Non-Dripper side
3470
THRESHOLD OF CONCERN = 8Doweled Joint, Class C Concr., UnloadedDJ-TC-N
Post-tensioned, Class C Concr.,Unloaded, Plastic Duct
PT-TC-N-PD
Post-tensioned, Class C Concr., S.Load, Plastic Duct
PT-TC-S-PD
Post-tensioned, Fly Ash Concrete,S. Load, Plastic Duct
PT-FA-S-PD
Post-tensioned, Class C Concr., S. Load, Epoxy Coated PT Bars
PT-TC-S-EB
Post-Tensioned, Class C Concr., S. Load, Galvanized PT Bars
PT-TC-S-GB
Doweled Joint, Class C Concr., Service Load
DJ-TC-S
Doweled Joint, Fly Ash Concrete, Service Load
DJ-FA-S
No Dowel, Class C Concr., Service LoadNJ-TC-S
No Dowel, Class C Concr., UnloadedNJ-TC-N
Column Variable
Doweled Joint, Class C Concr., UnloadedDJ-TC-N
Post-tensioned, Class C Concr.,Unloaded, Plastic Duct
PT-TC-N-PD
Post-tensioned, Class C Concr., S.Load, Plastic Duct
PT-TC-S-PD
Post-tensioned, Fly Ash Concrete,S. Load, Plastic Duct
PT-FA-S-PD
Post-tensioned, Class C Concr., S. Load, Epoxy Coated PT Bars
PT-TC-S-EB
Post-Tensioned, Class C Concr., S. Load, Galvanized PT Bars
PT-TC-S-GB
Doweled Joint, Class C Concr., Service Load
DJ-TC-S
Doweled Joint, Fly Ash Concrete, Service Load
DJ-FA-S
No Dowel, Class C Concr., Service LoadNJ-TC-S
No Dowel, Class C Concr., UnloadedNJ-TC-N
Column Variable
175
367
174143
159169
216177
148177
322
154
228
143
210178170
185
242
0
100
200
300
400
500
600
NJ-
TC-N
NJ-
TC-S
DJ-
FA-S
DJ-
TC-S
DJ-
TC-N
PT-T
C-N
-PD
PT-T
C-S
-PD
PT-F
A-S
-PD
PT-T
C-S
-EB
PT-T
C-S
-GB
Cor
rosi
on R
atin
g
Dripper side
Non-Dripper side
10123
Doweled Joint, Class C Concr., UnloadedDJ-TC-N
Post-tensioned, Class C Concr.,Unloaded, Plastic Duct
PT-TC-N-PD
Post-tensioned, Class C Concr., S.Load, Plastic Duct
PT-TC-S-PD
Post-tensioned, Fly Ash Concrete,S. Load, Plastic Duct
PT-FA-S-PD
Post-tensioned, Class C Concr., S. Load, Epoxy Coated PT Bars
PT-TC-S-EB
Post-Tensioned, Class C Concr., S. Load, Galvanized PT Bars
PT-TC-S-GB
Doweled Joint, Class C Concr., Service Load
DJ-TC-S
Doweled Joint, Fly Ash Concrete, Service Load
DJ-FA-S
No Dowel, Class C Concr., Service LoadNJ-TC-S
No Dowel, Class C Concr., UnloadedNJ-TC-N
Column Variable

511
Figure 5.80 Maximum Rebar Corrosion Rating in any two-inch Increment for All Specimens.
Figure 5.81 Total Rebar Corrosion Rating for All Specimens.
28
1 2 2 2 2 2 2 00
30
60
90
120
150
NJ-
TC-N
NJ-
TC-S
DJ-
FA-S
DJ-
TC-S
DJ-
TC-N
PT-T
C-N
-PD
PT-T
C-S
-PD
PT-F
A-S
-PD
PT-T
C-S
-EB
PT-T
C-S
-GB
Cor
rosi
on R
atin
g
THRESHOLD OF CONCERN = 8
Doweled Joint, Class C Concr., UnloadedDJ-TC-N
Post-tensioned, Class C Concr.,Unloaded, Plastic Duct
PT-TC-N-PD
Post-tensioned, Class C Concr., S.Load, Plastic Duct
PT-TC-S-PD
Post-tensioned, Fly Ash Concrete,S. Load, Plastic Duct
PT-FA-S-PD
Post-tensioned, Class C Concr., S. Load, Epoxy Coated PT Bars
PT-TC-S-EB
Post-Tensioned, Class C Concr., S. Load, Galvanized PT Bars
PT-TC-S-GB
Doweled Joint, Class C Concr., Service Load
DJ-TC-S
Doweled Joint, Fly Ash Concrete, Service Load
DJ-FA-S
No Dowel, Class C Concr., Service LoadNJ-TC-S
No Dowel, Class C Concr., UnloadedNJ-TC-N
Column Variable
232 19 26 35
9 3 12 6 00
100
200
300
400
500
600
NJ-
TC-N
NJ-
TC-S
DJ-
FA-S
DJ-
TC-S
DJ-
TC-N
PT-T
C-N
-PD
PT-T
C-S
-PD
PT-F
A-S
-PD
PT-T
C-S
-EB
PT-T
C-S
-GB
Cor
rosi
on R
atin
g
Doweled Joint, Class C Concr., UnloadedDJ-TC-N
Post-tensioned, Class C Concr.,Unloaded, Plastic Duct
PT-TC-N-PD
Post-tensioned, Class C Concr., S.Load, Plastic Duct
PT-TC-S-PD
Post-tensioned, Fly Ash Concrete,S. Load, Plastic Duct
PT-FA-S-PD
Post-tensioned, Class C Concr., S. Load, Epoxy Coated PT Bars
PT-TC-S-EB
Post-Tensioned, Class C Concr., S. Load, Galvanized PT Bars
PT-TC-S-GB
Doweled Joint, Class C Concr., Service Load
DJ-TC-S
Doweled Joint, Fly Ash Concrete, Service Load
DJ-FA-S
No Dowel, Class C Concr., Service LoadNJ-TC-S
No Dowel, Class C Concr., UnloadedNJ-TC-N
Column Variable

512
Figure 5.82 Maximum Dowel Corrosion Rating in any two-inch Increment for All Specimens.
Figure 5.83 Total Dowel Corrosion Rating for All Specimens.
2276
591
80
500
1000
1500
2000
2500
3000
DJ-
TC-N
DJ-
FA-S
DJ-
TC-S
Cor
rosi
on R
atin
g
THRESHOLD OF CONCERN = 8
Doweled Joint, Class C Concr., Service Load
DJ-TC-S
Doweled Joint, Fly Ash Concrete, Service Load
DJ-FA-S
Doweled Joint, Class C Concr., Unloaded
DJ-TC-N
Column Variable
Doweled Joint, Class C Concr., Service Load
DJ-TC-S
Doweled Joint, Fly Ash Concrete, Service Load
DJ-FA-S
Doweled Joint, Class C Concr., Unloaded
DJ-TC-N
Column Variable
619
86
2704
0
500
1000
1500
2000
2500
3000
DJ-
TC-N
DJ-
FA-S
DJ-
TC-S
Cor
rosi
on R
atin
g
Doweled Joint, Class C Concr., Service Load
DJ-TC-S
Doweled Joint, Fly Ash Concrete, Service Load
DJ-FA-S
Doweled Joint, Class C Concr., Unloaded
DJ-TC-N
Column Variable
Doweled Joint, Class C Concr., Service Load
DJ-TC-S
Doweled Joint, Fly Ash Concrete, Service Load
DJ-FA-S
Doweled Joint, Class C Concr., Unloaded
DJ-TC-N
Column Variable

513
Figure 5.84 Maximum Duct Corrosion Rating in any two-inch Increment for All Specimens.
Figure 5.85 Total Duct Corrosion Rating for All Specimens.
1732
2166
8
1802
232 292
8
25822656
2
1446
8
432
2657
Plas
tic
Plas
tic
Plas
tic
Plas
tic
Plas
tic
Plas
tic
0
500
1000
1500
2000
2500
3000
PT-T
C-N
-PD
PT-T
C-S
-PD
PT-F
A-S
-PD
PT-T
C-S
-EB
PT-T
C-S
-GB
Cor
rosi
on R
atin
gDuct #1Duct #2Duct #3Duct #4
THRESHOLD OF CONCERN = 8
Post-Tensioned, Class C Concr., S. Load, Galvanized PT Bars
PT-TC-S-GB
Post-tensioned, Class C Concr., S. Load, Epoxy Coated PT Bars
PT-TC-S-EB
Post-tensioned, Fly Ash Concrete,S. Load, Plastic Duct
PT-FA-S-PD
Post-tensioned, Class C Concr., S.Load, Plastic Duct
PT-TC-S-PD
Post-tensioned, Class C Concr.,Unloaded, Plastic Duct
PT-TC-N-PD
Column Variable
1740
2174
16
1810
276 312
12
25902664
4
1461
12
440
2665
Plas
tic
Plas
tic
Plas
tic
Plas
tic
Plas
tic
Plas
tic
0
500
1000
1500
2000
2500
3000
PT-T
C-N
-PD
PT-T
C-S
-PD
PT-F
A-S
-PD
PT-T
C-S
-EB
PT-T
C-S
-GB
Cor
rosi
on R
atin
g
Duct #1Duct #2Duct #3Duct #4
Post-Tensioned, Class C Concr., S. Load, Galvanized PT Bars
PT-TC-S-GB
Post-tensioned, Class C Concr., S. Load, Epoxy Coated PT Bars
PT-TC-S-EB
Post-tensioned, Fly Ash Concrete,S. Load, Plastic Duct
PT-FA-S-PD
Post-tensioned, Class C Concr., S.Load, Plastic Duct
PT-TC-S-PD
Post-tensioned, Class C Concr.,Unloaded, Plastic Duct
PT-TC-N-PD
Column Variable

514
Figure 5.86 Maximum PT-Bar Corrosion Rating in any two-inch Increment for All Specimens.
Figure 5.87 Total PT-Bar Corrosion Rating for All Specimens.
608
4 4 4 40
100
200
300
400
500
600
700
PT-T
C-N
-PD
PT-T
C-S
-PD
PT-F
A-S
-PD
PT-T
C-S
-EB
PT-T
C-S
-GB
Cor
rosi
on R
atin
g
THRESHOLD OF CONCERN = 8
Post-Tensioned, Class C Concr., S. Load, Galvanized PT Bars
PT-TC-S-GB
Post-tensioned, Class C Concr., S. Load, Epoxy Coated PT Bars
PT-TC-S-EB
Post-tensioned, Fly Ash Concrete,S. Load, Plastic Duct
PT-FA-S-PD
Post-tensioned, Class C Concr., S.Load, Plastic Duct
PT-TC-S-PD
Post-tensioned, Class C Concr.,Unloaded, Plastic Duct
PT-TC-N-PD
Column Variable
Post-Tensioned, Class C Concr., S. Load, Galvanized PT Bars
PT-TC-S-GB
Post-tensioned, Class C Concr., S. Load, Epoxy Coated PT Bars
PT-TC-S-EB
Post-tensioned, Fly Ash Concrete,S. Load, Plastic Duct
PT-FA-S-PD
Post-tensioned, Class C Concr., S.Load, Plastic Duct
PT-TC-S-PD
Post-tensioned, Class C Concr.,Unloaded, Plastic Duct
PT-TC-N-PD
Column Variable608
4 4 4 40
100
200
300
400
500
600
700
PT-T
C-N
-PD
PT-T
C-S
-PD
PT-F
A-S
-PD
PT-T
C-S
-EB
PT-T
C-S
-GB
Cor
rosi
on R
atin
g
THRESHOLD OF CONCERN = 8
Post-Tensioned, Class C Concr., S. Load, Galvanized PT Bars
PT-TC-S-GB
Post-tensioned, Class C Concr., S. Load, Epoxy Coated PT Bars
PT-TC-S-EB
Post-tensioned, Fly Ash Concrete,S. Load, Plastic Duct
PT-FA-S-PD
Post-tensioned, Class C Concr., S.Load, Plastic Duct
PT-TC-S-PD
Post-tensioned, Class C Concr.,Unloaded, Plastic Duct
PT-TC-N-PD
Column Variable
Post-Tensioned, Class C Concr., S. Load, Galvanized PT Bars
PT-TC-S-GB
Post-tensioned, Class C Concr., S. Load, Epoxy Coated PT Bars
PT-TC-S-EB
Post-tensioned, Fly Ash Concrete,S. Load, Plastic Duct
PT-FA-S-PD
Post-tensioned, Class C Concr., S.Load, Plastic Duct
PT-TC-S-PD
Post-tensioned, Class C Concr.,Unloaded, Plastic Duct
PT-TC-N-PD
Column Variable
15 1637 27 18
626
22 15 15 2116 27 12 4 1216
81
316 9
0
100
200
300
400
500
600
700
PT-T
C-N
-PD
PT-T
C-S
-PD
PT-F
A-S
-PD
PT-T
C-S
-EB
PT-T
C-S
-GB
Cor
rosi
on R
atin
g
PT-Bar #1
PT-Bar #2
PT-Bar #4
PT-Bar #5
plas
tic d
uct
plas
tic d
uct
plas
tic d
uct
plas
tic d
uct
epox
y co
ated
PT
bars
epox
y co
ated
PT
bars
plas
tic d
uct
plas
tic d
uct
galv
aniz
ed P
T ba
rs
galv
aniz
ed P
T ba
rs
Post-Tensioned, Class C Concr., S. Load, Galvanized PT Bars
PT-TC-S-GB
Post-tensioned, Class C Concr., S. Load, Epoxy Coated PT Bars
PT-TC-S-EB
Post-tensioned, Fly Ash Concrete,S. Load, Plastic Duct
PT-FA-S-PD
Post-tensioned, Class C Concr., S.Load, Plastic Duct
PT-TC-S-PD
Post-tensioned, Class C Concr.,Unloaded, Plastic Duct
PT-TC-N-PD
Column Variable

515
Based on the pitting values of Tables 5.12 and 5.13, and to put corrosion
ratings in perspective, a “threshold value of concern” was assigned at the
corrosion rating of 8, for the maximum (rebar, PT bars, and duct) corrosion rating
found in any two-inch interval. A corrosion rating of 8 corresponds to pitting
visible to the unaided eye in rebar or PT bars and pitting and severe corrosion
found on the duct surface. Above this threshold value, severe pitting, and section
loss is expected.
A threshold value is not indicated in the total corrosion ratings, since it
could be misleading. However, by comparing maximum corrosion ratings with
total corrosion rating, it is possible to gain a sense of corrosion severity and extent
in the element.
After six and a half years of exposure, Figure 5.78 shows that in the
dripper side, specimen NJ-TC-S (No dowel, type C concrete, service load)
showed extremely severe spiral corrosion rating, over 400 times the threshold
value. With applied loading the epoxy joint used in non-joint specimens could
have opened up in the North side (refer to applied moment direction in Figure
5.13) and moisture and chlorides could have been able to penetrate the joint (see
Figure 5.60). In addition, it appears that the concrete cover was between half to
one inch at the base of the column, instead of the design value of two inches, and
therefore moisture could have penetrated rapidly to the spiral level.
Specimen NJ-TC-N and DJ-TC-N also showed very high maximum spiral
corrosion ratings. Specimens DJ-FA-S, DJ-TC-S, and all post-tensioned
specimens showed essentially negligible maximum spiral corrosion ratings at or
below the threshold value. In the non-dripper side, all specimens showed
maximum corrosion ratings below the threshold value.
Spiral corrosion in all specimens was mostly concentrated in the bottom
18 inches. Total spiral corrosion was higher in specimen NJ-TC-S, the same

516
specimen that showed maximum spiral corrosion in any two-inch increment. The
worst performance of this specimen was followed by moderately elevated
readings for specimens NT-TC-N and DJ-TC-N. For all other specimens, (DJ-FA-
S, DJ-TC-S, and all PT specimens) total spiral corrosion rating is similar and
there is not a clear distinction between the dripper and the non dripper sides.
Maximum rebar corrosion rating as shows in Figure 5.80 was in all cases
below the threshold value, at levels of very light corrosion, except specimen NJ-
TC-S that had a rating of 8, just at the threshold value, meaning some pitting
visible with the unaided eye. Using maximum corrosion ratings no clear
distinction exists, between post-tensioned and non post-tensioned specimens, and
between specimens with Fly Ash concrete and Class C concrete.
Total rebar corrosion ratings of Figure 5.81 suggest a better performance
of PT specimens. However, the exception was specimen NJ-TC-N (No dowel,
class C concrete, no load), which showed very low total corrosion rating, only
surpassed by specimen PT-TC-S-GB.
Dowel corrosion was mostly concentrated at the column-foundation
interface. At this cold joint localized corrosion was extremely severe. Figure 5.82
indicated that specimens DJ-TC-N and DJ-FA-S showed very large dowel section
loss. Specimens DJ-TC-S showed a maximum corrosion rating equal to the
threshold value, representing some pitting in the bar surface. Total dowel
corrosion ratings were very similar to the maximum dowel corrosion ratings since
corrosion was localized. Dowel joints did not have an epoxy bonding agent at
the joint, as with the no-joint specimens, and therefore, moisture and chlorides
found an easy path towards the dowel location. The loaded specimen with
Standard Concrete may have been benefited from the precompression applied to
the joint. It is not clear the reason why Specimen DJ-FA-S showed more dowel
corrosion than Specimen DJ-TC-S. One possibility is to consider that loading
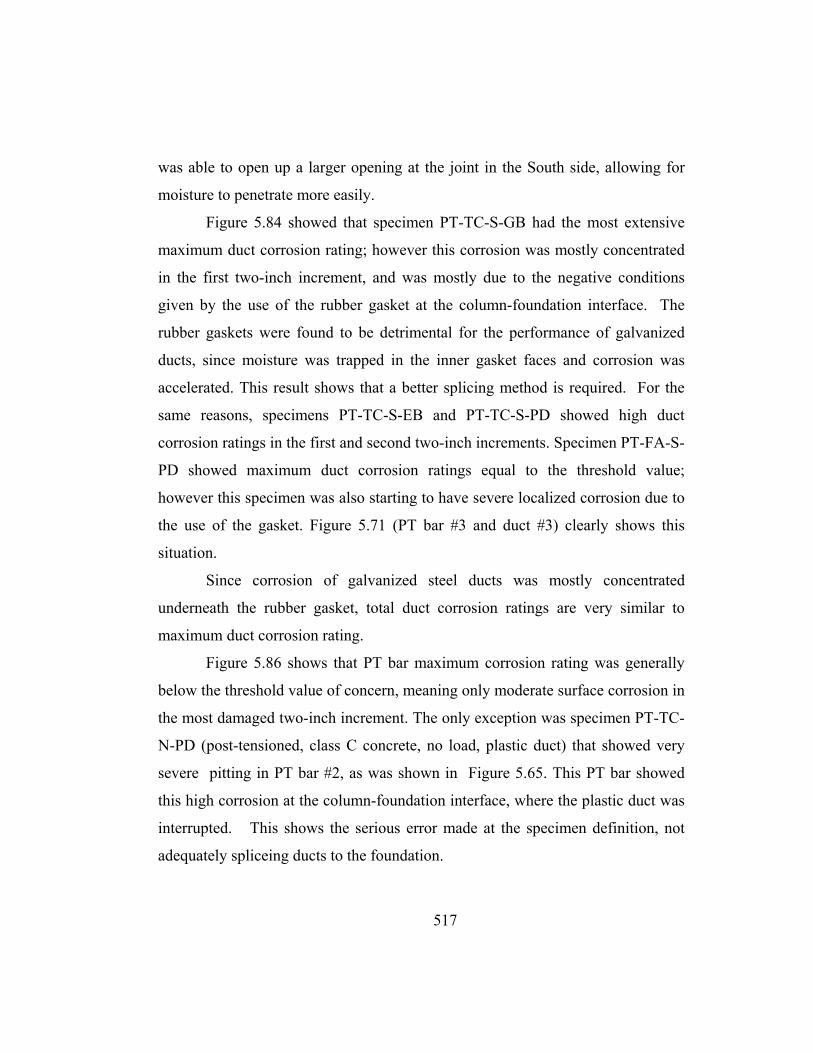
517
was able to open up a larger opening at the joint in the South side, allowing for
moisture to penetrate more easily.
Figure 5.84 showed that specimen PT-TC-S-GB had the most extensive
maximum duct corrosion rating; however this corrosion was mostly concentrated
in the first two-inch increment, and was mostly due to the negative conditions
given by the use of the rubber gasket at the column-foundation interface. The
rubber gaskets were found to be detrimental for the performance of galvanized
ducts, since moisture was trapped in the inner gasket faces and corrosion was
accelerated. This result shows that a better splicing method is required. For the
same reasons, specimens PT-TC-S-EB and PT-TC-S-PD showed high duct
corrosion ratings in the first and second two-inch increments. Specimen PT-FA-S-
PD showed maximum duct corrosion ratings equal to the threshold value;
however this specimen was also starting to have severe localized corrosion due to
the use of the gasket. Figure 5.71 (PT bar #3 and duct #3) clearly shows this
situation.
Since corrosion of galvanized steel ducts was mostly concentrated
underneath the rubber gasket, total duct corrosion ratings are very similar to
maximum duct corrosion rating.
Figure 5.86 shows that PT bar maximum corrosion rating was generally
below the threshold value of concern, meaning only moderate surface corrosion in
the most damaged two-inch increment. The only exception was specimen PT-TC-
N-PD (post-tensioned, class C concrete, no load, plastic duct) that showed very
severe pitting in PT bar #2, as was shown in Figure 5.65. This PT bar showed
this high corrosion at the column-foundation interface, where the plastic duct was
interrupted. This shows the serious error made at the specimen definition, not
adequately spliceing ducts to the foundation.
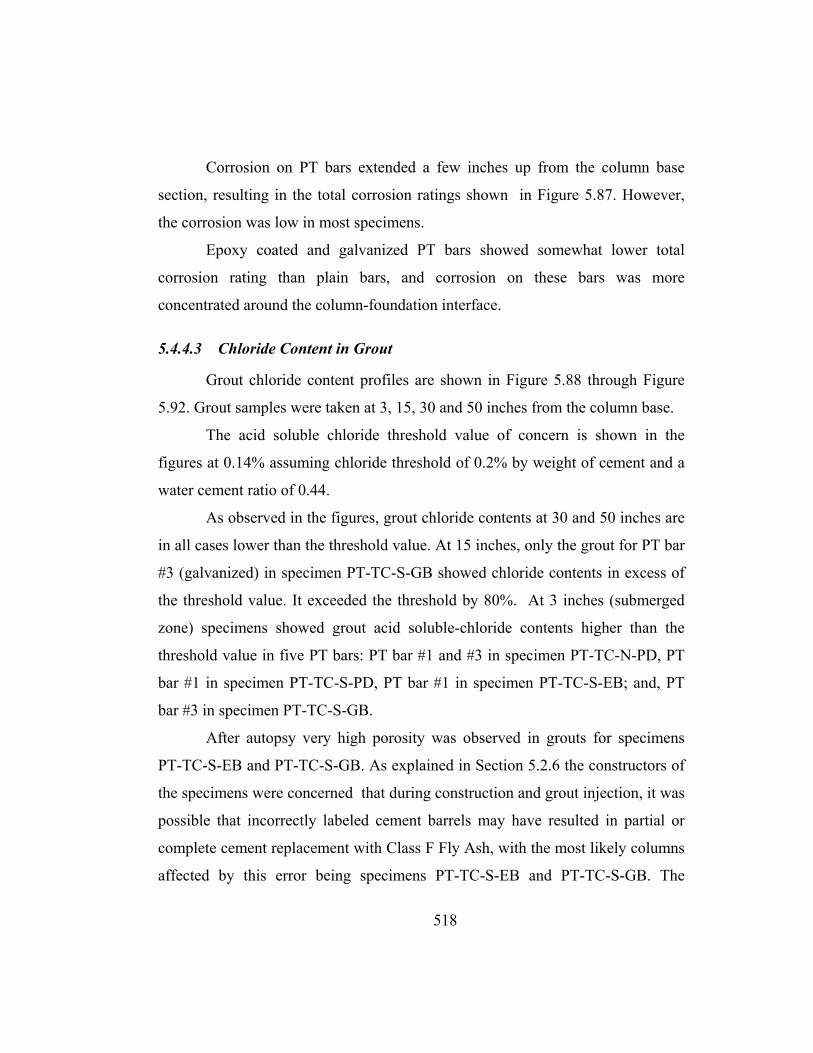
518
Corrosion on PT bars extended a few inches up from the column base
section, resulting in the total corrosion ratings shown in Figure 5.87. However,
the corrosion was low in most specimens.
Epoxy coated and galvanized PT bars showed somewhat lower total
corrosion rating than plain bars, and corrosion on these bars was more
concentrated around the column-foundation interface.
5.4.4.3 Chloride Content in Grout
Grout chloride content profiles are shown in Figure 5.88 through Figure
5.92. Grout samples were taken at 3, 15, 30 and 50 inches from the column base.
The acid soluble chloride threshold value of concern is shown in the
figures at 0.14% assuming chloride threshold of 0.2% by weight of cement and a
water cement ratio of 0.44.
As observed in the figures, grout chloride contents at 30 and 50 inches are
in all cases lower than the threshold value. At 15 inches, only the grout for PT bar
#3 (galvanized) in specimen PT-TC-S-GB showed chloride contents in excess of
the threshold value. It exceeded the threshold by 80%. At 3 inches (submerged
zone) specimens showed grout acid soluble-chloride contents higher than the
threshold value in five PT bars: PT bar #1 and #3 in specimen PT-TC-N-PD, PT
bar #1 in specimen PT-TC-S-PD, PT bar #1 in specimen PT-TC-S-EB; and, PT
bar #3 in specimen PT-TC-S-GB.
After autopsy very high porosity was observed in grouts for specimens
PT-TC-S-EB and PT-TC-S-GB. As explained in Section 5.2.6 the constructors of
the specimens were concerned that during construction and grout injection, it was
possible that incorrectly labeled cement barrels may have resulted in partial or
complete cement replacement with Class F Fly Ash, with the most likely columns
affected by this error being specimens PT-TC-S-EB and PT-TC-S-GB. The
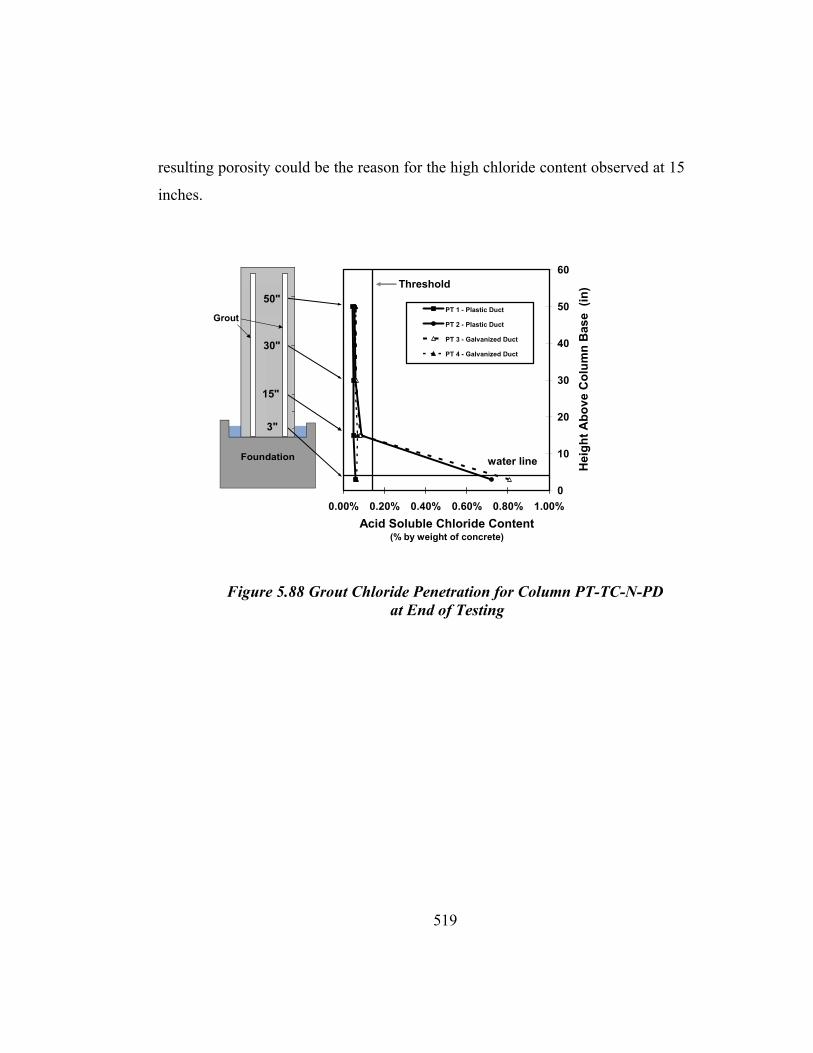
519
resulting porosity could be the reason for the high chloride content observed at 15
inches.
Figure 5.88 Grout Chloride Penetration for Column PT-TC-N-PD at End of Testing
0
10
20
30
40
50
60
0.00% 0.20% 0.40% 0.60% 0.80% 1.00%Acid Soluble Chloride Content
(% by weight of concrete)
Hei
ght A
bove
Col
umn
Bas
e (i
n)
PT 1 - Plastic Duct
PT 2 - Plastic Duct
PT 3 - Galvanized Duct
PT 4 - Galvanized Duct
water line
Threshold
Foundation
Column
15"
9"
3"3"
15"
30"
50"
Grout

520
Figure 5.89 Grout Chloride Penetration for Column PT-TC-S-PD at End of Testing
Figure 5.90 Grout Chloride Penetration for Column PT-FA-S-PD at End of Testing
0
10
20
30
40
50
60
0.00% 0.20% 0.40% 0.60% 0.80% 1.00%Acid Soluble Chloride Content
(% by weight of concrete)
Hei
ght A
bove
Col
umn
Bas
e (i
n)
PT 1 - Plastic Duct
PT 2 - Plastic Duct
PT 3 - Galvanized Duct
PT 4 - Galvanized Duct
water line
Threshold
Foundation
Column
15"
9"
3"3"
15"
30"
50"
Grout
0
10
20
30
40
50
60
0,00% 0,20% 0,40% 0,60% 0,80% 1,00%Acid Soluble Chloride Content
(% by weight of concrete)
Hei
ght A
bove
Col
umn
Bas
e (i
n)PT 1 - Plastic Duct
PT 2 - Plastic Duct
PT 3 - Galvanized Duct
PT 4 - Galvanized Duct
water line
Threshold
Foundation
Column
15"
9"
3"3"
15"
30"
50"
Grout

521
Figure 5.91 Grout Chloride Penetration for Column PT-TC-S-EB at End of Testing
Figure 5.92 Grout Chloride Penetration for Column PT-TC-S-GB at End of Testing
0
10
20
30
40
50
60
0.00% 0.20% 0.40% 0.60% 0.80% 1.00%Acid Soluble Chloride Content
(% by weight of concrete)
Hei
ght A
bove
Col
umn
Bas
e (i
n)
PT 1 - Galvanized Duct
PT 2 - Galvanized Duct
PT 3 - Galvanized Duct
PT 4 - Galvanized Duct
water line
Threshold
Foundation
Column
15"
9"
3"3"
15"
30"
50"
Grout
0
10
20
30
40
50
60
0.00% 0.20% 0.40% 0.60% 0.80% 1.00%Acid Soluble Chloride Content
(% by weight of concrete)
Hei
ght A
bove
Col
umn
Bas
e (i
n)
PT 1 - Galvanized Duct
PT 2 - Galvanizad Duct
PT 3 - Galvanized Duct
PT 4 - Galvanized Duct
water line
Threshold
Foundation
Column
15"
9"
3"3"
15"
30"
50"
Grout

522
5.5 ANALYSIS AND DISCUSSION OF RESULTS
After full autopsy has been performed on the column specimens at six and
a half years of accelerated exposure testing, the effect of all variables involved in
this testing program can be analyzed and compared. Limited autopsy results
performed at the end of 1998 for specimens DJ-TC-N (doweled joint - Class C
concrete - unloaded) and PT-TC-S-PD (post-tensioned – Class C concrete –
service load – plastic duct) were described in Reference 5.1.
5.5.1 Overall Performance
One of the objectives for this research program was to investigate the
effect of typical the cold joint between foundation and columns on chloride ion
movement and corrosion activity. After autopsy, corrosion in dowels, ducts and
post-tensioning bars was mostly found concentrated at the column-foundation
interface. The joint acted as a weak link in corrosion protection, behaving as a
pre-formed crack, which could have opened under loading. Specimen NJ-TC-N
(No dowel-Class C concrete – unloaded) showed very low spiral and rebar
corrosion with respect to the other specimens, which could be explained by the
epoxy bonding agent used to prepare the foundation surface on no-joint
specimens prior to casting. Figure 5.93 shows the severe section loss due to
corrosion in a dowel crossing the joint location.
The wicking effect (migration of chlorides upward in the concrete from
ponded base) was typically observed in the first 18 inches from the base of the
columns. Spiral, rebar, duct dowel and post-tensioned bar corrosion was very
severe at or near the column-foundation interface and decreased with increasing
column height.
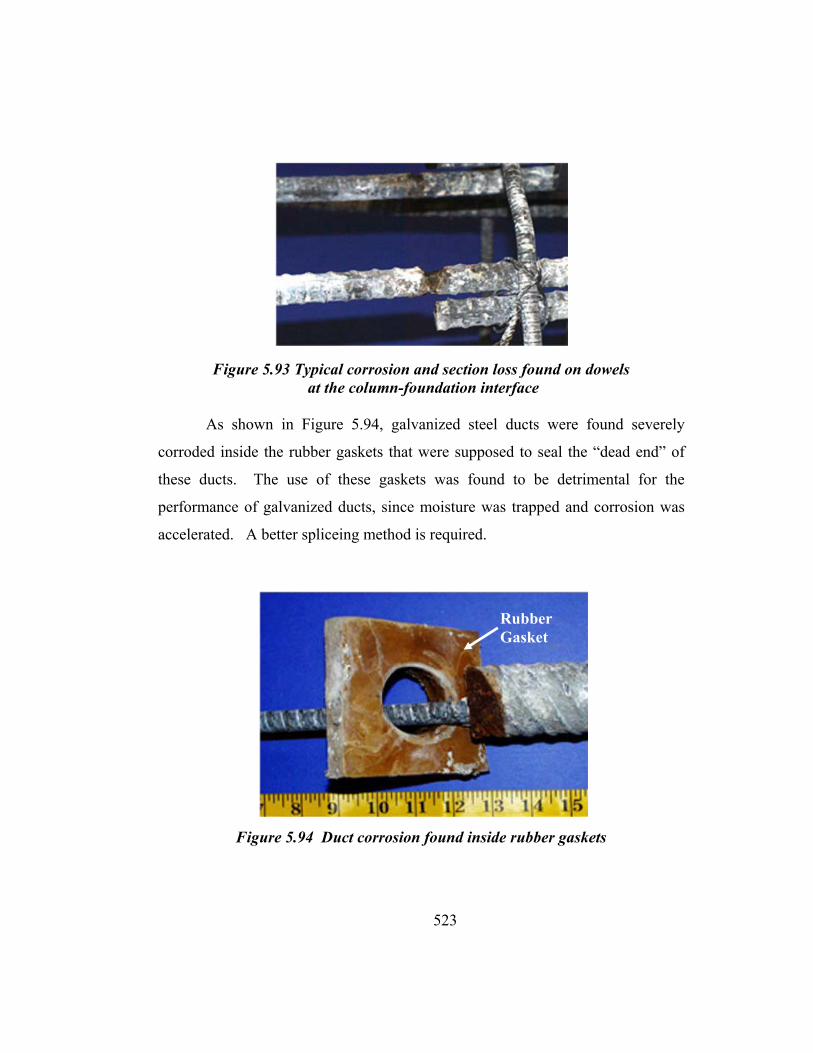
523
Figure 5.93 Typical corrosion and section loss found on dowels at the column-foundation interface
As shown in Figure 5.94, galvanized steel ducts were found severely
corroded inside the rubber gaskets that were supposed to seal the “dead end” of
these ducts. The use of these gaskets was found to be detrimental for the
performance of galvanized ducts, since moisture was trapped and corrosion was
accelerated. A better spliceing method is required.
Figure 5.94 Duct corrosion found inside rubber gaskets
Rubber Gasket

524
Epoxy coated bars and galvanized post-tensioned bars showed localized
corrosion at the column-foundation interface, but negligible occurrence of
corrosion away from the interface.
The relative performance of the column specimens is better described by
organizing the corrosion ratings according to performance. Figure 5.95 through
Figure 5.98 show the results for spiral, rebar, dowel and PT-bars. Ducts have not
been included, since some specimens have plastic ducts and others only
galvanized ducts, which makes it difficult to compare the specimens with average
values. Duct performance can be analyzed with the use of Figure 5.84 and
Figure 5.85.
Specimen NJ-TC-S shows the worst spiral corrosion rating. The reason
appears to be the effect of loading on the epoxy joint on this specimen, slightly
opening the North joint side and allowing moisture and chlorides to penetrate the
joint. In addition, concrete cover on spiral at the bottom of the column seems to
have been somewhat smaller than the 2-inch design cover, allowing for moisture
and chlorides to easily penetrate the concrete up to the spiral level. Post-
tensioned columns show the lesser spiral corrosion, showing the positive effect of
concrete and joint precompression.
The better rebar performance was shown for post-tensioned columns,
except for Specimen NJ-TC-N. This no-joint specimen was unloaded and epoxy
jointed. The worst rebar performance was shown on Specimen DJ-TC-N, since
this specimen did not have any epoxy bonding agent between the column and the
foundation, which allowed the joint to act as a preset crack. This specimen was
unloaded, which could have played an important role. There was not a distinct
trend among specimens with fly ash and standard concrete. Fly ash non-post-
tensioned specimen DJ-FA-S (doweled, fly ash concrete, service load) showed

525
only a slight decrease in rebar corrosion with respect to Specimen DJ-TC-S
(doweled specimen with standard concrete and service load).
Figure 5.95 Total Spiral Corrosion Rating Ordered According to Performance
Figure 5.96 Total Rebar Corrosion Rating Ordered According to Performance
291
331
337
339
351
360
458
532
595
10266
0 2000 4000 6000 8000 10000 12000
PT-TC-S-EB
PT-TC-S-GB
PT-FA-S-PD
PT-TC-S-PD
PT-TC-N-PD
DJ-FA-S
DJ-TC-S
NJ-TC-N
DJ-TC-N
NJ-TC-S
Corrosion Rating
Spiral decreasing performance after six and a half years of exposure
Doweled Joint, Class C Concr., UnloadedDJ-TC-N
Post-tensioned, Class C Concr.,Unloaded, Plastic Duct
PT-TC-N-PD
Post-tensioned, Class C Concr., S.Load, Plastic Duct
PT-TC-S-PD
Post-tensioned, Fly Ash Concrete,S. Load, Plastic Duct
PT-FA-S-PD
Post-tensioned, Class C Concr., S. Load, Epoxy Coated PT Bars
PT-TC-S-EB
Post-Tensioned, Class C Concr., S. Load, Galvanized PT Bars
PT-TC-S-GB
Doweled Joint, Class C Concr., Service Load
DJ-TC-S
Doweled Joint, Fly Ash Concrete, Service Load
DJ-FA-S
No Dowel, Class C Concr., Service LoadNJ-TC-S
No Dowel, Class C Concr., UnloadedNJ-TC-N
Column Variable
Doweled Joint, Class C Concr., UnloadedDJ-TC-N
Post-tensioned, Class C Concr.,Unloaded, Plastic Duct
PT-TC-N-PD
Post-tensioned, Class C Concr., S.Load, Plastic Duct
PT-TC-S-PD
Post-tensioned, Fly Ash Concrete,S. Load, Plastic Duct
PT-FA-S-PD
Post-tensioned, Class C Concr., S. Load, Epoxy Coated PT Bars
PT-TC-S-EB
Post-Tensioned, Class C Concr., S. Load, Galvanized PT Bars
PT-TC-S-GB
Doweled Joint, Class C Concr., Service Load
DJ-TC-S
Doweled Joint, Fly Ash Concrete, Service Load
DJ-FA-S
No Dowel, Class C Concr., Service LoadNJ-TC-S
No Dowel, Class C Concr., UnloadedNJ-TC-N
Column Variable291
331
337
339
351
360
458
532
595
10266
0 2000 4000 6000 8000 10000 12000
PT-TC-S-EB
PT-TC-S-GB
PT-FA-S-PD
PT-TC-S-PD
PT-TC-N-PD
DJ-FA-S
DJ-TC-S
NJ-TC-N
DJ-TC-N
NJ-TC-S
Corrosion Rating
Spiral decreasing performance after six and a half years of exposure
Doweled Joint, Class C Concr., UnloadedDJ-TC-N
Post-tensioned, Class C Concr.,Unloaded, Plastic Duct
PT-TC-N-PD
Post-tensioned, Class C Concr., S.Load, Plastic Duct
PT-TC-S-PD
Post-tensioned, Fly Ash Concrete,S. Load, Plastic Duct
PT-FA-S-PD
Post-tensioned, Class C Concr., S. Load, Epoxy Coated PT Bars
PT-TC-S-EB
Post-Tensioned, Class C Concr., S. Load, Galvanized PT Bars
PT-TC-S-GB
Doweled Joint, Class C Concr., Service Load
DJ-TC-S
Doweled Joint, Fly Ash Concrete, Service Load
DJ-FA-S
No Dowel, Class C Concr., Service LoadNJ-TC-S
No Dowel, Class C Concr., UnloadedNJ-TC-N
Column Variable
Doweled Joint, Class C Concr., UnloadedDJ-TC-N
Post-tensioned, Class C Concr.,Unloaded, Plastic Duct
PT-TC-N-PD
Post-tensioned, Class C Concr., S.Load, Plastic Duct
PT-TC-S-PD
Post-tensioned, Fly Ash Concrete,S. Load, Plastic Duct
PT-FA-S-PD
Post-tensioned, Class C Concr., S. Load, Epoxy Coated PT Bars
PT-TC-S-EB
Post-Tensioned, Class C Concr., S. Load, Galvanized PT Bars
PT-TC-S-GB
Doweled Joint, Class C Concr., Service Load
DJ-TC-S
Doweled Joint, Fly Ash Concrete, Service Load
DJ-FA-S
No Dowel, Class C Concr., Service LoadNJ-TC-S
No Dowel, Class C Concr., UnloadedNJ-TC-N
Column Variable
0
2
3
6
9
12
19
26
32
35
0 5 10 15 20 25 30 35 40
PT-TC-S-GB
NJ-TC-N
PT-TC-S-PD
PT-TC-S-EB
PT-TC-N-PD
PT-FA-S-PD
DJ-FA-S
DJ-TC-S
NJ-TC-S
DJ-TC-N
Corrosion Rating
Rebar decreasing performance after six and a half years of exposure
Doweled Joint, Class C Concr., UnloadedDJ-TC-N
Post-tensioned, Class C Concr.,Unloaded, Plastic Duct
PT-TC-N-PD
Post-tensioned, Class C Concr., S.Load, Plastic Duct
PT-TC-S-PD
Post-tensioned, Fly Ash Concrete,S. Load, Plastic Duct
PT-FA-S-PD
Post-tensioned, Class C Concr., S. Load, Epoxy Coated PT Bars
PT-TC-S-EB
Post-Tensioned, Class C Concr., S. Load, Galvanized PT Bars
PT-TC-S-GB
Doweled Joint, Class C Concr., Service Load
DJ-TC-S
Doweled Joint, Fly Ash Concrete, Service Load
DJ-FA-S
No Dowel, Class C Concr., Service LoadNJ-TC-S
No Dowel, Class C Concr., UnloadedNJ-TC-N
Column Variable
Doweled Joint, Class C Concr., UnloadedDJ-TC-N
Post-tensioned, Class C Concr.,Unloaded, Plastic Duct
PT-TC-N-PD
Post-tensioned, Class C Concr., S.Load, Plastic Duct
PT-TC-S-PD
Post-tensioned, Fly Ash Concrete,S. Load, Plastic Duct
PT-FA-S-PD
Post-tensioned, Class C Concr., S. Load, Epoxy Coated PT Bars
PT-TC-S-EB
Post-Tensioned, Class C Concr., S. Load, Galvanized PT Bars
PT-TC-S-GB
Doweled Joint, Class C Concr., Service Load
DJ-TC-S
Doweled Joint, Fly Ash Concrete, Service Load
DJ-FA-S
No Dowel, Class C Concr., Service LoadNJ-TC-S
No Dowel, Class C Concr., UnloadedNJ-TC-N
Column Variable0
2
3
6
9
12
19
26
32
35
0 5 10 15 20 25 30 35 40
PT-TC-S-GB
NJ-TC-N
PT-TC-S-PD
PT-TC-S-EB
PT-TC-N-PD
PT-FA-S-PD
DJ-FA-S
DJ-TC-S
NJ-TC-S
DJ-TC-N
Corrosion Rating
Rebar decreasing performance after six and a half years of exposure
Doweled Joint, Class C Concr., UnloadedDJ-TC-N
Post-tensioned, Class C Concr.,Unloaded, Plastic Duct
PT-TC-N-PD
Post-tensioned, Class C Concr., S.Load, Plastic Duct
PT-TC-S-PD
Post-tensioned, Fly Ash Concrete,S. Load, Plastic Duct
PT-FA-S-PD
Post-tensioned, Class C Concr., S. Load, Epoxy Coated PT Bars
PT-TC-S-EB
Post-Tensioned, Class C Concr., S. Load, Galvanized PT Bars
PT-TC-S-GB
Doweled Joint, Class C Concr., Service Load
DJ-TC-S
Doweled Joint, Fly Ash Concrete, Service Load
DJ-FA-S
No Dowel, Class C Concr., Service LoadNJ-TC-S
No Dowel, Class C Concr., UnloadedNJ-TC-N
Column Variable
Doweled Joint, Class C Concr., UnloadedDJ-TC-N
Post-tensioned, Class C Concr.,Unloaded, Plastic Duct
PT-TC-N-PD
Post-tensioned, Class C Concr., S.Load, Plastic Duct
PT-TC-S-PD
Post-tensioned, Fly Ash Concrete,S. Load, Plastic Duct
PT-FA-S-PD
Post-tensioned, Class C Concr., S. Load, Epoxy Coated PT Bars
PT-TC-S-EB
Post-Tensioned, Class C Concr., S. Load, Galvanized PT Bars
PT-TC-S-GB
Doweled Joint, Class C Concr., Service Load
DJ-TC-S
Doweled Joint, Fly Ash Concrete, Service Load
DJ-FA-S
No Dowel, Class C Concr., Service LoadNJ-TC-S
No Dowel, Class C Concr., UnloadedNJ-TC-N
Column Variable
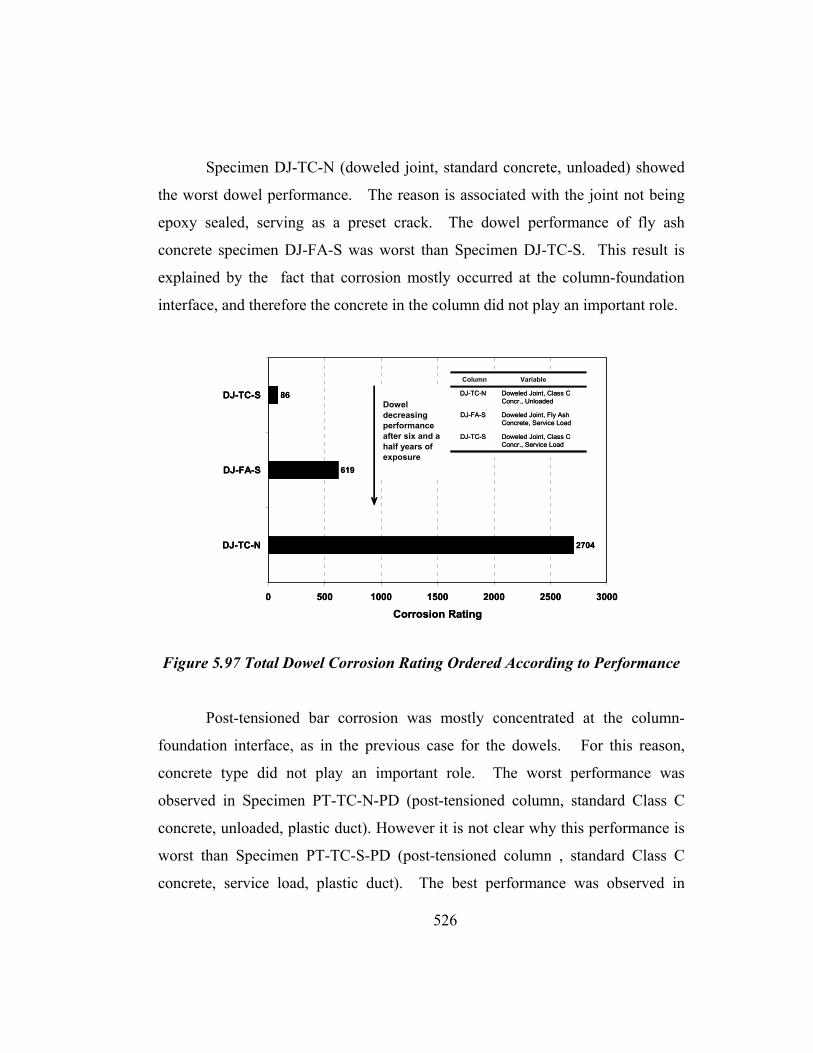
526
Specimen DJ-TC-N (doweled joint, standard concrete, unloaded) showed
the worst dowel performance. The reason is associated with the joint not being
epoxy sealed, serving as a preset crack. The dowel performance of fly ash
concrete specimen DJ-FA-S was worst than Specimen DJ-TC-S. This result is
explained by the fact that corrosion mostly occurred at the column-foundation
interface, and therefore the concrete in the column did not play an important role.
Figure 5.97 Total Dowel Corrosion Rating Ordered According to Performance
Post-tensioned bar corrosion was mostly concentrated at the column-
foundation interface, as in the previous case for the dowels. For this reason,
concrete type did not play an important role. The worst performance was
observed in Specimen PT-TC-N-PD (post-tensioned column, standard Class C
concrete, unloaded, plastic duct). However it is not clear why this performance is
worst than Specimen PT-TC-S-PD (post-tensioned column , standard Class C
concrete, service load, plastic duct). The best performance was observed in
2704
619
86
0 500 1000 1500 2000 2500 3000
DJ-TC-N
DJ-FA-S
DJ-TC-S
Corrosion Rating
Dowel decreasing performance after six and a half years of exposure
Doweled Joint, Class C Concr., Service Load
DJ-TC-S
Doweled Joint, Fly Ash Concrete, Service Load
DJ-FA-S
Doweled Joint, Class C Concr., Unloaded
DJ-TC-N
Column Variable
Doweled Joint, Class C Concr., Service Load
DJ-TC-S
Doweled Joint, Fly Ash Concrete, Service Load
DJ-FA-S
Doweled Joint, Class C Concr., Unloaded
DJ-TC-N
Column Variable

527
galvanized and epoxy coated post-tensioning bars, although in both cases
corrosion had started.
Figure 5.98 Total PT-Bar Corrosion Rating Ordered According to Performance
5.5.2 Comparison between Half-Cell Potentials and Corrosion Ratings
At the end of testing, half-cell potential readings were compared with
corrosion found during autopsies on specimen reinforcement. In general, half-
cell potentials were able to detect the higher probability of corrosion occurring at
the base of the column, and low to negligible probability of corrosion above
column mid-height. However, since dowel bars, post-tensioning bars and ducts
all showed severe corrosion at the joint area, it is difficult to determine which
source of corrosion potential was being detected by the half-cell readings. The
post-tensioning bar may have been in electrical contact with the mild steel
reinforcement, and therefore, half-cell potential measurements may have been a
combination of active corrosion sources.
673
146
95
60
52
0 100 200 300 400 500 600 700 800
PT-TC-N-PD
PT-TC-S-PD
PT-FA-S-PD
PT-TC-S-GB
PT-TC-S-EB
Corrosion Rating
PT-Bardecreasing performance after six and a half years of exposure Post-Tensioned, Class C Concr.,
S. Load, Galvanized PT BarsPT-TC-S-GB
Post-tensioned, Class C Concr., S. Load, Epoxy Coated PT Bars
PT-TC-S-EB
Post-tensioned, Fly Ash Concrete,S. Load, Plastic Duct
PT-FA-S-PD
Post-tensioned, Class C Concr., S.Load, Plastic Duct
PT-TC-S-PD
Post-tensioned, Class C Concr.,Unloaded, Plastic Duct
PT-TC-N-PD
Column Variable
Post-Tensioned, Class C Concr., S. Load, Galvanized PT Bars
PT-TC-S-GB
Post-tensioned, Class C Concr., S. Load, Epoxy Coated PT Bars
PT-TC-S-EB
Post-tensioned, Fly Ash Concrete,S. Load, Plastic Duct
PT-FA-S-PD
Post-tensioned, Class C Concr., S.Load, Plastic Duct
PT-TC-S-PD
Post-tensioned, Class C Concr.,Unloaded, Plastic Duct
PT-TC-N-PD
Column Variable

528
5.5.3 Effect of Loading
The effect of loading on spiral corrosion is not clear when looking at the
non-prestressed specimen corrosion rating data, Figure 5.95. Specimen NJ-TC-S
(No dowel-Class C concrete – service load) showed very high corrosion ratings
when compared to specimen NJ-TC-N (No dowel-Class C concrete-no load);
however, the trend was reversed for specimen DJ-TC-S (doweled – Class C
concrete – service load) that showed less corrosion rating than specimen DJ-TC-N
(doweled – Class C concrete – no load). A more clear distinction was found on
post-tensioned specimens, where spiral corrosion rating was higher in the non-
loaded specimen than in the specimens continuously subjected to service load.
Similar results were obtained for rebar corrosion, see Figure 5.96.
Dowels and post-tensioned bars (see Figures 5.97 and Figure 5.98) were
found to corrode more at the column-foundation interface in non-loaded
specimens; in contrast to galvanized ducts, which corroded more in specimens
under service loading. Service loading may have caused the joints to open.
However, the contradiction between dowel and duct corrosion, makes it difficult
to draw any definite conclusions.
5.5.4 Effect of Trickle Saltwater
The trickle system on one face of the columns did produce a clear increase
in spiral corrosion in non-prestressed specimens, as shown in Table 5.15. The
trend was not shown in post-tensioned specimens, where spiral corrosion ratings
were very similar in both column faces. Rebar, duct or post-tensioned bars did
not show any distinct corrosion trend with respect to dripper and non-dripper
sides (see Figure 5.13 for dripper and element location, and corrosion rating data
on Tables 5.18, 5.22 and 5.24).

529
5.5.5 Effect of Joint Type
Corrosion was mostly concentrated at the column-foundation interface,
see examples in Figures 5.53 and 5.57 (complete cage) At this section, doweled
and post-tensioned specimens showed very severe section loss, with less
corrosion observed in galvanized and epoxy coated PT-bars, as shown in Figure
5.98.
There was not a distinct trend with respect to the use of post-tensioned
joints versus doweled joints. The doweled joint would be expected to provide the
least corrosion protection since the joint is not precompressed. However, this
behavior was not clearly shown after autopsy.
As shown in Figure 5.95 and 5.96, the use of post-tensioning did provide
enhanced spiral and rebar corrosion protection, compared to non-post-tensioned
specimens. In the case of the spirals, the effect of post-tensioning was dramatic,
since very severe section loss and pitting in the stirrup in non-prestressed
specimens was reduced to light to moderate surface corrosion in post-tensioned
specimens.
The use of post-tensioned joints also provided better resistance to the
wicking effect, when acid-soluble chloride contents were compared to doweled
and no-joint specimens, see Figure 5.42.
5.5.6 Effect of Concrete Type
As shown in Figure 5.97 and Figure 5.98, the effect of concrete type was
not clearly shown in dowel and PT-bar performance since the corrosion in these
specimens was mainly at the column-foundation interface, and therefore, chloride
penetration through concrete had little effect. On the contrary, as shown in
Figures 5.84 and 5.85, duct corrosion –even when it was mostly concentrated at
the column base – was lower in Fly Ash specimens.

530
As shown in Figures 5.95 and 5.96, spiral and rebar corrosion in non-
prestressed specimens showed a better performance in Fly Ash concrete than in
Class C concrete specimens. This trend was not clearly shown in post-tensioned
specimens.
5.5.7 Effect of Duct Type
Since post-tensioning bar corrosion was mostly concentrated at the
column-foundation interface, where ducts were interrupted, the duct type had little
influence on PT-bar performance. However, advanced galvanized steel duct
corrosion inside the rubber gasket, suggested a significant superiority of plastic
duct. The use of the rubber gaskets was a serious error. Instead of gaskets, the
ducts must have been adequately spliced at the column-foundation interface to
avoid moisture and chlorides to penetrate at the joint section.
5.5.8 Effect of Post-Tensioning Bar Coatings
As shown in Figure 5.98, PT bar coatings, either epoxy or galvanized
(which showed very similar results) improved the performance of post-tensioning
bars, when compared to plain post-tensioning bars. From Figures 5.74 and 5.77
it is shown that the PT-bar coatings were not sufficient to stop corrosion from
occurring at the column-foundation interface, but corrosion was limited to
moderate surface corrosion in a few inches around the joint area.
When drawing conclusions from these observations, care must be
exercised, since localized corrosion in the black steel, once it has started, could
grow rapidly underneath the coatings and bar capacity could be threatened,
specially when corrosion is not extended in a large bar area.

531
5.6 SUMMARY AND CONCLUSIONS
Five non-prestressed and five post-tensioned columns specimens were used
to investigate corrosion mechanisms and chloride ion transport (“wicking effect )
in various column connection configurations and to evaluate column corrosion
protection measures. Variables included column to foundation connection (no
dowel joint, doweled joint and post-tensioned joint), loading (no loading and
service load – with combined moment and axial load), concrete type (TxDOT
Class C concrete, and Class C Fly Ash concrete – 35% replacement by volume),
prestressing bar coatings (uncoated, galvanized PT-bars, and epoxy coated PT-
bars), and post-tensioning ducts (plastic and galvanized steel). Trickle water was
used on one face of each column to determine the effect of salt water spray or
dripping. Test specimen exposure started in July of 1996 and ended in January of
2003, after six and a half years. Full autopsies were performed at the end of
testing, and conclusions are as follows.
5.6.1 Post-Tensioning to Improve Corrosion Protection
The possible weak link in corrosion protection at the column-foundation
interface was studied with three different configurations: no dowel joint, doweled
joint and post-tensioning joint. Determination of the effect of post-tensioning on
durability through precompression of the concrete and precompression of
construction joints was one of the main objectives of this research series. The
conclusions are as follows:
• Post-tensioned specimens did not show any distinct improvement in specimen
performance at the column foundation interface, when compared to doweled
specimens.
• Post-tensioning dramatically reduced the corrosion found on spiral
reinforcement in the first 18 inches from the column base.
532
• Post-tensioned specimens under loading showed an increase in spiral and mild
steel reinforcement corrosion protection when compared to non-loaded
specimens.
• Post-tensioning reduced the risk of spiral corrosion due to saltwater dripping.
• Post-tensioning provided better resistance to the wicking effect, when acid-
soluble chloride contents were compared to doweled and no-dowel specimens.
5.6.2 Fly Ash as Partial Cement Replacement in Concrete
TxDOT standard concrete mix Class C concrete was used in eight
specimens (w/c = 0.45, type I/II Cement, f´c=3600). In two columns, 35% of
cement by volume (31% by weight) was replaced with Class C Fly Ash, with no
other significant changes to the concrete mix. After autopsy, the following
conclusions are drawn:
• Fly ash concrete did seem to provide enhanced corrosion protection to
galvanized steel ducts.
• Spiral and mild steel reinforcement corrosion in non-prestressed specimens
showed a better performance in Fly Ash concrete than in Class C concrete
specimens. This trend was not clearly shown in post-tensioned specimens.
• Post-tensioned bar corrosion did not show any distinct trend with respect to
the type of concrete in the specimen.
5.6.3 Plastic Ducts for Post-Tensioning
Standard galvanized steel ducts were compared to impermeable plastic
ducts in three post-tensioned specimens: Class C concrete (unloaded and service
load) and Fly Ash concrete under service load. In all cases uncoated post-
tensioning bars were used. The conclusions are as follows:

533
• Although results are very limited, advanced galvanized steel duct corrosion at
the column base, inside the rubber gasket, show the superiority of using
plastic ducts.
• Corrosion in post-tensioned bars in plastic ducts and galvanized ducts was
always at the column-foundation interface, where the plastic or galvanized
duct was interrupted. Therefore, conclusions regarding duct performance
based on post-tensioning bar corrosion are not possible. The ducts need an
effective splice seal at all joints.
5.6.4 Post-Tensioning Bar Coatings
Two prestressing bar coatings were investigated: epoxy coated (according
to ASTM A775-97) and zinc galvanized prestressing bars. The coated bars were
compared directly to uncoated bars within individual specimens. In both cases,
anchorage hardware was either epoxy coated or galvanized. The following
conclusions are drawn:
• Epoxy coating or galvanized post-tensioning bars showed enhanced corrosion
protection, with respect to plain post-tensioning bars.
• Coatings were not sufficient to stop corrosion from occurring at the column-
foundation interface. Corrosion was very localized.
• Superiority of coated bars should not be concluded, since localized corrosion
may accelerate deterioration at the local level, which in turn may result in
unexpected failure.

534
5.7 IMPLEMENTATION OF RESULTS
After full autopsy of all ten column specimens, research results generated
the following findings to be implemented for partially submerged columns or
columns exposed to saltwater runoff:
Substructure Prestressing
• Column elements should be prestressed, to improve spiral and rebar
corrosion protection. However, designers should not rely entirely on
post-tensioning to provide adequate corrosion protection at the cold
joint. Other protection measures should be investigated.
Concrete Type
• Fly Ash concrete may be used to provide enhanced spiral, rebar and
duct corrosion protection.
Duct Types
• Plastic ducts may be used to better protect post-tensioning bars.
However, better sealing materials or splices should be used or
developed, to seal the duct “dead” ends and protect the post-tensioning
bar.
Gaskets
• Rubber gaskets are not effective to seal the duct “dead” ends and
should not be used.
Post-tensioning Bar Coatings
• Galvanized steel bars or epoxy coated bars provide enhanced
protection against uniform corrosion, but are susceptible to severe
localized corrosion.

535
CHAPTER 6
Durability Design Guidelines to Reduce Corrosion Risk
Durability design guidelines for durable bonded post-tensioned concrete
tendons are the most important implementation directed aspect of the research
program. Results are based on specimens that were purposely placed under a very
aggressive environment. By applying salt water in continuing two week wet and
dry cycles, a condition simulating a harsh and extended service application was
introduced. It cannot be directly related to any specific real life exposure age.
Interim design guidelines to reduce risk from various forms of attack,
including corrosion risk, were developed and published as explained in Section
1.2.3., based on research results up to 1999. After full forensic examinations of
all remaining specimens in the macrocell corrosion test series, all specimens in
the large scale column corrosion tests series and approximately half of the
specimens from the large scale beam corrosion test series, the following items are
recommended for immediate implementation. These items were included
previously as they pertained to each chapter. They are repeated here as a
summary of all the implementation measures found after conclusions were drawn.
6.1 MEASURES FOR IMPLEMENTATION FROM MACROCELL CORROSION
TESTS
Macrocell test results generated the following findings for immediate
implementation to improve corrosion protection for precast segmental
construction.

536
Duct type
• Plastic ducts for post-tensioning should be used in all situations where
aggressive exposure may occur.
Joint Type
• Epoxy joints should always be used with internal prestressing tendons.
• Dry joints should be avoided with external prestressing tendons in
aggressive exposures, to protect segment mild steel reinforcement at
joints and to block entry of chlorides that might be transported to
locations of flaws in external tendon sheaths or anchors.
• Stringent inspection and construction practices must be exercised to
guarantee good epoxy filling at the joints and complete grouting.
• Gaskets in epoxy joints should be avoided since there is a potential for
incomplete epoxy coverage of the joint. Preferred practice with epoxy
joints is to utilize a thorough swabbing of tendon ducts immediately
after initial segment placement and stressing to seal the duct edges at
the joint. Tightness of the joint should be checked by air pressure
testing. Carefully coupled ducts are an alternative as long as a positive
seal is obtained.
Grout type
• Calcium Nitrite Corrosion inhibitor added to the grout had little effect
on the onset of corrosion but did seem to provide enhanced long-term
strand corrosion protection.
6.2 MEASURES FOR IMPLEMENTATION FROM BEAM CORROSION TESTS
After final autopsies of twelve out of twenty-seven beam specimens and
partial autopsies of two beam specimens, research results generated the following
findings. Final autopsies of the remaining beam specimens will be more

537
conclusive for strand, duct and grout types, and also for the use of encapsulated
anchorage systems.
Level of Prestress
• Mixed reinforcement members should not be used in aggressive
exposures unless special provisions are made to effectively seal cracks
and concrete cover from exposure to chlorides.
• Fully prestressed members are recommended in aggressive
environments to delay moisture and chloride ingress.
• Post-tensioning systems need additional protection above the current
typical practice when in aggressive environments. In particular the use
of galvanized duct appears unwise. The use of plastic ducts and
encapsulated anchorage protection systems appear promising but while
plastic duct was clearly superior in the macrocell specimens the use in
the beam specimens cannot be conclusively evaluated until after final
autopsies of the remaining beam specimens.
Concrete type
• High Performance Concrete (low permeability concrete, w/c = 0.29) is
recommended in aggressive environments due to the significantly
reduced permeability and crack control.
• Fly ash (Class C) concrete with a higher water cement ratio (w/c =
0.44) may also be considered when the environment is less aggressive.
Duct Splices for Galvanized Ducts
• Neither the standard industry practice of duct taped sleeves nor heat
shrink splices should be considered as watertight
• Better systems than industry standard or heat-shrink splices for
galvanized steel ducts should be investigated and developed if
galvanized duct continues to be used in non-aggressive environments.

538
High Performance Fly Ash Grout
• Standard Class C grout with fly ash is not recommended.
• The use of antibleed admixture appears promising but cannot be
conclusively evaluated until after final autopsies of the remaining
beam specimens.
Grouting Procedure
• Stringent grouting procedures should be enforced during construction.
Plastic Chairs
• Fully plastic chairs are recommended for use throughout the
substructure to eliminate corrosion damage. Chairs or bolster strips
that contain any steel should be avoided.
6.3 MEASURES FOR IMPLEMENTATION FROM COLUMN CORROSION TESTS
After full autopsy of all ten column specimens, research results generated
the following findings to be implemented for partially submerged columns or
columns exposed to saltwater dripping:
Duct Types
• Plastic ducts may be used to better protect post-tensioning bars.
However, better sealing materials or splices should be used or
developed, to seal the duct “dead” ends and protect the post-tensioning
bar.
Substructure Prestressing
• Column elements should be prestressed, to improve spiral and rebar
corrosion protection. However, designers should not rely entirely on
post-tensioning to provide adequate corrosion protection at the cold
joint. Other protection measures should be investigated.

539
Concrete Type
• Non of the column specimens had high performance concrete, so no
conclusions can be made about this material.
• Fly Ash concrete (w/c = 0.42) may be used to provide enhanced spiral,
rebar and duct corrosion protection.
Gaskets
• Rubber gaskets are not effective to seal the duct “dead” ends and
should not be used.
Post-tensioning Bar Coatings
• Galvanized steel bars or epoxy coated bars provide enhanced
protection against uniform corrosion, but are susceptible to severe
localized corrosion.

540
(Page left blank intentionally)

541
CHAPTER 7 Summary and Conclusions
The research presented in this dissertation was part of the University of
Texas at Austin, Center for Transportation Research Project 0-1405: “Durability
Design of Post-Tensioned Bridge Substructure Elements.” The project sponsored
by the Texas Department of Transportation, involves two main components:
• Durability of Bridge Substructures, and
• Post-Tensioned Bridge Substructures.
The substructure emphasis is in response to the deteriorating condition of
bridge substructures in some areas of Texas. The second aspect is included since
there are many possible applications where post-tensioning can provide structural
and economical benefits, and can possibly improve durability.
The main problem that bridge engineers faced was that there were few
comprehensive durability design guidelines for post-tensioned concrete structures,
especially those expose to very severe environments.
The overall project objectives for TxDOT Project 0-1405 are the
following:
• To examine the use of post-tensioning in bridge substructures,
• To identify durability concerns for bridge substructures in Texas,
• To identify existing technology to ensure durability or improve
durability,
• To develop experimental testing programs to evaluate protection
measures for improving the durability of post-tensioned bridge
substructures, and

542
• To develop durability design guidelines and recommendations for
post-tensioned bridge substructures.
The author’s involvement in Project 0-1405 started in August 2000, after
exposure testing had begun in the macrocell, beam and column series. This
dissertation’s scope included the following:
• Continuation of exposure testing of the remaining macrocell
specimens,
• Continuation of exposure testing of all beam and column specimens,
• Performance of comprehensive autopsies and examinations of second
half of macrocell specimens,
• Performance of comprehensive autopsies and examinations of
approximately half of Phase I and Phase II beams, after four and a half
and three and a half years of exposure, respectively,
• Performance of comprehensive autopsies and examinations of all
column specimens after six and a half years of exposure testing, and
• Updating of durability design guidelines to reduce post-tensioning
system corrosion risk based on exposure testing and autopsy results
In the following sections the final results and findings from this
dissertation contribution to the above mentioned project, are described in detail.
Sections 7.1, 7.2 and 7.3 include the results from the macrocell corrosion tests,
large scale beam corrosion tests, and large scale column corrosion tests,
respectively. These results had been presented before at the end of Chapters 3, 4
and 5, and are repeated herein with minor changes as a summary of all
conclusions and findings.
Once all distinct series have been described and findings have been
presented, major overall conclusions are summarized in Section 7.4, for general
application in the design of bonded post-tensioning concrete systems.

543
Section 7.5 includes recommendations and directions for future research.
7.1 SUMMARY AND CONCLUSIONS FROM MACROCELL CORROSION TESTS
Thirty eight macrocell specimens were used to investigate the corrosion
protection of internal tendons at segmental joints. Half of the specimens were
autopsied after approximately four and a half years of highly aggressive exposure
and preliminary conclusions were reported.7.1 The variables analyzed during the
testing program included: joint type (dry or epoxy), duct type (galvanized steel or
plastic), grout type (3 grouts with differing additives) and level of joint
compression (3 different levels). The second half of the specimens was autopsied
with over eight years of very aggressive exposure. Numerous conclusions can be
drawn.
7.1.1 Overall Performance
• Superiority of plastic ducts was evident. Specimens with plastic duct had the
best overall performance (quantified in terms of strand, mild steel and duct
corrosion).
• All galvanized steel duct specimens showed some degree of duct corrosion,
from moderate uniform corrosion up to severe duct destruction.
• Thin epoxy joints provided substantially improved corrosion protection when
compared to dry joints. Incompletely filled epoxy joint performance was very
similar to that of a dry joint.
• Post-tensioning strands were corroded in all specimens, from light uniform
corrosion to moderate pitting.
• Mild steel bars were corroded in seventeen out of the nineteen specimens.
One third of those had from moderate corrosion to severe pitting.

544
• In many instances, the epoxy coverage, provided on the strand and mild steel
bars to limit the exposed length of the anode and cathode, failed to provide
complete corrosion protection to these areas. Epoxy paint peeled off in many
instances allowing for moisture and chloride ingress. Corrosion under the
epoxy paint was in many cases comparable to the corrosion condition in the
exposed lengths. Among other effects, this affected the current density
calculations.
• Metal loss calculations based on current density calculations failed to indicate
the amount of corrosion in the specimens.
7.1.2 Assessing Corrosion Activity Using Half-Cell Potential Measurements
Half-Cell Potentials were taken at two week intervals at the start of the
wet period and at the start of the dry period. All measurements were performed
according to ASTM C8767.2 using a saturated calomel electrode (SCE). In all
cases the prestressing tendon was not in contact with the galvanized duct, and it
was considered that the segmental joint allowed for ion movement. However,
while HC-Potentials in dry joint specimens had a good correlation with forensic
examination results, they failed to detect corrosion activity in six out of nine
epoxy joint specimens, and in one epoxy joint specimen with gasket.
With respect to testing variables, the following conclusions are drawn
based on Half-Cell Potential Data:
• Epoxy joint specimens showed less probability of strand corrosion than dry
joint specimens.
• Macrocell specimens with plastic ducts (discontinuous) at the joint showed
less probability of strand corrosion than similar specimens with galvanized
steel ducts.

545
• Dry joint specimen data indicated less probability of strand corrosion with
increasing levels of joint precompression. This trend was not clearly shown in
epoxy joint specimens.
• Dry Joint specimens with Corrosion Inhibitor (Calcium Nitrite) showed less
probability of strand corrosion with respect to specimens with Normal Grout.
7.1.3 Segmental Joints
To address typical North American practice, dry joints and epoxy joints,
with and without gaskets, were selected for investigation in this testing program.
All joint types were match-cast. The AASHTO Guide Specifications for
Segmental Bridges7.3 does not permit the use of dry joints with internal tendons.
However, dry joints were included as a worst case scenario for comparison
purposes. The thin epoxy-jointed specimens were assembled according to the
standard practice. In the epoxy/gasket joint, a foam gasket was glued to the face
of one segment around the duct opening prior to application of the epoxy.
Forensic examination after eight years of exposure included: seven specimens
with dry joints, nine specimens with epoxy joints and three specimens with epoxy
joints with gasket. The conclusions are as follows:
• All galvanized steel ducts and prestressing strands in the nineteen specimens
showed some degree of corrosion. The higher corrosion ratings were obtained
from dry joint specimens with galvanized steel ducts and normal grout.
Ducts in these specimens were extremely corroded, with corrosion centered at
the joint, and with concrete cracking in the top of the specimen. In general,
dry joint specimens showed increased chloride penetration and increased
corrosion of galvanized steel duct, prestressing strand and mild steel
reinforcement. These results show that dry joints do not provide adequate
corrosion protection for internal tendons in aggressive environments.

546
• Sound epoxy joint specimens with galvanized steel ducts showed moderate to
very severe duct corrosion centered away from the joint. Clear cover for
specimens was small (five eights to three quarters of an inch), significantly
lower than would be allowed by specifications. However, the test results
indicate the potential corrosion problems when using galvanized ducts in
aggressive environments if chlorides penetrate the concrete cover away from
the epoxy joint.
• Thin epoxy joints provided substantially improved corrosion protection when
compared to dry joints. However, test results showed that poor epoxy filling
at the joint is extremely detrimental to the performance of the duct, the
prestressing strand and the mild steel reinforcement. Incomplete filled epoxy
joint performance was very similar to that of a dry joint.
• Corrosion of mild steel in some epoxy joint specimens was found to be the
result of an external source of moisture and chlorides rather than from
penetration at the epoxy joint or through the concrete. This conclusion was
reinforced with chloride levels measured at the joint and away from the joint.
These findings reinforce the need to provide adequate clear cover over the
ends of longitudinal bars in the segments, even if external post-tensioning is
used.
• In some cases, the use of gaskets in epoxy jointed specimens prevented a
complete epoxy coverage of the joint. This condition could worsen under
field conditions.
7.1.4 Ducts for Internal Post-Tensioning
Two duct types were investigated; standard galvanized steel duct and
plastic duct. Due to size limitations, PVC pipe was used for the plastic duct.
Test results indicated:

547
• Superiority of plastic ducts was evident. Strand encased in plastic ducts
showed only light corrosion and discoloration. Specimens with plastic duct
had the best overall performance (quantified in terms of strand, mild steel and
duct corrosion).
• Galvanized steel duct was corroded in all specimens. Severe corrosion and
large duct destruction was observed in dry joint specimens. Such corrosion
was often centered on the dry joint. Epoxy joint specimens showed moderate
to severe duct corrosion. The corrosion was often centered away from the
joint.
• Concrete cover in specimens was lower than allowed by specifications.
However, test results indicate that these are potential corrosion problems
when using galvanized steel ducts in aggressive exposures if chlorides
penetrate the cover. Plastic ducts performed well in spite of the small cover.
7.1.5 Joint Precompression
Due to the small specimen size, the strand could not be post-tensioned
effectively. To simulate precompression across the joint due to post-tensioning,
the pairs of match –cast segments were stressed together using external loading
frames. Three levels of precompression were selected; 5 psi, 50 psi and 3√f’c psi.
The lowest level of 5 psi could represent the level of precompression encountered
in a precast segmental column under self weight. The precompression of 50 psi is
based on AASHTO Guide Specifications.7.3 The highest precompression value
corresponded to 190 psi for this testing program. Eight out of the nineteen
specimens (at eight years of exposure) had low precompression, seven medium
precompression and four high precompression. Conclusions are as follows:
• Test results did not show a clear trend with respect to joint precompression
when analyzing time to corrosion initiation and rate of corrosion in
548
prestressing strands and mild steel bars. An isolated result for dry joint
specimens with galvanized steel ducts and normal grout showed that at very
high levels of precompression, there is an increased level of strand and mild
steel protection. This result is not clearly shown for epoxy joint specimens
with and without gasket.
• Galvanized steel duct corrosion in dry joint specimens also showed better
performance with a higher level of precompression. However again, this
result is not clearly shown in epoxy joint specimens. Precompression level is
much important in dry joint specimens.
7.1.6 Grouts for Bonded Post-Tensioning
Three cement grout types were selected for evaluation; normal grout (plain
cement grout, no admixtures, w/c = 0.40), grout with silica fume (13% cement
replacement by weight, w/c = 0.32, superplasticizer added) and grout with a
commercial calcium nitrite corrosion inhibitor (w/c = 0.40). The dosage of
corrosion inhibitor used in this testing program was the same dosage normally
used for concrete (aprox. 20 liters/m3 concrete). The Calcium Nitrite dosage was
not adjusted to account for the higher cement content in grout. The testing
program for the nineteen remaining specimens at eight years of exposure included
thirteen specimens with normal grout, five with corrosion inhibitor and one with
silica fume. Conclusions are as follows:
• Grout voids, due to entrapped air, bleed water, incomplete grout filling or lack
of grout fluidity were detrimental not only to the prestressing strand, but also
to the galvanized steel duct.
• Dry joint Specimens with Corrosion Inhibitor (Calcium Nitrite) added to the
grout showed a lower strand corrosion rating (less strand corrosion severity) at

549
eight years of exposure, than specimens with normal grout (in the order of
seven times smaller). This trend was not clearly shown in epoxy joint
specimens. This result contradicts those obtained at four and a half years of
exposure where the most severe corrosion of the prestressing tendon was
found where calcium nitrite corrosion inhibitor was used.
• Epoxy joint specimens with silica fume, corrosion inhibitor and normal grout
had very similar performances. No clear distinction was evident.
7.2 SUMMARY AND CONCLUSIONS FROM BEAM CORROSION TESTS
Twelve out of the twenty-seven large scale beam specimens were fully
autopsied to evaluate the effect of post-tensioning on durability and to evaluate
the relative performance of a large number of corrosion protection variables. Two
additional specimens were partially autopsied. Full autopsies for the remaining
specimens will be performed at a future date. Beams were fabricated in two
phases in order to begin exposure testing on a portion of the specimens while the
remaining specimens were being fabricated. In Phase I (16 beams), which started
exposure testing in December 1997, researchers investigated the effect of
prestress level and crack width and also included one of the high performance
grout specimens. In Phase II (11 beams), which started exposure testing in
December 1998, researchers investigated duct splices, grout type, concrete type,
strand type, duct type, and end anchorage protection. After the first full autopsy
performed at four and a half years for six Phase I beams, and three and a half
years for six Phase II beams, and partial autopsies performed to two Phase I
beams, preliminary conclusions were drawn.
7.2.1 Overall Performance
The variables selected for evaluation in this beam testing program fall into
four main categories: level of prestress and crack width, concrete type,

550
prestressing strand coatings and post-tensioning hardware protection. In addition,
different post-tensioning duct splices were also evaluated. After the initial
autopsies of the fourteen beams, the use of large scale beam specimens was found
to be a very good method for determining the effect of most of these variables.
Prestressing strand coatings and post-tensioned hardware protection will be
evaluated at a future date, since they are included in the remaining specimens
under exposure testing. Based on the autopsies performed to date, the following
conclusions are drawn:
• Galvanized duct performed poorly. No plastic duct was used in the
specimens of the first set of full autopsies.
• Bleed water voids were present in the ducts even after “good grouting
procedures.” Anti-bleed grout was not evaluated in the first set of full
autopsies, but it is included in one of the remaining specimens for future
autopsy.
• Voids from bleed water in grout were shown to be very detrimental to the duct
• A clear trend was found with respect to cracking and mild steel corrosion. As
cracking increased, stirrup and rebar corrosion increased. This trend was not
clearly shown on strands, since strand ratings were all very low and close in
value
• Mixed reinforcing (2/3 PS) beams showed the worst corrosion resistance. The
best performance was obtained from 100%S PS specimens, followed by
100%U PS specimens
• Phase I beam results showed that there was a reduced risk of corrosion
damage with increasing levels of prestress
• High performance concrete specimens (low permeability, w/c=0.29) appear to
perform better than class C fly ash concrete specimens. However, both appear
to be effective in minimizing the chloride penetration through concrete

551
• Industry standard duct splices as well as heat shrink duct splices do not seem
to provide adequate corrosion protection
• Duct splice damage did not show a direct correlation with the severity of
corrosion
• No difference was found between normal and fly ash grout. Low strand
corrosion ratings on all specimens after autopsy, did not allow clear
identification of the effect of different types of grout
7.2.2 Load/Prestress Level versus Corrosion. The Effect of Cracking
The effect of cracking (width and number) on corrosion protection was an
area of great emphasis in this experimental program. The effect of cracking was
primarily investigated using standard variables and the sections that would be
expected to crack under service loads. The range of crack widths investigated in
this program were based on a survey of relevant literature performed by West7.4
regarding critical crack widths for corrosion and recommended allowable crack
widths. Consideration was also given to the applied moment-crack width
behavior computed for the sections. Three different load levels were used:
unloaded, service load, and temporary overloaded. The following conclusions
are drawn:
• The specimen corrosion protection decreases as the applied load increases
• Corrosion protection decreases with increasing cracking
• An increase in transverse crack width produces a decrease in corrosion
protection
• Longitudinal or splitting cracks in the concrete surface are a clear indication
of very severe corrosion within the member.
• The chloride content in the concrete is significantly higher at crack locations,
and increases as the crack width increases

552
• The specimen corrosion protection increases as the level of prestress increases
• Mixed reinforcement (2/3 PS) beams showed the worst corrosion
performance. Increasing the post-tensioning level from 2/3 PS to 100% PS
significantly increased the corrosion protection
• The corrosion protection of the 2/3 PS beam was much more similar to Non-
PS beams, as opposed to 100% PS Beams
• There was not a clear difference in the corrosion resistance among the fully
prestressed beams designed with the ultimate strength method as compared to
those designed with allowable stress method.
7.2.3 Fly Ash in Concrete
Concrete plays an important role in corrosion protection of steel
reinforcement. One of the objectives of this research program is to evaluate the
effectiveness of high performance concrete as a function of cracking. Three
different concrete mixes were selected for comparison. The reference mix was
the standard concrete: TxDOT Class C concrete. The alternates were a TxDOT
Class C concrete with 25% Class F Fly Ash and a High Performance Concrete
(0.29 w/c, 25% fly ash+superplasticizer). The following conclusions are drawn:
• Both the high performance concrete and the fly ash concrete beams showed
good corrosion protection by minimizing the chloride penetration through the
concrete
• The high performance concrete tends to show a slightly better corrosion
protection than the fly ash concrete, but the difference is not significant.
• No conclusions can be drawn on corrosion protection of the high performance
concrete and the fly ash concrete with respect to the standard TxDOT concrete
due to the unfortunate lack of directly comparable specimens at the time of the
first autopsy.

553
7.2.4 Duct Splices for Galvanized Steel Duct
In most practical applications, the post-tensioning ducts must be spliced at
some location. It was decided to compare industry standard (IS) splices to heat
shrink (HS) splices and unspliced duct. The effect of damaged splices was also
examined. The IS splice consisted of a 1 ft length of oversized duct placed over
the contact butt splice of the ducts. Concrete is prevented from entering the splice
by wrapping the ends with duct tape. The heat shrink splice consists of a 8 inch
length of heat shrink tubing placed over the contact butt splice of the ducts. The
original diameter of the heat shrink tubing was 4 inches. No mechanical
connection was made between the two ducts being connected. The conclusions
are as follows:
• The industry standard splice allowed moisture and chlorides to enter through
the sides of the splice and get trapped between the duct and the splice due to
inefficiency of duct tape.
• The heat-shrink splice also allowed moisture to enter through the sides and get
trapped due to insufficient adhesion between the splice and the duct. It also
traps bleed water from the grout.
• Damage inflicted on the duct splices did not show a direct correlation with the
severity of corrosion.
• Neither the industry standard splice nor the heat-shrink splice appears to be a
satisfactory duct splice for the corrosion protection of a galvanized steel duct.
7.2.5 High Performance Fly Ash Grouts
Two high performance grouts (a fly ash grout and an antibleed grout) were
selected for investigation, in comparison with TxDOT standard grout. The fly
ash grout specimen was autopsied, and results are reported herein. The antibleed
grout specimen will be autopsied at a future date. Antibleed grout had a water-

554
cement ratio of 0.33 with 2% cement weight of antibleed admixture. Based on the
information to date, the following conclusions are drawn:
• The fly ash grout aided in the corrosion protection of the galvanized steel
ducts
• The fly ash grout, in comparison to TxDOT standard grout, did not show an
increase in corrosion protection of the prestressing strand. This result may be
due to the strand ratings being very low and close in value. Several more
years of exposure testing may be require to yield more conclusive results
7.2.6 Exposure Testing Results
Half-cell potential readings were measured using a saturated calomel
reference electrode at the end of each wet cycle (once every four weeks). All
measurements were performed according to ASTM C876.7.2 In general, half-cell
potential readings are inadequate in determining the severity of corrosion activity,
but prove to be successful for relative comparison of specimens. The conclusions
are as follows:
• There is an exact correlation in specimen performance between the greatest
negative potential at the end of testing for autopsy beams and the time to
corrosion
• Both half cell potential readings and corrosion rating graphs show the loaded
Non-PS and 2/3 PS beams were the most corroded.
• Half-cell potential readings did not show a distinct correlation in high
performance and fly ash concrete specimens with the corresponding corrosion
ratings.
Corrosion rate measurements were taken four times during the exposure
duration. Two types of equipment were used in this experimental program: the
Pr Monitor and the 3LP. Measurements of the Phase I beams were taken after

555
seven, twelve, fifteen and forty-seven months of exposure. Measurements of the
Phase II beams were taken after 37 months of exposure. A final attempt to take
corrosion rate measurements of all beams was made immediately prior to the
forensic examination. This attempt was unsuccessful due to complications with
the 3LP equipment. Corrosion rate readings did not show good correlation with
forensic examination results. The presence of zinc in the galvanized steel ducts
may have played a role in the erroneous results.
Chloride content was found to be a useful method in determining the onset
of corrosion. However, there was not a direct relationship between the acid
soluble chloride content at the bar/duct level and the severity of corrosion at time
of autopsy.
7.3 SUMMARY AND CONCLUSIONS FROM COLUMN CORROSION TESTS
Five non-prestressed and five post-tensioned columns specimens were used
to investigate corrosion mechanisms and chloride ion transport (“wicking effect )
in various column connection configurations and to evaluate column corrosion
protection measures. Variables included column to foundation connection (no
dowel joint, doweled joint and post-tensioned joint), loading (no loading and
service load – with combined moment and axial load), concrete type (TxDOT
Class C concrete, and Class C Fly Ash concrete – 35% replacement by volume),
prestressing bar coatings (uncoated, galvanized PT-bars, and epoxy coated PT-
bars), and post-tensioning ducts (plastic and galvanized steel). Trickle water was
used on one face of each column to determine the effect of salt water spray or
dripping. Test specimen exposure started in July of 1996 and ended in January of
2003, after six and a half years. Full autopsies were performed at the end of
testing, and conclusions are as follows.
556
7.3.1 Post-Tensioning to Improve Corrosion Protection
The possible weak link in corrosion protection at the column-foundation
interface was studied with three different configurations: no dowel joint, doweled
joint and post-tensioning joint. Determination of the effect of post-tensioning on
durability through precompression of the concrete and precompression of
construction joints was one of the main objectives of this research series. The
conclusions are as follows:
• Post-tensioned specimens did not show any distinct improvement in specimen
performance at the column foundation interface, when compared to doweled
specimens.
• Post-tensioning dramatically reduced the corrosion found on spiral
reinforcement in the first 18 inches from the column base.
• Post-tensioned specimens under loading showed an increase in spiral and mild
steel reinforcement corrosion protection when compared to non-loaded
specimens.
• Post-tensioning reduced the risk of spiral corrosion due to saltwater dripping.
• Post-tensioning provided better resistance to the wicking effect, when acid-
soluble chloride contents were compared to doweled and no-dowel specimens.
7.3.2 Fly Ash as Partial Cement Replacement in Concrete
TxDOT standard concrete mix Class C concrete was used in eight
specimens (w/c = 0.45, type I/II Cement, f´c=3600). In two columns, 35% of
cement by volume (31% by weight) was replaced with Class C Fly Ash, with no
other significant changes to the concrete mix. After autopsy, the following
conclusions are drawn:
• Fly ash concrete did seem to provide enhanced corrosion protection to
galvanized steel ducts.
557
• Spiral and mild steel reinforcement corrosion in non-prestressed specimens
showed a better performance in Fly Ash concrete than in Class C concrete
specimens. This trend was not clearly shown in post-tensioned specimens.
• Post-tensioned bar corrosion did not show any distinct trend with respect to
the type of concrete in the specimen.
7.3.3 Plastic Ducts for Post-Tensioning
Standard galvanized steel ducts were compared to impermeable plastic
ducts in three post-tensioned specimens: Class C concrete (unloaded and service
load) and Fly Ash concrete under service load. In all cases uncoated post-
tensioning bars were used. The conclusions are as follows:
• Although results are very limited, advanced galvanized steel duct corrosion at
the column base, inside the rubber gasket, show the superiority of using
plastic ducts.
• Corrosion in post-tensioned bars in plastic ducts and galvanized ducts was
always at the column-foundation interface, where the plastic or galvanized
duct was interrupted. Therefore, conclusions regarding duct performance
based on post-tensioning bar corrosion are not possible. The ducts need an
effective splice seal at all joints.
7.3.4 Post-Tensioning Bar Coatings
Two prestressing bar coatings were investigated: epoxy coated (according
to ASTM A775-97) and zinc galvanized prestressing bars. The coated bars were
compared directly to uncoated bars within individual specimens. In both cases,
anchorage hardware was either epoxy coated or galvanized. The following
conclusions are drawn:
558
• Epoxy coating or galvanized post-tensioning bars showed enhanced corrosion
protection, with respect to plain post-tensioning bars.
• Coatings were not sufficient to stop corrosion from occurring at the column-
foundation interface. Corrosion was very localized.
• Superiority of coated bars should not be concluded, since localized corrosion
may accelerate deterioration at the local level, which in turn may result in
unexpected failure.
7.4 MAJOR OVERALL CONCLUSIONS
Based on the results from the macrocell, beam and column corrosion test
series, the following major overall conclusions are drawn:
Ducts for Internal Post-Tensioning
• The use of galvanized steel ducts appears unwise. Severe duct
destruction and pitting was found in most specimens with this type
of duct. From macrocell and column corrosion test results the
superiority of plastic ducts was evident. The use of plastic ducts
and encapsulated anchorage protection systems appear promising
but cannot be conclusively evaluated until after final autopsies of
the remaining beam specimens.
• Unspliced plastic ducts, such as those used in the macrocell and
column series, showed better protection of the strands or bars when
compared to galvanized steel ducts. However, the need for better
splicing systems to avoid any moisture and chloride penetration
and the corresponding localized strand or bar corrosion was
evident.

559
Cracking and Joints
• Cracking due to loading, had a definite effect on corrosion damage.
As cracking increased, reinforcement corrosion increased. Larger
crack widths and crack density were found to be the cause of very
severe localized and uniform reinforcement corrosion activity.
• Sound epoxy joint filling is mandatory to prevent moisture and
chloride ingress. Dry joints and incompletely filled epoxy joints
in the macrocell specimens showed very poor performance.
Similar results were observed in the column tests at the column
bases for the non-doweled specimens. Dry joints performed as
preset cracks.
Concrete Type
• High performance concrete appears to be effective in minimizing
the chloride penetration through concrete.
Concrete Cover
• Small concrete cover was clearly shown to be detrimental to
reinforcement performance. When segmental joints allowed for
moisture and chloride ingress, the smaller cover typical at the joint
faces increased the corrosion activity in the reinforcement.
Similar results were obtained at the base of the column specimens
when analyzing spiral performance.
Levels of Post-Tensioning
• As the level of post-tensioning or concrete precompression
increased, the corrosion protection increased. Mixed reinforced
beams showed substantially more corrosion than fully prestressed
members. Crack control and concrete precompression are definite
factors in reducing corrosion risk. Lower permeability due to

560
increased precompression also provided better resistance to
wicking effects.
Galvanized Ducts Splices
• Neither the industry standard splice nor the heat-shrink splice
appear to be a satisfactory duct splice to prevent moisture and
chloride ingress to the grout for the corrosion protection of a
galvanized steel duct.
Gaskets for Post-Tensioning
• The use of supplementary gaskets in the joints to avoid epoxy
filling of the ducts, in the case of the macrocell specimens; or the
use of rubber gaskets to seal the duct ends, in the case of the
column specimens, were detrimental to the performance of the
specimens. Both gaskets allowed for moisture and chloride ingress.
Gaskets used at the duct ends trapped moisture and produce
crevice corrosion in the galvanized steel ducts.
Grouts for Post-Tensioning
• The standard TxDOT Class C grout performed poorly in all
specimens under evaluation. Better results were obtained with
corrosion inhibitor added to the grout, and the use of fly ash.
However, grout voids were not avoided with these grout mixes.
The use of antibleed grouts appear promising but result cannot be
conclusive until final autopsies of the remaining beam specimens.
• Grout voids, due to entrapped air, bleed water, incomplete grout
filling or lack of grout fluidity showed to be detrimental not only to
the prestressing strand, but also to the galvanized duct. In
addition, bleed water was found to be detrimental to the galvanized
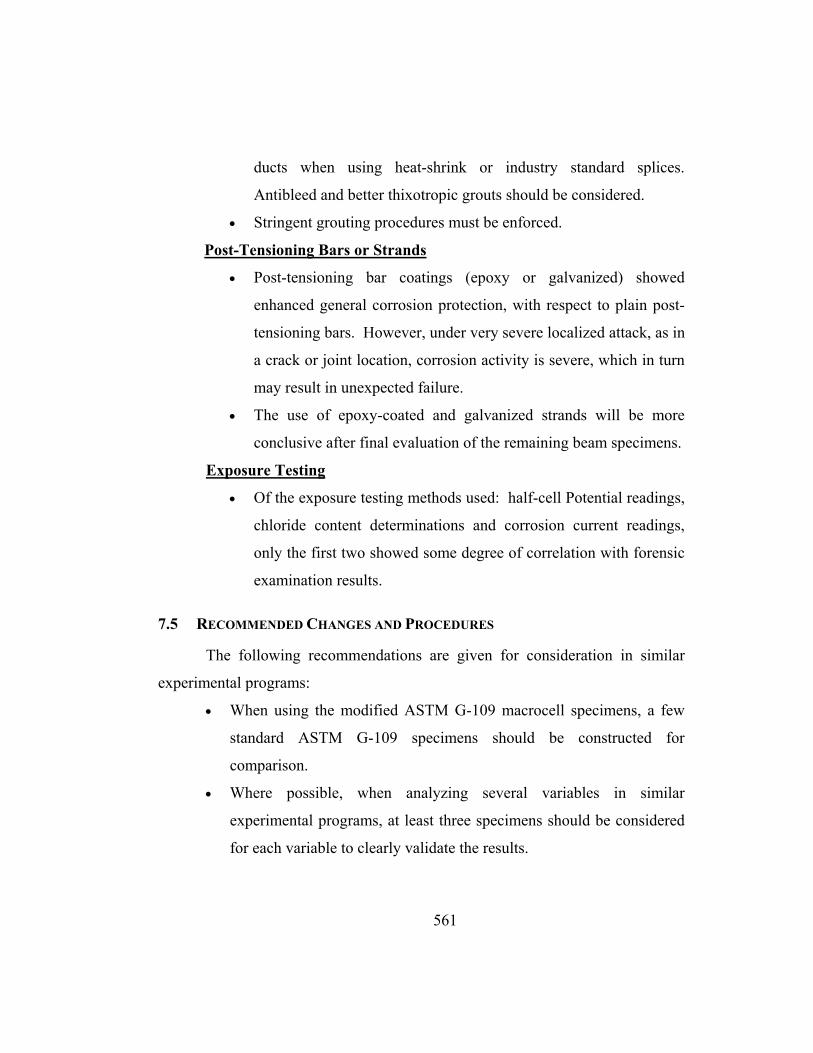
561
ducts when using heat-shrink or industry standard splices.
Antibleed and better thixotropic grouts should be considered.
• Stringent grouting procedures must be enforced.
Post-Tensioning Bars or Strands
• Post-tensioning bar coatings (epoxy or galvanized) showed
enhanced general corrosion protection, with respect to plain post-
tensioning bars. However, under very severe localized attack, as in
a crack or joint location, corrosion activity is severe, which in turn
may result in unexpected failure.
• The use of epoxy-coated and galvanized strands will be more
conclusive after final evaluation of the remaining beam specimens.
Exposure Testing
• Of the exposure testing methods used: half-cell Potential readings,
chloride content determinations and corrosion current readings,
only the first two showed some degree of correlation with forensic
examination results.
7.5 RECOMMENDED CHANGES AND PROCEDURES
The following recommendations are given for consideration in similar
experimental programs:
• When using the modified ASTM G-109 macrocell specimens, a few
standard ASTM G-109 specimens should be constructed for
comparison.
• Where possible, when analyzing several variables in similar
experimental programs, at least three specimens should be considered
for each variable to clearly validate the results.

562
• Connection wires used for non-destructive measurements should be
protected against the outdoor environment to avoid possible
deterioration and corrosion that would increase resistivity. Also,
wiring systems should be protected against salt water contact while
filling up the Plexiglas containers for the aggressive exposure of the
corrosion specimens.
7.6 DIRECTIONS FOR FUTURE RESEARCH
After the research results had been summarized, it is concluded that post-
tensioning in concrete structures can provide enhanced durability, besides the well
known structural and economical benefits. However, to ensure that the post-
tensioning system is well protected against corrosion or deterioration, further
research is needed in some specific areas. The author recommends additional
testing in the following fields:
• Use of encapsulated and electrically isolated systems
• Use of improved grouts for post-tensioning and better grouting
procedures
• Use of post-tensioning duct couplers
• Development of better splice systems for galvanized ducts that
might be used in non-aggressive environments.
• Use of impermeable surface membranes
• Development of better non-destructive methods for determining
corrosion activity within post-tensioned concrete members.
• Use of improved concrete mix designs
• Use of improved strand or bar materials

563
Appendix A Macrocell Corrosion Tests Supplementary Material
A.1 CORROSION CURRENT PLOTS
The following corrosion current plots complement those contained in Figures 3.6 through Figure 3.9. Main variables can be evaluated by inspection of the following figures per variable type: Joint Type (Figures A.1, A.2, A.3, A.4 and 3.6), Duct Type (Figures A.5 and 3.7), Joint Precompression (Figures A.6, A.7, A.8, A.9 and 3.8), and Grout Type (Figures A.10, A.11, A.12, A.13 and 3.9).
Figure A.1 Macrocell Corrosion Current: Dry, Epoxy and Epoxy with Gasket Joint, Steel Duct, Low Precompression and Normal Grout
-0.080-0.070-0.060-0.050-0.040-0.030-0.020-0.0100.0000.0100.0200.0300.0400.0500.0600.0700.080
0 250 500 750 1000 1250 1500 1750 2000 2250 2500 2750 3000
Time (days)
DJ-S-L-NG-2SE-S-L-NG-1EG-S-L-NG-1
Note: Negative current indicatesmacrocell corrosion is reversed.(i.e. bottom steel is corroding)

564
Figure A.2 Macrocell Corrosion Current: Dry, Epoxy and Epoxy with Gasket Joint, Steel Duct, Medium Precompression and Normal Grout
Figure A.3 Macrocell Corrosion Current: Dry and Epoxy Joint, Steel Duct, Low Precompression and Corrosion Inhibitor in Grout
-0.080-0.070-0.060-0.050-0.040-0.030-0.020-0.0100.0000.0100.0200.0300.0400.0500.0600.0700.080
0 250 500 750 1000 1250 1500 1750 2000 2250 2500 2750 3000
Time (days)
DJ-S-M-NG-2SE-S-M-NG-1EG-S-M-NG-1
Note: Negative current indicatesmacrocell corrosion is reversed.(i.e. bottom steel is corroding)
-0.080-0.070-0.060-0.050-0.040-0.030-0.020-0.0100.0000.0100.0200.0300.0400.0500.0600.0700.080
0 250 500 750 1000 1250 1500 1750 2000 2250 2500 2750 3000
Time (days)
DJ-S-L-CI-2SE-S-L-CI-1
Note: Negative current indicatesmacrocell corrosion is reversed.(i.e. bottom steel is corroding)

565
Figure A.4 Macrocell Corrosion Current: Dry and Epoxy Joint, Steel Duct, Medium Precompression and Corrosion Inhibitor in Grout
Figure A.5 Macrocell Corrosion Current: Epoxy Joint, Steel and Plastic Duct, Medium Precompression, and Normal Grout
-0.080-0.070-0.060-0.050-0.040-0.030-0.020-0.0100.0000.0100.0200.0300.0400.0500.0600.0700.080
0 250 500 750 1000 1250 1500 1750 2000 2250 2500 2750 3000
Time (days)
DJ-S-M-CI-2SE-S-M-CI-1
Note: Negative current indicatesmacrocell corrosion is reversed.(i.e. bottom steel is corroding)
-0.080-0.070-0.060-0.050-0.040-0.030-0.020-0.0100.0000.0100.0200.0300.0400.0500.0600.0700.080
0 250 500 750 1000 1250 1500 1750 2000 2250 2500 2750 3000Time (days)
SE-S-M-NG-1SE-P-M-NG-1
Note: Negative current indicatesmacrocell corrosion is reversed.(i.e. bottom steel is corroding)

566
Figure A.6 Macrocell Corrosion Current: Epoxy Joint, Steel Duct, Low, Medium and High Precompression, and Normal Grout
Figure A.7 Macrocell Corrosion Current: Epoxy with Gasket Joint, Steel Duct, Low, Medium and High Precompression, and Normal Grout
-0.080-0.070-0.060-0.050-0.040-0.030-0.020-0.0100.0000.0100.0200.0300.0400.0500.0600.0700.080
0 250 500 750 1000 1250 1500 1750 2000 2250 2500 2750 3000
Time (days)
SE-S-L-NG-1SE-S-M-NG-1SE-S-H-NG-1
Note: Negative current indicatesmacrocell corrosion is reversed.(i.e. bottom steel is corroding)
-0.080-0.070-0.060-0.050-0.040-0.030-0.020-0.0100.0000.0100.0200.0300.0400.0500.0600.0700.080
0 250 500 750 1000 1250 1500 1750 2000 2250 2500 2750 3000
Time (days)
EG-S-L-NG-1EG-S-M-NG-1EG-S-H-NG-1
Note: Negative current indicatesmacrocell corrosion is reversed.(i.e. bottom steel is corroding)

567
Figure A.8 Macrocell Corrosion Current: Dry Joint, Steel Duct, Low and Medium Precompression, and Corrosion Inhibitor in Grout
Figure A.9 Macrocell Corrosion Current: Epoxy Joint, Steel Duct, Low, Medium and High Precompression, and Corrosion Inhibitor in Grout
-0.080-0.070-0.060-0.050-0.040-0.030-0.020-0.0100.0000.0100.0200.0300.0400.0500.0600.0700.080
0 250 500 750 1000 1250 1500 1750 2000 2250 2500 2750 3000
Time (days)
DJ-S-L-CI-2DJ-S-M-CI-2
Note: Negative current indicatesmacrocell corrosion is reversed.(i.e. bottom steel is corroding)
-0.080-0.070-0.060-0.050-0.040-0.030-0.020-0.0100.0000.0100.0200.0300.0400.0500.0600.0700.080
0 250 500 750 1000 1250 1500 1750 2000 2250 2500 2750 3000
Time (days)
SE-S-L-CI-1SE-S-M-CI-1SE-S-H-CI-1
Note: Negative current indicatesmacrocell corrosion is reversed.(i.e. bottom steel is corroding)

568
Figure A.10 Macrocell Corrosion Current: Dry Joint, Steel Duct, Low Precompression, and Different Grouts (Normal and with Corrosion Inhibitor
Added)
Figure A.11 Macrocell Corrosion Current: Dry Joint, Steel Duct, Medium Precompresion, and Different Grouts (Normal and with Corrosion Inhibitor
Added)
-0.080-0.070-0.060-0.050-0.040-0.030-0.020-0.0100.0000.0100.0200.0300.0400.0500.0600.0700.080
0 250 500 750 1000 1250 1500 1750 2000 2250 2500 2750 3000
Time (days)
DJ-S-L-CI-2DJ-S-L-NG-2
Note: Negative current indicatesmacrocell corrosion is reversed.(i.e. bottom steel is corroding)
-0.080-0.070-0.060-0.050-0.040-0.030-0.020-0.0100.0000.0100.0200.0300.0400.0500.0600.0700.080
0 250 500 750 1000 1250 1500 1750 2000 2250 2500 2750 3000
Time (days)
DJ-S-M-CI-2DJ-S-M-NG-2
Note: Negative current indicatesmacrocell corrosion is reversed.(i.e. bottom steel is corroding)

569
Figure A.12 Macrocell Corrosion Current: Epoxy Joint, Steel Duct, Low Precompression and Different Grouts (Normal, Corrosion Inhibitor, Silica
Fume)
Figure A.13 Macrocell Corrosion Current: Epoxy Joint, Steel Duct, High Precompression, and Different Grouts (Normal and with Corrosion Inhibitor
Added)
-0.080-0.070-0.060-0.050-0.040-0.030-0.020-0.0100.0000.0100.0200.0300.0400.0500.0600.0700.080
0 250 500 750 1000 1250 1500 1750 2000 2250 2500 2750 3000
Time (days)
SE-S-L-NG-1SE-S-L-CI-1SE-S-L-SF-1
Note: Negative current indicatesmacrocell corrosion is reversed.(i.e. bottom steel is corroding)
-0.080-0.070-0.060-0.050-0.040-0.030-0.020-0.0100.0000.0100.0200.0300.0400.0500.0600.0700.080
0 250 500 750 1000 1250 1500 1750 2000 2250 2500 2750 3000
Time (days)
SE-S-H-NG-1SE-S-H-CI-1
Note: Negative current indicatesmacrocell corrosion is reversed.(i.e. bottom steel is corroding)

570
A.2 HALF CELL PLOTS
As with the corrosion current plots, the following Half-Cell reading plots complement those contained in Figures 3.10 through Figure 3.13. The main variables can be evaluated by inspection of the following figures per variable type: Joint Type (Figures A.14, A.15, A.16, A.17 and 3.10), Duct Type (Figures A.18 and 3.11), Joint Precompression (Figures A.19, A.20, A.21, A.22 and 3.12), and Grout Type (Figures A.23, A.24, A.25, A.26 and 3.13).
Figure A.14 Half-Cell Potentials: Dry , Epoxy and Epoxy with Gasket Joints, Steel Duct, Low Precompression, and Normal Grout
-800
-700
-600
-500
-400
-300
-200
-100
0
100
0 250 500 750 1000 1250 1500 1750 2000 2250 2500 2750 3000
Time (days)
DJ-S- L-NG-2SE-S-L-NG-1EG-S-L-NG-1
< 10% probabilityof corrosion
> 90% probabilityof corrosion

571
Figure A.15 Half-Cell Potentials: Dry, Epoxy and Epoxy with Gasket Joints,
Steel Duct, Medium Precompression and Normal Grout
Figure A.16 Half-Cell Potentials: Dry and Epoxy Joint, Steel Duct, Low
Precompression, and Corrosion Inhibitor in Grout
-800
-700
-600
-500
-400
-300
-200
-100
0
100
0 250 500 750 1000 1250 1500 1750 2000 2250 2500 2750 3000
Time (days)
DJ-S-M-NG-2SE-S-M-NG-1EG-S-M-NG-1
< 10% probabilityof corrosion
> 90% probabilityof corrosion
-800
-700
-600
-500
-400
-300
-200
-100
0
100
0 250 500 750 1000 1250 1500 1750 2000 2250 2500 2750 3000
Time (days)
DJ-S-L-CI-2SE-S-L-CI-1
< 10% probabilityof corrosion
> 90% probabilityof corrosion

572
Figure A.17 Half-Cell Potentials: Dry and Epoxy Joint, Steel Duct, Medium Precompression, and Corrosion Inhibitor in Grout
Figure A.18 Half Cell Potentials: Dry and Epoxy Joint, Steel and Plastic Duct,
Medium Precompression, and Normal Grout
-800
-700
-600
-500
-400
-300
-200
-100
0
100
0 250 500 750 1000 1250 1500 1750 2000 2250 2500 2750 3000
Time (days)
DJ-S-M-CI-2SE-S-M-CI-1
< 10% probabilityof corrosion
> 90% probabilityof corrosion
-800
-700
-600
-500
-400
-300
-200
-100
0
100
0 250 500 750 1000 1250 1500 1750 2000 2250 2500 2750 3000
Time (days)
DJ-S-M-NG-2DJ-P-M-NG-2SE-S-M-NG-1SE-P-M-NG-1
< 10% probabilityof corrosion
> 90% probabilityof corrosion

573
Figure A.19 Half-Cell Potentials: Epoxy Joint, Steel Duct, Low, Medium and High Precompression, and Normal Grout
Figure A.20 Half Cell Potentials: Epoxy Joint with Gasket, Steel Duct, Low, Medium and High Precompression, and Normal Grout
-800
-700
-600
-500
-400
-300
-200
-100
0
100
0 250 500 750 1000 1250 1500 1750 2000 2250 2500 2750 3000
Time (days)
SE-S-L-NG-1SE-S-M-NG-1SE-S-H-NG-1
< 10% probabilityof corrosion
> 90% probabilityof corrosion
-800
-700
-600
-500
-400
-300
-200
-100
0
100
0 250 500 750 1000 1250 1500 1750 2000 2250 2500 2750 3000
Time (days)
EG-S-L-NG-1EG-S-M-NG-1EG-S-H-NG-1
< 10% probabilityof corrosion
> 90% probabilityof corrosion

574
Figure A.21 Half-Cell Potentials: Dry Joint, Steel Duct, Low and Medium Precompression, and Corrosion Inhibitor in Grout
Figure A.22 Half-Cell Potentials: Epoxy Joint, Steel Duct, Low, Medium and High Precompression, and Corrosion Inhibitor in Grout
-800
-700
-600
-500
-400
-300
-200
-100
0
100
0 250 500 750 1000 1250 1500 1750 2000 2250 2500 2750 3000
Time (days)
DJ-S-L-CI-2DJ-S-M-CI-2
< 10% probabilityof corrosion
> 90% probabilityof corrosion
-800
-700
-600
-500
-400
-300
-200
-100
0
100
0 250 500 750 1000 1250 1500 1750 2000 2250 2500 2750 3000
Time (days)
SE-S-L-CI-1SE-S-M-CI-1SE-S-H-CI-1
< 10% probabilityof corrosion
> 90% probabilityof corrosion

575
Figure A.23 Half-Cell Potentials: Dry Joint, Steel Duct,
Low Precompression, Normal Grout and Grout with Corrosion Inhibitor Added
Figure A.24 Half-Cell Potentials: Dry Joint, Steel Duct, Medium Precompression, and Different Grouts (Normal and Corrosion Inhibitor Added)
-800
-700
-600
-500
-400
-300
-200
-100
0
100
0 250 500 750 1000 1250 1500 1750 2000 2250 2500 2750 3000
Time (days)
DJ-S-L-NG-2
DJ-S-L-CI-2
< 10% probabilityof corrosion
> 90% probabilityof corrosion
-800
-700
-600
-500
-400
-300
-200
-100
0
100
0 250 500 750 1000 1250 1500 1750 2000 2250 2500 2750 3000
Time (days)
DJ-S-M-NG-2
DJ-S-M-CI-2
< 10% probabilityof corrosion
> 90% probabilityof corrosion

576
Figure A.25 Half-Cell Potentials: Epoxy Joint, Steel Duct, Low Precompression, and Different Grouts (Normal, Silica Fume and Corrosion
Inhibitor Added)
Figure A.26 Half-Cell Potentials: Epoxy Joint, Steel Duct, High Precompression, and Different Grouts (Normal and Corrosion Inhibitor Added)
-800
-700
-600
-500
-400
-300
-200
-100
0
100
0 250 500 750 1000 1250 1500 1750 2000 2250 2500 2750 3000
Time (days)
SE-S-L-NG-1SE-S-L-SF-1SE-S-L-CI-1
< 10% probabilityof corrosion
> 90% probabilityof corrosion
-800
-700
-600
-500
-400
-300
-200
-100
0
100
0 250 500 750 1000 1250 1500 1750 2000 2250 2500 2750 3000
Time (days)
SE-S-H-NG-1SE-S-H-CI-1
< 10% probabilityof corrosion
> 90% probabilityof corrosion

577
A.3 SPECIMEN PERFORMANCE REPRODUCIBILITY
The following half-cell potential plots complement those included in Section 3.2.3.
Figure A.27 Half-Cell Potentials for Duplicated Specimens with Dry Joint, Steel Duct, Low Precompression and Normal Grout
Figure A.28 Half-Cell Potentials for Duplicated Specimens with Dry Joint, Steel Duct, Medium Precompression and Normal Grout
-800
-700
-600
-500
-400
-300
-200
-100
0
100
0 250 500 750 1000 1250 1500 1750 2000 2250 2500 2750 3000
Time (days)
Hal
f-cel
l Pot
entia
l (m
V)
DJ-S-L-NG-1DJ-S-L-NG-2
< 10% probabilityof corrosion
> 90% probabilityof corrosion
-800
-700
-600
-500
-400
-300
-200
-100
0
100
0 250 500 750 1000 1250 1500 1750 2000 2250 2500 2750 3000
Time (days)
Hal
f-cel
l Pot
entia
l (m
V)
DJ-S-M-NG-1DJ-S-M-NG-2
< 10% probabilityof corrosion
> 90% probabilityof corrosion

578
Figure A.29 Half-Cell Potentials for Duplicated Specimens with Dry Joint, Plastic Duct, Low Precompression, and Normal Grout
Figure A.30 Half-Cell Potentials for Duplicated Specimens with Dry Joint, Steel Duct, Low Precompression, and Grout with
Corrosion Inhibitor Added
-800
-700
-600
-500
-400
-300
-200
-100
0
100
0 250 500 750 1000 1250 1500 1750 2000 2250 2500 2750 3000
Time (days)
Hal
f-cel
l Pot
entia
l (m
V)
DJ-S-L-CI-1DJ-S-L-CI-2
< 10% probabilityof corrosion
> 90% probabilityof corrosion
-800
-700
-600
-500
-400
-300
-200
-100
0
100
0 250 500 750 1000 1250 1500 1750 2000 2250 2500 2750 3000
Time (days)
Hal
f-cel
l Pot
entia
l (m
V)
DJ-P-L-NG-1DJ-P-L-NG-2
< 10% probabilityof corrosion
> 90% probabilityof corrosion

579
Figure A.31 Half-Cell Potentials for Duplicated Specimens with Dry Joint, Steel Duct, Medium Precompression and Grout with
Corrosion Inhibitor Added
Figure A.32 Half-Cell Potentials for Duplicated Specimens with Epoxy Joint, Steel Duct, Low Precompression, and Normal Grout
-800
-700
-600
-500
-400
-300
-200
-100
0
100
0 250 500 750 1000 1250 1500 1750 2000 2250 2500 2750 3000
Time (days)
Hal
f-cel
l Pot
entia
l (m
V)
DJ-S-M-CI-1DJ-S-M-CI-2
< 10% probabilityof corrosion
> 90% probabilityof corrosion
-800
-700
-600
-500
-400
-300
-200
-100
0
100
0 250 500 750 1000 1250 1500 1750 2000 2250 2500 2750 3000
Time (days)
Hal
f-cel
l Pot
entia
l (m
V)
SE-S-L-NG-1SE-S-L-NG-2
< 10% probabilityof corrosion
> 90% probabilityof corrosion

580
Figure A.33 Half-Cell Potentials for Duplicated Specimens with Epoxy Joint, Steel Duct, Medium Precompression, and Normal Grout
Figure A.34 Half-Cell Potentials for Duplicated Specimens with Epoxy Joint, Plastic Duct, Low Precompression, and Normal Grout
-800
-700
-600
-500
-400
-300
-200
-100
0
100
0 250 500 750 1000 1250 1500 1750 2000 2250 2500 2750 3000
Time (days)
Hal
f-cel
l Pot
entia
l (m
V)
SE-S-M-NG-1SE-S-M-NG-2
< 10% probabilityof corrosion
> 90% probabilityof corrosion
-800
-700
-600
-500
-400
-300
-200
-100
0
100
0 250 500 750 1000 1250 1500 1750 2000 2250 2500 2750 3000
Time (days)
Hal
f-cel
l Pot
entia
l (m
V)
SE-P-L-NG-1SE-P-L-NG-2
< 10% probabilityof corrosion
> 90% probabilityof corrosion
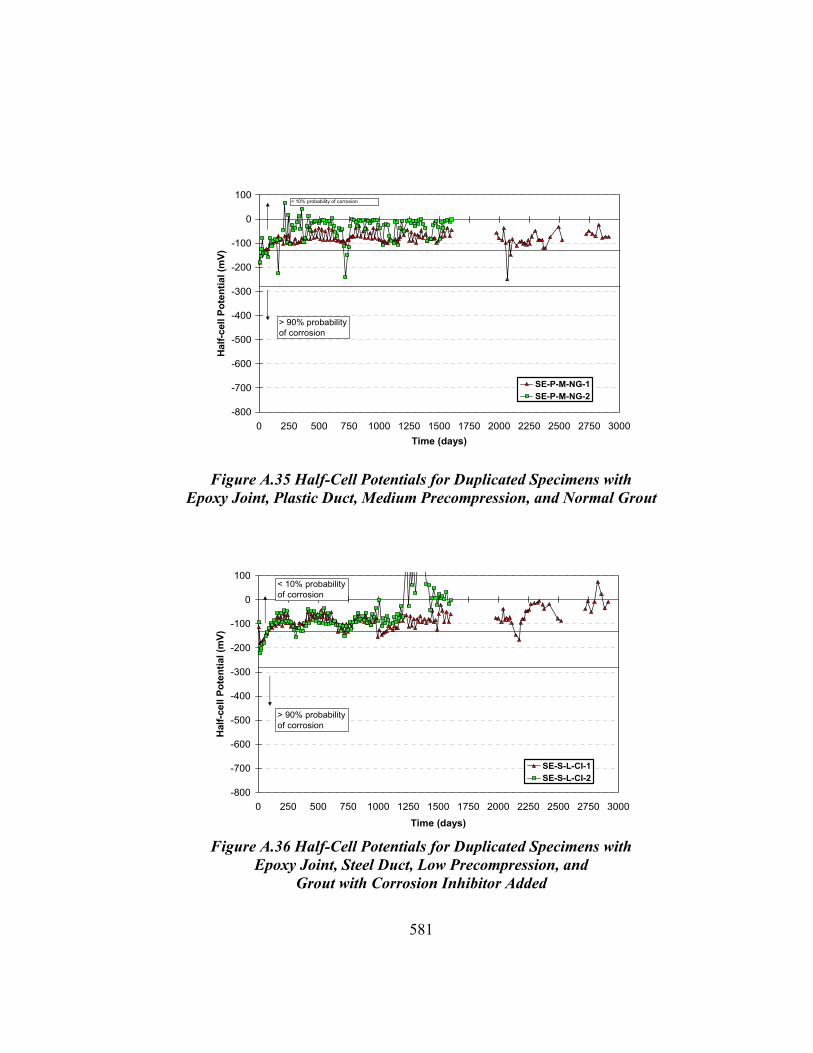
581
Figure A.35 Half-Cell Potentials for Duplicated Specimens with Epoxy Joint, Plastic Duct, Medium Precompression, and Normal Grout
Figure A.36 Half-Cell Potentials for Duplicated Specimens with Epoxy Joint, Steel Duct, Low Precompression, and
Grout with Corrosion Inhibitor Added
-800
-700
-600
-500
-400
-300
-200
-100
0
100
0 250 500 750 1000 1250 1500 1750 2000 2250 2500 2750 3000Time (days)
Hal
f-cel
l Pot
entia
l (m
V)
SE-P-M-NG-1SE-P-M-NG-2
< 10% probability of corrosion
> 90% probabilityof corrosion
-800
-700
-600
-500
-400
-300
-200
-100
0
100
0 250 500 750 1000 1250 1500 1750 2000 2250 2500 2750 3000
Time (days)
Hal
f-cel
l Pot
entia
l (m
V)
SE-S-L-CI-1SE-S-L-CI-2
< 10% probabilityof corrosion
> 90% probabilityof corrosion

582
Figure A.37 Half-Cell Potentials for Duplicated Specimens with Epoxy Joint, Steel Duct, Medium Precompression, and Grout
with Corrosion Inhibitor Added
Figure A.38 Half-Cell Potentials for Duplicated Specimens with Epoxy Joint, Steel Duct, High Precompression, and Grout with
Corrosion Inhibitor Added
-800
-700
-600
-500
-400
-300
-200
-100
0
100
0 250 500 750 1000 1250 1500 1750 2000 2250 2500 2750 3000
Time (days)
Hal
f-cel
l Pot
entia
l (m
V)
SE-S-M-CI-1SE-S-M-CI-2
< 10% probabilityof corrosion
> 90% probabilityof corrosion
-800
-700
-600
-500
-400
-300
-200
-100
0
100
0 250 500 750 1000 1250 1500 1750 2000 2250 2500 2750 3000
Time (days)
Hal
f-cel
l Pot
entia
l (m
V)
SE-S-H-CI-1SE-S-H-CI-2
< 10% probabilityof corrosion
> 90% probabilityof corrosion

583
Figure A.39 Half-Cell Potentials for Duplicated Specimens with Epoxy Joint, Steel Duct, Low Precompression, and Grout
with Silica Fume Added
Figure A.40 Half-Cell Potentials for Duplicated Specimens with Epoxy Joint with Gasket, Steel Duct, Low Precompression, and Normal Grout
-800
-700
-600
-500
-400
-300
-200
-100
0
100
0 250 500 750 1000 1250 1500 1750 2000 2250 2500 2750 3000
Time (days)
Hal
f-cel
l Pot
entia
l (m
V)
SE-S-L-SF-1SE-S-L-SF-2
< 10% probabilityof corrosion
> 90% probabilityof corrosion
-800
-700
-600
-500
-400
-300
-200
-100
0
100
0 250 500 750 1000 1250 1500 1750 2000 2250 2500 2750 3000
Time (days)
Hal
f-cel
l Pot
entia
l (m
V)
EG-S-L-NG-1EG-S-L-NG-2
< 10% probabilityof corrosion
> 90% probabilityof corrosion

584
Figure A.41 Half-Cell Potentials for Duplicated Specimens with Epoxy Joint with Gasket, Steel Duct, Medium Precompression, and
Normal Grout
Figure A.42 Half-Cell Potentials for Duplicated Specimens with Epoxy Joint with Gasket, Steel Duct, High Precompression, and Normal Grout
-800
-700
-600
-500
-400
-300
-200
-100
0
100
0 250 500 750 1000 1250 1500 1750 2000 2250 2500 2750 3000
Time (days)
Hal
f-cel
l Pot
entia
l (m
V)
EG-S-M-NG-1EG-S-M-NG-2
< 10% probabilityof corrosion
> 90% probabilityof corrosion
-800
-700
-600
-500
-400
-300
-200
-100
0
100
0 250 500 750 1000 1250 1500 1750 2000 2250 2500 2750 3000
Time (days)
Hal
f-cel
l Pot
entia
l (m
V)
EG-S-H-NG-1EG-S-H-NG-2
< 10% probabilityof corrosion
> 90% probabilityof corrosion

585
Appendix B Beam Corrosion Tests
Supplementary Material
B.1 DETAIL BEAM CONSTRUCTION DRAWINGS
Complete construction details of the four sections (Non-PS,2/3 PS, 100%U PS and 100%S PS) are shown in the following detailed drawings.
Figure B.1 Sheet 0: Drawing List4.2

586
Figure B.2 Sheet S1: Non-PS Section 4.2
Figure B.3 Sheet S2: Non-PS Stirrup Layout4.2

587
Figure B.4 Sheet S3: 100%S PS Section4.2
Figure B.5 Sheet S4: 100%S Stirrup Layout 4.2

588
Figure B.6 Sheet S5: 100%S Anchorage Zone 4.2
Figure B.7 Sheet S6: 100%S End Detail 4.2

589
Figure B.8 Sheet S7: 100%U PS Section 4.2
Figure B.9 Sheet S8: 100%U Stirrup Layout 4.2

590
Figure B.10 Sheet S9: 100%U Anchorage Zone4.2
Figure B.11 Sheet S10: 100%U End Detail 4.2

591
Figure B.12 Sheet S11: 100%S End Detail4.2
Figure B.13 Sheet S12: 2/3 PS Stirrup Layout 4.2

592
Figure B.14 Sheet S13: 2/3 PS Anchorage Zone4.2
Figure B.15 Sheet S14: 2/3 PS End Detail 4.2

593
Figure B.16 Sheet S15: Reaction Beam Section 4.2
Figure B.17 Sheet S16: Reaction Beam Stirrup Layout4.2

594
Figure B.18 Sheet D1: Bar Details 4.2
Figure B.19 Sheet D2: Anchorage Hardware 4.2

595
Figure B.20 Sheet D3: Post-Tensioning Duct and Splice Details 4.2
B.2 SURFACE CRACK PATTERNS AND WIDTHS PRIOR TO AUTOPSY
Crack patterns and widths for all Autopsy specimens immediately prior to concrete demolition and reinforcement removal, are shown in Figures B.21 through Figure B.32.

596
Figure B.21 Final Crack Pattern and Measurements – Beam 1.3
Figure B.22 Final Crack Pattern and Measurements – Beam 2.3
Beam 1.3: Non-PS - Constant Service Load
Beam 2.3: 2/3 PS - Constant Service Load
0.000
0.005
0.010
0.015
0.020
0.025
0.030
0.035
0.040
0 18 36 54 72 90 108 126 144 162
Distance Along Beam (in)
Surf
ace
Cra
ck W
idth
(in)
Maximum
Minimum
0.0000.0050.0100.0150.0200.0250.0300.0350.040
0 18 36 54 72 90 108 126 144 162Distance Along Beam (in)
Surf
ace
Cra
ck W
idth
(in)
Maximum
Minimum
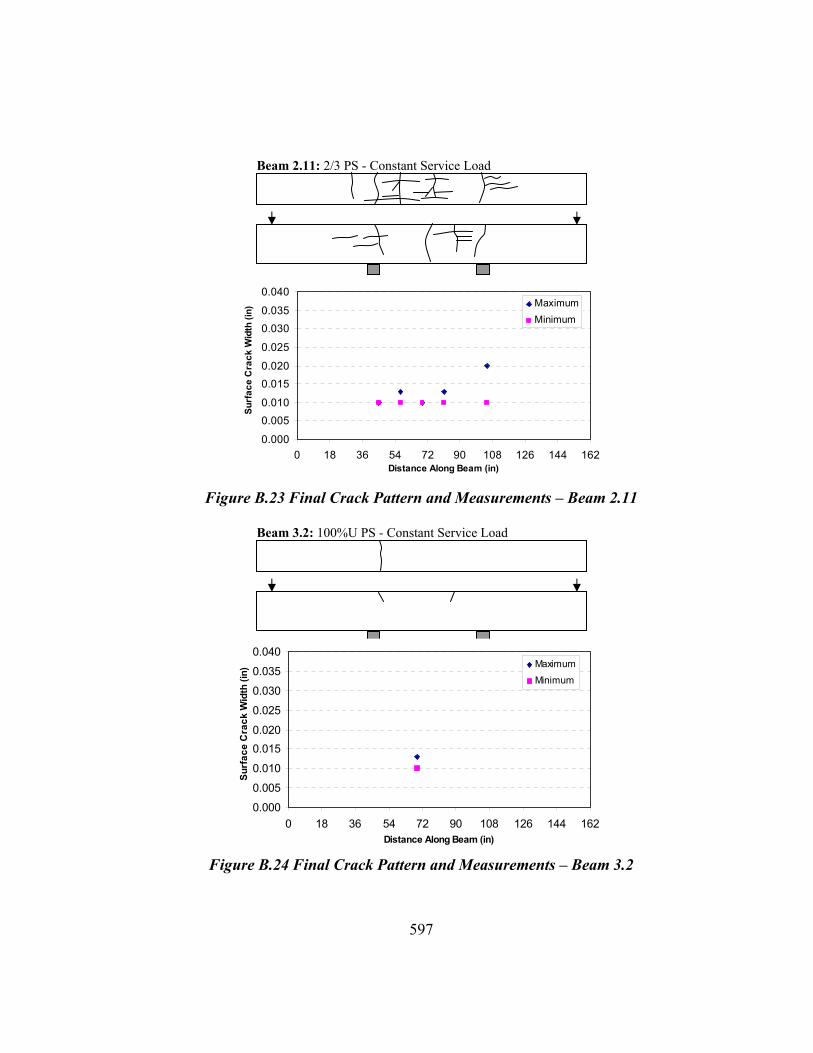
597
Figure B.23 Final Crack Pattern and Measurements – Beam 2.11
Figure B.24 Final Crack Pattern and Measurements – Beam 3.2
Beam 2.11: 2/3 PS - Constant Service Load
Beam 3.2: 100%U PS - Constant Service Load
0.000
0.0050.010
0.0150.020
0.025
0.0300.035
0.040
0 18 36 54 72 90 108 126 144 162Distance Along Beam (in)
Surf
ace
Cra
ck W
idth
(in)
MaximumMinimum
0.000
0.005
0.010
0.0150.020
0.025
0.030
0.035
0.040
0 18 36 54 72 90 108 126 144 162Distance Along Beam (in)
Surf
ace
Cra
ck W
idth
(in)
Maximum
Minimum

598
Figure B.25 Final Crack Pattern and Measurements – Beam 3.3
Figure B.26 Final Crack Pattern and Measurements – Beam 4.2
Beam 3.3: 100%U PS - 124% Overload
Beam 4.2: 100%S PS - Constant Service Load
0.0000.005
0.0100.015
0.0200.025
0.0300.035
0.040
0 18 36 54 72 90 108 126 144 162Distance Along Beam (in)
Surf
ace
Cra
ck W
idth
(in)
MaximumMinimum
0.000
0.0050.010
0.0150.020
0.025
0.0300.035
0.040
0 18 36 54 72 90 108 126 144 162Distance Along Beam (in)
Surf
ace
Cra
ck W
idth
(in)
Maximum
Minimum

599
Figure B.27 Final Crack Pattern and Measurements – Beam 1.5
Figure B.28 Final Crack Pattern and Measurements – Beam 1.6
Beam 1.5: Non-PS - Constant Service Load
Beam 1.6: Non-PS - Constant Service
0.000
0.005
0.010
0.015
0.020
0.025
0.030
0.035
0.040
0 18 36 54 72 90 108 126 144 162Distance Along Beam (in)
Surf
ace
Cra
ck W
idth
(in)
Maximum
Minimum
0.000
0.005
0.010
0.0150.020
0.025
0.030
0.035
0.040
0 18 36 54 72 90 108 126 144 162Distance Along Beam (in)
Surf
ace
Cra
ck W
idth
(in)
Maximum
Minimum

600
Figure B.29 Final Crack Pattern and Measurements – Beam 2.5
Figure B.30 Final Crack Pattern and Measurements – Beam 2.6
Beam 2.5: 2/3 PS - Constant Service Load
Beam 2.6: 2/3 PS - Constant Service Load
0.000
0.005
0.010
0.015
0.020
0.025
0.030
0.035
0.040
0 18 36 54 72 90 108 126 144 162Distance Along Beam (in)
Surf
ace
Cra
ck W
idth
(in)
MaximumMinimum
0.000
0.005
0.010
0.0150.020
0.025
0.030
0.035
0.040
0 18 36 54 72 90 108 126 144 162Distance Along Beam (in)
Surf
ace
Cra
ck W
idth
(in)
Maximum
Minimum

601
Figure B.31 Final Crack Pattern and Measurements – Beam 3.6
Figure B.32 Final Crack Pattern and Measurements – Beam 3.7
Beam 3.7: 100%U PS - Constant Service
0.000
0.005
0.010
0.015
0.020
0.025
0.030
0.035
0.040
0 18 36 54 72 90 108 126 144 162Distance Along Beam (in)
Surf
ace
Cra
ck W
idth
(in)
Maximum
Minimum
0.000
0.0050.010
0.015
0.020
0.0250.030
0.035
0.040
0 18 36 54 72 90 108 126 144 162Distance Along Beam (in)
Surf
ace
Cra
ck W
idth
(in)
Maximum
Minimum
Beam 3.6: 100%U PS - Constant Service Load

602
B.3 HALF-CELL POTENTIALS (LINE GRAPHS)
Figure B.33 Half-Cell Potential Readings for All Phase I Beams
Figure B.34 Half-Cell Potential Readings for All Non-PS Phase I Beams
-900
-800
-700
-600
-500
-400
-300
-200
-100
0
100
200
0 200 400 600 800 1000 1200 1400 1600 1800
Time (days)
Hal
f Cel
l Pot
entia
l (-m
V)1.1 1.2 1.3 1.4 2.1 2.2
2.3 2.4 2.11 3.1 3.2 3.3
3.4 3.5 4.1 4.2 <10% Probability
>90%Probability
-900
-800
-700
-600
-500
-400
-300
-200
-100
0
100
200
0 200 400 600 800 1000 1200 1400 1600 1800Time (days)
Hal
f Cel
l Pot
entia
l (-m
V)
1.1: Unloaded1.2: Service Load1.3: Service Load1.4: Overload
<10% Probability
>90% Probability

603
Figure B.35 Half-Cell Potential Readings for All 2/3 PS Phase I Beams
Figure B.36 Half-Cell Potential Readings for All 100%U PS Phase I Beams
-900
-800
-700
-600
-500
-400
-300
-200
-100
0
100
200
0 200 400 600 800 1000 1200 1400 1600 1800
Time (days)
Hal
f Cel
l Pot
entia
l (-m
V)
2.1: Service Load2.2: Service Load2.3: Service Load2.4: Overload2.11: FA Grout
<10% Probability
>90% Probability
-900
-800
-700
-600
-500
-400
-300
-200
-100
0
100
200
0 200 400 600 800 1000 1200 1400 1600 1800
Time (days)
Hal
f Cel
l Pot
entia
l (-m
V)
3.1: Unloaded 3.2: Service Load
3.3: Overload 3.4: Overload
3.5: Overload <10% Probability
>90% Probability

604
Figure B.37 Half-Cell Potential Readings for All 100%S PS Phase I Beams
Figure B.38 Half-Cell Potential Readings for All Unloaded Phase I Beams
-900
-800
-700
-600
-500
-400
-300
-200
-100
0
100
200
0 200 400 600 800 1000 1200 1400 1600 1800
Time (days)
Hal
f Cel
l Pot
entia
l (-m
V)
4.1: Service Load
4.2: Service Load<10%
Probability
>90% Probability
-900
-800
-700
-600
-500
-400
-300
-200
-100
0
100
200
0 200 400 600 800 1000 1200 1400 1600 1800
Time (days)
Hal
f Cel
l Pot
entia
l (-m
V)
1.1: Non-PS
3.1: 100%U PS<10%
Probability
>90%Probability

605
Figure B.39 Half-Cell Potential Readings for All 100% Service Load Phase I Beams
Figure B.40 Half-Cell Potential Readings for All Overloaded Phase I Beams
-900
-800
-700
-600
-500
-400
-300
-200
-100
0
100
200
0 200 400 600 800 1000 1200 1400 1600 1800
Time (days)
Hal
f Cel
l Pot
entia
l (m
V vs
SC
E)
1.2: Non-PS 1.3: Non-PS2.1: 2/3 PS 2.2: 2/3 PS2.3: 2/3 PS 2.11: 2/3 PS, FA Grout 3.2: 100%U PS 4.1: 100%S PS4.2: 100%S PS
<10% Probability
>90% Probability
-900
-800
-700
-600
-500
-400
-300
-200
-100
0
100
200
0 200 400 600 800 1000 1200 1400 1600 1800
Time (days)
Hal
f Cel
l Pot
entia
l (-m
V)
1.4: Non-PS 2.4: 2/3 PS
3.3: 100%U PS 3.4: 100%U PS
3.5: 100%U PS<10%
Probability
>90% Probability

606
Figure B.41 Half-Cell Potential Readings for All Phase II Beams
Figure B.42 Half-Cell Potential Readings for All 2/3 PS Phase II Beams
-900
-800
-700
-600
-500
-400
-300
-200
-100
0
100
200
0 200 400 600 800 1000 1200 1400
Time (days)
Hal
f Cel
l Pot
entia
l (-m
V)
1.5 1.6 2.5 2.6 2.7 2.8
2.9 2.10 2.12 3.6 3.7 <10% Probability
>90% Probability
-900
-800
-700
-600
-500
-400
-300
-200
-100
0
100
200
0 200 400 600 800 1000 1200 1400Time (days)
Hal
f Cel
l Pot
entia
l (-m
V)
2.5: FA Concrete 2.6: HP Concrete2.7: Epoxy Strand 2.8: Galvanized Strand2.9: Service Load 2.10: Anti-Bleed Grout2.12: Plastic Duct
<10% Probability
>90% Probability

607
Figure B.43 Half-Cell Potential Readings for All Fly Ash Concrete Phase II Beams
Figure B.44 Half-Cell Potential Readings for All High Performance Concrete Phase II Beams
-900
-800
-700
-600
-500
-400
-300
-200
-100
0
100
200
0 200 400 600 800 1000 1200 1400
Time (days)
Hal
f Cel
l Pot
entia
l (-m
V)
1.5: Non-PS2.5: 2/3 PS3.6: 100%U PS <10%
Probability
>90% Probability
-900
-800
-700
-600
-500
-400
-300
-200
-100
0
100
200
0 200 400 600 800 1000 1200 1400
Time (days)
Hal
f Cel
l Pot
entia
l (-m
V)
1.6: Non-PS2.6: 2/3 PS3.7: 100%U PS
<10% Probability
>90% Probability
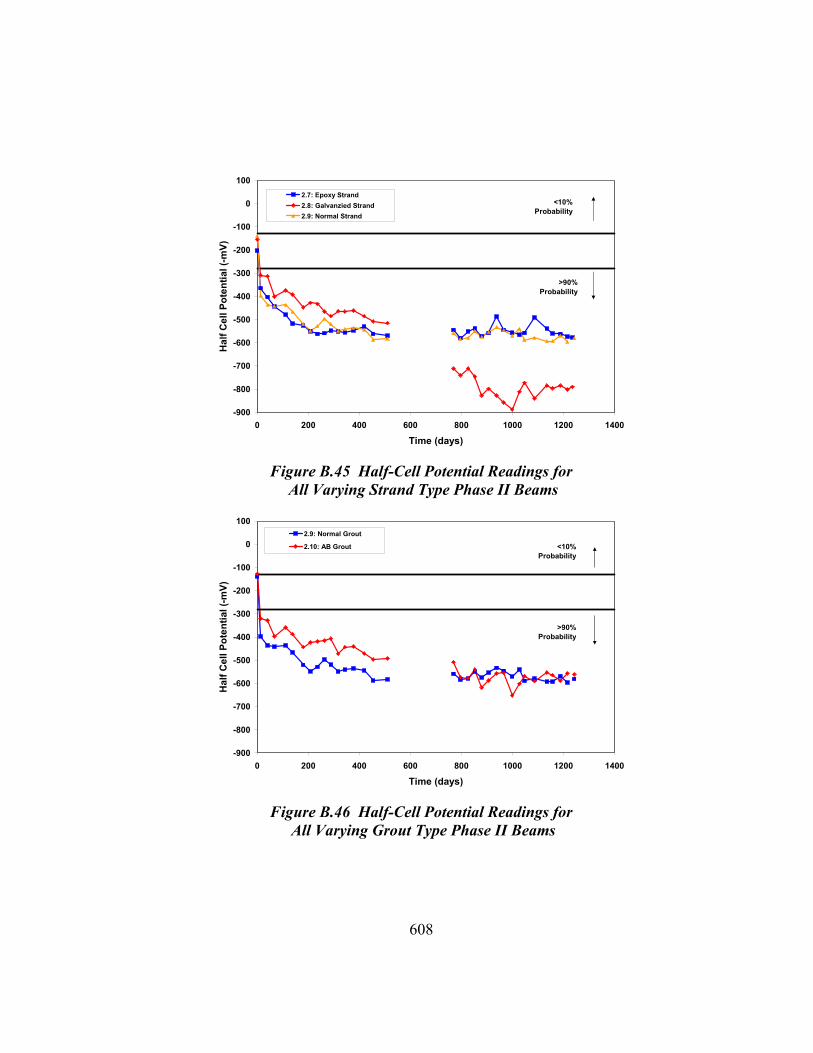
608
Figure B.45 Half-Cell Potential Readings for All Varying Strand Type Phase II Beams
Figure B.46 Half-Cell Potential Readings for All Varying Grout Type Phase II Beams
-900
-800
-700
-600
-500
-400
-300
-200
-100
0
100
0 200 400 600 800 1000 1200 1400
Time (days)
Hal
f Cel
l Pot
entia
l (-m
V)
2.7: Epoxy Strand2.8: Galvanzied Strand2.9: Normal Strand
<10% Probability
>90% Probability
-900
-800
-700
-600
-500
-400
-300
-200
-100
0
100
0 200 400 600 800 1000 1200 1400
Time (days)
Hal
f Cel
l Pot
entia
l (-m
V)
2.9: Normal Grout
2.10: AB Grout <10% Probability
>90% Probability

609
Figure B.47 Half-Cell Potential Readings for All Varying Duct Type Phase II Beams
-900
-800
-700
-600
-500
-400
-300
-200
-100
0
100
200
0 200 400 600 800 1000 1200 1400
Time (days)
Hal
f Cel
l Pot
entia
l (-m
V)
2.9: Steel Duct
2.12: Plastic Duct <10%Probability
>90%Probability

610
B.4 HALF-CELL POTENTIALS (CONTOUR MAPS)
Figure B.48 Contour Maps of Half-Cell Potential Readings at 498 Days4.3
-430 to -580 VSCE
-280 to -430 VSCE
-130 to -280 VSCE
+20 to -130 VSCE

611
B.5 HALF-CELL POTENTIALS (OUTLIERS)
Table B.1 Half-Cell Outliers – Phase I Beams
Beam Day of Reading
Initial Reading
Altered Reading
1.1 736 1297 1326
-269 -199 -171
-415 -447 -480
1.2 1297 1326 1445
-255 -261 -312
-550 -560 -550
2.2 212 -304 -537 3.1 778 -403 -172
3.2 1297 1326
-205 -173
-351 -402
4.1 1546 -791 -541
Table B.2 Half-Cell Outliers – Phase II Beams
Beam Day of Reading
Initial Reading
Altered Reading
2.8 938 966
-402 -389
-828 -858
3.6 454 1086
-262 -515
-370 -358
3.7 344 -470 -376

612
B.6 CORROSION RATE READINGS
0
5
10
15
20
25
30
35
Bea
m 1
.1
Bea
m 1
.2
Bea
m 1
.3
Bea
m 1
.4
Bea
m 2
.1
Bea
m 2
.2
Bea
m 2
.3
Bea
m 2
.4
Beam
2.1
1
Bea
m 3
.1
Bea
m 3
.2
Bea
m 3
.3
Bea
m 3
.4
Bea
m 3
.5
Bea
m 4
.1
Bea
m 4
.2
Cor
rosi
on C
urre
nt D
ensi
ty
(A
/cm
2 )
Midspan1 ft. Offset
Non-PS 2/3 PS 100%U 100%S
Una
ble
to o
btai
n re
adin
gs
HighCorrosionActivity
Figure B.49 Phase I Beams - Measured Corrosion Rates
(Seven Month Exposure Duration - PR Monitor Equipment)
0
5
10
15
20
25
30
35
Beam
1.1
Beam
1.2
Beam
1.3
Beam
1.4
Beam
2.1
Beam
2.2
Beam
2.3
Beam
2.4
Beam
2.1
1
Beam
3.1
Beam
3.2
Beam
3.3
Beam
3.4
Beam
3.5
Beam
4.1
Beam
4.2
Cor
rosi
on C
urre
nt D
ensi
ty
(A
/cm
2 )
Midspan1 ft. Offset
Non-PS 2/3 PS 100%U 100%S
HighCorrosionActivity
Figure B.50 Phase I Beams - Measured Corrosion Rates
(Twelve Month Exposure Duration – 3LP Equipment)

613
0
5
10
15
20
25
30
35
Beam
1.1
Beam
1.2
Beam
1.3
Beam
1.4
Beam
2.1
Beam
2.2
Beam
2.3
Beam
2.4
Beam
2.1
1
Beam
3.1
Beam
3.2
Beam
3.3
Beam
3.4
Beam
3.5
Beam
4.1
Beam
4.2
Cor
rosi
on C
urre
nt D
ensi
ty
(A
/cm
2 )
Midspan1 ft. Offset
Non-PS 2/3 PS 100%U 100%S
HighCorrosionActivity
Figure B.51 Phase I Beams - Measured Corrosion Rates
(Fifteen Month Exposure Duration - PR Monitor Equipment)
0
5
10
15
20
25
30
35
Beam
1.1
Beam
1.2
Beam
1.3
Beam
1.4
Beam
2.1
Beam
2.2
Beam
2.3
Beam
2.4
Beam
2.1
1
Beam
3.1
Beam
3.2
Beam
3.3
Beam
3.4
Beam
3.5
Beam
4.1
Beam
4.2
Cor
rosi
on C
urre
nt D
ensi
ty
(A
/cm
2 )
Midspan1 ft. Offset
Non-PS 2/3 PS 100%U 100%S
HighCorrosionActivity
Figure B.52 Phase I Beams - Measured Corrosion Rates
(Fifteen Month Exposure Duration – 3LP Equipment)

614
0
5
10
15
20
25
30
35
Bea
m 1
.1
Bea
m 1
.2
Bea
m 1
.3
Bea
m 1
.4
Bea
m 2
.1
Bea
m 2
.2
Bea
m 2
.3
Bea
m 2
.4
Beam
2.1
1
Bea
m 3
.1
Bea
m 3
.2
Bea
m 3
.3
Bea
m 3
.4
Bea
m 3
.5
Bea
m 4
.1
Bea
m 4
.2
Cor
rosi
on C
urre
nt D
ensi
ty
( µA
/cm2 )
Midspan1 ft. Offset
Non-PS 2/3 PS 100%U 100%S
Una
ble
to o
btai
n re
adin
gs
High Corrosion Activity
Figure B.53 Phase I Beams - Measured Corrosion Rates
(47 Month Exposure Duration – 3LP Equipment)
0
5
10
15
20
25
30
35
Bea
m 1
.5
Bea
m 1
.6
Bea
m 2
.5
Bea
m 2
.6
Bea
m 2
.7
Bea
m 2
.8
Bea
m 2
.9
Beam
2.1
0
Beam
2.1
2
Bea
m 3
.6
Bea
m 3
.7
Cor
rosi
on C
urre
nt D
ensi
ty
( µA
/cm2 )
Midspan1 ft. Offset
Non-PS 2/3 PS 100%U
Una
ble
to o
btai
n re
adin
gs
High Corrosion Activity
Figure B.54 Phase II Beams - Measured Corrosion Rates
(35 Month Exposure Duration – 3LP Equipment)
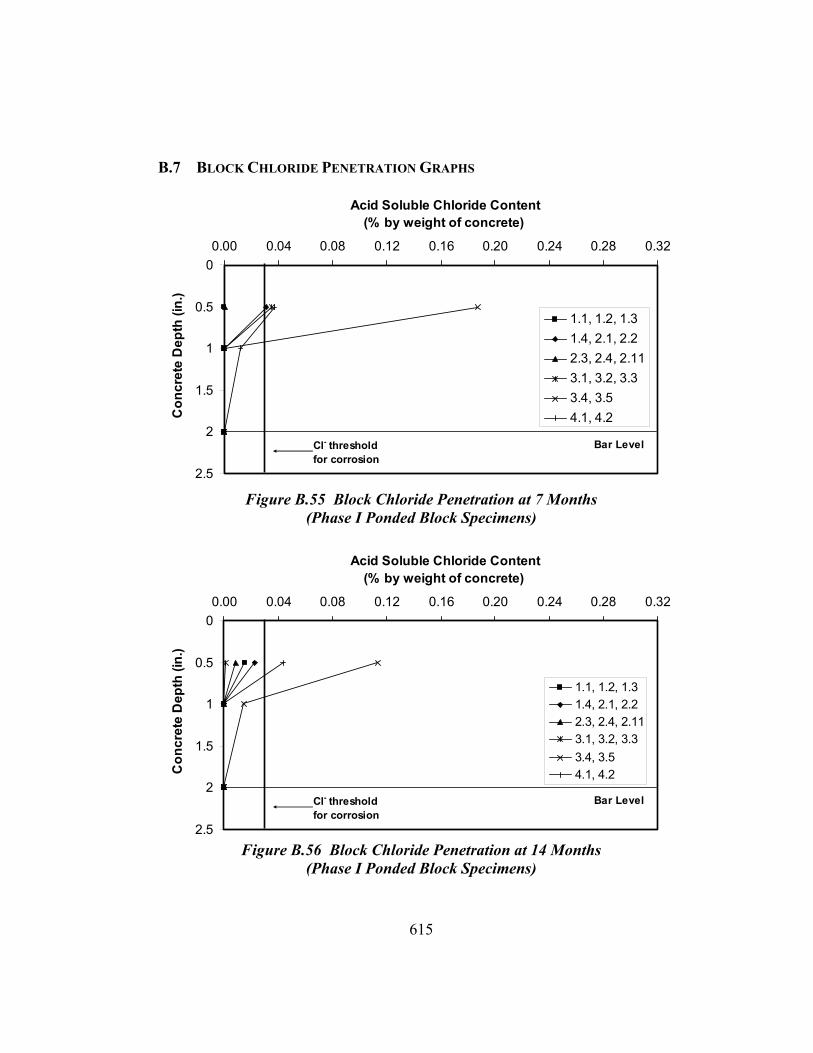
615
B.7 BLOCK CHLORIDE PENETRATION GRAPHS
0
0.5
1
1.5
2
2.5
0.00 0.04 0.08 0.12 0.16 0.20 0.24 0.28 0.32
Acid Soluble Chloride Content (% by weight of concrete)
Con
cret
e D
epth
(in.
)
1.1, 1.2, 1.31.4, 2.1, 2.22.3, 2.4, 2.113.1, 3.2, 3.33.4, 3.54.1, 4.2
Bar LevelCl- threshold for corrosion
Figure B.55 Block Chloride Penetration at 7 Months
(Phase I Ponded Block Specimens)
0
0.5
1
1.5
2
2.5
0.00 0.04 0.08 0.12 0.16 0.20 0.24 0.28 0.32
Acid Soluble Chloride Content (% by weight of concrete)
Con
cret
e D
epth
(in.
)
1.1, 1.2, 1.31.4, 2.1, 2.22.3, 2.4, 2.113.1, 3.2, 3.33.4, 3.54.1, 4.2
Bar LevelCl- threshold for corrosion
Figure B.56 Block Chloride Penetration at 14 Months
(Phase I Ponded Block Specimens)

616
0
0.5
1
1.5
2
2.5
0.00 0.04 0.08 0.12 0.16 0.20 0.24 0.28 0.32
Acid Soluble Chloride Content (% by weight of concrete)
Con
cret
e D
epth
(in.
)
1.1, 1.2, 1.31.4, 2.1, 2.22.3, 2.4, 2.113.1, 3.2, 3.33.4, 3.54.1, 4.2
Bar LevelCl- threshold for corrosion
Figure B.57 Block Chloride Penetration at 41 Months
(Phase I Ponded Block Specimens)
0
0.5
1
1.5
2
2.5
0.00 0.04 0.08 0.12 0.16 0.20 0.24 0.28 0.32
Acid Soluble Chloride Content (% by weight of concrete)
Con
cret
e D
epth
(in.
)
1.1, 1.2, 1.31.4, 2.1, 2.22.3, 2.4, 2.113.1, 3.2, 3.33.4, 3.54.1, 4.2
Bar LevelCl- threshold for corrosion
Figure B.58 Block Chloride Penetration at 54 Months
(Phase I Ponded Block Specimens)

617
0
0.5
1
1.5
2
2.5
0.00 0.04 0.08 0.12 0.16 0.20 0.24 0.28 0.32
Acid Soluble Chloride Content (% by weight of concrete)
Con
cret
e D
epth
(in.
)
1.5, 2.5, 3.6: FA Concrete
1.6, 2.6, 3.7: HP Concrete2.7, 2.8, 2.10: TxDOT Class C
2.9, 2.12: TxDOT Class C
Bar LevelCl- thresholdfor corrosion
Figure B.59 Block Chloride Penetration at 29 Months
(Phase II Ponded Block Specimens)
0
0.5
1
1.5
2
2.5
0.00 0.04 0.08 0.12 0.16 0.20 0.24 0.28 0.32
Acid Soluble Chloride Content (% by weight of concrete)
Con
cret
e D
epth
(in.
)
1.5, 2.5, 3.6: FA Concrte
1.6, 2.6, 3.7: HP Concrete
2.7, 2.8, 2.10: TxDOT Class C
2.9, 2.12: TxDOT Class C
Bar LevelCl- thresholdfor corrosion
Figure B.60 Block Chloride Penetration at 42 Months
(Phase II Ponded Block Specimens)

618
B.8 BEAM CHLORIDE PENETRATION GRAPHS
0
0.5
1
1.5
2
2.5
0.00 0.05 0.10 0.15 0.20 0.25 0.30 0.35 0.40 0.45 0.50 0.55 0.60
Acid Soluble Chloride Content (% by weight of concrete)
Con
cret
e D
epth
(in.
) 3" Offset
18" Offset27" Offset
32" Offset
Bar LevelCl- threshold for corrosion
Figure B.61 Chloride Penetration at 54 Months – Beam 1.1
0
0.5
1
1.5
2
2.5
0.00 0.05 0.10 0.15 0.20 0.25 0.30 0.35 0.40 0.45 0.50 0.55 0.60
Acid Soluble Chloride Content (% by weight of concrete)
Con
cret
e D
epth
(in.
) 3" Offset
18" Offset
27" Offset
32" Offset
Bar LevelCl- threshold for corrosion
Figure B.62 Chloride Penetration at 54 Months – Beam 1.3

619
0
0.5
1
1.5
2
2.5
0.00 0.05 0.10 0.15 0.20 0.25 0.30 0.35 0.40 0.45 0.50 0.55 0.60
Acid Soluble Chloride Content (% by weight of concrete)
Con
cret
e D
epth
(in.
) 3" Offset
18" Offset
27" Offset
32" Offset
Bar LevelCl- threshold for corrosion
Figure B.63 Chloride Penetration at 54 Months – Beam 2.3
0
0.5
1
1.5
2
2.5
0.00 0.05 0.10 0.15 0.20 0.25 0.30 0.35 0.40 0.45 0.50 0.55 0.60
Acid Soluble Chloride Content (% by weight of concrete)
Con
cret
e D
epth
(in.
) 3" Offset
18" Offset
27" Offset
32" Offset
Bar LevelCl- threshold for corrosion
Figure B.64 Chloride Penetration at 54 Months – Beam 2.11

620
0
0.5
1
1.5
2
2.5
0.00 0.05 0.10 0.15 0.20 0.25 0.30 0.35 0.40 0.45 0.50 0.55 0.60
Acid Soluble Chloride Content (% by weight of concrete)
Con
cret
e D
epth
(in.
) 3" Offset18" Offset
27" Offset32" Offset
Bar LevelCl- threshold for corrosion
Figure B.65 Chloride Penetration at 54 Months – Beam 3.1
0
0.5
1
1.5
2
2.5
0.00 0.05 0.10 0.15 0.20 0.25 0.30 0.35 0.40 0.45 0.50 0.55 0.60
Acid Soluble Chloride Content (% by weight of concrete)
Con
cret
e D
epth
(in.
) 3" Offset18" Offset
27" Offset32" Offset
Bar LevelCl- threshold for corrosion
Figure B.66 Chloride Penetration at 54 Months – Beam 3.2

621
0
0.5
1
1.5
2
2.5
0.00 0.05 0.10 0.15 0.20 0.25 0.30 0.35 0.40 0.45 0.50 0.55 0.60
Acid Soluble Chloride Content (% by weight of concrete)
Con
cret
e D
epth
(in.
) 3" Offset
18" Offset
27" Offset
32" Offset
Bar LevelCl- threshold for corrosion
Figure B.67 Chloride Penetration at 54 Months – Beam 3.3
0
0.5
1
1.5
2
2.5
0.00 0.05 0.10 0.15 0.20 0.25 0.30 0.35 0.40 0.45 0.50 0.55 0.60
Acid Soluble Chloride Content (% by weight of concrete)
Con
cret
e D
epth
(in.
) 3" Offset
18" Offset27" Offset
32" Offset
Bar LevelCl- threshold for corrosion
Figure B.68 Chloride Penetration at 54 Months – Beam 4.2

622
0
0.5
1
1.5
2
2.5
0.00 0.05 0.10 0.15 0.20 0.25 0.30 0.35 0.40 0.45 0.50 0.55 0.60
Acid Soluble Chloride Content (% by weight of concrete)
Con
cret
e D
epth
(in.
) 3" Offset
18" Offset27" Offset
32" Offset
Bar LevelCl- threshold for corrosion
Figure B.69 Chloride Penetration at 42 Months – Beam 1.5
0
0.5
1
1.5
2
2.5
0.00 0.05 0.10 0.15 0.20 0.25 0.30 0.35 0.40 0.45 0.50 0.55 0.60
Acid Soluble Chloride Content (% by weight of concrete)
Con
cret
e D
epth
(in.
) 3" Offset
18" Offset
27" Offset
32" Offset
Bar LevelCl- threshold for corrosion
Figure B.70 Chloride Penetration at 42 Months – Beam 1.6

623
0
0.5
1
1.5
2
2.5
0.00 0.05 0.10 0.15 0.20 0.25 0.30 0.35 0.40 0.45 0.50 0.55 0.60
Acid Soluble Chloride Content (% by weight of concrete)
Con
cret
e D
epth
(in.
) 3" Offset
18" Offset27" Offset
32" Offset
Bar LevelCl- threshold for corrosion
Figure B.71 Chloride Penetration at 42 Months – Beam 2.5
0
0.5
1
1.5
2
2.5
0.00 0.05 0.10 0.15 0.20 0.25 0.30 0.35 0.40 0.45 0.50 0.55 0.60
Acid Soluble Chloride Content (% by weight of concrete)
Con
cret
e D
epth
(in.
) 3" Offset
18" Offset
27" Offset
32" Offset
Bar LevelCl- threshold for corrosion
Figure B.72 Chloride Penetration at 42 Months – Beam 2.6

624
0
0.5
1
1.5
2
2.5
0.00 0.05 0.10 0.15 0.20 0.25 0.30 0.35 0.40 0.45 0.50 0.55 0.60
Acid Soluble Chloride Content (% by weight of concrete)
Con
cret
e D
epth
(in.
) 3" Offset
18" Offset
27" Offset
32" Offset
Bar LevelCl- threshold for corrosion
Figure B.73 Chloride Penetration at 42 Months – Beam 3.6
0
0.5
1
1.5
2
2.5
0.00 0.05 0.10 0.15 0.20 0.25 0.30 0.35 0.40 0.45 0.50 0.55 0.60
Acid Soluble Chloride Content (% by weight of concrete)
Con
cret
e D
epth
(in.
) 3" Offset
18" Offset
27" Offset
32" Offset
Bar LevelCl- threshold for corrosion
Figure B.74 Chloride Penetration at 42 Months – Beam 3.7

625
Appendix C Column Corrosion Tests Supplementary Material
C.1 HALF-CELL POTENTIAL PLOTS
The following Half-Cell potential plots complement those contained in Figure 5.22 through Figure 5.25. “All” Half-Cell Potential Readings are followed by “Average” Half-Cell Potential readings.
Figure C.1 All Half-Cell Potential Readings for Column NJ-TC-S
-500
-400
-300
-200
-100
0
100
200
0 400 800 1200 1600 2000 2400
Time (days)
Hal
f-Cel
l Pot
entia
l (m
V)
Bar 1 Bot. Bar 1 Mid. Bar 1 TopBar 3 Bot. Bar 3 Mid. Bar 3 TopBar 5 Bot. Bar 5 Mid. Bar 5 Top
< 10% probabilityof corrosion
> 90% probabilityof corrosion

626
Figure C.2 All Half-Cell Potential Readings for Column DJ-TC-S
Figure C.3 All Half-Cell Potential Readings for Column PT-TC-S-PD – Rebar
-500
-400
-300
-200
-100
0
100
200
0 400 800 1200 1600 2000 2400
Time (days)
Hal
f-Cel
l Pot
entia
l (m
V)
BottomMid-HeightTop
< 10% probabilityof corrosion
> 90% probabilityof corrosion
-500
-400
-300
-200
-100
0
100
200
0 400 800 1200 1600 2000 2400
Time (days)
Hal
f-Cel
l Pot
entia
l (m
V)
Bar 1 Bot. Bar 1 Mid. Bar 1 Top
Bar 3 Bot. Bar 3 Mid. Bar 3 Top
Bar 5 Bot. Bar 5 Mid. Bar 5 Top
< 10% probabilityof corrosion
> 90% probabilityof corrosion
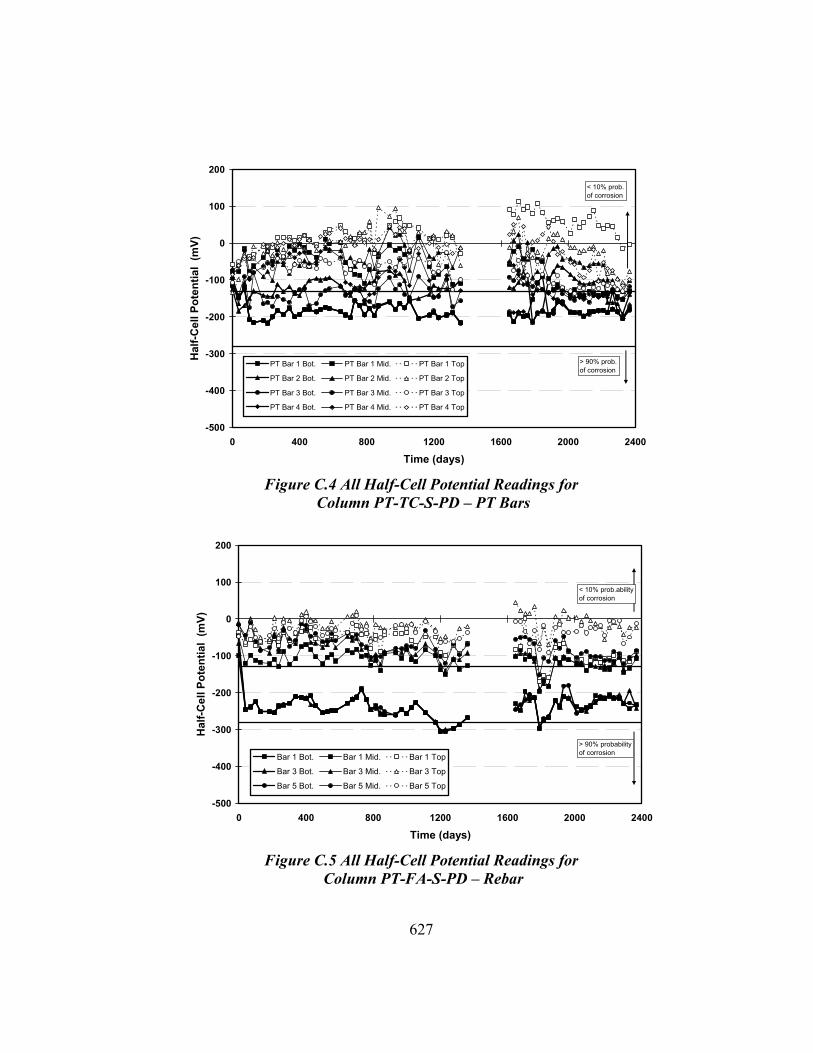
627
Figure C.4 All Half-Cell Potential Readings for Column PT-TC-S-PD – PT Bars
Figure C.5 All Half-Cell Potential Readings for Column PT-FA-S-PD – Rebar
-500
-400
-300
-200
-100
0
100
200
0 400 800 1200 1600 2000 2400
Time (days)
Hal
f-Cel
l Pot
entia
l (m
V)
PT Bar 1 Bot. PT Bar 1 Mid. PT Bar 1 Top
PT Bar 2 Bot. PT Bar 2 Mid. PT Bar 2 Top
PT Bar 3 Bot. PT Bar 3 Mid. PT Bar 3 Top
PT Bar 4 Bot. PT Bar 4 Mid. PT Bar 4 Top
< 10% prob. of corrosion
> 90% prob.of corrosion
-500
-400
-300
-200
-100
0
100
200
0 400 800 1200 1600 2000 2400
Time (days)
Hal
f-Cel
l Pot
entia
l (m
V)
Bar 1 Bot. Bar 1 Mid. Bar 1 Top
Bar 3 Bot. Bar 3 Mid. Bar 3 Top
Bar 5 Bot. Bar 5 Mid. Bar 5 Top
< 10% prob.abilityof corrosion
> 90% probabilityof corrosion
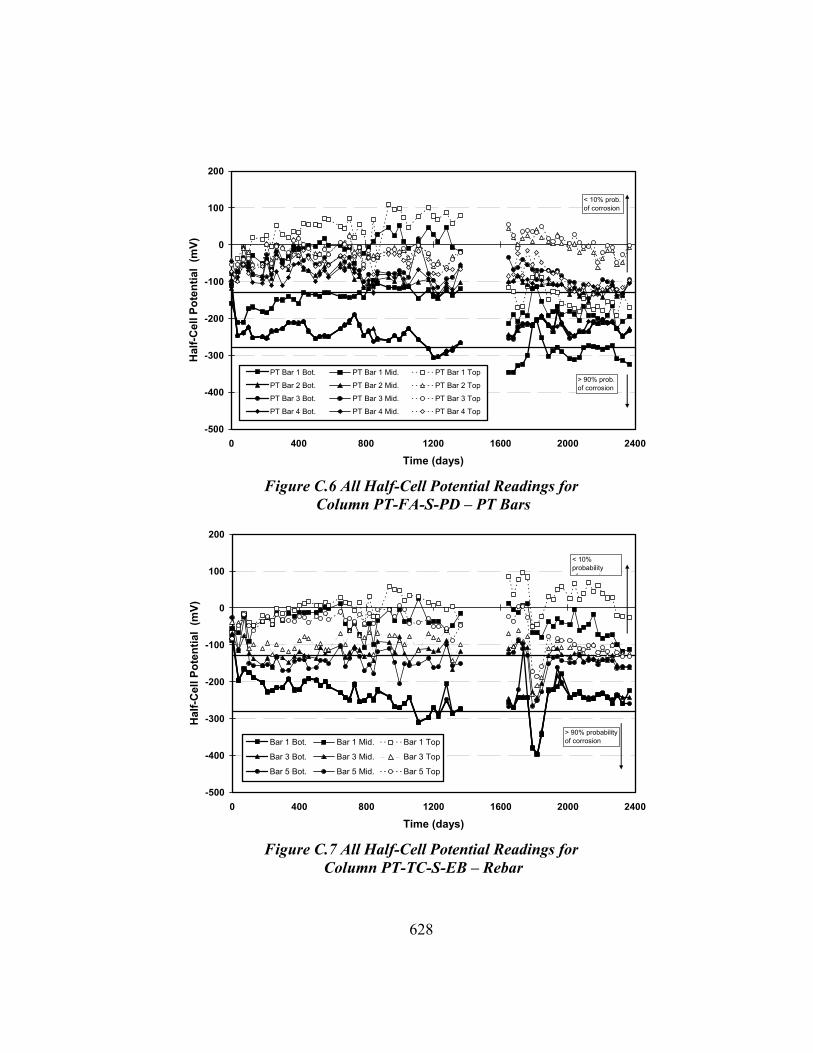
628
Figure C.6 All Half-Cell Potential Readings for Column PT-FA-S-PD – PT Bars
Figure C.7 All Half-Cell Potential Readings for Column PT-TC-S-EB – Rebar
-500
-400
-300
-200
-100
0
100
200
0 400 800 1200 1600 2000 2400
Time (days)
Hal
f-Cel
l Pot
entia
l (m
V)
PT Bar 1 Bot. PT Bar 1 Mid. PT Bar 1 Top
PT Bar 2 Bot. PT Bar 2 Mid. PT Bar 2 Top
PT Bar 3 Bot. PT Bar 3 Mid. PT Bar 3 Top
PT Bar 4 Bot. PT Bar 4 Mid. PT Bar 4 Top
< 10% prob.of corrosion
> 90% prob.of corrosion
-500
-400
-300
-200
-100
0
100
200
0 400 800 1200 1600 2000 2400
Time (days)
Hal
f-Cel
l Pot
entia
l (m
V)
Bar 1 Bot. Bar 1 Mid. Bar 1 Top
Bar 3 Bot. Bar 3 Mid. Bar 3 Top
Bar 5 Bot. Bar 5 Mid. Bar 5 Top
< 10% probability
f i
> 90% probabilityof corrosion

629
Figure C.8 All Half-Cell Potential Readings for Column PT-TC-S-EB – PT Bars
Figure C.9 All Half-Cell Potential Readings for Column PT-TC-S-GB – Rebar
-500
-400
-300
-200
-100
0
100
200
0 400 800 1200 1600 2000 2400
Time (days)
Hal
f-Cel
l Pot
entia
l (m
V)PT Bar 1 Bot. PT Bar 1 Mid. PT Bar 1 TopPT Bar 2 Bot. PT Bar 2 Mid. PT Bar 2 TopPT Bar 3 Bot. PT Bar 3 Mid. PT Bar 3 TopPT Bar 4 Bot. PT Bar 4 Mid. PT Bar 4 Top
< 10% probabilityof corrosion
> 90% probabilityof corrosion
-500
-400
-300
-200
-100
0
100
200
0 400 800 1200 1600 2000 2400
Time (days)
Hal
f-Cel
l Pot
entia
l (m
V)
Bar 1 Bot. Bar 1 Mid. Bar 1 TopBar 3 Bot. Bar 3 Mid. Bar 3 TopBar 5 Bot. Bar 5 Mid. Bar 5 Top
< 10% probabilityof corrosion
> 90% probabilityof corrosion

630
Figure C.10 All Half-Cell Potential Readings for Column PT-TC-S-GB – PT Bars
Figure C.11 Average Half-Cell Potential Readings for Column NJ-TC-N
-500
-400
-300
-200
-100
0
100
200
0 400 800 1200 1600 2000 2400
Time (days)
Hal
f-Cel
l Pot
entia
l (m
V)
PT Bar 1 Bot. PT Bar 1 Mid. PT Bar 1 TopPT Bar 2 Bot. PT Bar 2 Mid. PT Bar 2 TopPT Bar 3 Bot. PT Bar 3 Mid. PT Bar 3 TopPT Bar 4 Bot. PT Bar 4 Mid. PT Bar 4 Top
< 10% probability of corrosion
> 90% probabilityof corrosion
-500
-400
-300
-200
-100
0
100
200
0 400 800 1200 1600 2000 2400
Time (days)
Hal
f-Cel
l Pot
entia
l (m
V)
BottomMid-HeightTop
< 10% prob.of corrosion
> 90% prob.of corrosion

631
Figure C.12 Average Half-Cell Potential Readings for Column DJ-TC-N
Figure C.13 Average Half-Cell Potential Readings for Column DJ-FA-S
-500
-400
-300
-200
-100
0
100
200
0 400 800 1200 1600 2000 2400
Time (days)
Hal
f-Cel
l Pot
entia
l (m
V)
BottomMid-HeightTop
< 10% probabilityof corrosion
> 90% probabilityof corrosion
-500
-400
-300
-200
-100
0
100
200
0 400 800 1200 1600 2000 2400
Time (days)
Hal
f-Cel
l Pot
entia
l (m
V)
BottomMid-HeightTop
< 10% prob.of corrosion
> 90% prob.of corrosion

632
Figure C.14 Average Half-Cell Potential Readings for Column DJ-TC-S
Figure C.15 Average Half-Cell Potential Readings for Column NJ-TC-S
-500
-400
-300
-200
-100
0
100
200
0 400 800 1200 1600 2000 2400
Time (days)
Hal
f-Cel
l Pot
entia
l (m
V)
BottomMid-HeightTop
< 10% probabilityof corrosion
> 90% probabilityof corrosion
-500
-400
-300
-200
-100
0
100
200
0 400 800 1200 1600 2000 2400
Time (days)
Hal
f-Cel
l Pot
entia
l (m
V)
BottomMid-HeightTop
< 10% prob.of corrosion
> 90% prob.of corrosion

633
Figure C.16 Average Half-Cell Potential Readings for Column PT-TC-N-PD – Rebar
Figure C.17 Average Half-Cell Potential Readings for Column PT-TC-N-PD – PT Bars
-500
-400
-300
-200
-100
0
100
200
0 400 800 1200 1600 2000 2400
Time (days)
Hal
f-Cel
l Pot
entia
l (m
V)
Bottom
Mid-Height
Top
< 10% probabilityf i
> 90% probabilityof corrosion
-500
-400
-300
-200
-100
0
100
200
0 400 800 1200 1600 2000 2400
Time (days)
Hal
f-Cel
l Pot
entia
l (m
V)
BottomMid-HeightTop
< 10% probabilityof corrosion
> 90% probabilityof corrosion

634
C.2 CONCRETE CHLORIDE CONTENT PLOTS
The following Acid-Soluble Chloride Content Plots complement those
contained in Figure 5.36 through Figure 5.45. Chloride Threshold value is
indicated in the figures at 0.033%. This value, intended only as a guide, is based
on the widely accepted chloride threshold value of 0.2% of the weight of
cement.5.5
Figure C.18 Concrete Chloride Penetration for Column DJ-TC-N in Non-Dripper Side at End of Testing
0
4
8
12
16
0,00% 0,10% 0,20% 0,30% 0,40% 0,50% 0,60%Acid Soluble Chloride Content
(% by weight of concrete)
Hei
ght A
bove
Col
umn
Bas
e (i
n)
Depth = 0.5 inDepth = 1 in.Depth = 2 in.
water line
Foundation
Column
15"
9"
3"
Threshold

635
Figure C.19 Concrete Chloride Penetration for Column DJ-TC-N in Dripper Side at End of Testing
Figure C.20 Concrete Chloride Penetration for Column DJ-FA-S in Non-Dripper Side at End of Testing
0
4
8
12
16
0,00% 0,10% 0,20% 0,30% 0,40% 0,50% 0,60%Acid Soluble Chloride Content
(% by weight of concrete)
Hei
ght A
bove
Col
umn
Bas
e (i
n)
Depth = 0.5 inDepth = 1 in.Depth = 2 in.
water line
Foundation
Column
15"
9"
3"
Threshold
0
4
8
12
16
0,00% 0,10% 0,20% 0,30% 0,40% 0,50% 0,60%Acid Soluble Chloride Content
(% by weight of concrete)
Hei
ght A
bove
Col
umn
Bas
e (i
n)
Depth = 0.5 inDepth = 1 in.Depth = 2 in.
water line
Foundation
Column
15"
9"
3"
Threshold

636
Figure C.21 Concrete Chloride Penetration for Column DJ-FA-S
in Dripper Side at End of Testing
Figure C.22 Concrete Chloride Penetration for Column DJ-TC-S in Non-Dripper Side at End of Testing
0
4
8
12
16
0,00% 0,10% 0,20% 0,30% 0,40% 0,50% 0,60%Acid Soluble Chloride Content
(% by weight of concrete)
Hei
ght A
bove
Col
umn
Bas
e (i
n)
Depth = 0.5 inDepth = 1 in.Depth = 2 in.
water line
Foundation
Column
15"
9"
3"
Threshold
0
4
8
12
16
0,00% 0,10% 0,20% 0,30% 0,40% 0,50% 0,60%Acid Soluble Chloride Content
(% by weight of concrete)
Hei
ght A
bove
Col
umn
Bas
e (i
n)
Depth = 0.5 inDepth = 1 in.Depth = 2 in.
water line
Foundation
Column
15"
9"
3"
Threshold

637
Figure C.23 Concrete Chloride Penetration for Column DJ-TC-S in Dripper Side at End of Testing
.
Figure C.24 Concrete Chloride Penetration for Column NJ-TC-S in Non-Dripper Side at End of Testing
0
4
8
12
16
0,00% 0,10% 0,20% 0,30% 0,40% 0,50% 0,60%Acid Soluble Chloride Content
(% by weight of concrete)
Hei
ght A
bove
Col
umn
Bas
e (i
n)
Depth = 0.5 inDepth = 1 in.Depth = 2 in.
water line
Foundation
Column
15"
9"
3"
Threshold
0
4
8
12
16
0,00% 0,10% 0,20% 0,30% 0,40% 0,50% 0,60%Acid Soluble Chloride Content
(% by weight of concrete)
Hei
ght A
bove
Col
umn
Bas
e (i
n)
Depth = 0.5 inDepth = 1 in.Depth = 2 in.
water line
Foundation
Column
15"
9"
3"
Threshold

638
Figure C.25 Concrete Chloride Penetration for Column NJ-TC-S in Dripper Side at End of Testing
Figure C.26 Concrete Chloride Penetration for Column PT-TC-S-PD in Non-Dripper Side at End of Testing
0
4
8
12
16
0,00% 0,10% 0,20% 0,30% 0,40% 0,50% 0,60%Acid Soluble Chloride Content
(% by weight of concrete)
Hei
ght A
bove
Col
umn
Bas
e (i
n)Depth = 0.5 inDepth = 1 in.Depth = 2 in.
water line
Foundation
Column
15"
9"
3"
Threshold
0
4
8
12
16
0,00% 0,10% 0,20% 0,30% 0,40% 0,50% 0,60%Acid Soluble Chloride Content
(% by weight of concrete)
Hei
ght A
bove
Col
umn
Bas
e (i
n)
Depth = 0.5 inDepth = 1 in.Depth = 2 in.
water line
Foundation
Column
15"
9"
3"
Threshold

639
Figure C.27 Concrete Chloride Penetration for Column PT-TC-S-PD in Dripper Side at End of Testing
Figure C.28 Concrete Chloride Penetration for Column PT-FA-S-PD in Non-Dripper Side at End of Testing
0
4
8
12
16
0,00% 0,10% 0,20% 0,30% 0,40% 0,50% 0,60%Acid Soluble Chloride Content
(% by weight of concrete)
Hei
ght A
bove
Col
umn
Bas
e (i
n)Depth = 0.5 inDepth = 1 in.Depth = 2 in.
water line
Foundation
Column
15"
9"
3"
Threshold
0
4
8
12
16
0,00% 0,10% 0,20% 0,30% 0,40% 0,50% 0,60%Acid Soluble Chloride Content
(% by weight of concrete)
Hei
ght A
bove
Col
umn
Bas
e (i
n)
Depth = 0.5 inDepth = 1 in.Depth = 2 in.
water line
Foundation
Column
15"
9"
3"
Threshold

640
Figure C.29 Concrete Chloride Penetration for Column PT-FA-S-PD in Dripper Side at End of Testing
Figure C.30 Concrete Chloride Penetration for Column PT-TC-S-EB in Non-Dripper Side at End of Testing
0
4
8
12
16
0,00% 0,10% 0,20% 0,30% 0,40% 0,50% 0,60%Acid Soluble Chloride Content
(% by weight of concrete)
Hei
ght A
bove
Col
umn
Bas
e (i
n)
Depth = 0.5 inDepth = 1 in.Depth = 2 in.
water line
Foundation
Column
15"
9"
3"
Threshold
0
4
8
12
16
0,00% 0,10% 0,20% 0,30% 0,40% 0,50% 0,60%Acid Soluble Chloride Content
(% by weight of concrete)
Hei
ght A
bove
Col
umn
Bas
e (i
n)
Depth = 0.5 inDepth = 1 in.Depth = 2 in.
water line
Foundation
Column
15"
9"
3"
Threshold

641
Figure C.31 Concrete Chloride Penetration for Column PT-TC-S-EB in Dripper Side at End of Testing
Figure C.32 Concrete Chloride Penetration for Column PT-TC-S-GB in Non-Dripper Side at End of Testing
0
4
8
12
16
0,00% 0,10% 0,20% 0,30% 0,40% 0,50% 0,60%Acid Soluble Chloride Content
(% by weight of concrete)
Hei
ght A
bove
Col
umn
Bas
e (i
n)
Depth = 0.5 inDepth = 1 in.Depth = 2 in.
water line
Foundation
Column
15"
9"
3"
Threshold
0
4
8
12
16
0,00% 0,10% 0,20% 0,30% 0,40% 0,50% 0,60%Acid Soluble Chloride Content
(% by weight of concrete)
Hei
ght A
bove
Col
umn
Bas
e (i
n)
Depth = 0.5 inDepth = 1 in.Depth = 2 in.
water line
Foundation
Column
15"
9"
3"
Threshold

642
Figure C.33 Concrete Chloride Penetration for Column PT-TC-S-GB in Dripper Side at End of Testing
0
4
8
12
16
0,00% 0,10% 0,20% 0,30% 0,40% 0,50% 0,60%Acid Soluble Chloride Content
(% by weight of concrete)
Hei
ght A
bove
Col
umn
Bas
e (i
n)
Depth = 0.5 inDepth = 1 in.Depth = 2 in.
water line
Foundation
Column
15"
9"
3"
Threshold

643
References
Chapter 1 References
1.1 Matt, P. et al. (2000), “Durability of Prestressed Concrete Bridges in
Switzerland”, 16th Congress of IABSE, September 2000, Congress Report,
2000.
1.2 Woodward, R. (2001), “Durability of Post-tensioned tendons on road
bridges in the UK.” Durability of Post-tensioning tendons. fib-IABSE
Technical Report, Bulletin 15. Workshop 15-16 November 2001, Ghent
(Belgium), 2001, pp.1-10.
1.3 Godart, B. (2001), “Status of durability of post-tensioned tendons in
France.” Durability of Post-tensioning tendons. fib-IABSE Technical
Report, Bulletin 15. Workshop 15-16 November 2001, Ghent (Belgium),
2001, pp.25-42.
1.4 Mutsuyoshi, H (2001), “Present Situation of Durability of Post-
Tensioned PC Bridges in Japan.” Durability of Post-tensioning tendons.
fib-IABSE Technical Report, Bulletin 15. Workshop 15-16 November
2001, Ghent (Belgium), 2001, pp.75-88.
1.5 Bertgagnoli, G., Carbone, V.I., Giordano, L., Mancini, G. (2001),
“Repair and strengthening of damaged prestressed structures.” Durability
of Post-tensioning tendons. fib-IABSE Technical Report, Bulletin 15.
Workshop 15-16 November 2001, Ghent (Belgium), 2001, pp.139-153.

644
1.6 Freyermuth, C.L. (2001), “Status of the durability of post-tensioning
tendons in the United States.” Durability of Post-tensioning tendons. fib-
IABSE Technical Report, Bulletin 15. Workshop 15-16 November 2001,
Ghent (Belgium), 2001, pp. 43-50.
1.7 Moreton, A. (2001) “Performance of Segmental and Post-Tensioned
Bridges in Europe,” Journal of Bridge Engineering, ASCE, Vol. 6, No. 6,
November/December 2001.
1.8 Jungwirth, D. (2001), “Problems, Solutions and Developments at Pot-
Tensioning Tendons from the German Point of View,” Durability of Post-
tensioning tendons. fib-IABSE Technical Report, Bulletin 15. Workshop
15-16 November 2001, Ghent (Belgium), 2001, pp.11-24.
1.9 Eibl, J. (2001), “External prestressing of German bridges and its further
development.” Durability of Post-tensioning tendons. fib-IABSE Technical
Report, Bulletin 15. November 2001, Ghent (Belgium), 2001, pp.227-234.
1.10 Virlogeux, M., “Advocationg for quality in prestressed concrete.”
1.11 fib Bulletin No. 15 (2001), “Durability of Post-Tentensioning Tendons.”
Proceedings of Workshop, Ghent, Belgium, November 2001.
1.12 Poston, R.W., West, J.S. (2001), “North American Strategies for
Improving Bonded Post-tensioned Concrete Construction.” Durability of
Post-tensioning tendons. fib-IABSE Technical Report, Bulletin 15.
Workshop 15-16 November 2001, Ghent (Belgium), 2001, pp.245-255.
1.13 Chandra, V. (2002), “A Review of Post-Tensioning Tendons in the
Boston Central Artery/Tunnel Project”, 1st Annual Concrete Bridge
Conference, FHWA, NCBC, PCI. Nashville, TN, Octobre 9, 2002.
1.14 Potter, J.L. (2002),“National Status of Post-Tensioning Condition
Evaluations and Enhancements.” 1st Annual Concrete Bridge Conference,
FHWA, NCBC, PCI. Nashville, TN, October 9, 2002.
645
1.15 DeHaven, T.A. (2002), “Overview of Recent Developments in Grouting
of Post-Tensioning Tendons” 1st Annual Concrete Bridge Conference,
FHWA, NCBC, PCI. Nashville, TN, October 9, 2002.
1.16 FLDOT (2002), New Directions for Florida Post-Tensioned Bridges.
Florida Department of Transportation. Post-Tensioning in Florida
Bridges. By Corven Engineering, Inc. Tallahassee, Florida, February 2002
1.17 Theryo, T., García, P., Nickas, W. (2002) “ Lessons Learned from the
Vertical Tendon Corrosion Investigation of the Sunshine Skyway Bridge
High Level Approach Piers,” Proceedings of the first fib Congress:
Concrete Structures in the 21st Century, Session 8, Osaka, Japan, 2002.
1.18 ASBI (2002), “2002 Grouting Certification Training Manual,” American
Segmental Bridge Institute, Phoenix, Arizona, 2002.
1.19 PTI (2001), “Specification for Grouting of Post-Tensioned Structures,”
Post-Tensioning Institute (PTI), February 2001, First edition.
1.20 ASBI (2001), “Interim Statement on Grouting Practices,” American
Segmental Bridge Institute (ASBI), December 2000.
1.21 ASBI (2002), “2002 Grouting Certification Training Manual,” ASBI,
2002.
1.22 The Concrete Society (1996), “Durable Bonded Post-Tensioned Concrete
Bridges,” The Concrete Society Technical Report TR47. Crowthorne,
United Kingdom, 1996.
1.23 VSL (2002), “Grouting of Post-Tensioning Tendons,” VSL Report Series.
VSL International Ltd. Lyssach, Switzerland, May 2002.
1.24 FIP (1996),“Corrosion protection of Prestressing Steels,” Fédération
Internationale de la Précontrainte (FIP), London, 1996.

646
1.25 fib (2000), “Corrugated Plastic Ducts for Internal Bonded Post-
Tensioning,” Fédération Internationale du béton (fib) Technical Report
Bulletin No. 7, January, 2000.
1.26 fib (2000), “Grouting of tendons in prestressed concrete,” Fédération
Internationale du béton (fib) Technical Report Bulletin No. 20, July, 2000.
1.27 Hamada, Y. et al. (2001) “Maintenance of Prestressed Concrete
Bridges.” Fib-IABSE Technical Report, Bulletin 15. Workshop 15-16
November 2001, Ghent (Belgium), 2001, pp. 109-120.
1.28 Kitazono, H. et al. (2002) “Manual for Maintenance of Durable
Prestressed Concrete Bridges,” Proceedings of the first fib Congress:
Concrete Structures in the 21st Century, Session 12, Osaka, Japan, 2002.
1.29 Matt, P. (2001) “Non-destructive Evaluation and Monitoring of Post-
Tensioning Tendons,” Fib-IABSE Technical Report, Bulletin 15.
Workshop 15-16 November 2001, Ghent (Belgium), 2001, pp. 103-108.
1.30 West, J.S., Vignos, R.P.,Breen,J.E., and Kreger, M.E. (1999)
“Corrosion Protection for Bonded Internal Tendons in Precast Segmental
Construction,” Research Report 1405-4, Center for Transportation
Research, Bureau of Engineering Research, The University of Texas at
Austin, October 1999.
1.31 Ganz, H.R. (2002) “Recent Developments in the Protection of
Prestressing Steels,” Proceedings of the first fib Congress: Concrete
Structures in the 21st Century, Session 7, Osaka, Japan, 2002.
1.32 Schokker, A.J., Koester, B.D, Breen, J.E., and Kreger, M.E. (1999)
“Development of High Performance Grouts for Bonded Post-Tensioned
Structures,” Research Report 1405-2, Center for Transportation Research,
Bureau of Engineering Research, The University of Texas at Austin,
December 1999.

647
1.33 West, J.S. (1999) “Durability Design of Post-Tensioned Bridge
Substructures,” Ph.D. Dissertation, The University of Texas at Austin,
May 1999.
1.34 Schokker, A.J. (1999), “Improving Corrosion Resistance of Post-
Tensioned Substructures Emphasizing High Performance Grouts,” Ph.D.
Dissertation, The University of Texas at Austin, May 1999.
1.35 Koester, B.D. (1995), “Evaluation of Cement Grouts for Strand
Protection Using Accelerated Corrosion Tests,” Master of Science Thesis,
The University of Texas at Austin, December 1995.
1.36 Larosche, C.J. (1999), “Test Method for Evaluating Corrosion
Mechanisms in Standard Bridge Columns,” Master of Science Thesis, The
University of Texas at Austin, August 1999.
1.37 Kotys, A.L. (2003) “Durability Examination of Bonded Tendons in
Concrete Beams under Aggressive Corrosive Environment.” Unpublished
Master of Science Thesis, The University of Texas at Austin. (under
preparation), 2003.
1.38 Vignos, R.P. (1994), “Test Method for Evaluating the Corrosion
Protection of Internal Tendons Across Segmental Bridge Joints.” Master
of Science Thesis, The University of Texas at Austin, May 1994.
1.39 Hamilton, H.R. (1995), “Investigation of Corrosion Protection Systems
for Bridge Stay Cables,” Ph.D. Dissertation, The University of Texas at
Austin, 1995.

648
1.40 Schokker, A.J., West, J.S., Breen, J.E., and Kreger, M.E. (1999),
“Interim Conclusions, Recommendations, and Design Guidelines for
Durability of Post-Tensioned Bridge Substructures,” Research Report
1405-5, Center for Transportation Research. The University of Texas at
Austin, October 1999.
Chapter 2 References
2.1 Schupack, M. (2001). “Prestressing Reinforcement in the New
Millennium,” Concrete International, Vol 23, No. 12, December 2001.
2.2 Godart, B. (2001). “Status of durability of post-tensioned tendons in
France.” Durability of Post-tensioning tendons. fib-IABSE Technical
Report, Bulletin 15. Workshop 15-16 November, Ghent (Belgium), 25-42,
2001.
2.3 Yunovich, M., Thompson,N.G. (2003). “Corrosion of Highway Bridges:
Economic Impact and Control Methodologies,” Concrete International,
January 2003, pp.52-57.
2.4 Manning, D.(1988). “Durability of Prestressed Concrete Highway
Structures,” NCHRP 140. Transportation Research Board. National
Research Council. Washington, DC., 1988.
2.5 Freyermuth, C.L. (2001). “Status of the durability of post-tensioning
tendons in the United States.” Durability of Post-tensioning tendons. fib-
IABSE Technical Report, Bulletin 15. Workshop 15-16 November, Ghent
(Belgium), 2001, pp.43-50.
2.6 Schokker, A.J. (1999), “Improving Corrosion Resistance of Post-
Tensioned Substructures Emphasizing High Performance Grouts,” Ph.D.
Dissertation, The University of Texas at Austin, May 1999.

649
2.7 Jungwirth, D. and Gehlen, B. (2002). “Problems, Solutions,
Developments and Applications at Different Kinds of Post-Tensioning
Tendons from the European Point of View,” Proceedings of the first fib
Congress: Concrete Structures in the 21st Century, Session 2, Osaka,
Japan.
2.8 Virlogeux, M. (1999). “Message from the President,” Structural
Concrete, fib, Vol. P1, No.1, March 1999.
2.9 Chaussin R., Chabert, A. (2001). “Strategies for improvement –
Approach in France-” Durability of Post-tensioning tendons. fib-IABSE
Technical Report, Bulletin 15. Workshop 15-16 November, Ghent
(Belgium), 2001, pp.235-244.
2.10 FLDOT (2002). “New Direction for Florida Post-Tensioned Bridges,”
Corven Engineering Inc. Volume 1 of 5, Tallahassee, Florida, February
15.
2.11 AASHTO, LRFD (1998). Bridge Design Specifications, 2nd Edition,
American Association of State Highway and Transportation Officials,
Washington, D.C., 1998.
2.12 West, J.S. (1999). “Durability Design of Post-Tensioned Bridge
Substructures,” Ph.D. Dissertation, The University of Texas at Austin,
May 1999.
2.13 Kuesel, Th. R. (1990).“Whatever Happened to Long –Term Bridge
Design?,” Civil Engineering, February, 57-60
2.14 fib –IABSE (2001). “Durability of Post-Tensioned Tendons” Technical
Report. Bulletin 15. Workshop 15-16 November, Ghent, Belgium, 2001.
2.15 Zivanovic, I.,Lecinq,B.,Fuzier,JP.(2002). “Durability Specifics for
Prestressing,” Proceedings of the first fib Congress: Concrete Structures in
the 21st Century, Session 8, Osaka, Japan, 2002.

650
2.16 Mutsuyoshi, H. (2001). “Present Situation of Durability of Post-
Tensioned PC Bridges in Japan.” Durability of Post-tensioning tendons.
fib-IABSE Technical Report, Bulletin 15. Workshop 15-16 November,
Ghent (Belgium), 2001, pp.75-88.
2.17 Miller, M.D. (2000). “Durability Survey of Segmental Concrete Bridges,”
American Segmental Bridge Institute, ASBI, Second Edition, September
2000.
2.18 Theryo, T., García, P., Nickas, W. (2002). “ Lessons Learned from the
Vertical Tendon Corrosion Investigation of the Sunshine Skyway Bridge
High Level Approach Piers,” Proceedings of the first fib Congress:
Concrete Structures in the 21st Century, Session 8, Osaka, Japan, 2002.
2.19 ASBI (2002). “2002 Grouting Certification Training Manual,” American
Segmental Bridge Institute, Phoenix, Arizona, 2002.
2.20 ACI 222.R-96 (1997) Corrosion of Metals in Concrete. American
concrete Institute. March 1997.
2.21 Qing Li, Ch. (2002). “Initiation of Chloride-Induce Reinforcement
Corrosion in Concrete Structural Members – Prediction,” ACI Structural
Journal, Vol 99 No.2, March-April 2002, pp.133-141.
2.22 Hamada, Y. Ishikawa, Y., Mizoe, M., Miyagawa, T. (2001).
“Maintenance of Prestressed Concrete Bridges.” Durability of Post-
Tensioning Tendons. fib-IABSE Technical Report, Bulletin 15. Workshop
15-16 November, Ghent, Belgium, 2001, pp.109-120.
2.23 Domone, P.L. and Jefferis, S.A. (1994) Structural Grouts, Blackie
Academic & Professional, London, 1994.
2.24 Schupack,M. (1971). “Grouting Tests on Large Post-Tensioning Tendons
for Secondary Nuclear Containment Structures,” Journal of the
Prestressed Concrete Institute, March-April 1971, pp.85-97.
651
2.25 Shupack, M., (1974). “Admixture for Controlling Bleed in Cement Grout
Used in Post-Tensioning,” Journal of the Prestressed Concrete Institute,
November-December 1974.
2.26 Pielstick, B.H. (2002). “Grouting of Segmental Post-Tensioned Bridges in
America,” Proceedings of the first fib Congress: Concrete Structures in
the 21st Century, Session 8, Osaka, Japan, 2002.
2.27 Hamilton, H.R. (1995) “Investigation of Corrosion Protection Systems
for Bridge Stay Cables,” Doctor of Philosophy Dissertation, The
University of Texas at Austin, September 1995.
2.28 Jones, D.A. (1992). “Principles and Prevention of Corrosion,” Mac
Millan Publishing Company, New York, 1992.
2.29 Rosenberg, A., Hansson, C.M., and Andrade, C., (1989). “Mechanisms
of Corrosion of Steel in Concrete,” Materials Science of Concrete I, The
American Ceramic Society, 1989, pp.285-313.
2.30 Fontana, M.G. (1986). Corrosion Engineeering, McGraw-Hill Book
Company, New York, 1986.
2.31 Violetta, B. (2002) “Life-365 Service Life Prediction Model,” Concrete
International, Vol 24, No. 12, December 2002, pp.53-57.
2.32 Ganz, H.R. (2001). “Evolution of Prestressing Systems.” Durability of
Post-Tensioning Tendons. fib-IABSE Technical Report, Bulletin 15.
Workshop 15-16 November. Ghent, Belgium, 2001, pp.155-171.
2.33 Shupack,M. and Suarez, M.G. (1982) “Some Recent Corrosion
Embrittlement Failures of Prestressing Sytems in the United States,”
Journal of the Prestressed Concrete Institute, March-April 1982.

652
2.34 Ikawa,K.,Ishii,K.,Fukute,T. and Seki,H. (1996). “Behavior and
Protection of Hydrogen Embrittlement on Tendons of PC Members,”
Concrete in marine Environment: Proceedings of the Third
CANMET/ACI International Conference, St. Andrews by-the-Sea,
Canada, SP-163, V.M. Malhotra, Ed., 1996, pp.253-273.
2.35 Yamaoka, Y., Hideyoshi, T. and Kurauchi, M. (1988). “Effect of
Galvanizing on Hydrogen Embrittlement of Prestressing Wire,” Journal of
the Prestressed Concrete Institute, July-August 1988.
2.36 Woodward, R. (2001), “Durability of Post-tensioned tendons on road
bridges in the UK.” Durability of Post-tensioning tendons. fib-IABSE
Technical Report, Bulletin 15. Workshop 15-16 November 2001, Ghent
(Belgium), 2001, pp.1-10.
2.37 The Concrete Society (1996), “Durable Bonded Post-Tensioned Concrete
Bridges,” The Concrete Society Technical Report TR47. Crowthorne,
United Kingdom, 1996.
2.38 Ganz, H.R. (2002). “Recent Developments in the Protection of
Prestressing Steels,” Proceedings of the first fib Congress: Concrete
Structures in the 21st Century, Session 7, Osaka, Japan, 2002.
2.39 Matt, P. (2000). “Performance of Post-Tensioned Bridges in Switzerland
and Practical Experience with a New Generation of Tendons,” ASBI
Annual Convention , Brookling, USA, 2000, pp.7-8.
2.40 Schupack, M.(2001). “Prestressing Reinforcement in the New
Millennium,” Concrete International, Vol. 23, No. 12, December 2001,
pp.38-45.
2.41 Neville, A.M.,(1997). Properties of Concrete, 4th Edition, John Wiley &
Sons, New York, NY.1997.

653
2.42 Mindess, S., and Young, J.F. (1981). Concrete, Prentice-Hall Inc.,
Englewood Cliffs, New Jersey, 1981.
2.43 CEB (1989), Durable Concrete Structures – CEB Design Guide, Bulletin
D’information No. 182, Comité Euro-International du Béton, Laussanne,
June 1989.
2.44 Nmai, C.K. (1995). “Corrosion-Inhibiting Admixtures: Passive, Passive-
Active versus Active Systems,” Advances in Concrete Technology:
Proceedings of the Second CANMET/ACI International Symposium, Las
Vegas, Nevada, SP-154, V.M. Malhontra, Ed., 1995, pp.565-585.
2.45 Shaw,M. (1997). “Migrating Corrosion Inhibitors for Reinforced Concrete
Protection,” Proceedings of the seventh International Conference on
Structural Faults and Repair, Volume 2, Edinburgh, Scotland, 1997,
pp.317-324.
2.46 Wollman, G.P., Yates, D.L., and Breen, J.E, (1988). ”Freeting Fatigue in
Post-Tensioned Concrete,” Research Report 465-2F, Center for
Transportation Research, The University of Texas at Austin, November,
1988.
2.47 PTI (2001). “Guide Specification for Grouting of Post-Tensioned
Structures,” Post-Tensioning Institute (PTI), February 2001, First edition,
2001.
2.48 fib (2000). “Grouting of tendons in prestressed concrete,” Fédération
Internationale du béton. Technical Report Bulletin No. 20, Laussane,
Switzerland, July 2000.
2.49 VSL (2002). “Grouting of Post-Tensioning Tendons,” VSL Report Series.
VSL International Ltd. Lyssach, Switzerland, May 2002.

654
2.50 Tourneur, S. (2002). “Prestressing: 60 years of innovation,” Proceedings
of the first fib Congress: Concrete Structures in the 21st Century, Osaka,
Japan, 2002.
2.51 fib (2000), “Corrugated Plastic Ducts for Internal Bonded Post-
Tensioning,” Fédération Internationale du béton (fib) Technical Report
Bulletin No. 7, Laussane, Switzerland, 2000.
2.52 Moreton, A. (2001). “Performance of Segmental and Post-Tensioned
Bridges in Europe,” Journal of Bridge Engineering, ASCE, Vol. 6, No.6,
November/December 2001.
2.53 Clark, G. (2001). “Strategies for improvement – Approach in Europe –
The UK strategy and fib developments,” Durability of Post-Tensioned
Tendons. Fib-IABSE Technical Report, Bulletin 15. Workshop 15-16
November, Ghent, Belgium, 2001, pp.221-226.
2.54 ACI 222.3R. Unpublished ACI Committee Report 222. (under
preparation)
2.55 McCraven, S.C. (2001). “New Generation of Reinforcement for
Transportation Instrastructure,” Concrete Construction, September 2001,
pp.41-47.
2.56 (2001) “Will new generation reinforcing materials solve our corrosion
problems?,” Concrete Perspectives, Concrete Construction. September
2001, pp.51-54.
2.57 Gaubinger, B., Bahr,G, Hampel,G, Kollegger,J. (2002). “Innovative
Anchorage System for CFRP-Tendons,” Proceedings of the first fib
Congress: Concrete Structures in the 21st Century, Session 7, Osaka,
Japan, 2002.

655
2.58 Matt, P. (2001). “Non-destructive Evaluation and Monitoring of Post-
Tensioning Tendons,” Durability of Post-Tensioned Tendons. Fib-IABSE
Technical Report, Bulletin 15. Workshop 15-16 November, Ghent,
Belgium, 2001, pp.103-108.
2.59 Raiss, M.E. (2001). “Appropriate detailing in the design process for
durable post-tensioned bridges,” Durability of Post-Tensioned Tendons.
Fib-IABSE Technical Report, Bulletin 15. Workshop 15-16 November,
Ghent, Belgium, 2001, pp.203-220.
Chapter 3 References
3.1 Freyermuth, C.L. (2001). “Status of the durability of post-tensioning
tendons in the United States.” Durability of Post-tensioning tendons. fib-
IABSE Technical Report, Bulletin 15. Workshop 15-16 November, Ghent
(Belgium), 2001, pp.43-50.
3.2 AASHTO (1989), Guide Specifications for Design and Construction of
Segmental Concrete Bridges , American Association of State Highway
and Transportation Officials, Washington, D.C., 1989.
3.3 West, J.S. (1999). “Durability Design of Post-Tensioned Bridge
Substructures,” Ph.D. Dissertation, The University of Texas at Austin,
May 1999.
3.4 Vignos, R.P. (1994), “Test Method for Evaluating the Corrosion
Protection of Internal Tendons Across Segmental Bridge Joints.” Master
of Science Thesis, The University of Texas at Austin, May 1994.

656
3.5 ASTM (1992), “Standard Test Method for Determining the Effects of
Chemical Admixtures on the Corrosion of Embedded Steel Reinforcement
in Concrete Exposed to Chloride Environments,” ASTM G109-92,
American Society for Testing and Materials, Philadelphia, PA., 1992.
3.6 AASHTO (1999), Guide Specifications for Design and Construction of
Segmental Concrete Bridges, American Association of State Highway and
Transportation Officials, Washington, D.C. 2nd Edition, 1999.
3.7 ASTM (1991), “Standard Test Method for Half-Cell Potentials of
Uncoated Reinforcing Steel in Concrete,” ASTM C876-91, American
Society for Testing and Materials, Philadelphia, Pa., 1991.
3.8 West, J.S., Vignos, R.P., Breen, J.E., and Kreger, M.E. (1999),
“Corrosion Protection for Bonded Internal Tendons in Precast Segmental
Construction,” Research Report 1405-4,Center for Transportation
Research, The University of Texas at Austin, Austin, Texas, October
1999.
3.9 Broomfield, J.P., Rodriguez, J., Ortega, L.M., and Garcia, A.M.
(1993), “Corrosion Rate Measurement and Life Prediction for Reinforced
Concrete Structures,” Proceedings of the 5th International Conference on
Structural Faults and Repair held on June 29, Vol. 2, Venue, University of
Edinburgh, 1993, pp.155-163.
3.10 Al-Qadi, I.L., Peterson, J.E., and Weyers, R.E. (1993), “A Time to
Cracking Model for Critically Contaminated Reinforced Concrete
Structures,” Proceedings of the 5th International Conference on Structural
Faults and Repair held on June 29. Vol. 3, Venue, University of
Edinburgh, 1993, pp.91-99.

657
3.11 Concrete Reinforcing Steel Institute (1992), “CRSI Performance
Research: Epoxy-Coated Reinforcing Steel,” Interim Report, CRSI,
Schaumburg, Ill, January 1992.
3.12 Virmani, Y.P., Clear, K.C., and Pasko, T.J. (1983), “Time-to-
Corrosion of Reinforcing Steel in Concrete Slabs, Vol. 5,: Calcium Nitrite
Admixture or Epoxy-Coated Reinforcing Bars as Corrosion Protection
Systems,” Report No. FHWA/RD-83/012, Federal Highway
Administration, Washington, D.C., September 1983, pp.71.
3.13 AASHTO (1994), “Sampling and Testing for Chloride Ion in Concrete
and Concrete Raw Materials,” AASHTO T 260-94, American Association
of State Highway and Transportation Officials, Washington, D.C., 1994.
3.14 Poston, R.W. (1984), “Improving Durability of Bridge Decks by
Transverse Prestressing,” Doctor of Philosophy Dissertation, The
University of Texas at Austin, 1984.
3.15 Hamilton, H.R. (1995), “Investigation of Corrosion Protection Systems
for Bridge Stay Cables,” Doctor of Philosophy Dissertation, The
University of Texas at Austin, 1995.
3.16 Sason, A.S. (1992), “Evaluation of Degree of Rusting on Prestressed
Concrete Strand,” PCI Journal, Vol. 37, No. 3, May-June 1992, pp.25-30.
3.17 Wouters, J.P. (1998), Personal Communication, Whitlock Dalrymple
Poston and Associates, Inc., Manassas, Virginia, July 1998..
3.18 ACI Committee 222, (1996), “Corrosion of Metals in Concrete,” ACI
222R-96, American Concrete Institute, Detroit, Michigan, 1996.
3.19 Koester, B.D. (1995), “Evaluation of Cement Grouts for Strand Protection
Using Accelerated Corrosion Tests,” Master of Science Thesis, the
University of Texas at Austin, December 1995.

658
Chapter 4 References
4.1 Armstrong, S.D., Salas, R.M., Wood, B.A., Breen, J.E. and Kreger,
M.E., (1997) “Behavior and Design of Large Structural Bridge Pier
Overhangs,” Research Report 1364-1, Center of Transportation Research,
University of Texas at Austin, 1997.
4.2 West, J.S., (1999) “Durability Design of Post-Tensioned Bridge
Substructures,” Doctor of Philosophy Dissertation, The University of
Texas at Austin, May 1999.
4.3 Schokker, A.J., (1999) “Improving Corrosion Resistance of Post-
Tensioned Substructures Emphasizing High Performance Grouts,” Doctor
of Philosophy Dissertation, The University of Texas at Austin, May 1999.
4.4 West, J.S., Schokker, A.J., Larosche,C.J., Breen, J.E., Kreger, M.E.
(1999) “Long-Term Post-Tensioned Beam and Column Exposure Test
Specimens: Experimental Program,” Center for Transportation Research,
Report 1405-3. The University of Texas at Austin, October 1999.
4.5 Kotys, A.L., (2003) “Durability Examination of Bonded Tendons in
Concrete Beams Under Aggressive Corrosive Environment,” Master of
Science in Engineering Thesis, The University of Texas at Austin, May
2003.
4.6 AASHTO, (1998) “LRFD Bridge Design Specifications,” 2nd Edition,
American Association of State Highway and Transportation Officials,
Washington, D.C., 1998.
4.7 ACI Committee 318, (1995) “Building Code Requirements for Structural
Concrete,” ACI 318-95, American Concrete Institute, Detroit, MI, 1995.

659
4.8 Breen, J.E., Burdet, O., Roberts, C., Sanders, D. and Woollman, G.,
(1994) “Anchorage Zone Reinforcement for Post-Tensioned Concrete
Girders,” NCHRP Report 356, Transportation Research Board,
Washington, D.C., 1994, 204 pp.
4.9 ASTM G109, (1992) “Standard Test Method for Determining the Effects
of Chemical Admixtures on the Corrosion of Embedded Steel
Reinforcement in Concrete Exposed to Chloride Environments,” ASTM
G109-92, American Society for Testing and Materials, Philadelphia, PA.,
1992.
4.10 AASHTO T259, (1980) “Standard Method of Test for Resistance of
Concrete to Chloride Ion Penetration,” AASHTO Designation T 259-80,
American Association of State Highway and Transportation Officials,
Washington, D.C., 1980.
4.11 Jones, D.A., (1992) “Principles and Prevention of Corrosion,” Mac
Millan Publishing Company, New York, 1992.
4.12 ASTM C876, (1991) “Standard Test Method for Half-Cell Potentials of
Uncoated Reinforcing Steel in Concrete,” ASTM C876-91, American
Society for Testing and Materials, Philadelphia, PA., 1991.
4.13 Fontana, M.G., (1986) “Corrosion Engineering,” 3rd Edition, McGraw-
Hill, INC., New York, New York, 1986.
4.14 Jones, D.A., (1996) “Principles and Prevention of Corrosion,” 2nd
Edition, Prentice Hall, Inc., Upper Saddle River, NJ, 1996.
4.15 Flis, J., Sehal, A., Li, D., Kho, Y., Sabol, S., Pickering, H., Osseo-
Asare, K., and Cady, P.D., (1992) “Condition Evaluationof Concrete
Bridges Relative to Reinforcement Corrosion, Volume 2: Method for
Measuring the Corrosion Rate of Reinforcing Steel,” SHRP-S/FR-92-104,
Strategic Highway Research Program, Washington, D.C., 1992.

660
4.16 Andrade, C., Castelo, V., Alonso, C. and Gonzalez J.A., (1986) “The
Determination of Corrosion Rate of Steel Embedded in Concrete by the
Polarization Resistance and AC Impedance Methods,” Corrosion Effect of
Stray Currents and the Techniques for Evaluation Corrosion of Rebars in
Concrete, ASTM STP 906, V. Chaker, Editor, American Society for
Testing and Materials, Philadelphia, PA., 1986.
4.17 CONCORR, Inc., (1996) “FHWA-SHRP Showcase: Assessment of
Physical Condition of Concrete Bridge Components,” Federal Highway
Administration, Washington, D.C., 1996.
4.18 Cady, P., and Gannon, E., (1992) “Condition Evaluation of Concrete
Bridges Relative to Reinforcement Corrosion, Volume 8: Procedure
Manual,” SHRP-S/FR-92-330, Strategic Highway Research Program,
Washington, D.C., 1992
4.19 AASHTO T260, (1994) “Standard Method of Test for Sampling and
Testing for Chloride Ion in Concrete Ram Materials,” AASHTO
Designation T 260-94, American Association of State Highway and
Transportation Officials, Washington, D.C., 1994.
4.20 ACI Committee 222, (1996) “Corrosion of Metals in Concrete,” ACI 222
R-96, American Concrete Institute, Detroit, Michigan, 1996.
4.21 West, J.S., Vignos, R.P., Breen, J.E., and Kreger, M.E. (1999),
“Corrosion Protection for Bonded Internal Tendons in Precast Segmental
Construction,” Research Report 1405-4,Center for Transportation
Research, The University of Texas at Austin, Austin, Texas, October,
1999.
4.22 Poston, R.W., (1984) “Improving Durability of Bridge Decks by
Transverse Prestressing,” Doctor of Philosophy Dissertation, The
University of Texas at Austin, 1984.

661
4.23 Hamilton, H.R., (1995) “Investigation of Corrosion Protection Systems
for Bridge Stay Cables,” Doctor of Philosophy Dissertation, The
University of Texas at Austin, 1995.
4.24 Sanson, A.S., (1992) “Evaluation of Degree of Rusting on Prestressed
Concrete Strand,” PCI Journal, Vol. 37, No. 3, May-June 1992.
Chapter 5 References
5.1 West, J.S., (1999) “Durability Design of Post-Tensioned Bridge
Substructures,” Doctor of Philosophy Dissertation, The University of
Texas at Austin, May 1999.
5.2 Schokker, A.J., (1999) “Improving Corrosion Resistance of Post-
Tensioned Substructures Emphasizing High Performance Grouts,” Doctor
of Philosophy Dissertation, The University of Texas at Austin, May 1999.
5.3 West, J.S., Schokker, A.J., Larosche,C.J., Breen, J.E., Kreger, M.E.
(1999) “Long-Term Post-Tensioned Beam and Column Exposure Test
Specimens: Experimental Program,” Center for Transportation Research,
Report 1405-3. The University of Texas at Austin, October 1999.
5.4 ASTM, (1991) “Standard Test Method for Half-Cell Potentials of
Uncoated Reinforcing Steel in Concrete,” ASTM C876-91, American
Society for Testing and Materials, Philadelphia, Pa., 1991.
5.5 ACI Committee 222 (1996), “Corrosion of Metals in Concrete,” ACI 222
R-96, American Concrete Institute, Detroit, Michigan, 1996.

662
5.6 West, J.S., Vignos, R.P., Breen, J.E., and Kreger, M.E. (1999),
“Corrosion Protection for Bonded Internal Tendons in Precast Segmental
Construction,” Research Report 1405-4,Center for Transportation
Research, The University of Texas at Austin, Austin, Texas, October
1999.
Chapter 7 References
7.1 West, J.S., Vignos, R.P., Breen, J.E., and Kreger, M.E. (1999),
“Corrosion Protection for Bonded Internal Tendons in Precast Segmental
Construction,” Research Report 1405-4,Center for Transportation
Research, The University of Texas at Austin, Austin, Texas, October
1999.
7.2 ASTM (1991), “Standard Test Method for Half-Cell Potentials of
Uncoated Reinforcing Steel in Concrete,” ASTM C876-91, American
Society for Testing and Materials, Philadelphia, Pa., 1991.
7.3 AASHTO (1999), Guide Specifications for Design and Construction of
Segmental Concrete Bridges, American Association of State Highway and
Transportation Officials, Washington, D.C. 2nd Edition, 1999.
7.4 West, J.S., (1999) “Durability Design of Post-Tensioned Bridge
Substructures,” Doctor of Philosophy Dissertation, The University of
Texas at Austin, May 1999.

663
Vita
Rubén Mario Salas Pereira was born on June 20, 1968 in San José, Costa
Rica, and is the son of Rubén Salas Granados and María Teresa Pereira García.
After graduating with honors from the Lice Laboratorio (High School), San José,
Costa Rica, in 1985, he entered the Universidad de Costa Rica, in San José, where
he received the degree of “Licenciado en Ingeniería Civil” with Distinction in
April, 1991, he was awarded “Graduación de Honor.” During the summers of
1987 to 1989, and the year of 1990, he was employed as an Engineering Assistant
at CARREZ S.A. Construction Company, San José, Costa Rica. In 1991, he
worked part time in the Engineering Division of SALPER S.A. Construction
Company, San José, Costa Rica. In the same year he joined the team that
subsequently developed the Great Metropolitan Area Transportation Master Plan
for the Costa Rican Ministry of Public Works and Transportation. In June of
1991, he became a Professor in the Civil Engineering Department, Universidad de
Costa Rica, where he was later awarded “profesor adjunto.” In January of 1992,
he worked at the Pan American Institute of Highways, Federal Highway
Administration, McLean Virginia, and became International Instructor for Federal
Highway Administration teaching short courses in Latin America in the field of
Scour at Highway Bridges. He enrolled in the Master of Science program at The
University of Texas at Austin, where he received his Master’s Degree in May
1994. Back in Costa Rica, he worked at Francisco Mas & Asociados S.A., a
consulting firm, and in 1996 he was employed at Franz Sauter & Asociados S.A.,
an engineering and architecture consulting firm, where he is now a partner and
serves as Project Manager and Structural Engineer. In September 2000 he entered
the Graduate School at The University of Texas at Austin to pursue a Ph.D. in
structural engineering.

664
Permanent Address: P.O. Box 582-2070
San José, COSTA RICA
This dissertation was typed by the author


