Embed Size (px)
Citation preview
© 2020 SCTE•ISBE and NCTA. All rights reserved. 1
Access Capacity Planning: Staying Well Ahead Of Customer Demand Helped Ensure Stability During
COVID-19
A Technical Paper prepared for SCTE•ISBE by
Bruce E. Barker Jr. Vice President, Capacity Engineering
Next Generation Access Network (NGAN), Comcast Cable 1701 JFK Blvd., Philadelphia, PA 19103
609-685-4269 [email protected]
Claude Bou Abboud, Sr. Director, Comcast Cable
Erik Neeld, Sr. Director, Comcast Cable
© 2020 SCTE•ISBE and NCTA. All rights reserved. 2
Table of Contents Title Page Number
1. Introduction .................................................................................................................................... 3 2. Historic Context.............................................................................................................................. 3 3. Problem Statement ........................................................................................................................ 4 4. Solutions ........................................................................................................................................ 6
4.1 Proactive Capacity Planning .................................................................................................... 7 4.2 New and Modified Reporting ................................................................................................... 9 4.3 Capacity Acceleration ........................................................................................................... 10
5. Conclusion ................................................................................................................................... 14
Acknowledgements ............................................................................................................................... 16 Abbreviations......................................................................................................................................... 17
List of Figures
Title Page Number Figure 1 – Traffic Growth Since Late February 2020 (Source: Comcast Capacity Management) ............... 5 Figure 2 – CMTS Upstream Service Group Utilization Shift (Source: Comcast Capacity Management)
........................................................................................................................................................ 5 Figure 3 – Upstream Hourly Consumption Shift (Source: Comcast Capacity Management) ...................... 6 Figure 4 – Traffic Forecasting Using ETS Methodology (Source: Comcast Capacity Management) .......... 7 Figure 5 – Comparison of Capacity Solutions (Source: Comcast Capacity Management) ......................... 8 Figure 6 – Example CMTS Scorecard (Source: Comcast Capacity Management) .................................... 9 Figure 7 – Example CMTS SG Saturation or ”Flatlining” (Source: Comcast Service Performance
Database) ...................................................................................................................................... 10 Figure 8 – Example DOCSIS Upstream Channel Lineup With Fifth and Sixth Upstream Channel
(Source: Comcast Next Generation Access Engineering) ............................................................... 11 Figure 9 – Octave High Level System Diagram (Source: Comcast Next Generation Access
Engineering) .................................................................................................................................. 12 Figure 10 – Highly Utilized CMTS SG Trending (Source: Comcast Capacity Management) .................... 14
© 2020 SCTE•ISBE and NCTA. All rights reserved. 3
1. Introduction As means to control the spread of the COVID-19 virus, many countries implemented measures to quarantine large portions of their populations in early 2020. Remote working and schooling policies were applied to a fairly large extent. Large portions of the workforce, especially in the hospitality industry, were laid off. Essentially, many people found themselves stuck at home for one reason or another.
This resulted in a significant increase in network traffic in many areas for many service providers. This was especially true for upstream traffic generated by various teleconferencing and VoIP-type protocols that were heavily leveraged to support remote working and schooling. Additionally, there was a noted shift in the daily peak time - from evenings to daytime in many locations.
Traffic increases caused an increase in the utilization of all network elements including cable modem termination system (CMTS) service groups (SGs) which provide connectivity between the core network the access network where customer homes and businesses reside. High utilization can result in potential impact to customer experience such as slow speeds, poor video quality, and intermittent service if not resolved. Speed test data and various industry models have helped us to define highly utilized CMTS SGs as those with utilization exceeding 85% consistently.
Sharp increases in traffic and CMTS SG utilization like what was observed during the COVID-19 event can be well-managed through a combination of proactive and reactive capacity management activities. Proactive measures are mainly focused on predictive traffic forecasting and capacity deployment planning. Reactive measures include a plethora of specialized reporting mechanisms, to help prioritize near-term capacity work, and adaptations to existing long-term plans where applicable.
Accelerated development of new solutions, techniques, and technologies is also a key aspect of any strategy during a crisis. To expand upstream capacity, development and testing for additional upstream channels was prioritized and successfully deployed. The profile management application (PMA) platform, known by the name “Octave” at Comcast and initially developed for DOCSIS 3.1 downstream capacity, was rapidly modified to enable more DOCSIS 3.0 upstream capacity. To help operationalize and deploy new solutions, other tools and automation were also quickly developed and modified.
Furthermore, the partnership between capacity management, engineering, finance, and technical operations teams on the planning and execution of capacity solutions was critical to tackling the challenge imposed by the sudden network growth. It was only through this partnership and alignment that extraordinary innovations and accomplishments were made. Node split work to mitigate highly utilized CMTS SGs, for example, increased 100% from normal levels as all teams rallied around a common goal. This would not have been possible otherwise. All efforts to manage capacity in extreme circumstances like during COVID-19 are only effective when there is good partnership and solid alignment across the organization.
2. Historic Context There are various factors involved in the management of traffic growth and customer experience. Subscriber growth and increased usage per subscriber are key factors in driving traffic growth over time. In recent years, annual upstream network traffic growth has been in the 15-25% range, on average. Downstream traffic growth has typically been in the 25-35% range on average. Not accounting for seasonality, this has translated to averaged monthly growth of approximately 1-2% for upstream traffic and 2-3% for downstream traffic.
© 2020 SCTE•ISBE and NCTA. All rights reserved. 4
While traffic grows on some average amount, it typically does not grow in a linear or consistent manner in most locations. In reality, traffic follows seasonal patterns in which it grows faster or slower based on the time of year. Generally, traffic growth is higher during the autumn and winter months in most areas in the United States especially in the northern latitudes for a multitude of reasons. Schooling, for example, typically resumes in the late August and September timeframes with ever increasing reliance on the internet to complete homework assignments and projects. In this same timeframe, new primetime television shows and series are released both on traditional broadcast and over-the-top (OTT) providers. Not surprisingly, content from traditional broadcast providers is mostly watched via video-on-demand (VOD) platforms to better fit with hectic schedules. All OTT content and much of the VOD content is IP-based and delivered over DOCSIS for cable operators. Near the Thanksgiving and Christmas holidays, even more video content is made available as well as new games and gaming updates, all of which are delivered over DOCSIS and manifest in higher traffic than normal. And of course, winter weather events and generally unfavorable outdoor weather conditions cause many people to stay inside and spend their time watching more video content or playing more online games. Traffic then typically begins to flatten and even decline going into the spring and summer months, as people spend more time outdoors and new video content is limited.
Vacation areas also demonstrate seasonality on network traffic. Summer vacation homes near beaches, lakes, or mountains drive a significant amount of localized traffic, mostly during the summer months. Likewise, winter vacation homes near winter activity areas and in warmer southern latitudes (i.e. “snow-bird” communities) drive higher localized traffic during the winter months.
Daily peak usage time is another factor that may affect how capacity is managed. In most areas, the daily peak usage time happens during the evening hours. Some areas with a heavy penetration of business services customers may peak during the day.
Traffic growth and timing of traffic growth impacts the utilization of network elements including CMTS SGs and potentially customer experience. Most providers strive to account for the various factors related to traffic growth in order to minimize high utilization and ensure good product quality and service reliability at all times. At Comcast, the number of highly utilized CMTS SGs has typically been managed to a nominal number, even accounting for factors like seasonality and peak time usage.
There are various approaches to measuring CMTS SG utilization used across the industry. Our approach is based on calculating the 98thpercentile of peak, of weekly 5-minute polling data averaged over four weeks. Each week, there are 2,016 5-minute utilization measurements collected. The data set is then sorted in descending order and the top 2% or 40 of these data points are removed. These top 2% or 40 data points are considered outliers. The 41st data point becomes the reported weekly utilization value for a given CMTS SG. We then calculate the average of the trailing four weeks to derive the official utilization value per CMTS SG. CMTS SGs with 4-week utilization values exceeding 85% are considered highly utilized. Normally, less than .1% of downstream SGs and less than .5% of upstream SGs exceed 85% utilization.
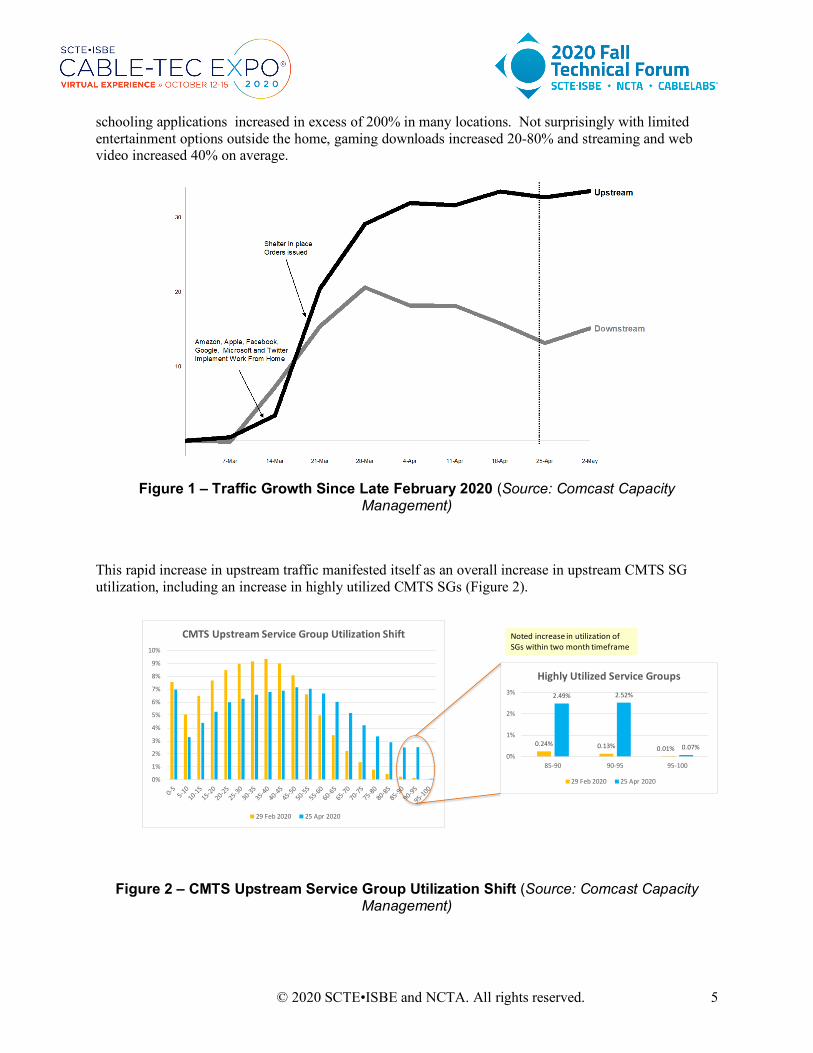
3. Problem Statement Rapid growth in network traffic can cause an increase in highly utilized CMTS SGs, resulting in potential impact to customer experience in some areas. In April 2020, upstream traffic increases in excess of 30% and downtstream traffic increases in excess of 20%, on average, were not uncommon (Figure 1). This was especially true in more urbanized areas and areas where large populations of the workforce teleworked. Voice over IP (VoIP) and video teleconferencing traffic generated by remote working and
© 2020 SCTE•ISBE and NCTA. All rights reserved. 5
schooling applications increased in excess of 200% in many locations. Not surprisingly with limited entertainment options outside the home, gaming downloads increased 20-80% and streaming and web video increased 40% on average.
Figure 1 – Traffic Growth Since Late February 2020 (Source: Comcast Capacity
Management)
This rapid increase in upstream traffic manifested itself as an overall increase in upstream CMTS SG utilization, including an increase in highly utilized CMTS SGs (Figure 2).
Figure 2 – CMTS Upstream Service Group Utilization Shift (Source: Comcast Capacity Management)
0%
1%
2%
3%
4%
5%
6%
7%
8%
9%
10%
CMTS Upstream Service Group Utilization Shift
29 Feb 2020 25 Apr 2020
0.24% 0.13% 0.01%
2.49% 2.52%
0.07%0%
1%
2%
3%
85-90 90-95 95-100
Highly Utilized Service Groups
29 Feb 2020 25 Apr 2020
Noted increase in utilization of SGs within two month timeframe
© 2020 SCTE•ISBE and NCTA. All rights reserved. 6
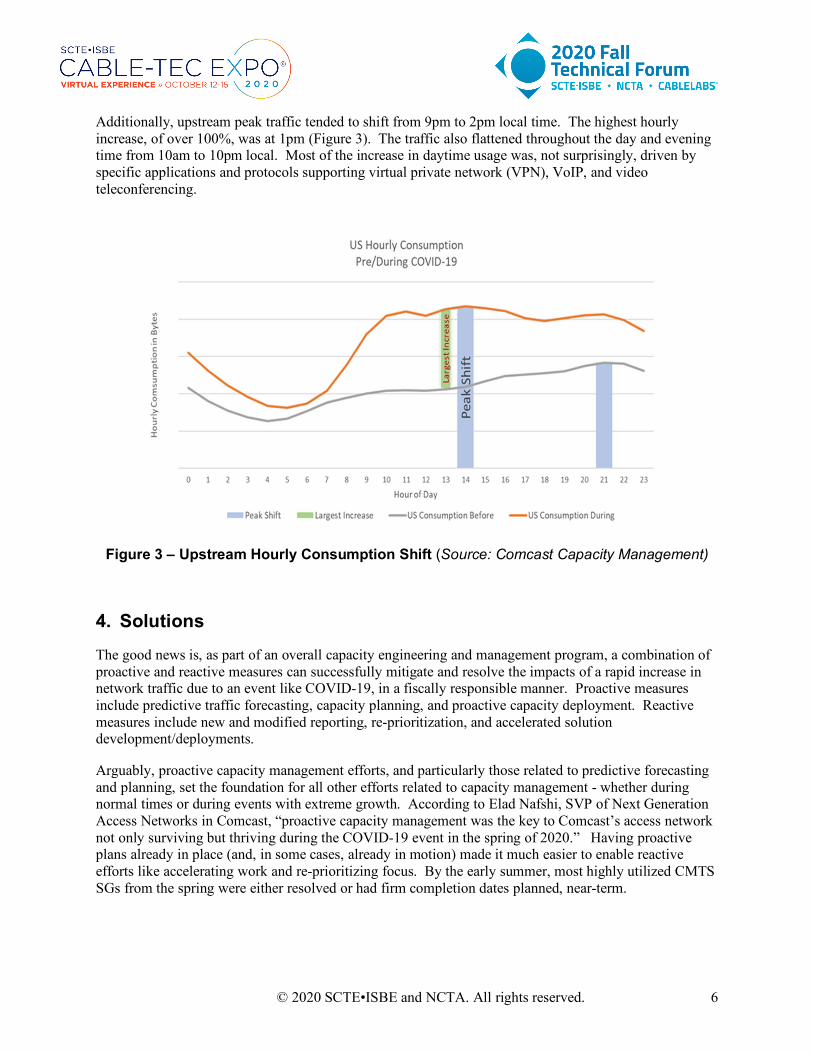
Additionally, upstream peak traffic tended to shift from 9pm to 2pm local time. The highest hourly increase, of over 100%, was at 1pm (Figure 3). The traffic also flattened throughout the day and evening time from 10am to 10pm local. Most of the increase in daytime usage was, not surprisingly, driven by specific applications and protocols supporting virtual private network (VPN), VoIP, and video teleconferencing.
Figure 3 – Upstream Hourly Consumption Shift (Source: Comcast Capacity Management)
4. Solutions The good news is, as part of an overall capacity engineering and management program, a combination of proactive and reactive measures can successfully mitigate and resolve the impacts of a rapid increase in network traffic due to an event like COVID-19, in a fiscally responsible manner. Proactive measures include predictive traffic forecasting, capacity planning, and proactive capacity deployment. Reactive measures include new and modified reporting, re-prioritization, and accelerated solution development/deployments.
Arguably, proactive capacity management efforts, and particularly those related to predictive forecasting and planning, set the foundation for all other efforts related to capacity management - whether during normal times or during events with extreme growth. According to Elad Nafshi, SVP of Next Generation Access Networks in Comcast, “proactive capacity management was the key to Comcast’s access network not only surviving but thriving during the COVID-19 event in the spring of 2020.” Having proactive plans already in place (and, in some cases, already in motion) made it much easier to enable reactive efforts like accelerating work and re-prioritizing focus. By the early summer, most highly utilized CMTS SGs from the spring were either resolved or had firm completion dates planned, near-term.
© 2020 SCTE•ISBE and NCTA. All rights reserved. 7
4.1 Proactive Capacity Planning Detailed traffic forecasting at the hub site level can be used to proactively build capacity with a fairly high degree of accuracy. The behavior of traffic growth varies significantly between different geographies and demographics. Understanding these variations at a granular level is key to being able to accurately predict growth and even acceleration of growth due to an event like COVID-19. This is not to say that traffic forecasts related to specific one-time events can be predicted, but rather that the propensity of a site to be affected by a major event can be better understood. Higher growth sites, for instance, will likely react the most dramatically to specific events that drive sudden increases in traffic.
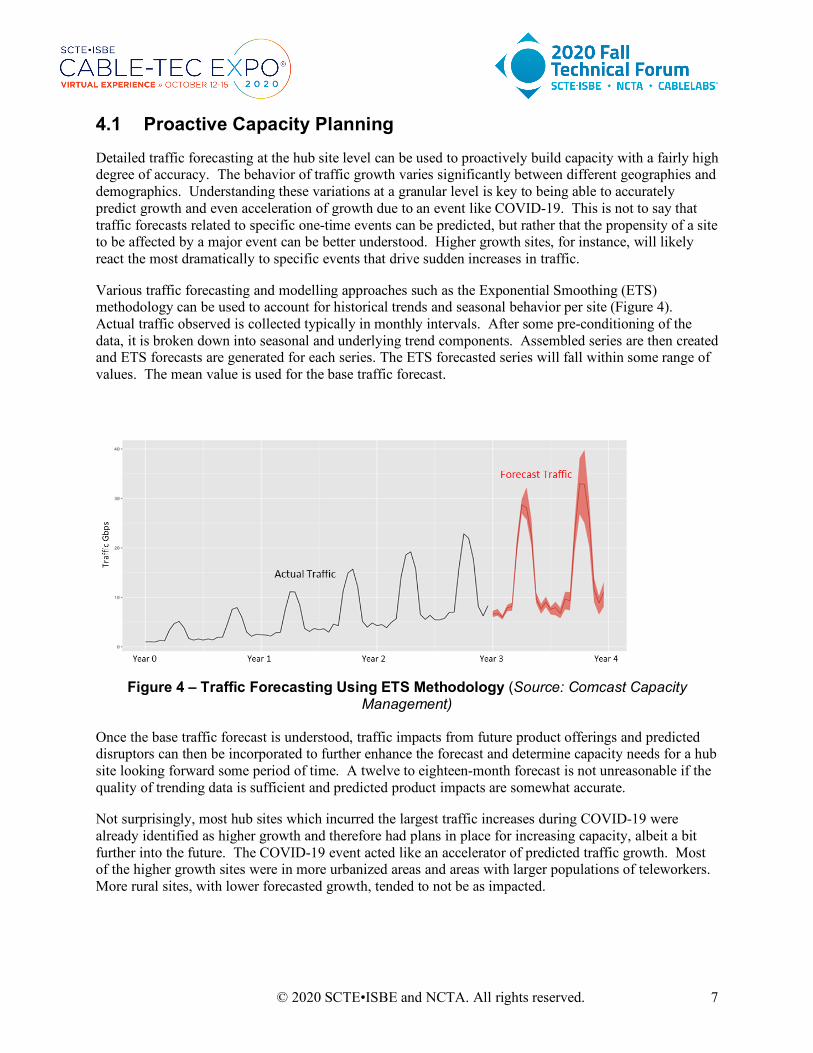
Various traffic forecasting and modelling approaches such as the Exponential Smoothing (ETS) methodology can be used to account for historical trends and seasonal behavior per site (Figure 4). Actual traffic observed is collected typically in monthly intervals. After some pre-conditioning of the data, it is broken down into seasonal and underlying trend components. Assembled series are then created and ETS forecasts are generated for each series. The ETS forecasted series will fall within some range of values. The mean value is used for the base traffic forecast.
Figure 4 – Traffic Forecasting Using ETS Methodology (Source: Comcast Capacity
Management)
Once the base traffic forecast is understood, traffic impacts from future product offerings and predicted disruptors can then be incorporated to further enhance the forecast and determine capacity needs for a hub site looking forward some period of time. A twelve to eighteen-month forecast is not unreasonable if the quality of trending data is sufficient and predicted product impacts are somewhat accurate.
Not surprisingly, most hub sites which incurred the largest traffic increases during COVID-19 were already identified as higher growth and therefore had plans in place for increasing capacity, albeit a bit further into the future. The COVID-19 event acted like an accelerator of predicted traffic growth. Most of the higher growth sites were in more urbanized areas and areas with larger populations of teleworkers. More rural sites, with lower forecasted growth, tended to not be as impacted.
© 2020 SCTE•ISBE and NCTA. All rights reserved. 8
The proactive deployment of capacity is a preventive measure that can be used to mitigate the effects of a rapid and significant increase in network traffic. It is most effective when used in conjunction with a predictive hub site forecast.
One fairly common aspect of a proactive capacity deployment program is the use of utilization thresholds. Utilization thresholds are used to initiate capacity work before a CMTS SG becomes highly utilized. If set appropriately, this threshold would allow enough time to complete the required capacity work and provide ample headroom to account for unforeseen circumstances, such as work delays or a sudden spike in traffic growth. A more sophisticated use of utilization thresholds involves leveraging a hub site’s traffic forecast to inform growth trajectories. Higher growth sites likely need to set a lower utilization threshold for capacity deployment. Thresholds could be intelligently set per hub site based on the predicted growth rate.
Proactive capacity deployment also considers the implementation of capacity solutions which provide some minimum time horizon before having to be addressed again. This varies depending on hub site growth rates. To meet a certain desired time horizon, higher growth sites require a more aggressive capacity solution. For example, a CMTS SG may breach 85% utilization and get resolved with a basic node segmentation. If the annualized growth rate of the CMTS SG is roughly 25%, it will return to the 85% utilization level again within approximately three years. If the desire is to have a longer time horizon for this CMTS SG, then a more aggressive capacity solution would be required.
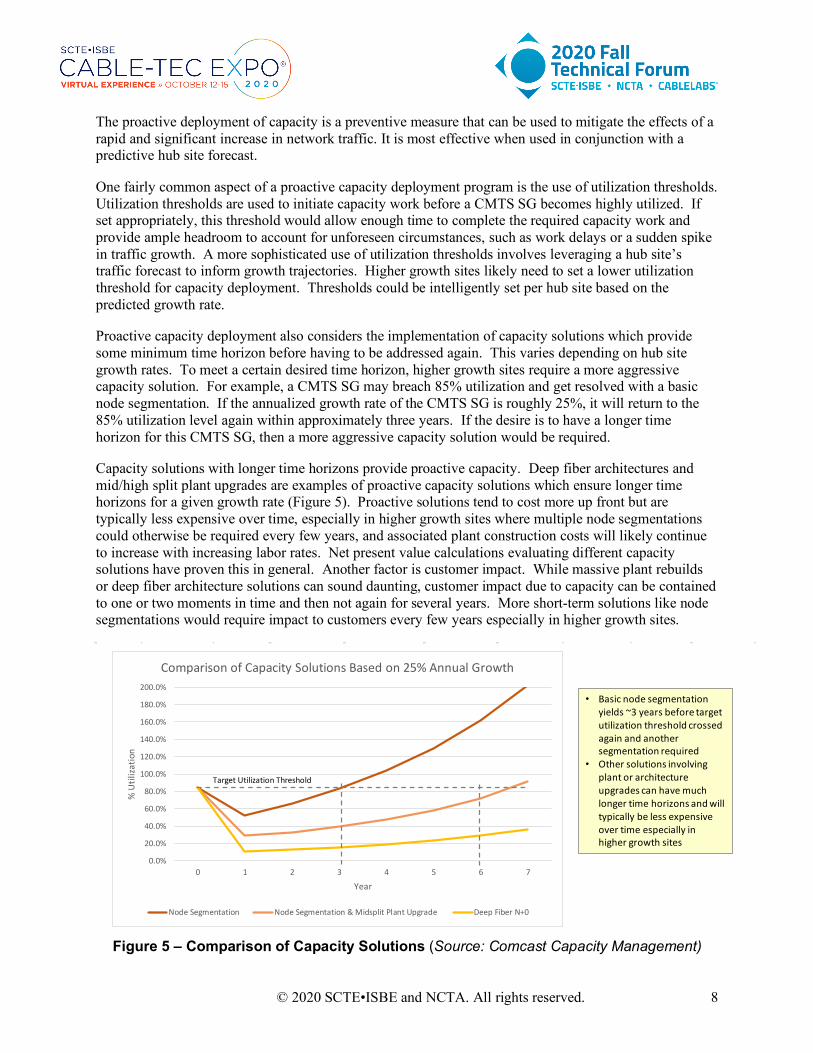
Capacity solutions with longer time horizons provide proactive capacity. Deep fiber architectures and mid/high split plant upgrades are examples of proactive capacity solutions which ensure longer time horizons for a given growth rate (Figure 5). Proactive solutions tend to cost more up front but are typically less expensive over time, especially in higher growth sites where multiple node segmentations could otherwise be required every few years, and associated plant construction costs will likely continue to increase with increasing labor rates. Net present value calculations evaluating different capacity solutions have proven this in general. Another factor is customer impact. While massive plant rebuilds or deep fiber architecture solutions can sound daunting, customer impact due to capacity can be contained to one or two moments in time and then not again for several years. More short-term solutions like node segmentations would require impact to customers every few years especially in higher growth sites.
Figure 5 – Comparison of Capacity Solutions (Source: Comcast Capacity Management)
0.0%
20.0%
40.0%
60.0%
80.0%
100.0%
120.0%
140.0%
160.0%
180.0%
200.0%
0 1 2 3 4 5 6 7
% U
tiliz
atio
n
Year
Comparison of Capacity Solutions Based on 25% Annual Growth
Node Segmentation Node Segmentation & Midsplit Plant Upgrade Deep Fiber N+0
Target Utilization Threshold
• Basic node segmentation yields ~3 years before target utilization threshold crossed again and another segmentation required
• Other solutions involving plant or architecture upgrades can have much longer time horizons and will typically be less expensive over time especially in higher growth sites
© 2020 SCTE•ISBE and NCTA. All rights reserved. 9
Hub sites built with deep fiber architectures were found to be very resilient to the rapid increases in traffic during COVID-19. Especially where N+0 amplifier cascades are implemented, node sizes for deep fiber architectures tend to be relatively small. This enables less subscribers to share the same or more capacity available on a normal node resulting in lower utilization. The percent of increase in traffic on deep fiber nodes was still relatively significant, but the impact to utilization was generally not a concern given the low utilization prior to the increase. For example, a 50% utilized node that incurred a 30% increase in traffic became 65% utilized - far below the 85% thresold of being considered highly utilized. By constrast, a 70% node that incurred the same 30% increase in traffic became 91% utilized - above the 85% threshold befor being considered highly utilized. Of course, deep fiber nodes will continue to grow naturually with growth in traffic over time and will eventually need to be addressed, but that time horizon is many years down the road.
4.2 New and Modified Reporting A successful capacity management program is not only proactive by nature but also very adaptable to sudden change. Adaption is largely supported by exposing the right metrics and data in order to focus and prioritize capacity work efforts in the most productive ways possible. Specialized reporting and dashboards can be very helpful to this end and do not have to be overly sophisticated. Data is the foundation, and how it is manipulated and used to tell a clear and compelling story is the key. Ideally, there are already reports and dashboards in place to help manage capacity, which can be modified during events like COVID to help adapt activities as needed.
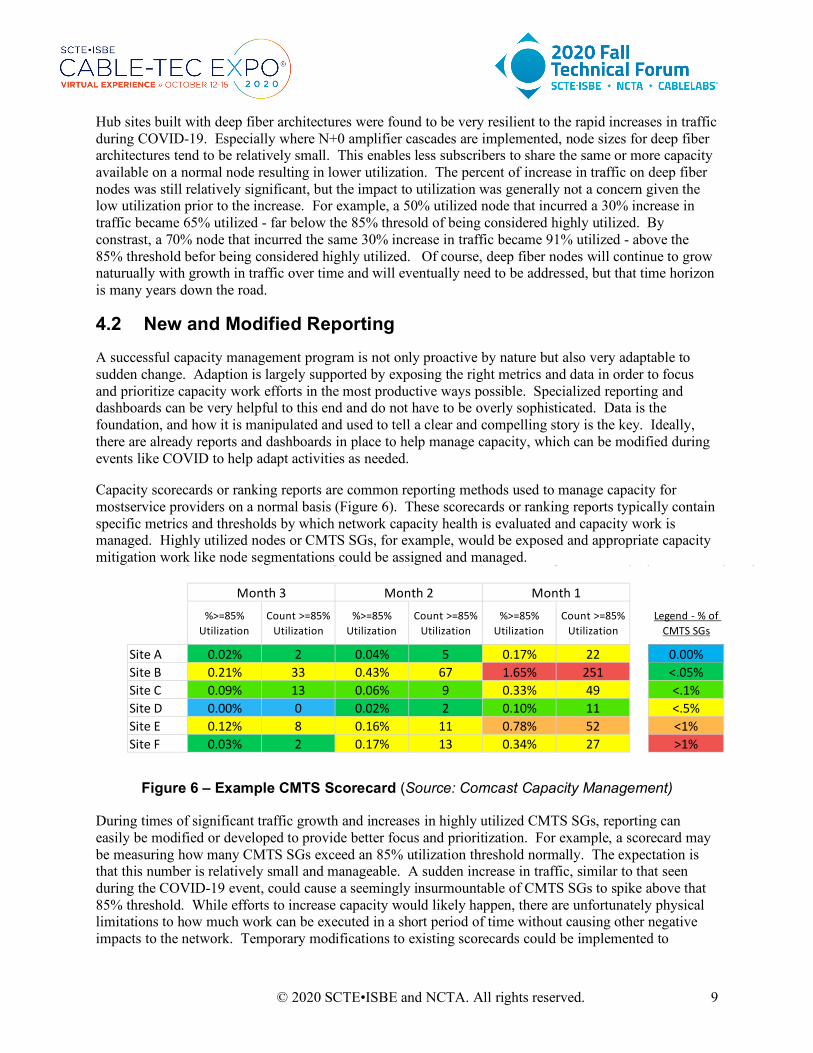
Capacity scorecards or ranking reports are common reporting methods used to manage capacity for mostservice providers on a normal basis (Figure 6). These scorecards or ranking reports typically contain specific metrics and thresholds by which network capacity health is evaluated and capacity work is managed. Highly utilized nodes or CMTS SGs, for example, would be exposed and appropriate capacity mitigation work like node segmentations could be assigned and managed.
Figure 6 – Example CMTS Scorecard (Source: Comcast Capacity Management)
During times of significant traffic growth and increases in highly utilized CMTS SGs, reporting can easily be modified or developed to provide better focus and prioritization. For example, a scorecard may be measuring how many CMTS SGs exceed an 85% utilization threshold normally. The expectation is that this number is relatively small and manageable. A sudden increase in traffic, similar to that seen during the COVID-19 event, could cause a seemingly insurmountable of CMTS SGs to spike above that 85% threshold. While efforts to increase capacity would likely happen, there are unfortunately physical limitations to how much work can be executed in a short period of time without causing other negative impacts to the network. Temporary modifications to existing scorecards could be implemented to
%>=85% Utilization
Count >=85% Utilization
%>=85% Utilization
Count >=85% Utilization
%>=85% Utilization
Count >=85% Utilization
Legend - % of CMTS SGs
Site A 0.02% 2 0.04% 5 0.17% 22 0.00%Site B 0.21% 33 0.43% 67 1.65% 251 <.05%Site C 0.09% 13 0.06% 9 0.33% 49 <.1%Site D 0.00% 0 0.02% 2 0.10% 11 <.5%Site E 0.12% 8 0.16% 11 0.78% 52 <1%Site F 0.03% 2 0.17% 13 0.34% 27 >1%
Month 3 Month 2 Month 1
© 2020 SCTE•ISBE and NCTA. All rights reserved. 10
prioritize work efforts on all CMTS SGs exceeding 90% utilization, for example. Once the elements exceeding 90% are resolved, then focus can be placed back on those exceeding 85%. This approach was successfully adopted and implemented by Comcast to improve prioritization of work.
Other modifications to existing reporting could involve the frequency of data evaluation. Data may normally be evaluated on a weekly or even monthly cadence in the interest of removing any anomalies, such as temporary traffic spikes and CMTS SG utilization that could occur in a very specific timeframe, but subsequently decline back to pre-existing levels. Unfortunately, sudden and less temporary increases in traffic from events like COVID-19 would not be exposed initially using weekly or monthly data. Additionally, granular changes in traffic and utilization would not be known until well after the fact. A switch to more frequent reporting using daily, hourly, or even shorter time intervals is required to gain visibility to rapid increases in traffic and utilization and allow capacity management efforts to start mobilizing to the right areas faster. Furthermore, a daily review of the capacity data is warranted to ensure work teams are aligned and focused on the core priorities.
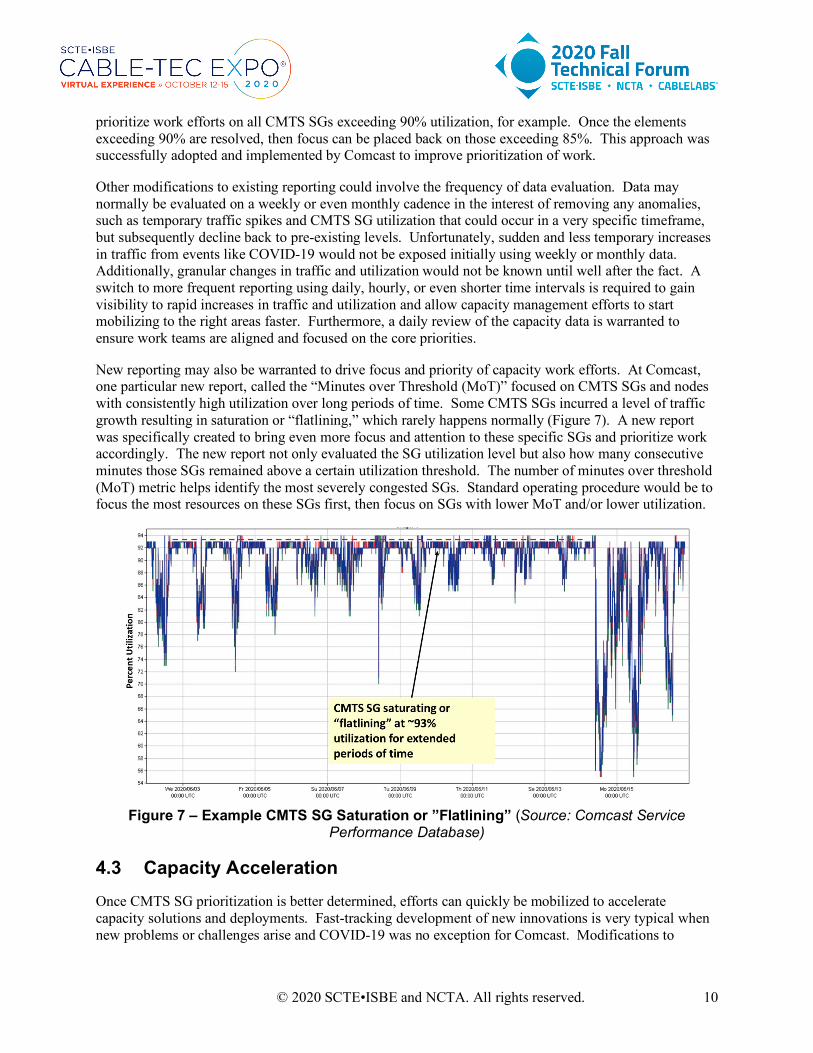
New reporting may also be warranted to drive focus and priority of capacity work efforts. At Comcast, one particular new report, called the “Minutes over Threshold (MoT)” focused on CMTS SGs and nodes with consistently high utilization over long periods of time. Some CMTS SGs incurred a level of traffic growth resulting in saturation or “flatlining,” which rarely happens normally (Figure 7). A new report was specifically created to bring even more focus and attention to these specific SGs and prioritize work accordingly. The new report not only evaluated the SG utilization level but also how many consecutive minutes those SGs remained above a certain utilization threshold. The number of minutes over threshold (MoT) metric helps identify the most severely congested SGs. Standard operating procedure would be to focus the most resources on these SGs first, then focus on SGs with lower MoT and/or lower utilization.
Figure 7 – Example CMTS SG Saturation or ”Flatlining” (Source: Comcast Service
Performance Database)
4.3 Capacity Acceleration Once CMTS SG prioritization is better determined, efforts can quickly be mobilized to accelerate capacity solutions and deployments. Fast-tracking development of new innovations is very typical when new problems or challenges arise and COVID-19 was no exception for Comcast. Modifications to
© 2020 SCTE•ISBE and NCTA. All rights reserved. 11
existing processes and tools, accelerated bulk purchasing of materials, and rapid deployment are some other areas where Comcast focused to quickly react to the rapid increase in traffic during the COVID-19 event.
To specifically address upstream capacity challenges caused by significant teleworking and remote schooling, Comcast became highly focused on building innovative solutions to provide more upstream capacity in a condensed development timeframe. Fast-tracking development of new innovations was an essential part of our strategy during COVID-19. Resources for development and testing of new solutions were quickly re-prioritized in order to maximize speed to market of new solutions needed to expand upstream capacity. These solutions involved adding upstream channels into already fairly limited spaces in the DOCSIS radio frequency (RF) return path spectrum and implementing PMA/Octave for improved efficiency of DOCSIS 3.0 upstream performance.
Upstream channel capacity is always a challenge for cable systems limited to a 5-42 MHZ DOCSIS RF return path. The typical 5-42 MHz DOCSIS return path is built with four contiguous channels at a 6.4 MHz channel-width and 64 QAM modulation roughly in the 14-40 MHz range. This is typically the maximum configuration utilized to date in most systems and enables approximately 123 Mbps of total upstream capacity. After removing all time and physical layer overhead, the usable MAC layer data rate is approximately 86 Mbps.
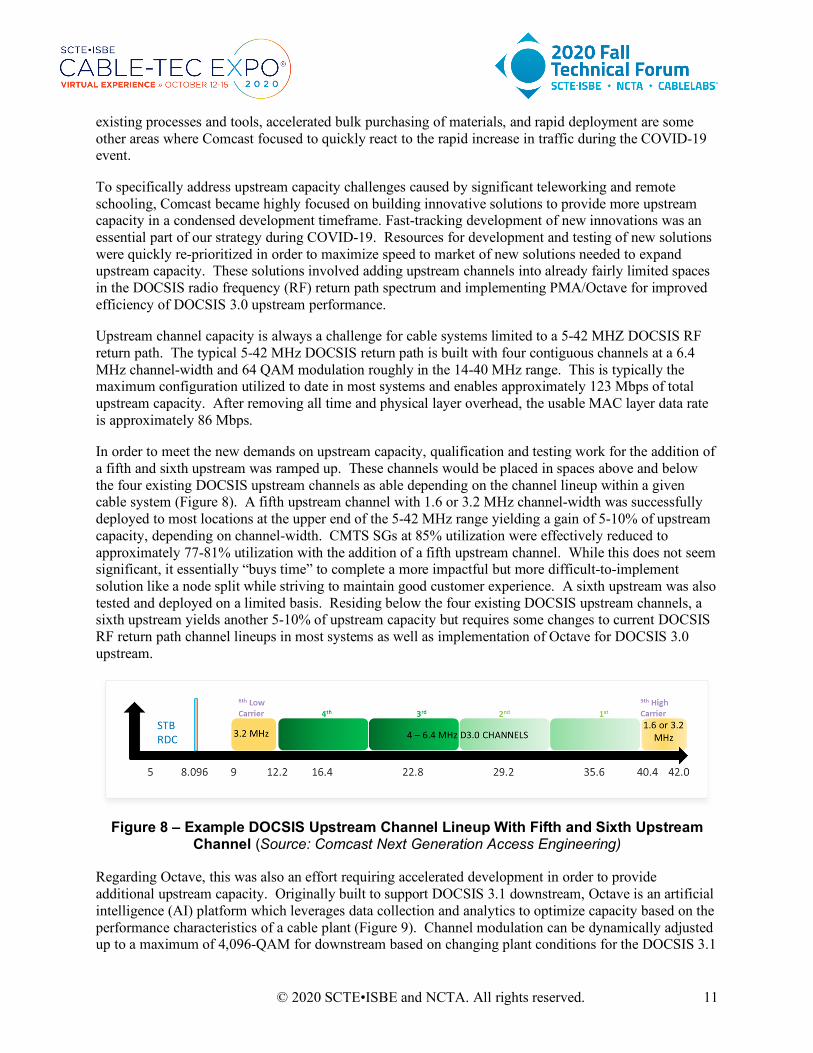
In order to meet the new demands on upstream capacity, qualification and testing work for the addition of a fifth and sixth upstream was ramped up. These channels would be placed in spaces above and below the four existing DOCSIS upstream channels as able depending on the channel lineup within a given cable system (Figure 8). A fifth upstream channel with 1.6 or 3.2 MHz channel-width was successfully deployed to most locations at the upper end of the 5-42 MHz range yielding a gain of 5-10% of upstream capacity, depending on channel-width. CMTS SGs at 85% utilization were effectively reduced to approximately 77-81% utilization with the addition of a fifth upstream channel. While this does not seem significant, it essentially “buys time” to complete a more impactful but more difficult-to-implement solution like a node split while striving to maintain good customer experience. A sixth upstream was also tested and deployed on a limited basis. Residing below the four existing DOCSIS upstream channels, a sixth upstream yields another 5-10% of upstream capacity but requires some changes to current DOCSIS RF return path channel lineups in most systems as well as implementation of Octave for DOCSIS 3.0 upstream.
Figure 8 – Example DOCSIS Upstream Channel Lineup With Fifth and Sixth Upstream
Channel (Source: Comcast Next Generation Access Engineering)
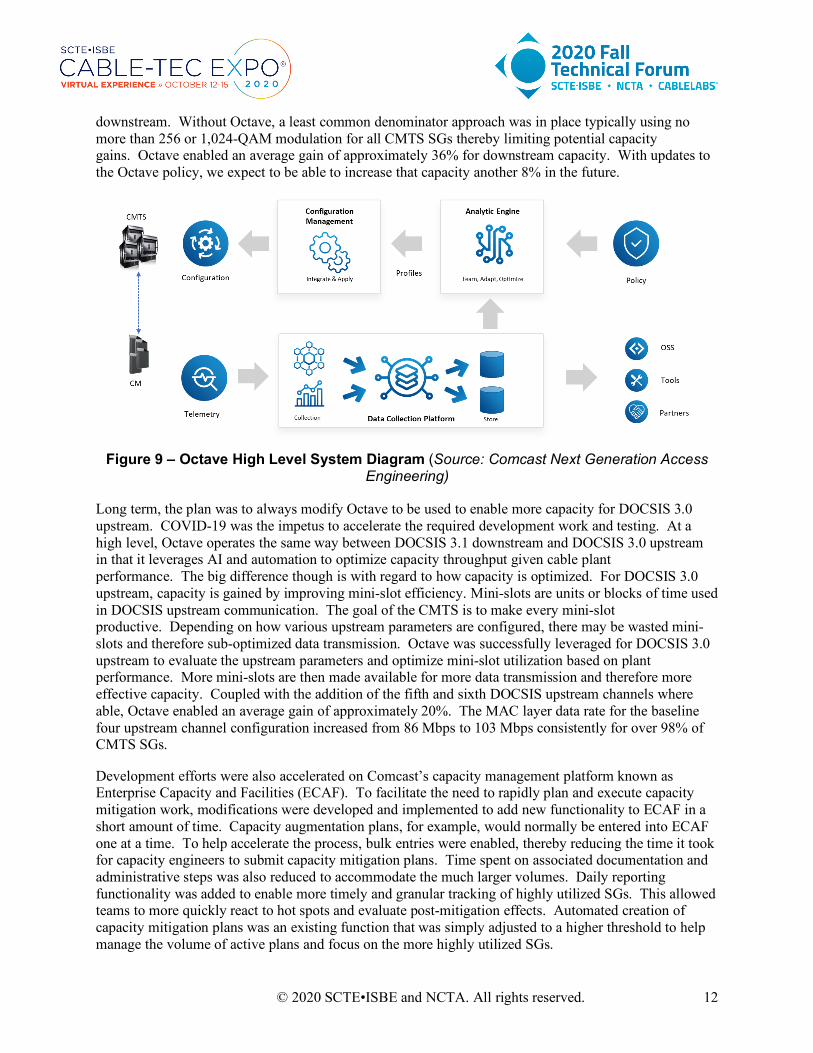
Regarding Octave, this was also an effort requiring accelerated development in order to provide additional upstream capacity. Originally built to support DOCSIS 3.1 downstream, Octave is an artificial intelligence (AI) platform which leverages data collection and analytics to optimize capacity based on the performance characteristics of a cable plant (Figure 9). Channel modulation can be dynamically adjusted up to a maximum of 4,096-QAM for downstream based on changing plant conditions for the DOCSIS 3.1
© 2020 SCTE•ISBE and NCTA. All rights reserved. 12
downstream. Without Octave, a least common denominator approach was in place typically using no more than 256 or 1,024-QAM modulation for all CMTS SGs thereby limiting potential capacity gains. Octave enabled an average gain of approximately 36% for downstream capacity. With updates to the Octave policy, we expect to be able to increase that capacity another 8% in the future.
Figure 9 – Octave High Level System Diagram (Source: Comcast Next Generation Access
Engineering)
Long term, the plan was to always modify Octave to be used to enable more capacity for DOCSIS 3.0 upstream. COVID-19 was the impetus to accelerate the required development work and testing. At a high level, Octave operates the same way between DOCSIS 3.1 downstream and DOCSIS 3.0 upstream in that it leverages AI and automation to optimize capacity throughput given cable plant performance. The big difference though is with regard to how capacity is optimized. For DOCSIS 3.0 upstream, capacity is gained by improving mini-slot efficiency. Mini-slots are units or blocks of time used in DOCSIS upstream communication. The goal of the CMTS is to make every mini-slot productive. Depending on how various upstream parameters are configured, there may be wasted mini-slots and therefore sub-optimized data transmission. Octave was successfully leveraged for DOCSIS 3.0 upstream to evaluate the upstream parameters and optimize mini-slot utilization based on plant performance. More mini-slots are then made available for more data transmission and therefore more effective capacity. Coupled with the addition of the fifth and sixth DOCSIS upstream channels where able, Octave enabled an average gain of approximately 20%. The MAC layer data rate for the baseline four upstream channel configuration increased from 86 Mbps to 103 Mbps consistently for over 98% of CMTS SGs.
Development efforts were also accelerated on Comcast’s capacity management platform known as Enterprise Capacity and Facilities (ECAF). To facilitate the need to rapidly plan and execute capacity mitigation work, modifications were developed and implemented to add new functionality to ECAF in a short amount of time. Capacity augmentation plans, for example, would normally be entered into ECAF one at a time. To help accelerate the process, bulk entries were enabled, thereby reducing the time it took for capacity engineers to submit capacity mitigation plans. Time spent on associated documentation and administrative steps was also reduced to accommodate the much larger volumes. Daily reporting functionality was added to enable more timely and granular tracking of highly utilized SGs. This allowed teams to more quickly react to hot spots and evaluate post-mitigation effects. Automated creation of capacity mitigation plans was an existing function that was simply adjusted to a higher threshold to help manage the volume of active plans and focus on the more highly utilized SGs.
© 2020 SCTE•ISBE and NCTA. All rights reserved. 13
Node split planning and implementation is a key element of most capacity management programs. Depending on the specific type of split required, there are opportunities to fast-track work when circumstances require it. More simple node decombines are low-cost and easy-to-execute with little labor required and little (if any) infrastructure work. Adding optics to existing segmentable node housings is another relatively low-cost effort with a reasonably low amount of labor that can be executed fairly quickly. Construction-based node splits are relatively high-cost and labor intensive and typically require more time. Nonetheless, resources can be shifted away from other priorities, like new plant builds and metro Ethernet fiber construction, for example, and focused strictly on construction-based node splits. Node split construction permit approvals can be fast-tracked with municipalities in the interest of supporting good services to communities. Comcast effectively leveraged most of these solutions to increase node split production by 100% from normal business as usual (BAU) levels during the COVID-19 event.
Like node splits, DOCSIS channel adds are also a key part of capacity management normally. This has typically been supported over time by implementing better compression on both broadcast and narrowcast video, and then migrating available spectrum to DOCSIS. Once spectrum is available, it is fairly easy to implement on the CMTS platforms at a reasonable cost. Unfortunately, there may not be a viable means to recover further spectrum to support DOCSIS capacity near term. There may be longer term dependencies, such as conversion of video from QAM to IP-delivery. For the upstream signal path specifically, there may not be an ability to activate more DOCSIS spectrum without a costly plant upgrade. Despite the challenges, DOCSIS channel adds can easily be fast-tracked when able to make a practically instant impact on capacity utilization. As mentioned previously, adding a fifth upstream adds approximately 5-10% of capacity depending on channel-width and modulation configuration. This effectively results in a reduction of utilization of ~4-9%. Adding eight 6 MHz downstream channels to an existing 32-channel SG reduces utilization by 18-23% on average.
Regardless of the type, most capacity work requires some amount of hardware and software investment. This is where solid communications and relationships with a company’s finance and procurement organizations come into play. Vendor relationships are also a crucial part of the overall supply chain. Normal planning should be in place to set internal budget forecasts and provide some degree of material forecasting and revenue planning for vendors. Rapid increases in node splits and DOCSIS channel additions drive the need for more hardware and DOCSIS licensing sooner. Capital was efficiently accelerated to support higher volumes of work needed. Vendors mobilized resources to support the higher demand even amidst challenging workplace restrictions. Not surprisingly, acceleration of hardware and software is most successful when a proactive site-level plan in is already in place. The effort is mostly a matter of accelerating existing plans and making slight adjustments where needed.
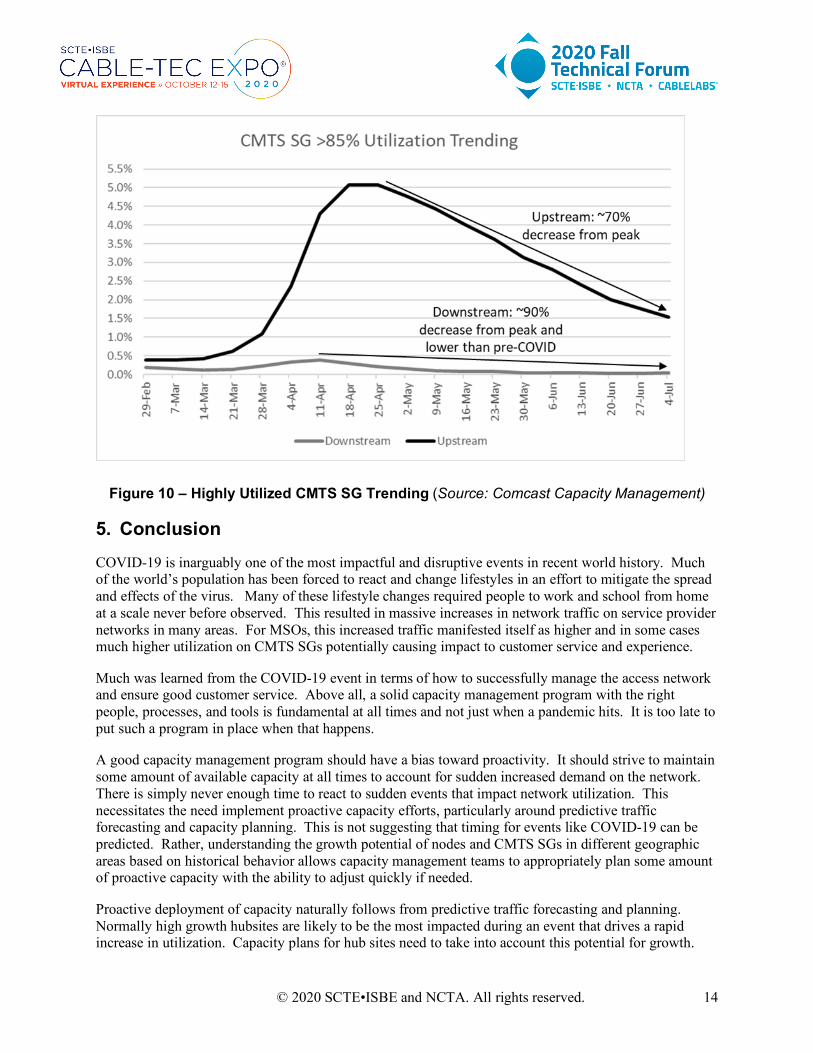
The numerous capacity solutions and efforts described here have proven successful in mitigating highly utilized CMTS SGs. From its peak in mid April, upstream SG utilization was reduced approximately 70% by early July. Likewise, downstream SG utilization was reduced approximately 90% by early July and lower than pre-COVID-19 levels tracked in February (Figure 10).
© 2020 SCTE•ISBE and NCTA. All rights reserved. 14
Figure 10 – Highly Utilized CMTS SG Trending (Source: Comcast Capacity Management)
5. Conclusion COVID-19 is inarguably one of the most impactful and disruptive events in recent world history. Much of the world’s population has been forced to react and change lifestyles in an effort to mitigate the spread and effects of the virus. Many of these lifestyle changes required people to work and school from home at a scale never before observed. This resulted in massive increases in network traffic on service provider networks in many areas. For MSOs, this increased traffic manifested itself as higher and in some cases much higher utilization on CMTS SGs potentially causing impact to customer service and experience.
Much was learned from the COVID-19 event in terms of how to successfully manage the access network and ensure good customer service. Above all, a solid capacity management program with the right people, processes, and tools is fundamental at all times and not just when a pandemic hits. It is too late to put such a program in place when that happens.
A good capacity management program should have a bias toward proactivity. It should strive to maintain some amount of available capacity at all times to account for sudden increased demand on the network. There is simply never enough time to react to sudden events that impact network utilization. This necessitates the need implement proactive capacity efforts, particularly around predictive traffic forecasting and capacity planning. This is not suggesting that timing for events like COVID-19 can be predicted. Rather, understanding the growth potential of nodes and CMTS SGs in different geographic areas based on historical behavior allows capacity management teams to appropriately plan some amount of proactive capacity with the ability to adjust quickly if needed.
Proactive deployment of capacity naturally follows from predictive traffic forecasting and planning. Normally high growth hubsites are likely to be the most impacted during an event that drives a rapid increase in utilization. Capacity plans for hub sites need to take into account this potential for growth.
© 2020 SCTE•ISBE and NCTA. All rights reserved. 15
More aggressive and proactive capacity solutions like deep fiber or plant upgrades should be deployed into sites with higher growth. Lower growth sites may be fine with less aggressive solutions. In most cases, proactively deployed capacity will be sufficient to handle extreme events that drive rapid increases in network utilization. In others, additional reactive measures may be required. Either way, there is no chance for success without proactive capacity in some form.
As an event unfolds driving significant network utilization growth, capacity management programs need to implement a variety of reactive measures building from a foundation people, processes, and tools that should already be in place. Reactive measures start with enhancements in reporting such as scorecards and dashboards to better identify problems and prioritize capacity mitigation work. Altogether new reports may need to be developed using existing or new data feeds. Development resources may need to be shifted to focus on building new functionality in reporting and tools.
Once impacts from suddent increases in network utilization are better understood leveraging enhanced reporting and data, efforts can be made to accelerate and prioritize capacity work. Fast-tracking development of new innovations such as Octave are effective ways to rapidly deploy additional upstream capacity especially to areas with high utilization without any additional hardware or physical work required. New functionality in capacity management platforms like ECAF enables higher velocity of capacity solution execution.
Acceleration of existing capacity plans like node splits and DOCSIS channel adds are extremely effective and generally easy to execute depending on the specifc circumstances for a given node, CMTS SG, or hub site. Node split volumes were doubled at Comcast as part of efforts to accelerate capacity. Additional or accelerated purchasing of hardware and software may be needed.
Solid partnership with finance, purchasing, and vendor teams is needed here. Rapid execution of physical work in support of capacity solutions requires commitment and dedication from construction, operations, and government affairs teams to name a few. Ultimately, victory in the battle against rapid growth in network utilization happens when all teams and organizations come together on the aligned goal to accelerate capacity,
Hopefully, we will not see another pandemic like COVID-19 for a very long time. But, the reality of the matter is that unforeseen events of varying magnitude and impact will always happen. That’s life. For those events that drive significent impact on service provider networks even if only on a limited scale, the lessons learned from the COVID-19 about capacity management will always be valuable and applicable.
© 2020 SCTE•ISBE and NCTA. All rights reserved. 16
Acknowledgements I would like to thank all of the Comcast capacity management, engineering, and operationsteams and partners for their hard work, effort, and relentless passion. Their perseverence was key to successfully managing capacity during extreme circumstances.
I would also like to ackowledge the great work done by Dan Rice, Vice President of Access Engineering at Comcast Cable, and the extended Octave team for their efforts in rapidly adjusting focus to develop and test new upstream capacity solutions for accelerated deployment in response to extreme network growth incurred after lock-downs imposed at onset of COVID-19 . Dan’s team enabled the accelerated deployment of fifth and sixth DOCSIS upstream channels in the 5-42 MHz DOCSIS return path. Additionally, Dan’s team was able to successfully modify and launch PMA/Octave for DOCSIS 3.0 upstream capacity optimization.
© 2020 SCTE•ISBE and NCTA. All rights reserved. 17
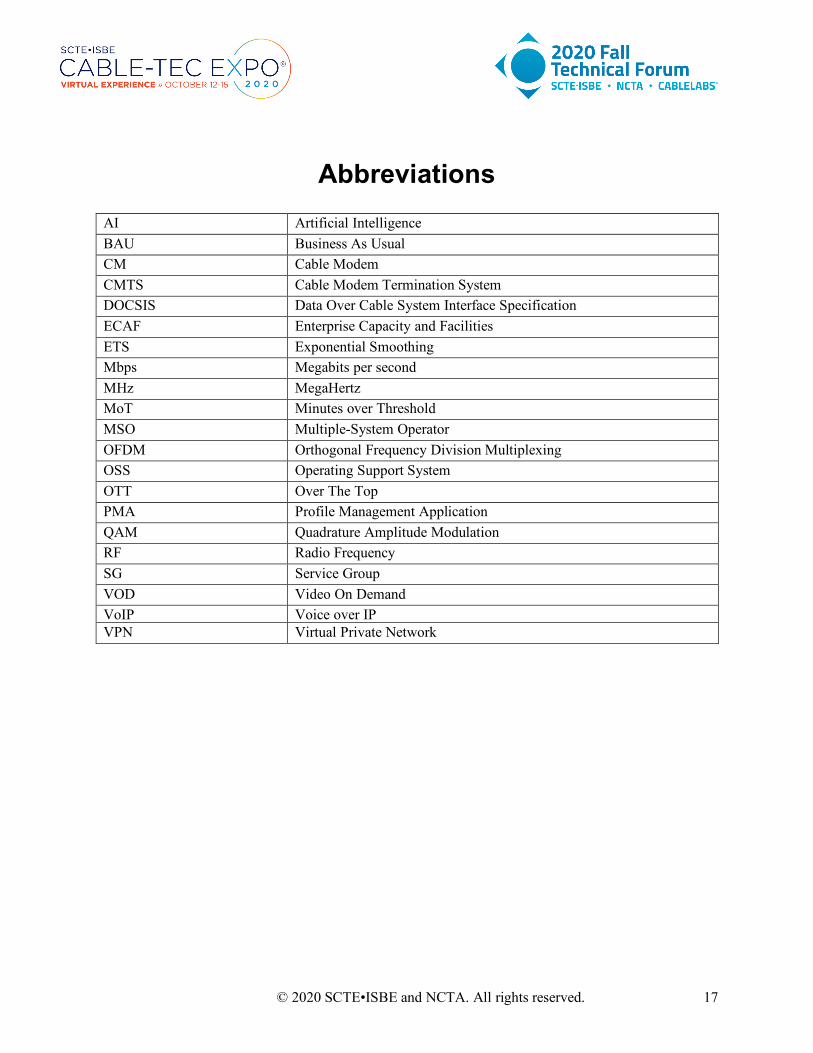
Abbreviations
AI Artificial Intelligence BAU Business As Usual CM Cable Modem CMTS Cable Modem Termination System DOCSIS Data Over Cable System Interface Specification ECAF Enterprise Capacity and Facilities ETS Exponential Smoothing Mbps Megabits per second MHz MegaHertz MoT Minutes over Threshold MSO Multiple-System Operator OFDM Orthogonal Frequency Division Multiplexing OSS Operating Support System OTT Over The Top PMA Profile Management Application QAM Quadrature Amplitude Modulation RF Radio Frequency SG Service Group VOD Video On Demand VoIP Voice over IP VPN Virtual Private Network


