Embed Size (px)
Citation preview
ACCESS TO HEALTH CARE FOR DISADVANTAGED INDIVIDUALS: A QUALITATIVE INQUIRY
Laurie Jean Goldsmith, MSc
A dissertation submitted to the faculty of the University of North Carolina at Chapel Hill in partial fulfillment of the requirements for the degree of Doctor of Philosophy in the
Department of Health Policy and Administration, School of Public Health
Chapel Hill 2007
Approved by: Thomas C. Ricketts, PhD (Advisor)
Donald Madison, MD R. Gary Rozier, DDS, MPH Felicia Mebane, PhD
Samuel Sheps, MD, MSc
brought to you by COREView metadata, citation and similar papers at core.ac.uk
provided by Carolina Digital Repository

ii
©2007 Laurie Jean Goldsmith
ALL RIGHTS RESERVED
iii
ABSTRACT
LAURIE JEAN GOLDSMITH: Access to Health Care for Disadvantaged Individuals: A Qualitative Inquiry (Under the direction of Thomas C. Ricketts, PhD)
Despite access to health care long being central in health services research and policy,
we still seek answers to fundamental questions. Access theory has also been criticized for
being unsuccessful at predicting and explaining health care use, for being inapplicable to
disadvantaged populations, and for treating access as a static phenomenon. I argue that we
need a better understanding of the mechanisms and context of access and must pay attention
to theory development.
I designed this study to address these criticisms and better understand access to care.
Using grounded theory, I examined the contextual and holistic nature of access by
conducting an inductive investigation of disadvantaged individual's experiences in four rural
communities. I conducted 42 individual and two-person in-depth, unstructured interviews on
getting and using health care. Individuals in this study consisted of persons most likely to
experience trouble using the health care system and to have the most need for care. The
communities used in this study illustrated a variety of approaches to and problems with rural
health care delivery in North Carolina and Ontario.
Participants' access narratives described dealing with and struggling with competing
needs and demands to achieve or maintain a state of balance in having their needs met.
Achieving and maintaining balance is part of a dynamic process with four stages in the
balance process: seeking balance, achieving balance, maintaining balance, and balance
iv
upsets. This continual process requires tradeoffs and adaptation as circumstances change.
Getting stuck or being unable to achieve balance results in adverse consequences for the
individual and the individual's relationship with the health care system. The balance process
operates throughout an individual's life, reflecting careers with health needs and the health
care system.
This conceptualization of access as a balance process shares commonalities with
existing access theories as well as contributing new concepts including the iterative nature of
access and the importance of personal interactions and community context. Conceptualizing
access as a staged process of achieving balance also provides multiple distinct policy
intervention opportunities.

v
To those who shared their stories
vi
ACKNOWLEDGEMENTS Relationships matter. The importance of relationships proved to be a key theme in
this dissertation, both in the study contained in these pages and in the completion of the
dissertation itself. I consider myself extremely fortunate to have been supported in this
journey by so many individuals.
Most importantly, this work would not have possible without the generous
participation of the 45 individuals who shared their personal experiences of getting and using
health care and the many community leaders who helped me to understand each community
and provided recruiting assistance. Thank you for entrusting me with your stories; I hope I
have done justice to your experiences.
I would also have not been able to complete this project without the assistance of
Tom Ricketts, my advisor and chair of my doctoral committee. More than once, Tom
understood my project and my goals in ways that no one else had, energizing me to continue
to struggle with making this project live up to its potential. Tom's impressive grasp of
multiple disciplines and the history of health services research was especially valuable. Tom
also helped in many practical ways. His numerous rural health contacts aided immensely in
my entering the field; his name literally opened doors and facilitated meetings. He let me
stay at his house in Oriental while collecting data in Bayboro, North Carolina, provided me
with some research funds and enthusiastically supported other funding applications. Tom
also schooled me in health services research though employment in the North Carolina Rural
Health Program. I was fortunate to learn about rural health as part of a team that provided
vii
community service through research, a dynamic that I will always associate with Tom.
Thank you, Tom, for your profound influence in my development as a scholar.
Sam Sheps served as the Canadian expert on my dissertation committee. Sam has
been an significant supporter and cheerleader ever since we met through another Canadian in
Chapel Hill (I owe you, Mark Daniel, for introducing Sam and I.) Sam was always willing to
talk about my work and was extremely helpful as I labored through the difficult bits. He did
not hesitate to tell me when something was not working and was quick to praise when the
pieces had fallen into place. I look forward to many more years, Sam, of having you as my
mentor, colleague and friend.
Gary Rozier and Don Madison also provided helpful suggestions for this dissertation.
Both of them made me think about my project in different ways that served to make this
work more complete than I would have done on my own. Felicia Mebane also provided
important encouragement and support at a key time. Margarete Sandelowski provided
exceptional advice for some vexing and difficult methodological bits. Her impressive and
thoughtful publications about qualitative methods were also invaluable, as evidenced by the
numerous times I cite her in this work.
A number of other individuals provided assistance with my data collection. Evie
Schmidt, the director of the Lincoln Community Health Center in Durham, North Carolina,
was generous with her time and thoughts. Tim Carey allowed me to observe one of his
medical clinics at the Interfaith Council Community House and facilitated my observation
activities at the urgent care clinic at the University of North Carolina Hospital Thanks as
well to the patients and doctors who allowed me to observe their interactions at both places.
Glenn Wilson provided me with a contact person in Blind River and the staff at the Lakeview
viii
Inn in Blind River provided other helpful suggestions for contact persons. Nancy Fitch, Lori
Fitch, Luis Jose and Dave Ryan shared their home in Marathon, Ontario. Claudia Sanmartin
and Brenda Wannell at Statistics Canada and Bryan Ferguson and John Anacleto at Applied
Management helped me find the most appropriate data for part of my description of the
health care systems in Ontario.
This work was funded through a variety of mechanisms. Research funding and salary
support was provided by a health services research dissertation grant from the Agency for
Healthcare Research and Quality (1 R03 HSO13592-01); the North Carolina Rural Health
Research Program, Cecil G. Sheps Center for Health Services Research, University of North
Carolina at Chapel Hill; an Overseas Travel Grant from the Department of Health Policy and
Administration, University of North Carolina at Chapel Hill; the Centre for Health
Economics and Policy Analysis, McMaster University; and Ron and Colleen Evans. Sandy
Tilden, Deborah Billings and Trisha Tant provided helpful grant support.
More generally, a number of individuals supported my development as a student, a
researcher, and a person. I was extremely lucky to have Jessica Lee, Courtney Harold van
Houtven, Wayne Andersen, and Lauren McCormack as classmates and friends. Liz Fournier
and Swan Kim made for an invaluable dissertation group at a key time. Kathy Brodsky,
Mary McKinney, Gina Hiatt, and Linda Stull lent their coaching expertise to this endeavor,
sharing a multitude of work and life strategies that sustained me and inspired me. My
writing group was also a priceless source of advice and inspiration. Thank you for your
wisdom Carol Chin, Prudence Plummer-D'Amato, Gina Hiatt, Colleen Lenihan, Rebecca
Schwartz-Bishir, Sophia Isako Wong, Ani Ross Grubb, Shirley Summers, T.G., Terri,
ix
Michelle Leavitt, and the others who remain anonymous. Extra thanks to Gina Hiatt for
organizing this group.
I was also extremely fortunate to meet Gillian Mulvale and Cindy Saunders during
the latter half of this dissertation. Both shared their passion for qualitative research and
participated in multiple discussions of this work. Susan Whittaker and Emmy Arnold shared
their experience with grounded theory at a crucial time.
My work was supported by the collegial environment and resources of the Cecil G.
Sheps Center for Health Services Research at the University of North Carolina at Chapel
Hill. Special thanks to those who went above and beyond in their support: Ruth Petersen,
Neil Thakur, Bob Konrad, Lynn Gunter, Priscilla Guild, and all of the members of the North
Carolina Rural Health Program.
My mentors, friends and colleagues at the Centre for Health Economics and Policy
Analysis at McMaster University encouraged me to undertake my PhD in the first place and
also invited me to return to CHEPA in the latter half of my dissertation. Mita Giacomini has
continued to be an invaluable mentor and friend and I am profoundly grateful. Thanks also
to Brian Hutchison, Jerry Hurley, Julia Abelson, Vicki Rynard, Lisa Dolovich, Deborah
Marshall, Donna Wilcockson, Deirdre DeJean, Terry Martens, Marilyn Swinton, Sonja
DePauw, Patricia Collins, Bill Furlong, and Gioia Buckley. Judy Brown, Lauren Griffith,
and Ann McKibbon all shared their own dissertation war stories whenever I ran into them in
the halls, helping me feel like I was on track. Thy Dihn and Rivka Birkan also provided
valuable research assistance during this time.
The goddesses—Teri Burgess, Kathryn Denning, Erika Liver, Nancy Fitch, Susan
Cooper, and Armanda Pinho—kept me sustained with good food, good conversation, and
x
much love. Special thanks to Teri for the check-in phone calls filled with unflagging
confidence in my ability and to Kate for demonstrating equanimity while finishing her own
dissertation and sharing the secrets. Toni Newman and Barbara Gregoire were other
extraordinary friends for this long journey. How could I be so lucky to have two of you that
were so good at saying the right thing at the right time?
My mother was diagnosed with Alzheimer’s Disease early in my doctoral degree.
Without the community of support that aided our family in caring for her, I would not have
been able to have the time and energy to push this project forward. The professional
caregivers that came into our home, took care of Mom at the day program, and continue to
care for Mom at the nursing home provided invaluable respite from our caregiving task.
Thank you to Bonnie, Pat, Jeannie, Sharon, Hildegaard and the rest of the staff at St. Joseph's
Villa day program, and the staff at St. Peter's at Chedoke long term care facility. Special
thanks to the many family friends that visited with and took care of Mom. There are far too
many of you to list, but you certainly know who you are and how special you are to our
family.
My sister, Ann Gomez, was an unwavering source of support. She found many ways
to remind me that I was doing important work. With the help of my brother-in-law, Enrique
Gomez, my wonderful nephew, Christopher Gomez, and my amazing niece Taylor Gomez,
Ann also ensured that my downtime was filled with joy and laughter.
My parents, Lorraine and Charlie Goldsmith, deserve an entire book of thanks. So
much of how I was raised came into play in this work. Thank you in particular for teaching
me to treat all people, regardless of their role or status, with generosity and kindness. This
philosophy has made me a better person and a better qualitative researcher. Thank you,
xi
Mom, for making it clear that I should continue my studies no matter what happened to your
health. I am pleased that I have been able to follow this advice, albeit slower than you likely
intended. Thank you, Dad, for the late night methods consultations, for always being willing
to share your vast academic experience, and for believing in me. Your air miles and financial
support also made the journey a lot easier.
And finally, special thanks to Brian Thomas, my best friend and life partner. Your
editing and thoughtful suggestions strengthened this project and your unconditional love,
faith, humor and insistence on dancing in the living room kept me going. Without you,
finishing this dissertation would have been much more difficult. I cannot imagine life
without you and am very glad to have you by my side and at the next desk.

xii
TABLE OF CONTENTS
LIST OF TABLES............................................................................................................... xviii
LIST OF FIGURES ............................................................................................................... xix
LIST OF ABBREVIATIONS................................................................................................ xxi
CHAPTER 1: INTRODUCTION............................................................................................. 1
CHAPTER 2: THE EVOLUTION OF THE EMPIRICAL STUDY OF ACCESS ................. 5
The Definition of Access ...................................................................................................... 7
The Measurement of Access............................................................................................... 14
What Do We Know About Access?.................................................................................... 15
Access and the Structure of the Health Care System...................................................... 15
Comparative Examination of Health Care Systems.................................................... 15
Health Insurance Design ............................................................................................. 19
Access and the Importance of Place ............................................................................... 22
Access and Individual Level Factors .............................................................................. 24
Usual Source of Care .................................................................................................. 24
Race and Ethnicity ...................................................................................................... 25
Who Is Likely To Have Trouble With Access?.............................................................. 27
What Do We Still Need To Know? .................................................................................... 28
CHAPTER 3: THE EVOLUTION OF ACCESS TO CARE THEORY................................ 30
The Andersen Behavioral Model ........................................................................................ 30
Phase 1: Initial Development and Testing ...................................................................... 33

xiii
The Original Behavioral Model: Andersen, 1968....................................................... 33
Revision #1: Andersen, Smedby & Anderson, 1970 .................................................. 39
Phase 2: Theoretical Refinement .................................................................................... 46
Revision #2: Andersen & Newman, 1973 .................................................................. 46
Revision #3: Aday & Andersen, 1974 ........................................................................ 51
Revision #4: Andersen, Marcus & Mahshigan, 1995 ................................................. 54
Revision #5: Andersen, 1995...................................................................................... 57
Revision #6: Andersen & Davidson, 2001 ................................................................. 60
Other Access Theories ........................................................................................................ 64
Component Parts Theories.............................................................................................. 64
Penchansky, 1977 ....................................................................................................... 64
Tanahasi, 1978 ............................................................................................................ 67
Multiple Influences Theories .......................................................................................... 69
Khan & Bhardwaj, 1994 ............................................................................................. 69
Institute of Medicine, 1993 ......................................................................................... 73
Gold, 1998................................................................................................................... 75
Gross, 1972 ................................................................................................................. 77
Access Theory Use: Citation Analysis ............................................................................... 79
Criticisms of Access Theory............................................................................................... 84
How Should We Be Studying Access To Care?................................................................. 88
CHAPTER 4: RESEARCH METHODS................................................................................ 91
Grounded Theory ................................................................................................................ 92
Study Sample ...................................................................................................................... 94
xiv
Communities ................................................................................................................... 94
Individual Participants .................................................................................................... 95
Sample Size................................................................................................................. 96
Data Collection ................................................................................................................... 97
Sensitizing Activities ...................................................................................................... 97
Gaining Entry.................................................................................................................. 99
Community Descriptions .............................................................................................. 101
Participant Recruitment ................................................................................................ 102
Individual Interviews .................................................................................................... 103
Self-as-Instrument......................................................................................................... 107
Reciprocity.................................................................................................................... 109
Ethics............................................................................................................................. 110
Analysis............................................................................................................................. 111
Open coding .................................................................................................................. 112
Axial Coding................................................................................................................. 113
Selective Coding ........................................................................................................... 114
Trustworthiness................................................................................................................. 116
Credibility ..................................................................................................................... 117
Rigorous Research Methods ..................................................................................... 117
Credibility of Researcher .......................................................................................... 121
Transferability............................................................................................................... 121
Dependability and Confirmability ................................................................................ 122

xv
CHAPTER 5: DESCRIPTIVE RESULTS ........................................................................... 123
On Data and Data Presentation ......................................................................................... 123
The Study Communities ................................................................................................... 125
Two Health Care Systems: North Carolina and Ontario .............................................. 125
North Carolina .......................................................................................................... 125
Ontario ...................................................................................................................... 128
The Four Communities ..................................................................................................... 131
Bayboro, North Carolina........................................................................................... 131
Pembroke, North Carolina ........................................................................................ 138
Blind River, Ontario.................................................................................................. 144
Marathon, Ontario..................................................................................................... 151
Context Matters: The Key Theme From the Communities ......................................... 158
Individual Participants ...................................................................................................... 159
Participant Characteristics ............................................................................................ 159
Relationships Matter: The Key Theme for Individuals ............................................... 166
The Good Doctor ...................................................................................................... 166
Being Known ............................................................................................................ 171
Summary ........................................................................................................................... 174
CHAPTER 6: THEORETICAL RESULTS: ACCESS AS A PROCESS OF ACHIEVING BALANCE .............................................................................................. 175
Access as a Balance Process ............................................................................................. 175
Being in Balance ........................................................................................................... 176
Being Out of Balance.................................................................................................... 178
The Balance Process ..................................................................................................... 179
xvi
Competing Demands................................................................................................. 180
Consequences of Not Achieving Balance................................................................. 182
Further Details on the Balance Process .................................................................... 183
Seeking Balance................................................................................................................ 183
Recognition of Health Need.......................................................................................... 184
Determination of Method of Need Resolution.............................................................. 185
Negotiating the Health Care System............................................................................. 187
Identifying A Usable Source of Health Care ............................................................ 188
Using Health Care..................................................................................................... 199
Achieving Balance Versus Getting Stuck......................................................................... 211
Individual Behaviors..................................................................................................... 212
Adapting.................................................................................................................... 213
Assistance From the Health Care System..................................................................... 214
Maintaining Balance ......................................................................................................... 215
Maintaining Balance Versus Balance Upsets ................................................................... 217
The Continuous Cycle Of Access As A Balance Process................................................. 218
CHAPTER 7: DISCUSSION................................................................................................ 221
Study limitations ............................................................................................................... 220
Comparing my access theory with other access theories.................................................. 221
The Andersen Behavioral Model .................................................................................. 221
Other Access Theories .................................................................................................. 223
Comparing My Empirical Results With Other Empirical work ....................................... 225
Directions for Future research .......................................................................................... 227
xvii
Policy Implications ........................................................................................................... 230
The Seeking Balance Process ....................................................................................... 231
The Maintaining Balance Process................................................................................. 232
Context Matters............................................................................................................. 233
Relationships Matter ..................................................................................................... 234
Listening to Users ......................................................................................................... 234
APPENDIX A: GENERIC LETTER TO COMMUNITY LEADERS ................................ 236
APPENDIX B: COMMUNITY CONTACTS INTERVIEW GUIDE ................................. 238
APPENDIX C: CONSENT FORM ...................................................................................... 241
APPENDIX D: DEMOGRAPHIC INFORMATION FORM .............................................. 245
APPENDIX E: CONFERENCES, MEETINGS, AND RESEARCH GROUPS WHERE I PRESENTED MY EMERGING THEORY........................................................ 248 APPENDIX F: COMMUNITY LEADERS, NEWSPAPERS AND OTHER DOCUMENTS CONSULTED FOR BACKGROUND INFORMATION ABOUT STUDY COMMUNITIES ..................................................................................... 249 REFERENCES ..................................................................................................................... 254
xviii
LIST OF TABLES
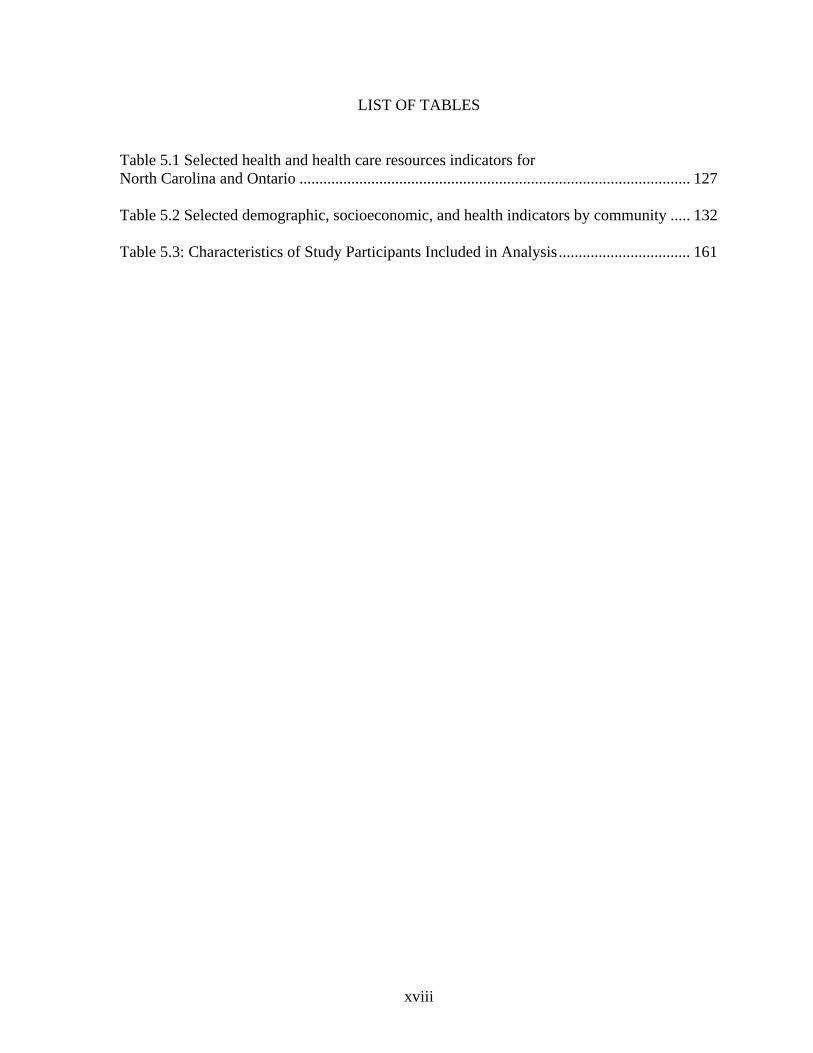
Table 5.1 Selected health and health care resources indicators for North Carolina and Ontario .................................................................................................. 127 Table 5.2 Selected demographic, socioeconomic, and health indicators by community ..... 132 Table 5.3: Characteristics of Study Participants Included in Analysis................................. 161
xix
LIST OF FIGURES
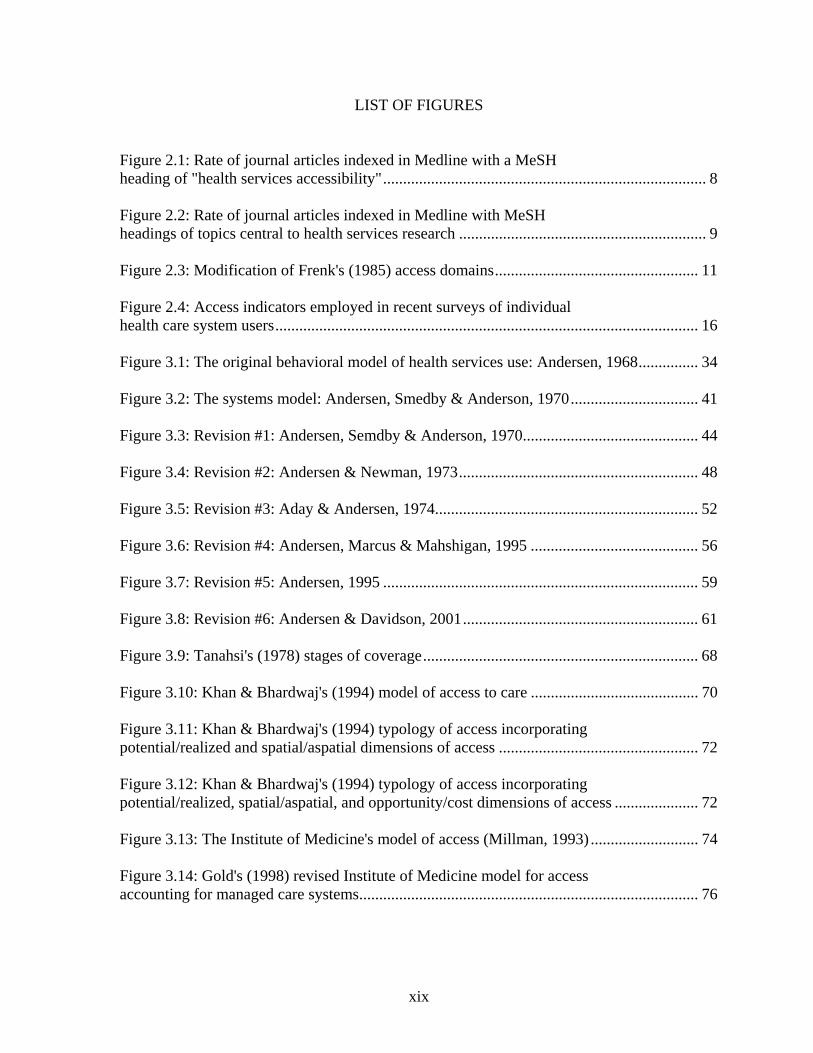
Figure 2.1: Rate of journal articles indexed in Medline with a MeSH heading of "health services accessibility"................................................................................. 8 Figure 2.2: Rate of journal articles indexed in Medline with MeSH headings of topics central to health services research .............................................................. 9 Figure 2.3: Modification of Frenk's (1985) access domains................................................... 11 Figure 2.4: Access indicators employed in recent surveys of individual health care system users.......................................................................................................... 16 Figure 3.1: The original behavioral model of health services use: Andersen, 1968............... 34 Figure 3.2: The systems model: Andersen, Smedby & Anderson, 1970................................ 41 Figure 3.3: Revision #1: Andersen, Semdby & Anderson, 1970............................................ 44 Figure 3.4: Revision #2: Andersen & Newman, 1973............................................................ 48 Figure 3.5: Revision #3: Aday & Andersen, 1974.................................................................. 52 Figure 3.6: Revision #4: Andersen, Marcus & Mahshigan, 1995 .......................................... 56 Figure 3.7: Revision #5: Andersen, 1995 ............................................................................... 59 Figure 3.8: Revision #6: Andersen & Davidson, 2001........................................................... 61 Figure 3.9: Tanahsi's (1978) stages of coverage..................................................................... 68 Figure 3.10: Khan & Bhardwaj's (1994) model of access to care .......................................... 70 Figure 3.11: Khan & Bhardwaj's (1994) typology of access incorporating potential/realized and spatial/aspatial dimensions of access .................................................. 72 Figure 3.12: Khan & Bhardwaj's (1994) typology of access incorporating potential/realized, spatial/aspatial, and opportunity/cost dimensions of access ..................... 72 Figure 3.13: The Institute of Medicine's model of access (Millman, 1993) ........................... 74 Figure 3.14: Gold's (1998) revised Institute of Medicine model for access accounting for managed care systems..................................................................................... 76
xx
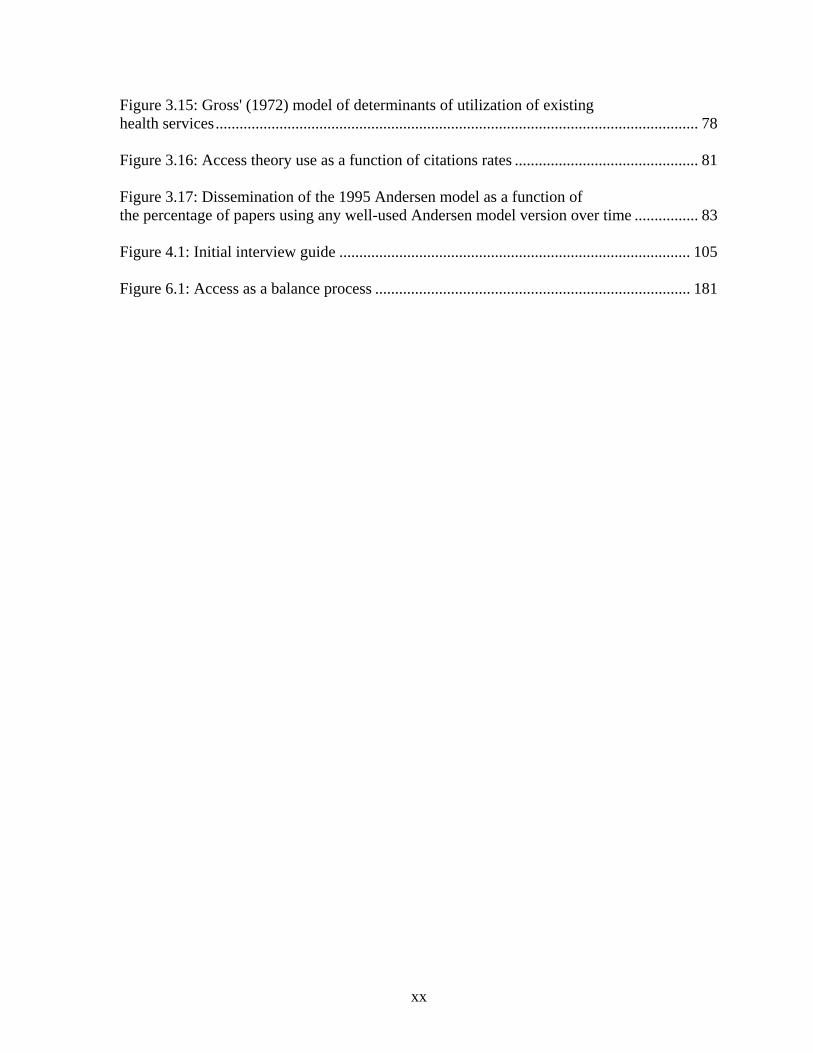
Figure 3.15: Gross' (1972) model of determinants of utilization of existing health services......................................................................................................................... 78 Figure 3.16: Access theory use as a function of citations rates .............................................. 81 Figure 3.17: Dissemination of the 1995 Andersen model as a function of the percentage of papers using any well-used Andersen model version over time ................ 83 Figure 4.1: Initial interview guide ........................................................................................ 105 Figure 6.1: Access as a balance process ............................................................................... 181
xxi
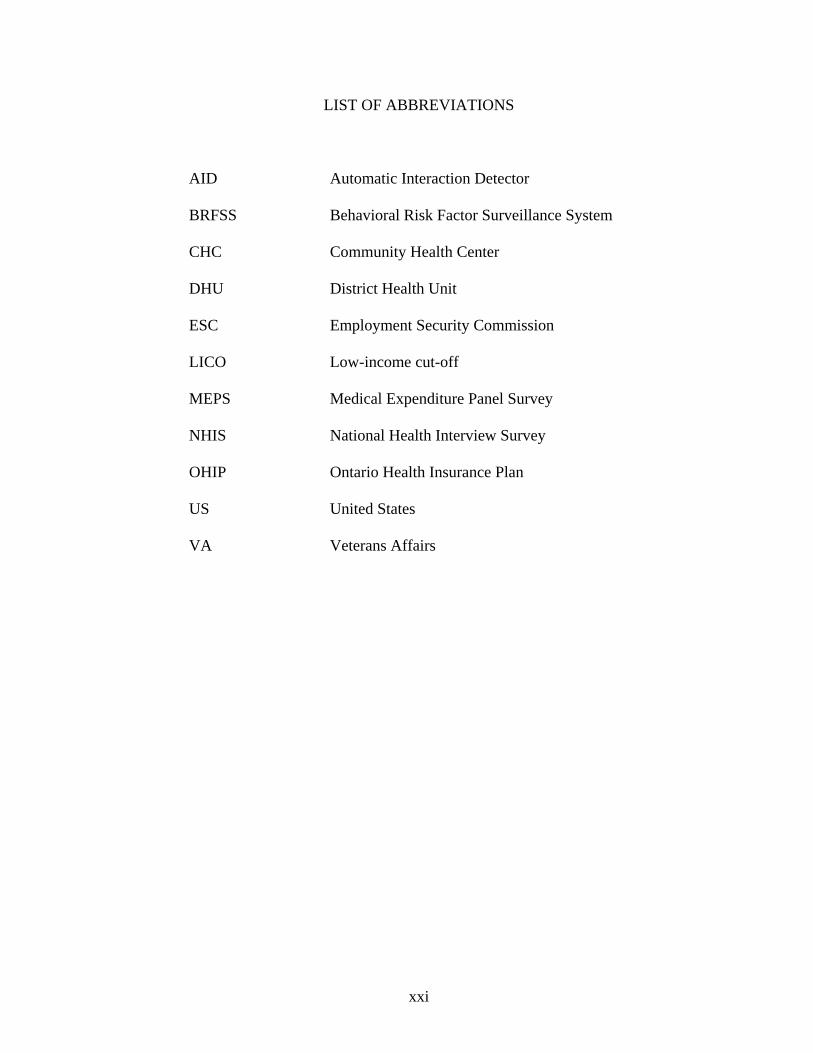
LIST OF ABBREVIATIONS
AID Automatic Interaction Detector
BRFSS Behavioral Risk Factor Surveillance System
CHC Community Health Center
DHU District Health Unit
ESC Employment Security Commission
LICO Low-income cut-off
MEPS Medical Expenditure Panel Survey
NHIS National Health Interview Survey
OHIP Ontario Health Insurance Plan
US United States
VA Veterans Affairs
CHAPTER 1: INTRODUCTION
Far better an approximate answer to the right question, than the exact answer to the wrong question, which can always be made precise.
- John Tukey, 1962, p. 13-14
Access to care has been a central research topic in health services research and public
health policy since the 1960's (Davis, 1991). Despite ever-increasing amounts of research
focusing on access to care, and sustained attention to access in health policies, the health
services research community and policy makers continue to seek answers to fundamental
questions. There remains great uncertainty about the relationship between access to care and
the design of health care systems and health policies. Research and policy questions of
ongoing interest include how to facilitate appropriate use and impede unnecessary use,
enhance quality, improve health outcomes and increase patient satisfaction.
For the most part, access to health care remains a black box. While we know much
about the dimensions of the box—such as the characteristics of individuals most likely to
experience problems accessing care—we do not know how the components of the box
influence each other. We do not clearly understand, for example, the interaction between an
individual's race or ethnicity and the health care that they receive. We cannot distinguish
between individuals facing multiple access barriers that persist in seeking and obtaining care
from individuals with the same barriers that do not seek or obtain care. This situation
persists because neither the empirical literature nor access theory is oriented to understand
the black box of access. Access to care research predominantly employs a hypothesis testing
2
approach. Deductive inquiry cannot penetrate the black box very easily as, by its very
nature, it cannot examine what has not been hypothesized. Deductive inquiry is also a
roundabout way of establishing the mechanisms of complicated processes. In short,
hypothesis testing is only as good as the established hypotheses. While existing access to
care theory has been used to guide some empirical work, much of the theory was not
inductively derived in the first place. It is reasonable to ask, therefore, whether we are
conceptualizing access appropriately and whether we are asking the right questions. Indeed,
existing access to care theory has been criticized for being unsuccessful at predicting health
care use and explaining too little variation in actual health services use, for encouraging a
fragmented understanding of access, for not being applicable to populations other than
"dominant-culture, middle-class populations" in the United States, for treating access as a
static phenomenon rather than one that shifts over time, for not incorporating individual
perceptions and beliefs, and for not incorporating the interaction between the health care
system and the individual. In short, more attention is needed to the context of access to care,
to the individual perspective, and to theory generation.
A variety of audiences are concerned with access to health care. Improved access to
care has and continues to be a "fundamental objective of health policy-making" across
developed countries (Organisation for Economic Co-Operation and Development, 2004, p.
10). United States Federal government agencies concerned with access include the Center
for Medicare and Medicaid Services ("access to quality care" is a program objective
including "eliminating health disparities") and the Health Resources and Services
Administration (with a mission of "to improve and expand access to quality health care for
all" and a goal of "moving toward 100 percent access to health care and 0 health disparities
3
for all Americans"). The Canada Health Act, with its explicit provision for accessibility, is
one of many government policy examples situated outside the United States. Access is a
central mandate for a variety of foundations and government granting agencies, including the
Robert Wood Johnson Foundation (with a goal "to assure that all Americans have access to
quality health care at reasonable cost"), the Commonwealth Fund ("The Fund's two national
program areas are improving health insurance coverage and access to care and improving the
quality of health care services"), the Kaiser Family Foundation (through the Kaiser
Commission on Medicaid and the Uninsured, focuses on "the impact of lack of insurance on
access to care and health status with a particular focus on the low-income population"), and
the Agency for Healthcare Research and Quality (with a strategic goal to "identify strategies
that improve access, foster appropriate use, and reduce unnecessary expenditure"). A better
understanding of access will help researchers, granting agencies, and policy makers improve
empirical investigation, health policy, and health care delivery.
The purpose of this study is to develop a better understanding of access to care. This
study was designed in direct response to the access theory criticisms described above. Using
grounded theory, I examined the contextual and holistic nature of access by conducting an
inductive, theory-generating investigation of access to care experiences from the individual's
point of view in four communities. Data were collected through individual and two-person
in-depth, unstructured interviews focusing on experiences of getting and using health care. I
considered access to be concerned with a broad continuum of concepts, including
contemplating care, care seeking, system entry, care receiving, and outcomes. Individuals
included in this study consisted of persons most likely to experience trouble using the health
care system and to have the most need for health care (referred to as "disadvantaged
4
individuals"). The four communities used in this study, while capitalizing on personal
contacts, were chosen to illustrate a variety of approaches to health care delivery. The
communities were selected from rural communities in North Carolina and Northern Ontario
to provide additional variation on access problems.
The context and design of this study was informed by existing access to care theory
and empirical literature. Accordingly, an overview of theory and empirical evidence are
provided in the next two chapters, along with the history of the study of access to care in
health services research. These topics are followed by a detailed description of this study's
methods and results. The final chapter discusses the implications of my access theory for
existing theoretical, empirical and policy work on access to care. The policy utility of this
study comes from the practical help it provides to those who wish to understand how to
provide better access to care when they design and manage programs. My research
participants made passionate claims about the need for a better understanding of their
realities, such as was expressed by one participant from North Carolina:
I'm thankful for [the health care] I do get, but I just think that some things could be done better. [The government] needs to search out things, and they need to do what you're doing. Talk to people. Find out what's going on. Find out what people think and see if there are ways they can help make this better. That's what I think. They need to really talk to people and get out, you know. Come to rural areas, come to areas like these, and find out what us little people have to say and how we feel the way things are going. Let it count for something. Don't just push it under the table or sweep it under the rug, let it count. Listen to what people say. We should be able to come up with something better, you know, to help this. [pause] And that's it!
To which I replied: "That's the introduction to my study, I think. Right there!"
CHAPTER 2: THE EVOLUTION OF
THE EMPIRICAL STUDY OF ACCESS
The empirical study of access to care has and continues to be a central topic, if not a
defining aspect, of health services research. Indeed, the study of access to health care has
been included in every definition of health services research since the emergence of the field
in the 1960s (see the review of health services research definitions by Lohr & Steinwachs,
2002).
The history of the study of access can be divided into four stages (this is heavily
borrowed from Pescosoldio & Kronenfeld's 1995 overview of medical sociology's study of
utilization). The first two stages predate the field of health services research. During the first
two stages, access was conceptualized as utilization. In the latter two stages, the study of
utilization shifted to the study of access along with the development of the field of health
services research and the emergence, refinement, and dominance of the Andersen Behavioral
Model of Health Services Use (Andersen, 1968b; reviewed in detail in the next chapter).1
Stage one lasted roughly from 1930 to 1955, reflecting the rise of the medical
profession. Utilization studies from this stage focused on the use of medical doctors in place
of traditional (non-medical) forms of health care. Sociologists were the main drivers of
research in this stage and the next (Pescosoldio & Kronenfeld, 1995).
1Pescosolido and Kronenfeld (1995) use "utilization" as the label for this topic area throughout their four stages.
6
Stage two occurred from the mid-1950s to the mid-1960s. This stage was
distinguished by the establishment of medicine as an institution and the development of
functionalist theory in sociology. Medical providers and patients were thought to have
specific roles reinforced by social structure, norms and expectations (e.g., Parsons' 1951
"sick role"). Utilization studies from this stage examined the use and non-use of medical
doctors (Pescosoldio & Kronenfeld, 1995).
Stage three lasted from the mid-1960s until 1980. The most influential access model,
Andersen's Behavioral Model of Health Services Use (Andersen, 1968b) was introduced,
revised and widely used during this stage. Rosenstock's Health Belief Model (Rosenstock,
1966) was also developed during this time, becoming a central theory in the field of health
behavior. The field of health services research was established, providing a home for cross-
disciplinary collaboration. Access and equity became central research and policy issues,
particularly against the backdrop of the introduction of Medicare and Medicaid. Quantitative
surveys and nationally representative samples became the dominant research strategies,
accompanied by increasing sophistication of quantitative methods, including multivariate
causal models (Pescosoldio & Kronenfeld, 1995).
Stage four, from 1980 to the present, has focused predominantly on cost and
outcomes of use (Pescosoldio & Kronenfeld, 1995). The shift in emphasis from system entry
and other process factors was influenced by the rise in managed care (Andersen, 1998).
Andersen's Behavioral Model of Health Services Use has continued to dominate during this
stage and has been used in ever more quantitatively sophisticated ways. Health economists
began to dominate health services research, marginalizing the influence of sociologists.
7
Access studies have focused on improvements in efficiency of outcomes and the relationship
between use as well as health status and use and satisfaction (Andersen, 1998).
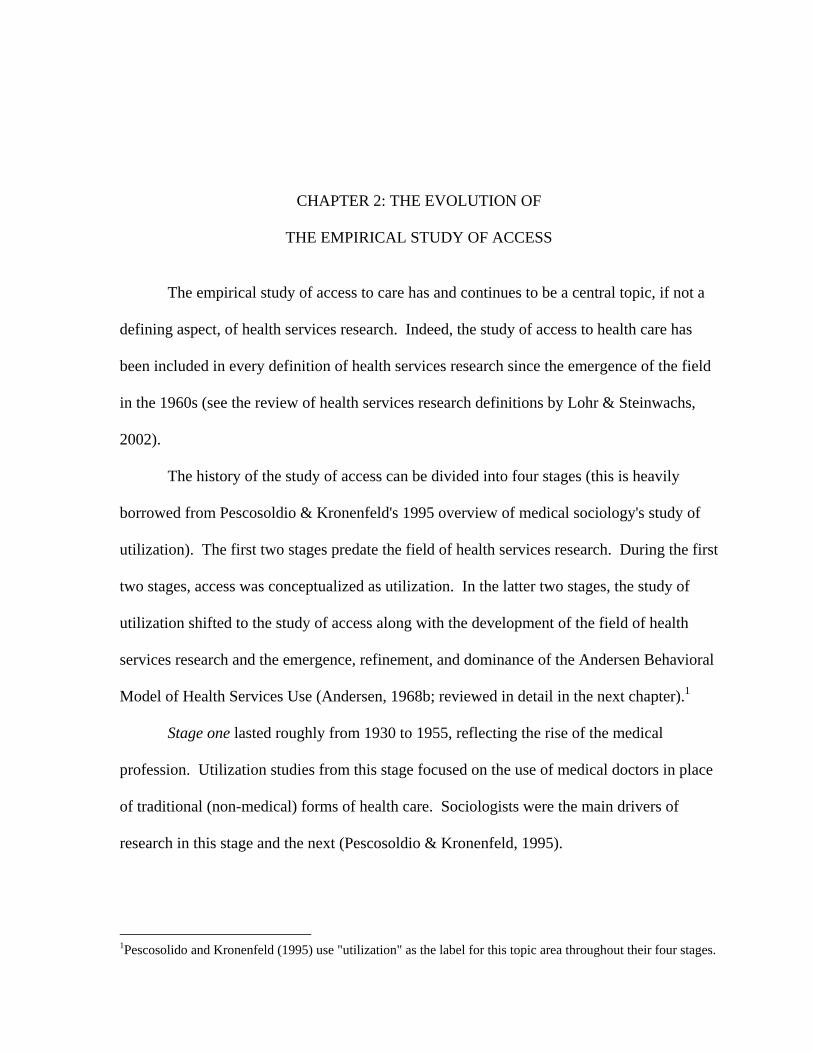
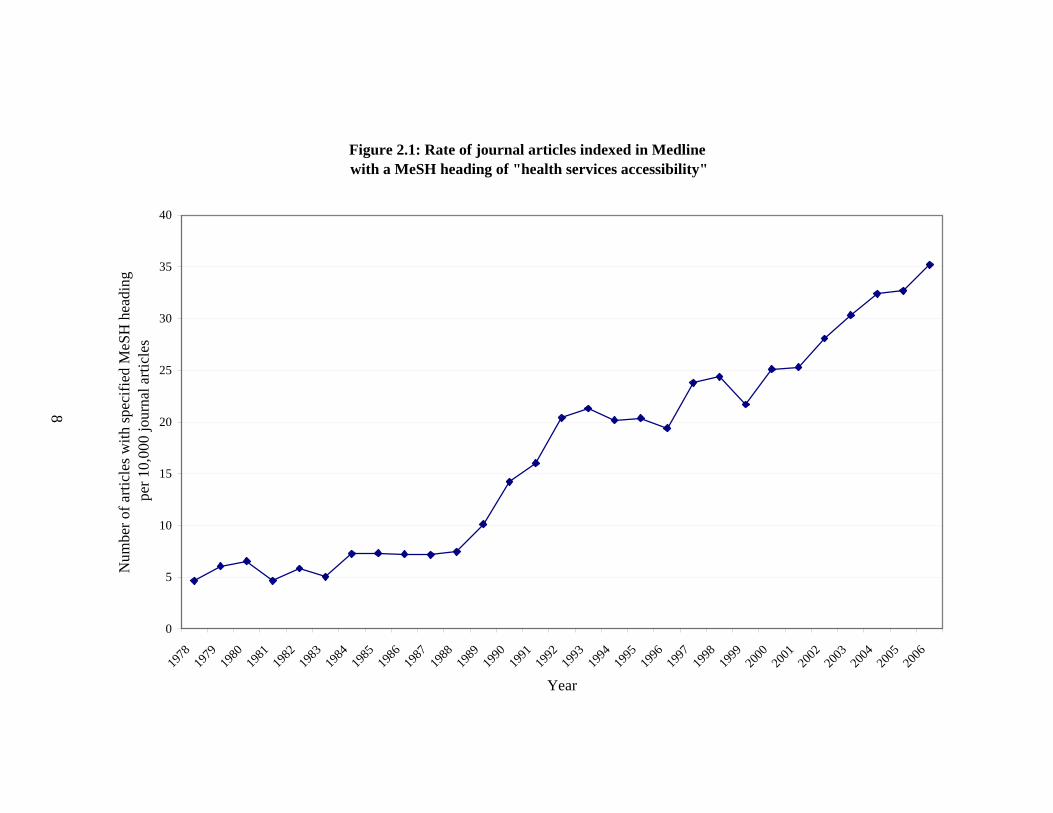
In addition to varying in emphasis, the study of access has increased over time. This
can be shown through tracking the articles indexed with a MeSH heading of health services
accessibility. The National Library of Medicine created this MeSH heading in 1978 (towards
the end of Pescosolido & Kronenfeld's third stage). Since then, the rate of journal articles
indexed in Medline with a MeSH heading of health services accessibility has increased
substantially, particularly since the 1990s (Figure 2.1).2 A second figure puts this rate in
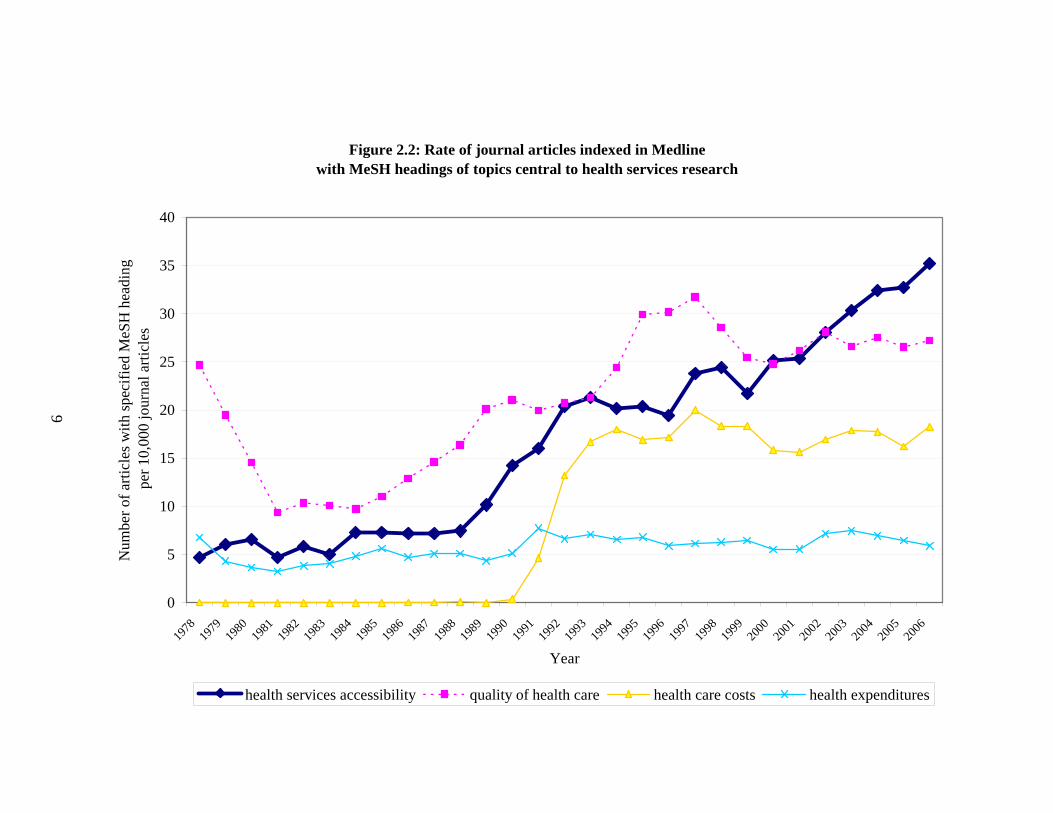
context. Figure 2.2 adds the similar rates for other MeSH headings corresponding to other
central health services research topics: quality of health care, health care costs, and health
expenditures. Health services accessibility (the darkest and thickest line in Figure 2.2) has
been second in the index rankings among the four topics for most of the last 26 years.
Quality of health care (the dashed line) has been first in the index rankings (in 4 cases,
virtually tied for first) until 2003, when health services accessibility surpassed quality of
health care. Health expenditures and health care costs (the latter was introduced as a MeSH
heading in 1992) have been last and third in index rankings among the four topics, with less
of an indexing increase over time than health services accessibility or quality of health care.
THE DEFINITION OF ACCESS
Despite widespread usage of access as a term, considerable variation in the meaning
and use of the concept exists. There is no one accepted definition of access in health services
research (Berk & Schur, 1998a; Bindman & Gold, 1998; Frenk, 1998; Gulzar, 1999;
2I conducted this search using Ovid Medline. The start date for this search was 1978, the year this MeSH heading was introduced, and the end date for the search was 2006. The publication type was limited to "journal articles." I last updated this search in March 2007.
8
Figure 2.1: Rate of journal articles indexed in Medline with a MeSH heading of "health services accessibility"
0
5
10
15
20
25
30
35
40
1978
1979
1980
1981
1982
1983
1984
1985
1986
1987
1988
1989
1990
1991
1992
1993
1994
1995
1996
1997
1998
1999
2000
2001
2002
2003
2004
2005
2006
Year
Num
ber o
f arti
cles
with
spec
ified
MeS
H h
eadi
ng p
er 1
0,00
0 jo
urna
l arti
cles
9
Figure 2.2: Rate of journal articles indexed in Medline with MeSH headings of topics central to health services research
0
5
10
15
20
25
30
35
40
1978
1979
1980
1981
1982
1983
1984
1985
1986
1987
1988
1989
1990
1991
1992
1993
1994
1995
1996
1997
1998
1999
2000
2001
2002
2003
2004
2005
2006
Year
Num
ber o
f arti
cles
with
spec
ified
MeS
H h
eadi
ng p
er 1
0,00
0 jo
urna
l arti
cles
health services accessibility quality of health care health care costs health expenditures
10
Penchansky, 1977; Pescosolido, 1992; Racher & Volman, 2002; Weissman & Epstein,
1993). While standard dictionary definitions limit access to the concept of entry (e.g.,
"freedom or ability to obtain or make use of something;" Merriam-Webster, 2003), many
health services researchers employ access as a broader concept than health care system
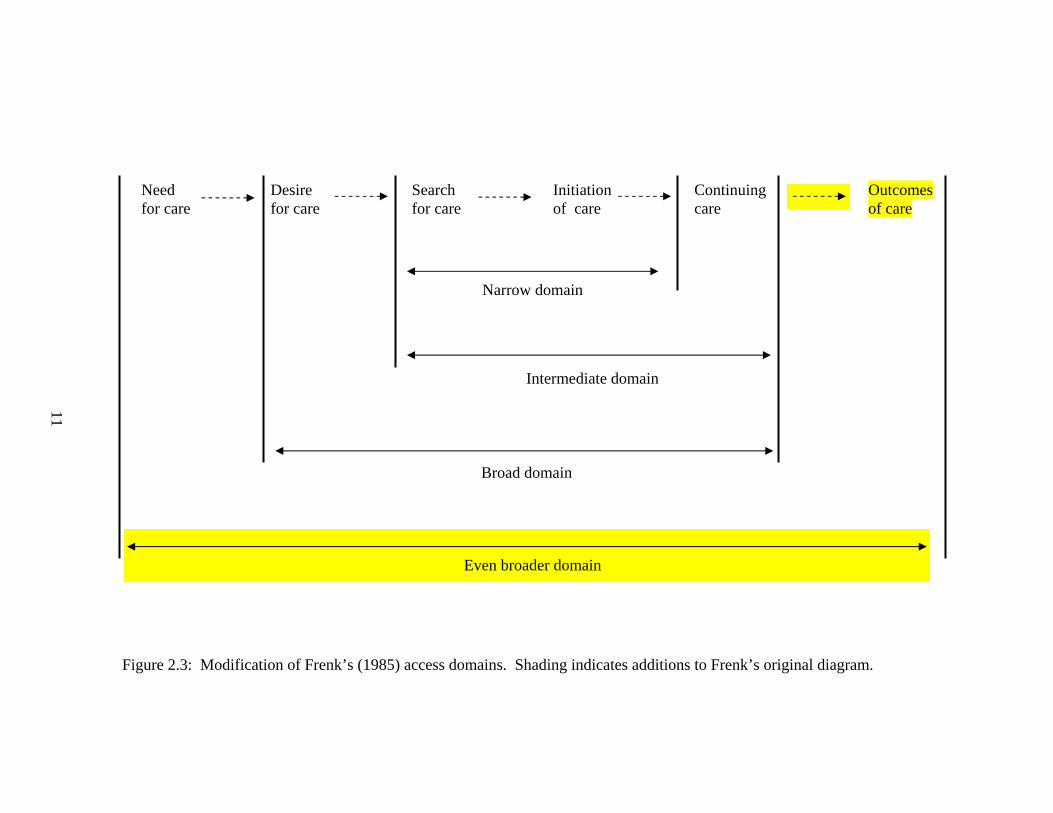
entrance alone. Julio Frenk (1985/1992) suggested that researchers used one of three
domains when using the term access (Figure 2.3).3 His first domain, the narrow domain,
includes the search for care and the initiation of care. In other words, the narrow domain is
only concerned with patient entry into the health care system, with need for care and desire
for care assumed to already exist. The second domain, the intermediate domain, adds
continuing care within the system for a particular episode of health care. These two domains
map onto Lurie's (1997) primary and secondary access categorizations ("entry into the health
care system" and "care once the system has been entered," respectively, p. 691). Frenk's
third domain, the broad domain, further expands to include the desire for health care.
According to Frenk, this broad domain is problematic as it equates access with use of
services. Although Frenk does not consider this, I suggest there exists an even broader
domain as some researchers include health care outcomes as well as need for care in their
(implicit or explicit) definitions of access (e.g., Aday & Andersen, 1974).
To add to the confusion, some authors draw a distinction between "access" and
"accessibility" (Frenk, 1985/1992; Penchansky, 1977), although the majority use the terms
interchangeably. I fall in the latter camp. I propose that the two groups are actually
employing different approaches. Those who distinguish access and accessibility see access
as a characteristic or attribute of a health care system (as proposed by Donabedian, 1973),
3Frenk's (1985) review was focused on the term "accessibility" rather than "access." The debate over the interchangeability of these terms is outlined below.
11
Need for care
Desire for care
Search for care
Initiation of care
Continuing care
Outcomes of care
Narrow domain
Intermediate domain
Broad domain
Even broader domain
Figure 2.3: Modification of Frenk’s (1985) access domains. Shading indicates additions to Frenk’s original diagram.
12
hence the use of the term accessibility, the noun form of the adjective "accessible." On the
other hand, those using the terms interchangeably are interested in access as a process and
the term "accessibility" is simply employed as another descriptor of the process.
Accessibility in this context also generally refers to a positive notion, an indication of the
ease of the process, while the former use of accessibility is more neutral.
The definition of access has generally broadened over time. Avedis Donabedian was
among the first to define access (using the term "accessibility"), describing it as "those
characteristics of the [health care] resource that facilitate or obstruct use by potential clients"
(1973, p. 419). He divided the concept into two subconcepts: geographic accessibility and
socio-organizational accessibility. Geographic accessibility is concerned with the physical
coming together of the individual seeking care and the source of care. Socio-organizational
accessibility is concerned with the "fit" between the "social, cultural, economic or
psychological characteristics" of individuals and the source of care (p. 424). Donabedian's
notion of "fit" has been carried forward by two access theories described in the next chapter
(specifically, Penchansky, 1997, and Tanahasi, 1978). Donabedian's definition of access
falls under Frenk's narrow domain as it is only concerned with system entry.
A second narrow domain definition also paid attention to the confusion around access
and related topics. In A Discursive Dictionary of Health Care, authored by the U.S.
Congress in 1976, access was defined as:
An individual's (or group's) ability to obtain medical care. Access has geographic, financial, social, ethnic and psychic components and is thus very difficult to define and measure operationally. Many government health programs have as their goal improving access to care for specific groups or equity of access in the whole population. Access is also a function of the availability of health services, and their acceptability. In practice, access, availability, and acceptability, which collectively describe the things which determine the care people use, are very hard to differentiate. (p. 5)
13
Another early access definition combined system entry with continuing care, falling
under Frenk's intermediate domain. Andersen, Smedby and Anderson (1970)
conceptualized access as a subcomponent of the organization of a health services system.
They provided the following definition:
"Access" refers to the means through which the patient gains entry to the medical care system and continues the treatment process. It specifies the requirements that must be met and the barriers which must be overcome before medical care is received. (p. 7)
The National Library of Medicine's 1978 introduction of the MeSH heading of health
services accessibility was accompanied by the following similar definition:
The degree to which individuals are inhibited or facilitated in their ability to gain entry to and to receive care and services from the health care system. Factors influencing this ability include geographic, architectural, transportational, and financial considerations, among others.
Later definitions expanded into and beyond Frenk's broad domain by including health
beliefs and need for care as part of access (e.g., Aday and Andersen's 1974 access model).
Later definitions also included the explicit mention of health care outcomes. The
appropriateness and quality of care is central to these definitions. For example, the Institute
of Medicine defined access as "the timely use of personal health services to achieve the best
possible health outcomes" (Millman, 1993, p. 33). Gulzar (1999) defined access as "the fit
among personal, sociocultural, economic and system-related factors that enable individuals,
families and communities to have timely, needed, necessary, continuous, and satisfactory
health services" (p. 17). And lastly, in the most recent iteration of the Andersen Behavioral
Model of Health Services Use, Andersen and Davidson (2001) wrote:
We define access as actual use of personal health services and everything that facilitates or impedes their use. It is the link between health services systems and the
14
populations they serve. Access means not only getting to service but also getting to the right services at the right time to promote improved health outcomes. (p. 3)
Political realities also shape the definition of access, as would be expected with a
concept so closely aligned with policy. Access to care is seen as such an obviously important
policy objective, so much so that it becomes a safe concept, elevated to the level of (almost)
indisputable values. In addition, the lack of a consistent definition for access allows for
multiple policy applications of the term. In the United States, access is often used as a
synonym for insurance coverage (Goldman & McGlynn, 2005). In Canada, access used to
be synonymous with user fees for health care, based on the concept of accessibility included
in the 1984 Canada Health Act. More recently, access has been used to indicate waiting
times for medical care (e.g., Commission on the Future Health Care in Canada, 2002; Health
Council of Canada, 2005; Sanmartin, Pierre & Tremblay, 2006; Sanmartin & Ross, 2006; Tu,
Pinfold, McColgan & Laupacis, 2005). Access has also had a long history of association
with physician supply in both countries.
THE MEASUREMENT OF ACCESS
Access has also been measured in a variety of ways at the level of the health care
system and the individual user (Berk & Schur, 1998). Health care system level measures
have included health care supply rates, population utilization rates, disease outcome rates,
and preventable hospitalizations (e.g., Millman, 1993). Individual level measures have been
employed in multiple access surveys, such as the Medical Expenditure Panel Survey (MEPS)
and the National Health Interview Survey (NHIS). Individual level access measures can be
broadly classified into three categories: (a) measures of service use relative to need, (b)
15
measures of structure or process of care, and (c) measures of consumer perspectives on
barriers to needed care and satisfaction with care (Kasper, 1998). Specific measures have
included survey questions about the use of acute and preventive health care services, the
presence and characteristics of a usual source of care, the presence of health insurance, the
organization of care, delays in obtaining care, barriers to care, and satisfaction with care and
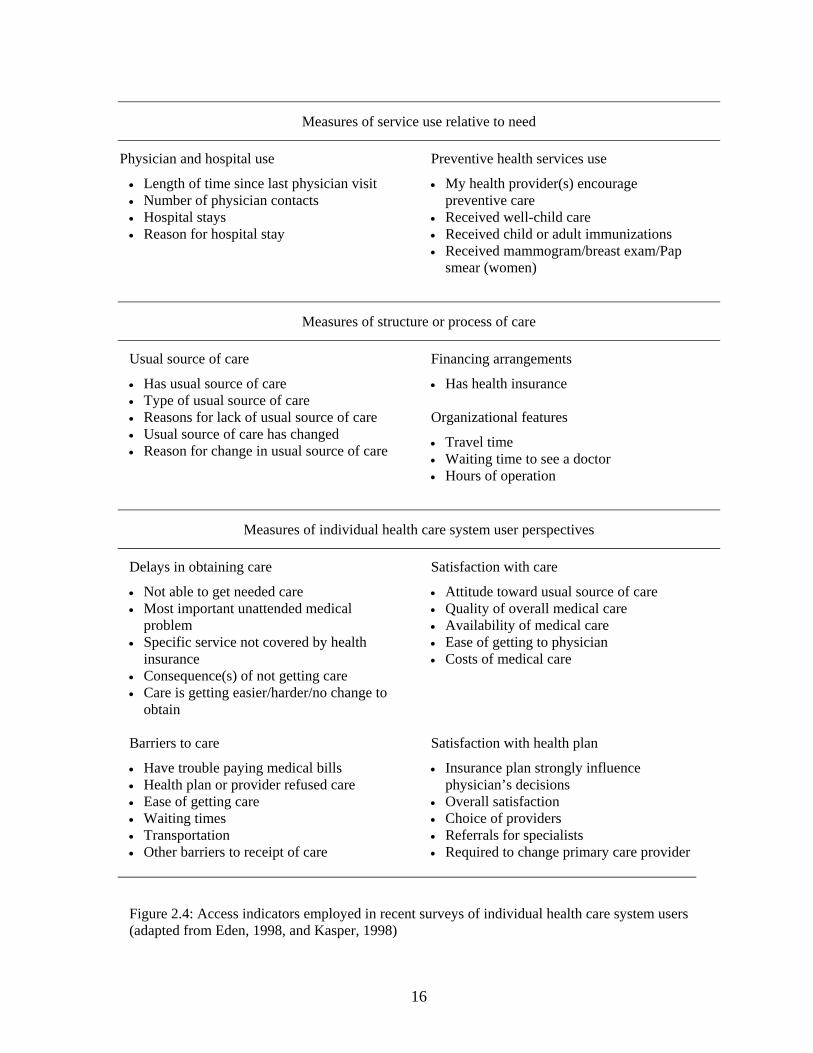
the health plan (see Figure 2.4; Eden, 1998; Kasper, 1998). Many of these measures have
been overlaid with health status measures to further reflect need.
WHAT DO WE KNOW ABOUT ACCESS?
After so many years of access being a central idea in health services research, and
with multiple measures, what do we know? We certainly know a lot. The empirical
literature on access is vast. In 2006 alone, almost 1400 journal articles were published with a
major MeSH heading of "health services accessibility."4 Rather than systematically
reviewing the empirical access literature (which would be a substantial research project on its
own), I briefly review the highlights of what we know about access. This review generally
proceeds from macro conditions to micro conditions and generally focuses on adult, non-
elderly populations in the United States.
Access and the Structure of the Health Care System
Comparative Examination of Health Care Systems
The broadest way that access has been examined is through cross-country
comparisons of the organization of health care systems and of health outcomes. Gerard
Anderson and colleagues have used data from the Organization for Economic Cooperation 4Results of a PubMed search in March 2007.
16
Measures of service use relative to need
Physician and hospital use
• Length of time since last physician visit • Number of physician contacts • Hospital stays • Reason for hospital stay
Preventive health services use
• My health provider(s) encourage preventive care
• Received well-child care • Received child or adult immunizations • Received mammogram/breast exam/Pap
smear (women)
Measures of structure or process of care
Usual source of care
• Has usual source of care • Type of usual source of care • Reasons for lack of usual source of care • Usual source of care has changed • Reason for change in usual source of care
Financing arrangements
• Has health insurance
Organizational features
• Travel time • Waiting time to see a doctor • Hours of operation
Measures of individual health care system user perspectives
Delays in obtaining care
• Not able to get needed care • Most important unattended medical
problem • Specific service not covered by health
insurance • Consequence(s) of not getting care • Care is getting easier/harder/no change to
obtain Barriers to care
• Have trouble paying medical bills • Health plan or provider refused care • Ease of getting care • Waiting times • Transportation • Other barriers to receipt of care
Satisfaction with care
• Attitude toward usual source of care • Quality of overall medical care • Availability of medical care • Ease of getting to physician • Costs of medical care Satisfaction with health plan
• Insurance plan strongly influence physician’s decisions
• Overall satisfaction • Choice of providers • Referrals for specialists • Required to change primary care provider
Figure 2.4: Access indicators employed in recent surveys of individual health care system users (adapted from Eden, 1998, and Kasper, 1998)
17
and Development (OECD) to compare the health care system performance in industrialized
countries (Anderson & Hussey, 2001; Anderson & Poullier, 1999; Reinhardt, Hussey &
Anderson, 2003). The United States was close to the median of the twenty-nine OECD
countries for physician supply in 1998, with 6.0 physician visits per capita and 2.7 practicing
physicians per 1,000 persons, and below the median for hospital supply with 3.1 hospital
beds per 1,000 persons (OECD median = 4.3) (Anderson & Hussey, 2001). With respect to
health outcomes, the United States was among the worst performing OECD countries on the
potential years of life lost measure, which the authors attribute to poor infant mortality and
child mortality rates (Anderson & Hussey, 2001). This broad strokes comparative picture of
the United States suggested that the health resources are not as available to or not meeting the
health care needs of segments of the population as well as other countries have better health
outcomes with similar overall economics and resources.
Other researchers have used surveys of the users of health care systems to investigate
access to care differences between countries. Robert Blendon, Cathy Schoen, Karen
Donelan, and other Harvard and Commonwealth Fund researchers have conducted a series of
cross-country surveys since the 1980s (Blendon et al., 1995; Blendon, Schoen, DesRoches,
Osborn & Zapert, 2003; Blendon et al., 2002; Donelan, Blendon, Benson, Leitman & Taylor,
1996; Donelan, Blendon, Schoen, Davis & Binns, 1999; Donelan et al., 2000; Schoen, Davis,
DesRoches, Donelan & Blendon, 2000; Schoen & Doty, 2004; Schoen et al., 2004). The
most recent surveys compare the perspectives of persons from the United States, Canada,
United Kingdom, Australia and New Zealand on a variety of measures related to health care
receipt and delivery.
18
Survey participants from the US reported problems with health care costs (Blendon et
al., 2003; Schoen & Doty, 2004; Schoen et al., 2004), inadequate coverage (Blendon et al.,
2003), and concerns with a variety of measures of the quality of the doctor-patient
relationship and provider communication (Schoen & Doty, 2004; Schoen et al., 2004). All of
these concerns differed significantly by income, with those of below-average income
reporting more trouble than those of above-average income (Schoen & Doty, 2004). These
income effects persisted after multivariate adjustment for insurance status, race, ethnicity,
and immigration status (Schoen & Doty, 2004). Survey participants from Canada, Australia,
New Zealand, and the United Kingdom also reported cost-related access problems varying by
socioeconomic status, particularly for health care services that were not covered by the
national insurance plans (Blendon et al., 2002; Schoen, Osborn, Huynh & Doty, 2005;
Schoen & Doty, 2004), although low income persons from the US reported the most
problems getting care out of all the countries (Blendon et al., 2002; Schoen et al., 2005).
Waiting times and physician and hospital shortages were reported as problems in every
country but the US (Blendon et al., 2003).
Other work comparing service delivery in the US and Canada found that low-income
Canadians had more physician and hospital visits than low-income Americans across all
levels of health status (Katz, Hofer & Manning, 1996; Katz, Hofer & Manning, 1996). These
results were later supported by a study finding that physician use in Ontario was based on
need rather than income (Finkelstein, 2001). Subsequent work found that the receipt of
breast and cervical cancer screening was inversely associated with socioeconomic gradients
in both countries (Katz & Hofer, 1994; Katz, Zemencuk & Hofer, 2000), suggesting that
factors other than insurance are involved in the successful receipt of preventive care.
19
Another examination of preventive care in the two countries found a larger socioeconomic
gradient in the US than in Canada (Billings, Anderson & Newman, 1996).
Health Insurance Design
Health insurance has long been the most prominently studied feature of health care
systems. Studies of the effects of insurance on access have investigated the problems
associated with uninsurance as well as comparing access under various types of insurance,
changes in insurance programs, and the effects of cost-sharing mechanisms.
In general, having health insurance has been consistently found to aid individuals in
getting and using health care (Institute of Medicine, 2001; Institute of Medicine, 2002; US
Congress, Office of Technology Assessment, 1992; Weissman & Epstein, 1993). Persons
without health insurance have been shown to be more likely than the insured to go without
needed medical care, to have not used health care services in the past year, to have fewer
visits, to be less satisfied with their care, to be less likely to have a usual source of care, and
be in poorer health (Baker, Sudano, Albert, Borawksi & Dor, 2005; Hadley, 2007; Institute
of Medicine, 2001; Kasper, Giovannini & Hoffman, 2000; Lurie, Ward, Shapiro & Brook,
1984; Lurie, Shaprio, Gallego, Vaghaiwalla & Brook, 1986; Sudano & Baker, 2003;
Weissman & Epstein, 1993). Gaining insurance has been shown to increase service use and
reduce unmet need (Enterline, Salter, McDonald & McDonald, 1973; Feinberg, Swartz,
Zaslavsky, Gardner & Walker, 2002; Kasper et al., 2000; McWilliams, Zaslavsky, Meara &
Ayanian, 2003), although persons recently gaining insurance still lag behind the preventive
service rates and health status of persons with continuous insurance histories (Baker et al.,
2005; McWilliams et al., 2003; Sudano & Baker, 2003).
20
Insurance Type
The access effects of different types of insurance have also been well-studied over
time. The majority of studies compare the access experiences of persons with public
insurance, particularly Medicaid, and persons with private insurance. These studies find
mixed access effects. For some access measures, persons with Medicaid report more trouble
than persons with private insurance. For example, persons on Medicaid are more likely to
travel further (Weissman & Epstein, 1993) and wait longer for care (Shi, 2000; Weissman &
Epstein, 1993), and are more likely to report being unable to receive needed care (Berk &
Schur, 1998b; Himmelstein & Woolhandler, 1995; Schoen, Lyons, Rowland, Davis & Puleo,
1997), although another study found no difference in unmet need between mothers on
Medicaid and low-income mothers with private insurance after controlling for insurance
selection effects (Long, Coughlin & King, 2005).
Persons with Medicaid and persons with private insurance report similar experiences
with respect to other access measures. Medicaid and privately insured persons are as likely
to report a usual source of care (Long et al., 2005; Mooney, Hall, Donaldson & Gerard, 1991;
Schoen et al., 1997), are similarly satisfied with their care (Davis, Schoen, Doty & Tenney,
2002; Schoen et al., 1997; Shi, 2000; Weissman & Epstein, 1993), and report similar
experiences with continuity of care and interpersonal treatment by and trust in their health
care provider (Shi, 2000). Persons with Medicaid and persons with employer-sponsored
insurance also report similar access problems due to cost such as not filling a prescription or
skipping a recommended test or follow-up and bill problems such as not being able to pay
medical bills, although persons with Medicaid were more likely to have spent 5 percent of
21
more of their income on out of pocket health care costs, even after adjustment for income and
other factors (Davis et al., 2002).
Persons with Medicaid report less trouble than persons with private insurance on still
other access measures. With respect to reports about their insurance plans, one recent study
found that persons with Medicaid were more likely to rate their insurance as excellent, were
less likely to report negative insurance plan experiences, and less likely to report paying "a
lot" out of pocket for drugs or dental services than persons with employer-sponsored
insurance (Davis et al., 2002). Medicaid patients are also more likely to receive care than
privately insured persons (Berk & Schur, 1998b; Schoen et al., 1997), a pattern that persists
even when only low-income persons (who are likely sicker and in more need of care) are
compared across both groups (Weissman & Epstein, 1993).
Cost-Sharing Mechanisms
The RAND health insurance experiment (Lohr, Brook & Kamberg, 1986; Newhouse,
1993; Shapiro, Ware & Sherbourne, 1986) showed that health insurance plans with higher
cost sharing mechanisms decreased both necessary and unnecessary health services use.
More recent work has also demonstrated that increased cost sharing decreases the use of
acute primary care, preventive services, emergency care, and prescription drugs, particularly
among low-income or other vulnerable groups (Hsu et al., 2004; Piette, Heisler & Wagner,
2004; Rector & Venus, 2004; Rice & Matsukoa, 2004; Solanki & Schauffler, 1999; Stuart &
Zacker, 1999; Tamblyn et al., 2001; Tseng, Brook, Keeler, Steers & Mangione, 2004; Wong,
Andersen, Sherbourne, Hays & Shaprio, 2001; Wright et al., 2005). Increased cost-sharing
has also been shown to have adverse health effects in some studies (Rice & Matsukoa, 2004;
22
Tamblyn et al., 2001) but not in others (Lohr et al., 1986; Newhouse, 1993; Shapiro et al.,
1986; Wong et al., 2001).
Access and the Importance of Place
There is a long history of the study of geographical variation in health care service
availability, health care use, and health outcomes. A variety of levels of geographies have
been used in such work, including regions within countries (e.g., Eberhardt et al.),
rural/urban comparisons (e.g., Ricketts, 1999) and "small areas" such as hospital service
areas (e.g., Wennberg & Cooper, 1996; Wennberg & Gittelsohn, 1973) and primary care
market areas (e.g., Ricketts, Randolph, Howard, Pathman & Carey, 2001). These studies
have consistently demonstrated that place matters for health care service availability, health
care use, and health outcomes.
With respect to health care service availability, for example, the supply of hospital
beds varies greatly across the United States, with the Midwest, Upper Midwest and South
having the highest number of acute care hospital beds per thousand persons (Wennberg &
Cooper, 1996). Rural areas have proportionally fewer physicians to serve the local
population than do urban areas (Ricketts, 2000) as well as proportionally fewer persons with
health insurance (Ricketts, 2000; Schur & Franco, 1999).
The use of specific health care services varies greatly across the United States, with
no one clear geographical trend (Wennberg & Cooper, 1996). The ease of obtaining health
care has been shown to vary by community for uninsured persons (Cunningham & Kemper,
1998) and for low-income persons (Andersen et al., 2002), with some evidence that wealthier
and economically strong communities confer protective effects on vulnerable persons
23
(Andersen et al., 2002). The influence of the community on access has also been shown to
persist even after controlling for individual characteristics (Hendryx, Ahern, Lovrich &
McCurdy, 2002; Prentice, 2006). When urban and rural areas are compared, individuals
report difficulty getting needed care at similar rates, although rural residents are more likely
to report delaying care because of financial barriers (Schur & Franco, 1999). Rural and
urban residents were similarly likely to report having a usual source of care and had similar
doctor visit rates (Schur & Franco, 1999). Rural residents travel further and longer for care
than do urban residents (Schur & Franco, 1999; Slifkin, 2002). Increased distance to care has
been shown to decrease the likelihood of rural residents receiving care for regular check-ups
and chronic conditions but not for acute conditions (Arcury et al., 2005).
Health status and health outcomes have been shown to vary geographically as well.
Rural residents are more likely to report being in fair or poor health than urban residents
(Schur & Franco, 1999). Mortality rates are generally higher in rural areas than in urban
areas, with some variation by regions (e.g., infant mortality rates are higher in rural areas
than in urban in the South and West, while the Northwest and Midwest's infant mortality
rates are highest in central urban areas; Eberhardt et al., 2001). Rural residents are also more
likely to report higher rates of chronic disease and activity limitation than are urban residents
(Eberhardt et al., 2001; Schur & Franco, 1999).
Geographical variation also exists in the link between health outcomes and health
care service use. Hospital admission rates for ambulatory care sensitive conditions (i.e.,
hospitalizations thought to be potentially preventable with adequate primary care) vary
regionally across the US, although the West generally fares the best and the South the worst
of the regions on the majority of conditions (Kruzikas et al., 2004). In this same study,
24
ambulatory care sensitive condition rates were significantly higher for rural populations than
for urban populations in half of the 17 specific conditions, including chronic obstructive
pulmonary disease, uncontrolled diabetes without complications, and hypertension. Rural
and urban preventable hospitalization rates were similar for the remaining conditions,
including diabetes complications, congestive heart failure, and pediatric and adult asthma
(Kruzikas et al., 2004). Low income communities had significantly higher preventable
hospitalization rates than higher income communities for all 17 conditions (Kruzikas et al.,
2004). Other work has shown that communities believed to have poor access to medical care
(evaluated using overall assessments by residents or experts) have higher rates of preventable
hospitalizations (Bindman et al., 1995; Ricketts, Randolph, Howard, Pathman & Carey,
2001). Physician supply and physician practice style were not associated with preventable
hospitalizations in these same studies, although other studies have shown such a link (Ansari,
Laditka & Laditka, 2006).
Access and Individual Level Factors
Usual Source of Care
Having a usual source of care (a place where one receives health care on a regular
basis) is considered to be an important component of access. The concept of a usual source
of care has both been used as an indicator of access (i.e., having a usual source of care is
equated with access, such as in some of the literature described above) and as a predictor of
access when access is broadly defined as including health outcomes (i.e., the "even broader
domain" definition of access from Chapter 2, Figure 2.3) (Lambrew, DeFriese, Carey,
Ricketts & Biddle, 1996). As a predictor of health care use, having a usual source of care has
25
been shown to be associated with receiving more acute care, chronic care, and preventive
services; more appropriate, timely, and higher quality care; improved health outcomes; and
increased patient satisfaction (Bindman, Grumbach, Osmond, Vranizan & Stewart, 1996;
Corbie-Smith, Flagg, Doyle & O'Brien, 2002; Dietrich & Marton, 1982; Ettner, 1999;
Freeman et al., 1987; Hayward, Bernard, Freeman & Corey, 1991; Hurley, Freund & Gage,
1991; Lambrew et al., 1996; Lurie et al., 1984; Lurie et al., 1986; Sox, Swartz, Burstin &
Brennan, 1998; Starfield, 1992; Weiss & Ramsey, 1989).
Individuals do not need to have health insurance to have a usual source of care,
although there is an association between being uninsured and not having a usual source of
care (Williams, 2002). Having a usual source of care has been found to have a stronger
association with getting timely needed care and specific services than having health
insurance (DeVoe, Fryer, Phillips & Green, 2003; Seid & Stevens, 2005; Sox et al., 1998;
Williams, 2002). Problems with using a usual source of care vary by insurance status and
type, with uninsured and publicly insured persons experiencing more difficulties (Shi, 2000;
Williams, 2002).
Race and Ethnicity
When compared to white persons, racial and ethnic minorities have been shown to
have more problems with access on multiple measures, even after controlling for other
factors thought to influence access. Minorities are less likely to have health insurance than
whites (Collins et al., 2002; Smedley, Stith & Nelson, 2002). Of those with health insurance,
minorities are less likely to have private health insurance and more likely to be underinsured
than whites (Agency for Healthcare Research and Quality, 2005; Smedley et al., 2002).
26
Minorities are less likely to receive preventive, acute, and chronic care services (Agency for
Healthcare Research and Quality, 2005; Corbie-Smith et al., 2002; Fiscella, Franks, Doescher
& Saver, 2002; Hargraves & Hadley, 2003; Kirby, Taliaferro & Zuvekas, 2006; Mayberry,
Mili & Ofili, 2000; Mayberry et al., 2000; Mueller, Patil & Boilson, 1998; Shi, 1999;
Weinick, Zuvekas & Cohen, 2000), and are more likely to be hospitalized for preventable
conditions (Bindman et al., 1995; Gaskin & Hoffman, 2000) or report having unmet needs
than whites (Agency for Healthcare Research and Quality, 2005; Hargraves & Hadley, 2003;
Kirby et al., 2006; Smedley et al., 2002). When receiving services, persons of racial or
ethnic minorities are less likely to have a choice in where they go for care (Collins et al.,
2002); receive less timely care (Agency for Healthcare Research and Quality, 2005) and
fewer clinically appropriate services for a variety of diseases and conditions (Agency for
Healthcare Research and Quality, 2005; Mayberry et al., 2000; Smedley et al., 2002); and are
more likely to be treated by poorer quality physicians than whites (Bach, Hoangmai, Schrag,
Tate & Hargraves, 2004).
Racial and ethnic minorities are less likely to have a usual source of care than whites
(Agency for Healthcare Research and Quality, 2005; Collins et al., 2002; Hargraves &
Hadley, 2003; Hargraves & Hadley, 2003; Kirby et al., 2006; Zuvekas & Weinick, 1999). Of
those having a usual source of care, minorities were less likely to obtain care at a physician's
office (Doescher, Saver, Fiscella & Franks, 2001; Shi, 1999) and were more likely to have
trouble using their usual source of care than whites (Cooper, Beach, Johnson & Inui, 2006;
Shi, 1999; Shi, Forrest, Von Schrader & Ng, 2003; Taira et al., 2001). Experiencing shorter
office waits and having had a relationship with the usual source of care for longer than a year
27
help decrease such trouble, however, particularly for sicker and poorer persons of racial and
ethnic minorities (Shi et al., 2003).
A number of individual level factors have been shown to decrease—but not
eliminate—disparities by race and ethnicity including having health insurance (Hargraves &
Hadley, 2003; Mayberry et al., 2000; Mueller et al., 1998; Weinick et al., 2000; Zuvekas &
Taliaferro, 2003), being of higher income or higher education levels (Weinick et al., 2000;
Zuvekas & Taliaferro, 2003), and being able to speak English (Fiscella et al., 2002; Kirby et
al., 2006). Various community effects are also associated with a decrease in racial and ethnic
disparities, including the community's racial/ethnic composition and socioeconomic
conditions (Haas et al., 2004; Kirby et al., 2006; Mueller et al., 1998).
Who Is Likely To Have Trouble With Access?
In summary, persons who are most likely to have trouble with getting and using
health care are those meeting at least one of the following criteria:
• Are uninsured, underinsured, or do not have private insurance;
• Are of low income;
• Reside in rural areas;
• Are members of racial or ethnic minority groups; or
• Have multiple or greater health needs.
Persons often experience these adverse factors in combination, which heightens the
likelihood that individuals will experience trouble with access. For example, minority
persons of rural residence are less likely to receive cancer screening and diabetes care and
have higher cardiovascular disease death rates than urban minorities (Slifkin, Goldsmith &
28
Ricketts, 2000). Other research has shown that individuals have an increased likelihood of
being uninsured when they are of low income, poor health, and minority status rather than
any one or two of these factors alone (Shi, 2001). Still other research has suggested that the
access effects of minority status are dependent on socioeconomic status, specifically
education and employment (Farmer & Ferraro, 2004).
WHAT DO WE STILL NEED TO KNOW?
Despite the abundance of empirical access literature, we continue to seek answers to
the same fundamental questions. Research and policy questions of ongoing interest include
how to facilitate appropriate use and impede unnecessary use, enhance quality, improve
health outcomes and increase patient satisfaction. The majority of the empirical literature
uses a quantitative, hypothesis testing approach and is concerned with establishing causality
and generalizability. There have been exceptions to this deductive approach, of course,
although these exceptions are few and limited. Michelle van Ryn (2002) proposed a
theoretical framework for a specific piece of access, namely the provider contribution to
racial and ethnic access disparities. Other researchers have undertaken qualitative work to
provide depth and context to other research (Bedos et al., 2003; Bradley et al., 2002; Goins,
Williams, Carter, Spencer & Solovieva, 2005; Mofidi, Rozier & King, 2002; Sered &
Fernandopulle, 2005; Shirk, Trost & Schultz, 2000; Stewart et al., 2001), but such work has
generally not gone beyond description to theory generation. The one exception expanded on
a pre-existing access theory that was not inductively derived in the first place (Bradley et al.,
2002).
29
The overall focus on hypothesis testing and description has come at the expense of an
understanding of the mechanisms and context of access. Although this type of tradeoff often
occurs in applied research (Cook & Campbell, 1979), an emphasis on hypothesis testing
produces knowledge that is only as good as the hypotheses in the first place. We must
ensure, therefore, that we pay attention to theory development along with our search for
causality and generalizability. This idea is not new; health services researchers have been
making similar claims with respect to the study of access problems for racial and ethnic
minorities. Consider the following quotes focusing on the study of access:
While racial and ethnic disparities in health have been documented in the United States for decades…, we are not completely knowledgeable about what accounts for disparities and what to do to address them. (Bigby, 2002, p. 489) We need to consider the larger systems within which access to care is structured, and the pathways through which racial/ethnic disparities have been institutionalized. (Fennell, 2005, p. 1715) Little is known about why Black patients and other ethnic/racial minorities are less likely to receive the best treatments independent of clinical appropriateness, payer, and treatment site….The current lack of research in this area creates a significant barrier to the development of evidence-based interventions addressing race/ethnicity disparities in care. (van Ryn, 2002, p. I-140, I-147) The results of most studies provide intriguing snapshots of unexplained differences in care but, like scattered pieces of a puzzle, do not provide insights regarding the pathways through which race, ethnicity, and socioeconomic position influence overall disparities in health… Health services researchers…are struggling to develop conceptual frameworks. (Clancy & Stryer, 2001, p. 979)
Paying attention to theory development requires two tasks: (i) understanding the
development of existing theory, and (ii) developing new theory. The rest of this dissertation
undertakes both of these tasks. In the next chapter, I review the state and history of existing
access theory. This is followed by a description of the methods and results of my attempt at
developing new access theory.
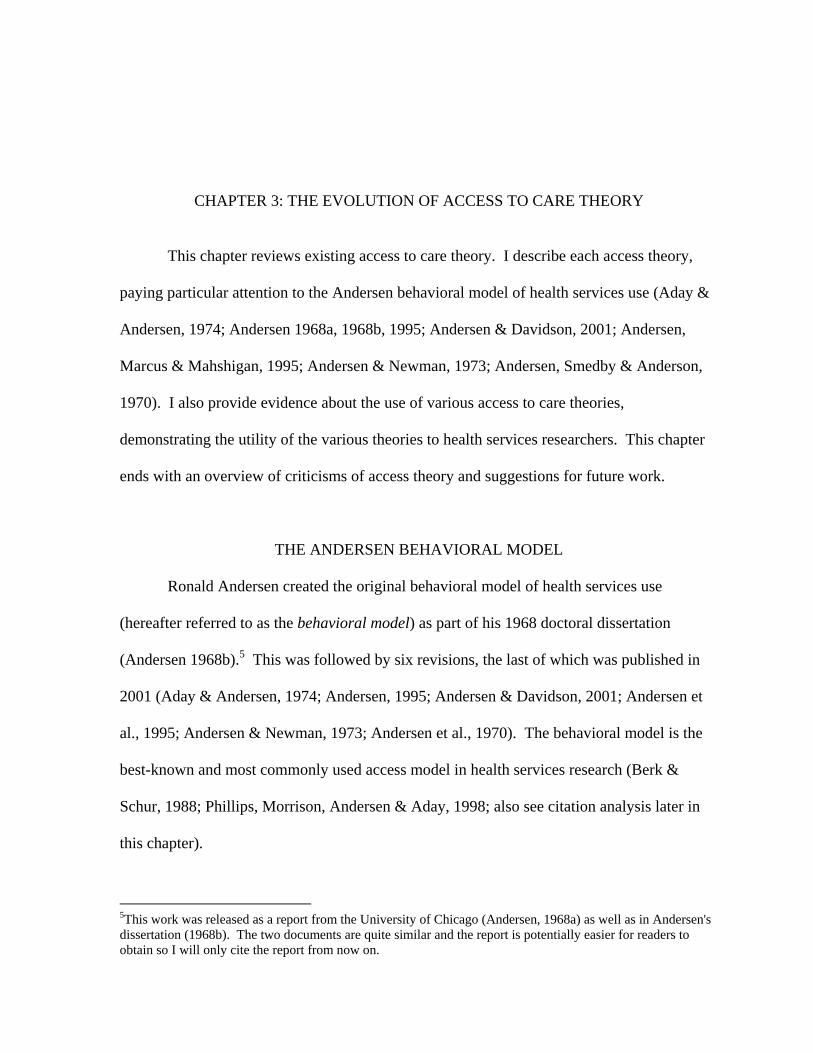
CHAPTER 3: THE EVOLUTION OF ACCESS TO CARE THEORY
This chapter reviews existing access to care theory. I describe each access theory,
paying particular attention to the Andersen behavioral model of health services use (Aday &
Andersen, 1974; Andersen 1968a, 1968b, 1995; Andersen & Davidson, 2001; Andersen,
Marcus & Mahshigan, 1995; Andersen & Newman, 1973; Andersen, Smedby & Anderson,
1970). I also provide evidence about the use of various access to care theories,
demonstrating the utility of the various theories to health services researchers. This chapter
ends with an overview of criticisms of access theory and suggestions for future work.
THE ANDERSEN BEHAVIORAL MODEL
Ronald Andersen created the original behavioral model of health services use
(hereafter referred to as the behavioral model) as part of his 1968 doctoral dissertation
(Andersen 1968b).5 This was followed by six revisions, the last of which was published in
2001 (Aday & Andersen, 1974; Andersen, 1995; Andersen & Davidson, 2001; Andersen et
al., 1995; Andersen & Newman, 1973; Andersen et al., 1970). The behavioral model is the
best-known and most commonly used access model in health services research (Berk &
Schur, 1988; Phillips, Morrison, Andersen & Aday, 1998; also see citation analysis later in
this chapter).
5This work was released as a report from the University of Chicago (Andersen, 1968a) as well as in Andersen's dissertation (1968b). The two documents are quite similar and the report is potentially easier for readers to obtain so I will only cite the report from now on.
31
The behavioral model changed significantly over the more than 30 years of
development and refinement, providing a window into the development of health services
research as a field as well as the development of the study of access. The model's initial
focus was the use of health services, with a shift to a focus on access by the fourth version of
the model. The model also gradually shifted from a focus on the individual to a shared focus
between the individual and the environment. Many new components were added along the
way and the model became more complex. More and more links were added between model
components, including feedback loops.
In an acceptance speech for the 1994 Leo G. Reeder Award for Distinguished Service
to Medical Sociology (reprinted in Andersen, 1995), Andersen divided the history of the
behavioral model into four phases based on the types of changes made to the model: (a) the
original model, (b) the addition of the health care system in the three model revisions of the
1970s (Aday & Andersen, 1974; Andersen & Newman, 1973; Andersen et al., 1970) (c) the
addition of health status, the external environment and personal health practices in the first
model revision of the 1990s (Andersen et al., 1995), and (d) the recognition of multiple
influences on health services use and the existence of feedback loops in the model revision
introduced during this speech (Andersen, 1995). Andersen's four phases highlight the major
model changes over time but there is much more to this story. The progression of the
Andersen behavioral model also provides insight into the process of theory development in
health services research. I propose an alternate classification of the history of the behavioral
model based on the process of theory development. This alternate classification consists of
two phases: (a) the initial development and testing phase, and (b) the theoretical refinement
phase.
32
Phase 1, or the initial development and testing phase, included the original behavioral
model (Andersen, 1968a) and the first revision (Andersen et al., 1970). This phase was
characterized by the model being presented as part of a larger explanatory or exploratory
study. Consequently, model changes in this phase reflected empirical needs. In contrast, in
Phase 2 or the theoretical refinement phase, the model was simply presented on its own.
Model changes in this phase did not explicitly result from the needs of an empirical study.
Rather, model changes in this period were motivated by trends and developments in health
policy, health services research and methodology. Phase 2 covered the remaining five
revisions from 1973 to 2001 (Aday & Andersen, 1974; Andersen, 1995; Andersen &
Davidson, 2001; Andersen et al., 1995; Andersen & Newman, 1973) .
Each model is described below within its phase, including the latest model revision
(Andersen & Davidson, 2001), which had not been published when Andersen conducted his
1994 review (Andersen, 1995). I describe model changes and internal consistencies. On the
accompanying model diagrams, I shade the areas where changes occurred since the previous
model. For the models in the first phase, I also describe the use and testing of the model. In
contrast, model descriptions in the second phase are much less analytical and receive less
emphasis in this text. I use consistent terms to describe the levels in each model. Early
models have three levels—the terms components, subcomponents, and variables (Andersen,
1968a) describe the model levels in decreasing order. When the model gets more
complicated, the term dimension indicates concepts that encompass the other three levels.
This review was predominantly informed by my own comparisons of the original
model descriptions. Supplemental information was provided by Andersen's 1994 review
(Andersen, 1995) and Aday and Awe's 1997 review of health services utilization models. I
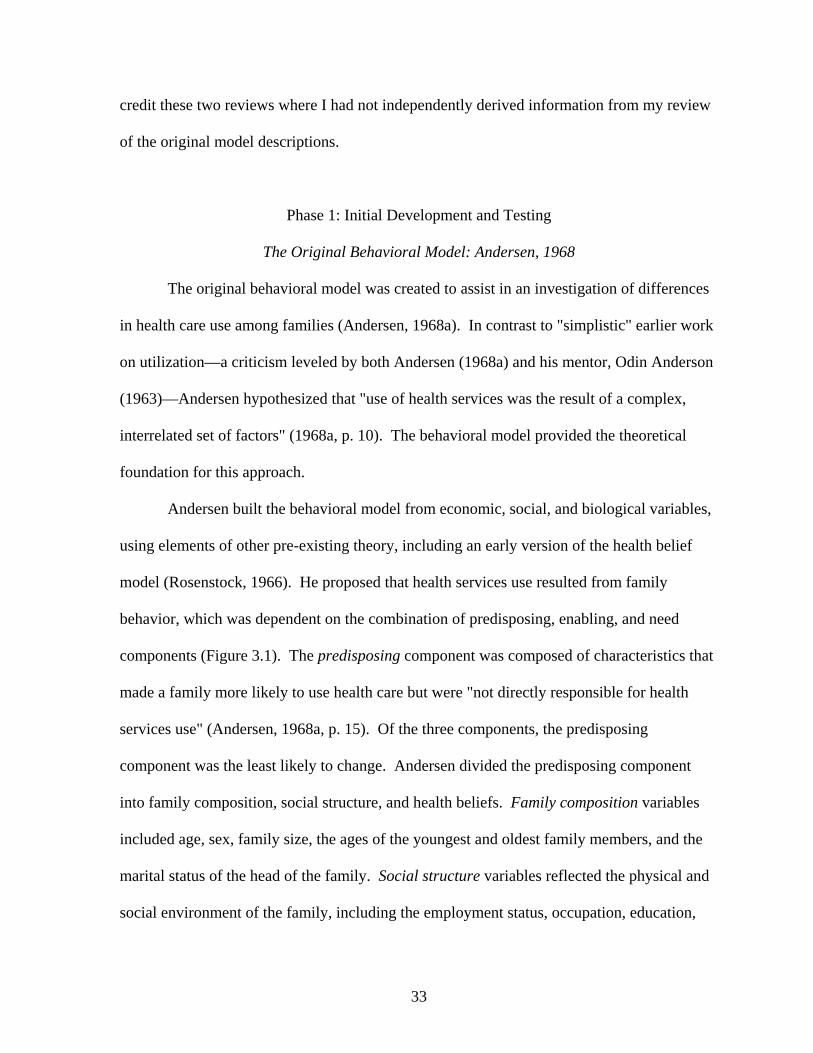
33
credit these two reviews where I had not independently derived information from my review
of the original model descriptions.
Phase 1: Initial Development and Testing
The Original Behavioral Model: Andersen, 1968
The original behavioral model was created to assist in an investigation of differences
in health care use among families (Andersen, 1968a). In contrast to "simplistic" earlier work
on utilization—a criticism leveled by both Andersen (1968a) and his mentor, Odin Anderson
(1963)—Andersen hypothesized that "use of health services was the result of a complex,
interrelated set of factors" (1968a, p. 10). The behavioral model provided the theoretical
foundation for this approach.
Andersen built the behavioral model from economic, social, and biological variables,
using elements of other pre-existing theory, including an early version of the health belief
model (Rosenstock, 1966). He proposed that health services use resulted from family
behavior, which was dependent on the combination of predisposing, enabling, and need
components (Figure 3.1). The predisposing component was composed of characteristics that
made a family more likely to use health care but were "not directly responsible for health
services use" (Andersen, 1968a, p. 15). Of the three components, the predisposing
component was the least likely to change. Andersen divided the predisposing component
into family composition, social structure, and health beliefs. Family composition variables
included age, sex, family size, the ages of the youngest and oldest family members, and the
marital status of the head of the family. Social structure variables reflected the physical and
social environment of the family, including the employment status, occupation, education,
34
Figure 3.1: The original behavioral model of health services use: Andersen, 1968.
Predisposing
Response
Health Beliefs
Social Structure
Family Composition
Community Resources
Illness
Use
Family Resources
Enabling Need
35
social class, race and ethnicity of the head of the family. Health beliefs variables included
the family head's beliefs about health, health services, health insurance, physicians, and
disease.
The enabling component was composed of characteristics that allowed a family to
take action to use services and make health care services available. The enabling component
was divided into family resources and community resources. Family resources variables
included "their economic resources and their source of medical care" (Andersen, 1968a, p.
16), such as the family's income and savings, having health insurance, having a regular
source of medical care, and qualifying for welfare health care services.6 Community
resources variables were concerned with the availability of health care services, such as the
physician to population ratio, the hospital bed to population ratio, and the urban/rural
classification and geographical region of the family's residence. Andersen equated the
availability of health care services with "geographic accessibility to services" (Andersen,
1968a, p. 16). This was the only mention of access in the 1968 behavioral model. As this
model was designed to investigate use, the placement of access suggests that at least at this
point in time Andersen saw use as an outcome of access.
Need included the family's perception of illness and the family's response to that
perception. Variables used in the illness subcomponent were all self-reported and included a
subjective measure of health status, reports of symptoms and disability days, and whether the
family received free care for major illnesses. Response was concerned with preventive care
as well as illness care and was represented by two variables: the frequency with which a
6Andersen (1968a) operationalized "qualifying for welfare health care services" as "having welfare care," and acknowledged that this approach conflated the enabling component of having welfare care available with the outcome of use of welfare care. Although he did not explicitly state this, the reader is left with the impression that this choice was constrained by the variables in the available data. These constraints became more problematic when Andersen operationalized need, as described in the text.
36
doctor was seen for reported symptoms, and whether the family had a history of regular
physical examinations. Both of these variables were set in the same time period as the
outcome of use of health care services. Andersen operationalized the need component,
therefore, as a combination of previous behaviors, current perceptions (that conceivably were
based on previous experiences and behaviors) and current behaviors. Employing current
health services seeking behaviors as need variables introduced statistical simultaneity to the
behavioral model. Predicting the use of health services by the use of health services (such as
in the free care for major illness variable, or either of the two response variables) was an
excellent way to (perfectly!) predict use but a problematic way to build a model. Andersen
did not deal with this model validity issue at this time, although he acknowledged that the
free care variable was "a combined measure of illness and means for attaining care"
(Andersen, 1968a, p. 17).
Predisposing, enabling, and need components independently explained the use of
health services as well as correlating with and influencing one other (e.g., the predisposing
variable of the family head's occupation was linked to the likelihood of the enabling variable
of having health insurance). The position of each component in the "sequence of conditions"
(Andersen, 1968a, p. 14, italics mine) reflected the hypothesized relative importance of that
component in determining and producing use. The closer the component to the outcome of
health services use, the higher the expected correlations between that component and use.
Need, therefore, would be the most influential of the three components in explaining use.
The enabling component would be the second most influential and the predisposing
component would be the least influential of the three.
37
Andersen also hypothesized that the contribution of each component would be
influenced by the discretionary nature of the health service. Need would contribute more to
explaining use for non-discretionary health services, such as when a family member was very
sick or facing a medical emergency, than for discretionary health services. In contrast, the
more discretionary the health service (or services where the family had a choice about
seeking services), the stronger the contribution would be expected from predisposing and
enabling components. Although he did not specifically address this, he implied that the
relative influence of the discretionary nature of the health service would not contradict the
temporal sequence of conditions. In other words, need would still be the strongest predictor
of health care use among the three components regardless of the discretionary nature of the
health service.
When considering the health policy implications of his model, Andersen explored its
application to the equitable distribution of health services. He claimed that the predisposing
family composition and illness subcomponents should be the drivers of use under a health
care system with equitable distribution. The effects of the remaining predisposing
subcomponents and the enabling component should be minimized.
Using the Behavioral Model
Using data from a 1964 national survey, Andersen found that predisposing, enabling,
and need components all contributed to explaining health care use,7 although the three
components did not consistently operate as a sequence of conditions. In a stepwise
multivariable analysis using the three components as separate stages, need was the strongest
7Health care use was measured by weighting services by "standard prices", resulting in "dollar equivalents" or "units of use" (Andersen 1968a, p. 22), which allowed for combining different health services (e.g., hospital stays, physician visits, drug use) and controlling for price differences.
38
contributor to all health care use (explaining 20 percent of the variance) followed closely by
the predisposing component (explaining 18 percent of the variance). The enabling
component—which was hypothesized to be a stronger contributor to explaining health care
use than the predisposing component—was the least important of the three, explaining only 6
percent of the variance. Andersen suggested the contrary performance of the enabling
component in the stepwise model resulted from correlation between the enabling variable of
income and the variables for the predisposing subcomponent of social structure such as
employment (which entered into the stepwise model before the enabling variables). This
explanation casts doubt on the theoretical underpinnings of the behavioral model, particularly
the distinction between enabling and predisposing components and the sequential positioning
of predisposing and enabling components.
Andersen's hypotheses about the influence of the discretionary nature of the health
service on the behavioral model were also not consistently supported. The need component
contributed the most to explaining physician use (an intermediate discretionary health
service), followed by hospital use (a non-discretionary health service), rather than the
reverse. Need was unimportant, as hypothesized, in explaining dental care use (the most
discretionary health service of the three services examined). With respect to the predisposing
component, social structure variables were sensitive to discretion while family composition
variables were not. The enabling component continued to explain little variation regardless
of the discretionary nature of the health service, accounting for 2 to 6 percent of the variation
for each of the three types of health care services.
Andersen also explored the path structure of the multivariable model for all health
care use. The multivariable analysis method he used throughout the study, Automatic
39
Interaction Detector (AID8), is an approach that divides the sample into distinct subgroups
based on the best predictors of the dependent variable. Since he conducted the analysis in a
stepwise fashion, causal pathways were produced for each of the three components. Within
the enabling component, for example, Andersen's sample divided into five mutually
exclusive groups based on levels of use: (a) families with a regular source of care and health
insurance; (b) families with a regular source of care, no health insurance, and previous use of
welfare services; (c) families with a regular source of care, no health insurance, and not
previous use of welfare services; (d) families with no regular source of care but with health
insurance; and (e) families with no regular source of care and no health insurance.
Based on the empirical results, Andersen suggested that while his behavioral model
held for physician use, the behavioral model should be revised for hospital and dental use.
The revised behavioral model for hospital use dropped the enabling component and the
revised behavioral model for dental use dropped need. He did not comment on the
applicability of the behavioral model for all health care use, despite the sequence of
conditions not being supported. His suggested model revisions did not appear in the later
literature.
Revision #1: Andersen, Smedby & Anderson, 1970
The first revision of the behavioral model (Andersen et al., 1970) arose from an
investigation of differences in health services use between the United States and Sweden.
Initial exploration of their utilization differences led Andersen and colleagues to conclude
that the organization of health services was an important factor deserving more study
8Structural equation modeling might be used in place of AID had such an exploration been undertaken with today's methodologies and technology. Structural equation modeling allows for the presence of feedback loops while AID does not.
40
(Andersen, Anderson & Smedby, 1968). In their 1970 report, therefore, they introduced the
health care system as an input to health services use, creating a completely separate model
depicting the influential components of the health care system (referred to as the systems
model) in addition to the behavioral model. The systems model allowed for comparisons of
health care systems with respect to differences in individual utilization while the individual-
level behavioral model investigated utilization differences within a particular health care
system.
The Systems Model
The systems model consisted of two main components concerned with health services
delivery: resources and organization (Figure 3.2). Resources referred to the health care labor
and capital in the system. Health system resources were described by two subcomponents:
the volume of the resources and the geographical distribution of the resources. Volume was a
direct measure of the labor and capital in the system. Examples of volume variables included
physician to population ratios and the number of hospital beds for a defined population.
Distribution reflected resource availability by geography within a health care system and was
measured by adjusting volume using geographical measures, such as comparing physician to
population ratios in urban and rural areas.
The organization of a health care system was concerned with the arrangement of
resources. Organization contained two subcomponents: access and structure. Andersen and
colleagues provided a long and detailed definition for access:
'Access' refers to the means through which the patient gains entry to the medical care system and continues the treatment process. It specifies the requirements that must be met and the barriers which must be overcome before medical care is received. The degree of access in any system varies
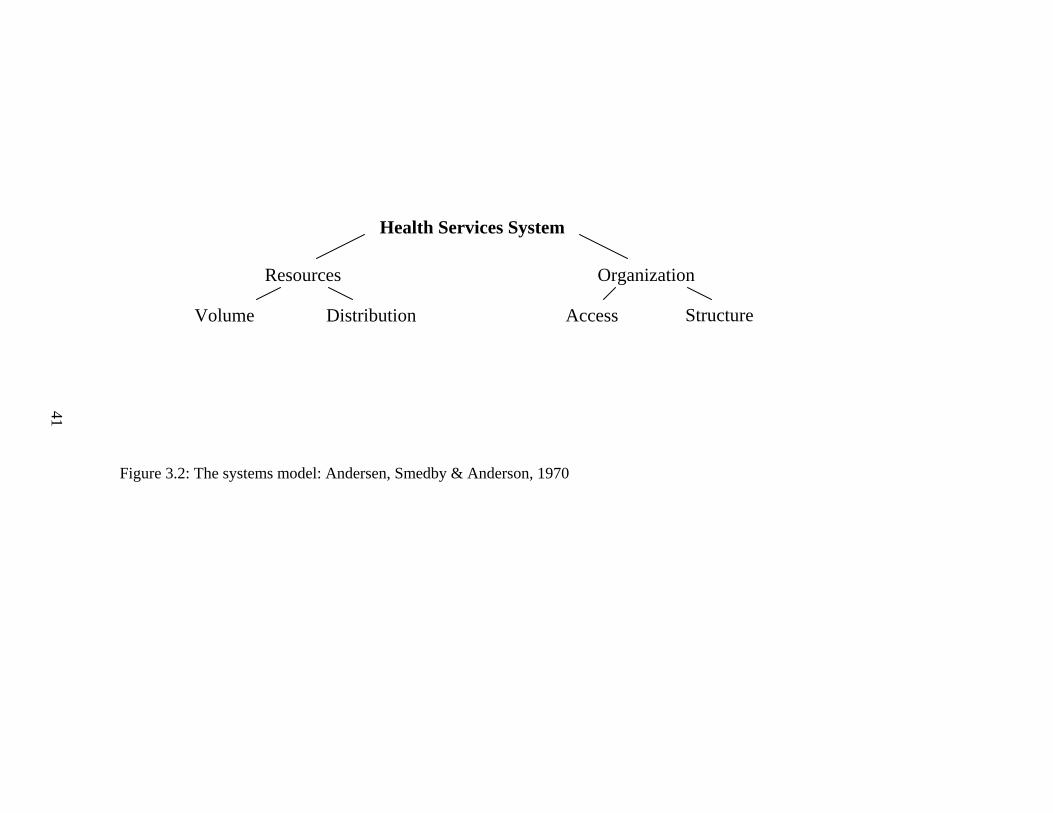
41
Figure 3.2: The systems model: Andersen, Smedby & Anderson, 1970
Health Services System
Resources Organization
Access Distribution Volume Structure
42
according to such things as direct out-of-pocket cost for medical care to the patient, the length of the queue for various kinds of treatments and general definitions concerning conditions which qualify the patient for treatment. Accessibility is assumed to increase as the proportion of medical care expenditures paid for by the government, voluntary health insurance, or other third-party payers increases, as the waiting time for medical care decreases, and as the range of conditions accepted for treatment increases. (1970, pp. 7-8)
Very clearly, access was no longer constrained to geographic distribution as in the original
model. Access played a bigger and much more explicit role in this revised behavioral model.
Despite the breadth and scope of this definition, however, Andersen and colleagues used
third party payment as the sole measurement of access in their study.
Structure referred to the health care system arrangements influencing care after an
individual enters the health care system. They claimed that structure is difficult to define and
connect with use as structure encompasses many different ideas (examples they gave
included referral patterns, the practice approach of the provider, and hospital care
characteristics) and overlaps with other pieces of the systems model (i.e., "Certainly, access
as we have defined it depends in part on structure, and the structure of any system is
dependent on the resources available to it." [Andersen et al., 1970, p. 8]). Despite the
difficulties associated with defining, measuring, and specifying hypotheses for the structure
subcomponent (or perhaps because of these difficulties), they claimed that "the biggest
payoff for both understanding one system and for making comparisons between systems will
probably flow from knowledge of this structural component" (Andersen et al., 1970, p. 9).
Testable hypotheses for volume, distribution, and access came from the systems
model directly. One health care system would be expected to have greater health services
utilization than another health care system when the first health care system had a greater
volume of health resources, or a greater distribution of health resources, or higher third party
43
payment for health care services, all other things being equal. In contrast, testable
hypotheses for the structure dimension depended on knowledge about utilization differences
between health services systems in addition to knowledge about health services system
resources and organization. For example, since prior work had shown that the United States
had a higher mean number of physician visits per person than Sweden, Andersen and
colleagues hypothesized that the higher use of non-physician providers in Sweden could
account for the difference in physician use rates in the two countries.
Changes to the Behavioral Model
Andersen and colleagues made three explicit changes to the behavioral model (Figure
3.3). First, the unit of analysis became the individual rather than the family, reflecting the
available data and Andersen's earlier claim that "the [original behavioral] model could be
adapted to an analysis using either individuals or geographical areas as units of analysis"
(Andersen, 1968a, p. 14). Second, they dropped the health beliefs predisposing
subcomponent. This may have resulted from not having available data as it reappeared in the
next version of the behavioral model. Third, the need component was completely
overhauled. Response was dropped and illness was no longer measured using any response-
associated variable (i.e., the variable free care for major illness), removing the simultaneity
problem of the original behavioral model. Illness replaced need as the name for this
component and the addition of "perceived" to the label highlighted that this component dealt
with self-report and the individual perspective rather than clinically evaluated illness.
Other changes were less explicit. The idea that the proximity of a component
to use determined the relative strength of that component's influence on use was no longer
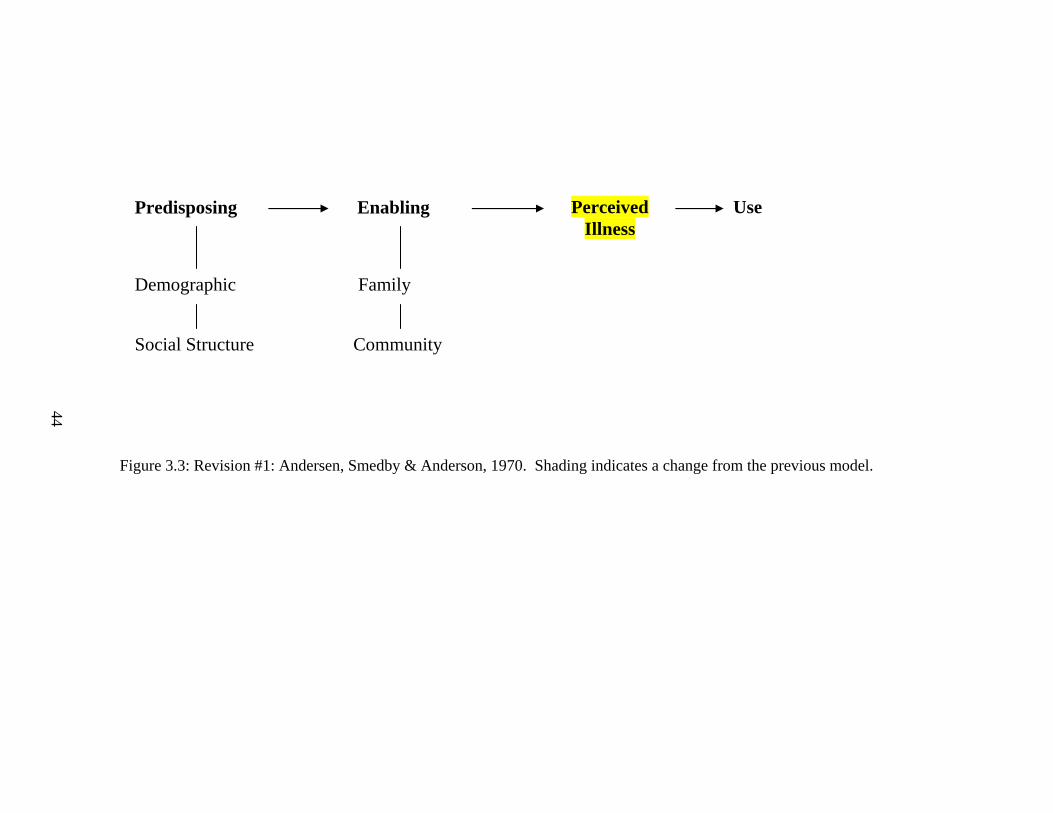
44
Figure 3.3: Revision #1: Andersen, Smedby & Anderson, 1970. Shading indicates a change from the previous model.
Predisposing
Social Structure
Demographic
Community
Family
Perceived Illness
Enabling Use
45
mentioned or employed, although Andersen and colleagues still described the components of
the behavioral model as "a sequence of conditions" (Andersen et al., 1970, p. 28). More
importantly, using the systems model in conjunction with the behavioral model changed the
relative importance and influence of predisposing, enabling and need/illness components on
use. Andersen and colleagues provided examples of all components of the systems model
affecting individual-level patterns of use. The accessibility of the health services system was
the most influential, affecting all three components in the behavioral model. Specifically, the
greater the share of third party payment in a health care system (their measure of system
accessibility), the more important perceived illness became at explaining use. Demographic
predisposing subcomponents were also better predictors of use in a health care system with
greater third party payment than in a health care system with lesser third party payment.
Conversely, social structure predisposing subcomponents and enabling components were less
important for explaining use in a health care system with high accessibility than in a health
care system with low accessibility.
Using the Systems Model and the Behavioral Model
Andersen and colleagues conducted a number of analyses of the systems model alone,
the behavioral model alone, and the combination of the systems and behavioral models.
Some hypotheses were supported by the analyses, others were not supported, and still others
were indeterminate. Since the 1970 systems and behavioral models were designed to be
exploratory—unlike the explanatory focus of Andersen's original work in 1968—Andersen
and colleagues did not suggest model revisions based on their results. Rather, they called for
others to undertake international comparisons using their models as "a general frame of
46
reference that can be utilized, altered, and expanded" (Andersen et al., 1970, p. 4), claiming
that their models were "a helpful device for comparing how health service systems are used
by people in different countries" (Andersen et al., 1970, p. 122).
Their reluctance to suggest model revisions was a missed opportunity for improving
the model. Two issues had particularly striking ramifications for research and policy. First,
Andersen and colleagues suggested that access barriers brought about by higher out-of-
pocket payments may be cancelled out by the greater volume and distribution of resources,
implying that one aspect of the systems model might be compensated for by other aspects.
Other results suggested that the process of entry to the health care system was significantly
different from the process of receiving services once in the health care system. Andersen and
colleagues handled this by analyzing system entry and service volume as separate outcomes
in the behavioral model. Alternatively, this could have suggested that the behavioral model
should have two dimensions—an entry dimension and a services received dimension—each
with their own outcome measure.
Phase 2: Theoretical Refinement
Revision #2: Andersen & Newman, 1973
The second revision of the model (Andersen & Newman, 1973) was the first version
to be published as a peer-reviewed paper. This was also the first time the model was
presented as a stand-alone framework rather than being used to explain or explore data (i.e.,
the beginning of the theoretical refinement phase). Andersen and Newman directly linked
the 1970 systems model with the individual determinants of health care use in the behavioral
model to rectify the lack of attention paid to the relationship between individuals and societal
47
forces (Figure 3.4). This also added a level of categorization to the model, with the health
services system and the individual determinants becoming dimensions of the same model.
Model pieces introduced included a new dimension of societal determinants, an individual
determinant subcomponent of evaluated illness, components for use, and the concept of the
degree of mutability of predisposing and enabling components.
The societal determinants dimension was composed of two components: technology
and norms. Societal determinants influenced utilization through two pathways: (a) through
individual determinants and (b) through the health services system, subsequently passing
through individual determinants on the way to utilization. Andersen and Newman provided a
number of illustrative examples for both pathways. Examples for the first pathway covered
each component of individual determinants. Their predisposing component example
described individual health beliefs as directly influenced by changing societal norms about
the value of hospital births over home births, leading to more hospital-based births. Their
example for the enabling component traced an increase in the level of individual health
insurance because of an increase in the value of medical care to society and the subsequent
introduction of government-provided health insurance, leading to more health services
utilization. The illness level component was illustrated by a tuberculosis (TB) example:
technological improvements in treating and preventing tuberculosis (TB) decreased
individual-level illness which in turn decreased utilization of TB hospitals.
The illustrative examples for the second pathway—through the health services
system—included technological improvements in hospitals and changes in mental health
treatment. Technological developments changed hospitals "from a custodial institution for
the poor to a curative institution providing services for the total population" (Andersen &
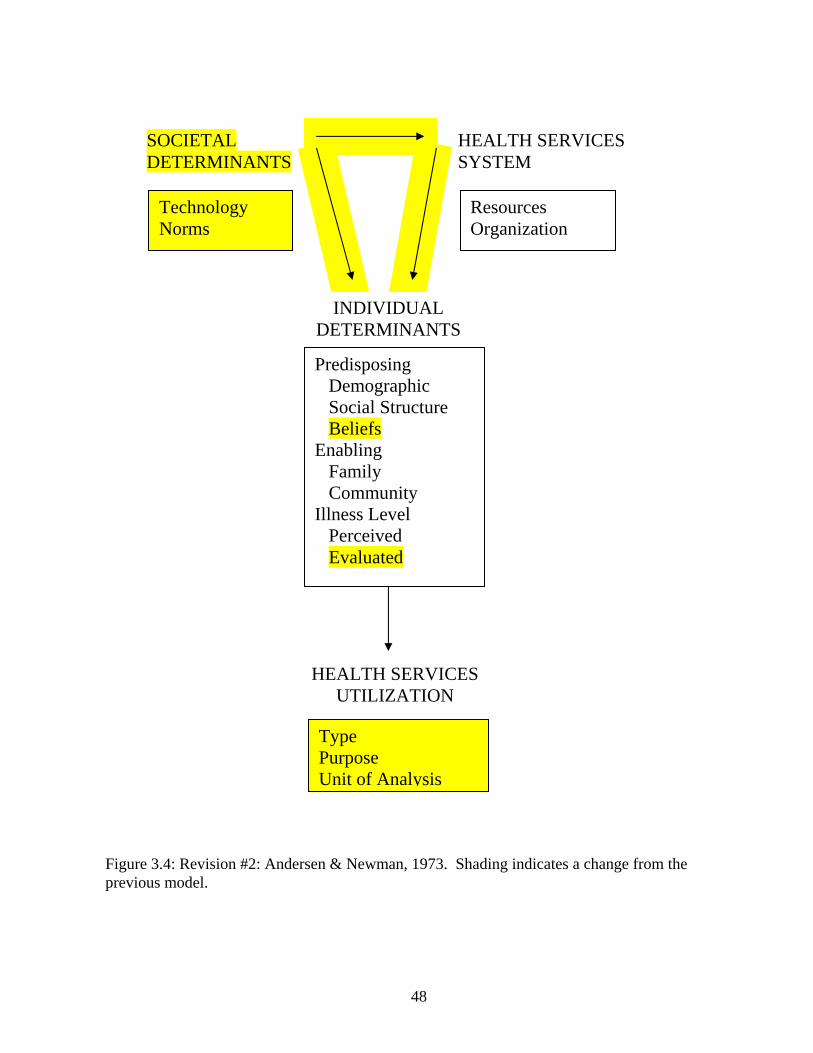
48
HEALTH SERVICES SYSTEM
Technology Norms
Resources Organization
SOCIETAL DETERMINANTS
INDIVIDUAL DETERMINANTS
HEALTH SERVICES UTILIZATION
Type Purpose Unit of Analysis
Predisposing Demographic Social Structure Beliefs Enabling Family Community Illness Level Perceived Evaluated
Figure 3.4: Revision #2: Andersen & Newman, 1973. Shading indicates a change from the previous model.
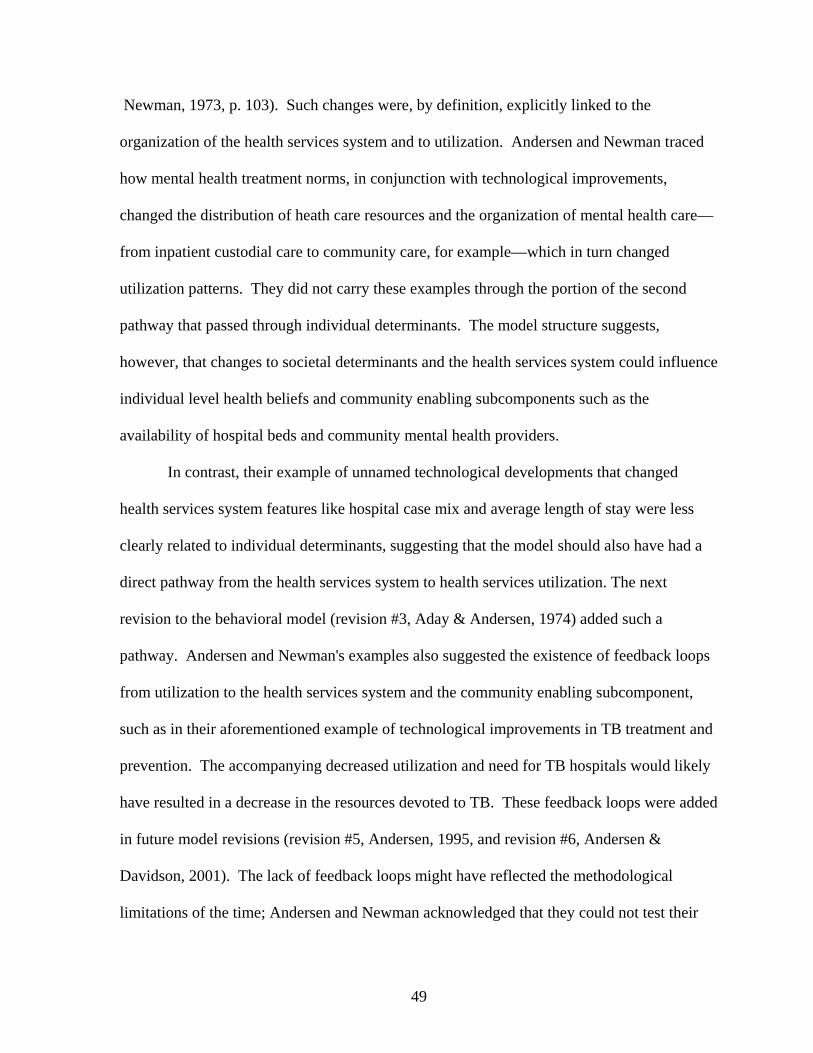
49
Newman, 1973, p. 103). Such changes were, by definition, explicitly linked to the
organization of the health services system and to utilization. Andersen and Newman traced
how mental health treatment norms, in conjunction with technological improvements,
changed the distribution of heath care resources and the organization of mental health care—
from inpatient custodial care to community care, for example—which in turn changed
utilization patterns. They did not carry these examples through the portion of the second
pathway that passed through individual determinants. The model structure suggests,
however, that changes to societal determinants and the health services system could influence
individual level health beliefs and community enabling subcomponents such as the
availability of hospital beds and community mental health providers.
In contrast, their example of unnamed technological developments that changed
health services system features like hospital case mix and average length of stay were less
clearly related to individual determinants, suggesting that the model should also have had a
direct pathway from the health services system to health services utilization. The next
revision to the behavioral model (revision #3, Aday & Andersen, 1974) added such a
pathway. Andersen and Newman's examples also suggested the existence of feedback loops
from utilization to the health services system and the community enabling subcomponent,
such as in their aforementioned example of technological improvements in TB treatment and
prevention. The accompanying decreased utilization and need for TB hospitals would likely
have resulted in a decrease in the resources devoted to TB. These feedback loops were added
in future model revisions (revision #5, Andersen, 1995, and revision #6, Andersen &
Davidson, 2001). The lack of feedback loops might have reflected the methodological
limitations of the time; Andersen and Newman acknowledged that they could not test their
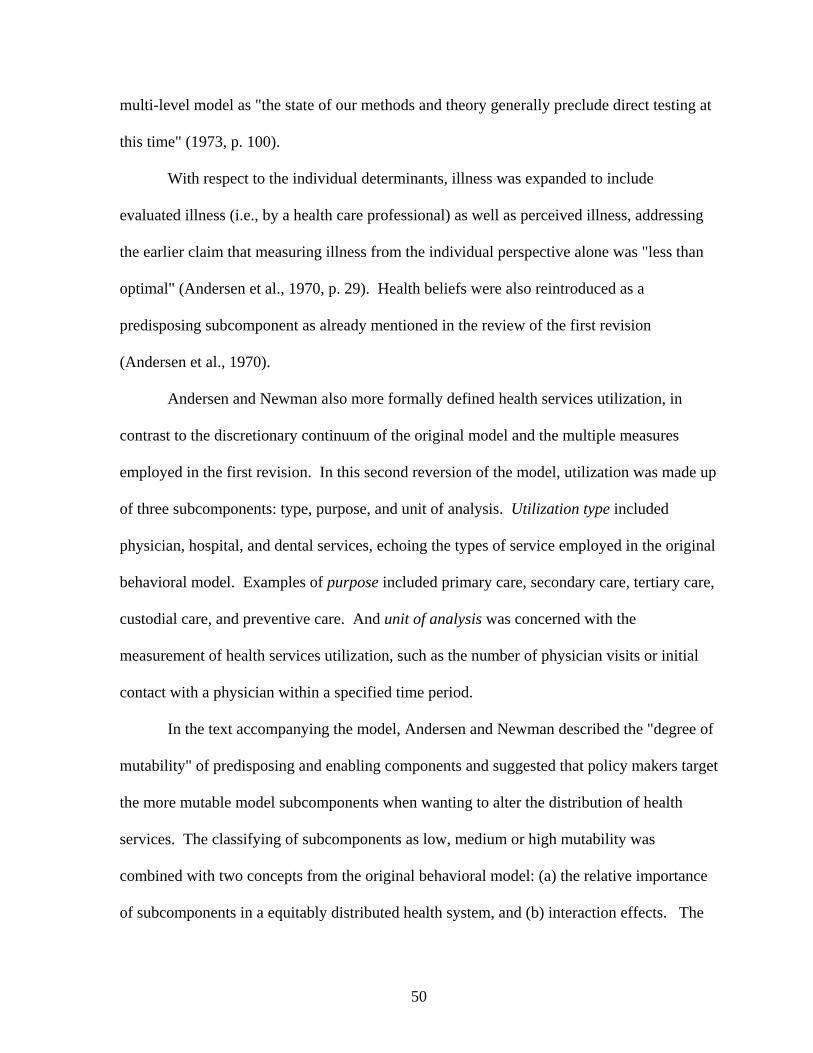
50
multi-level model as "the state of our methods and theory generally preclude direct testing at
this time" (1973, p. 100).
With respect to the individual determinants, illness was expanded to include
evaluated illness (i.e., by a health care professional) as well as perceived illness, addressing
the earlier claim that measuring illness from the individual perspective alone was "less than
optimal" (Andersen et al., 1970, p. 29). Health beliefs were also reintroduced as a
predisposing subcomponent as already mentioned in the review of the first revision
(Andersen et al., 1970).
Andersen and Newman also more formally defined health services utilization, in
contrast to the discretionary continuum of the original model and the multiple measures
employed in the first revision. In this second reversion of the model, utilization was made up
of three subcomponents: type, purpose, and unit of analysis. Utilization type included
physician, hospital, and dental services, echoing the types of service employed in the original
behavioral model. Examples of purpose included primary care, secondary care, tertiary care,
custodial care, and preventive care. And unit of analysis was concerned with the
measurement of health services utilization, such as the number of physician visits or initial
contact with a physician within a specified time period.
In the text accompanying the model, Andersen and Newman described the "degree of
mutability" of predisposing and enabling components and suggested that policy makers target
the more mutable model subcomponents when wanting to alter the distribution of health
services. The classifying of subcomponents as low, medium or high mutability was
combined with two concepts from the original behavioral model: (a) the relative importance
of subcomponents in a equitably distributed health system, and (b) interaction effects. The
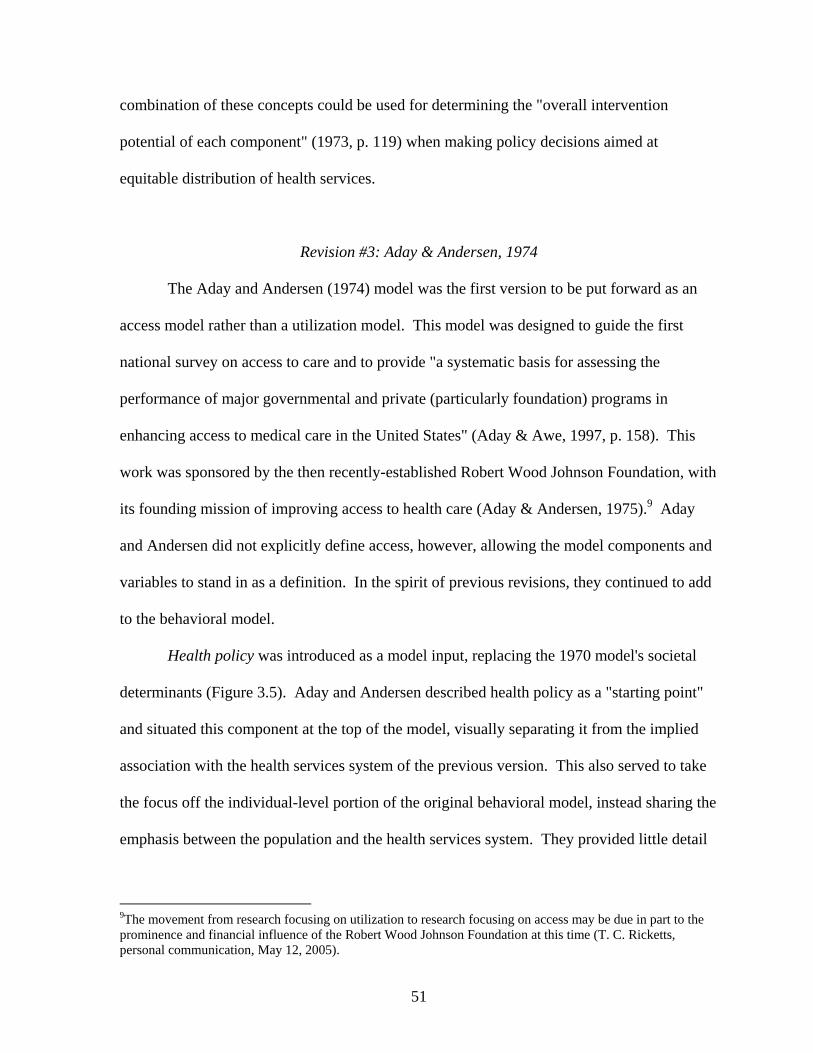
51
combination of these concepts could be used for determining the "overall intervention
potential of each component" (1973, p. 119) when making policy decisions aimed at
equitable distribution of health services.
Revision #3: Aday & Andersen, 1974
The Aday and Andersen (1974) model was the first version to be put forward as an
access model rather than a utilization model. This model was designed to guide the first
national survey on access to care and to provide "a systematic basis for assessing the
performance of major governmental and private (particularly foundation) programs in
enhancing access to medical care in the United States" (Aday & Awe, 1997, p. 158). This
work was sponsored by the then recently-established Robert Wood Johnson Foundation, with
its founding mission of improving access to health care (Aday & Andersen, 1975).9 Aday
and Andersen did not explicitly define access, however, allowing the model components and
variables to stand in as a definition. In the spirit of previous revisions, they continued to add
to the behavioral model.
Health policy was introduced as a model input, replacing the 1970 model's societal
determinants (Figure 3.5). Aday and Andersen described health policy as a "starting point"
and situated this component at the top of the model, visually separating it from the implied
association with the health services system of the previous version. This also served to take
the focus off the individual-level portion of the original behavioral model, instead sharing the
emphasis between the population and the health services system. They provided little detail
9The movement from research focusing on utilization to research focusing on access may be due in part to the prominence and financial influence of the Robert Wood Johnson Foundation at this time (T. C. Ricketts, personal communication, May 12, 2005).
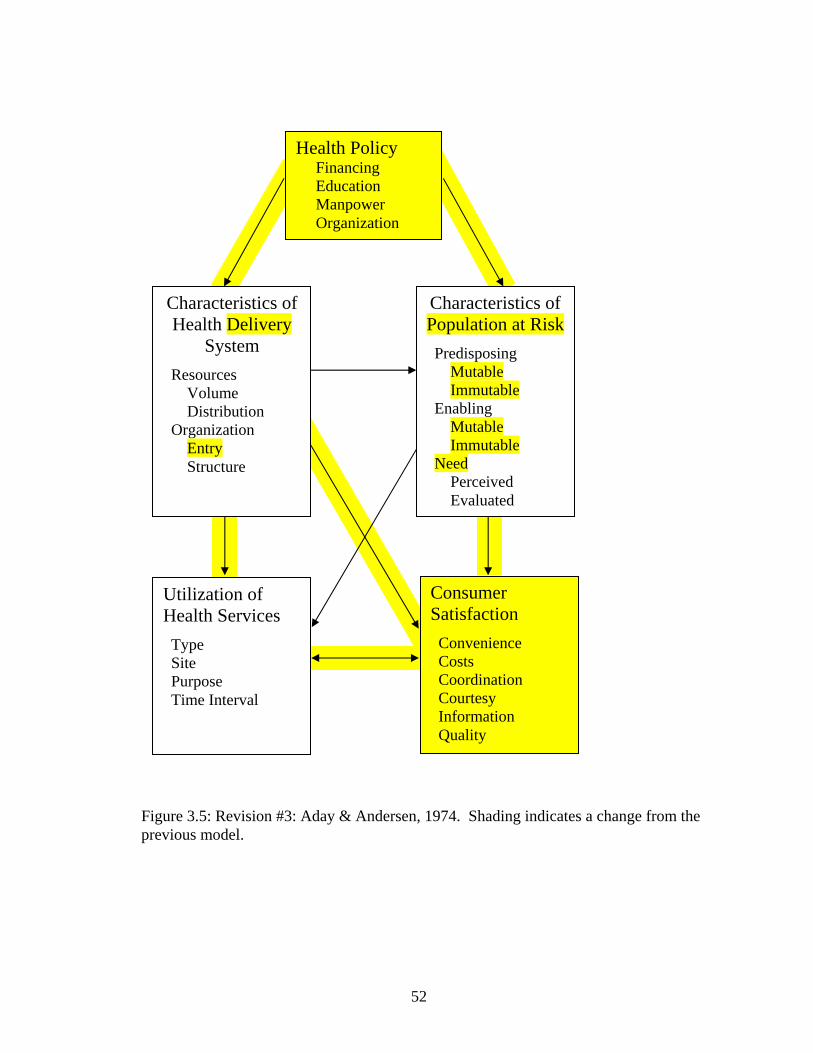
52
Utilization of Health Services
Type Site Purpose Time Interval
Consumer Satisfaction
Convenience Costs Coordination Courtesy Information Quality
Characteristics of Health Delivery
System
Resources Volume Distribution Organization Entry Structure
Characteristics of Population at Risk
Predisposing Mutable Immutable Enabling Mutable Immutable Need Perceived Evaluated
Health Policy Financing Education Manpower Organization
Figure 3.5: Revision #3: Aday & Andersen, 1974. Shading indicates a change from the previous model.
53
about the health policy dimension, including no description of the four components of
financing, education, manpower, and organization.
The health services system dimension was relabeled the health delivery system to
focus on those system aspects related to delivering health care rather than the original
diffuseness of any system aspect. The access subcomponent of organization was decreased
in breadth to include system entry only and was appropriately relabeled entry, resolving the
overlap between the two organization subcomponents in the 1970 model (revision #1). The
health delivery system was also modeled as directly influencing the utilization of health
services (as was suggested but not explicated in revision #2 in 1973) as well as mediated
through individual characteristics.
The individual determinants dimension was relabeled the population at risk, although
the individual was still considered to be the unit of analysis for this portion of the model.
Aday and Andersen did not specify what was meant by "at risk" at this time. Later work
clarified that "at risk" included persons "at greater risk of illness or poorer access to care"
(Aday & Awe, 1997, p. 160), suggesting that the model was only designed for vulnerable
populations (although the model has been used for all types of populations). Previous
predisposing and enabling subcomponents were reclassified as mutable and immutable, using
the mutability concept from the previous revision, and illness level was returned to the
original label of need.
The measurement of utilization was refined slightly from the previous revision's type,
purpose and unit of analysis. Site was added as a fourth component, ensuring more
measurement detail than was provided by the type component alone. Unit of analysis was
54
replaced by time interval, with the specification of subcomponents of the timing for contact,
the volume or the number of contacts in a given time interval, and the continuity of care.
Most significantly, they added consumer satisfaction as a second model output, in
recognition that "use of services was, from a policy perspective, a means to other ends and
outcomes" (Andersen, 1995, p. 6). Consumer satisfaction also represented "patients'
subjective experiences of care seeking in evaluating their access to care" (Aday & Awe,
1997, p. 160). Consumer satisfaction was directly influenced by the characteristics of the
health delivery system and of the population at risk. The two-headed arrow between
consumer satisfaction and the utilization of health services reflected the expected influence
that each has on the other over time. This was the first instance of an explicit feedback loop
in the model.
In later work, Aday and Andersen (1981) used a slightly revised version of this model
to conceptualize and measure equity of access. Aday and others (Aday, Begley, Lairson &
Balkrishnan, 2004; Aday, Begley, Lairson & Slater, 1993; Aday, Begley, Lairson & Slater,
1998) further elaborated on this model, adding equity, efficiency, effectiveness and well-
being as outcomes. Some describe Aday and colleagues' model variations as access models
but I do not. The models may include a reference to access but they are explicitly described
by the authors themselves as a "conceptual framework of equity" (Aday et al., 2004, p. 196;
Aday et al., 1998, p. 179).
Revision #4: Andersen, Marcus & Mahshigan, 1995
The fourth revision of the behavioral model (Andersen et al., 1995) was published in
a dental disease prevention and oral health promotion textbook. Access was not mentioned
55
in this model or the text. The emphasis in this model, rather, was in "comparing the
preventive orientation of oral health care systems" (p. 310). Despite the shift in emphasis,
this model made a number of important changes that were used in future access-oriented
models. Andersen seemed to agree as this model was presented by itself in one of his four
phases of development in his 1994 speech (Andersen, 1995).
There were three significant changes in the structure of the model (Figure 3.6). First,
use was no longer a final outcome. Use was instead modeled as a component of an
intermediate dimension (they used the organizational theory terminology of "throughput")
called health behavior between the model input dimension of primary determinants of health
and the model output dimension of health outcomes. This change was accompanied by the
removal of the feedback loop from consumer satisfaction to health services use (although the
feedback loop reappears in the next revision, Andersen & Davidson, 2001). Second, health
policy was no longer modeled as the primary driver of the model and was now included with
the health care system component. And third, the model took on a more dynamic nature than
previous models, employing feedback loops among the primary determinants of health
components and the health outcomes components.
Andersen and colleagues (1995) also added four components to the model. The
external environment became a third primary determinant of health. The health
subcomponent of the external environment reflected the increasing importance of population
health in health services research (Andersen, 1995). The general subcomponent of the
external environment included the reintroduction of norms from the societal determinants
component of the 1973 model. Other model additions included personal health practices as
a second component of the health behavior dimension, and evaluated health status and
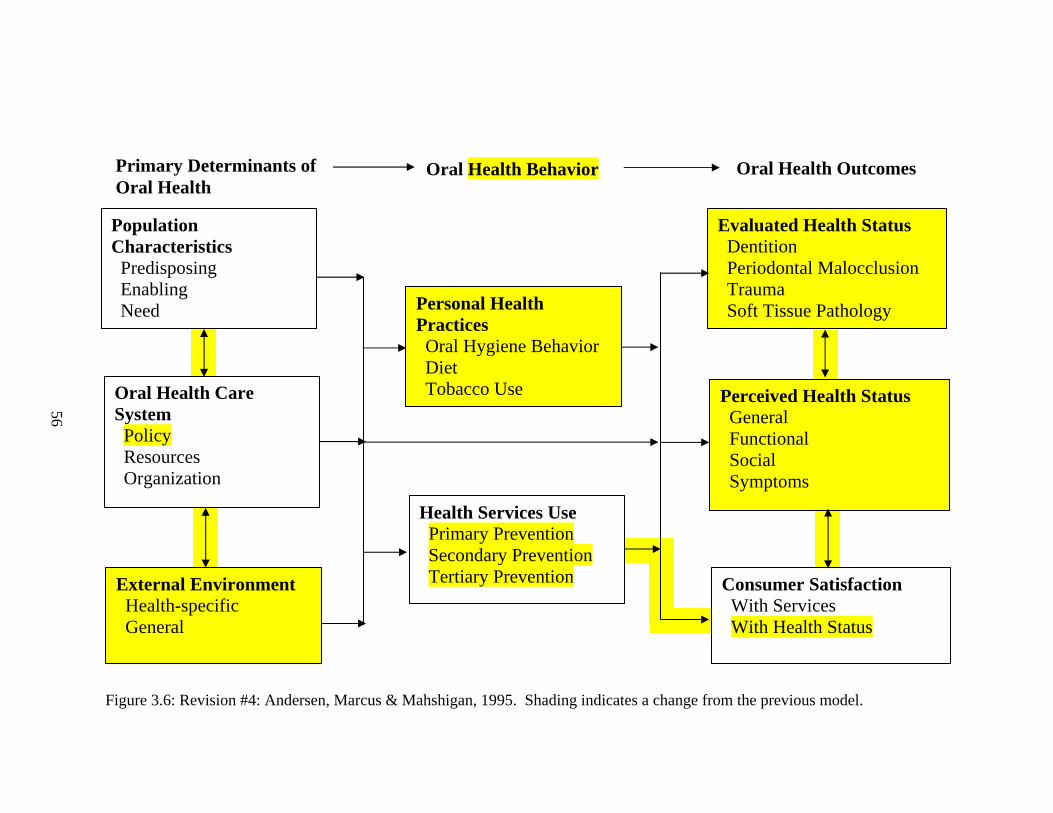
56
Primary Determinants of Oral Health
Oral Health Outcomes
Personal Health Practices Oral Hygiene Behavior Diet Tobacco Use
Health Services Use Primary Prevention Secondary Prevention Tertiary Prevention Consumer Satisfaction
With Services With Health Status
Perceived Health Status General Functional Social Symptoms
Evaluated Health Status Dentition Periodontal Malocclusion Trauma Soft Tissue Pathology
Oral Health Behavior
Population Characteristics Predisposing Enabling Need
Oral Health Care System Policy Resources Organization
External Environment Health-specific General
Figure 3.6: Revision #4: Andersen, Marcus & Mahshigan, 1995. Shading indicates a change from the previous model.
57
perceived health status to accompany consumer satisfaction as health outcomes components.
The two health status components were added to "recogni[ze] that health services are
supposed to have something to do with maintaining and improving the health status of the
population" (Andersen, 1995, p. 6).
Other components were reconceptualized. Health services use, in its new position,
was subdivided according to the level of service (primary, secondary, or tertiary care),
recalling Aday and Andersen's 1974 (revision #3) purpose classification. Consumer
satisfaction was expanded to include satisfaction with health status to complement the
previously introduced subcomponent of satisfaction with health services. This was a one-
time appearance; Satisfaction with health status was not included in future model revisions.
Revision #5: Andersen, 1995
Andersen (1995) introduced the next version of the model at the same time he was
reviewing the history of the behavioral model. He provided no overall definition of access at
this time, despite using the term throughout, but introduced four formal "measures of access"
(Andersen, 1995, p. 4) in relation to the original behavioral model. He provided definitions
for potential access ("the presence of enabling resources"), realized access ("actual use of
services"),10 equitable access ("when demographic and need variables account for most of
the variance in utilization") and inequitable access ("when social structure [e.g., ethnicity],
health beliefs, and enabling resources [e.g., income] determine who gets medical care")
(Andersen, 1995, pp. 4-5). The inclusion of the health status measures in the previous model
version (Andersen et al., 1995) allowed for two additional access measures which were
10The concepts of potential and realized access were first introduced in empirical work by Aday, Andersen and Fleming (1980), which was motivated by the 1974 model revision (Aday & Andersen, 1974).
58
"particularly important for health policy and health reform": effective access ("the use of
health services leading to improved health status or improved satisfaction") and efficient
access ("improving health services use outcomes at the least cost") (Andersen, 1995, p. 6).
Andersen provided few details for the 1995 model revision. The basic structure of the model
changed again when compared with earlier versions (Figure 3.7). The previous primary
determinants of health dimension was divided into two dimensions: population
characteristics and the environment, with the environment dimension situating as the driver
of the model. The feedback loop from population characteristics to the environment shown
in the previous revision was dropped, without reappearing in the future. Other feedback
loops were added to this model revision. Health behavior was modeled as directly linking
back to population characteristics and health outcomes provided feedback to both health
behavior and population characteristics. The link between health outcomes and health
behavior expanded on the 1974 revision's (revision #3) feedback loop from consumer
satisfaction to use. Andersen (1995) credits the earlier addition of health status outcomes (in
the first 1995 model, revision #4) as the motivation for these feedback loops. Two direct
forward links were also added, both expanding on links present in the 1974 revision (and
absent from the first 1995 revision [revision #4]): (a) from the environment to outcomes, and
(b) from population characteristics to outcomes.
The relationship between most of the components was uncertain at this stage.
Arrowless lines linked the health care system and the environment, personal health practices
and use of health services, and perceived health status, evaluated health status and consumer
satisfaction. This ambiguity continued into the next model revision. At this point in the
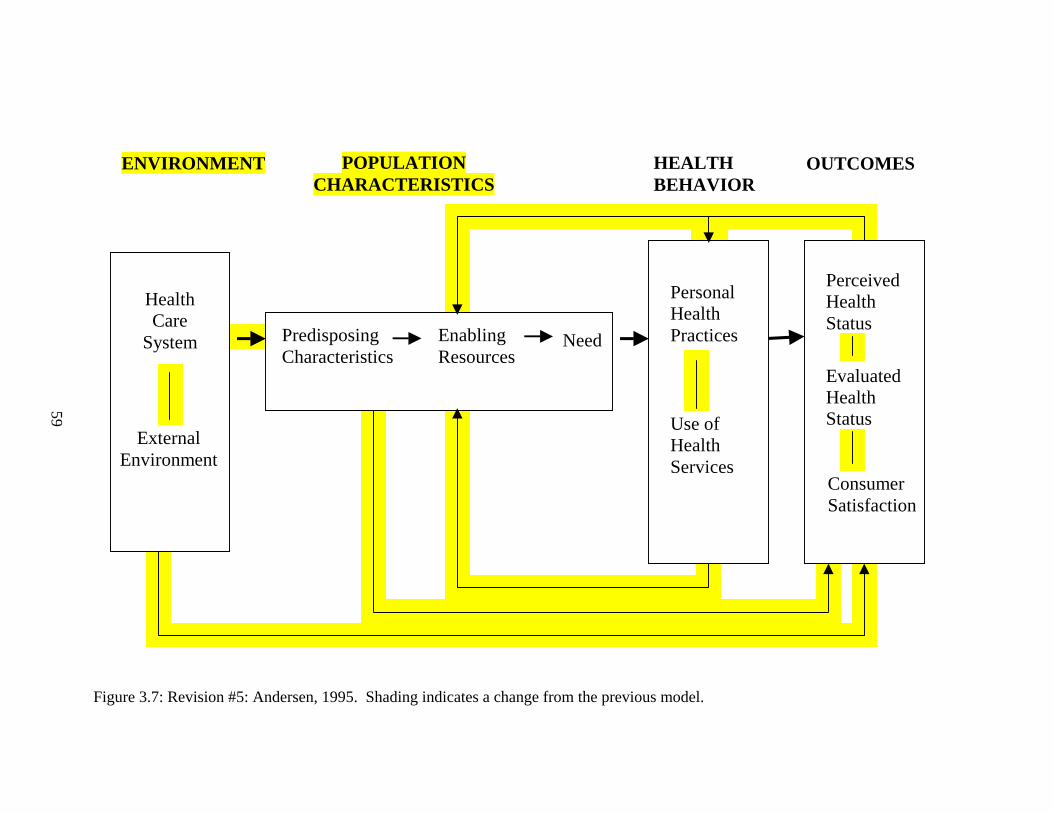
59
Health Care
System
External Environment
Predisposing Characteristics
Enabling Resources
Need
Personal Health Practices
Use of Health Services
Perceived Health Status
Evaluated Health Status
Consumer Satisfaction
ENVIRONMENT POPULATION CHARACTERISTICS
HEALTH BEHAVIOR
OUTCOMES
Figure 3.7: Revision #5: Andersen, 1995. Shading indicates a change from the previous model.
60
model history, perhaps the model shifted to be less about the relationship within the
categories and more about the big picture or the relationship between components.
Revision #6: Andersen & Davidson, 2001
The sixth and most current version of the behavioral model (Andersen & Davidson,
2001) provided another detailed definition of access:
We define access as actual use of personal health services and everything that facilitates or impedes their use. It is the link between health services systems and the populations they serve. Access means not only getting to service but also getting to the right services at the right time to promote improved health outcomes. (p. 3)
They also connected access with three health policy objectives: (a) health services use, (b)
social justice, and (c) health service delivery effectiveness and efficiency.
This revision included significant expansions in the contextual aspects of the model
(Figure 3.8) in response to suggestions by Phillips and colleagues (1998). In a systematic
review of researchers' inclusion of environmental and provider-related variables when using
the behavioral model, Phillips and colleagues found that less than half of researchers
included such variables. They attributed this inattention, in part, to problems with the
behavioral model itself. Phillips and colleagues called for an elaboration of the environment
dimension of the model, particularly with respect to distinguishing between the environment
dimension and the community enabling subcomponent. They also pointed out that the model
did not explicitly include provider-related variables, suggesting that future model revisions
include "provider-patient interactions" (Phillips et al., 1998, p. 590). Andersen and Davidson
(2001) followed these suggestions to the letter with three changes related to context: (a)
expanding the environment dimension, (b) changing the categorization of individual enabling
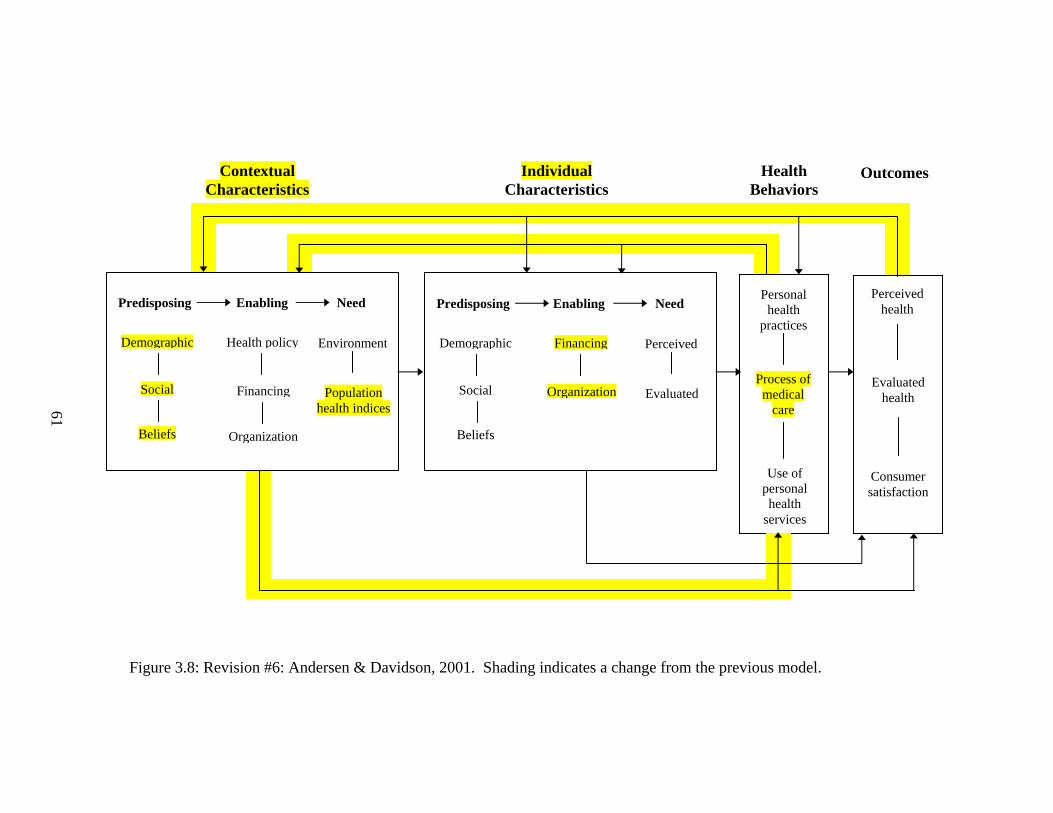
61
Personal health
practices
Process of medical
care
Use of personal health
services
Predisposing Enabling Need
Evaluated
Perceived
Organization
Financing
Social
Beliefs
Demographic
Perceived health
Evaluated health
Consumer satisfaction
Predisposing Enabling Need
Population health indices
Environment
Organization
Financing
Health policy
Social
Beliefs
Demographic
Contextual Characteristics
Individual Characteristics
Health Behaviors
Outcomes
Figure 3.8: Revision #6: Andersen & Davidson, 2001. Shading indicates a change from the previous model.
62
characteristics subcomponents, and (c) adding a component representing provider-patient
interactions.
In the first context-related change, the environment dimension was relabeled
contextual characteristics and subdivided into predisposing, enabling and need components.
Predisposing contextual characteristics, the newest of the three components, included
demographic, social and beliefs subcomponents. This structure mirrored that of the
individual level predisposing component. The beliefs subcomponent of predisposing
contextual characteristics was similar to the norms component of societal determinants in the
1973 revision (revision #2) and the general external environment subcomponent of the first
1995 revision (revision #4). Demographic and social predisposing contextual characteristics
captured the influence of community characteristics on health and health care services.
Examples provided by Andersen and Davidson included differing health services available in
communities with large senior or child populations (demographic variables) and the
community support for health and access to health services arising from educational levels or
racial and ethnic composition (social variables). Enabling contextual characteristics
encompassed the health care system portion of earlier models. Similarly, need contextual
characteristics replaced the external environment portion of the two 1995 models (revisions
#4 and #5). What was previously called health-specific external environment characteristics
was simply relabeled environmental and what was previously called general external
environment was relabeled population health, further reflecting the influence of population
health on the later revisions of the model.
In the second context-related change, Andersen and Davidson changed the individual-
dimension enabling characteristics subcomponents from individual and community to
63
financing and organization. This new categorization reduced the overlap between the
environment and individual-dimension enabling characteristics (specifically the community
subcomponent) while also mirroring the subcomponents of the contextual-dimension
enabling characteristics. One consequence of this new categorization was the regrouping of
enabling variables. For example, where an individual's health insurance status and whether
an individual had a usual source of care were previously categorized together under the
individual subcomponent, the former became a financing variable and the latter an
organization variable.
The third context-related change was the addition of provider-patient interactions—
labeled the process of medical care—as a component of health behaviors. This resulted in a
model with a parallel structure in the second half of the model as well as in the first half.
Other model changes were not related to context. The measurement of health
services use was no longer formally defined nor detailed with subcomponents. Andersen and
Davidson instead referenced the original behavioral model's discretionary continuum as well
as indicating the importance of both specific and global measures of use. Examples that they
provided included treatment used for rheumatoid arthritis as a specific measure of use and
number of physician visits as a global measure of use.
More links were added between model components. The direct influence of
contextual characteristics on health behaviors shown in the first 1995 revision (revision #4)
was reintroduced after being dropped in the intervening model revision. The feedback loops
of the previous revision were expanded, with new feedback loops from outcomes to
contextual characteristics and health behaviors to contextual characteristics. This resulted in
a model with direct links to and from all components of the model, excepting a feedback loop
64
from individual characteristics to contextual characteristics.11 Not surprisingly, Andersen
and Davidson described feedback as "central to the model" (2001, p. 9).
OTHER ACCESS THEORIES
The Andersen model's striking longevity and many revisions resulted, at least in part,
from the model's high profile and use. No other access theory is as well known or well used.
That being said, other access theories still contribute to explaining how health services
researchers have approached the study of access.
Other access theories have taken one of two approaches to developing their models:
(a) breaking the concept down into component parts, or (b) detailing the multiple influences
that produce access outcomes, a la Andersen and colleagues.
Component Parts Theories
Penchansky, 1977
Penchansky (1977) proposed a model of access as the "fit" between the users of the
health care system and the health care system itself. The degree of the fit influences service
utilization, patient satisfaction, and provider practice patterns (Penchansky & Thomas, 1981)
through five dimensions: availability, accessibility, accommodation, affordability, and
acceptability (Penchansky, 1977). Availability is the relationship between the health care
resources and services and the users' needs, such as the adequacy of the physician supply.
Accessibility is concerned with the relationship between the geographic location of the health
care resources and the users, such as the time needed to travel to care. Accommodation is the
11The modeling of individual characteristics influencing contextual characteristics was introduced in an earlier model (revision #4, Andersen, Marcus & Mahshigan, 1995) but not carried forward to later models (revision #5, Andersen, 1995, and revision #6, Andersen & Davidson, 2001).
65
relationship between the organization of resources and the users' ability to adapt to this
organization, such as a physician's office hours. Users' perceptions about the organization of
services are also included under accommodation. Affordability refers to the relationship
between the price of services or the design of insurance and the users ability to cover the
costs, whether through out of pocket payments or insurance. The level of co-payments and
deductibles in health insurance plans is one example of affordability. Acceptability refers to
providers' willingness to interact with users and vice versa, such as a woman's preference for
a female obstetrician-gynecologist or a provider's unwillingness to accept Medicaid clients.
Penchansky proposed these access dimensions in work commissioned by the U.S.
federal Department of Health, Education, and Welfare to clarify the definition of access. He
critically synthesized the access literature, including early versions of the Andersen
behavioral model. Penchansky adopted Donabedian's (1973) definition of access as the
interaction between health care users and the health care supply,12 and explicitly rejected
others that "define access as all factors that influence use" (Penchansky, 1977, p. 31).
Penchansky compared his approach to Andersen's early work, describing his measure of fit
as similar to Andersen's enabling variables. To Penchansky, the concept of access was
distinct from Andersen's concepts of need and predisposing factors, although Penchansky
acknowledged that access, need and predisposing factors partially overlap in their influence
on use.
Penchansky and Thomas (1981) tested this conceptualization using data from a
patient satisfaction survey. They found support for construct validity and dimensional
12Donabedian (1973) described two types of access: socio-organizational accessibility, or the interaction or fit between the source of care and the client, and geographical accessibility, which was concerned with spatial aspects of access to care. Penchansky (1977) only acknowledged the first type of access.
66
validity13 for the five dimensions. In other words, the five dimensions were shown to map
onto phenomenon thought to relate to each dimension as well as to be distinct from one
another.14 These results are not generalizable as the survey was small (287 people answered
all of the satisfaction questions) and was only administered to a fairly homogeneous
population of spouses of hourly employees from one manufacturing plant (with unspecified
insurance status).
They also examined the influence of access on utilization using the same patient
satisfaction survey, hypothesizing that access influenced utilization through patient
satisfaction (Thomas & Penchansky, 1984). This pathway contrasts with the direct link
between access and utilization described in their earlier work (Penchansky & Thomas, 1981).
This later work also indicated that socio-demographic characteristics of patients were a
necessary consideration in explaining variation in the relationship between patient
satisfaction with the access dimensions and service utilization. In other words, Penchansky's
access conceptualization (similar to Andersen's enabling factor) was unable to explain
utilization without the addition of variables resembling those in Andersen's predisposing
factor. Testing the direct influence of their access conceptualization on utilization (rather
than mediated through the outcome of patient satisfaction) would have been truer to
Penchansky's original model. No such testing has been reported by Penchansky or Thomas.
13I provided the dimensional validity label, which I believe best describes the investigation undertaken by Penchansky and Thomas (1981). They used the label discriminate validity, which usually indicates the ability of a measurement tool to distinguish between persons with high and low outcomes (in this case, high and low access). They did not undertake such an investigation. 14Penchansky and Thomas considered the correlations between the access dimensions as supportive of dimensional/discriminant validity in 1981 (i.e., not showing a high degree of correlation). They later described these same data as showing a "high degree of correlation" (Thomas & Penchansky, 1984, p. 562).
67
Tanahasi, 1978
Another component parts model used in studying access is Tanahasi's (1978)
coverage stages. Tanahasi described coverage as the interaction between the health care
system and the individuals intended to be served by the health care system. The emphasis on
the interaction between the system and the individual is similar to Penchansky's (1977)
degree of fit. Unlike Penchansky, Tanahasi proposed a hierarchy of measures, with each
level in the hierarchy a subset of previous levels (Figure 3.9). Each stage can be expressed in
terms of population ratios with the number of persons meeting the specific stage as the
numerator and the total population as the denominator. The first stage in the hierarchy,
availability coverage, is concerned with the capacity of available resources and the amount
of services available to be offered to a population. Accessibility coverage, the second stage,
is concerned with the number of people who can use the service (with the ability to use
services defined as services located within a "reasonable reach" p. 296). The numerator of
the third stage, acceptability coverage, is the willingness of people to use the services. The
number of people who actually use the health care services, or contact coverage, is the fourth
level. The fifth and final level, or effectiveness coverage, includes people who have received
effective health care. These five coverage stages can also be divided into two categories:
potential coverage (availability coverage, accessibility coverage, and acceptability coverage)
and actual coverage (contact coverage and effectiveness coverage).
As shown in Figure 3.9, Tanahasi graphed the coverage stages to develop an
operation curve. Smooth operation curves indicate well-designed services. Operation curves
that move sharply to the left (i.e., there is a large difference between two neighboring
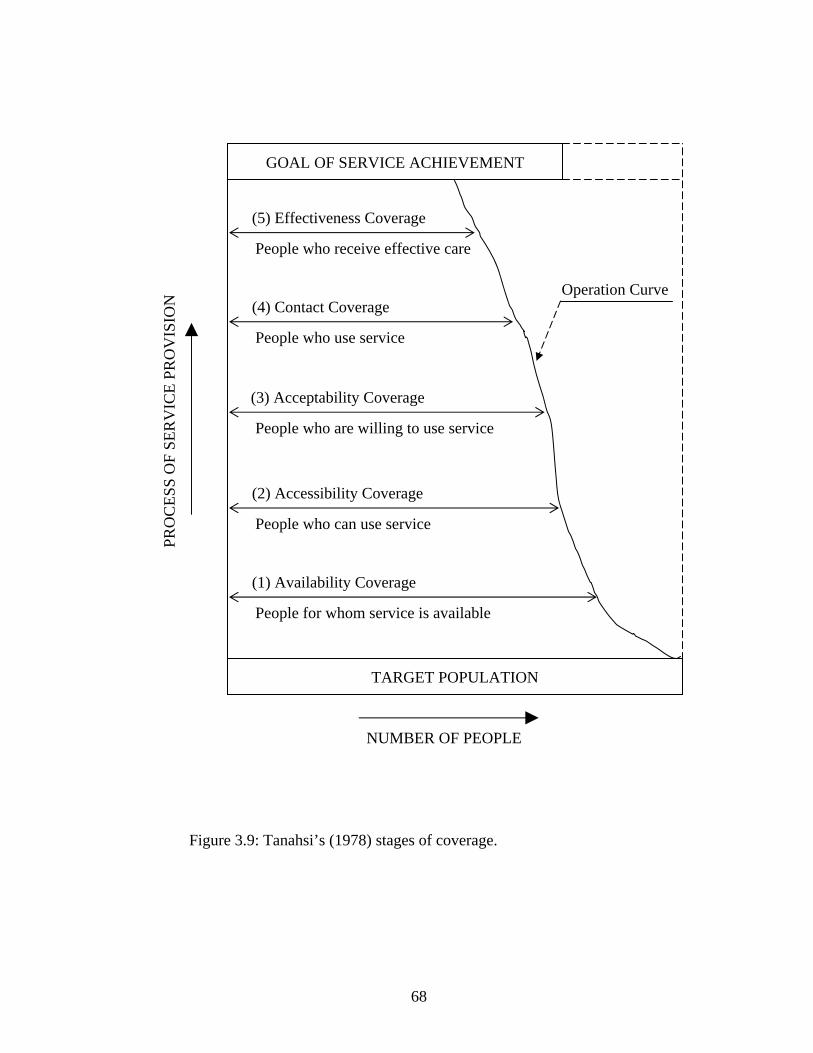
68
(1) Availability Coverage
People for whom service is available
(2) Accessibility Coverage
People who can use service
(3) Acceptability Coverage
People who are willing to use service
(4) Contact Coverage
People who use service
(5) Effectiveness Coverage
People who receive effective care
TARGET POPULATION
GOAL OF SERVICE ACHIEVEMENT PR
OC
ESS
OF
SER
VIC
E PR
OV
ISIO
N
NUMBER OF PEOPLE
Figure 3.9: Tanahsi’s (1978) stages of coverage.
Operation Curve
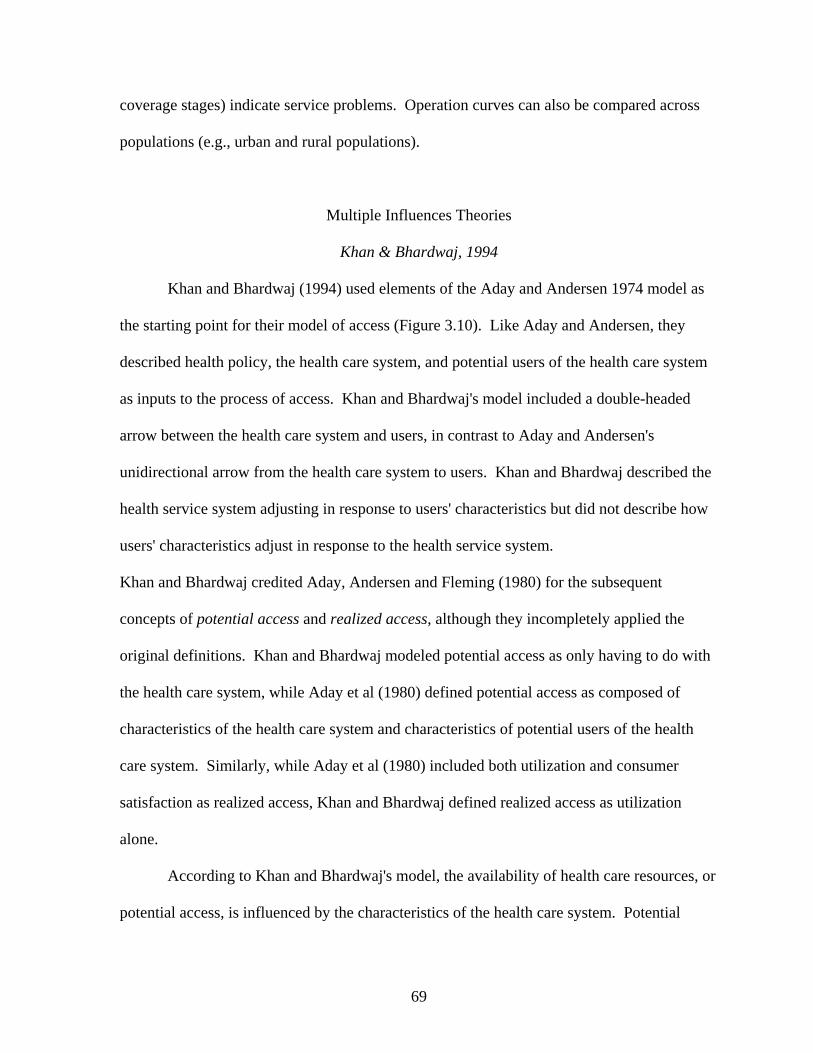
69
coverage stages) indicate service problems. Operation curves can also be compared across
populations (e.g., urban and rural populations).
Multiple Influences Theories
Khan & Bhardwaj, 1994
Khan and Bhardwaj (1994) used elements of the Aday and Andersen 1974 model as
the starting point for their model of access (Figure 3.10). Like Aday and Andersen, they
described health policy, the health care system, and potential users of the health care system
as inputs to the process of access. Khan and Bhardwaj's model included a double-headed
arrow between the health care system and users, in contrast to Aday and Andersen's
unidirectional arrow from the health care system to users. Khan and Bhardwaj described the
health service system adjusting in response to users' characteristics but did not describe how
users' characteristics adjust in response to the health service system.
Khan and Bhardwaj credited Aday, Andersen and Fleming (1980) for the subsequent
concepts of potential access and realized access, although they incompletely applied the
original definitions. Khan and Bhardwaj modeled potential access as only having to do with
the health care system, while Aday et al (1980) defined potential access as composed of
characteristics of the health care system and characteristics of potential users of the health
care system. Similarly, while Aday et al (1980) included both utilization and consumer
satisfaction as realized access, Khan and Bhardwaj defined realized access as utilization
alone.
According to Khan and Bhardwaj's model, the availability of health care resources, or
potential access, is influenced by the characteristics of the health care system. Potential
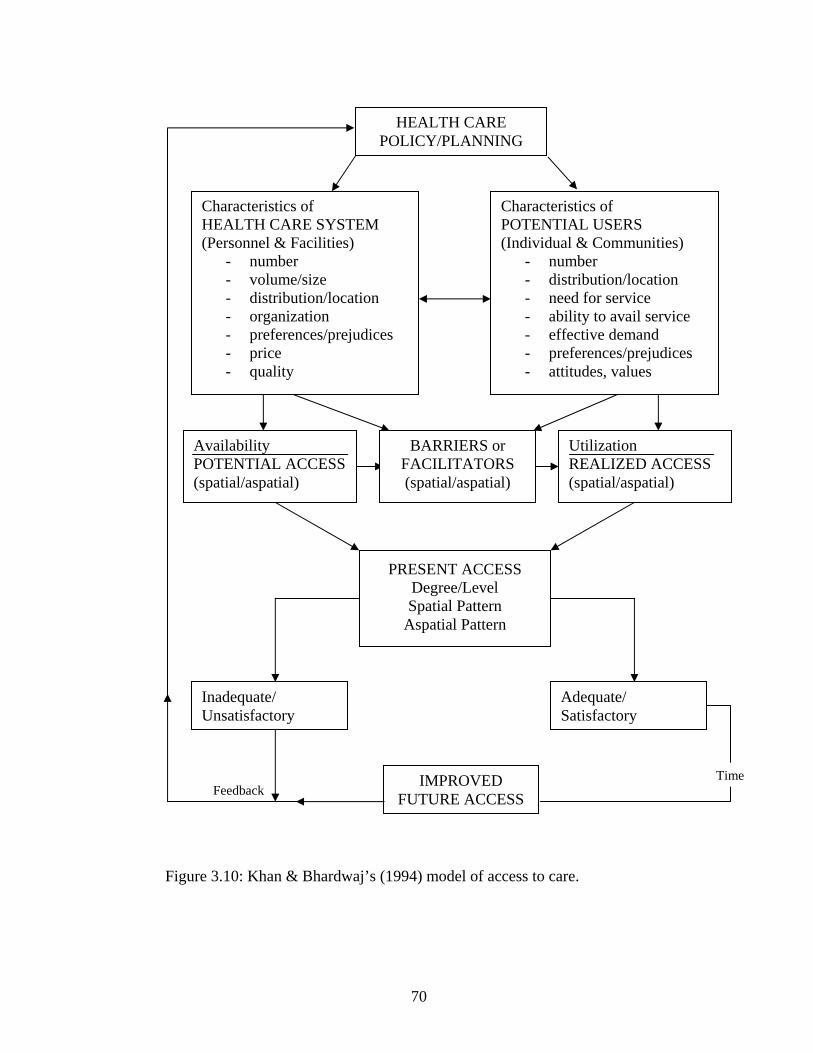
70
Characteristics of HEALTH CARE SYSTEM (Personnel & Facilities)
- number - volume/size - distribution/location - organization - preferences/prejudices - price - quality
Characteristics of POTENTIAL USERS (Individual & Communities)
- number - distribution/location - need for service - ability to avail service - effective demand - preferences/prejudices - attitudes, values
HEALTH CARE POLICY/PLANNING
Availability POTENTIAL ACCESS (spatial/aspatial)
Utilization REALIZED ACCESS (spatial/aspatial)
PRESENT ACCESS Degree/Level Spatial Pattern
Aspatial Pattern
Inadequate/ Unsatisfactory
Adequate/ Satisfactory
IMPROVED FUTURE ACCESS
Figure 3.10: Khan & Bhardwaj’s (1994) model of access to care.
BARRIERS or FACILITATORS (spatial/aspatial)
Feedback Time
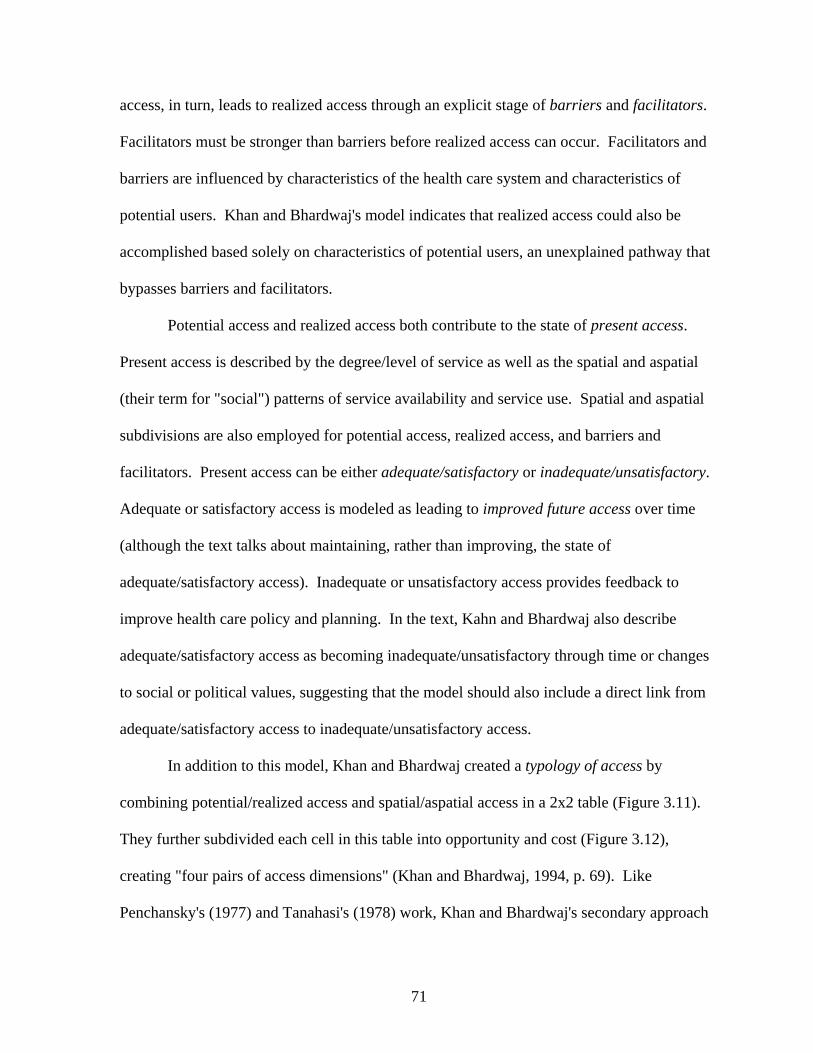
71
access, in turn, leads to realized access through an explicit stage of barriers and facilitators.
Facilitators must be stronger than barriers before realized access can occur. Facilitators and
barriers are influenced by characteristics of the health care system and characteristics of
potential users. Khan and Bhardwaj's model indicates that realized access could also be
accomplished based solely on characteristics of potential users, an unexplained pathway that
bypasses barriers and facilitators.
Potential access and realized access both contribute to the state of present access.
Present access is described by the degree/level of service as well as the spatial and aspatial
(their term for "social") patterns of service availability and service use. Spatial and aspatial
subdivisions are also employed for potential access, realized access, and barriers and
facilitators. Present access can be either adequate/satisfactory or inadequate/unsatisfactory.
Adequate or satisfactory access is modeled as leading to improved future access over time
(although the text talks about maintaining, rather than improving, the state of
adequate/satisfactory access). Inadequate or unsatisfactory access provides feedback to
improve health care policy and planning. In the text, Kahn and Bhardwaj also describe
adequate/satisfactory access as becoming inadequate/unsatisfactory through time or changes
to social or political values, suggesting that the model should also include a direct link from
adequate/satisfactory access to inadequate/unsatisfactory access.
In addition to this model, Khan and Bhardwaj created a typology of access by
combining potential/realized access and spatial/aspatial access in a 2x2 table (Figure 3.11).
They further subdivided each cell in this table into opportunity and cost (Figure 3.12),
creating "four pairs of access dimensions" (Khan and Bhardwaj, 1994, p. 69). Like
Penchansky's (1977) and Tanahasi's (1978) work, Khan and Bhardwaj's secondary approach
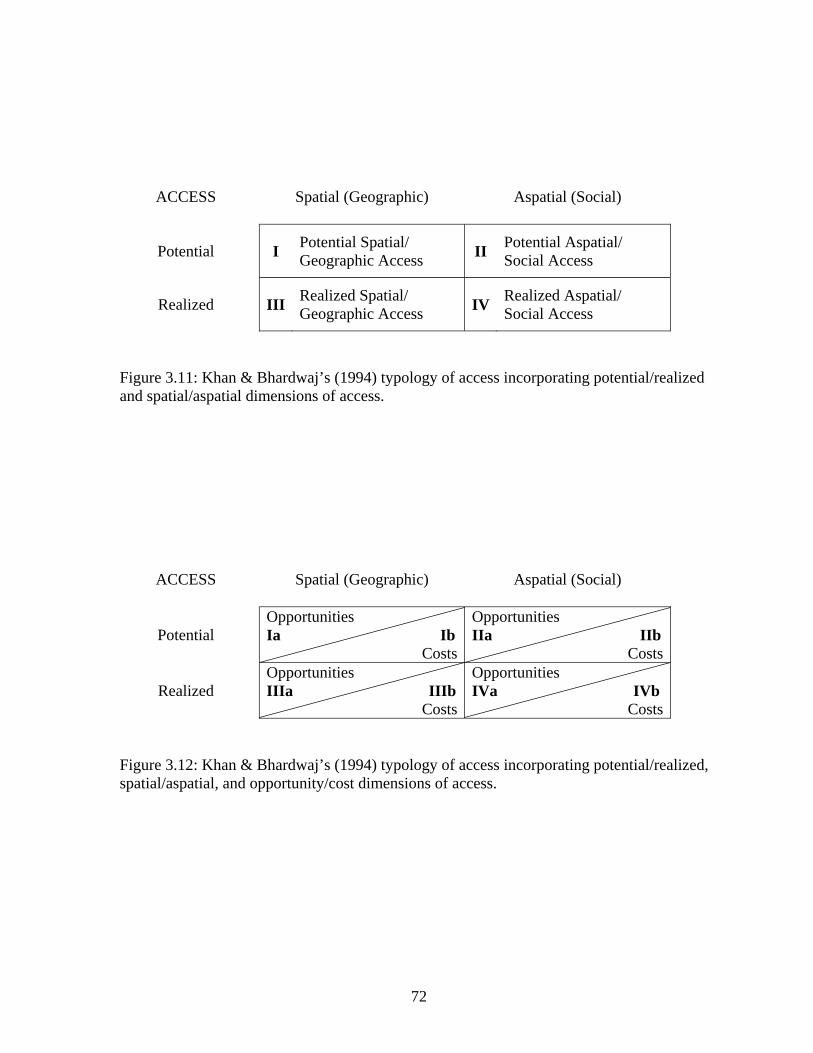
72
ACCESS Spatial (Geographic)
Aspatial (Social)
Potential I Potential Spatial/ Geographic Access II Potential Aspatial/
Social Access
Realized III Realized Spatial/ Geographic Access IV Realized Aspatial/
Social Access
Figure 3.11: Khan & Bhardwaj’s (1994) typology of access incorporating potential/realized and spatial/aspatial dimensions of access.
ACCESS Spatial (Geographic)
Aspatial (Social)
Potential Opportunities Ia Ib
Costs
Opportunities IIa IIb
Costs
Realized Opportunities IIIa IIIb
Costs
Opportunities IVa IVb
Costs Figure 3.12: Khan & Bhardwaj’s (1994) typology of access incorporating potential/realized, spatial/aspatial, and opportunity/cost dimensions of access.
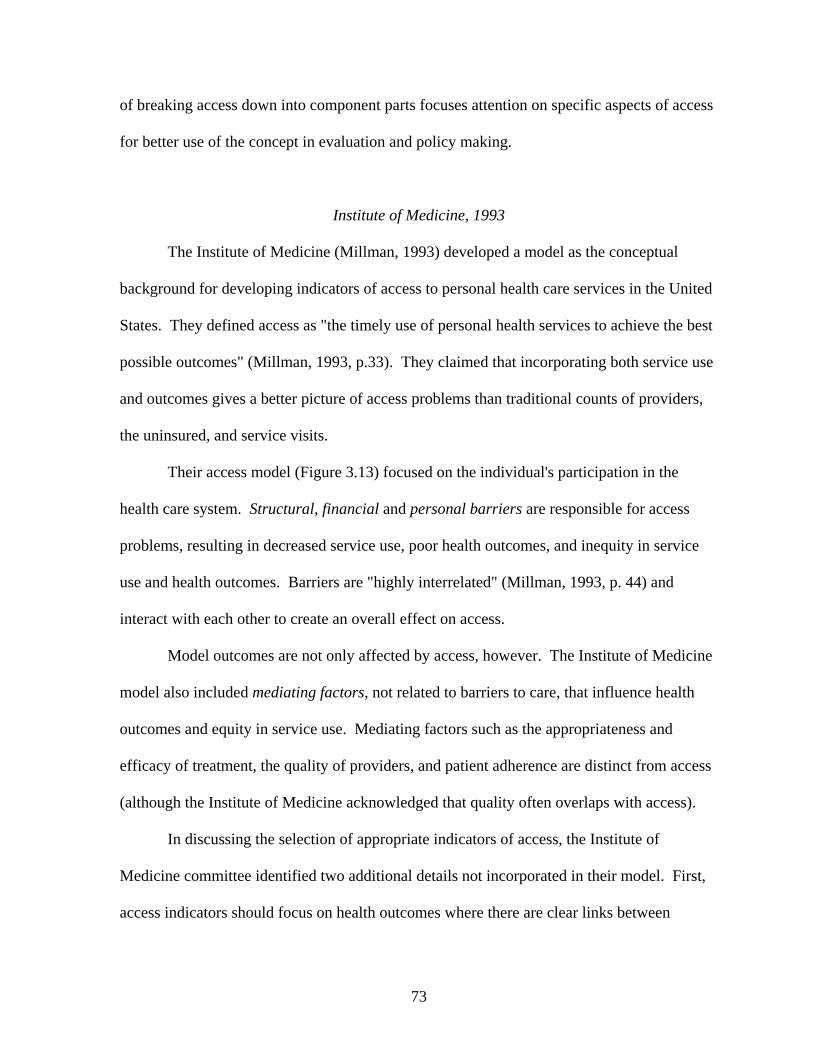
73
of breaking access down into component parts focuses attention on specific aspects of access
for better use of the concept in evaluation and policy making.
Institute of Medicine, 1993
The Institute of Medicine (Millman, 1993) developed a model as the conceptual
background for developing indicators of access to personal health care services in the United
States. They defined access as "the timely use of personal health services to achieve the best
possible outcomes" (Millman, 1993, p.33). They claimed that incorporating both service use
and outcomes gives a better picture of access problems than traditional counts of providers,
the uninsured, and service visits.
Their access model (Figure 3.13) focused on the individual's participation in the
health care system. Structural, financial and personal barriers are responsible for access
problems, resulting in decreased service use, poor health outcomes, and inequity in service
use and health outcomes. Barriers are "highly interrelated" (Millman, 1993, p. 44) and
interact with each other to create an overall effect on access.
Model outcomes are not only affected by access, however. The Institute of Medicine
model also included mediating factors, not related to barriers to care, that influence health
outcomes and equity in service use. Mediating factors such as the appropriateness and
efficacy of treatment, the quality of providers, and patient adherence are distinct from access
(although the Institute of Medicine acknowledged that quality often overlaps with access).
In discussing the selection of appropriate indicators of access, the Institute of
Medicine committee identified two additional details not incorporated in their model. First,
access indicators should focus on health outcomes where there are clear links between
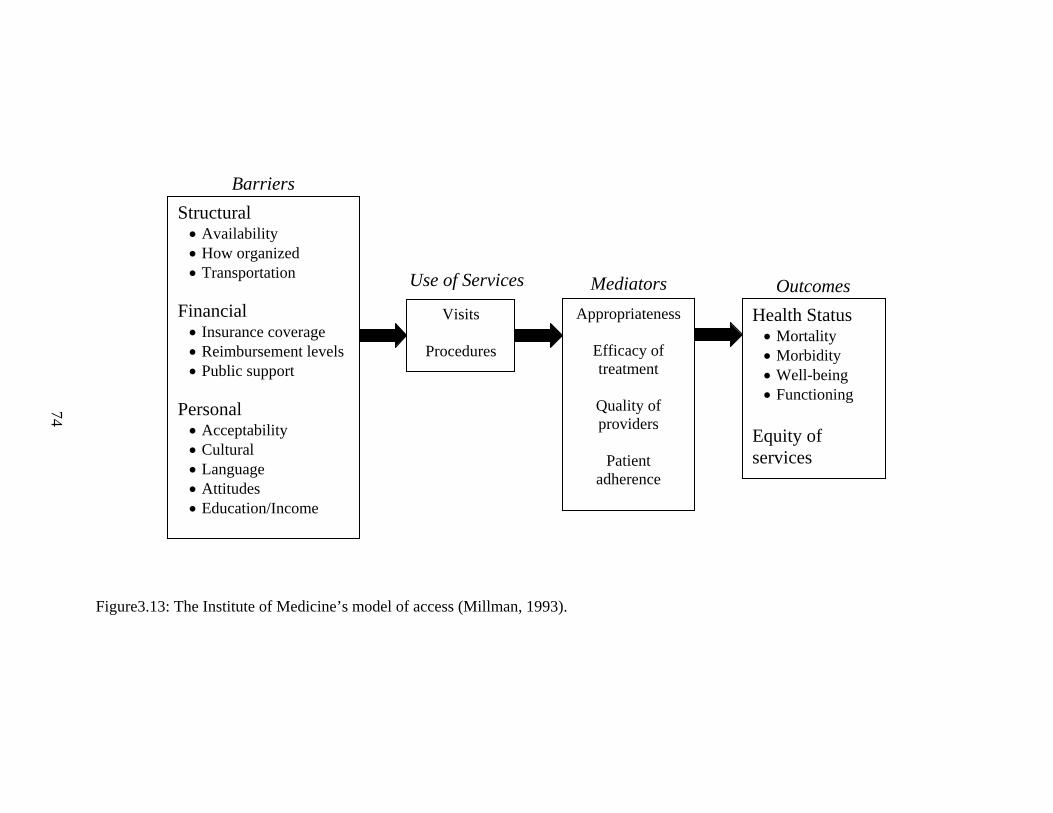
74
Figure3.13: The Institute of Medicine’s model of access (Millman, 1993).
Structural • Availability • How organized • Transportation
Financial • Insurance coverage • Reimbursement levels • Public support
Personal • Acceptability • Cultural • Language • Attitudes • Education/Income
Barriers
Visits
Procedures
Use of Services
Appropriateness
Efficacy of treatment
Quality of providers
Patient
adherence
Mediators
Health Status • Mortality • Morbidity • Well-being • Functioning
Equity of services
Outcomes
75
services and desired benefits rather than health outcomes with poor treatment or preventive
services. Second, utilization must also be linked to need to address service overuse and
underuse not related to access problems. The Institute of Medicine committee identified 15
sentinel access indicators, including adequacy of prenatal care, incidence of vaccine-
preventable childhood diseases, breast and cervical cancer screening procedures, avoidable
hospitalization for chronic diseases, and percentage of healthy individuals who do not contact
a physician during an acute episode of illness.
Gold, 1998
Gold (1998) later built on the Institute of Medicine model to specifically examine
access within managed care settings (Figure 3.14). In place of the Institute of Medicine's
structural, financial and personal barriers to accessing care, Gold listed the structural,
financial, and personal determinants of plan selection. Plan selection was followed by health
plan choice/enrollment on the way to service use. She also expanded the Institute of
Medicine's mediators and outcomes and added model components for the associated health
plan and delivery system and the determinants of continuity of enrollment. Many arrows
detailed the relationships between model components although none of these relationships
were explained by Gold.
Gold's model is the most specialized of the theories presented in this chapter. This
specification comes at the expense of wide application, as this theory is only applicable to the
United States during managed care's peak.
76
Figure 3.14: Gold’s (1998) revised Institute of Medicine model for access accounting for managed care systems
Determinants of Plan Selection Structural Available plan choices and
characteristics/reputation Associated characteristics of provider
networks/reputation Extent/nature of active marketing and
information available on choices/plan characteristics
Market characteristics (e.g., % HMO penetration, managed care maturity)
Financial Premium, benefits, cost sharing Other supplemental coverage through
self/spouse and any external subsidy Income and liquid financial assets Personal Knowledge/assumptions re managed
care and requirements Previous experience with managed care
and existing attitudes Existing physician relationships/care-
seeking behavior Demographics and socioeconomic
characteristics Health/disability status and any special
needs Other special needs (e.g., geographical
mobility)
Use of Services
Visits/Procedures
Mediators
Appropriateness Efficacy of treatment
Quality of providers Quality of care
Patient adherence Timeliness of initial treatment re illness
Complicating patients
conditions/factors Continuity of care
Clinical and Policy Outcomes
Health Status
Mortality Morbidity Well-being Functioning
Equity of service and enrollment
Equity of
resource use
Health Plan Choice/Enrollment
Associated Health Plan and Delivery System
Hours and locations of service
(including any provider subsystems) Provider mix/network size/waiting time Gatekeeper and referral rules Utilization management and quality
oversight Active outreach/education—new,
existing members Transportation/cultural acceptability Administrative accessibility
Determinants of Continuity of Enrollment
Patient satisfaction Provider satisfaction/stability of
network/turnover Stability of plan/plan participation Stability of service area/patient location Stability of health plan choices Changing patient needs and status Death
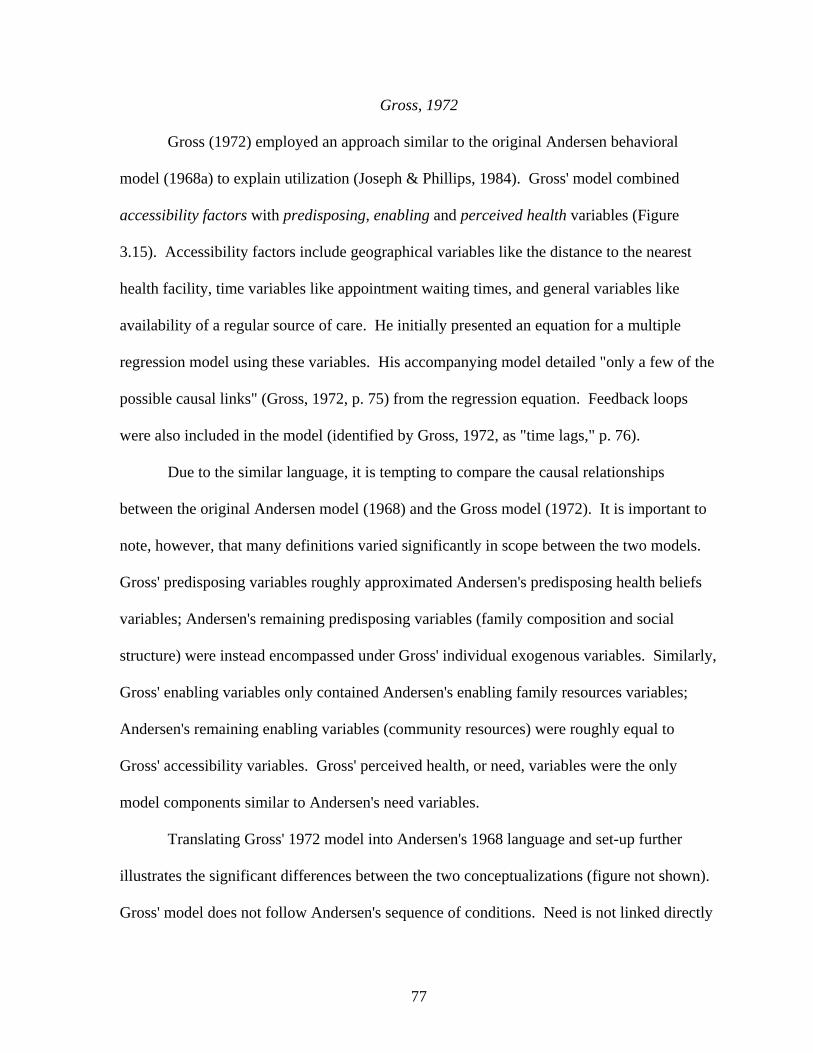
77
Gross, 1972
Gross (1972) employed an approach similar to the original Andersen behavioral
model (1968a) to explain utilization (Joseph & Phillips, 1984). Gross' model combined
accessibility factors with predisposing, enabling and perceived health variables (Figure
3.15). Accessibility factors include geographical variables like the distance to the nearest
health facility, time variables like appointment waiting times, and general variables like
availability of a regular source of care. He initially presented an equation for a multiple
regression model using these variables. His accompanying model detailed "only a few of the
possible causal links" (Gross, 1972, p. 75) from the regression equation. Feedback loops
were also included in the model (identified by Gross, 1972, as "time lags," p. 76).
Due to the similar language, it is tempting to compare the causal relationships
between the original Andersen model (1968) and the Gross model (1972). It is important to
note, however, that many definitions varied significantly in scope between the two models.
Gross' predisposing variables roughly approximated Andersen's predisposing health beliefs
variables; Andersen's remaining predisposing variables (family composition and social
structure) were instead encompassed under Gross' individual exogenous variables. Similarly,
Gross' enabling variables only contained Andersen's enabling family resources variables;
Andersen's remaining enabling variables (community resources) were roughly equal to
Gross' accessibility variables. Gross' perceived health, or need, variables were the only
model components similar to Andersen's need variables.
Translating Gross' 1972 model into Andersen's 1968 language and set-up further
illustrates the significant differences between the two conceptualizations (figure not shown).
Gross' model does not follow Andersen's sequence of conditions. Need is not linked directly
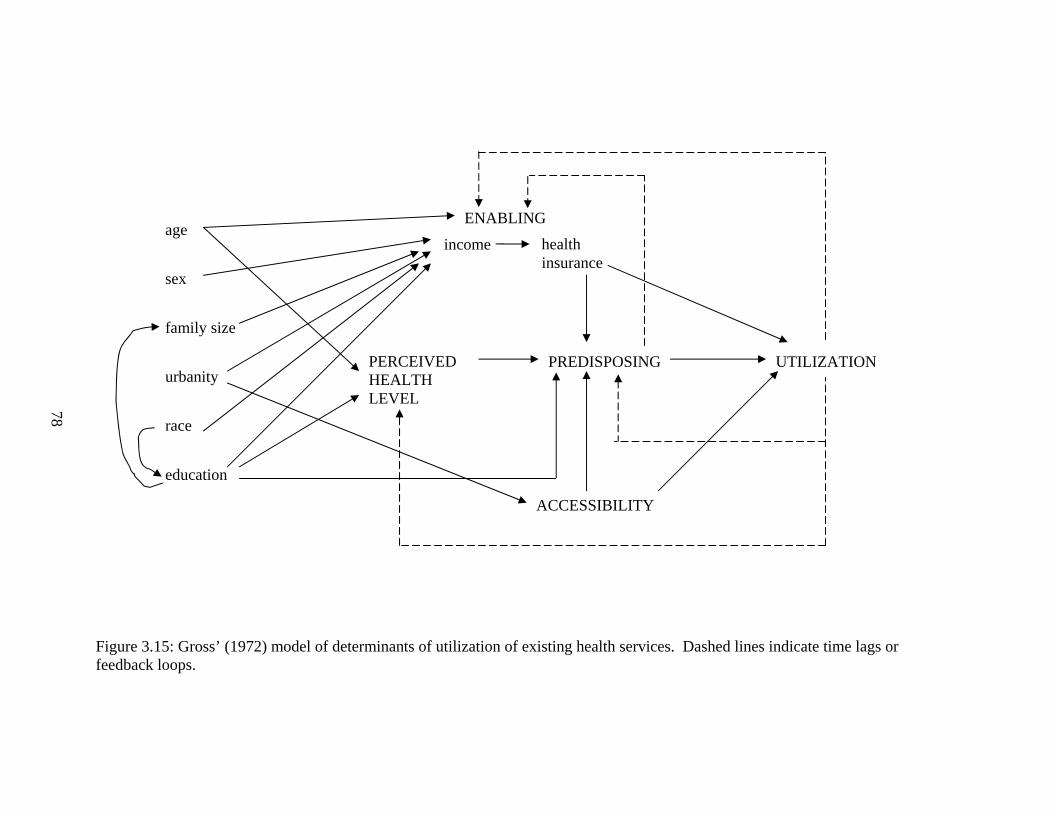
78
Figure 3.15: Gross’ (1972) model of determinants of utilization of existing health services. Dashed lines indicate time lags or feedback loops.
age sex family size urbanity race education
PREDISPOSING UTILIZATION
ACCESSIBILITY
PERCEIVED HEALTH LEVEL
ENABLING
income health insurance
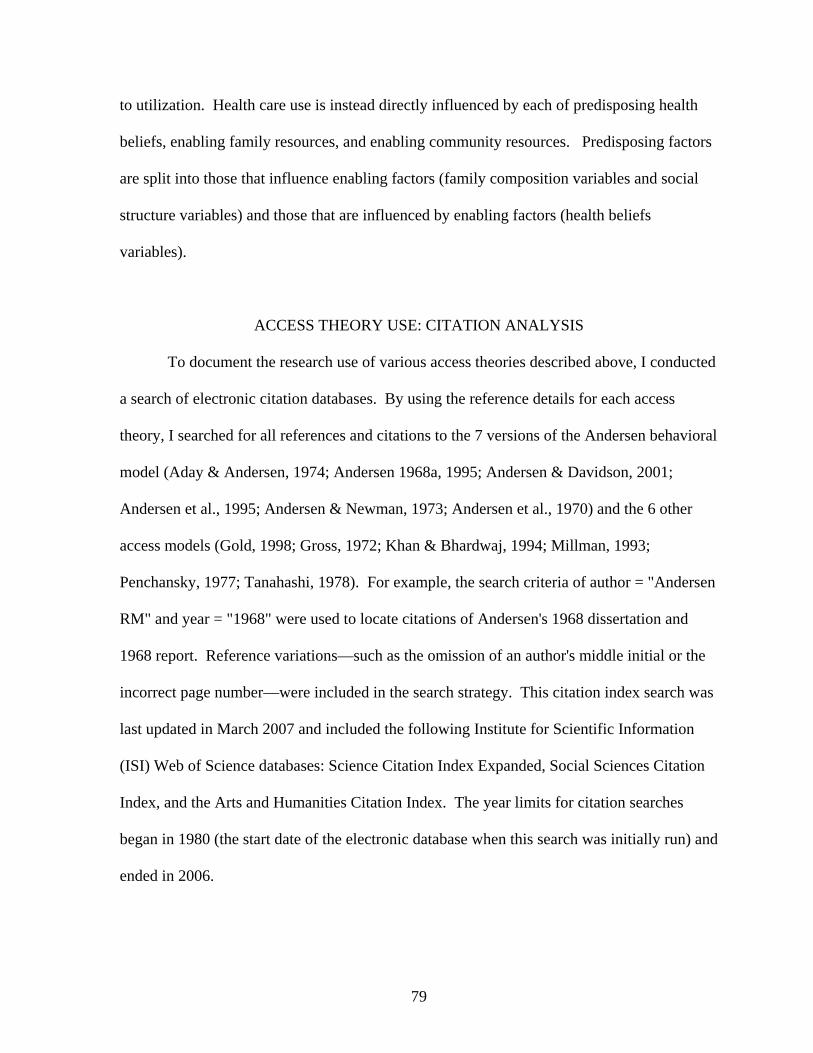
79
to utilization. Health care use is instead directly influenced by each of predisposing health
beliefs, enabling family resources, and enabling community resources. Predisposing factors
are split into those that influence enabling factors (family composition variables and social
structure variables) and those that are influenced by enabling factors (health beliefs
variables).
ACCESS THEORY USE: CITATION ANALYSIS
To document the research use of various access theories described above, I conducted
a search of electronic citation databases. By using the reference details for each access
theory, I searched for all references and citations to the 7 versions of the Andersen behavioral
model (Aday & Andersen, 1974; Andersen 1968a, 1995; Andersen & Davidson, 2001;
Andersen et al., 1995; Andersen & Newman, 1973; Andersen et al., 1970) and the 6 other
access models (Gold, 1998; Gross, 1972; Khan & Bhardwaj, 1994; Millman, 1993;
Penchansky, 1977; Tanahashi, 1978). For example, the search criteria of author = "Andersen
RM" and year = "1968" were used to locate citations of Andersen's 1968 dissertation and
1968 report. Reference variations—such as the omission of an author's middle initial or the
incorrect page number—were included in the search strategy. This citation index search was
last updated in March 2007 and included the following Institute for Scientific Information
(ISI) Web of Science databases: Science Citation Index Expanded, Social Sciences Citation
Index, and the Arts and Humanities Citation Index. The year limits for citation searches
began in 1980 (the start date of the electronic database when this search was initially run) and
ended in 2006.
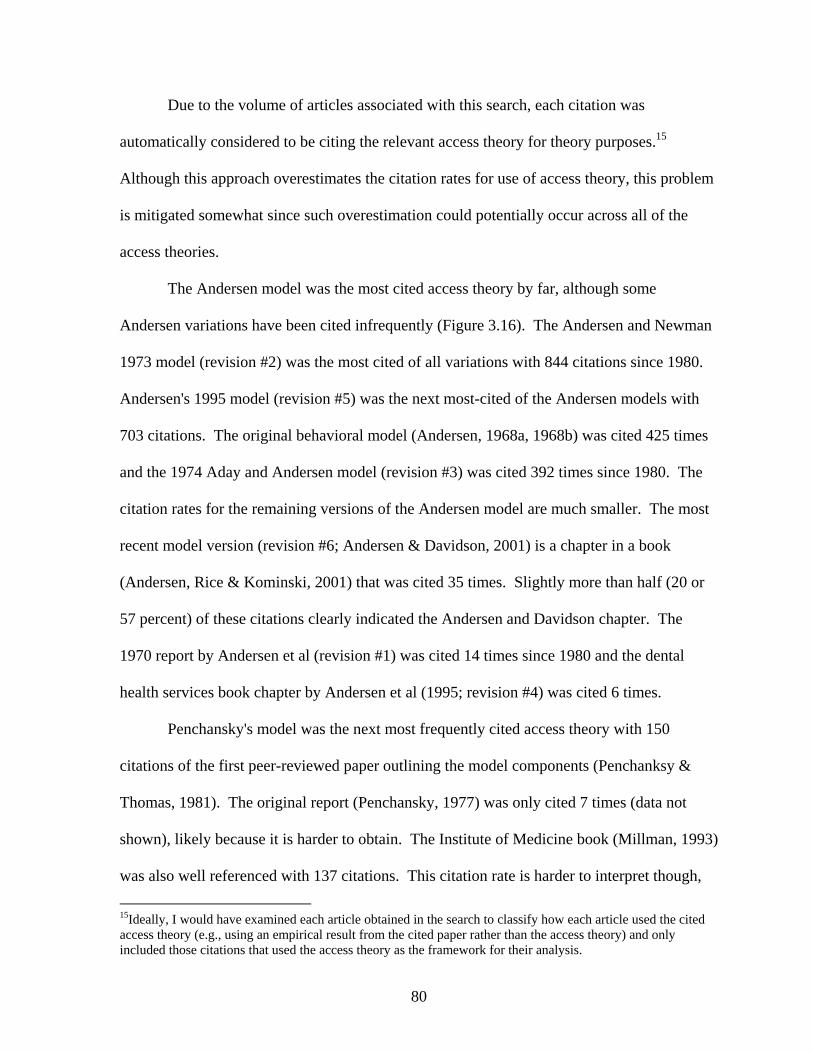
80
Due to the volume of articles associated with this search, each citation was
automatically considered to be citing the relevant access theory for theory purposes.15
Although this approach overestimates the citation rates for use of access theory, this problem
is mitigated somewhat since such overestimation could potentially occur across all of the
access theories.
The Andersen model was the most cited access theory by far, although some
Andersen variations have been cited infrequently (Figure 3.16). The Andersen and Newman
1973 model (revision #2) was the most cited of all variations with 844 citations since 1980.
Andersen's 1995 model (revision #5) was the next most-cited of the Andersen models with
703 citations. The original behavioral model (Andersen, 1968a, 1968b) was cited 425 times
and the 1974 Aday and Andersen model (revision #3) was cited 392 times since 1980. The
citation rates for the remaining versions of the Andersen model are much smaller. The most
recent model version (revision #6; Andersen & Davidson, 2001) is a chapter in a book
(Andersen, Rice & Kominski, 2001) that was cited 35 times. Slightly more than half (20 or
57 percent) of these citations clearly indicated the Andersen and Davidson chapter. The
1970 report by Andersen et al (revision #1) was cited 14 times since 1980 and the dental
health services book chapter by Andersen et al (1995; revision #4) was cited 6 times.
Penchansky's model was the next most frequently cited access theory with 150
citations of the first peer-reviewed paper outlining the model components (Penchanksy &
Thomas, 1981). The original report (Penchansky, 1977) was only cited 7 times (data not
shown), likely because it is harder to obtain. The Institute of Medicine book (Millman, 1993)
was also well referenced with 137 citations. This citation rate is harder to interpret though,
15Ideally, I would have examined each article obtained in the search to classify how each article used the cited access theory (e.g., using an empirical result from the cited paper rather than the access theory) and only included those citations that used the access theory as the framework for their analysis.
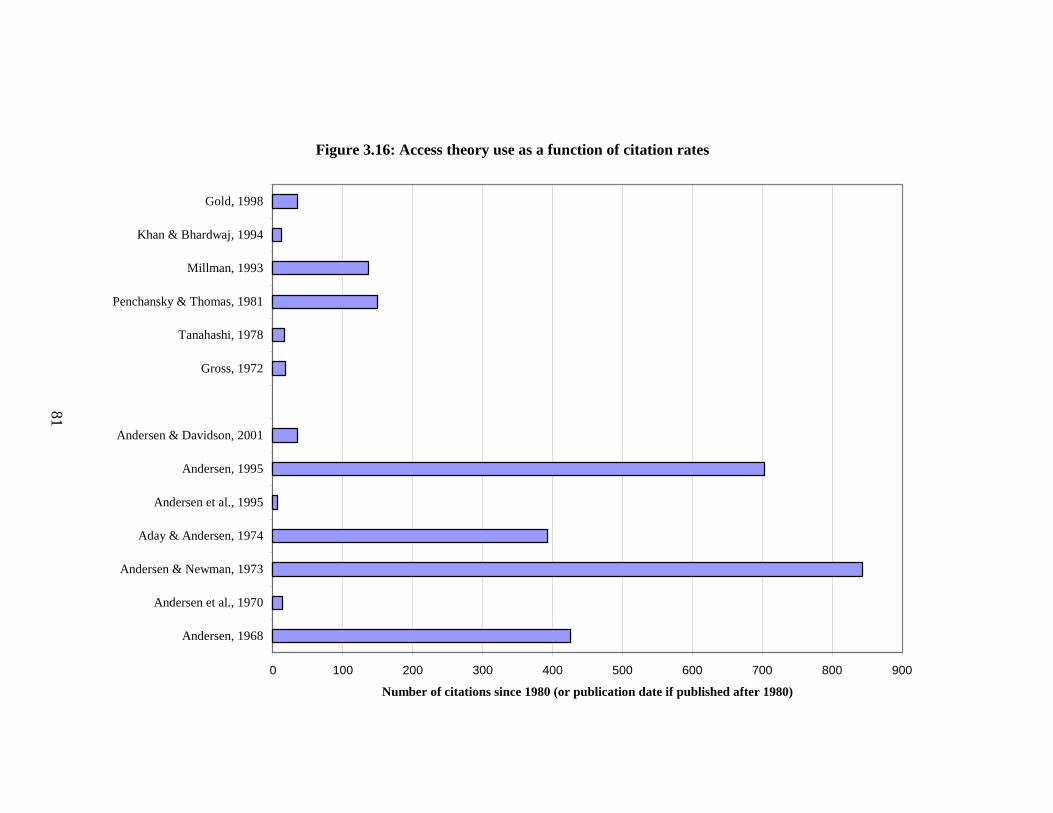
81
Figure 3.16: Access theory use as a function of citation rates
0 100 200 300 400 500 600 700 800 900
Andersen, 1968
Andersen et al., 1970
Andersen & Newman, 1973
Aday & Andersen, 1974
Andersen et al., 1995
Andersen, 1995
Andersen & Davidson, 2001
Gross, 1972
Tanahashi, 1978
Penchansky & Thomas, 1981
Millman, 1993
Khan & Bhardwaj, 1994
Gold, 1998
Number of citations since 1980 (or publication date if published after 1980)

82
as the book contains discussion of a variety of suggested indicators and data in addition to the
model. The remaining access theories have much smaller citation rates, varying from a high
of 35 citations for Gold (1998) to a low of 12 citations for Kahn and Bhardwaj (1994).
Citation rates can also illustrate the uptake of the Andersen model revisions. The
small number of citations for the latest revision (revision #6; Andersen & Davidson, 2001) is
not surprising given it was recently published. The 1995 Andersen model (revision #5) has
had enough time to become the dominant model but it still lags behind the citation rates of
the 1973 model (revision #2; Andersen & Newman, 1973), largely due to the 22-year gap.
By the year 2000, citation rates by year for the 1995 model exceeded those for the 1973
model (data not shown). There remains a significant minority of researchers, however, that
are not using the 1995 version when using the Andersen behavioral model. Figure 3.17
illustrates the dissemination pattern of the 1995 model by computing the papers that did not
cite the 1995 version as a percentage of papers that cited any of the well-used Andersen
model versions (1968, 1973, 1974, or the second 1995; the original and revisions #2, #3, and
#5, respectively) since 1996. The percentage of papers not using the 1995 version has
quickly fallen over time from a high of 87 percent in 1996, one year after publication of the
1995 version, to a low of 34 percent in 2004.16
Although Andersen did not make this explicit, later model revisions were conceivably
intended to replace or improve upon older models. If improvement was indeed the objective,
why do slightly more than a third of all published papers continue to use an older Andersen
model? Without systematically reviewing these papers and surveying the authors, it is
impossible to know for sure. Reasons for not using the 1995 model could include not
16The 2001 model (revision #6) has been slowly disseminating in the short time since its publication (data not shown). In a similar calculation, the percentage of papers not using the 2001 version has fallen over time from a high of 98 percent in 2002, one year after publication, to a low of 94 percent in each of 2005 and 2006.
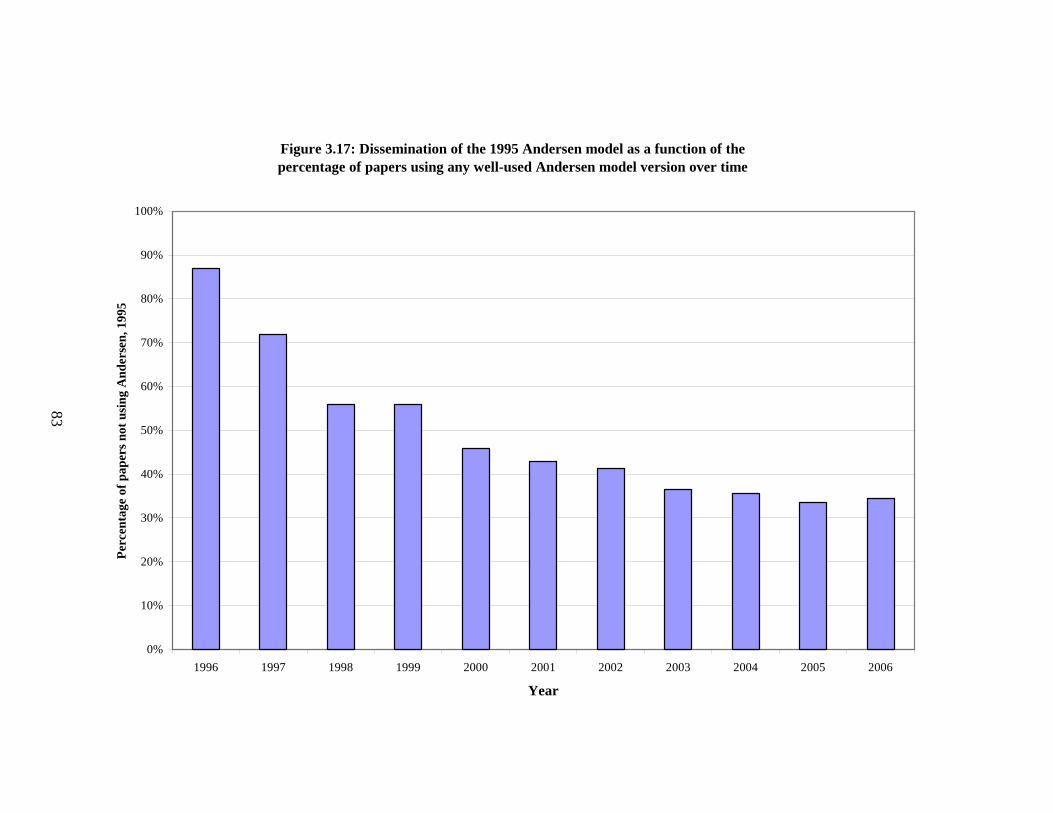
83
Figure 3.17: Dissemination of the 1995 Andersen model as a function of the percentage of papers using any well-used Andersen model version over time
0%
10%
20%
30%
40%
50%
60%
70%
80%
90%
100%
1996 1997 1998 1999 2000 2001 2002 2003 2004 2005 2006
Year
Perc
enta
ge o
f pap
ers n
ot u
sing
And
erse
n, 1
995
84
knowing about this revised model, not agreeing with the revisions and preferring an older
model, data limitations, and methodological limitations.
During the course of this work, I had the opportunity to question three separate
researchers (a pharmacist, a physical therapist, and a general health services researcher) who
were using the 1973 model in place of later versions. Each researcher was aware of the 1995
model and explicitly chose to use the 1973 version instead. When asked about their
reasoning, each researcher indicated that the 1973 model better fit their conceptual approach
and their data. The pharmacist also argued that the using the 1973 theory was consistent with
and supported by previous pharmaceutical research. These choices were supported by the
field. All three works received approval from other health services researchers since they
were published in peer-reviewed journals or received grant funding.
CRITICISMS OF ACCESS THEORY
Despite widespread use of the Andersen model, numerous and varied criticisms exist.
Access theory has been criticized for modeling access as a static phenomenon rather than one
that shifts over time (Pescosolido & Kronenfeld, 1995), for not incorporating individual
perceptions and beliefs (Thomas & Penchansky, 1984), and for not incorporating the
interaction between the health care system and the individual (Gold, 1998). The Andersen
theory has been criticized on additional theoretical grounds as well as for empirical reasons.
The critical attention paid to the Andersen behavioral model likely results from its
prominence. Complaints include claims that the behavioral model defines access too broadly
(Penchansky, 1977), encourages a fragmented approach to the study of access (Ricketts &
Savitz, 1994), and is only applicable to "dominant-culture, middle-class populations" within
85
the United States (Zambrana, 1987). Andersen himself documented that others criticized the
model for not incorporating social interactions or culture (Bass, Looman & Ehrlich, 1992;
Guendelman, 1991; Mechanic, 1979; Portes, Kyle & Eaton, 1992), although he felt that the
presence of the social structure predisposing subcomponent answered this criticism
(Andersen, 1995). Kronenfeld (1978; 1980) argued that the model should emphasize
provider variables rather than subsuming them under the enabling component. In response to
other similar criticisms (Gilbert, Branch & Longmate, 1993; Kelley, Perloff, Morris & Lie
Wangyue, 1992; Patrick, Stein, Porta, Porter & Ricketts, 1988), Andersen (1995) suggested
expanding the enabling component was an acceptable approach. Pescosolido argued for
replacing the Andersen model (and the Health Belief Model) entirely as the model has
"neglect[ed] process, and… relied far too greatly on the 'rational' decision-making ability of
the individual" (1991, p. 166).
Empirically, the Andersen behavioral model has been unsuccessful at predicting
health care use, and has explained too little variation in actual health services use (Houle,
Salmoni, Pong, Laflamme & Viverais-Dresler, 2001; Patrick et al., 1988; Porter, 2000;
Shortell S. M., Wickizer & Wheeler, 1984; Wolinsky & Johnson, 1991; among others).
Mechanic (1979) in particular pointed out that much of the variation in use has been
attributed to need variables. Houle and colleagues (2001) found no empirical support for the
conceptual core of the behavioral model of predisposing, enabling, and need components in a
factor analysis using data on physician use by the elderly in Ontario. In focus group work
investigating the use of long-term care services, Bradley and colleagues (2002) found that
predisposing characteristics—particularly an expanded subcomponent of psychosocial
determinants—were directly related to use and that enabling and need factors precede, rather
86
than follow, predisposing factors. Similarly, as described earlier in this chapter, early testing
of the behavioral model did not support the conceptual core. Lackluster testing results from
the original model indicated that enabling and predisposing factors may be too correlated to
be distinct concepts and that the model was only appropriate for physician use, one of the
three types of use tested. Analyses conducted with the first revised model indicated that
system entry and health services use were distinct concepts that might be better served in a
model that used these concepts as separate outcome measures.
The use of Andersen's behavioral model has also come under criticism. Phillips and
colleagues (1998) found that fewer than half of studies using the behavioral model actually
included environmental variables, despite the environment being part of the model in one
form or another since the 1973 version (Andersen & Newman, 1973). Further, of the studies
including environmental variables, fewer than half used methods that incorporate feedback
loops (e.g., structural equation models or simultaneous equations) or complex relationships
(e.g., path analysis). None of the studies including environmental variables used methods
that would capture different units of measurement (e.g., multilevel analysis). The latest
version of the behavioral model (Andersen & Davidson, 2001) elaborated on the
environmental dimension to draw more attention to the importance of context. My finding of
incomplete uptake of later model versions suggests that this latest model, despite its
improvements, will not see extensive use for a long time. And even if the latest model
becomes widely adopted, Phillips and colleagues' (1998) work also suggests modest use of
methods best suited to the complex aspects of the model. More broadly, Chappell (1994) has
suggested that the dependence on the Andersen model be replaced by the use of other models
for studies of the use of home care. Her concern that "any biases within [one theoretical]
87
approach are repeated from study to study" (1994, p. 118) could easily apply to topics other
than home care.
Given these varied criticisms, why do researchers continue to use the Andersen
behavioral model? I believe there are three reasons for its dominance. First, the behavioral
model can incorporate practically anything thought to be related to access. This "everything-
but-the-kitchen-sink" approach means that this theory can be used by many different
researchers and yet not be disproved easily. Second, borrowing from Kuhn's (1962)
paradigm shift work, any successful challenger must have fewer problems and
inconsistencies than the behavioral model. Each access theory has enough problems and
enough critics that the field continues to employ the behavioral model. Third, the field has
accepted wide variation in the use of the behavioral model. Recent behavioral models have
not been universally used in favor of older model versions. Some model users have not
systematically included all model components or employed model-appropriate methods (e.g.,
Phillips et al., 1998). Other researchers have simply added components they feel are missing
from the behavioral model when using the model in their work. For example, Gelberg and
colleagues (2000) modified the behavioral model for use in vulnerable populations, adding
"vulnerable domains" to accompany the "traditional domains" for each model component.
Kronenfeld (1978, 1980) added a "provider of care" component, including variables for the
number of sources of medical care, the location of each source, and the specialty of each
medical provider. She situated the provider of care component between need and use and
combined the predisposing and enabling components. Aday and Awe (1997) documented
other instances where researchers added components to the model (Bass & Noelker, 1987;
e.g., Gilbert, Branch & Orav, 1990; Kurz, Haddock, VanWinkle & Wang, 1991; Nichol,
88
McCombs, Johnson, Spacapan & Sclar, 1930; Portes et al., 1992), describing such behavior
as a positive indication of the flexibility of the behavioral model.
HOW SHOULD WE BE STUDYING ACCESS TO CARE?
The substantial transformation of the Andersen behavioral model over time has
obviously not satisfied all. Despite the fact that health services researchers have driven some
of the model changes, the field has not universally embraced later models and substantial
criticisms remain unanswered. Some health services researchers have responded by adding
to the Andersen model. Others use older versions. Still others may be satisfied with further
revisions to the Andersen model. The remaining critics would only be satisfied by replacing
the model entirely.
Problems and gaps already identified in access theory would be one starting place for
the creation of a new access model. For example, after criticizing the Andersen model and
calling for its replacement, Pescosolido specified that any new model should reflect that "the
experience of illness is embedded in its social life and rhythms, that it is constrained by
social structure, and that it is created in negotiation with others" (Pescosolido 1991, p. 166).
Pescosolido and Kronenfeld (1995) further specified that "relevant" models of health care use
should: (i) be community-based, (ii) be dynamic and incorporate process, (iii) be
multimethod and multilevel, and (iv) make social relationships central to the model.
Pescosolido (1991) proposed a network-episode model that described health care use
as arising from interaction in social networks, with distinct social network interaction
patterns producing different pathways of health care use. Empirical work using this model
showed that conceptualizing use as a dichotomous pattern of physician/no physician use
89
overlooked important distinctions between individuals. The network-episode model
unpacked variation in patterns of physician use patterns that the Andersen behavioral model
could not (Pescosolido, 1992). The network-episode model also improved upon the
behavioral model's reliance on need to explain health care use, despite both models
employing many similar independent variables. Age, sex, marital status, frequency of
attendance at religious services, years of education, size of social network, and perceived
degree of social support were all statistically significant predictors of health care use in
addition to need under the network-episode model (Pescosolido, Wright, Alegria & Vera,
1998).
The filling-in-identified-gaps approach may get us no further in the end, however, as
we would still be relying on what is already known and identified. An inductive approach
would be better suited to systematic theory development that reflects the individual reality of
access to care. While this approach may not answer all of the criticisms of current access
models, inductive theory development stands a better chance of illuminating previously
unexplored areas and explaining health care use. Such work would not rely on incremental
change, the basic soundness (or unsoundness) of previously established models, or critics
abilities to identify current model problems.
We need to invest in improving access theory. Access is too central to health services
research and health policy and the criticisms of existing access theory are too significant to
settle for the status quo. Systematic theory generation work on access to care is long
overdue. Although the Andersen model has brought us far in the study of access to care, it
needs to answer the critics or be replaced. The remainder of this dissertation answers this
call. In what follows, I describe my attempt at generating new access theory.
90
Improving access theory is not just an academic exercise, however. Like most health
services research, access research and theory is intended to inform policy. Building better
theories of access can assist in building better access policy. Although the utility of access
research and theory for policy is ultimately demonstrated through policy application, a
number of strategies can heighten the possibility of utility. Explicitly describing the access
process from the user's point of view would provide immediate relevance and feedback for
the policy maker. Extending the individual focus to include the interaction between the
individual and the health care system might illuminate system variables that can be
manipulated by policy. Comparing access in different communities and under different
health care systems may provide guidance on how people and institutions would behave in a
changed system. Documenting context and culture can also assist the policy maker with the
application of the information. I employ these strategies in the hopes that this dissertation
might inform better policy and better system design in addition to responding to criticisms of
access theory.
CHAPTER 4: RESEARCH METHODS
I designed this study to contribute to new theory development for access to care. I
argued in the previous chapter that such new theory development, with attention to policy
application, was a needed investment in health services research. Accordingly, I set out to
investigate the contextual and holistic nature of access to care from the individual health care
system user's point of view. I employed grounded theory to generate a conceptual
framework of the access to care experience from the individual's perspective, conducting in-
depth, unstructured interviews with disadvantaged individuals in rural communities. I also
collected data in multiple communities to document the influence of the design of the health
care system on the individual's experience.
Specifics of the research methods follow in the remainder of this chapter. I provide
an overview of grounded theory followed by description of my sampling, data collection, and
analysis activities. I describe my methodological decisions in much detail so the reader can
evaluate the quality and truth value of my work (Chenail, 1995; Constas, 1992). The chapter
ends with a discussion of the remainder of the strategies I employed to ensure
trustworthiness.

92
GROUNDED THEORY
Grounded theory was developed in the 1960's by Barney Glaser and Anselm Strauss
as a way of systematically developing mid-range theory from data. They intended grounded
theory to counter sociology's overemphasis on theory verification (Glaser & Strauss, 1967).
Grounded theory reflected the combination of Glaser and Strauss' educational backgrounds at
Columbia University and the University of Chicago, respectively. From the marriage of
Columbia's positivism and quantitative sociology and the Chicago School's traditions of
pragmatism, symbolic interactionism and ethnographic fieldwork, Glaser and Strauss
proposed analyzing qualitative data using joint coding and analysis following systematic
guidelines. Codes were to be developed from the data rather than from predetermined
categories. Constant comparison was to be employed to ensure consistency within and
between codes. Data were to be collected to further theory development rather than for
statistical representation and data collection was to continue until the theory was complete.
In short, the analyst was to remain close to, or "grounded" in, the data, throughout the entire
process. This grounded approach would ensure the production of a valid and high quality
theory, or one that meets the criteria of fit, relevance, and work (Glaser, 1978; Glaser &
Strauss, 1967). Fit means that the components of the theory correspond to the data.
Relevance means a theory captures the essential features of a phenomenon and therefore has
"grab" (Glaser, 1978, p. 4) and proves itself to be important and interesting. Work means
that a theory explains variation and is able to predict future phenomena.
Glaser and Strauss went on to independently refine grounded theory (Glaser, 1978;
Glaser, 1992; Strauss & Corbin, 1990; Strauss & Corbin, 1998; Strauss, 1987). There exists
much commentary on the substance of their divergence (e.g., Charmaz, 2000, 2006; Dey,
93
1999; Melia, 1996), including a book by Glaser (1992) himself. The basic distinctions
between the two approaches are that Glaser emphasizes the emergence of the theory from the
data and the use of "basic social processes" in explaining much of the action of the theory
while Strauss (in part with Corbin) emphasizes a systematic approach to generating theory
and the validation of data (while still acknowledging the importance of emergence and
inductive thought) (Charmaz, 2000; Charmaz, 2006; Heath & Cowley, 2004). I chose to
employ Strauss' approach in this study as it felt like a better fit for me. I found Strauss'
systematic approach to be accessible and user-friendly and was particularly attracted to the
emphasis on validation, likely due to my original quantitative training. I was aware of
criticisms that Strauss' approach was too rigid and formulaic (Keddy, Sims & Stern, 1996;
Melia, 1996) but felt that I could reject the more deductive and contrived techniques
suggested by Strauss & Corbin (1990, 1998) while still following their overall approach. I
also relied more on Strauss and Corbin's second edition of Basics of Qualitative Research
(1998) rather than the first edition (1990), as the second edition presented a less rigid
approach to analysis and allowed more room for inductive work (Heath & Cowley, 2004).
Choosing to employ Strauss' approach was also an expression of my discomfort with
Glaser's emphasis on emergent theory (also see Robrecht, 1995). Such an emphasis struck
me as removing the analyst from the equation. (I agree with Bazeley & Richards, 2002, p. 90,
who say: "theory does not 'emerge' without the agency of the researcher. You have to
'emerge' your theory.") That being said, however, I still found it helpful to borrow from
Glaser's early book, Theoretical Sensitivity (Glaser, 1978), as it elaborated on many aspects
of the original presentation of grounded theory (Glaser & Strauss, 1967) and was heavily
cited by Strauss (1987) and Strauss and Corbin (1990, 1998). Charmaz's (2000, 2006)
94
"constructivist grounded theory" approach also informed my analysis as I saw myself as part
of, rather than removed from, the data creation process and did not assume the existence of
universal meanings. And finally, Dey's (1999) reflection on grounded theory also aided in
my own reflection and refinement of my use of grounded theory, such as not using Strauss
and Corbin's (1990; 1998) suggested techniques in a contrived way.
STUDY SAMPLE
Communities
As the community and the health care system were expected to influence the
individual access to care experiences, I recruited individuals from two communities in North
Carolina and two communities in Ontario. All of the communities were located in rural areas
as the provider supply, transportation, and economic issues in rural areas were expected to
heighten individual access problems. The four rural communities were chosen from among
ones where I, my advisor, or another colleague had personal contacts and where there was an
intriguing aspect of the local health care system or community. The four communities were
Bayboro, North Carolina; Pembroke, North Carolina; Blind River, Ontario; and Marathon,
Ontario. The specific intriguing aspect prompting my selection of these four communities
follows with fuller descriptions of each community provided in the first results chapter.
Bayboro, North Carolina has a free medical clinic. In Pembroke, North Carolina, the
majority of the population identifies as American Indian (specifically Lumbee Indian). Blind
River, Ontario is located halfway between two cities serving as northern health centers. The
doctors in Marathon, Ontario operate in a group practice specially designed to practice rural
general medicine in a sustainable way.
95
Individual Participants
I employed a combination of selective and theoretical sampling procedures in
recruiting individuals for this study, a typical approach for grounded theory (Sandelowski,
1995b). Selective sampling is a purposeful sampling strategy based on predetermined
characteristics thought to be relevant to the studied phenomenon (Schatzman & Strauss,
1973). Theoretical sampling, on the other hand, cannot be determined in advance.
Theoretical sampling is based on the developing theory and is guided by comparisons
between individuals and groups thought to be helpful to further the developing theory (Glaser
& Strauss, 1967).
Throughout the entire study, I purposefully recruited individuals most likely to
experience trouble using the health care system and to have the most need for care with the
hope that this sampling frame would yield rich data. Based on the empirical access literature,
I defined such individuals as persons who were disadvantaged by at least one of the
following criteria: poverty, lack of education, minority status, unemployment,
underinsurance or lack of health insurance (referred to as "disadvantaged individuals").
Within each community, I also tried to ensure that the recruited individuals represented both
sexes, a variety of ages, and a range of illness experience (e.g., generally well, chronically ill)
to provide some variation on expected health care need.
I employed this selective sampling approach at the start in each community. After
interviewing a few participants in each community, reflecting on what they had to say, and
integrating those data with what I was learning about the community, I turned my attention to
theoretical sampling to further my developing conceptualization. The theoretical sampling
decisions that I made fell into the general category of new ways of conceptualizing access
96
difficulties. For example, I purposively sampled for a variety of relationships with primary
care providers, such as persons who did and did not have a primary care provider and persons
who traveled outside their community for primary care even when providers were available
in their community. I also purposively sampled for persons who had not tapped into the
community networks generally and particularly those related to health care.
In general, many of the preconceived characteristics used in the initial selective
sampling criteria also served theoretical purposes, suggesting that the extensive empirical
access to care literature is effectively identifying important and valid characteristics. The
selective sampling procedure also provided me with variation on a number of other
characteristics that proved to be important in the developing theory, an inadvertent form of
theoretical sampling, if you will. For example, individuals recruited for this study had a
variety of illnesses, health statuses, frequency of recent interactions with the health care
system, and relationships with health care providers. Further inadvertent theoretical
sampling resulted from the use of multiple communities. The striking differences in each
community's health care system and organization provided excellent fodder for conducting
constant comparison.
Sample Size
In grounded theory, data collection should continue until the point of theoretical
saturation, or where no additional data are found that illuminate the emerging theory (Glaser
& Strauss, 1967). This point can only be determined during the study. That being said,
however, many qualitative researchers use previous research and resource considerations to
determine a reasonable advance estimation of sample size (Goldsmith, 1997). To allow for
97
an in-depth examination of each participant's access to care experience while balancing off
time and resource constraints, I planned and achieved a sample about 10 individuals in each
community, for a total of about 40 participants. This predicted sample size was consistent
with Morse's (1994) recommended minimum sample size of 30 to 50 interviews for a
grounded theory study.
DATA COLLECTION
Sensitizing Activities
Working with theoretical sensitivity is a key requirement of researchers using
grounded theory (Glaser & Strauss, 1967; Glaser, 1978; Strauss, 1987; Strauss & Corbin,
1990, 1998). Having theoretical sensitivity means that a researcher operates with "an
awareness of the subtleties of meaning of data [which includes] having insight, the ability to
give meaning to data, the capacity to understand, and capability to separate the pertinent from
that which isn't" (Strauss & Corbin, 1990, p. 41-2). Theoretical sensitivity includes the
approach the researcher takes during the study as well as the personal characteristics of the
researcher. Consequently, I reflected on my personal characteristics while designing this
study to be as aware as possible about the sensitivities I was bringing to the research topic as
well as how I might be received during fieldwork (Finlay, 2002; Patton, 2002). I particularly
considered how I would be similar and dissimilar to the persons I would be interviewing.
What kinds of things did I consider in this self-reflection? Most strikingly, as an educated,
middle-class white individual, I would not classify myself as disadvantaged and have
generally operated from a position of privilege. I have, however, been without general health
insurance, dental insurance and prescription drug coverage. I have also had to make financial
98
tradeoffs (of wants, not needs) to afford out of pocket expenses for health care. I have never
forgone health care I felt was necessary because of financial issues. With respect to health
care usage, I have never been without a regular source of care, although the family doctors
and nurse practitioners that I have used on a regular basis have varied to the extent that I felt
connected to them and well understood. As is the case with many women, I use the health
care system on a regular basis for preventive care and acute care. I have also had periods of
regular contact with the health care system and different providers for a chronic health
problem of my own as well as a caregiver for a loved one with a longstanding and
degenerative disease. With respect to more general experiences, I have not lived in rural
areas, although both of my parents were raised in rural areas and I heard many stories of their
early lives and visited their hometowns numerous times. I have lived and used health care in
both the United States and Canada. In Canada, I have also worked as a receptionist, billing
clerk, and medical transcriptionist for a variety of primary care physicians and as a personal
care attendant for a variety of persons with a variety of medical conditions, including
cerebral palsy and spinal paralysis.
This self-reflection helped me realize that I needed to enhance my understanding of
the general relationship between being disadvantaged and access to care. Consequently, I
undertook a variety of disadvantage-specific sensitizing tasks before beginning data
collection for this study. I reviewed the empirical and theoretical literature on access to care
for disadvantaged populations. I interviewed Evie Schmidt, the longtime director of the
Lincoln Community Health Center in Durham, North Carolina, about her experience with
providing access to care for disadvantaged populations. I spent 20 hours observing patient
and provider interactions at the urgent care clinic at the University of North Carolina
99
Hospital and at the medical clinic at the Interfaith Council Community House, a homeless
shelter in Chapel Hill. These activities helped prepare me for truly hearing and better
understanding the access stories of disadvantaged individuals, particularly preparing me for
how such stories might be told as well as expanding the range of my personal experience. I
also gained appreciation for the numerous ways the health care system can support and
facilitate access to care for disadvantaged individuals, such as a doctor considering costs
when choosing a prescription for an individual without drug insurance. In addition, my
previous and ongoing involvement in rural health research (Goldsmith & Ricketts, 1999;
Ricketts et al., 2002; Slifkin, Goldsmith & Ricketts, 2000) also helped orient me to rural
health issues.
Gaining Entry
After completing the above sensitizing activities, I was ready to begin planning my
entry to the study communities. Before visiting each community, I contacted my personal
contacts and those of my advisor and other colleagues. I asked each personal contact for an
informational interview about the community and assistance in identifying individuals to
recruit for my study. During these interviews, I asked for recommendations of other
community leaders to interview and help in recruiting. I also conducted a number of "cold
calls" within each community, using contact persons in health care organizations and social
services that I found in telephone books and community information guides. I prepared a
letter describing my study and my request for an informational interview (Appendix A) and
faxed or hand delivered this letter to all contact persons.
100
Many of the personal contacts immediately agreed to meet with me as well as suggest
other community leaders and possible study participants. Other personal contacts needed a
little more convincing. One doctor in the Bayboro area eventually agreed to meet with me
after my advisor personally intervened on my behalf, appealing to the friendship between the
doctor and himself. Another community leader in Pembroke (a loose personal contact of my
advisor) asked me to meet up with her at the local Pow Wow. I made a special trip to
Pembroke to do so (a 2.5 hour drive one-way). After shaking hands and talking for a few
minutes, she agreed to set up a meeting with me. I surmised I had passed some sort of test,
perhaps simply by being willing to show up at the Pow Wow.
Using the initial community contacts as referrals helped open many doors in the
community. For example, one doctor in Pembroke explicitly told me that he was meeting
with me because I had already been vetted by another community leader. In contrast, results
from the cold calls were uneven. The cold calls worked best with academics at the
University of Pembroke and with community leaders that were expected to interact with the
community as part of their job. A few of the community leaders contacted through cold calls
seemed to be responding to my affiliation with the University of North Carolina or McMaster
University (in Hamilton, Ontario; where I started working a third of the way through my
fieldwork17). Others clearly identified with my Hamilton residence and wanted to help me
because of that affiliation. For example, the one doctor in Blind River who agreed to be
interviewed made a special point of telling me that he grew up in Hamilton and wanted to
compare stories about the city. Many in Pembroke identified Hamilton as being nearby a
large First Nations reserve (Six Nations in Brantford) and welcomed me as if I were
17Once I moved, I listed both McMaster University and the University of North Carolina at Chapel Hill on my informational letters, study descriptions, and consent forms.
101
associated with Six Nations (and my being clear that I had no association with Six Nations
did not dampen the warmth of my welcome). Some of the Lumbee community leaders in
Pembroke also commented that my being a Canadian citizen meant that I was an outsider in
the South, much like they were, and this shared experience contributed to their welcoming of
my inquiry.
Community Descriptions
I collected information on each community's health care system and larger
environment, building on existing community assessments as well as census, health, and
survey data. As already described above, I interviewed community leaders in health care and
non-health care areas to gain a better understanding of each community and to help me
conduct better interviews in the main part of the study. I specifically asked each community
leader to describe their community, including its greatest strengths and problems, health care
resources, and health care needs (see Appendix B for the interview guide). Most of the
community leader interviews lasted between 45 and 60 minutes, during which I took detailed
notes. I also collected documents, reports, and educational materials related to each
community's health care system.
I spent three to four weeks in each community while conducting study interviews.
For all but one community (Marathon), my time was spread out over multiple trips.
Breaking up my time in the community gave me more flexibility in setting up appointments
and enhanced my networking. The extra time also provided me with the space to reflect on
the quality of the data collection as well as conduct initial analyses to direct theoretical
sampling.
102
While staying in each community, I spent time in restaurants and coffee shops, bars,
community centers, libraries, museums, medical clinics and hospitals. I read the local
newspapers and shopped in local shops.18 I drove around to familiarize myself with the town
layout, boundaries, and proximity to other communities. I attended a Pow Wow and a day
long conference on strategies to reduce high infant mortality rates in Pembroke, toured the
provincial park and mines outside Marathon, and observed the workings of the Hope Clinic
in Bayboro. During this time, I gained insight into the culture of each community and started
to develop an understanding of each community's structure, values, and challenges. While I
did not spend nearly enough time in any community to develop an insider status, I certainly
learned much in the time I was there and was able to better relate to the people I interviewed
and the circumstances under which they were operating. I developed a network of
relationships within the community and was trusted enough to be given assistance in
recruiting individuals for my study.
Participant Recruitment
A variety of community contacts assisted me in recruiting individuals for my study. I
used a combination of health care providers and organizations and non-health care providers
and organizations to attempt to include both current health care users and individuals not
currently using health care. In each community, I first approached health care providers for
recruiting assistance. These included local doctors, medical clinic nurses, prenatal support
workers, public health nurses, home care caseworkers, welfare administrators and a mental
health support group leader. I also approached people in the waiting room of the free
18In Marathon, I also conducted a historical review of the local newspaper to locate a series of letters to the editor about changes in local health care delivery.
103
medical clinic in Bayboro. Non-health care sources for recruitment included social service
workers such as employment counselors, subsidized housing workers, church ministers, and
leaders of community organizing and community outreach groups. A few participants were
recruited through other participants or community members. Each recruiter was directed to
first ask permission from potential participants before providing me with contact information
for potential participants. Recruiters were provided with information sheets about the study
(a slightly revised consent form) to share with potential participants. I used a recruitment
poster in one community's employment office, although I received no response from the
poster.
Individual Interviews
Data collection consisted of individual and two-person, face-to-face interviews
conducted in English.19 Each individual was interviewed once, with the exception of one
participant who requested a second interview after reflecting on additional details to share.
Interviews were set up at a place and time convenient to each participant. Locations of
interviews included participant's homes as well as meeting rooms in public libraries, medical
clinics, public health departments, and other community organizations. One interview took
place at a participant's favorite restaurant in the middle of the afternoon when the restaurant
was quiet. Each participant was paid $15 in local currency at the completion of the
interview.
The individual interviews focused on an in-depth examination of access to care, with
most interviews lasting between 60 and 90 minutes. I asked participants to reflect on their
experiences of getting and using health care, including contemplating care, care seeking, 19Most of the interviews were individual interviews. See the descriptive results for more detail.
104
system entry, care receiving, and outcomes (i.e., the "even broader domain" definition of
access from Chapter 2, Figure 2.3). The majority of questions were inductively-oriented and
open-ended (e.g., tell me about the last time you received health care). I let each individual
tell their story in their most natural way. Most interviews began with the participant's most
salient health care experience. After following this topic to its natural ending—which took
up most of the interview time—I found it helpful to question individuals using the six
remaining areas on the initial interview guide (Figure 4.1), using more structured questions
towards the end of each interview to address any issues that were not covered in the
unstructured portion of the interview. As data collection unfolded, I also included questions
to explore the unfolding analysis, such as probes on the nature of the good doctor and the
doctor-patient relationship.
Each interview session began with the reading and signing of a consent form
(Appendix C). The consent form contained simple and straightforward language so that the
required reading level was as low as possible. I also offered to read the consent form aloud
to all; two participants took me up on this offer. Before moving into starting the interview
questions, I checked if each participant had any questions about the project or the process. I
then collected descriptive information about the participant, including their age group, their
sex, their racial and ethnic self-identification, whether they live alone or with others, their
usual form of transportation for using health care services, their insurance status, their health
status, and their recent health history (form provided in Appendix D). This descriptive
information provided me with a quick thumbnail sketch about each participant and facilitated
the movement into the unstructured portion of the interview. The collecting of descriptive
information worked so well as a facilitator that, at times, it was easier to launch into the
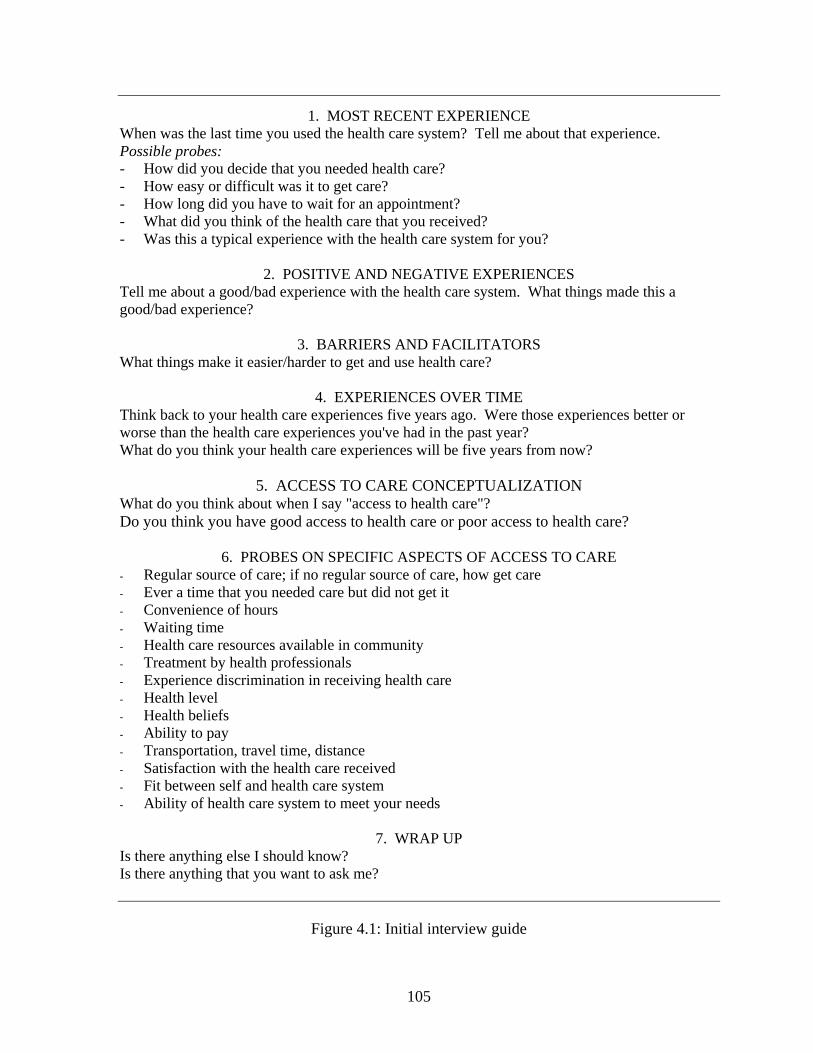
105
1. MOST RECENT EXPERIENCE When was the last time you used the health care system? Tell me about that experience. Possible probes: - How did you decide that you needed health care? - How easy or difficult was it to get care? - How long did you have to wait for an appointment? - What did you think of the health care that you received? - Was this a typical experience with the health care system for you?
2. POSITIVE AND NEGATIVE EXPERIENCES Tell me about a good/bad experience with the health care system. What things made this a good/bad experience?
3. BARRIERS AND FACILITATORS What things make it easier/harder to get and use health care?
4. EXPERIENCES OVER TIME Think back to your health care experiences five years ago. Were those experiences better or worse than the health care experiences you've had in the past year? What do you think your health care experiences will be five years from now?
5. ACCESS TO CARE CONCEPTUALIZATION What do you think about when I say "access to health care"? Do you think you have good access to health care or poor access to health care?
6. PROBES ON SPECIFIC ASPECTS OF ACCESS TO CARE - Regular source of care; if no regular source of care, how get care - Ever a time that you needed care but did not get it - Convenience of hours - Waiting time - Health care resources available in community - Treatment by health professionals - Experience discrimination in receiving health care - Health level - Health beliefs - Ability to pay - Transportation, travel time, distance - Satisfaction with the health care received - Fit between self and health care system - Ability of health care system to meet your needs
7. WRAP UP Is there anything else I should know? Is there anything that you want to ask me?
Figure 4.1: Initial interview guide
106
unstructured interview in the middle of descriptive questions and reserve the remaining
descriptive questions until the end of the interview.
During each interview, I shared bits of myself where it seemed appropriate and
helpful in building rapport (e.g., "my Mom has been sick too"). I reached out and touched
people on the arm when I was moved to provide some comfort. I laughed with participants
and cried with participants. In short, I tried to be fully present for each interview and interact
in a genuine way.
Each interview was audio-taped, with the participant's permission. Only one
participant refused to be audio-taped; I took detailed notes during this one interview and
reconstructed it as best as I could after the interview. For the remaining interviews, I took
some notes during the interview to act as backup in case the taping did not work and to help
me keep track of where I might direct the interview after following the current thread to
completion. After each interview, I took notes on what I had learned from that particular
interview and how that learning affected my developing theory. I also reflected on new
topics to explore in future interviews and how to improve future interviews.
The interview recordings were transcribed verbatim (with the exception of names of
individuals). I personally transcribed five interviews from various stages of data collection
and had professional transcriptionists complete the rest. I reviewed each transcript for
accuracy and corrected any errors found. Since I had been present at the interview and had
much more of an understanding of the context, I could often decipher the quickly spoken
words and particular pronunciations with which other transcriptionists had trouble. Like
Poland (2002), I found transcription errors of mistaken wording, misspelling of place names,
and inappropriate punctuation. Examples of punctuation errors included changing starts and
107
stops, with associated changes in meanings of phrases, and not using quotation marks when a
participant was mimicking another speaker, leaving the impression that the statements were
attributable to the participant rather than another speaker. I paid particular attention to
correcting punctuation errors as they had the most potential to distort the participant's voice.
Self-as-Instrument
In qualitative research, the researcher is the data collection instrument. This study,
therefore, was highly dependent on my qualitative research skills, particularly the quality of
my interviewing ability and the interaction between myself and the participants. Lincoln and
Guba (1985, p. 194) suggest that the "human instrument" can be refined much like a paper
instrument; Brown (1996, p. 42) refers to this as "sharpening the instrument." This
instrument refinement and sharpening includes qualitative research training, experience, and
attention to skill improvement (Brown, 1996; Lincoln & Guba, 1985). With respect to my
own skills as a qualitative researcher, prior to this study I had already been part of a few
qualitatively oriented health services research teams (Giacomini, Abelson, Goldsmith &
Garland, 1998; Giacomini & Goldsmith, 1996; Giacomini, Hurley, Lomas, Bhatia &
Goldsmith, 1996; Grootendorst, Goldsmith, Hurley, O'Brien & Dolovich, 1996; Hurley,
Lomas & Goldsmith, 1997). I had also taken a number of qualitative research classes and
attended qualitative research conferences. I continued to refine my qualitative research skills
through participating in further classes and conferences during this study's data collection
and analysis stages. Much like a quantitative researcher would do with a paper instrument, I
conducted a pilot test prior to beginning data collection and reflected on how the pilot
interview could have gone better. I changed the interview guide significantly after this pilot
108
test, most notably moving the mentioning of access to care to the end of the interview where
it was less likely to interrupt the individual's personal story and flow.20 I also continued to
reflect on and endeavor to improve my interviewing skills throughout the data collection
process.
Another important component of the researcher-as-instrument is self-awareness,
particularly an understanding of how one might affect the study. Being aware of one's
influence on the study contributes to the richness of the collected data as well as the
credibility of the results (Brown, 1996; Patton, 2002). The sensitizing activities described
earlier, particularly reflecting on how my experiences resembled and differed from the
experiences of my research participants, certainly helped me to begin my fieldwork with self-
awareness. After documenting that I was leaving many of my early interviews feeling
humbled, I was able to acknowledge that I was expecting my participants to be less capable
than they proved to be. I was then able to process this negative assumption and approach the
remaining interviews with an attitude of respect and admiration for each participant's coping
skills, which may have resulted in richer and more genuine data. I was unable to evaluate the
independent effect of my attitude change as I also refined both the interview guide and my
interviewing skills over time. Certainly, later interviews ran more smoothly and yielded
more helpful and rich data.
I also employed critical reflection and attention to the unfolding of each interview to
ensure that my attempts at building rapport did not become manipulative. I found it easy to
establish rapport with many of my participants very quickly and was surprised at the
20The pilot test interviewee was not familiar with the term "access to care." This proved to be the case with a number of other interview participants (when asked about the term, one participant described access as "one of them high society terms"). Interestingly, the inclusion of the term access in the consent form did not prompt any questions. In retrospect, I assume those who did know recognize the term simply skipped over it.
109
intimacy of the stories participants chose to share with me and the trust with which
individuals participated in the interviews. I attributed some of this to my natural warmth and
genuine interest in individual motivations and values, and was comfortable with that aspect
of rapport building. I knew, however, that some of my natural behaviors—such as touching
people on the arm when a comforting touch seemed appropriate or tearing up when told a sad
story—could easily slip into manipulative behavior if I was not vigilant. I believe I did
negotiate this line with integrity by always attempting to operate from a genuine place within
myself, but I share this information so the reader can make her or his own evaluation.
Reciprocity
Reciprocity, a form of mutual exchange or give and take, fosters the collection of
good data (Harrison, MacGibbon & Morton, 2001). Offering the interview participants
financial compensation for the interviews was one way I explicitly incorporated reciprocity
in data collection. Where the opportunity arose, I drove participants to their next event or to
their home after the interview as an additional show of appreciation for their time and
thoughts. I also engaged in each interview as fully and as humanly as possible as a sign of
respect for the sharing of each story. Bearing witness to each person's story became another
form of payment; many participants expressed that it felt good to talk about their problems.
Some women even hugged me as we were preparing to part. Another opportunity for
employing reciprocity occurred at the end of many interviews when participants asked me
questions about myself. I honestly and openly answered their questions about my family, my
upbringing, and my career goals in the hopes that the sharing of my story served as additional
compensation for their story. Interview participants also engaged in a "paying it forward"
110
approach of reciprocity, often expressing the hope that their participation in this research
might help others in the future.
Entering each community was greatly aided by different types of reciprocity. Like
the interview participants, a number of community leaders operated under a paying it forward
approach and treated my request for help as an opportunity to repay help they had received
from others in the past. One personal contact in Marathon had been a friend of mine for a
long time and certainly helped me gain entry to that community because of our friendship.
Others were assisting me because they had been previously helped by my advisor or they
hoped to build a better relationship with my advisor and other researchers at the University of
North Carolina. I, in turn, extended benefits back to the community leaders. I assisted one
person in Blind River with analyzing a short survey and offered to return my research results
at the end of the study to all of the community leaders.
Ethics
This study was approved by the University of North Carolina School of Public Health
Institutional Review Board (IRB) on Research Involving Human Subjects. Despite the ethics
planning required to receive this IRB approval, I found that I had underestimated the effects
of the sharing of some aspects of access stories on certain interview participants and on
myself.
After completing an interview with a mother with a seriously sick child, we both
realized that the sharing of this history had been more emotionally taxing than either one of
us expected. We discussed how to handle this emotional risk with future interviewees and
ultimately decided that I should begin to warn participants that the sharing of one's stories
111
may be draining or upsetting. I added this warning to my verbal description of the study at
the beginning of subsequent interviews.
As for myself, I found it difficult to process the multiple accounts of sexual abuse and
the stories with strong themes of isolation, loneliness, and marginalization. I ended up
enlisting the help of a trusted confident to be able to decompress after haunting or upsetting
interviews.
Based on these experiences, I also decided to flag potentially upsetting interviews for
the transcriptionists. I identified the type of potentially upsetting issue (e.g., rape, death of a
loved one) and gave each transcriptionist the opportunity to refuse the assignment of the
interview. No transcriptionist passed on an interview but all were pleased to be given the
option and the advance warning.
ANALYSIS
As grounded theory relies on iterative data collection and analysis, I began informal
analysis and reflection immediately after entering the field. Formal analysis (i.e., coding)
commenced shortly after initial interviews were transcribed. I used NVivo 2.0, a qualitative
data analysis program, to store and explore my data as well as develop and refine my coding
scheme.
I analyzed the interview data using three types of coding: (a) open or initial coding,
(b) axial coding, and (c) selective or focused coding (Strauss & Corbin, 1990, 1998). These
three coding types represent different level of focus of the analysis. The ultimate objective of
this coding approach is to identify a central or core category and create an integrated theory
around this central category. Despite the existence of three distinct coding types, the
112
majority of coding did not occur in set stages. The coding approach is best described as a
series of analytic moves.21 Insights from one type of coding led me to use other types of
coding, both to revisit existing analysis and undertake new analysis. Rather than detailing all
of the back and forth movement (and risking giving the reader motion-sickness), I describe
each coding type individually in what follows.
Open coding
Open coding has a descriptive focus and provides the beginning sense-making of the
data. Open coding uses line-by-line analysis to identify categories, subcategories and
attendant properties and dimensions. Categories are simply labels for phenomena, or
analytic ideas, such as "waiting for care" or "advocating for self." Where possible, I used in
vivo codes (the words of the participants themselves) and gerund labels for the categories to
provide vividness and capture action (Glaser, 1978). Properties and dimensions flesh out
categories, detailing the characteristics and range of variation within categories, such as
"duration of wait time," "long wait times" or "no wait time." I developed and refined
working definitions for categories, properties, and dimensions while coding to better identify
and discriminate between phenomena addressing getting and using health care. Where
concepts arose that were similar to those already employed in the literature (e.g., usual source
of care), I compared the emergent concept in its specific context with that in the literature
rather than assuming they were identical. I also frequently compared new data with already
coded data to ensure that all belonged to the same category, property or dimension (Glaser &
Strauss, 1967; Glaser, 1978; Glaser, 1992; Strauss, 1987; Strauss & Corbin, 1990, 1998). I
continued to employ this constant comparison technique throughout the other types of coding 21Thanks to Margarete Sandelowski for the phrase "analytic moves."
113
to ensure the analysis incorporated the variation within and remained grounded in the data
(Strauss & Corbin, 1998). As the number of categories grew, I grouped similar categories
together within NVivo, moving from a flat coding structure to one resembling a tree with
multiple branches. As soon as I started the initial coding for this project, I also began
documenting my thoughts about the project and the coding scheme in analytical memos
stored within NVivo, moving between and linking coding and memos when appropriate.
Axial Coding
Axial coding moves the analysis from the descriptive level to the conceptual level by
relating categories and subcategories. The term axial refers to "the coding occur[ing] around
the axis of a category, linking categories at the level of properties and dimensions" (Strauss
& Corbin, 1998, p. 123). I created informal hypotheses about linkages between categories,
explored these hypotheses against the data using NVivo's search function, and documented
these hunches and their verification in analytical memos. Hunches that did not pan out often
still led to fruitful avenues that I could not see before testing the original hypothesis. I also
found it helpful to use Strauss and Corbin's (1990, 1998) coding paradigm—the conditions
(causal, intervening and contextual), actions/interactions, and consequences surrounding
particular phenomena. By considering whether categories might be intervening conditions or
consequences, for example, I was able to better identify relationships between categories.
The coding paradigm also served to bring attention to process, or changes over time,
particularly by helping me recognize "movement, sequence, and change" and "response to
changes in context or conditions" (Strauss & Corbin, 1998, p. 167).
114
Selective Coding
Selective coding refers to "the process of integrating and refining the theory" (Strauss
& Corbin, 1998, p. 143). A key objective of selective coding is to identify the central, or
core, category—a category which "appears frequently," "explain[s] variation" in the data, and
is connected to all the other major categories (Strauss & Corbin, 1998, p. 147). I found that
identifying the central category required a leap of faith, trusting myself and my immersion in
the data to be able to identify "what seems to be going on here" (Strauss & Corbin, 1998, p.
148; also see Glaser, 1978). Attempting to pin down the key story in the data—a technique
Strauss and Corbin call "writing the storyline" (1998, p. 148)—eventually led me to the
ultimate central category of "achieving balance."
Identifying the central category was the most difficult part of the analysis and
required much time and trying out of different approaches. I initially tried out elements of
the doctor-patient relationship and the "good doctor" as the central category but abandoned
this approach as it did not capture process or categories that were not related to the health
care system. A second approach posited two parallel processes: the care process and the
system process. While this second approach dealt with the earlier problems, I eventually
rejected the second approach as it did not adequately capture the story I was hearing in my
data. I returned again and again to the original data, trying to answer the following
questions: "What is the main issue or problem with which these people seem to be grappling?
What keeps striking me over and over? What comes through, although it might not be said
directly?" (Strauss & Corbin, 1998, p. 148). After reading one particular interview for what
felt like the hundredth time, I was captured by the participant's description of the
115
precariousness of the illness experience as "living on the edge."22 This image, with its
association with falling and tipping, helped me to see that my participants were describing
access as a process of achieving balance. Unfortunately, I did not arrive at this
conceptualization until I was out of the field and was unable to collect further data. In place
of collecting new data, I returned to my previously collected data and recoded events using
the new conceptualization, a type of theoretical sampling (Strauss & Corbin, 1998). It is also
important to note that my final conceptualization was informed by and included categories
from the earlier approaches. Both earlier approaches helped to direct my theoretical
sampling in the field and changes to the interview questions, so my final conceptualization
also incorporated an indirect form of theoretical sampling.
Identifying the central category was only the beginning of selective coding. I still
needed to explicate the theoretical framework and refine the theory. To produce the overall
framework for the theory, I worked at systematically linking the central category to the other
categories produced in open and axial coding (Strauss, 1987). I developed a diagram to
explicate the major relationships in the process of achieving balance and reviewed and sorted
my analytical memos. To further refine the theory, I reviewed the theory for internal
consistency and logic, filled in poorly developed categories, and validated the theory by
checking that the theory could explain the original data (Strauss & Corbin, 1998). While
conducting these theory refining tasks, I revised existing codes, conducted new open and
axial coding and expanded on existing analytical memos. I reviewed each individual's story
to ensure that it could be accommodated by the process explicated in the theory. Where I
found negative cases—stories that did not seem to fit my theory—I worked to revise the
theory and the definitions of the major categories. For example, when a participant with an 22This idea of "living on the edge" was not referring to disadvantage or economic marginalization.
116
unresolved back injury simultaneously belonged in the seeking balance phase and the
maintaining balance phase, I took that as a cue to refine my definition of balance. When
faced with health care needs of my own, such as when I fractured my elbow during the final
phase of this dissertation, I also checked that I could accommodate my own experiences in
the theory. I used the disconnects between my own experiences and the theory as an
additional assist for revisiting the data. Presenting the emerging theory at various
conferences, meetings, and research groups (see list in Appendix E) and writing up the
results for this dissertation served as additional checks on the completeness of my work.
I continued to use these selective coding techniques until I felt that I had done justice
to the story that there was to tell. My theory was conceptually dense (Strauss, 1987). I
ensured that I had reached the point at which "no new properties and dimensions emerge
from the data, and the analysis has accounted for much of the possible variability" (Strauss &
Corbin, 1998, p. 158). Consequently, despite having stopped collecting new data prior to my
final theoretical conceptualization, I believe that this theory is indeed theoretically
saturated.23
TRUSTWORTHINESS
There are a number of criteria for high quality qualitative research. Lincoln and Guba
(1985), in a classic reference, suggest that qualitative research must demonstrate
trustworthiness or that "the findings of an inquiry are worth paying attention to" (p. 290).
Trustworthiness is composed of four criteria: (a) credibility, the "truth value" of the findings;
23Claiming that my theory is theoretically saturated requires a leap of faith on my part (Cutcliffe & McKenna, 2002). By this point, however, I have lived with the data a long time and know the data inside and out (Glaser, 1978).
117
(b) transferability, the applicability of the findings to other contexts; (c) dependability, the
acceptability of the research process; and (d) confirmability, the strength of the connection
between the data and the results (Lincoln & Guba, 1985, p. 290). 24 Lincoln and Guba (1985)
suggest numerous techniques to achieve these criteria for trustworthiness, many of which I
included in this study and describe below. Demonstrating these criteria also serves to
provide evidence of the adequacy of the research process, a grounded theory quality criterion
proposed by Strauss and Corbin (1990, 1998).
Credibility
Establishing credibility is arguably the most important task as the other
trustworthiness criteria are worthless if the reader is not confident that the research findings
have truth value. Patton (2002) details three elements that contribute to the credibility of
qualitative inquiry: rigorous research methods, credibility of the researcher, and a belief in
the value of qualitative inquiry. I will not deal with defending the value of qualitative
inquiry here, except to comment that I hope any skeptical readers will see this study as
demonstrating the importance and usefulness of such work. The remaining two elements are
expanded on below.
Rigorous Research Methods
Data Collection
I employed a number of strategies during data collection to enhance credibility and
rigor, including prolonged engagement, persistent observation, and triangulation (Lincoln &
24For quantitatively oriented readers, these four criteria mirror internal validity, external validity, reliability, and objectivity, respectively.
118
Guba, 1985). Prolonged engagement refers to spending sufficient time in the study setting to
learn the culture and to build trust (Lincoln & Guba, 1985). I spent three to four weeks in
each community, participating in a variety of activities to better understand each community.
My interviewing of community leaders helped establish rapport and build relationships
within the community, which also aided in my understanding of the culture. My focus on
each community's health care infrastructure, health care use patterns, and health status during
these interviews also contributed to persistent observation and being able to identify "those
things that really count" (Lincoln & Guba, 1985, p. 304). The long and detailed interviews
with community leaders and with study participants provided other opportunities for
persistent observation.
Triangulation refers to the use of multiple sources, methods, investigators, or theories
to provide different perspectives on the same phenomenon (Denzin, 1978). My use of
multiple participants in multiple communities provided a triangulation of sources. Further
triangulation was achieved under Patton's (2002) expanded approach, which suggests that
triangulation of analysts can be accomplished through audience review and expert audit
review in addition to Denzin's use of multiple investigators. Audience review is described as
part of the analysis section that follows. As for expert audit review, Patton claims that this is
performed by the dissertation committee.25
Analysis
A number of the techniques inherent in grounded theory serve to ensure the study's
credibility. Glaser and Strauss (1967) argue that the use of constant comparison is a key
25Sandelowski (1998a) cautions that the "outsider-expert" cannot confirm the validity of a study. Rather, they serve as "expert critics," strengthening the study through their questions and advice.
119
contributor to the credibility of grounded theory as the researcher is continually required to
return to and be true to the data. Constant comparison was also a powerful way to explore
differences that arose from the triangulation of sources.26 The search for negative cases
highlighted where my analysis was not working and helped me to refine and ultimately
improve the analysis and theory development. Memo writing and my reflexive journal
helped me elaborate the connections I was making and identify where the connections
needed more evidence. Through being reflexive, I was also able to identify areas where I
was trying to force the data rather than letting the data speak. The search for the theoretical
framework with the best fit, work and relevance helped me to see what was wrong with
earlier approaches and helped me persevere to develop the grounded theory that is explained
in the next chapter. And finally, by continuing my analysis until I reached theoretical
saturation, I guarded against premature closure (Sandelowski, 1995a; Skodol Wilson &
Ambler Hutchinson, 1996).
Other techniques I employed during analysis to enhance credibility and rigor included
reviewing the transcripts for accuracy, using NVivo, peer debriefing, and audience review.
Reviewing the transcripts for accuracy ensured that each participant's written words was as
trustworthy a voice as possible (Poland, 2002). The use of NVivo allowed me to be as
rigorous as possible with my analysis, specifically contributing to my consistency and speed,
as well as providing consolidation of materials (Weitzman, 2003). I was able to compare all
coding on a particular point, conducting searches for specific terms across all transcripts, and
comparing the overlap of various codes and categories. The speed and ease of asking
questions about my analysis in NVivo facilitated my exploring of relationships within my
26As Patton (2002) points out, the strength in triangulation lies in exploring why there are differences rather than in reinforcing the same ideas.
120
data as required by the constant comparison method. The speed and ease of reassigning
codes also made it possible to rework my coding scheme without fear of losing data. Having
my data, my codes, and my memos all in one spot with the possibility of links between all of
them also facilitated my thinking about the analysis while maintaining momentum and
creative energy.
Peer debriefing and audience review meant that I used a number of individuals to
review my emerging analysis at various points in time. In peer debriefing, I was able to
explain my analysis to various colleagues (including members of my dissertation committee)
and respond to their queries. This helped me to remain true to my analysis, to test working
hypotheses, and to see further avenues to explore in the research (Lincoln & Guba, 1985). In
audience review, I presented my emerging analysis at a variety of conferences and meetings
as a test of the face validity of the results (Patton, 2002). Audience members at these various
conferences and meetings included qualitative researchers, rural health researchers, health
services researchers, clinicians, policy makers, and social service providers. Some audience
members made a point as also identifying as health care users for specific problems or as
caregivers for others. Audience members reported that my analysis did have believability
and did capture a way of making sense of access to care. One policy maker also indicated
that the process I identified could help in conceptualizing targeted interventions.
Presentation of Results
The presentation of the research results is another important component in
demonstrating the rigor of the methods. I therefore labored over the quality of my writing as
well as the content. I focused on presenting a comprehensive and compelling story, knowing
121
that this required attention to the description of both the theory and the data (Glaser &
Strauss, 1967; Sandelowski, 1998b). When describing the theory, I ensured that I explained
variation in the process as well as a providing a detailed portrayal of the process itself
(Strauss, 1987; Strauss & Corbin, 1990, 1998). When using participant quotes as evidence
for my theoretical conceptualization, I provide guidance to the reader about key ideas as well
as information about participants when needed to reflect important variation (Sandelowski,
1994). I also select quotes that would allow the reader to "almost literally see and hear" the
research participants (Glaser & Strauss, 1967, p. 228) and contribute to the grab of my
writing (Glaser, 1978).
Credibility of Researcher
I employed a reflexive stance in this chapter to establish my credibility as the
instrument of inquiry and as the analyst. I have described the sensitizing and sharpening
activities I undertook prior to entering the field, how I was received in the field by
community leaders and research participants, how I presented myself during interviews, and
the strategies I used to maintain self-awareness. I have also provided details of my analytic
moves, demonstrating my responsiveness to the demands required to create credible work
(Morse, Barrett, Mayan, Olson, & Spiers, 2002).
Transferability
Transferability is concerned with the applicability of the study's findings in other
contexts. In a qualitative study, the researcher is responsible for providing thick description
(Geertz, 1973) so that the reader can assess the transferability of the results to another setting
122
(Lincoln & Guba, 1985). I provide much detail in the results chapters that follow to meet
this criterion of transferability.
Dependability and Confirmability
Dependability is concerned with the acceptability of the research process.
Confirmability is concerned with the acceptability of the research product, particularly with
ensuring that the results correspond to the data and are not unduly influenced by the
researcher. As both concepts evaluate the research methods (albeit for different outcomes),
the same technique can be used to meet both criteria. Lincoln & Guba (1985) suggest an
inquiry audit, or a review of the study materials, be conducted by an external evaluator.
Koch (2004) suggests that the reader serves the role of the external evaluator, and charges the
researcher with the responsibility of providing an audit trail for the reader. Accordingly, I
detail my analytic decisions and reflections throughout this chapter as well as provide quotes
as evidence for my descriptive results in Chapter 5 and my theoretical conceptualization in
Chapter 6.
CHAPTER 5: DESCRIPTIVE RESULTS
The results from this study are divided into two chapters. This first results chapter
provides descriptions of the study communities and individual interview participants as well
as key themes from data collection at the community level and the individual level. This
chapter is intended to provide background material for the theoretical results presented in the
next chapter. Presenting the key descriptive themes in this first results chapter also helps
preserve the flow of the second results chapter. The key themes described in this first results
chapter play important roles in the balance process described in the second results chapter
and are woven throughout the theoretical conceptualization of access as a process of
achieving balance.
ON DATA AND DATA PRESENTATION
I conducted interviews for this study from July 2002 to April 2003 and generally use
the past tense to describe the communities and individuals. The information provided in the
description of individual study participants comes solely from this study's individual
interviews. The details provided in the community descriptions are from multiple sources,
including this study's community leader interviews, existing community assessments,
documents, reports, and newspaper articles (specifics of the aforementioned provided in
Appendix F), as well as this study's individual interviews, my research notes, and census,
124
health, and survey data.27
The census, health and survey data presented here are for the year 2002 when
available; otherwise, I present data from as close to 2002 as possible. These data are
intended to provide a general feel of the differences between the four communities rather
than a definitive comparison of North Carolina and Ontario. No dataset used in this chapter
contains data from both countries (indeed, few instances exist; applicable datasets that
contain data from both countries are not designed for sub-country units of measurement).
Data collection differences will account for some of the variation of measures between the
two countries. Where I present data from different geographical regions within the same
country, however, I always use the same dataset. It is possible and reasonable, therefore, to
compare across the town, county, and state figures in North Carolina. The same applies for
the town, health region, and provincial figures in Ontario.
To preserve confidentiality, all quotations from individuals or community leaders are
presented without identifying the speaker and, in many cases, the community. I provide
background information about the speaker when such information contextualizes the
quotation. I edited some quotes to decrease the identifying features of dialect and to remove
some of the more jarring speech patterns (e.g., multiple "you know"s), taking care not to
distort the individual's meaning or overall rhythm (Sandelowski, 1994). In some cases,
gender or other identifying details have been changed to protect identities. I also employed
the generic "Dr. X" to replace any specific use of a doctor's name. Ellipses indicate other
omissions and square brackets replace other identifying features or provide clarifying
information.
27The below community descriptions resemble case studies, but should not be evaluated as such. As described in the previous methods chapter, the community descriptions were intended to aid me in conducting the individual interviews. I recognize that this resulted in incomplete and inconsistent community descriptions.
125
THE STUDY COMMUNITIES
In this section, I describe each community's context and the access barriers and
facilitators specific to each community. I precede the individual community descriptions by
an overview of North Carolina and Ontario, with a focus on health outcomes and the
structure of the two health care systems, to orient the reader to the two regions. I have
assumed that the reader has a basic understanding of the structure of the health care system in
the United States and less knowledge about the Canadian health care system.
Two Health Care Systems: North Carolina and Ontario
As outlined in the methods chapter, I chose to collect data in North Carolina and
Ontario based on convenience and personal contacts rather than for the rigor of the
comparisons between the two regions. Regardless, the two regions followed the general
trends of a comparison between the US and Canadian health care systems: North Carolina
had poorer health indicators than Ontario and Ontario employed fewer health care resources
than North Carolina. And, of course, there is the oft-cited difference in the provision and
universality of health insurance. Specific health and health care details for North Carolina
and Ontario follow.
North Carolina
North Carolina has long contained some of the poorest parts of the United States and
continues to rank among the lowest of states for health indicators. In the 2002 Behavioral
Risk Factor Surveillance System (BRFSS), for instance, 21 percent of respondents from
126
North Carolina reported being in fair or poor health while the national average was 16
percent (Table 5.1; North Carolina State Center for Health Statistics, n.d.a). In 2000, North
Carolina had a low birth weight rate of 8.8 percent, or the 6th worst rate among all states, and
an infant mortality rate of 8.6 per 1,000 live births, the 7th worst rate in the nation (North
Carolina State Center for Health Statistics, 2002a).
With respect to the availability of health care resources, North Carolina operated at
about the median of all states. In 2001, there were 205 physicians per 100,000 persons (with
a US average of 227) and 2.9 hospital beds per 1,000 persons (the same as the US average;
North Carolina State Center for Health Statistics, 2002b).
With respect to health insurance coverage, almost 17 percent of the population had no
health insurance for the entire year in 2002, which was higher than the national average of 15
percent (U.S. Census Bureau, 2003b). Of those North Carolinians who had health insurance,
79 percent were covered by private insurance, 18 percent were covered by Medicare, and 14
percent were covered by Medicaid (U.S. Census Bureau, 2003b).28 Along with a higher rate
of uninsurance than the national average, more North Carolinians reported not getting needed
medical care than the national average in the 2002 BRFSS (8.5 versus 6.6 percent,
respectively; p < 0.05; North Carolina State Center for Health Statistics, n.d.a). Cost was the
major barrier to getting needed care; 69 percent of North Carolinians reporting not getting
needed medical care reported cost as the major reason(North Carolina State Center for Health
Statistics, n.d.b). The cost barrier is commonly attributed, at least in part, to uninsurance and
underinsurance.
28Percentages sum to greater than 100 as some persons have more than one type of insurance.
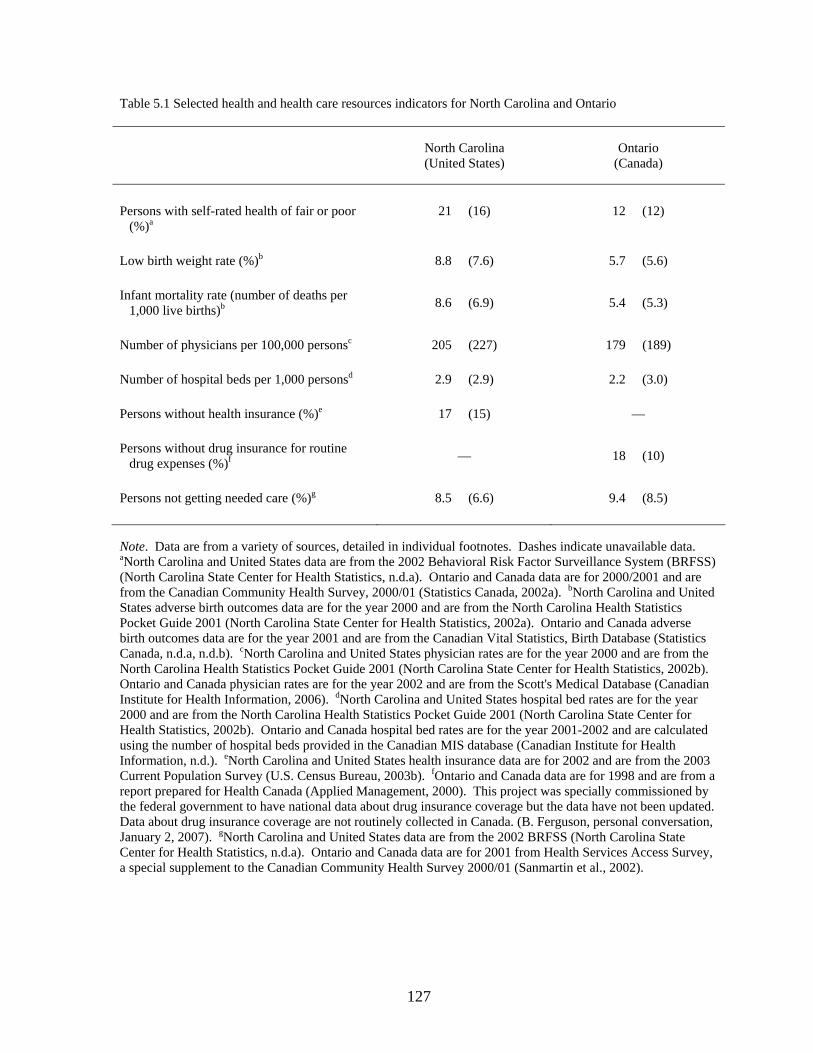
127
Table 5.1 Selected health and health care resources indicators for North Carolina and Ontario
North Carolina (United States)
Ontario (Canada)
Persons with self-rated health of fair or poor
(%)a 21 (16) 12 (12)
Low birth weight rate (%)b 8.8 (7.6) 5.7 (5.6)
Infant mortality rate (number of deaths per
1,000 live births)b 8.6 (6.9) 5.4 (5.3)
Number of physicians per 100,000 personsc 205 (227) 179 (189)
Number of hospital beds per 1,000 personsd 2.9 (2.9) 2.2 (3.0)
Persons without health insurance (%)e 17 (15) —
Persons without drug insurance for routine
drug expenses (%)f — 18 (10)
Persons not getting needed care (%)g 8.5 (6.6) 9.4 (8.5)
Note. Data are from a variety of sources, detailed in individual footnotes. Dashes indicate unavailable data. aNorth Carolina and United States data are from the 2002 Behavioral Risk Factor Surveillance System (BRFSS) (North Carolina State Center for Health Statistics, n.d.a). Ontario and Canada data are for 2000/2001 and are from the Canadian Community Health Survey, 2000/01 (Statistics Canada, 2002a). bNorth Carolina and United States adverse birth outcomes data are for the year 2000 and are from the North Carolina Health Statistics Pocket Guide 2001 (North Carolina State Center for Health Statistics, 2002a). Ontario and Canada adverse birth outcomes data are for the year 2001 and are from the Canadian Vital Statistics, Birth Database (Statistics Canada, n.d.a, n.d.b). cNorth Carolina and United States physician rates are for the year 2000 and are from the North Carolina Health Statistics Pocket Guide 2001 (North Carolina State Center for Health Statistics, 2002b). Ontario and Canada physician rates are for the year 2002 and are from the Scott's Medical Database (Canadian Institute for Health Information, 2006). dNorth Carolina and United States hospital bed rates are for the year 2000 and are from the North Carolina Health Statistics Pocket Guide 2001 (North Carolina State Center for Health Statistics, 2002b). Ontario and Canada hospital bed rates are for the year 2001-2002 and are calculated using the number of hospital beds provided in the Canadian MIS database (Canadian Institute for Health Information, n.d.). eNorth Carolina and United States health insurance data are for 2002 and are from the 2003 Current Population Survey (U.S. Census Bureau, 2003b). fOntario and Canada data are for 1998 and are from a report prepared for Health Canada (Applied Management, 2000). This project was specially commissioned by the federal government to have national data about drug insurance coverage but the data have not been updated. Data about drug insurance coverage are not routinely collected in Canada. (B. Ferguson, personal conversation, January 2, 2007). gNorth Carolina and United States data are from the 2002 BRFSS (North Carolina State Center for Health Statistics, n.d.a). Ontario and Canada data are for 2001 from Health Services Access Survey, a special supplement to the Canadian Community Health Survey 2000/01 (Sanmartin et al., 2002).
128
Ontario
In contrast to North Carolina, Ontario is one of the wealthiest provinces in Canada,
although Northern Ontario (where the two communities used in this study are located) is
generally poorer than Southern Ontario. The province performs close to the national average
on most health indicators. For example, in the 2000/2001 Canadian Community Health
Survey, 12 percent of respondents from Ontario reported being in fair or poor health, a figure
matching the national average (Table 5.1; Statistics Canada, 2002a). Ontario had a three-
year average infant mortality rate of 5.4 per 1,000 live births in 2000 to 2002, which also
placed the province at the median of all thirteen provinces and territories (Statistics Canada,
n.d.a). Ontario generally fared worse than average, however, on low birth weight measures;
only two provinces/territories (Alberta and Nunavut) had higher low birth weight rates than
Ontario's 5.7 percent for the 2000 to 2002 three-year average (Statistics Canada, n.d.b).
With respect to availability of health care resources, Ontario has been above the
national median for certain health resources and below the median for others. In 2002,
Ontario had 179 physicians per 100,000 persons. Although the Canadian average was 189
physicians per 100,000 persons, only 4 provinces had higher rates than Ontario (Canadian
Institute for Health Information, 2006). Ontario had 2.2 hospital beds per 1,000 persons,
which was lower than the Canadian average of 3.0. Only the Yukon Territories and Nunavut
(large northern territories with remote communities) had lower rates of hospital beds
(Canadian Institute for Health Information, n.d.).
With respect to health insurance, all Ontario residents receive coverage for
"medically necessary" physician and hospital services under the Ontario Health Insurance
Plan (OHIP). At the time of data collection for this study, OHIP also provided universal
129
coverage for physiotherapy services in public clinics and routine eye examinations as well as
partial coverage for podiatry services.29
Health insurance for other services is not provided on a universal basis. Persons in
Ontario receive prescription drug insurance, for example, through a variety of means with a
variety of copayment and deductible structures. Some persons are covered through employer
packages; others receive drug insurance from the provincial government through eligibility
for social assistance (disability or welfare [called Ontario Works]), old age benefits, or
residence in a long-term care facility. First Nations persons (native Canadians) have a drug
insurance plan through the federal government. All residents of Ontario are also eligible for
the province's catastrophic drug plan, the Trillium Plan, which provides income-adjusted
coverage in the event of catastrophic drug costs (i.e., last dollar coverage). With respect to
first dollar coverage for prescription drugs, 82 percent of Ontario residents had some
insurance coverage in 1998, leaving 18 percent with no coverage for routine drug expenses
(Applied Management, 2000).30 This uninsurance rate was substantially higher than the
national average of 10 percent. The same study found an additional 6 percent of Ontario
residents had drug coverage that was considered inadequate (defined as paying 35 percent or
more of routine drug costs out of pocket; Applied Management, 2000), resulting in a total of
24 percent of Ontario residents being uninsured or underinsured for prescription drugs.
In addition to providing health insurance, the Ontario Ministry of Health and Long-
Term Care also provides grants for trips in excess of 100 kilometers (62 miles; distance is for
29Since data collection was completed, OHIP coverage for physiotherapy and eye examinations has been withdrawn for healthy persons aged 20 to 64 years. 30Data about drug insurance coverage are not routinely collected in Canada. The project cited above was specially commissioned by the federal government to have national data about drug insurance coverage but the data have not been updated. This project also did not prepare data at the sub-province level (B. Ferguson, personal conversation, January 2, 2007).
130
one-way) for Northern residents receiving specialist and hospital care outside of their
community. While the Northern Health Travel Grant program has been helpful in
addressing some of the financial barriers associated with travel, it does not cover meals or
accommodation costs. Most community leaders and individual interviewees felt that the
grant amount needed to be higher, with one community leader describing the grant amount as
"a spit in the wind." Waiting for reimbursement from the Northern Health Travel Grant—
which could take as long as three months—was also problematic, particularly for persons
with low incomes. Some social service agencies and local churches provide up-front loans to
disadvantaged individuals for the amount expected from the Northern Health Travel Grant,
making travel possible for those with limited funds (although the extra costs are still difficult
to bear). All First Nations reserves also run a transportation program for the First Nations
population, providing no-cost transportation to health care appointments within the local area
as well as long distance.
Canadians still report unmet health needs despite the existence of universal health
insurance for physician and hospital services. In 2001, 9.4 percent of Ontarians and 8.5
percent of Canadians reported not getting needed health care services (difference not
statistically significant at p = 0.05 level; Sanmartin, Houle, Berthelot & White, 2002). Long
waiting times for health care services was the main reason reported as the major barrier to
needed health care services (almost half of Canadians with unmet health needs identified
long waiting times as the reason; Sanmartin et al., 2002). Long waiting times are commonly
attributed to inadequate health care resources, particularly doctors and hospital beds.
131
THE FOUR COMMUNITIES
As outlined in the methods chapter, the four specific study communities were chosen
in part based on an intriguing aspect of the local health care system or community (including
a free medical clinic, a large American Indian population, the geographic location, and a
specially designed group medical practice). In the sections that follow, I expand on these
intriguing aspects to provide a fuller description of each community. I specifically provide
detail about each community's geography, social and economic characteristics, strengths and
challenges, health and health care needs, and health resources. The community level access
barriers and facilitators are integrated with each community description.
Bayboro, North Carolina
Bayboro is the county seat and geographical center of Pamlico County, a rural county
located on the central east coast of North Carolina. The county is also geographically
isolated as it is located on a peninsula and there is only one main highway running through
the county. Perhaps because of this geographic isolation, Bayboro was the most diffuse
community of the four included in this study. Study participants came from locations outside
of Bayboro as well as from the town itself.
In the 2000 census, Bayboro had a population of 741 persons, with slightly more than
half of the population being black (Table 5.2; U.S. Census Bureau, n.d.a). The racial
composition of the county was more unbalanced, however, with almost three-quarters of the
population being white (U.S. Census Bureau, n.d.c). There was a small but growing
Hispanic/Latino population in the town and the county. Both Bayboro and Pamlico County
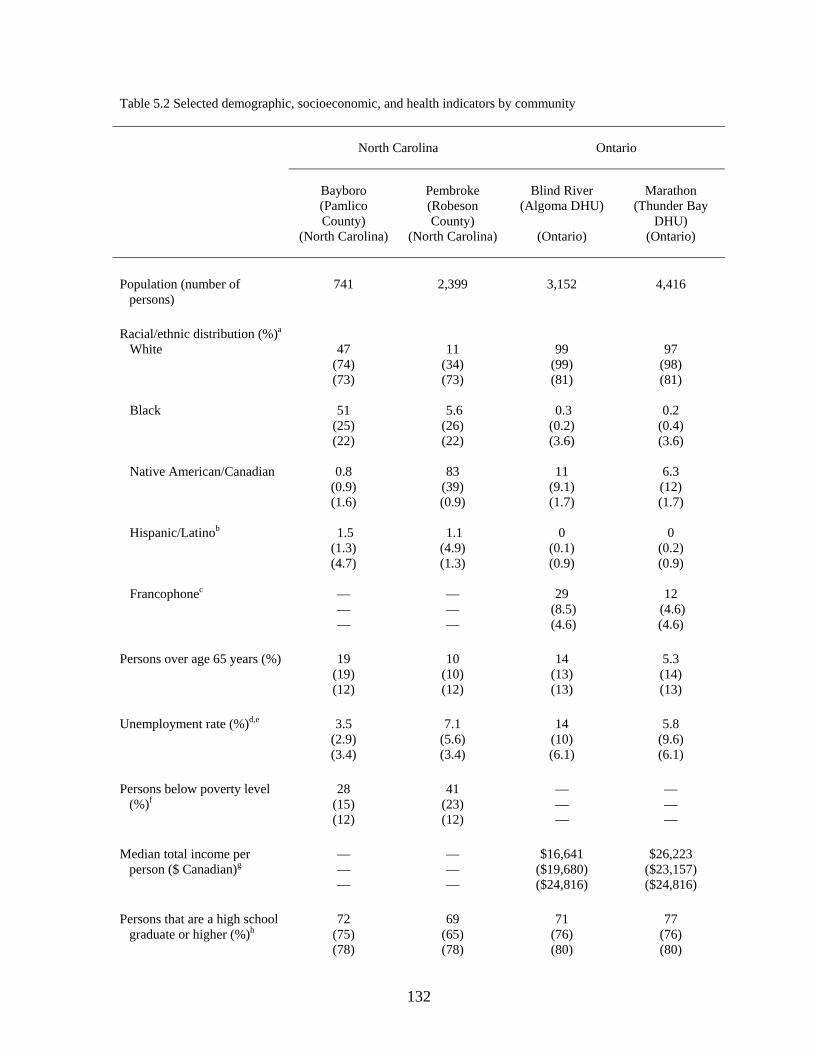
132
Table 5.2 Selected demographic, socioeconomic, and health indicators by community
North Carolina Ontario
Bayboro (Pamlico County)
(North Carolina)
Pembroke (Robeson County)
(North Carolina)
Blind River (Algoma DHU)
(Ontario)
Marathon (Thunder Bay
DHU) (Ontario)
Population (number of
persons) 741 2,399 3,152 4,416
Racial/ethnic distribution (%)a White Black Native American/Canadian Hispanic/Latinob
Francophonec
47
(74) (73)
51
(25) (22)
0.8
(0.9) (1.6)
1.5 (1.3) (4.7)
— — —
11
(34) (73)
5.6 (26) (22)
83
(39) (0.9)
1.1 (4.9) (1.3)
— — —
99
(99) (81)
0.3 (0.2) (3.6)
11
(9.1) (1.7)
0
(0.1) (0.9)
29
(8.5) (4.6)
97
(98) (81)
0.2
(0.4) (3.6)
6.3 (12) (1.7)
0
(0.2) (0.9)
12
(4.6) (4.6)
Persons over age 65 years (%) 19
(19) (12)
10 (10) (12)
14 (13) (13)
5.3 (14) (13)
Unemployment rate (%)d,e
3.5 (2.9) (3.4)
7.1 (5.6) (3.4)
14 (10) (6.1)
5.8 (9.6) (6.1)
Persons below poverty level
(%)f 28
(15) (12)
41 (23) (12)
— — —
— — —
Median total income per
person ($ Canadian)g — — —
— — —
$16,641 ($19,680) ($24,816)
$26,223 ($23,157) ($24,816)
Persons that are a high school
graduate or higher (%)h 72
(75) (78)
69 (65) (78)
71 (76) (80)
77 (76) (80)
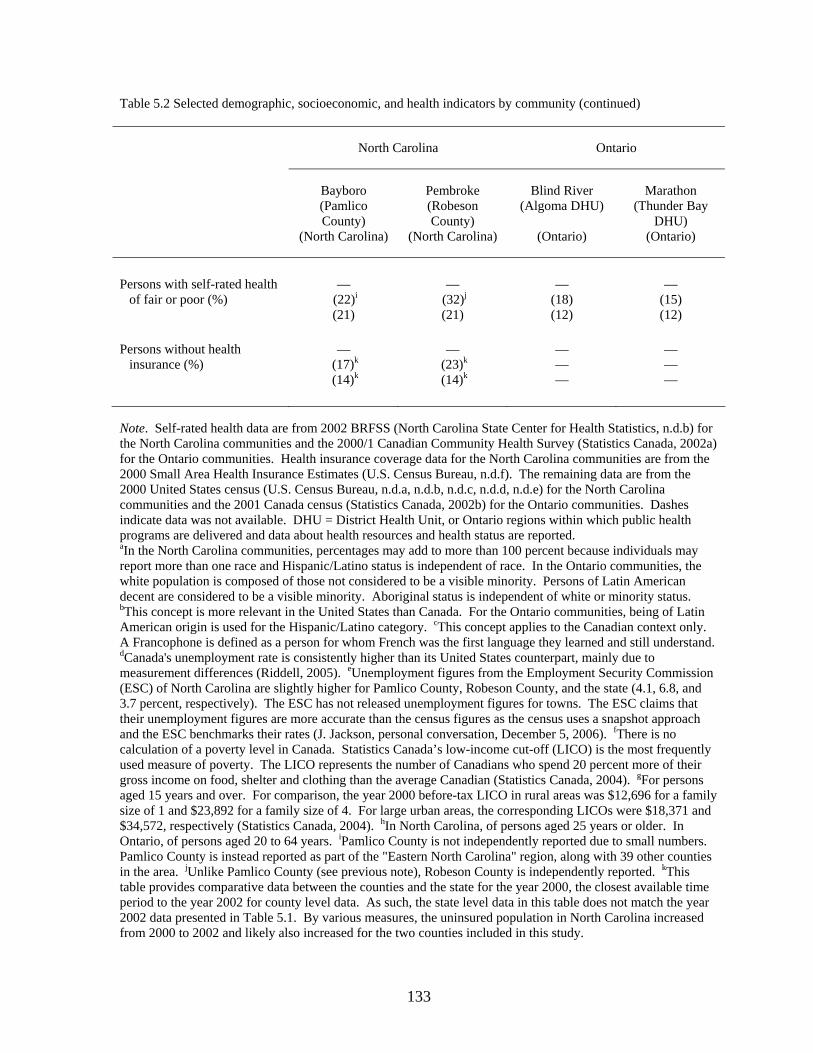
133
Table 5.2 Selected demographic, socioeconomic, and health indicators by community (continued)
North Carolina Ontario
Bayboro (Pamlico County)
(North Carolina)
Pembroke (Robeson County)
(North Carolina)
Blind River (Algoma DHU)
(Ontario)
Marathon (Thunder Bay
DHU) (Ontario)
Persons with self-rated health
of fair or poor (%) —
(22)i
(21)
— (32)j
(21)
— (18) (12)
— (15) (12)
Persons without health
insurance (%) —
(17)k
(14)k
— (23)k (14)k
—
— —
—
— —
Note. Self-rated health data are from 2002 BRFSS (North Carolina State Center for Health Statistics, n.d.b) for the North Carolina communities and the 2000/1 Canadian Community Health Survey (Statistics Canada, 2002a) for the Ontario communities. Health insurance coverage data for the North Carolina communities are from the 2000 Small Area Health Insurance Estimates (U.S. Census Bureau, n.d.f). The remaining data are from the 2000 United States census (U.S. Census Bureau, n.d.a, n.d.b, n.d.c, n.d.d, n.d.e) for the North Carolina communities and the 2001 Canada census (Statistics Canada, 2002b) for the Ontario communities. Dashes indicate data was not available. DHU = District Health Unit, or Ontario regions within which public health programs are delivered and data about health resources and health status are reported. aIn the North Carolina communities, percentages may add to more than 100 percent because individuals may report more than one race and Hispanic/Latino status is independent of race. In the Ontario communities, the white population is composed of those not considered to be a visible minority. Persons of Latin American decent are considered to be a visible minority. Aboriginal status is independent of white or minority status. bThis concept is more relevant in the United States than Canada. For the Ontario communities, being of Latin American origin is used for the Hispanic/Latino category. cThis concept applies to the Canadian context only. A Francophone is defined as a person for whom French was the first language they learned and still understand. dCanada's unemployment rate is consistently higher than its United States counterpart, mainly due to measurement differences (Riddell, 2005). eUnemployment figures from the Employment Security Commission (ESC) of North Carolina are slightly higher for Pamlico County, Robeson County, and the state (4.1, 6.8, and 3.7 percent, respectively). The ESC has not released unemployment figures for towns. The ESC claims that their unemployment figures are more accurate than the census figures as the census uses a snapshot approach and the ESC benchmarks their rates (J. Jackson, personal conversation, December 5, 2006). fThere is no calculation of a poverty level in Canada. Statistics Canada’s low-income cut-off (LICO) is the most frequently used measure of poverty. The LICO represents the number of Canadians who spend 20 percent more of their gross income on food, shelter and clothing than the average Canadian (Statistics Canada, 2004). gFor persons aged 15 years and over. For comparison, the year 2000 before-tax LICO in rural areas was $12,696 for a family size of 1 and $23,892 for a family size of 4. For large urban areas, the corresponding LICOs were $18,371 and $34,572, respectively (Statistics Canada, 2004). hIn North Carolina, of persons aged 25 years or older. In Ontario, of persons aged 20 to 64 years. iPamlico County is not independently reported due to small numbers. Pamlico County is instead reported as part of the "Eastern North Carolina" region, along with 39 other counties in the area. jUnlike Pamlico County (see previous note), Robeson County is independently reported. kThis table provides comparative data between the counties and the state for the year 2000, the closest available time period to the year 2002 for county level data. As such, the state level data in this table does not match the year 2002 data presented in Table 5.1. By various measures, the uninsured population in North Carolina increased from 2000 to 2002 and likely also increased for the two counties included in this study.
134
had more elderly persons than the state average (19, 19 and 12 percent, respectively; U.S.
Census Bureau, n.d.a, n.d.c).
Bayboro and Pamlico County were considered to be economically depressed,
although the presence of retirement communities like Oriental and Minnesott Beach provided
pockets of relative affluence for the county. Bayboro's 2000 unemployment rate was 3.5
percent, which was higher than both the county's and the state's unemployment rate (2.9 and
3.4 percent, respectively; U.S. Census Bureau, n.d.a, n.d.b, n.d.c). The town had a poverty
rate of 28 percent, which was much higher than that for the county or the state (15 and 12
percent, respectively). Bayboro also had a lower percentage of high school graduates than
the county or state (72, 75 and 78 percent, respectively; U.S. Census Bureau, n.d.a, n.d.b,
n.d.c).
Greatest Strengths and Challenges
Bayboro's greatest strengths were resilience and cohesiveness. The community
leaders that I interviewed believed the community would pull together if facing a difficult
situation, despite little current integration between races and the "from here's and come
here's" (i.e., persons born in the community and persons who were not). The geographic
isolation of the community contributed to the community cohesiveness as well as
contributing to economic difficulty. Other problems facing the community included
increasing financial and health disparities, diminished expectations, and resistance to change.
135
Health and Health Care Needs
The leading cause of death for the county was unintentional motor vehicle deaths.
Other leading health problems included diabetes, heart disease, hypertension, cancers, and
drug abuse, particularly among the youth. The county also had high repeat teen pregnancy
rates. With respect to self-rated health, in 2002 the population in Eastern North Carolina
reporting fair or poor health was slightly higher than the state average (22 percent versus 21
percent, respectively; Pamlico County was not reported on its own due to small numbers;
North Carolina State Center for Health Statistics, n.d.b). In 2000, 17 percent of Pamlico
County residents were estimated to be without health insurance, which was higher than the
state average of 14 percent (U.S. Census Bureau, n.d.f).31
Health Care Resources
The county was classified both as a primary care Health Professional Shortage Area
and a Medically Underserved Area. There was one family medicine group practice in the
county, with four doctors and one physician assistant. The Pamlico Medical Center's main
office was located in Bayboro, with a satellite office located in Oriental (a well-off retirement
community in the country). The providers in this practice did not accept Medicaid patients
and only accepted uninsured/self-pay patients under limited conditions (conditions so limited
that most described Pamlico Medical Center as not accepting self-pay patients). One
estimate of the breakdown of insurance coverage status of patients served by Pamlico
Medical Center was 20 percent of the patients had private insurance, 65 to 75 percent had
Medicare, and the remainder were uninsured. Pamlico Medical Center had alienated parts of
31More recent uninsurance estimates were not available at the county level. The uninsurance estimate for North Carolina had increased by 1.6 percent from 2000 to 2002 (U.S. Census Bureau, 2003a). Pamlico County's uninsurance rate was also likely higher in 2002 than the 2000 estimate provided here.
136
the community due to their restrictive practice and lack of collaboration with other providers.
I found the Pamlico Medical Center unresponsive despite repeated attempts and was only
able to interview one of their doctors after a personal contact made a special plea on my
behalf.
A pediatrician opened a practice in Bayboro in 1999. This was the first time that
pediatric specialty care was offered in the county. The pediatrician accepted all patients,
including those with Medicaid and the uninsured.
Two dentists practiced in the county. Neither dentist took Medicaid. Prenatal
services were provided through collaboration between the Pamlico County Health
Department and the Craven County Health Department, with services provided at both
locations. No other specialty care was provided in Pamlico County.
There was no hospital in the county. As with most specialty care, residents must
travel outside the county. The closest hospital was located in the next county, Craven
County, in the town of New Bern, about a 40 minute drive from Bayboro. Some reported
that the Emergency Department at the Craven Regional Medical Center discriminates on the
basis of race and insurance status. Other hospitals used by residents of Pamlico County
included the Beaufort County Hospital in Washington, about a 90 minute drive, and Carteret
County General Hospital in Morehead City, about 75 minutes away by ferry.
The Pamlico County Health Department offered free immunizations and a variety of
other preventive services (e.g., well baby checks, cervical cancer screening, diabetes
screening) on a sliding fee scale or through insurance coverage. A free health clinic for the
uninsured, named the Hope Clinic, was started by a local church in 1999. The Hope Clinic
provided primary medical care out of the health department one night a week. On an average
137
evening, the clinic saw 40 patients, using the labor of 3 volunteer physicians or physician
assistants and 6 volunteer nurses. Six additional volunteers processed potential patients for
clinic eligibility, dispensed drugs from the clinic pharmacy, and helped patients to apply for
pharmacy assistance programs offered by pharmaceutical companies. The Hope Clinic also
tried to refer to specialists willing to take uninsured patients for low or no cost as well as
helped patients apply for Medicaid and disability coverage and facilitate transfers to new
primary care providers for those gaining Medicaid or Medicare coverage. The local
pharmacy, Bayboro Pharmacy, helped residents deal with drug costs through extended
payment plans and collaborates with the Hope Clinic when needed. A local charity also ran a
fund through Bayboro Pharmacy to cover one-time drug costs for individuals in need.
Although the above services provided valuable help for persons in need in Bayboro
and Pamlico County, health care gaps and problems remained. Adults with Medicaid faced
the most problems getting health care, as the Health Department was the only adult provider
in the county that would accept Medicaid and the Health Department only offered preventive
services. At least one of the private insurance companies serving the area required high
deductibles, resulting in underinsured populations. The Hope Clinic's excellent work in
serving the uninsured was only available one evening a week, leaving those without
insurance to use emergency departments and urgent care facilities outside of the county when
care was needed at other times. All adults requiring specialty care also had to travel outside
the county. Traveling for care was generally not seen as problematic, however, as
individuals were used to driving distances for many different services and the vast majority
of individuals had a personal vehicle or could get family or friends to drive them places.
138
Pembroke, North Carolina
Pembroke, North Carolina is located in the center of Robeson County, a county in the
southeast portion of the state, buttressing the South Carolina border. Interstate 95, the
highway connecting New York and Miami, runs through the eastern part of the county and
through Lumberton, a small metro area that serves as the county seat. Pembroke is 12 miles
west of Lumberton, with about a 20-minute drive between the two communities.
In 2000, the town of Pembroke had 2,399 persons (Table 5.2; U.S. Census Bureau,
n.d.d). There was a large Lumbee Indian population in the community; 83 percent of
Pembroke residents identified their race as American Indian or Alaska Native. White and
Black persons made up much of the remainder of the population (11 and 6 percent,
respectively; U.S. Census Bureau, n.d.d). The county itself had a long history of close to
equal proportions of Native American, Black and White populations, making for a unique
racial distribution (U.S. Census Bureau, n.d.e). Pembroke and Robeson County also had a
younger population, with both having fewer elderly than the state average (U.S. Census
Bureau, n.d.b, n.d.d, n.d.e).
Robeson County had been in economic decline for a number of years due to multiple
factory closings in the mid-1990s as manufacturing moved outside of the country. Many of
the remaining jobs were service sector jobs, which generally offered lower wages, less full-
time work, and few or no benefits. Politicians and business leaders had been struggling to
attract new employers to the county and to educate the available workforce. Consequently,
the county and town had high poverty and unemployment rates. In 2000, Pembroke had an
unemployment rate of 7.1 percent, which was higher than the county average and more than
twice the state average (5.6 and 3.4 percent, respectively; U.S. Census Bureau, n.d.b, n.d.d,

139
n.d.e). Robeson County had been classified as an area of persistent poverty, having had a
poverty rate of 20 percent or higher in the 1970, 1980, 1990 and 2000 census (Economic
Research Service, 2004). Pembroke had also been in persistent poverty over the same time
period, although at a much higher level than the county. In 2000, for example, Pembroke's
poverty rate of 41 percent was almost double the county rate and more than three times the
state average poverty rate (U.S. Census Bureau, n.d.b, n.d.d, n.d.e).
The population in Pembroke and Robeson County were also less educated than the
state average, particularly with respect to high school graduation rates (69, 65 and 78 percent,
respectively), although the town had double the county rate of persons with higher education
(22 percent of Pembroke's population had a bachelor's degree or higher, versus 11 percent of
Robeson County's population; U.S. Census Bureau, n.d.b, n.d.d, n.d.e). Having the
University of North Carolina at Pembroke in town may explain the greater higher education
rate. This university was originally built to educate Native Americans and still consists of a
significant number of Native American students.
Greatest Strengths and Challenges
Pembroke's greatest challenge was the economic decline and the associated
unemployment, poverty, uninsurance, and health issues. The economic decline had also
contributed to health and social problems like substance abuse and domestic violence along
with a sense of resignation and complacency among part of the population. There was also a
long history of racial division in Pembroke and the surrounding county, although many said
that the division was improving. While I was visiting Pembroke, serious fighting between
Lumbee Indian and Black students occurred at the local high school, with many students
140
charged with inciting a riot and assault. School officials were subsequently accused of
discriminatory discipline by both sides.
On the other hand, Pembroke was a strong community with many well-intentioned
people. People were very attached to this community and their history in the community.
Like Bayboro, many described this community as resilient and cohesive, particularly under
crisis situations. There were a number of social support and community organizations
working to improve social conditions and health problems. Many of these groups
collaborated and used social networks to educate and support individuals. Organizations like
the Lumbee Regional Development Association, the Healing Lodge, and the Robeson
County Partnership for Community Health delivered health programs addressing infant
mortality prevention, teen pregnancy, nutrition, diabetes, heart disease, domestic violence
and sexually transmitted diseases. Some of these programs were delivered in collaboration
with the hospital or the county health department, both located in nearby Lumberton. Some
of the community organizations also provided funds to needy persons for health care
services, food, and electrical and heating costs. The Healing Lodge also had plans to develop
a free medical clinic in Pembroke.
Health and Health Care Needs
Robeson County had a consistent history of poor health indicators, despite many
programs and interventions. The county had the highest rate of diabetes mortality in the
state. Other disease rates ranked the county high nationally; Robeson County had the highest
sexually transmitted disease (STD) rates in the country as well as the seventh highest county
in the United States in heart disease incidence and the ninth highest county in stroke
141
incidence. The extremely high STD rates attracted the attention of the federal government's
Centers for Disease Control and Prevention and became the flashpoint for the involvement of
the area Baptist Churches in sexual health education. The county also had high infant
mortality rates and high teenage birth rates, as well as notable problems with drug abuse
(particularly cocaine and prescription drugs), domestic violence and child abuse. Not
surprisingly, Robeson County residents were more likely to report being in fair or poor health
than the state average in 2002 (32 percent versus 21 percent, respectively; North Carolina
State Center for Health Statistics, n.d.b). With respect to health insurance coverage, 23
percent of residents of Robeson County were estimated to be uninsured in 2000, which was
much higher than the state estimate of 14 percent (U.S. Census Bureau, n.d.f).32
Health Care Resources
Although the county was classified both as a primary care Health Professional
Shortage Area and a Medically Underserved Area, there were many health resources in
Pembroke. Pembroke had a Community Health Center (CHC), two Rural Health Clinics
(one of which serves as a walk-in clinic only), three privately owned clinics, and one solo
practice physician. In total, there were 11 adult primary care physicians and 2 pediatricians
practicing in town. The vast majority of the physicians were Native Americans who had
grown up in the area. A few physician assistants and nurse practitioners augmented the local
physicians and the CHC employed two maternal outreach workers. There were two dentists
in town; both dentists accept Medicaid and self-pay patients. Numerous health screening and
education programs were also delivered in the community, as already detailed above.
32More recent uninsurance estimates were not available at the county level. The uninsurance estimate for North Carolina had increased by 1.6 percent from 2000 to 2002 (U.S. Census Bureau, 2003a). Robeson County's uninsurance rate was also likely higher in 2002 than the 2000 estimate provided here.
142
There was no hospital in Pembroke although a number of hospitals were within
reasonable driving distance. The closest hospital was Southeastern Regional Medical Center
in Lumberton. The emergency room at Southeastern was the sixth busiest emergency room
in the state. Other hospitals used by Pembroke residents included Scotland Memorial
Hospital in Laurinburg, about a 30 minute drive, Moore Regional Hospital in Pinehurst,
about a 45 minute drive, and Cape Fear Valley Hospital in Fayetteville, about a 60 minute
drive.
All of the physicians in Pembroke claimed to serve patients regardless of insurance
status or type. One local doctor claimed that it would be impossible to sustain a practice
without accepting Medicaid since Medicaid was the predominant form of insurance in
county. Some of the providers charged uninsured patients using a sliding fee scale while
others charged uninsured patients the regular amounts. Some of the providers accepted
payment plans. Some of the medical clinics assisted patients with applying for pharmacy
assistance programs offered by various pharmaceutical companies and most providers made
it a point to use drug samples to assist those without drug insurance. The county health
department in nearby Lumberton also provided adult and child primary care clinics, prenatal
and postnatal care, free immunizations, a variety of cancer and disease screening programs,
and a dental clinic. The health department accepted all forms of insurance, offers a sliding
fee scale, and saw patients regardless of their outstanding debt status. There were long wait
times for care at the health department, however.
Despite the existence of varied forms of financial assistance, some community leaders
and members of the community reported problems with getting care when unable to pay.
Patients had been turned away from various providers for previous unpaid bills or for an
143
inability to pay the sliding scale's $10 minimum fee. At least one of the private clinics
required cash payment prior to services for uninsured patients. This situation contributed to
reports that people go to the emergency department for care instead of the local doctors since
the hospital accepted payment plans, did not demand up-front payment, and did not turn
people away for previous unpaid bills. Others reported that financial barriers could be
minimized based on who you know and which receptionist deals with you that day.
Transportation and traveling for care was described as a significant barrier by many
community leaders but not in the individual interviews. Even the poorest individuals
interviewed were generally able to cobble together a way of getting to needed care despite
not having transportation of their own. All individuals described traveling for care to
Lumberton as well as other surrounding communities as an inevitable part of life in the
community rather than a barrier. Some of the traveling for care simply reflected preferences
and specialist availability while other of the traveling for care reflected beliefs about
discrimination and quality of care. All community leaders and individual interviews
described the hospital in Lumberton as not providing quality care to the Lumbee population
in the 1950s and 1960s. At the time of data collection, some still considered that hospital as
the last place to go for care, preferring to travel to hospitals up to a 60 minute drive from
Pembroke. For example, Moore Regional Hospital in Pinehurst, a 45 minute drive, was cited
as a preferred hospital as it had no history of racial problems and was widely perceived as
delivering the highest quality of care in the area.
144
Blind River, Ontario
Blind River is located in Northern Ontario, on the north channel of Lake Huron
midway between the cities of Sault Ste. Marie and Sudbury. It is a 2-hour drive from Blind
River to either city. The Trans-Canada Highway, the main highway in Northern Ontario, runs
directly through town. The Mississauga First Nation reserve is located just outside of town.
The reserve operates independently from the town, although the two governments have
worked together on occasional projects. Blind River is also located on the southeastern
border of the Algoma District Health Unit region (District Health Units are the primary unit
for reporting health data in Ontario).
In 2001, Blind River had a population of 3,152 persons (Table 5.2; Statistics Canada,
2002b). The population was predominantly not of a visible minority group (Statistics
Canada's corollary of the U.S. Census Bureau's white category; Statistics Canada, 2002b).
Eleven percent of the population in Blind River identified as a native Canadian (Statistics
Canada, 2002b), as some members of the Mississauga First Nation had choose to live in town
rather than on the local reserve. Twenty-nine percent of Blind River's population was
Francophone, which was higher than the region's 8.5 percent (Statistics Canada, 2002b). The
population in Blind River was also older than the surrounding region and province, with 14
percent of the population over the age of 65 years (Statistics Canada, 2002b).
The town had been in economic decline for many years. Blind River's economy was
built on mining and lumber, but by the early 1990's the mines and mill had closed. The town
had most recently invested heavily in the tourism sector. By 2002, the majority of the jobs
were in the service industry. The Tim Horton's coffee shop in town, located right on the
Trans-Canada highway, was among the 10 busiest Tim Horton's in Canada (which was a
145
remarkable statistic as Tim Horton's coffee shops are extremely popular and ubiquitous
throughout Ontario).
Blind River's 2001 unemployment rate of 14 percent was higher than the region's
average and more than double the provincial average (10 and 6.1 percent, respectively;
Statistics Canada, 2002b). The median total income for persons aged 15 years and older in
Blind River was less than $17,000 in 2001, which was lower than the regional and provincial
average ($19,680 and $24,816, respectively; Statistics Canada, 2002b). Fewer persons in
Blind River also had at least a high school education than in the region or the province (71,
76 and 80 percent, respectively; Statistics Canada, 2002b).
Greatest Strengths and Challenges
Blind River's greatest strengths were its resiliency and emphasis on community
building. Community leaders described Blind River as a supportive, caring, and friendly and
open community. There were good relations between the town and the First Nations reserve,
as well as between the English and French communities. I too found Blind River to be a
friendly community; I felt most warmly welcomed in this town out of the four towns I
visited, despite having only one arms-length contact in the area.
The weakened economy and few opportunities for employment had provided Blind
River with significant challenges, however. Most of the younger people had left town to find
employment elsewhere. Limited services were available in town because of the lack of
business (one of the two grocery stores had closed in the recent past, for example). Some of
the community leaders also cited the current dependence on the tourist economy as a problem
for the town as it only provided low-paying service jobs.
146
Blind River was also struggling to provide primary health care to all of its residents.
Prior to my data collection, Blind River was already considered to be short one physician and
was classified as a medically underserved community. The one female physician in town
had also been sick with breast cancer and had not been working full-time for many months.
All of the doctors considered their practices to be full and were not accepting new patients
even though a number of residents of Blind River were without a family physician. The
public health unit estimated that 90 percent of their clients were without a family physician.
The average wait time for an appointment with a doctor was six weeks, regardless of the
urgency of the problem. Townspeople were forced to use the emergency department as a
walk-in clinic, with the doctor on-call seeing an average of 30 patients a day.
Shortly before my arrival in the community, one of the local doctors died suddenly,
orphaning 1700 patients. The other doctors in the community picked up some of the sickest
patients but, as their practices were already full, left the remaining orphaned patients to use
the emergency room as their primary source of care, even for prescription renewals. The
number of people using the emergency department increased to an average of 50 patients a
day and the minimum wait times for non-emergency issues increased to 3 to 7 hours.
Individual interviewees described waiting in the emergency department all day long to
simply renew a prescription or review test results.
Health and Health Care Needs
Like many Northern Ontario communities, Blind River had high smoking rates. The
population also has increased rates of cancers, heart disease, stroke, chronic obstructive
pulmonary disease, asthma, and diabetes. Some health care providers described problems
147
with alcohol and drug abuse, although others did not agree that this was a problem. With
respect to self-rated health, persons in the region were more likely to report being in fair or
poor health than the provincial average (18 percent versus 12 percent, respectively; Statistics
Canada, 2002a).
Health Care Resources
There were 7 doctors in town (not including the doctor who died suddenly). Two of
the doctors were semi-retired (one of these doctors was 85 years old at the time of data
collection) and worked out of solo offices in the central part of town. The remaining 5
doctors operated out of the same office, located beside the hospital at the outskirts of town.
Despite being located in the same office, these doctors did not function as a group practice
and were often described as not getting along with one another. One community leader
suggested that the multi-doctor office would not have happened except that the town built the
office and offered it to the doctors rent-free. The quality of care delivered by the local
physicians was often described as questionable or lacking by community leaders and
interviewees. Some attributed the delivery problems to the quality of the physicians
themselves, while others attributed the quality of care issues to the physicians' heavy
workloads. The town had been trying to attract another physician to the community for many
years. Recruitment efforts had not been successful at the time of this writing. The hospital
was also trying to recruit a nurse practitioner, although the local doctors were not supportive
of this initiative.
Blind River's District Health Centre had 16 acute care beds, 10 chronic care beds and
32 long term care beds. This hospital was moved from the center of town to the edge of town
148
in 1992. Although the new hospital was a beautiful freshly-built building, the move
"devastated the town." The new location was considered to be too far from town and a poor
tradeoff for the central and lakeside location of the original. Blind River residents were
convinced that fewer services were available in the new hospital even though the move to the
new hospital building allowed for the delivery of more services and updating of technologies.
Townspeople associated the new hospitals with the cessation of minor surgery and the local
delivery of babies when the move to the new hospital was not related to either service being
withdrawn. Minor surgery was performed by some of the older physicians who have since
decreased their practice or left town. The younger doctors did not perform minor surgeries,
reflecting the specialization of medicine over the years rather than a withdrawal of services.
The hospital also did not hire an anesthetist when the general physicians with anesthetic
training decreased their practice or left town. With respect to the delivery of babies, the local
doctors stopped delivering babies in the mid-1980s due to low caseloads and increasing
insurance rates. In any case, people still talked passionately about the old hospital and
services when I was collecting data in town, more than 10 years after the move to the new
hospital.
A variety of specialists visited the hospital on a monthly, quarterly, or biyearly basis,
including specialists in cardiology, internal medicine, orthopedics, urology, nephrology, and
geriatrics. The appointment slots for these specialists were filled quickly and more than one
interviewee recounted that it was easier to travel to Sault Ste. Marie or Sudbury for a
specialty appointment than trying to get one in town. The hospital also provided radiology,
laboratory, chemotherapy, and diabetes education services.
149
The local public health unit had 2 public health nurses delivering a variety of
services, including immunization clinics, maternal and child support programs including a
drop-in information centre for parents, and sexual health clinics including subsidized birth
control pills and pregnancy and sexually transmitted disease testing. A variety of
organizations provided counseling services using social workers and psychologists, although
there were long waiting lists for counseling and mental health support. Most of the
counseling services were only available on a part-time basis as the services were shared with
other communities in the area. These counseling services were funded through a variety of
mechanisms, with many charging fees based on a sliding scale.
In 2000, a number of local service providers established a children's coalition to
deliver services more effectively. This coalition helped them to be more aware of services
available in the community which led to increased referrals between various agencies and the
identification of gaps in children's services. They had received funding from the federal
government to hire a coordinator and establish additional services but had only hired a
coordinator by the time I was in the community.
Other health care services in town included two pharmacies, two physiotherapists
(with one only accepting private insurance; the other accepted OHIP but mainly provided
outpatient physiotherapy through the hospital), two dentists, a chiropractor. There was also a
women's shelter for victims of domestic abuse located on the Mississuaga First Nations
Reserve. Women from Blind River were welcome at the shelter but the location made it less
likely that non-First Nations women would use the service.
Transportation and travel to health care services was frequently identified as a
problem in Blind River, giving me the impression that Blind River residents were less likely
150
to have personal transportation or less able to receive transportation assistance from family
and friends than residents of any of my other three communities. Certainly more elderly
were without family members located in Blind River due to the poor employment conditions.
With respect to local travel for health care services, a number of interviewees talked about
their difficulty getting to the hospital or multi-doctor office located at the edge of town. The
hospital and multi-doctor office was a 20-minute walk from downtown Blind River and a 45-
minute walk from the other side of town. One unemployed individual without transportation
would pay $8 to take a taxi to the doctor (one-way). When transportation was required
outside the community, these problems were exacerbated. The Northern Health Travel Grant
barely covered the cost of the Greyhound bus between Blind River and Sault Ste. Marie or
Sudbury. Those taking the Greyhound bus to the city then had to get to the specialist's office
or hospital, which usually required additional expenditure on a city taxi. Visiting Sault Ste.
Marie or Sudbury to see a specialist or have a test would take most of a day under the best
circumstances.
There were multiple transportation programs in Blind River to deal with these
transportation issues, although not all persons with transportation problems were eligible for
these programs. Ontario Works had purchased two vans to deliver clients to their jobs as
many of their clients did not have their own transportation. The town operated a low-cost
bus for persons with physical or mental difficulties, with service available at limited times
within Blind River. The hospital also provided a transportation program using volunteer
drivers to assist seniors and persons with physical and mental difficulties in traveling to
health care appointments in town and outside of town. This transportation program also
charged users, although the Northern Health Travel Grant could be used to offset this fee.
151
First Nations persons could use the reserve's medical van for transportation to health care
appointments in town or outside of town, regardless of whether they lived on the reserve or
in town.
Marathon, Ontario
Marathon, Ontario is a rural and remote town located in Northwestern Ontario, at the
top of Lake Superior and a few minutes off the Trans-Canada highway. The closest
communities to Marathon are two First Nations reserves, one of which is a 20 minute drive
from town and the other is a 45 minute drive. The closest town, Terrace Bay, is a 60 minute
drive from Marathon and the closest city, Thunder Bay, is a 4-hour drive away. Marathon is
also located in the center of the southern border of the Thunder Bay District Health Unit
region.
In 2001, Marathon had 4,416 people (Table 5.2; Statistics Canada, 2002b). The two
First Nations reserves were considered to be part of the catchment area for the Marathon
doctors, increasing the population served by the doctors to be about 7,000 persons. Of the
people in Marathon itself, 97 percent were not of a visible minority, 6 percent of the
population in Marathon identified as a native Canadian, and 12 percent of the population was
Francophone (Statistics Canada, 2002b). Marathon's population was younger than average:
only 5 percent of Marathon's population was over the age of 65 years, which was 40 percent
of Thunder Bay's District Health Unit's and Ontario's rates (Statistics Canada, 2002b).
Marathon's economy was strong, largely due to the pulp mill (founded in 1944) and
the two mines (gold was found in the area in 1983, the richest gold deposit ever to be found
in Canada). These employers had a history of paying well and providing good benefits. The
152
2001 unemployment rate in Marathon was lower than the surrounding region and the
provincial average (5.8, 9.6 and 6.1 percent, respectively; Statistics Canada, 2002b). The
median total income for persons aged 15 years and older in Marathon was more than $26,000
in 2001, which was also higher than the region and the provincial average ($23,157 and
$24,816, respectively; Statistics Canada, 2002b). The percentage of the population that has a
high school education or higher was similar across the town, region, and province (Statistics
Canada, 2002b).
Greatest Strengths and Challenges
The strong economy and the associated prosperity for much of the population was
Marathon's greatest strength. A number of community leaders described the town as vibrant,
with much participation in volunteering and recreational activities. The town could also
easily raise money for causes deemed to be important. For example, after a community
leader's sick child needed extended specialized health care in Toronto (a 14-hour drive
away), the town established a Sick Children's Fund to help families with travel,
accommodation, loss of income, and medical costs not covered by the Northern Health
Travel Grant or employment benefits. Community members contributed $40,000 towards
this fund in the first two hours of collection. A yearly golf tournament to raise money for the
fund was also established.
The town's prosperity was not evenly distributed, however, and the affluence
rendered the poor population "almost invisible." Despite the existence of 3 subsidized
apartment buildings and a literal "wrong side of the tracks" part of town, many community
members were described as unaware that there were needy persons in Marathon. A number
153
of community leaders described Marathon as "a tough place to be poor" because of the lack
of awareness and the surrounding wealth. Marathon's strong economy was also expected to
be threatened by the future depletion of the area's non-renewable resources. During data
collection, I was told that the mines had 7 to 10 years of life left. At the time of this writing,
technological advances had extended the lives of the mines and the town's economy
remained robust but the mines were still expected to be exhausted at some point in the future.
The paper mill had also been sold a number of times, leading to some doubt about the
stability of this industry.
I also received mixed information about the community's cohesiveness. The Sick
Children's travel fund, the large number of volunteers in various programs, and the local
United Church recent move to become an "affirming" congregation (welcoming full
participation by gay and lesbian persons) were cited as evidence of the community's
inclusiveness and ability to work together. However, the United Church's decision was
criticized by many in Marathon. Some community leaders and individual interviewees used
this as an example of the community's narrow-minded and restrictive stance. The lack of
awareness of the poor in the community was used as another example of fragmentation.
There also were tensions between the First Nations communities and others and the English
and French populations, particularly in the schools. One community leader described the
town as "cautious" and "not the most hospitable," attributing these attitudes to a police cover-
up of multiple child molestations by a community leader in the 1980's. Certainly, I did not
find Marathon as welcoming as the other three communities and had to work much harder to
network and gather information, despite having a friend in the community.
154
Marathon's second primary strength was the stable group of doctors serving the
community, which had reversed Marathon's history of medical underservice and transient
doctors. The current doctors had been in the community since 1996 and had invested much
time and energy in setting up a group practice to serve the community in a sustainable way.
Under a special payment plan arranged with the Ontario government, the 9 doctors practicing
in Marathon shared 6 full-time equivalent positions. This allowed the doctors to have a
reasonable call schedule (they were committed to a call schedule of one shift a week) as well
as time off for continuing education, recreation, and vacation. From the doctors' point of
view, this group practice allowed them to deliver high quality care without burning out.
The community saw things a bit differently, however, primarily because these doctors
employed a different practice philosophy than previous doctors. Rather than accommodate
immediate appointments for everyone, as previous doctors had done, the current doctors
booked non-urgent appointments many weeks in the future. The current doctors instead
filled their immediate time with active management of persons with chronic illness in
addition to dealing with urgent health care needs. The current doctors also introduced newer
treatment approaches; most notably, antibiotics were no longer automatically prescribed for
children with ear infections. The community did not cope well with these changes and
complained that care was contrary to what they had come to expect. The early discontent
culminated in a series of letters in the local paper in late 1999, including a letter to the
community from the doctors (The family physicians of Marathon Family Practice, 1999;
Hollway et al., 1999; Otiquam, 1999; Sullivan, 1999). Despite the doctors' efforts at patient
education, these same sentiments persisted into 2002, when I was collecting data in the
community. Individuals continued to question why wait times for appointments were so
155
long, particularly given there were so many doctors serving the community. While people
with chronic conditions and urgent health needs could be accommodated in a timely way and
reported receiving excellent care, those with non-urgent conditions had to wait two to three
months for an appointment. Some participants also recounted having trouble trusting that the
current doctors would continue to stay and serve the community, despite the group practice
having been in existence for 6 years. The combination of long wait times and reluctance to
trust meant that generally healthy people felt unable to establish strong doctor-patient
relationships and questioned whether they could truly claim to have a family doctor. "It's
almost a joke when someone asks who your family doctor is," described one Marathon
resident. I was also told that some community members expressed their displeasure with the
local physicians by choosing to obtain health care from physicians in other communities,
although I was unable to identify such individuals to interview.
Health and Health Care Needs
Like Blind River, Marathon had high smoking rates, asthma rates, and problems with
chronic diseases. Marathon also had high allergy rates. The asthma and allergy problems
were frequently attributed to the poor air quality from the local industries. While recreational
drug use was reported by community leaders in Marathon, there was not a strong sense that
such drug use was causing health problems. Diabetes, obesity, and teenage pregnancy were
the biggest health problems facing the local First Nations population, particularly for those
on the two reserves. More residents of the Thunder Bay health region also reported their
self-rated health as fair or poor than the provincial average (15 percent versus 12 percent,
respectively; Statistics Canada, 2002b).
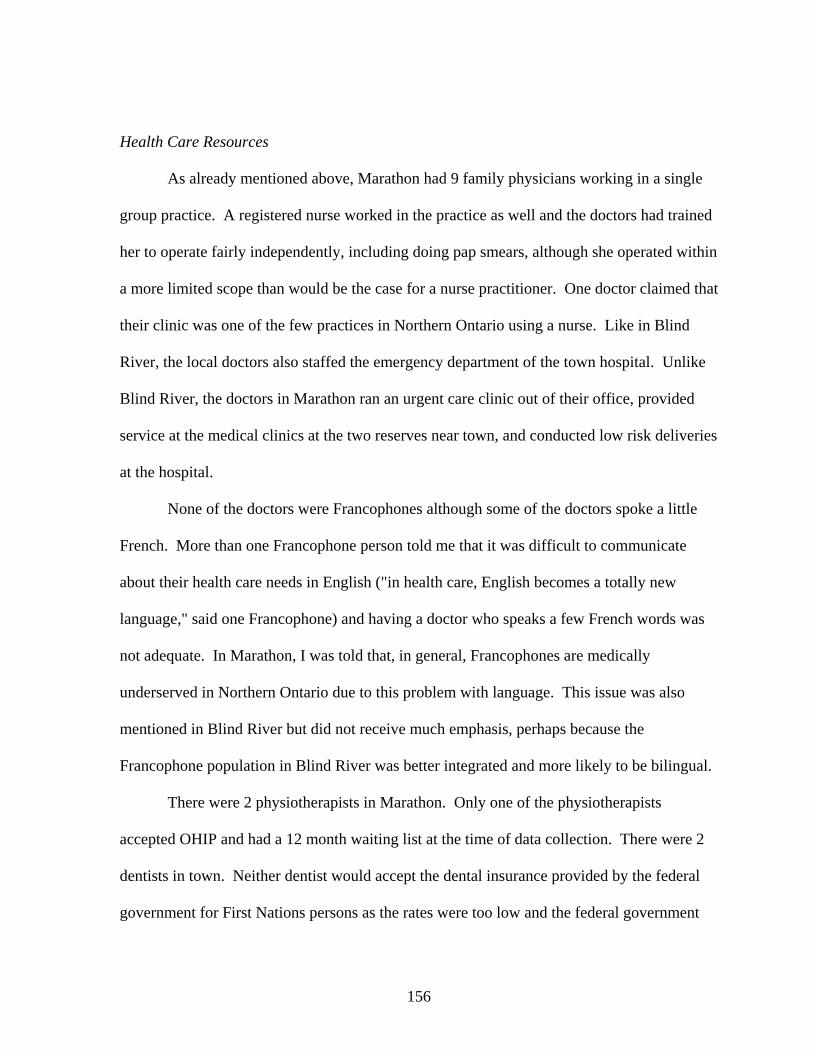
156
Health Care Resources
As already mentioned above, Marathon had 9 family physicians working in a single
group practice. A registered nurse worked in the practice as well and the doctors had trained
her to operate fairly independently, including doing pap smears, although she operated within
a more limited scope than would be the case for a nurse practitioner. One doctor claimed that
their clinic was one of the few practices in Northern Ontario using a nurse. Like in Blind
River, the local doctors also staffed the emergency department of the town hospital. Unlike
Blind River, the doctors in Marathon ran an urgent care clinic out of their office, provided
service at the medical clinics at the two reserves near town, and conducted low risk deliveries
at the hospital.
None of the doctors were Francophones although some of the doctors spoke a little
French. More than one Francophone person told me that it was difficult to communicate
about their health care needs in English ("in health care, English becomes a totally new
language," said one Francophone) and having a doctor who speaks a few French words was
not adequate. In Marathon, I was told that, in general, Francophones are medically
underserved in Northern Ontario due to this problem with language. This issue was also
mentioned in Blind River but did not receive much emphasis, perhaps because the
Francophone population in Blind River was better integrated and more likely to be bilingual.
There were 2 physiotherapists in Marathon. Only one of the physiotherapists
accepted OHIP and had a 12 month waiting list at the time of data collection. There were 2
dentists in town. Neither dentist would accept the dental insurance provided by the federal
government for First Nations persons as the rates were too low and the federal government
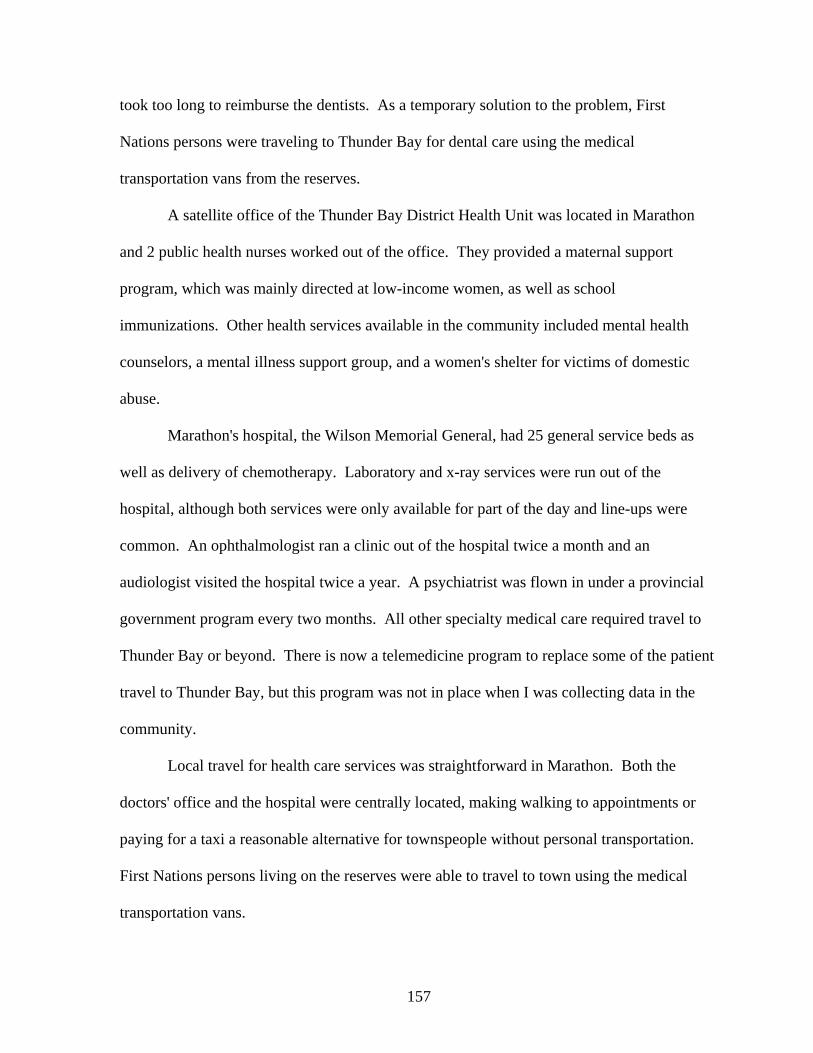
157
took too long to reimburse the dentists. As a temporary solution to the problem, First
Nations persons were traveling to Thunder Bay for dental care using the medical
transportation vans from the reserves.
A satellite office of the Thunder Bay District Health Unit was located in Marathon
and 2 public health nurses worked out of the office. They provided a maternal support
program, which was mainly directed at low-income women, as well as school
immunizations. Other health services available in the community included mental health
counselors, a mental illness support group, and a women's shelter for victims of domestic
abuse.
Marathon's hospital, the Wilson Memorial General, had 25 general service beds as
well as delivery of chemotherapy. Laboratory and x-ray services were run out of the
hospital, although both services were only available for part of the day and line-ups were
common. An ophthalmologist ran a clinic out of the hospital twice a month and an
audiologist visited the hospital twice a year. A psychiatrist was flown in under a provincial
government program every two months. All other specialty medical care required travel to
Thunder Bay or beyond. There is now a telemedicine program to replace some of the patient
travel to Thunder Bay, but this program was not in place when I was collecting data in the
community.
Local travel for health care services was straightforward in Marathon. Both the
doctors' office and the hospital were centrally located, making walking to appointments or
paying for a taxi a reasonable alternative for townspeople without personal transportation.
First Nations persons living on the reserves were able to travel to town using the medical
transportation vans.
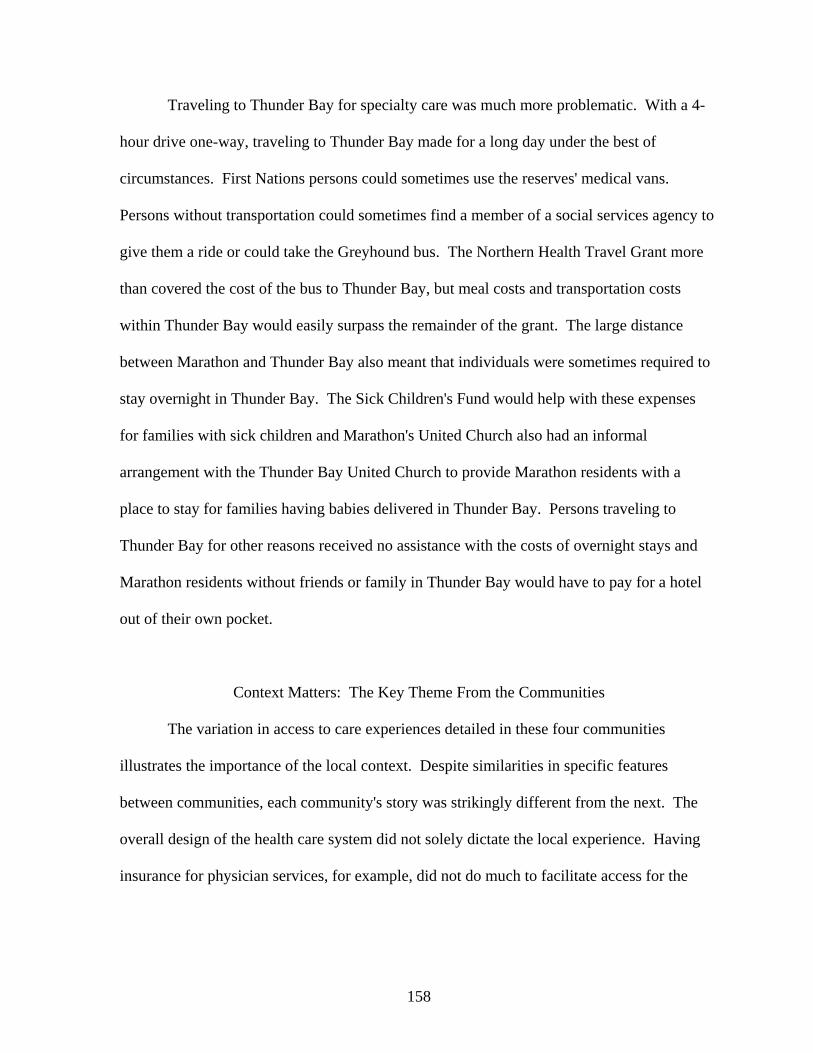
158
Traveling to Thunder Bay for specialty care was much more problematic. With a 4-
hour drive one-way, traveling to Thunder Bay made for a long day under the best of
circumstances. First Nations persons could sometimes use the reserves' medical vans.
Persons without transportation could sometimes find a member of a social services agency to
give them a ride or could take the Greyhound bus. The Northern Health Travel Grant more
than covered the cost of the bus to Thunder Bay, but meal costs and transportation costs
within Thunder Bay would easily surpass the remainder of the grant. The large distance
between Marathon and Thunder Bay also meant that individuals were sometimes required to
stay overnight in Thunder Bay. The Sick Children's Fund would help with these expenses
for families with sick children and Marathon's United Church also had an informal
arrangement with the Thunder Bay United Church to provide Marathon residents with a
place to stay for families having babies delivered in Thunder Bay. Persons traveling to
Thunder Bay for other reasons received no assistance with the costs of overnight stays and
Marathon residents without friends or family in Thunder Bay would have to pay for a hotel
out of their own pocket.
Context Matters: The Key Theme From the Communities
The variation in access to care experiences detailed in these four communities
illustrates the importance of the local context. Despite similarities in specific features
between communities, each community's story was strikingly different from the next. The
overall design of the health care system did not solely dictate the local experience. Having
insurance for physician services, for example, did not do much to facilitate access for the
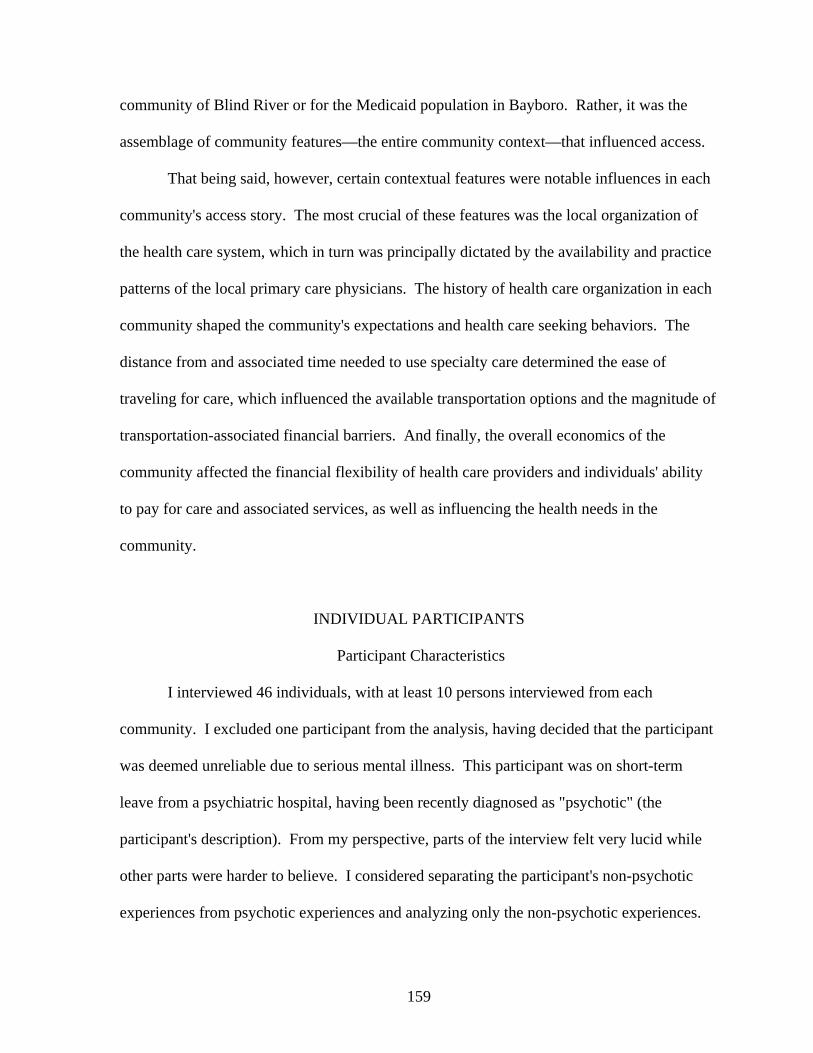
159
community of Blind River or for the Medicaid population in Bayboro. Rather, it was the
assemblage of community features—the entire community context—that influenced access.
That being said, however, certain contextual features were notable influences in each
community's access story. The most crucial of these features was the local organization of
the health care system, which in turn was principally dictated by the availability and practice
patterns of the local primary care physicians. The history of health care organization in each
community shaped the community's expectations and health care seeking behaviors. The
distance from and associated time needed to use specialty care determined the ease of
traveling for care, which influenced the available transportation options and the magnitude of
transportation-associated financial barriers. And finally, the overall economics of the
community affected the financial flexibility of health care providers and individuals' ability
to pay for care and associated services, as well as influencing the health needs in the
community.
INDIVIDUAL PARTICIPANTS
Participant Characteristics
I interviewed 46 individuals, with at least 10 persons interviewed from each
community. I excluded one participant from the analysis, having decided that the participant
was deemed unreliable due to serious mental illness. This participant was on short-term
leave from a psychiatric hospital, having been recently diagnosed as "psychotic" (the
participant's description). From my perspective, parts of the interview felt very lucid while
other parts were harder to believe. I considered separating the participant's non-psychotic
experiences from psychotic experiences and analyzing only the non-psychotic experiences.
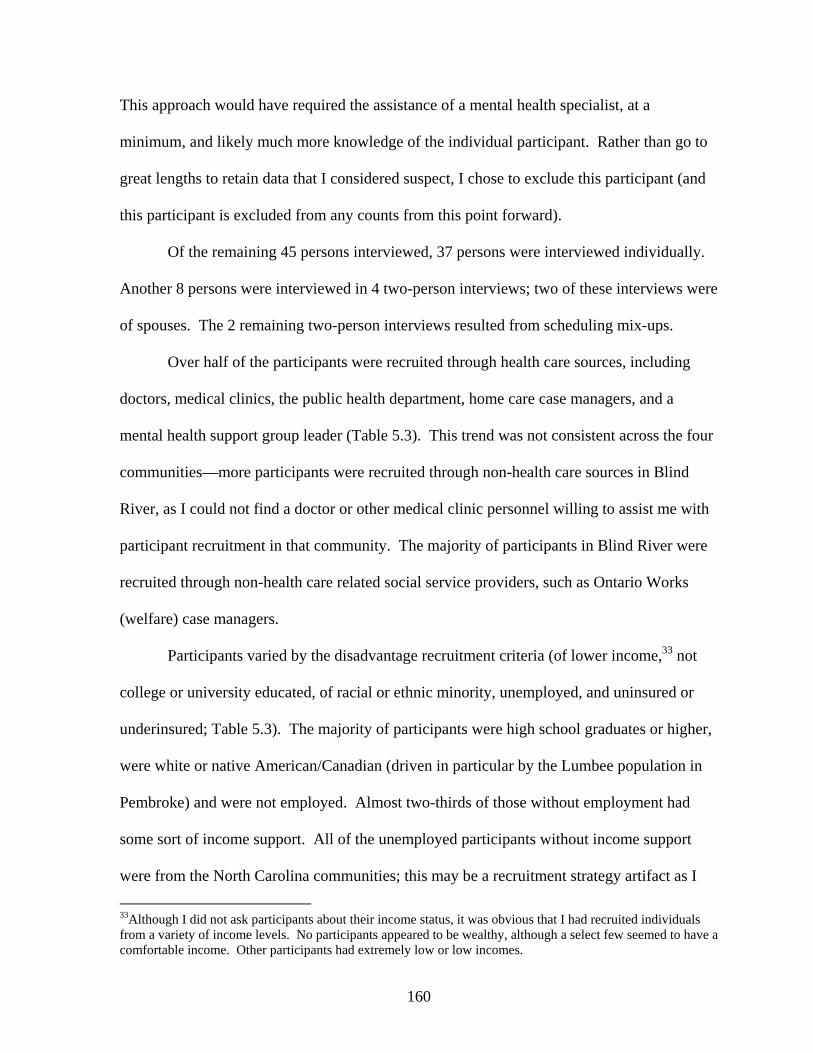
160
This approach would have required the assistance of a mental health specialist, at a
minimum, and likely much more knowledge of the individual participant. Rather than go to
great lengths to retain data that I considered suspect, I chose to exclude this participant (and
this participant is excluded from any counts from this point forward).
Of the remaining 45 persons interviewed, 37 persons were interviewed individually.
Another 8 persons were interviewed in 4 two-person interviews; two of these interviews were
of spouses. The 2 remaining two-person interviews resulted from scheduling mix-ups.
Over half of the participants were recruited through health care sources, including
doctors, medical clinics, the public health department, home care case managers, and a
mental health support group leader (Table 5.3). This trend was not consistent across the four
communities—more participants were recruited through non-health care sources in Blind
River, as I could not find a doctor or other medical clinic personnel willing to assist me with
participant recruitment in that community. The majority of participants in Blind River were
recruited through non-health care related social service providers, such as Ontario Works
(welfare) case managers.
Participants varied by the disadvantage recruitment criteria (of lower income,33 not
college or university educated, of racial or ethnic minority, unemployed, and uninsured or
underinsured; Table 5.3). The majority of participants were high school graduates or higher,
were white or native American/Canadian (driven in particular by the Lumbee population in
Pembroke) and were not employed. Almost two-thirds of those without employment had
some sort of income support. All of the unemployed participants without income support
were from the North Carolina communities; this may be a recruitment strategy artifact as I
33Although I did not ask participants about their income status, it was obvious that I had recruited individuals from a variety of income levels. No participants appeared to be wealthy, although a select few seemed to have a comfortable income. Other participants had extremely low or low incomes.
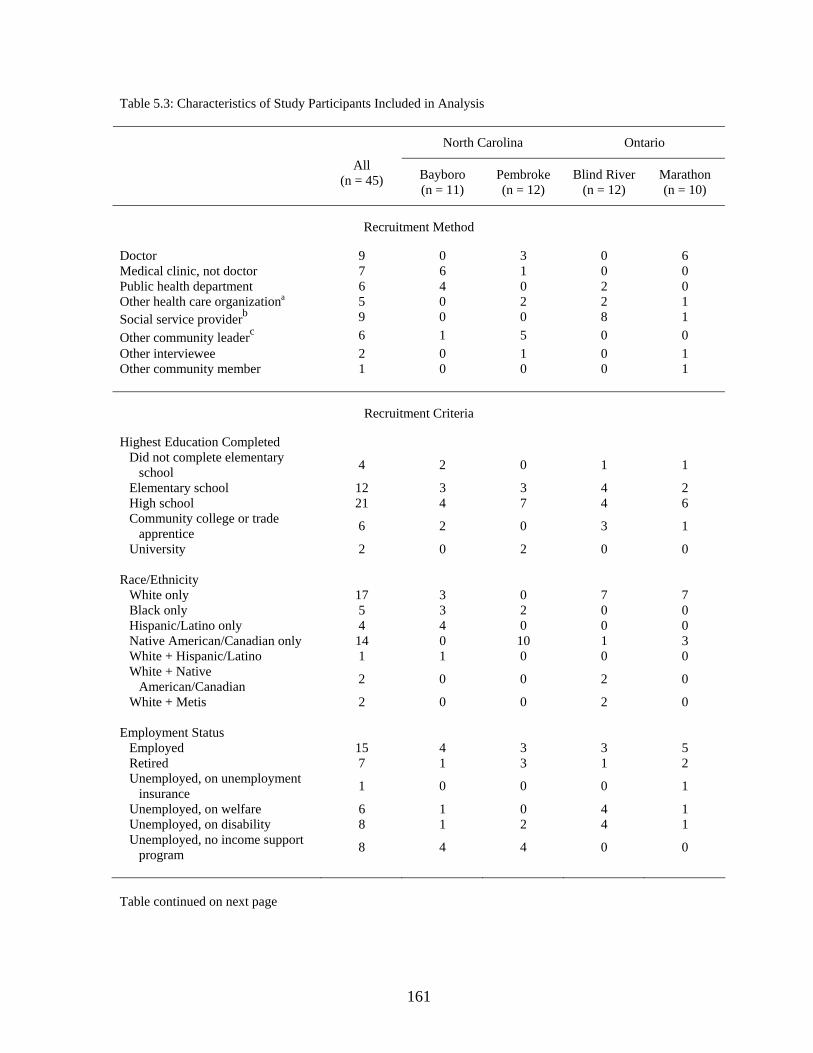
161
Table 5.3: Characteristics of Study Participants Included in Analysis North Carolina Ontario
All (n = 45) Bayboro
(n = 11) Pembroke (n = 12)
Blind River (n = 12)
Marathon (n = 10)
Recruitment Method
Doctor 9 0 3 0 6 Medical clinic, not doctor 7 6 1 0 0 Public health department 6 4 0 2 0 Other health care organizationa 5 0 2 2 1 Social service providerb 9 0 0 8 1 Other community leaderc 6 1 5 0 0 Other interviewee 2 0 1 0 1 Other community member 1 0 0 0 1
Recruitment Criteria
Highest Education Completed Did not complete elementary
school 4 2 0 1 1
Elementary school 12 3 3 4 2 High school 21 4 7 4 6 Community college or trade
apprentice 6 2 0 3 1
University 2 0 2 0 0 Race/Ethnicity
White only 17 3 0 7 7 Black only 5 3 2 0 0 Hispanic/Latino only 4 4 0 0 0 Native American/Canadian only 14 0 10 1 3 White + Hispanic/Latino 1 1 0 0 0 White + Native
American/Canadian 2 0 0 2 0
White + Metis 2 0 0 2 0 Employment Status
Employed 15 4 3 3 5 Retired 7 1 3 1 2 Unemployed, on unemployment
insurance 1 0 0 0 1
Unemployed, on welfare 6 1 0 4 1 Unemployed, on disability 8 1 2 4 1 Unemployed, no income support
program 8 4 4 0 0
Table continued on next page
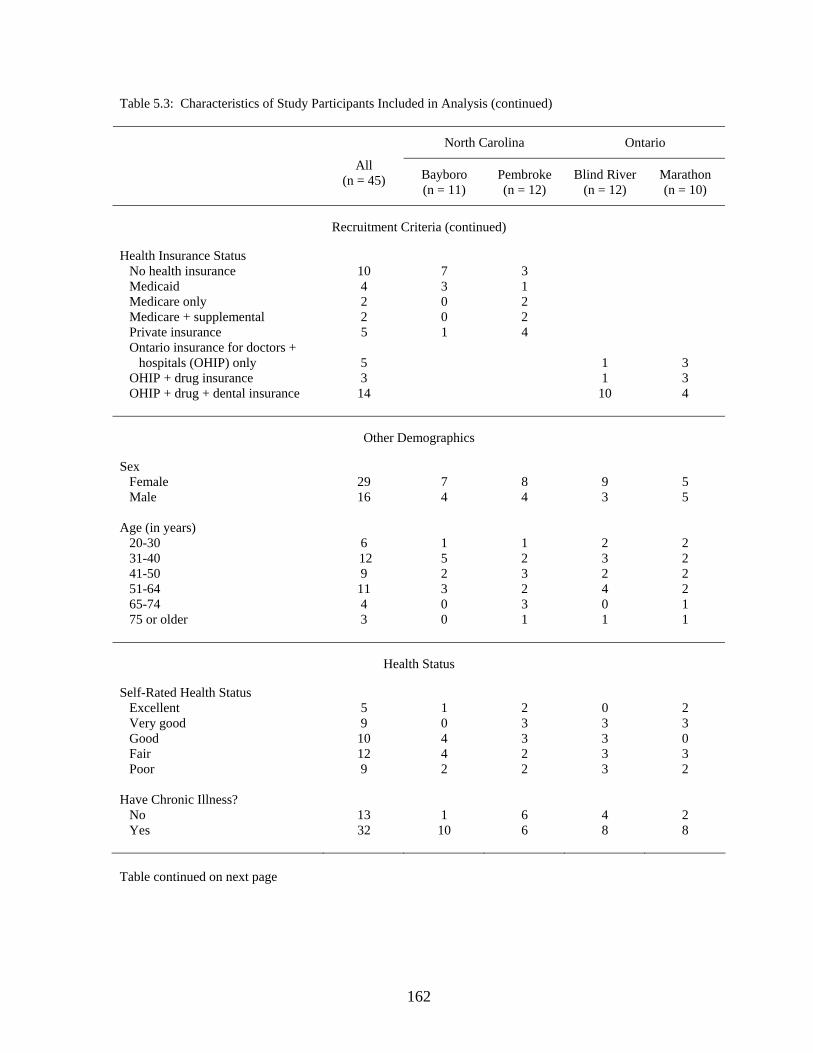
162
Table 5.3: Characteristics of Study Participants Included in Analysis (continued) North Carolina Ontario
All (n = 45) Bayboro
(n = 11) Pembroke (n = 12)
Blind River (n = 12)
Marathon (n = 10)
Recruitment Criteria (continued)
Health Insurance Status No health insurance 10 7 3 Medicaid 4 3 1 Medicare only 2 0 2 Medicare + supplemental 2 0 2 Private insurance 5 1 4 Ontario insurance for doctors +
hospitals (OHIP) only
5
1
3 OHIP + drug insurance 3 1 3 OHIP + drug + dental insurance 14 10 4
Other Demographics
Sex Female 29 7 8 9 5 Male 16 4 4 3 5
Age (in years)
20-30 6 1 1 2 2 31-40 12 5 2 3 2 41-50 9 2 3 2 2 51-64 11 3 2 4 2 65-74 4 0 3 0 1 75 or older 3 0 1 1 1
Health Status
Self-Rated Health Status Excellent 5 1 2 0 2 Very good 9 0 3 3 3 Good 10 4 3 3 0 Fair 12 4 2 3 3 Poor 9 2 2 3 2
Have Chronic Illness?
No 13 1 6 4 2 Yes 32 10 6 8 8
Table continued on next page
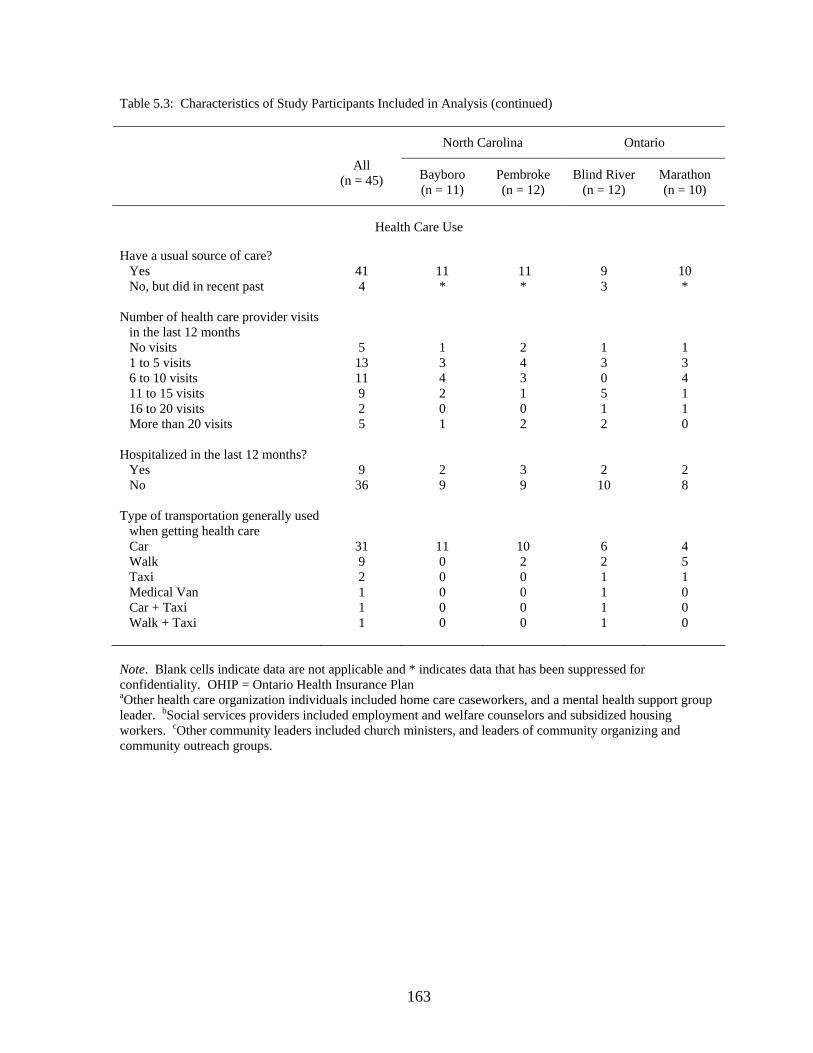
163
Table 5.3: Characteristics of Study Participants Included in Analysis (continued) North Carolina Ontario
All (n = 45) Bayboro
(n = 11) Pembroke (n = 12)
Blind River (n = 12)
Marathon (n = 10)
Health Care Use
Have a usual source of care? Yes 41 11 11 9 10 No, but did in recent past 4 * * 3 *
Number of health care provider visits in the last 12 months
No visits 5 1 2 1 1 1 to 5 visits 13 3 4 3 3 6 to 10 visits 11 4 3 0 4 11 to 15 visits 9 2 1 5 1 16 to 20 visits 2 0 0 1 1 More than 20 visits 5 1 2 2 0
Hospitalized in the last 12 months?
Yes 9 2 3 2 2 No 36 9 9 10 8
Type of transportation generally used when getting health care
Car 31 11 10 6 4 Walk 9 0 2 2 5 Taxi 2 0 0 1 1 Medical Van 1 0 0 1 0 Car + Taxi 1 0 0 1 0 Walk + Taxi 1 0 0 1 0
Note. Blank cells indicate data are not applicable and * indicates data that has been suppressed for confidentiality. OHIP = Ontario Health Insurance Plan aOther health care organization individuals included home care caseworkers, and a mental health support group leader. bSocial services providers included employment and welfare counselors and subsidized housing workers. cOther community leaders included church ministers, and leaders of community organizing and community outreach groups.
164
did not request assistance from employment and welfare counselors in North Carolina but did
in Ontario.
With respect to health insurance, a sizeable minority of participants from North
Carolina were without any health insurance. More than half of those from North Carolina
who had health insurance were using a government plan. All of the participants from Ontario
had OHIP. The majority of participants from Ontario also had drug and dental insurance
with cost-sharing mechanisms.
Participants also varied by other demographic details and by health status. The
majority of participants were women and between the ages of 31 and 64. Almost half of
participants (47 percent) rated their health as fair or poor and more than 70 percent reported
having at least one chronic illness. The most common chronic illnesses and health problems
reported by participants included arthritis, diabetes, asthma, back trouble, and high blood
pressure.
All of my interview participants described having a usual source of care at the time of
the interview or in the recent past. Not having a usual source of care at the time of the
interview was always because of extenuating circumstances. One participant had recently
moved to town, leaving her usual source of care behind, but expected to identify a new usual
source of care once she got settled. Three other participants were patients of the Blind River
doctor that had died suddenly; these participants had not been picked up by other doctors in
the community despite two of the three individuals having health needs with ongoing care
requirements.34 All three of these participants were transitioning into identifying the
34A fourth participant from Blind River had also been a patient of the doctor that died suddenly. This participant was able to join another doctor's practice as the second doctor already took care of other members of her family. This participant also had ongoing health needs but did not appear to differ significantly from those who were not picked up by the remaining doctors.
165
emergency department as their usual source of care as no other care options existed in town,
although it was clear that all three would have preferred to identify a specific doctor as their
usual source of care.
Of those 41 participants with a usual source of care at the time of the interview, the
site of the usual source of care varied. Most persons identified a specific doctor as their
source of care. Most of the users of the Hope Clinic identified the clinic as their source of
care, although a few Hope Clinic users identified with a specific doctor at the clinic. Two
participants from Pembroke identified the emergency department as their usual source of
care. The emergency department became their usual source of care by default as these
individuals did not have insurance and could not find a doctor in Pembroke to treat them
because of their lack of insurance.
With respect to other patterns of health care use, most participants had seen at least
one health care provider in the last 12 months. Five participants reported not seeing any
health care provider in the last 12 months. Reasons for not seeing a provider varied and
included being of general good health and not needing health care services, not liking using
health care and being without health insurance despite needing health care services. Over
half of those who had seen a provider in the last year reported having 10 or fewer visits,
although a striking minority reported more than 20 visits in the past 12 months. Nine
participants also reported having been hospitalized in the past 12 months. This level of
interaction with the health care system was not unexpected given the number of participants
reporting chronic illness and fair or poor health.
With respect to the type of transportation generally used when getting health care
locally, the majority of participants reported using a car (either their own or receiving a ride
166
in someone else's car). All 11 participants from Bayboro reported using a car. Walking was
the second-most frequent response. Some taxi use was reported for local transportation in
the two Ontario communities. Transportation patterns differed when individuals were using
health care outside of their communities. Walking and the use of taxis were generally
replaced by cars. Some individuals from the Ontario communities also reported using the
Greyhound bus.
Relationships Matter: The Key Theme for Individuals
The majority of participants' experiences with the health care system were dependent
on interactions with physicians.35 These interactions were about much more than diagnosis
and health care interventions. The doctor-patient relationship was the central theme in
participants' recounting of getting and receiving care. Time and time again, participants
returned to the "social interaction" between a doctor and themselves, placing great
importance on the quality of the relationship and the personal connection. A quality doctor-
patient relationship was facilitated by the "good doctor" and could evolve into a state of
"being known."
The Good Doctor
From the individual's point of view, a quality doctor-patient relationship relied
heavily on the quality of the doctor. Participants judged a doctor's quality using two
dimensions: (i) the doctor's diagnostic and care skills, and (ii) the doctor's interpersonal
35Other health care providers such as nurses, counselors, and home care workers were also mentioned by participants but all were overshadowed by the role of physicians. The physician was the face of the health care system for all participants.
167
skills. A doctor that performs well on both of these dimensions is considered a "good
doctor."
Diagnostic and Care Skills: Competence
The primary reason for considering a doctor's diagnostic and care skills is to assess
the doctor's competence. A good doctor demonstrates competence by making appropriate
diagnoses and care suggestions. Participants did not expect a doctor to be infallible to be
labeled a good doctor, however. All participants recognized that some health problems were
more complicated than others. When dealing with complicated health needs, a good doctor is
distinguished by her or his persistence and dedication to getting the patient a diagnosis and
appropriate care.
A good doctor is also one that does not display the diagnostic and care skills of a bad
doctor. A doctor's skills were generally considered to be inadequate when another doctor
was able to diagnose and care for a health problem that the first doctor could not solve,
excepting cases where the second doctor had a special expertise or the patient's health
problem was tricky or unusual. Participants were especially negative about doctors claiming
there was nothing wrong with a person later shown to be sick, inappropriate changes to
medication regimens that had been working, and the ordering of unnecessary tests. Doctors
with reputations for too many cases of misdiagnosis or being over-reliant on prescribing
medication were also branded bad doctors. In a few instances, participants considered a
doctor to possess inadequate skills without such external or historical evidence, relying
instead on their own instincts. "It doesn't seem to me like he knows what he is doing,"
claimed one participant; "I don't think he knows what he's talking about," was the instinct of
168
another. Absent any of these hallmarks of a bad doctor, participants assumed that a doctor
had good medical skills, perhaps because lay persons do not have the expertise to effectively
judge the adequacy of diagnostic and care skills.
Other Diagnostic and Care Skills
Other diagnostic and care skills were also suggested as important components of the
makeup of a good doctor. These other diagnostic and care skills overlap with the demand for
good interpersonal skills, which is described in more detail below. Primary among the
additional diagnostic and care skills was the good doctor's sharing of information about the
individual's diagnosis and treatment. Many participants described how helpful and
reassuring it was when a doctor took the time to explain, as demonstrated by the following
quotes:
This doctor gives you the information so you know he's got the information. With a lot of them you don't really know if they've got any information at all because they don't tell you nothing. He's honest. He sits down and talks to you. He explains things to you. If you don't understand the word, you give him a look like this [mimes a puzzled look], and he'll sit down, he'll break it down. He was really nice. Explained everything he was doing. I watched everything on the monitor which was really cool. He was really, really nice to me. He did find out that, he confirmed the [diagnosis] and he showed me what [the condition] looked like.
Good doctors are also familiar with each patient's case and medical history. She or he
understands how an individual got to where she or he is, including the individual's
expectations for care and the treatment options that have been tried and those that have been
ruled out. A few participants additionally suggested that a good doctor is unafraid of
169
opposing or challenging a patient when that patient is exhibiting health-harming behaviors,
such as smoking, or abusing prescription drugs.
Interpersonal Skills
Despite the obvious importance of a doctor's diagnostic and care skills, the majority
of the descriptions of a good doctor were concerned with doctors' interpersonal skills. The
personal connection in the doctor-patient relationship was emphasized, particularly
concerning the doctor's treatment of patients as people. Good doctors were described as
"kind," "friendly," "caring," "trustworthy," "honest," and "giving." Good doctors enjoyed
providing care and often expended extra effort in helping their patients. These descriptions
could be distilled into three distinct behaviors: (i) demonstrating investment and interest in
the patient as a person; (ii) treating patients with respect, and (iii) being a good listener.
The good doctor demonstrates investment in their patient and interest in the entirety
of the patient's life through considering a patient's life issues as well as their health issues. A
good doctor treats a patient as a "whole person" rather than just a disease or illness or
problem. One participant described her doctor's concern for her entire life with the following
example:
I said "Well I won't be able to come such and such week," because my husband had to have an operation—a little out-patient operation—and I had to be with him. And [my doctor] acted so concerned: "Well what's wrong with him, what's wrong?" And you know my husband wasn't a patient of his and he didn't know him but he cared.
Another participant had a good doctor and a not-as-good doctor in charge of caring for his
life-threatening illness. One feature that distinguished the good doctor from the not-as-good
doctor was the scope of each doctor's concern for him: "[The good doctor] is interested in
what's happening with me, while the other doctor is just basically keeping me alive."
170
Treating patients with respect, the second behavior of a good doctor, is accomplished
in a variety of ways. Good doctors do not elevate themselves above their patients but treat
their patients as equals, such as the doctor described by this participant: "I have been to
doctors where they make me feel inferior…..With [my doctor] I don't….Right from the
beginning…she was down to earth. She didn't put herself up there." Good doctors also show
respect through supporting patient autonomy and decision making—even if patients make
decisions that may be contrary to the doctor's opinion—and take patient concerns seriously.
For example, one participant refused to get a recommended sleep test as she was afraid of
doing something embarrassing while sleeping and her doctor accepted that decision. She
went on to elaborate: "He never forced the issue or nothing. He never said 'you have to go.'
He never does that. He always lets me make up my mind." For another participant, an
exemplary doctor was defined by his responsiveness to her concerns, preferences, and
questions:
He had a concern in him and wasn't ever in too great a hurry that he couldn't hear what you had to say. Anything you had to ask was serious to him. He didn't take it lightly. If it was something that concerned you, he was concerned enough to give you a direct, good, solid answer. In other words, you didn't have to think whether he'll think I'm crazy, that I should know this or this or this.
For participants with health problems often associated with stigma, like HIV, alcoholism,
mental illness, or obesity, a good doctor also demonstrates respect by not overreacting to the
health problem, such as putting on rubber gloves before talking to the patient or blaming
every health issue on the patient being overweight.
A good doctor is also a good listener, taking the time that is needed to listen properly
to a patient and conveying true interest in what a patient has to say. A good doctor is
171
someone who is easy to talk to and encourages the patient to tell her or his story, such as the
doctors described by these participants:
He says: "Don't even worry about how much time you take up. Because the time that you need is important. If you need to talk about stuff, if it's important to you, then I will be more than happy to take the time to listen." He's been very good. I've cried in his office. I've laughed in his office. I've even hugged him. I'm so appreciative towards him listening to me and looking after me as well as he does. He's a very good doctor. He listened and cared about you. When you were in his office, he was a hundred percent there with you. You could tell he wasn't thinking about his patient before you or the patient after you. He was actually listening to what you had to say.
Bad doctors, in contrast, come across as uncaring and unsympathetic. Bad doctors
are disrespectful and do not treat the patient as a person; examples provided by participants
included being treated as "a nobody," "a number," "a statistic," and a "dollar sign." Bad
doctors do not listen or take the time the patient believes is due to her or his health needs,
such as in the following example:
We called [the doctor] to ask him something—[my mother] was too bad off to run back and forth to the doctor's office, she was bed-ridden—and he said he didn't have time to call his patients, he didn't have time to talk to them. The only way he'd talk to her is if we took her into the office. And she was in such pain and weak. She couldn't hardly eat and everything and she couldn't drive back and forth to the office all the time. He was really a bad doctor.
Being Known
Within an established doctor-patient relationship, the best examples of the good
doctor can lead to the individual patient achieving a state of "being known." Being known
means your medical history and other relevant aspects of your life features are understood
and providers do not need to start at the beginning when they interact with you. One
participant explained this idea as follows:
172
[Your doctor] knows you. You feel comfortable with your physician. And [when I] go in somewhere to see a stranger, I'm somewhat, I'm not very good at—especially a professional field such as doctors—I sort of feel uncomfortable and I say "Oh shit, now I have to tell the whole story again."
Being known also means your values and preferences are understood, such as was described
by another participant:
We have other doctors that we could go to here but we've been here with Dr. X over four years. And we like Dr. X. She knows us, she knows our problems and we can talk to her and she can relate to us. So a lot of times when you have that situation, you're better off…They don't have to be investigating every time you talk to them: "Why do you want this? Why do you want that?"
Being known further means that health care providers understand your mannerisms and
personality. "They know me, and they know what type of person I am. So they know how to
handle me," said one participant who described herself as "blunt and straightforward," which
had sometimes led those who did not know her to "make an issue out of minor things."
Dealing with providers who you already know and who already know you helps to
make the experience of receiving health care more comfortable, which can be particularly
important when an individual is dealing with a difficult or sensitive health issue. The father
of a seriously ill child described it as follows: "They [the health care providers at a specialty
clinic] all know her there pretty much… It [makes for a better experience for us] because
she's more comfortable when she goes in, she's not meeting a lot of strangers."
A key consequence of being known is that your judgment is trusted and you are taken
seriously by health care providers about your health care needs. For example, a grandmother
described how when she arrived at the emergency department with her asthmatic grandson,
the staff knew that the asthma attack was serious and would immediately begin treatment.
She said: "We got to the point where we were there so much with him and they knew what
his problem was and they knew when we got there that he [needed help], we had done all we
173
could do." Another participant—a recovering alcoholic—described how her doctor knew her
extremely well and trusted her coping ability, even when she experienced slipups in
abstaining from alcohol. In contrast, this participant described an encounter with another
doctor who did not know her as well. This second doctor tried to send her to alcohol
rehabilitation because she was struggling with her alcoholism—an intervention that this
participant felt was hasty and not consistent with her own judgment. Similarly, after moving
to a new community, a mother of a child with a rare disorder experienced not being taken
seriously by the child's new pediatrician. The pediatrician had never heard of the child's
condition and suggested that the child had one of a number of significantly less serious
problems. The mother had to appeal to the child's specialist to provide the legitimacy she
needed to deal with the new pediatrician.
Being trusted and taken seriously as a patient can also result in being afforded some
financial flexibility by others, such as the participant who was able to establish a small credit
account with a local taxi service for transportation to doctor's appointments. Another
participant attributed her doctor's willingness to institute an extended payment plan because
"they knew that sooner or later I would get on my feet and pay for it."
Being known was particularly important to participants with chronic, complicated,
stigmatized, rare or life-threatening illness. One individual with a multi-year history of
complicated health problems described this sentiment as follows: "I need a doctor that is
really going to take care of me, you know, know my history, take the time to know my
history." Another participant expressed the importance of being known by refusing to use
the drug treatments for his HIV until he had a doctor that was "more understanding of where
I was coming from" with respect to the toxicity of the drug treatments.
174
SUMMARY
This chapter provided descriptive details of the communities and the individuals in
this study. The stories of the communities and the individuals included in this study illustrate
the importance of context and relationships. The personal connection was a particularly
important aspect of the doctor-patient relationship, as illustrated by the good doctor and
being known. These themes perform important supporting roles in the theoretical
conceptualization that follows.
CHAPTER 6: THEORETICAL RESULTS:
ACCESS AS A PROCESS OF ACHIEVING BALANCE
The remainder of my analysis focused on the dynamic experience of getting and
using health care. In this chapter, I describe my grounded theory of access as a process of
achieving balance.
ACCESS AS A BALANCE PROCESS
Taken as a whole, participants' narratives of getting and using health care were stories
of dealing with and struggling with multiple competing needs and demands, not all of which
were directly related to health and health care. Dealing with multiple competing needs and
demands occurred both at the level of a single health need or a single interaction between an
individual and the health care system and at the level of an individual's career with health
needs and the health care system.36 Individual careers encompassed the individual's past and
present health needs and health care system interactions as well as predictions about future
needs and interactions. Careers were based on particular illnesses or injuries, particularly if
the illness or injury was chronic or complicated, as well as multiple illnesses and injuries.
Single incidents and careers were also described for persons close to the individual, such as a
child, parent or spouse, which took on special importance when the individual was in a
caregiving role.
36Thanks to Tom Ricketts for suggesting the term "career" and its importance while I was planning this work. Also see Pescosolido (1991) for a discussion of "illness careers."
176
The stories of dealing with and struggling with multiple competing needs and
demands had a goal of achieving or maintaining a state of balance, that is, having one's needs
met, particularly one's dominant need or needs.37 I employ the term balance to describe this
process of meeting needs because of its strong imagery of equilibrium and harmony. While I
do not equate the balance process described here with the trendy and colloquial usage of
balance (e.g., work-life balance), it is helpful that both the process described here and the
colloquial usage emphasize multiple areas, individual values, tradeoffs among various needs
and demands, as well as adaptations to changing circumstances.
The majority of the competing needs described by participants were directly related to
health and health care. This focus on health-related needs was expected given the structure
of the interviews. Non-health related needs were often important parts of participants'
narratives, however. Indeed, non-health needs competed with or crowded-out health needs
for a number of participants. Following through on this project's purpose, I will emphasize
health-related needs in this grounded theory. Non-health needs will be included where they
interweave with health needs and individual narratives. In other words, achieving and
maintaining balance is about having one's health needs met, which may also be accompanied
by having non-health needs met.
Being in Balance
Being in balance is a natural state, where individuals want to remain and to which
individuals want to return. Being in balance is ultimately about feeling healthy or being on
one's way to feeling healthy. Feeling healthy is the absence of health needs from the
37Tom Ricketts suggested the phrase "ecological homeostasis" as another description of the balance process (personal conversation, April 20, 2006). Sam Sheps also independently employed "homestasis" when discussing the balance process (personal conversation, October 11, 2006).
177
individual's perspective (i.e., the absence of health needs that the individual is willing to deal
with and sees as important enough to do something about). For those who cannot expect to
have full health, such as persons with chronic disease, being in balance comes from
effectively managing one's health condition and feeling healthy within the constraints of
one's pre-existing illness. This also applies to persons needing time to heal or recover before
returning to a previous healthier state, such as recovering from surgery or healing a broken
bone. This state of being in balance despite not achieving full health can be described as a
state of finding balance within being out of balance. The idea of being "in control" or "under
control" often resonated in such circumstances. For example, one participant with a history
of multiple heart surgeries as well as diabetes and high blood pressure described her current
state as "everything's under control." Other chronically ill participants, as well as those
recovering from illness or injury, were willing to have their current health state summed up
as being under or in control (or being out of control), where applicable. This state of being in
control freed up their resources and energy to be able to feel healthy within the constraints of
their illness and ultimately operate in balance.
Being in balance is accompanied by the freedom to suspend worry about one's health
needs. For those with chronic health needs or health needs with a long resolution time, this
suspension of worry is built on a foundation of trust and faith in health care providers and the
health care system. A crucial factor in this trust and faith, as well as a support for the feeling
of control, is the existence of an established doctor-patient relationship with a good doctor.
One does not need to have an established doctor-patient relationship to be in balance, but
persons with ongoing (particularly serious and ongoing) health needs identified having an
established doctor-patient relationship with a good doctor as an important facilitator of
178
balance. The longitudinal aspect of the relationship is key, as the doctor must have
demonstrated that she or he has been able to help with past health needs and can be relied
upon to continue to be helpful.
For persons with complicated, chronic, or long-lasting illness, being in balance can
also (but does not necessarily) reflect the ability to take responsibility for oneself and employ
self-knowledge. Any existing health needs are no longer simply the purvey of health care
providers and the health care system. The individual has a valuable role to play and is intent
on playing it, even if that results in decision-making about health needs that are contrary to
medical advice.
Being Out of Balance
Quite simply, being out of balance is the opposite of being in balance. One's central
health needs are not met. Being out of balance may include impaired functioning, feeling
that ongoing health needs are out of control, or a reluctance to take care of oneself and seek
help. Being out of balance can be stressful and accompanied by worry or fear, particularly if
one's health needs are complicated, worsening or life-threatening.
While being out of balance is driven by unmet illness or injury, the individual's
interactions with the health care system can also contribute to being out of balance. New
health needs can be created or existing health needs exacerbated through not receiving
needed health care services, either because of barriers to getting care or problems with
diagnosis, or through health care that is not timely or appropriate. It is important to note that
in the absence of health needs from the individual's perspective, one's relationship with the
health care system has little to no influence over whether the individual is in balance or not.
179
The Balance Process
Being in balance requires achieving balance as well as maintaining balance. At its
simplest expression, this can be thought of as a seesaw or teeter-totter with a discrete health
care need on one side and the appropriate intervention on the other side. For example, if I
have an extremely sore throat that is not going away, I may go to the doctor for assistance
and get diagnosed with strep throat. A short course of antibiotics should clear me up nicely
and balance off my need.
In actuality, however, most experiences are not so easily expressed as a balancing of
two opposing forces. A more appropriate analogy is that of a spinning top, with multiple
forces needing to operate in harmony to keep the top rotating and upright. Individuals' health
needs may be complicated and not easily diagnosable. Appropriate interventions may not be
quick, offer a complete cure, or be devoid of adverse effects. Individuals may have more
than one health-related need or non-health needs may accompany health needs. Individuals
may also have barriers to getting and receiving needed health care, such as not having health
insurance that covers doctor visits or prescription drugs and being without discretionary
funds to easily pay for such health care. Needed health care may be located far away, have
long waiting times, or otherwise require an investment of time or money. Available doctors
may not be the best match or have the needed skills. When even a few of these various
factors simultaneously occur, individuals have to make tradeoffs to achieve or maintain
balance.
Achieving and maintaining balance is part of a dynamic process tracking the
movement of individuals from being in balance to being out of balance and vice versa. There
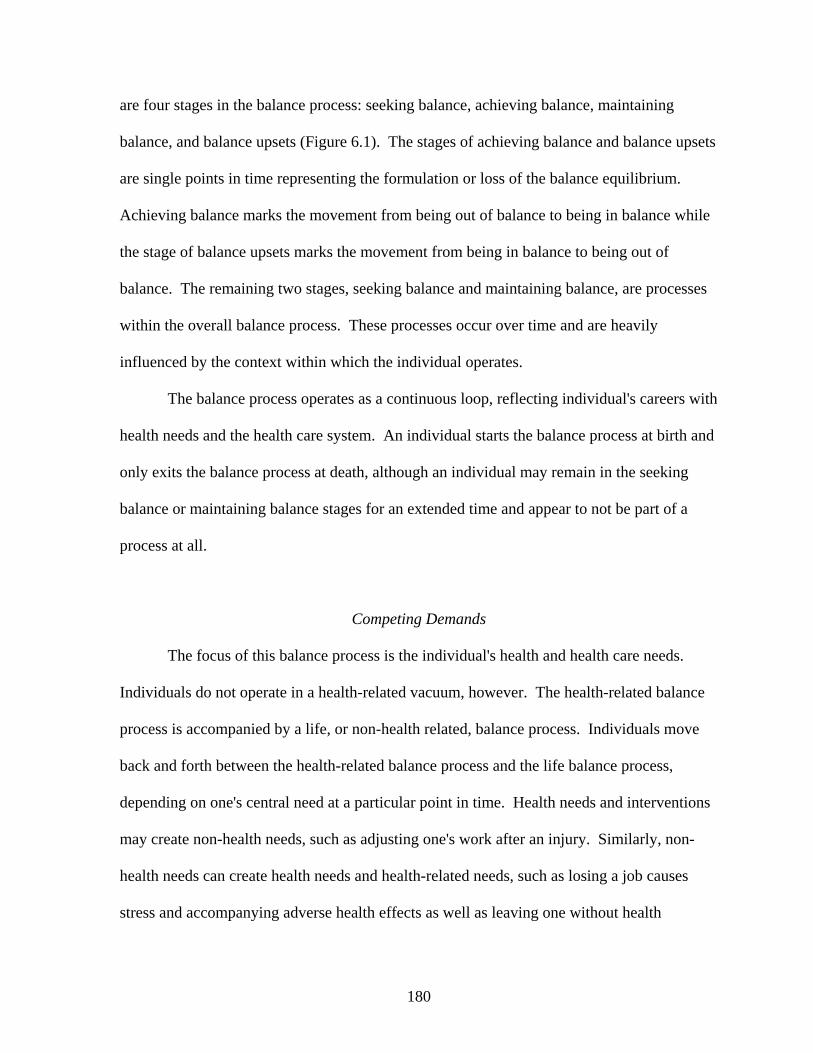
180
are four stages in the balance process: seeking balance, achieving balance, maintaining
balance, and balance upsets (Figure 6.1). The stages of achieving balance and balance upsets
are single points in time representing the formulation or loss of the balance equilibrium.
Achieving balance marks the movement from being out of balance to being in balance while
the stage of balance upsets marks the movement from being in balance to being out of
balance. The remaining two stages, seeking balance and maintaining balance, are processes
within the overall balance process. These processes occur over time and are heavily
influenced by the context within which the individual operates.
The balance process operates as a continuous loop, reflecting individual's careers with
health needs and the health care system. An individual starts the balance process at birth and
only exits the balance process at death, although an individual may remain in the seeking
balance or maintaining balance stages for an extended time and appear to not be part of a
process at all.
Competing Demands
The focus of this balance process is the individual's health and health care needs.
Individuals do not operate in a health-related vacuum, however. The health-related balance
process is accompanied by a life, or non-health related, balance process. Individuals move
back and forth between the health-related balance process and the life balance process,
depending on one's central need at a particular point in time. Health needs and interventions
may create non-health needs, such as adjusting one's work after an injury. Similarly, non-
health needs can create health needs and health-related needs, such as losing a job causes
stress and accompanying adverse health effects as well as leaving one without health
181
Seeking Balance
Maintaining Balance
Balance Upsets
Achieving Balance
Figure 6.1: Access as a balance process
182
insurance. For example, a participant undergoing a divorce and moving back to her home
community knew she needed to find a new doctor and get some breast cancer screening tests
done, including the removal of a suspicious lump. Her health needs were secondary to her
employment, housing, and health insurance needs for herself and her children. When asked
when she would look for a doctor, she described her ranking process as follows:
I will [find a doctor] as soon as I feel like I've gotten on my feet. Right now, I don't feel like I'm—I'm on point A now, I just got a job. Point B is trying to get a place to stay and then once I do that, you know, I'll think about me.
Competing demands also occur in the realm of the individual and the dependent other
(e.g., child, spouse, parent). Generally, the dependent other takes precedence over the self,
unless the needs of the individual become so great as to overwhelm the needs of the
dependent other or affect the individual's ability to care for the dependent other. For
example, the same divorcing mother described above had already established a pediatrician
for her chronically ill child, despite having to deal with her and her family's non-health
needs. Another participant described the energy and time invested in helping to deal with his
wife's serious, multiple, long term health issues. This focus on his wife was interrupted by
his own health issues. The acute nature of his own health issues forced his own needs into
the foreground until his health needs were somewhat under control.
Consequences of Not Achieving Balance
Moving from being out of balance to being in balance can be difficult and the
individual can get stuck in the seeking balance stage. Getting stuck, or being unable to
achieve balance, results in adverse consequences for the individual and the individual's
183
relationship with the health care system. These adverse consequences vary according to the
length of time the individual is out of balance. Short term consequences for the individual
include having unmet needs, delayed care, and a variety of negative emotions such as
frustration, anger, worry, fear, distress, distrust and defeat. Under these circumstances,
individuals may change doctors in an attempt to get their needs met or may refuse further
care out of frustration and lack of trust. Long term consequences of not achieving balance
include poor health and poor care outcomes. The individual may also develop a negative
view of specific health care providers or the health care system as a whole.
Further Details on the Balance Process
The remainder of this chapter elaborates on the above description of access as a
balance process. I start this elaboration in the seeking balance stage, having assumed the
occurrence of a new or worsening illness or injury. 38 The seeking balance stage is the most
complicated portion of the balance process and takes up most of the remainder of this
chapter.
SEEKING BALANCE
Seeking balance is concerned with moving the individual from a state of being out of
balance to a state of being in balance. Achieving balance requires that there is a good match
between the individual and the means of resolving her or his health need. The seeking
balance process is composed of a number of components that bring the individual and the
38That being said, however, starting with seeking balance was a fairly arbitrary decision as the balance process is a continuous cycle.
184
means together, including recognizing one's health need, determining the method of need
resolution, and negotiating the health care system.
Recognition of Health Need
The recognition of a health need is the first step in seeking balance. For many
individuals, the simple fact of feeling unwell or getting injured is enough of a trigger to
recognize their health need and move into the seeking balance process. Participants'
descriptions of this recognition varied by the specifics of their health need. Injuries made
themselves known in multiple ways, including bleeding, mangled limbs, or loss of
consciousness. Feeling unwell could be a vague description (e.g., "I don't feel good") or be
associated with a particular health problem, such as acute illness or the worsening of a
chronic disease. Individuals described having learned to recognize the signs and symptoms
of asthma attacks, rapidly dropping blood sugars, urinary tract infections, and allergic
reactions, for example.
Acceptance of one's health need is a necessary condition to move into the seeking
balance process. Some individuals described being disconcerted by a preceding balance
upset and unable to acknowledge their health need. Being unable to deal with the
ramifications of one's health need could be a significant obstacle in achieving balance, such
as was described by a woman who was told that her health problems were so debilitating that
she would not be able to work again. Marie (a pseudonym employed for this passage) details
her struggle to acknowledge her health need as follows:
I was working at the time. When [my doctor] told me, "Marie, you can't work any more," I went into depression….It took me three years to climb out of that depression. I was in and out of the hospital. I was off and on Prozac and stuff like that. And I just said, "Marie, you can't do this no more. You face it." And I had to face it….You
185
know I'd been working since I was 14 and a half years old. And when he just told me, at [age] 35, "You aren't working any more." "What?" I looked at him, "What!" I said, "No. I won't accept that."…My kids were like, "Mom, what do you want to do? Sit here and be depressed or do you want to go on with your lives with us." And that hit me between the eyes, big time! And that's when I did a 365 degree turn and I accepted it….If it weren't for that turning point, I really couldn't tell you where I'd be at today.
Other individuals described competing demands as obstacles to being able to acknowledge
their health need, as was detailed earlier in this chapter.
Determination of Method of Need Resolution
Once a health need is recognized, the individual must decide on a method for
resolving this need. Participants' choices fell into two categories: self-care and health care.39
All individuals described using self-care when one's health need appeared to be amenable
without the use of the health care system or when the health need did not seem to be serious
enough to warrant medical intervention. One older participant, for example, detailed the
latter choice after falling and hurting her leg. Despite having "suffered a lot" from the leg
injury, she chose self-treatment over going to the doctor because "I figured I didn't break
anything." She summarized the approach of many participants when she described her belief
system:
I believe we should go to the doctor when we're sick. Yes, I agree. Because sometimes we can have something very wrong that we wouldn't know. BUT, I don't believe in going to the doctor for a little scratch, a little bit of the flu. You take some medication at home, first, and you try that.
39For the purposes of this work, I consider health care to include non-western medicine and alternative health care (e.g., such as practiced by a medicine man or herbologist) as well as western doctors, hospitals, and medical clinics. The majority of the health care interactions described by participants in this study were with western-style health care providers, particularly doctors.
186
Using self-care as the first option was not necessarily a rejection of the health care
system. Many individuals claimed they would be willing to switch to using health care if
self-care did not improve the illness or injury, such as described by another participant:
I had this episode yesterday which I hadn't had, I don't know, the only time I had anything that felt like that was when I had a cold or something. But if I hadn't gotten better, I would have been going to the doctor. But after I got some juices or some sugar and stuff in my system, I started feeling better, so I guess my sugar just got too low.
Other individuals described using self-care as much as possible, only using the health
care system when absolutely necessary. These individuals employed rationales like "I know
my own body," and "I know these things work," even in the face of situations that many
others would describe as needing medical intervention. Persons favoring self-care over the
health care system tended to be fairly healthy. Some of these individuals employed folk
remedies, such as one participant described for a childhood injury:
I told [my parents] I stepped on a nail and I showed them the nail and they pulled the shoe off and they took out a potato, scraped off the potato, and tied it on the foot. When I got up the next morning, it had drawn that poison out. It turned it black. Then they took a penny and tied it around there and left it and that finished drawing the poison out….By that evening, I could walk.
Other participants favoring self-care had a history of engaging in unorthodox types of
self-care and tailoring health care interventions to meet their own needs and beliefs as well as
avoid future interactions with the health care system. For example, one participant described
stockpiling antibiotics to use on her own when she felt she needed them:
I take [antibiotics] only until I feel fine and then I stop taking them and keep them, I have my own antibiotic thing that I do. I double dose for a certain length of time and then I stop because I find that there's too much stress in between antibiotics, it's down and by the time you have to take another one and then your body has to go back up and it's not fighting it good enough so I double dose for so many days and then I taper off and then I feel it going away and then I stop and then I put them away and the
187
next time, when I feel it coming on, I take a couple out for a couple of days and I never get sick.
Preventive health care was not a priority for and was looked upon with skepticism by
the subset of individuals favoring self-care. "If it ain't broke, don't fix it," stated the
antibiotic-stockpiling participant, endorsing this statement despite previous preventive care
having identified a large tumor in her uterus. In a previous community, this participant was
required to register with a family doctor. As part of the registration process, the doctor
conducted a physical and found the tumor. A subsequent specialist estimated that the tumor
had been growing for 10 years and ended up removing her "ovaries and everything" along
with the tumor. Despite the seriousness of this experience, this participant did not attend
subsequent check-ups and continued to doubt the importance of preventive health care as she
felt she "would know" if she was sick again.
Negotiating the Health Care System
When an individual decides to attempt to resolve her or his health need through the
health care system, the individual must then negotiate the health care system. Negotiating
the health care system is a key aspect of seeking balance. Successful negotiation is
dependent on the adequacy of the match between the individual and the health care system.
Negotiating the health care system is composed of two stages: (i) entering the health care
system through identifying a usable source of care, and (ii) using health care once entry has
been obtained.
188
Identifying A Usable Source of Health Care
The usability of a source of health care is determined by the individual based on the
combination of two factors: availability and acceptability. Availability refers to a source of
care that is obtainable from the individual's point of view and is willing to be of service to
that individual. Acceptability refers to the suitableness of the source of care for the
individual's health care and interpersonal needs. In other words, availability and
acceptability reflect the agreement between the individual's needs and expectations and the
source of care.
Availability
More specifically, availability reflects how well the individual conforms to what is
being offered by a source of care. What is offered by a source of care is shaped by multiple
macro forces at the level of the community and health care system: the local supply of
doctors and other health care providers; the organization of the local health care system
including the practice philosophy and patterns of the local health care providers; the location
of specialty care; and system rules, such as rules about eligibility, types of insurance accepted
and up-front payment. The previous chapter provided numerous examples of the importance
of this context in shaping what sources of health care offered to individuals. Contrast, for
instance, the willingness of Pembroke physicians and the unwillingness of Bayboro physician
to serve adults with Medicaid.
Individuals experience these macro forces as waiting for care, traveling for care,
insurance status, and ability to pay. Individuals must be able to meet the minimum
thresholds established by the source of care in each of these areas. This means that an
189
individual must be both able and willing to accommodate to the schedule of the source of
care, wait for an appointment, and travel to the source of care. An individual must also be
able and willing to accommodate the source's requirement for payment of services, which
could include options such as having an acceptable sort of health insurance, having the
ability to pay up front, or establishing a payment plan.
For each episode of seeking balance, the individual makes a unique calculation of her
or his ability and willingness to meet a source's minimum threshold. The type of health care
need is a primary driver in this calculation. When the individual has an acute or emergency
health care need, the individual has a strong incentive to find a source of care with short
waiting times, such as was described by this woman:
I had a bladder infection or something like that and I needed to see somebody right away. And I had called [one clinic] and I couldn't see anybody for a week or two or whatever, and I'm dealing with an infection! So I went to [another clinic] and that's where I got to see Dr. X.
In contrast, when an individual has a health care need requiring specialty care, the individual
generally has to accommodate longer waiting times for appointments and, in rural areas, be
able to travel outside of her or his community. Such accommodation for travel becomes
much more difficult when individuals are of low income, are penalized for taking time off
work, or reside in a community that is far away from the specialty care. The amount of effort
required to meet the minimum threshold for availability may even put the source of care
beyond an individual's reach on an ongoing basis. One Northern Ontario participant with a
serious and ongoing disease described how he could only occasionally afford to travel to
Toronto to see the specialist he preferred. He supplemented these occasional visits with care
from another specialist available in Northern Ontario, a decision accompanied by lower
travel costs and subsidization from the Northern Health Travel Grant.
190
An individual may find a particular source of care to be available for one type of
health care need but not available for another type of health care need. The emergency
department is a prime example; while an emergency department is available on the surface to
all who present for care, the sort of care provided by the emergency department is only
helpful for persons with emergency or acute health care needs. Persons with chronic,
ongoing, or complicated health care needs cannot get appropriate care from the emergency
department. Patients of Bayboro's Hope Clinic were able to get an array of primary care,
including management of chronic disease, but the clinic did not have specialists or provide
specialty care. The long wait times for appointments with family doctors in Blind River
rendered that source of care unavailable for many health care needs, as described by one
participant: "It's kind of, it's almost, well, I shouldn't say pointless, but unless it's something
that you don't need to see the doctor for at least two months….[My doctor]'s pretty much
only good for refilling prescriptions."
An individual's insurance status also influences her or his ability and willingness to
meet the source's minimum threshold. Persons with an undesirable insurance status may be
shut out entirely by a source of care, such as Bayboro residents with Medicaid and certain
uninsured Pembroke residents. Underinsured and uninsured persons must also calculate the
affordability of out of pocket costs associated with using a source of care when a source of
care is willing to consider seeing them. For example, an uninsured North Carolina
participant described being unsuccessful at making an appointment with a specialist after the
receptionist told him that he needed to bring $250 in cash to the first visit, a sum that he
could not fathom being able to pay.
191
Acceptability
Acceptability, on the other hand, reflects how well the source of care conforms to the
individual (i.e., acceptability operates in the reverse direction of availability). The
acceptability of a source of care (or a health care provider) is determined by whether the
source meets the minimum threshold established by the individual's expectations, values and
preferences. A key aspect of acceptability is the health care provider's clinical skills,
personality, and behaviors (i.e., whether the doctor is a good doctor or not). Consider, for
example, the reputation of the hospital closest to Pembroke. Based on the hospital's history
of poor treatment of the Lumbee population, many participants did not consider this hospital
to be an acceptable source in the present. Fixed characteristics of the health care provider,
such as sex, age, or nationality, are often also included as important considerations under this
aspect of acceptability (e.g., "I wanted a woman doctor," "He's from India….somebody I
don't understand like that, I have problems with it").
A second key aspect of acceptability is the organization of a source of care. The
same factors that an individual experiences under availability (i.e., waiting for care, traveling
for care, insurance status, ability to pay or affordability) are assessed by the individual for
acceptability. In other words, the individual determines whether she or he considers the
source of care to be satisfactory and suitable given what the source of care offers to the
individual. Many participants in Marathon and Blind River, for instance, did not consider the
long wait times for an appointment for non-urgent care to be acceptable. As one Marathon
participant said:
[He's] supposed to be my family doctor. See, I got to wait three months to see him. You know, I could be dead before that time….I should be able to see my doctor in two or three days, you know, phone him up: "Okay. This is what's the matter with me. I'd like to see you." It shouldn't take three months.
192
Acceptability further includes an assessment of the worth or utility of the financial,
time, and belief costs associated with interacting with the source of care. For example, some
persons in the Bayboro area do not use the Hope Clinic despite needing the free care because
they are "too proud" to accept free care (at least according to some Hope Clinic users); in
other words, the non-users have determined the belief cost to be unacceptable.
As was the case for availability, the type of health care need is a primary driver in the
individual's evaluation of the acceptability of a source of care. Individuals with an acute
health problem generally only require the source of care to have reasonable diagnostic skills
(i.e., minimal acceptability). Such individuals do not require a source of care that
understands them or is sensitive to their special needs resulting from their life situation.40 In
contrast, individuals with health needs that are complicated, stigmatized, personal, or require
intrusive examinations have higher minimum thresholds for acceptability, regardless of the
acuteness of the health problem, such as illustrated in the following quote:
I saw one doctor in town, here, at the Emergency because I was sick one day. And when I told him I was HIV positive, he completely backed off and he was quite rude to me, different from how he was in the first minute or two of our interview. So after that I've made a point of not going to the hospital if he's on call. Even if I'm sick, I'll wait till the next day.
Having an established doctor-patient relationship, dealing with a good doctor, and being
known facilitate the acceptability demands of persons with complicated, stigmatized,
personal, or intrusive health problems.
As was also the case for availability, an individual may find a particular source of
care to be acceptable for one type of health care need but not acceptable for another type of
40Such individuals may, of course, prefer (in contrast to require) receiving care from a source with which she or he has already established a relationship, or a source of care that is a good doctor in the interpersonal sense as well as the diagnostic sense.
193
health care need. For example, one female participant described only undergoing physical
examinations with female doctors because she had been sexually abused by a man when she
was younger. Despite having a "pretty good" male doctor in a previous community, she
"would never let him do a physical." Another woman described being reluctant to visit her
doctor for any health need that could be linked to her weight, because her doctor "looks down
on people with obesity." She found his negative attitude about her weight to be frustrating
and unsupportive, although she described her doctor as a good doctor overall and had not
changed doctors despite having the option to do so.
Evaluating and Choosing a Usable Source of Care
When seeking a usable source of care, the individual must evaluate the availability
and the acceptability of possible sources. Gathering information about availability is often
easier than for acceptability. Availability can usually be determined with little interaction
with a source of care—information can be gathered over the telephone, for example, about
the next available appointment for a doctor or whether the doctor is taking new patients. The
source of care also has a vested interest in aiding the individual in gathering information
about availability, as the source of care wants to assess how well the individual conforms to
the system before granting the individual entry.
In contrast, with acceptability, the individual usually needs to interact with a source
of care for a longer period of time to gather the required information about the source.
Although expected acceptability can be determined through fixed provider characteristics,
second-hand information or generalizations from experiences with similar sources of care,
194
the actual acceptability of a source cannot be determined without first hand interaction with a
particular source of care.
The special case of having a usual source of care.
Through previous interactions with the health care system, individuals have already
gathered information on the usability of various sources of care. Individuals may even have
already identified a usual source of care—a source which has been usable by that individual
at least once in the past and which the individual can reasonably expect to be usable in the
future. Of course, there are different types of usual source of care. Some individuals have
chosen their usual source of care based on the source's availability and acceptability. Other
individuals have not had flexibility of choice due to constraints on availability factors,
particularly local doctor supply and system rules. These individuals identified what has
become their usual source of care by default, such as when only one doctor in the community
is accepting new patients or a particular type of insurance. A special case of default
identification results from individuals that are so constrained by availability factors that the
only care sources available to them are safety net sources such as the emergency department
or free clinics. One uninsured participant from Pembroke described such default
identification with respect to his recurring stomach problem:
It could flare up on me now, and I would need to go to the doctor. And then this would be the first thing that would pop into my mind: "I got no doctor, got no health care. The only place to go is the emergency room."
Usual sources of care that have been identified by default may or may not meet all of
the individual's availability and acceptability preferences. The particular case of the
emergency department serving as the usual source of care is even less likely to meet all of the
195
individual's availability and acceptability preferences than other default cases, as the
emergency department has not been designed to be a source of care where appointments can
be made, where wait times are reasonable for non-emergency needs, where doctor-patient
relationships can be established, and where persons with chronic, ongoing, or complicated
health needs get appropriate treatment.
The malleability of availability and acceptability.
Regardless of whether one has a usual source of care or not, the individual must
identify a source of care to use for her or his present health care need. Even a usual source of
care must be evaluated for availability and acceptability under the present conditions in the
community and for the individual. The present community conditions may have rendered
one's usual source of care to be unusable, for instance, as was the case with the sudden death
of the doctor in Blind River. The individual may have had a change in her or his insurance,
for instance, and be no longer eligible for her or his usual source of care, as was the case for
two users of the Hope Clinic (one of whom obtained Medicaid; the second person aged into
Medicare). The individual's health care need may also differ from previous health care needs
and her or his usual source of care may no longer be available or acceptable, as described
earlier in multiple examples.
All goes smoothly if the individual can identify a source of care that is both available
and acceptable given the individual's resources, preferences, and expectations. The majority
of my participants did not describe such experiences. In many of my cases, an individual
made tradeoffs between availability and acceptability factors to ensure the usability of at
least one source of care, after having determined that a compromise would be worthwhile.
196
The most common tradeoff between availability and acceptability was traveling to be
able to use a source of care that the individual considered to be more acceptable than the
local options, particularly with respect to the source's interpersonal skills. A participant from
North Carolina gave the following reason for continuing to drive 40 minutes for care in her
former community:
I'd rather drive down there and get the care where I know I am treated right, with respect, and be a human being, and my health is important, and not the money. And not what kind of race you are or anything, you know. You could have a dollar in your pocket or you could have 500 and you're treated the same.
The longevity of the relationship between the individual and the doctor was another
influence in traveling for care, such as described by this mother:
Where I go for them, that's still a good little distance for taking your kids. I wanted to, I was thinking about having them move down here. We have a children's doctor down here now, Dr. X. I have a lot of friends that go there that say she's an excellent doctor. But my kids have been going to Dr. Y since they were babies. My oldest daughter will be 18 in March, that's how many years we've been there and they are very good with them so I don't really want to switch. For me, you know, us having that relationship, being there that many years, I'd rather drive the distance and be comfortable knowing that I'm going to get the service that I get, you know.
The perceived expertise of the source of care was a third factor influencing traveling
for care. For example, a Northern Ontario participant had arranged to attend a private clinic
in Toronto for a multi-day, comprehensive checkup as she felt that her local doctor was not
taking her health problems seriously and felt "bounced around" by local doctors. She
believed this private clinic would give her better care. Long wait times for appointments
with family doctors in Blind River and Marathon was an additional factor influencing
traveling for care. Long wait times did not always drive an individual to care outside of the
community. Such travel only occurred when an individual was displeased with the wait time
197
for an appointment and could easily identify a usable source in another community and the
individual's health care need would likely get worse over time. A diabetic participant from
Blind River who was having trouble regulating her blood sugar described her decision to
travel for care as follows:
I had to wait a month before I could even get in to see him. His holidays were more important than a lot of his patients is the way I look at it. I got upset and I called Dr. X up in Elliott Lake, who was a diabetic doctor that Dr. Y had sent me to see a couple of times because of my diabetes. I called him up and I told his nurse what was happening. I [got an appointment] in Elliott Lake the next day.
Paying higher out of pocket costs for services was another type of tradeoff between
availability and acceptability. Individuals described paying more to be able to use a good
doctor rather than paying less (or nothing) out of pocket for a doctor that was not as good.
The Northern Ontario participant from above, for example, was prepared to pay out of pocket
for services at the private Toronto clinic if OHIP would not cover the services, as well as the
not unsubstantial travel, hotel, and meal costs. Another woman from North Carolina
described being reluctant to switch from her children's current pediatrician to another source
which charged less for services. Despite having recently lost her and her children's Medicaid
coverage and obviously struggling to make ends meet, she said:
I like Dr. X, he's a good doctor. I prefer for them to stay there but if I had to [switch], then I guess I would….I just feel comfortable with him and it's kinda hard to just keep switching doctors, not when you get set with one doctor and you get comfortable with that doctor. It's kinda hard to just keep switching and moving and moving.
That being said, however, there were a number of participants who did not have the financial
flexibility of paying more out of pocket to be able to use a doctor they preferred. Individuals
who were having to give up using a good doctor because of affordability issues were
198
obviously torn over the decision. Other individuals described choosing a source based on its
affordability, even though they were aware that they were compromising on acceptability:
Instead of going to a doctor and paying 70 dollars, I'll go to a doctor that costs 25. Even though I know that the stuff he's got in there is not like the one down the street. But at least I know it's cheaper and at least I'm not going to be in debt and I do get some kind of care….And it would maybe take care of the problem, maybe not as long term, but at least for a little while.
Not every participant had the capacity to make tradeoffs. When the availability of
care sources was constrained, particularly when only one source of care was available to an
individual (i.e., the default case described above with respect to usual source of care), the
individual's acceptability preferences no longer matter. Tradeoffs between availability and
acceptability cannot occur in such a situation, as shown by this exchange between a Blind
River participant and myself:
Participant: But there are no other doctors here….Well, we have no other alternatives. We have nobody else to go to…. And if there was another doctor available that would be taking patients, yep, I would have been out of there. LJG: Okay. So you either have a bad family doctor or no family doctor. Participant: Exactly.
Still other individuals engaged in alternate actions to expand their options. In place
of making availability and acceptability tradeoffs or compromising their preferences, these
individuals broke rules or employed deception to change what was being offered to them by
the health care system. One individual, for example, described how she would lie about her
health need to obtain an appointment with a short wait time even when the doctor was
booked up:
If I needed to go see the doctor tomorrow…and they said, "Well, I can't make you an appointment for three weeks," I would wait an hour and I would call back and I would say, "I have pink eye." And that would get you in there right quick…. And
199
then when you get into the office the nurse has no idea why you're there, so you just tell her [the real reason].
This participant claimed that she was justified in lying about her health need because she was
an infrequent user of the health care system and "I only go because I have to." Another
participant took great delight in telling how he had got his specialist for his life-threatening
disease when no specialists in Ontario were taking new patients:
I asked a few people who would be a good doctor. I heard of this guy, Dr. X, and I went up there. They wouldn't let me in, so I just barged into his office when I saw a patient leave. I just went into the office and said, "Look, if you have a problem with me, you can phone the police now. But while we're waiting, can I please talk to you and tell you my story?"…So he listened to me. And we kind of got into an argument about the treatment….We just hit it off.
Still other participants described how they omitted details about their living situation to
protect their Medicaid status in North Carolina. One mother told the government that her
husband was not living in the home to better ensure that her family could qualify for
Medicaid. "I've got to look out for me and my children," she said. Another participant did
not tell the Medicaid officials she had moved communities in an effort to retain her doctor,
although she expected that this deception would catch up with her.
Using Health Care
Once an individual has identified a usable source of care, she or he can move into
using the source of care and getting health care services and interventions. Using health care
is composed of getting a diagnosis as well as considering the availability and acceptability of
health care services and interventions.
200
Getting a Diagnosis
Getting a diagnosis from a health care provider is an initial step in using health care.
An individual's entry to additional care and interventions is dependent on convincing a health
care provider (usually a doctor) that something is wrong with the individual's health and that
the need can be potentially met through health care services. The ease of the diagnosis
process is influenced by two factors: (i) the type of health care problem, and (ii) the
involvement of a good doctor.
Type of health problem.
The type of health problem is a major feature in getting a diagnosis. The individual's
health problem can be simple and straightforward to identify and treat, such as can be the
case with strep throat, the flu, or a broken arm. The individual's health problem can also be
simple and straightforward when the individual is already involved in ongoing care and the
particular health problem is a manifestation of the larger health issue or is an adverse reaction
to previous treatment.
Many of the health problems described by my participants, however, were not simple
and straightforward. Some health problems were rare and were only able to be diagnosed by
a subspecialist. Other health problems consisted of general or nonspecific symptoms like
dizziness, headaches, or sudden weight loss and required multiple tests and detailed
investigation before a doctor could determine the cause and course of treatment. For
example, one participant described the diagnosis process for her headaches as follows:
They ruled out that I don't have a tumor. I don't have lupus. I don't have arthritis. And some other disease. They had me go through a whole bunch of tests, like blood tests, x-rays, I went through the whole kit and caboodle all over again. And they
201
ruled all that out and said I don't have cancer. Nothing like that. So they figured that it was migraines.
Other health problems presented with unusual symptoms or did not respond to
diagnostic tests as would be expected. As one man stated:
My wife has a situation that we're unable to resolve and it's not that we haven't tried. It's not that the doctors haven't tried. It's just that we have not found the problem that's causing her to have the pain she has….All of her problems are unique. They're not normal.
Another participant described the difficulty various doctors had in determining that he had
broken his shoulder. There was no doubt that something was wrong with his shoulder as he
was experiencing pain and disability. The nature of the injury eluded the doctors, however,
as the shoulder looked fine on a x-ray, a CAT scan, and a MRI scan. After 18 months of
inconclusive investigation and treatment, a specialist decided to operate and discovered the
fracture. None of the doctors involved could understand why the fracture had not been
discovered earlier through conventional means.
The involvement of a good doctor.
Getting a diagnosis is heavily reliant on the involvement of a good doctor. A number
of participants described situations of misdiagnosis resulting from a "bad doctor,"
particularly because of poor clinical skills. Bad doctors often continued to stick with the
initial misdiagnosis despite the individual getting sicker and not responding to treatment. "I
knew there was something else going on but [my doctor] kept on the kick of this gallbladder
nonsense," described one participant, claiming that she was stuck in this situation because her
doctor "has a one-track mind and doesn't like to be told what to do." Bad doctors also ruled
out diagnoses using inappropriate evidence and did not compare ongoing evidence with the
202
ruled out diagnosis. For example, one young man described how his mother eventually was
diagnosed for diabetes:
She went to a doctor here in town and he said "Well, you don't have diabetes"… and then they just kept ruling out diabetes each time she went after that. She was always sick and feeling lethargic, tired and sweating….She went to the eye doctor and the eye doctor told her she had diabetes. Went to the hospital and they didn't know why she was still awake. She was pretty much sweating sugar and stuff like that. And it was all because the doctor said "No, you don't have diabetes."
Other individuals described being told there was nothing wrong with them or that no
health care intervention was needed, despite their being sick or in pain. In many of these
instances, the individual described the doctor as not taking her or him seriously, as
minimizing her or his complaint's, or as being arrogant or stubborn. For instance, one
participant described the difficulty in getting her daughter taken care of for stomach pain, a
problem she prescribed in part to discrimination about her daughter's weight:
She kept having these pains in her stomach, for the longest time—and my daughter's obese, she's even heavier than I am….She got up one morning and was doing a lot of crying. I ended up having to take her to the hospital. Well they couldn't find anything….They thought it was a stomach discomfort: "Okay, she might need laxatives, she might need to use oil, this might be blah, blah, blah." Well I brought her home. A couple of hours later I had to take her back to the hospital again because she was in so much pain. They decided to go and do some more extensive tests. They did more tests and they came back and said, "Well we can't find out what's wrong with her, blah, blah, blah, blah, blah."
Many of these stories also told of the later involvement of another doctor, a good
doctor specifically serving as a champion for their case. Like the woman learning of her
diabetes at an eye exam, these champions encountered individuals as they struggled to get an
appropriate diagnosis and treatment. The good doctor champion recognized that the
individual needed help and invested time in getting a correct diagnosis, such as occurred in
the continuation of the story of the daughter with stomach trouble:
203
Then this one doctor said "Look, something's not right with this child and we're going to find out what is wrong with her NOW." This was an emergency room doctor. He said: "She's not going back home this time. She's already been home, she's not going again. We're going to find it." He said: "Whatever it takes." He said: "Miss X, don't worry. We're going to take care of it." And he took her, they took her, and did some kind of scans or whatever and sure enough she had a tumor about the size of this [cigar] box in her stomach.
Like this emergency room doctor, champions were poster examples of good doctors. They
had good clinical skills and were persistent and dedicated in getting the patient a correct
diagnosis and appropriate care even if that meant expending extra effort. They also treated
patients with respect, and took the time to thoroughly listen to the patient.
Other Aspects of Using Health Care: Availability and Acceptability Revisited
The process of using health care is also shaped by availability and acceptability
factors. Many of the availability and acceptability issues discussed in identifying a usable
source of care operate similarly in the using care process and will not be repeated here. Wait
times and affordability are elaborated on below, however, as different details are important
when using health care services and interventions.
Waiting to use care.
Under most circumstances, there is a waiting period between identifying a source of
care and using a source of care. The nature of the availability of the source with respect to
this time gap is dependent on the set-up of the source of care. For example, the Hope Clinic
and the various emergency departments in the four communities queued patients as they
presented for care, with the emergency departments adjusting an individual's wait time based
on the severity of her or his health care need. Other care sources in this study employed
204
appointment systems, most of which also adjusted wait times for health care needs. Wait
times are also associated with diagnostic tests and certain interventions (e.g., non-urgent
surgeries).
Waiting for care is simply considered to be part of the process of using health care—
and therefore acceptable—if the wait time for using a source of care or intervention matches
the individual's perception of the urgency of her or his health care need. Waiting for care can
also be considered an acceptable (enough) part of the care process when individuals perceive
they are "waiting their turn" under fair conditions. Fair conditions include explicit rules
about the order in which patients are served based on health need, such as triage in an
emergency department. The Hope Clinic's "first come, first served" rule was also considered
to be fair, as explained by this Hope Clinic user:
They have to give everybody a thorough exam just like they would do me if I was to go back there. So you just have to be patient and wait. If you don't have the patience to wait, then there's no need to be coming here….And if you're not willing to go by these rules, then you just need to turn around and go back out.
For persons making advance appointments with a source of care, fair conditions generally are
defined as being seen by the doctor close to the time of one's appointment. Running behind
is an acceptable exception when the doctor had built up a positive history with the individual,
such as described by this participant:
I don't mind waiting. I always feel like Dr. X is busy. I always feel like—even if she's not there, she's at the hospital, or if she's there, she's taking care of business. She's busy. It's not intentional that she's letting you wait. It's that she's taking care of other matters and I feel like if someone else is sick or someone else needs attention or whatever, whatever she needs to do, she needs to go ahead and do what she has to do. I don't mind waiting for that.
Waiting for care is less acceptable when the wait time is significantly longer than the
individual considers reasonable given her or his health care need. "It's pretty well impossible
205
to get an appointment with your doctor when you want one," claimed a participant from
Blind River when describing her community's wait time of two months for an office
appointment. A number of Marathon participants similarly claimed "you don't get
appointments right away here" when faced with wait times of six weeks for routine care such
as prescription referrals and physicals.
Wait times are even more unacceptable when care sources do not appear to follow
their own rules, such as described by this participant:
I went to the emergency room one time and I had asthma real bad and I couldn't breathe. I really couldn't breathe. And there were other people in there for like minor things, I felt, and they didn't take me right then.
Some participants from North Carolina also described instances where they felt that persons
with desirable insurance (i.e., private insurance) were served before persons with less
desirable insurance (e.g., Medicaid) but more urgent health care needs.
Affordability of otherwise available services and interventions.
The affordability of health care services and interventions is a primary factor in most
decisions about use. Individuals will delay or omit services and interventions when they are
not able to accommodate out of pocket costs, particularly up front out of pocket costs.
Persons without health insurance are most affected by affordability issues as they have no
assistance with costs, are usually of low income, and are more likely to be chronically ill or
need more intense services or interventions. Uninsured participants in my study described
not going to the doctor, not getting needed surgeries, and not getting prescriptions filled
because of cost. An unemployed participant from Ontario without drug insurance explained:
Any prescriptions I have now I've been avoiding getting because I don't have the money to do it…. I'll do without [prescription drugs for pain and emphysema]….
206
Because it the old age thing. You have to eat everyday. Like it's a dirty habit, you have to do it. So yeah, my stomach comes first, periodically…. [Money]'s tight enough that I have to make such choices.
Not getting needed services and interventions often results in adverse health and life
effects, such as in the case of a young, uninsured participant needing knee surgery. She was
unable to pay the $2400 up front fee required by the orthopedic surgeon to have the surgery
and her knee continued to get worse. She was unable to work, had been turned down for
disability coverage, and was reduced to using medication to control her knee pain as no other
sources of care were available to her.
Other uninsured participants described a number of strategies to reduce the immediate
costs while still using services and interventions. Skipping medication was common, such as
described by this participant: "That Vioxx is expensive! It's expensive. That's the reason I
skip a pill every once in a while…to save stuff, that stuff's expensive." Others partially filled
their prescriptions to control costs, intending to skip pills or hoping that they would be able
to afford the remainder of the prescription in the near future. This strategy was not always
accommodated by the pharmacy, as described by a mother without insurance for herself and
her children:
[My son]'s hyperactive. He takes medicine and he's been out of his medicine for about a month and I can tell. But I've been having to try to deal with him and calm him down and everything. I went to the drug store to see if they would give me half of it but they say it's a narcotic medicine [and refused]. That medicine is $104 for 30 pills and I can't afford that.
Some uninsured participants described receiving assistance from the local community
or the local health care system to be able to still use services and interventions despite not
being able to afford the costs themselves. The Hope Clinic was an exemplar of this
207
community assistance, particularly with respect to providing prescription medication at no
cost to the individual. Uninsured participants also told of their doctors giving them samples
and helping them to apply for pharmacy assistance programs from drug companies. One
participant also described how her pharmacist once paid for her entire prescription on her
behalf rather than see her not get her medication. Another uninsured participant was able to
get one-time emergency assistance from the county to cover her daughter's medicine. In
contrast, other programs that were designed to help individuals with prescription costs and
travel costs, such as Ontario's Trillium Plan and Northern Health Travel Grant, were not
always as helpful. The Trillium Plan's deductible was too high for uninsured low income
persons to reasonably meet (despite the deductible being income adjusted) and the Northern
Health Travel Grant took too long to reimburse individuals.
While uninsured persons are those most vulnerable to having cost-related problems,
persons with health insurance are not immune from affordability issues. Insurance rules and
cost sharing mechanisms also result in out of pocket costs that must be accommodated by the
individual. Low-income persons generally reported that co-payments under $10 were
affordable but higher co-payments were not. One low-income participant with insurance had
delayed seeing a dermatologist for two years because of the $35 co-payment, despite having
a birthmark that had spread, become raised, and had started itching "like the dickens!"
Cost sharing mechanisms can also make services and interventions unaffordable for
insured persons requiring numerous prescription medicines with life-threatening,
complicated or multiple illness, even if they are not poor. Numerous insured participants
from North Carolina claimed to have monthly co-payments of $300 to $500 for prescription
208
drugs. Some of these participants also recounted that such amounts were not always
affordable and they would sometimes skip taking their medicine.
Insurance rules also meant that certain services and interventions were not covered at
all, often leaving insured persons in the same boat as uninsured individuals. In such
situations, insured participants also chose to delay or omit care and services, such as this
insured participant: "[My pharmacist] tries to find me something that's covered under my
plan and if it isn't I say 'oh well' because I can't afford $93 prescriptions." Some insured
individuals attempted to get around this issue by substituting covered services for non-
covered services. This strategy was often not very successful, such as described by this
participant:
Like with my Medicare, it doesn't pay for dental and I had this bad tooth and it needed to be pulled, but I didn't have the money, you know. And when it would get so bad, I'd go [to the dentist] and he'd medicate me and then he'd tell me I need to come back and get it pulled. And I kept messing with it until I think that it poisoned my bloodstream. And I ended up in the hospital and everything, taking those antibiotics, you know, through the IV and stuff and eventually I got it pulled after that.
Insurance rules and being uninsured did not stop individuals from using services and
interventions for life-threatening or otherwise serious health conditions, however.
Individuals described feeling as if they could not choose to delay or omit such services or
interventions. These decisions were usually not accompanied by up front payment, which
removed the immediacy of the issue of affordability. For example, one mother described
going ahead with surgery for her seriously ill child despite being between insurance plans:
My husband had switched jobs and it was two days before his insurance was going to be effective. [The doctors] were saying "We need to do the surgery today." And the insurance company would not waive those two days. They would not agree. So what we did is we had the surgery done. I mean, you know, we didn't have the
209
choice….You can't choose when it comes to that, you definitely want to have the surgery….We're still making payments on that.
Another woman similarly described agreeing to be responsible for the hospital costs for her
seriously ill and uninsured husband:
When he was in the hospital, they didn't know what was wrong with him. And they did tests and tests and tests. Of course, I couldn't have imagined, I didn't know how high the bills would be. But this is my husband's life you know. And I told them—I think they were about to send him home one time and they still didn't know the problem and something had been going on for a few months. We knew something was wrong. And I told them that I thought, I didn't care how much it cost, somehow we would take care of it.
Acceptability of available services and interventions.
In the context of using care, acceptability refers to how well the available health care
services and interventions conform to the individual's expectations, values, and preferences.
This accommodation is facilitated by having an established doctor-patient relationship with a
good doctor (particularly with respect to the doctor's interpersonal skills) and being known,
as described by two participants:
[My doctor] knows already I don't like taking stuff [medication]. So she doesn't try to give me too much junk because she knows I'm not going to use it anyways. I'm Jehovah's Witness and I don't take blood and I make that known to [to my doctors] to start with…. In my religious preference, there have been no problems with any of my doctors. They know Jehovah's Witnesses and there's no problem.
The ultimate measure of the acceptability of available services and interventions is whether
one's health needs are resolved, such as was the case with this participant with emphysema:
"[I get] excellent service!...I'm not dragging. And I can breathe." Being able to use services
and interventions to get one's health need resolved, however, requires that the service or
intervention be acceptable in the first place. There are multiple reasons why individuals may
find available services and interventions to be unacceptable.
210
Some individuals already have experience with a particular service or intervention
and had not found it to be helpful in the past. They do not want to spend time or energy or
sacrifice their quality of life (or life itself) on a solution that will likely not work and reject
the available service or intervention in favor of their own advocacy and behaviors to find a
more acceptable solution. A participant with cancer could not convince her specialist to
prescribe medical marijuana: "He prescribed me Marinol [a synthetic pill form of marijuana],
which I've been prescribed many times before as well as other drugs. They just don't work.
They really don't." She stared buying and using marijuana from illegal sources. Another
participant, who had previously recovered from prostrate cancer, experienced a subsequent
rise in his prostate-specific antigen (PSA) levels. He was advised by his specialists to simply
watch and wait:
[The oncologists] told me that I had nothing to worry about at the present time…because the PSA hadn't risen high enough. They said: "When your PSA gets up to 5, come back and see us." Well that didn't sit too well with me because I could be dead by the time my PSA was up to 5.
He went on to describe what he did instead:
So when my PSA got up to 4, I told my [family] doctor that we had to do something about it. I don't agree that I should sit around and wait until the cancer shows up, if I can do something to prevent it. So I started taking Lupron shots.41
Other individuals find the available service or intervention to be too severe an option
and simply reject the option outright. Examples from participant's narratives included an
individual with a severe back injury that "was not looking for surgery" so he refused to
continue to consult with a specialist who "didn't offer us much except for surgery." Another
41Lupron suppresses the production of testosterone in the testicles and can slow the growth of prostate cancer cells.
211
participant described her rejection of a diet intended to help her lose weight: "I didn't even
diet. I mean, that diet was—Lord Jesus! I would pretty starve!"
Still other individuals did not want to make the tradeoff required to use the service or
intervention. A participant with HIV explained why he had not initially used any medication
as follows: "I realized I had a deadly disease, but I'd rather die from the disease than being
killed by some poisons they're pumping into my body." Another participant refused to
switch family doctors despite the possibility of receiving his many prescriptions with no
copayments from a Veterans Affairs (VA) doctor. He had been with his current family
doctor for a long time and "love[d] him to death." In contrast, the VA doctor was "pure
mean" and "strange."
As was the case when identifying a usable source of care, some individuals broke
rules or employed deception to expand their options when the options on offer were
unacceptable, such as the above cancer patient and the illegal marijuana. Another
participant, an immigrant from Mexico, returned home to import "herbs" from traditional
healers to treat his illness. Other participants told of using medications that had been
prescribed to friends or family.
ACHIEVING BALANCE VERSUS GETTING STUCK
An individual moves through the seeking balance stage and goes on to achieve
balance when there is a good match between the individual and the means of resolving her or
his health need, such as in this simple example introduced at the beginning of this chapter:
If I have an extremely sore throat that is not going away, I may go to the doctor for assistance and get diagnosed with strep throat. A short course of antibiotics should clear me up nicely and balance off my need.
212
Despite being a simple health problem, getting strep throat resolved this easily requires that
one does not get stuck at any of the steps in seeking balance. There are many different
locations to get stuck along the way in this strep throat example, including one:
• Believing in using health care and medicine;
• Having insurance for physician services and prescription medicine (or enough
discretionary income that these costs are inconsequential);
• Having a usable source of care, with a specific emphasis on a short waiting time;
• Getting a diagnosis from a doctor with appropriate clinical skills;
• Getting the right antibiotic for the infection; and
• Not having an adverse reaction to the medication.
Getting stuck does not necessarily mean that the individual is unable to achieve
balance. Getting stuck does mean, however, that the existing circumstances present enough
of a barrier that the individual must achieve balance through another path. This alternate
path can be a simple change, such as a modification in medication. In most cases, however,
getting unstuck requires more involved actions, such as changing doctors, traveling to
another community for care, investigating and advocating for alternate interventions, moving
into self care from health care, or receiving assistance from the health care system.
Individual Behaviors
Individuals who engage in behaviors to get themselves unstuck believe they have
options and believe they can change the situation in which they find themselves. This is
often reinforced by a belief that one's health care need will worsen by getting stuck. For

213
example, one participant described advocating for her seriously sick friend after waiting over
four hours in the emergency room without getting seen:
I got upset. I got very upset….I said, “Look, we’ve been sitting here since 5:30. Something’s wrong with my friend. And if you can’t take care of it, I’m going to find out why.” And they took her on back in there and that’s when they found out that she had had a light stroke.
Another participant refused to obey her doctor's request that she present only one complaint
in an office visit:
Do you think I'm going to get off that chair if he doesn't deal with everything I need? And I told him that one day. I said, "Excuse me! By the time I had the appointment with you, I had all these other things happen to me." So he got all red in the face because he knew I was not going anywhere until he did something.
In contrast, individuals who do not engage in behaviors to get themselves unstuck feel
as if they have no other choice or power, such as this participant who was caught in the
Ontario caps on surgical procedures:
It was a whole 12 months later before I actually got the operation. And that was PURELY because, the [surgeon] said, “I can only do so many of each certain operation a year.” So what can you do? I just had to wait my turn.
Adapting
A special case of getting stuck arises when individuals develop a life-threatening,
serious, or chronic disease. Such individuals must effectively manage her or his new health
condition within the constraints of their new illness to achieve balance within being out of
balance. This process of adapting occurs despite the previous unacceptability of the new
state of balance. Adapting requires individuals to change their expectations and
accommodate the circumstances in which they find themselves, such as this participant
facing the probable reoccurrence of her cancer:
214
I have cancer. I had cancer and it was gone and it's now something I have to live with again. So you make the best of it. In other words, I'm not going to sit here and dwell on it and make myself sick when there's nothing I can do about it that I'm not doing already….The only thing that is affecting me in that sense is the presence of [the probability of cancer] but it's not, it's not, it's not changing my lifestyle. I'm not worried to death about it. Because it's under control.
A participant with HIV—quoted earlier about his initial reluctance to use HIV medication—
described this process of adapting after deciding to use medication:
That’s why I had such a strong opinion of not going on medication. Because it made me feel like I WAS dying….Like I was hallucinating. It was just weird….Until you learn how to deal with being like that and cooperate. Because that’s all I’ve done with the medication I’m on right now, you know? I’ve adapted to it.
Adapting can have additional benefits, such as was described by the wife of a man
with a life-threatening disease:
We’ve been through a lot. And it’s not just with the disease, but the whole lifestyle changes. The disease has calmed him down and made him look at life differently and say, “Hey, I’m only here for a little while. I’d better slow down and appreciate my family. Appreciate my wife and my kids.”…So that’s been a blessing in some ways. And we DO look at it that way.
Assistance From the Health Care System
Individual behaviors to get oneself unstuck can be supported by having adequate
health insurance and an established relationship with a good doctor, such as was the case
with the above participant with rising PSA levels. While his taking of Lupron shots was
initially driven by his own advocacy, this decision was certainly facilitated by having health
insurance that covered all but $10 of the $2400 per shot cost. The health care system
similarly reinforces persons who do not engage in behaviors to get themselves unstuck. Such
215
persons described being powerless and without choices due in part to not having health
insurance, a desired type of health insurance, or a usable source of care.
The local organization of the health care system and persons operating within the
system can also help individuals in getting unstuck. The Hope Clinic is again a natural
example, not only for the health care services they provide but for helping persons get
Medicaid to broaden their service coverage to include specialty care. Other health care
related programs in Ontario and North Carolina purchased newly needed physical supports
for participants' homes, such as bars in the bathroom, shower chairs, walkers, and wheelchair
ramps. And finally, the existence of patient champions among health care providers can help
ensure that individuals get appropriate diagnoses and interventions.
MAINTAINING BALANCE
Once an individual has achieved balance, she or he moves into the maintaining
balance process. The objective of maintaining balance is to remain in balance, that is to
sustain the absence of health needs achieved by progressing through seeking balance.
The primary strategy the individual uses in maintaining balance is to avoid a tipping
point. A tipping point refers to the place where the individual loses her or his balance
through a new illness or injury or the worsening of a chronic or recovering illness or injury.
Tipping points may happen gradually or suddenly. The individual also may or may not be
aware of the approaching tipping point and may or may not have control over avoiding the
tipping point. If the individual is aware of approaching a tipping point and the approach is
not too sudden, the individual has the possibility to engage in reactive behaviors to move
away from the tipping point and remain in the maintaining balance stage. Reactive behaviors
216
may be at the level of the individual (self care) or may be through interactions with the health
care system. For example, a participant with asthma described his actions to try and stave off
being hospitalized when his asthma flared up as follows: "If I get an asthma attack, I can
usually just take a puff or two of my inhaler and I'm fine. But if I don’t have an inhaler, then
I'm on my way to the emergency department." Another participant described "going in more
often" to her doctor when her diabetes started to feel like it was heading out of control.
Individuals also engage in health maintenance behaviors to keep themselves from a
tipping point. As was the case with reactive behaviors, health maintenance behaviors may be
at the level of the individual (self care) or may be through interactions with the health care
system. Health maintenance behaviors for all individuals include general health behaviors
like eating well, exercising, and getting enough sleep. For persons with an ongoing illness
that is enough under control to have achieved balance in the first place, health maintenance
behaviors include illness specific activities, such taking prescription medicines as directed,
continuing counseling in the case of depression, and—as one participant stated—"watching
blood pressure, cholesterol, diabetes, all that stuff, you know, try to keep it manageable so
that I can live with it." Another participant with a number of chronic illnesses said: "You
keep on doing what works." Health maintenance behaviors for persons with chronic illness
also includes the continuation of one's health care through regular visits with a health care
provider.
Additional health maintenance behaviors can be subdivided into two types: (i)
rehabilitative behaviors, and (ii) preventive behaviors. Rehabilitative behaviors are
employed by individuals that have moved into balance but still need recovery and healing
time from an illness or injury, such as a heart attack or a broken bone. Such behaviors are
217
usually assisted by health care providers including occupational therapists, physical
therapists, and home care services. Preventive behaviors are aimed at preventing the
exacerbation of one's illness or injury. Individual level preventive behaviors require
knowledge about one's body, reactions, and illness or injury. As such, adequate preventive
behaviors are often arrived at through trial and error. One participant, a mother of a child
with a life-threatening illness, identified such knowledge gained through years of dealing
with her child's illness being in and out of control. She described using both self care and
health care to prevent the child's immune system from being overwhelmed:
I’m very particular about him, you know, especially going outside to play and things and washing his hands and not touching things, you know. It’s a busy job!
He had picked up a cold a few weeks ago and I went in to take him in [to the doctor]— we try to get him on antibiotics right away and that’ll stop any type of cold infection and keep [his disease] from occurring again, because once it starts, that’s when we have to worry.
MAINTAINING BALANCE VERSUS BALANCE UPSETS
Maintaining balance behaviors, whether at the individual level or through interactions
with the health care system, may or may not successfully avoid a tipping point. Such success
or failure depends on the same factors outlined for seeking balance: the severity of health
problem; the responsiveness of the health problem to self care or health care; and the
availability and acceptability of a source of health care and health care services and
interventions. For persons with chronic illnesses, successfully maintaining balance is
especially helped by having an established doctor-patient relationship with a good doctor and
being known.
218
When an individual is unsuccessful at avoiding a tipping point, she or he also moves
from being in balance to being out of balance. This balance upset is a single point in time
representing the loss of the balance equilibrium. Moving from maintaining balance to a
balance upset is naturally followed by a return to the seeking balance stage and an attempt to
reestablish balance as being in balance is a natural state to which individuals want to return.
THE CONTINUOUS CYCLE OF ACCESS AS A BALANCE PROCESS
The individual faces new conditions with each cycle of the balance process as the
underlying context shifts and changes over time. This concept of shifting context was
vividly illustrated by the sudden death of one of the doctors in Blind River, Ontario. That
community's local health care system literally changed overnight.
The individual's relationship with the health care system also changes over time.
Individuals gain and lose health insurance, change doctors, and vary in their ability to pay out
of pocket costs. Through multiple cycles of the balance process, individuals also gain
knowledge about how to negotiate the health care system.
And, of course, the individual's health needs can also shift over time, with ebbs and
flows to one's health status, such as was described by one participant: "I think I’ve seen a
doctor more in the last three years than I’ve seen in the rest of my lifetime." Individuals also
learn more about their reactions to and ways of coping with illness and injury.
CHAPTER 7: DISCUSSION
This study's purpose was to better understand access to care through developing
access theory using an inductive approach. This study was designed in response to criticisms
of existing access theory and documents the disadvantaged individual's point of view of
getting and using health care in four rural communities from two countries. I found that
access to care is multi-faceted and highly dependent on the community context, the extent
and quality of the doctor-patient relationship, and the quality of the doctor herself or himself.
I conceptualized access as a process of achieving balance, where balance describes
having one's health needs met. Individuals are either in a state of balance, where they then
work to maintain this state, or are out of balance and work towards achieving balance.
Seeking balance is a multi-staged process and individuals can get stuck at any point along the
way. A major component of seeking balance is negotiating the health care system, which
involves assessing the availability and acceptability of sources of care and health care
services and interventions. The type of health problem and clinical and interpersonal skills
of the health care provider also play important roles in seeking balance. When necessary,
individuals trade off among these factors or engage in actions to expand their options. Once
balance is achieved, the individual is concerned with maintaining balance and avoiding
moving into balance upsets. Individuals engage in reactive and health maintenance
behaviors to maintain their balance. If an individual is unable to remain in a state of balance,
she or he starts the balance cycle anew and attempts to reestablish balance under contextual
220
and relationship conditions that have likely changed since the individual was previously at
this stage.
STUDY LIMITATIONS
Several limitations should be recognized when using and interpreting with this work.
This study was solely conducted in rural areas and the resulting theory likely needs to be
refined to be applicable to urban areas. Urban areas have different contexts, particularly with
respect to availability factors such as traveling for care and more choice of sources of
primary and specialty care, including non-physician providers. There were few nurse
practitioners and physician assistants practicing in the four communities in my study, for
instance. Conducting the interviews in English only also limited my ability to investigate
cultural, particularly language, influences on access to care.
The preponderance of data that I collected was from the individual's perspective.
While this design feature was intended to address the criticism that previous access theories
did not incorporate the individual's perspective, it is important to recognize that the
individual's perspective can differ from a health care provider's or health care policy maker's
perspective. These aspects of the health care system are certainly included in my theory
(aided by my community leader interviews), but they only play a supporting role to the
individual's perspective. I have little information, for instance, on the tradeoffs a health care
provider may make to facilitate access for an individual or a community.
My access theory also stresses the importance of time and individuals' careers with
using the health care system, yet I only interviewed participants once. Some of what
distinguishes individuals who get stuck in seeking balance from those that don't get stuck, for
221
instance, is simply the point in time that I met each person in their own particular balance
cycle. Asking participants to reflect on their history of getting and using health care and
purposefully sampling individuals with different levels of health needs and chronicity helped
to decrease the effects of this limitation.
As described in my methods chapter, I did not arrive at my theoretical
conceptualization of access as a balance process until I had left the field and was unable to
collect further data. To ensure that I still engaged in a process of iterative sampling and
analysis, I returned to my previously collected data and recoded events using the new
conceptualization. I continued analysis until I felt that my theory was conceptually dense
and believe that this theory is theoretically saturated.
COMPARING MY ACCESS THEORY WITH OTHER ACCESS THEORIES
The Andersen Behavioral Model
My theoretical conceptualization provided some support for the most recent Andersen
behavioral model (Andersen & Davidson, 2001). Both of our models have claimed that the
overall context is an important aspect of access and that the context influences the individual
level experience. Both models also have conceptualized outcomes of health care use as
informing future health behaviors. Andersen & Davidson's (2001) suggestion that individual
enabling characteristics were better subdivided into financing and organization categories
(rather than individual and community categories) was additionally supported by my
theoretical results.
However, like Phillips and colleagues (1998), my work demonstrates that the lack of
attention paid to interactions between the health care provider and the individual in the
222
Andersen model is problematic. My theory does the equivalent of expanding the
unelaborated provider-patient interactions component (labeled the "process of medical
care"42) in the Andersen and Davidson (2001) model, a component which was intended to
answer Phillips et al.'s criticism in the first place. My theory puts the provider-patient
interactions front and center rather than having such interactions play a minor role, as in the
Andersen and Davidson model. This finding in particular provides additional evidence that
the Andersen model does not adequately capture interactions between the individual and the
health care system (Gold, 1998).
As was the case in the original Andersen model (1995a), one's health need is the
primary driver of my model. However, I did not find it helpful to develop an equivalent of
Andersen's predisposing factors (which were defined as "not directly responsible for health
services use") as all of the factors that explained variation in my examination of getting and
using care were directly related to this driver of health need or one's interaction with the
health care system. Remember as well that Andersen did not find empirical support for
having separate predisposing variables either, even though that conceptualization remained in
all subsequent Andersen models.
My study also showed support for two issues that arose in the use of the Andersen,
Smedby and Anderson model (1970; revision #1) but were not carried forward to subsequent
revisions. Their work suggested that one aspect of the health care system might be
compensated for by other aspects. My four communities certainly demonstrated such effects;
take, for instance, Pembroke doctors needing to accept Medicaid because it was the
predominant form of insurance in the community. The second model revision suggested by
42This use of "process of medical care" is not related to Donabedian's (1966) process component of quality, despite having the same label.
223
Andersen, Smedby, and Anderson's work was that the process of entry to the health care
system was significantly different from the process of receiving services once in the health
care system. Again, my results supported this conceptualization, which is why I have
distinguished seeking balance from maintaining balance and distinguished identifying a
usable source of care from using health care.
At a minimum, my theoretical conceptualization suggests that the Andersen model
needs to be revised. Combining my work with the myriad complaints leveled against the
model described in Chapter 3, however, strongly suggests that we need to reconsider our
reliance on the Andersen model.
Other Access Theories
This study suggests that other access theories have more empirical grounding than
does the Andersen model. My use of the match or agreement between the individual and the
health care system as part of seeking and maintaining balance is similar to Donabedian's
(1973) idea of "fit" between the individual and the health care system and Penchansky's
(1977) subsequent adoption of Donabedian's concept. Penchansky's five dimensions of
access overlap with my availability and acceptability factors, even though our definitions for
individual terms differ. Penchansky's availability and acceptability factors, for example,
measure the fit between the individual and the health care system in both directions while my
availability and acceptability factors are unidirectional. I also position affordability as a
subset of both availability and acceptability while Penchansky sees all three terms as equals.
Despite the differences in our definitions, of all existing access theories, my work most
resembles Penchansky's approach. If my study had combined a more explicit health care
224
provider perspective in addition to the individual perspective, I may have found even more
evidence in support of Penchansky's theory. That being said, however, Penchansky's model
does not incorporate process but rather divides access into component parts. His static and
fragmented approach to conceptualizing access is the complete opposite to my theoretical
conceptualization.
Like Penchansky, Tanahasi's (1978) theory relies on the interaction between the
individual and the health care system. Our definitions of availability and acceptability are
also similar. His hierarchy of coverage is the most different from my approach of all the
access theories, however. I do provide limited evidence in support of Tanahasi's claim that
availability coverage is broader than acceptability coverage, specifically finding that when
persons have only one source of care available to them, their acceptability preferences no
longer matter.
Khan and Bhardaj's (1994) suggestion that health care use can only occur when
access facilitators are stronger than access barriers is also supported by my study, specifically
through many of the aspects of getting stuck while seeking balance. My conceptualization of
a usable source of care also resembles their movement from availability to utilization. The
Institute of Medicine's (Millman, 1993) barriers and mediators are also similar to those found
in my study. My study's emphasis on the good doctor and the importance of the
appropriateness of health care for the individual's needs also resembles the quality measures
suggested in the models by the Institute of Medicine (Millman, 1993), Khan and Bhardaj
(1994), and Tanahasi (1978).
225
COMPARING MY EMPIRICAL RESULTS WITH OTHER EMPIRICAL WORK
From an empirical perspective, my study had much in common with the existing
literature on access. Like the many studies reviewed in Chapter 2, I found that having health
insurance was often a facilitator for getting and using care and that not having insurance
could lead to delayed or omitted services and interventions as well as adverse health effects.
I also found that the local community context could mitigate some of these adverse effects,
such as was the case with the Hope Clinic in Bayboro. The local community context could
also impair the facilitative effect of insurance, such as was the case in Blind River.
The stages of my balance process are similar to those in the illness career literature,
such as recognizing and assuming a sick role, interacting with the health care system, and
compliance with care recommendations (Clausen & Yarrow, 1955; Corbin & Strauss, 1988;
Parsons, 1951; Pescosolido, 1991; Suchman, 1972; Zola, 1973). My process of getting one's
health needs met was also similar to other inductively-oriented empirical work investigating
the process of access. In detailing the dental care pathways of economically disadvantaged
persons, Bedos and colleagues (2003), described steps of deciding to see a dentist and
searching for dentist as well as incidents where individuals were unable to identify a usable
dentist or where they were interrupted in the process of getting their need met. Sobo, Seid,
and Gelhard (2006) described the substantial influence of interactions with physicians on an
individual's experience of getting care. They also found that negative experiences with
getting care resulted in negative consequences for the individual, including distrust of the
health care system and remaining in poor health.
My findings of the importance of the doctor-patient relationship, the "good doctor"
and the emphasis on her or his interpersonal skills, and "being known" also overlap with the
226
research on continuity of care, particularly interpersonal continuity (Saultz, 2003; also known
as relational continuity, Reid, Haggerty & McKendry, 2002). The interpersonal continuity
literature has found that individuals place high value on having an ongoing relationship with
a specific doctor and are willing to make tradeoffs to maintain an existing doctor-patient
relationship, including waiting longer for care and paying more for care (Pandhi & Saultz,
2006). As was also the case in my study, interpersonal continuity was more valued by
populations more likely to need and use care, including persons with chronic conditions, or to
have trouble using care, such as persons of lower socioeconomic status (Pandhi & Saultz,
2006).
My study also showed that having an ongoing relationship with a "good doctor" can
facilitate an individual's movement through seeking balance (by decreasing the likelihood
that she or he will get stuck or by helping in getting the individual unstuck) and can
contribute to helping an individual remain in maintaining balance. Others' work, including a
series of reviews by Saultz and colleagues, has similarly shown that having interpersonal
continuity is associated with higher patient satisfaction, improved delivery of preventive
care, and lower rates of hospitalization (with mixed evidence about the association with
chronic care delivery) (Saultz, 2004; Saultz & Lochner, 2005). Another study found that
"provider support" (which contained elements of the "good doctor") was associated with
greater confidence in diabetes and asthma self-management for low-income individuals
(Greene & Yedidia, 2005).
"Being known" was also a strong and important theme in my data, as was the case
with another study of individuals' perceptions of communication in cancer care (Thorne et
al., 2005). Even though I only learned of their work while wrapping up my study, Thorne
227
and colleagues' experience of the emergence of "being known" perfectly captured my
experience; They claimed that "being known" was a "powerful common theme…[and] a
phenomenon so persuasive that it demanded explication on its own" (Torne et al., 2005, p.
890). Our descriptions of "being known" also share other common details, despite the
independence of our two studies. In both cases, multiple study participants used the actual
language of "being known," despite neither study employing specific interview questions
about interpersonal connections with health care providers. Other similar characteristics of
"being known" include the recognition of the person as well as the disease; an understanding
of the individual's values, preferences, and life circumstances; and the investment in and
commitment to the individual by the provider. My finding that "being known" was
particularly important to participants with chronic, complicated, stigmatized, rare or life-
threatening illnesses also overlapped with their study population of persons with cancer and
their claim that illness stage was an important source of variation in "being known" (Thorne
et al., 2005). Our two conceptualizations differed in that they found that "being known"
could occur within clinical care alone while I found that interpersonal interaction was a
necessary component.
DIRECTIONS FOR FUTURE RESEARCH
This theory of access as a balance process is only at its infancy and I would like to
extend this work in a number of different ways. One task would be to collect new data
across time and settings. It would be particularly helpful to conduct multiple, unstructured,
in-depth interviews with the same set of individuals over a few years to capture temporal
effects prospectively. I would also like to expand the settings for data collection to new rural
228
and urban communities in Canada and the US, including communities that have undergone
system level change (such as British Columbia, Canada after the amalgamation of rural and
urban health authorities).
A second way of extending this work would be to analyze related published work for
evidence to support and expand this study's theoretical conceptualization. Glaser and Strauss
(1967) suggested that related collections of stories, or "caches of material" can function much
like a set of qualitative interviews for secondary analysis purposes. I plan to use books that
recount interactions between disadvantaged individuals and the health care system (e.g.,
Abraham, 1993; Fadiman, 1997; Sered & Fernandopulle, 2005) as another dataset for my
theory development.
A number of the factors identified in the balance process could be used as new
measures of access to care. The concept of a usable source of care stands out in particular.
My study suggests that considering the usability of a source of care is a more refined and
contemporaneous measure of one's ability to get health care than asking whether an
individual has a usual source of care. The usability of a source of care also adjusts for the
type of health care need and actively incorporates barriers and facilitators, while a usual
source of care measure does not do so without additional qualification. The usability concept
can also be applied to health care services and interventions.
Other potential new measures of access suggested by my study include:
• The amount of control the individual feels she or he has over her or his health needs;
• Which features of the health care system contributes to this feeling of being in control or
out of control;
• Whether the individual has had to make tradeoffs to identify a usable source of care;
229
• Whether the individual feels stuck in trying to get her or his health care need resolved and
if so, where in process of negotiating the health care system she or he is stuck; and
• Whether the individual feels as if she or her has the ability to get herself or himself
unstuck.
Much future work remains to fully operationalize and test the feasibility of using
these concepts as measures of access. One way that I could accomplish this is to collaborate
with the individuals that design and administer the Health Services Access Survey at
Statistics Canada. By including these potential new access measures into an existing survey
using traditional access measures, we would be able to systematically investigate the
psychometric properties of the new measures in reference to traditional measures.
There also remains much to develop about the concept of "being known." I did not
follow the analysis of "being known" to its fullest completion in my data as I faced a point in
the project where I had to commit to one central or core category (Strauss and Corbin, 1998)
and "being known" did not meet the study's purpose as well as the balance process. I would
like to revisit this conceptualization of "being known" and design a new study to explore its
role in the provider-patient relationship and in helping individuals in getting and receiving
care. Such a study could use the combination of my conceptualization and that of Thorne
and colleagues (2005) as a starting point, following Strauss' (1970) suggestion of developing
a new grounded theory on the foundation of an original grounded theory. Such a study
should pay particular attention to extending "being known" through areas that have been
omitted from the original conceptualization (Strauss, 1970), including the role of "being
known" in healthy persons or those without serious disease, as well as investigating the key
difference between Thorne et al.'s (2005) work and my own, namely the possibility of "being
230
known" without quality interpersonal interaction. It would also be important to further
develop Strauss and Corbin's (1990, 1998) coding paradigm for "being known," elaborating
on the conditions, actions/interactions, and consequences already indicated by Thorne et al.
(2005) and myself.
With respect to the bigger picture of the study of access in health services research, I
believe that we need to develop a more conceptually robust definition of access to care. As
described in the beginning of this dissertation, there is no one accepted definition of access
and existing definitions vary in breadth. Yet we too often act as if there is one meaning of
access. I would like to systematically review the variety of ways that access has been used,
using the concept analysis principles outlined by Walker and Avant (1995) to clarify the use
of access as a concept in research and policy.
POLICY IMPLICATIONS
This study also suggests there are multiple opportunities for policy intervention in
access to care. A key initial question is where the individual is situated in terms of balance
and their relationship with the health care system and their own support network. In the
language of this work, this is the balance process, which involves determining whether the
individual is in the seeking balance process, where she or he is attempting to get their health
needs under control, or whether the individual is in the maintaining balance process, where
she or he is attempting to keep from developing new health needs or worsening existing
illness and injury. Effective policy interventions are those that can assist the individual with
moving into achieving balance or avoiding a balance upset.
231
The Seeking Balance Process
The first two stages of the seeking balance process—recognizing one's health need
and determining the method of need resolution—are concerned with an individual's decisions
prior to interacting with the health care system. When health needs are dependent on early
health care interventions for optimal outcomes, such as with a heart attack or a stroke, policy
makers have an incentive to assist individuals to move quickly through these first two stages
and onto using the health care system. Public and patient education programs of warning
signs and symptoms and the importance of early medical care are examples of interventions
that target this aspect of being out of balance. Conversely, the health care system can also
play a role in educating individuals when health needs are best dealt with through self-care,
such as with short lived colds in healthy adults.
Once an individual decides to resolve her or his health need through the health care
system, the individual is faced with identifying a usable (in contrast to usual) source of care.
Policy makers must remember that a usable source of care reflects the adequacy of the match
between the individual and the health care system, which includes both availability and
acceptability considerations. Too often, health care policy is designed only considering
availability, or how well the individual conforms to the health care system, rather than also
considering acceptability, or how well the health care system conforms to the individual.
The acceptability of the health care system to individuals is an important consideration. In
my study, individuals tied the acceptability of care sources, services, and interventions to
their likelihood of using health care and of achieving positive health outcomes.
Within availability considerations, health insurance is too often treated as a sufficient
facilitator of access. However, health insurance does an individual little good if no local

232
provider is taking new patients or accepting the type of health insurance that the individual
holds, or when the individual's copayments, deductibles or travel costs are unaffordable.
Health care sources, services, and interventions should be designed so that individuals can
reasonably accommodate any required waiting times, travel times and costs, and other out of
pocket costs.
Within acceptability considerations, the "good doctor" is of primary importance. The
magnitude of interpersonal skills in descriptions of the "good doctor" suggests a key area for
medical education and training. Certainly, there has been increased emphasis on
communication training for medical students in the recent past. For example, one such
training program developed in 1999 includes core skills like active listening, eliciting the
patient's perspective, and operating with a respectful and supportive attitude (Kalet A. et al.,
2004). Such programs should continue. Further education programs could include
encouraging doctors to operate as champions for individual patients having trouble using
care. The "good doctor" champions described by my participants played important roles in
getting people unstuck and ensuring that individuals received correct diagnoses and
treatment. Providers could also be encouraged to act as patient champions through
institutional recognition programs, mission statements, and the involvement of local opinion
leaders (e.g., Lomas et al., 1991).
The Maintaining Balance Process
Policy implications in the maintaining balance process are concerned with assisting
individuals so that they may avoiding approaching or reaching a tipping point, past which
their health suffers. When individuals need to interact with the health care system to remain
233
in balance, the policy implications outlined above for availability and acceptability of care
sources, services and interventions also apply. For individuals with chronic illness, the
health care system must also provide appropriate care and self-management support (Wagner
et al., 2001). Interventions encouraging healthy behaviors that can keep persons in the
maintaining balance process can be also aimed at populations using health promotion
campaigns and health protection policies.
Context Matters
The importance of context, this study's key theme at the community level, also has
key policy implications. As the local context can profoundly change, and therefore change
the individual level experience of getting and using health care, access programs and policies
should be designed with flexibility for tailoring to local context. The US federal government
regulations for Health Professional Shortage Areas and Medically Underserved Areas, for
example, have special provisions for areas with unusually high medical needs or insufficient
capacity of existing primary care providers, as well as special designations for underserved
population groups facing local access barriers such as providers refusing to accept Medicaid.
Local conditions must also be monitored or reviewed on a regular basis as context
changes over time and these changes affect the individual's access to care experience.
Providers move away or close their practice to new patients, the local economy declines, or
insurance plans change their reimbursement rules or rates. It may also be the case that a
community has a stable and adequate number of providers, but this is accomplished by
regular turnover, a characteristic that could upset the balance process. State/provincial or
federal changes in health policy can also affect local communities in different ways
234
depending on the conditions already present in the community. The Institute of Medicine has
called for such monitoring with respect to the health care safety net for the same reason
(Lewin & Altman, 2000).
Relationships Matter
The importance of the doctor-patient relationship, this study's key theme at the
individual level, also should inform policy decision making. Established doctor-patient
relationships with a "good doctor" helped individuals to negotiate the health care system, get
unstuck, and reestablish or maintain balance. Establishing and maintaining relationships
between individuals and specific health care providers should therefore be encouraged
through health care policy, particularly for individuals with ongoing health care needs. This
recommendation may be more difficult to implement than other policy recommendations,
however, as the US health care system has been generally moving away from continuity of
care with specific providers in favor of site continuity (Pandhi & Saultz, 2006).
Listening to Users
Policy makers should also take the time to listen to the users of health care as the
users have the experience and knowledge about how to make things better for themselves and
other users. Individuals provide a unique perspective of the dynamics of getting and using
care. The current approach in both the US and Canada of conducting regular access surveys
certainly provides some of this information, although survey questions are generally
conducted within a predetermined framework and fragment the access experience. Policy
235
makers must seek out more open-ended and narrative-based alternatives to understand the
user's access experiences in a contextual and holistic way.
The Kaiser Commission undertook such an approach, for example, in documenting
the stories of eight families living without health insurance from among the over 1000
families that had participated in their longitudinal Survey of Family Health Experiences
(Shirk, Trost & Schultz, 2000). A much more extensive documentation of individual
experiences with getting and using health care played a central part of the Romanow
Commission of the Future of Health Care in Canada (Commission on the Future of Health
Care in Canada, 2002a). The Commission conducted "multi-faceted consultations with
Canadians" about the health care system including open public hearings and gathering
written submissions from individuals about myriad aspects of the health care system
including aboriginal health, prescription drugs and drug insurance, the private provision of
health care services, problems facing rural and remote communities, and home care use.
This study provided another powerful example of the richness and importance of the
information that individuals can provide about access. My study participants felt the same
way. Remember the participant from North Carolina quoted at the end of Chapter 1? He
called for policy makers to "listen to what people say" to improve the delivery of health care.
A similar spontaneous plea came from a participant from Ontario. I leave her the last word:
It’s important, very important, that we have more of a voice in everything that goes on. I mean, it’s experiences, it’s experiences that we go through, and I don’t think the people have enough VOICE. [The government] should maybe conduct a survey and SEE exactly how each individual FEELS. I don’t care if it’s done on paperwork, cassette, video, whatever. How a person feels about his or her medical care and the medical—something like you’re doing now, but MORE intense. Like with more people. Individual people. Different age groups, ethnic groups, everything. And find out and see just where the medical care is going.
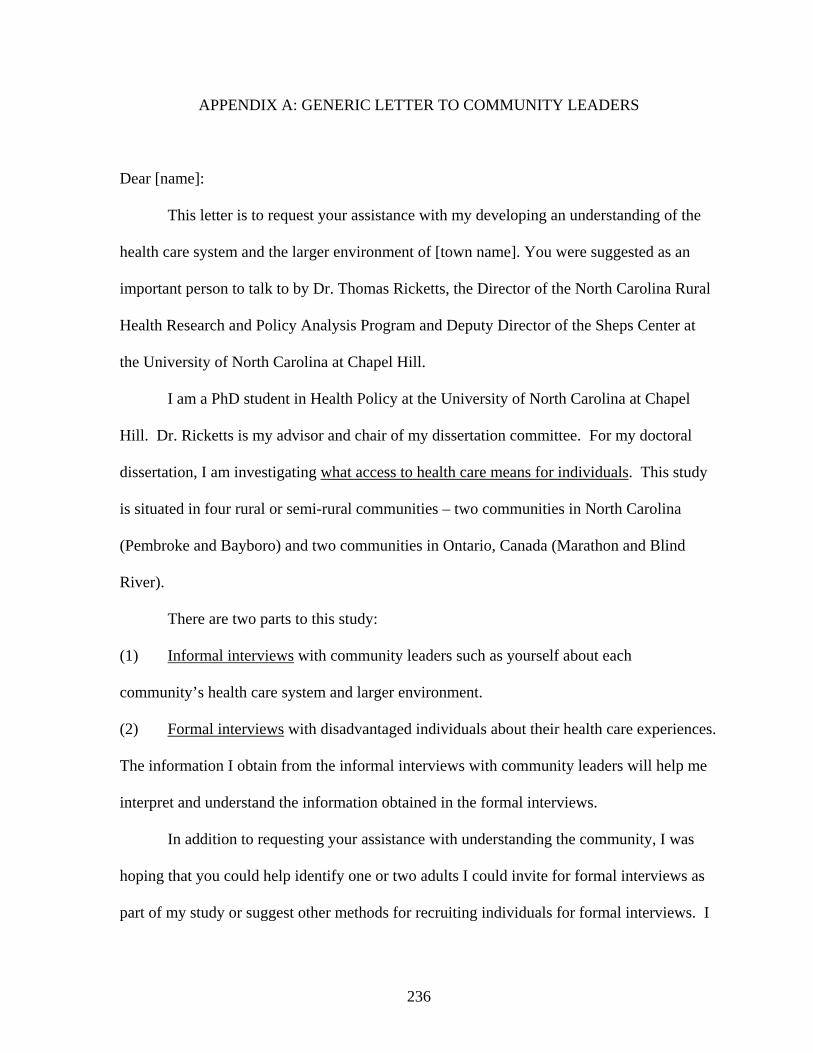
236
APPENDIX A: GENERIC LETTER TO COMMUNITY LEADERS
Dear [name]:
This letter is to request your assistance with my developing an understanding of the
health care system and the larger environment of [town name]. You were suggested as an
important person to talk to by Dr. Thomas Ricketts, the Director of the North Carolina Rural
Health Research and Policy Analysis Program and Deputy Director of the Sheps Center at
the University of North Carolina at Chapel Hill.
I am a PhD student in Health Policy at the University of North Carolina at Chapel
Hill. Dr. Ricketts is my advisor and chair of my dissertation committee. For my doctoral
dissertation, I am investigating what access to health care means for individuals. This study
is situated in four rural or semi-rural communities – two communities in North Carolina
(Pembroke and Bayboro) and two communities in Ontario, Canada (Marathon and Blind
River).
There are two parts to this study:
(1) Informal interviews with community leaders such as yourself about each
community’s health care system and larger environment.
(2) Formal interviews with disadvantaged individuals about their health care experiences.
The information I obtain from the informal interviews with community leaders will help me
interpret and understand the information obtained in the formal interviews.
In addition to requesting your assistance with understanding the community, I was
hoping that you could help identify one or two adults I could invite for formal interviews as
part of my study or suggest other methods for recruiting individuals for formal interviews. I
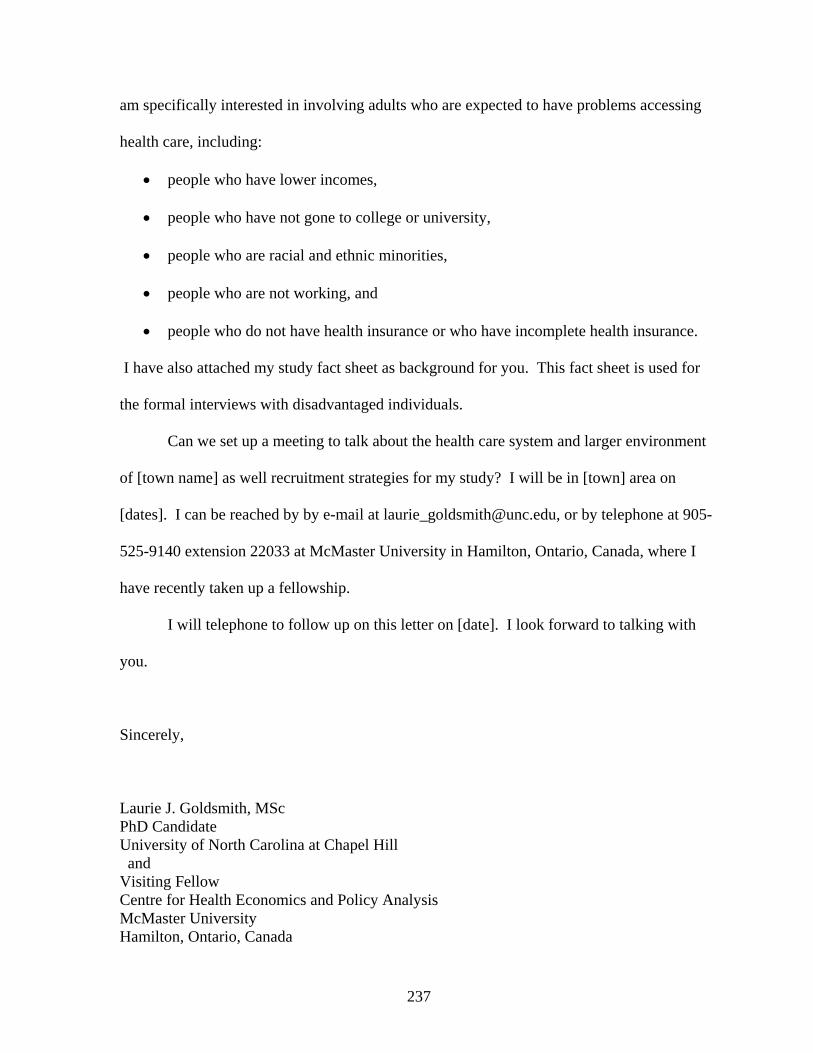
237
am specifically interested in involving adults who are expected to have problems accessing
health care, including:
• people who have lower incomes,
• people who have not gone to college or university,
• people who are racial and ethnic minorities,
• people who are not working, and
• people who do not have health insurance or who have incomplete health insurance.
I have also attached my study fact sheet as background for you. This fact sheet is used for
the formal interviews with disadvantaged individuals.
Can we set up a meeting to talk about the health care system and larger environment
of [town name] as well recruitment strategies for my study? I will be in [town] area on
[dates]. I can be reached by by e-mail at [email protected], or by telephone at 905-
525-9140 extension 22033 at McMaster University in Hamilton, Ontario, Canada, where I
have recently taken up a fellowship.
I will telephone to follow up on this letter on [date]. I look forward to talking with
you.
Sincerely,
Laurie J. Goldsmith, MSc PhD Candidate University of North Carolina at Chapel Hill and Visiting Fellow Centre for Health Economics and Policy Analysis McMaster University Hamilton, Ontario, Canada
238
APPENDIX B: COMMUNITY CONTACTS INTERVIEW GUIDE
1. General understanding of community
• what makes up this community (geograpically)
• who makes up the community
• what the community looks like
• nature of diversity and division in community
• specific disadvantage details:
o poverty
o education
o unemployed
o uninsured or underinsured
• relevant economic and social policies
• community’s greatest strengths
• community’s most pressing needs and problems
• anything else important for an outsider to understand?
2. Health Care Resources
• specific counts and details:
o primary care providers
o specialists
o pharmacists
o social workers
239
o public health department
o hospitals
o emergency care
• increased/decreased over time?
• turnover?
• who takes uninsured?
• who takes Medicaid?
• who/what contributes to the safety net (formal and informal)?
• where else do people go for care? do they travel outside this community?
• relationships between health care providers
3. Health Care Needs
• biggest health problems in community
o overall
o specifically for the disadvantaged
• who are the uninsured?
o describe typical
o working or not?
o where live? remote?
o other demographics
240
• who are the underinsured?
o describe typical
o working or not?
o where live? remote?
o other demographics
• what is access to health care like in this community?
o barriers
o facilitators
o how changed over time?
4. Other people to talk to?
5. Other things to know?
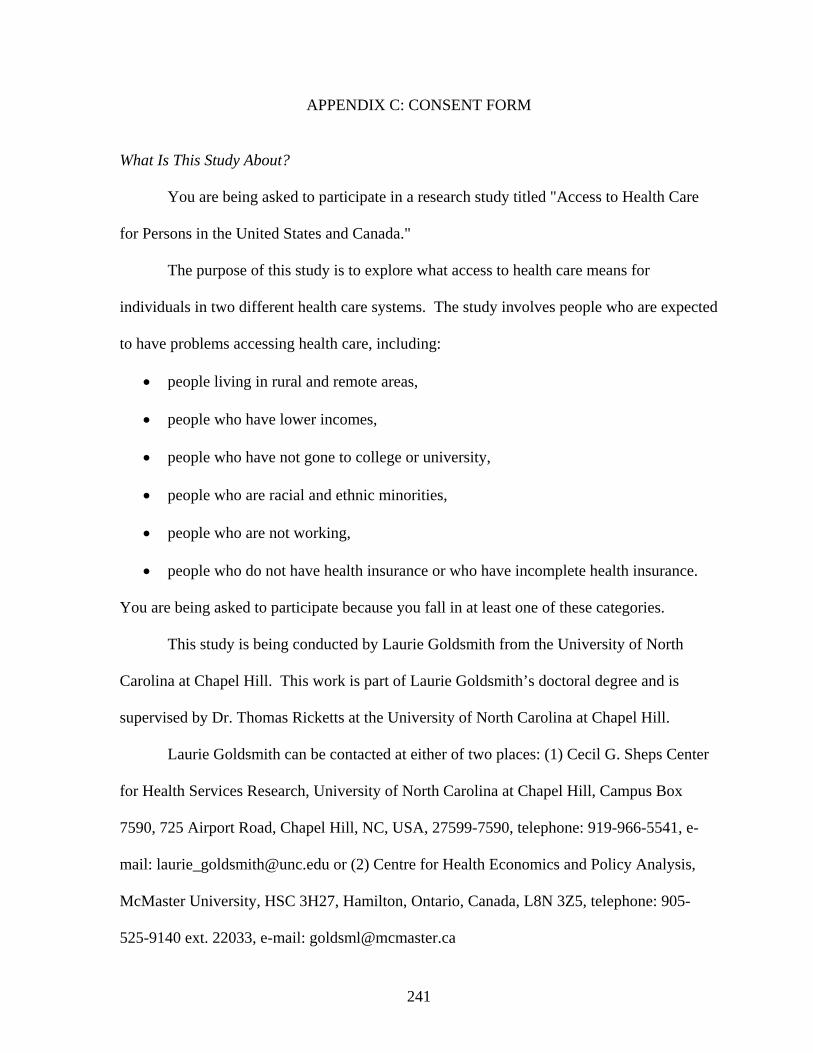
241
APPENDIX C: CONSENT FORM
What Is This Study About?
You are being asked to participate in a research study titled "Access to Health Care
for Persons in the United States and Canada."
The purpose of this study is to explore what access to health care means for
individuals in two different health care systems. The study involves people who are expected
to have problems accessing health care, including:
• people living in rural and remote areas,
• people who have lower incomes,
• people who have not gone to college or university,
• people who are racial and ethnic minorities,
• people who are not working,
• people who do not have health insurance or who have incomplete health insurance.
You are being asked to participate because you fall in at least one of these categories.
This study is being conducted by Laurie Goldsmith from the University of North
Carolina at Chapel Hill. This work is part of Laurie Goldsmith’s doctoral degree and is
supervised by Dr. Thomas Ricketts at the University of North Carolina at Chapel Hill.
Laurie Goldsmith can be contacted at either of two places: (1) Cecil G. Sheps Center
for Health Services Research, University of North Carolina at Chapel Hill, Campus Box
7590, 725 Airport Road, Chapel Hill, NC, USA, 27599-7590, telephone: 919-966-5541, e-
mail: [email protected] or (2) Centre for Health Economics and Policy Analysis,
McMaster University, HSC 3H27, Hamilton, Ontario, Canada, L8N 3Z5, telephone: 905-
525-9140 ext. 22033, e-mail: [email protected]
242
Dr. Thomas Ricketts can be contacted at: Cecil G. Sheps Center for Health Services
Research, University of North Carolina at Chapel Hill, Campus Box 7590, 725 Airport Road
Chapel Hill, NC, USA, 27599-7590, telephone: 919-966-5541, e-mail:
What Will I Be Asked To Do?
You will be asked to talk about your experiences with getting and using health care.
Your interview will be audio-taped, with your permission.
The interview will occur at a time and place that is convenient for you. We estimate
that the interview will take about an hour and a half of your time. Your participation is one
time only. Laurie Goldsmith may contact you in the future to clarify details of the interview.
What Are the Risks and Benefits Of My Participation?
We do not anticipate any risks with this study. You may find it interesting and
enjoyable to talk about your experiences accessing health care. You may also benefit
indirectly from the use of these research results. The results of this research may help make
better future research on access to health care and may inform better health care system
design and health care policy.
If you were recruited through an organization, your decision whether or not to
participate in this study will not affect the services you receive through that organization.
For example, if your doctor asked you if you were interested in participating in this study,
your decision whether or not to participate in this study will not affect your medical care.
243
Are There Any Costs? Will I Be Paid?
You will receive $15, in cash, at the completion of the interview. It is expected that
this money will cover costs for child care, elder care, parking or other transportation costs if
such costs were necessary for you to participate in the interview.
You will be asked to sign a receipt for the money. The receipt book will be kept
separate from the information you provide in the interview.
Participant's Rights and Confidentiality:
Your participation in this study is voluntary. You do not have to participate. You
have the right to withdraw your consent or stop your participation at any time. You have the
right to refuse to answer any questions. You have the right to refuse to have the interview
audio-taped. If you agree to audio-tape the interview, you have the right to turn off the tape
recorder at any time.
To protect your privacy, your name will not be attached to your interview. All of the
information you provide will be stored with an identification number only, not with your
name. Laurie Goldsmith will be the primary person with access to the information you
provide. Her dissertation committee will also have access to the information. Her
dissertation committee consists of Dr. Thomas Ricketts (University of North Carolina at
Chapel Hill), Dr. Gary Rozier (University of North Carolina at Chapel Hill), Dr. Don
Madison (University of North Carolina at Chapel Hill), Dr. Margarete Sandelowski
(University of North Carolina at Chapel Hill), and Dr. Sam Sheps (University of British
Columbia).
244
The audio-tapes from your interview will be stored in a locked cabinet. The audio-
tapes will be transcribed and the transcriptions will be stored on a password protected
computer. The audio-tapes will be kept indefinitely after transcription. Any identifying
information collected on the audio-tape, such as your name, will be deleted from the original
interview audio-tape prior to transcription.
Every effort will be taken to protect the identity of the participants in the study.
However, there is no guarantee that the information cannot be obtained by legal process or
court order. You will not be identified in any report or publication of this study or its results.
If you wish to withdraw from the study or have any questions, contact Laurie
Goldsmith. You may call collect if you wish.
This study has been reviewed and approved by the School of Public Health
Institutional Review Board on Research Involving Human Subjects. This is a group that
makes sure study participants are treated fairly and protected from harm. If you have
questions about your rights as a study participant, or are dissatisfied at any time with any
aspect of this study, you may contact — anonymously, if you wish — the School of Public
Health Institutional Review Board, University of North Carolina at Chapel Hill, CB #7400,
Chapel Hill, NC, USA, 27599-7400, or by telephone at 919-966-3012. You may call collect.
The extra copy of this consent form is for you to keep.
AGREEMENT STATEMENTS:
I have read and understand the information presented here. I freely give my consent to
participate in this study.
Signature: ______________________________________ Date: ________________

245
APPENDIX D: DEMOGRAPHIC INFORMATION FORM
Interview community: ____________________ Interview number: ________
Interview date and time: ________________________
1. Age group: 20 – 30 years ____ 31 – 40 years ______ 41-50
years ______
51- 64 years ____ 65 – 74 years ______ 75 years or
older ____
2. Sex: Female ______ Male ______
3. What racial and ethnic categories do you consider yourself to belong to?
Hispanic or Latino ______ Not Hispanic or Latino ______
White ______ Black or African-American ______
Asian ______ Native Hawaiian or Other Pacific Islander _____
American Indian/Alaska Native/First Nations/Aboriginal _________
Other __________________
4. Do you live alone or with others? Live alone ____ With others ____
# in household ___
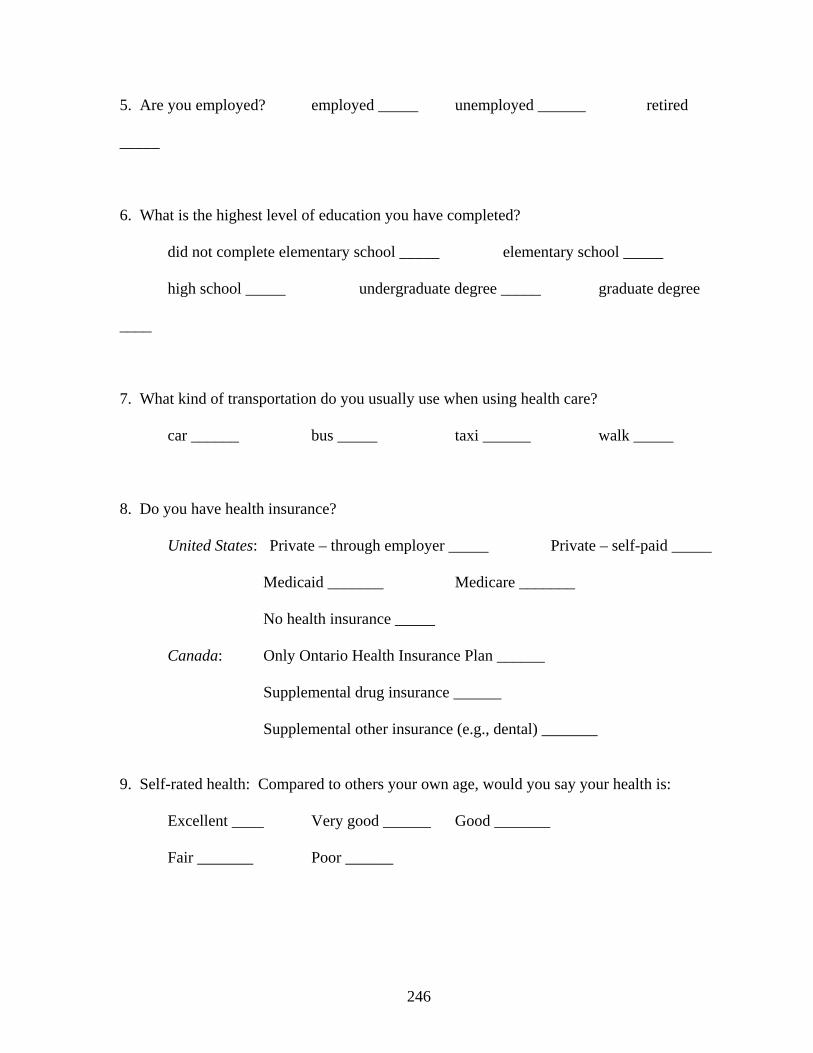
246
5. Are you employed? employed _____ unemployed ______ retired
_____
6. What is the highest level of education you have completed?
did not complete elementary school _____ elementary school _____
high school _____ undergraduate degree _____ graduate degree
____
7. What kind of transportation do you usually use when using health care?
car ______ bus _____ taxi ______ walk _____
8. Do you have health insurance?
United States: Private – through employer _____ Private – self-paid _____
Medicaid _______ Medicare _______
No health insurance _____
Canada: Only Ontario Health Insurance Plan ______
Supplemental drug insurance ______
Supplemental other insurance (e.g., dental) _______
9. Self-rated health: Compared to others your own age, would you say your health is:
Excellent ____ Very good ______ Good _______
Fair _______ Poor ______
247
10. Do you have a long-term, chronic illness, such as heart disease, arthritis, or diabetes?
yes ____ no ____
11. About how many times did you see a health care provider in the last year? ________
12. Have you been hospitalized in the last year? yes _____ no _____
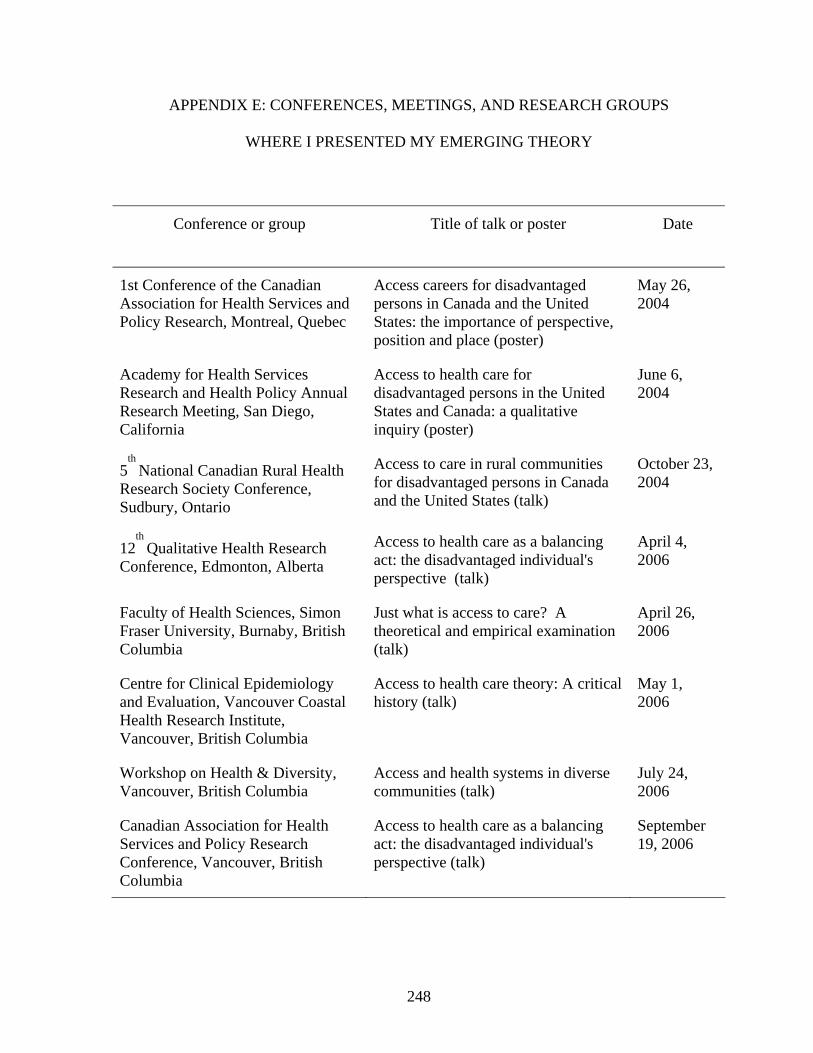
248
APPENDIX E: CONFERENCES, MEETINGS, AND RESEARCH GROUPS
WHERE I PRESENTED MY EMERGING THEORY
Conference or group
Title of talk or poster Date
1st Conference of the Canadian Association for Health Services and Policy Research, Montreal, Quebec
Access careers for disadvantaged persons in Canada and the United States: the importance of perspective, position and place (poster)
May 26, 2004
Academy for Health Services Research and Health Policy Annual Research Meeting, San Diego, California
Access to health care for disadvantaged persons in the United States and Canada: a qualitative inquiry (poster)
June 6, 2004
5th
National Canadian Rural Health Research Society Conference, Sudbury, Ontario
Access to care in rural communities for disadvantaged persons in Canada and the United States (talk)
October 23, 2004
12th
Qualitative Health Research Conference, Edmonton, Alberta
Access to health care as a balancing act: the disadvantaged individual's perspective (talk)
April 4, 2006
Faculty of Health Sciences, Simon Fraser University, Burnaby, British Columbia
Just what is access to care? A theoretical and empirical examination (talk)
April 26, 2006
Centre for Clinical Epidemiology and Evaluation, Vancouver Coastal Health Research Institute, Vancouver, British Columbia
Access to health care theory: A critical history (talk)
May 1, 2006
Workshop on Health & Diversity, Vancouver, British Columbia
Access and health systems in diverse communities (talk)
July 24, 2006
Canadian Association for Health Services and Policy Research Conference, Vancouver, British Columbia
Access to health care as a balancing act: the disadvantaged individual's perspective (talk)
September 19, 2006
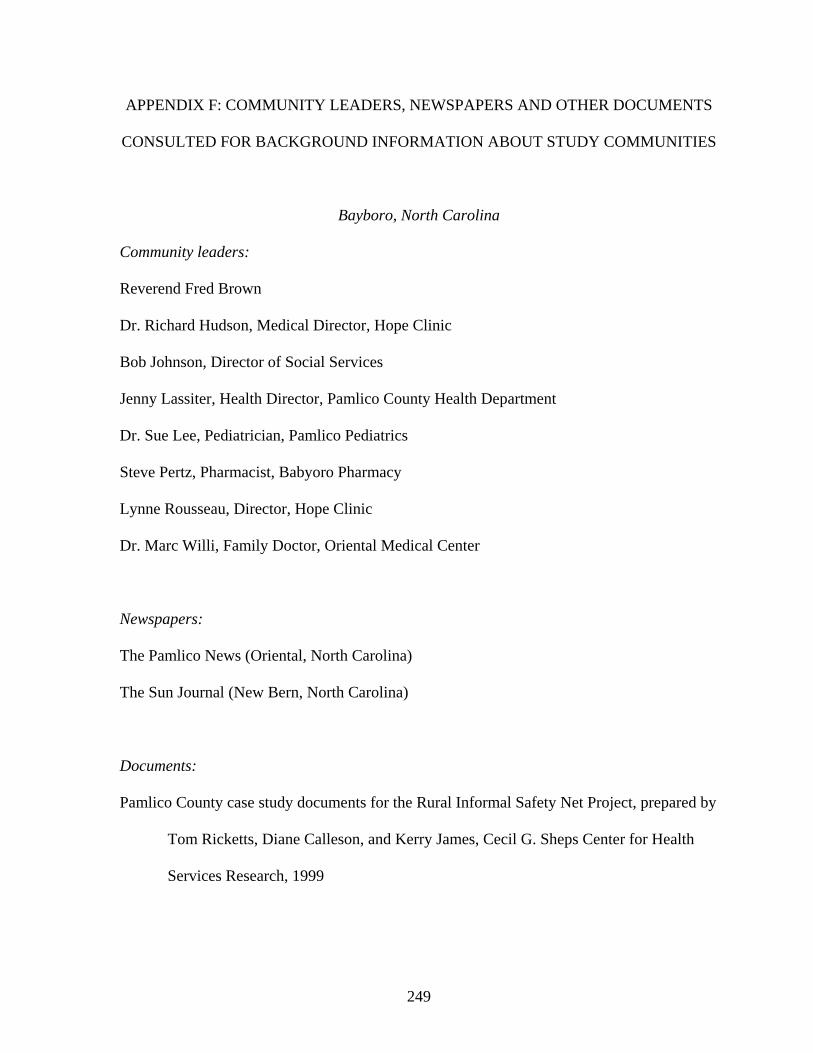
249
APPENDIX F: COMMUNITY LEADERS, NEWSPAPERS AND OTHER DOCUMENTS
CONSULTED FOR BACKGROUND INFORMATION ABOUT STUDY COMMUNITIES
Bayboro, North Carolina
Community leaders:
Reverend Fred Brown
Dr. Richard Hudson, Medical Director, Hope Clinic
Bob Johnson, Director of Social Services
Jenny Lassiter, Health Director, Pamlico County Health Department
Dr. Sue Lee, Pediatrician, Pamlico Pediatrics
Steve Pertz, Pharmacist, Babyoro Pharmacy
Lynne Rousseau, Director, Hope Clinic
Dr. Marc Willi, Family Doctor, Oriental Medical Center
Newspapers:
The Pamlico News (Oriental, North Carolina)
The Sun Journal (New Bern, North Carolina)
Documents:
Pamlico County case study documents for the Rural Informal Safety Net Project, prepared by
Tom Ricketts, Diane Calleson, and Kerry James, Cecil G. Sheps Center for Health
Services Research, 1999
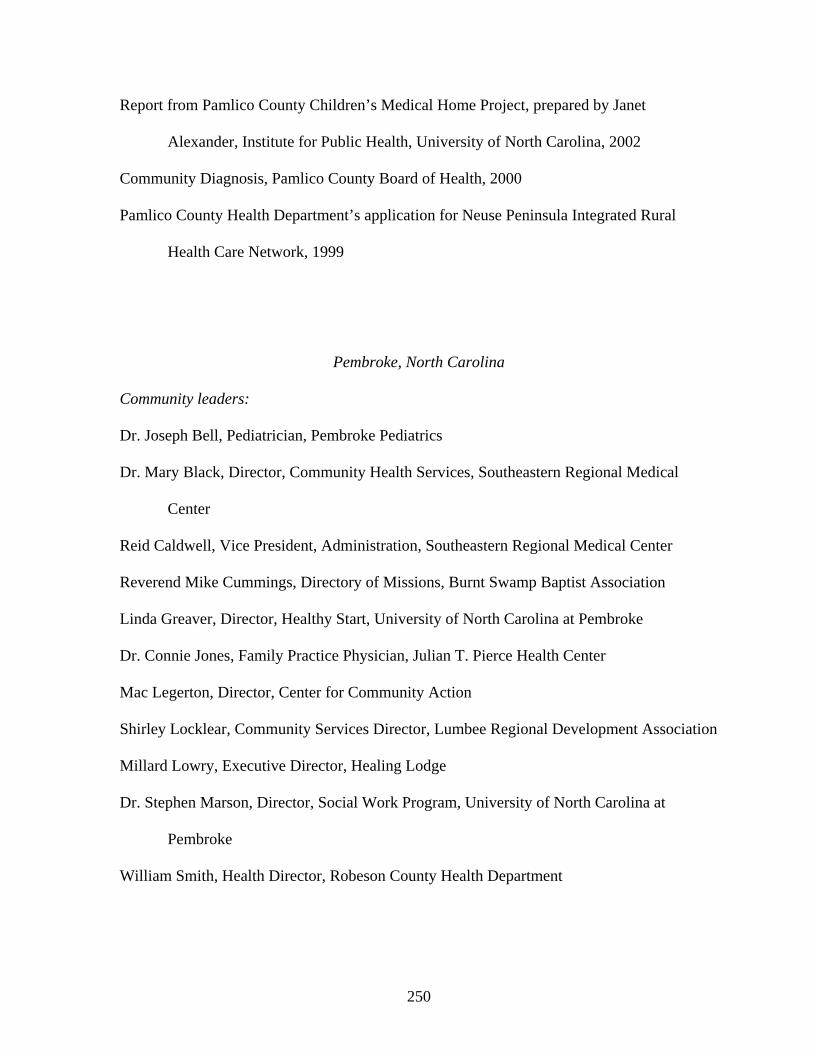
250
Report from Pamlico County Children’s Medical Home Project, prepared by Janet
Alexander, Institute for Public Health, University of North Carolina, 2002
Community Diagnosis, Pamlico County Board of Health, 2000
Pamlico County Health Department’s application for Neuse Peninsula Integrated Rural
Health Care Network, 1999
Pembroke, North Carolina
Community leaders:
Dr. Joseph Bell, Pediatrician, Pembroke Pediatrics
Dr. Mary Black, Director, Community Health Services, Southeastern Regional Medical
Center
Reid Caldwell, Vice President, Administration, Southeastern Regional Medical Center
Reverend Mike Cummings, Directory of Missions, Burnt Swamp Baptist Association
Linda Greaver, Director, Healthy Start, University of North Carolina at Pembroke
Dr. Connie Jones, Family Practice Physician, Julian T. Pierce Health Center
Mac Legerton, Director, Center for Community Action
Shirley Locklear, Community Services Director, Lumbee Regional Development Association
Millard Lowry, Executive Director, Healing Lodge
Dr. Stephen Marson, Director, Social Work Program, University of North Carolina at
Pembroke
William Smith, Health Director, Robeson County Health Department
251
Newspapers:
The Lumbee News & Reporter (Pembroke, North Carolina)
The Robesonian (Lumberton, North Carolina)
The Fayetteville Observer (Fayetteville, North Carolina)
Documents:
Pembroke case study documents for the Rural Informal Safety Net Project, prepared by Tom
Ricketts and Kerry James, Cecil G. Sheps Center for Health Services Research, 1999
Report from Community Health Priority Project of Robeson County, prepared by the
Robeson County Partnership for Community Health, 2001
Various reports and descriptions of future projects from the Opening Doors Project in
Robeson County, a two-year project funded by Robert Wood Johnson based on a
collaboration between Research Triangle Institute, the Robeson Health Care
Corporation, and the Center for Community Action, 1998 and earlier
Blind River, Ontario
Community leaders:
Dr. Chris Barnes, Family Physician, Blind River Family Medical Clinic and Chief of Staff,
Blind River District Health Centre
Sister Diane Bottos, former Director of Nursing at St. Joseph's Hospital (previous name of
Blind River District Health Centre), member of Silver Belles, a social organization of

252
retired local nurses, and member of Board of Directors for Algoma Community Care
Access Centre
Aline Charron, retired local nurse and member of Silver Belles, a social organization of
retired local nurses
Reverend Heather Davies, Minister St. Andrews United Church
Gloria Davwich, Director, Mississauga First Nation Health & Social Services Unit
Melinda Freeman, Public Health Nurse, Algoma District Health Unit, Blind River Office
Bob Gallagher, Mayor, Town of Blind River
Ken Gibson, Client Services Supervisor, Algoma District Services Administration Board
Muriel Gibson, Case Manager, Algoma Community Care Access Centre, Blind River Office
Christopher La Berge, Community Support Program Coordinator, Blind River District Health
Centre
Sister Bernadette Paquette, Church Administrator, Paroisse Sainte-Family (Holy Family
Parish, the local French Roman Catholic Church)
Roberta Wilson-Garrett, Case Manager, Ontario Works
Newspapers:
The Blind River Sentinel (Blind River, Ontario)
The Standard (Elliot Lake, Ontario)
Documents:
Medical Manpower report prepared by Dr. Chris Barnes, no date
253
Marathon, Ontario
Community leaders:
Debra Chiasson, Client Services Advisor, Ontario Government Information Centre
Dr. Nancy Fitch, Family Physician, Marathon Family Practice
Dave Guilianio, Minister, St. John's United Church
Dr. Gord Holloway, Family Physician, Marathon Family Practice
Lucie Lehoux, Employment Advisor, Job Connect (youth employment service); also a
member of the Francophone Women of Northwestern Ontario
Carole Lorraine, Community Outreach Worker, Mental Illness Support Network
Tracy Mashanio Stewart, Director, Health Centre, Pic River First Nation
Rhonda O'Connor, Public Health Nurse, Marathon Health Unit
Sharon Otiquam, member, Pic River First Nation
Newspapers:
Marathon Mercury (Marathon, Ontario)
The Chronicle-Journal (Thunder Bay, Ontario)
Documents:
Marathon Family Practice Patient Newsletters
Various articles about structure of Marathon Family Practice in The Medical Post, the
Canadian Medical Association Journal
Environmental scan of Thunder Bay district, prepared by Chris Southcott, Lakehead
University, 2001
254
REFERENCES
Abraham, LK (1993). Mama might be better off dead: The failure of health care in urban America. The University of Chicago Press, Chicago, IL.
Aday, L. A., & Andersen, R. (1974). A framework for the study of access to medical care.
Health Services Research, 9, 208-220.
Aday, L. A., & Andersen, R. (1975). Development of indices of access to medical care. Ann Arbor, MI: Health Administration Press.
Aday, L. A., & Andersen, R. M. (1981). Equity of access to medical care: A conceptual and empirical overview. Medical Care, 19, 4-27.
Aday, L. A., & Awe, W. C. (1997). Health services utilization models. In D. S. Gochman (Ed.), Handbook of health behavior research I: Personal and social determinants of health (pp. 153-172). New York, NY: Plenum.
Aday, L. A., Andersen, R., & Fleming, G. V. (1980). Health care in the U.S. Equitable for whom? Beverly Hills, CA: Sage Publications.
Aday, L. A., Begley, C. E., Lairson, D. R., & Balkrishnan, R. (2004). Evaluating the healthcare system: Effectiveness, efficiency, and equity (3rd ed.). Chicago, IL: Health Administration Press.
Aday, L. A., Begley, C. E., Lairson, D. R., & Slater, C. H. (1993). Evaluating the medical care system: Effectiveness, efficiency, and equity. Ann Arbor, MI: Health Administration Press.
Aday, L. A., Begley, C. E., Lairson, D. R., & Slater, C. H. (1998). Evaluating the healthcare system: Effectiveness, efficiency, and equity (2nd ed.). Chicago, IL: Health Administration Press.
Agency for Healthcare Research and Quality ( 2005). National healthcare disparities report: 2005 (Vol. AHRQ Publication No. 06-0017). Rockville, MD: Author.
Andersen, R. M. (1968a). A behavioral model of families' use of health services (Research series No. 25). Chicago, IL: Center for Health Administration Studies, University of Chicago.
Andersen, R. M. (1968b). Families' use of health services: A behavioral model of predisposing, enabling, and need components. Dissertation Abstracts International, 29 (08), 2819A. (UMI No. AAT 6902884)
Andersen, R. M. (1995). Revisiting the behavioral model and access to medical care: Does it matter? Journal of Health and Social Behavior, 36 , 1-10.
Andersen, R. M., & Davidson, P. L. (2001). Improving access to care in America: Individual
255
and contextual indicators. In R. M. Andersen, T. H. Rice & G. F. Kominski (Eds.), Changing the US health care system (2nd ed., pp. 3-30). San Francisco, CA: Jossey-Bass.
Andersen, R. M., Rice, T. H., & Kominski, G. F. (Eds.). (2001). Changing the US health care system (2nd ed.). San Francisco, CA: Jossey-Bass.
Andersen, R. M., Yu, H., Wyn, R., Davidson, P. L., Brown, R. E., & Teleki, S. (2002). Access to medical care for low-income persons: How do communities make a difference? Medical Care Research and Review, 59, 384-411.
Andersen, R., & Newman, J. F. (1973). Societal and individual determinants of medical care utilization. Milbank Memorial Fund Quarterly, 51, 95-124.
Andersen, R., Anderson, O. W., & Smedby, B. (1968). Perception of and response to symptoms of illness in Sweden and the United States. Medical Care, 6, 18-30.
Andersen, R., Marcus, M., & Mahshigan, M. (1995). A comparative systems perspective on oral health promotion and disease prevention. In L. K. Cohen & H. C. Gift (Eds.), Disease prevention and oral health promotion: Socio-dental sciences in action (pp. 307-340). Muskgaard, Copenhagen.
Andersen, R., Smedby, B., & Andersen, O. (1970). Medical care use in Sweden and the United States: A comparative analysis of systems and behavior (Research Series Vol. 27. Chicago, IL: Center for Health Administration Studies, University of Chicago.
Anderson, G. F., & Poullier, J.-P. (1999). Health spending, access, and outcomes: Trends in industrialized countries.18, 178-192.
Anderson, G., & Hussey, P. S. (2001). Comparing health system performance in OECD countries. Health Affairs, 20, 219-232.
Anderson, O. (1963). The utilization of health services. In H. E. Freeman, S. Levine & L. G. Reeder (Eds.), Handbook of Medical Sociology (pp. 349-367). Englewood Cliffs: Prentice-Hall, Inc.
Ansari, Z., Laditka, J. N., & Laditka, S. B. (2006). Access to health care and hospitalization for ambulatory care sensitive conditions. Medical Care Research and Review, 63, 719-741.
Applied Management (with Fraser Group and Tristat Resources). (2000). Canadians' access to insurance for prescription medicines. Volume 2: The un-insured and under-insured. Retrieved February 10, 2007, from http://www.appliedmanagement.ca/ presentations.htm
Arcury, T. A., Gesler, W. M., Preisser, J. S., Sherman, J., Spencer, J., & Perin, J. (2005). The effects of geography and spatial behavior on health care utilization among the residents of a rural region. Health Services Research, 40, 135-155.
256
Bach, P. E., Hoangmai, H., Schrag, D., Tate, R. C., & Hargraves, J. L. (2004). Primary care physicians who treat blacks and whites. New England Journal of Medicine, 351, 575-584.
Baker, D. W., Sudano, J. J., Albert, J. M., Borawksi, E. A., & Dor, A. (2005). Lack of health insurance and decline in overall health in late middle age. New England Journal of Medicine, 345, 1106-1112.
Bass, D. M., Looman, W. J., & Ehrlich, P. (1992). Predicting the volume of health and social services: Integrating cognitive impairment into the Modified Andersen Framework. The Gerontologist, 32, 33-43.
Bass, D., & Noelker, L. (1987). The influence of family caregivers on elder's use of in-home services: An expanded conceptual framework. Journal of Health and Social Behavior, 28, 184-196.
Bazeley, P., & Richards, L. (2000). The NVivo qualitative project book. Thousand Oaks, CA: Sage.
Bedos, C., Brodeur, J. M., Boucheron, L., Richard, L., Benigeri, M., Olivier, M. et al. (2003). The dental care pathway of welfare recipients in Quebec. Social Science & Medicine, 57, 2089-2099.
Berk, M. L., & Schur, C. (1998a). Measuring access to care: Improving information for policymakers. Health Affairs, 17, 180-186.
Berk, M. L., & Schur, C. L. (1998b). Access to care: How much difference does Medicaid make? Health Affairs, 17, 169-180.
Bigby, J. (2002). The challenge of eliminating disparities in health [editorial]. Journal of General Internal Medicine, 17, 489-490.
Billings, J., Anderson, G. M., & Newman, L. S. ( 1996). Recent findings on preventable hospitalizations. Health Affairs, 15, 239-49.
Bindman, A. B., & Gold, M. R. (Eds.) (1998). Measuring access to care through population based surveys in a managed care environment [Special issue]. Health Services Research, 33, 611-766.
Bindman, A. B., Grumbach, K., Osmond, D., Komaromy, M., Vranzian, K., Lurie, N. et al. (1995). Preventable hospitilizations and access to health care. Journal of the American Medical Association, 274, 305-311.
Bindman, A. B., Grumbach, K., Osmond, D., Vranizan, K., & Stewart, A. L. (1996). Primary care and receipt of preventive services. Journal of General Internal Medicine, 11, 269-276.
Blendon, R. J., Benson, J., Donelan, K., Leitman, R., Taylor, H., Koeck, C. et al. (1995).
257
Who has the best health care system? A second look. Health Affairs, 14, 220-30.
Blendon, R. J., Schoen, C., DesRoches, C. M., Osborn, R., Scoles, K. L., & Zapert, K. (2002). Inequities in health care: a five-country survey. Health Affairs, 21, 182-91.
Blendon, R. J., Schoen, C., DesRoches, C., Osborn, R., & Zapert, K. (2003). Common concerns amid diverse systems: Health care experiences in five countries. Health Affairs, 22, 106-21.
Bradley, E. H., McGraw, S. A., Curry, L., Buckser, A., King, K. L., Kasl, S. V. et al. (2002). Expanding the Andersen Model: The role of psychosocial factors in long-term care use. Health Services Research, 37, 1221-1242.
Brown, J. R. (1996). The I in science: Training to utilize subjectivity in research. Oslo, Norway: Scandinavian University Press.
Canadian Institute for Health Information. (2006). Supply, distribution and migration of Canadian physicians, 2005. Ottawa, Ontario: Author.
Canadian Institute for Health Information. (n.d.). Number of hospitals and number of hospital beds, by province, territory and Canada, 1999-2000 to 2003-2004 & preliminary 2004-2005. Canadian MIS Database [Database]. Retrieved February 10, 2007, from http://qstat.cihi.ca/discoverer4i/viewer?ac=qpublic1~40cihidb04.cihi.ca&eul=QSEUL&nlsl=en-ca&_po=10000011101111111111011&wbk=CMDB1&pw=cihiqs
Chappell, N. L. (1994). Home care research: What does it tell us? The Gerontologist, 34, 116-120.
Charmaz, K. (2000). Constructivist and objectivist grounded theory. In N. K. Denzin & Y. Lincoln (Eds.), Handbook of Qualitative Research (2nd edition, pp. 509-535). Thousand Oaks, CA: Sage.
Charmaz, K. (2006). Constructing grounded theory: A practical guide through qualitative analysis. Thousand Oaks, CA: Sage.
Chenail, R. J. (95). Presenting qualitative data. The Qualitative Report, 2(3). Retrieved December 5, 2006, from http://www.nova.edu/ssss/QR/QR2-3/presenting.html
Clancy, C. M., & Stryer, D. B. (2001). Racial and ethnic disparities and primary care experience [editorial]. Health Services Research, 36, 979-986.
Clausen, J., & Yarrow, M. (1955). Pathways to the mental hospital. Journal of Social Issues, 11, 25-32.
Collins, K. S., Hughes, D. L., Doty, M. M., Ives, B. L., Edwards, J. N., & Tenney, K. (2002). Diverse communities, common concerns: Assessing health care quality for minority Americans. New York, NY: The Commonwealth Fund.
258
Commission on the Future of Health Care in Canada (2002a). Building on Values: The Future of Health Care in Canada--Final Report. Ottawa, ON: Author.
Commission on the Future Health Care in Canada (2002b). Discussion paper: Access to healthcare in Canada. Ottawa, ON: Author.
Constas, M. A. (1992). Qualitative analysis as public event: The documentation of category development procedures. American Educational Research Journal, 29, 253-266.
Cook, T. D., & Campbell, D. T. (1979). Quasi-experimentation: Design and analysis issues for field settings. Boston, MA: Houghton Mifflin Company.
Cooper, L. A., Beach, M. C., Johnson, R. L., & Inui, T. S. (2006). Delving below the surface. Understanding how race and ethnicity influence relationships in health care. Journal of General Internal Medicine, 21 Suppl 1, S21-7.
Corbie-Smith, G., Flagg, E. W., Doyle, J. P., & O'Brien, M. A. (2002). Influence of usual source of care on differences by race/ethnicity in receipt of preventive services. Journal of General Internal Medicine, 17, 458-464.
Corbin, J. M., & Strauss, A. (1988). Unending work and care: Managing chronic illness at home. San Francisco, CA: Jossey-Bass.
Cunningham, P. J., & Kemper, P. (1998). Ability to obtain medical care for the uninsured: How much does it vary across communities. The Journal of the American Medical Association, 280, 921-927.
Cutcliffe, J. R., & McKenna, H. P. (2002). When do we know what we know? Considering the truth of research findings and the craft of qualitative research. International Journal of Nursing Studies, 39, 611-618.
Davis, K. (1991). Inequality and access to health care. Milbank Quarterly, 69, 253-273.
Davis, K., Schoen, C., Doty, M., & Tenney, K. (2002). Medicare versus private insurance: Rhetoric and reality. Health Affairs, October, Web Exclusive, W311-W324.
Denzin, N. K. (1978). Sociological methods. New York: McGraw-Hill.
DeVoe, J. E., Fryer, G. E., Phillips, R., & Green, L. (2003). Receipt of preventive care among adults: Insurance status and usual source of care. American Journal of Public Health, 93, 786-791.
Dey, I. (1999). Grounding grounded theory: Guidelines for qualitative inquiry. San Diego, CA: Academic Press.
Dietrich, A. J., & Marton, K. I. (1982). Does continuous care from a physician make a difference? Journal of Family Practice, 15, 929.
259
Doescher, M. P., Saver, B. G., Fiscella, K., & Franks, P. (2001). Racial/ethnic inequities in continuity and site of care: Location, location, location. Health Services Research, 36, 78-89.
Donabedian, A. (1966). Evaluating the quality of medical care. Milbank Memorial Fund Quarterly, 44, 166-203.
Donabedian, A. (1973). Aspects of medical care administration: Specifying requirements for health care. Cambridge, MA: Harvard University Press.
Donelan, K., Blendon, R. J., Benson, J., Leitman, R., & Taylor, H. (1996). All payer, single payer, managed care, no payer: Patients' perspectives in three nations. Health Affairs, 15, 254-65.
Donelan, K., Blendon, R. J., Schoen, C., Binns Katherine. , Osborn, R., & Davis, K. (2000). The elderly in five nations: The importance of universal coverage. Health Affairs, 19, 226-35.
Donelan, K., Blendon, R. J., Schoen, C., Davis, K., & Binns, K. (1999). The cost of health system change: Public discontent in five nations. Health Affairs, 18, 206-16.
Eberhardt, M. S., Ingram, D. D., Makuc, D. M., Pamuk, E. R., Freid, V. M., Harper, S. B. et al. (2001). Urban and rural chartbook. Health, United States, 2001. Hyattsville, MD: National Center for Health Statistics.
Economic Research Service. (2004). 2004 ERS County Typology Codes. Version updated August 26, 2004. Retrieved February 10, 2007, from http://www.ers.usda.gov/Data/ TypologyCodes/2004/all_final_codes.xls
Eden, J. (1998). Measuring access to care through population-based surveys: Where are we now? Health Services Research, 33, 685-707.
Enterline, P. E., Salter, V., McDonald, A. D., & McDonald, C. J. (1973). The distribution of medical services before and after "free" medical care: The Quebec experience. The New England Journal of Medicine, 289, 1174-1178.
Ettner, S. (1999). The relationship between continuity of care and the health behaviors of patients: Does having a usual source of care make a difference? Medical Care, 37, 547-555.
Fadiman, A (1997). The spirit catches you and you fall down: A Hmong child, her American doctors, and the collision of two cultures. Farrar, Strauss and Giroux, New York, NY.
Farmer, M., & Ferraro, K. (2004). Are racial disparities in health conditional on
socioeconomic status? Social Science & Medicine, 60, 191-204.
Feinberg, E., Swartz, K., Zaslavsky, A., Gardner, J., & Walker, D. K. (2002). Family income
260
and the impact of a children's healht insurance program on reported need for health services and unmet health need. Pediatrics, 109, 29-38.
Fennell, M. L. (2005). Racial disparities in care: looking beyond the clinical encounter [editorial]. Health Services Research, 40, 1713-1721.
Finkelstein, M. M. (2001). Do factors other than need determine utilization of physicians' services in Ontario? Canadian Medical Association Journal, 165, 565-570.
Finlay, L. (2002). "Outing" the researcher: The provenance, process, and practice of reflexivity. Qualitative Health Research, 12, 531-545.
Fiscella, K., Franks, P., Doescher, M. P., & Saver, B. G. (2002). Disparities in health care by race, ethnicity, and language among the insured. Medical Care, 40, 52-59.
Freeman, H. E., Blendon, R. J., Aiken, L. H., Sudman, S., Mullinix, C. F., & Corey, C. R. (1987). Americans report on their access to health care. Health Affairs, 6, 6-8.
Frenk, J. (1992). The concept and measurement of accessibility. In K. L. White, J. Frenk, C. Ordonez, J. M. Paganini & B. Starfield (Eds.), Health services research: an anthology (pp. 842-855). Washington, DC: Pan American Health Organization. (Original work published 1985).
Frenk, J. (1998). Medical care and health improvement. Annals of Internal Medicine, 129, 419-420.
Gaskin, D. J., & Hoffman, C. (2000). Racial and ethnic differences in preventable hospitalizations across 10 states. Medical Care Research and Review, 57, 85-107.
Geertz, C. (1973). The Interpretation of Cultures. New York: Basic Books.
Gelberg, L., Andersen, R. M., & Leake, B. D. (2000). The Behavioral Model for Vulnerable Populations: Application to medical care use and outcomes for homeless people. Health Services Research, 34, 1273-1302.
Giacomini, M., & Goldsmith, L. J. (1996). Case study methodology for studying financial incentives in context. Hamilton, ON: McMaster University, Centre for Health Economics and Policy Analysis.
Giacomini, M., Abelson, J., Goldsmith, L. J., & Garland, L. S. (1998). Community interservice team (CIT): Experiences of CIT providers and clients of home care. Hamilton, ON: McMaster University, Centre for Health Economics and Policy Analysis.
Giacomini, M., Hurley, J., Lomas, J., Bhatia, V., & Goldsmith, L. J. (1996). The many meanings of money: A health policy analysis framework for understanding financial incentives. Hamilton, ON: McMaster University, Centre for Health Economics and Policy Analysis.
261
Gilbert, G. H., Branch, L. G., & Longmate, J. (1993). Dental care use by U.S. veterans eligible for VA care. Social Science & Medicine, 36, 361-370.
Gilbert, G., Branch, L., & Orav, J. (1990). Predictors of older adults' longitudinal dental care use: Ten year results. Medical Care, 28, 1165-1180.
Glaser, B. G. (1978). Theoretical sensitivity: Advances in the methodology of grounded theory. Mill Valley, CA: Sociology Press.
Glaser, B. G. (1992). Basics of grounded theory analysis: Emergence vs. forcing. Mill Valley, CA: Sociology Press.
Glaser, B. G., & Strauss, A. L. (1967). The discovery of grounded theory: Strategies for qualitative research. New York: Aldine De Gruyter.
Goins, R. T., Williams, K. A., Carter, M. W., Spencer, M., & Solovieva, T. (2005). Perceived barriers to health care access among rural older adults: A qualitative study. Journal of Rural Health, 21, 206-13.
Gold, M. (1998). Beyond coverage and supply: Measuring access to healthcare in today's market. Health Services Research, 33, 625-652.
Goldman, D. P., & McGlynn, E. A. (2005). U.S. health care: Facts about cost, access, and quality. Santa Monica, CA: RAND Corporation.
Goldsmith, L. J. (1997). Sample size determination in qualitative research. Unpublished master's thesis, McMaster University, Hamilton, Ontario, Canada.
Goldsmith, L. J., & Ricketts, T. C. (1999). Proposed changes to designations of medically underserved populations and health professional shortage areas: Effects on rural areas. Journal of Rural Health, 15, 44-54.
Greene, J., & Yedidia, M. J. (2005). Provider behaviors contributing to patient self-management of chronic illness among underserved populations. Journal of Health Care for the Poor and Underserved, 16, 808-824.
Grootendorst, P., Goldsmith, L. J., Hurley, J., O'Brien, B., & Dolovich, L. (1996). Financial incentives to dispense low cost drugs: A case study of British Columbia Pharmacare. Hamilton, ON: McMaster University, Centre for Health Economics and Policy Analysis.
Gross, P. F. (1972). Urban health disorders, spatial analysis, and the economics of health facility location. International Journal of Health Services, 2, 63-84.
Guendelman, S. (1991). Health care users residing on the Mexican border: What factors determine choice of the U.S. or Mexican health care system? Medical Care, 29, 419-429.
262
Gulzar, L. (1999). Access to health care. Image - the Journal of Nursing Scholarship, 31, 13-9.
Haas, J. S., Phillips, K. A., Sonneborn, D., McCulloch, C. E., Baker, L. C., Kapln, C. P. et al. (2004). Variation in access to health care for different racial/ethnic groups by the racial/ethnic composition of an individual's county of residence. Medical Care, 42, 707-714.
Hadley, J. (2007). Insurance coverage, medical care use, and short-term health changes following an unintentional injury or the onset of a chronic condition. Journal of the American Medical Association, 297, 1073-1084.
Hargraves, J. L., & Hadley, J. (2003). The contribution of insurance coverage and community resources to reducing racial/ethnic disparities in access to care. Health Services Research, 38, 809-829.
Harrison, J., MacGibbon, L., & Morton, M. (2001). Regimes of trustworthiness in qualitative research: the rigors of reciprocity. Qualitative Inquiry, 7, 323-345.
Hayward, R. A., Bernard, A. M., Freeman, H. E., & Corey, C. R. (1991). Regular source of ambulatory care and access to health services. American Journal of Public Health, 81, 434.
Health Council of Canada (2005). Health care renewal in Canada: accelerating change. Toronto, Ontario, Canada: Health Council of Canada.
Heath, H., & Cowley, S. (2004). Developing a grounded theory approach: A comparison of Glaser and Strauss. International Journal of Nursing Studies, 41, 141-150.
Hendryx, M. S., Ahern, M. M., Lovrich, N. P., & McCurdy, A. H. (2002). Access to health care and community social captial. Health Services Research, 37, 87-103.
Himmelstein, D. U., & Woolhandler, S. (1995). Care denied: US residents who are unable to obtain needed medical services. American Journal of Public Health, 85, 341-344.
Hollway, G., MacLeod, B., Newbery, S., Orrantia, E., Wilson, M., & Wilson, S. (1999, November 9). Doctors disheartened by critics of practice style [Letter to the editor]. The Marathon Mercury, p. 6.
Houle, L. G., Salmoni, A. W., Pong, R. W., Laflamme, S., & Viverais-Dresler, G. A. (2001). Predictors of family physician use among older residents of Ontario and an analysis of the Andersen-Newman Behavior Model. Canadian Journal on Aging, 20, 233-249.
Hsu, J., Reed, M., Brand, R., Fireman, B., Newhouse, J. P., & Selby, J. V. (2004). Cost sharing: patient knowledge and effects on seeking emergency department care. Medical Care, 42, 290-296.
Hurley, J., Lomas, J., & Goldsmith, L. J. (1997). Physician responses to global physician
263
expenditure budgets: A common property perspective. Milbank Quarterly, 75, 343-364.
Hurley, R. E., Freund, D. A., & Gage, B. J. (1991). Gatekeeper effects on patterns of physician use. Journal of Family Practice, 32, 167.
Institute of Medicine (2001). Coverage matters: Insurance and health care. Washington, DC: National Academy PresS.
Institute of Medicine (2002). Care without coverage: Too little, too late. Washington, DC: National Academy Press.
Joseph, A. E., & Phillips, D. R. (1984). Accessibility and utilization: Geographical perspectives on health care delivery. New York: Harper & Row Publishers.
Kalet A., Pugnaire, M. P., Cole-Kelly, K., Janick, R., Ferrara, E., Schwartz, M. D. et al. (2004). Teaching communication in clinical clerkships: Models from the Macy Initiative in Health Communications. Academic Medicine, 79, 511-520.
Kasper, J. D. (1998). Asking about access: challenges for surveys in a changing healthcare environment. Health Services Research, 33, 715-740.
Kasper, J. D., Giovannini, T. A., & Hoffman, C. (2000). Gaining and losing health insurance: Strengthening the evidence for effects on access to care and health outcomes. Medical Care Research and Review, 57, 298-318.
Katz, S. J., & Hofer, T. P. (1994). Socioeconomic disparities in preventive care persist despite universal coverage: Breast and cervical cancer screeeings in Ontario and the United States. Journal of the American Medical Association, 272, 530-534.
Katz, S. J., Hofer, T. P., & Manning, W. G. (1996). Hospital utilization in Ontario and the United States: The impact of socioeconomic status and health status. Canadian Journal of Public Health. Revue Canadienne De Sante Publique, 87, 253-6.
Katz, S. J., Hofer, T. P., & Manning, W. G. (1996). Physician use in Ontario and the United States: The impact of socioeconomic status and health status. American Journal of Public Health, 86, 520-524.
Katz, S. J., Zemencuk, J. K., & Hofer, T. P. (2000). Breast cancer screening in the United States and Canada, 1994: Socioeconomic gradients persist. American Journal of Public Health, 90, 799-803.
Keddy, B., Sims, S. L., & Stern, P. N. (1996). Grounded theory as feminist research methodology. Journal of Advanced Nursing, 23, 448-453.
Kelley, M. A., Perloff, J. D., Morris, N. M., & Lie Wangyue (1992). Primary care arrangements and access to care among African American women in three Chicago communities. Women and Health, 18, 91-106.
264
Khan, A. A., & Bhardwaj, S. M. (1994). Access to health care: A conceptual framework and its relevance to health care planning. Evaluation and the Health Professions, 17, 60-76.
Kirby, J. B., Taliaferro, G., & Zuvekas, S. H. ( 2006). Explaining racial and ethnic disparities in health care. Medical Care, 44, I64-I72.
Koch, T. (2004). Commentary: Expert researchers and audit trails. Journal of Advanced Nursing, 45, 126-135.
Kronenfeld, J. J. (1978). Provider variables and the utilization of ambulatory care services. Journal of Health and Social Behavior, 19, 68-76.
Kronenfeld, J. J. (1980). Sources of ambulatory care and utilization models. Health Services Research, 15, 3-20.
Kruzikas, D. T., Jiang, H. J., Remus, D., Barrett, M. L., Coffey, R. M., & Andrews, R. (2004). Preventable hospitazations: A window into primary and preventive care, 2000 (HCUP Fact Book No. 5, AHRQ Publication No. 04-0056). Rockville, MD: Agency for Healthcare Research and Quality.
Kuhn, T. S. (1962). The structure of scientific revolutions. Chicago, IL: University of Chicago Press.
Kurz, R., Haddock, C., VanWinkle, D., & Wang, G. (1991). The effects of hearing impairment on health services utilization. Medical Care, 29, 878-889.
Lambrew, J. M., DeFriese, G. H., Carey, T., Ricketts, T. C., & Biddle, A. K. (1996). The effects of having a regular doctor on access to primary care. Medical Care, 34, 138-151.
Lewin, M. E., & Altman, S. editors. (2000). America's health care safety net: Intact but endangered. Washington, DC: National Academy Press.
Lincoln, Y. S., & Guba, E. G. (1985). Naturalistic inquiry. Newbury Park, CA: Sage.
Lohr, K. N., Brook, R. H., & Kamberg, C. J. (1986). Use of medical care in the RAND HIE: diagnosis- and service-specific analyses in a randomized controlled trial. Medical Care, 24, S1-S87.
Lomas, J., Enkin, M., Anderson, G. M., Hannah, W. J., Vayda, E., & Singer, J. (1991). Opinion leaders vs audit and feedback to implement practice guidelines. Delivery after previous cesarean section. JAMA, 265, 2202-2207.
Long, S. K., Coughlin, T., & King, J. (2005). How well does Medicaid work in improving access to care? Health Services Research, 40, 39-58.
Lurie, N. W. N. B., Shaprio, M. F., Gallego, C., Vaghaiwalla, R., & Brook, R. H. (1986).
265
Termination of Medi-Cal benefits: A follow-up study one year later. New England Journal of Medicine, 314, 1266-1268.
Lurie, N., Ward, N. B., Shapiro, M. F., & Brook, R. H. (1984). Termination from Medi-Cal -- does it affects health? New England Journal of Medicine, 311, 480-484.
Mayberry, R. M., Mili, F., & Ofili, E. (2000). Racial and ethnic differences in access to medical care. Medical Care Research & Review, 57 Suppl 1, 108-145.
McWilliams, J. M., Zaslavsky, A. M., Meara, E., & Ayanian, J. Z. (2003). Impact of Medicare coverage on basic clinical services for previously uninsured adults. Journal of the American Medical Association, 290, 757-764.
Mechanic, D. (1979). Correlates of physician utilization: Why do major multivariate studies of physician utilization find trivial psychosocial and organizational effects? Journal of Health and Social Behavior, 20, 387-396.
Melia, K. M. (1996). Rediscovering Glaser. Qualitative Health Research, 6, 368-378.
Merriam-Webster. (2003). Merriam-Webster's Collegiate Dictionary (11th ed.). Springfield, MA: Author.
Millman, M. (1993). Access to health care in America. Washington, DC: National Academy Press.
Mofidi, M., Rozier, G., & King, R. S. (2002). Problems with access to dental care for Medicaid-insured children: What caregivers think. American Journal of Public Health, 92, 53-58.
Mooney, G., Hall, J., Donaldson, C., & Gerard, K. (1991). Utilisation as a measure of equity: Weighing heat? Journal of Health Economics, 10, 475-80.
Morse, J. (1994). Designing funded qualitative research. In N. K. Denzin & Y. S. Lincoln (Eds.), Handbook of Qualitative Research (pp. 220-235). Thousand Oaks, CA: Sage.
Morse, J. M., Barrett, M., Mayan, M., Olson, K., & Spiers, J. (2002). Verification strategies for establishing reliability and validity in qualitative research. International Journal of Qualitative Methods, 1(2), Article 2. Retrieved December 5, 2006, from http://www.ualberta.ca/~ijqm
Mueller, K. J., Patil, K., & Boilson, E. (1998). The role of uninsurance and race in healthcare utilization by rural minorities. Health Services Research, 33, 597-610.
Newhouse, J. P. (1993). Free for all? Lessons from the RAND health insurance experiment. Cambridge, MA: Harvard University Press.
Nichol, M., McCombs, J., Johnson, K., Spacapan, S., & Sclar, D. (1930). The effects of consultation on over-the-counter medication purchasing decisions. Medical Care.
266
North Carolina State Center for Health Statistics. (2002a). Table 4: Pregnancy outcome statistics (table). North Carolina health statistics pocket guide 2001. Retrieved February 10, 2007, from http://www.schs.state.nc.us/SCHS/data/pocketguide/2001/ table4.pdf
North Carolina State Center for Health Statistics. (n.d.a). Health status. 2002 BRFSS Survey Results: Nationwide Data [Database]. Version updated July 28, 2003. Retrieved February 10, 2007, from http://www.schs.state.nc.us/SCHS/brfss/2002/us/ genhlth.html
North Carolina State Center for Health Statistics. (n.d.b). Health care access: What is the main reason you did not get medical care?. 2002 BRFSS Survey Results: Nationwide Data [Database]. Version updated July 28, 2003. Retrieved February 10, 2007, from http://www.schs.state.nc.us/SCHS/brfss/2002/us/medreas.html
North Carolina State Center for Health Statistics. (n.d.b). Health status. 2002 BRFSS Survey Results: North Carolina [Database]. Version updated July 28, 2003. Retrieved February 10, 2007, from http://www.schs.state.nc.us/SCHS/brfss/2002/nc/all/ genhlth.html
Organisation for Economic Co-Operation and Development (2004). The OECD Health Project: Towards high-performing health systems. Paris, France: OECD, Organisation for Economic Co-Operation and Development.
Otiquam, S. (1999, October 26). Marathon medical service: Is it really improved? [Letter to the editor]. The Marathon Mercury, p. 8.
Pandhi, N., & Saultz, J. W. (2006). Patients' perceptions of interpersonal continuity of care. Journal of the American Board of Family Medicine, 19, 390-397.
Parsons, T. The Social System. (1951). Glencoe, IL: Free Press.
Patrick, D. L., Stein, J., Porta, M., Porter, C. Q., & Ricketts, T. C. (1988). Poverty, health services, and health status in rural America. Milbank Quarterly, 66, 105-136.
Patton, M. Q. (2002). Qualitative research & evaluation methods (3rd edition). Thousand Oaks, CA: Sage.
Penchanksy, R., & Thomas, J. W. (1981). The concept of access: Definition and relationship to consumer satisfaction. Medical Care, 19, 127-140.
Penchansky, R. (1977). The concept of access: A definition. Hyattsville, MD: National Health Planning Information Center.
Pescosolido, B. A. (1991). Illness careers and network ties: a conceptual model of utilization and compliance. In G. Albrecht & J. Levy (Eds.), Advances in Medical Sociology (Vol. 2, pp. 161-184). Greenwich, CT: JAI Press Inc.
267
Pescosolido, B. A. (1992). Beyond rational choice: The social dynamics of how people seek help. American Journal of Sociology, 97, 1096-1138.
Pescosolido, B. A., & Kronenfeld, J. J. (1995). Health, illness, and healing in an uncertain era: Challenges from and for medical sociology. Journal of Health and Social Behavior, Extra Issue, 5-33.
Phillips, K. A., Morrison, K. R., Andersen, R., & Aday, L. A. (1998). Understanding the context of healthcare utilization: Assessing environmental and provider-related variables in the behavioral model of utilization. Health Services Research, 33, 571-596.
Piette, J. D., Heisler, M., & Wagner, T. H. (2004). Cost-related medication underuse among chronically ill adults: The treatments people forgo, how often, and who is at risk. American Journal of Health, 94, 1782-1787.
Poland, B. D. (2002). Transcription quality. In J. F. Gubrium & J. A. Holstein (Eds.), Handbook of interview research: Context & method (pp. 629-649). Thousand Oaks, CA: Sage.
Porter, E. J. (2000). Research on home care utilization: A critical analysis of the preeminent approach. Journal of Aging Studies, 14, 25-38.
Portes, A., Kyle, D., & Eaton, W. W. (1992). Mental illness and help-seeking behavior among Mariel Cuban and Haitian refugees in South Florida. Journal of Health and Social Behavior, 33, 283-298.
Prentice, J. C. (2006). Neighborhood effects on primary care access in Los Angeles. Social Science & Medicine, 62.
Racher, F. E., & Vollman, A. R. (2002). Exploring the dimensions of access to health services: Implications for nursing research and practice. Research and Theory for Nursing Practice: An International Journal, 16, 77-90.
Rector, T. S., & Venus, P. J. (2004). Do drug benefits help Medicare beneficiaries afford prescribed drugs? Health Affairs, 23, 213-222.
Reid, R., Haggerty, J., & McKendry, R. (2002). Defusing the confusion: Concepts and measures of continuity of healthcare.
Reinhardt, U. E., Hussey, P. S., & Anderson, G. F. (2003). Cross-national comparisons of helath systems using OECD data, 1999. Health Affairs, 21 , 169-181.
Rice, T., & Matsukoa, K. Y. (2004). The impact of cost-sharing on appropriate utilization and health status: A review of the literature on seniors. Medical Care Research and Review, 61 , 415-452.
Ricketts, T. C. (2000). The changing nature of rural health care. Annual Review of Public
268
Health, 21, 639-657.
Ricketts, T. C. (Ed.). (1999). Rural health in the United States. New York, NY: Oxford University Press.
Ricketts, T. C., & Savitz, L. A. (1994). Access to health services. In T. C. Ricketts, L. A. Savitz, W. M. Gesler & D. N. Osborne (Eds.), Geographic Methods for Health Services Research Lanham, MD: University Press of America, Inc.
Ricketts, T. C., Goldsmith, L. J., Randolph, R. K., Holmes, G. M., Ostermann, J., Pendergraft, T. et al. (2002). Toward a new designation of underservice: Final report of proposed method, analyses of effects and commentary on related areas. (Prepared for the Department of Health and Human Services, Health Resources and Services Administration, Bureau of Health Professions). Cecil G. Sheps Center for Health Services Research, University of North Carolina at Chapel Hill.
Ricketts, T. C., Randolph, R., Howard, H. A., Pathman, D., & Carey, T. (2001). Hospitalization rates as indicators of access to primary care. Health & Place, 7, 27-38.
Riddell, W. C. (2005). Why is Canada's unemployment rate persistently higher than in the United States? Canadian Public Policy, 31, 93-100.
Robrecht, L. C. (1995). Grounded theory: Evolving methods. Qualitative Health Research, 5, 169-177.
Rosenstock, I. M. (1966). Why people use health services. Milbank Memorial Fund Quarterly, 44, 94-127.
Sandelowski, M. (1994). The use of quotes in qualitative research. Research in Nursing & Health, 17, 479-482.
Sandelowski, M. (1995a). Qualitative analysis: What it is and how to begin. Research in Nursing & Health, 18, 371-375.
Sandelowski, M. (1995b). Sample size in qualitative research. Research in Nursing & Health, 18, 179-183.
Sandelowski, M. (1998a). The call to experts in qualitative research. Research in Nursing & Health, 21, 467-471.
Sandelowski, M. (1998b). Writing a good read: Strategies for re-presenting qualitative data. Research in Nursing & Health, 21, 375-382.
Sanmartin, C., & Ross, N. (2006). Experiencing difficulties accessing first-contact health services in Canada. Healthcare Policy, 1, 103-119.
Sanmartin, C., Houle, C., Berthelot, J.-M., & White, K. (2002). Access to health care
269
services in Canada, 2001(Catalogue no. 82-575-XIE). Ottawa, Ontario: Statistics Canada.
Sanmartin, C., Pierre, F., & Tremblay, S. (2006). Waiting for care in Canada: Findings from the Health Services Access Survey. Healthcare Policy, 2, 43-51.
Saultz, J. W. (2003). Defining and measuring interpersonal continuity of care. Annals of Family Medicine, 1, 134-143.
Saultz, J. W. (2004). Interpersonal continuity of care and patient satisfaction: A critical review. Annals of Family Medicine, 2, 445-451.
Saultz, J. W., & Lochner, J. (2005). Interpersonal continuity of care and care outcomes: A critical review. Annals of Family Medicine, 3, 159-166.
Schatzman, L., & Strauss, A. (1973). Field research. Englewood Cliffs, NJ: Prentice-Hall.
Schoen, C., & Doty, M. M. (2004). Inequities in access to medical care in five countries: Findings from the 2001 Commonwealth Fund International Health Policy Survey. Health Policy, 67, 309-322.
Schoen, C., Davis, K., DesRoches, C., Donelan, K., & Blendon, R. (2000). Health insurance markets and income inequality: Findings from an international health policy survey. Health Policy, 51, 67-85.
Schoen, C., Lyons, B., Rowland, D., Davis, K., & Puleo, E. (1997). Insurance matters for low-income adults: Results from a five-state survey. Health Affairs, 16, 163-171.
Schoen, C., Osborn, R., Huynh, P. T., & Doty, M. Z. K. P. J. D. K. (2005). Taking the pulse of health care systems: Experiences of patients with health problems in six countries. Health Affairs, W5, 509-525.
Schoen, C., Osborn, R., Huynh, P. T., Doty, M., Davis, K., Zapert, K. et al. (2004). Primary care and health system performance: Adults' experiences in five countries. Health Affairs, W4, 487-503.
Schur, C. L., & Franco, S. J. (1999). Access to health care. In T. C. Ricketts (Ed.), Rural Health in the United States (pp. 25-37). New York, NY: Oxford University Press.
Seid, M., & Stevens, G. D. (2005). Access to care and children's primary care experiences: Results from a prospective cohort study. Health Serv Res, 40, 1758-80.
Sered, S. S., & Fernandopulle, R. (2005). Uninsured in America: Life and death in the land of opportunity. Berkeley, CA: University of California Press.
Shapiro, M. F., Ware, J. E. Jr., & Sherbourne, C. D. (1986). Effects of cost sharing on seeking care for serious and minor symptoms: Results of a randomized controlled trial. Annals of Internal Medicine, 104, 246-251.
270
Shi, L. (1999). Experience of primary care by racial and ethnic groups in the United States. Medical Care, 37, 1068-1077.
Shi, L. (2000). Type of health insurance and the quality of primary care experience. American Journal of Public Health, 90, 1848-1855.
Shi, L. (2001). The convergence of vulnerable characteristics and health insurance in the US. Social Science & Medicine, 53, 519-529.
Shi, L., Forrest, C. B., Von Schrader, S., & Ng, J. (2003). Vulnerability and the patient-practitioner relationship: The roles of gatekeeping and primary care performance. American Journal of Public Health, 93, 138-44.
Shirk, M. S., Trost, C., & Schultz, S. (2000). In their own words: The uninsured talk about living without health insurance. Washington, DC: The Kaiser Commission on Medicaid and the Uninsured.
Shortell S. M., Wickizer, T. M., & Wheeler, J. R. C. (1984). Hospital-sponsored primary care: I. Organizational and financial effects. American Journal of Public Health, 74, 784-791.
Skodol Wilson, H., & Ambler Hutchinson, S. (1996). Methodologic mistakes in grounded theory. Nursing Research, 45, 122-124.
Slifkin, R. T. (2002). Developing policies responsive to barriers to health care among rural residents: What do we need to know? Journal of Rural Health, Supplemental, 233-241.
Slifkin, R., Goldsmith, L. J., & Ricketts, T. C. (2000). Race and place: Urban-rural differences in health for racial and ethnic minorities (Working Paper 66). North Carolina Rural Health Research Program, Cecil G. Sheps Center for Health Services Research, University of North Carolina at Chapel Hill.
Smedley, B. D., Stith, A. Y., & Nelson, A. R. (2002). Unequal treatment: Confronting racial and ethic disparities in health care. Washington, DC: National Academy Press.
Sobo, E. J., Seid, M., & Gelhard, L. R. (2006). Parent-identified barriers to pediatric health care: A process-oriented model. Health Services Research, 41, 148-172.
Solanki, G., & Schauffler, H. H. (1999). Cost-sharing and the utilization of clinical preventive services. American Journal of Preventive Medicine, 17, 127-133.
Sox, C. M., Swartz, K., Burstin, H. R., & Brennan, T. A. (1998). Insurance or a regular physician: Which is the most powerful predictor of health care? American Journal of Public Health, 88, 363-370.
Starfield, B. (1992). Primary care: Concept, evaluation, and policy. New York, NY: Oxford University Press.
271
Statistics Canada. (2002a). Self-rated health, by sex, household population aged 12 and over, Canada, provinces, territories, health regions and peer groups, 2000/01 (table). Health indicators, 2002(1). Statistics Canada Catalogue no. 82-221-XIE. Retrieved February 9, 2007b, from http://www.statcan.ca/english/freepub/82-221-XIE/2005002/tables/ html/1116.htm
Statistics Canada. (2002b). 2001 Community Profiles. Version updated November 30, 2005. Retrieved February 10, 2007, from http://www12.statcan.ca/english/profil01/CP01/ Index.cfm?Lang=E
Statistics Canada. (2004). Low income cutoffs from 1994 to 2003 and low income measures from 1992 to 2001. Catalogue no. 75F0002MIE2004002. Retrieved February 10, 2007, from http://www.statcan.ca/english/research/75F0002MIE/ 75F0002MIE2004002.pdf
Statistics Canada. (n.d.a). Table 102-0207: Infant mortality, by sex, three-year average, Canada, provinces, territories, health regions and peer groups, occasional. CANSIM [Database]. Version updated March 22, 2006. Retrieved February 10, 2007, from http://cansim2.statcan.ca/cgi-win/CNSMCGI.EXE?&Lang=E&ArrayId=102-0207&Array_Pick=1&Detail=1&ResultTemplate=CII/CII___&RootDir=CII/ &TblDetail=1&C2SUB=HEALTH
Statistics Canada. (n.d.b). Table 102-4203 Low birth weight babies (less than 2,500 grams), by sex, three-year average, Canada, provinces, territories, health regions and peer groups, occasional. CANSIM [Database]. Version updated March 22, 2006. Retrieved February 10, 2007, from http://cansim2.statcan.ca/cgi-win/ CNSMCGI.EXE?&Lang=E&ArrayId=102-4203&Array_Pick=1&Detail=1& ResultTemplate=CII/CII___&RootDir=CII/&TblDetail=1&C2SUB=HEALTH
Stewart, M., Fast, J., Letourneau, N., Love, R. L., Raine, K., Raphael, D. et al. (2001). Low-income consumers' perspectives on determinants of health services use.
Strauss, A. (1970). Discovering new theory from previous theory. In T. Shibutani (editor), Human nature and collective theory (pp. 46-53). Englewood Cliffs, NJ: Prentice-Hall Publishing Co.
Strauss, A. L. (1987). Qualitative analysis for social scientists. New York, NY: Cambridge University Press.
Strauss, A., & Corbin, J. (1990). Basics of qualitative research: Grounded theory procedures and techniques. Newbury Park, CA: Sage.
Strauss, A., & Corbin, J. (1998). Basics of qualitative research: Techniques and procedures for developing grounded theory (2nd edition). Thousand Oaks, CA: Sage.
Stuart, B., & Zacker, C. (1999). Who bears the burden of Medicaid drug copayment policies? Health Affairs, 18, 201-212.
272
Suchman, E. (1972). Social patterns of illness and medical care. In E. G. Jaco (Ed.), Patients, physicians and illness (pp. 262-279). New York, NY: Free Press.
Sudano, J. J., & Baker, D. W. (2003). Intermittent lack of health insurance coverage and use of preventive services. American Journal of Public Health, 93, 130-137.
Sullivan, I. (1999, November 2). WMGH chairman says all patient concerns addressed [Letter to the editor]. The Marathon Mercury, p. 6.
Taira, D. A., Safran, D. G., Seto, T. B., Rogers, W. H., Inui, T. S., Montgomery, J. et al. (2001). Do patient assessments of primary care differ by patient ethnicity? Health Services Research, 36, 1059-71.
Tamblyn, R., Laprise, R., Hanley, J. A., Abrahamowicz, M., Scott, S., Mayo, N. et al. (2001). Adverse events associated with prescription drug cost-sharing among poor and elderly persons. Journal of the American Medical Association, 285, 421-429.
Tanahashi, T. (1978). Health services coverage and evaluation. Bulletin of the World Health Organization, 56, 295-303.
The family physicians of Marathon Family Practice. (1999, November 9). An open letter to our patients and community from the Marathon Family Practice [Letter to the editor]. The Marathon Mercury, p. 8.
Thomas, J. W., & Penchansky, R. (1984). Relating satisfaction with access to utilization of services. Medical Care, 22, 553-568.
Thorne, S. E., Kuo, M., Armstrong, E. A., McPherson, G., Harris, S. R., & Hislop, T. G. (2005). 'Being known': Patients' perspectives of the dynamics of human connection in cancer care. Psycho-Oncology, 14, 887-898.
Tseng, C., Brook, R. H., Keeler, E., Steers, W. N., & Mangione, C. M. (2004). Cost-lowering strategies used by Medicare beneficiaries who exceed drug benefit caps and have a gap in drug coverage. Journal of the American Medical Association, 292, 952-960.
Tu, J. V., Pinfold, S. P., McColgan, P., & Laupacis, A. (2005). Access to health services in Ontario. Toronto, ON: Institute for Clinical Evaluative Sciences.
Tukey, J. W. (1962). The future of data analysis. Annals of Mathematical Statistics, 33, 1-67. U.S. Census Bureau. (2003a). Table 4: Percent of people without health insurance coverage
for the entire year by state (3-year average): 2000 to 2002 (table). Health insurance coverage in the United States: 2002. Current Population Reports #P60-223. Retrieved February 10, 2007, from http://www.census.gov/prod/2003pubs/p60-223.pdf
U.S. Census Bureau. (2003b). Table H105: Health insurance coverage status and type of coverage by state and age for all people: 2002 (table). Health insurance coverage: 2002. Current Population Survey, 2003 Annual Social and Economic Supplement
273
[Database]. Version updated July 14, 2004. Retrieved February 10, 2007, from http://pubdb3.census.gov/macro/032003/health/h05_000.htm
U.S. Census Bureau. (n.d.a). Bayboro town, North Carolina (table). United States Census 2000 demographic profiles. Retrieved February 10, 2007, from http://censtats.census. gov/data/NC/1603703960.pdf
U.S. Census Bureau. (n.d.b). North Carolina (table). United States Census 2000 demographic profiles. Retrieved February 10, 2007, from http://censtats.census.gov/data/NC/ 04037.pdf
U.S. Census Bureau. (n.d.c). Pamlico County, North Carolina (table). United States Census 2000 demographic profiles. Retrieved February 10, 2007, from http://censtats.census. gov/data/NC/05037137.pdf
U.S. Census Bureau. (n.d.d). Pembroke town, North Carolina (table). United States Census 2000 demographic profiles. Retrieved February 10, 2007, from http://censtats.census. gov/data/NC/1603751080.pdf
U.S. Census Bureau. (n.d.e). Robeson County, North Carolina (table). United States Census 2000 demographic profiles. Retrieved February 10, 2007, from http://censtats.census. gov/data/NC/05037155.pdf
U.S. Census Bureau. (n.d.f). Small area health insurance estimates by county, 2000. Version updated July 21, 2005. Retrieved February 10, 2007, from http://www.census.gov/ hhes/www/sahie/data.html
U.S. Congress, Office of Technology Assessment. (1992). Does health insurance make a difference?Background paper (OTA-BP-H-99). Washington, DC: US Government Printing Office.
U.S. Congress. House. (1976). A Discursive Dictionary of Health Care. Washington, DC: US Government Printing Office.
van Ryn, M. (2002). Research on the provider contribution to race/ethnicity disparities in medical care. Medical Care, 40, I140-I151.
Wagner, E. H., Austin, B. T., Davis, C., Hindmarsh, M., Schafer, J., & Bonomi, A. (2001). Improving chronic illness care: Translating evidence into action. Health Affairs, 20, 64-78.
Walker L, Avant K (1995). Strategies for theory construction in nursing, 3rd edition. Appleton & Lange, Norwalk, CT.
Weinick, R. M., Zuvekas, S. H., & Cohen, J. W. ( 2000). Racial and ethnic differences in
access to and use of health care services, 1977 to 1996. Mecial Care Research and Review, 57, 36-54.
274
Weiss, G. L., & Ramsey, C. A. (1989). Regular source of primary medical care and patient satisfaction. Quality Review Bulletin, 15, 180-184.
Weissman, J. S., & Epstein, A. M. (1993). The insurance gap: Does it make a difference?. Annual Review of Public Health, 14, 243-270.
Weitzman, E. A. (2003). Software and qualitative research. In N. K. Denzin & Y. S. Lincoln (Eds.), Collecting and interpreting qualitative materials (2nd edition, pp. 310-339). Thousand Oaks, CA: Sage.
Wennberg, J. E., & Cooper, M. M. (Eds.). (1996). The Dartmouth atlas of health care. Chicago, IL: American Hospital Publishing.
Wennberg, J., & Gittelsohn, A. (1973). Small area variations in health care delivery. Science, 182, 1102-1108.
Williams, C. (2002). From coverage to care: Exploring links between health insurance, a usual source of care, and access (The Synthesis Project: Research synthesis, Report 1). Princeton, NJ: The Robert Wood Johnson Foundation.
Wolinsky, F. D., & Johnson, R. J. (1991). The use of health services by older adults. Journal of Gerontology, 46, S345-S357.
Wong, M. D., Andersen, R., Sherbourne, C. D., Hays, R. D., & Shaprio, M. F. (2001). Effects of cost sharing on care seeking and health status: Results from the Medical Outcomes study. American Journal of Public Health, 91, 1889-1894.
Wright, B. J., Carlson, M. J., Edlund, T., DeVoe, J., Gallia, C., & Smith, J. (2005). The impact of increased cost sharing on Medicaid enrollees. Health Affairs, 24, 1106-1116.
Zambrana, R. E. (1987). A research agenda on issues affecting poor and minority women: A model for understanding their health needs. Women and Health, 12, 137-160.
Zola, I. (1973). Pathways to the doctor: From person to patient. Social Science & Medicine, 7, 677-689.
Zuvekas, S. H., & Taliaferro, G. S. (2003). Pathways to access: Health insurance, the health care delivery system, and racial/ethnic disparities. Health Affairs, 22, 139-153.
Zuvekas, S. H., & Weinick, R. M. (1999). Changes in access to care, 1977-1996: The role of health insurance. Health Services Research, Part II, 271-279.


