Embed Size (px)
Citation preview

1st SPWLA India Regional Conference, March 19-20, 2007
1 Paper presented at SPWLA India Symposium held in Mumbai, March 19-20, 2007 2 Chevron Energy Technology Co., San Ramon, CA 94583, USA; 3 Chevron Energy Technology Co., Houston, TX 77002, USA
Accuracy of Porosity Measured in High-angle and Horizontal Wells: An Overview1
Ahmed Badruzzaman,2 Ed Stockhausen3 and Barry Reik2
Copyright 2007, held jointly by the Society of Petrophysicists and Well Log Analysts (SPWLA) and the submitting authors.
This paper was prepared for presentation at the SPWLA Conference held in Mumbai, India, March 19-20, 2007.
ABSTRACT
Issues related to significant differences observed between porosity and density predicted in high-angle/horizontal wells and those predicted in vertical wells are explored, especially in the presence of thin beds. Related field data are discussed and tool response simulation studies performed to understand these differences are surveyed. Hole-angle and tool azimuth appear to have a significant effect on the accuracy of density and porosity in the presence of thin beds. The bed resolution is predicated by the spatial extent of the response sensitivity. Thus, as the hole-angle increases, beds are better resolved. This follows from theoretical considerations and appears to be confirmed by log data and numerical modeling studies. Enhancement procedures, developed to resolve thin beds better in vertical wells , do not appear to add value as the hole-angle increases and can even add to errors. Artifacts such as the variable standoff that arises in logging-while -drilling, asymmetric invasion profiles in HA/HZ wells, certain muds affecting the properties of near-bore fluids would cause special challenges. The paper discusses key issues which need to be addressed for adequate bed resolution and ultimately an accurate determination of the porosity in HA/HZ wells are outlined.
INTRODUCTION High-angle and horizontal (HA/HZ) wells, initially drilled primarily as in-fill wells to improve recovery, are being increasingly relied upon for log data acquisition and resulting reserves estimation. Such wells are usually surveyed using logging-while -drilling (LWD) tools. Several papers have reported significant difference between porosity and resistivity determined using HA/HZ wells those using vertical wells , especially in thin beds. Clavier (1991) had described the challenges that are likely in using horizontal well data to interpret petrophysical parameters. Recent papers have borne these out (Rendeiro, et al. 2005; Passey, et al. 2005: Mendoza, et al. 2006; Radtke, et al. 2006). Rendeiro, et al. (2005), reported a higher porosity and resistivity and an erroneous formation
thickness using HA/HZ wells compared to vertical wells and concluded that quantitative formation evaluation may be difficult in HA/HZ wells . Radtke, et al. (2006), and Badruzzaman, et al. (2007), report that relative to vertical wells LWD density data in a horizontal well resulted in a 3-4 pu increase in porosity in a thin-bedded reservoir while it decreased in non-reservoir rocks. The increase in porosity confirmed the findings of Rendeiro, et al. (2005). However, (the lower density and thus) the higher porosity from the horizontal well in the thin-bedded reservoir matched core porosity while that from vertical wells did not. Thin beds present a particularly interesting situation in HA/HZ wells . Even in vertical wells, nuclear logs acquired through thin beds pose an interpretation challenge. A number of correction or enhancement algorithms have been proposed to improve bed resolution in both neutron-porosity and formation density measurements in such wells (Flaum, et al., 1987; Mathis & Gerahart, 1988; Galford, et al., 1989; Gartner, 1989; Jacobson, et al., 1990). In the case of HA/HZ wells, the question is whether such procedures can improve bed resolution since how sharply a tool sees beds in a horizontal well is fundamentally different from that in a vertical well. This could very well explain why the density estimated in a thin-bedded reservoir using HA/HZ wells may be more accurate. However, a number issues need to be addressed to determine if the horizontal well porosity is indeed basically more accurate in a thin-bedded reservoir. This has led to a number of simulation studies have been performed to understand nuclear tool response in HA/HZ wells and further investigate the issue of thin beds. The challenges noted previously in interpreting log data will be compounded by fundamental differences between nuclear wireline and LWD tool designs and the environment they operate in. The source and detectors in wireline nuclear tools, neutron and density, are generally placed along the axis of the tool which is placed eccentered in the well bore. One assumes negligible standoff in the absence of rugosity. On the other hand, nuclear LWD tools are designed such that the neutron tool has a built-in standoff while the density tool has negligible standoff. However, in reality the standoff can vary significantly, thereby severely affecting the response, even in a vertical well (Day and Petler, 1991; Badruzzaman, et al. 1997). Various procedures have been designed to improve the accuracy of

1st SPWLA India Regional Conference, March 19-20, 2007
neutron porosity and bulk density from LWD tools. The question is: will these be appropriate for HA/HZ wells? Two additional layers of complexity were reported in the literature on horizontal wells that would compound the challenges interpreting nuclear data acquired in such wells. For example, Stockhausen and Lasso, (2003), noted a lack of continuous survey and need for information on angle of inclination (or apparent dip) between borehole and formation. These will impact how well we know the true vertical thickness (TVT). Continuous survey will ensure accurate determination of true vertical depth (TVD). As will be seen later, the angle of inclination of the hole has a significant affect on density and porosity behavior. The second challenge was reported by Peeters, et al. (2002), who showed by laboratory simulations that invasion profiles may not be symmetric around horizontal bore holes. The challenges described above will be compounded by additional characteristics observed in nuclear logs. One is related to use of LWD tools to acquire data in most HA/HZ wells. Variable standoff, as the LWD tool rotates in the well bore, has been shown to cause significant errors in both neutron porosity and density predicted in a homogeneous reservoir (Day and Petler, 1991; Badruzzaman, et al. 1997). As discussed in the present paper, variable standoff can also add to the uncertainty in the interpretation of such tools in HA/HZ wells in thin-bedded reservoirs. Another challenge is related to the observations reported by Lugol, et al. (2000), that invasion by certain exotic drilling muds, which alter the properties of near-bore fluid, changes the response of nuclear tools. This can cause an additional challenge in thin-bedded reservoirs. The present paper illustrates the differences between porosity and density estimates observed in the field using HA/HZ wells vs. vertical wells . The paper surveys recent simulation studies to understand tool response to address these differences. It then assesses the efficacy, in HA/HZ wells, of the state-of-the art techniques used to improve bed resolution in vertical wells . The paper discusses challenges that would arise from variable standoff in LWD, non-symmetric invasion profiles observed in HA/HZ and the possible alteration of invasion fluid properties observed when certain muds are used. The paper concludes by summarizing major findings and outlining key issues which need to be addressed for adequate bed resolution and ultimately an accurate determination of the porosity in such wells.
FIELD DATA IN HA/HZ WELLS VS. VERTICAL WELLS
Let us illustrate the differences observed between porosity and density in HA/HZ wells and vertical wells.
Figures 1 and 2 adopted from Rendeiro, et al. (2005), display logs acquired in a near-vertical well and a nearby HA/HZ well in a heavy-oil field in South America. The field was delineated using the near-vertical well and developed using HA/HZ wells resulting in the two wells passing close to each other. The authors compared the ~2670-2680 ft. measured depth (MD) in Figure 1 with the equivalent ~4500-4700 ft. MD in Figure 2. Note that the bulk density in the horizontal well is considerably lower than in the vertical well. Assuming a quartz matrix and 1 gm/cc water as the fluid, the authors conclude that the estimated density porosity is approximately 32.1 pu in the horizontal well vs. approximately 28.5 pu in the vertical well. It should also be noted that maximum deep resistivity in the horizontal well is 20 ohmm vs. 11 ohmm in the vertical well and will result in a significant difference in the estimated water saturation. Assuming vertical data to be correct, the authors conclude a significantly higher estimation of hydrocarbon pore volume using the horizontal well data. However, they note that the data are not sufficient to conclude of the difference is due HA/HZ effects or a change in the reservoir. Figure 3 compares log data acquired through a vertical well using a wireline tool and a near-horizontal well using an LWD tool in a thin-bedded reservoir in Africa. Note that the gamma-ray and density curves in the horizontal well exhibit more character than those that in the vertical well. The estimated density porosity is approximately 3-4 pu higher in the horizontal well. The resistivity is considerably higher too. Both features confirm the results in Figures 1 and 2. The resultant water saturation (SW) is 10 SU higher and the permeability was 5 to10 fold higher. The above examples raise the question of accuracy of porosity estimated using horizontal wells, especially in thin beds. Figure 4 compares the log density with core density in the same thin-bedded reservoir in Africa as in Figure 3. Note that the density in the horizontal well log agrees well with the core density but the density from the vertical well does not. Clearly, availability of core data was critical to resolve the difference.
RESPONSE MODELING STUDIES A number of modeling studies were performed to understand tool response and address the above differences. All used MNCP, the Monte Carlo radiation transport code from Los Alamos National Laboratory (Briesmeister, J., 2003). Simulations by Yin, et al. (2006), investigated a number of issues in nuclear logs in HA/HZ wells including the effect of bed boundary, depth of investigation, borehole inclination (dip), angle of tool rotation (azimuth) assuming a 25 pu sand bed on top of a 30-pu shale bed, using a model LWD neutron and LWD density tool. Each bed was five feet thick. They also investigated the effect of a thin bed,

1st SPWLA India Regional Conference, March 19-20, 2007
from 0.5 cm to 5 cm, superposed between the thicker beds. They also studied the impact of dip angle on the density image. Mendoza, et al. (2006), studied the response of a model neutron tool in a vertical well and two high-angle wells, first in a formation consisting of 25-pu sand bounded by a 30-inch shale bed and repeated the simulations for a 16-inch bed formation. They performed a similar analysis of a model density tool. Radtke, et al. (2006), via modeling, studied the response of a commercial LWD density tool in a horizontal well in a formation consisting of a 2.6 gm/cc bed and a 2.0 gm/cc bed and compared that with the corresponding response in a vertical well. In each case, they studied bed thickness 16, 8, 4 and 2 inches. For horizontal wells, they studied 10, 8, 6, 4 and 2 inch thick beds. They investigated the impact of various correction or enhancement procedures they use to resolve thin beds in vertical wells. Badruzzaman, et al. (2007), report on their work on studying the effect, on a density tool, of concurrent variation of three key parameters in HA/HZ wells, 1) the hole-angle, 2) bed thickness and 3) azimuth to assess as the tool traverses beds of varying thickness and rotates in the well-bore in acquiring LWD data. The bed thicknesses studied were 8, 6, 4 and 2 inches. They also investigate the impact of using bed resolution enhancement procedures utilized by vendors. It should be noted that none of the above papers considered the issue of variable standoff that may arise in LWD tools. Yin, et al. (2006), Mendoza, et al. (2006), and Badruzzaman, et al. (2007), assumed wireline-like tools eccentered in the wellbore. Radtke, et a l. (2006), did study a commercial LWD density tool but considered the only the bottom quadrant data that has nominally negligible standoff. NUCLEAR TOOL RESPONSE CHARACTERISTICS
Basic response Behavi or Liquid-filled reservoirs In order to understand the effects reported on nuclear tool response in horizontal vs. vertical wells, especially in thin beds, we examine two figures adopted from Mendoza, et al. (2006). These assume a 25-pu water-filled homogeneous sandstone formation. Figure 5 displays the spatial importance function of a conceptual dual-detector thermal neutron porosity tool obtained by simulating the response of the tool in 3-D using the MCNP code. For the Near detector, the vertical extent of the response is approximately 10 inches while the maximum radial extent is approximately 5 to 6 inches. The corresponding parameters are approximately 30 inches and 10 inches respectively for the Far detector.
Figure 6 displays the spatial importance function of a corresponding conceptual dual-detector density tool. The short-spaced (SS) detector1 has a vertical extent of about 5 inches while the radial extent is about 2-3 inches. The corresponding parameters for the long-spaced (LS) detector are approximately 16 inches and a little over four inches respectively. We also note that the density response is much more focused than is the neutron response. Note that in each of the above case, the vertical extent of the response is of the order of the source-detector (S-D) spacing while the radial extent defines the depth-of-investigation (DOI). Bed resolution Liquid-filled formation Conceptually, one would expect that the spatial extent, axial and radial, of the response sensitivity of a detector will determine the thickness of formation the detector will interrogate. Thus, it will determine how well a given nuclear tool, neutron or density, will resolve a bed. Clearly, a given detector in a vertical well will not be able to resolve a bed thinner than its S-D spacing. The corresponding resolution in a perfectly horizontal well will be limited by the DOI of the detector. This is illustrated schematically in Figure 7. Thus, for the dual-detector neutron tool examined in Figure 5, the bed resolution by the Near-detector will be limited to no less than approximately 10 inches while that by the Far detector will be about 30 inches in vertical a well. If the same tool is placed horizontally, its Near-detector will be able to resolve about 5-6 inches while the Far detector will be able to resolve approximately 10 inches. For the dual-detector density tool studied in Figure 6, the bed resolution in a vertical well will be about five inches and 16 inches, by the SS and LS detector respectively. In a perfectly horizontal well, these will be between 2-3 inches for the SS detector and 4-5 inches for the LS detector. Thus, the DOI of usual nuclear tools being shorter than their S-D spacing would allow a better bed resolution. Consequently, thin beds would in general be better resolved when these tools are placed in horizontal wells, asuming nominal conditions with no borehole complexities. Results of modeling studies reported and log data in HA/HZ can be understood in light of the above conceptual description. For example, the location predicted by Yin, et al. (2006), in a horizontal zone at which their model tool
1 We follow the usual convention of designating the detectors in a dual-detector neutron tool as Near and Far detectors, respectively, relative to the source location in the tool. The corresponding designations in a dual-detector density tool are short-spaced (SS) and long-spaced (LS) detectors respectively.

1st SPWLA India Regional Conference, March 19-20, 2007
senses an adjacent zone as it is moved towards the zone boundary can be understood by considering the DOI of the tool. It should be noted there is a commercial density tool with a third detector at nearly two inches from the source (Eyl, et al. 1994). Thus, in principle, in a vertical well, this tool should be able to resolve beds thinner than other tools can. The tool is unlikely to add much value in a horizontal well. In both vertical and horizontal wells, borehole effects may be too large for the two-inch detector to overcome. For commercial tools , exact values of spatial parameters determining bed resolution will depend on the specific design, but the values cited in the present paper are representative for most dual-detector wireline tools . They clearly indicate a theoretical limit of bed resolution by wireline nuclear tools placed in vertical and horizontal wells . While above discussions indicate that resolution of thin beds with nuclear tools would improve when the tools are placed in horizontal wells , as noted previously, additional issues will arise with LWD tools and will be discussed later. Also, note the comments below on neutron tools in low-porosity or gas -filled reservoirs. Porosity-dependence/gas reservoirs It should be noted that Figures 5 and 6 assume a 25-pu water-filled sandstone formation. It is well known and also was also graphically demonstrated by Mendoza, et al. (2006), that a neutron detector will see deeper, radially, if the formation porosity is actually is lower or if fluid in the formation is gas. This is related to the hydrogen index. In such reservoirs, the hydrogen index is lower and thus the slowing down length is greater than in a high-porosity liquid -filled reservoir. Thus, neutrons can travel further out radially. Consequently, in a horizontal well, the (vertical) bed-resolution of a neutron detector in low porosity or gas can be considerably worse than that in a liquid-filled high-porosity formation. Density tools are affected much less by this due to tool design and the nature of Compton scattering. Porosity and Density Interpretation: Response Compensation and Enhancement Nuclear tools have a shallow depth of investigation (DOI) and thus are affected significantly by borehole complexities such standoff, mudcake, etc. Consequently, compensated interpretation algorithms that combine the response of the two detectors are utilized. In neutron tools , the near/far counts ratio is used to obtain the neutron porosity. In density tools, the so-called spine-and-ribs technique is utilized. However, these compensation procedures result in the final porosity and density dominated by the Far detector in neutron tools and the LS detector in density tools ,
respectively. Thus, these procedures can significantly worsen the bed resolution obtained from the final interpretation of nuclear tool response in vertical wells. Consequently, as noted in the introduction, several correction procedures, known either as alpha-processing or enhancement techniques, have been developed for both neutron and density response to enhance the vertical resolution of the compensated interpretation. These are discussed in detail in references cited. We confine our discussions to density tools. The compensated density is given by
)( ρρρ ∆+= LSB ,
where ρ∆ is the correction from the “spine-and-ribs” methodology. As we will see this correction can degrade the vertical resolution. In order to improve the vertical resolution of the compensated density, Flaum, et al. (1987), developed a procedure to incorporate the vertical information contained in the SS detector. Specifically, they modify the bulk-density computed using the spine-and-ribs procedure as follows:
)( SSSSBenh ρρρρ −+= ,
where ρB is the standard “spine-and-ribs” density, ρSS is the un-averaged SS detector density and SSρ is its value
averaged to match the vertical resolution of Bρ . The authors cite two criteria that need to be met for this algorithm to work. One requires the density sensitivity and statistical uncertainty of the SS detector are adequate for the precision needed. Standard density tools have sufficient sampling rate to meet these. The second criterion requires that systematic perturbations due to mostly borehole environmental effects vary more slowly than actual density variation. “Reasonably” good borehole shapes meet this criterion. Rugose, washed-out holes or holes with significant mud cake thickness would not meet this criterion as would not large and variable standoff with LWD. Modeling Results: Density Response vs. Hole-angle Model tool in varying bore-hole inclination Badruzzaman, et al. (2007), investigated the density behavior as the hole-inclination changes from vertical to horizontal. Figure 8 displays the schematic. Figure 9 displays the density at five different borehole inclinations (or dips) in a formation with 8-inch beds. We note the following.

1st SPWLA India Regional Conference, March 19-20, 2007
As expected from the discussions on Figure 7, the SS detector has much better bed resolution at all angles. This is related to its shorter S-D spacing which will determine the bed resolution in vertical wells and shallower DOI which will determine it in horizontal wells. At angles in-between, both parameters will contribute. The LS detector with about 16-inch S-D spacing shows little sensitivity in this (8 inch) bed at low angles. However, above 50 degrees, this detector shows significant sensitivity. We note that here the response of both detectors correlates with the bed density and the correlation improves with hole-angle. At 85 degrees, both detectors reproduce the values reasonably well. We note that the compensated density in Figure 9 anti-correlates with the density of the bed in a vertical we ll and this continues with hole-angle increase even at 25 degrees. This is not surprising since the S-D spacing of the LS detector is significantly larger than the thickness of this bed and the detector sees several beds at the same time. The correlation begins to improve as the hole-angle increases and the DOI begins to determine the spatial extent of the interrogation by the tool; at the 50-degree hole -angle the correlation is clear. Using a linear interpolation, we estimate that the correct trend picks up at around 40 degrees. However, at 85 degrees, the procedure seems to overestimate the correction in the low-density bed, thereby yielding a lower density (and a higher porosity). We note that the enhanced density correlates with the bed density but its accuracy improves with hole-angle. However, at 50 degrees it matches the low density but underestimates the high density. As the angle increases further, it considerably underestimates the low-density (by nearly 0.4 gm/cc) while it appears to match the high density. This would have a considerable effect on the estimated porosity. Figure 10 displays the density response of the model tool with hole-angle variation with four-inch thick beds. Only the SS detector response shows sensitivity in the vertical well (zero degree) with this bed thickness. As the hole-angle increases, the sensitivity increases and at 85 degrees both detectors are able to resolve the beds significantly better, although not exactly in the high-density bed. At 85 degrees, the maximum of the SS response in the low-density bed matches well but the higher density bed is still underestimated. The compensated and enhanced densities appear similar. The enhanced density correlates with the bed density variation, but shows greater agreement with the low-density bed as the hole-angle increases. The benefit of the enhancement procedure diminishes as hole-angle increases and is almost non-existent at 85 degrees. From the above we also note that at high angles, the SS density is clearly the most accurate density in thin beds.
Horizontal Vs. Vertical density response of a commercial LWD tool Radtke, et al. (2006), had investigated the response of a commercia l LWD density tool in a horizontal vs. a vertical well for various bed thicknesses. In the field, the tool acquires counts in 16 sectors as the tool rotates and then groups them into four quadrants, bottom, right, up and left. In the model, the tool stabilizer is assumed engaged and the results in the Figures 11 and 12 represent the bottom quadrant density, ROBB, which will have negligible standoff with an engaged tool. The authors concluded that the enhanced processing had significantly improved the bed resolution in the vertical well. They further concluded that the density tool is able to resolve the bed density for thinner beds than the tool in a vertical well. Figure 11 is a more detailed display of the interpreted density using various processing techniques in a vertical well on modeled response courtesy of Radtke, et al. (2006), after their original paper was published. Note that the sensitivity to bed thickness diminishes as bed thickness reduces. For the two-inch bed, LS-density and compensated density show no sensitivity while the SS-density and alpha-processed (enhanced) density do show some sensitivity but the magnitudes of the density are clearly underestimated. Figure 12 displays the density as the same LWD tool is inserted in horizontal beds of various thicknesses. We recall that here the bed resolution is determined by the DOI. We note that even for the two-inch thick bed, both detectors show more sensitivity than in the vertical well since their DOI are considerably less than the S-D spacing. As in the case of the model tool, the SS detector is much more responsive, as expected. Also, note that the compensated and alpha-processed densities are identical in this figure. Figures 11 and 12 confirm many of the findings in Figures 9 and 10. For example, the benefit of enhanced or alpha processing seen in a vertical well is absent in a horizontal well. In fact, such processing can cause problems in rugose holes, since they utilize SS detector information and this detector is affected more by hole rugosity. We notice an interesting difference between the results in Figures 11 and 12 for the commercial LWD tool and those from Figures 9 and 10 for the model tool. In the commercial LWD tool, the anti-correlation of the compensated density in the vertical well occurred in the four-inch bed. In the model tool we saw it for the eight-inch beds and shallow bore-hole angles. This arises from a combination of the effect of the tool design, which determines S-D spacing and DOI, and the hole-angle which determines the optical thickness (density x physical thickness) the tool interrogates.
1st SPWLA India Regional Conference, March 19-20, 2007
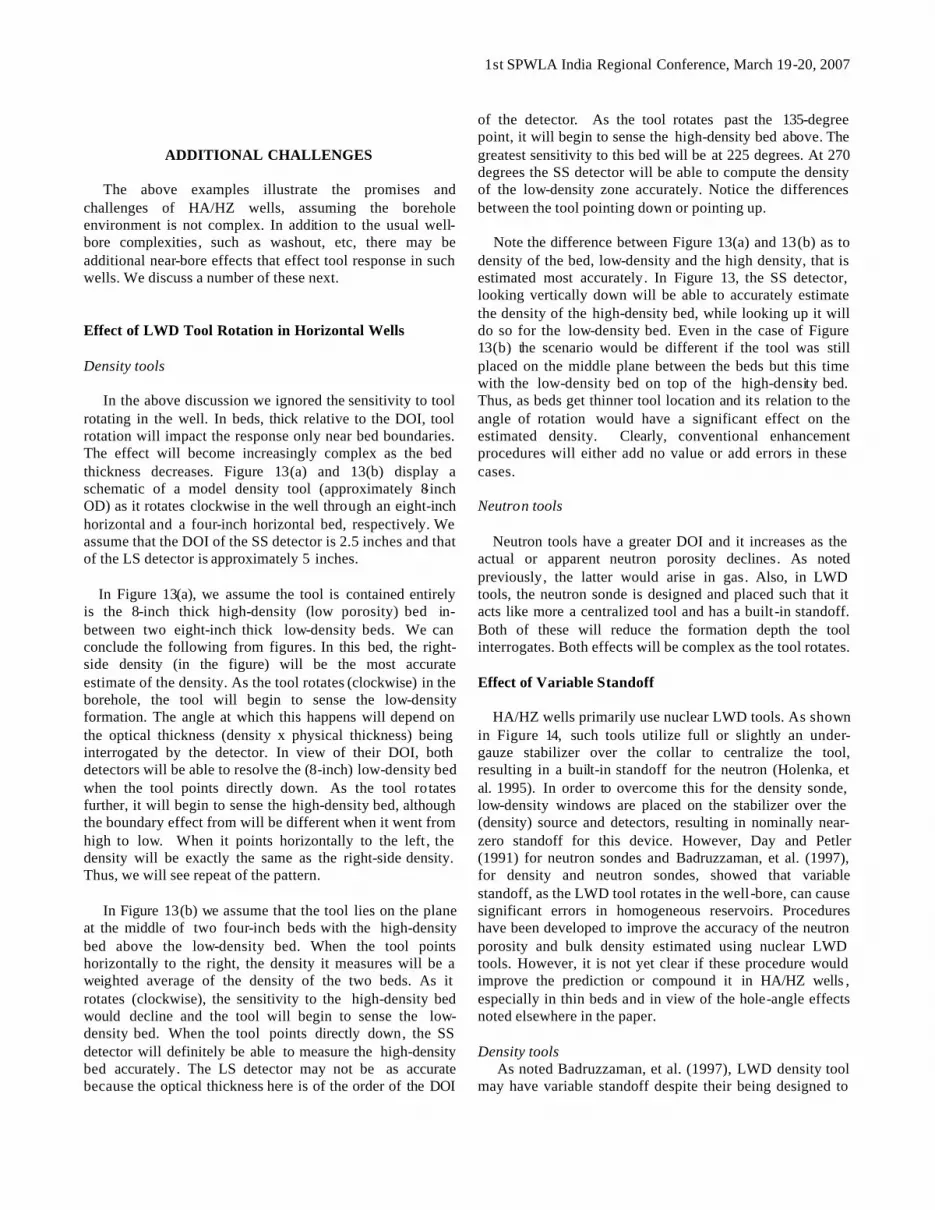
ADDITIONAL CHALLENGES The above examples illustrate the promises and challenges of HA/HZ wells, assuming the borehole environment is not complex. In addition to the usual well-bore complexities, such as washout, etc, there may be additional near-bore effects that effect tool response in such wells. We discuss a number of these next. Effect of LWD Tool Rotation in Horizontal Wells Density tools In the above discussion we ignored the sensitivity to tool rotating in the well. In beds, thick relative to the DOI, tool rotation will impact the response only near bed boundaries. The effect will become increasingly complex as the bed thickness decreases. Figure 13(a) and 13(b) display a schematic of a model density tool (approximately 8-inch OD) as it rotates clockwise in the well through an eight-inch horizontal and a four-inch horizontal bed, respectively. We assume that the DOI of the SS detector is 2.5 inches and that of the LS detector is approximately 5 inches. In Figure 13(a), we assume the tool is contained entirely is the 8-inch thick high-density (low porosity) bed in-between two eight-inch thick low-density beds. We can conclude the following from figures. In this bed, the right-side density (in the figure) will be the most accurate estimate of the density. As the tool rotates (clockwise) in the borehole, the tool will begin to sense the low-density formation. The angle at which this happens will depend on the optical thickness (density x physical thickness) being interrogated by the detector. In view of their DOI, both detectors will be able to resolve the (8-inch) low-density bed when the tool points directly down. As the tool rotates further, it will begin to sense the high-density bed, although the boundary effect from will be different when it went from high to low. When it points horizontally to the left , the density will be exactly the same as the right-side density. Thus, we will see repeat of the pattern. In Figure 13(b) we assume that the tool lies on the plane at the middle of two four-inch beds with the high-density bed above the low-density bed. When the tool points horizontally to the right, the density it measures will be a weighted average of the density of the two beds. As it rotates (clockwise), the sensitivity to the high-density bed would decline and the tool will begin to sense the low-density bed. When the tool points directly down, the SS detector will definitely be able to measure the high-density bed accurately. The LS detector may not be as accurate because the optical thickness here is of the order of the DOI
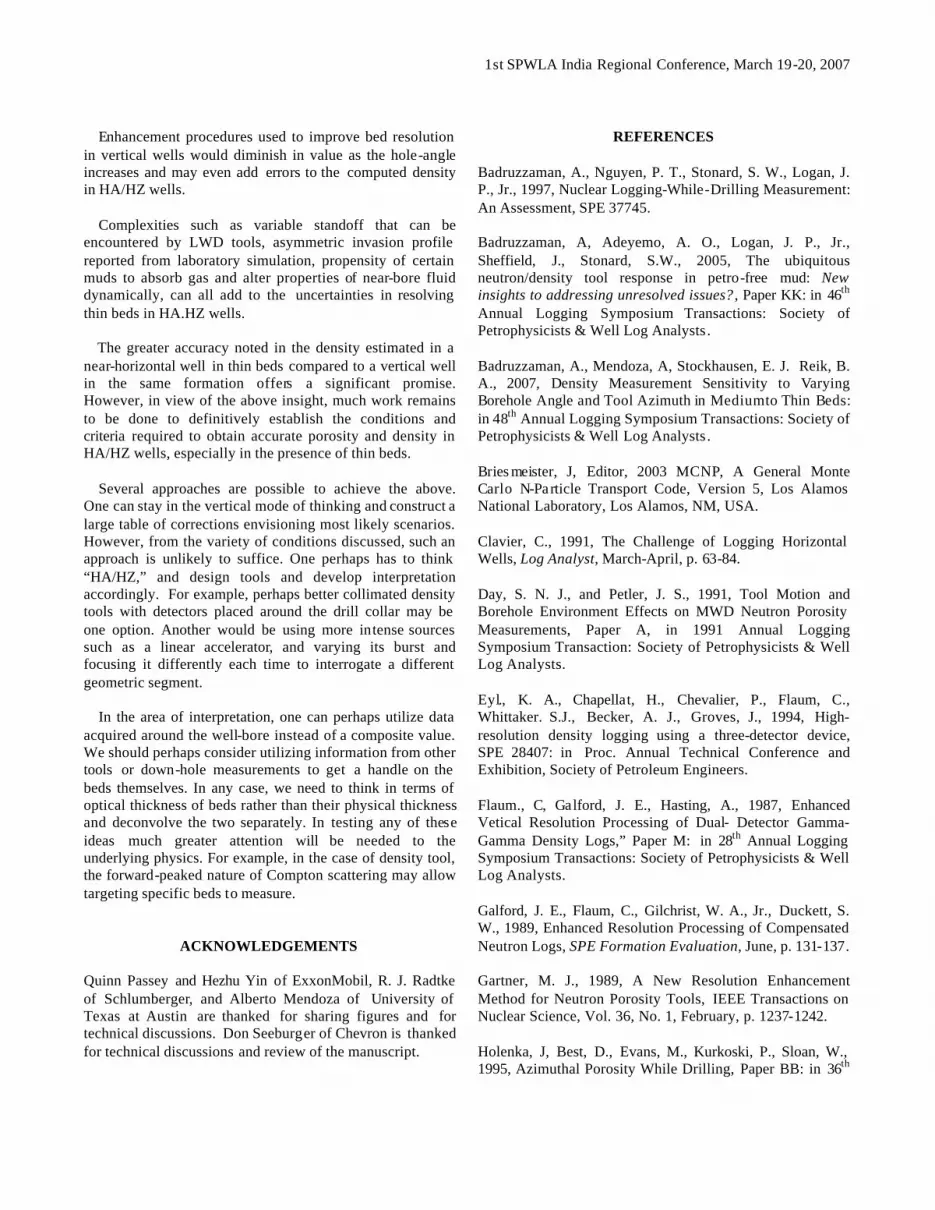
of the detector. As the tool rotates past the 135-degree point, it will begin to sense the high-density bed above. The greatest sensitivity to this bed will be at 225 degrees. At 270 degrees the SS detector will be able to compute the density of the low-density zone accurately. Notice the differences between the tool pointing down or pointing up. Note the difference between Figure 13(a) and 13(b) as to density of the bed, low-density and the high density, that is estimated most accurately. In Figure 13, the SS detector, looking vertically down will be able to accurately estimate the density of the high-density bed, while looking up it will do so for the low-density bed. Even in the case of Figure 13(b) the scenario would be different if the tool was still placed on the middle plane between the beds but this time with the low-density bed on top of the high-density bed. Thus, as beds get thinner tool location and its relation to the angle of rotation would have a significant effect on the estimated density. Clearly, conventional enhancement procedures will either add no value or add errors in these cases. Neutron tools Neutron tools have a greater DOI and it increases as the actual or apparent neutron porosity declines. As noted previously, the latter would arise in gas. Also, in LWD tools, the neutron sonde is designed and placed such that it acts like more a centralized tool and has a built-in standoff. Both of these will reduce the formation depth the tool interrogates. Both effects will be complex as the tool rotates. Effect of Variable Standoff HA/HZ wells primarily use nuclear LWD tools. As shown in Figure 14, such tools utilize full or slightly an under-gauze stabilizer over the collar to centralize the tool, resulting in a built-in standoff for the neutron (Holenka, et al. 1995). In order to overcome this for the density sonde, low-density windows are placed on the stabilizer over the (density) source and detectors, resulting in nominally near-zero standoff for this device. However, Day and Petler (1991) for neutron sondes and Badruzzaman, et al. (1997), for density and neutron sondes, showed that variable standoff, as the LWD tool rotates in the well-bore, can cause significant errors in homogeneous reservoirs. Procedures have been developed to improve the accuracy of the neutron porosity and bulk density estimated using nuclear LWD tools. However, it is not yet clear if these procedure would improve the prediction or compound it in HA/HZ wells , especially in thin beds and in view of the hole-angle effects noted elsewhere in the paper. Density tools As noted Badruzzaman, et al. (1997), LWD density tool may have variable standoff despite their being designed to

1st SPWLA India Regional Conference, March 19-20, 2007
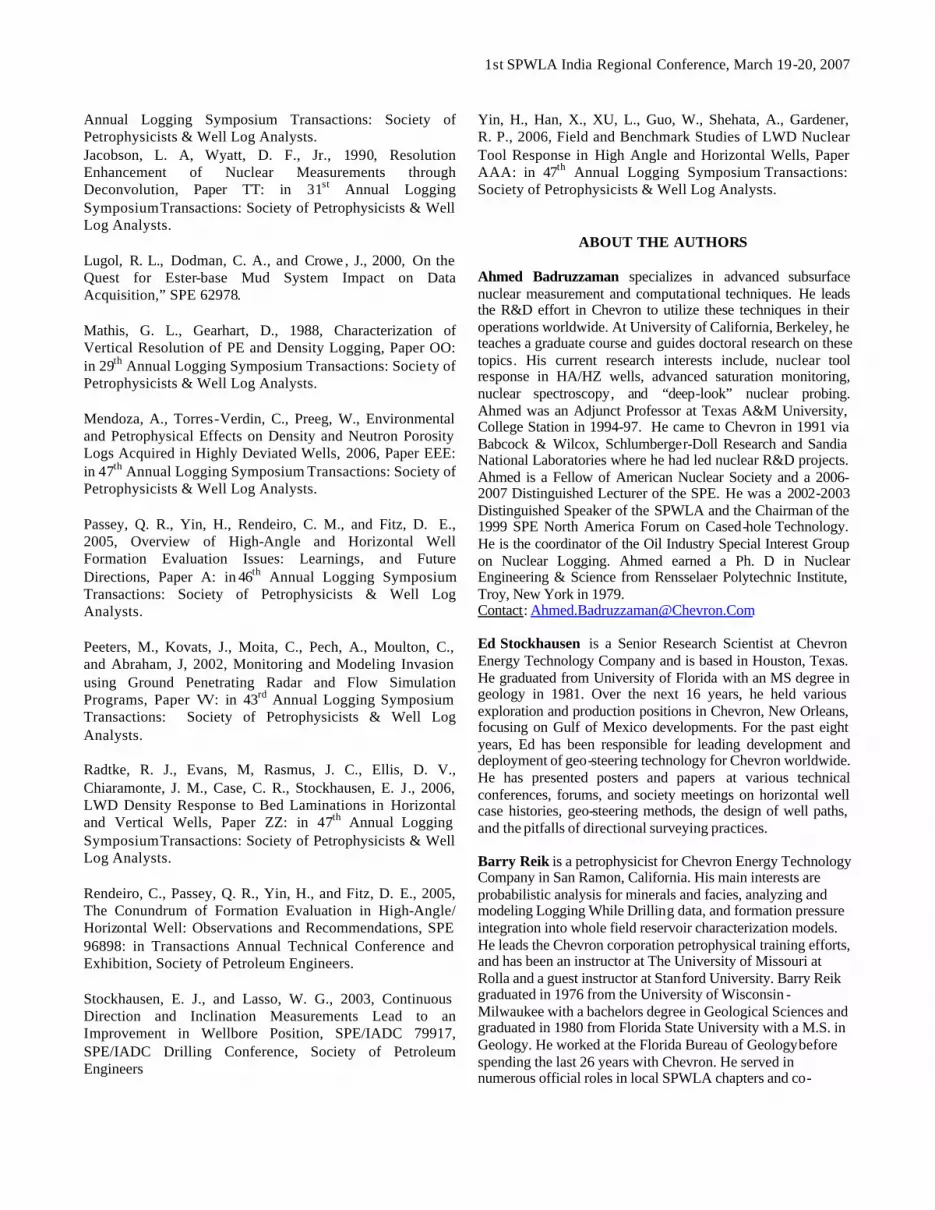
have negligible standoff. This could arise if the tool is not centralized in the hole. This could underestimate the formation density and thus overestimate the porosity. Another such configuration would be if the well becomes elliptical. Figures 15(a) and 15(b) display two configurations, similar to those in Figures 13(a) and 13(b) respectively. Note that directly looking up or down bed resolution improves Thus, in both 8-inch and 4-inch bed configurations, the variable tool standoff will compound the challenges discussed in measuring density with the circular hole in Figure 13(b). Procedures have been developed to correct for the effects of variable standoff. In one such procedure, counts in each detector are acquired in 16 sectors which are then grouped into four quadrants. The bottom quadrant density with the least standoff will be the most accurate density. In circular holes this will work reasonably well. However, as discussed by Badruzzaman, et al. (1997), substantial errors will remain if the standoff is substantial such as when the hole is elliptical. For example, the authors in their configuration predicted a three-pu overestimation in a 20-pu homogeneous reservoir when the model assumed 8.5 in x 9.5 inch elliptical hole and bottom quadrant data. In the case of 8.5 inch x 12.25 elliptical hole, the corresponding overestimation was 20.4 pu! From the configurations in Figure 15, we see that presence of water standoff in a horizontal well can act as a low-density thin bed to the DOI, while any mudcake could act like a high-density thin bed. Thus, the uncertainty in predictions will be more complicated in thin-bedded reservoirs and use of so-called bottom-quadrant density may not suffice. Neutron tools Although the LWD neutron sonde is designed with built-in standoff in its stabilized rotating mode, the standoff can vary, thereby affecting the response as noted by Day and Petler (1991) and Badruzzaman, et al. (1997). One scenario reported by the latter authors was when the tool was at the bottom of the hole in an unconsolidated sandstone reservoir, reducing the bottom-hole neutron sonde standoff to zero and causing a nearly 5-pu lower porosity estimation by the LWD tool relative to a wireline tool. Clearly, such behavior will add complexity to the LWD neutron tool response as bed thickness reduces. Invasion Effects Non-symmetric variation In the above discussions, we have ignored effects of invasion. In vertical wells with homogeneous reservoirs, the invasion is assumed to be homogeneous and circular. This assumption will not be valid as the reservoir heterogeneity increases. Peeters , et al. (2002), have shown from laboratory simulation that invasion profile around horizontal wells may
be asymmetric. This may significantly affect the response, particularly of the neutron tool which has greater DOI than the density tool. Gas-like effect of Petrofree mud Lugol et al. (2000), reported unexpected gas -like crossovers in certain fields in Africa, when petro-free mud was utilized in the drilling. Badruzzaman, et al. (2005), showed from their modeling study of homogeneous reservoirs that this would be the consequence of an experimentally observed property of this mud, namely , that it can absorb gas under pressure and temperature. Thus, as it passes by a gas zone, it may absorb gas and when it invades a liquid-filled zone one observes a gas-like response in nuclear tools. In gas reservoirs, the mud would first invade and displace the gas with the response evolving to a liquid-like response. The mud then absorbs gas and a gas-like separation reappears. The timing in recording of this dynamic behavior is different between LWD and wireline logging and thus affects seen will differ. Pressure and temperature affect this behavior. These features are likely to add to the complexity of the effects we discussed on nuclear logs in HA/HZ wells, especially in thin beds.
CONCLUSIONS We draw the following conclusions from the discussions in this paper. In the absence of borehole complexities, thin-bed resolution by nuclear tools would be better in HA/HZ wells than in vertical wells. Thus, in such a condition, the computed porosity and density in thin-bedded reservoirs will, in principle, be more accurate in HA/HZ than in vertical wells. The results surveyed in the paper clearly indicate that this arises from the response of nuclear tools in HA/HZ wells being fundamentally different than that in vertical wells. Thus, bed resolution would be different. In vertical wells , the source-detector (S-D) spacing determines bed resolution while in horizontal well this is determined by the depth of investigation (DOI). In wells at angles in- between, the bed resolution is determined by a combination of effects of the two parameters. Recent modeling results definitively and quantitatively establish these intuitively obvious facts. Modeling also establishes that the magnitude of effects will, in general, depend on a combination of tool design, bed thickness and hole-angle. In view of the higher DOI of neutron tools, they are less likely to resolve thin beds as well as the density tool can in HA/HZ wells . Also, low porosity and low fluid density, both of which increases DOI of neutron tools , will make it more challenging to resolve thin beds in low-porosity formations or in gas reservoirs, using such tools .
1st SPWLA India Regional Conference, March 19-20, 2007
Enhancement procedures used to improve bed resolution in vertical wells would diminish in value as the hole-angle increases and may even add errors to the computed density in HA/HZ wells. Complexities such as variable standoff that can be encountered by LWD tools, asymmetric invasion profile reported from laboratory simulation, propensity of certain muds to absorb gas and alter properties of near-bore fluid dynamically, can all add to the uncertainties in resolving thin beds in HA.HZ wells. The greater accuracy noted in the density estimated in a near-horizontal well in thin beds compared to a vertical well in the same formation offers a significant promise. However, in view of the above insight, much work remains to be done to definitively establish the conditions and criteria required to obtain accurate porosity and density in HA/HZ wells, especially in the presence of thin beds. Several approaches are possible to achieve the above. One can stay in the vertical mode of thinking and construct a large table of corrections envisioning most likely scenarios. However, from the variety of conditions discussed, such an approach is unlikely to suffice. One perhaps has to think “HA/HZ,” and design tools and develop interpretation accordingly. For example, perhaps better collimated density tools with detectors placed around the drill collar may be one option. Another would be using more intense sources such as a linear accelerator, and varying its burst and focusing it differently each time to interrogate a different geometric segment. In the area of interpretation, one can perhaps utilize data acquired around the well-bore instead of a composite value. We should perhaps consider utilizing information from other tools or down-hole measurements to get a handle on the beds themselves. In any case, we need to think in terms of optical thickness of beds rather than their physical thickness and deconvolve the two separately. In testing any of these ideas much greater attention will be needed to the underlying physics. For example, in the case of density tool, the forward-peaked nature of Compton scattering may allow targeting specific beds to measure.
ACKNOWLEDGEMENTS Quinn Passey and Hezhu Yin of ExxonMobil, R. J. Radtke of Schlumberger, and Alberto Mendoza of University of Texas at Austin are thanked for sharing figures and for technical discussions. Don Seeburger of Chevron is thanked for technical discussions and review of the manuscript.
REFERENCES
Badruzzaman, A., Nguyen, P. T., Stonard, S. W., Logan, J. P., Jr., 1997, Nuclear Logging-While-Drilling Measurement: An Assessment, SPE 37745. Badruzzaman, A, Adeyemo, A. O., Logan, J. P., Jr., Sheffield, J., Stonard, S.W., 2005, The ubiquitous neutron/density tool response in petro-free mud: New insights to addressing unresolved issues? , Paper KK: in 46th Annual Logging Symposium Transactions: Society of Petrophysicists & Well Log Analysts . Badruzzaman, A., Mendoza, A, Stockhausen, E. J. Reik, B. A., 2007, Density Measurement Sensitivity to Varying Borehole Angle and Tool Azimuth in Medium to Thin Beds: in 48th Annual Logging Symposium Transactions: Society of Petrophysicists & Well Log Analysts . Bries meister, J, Editor, 2003 MCNP, A General Monte Carlo N-Particle Transport Code, Version 5, Los Alamos National Laboratory, Los Alamos, NM, USA. Clavier, C., 1991, The Challenge of Logging Horizontal Wells, Log Analyst, March-April, p. 63-84. Day, S. N. J., and Petler, J. S., 1991, Tool Motion and Borehole Environment Effects on MWD Neutron Porosity Measurements, Paper A, in 1991 Annual Logging Symposium Transaction: Society of Petrophysicists & Well Log Analysts. Eyl., K. A., Chapellat, H., Chevalier, P., Flaum, C., Whittaker. S.J., Becker, A. J., Groves, J., 1994, High-resolution density logging using a three-detector device, SPE 28407: in Proc. Annual Technical Conference and Exhibition, Society of Petroleum Engineers. Flaum., C, Galford, J. E., Hasting, A., 1987, Enhanced Vetical Resolution Processing of Dual- Detector Gamma-Gamma Density Logs,” Paper M: in 28th Annual Logging Symposium Transactions: Society of Petrophysicists & Well Log Analysts. Galford, J. E., Flaum, C., Gilchrist, W. A., Jr., Duckett, S. W., 1989, Enhanced Resolution Processing of Compensated Neutron Logs, SPE Formation Evaluation, June, p. 131-137. Gartner, M. J., 1989, A New Resolution Enhancement Method for Neutron Porosity Tools, IEEE Transactions on Nuclear Science, Vol. 36, No. 1, February, p. 1237-1242. Holenka, J, Best, D., Evans, M., Kurkoski, P., Sloan, W., 1995, Azimuthal Porosity While Drilling, Paper BB: in 36th
1st SPWLA India Regional Conference, March 19-20, 2007
Annual Logging Symposium Transactions: Society of Petrophysicists & Well Log Analysts. Jacobson, L. A, Wyatt, D. F., Jr., 1990, Resolution Enhancement of Nuclear Measurements through Deconvolution, Paper TT: in 31st Annual Logging Symposium Transactions: Society of Petrophysicists & Well Log Analysts. Lugol, R. L., Dodman, C. A., and Crowe , J., 2000, On the Quest for Ester-base Mud System Impact on Data Acquisition,” SPE 62978. Mathis, G. L., Gearhart, D., 1988, Characterization of Vertical Resolution of PE and Density Logging, Paper OO: in 29th Annual Logging Symposium Transactions: Society of Petrophysicists & Well Log Analysts. Mendoza, A., Torres-Verdin, C., Preeg, W., Environmental and Petrophysical Effects on Density and Neutron Porosity Logs Acquired in Highly Deviated Wells, 2006, Paper EEE: in 47th Annual Logging Symposium Transactions: Society of Petrophysicists & Well Log Analysts. Passey, Q. R., Yin, H., Rendeiro, C. M., and Fitz, D. E., 2005, Overview of High-Angle and Horizontal Well Formation Evaluation Issues: Learnings, and Future Directions, Paper A: in 46th Annual Logging Symposium Transactions: Society of Petrophysicists & Well Log Analysts. Peeters, M., Kovats, J., Moita, C., Pech, A., Moulton, C., and Abraham, J, 2002, Monitoring and Modeling Invasion using Ground Penetrating Radar and Flow Simulation Programs, Paper VV: in 43rd Annual Logging Symposium Transactions: Society of Petrophysicists & Well Log Analysts. Radtke, R. J., Evans, M, Rasmus, J. C., Ellis, D. V., Chiaramonte, J. M., Case, C. R., Stockhausen, E. J., 2006, LWD Density Response to Bed Laminations in Horizontal and Vertical Wells, Paper ZZ: in 47th Annual Logging Symposium Transactions: Society of Petrophysicists & Well Log Analysts. Rendeiro, C., Passey, Q. R., Yin, H., and Fitz, D. E., 2005, The Conundrum of Formation Evaluation in High-Angle/ Horizontal Well: Observations and Recommendations, SPE 96898: in Transactions Annual Technical Conference and Exhibition, Society of Petroleum Engineers. Stockhausen, E. J., and Lasso, W. G., 2003, Continuous Direction and Inclination Measurements Lead to an Improvement in Wellbore Position, SPE/IADC 79917, SPE/IADC Drilling Conference, Society of Petroleum Engineers
Yin, H., Han, X., XU, L., Guo, W., Shehata, A., Gardener, R. P., 2006, Field and Benchmark Studies of LWD Nuclear Tool Response in High Angle and Horizontal Wells, Paper AAA: in 47th Annual Logging Symposium Transactions: Society of Petrophysicists & Well Log Analysts.
ABOUT THE AUTHORS Ahmed Badruzzaman specializes in advanced subsurface nuclear measurement and computational techniques. He leads the R&D effort in Chevron to utilize these techniques in their operations worldwide. At University of California, Berkeley, he teaches a graduate course and guides doctoral research on these topics. His current research interests include, nuclear tool response in HA/HZ wells, advanced saturation monitoring, nuclear spectroscopy, and “deep-look” nuclear probing. Ahmed was an Adjunct Professor at Texas A&M University, College Station in 1994-97. He came to Chevron in 1991 via Babcock & Wilcox, Schlumberger-Doll Research and Sandia National Laboratories where he had led nuclear R&D projects. Ahmed is a Fellow of American Nuclear Society and a 2006-2007 Distinguished Lecturer of the SPE. He was a 2002-2003 Distinguished Speaker of the SPWLA and the Chairman of the 1999 SPE North America Forum on Cased-hole Technology. He is the coordinator of the Oil Industry Special Interest Group on Nuclear Logging. Ahmed earned a Ph. D in Nuclear Engineering & Science from Rensselaer Polytechnic Institute, Troy, New York in 1979. Contact: [email protected] Ed Stockhausen is a Senior Research Scientist at Chevron Energy Technology Company and is based in Houston, Texas. He graduated from University of Florida with an MS degree in geology in 1981. Over the next 16 years, he held various exploration and production positions in Chevron, New Orleans, focusing on Gulf of Mexico developments. For the past eight years, Ed has been responsible for leading development and deployment of geo-steering technology for Chevron worldwide. He has presented posters and papers at various technical conferences, forums, and society meetings on horizontal well case histories, geo-steering methods, the design of well paths, and the pitfalls of directional surveying practices. Barry Reik is a petrophysicist for Chevron Energy Technology Company in San Ramon, California. His main interests are probabilistic analysis for minerals and facies, analyzing and modeling Logging While Drilling data, and formation pressure integration into whole field reservoir characterization models. He leads the Chevron corporation petrophysical training efforts, and has been an instructor at The University of Missouri at Rolla and a guest instructor at Stanford University. Barry Reik graduated in 1976 from the University of Wisconsin -Milwaukee with a bachelors degree in Geological Sciences and graduated in 1980 from Florida State University with a M.S. in Geology. He worked at the Florida Bureau of Geology before spending the last 26 years with Chevron. He served in numerous official roles in local SPWLA chapters and co-

1st SPWLA India Regional Conference, March 19-20, 2007
chaired the 1992 SPWLA Topical Conference on Invasion and Permeability.

1st SPWLA India Regional Conference, March 19-20, 2007
Fig. 1 Tool response in a vertical well in South America (Renderio, et al., 2005). The bulk density is 2.18 gm/cc, and the resistivity is 11 ohmm
Fig 2. Tool response in horizontal well near the vertical well in Figure 1, South America (Renderio, et al., 2005). The bulk density is 2.12 gm/cc and resistivity is 20 ohmm

1st SPWLA India Regional Conference, March 19-20, 2007
Fig 3. Comparison of density from vertical and horizontal wells in a thin-bedded reservoir in Africa. The porosity was ~ 3-4 Pu higher in the horizontal well.
Standard Log Density1.95 (g/cm3) 2.95
Core Density1.95 (g/cm3) 2.95
CoreDensity
Deviated well
standard Density
Log
Standard Log Density1.95 (g/cm3) 2.95
Core Density1.95 (g/cm3) 2.95
Core Density1.95 (g/cm3) 2.95
CoreDensity
Deviated well
standard Density
Log
Horizontal Well Density1.95 (g/cm3) 2.95
Vertical Well Density1.95 (g/cm3) 2.95
HorizontalWell
VerticalWell
Horizontal Well Density1.95 (g/cm3) 2.95
Vertical Well Density1.95 (g/cm3) 2.95
Horizontal Well Density1.95 (g/cm3) 2.95
Horizontal Well Density1.95 (g/cm3) 2.95
Vertical Well Density1.95 (g/cm3) 2.95
Vertical Well Density1.95 (g/cm3) 2.95
HorizontalWell
VerticalWell
Fig 4. Comparison of density from vertical and horizontal wells in a thin-bedded reservoir in Africa.
GR GRRES RES
DEN
TVD
TVD
xx00
xx00
xx50
xx50
xx50
Neutron
Neutron
Vertical Well Log Vertical Well Log TVD Log TVD Log -- Horizontal Well LandingHorizontal Well Landing
DEN
GR GRRES RES
DEN
TVD
TVD
xx00
xx00
xx50
xx50
xx50
Neutron
Neutron
Vertical Well Log Vertical Well Log TVD Log TVD Log -- Horizontal Well LandingHorizontal Well Landing
DEN

1st SPWLA India Regional Conference, March 19-20, 2007
Near Far
Fig 6. Response functions of Short-spaced and Long-spaced detectors of a model density tool from Monte Carlo modeling (Mendoza, et. al., 2006)
Fig 5. Response functions of Near and Far detectors of a model neutron tool from Monte Carlo modeling (Mendoza, et. al., 2006)
Fig 7. Schematic of the spatial extent of the response sensitivity of a nominal nuclear tool in a vertical vs. a horizontal well in a thin-bedded reservoir.

1st SPWLA India Regional Conference, March 19-20, 2007
0
4
8
12
16
-4
-8
-12
-16
-20
-24
X
Y
ρ = 2.0 g/cm3
ρ = 2.6 3
dip=85 °
Fig 8. Schematic of hole inclination (DIP) with 8- inch beds.
Fig 9. Response of a model density tool vs. hole-angle in 8-inch beds, from Monte Carlo simulation. Shaded beds are low-density (2.0 gm/cc) and white beds are high density (2.6 gm/cc). Note the anti-correlation at zero-degree hole inclination (vertical) and at 25 degrees. Also, note the overestimation by the enhanced density at 75 and 85 degrees.

1st SPWLA India Regional Conference, March 19-20, 2007
Fig 10. Response of a model density tool vs. hole-angle in 4-inch beds. Shaded beds are low-density (2.0 gm/cc) and white beds are high density (2.6 gm/cc).
-18
-12
-6
0
6
12
18
2 in 4 in 8 in 16 in
SS filtered and resolution match LS Compensated Unfiltered SS Alpha-processed
Fig 11. Response of a commercial LWD density tool in a vertical well, laminated beds, from Monte Carlo modeling (Courtesy of R. J. Radtke, Schlumberger). Note the anti-correlation of the computed density with the actual density in the 4-inch bed.
2.0 g/cm3 2.6 g/cm3
0

1st SPWLA India Regional Conference, March 19-20, 2007
-18
-12
-6
0
6
12
18
2 in 4 in 8 in 10 in
SS LS Compensated Alpha-processed
Fig 12. Response of a commercial LWD density tool in a horizontal well, laminated beds, from Monte Carlo modeling (Courtesy of R. J. Radtke, Schlumberger).
2.6 g/cm3
2.0 g/cm3
0
Fig 13a. Schematic of an 8-inch OD LWD density tool rotating in an 8-inch thick high-density bed in-between two eight- inch thick low- density beds (shaded), it rotates in a circular horizontal well, fully in gauge.
Fig 13b. Schematic of an 8- inch OD LWD density tool placed at the interface of a 4- inch thick high-density bed and a 4- inch thick low density (shaded) bed as it rotates in a circular horizontal well, fully in gauge.

1st SPWLA India Regional Conference, March 19-20, 2007
Fig 14. Schematic of a commercial nuclear LWD tool (Holenka, et. al, 1995). Note the nominal near-zero stand-off of the density sonde and the built- in stand-off of the neutron sonde, when stabilized.

1st SPWLA India Regional Conference, March 19-20, 2007
Fig 15a. Schematic of an 8-inch OD LWD density tool rotating in an 8-inch thick high-density bed in-between two eight- inch thick low-density (shaded) beds as the tool rotates in an elliptical horizontal well.
Fig 15b. Schematic of an 8- inch OD LWD density tool placed at the interface of a 4- inch thick high-density bed and a 4-inch thick low density (shaded) bed as the tool rotates in an elliptical horizontal well.

1st SPWLA India Regional Conference, March 19-20, 2007


