Embed Size (px)
Citation preview
ACETIC ANHYDRIDE
Method no.:
Matrix:
Target concentration:
Procedure:
Recommended air volume and sampling rate:
Reliable quantitation limit:
Standard error of estimate at the target concentration:(Section 4.7.)
Special caution:
Status of method:
Date: April 1990
82
Air
5 ppm (20 mg/m3)
Samples are collected by drawing air through glass fiber filters impregnated with 2.5 mg of 1-(2-pyridyl)piperazine (1-2PP). Samples are extracted with 50:50 (v/v) 2-propanol/toluene containingbenzalazine as an internal standard and analyzed by GC using a nitrogen-phosphorus detector (NPD).
0.75 L at 0.05 L/min
0.17 ppm (0.68 mg/m3)
7.5%
The method is subject to interference from ketene and acetylchloride.
Evaluated method. This method has been subjected to the establishedevaluation procedures of the Organic Methods Evaluation Branch.
Chemist: Yihlin Chan
Organic Methods Evaluation BranchOSHA Analytical Laboratory
Salt Lake City, Utah
Withdrawn Provided for Historical Reference Only
Note: OSHA no longer uses or supports this method (December 2019).
WITHDRAWN
1. General Discussion
1.1. Background
1.1.1. History
The current NIOSH method (Ref. 5.1.) for monitoring airborne acetic anhydride specifies collection with a midget bubbler containing alkaline hydroxylamine and analysis by spectrophotometry. The bubbler is cumbersome and spectrophotometry is nonspecific. Airborne acetic anhydride has also been collected on Porapak N solid sorbent and analyzedby GC/FID (Ref. 5.2.). However, the samples can not be stored for more than10 days without significant degradation, even with freezing. A more convenient sampling method using glass beads coated with 1-2PP has beenreported (Ref. 5.3.). The derivative, 1-acetyl-4-(2-pyridyl)piperazine (AcPP), was analyzed by high performance thin layer chromatography. The derivatization stabilizes the analyte and eliminates the interference from acetic acid. It is recognized that ketene and acetyl chloride will also react with 1-2PP to form AcPP, but neither chemical is used widely in industry (Ref. 5.4.).
In this method, a glass fiber filter (GFF) impregnated with 1-2PP was selected as the sampling medium and the derivative (AcPP) was analyzed byGC/NPD. Analysis by HPLC/UV is also possible, but not as sensitive as GC/NPD. A flow rate of 0.05 L/min was selected because capacity of the sampler was reduced at higher flow rates. Samples are collected closed-face to minimize contamination. The problem of the analyte concentrating in thecenter of the filter is minimized by the use of an extra spacer in the cassette.
1.1.2. Toxic effects (This section is for information only and should not be taken asthe basis of OSHA policy.) (Ref. 5.5. and 5.6.)
Acetic anhydride vapors may be irritating to the eyes, nose and throat. Inhalation of vapors may cause severe irritation of the respiratory system. Due to its irritating effects, a ceiling value of 5 ppm (20 mg/m3) is set for OSHA PEL. Contact with the skin or eyes may cause burns. Ingestion may cause severe burns of the mouth, throat, and stomach. Ingestion may also cause nausea and vomiting.
1.1.3. Workplace exposure
Exposure to acetic anhydride may occur in the following operations: manufacture of cellulose esters, fibers, plastics, lacquers, protective coatingsolutions, photographic films, cigarette filters, magnetic tape, and thermoplastic
Withdrawn Provided for Historical Reference Only
Note: OSHA no longer uses or supports this method (December 2019).
WITHDRAWN
molding compositions; manufacture of pharmaceuticals and pharmaceuticalintermediates; use in organic synthesis as an acetylating agent, bleachingagent, and dehydrating agent; synthesis of perfume chemicals, explosives,and weed killers; use in acetylation of animal and vegetables oils; use as anacetylating agent and dehydrating agent in textile dyeing, chemical treatmentof paper, and chemical analysis. (Ref. 5.7.) Of these, by far the greatest single application for acetic anhydride is in the manufacture of cellulose esters. It is estimated that 95% of the total U.S. production is used for this purpose. (Ref. 5.8.)
1.1.4. Physical properties and other descriptive information (Ref. 5.9. unless notedotherwise)
chemical name: acetic anhydride CAS no.: 108-24-7 synonyms: acetic acid, anhydride; acetic oxide; acetyl anhydride;
acetyl ether; acetyl oxide; ethanoic anhydrate formula: (CH3CO)2O mol wt: 102.10 boiling point: 139EC melting point: -73EC vapor pressure: 0.67 kPa (5 mmHg) at 25EC (Ref.5.10.)flash point: 49EC (closed cup)specific gravity: 1.080 color: colorless odor: strong acetic odor
Derivative: (Ref. 5.11.)chemical name: 1-acetyl-4-(2-pyridyl)piperazine structural formula: Figure 1.1.4. mol wt: 205.27 melting point: 89.5-91.5EC solubility: soluble in methanol, acetonitrile, toluene, isopropanol,
methylene chloride mass spectrum: Figure 1.1.4.
The analyte air concentrations throughout this method are based on the recommended sampling andanalytical parameters. Air concentrations listed in ppm are referenced to 25EC and 101 kPa (760 mmHg). The analyte concentrations are listed as those of acetic anhydride even though the derivative is the actual species analyzed.
Withdrawn Provided for Historical Reference Only
Note: OSHA no longer uses or supports this method (December 2019).
WITHDRAWN
1.2. Limit defining parameters
1.2.1. Detection limit of the analytical procedure
The detection limit of the analytical procedure is 11 pg on column (1.0 µL injection of 0.076 µg/mL solution with 7:1 split). This is the amount of analyte which gave a peak with height about 5 times the baseline noise. (Section 4.1.)
1.2.2. Detection limit of the overall procedure
The detection limit of the overall procedure is 0.51 µg per sample (0.16 ppm,0.68 mg/m3). This is the amount of analyte spiked on the sampling devicewhich allows recovery of an amount equivalent to the detection limit of theanalytical procedure. (Section 4.2.)
1.2.3. Reliable quantitation limit
The reliable quantitation limit is 0.51 µg per sample (0.16 ppm, 0.68 mg/m3).This is the smallest amount of analyte spiked on the sampling device whichcan be quantitated within the requirements of a recovery of at least 75% anda precision (±1.96 SD) of ±25% or better. (Section 4.3.)
The reliable quantitation limit and detection limits reported in the method are basedupon optimization of the instrument for the smallest possible amount of the analyte. When the target concentration of the analyte is exceptionally higher than these limits,they may not be attainable at the routine operating parameters.
1.2.4. Instrument response to the analyte
The instrument response over the concentration range of 0.5 to 2 times the target concentration is linear. (Section 4.4.)
1.2.5. Recovery
The recovery of AcPP from samples used in a 15-day storage test remainedabove 83% when the samples were stored at ambient temperature. (Section4.5.) The recovery of an analyte from the collection medium during storagemust be 75% or greater.
1.2.6. Precision (analytical procedure only)
Nine analytical standards were prepared from three stock standards (individually prepared) by making serial dilutions to represent 0.5, 1, and 2times the target concentration.
Withdrawn Provided for Historical Reference Only
Note: OSHA no longer uses or supports this method (December 2019).
WITHDRAWN
The pooled coefficient of variation obtained from duplicate injections of thenine analytical standards is 0.034. (Section 4.6.)
1.2.7. Precision (overall procedure)
The precision at the 95% confidence level for the ambient 15-day storage testis ±14.7%. (Section 4.7.) This includes an additional ±5% for pump error. The overall procedure must provide results at the target concentration that are±25% or better at the 95% confidence level.
1.2.8. Reproducibility
A draft copy of this procedure and six samples collected from a controlled test atmosphere at the target concentration [80% RH, 23EC, 87.7 kPa (658 mmHg)] were given to a chemist unassociated with this evaluation. The samples were stored in a refrigerator at 0EC for l day before being analyzed. No individual sample result deviated from its theoretical value by more thanthe precision reported in Section 1.2.7. (Section 4.8.)
1.3. Advantage
The acetic anhydride is derivatized in situ, eliminating the possibility of its beinghydrolyzed during storage.
1.4. Disadvantage
The method is subject to interference from ketene and acetyl chloride.
2. Sampling Procedure
2.1. Apparatus
2.1.1. A personal sampling pump that can be calibrated to within ±5% of the recommended flow rate with the sampling device in line.
2.1.2. A four-piece polystyrene cassette containing two glass fiber filters each impregnated with 2.5 mg of 1-2PP. Impregnated filters are prepared byapplying 0.5 mL of a solution of 5.0 mg/mL 1-2PP in methylene chloride toeach glass fiber filter and allowing them to dry in a hood. Impregnated filtersshould be stored in a closed jar at reduced temperature before assembly.
2.1.3. Assemble the cassette by placing the extra spacer in front of the first filter. (Figure 2.3.1.)
Withdrawn Provided for Historical Reference Only
Note: OSHA no longer uses or supports this method (December 2019).
WITHDRAWN
2.2. Reagents
No reagent is required for sampling.
2.3. Sampling technique
2.3.1. Remove the plugs from the top and bottom pieces. Attach the sampler to thesampling pump with a piece of flexible tubing and place it in the worker's breathing zone.
2.3.2. Replace the small plugs after sampling. Seal the sample end-to-end with an official OSHA seal (Form 21).
2.3.3. Submit at least one blank with each set of samples. Handle the blank the same as the other samples except draw no air through it.
2.3.4. List any potential interferences on the sample data sheet.
2.4. Sampler capacity
The sampler capacity was evaluated with a test atmosphere (80% RH) at 1.7 timesthe target concentration. Two samplers were placed in series. The upstream samplercontained only the front filter. The back sampler was replaced with a new samplerevery 20 min to monitor the downstream air concentration. The 5% breakthroughpoint, defined as the point where the downstream analyte concentration is 5% of the upstream concentration, was reached at 180 min of sampling at the recommended sampling rate. (Section 4.9.)
2.5. Extraction efficiency and stability of extracted samples (Section 4.10.)
2.5.1. The average extraction efficiency at the target concentration was 97.7%.
2.5.2. Extracted samples remain stable for at least 24 h when stored at room temperature.
2.6. Recommended air volume and sampling rate
2.6.1. The recommended air volume is 0.75 L.
2.6.2. The recommended air sampling rate is 0.05 L/min.
2.7. Interferences (sampling)
Compounds that can react with 1-2PP, such as isocyanates, acid chlorides, and otheranhydrides, may interfere by consuming part of the derivatizing agent. Acetyl chloride and ketene cause positive interferences.
Withdrawn Provided for Historical Reference Only
Note: OSHA no longer uses or supports this method (December 2019).
WITHDRAWN
2.8. Safety precautions (sampling)
Attach the sampling equipment to the worker in such a manner that it will not interfere with work performance or safety. Follow all safety practices applicable to the work area.
3. Analytical Procedure
3.1. Apparatus
3.1.1. A GC equipped with a nitrogen-phosphorus detector (NPD). A Hewlett-Packard 5890 GC equipped with an NPD and a 7673A autosampler was usedin this evaluation.
3.1.2. A GC column capable of separating AcPP, benzalazine, and anyinterferences. A 15 m SPB-5 (0.32-mm i.d., 1-µm film) column was used inthis evaluation.
3.1.3. An electronic integrator or other suitable means of measuring detector response. A Hewlett-Packard 3357 laboratory data system was used in thisevaluation.
3.1.4. Scintillation vials, 20 mL.
3.1.5. Volumetric flasks and pipets.
3.2. Reagents
3.2.1. Acetic anhydride. Acetic anhydride, ACS reagent grade, was obtained from Aldrich Chemical.
3.2.2. 1-(2-Pyridyl)piperazine. 1-(2-Pyridyl)piperazine, 98%, was obtained from Aldrich Chemical.
3.2.3. 1-Acetyl-4-(2-pyridyl)piperazine (AcPP). Synthesized as in Section 4.12.
3.2.4. Benzalazine. Benzalazine from K & K was used in this evaluation.
3.2.5. Toluene. Toluene was obtained from American Burdick and Jackson.
3.2.6. 2-Propanol. 2-Propanol, Optima, from Fisher was used.
3.2.7. Extraction solvent with internal standard. Dissolve 10 mg of benzalazine in 1 L of toluene/2-propanol (50:50).
3.3. Standard preparation
3.3.1. Prepare stock standards by weighing 10-20 mg of AcPP (prepared as in Section 4.12.) in l0-mL volumetric flasks and diluting to volume with theextraction solvent. Apply a factor of 0.4973 to the weight of AcPP to convertit to
Withdrawn Provided for Historical Reference Only
Note: OSHA no longer uses or supports this method (December 2019).
WITHDRAWN

Withdrawn Provided for Historical Reference Only
Note: OSHA no longer uses or supports this method (December 2019).
WITHDRAWN
that of free acetic anhydride. For example, 10 mg of AcPP dissolved in 10mL will give a standard stock solution representing 0.4973 mg/mL or 497.3µg/mL of acetic anhydride.
(MW acetic anhydride)/(MW AcPP) = 102.09/205.27 = 0.4973
3.3.2. Prepare analytical standards by further diluting the stock standards with theextraction solvent. An analytical standard of 3.0 µg/mL represents 1 timesthe target concentration.
3.3.3. Prepare a sufficient number of standards to generate calibration curves. Analytical standard concentrations must bracket sample concentrations.
3.4. Sample preparation
3.4.1. Transfer the front and the back filters into separate 20-mL scintillation vials.
3.4.2. Add 5.0 mL of the extraction solvent to each vial.
3.4.3. Cap the vials and shake them on a mechanical shaker for 1 h.
3.5. Analysis
3.5.1. GC conditions
column: SPB-5 (15 m, 0.32-mm i.d., 1-µm film) zone temperatures: column- 170EC to 250EC at 10EC/min
injector- 200EC detector- 250EC
gas flows (mL/min): hydrogen (carrier)- 3.0 nitrogen - 27 air - 95 hydrogen - 3.8
injection volume: 1 µL (with a 7:1 split)retention times (min): 1-2PP- 1.73
benzalazine- 4.27 AcPP- 4.64
chromatogram: Figure 3.5.1.
3.5.2. Measure detector response using a suitable method such as electronic integration.
3.5.3. Construct a calibration curve using an internal standard method by plottingµg/mL versus ISTD-corrected response of standard injections. Bracket the samples with analytical standards.
Withdrawn Provided for Historical Reference Only
Note: OSHA no longer uses or supports this method (December 2019).
WITHDRAWN
3.6. Interferences (analytical)
3.6.1. Any compound that responds on an NPD and has a similar retention time asbenzalazine or AcPP is a potential interference. Generally, chromatographicconditions can be altered to separate an interference.
3.6.2. Ketene and acetyl chloride, being able to react with 1-2PP to form AcPP, areinterferences.
3.6.3. Retention time on a single column is not considered proof of chemical identity. Analyte identity should be confirmed by GC/mass spectrometry if possible. The mass spectrum of AcPP is shown in Figure 1.1.3.
3.7. Calculations
The analyte concentration for samples is obtained from the calibration curve in termsof micrograms per milliliter uncorrected for extraction efficiency. The concentrations are converted to µg per sample bymultiplying with 5.0 mL (extractionvolume). The back filter is analyzed primarily to determine if there was anybreakthrough from the front filter during sampling. If a significant amount of analyteis found on the back filter (e.g., greater than 25% of the amount found on the frontfilter), this fact should be reported with sample results. If any analyte is found on theback filter, it is added to the amount found on the front filter. This total analyte amount is corrected by subtracting the amount found in the blank. The air concentration is obtained by using the following formula.
(micrograms of analyte per sample) mg/m3 = (liters of air sampled)(extraction efficiency)
where extraction efficiency = 0.977
(mg/m3) (24.46) ppm = (102.09)
where 24.46 = molar volume (liters) at 101 kPa (760 mmHg) and 25EC 102.09 = molecular weight of acetic anhydride
3.8. Safety precautions (analytical)
Avoid skin contact and inhalation of all chemicals. Restrict the use of all chemicals to a fume hood when possible. Wear safety glasses and a lab coat at all times while in the lab area.
Withdrawn Provided for Historical Reference Only
Note: OSHA no longer uses or supports this method (December 2019).
WITHDRAWN
4. Backup Data
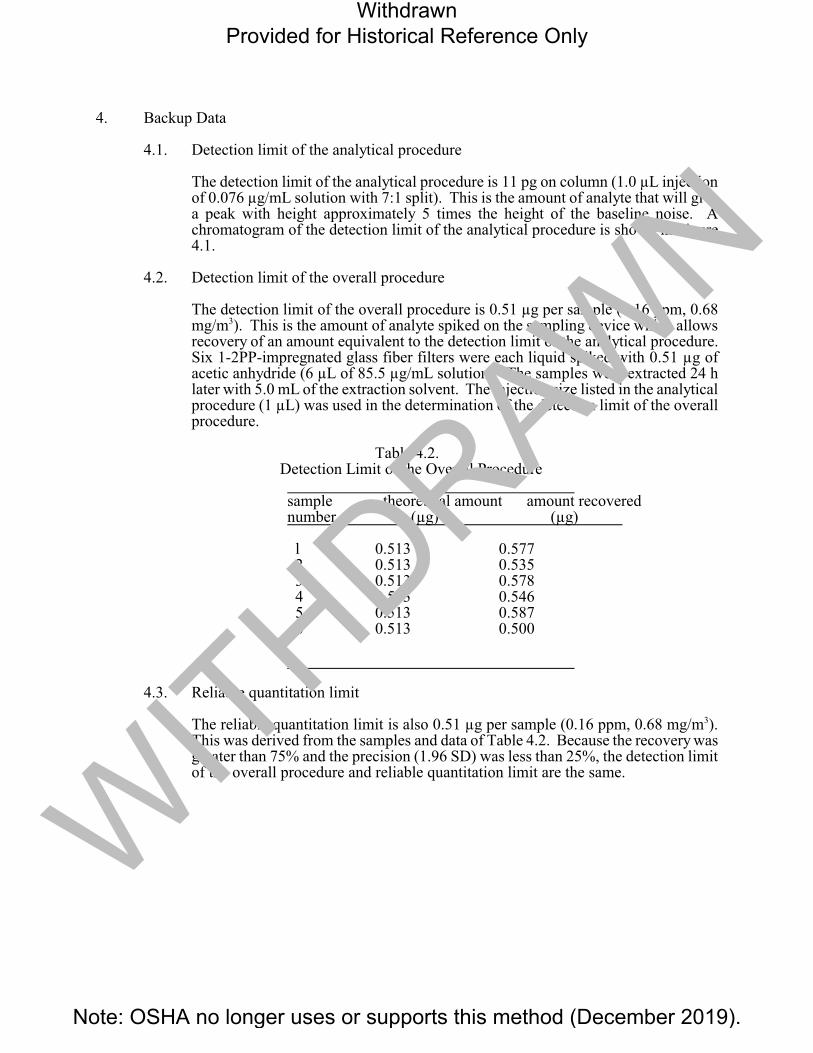
4.1. Detection limit of the analytical procedure
The detection limit of the analytical procedure is 11 pg on column (1.0 µL injectionof 0.076 µg/mL solution with 7:1 split). This is the amount of analyte that will give a peak with height approximately 5 times the height of the baseline noise. A chromatogram of the detection limit of the analytical procedure is shown in Figure4.1.
4.2. Detection limit of the overall procedure
The detection limit of the overall procedure is 0.51 µg per sample (0.16 ppm, 0.68mg/m3). This is the amount of analyte spiked on the sampling device which allowsrecovery of an amount equivalent to the detection limit of the analytical procedure. Six 1-2PP-impregnated glass fiber filters were each liquid spiked with 0.51 µg ofacetic anhydride (6 µL of 85.5 µg/mL solution). The samples were extracted 24 h later with 5.0 mL of the extraction solvent. The injection size listed in the analyticalprocedure (1 µL) was used in the determination of the detection limit of the overallprocedure.
Table 4.2. Detection Limit of the Overall Procedure
sample theoretical amount amount recovered number (µg) (µg)
l 0.513 0.577 2 0.513 0.535 3 0.513 0.578 4 0.513 0.546 5 0.513 0.587 6 0.513 0.500
4.3. Reliable quantitation limit
The reliable quantitation limit is also 0.51 µg per sample (0.16 ppm, 0.68 mg/m3).This was derived from the samples and data of Table 4.2. Because the recovery wasgreater than 75% and the precision (1.96 SD) was less than 25%, the detection limitof the overall procedure and reliable quantitation limit are the same.
Withdrawn Provided for Historical Reference Only
Note: OSHA no longer uses or supports this method (December 2019).
WITHDRAWN
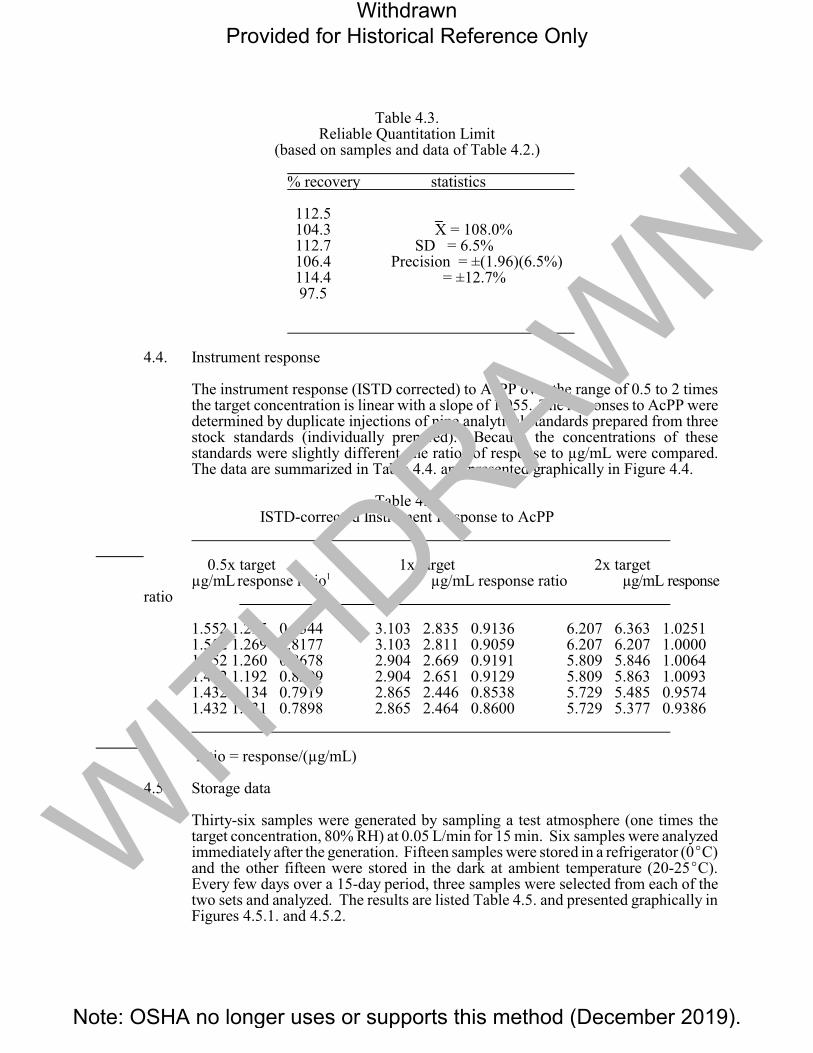
Table 4.3. Reliable Quantitation Limit
(based on samples and data of Table 4.2.)
% recovery statistics
112.5 104.3 X = 108.0% 112.7 SD = 6.5% 106.4 Precision = ±(1.96)(6.5%)114.4 = ±12.7% 97.5
4.4. Instrument response
The instrument response (ISTD corrected) to AcPP over the range of 0.5 to 2 timesthe target concentration is linear with a slope of 1.055. The responses to AcPP weredetermined by duplicate injections of nine analytical standards prepared from threestock standards (individually prepared). Because the concentrations of these standards were slightly different, the ratios of response to µg/mL were compared.The data are summarized in Table 4.4. and presented graphically in Figure 4.4.
Table 4.4. ISTD-corrected Instrument Response to AcPP
0.5x target 1x target 2x target µg/mL response ratio1 µg/mL response ratio µg/mL response
ratio
1.552 1.295 0.8344 3.103 2.835 0.9136 6.207 6.363 1.0251 1.552 1.269 0.8177 3.103 2.811 0.9059 6.207 6.207 1.0000 1.452 1.260 0.8678 2.904 2.669 0.9191 5.809 5.846 1.0064 1.452 1.192 0.8209 2.904 2.651 0.9129 5.809 5.863 1.0093 1.432 1.134 0.7919 2.865 2.446 0.8538 5.729 5.485 0.9574 1.432 1.131 0.7898 2.865 2.464 0.8600 5.729 5.377 0.9386
1ratio = response/(µg/mL)
4.5. Storage data
Thirty-six samples were generated by sampling a test atmosphere (one times the target concentration, 80% RH) at 0.05 L/min for 15 min. Six samples were analyzedimmediately after the generation. Fifteen samples were stored in a refrigerator (0EC)and the other fifteen were stored in the dark at ambient temperature (20-25EC).Every few days over a 15-day period, three samples were selected from each of thetwo sets and analyzed. The results are listed Table 4.5. and presented graphically inFigures 4.5.1. and 4.5.2.
Withdrawn Provided for Historical Reference Only
Note: OSHA no longer uses or supports this method (December 2019).
WITHDRAWN

Withdrawn Provided for Historical Reference Only
Note: OSHA no longer uses or supports this method (December 2019).
WITHDRAWN
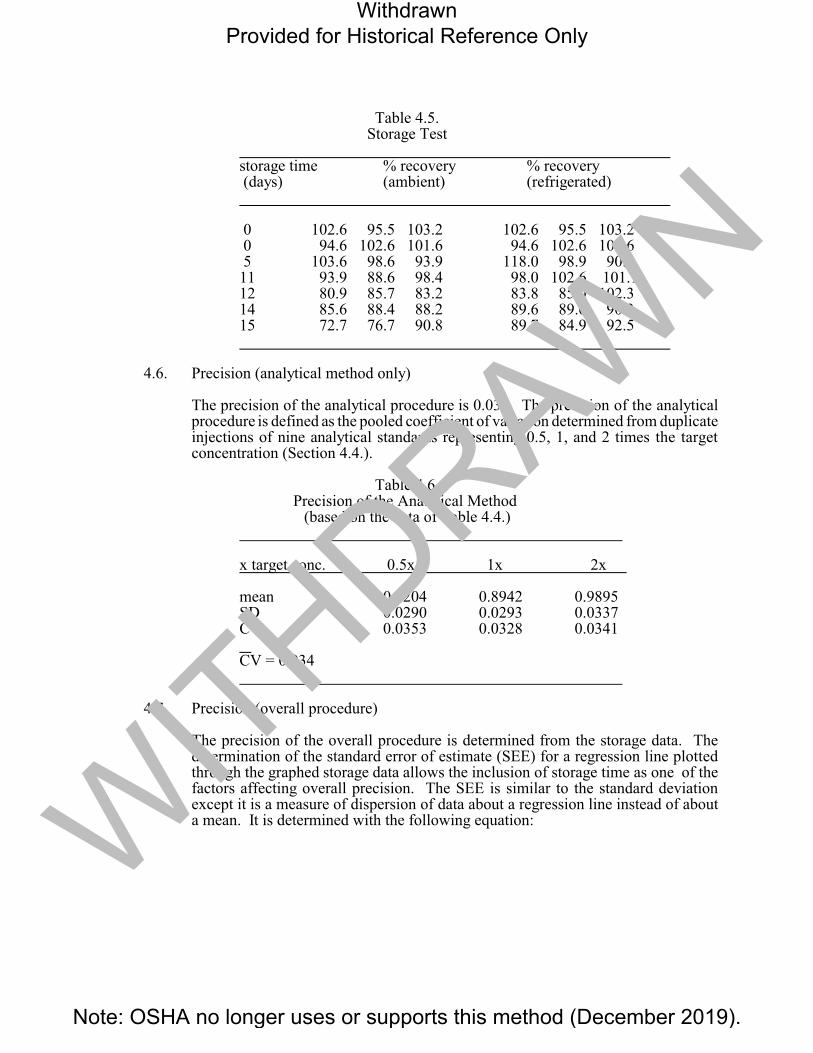
Table 4.5. Storage Test
storage time % recovery % recovery (days) (ambient) (refrigerated)
0 102.6 95.5 103.2 102.6 95.5 103.2 0 94.6 102.6 101.6 94.6 102.6 101.6 5 103.6 98.6 93.9 118.0 98.9 90.4 11 93.9 88.6 98.4 98.0 102.6 101.1 12 80.9 85.7 83.2 83.8 85.0 102.3 14 85.6 88.4 88.2 89.6 89.6 90.3 15 72.7 76.7 90.8 89.7 84.9 92.5
4.6. Precision (analytical method only)
The precision of the analytical procedure is 0.034. The precision of the analyticalprocedure is defined as the pooled coefficient of variation determined from duplicateinjections of nine analytical standards representing 0.5, 1, and 2 times the target concentration (Section 4.4.).
Table 4.6. Precision of the Analytical Method
(based on the data of Table 4.4.)
x target conc. 0.5x 1x 2x
mean 0.8204 0.8942 0.9895 SD 0.0290 0.0293 0.0337 CV 0.0353 0.0328 0.0341
CV = 0.034
4.7. Precision (overall procedure)
The precision of the overall procedure is determined from the storage data. The determination of the standard error of estimate (SEE) for a regression line plottedthrough the graphed storage data allows the inclusion of storage time as one of the factors affecting overall precision. The SEE is similar to the standard deviation except it is a measure of dispersion of data about a regression line instead of about a mean. It is determined with the following equation:
Withdrawn Provided for Historical Reference Only
Note: OSHA no longer uses or supports this method (December 2019).
WITHDRAWN
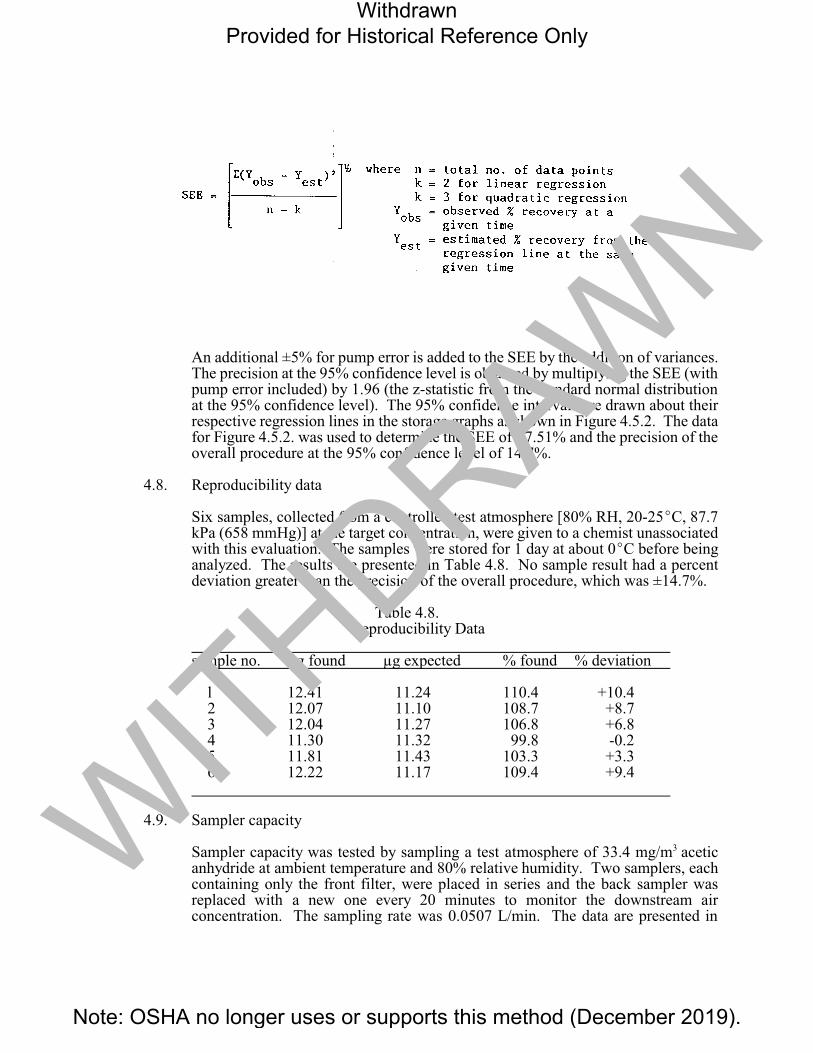
An additional ±5% for pump error is added to the SEE by the addition of variances. The precision at the 95% confidence level is obtained by multiplying the SEE (withpump error included) by 1.96 (the z-statistic from the standard normal distributionat the 95% confidence level). The 95% confidence intervals are drawn about their respective regression lines in the storage graphs as shown in Figure 4.5.2. The data for Figure 4.5.2. was used to determine the SEE of ±7.51% and the precision of theoverall procedure at the 95% confidence level of 14.7%.
4.8. Reproducibility data
Six samples, collected from a controlled test atmosphere [80% RH, 20-25EC, 87.7 kPa (658 mmHg)] at the target concentration, were given to a chemist unassociatedwith this evaluation. The samples were stored for 1 day at about 0EC before beinganalyzed. The results are presented in Table 4.8. No sample result had a percentdeviation greater than the precision of the overall procedure, which was ±14.7%.
Table 4.8. Reproducibility Data
sample no. µg found µg expected % found % deviation
l 12.41 11.24 110.4 +10.4 2 12.07 11.10 108.7 +8.7 3 12.04 11.27 106.8 +6.8 4 11.30 11.32 99.8 -0.2 5 11.81 11.43 103.3 +3.3 6 12.22 11.17 109.4 +9.4
4.9. Sampler capacity
Sampler capacity was tested by sampling a test atmosphere of 33.4 mg/m3 acetic anhydride at ambient temperature and 80% relative humidity. Two samplers, each containing only the front filter, were placed in series and the back sampler was replaced with a new one every 20 minutes to monitor the downstream air concentration. The sampling rate was 0.0507 L/min. The data are presented in
Withdrawn Provided for Historical Reference Only
Note: OSHA no longer uses or supports this method (December 2019).
WITHDRAWN

Figure 4.9. The 5% breakthrough point, defined as the point where the downstreamanalyte concentration reaches 5% of the upstream concentration, was 180 min.
82-15
Withdrawn Provided for Historical Reference Only
Note: OSHA no longer uses or supports this method (December 2019).
WITHDRAWN
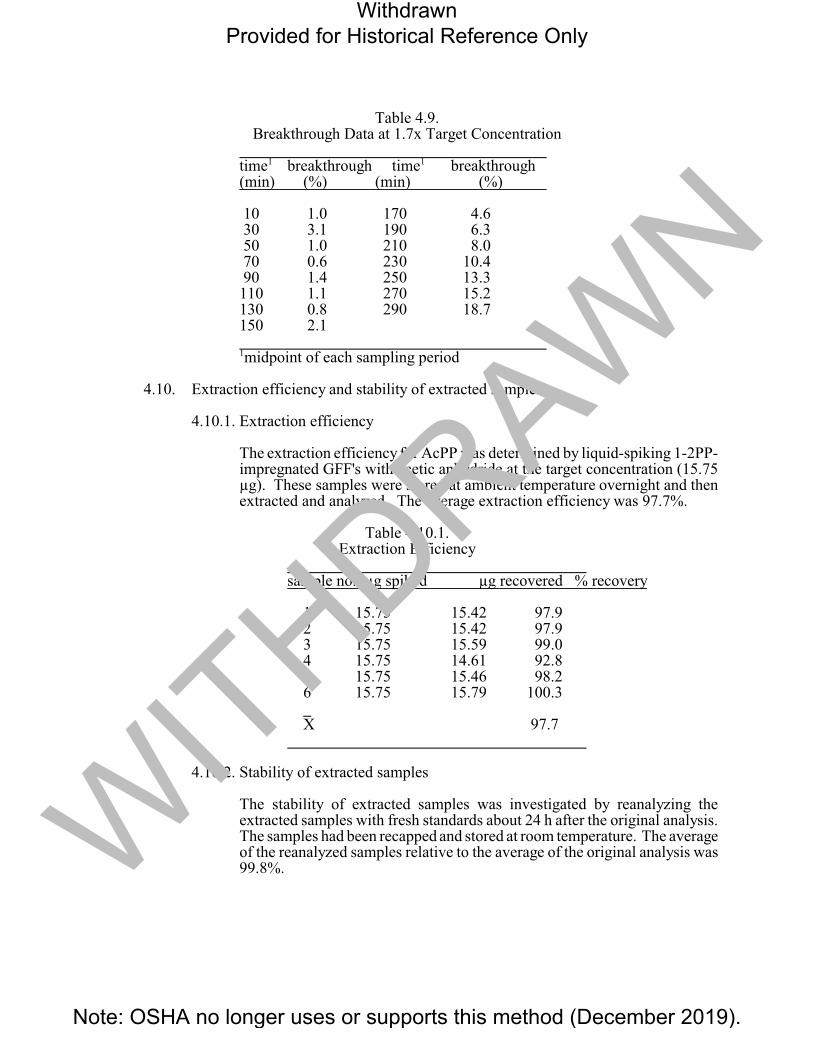
Table 4.9. Breakthrough Data at 1.7x Target Concentration
time1 breakthrough time1 breakthrough (min) (%) (min) (%)
10 1.0 170 4.6 30 3.1 190 6.3 50 1.0 210 8.0 70 0.6 230 10.4 90 1.4 250 13.3 110 1.1 270 15.2 130 0.8 290 18.7 150 2.1
1midpoint of each sampling period
4.10. Extraction efficiency and stability of extracted samples
4.10.1. Extraction efficiency
The extraction efficiency for AcPP was determined by liquid-spiking 1-2PP-impregnated GFF's with acetic anhydride at the target concentration (15.75 µg). These samples were stored at ambient temperature overnight and thenextracted and analyzed. The average extraction efficiency was 97.7%.
Table 4.10.1. Extraction Efficiency
sample no. µg spiked µg recovered % recovery
1 15.75 15.42 97.9 2 15.75 15.42 97.9 3 15.75 15.59 99.0 4 15.75 14.61 92.8 5 15.75 15.46 98.2 6 15.75 15.79 100.3
X 97.7
4.10.2. Stability of extracted samples
The stability of extracted samples was investigated by reanalyzing the extracted samples with fresh standards about 24 h after the original analysis. The samples had been recapped and stored at room temperature. The averageof the reanalyzed samples relative to the average of the original analysis was99.8%.
Withdrawn Provided for Historical Reference Only
Note: OSHA no longer uses or supports this method (December 2019).
WITHDRAWN
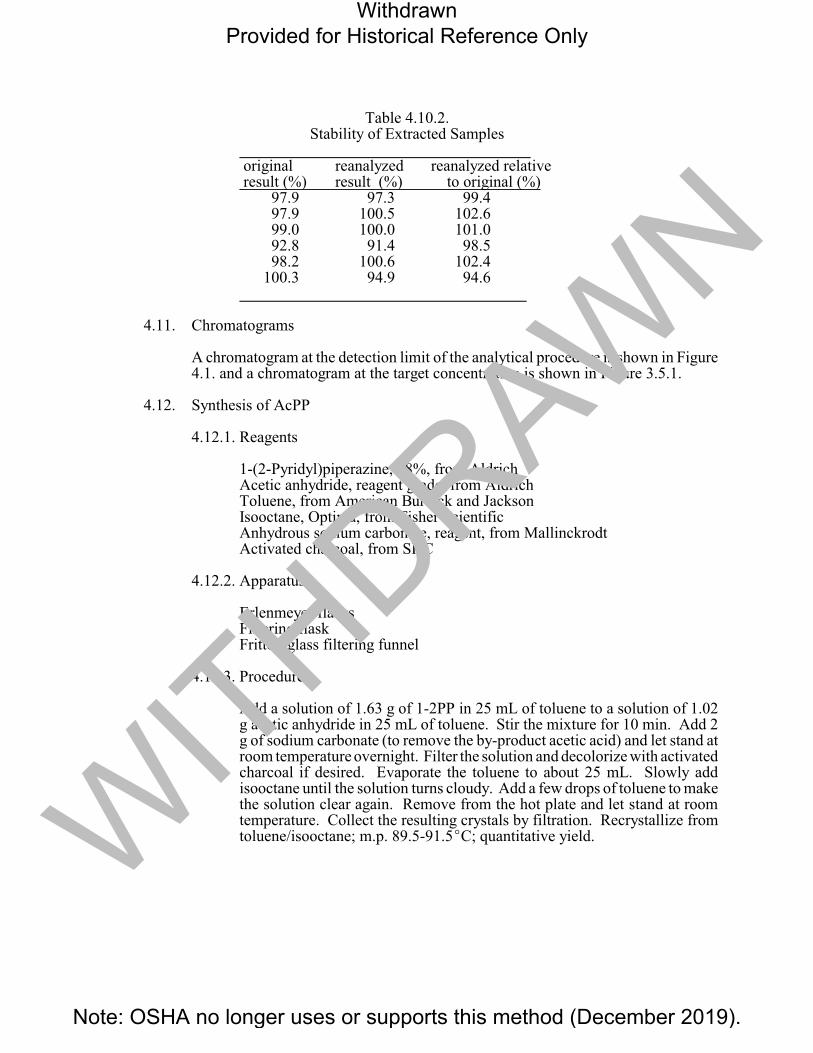
Table 4.10.2. Stability of Extracted Samples
original result (%)
97.9
reanalyzed result (%)
97.3
reanalyzed relative to original (%)
99.4 97.9 100.5 102.6 99.0 100.0 101.0 92.8 91.4 98.5 98.2 100.6 102.4
100.3 94.9 94.6
4.11. Chromatograms
A chromatogram at the detection limit of the analytical procedure is shown in Figure4.1. and a chromatogram at the target concentration is shown in Figure 3.5.1.
4.12. Synthesis of AcPP
4.12.1. Reagents
1-(2-Pyridyl)piperazine, 98%, from Aldrich Acetic anhydride, reagent grade, from Aldrich Toluene, from American Burdick and Jackson Isooctane, Optima, from Fisher Scientific Anhydrous sodium carbonate, reagent, from Mallinckrodt Activated charcoal, from SKC
4.12.2. Apparatus
Erlenmeyer flasksFiltering flaskFritted-glass filtering funnel
4.12.3. Procedure
Add a solution of 1.63 g of 1-2PP in 25 mL of toluene to a solution of 1.02g acetic anhydride in 25 mL of toluene. Stir the mixture for 10 min. Add 2 g of sodium carbonate (to remove the by-product acetic acid) and let stand atroom temperature overnight. Filter the solution and decolorize with activatedcharcoal if desired. Evaporate the toluene to about 25 mL. Slowly add isooctane until the solution turns cloudy. Add a few drops of toluene to make the solution clear again. Remove from the hot plate and let stand at room temperature. Collect the resulting crystals by filtration. Recrystallize from toluene/isooctane; m.p. 89.5-91.5EC; quantitative yield.
Withdrawn Provided for Historical Reference Only
Note: OSHA no longer uses or supports this method (December 2019).
WITHDRAWN
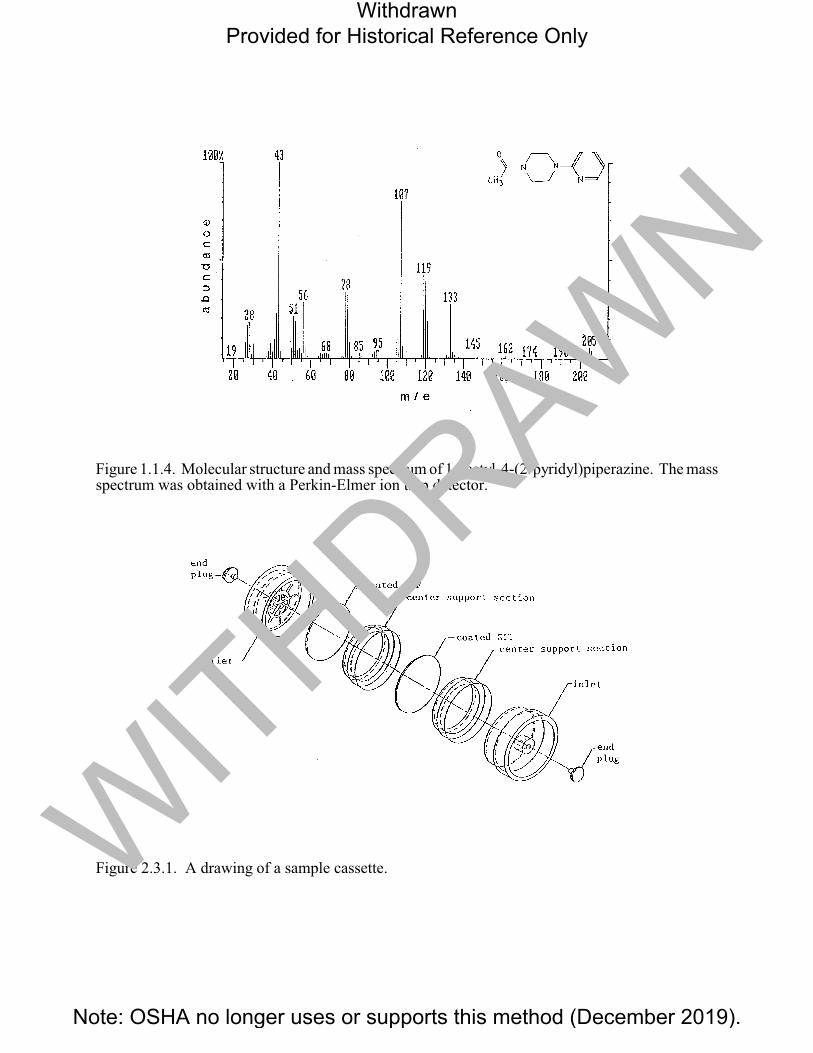
Figure 1.1.4. Molecular structure and mass spectrum of 1-acetyl-4-(2-pyridyl)piperazine. The massspectrum was obtained with a Perkin-Elmer ion trap detector.
Figure 2.3.1. A drawing of a sample cassette.
Withdrawn Provided for Historical Reference Only
Note: OSHA no longer uses or supports this method (December 2019).
WITHDRAWN
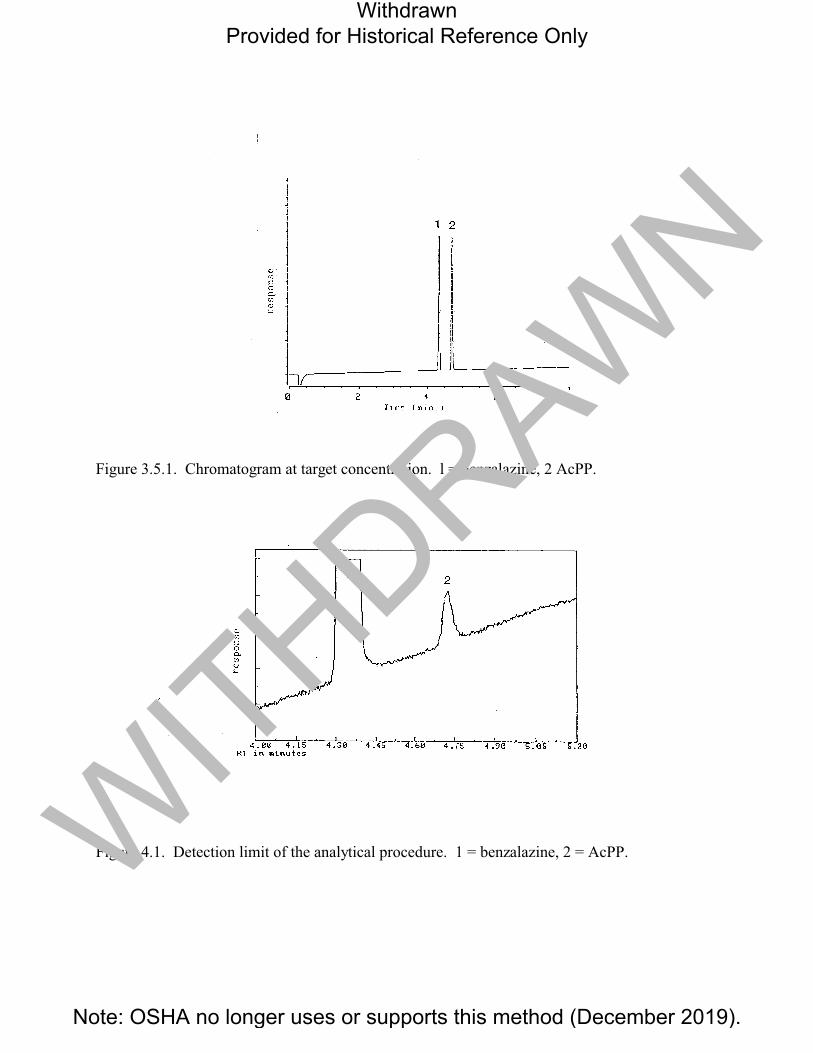
Figure 3.5.1. Chromatogram at target concentration. l = benzalazine, 2 AcPP.
Figure 4.1. Detection limit of the analytical procedure. 1 = benzalazine, 2 = AcPP.
Withdrawn Provided for Historical Reference Only
Note: OSHA no longer uses or supports this method (December 2019).
WITHDRAWN
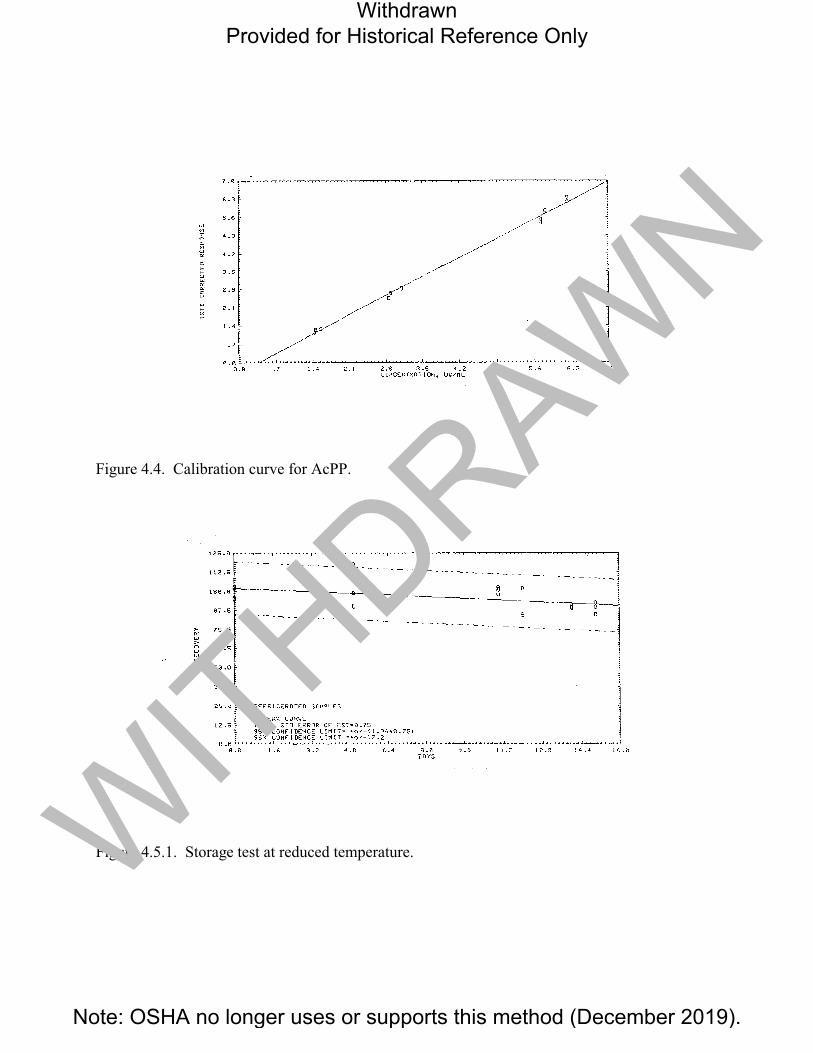
Figure 4.4. Calibration curve for AcPP.
Figure 4.5.1. Storage test at reduced temperature.
Withdrawn Provided for Historical Reference Only
Note: OSHA no longer uses or supports this method (December 2019).
WITHDRAWN
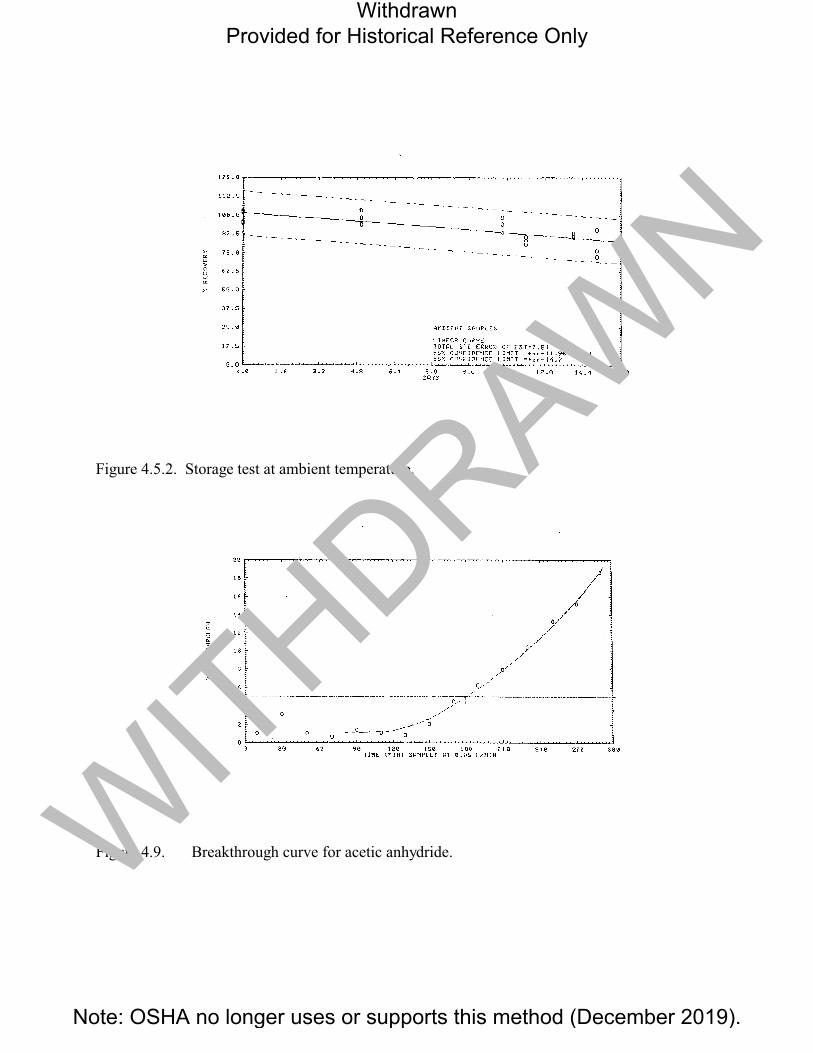
Figure 4.5.2. Storage test at ambient temperature.
Figure 4.9. Breakthrough curve for acetic anhydride.
Withdrawn Provided for Historical Reference Only
Note: OSHA no longer uses or supports this method (December 2019).
WITHDRAWN
5. References
5.1. Method No. 3506 in "NIOSH Manual of Analytical Methods", 3rd edition, 1985 Supplement, U.S. Department of Health and Human Services, Center for Disease Control, NIOSH; Cincinnati, OH, 1986.
5.2. Qazi, A.H. and Vincent, W.J., "Sampling and Analysis of Acetic Anhydride in Air", Am. Ind. Hyg. Assoc. J., 40(9): 803-808 (1979).
5.3. Langhorst, M.L., "Monitoring Airborne Reactive Chemicals by Derivatization and High Performance Thin Layer Chromatography - Anhydrides, Acid Halides, Isocyanates", Am. Ind. Hyg. Assoc. J., 46(5): 236-243 (1985).
5.4. Standen, A., Ed., "Kirk-Othmer Encyclopedia of Chemical Technology", 3rd edition,Volume 1, p. 163. Interscience Publishers, New York, N.Y., 1984.
5.5. J.T. Baker Material Safety Data Sheets (MSDS).
5.6. "Air Contaminants - Permissible Exposure Limits", Code of Federal Regulations,Title 29; 1910.1000, U.S. Department of Labor, OSHA; Washington, D.C., 1989,DOL (OSHA) Publ. No. OSHA 3112.
5.7. "NIOSH/OSHA Occupational Health Guidelines for Chemical Hazards", U.S. Department of Health and Human Services, Government Printing Office, DHHS(NIOSH) Publication No. 81-123.
5.8. Reference 5.4. Volume 1, p. 158.
5.9. Sweet, D.V., Ed., "Registry of Toxic Effects of Chemical Substances", 1985-86 edition, U.S. Department of Health and Human Services, Government PrintingOffice, DHHS(NIOSH) Publication No. 87-114.
5.10. Weast, R.C., Ed., "Handbook of Chemistry and Physics", 67th edition, Boca Raton,Florida, CRC Press, 1986.
5.11. Author's personal observations.
Withdrawn Provided for Historical Reference Only
Note: OSHA no longer uses or supports this method (December 2019).
WITHDRAWN


