Embed Size (px)
Citation preview
1 23
Environmental Science and PollutionResearch ISSN 0944-1344 Environ Sci Pollut ResDOI 10.1007/s11356-013-1568-2
Acetylcholinesterase in honey bees (Apismellifera) exposed to neonicotinoids,atrazine and glyphosate: laboratory andfield experiments
Monique Boily, Benoit Sarrasin,Christian DeBlois, Philippe Aras &Madeleine Chagnon

1 23
Your article is protected by copyright and
all rights are held exclusively by Springer-
Verlag Berlin Heidelberg. This e-offprint is
for personal use only and shall not be self-
archived in electronic repositories. If you
wish to self-archive your work, please use the
accepted author’s version for posting to your
own website or your institution’s repository.
You may further deposit the accepted author’s
version on a funder’s repository at a funder’s
request, provided it is not made publicly
available until 12 months after publication.
RESEARCH ARTICLE
Acetylcholinesterase in honey bees (Apis mellifera) exposedto neonicotinoids, atrazine and glyphosate: laboratoryand field experiments
Monique Boily & Benoit Sarrasin & Christian DeBlois &
Philippe Aras & Madeleine Chagnon
Received: 19 October 2012 /Accepted: 11 February 2013# Springer-Verlag Berlin Heidelberg 2013
Abstract In Québec, as observed globally, abnormally highhoney bee mortality rates have been reported recently.Several potential contributing factors have been identified,and exposure to pesticides is of increasing concern. In maizefields, foraging bees are exposed to residual concentrationsof insecticides such as neonicotinoids used for seed coating.Highly toxic to bees, neonicotinoids are also reported toincrease AChE activity in other invertebrates exposed tosub-lethal doses. The purpose of this study was thereforeto test if the honey bee’s AChE activity could be altered byneonicotinoid compounds and to explore possible effects ofother common products used in maize fields: atrazine andglyphosate. One week prior to pollen shedding, beehiveswere placed near three different field types: certified organ-ically grown maize, conventionally grown maize or non-cultivated. At the same time, caged bees were exposed toincreasing sub-lethal doses of neonicotinoid insecticides(imidacloprid and clothianidin) and herbicides (atrazineand glyphosate) under controlled conditions. While
increased AChE activity was found in all fields after 2 weeksof exposure, bees close to conventional maize crops showedvalues higher than those in both organic maize fields andnon-cultivated areas. In caged bees, AChE activity increasedin response to neonicotinoids, and a slight decrease wasobserved by glyphosate. These results are discussed withregard to AChE activity as a potential biomarker of expo-sure for neonicotinoids.
Keywords Apis mellifera . Biomarker . Neonicotinoids .
Acetylcholinesterase . Maize cultivation
Introduction
In the last few years, important losses of honey bee (Apismellifera L.) colonies have been reported worldwide, espe-cially in Europe (Potts et al. 2010) and in North America(van Eaglesdorps et al. 2009). Although several factors areinvolved in these losses, including numerous pathogens andparasites, the extensive use of pesticides is regularly cited asa potential contributor (Johnson et al. 2010; Wu et al. 2011).Of growing concern are neonicotinoid insecticides such asimidacloprid, clothianidin and thiamethoxam as severalstudies have provided evidence that these products can beharmful to honey bees (Yang et al. 2008; Maini et al. 2010).Largely used for seed coating of many crops, especially cornand soya, these systemic insecticides protect the seeds andyoung plants from pests. In Québec, coated seeds count formore than 99 % of maize crops and 30 % to 50 % of soyacrops (Giroux and Pelletier 2012). The flying bees, beehivesor flowers attracting bees may come into contact with thedust resulting from the pneumatic action of sowing ma-chines (Tremolada et al. 2010). More often, honey beesare exposed to residual neonicotinoid concentrations in
Responsible editor: Markus Hecker
M. Boily (*) :M. ChagnonDépartement des Sciences Biologiques, Université du Québec àMontréal, Succursale Centre-Ville, C.P. 8888, Montréal,QC H3C 3P8, Canadae-mail: [email protected]
B. Sarrasin : C. DeBloisMinistère du Développement durable, de I’Environnement,de la Faune et des Parcs du Québec, Centre d’expertise en analyseenvironnementale du Québec, 2700 rue Einstein, Local B2-104,Sainte-Foy, QC GlP 3W8, Canada
P. Aras :M. ChagnonCentre de recherche en sciences animales de Deschambault,120-A, Chemin du Roy,Deschambault, QC G0A 1S0, Canada
Environ Sci Pollut ResDOI 10.1007/s11356-013-1568-2
Author's personal copy
plants and flowers—the pesticide originating in coatedseeds (Bonmatin et al. 2005; Chauzat et al. 2006).
Neonicotinoids and their metabolites are agonists of ace-tylcholine (Nauen et al. 2001). They bind to the post-synapticnicotinic receptors nAChERs triggering a continuous signalleading to the death of the insect. Their high efficiency isattributed to the irreversible link with the nAChERs receptors(Thany 2009) recognized as the most abundant in insects(Gauthier 2010) and the partial inhibition of γ-aminobutyricacid (GABA) receptors known to protect the cell fromoverstimulation (Déglise et al. 2002). This dual mechanismresults in the lowest LD50 values (0.003 to 0.006 μg/bee, oralexposure) tested on bees among all currently used pesticides(Decourtye and Devillers 2010). Moreover, severalneonicotinoid metabolites, e.g. imidacloprid, retain the toxi-cological characteristics of the parent molecules in terms ofreceptor affinity and toxicity (Suchail et al. 2001). Theneonicotinoids, unlike pyrethroid insecticides (cypermethrinand deltamethrin), are not generally known to alter the AChEactivity. However, increased AChE activity has been reportedin the German cockroach after exposure to the neonicotinoidacetamiprid (Morakchi et al. 2005).
Neonicotinoids are not the only source of pesticides posinga threat to honey bees. The annual monitoring of surfacewaters in agricultural areas by the Ministry of Environmentof Québec showed that atrazine and glyphosate (RoundUp®)are among the most abundant products detected (Giroux andPelletier 2012). In the most contaminated areas, several ad-verse physiological effects have been found in resident frogs(Bérubé et al. 2005; Boily et al. 2005, 2009) including a highAChE activity in plasma (Marcogliese et al. 2009). It ispossible that these contaminants may also affect honey bees.Atrazine has been linked to oxidative stress damage (Thorntonet al. 2010) and altered activities of cytochrome P450 andglutathione-S-transferase (GST) in Drosophila melanogaster(Le Goff et al. 2006), while reduced longevity has beenobserved in Coccinelidae Eriopis connexa Germar (Mirandeet al. 2010) and the wolf spider Pardosa milvina (Evans et al.2010) treated with different formulations of glyphosate. Sucheffects have not been investigated in field studies with beesdue to limitations in methods. Whereas in vertebrate species,oxidative stress and enzyme-based biomarkers have beendeveloped, no such tools exist for honey bees. The objectivesof this study were therefore to explore the effects of the mainpesticides used in maize fields on the honey bee and toevaluate AChE activity as a potential biomarker forneonicotinoids exposure. Honey bees were exposed by plac-ing their hives near organically grown or conventionallygrown cornfields and were compared with those located nearnon-cultivated areas. Lab experiments, conducted in parallelto the field studies, exposed different groups of bees to in-creasing sub-lethal doses of imidacloprid, clothianidin, atra-zine and glyphosate. AChE activity, protein concentration and
body mass were used for comparison between the in-field andlaboratory conditions.
Materials and methods
Chemicals
Triton X-100 ( t-octylphenoxypolyethoxyethanol),acetylthiocholine iodide, DMSO (dimethyl sulfoxide), DTNB(5,5′-dithio-bis(2-nitrobenzoic acid)), sodium phosphatemonobasic, Trizma base (tris[hydroxymethyl]aminomethane),technical carbaryl (Sevin, 99.8% pure), diazinon (99.4% pure)and clothianidin ((E)-1-(2-chloro-5-thiazolylmethyl)-3-meth-yl-2-nitroguanidine, 99.9 % pure) were purchased fromSigma-Aldrich Ltd. (Oakville, ON, Canada). BSA (bovinealbumin serum) and Pierce BCA protein assay kits were fromFisher Scientific (Montreal, QC, Canada). Commercial formu-lation of pesticides imidacloprid (Admire® 240F), atrazine(Aatrex® 480) and glyphosate (Weathermax® 240) were pro-vided by Centre de Recherche en Science Animale deDeschambault (CRSAD, QC, Canada) and represent common-ly applied pesticide formulations in Québec.
AChE solubilization
All the following steps were carried out between 0 °C and 4 °C,and all media were newly prepared. The AChE solubilizationwas based on Badiou et al. (2008) with slight modifications.The method was developed with bees from a healthy beehive,supplied from CRSAD. Eight to ten bees were individuallyweighed prior to severing the heads from the body in weighingdishes disposed on dry ice. Heads were pooled (>100 mg oftissues) and immediately homogenized with a glass Potterhomogenizer in 1.0 ml of LST buffer (10 mM NaCl, 1 % w/vTriton X-100, 15 mM sodium phosphate), pH7.3 in order tomake a 10 % (w/v) extract. The homogenates were centrifugedat 100,000×g for 1 h at 4 °C (rotor SW 50.1, Beckman CounterOptima L-100 XP). The supernatants were set aside, and thepellets were rinsed without agitation using 200 μl LSTbuffer, which was recovered and combined with the super-natant. The pellets were subjected to a second homogeniza-tion with 500 μl of LST buffer and processed as above. Thecombined supernatants and rinsing volumes (±1,700 μl)were used for AChE assay and protein analysis.
AChE assay
Acetylcholinesterase assay was carried out following themethod of Ellman using acetylthiocholine as the substrate. Areactivemediumwasmade for each sample bymixing 2.87mlTris–HCl buffer (0.01 M, pH7.6) in a sterile glass tube, alongwith 100 μl DTNB (1.5 mM Tris–HCl, pH7.6) and 30 μl
Environ Sci Pollut Res
Author's personal copy
supernatant. Blank reaction tubes consisted of all reagentsexcept supernatants. A volume of 20 μl of the medium com-posed of 0.3 mM acetylthiocholine iodide and 1.5 mMDTNB, Tris–HCl, pH8.0, was deposited in a non-sterile 96-well microplate (three replicates per sample). The microplatewas covered, and the reaction rate was monitored at 10 and35 min on a spectrophotometer (model Infinite M1000Quadruple Monochromator Microplate Reader, Tecan GroupLtd., Durham, NC, USA) set at 412 nm. Analyses (6 to 15)were performed for each dose of pesticides tested and theircontrol group. Values of blank reaction tubes were subtractedto provide specific AChE activity. The expression of theactivity was based on substrate degradation either by micro-moles per hour per gram of tissue or nanomoles per hour permilligram protein and is referred in the text as AChE activity.
Inhibition study
The AChE activity was inhibited in vitro by two insecti-cides: diazinon and carbaryl. Tested separately, each com-pound was dissolved in DMSO, which never exceeded 2 %in the reaction medium. Diazinon and carbaryl at molarconcentrations ranging from 10−10 to 10−5 were added tosolutions resulting from AChE solubilization. The extrac-tion and analysis (three replicates per dose per pool) werecarried out as described above using two different pools ofbees from the control groups.
Protein concentration
The protein content in each sample was determined usingPierce BCA protein assay kit.
Field study
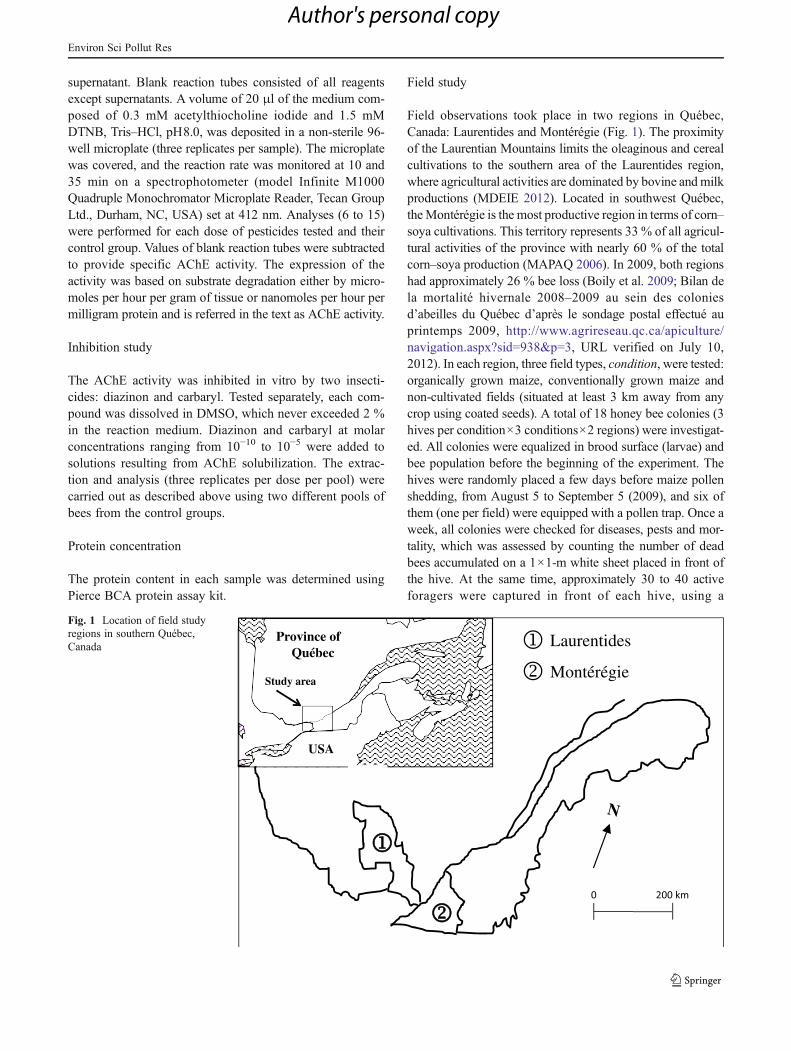
Field observations took place in two regions in Québec,Canada: Laurentides and Montérégie (Fig. 1). The proximityof the Laurentian Mountains limits the oleaginous and cerealcultivations to the southern area of the Laurentides region,where agricultural activities are dominated by bovine andmilkproductions (MDEIE 2012). Located in southwest Québec,theMontérégie is the most productive region in terms of corn–soya cultivations. This territory represents 33 % of all agricul-tural activities of the province with nearly 60 % of the totalcorn–soya production (MAPAQ 2006). In 2009, both regionshad approximately 26 % bee loss (Boily et al. 2009; Bilan dela mortalité hivernale 2008–2009 au sein des coloniesd’abeilles du Québec d’après le sondage postal effectué auprintemps 2009, http://www.agrireseau.qc.ca/apiculture/navigation.aspx?sid=938&p=3, URL verified on July 10,2012). In each region, three field types, condition, were tested:organically grown maize, conventionally grown maize andnon-cultivated fields (situated at least 3 km away from anycrop using coated seeds). A total of 18 honey bee colonies (3hives per condition×3 conditions×2 regions) were investigat-ed. All colonies were equalized in brood surface (larvae) andbee population before the beginning of the experiment. Thehives were randomly placed a few days before maize pollenshedding, from August 5 to September 5 (2009), and six ofthem (one per field) were equipped with a pollen trap. Once aweek, all colonies were checked for diseases, pests and mor-tality, which was assessed by counting the number of deadbees accumulated on a 1×1-m white sheet placed in front ofthe hive. At the same time, approximately 30 to 40 activeforagers were captured in front of each hive, using a
Laurentides
Montérégie
N
Province of Québec
USA
Study area
Fig. 1 Location of field studyregions in southern Québec,Canada
Environ Sci Pollut Res
Author's personal copy
collector’s net, immediately euthanized by placing the sampleon dry ice, and then kept in a freezer at −80 °C until analysis.Eight to 15 pools of ten bee heads were analyzed for eachhive, the hives being the experimental units. Once a week,pollen traps were emptied, and the content was transferred to aplastic bag and kept at −20 °C. Sub-samples of pollen (2 sub-samples per condition×3 conditions×4 weeks=24 total) weresorted in the laboratory as suggested by Louveaux et al.(1978) using the glycerine-gelatine dyed with fuchsine meth-od. The pollen grains were then examined under the micro-scope (×1,000) to identify pollen from maize plants. Sampleshaving maize pollen were analyzed for neonicotinoid content.
Chronic exposure (cage experiments)
Honey bees were taken on frames without brood from ahealthy beehive (directly supplied by CRSAD) andplaced in acrylic cages (13×14×18 cm) in groups of30. They were maintained in a temperature-controlledroom (darkness, 25±1 °C with 55±5 % relative humid-ity) and fed with a sucrose solution (50 % w/w) adlibitum for 24 h. Prior to pesticide exposures, tests wereconducted to estimate the daily mean consumption ofsyrup per bee. The highest selected doses represented5 % or less than the published LD50 values in order torespect the sub-lethal domain. For example, the highestdoses for atrazine and glyphosate (10 ng/bee) were0.01 % and 0.04 % of the LD50 values associated withthese pesticides, 97 and 28 μg/bee, respectively. Theoral LD50 value for imidacloprid, 6.12 ng/bee, waspreviously determined in our laboratory (data notshown). The lowest exposure levels were based onanalyzed in-field pollen and nectar concentrations(Bonmatin et al. 2005; Chauzat et al. 2006) in orderto represent field-realistic exposures. Bees were offeredsugar solutions spiked with nominal concentrations ofimidacloprid (0.08, 0.16, 0.24 and 0.30 ng per bee),clothianidin (0.03, 0.06, 0.12 and 0.24 ng per bee),atrazine (1.25, 2.5, 5.0 and 10 ng per bee) and glyph-osate (1.25, 2.5, 5.0 and 10 ng per bee). Bees in thecontrol groups were fed a sugar solution without pesti-cides. Only the technical compound clothianidin wasfirst dissolved in DMSO prior to be mixed with thesugar solution. The DMSO in contaminated syrup neverexceeded 0.02 %. An additional solvent control groupwas set up for clothianidin with sugar solutioncontaining 0.02 % DMSO. The doses for imidacloprid,atrazine and glyphosate were based on the quantity ofactive matter (a.m.) of their respective commercial for-mulation. The sugar solutions of all cages (three repli-cates per dose and controls) were changed daily for the10-day duration of the test. The control and contami-nated sugar solutions were prepared 10 days prior of
exposure, kept at −20 °C and thawed at room temper-ature before use. Mortality and hyperactivity (tumblingand trembling) were recorded every 12 h. After 10 days,bees were anesthetized/euthanized by placing the cagesin an insulated container with dry ice for 5 min. Afterthis time, bees exposed to the same dose (four cages)were randomly mixed, transferred to identified plasticbags and stored at −80 °C until analyses. Seven to tenpools of bee heads were analyzed for each dose of thecompounds tested.
Neonicotinoids analysis
Pollen samples (from beehives with maize pollen) weretested for neonicotinoids based on the method of Garcia etal. (2007). Pollen (3 g) tissue samples were thawed in a glasscontainer. Tebuthiuron (99 % pure; Accustandard, NewHaven, CT, USA) and 30 ml acetone were added to thesamples, which were transferred to an ultrasonic bath for10 min. The organic extract was filtered through Celite(0.5 g; Supelco, Bellefonte, PA, USA) in a Buchner funnel,and the residue was rinsed with 10 mL acetone. A secondextraction using 25 ml of acetone was performed on anEberbach reciprocal shaker followed by filtration on Celiteand the addition of 50 ml coagulating solution consisting ofaqueous ammonium chloride 1 % and orthophosphoric acid2 % in water. After 30 min, the solution was filtered througha new portion of Celite (0.5 g) and washed with 10 mL ofacetone:water (40:60, v/v). The filtered solution was trans-ferred into a separation funnel with 50 ml of NaCl 2 % alongwith 100 ml dichloromethane, and the compounds wereextracted by shaking by hand for 2 min. The extractionprocedure was repeated using 50 ml dichloromethane. Theresulting organic phases were combined and evaporated todryness by rotary evaporation (30 °C). The extract wastransferred to a 10-ml tube, and the remaining solvent wasevaporated to dryness under a gentle stream of nitrogen gas.The extract was redissolved in 1 mL of formic acid (0.1 %),acetonitrile (5 %) in water and internal standard was added(Atrazine-D5, Cambridge Isotope Laboratories Inc,Andover, MA, USA). The extract was filtered through a0.45-μm PTFE filter, and 30 μl was injected in the LC-MS/MS system. Analysis was carried out on an API-3000PE SCIEX LC-MS/MS with the turbo spray source in pos-itive mode. The mass spectrometer was coupled to anAgilent 1100 quaternary pump and autosampler. A columnZorbax Eclipse XDS-C8 (150×4.6 mm, with 5-μm particle)was used. The gradient program, with a flow rate of0.2 ml/min, was: A, 100 % acetonitrile and B, 0.1 % formicacid in water. A linear mobile phase gradient was initiatedfrom B (90 %) to B (57 %) for 3 min. After 4.5 min, B wasreduced to 20 % and held from 8 to 14 min. The run endedby a column equilibration at initial conditions from 14.5 to
Environ Sci Pollut Res
Author's personal copy
30 min. Eight neonicotinoids and metabolites were analyzedwith quantitative limits of detection of 0.0003 μg/g andrecoveries varying between 28 % and 54 % depending uponthe compound. The analytes are the following: imidacloprid,imidacloprid urea, thiamethoxam, acetamiprid, fenamidonemetabolite, fenamidone, azoxystrobin and clothianidin.
Statistical analysis
Otherwise noted, AChE activity was tested with both units:micromoles per hour per gram of tissue and nanomoles perhour per milligram protein. For the field experiment, differ-ences between time points for AChE activity, protein andweight (mean values for each hive, 8 to 15 pools of 10 bees)were compared between conditions (organic, conventionaland non-cultivated fields) using two-way repeated measuresANOVA, 3×2 design (treatment× region). Significantmodels (p<0.05) were submitted to contrast procedures orpost-hoc tests using Bonferroni correction. In case of non-respect of sphericity, Greenhouse–Geisser statistic was used.Mortality (total count of dead bees) was tested betweenregions with Fisher’s exact test, while χ2 test was used tocompare the field conditions within the same region.Relationship between AChE activity and protein concentra-tion was explored within conditions at each week usingPearson correlations. In the case of chronic exposures toimidacloprid, clothianidin, atrazine and glyphosate, meansdata (7 to 10 pools of 10 bees) for AChE activity, proteinconcentration and weight were compared using a GLMone-way analysis of variance. The significant models(p<0.05) were followed by a Dunnett t test in relationto the control group. In the case of unequal variances, aT3 Dunnett test was applied. All multiple comparisonstests were submitted to Bonferroni correction in order tocontrol the rate of false positives. In certain cases, e.g.exposure to atrazine, a Jonckheere–Terpstra analysis(JT) was used in order to detect the influence of in-creasing doses of pesticides, based on the medians or-dered in a particular direction. Pearson correlations wereperformed to explore the relationship between the honeybee protein concentration and AChE activity. The valuesfor hyperactivity and survival (percent) were computedfrom the means (n=4) of the total counts of observa-tions per cage, after 10 days. Exposed groups werecompared to the control group using Fisher’s exact test.For the highest dose of imidacloprid exposure, survivaldata were submitted to non-linear regression analysis todetermine LC50 value. AChE activity, protein concentra-tion and weight values for clothianidin were comparedbetween the two control groups (with and withoutDMSO) with a Student’s t test. All statistical analyseswere performed using SPSS® Statistic 18.0 software(IBM® Corporation, Armonk, NY, USA).
Results
AChE activity in honey bee heads and enzyme inhibitionstudy
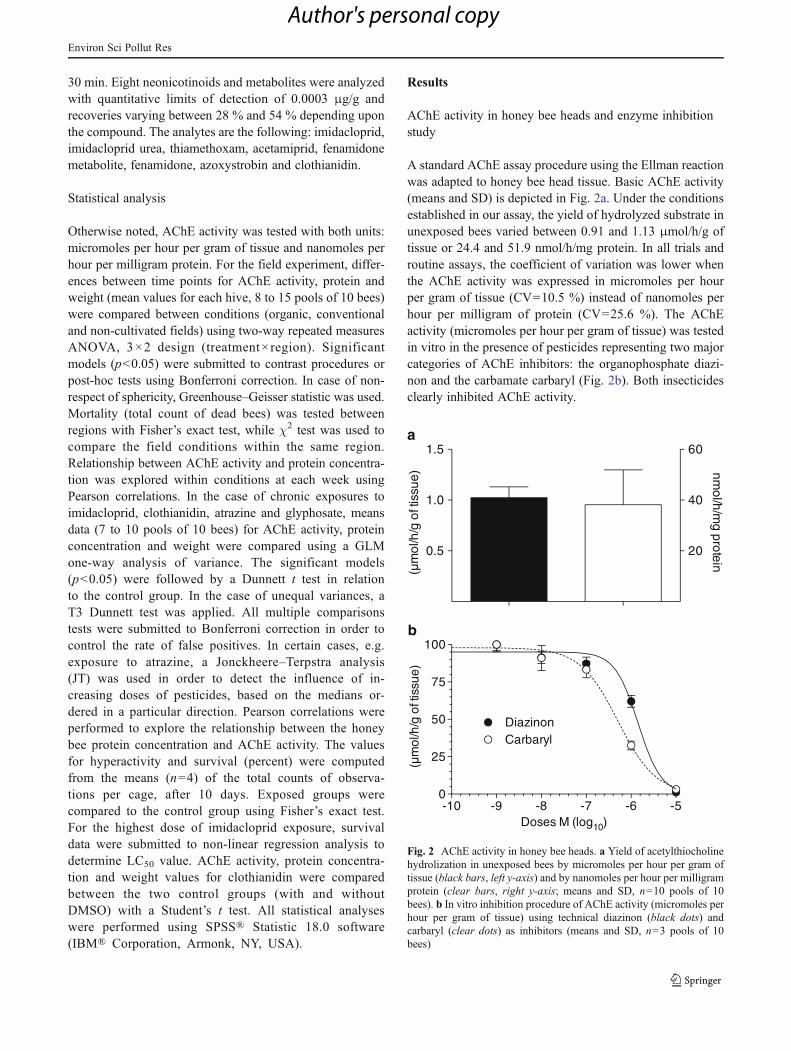
A standard AChE assay procedure using the Ellman reactionwas adapted to honey bee head tissue. Basic AChE activity(means and SD) is depicted in Fig. 2a. Under the conditionsestablished in our assay, the yield of hydrolyzed substrate inunexposed bees varied between 0.91 and 1.13 μmol/h/g oftissue or 24.4 and 51.9 nmol/h/mg protein. In all trials androutine assays, the coefficient of variation was lower whenthe AChE activity was expressed in micromoles per hourper gram of tissue (CV=10.5 %) instead of nanomoles perhour per milligram of protein (CV=25.6 %). The AChEactivity (micromoles per hour per gram of tissue) was testedin vitro in the presence of pesticides representing two majorcategories of AChE inhibitors: the organophosphate diazi-non and the carbamate carbaryl (Fig. 2b). Both insecticidesclearly inhibited AChE activity.
-10 -9 -8 -7 -6 -50
25
50
75
100
Doses M (log10)
(m
ol/h
/g o
f tis
sue)
DiazinonCarbaryl
0.5
1.0
1.5
20
40
60
(m
ol/h
/g o
f tis
sue)
nmol/h/m
g protein
a
b
Fig. 2 AChE activity in honey bee heads. a Yield of acetylthiocholinehydrolization in unexposed bees by micromoles per hour per gram oftissue (black bars, left y-axis) and by nanomoles per hour per milligramprotein (clear bars, right y-axis; means and SD, n=10 pools of 10bees). b In vitro inhibition procedure of AChE activity (micromoles perhour per gram of tissue) using technical diazinon (black dots) andcarbaryl (clear dots) as inhibitors (means and SD, n=3 pools of 10bees)
Environ Sci Pollut Res
Author's personal copy
Field experiment
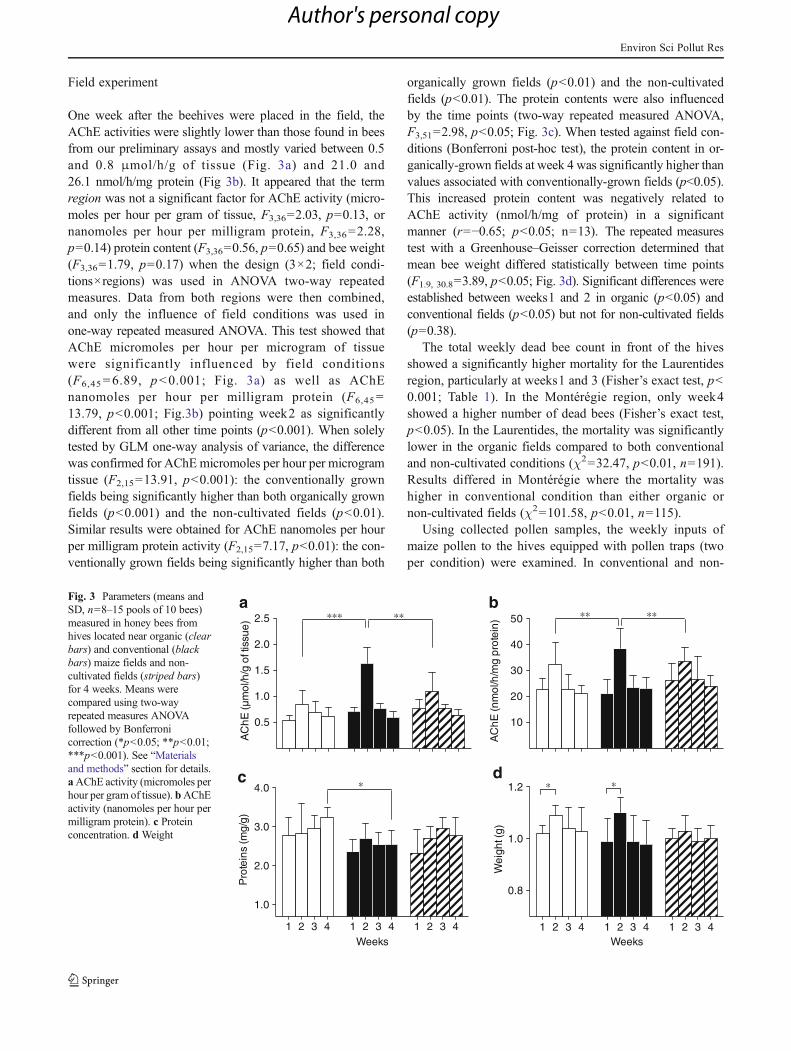
One week after the beehives were placed in the field, theAChE activities were slightly lower than those found in beesfrom our preliminary assays and mostly varied between 0.5and 0.8 μmol/h/g of tissue (Fig. 3a) and 21.0 and26.1 nmol/h/mg protein (Fig 3b). It appeared that the termregion was not a significant factor for AChE activity (micro-moles per hour per gram of tissue, F3,36=2.03, p=0.13, ornanomoles per hour per milligram protein, F3,36=2.28,p=0.14) protein content (F3,36=0.56, p=0.65) and bee weight(F3,36=1.79, p=0.17) when the design (3×2; field condi-tions×regions) was used in ANOVA two-way repeatedmeasures. Data from both regions were then combined,and only the influence of field conditions was used inone-way repeated measured ANOVA. This test showed thatAChE micromoles per hour per microgram of tissuewere significantly influenced by field conditions(F6,45=6.89, p<0.001; Fig. 3a) as well as AChEnanomoles per hour per milligram protein (F6,45=13.79, p<0.001; Fig.3b) pointing week2 as significantlydifferent from all other time points (p<0.001). When solelytested by GLM one-way analysis of variance, the differencewas confirmed for AChE micromoles per hour per microgramtissue (F2,15=13.91, p<0.001): the conventionally grownfields being significantly higher than both organically grownfields (p<0.001) and the non-cultivated fields (p<0.01).Similar results were obtained for AChE nanomoles per hourper milligram protein activity (F2,15=7.17, p<0.01): the con-ventionally grown fields being significantly higher than both
organically grown fields (p<0.01) and the non-cultivatedfields (p<0.01). The protein contents were also influencedby the time points (two-way repeated measured ANOVA,F3,51=2.98, p<0.05; Fig. 3c). When tested against field con-ditions (Bonferroni post-hoc test), the protein content in or-ganically-grown fields at week 4 was significantly higher thanvalues associated with conventionally-grown fields (p<0.05).This increased protein content was negatively related toAChE activity (nmol/h/mg of protein) in a significantmanner (r=−0.65; p<0.05; n=13). The repeated measurestest with a Greenhouse–Geisser correction determined thatmean bee weight differed statistically between time points(F1.9, 30.8=3.89, p<0.05; Fig. 3d). Significant differences wereestablished between weeks1 and 2 in organic (p<0.05) andconventional fields (p<0.05) but not for non-cultivated fields(p=0.38).
The total weekly dead bee count in front of the hivesshowed a significantly higher mortality for the Laurentidesregion, particularly at weeks1 and 3 (Fisher’s exact test, p<0.001; Table 1). In the Montérégie region, only week4showed a higher number of dead bees (Fisher’s exact test,p<0.05). In the Laurentides, the mortality was significantlylower in the organic fields compared to both conventionaland non-cultivated conditions (χ2=32.47, p<0.01, n=191).Results differed in Montérégie where the mortality washigher in conventional condition than either organic ornon-cultivated fields (χ2=101.58, p<0.01, n=115).
Using collected pollen samples, the weekly inputs ofmaize pollen to the hives equipped with pollen traps (twoper condition) were examined. In conventional and non-
1 2 3 4 1 2 3 4 1 2 3 4
0.8
1.0
1.2
Weeks
Wei
ght (
g)
**
1 2 3 4 1 2 3 4 1 2 3 4
1.0
2.0
3.0
4.0
Weeks
Pro
tein
s (m
g/g)
*
0.5
1.0
1.5
2.0
2.5
AC
hE (
mol
/h/g
of t
issu
e)
*** **
10
20
30
40
50
AC
hE (n
mol
/h/m
g pr
otei
n)
** **a
c
b
d
Fig. 3 Parameters (means andSD, n=8–15 pools of 10 bees)measured in honey bees fromhives located near organic (clearbars) and conventional (blackbars) maize fields and non-cultivated fields (striped bars)for 4 weeks. Means werecompared using two-wayrepeated measures ANOVAfollowed by Bonferronicorrection (*p<0.05; **p<0.01;***p<0.001). See “Materialsand methods” section for details.aAChE activity (micromoles perhour per gram of tissue). bAChEactivity (nanomoles per hour permilligram protein). c Proteinconcentration. d Weight
Environ Sci Pollut Res
Author's personal copy
cultivated fields, maize pollen was present in traps at weeks1 and 2 (Table 2), while in organic fields maize, pollen waspresent in the trap at week2 and at week4. No maize pollenwas found in weeks3 and 4 for conventional and non-cultivated conditions. No neonicotinoids were detected inthe pollen samples at concentrations above the detectionlimit of 0.0003 μg/g.
Chronic pesticides exposure
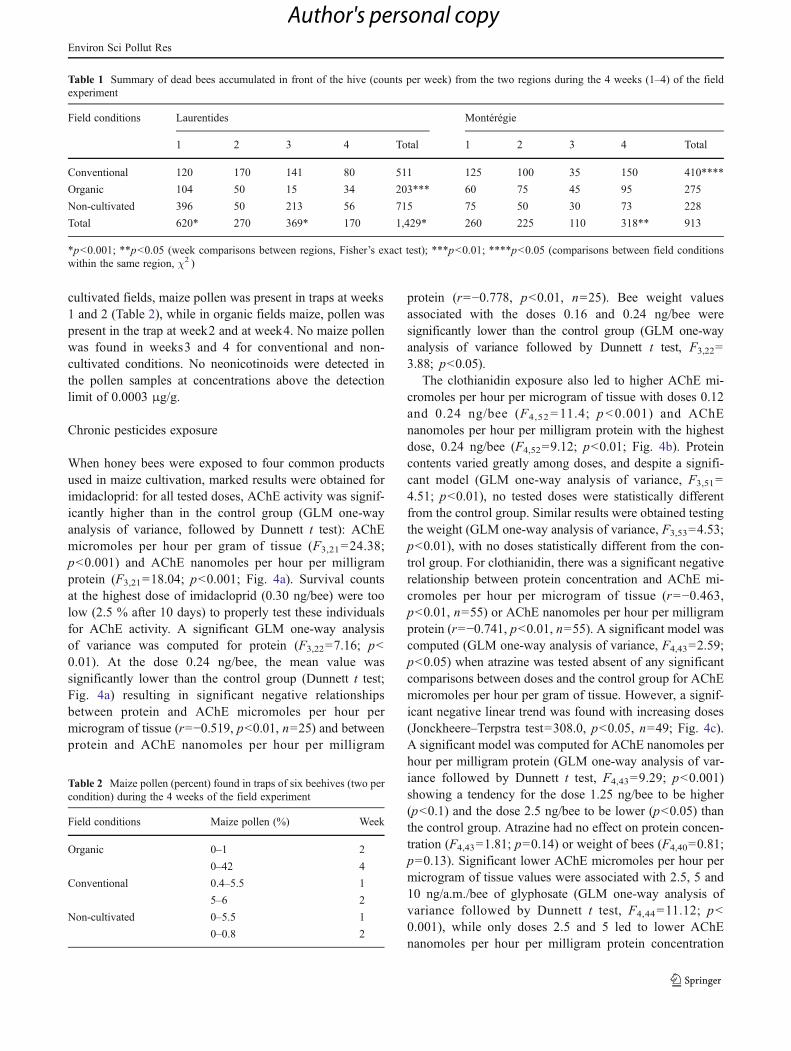
When honey bees were exposed to four common productsused in maize cultivation, marked results were obtained forimidacloprid: for all tested doses, AChE activity was signif-icantly higher than in the control group (GLM one-wayanalysis of variance, followed by Dunnett t test): AChEmicromoles per hour per gram of tissue (F3,21=24.38;p<0.001) and AChE nanomoles per hour per milligramprotein (F3,21=18.04; p<0.001; Fig. 4a). Survival countsat the highest dose of imidacloprid (0.30 ng/bee) were toolow (2.5 % after 10 days) to properly test these individualsfor AChE activity. A significant GLM one-way analysisof variance was computed for protein (F3,22=7.16; p<0.01). At the dose 0.24 ng/bee, the mean value wassignificantly lower than the control group (Dunnett t test;Fig. 4a) resulting in significant negative relationshipsbetween protein and AChE micromoles per hour permicrogram of tissue (r=−0.519, p<0.01, n=25) and betweenprotein and AChE nanomoles per hour per milligram
protein (r=−0.778, p<0.01, n=25). Bee weight valuesassociated with the doses 0.16 and 0.24 ng/bee weresignificantly lower than the control group (GLM one-wayanalysis of variance followed by Dunnett t test, F3,22=3.88; p<0.05).
The clothianidin exposure also led to higher AChE mi-cromoles per hour per microgram of tissue with doses 0.12and 0.24 ng/bee (F4,52 = 11.4; p<0.001) and AChEnanomoles per hour per milligram protein with the highestdose, 0.24 ng/bee (F4,52=9.12; p<0.01; Fig. 4b). Proteincontents varied greatly among doses, and despite a signifi-cant model (GLM one-way analysis of variance, F3,51=4.51; p<0.01), no tested doses were statistically differentfrom the control group. Similar results were obtained testingthe weight (GLM one-way analysis of variance, F3,53=4.53;p<0.01), with no doses statistically different from the con-trol group. For clothianidin, there was a significant negativerelationship between protein concentration and AChE mi-cromoles per hour per microgram of tissue (r=−0.463,p<0.01, n=55) or AChE nanomoles per hour per milligramprotein (r=−0.741, p<0.01, n=55). A significant model wascomputed (GLM one-way analysis of variance, F4,43=2.59;p<0.05) when atrazine was tested absent of any significantcomparisons between doses and the control group for AChEmicromoles per hour per gram of tissue. However, a signif-icant negative linear trend was found with increasing doses(Jonckheere–Terpstra test=308.0, p<0.05, n=49; Fig. 4c).A significant model was computed for AChE nanomoles perhour per milligram protein (GLM one-way analysis of var-iance followed by Dunnett t test, F4,43=9.29; p<0.001)showing a tendency for the dose 1.25 ng/bee to be higher(p<0.1) and the dose 2.5 ng/bee to be lower (p<0.05) thanthe control group. Atrazine had no effect on protein concen-tration (F4,43=1.81; p=0.14) or weight of bees (F4,40=0.81;p=0.13). Significant lower AChE micromoles per hour permicrogram of tissue values were associated with 2.5, 5 and10 ng/a.m./bee of glyphosate (GLM one-way analysis ofvariance followed by Dunnett t test, F4,44=11.12; p<0.001), while only doses 2.5 and 5 led to lower AChEnanomoles per hour per milligram protein concentration
Table 1 Summary of dead bees accumulated in front of the hive (counts per week) from the two regions during the 4 weeks (1–4) of the fieldexperiment
Field conditions Laurentides Montérégie
1 2 3 4 Total 1 2 3 4 Total
Conventional 120 170 141 80 511 125 100 35 150 410****
Organic 104 50 15 34 203*** 60 75 45 95 275
Non-cultivated 396 50 213 56 715 75 50 30 73 228
Total 620* 270 369* 170 1,429* 260 225 110 318** 913
*p<0.001; **p<0.05 (week comparisons between regions, Fisher’s exact test); ***p<0.01; ****p<0.05 (comparisons between field conditionswithin the same region, χ2 )
Table 2 Maize pollen (percent) found in traps of six beehives (two percondition) during the 4 weeks of the field experiment
Field conditions Maize pollen (%) Week
Organic 0–1 2
0–42 4
Conventional 0.4–5.5 1
5–6 2
Non-cultivated 0–5.5 1
0–0.8 2
Environ Sci Pollut Res
Author's personal copy
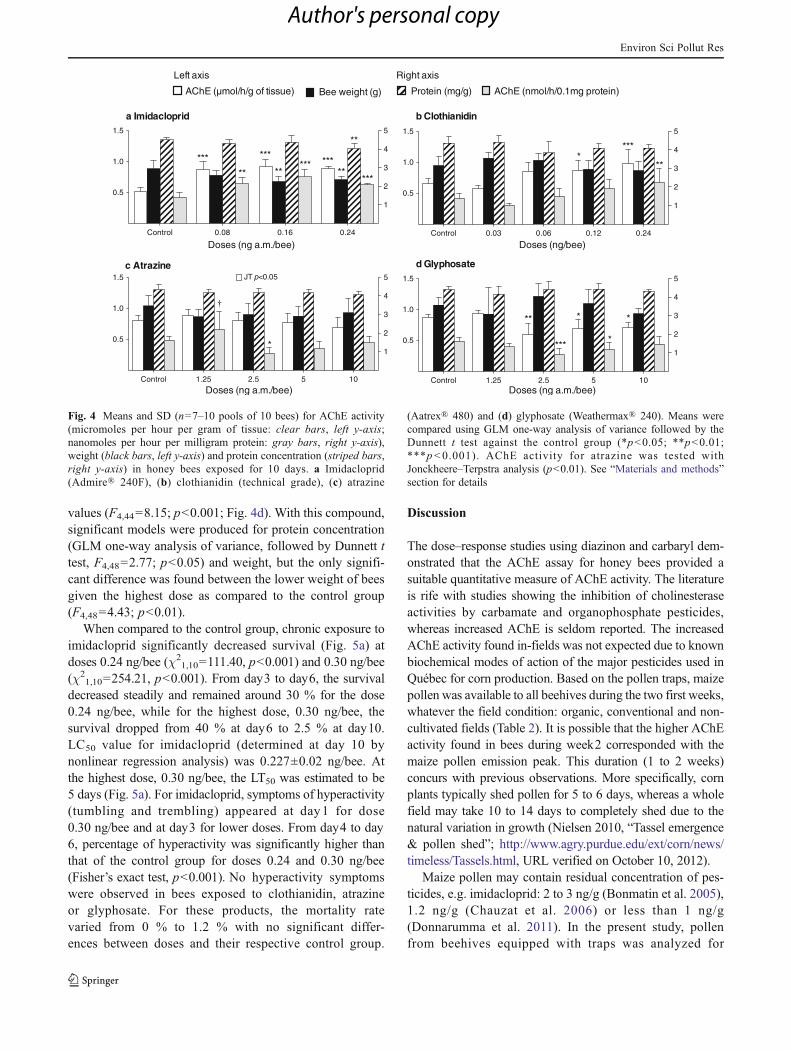
values (F4,44=8.15; p<0.001; Fig. 4d). With this compound,significant models were produced for protein concentration(GLM one-way analysis of variance, followed by Dunnett ttest, F4,48=2.77; p<0.05) and weight, but the only signifi-cant difference was found between the lower weight of beesgiven the highest dose as compared to the control group(F4,48=4.43; p<0.01).
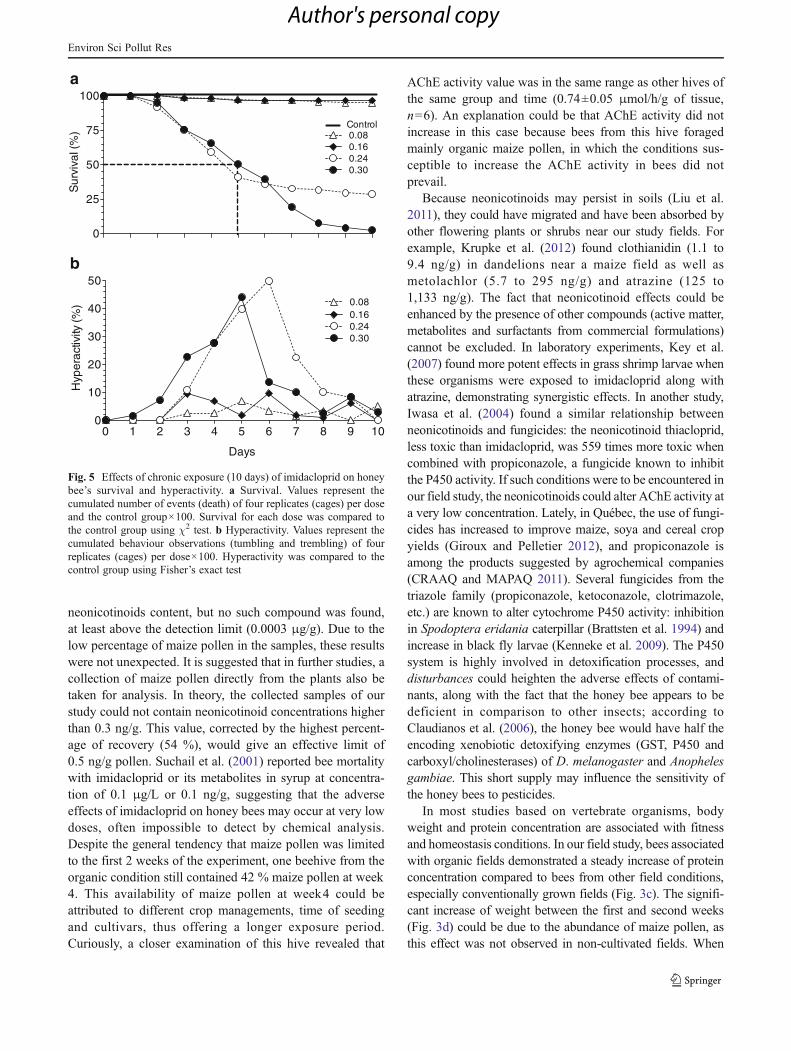
When compared to the control group, chronic exposure toimidacloprid significantly decreased survival (Fig. 5a) atdoses 0.24 ng/bee (χ2
1,10=111.40, p<0.001) and 0.30 ng/bee(χ2
1,10=254.21, p<0.001). From day3 to day6, the survivaldecreased steadily and remained around 30 % for the dose0.24 ng/bee, while for the highest dose, 0.30 ng/bee, thesurvival dropped from 40 % at day6 to 2.5 % at day10.LC50 value for imidacloprid (determined at day 10 bynonlinear regression analysis) was 0.227±0.02 ng/bee. Atthe highest dose, 0.30 ng/bee, the LT50 was estimated to be5 days (Fig. 5a). For imidacloprid, symptoms of hyperactivity(tumbling and trembling) appeared at day1 for dose0.30 ng/bee and at day3 for lower doses. From day4 to day6, percentage of hyperactivity was significantly higher thanthat of the control group for doses 0.24 and 0.30 ng/bee(Fisher’s exact test, p<0.001). No hyperactivity symptomswere observed in bees exposed to clothianidin, atrazineor glyphosate. For these products, the mortality ratevaried from 0 % to 1.2 % with no significant differ-ences between doses and their respective control group.
Discussion
The dose–response studies using diazinon and carbaryl dem-onstrated that the AChE assay for honey bees provided asuitable quantitative measure of AChE activity. The literatureis rife with studies showing the inhibition of cholinesteraseactivities by carbamate and organophosphate pesticides,whereas increased AChE is seldom reported. The increasedAChE activity found in-fields was not expected due to knownbiochemical modes of action of the major pesticides used inQuébec for corn production. Based on the pollen traps, maizepollen was available to all beehives during the two first weeks,whatever the field condition: organic, conventional and non-cultivated fields (Table 2). It is possible that the higher AChEactivity found in bees during week2 corresponded with themaize pollen emission peak. This duration (1 to 2 weeks)concurs with previous observations. More specifically, cornplants typically shed pollen for 5 to 6 days, whereas a wholefield may take 10 to 14 days to completely shed due to thenatural variation in growth (Nielsen 2010, “Tassel emergence& pollen shed”; http://www.agry.purdue.edu/ext/corn/news/timeless/Tassels.html, URL verified on October 10, 2012).
Maize pollen may contain residual concentration of pes-ticides, e.g. imidacloprid: 2 to 3 ng/g (Bonmatin et al. 2005),1.2 ng/g (Chauzat et al. 2006) or less than 1 ng/g(Donnarumma et al. 2011). In the present study, pollenfrom beehives equipped with traps was analyzed for
Control 0.08 0.16 0.24
0.5
1.0
1.5
1
2
3
4
5
***
** **
******
**
*****
***
Control 1.25 2.5 5 10
0.5
1.0
1.5
1
2
3
4
5JT p<0.05
*
Control 0.03 0.06 0.12 0.24
0.5
1.0
1.5
1
2
3
4
5
****
**
Control 1.25 2.5 5 10
0.5
1.0
1.5
1
2
3
4
5
** * *
****
*
a Imidacloprid b Clothianidin
c Atrazine d Glyphosate
Doses (ng a.m./bee)
AChE ( mol/h/g of tissue) Bee weight (g) AChE (nmol/h/0.1mg protein)Protein (mg/g)
Left axis Right axis
Doses (ng a.m./bee)
Doses (ng a.m./bee) Doses (ng/bee)
Fig. 4 Means and SD (n=7–10 pools of 10 bees) for AChE activity(micromoles per hour per gram of tissue: clear bars, left y-axis;nanomoles per hour per milligram protein: gray bars, right y-axis),weight (black bars, left y-axis) and protein concentration (striped bars,right y-axis) in honey bees exposed for 10 days. a Imidacloprid(Admire® 240F), (b) clothianidin (technical grade), (c) atrazine
(Aatrex® 480) and (d) glyphosate (Weathermax® 240). Means werecompared using GLM one-way analysis of variance followed by theDunnett t test against the control group (*p<0.05; **p<0.01;***p<0.001). AChE activity for atrazine was tested withJonckheere–Terpstra analysis (p<0.01). See “Materials and methods”section for details
Environ Sci Pollut Res
Author's personal copy
neonicotinoids content, but no such compound was found,at least above the detection limit (0.0003 μg/g). Due to thelow percentage of maize pollen in the samples, these resultswere not unexpected. It is suggested that in further studies, acollection of maize pollen directly from the plants also betaken for analysis. In theory, the collected samples of ourstudy could not contain neonicotinoid concentrations higherthan 0.3 ng/g. This value, corrected by the highest percent-age of recovery (54 %), would give an effective limit of0.5 ng/g pollen. Suchail et al. (2001) reported bee mortalitywith imidacloprid or its metabolites in syrup at concentra-tion of 0.1 μg/L or 0.1 ng/g, suggesting that the adverseeffects of imidacloprid on honey bees may occur at very lowdoses, often impossible to detect by chemical analysis.Despite the general tendency that maize pollen was limitedto the first 2 weeks of the experiment, one beehive from theorganic condition still contained 42 % maize pollen at week4. This availability of maize pollen at week4 could beattributed to different crop managements, time of seedingand cultivars, thus offering a longer exposure period.Curiously, a closer examination of this hive revealed that
AChE activity value was in the same range as other hives ofthe same group and time (0.74±0.05 μmol/h/g of tissue,n=6). An explanation could be that AChE activity did notincrease in this case because bees from this hive foragedmainly organic maize pollen, in which the conditions sus-ceptible to increase the AChE activity in bees did notprevail.
Because neonicotinoids may persist in soils (Liu et al.2011), they could have migrated and have been absorbed byother flowering plants or shrubs near our study fields. Forexample, Krupke et al. (2012) found clothianidin (1.1 to9.4 ng/g) in dandelions near a maize field as well asmetolachlor (5.7 to 295 ng/g) and atrazine (125 to1,133 ng/g). The fact that neonicotinoid effects could beenhanced by the presence of other compounds (active matter,metabolites and surfactants from commercial formulations)cannot be excluded. In laboratory experiments, Key et al.(2007) found more potent effects in grass shrimp larvae whenthese organisms were exposed to imidacloprid along withatrazine, demonstrating synergistic effects. In another study,Iwasa et al. (2004) found a similar relationship betweenneonicotinoids and fungicides: the neonicotinoid thiacloprid,less toxic than imidacloprid, was 559 times more toxic whencombined with propiconazole, a fungicide known to inhibitthe P450 activity. If such conditions were to be encountered inour field study, the neonicotinoids could alter AChE activity ata very low concentration. Lately, in Québec, the use of fungi-cides has increased to improve maize, soya and cereal cropyields (Giroux and Pelletier 2012), and propiconazole isamong the products suggested by agrochemical companies(CRAAQ and MAPAQ 2011). Several fungicides from thetriazole family (propiconazole, ketoconazole, clotrimazole,etc.) are known to alter cytochrome P450 activity: inhibitionin Spodoptera eridania caterpillar (Brattsten et al. 1994) andincrease in black fly larvae (Kenneke et al. 2009). The P450system is highly involved in detoxification processes, anddisturbances could heighten the adverse effects of contami-nants, along with the fact that the honey bee appears to bedeficient in comparison to other insects; according toClaudianos et al. (2006), the honey bee would have half theencoding xenobiotic detoxifying enzymes (GST, P450 andcarboxyl/cholinesterases) of D. melanogaster and Anophelesgambiae. This short supply may influence the sensitivity ofthe honey bees to pesticides.
In most studies based on vertebrate organisms, bodyweight and protein concentration are associated with fitnessand homeostasis conditions. In our field study, bees associatedwith organic fields demonstrated a steady increase of proteinconcentration compared to bees from other field conditions,especially conventionally grown fields (Fig. 3c). The signifi-cant increase of weight between the first and second weeks(Fig. 3d) could be due to the abundance of maize pollen, asthis effect was not observed in non-cultivated fields. When
0
25
50
75
100
Sur
viva
l (%
)a
0.240.30
0.080.16
Control
0 1 2 3 4 5 6 7 8 9 100
10
20
30
40
50
Days
Hyp
erac
tivity
(%)
b
0.300.240.160.08
Fig. 5 Effects of chronic exposure (10 days) of imidacloprid on honeybee’s survival and hyperactivity. a Survival. Values represent thecumulated number of events (death) of four replicates (cages) per doseand the control group×100. Survival for each dose was compared tothe control group using χ2 test. b Hyperactivity. Values represent thecumulated behaviour observations (tumbling and trembling) of fourreplicates (cages) per dose×100. Hyperactivity was compared to thecontrol group using Fisher’s exact test
Environ Sci Pollut Res
Author's personal copy
apiaries are located near large corn culture areas, bees feedalmost exclusively on this pollen source (Decourtye et al.2011). While the protein value associated to maize pollen isstill a question of debate, bees submitted to maize pollen dietdemonstrated reduced brood productivity and lifespan(Höcheri et al. 2012). A more detailed protein profile couldhelp monitor the honey bee’s physiological status while alsoadding to current knowledge of its actionmechanisms, such asthe possibility of decreased fitness.
There is no clear pattern or trend regarding the in-fieldmortality. While the mortality was more important in theLaurentides region compared to the Montérégie, the countof dead bees in front of the hive varied greatly among weeksand in-field conditions. Further studies should include areport of hive variation pre-treatment in order to controlthe detectable differences between the hives. In healthybeehives, worker bees normally dispose of dead beespreventing infection or diseases. However, a weekly cumu-lated high number of dead bees in front of the hives couldsuggest a symptom of poisoning or colony disorder.According to Johansen and Mayer (1990), the dead beecount in front of the hive could represent 1 % to 20 % ofthe total (real) mortality (in-field and inside the hive).
For bees exposed to imidacloprid (lab experiment), neu-rotoxic symptoms and mortality occurred at the lowest dosetested, 0.08 ng/bee or 1.1 μg/L. These results were also inagreement with values published by Suchail et al. (2001).The hyperactivity effects were not observed in bees exposedto clothianidin. This difference could be attributed to aslightly different action mechanism or to the fact thatclothianidin was a pure compound and not a commercialformulation. When Franklin et al. (2004) exposed Bombusimpatiens to both products, trembling was observed withimidacloprid but not with clothianidin. The negative rela-tionship between AChE activity and protein concentrationfound in caged bees exposed to neonicotinoids and in or-ganic field conditions at week4 suggest indirect effects orspecific protein synthesis. Studies focusing on specificgenes and protein responses (e.g. RT-PCR) could indicateif the high AChE activity that we reported here has beeninduced by neonicotinoid exposure.
Our laboratory study showed that exposure toneonicotinoids increased AChE activity in honey bees andthat hyperactivity and decreased survival were closelylinked. In the fields, the increased AChE activity seemedto be associated to the maize pollen availability. Furtherresearch will be necessary to detect and identify the sourcesof neonicotinoids as well as other compounds susceptible toinfluence the AChE expression as deltamethrin. In a labo-ratory experiment where the honey bees were exposed todeltamethrin, AChE activity increased in surviving bees anddecreased in dead bees (Badiou et al. 2008). Pyrethroidinsecticides are rarely used in maize crops, but they could
have been used in nearby productions of vegetables, fruits oreven sweet corn. Herbicides though are commonly used.Reduced protein concentration, P450 enzymes and AChEactivity have been reported in aquatic midge exposed tometolachlor (Ying et al. 2008). When Modesto andMartinez (2010) exposed the fish Prochilodus lineatus toRoundup Transorb (1 m/L), they observed ROS (reactiveoxygen species) damages after 24 h and inhibition of brainAChE activity after 96 h. Without presuming direct com-parison between vertebrates and invertebrates, a reducedAChE activity was also observed when we exposed beesto a commercial formulation of Roundup Weathermax.
At this point, the exact action mechanisms triggeringadverse effects in bees exposed to agricultural contaminantsare not known. In our study, we had not anticipated thatneonicotinoids primary action on nAChERs would elicitheightened cholinesterase activity, as clearly demonstratedby our laboratory experiment. We can only presume thatbecause neonicotinoids occupy the binding-site of acetyl-choline, this compound tends to accumulate in the synapses,stimulating the action of AChE, in a typical substrate-enzyme cellular response.
Conclusions
To our knowledge, this is the first time that an increasedAChE activity is reported for both in-field and laboratorydata implicating honey bees. While many laboratory exper-iments have been conducted to test the toxicity of severalchemicals on honey bees, the real impact of sub-lethalexposures to a mixture of contaminants faced by the beesin wild environments is yet to be discovered. The preciseconcentration triggering the observed effects is difficult topredict. The results of the chronic exposure under controlledconditions suggest that the NOEL (no observable effectslevel) for imidacloprid alone is less than 0.08 ng per bee.The age of the bees, their genetic background and theirpotential for detoxification are unknown factors that mayhave a profound influence on toxicological studies.Furthermore, the mixture of contaminants in the wild envi-ronment, the use of various surfactants in commercial for-mulation products, the trophallaxis practices and thepossible repellent character of certain contaminated syrupused for cage experiments prevent the exact amount ofproduct absorbed by the bees to be known.
While the dose–effect relationships are yet to beestablished for many pesticides used in agricultural areas, in-field data and measures of effects, other than mortality, areexpressly needed. AChE activity could be useful for monitor-ing effects associated with neonicotinoids or other neurotoxiccompounds. Parameters like bee weight and protein concen-tration should not be overlooked. Considering weight and
Environ Sci Pollut Res
Author's personal copy
protein concentration, bees in organic fields of our studyappeared to have a slight advantage from other field condi-tions. We can only speculate on the long-term impact ofaltered nervous transmission, unbalanced protein synthesisand possible deficient detoxification mechanisms faced byhoney bees on an individual or collective basis. With thecontinuing development of phytosanitary products and thetendency for increasing cultivation of wide-row crops, onemay expect greater environmental hazards for the honey beeand for other pollinators.
Acknowledgments The authors would like to thank Isabelle Ferland,Geneviève Beaunoyer, Cynthia Franci, Karine Dufresne, Dieynaba Diop,Hannan Alami and Arnaud Villier for their technical assistance. We alsothank Émile Houle andMichael Benoit from CRSAD and the beekeepersand farmers involved in the field study. We acknowledge the contributionof Stéphane Laramée, André Pettigrew and François Gouin-Legault forfieldwork.We are grateful to TOXEN-CIRE (Centre interinstitutionnel derecherche en toxicologie de l’environnement–Centre Interinstitutionnelde recherche en écotoxicologie) for the use of laboratories and analyticalequipment. The authors thank Dr. Philip Spear and Stephanie Hedrei-Helmer,M.Sc. for reviewing the manuscript. This studywas supported byProgramme de soutien à l’innovation en agroalimentaire (PSIA) fromMinistère de l’Agriculture, des pêcheries et de l’alimentation du Québec(MAPAQ), Conseil pour le développement de l’agriculture du Québec(CDAQ) from Agriculture et Agroalimentaire Canada and CanadianPollinator Initiative (CANPOLIN), grants attributed to M. Chagnon.
References
Badiou A, Meled M, Belzunces LP (2008) Honeybee Apis melliferaacetylcholinesterase—a biomarker to detect deltamethrin expo-sure. Ecotoxicol Environ Saf 69:246–253
Bérubé V, Boily MH, DeBlois C, Dassylva N, Spear PA (2005) Plasmaretinoid profile in bullfrogs, Rana catesbeiana, in relation toagricultural intensity of sub-watersheds in the Yamaska Riverdrainage basin, Québec, Canada. Aquat Toxicol 71:109–120
Boily M, Bérubé VE, Spear PA, DeBlois C, Dassylva N (2005)Hepatic retinoids of bullfrogs in relation to agricultural pesticides.Environ Toxicol Chem 24:1099–1106
Boily M, Thibodeau J, Bisson M (2009) Retinoid metabolism (LRAT,REH) in the liver and plasma retinoids of bullfrog, Ranacatesbeiana, in relation to agricultural contamination. AquatToxicol 91:118–125
Bonmatin JM, Marchand PA, Charvet R, Moineau I, Bengsch ER,Colin ME (2005) Quantification of imidacloprid uptake in maizecrops. J Agric Food Chem 53:5336–5341
Brattsten LB, Berger DA, Dungan LB (1994) In vitro inhibition ofmidgut microsomal P450s from Spodoptera eridania caterpillarsby demethylation inhibitor fungicides and plant growth regula-tors. Pest Biochem Physiol 49:234–243
Chauzat MP, Faucon JP, Martel AC, Lachaize J, Cougoule N, AubertM (2006) A survey on pesticide residues in pollen loads collectedby honey bees (Apis mellifera) in France. J Econ Entomol99:253–262
Claudianos C, Ranson H, Johnson RM, Biswas S, Schuler MA,Berenbaum MR, Feyereisen R, Oakeshott JG (2006) A deficitof detoxification enzymes: pesticide sensitivity and environ-mental response in the honeybee. Insect Mol Biol 15:615–636
CRAAQ and MAPAQ (2011) Répertoire 2011, Traitements de protec-tion des grandes cultures, Québec, Centre de référence en agri-culture et agroalimentaire du Québec et ministère de l’Agriculturede Pêcheries et de l’Alimentation du Québec, 571 p
Decourtye A, Devillers J (2010) Insect nicotinic acetylcholine recep-tors. In: Thany SH (ed) Insect nicotinic acetylcholine receptors.Springer, Berlin, pp 85–96
Decourtye A, Alaux C, Odoux J-F, Henry M, Vaissière BE, Le Conte Y(2011) Why enhancement of floral resources in agro-ecosystemsbenefit honeybees and beekeepers? In: Grillo O, Venora G (eds)Ecosystems biodiversity. In Tech, Chapter 16, pp 371–388
Déglise P, Grünewald B, Gauthier M (2002) The insecticideimidacloprid is a partial agonist of the nicotinic receptor of hon-eybee Kenyon cells. Neurosci Lett 321:13–16
Donnarumma L, Pulcini P, Pochi D, Rosati S, Lusco L, Conte L (2011)Preliminary study on persistence in soil and residues in maize ofimidacloprid. J Environ Sci Health B 46:469–472
Evans SC, Shaw EM, Rypstra AL (2010) Exposure to a glyphosate-based herbicide affects agrobiont predatory arthropod behaviourand long-term survival. Ecotoxicol 19:1249–1257
Franklin MT, Winston ML, Morandin LA (2004) Effects ofclothianidin on Bombus impatiens (Hymenoptera: Apidae) colonyhealth and foraging ability. J Econ Entomol 97:369–373
Garcia MDG, Galera MM, Valverde RS, Galanti A, Girotti S (2007)Column switching liquid chromatography and post-column pho-tochemically fluorescence detection to determine imidaclopridand 6-chloronicotinic acid in honey bees. J Chromatogr A1147:17–23
Gauthier M (2010) State of the art on insect nicotinic acetylcholinereceptor function in learning and memory. In: Thany SH (ed)Insect nicotinic acetylcholine receptors. Springer, Berlin, pp 97–115
Giroux I, Pelletier L (2012) Présence de pesticides dans l’eau auQuébec: bilan dans quatre cours d’eau de zones en culture demaïs et de soya en 2008, 2009 et 2010, Québec, ministère duDéveloppement durable, de l’Environnement et des Parcs,Direction du suivi de l’état de l’environnement, ISBN 978-2-550-64159-9, 46 pp +3 annexes
Höcheri N, Siede R, Illies I, Gätschenberger H, Tautz J (2012)Evaluation of the nutritive value of maize for honey bees. JInsect Physiol 58:278–285
Iwasa T, Motoyama N, Ambrose JT, Roe MR (2004) Mechanism forthe differential toxicity of neonicotinoid insecticides in the honeybee, Apis mellifera. Crop Prot 23:371–378
Johansen C, Mayer D (1990) Pollinator protection: A bee and pesticidehandbook. Wicwas, Cheshire
Johnson RM, Ellis MD, Mullin CA, Frazier M (2010) Pesticides andhoney bee toxicity. Apidologie 41:312–332
Kenneke JF, Mazur CS, Kellock KA, Overmyer JP (2009) Mechanisticapproach to understanding the toxicity of the azole fungicidetriadimefon to a nontarget aquatic insect and implications forexposure assessment. Environ Sci Technol 43:5507–5513
Key P, Chung K, Siewicki T, Fulton M (2007) Toxicity of threepesticides individually and in mixture to larval grass shrimp(Palaemonetes pugio). Ecotoxicol Environ Saf 68:272–277
Krupke CH, Hunt GJ, Eitzer BD, Andino G, Given K (2012) Multipleroutes of pesticide exposure for honey bees living near agriculturalfields. PLoS One 7:e29268. doi:10.1371/journal.pone.0029268
Le Goff G, Hillioub F, Siegfried BD, Boundya S, Wajnbergb E, SoferbL, Audantb P, ffrench-Constanta RH, Feyereisenb R (2006)Xenobiotic response in Drosophila melanogaster: sex depen-dence of P450 and GST gene induction. Insect Biochem MolBiol 36:674–682
Liu Z, Dai Y, Huang G, Gu Y, Ni J, Wei H, Yuan S (2011) Soilmicrobial degradation of neonicotinoid insecticides imidacloprid,acetamiprid, thiacloprid and imidaclothiz and its effect on the
Environ Sci Pollut Res
Author's personal copy
persistence of bioefficacy against horsebean aphid Aphiscraccivora Koch after soil application. Pest Manag Sci67:1245–1252
Louveaux J, Maurizio A, Vorwohl G (1978) Methods ofmelissopalynology. Bee World 59:139–162
Maini S, Medrzycki P, Porrini C (2010) The puzzle of honey beelosses: a brief review. Bull Insectol 63:153–160
MAPAQ (2006) Profil agroalimentaire de la Montérégie. Ministère del’Agriculture, des pêcheries et de l’alimentation du Québec, 102 p
Marcogliese DJ, King KC, Salo HM, Fournier M, Brousseau P, SpearP, Champoux L, McLaughlin JD, Boily M (2009) Combinedeffects of agricultural activity and parasites on biomarkers in thebullfrog, Rana catasbeiana. Aquat Toxicol 91:126–134
MDEIE (2012) Profil régional - Laurentides. Ministère duDéveloppement économique, de l’innovation et de l’exportation,12 p
Mirande L, Haramboure M, Smagghe G, Piñeda S, Schneider MI(2010) Side-effects of glyphosate on the life parameters ofEriopis connexa (Coleoptera: Coccinelidae) in Argentina.Commun Agric Appl Biol Sci 75:367–72
Modesto KA, Martinez CB (2010) Effects of roundup transorb on fish:hematology, antioxidant defenses and acetylcholinesterase activi-ty. Chemosphere 81:781–787
Morakchi S, Maïza A, Farine P, Aribi N, Soltani N (2005) Effects of aneonicotinoid insecticide (acetamiprid) on acetylcholinesteraseactivity and cuticular hydrocarbons profil in German cockroaches.Commun Agric Appl Biol Sci 70:843–848
Nauen RU, Ebbinghaus-Kintscher U, Schmuck R (2001) Toxicity andnicotinic acetylcholine receptor interaction of imidacloprid and itsmetabolites in Apis mellifera (Hymenoptera: Apidae). Pest ManagSci 57:577–586
Potts SG, Roberts SPM, Dean R, Marris G, Brown MA, Jones R,Neumann P, Settele J (2010) Declines of managed honey beesand beekeepers in Europe. J Api Res 49:15–22
Suchail S, Guez D, Belzunces LP (2001) Discrepancy between acuteand chronic toxicity induced by imidacloprid and its metabolitesin Apis mellifera. Environ Toxicol Chem 20:2482–2486
Thany SH (2009) Agonist actions of clothianidin on synaptic andextrasynaptic nicotinic acetylcholine receptors expressed on cock-roach sixth abdominal ganglion. Neurotoxicol 30:1045–1052
Thornton BJ, Elthon TE, Cerny RL, Siegfried BD (2010) Proteomicanalysis of atrazine exposure in Drosophila melanogaster(Diptera: Drosophilidae). Chemosphere 81:235–241
Tremolada P, Mazzoleni M, Saliu F, Colombo M, Vighi M (2010) Fieldtrial for evaluating the effects on honey bees of corn sown usingCruiser and Celest xl treated seeds. Bull Environ Contam Toxicol85:229–234
van Eaglesdorps D, Evans JD, Saegerman C, Mullin C, Haubruge E,Nguyen BK, Frazier M, Frazier J, Cox-Foster D, Chen Y,Underwood R, Tarpy DR, Pettis JS (2009) Colony collapse dis-order: a descriptive study. PLoS ONE 4:64–81
Wu JY, Anelli CM, Sheppard WS (2011) Sub-lethal effects of pesticideresidues in brood comb on worker honey bee (Apis mellifera)development and longevity. PLoS ONE 6:e14720. doi:10.1371/journal.pone.0014720
Yang EC, Chuang YC, Chen YL, Chang LH (2008) Abnormal foragingbehavior induced by sublethal dosage of imidacloprid in the honeybee (Hymenoptera: Apidae). J Econ Entomol 101:1743–1748
Ying JC, Anderson TD, Zhu KY (2008) Effect of alachlor andmetolachlor on toxicity of chlorpyrifos and major detoxificationenzymes in the aquatic midge, Chironomus tentans (Diptera:Chironomidae). Arch Environ Contam Toxicol 54:645–652
Environ Sci Pollut Res
Author's personal copy


