Embed Size (px)
Citation preview
www.cedlas.econo.unlp.edu.ar
CC | EE | DD | LL | AA | SS
Centro de Estudios Distributivos, Laborales y Sociales
Maestría en Economía
Facultad de Ciencias Económicas Universidad Nacional de La Plata
Achieving the MDGs in Yemen: An Assessment
Abdulmajeed Al-Batuly, Mohamed Al-Hawri, Martin Cicowiez, Hans Lofgren y Mohammad Pournik
Documento de Trabajo Nro. 131
Abril, 2012
ISSN 1853-0168
1
Achieving the MDGs in Yemen: An Assessment+
Abdulmajeed Al-Batuly*
Mohamed Al-Hawri**
Martin Cicowiez***
Hans Lofgren****
Mohammad Pournik*****
Abstract
Once the current political crisis in Yemen has been resolved, it will be ever more urgent
to speed up progress, including Millennium Development Goal (MDG) achievements.
Drawing on simulations with the Maquette for MDG Simulations (MAMS), a model for
strategy analysis, and a linked microsimulation model, this paper addresses Yemen’s
MDG challenges. A first simulation set considers scaled-up government actions with the
aim of fully achieving the 2015 international MDG targets with required additional
financing from foreign or domestic sources. The main finding is sobering but not
surprising: given the required expansion of MDG-related services, on-time achievement
+ This document is based on a report prepared as part of the project “Assessing Development Strategies to Achieve the MDGs in the Arab Region”, undertaken by UN-DESA, UNDP and World Bank in collaboration with governments and researchers in the region. In addition to Yemen, the project covers Morocco, Tunisia, Egypt and Jordan. The authors are grateful for helpful comments from Marco Sanchez. The authors would also like to thank the Knowledge for Change Program (KCP) Trust Fund for funding of the MAMS work program. The views, findings and conclusions expressed in this paper are entirely those of the authors and do not necessarily reflect those of the institutions with which the authors are associated, including the World Bank, its Executive Board, or member country governments. Corresponding author: Hans Lofgren, email: [email protected]. * Ministry of Planning and International Cooperation, Sana’a. ** Ministry of Planning and International Cooperation, Sana’a. *** CEDLAS-UNLP, La Plata, Argentina. **** Development Economics Prospects Group World Bank, Washington, D.C. ***** UNDP, Regional Center for Arab States, Cairo.
2
of key MDG targets does not appear to have been a realistic objective even if the
government, hypothetically, would have expanded services with grant aid financing
starting from 2005; macroeconomic stability, government efficiency, and the production
of tradables would all have suffered due to the size of spending and aid increases as well
as the resulting real exchange rate appreciation. The results suggest that countries, instead
of relying on international targets, should set MDG targets grounded in their own reality.
In light of these results, the authors designed a second simulation set that is focused on
the remaining period up to 2015, and on what may be feasible once the current conflict
has been settled. The simulations introduce moderate increases in foreign aid or
government allocative efficiency. The government uses the resulting fiscal space for
spending and service expansion in infrastructure and human development without losses
in productive efficiency. The results suggest that, under these conditions, substantial
improvements could still be achieved.
JEL classification: C68, E62, O15
Keywords: Millennium Development Goals, Yemen, Computable General Equilibrium,
MAMS
3
Table of contents
1. Introduction ................................................................................................................. 4
2. Economic performance and MDG trends ..................................................................... 7
Main reforms, macroeconomic policy, performance and vulnerabilities ....................... 7
Evolution and structure of public spending ................................................................ 12
Evolution of MDG indicators 1990-2009 ................................................................... 13
3. Method and data ........................................................................................................ 16
4. MDG simulations and analysis of results ................................................................... 22
Base scenario ............................................................................................................. 22
MDG simulations ...................................................................................................... 26
5. Alternative scenarios: aid and government allocative efficiency................................. 32
Aid scenarios ............................................................................................................. 34
Efficiency scenarios................................................................................................... 36
6. Conclusions and policy recommendations ................................................................. 37
References ..................................................................................................................... 40
4
1. Introduction
Yemen is one of the poorest countries in the Arab region with a per capita GDP of
US$1,160 for 2008 (WDI, 2010) and faces a wide range of developmental challenges,
amplified in 2011 by deepened domestic conflict. In 2007, the country was ranked 140
out of 182 according to the HDI (Human Development Index) (UNDP, 2009). Ever since
reunification in 1990, Yemen’s relative position on the HDI index has remained more or
less unchanged, with very slow progress towards attaining the Millennium Development
Goals (MDGs). At 3 percent, the country has one of the highest population growth rates
globally, with the population expected to double in 23 years to around 40 million. This
increases the demand for educational and health services, drinking water and employment
opportunities. Yemen faces a severe water shortage, with available ground water being
depleted at an alarming rate. Its oil production and reserves are declining with severe
budgetary consequences. The Yemeni economy is caught in a jobless slow growth cycle
leading to stagnant per capita incomes and rising levels of unemployment, particularly
amongst the youth. Unless resolved promptly, the political crisis that erupted in 2011
threatens to make Yemen’s prospects for rapid growth and progress on MDGs even
bleaker.
Social development indicators, such as child malnutrition, maternal mortality, and
educational attainment remain discouraging. The Household Budget Survey of 2005/06
indicates that about 35 percent of the population lives below the national poverty line,
with poverty more widespread and persistent in rural areas. However, given persistent
increases in consumer prices, notably food prices, the rate of poverty had increased to
42.4 percent in 2010 (MOPIC, 2011).1 There are large gender disparities, with significant
gaps in women’s access to economic, social and political opportunities. As indicated by
its first and second MDG Reports, Yemen was off track with respect to meeting the MDG
1 The Fourth Five-Year Socio-Economic Development Plan for Poverty Reduction 2011-2015 is an official document that, among other things, provides projections for several variables useful for generating the MAMS reference scenario as further explained below.
5
targets that the international community agreed to pursue at the 2000 UN Millennium
Summit (MOPIC, 2003, 2010).
Nevertheless, Yemen’s government has stated that it views accelerated MDG progress
and, if possible, full achievement of the MDG targets as a high priority. To this end, it
has issued the abovementioned MDG Reports as well as one “Needs Assessment”
(MOPIC, 2005). Using a bottom-up approach, the latter study attempts to specify the
requirements for full MDG achievements in terms of spending and service delivery. The
analysis does not use an integrated approach but treats each sector that is directly linked
to the MDGs (most importantly health, education, and water-sanitation) in isolation from
each other and from the rest of the economy.
In terms of the required service expansion and other changes needed to achieve the
MDGs covered in this paper, the analysis takes the information in the 2005 “Needs
Assessment” as its point of departure. However, it goes beyond that assessment by
situating the pursuit of alternative MDG strategies in the context of Yemen’s economy,
for each scenario simulating its impact on a wide range of interrelated economic
indicators; in addition to key MDG indicators (related to poverty, health, primary
education, and water and sanitation), the analysis covers the impacts on national accounts
aggregates, macroeconomic balances (including the government budget and the balance
of payments), the size of the government relative to the rest of the economy, as well as
production and trade in different sectors. One key aspect of the analysis is that it
considers the repercussions of relying on different sources (foreign or domestic) for the
additional government financing that is required.
In terms of method, the simulation analysis is based on MAMS, an economy-wide model
developed at the World Bank for MDG and development strategy analysis. Results from
MAMS scenarios are passed on to a microsimulation model that relies on household
survey data to assess effects on poverty and inequality.
More specifically, the initial set of simulations, which covers the period 2004-2015,
addresses the extent of the scaling-up of government services that would have been
required to achieve international MDG targets for education, health, and water-sanitation,
6
as well as the economic impact and feasibility of such a scaling-up. The achievement of
these MDGs are targeted under macroeconomic feasibility of pursuing the achievement
of international MDG targets for education, health and water-sanitation under four
alternative financing scenarios, two based on enhanced domestic resource mobilization
(direct taxes and borrowing) and two based on foreign financing (grants and borrowing).
The main finding of this set of simulations is sobering but not surprising considering the
magnitude of the MDG challenge for Yemen. Given the requirements identified in the
“Needs Assessment”, which feed into the model-based analysis, full, on-time MDG
achievement by 2015 does not appear to have been a realistic objective even if the
government would have expanded its spending on services in the MDG area starting from
2005. Substantial reliance on domestic financing for the additional funding required to
expand such government services would have left less resources for the private sector to
the detriment of growth and the achievement of the poverty MDG. If sufficient foreign
aid would have been available (which is questionable), macroeconomic stability would
have been threatened and Dutch disease would have posed a danger as growth in the
production of tradables (for export or import-substitution) would have slowed down in
response real exchange rate appreciation. Moreover, institutional and labor market
constraints would have made it extremely challenging for the government to bring about
the required increases in spending without substantial efficiency losses, limited the
increases in real service delivery. This suggests that, in its pursuit to reduce poverty and
improve human development, instead of relying on international targets, the government
should set targets that, while remaining ambitious, are grounded in Yemen’s reality and
priorities.
In light of this finding, a second set of simulations was designed to consider scenarios
that are forward-looking and grounded in what may be feasible given Yemen’s current
situation, once the current internal conflict has been settled. In these simulations,
moderate exogenous increases are introduced for foreign aid or government allocative
efficiency. The government makes use of the resulting addition to fiscal space to expand
spending and service delivery in infrastructure and human development. The results
7
suggest that substantial improvements could be achieved if, as a result of one (or more) of
these exogenous changes, fiscal space would increase and the government could expand
spending without losses in productive efficiency.
The rest of the paper contains five sections. Background on the Yemeni economy and
MDGs since 1990 is provided in Section 2, followed by a presentation of methods and
data, covering both MAMS and the microsimulation model (Section 3). Sections 4 and 5
present and analyze the two set of simulations and their results. Section 6 concludes and
provides some policy recommendations.
2. Economic performance and MDG trends2
Main reforms, macroeconomic policy, performance and vulnerabilities
The birth of a unified Yemen in 1990 was marred by the impact of the Iraqi invasion of
Kuwait on Yemenis living and working in Gulf Cooperation Council (GCC) countries, as
the return of up to one million Yemenis deprived the country of a large annual inflow of
remittances and added substantially to the numbers of persons who needed jobs,
schooling, health and other basic social services. The country also had to absorb the costs
of integrating two different civil service structures and economic systems. The decision
to keep all civil servants of the pre-existing two governments and to apply the higher pay
scale prevalent in the North to the unified civil service led to a substantial increase in the
public sector wage bill. Despite all the disruptions associated with unification and the
civil war of 1994 and external shocks, official data show positive (albeit highly variable)
growth averaging 5.5 percent over the period 1990 to 1999. Since 1999, growth has been
more stable though significantly lower, at around 4 percent. As will be seen below, the
fast growth period of the 1990s coincided with rapid expansion for the oil sector which,
during most of the period since 2000, has seen its real output shrink but has been
somewhat more stable in nominal terms since prices have increased. The decline in GDP
2 This review covers the period up to 2009, the last year for which relatively comprehensive data was available when this paper was written. The current political turmoil is having a strong impact on the economy, including GDP growth, foreign trade, and foreign exchange reserves.
8
growth in per capita terms has been mitigated by a decline in the population growth rate
from 4 percent in the early 1990s to less than 3 percent since 1999. Still, current per-
capita growth rates are not sufficient to permit a sustained reduction in poverty.
The initial period of Yemen as a unified country was marked by an increase in fiscal
imbalances, related to high costs of unification, and leading to increasing rates of
inflation. The government responded by introducing direct restrictions on imports,
investments and movements of the exchange and interest rates. In 1995, it embarked on
market-oriented reforms, focused on price stabilization and trade liberalization, fiscal
adjustments and the exchange rate regime. The more liberal regime has continued,
including a gradual reduction of subsidies on major items including petroleum products.
Apparently, these efforts helped to stabilize the economy. However, in conjunction with
other factors influencing Yemen’s economy (including the halt to oil expansion), these
policy changes were not able to maintain growth at the rates witnessed in the first half of
the 1990s.
Since 2003, government policy has been guided by a Poverty Reduction Strategy Paper
(PRSP) that aims at reducing poverty by means of increased allocations to basic social
services and the fostering of more rapid, broad-based growth. However, progress reports
demonstrate a lack of success in achieving the stated strategic objective of raising the
shares of government spending allocated to social services (most importantly health and
education).
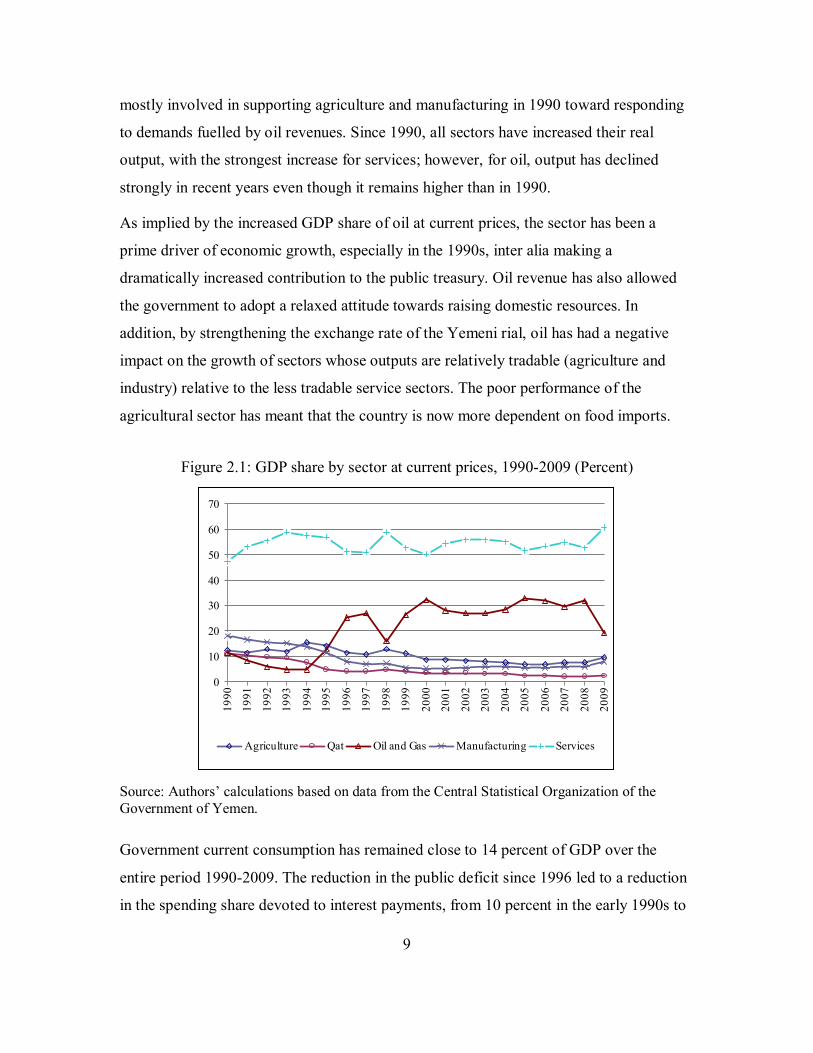
The structure of the economy underwent fundamental changes over the period from 1990
to 2009, with the share of key sectors changing substantially. Figure 2.1 shows that the
GDP shares (at current prices) have increased for oil (including gas) and services. For oil,
the fluctuations are strong, in part due to changing world prices. Manufacturing and qat
have declined strongly while (other) agriculture is relatively unchanged.3 In addition to
its increased relative importance, the nature of the service sector has changed from being
3 At constant prices (not shown here) the importance of the oil sector has shrunk sharply (indicating a decline in physical output) while the decline for qat is less drastic; for other sectors, the changes under constant and current prices are quite similar. Qat is a mild narcotic accounting for over one–third of agricultural production.
9
mostly involved in supporting agriculture and manufacturing in 1990 toward responding
to demands fuelled by oil revenues. Since 1990, all sectors have increased their real
output, with the strongest increase for services; however, for oil, output has declined
strongly in recent years even though it remains higher than in 1990.
As implied by the increased GDP share of oil at current prices, the sector has been a
prime driver of economic growth, especially in the 1990s, inter alia making a
dramatically increased contribution to the public treasury. Oil revenue has also allowed
the government to adopt a relaxed attitude towards raising domestic resources. In
addition, by strengthening the exchange rate of the Yemeni rial, oil has had a negative
impact on the growth of sectors whose outputs are relatively tradable (agriculture and
industry) relative to the less tradable service sectors. The poor performance of the
agricultural sector has meant that the country is now more dependent on food imports.
Figure 2.1: GDP share by sector at current prices, 1990-2009 (Percent)
0
10
20
30
40
50
60
70
19
90
19
91
19
92
19
93
19
94
19
95
19
96
19
97
19
98
19
99
20
00
20
01
20
02
20
03
20
04
20
05
20
06
20
07
20
08
20
09
Agriculture Qat Oil and Gas Manufacturing Services
Source: Authors’ calculations based on data from the Central Statistical Organization of the Government of Yemen.
Government current consumption has remained close to 14 percent of GDP over the
entire period 1990-2009. The reduction in the public deficit since 1996 led to a reduction
in the spending share devoted to interest payments, from 10 percent in the early 1990s to
10
7 percent in recent years. Domestic borrowing remained within reasonable levels and
external debt was cut substantially through debt reduction measures agreed with major
lenders in the early 2000s. In 2009, the total stocks of external and domestic public debt
were at 20.6 and 15.8 percent of GDP, respectively, with the government being able to
service these debts without difficulty.
Thanks to rising oil prices, export earnings and foreign exchange reserves expanded
during the period 2002-2009; in 2009, reserves were sufficient to cover imports for 7.5
months (IMF, 2010).4 Up to and including 2009, Yemen gradually liberalized trade, with
tariff rates on most items cut to single digits and most non-tariff barriers removed.
However, oil reserves are expected to be depleted before 2020 (EIU, 2008, p. 3). In
addition, Yemen is also facing the depletion of its groundwater. These challenges are
compounded by population growth at rates exceeding 3 percent, poor infrastructure, weak
institutional capacity, a fragile security situation, and the widespread use of qat.5 In
addition, rising food prices pose a particularly difficult problem, given the very slow
increase in domestic food production since unification, with the country currently
dependent on imports for over 80 percent of its basic food staples.
As an element of its inflation control policy, the Central Bank of Yemen has been
maintaining a fairly stable nominal exchange rate of the Yemeni rial relative to the US
dollar during the period 2002-2009, allowing an annual depreciation of 3-5 percent.
Nevertheless, given an average inflation rate of around 10 percent during the same
period, the real exchange rate has appreciated, boosting imports and undermining non-oil
exports, a development that has been made possible by still high oil revenues.
4 In the context of the ongoing conflict, reserves of foreign exchange declined drastically during the first half of 2011, according to IMF’s Arab News on 3 August 2011, downloaded from: <http://arabnews.com/economy/article482640.ece>. 5 In addition to accounting for over one–third of agricultural production, as said, the production of qat requires a quarter of total water resource use. Furthermore, according to the Yemen Poverty Assessment (Government of Yemen and others, 2007: p. 43), “qat impacts the economy in a negative manner through the opportunity cost of lost savings as well as lost work-hours. Although the authorities have developed public awareness campaigns, citing the drawbacks of qat consumption, discouraging qat consumption is a complex and difficult task; it is far too well integrated into the Yemeni economy and social structure to be eliminated on a short-term basis without adverse effects”.
11
The tax effort of the government has been modest. The share of total tax revenue to GDP
fell over the period from 10 percent in 1992 to 7 percent by 2009. This is due to a drastic
reduction in indirect taxes, from 7.5 percent of GDP in 1991 to 3.2 percent by 2009. On
the other hand, direct taxes increased gradually, from a mere 2.5 percent of GDP in 1991
to 3.5 percent by 2009. The share of oil revenue in public revenues rose from around 30
percent in the early 1990s to over 70 percent in the period since 2000.
Yemen’s economy is highly integrated with the outside world. In 2008, foreign trade (the
sum of exports and imports) accounted for around 67 percent of GDP, with a trade deficit
of around 5 percent of GDP. In 2009, these shares were at 56 and 10 percent of GDP,
respectively. The trade deficit (and higher levels of domestic final demand) have been
made possible by foreign transfers (aid and remittances), which in 2008 and 2009
accounted for 7 and 5 percent of gross national disposable income (GNDI), respectively.
With regard to aid, the government of Yemen is receiving official development assistance
from neighboring Arab countries as well as from OECD donors, but the level of
assistance has been negatively affected by political developments since the first Gulf
War. The average level of assistance received by Yemen in the past 10 years has been
between US$13 and US$22 per capita, which is very low when compared with levels of
assistance received by other low-income countries. Yemen is also dependent on
remittances to the tune of US$1-2 billion per year; due to the concentration of Yemeni
expatriates in GCC member countries, this income has been vulnerable to political
shocks.
The 2008 global financial crisis has affected the Yemeni economy negatively through
declines in the world price of oil, foreign direct investment, and remittances of Yemeni
expatriates (Central Bank of Yemen, 2010; MOPIC, 2010). In addition, the economic
situation has been aggravated by internal factors, including the declining oil production
and security problems that damage the investment climate, culminating in the internal
conflict that erupted in early 2011. As a result of these developments, Yemen’s fiscal and
external accounts have faced growing deficits, among other things leading to depreciation
of the Yemeni Rial and increased inflation.
12
Evolution and structure of public spending
In the period from 1990 to 1995, the government put greater emphasis in its budget
policy on maintaining public services at the cost of running persistent budget deficits.
However, following the adoption of a structural adjustment program from 1995, stability
was given greater importance at the cost of reducing the quality of public services.
As noted, the PRSP adopted in 2003 called for a substantial real increase in spending on
social sectors, with the ratio expected to reach 12.8 percent of GDP by 2004. While
spending on social sectors had followed an upward trend for the period since 1991, its
2004 GDP share fell short of the PRSP target. According to the MAMS database (see
below), total spending on health and education, which represent the bulk of social
spending, only reached 6.7 percent of GDP in 2004. In 2006, total social spending had
increased to 8.4 percent of GDP, still substantially short of the PRSP target (Bulletin of
Government Finance Statistics). The majority of this spending is on education (6.1 percent
of GDP) and health (1.7 percent of GDP). A significant proportion of the budget is used
to subsidize electricity and oil derivatives, mostly diesel. These subsidies rose from 3.1
percent of GDP in 2002 to 6.3 percent in 2004, and peaked at close to 10 percent of GDP
in 2006, substantially exceeding the allocation to education.6 In 2005, the government
started to reduce these subsidies on a gradual basis, bringing the petroleum subsidy down
to 6.5 percent of GDP in 2009.
The combined health and education share in total government spending increased by one
percentage point between 1991 and 2009, from 18.7 to 19.8 (see Table 2.1). As a share of
GDP, government spending in health and education increased only very marginally, from
5.5 to 5.7 percent, during the same period. It is interesting that, in the intervening period
between 1991 and 2006, the share of health and education in total public expenditures
peaked at 25.7 percent in 1994 and, after reaching another high point in 2000 at 22.1
percent, has been on a downward trend, falling to under 20 percent since 2006.
6 It should be noted that the fiscal cost of the petroleum subsidy depends on the world price of petroleum products, as the domestic price is fixed.
13
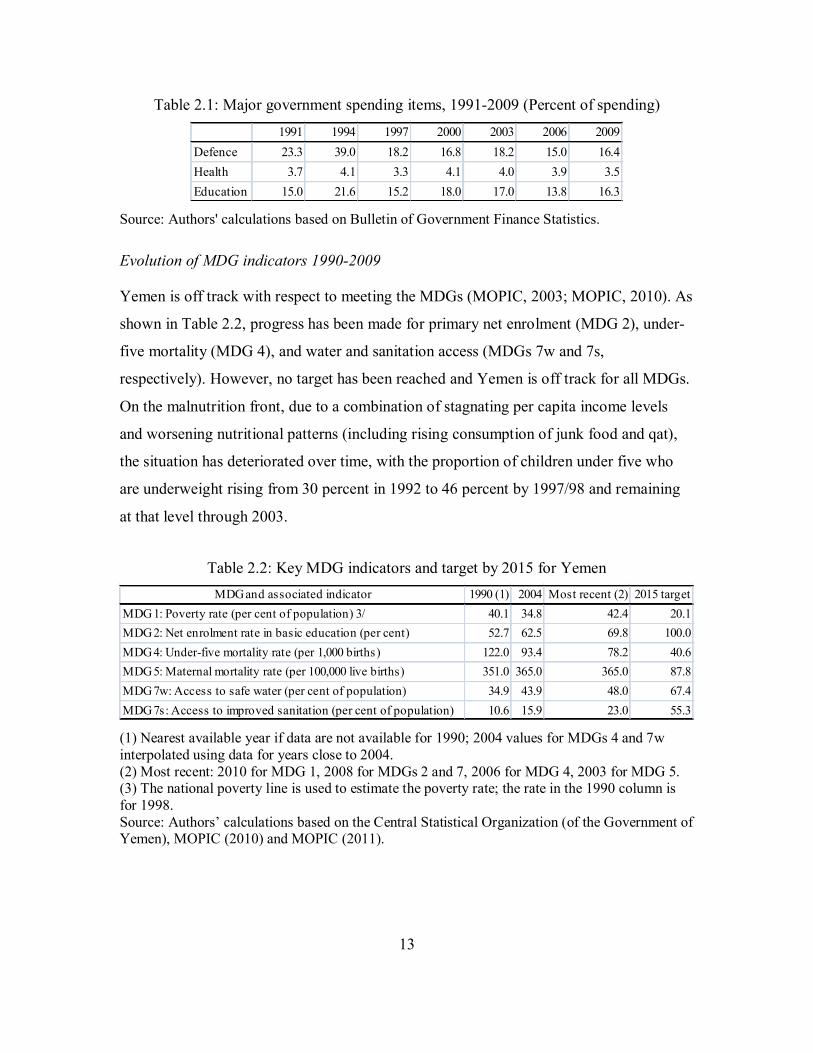
Table 2.1: Major government spending items, 1991-2009 (Percent of spending)
1991 1994 1997 2000 2003 2006 2009
Defence 23.3 39.0 18.2 16.8 18.2 15.0 16.4
Health 3.7 4.1 3.3 4.1 4.0 3.9 3.5
Education 15.0 21.6 15.2 18.0 17.0 13.8 16.3
Source: Authors' calculations based on Bulletin of Government Finance Statistics.
Evolution of MDG indicators 1990-2009
Yemen is off track with respect to meeting the MDGs (MOPIC, 2003; MOPIC, 2010). As
shown in Table 2.2, progress has been made for primary net enrolment (MDG 2), under-
five mortality (MDG 4), and water and sanitation access (MDGs 7w and 7s,
respectively). However, no target has been reached and Yemen is off track for all MDGs.
On the malnutrition front, due to a combination of stagnating per capita income levels
and worsening nutritional patterns (including rising consumption of junk food and qat),
the situation has deteriorated over time, with the proportion of children under five who
are underweight rising from 30 percent in 1992 to 46 percent by 1997/98 and remaining
at that level through 2003.
Table 2.2: Key MDG indicators and target by 2015 for Yemen
MDG and associated indicator 1990 (1) 2004 Most recent (2) 2015 target
MDG 1: Poverty rate (per cent of population) 3/ 40.1 34.8 42.4 20.1
MDG 2: Net enrolment rate in basic education (per cent) 52.7 62.5 69.8 100.0
MDG 4: Under-five mortality rate (per 1,000 births) 122.0 93.4 78.2 40.6
MDG 5: Maternal mortality rate (per 100,000 live births) 351.0 365.0 365.0 87.8
MDG 7w: Access to safe water (per cent of population) 34.9 43.9 48.0 67.4
MDG 7s: Access to improved sanitation (per cent of population) 10.6 15.9 23.0 55.3
(1) Nearest available year if data are not available for 1990; 2004 values for MDGs 4 and 7w interpolated using data for years close to 2004. (2) Most recent: 2010 for MDG 1, 2008 for MDGs 2 and 7, 2006 for MDG 4, 2003 for MDG 5. (3) The national poverty line is used to estimate the poverty rate; the rate in the 1990 column is for 1998. Source: Authors’ calculations based on the Central Statistical Organization (of the Government of Yemen), MOPIC (2010) and MOPIC (2011).
14
The 2005/06 household budget survey (HBS) indicates that, in the survey year, 35
percent of the Yemeni population lived under the national moderate (expenditure)
poverty line, with a much higher rate in rural areas (40 percent as opposed to an urban
rate of 21 percent). Disparities between different governorates are also strong, with
poverty incidence highest in the Amran governorate (64 percent), and lowest in Al
Mahrah (9 percent). The 2005/06 rate was significantly lower than the 1997/98 rate of 40
percent, generated by a comparable household budget survey. The reduction was
remarkable in urban areas, with the poverty rate falling by over one third, while the rural
rate remained stubbornly high at above 40 percent. However, according to more recent
estimates, the poverty rate is once more on the increase, reaching 42.4 percent in 2010,
primarily as a result of increased food prices (MOPIC, 2011).
Analysis carried out based on data from the 2005/06 HBS also demonstrates that the
substantial amounts spent on fuel subsidies only partially benefited the poor, with around
80 percent of the benefits accruing to the non-poor, while the high cost of health care
discourages the poor from seeking care (Government of Yemen and others, 2007). The
survey also confirms that public health care services and the increasing share of
education expenditures allocated to the tertiary sub-sector do not target the poor. There
are also major leakages in the public transfer schemes targeting the poor.
Trends over the last few years in primary education point to an increase in the gross
enrolment rate (GER) in basic education from 58 percent in 1997/98 to 66.5 percent in
2003/04, with adult literacy reaching 50 percent by 2006. Despite substantial progress in
girls’ education, the GER for girls only reached 51.5 percent in 2003. These average rates
of school enrolment in the country hide serious geographic disparities. Boys and urban
children enjoy greater education opportunities and higher enrolment rates.
While the gender gap in primary enrolment decreased from 37.2 in 1990/91 to 24.8 in
2002, the female enrolment rate in the first year of basic education was only 75 percent of
the male enrolment rate. Both boys and girls intake rates in the past few years have
increased in large measure due to the emphasis on improving primary school education.
15
Boys are making greater gains in response to these improvements in education access,
while girls’ primary intake rate continues to lag behind.
Available data shows that both under-five and infant mortality rates had a clear
downward trend from 1990 to 2006—especially during 1990-1997 and 2003-2006. On
the other hand, maternal mortality in Yemen in 1990 was generally believed to exceed
500 per 100,000 live births. The ratio had fallen to around 350 by the time the 1997 DHS
was carried out, but has not shown much change since, as illustrated by a figure of 365
given in the DHS of 2003. Maternal mortality is the leading cause of deaths among
women of reproductive age, accounting for 42 percent of all deaths; 77 percent of births
took place at home, with less than 30 percent attended by a qualified person. The high
neonatal mortality rate, at 37 per 1,000 live births, is closely correlated with the maternal
mortality rate.
Yemen is also unlikely to meet the MDG target of a 50 percent reduction in the
proportion of people without access to safe drinking water. The rate of progress in access
to safe water has been slow and, without an improvement in the rate of change, the target
is unlikely to be met. The same can be said about the target for access to improved
sanitation.
The likely reasons for the slow pace of improvement for most MDG indicators include
insufficient allocation of resources to MDGs and infrastructure, poor use of resources
actually allocated to MDGs, and slow growth in household incomes. The persistence of
high population growth further complicates the task of reaching the MDGs by requiring
substantial increases in services provided simply in order to maintain current coverage
rates. While there are opportunities for improving the contribution that economic growth
and social policies make towards attainment of MDGs, the gap between the targets and
what has been achieved suggests the need to adopt realistic and country-specific targets
that actually can serve as guides to action.
16
3. Method and data
Our quantitative analysis is based on MAMS, a recursive dynamic computable general
equilibrium (CGE) model, and a (linked) microsimulation model. Taking as reference a
baseline scenario for 2004-2015 that assumes continuation of major economic trends,
simulations are conducted to analyze different aspects of MDG achievement. MAMS
innovatively incorporates an MDG module that links specific MDG interventions to
MDG achievements. The relatively detailed treatment of government activities in MAMS
makes this link possible. Specifically, MAMS has a relatively detailed treatment of (1)
government and private sector activities in MDG-related areas, in education extended to
include higher levels and (2) MDG outcomes as a function of relevant services (provided
by the government and private sectors) and other determinants. A sequential “top-down”
approach is followed to link the labor market results of MAMS to the microsimulation
model, which is used to quantify the evolution of poverty and inequality. For a detailed
description of MAMS and the microsimulation models, see Lofgren et al. (2012) and Vos
and Sanchez (2010), respectively. In this section, we describe the Yemen data used for
the two models.
MAMS was calibrated to a 2004 Social Accounting Matrix (SAM) and other data for
Yemen.7 The main sources of information for the construction of the Yemeni 2004 SAM
were the supply and use tables for the same year, complemented by data on the balance
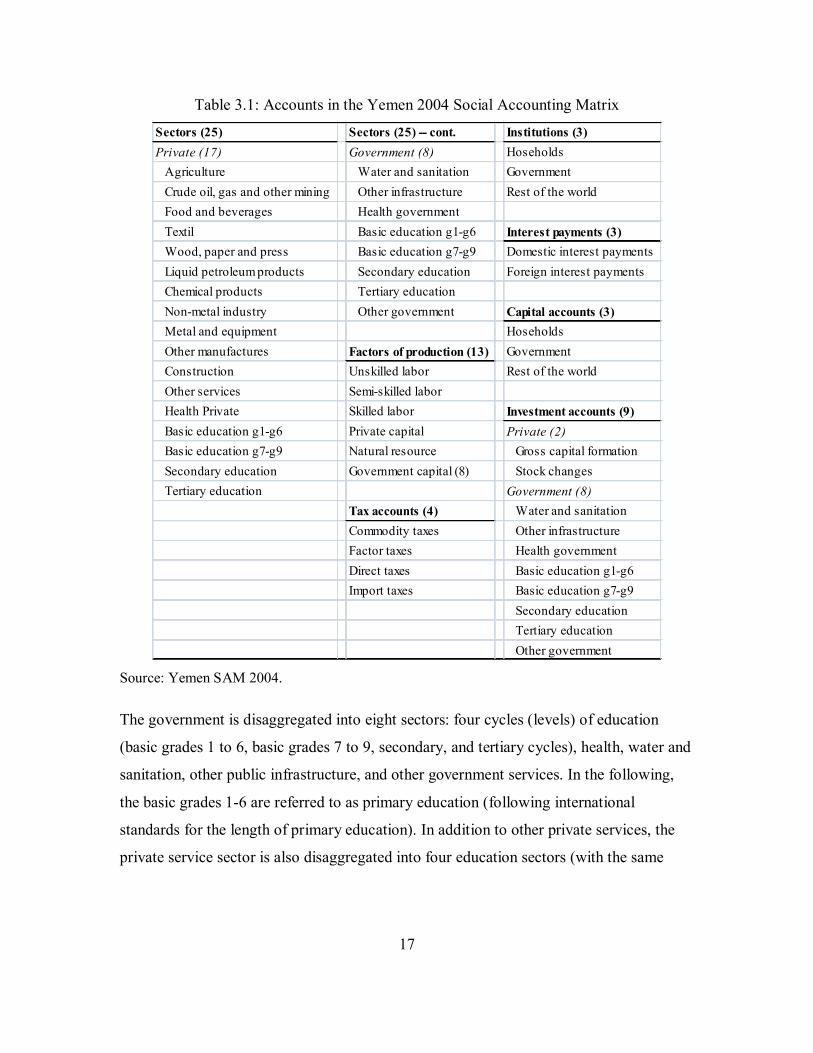
of payments and government finance statistics as well as the 2005 HBS. Table 3.1 shows
the accounts in the SAM, which determine the size (i.e., disaggregation) of the model.
7 See Pacheco (2009) for details on the construction of this SAM.
17
Table 3.1: Accounts in the Yemen 2004 Social Accounting Matrix
Sectors (25) Sectors (25) -- cont. Institutions (3)
Private (17) Government (8) Hoseholds
Agriculture Water and sanitation Government
Crude oil, gas and other mining Other infrastructure Rest of the world
Food and beverages Health government
Textil Basic education g1-g6 Interest payments (3)
Wood, paper and press Basic education g7-g9 Domestic interest payments
Liquid petroleum products Secondary education Foreign interest payments
Chemical products Tertiary education
Non-metal industry Other government Capital accounts (3)
Metal and equipment Hoseholds
Other manufactures Factors of production (13) Government
Construction Unskilled labor Rest of the world
Other services Semi-skilled labor
Health Private Skilled labor Investment accounts (9)
Basic education g1-g6 Private capital Private (2)
Basic education g7-g9 Natural resource Gross capital formation
Secondary education Government capital (8) Stock changes
Tertiary education Government (8)
Tax accounts (4) Water and sanitation
Commodity taxes Other infrastructure
Factor taxes Health government
Direct taxes Basic education g1-g6
Import taxes Basic education g7-g9
Secondary education
Tertiary education
Other government
Source: Yemen SAM 2004.
The government is disaggregated into eight sectors: four cycles (levels) of education
(basic grades 1 to 6, basic grades 7 to 9, secondary, and tertiary cycles), health, water and
sanitation, other public infrastructure, and other government services. In the following,
the basic grades 1-6 are referred to as primary education (following international
standards for the length of primary education). In addition to other private services, the
private service sector is also disaggregated into four education sectors (with the same
18
cycles as in government education) and a private health sector.8 The database also
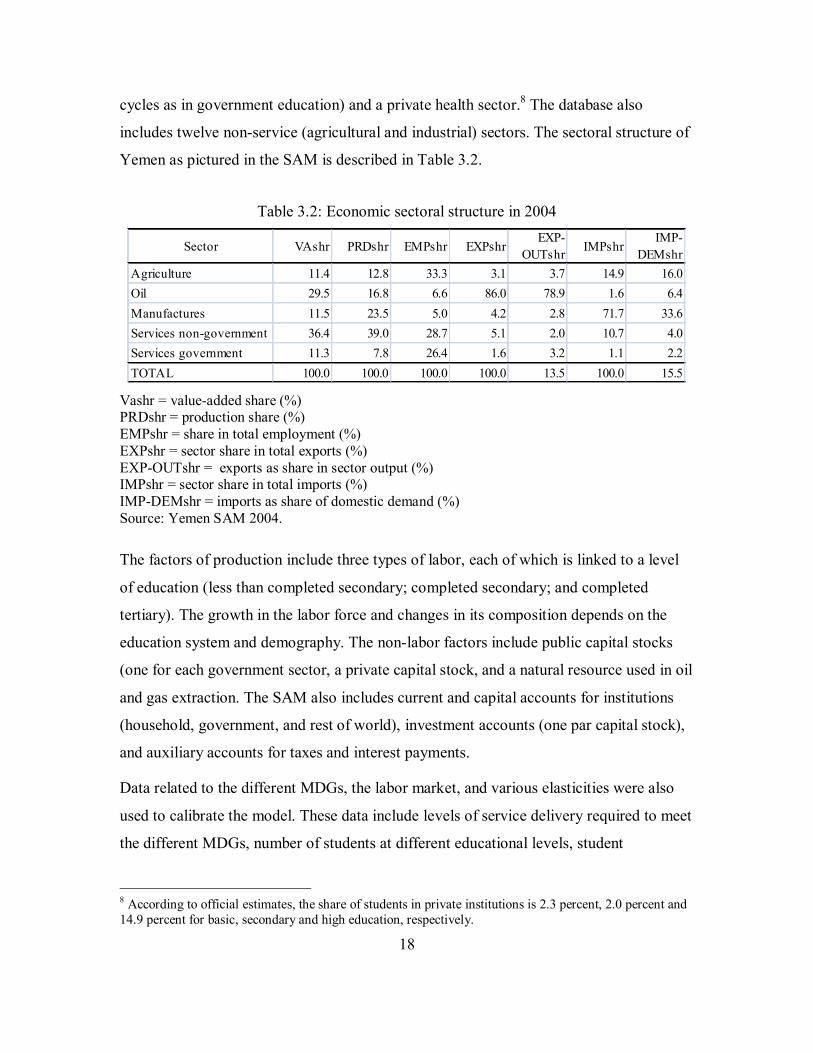
includes twelve non-service (agricultural and industrial) sectors. The sectoral structure of
Yemen as pictured in the SAM is described in Table 3.2.
Table 3.2: Economic sectoral structure in 2004
Sector VAshr PRDshr EMPshr EXPshrEXP-
OUTshrIMPshr
IMP-
DEMshr
Agriculture 11.4 12.8 33.3 3.1 3.7 14.9 16.0
Oil 29.5 16.8 6.6 86.0 78.9 1.6 6.4
Manufactures 11.5 23.5 5.0 4.2 2.8 71.7 33.6
Services non-government 36.4 39.0 28.7 5.1 2.0 10.7 4.0
Services government 11.3 7.8 26.4 1.6 3.2 1.1 2.2
TOTAL 100.0 100.0 100.0 100.0 13.5 100.0 15.5
Vashr = value-added share (%) PRDshr = production share (%) EMPshr = share in total employment (%) EXPshr = sector share in total exports (%) EXP-OUTshr = exports as share in sector output (%) IMPshr = sector share in total imports (%) IMP-DEMshr = imports as share of domestic demand (%) Source: Yemen SAM 2004.
The factors of production include three types of labor, each of which is linked to a level
of education (less than completed secondary; completed secondary; and completed
tertiary). The growth in the labor force and changes in its composition depends on the
education system and demography. The non-labor factors include public capital stocks
(one for each government sector, a private capital stock, and a natural resource used in oil
and gas extraction. The SAM also includes current and capital accounts for institutions
(household, government, and rest of world), investment accounts (one par capital stock),
and auxiliary accounts for taxes and interest payments.
Data related to the different MDGs, the labor market, and various elasticities were also
used to calibrate the model. These data include levels of service delivery required to meet
the different MDGs, number of students at different educational levels, student
8 According to official estimates, the share of students in private institutions is 2.3 percent, 2.0 percent and 14.9 percent for basic, secondary and high education, respectively.
19
behavioral patterns in terms of promotion rates and other indicators, and number of
workers and initial unemployment rates by skill level (i.e., educational achievement). The
elasticities include those in production, trade, consumption, and in the different MDG
functions. The application of MAMS to Yemen covers MDGs 2 (primary education), 4
(under-five mortality) and 7 (water and sanitation access).9 The elasticities for the MDG
functions are informed by Sánchez and Sbrana (2009) and Sbrana (2009) for education
and water and sanitation, respectively. However, rather than using the exact point
estimates from the econometric partial equilibrium analysis, we use the relative
importance of the determinants in choosing the (general equilibrium) elasticities. In
addition, the MAMS elasticities were adjusted in order to generate plausible trends under
baseline conditions—and this procedure was, in fact, entirely used to define plausible
elasticity values for MDG 4 in view of a lack of empirical studies and data to better
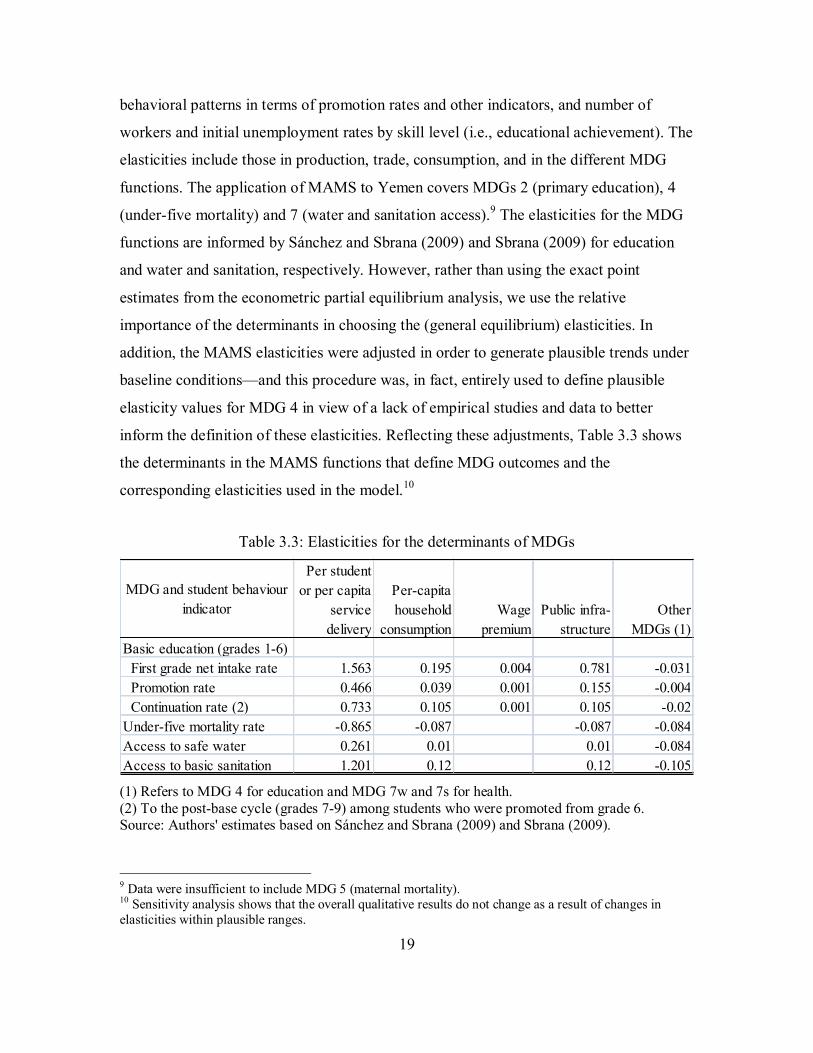
inform the definition of these elasticities. Reflecting these adjustments, Table 3.3 shows
the determinants in the MAMS functions that define MDG outcomes and the
corresponding elasticities used in the model.10
Table 3.3: Elasticities for the determinants of MDGs
MDG and student behaviour
indicator
Per student
or per capita
service
delivery
Per-capita
household
consumption
Wage
premium
Public infra-
structure
Other
MDGs (1)
Basic education (grades 1-6)
First grade net intake rate 1.563 0.195 0.004 0.781 -0.031
Promotion rate 0.466 0.039 0.001 0.155 -0.004
Continuation rate (2) 0.733 0.105 0.001 0.105 -0.02
Under-five mortality rate -0.865 -0.087 -0.087 -0.084
Access to safe water 0.261 0.01 0.01 -0.084
Access to basic sanitation 1.201 0.12 0.12 -0.105
(1) Refers to MDG 4 for education and MDG 7w and 7s for health. (2) To the post-base cycle (grades 7-9) among students who were promoted from grade 6. Source: Authors' estimates based on Sánchez and Sbrana (2009) and Sbrana (2009).
9 Data were insufficient to include MDG 5 (maternal mortality). 10 Sensitivity analysis shows that the overall qualitative results do not change as a result of changes in elasticities within plausible ranges.
20
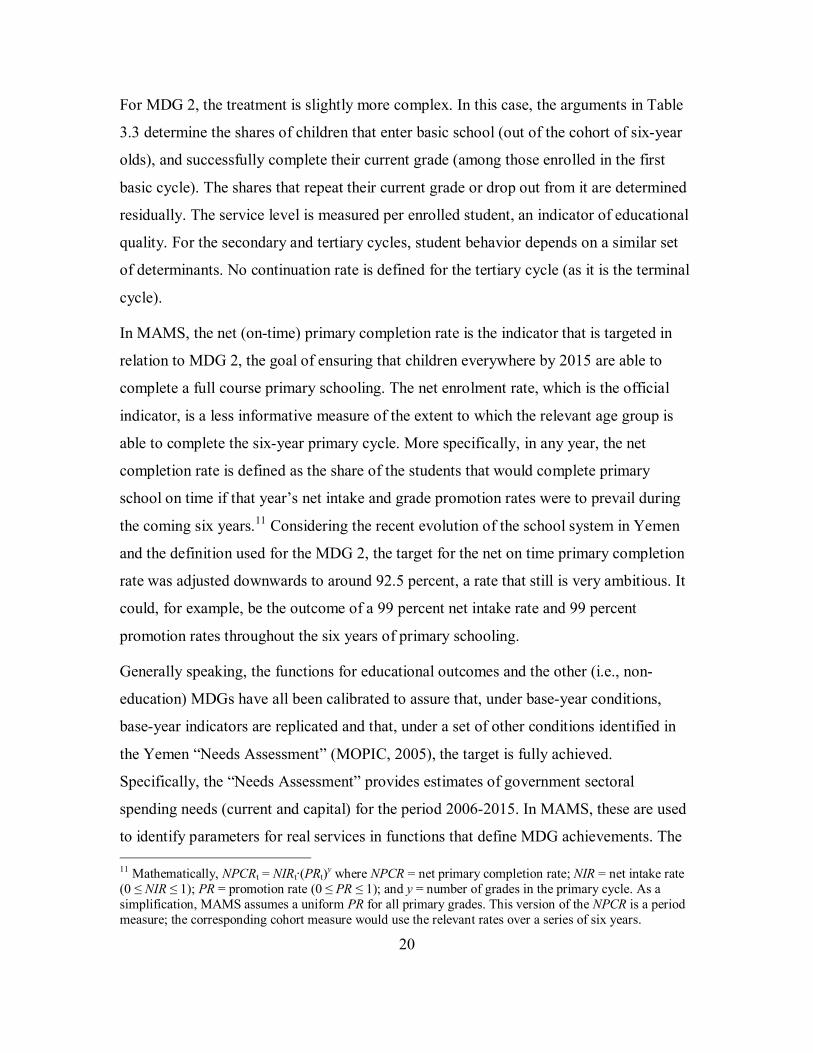
For MDG 2, the treatment is slightly more complex. In this case, the arguments in Table
3.3 determine the shares of children that enter basic school (out of the cohort of six-year
olds), and successfully complete their current grade (among those enrolled in the first
basic cycle). The shares that repeat their current grade or drop out from it are determined
residually. The service level is measured per enrolled student, an indicator of educational
quality. For the secondary and tertiary cycles, student behavior depends on a similar set
of determinants. No continuation rate is defined for the tertiary cycle (as it is the terminal
cycle).
In MAMS, the net (on-time) primary completion rate is the indicator that is targeted in
relation to MDG 2, the goal of ensuring that children everywhere by 2015 are able to
complete a full course primary schooling. The net enrolment rate, which is the official
indicator, is a less informative measure of the extent to which the relevant age group is
able to complete the six-year primary cycle. More specifically, in any year, the net
completion rate is defined as the share of the students that would complete primary
school on time if that year’s net intake and grade promotion rates were to prevail during
the coming six years.11 Considering the recent evolution of the school system in Yemen
and the definition used for the MDG 2, the target for the net on time primary completion
rate was adjusted downwards to around 92.5 percent, a rate that still is very ambitious. It
could, for example, be the outcome of a 99 percent net intake rate and 99 percent
promotion rates throughout the six years of primary schooling.
Generally speaking, the functions for educational outcomes and the other (i.e., non-
education) MDGs have all been calibrated to assure that, under base-year conditions,
base-year indicators are replicated and that, under a set of other conditions identified in
the Yemen “Needs Assessment” (MOPIC, 2005), the target is fully achieved.
Specifically, the “Needs Assessment” provides estimates of government sectoral
spending needs (current and capital) for the period 2006-2015. In MAMS, these are used
to identify parameters for real services in functions that define MDG achievements. The
11 Mathematically, NPCRt = NIRt∙(PRt)
y where NPCR = net primary completion rate; NIR = net intake rate (0 ≤ NIR ≤ 1); PR = promotion rate (0 ≤ PR ≤ 1); and y = number of grades in the primary cycle. As a simplification, MAMS assumes a uniform PR for all primary grades. This version of the NPCR is a period measure; the corresponding cohort measure would use the relevant rates over a series of six years.
21
cost of providing real services will depend on scenario-specific input prices and
efficiency in government service production.
For all the scenarios that it simulates, MAMS provides wage and employment by activity
and labor category (with labor split between three educational levels) as well as non-labor
incomes. In the microsimulation model, this information is used, in turn, to generate a full
picture of the impact of changes in the labor market variables on the level and
distribution of micro-level household incomes.
As the database for our microsimulation model, we use the Yemen 2005/06 HBS; it
covers 98,941 individuals in 13,136 households. The information from the household
survey is used to estimate the poverty and inequality impacts of different counterfactual
scenarios, linking the microsimulation model to the results generated by MAMS. MAMS
communicates with the microsimulation model in a “top-down” fashion (i.e., without
feedback) via the following aggregate linking variables: wages, sectoral structure of
employment, unemployment, and non-labor income. That is to say, results from MAMS
scenarios are taken and applied to the full distribution of income as given by the
household survey and assume there are no further feedback effects that would affect
MAMS. The microsimulation model follows the non-parametric methodology described
in Vos and Sanchez (2010) but extended to consider changes in non-labor income. The
labor-market structure is defined in terms of the following parameters: unemployment
among different groups of the population at working age defined according to skill,
sectoral structure of employment, relative and overall level of wages, and skill
composition of the employed population. The effect of altering each of those six
parameters on poverty and inequality is analyzed. In addition, we consider changes in
non-labor income. Specifically, the (per capita) non-labor income is increased or
decreased in order to match the change in per capita household income estimated using
MAMS. The change in per capita non-labor income depends on the household initial
endowment of non-labor income. As a consequence, the absolute change in non-labor
income is larger for those households that, according to the HBS, have more non-labor
income in the base year.
22
The microsimulation model generates counterfactual individual labor and non-labor
incomes for each MAMS scenario. This new individual income distribution is used to
compute a counterfactual household income distribution. Then, we calculate several
standard inequality and poverty indicators such as the Gini coefficient and the poverty
headcount ratio.
4. MDG simulations and analysis of results
This section presents the simulations and analyzes the results for both MAMS and the
microsimulation model. The first simulation (base) addresses the question of whether
Yemen will achieve the MDGs under current policies and trends.
Base scenario
For the base scenario, which serves as a benchmark for comparisons, we impose the
observed growth rates in real GDP at factor cost for the period 2005-2010, and an
average growth of 5.2 percent starting from 2011, based on projections from the Fourth
Five-Year Socio-Economic Development Plan for Poverty Reduction 2011-2015.12 In
addition, a decrease in the exploitation of the natural resource factor in the oil and gas
extraction sector is also imposed to reflect the expected evolution of the oil and gas sector
in Yemen.13
Government consumption of (or demand for) education and non-education services is
kept fixed as a share of GDP at the base year value. Transfers from government to
households are also kept fixed as a share of GDP. Tax rates are fixed over time, while the
amount spent on commodity subsidies (basically, refined oil products) decreases
gradually between 2011 and 2015, according to official projections. The ratio between
domestic government debt stock and GDP increases from 10 percent in 2004 to about 17
percent during 2011-2015; domestic borrowing is adjusted accordingly. The ratio of
foreign debt to GDP increases from 30 percent in the base year to 33.6 percent in 2015, 12 The exogenous part of TFP growth is adjusted to generate such a growth path. GDP growth is endogenous for all non-base scenarios. 13 Specifically, our assumption is based on past and expected evolution of the oil and gas extraction sector real GDP; data was taken from official sources.
23
being 23 percent in 2009. These assumptions generate results that are consistent with
recent trends (Central Bank of Yemen, 2010).
At the macro level, MAMS—as any other CGE model—has three underlying balances
(Robinson and Lofgren, 2005). For the base scenario, the government fiscal account is
balanced via adjustments in foreign borrowing. The base assumption for private
investment is that it is fixed as a share of domestic absorption; given this, adjustments in
private savings clear the savings-investment balance; i.e. savings is investment-driven.
Across all simulations, the real exchange rate equilibrates inflows and outflows of foreign
exchange, by influencing export and import quantities. The non-trade-related payments of
the balance of payments (transfers and foreign investment) are non-clearing, kept fixed as
shares of GDP. The CPI is the model numéraire.
Among factor stocks, growth is driven by investment and depreciation for the different
capital types, by a combination of demographic factors and the functioning of the
educational system for the different labor categories, and by an exogenous growth rate for
natural resources used in the oil and gas extraction sector. For the different types of
government capital, markets are not specified; however, it is required that investment be
sufficient to ensure that stocks grow at the same pace as the services that are produced.
For other factors, flexible wages (or rents) clear the markets. For the different labor types,
the unemployment rate and the wage will both change following a “wage-curve”
formulation (Blanchflower and Oswald, 1994); declines in the unemployment rate will be
combined with wage increases and vice versa unless unemployment is at the minimum
level (set at 5 percent), at which point wage-clearing movements only will influence the
demand side. For non-labor factors, supply curves are vertical leaving the adjustments to
the demand side.
In the base scenario, the economy evolves according to recent trends, with most macro
aggregates growing at 5-6 percent per year, at the upper end of this range for public
consumption and investment and at the lower end for exports. Relative to GDP, exports
and imports decrease. Per-capita household consumption grows at a rate of 1.9 percent
per year. The exchange rate depreciates over time, reflecting the decrease in (real) oil
24
exports. As explained, the foreign-debt-to-GDP ratio reaches 33.6 percent in 2015, a level
that is within the range observed for other countries at Yemen’s income level. This
increase in foreign borrowing brings about a net improvement in the non-trade balance
(in foreign currency) and an increase in the trade deficit (also in foreign currency).
However, the decline in oil exports is so large that some depreciation is still required to
keep the trade deficit within the permitted limit.
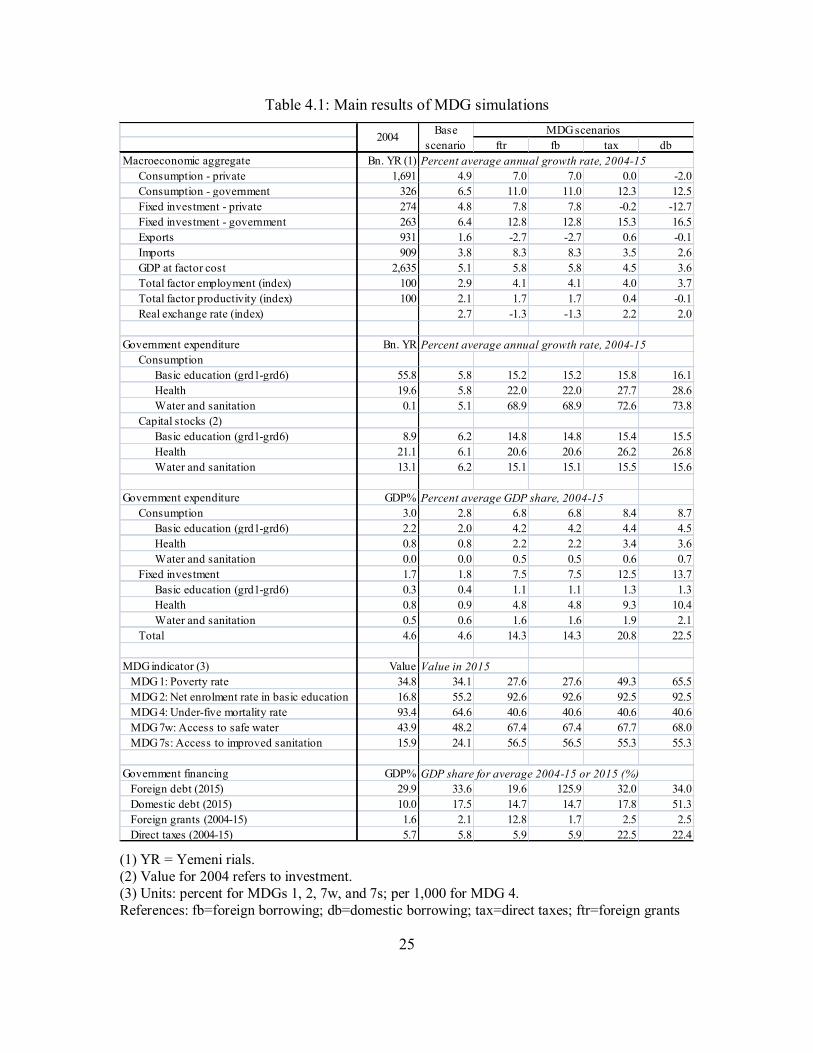
Table 4.1 shows key results for the base and the MDG scenarios. As a result of growth in
GDP, government service provision and household per capita consumption, the indicators
for MDGs 2 (completion of primary education), 4 (under-five mortality), 7w (water
access) and 7s (sanitation access) as well as poverty all improve. However, under the
base scenario, Yemen falls short of fully meeting the targets by the 2015 deadline.
25
Table 4.1: Main results of MDG simulations
ftr fb tax db
Macroeconomic aggregate Bn. YR (1) Percent average annual growth rate, 2004-15
Consumption - private 1,691 4.9 7.0 7.0 0.0 -2.0
Consumption - government 326 6.5 11.0 11.0 12.3 12.5
Fixed investment - private 274 4.8 7.8 7.8 -0.2 -12.7
Fixed investment - government 263 6.4 12.8 12.8 15.3 16.5
Exports 931 1.6 -2.7 -2.7 0.6 -0.1
Imports 909 3.8 8.3 8.3 3.5 2.6
GDP at factor cost 2,635 5.1 5.8 5.8 4.5 3.6
Total factor employment (index) 100 2.9 4.1 4.1 4.0 3.7
Total factor productivity (index) 100 2.1 1.7 1.7 0.4 -0.1
Real exchange rate (index) 2.7 -1.3 -1.3 2.2 2.0
Government expenditure Bn. YR Percent average annual growth rate, 2004-15
Consumption
Basic education (grd1-grd6) 55.8 5.8 15.2 15.2 15.8 16.1
Health 19.6 5.8 22.0 22.0 27.7 28.6
Water and sanitation 0.1 5.1 68.9 68.9 72.6 73.8
Capital stocks (2)
Basic education (grd1-grd6) 8.9 6.2 14.8 14.8 15.4 15.5
Health 21.1 6.1 20.6 20.6 26.2 26.8
Water and sanitation 13.1 6.2 15.1 15.1 15.5 15.6
Government expenditure GDP% Percent average GDP share, 2004-15
Consumption 3.0 2.8 6.8 6.8 8.4 8.7
Basic education (grd1-grd6) 2.2 2.0 4.2 4.2 4.4 4.5
Health 0.8 0.8 2.2 2.2 3.4 3.6
Water and sanitation 0.0 0.0 0.5 0.5 0.6 0.7
Fixed investment 1.7 1.8 7.5 7.5 12.5 13.7
Basic education (grd1-grd6) 0.3 0.4 1.1 1.1 1.3 1.3
Health 0.8 0.9 4.8 4.8 9.3 10.4
Water and sanitation 0.5 0.6 1.6 1.6 1.9 2.1
Total 4.6 4.6 14.3 14.3 20.8 22.5
MDG indicator (3) Value Value in 2015
MDG 1: Poverty rate 34.8 34.1 27.6 27.6 49.3 65.5
MDG 2: Net enrolment rate in basic education 16.8 55.2 92.6 92.6 92.5 92.5
MDG 4: Under-five mortality rate 93.4 64.6 40.6 40.6 40.6 40.6
MDG 7w: Access to safe water 43.9 48.2 67.4 67.4 67.7 68.0
MDG 7s: Access to improved sanitation 15.9 24.1 56.5 56.5 55.3 55.3
Government financing GDP% GDP share for average 2004-15 or 2015 (%)
Foreign debt (2015) 29.9 33.6 19.6 125.9 32.0 34.0
Domestic debt (2015) 10.0 17.5 14.7 14.7 17.8 51.3
Foreign grants (2004-15) 1.6 2.1 12.8 1.7 2.5 2.5
Direct taxes (2004-15) 5.7 5.8 5.9 5.9 22.5 22.4
2004Base
scenario
MDG scenarios
(1) YR = Yemeni rials. (2) Value for 2004 refers to investment. (3) Units: percent for MDGs 1, 2, 7w, and 7s; per 1,000 for MDG 4. References: fb=foreign borrowing; db=domestic borrowing; tax=direct taxes; ftr=foreign grants
26
Source: Authors’ estimates based on results from simulations with MAMS and the microsimulation model.
MDG simulations
As seen, the MDGs are not achieved under the base. Taking this base scenario as a
benchmark, the MDG simulations were generated to assess what would have been
required to achieve the MDGs by 2015 if the government had undertaken a gradual
expansion in government spending and services starting from 2005, also considering the
costs involved, and the economy-wide effects of these actions.14 These simulations serves
the purpose of enhancing our understanding of how an economy like Yemen’s may
respond to an ambitious scaling-up of government services, including an assessment of
whether, in the first place, these international objectives were feasible for Yemen.
This first set of simulations was run under alternative assumptions about the source of
financing for the required additional government spending: foreign transfers (ftr), foreign
borrowing (fb), domestic taxes (tax), or domestic borrowing (db). Technically, this means
that the rules for balancing the government accounts varied across scenarios, with
sufficient increases in the indicated financing source playing the role of clearing the
government balance. The “domestic borrowing” scenario is an exception since, in spite of
its label, it is a mixed scenario, combining an (exogenous) increase in annual domestic
borrowing of around 5 percent of GDP with an endogenous increase in direct taxes
(which clears the government balance). This scenario formulation was necessary given
that domestic borrowing levels would become unrealistically high in the absence of
partial reliance on taxation for marginal financing.
Compared to the base, another change in these scenarios is a modification in the rule for
achieving savings-investment balance: private investment adjusts endogenously to
maintain balance between total savings (from different sources) and total investment (i.e.,
investment becomes savings-driven).15 Consequently, these scenarios capture the
14 In addition, scenarios that target one MDG at a time are presented in Al-Batuly and others (2011). 15 The assumption under the base scenario (that private investment was a fixed share of absorption) ensured that private investment would grow at rates consistent with overall economic growth. However, in
27
crowding-out of private investment when domestic sources of financing are used to
achieve the MDGs through increased government spending.
In these scenarios—as in the base, MDG 1, the poverty headcount, is not targeted but
monitored, both for technical reasons (the top-down approach followed when generating
the poverty-inequality results in the microsimulation model) and, more fundamentally,
because governments (including Yemen’s) in practice cannot target specific poverty
outcomes (as they are the result of processes that are not dominated by any available
policy tool).
The other MDGs are targeted via endogenous variations in government demand
(consumption) for and production of the relevant services: primary education services for
MDG 2, health for MDG 4, and water and sanitation for MDGs 7w and 7s. MDG 2 is
targeted indirectly (not directly like MDGs 4, 7w, and 7s) by targeting, in each year
during 2010-2015, the promotion rate for grades 1-6 of basic school.16 Post-primary
education services also expand in order to keep the same educational quality (defined as
real services per enrolled student) as in the base scenario in the face of increases in the
number of graduates from primary school. The resulting growth in government service
production will require increases in government investment; a fixed coefficient
relationship links government service provision to government capital demand and
required stock growth. This is the key difference between these simulations and the
baseline simulation, under which government demand growth follows an exogenous
path.17 For the MDG simulations, GDP growth may deviate from the rates under the
counterfactual scenarios, it is less appropriate since it renders private investment implausibly insensitive to scenario-specific changes in economic conditions. 16 As noted, the target for the promotion rate for grades 1-6 is set at 0.99; given that the net intake rate to the first grade (out of the population that is in the right age to enter first grade) also reaches 0.99 in 2015, the target value for the MDG 2 in 2015 is around 92.5 percent (100 times 0.997). 17 In addition, the following assumptions are made regarding government consumption of non-MDG related commodities (i.e., “other government”) in the MDG simulations: (1) absorption share is fixed for scenarios with domestic financing (i.e., those in which absorption decreases), and (2) real growth is the same as in the base for scenarios with foreign financing (i.e., those in which absorption increases). In effect, we assume that the domestic financing option requires not only raising additional domestic resources (via more borrowing or more taxes) but also some domestic reallocation of government resources. As a result, the government items that expand more rapidly under the MDG scenarios are those directly related to the relevant MDG(s), as well as post-primary education, given that expansion is unavoidable when the number of graduates from primary schooling increases.
28
baseline scenario due to different growth rates for TFP (due to changes in the stock of
infrastructure and trade openness) and factor stocks, as well as changes in labor
unemployment rates.
The impact on the rest of the economy from reaching the MDGs depends on the
financing mechanism. In case the marginal financing comes from domestic sources
(direct taxes or domestic borrowing), growth declines for private consumption,
investment, and GDP. These declines are stronger for the domestic borrowing scenarios,
since borrowing directly reduces funding available for private investment, thereby
bringing about stronger declines in GDP and private consumption. To make up for the
loss in private consumption (which has a positive impact on MDG achievements), it is
therefore necessary for the government to add to its spending increase when marginal
financing is from domestic borrowing. On the other hand, when marginal financing
comes from foreign sources (in the form of grants or borrowing), the negative impact
from increased domestic resource mobilization on private investment will be absent.
However, the inflow of foreign resources will give rise to a slower export growth and
faster import growth, both will be induced by an appreciation of the real exchange rate.
The simulation results for the alternative options for financing simultaneous achievement
of MDGs 2, 4, 7w and 7s are presented in Table 4.1. They show that a large and sustained
increase in government spending relative to the amount spent under the base scenario is
required in order to reach all the targets by 2015. In all instances, the required growth rate
for aggregate government consumption and investment spending are almost doubled
compared to the baseline. The challenges are even more difficult for the MDG sectors for
which average annual growth rates in government services and capital stocks for the
period 2005-2015 are above 15 percent. Compared to the base scenario, additional public
spending in primary education, health, and water and sanitation reaches an average 9.6
percent of GDP for the whole simulation period in the foreign financing scenarios, of
which 4 percent of GDP is for current expenditures and 5.7 percent for additional capital
spending. It does not seem realistic for Yemen to deliver such rapid increases in real
29
service provision; also if the financing were available, it would be difficult to use it
without significant losses in efficiency, reducing growth for services actually delivered.18
At the macro level, GDP growth for the foreign-financing scenarios is around 0.7
percentage points higher than for the base, making it possible to reduce the
unemployment rate, which by 2015 has decreased by as much as 7.3 percentage points.
This boost to GDP growth spills over into stronger growth in household consumption,
made possible by a stronger increase in the supply of skilled labor and increased
employment generated by higher public and private investment. On the other hand, there
is a strong decrease in GDP growth in the domestic borrowing scenario, from 5.1 percent
in the baseline to 3.6 percent. The decrease in GDP growth is smaller under the tax
financing scenario. As explained, GDP growth in the domestic financing scenarios
declines as a consequence of the crowding-out of private investment.
In the scenarios that use foreign financing, the exchange rate appreciates at the same time
as the trade deficit increases with a surge in imports and a decline in exports. As
described in Sundberg and Lofgren (2006) for the case of Ethiopia, Dutch Disease effects
can be a serious concern. In our case, aid-induced appreciation of the real exchange rate
and the drop in exports are severe in view of the high cost of MDG financing. In fact,
under the foreign transfer scenario, exports in 2015 are 37.8 percent lower than in the
base scenario, while the real exchange rate appreciates by 35.4 percent.
In case additional financing needs are met with foreign loans, the foreign debt-to-GDP
ratio increases to 125.9 percent in 2015 (see Table 4). This ratio is 92.3 percentage points
higher than for the baseline. In the foreign transfer scenario, foreign grants to the
government attain an average level of 12.8 percent of GDP throughout the simulation
period, compared to 2.1 percent in the baseline. In the tax financing scenario, the average
direct tax collection increases from 5.8 to 22.5 percent of GDP between 2004 and 2015.
18 In support of this assessment, note that Yemen consistently ranks among the lowest 25 percent among countries for most governance indicators, including government effectiveness (see <http://www.govindicators.org>; Kaufmann et al. 2010). For the basic education sector, World Bank (2006) highlights issues that point to difficulties of scaling-up spending while maintaining or improving efficiency.
30
Compared to the baseline scenario, all four MDG simulations lead to lower stock growth
for unskilled workers but higher growth for semi-skilled and skilled workers. This
reflects that, instead of entering the labor force, more students remain in school,
decreasing the supply of unskilled workers. On the other hand, as more students graduate
from secondary and tertiary, the supplies of semi-skilled and skilled workers increase.
Consequently, the structure of the labor force changes. For example, in the foreign
borrowing simulation, the (relatively large) stock of unskilled labor reaches a level in
2015 that is 3.5 percent below that of the baseline, while the (smaller) stocks of
semiskilled and skilled increase their participation in the total labor force. At the same
time, demand for semi-skilled and skilled workers increases as the education and health
sectors expand. As a result, wages of skilled workers grow faster than those of other
workers.
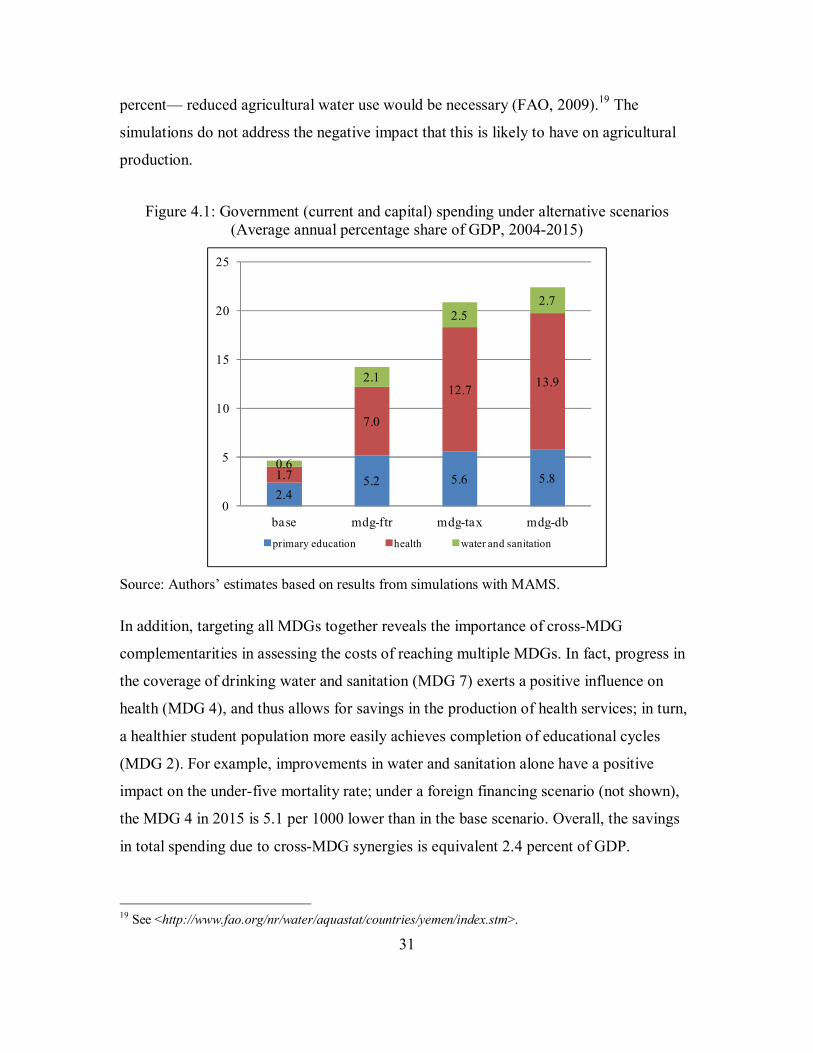
In Figure 4.1, based on Table 4.1, the required government current and capital spending
is disaggregated across education, health and water and sanitation. For example, the
average 2004-2015 GDP share of government recurrent and capital spending in primary
education reaches 5.2-5.8 percent in 2004-2015, compared to 2.4 percent for the baseline
scenario. In turn, government recurrent and capital spending on health reaches 2.2-3.6
and 4.8-10.4 percent of GDP (average 2004-2015) as compared to 0.8 for both recurrent
and capital spending in the base—the jump in investment reflects that the expansion of
production in the sector also requires an expanded capital stock. Of course, it may be
difficult to implement such a strong spending increase during this short time period. In
relation to other Arab countries, this GDP share is high; for example, in 2007, the GDP
spending shares on health in Morocco and Jordan were 5 percent and 9 percent,
respectively (WDI, 2010). The MDGs 7w and 7s are the least costly to achieve; the
average GDP share of government current and capital spending in water and sanitation
increases in 1.5-2.2 percentage points. It should also be noted that Yemen is very poor in
water resources and faces depletion of its groundwater. Given that agriculture accounts
for some 90 percent of total water use—industrial and municipal water uses are 8 and 2
31
percent— reduced agricultural water use would be necessary (FAO, 2009).19 The
simulations do not address the negative impact that this is likely to have on agricultural
production.
Figure 4.1: Government (current and capital) spending under alternative scenarios (Average annual percentage share of GDP, 2004-2015)
2.45.2 5.6 5.81.7
7.0
12.713.9
0.6
2.1
2.52.7
0
5
10
15
20
25
base mdg-ftr mdg-tax mdg-db
primary education health water and sanitation
Source: Authors’ estimates based on results from simulations with MAMS.
In addition, targeting all MDGs together reveals the importance of cross-MDG
complementarities in assessing the costs of reaching multiple MDGs. In fact, progress in
the coverage of drinking water and sanitation (MDG 7) exerts a positive influence on
health (MDG 4), and thus allows for savings in the production of health services; in turn,
a healthier student population more easily achieves completion of educational cycles
(MDG 2). For example, improvements in water and sanitation alone have a positive
impact on the under-five mortality rate; under a foreign financing scenario (not shown),
the MDG 4 in 2015 is 5.1 per 1000 lower than in the base scenario. Overall, the savings
in total spending due to cross-MDG synergies is equivalent 2.4 percent of GDP.
19 See <http://www.fao.org/nr/water/aquastat/countries/yemen/index.stm>.
32
In case marginal financing comes from foreign sources, the poverty headcount rate falls
to 27.6 percent, falling short of achieving MDG 1 target by 7.2 percentage points. The
main drivers of this result are a decrease in unemployment, a higher average wage, and
an increase in non-labor income. In addition, there is an increase in the wage gap between
unskilled and semi-skilled labor. On the other hand, the poverty headcount rises relative
to the base under the domestic financing scenarios. In the scenarios that use domestic
resources, there is a sharp decrease in household income net of direct taxes and savings.
Consequently, the poverty rate increases even though the labor market results are similar
to those of the foreign financing scenarios. Specifically, employment and average wages
increase resulting from the change in the sectoral structure of production, which shows
increases in labor intensive sectors (i.e., MDG-related services and construction) and
decreases in less labor intensive sectors.
5. Alternative scenarios: Aid and government allocative efficiency
In light of the above results, this second set of simulations was designed to explore
options for the future, grounded in the situation that Yemen may face once it has emerged
from the current political impasse. In these simulations, more fiscal space is created
through exogenous increases for foreign aid (grants) or government efficiency. The
government makes use of the resulting addition to fiscal space to expand spending and
service delivery in infrastructure and human development. Thus, the purpose of this
second set of simulations is to assess what those different options entail in terms of
promoting economic growth, achieving the MDGs, and reducing poverty.
The baseline scenario is the same as in the previous set of simulations; on the other hand,
the counterfactual model closure rule assumes that adjustments in public spending on
human development or infrastructure clear the government budget. The following
additional simulations were implemented:
aid-hd: increase in transfers from the rest of the world to the government so that they
reach an average of US$69 per capita for the period 2011-2015, close to the average
for low income countries in 2007—aid per capita is increased from US$13.7 in 2010
33
to US$71.4 in 2011 and US$66.7 in 2015; under the base scenario per capita aid was
US$13.3 during the period 2011-2015. In terms of GDP, aid reaches an average of
around 10 percent for the period 2011-2015. The increase in government receipts is
used to finance an increase in government consumption of (demand for) MDG-related
services (primary education, health and water and sanitation). In addition, post-
primary education also expands sufficiently to keep the same educational quality
(defined as real services per enrolled student) as in the base scenario as the sector
faces increases in the number of graduates from primary school.
aid-infra: similar to the previous scenario, but the increase in government spending
is used to finance an increase in the public infrastructure capital stock.
eff-hd: gains in the allocative efficiency of government spending via a 50 percent cut
in the growth rate for other government expenditures (that is, not related to human
development or infrastructure) during 2011-2015 with expansion in human
development-related spending sufficient to make use of the resulting fiscal space.
Thus, we assume that cost savings are realized through efficiency gains such as
elimination of overlapping government functions and/or functions that do not
contribute to production in other areas. The increase in fiscal space is created through
declines in current and capital spending in other government activities.
eff-infra: similar to the previous scenario, but the increase in government spending is
used to finance an increase in investment in public infrastructure.
In this section we concentrate on the period 2011-2015 as shown in Table 5.1. As before,
during the period 2004-2010, the baseline scenario is designed to capture the main
developments of the Yemeni economy. The non-base simulations only deviate from the
base for the period 2011-2015.
34
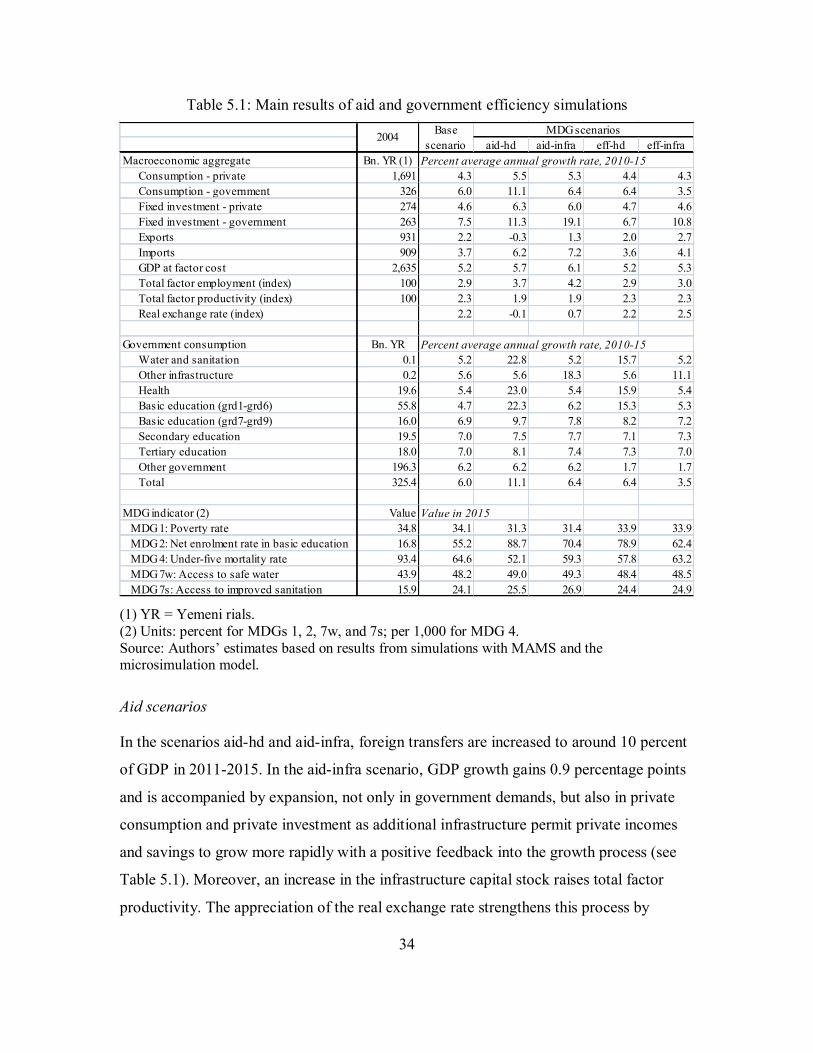
Table 5.1: Main results of aid and government efficiency simulations
aid-hd aid-infra eff-hd eff-infra
Macroeconomic aggregate Bn. YR (1) Percent average annual growth rate, 2010-15
Consumption - private 1,691 4.3 5.5 5.3 4.4 4.3
Consumption - government 326 6.0 11.1 6.4 6.4 3.5
Fixed investment - private 274 4.6 6.3 6.0 4.7 4.6
Fixed investment - government 263 7.5 11.3 19.1 6.7 10.8
Exports 931 2.2 -0.3 1.3 2.0 2.7
Imports 909 3.7 6.2 7.2 3.6 4.1
GDP at factor cost 2,635 5.2 5.7 6.1 5.2 5.3
Total factor employment (index) 100 2.9 3.7 4.2 2.9 3.0
Total factor productivity (index) 100 2.3 1.9 1.9 2.3 2.3
Real exchange rate (index) 2.2 -0.1 0.7 2.2 2.5
Government consumption Bn. YR Percent average annual growth rate, 2010-15
Water and sanitation 0.1 5.2 22.8 5.2 15.7 5.2
Other infrastructure 0.2 5.6 5.6 18.3 5.6 11.1
Health 19.6 5.4 23.0 5.4 15.9 5.4
Basic education (grd1-grd6) 55.8 4.7 22.3 6.2 15.3 5.3
Basic education (grd7-grd9) 16.0 6.9 9.7 7.8 8.2 7.2
Secondary education 19.5 7.0 7.5 7.7 7.1 7.3
Tertiary education 18.0 7.0 8.1 7.4 7.3 7.0
Other government 196.3 6.2 6.2 6.2 1.7 1.7
Total 325.4 6.0 11.1 6.4 6.4 3.5
MDG indicator (2) Value Value in 2015
MDG 1: Poverty rate 34.8 34.1 31.3 31.4 33.9 33.9
MDG 2: Net enrolment rate in basic education 16.8 55.2 88.7 70.4 78.9 62.4
MDG 4: Under-five mortality rate 93.4 64.6 52.1 59.3 57.8 63.2
MDG 7w: Access to safe water 43.9 48.2 49.0 49.3 48.4 48.5
MDG 7s: Access to improved sanitation 15.9 24.1 25.5 26.9 24.4 24.9
2004Base
scenario
MDG scenarios
(1) YR = Yemeni rials. (2) Units: percent for MDGs 1, 2, 7w, and 7s; per 1,000 for MDG 4. Source: Authors’ estimates based on results from simulations with MAMS and the microsimulation model.
Aid scenarios
In the scenarios aid-hd and aid-infra, foreign transfers are increased to around 10 percent
of GDP in 2011-2015. In the aid-infra scenario, GDP growth gains 0.9 percentage points
and is accompanied by expansion, not only in government demands, but also in private
consumption and private investment as additional infrastructure permit private incomes
and savings to grow more rapidly with a positive feedback into the growth process (see
Table 5.1). Moreover, an increase in the infrastructure capital stock raises total factor
productivity. The appreciation of the real exchange rate strengthens this process by
35
adding to domestic purchasing power. It represents a response to the fact that, due to the
aid, Yemen is now able to have a more negative trade balance, importing more and/or
exporting less, and raising its total domestic final demand at any given level of GDP. As
explained, such aid-induced Dutch Disease effects can be a serious concern if, in the
future, these trade deficits are unsustainable and if the economy becomes locked into a
structure that is unable to expand production of tradables. However, these concerns
should be weighed against the benefits of foreign aid, indicated by the simulation results.
For the aid-hd scenario, the acceleration of growth in GDP is weaker—the GDP growth
rate increases by 0.5 percentage points. MDGs 2, 4, 7w, and 7s all improve, as
government consumption of primary education, health and water and sanitation increases.
The average GDP share of government current and capital spending in MDG-related
commodities reaches 10.5 percent during 2010-2015, starting from the 4.5 percent for the
baseline scenario. The additional public spending in education and health (i.e., scenario
aid-hd) has a positive impact on the relative demand for skilled workers, initially pushing
up their relative wage. In fact, the wage gap between skilled and unskilled workers is (on
average) 11 percent higher than in the base scenario—this result reflects a bottleneck in
the form of a shortage of highly educated labor to provide these services; e.g., teachers
and nurses. In the long run—beyond 2015, the end-year of our simulations, however, the
combination of increased education spending and high wages for highly educated labor,
both of which make it attractive for students to remain in school and obtain secondary
and tertiary education degrees, would lead to an increase in the supply of highly educated
labor and a decreasing wage gap between skilled and unskilled workers. In sum,
expanding expenditure in human development requires careful preparation to align the
speed of expenditure increases with the ability of education and training programs to
deliver properly educated workers. There may also be a need to monitor wage pressures
to avoid large increases in the wage bill that could crowd out other expenditures.
In the aid-infra scenario, infrastructure spending promotes growth and the MDGs.
Infrastructure has a direct positive impact on education and health MDG indicators
because it facilitates the delivery of these services (e.g., more infrastructure lowers the
36
cost of getting to schools for both teachers and students). There is also an indirect effect
through higher growth—higher per capita income increases private demand for education
and health services.
The poverty impact captured in the microsimulation model depends essentially on two
factors: the change in the labor market conditions and the increase in per capita
disposable (i.e., net of taxes and savings) income. In both aid scenarios, the 2015 poverty
rate is lower than for the baseline, mainly as a result of a decrease in unemployment, a
higher average wage, a decrease in the wage gap between unskilled and semi-skilled
labor, and an increase in non-labor income. Moreover, the poverty effect would be larger
if a multidimensional measure of poverty were considered instead of only monetary
poverty.
In this set of scenarios, it is important to consider the trade-off between the eventual
competitiveness loss caused by aid induced Dutch Disease and the long term gains of
improving MDGs. In addition, the aid scenarios show that making effective use of aid
resources requires fully spending and absorbing the additional aid. The policy implication
is that scaled-up aid requires consistent fiscal and monetary policies: fiscal policy needs
to spend the additional resources, and monetary policy needs to allow the real
appreciation required to bring about the increased absorption through a widening in the
trade deficit (see Gottschalk and others, 2009).
Efficiency scenarios
For the eff-infra scenario, annual growth in GDP accelerates by 0.1 percentage points.
The government reallocates spending from consumption to investment, as infrastructure
is more capital-intensive than other government services. MDGs 2, 4, 7w (water), and 7s
(sanitation) all improve. For the eff-hd scenario, the acceleration of growth in GDP is
weaker (i.e., positive but less than 0.1 percentage points). The government provision of
primary education, health and water and sanitation services grows 5.7 percentage points
more than in the base scenario. Certainly, this expenditure shift helps to promote the
MDGs. The resulting improvements are stronger for MDGs 2 and 4 and less so for
MDGs 7w and 7s. By 2015, the poverty rate is 0.3 percentage points lower than in the
37
baseline. In terms of the comparison between the HD and infra scenarios, the results are
similar to those reported for the aid scenarios.
Interestingly, these additional simulations show that spending on HD is better for poverty
reduction than spending on infrastructure, in spite of more rapid GDP growth in aid-infra
and eff-infra compared to aid-hd and aid-infra, respectively. This result reflects that,
relatively speaking, the HD scenarios benefit labor incomes and that labor is owned by
the households, whereas the infrastructure scenarios benefit capital and natural resource
incomes, which to a significant extent are owned by the government and the rest of the
world. As a consequence, in the infrastructure scenarios an important share of income
leaks into spending that has a weaker link to household consumption and poverty
reduction.
Notice that when comparing the outcomes for these scenarios relative to the situation in
2010 and/or other scenarios, it is important to keep in mind that the time period during
which the changes are introduced (2011-2015) is much shorter than for the first set of
simulations.
6. Conclusions and policy recommendations
According to our results, under “business as usual” conditions up to 2015, Yemen will
not reach the targets for the MDGs that are covered by our analysis: poverty, primary
education, under-five mortality, water, and sanitation. At the time when this is written, in
late 2011, a severe political crisis has pushed policies for development to the background.
Unless the situation can be resolved soon, the actual evolution of Yemen’s economy may
fall far short of what is assumed under a “business as usual” scenario.
In order to better understand what may be needed for Yemen to make stronger progress
according to key MDG indicators, we carried out two sets of simulations. The first set is
retrospective, addressing the impact of scaled-up government actions starting in 2005
with the aim of fully achieving the 2015 international MDG targets with reliance on
alternative sources (foreign or domestic) for required additional financing. The
simulations provide insights about the extent of the scaling-up of government services
38
that would have been required to achieve international MDG targets for education, health,
and water-sanitation, as well as the economic impact and feasibility of such a scaling-up.
The achievement of these MDGs are targeted under four alternative financing scenarios,
two based on enhanced domestic resource mobilization (direct taxes and borrowing) and
two based on foreign financing (grants and borrowing).
The results suggest that full, on-time MDG achievement by 2015 may not have been a
realistic objective even if government services in MDG areas would have been scaled-up
starting from 2005. Substantial reliance on domestic financing for the additional funding
required to expand such government services would have left less resources for the
private sector to the detriment of growth and the achievement of the poverty MDG. If
sufficient foreign grant aid would have been available (and the realism of this assumption
is questionable), it would have threatened macroeconomic stability and eroded the
competitiveness of Yemen’s production of tradables (exports and import substitutes)
outside of the oil and gas sector (a so-called Dutch Disease effect). It would also have
been extremely difficult to efficiently manage the required expansion in services,
including mobilization of the skilled labor that would be needed in health and education.
The results add support to the observation of Easterly (2009) that the MDG targets were
formulated in a manner that made it particularly difficult for low-income countries to
achieve them – for example, to achieve the target of ensuring that all children complete
primary education is more difficult the further a country is away from this target as it
starts out. This suggests that the government should set targets that are grounded in
Yemen’s reality and priorities and, in order to get a strong positive impact of available
resources, strive to improve efficiency and to allocate a larger share of total spending to
the areas that have the strongest payoffs in terms of growth and human development.
More specifically, for the scenario that targets the achievement of all non-poverty MDGs
(and benefits from synergies) with marginal financing from foreign grants, the required
annual real growth in government services for the period 2004-2015 would have been at
22 percent for health and 15.2 percent for primary education. In 2015, the total (current
and capital) spending on primary education, health, and water-sanitation would have
39
reached close to 22.7 percent of GDP as compared to 4.3 percent in 2004. The GDP
shares are significantly larger for scenarios that rely on domestic financing since growth
is slower and the required real increase in government services larger (as growth in
private incomes and demand for social services slows down). Total government
consumption and investment reaches 43 percent of GDP, compared to 23 percent in 2004
and 25.6 percent for the baseline in 2015.
The challenges would also be severe on the financing side, in part a reflection of the need
to replace declining oil revenues with other sources of financing. For the scenario that
targets all MDGs and relies on foreign transfers, these transfers would have to increase
from 1.6 percent of GDP in 2004 to 23.4 percent of GDP (or US$231 per capita) in 2015.
In light of these conclusions and in order to provide a complementary forward-looking
perspective, we carried out additional simulations. Their underlying assumption is that
the conflict that erupted in 2011 can be resolved promptly, permitting Yemen’s
government to assume its developmental functions at a level of efficiency that is similar
to what has prevailed in the past. The results from these simulations indicate that, even
though Yemen does not achieve the MDG targets, the country can still realize significant
gains if moderate increases in foreign aid can be used to generate improved infrastructure
and/or additional human development services. In addition, progress can also be made if
government spending efficiency is improved. However, also for these scenarios, reliance
on foreign aid brings about a Dutch Disease effect (albeit one that is more moderate than
for the first simulation set), which harms growth in the production of tradables. This
drawback should be weighed against the medium and long term socioeconomic benefits
of improved MDG indicators. In future analysis, it would be important to assess the
effects of different policies under different scenarios, with different degrees of disruption
due to conflict and considering the fact that, over a longer time horizon, improved human
development indicators promise stronger developmental gains in future decades.
40
References
Al-Batuly, Abdulmajeed, Mohamed Al-Hawri, Martin Cicowiez, Hans Lofgren and Mohammad Pournik. 2011. “Achieving the MDGs in Yemen: An Assessment”. Final Report of the Project Assessing Development Strategies to achieve the Millennium Development Goals in the Arab Region, UNDP-RBAS, UN-DESA and World Bank [downloadable from: http://www.un.org/en/development/desa/policy/capacity/output_studies.shtml].
Central Bank of Yemen. 2010. Annual Report 2009.
Blanchflower, David G. and Andrew J. Oswald. 1994. The Wage Curve. Cambridge: The MIT Press.
Easterly, William. 2009. “How the Millennium Development Goals are Unfair to Africa”. World Development 37 (1): 26–35.
EIU (Economist Intelligence Unit). 2008. Yemen: Country Profile. London: UK.
FAO. 2009. Irrigation in the Middle East Region in Figures: AQUASTAT Survey – 2008. Food and Agriculture Organization of the United Nations.
Gottschalk, Jan, Vu Manh Le, Hans Lofgren and Kofi Nouve. 2009. “Analyzing Fiscal Space Using the MAMS Model: An Application to Burkina Faso”. IMF Working Paper 09/227. International Monetary Fund.
Government of Yemen, World Bank, United Nations Development Program. 2007. Yemen Poverty Assessment.
IMF. 2010. “Republic of Yemen: Request for a Three-Year Arrangement under the Extended Credit Facility—Staff Report”; Press Release on the Executive Board Discussion; and Statement by the Executive Director for Yemen. September.
Kaufmann, Daniel, Aart Kraay and Massimo Mastruzzi (2010). The Worldwide Governance Indicators: Methodology and Analytical Issues. World Bank Policy Research Working Paper 5430 (www.govindicators.org)
Lofgren, Hans, Martin Cicowiez and Carolina Díaz-Bonilla. 2012. “MAMS – A Computable General Equilibrium Model for Developing Country Strategy Analysis”. Forthcoming in Peter B. Dixon and Dale Jorgenson (eds). Handbook of Computable General Equilibrium Modeling. Elsevier-North Holland.
MOPIC. 2003. Millennium Development Goals: Progress Report for Yemen. Ministry of Planning and International Cooperation.
MOPIC. 2005. Millennium Development Goals Needs Assessment. Yemen Country Report. Ministry of Planning and International Cooperation.
MOPIC. 2010. The Second National Millennium Development Goals Report. Ministry of Planning and International Cooperation.
41
MOPIC. 2011. Fourth Five-Year Socio-Economic Development Plan for Poverty Reduction 2011-2015. Ministry of Planning and International Cooperation.
Pacheco, Ana María. 2009. “A Technical Note on the Construction of a 2004 SAM for Yemen”. Prepared for the Project Assessing Development Strategies to achieve the Millennium Development Goals in the Arab Region, UNDP-RBAS, UN-DESA and World Bank [downloadable from: http://www.un.org/en/development/desa/policy/capacity/yemen.shtml].
Robinson, Sherman and Hans Lofgren. 2005. “Macro Models and Poverty Analysis: Theoretical Tensions and Empirical Practice”. Development Policy Review 23 (3): 267-283.
Sánchez, Marco V. and Giacomo Sbrana. 2009. “Determinants of Education Attainment and Development Goals in Yemen”. Prepared for the Project Assessing Development Strategies to achieve the Millennium Development Goals in the Arab Region, UNDP-RBAS, UN-DESA and World Bank [downloadable from: http://www.un.org/en/development/desa/policy/capacity/yemen.shtml].
Sbrana, Giacomo. 2009. “Technical Note on the Determinants of Water and Sanitation in Yemen”. Prepared for the Project Assessing Development Strategies to achieve the Millennium Development Goals in the Arab Region, UNDP-RBAS, UN-DESA and World Bank [downloadable from: http://www.un.org/en/development/desa/policy/capacity/yemen.shtml].
Sundberg, Mark and Hans Lofgren. 2006. Absorptive Capacity and Achieving the MDGs: The Case of Ethiopia. In Peter Isard, Leslie Lipschitz, Alexandros Mourmouras and Boriana Yontcheva (eds). The Macroeconomic Management of Foreign Aid: Opportunities and Pitfalls. Washington, D.C.: International Monetary Fund.
UNDP. 2009. Human Development Report 2009, Overcoming Barriers: Human Mobility and Development. United Nations Development Program.
Vos, Rob and Marco V. Sánchez. 2010. “A Non-Parametric Microsimulation Approach to Assess Changes in Inequality and Poverty”. International Journal of Microsimulation 3 (1): 8-23.
WDI. 2010. World Bank Development Indicators. Washington D.C: The World Bank. [downloadable from: http://data.worldbank.org/data-catalog/world-development-indicators/wdi-2010].
World Bank. 2006. Tracking Basic Education Expenditures in Yemen: Analyses of Public Resource Management and Teacher Absenteeism.


