Embed Size (px)
Citation preview
This report was funded by the Region of Peel.
The Ted Rogers School of Management’s Diversity Institute (Ryerson University) wishes to acknowledge the valuable contributions of the 675 Peel Region residents who took part in this survey, as well as the 49 representatives from settlement organizations, employers, faith groups and government who participated in stakeholder workshops.
In particular, we would like to thank the Newcomer Centre of Peel for their support of this project’s data collection and community engagement efforts.
The lead researchers for this report are:
• Dr. Wendy Cukier MA, MBA, PhD, DU (Hon) LLD (Hon) M.S.C. (civilian), Ryerson University, Founder & Director, Diversity Institute, Professor, Entrepreneurship & Strategy
• Samantha Jackson, MA, PhD (ABD), Research Associate, Diversity Institute
• Charity-Ann Hannan, MA, PhD (ABD), Research Associate, Diversity Institute
• Henrique Hon, M.Eng., MBA, Research Assistant, Diversity Institute
This report would not be possible without the contributions of the following colleagues:
• Geoff McIlroy, M.Sc.Pl., Specialist, Human Services Department, Region of Peel
• Erin Roach, MA, Senior Research Associate, Diversity Institute
• Mohammed Patel and Abisarikka Pillaiyinar, Research Assistants, Diversity Institute
• Shelley Mohamed, PMP, Project Manager, Diversity Institute
• Akos Katona, Laura Iruegas, and Jacky Au Duong, Centre for Communicating Knowledge, Ryerson University
• Ted Killin, BA and Melissa Tanti, PhD, Copyeditors
• Darren Cyr, PhD, Research Associate, Diversity Institute
• Kevin Mahadeo, MA, Human Services Department, Region of Peel
• Junior Higgins, MSc, MA, PMP, Region of Peel
For inquiries about this report contact:Diversity Institute, Ted Rogers School of Management, Ryerson University [email protected] Tel: 1-416-979-5000, ext. 7268 www.ryerson.ca/diversity
Acknowledgements
@RyersonDI@TRSMRyersonU
Diversity Institute ©November, 2018
02 Table of Figures
04 Definitions
05 Executive Summary
12 Background of Project and Context
18 Literature Review: Social Mobility
22 Findings
70 Policy and Service Implications for Peel Region
74 Appendix A – Methodology and Analysis
78 Appendix B – Demographic Factors
82 Appendix C – Employment Factors
86 Appendix D – Career Satisfaction
90 Appendix E – Income Factors
94 Appendix F – Strategies for Settlement Organizations
96 Appendix G – References
01 Table of Contents
02 Table of Figures
Figure 1: Ecological Model of Social Mobility
Figure 2: Reasons for Coming to Peel Region and Canada by Gender
Figure 3: Perceptions of Settlement Success Across Generations
Figure 4: Perceptions of Settlement Success by Generation and Gender
Figure 5: Demographic Factors and Settlement Success
Figure 6: Immigration and Citizenship Factors and Settlement Success
Figure 7: Perceptions of Career, Community, and Life Satisfaction
Figure 8: Perceptions of Occupational, Employment, and Wealth Prestige Before Immigration, at Arrival and at Present
Figure 9: Perceptions of Inclusion in Peel Region
Figure 10: Pre-Migration Factors Impacting Settlement Success
Figure 11: Importance of Community Factors in Personal Development Pre- and Post-Migration – Women
Figure 12: Importance of Community Factors in Personal Development Pre- and Post-Migration – Men
Figure 13:FactorsInfluencingCommunityGroupParticipationPre-andPost-Migration
Figure 14: Importance of Education-Related Factors in Development and Success Pre- and Post-Migration- Women
Figure 15: Importance of Education-Related Factors in Development and Success Pre- and Post-Migration - Men
Figure 16: Importance of Education-Related Factors in Development and Success Pre-Migration - Successful Men
Figure 17: Income and Racialization: First-Generation Respondents
Figure 18: Income and Racialization: Second-Generation Respondents
Figure 19: Income and Racialized Group: First-Generation Respondents
Figure 20: Income and Racialized Group: Second-Generation Respondents
Figure 21: Location of Highest Education and Income: First Generation Respondents
Figure 22: Age of Arrival and Income at Present
Figure 23: AccesstoSignificantSavingsBeforeandAfterImmigration
Figure 24: Access to Savings Before Immigration and Successful Resettlement
Figure 25: Experiencing Time Without Necessities Before Immigration and Current Income
Figure 26: Experiencing Time Without Necessities After Immigration and Current Income
Figure 27: Income and Social Experiences
Figure 28: Current Employment Status and Gender
SOCIAL MOBILITY OF IMMIGRANTS TO PEEL REGION
02
Figure 29: Employment Status Before Immigration, At Arrival and At Present
Figure 30: Employment Status and Racialization Before Immigration, At Arrival and At Present
Figure 31: Employment Status at Present by Racialized Group
Figure 32: Importance of Factors in Finding Work
Figure 33: Employment Status Before Immigration, at Arrival and at Present
Figure 34: First Generation’s Employment Status Before Immigration, at Arrival and at Present
Figure 35: Employment Status by Immigration Stream Before, At Arrival, and At Present
Figure 36: Importance of Barriers to Finding Work by Gender and Generation
Figure 37: Importance of Barriers to Work by Employment Status
Figure 38: Perceptions of Discrimination by Generation
Figure 39: Settlement Success and Current Age
Figure 40: Occupation and Generation
Figure 41: Occupations Before, At Arrival, and At Present
Figure 42: Career Satisfaction and Year of Arrival
Figure 43: Career Satisfaction and Age at Arrival
Figure 44: Career Satisfaction and Location of Highest Education
Figure 45: Income and Gender by Generation
Figure 46: Occupation and Income – First Generation
Figure 47: Perceptions of Wealth Before Immigration, at Arrival and at Present
03
REGION OF PEEL AND DIVERSITY INSTITUTE

Definitions
03
SOCIAL MOBILITY OF IMMIGRANTS TO PEEL REGION
04
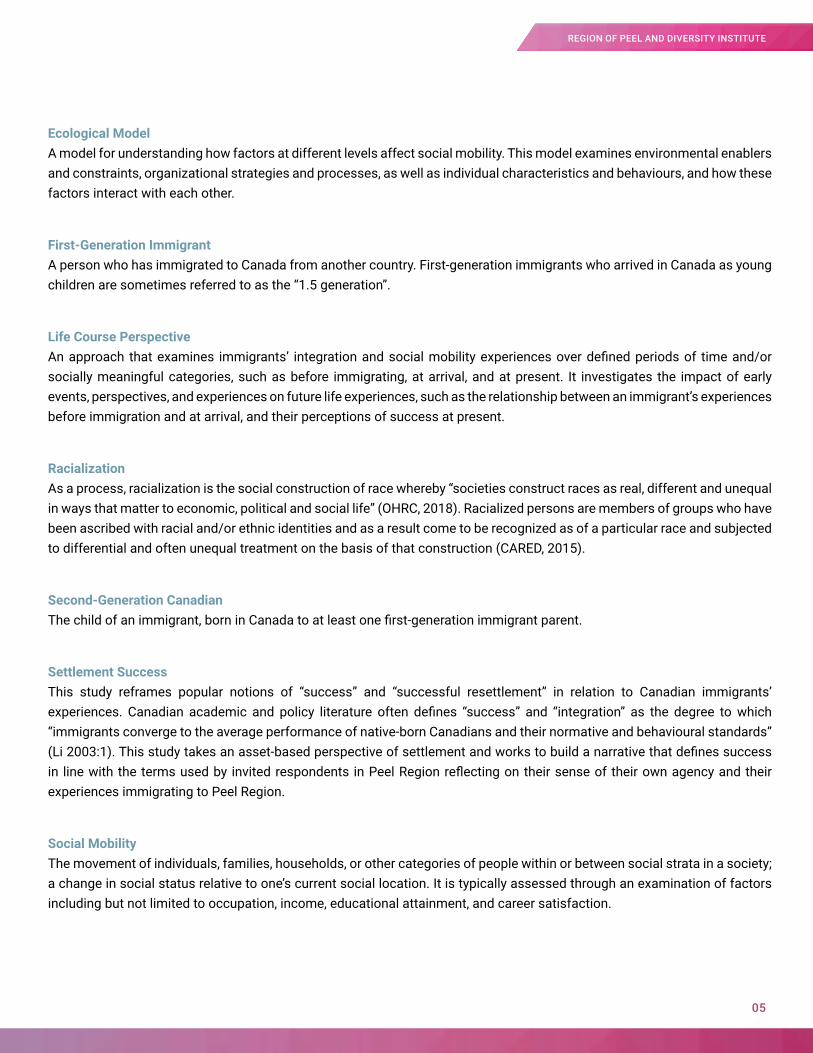
Ecological Model A model for understanding how factors at different levels affect social mobility. This model examines environmental enablers and constraints, organizational strategies and processes, as well as individual characteristics and behaviours, and how these factors interact with each other.
First-Generation Immigrant A person who has immigrated to Canada from another country. First-generation immigrants who arrived in Canada as young children are sometimes referred to as the “1.5 generation”.
Life Course Perspective An approach that examines immigrants’ integration and social mobility experiences over defined periods of time and/or socially meaningful categories, such as before immigrating, at arrival, and at present. It investigates the impact of early events, perspectives, and experiences on future life experiences, such as the relationship between an immigrant’s experiences before immigration and at arrival, and their perceptions of success at present.
Racialization As a process, racialization is the social construction of race whereby “societies construct races as real, different and unequal in ways that matter to economic, political and social life” (OHRC, 2018). Racialized persons are members of groups who have been ascribed with racial and/or ethnic identities and as a result come to be recognized as of a particular race and subjected to differential and often unequal treatment on the basis of that construction (CARED, 2015).
Second-Generation CanadianThe child of an immigrant, born in Canada to at least one first-generation immigrant parent.
Settlement SuccessThis study reframes popular notions of “success” and “successful resettlement” in relation to Canadian immigrants’ experiences. Canadian academic and policy literature often defines “success” and “integration” as the degree to which “immigrants converge to the average performance of native-born Canadians and their normative and behavioural standards” (Li 2003:1). This study takes an asset-based perspective of settlement and works to build a narrative that defines success in line with the terms used by invited respondents in Peel Region reflecting on their sense of their own agency and their experiences immigrating to Peel Region.
Social MobilityThe movement of individuals, families, households, or other categories of people within or between social strata in a society; a change in social status relative to one’s current social location. It is typically assessed through an examination of factors including but not limited to occupation, income, educational attainment, and career satisfaction.
05
REGION OF PEEL AND DIVERSITY INSTITUTE

Executive Summary
04
SOCIAL MOBILITY OF IMMIGRANTS TO PEEL REGION
06
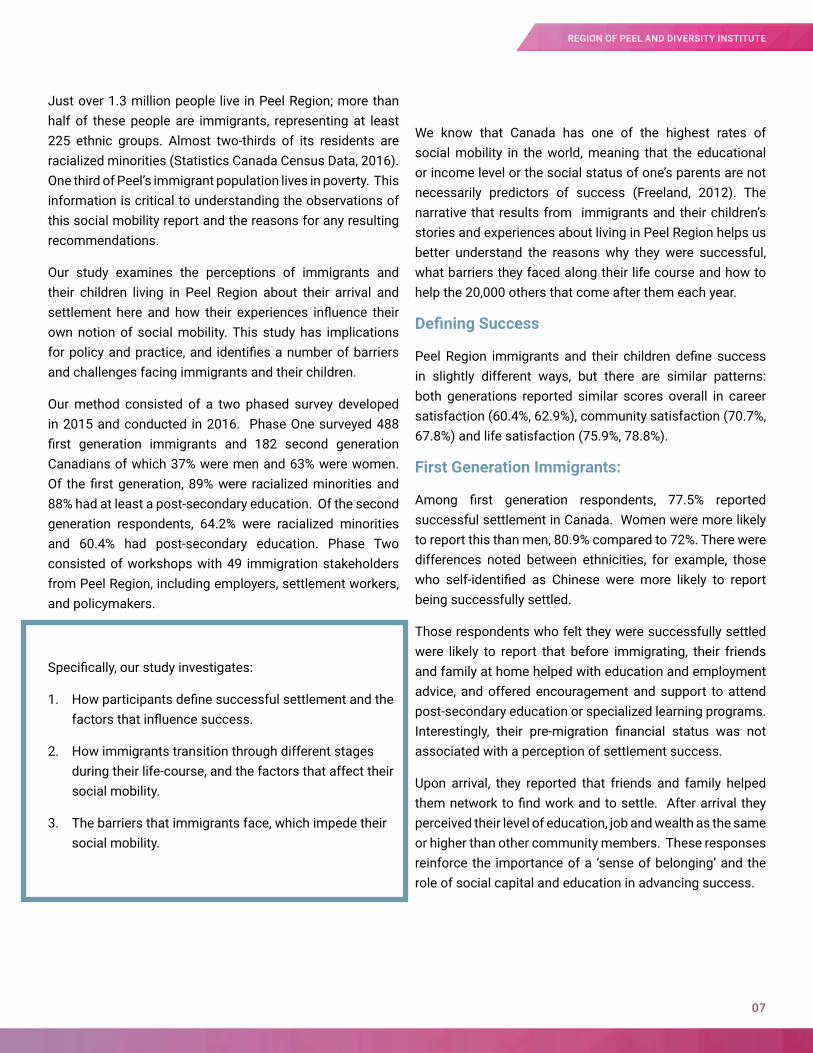
Just over 1.3 million people live in Peel Region; more than half of these people are immigrants, representing at least 225 ethnic groups. Almost two-thirds of its residents are racialized minorities (Statistics Canada Census Data, 2016). One third of Peel’s immigrant population lives in poverty. This information is critical to understanding the observations of this social mobility report and the reasons for any resulting recommendations.
Our study examines the perceptions of immigrants and their children living in Peel Region about their arrival and settlement here and how their experiences influence their own notion of social mobility. This study has implications for policy and practice, and identifies a number of barriers and challenges facing immigrants and their children.
Our method consisted of a two phased survey developed in 2015 and conducted in 2016. Phase One surveyed 488 first generation immigrants and 182 second generation Canadians of which 37% were men and 63% were women. Of the first generation, 89% were racialized minorities and 88% had at least a post-secondary education. Of the second generation respondents, 64.2% were racialized minorities and 60.4% had post-secondary education. Phase Two consisted of workshops with 49 immigration stakeholders from Peel Region, including employers, settlement workers, and policymakers.
Specifically, our study investigates:
1. How participants define successful settlement and the factors that influence success.
2. How immigrants transition through different stages during their life-course, and the factors that affect their social mobility.
3. The barriers that immigrants face, which impede their social mobility.
We know that Canada has one of the highest rates of social mobility in the world, meaning that the educational or income level or the social status of one’s parents are not necessarily predictors of success (Freeland, 2012). The narrative that results from immigrants and their children’s stories and experiences about living in Peel Region helps us better understand the reasons why they were successful, what barriers they faced along their life course and how to help the 20,000 others that come after them each year.
DefiningSuccess
Peel Region immigrants and their children define success in slightly different ways, but there are similar patterns: both generations reported similar scores overall in career satisfaction (60.4%, 62.9%), community satisfaction (70.7%, 67.8%) and life satisfaction (75.9%, 78.8%).
First Generation Immigrants:
Among first generation respondents, 77.5% reported successful settlement in Canada. Women were more likely to report this than men, 80.9% compared to 72%. There were differences noted between ethnicities, for example, those who self-identified as Chinese were more likely to report being successfully settled.
Those respondents who felt they were successfully settled were likely to report that before immigrating, their friends and family at home helped with education and employment advice, and offered encouragement and support to attend post-secondary education or specialized learning programs. Interestingly, their pre-migration financial status was not associated with a perception of settlement success.
Upon arrival, they reported that friends and family helped them network to find work and to settle. After arrival they perceived their level of education, job and wealth as the same or higher than other community members. These responses reinforce the importance of a ‘sense of belonging’ and the role of social capital and education in advancing success.
07
REGION OF PEEL AND DIVERSITY INSTITUTE
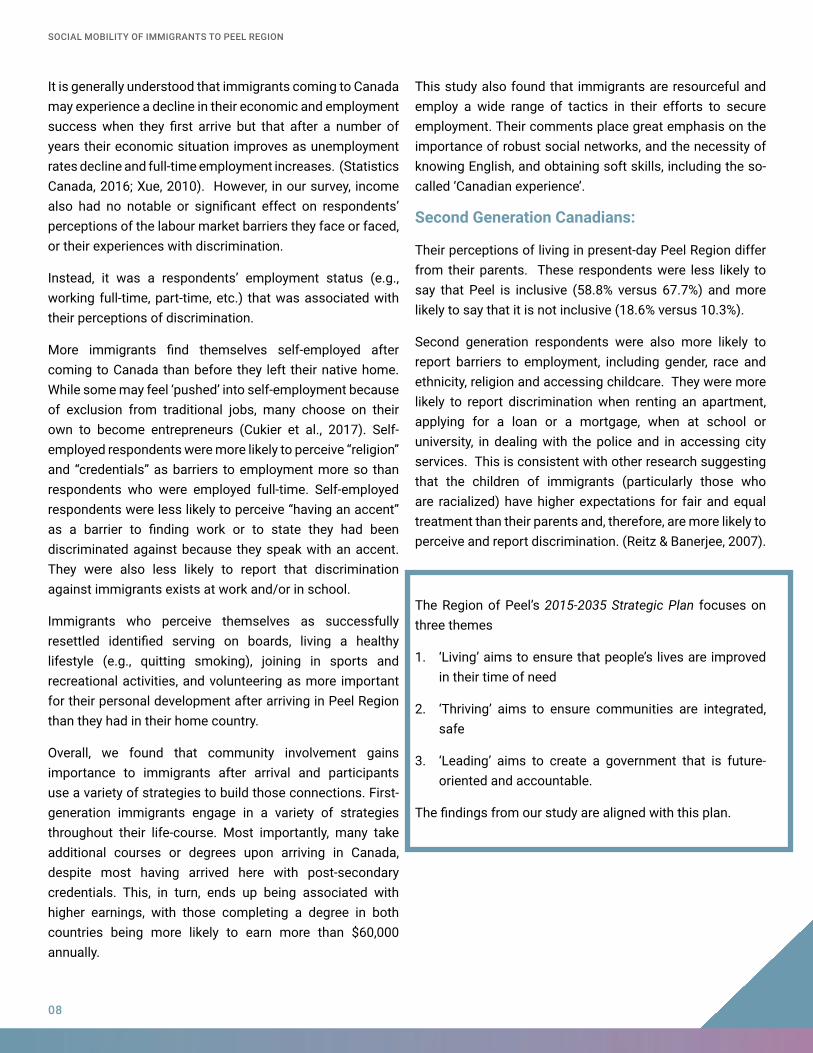
It is generally understood that immigrants coming to Canada may experience a decline in their economic and employment success when they first arrive but that after a number of years their economic situation improves as unemployment rates decline and full-time employment increases. (Statistics Canada, 2016; Xue, 2010). However, in our survey, income also had no notable or significant effect on respondents’ perceptions of the labour market barriers they face or faced, or their experiences with discrimination.
Instead, it was a respondents’ employment status (e.g., working full-time, part-time, etc.) that was associated with their perceptions of discrimination.
More immigrants find themselves self-employed after coming to Canada than before they left their native home. While some may feel ‘pushed’ into self-employment because of exclusion from traditional jobs, many choose on their own to become entrepreneurs (Cukier et al., 2017). Self-employed respondents were more likely to perceive “religion” and “credentials” as barriers to employment more so than respondents who were employed full-time. Self-employed respondents were less likely to perceive “having an accent” as a barrier to finding work or to state they had been discriminated against because they speak with an accent. They were also less likely to report that discrimination against immigrants exists at work and/or in school.
Immigrants who perceive themselves as successfully resettled identified serving on boards, living a healthy lifestyle (e.g., quitting smoking), joining in sports and recreational activities, and volunteering as more important for their personal development after arriving in Peel Region than they had in their home country.
Overall, we found that community involvement gains importance to immigrants after arrival and participants use a variety of strategies to build those connections. First-generation immigrants engage in a variety of strategies throughout their life-course. Most importantly, many take additional courses or degrees upon arriving in Canada, despite most having arrived here with post-secondary credentials. This, in turn, ends up being associated with higher earnings, with those completing a degree in both countries being more likely to earn more than $60,000 annually.
This study also found that immigrants are resourceful and employ a wide range of tactics in their efforts to secure employment. Their comments place great emphasis on the importance of robust social networks, and the necessity of knowing English, and obtaining soft skills, including the so-called ‘Canadian experience’.
Second Generation Canadians:
Their perceptions of living in present-day Peel Region differ from their parents. These respondents were less likely to say that Peel is inclusive (58.8% versus 67.7%) and more likely to say that it is not inclusive (18.6% versus 10.3%).
Second generation respondents were also more likely to report barriers to employment, including gender, race and ethnicity, religion and accessing childcare. They were more likely to report discrimination when renting an apartment, applying for a loan or a mortgage, when at school or university, in dealing with the police and in accessing city services. This is consistent with other research suggesting that the children of immigrants (particularly those who are racialized) have higher expectations for fair and equal treatment than their parents and, therefore, are more likely to perceive and report discrimination. (Reitz & Banerjee, 2007).
The Region of Peel’s 2015-2035 Strategic Plan focuses on three themes
1. ‘Living’ aims to ensure that people’s lives are improved in their time of need
2. ‘Thriving’ aims to ensure communities are integrated, safe
3. ‘Leading’ aims to create a government that is future-oriented and accountable.
The findings from our study are aligned with this plan.
SOCIAL MOBILITY OF IMMIGRANTS TO PEEL REGION
08
For new immigrants to Peel Region, and those who have not over the years been able to find their place of ‘being settled’, a key thrust of the Region of Peel must be a continued focus for opportunities for stable non-discriminatory employment and affordable housing. Other areas of importance are access to childcare and public transportation, access to recreational opportunities and promoting healthy lifestyles, such as quitting smoking.
Responsibility for policies and programs aimed at advancing immigrant inclusion and success are shared by municipal, regional, provincial and federal governments. To help support immigrant success, there is a role for strengthened advocacy by the Region of Peel with and about immigrants, to other levels of government, and to organizations and institutions within Peel Region. This could result in greater coordination, or even integration, in terms of funding, delivery and setting policy goals.
Finally, creating inclusive environments is critical to attract and retain skilled talent in the workplace, support the educational success of immigrants and their children and to foster an overall sense of belonging within their community. Understanding the expectations and experiences of first and second generation Canadians with regards to employment, education, public services, (including policing) is required to build fair, equitable and inclusive processes, policies and environments.
09
REGION OF PEEL AND DIVERSITY INSTITUTE
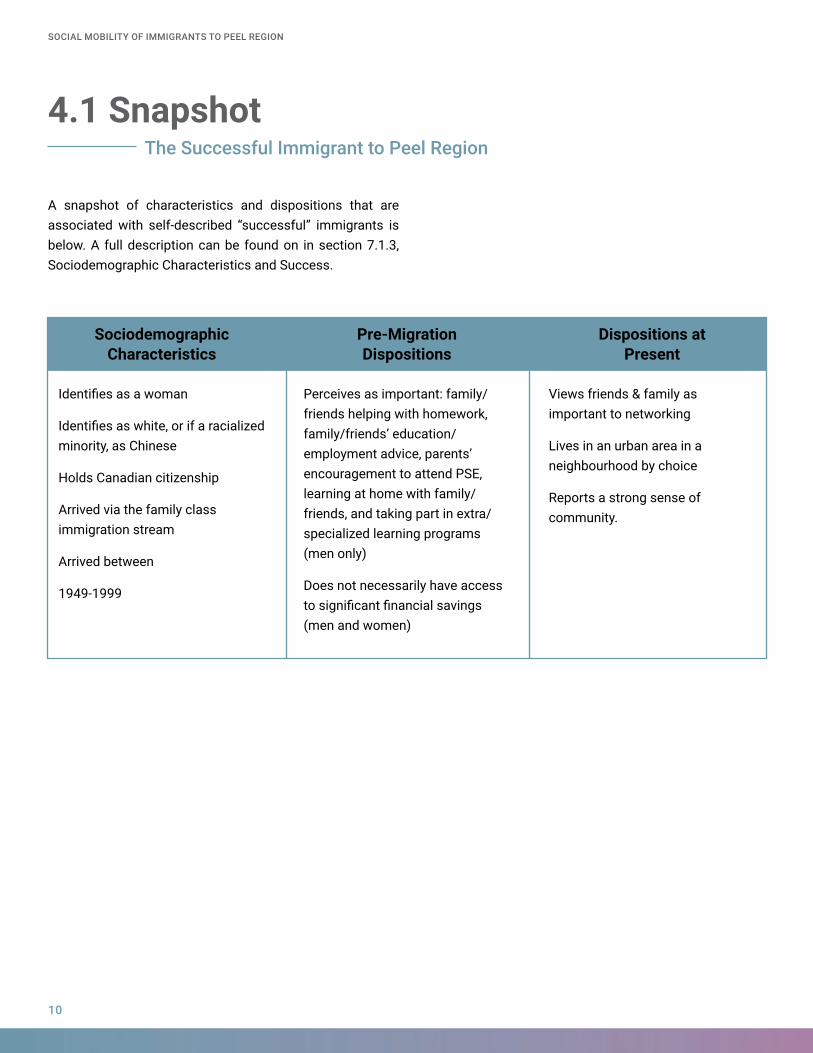
4.1 SnapshotThe Successful Immigrant to Peel Region
A snapshot of characteristics and dispositions that are associated with self-described “successful” immigrants is below. A full description can be found on in section 7.1.3, Sociodemographic Characteristics and Success.
Identifies as a woman
Identifies as white, or if a racialized minority, as Chinese
Holds Canadian citizenship
Arrived via the family class immigration stream
Arrived between
1949-1999
Sociodemographic Characteristics
Pre-Migration Dispositions
Dispositions at Present
Perceives as important: family/friends helping with homework, family/friends’ education/employment advice, parents’ encouragement to attend PSE, learning at home with family/friends, and taking part in extra/specialized learning programs (men only)
Does not necessarily have access to significant financial savings (men and women)
Views friends & family as important to networking
Lives in an urban area in a neighbourhood by choice
Reports a strong sense of community.
SOCIAL MOBILITY OF IMMIGRANTS TO PEEL REGION
10
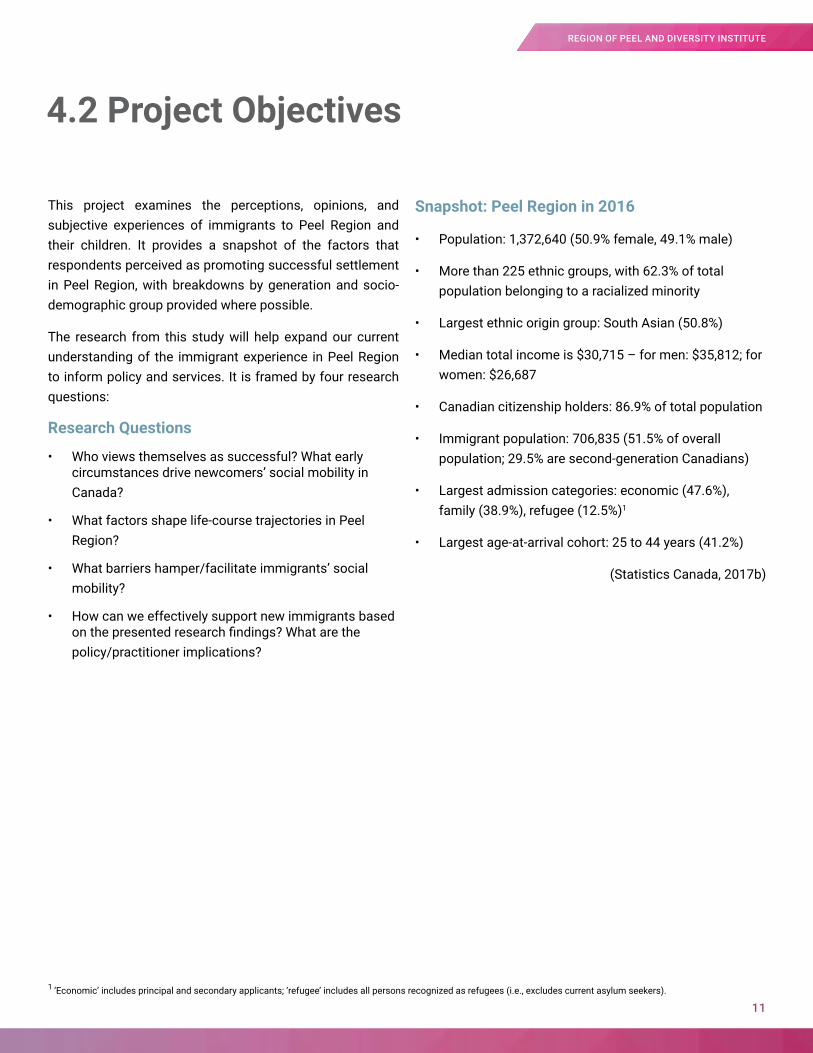
This project examines the perceptions, opinions, and subjective experiences of immigrants to Peel Region and their children. It provides a snapshot of the factors that respondents perceived as promoting successful settlement in Peel Region, with breakdowns by generation and socio-demographic group provided where possible.
The research from this study will help expand our current understanding of the immigrant experience in Peel Region to inform policy and services. It is framed by four research questions:
Research Questions
• Who views themselves as successful? What early circumstances drive newcomers’ social mobility in Canada?
• What factors shape life-course trajectories in Peel Region?
• What barriers hamper/facilitate immigrants’ social mobility?
• How can we effectively support new immigrants based on the presented research findings? What are the policy/practitioner implications?
Snapshot: Peel Region in 2016
• Population: 1,372,640 (50.9% female, 49.1% male)
• More than 225 ethnic groups, with 62.3% of total population belonging to a racialized minority
• Largest ethnic origin group: South Asian (50.8%)
• Median total income is $30,715 – for men: $35,812; for women: $26,687
• Canadian citizenship holders: 86.9% of total population
• Immigrant population: 706,835 (51.5% of overall population; 29.5% are second-generation Canadians)
• Largest admission categories: economic (47.6%), family (38.9%), refugee (12.5%)1
• Largest age-at-arrival cohort: 25 to 44 years (41.2%)
(Statistics Canada, 2017b)
4.2 Project Objectives
1 ‘Economic’ includes principal and secondary applicants; ‘refugee’ includes all persons recognized as refugees (i.e., excludes current asylum seekers).
11
REGION OF PEEL AND DIVERSITY INSTITUTE

Background of Project and Context
05
SOCIAL MOBILITY OF IMMIGRANTS TO PEEL REGION
12
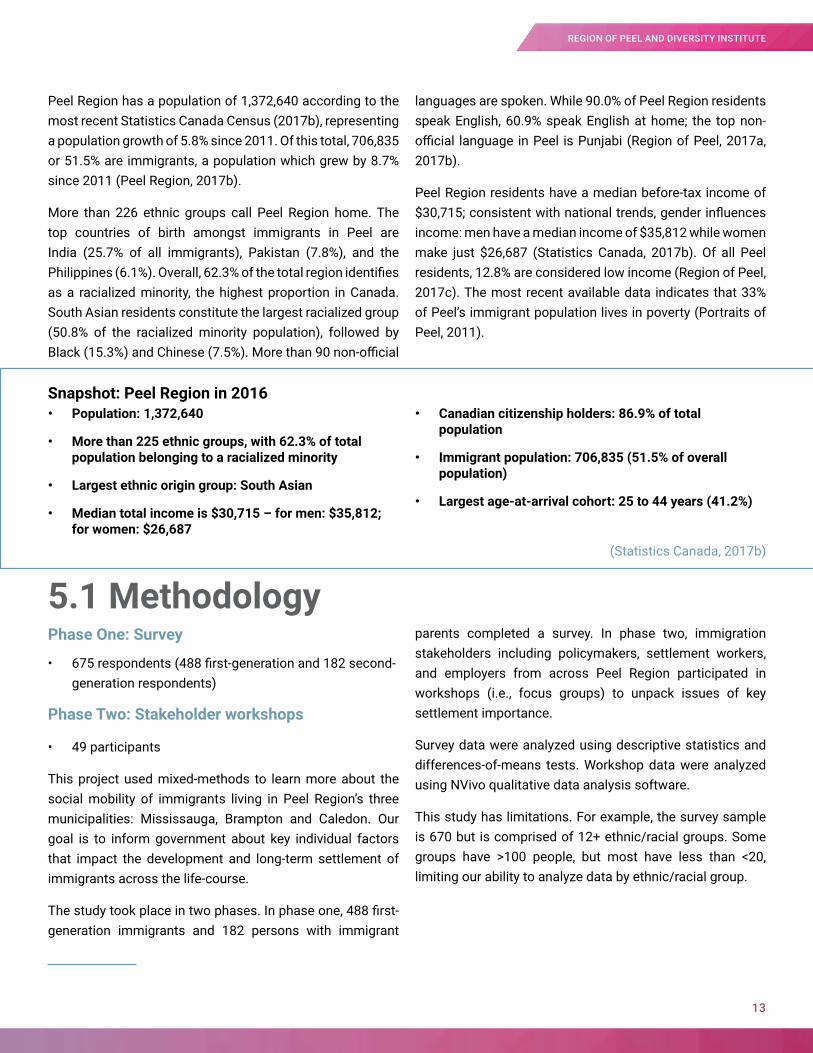
Peel Region has a population of 1,372,640 according to the most recent Statistics Canada Census (2017b), representing a population growth of 5.8% since 2011. Of this total, 706,835 or 51.5% are immigrants, a population which grew by 8.7% since 2011 (Peel Region, 2017b).
More than 226 ethnic groups call Peel Region home. The top countries of birth amongst immigrants in Peel are India (25.7% of all immigrants), Pakistan (7.8%), and the Philippines (6.1%). Overall, 62.3% of the total region identifies as a racialized minority, the highest proportion in Canada. South Asian residents constitute the largest racialized group (50.8% of the racialized minority population), followed by Black (15.3%) and Chinese (7.5%). More than 90 non-official
languages are spoken. While 90.0% of Peel Region residents speak English, 60.9% speak English at home; the top non-official language in Peel is Punjabi (Region of Peel, 2017a, 2017b).
Peel Region residents have a median before-tax income of $30,715; consistent with national trends, gender influences income: men have a median income of $35,812 while women make just $26,687 (Statistics Canada, 2017b). Of all Peel residents, 12.8% are considered low income (Region of Peel, 2017c). The most recent available data indicates that 33% of Peel’s immigrant population lives in poverty (Portraits of Peel, 2011).
Phase One: Survey
• 675 respondents (488 first-generation and 182 second-generation respondents)
Phase Two: Stakeholder workshops
• 49 participants
This project used mixed-methods to learn more about the social mobility of immigrants living in Peel Region’s three municipalities: Mississauga, Brampton and Caledon. Our goal is to inform government about key individual factors that impact the development and long-term settlement of immigrants across the life-course.
The study took place in two phases. In phase one, 488 first-generation immigrants and 182 persons with immigrant
parents completed a survey. In phase two, immigration stakeholders including policymakers, settlement workers, and employers from across Peel Region participated in workshops (i.e., focus groups) to unpack issues of key settlement importance.
Survey data were analyzed using descriptive statistics and differences-of-means tests. Workshop data were analyzed using NVivo qualitative data analysis software.
This study has limitations. For example, the survey sample is 670 but is comprised of 12+ ethnic/racial groups. Some groups have >100 people, but most have less than <20, limiting our ability to analyze data by ethnic/racial group.
5.1 Methodology
• Population: 1,372,640
• More than 225 ethnic groups, with 62.3% of total population belonging to a racialized minority
• Largest ethnic origin group: South Asian
• Median total income is $30,715 – for men: $35,812; for women: $26,687
• Canadian citizenship holders: 86.9% of total population
• Immigrant population: 706,835 (51.5% of overall population)
• Largest age-at-arrival cohort: 25 to 44 years (41.2%)
Snapshot: Peel Region in 2016
(Statistics Canada, 2017b)
13
REGION OF PEEL AND DIVERSITY INSTITUTE
This report engages a life course perspective to understand changes in social mobility over time. A life course perspective emphasizes sociological characteristics, as well as greater contextual factors that have an impact on an individual or groups’ experience with social mobility and complements the ecological approach taken to analyze these data (see Figure 1, Ecological Model of Social Mobility) (Edmonston, 2013).
In the context of migration, a life course approach examines how socio-economic variables before migration and at arrival will influence subsequent post-migration experiences. Where possible, findings from before immigration, at arrival, and at present are compared to identify significant differences in the relationship between life events (e.g., access to resources pre-migration) and long-term outcomes.
This project takes an asset-based approach to highlight the strategies engaged by immigrants who self-identify as “successful”. Individual experiences and self-defined trajectories are taken into account to understand disparities in outcomes among immigrant populations and identify factors that can help improve immigrant trajectories over a lifetime and across generations. A full description of recruitment, data collection, and analytical methods can be found in Appendix A.
Of the more than 1.3 million residents of Peel Region, more than half (51.5%) are immigrants, representing more than 225 ethnic groups. More than half (62.3%) are racialized minorities.
5.1.1 Life Course Perspective
5.1.2 Ecological Model of Social MobilityAn ecological model of systems change also informs the survey design and data analysis. Newcomers, employers, and government, private, or settlement sector bodies do not operate in a vacuum. Actions and perceptions are the outcome of a complex interplay of factors at the individual, organizational, and societal levels.
Societal: Factors at the societal level include political and social institutions and structures, including policies, legislation, media representations and norms around inclusion, racism and discrimination. These broad societal forces shape immigrants’ abilities to climb the socio-economic ladder both directly and indirectly, as they in turn shape non-immigrants’ understandings of places for newcomers in Peel Region.
Organizational: Organizational policies and procedures impact first- and second-generation respondents’ experiences in Peel Region. This includes the practices of settlement organizations, as well as workplace policies, such as those surrounding discrimination, equity and hiring, and organizational culture.
Individual: Sociodemographic factors at the individual level can also be important social mobility influencers, including level of education, language abilities, and health status.
Factors at each level substantiate and inform one another to shape an immigrant’s social mobility trajectory in Peel Region. For example, it is not one’s race or gender that determines impact on their success, but rather, the broader societal context – including sexism, racism, and discrimination – in which these identities are operating.
More than half of Peel’s residents are immigrants, representing 225+ ethnic backgrounds.
SOCIAL MOBILITY OF IMMIGRANTS TO PEEL REGION
14
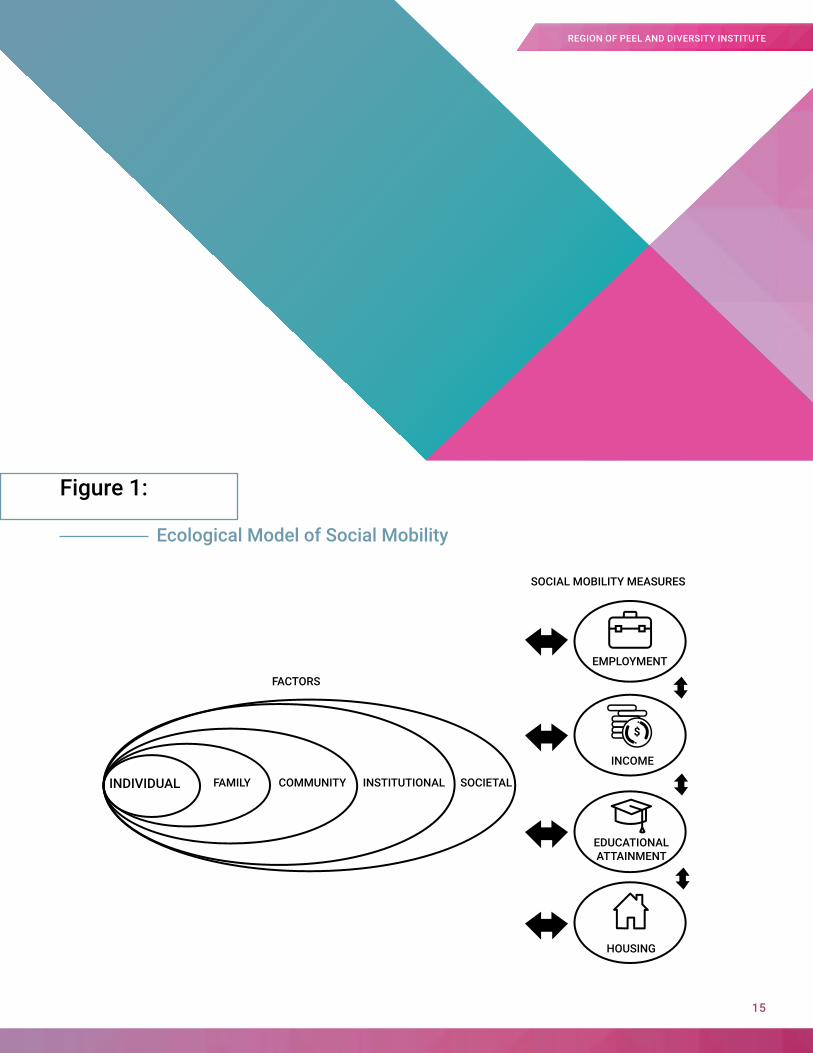
Figure 1:
Ecological Model of Social Mobility
15
REGION OF PEEL AND DIVERSITY INSTITUTE
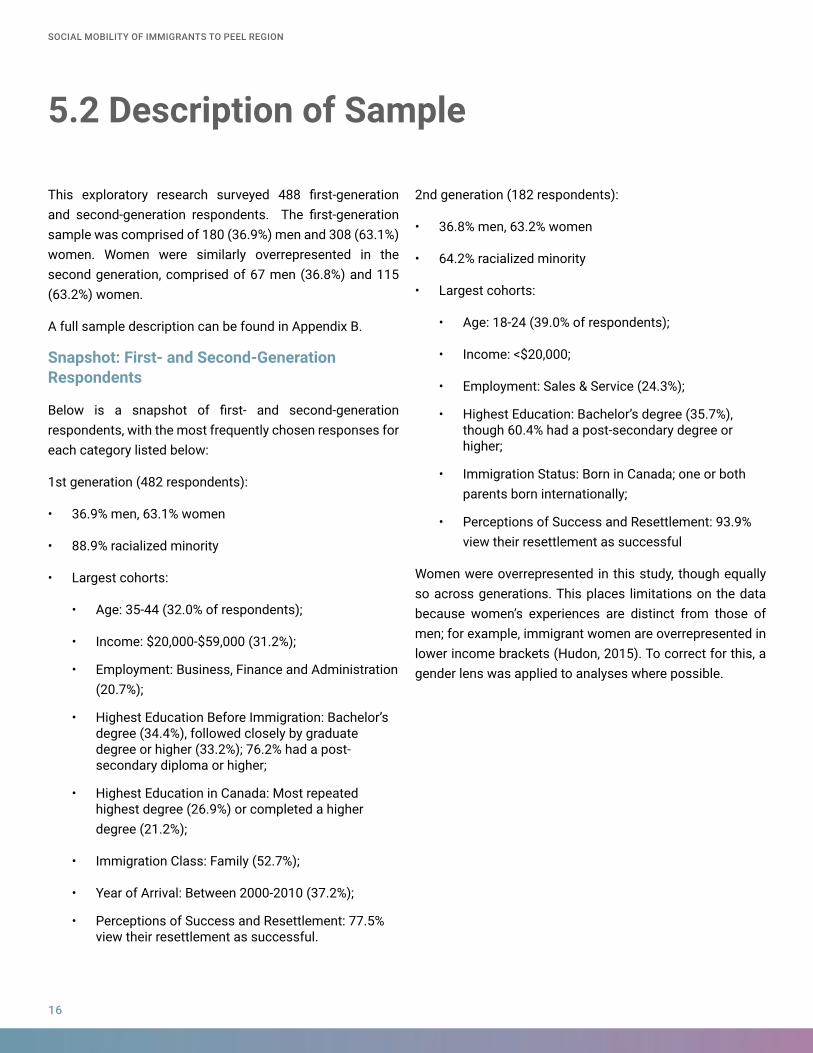
This exploratory research surveyed 488 first-generation and second-generation respondents. The first-generation sample was comprised of 180 (36.9%) men and 308 (63.1%) women. Women were similarly overrepresented in the second generation, comprised of 67 men (36.8%) and 115 (63.2%) women.
A full sample description can be found in Appendix B.
Snapshot: First- and Second-Generation Respondents
Below is a snapshot of first- and second-generation respondents, with the most frequently chosen responses for each category listed below:
1st generation (482 respondents):
• 36.9% men, 63.1% women
• 88.9% racialized minority
• Largest cohorts:
• Age: 35-44 (32.0% of respondents);
• Income: $20,000-$59,000 (31.2%);
• Employment: Business, Finance and Administration (20.7%);
• Highest Education Before Immigration: Bachelor’s degree (34.4%), followed closely by graduate degree or higher (33.2%); 76.2% had a post-secondary diploma or higher;
• Highest Education in Canada: Most repeated highest degree (26.9%) or completed a higher degree (21.2%);
• Immigration Class: Family (52.7%);
• Year of Arrival: Between 2000-2010 (37.2%);
• Perceptions of Success and Resettlement: 77.5% view their resettlement as successful.
2nd generation (182 respondents):
• 36.8% men, 63.2% women
• 64.2% racialized minority
• Largest cohorts:
• Age: 18-24 (39.0% of respondents);
• Income: <$20,000;
• Employment: Sales & Service (24.3%);
• Highest Education: Bachelor’s degree (35.7%), though 60.4% had a post-secondary degree or higher;
• Immigration Status: Born in Canada; one or both parents born internationally;
• Perceptions of Success and Resettlement: 93.9% view their resettlement as successful
Women were overrepresented in this study, though equally so across generations. This places limitations on the data because women’s experiences are distinct from those of men; for example, immigrant women are overrepresented in lower income brackets (Hudon, 2015). To correct for this, a gender lens was applied to analyses where possible.
5.2 Description of Sample
SOCIAL MOBILITY OF IMMIGRANTS TO PEEL REGION
16

17
REGION OF PEEL AND DIVERSITY INSTITUTE
Literature Review: Social Mobility
06
SOCIAL MOBILITY OF IMMIGRANTS TO PEEL REGION
18
Highlights from the Literature:
• Canada is recognized as having one of the highest rates of intergenerational social mobility in the world
• Child’s economic success is influenced but not defined by parental income (Corak, 2006)
• Relationship between parent’s wage and a child’s future wage is weakest amongst lower incomes (Chen et al., 2016)
• 9 out of every 10 Canadians move to a higher income bracket over time (Lamman et al., 2012)
• Key social mobility drivers include education, feelings of inclusion, and opportunity (Berteaux & Thompson, 2006)
Canada is recognized as having one of the highest rates of social mobility in the world: inequalities experienced in one generation will not necessarily be passed on to the next. Social mobility analyses typically assume mobility is measured across generations: to what extent does one generation pass its advantages and challenges to the next cohort? What tools do subsequent generations use to achieve beyond their parents? (Blau & Duncan, 1967; Hout, 2014). Canada also has a notably high level of mobility between generations; a child’s social location at birth will influence, but not be determinative of their social location in adulthood (Corak, 2006). Indeed, research indicates that compared to like societies, including the United States and the United Kingdom, Canadians enjoy a higher degree of intergenerational social mobility (Aydemir et al., 2009).
The promise of social mobility tells us a lot about the underlying principles of a society (Sharkey, 2008). While immigrants may not start at the same place as their Canadian-born counterparts, the multicultural mosaic narrative suggests that in the short term, the benefits of immigration will outweigh setbacks in income or job prestige and over time, immigrants will succeed. This does not discount the inequalities and discrimination that many experience, however “it does ensure that privilege is not simply a birthright” (Kelly, 2014: 3).
Canada’s social mobility is particularly evident vis-à-vis income, the most common measure of social mobility (Chen et al., 2016). In fact, the relationship between a parent’s wage and their children’s future wage is at its weakest amongst lower income brackets (Chen et al., 2016). The Federal Reserve Bank of St. Louis found that children born to parents in the bottom fifth of the income distribution in Canada had a 13.5% chance of reaching the top fifth income level. This may seem relatively small, but compared to the United States (7.5%), the United Kingdom (9.0%), and Denmark (9.0%), the chance of moving across social strata in Canada is fairly high (Chetty, 2017). Indeed, the earnings of parents do not necessarily dictate the future earnings of their children, especially for very low-income parents (Chen et al., 2016). It follows that, downward social mobility occurs in the same way. Canadian children born to the top-tenth of all earners are less likely (18.0%) than their American counterparts (26.0%) to remain in this top bracket (Corak, 2010). A similar study found that 36% of top 20% earners moved down at least one income bracket between 1990 to 2009 while 21% of the bottom 20% moved to the top 20% of earners nationally in the same period, demonstrating that mobility is multidirectional (Statistics Canada, 2012 in Lamman et al., 2012). Existing research suggests that in Canada one’s social location at birth is not a definitive predictor of one’s future.
While there is a dearth of intergenerational research on immigrant income mobility, longitudinal data indicates that immigrants to Canada report lower wages but experience upward wage trajectories over time. In 2006, the median wages of immigrants to Canada was $17,600 across all immigrant categories; this increased to $25,000 five years after arrival, and $32,000 ten years after landing (Statistics Canada, 2017a). Wages vary by area of birth and sex; in 2015, European-born immigrants reported median earnings of $50,000 (males) and $34,000 (females) annually, whereas immigrants from Eastern Asia reported median earnings of $30,000 and $24,000, respectively. Overall, women who immigrate to Canada earn less than men who immigrate, as do men and women born in Canada.
19
REGION OF PEEL AND DIVERSITY INSTITUTE
Income may also be related to age of arrival, as well as year of arrival; immigrants who arrived before the age of 20 between 1980 and 1991 filed median incomes of $49,000 in 2015, whereas the Canadian born population aged 25-54 earned a median income of $48,000 in 2016 (Statistics Canada, 2017a).
On a similar note, Aydemir et al. (2013) found that lower-earning immigrant parents are more likely to have educated children than Canadian-born lower-earning parents. Moreover, the authors identify important patterns specific to immigrant communities, including that second-generation Canadians from some communities experience the same social mobility barriers as their parents; for example, children of immigrants from the Caribbean and West Africa reported higher than average education but lower than average earnings, an experience mirroring that of their parents. There are a multitude of factors that might shape these outcomes; for example, research has shown that financial stability may limit the psycho-social stress of starting over, ease initial stress relating to housing and education, and provide some ‘breathing room’ for newcomers to find desirable employment (Abada & Tenkorang, 2009). Financial assets upon arrival can also shape neighbourhood choice and access to preferred schools (Zhou, 1997). Family legacies and achievements, as well as personal past experiences can also shape the aspirations and successes of future generations (Hout, 2014).
Beyond income, other indicators of ‘moving up’ in Canadian society include measurable factors such as educational attainment (Bertaux & Thompson, 2006). Importantly, research shows only weak associations between an immigrant to Canada’s level of education and the level of education of their Canadian-born children, to the extent that second-generation Canadians experience more upward educational mobility than persons born to Canadian-born parents (Aydemir et al., 2013). Amongst first-generation immigrants, certain groups have also surpassed their Canadian-born counterparts with respect to educational attainment (Thiessen, 2009). A recent study found that education of parents can matter, but as immigrants tend to have higher levels of education, so too do their children.
SOCIAL MOBILITY OF IMMIGRANTS TO PEEL REGION
20
Moreover, second-generation Canadians were more likely to hold university degrees (36% of persons aged 25 to 35) compared to 24% of persons in the same age group with Canadian-born parents (Keung, 2018).
Education and income are important indicators of social mobility. However, understanding the role of less studied factors, such as access to pre-migration supports and resources will paint a more vivid picture of the subjective experience of social mobility. It will also better equip policymakers with the tools needed to ensure pathways to upward mobility remain open.
This study provides a snapshot of characteristics associated with perceptions of success and life satisfaction. It analyzes how factors including country of origin, immigration stream and year of arrival, as well as characteristics including gender and racialization influence these perceptions. It also maps the first generation’s experiences, including familial influences, community supports and access to resources across three distinct time periods: before migration, at arrival, and present day to illustrate how early circumstances, perceptions and behaviours will shape future experiences after migration (Hout, 2014). Similarly, the early-life circumstances of persons born to immigrants are identified to illustrate social mobility trajectories across the second generation’s life courses. Indeed, with more than 17.4% of all Canadians identifying as second-generation in 2011, the success of this cohort drives Canada’s success overall (Kelly, 2014). Understanding how immigrants and their children experience social mobility, including how they understand success and the factors that support their climb up the social ladder, is pertinent.
A variety of factors influence Canada’s relatively high intergenerational income and educational attainment rates. High quality public health and social service systems minimize the personal risks associated with becoming ill, falling out of employment, or requiring family supports. Robust public education similarly removes some barriers to achieving educational success, as do provincially-specific post-secondary assistance programs such as tuition assistance for low-income families in Ontario.
Canada’s settlement sector offers a comprehensive menu of settlement services free of charge to most newcomers, including language and employment support. However, permissive macro-level structural conditions like access to health and education are necessary but insufficient factors to achieving social mobility. Other macro- and meso-level factors such as high barriers to entering the housing market or accessing childcare in Peel Region, as well as individual-level characteristics such as confidence and transferability of skill sets will shape an immigrant’s ability to thrive. These interrelated factors are enveloped within greater systems of racial and gender inequality that create friction for many immigrants trying to climb the social ladder.
Critically, no single variable will be determinative in all immigrants’ life courses (Hout, 2014). The strength of any given factor – be it gender or level of education – will change across time and interact differently with socio-economic contexts and individual immigrants’ expectations to create different understandings of success. Moreover, important variations exist between and within groups; for example, while second-generation immigrants have been shown to experience significant upward mobility compared to their parents, this is not uniformly true, and some communities face continued hardships across generations (Kelly, 2014).
While Canada boasts relatively higher rates of social mobility, inequality is on the rise, with immigrants being especially vulnerable (Hulchanski, 2010; Toronto Foundation, 2016). Consequences of a changing labour market, including the rise of the ‘gig economy’ and precarious work, automation and artificial intelligence raise important questions around who will thrive and who will be left behind. Examining first- and second-generation respondents’ experiences across the life course helps identify factors that constrain outcomes and success, as well as the strategies being deployed to achieve social mobility. This knowledge can inform municipal and regional policymakers’ strategies to facilitate mobility amongst newcomer and second-generation communities.
21
REGION OF PEEL AND DIVERSITY INSTITUTE

Findings
07
SOCIAL MOBILITY OF IMMIGRANTS TO PEEL REGION
22
Who perceives their resettlement as a “success”?
Key Findings:• Overall, most respondents perceive themselves to be
successfully settled;
• Perceptions of settlement success were generally high amongst respondents of all ethno-cultural groups, with no statistically significant differences between groups;
• A ‘u-shaped’ pattern of upward social mobility is seen in perceived educational, occupational, and wealth prestige—while perceived prestige dropped after migration, it returns to higher levels over time;
• First-generation white male respondents are least likely to view Peel as inclusive;
• Reasons for coming to Canada generally and Peel specifically are relatively consistent, with the most common reason for immigration being a better quality of life.
Prior to examining who views themselves as successfully resettled, it is important to understand why respondents chose to immigrate to Peel Region. Respondents checked all factors that applied to them in response to the survey
question: what were your reasons, or your parents’ reasons, for coming to Canada and Peel Region? The most common reason for immigration to Canada and Peel is for a better quality of life.
7.1.1 Reasons for Coming to Peel Region and Canada
7.1 Question 1
A ‘u-shaped’ pattern of upward social mobility is seen in perceived educational, occupational, and wealth prestige—while perceived prestige dropped after migration, it returns to higher levels over time.
23
REGION OF PEEL AND DIVERSITY INSTITUTE
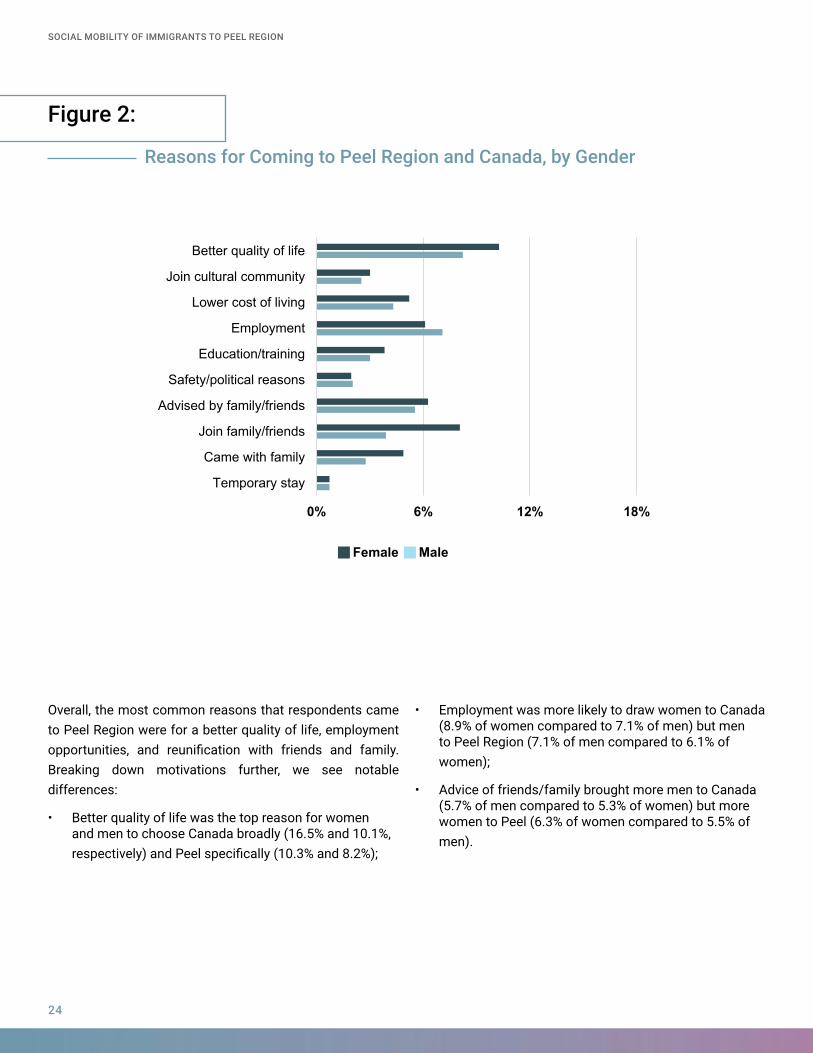
Figure 2:
Overall, the most common reasons that respondents came to Peel Region were for a better quality of life, employment opportunities, and reunification with friends and family. Breaking down motivations further, we see notable differences:
• Better quality of life was the top reason for women and men to choose Canada broadly (16.5% and 10.1%, respectively) and Peel specifically (10.3% and 8.2%);
• Employment was more likely to draw women to Canada (8.9% of women compared to 7.1% of men) but men to Peel Region (7.1% of men compared to 6.1% of women);
• Advice of friends/family brought more men to Canada (5.7% of men compared to 5.3% of women) but more women to Peel (6.3% of women compared to 5.5% of men).
Reasons for Coming to Peel Region and Canada, by Gender
0% 6% 12% 18%
Temporary stay
Came with family
Join family/friends
Advised by family/friends
Safety/political reasons
Education/training
Employment
Lower cost of living
Join cultural community
Better quality of life
Female Male
SOCIAL MOBILITY OF IMMIGRANTS TO PEEL REGION
24
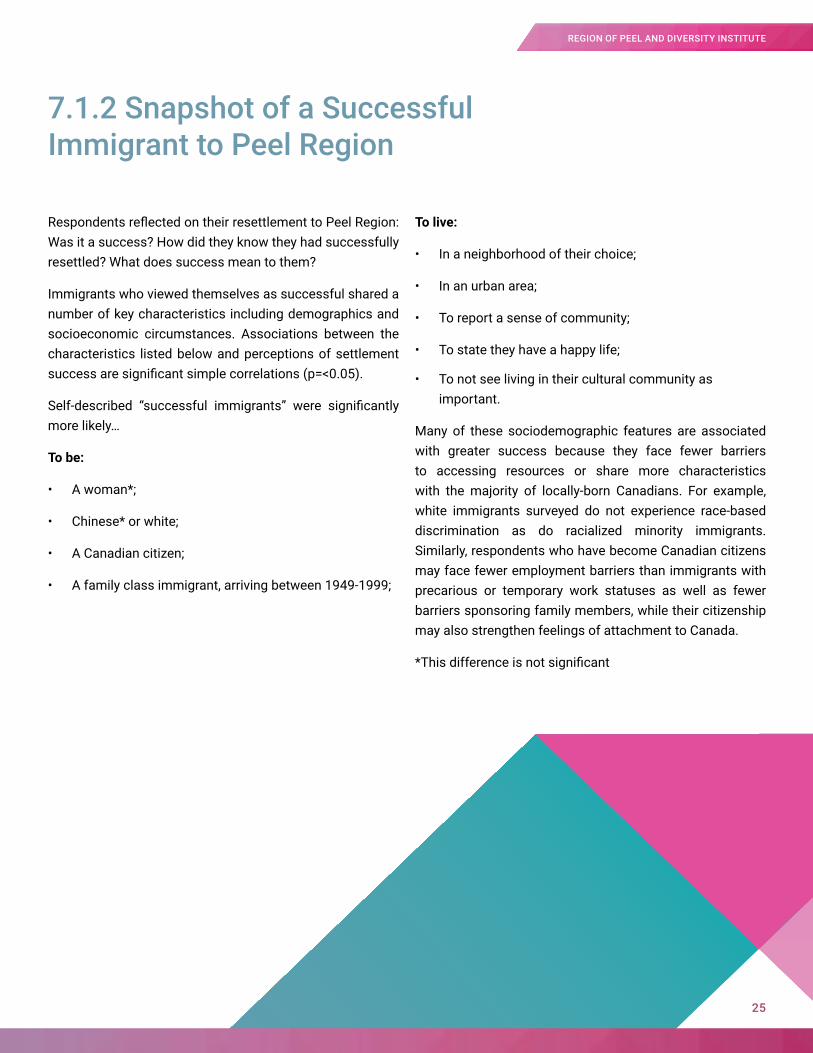
Respondents reflected on their resettlement to Peel Region: Was it a success? How did they know they had successfully resettled? What does success mean to them?
Immigrants who viewed themselves as successful shared a number of key characteristics including demographics and socioeconomic circumstances. Associations between the characteristics listed below and perceptions of settlement success are significant simple correlations (p=<0.05).
Self-described “successful immigrants” were significantly more likely…
To be:
• A woman*;
• Chinese* or white;
• A Canadian citizen;
• A family class immigrant, arriving between 1949-1999;
To live:
• In a neighborhood of their choice;
• In an urban area;
• To report a sense of community;
• To state they have a happy life;
• To not see living in their cultural community as important.
Many of these sociodemographic features are associated with greater success because they face fewer barriers to accessing resources or share more characteristics with the majority of locally-born Canadians. For example, white immigrants surveyed do not experience race-based discrimination as do racialized minority immigrants. Similarly, respondents who have become Canadian citizens may face fewer employment barriers than immigrants with precarious or temporary work statuses as well as fewer barriers sponsoring family members, while their citizenship may also strengthen feelings of attachment to Canada.
*This difference is not significant
7.1.2 Snapshot of a Successful Immigrant to Peel Region
25
REGION OF PEEL AND DIVERSITY INSTITUTE
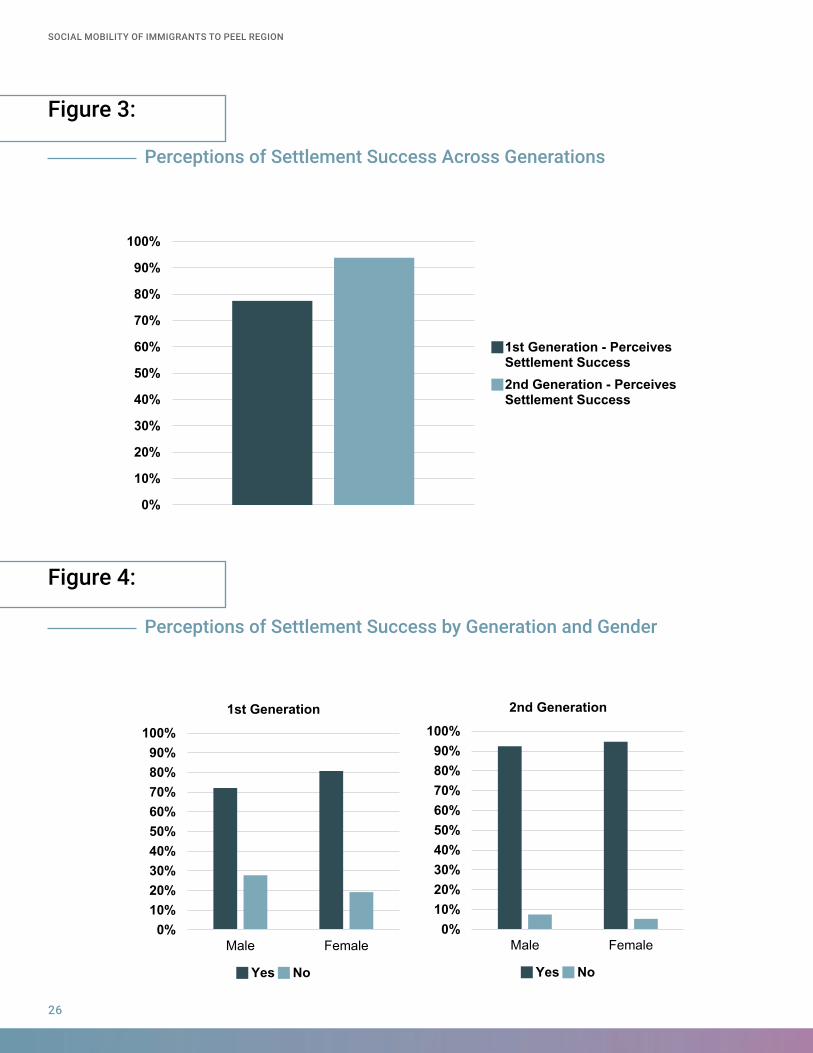
Figure 4:
Perceptions of Settlement Success by Generation and Gender
0%
10%
20%
30%
40%
50%
60%
70%
80%
90%
100%
1st Generation - PerceivesSettlement Success2nd Generation - PerceivesSettlement Success
0%10%20%30%40%50%60%70%80%90%
100%
Male Female
1st Generation
Yes No
0%10%20%30%40%50%60%70%80%90%
100%
Male Female
2nd Generation
Yes No
Figure 3:
Perceptions of Settlement Success Across Generations
SOCIAL MOBILITY OF IMMIGRANTS TO PEEL REGION
26
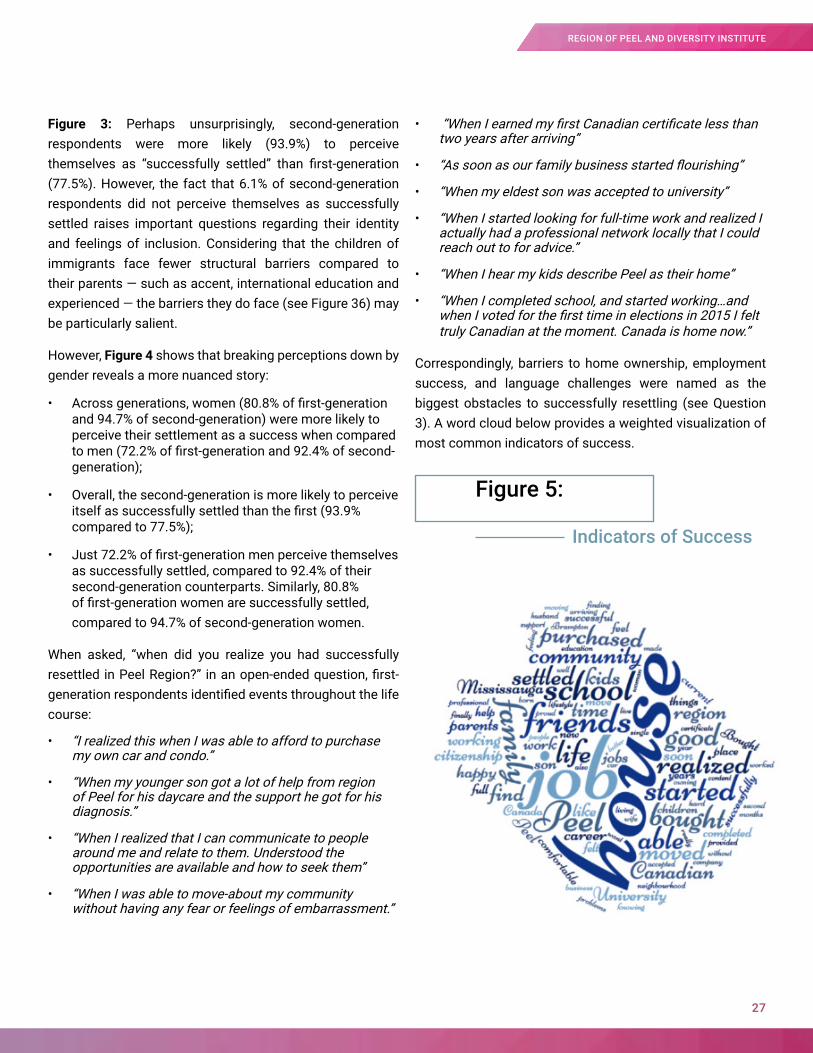
Figure 3: Perhaps unsurprisingly, second-generation respondents were more likely (93.9%) to perceive themselves as “successfully settled” than first-generation (77.5%). However, the fact that 6.1% of second-generation respondents did not perceive themselves as successfully settled raises important questions regarding their identity and feelings of inclusion. Considering that the children of immigrants face fewer structural barriers compared to their parents — such as accent, international education and experienced — the barriers they do face (see Figure 36) may be particularly salient.
However, Figure 4 shows that breaking perceptions down by gender reveals a more nuanced story:
• Across generations, women (80.8% of first-generation and 94.7% of second-generation) were more likely to perceive their settlement as a success when compared to men (72.2% of first-generation and 92.4% of second-generation);
• Overall, the second-generation is more likely to perceive itself as successfully settled than the first (93.9% compared to 77.5%);
• Just 72.2% of first-generation men perceive themselves as successfully settled, compared to 92.4% of their second-generation counterparts. Similarly, 80.8% of first-generation women are successfully settled, compared to 94.7% of second-generation women.
When asked, “when did you realize you had successfully resettled in Peel Region?” in an open-ended question, first-generation respondents identified events throughout the life course:
• “I realized this when I was able to afford to purchase my own car and condo.”
• “When my younger son got a lot of help from region of Peel for his daycare and the support he got for his diagnosis.”
• “When I realized that I can communicate to people around me and relate to them. Understood the opportunities are available and how to seek them”
• “When I was able to move-about my community without having any fear or feelings of embarrassment.”
• “When I earned my first Canadian certificate less than two years after arriving”
• “As soon as our family business started flourishing”
• “When my eldest son was accepted to university”
• “When I started looking for full-time work and realized I actually had a professional network locally that I could reach out to for advice.”
• “When I hear my kids describe Peel as their home”
• “When I completed school, and started working…and when I voted for the first time in elections in 2015 I felt truly Canadian at the moment. Canada is home now.”
Correspondingly, barriers to home ownership, employment success, and language challenges were named as the biggest obstacles to successfully resettling (see Question 3). A word cloud below provides a weighted visualization of most common indicators of success.
Figure 5:
Indicators of Success
27
REGION OF PEEL AND DIVERSITY INSTITUTE
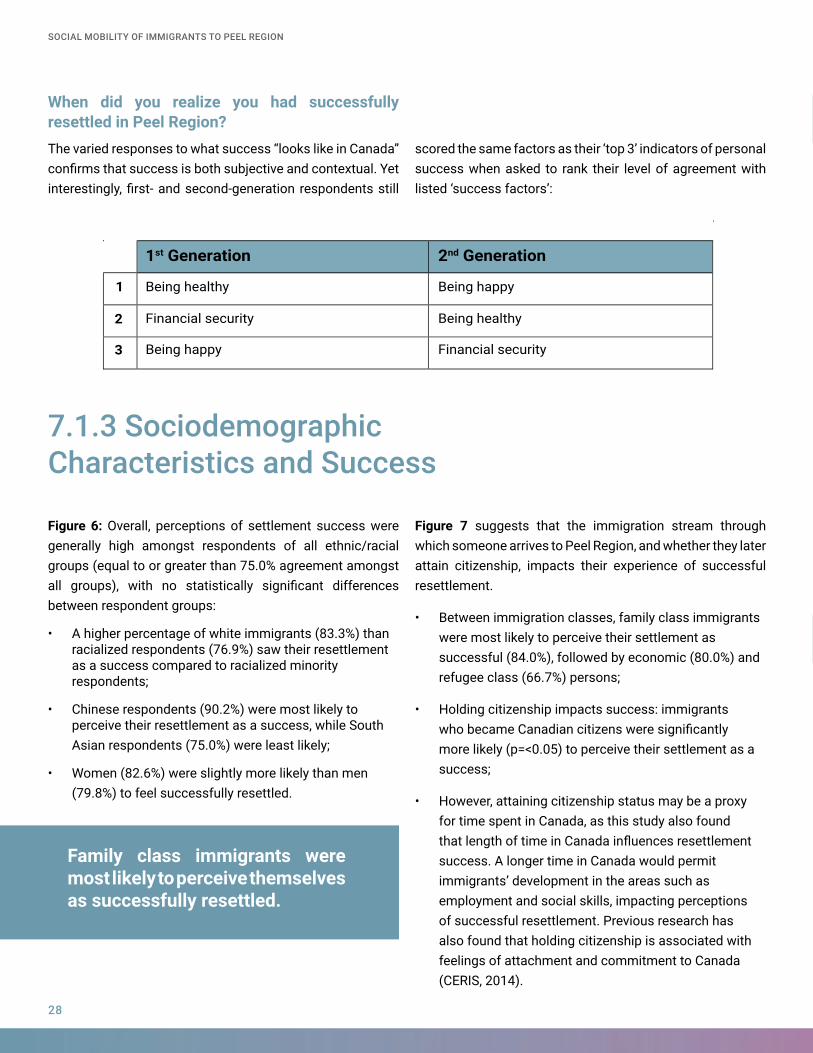
The varied responses to what success “looks like in Canada” confirms that success is both subjective and contextual. Yet interestingly, first- and second-generation respondents still
scored the same factors as their ‘top 3’ indicators of personal success when asked to rank their level of agreement with listed ‘success factors’:
When did you realize you had successfully resettled in Peel Region?
Figure 6: Overall, perceptions of settlement success were generally high amongst respondents of all ethnic/racial groups (equal to or greater than 75.0% agreement amongst all groups), with no statistically significant differences between respondent groups:
• A higher percentage of white immigrants (83.3%) than racialized respondents (76.9%) saw their resettlement as a success compared to racialized minority respondents;
• Chinese respondents (90.2%) were most likely to perceive their resettlement as a success, while South Asian respondents (75.0%) were least likely;
• Women (82.6%) were slightly more likely than men (79.8%) to feel successfully resettled.
Figure 7 suggests that the immigration stream through which someone arrives to Peel Region, and whether they later attain citizenship, impacts their experience of successful resettlement.
• Between immigration classes, family class immigrants were most likely to perceive their settlement as successful (84.0%), followed by economic (80.0%) and refugee class (66.7%) persons;
• Holding citizenship impacts success: immigrants who became Canadian citizens were significantly more likely (p=<0.05) to perceive their settlement as a success;
• However, attaining citizenship status may be a proxy for time spent in Canada, as this study also found that length of time in Canada influences resettlement success. A longer time in Canada would permit immigrants’ development in the areas such as employment and social skills, impacting perceptions of successful resettlement. Previous research has also found that holding citizenship is associated with feelings of attachment and commitment to Canada (CERIS, 2014).
7.1.3 Sociodemographic Characteristics and Success
1st Generation 2nd Generation
Being healthy Being happy
Financial security Being healthy
Being happy Financial security
1
2
3
Family class immigrants were most likely to perceive themselves as successfully resettled.
SOCIAL MOBILITY OF IMMIGRANTS TO PEEL REGION
28
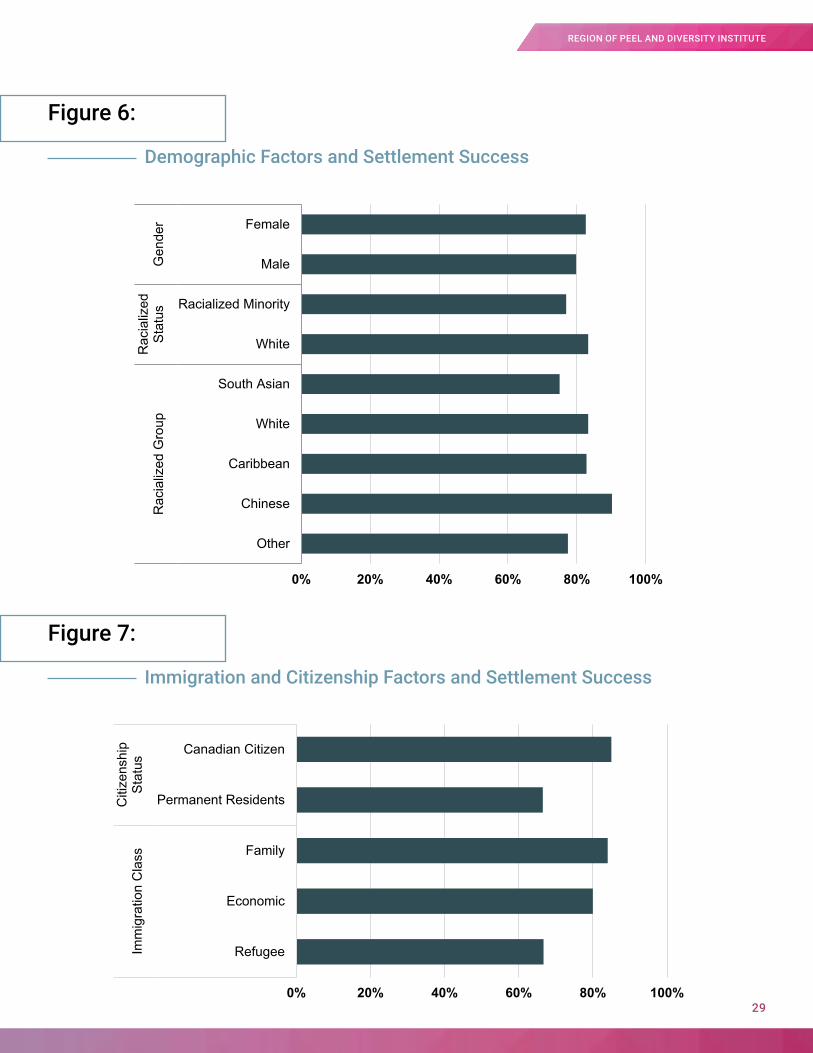
Figure 6:
Figure 7:
Demographic Factors and Settlement Success
Immigration and Citizenship Factors and Settlement Success
0% 20% 40% 60% 80% 100%
Other
Chinese
Caribbean
White
South Asian
White
Racialized Minority
Male
Female
Rac
ializ
ed G
roup
Rac
ializ
edSt
atus
Gen
der
0% 20% 40% 60% 80% 100%
Refugee
Economic
Family
Permanent Residents
Canadian Citizen
Imm
igra
tion
Cla
ssC
itize
nshi
pSt
atus
29
REGION OF PEEL AND DIVERSITY INSTITUTE
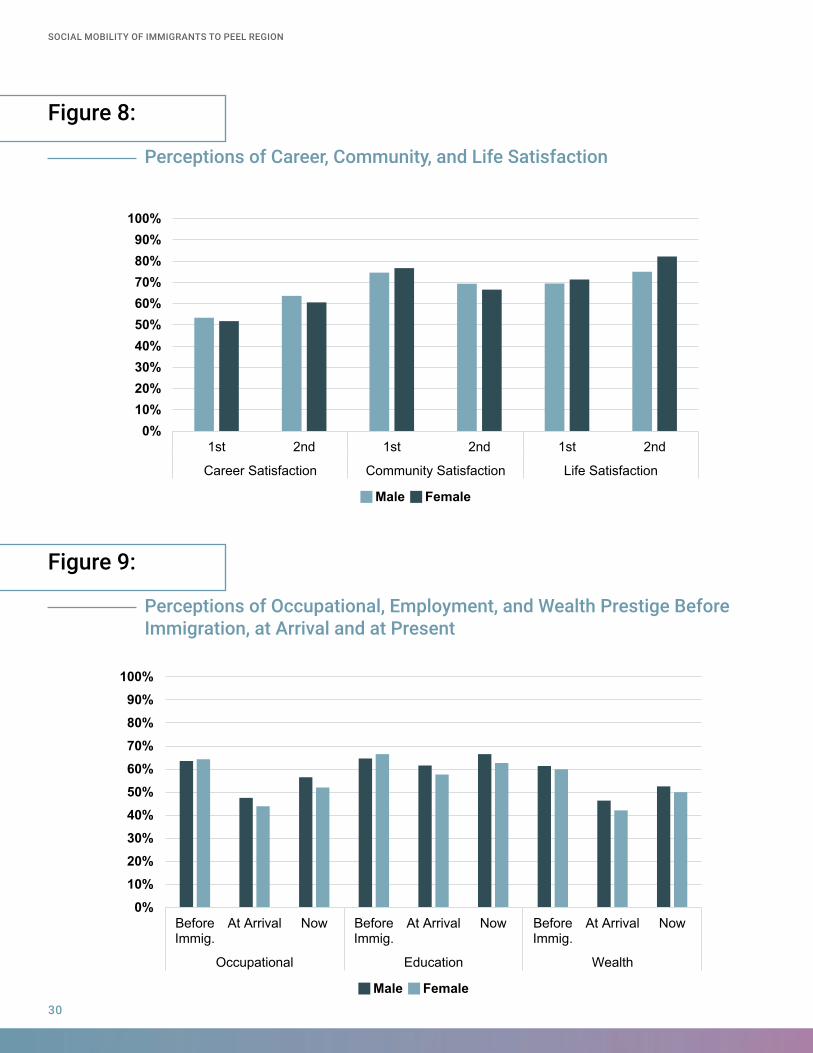
Figure 8:
Figure 9:
Perceptions of Career, Community, and Life Satisfaction
Perceptions of Occupational, Employment, and Wealth Prestige BeforeImmigration, at Arrival and at Present
0%10%20%30%40%50%60%70%80%90%
100%
1st 2nd 1st 2nd 1st 2nd
Career Satisfaction Community Satisfaction Life Satisfaction
Male Female
0%10%20%30%40%50%60%70%80%90%
100%
BeforeImmig.
At Arrival Now BeforeImmig.
At Arrival Now BeforeImmig.
At Arrival Now
Occupational Education Wealth
Male Female
SOCIAL MOBILITY OF IMMIGRANTS TO PEEL REGION
30
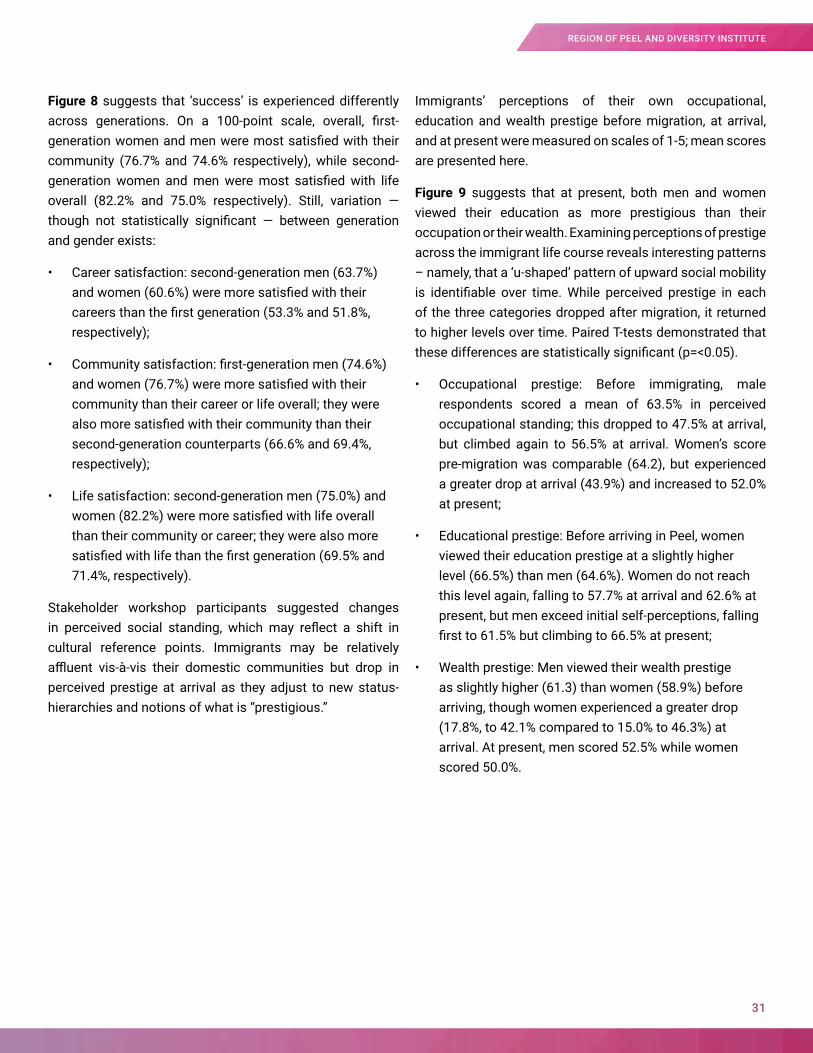
Figure 8 suggests that ‘success’ is experienced differently across generations. On a 100-point scale, overall, first-generation women and men were most satisfied with their community (76.7% and 74.6% respectively), while second-generation women and men were most satisfied with life overall (82.2% and 75.0% respectively). Still, variation — though not statistically significant — between generation and gender exists:
• Career satisfaction: second-generation men (63.7%) and women (60.6%) were more satisfied with their careers than the first generation (53.3% and 51.8%, respectively);
• Community satisfaction: first-generation men (74.6%) and women (76.7%) were more satisfied with their community than their career or life overall; they were also more satisfied with their community than their second-generation counterparts (66.6% and 69.4%, respectively);
• Life satisfaction: second-generation men (75.0%) and women (82.2%) were more satisfied with life overall than their community or career; they were also more satisfied with life than the first generation (69.5% and 71.4%, respectively).
Stakeholder workshop participants suggested changes in perceived social standing, which may reflect a shift in cultural reference points. Immigrants may be relatively affluent vis-à-vis their domestic communities but drop in perceived prestige at arrival as they adjust to new status-hierarchies and notions of what is “prestigious.”
Immigrants’ perceptions of their own occupational, education and wealth prestige before migration, at arrival, and at present were measured on scales of 1-5; mean scores are presented here.
Figure 9 suggests that at present, both men and women viewed their education as more prestigious than their occupation or their wealth. Examining perceptions of prestige across the immigrant life course reveals interesting patterns – namely, that a ‘u-shaped’ pattern of upward social mobility is identifiable over time. While perceived prestige in each of the three categories dropped after migration, it returned to higher levels over time. Paired T-tests demonstrated that these differences are statistically significant (p=<0.05).
• Occupational prestige: Before immigrating, male respondents scored a mean of 63.5% in perceived occupational standing; this dropped to 47.5% at arrival, but climbed again to 56.5% at arrival. Women’s score pre-migration was comparable (64.2), but experienced a greater drop at arrival (43.9%) and increased to 52.0% at present;
• Educational prestige: Before arriving in Peel, women viewed their education prestige at a slightly higher level (66.5%) than men (64.6%). Women do not reach this level again, falling to 57.7% at arrival and 62.6% at present, but men exceed initial self-perceptions, falling first to 61.5% but climbing to 66.5% at present;
• Wealth prestige: Men viewed their wealth prestige as slightly higher (61.3) than women (58.9%) before arriving, though women experienced a greater drop (17.8%, to 42.1% compared to 15.0% to 46.3%) at arrival. At present, men scored 52.5% while women scored 50.0%.
31
REGION OF PEEL AND DIVERSITY INSTITUTE
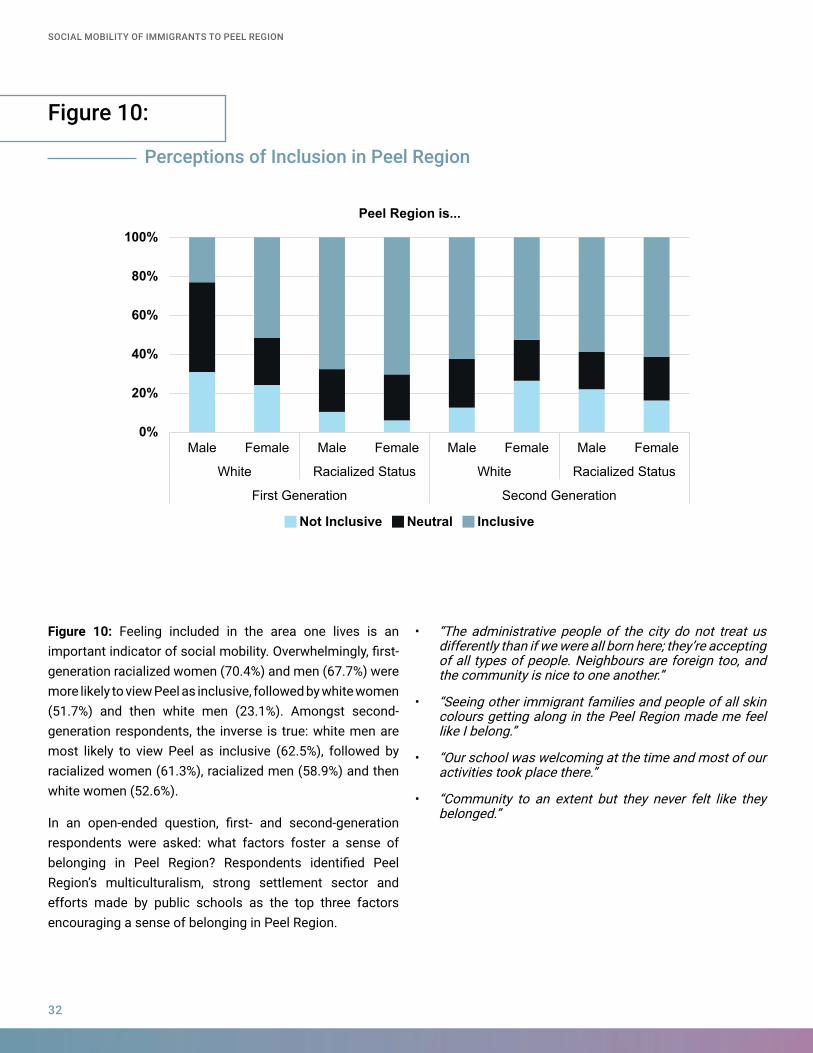
Figure 10: Feeling included in the area one lives is an important indicator of social mobility. Overwhelmingly, first-generation racialized women (70.4%) and men (67.7%) were more likely to view Peel as inclusive, followed by white women (51.7%) and then white men (23.1%). Amongst second-generation respondents, the inverse is true: white men are most likely to view Peel as inclusive (62.5%), followed by racialized women (61.3%), racialized men (58.9%) and then white women (52.6%).
In an open-ended question, first- and second-generation respondents were asked: what factors foster a sense of belonging in Peel Region? Respondents identified Peel Region’s multiculturalism, strong settlement sector and efforts made by public schools as the top three factors encouraging a sense of belonging in Peel Region.
• “The administrative people of the city do not treat us differently than if we were all born here; they’re accepting of all types of people. Neighbours are foreign too, and the community is nice to one another.”
• “Seeing other immigrant families and people of all skin colours getting along in the Peel Region made me feel like I belong.”
• “Our school was welcoming at the time and most of our activities took place there.”
• “Community to an extent but they never felt like they belonged.”
Figure 10:
Perceptions of Inclusion in Peel Region
0%
20%
40%
60%
80%
100%
Male Female Male Female Male Female Male Female
White Racialized Status White Racialized Status
First Generation Second Generation
Peel Region is...
Not Inclusive Neutral Inclusive
SOCIAL MOBILITY OF IMMIGRANTS TO PEEL REGION
32
7.2 Question 2What factors shape social mobility life course trajectories for immigrants in Peel Region?
Key Findings:• Men and women perceived several forms of civic
and community engagement as significantly more important for their personal development after immigrating to Peel, including volunteering, serving on boards and joining cultural organizations. Conversely, the importance of friends and family in one’s personal development became significantly less important;
• Reasons behind immigrants’ civic and community engagement also shifted. Increasing connections with others, gaining new experiences/skills and maintaining a sense of belonging to one’s cultural community were identified as significantly more important drivers of community involvement post-migration;
• Women perceived the role of paid tutors and being encouraged to pursue post-secondary education as significantly less important to their education success after arriving in Peel;
• Women generally and racialized women specifically are overrepresented in lower income brackets across both generations.
What drives success may differ across genders, geographies, and the life course. Identifying pre- and post-immigration success factors is vital to understanding the ‘bigger picture’ of immigrants’ success – what happens before newcomers arrive in Peel Region that positively influences their post-
migration experience? What post-migration experiences, supports, and behaviours will influence success?
7.2.1 Pre- and Post-Migration Success Factors
33
REGION OF PEEL AND DIVERSITY INSTITUTE
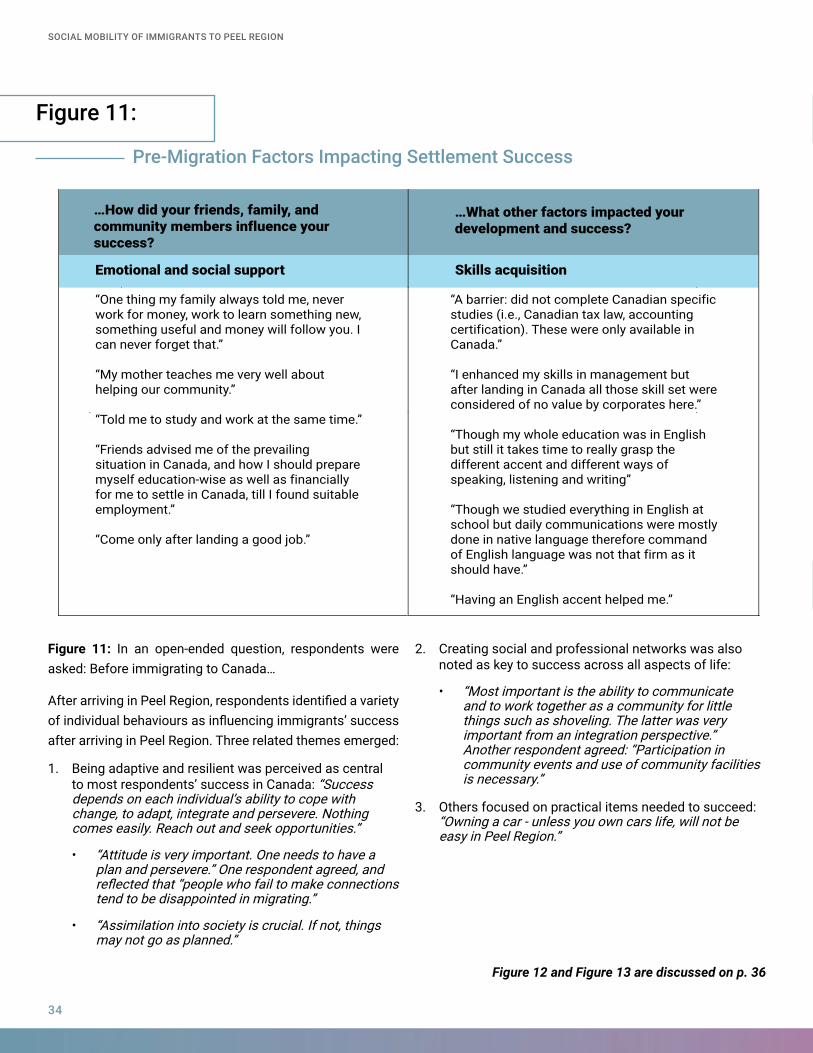
Figure 11: In an open-ended question, respondents were asked: Before immigrating to Canada…
After arriving in Peel Region, respondents identified a variety of individual behaviours as influencing immigrants’ success after arriving in Peel Region. Three related themes emerged:
1. Being adaptive and resilient was perceived as central to most respondents’ success in Canada: “Success depends on each individual’s ability to cope with change, to adapt, integrate and persevere. Nothing comes easily. Reach out and seek opportunities.”
• “Attitude is very important. One needs to have a plan and persevere.” One respondent agreed, and reflected that “people who fail to make connections tend to be disappointed in migrating.”
• “Assimilation into society is crucial. If not, things may not go as planned.”
2. Creating social and professional networks was also noted as key to success across all aspects of life:
• “Most important is the ability to communicate and to work together as a community for little things such as shoveling. The latter was very important from an integration perspective.” Another respondent agreed: “Participation in community events and use of community facilities is necessary.”
3. Others focused on practical items needed to succeed: “Owning a car - unless you own cars life, will not be easy in Peel Region.”
Figure 12 and Figure 13 are discussed on p. 36
Figure 11:
Pre‐Migration Factors Impacting Settlement Success
SOCIAL MOBILITY OF IMMIGRANTS TO PEEL REGION
34
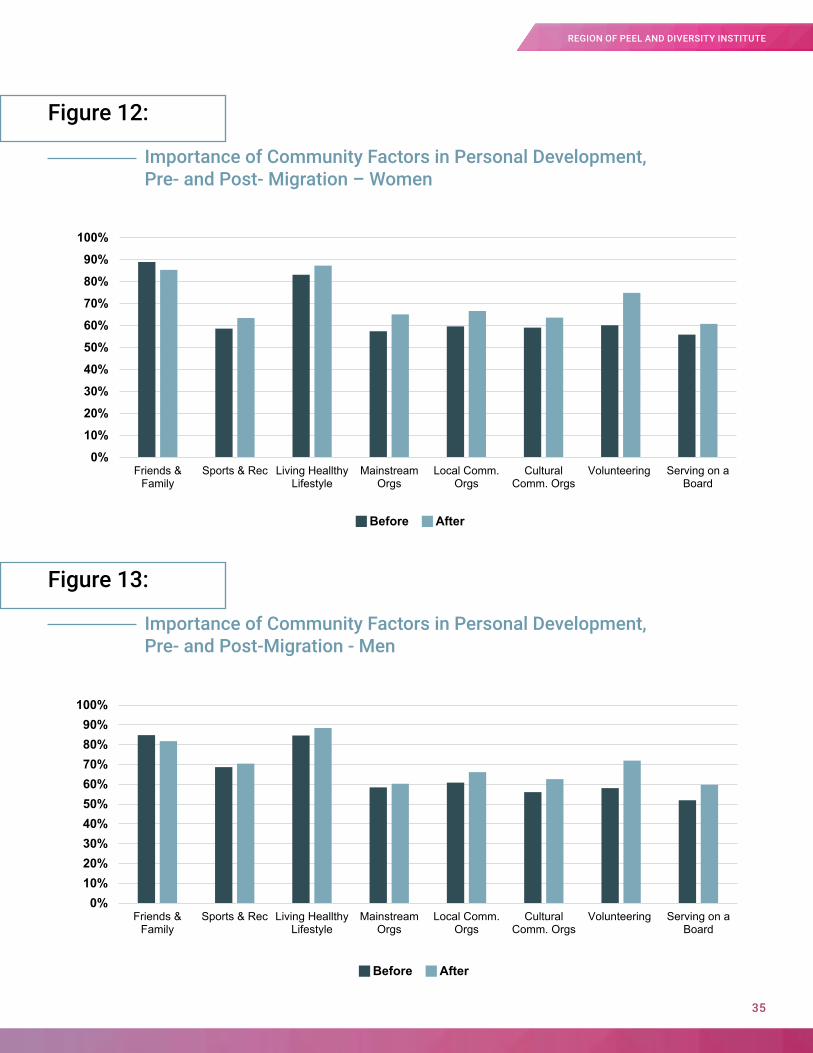
Figure 12:
Figure 13:
Importance of Community Factors in Personal Development, Pre‐ and Post‐ Migration – Women
Importance of Community Factors in Personal Development,Pre‐ and Post‐Migration ‐ Men
Before After
0%10%20%30%40%50%60%70%80%90%
100%
Friends &Family
Sports & Rec Living HeallthyLifestyle
MainstreamOrgs
Local Comm.Orgs
CulturalComm. Orgs
Volunteering Serving on aBoard
Before After
0%10%20%30%40%50%60%70%80%90%
100%
Friends &Family
Sports & Rec Living HeallthyLifestyle
MainstreamOrgs
Local Comm.Orgs
CulturalComm. Orgs
Volunteering Serving on aBoard
35
REGION OF PEEL AND DIVERSITY INSTITUTE
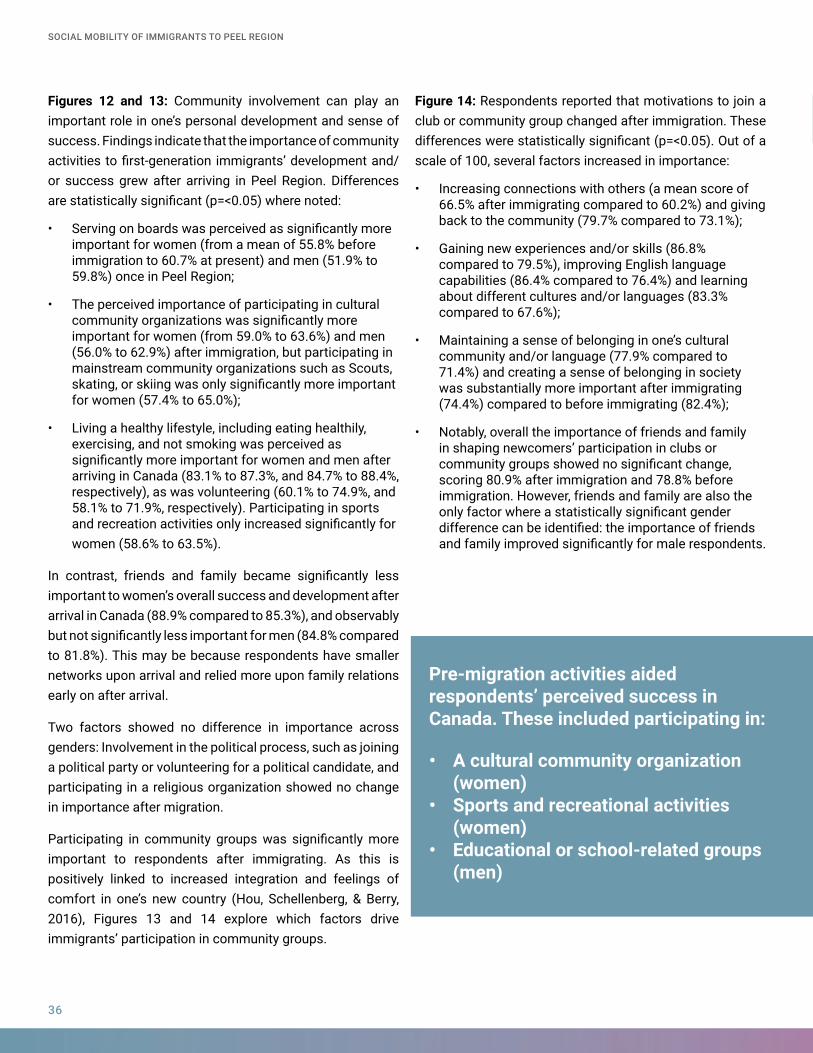
Figures 12 and 13: Community involvement can play an important role in one’s personal development and sense of success. Findings indicate that the importance of community activities to first-generation immigrants’ development and/or success grew after arriving in Peel Region. Differences are statistically significant (p=<0.05) where noted:
• Serving on boards was perceived as significantly more important for women (from a mean of 55.8% before immigration to 60.7% at present) and men (51.9% to 59.8%) once in Peel Region;
• The perceived importance of participating in cultural community organizations was significantly more important for women (from 59.0% to 63.6%) and men (56.0% to 62.9%) after immigration, but participating in mainstream community organizations such as Scouts, skating, or skiing was only significantly more important for women (57.4% to 65.0%);
• Living a healthy lifestyle, including eating healthily, exercising, and not smoking was perceived as significantly more important for women and men after arriving in Canada (83.1% to 87.3%, and 84.7% to 88.4%, respectively), as was volunteering (60.1% to 74.9%, and 58.1% to 71.9%, respectively). Participating in sports and recreation activities only increased significantly for women (58.6% to 63.5%).
In contrast, friends and family became significantly less important to women’s overall success and development after arrival in Canada (88.9% compared to 85.3%), and observably but not significantly less important for men (84.8% compared to 81.8%). This may be because respondents have smaller networks upon arrival and relied more upon family relations early on after arrival.
Two factors showed no difference in importance across genders: Involvement in the political process, such as joining a political party or volunteering for a political candidate, and participating in a religious organization showed no change in importance after migration.
Participating in community groups was significantly more important to respondents after immigrating. As this is positively linked to increased integration and feelings of comfort in one’s new country (Hou, Schellenberg, & Berry, 2016), Figures 13 and 14 explore which factors drive immigrants’ participation in community groups.
Figure 14: Respondents reported that motivations to join a club or community group changed after immigration. These differences were statistically significant (p=<0.05). Out of a scale of 100, several factors increased in importance:
• Increasing connections with others (a mean score of 66.5% after immigrating compared to 60.2%) and giving back to the community (79.7% compared to 73.1%);
• Gaining new experiences and/or skills (86.8% compared to 79.5%), improving English language capabilities (86.4% compared to 76.4%) and learning about different cultures and/or languages (83.3% compared to 67.6%);
• Maintaining a sense of belonging in one’s cultural community and/or language (77.9% compared to 71.4%) and creating a sense of belonging in society was substantially more important after immigrating (74.4%) compared to before immigrating (82.4%);
• Notably, overall the importance of friends and family in shaping newcomers’ participation in clubs or community groups showed no significant change, scoring 80.9% after immigration and 78.8% before immigration. However, friends and family are also the only factor where a statistically significant gender difference can be identified: the importance of friends and family improved significantly for male respondents.
Pre-migration activities aided respondents’ perceived success in Canada. These included participating in:
• A cultural community organization (women)
• Sports and recreational activities (women)
• Educational or school-related groups (men)
SOCIAL MOBILITY OF IMMIGRANTS TO PEEL REGION
36
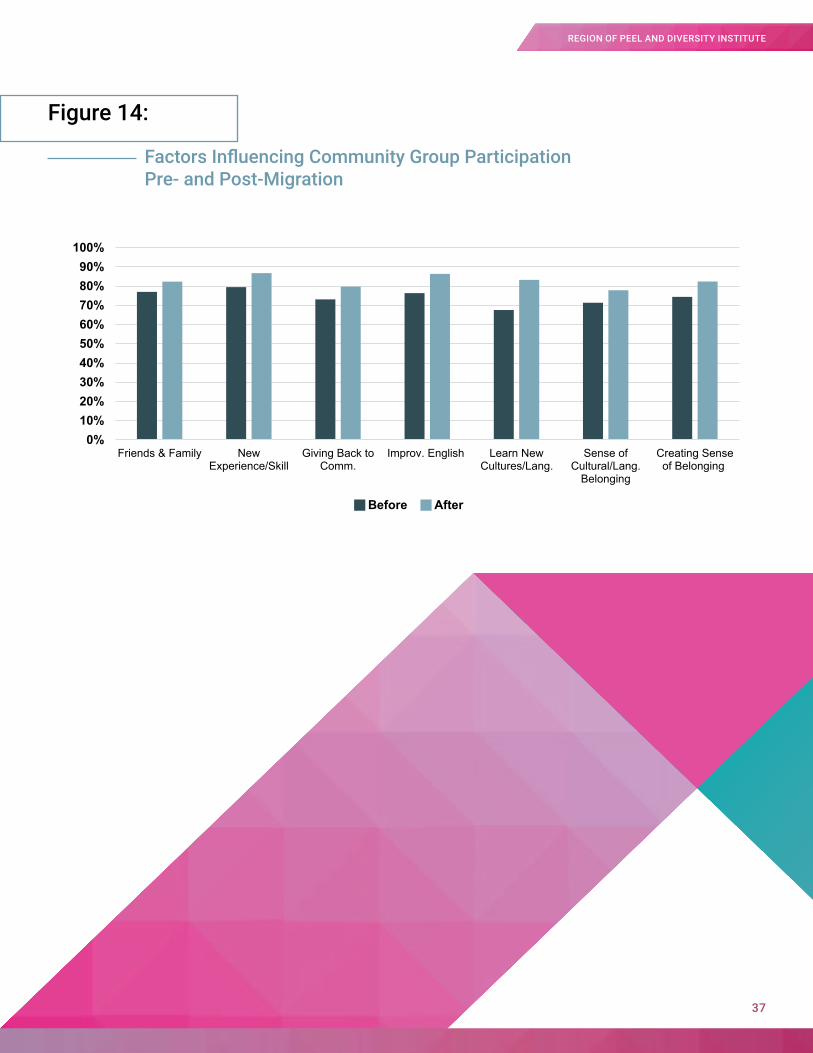
Figure 14:
Factors Influencing Community Group Participation Pre- and Post-Migration
Before After
0%10%20%30%40%50%60%70%80%90%
100%
Friends & Family NewExperience/Skill
Giving Back toComm.
Improv. English Learn NewCultures/Lang.
Sense ofCultural/Lang.
Belonging
Creating Senseof Belonging
37
REGION OF PEEL AND DIVERSITY INSTITUTE
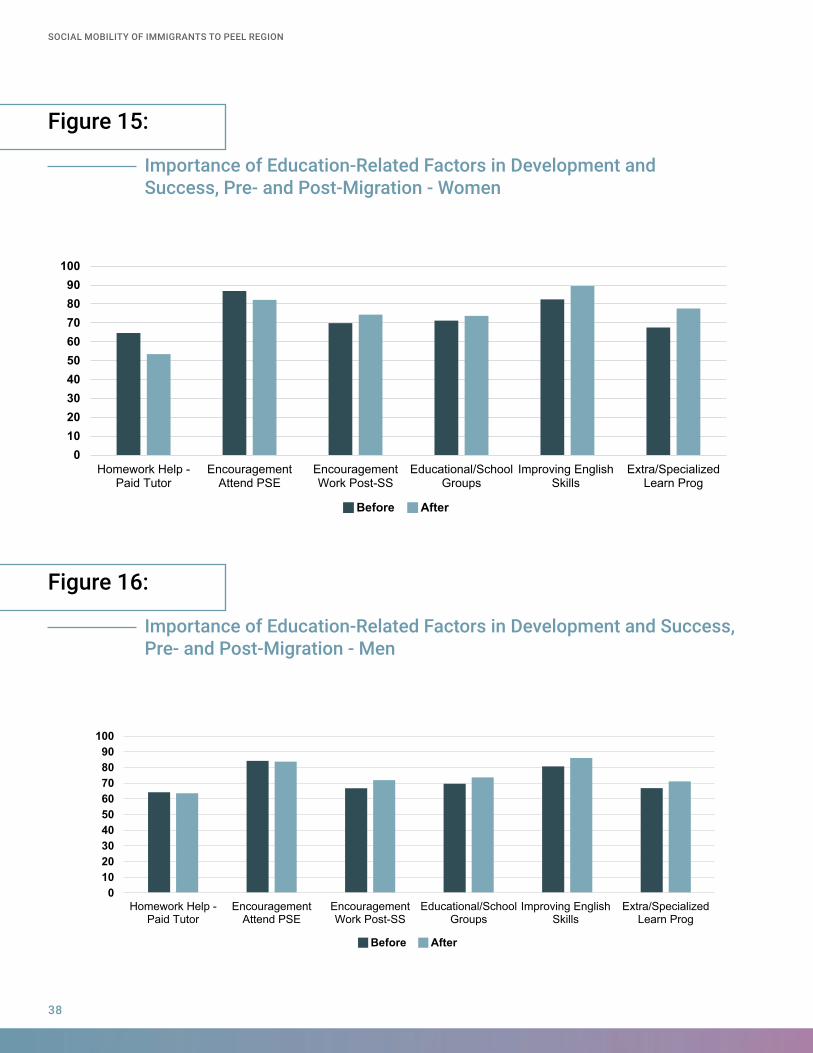
Figure 16:
Importance of Education-Related Factors in Development and Success, Pre- and Post-Migration - Men
Before After
0102030405060708090
100
Homework Help -Paid Tutor
EncouragementAttend PSE
EncouragementWork Post-SS
Educational/SchoolGroups
Improving EnglishSkills
Extra/SpecializedLearn Prog
Figure 15:
Importance of Education-Related Factors in Development and Success, Pre- and Post-Migration - Women
Before After
0102030405060708090
100
Homework Help -Paid Tutor
EncouragementAttend PSE
EncouragementWork Post-SS
Educational/SchoolGroups
Improving EnglishSkills
Extra/SpecializedLearn Prog
SOCIAL MOBILITY OF IMMIGRANTS TO PEEL REGION
38
Figures 15 and 16: The perceived impact of education-related behaviours on newcomres’ success changed over the life course. These results are highly gendered. On a 100-point scale, most factors increased in importance after immigration; where noted, differences are statistically significant (p=<0.05):
• Accessing extra or specialized learning programs (e.g., speech and language, physical therapists, behaviourists, etc.) was significantly more important for women (a mean score of 67.5% before immigration compared to 77.6% after arriving in Peel) and observably more important for men (80.8% compared to 86.1%);
• Being encouraged to start working after graduating secondary school by your parents/guardians also increased significantly in importance for women (82.1% compared to 86.9%) and observably for men (66.8% compared to 72.0%). That parental encouragement may be more influential post-migration, which has important implications for settlement strategies and school programming;
• Improving your ability to speak, read, and/or write English was predictably perceived as significantly more important in Canada for women (82.5% compared to 89.5%) and men (80.8% compared to 86.1%). This might indicate that immigration to an English-speaking country was not a lifelong plan, or that newcomers’ perceptions of their own language skills and what was needed to succeed changed after arrival. Settlement workers identified the latter explanation in the stakeholder workshop, and suggested that newcomers may overestimate their language abilities before arrival.
Notably, two developmental factors were perceived as significantly less important after arriving in Canada for women. Paid tutors helping with homework had a higher value before immigration (64.6%) than after (53.5%), whereas its perceived importance by men went virtually unchanged (63.6% compared to 64.3%). Similarly, being encouraged to pursue a post-secondary education (PSE) by your parents/guardians was significantly more important before immigrating (86.9%) than after (82.1%) for women, and again virtually unchanged for men (83.8% compared to 84.3%).
Statistically significant differences were only observable among male respondents; there were no statistically meaningful differences between the responses of self-described successful and unsuccessful women.
Successful male respondents identified six pre-migration factors as driving their success:
• Parents incorporating organized activities into a child’s life;
• Being helped with homework by friends and/or family;
• Speaking with friends, family and/or educational professionals about your education and employment options after graduating secondary school;
• Being encouraged to pursue a post-secondary education by your parents/guardians;
• Learning at home with family and/or friends;
• Taking part in extra and/or specialized learning programs (e.g., speech and language, mental health, behavioural, etc.).
39
REGION OF PEEL AND DIVERSITY INSTITUTE
Most frequently, respondents indicated that friends and family provide social support in the form of advice, childcare, and friendship:
• “I felt sense of belonging in the Peel Region because most of my friends live in and around this area” (first-generation respondent)
• “I had to work full time and study full time simultaneously. Family members were helping where they could, e.g., cooking, older kids looking after the younger ones. I had family support to care for my children when I was working long hours” (first- generation respondent)
• “Family and friends helped me care for my children” (first-generation respondent)
• “My family watched my kids while I went to school, and I later got a full-time job” (first-generation respondent)
• “Friends helped with university applications and told me the importance of volunteering” (first-generation respondent)
• “Having family around does make a difference mentally even though they did not help me financially. I love and respect my parents. They did what they could. Friends gave me support as I was going through depression” (first-generation respondent)
• “A friend of my family helped us to settle in Peel. He gave us knowledge about Brampton library. When we visit library, we learnt a lot of new things” (first-generation respondent)
Among first generation immigrants, family and friends were seen as catalysts to network growth and employment:
• “Making friends in the Peel Region allowed my family to have a professional connection with some employers”
• “Friends helped the development of a social network and a professional network that allowed me to eventually establish my own business”
• “Access to network of friends’ parents who helped me get my first job”
Friends and family provided a means to connect to cultural practices and language:
• “I grew up in a community that had people similar from my culture which really helped me fit and feel like I belong” (first-generation respondent)
• “As a child, I was not very interested in belonging to my cultural community and wanted to fit in with everyone else. However, as an adult I have learned to respect and appreciate my cultural background and am trying to navigate my life as an Indian-Canadian” (second-generation respondent)
“Volunteering at the local school allowed me to fully engage with the community I live in and develop good social connections. It doesn’t have to be the same ethnic background. How and where you live is more your cultural community than simply your ethnic community.”
Friends, family and community clearly play a critical role in the lives of newcomers. Though the nature of this role may change over time (see Figure 13), it is clear that personal and community networks influence resettlement in Peel Region. An open-ended question unpacked this role for these factors. Respondents were asked to describe how friends, family, community and/or professional network influenced their effort to settle in Peel Region. Several themes were identified.
7.2.2 Role of Friends, Family and Community in Success
SOCIAL MOBILITY OF IMMIGRANTS TO PEEL REGION
40
7.2.3 Income and Social Mobility
Income is an important measure of social mobility. Financial stability provides immigrants with the opportunity to invest in skills development and education, as well as to secure comfortable housing and life essentials.
This section examines the factors that impact immigrants’ income in Peel Region. Further analyses are available in Appendix E.
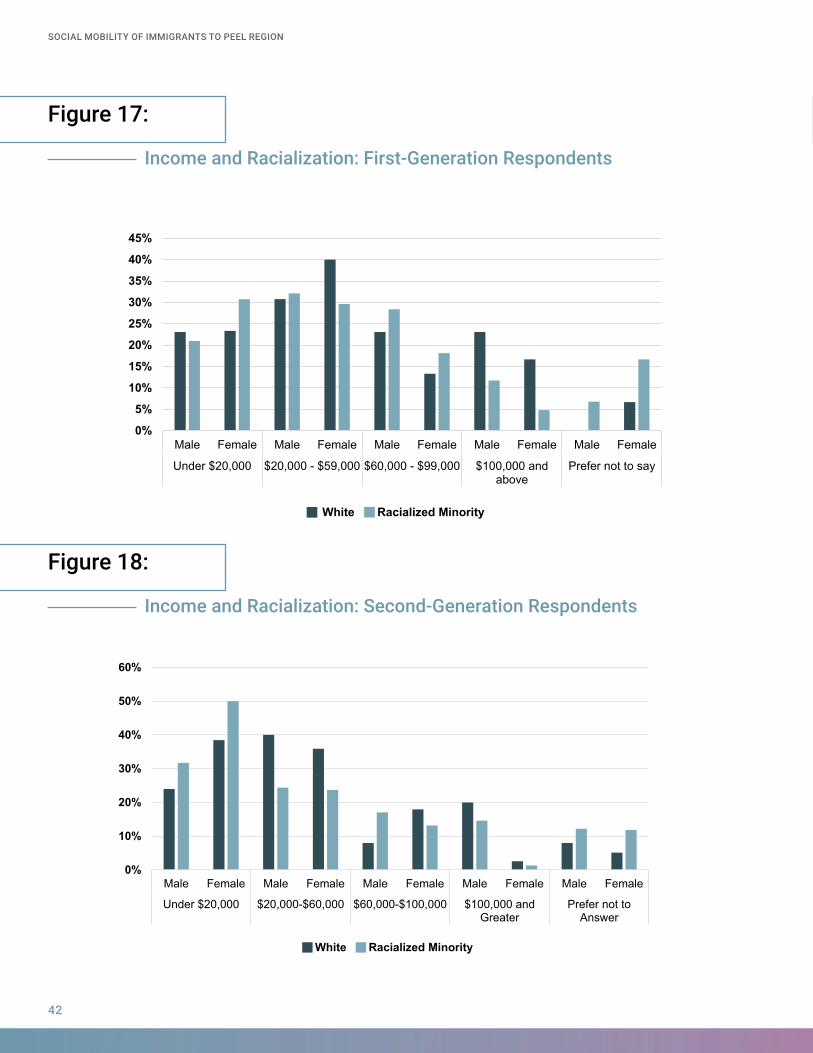
Figures 17 and 18 (p.42) show that racialization impacts earnings across generations. However, because racialized persons responded to the survey in greater numbers than white immigrants, the ability to draw conclusions based on statistical significance is limited.
• The greatest proportion of first-generation (30.7%) and second-generation racialized women (50.0%) and white women (38.5%) earned under $20,000 annually. The greatest proportion of first-generation white women (40.0%) earned between $20,000-$59,000;
• The greatest proportion of first-generation racialized men (32.1%) and white men (30.8%) earned between $20,000-$59,000, while the greatest proportion of second-generation counterparts (40.0% of racialized respondents and 31.7% of white respondents) earned between $20,000-$59,000 and under $20,000 annually, respectively;
• White earners were more likely to make more than $100,000/annually across generations;
• Overall, 67.9% of first-generation white women and 71.6% of racialized first-generation women earned less than $60,000 a year, compared to 78.4% and 83.6% of their second-generation counterparts, respectively;
• Overall, 53.8% of first-generation white men and 41.4% of first-generation racialized men earned the same, compared to 26.1% and 63.9% of their second-generation respondents, respectively, suggesting that racialized women face particular barriers or constraints on reaching higher income brackets.
Many respondents also praised their parents’ efforts to ensure they were not culturally siloed:
• “My single mom introduced our family to many cultures other than our own, so it was very helpful in dealing with others and developing meaningful relationships and instilling acceptance and respect. Volunteering at a young age also shaped my character” (second-generation respondent)
• “With friends and family within close range but not too close, we were able to strike a healthy balance of exploring communities and experience aside from those familiar to us while retaining previous friendships and family ties. This balance created a very sustainable and enjoyable long-term lifestyle” (first-generation respondent)
Sometimes family, friends and community members were seen as cause of stress or barrier to success:
• “Conformity. I was to be a doctor. Or a lawyer or something to that affect. Anything less was failure. And so I lived the majority of my adolescence keenly and intimately familiar with the feeling of being a failure. And this also created a sense of loss. So I never thought I’d ever been good at anything else” (first-generation respondent)
Racialized women were paid less than white women, and women overall were paid less than men overall.
41
REGION OF PEEL AND DIVERSITY INSTITUTE
0%
5%
10%
15%
20%
25%
30%
35%
40%
45%
Male Female Male Female Male Female Male Female Male Female
Under $20,000 $20,000 - $59,000 $60,000 - $99,000 $100,000 andabove
Prefer not to say
White Racialized Minority
Figure 17:
Figure 18:
Income and Racialization: First-Generation Respondents
Income and Racialization: Second-Generation Respondents
0%
10%
20%
30%
40%
50%
60%
Male Female Male Female Male Female Male Female Male Female
Under $20,000 $20,000-$60,000 $60,000-$100,000 $100,000 andGreater
Prefer not toAnswer
White Racialized Minority
SOCIAL MOBILITY OF IMMIGRANTS TO PEEL REGION
42
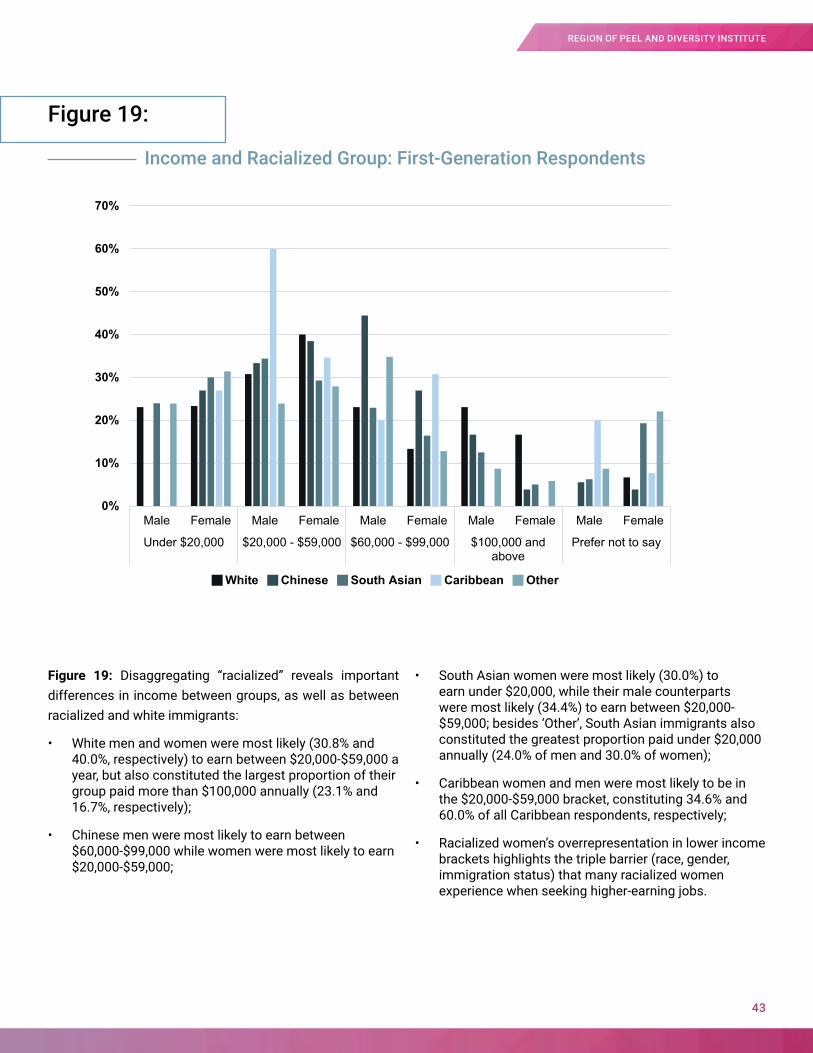
Figure 19:
Income and Racialized Group: First-Generation Respondents
Figure 19: Disaggregating “racialized” reveals important differences in income between groups, as well as between racialized and white immigrants:
• White men and women were most likely (30.8% and 40.0%, respectively) to earn between $20,000-$59,000 a year, but also constituted the largest proportion of their group paid more than $100,000 annually (23.1% and 16.7%, respectively);
• Chinese men were most likely to earn between $60,000-$99,000 while women were most likely to earn $20,000-$59,000;
• South Asian women were most likely (30.0%) to earn under $20,000, while their male counterparts were most likely (34.4%) to earn between $20,000-$59,000; besides ‘Other’, South Asian immigrants also constituted the greatest proportion paid under $20,000 annually (24.0% of men and 30.0% of women);
• Caribbean women and men were most likely to be in the $20,000-$59,000 bracket, constituting 34.6% and 60.0% of all Caribbean respondents, respectively;
• Racialized women’s overrepresentation in lower income brackets highlights the triple barrier (race, gender, immigration status) that many racialized women experience when seeking higher-earning jobs.
0%
10%
20%
30%
40%
50%
60%
70%
Male Female Male Female Male Female Male Female Male Female
Under $20,000 $20,000 - $59,000 $60,000 - $99,000 $100,000 andabove
Prefer not to say
White Chinese South Asian Caribbean Other
43
REGION OF PEEL AND DIVERSITY INSTITUTE
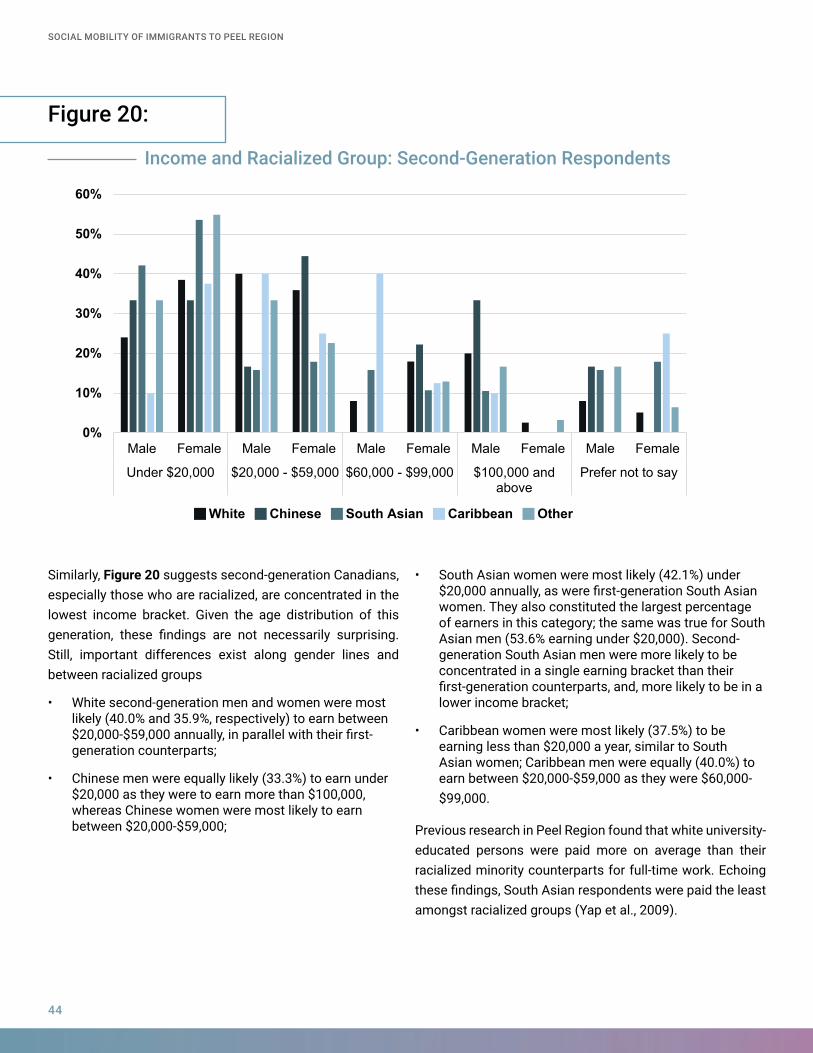
Figure 20:
Income and Racialized Group: Second-Generation Respondents
Similarly, Figure 20 suggests second-generation Canadians, especially those who are racialized, are concentrated in the lowest income bracket. Given the age distribution of this generation, these findings are not necessarily surprising. Still, important differences exist along gender lines and between racialized groups
• White second-generation men and women were most likely (40.0% and 35.9%, respectively) to earn between $20,000-$59,000 annually, in parallel with their first-generation counterparts;
• Chinese men were equally likely (33.3%) to earn under $20,000 as they were to earn more than $100,000, whereas Chinese women were most likely to earn between $20,000-$59,000;
• South Asian women were most likely (42.1%) under $20,000 annually, as were first-generation South Asian women. They also constituted the largest percentage of earners in this category; the same was true for South Asian men (53.6% earning under $20,000). Second-generation South Asian men were more likely to be concentrated in a single earning bracket than their first-generation counterparts, and, more likely to be in a lower income bracket;
• Caribbean women were most likely (37.5%) to be earning less than $20,000 a year, similar to South Asian women; Caribbean men were equally (40.0%) to earn between $20,000-$59,000 as they were $60,000-$99,000.
Previous research in Peel Region found that white university-educated persons were paid more on average than their racialized minority counterparts for full-time work. Echoing these findings, South Asian respondents were paid the least amongst racialized groups (Yap et al., 2009).
0%
10%
20%
30%
40%
50%
60%
Male Female Male Female Male Female Male Female Male Female
Under $20,000 $20,000 - $59,000 $60,000 - $99,000 $100,000 andabove
Prefer not to say
White Chinese South Asian Caribbean Other
SOCIAL MOBILITY OF IMMIGRANTS TO PEEL REGION
44
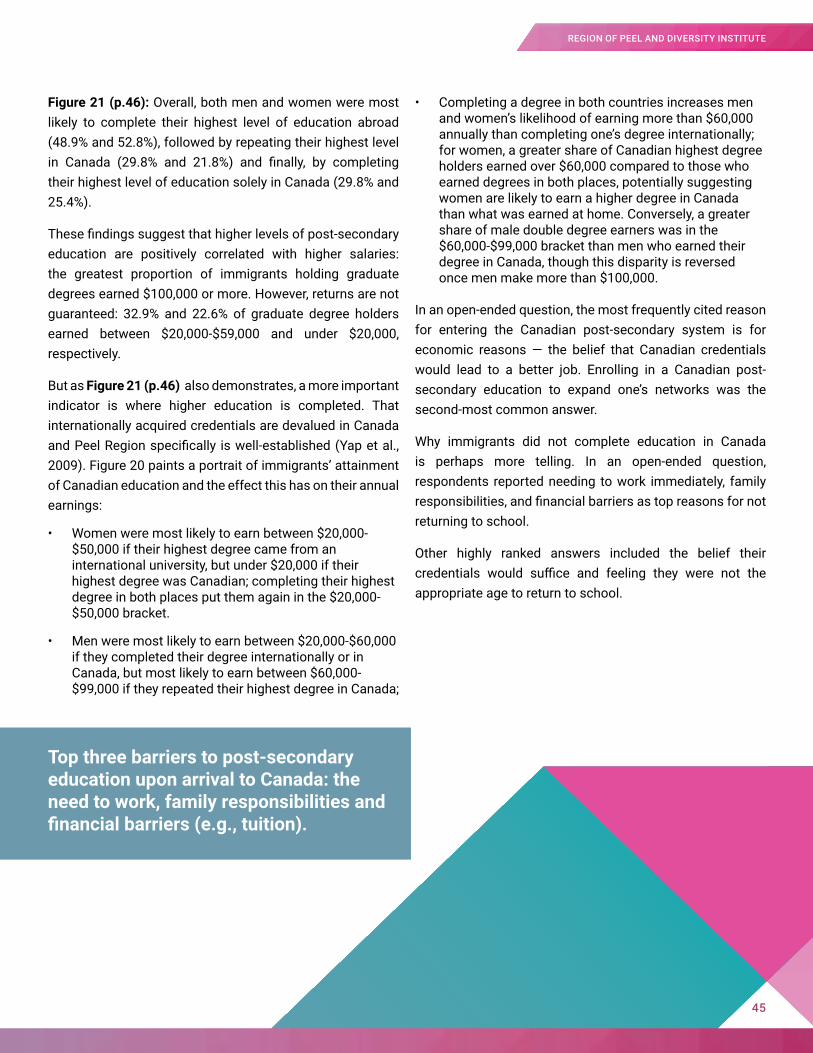
Figure 21 (p.46): Overall, both men and women were most likely to complete their highest level of education abroad (48.9% and 52.8%), followed by repeating their highest level in Canada (29.8% and 21.8%) and finally, by completing their highest level of education solely in Canada (29.8% and 25.4%).
These findings suggest that higher levels of post-secondary education are positively correlated with higher salaries: the greatest proportion of immigrants holding graduate degrees earned $100,000 or more. However, returns are not guaranteed: 32.9% and 22.6% of graduate degree holders earned between $20,000-$59,000 and under $20,000, respectively.
But as Figure 21 (p.46) also demonstrates, a more important indicator is where higher education is completed. That internationally acquired credentials are devalued in Canada and Peel Region specifically is well-established (Yap et al., 2009). Figure 20 paints a portrait of immigrants’ attainment of Canadian education and the effect this has on their annual earnings:
• Women were most likely to earn between $20,000-$50,000 if their highest degree came from an international university, but under $20,000 if their highest degree was Canadian; completing their highest degree in both places put them again in the $20,000-$50,000 bracket.
• Men were most likely to earn between $20,000-$60,000 if they completed their degree internationally or in Canada, but most likely to earn between $60,000-$99,000 if they repeated their highest degree in Canada;
• Completing a degree in both countries increases men and women’s likelihood of earning more than $60,000 annually than completing one’s degree internationally; for women, a greater share of Canadian highest degree holders earned over $60,000 compared to those who earned degrees in both places, potentially suggesting women are likely to earn a higher degree in Canada than what was earned at home. Conversely, a greater share of male double degree earners was in the $60,000-$99,000 bracket than men who earned their degree in Canada, though this disparity is reversed once men make more than $100,000.
In an open-ended question, the most frequently cited reason for entering the Canadian post-secondary system is for economic reasons — the belief that Canadian credentials would lead to a better job. Enrolling in a Canadian post-secondary education to expand one’s networks was the second-most common answer.
Why immigrants did not complete education in Canada is perhaps more telling. In an open-ended question, respondents reported needing to work immediately, family responsibilities, and financial barriers as top reasons for not returning to school.
Other highly ranked answers included the belief their credentials would suffice and feeling they were not the appropriate age to return to school.
Top three barriers to post-secondary education upon arrival to Canada: the need to work, family responsibilities and financialbarriers(e.g.,tuition).
45
REGION OF PEEL AND DIVERSITY INSTITUTE
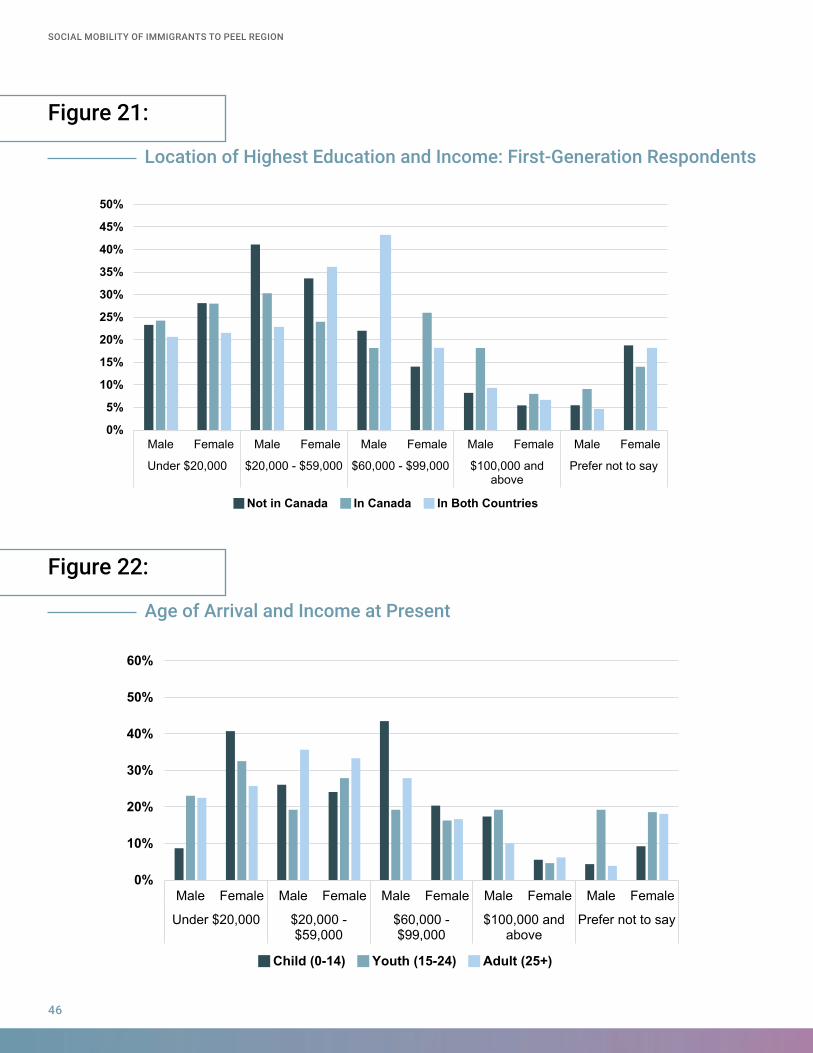
Figure 21:
Figure 22:
Location of Highest Education and Income: First-Generation Respondents
Age of Arrival and Income at Present
0%
5%
10%
15%
20%
25%
30%
35%
40%
45%
50%
Male Female Male Female Male Female Male Female Male Female
Under $20,000 $20,000 - $59,000 $60,000 - $99,000 $100,000 andabove
Prefer not to say
Not in Canada In Canada In Both Countries
0%
10%
20%
30%
40%
50%
60%
Male Female Male Female Male Female Male Female Male Female
Under $20,000 $20,000 -$59,000
$60,000 -$99,000
$100,000 andabove
Prefer not to say
Child (0-14) Youth (15-24) Adult (25+)
SOCIAL MOBILITY OF IMMIGRANTS TO PEEL REGION
46
Figure 22 suggests that age of arrival may shape future income possibilities of Peel Region immigrants:
• Among men who arrived as children, the largest cohort (43.5%) earns between $60,000-$99,000 annually. Of women who arrived as children, most (40.7%) earn less than $20,000 each year;
• Among men and women who arrived as youth, the largest groups (23.1% and 32.6%, respectively) earned under $20,000 each year;
• Among men and women who arrived as adults, the largest groups (35.7% and 33.3%) earn between $20,000-$59,000.
That adult arrivals are most likely to earn between $20,000-$59,000 annually may be linked to their efforts to obtain Canadian credentials: 25.3% of all adult arrivals completed their highest level of education both in Canada and internationally, while an additional 13.5% completed solely a Canadian program (see Figure 21). This is interesting, as arriving later in life may pose barriers if education and experience were earned internationally; similarly, they may face particular difficulties adapting to language and cultural norms (Schaafsma & Sweetman, 2001).
Figure 23 (p.48) suggests that access to significant savings, investments and/or assets before migration may influence access to savings after arriving in Peel Region:
• Men and women had greater access to savings pre-immigration compared to post-immigration until they reached earnings of $100,000 or more;
• Amongst all women and men, those earning $100,000 or more were the least likely to have access to pre-immigration savings: 6.7% of all men and 2.6% of all women earned in this category and had access to savings before arriving;
• Overall, men (60.0%) were more likely than women (52.1%) to have access to pre-immigration savings;
• Across all income brackets, more than half (55.0%) of all first-generation immigrants or their parents had access to significant savings, investments and/or assets before immigrating.
Figure 24 (p.48): Importantly however, pre-migration access to savings was not related to resettlement success:
• Having access to pre-migration savings had no impact on preceived success after arriving in Peel;
• Correspondingly, amongst immigrants who did not have access to savings pre-immigration, the same percentage (45.2%) reported perceiving themselves as successfully resettled as those who did not (45.2%).
Arriving with funds can make the transition to a new country easier and long-term investment in one’s resettlement more accessible. However, this finding indicates that an absence of savings, investments and assets pre-migration does not preclude resettlement success.
There was no relationship between accesstofinancialsavingsbeforeimmigrating and perceived success in Peel Region.
47
REGION OF PEEL AND DIVERSITY INSTITUTE
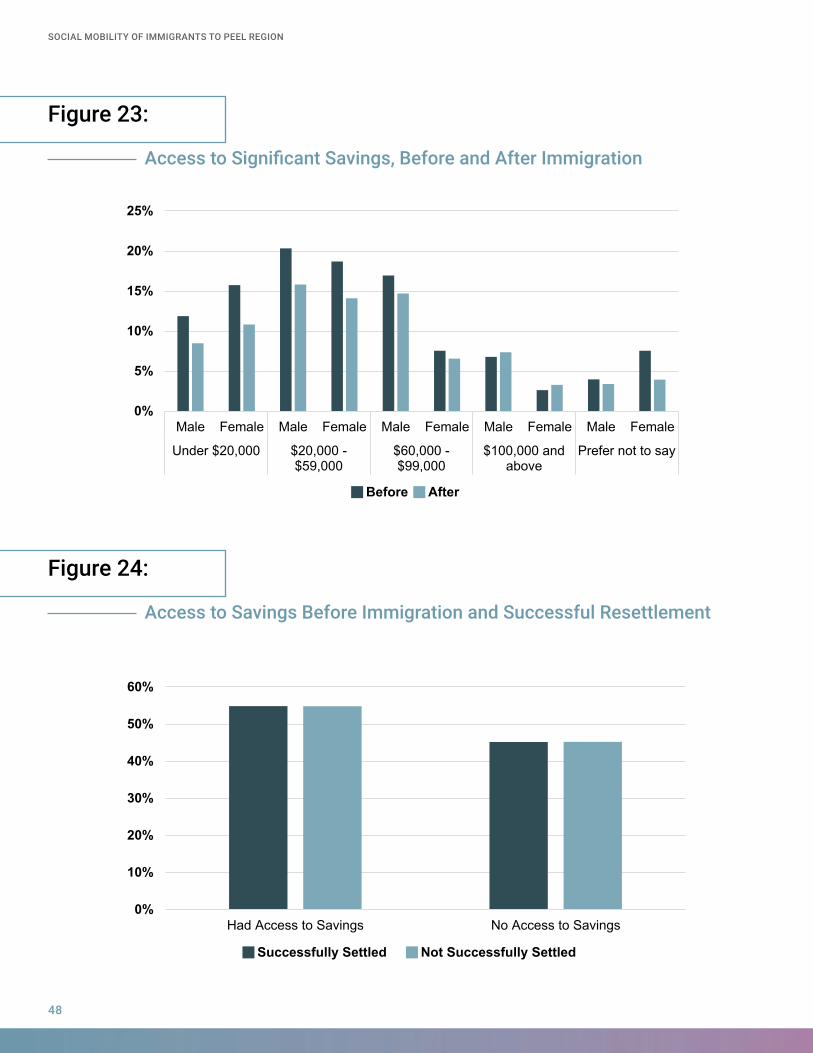
Figure 23:
Figure 24:
Access to Significant Savings, Before and After Immigration
Access to Savings Before Immigration and Successful Resettlement
0%
5%
10%
15%
20%
25%
Male Female Male Female Male Female Male Female Male Female
Under $20,000 $20,000 -$59,000
$60,000 -$99,000
$100,000 andabove
Prefer not to say
Before After
0%
10%
20%
30%
40%
50%
60%
Had Access to Savings No Access to Savings
Successfully Settled Not Successfully Settled
SOCIAL MOBILITY OF IMMIGRANTS TO PEEL REGION
48
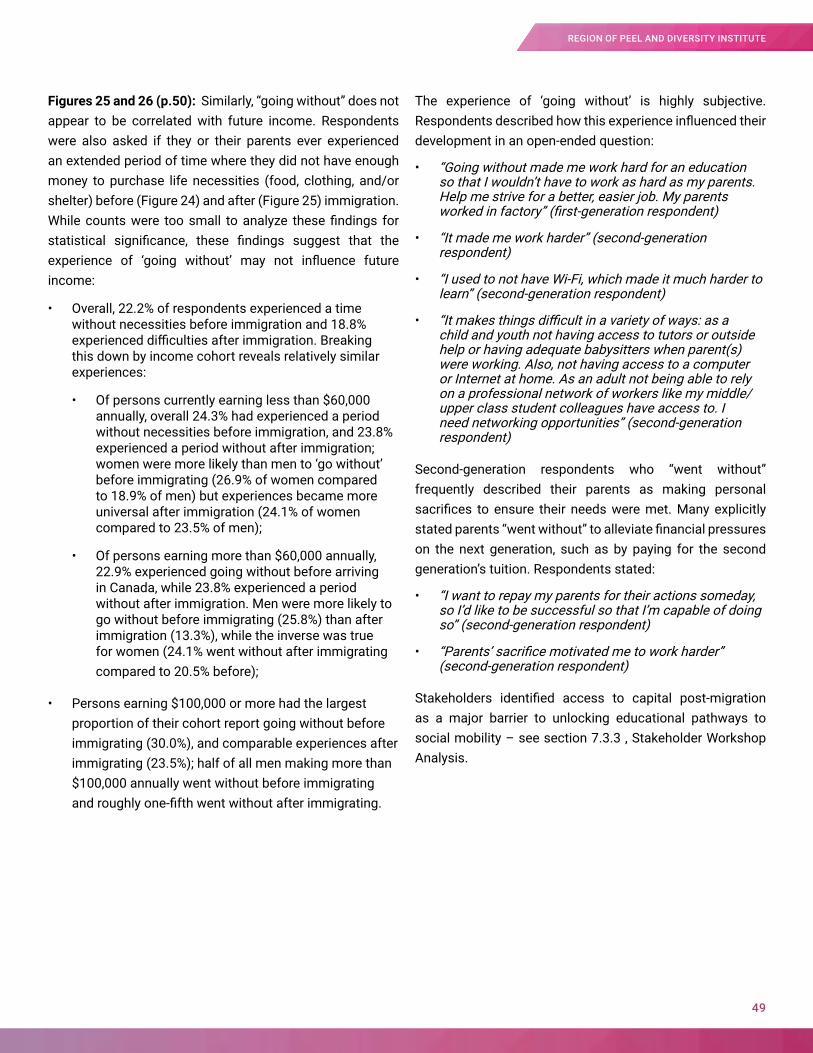
Figures 25 and 26 (p.50): Similarly, “going without” does not appear to be correlated with future income. Respondents were also asked if they or their parents ever experienced an extended period of time where they did not have enough money to purchase life necessities (food, clothing, and/or shelter) before (Figure 24) and after (Figure 25) immigration. While counts were too small to analyze these findings for statistical significance, these findings suggest that the experience of ‘going without’ may not influence future income:
• Overall, 22.2% of respondents experienced a time without necessities before immigration and 18.8% experienced difficulties after immigration. Breaking this down by income cohort reveals relatively similar experiences:
• Of persons currently earning less than $60,000 annually, overall 24.3% had experienced a period without necessities before immigration, and 23.8% experienced a period without after immigration; women were more likely than men to ‘go without’ before immigrating (26.9% of women compared to 18.9% of men) but experiences became more universal after immigration (24.1% of women compared to 23.5% of men);
• Of persons earning more than $60,000 annually, 22.9% experienced going without before arriving in Canada, while 23.8% experienced a period without after immigration. Men were more likely to go without before immigrating (25.8%) than after immigration (13.3%), while the inverse was true for women (24.1% went without after immigrating compared to 20.5% before);
• Persons earning $100,000 or more had the largest proportion of their cohort report going without before immigrating (30.0%), and comparable experiences after immigrating (23.5%); half of all men making more than $100,000 annually went without before immigrating and roughly one-fifth went without after immigrating.
The experience of ‘going without’ is highly subjective. Respondents described how this experience influenced their development in an open-ended question:
• “Going without made me work hard for an education so that I wouldn’t have to work as hard as my parents. Help me strive for a better, easier job. My parents worked in factory” (first-generation respondent)
• “It made me work harder” (second-generation respondent)
• “I used to not have Wi-Fi, which made it much harder to learn” (second-generation respondent)
• “It makes things difficult in a variety of ways: as a child and youth not having access to tutors or outside help or having adequate babysitters when parent(s) were working. Also, not having access to a computer or Internet at home. As an adult not being able to rely on a professional network of workers like my middle/upper class student colleagues have access to. I need networking opportunities” (second-generation respondent)
Second-generation respondents who “went without” frequently described their parents as making personal sacrifices to ensure their needs were met. Many explicitly stated parents “went without” to alleviate financial pressures on the next generation, such as by paying for the second generation’s tuition. Respondents stated:
• “I want to repay my parents for their actions someday, so I’d like to be successful so that I’m capable of doing so” (second-generation respondent)
• “Parents’ sacrifice motivated me to work harder” (second-generation respondent)
Stakeholders identified access to capital post-migration as a major barrier to unlocking educational pathways to social mobility – see section 7.3.3 , Stakeholder Workshop Analysis.
49
REGION OF PEEL AND DIVERSITY INSTITUTE
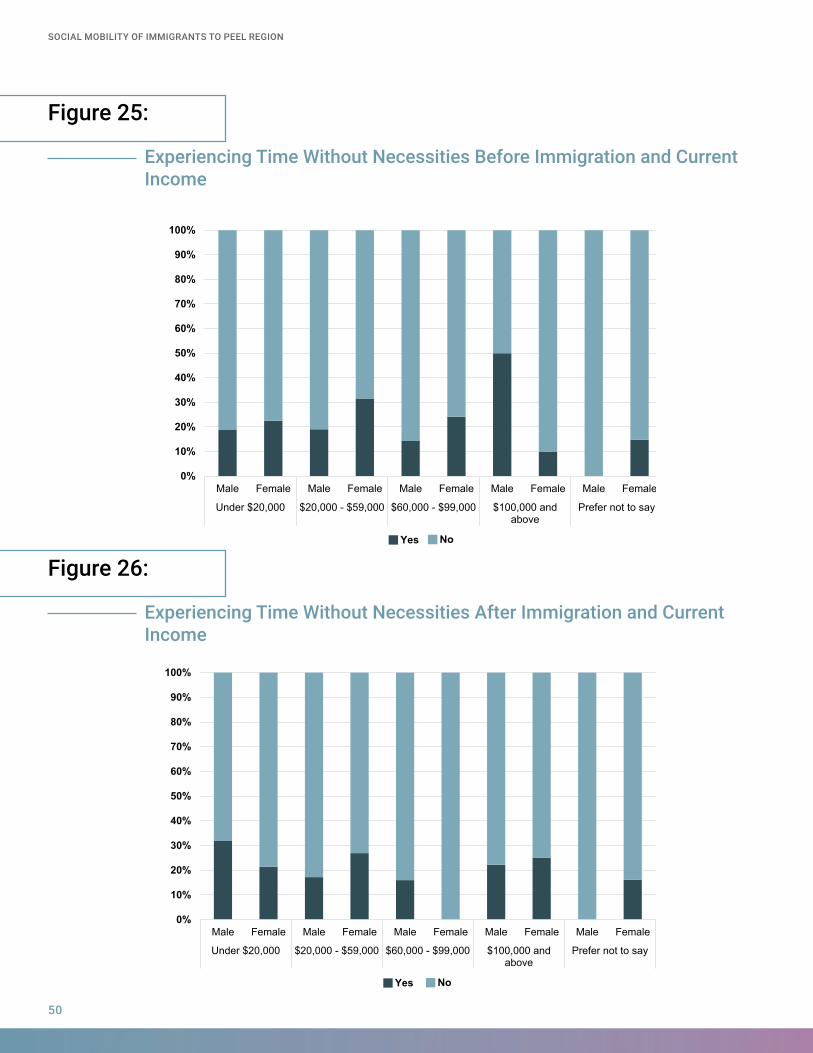
Figure 25:
Figure 26:
Experiencing Time Without Necessities Before Immigration and Current Income
Experiencing Time Without Necessities After Immigration and Current Income
0%
10%
20%
30%
40%
50%
60%
70%
80%
90%
100%
Male Female Male Female Male Female Male Female Male Female
Under $20,000 $20,000 - $59,000 $60,000 - $99,000 $100,000 andabove
Prefer not to say
Yes No
0%
10%
20%
30%
40%
50%
60%
70%
80%
90%
100%
Male Female Male Female Male Female Male Female Male Female
Under $20,000 $20,000 - $59,000 $60,000 - $99,000 $100,000 andabove
Prefer not to say
Yes No
SOCIAL MOBILITY OF IMMIGRANTS TO PEEL REGION
50
Figures 27 and 28 (p.52): Financial success does not appear to influence immigrants’ perceptions of employment, settlement, or social support services. Income also had no notable or significant effect on respondents’ perceptions of the labour market barriers they face, or their experiences with discrimination.
On a 100-point scale, first- and second-generation respondents expressed:
• Positive perceptions of the need for settlement support services: All income brackets reported similar, fairly strong perceptions of the need for settlement support services;
• Persons in the $20,000-$59,999 and the $60,000-plus brackets averaging a score of 69.9% and 69.8%, respectively, while persons earning under $20,000 perceived the highest need for settlement support services, scoring an average of 71.2%;
• Slightly varied responses about the social support they receive: Social support receipt has the greatest variation among respondents;
• Respondents earning less than $20,000 reported the lowest average score (62.4%), followed by $60,000-plus earners with an average score of 64.8%, and then by persons in the $20,000-$59,999 bracket, who scored 67.8% on the social support scale;
• Slightly varied responses about the barriers to work they encounter: On the barriers to finding work scale, a higher score indicates higher incidence of encountering barriers to work;
• Respondents earning less than $20,000 annually reported encountering the highest barriers to finding work, scoring an average of 69.0%. Persons in the $60,000-plus category reported a score of 65.3%, while respondents earning between $20,000-$59,000 averaged a score of 63.9%. Predictably, persons who earn lower incomes report facing higher barriers to finding employment;
• Similar levels of discrimination reported: All income brackets reported similar levels of discrimination;
• While no category scored more than 50.0% on the discrimination scale, all scored averaged above 46.0%, indicating that discrimination in Peel Region is prevalent;
• Persons who earned most reported the most discrimination: $60,000-plus earners scored 48.1% on the scale, followed by $20,000-$59,999 earners scoring 46.9%, and persons earning under $20,000 scored an average of 46.3% on the scale;
• First-generation immigrants reported instances of discrimination as pervasive, but often difficult to identify or ‘call out’;
• “Discrimination exists in subtle forms other than above; an immigrant has to give 200% of efforts to prove oneself.” (first-generation respondent);
• “The police need more diversity. Not enough Sikh officers.” (first-generation respondent);
• “I do feel that I belong here, but sometimes certain individuals that are very racist.” (first-generation respondent);
• Both generations placed a high value on job search strategies: The “finding work” scale collapsed indicators measuring the importance of networking, credential recognition, skills upgrading, understanding the local labour market, being entrepreneurial, and being involved in one’s community;
• Respondents who earned under $20,000 and respondents who earned more than $60,000 reported a mean score of 72.0% and 71.0%, respectively. Persons in the $20,000-$59,999 bracket reported an average of 73.4%;
• This indicates that regardless of income, all respondents place fairly high value on traditional job search and job readiness activities in finding work.
Respondents across all income levels reported experiencing discrimination in Peel Region.
51
REGION OF PEEL AND DIVERSITY INSTITUTE
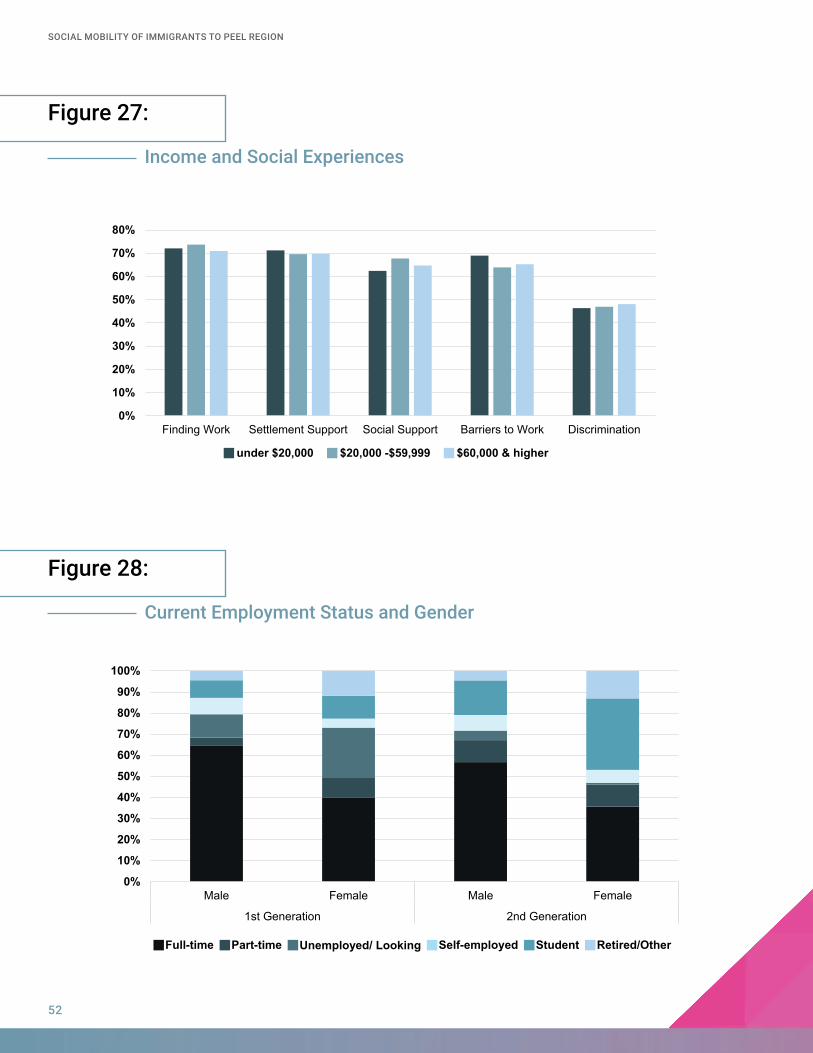
Figure 27:
Figure 28:
Income and Social Experiences
Current Employment Status and Gender
0%
10%
20%
30%
40%
50%
60%
70%
80%
Finding Work Settlement Support Social Support Barriers to Work Discrimination
under $20,000 $20,000 -$59,999 $60,000 & higher
0%
10%
20%
30%
40%
50%
60%
70%
80%
90%
100%
Male Female Male Female
1st Generation 2nd Generation
Full-time Part-time Unemployed/ Looking Self-employed Student Retired/Other
SOCIAL MOBILITY OF IMMIGRANTS TO PEEL REGION
52
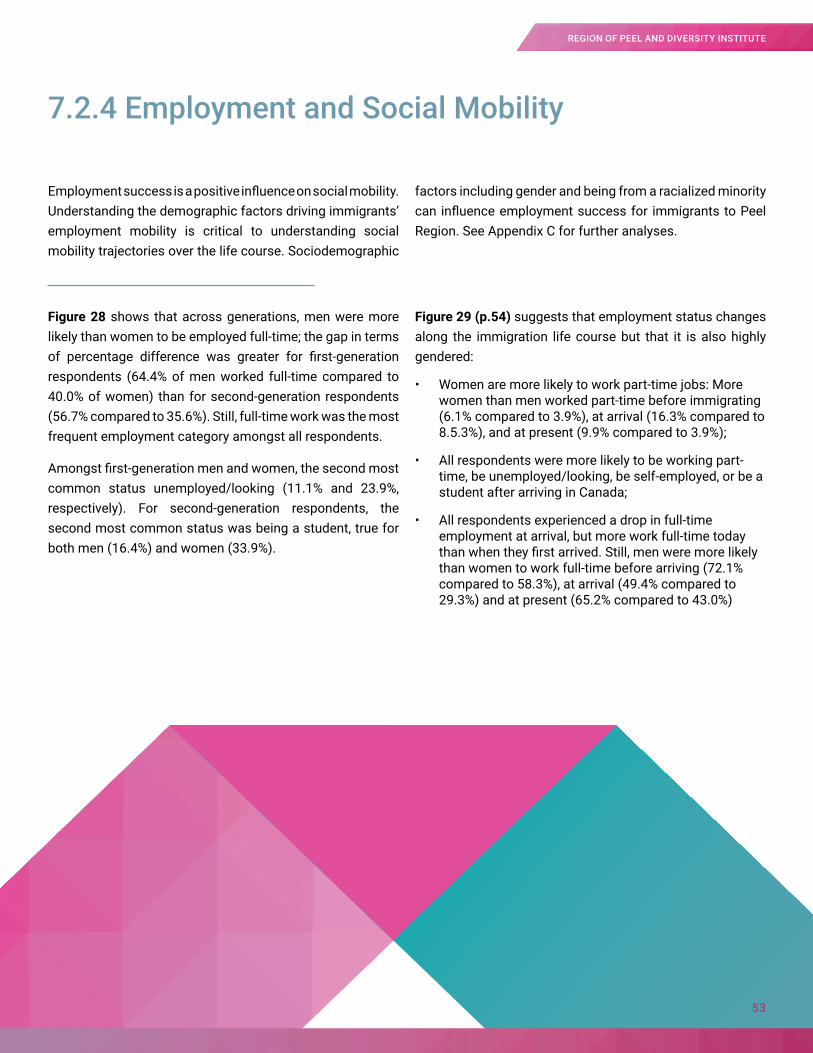
7.2.4 Employment and Social Mobility
Employment success is a positive influence on social mobility. Understanding the demographic factors driving immigrants’ employment mobility is critical to understanding social mobility trajectories over the life course. Sociodemographic
factors including gender and being from a racialized minority can influence employment success for immigrants to Peel Region. See Appendix C for further analyses.
Figure 28 shows that across generations, men were more likely than women to be employed full-time; the gap in terms of percentage difference was greater for first-generation respondents (64.4% of men worked full-time compared to 40.0% of women) than for second-generation respondents (56.7% compared to 35.6%). Still, full-time work was the most frequent employment category amongst all respondents.
Amongst first-generation men and women, the second most common status unemployed/looking (11.1% and 23.9%, respectively). For second-generation respondents, the second most common status was being a student, true for both men (16.4%) and women (33.9%).
Figure 29 (p.54) suggests that employment status changes along the immigration life course but that it is also highly gendered:
• Women are more likely to work part-time jobs: More women than men worked part-time before immigrating (6.1% compared to 3.9%), at arrival (16.3% compared to 8.5.3%), and at present (9.9% compared to 3.9%);
• All respondents were more likely to be working part-time, be unemployed/looking, be self-employed, or be a student after arriving in Canada;
• All respondents experienced a drop in full-time employment at arrival, but more work full-time today than when they first arrived. Still, men were more likely than women to work full-time before arriving (72.1% compared to 58.3%), at arrival (49.4% compared to 29.3%) and at present (65.2% compared to 43.0%)
53
REGION OF PEEL AND DIVERSITY INSTITUTE
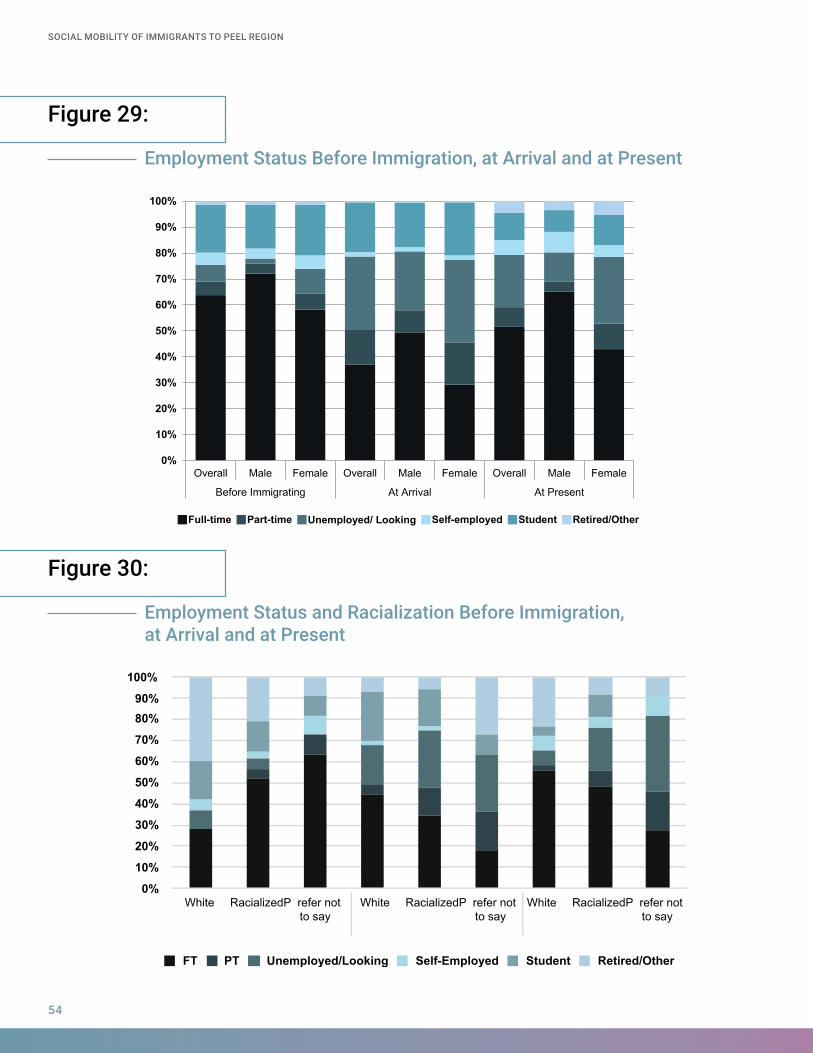
Figure 29:
Figure 30:
Employment Status Before Immigration, at Arrival and at Present
Employment Status and Racialization Before Immigration, at Arrival and at Present
0%
10%
20%
30%
40%
50%
60%
70%
80%
90%
100%
Overall Male Female Overall Male Female Overall Male Female
Before Immigrating At Arrival At Present
Full-time Part-time Unemployed/ Looking Self-employed Student Retired/Other
0%
10%
20%
30%
40%
50%
60%
70%
80%90%
100%
FT PT Unemployed/Looking Self-Employed Student Retired/Other
RacializedP refer not to say
White RacializedP refer not to say
White RacializedP refer not to say
White
SOCIAL MOBILITY OF IMMIGRANTS TO PEEL REGION
54
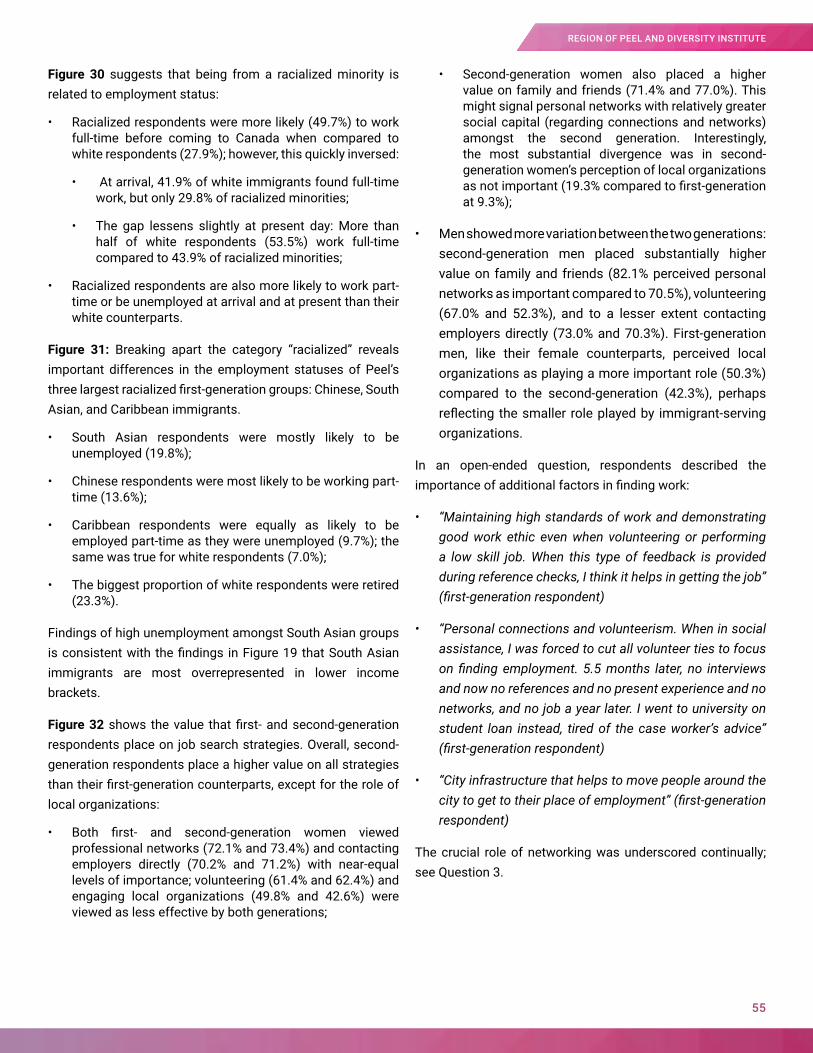
Figure 30 suggests that being from a racialized minority is related to employment status:
• Racialized respondents were more likely (49.7%) to work full-time before coming to Canada when compared to white respondents (27.9%); however, this quickly inversed:
• At arrival, 41.9% of white immigrants found full-time work, but only 29.8% of racialized minorities;
• The gap lessens slightly at present day: More than half of white respondents (53.5%) work full-time compared to 43.9% of racialized minorities;
• Racialized respondents are also more likely to work part-time or be unemployed at arrival and at present than their white counterparts.
Figure 31: Breaking apart the category “racialized” reveals important differences in the employment statuses of Peel’s three largest racialized first-generation groups: Chinese, South Asian, and Caribbean immigrants.
• South Asian respondents were mostly likely to be unemployed (19.8%);
• Chinese respondents were most likely to be working part-time (13.6%);
• Caribbean respondents were equally as likely to be employed part-time as they were unemployed (9.7%); the same was true for white respondents (7.0%);
• The biggest proportion of white respondents were retired (23.3%).
Findings of high unemployment amongst South Asian groups is consistent with the findings in Figure 19 that South Asian immigrants are most overrepresented in lower income brackets.
Figure 32 shows the value that first- and second-generation respondents place on job search strategies. Overall, second-generation respondents place a higher value on all strategies than their first-generation counterparts, except for the role of local organizations:
• Both first- and second-generation women viewed professional networks (72.1% and 73.4%) and contacting employers directly (70.2% and 71.2%) with near-equal levels of importance; volunteering (61.4% and 62.4%) and engaging local organizations (49.8% and 42.6%) were viewed as less effective by both generations;
• Second-generation women also placed a higher value on family and friends (71.4% and 77.0%). This might signal personal networks with relatively greater social capital (regarding connections and networks) amongst the second generation. Interestingly, the most substantial divergence was in second-generation women’s perception of local organizations as not important (19.3% compared to first-generation at 9.3%);
• Men showed more variation between the two generations: second-generation men placed substantially higher value on family and friends (82.1% perceived personal networks as important compared to 70.5%), volunteering (67.0% and 52.3%), and to a lesser extent contacting employers directly (73.0% and 70.3%). First-generation men, like their female counterparts, perceived local organizations as playing a more important role (50.3%) compared to the second-generation (42.3%), perhaps reflecting the smaller role played by immigrant-serving organizations.
In an open-ended question, respondents described the importance of additional factors in finding work:
• “Maintaining high standards of work and demonstrating good work ethic even when volunteering or performing a low skill job. When this type of feedback is provided during reference checks, I think it helps in getting the job” (first-generation respondent)
• “Personal connections and volunteerism. When in social assistance, I was forced to cut all volunteer ties to focus on finding employment. 5.5 months later, no interviews and now no references and no present experience and no networks, and no job a year later. I went to university on student loan instead, tired of the case worker’s advice” (first-generation respondent)
• “City infrastructure that helps to move people around the city to get to their place of employment” (first-generation respondent)
The crucial role of networking was underscored continually; see Question 3.
55
REGION OF PEEL AND DIVERSITY INSTITUTE
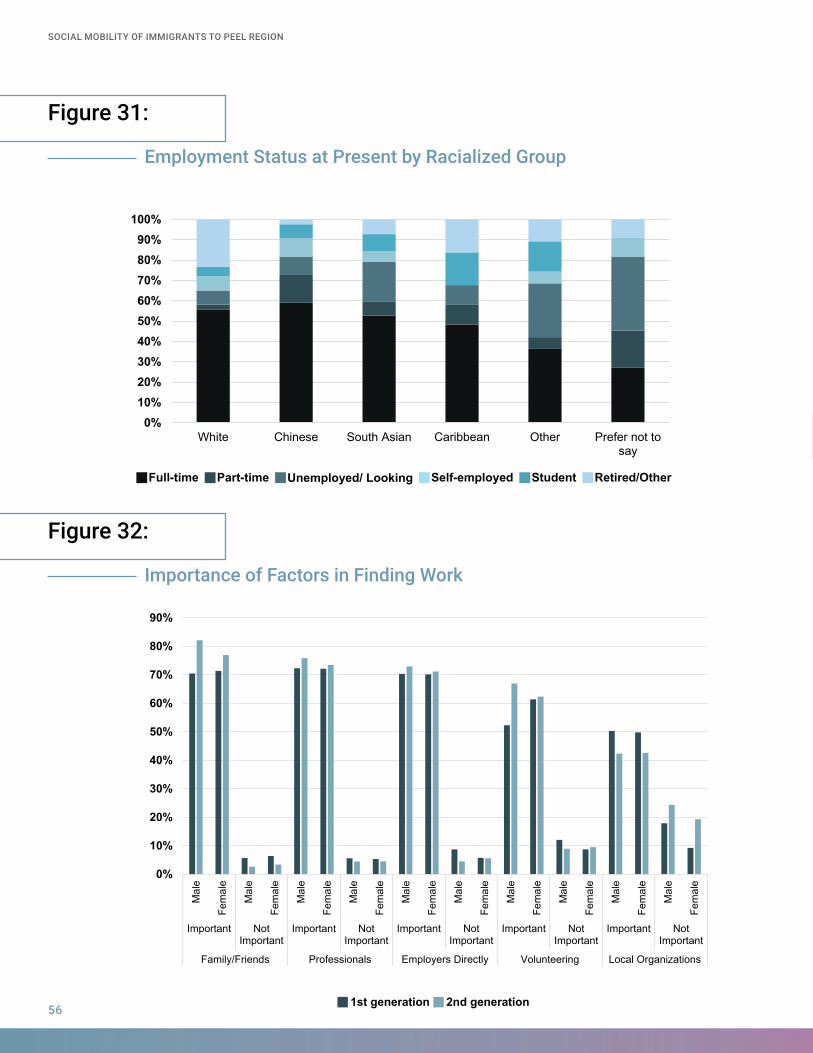
Figure 31:
Figure 32:
Employment Status at Present by Racialized Group
Importance of Factors in Finding Work
0%10%20%30%40%50%60%70%80%90%
100%
White Chinese South Asian Caribbean Other Prefer not tosay
Full-time Part-time Unemployed/ Looking Self-employed Student Retired/Other
0%
10%
20%
30%
40%
50%
60%
70%
80%
90%
Mal
e
Fem
ale
Mal
e
Fem
ale
Mal
e
Fem
ale
Mal
e
Fem
ale
Mal
e
Fem
ale
Mal
e
Fem
ale
Mal
e
Fem
ale
Mal
e
Fem
ale
Mal
e
Fem
ale
Mal
e
Fem
ale
Important NotImportant
Important NotImportant
Important NotImportant
Important NotImportant
Important NotImportant
Family/Friends Professionals Employers Directly Volunteering Local Organizations
1st generation 2nd generation
SOCIAL MOBILITY OF IMMIGRANTS TO PEEL REGION
56
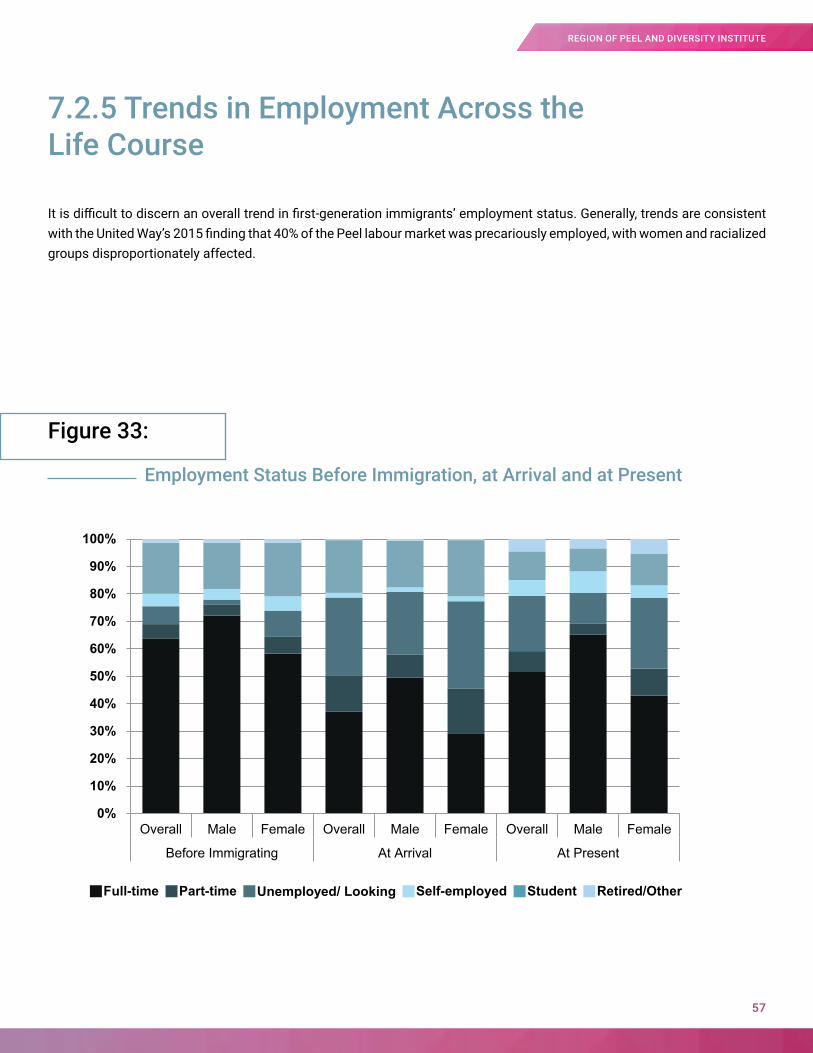
Figure 33:
Employment Status Before Immigration, at Arrival and at Present
7.2.5 Trends in Employment Across the Life Course
It is difficult to discern an overall trend in first-generation immigrants’ employment status. Generally, trends are consistent with the United Way’s 2015 finding that 40% of the Peel labour market was precariously employed, with women and racialized groups disproportionately affected.
0%
10%
20%
30%
40%
50%
60%
70%
80%
90%
100%
Overall Male Female Overall Male Female Overall Male Female
Before Immigrating At Arrival At Present
Full-time Part-time Unemployed/ Looking Self-employed Student Retired/Other
57
REGION OF PEEL AND DIVERSITY INSTITUTE
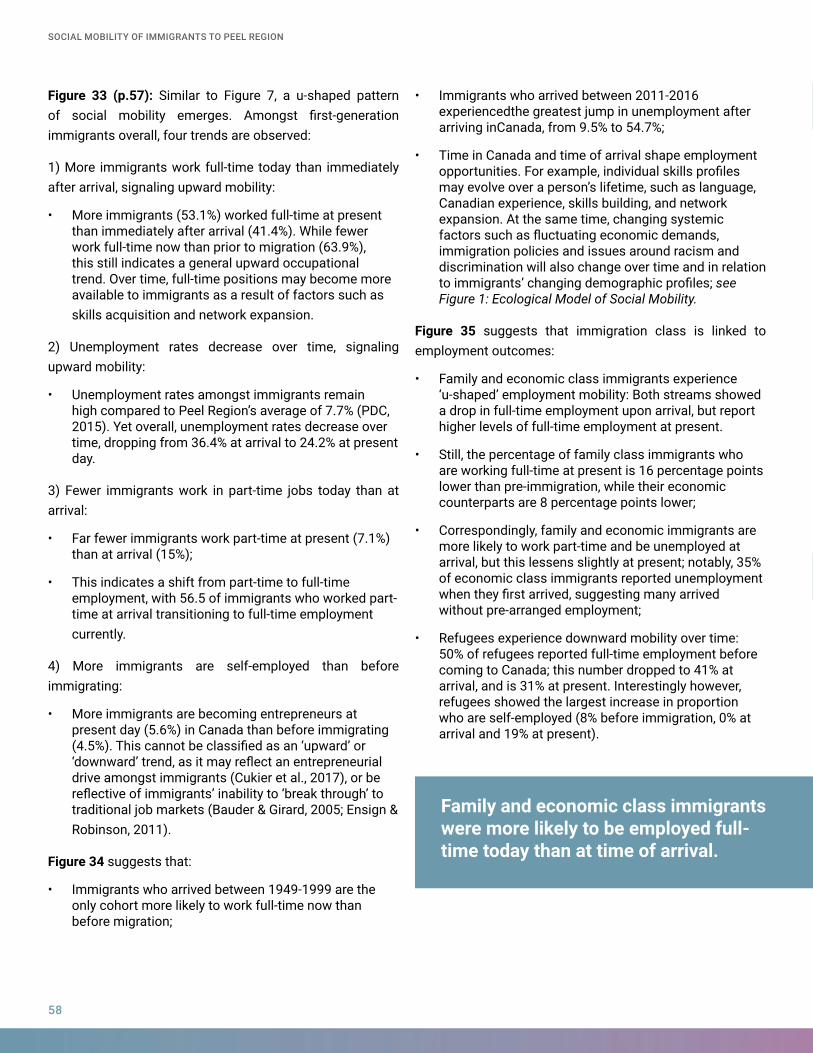
Figure 33 (p.57): Similar to Figure 7, a u-shaped pattern of social mobility emerges. Amongst first-generation immigrants overall, four trends are observed:
1) More immigrants work full-time today than immediately after arrival, signaling upward mobility:
• More immigrants (53.1%) worked full-time at present than immediately after arrival (41.4%). While fewer work full-time now than prior to migration (63.9%), this still indicates a general upward occupational trend. Over time, full-time positions may become more available to immigrants as a result of factors such as skills acquisition and network expansion.
2) Unemployment rates decrease over time, signaling upward mobility:
• Unemployment rates amongst immigrants remain high compared to Peel Region’s average of 7.7% (PDC, 2015). Yet overall, unemployment rates decrease over time, dropping from 36.4% at arrival to 24.2% at present day.
3) Fewer immigrants work in part-time jobs today than at arrival:
• Far fewer immigrants work part-time at present (7.1%) than at arrival (15%);
• This indicates a shift from part-time to full-time employment, with 56.5 of immigrants who worked part-time at arrival transitioning to full-time employment currently.
4) More immigrants are self-employed than before immigrating:
• More immigrants are becoming entrepreneurs at present day (5.6%) in Canada than before immigrating (4.5%). This cannot be classified as an ‘upward’ or ‘downward’ trend, as it may reflect an entrepreneurial drive amongst immigrants (Cukier et al., 2017), or be reflective of immigrants’ inability to ‘break through’ to traditional job markets (Bauder & Girard, 2005; Ensign & Robinson, 2011).
Figure 34 suggests that:
• Immigrants who arrived between 1949-1999 are the only cohort more likely to work full-time now than before migration;
• Immigrants who arrived between 2011-2016 experiencedthe greatest jump in unemployment after arriving inCanada, from 9.5% to 54.7%;
• Time in Canada and time of arrival shape employment opportunities. For example, individual skills profiles may evolve over a person’s lifetime, such as language, Canadian experience, skills building, and network expansion. At the same time, changing systemic factors such as fluctuating economic demands, immigration policies and issues around racism and discrimination will also change over time and in relation to immigrants’ changing demographic profiles; see Figure 1: Ecological Model of Social Mobility.
Figure 35 suggests that immigration class is linked to employment outcomes:
• Family and economic class immigrants experience ‘u-shaped’ employment mobility: Both streams showed a drop in full-time employment upon arrival, but report higher levels of full-time employment at present.
• Still, the percentage of family class immigrants who are working full-time at present is 16 percentage points lower than pre-immigration, while their economic counterparts are 8 percentage points lower;
• Correspondingly, family and economic immigrants are more likely to work part-time and be unemployed at arrival, but this lessens slightly at present; notably, 35% of economic class immigrants reported unemployment when they first arrived, suggesting many arrived without pre-arranged employment;
• Refugees experience downward mobility over time: 50% of refugees reported full-time employment before coming to Canada; this number dropped to 41% at arrival, and is 31% at present. Interestingly however, refugees showed the largest increase in proportion who are self-employed (8% before immigration, 0% at arrival and 19% at present).
Family and economic class immigrants were more likely to be employed full-time today than at time of arrival.
SOCIAL MOBILITY OF IMMIGRANTS TO PEEL REGION
58
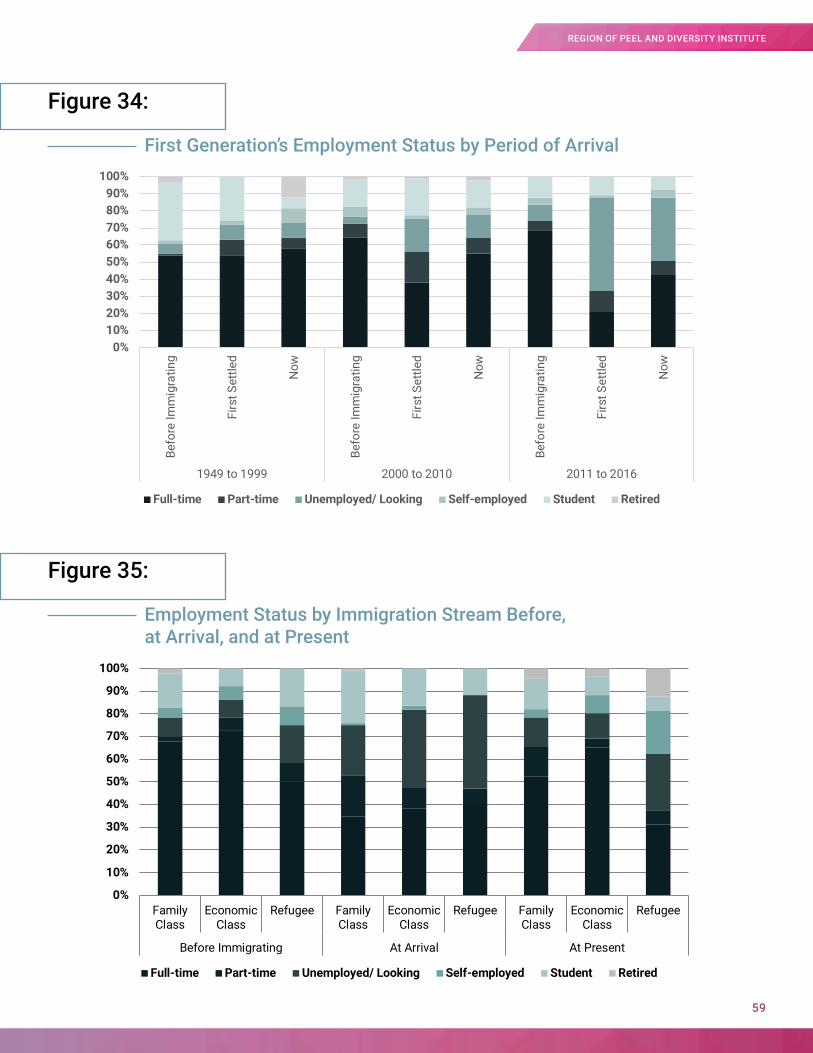
0%10%20%30%40%50%60%70%80%90%
100%Be
fore
Imm
igra
ting
Firs
t Set
tled
Now
Befo
re Im
mig
ratin
g
Firs
t Set
tled
Now
Befo
re Im
mig
ratin
g
Firs
t Set
tled
Now
1949 to 1999 2000 to 2010 2011 to 2016
Full-time Part-time Unemployed / Looking Self-employed Student Retired
0%
10%
20%
30%
40%
50%
60%
70%
80%
90%
100%
FamilyClass
EconomicClass
Refugee FamilyClass
EconomicClass
Refugee FamilyClass
EconomicClass
Refugee
Before Immigrating At Arrival At Present
Full-time Part-time Unemployed / Looking Self-employed Student Retired
Figure 34:
Figure 35:
First Generation’s Employment Status by Period of Arrival
Employment Status by Immigration Stream Before, at Arrival, and at Present
59
REGION OF PEEL AND DIVERSITY INSTITUTE
7.3 Question 3What barriers hinder immigrants’ social mobility?
Key Findings:• Both generations were most likely to report
experiencing discrimination in the workplace and when interacting with police officers;
• Generational differences arise in workplace experiences; first-generation immigrants were most likely to perceive gender as the biggest barrier to finding work, while second-generation respondents perceived religion as the most important barrier;
• Stakeholders identified factors shaping social mobility at the societal, organizational, and individual level, including immigration policies, the presence of established cultural communities, and access to pre-migration information.
Extensive research has been conducted to understand roadblocks to immigrants’ success. This report examines these barriers in the context of Peel Region, and dives
deeper in order to understand differences in discrimination experienced at specific time points, as well as interactions with municipal services.
In an open-ended question, first- and second-generation respondents identified factors they perceived as inhibiting immigrants’ social mobility in Peel Region. Responses
organized around factors ranging from an inaccessible housing market to feelings of isolation from broader society:
7.3.1 Facilitators and Barriers to Success and Social Mobility
SOCIAL MOBILITY OF IMMIGRANTS TO PEEL REGION
60
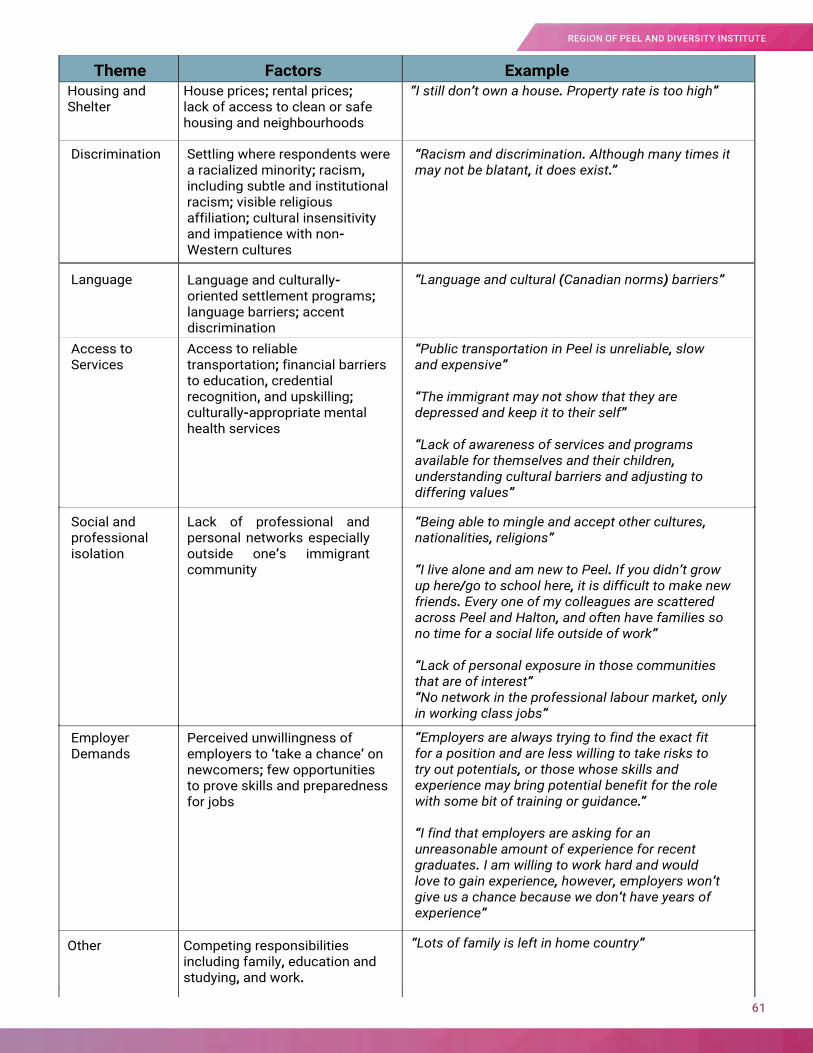
61
REGION OF PEEL AND DIVERSITY INSTITUTE
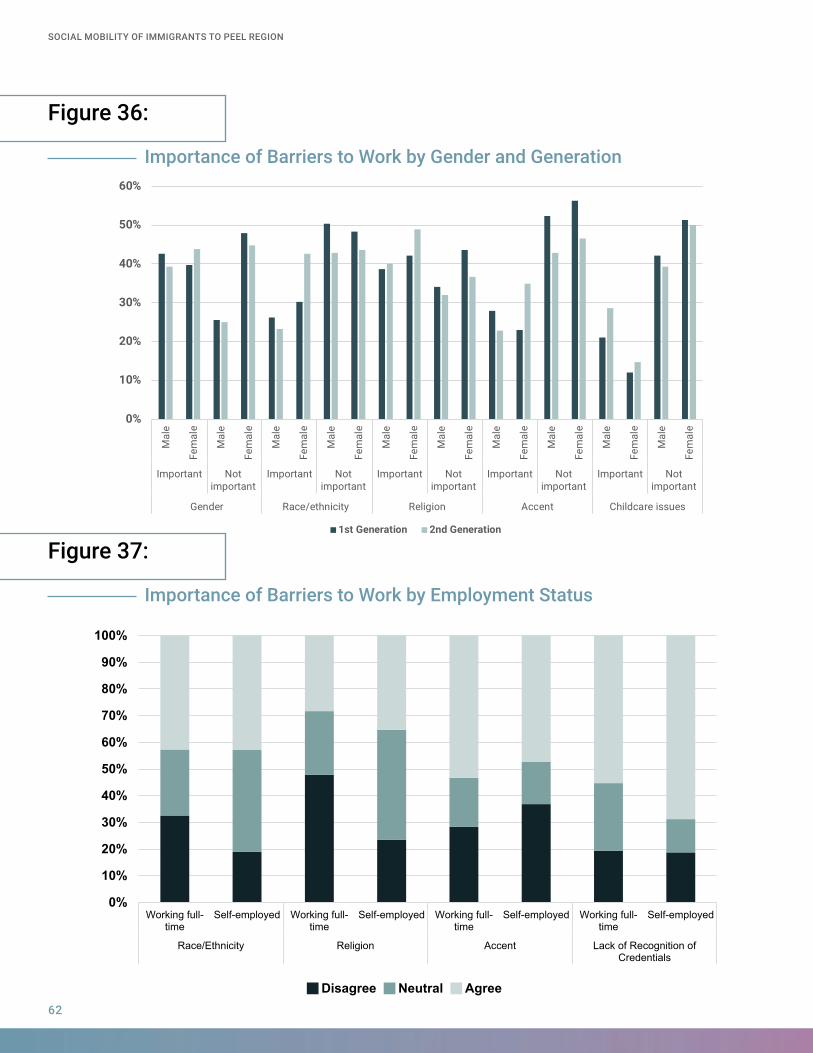
0%
10%
20%
30%
40%
50%
60%
Mal
e
Fem
ale
Mal
e
Fem
ale
Mal
e
Fem
ale
Mal
e
Fem
ale
Mal
e
Fem
ale
Mal
e
Fem
ale
Mal
e
Fem
ale
Mal
e
Fem
ale
Mal
e
Fem
ale
Mal
e
Fem
ale
Important Notimportant
Important Notimportant
Important Notimportant
Important Notimportant
Important Notimportant
Gender Race/ethnicity Religion Accent Childcare issues
1st Generation 2nd Generation
Figure 36:
Figure 37:
Importance of Barriers to Work by Gender and Generation
Importance of Barriers to Work by Employment Status
0%
10%
20%
30%
40%
50%
60%
70%
80%
90%
100%
Working full-time
Self-employed Working full-time
Self-employed Working full-time
Self-employed Working full-time
Self-employed
Race/Ethnicity Religion Accent Lack of Recognition ofCredentials
Disagree Neutral Agree
SOCIAL MOBILITY OF IMMIGRANTS TO PEEL REGION
62
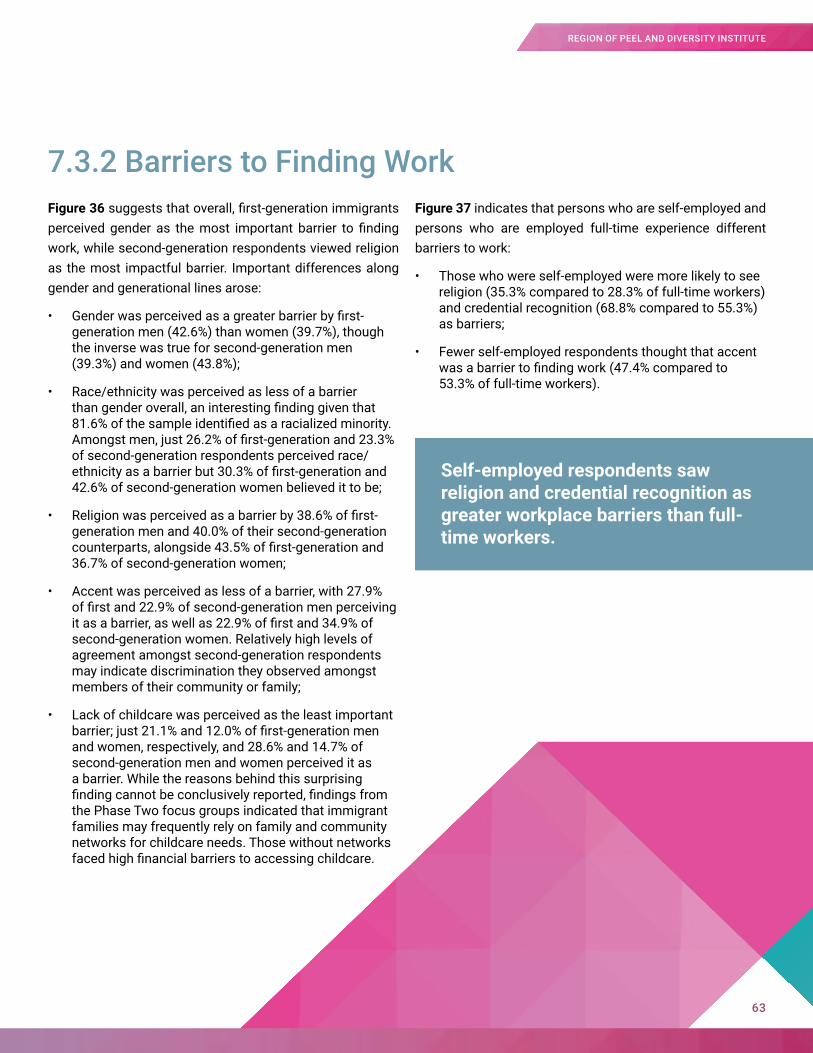
7.3.2 Barriers to Finding WorkFigure 36 suggests that overall, first-generation immigrants perceived gender as the most important barrier to finding work, while second-generation respondents viewed religion as the most impactful barrier. Important differences along gender and generational lines arose:
• Gender was perceived as a greater barrier by first-generation men (42.6%) than women (39.7%), though the inverse was true for second-generation men (39.3%) and women (43.8%);
• Race/ethnicity was perceived as less of a barrier than gender overall, an interesting finding given that 81.6% of the sample identified as a racialized minority. Amongst men, just 26.2% of first-generation and 23.3% of second-generation respondents perceived race/ethnicity as a barrier but 30.3% of first-generation and 42.6% of second-generation women believed it to be;
• Religion was perceived as a barrier by 38.6% of first-generation men and 40.0% of their second-generation counterparts, alongside 43.5% of first-generation and 36.7% of second-generation women;
• Accent was perceived as less of a barrier, with 27.9% of first and 22.9% of second-generation men perceiving it as a barrier, as well as 22.9% of first and 34.9% of second-generation women. Relatively high levels of agreement amongst second-generation respondents may indicate discrimination they observed amongst members of their community or family;
• Lack of childcare was perceived as the least important barrier; just 21.1% and 12.0% of first-generation men and women, respectively, and 28.6% and 14.7% of second-generation men and women perceived it as a barrier. While the reasons behind this surprising finding cannot be conclusively reported, findings from the Phase Two focus groups indicated that immigrant families may frequently rely on family and community networks for childcare needs. Those without networks faced high financial barriers to accessing childcare.
Figure 37 indicates that persons who are self-employed and persons who are employed full-time experience different barriers to work:
• Those who were self-employed were more likely to see religion (35.3% compared to 28.3% of full-time workers) and credential recognition (68.8% compared to 55.3%) as barriers;
• Fewer self-employed respondents thought that accent was a barrier to finding work (47.4% compared to 53.3% of full-time workers).
Self-employed respondents saw religion and credential recognition as greater workplace barriers than full-time workers.
63
REGION OF PEEL AND DIVERSITY INSTITUTE
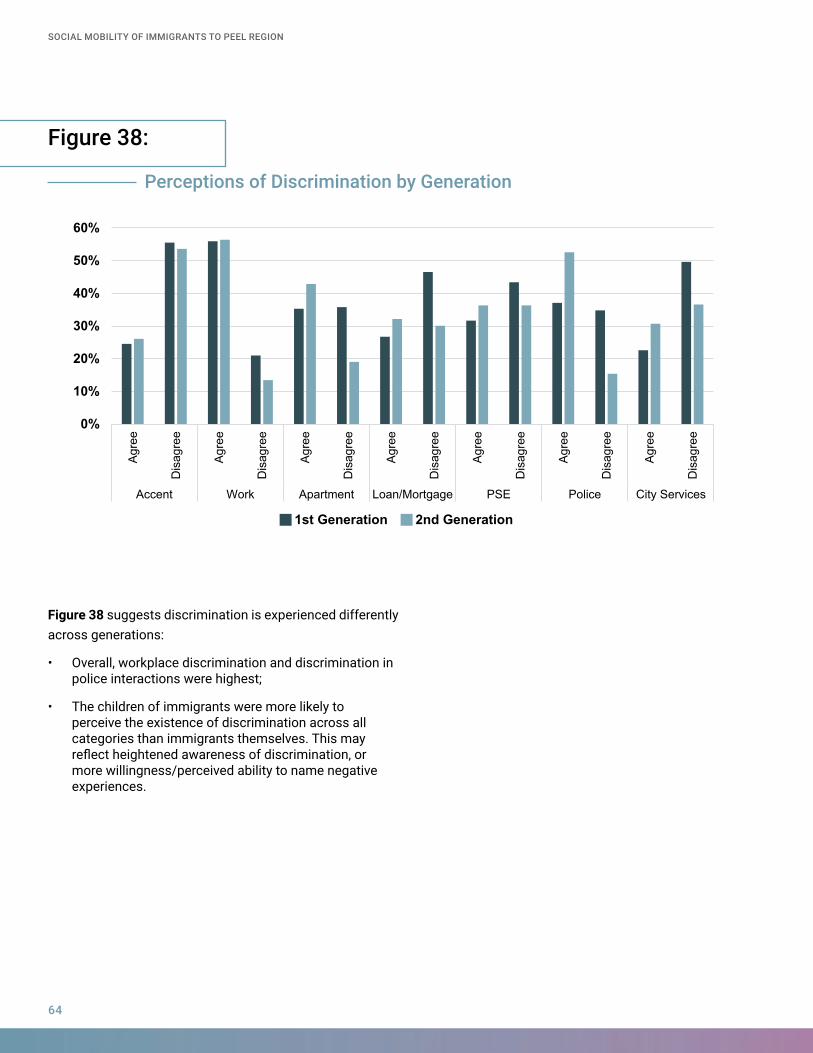
Figure 38:
Perceptions of Discrimination by Generation
0%
10%
20%
30%
40%
50%
60%
Agre
e
Dis
agre
e
Agre
e
Dis
agre
e
Agre
e
Dis
agre
e
Agre
e
Dis
agre
e
Agre
e
Dis
agre
e
Agre
e
Dis
agre
e
Agre
e
Dis
agre
e
Accent Work Apartment Loan/Mortgage PSE Police City Services
1st Generation 2nd Generation
Figure 38 suggests discrimination is experienced differently across generations:
• Overall, workplace discrimination and discrimination in police interactions were highest;
• The children of immigrants were more likely to perceive the existence of discrimination across all categories than immigrants themselves. This may reflect heightened awareness of discrimination, or more willingness/perceived ability to name negative experiences.
SOCIAL MOBILITY OF IMMIGRANTS TO PEEL REGION
64

65
REGION OF PEEL AND DIVERSITY INSTITUTE
7.3.3 Stakeholder Workshop Analyses
Workshop stakeholder analyses revealed social mobility factors that are unique to Peel Region but also those that are applicable to the broader Canadian context. Data from workshops was analyzed using NVivo using a grounded theory approach to identify key themes and trends. Findings are organized around two key questions below.
First, what does social mobility ‘look like’ for immigrants?
Social mobility is relative, stressed respondents. Even if absolute incomes rise in Canada, perceived social standing and how far one’s earnings stretch after taxes can be perceived as highly limiting to many newcomers.
One respondent framed the issue as this: “Let me explain. To come to Canada, you must have a degree. You must be working in your job for a few years. You must have a certain level of language, and to bring in $19,000. Anyone who can come up with $19,000 in addition to travel expenses is a very, very rich person in a third-world country. They’re not poor by any means,” he explained. However, this may change quickly upon arrival to Canada. Perceived lower social standing is compounded by the need to take a survival job. At that point, “you’re talking about three to five years to get an entry level position in their field,” he stated.
A representative of municipal government agreed: “It depends on your socioeconomic position in the country of origin,” she stated, highlighting that remittances can flow from sending country to new country: “My mother-in-law doesn’t have to work because she gets paid from family at home. So you could say, oh, she has good social status or economic status in Canada. Whereas if you compare it to my mom, she doesn’t have that income coming from Colombia, so she has to work, so my mom cleans. It’s funny because we come from the same city, they are both educated and all those things but some people have that support from back home so then it’s easier for them to move here. If you don’t have that support back home, you’re at a different level.”
Similarly, quality of life and norms around wealth and class are also important factors. “The issue is measuring the difference in the quality of life between different countries. I have clients who will say, I had a maid and I had a driver… And I had all this, and I had all that, whereas their income, really comparatively would be mid-level here… but because of the quality of life and the culture is different there, they can’t have those things here, even though they’re still making roughly about the same amount of money. But in their mind, their quality of life has gone down and they’re not where they were,” they explained. “To have a driver and a maid here, you have to be pretty well-off, so it’s not attainable anymore.” The effects can be strong: “It almost feels like they enter a state of depression because it’s completely different from where they were to begin with.”
Still, understanding immigrants’ perceptions of their own social mobility is complex, suggest stakeholders. While financial mobility might influence perceived social mobility, other variables also factor, including their current quality of life compared to their life in their home country; their ability to meet family and social obligations; and their perceived sense of job satisfaction.
Second, what factors shape newcomers’ and immigrants’ success and social mobility? Many respondents expressed reservation with this task. To constitute what made an “immigrant group,” stakeholders drew interchangeably on: 1) country of origin, 2) location of training and education, 3) country of origin’s country’s colonial history as well as tradition of migrating to Canada, and 4) immigration stream through which they entered.
Social mobility is often relative, and perceptions of mobility may vary between groups.
SOCIAL MOBILITY OF IMMIGRANTS TO PEEL REGION
66
Stakeholder-identified success and social mobility factors are organized using the Ecological Model of Social Mobility (see Appendix A). The Ecological Model illustrates how success factors and barriers are mutually constitutive and are expressed differently across contexts. Factors are identified at three levels: societal (macro), organizational/sectoral (meso) and the individual (micro) level.
Societal (Macro) Level:
Shifts in federal immigration policy to prioritize highly skilled workers who arrive with employment opportunities were generally seen as positive, though overly selective. One employer lauded the Express Entry program, introduced in 2015: “Instead of taking them five years to come here, it takes them only six months and they have prospective employer.”
While immigration stream is not a significant indicator of success, workshop stakeholders perceived important differences between the experiences of privately sponsored refugees and government-sponsored refugees. However, the level of health and social support provided to all refugees was seen as needed to ensure success of all immigrants: “In many ways, even government refugees are better off. The government assists them with transit, with opening bank accounts, with even housing. Skilled immigrants – they have to do everything on their own.” Family reunification barriers inhibit immigrants’ social mobility, suggested stakeholders. Specifically, the Parent and Grandparent Super Visa (introduced in 2012) was identified in focus groups as creating barriers to resettlement because of its associated higher costs, which be prohibitively expensive for lower-income families. Workshop participants suggested this may result in added strain and financial burden for families who cannot rely on family networks for childcare and household support, which in turn has gendered impacts on women’s ability to work and the type of job she may take.
International students face continued flux and uncertainty. Frequent policy changes for international students are difficult to track: sometimes widening pathways to permanency by lengthening timelines, creating a patchwork of changes that respondents fear is incentivizing students from applying to remain in Canada, because they no longer believe they are eligible. The 2015 changes to OSAP grant funding were an example of policy shifts with mixed results: while free university tuition for low-income families was applauded and signaled “governments were listening,” the $50,000 household income cut-off was too low to provide meaningful assistance to working poor families. Stakeholders felt more was needed to ensure such changes created meaningful mechanisms for families to improve their social mobility outcomes.
Non-immigration related policies also shape settlement successes. Provincial policies such as accessibility changes related to AODA legislation were seen as supporting lower-level changes and opening doors for specific cohorts of immigrants, such as those with disabilities: “Legislation changed, so our policies changed and we implemented and created new programs and procedures. We’re definitely flourishing now – still a long way to go, but that’s what started us,” said one private employer. Relatedly, participants cited the Ontario Human Rights Commission’s 2015 decision to label employer demands for “Canadian experience” as grounds for discrimination as an important step towards eliminating workplace discrimination. Respondents also noted a broader societal acceptance of immigration and diversity as improving the everyday experiences and comfort of immigrants: “Sure you’ll have a vocal minority who are absolutely against any kind of immigration, but just look at the government who was voted in. People and society are much friendlier to immigrants.”
67
REGION OF PEEL AND DIVERSITY INSTITUTE
Organizational/Sectoral (Meso) Level:
The presence of an established immigrant community willing to help with factors such as job searches is strongly linked to a new arrival’s success. Established communities was linked to establishing professional networks. However, this can also be a barrier if a community is largely segregated to a specific type of work, or is not generally integrated into the Canadian workforce: “What we are seeing is certain communities would come and look for only their communities, would land at the job in that community itself, and would not even try to learn English because they’re well settled into a factory owned by their community people. They’ve been here for years yet they don’t try to learn English.” These barriers can be generational and ease over time: “I know many Chinese immigrants came really just for surviving and they don’t have English at all, but now is the age of immigrants is getting young. They come here first as international students with no language barriers. They get the training here. They know everything, how the system works, so once they graduated, they get jobs.”
Programs for low-income Peel Region residents were perceived as useful for those who have access, but often inaccessible for many newcomers. For example, the MiWay Affordable Transit Pilot Program was perceived as a potential tool to increase social and physical mobility for newcomers; however, in its current state it is largely inaccessible for new immigrants and refugees because it required proof of income from the Canadian Revenue Agency. Newly arrived refugees and immigrants who are most in need of such programs must wait until they file taxes in Canada to access these services. Credential recognition is a sticky, persistent social mobility barrier.
For many immigrants across categories, skills bridging programs are prohibitively expensive. Traditional channels to accessing low-interest loans — such OSAP student loans — often have residency requirements and are inaccessible to newcomers.
Further, subsidies that do exist for low-income families were perceived as having income ceilings that are inaccessibly low — for example, in order to be able to access subsidized childcare, a family must fall below the poverty line. Respondents also perceived increasing regulations and/or financial barriers in common ‘immigrant’ occupations, such as the childcare sector or becoming an entrepreneur. Respondents urged for the creation of immigrant-specific pathways that lower financial barriers to help immigrants join regulated professions or create their own employment opportunities. “Now that the ECE profession is becoming very regulated, it is becoming difficult for many newcomers”, stated a settlement worker.
Respondents also lauded the Diversity & Inclusion Charter of Peel as a positive policy development. It was described as a best practice both for its community-based development process and for its content. One settlement worker described the Charter as “a strategy that worked and helped further our work.” Similarly, a greater emphasis on diversity, inclusion, and anti-discrimination in many workplaces were applauded as a positive influence on social mobility for immigrants, who can dedicate themselves to tasks without contending with social grievances. Organizations that advertise and celebrate these policies were described as desired places to work for immigrant communities. “Obviously a policy perspective there’s been changes,” said one employer, “but internally, they now talk about diversity and inclusion. Before, it was never talked about. It was never discussed… [Previously, it was]: ‘No, we can’t accommodate that, or no, our, our environment’s not built for that, so it’s not a conversation we’re going have, end of story, right? And that’s not the same anymore.” Respondents applauded light-hearted events and deeper conversations as important developments in organizational policy and practice.
Skills bridging programs can be prohibitivelyexpensive;financialsupports like OSAP are often inaccessible.
SOCIAL MOBILITY OF IMMIGRANTS TO PEEL REGION
68

69
REGION OF PEEL AND DIVERSITY INSTITUTE
Policy and Service Implications for Peel Region
08
SOCIAL MOBILITY OF IMMIGRANTS TO PEEL REGION
70
8.1How can we effectively support new immigrants using the research find-ings? What are the implications?
The Region of Peel’s 2015-2035 Strategic Plan vision for Peel is ‘Community for Life’; a place where all residents of Peel Region can enjoy a sense of belonging and have access to the needed services and opportunities throughout each stage of their lives. Like other municipalities throughout Ontario, the Region of Peel recognizes the need to support stakeholders and guide public decision making to ensure respect and promotion of immigrant success and their upward mobility. The strategic plan is to be realized in phases which provide an opportunity to research and better support the approximate 20,000 newcomers to Peel Region each year.
Access to appropriate and affordable housing, a secure income and early childhood development and learning are key platforms to provide the way forward for all who live in Peel Region. These platforms also link with the observations of this research study which outline the same important components for immigrant success and social mobility. What should be considered as well in any kind of policy redress are the barriers that hinder success, i.e., a lack of recognition of foreign education credentials and discrimination that impacts both employment (and therefore income), and housing.
A better understanding of immigrant and newcomer issues at the preparation, implementation, reprogramming and evaluation points of program development will ensure the Region of Peel’s support to immigrants living within Peel Region. To do this, a strengthened policy commitment will be required.
To further support newcomers, it is recommended that the following opportunities are considered by the Region of Peel.
Recommendations for Consideration:
1.To improve access to appropriate and affordable housing:
• Consider inclusion of a newcomer and immigrant lens within the goals of the Peel Housing and Homelessness Plan and the building of affordable housing;
• To help with the implementation of a Peel Housing and Homelessness Plan a group with lived experience that can apply an immigrant lens to its work should be considered.
71
REGION OF PEEL AND DIVERSITY INSTITUTE
2. To improve low income status for immigrants:
• Working with key community stakeholders, continue to identify and address barriers for immigrants who need support to acquire additional education or skills, credential recognition, and ‘Canadian experience’;
• Offering more targeted assistance to individuals who have been out of the workforce for long periods of time or those starting a second career so that they can transition back into the workforce;
• Consider eliminating ‘required proof of income’ from the Canada Revenue Agency for programs. This type of proof, typically used in transportation and recreation subsidies, is not accessible for newcomers until some months or even a full year after arrival in Canada;
• Offer financial support through grants or low-interest loans for low-income immigrants in Peel Region to acquire citizenship, as the cost for application has risen by more than 50% and citizenship applications have fallen by the same margin. Citizenship plays a role in not only increasing a ‘sense of belonging’ to an immigrant, but also improves the sense of ‘acceptance’ from the wider community as well;
• Offer interest free loans for newcomers to upgrade skills or education or acquire Canadian credentials beyond existing programs (e.g. OSAP), which have residency requirements;
• Actively promote the value of international education and credentials to employers in Peel Region through existing forums such as the Local Employment Planning Council;
• Provide regional support for municipal governments and economic development programs, such as offering partnership with the Economic Development Offices in both Brampton and Mississauga;
• Continue to financially support stakeholders who work with newcomers and to work in collaboration with other organizations to commit to immigrants living in Peel Region;
• Offer assistance in co-locating and coordinating settlement and other agencies, particularly through the community hub model.
3. To improve access to childcare services in Peel Region
• Increase research, either through the Early Years and Child Care Services division, and/or in partnership with the Peel Poverty Reduction Strategy or the Peel Newcomer Strategy Group to determine the child care and education needs as well as the enrollment pattern of immigrant families;
• Require early childhood programs to develop and implement family inclusion policies with key performance indicators that demonstrate to what extent programs intentionally address the needs of immigrant families; particularly as it relates to culture and language for the child and the family. This can be done through strengthened interpretation, hiring practices that support ethnic diversity and special training to ensure cultural sensitivity in contact with families and programming;
• Support a child care home visitor program, so that prior to starting elementary school, each newcomer child and their family may receive a home visit to offer school-related information;
• Continue to collaborate with schools and early childhood centres to ensure integrated service delivery.
SOCIAL MOBILITY OF IMMIGRANTS TO PEEL REGION
72
It is recommended that employers in the public and private sectors in Peel:
• Create policies and offer in-house programs/services that proactively support immigrant and internationally-educated employees utilizing their skills to their full abilities in their organizations. Solution-based approaches in this area include:
• Offering work placements, on-job training, internship, co-ops to help job seekers expand their Canadian work experience in jobs matching their skills;
• Establishing in-house mentoring initiatives where junior employees are matched with more senior employees who have some natural connection (i.e., work specialization, career aspirations etc.);
• Increasing their understanding of foreign academic credentials, institutions and trends (e.g., Foreign Credential Recognition - FCR);
• Improving linkages with existing credential evaluation services;
• Encouraging (and compensate) employees to become mentors outside the workplace to new immigrants in corresponding occupations.
4. To support Regional Policies and Programs
• Implement a formal commitment to an immigrant/newcomer lens to all programming development and redevelopment;
• Create a formal role for newcomer and immigrant issues within income, affordable housing and childcare strategies and plans;
• Create a formal advocacy role for the Region of Peel by working directly with the Association of Municipalities of Ontario to ensure the Canada-Ontario Immigration Agreement signed in November 2017, is acknowledged and promoted in Peel;
• Develop an inclusion training program with a newcomer and immigrant lens so that policy, management and front-line staff are aware of the different types of needs of immigrants and how regional programming can better meet these needs;
• Recognize that the Region’s programs may be stigmatized or not reaching the most vulnerable immigrants. Make special contributions to settlement programs to conduct outreach programs that address this.
• Engage employers as partners by involving employers in course design and program development to ensure they are up to date and relevant for assisting individuals accessing the labour market at all job levels;
• Establish employer engagement strategies based on the post-recession hiring needs of employers and establishing partnerships that support relevant employer participation (e.g., mentors or hosts of job placements);
• Recognize employers who have shown leadership in hiring immigrants and use them as ambassadors to engage others.
73
REGION OF PEEL AND DIVERSITY INSTITUTE

Appendix A – Methodology and Analysis
09
SOCIAL MOBILITY OF IMMIGRANTS TO PEEL REGION
74
9.1 Data Collection and Analysis
A review of academic and grey literature identified factors shaping social mobility generally and amongst immigrants specifically. This literature, alongside a review of relevant survey instruments informed the design of the survey used in phase one of this study.
Data analysis involved two phases: a survey of first- and second-generation respondents, and stakeholder workshops.
Phase 1: Survey
First- and second-generation respondents were invited to participate in an online survey discussing their immigration journey to Peel.
Recruitment strategy: Survey respondents were required to live in Peel Region, to be a first- or second-generation Canadian, and to be 16 years of age or older. First-generation immigrants are defined as having been born outside of Canada; second-generation Canadians are born in Canada and have at least one parent born internationally.
Online surveys were completed in three waves. First, in February 2016, participants were recruited through organizational partners of the Diversity Institute and Region of Peel, including settlement agencies and immigrant-serving organizations. Partners were emailed an invitation to support the study by distributing the link via organizational websites, listservs, and social media. Posters and postcards advertising the survey were also distributed to partners. Responses were tracked through the survey host site, Qualtrics. Following lower response rates and in response to user feedback, Toronto-based research firm CIDO was commissioned to promote the survey in March 2016. Finally,
a third round of email invitations to promote the survey through partner organizations was launched in May 2016. All respondents received a $10 Tim Horton’s gift card as an incentive to participate.
The online survey closed on June 8th, 2016. Responses were analyzed for completeness and compliance with geographic requirements throughout the survey process.
Survey development: Survey instruments were developed through multiple rounds of feedback with the Region of Peel and project stakeholders. Survey questions focused on strategies to overcoming barriers and steps taken to achieve social mobility. A life-course model provided by Peel Region guided survey design in order to make clear the relationship between different factors that impact the social mobility of immigrants before and after arrival.
The survey was comprised of multiple choice and open-ended questions, including questions investigating respondents’ individual/family education, job prestige, and wealth, both before and after arriving in Canada. These questions are useful for measuring changes in social mobility over time, as in the MacArthur Scale of Subjective Social Status.
Survey and stakeholder consultation questions were informed from previous research (e.g., the Region of Peel’s Human Services’ Meeting the Needs of Immigrants throughout the Life Cycle).
75
REGION OF PEEL AND DIVERSITY INSTITUTE
Dataset
In total, 675 respondents completed the survey, comprised of 488 first- and 182 second-generation respondents. Both samples were nearly identically skewed (63.1% and 63.2%) towards female respondents. In total, 423 respondents (62.5%) were women, and 551 (81.6%) were from racialized groups, representing an oversample of women and racialized minorities in Peel Region.
Before data cleaning, n=1,588 responses. After cleaning, n=675, exceeding our target of 600 responses. At different stages, quality control measures were added to limit responses from outside the Peel Region, including inserting ‘captcha’ requirements and tracking respondent latitude and longitude measures. first-generation immigrants were provided with 93 main questions, while second-generation respondents were provided with 63. The average survey took 45 – 60 minutes to complete.
A total of 49 stakeholders participated in phase two workshops. Workshops were organized to ensure representation of each sector.
Analytical Approach
Survey data were analyzed using SPSS software. An initial univariate (descriptive) analysis was undertaken to ensure the sample was comparably reflective of Peel Region’s diversity.
Analysis identified key independent and dependent variables. Associations between independent and dependent variables were measured using cross-tabs and significance testing via a comparison of means. The relationship between independent and dependent variables were also measured before immigration, at first arrival, and as a current measurement.
Several questions had sub-questions with potential responses along a Likert scale. Where appropriate, sub-questions were collapsed into a single scale and transformed into a mean score for ease of reporting and comparison.
Stakeholder workshops were audio-recorded and transcribed. Transcriptions were analyzed to identify patterns using NVivo qualitative analytical software. Workshops produced rich data on barriers, strategies, and recommendations to improve social mobility among immigrants. Where necessary, responses were edited for brevity and clarity.
An ecological model of systems change also informs the survey design and data analysis. Newcomers, employers, and government, private, or settlement sector bodies do not operate in a vacuum. Rather, actions and perceptions are the outcome of a complex interplay of factors at each of the individual, organizational, and societal levels. Understanding how factors, including individual biases, organizational practices, and law and policy shape interactions and perceptions also helps us understand how these interactions shape immigrants’ outcomes. The ecological model illustrates the nexus between theory and praxis when creating social change (Cukier et al., 2014) and helps organizations and government create evidence-based, sustainable strategies to create positive changes for immigrants in Peel Region.
SOCIAL MOBILITY OF IMMIGRANTS TO PEEL REGION
76
Limitations to Research
Five key limitations arise in analyzing and interpreting this study’s data:
1. This is a study of perceptions. As a survey-based analysis, this study reports perceptions and the personal perspectives/opinions of respondents.
2. The number of respondents across ethnic/racial groups limit our ability to draw conclusions based on demographic group. While survey demographics closely correspond to greater Peel Region population, a sample that is both representative of Peel’s ethnic/racial diversity and large enough to undertake statistical analyses was not attainable.
3. This study is not an intergenerational analysis of immigrants’ social mobility. Rather, it captures the perceptions of immigrants at different stages of the life course: prior to departure, at arrival, and currently. It also compares the perceptions of immigrants by year of arrival, to understand the effects of time on social mobility. It includes several univariate and descriptive analyses to test for meaningful associations between variables. Regression analyses were not included due to a small sample size.
4. Lower response rates amongst second-generation respondents limit intergenerational comparisons. Further, this sample is not reresentative of all immigrant or ethnic groups in Peel Region, limiting this type of analysis.
5. Women are overrepresented in this sample. Data were analyzed by gender were possible to correct this overrepresentation.
77
REGION OF PEEL AND DIVERSITY INSTITUTE
Appendix B – Demographic Factors
10
SOCIAL MOBILITY OF IMMIGRANTS TO PEEL REGION
78
All respondents were aged 18 years or older. Amongst first-generation respondents, the largest cohort was the 35-44-year-old age group (representing 32% of respondents), followed by 25-34 years (25.6% of respondents). Amongst second-generation respondents, the largest cohort was the 18-24 (39.0%), followed by 25-34 (26.9%). Interestingly, this follows broader second-generation demographic trends in Canada: 19.8% of all Canadians between the ages of 15-24 are the child of an immigrant (Kelly, 2014).
Income: The largest proportion of first-generation respondents (31.6%) made $20,000-$59,000 before taxes in 2015, followed by under $20,000 (26.0%). Surprisingly, the inverse was true amongst second-generation respondents: the largest proportion (40.1%) made under $20,000, followed by $20,000-$59,000 (28.6%). A larger proportion of first-generation (21.3%) immigrants earned between $60,000-$99,000 than second-generation (14.3%), while slightly more first-generation respondents (8.2% compared to 7.1%) earned more than $100,000 annually.
The large discrepancy in earnings and large proportion of second-generation respondents making less than $20,000 is important. Notably, second-generation respondents were almost as likely to be working full time (40.1%) as first-generation respondents (45.2%), and were less likely to be unemployed (2.2% of second-generation versus 19.4% of first-generation).
Income: Full-Time Workers, by Generation: 40.1% of second-generation respondents worked one full time job and 3.3% worked multiple jobs. Collectively, the largest proportion (45.6%) of second-generation full-time workers earned between $20,000-$59,000, though salaries ranged; 6.3% earned under $20,000; 12.7% earned between $60,000-$99,000; and 12.7% earned more than $100,000.
This is in contrast to first-generation full-time workers. 48.3% worked one full-time job while 2.0% worked multiple jobs. The largest proportion (35.4%) earned between $20,000-$59,000, while 11.4% earned under $20,000, 33.8% earned between $60,000-$99,000, and 12.2% earned more than $100,000 annually.
The median income in Peel Region was $30,715 in 2016 (Statistics Canada, 2017), which falls in the income range of most first-generation respondents but is higher than that of most second-generation respondents.
Occupation and Employment Status: The largest proportion of first-generation immigrants work in Business, Finance, and Administration (20.7%) while the smallest slice work in Arts & Recreation (1.8%). Both generations are most likely to be working one full-time job. While more first-generation respondents were unemployed or looking (19.4% compared to 2.2%), they were less likely to be students (9.7% were students compared to 27.4% of second-generation respondents). Women are overrepresented in part-time work after arriving in Canada.
Racialization: 88.9% of first-generation and 64.2% of second-generation identified as racialized minorities; overall, 81.3% were from racialized groups.
Ethnic Breakdown: Amongst first-generation respondents, the largest cohort identified as South Asian (48.7%), followed by Chinese (9.0%), white (8.8%) and Caribbean (6.3%). Amongst second-generation respondents, the largest cohort was white (35.4%), followed by South Asian (26.0%), Caribbean (9.9%) and Chinese (8.3%). This survey’s sample is similar to that of greater Peel Region: 56.8% of the overall population identifies as a racialized minority, with the largest cohort being South Asian at 48.6%, followed by Black (15.9%) and Chinese (8.0%) (Region of Peel, 2013).
Immigration Stream: The majority of first-generation respondents arrived through the family class stream (52.7%), followed by 26.6% arriving through the economic class. 7.7% of respondents arrived via refugee protection streams, and 13.1% arrived through ‘other’ streams.
Second-generation respondents were born in Canada and had one or more parent born internationally.
Current Immigration Status: The majority (59.4%) were Canadian citizens at the time of the survey, followed by permanent residents (37.6%). 1.4% of respondents were living in Peel on a temporary visa. The remaining persons identified as refugees or did not wish to disclose.
79
REGION OF PEEL AND DIVERSITY INSTITUTE
Country of Birth: The greatest proportion of respondents (48.9%) listed their country of birth as residing in South Asia. The remaining respondents were divided between North Africa, the Middle East, and West Asia (9.9%), the Caribbean and Central and South America (9.9%), East Asia (9.3%), South East Asia (5.7%), Eastern Europe (5.3%), Sub-Saharan Africa (3.7%), Western Europe (4.7%), USA, Oceania (0.6%) and ‘other’ (2.0%).
Region of Birth: The greatest proportion of respondents (49.9%) listed their country of birth as residing in South Asia. The remaining respondents were divided between Caribbean, Central & South America (10.1%) and North Africa, Middle East and West Asia (10.1%), followed by East Asia (9.5%), South East Asia (5.8%), Eastern Europe (5.4%) and Western Europe, USA, and Oceania (5.4%), and finally Sub-Saharan Africa (3.7%).
Year to Canada: Three categories adapted from Gilkinson and Sauvé (2010) were constructed to allow for meaningful analysis with year to Canada as an independent variable: earlier immigrants (1949-1999), recent immigrants (2000 to 2010) and newcomers (2011 to 2016).
Respondents were evenly distributed across these three categories: 30.3% of respondents arrived to Canada from 1949-1999, 37.2% arrived from 2000-2010, and 32.4% arrived between 2011-2016. Within the largest category by year (1949-1999), more than half (55.9%) arrived between 1989-1999.
Highest Level of Education by Generation: Consistent with research on children of immigrants in Canada (Kelly, 2015), second-generation Canadians had higher levels of education than first-generation respondents. While it is true that children outperform their parents in educational attainment across all cohorts in Canada, the children of immigrants are particularly successful in post-secondary attainment.
Overall, 88.0 % of first-generation and 60.4% of second-generation immigrants had earned a post-secondary degree or higher. This is consistent with previous research finding that 44% of recent immigrants had a bachelor’s degree or higher (Portraits of Peel, 2011).
After arriving in Canada, first-generation respondents were more likely to complete a Canadian degree or diploma than not. While 14.1% repeated a lower level of education in Canada, 26.9% repeated the same level and 21.2% completed a higher education. This pattern may be reflective of immigrants’ responding to discrimination against their internationally acquired credentials.
SOCIAL MOBILITY OF IMMIGRANTS TO PEEL REGION
80
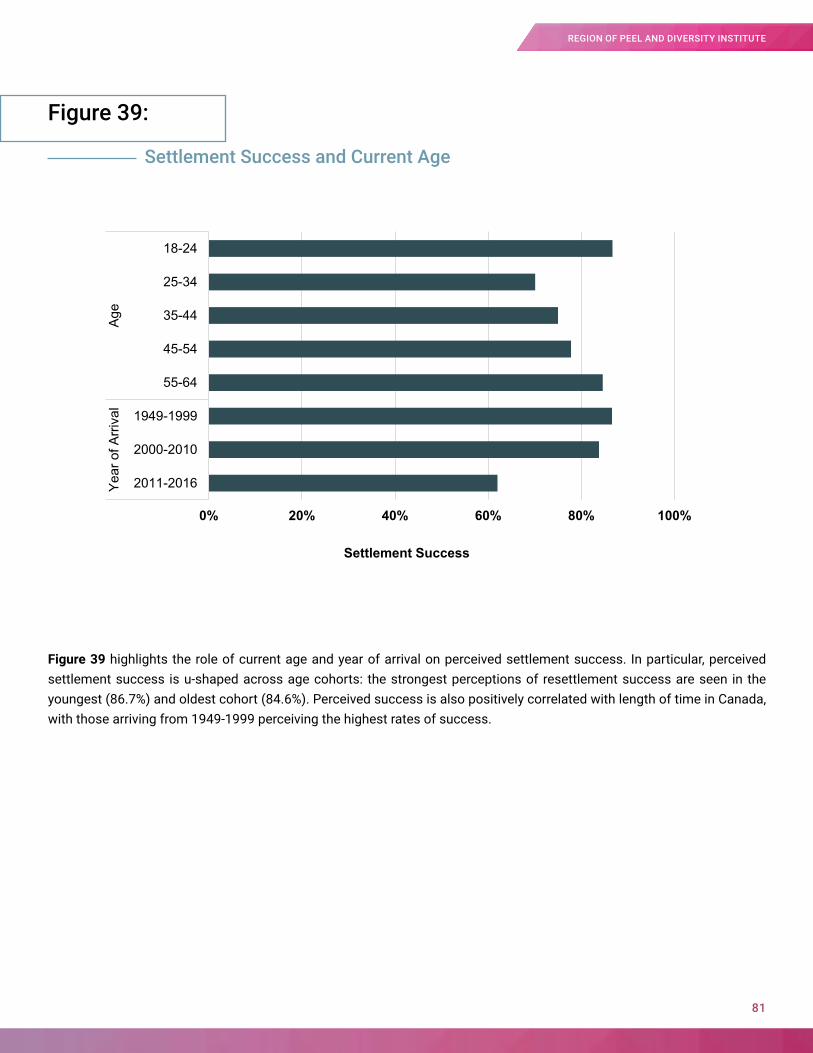
Figure 39 highlights the role of current age and year of arrival on perceived settlement success. In particular, perceived settlement success is u-shaped across age cohorts: the strongest perceptions of resettlement success are seen in the youngest (86.7%) and oldest cohort (84.6%). Perceived success is also positively correlated with length of time in Canada, with those arriving from 1949-1999 perceiving the highest rates of success.
Figure 39:
Settlement Success and Current Age
0% 20% 40% 60% 80% 100%
2011-2016
2000-2010
1949-1999
55-64
45-54
35-44
25-34
18-24
Yea
r of A
rriva
lA
ge
Settlement Success
81
REGION OF PEEL AND DIVERSITY INSTITUTE

Appendix C –Employment Factors
11
SOCIAL MOBILITY OF IMMIGRANTS TO PEEL REGION
82
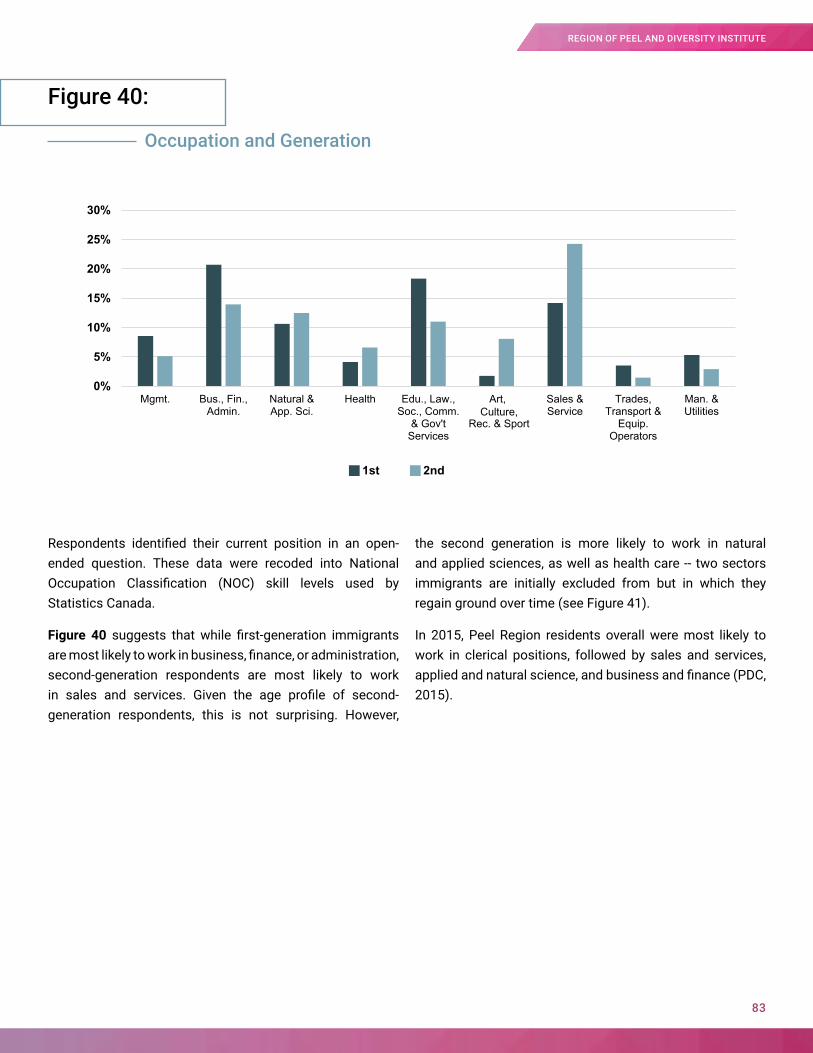
Respondents identified their current position in an open-ended question. These data were recoded into National Occupation Classification (NOC) skill levels used by Statistics Canada.
Figure 40 suggests that while first-generation immigrants are most likely to work in business, finance, or administration, second-generation respondents are most likely to work in sales and services. Given the age profile of second-generation respondents, this is not surprising. However,
the second generation is more likely to work in natural and applied sciences, as well as health care -- two sectors immigrants are initially excluded from but in which they regain ground over time (see Figure 41).
In 2015, Peel Region residents overall were most likely to work in clerical positions, followed by sales and services, applied and natural science, and business and finance (PDC, 2015).
Figure 40:
Occupation and Generation
1st 2nd
0%
5%
10%
15%
20%
25%
30%
Mgmt. Bus., Fin.,Admin.
Natural &App. Sci.
Health Edu., Law.,Soc., Comm.
& Gov'tServices
Art, Culture,
Rec. & Sport
Sales &Service
Trades,Transport &
Equip.Operators
Man. &Utilities
83
REGION OF PEEL AND DIVERSITY INSTITUTE
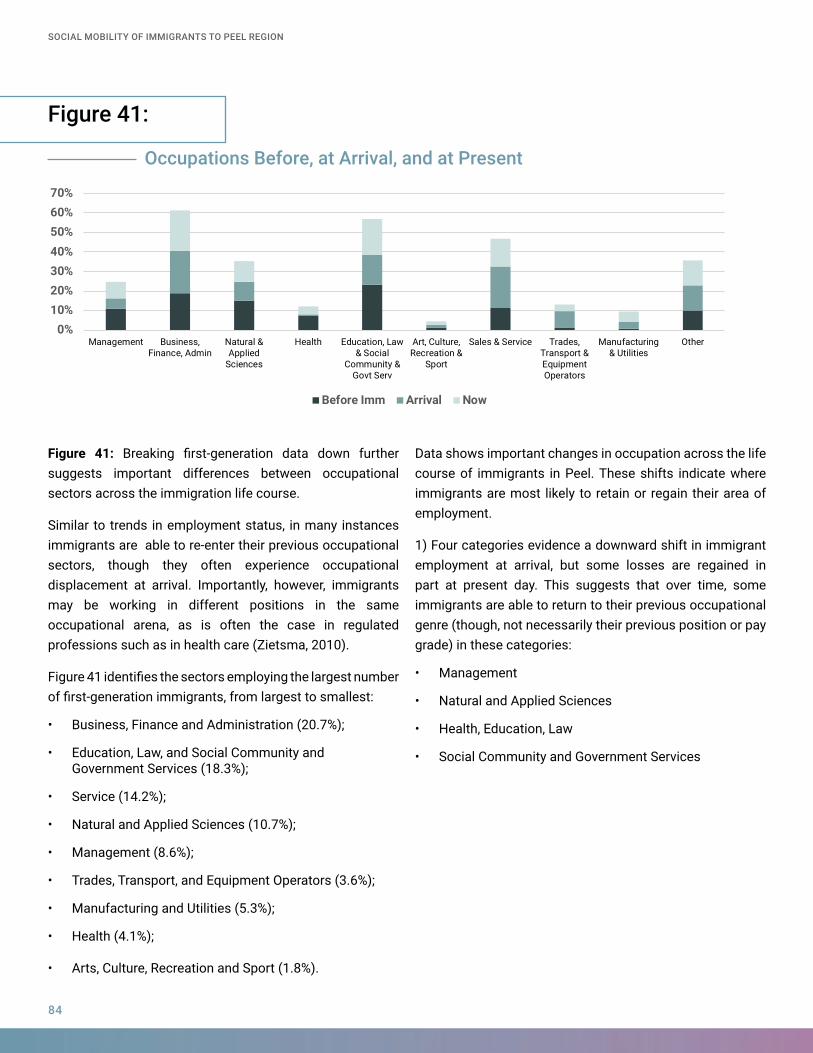
Figure 41:
Occupations Before, at Arrival, and at Present
Figure 41: Breaking first-generation data down further suggests important differences between occupational sectors across the immigration life course.
Similar to trends in employment status, in many instances immigrants are able to re-enter their previous occupational sectors, though they often experience occupational displacement at arrival. Importantly, however, immigrants may be working in different positions in the same occupational arena, as is often the case in regulated professions such as in health care (Zietsma, 2010).
Figure 41 identifies the sectors employing the largest number of first-generation immigrants, from largest to smallest:
• Business, Finance and Administration (20.7%);
• Education, Law, and Social Community and Government Services (18.3%);
• Service (14.2%);
• Natural and Applied Sciences (10.7%);
• Management (8.6%);
• Trades, Transport, and Equipment Operators (3.6%);
• Manufacturing and Utilities (5.3%);
• Health (4.1%);
• Arts, Culture, Recreation and Sport (1.8%).
Data shows important changes in occupation across the life course of immigrants in Peel. These shifts indicate where immigrants are most likely to retain or regain their area of employment.
1) Four categories evidence a downward shift in immigrant employment at arrival, but some losses are regained in part at present day. This suggests that over time, some immigrants are able to return to their previous occupational genre (though, not necessarily their previous position or pay grade) in these categories:
• Management
• Natural and Applied Sciences
• Health, Education, Law
• Social Community and Government Services
0%10%20%30%40%50%60%70%
Management Business,Finance, Admin
Natural &Applied
Sciences
Health Education, Law& Social
Community &Govt Serv
Art, Culture,Recreation &
Sport
Sales & Service Trades,Transport &EquipmentOperators
Manufacturing& Utilities
Other
Before Imm Arrival Now
SOCIAL MOBILITY OF IMMIGRANTS TO PEEL REGION
84
2) Two categories show an upward shift in immigrant employment: more immigrants work in this category now than before immigrating or at arrival. This suggests that these sectors have lower barriers to entry for immigrants:
• Manufacturing and Arts
• Culture, Recreation and Sport
3) Three categories show an upward shift in immigrant employment at arrival, followed by a decrease of employment at present day. This suggests that over time, these sectors may become more attractive or more accessible (e.g., through skills acquisition) to immigrants:
• Business, Finance & Administration
• Sales & Service
• Trades
The average earnings of an Ontarian working in Business, Finance and Administration was $55,490 in 2015 (Statistics Canada, 2017b), within the range earned by immigrant respondents working in this area ($20,000-$59,000 annually).
Workshop participants argued that one’s type of career matters in achieving parity and a sense of social mobility, not just because many will have to switch gears to seek unregulated professions, but also because the perceived “personal identity cost” to switching occupations is heightened for professionals: “It’s not the same thing if you’re a doctor or if you study media arts, where I can go to another country and be flexible because the career that I studied doesn’t give me my identity. I don’t identify myself as, “I am a media artist” but this is what doctors do. This affects their identity and their career attachment… there is a lot of research on this. If your profession gives you identity, then it’s harder for you to let go.”
Another stakeholder agreed, but suggested that a change in career identity could actually be a faster track to achieving occupational parity, as it provides a “fresh start” to learn new skills and approaches related to that specific career in Canada. “We are also looking at people who decided to change their career identity and how does it work for them.”
Supported one municipal representative: “I can give you 50 other examples that I see on a day-to-day basis where people have had to give up their education and their skills of before and find new employment and new skills to make inroads in that social mobility equation.”
The majority of stakeholders knew of immigrants who were not able to re-enter the profession or field they were trained in. “I have individuals who aren’t able to get employment in their profession and go work in a warehouse and that’s a totally different beast,” suggested one respondent. “If they’re not able to be hired in their field within a year or two, and they must take a warehouse or technical role of something like that, yes it can take them awhile. It can take them five years to get into a role they should be in.”
Several respondents acknowledged that professional parity — on par with those born, raised, and educated in Canada — may never happen.
Immigrants may also exceed previous occupational or income levels fairly quickly, suggested one respondent. However, a rise in income levels does not necessarily mean social mobility or a better quality of life: “There are many females who are not employed in their country of origin and when they do come here, circumstances force them to go seek employment, whether it is survival jobs or whether it is something better. So if we were going to compare those points, absolutely, they make more than what they were earning before in terms of the actual dollars,” suggested the municipal government representative. However, accounting for factors including the ability to choose how one allocates their time and the ability to tend to other priorities including family, the notion of ‘social mobility’ is complicated: “In terms of the cost and if we are going to look at the full spectrum of social mobility, their mental health, their wellbeing, their family structures, you know, their parenting, their contribution to the community… continues to slide.” Another agreed: “It’s not really enough to see what me and my wife are earning now and see that as better than my grandparents in the old country, right? A lot of the world is 30, 40 years behind here in terms of expectations around income.”
85
REGION OF PEEL AND DIVERSITY INSTITUTE

Appendix D – Career Satisfaction
12
SOCIAL MOBILITY OF IMMIGRANTS TO PEEL REGION
86
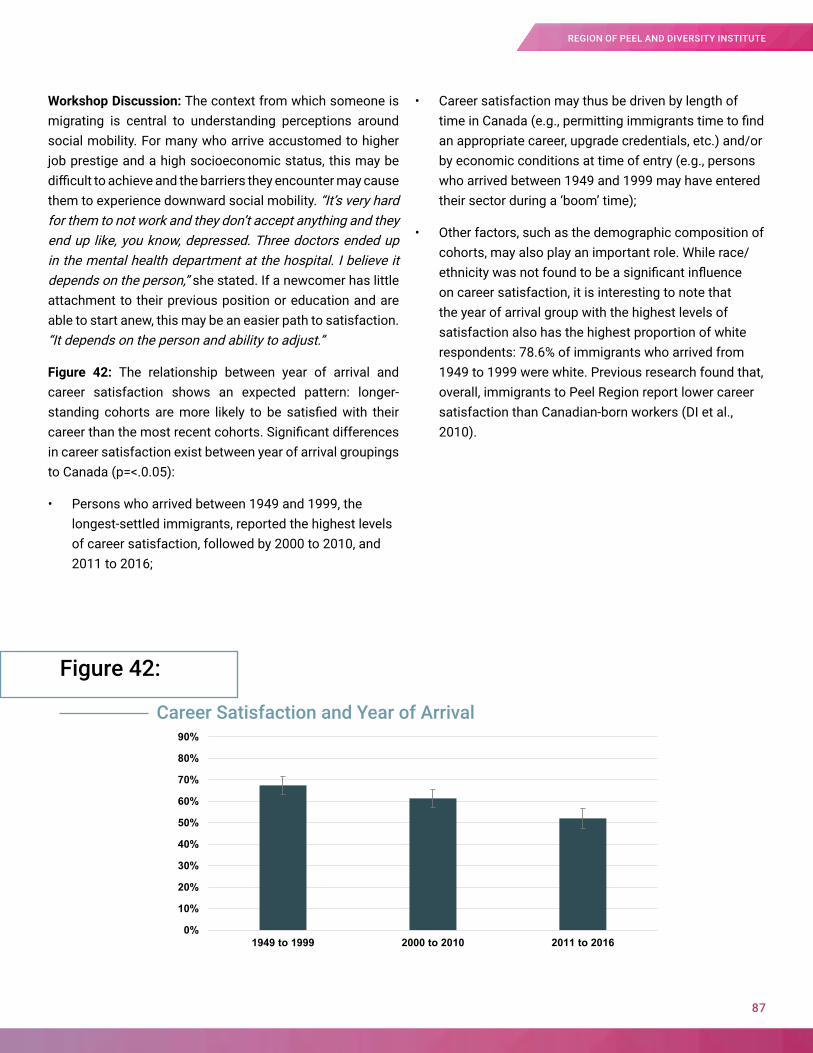
Workshop Discussion: The context from which someone is migrating is central to understanding perceptions around social mobility. For many who arrive accustomed to higher job prestige and a high socioeconomic status, this may be difficult to achieve and the barriers they encounter may cause them to experience downward social mobility. “It’s very hard for them to not work and they don’t accept anything and they end up like, you know, depressed. Three doctors ended up in the mental health department at the hospital. I believe it depends on the person,” she stated. If a newcomer has little attachment to their previous position or education and are able to start anew, this may be an easier path to satisfaction. “It depends on the person and ability to adjust.”
Figure 42: The relationship between year of arrival and career satisfaction shows an expected pattern: longer-standing cohorts are more likely to be satisfied with their career than the most recent cohorts. Significant differences in career satisfaction exist between year of arrival groupings to Canada (p=<.0.05):
• Persons who arrived between 1949 and 1999, the longest-settled immigrants, reported the highest levels of career satisfaction, followed by 2000 to 2010, and 2011 to 2016;
• Career satisfaction may thus be driven by length of time in Canada (e.g., permitting immigrants time to find an appropriate career, upgrade credentials, etc.) and/or by economic conditions at time of entry (e.g., persons who arrived between 1949 and 1999 may have entered their sector during a ‘boom’ time);
• Other factors, such as the demographic composition of cohorts, may also play an important role. While race/ethnicity was not found to be a significant influence on career satisfaction, it is interesting to note that the year of arrival group with the highest levels of satisfaction also has the highest proportion of white respondents: 78.6% of immigrants who arrived from 1949 to 1999 were white. Previous research found that, overall, immigrants to Peel Region report lower career satisfaction than Canadian-born workers (DI et al., 2010).
Figure 42:
Career Satisfaction and Year of Arrival
0%
10%
20%
30%
40%
50%
60%
70%
80%
90%
1949 to 1999 2000 to 2010 2011 to 2016
87
REGION OF PEEL AND DIVERSITY INSTITUTE
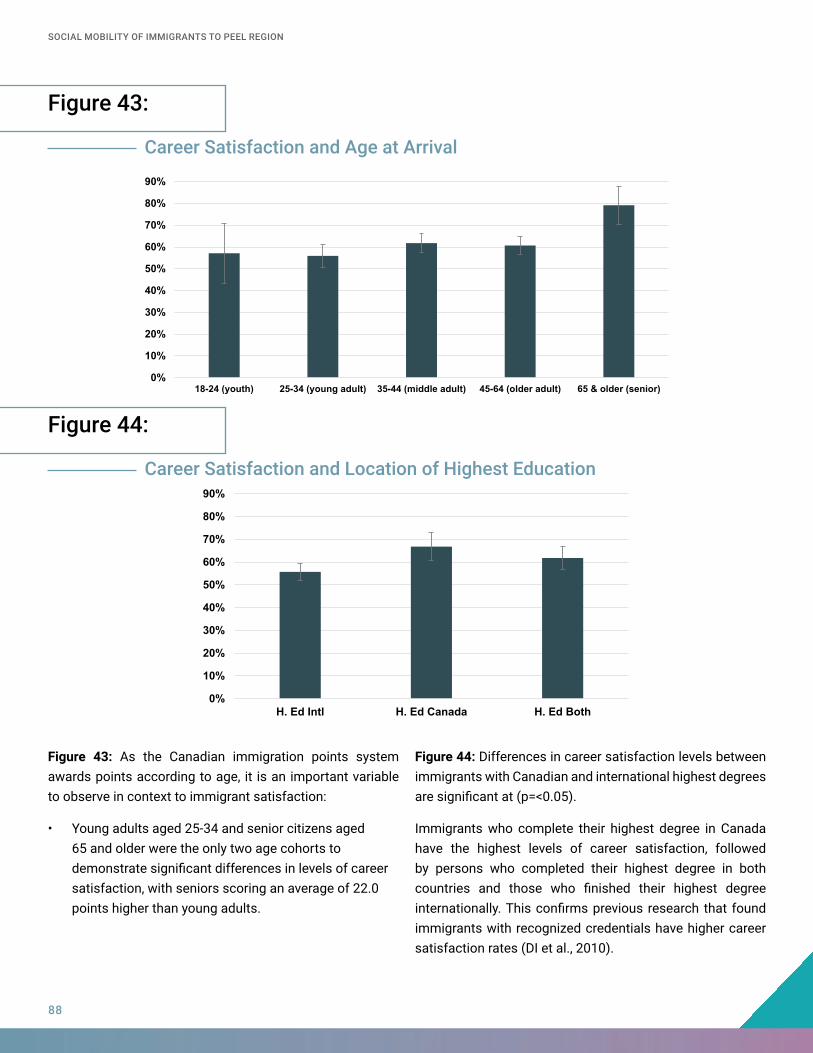
Figure 43:
Figure 44:
Career Satisfaction and Age at Arrival
Career Satisfaction and Location of Highest Education
0%
10%
20%
30%
40%
50%
60%
70%
80%
90%
18-24 (youth) 25-34 (young adult) 35-44 (middle adult) 45-64 (older adult) 65 & older (senior)
0%
10%
20%
30%
40%
50%
60%
70%
80%
90%
H. Ed Intl H. Ed Canada H. Ed Both
Figure 43: As the Canadian immigration points system awards points according to age, it is an important variable to observe in context to immigrant satisfaction:
• Young adults aged 25-34 and senior citizens aged 65 and older were the only two age cohorts to demonstrate significant differences in levels of career satisfaction, with seniors scoring an average of 22.0 points higher than young adults.
Figure 44: Differences in career satisfaction levels between immigrants with Canadian and international highest degrees are significant at (p=<0.05).
Immigrants who complete their highest degree in Canada have the highest levels of career satisfaction, followed by persons who completed their highest degree in both countries and those who finished their highest degree internationally. This confirms previous research that found immigrants with recognized credentials have higher career satisfaction rates (DI et al., 2010).
SOCIAL MOBILITY OF IMMIGRANTS TO PEEL REGION
88

89
REGION OF PEEL AND DIVERSITY INSTITUTE
Appendix E –Income Factors
13
SOCIAL MOBILITY OF IMMIGRANTS TO PEEL REGION
90
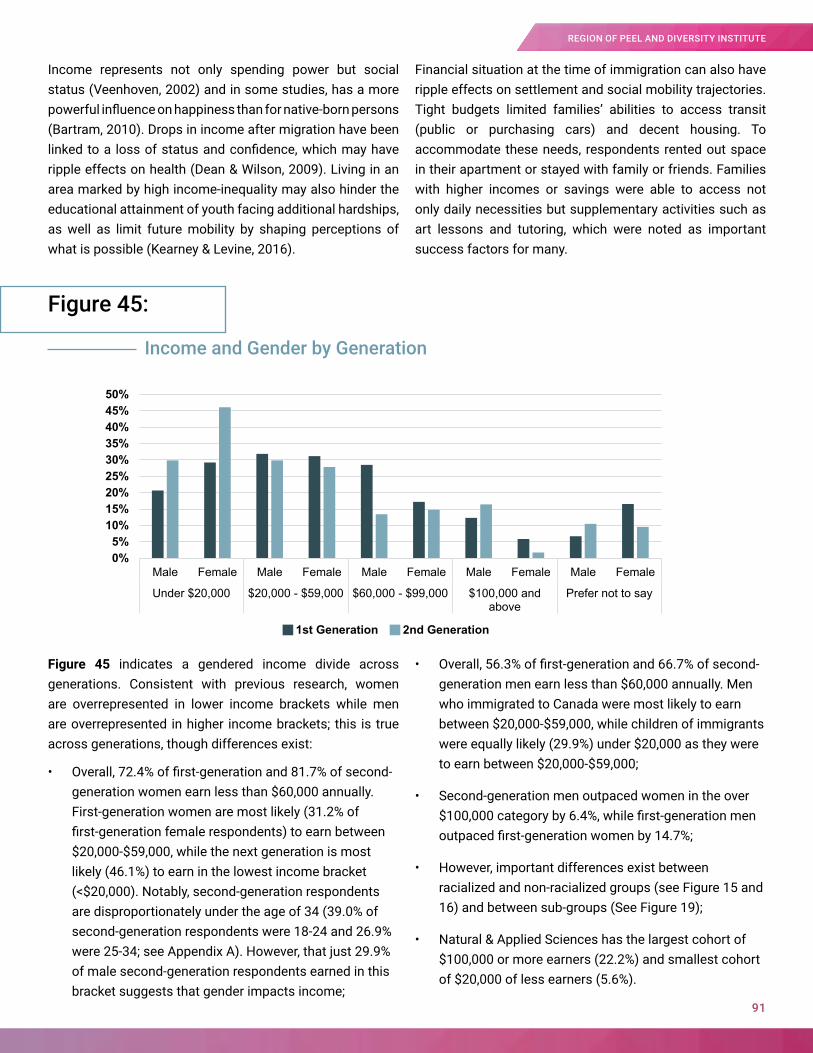
Income represents not only spending power but social status (Veenhoven, 2002) and in some studies, has a more powerful influence on happiness than for native-born persons (Bartram, 2010). Drops in income after migration have been linked to a loss of status and confidence, which may have ripple effects on health (Dean & Wilson, 2009). Living in an area marked by high income-inequality may also hinder the educational attainment of youth facing additional hardships, as well as limit future mobility by shaping perceptions of what is possible (Kearney & Levine, 2016).
Financial situation at the time of immigration can also have ripple effects on settlement and social mobility trajectories. Tight budgets limited families’ abilities to access transit (public or purchasing cars) and decent housing. To accommodate these needs, respondents rented out space in their apartment or stayed with family or friends. Families with higher incomes or savings were able to access not only daily necessities but supplementary activities such as art lessons and tutoring, which were noted as important success factors for many.
Figure 45 indicates a gendered income divide across generations. Consistent with previous research, women are overrepresented in lower income brackets while men are overrepresented in higher income brackets; this is true across generations, though differences exist:
• Overall, 72.4% of first-generation and 81.7% of second-generation women earn less than $60,000 annually. First-generation women are most likely (31.2% of first-generation female respondents) to earn between $20,000-$59,000, while the next generation is most likely (46.1%) to earn in the lowest income bracket (<$20,000). Notably, second-generation respondents are disproportionately under the age of 34 (39.0% of second-generation respondents were 18-24 and 26.9% were 25-34; see Appendix A). However, that just 29.9% of male second-generation respondents earned in this bracket suggests that gender impacts income;
• Overall, 56.3% of first-generation and 66.7% of second-generation men earn less than $60,000 annually. Men who immigrated to Canada were most likely to earn between $20,000-$59,000, while children of immigrants were equally likely (29.9%) under $20,000 as they were to earn between $20,000-$59,000;
• Second-generation men outpaced women in the over $100,000 category by 6.4%, while first-generation men outpaced first-generation women by 14.7%;
• However, important differences exist between racialized and non-racialized groups (see Figure 15 and 16) and between sub-groups (See Figure 19);
• Natural & Applied Sciences has the largest cohort of $100,000 or more earners (22.2%) and smallest cohort of $20,000 of less earners (5.6%).
Figure 45:
Income and Gender by Generation
0%5%
10%15%20%25%30%35%40%45%50%
Male Female Male Female Male Female Male Female Male Female
Under $20,000 $20,000 - $59,000 $60,000 - $99,000 $100,000 andabove
Prefer not to say
1st Generation 2nd Generation
91
REGION OF PEEL AND DIVERSITY INSTITUTE
Figure 46 shows income differences across occupations:
• Manufacturing has the largest cohort of persons earning $20,000 or less (44.4%) and the smallest proportion of persons earning $100,000 or more (5.6%);
• Earning between $20,000-$59,000 was the most common income bracket for all categories except for management; first-generation immigrants are most likely to work in business, while the second generation is most likely to be employed in sales and service (see Figure 40);
• Management was the only cohort where a different income bracket, $60,000-$99,000 was most common, with 41.4% of management workers earning within this range.
Wealth has subjective dimensions. Figure 47 suggests that first-generation immigrants’ perceptions of their own wealth fluctuates over time, but indicates a slight upward trend. Respondents scored their wealth perception at 63.4/100 before immigration, which dipped to 49.1% immediately after arriving in Canada, but rose again to 56.2% at present day.
This indicates that first-generation immigrants perceive their wealth standing as having improved since immigrating. The drop overall compared to pre-migration levels may be attributed to a drop in absolute income or, as several stakeholders suggest, a change in ‘how far’ one’s money will go in Canada.
SOCIAL MOBILITY OF IMMIGRANTS TO PEEL REGION
92
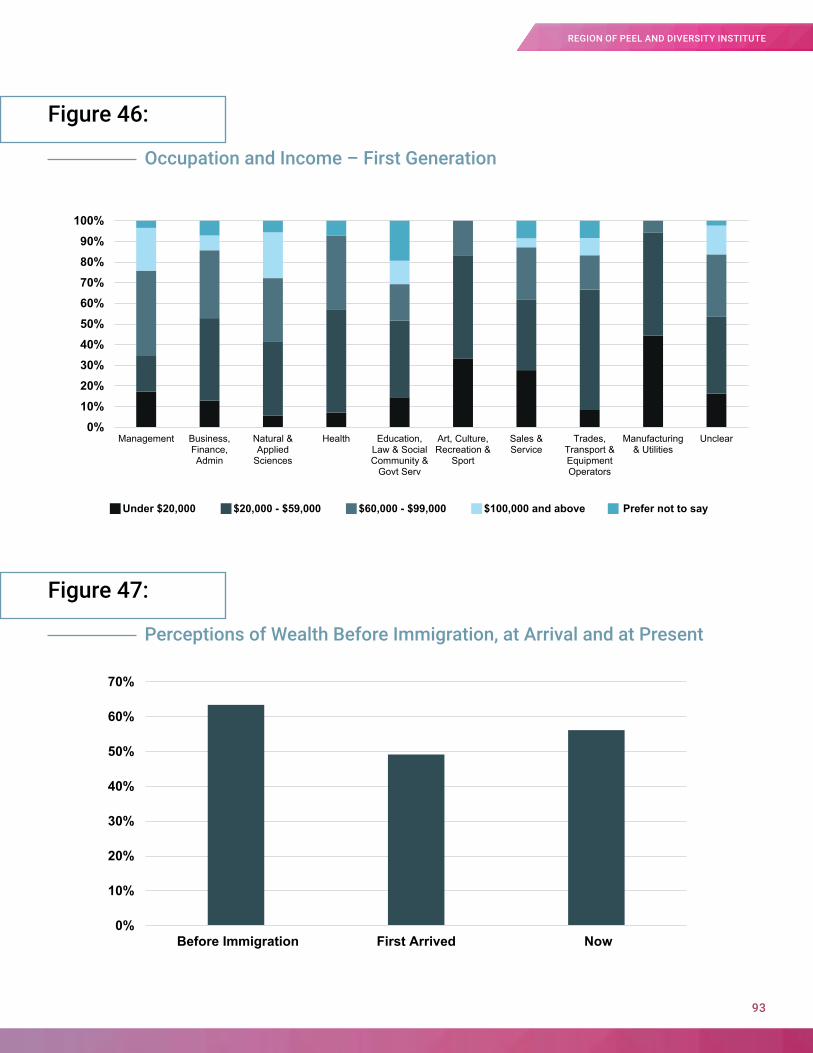
Figure 46:
Figure 47:
Occupation and Income – First Generation
Perceptions of Wealth Before Immigration, at Arrival and at Present
0%10%20%30%40%50%60%70%80%90%
100%
Management Business,Finance,Admin
Natural &Applied
Sciences
Health Education,Law & SocialCommunity &
Govt Serv
Art, Culture,Recreation &
Sport
Sales &Service
Trades,Transport &EquipmentOperators
Manufacturing& Utilities
Unclear
Under $20,000 $20,000 - $59,000 $60,000 - $99,000 $100,000 and above Prefer not to say
0%
10%
20%
30%
40%
50%
60%
70%
Before Immigration First Arrived Now
93
REGION OF PEEL AND DIVERSITY INSTITUTE
Appendix F – Strategies for Settlement Organizations
14
SOCIAL MOBILITY OF IMMIGRANTS TO PEEL REGION
94
Stakeholders from across settlement organizations were asked: What strategies does your organization use to create impact? Key themes and quotations that are indicative of broader findings are included here.
Encourage pre-migration knowledge-building: “Before the immigrants arrive, they correspond with our staff members with regards to labour market information; some of them are experts in resettlement, some of us are experts in employment. So labour market information, writing, all the things that before they arrive in Canada, they get all this information so that when they are arrived in Canada, it’s easier, it’s smoother, you know… they can get a job as soon as, well… their employment wait will be shorter than the average immigrant.”
Employ a family-based engagement strategy: “The strategy I know that we use for families is getting them into mainstream programs and activities. Beyond that, taking some calculated risks. Doing a program that you may not know anything about, try doing something that’s a little bit outside your comfort zone, try something for the first time with your child, sign him up for swimming class. Just getting them to do a little bit of things that are outside the comfort zone.”
Focus on youth engagement strategies: “We have peer-led orientation programs. Usually when newcomer youths come without the language, without knowing the environment, they are very nervous. They have anxiety. We created peer-led, before-school programs to help them while they are going through this. We have peer leaders who have that immigrant experience to share their struggles, their challenges and how they get supported, helped, and then adapted into the system and become successful.”
Develop neighbourhood engagement strategies to drive inclusion: “Right now we’re doing a neighbourhood survey in some specific neighbourhoods in Peel. The survey is finding out what the needs are in specific neighbourhoods and then there are different tools that we utilize in order to identify and engage all people in that neighbourhood.”
Support newcomers in their volunteer efforts: “Many immigrants are not familiar with volunteering or its potential benefits until after arriving in Canada. Back home, volunteering – the concept doesn’t exist. Why would you work for free? A substantive explanation around the benefits of volunteering as well as how to set the newcomer up for a successful volunteer opportunity is important otherwise they won’t get anything out of it.”
One government worker shared a personal story: “Volunteering, doing a co-op or maybe finding lower employment in the same field as your professional job can be useful. My dad was a volunteer at Trillium Hospital, then he moved to hospitality, then from hospitality to emergency room and then because he was there, he became aware of some opportunities where he could get a certificate of a license. And then he did.” Appendix I – Stakeholder Analysis of Policy & Social Mobility
95
REGION OF PEEL AND DIVERSITY INSTITUTE

Appendix G – References
15
SOCIAL MOBILITY OF IMMIGRANTS TO PEEL REGION
96
Abada, T., & Tenkorang, E. Y. (2009). Pursuit of university education among the children of immigrants in Canada: The roles of parental human capital and social capital. Journal of Youth Studies, 12(2), 185-207.
Aydemir, A. (2003). Effects of business cycles on the labour market assimilation of immigrants. Canadian Immigration Policy for the 21st Century. Statistics Canada [online]. Retrieved from http://econwpa.repec.org/eps/lab/papers/0309/0309010.pdf
Aydemir, A., Chen, W. H., & Corak, M. (2009). Intergenerational earnings mobility among the children of Canadian immigrants. The Review of Economics and Statistics, 91(2), 377-397.
Aydemir, A., Chen, W. H., & Corak, M. (2013). Intergenerational education mobility among the children of Canadian immigrants. Canadian Public Policy, 39(Supplement 1), S107-S122.
Bartram, D. (2010). Economic Migration and Happiness: Comparing Immigrants’ and Natives’ Happiness Gains From Income. Social Indicators Research. Retrieved from https://papers.ssrn.com/sol3/papers.cfm?abstract_id=1590265
Bauder, H. & Girard, E. R. (2005). Barriers blocking the integration of foreign-trained immigrant professionals: implications for smaller communities in Ontario. University of Guelph. Retrieved from https://www.researchgate.net/publication/228592454_Barriers_blocking_the_integration_of_foreign-trained_immigrant_professionals_ implications_for_smaller_communities_in_Ontario
Beach, C., Green, A., & Worswick, C. (2009). Improving Canada’s Immigration Policy. Retrieved from https://www.cdhowe.org/sites/default/files/attachments/research_papers/mixed//ebrief_87.pdf
Bertaux, D & Thompson, P. (2006). Pathways to Social Class: A Qualitative Approach to Social Mobility. New Brunswick: Transaction Publishers
Blau, P. & Duncan, O. (1967). The American Occupational Structure. New York: Wiley..
CERIS. (2014). Citizenship Research Synthesis 2009 - 2013. Citizenship and Immigration [online]. Retrieved from http://ceris.ca/wp-content/uploads/2015/01/CERIS-Research-Synthesis-on-Citizenship.pdf
Calgary Anti-Racism Education (CARED) (2015). Racialization. CARED [online]. Retrieved from http://www.ucalgary.ca/cared/racialization
Chen, W.H. & Ostrovsky, Y. (2016 June). Intergenerational Income Mobility: New Evidence from Canada. Statistics Canada [online]. Retrieved from http://www.statcan.gc.ca/pub/11-626-x/11-626-x2016059-eng.htm
Corak, M. (2006). Do Poor Children Become Poor Adults? Lessons from a Cross-Country Comparison of Generational Earnings Mobility. Research on Economic Inequality, 13 (1), 143-188.
Chetty, R. (2017). Improving opportunities for economic mobility: New evidence and policy lessons. Federal Reserve Bank of St. Louis. Retrieved from https://www.stlouisfed.org/~/media/Files/PDFs/Community%20Development/EconMobilityPapers/Section1/EconMobility_1-1Chetty_508.pdf?d=l&s=tw
Cukier, W., Gagnon, S., Mae Lindo, L., Hannan, C., & Amato, S. (2014). A [critical] ecological model to enabling change: Promoting diversity and inclusion. In Getting Things Done (pp. 245-275). Emerald Group Publishing Limited.
Corak, M. (2010). Chasing the Same Dream, Climbing Different Ladders. Economic Mobility in the United States and Canada. Economic Mobility Project. Retrieved from http://www.pewtrusts.org/~/media/legacy/uploadedfiles/pcs_assets/2010/pewempuscanadapdf.pdf
97
REGION OF PEEL AND DIVERSITY INSTITUTE
Cukier, W., Hon, H., McGraw, S., Latif, R. & Roach, E. (2017). Immigrant Entrepreneurship: Barriers and facilitators to growth. Toronto, Ontario: Diversity Institute. http://www.ryerson.ca/content/dam/diversity/reports/ImmigrantEntrepreneur.pdf
Dean, J. A. & Wilson, K. (2009). ‘Education? It is irrelevant to my job now. It makes me very depressed …’: exploring the health impacts of under/unemployment among highly skilled recent immigrants in Canada. Ethnicity & Health, 14(2), 185-204.
Ensign, P. C., & Robinson N. P. (2011). Entrepreneurs because they are Immigrants or Immigrants because they are Entrepreneurs? A Critical Examination of the Relationship between the Newcomers and the Establishment. The Journal of Entrepreneurship, 20(1), 33-53.
Gilkinson, T. & Sauvé G. (2010). Recent Immigrants, Earlier Immigrants and the Canadian Born: Association with Collective Identities. Citizenship and Immigration Canada. Retrieved from https://www.canada.ca/content/dam/ircc/migration/ircc/english/resources/research/2011-collectid/documents/pdf/rr201103_03e.pdf
Hout, M. (2014). A Summary of What We Know about Social Mobility. Annals of the American Academy of Political and Social Science, 657(1), 27-36.
Hudon, T. (2015). Women in Canada: A Gender-based Statistical Report. Ministry of Industry. Retrieved from http://www.statcan.gc.ca/pub/89-503-x/2015001/article/14217-eng.pdf
Hou, F., Schellenberg, G. & Berry, J. (2016). Patterns and Determinants of Immigrants’ Sense of Belonging to Canada and their Source Country. Statistics Canada [online]. Retrieved from http://www.statcan.gc.ca/pub/11f0019m/11f0019m2016383-eng.pdf.
Hulchanski, J. D. (2010). The three cities within Toronto: Income polarization among Toronto’s neighbourhoods, 1970-2005. Toronto: University of Toronto’s Cities Centre. Retrieved from http://www.urbancentre.utoronto.ca/pdfs/curp/tnrn/Three-Cities-Within-Toronto-2010-Final.pdf
Keung, N. (2018). Immigrants are largely behind Canada’s status as one of the best-edcuated countries. Toronto Star [online]. Retrieved from https://www.thestar.com/news/immigration/2018/02/01/immigrants-are-largely-behind-canadas-status-as-one-of-the-best-educated-countries.html
Kearney, M. S., & Levine P. B. (2016). Income Inequality, Social Mobility, and the Decision to Drop Out of High School. Brookings Papers on Economic Activity, 2016(1), 333-396.
Kelly, P. (2014). Understanding Intergenerational Social Mobility: Filipino Youth in Canada. IRPP Study, 45. Retrieved from http://irpp.org/wp-content/uploads/assets/research/diversity-immigration-and-integration/filipino-youth/kelly-feb-2014.pdf
Lammam, C., Karabegovic, A. & Veldhuis, N. (2012). Measuring income mobility in Canada. Fraser Institute [online]. Retrieved from https://www.fraserinstitute.org/sites/default/files/measuring-income-mobility-in-canada-rev.pdf
Li, P. S. (2003). Deconstructing Canada’s discourse of immigrant integration. Journal of International Migration and Integration, 4(3), 315-333.
Ontario Human Rights Commission (2018). Racial discrimination, race and racism (fact sheet). OHRC [online]. Retrieved from http://www.ohrc.on.ca/en/racial-discrimination-race-and-racism-fact-sheet
Peel Data Centre (2015). Executive summary. Region of Peel [online]. Retrieved from https://www.peelregion.ca/finance/dashboard-eco/peel-eco-pulse/exec-summ.html
SOCIAL MOBILITY OF IMMIGRANTS TO PEEL REGION
98
Portraits of Peel, 2011 Retrieved from https://www.peelregion.ca/social-services/pdfs/2011-Portraits-of-Peel-A-Community-Left-Behind.pdf
Region of Peel. (2017b August). 2016 Census bulletin: Languages. Retrieved from https://www.peelregion.ca/planning-maps/censusbulletins/2016-languages-bulletin.pdf
Region of Peel. (2017a October). 2016 Census bulletin: Immigration and ethnic diversity. Retrieved from https://www.peelregion.ca/planning-maps/CensusBulletins/2016-immigration-ethnic-diversity.pdf
Region of Peel. (2017c September). 2016 Census bulletin: Income. Retrieved from https://www.peelregion.ca/planning-maps/censusbulletins/2016-income-bulletin.pdf
Reitz, J. G., & Banerjee, R. (2007). Racial inequality, social cohesion and policy issues in Canada. Institute for Research on Public Policy.
Schaafsma, J & Sweetman, A. (2001). Immigrant earnings: age at immigration matters. Canadian Journal of Economics, 34(4), 1066-1099.
Statistics Canada. (2016). Income and mobility of immigrants, 2014. The Daily. December 12. Statistics Canada. Catalogue no. 11-001-X [online]. Retrieved from http://www.statcan.gc.ca/daily-quotidien/161212/dq161212b-eng.pdf
Statistics Canada (2017a). Income and mobility of immigrants, 2015. Statistics Canada [online]. Retrieved from http://www.statcan.gc.ca/daily-quotidien/171127/dq171127a-eng.htm
Statistics Canada (2017b). Census profile, 2016 Census. Statistics Canada [online]. Retrieved from http://www12.statcan.gc.ca/census-recensement/2016/dp-pd/prof/details/page.
Sharkey, P. (2008). The Intergenerational Transmission of Context 1. American Journal of Sociology, 113(4), 931-969.
Thiessen, V. (2009). The Pursuit of Postsecondary Education: A Comparison of First Nations, African, Asian, and European Canadian Youth. Canadian Review of Sociology, 46(1), 5-37.
Toronto Foundation. (2016). Toronto’s Vital Signs Report 2016. Retrieved from https://torontofoundation.ca/torontos-vital-signs-report/
Veenhoven, R. (2002). Why social policy needs subjective indicators. Assessing Quality of Life and Living Conditions to Guide National Policy, 58, 33-45. Retrieved from https://link.springer.com/book/10.1007/0-306-47513-8#page=39
Xue, L. (2010). Initial labour market outcomes: A comprehensive look at the employment experience of recent immigrants during the first four years in Canada. Citizenship and Immigration Canada.
Yap, M., Cukier, W., Hannan, C.A.,, Holmes, M., Jeffery, K. & Lejaisaks, L. (2009). Peel Immigraiton Labour Market Survey Findings. Peel Region [online]. Retrieved from https://www.ryerson.ca/content/dam/diversity/reports/PeelReport_2010.pdf
Zhou, M. (1997). Growing Up American: The Challenge Confronting Immigrant Children and Children of Immigrants. Annual Review of Sociology, 23, 63-95.
Zietsma, D. (2010). Immigrants working in regulated occupations. Perspectives on labour and income. Statistics Canada [online]. Retrieved from https://www.statcan.gc.ca/pub/75-001-x/2010102/article/11121-eng.html
99
REGION OF PEEL AND DIVERSITY INSTITUTE

We undertake research on diversity in the workplace to improve practices in organizations. We work with organizations to develop customized strategies, programming, and resources to promote new, interdisciplinary knowledge and practice about diversity with respect to gender, race/ethnicity, Aboriginal peoples, abilities and sexual orientation. Using an ecological model of change, our action-oriented, evidence-based approach is driving social innovation across sectors.
ABOUT THE
DIVERSITYINSTITUTE
CONTACT US
WWW.RYERSON.CA/DIVERSITY [email protected]
416-979-5000 EXT. 7268 FOLLOW US AT @RYERSONDI


