Embed Size (px)
Citation preview
Sound communication among animals is constrained bytheir size and, because insects tend to be small, there arephysical limits to both the power and frequency of the signalthey can produce (Bailey, 1991; Bennet-Clark, 1998). As aconsequence, there is a close correlation between the size ofthe sound-producing structure and the song frequency (Bennet-Clark, 1998). Because high frequencies are attenuated by theenvironment at a greater rate than low frequencies and because,for the most part, insects gain by transmitting the signal overthe furthest distance, there is a constant trade-off between the
production of signals at high frequencies, which can beproduced more efficiently, versusat low frequencies, whichcan travel further (Römer, 1993).
Insects have exploited three strategies to achieve effectivesound transmission. First, concentrating the sound powerwithin a narrow frequency band improves the effective signal-to-noise ratio and is achieved by the use of resonant sound-producing structures. The second requirement is for efficientcoupling or impedance matching between the sound-producingstructures and the surrounding air. Finally, related to both
2827The Journal of Experimental Biology 204, 2827–2841 (2001)Printed in Great Britain © The Company of Biologists Limited 2001JEB3299
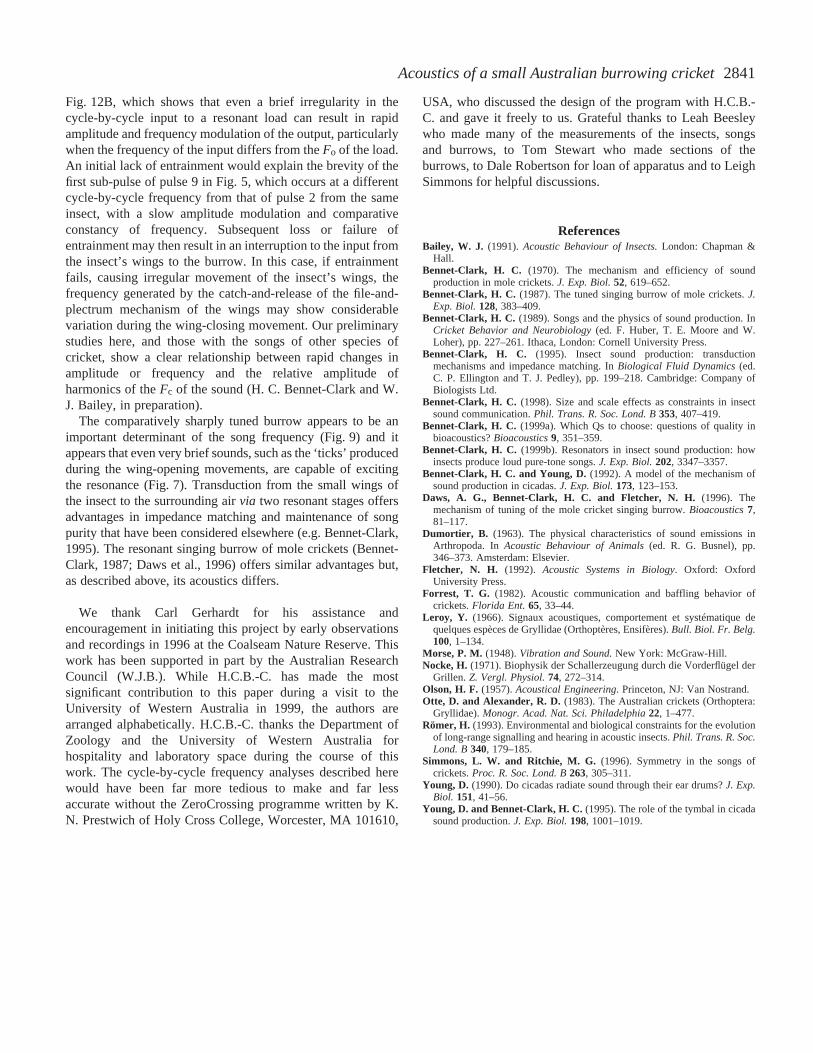
For most insects, size determines the call frequency.This paper describes the acoustics of a smallbrachypterous cricket (Rufocephalus sp.; body length9.6 mm) producing a call with a carrier frequency ofapproximately 3.2 kHz from a subterranean burrow.Crickets such as Gryllus campestrisare approximatelytwice this length and produce a call frequency close to5 kHz. The burrow of Rufocephalusopens via a small holewith a diameter of 3.2 mm. The neck of the hole atapproximately 1.4 mm depth opens to a vertical two-partburrow with an upper vase-shaped chamber 16.1 mm inheight with a diameter of 9.4 mm. This top chamberconnects via a 6.4 mm high (diameter 5.2 mm) neck to amore irregular chamber approximately 18 mm high with awidth of approximately 11 mm. The walls of the topchamber neck and of the upper part of the lower chamberare smooth and appear to be sealed with saliva.
The song has a mean centre frequency of 3.2 kHz and ismade up of variable-length trills of pulses of meanduration 15.8 ms. Many song pulses had smooth envelopesand their frequency did not vary by more than ±40 Hzfrom the centre frequency, with a relative bandwidthQ−3dB of over 50. Other pulses showed considerableamplitude and frequency modulation within the pulse.
When driven by external sound, burrows resonated at amean frequency of 3.5 kHz with a mean quality factor Q
of 7.4. Natural-size model burrows resonated at similarfrequencies with similar Q values. One cricket, which hadpreviously called from its own burrow at 2.95 kHz, sang at3.27 kHz from a burrow that resonated at the samefrequency.
Life-size model burrows driven by external soundresonated at similar frequencies to the actual burrows;models three times life size resonated at one-third of thisfrequency. In all models, the sound pressure was more-or-less constant throughout the top chamber but fell rapidlyin the neck of the burrow; the phase of the sound waseffectively constant in the top chamber and neck and fellthrough approximately 180 ° in passing from the neck intothe lower chamber. A numerical model of the sound flowfrom region to region gave essentially similar results.
A resonant electrical model fed from a high-impedancesource with discrete tone bursts at different frequenciesshowed similar amplitude and frequency modulation tothe various types of song pulses that were observed. It issuggested that the high purity of the songs results fromclose entrainment of the sound-producing mechanism ofthe insect’s wings to the sharply resonant burrow.
Key words: acoustics, cricket, song, tuned burrow, frequency, songpurity, Rufocephalussp., communication, sound.
Summary
Introduction
ACOUSTICS OF A SMALL AUSTRALIAN BURROWING CRICKET: THE CONTROLOF LOW-FREQUENCY PURE-TONE SONGS
W. J. BAILEY1, H. C. BENNET-CLARK2,* AND N. H. FLETCHER3
1Department of Zoology, University of Western Australia, Nedlands, WA 6907, Australia, 2Department of Zoology,University of Oxford, South Parks Road, Oxford OX1 3PS, UK and3Department of Electronic Materials,
Engineering Research School of Physical Sciences and Engineering, Australian National University, Canberra,ACT 0200, Australia
*Author for correspondence (e-mail: [email protected])
Accepted 4 June 2001
2828
sound power and increasing the insect’s effective size, insectshave exploited external structures that are larger thanthemselves (Forrest, 1982; Bennet-Clark, 1998).
The forewings of male crickets are specialised for soundproduction: a plectrum on the posterior edge of one wingengages with the teeth of a file on the underside of the oppositewing. Crickets sing by closing the forewings and therebycreating a series of catch-and-release actions between theplectrum and file, which in turn distorts specialised veins ofthe wings (the harp), exciting their resonant vibration (Nocke,1971; for reviews, see Bennet-Clark, 1989; Bennet-Clark,1999b). Each wing-closure causes a series of excitations ofthe harp resonators, which merge into a sustained coherentvibration that is radiated as a sound pulse.
Because the resonant frequencies of the harp regions of thetwo wings are similar and sharply tuned, cricket songs aremusical and most songs are confined to a narrow frequencyband corresponding closely to the resonant frequency of theharps (Nocke, 1971). However, this rather simplisticallysuggests that crickets produce pure-tone calls, although this isseldom observed: in many crickets, the frequency of the signaldecreases within each pulse (Leroy, 1966; Simmons andRitchie, 1996); the effective resonant frequency appears todecrease throughout the closing stroke (Bennet-Clark, 1999b).In this paper, we examine the extent to which a pure-tonecarrier frequency can be maintained by a calling insect.
Efficient impedance matching between a vibrating structureand the surrounding fluid medium depends on the effective sizeof the sound-producing structure. For example, the radius of amonopole source that radiates sound from only one side shouldexceed one-sixth of the carrier frequency wavelength; if thesource is a doublet, radiating sound from both sides, theeffective radius should exceed one-quarter wavelength (Olson,1957; Fletcher, 1992). Not surprisingly, where there has beenstrong selection on low-frequency pure-tone signals, insectshave evolved second-stage transduction devices thateffectively increase the size of the sound source.
Many insects that produce pure-tone sounds increase thepower of the signal by coupling the sound-producing organ toa resonator (Forrest, 1982). These resonators can form part ofthe sound-producing structures themselves, but the insect mayalso use external structures to enhance the signal further. Suchdevices may include leaves as baffles (Forrest, 1982) or thespecially shaped burrows of mole crickets that are tuned to theresonant frequency of the sound-producing wings (Bennet-Clark, 1970; Bennet-Clark, 1987; Daws et al., 1996). Incicadas, the primary resonators are small paired tymbals on theside of the abdomen which, in many cicadas, drive a Helmholtzresonator consisting of the abdominal air sac and ear drums(Young, 1990; Bennet-Clark and Young, 1992). A feature ofboth the mole cricket and the cicada systems is that the secondstage of impedance matching increases the effective size of thesound source to close to the optimum and, since it is tuned tothe carrier frequency of the song, tonal purity is maintained.
This paper describes a grylline system analogous to thatof the mole cricket (Gryllotalpidae). The remarkably low
frequency of the song, with its almost pure tone, is producedby a very small cricket, thus challenging the notion that smallinsects can produce only high-frequency calls. This exampleof an insect that uses external means to enhance its callingperformance represents, to the best of our knowledge, the firstdescription of a member of the Gryllidae using a complextuned burrow for this purpose. We test the acoustics of such asystem by natural experiment and also by developing bothmodel burrows and model crickets. Finally, we drawcomparisons between the subject of this paper, an undescribedspecies of Rufocephalus, and the acoustics of mole crickets.
Materials and methodsInsects
The cricket described in this paper is tentatively assigned tothe genus RufocephalusOtte and Alexander, 1983. The fourRufocephalusspecies described by Otte and Alexander (Otteand Alexander, 1983) occur several hundred kilometres northof our study site, extending from the Pilbara Ranges to theKimberley Plateau in Western Australia. The song types ofthese four species are different from those described here, asare their carrier frequencies. It is almost certainly a new specieswithin the genus and, throughout this paper, we therefore referto it as Rufocephalus. Voucher specimens are lodged with theAustralian National Insect Collection, Canberra.
Male insects were collected from the Coalseam NatureReserve on the Irwin River north of Mingenew in WesternAustralia on three occasions in October and November 1999.Insects were located by their song during the night and dug upimmediately after song recordings had been made. The insectsmade their burrows in red alluvial sandstone clays where thetop 20–30 mm hardens to a crust-like cap. Some burrows werephotographed while the insect was calling, enabling ameasurement of the exposed length of their antennae. Insectswere brought back live to Perth in separate specimen jarsand were subsequently preserved in 70 % ethanol. Bodydimensions of preserved insects were measured to the nearest0.1 mm using a graticule eyepiece in an Olympus binocularmicroscope.
Measurements of song parameters
After the burrow opening had been located, recordings weremade from a distance of approximately 150 mm. Themicrophone was a Tandy tie-clip microphone (catalogue no.33-1052) fastened to the end of a 400 mm long 7 mm diameterplastic pipe; this was calibrated against a Bruel and Kjaermicrophone (type 4165) and Bruel and Kjaer sound level meter(type 2209); its response was flat ±2 dB between 1 and 20 kHz.Recordings were made at 12 dB below peak level into onechannel of a Sony TCD-D8 digital audio tape recorder, with aspecified and measured frequency response that was flat ±1 dBfrom 20 Hz to 22 kHz. Recordings were voice-cued with thedate and serial number of the insect. Between 30 and 60 s ofrecording were made for each insect.
Sound level measurements were made in the field using a
W. J. BAILEY, H. C. BENNET-CLARK AND N. H. FLETCHER
2829Acoustics of a small Australian burrowing cricket
Bruel and Kjaer (type 2231) sound level meter with integratingmodule (type BZ7100) and microphone (type 4155). Bothmean sound pressure and peak sound pressure levels weremeasured with a distance of 200 mm between the mouth of theburrow and the face of the microphone.
Tape recordings were analysed either using Signal(Engineering Design, Belmont, MA, USA) data-acquisitionand analysis software or using the sound-acquisition input ofan Apple Macintosh Powerbook 3400C and Canary 1.2.1sound-analysis software sampling at 44.1 kilosamples s−1.Pulse duration was measured directly from oscillograms; thedominant frequency was measured by Fast Fourier Transform(FFT), and cycle-by-cycle frequency was measured by zero-crossing analysis.
Most FFT analyses using the Canary software were madeusing a Hamming window and a 2048-point analysis windowgiving a filter bandwidth of 87 Hz. Most recordings wereanalysed without filtering, but in some cases where there wasintrusive wind noise, frequencies below 500 Hz and above12 kHz were removed before signal analysis with the ‘filterout’ tool in the Canary software; this filters by 30 dB in 50 Hz,regardless of the frequency. The harmonic content of differentparts of song pulses was observed by similar filtering-out ofthe frequency band from 1 to 4.5 kHz and comparing thefiltered pulse with the unfiltered one. The frequency spectra ofshort sections of sound pulses were analysed by copying partof the pulse and pasting it into the middle of a 0.5 s durationblank recording. To improve the resolution of the FFT analysis,single song pulses were analysed by copying them into a 0.5 sduration blank recording and making a 16 384-point analysis,giving a filter bandwidth of 10.9 Hz.
Resolution of the cycle-by-cycle or instantaneous frequencywithin the pulses was performed using ZeroCrossing ZCversion 3 software written by K. N. Prestwich, which measuresthe time of zero crossing of the wave form to a precision ofapproximately 0.5µs by exploiting the interpolation betweensample points provided by the Canary software. Tests with3 kHz sine-wave signals showed that the frequency ofindividual cycles was measured to less than ±5 Hz. Furthertests showed that the method can give anomalous results withsignals with any direct current component or where the signal-to-noise ratio is poor: the analyses reported here were madeafter using the software to filter out all signal componentsbelow 500 Hz and normally only with signals for which thesignal-to-noise ratio exceeded 40 dB.
Burrows
Casts of burrows were made in the field by pouring dentalplaster made up to a fluid consistency through the surface holeof the burrow. A 15 mm high ring of plastic water pipe wasused to confine the plaster to the region of the mouth of theburrow. The casts were dug up the next day, and adherent soilwas washed away.
Most dimensions of the washed plaster casts were measuredto the nearest 0.1 mm using Mitutoyo digital callipers. Actualburrows in the soil were fragile, so the dimensions of the
surface holes and other regions were measured optically in thelaboratory or from photographs taken in the field with areference scale. Further measurements were made directlyfrom casts of burrows, which were dug up and then sectionedin the laboratory.
The porosity of different regions of the burrows wasassessed by painting the inside of the burrow with cellulosepaint and subsequent washing to remove soil particles. Surfaceroughness was measured from sections of the burrow cut afterembedding the parts of the burrow in epoxy resin.
For acoustic tests, blocks of approximately the top50–100 mm of soil, each containing a burrow, were dug up andtransported to the laboratory. Acoustic testing was carried outafter placing the block of soil containing the burrow on a10 mm thick layer of cotton wool on top of a 100 mm thicklayer of acoustic foam.
Tests with model burrows
Natural-size models of the burrow cavity were carved fromparaffin wax to dimensions taken from representative plastercasts of the insects’ burrows; any rough carved marks weresmoothed with a warm soldering iron. The models werecarved so that the dimensions of the surface hole, upper andlower chambers and neck (see Fig. 1) were within ±0.2 mmof the dimensions of the plaster casts of burrows, but themodels were made with a longer neck at the surface hole anda long exit tunnel, giving a total length of 150 mm andwithout the natural and occasional deformations that occurredin the casts of the burrows. The wax models were cast in thecentre of a 30 mm square block of plaster, so the wallthickness of the cast exceeded 10 mm. After the cast had set,it was dried and heated to melt out the wax. Holes 1.3 mm indiameter were drilled through the walls of the cast into themodel cavity to allow the insertion of probe microphones;when not in use, these holes were plugged with wooden pegs.The sharp lip of the surface hole of the real burrow wassimulated by grinding away any excess plaster left after thecasting process.
The natural-size models were driven by an external soundsource placed 40 mm from the top surface of the model, andmeasurements were made at 5 mm intervals along the lengthof the cavity as well as across the outside of the models at theplane of the surface hole (see Fig. 1). The strong resonancesdue to the 100–120 mm length of the cavity were damped byfilling the lower half of the models with cotton wool; tests witha probe microphone inserted into the cotton wool showed (i)that the resonance seen in the upper part of the model did notappear at the bottom end of the model and (ii) that the soundwas attenuated by over 40 dB relative to the peak pressures inthe upper part of the models. Further, measurements in theupper parts of the model with the bottom end of the modelsealed with modelling clay were the same as those with the endopen.
A model cricket body was made from a cylinder (10 mmlong and 3 mm in diameter) of modelling clay mounted on astraight length of 0.2 mm wire, which was inserted through the
2830
bottom end of the plaster model. Using a scale attached to thewire, this was moved to measured positions along the lengthof the burrow.
A series of model burrows approximately three timesnatural size was made from 30 mm internal diameter by45 mm internal length polyethylene film canisters, joined bylengths of 14.5 mm internal diameter polystyrene tubing. Avariety of surface holes was provided by washers in which thehole had been chamfered to give a sharp edge. Holes 1.5 mmin diameter were drilled along the length of the model for theinsertion of probe microphones. A 3 mm wide slot cut alongthe length of the top chamber of the model allowed the soundsource to be moved along the chamber, where it was sealedin place with modelling clay. The modular constructionallowed the dimensions of the models to be altered.Termination in the models was provided by a 300 mm lengthof 14 mm internal diameter plastic tubing filled with cottonwool. Variable porosity was provided by rows of 1.5 mmdiameter holes in the walls of the model which could be sealedwith modelling clay.
The relative amplitudes and phases of the inputs andresponses of the models were measured directly from anoscilloscope. Phase was measured in degrees, and phase leadrelative to that at the datum was, for convenience, given apositive value.
An electrical model of the burrow was made from a parallelLCR (inductor, capacitor and resistor: Fig. 12C, inset) resonantcircuit in which a 20 mH inductor was tuned by a 0.15µFcapacitor to 2.9 kHz and adjusted with a 20 kΩ shunt resistorto a quality factor Q of 10. This was driven via a 22 kΩ resistor,which provided a source of similar impedance to that of theresonant circuit at its resonant frequency, from a Tektronix FG501A function generator gated to produce tone bursts by pulsesfrom a Digitimer DS9A stimulator, and measurements weremade of the response across the inductor. The frequency withinthe tone bursts was set to the nearest 10 Hz using a TestlabM2365 multimeter.
Sound sources
The wings of crickets are held above the body, so there issound leakage from the two sides around the edges of thewings. An appropriate model is a doublet source consistingof a moving diaphragm open on both sides so that the anti-phase sound radiated from one side interacts with that fromthe other side. A high-quality Sony 15 mm diameter earphonewas removed from its housing and glued to a 2 mm squaresupport rod parallel to the plane of its diaphragm. The backof the diaphragm radiates sound through small ports in theearphone surround anti-phase with that radiated from thefront of the diaphragm. To balance the output from the twosides of the diaphragm, a 12 mm diameter disc of adhesivetape was attached to occlude the central part of the front faceof the earphone. The following tests confirmed that the sourceacted as a suitable dipole or doublet source: first, the phaseof the sound output at the front of the source differed by 180 °from that at the back; second, measurements made by moving
a probe microphone in a straight line normal to the plane ofthe diaphragm, 1 mm away from the edge of the earphone,showed a nearly symmetrical V-shaped distribution of soundpressure on either side of the diaphragm with a null at theplane of the diaphragm and a 180 ° phase shift either side ofthe null.
Burrows and models were also driven externally by anunmodified Sony earphone mounted on a 2 mm square supportrod at a range of 50 mm from the surface hole with the centreof the diaphragm on the axis of the burrow.
Both sound sources were driven directly by a HewlettPackard 8111A pulse and function generator gated to producediscrete tone bursts of complete sinusoidal cycles by pulsesgenerated by a Neurolog pulse and delay-width generator. Bothsources were effectively aperiodic when driven by tone burstsbetween 0.8 and 5 kHz; in other words, there were nosignificant resonances in the frequency band studied here and,when the source was driven by a tone burst of 10 cycles, itproduced 10 cycles of sound.
Probe microphones
Measurements of the acoustics of burrows, casts and modelswere made using a pair of probe microphones similar to thosedescribed by Young and Bennet-Clark (Young and Bennet-Clark, 1995) made from Realistic Electret tie-pin microphones(Tandy catalogue 33-1052) but with 18 mm long probe tubesof 1.25 mm external diameter and 0.8 mm internal diameter.The microphones were used in conjunction with a speciallyconstructed two-channel preamplifier and, overall, theresponses were amplitude-matched to less than ±0.5 dB from200 Hz to 6 kHz with a time difference of less than ±5µsequivalent to ±5 ° at 3 kHz.
Terminology
The sharpness of tuning of resonances is quoted as thequality factor (or Q), given by π/loge(decrement) of the freedecay of an oscillation. The Q value is also the ratio of theresonance frequency of a system to the width of the responsecurve at 50 % amplitude or at 3 dB below the peak response(Morse, 1948).
The relative bandwidth of frequency spectra is quoted asQ−3dB, given by the frequency at which amplitude is maximaldivided by the bandwidth at 3 dB below the maximum.
Two separate terms are used here because they concerndifferent aspects of the sound signals we describe. The contextsin which the use of different measurements of Q areappropriate are discussed in Bennet-Clark (Bennet-Clark,1999a).
The frequency at which the acoustic response to asinusoidal drive is maximal is termed the resonant frequency,Fo. The frequency of maximum power in a frequency versusrelative power spectrum is termed the best or centrefrequency, Fc.
In power spectra, the relative power is given in decibels (dB)relative to the peak power: 10 dB is a 10-fold change in power;20 dB is a 10-fold change in amplitude.
W. J. BAILEY, H. C. BENNET-CLARK AND N. H. FLETCHER
2831Acoustics of a small Australian burrowing cricket
ResultsInsects and burrows
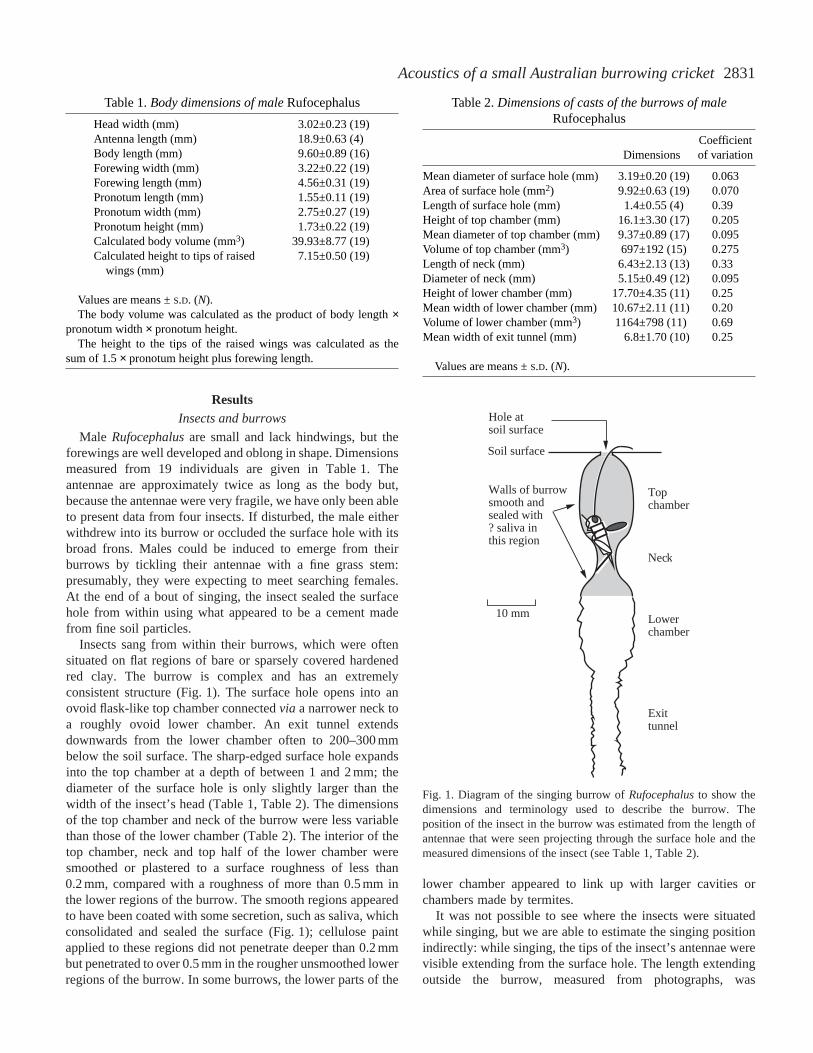
Male Rufocephalusare small and lack hindwings, but theforewings are well developed and oblong in shape. Dimensionsmeasured from 19 individuals are given in Table 1. Theantennae are approximately twice as long as the body but,because the antennae were very fragile, we have only been ableto present data from four insects. If disturbed, the male eitherwithdrew into its burrow or occluded the surface hole with itsbroad frons. Males could be induced to emerge from theirburrows by tickling their antennae with a fine grass stem:presumably, they were expecting to meet searching females.At the end of a bout of singing, the insect sealed the surfacehole from within using what appeared to be a cement madefrom fine soil particles.
Insects sang from within their burrows, which were oftensituated on flat regions of bare or sparsely covered hardenedred clay. The burrow is complex and has an extremelyconsistent structure (Fig. 1). The surface hole opens into anovoid flask-like top chamber connected via a narrower neck toa roughly ovoid lower chamber. An exit tunnel extendsdownwards from the lower chamber often to 200–300 mmbelow the soil surface. The sharp-edged surface hole expandsinto the top chamber at a depth of between 1 and 2 mm; thediameter of the surface hole is only slightly larger than thewidth of the insect’s head (Table 1, Table 2). The dimensionsof the top chamber and neck of the burrow were less variablethan those of the lower chamber (Table 2). The interior of thetop chamber, neck and top half of the lower chamber weresmoothed or plastered to a surface roughness of less than0.2 mm, compared with a roughness of more than 0.5 mm inthe lower regions of the burrow. The smooth regions appearedto have been coated with some secretion, such as saliva, whichconsolidated and sealed the surface (Fig. 1); cellulose paintapplied to these regions did not penetrate deeper than 0.2 mmbut penetrated to over 0.5 mm in the rougher unsmoothed lowerregions of the burrow. In some burrows, the lower parts of the
lower chamber appeared to link up with larger cavities orchambers made by termites.
It was not possible to see where the insects were situatedwhile singing, but we are able to estimate the singing positionindirectly: while singing, the tips of the insect’s antennae werevisible extending from the surface hole. The length extendingoutside the burrow, measured from photographs, was
Table 1. Body dimensions of male Rufocephalus
Head width (mm) 3.02±0.23 (19)Antenna length (mm) 18.9±0.63 (4)Body length (mm) 9.60±0.89 (16)Forewing width (mm) 3.22±0.22 (19)Forewing length (mm) 4.56±0.31 (19)Pronotum length (mm) 1.55±0.11 (19)Pronotum width (mm) 2.75±0.27 (19)Pronotum height (mm) 1.73±0.22 (19)Calculated body volume (mm3) 39.93±8.77 (19)Calculated height to tips of raised 7.15±0.50 (19)
wings (mm)
Values are means ±S.D. (N).The body volume was calculated as the product of body length ×
pronotum width × pronotum height.The height to the tips of the raised wings was calculated as the
sum of 1.5 × pronotum height plus forewing length.
Table 2.Dimensions of casts of the burrows of maleRufocephalus
Coefficient Dimensions of variation
Mean diameter of surface hole (mm) 3.19±0.20 (19) 0.063Area of surface hole (mm2) 9.92±0.63 (19) 0.070Length of surface hole (mm) 1.4±0.55 (4) 0.39Height of top chamber (mm) 16.1±3.30 (17) 0.205Mean diameter of top chamber (mm) 9.37±0.89 (17) 0.095Volume of top chamber (mm3) 697±192 (15) 0.275Length of neck (mm) 6.43±2.13 (13) 0.33Diameter of neck (mm) 5.15±0.49 (12) 0.095Height of lower chamber (mm) 17.70±4.35 (11) 0.25Mean width of lower chamber (mm) 10.67±2.11 (11) 0.20Volume of lower chamber (mm3) 1164±798 (11) 0.69Mean width of exit tunnel (mm) 6.8±1.70 (10) 0.25
Values are means ±S.D. (N).
10 mm
Walls of burrow smooth and sealed with ? saliva in this region
Hole at soil surface
Top chamber
Neck
Lower chamber
Exit tunnel
Soil surface
Fig. 1. Diagram of the singing burrow of Rufocephalusto show thedimensions and terminology used to describe the burrow. Theposition of the insect in the burrow was estimated from the length ofantennae that were seen projecting through the surface hole and themeasured dimensions of the insect (see Table 1, Table 2).
2832
4.1±1.3 mm (mean ±S.D., N=5). The mean length of theantennae is 18.9 mm (Table 1) so, using the dimensions of thesurface hole and top chamber, we estimate that the anterior ofthe insect’s head was probably between 13 and 14 mm belowthe soil surface and between 4 and 5 mm above the burrowneck, with the posterior half of the body extending into theneck and the wings extended across the lower end of the topchamber (Fig. 1).
Songs
Insects sang in three periods, first for approximately 1 hstarting approximately 30 min after sunset, second forapproximately 2 h starting just before midnight and third forapproximately 1 h starting 1 h before dawn.
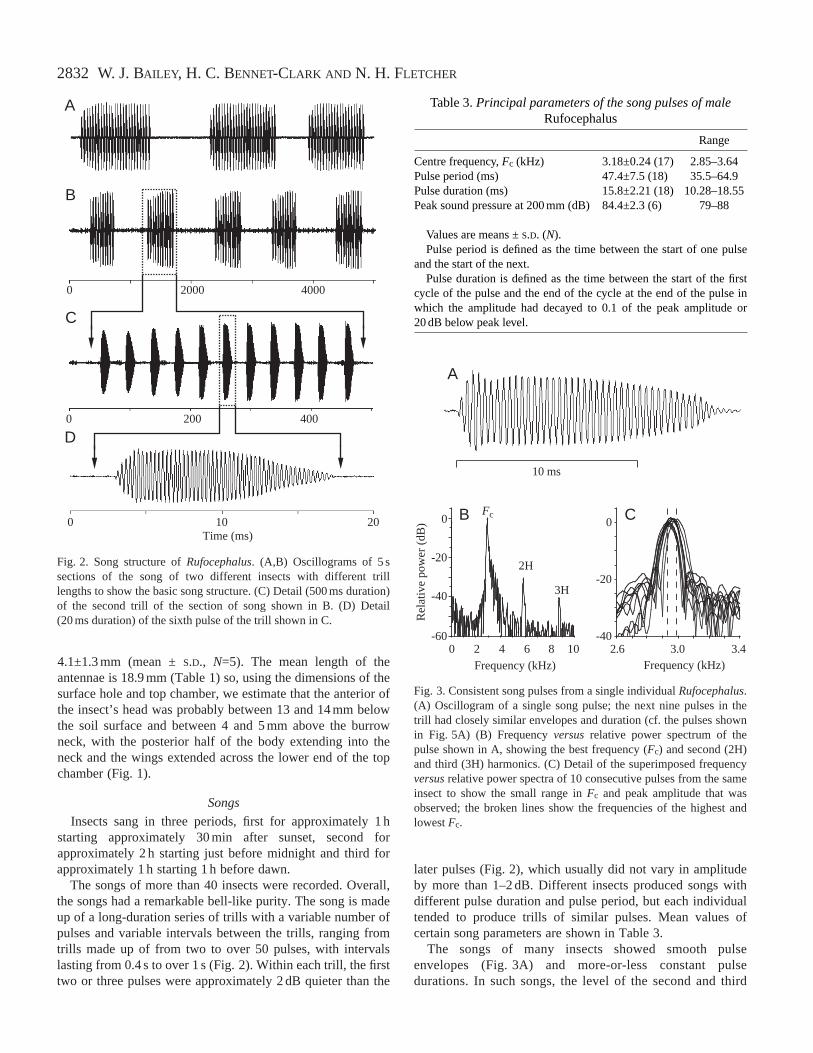
The songs of more than 40 insects were recorded. Overall,the songs had a remarkable bell-like purity. The song is madeup of a long-duration series of trills with a variable number ofpulses and variable intervals between the trills, ranging fromtrills made up of from two to over 50 pulses, with intervalslasting from 0.4 s to over 1 s (Fig. 2). Within each trill, the firsttwo or three pulses were approximately 2 dB quieter than the
later pulses (Fig. 2), which usually did not vary in amplitudeby more than 1–2 dB. Different insects produced songs withdifferent pulse duration and pulse period, but each individualtended to produce trills of similar pulses. Mean values ofcertain song parameters are shown in Table 3.
The songs of many insects showed smooth pulseenvelopes (Fig. 3A) and more-or-less constant pulsedurations. In such songs, the level of the second and third
W. J. BAILEY, H. C. BENNET-CLARK AND N. H. FLETCHER
0 400200
0 2000 4000
0 10 20Time (ms)
D
C
A
B
Fig. 2. Song structure of Rufocephalus. (A,B) Oscillograms of 5 ssections of the song of two different insects with different trilllengths to show the basic song structure. (C) Detail (500 ms duration)of the second trill of the section of song shown in B. (D) Detail(20 ms duration) of the sixth pulse of the trill shown in C.
Table 3.Principal parameters of the song pulses of maleRufocephalus
Range
Centre frequency, Fc (kHz) 3.18±0.24 (17) 2.85–3.64Pulse period (ms) 47.4±7.5 (18) 35.5–64.9Pulse duration (ms) 15.8±2.21 (18) 10.28–18.55Peak sound pressure at 200 mm (dB) 84.4±2.3 (6) 79–88
Values are means ±S.D. (N).Pulse period is defined as the time between the start of one pulse
and the start of the next.Pulse duration is defined as the time between the start of the first
cycle of the pulse and the end of the cycle at the end of the pulse inwhich the amplitude had decayed to 0.1 of the peak amplitude or20 dB below peak level.
3.43.02.6-40
-20
0
1086420-60
-40
-20
0Fc
2H
3H
A
Rel
ativ
e po
wer
(dB
)
10 ms
B C
Frequency (kHz) Frequency (kHz)
Fig. 3. Consistent song pulses from a single individual Rufocephalus.(A) Oscillogram of a single song pulse; the next nine pulses in thetrill had closely similar envelopes and duration (cf. the pulses shownin Fig. 5A) (B) Frequency versusrelative power spectrum of thepulse shown in A, showing the best frequency (Fc) and second (2H)and third (3H) harmonics. (C) Detail of the superimposed frequencyversusrelative power spectra of 10 consecutive pulses from the sameinsect to show the small range in Fc and peak amplitude that wasobserved; the broken lines show the frequencies of the highest andlowest Fc.
2833Acoustics of a small Australian burrowing cricket
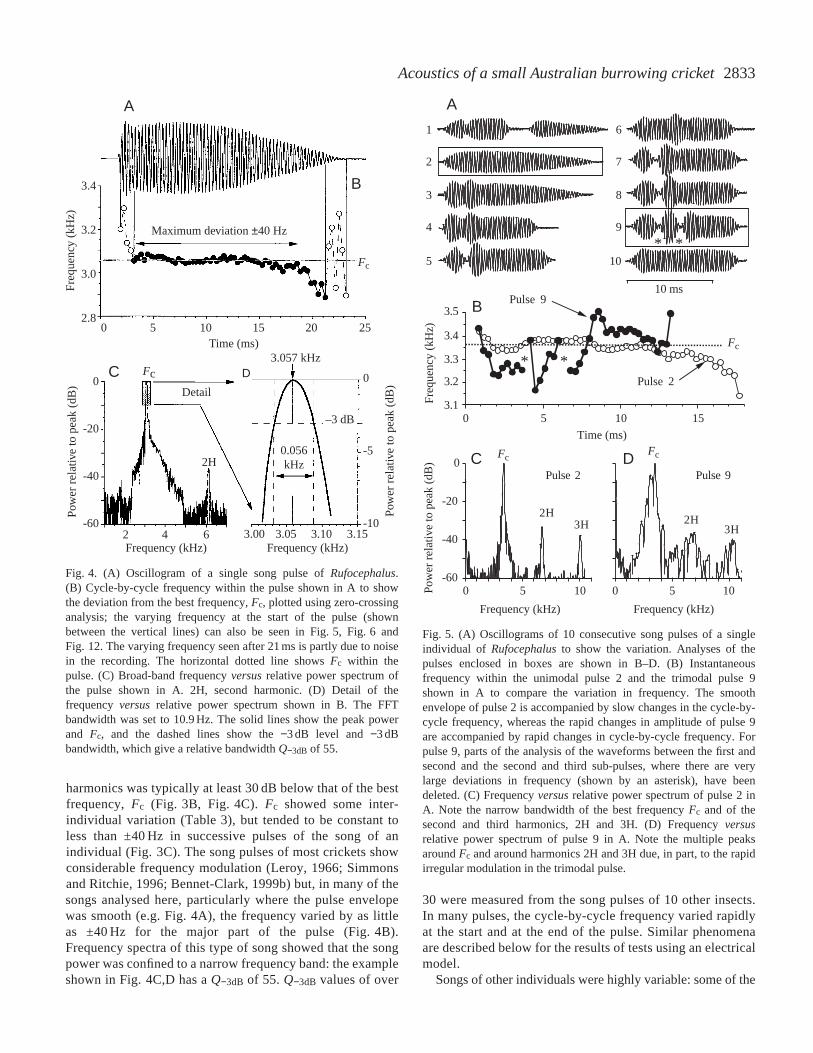
harmonics was typically at least 30 dB below that of the bestfrequency, Fc (Fig. 3B, Fig. 4C). Fc showed some inter-individual variation (Table 3), but tended to be constant toless than ±40 Hz in successive pulses of the song of anindividual (Fig. 3C). The song pulses of most crickets showconsiderable frequency modulation (Leroy, 1966; Simmonsand Ritchie, 1996; Bennet-Clark, 1999b) but, in many of thesongs analysed here, particularly where the pulse envelopewas smooth (e.g. Fig. 4A), the frequency varied by as littleas ±40 Hz for the major part of the pulse (Fig. 4B).Frequency spectra of this type of song showed that the songpower was confined to a narrow frequency band: the exampleshown in Fig. 4C,D has a Q−3dB of 55. Q−3dB values of over
30 were measured from the song pulses of 10 other insects.In many pulses, the cycle-by-cycle frequency varied rapidlyat the start and at the end of the pulse. Similar phenomenaare described below for the results of tests using an electricalmodel.
Songs of other individuals were highly variable: some of the
3.4
3.2
3.0
2.80 5 10 15 20 25
Time (ms)
Fre
quen
cy (
kHz)
A
B
C D
Maximum deviation ±40 Hz
Fc
Fc
Pow
er r
elat
ive
to p
eak
(dB
) 0
-20
-40
-602 4 6
Detail
2H
3.057 kHz
–3 dB
Pow
er r
elat
ive
to p
eak
(dB
)0
-5
-103.00 3.05 3.10 3.15
Frequency (kHz) Frequency (kHz)
0.056kHz
Fig. 4. (A) Oscillogram of a single song pulse of Rufocephalus.(B) Cycle-by-cycle frequency within the pulse shown in A to showthe deviation from the best frequency, Fc, plotted using zero-crossinganalysis; the varying frequency at the start of the pulse (shownbetween the vertical lines) can also be seen in Fig. 5, Fig. 6 andFig. 12. The varying frequency seen after 21 ms is partly due to noisein the recording. The horizontal dotted line shows Fc within thepulse. (C) Broad-band frequency versusrelative power spectrum ofthe pulse shown in A. 2H, second harmonic. (D) Detail of thefrequency versus relative power spectrum shown in B. The FFTbandwidth was set to 10.9 Hz. The solid lines show the peak powerand Fc, and the dashed lines show the −3 dB level and −3 dBbandwidth, which give a relative bandwidth Q−3dB of 55.
1
2
3
4
5
6
7
8
9
10
A
10 ms
151050
3.2
3.4
Pulse 9
3.3
3.1
3.5
1050-60
-40
-20
0
1050
Fc
2H3H
Fc
2H
Pulse 2
Frequency (kHz)
Pow
er r
elat
ive
to p
eak
(dB
)
Frequency (kHz)
Fre
quen
cy (
kHz)
Time (ms)
Fc
Pulse 2
3H
Pulse 9C D
B
* *
* *
Fig. 5. (A) Oscillograms of 10 consecutive song pulses of a singleindividual of Rufocephalusto show the variation. Analyses of thepulses enclosed in boxes are shown in B–D. (B) Instantaneousfrequency within the unimodal pulse 2 and the trimodal pulse 9shown in A to compare the variation in frequency. The smoothenvelope of pulse 2 is accompanied by slow changes in the cycle-by-cycle frequency, whereas the rapid changes in amplitude of pulse 9are accompanied by rapid changes in cycle-by-cycle frequency. Forpulse 9, parts of the analysis of the waveforms between the first andsecond and the second and third sub-pulses, where there are verylarge deviations in frequency (shown by an asterisk), have beendeleted. (C) Frequency versusrelative power spectrum of pulse 2 inA. Note the narrow bandwidth of the best frequency Fc and of thesecond and third harmonics, 2H and 3H. (D) Frequency versusrelative power spectrum of pulse 9 in A. Note the multiple peaksaround Fc and around harmonics 2H and 3H due, in part, to the rapidirregular modulation in the trimodal pulse.
2834
pulses from within the same trill had smooth unimodalenvelopes (e.g. pulses 2 and 10 in Fig. 5A), while others werebimodal or even trimodal (Fig. 5A pulse 9). These variablepulses showed contrasting distributions of the cycle-by-cyclefrequency: when the envelope was smooth, the frequencytended to show a similar constancy to that in Fig. 4B or to varyslowly with time, but the pulses with ragged envelopes showedrapid changes of frequency associated with the modulation ofthe envelope (Fig. 5B). There was similar contrast in thefrequency versuspower spectra: those of the smooth pulsesshowed a single sharply tuned peak (Fig. 5C), whereas thepulses with irregular envelopes showed both broader spectraand a series of side-bands due to the rapid and irregularamplitude modulation of the signal (Fig. 5D).
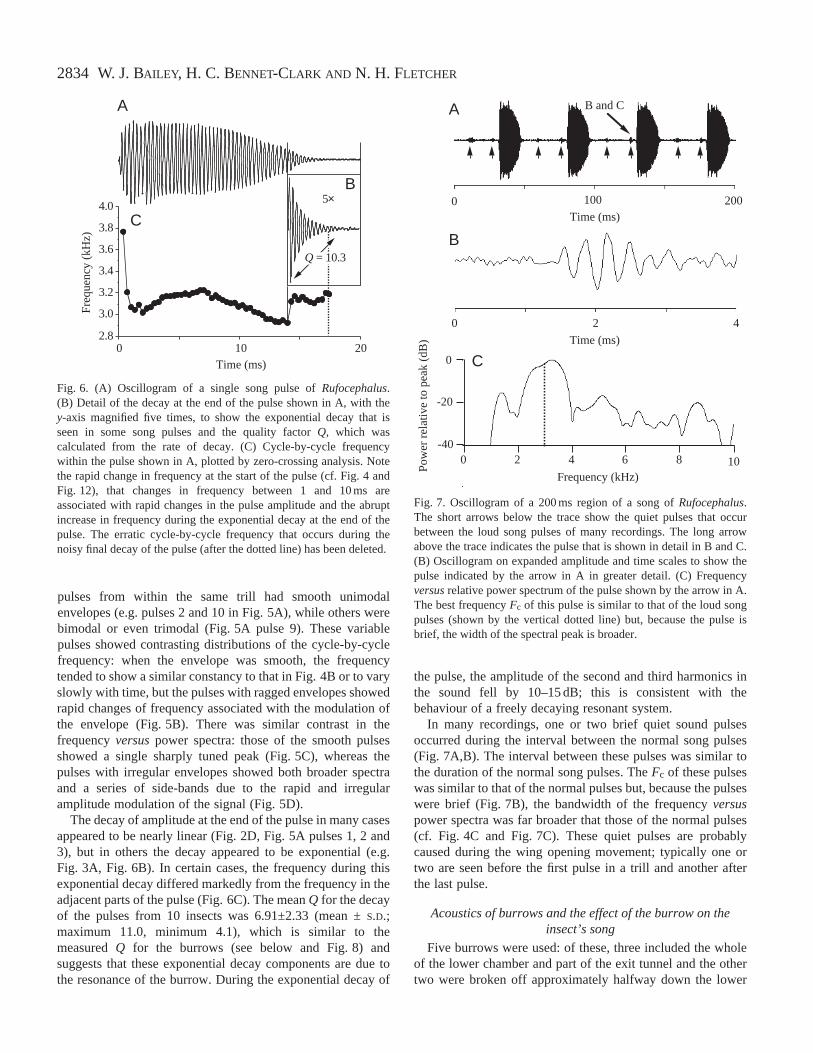
The decay of amplitude at the end of the pulse in many casesappeared to be nearly linear (Fig. 2D, Fig. 5A pulses 1, 2 and3), but in others the decay appeared to be exponential (e.g.Fig. 3A, Fig. 6B). In certain cases, the frequency during thisexponential decay differed markedly from the frequency in theadjacent parts of the pulse (Fig. 6C). The mean Q for the decayof the pulses from 10 insects was 6.91±2.33 (mean ±S.D.;maximum 11.0, minimum 4.1), which is similar to themeasured Q for the burrows (see below and Fig. 8) andsuggests that these exponential decay components are due tothe resonance of the burrow. During the exponential decay of
the pulse, the amplitude of the second and third harmonics inthe sound fell by 10–15 dB; this is consistent with thebehaviour of a freely decaying resonant system.
In many recordings, one or two brief quiet sound pulsesoccurred during the interval between the normal song pulses(Fig. 7A,B). The interval between these pulses was similar tothe duration of the normal song pulses. The Fc of these pulseswas similar to that of the normal pulses but, because the pulseswere brief (Fig. 7B), the bandwidth of the frequency versuspower spectra was far broader that those of the normal pulses(cf. Fig. 4C and Fig. 7C). These quiet pulses are probablycaused during the wing opening movement; typically one ortwo are seen before the first pulse in a trill and another afterthe last pulse.
Acoustics of burrows and the effect of the burrow on theinsect’s song
Five burrows were used: of these, three included the wholeof the lower chamber and part of the exit tunnel and the othertwo were broken off approximately halfway down the lower
W. J. BAILEY, H. C. BENNET-CLARK AND N. H. FLETCHER
201002.8
3.0
3.2
3.4
3.6
3.8
4.05×
A
B
C
Q = 10.3
Time (ms)
Fre
quen
cy (
kHz)
Fig. 6. (A) Oscillogram of a single song pulse of Rufocephalus.(B) Detail of the decay at the end of the pulse shown in A, with they-axis magnified five times, to show the exponential decay that isseen in some song pulses and the quality factor Q, which wascalculated from the rate of decay. (C) Cycle-by-cycle frequencywithin the pulse shown in A, plotted by zero-crossing analysis. Notethe rapid change in frequency at the start of the pulse (cf. Fig. 4 andFig. 12), that changes in frequency between 1 and 10 ms areassociated with rapid changes in the pulse amplitude and the abruptincrease in frequency during the exponential decay at the end of thepulse. The erratic cycle-by-cycle frequency that occurs during thenoisy final decay of the pulse (after the dotted line) has been deleted.
0
0
-20
-400 2 4 6 8
A
B
C
Pow
er r
elat
ive
to p
eak (
dB)
100 200Time (ms)
0 2 4
Time (ms)
Frequency (kHz)10
B and C
Fig. 7. Oscillogram of a 200 ms region of a song of Rufocephalus.The short arrows below the trace show the quiet pulses that occurbetween the loud song pulses of many recordings. The long arrowabove the trace indicates the pulse that is shown in detail in B and C.(B) Oscillogram on expanded amplitude and time scales to show thepulse indicated by the arrow in A in greater detail. (C) Frequencyversusrelative power spectrum of the pulse shown by the arrow in A.The best frequency Fc of this pulse is similar to that of the loud songpulses (shown by the vertical dotted line) but, because the pulse isbrief, the width of the spectral peak is broader.
2835Acoustics of a small Australian burrowing cricket
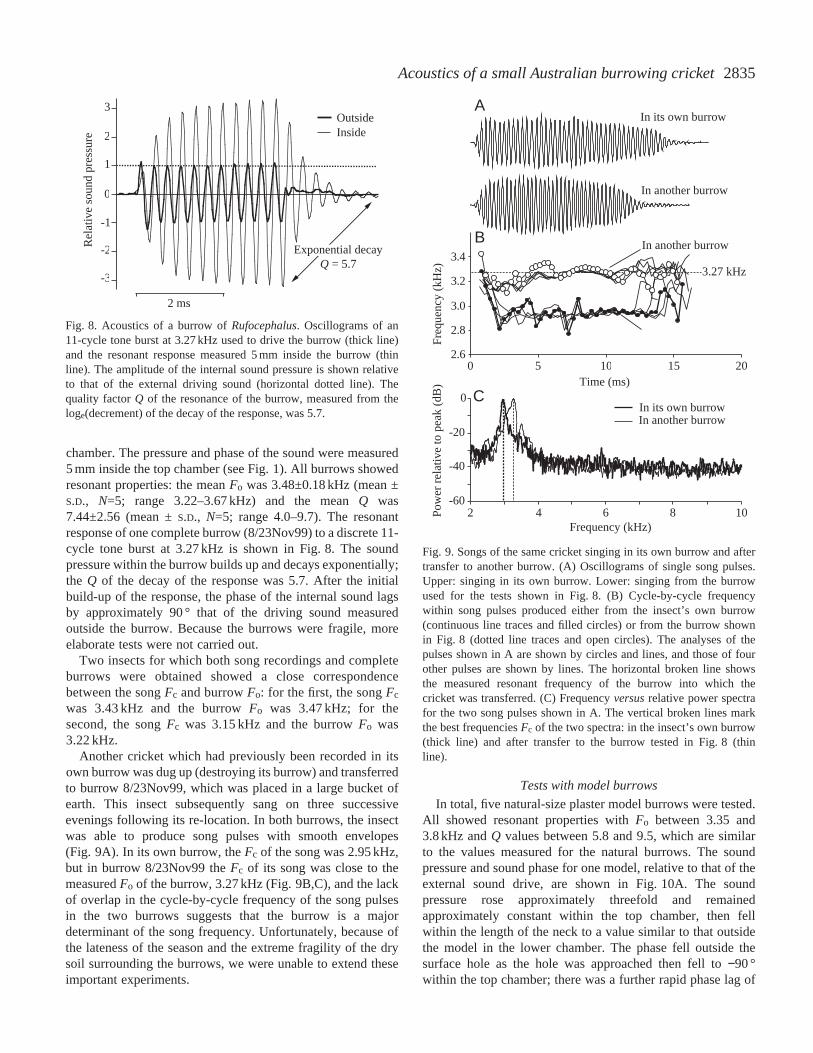
chamber. The pressure and phase of the sound were measured5 mm inside the top chamber (see Fig. 1). All burrows showedresonant properties: the mean Fo was 3.48±0.18 kHz (mean ±S.D., N=5; range 3.22–3.67 kHz) and the mean Q was7.44±2.56 (mean ±S.D., N=5; range 4.0–9.7). The resonantresponse of one complete burrow (8/23Nov99) to a discrete 11-cycle tone burst at 3.27 kHz is shown in Fig. 8. The soundpressure within the burrow builds up and decays exponentially;the Q of the decay of the response was 5.7. After the initialbuild-up of the response, the phase of the internal sound lagsby approximately 90 ° that of the driving sound measuredoutside the burrow. Because the burrows were fragile, moreelaborate tests were not carried out.
Two insects for which both song recordings and completeburrows were obtained showed a close correspondencebetween the song Fc and burrow Fo: for the first, the song Fc
was 3.43 kHz and the burrow Fo was 3.47 kHz; for thesecond, the song Fc was 3.15 kHz and the burrow Fo was3.22 kHz.
Another cricket which had previously been recorded in itsown burrow was dug up (destroying its burrow) and transferredto burrow 8/23Nov99, which was placed in a large bucket ofearth. This insect subsequently sang on three successiveevenings following its re-location. In both burrows, the insectwas able to produce song pulses with smooth envelopes(Fig. 9A). In its own burrow, the Fc of the song was 2.95 kHz,but in burrow 8/23Nov99 the Fc of its song was close to themeasured Fo of the burrow, 3.27 kHz (Fig. 9B,C), and the lackof overlap in the cycle-by-cycle frequency of the song pulsesin the two burrows suggests that the burrow is a majordeterminant of the song frequency. Unfortunately, because ofthe lateness of the season and the extreme fragility of the drysoil surrounding the burrows, we were unable to extend theseimportant experiments.
Tests with model burrows
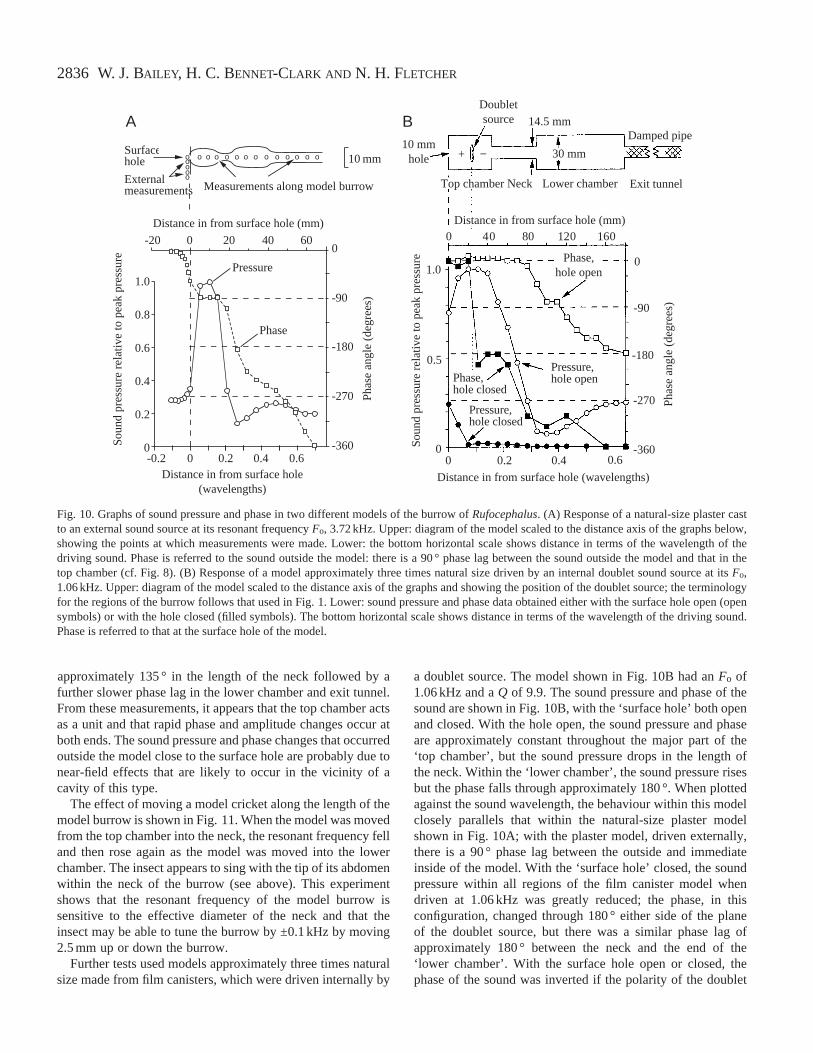
In total, five natural-size plaster model burrows were tested.All showed resonant properties with Fo between 3.35 and3.8 kHz and Q values between 5.8 and 9.5, which are similarto the values measured for the natural burrows. The soundpressure and sound phase for one model, relative to that of theexternal sound drive, are shown in Fig. 10A. The soundpressure rose approximately threefold and remainedapproximately constant within the top chamber, then fellwithin the length of the neck to a value similar to that outsidethe model in the lower chamber. The phase fell outside thesurface hole as the hole was approached then fell to −90 °within the top chamber; there was a further rapid phase lag of
-1
0
1
Rel
ativ
e so
und
pres
sure
-2
-3
2
3
Q = 5.7
OutsideInside
Exponential decay
2 ms
Fig. 8. Acoustics of a burrow of Rufocephalus. Oscillograms of an11-cycle tone burst at 3.27 kHz used to drive the burrow (thick line)and the resonant response measured 5 mm inside the burrow (thinline). The amplitude of the internal sound pressure is shown relativeto that of the external driving sound (horizontal dotted line). Thequality factor Q of the resonance of the burrow, measured from theloge(decrement) of the decay of the response, was 5.7.
201510502.6
2.8
3.0
3.2
3.4
108642-60
-40
-20
0
A
B
C
In its own burrow
In another burrow
In another burrow
Freq
uenc
y (k
Hz)
Pow
er r
elat
ive
to p
eak
(d
B)
Frequency (kHz)
Time (ms)
In another burrowIn its own burrow
3.27 kHz
Fig. 9. Songs of the same cricket singing in its own burrow and aftertransfer to another burrow. (A) Oscillograms of single song pulses.Upper: singing in its own burrow. Lower: singing from the burrowused for the tests shown in Fig. 8. (B) Cycle-by-cycle frequencywithin song pulses produced either from the insect’s own burrow(continuous line traces and filled circles) or from the burrow shownin Fig. 8 (dotted line traces and open circles). The analyses of thepulses shown in A are shown by circles and lines, and those of fourother pulses are shown by lines. The horizontal broken line showsthe measured resonant frequency of the burrow into which thecricket was transferred. (C) Frequency versusrelative power spectrafor the two song pulses shown in A. The vertical broken lines markthe best frequencies Fc of the two spectra: in the insect’s own burrow(thick line) and after transfer to the burrow tested in Fig. 8 (thinline).
2836
approximately 135 ° in the length of the neck followed by afurther slower phase lag in the lower chamber and exit tunnel.From these measurements, it appears that the top chamber actsas a unit and that rapid phase and amplitude changes occur atboth ends. The sound pressure and phase changes that occurredoutside the model close to the surface hole are probably due tonear-field effects that are likely to occur in the vicinity of acavity of this type.
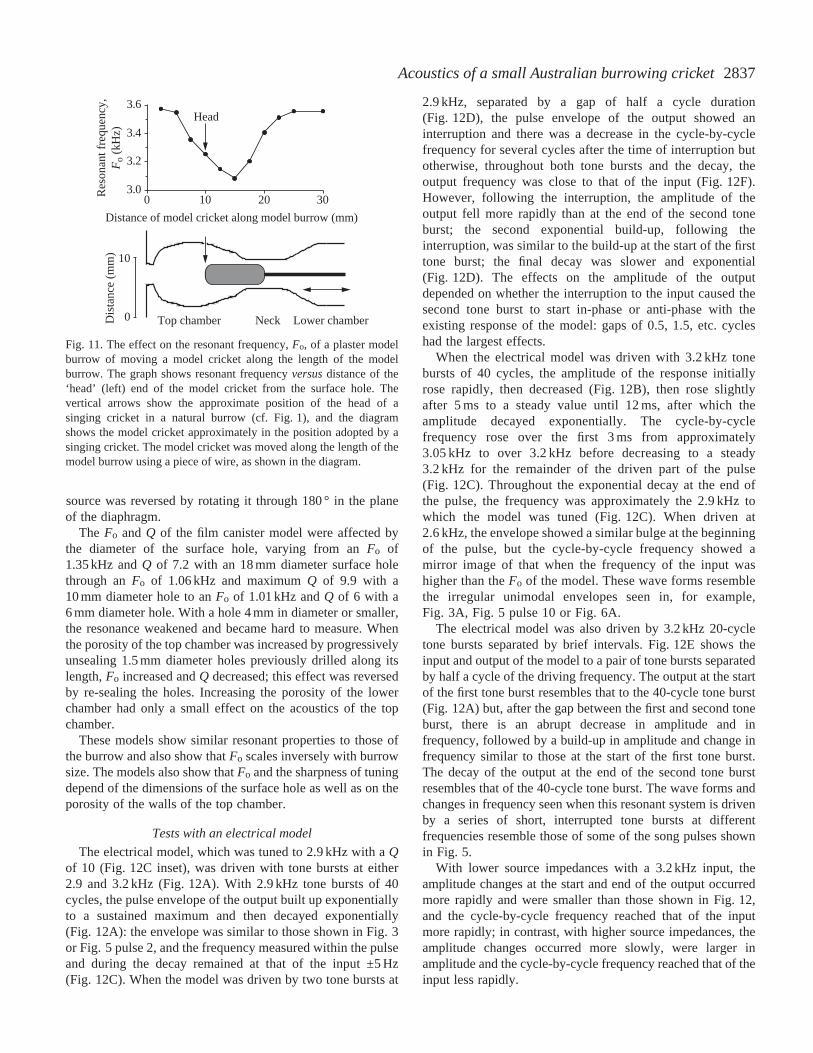
The effect of moving a model cricket along the length of themodel burrow is shown in Fig. 11. When the model was movedfrom the top chamber into the neck, the resonant frequency felland then rose again as the model was moved into the lowerchamber. The insect appears to sing with the tip of its abdomenwithin the neck of the burrow (see above). This experimentshows that the resonant frequency of the model burrow issensitive to the effective diameter of the neck and that theinsect may be able to tune the burrow by ±0.1 kHz by moving2.5 mm up or down the burrow.
Further tests used models approximately three times naturalsize made from film canisters, which were driven internally by
a doublet source. The model shown in Fig. 10B had an Fo of1.06 kHz and a Q of 9.9. The sound pressure and phase of thesound are shown in Fig. 10B, with the ‘surface hole’ both openand closed. With the hole open, the sound pressure and phaseare approximately constant throughout the major part of the‘top chamber’, but the sound pressure drops in the length ofthe neck. Within the ‘lower chamber’, the sound pressure risesbut the phase falls through approximately 180 °. When plottedagainst the sound wavelength, the behaviour within this modelclosely parallels that within the natural-size plaster modelshown in Fig. 10A; with the plaster model, driven externally,there is a 90 ° phase lag between the outside and immediateinside of the model. With the ‘surface hole’ closed, the soundpressure within all regions of the film canister model whendriven at 1.06 kHz was greatly reduced; the phase, in thisconfiguration, changed through 180 ° either side of the planeof the doublet source, but there was a similar phase lag ofapproximately 180 ° between the neck and the end of the‘lower chamber’. With the surface hole open or closed, thephase of the sound was inverted if the polarity of the doublet
W. J. BAILEY, H. C. BENNET-CLARK AND N. H. FLETCHER
-270
-180
-90
0
-360
Pha
se a
ngle
(de
gree
s)
Externalmeasurements
Surfacehole 10 mm
Soun
d pr
essu
re r
elati
ve to
pea
k pr
essu
re
Measurements along model burrow
-20 0 20 40 60
1.0
0.8
0.6
0.4
0.2
0-0.2 0 0.2 0.4 0.6
Pressure
Phase
Distance in from surface hole(wavelengths)
0
Pressure, hole open
Pressure, hole closed
16012080400
10 mmhole
Doubletsource 14.5 mm
30 mm
Damped pipe
Exit tunnelLower chamberTop chamber Neck
Distance in from surface hole (mm)
-180
-90
-270
-360
Pha
se a
ngle
(de
gree
s)
0 0.2 0.4 0.6
Distance in from surface hole (wavelengths)
Phase,hole open1.0
0.5
0Soun
d pr
essu
re r
elati
ve to
pea
k pr
essu
re
BA
Distance in from surface hole (mm)
Phase, hole closed
+ −oooooo
o o o o o o o o o oo o
Fig. 10. Graphs of sound pressure and phase in two different models of the burrow of Rufocephalus. (A) Response of a natural-size plaster castto an external sound source at its resonant frequency Fo, 3.72 kHz. Upper: diagram of the model scaled to the distance axis of the graphs below,showing the points at which measurements were made. Lower: the bottom horizontal scale shows distance in terms of the wavelength of thedriving sound. Phase is referred to the sound outside the model: there is a 90 ° phase lag between the sound outside the model and that in thetop chamber (cf. Fig. 8). (B) Response of a model approximately three times natural size driven by an internal doublet sound source at its Fo,1.06 kHz. Upper: diagram of the model scaled to the distance axis of the graphs and showing the position of the doublet source; the terminologyfor the regions of the burrow follows that used in Fig. 1. Lower: sound pressure and phase data obtained either with the surface hole open (opensymbols) or with the hole closed (filled symbols). The bottom horizontal scale shows distance in terms of the wavelength of the driving sound.Phase is referred to that at the surface hole of the model.
2837Acoustics of a small Australian burrowing cricket
source was reversed by rotating it through 180 ° in the planeof the diaphragm.
The Fo and Q of the film canister model were affected bythe diameter of the surface hole, varying from an Fo of1.35 kHz and Q of 7.2 with an 18 mm diameter surface holethrough an Fo of 1.06 kHz and maximum Q of 9.9 with a10 mm diameter hole to an Fo of 1.01 kHz and Q of 6 with a6 mm diameter hole. With a hole 4 mm in diameter or smaller,the resonance weakened and became hard to measure. Whenthe porosity of the top chamber was increased by progressivelyunsealing 1.5 mm diameter holes previously drilled along itslength, Fo increased and Q decreased; this effect was reversedby re-sealing the holes. Increasing the porosity of the lowerchamber had only a small effect on the acoustics of the topchamber.
These models show similar resonant properties to those ofthe burrow and also show that Fo scales inversely with burrowsize. The models also show that Fo and the sharpness of tuningdepend of the dimensions of the surface hole as well as on theporosity of the walls of the top chamber.
Tests with an electrical model
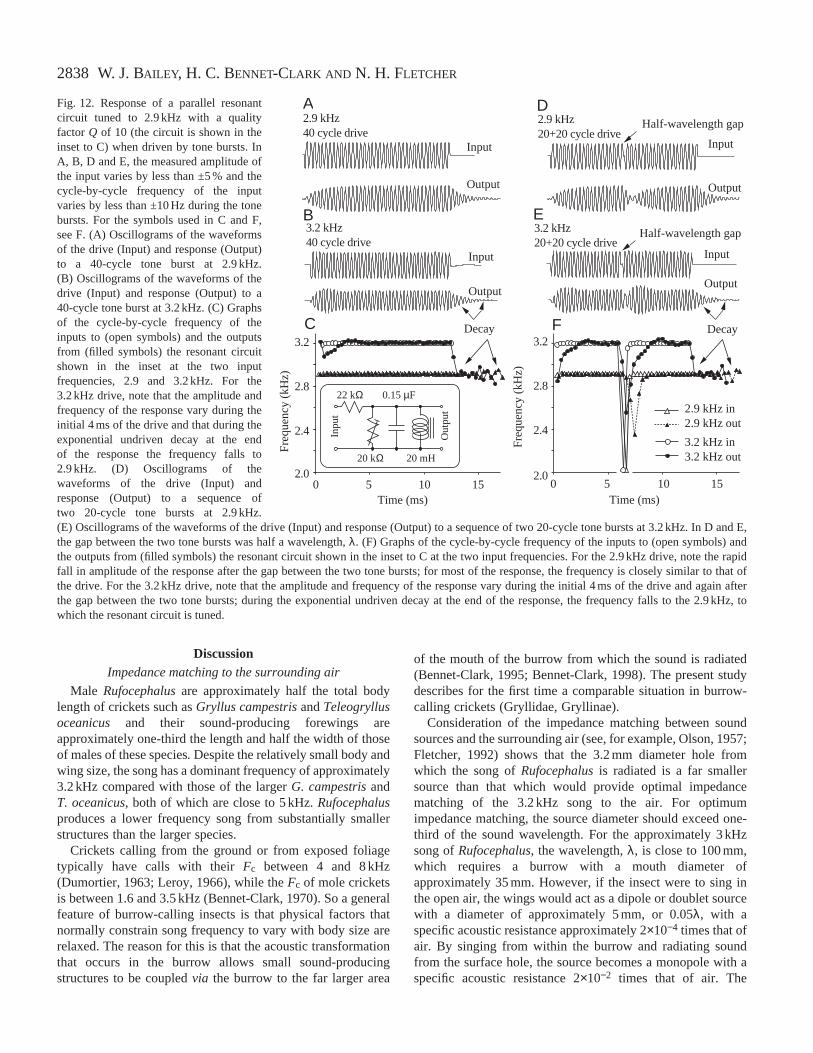
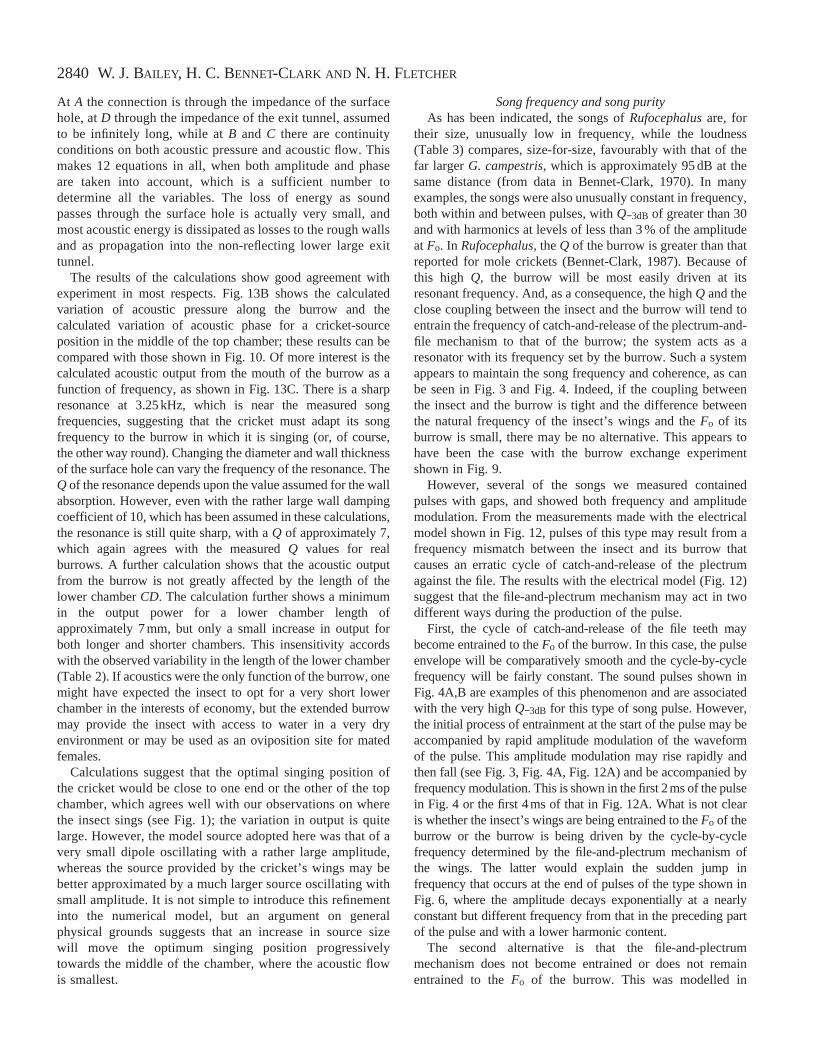
The electrical model, which was tuned to 2.9 kHz with a Qof 10 (Fig. 12C inset), was driven with tone bursts at either2.9 and 3.2 kHz (Fig. 12A). With 2.9 kHz tone bursts of 40cycles, the pulse envelope of the output built up exponentiallyto a sustained maximum and then decayed exponentially(Fig. 12A): the envelope was similar to those shown in Fig. 3or Fig. 5 pulse 2, and the frequency measured within the pulseand during the decay remained at that of the input ±5 Hz(Fig. 12C). When the model was driven by two tone bursts at
2.9 kHz, separated by a gap of half a cycle duration(Fig. 12D), the pulse envelope of the output showed aninterruption and there was a decrease in the cycle-by-cyclefrequency for several cycles after the time of interruption butotherwise, throughout both tone bursts and the decay, theoutput frequency was close to that of the input (Fig. 12F).However, following the interruption, the amplitude of theoutput fell more rapidly than at the end of the second toneburst; the second exponential build-up, following theinterruption, was similar to the build-up at the start of the firsttone burst; the final decay was slower and exponential(Fig. 12D). The effects on the amplitude of the outputdepended on whether the interruption to the input caused thesecond tone burst to start in-phase or anti-phase with theexisting response of the model: gaps of 0.5, 1.5, etc. cycleshad the largest effects.
When the electrical model was driven with 3.2 kHz tonebursts of 40 cycles, the amplitude of the response initiallyrose rapidly, then decreased (Fig. 12B), then rose slightlyafter 5 ms to a steady value until 12 ms, after which theamplitude decayed exponentially. The cycle-by-cyclefrequency rose over the first 3 ms from approximately3.05 kHz to over 3.2 kHz before decreasing to a steady3.2 kHz for the remainder of the driven part of the pulse(Fig. 12C). Throughout the exponential decay at the end ofthe pulse, the frequency was approximately the 2.9 kHz towhich the model was tuned (Fig. 12C). When driven at2.6 kHz, the envelope showed a similar bulge at the beginningof the pulse, but the cycle-by-cycle frequency showed amirror image of that when the frequency of the input washigher than the Fo of the model. These wave forms resemblethe irregular unimodal envelopes seen in, for example,Fig. 3A, Fig. 5 pulse 10 or Fig. 6A.
The electrical model was also driven by 3.2 kHz 20-cycletone bursts separated by brief intervals. Fig. 12E shows theinput and output of the model to a pair of tone bursts separatedby half a cycle of the driving frequency. The output at the startof the first tone burst resembles that to the 40-cycle tone burst(Fig. 12A) but, after the gap between the first and second toneburst, there is an abrupt decrease in amplitude and infrequency, followed by a build-up in amplitude and change infrequency similar to those at the start of the first tone burst.The decay of the output at the end of the second tone burstresembles that of the 40-cycle tone burst. The wave forms andchanges in frequency seen when this resonant system is drivenby a series of short, interrupted tone bursts at differentfrequencies resemble those of some of the song pulses shownin Fig. 5.
With lower source impedances with a 3.2 kHz input, theamplitude changes at the start and end of the output occurredmore rapidly and were smaller than those shown in Fig. 12,and the cycle-by-cycle frequency reached that of the inputmore rapidly; in contrast, with higher source impedances, theamplitude changes occurred more slowly, were larger inamplitude and the cycle-by-cycle frequency reached that of theinput less rapidly.
3.0
3.2
3.4
3.6R
eson
ant f
requ
ency
,F
o (k
Hz)
Distance of model cricket along model burrow (mm)
Head
0 10 20 30
10
0Dis
tanc
e (m
m)
Top chamber Neck Lower chamber
Fig. 11. The effect on the resonant frequency, Fo, of a plaster modelburrow of moving a model cricket along the length of the modelburrow. The graph shows resonant frequency versusdistance of the‘head’ (left) end of the model cricket from the surface hole. Thevertical arrows show the approximate position of the head of asinging cricket in a natural burrow (cf. Fig. 1), and the diagramshows the model cricket approximately in the position adopted by asinging cricket. The model cricket was moved along the length of themodel burrow using a piece of wire, as shown in the diagram.
2838
DiscussionImpedance matching to the surrounding air
Male Rufocephalusare approximately half the total bodylength of crickets such as Gryllus campestrisand Teleogryllusoceanicus and their sound-producing forewings areapproximately one-third the length and half the width of thoseof males of these species. Despite the relatively small body andwing size, the song has a dominant frequency of approximately3.2 kHz compared with those of the larger G. campestrisandT. oceanicus, both of which are close to 5 kHz. Rufocephalusproduces a lower frequency song from substantially smallerstructures than the larger species.
Crickets calling from the ground or from exposed foliagetypically have calls with their Fc between 4 and 8 kHz(Dumortier, 1963; Leroy, 1966), while the Fc of mole cricketsis between 1.6 and 3.5 kHz (Bennet-Clark, 1970). So a generalfeature of burrow-calling insects is that physical factors thatnormally constrain song frequency to vary with body size arerelaxed. The reason for this is that the acoustic transformationthat occurs in the burrow allows small sound-producingstructures to be coupledvia the burrow to the far larger area
of the mouth of the burrow from which the sound is radiated(Bennet-Clark, 1995; Bennet-Clark, 1998). The present studydescribes for the first time a comparable situation in burrow-calling crickets (Gryllidae, Gryllinae).
Consideration of the impedance matching between soundsources and the surrounding air (see, for example, Olson, 1957;Fletcher, 1992) shows that the 3.2 mm diameter hole fromwhich the song of Rufocephalusis radiated is a far smallersource than that which would provide optimal impedancematching of the 3.2 kHz song to the air. For optimumimpedance matching, the source diameter should exceed one-third of the sound wavelength. For the approximately 3 kHzsong of Rufocephalus, the wavelength, λ, is close to 100 mm,which requires a burrow with a mouth diameter ofapproximately 35 mm. However, if the insect were to sing inthe open air, the wings would act as a dipole or doublet sourcewith a diameter of approximately 5 mm, or 0.05λ, with aspecific acoustic resistance approximately 2×10⁻⁴ times that ofair. By singing from within the burrow and radiating soundfrom the surface hole, the source becomes a monopole with aspecific acoustic resistance 2×10⁻² times that of air. The
W. J. BAILEY, H. C. BENNET-CLARK AND N. H. FLETCHER
Fig. 12. Response of a parallel resonantcircuit tuned to 2.9 kHz with a qualityfactor Q of 10 (the circuit is shown in theinset to C) when driven by tone bursts. InA, B, D and E, the measured amplitude ofthe input varies by less than ±5 % and thecycle-by-cycle frequency of the inputvaries by less than ±10 Hz during the tonebursts. For the symbols used in C and F,see F. (A) Oscillograms of the waveformsof the drive (Input) and response (Output)to a 40-cycle tone burst at 2.9 kHz.(B) Oscillograms of the waveforms of thedrive (Input) and response (Output) to a40-cycle tone burst at 3.2 kHz. (C) Graphsof the cycle-by-cycle frequency of theinputs to (open symbols) and the outputsfrom (filled symbols) the resonant circuitshown in the inset at the two inputfrequencies, 2.9 and 3.2 kHz. For the3.2 kHz drive, note that the amplitude andfrequency of the response vary during theinitial 4 ms of the drive and that during theexponential undriven decay at the endof the response the frequency falls to2.9 kHz. (D) Oscillograms of thewaveforms of the drive (Input) andresponse (Output) to a sequence oftwo 20-cycle tone bursts at 2.9 kHz.(E) Oscillograms of the waveforms of the drive (Input) and response (Output) to a sequence of two 20-cycle tone bursts at 3.2 kHz. In D and E,the gap between the two tone bursts was half a wavelength, λ. (F) Graphs of the cycle-by-cycle frequency of the inputs to (open symbols) andthe outputs from (filled symbols) the resonant circuit shown in the inset to C at the two input frequencies. For the 2.9 kHz drive, note the rapidfall in amplitude of the response after the gap between the two tone bursts; for most of the response, the frequency is closely similar to that ofthe drive. For the 3.2 kHz drive, note that the amplitude and frequency of the response vary during the initial 4 ms of the drive and again afterthe gap between the two tone bursts; during the exponential undriven decay at the end of the response, the frequency falls to the 2.9 kHz, towhich the resonant circuit is tuned.
2.4
2.8
3.2
2.0
Fre
quen
cy (
kHz)
A
B
C
3.2 kHz40 cycle drive
2.9 kHz40 cycle drive
2.9 kHz20+20 cycle drive
D
3.2 kHz20+20 cycle drive
E
F
Fre
quen
cy (
kHz)
Time (ms) Time (ms)
2.9 kHz in2.9 kHz out
3.2 kHz in3.2 kHz out
2.4
2.8
3.2
2.00 5 10 15 0 5 10 15
Input
Output
Input
Output
Input
Output
Input
Output
Decay Decay
Half-wavelength gap
Half-wavelength gap
Out
put
20 kΩ
0.15 µF
20 mH
Inpu
t
22 kΩ
2839Acoustics of a small Australian burrowing cricket
burrow thus provides a 100-fold improvement in the couplingbetween the insect and the air, permitting far louder and moreefficient sound production; similar advantages have beenproposed for the singing burrows of mole crickets (Bennet-
Clark, 1987) or the abdominal resonator of cicadas (Bennet-Clark and Young, 1992).
In contrast to the tuned low-Q singing burrow of molecrickets (Bennet-Clark, 1987; Daws et al., 1996), that ofRufocephalusis far more sharply tuned, typically with a Q ofover 7. This is achieved by radiating a relatively smallproportion of the sound energy in the burrow via the smallsurface hole, in contrast to the far larger burrows (and hencefar larger resonant mass) of mole crickets, which radiate soundfrom surface holes that approach the optimal size forimpedance matching with the surrounding air (Bennet-Clark,1995). Mole crickets are large robust insects that weighbetween 10 and 50 times as much as Rufocephalusand are,hence, capable of transducing a commensurately greatermechanical power into sound. Also, by virtue of their fargreater size, mole crickets are able to build large burrows withsurface hole dimensions approaching that of the soundwavelength, which would be extremely energy-demanding foran insect as small as Rufocephalus.
A numerical model of the burrow
A theoretical model is helpful in understanding the observedtonal purity of the insects’ songs and the resonant propertiesof the burrow. For this purpose, we adopt the simplest modelpossible and require that it have no adjustable parameters.
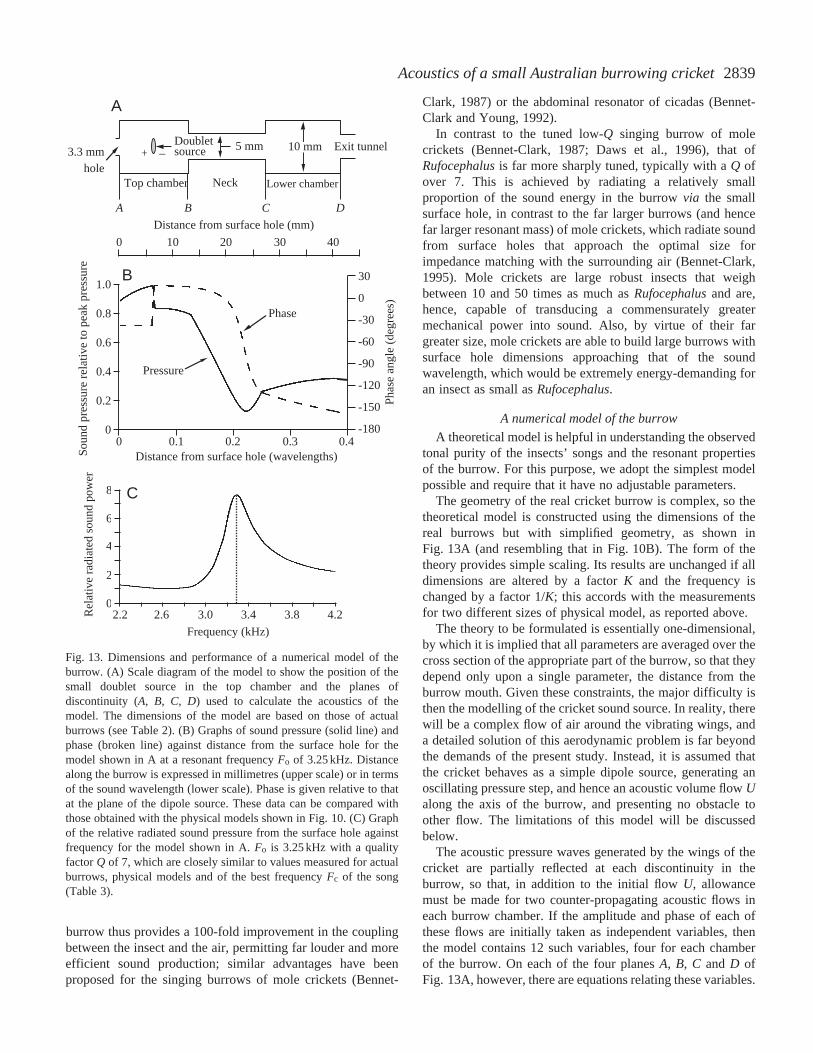
The geometry of the real cricket burrow is complex, so thetheoretical model is constructed using the dimensions of thereal burrows but with simplified geometry, as shown inFig. 13A (and resembling that in Fig. 10B). The form of thetheory provides simple scaling. Its results are unchanged if alldimensions are altered by a factor K and the frequency ischanged by a factor 1/K; this accords with the measurementsfor two different sizes of physical model, as reported above.
The theory to be formulated is essentially one-dimensional,by which it is implied that all parameters are averaged over thecross section of the appropriate part of the burrow, so that theydepend only upon a single parameter, the distance from theburrow mouth. Given these constraints, the major difficulty isthen the modelling of the cricket sound source. In reality, therewill be a complex flow of air around the vibrating wings, anda detailed solution of this aerodynamic problem is far beyondthe demands of the present study. Instead, it is assumed thatthe cricket behaves as a simple dipole source, generating anoscillating pressure step, and hence an acoustic volume flow Ualong the axis of the burrow, and presenting no obstacle toother flow. The limitations of this model will be discussedbelow.
The acoustic pressure waves generated by the wings of thecricket are partially reflected at each discontinuity in theburrow, so that, in addition to the initial flow U, allowancemust be made for two counter-propagating acoustic flows ineach burrow chamber. If the amplitude and phase of each ofthese flows are initially taken as independent variables, thenthe model contains 12 such variables, four for each chamberof the burrow. On each of the four planes A, B, C and D ofFig. 13A, however, there are equations relating these variables.
Rel
ativ
e ra
diat
ed s
ound
pow
er
0
2
4
8
6
A
+Doublet source3.3 mm
hole
C
5 mm 10 mm Exit tunnel
NeckTop chamber Lower chamber
A B C D
Distance from surface hole (mm)
0 10 20 30 40
B1.0
0.8
0.6
0.4
0.2
00 0.1 0.2 0.3 0.4
Phase
Pressure
30
0
-30
-60
-90
-120
-150
-180
Pha
se a
ngle
(deg
ree
s)
2.2 2.6 3.0 3.4 3.8 4.2
–
Distance from surface hole (wavelengths)So
un
d p
ress
ure
re
lativ
e to
pe
ak
pre
ssu
re
Frequency (kHz)
Fig. 13. Dimensions and performance of a numerical model of theburrow. (A) Scale diagram of the model to show the position of thesmall doublet source in the top chamber and the planes ofdiscontinuity (A, B, C, D) used to calculate the acoustics of themodel. The dimensions of the model are based on those of actualburrows (see Table 2). (B) Graphs of sound pressure (solid line) andphase (broken line) against distance from the surface hole for themodel shown in A at a resonant frequency Fo of 3.25 kHz. Distancealong the burrow is expressed in millimetres (upper scale) or in termsof the sound wavelength (lower scale). Phase is given relative to thatat the plane of the dipole source. These data can be compared withthose obtained with the physical models shown in Fig. 10. (C) Graphof the relative radiated sound pressure from the surface hole againstfrequency for the model shown in A. Fo is 3.25 kHz with a qualityfactor Q of 7, which are closely similar to values measured for actualburrows, physical models and of the best frequency Fc of the song(Table 3).
2840
At A the connection is through the impedance of the surfacehole, at D through the impedance of the exit tunnel, assumedto be infinitely long, while at B and C there are continuityconditions on both acoustic pressure and acoustic flow. Thismakes 12 equations in all, when both amplitude and phaseare taken into account, which is a sufficient number todetermine all the variables. The loss of energy as soundpasses through the surface hole is actually very small, andmost acoustic energy is dissipated as losses to the rough wallsand as propagation into the non-reflecting lower large exittunnel.
The results of the calculations show good agreement withexperiment in most respects. Fig. 13B shows the calculatedvariation of acoustic pressure along the burrow and thecalculated variation of acoustic phase for a cricket-sourceposition in the middle of the top chamber; these results can becompared with those shown in Fig. 10. Of more interest is thecalculated acoustic output from the mouth of the burrow as afunction of frequency, as shown in Fig. 13C. There is a sharpresonance at 3.25 kHz, which is near the measured songfrequencies, suggesting that the cricket must adapt its songfrequency to the burrow in which it is singing (or, of course,the other way round). Changing the diameter and wall thicknessof the surface hole can vary the frequency of the resonance. TheQ of the resonance depends upon the value assumed for the wallabsorption. However, even with the rather large wall dampingcoefficient of 10, which has been assumed in these calculations,the resonance is still quite sharp, with a Q of approximately 7,which again agrees with the measured Q values for realburrows. A further calculation shows that the acoustic outputfrom the burrow is not greatly affected by the length of thelower chamber CD. The calculation further shows a minimumin the output power for a lower chamber length ofapproximately 7 mm, but only a small increase in output forboth longer and shorter chambers. This insensitivity accordswith the observed variability in the length of the lower chamber(Table 2). If acoustics were the only function of the burrow, onemight have expected the insect to opt for a very short lowerchamber in the interests of economy, but the extended burrowmay provide the insect with access to water in a very dryenvironment or may be used as an oviposition site for matedfemales.
Calculations suggest that the optimal singing position ofthe cricket would be close to one end or the other of the topchamber, which agrees well with our observations on wherethe insect sings (see Fig. 1); the variation in output is quitelarge. However, the model source adopted here was that of avery small dipole oscillating with a rather large amplitude,whereas the source provided by the cricket’s wings may bebetter approximated by a much larger source oscillating withsmall amplitude. It is not simple to introduce this refinementinto the numerical model, but an argument on generalphysical grounds suggests that an increase in source sizewill move the optimum singing position progressivelytowards the middle of the chamber, where the acoustic flowis smallest.
Song frequency and song purityAs has been indicated, the songs of Rufocephalusare, for
their size, unusually low in frequency, while the loudness(Table 3) compares, size-for-size, favourably with that of thefar larger G. campestris, which is approximately 95 dB at thesame distance (from data in Bennet-Clark, 1970). In manyexamples, the songs were also unusually constant in frequency,both within and between pulses, with Q−3dB of greater than 30and with harmonics at levels of less than 3 % of the amplitudeat Fo. In Rufocephalus, the Q of the burrow is greater than thatreported for mole crickets (Bennet-Clark, 1987). Because ofthis high Q, the burrow will be most easily driven at itsresonant frequency. And, as a consequence, the high Q and theclose coupling between the insect and the burrow will tend toentrain the frequency of catch-and-release of the plectrum-and-file mechanism to that of the burrow; the system acts as aresonator with its frequency set by the burrow. Such a systemappears to maintain the song frequency and coherence, as canbe seen in Fig. 3 and Fig. 4. Indeed, if the coupling betweenthe insect and the burrow is tight and the difference betweenthe natural frequency of the insect’s wings and the Fo of itsburrow is small, there may be no alternative. This appears tohave been the case with the burrow exchange experimentshown in Fig. 9.
However, several of the songs we measured containedpulses with gaps, and showed both frequency and amplitudemodulation. From the measurements made with the electricalmodel shown in Fig. 12, pulses of this type may result from afrequency mismatch between the insect and its burrow thatcauses an erratic cycle of catch-and-release of the plectrumagainst the file. The results with the electrical model (Fig. 12)suggest that the file-and-plectrum mechanism may act in twodifferent ways during the production of the pulse.
First, the cycle of catch-and-release of the file teeth maybecome entrained to the Fo of the burrow. In this case, the pulseenvelope will be comparatively smooth and the cycle-by-cyclefrequency will be fairly constant. The sound pulses shown inFig. 4A,B are examples of this phenomenon and are associatedwith the very high Q−3dB for this type of song pulse. However,the initial process of entrainment at the start of the pulse may beaccompanied by rapid amplitude modulation of the waveformof the pulse. This amplitude modulation may rise rapidly andthen fall (see Fig. 3, Fig. 4A, Fig. 12A) and be accompanied byfrequency modulation. This is shown in the first 2ms of the pulsein Fig. 4 or the first 4ms of that in Fig. 12A. What is not clearis whether the insect’s wings are being entrained to the Fo of theburrow or the burrow is being driven by the cycle-by-cyclefrequency determined by the file-and-plectrum mechanism ofthe wings. The latter would explain the sudden jump infrequency that occurs at the end of pulses of the type shown inFig. 6, where the amplitude decays exponentially at a nearlyconstant but different frequency from that in the preceding partof the pulse and with a lower harmonic content.
The second alternative is that the file-and-plectrummechanism does not become entrained or does not remainentrained to the Fo of the burrow. This was modelled in
W. J. BAILEY, H. C. BENNET-CLARK AND N. H. FLETCHER
2841Acoustics of a small Australian burrowing cricket
Fig. 12B, which shows that even a brief irregularity in thecycle-by-cycle input to a resonant load can result in rapidamplitude and frequency modulation of the output, particularlywhen the frequency of the input differs from the Fo of the load.An initial lack of entrainment would explain the brevity of thefirst sub-pulse of pulse 9 in Fig. 5, which occurs at a differentcycle-by-cycle frequency from that of pulse 2 from the sameinsect, with a slow amplitude modulation and comparativeconstancy of frequency. Subsequent loss or failure ofentrainment may then result in an interruption to the input fromthe insect’s wings to the burrow. In this case, if entrainmentfails, causing irregular movement of the insect’s wings, thefrequency generated by the catch-and-release of the file-and-plectrum mechanism of the wings may show considerablevariation during the wing-closing movement. Our preliminarystudies here, and those with the songs of other species ofcricket, show a clear relationship between rapid changes inamplitude or frequency and the relative amplitude ofharmonics of the Fc of the sound (H. C. Bennet-Clark and W.J. Bailey, in preparation).
The comparatively sharply tuned burrow appears to be animportant determinant of the song frequency (Fig. 9) and itappears that even very brief sounds, such as the ‘ticks’ producedduring the wing-opening movements, are capable of excitingthe resonance (Fig. 7). Transduction from the small wings ofthe insect to the surrounding air via two resonant stages offersadvantages in impedance matching and maintenance of songpurity that have been considered elsewhere (e.g. Bennet-Clark,1995). The resonant singing burrow of mole crickets (Bennet-Clark, 1987; Daws et al., 1996) offers similar advantages but,as described above, its acoustics differs.
We thank Carl Gerhardt for his assistance andencouragement in initiating this project by early observationsand recordings in 1996 at the Coalseam Nature Reserve. Thiswork has been supported in part by the Australian ResearchCouncil (W.J.B.). While H.C.B.-C. has made the mostsignificant contribution to this paper during a visit to theUniversity of Western Australia in 1999, the authors arearranged alphabetically. H.C.B.-C. thanks the Department ofZoology and the University of Western Australia forhospitality and laboratory space during the course of thiswork. The cycle-by-cycle frequency analyses described herewould have been far more tedious to make and far lessaccurate without the ZeroCrossing programme written by K.N. Prestwich of Holy Cross College, Worcester, MA 101610,
USA, who discussed the design of the program with H.C.B.-C. and gave it freely to us. Grateful thanks to Leah Beesleywho made many of the measurements of the insects, songsand burrows, to Tom Stewart who made sections of theburrows, to Dale Robertson for loan of apparatus and to LeighSimmons for helpful discussions.
ReferencesBailey, W. J. (1991). Acoustic Behaviour of Insects.London: Chapman &
Hall.Bennet-Clark, H. C. (1970). The mechanism and efficiency of sound
production in mole crickets. J. Exp. Biol. 52, 619–652.Bennet-Clark, H. C. (1987). The tuned singing burrow of mole crickets. J.
Exp. Biol. 128, 383–409.Bennet-Clark, H. C. (1989). Songs and the physics of sound production. In
Cricket Behavior and Neurobiology (ed. F. Huber, T. E. Moore and W.Loher), pp. 227–261. Ithaca, London: Cornell University Press.
Bennet-Clark, H. C. (1995). Insect sound production: transductionmechanisms and impedance matching. In Biological Fluid Dynamics(ed.C. P. Ellington and T. J. Pedley), pp. 199–218. Cambridge: Company ofBiologists Ltd.
Bennet-Clark, H. C. (1998). Size and scale effects as constraints in insectsound communication. Phil. Trans. R. Soc. Lond. B353, 407–419.
Bennet-Clark, H. C. (1999a). Which Qs to choose: questions of quality inbioacoustics? Bioacoustics 9, 351–359.
Bennet-Clark, H. C. (1999b). Resonators in insect sound production: howinsects produce loud pure-tone songs. J. Exp. Biol. 202, 3347–3357.
Bennet-Clark, H. C. and Young, D.(1992). A model of the mechanism ofsound production in cicadas. J. Exp. Biol. 173, 123–153.
Daws, A. G., Bennet-Clark, H. C. and Fletcher, N. H.(1996). Themechanism of tuning of the mole cricket singing burrow. Bioacoustics 7,81–117.
Dumortier, B. (1963). The physical characteristics of sound emissions inArthropoda. In Acoustic Behaviour of Animals(ed. R. G. Busnel), pp.346–373. Amsterdam: Elsevier.
Fletcher, N. H. (1992). Acoustic Systems in Biology. Oxford: OxfordUniversity Press.
Forrest, T. G. (1982). Acoustic communication and baffling behavior ofcrickets. Florida Ent. 65, 33–44.
Leroy, Y. (1966). Signaux acoustiques, comportement et systématique dequelques espèces de Gryllidae (Orthoptères, Ensifères). Bull. Biol. Fr. Belg.100, 1–134.
Morse, P. M. (1948). Vibration and Sound.New York: McGraw-Hill.Nocke, H.(1971). Biophysik der Schallerzeugung durch die Vorderflügel der
Grillen. Z. Vergl. Physiol. 74, 272–314.Olson, H. F. (1957). Acoustical Engineering. Princeton, NJ: Van Nostrand.Otte, D. and Alexander, R. D.(1983). The Australian crickets (Orthoptera:
Gryllidae). Monogr. Acad. Nat. Sci. Philadelphia 22, 1–477.Römer, H. (1993). Environmental and biological constraints for the evolution
of long-range signalling and hearing in acoustic insects. Phil. Trans. R. Soc.Lond. B 340, 179–185.
Simmons, L. W. and Ritchie, M. G. (1996). Symmetry in the songs ofcrickets. Proc. R. Soc. Lond. B263, 305–311.
Young, D. (1990). Do cicadas radiate sound through their ear drums? J. Exp.Biol. 151, 41–56.
Young, D. and Bennet-Clark, H. C.(1995). The role of the tymbal in cicadasound production. J. Exp. Biol. 198, 1001–1019.


