Embed Size (px)
Citation preview

Available online at www.sciencedirect.com
08) 153–160
Intelligence 36 (20ACT and general cognitive ability
Katherine A. Koenig ⁎, Meredith C. Frey, Douglas K. Detterman
Department of Psychology, Case Western Reserve University, United States
Received 1 July 2006; received in revised form 16 March 2007; accepted 27 March 2007Available online 2 May 2007
Abstract
Research on the SAT has shown a substantial correlation with measures of g such as the Armed Services Vocational AptitudeBattery (ASVAB). Another widely administered test for college admission is the American College Test (ACT). Using the NationalLongitudinal Survey of Youth 1979, measures of g were derived from the ASVAB and correlated with ACT scores for 1075participants. The resulting correlation was .77. The ACT also shows significant correlations with the SAT and several standard IQtests. A more recent sample (N=149) consisting of ACT scores and the Raven's APM shows a correlation of .61 between Raven's-derived IQ scores and Composite ACT scores. It appears that ACT scores can be used to accurately predict IQ in the generalpopulation.© 2007 Elsevier Inc. All rights reserved.
Keywords: ACT; General cognitive ability; SAT; Advanced progressive matrices; ASVAB
A primary concern of college-bound adolescents isperformance on a college admissions test. One of themost widely used tests is the American College Test(ACT). The ACT is accepted by colleges throughout theUnited States and is administered to over 1 millionstudents annually. Designed in 1959 as an alternative tothe SAT, the ACT purports to closely parallel highschool curriculum and to measure the preparedness ofthe test-taker for more advanced education. Accordingto the ACT web site: “The ACT is curriculum-based.The ACT is not an aptitude or an IQ test” (Facts aboutthe ACT). Frey and Detterman (2004) showed that theSAT was correlated with measures of general intelli-gence .82 (.87 when corrected for nonlinearity). In
⁎ Corresponding author. Department of Psychology, Case WesternReserve University, 10900 Euclid Avenue, Cleveland, OH 44106,United States.
E-mail address: [email protected] (K.A. Koenig).
0160-2896/$ - see front matter © 2007 Elsevier Inc. All rights reserved.doi:10.1016/j.intell.2007.03.005
addition, a correlation of .92 was found between SAT IVerbal+Math and ACT composite scores in a sample of103,525 students, and ACT Math correlated .89 withSAT I Math (Dorans, Lyu, Pommerich, & Houston,1997). Given the similarity between the SAT and theACT it is not unreasonable to expect that the ACTwouldshow similar correlations with general intelligence,despite claims to the contrary. However, to the best ofour knowledge, the relationship between the ACT andgeneral intelligence has never been investigated in alarge sample.
The ACT is composed of four sections measuringMathematics, English, Reading, and Science, with acomposite score that is the average of the four subtestscores. The score range for each subtest is 1–36 with a2003 average of 20.8. Composite and subtest scores havevaried little in the past decade, though changes to theACT were implemented in 2005 in the form of anoptional writing test (Facts about the ACT).

154 K.A. Koenig et al. / Intelligence 36 (2008) 153–160
Much research has focused on the usefulness of theACT for predicting success in college. Stumpf andStanley (2002) found that ACT scores show a .70correlation with college graduation rates. In addition,ACT scores have been shown to correlate with collegeGPA from .54 to .63, and the ACT math subtestcorrelates with math GPA from .48 to .64 (Koretz &Berends, 2001; Pettijohn, 1995; Sibert & Ayers, 1989;Snowman, Leitner, Snyder, & Lockhart, 1980). Com-posite ACT scores are generally better at predictingcollege GPA than is high school GPA, especially at highlevels of ability (Noble & Sawyer, 2002). In datagathered at St. Norbert College, ACT composite scorescorrelated with final college GPA about .50, and thecorrelation between ACT composite scores and highschool GPA was found to be about .55. (St. NorbertCollege, 2002).
In general, tests of academic achievement correlatewith IQ scores about .50 (Brody, 1997; Petrill &Wilkerson, 2000). Several studies have explored therelationship between IQ and ACT scores specifically(Lewis & Johnson, 1985; Steinberg, Segel, & Levine,1967). These studies used relatively small samples andfound moderate to high correlations between verbal,performance, and full scale IQ and English, Mathe-matics, and Composite ACTscores. In addition, the ACTcomposite scores show gender effects, with malesscoring significantly higher than females (Mau &Lynn, 2001). This does not mean that the ACT is abiased test. Drasgow (1987) used Item Response Theoryto analyze a sample of over 8000 individual scores on theACT Mathematics and English subtests and found nogender or race bias.
The psychometric similarities between measures ofacademic achievement and measures of IQ are great.Coyle (2006) correlated scores on the SAT and ACTwith performance on three highly g-loaded cognitivemeasures (college GPA, the Wonderlic Personnel Testand a word recall task). The g, or general, factor is acommon element among all tests of mental ability, thefirst shared factor that is extracted through factoranalysis. Coyle performed a factor analysis that showedhigh g-loading for raw ACT and SAT scores, and theraw scores were significantly predictive of scores onmeasures of cognitive ability. Coyle also calculatedchange scores on the SAT and ACT (all subjects hadtaken the exams twice). Change scores did not correlatewith g, indicating that a change in score on a test ofacademic achievement does not represent a change in g.Rather, change scores may represent change in a groupfactor, such as memory or spatial ability. This isconsistent with research that shows that for tests of
cognitive ability test–retest change scores are not relatedto g (Jensen, 1998, pp. 314–316).
There is also considerable research on the relation-ship between IQ, academic achievement, and herit-ability. It is well-established that the genetic influenceon IQ is significant. As an individual ages, there isevidence that the heritability of IQ increases, so thatenvironment accounts for less individual variance(Plomin, 1986). Twin studies show that levels ofheritability for academic achievement are only slightlylower than levels of heritability for IQ. For example, in asample of 91 adult male twin pairs, Lichtenstein andPederson (1997) found that the heritability of educa-tional attainment was .42. In a sample of 132 dizygotictwin pairs and 146 monozygotic twin pairs, aged 6–12,Thompson, Detterman, and Plomin (1991) found thegenetic contribution to academic achievement was about.30, while the shared family environment effect was .60.Academic achievement appears to follow the samepattern of heritability, with heritability increasing withage (see review in Petrill & Wilkerson, 2000).
In a study of the Queensland Core Skills Test (QCST),Wainwright, Wright, Geffen, Luciano, and Martin(2005) investigated genetic and environmental contribu-tions to performance. The QCST is a test of academicachievement given to students in the 12th year ofschooling. It includes writing, multiple choice, and shortresponse, and is designed to test reasoning and the abilityto integrate information. 326 dizygotic twin pairs and256 monozygotic twin pairs ranging from 15 to 22 yearswere administered the QCST and the MultidimensionalAptitude Battery (MAD), a measure of IQ. The adjustedheritability on the QCST was found to be .64. Acorrelation of .81 was found between MAD Verbal IQand QCST scores and .57 between MAD Math IQ andQCST scores. The authors also found that the geneticinfluences responsible for the heritability of IQ over-lapped almost completely with those responsible for theheritability of academic achievement. This is similar tothe findings of Thompson et al. (1991), who also foundthat genetic influences can best explain the covariancebetween cognitive ability and achievement. Accordingto Wainwright et al. (2005), this finding makes intuitivesense. Tests of academic achievement in many respectsmeasure what a student has been exposed to andassimilated during his or her education. Many widely-used IQ tests include subtests (such as Vocabulary) thatdepend on knowledge an individual has been exposed tothrough culture. Indeed, in many cases Verbal IQcorrelates more highly with measures of academicachievement than Performance IQ (Thompson et al.,1991; Wainwright et al., 2005).

155K.A. Koenig et al. / Intelligence 36 (2008) 153–160
As discussed in Frey and Detterman (2004), theability to predict IQ from widely used tests such as theSAT and ACT can increase the accuracy of estimates ofpre-morbid functioning in clinical populations. Clini-cians currently use a number of demographic variablesand current performance on psychological measures topredict pre-morbid functioning in individuals whosustain, for example, an injury causing brain damage(Baade & Schoenberg, 2004). While demographicvariables alone can be useful in prediction, the additionof tests of current functioning increases predictionsubstantially (Axelrod, Vanderploeg, & Schinka, 1999).However, premorbid ACT scores may provide a moreefficient and more accurate means of estimation.Because a large number of students have taken theACT, the potential impact of a more accurate estimateof IQ is great.
In a review of existing research, Baade andSchoenberg (2004) looked at 15 studies of academicachievement and IQ. Their review finds a highcorrelation between a variety of achievement tests(including the ACT) and scores on the WAIS orWISC. The authors suggest the use of the predicted-difference algorithm to calculate IQ from test scores, butcaution that at the time of the review no large scaleresearch had looked at the relationship between many ofthe measures of academic achievement and IQ. Thevalidity of the predicted-difference method described inthe article depends on a high correlation between IQscores and measures of academic achievement, andconfirmation of the relationship is critical.
The growing field of cognitive epidemiology wouldalso benefit from a widely-used test of cognitiveabilities. By exploring the link between differences ingeneral intelligence and illness and injury rates,investigators can account for group differences in healthoutcomes. With a fuller understanding of the causes ofdisparate health outcomes, more appropriate preventa-tive measures can be developed and implemented(Gottfredson, 2004; Gottfredson & Deary, 2004). Atest as widely used as the ACTwould surely be an assetto this research. Beyond the idea of group differences,knowledge of an individual's level of cognitivefunctioning can aid health workers in identifying thoseindividuals who may need additional assistance under-standing the “job” of managing their healthcare(Lubinski & Humphreys, 1997).
Use of ACT as a measure of intelligence hasimplications for other research as well. Researchersthat use undergraduate populations will gain a valuabletool, as ACT scores could be used as an estimate of IQwhen administration of traditional IQ tests is imprac-
tical. As noted, ACTscores have already been used as anestimate of IQ in some research. The conclusions ofthese papers depend on the relationship between ACTand cognitive ability. A transformation equation willprovide an accurate estimate of IQ that preservestraditional scaling for comparison across studies. Byexamining the relationship between ACT and cognitiveability in a large sample we hope to develop an equationto quickly predict cognitive ability from ACT.
1. Study 1
1.1. Method
1.1.1. SampleThe current study utilized the National Longitudinal
Survey of Youth 1979 (NLSY79) data set, availablefrom the Center for Human Resource Research at TheOhio State University (www.chrr.ohio-state.edu). TheNational Longitudinal Surveys are directed by theBureau of Labor Statistics of the U.S. Department ofLabor. They were originally developed to collect labormarket and labor force data, but the content of thequestions cover a variety of subjects.
The NLSY79 is a sample of 12,686 individuals livingin the United States in 1979. Participants were 14–22 year-old in 1979. They were interviewed annuallyfrom 1979 to 1994 and continue to be interviewed everyother year. The sample was designed to be nationallyrepresentative, with 24% African–American respon-dents, 15% Hispanic respondents, 41% Caucasianrespondents (National Longitudinal Surveys).
1.1.2. ProceduresVariables used for analysis included the ACT Verbal
and Math subtests, the Armed Services VocationalAptitude Battery (ASVAB), the Scholastic Aptitude Test(SAT), and six standard intelligence tests.
The ASVAB is administered to new recruits by theUS military to determine eligibility and trainability.The Department of Defense selected the nationallyrepresentative NLSY79 sample to update the ASVABnorms. At the request of the Department of Defense,the ASVAB was administered to 11,914 NLSY79participants (94% of the total sample) in 1980.Participants were born between 1957 and 1964 (Miller,2004).
A measure of g was derived from the 10 ASVABsubtests using principal factor analysis. Ree and Carretta(1994) found a three-factor hierarchical model bestrepresents the ASVAB, with 63.8% of common varianceaccounted for by the first factor g. Kass, Mitchell,

Fig. 1. Scatter plot of the relationship between total (Math+Verbal)ACT score and ASVAB IQ.
156 K.A. Koenig et al. / Intelligence 36 (2008) 153–160
Grafton, and Wing (1983) factor analyzed a sample of98,689 ASVAB scores from Army applicants. Theyfound few meaningful differences in factor loadingsacross race/ethnic group or gender. Ree and Carretta(1995) analyzed ASVAB scores from a portion of theNLSY79 sample. For all gender groups and racial/ethnicgroups g accounted for the most variance, and theresearchers concluded that predictiveness should beconsistent across groups.
A total of 11,914 subjects had available ASVABscores, and all 10 subtests showed loading on g.Explained variance ranged from .687 for CodingSpeed to .896 for Word Knowledge. The equationIQ=(z⁎15)+100 was used to transform the first factoronto an IQ scale.
Table 1Correlations between ACT and tests of mental ability
Test 1 2 3 4
1. California test rN
– .757⁎⁎
12.7696
.87
2. Otis–Lennon – .864⁎⁎
27.511
3. Lorge–Thorndike – .312
4. Henmon–Nelson –
5. Differential aptitude
6. Coop school and college
7. ACT Total
8. ASVAB
⁎pN .05 ⁎⁎pN .01.
ACT, SAT, and standard intelligence test data weregathered from high school and transcript surveys forthose respondents over 17 years of age. Three rounds ofdata were collected in 1980, 1981, and 1983 (Miller,2004).
The IQ scores derived from the ASVAB werecorrelated with the ACT scores for the 1075 respondentswho had scores on the ASVAB, ACT verbal, and ACTmath. One participant was discarded because both ACTmath and verbal scores were not within the allowedrange of ACT scores. Simple correlations were exam-ined between ACT, SAT, ASVAB factor scores and thesix standard intelligence tests.
1.2. Results
1075 subjects had scores on all ASVAB subtests andscores on the Verbal and Math portions of the ACT. Asignificant correlation was found between total (Math+Verbal) ACT score and ASVAB IQ (r=.77, pb .001).A scatter plot of this relationship revealed an r-squaredof .5853 (Fig. 1). A squared component of the totalACT score added a significant but small amount ofprediction and was not included in the regression (r=.77,pb .001).
Total ACT showed significant correlations (pb .01)with all of the standard intelligence tests, ranging from.55 to .81 (Table 1). The ACT and all standardintelligence tests show significant correlations (pb .01)with the first factor of the ASVAB. The highestcorrelation with the ASVAB factor score was theCoop School and College Test (r=.83, pb .01), followedby the California Test (r=.78, pb .01) and the ACT
5 6 7 8 Total N
78⁎⁎ .582⁎⁎
25.888⁎⁎
19.794⁎⁎
64.777⁎⁎
358599
25 .738⁎⁎
85.6055
.719⁎⁎
97.756⁎⁎
5721,191
77 .545⁎⁎
64.485⁎
17.545⁎⁎
32.560⁎⁎
295691
− .5327
.858⁎⁎
19.713⁎⁎
29.690⁎⁎
166201
– .770⁎⁎
28.783⁎⁎
110.751⁎⁎
600569
– .814⁎⁎
33.825⁎⁎
162164
– .767⁎⁎
10751,123
– 11,914
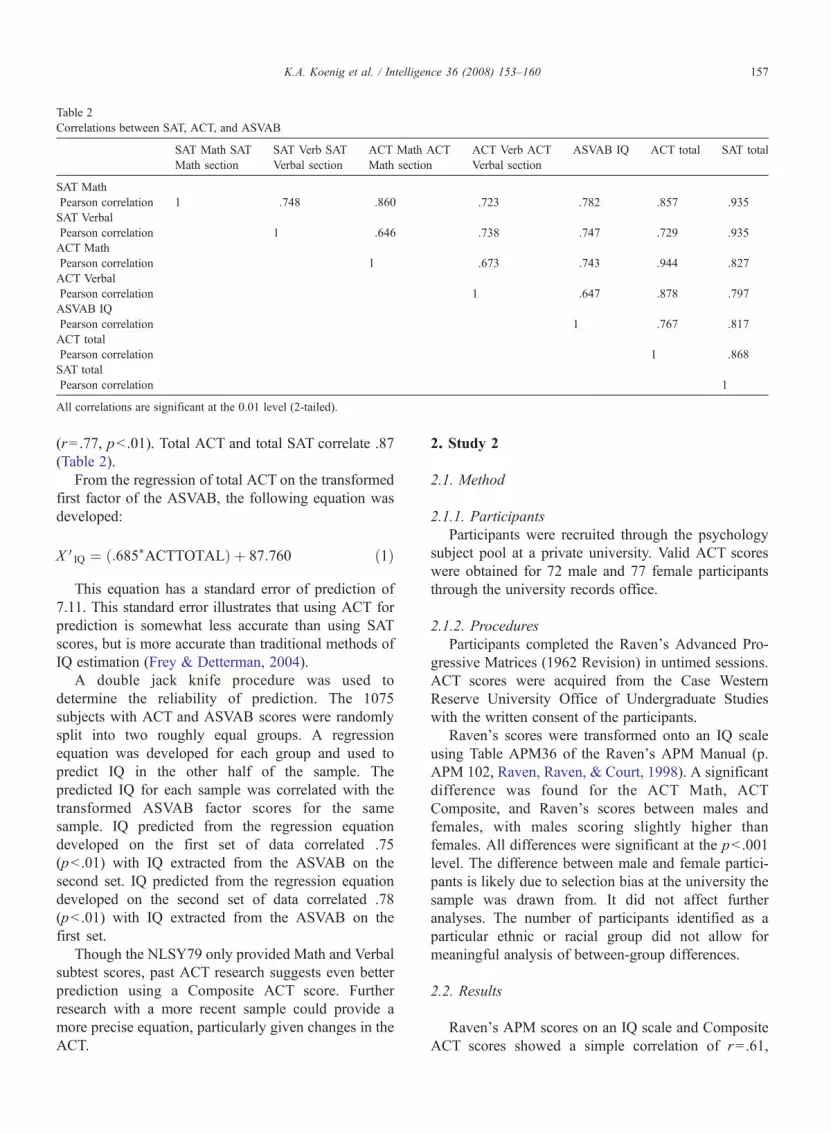
Table 2Correlations between SAT, ACT, and ASVAB
SAT Math SATMath section
SAT Verb SATVerbal section
ACT Math ACTMath section
ACT Verb ACTVerbal section
ASVAB IQ ACT total SAT total
SAT MathPearson correlation 1 .748 .860 .723 .782 .857 .935SAT VerbalPearson correlation 1 .646 .738 .747 .729 .935ACT MathPearson correlation 1 .673 .743 .944 .827ACT VerbalPearson correlation 1 .647 .878 .797ASVAB IQPearson correlation 1 .767 .817ACT totalPearson correlation 1 .868SAT totalPearson correlation 1
All correlations are significant at the 0.01 level (2-tailed).
157K.A. Koenig et al. / Intelligence 36 (2008) 153–160
(r=.77, pb .01). Total ACT and total SAT correlate .87(Table 2).
From the regression of total ACT on the transformedfirst factor of the ASVAB, the following equation wasdeveloped:
X VIQ ¼ :685⁎ACTTOTALð Þ þ 87:760 ð1Þ
This equation has a standard error of prediction of7.11. This standard error illustrates that using ACT forprediction is somewhat less accurate than using SATscores, but is more accurate than traditional methods ofIQ estimation (Frey & Detterman, 2004).
A double jack knife procedure was used todetermine the reliability of prediction. The 1075subjects with ACT and ASVAB scores were randomlysplit into two roughly equal groups. A regressionequation was developed for each group and used topredict IQ in the other half of the sample. Thepredicted IQ for each sample was correlated with thetransformed ASVAB factor scores for the samesample. IQ predicted from the regression equationdeveloped on the first set of data correlated .75(pb .01) with IQ extracted from the ASVAB on thesecond set. IQ predicted from the regression equationdeveloped on the second set of data correlated .78(pb .01) with IQ extracted from the ASVAB on thefirst set.
Though the NLSY79 only provided Math and Verbalsubtest scores, past ACT research suggests even betterprediction using a Composite ACT score. Furtherresearch with a more recent sample could provide amore precise equation, particularly given changes in theACT.
2. Study 2
2.1. Method
2.1.1. ParticipantsParticipants were recruited through the psychology
subject pool at a private university. Valid ACT scoreswere obtained for 72 male and 77 female participantsthrough the university records office.
2.1.2. ProceduresParticipants completed the Raven's Advanced Pro-
gressive Matrices (1962 Revision) in untimed sessions.ACT scores were acquired from the Case WesternReserve University Office of Undergraduate Studieswith the written consent of the participants.
Raven's scores were transformed onto an IQ scaleusing Table APM36 of the Raven's APM Manual (p.APM 102, Raven, Raven, & Court, 1998). A significantdifference was found for the ACT Math, ACTComposite, and Raven's scores between males andfemales, with males scoring slightly higher thanfemales. All differences were significant at the pb .001level. The difference between male and female partici-pants is likely due to selection bias at the university thesample was drawn from. It did not affect furtheranalyses. The number of participants identified as aparticular ethnic or racial group did not allow formeaningful analysis of between-group differences.
2.2. Results
Raven's APM scores on an IQ scale and CompositeACT scores showed a simple correlation of r=.61,

Table 3Comparison of mean ACT scores
Study 1 Study 2 Nationalscores
English Mean17.57
SD5.51
Mean27.9
SD4.06
Mean20.4
SD5.9
Math Mean17.51
SD7.99
Mean28.3
SD3.87
Mean20.7
SD5.0
Composite – Mean28.2
SD3.24
Mean20.9
SD4.8
158 K.A. Koenig et al. / Intelligence 36 (2008) 153–160
pb .001. Math ACT scores correlated with IQ at r=.56,pb .001, and English ACT showed a correlation ofr=.43, pb .001.
The current sample shows a restriction of range(Table 3). The ACT has no targeted population standarddeviation, but a correction for restriction of range wasperformed using the 2005 average scores and standarddeviations for all students taking the ACT (1,186,251individuals). Composite ACT showed a correctedcorrelation of r= .75, Math ACT showed a correctedcorrelation of r= .65, and English ACT showed acorrected correlation of r= .57.
As in Study 1, a jack knife procedure was used to testfor reliability of prediction. The dataset was randomlysplit and a regression equation was developed for eachhalf using ACT comprehensive scores. The Raven'sderived IQ scores were correlated with IQ scorespredicted from the regression equation developed onthe other half of the data. IQ predicted from the equationdeveloped on half one correlated .53, pb .01 withRaven's IQ on half two. IQ predicted from the equationdeveloped on half two correlated .67, pb .01 withRaven's IQ on half one.
2.2.1. Cross validationIn order to validate our equations across data sets we
applied the regression equation developed on eachdataset to the other. The equation created using Study 1data was used to predict IQ in the Study 2 dataset. IQspredicted from the first equation correlated significantlywith the Raven's IQ (r= .61, pb.01). Study 1 IQpredicted from the Study 2 equation correlated withASVAB IQ (r=.77, pb .01).
2.3. Discussion
The analyses presented above demonstrate a sig-nificant relationship between measures of cognitiveability and ACT scores. Based upon correlations withconventional intelligence tests and the first factor of theASVAB, it appears that that ACT is a measure of general
intelligence. Indeed, based on the correlations amongthe tests in Study 1, the ACT is indistinguishable fromother tests that are identified as intelligence tests. Inaddition, the ACT shows a high correlation with theSAT, itself considered to be a measure of intelligence(Frey & Detterman, 2004). The jackknife analysisconfirms the stability of these results.
In an analysis of three test batteries, Johnson,Bouchard, Krueger, McGue, and Gottesman (2004)found that the g factors extracted from each test areessentially identical. The three batteries were composedof over 42 subtests, tapping a variety of mental abilities.They concluded that a common component of mentalability, g, is consistently tapped by even very distincttests of mental ability. This conclusion was alsosupported by Roznowski (1987) in a sample of over20,000 individuals. In this study males and females weregiven sets of tests that were selected to be gender-biased.For example, female tests included etiquette, foods, andhome economics. Male tests included mechanics,military, and fishing. Scores on these narrow tests werehighly correlated with measures of general intelligenceand were highly predictive of general intelligence. Wesuspect that a factor analysis of all four subtests of theACT would yield a common factor that is highlycorrelated with the first factor of other tests of mentalability. In addition, evidence that the ACT is an IQ test isshown though equivalency of prediction. The ASVAB isknown to be a measure of crystallized intelligence, whilethe Raven's is well established as a measure of fluidintelligence (Roberts et al., 2000). That both types oftests are so closely related to the ACT is evidence that theACT is an acceptable measure of general intelligence.
The more recent sample obtained in Study 2, whileshowing restriction of range, also shows significantcorrelation between a measure of cognitive ability andACTscores. In particular, use of a Composite ACTscoreas a rough estimate of IQ can prove useful when othertesting methods are unavailable or not practical. Thisapplication will prove especially useful to thoseresearchers working in fields that utilize large samplesizes drawn from the general population, and those thatwork with college students, many of whom will haveACT scores on file. Clinicians will find ACT scores areliable estimate of premorbid intelligence in individualswhere no conventional measure of premorbid IQ isavailable. ACT scores show high correlations withconventional IQ measures and are more quickly andeasily obtained and converted than demographic dataand measures of current functioning.
As discussed in the opening of this article, ACT, Inc.claims that the ACT is not an IQ test, but rather measures

159K.A. Koenig et al. / Intelligence 36 (2008) 153–160
the preparedness of the test-taker for advanced educa-tion. Given the results of the current study, this statementis misleading. Colleges that use scores on the ACT andSAT for admission decisions are basing admissionspartially on intelligence test results. Whether this isacceptable or efficient practice is beyond the scope ofthis article, but we argue that the testing companies havea responsibility to the public to accurately describe whatthese widely-used tests measure.
References
Axelrod, B. N., Vanderploeg, R. D., & Schinka, J. A. (1999).Comparing methods for estimating premorbid intellectual func-tioning. Archives of Clinical Neuropsychology, 14(4), 341−346.
Baade, L. E., & Schoenberg, M. R. (2004). A proposed method toestimate premorbid intelligence utilizing group achievementmeasures from school records. Archives of Clinical Neuropsychol-ogy, 19, 227−243.
Brody, N. (1997). Intelligence, schooling, and society. AmericanPsychologist, 52(10), 1046−1050.
Coyle, T. R. (2006). Test–retest changes on scholastic aptitude tests arenot related to g. Intelligence, 34, 15−27.
Dorans, N. J., Lyu, C. F., Pommerich, M., & Houston, W. M. (1997).Concordance between ACT Assessment and Recentered SAT Isum scores. College and University, 73(2), 24−34.
Drasgow, F. (1987). Study of the measurement bias of twostandardized psychological tests. Journal of Applied Psychology,72(1), 19−29.
Facts about the ACT. (n.d.) Retrieved September 13, 2004, from ACTWeb site: http://www.act.org/news/aapfacts.html
Frey, M. C., & Detterman, D. K. (2004). Scholastic assessment or g?The relationship between the SAT and general cognitive ability.Psychological Science, 15(6), 373−378.
Gottfredson, L. S. (2004). Intelligence: is it the epidemiologists'elusive “fundamental cause” of social class inequalities inhealth. Journal of Personality and Social Psychology, 86,174−199.
Gottfredson, L. S., & Deary, I. J. (2004). Intelligence predicts healthand longevity, but why? Current Directions in PsychologicalScience, 13(1), 1−4.
Jensen, A. R. (1998). The g factor: The science of mental ability.Westport, CT: Praeger.
Johnson, W., Bouchard, T. J., Jr., Krueger, R. F., McGue, M., &Gottesman, I. I. (2004). Just one g: consistent results from threetest batteries. Intelligence, 32, 95−107.
Kass, R. A., Mitchell, K. J., Grafton, F. C., & Wing, H. (1983).Factorial validity of the Armed Services Vocational AptitudeBattery (ASVAB), Forms 8, 9, and 10: 1981 army applicantsample. Educational and Psychological Measurement, 43,1077−1087.
Koretz, D., & Berends, M. (2001). Changes in high school gradingstandards in mathematics, 1982-1992: Appendix C- Analysis ofthe feasibility of using SAT and ACT scores as covariates.SantaMonica, CA: Rand Corporation Retrieved September 13, 2004from the Rand Corporation Website: http://www.rand.org/publications/MR/MR1445/MR1445.appc.pdf
Lichtenstein, P., & Pederson, N. L. (1997). Does genetic variance forcognitive abilities account for genetic variance in educational
achievement and occupational status? A study of twins reared apartand reared together. Social Biology, 44(1–2), 77−90.
Lewis, M. L., & Johnson, J. L. (1985). Comparison of WAIS andWAIS-R IQs from two equivalent college populations. Journal ofPsychoeducational Assessment, 3(1), 55−60.
Lubinski, D., & Humphreys, L. G. (1997). Incorporating generalintelligence into epidemiology and the social sciences. Intelli-gence, 24, 159−201.
Mau, W., & Lynn, R. (2001). Gender Differences on the ScholasticAptitude Test, the American College Test and College Grades.Educational Psychology, 21(2), 133−136.
Miller, S. (Ed.). (2004). NLSY79 Users Guide: A Guide to the 1979-2002 National Longitudinal Survey of Youth Data RetrievedAugust 15, 2004, from U.S. Department of Labor, Bureau of LaborStatistics Web site: http://www.bls.gov/nls/79guide/nls79usg.htm
National Longitudinal Surveys (n.d.) Retrieved August 15, 2004, fromBureau of Labor Statistics Web site: http://www.bls.gov/nls/
Noble, J., & Sawyer, R. (2002). Predicting different levels of academicsuccess in college using high school GPA and ACT compositescore.ACT Research Report Series 2002-4 Iowa City, Iowa: ACTRetrieved September 13, 2004 from the ACTwebsite: http://www.act.org/research/reports/pdf/ACT_RR2002-4.pdf
Petrill, S. A., & Wilkerson, B. (2000). Intelligence and achievement: abehavioral genetic perspective. Educational Psychology Review,12(2), 185−199.
Pettijohn, T. F. (1995). Correlations among college students' gradepoint averages and American College Test scores. PsychologicalReports, 76, 336−338.
Plomin, R. (1986). Development, genetics, and psychology. Hillsdale,NJ: Erlbaum.
Raven, J., Raven, J. C., & Court, J. H. (1998). Manual for Raven'sProgressiveMatrices andVocabulary Scales. Section 4: TheAdvancedProgressive Matrices. San Antonio, TX: Harcourt Assessment.
Ree, M. J., & Carretta, T. R. (1994). Factor analysis of the ASVAB:confirming a Vernon-like structure. Educational and Psychologi-cal Measurement, 54(2), 459−463.
Ree, M. J., & Carretta, T. R. (1995). Group differences in aptitudefactor structure on the ASVAB. Educational and PsychologicalMeasurement, 55(2), 268−277.
Roberts, R. D., Goff, G. N., Anjoul, F., Kyllonen, P. C., Pallier, G., &Stankov, L. (2000). The Armed Services Vocational AptitudeBattery (ASVAB): little more than acculturated learning (Gc)!?Learning and Individual Differences, 12(1), 81−103.
Roznowski, M. (1987). Use of tests manifesting sex differences asmeasures of intelligence: Implications for measurement bias.Journal of Applied Psychology, 72, 480−483.
St. Norbert College. (2002). Institutional Effectiveness, 1: 2. (pp. 2)Retrieved September 13, 2004 from St. Norbert College Web site:http://www.snc.edu/oie/openarea/assessment_news_components/issue2.pdf
Sibert, P. C., & Ayers, J. B. (1989). Relationships between scores fromthe ACT, PPST, NTE, ACTCOMP, and GPA. Educational andPsychological Measurement, 49, 945−948.
Snowman, J., Leitner, D. W., Snyder, V., & Lockhart, L. (1980). Acomparison of the predictive validities of selected academic testsof the American College Test (ACT) Assessment Program and theDescriptive Tests of Language Skills for college freshman in abasic skills program. Educational and Psychological Measure-ment, 40, 1159−1166.
Steinberg, M., Segal, R. H., & Levine, H. D. (1967). Psychologicaldeterminants of academic success: a pilot study. Educational andPsychological Measurement, 27(2), 413−422.

160 K.A. Koenig et al. / Intelligence 36 (2008) 153–160
Stumph, H., & Stanley, J. C. (2002). Group data on high school gradepoint averages and scores on academic aptitude tests as predictorsof institutional graduation rates. Educational and PsychologicalMeasurement, 62(6), 1042−1052.
Thompson, L. A., Detterman, D. K., & Plomin, R. (1991).Associations between cognitive abilities and scholastic achieve-
ment: genetic overlap but environmental differences. Psychologi-cal Science, 2(3), 158−165.
Wainwright, M. A., Wright, M. J., Geffen, G. M., Luciano, M., &Martin, N. G. (2005). The genetic basis of academic achievementon the Queensland core skills test and its shared genetic variancewith IQ. Behavior Genetics, 35(2), 133−145.