Embed Size (px)
Citation preview

ART ICLES
Activator–inhibitor coupling between Rho signallingand actin assembly makes the cell cortex anexcitable mediumWilliamM. Bement1,6,7,8, Marcin Leda2, Alison M. Moe1, Angela M. Kita1, Matthew E. Larson1,Adriana E. Golding1, Courtney Pfeuti1, Kuan-Chung Su3, Ann L. Miller4, Andrew B. Goryachev2,7,8and George von Dassow5,6,7,8
Animal cell cytokinesis results from patterned activation of the small GTPase Rho, which directs assembly of actomyosin in theequatorial cortex. Cytokinesis is restricted to a portion of the cell cycle following anaphase onset in which the cortex is responsiveto signals from the spindle. We show that shortly after anaphase onset oocytes and embryonic cells of frogs and echinodermsexhibit cortical waves of Rho activity and F-actin polymerization. The waves are modulated by cyclin-dependent kinase 1 (Cdk1)activity and require the Rho GEF (guanine nucleotide exchange factor), Ect2. Surprisingly, during wave propagation, although Rhoactivity elicits F-actin assembly, F-actin subsequently inactivates Rho. Experimental and modelling results show that wavesrepresent excitable dynamics of a reaction–diffusion system with Rho as the activator and F-actin the inhibitor. We propose thatcortical excitability explains fundamental features of cytokinesis including its cell cycle regulation.
Cytokinesis begins with activation of Rho in a narrow zone at theplasmamembrane1. Rho directs assembly of the cytokinetic apparatus,a transient array of F-actin andmyosin-2. Spindle-derived cues specifythe Rho zone; accordingly, considerable effort has been directed atcharacterization of these signals and their transport. The currentconsensus is that the centralspindlin complex interprets spindlemicrotubule organization to concentrate Ect2 at the equator, thusdefining the Rho zone2,3.
The cortex is not a passive substrate in cytokinesis, but rathermay actively process and amplify spindle-derived signals duringa discrete window of the cell cycle. Physical manipulations ofechinoderm embryos showed that the cortex becomes responsive (asmanifest by furrowing) shortly after anaphase onset and remainsso until shortly before the next M-phase4 whereas experimental M-phase arrest prevents development of this responsiveness5. Similarly,manipulations of cultured mammalian cells showed that forcedanaphase entry results in ∼50min of ectopic cortical contractilityeven after ablation of the spindle, leading to the concept of ‘C-phase’(‘cytokinetic phase’), a period of the cell cycle during which large-scalecortical contractility can be focused by signalling6.
Here we describe the discovery of a cell-cycle-entrained behaviourthat we propose reflects the capacity of the cortex to supportcytokinesis—cortical excitability. This behaviour is manifest asmutually coordinated cortical waves of Rho activity and F-actinassembly that are Ect2-dependent andmodulated by cyclin-dependentkinase 1 (Cdk1). We show that cortical excitability is present invertebrates and invertebrates, that it coincides with the ability ofdifferent cells to respond to spindle signals, and that it involves F-actin-dependent Rho inactivation.
RESULTSCortical F-actin waves in activated Xenopus eggs and embryosPrevious low-resolution imaging of cytokinesis in Xenopus embryosrevealed cortical ‘flickers’ of F-actin outside the furrow7. Remarkably,when imaged at higher resolution, the flickers resolved into wavesof F-actin (Fig. 1a,b and Supplementary Videos 1 and 2), similar tothose previously described in chemotactic cells8. F-actin waves can bedetected using two different F-actin probes, UtrCH (ref. 9; Fig. 1a,b) orLifeact10 (see Supplementary Fig. 1a). Apparently identical structuresexist in fixed, uninjected embryos stained with phalloidin (Fig. 1c),
1Laboratory of Cell and Molecular Biology, Graduate Program in Cell and Molecular Biology, University of Wisconsin-Madison, Madison, Wisconsin 53706, USA. 2Centrefor Synthetic and Systems Biology, University of Edinburgh, Edinburgh EH9 3BF, UK. 3Whitehead Institute for Biomedical Research, Massachusetts Institute ofTechnology, Boston, Massachusetts 02142, USA. 4Department of Molecular, Cellular and Developmental Biology, University of Michigan, Ann Arbor, Michigan 48190,USA. 5Oregon Institute of Marine Biology, University of Oregon, Charleston, Oregon 97420, USA. 6These authors contributed equally to this work. 7These authors jointlysupervised this work.8Correspondence should be addressed to W.M.B., A.B.G. or G.v.D. (e-mail: [email protected] or [email protected] or [email protected])
Received 17 February 2015; accepted 8 September 2015; published online 19 October 2015; DOI: 10.1038/ncb3251
NATURE CELL BIOLOGY ADVANCE ONLINE PUBLICATION 1
© 2015 Macmillan Publishers Limited. All rights reserved

ART ICLES
a bFrog embryo/F-actin
01:46 29:28
30:04
29:52
29:40
t–1 t+1t0
30:16
30:52
30:40
30:28
08:46
22:02
12:44
11:29
00:22
50 μm
50 μm
50 μm
20 μm
50 μm
Activated frog egg/F-actin
d Frog embryo/F-actin, Lifeact + Utr d′
Lifeact/Utr time-shift
15050 100–1
0
1
Cro
ss-c
orre
latio
n
Time (s)
15 s
Lifeact/Utr
2 m
in
2 m
in
c
20 μm
Frog embryo; fixed/F-actin
1
2
1 2
Figure 1 Cortical waves of actin assembly and disassembly in activated frogeggs and embryos. (a) Surface view of a frog blastomere expressing GFP–UtrCH to label F-actin. Top left: single frame; cortical F-actin consists ofirregularly sized patches throughout the cortex, which, as illustrated in thekymograph made from the outlined region (bottom left) travel continuallyacross the surface (see Supplementary Video 1). In the kymograph, F-actinwaves create slanted bands with semi-regular spacing. Right: sequentialframes from the same sequence throughout cytokinesis; horizontal lines inthe kymograph indicate times corresponding to individual en face framesshown to the right. For this and all other figures, time is in min:s. (b) High-magnification time-lapse sequence of an activated frog egg expressing GFP–UtrCH (see Supplementary Video 2), colour coded by rendering the currentframe malachite, next frame blue, last frame copper: thus, new F-actinis bluish, and old F-actin is reddish. On the left, the leading edge ofthe F-actin wave progresses downward while the trailing edge disappears.On the lower right, the old F-actin wave dissipates. Cables of F-actinare apparent within and between receding waves. Swatch shows colours
resulting from blending RGB channels with low (bottom of swatch) tohigh (top of swatch) overlap. Arrowheads indicate rising (left) and falling(right) wavefronts (arrow colour sampled locally). (c) A fixed frog embryostained with fluorescent phalloidin to reveal endogenous cortical F-actin;closely resembles b. ×2 enlarged insets (bottom) correspond to outlinedareas. Inset 1 shows a region between waves; inset 2 shows a wave.Cables are present in both but are brighter and denser in the wave.(d) Kymograph from a time series of a frog embryo co-expressing GFP–Lifeact (yellow) and mCherry–UtrCH (blue) to label newer and older actin,respectively (see Supplementary Video 3 and Supplementary Fig. 1d);inset is a ×3 blowup. Leading edges of each wave (top of bands inkymograph) have proportionately more Lifeact and trailing edges (lowerpart of bands) more UtrCH, even though both probes qualitatively labelthe same features (Supplementary Fig. 1d). (d′) Cross-correlational analysisshowing 15 s delay between recruitment of Lifeact and UtrCH. Images arerepresentative of at least 40 (a), at least 30 (b), and 3 (c,d) independentexperiments, respectively.
demonstrating that they are endogenous to the system.Waves traversethe cortex in an apparently random manner at 0.22± 0.1 µms−1
(mean± s.d.; n=80 waves) with a period of 80–120 s (Fig. 1b,d andSupplementary Videos 1 and 2). Waves that were unambiguouslyobserved to undergo collision annihilated each other (SupplementaryFig. 1d). Waves occur in artificially activated eggs, which do notcleave but otherwise mimic embryos (Fig. 1b and SupplementaryFig. 1b), but not oocytes arrested in prophase of meiosis I(Supplementary Fig. 1c).
To investigate whether the waves reflect actin assembly anddisassembly, we double-labelled embryos with GFP–Utr and
mCherry–Lifeact because Utr-based probes bind to F-actin slowerthan probes that also label G-actin, such as Lifeact9,11. Although bothprobes clearly reveal the same features (Supplementary Fig. 1d), theleading edges of waves had more Lifeact than Utr, and the trailingedges more Utr than Lifeact (Fig. 1d,d′ and Supplementary Video 3),demonstrating that the waves represent new assembly followed bydisassembly, not cortical contraction or irruption from below. Further,the myosin-2 inhibitor blebbistatin12 had no significant effect onwave period (Con= 78± 11 s; blebbistatin= 83± 8 s; mean± s.d.;P= 0.46; n= 270 correlation curves; analysis of variance). However,by suppressing cortical contraction, blebbistatin reduced side-to-side
2 NATURE CELL BIOLOGY ADVANCE ONLINE PUBLICATION
© 2015 Macmillan Publishers Limited. All rights reserved
ART ICLES
c dActivated frog eggnormal/active Rho
Raw 20 μm 20 μm
Raw
Raw
RawSub Sub
Sub Sub
ba Activated frog eggnormal/F-actin
a′ C3 inj./F-actina″DN Ect2/F-actin
Activated frog eggEct2 OE/active Rho
800
0
400
Contro
lC3
DN Ect
2
∗∗
∗∗Am
plit
ude
(a.u
.)
20 μm
2 m
in
20 μm
2 m
in
20 μm
2 m
in
20 μm
2 m
in
20 μm
2 m
in
Figure 2 Cortical F-actin waves in activated frog eggs are Rho-dependentand are accompanied by Rho activity waves. (a) Kymograph from a controlactivated frog egg expressing GFP–UtrCH to label F-actin. (a′) Kymographfrom an activated frog egg expressing GFP–UtrCH and dominant negativeEct2. (a′′) Kymograph from an activated frog egg expressing GFP–UtrCH and C3 exotransferase to inactivate Rho. Arrowheads indicatewaves. (b) Plot of wave amplitude in controls versus cells expressingdominant negative Ect2 or C3. Results are mean + s.d.; n = 100waves; P=0.00012 for C3 versus control and 0.00015 for DN Ect2versus control; t-test. (c) Activated frog egg expressing 3×GFP–rGBDto label active Rho (see Supplementary Video 4): single frame (top)and kymograph (bottom), raw (left) and subtracted data (right, t0–t−3),
highlighting rising Rho activity. The kymograph demonstrates that whatotherwise looks like mundane inhomogeneity in the still image actuallyreflects regular waves of Rho activity; these are more evident in theprocessed half of both the image and kymograph. (d) Activated frog eggexpressing 3×GFP–rGBD to label active Rho and subjected to low-leveloverexpression of wild-type Xenopus Ect2 (see Supplementary Video 5);figure processed and presented as in c. Waves are sharper (that is, havehigher amplitude) and more continuous than normal cells (compare withc) and are clearly evident even without processing. c and d are derivedfrom average projections of 4 1 µm sections at 10 s intervals. Images arerepresentative of at least 30 (a), 3 (a′,a′′,b), 4 (c) and 6 (d) independentexperiments, respectively.
movement of the cortex, which permitted quantification of wave runlength (maximum run length=25µm; mean=3.7 µm).
Ect2 regulates cortical Rho waves in activated Xenopus eggsand embryosC3 exotransferase, a specific Rho inhibitor, eliminated actin waves,but not other forms of actin assembly, such as comets (Fig. 2a′′,band Supplementary Fig. 2a). A dominant negative Ect2 (refs 2,13;the conserved GEF involved in cytokinesis) also eliminated the actinwaves (Fig. 2a′,b and Supplementary Fig. 2b). We therefore sought todetect concomitant waves of cortical Rho activity. A probe for activeRho (GFP–rGBD; ref. 14) did not express quickly enough to detectany Rho patterning other than the cytokinetic Rho zone. However,Rho activity waves could be detected in activated eggs expressing3×GFP–rGBD protein (c) or in embryos microinjected with recombi-nant GFP–rGBD protein (Supplementary Fig. 2c). In addition, anillin,a Rho effector protein15, also exhibits cortical waves (Supplementary
Fig. 2d) and low-level overexpression of wild-type Ect2 resulted in astriking increase in the amplitude and regularity of the Rho waves(Fig. 2d and Supplementary Fig. 2e and Supplementary Video 5).
Cortical Rho waves in starfish oocytes and embryosIn parallel experiments we discovered that Patiria miniata (starfish)oocytes and embryos exhibit cortical Rho activity waves that, incontrast to frog, are clearly visible only during a∼10–15min windowpost-anaphase. At anaphase of meiosis I, Rho activity spread fromthe vegetal pole towards the animal pole, culminating in polarbody emission (Fig. 3a and Supplementary Video 6). Low-leveloverexpression of wild-type Ect2 profoundly amplified meiotic Rhoactivity and extended its duration, producing extremely regular,persistent (maximum run length = 55.8 µm; mean = 6.5 µm), high-amplitude waves kinematically similar to those in frogs, includingovertly spiral repeating patterns (Fig. 3b,c and SupplementaryVideo 7). Higher-magnification videos of normal starfish oocytes
NATURE CELL BIOLOGY ADVANCE ONLINE PUBLICATION 3
© 2015 Macmillan Publishers Limited. All rights reserved

ART ICLES
50 μm 00:00 06:00 08:40 10:40
00:00
04:24 07:24 08:24 10:24
17:00
04:54 01:06
4
123
02:12 03:23
∗
04:34
05:42
07:30
09:18
1
2
2
1
pb
18:36
08:40 13:20 16:00
14:40
20:4050 μm
20 μm
20 μm
2 m
in
2 m
in
20 μm
20 μm
20 μm
1 2 3 4
∗ ∗
a
b
c
d e
Starfish oocytes, medial slab; normal versus Ect2 OE/active Rho
Starfish oocyte, surface; Ect2 OE/active Rho
Starfish oocyte, surface; normal/active Rho Starfish embryo, 1 of 4 cells; normal/active Rho
Figure 3 Rho activity waves in starfish oocytes and embryos. (a,b) Framesfrom time-lapse sequences of Rho activity during meiosis I in a normal starfishoocyte (top; projection of 8 1 µm sections) and an oocyte overexpressing wild-type Strongylocentrotus purpuratus Ect2 (bottom; projection of 8 1.5 µmsections). See Supplementary Video 6. Arrowhead indicates animal pole.Rho activity appears at the vegetal pole, spreads upward, and converges onthe nascent polar body, forming a cytokinetic Rho zone. In Ect2-expressingoocytes the global pattern of Rho activity mirrors that of controls but wavesare much brighter, travel further, and persist after polar body emission.(c) Surface view of cortical Rho activity in a meiosis II oocyte overexpressingEct2 (see Supplementary Video 7; pb, polar body; projection of 14 1 µmsections). High-amplitude waves form and settle into repetitive, often spiral,patterns. Inset montages are successive 60 s time points from the outlinedregion on the left starting at 17:00 (1) or 18:36 (2), showing patterns thatapproximately replicate on a∼70 s timescale (1 is spiral, 2 is centre-surroundwith a slash underneath). Kymograph on the right was generated from the
area indicated by the outlined strip, fourth frame. Diagonal bands span halfthe oocyte, showing that waves travel at least this far. Horizontal lines in thekymograph mark times of frames shown on the left. Arrowheads point to awavefront that traverses tens of micrometres at a steady speed. (d) Surfaceview of cortical Rho activity in a normal starfish oocyte; single frames (left)and kymograph (right). Rho waves appear, brighten, and coalesce into acontinuous zone around the nascent polar body (see Supplementary Video 8).Arrowheads indicate a wavelet that appears in both the kymograph and thestill frame. (e) Rho activity in a normal starfish blastomere (1 of 4 cells); stillframes and kymographs generated from the strips outlined in blue: 1, furrowcentre; 2, furrow periphery; 3, just outside furrow; 4, across furrow. Rho wavesfocus at the equator before ingression, appear in the furrow (arrows), andeventually merge into a coherent Rho zone. Asterisk indicates a particularlybright focus that appears in the fourth still frame and kymographs 1 and4. Images are representative of 10 (a,d), 20 (b,c) and 4 (e) independentexperiments, respectively.
4 NATURE CELL BIOLOGY ADVANCE ONLINE PUBLICATION
© 2015 Macmillan Publishers Limited. All rights reserved

ART ICLES
a
b
e
c d
f g
Starfish 1 of 4 cellsnormal/Rho + F-actin
04:15
20 μm
20 μm
20 μm
20 μm
20 μm
20 μm
20 μm
20 μm
20 μm 20 μm
5 m
in2
min
2 m
in
5 m
in
2 m
in
05:57 07:56
Starfish oocyte, surface Ect2 OE/Rho + F-actin
Frog egg, surfaceEct2 OE/Rho + F-actin
Frog blastomeres; normal/Rho + F-actin
Starfish zygote: Ect2 OE/Rho + F-actin
–1.0
0
–0.5
1.0
0.5
–1.0
0
–0.5
1.0
0.5
50
Time (s)
150 250
Tim
e co
rrel
atio
n
T = 80 s
Raw
11
2
00:56
08:56
11:36
06:36
09:42
12:12
14:30
2
Subtracted: t0 – t–3
F-actin
F-actin
Rho activity
Rho
Sp
ace
corr
elat
ion
10Distance (μm)
30 50
= 18 μmλ
Figure 4 F-actin assembly fronts directly follow, but overlap minimally with,Rho activity waves. The colour table in b applies to all images in thisfigure. (a) A normal starfish blastomere co-expressing GFP–rGBD (malachite;Rho activity) and GFP–Utr (copper; F-actin); selected frames (top) from atime-lapse sequence of cytokinesis (Supplementary Video 9), and raw andsubtracted kymographs (bottom) made from the outlined strip. In the stillimages, the cytokinetic furrow is populated by apparently random densitiesof active Rho and F-actin; kymographs show these correspond to waveletsin which Rho activity rises, and then falls as actin assembles. (b) Stillimages (left) and kymographs (right) from a time-lapse video of corticalF-actin and Rho activity in a frog embryo showing two cells (1, 2) undergoingcytokinesis. Rho waves in the furrow are followed by F-actin assembly waves.(c) Rho activity and F-actin in a starfish oocyte modestly overexpressing wild-type Ect2; kymograph (bottom) made from the strip outlined in the stillframe (top). See Supplementary Video 10. Except during the global burstof Rho activity accompanying each meiotic cytokinesis, Rho activity wavesimmediately precede F-actin assembly, and F-actin disassembly precedes
each Rho activation wave. Inset magnifies four cycles from the wave trainafter the first meiosis, emphasizing the minimal overlap (yellow) betweenmalachite and copper, and the dark zone separating copper from the nextmalachite wave. (d) An activated frog egg subjected to Ect2 overexpression;probes and presentation as in c (see Supplementary Video 11). Althoughwaves are more tightly packed in frog eggs, kymographs show a strikinglysimilar relationship between Rho and actin waves as in normal starfish.(e) A starfish zygote overexpressing Ect2 (see Supplementary Video 12);probes and presentation as in c and d; positions of still frames (left) areindicated by dashes in the kymograph (right). Faint waves precede the globalrise in Rho activity that focuses equatorially, leaving lower-amplitude waves innon-furrow regions; throughout, F-actin assembly follows peak Rho activity,and dark phases precede each Rho wave. (f) Temporal correlation plot ofRho waves from starfish oocytes overexpressing Ect2. Wave period ∼80 s.(g) Spatial correlation plot of Rho waves from starfish oocytes overexpressingEct2. Wavelength 18 µm. Images are representative of 4 (a,b) 8 (c), or5 (d) independent experiments, respectively.
NATURE CELL BIOLOGY ADVANCE ONLINE PUBLICATION 5
© 2015 Macmillan Publishers Limited. All rights reserved

ART ICLES
(that is, oocytes not subject to Ect2 overexpression) showed thatmuch of the meiotic Rho activity comprised low-amplitude, rapidlydamped cortical waves (Fig. 3d and Supplementary Video 8). Rhoactivity subsided before onset of meiosis II, reappeared coincidentwith anaphase of meiosis II, again spreading from the vegetal to theanimal pole, and culminated in polar body emission (not shown). Inthe largest mitotic cells, waves of cortical Rho activity also formed atanaphase onset, but were rapidly lost from polar regions and insteadwere confined to the equatorial cortex (Fig. 3e and SupplementaryFig. 3a,b). Waves initially dominated the furrow region itself, butas the furrow ingressed, relatively stable patches of Rho activityeventually merged into a coherent cytokinetic Rho zone (Fig. 3eand Supplementary Fig. 3b–d). As cells decreased in size, the timewindow in which polar waves were apparent after anaphase onsetbecame narrower, as did the prominence of waves in the furrow itself(Supplementary Fig. 3c,d).
Spatio-temporal coordination of Rho and actin wavesSimultaneous imaging of active Rho and F-actin within the cleavagefurrow of control starfish zygotes and frog blastomeres revealedanother surprise: instead of overlapping, F-actin assembly frontsdirectly follow Rho activity waves (Fig. 4a,b and SupplementaryVideo 9). The same pattern (high-amplitude Rho waves followed byF-actin waves) was triggered globally in both activated frog eggs andstarfish oocytes or mitotic cells by Ect2 overexpression (Fig. 4c–e andSupplementary Videos 10–12). In all cases (except once waves cedeto coherent zones, for example, in progressing furrows) peak actinassembly coincides spatially with decreasing Rho activity, and a latentperiod with relatively low cortical Rho and actin follows each cycle.Although superficially similar to calciumwaves that develop followingexpression of exogenous neurotransmitter receptors16, the Rho andactin waves are ∼10 times slower than calcium waves and are notassociated with elevated calcium (not shown).
To quantitatively characterize the wave pattern, we performedspatial and temporal autocorrelation analyses17,18. These analysesdemonstrated that in starfish oocytes both Rho and actin waveshad a wavelength of 18 µm and propagated with the same velocity,∼0.225 µms−1 (Fig. 4f,g). In activated frog eggs, thewaveswere slower,∼0.18 µms−1, and longer,∼21 µm. Importantly, analysis of the cross-correlation between Rho and F-actin signals showed that F-actinwaves followed Rho with a fixed delay, 18 s in starfish and 48 s in frog.Thus, Rho and F-actin waves are mutually coordinated parts of thesame wave pattern. Furthermore, such a constant time delay suggeststhat F-actin might effectively suppress Rho activation.
Rho–actin waves represent cortical excitability leading to spiralturbulencePropagating waves that undergo self-annihilation on collision suggestexcitable dynamics19. Excitable media generate waves that travelwithout damping because they are generated de novo by rapid localautoactivation at their front and extinguished at their wake by delayednegative feedback. Rho is a good candidate for the activator as smallGTPases can indirectly activate themselves autocatalytically20. Onthe basis of our kinematic observations, F-actin seemed a promisingcandidate for negative feedback. To test this possibility, we exploitedthe fact that quantitative relationships between Rho and F-actin can
be directly inferred from imaging data17 (seeMethods). In cortical loci(image pixels) with low F-actin signal, the rate of Rho signal changeand the value of Rho signal itself are statistically positively correlated(Fig. 5a). As F-actin concentration is low at the front of the excitablewave, this correlation implies that, at the wavefront, Rho amplifiesitself in a positive feedback loop, which is the required property ofthe activator. Likewise, F-actin assembly positively correlates withRho activity at the wavefront (Fig. 5b), and Rho activity negativelycorrelates with F-actin accumulation at the wave back (Fig. 5c). Wealready established that Rho activity is required for actin assemblywaves and that amplifying Rho activity elicits excess actin assembly;the correlative image analysis, thus, quantitatively confirms thedynamic relationship expected for the activator–inhibitor coupling(see Supplementary Fig. 4a–c).
What factors shape the wave patterns? Random fluctuations inF-actin density and concentrations of other proteins are necessary toinduce dynamics in excitable cellular systems19. However, occasionallyvisible fragments of spiral waves (Fig. 3c and SupplementaryVideos 7, 10 and 11) suggest an underlying behaviour much morecomplex than simply uncorrelated spatio-temporal noise. To revealit, we reconstructed the phase of the excitable dynamics usinga recently developed procedure21 (Fig. 5d–f and Methods). Thisapproach revealed multiple spiral waves (normally obscured by noise)whose cores spontaneously emerge, erratically move and disappeargenerating spiral wave turbulence. Although most spiral cores werevery short lived (a few seconds), some persisted for up to ∼59min(Supplementary Video 13), reminiscent of the self-sustained spiralwaves that emerge from the ends of broken wavefronts of cardiacexcitation and cause atrial fibrillation in the heart22.
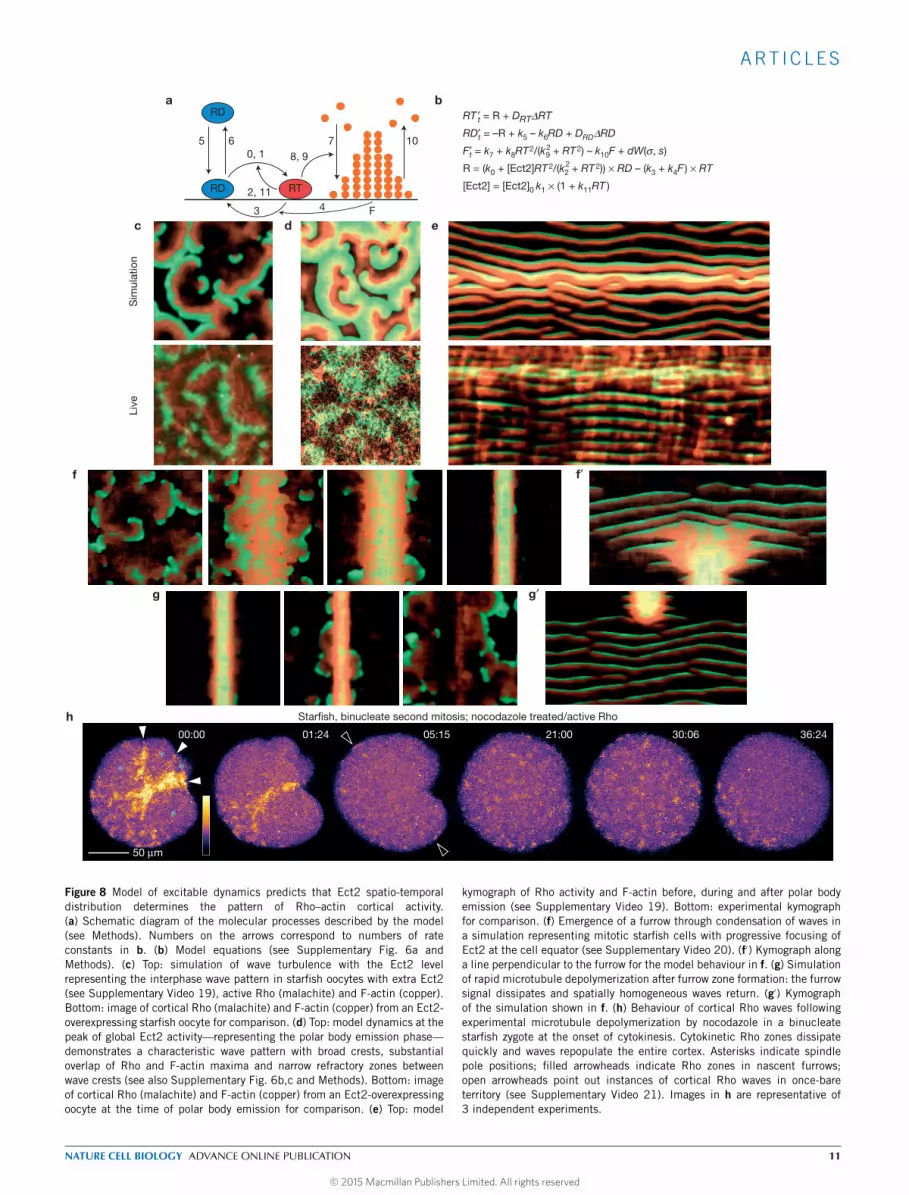
Antagonism of Rho by F-actinThe excitability model predicts that restricting F-actin assemblywould extend the rising phase of Rho activation, resulting inwaves with higher amplitude and crest widths. Treatment of starfishoocytes overexpressing Ect2 with latrunculin B to reduce F-actincaused global collapse of cortical F-actin and increased Rho activity(Supplementary Fig. 5a); conversely, treatment with jasplakinolide tostabilize F-actin attenuated Rho waves (Supplementary Fig. 4e,e′).Local F-actin disruption bymeans of latrunculin B-filledmicroneedlespositioned near the cell surface was more informative: high needleconcentrations (>5µM) of latrunculin caused rapid local dissolutionof cortical actin and a parallel burst of Rho activity (Fig. 5gand Supplementary Video 14), which tapered off after the entirecortical actin network dissolved. Lower concentrations (1–0.5 µM;Fig. 5h and Supplementary Video 15), or greater distance fromthe needle (Fig. 5g, lower cell), resulted in slower loss of corticalF-actin and a corresponding amplification of Rho wave amplitudeand crest width. Importantly, when applied at concentrations thatpermitted some residual actin assembly to cells with active waves,latrunculin induced a sustained shift to higher wave amplitudeand longer period (Fig. 5h). Similar results, albeit less pronounced,were observed in latrunculin-treated normal cells (SupplementaryFig. 5). This directly confirms that F-actin assembly somehowsuppresses Rho activation, supporting a model of cortical excitabilityin which F-actin-dependent Rho inhibition represents the essentialnegative feedback.
6 NATURE CELL BIOLOGY ADVANCE ONLINE PUBLICATION
© 2015 Macmillan Publishers Limited. All rights reserved

ART ICLES
50 μm
20 μm
3
4
1 2 3 4
1 2
02:20
00:00 02:00 04:20 06:40 09:20
5 m
in
04:20 06:20 08:20 11:20 16:40
F-actin
Rho
0.8 1.0
0
0.01
0.02
0.60.40.20
d[R
ho]/
dt
[Rho]
Rho
−0.01
0
0.01
0.02
0.8 1.00.60.40.20[Rho]
d[a
ctin
]/d
t
Rho Actin
RhoActin
−0.02
0
0.02
0.8 1.00.60.40.20[actin]
d[R
ho]/
dt
a
g
h
cb
fed
0
1.0
0.2
0.4
0.6
0.8
[act
in]
0.80 0.2 0.4 0.6 1.0[Rho]
0
π
−π
Starfish oocytes; Ect2 OE + local latrunculin application—high dose/active Rho + F-actin
Starfish oocyte; Ect2 OE + local latrunculin application—low dose/active Rho + F-actin
20 μm
20 μm
Figure 5 Analysis of Rho and F-actin dynamics reveals cortical excitability andspiral turbulence. (a) The Rho activation rate (mean± s.d.) increases with Rhoactivity signal indicating that Rho activates itself in a positive feedback loop.Correlation assessed from pixels with low F-actin signal (see SupplementaryFig. 4a). (b) The F-actin accumulation rate is positively correlated withRho activity (assessed from pixels with low F-actin signal). (c) The Rhoactivation rate is inversely correlated with F-actin signal, to the point ofswitching to inactivation at high F-actin density (assessed from pixels withhigh Rho activity signal). Results are mean + s.d.; n=900 cycles. (d) Eachcortical locus (image pixel) can be mapped by its particular values of Rhoactivity and F-actin density to a single phase value, an angle between 0and 2π, shown in rainbow colours: Cortical loci at the front of waves appeargreen, loci at Rho wave crests as cyan, at F-actin wave crests as dark blue–magenta, and loci at the back of the wave are red and orange. (e) Phasereconstruction for a starfish oocyte overexpressing Ect2 (SupplementaryVideo 13). Points where all rainbow colours (phase values) merge indicate
spiral cores (arrows). Inset: magnification of spiral wave core neighbourhoodoutlined by the dashed line. (f) Phase reconstruction for an activated frogegg overexpressing Ect2. (g) Meiotic Ect2-overexpressing starfish zygotescontaining GFP–rGBD (Rho activity; malachite) and mCherry–Utr (F-actin;copper); time-lapse sequence after application of a high concentration oflatrunculin B (10 µM) from an agarose-filled pipette (position indicated bycartoon); treatment causes rapid cortical F-actin collapse and a correspondingburst of Rho activation (see Supplementary Video 14). Insets: single-channelimages of cells/stages indicated by numerals: (1) initial response, (2) waveregime on far side, collapse on near side, (3) total collapse, (4) waveregime on near side of distant oocyte. (h) Similar to g, but low-dose (1 µM)latrunculin B induces a shift from the typical Ect2-enhanced wave regime to ahigher-amplitude, longer-period wave regime, in which large-scale Rho wavespropagate away from the site of local F-actin disassembly (see SupplementaryVideo 15); rightmost image is a kymocube rendered using ImageJ. Images arerepresentative of 5 independent experiments.
NATURE CELL BIOLOGY ADVANCE ONLINE PUBLICATION 7
© 2015 Macmillan Publishers Limited. All rights reserved

ART ICLES
a b
e
c
d
Frog; normal
Starfish; Ect2 OE + Δ90 CycB
Frog; normal + Δ90 CycB
Starfish oocytes; Ect2 OE + Δ90 CycB, roscovitine treated/active Rho
Starfish oocyte; Ect2 OE
1
1
1 2
2
3
3
4
4
5
5
1:05:14
12:02 00:00 06:58 11:43 14:53 25:01 1:24:14
6
6
F-actin F-actinMT MTMT
MT
Rho
Rho
ms
I
M
I
M
I
M
M
I
20 μm
50 μm
50 μm
ms
20 μm
5 m
in
5 m
in
10 m
in
20 μm
50 μm
20 μm
10 m
in20
min
Figure 6 Cdk1 gates excitability. (a) Kymograph from a normal frog embryoshowing waves of cortical F-actin (left) and cortical microtubules (right). I,interphase; M, M-phase; yellow lines on right indicate M-phase onset, asrevealed by loss of cortical microtubules. Actin waves persist throughoutM-phase but wave density varies: at M-phase onset (blue line on left),waves are spaced farther apart; this is followed by a period of thesame length as M-phase but slightly delayed in which F-actin wavesare brighter (red lines). (b) Kymograph from a double-labelled starfishoocyte overexpressing Ect2 showing waves of cortical Rho activity (left)and cortical microtubules (right). Rho waves cease in each M-phaseand reappear in each interphase. ms, meiotic spindle. (c) Kymographof a frog blastomere expressing 190 cyclin B showing cortical F-actin(left) and cortical microtubules (right). As the time of high Cdk1 activitylengthens (revealed by loss of cortical microtubules) cortical F-actin wavesprogressively disappear. (d) Kymograph of an Ect2-overexpressing starfishoocyte expressing 190 cyclin B as well, showing cortical Rho activity(left) and cortical microtubules (right). Rho waves fail to appear as the
cell remains arrested with high Cdk1 activity. (e) Top left: Rho activity instarfish oocytes overexpressing Ect2 and expressing 190 cyclin B, 65 minafter treatment with 40 µM roscovitine to inhibit Cdk1 (see SupplementaryVideo 16). The weather vane indicates the direction of roscovitine flow.Roscovitine-containing sea water perfused around tight-packed oocytesfrom southeast to northwest at time 00:00; cells 1 and 2 are at thecluster edge, and cells 5 and 6 are in the cluster centre; hence, theweathervane indicates the presumed gradient of drug exposure. All oocytesshow robust Rho waves at this time point. Top right: kymographs of oocytes(identified by numerals) showing development of cortical Rho activity wavesfollowing roscovitine treatment. Note that the onset of waving follows theexpected rate of Cdk1 inhibition based on access to drug in perfusedmedia. Bottom: successive frames showing oocyte 1 alone; inset showschromosomes, and arrowhead indicates position of meiotic spindle. Rhowaves are well developed at least five minutes before anaphase begins.Images are representative of 4 (a), 3 (b), 5 (c) and 6 (d) independentexperiments, respectively.
8 NATURE CELL BIOLOGY ADVANCE ONLINE PUBLICATION
© 2015 Macmillan Publishers Limited. All rights reserved

ART ICLES
a
e
b
b′ c
d
Starfish oocytes nucleate versus anucleate,Ect2 OE/active Rho
Starfish oocyte 2 nucleate halvesEct2 OE/active Rho
Starfish oocyte meiosis I; normal/Rho + MTs
Starfish; binucleate second mitosis/Rho + MTs
50 μm
50 μm
50 μm
20 μm
50 μm
10 m
in
10 m
in
08:00
sep
pbms
13:40
17:40 35:40
00:00
00:00 06:08
01:00
03:36
15:20 18:20 23:20 40:00 50:00 54:20
Mei II
1
1 2
2
M1
M1
M1
M2
Starfish oocyte—nocodazole treated/active Rho
ms
sep20 μmV
A 00:00 06:40 09:20 40:32 44:48 46:56 49:0403:12
Figure 7 Excitability does not require spindles but is locally modulated bymicrotubules. (a) Still frame (top) and kymograph (bottom) from a time-lapsevideo showing cortical Rho activity in two nucleate fragments derived frombisection of an Ect2-overexpressing starfish oocyte. Waves of Rho activityappear and disappear in synchrony in each half. The pseudocolour tableshown applies to a,b,b′, and e; in a and b′, the outlined strips indicatethe kymograph region, and the dashes in the kymographs are times ofthe still frames. (b) Frames from a time-lapse video showing cortical Rhoactivity in the nucleate half (top) and the anucleate cytoplast (bottom) afterbisection of an Ect2-overexpressing starfish oocyte just before meiosis I.Waves appear and disappear on time in the anucleate cytoplast in spiteof the fact that it lacks a spindle, chromosomes, or even centrosomes(see Supplementary Video 17). (b′) Similar bisection but after meiosis; twoframes (top), during and after the first cleavage, and kymographs (bottom,1: nucleated, 2: anucleate). Cortical Rho waves appear and disappear in
both halves, although the first mitosis is delayed in the anucleate cytoplast.(c) Frames from a time-lapse video showing microtubules (cyan) and activeRho (gold) in a normal starfish oocyte during meiosis I. Rho activity issuppressed in the region occupied by the spindle aster. (d) Frames froma time-lapse video showing microtubules (cyan) and active Rho (gold) ina starfish zygote with two spindles. Rho activity waves are excluded fromregions occupied by spindle asters leading to focusing of Rho waves intoa cruciform Rho zone. (e) Meiotic Rho activity in a normal starfish oocyteafter treatment with 5 µM nocodazole to depolymerize microtubules (seeSupplementary Video 18). The overall pattern of Rho activation is similarto controls—initiation at the vegetal end, rapid progression to the animalpole, inactivation in M-phase—except that the animal pole is a Rho hotspotinstead of a suppressed area; sep, sperm entry point, ms, meiotic spindle.Images are representative of 3 (a,b), 12 (c), 17 (d) and 3 (e) independentexperiments, respectively.
NATURE CELL BIOLOGY ADVANCE ONLINE PUBLICATION 9
© 2015 Macmillan Publishers Limited. All rights reserved

ART ICLES
Cdk1-dependent control of excitabilityTo better characterize the relationship between cell cycle progressionand excitability, cortical microtubules were used as a marker for cellcycle progression23 and compared with either cortical F-actin (frogs)or cortical Rho (starfish). Cortical microtubule abundance changedrhythmically with the cell cycle in frog embryos, with high levels ininterphase and very low levels in M-phase, but cortical actin waveswere present throughout (Fig. 6a). However, in starfish oocytes orembryonic cells overexpressing Ect2, cortical Rho waves were evidentfor ∼63% of the cell cycle, disappearing and appearing in concertwith cortical microtubules (Fig. 6b). In control cells, Rho waves werenormally visible for∼20% of the cell cycle (not shown).
As M-phase results from activation of cyclin-dependent kinase 1(Cdk1), we microinjected cells with messenger RNA encoding190 cyclin B, which prevents Cdk1 inactivation24. In frogs, thisresulted in progressive disappearance of actin waves coincidentwith complete disappearance of cortical microtubules (Fig. 6c).Similarly, in starfish, 190 cyclin B produced an indefinite cessationof Rho waves (Fig. 6d). Thus, Cdk1 activity suppresses excitabilityin both systems. To determine whether Cdk1 inactivation initiatesexcitability, Ect2-overexpressing starfish oocytes were microinjectedwith 190 cyclin B mRNA, and subsequently treated with roscovitineto inhibit Cdk1 (ref. 25). Roscovitine treatment triggered reappearanceof cortical Rho waves in a manner that paralleled the expectedexposure to the drug (Fig. 6e and Supplementary Video 16).Moreover, simultaneous imaging of active Rho and fluorescent histonedemonstrated that roscovitine treatment actually released Rho waveseven before anaphase onset (Fig. 6e and Supplementary Video 16).Thus, Cdk1 inactivation is indeed a trigger of excitability.
DNA, centrosomes, microtubules and excitabilityC-phase onset and cessation are regulated independently ofthe spindle6. To determine whether excitability is likewisespindle-independent, starfish oocytes overexpressing Ect2 weremicrodissected to produce pairs of cytoplasts that contain or lackessential spindle components—DNA and centrosomes23. Cytoplaststhat contained neither DNA nor centrosomes nonetheless exhibitedexcitability (Fig. 7b and Supplementary Video 17), and the timingand character of waves were remarkably similar to those of nucleatedcytoplasts or whole cells (Fig. 7a,b), with the exception of a longdelay between meiosis and the first mitosis in anucleates (Fig. 7b′).Thus, neither DNA, nor nuclei, nor spindles are required for temporalregulation of excitability.
Although the temporal regulation of C-phase is independent ofmicrotubules, microtubules nevertheless spatially regulate corticalcontractility during C-phase6. Simultaneous imaging of microtubulesand Rho activity in starfish oocytes and embryos illustrates thatexcitability is subject to spatial regulation bymicrotubules, as expectedfor a manifestation of C-phase: Rho waves were suppressed in regionswhere astral microtubules densely populate the cortex (Fig. 7c,d).Further, microtubule disassembly by nocodazole prevented formationof the wave-free region at the animal pole in oocytes (Fig. 7e andSupplementary Video 18) but had no apparent effect on the timing ofwave appearance or disappearance (Fig. 7e), indicating that, althoughmicrotubules do not control the timing of excitability, they arenonetheless responsible for locally modulating it.
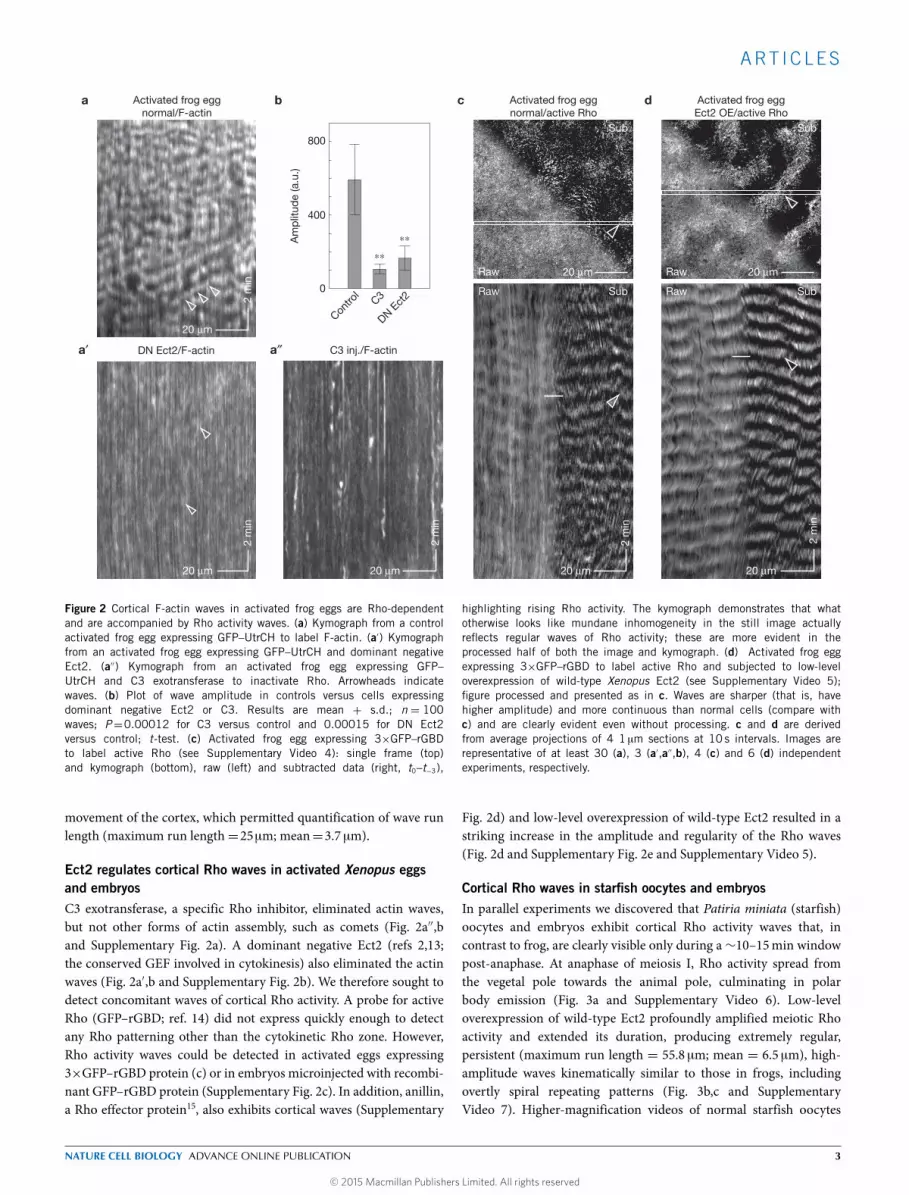
A model for cortical excitability suggests the route to furrowformationTo better understand cortical excitability, we developed a simplemodel (Fig. 8a,b) that incorporates membrane–cytoplasmic shuttlingof inactive Rho, its Ect2-dependent autocatalytic activation and itsinactivation via a slower, F-actin-mediated negative feedback (seeMethods). The spatio-temporal excitable dynamics of the modeldriven by molecular noise (Fig. 8 and Supplementary Fig. 6b,c)faithfully recapitulates the pattern of spontaneously emerging,erratically moving and colliding waves. Moreover, the wave patternand kymograph signature of the global wave-like rise in Rhoactivity observed during meiosis are captured by the model simplyby including a transient peak in Ect2 activity (Fig. 8c–e andSupplementary Fig. 6b,c and SupplementaryVideo 19), suggesting thatthe overall increase in Rho activity and specific changes in the wavepattern following anaphase onset reflect the rise in Ect2 activity.
We further questioned whether the transition of mitotic cellsfrom uniform wave dynamics to equatorially focused waves couldreflect microtubule-mediated redistribution of Ect2 towards the cellequator. Indeed, model simulations demonstrated a transition from aweak global excitability to progressively narrower and more intenseexcitability at the equator (Fig. 8f,f′ and Supplementary Video 20).Driving Ect2 localization to an even narrower band with higher localconcentration caused themodel to transition from excitability to a newsteady state in which both Rho activity and F-actin density are highand stable, which corresponds to the behaviour observed in matureingressing furrows. Excitable dynamics could still be visible on furrowmargins where Ect2 concentration sharply drops, just as seen in vivo(Figs 3e and 4a). Finally, we modelled the consequences of rapidmicrotubule depolymerization on the established cytokinetic zone.This produced a rapid loss of high excitability from the furrow andre-emergence of weaker excitability elsewhere (Fig. 8g,g′). This modelprediction was tested by treating Ect2-overexpressing starfish zygoteswith nocodazole after the formation of the cytokinetic Rho zone. Thiscompletely reversed the sequence of events seen in wild-type cells:the furrow disassembled and waves reappeared throughout the cellcortex (Fig. 8h and Supplementary Video 21), in close agreement withmodel simulations.
DISCUSSIONWe have discovered that the cortex of vertebrate and invertebrateoocytes and embryos is an excitable medium, which is based on Rhoautoactivation and F-actin-mediated Rho inhibition (Fig. 8). Positivefeedback (Rho autoactivation) would allow the cortex to respond tospindles experimentally deprived of astral or midzone microtubules23
via auto-amplification at the cortex. Conversely, the negative feedback(F-actin-mediated Rho inhibition) would efface established Rho zonesand cytokinetic apparatuses on repositioning of the spindle4,26,27. Thus,excitability explains both the sensitivity of the cortex to spindle-generated signals and the rapid adaptation of the cortex to changesin spindle position.
The relationship between cortical excitability and the cell cycle,together with the fact that cytokinesis ensues when excitabilitybecomes confined to the equator, provides a simple explanation forC-phase: it represents the period of the cell cycle in which corticalexcitability is fully enabled. Consistent with this proposal, it has been
10 NATURE CELL BIOLOGY ADVANCE ONLINE PUBLICATION
© 2015 Macmillan Publishers Limited. All rights reserved
ART ICLES
f f′
g g′
50 μm
h Starfish, binucleate second mitosis; nocodazole treated/active Rho
∗∗
∗
∗
00:00 01:24 05:15 21:00 30:06 36:24
c ed
Sim
ulat
ion
Live
RT ′t = R + DRT RT
RD′t = –R + k5 – k6RD + DRD RD
F′t = k7 + k8RT2/(k9 + RT2) – k10F + dW( , s)
R = (k0 + [Ect2]RT2/(k2 + RT2)) × RD – (k3 + k4F ) × RT
[Ect2] = [Ect2]0 k1 × (1 + k11RT )
ba
RT
RD
RD
F
107
8, 9
43
60, 1
5
2, 11
2
2 σ
Δ
Δ
Figure 8 Model of excitable dynamics predicts that Ect2 spatio-temporaldistribution determines the pattern of Rho–actin cortical activity.(a) Schematic diagram of the molecular processes described by the model(see Methods). Numbers on the arrows correspond to numbers of rateconstants in b. (b) Model equations (see Supplementary Fig. 6a andMethods). (c) Top: simulation of wave turbulence with the Ect2 levelrepresenting the interphase wave pattern in starfish oocytes with extra Ect2(see Supplementary Video 19), active Rho (malachite) and F-actin (copper).Bottom: image of cortical Rho (malachite) and F-actin (copper) from an Ect2-overexpressing starfish oocyte for comparison. (d) Top: model dynamics at thepeak of global Ect2 activity—representing the polar body emission phase—demonstrates a characteristic wave pattern with broad crests, substantialoverlap of Rho and F-actin maxima and narrow refractory zones betweenwave crests (see also Supplementary Fig. 6b,c and Methods). Bottom: imageof cortical Rho (malachite) and F-actin (copper) from an Ect2-overexpressingoocyte at the time of polar body emission for comparison. (e) Top: model
kymograph of Rho activity and F-actin before, during and after polar bodyemission (see Supplementary Video 19). Bottom: experimental kymographfor comparison. (f) Emergence of a furrow through condensation of waves ina simulation representing mitotic starfish cells with progressive focusing ofEct2 at the cell equator (see Supplementary Video 20). (f′) Kymograph alonga line perpendicular to the furrow for the model behaviour in f. (g) Simulationof rapid microtubule depolymerization after furrow zone formation: the furrowsignal dissipates and spatially homogeneous waves return. (g′) Kymographof the simulation shown in f. (h) Behaviour of cortical Rho waves followingexperimental microtubule depolymerization by nocodazole in a binucleatestarfish zygote at the onset of cytokinesis. Cytokinetic Rho zones dissipatequickly and waves repopulate the entire cortex. Asterisks indicate spindlepole positions; filled arrowheads indicate Rho zones in nascent furrows;open arrowheads point out instances of cortical Rho waves in once-bareterritory (see Supplementary Video 21). Images in h are representative of3 independent experiments.
NATURE CELL BIOLOGY ADVANCE ONLINE PUBLICATION 11
© 2015 Macmillan Publishers Limited. All rights reserved

ART ICLES
shown that furrowing in sand dollar zygotes normally occupies about20% of the cell cycle but can be extended to∼60% by manipulation ofspindle position4, closely paralleling our observation that Rho wavesare normally evident for about 20% of the cell cycle but can beextended to about ∼60% by overexpression of Ect2. Further, earlyfrog blastomeres exhibit continuous excitability consistent with theobservation that C-phase of one cell cycle overlaps with C-phase of thenext cell cycle such thatmultiple furrowsmay be found in a single cell4.
How, exactly, is excitability regulated? The results point clearlyto Cdk1. Not only does cessation of excitability in starfish oocytesand zygotes coincide precisely with the onset of M-phase, wavesare stripped from the cortex in an animal-to-vegetal pole manner,following the known spatial pattern of Cdk1 activation28,29. Further,suppression of Cdk1 inactivation arrests cells in a non-excitable state,which is rapidly converted to excitable by experimental inhibition ofCdk1. Thus, excitability in echinoderms is negatively regulated byCdk1 and it is extremely likely that the characteristic top-to-bottomstripping of the waves from the cortex reflects the underlying ‘triggerwave’ of Cdk1 activation30. Ect2 is a potential target of Cdk1 in thiscontext, in that Cdk1 phosphorylation compromises the ability of Ect2to bind the plasma membrane13. Why waves are not fully suppressedin M-phase in frogs remains to be seen, but on the basis of thedemonstration that these cells are metachronous28,31 and the fact thatthey do terminate wave activity when forced into a prolonged M-phase, we speculate that their normal Cdk1 activity levels fail to reachthe threshold needed to suppress excitability.
The F-actin-mediated antagonism of Rho activity observed hereseems counterintuitive to the point of deviance given traditional viewson collaboration of Rho and F-actin in contractile arrays. However,at least two parallels are found in other processes. During single-cellwound repair, a ring-like wave of Rho activity forms in a region of lowcortical F-actin density32; as the Rho wave closes, it is ‘chased’ inwardby a surrounding, ring-like wave of F-actin. Similarly, during blebbing,it is thought that Rho activity rapidly rises in regions of the cortex fromwhich F-actin is cleared, and as Rho activity falls, F-actin rises33–35.Further, although not yet directly demonstrated, negative feedbackfrom F-actin to Rho family GTPases explains essential features of celllocomotion-associated F-actin waves36,37.
Finally, two other striking points emerge from this study. First,the fact that furrowing commences as overlapping waves of Rhoactivity and F-actin become confined to the equator suggests thatthe continuous and relatively stable structures proposed in textbookmodels of the cytokinetic apparatus need revision. Second, theobservation that Ect2 overexpression produces a cell-wide version ofwhat occurs at the equator during cytokinetic apparatus specificationsuggests that cytokinetic signalling by the spindle might simply reflectredistribution of Ect2 from non-equatorial regions to the equator.More complex scenarios, in which astral microtubules stimulate RhoGAPs in non-equatorial regions or otherwise inhibit Rho, may notbe necessary. �
METHODSMethods and any associated references are available in the onlineversion of the paper.
Note: Supplementary Information is available in the online version of the paper
ACKNOWLEDGEMENTSMany thanks to S. Maslakova for laboratory space and to B. Dlouhy-Massengaleand S. Yang for technical assistance. This work was supported by the NationalInstitutes of Health (GM52932 to W.M.B.) and the National Science Foundation(NSF MCB-0917887 and MCB-1041200 to G.v.D.) and by NIH instrumentationgrant 1S10RR026729-01 (K. Eliceiri PI).
AUTHOR CONTRIBUTIONSW.M.B. and A.L.M. performed frog experiments; G.v.D. and W.M.B. performedstarfish experiments. A.B.G. andM.L. developed the model, performed simulations,and conducted data analyses. A.M.M., A.M.K., M.E.L., A.E.G., C.P. and K.-C.S.generated and tested reagents. W.M.B., G.v.D. and A.B.G. wrote the manuscript.
COMPETING FINANCIAL INTERESTSThe authors declare no competing financial interests.
Published online at http://dx.doi.org/10.1038/ncb3251Reprints and permissions information is available online at www.nature.com/reprints
1. Bement, W. M., Miller, A. L. & von Dassow, G. Rho GTPase activity zones and transientcontractile arrays. Bioessays 28, 983–993 (2006).
2. Su, K.-C., Bement, W. M., Petronczki, M. & von Dassow, G. An astral simulacrum ofthe central spindle accounts for normal, spindle-less, and anucleate cytokinesis inechinoderm embryos. Mol. Biol. Cell 25, 4049–4062 (2014).
3. Green, R. A., Paluch, E. & Oegema, K. Cytokinesis in animal cells. Annu. Rev. CellDev. Biol. 28, 29–58 (2012).
4. Rappaport, R. Cytokinesis in Animal Cells (Cambridge Univ. Press, 1996).5. Shuster, C. B. & Burgess, D. R. Transitions regulating the timing of cytokinesis in
embryonic cells. Curr. Biol. 12, 854–858 (2002).6. Canman, J. C., Hoffman, D. B. & Salmon, E. D. The role of pre- and post-
anaphase microtubules in the cytokinesis phase of the cell cycle. Curr. Biol. 10,611–614 (2000).
7. Miller, A. L. & Bement, W. M. Regulation of cytokinesis by Rho GTPase flux. Nat. CellBiol. 11, 71–77 (2009).
8. Weiner, O. D., Marganski, W. A., Wu, L. F., Altschuler, S. J. & Kirschner, M. W. Anactin-based wave generator organizes cell motility. PLoS Biol. 5, e221 (2007).
9. Burkel, B. M., von Dassow, G. & Bement, W. M. Versatile fluorescent probes for actinfilaments based on the actin-binding domain of utrophin. Cell Motil. Cytoskeleton64, 822–832 (2007).
10. Riedl, J. et al. Lifeact: a versatile marker to visualize F-actin. Nat. Methods 5,605–607 (2008).
11. Yoo, S. K. et al. Differential regulation of protrusion and polarity by PI3K duringneutrophil motility in live zebrafish. Dev. Cell 18, 226–236 (2010).
12. Straight, A. F. et al. Dissecting temporal and spatial control of cytokinesis with amyosin II inhibitor. Science 299, 1743–1747 (2003).
13. Su, K.-C., Takaki, T. & Petronczki, M. Targeting of the RhoGEF Ect2 to the equatorialmembrane controls cleavage furrow formation during cytokinesis. Dev. Cell 21,1104–1115 (2011).
14. Benink, H. A. & Bement, W. M. Concentric zones of active RhoA and Cdc42 aroundsingle cell wounds. J. Cell Biol. 168, 429–439 (2005).
15. Piekny, A. J. & Maddox, A. S. The myriad roles of Anillin during cytokinesis. Semin.Cell Dev. Biol. 21, 881–891 (2010).
16. Lechleiter, J., Girard, S., Peralta, E. & Clapham, D. Spiral calcium wave propagationand annihilation in Xenopus laevis oocytes. Science 252, 123–126 (1991).
17. Shibata, T., Nishikawa, M., Matsuoka, S. & Ueda, M. Modeling the self-organizedphosphatidylinositol lipid signaling system in chemotactic cells using quantitativeimage analysis. J. Cell Sci. 125, 5138–5150 (2012).
18. Arai, Y. et al. Self-organization of the phosphatidylinositol lipids signaling system forrandom cell migration. Proc. Natl Acad. Sci. USA 107, 12399–12404 (2010).
19. Allard, J. & Mogilner, A. Traveling waves in actin dynamics and cell motility. Curr.Opin. Cell Biol. 25, 107–115 (2013).
20. Goryachev, A. B. & Pokhilko, A. V. Dynamics of Cdc42 network embodies a Turing-type mechanism of yeast cell polarity. FEBS Lett. 582, 1437–1443 (2008).
21. Taniguchi, D. et al. Phase geometries of two-dimensional excitable waves governself-organized morphodynamics of amoeboid cells. Proc. Natl Acad. Sci. USA 110,5016–5021 (2013).
22. Winfree, A. T. Electrical turbulence in three-dimensional heart muscle. Science 266,1003–1006 (1994).
23. Von Dassow, G., Verbrugghe, K. J., Miller, A. L., Sider, J. R. & Bement, W. M. Actionat a distance during cytokinesis. J. Cell Biol. 187, 831–845 (2009).
24. Murray, A. W. & Kirschner, M. W. Cyclin synthesis drives the early embryonic cellcycle. Nature 339, 275–280 (1989).
25. Gray, N., Détivaud, L., Doerig, C. & Meijer, L. ATP-site directed inhibitors of cyclin-dependent kinases. Curr. Med. Chem. 6, 859–875 (1999).
26. Bement, W. M., Benink, H. A. & von Dassow, G. A microtubule-dependent zone ofactive RhoA during cleavage plane specification. J. Cell Biol. 170, 91–101 (2005).
27. Rappaport, R. & Ebstein, R. P. Duration of stimulus and latent periods preceedingfurrow formation in sand dollar eggs. J. Exp. Zool. 158, 373–382 (1965).
28. Rankin, S. & Kirschner, M. W. The surface contraction waves of Xenopus eggs reflectthe metachronous cell-cycle state of the cytoplasm. Curr. Biol. 7, 451–454 (1997).
12 NATURE CELL BIOLOGY ADVANCE ONLINE PUBLICATION
© 2015 Macmillan Publishers Limited. All rights reserved

ART ICLES
29. Lim, D. et al. The M-phase-promoting factor modulates the sensitivity of the Ca2+
stores to inositol 1,4,5-trisphosphate via the actin cytoskeleton. J. Biol. Chem. 278,42505–42514 (2003).
30. Chang, J. B. & Ferrell, J. E. Mitotic trigger waves and the spatial coordination of theXenopus cell cycle. Nature 500, 603–607 (2013).
31. Pérez-Mongiovi, D., Chang, P. & Houliston, E. A propagated wave of MPF activationaccompanies surface contraction waves at first mitosis in Xenopus. J. Cell Sci. 111,385–393 (1998).
32. Burkel, B. M., Benink, H. A., Vaughan, E. M., von Dassow, G. & Bement, W. M. A RhoGTPase signal treadmill backs a contractile array. Dev. Cell 23, 384–396 (2012).
33. Charras, G. T., Hu, C.-K., Coughlin, M. & Mitchison, T. J. Reassembly of contractileactin cortex in cell blebs. J. Cell Biol. 175, 477–490 (2006).
34. Berndt, J. D., Clay, M. R., Langenberg, T. & Halloran, M. C. Rho-kinase and myosin IIaffect dynamic neural crest cell behaviors during epithelial to mesenchymal transitionin vivo. Dev. Biol. 324, 236–244 (2008).
35. Clay, M. R. & Halloran, M. C. Rho activation is apically restricted by Arhgap1 inneural crest cells and drives epithelial-to-mesenchymal transition. Development 140,3198–3209 (2013).
36. Holmes, W. R., Carlsson, A. E. & Edelstein-Keshet, L. Regimes of wave type patterningdriven by refractory actin feedback: transition from static polarization to dynamicwave behaviour. Phys. Biol. 9, 046005 (2012).
37. Ryan, G. L., Petroccia, H. M., Watanabe, N. & Vavylonis, D. Excitableactin dynamics in lamellipodial protrusion and retraction. Biophys. J. 102,1493–1502 (2012).
NATURE CELL BIOLOGY ADVANCE ONLINE PUBLICATION 13
© 2015 Macmillan Publishers Limited. All rights reserved

METHODS DOI: 10.1038/ncb3251
METHODSXenopus oocytes and artificially activated eggs.Chunks of ovaries were removedfrom anaesthetized, adult female Xenopus laevis, rinsed in 1× Barths solution(87.4mM NaCl, 1mM KCl, 2.4mM NaHCO3, 0.82mM MgSO4, 0.6mM NaNO3,0.7mM CaCl2 and 10mM HEPES at pH 7.4), and then collagenase treated for 1 hat 17 ◦C. After extensive rinsing in 1× Barths, oocytes were allowed to recoverovernight at 17 ◦C. After recovery, oocytes were injected with 40 nl of mRNA (0.01–1mgml−1 needle concentration). Oocytes destined to be imaged as full grownoocytes were maintained at 17 ◦C overnight and imaged the next day. Oocytesdestined to be converted to activated eggs were maintained at room temperaturefor 3–6 h, then treated with 5 µgml−1 progesterone for 15min and transferred to17 ◦C overnight. The following day, meiotically mature eggs were activated with10 µgml−1 ionomycin in 0.1× MMR for 2–4min. Activated eggs (identified bypigment contraction) were rinsed three times in 1× Barths and then maintainedat 17 ◦C for 2 h before imaging. In experiments involving Ect2 overexpression, eggswere subject to a second round of microinjection at 30min post activation with 10 nlof 0.01mgml−1 Ect2 mRNA (needle concentration).
Xenopus embryos.Ovulation was induced by injecting adult female Xenopus laeviswith 600–800UHCG followed by overnight maintenance at 18 ◦C. The next day, eggrelease was promoted by gentle squeezing of the abdomen. Eggs were maintainedin 1× MMR (100mM NaCl, 2mM KCl, 2mM CaCl2, 1mM MgCl2, 5mM Hepes,pH 7.4), fertilized and then dejellied in 2% cysteine in 0.1× MMR. At the two-cellstage, embryos were microinjected with 5 nl of mRNA at 0.01–1mgml−1 (needleconcentration) or, for the protein version of GFP–rGBD, 5 nl of protein at 1mgml−1(needle concentration). In some experiments, a second round of injections tookplace at the four-cell stage; such injections used a volume of 2.5 nl. Embryos weremaintained at 17 ◦C until imaging.
Starfish. Patiria miniata was purchased from Marinus Scientific of Long Beach,California and kept in flowing natural sea water at OIMB. Fragments of gonad wereobtained by penetrating the bodywall of one armwith a 4mmbiopsy punch.Ovarieswere rinsed in calcium-free artificial sea water (CFSW; Stricker and Schroeder’srecipe), then teased apart with forceps and shaken gently to release full-size oocytes.Weused only oocytes frombatches inwhichmost large oocyteswere full sized, and inwhich the spontaneous maturation rate after an hour in CFSWwas less than∼25%.Several rinses in CFSW over the course of 1–2 h was sufficient to fully defolliculateoocytes, which were then transferred to 0.22-µm filtered natural sea water (MFSW)before injection. Testis fragments were kept dry inmicrofuge tubes until needed, andthen sperm were obtained by perforating a swollen lobe in MFSW.
Starfish egg handling. While sitting in a dish of sea water, starfish oocytes tendto release mucus that makes handling difficult. Therefore, just before injection,defolliculated oocytes were passed repeatedly through a mouth pipette cut toa diameter slightly exceeding the outer diameter of the oocytes plus jelly coat,∼250 µm. For injection, oocytes were arranged by mouth pipette in rows oncoverslip-bottomed dishes (MatTek) that had been coated by washing 30 s with 1%protamine sulphate in distilled water, followed by rinsing in water and air drying.Following injection, oocytes were incubated in MFSW in their injection dishes ortransferred to uncoated 35mm Petri dishes, often with the addition of 50 µgml−1streptomycin, and kept either at seatable temperature (12–16 ◦C) or on a Peltier coldplate (Torrey Pines Scientific) at 12–16 ◦C.
Maturation was induced by addition of 1mM 1-methyladenine in water to afinal concentration of 10−6–10−5. After germinal vesicle breakdown, which usuallytakes 45–60min at the temperatures used, maturing oocytes were inseminated byaspirating a suspension of motile sperm from the vicinity of a just-poked testisfragment. Sperm activity, oocyte binding, and fertilization success (as judged byenvelope elevation) were observed carefully under a dissecting microscope, becauseof the high risk of polyspermy in microinjected oocytes.
For some experiments, fertilized eggs were deprived of their envelope by brieftreatmentwith 1% sodium thioglycolate inMFSWat pH9.5–10.0 followed by severaltransfers to normalMFSW. Thioglycolate solution was made fresh within an hour ortwo of use, and titrated by addition of 1MKOHwhile stirring vigorously. During andafter envelope dissolution, eggs were kept well separated in agarose-coated 35mmPetri dishes. Gentle shearing with a mouth pipette during treatment speeds removalof coats (that is, before full dissolution), limiting the time spent in high-pH seawater.
Microinjection and micromanipulation. For Xenopus, pressure microinjectionswere performed with a PLI-100 picoinjector (Medical Systems Corp.) using needlespulled from capillary tubes and calibrated using oil and a stage micrometer. Oocyteswere microinjected in 1× Barths in a 5ml Petri dish with plastic mesh affixed to thebottom; embryos were microinjected in 0.1×MMR+ 5% Ficoll in a meshed dish.
Starfish oocytes were injected in coverslip-bottomed dishes on an invertedmicroscope at 18–20 ◦C using an oil-hydraulic manipulator (Narishige), pressure
injector (Dagan), and glass needles pulled from 1mm OD filament-containingcapillaries (Sutter) using a P-97 Flaming-Brown puller (Sutter). Before loading,pulled needles were silanized by adding ∼100 µl hexamethyldisilazane to a closedbox containing the needles. Backfilled needles were broken to appropriate size(3–5 µm) against a coverslip fragment held to the bottom of the injection dish withhigh-vacuum grease. In our hands, starfish oocytes tend to eject the germinal vesicleif the needle penetrates it; therefore, we systematically injected into the cytoplasm apuff corresponding to<1% of oocyte volume.
To generate anucleate cytoplasts or locally apply drugs, fertilized eggs werestripped of their fertilization envelopes and then arranged in coverslip-bottomdishes. Bisections were performed with an injection needle held by an oil-hydaulicmicromanipulator. Local drug applications were conducted by filling a large-bore(20–50 µm), fire-polished drawn capillary with 0.5% low-melt agarose containinglatrunculin B at 0.5–5 µM. Roscovitine and nocodazole treatment do not requireenvelope removal, and global, timed drug application was accomplished by trappingsmall groups of oocytes between a slide and coverslip, and then flooding one openchamber edge with drug-containing MFSW while wicking away medium from theopposite opening with filter paper.
Actin staining. Xenopus embryos were rinsed 3× in PBS (phosphate-bufferedsaline—100mM NaCl, 3mM KCl, 10mM Na2HPO4, 2mM KH2PO4, pH 7.4)and fixed for 1 h at room temperature in Zevon’s fixative (100mM KCl, 10mMHepes, 3mM MgCl2, 1mM EGTA, pH 7.6) +3.7% fresh paraformaldehyde, 0.1%glutaraldehyde, 0.1% Triton X-100, and 1Uml−1 AX-488 phalloidin (MolecularProbes). Embryos were then washed 3× 10min in PBS, and then 1 h in TBSN (Tris-buffered saline—50mM Tris, pH 7.5, 150mM NaCl+ 0.1% NP-40).
Imaging. Frog oocytes, activated eggs, and embryos were imaged using a PrairieView Laser Scanning Confocal (Bruker Nano Surfaces) on a Nikon Eclipse Ti.Samples were prepared as described previously38 and imaged using a 40× 1.0 NAor a 60× 1.4 NA objective.
All imaging of starfish oocytes and embryos was conducted on an OlympusFluoView1000 laser-scanning confocal on an IX81 inverted stand, using 60× 1.2NAor 40× 1.15 NA water-immersion objectives, or a 20× dry 0.75 NA objective.Cells were either held between a slide and coverslip separated by two ridges ofhigh-vacuum grease (Dow Corning) and compressed to trap the cells, or werefilmed in ethanol-cleaned coverslip-bottomed dishes; clean glass clings just enoughto demembranated oocytes that they are prevented from drifting off, but notrendered overtly abnormal. To keep cells at viable temperatures, we used stage-mounted Peltier cooling adaptors (Dagan) set to 12–14 ◦C. When using coverslip-bottomed dished filled with sea water and water-immersion objectives, in-bathmeasurements and comparison of developmental rates with controls suggest aneffective temperature 1–3 ◦C above the set point, slightly more for cells heldin slide chambers. Volumes of sea water and numbers of oocytes per dish orslide were limited to avoid anoxia (10–20 embryos per slide preparation; <50in dishes).
Constructs and in vitro synthesis of mRNA. The following constructs usedwere described previously and for both frog and starfish injected at concentrationranges as follows: eGFP–rGBD (ref. 14), 100–500 ng µl−1; mCh–UtrCH (ref. 9), 100–200 ng µl−1; mCh–H2B, 50 ng µl−1; 2×mCh EMTB, 50–200 ng µl−1 (ref. 23); 1×GFP,3×GFP– or 3×mCh–SpEct2 (ref. 2), 10–50 ng µl−1; anillin–3×GFP, 100 ng µl−1(ref. 39). 3×GFP–rGBD was generated by cloning rGBD into pCS2+ downstreamof 3 tandemly repeated GFPs and was injected at 800 ng nl−1. Xenopus Ect2 (OpenBiosystems) was cloned into pCS2+ and dominant negative Xenopus Ect2 wasmade by changing the conserved residues 593PVQR596 in the catalytic domain toalanines2,13using aQuikchange kit (NewEnglandBiolabs) and the following primers:F:5′−cttatcagagctgctgcagcattaccaagcgtcgctcttcttctg-3′; R:5′-gcgacgcttggtaatgctgcagcagctctgataagtaactcgac-3′. Wild-type Xenopus Ect2 was injected at 5–10 ng µl−1;dominant negative Xenopus Ect2 was injected at 50–100 ng nl−1. 190 cyclin wasmade by cloning full-length human cyclin B into pCS2 and then removing the first270 nucleotides; it was injected at 50 ng µl−1 for both frog and starfish. mRNAs weretranscribed from linearized plasmids in vitro using themMessagemMachine SP6 kit(Ambion) and were polyadenylated using a Poly(A) tailing kit (Ambion).
Expression of FLAG–GFP–rGBD. A 5′ terminal Kozak consensus sequence andFLAG epitope were added to the GFP–rGBD construct from ref. 14 using PCR.The resultant amplicon was inserted into the bacmid donor plasmid pFastBac1 togenerate recombinant bacmidDNA inDH10Bac (Invitrogen) bacteria. Recombinantbaculovirus was produced in Sf21 insect cells and used to infect additionalSf21 monolayers. Recombinant protein was purified using anti-FLAG M2 affinityresin (Sigma) with Arg-based elution40. Elution fractions were pooled and theprotein concentrated to 50 µM in 25mM HEPES, 100mM KCl pH 7.5 beforeoocyte injections.
NATURE CELL BIOLOGY
© 2015 Macmillan Publishers Limited. All rights reserved

DOI: 10.1038/ncb3251 METHODS
Image processing. All image processing (projection, brightness and contrast,averaging, and so on) was conducted in ImageJ, except for false colouring and figurecomposition in Photoshop CS6. All kymographs were prepared in ImageJ by re-slicing a strip of a time series (as shown by outlines in figures), 6 or 12 pixels wide(∼1 µm), then averaging the re-slicing planes and stretching along the time axis forclarity, with or without bicubic interpolation. Subtraction was performed in ImageJusing the image calculator function, and thenmedian filtered (3× 3) to reduce noise.No other convolution filters or other image processing was applied to any image. Forgreyscale images, adjustments were limited to white and black points, preservingthe linearity intensity range between. For certain data, pseudocolour tables wereused to perceptually balance bright versus dim features while preserving luminosityin single-channel images (the Abattoir Blues lookup table in Figs 3c,d, 7a,b,e, and8h) or to blend two channels while providing a distinct colour for co-localization(the Copper/Malachite lookup table in Figs 4a–e, 5g,h and 8a–g, and SupplementaryFig. 5). Colour tables for both are reproduced adjacent to several figure panels thatmake use of the range. Identical colour tables were used for supplementary videos,but with gamma adjustment to un-do a non-user-controlled gamma adjustmentapplied by the QuickTime H.264 codec.
Data analyses. For most analyses, the data were extracted with ImageJ fromexperimental time-lapse videos of Rho and F-actin dynamics in the form ofkymographs, that is, matrices uR
i,j,uAi,j, where index i represents time and index j is the
spatial position of an image pixel along a chosen linear segment. Spatial and timecorrelation analyses were performed according to the standard signal processingmethod; for example, the time autocorrelation function for the Rho signal at aspecific pixel j is given by
CRj (τ )=
∫ t
0uRj (t+τ)u
Rj (t)dt
where the integral is taken along the jth column of the data kymograph. Toobtain statistical information (Fig. 4f,g), computed spatial and time correlationfunctions were averaged over multiple lines and columns of the kymograph,respectively. Furthermore, for the computation of the spatial autocorrelationfunction, kymographs were taken over multiple varied spatial directions onthe images.
To compute the statistical distribution of wave runs, the above kymographs werefirst normalized to lie within [0,1] and then processed using the MATLAB functioncontourf() that performs non-polynomial interpolation and contour extractionin two-dimensional images. The candidate positions of the wavefront were thenextracted at locations of the contour computed at the half-maximal height, 0.5. Ateach contour point its slope was computed with a centred 5-point template. Toseparate waves from non-propagating excitable dynamics, only points with a slopeabove a suitable threshold calculated on the basis of spatial and temporal resolutionof the original time-lapse video were retained for the following analysis. Allcandidate runs shorter than 4 consecutive time points (frames) were discarded fromthe analysis. The lengths of these unbroken wave runs were then binned and used forthe calculation of a histogram representing the statistical distribution of wave runs.
For the kinetic analysis17 (Fig. 5a–c and Supplementary Fig. 4a–c), in additionto signal values, time derivatives d[Rho]/dt and d[actin]/dt were calculatednumerically from the kymographs using finite-difference approximation. The datawere then suitably binned and the average and standard deviation were computedper bin to reveal the dependences between the Rho and F-actin signals. Toreconstruct the phase of the excitable dynamics, we implemented Morlet waveletanalysis21 using MATLAB. For the time series of Rho or F-actin signal at a givenimage pixel, this method generates two two-dimensional functions, amplitude andphase (Supplementary Fig. 4d). The maximal value of amplitude for each given timepoint defines the dominant value of the time period T (t), which need not be thesame for all time points. Morlet wavelet analysis, thus, allows one to determine thephase even when the periodicity of the signal changes with time. In the case shownin Supplementary Fig. 5d, T =80 s uniformly within the time series. The curve ofamplitude maxima (in this case, a straight line segment) is then transferred onto theMorlet phase function and the value of the phase at each time t is read along thecurve. The value of the phase (−π:π) is then computed in each image pixel and timepoint and plotted as a colour-coded value (Fig. 5d–f). This method reveals spiralwave cores that are seen as the spatial points in which all rainbow colours cometogether even in very noisy data, where interaction of multiple unstable spiral wavesmakes it impossible to directly observe contiguous spirals by eye.
The change in the wave pattern of the cortical dynamics observed throughoutthe cell cycle prompted us to introduce the activity ratio, a heuristic measure of the
fraction of the full period that the system spends in the excited state. To compute theactivity ratio in space (Supplementary Fig. 6b,c), the average value of the normalizedsignal of Rho or F-actin is computed first along the ith line of the data kymograph.The data are then converted to 1 if the pixel value is above the average and to 0if below. Activity ratios are then computed as shown in Supplementary Fig. 6b forevery spatial period and averaged along the ith line of the kymograph. This valueis the activity ratio at time t (Supplementary Fig. 6c). Larger statistics was obtainedby averaging over multiple kymographs. As shown in Supplementary Fig. 6, the thusdefined activity ratio is easily computed even from noisy experimental data and canbe readily compared with the behaviour of the model (see below).
Modelling. The model (Fig. 8a,b) consists of three reaction–diffusion equationsrepresenting dynamics of active (RT) and inactive (RD) Rho (ref. 20) as well asthe density of polymeric F-actin (F) that does not diffuse. Diffusion of RT and RDis explicitly represented by the diffusion terms DRT1RT ,DRD1RD, where ∆ is theLaplace operator. The numbers on the reaction arrows in Fig. 8a (shown in curlybraces {} below) correspond to the numbers of the reaction rate constants in Fig. 8b(values given in Supplementary Fig. 6a). In our model, we explicitly consider onlythe dynamics of membrane-bound active and inactive forms of Rho and assumethat the inactive form, RD, is freely exchanging with a constant large pool in thecytoplasm ({5} k5, {6}−k6RD). Reaction term R describes nucleotide cycling of Rhoand includes activation of Rho potentially by several GEFs ({0} k0RD) of whichGEF activity of Ect2 is singled out explicitly ({1, 2, 11} [Ect2]RT 2RD/(k22+RT 2),[Ect2] = [Ect2]0k1 × (1+ k11RT )) to highlight the autocatalytic character of Rhoactivation by means of Ect2. Inactivation of Rho is assumed to be both constitutive({3}−k3RT ) andF-actin-dependent ({4}−k4F×RT ); the latter term reflects F-actin-mediated negative feedback to the activity of Rho. F-actin polymerization is a weakconstitutive process in the absence of Rho activity ({7} k7) and is significantlystimulated by the active Rho ({8, 9} k8RT 2/(k29+RT 2)). Depolymerization of actin,for simplicity, is taken to be an unregulated first-order reaction ({10} −k10F).Molecular fluctuations that are necessary for the induction of excitable dynamicsare taken into consideration by the stochastic term dW (σ , s) that denotes spatiallydistributed Gaussian white noise with mean 0, standard deviation σ and spatialcorrelation length s. Unknown membrane diffusion coefficients of active andinactive Rho, DRT ,DRD, were varied in the ranges shown (Supplementary Fig. 6a).Other model parameters were chosen to fit the dynamics observed experimentallyin starfish cells. In particular, the model reproduces the characteristic wavelengthand the temporal period of excitable dynamics as well as the time delay between theRho and F-actin maxima.
To model wave dynamics observed in starfish oocytes between consecutiveM-phases (Fig. 8c–e and Supplementary Fig. 6c), it was assumed that temporalactivity of Ect2 is governed by a Gaussian function TG(t)=[Ect2]0(1+ exp(−(t−t0)2/2τ 2)), where t0 and τ=80 s were estimated from the imaging data. To simulatefurrow formation in mitotic starfish cells (Fig. 8f,f′), Ect2 temporary activity givenby TG(t) was assumed to be further modulated by a spatially dependent termSG(x , t)= exp(−(x−x0)2/2β(t)2), where x is the spatial dimension that spans thepole-to-pole distance L of a mitotic cell and β(t) decreases linearly in time from L tolf=7µm, the furrowwidth estimated from the data. To simulate depolymerization ofmicrotubules by nocodazole (Fig. 8g,g′), the Ect2 concentration profile was rapidlyrelaxed to a spatially uniform distribution with an equivalent total quantity of Ect2.Model reaction–diffusion equations were solved with the standard forward Eulerfinite-difference method using a custom-developed C code.
All computer codes generated in this study are freely available from the authorson request.
Reproducibility of experiments.All of the results reported were replicated at leastthree times to ensure repeatability; the basic results—for example, Ect2-amplifiableactin and Rho waves—were replicated 60 or more times. The only issues withreproducibility arose when probes were under- or over-expressed or when toomuchEct2 was expressed (this resulted in contractions that were either too extreme tofilm or that resulted in cell lysis). The specific number of repeats is indicated in eachfigure legend.
38. Woolner, S., Miller, A. L. & Bement, W. M. Imaging the cytoskeleton in live Xenopuslaevis embryos. Methods Mol. Biol. 586, 23–39 (2009).
39. Reyes, C. C. et al. Anillin regulates cell-cell junction integrity by organizing junctionalaccumulation of Rho-GTP and actomyosin. Curr. Biol. 24, 1263–1270 (2014).
40. Futatsumori-Sugai, M. et al. Utilization of Arg-elution method for FLAG-tag basedchromatography. Protein Expr. Purif. 67, 148–155 (2009).
NATURE CELL BIOLOGY
© 2015 Macmillan Publishers Limited. All rights reserved

S U P P L E M E N TA RY I N F O R M AT I O N
WWW.NATURE.COM/NATURECELLBIOLOGY 1
DOI: 10.1038/ncb3251
a cbFrog embryo / Lifeact
d
d′
Frog embryo / Lifeact + Utrophin
Activated frog egg / Utr Full-grown frog oocyte / Utr
LA
Utr
1
2
1
2
Bement et al. Supplemental Figure 1
Supplementary Figure 1 Cortical waves of actin assembly and disassembly in activated frog eggs and embryos. (a) Surface view of frog blastomeres expressing GFP-lifeact to label F-actin. Top: single frame; cortical F-actin consists of irregularly sized patches throughout cortex, which, as illustrated in the kymograph made from the outlined region (bottom) travel continually across the surface. Bottom: In the kymograph, F-actin waves create slanted bands with semi-regular spacing. (b) High magnification surface view of activated frog egg expressing GFP-UtrCH. Top: single frame; cortical F-actin consists of irregularly sized patches, which, as illustrated in the kymograph made from the outlined region (bottom) travel continually across the surface. Bottom: In the kymograph, F-actin waves create slanted bands with semi-regular spacing. (c) High magnification surface view of full-grown (prophase
1-arrest) frog oocyte expressing GFP-UtrCH. Top: single frame; cortical F-actin is relatively uniform with no obvious patches and no apparent waving behavior as illustrated in the kymograph made from the outlined region (bottom). Bottom: In the kymograph, cortical F-actin is quite stable. (d) Single frame from time-series of frog embryo co-expressing GFP-Lifeact and mCherry-UtrCH, single channels with pseudocoloring as shown in swatch (pure Lifeact would be yellow; pure UtrCH would be blue; equal blend of each by intensity would be gray). Diagonal band on left panel is the zone for kymograph in Fig. 1d; boxed regions 1 and 2 blown up 2x in d’ show wave fronts colliding. In each, the wave fronts are initially yellowish, turn bluish after collision, then fade. Images are representative of at least 10 (a), at least 30 (b) or 3 (c, d)independent experiments, respectively.
© 2015 Macmillan Publishers Limited. All rights reserved

S U P P L E M E N TA RY I N F O R M AT I O N
2 WWW.NATURE.COM/NATURECELLBIOLOGY
a Activated frog eggC3 inj. / F-actin
e Activated frog eggEct2 OE / Active Rho
c Frog embryoGFP-rGBD protein
raw sub
raw sub
d Activated frog eggGFP-Anillin
raw sub
rawsub
Bement et al. Supplemental Figure 2
b Frog embryoDN Ect2 (left cell) / F-actin
Supplementary Figure 2 Cortical Rho activity waves and Rho- Ect2-dependence of cortical F-actin waves in activated frog eggs and frog embryos. (a) Time-lapse sequence from activated frog egg expressing GFP-UtrCH to label F-actin and injected with C3 exotransferase to inhibit Rho (6 s intervals). No cortical F-actin waves are present but actin assembly occurs nonetheless as shown by comet like movement of F-actin-associated invagination. (b) Frog embryo expressing GFP-UtrCH and then microinjected with dominant negative Ect2 (left blastomere) or, as a control, nothing (right blastomere); top-still frames, bottom, kymograph. Dominant negative Ect2 eliminates the F-actin waves in the dominant negative Ect2 expressing cell. (c) Frog embryo microinjected with recombinant GFP-rGBD protein to label active Rho. Single frame (top) and kymograph (bottom), raw (left) and subtracted data (right, t0–t-3), highlighting rising Rho activity.
The kymograph demonstrates that what otherwise looks like mundane inhomogeneity in the still image actually reflects regular waves of Rho activity; these are more evident in the processed half of both the image and kymograph. (d) Activated frog egg expressing GFP-anillin. Single frame (top) and kymograph (bottom), raw (left) and subtracted data (right, t0–t-3), highlights waves of cortical anillin recruitment. (e) Time-lapse sequence from activated frog egg expressing 3XGFP-rGBD to label active Rho and overexpressing Ect2. Top: Each panel is 20 s after previous panel. While the Rho wave patterns change rapidly every 20 s, note the repetition evident every 100 s (compare panels as columns). Bottom: inverted, black and white representation of dominant wave pattern in each column. Images are representative of 3 (a, b, d), 4 (c) and 6(e) independent experiments, respectively.
© 2015 Macmillan Publishers Limited. All rights reserved

S U P P L E M E N TA RY I N F O R M AT I O N
WWW.NATURE.COM/NATURECELLBIOLOGY 3
1
1
2
2
3
3
4
4
1 2 3 4
1 23
4
5
5
6
6
a
b b'
c
d
Starfish, 2-cell embryoNormal / Active Rho
Starfish, 1 of 16Normal / Active Rho
Starfish, 1 of 16Normal / Active Rho
Starfish, 4 of 64; Normal / Active Rho
Starfish,128+ cells; Normal / Active Rho
Bement et al. Supplemental Figure 3Supplementary Figure 3 Cortical Rho activity waves in starfish blastomeres. (a) Image from time-lapse movie showing waves of cortical Rho activity within ingressing zygote furrows. (b,b’) Top: Images from time-lapse movie showing cortical Rho activity waves at equator of dividing blastomeres. Bottom: kymographs taken from blastomeres above. Waves persist during much of furrow ingression. See Supplementary Video 22. (c) Top: Image from time-lapse movie showing cortical Rho activity at equator of four
different blastomeres. Bottom: kymographs taken from blastomeres above. Waves are present during ingression. See Supplementary Video 23. (d) Top: Image from time-lapse movie showing cortical Rho activity in later, smaller blastomeres than those in a-c. Rho activity at equator is more continuous. Bottom: Kymographs taken from blastomeres indicated above. Rho activity is largely continuous rather than wave-like. See Supplementary Video 24. Images representative of 4 independent experiments.
© 2015 Macmillan Publishers Limited. All rights reserved

S U P P L E M E N TA RY I N F O R M AT I O N
4 WWW.NATURE.COM/NATURECELLBIOLOGY
10.60.40.20[Rho]
−0.02
0
0.02
d[R
ho]/d
t
low actin
high actin0.8
0.8 10.60.40.20[actin]
−0.01
0.01
0.02
d[ac
tin]/d
t
0
low Rho
high Rho
a b
c
0.80 0.2 0.4 0.6 1[actin]
-0.4
0
0.4
d[ac
tin]/d
t
high Rho
low Rho
0.80 0.2 0.4 0.6 1[Rho]
-0.1
0
0.1
0.2
d[R
ho]/d
t
low actin
high actin
d
Rho
perio
d, s
50100150
T = 80s
time, s0 200 400 600
phas
e
0
-π
π
50100150
perio
d, s
amplitude
phase
0.80 0.2 0.4 0.6 10
1
0.2
0.4
0.6
0.8
[Rho]
[act
in]
low actin
high actin
high
Rho
low
Rho
0
π
-π
Bement et al. Supplemental Figure 4
e′e Starfish oocytes; Ect2 OE + 10 µM Jasplakinolide / Active Rho
Supplementary Figure 4 Reconstruction of excitable dynamics. (a) Projection of full wavelength onto plane of normalized concentrations (Rho, actin) generates a closed loop parameterized by phase (-π,π) and color-coded. Loop computed using activator-inhibitor model introduced here. Domain boundaries of high/low values of Rho and F-actin used to reconstruct kinetic relationships in panels b, c denoted by straight-line segments. (b) Left panel: activator-inhibitor model prediction (Rho – activator, F-actin – inhibitor) for dependence of d[Rho]/dt on [Rho] based on panel a. Parameterization by phase shown for comparison with a. Right panel: d[Rho]/dt versus [Rho] from images (see Methods). Data shown as mean ± std. Note qualitative agreement between data and model prediction. (c) Left panel: activator-inhibitor model prediction (Rho – activator, F-actin – inhibitor) for dependence of d[actin]/dt on [actin] based on panel a. Right panel: d[actin]/dt versus [actin] from images. Note qualitative agreement between data and model prediction. Results are mean + SD; n=900 cycles. (d) Phase of excitable dynamics reconstructed from Rho time series (top panel) measured at cortex. Morlet
transform of time series generates amplitude and phase functions for every time point and candidate temporary period of dynamics. Amplitude maxima (yellow dashed line) show how most likely value of period T depends on time (here, T = 80s). T = 80s line is projected onto the Morlet phase function and a single time-dependent value of phase (bottom panel) is read along that line (yellow dashed line). (e) Rho wave attenuation in Ect2-overexpressing starfish oocytes treated with 10 µM Jasplakinolide during first meiosis; kymographs made from strips indicated in e’, numbered by order of anaphase entry. Gap in kymographs shows time of drug addition. Jasplakinolide induces slow accumulation of excess cortical actin but does not completely abolish actin turnover (not shown). Before drug addition, oocytes 1-3 exhibited prominent waves; without treatment, waves typically continue about half the time between metaphases I and II; in three of these cells, jasplakinolide rapidly reduces wave amplitude (the fourth may not have experienced the same concentration of drug). e’ displays wave patterns just before and shortly after drug addition. Images are representative of 3 independent experiments.
© 2015 Macmillan Publishers Limited. All rights reserved
S U P P L E M E N TA RY I N F O R M AT I O N
WWW.NATURE.COM/NATURECELLBIOLOGY 5
a
c
c′
b
Starfish oocytes; Ect2 OE, flooded with 15 µM Latrunculin / Active Rho + F-actin
Starfish oocyte; Normal, Latrunculin-filled pipette / Active Rho + F-actin
Starfish, 1 of 4 cells; Normal, Latrunculin-filled pipette / Active Rho + F-actin
Rho
Rho
Rho
F-actin
F-actin
Bement et al. Supplemental Figure 5
Supplementary Figure 5 Cortical F-actin antagonizes Rho activation. (a) Time-lapse series showing active Rho (malachite) and F-actin (copper) in merge or as single channels in starfish oocyte overexpressing Ect2 and subject to global treatment with latrunculin. Shortly after latrunculin application the entire cortical F-actin network shatters, an event accompanied by a transient and global increase of Rho activity. Arrowhead indicates site of meiotic spindle. (b) Time-lapse series showing active Rho (malachite) and F-actin (copper) in merge or as single channels in normal (i.e., non-Ect2 overexpressing) starfish oocyte subject to local F-actin disassembly at site indicated by pipet tip schematic. As in cells overexpressing Ect2 (Fig.
5g,h) local F-actin disassembly is accompanied by a burst of Rho activation. Hollow arrowhead indicates site of meiotic spindle; filled arrowheads indicate bursts of Rho activity. (c) Time-lapse series showing active Rho (malachite) and F-actin (copper) in normal starfish blastomere subject to local F-actin disassembly at site indicated by pipet tip schematic. Loss of cortical F-actin from the equator (white rectangle) produces a burst of Rho activity just as it does elsewhere on cell cortex. (c’’) Images of equator taken from time-lapse movie of cell above showing bursts of Rho activation following F-actin disruption within nascent furrow. Images are representative of 6 (a) and 3 (b, c) independent experiments, respectively.
© 2015 Macmillan Publishers Limited. All rights reserved

S U P P L E M E N TA RY I N F O R M AT I O N
6 WWW.NATURE.COM/NATURECELLBIOLOGY
a
b c
0.8
0.0
0.4
distance, pixels
Rho
20 10060
0.8
0.0
0.4
actin
norm
aliz
ed s
igna
l la
la
λ
λ
la /λ=
=
0.3
la /λ= 0.6200 400 6000
0.8
0.0
0.4
0.8
0.0
0.4
time, seconds
activ
ity ra
tio
Bement et al. Supplemental Figure 6
Supplementary Figure 6. Computational model of excitable cortical dynamics. (a) A set of parameters used for model simulations has been chosen to fit the temporal period and dominant wavelength of excitable wave pattern as well as the time shift between Rho and F-actin signals observed in starfish oocytes overexpressing Ect2. (b) The model predicts that the increase in Ect2 activity results in the change of the wave pattern that can be quantified by the activity ratio, which is defined as al l, the fraction of the wavelength λ where the value of normalized Rho signal is above 50% of the average over one wave period. Top panel: At the Ect2 activity generating the wave pattern typical of meiotic starfish oocyte
interphase ([Ect2]0 = 1 μM), activity ratio is 0.3. Bottom panel: Increase in Ect2 activity ([Ect2]0 = 2 μM) results in the wave pattern with broad wave crests and narrow refractory zones; activity ratio is 0.6. Average level of normalized Rho signal is indicated by dashed line. (c) The model predicts that the wave pattern observed in meiotic starfish oocytes during polar body emission can be explained by an increase in Ect2 activity. Top panel: Activity ratio computed from the experimental data (see Methods for details). The peak in activity ratio corresponds to polar body emission. Bottom panel: Activity ratio computed from the results of simulation with changing activity of Ect2. Data are shown as mean ± SD.
© 2015 Macmillan Publishers Limited. All rights reserved

S U P P L E M E N TA RY I N F O R M AT I O N
WWW.NATURE.COM/NATURECELLBIOLOGY 7
Supplementary Videos Legends
Supplementary Video 1. Surface view of cleaving blastomere in mid-cleavage stage frog embryo (one of 32+ cells) expressing GFP-Utr, single optical plane, 2.4 sec/frame at 30 fps (time in seconds). Corresponds to Figure 1a. F-actin foci come and go rapidly, transiently increasing in density to near-uniformity shortly before cytokinetic furrow formation, whereafter the density declines again.
Supplementary Video 2 High-magnification surface view of activated frog egg expressing GFP-Utr, single optical plane, 4 sec/frame at 30 fps (time in min:sec). Corresponds to Figure 1b, without color coding. Kymograph scrolling beneath frame sequence made by averaging across the rectangle indicated. This sequence spans two apparent M-phases in 46 minutes, after each of which F-actin density transiently increases to near uniformity. Between these pulses, waves continually traverse the surface with apparently random direction changes; cable networks are frequently apparent between the margins of fading wave fronts.
Supplementary Video 3 Cleaving frog blastomere expressing both GFP-Utr (blue) and Lifeact-mCherry (yellow); single optical plane, 12 sec/frame at 30 fps (time in min:sec). Corresponds to Figure 1d. Throughout, leading wave fronts are yellowish, whereas trailing edges, and cable networks left in the wake of passing waves, are white or bluish. Note, as shown in Fig. 1d, that GFP-Utr and Lifeact-mCherry both label the same structures – that is, there is no pure color in this sequence, all structures contain some blue and some yellow.
Supplementary Video 4 Surface view of activated frog egg expressing 3xGFP-rGBD, average projection of 4 1 micron sections, 10 sec/frame at 15 fps (time in min:sec). Corresponds to Figure 2c. 20-min. sequence plays twice, the second time alongside a median-filtered rearward subtraction (current time minus three frames previous). This highlights the subtle waves traveling across a background of low-level cortical Rho activity.
Supplementary Video 5 Surface view of activated frog egg expressing 3xGFP-rGBD plus wild-type Xenopus Ect2, average projection of 4 1 micron sections, 10 sec/frame at 15 fps (time in min:sec). Corresponds to Figure 2d. 20-min. sequence plays twice, the second time alongside a median-filtered rearward subtraction (current time minus three frames previous). Compared to normal cells (Fig. 2c, Video 4) waves of Rho activity are far more pronounced. Not only is the amplitude greater, waves appear to occur in quasi-repeating patterns, and individual wave fronts continue further across the surface before dissipating or colliding with other waves.
Supplementary Video 6 Medial focal slabs of two starfish oocytes expressing GFP-rGBD, one with extra wild-type S. purpuratus Ect2. Both sequences cover first meiosis with polar body emission. First sequence (normal oocyte) is a max. projection of 8 1 micron sections, second sequence (Ect2 over-expressing) is a max. projection of 8 1.5 micron sections; both are 20 sec/frame at 15 fps (time in min:sec). Correspond to Figures 3a and 3b. In the normal oocyte, a broad coherent wave of Rho activity initiates at the vegetal pole, passes toward the animal pole, and “breaks” around the meiotic spindle, coalescing into the cytokinetic zone that pinches off the polar body. With extra Ect2, the single coherent wave breaks up into brighter, more persistent wavelets, which continue throughout and after polar body emission. Second sequence plays twice, the second time with the first sequence inset for comparison.
Supplementary Video 7 Surface view of Rho waves in starfish oocyte expressing GFP-rGBD and wild-type S. purpuratus Ect2, max. projection of 11 1 micron sections, 12 sec/frame at 15 fps (time in min:sec). Corresponds to Figure 3c. This sequence covers second meiosis; first polar body has been successfully extruded already. Waves start just before second polar body emission, show a global increase in intensity, then settle into a regime with prominent, well-spaced fronts that travel tens of microns with consistent direction. As highlighted by insets in Fig. 3c, approximately repeating patterns emerge post-meiotically.
Supplementary Video 8 High-magnification surface view of Rho waves in normal starfish oocyte expressing GFP-rGBD, max. projection of 5 0.6 micron sections, 6 sec/frame at 30 fps (time in min:sec). Corresponds to Figure 3d. This sequence covers first meiosis in a slightly compressed oocyte. Likely due to the compression, polar body emission fails in this case; nevertheless, the sequence of events is otherwise normal: Rho activity begins at the end of M-phase at the vegetal pole, thus sweeping in from the left edge in this view. The macro-wave of Rho activation can be seen to consist of many short-lived low-amplitude wavelets that scatter like chop in a sea breeze. While the cytokinetic zone is more persistent, flickers reveal that it too consists of a flock of similar wavelets.
Supplementary Video 9 One of four cells in a normal starfish embryo expressing both GFP-rGBD (malachite) and mCherry-Utr (copper), max. projection of 14 0.6 micron sections, 17 sec/frame at 15 fps (time in min:sec). Corresponds to Figure 4a. Cytokinetic Rho activity begins with a transient, global but non-uniform pulse, rapidly focusing at the equator. Wavelets similar in size to those observed in oocytes populate the early furrow. F-actin enrichment does not overlap perfectly with Rho activity; rather, F-actin enrichment develops in the wake of Rho activity waves.
Supplementary Video 10 Starfish oocyte expressing both GFP-rGBD (malachite) and mCherry-Utr (copper), plus wild-type S. purpuratus Ect2. Projection of 14 0.8 micron sections, 17 sec/frame at 20 fps (time in min:sec). Corresponds to Figure 4c. In this nearly-animal-pole view, the site of meiosis is just out of view beyond the bottom of the frame. F-actin waves consistently follow, rather than overlap with, Rho waves, and Rho waves move into F-actin-poor zones.
Supplementary Video 11 Activated frog egg expressing GFP-rGBD (malachite) and mCherry-Utr (copper), plus wild-type Xenopus Ect2, average projection of 4 1 micron sections, 10 sec/frame at 20 fps (time in min:sec). Corresponds to Fig. 4d. Rho activity waves and F-actin assembly waves have similar forms but at successive times; consequently, there is little overlap between wave peaks. Thus, throughout this sequence very little yellow (indicating colocalization) intercedes between malachite and copper.
Supplementary Video 12 Starfish zygote expressing GFP-rGBD (malachite) and mCherry-Utr (copper), plus wild type S. purpuratus Ect2, max. projection of 5 0.5 micron sections, 6 sec/frame at 20 fps (time in min:sec). Corresponds to Fig. 4e. This sequence begins in M-phase, with a relatively uniform F-actin carpet dominated by microvilli, and low-amplitude Rho activity waves. At anaphase Rho waves rapidly build to a near-uniform peak as microvilli give way to a finer-textured F-actin cortical layer, which in turn quickly breaks into waves as the cytokinetic zone develops. As furrow ingression proceeds, Rho/F-actin waves continue in tropical and polar regions. Little yellow is evident between malachite and copper fronts, but distinct dark areas separate advancing malachite front from trailing edges of copper waves.
Supplementary Video 13 Reconstruction of excitable phase on the cortex of starfish oocyte overexpressing Ect2 permits to reveal spiral wave cores. Phase (right panel) is color-coded as in Figure 5. Arrowhead points to a spiral wave core that persists for nearly 59 min. Corresponding Rho activity signal (GFP-rGBD) is shown for comparison (right panel). Note that no spiral wave is readily distinguishable in the Rho activity pattern by naked eye. Corresponds to Figure 5d-f. Frame rate is 41.3 sec.
© 2015 Macmillan Publishers Limited. All rights reserved

S U P P L E M E N TA RY I N F O R M AT I O N
8 WWW.NATURE.COM/NATURECELLBIOLOGY
Supplementary Video 14 Ect2-expressing starfish oocytes (malachite=GFP-rGBD, copper=mCherry-Utr) exposed to a pipette filled with agarose impregnated with 10 µM Latrunculin B in seawater. Max. projection of 15 1.5 micron sections, 20 sec/frame at 15 fps (time in min:sec). Corresponds to Figure 5g. In the oocyte nearest the drug source, the cortical F-actin rind shatters and melts on the side facing the pipette, accompanied by a surge of Rho activation. On the other side of the oocyte, waves transiently switch to a high-amplitude, long-period regime before the cortical F-actin layer shreds and ultimately collapses there too. In contrast, the oocyte further from the drug source never undergoes complete F-actin disassembly, and, following an initial burst, sustains the high-amplitude long-period wave regime for nearly 10 minutes. Note that because oocytes contain a fixed amount of the Utrophin-based probe for F-actin, even complete disassembly does not change the average fluorescence in the cell.
Supplementary Video 15 Ect2-expressing starfish oocyte (malachite=GFP-rGBD, copper=mCherry-Utr) exposed to a pipette filled with agarose impregnated with 1 µm Latrunculin B in seawater. Max. projection of 19 1 micron sections, 18 sec/frame at 15 fps (time in min:sec). Corresponds to Figure 5h. This oocyte was post-meiotic, and exhibited Ect2-enhanced waves typical for this stage (similar to Fig. 4c), when the pipette was brought close to the right edge. At the applied dose, F-actin never completely disassembled, and indeed new assembly continued throughout the sequence. However, the period and amplitude of Rho/F-actin waves increased dramatically, first near the pipette and then around the entire cell, except in the patch of cortex attached to the coverslip, which apparently experiences lower drug concentration such that the original wavelength remains. The high-amplitude, long-period regime continued for ~30 min. before onset of zygotic M-phase put a stop to excitability.
Supplementary Video 16 Starfish oocytes expressing GFP-rGBD, wild-type S. purpuratus Ect2, and ∆90-Cyclin B, treated with Roscovitine. Max. projection of 11 2 micron sections, 19 sec/frame at 30 fps (time in min:sec after Roscovitine treatment). Corresponds to Figure 6e. A group of ~12 oocytes were held tightly packed and slightly compressed between a slide and coverslip; 40 µM Roscovitine was added by perfusing the chamber; the perfusing stream ran SE-NW, and oocytes on the left and lower right were directly exposed to the stream, while the other were partially occluded (note that Z-series did not reach maximum diameter: oocytes on the left side were tightly packed). Roscovitine elicits excitability in the solvent-exposed cells within 5 minutes, culminating in C-phase-like burst of global Rho activation, followed by sustained waves over 2+ hours. Buried oocytes respond later but similarly, with a longer build-up from wave initiation to the global burst of Rho activity.
Supplementary Video 17 Fertilized starfish oocyte expressing GFP-rGBD and wild-type S. purpuratus Ect2, cut before 1st meiosis into nucleated and anucleate halves. Max. projection of 14 1 micron sections, 20 sec/frame at 20 fps (time in min:sec). Corresponds to Figure 7a. Upper half contains sperm entry point and meiotic spindle; lower half is anucleate and lacks centrosomes. Both halves become synchronously excitable for 1st meiosis, then 2nd meiosis. This oocyte apparently received a modest dose of Ect2, such that excitability persists only for a short time around meiotic divisions, which both complete successfully in the nucleated half.
Supplementary Video 18 Fertilized starfish oocyte expressing GFP-rGBD (no extra Ect2) and treated with 5 µM nocodazole prior to 1st meiosis. Max. projection of 14 0.6 micron sections, 16 sec/frame at 20 fps (time in min:sec). Corresponds to Figure 7e. Sperm entry point is visible to the lower left, meiotic spindle to the upper right. Vegetal-to-animal “macro-waves” of Rho activation proceed as normal, except that instead of culminating in a cytokinetic zone they reach the animal pole and dissipate. There is no zone of Rho suppression around the site of meiosis, as there normally would be; indeed, the very animal pole exhibits peak Rho activity, and even persistent activity between divisions.
Supplementary Video 19 Simulation of the excitable dynamics on the cortex of starfish oocyte undergoing meiosis. Rho activity and F-actin density are color-coded as in Figure 8. Note a striking change in the wave pattern during the increase in global Ect2 activity that represents the polar body extrusion phase (see Methods for details). Compare with Supplementary Figure 6d. Corresponds to Figure 8a-c.
Supplementary Video 20 Simulation of the furrow formation in mitotic starfish blastomere. Rho activity and F-actin density are color-coded as in Figure 8. During the simulation spatial distribution of cortical Ect2 is focused towards the equator to imitate the microtubule-dependent translocation (see Methods for details). Compare with Figures 3e, 4a. Corresponds to Figure 8d,e.
Supplementary Video 21 GFP-rGBD- and Ect2-expressing starfish embryo treated with 40 µM nocodazole during cytokinesis. Max. projection of 8 1 micron sections, 20 sec/frame at 20 fps (time in min:sec after nocodazole treatment). Corresponds to Figure 8h. A binucleate cell that had failed first cleavage was chosen, because at the time of treatment it displays a) prominent cytokinetic Rho zones, b) a spindle-distant zone to the left populated by distinct waves, and c) spindle-proximal zones that lack waves. Nocodazole treatment abolishes the cytokinetic Rho zones and low-level waves repopulate the entire surface as furrows regress; waves disappear after ~30 min. as next M-phase commences.
Supplementary Video 22 GFP-rGBD in a normal cleaving blastomere from a 16-cell starfish embryo. Max. projection of 42 0.5 micron sections, 12 sec/frame at 15 fps. Corresponds to Supplementary Figure 3b. A narrow strip around the equator was imaged so as to capture ~one-third of the entire furrow circumference as it ingresses. Animation leaves kymograph (as in Sup. Fig. 3b) in its wake. Blotches of Rho activity at each time point actually represent waves within the furrow.
Supplementary Video 23 GFP-rGBD in a normal 64-cell starfish embryo, four cells. Max. projection of 16 0.6 micron sections, 9 sec/frame at 15 fps. Corresponds to Supplementary Figure 3c. At this stage, furrow zones are coherent but still clearly exhibit waves during zone formation and initial ingression.
Supplementary Video 24 GFP-rGBD in a normal starfish embryo, 128+ cells. Max. projection of 12 0.8 micron sections, 14 sec/frame at 15 fps. Corresponds to Supplementary Figure 3d. As cell size decreases throughout embryogenesis, waves are less apparent in cleavage furrows. Rho activity zones are initially inhomogeneous, but rapidly cohere as ingression proceeds.
© 2015 Macmillan Publishers Limited. All rights reserved