Embed Size (px)
Citation preview

1 | P a g e ( 5 t h J u l 2 0 2 2 )
For any further query, please email us on [email protected]
Adani Enterprise Ltd
A goose that lays golden eggs

2 | P a g e ( 5 t h J u l 2 0 2 2 )
For any further query, please email us on [email protected]
TABLE OF CONTENTS
Summary 03
Valuation and Peer Comparison 04
- SOTP Valuation for AEL 04
- Band Charts & Price Performance 05
- Peer comparison & Scatter plot 07
Financial Summary & Story in Charts 09
Company Overview 11
Financial Analysis & Projections 16
AEL’s Business Segments 17
Capital Management 17
Green Hydrogen – Adani New Industries Ltd (ANIL) 24
Coal – Commercial Mining, MDO & IRM 69
Road Construction 81
Data Center – Adani Connex 92
Airport Operations 101
FMCG – Adani Wilmar 121
Defence & Aerospace 137
Copper 150
Green PVC 155
Digital – Super App 160
Business Quality Score 165
Annual Report Takeaways 166
Key Management Personnel 169
Risk & Concerns 169
Summary of Management Commentary on Quarterly Performance 170
Financial Statement Analysis & Projections 171
Disclaimer 172

3 | P a g e ( 5 t h J u l 2 0 2 2 )
For any further query, please email us on [email protected]
On 9th Dec 2021, we initiated coverage on the listed business units of Adani Group
which included Adani Enterprises Ltd (AEL). Post our coverage, AEL has undertaken
several initiatives that warrant detailed coverage. Through Adani New Industries
Ltd (ANIL), the group’s recent incubator in the production of renewable energy,
green H2 and downstream products (ammonia, urea & methanol), AEL will emerge
as the world’s primary leader in the green H2 ecosystem. ANIL has a vision to be the
lowest cost producer of green H2 and in partnership with TotalEnergies, we expect
this platform to be extended to the global theatre in the forthcoming future. ANIL
will be leveraging TotalEnergies balance sheet to help lower cost of funds.
Apart from ANIL, AEL’s other incubating businesses, in the domains of Airports, Data
Centers, Roads and Defence are on the verge of gaining traction and should be value
accretive in the short to medium term. AEL’s new incubating forays into copper and
green PVC have significant drivers in place to ensure long-term profitability and the
equity contribution is expected to be funded from internal accruals.
The existing coal ecosystem (captive mines, IRM and MDO) has favourable tailwinds
which will endure the already appreciated energy pricing (post the Russia-Ukraine
conflict). The favourable pricing environment has ensured that the break-even for
the Carmichael mine is upended and profitability should be realized sooner.
Given the favourable outlook across all business segments, we value AEL at INR
2,900 per share based on our SOTP valuation methodology. This represents an
upside of 29.2% from the current CMP of INR 2,245. We believe that a demerger of
the incubating business can result in significant value unlocking and is an upside risk
to our estimates. A case in point is the 153% appreciation in the stock price of Adani
Wilmar Ltd post-IPO. We expect the airport business to be the next value-unlocking
story that should play out over the next couple of years.
Risks to our upside thesis are (i) unexpected downturn in the economy, (ii) delay in
project execution and (iii) project finance. Historically, AEL has proven adequately
its project execution skills with timely delivery and capital management discipline.
Hence in our view, the risk factors are significantly diluted.
Key Consolidated Financial Data (INR Cr, unless specified)
Net Revenue
EBITDA Net
Profit EBITDA
(%) Net (%)
Adj EPS (₹)
Adj BPS (₹)
RoE (%)
RoIC (%)
P/E (X)
P/BV (X)
EV/EBITDA (X)
FY21 39,537 2,505 923 6.3 2.3 7.8 159.6 5.4 6.3 288.3 14.1 111.9
FY22 69,420 3,713 777 5.3 1.1 6.6 227.3 3.5 4.2 342.6 9.9 81.6
FY23E 58,656 6,835 1,517 11.7 2.6 12.8 289.7 5.5 4.7 175.3 7.7 48.3
FY24E 78,084 13,738 6,122 17.6 7.8 51.7 388.2 16.7 7.2 43.5 5.8 27.1
FY25E 118,612 21,903 6,917 18.5 5.8 58.4 488.6 14.8 7.9 38.5 4.6 19.3
We have consolidated 75% of ANIL and 50% of AdaniConnex financials in our estimated numbers
BUY @ CMP INR 2,245 Target: INR 2,821 in 24 months Upside Potential: 25.7%
A goose that lays golden eggs
Industry Diversified
Scrip Details
Face Value (INR) 1.0
Market Cap (INR Cr) 255,976
Price (INR) 2,245
No of Sh O/S (Cr) 114
3M Avg Vol (000) 336
52W H/L (INR) 2,420/1,333
Dividend Yield (%) 0.05
Shareholding (%) Mar 2022
Promoter 72.3
Institution 21.5
Public 6.2
TOTAL 100.0
Price Chart
0
5,000
10,000
15,000
20,000
0
500
1,000
1,500
2,000
2,500
3,000
Jun-19 Jun-20 Jun-21 Jun-22
AEL Nifty
Adani Enterprise Ltd

4 | P a g e ( 5 t h J u l 2 0 2 2 )
For any further query, please email us on [email protected]
Valuation
We value AEL on a SOTP basis for a price target of INR 2,821 per share# (FY25 EV/EBITDA of
21.9X) and recommend a BUY at a CMP of INR 2,245, representing an upside of 25.7% over the
next 24 months.
AEL valuation summary
Source: Company Reports
# Valuation is based on 1.0 MMTPA of green H2 capacity
Although the company has announced plans for 2.5 MMTPA of green H2 generation we have
clear visibility of 1 MMTPA production and hence we have valued ANIL on the basis of the
conservative numbers. Any announcements to ramp up capacity to 2.5 MMTPA will be an
upside risk to our price estimates.
ParticularsValuation
method
Mar 2025
Value
(INR Cr)
AEL Stake
(%)
AEL Stake
Value
(INR Cr)
Conglomerate
Discount (%)
Equity value
attributable
to AEL
(INR Cr)
Attributable
value per
share (INR)
Existing Businesses
Airports DCF 1,10,660 100 1,10,660 15 94,061 794
Road Consutruction DCF 34,742 100 34,742 15 29,530 249
FMCG DCF 63,438 44 27,913 15 23,726 200
Coal (Carmichael + IRM & MDO) DCF 12,882 100 12,882 15 10,950 92
Defence EV/EBITDA 9,112 100 9,112 15 7,745 65
Value from existing businesses 1,66,012 1,401
Future Businesses
Green Hydrogen DCF 2,07,397 75 1,55,548 15 1,32,216 1,116
Data Centers DCF 10,346 50 5,173 15 4,397 37
Copper DCF 22,503 100 22,503 15 19,128 161
Petrochemicals DCF 14,787 100 14,787 15 12,569 106
Value from future businesses 1,68,309 1,420
Consolidated Value of AEL 2,821
Current Market Value of AEL 2,245
Upside Potential (%) 25.7

5 | P a g e ( 5 t h J u l 2 0 2 2 )
For any further query, please email us on [email protected]
Source: Ventura Research
1,200
1,500
1,800
2,100
2,400
2,700
3,000
Ap
r-2
1
May
-21
Jun
-21
Jul-
21
Au
g-2
1
Sep
-21
Oct
-21
No
v-2
1
De
c-2
1
Jan
-22
Feb
-22
Mar
-22
Ap
r-2
2
May
-22
Jun
-22
1 year forward EV/EBITDA
EV per sh 64.8x 68.8x
72.8x 76.8x 80.8x
60
65
70
75
80
85
90
Ap
r-2
1
May
-21
Jun
-21
Jul-
21
Au
g-2
1
Sep
-21
Oct
-21
No
v-2
1
De
c-2
1
Jan
-22
Feb
-22
Mar
-22
Ap
r-2
2
May
-22
Jun
-22
EV/EBITDA and Std Deviation
EV/EBITDA Average
1 SD Lower Band 2 SD Lower Band
1 SD Upper Band 2 SD Upper Band
-20
0
20
40
60
80
100
120
140
Ap
r-2
1
May
-21
Jun
-21
Jul-
21
Au
g-2
1
Sep
-21
Oct
-21
No
v-2
1
De
c-2
1
Jan
-22
Feb
-22
Mar
-22
Ap
r-2
2
May
-22
Jun
-22
Price performance: AEL vs RIL
AEL RIL
3.5
4.0
4.5
5.0
5.5
6.0
Ap
r-2
1
May
-21
Jun
-21
Jul-
21
Au
g-2
1
Sep
-21
Oct
-21
No
v-2
1
De
c-2
1
Jan
-22
Feb
-22
Mar
-22
Ap
r-2
2
May
-22
Jun
-22
Valuation gap between AEL & RIL - Ready infra for H2 & RE has created a valuation gap
AEL to RIL EV/EBITDA (X)
A healthy mix of profitable businesses with high growth incubating businesses deserves premium valuation

6 | P a g e ( 5 t h J u l 2 0 2 2 )
For any further query, please email us on [email protected]
Adani Enterprise Ltd SWOT Analysis in a nutshell
Adani Enterprises Ltd
Growth Drivers
Changing energy mix towards renewables and green H2.
Increasing demand for data localization due to significant surge in local data usage.
Rise in construction activities of expressways for seamless connectivity between upcoming or new growth cities.
Focus on domestic procurement of defence equipments to increase indeginsation.
Increase in number of airports under UDAAN is expected to enhance airpassenger
Key Challenges
Green H2 is at nascent stage and therefore its cost of production is high. In addition, land availability for additoin solar capacity would be a challenge
Finding a real estate land for data center at a reasonable price is a challenge.
New Trends
Renewables and green H2 in India's energy mix could offer significant and decadal growth opportunity
We have been dependet on overseas data centers. localization of data has increased the demand for data centers in India
Investment Themes
Tieups with global leaders in different business verticals
- EdgeConnex in data center
- TotalEnergies in green H2
Infrastructure readiness for new age future businesses
Superior execution skills in large scale complex projects within stipulated time
For any further query, please email us on [email protected]

7 | P a g e ( 5 t h J u l 2 0 2 2 )
For any further query, please email us on [email protected]
Valuation and comparable metric of domestic and global companies
Source: Ventura Research & Bloomberg
Company Name Mkt Cap PricePEG
20252022 2023 2024 2025 2022 2023 2024 2025 2022 2023 2024 2025 2022 2023 2024 2025 2022 2023 2024 2025 2022 2023 2024 2025 2022 2023 2024 2025 2022 2023 2024 2025
Domestic Peers (fig in INR cr, unless specified)
Adani Enterprise Ltd 2,55,930 2,245.0 0.3 329.6 NA 41.8 37.0 11.5 9.3 7.0 5.5 80.7 43.1 23.0 15.6 3.5 5.5 16.7 14.8 3.7 6.5 10.8 12.1 69,420 58,656 78,084 1,18,612 5.3 11.7 17.6 18.5 1.1 2.6 7.8 5.8
Reliance Industries Ltd 16,46,090 2,433.0 1.0 27.0 20.0 17.9 17.1 2.1 1.9 1.7 1.6 15.6 11.8 10.3 8.9 7.7 9.5 9.7 9.2 9.4 11.8 12.5 14.5 6,94,803 8,67,101 9,06,712 9,64,233 16.0 17.0 18.0 17.8 8.8 9.5 10.1 10.0
Grasim Industries Ltd 88,837 1,350.0 0.2 13.0 12.6 9.0 6.0 1.2 1.1 1.0 0.8 6.5 6.4 4.9 3.0 9.3 8.6 10.7 13.5 2.2 14.0 18.4 23.9 88,958 1,13,715 1,23,494 1,36,713 21.6 19.2 21.6 22.3 7.7 6.2 8.0 10.8
ITC Ltd 3,53,369 287.0 1.6 23.2 20.6 18.7 17.2 5.6 5.5 5.2 5.2 17.5 15.6 13.7 11.9 24.2 26.5 27.9 30.2 31.6 36.2 45.9 58.5 57,495 64,056 69,209 76,141 34.7 34.8 35.5 36.2 26.5 26.8 27.3 26.9
Larsen & Toubro Ltd 2,19,828 1,564.0 0.7 23.7 19.6 16.2 14.0 2.7 2.5 2.2 2.0 17.3 14.8 12.7 11.5 11.3 12.5 13.8 14.5 8.7 9.8 11.0 11.7 1,57,184 1,79,192 2,02,283 2,26,755 11.8 12.0 12.4 12.5 5.9 6.3 6.7 6.9
Vedanta Ltd 80,607 217.0 0.4 4.2 3.3 3.5 3.3 1.2 1.1 1.0 0.9 2.5 2.1 2.1 1.9 28.7 34.0 28.8 28.1 37.1 44.7 40.6 34.2 1,21,482 1,37,566 1,34,007 1,33,594 36.7 37.4 36.6 38.3 16.0 17.7 17.1 18.1
Tata Power Ltd 67,981 213.0 1.4 30.2 25.4 23.5 20.2 3.1 2.8 2.5 2.2 14.6 12.8 11.4 10.1 10.2 10.9 10.6 11.0 7.3 8.5 9.1 7.8 37,975 47,625 51,555 59,598 20.0 18.6 19.3 19.8 5.9 5.6 5.6 5.6
NTPC Ltd 1,37,111 141.4 1.0 8.8 7.6 6.5 7.1 1.0 0.9 0.8 0.8 8.3 5.2 4.6 6.4 11.6 12.1 13.0 11.8 8.0 13.1 13.9 9.6 1,30,493 1,43,628 1,54,096 1,47,879 31.3 31.5 31.9 30.9 12.0 12.5 13.7 13.0
Coal India Ltd 1,12,932 183.3 0.4 7.0 6.1 6.1 4.8 2.7 2.3 2.1 1.7 4.2 3.5 3.5 3.0 39.3 38.5 33.5 34.8 51.4 50.6 45.6 46.9 1,05,598 1,17,009 1,21,209 1,23,162 21.8 22.4 22.0 19.8 15.4 15.9 15.2 19.1
NMDC Ltd 31,900 108.9 1.5 3.3 3.5 3.3 3.1 0.9 0.9 0.8 0.8 2.5 2.7 2.7 2.5 27.5 24.8 25.7 25.2 41.8 24.3 21.8 13.9 26,191 25,281 25,737 28,310 40.7 39.2 40.7 39.0 36.9 36.2 38.1 36.3
IRB Infrastructure Ltd 11,776 195.0 0.1 37.1 19.0 12.2 8.7 0.9 0.9 0.8 0.8 7.7 7.6 6.3 6.4 2.6 4.7 7.0 9.2 9.4 9.2 10.7 10.0 5,906 6,752 7,771 8,989 48.6 46.9 47.6 48.3 5.4 9.2 12.5 15.1
KNR Construction Ltd 6,647 236.0 0.8 19.0 14.1 12.8 12.5 2.8 2.4 2.1 1.8 9.8 8.4 7.6 7.0 15.0 16.9 16.4 14.5 26.8 23.2 25.0 22.2 3,200 3,900 4,471 4,716 20.3 19.5 18.8 19.2 10.9 12.1 11.7 11.2
Dilip Buildcon Ltd 2,891 198.0 1.3 9.0 9.5 8.3 7.5 0.7 0.6 0.6 0.5 7.1 3.7 3.4 3.1 7.5 6.4 7.1 7.2 8.0 14.5 14.2 14.8 9,303 10,408 10,755 11,831 8.6 13.9 13.9 13.9 3.5 2.9 3.2 3.2
Ashoka Buildcon Ltd 2,096 74.7 0.1 6.3 3.9 3.1 2.8 2.2 1.1 0.8 0.6 4.6 3.8 3.0 2.7 34.6 27.9 26.3 22.4 59.6 52.9 51.3 47.4 5,587 6,273 7,133 7,846 9.2 9.7 9.9 9.9 5.9 8.5 9.6 9.6
PNC Infratech Ltd 6,186 241.0 0.8 13.0 10.8 9.5 9.2 1.8 1.6 1.4 1.3 7.0 6.0 5.5 5.1 14.1 14.7 14.5 13.6 23.8 25.4 23.0 21.2 6,085 7,225 8,134 8,784 13.5 13.1 13.3 13.3 7.8 7.9 8.0 7.7
Global Peers (fig in USD mn, unless specified)
BHP Group Ltd (Australia) 1,50,503 29.7 -0.7 6.9 8.0 11.1 13.0 2.8 2.8 2.8 2.4 3.6 3.9 5.0 5.0 41.1 35.3 25.3 18.6 64.8 60.1 44.6 38.8 66,558 61,556 52,468 51,392 63.8 62.3 57.0 55.0 32.9 30.6 25.8 22.6
Rio Tinto (Australia) 1,10,919 74.8 -0.6 5.8 7.8 9.2 10.9 2.1 2.1 1.9 1.9 3.3 4.1 4.5 4.7 36.4 26.6 21.1 17.6 55.6 39.7 32.5 27.1 59,507 52,548 49,406 45,498 56.4 52.0 49.9 50.4 31.9 27.2 24.4 22.3
China Shenhua Energy (China) 90,870 4.9 1.4 8.9 8.7 8.4 7.6 1.6 1.6 1.5 1.3 4.1 4.1 3.9 3.6 17.9 17.9 17.9 16.5 41.2 35.8 34.6 30.1 50,708 51,783 52,861 58,147 35.0 35.7 36.3 36.3 20.0 20.2 20.6 20.6
Anglo American PLC (UK) 51,974 42.4 -0.6 6.1 7.6 9.2 13.2 1.6 1.4 1.3 1.2 2.9 3.2 3.6 3.7 26.7 19.1 14.5 9.1 46.4 34.4 27.0 21.8 41,743 39,124 36,994 33,518 46.4 43.4 40.7 41.7 20.3 17.6 15.3 11.8
Tronox Holdings PLC (USA) 2,492 16.0 0.3 4.9 4.3 4.1 3.4 1.1 0.9 0.8 0.6 4.4 3.8 3.5 2.2 21.7 20.9 19.4 19.0 17.2 18.2 17.7 25.0 3,992 4,130 4,203 4,443 27.0 28.1 28.6 30.9 12.8 14.0 14.4 16.5
Renew Energy PLC (USA) 2,361 5.9 0.2 78.7 54.4 41.4 12.8 1.6 1.6 1.4 1.3 9.6 9.0 8.8 7.4 2.1 2.8 3.4 10.0 8.3 8.0 8.0 9.5 797 1,125 1,336 1,471 88.5 80.3 82.9 77.8 3.8 3.9 4.3 12.6
Montauk Renewables (USA) 2,039 14.2 0.7 39.0 27.6 22.0 19.0 8.6 6.5 5.0 4.0 22.0 19.2 15.6 14.1 22.0 23.7 22.9 21.0 25.6 27.0 25.5 22.7 204 224 269 303 45.9 48.2 49.3 48.3 25.6 33.1 34.4 35.4
Transalta Corp (Canada) 2,968 11.0 -1.8 15.5 42.8 62.6 73.2 4.6 4.4 4.4 6.1 8.7 6.4 6.1 5.8 29.6 10.3 7.0 8.4 16.9 12.8 12.7 15.0 1,832 1,665 1,588 1,562 33.7 51.2 54.3 54.7 10.5 4.2 3.0 2.6
Ormat Technologies (USA) 4,128 73.6 1.3 55.4 37.0 32.8 29.8 2.0 2.0 1.8 1.7 14.0 11.7 10.6 9.6 3.6 5.3 5.5 5.7 5.2 6.8 8.3 4.8 722 872 942 955 59.5 59.7 59.6 64.6 10.3 12.8 13.4 14.5
Capital Power Corp (Canada) 4,115 33.9 3.1 16.7 21.5 17.8 14.6 2.3 2.3 2.4 2.8 8.7 7.7 7.7 7.5 13.9 10.9 13.7 19.2 10.7 9.3 11.3 12.9 1,547 1,534 1,569 1,539 49.0 56.4 55.7 56.2 15.9 12.5 14.7 18.3
Vistara Corp (USA) 9,725 22.5 19.5 13.3 7.4 12.1 13.0 1.8 1.8 1.8 3.0 5.8 5.0 5.4 5.4 13.7 24.1 14.8 23.2 9.3 15.7 9.7 7.0 14,972 15,037 13,796 12,124 21.1 23.7 25.9 28.9 4.9 8.7 5.8 6.2
Northland Power (Canada) 6,541 28.3 2.5 19.9 21.4 20.0 16.4 4.1 4.0 4.5 2.7 11.7 11.3 11.9 13.6 20.4 18.6 22.2 16.3 10.9 11.1 9.2 5.7 1,699 1,747 1,762 1,811 57.7 58.5 59.6 60.2 19.4 17.5 18.5 22.0
Clearway Energy Inc (USA) 6,125 28.7 1.6 38.0 25.6 26.0 24.6 1.8 1.8 1.7 1.6 10.0 9.6 9.6 9.3 4.8 6.9 6.5 6.5 4.1 5.0 4.9 5.7 1,367 1,325 1,333 1,373 90.2 96.9 94.7 95.5 11.8 18.1 17.6 18.2
Nextera Energy (USA) 5,638 67.2 1.8 28.2 24.0 24.2 20.4 2.7 1.4 3.1 7.6 6.5 6.0 5.8 5.4 9.4 5.7 12.7 37.2 7.8 7.2 10.5 14.2 1,741 1,968 2,142 2,291 97.8 96.0 96.8 95.7 11.5 11.9 10.9 12.1
Inergex Renewable (Canada) 2,690 13.2 0.2 126.6 46.5 31.7 19.3 3.6 3.9 5.0 3.7 13.0 12.3 12.8 12.7 2.9 8.4 15.9 19.1 5.2 5.9 6.3 6.0 683 721 751 762 75.9 75.5 74.4 74.6 3.1 8.0 11.3 18.3
Sunnova Energy Int. (USA) 2,012 17.6 0.2 33.5 ##### 72.5 10.0 1.2 0.8 1.4 1.2 54.5 43.1 37.8 31.7 3.4 -0.7 1.9 12.2 -1.0 -0.0 0.3 0.9 353 509 657 849 34.5 38.1 41.6 44.8 17.0 -3.5 4.2 23.6
Altus Power (USA) 1,186 7.7 -1.8 18.4 90.3 42.0 38.1 3.2 3.0 2.8 2.6 24.7 12.4 7.6 6.9 17.2 3.4 6.7 6.9 7.9 8.7 14.2 14.9 104 179 284 312 54.8 63.1 65.0 65.0 61.9 7.3 10.0 10.0
Terna Energy SA (Greece) 2,148 18.5 0.4 32.0 19.6 17.0 13.8 3.8 3.2 3.2 2.7 17.4 12.5 12.1 11.4 11.8 16.2 18.8 20.0 8.2 11.1 11.5 12.1 311 402 447 494 57.2 61.6 59.8 60.3 21.6 27.2 28.3 31.6
Voltalia SA (France) 1,789 18.8 1.1 43.4 27.4 25.2 24.1 2.4 2.2 2.0 1.9 13.8 11.0 9.7 9.5 5.5 8.1 7.8 7.9 6.5 8.2 9.2 8.9 488 579 588 603 43.9 49.9 55.3 59.1 8.5 11.3 12.1 12.3
ABO Wind AG (Germany) 524 56.8 0.7 33.7 22.2 18.8 17.1 3.0 2.7 2.4 2.1 16.0 11.6 10.0 9.1 8.9 12.0 12.9 12.4 10.0 14.3 16.5 16.3 217 260 280 377 17.6 19.6 20.5 16.7 7.2 9.1 9.9 8.1
CGN New Energy (China) 1,864 0.4 0.5 7.7 6.8 6.1 5.5 1.2 1.1 0.9 0.8 15.1 13.9 13.2 12.0 16.2 16.1 15.5 14.5 6.7 7.2 7.6 8.0 1,956 2,117 2,258 2,483 26.3 26.5 26.2 26.2 12.4 13.0 13.5 13.5
New Energy Solar (Australia) 180 0.6 -0.9 7.2 7.4 11.8 10.8 0.6 0.6 0.6 0.5 6.8 6.7 10.8 9.8 8.5 7.9 4.8 5.0 9.1 8.6 5.2 5.4 29 28 18 20 89.3 92.4 88.3 88.3 85.6 86.3 82.4 82.4
EBITDA Margin (%) Net Margin (%)P/E (X) P/B (X) EV/EBITDA (X) RoE (%) RoIC (%) Sales
For any further query, please email us on [email protected]

8 | P a g e ( 5 t h J u l 2 0 2 2 )
For any further query, please email us on [email protected]
AEL is in a high growth phase, which could reduce its RoIC, however, it is well-positioned for decadal growth
Source: Ventura Research, ACE Equity & Bloomberg
Adani Ent
RIL
Grasim
LT
Vedanta
Tata PowerNTPC
Coal India
NMDC
IRB Infra
KNR Const
Dilip Build
Ashoka Build
PNC Infra
BHP Grp
Rio Tinto
China Shenhua
Anglo American
Tronox
Renew Energy
Montauk
Transalta
Ormat Tech
Capital Power
VistaraNorthland Power
Clearway Energy
Nextera Energy
Inergex Renewable
Sunnova Energy
Altus Power
Terna Energy
Voltalia SA
ABO Wind
CGN New Energy
New Energy Solar
-5
5
15
25
35
45
55
-1.0 -0.5 0.0 0.5 1.0 1.5 2.0 2.5 3.0 3.5 4.0 4.5
FY2
5 R
oIC
(%
)
EV/EBITDA to EBTIDA CAGR (X)
Adani Ent
RIL
Grasim
ITC
LT
Vedanta
Tata Power
NTPCCoal India
NMDC
IRB Infra
KNR Const
Dilip Build
Ashoka Build
PNC Infra
0
3
6
9
12
15
18
21
5 10 15 20 25 30 35 40 45 50
FY2
2-2
5 R
eve
nu
e C
AG
R (
%)
FY25 EBITDA Margin (%)

9 | P a g e ( 5 t h J u l 2 0 2 2 )
For any further query, please email us on [email protected]
AEL Consolidated Financial Summary
Source: Company Reports & Ventura Research
Fig in INR Cr (unless specified) FY17 FY18 FY19 FY20 FY21 FY22 FY23E FY24E FY25E
Revenue from operations 37,238 38,424 41,056 43,403 39,537 69,420 58,656 78,084 1,18,612
YoY Growth (%) 9.7 3.2 6.9 5.7 -8.9 75.6 -15.5 33.1 51.9
RM Cost and Opex 34,891 35,166 38,914 41,118 37,032 65,707 51,822 64,346 96,709
Expenses to Sales (%) 93.7 91.5 94.8 94.7 93.7 94.7 88.3 82.4 81.5
EBITDA 2,348 3,258 2,143 2,284 2,505 3,713 6,835 13,738 21,903
EBITDA Margin (%) 6.3 8.5 5.2 5.3 6.3 5.3 11.7 17.6 18.5
YoY Growth (%) (34.2) 6.6 9.7 48.2 84.1 101.0 59.4
Depreciation -34.4 108.6 416 472 537 1,248 2,501 3,340 5,920
EBIT 2,382.1 3,149.5 1,726 1,812 1,968 2,465 4,333 10,398 15,983
EBIT Margin (%) 4.2 4.2 5.0 3.6 7.4 13.3 13.5
YoY Growth (%) (45.2) 5.0 8.6 25.3 75.8 139.9 53.7
Other Income 118.5 236.4 580 684 754 1,013 651 1,628 409
Finance Cost 491.6 337.1 1,637 1,572 1,377 2,526 3,178 5,236 8,633
Exceptional Items 1 (161) (158) 199 (259) 0 0 0 0
PBT 2,010 2,888 511 1,122 1,086 952 1,807 6,790 7,759
PBT Margin (%) 1.2 2.6 2.7 1.4 3.1 8.7 6.5
YoY Growth (%) -82.3 119.7 -3.2 -12.3 89.8 275.8 14.3
Tax Expense 60 127 194 324 340 477 738 1,272 1,569
Tax Rate (%) 3.0 4.4 38.0 28.9 31.3 50.1 40.8 18.7 20.2
PAT 1,950 2,761 317 798 746 475 1,069 5,518 6,190
PAT Margin (%) 0.8 1.8 1.9 0.7 1.8 7.1 5.2
YoY Growth (%) -88.5 152.1 -6.5 -36.3 124.9 416.2 12.2
Min Int/Sh of Associates (963) (2,004) 401 340 176 301 448 604 727
Net Profit 988 757 717 1,138 923 777 1,517 6,122 6,917
Net Margin (%) 2.7 2.0 1.7 2.6 2.3 1.1 2.6 7.8 5.8
YoY Growth (%) -5.3 58.7 -18.9 -15.8 95.4 303.5 13.0
Adjusted EPS 9.0 6.9 6.5 10.3 8.4 7.1 13.8 55.7 62.9
P/E (X) 250.0 326.1 344.3 216.9 267.6 317.9 162.7 40.3 35.7
Adjusted BVPS 128.5 137.2 134.2 154.1 156.0 202.4 248.9 333.1 423.9
P/BV (X) 17.5 16.4 16.7 14.6 14.4 11.1 9.0 6.7 5.3
Enterprise Value 2,85,066 2,81,713 2,75,564 2,75,020 2,80,193 3,03,073 3,29,931 3,72,917 4,21,802
EV/EBITDA (X) 121.4 86.5 128.6 120.4 111.9 81.6 48.3 27.1 19.3
Net Worth 14,136 15,089 14,756 16,947 17,159 22,261 27,378 36,639 46,616
Return on Equity (%) 7.0 5.0 4.9 6.7 5.4 3.5 5.5 16.7 14.8
Capital Employed 34,982 32,726 25,999 29,366 33,160 63,284 92,676 1,44,914 2,04,006
Return on Capital Employed (%) 4.4 4.5 4.1 4.4 4.1 1.9 2.8 5.8 6.3
Invested Capital 33,170 30,770 24,287 25,934 31,319 59,301 91,276 1,43,524 2,02,385
Return on Invested Capital (%) 5.1 6.5 7.1 7.0 6.3 4.2 4.7 7.2 7.9
Cash Flow from Operations 774 2,942 3,327 2,454 4,094 1,385 5,979 8,174 5,245
Cash Flow from Investing (1,229) (7,706) 1,809 (2,323) (7,902) (17,487) (31,245) (49,082) (48,592)
Cash Flow from Financing 716 5,120 -6,158 -221 3,059 15,901 24,696 40,880 43,542
Net Cash Flow 261 355 -1,023 -90 -750 -201 -570 -28 194
Free Cash Flow -1,476 -4,424 929 612 441 -11,582 -29,234 -43,010 -44,926
FCF to Revenue (%) (4.0) (11.5) 2.3 1.4 1.1 (16.7) (49.8) (55.1) (37.9)
FCF to EBITDA (%) (62.9) (135.8) 43.3 26.8 17.6 (311.9) (427.7) (313.1) (205.1)
FCF to Net Profit (%) (149.4) (584.2) 129.5 53.8 47.8 (1,491.5) (1,926.7) (702.5) (649.5)
FCF to Net Worth (%) (10.4) (29.3) 6.3 3.6 2.6 (52.0) (106.8) (117.4) (96.4)
Net Capex 1,765 2,722 3,359 13,493 31,172 46,857 46,803
Net Capex to Revenue (%) 4.3 6.3 8.5 19.4 53.1 60.0 39.5
Total Debt 20,846 17,637 11,243 12,419 16,001 41,024 65,298 1,08,275 1,57,390
Net Debt 19,034 15,681 9,531 8,988 14,161 37,041 63,898 1,06,885 1,55,769
Net Debt to Equity (X) 1.3 1.0 0.6 0.5 0.8 1.7 2.3 2.9 3.3
Net Debt to EBITDA (X) 8.1 4.8 4.4 3.9 5.7 10.0 9.3 7.8 7.1
Interest Coverage Ratio (X) 1.1 1.1 1.1 1.2 1.4 1.0 1.4 2.0 1.9
10 | P a g e ( 5 t h J u l 2 0 2 2 )
For any further query, please email us on [email protected]
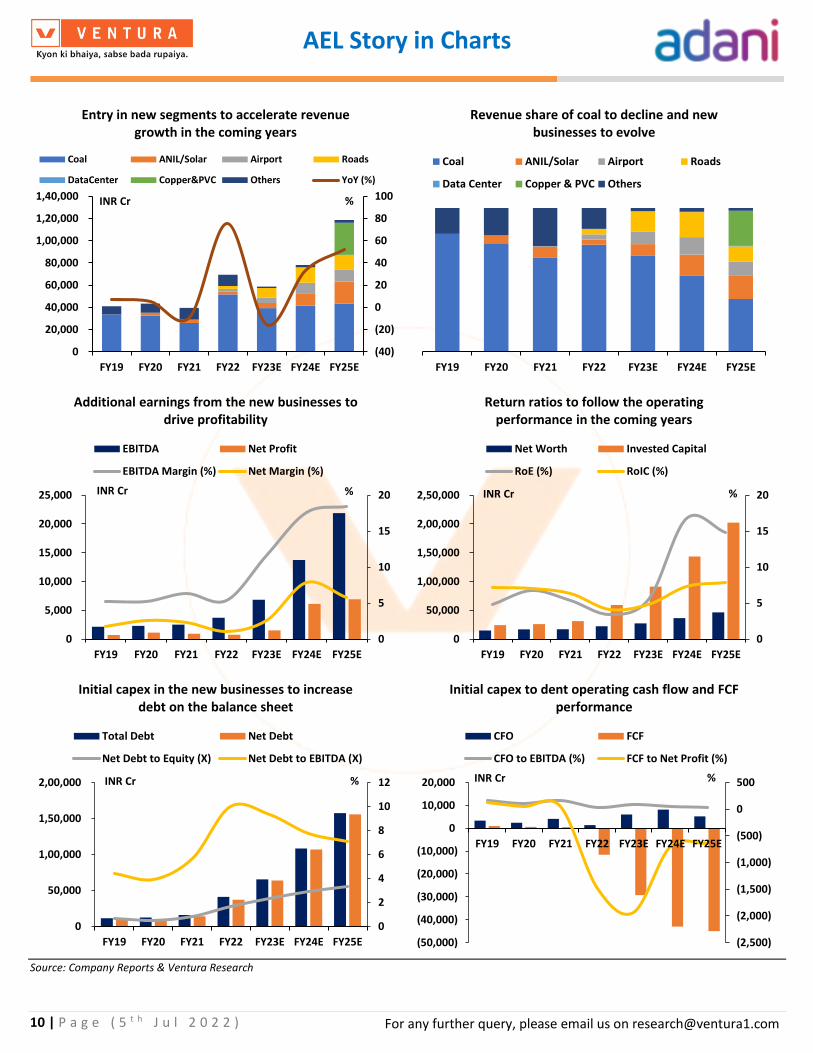
Source: Company Reports & Ventura Research
(40)
(20)
0
20
40
60
80
100
0
20,000
40,000
60,000
80,000
1,00,000
1,20,000
1,40,000
FY19 FY20 FY21 FY22 FY23E FY24E FY25E
Entry in new segments to accelerate revenue growth in the coming years
Coal ANIL/Solar Airport Roads
DataCenter Copper&PVC Others YoY (%)
INR Cr %
FY19 FY20 FY21 FY22 FY23E FY24E FY25E
Revenue share of coal to decline and new businesses to evolve
Coal ANIL/Solar Airport Roads
Data Center Copper & PVC Others
0
5
10
15
20
0
5,000
10,000
15,000
20,000
25,000
FY19 FY20 FY21 FY22 FY23E FY24E FY25E
Additional earnings from the new businesses to drive profitability
EBITDA Net Profit
EBITDA Margin (%) Net Margin (%)
INR Cr %
0
5
10
15
20
0
50,000
1,00,000
1,50,000
2,00,000
2,50,000
FY19 FY20 FY21 FY22 FY23E FY24E FY25E
Return ratios to follow the operating performance in the coming years
Net Worth Invested Capital
RoE (%) RoIC (%)
INR Cr %
0
2
4
6
8
10
12
0
50,000
1,00,000
1,50,000
2,00,000
FY19 FY20 FY21 FY22 FY23E FY24E FY25E
Initial capex in the new businesses to increase debt on the balance sheet
Total Debt Net Debt
Net Debt to Equity (X) Net Debt to EBITDA (X)
INR Cr %
(2,500)
(2,000)
(1,500)
(1,000)
(500)
0
500
(50,000)
(40,000)
(30,000)
(20,000)
(10,000)
0
10,000
20,000
FY19 FY20 FY21 FY22 FY23E FY24E FY25E
Initial capex to dent operating cash flow and FCF performance
CFO FCF
CFO to EBITDA (%) FCF to Net Profit (%)
INR Cr %
AEL Story in Charts

11 | P a g e ( 5 t h J u l 2 0 2 2 )
For any further query, please email us on [email protected]
Understanding AEL’s business and growth opportunities
AEL is one of India’s largest listed incubators which have conceived, grown, matured and
demerged many successful businesses such as Adani Ports & SEZ (in the year 2007), Adani
Power (in 2009), Adani Transmission (in 2015), Adani Green Energy (in 2018), Adani Total Gas
(in 2018) and Adani Wilmar (in 2022). Each of these listed entities have themselves emerged
as leaders in their respective sectors.
AEL’s business journey
Source: Company Reports
1988- Started commodity trading
1994- Listed on BSE and NSE @ INR 150
per share
1995- Mundra Port commences operations
1996- Bonus issue 1:1
1999- Commencement of IRm business.
Signed JV with Wilmar
2001- Started City gas distribution business
2005- Awarded india's first MDO contract
2006- Stock split of AEL (10:1)
2007- APSEZ IPO2008- Acquirede
Bunya Mine, Indonesia2009- Adani Power
IPO
2010- Acquired Carmichael Mine at
Australia
2015- Completed demerger of APL and
ATL
2017- Started manufacturing solar
PV panels
2018- Demerger of Adani Green and
Adani gas
2019- Emerged 2nd largest IRM player in
the world
2020- Forayed into airports business
2021- Formed data center JV 'Adani
Connex' with Edge Connex
2022- Adani Wilmar IPO subscribed 17X.
Completed the acquisition of MIAL

12 | P a g e ( 5 t h J u l 2 0 2 2 )
For any further query, please email us on [email protected]
Currently, AEL is incubating a mix of new and old-world businesses which includes
• Existing businesses
o Airport operations – Managing 8 airports (7 operational and 1 under
construction) in India and their weighted average life is 70 years, providing
good long-term cash flow visibility.
o Road construction – 376 lane km of highways are under operation, while 1,694
lane km are under construction. An additional 3,676 lane km of concession
agreements have been signed.
o FMCG – A JV between AEL and Wilmar Group catering to essential kitchen
commodities like edible oil, rice, flour, pulses, etc. The company recently
acquired the Kohinoor brand in basmati rice.
o Commercial mining, MDO and IRM – It has one operational commercial mine
in Australia (Carmichael mine) and 4 commercial mines in India that are under
development. The segment also offers end-to-end logistics for coal consumers
(IRM business) and turnkey services to coal & iron ore mine owners (MDO
business).
o Other businesses include defence (production of small arms, UAVs, drones &
aircraft parts), water, digital etc.
• Future businesses
o Green Hydrogen – ANIL has outlined a capex plan of USD 50 bn to set up a 2.5
MMTPA of green H2 manufacturing capacity over the next 10 years. The first
phase of 1.0 MMTPA green H2 capacity is expected to be commissioned before
2030.
o Data centres – A JV between AEL and EdgeConneX should start with 8 MW of
operations in FY23 and grow into 323 MW by FY30
o Other future businesses include copper (to commence production from FY25
with an initial capacity of 0.5 MMTPA) and PVC (to commence production of
green PVC from FY25)
With most of the business verticals in the investment phase, profit metrics are in the nascent
stage and do not reflect steady-state run rates. Given its past records, execution skills, ready
infrastructure in place, foreign collaboration for technical tie-ups and low-cost funding, we
remain confident of the AEL’s ability to turn its new set of businesses into giant organizations
and unlock value from them either through a stake sale or through a direct listing.

13 | P a g e ( 5 t h J u l 2 0 2 2 )
For any further query, please email us on [email protected]
AEL’s Business Structure
Source: Company Reports
AEL
Existing Businesses
Others
Defence
(Adani Defence & Aerospace Ltd)
Water
(Adani Water Ltd)
Digital
(Adani Digital Labs)
Airports
(Adani Airport Holdings Ltd)
Roads
(Adani Road Transport Ltd)
FMCG
(Adani Wilmar Ltd)
AEL: 44% / Wilmar: 44%
Coal
Commercial Mines
(Adani Mining Pvt Ltd)
IRM and MDO
Future Businesses
Green Hydrogen
(Adani New Industries Ltd)
AEL: 75% / TotalEner: 25%
Data Center
(Adani ConneX Ltd)
AEL: 50% / ConneX: 50%
Copper
(Kutch Copper Ltd)
PVC
(Adani Petrochemicals Ltd)

14 | P a g e ( 5 t h J u l 2 0 2 2 )
For any further query, please email us on [email protected]
AEL has successfully incubated a number of businesses across a variety of sectors which have
grown to become large business opportunities in their own right. This has been aptly
demonstrated by the business growth and shareholder value created as shown in the table
below –
Demerged businesses from AEL and their performance
Source: Company Reports & Ventura Research
This success is largely derived from a broad-based competitive advantage comprising of:
• Timely project implementation,
• Ability to commission projects faster than the sectorial curve,
• Competence to do so at a cost lower than the industry average,
• Foresight to not merely service the market but to grow it,
• Establish a decisive sustainable leadership, and
• Evolve the company’s position into a generic name within the sector of its presence.
We believe that all the above characteristics will enable AEL to build strong businesses across
all the recent forays.
Company NameAdani Ports &
SEZ LtdAdani Power Ltd
Adani
Transmission Ltd
Adani Green
Energy Ltd
Adani Total
Gas LtdAdani Wilmar Ltd
Current status
in industry
Largest commercial
port operator in
India with 560 MMT
capacity
One of the largest
power companies in
India with the
thermal power
capacity of 13.6 GW
Largest private
transmission
company in India
with 18,795 ckm
line
One of the largest
renewable
companies in India
with a project
portfolio of 20.5 GW
Largest CGD
company in India
with presence
across 52 GAs
One of the largest
companies in India
to offer most of the
essential kitchen
commodities
Revenue FY17 8,439 22,616 2,876 502 1,087 22,973
Revenue FY22 15,934 27,711 11,258 5,133 3,038 52,361
5 yrs Revenue CAGR (%) 13.6 4.1 31.4 59.2 22.8 17.9
EBITDA FY17 5,418 5,980 1,983 403 278 643
EBITDA FY22 8,879 9,814 4,206 3,539 773 1,725
5 yrs EBITDA CAGR (%) 10.4 10.4 16.2 54.4 22.7 21.8
Net Profit FY17 3,912 -6,174 416 -47 101 230
Net Profit FY22 4,728 4,912 1,205 489 505 808
5 yrs net profit CAGR (%) 3.9 NA 23.7 NA 38.0 28.6
Date of demerger 39,416 40,046 42,216 43,273 43,405 44,603
Listing Price 184 103 28 30 80 381
Current Price 673 270 2,123 1,880 2,262 584
Price CAGR since listing (%) 9.3 7.8 86.6 181.1 149.4 212.0

15 | P a g e ( 5 t h J u l 2 0 2 2 )
For any further query, please email us on [email protected]
Growth profile of incubating businesses
Source: Company Reports
Early-stage incubating businesses
Source: Company Report

16 | P a g e ( 5 t h J u l 2 0 2 2 )
For any further query, please email us on [email protected]
Financial Analysis & Projections
FY19-22: Maintained consistency in revenue performance
During FY19-22, AEL’s revenue grew at a CAGR of 19.8% to INR 69,420 cr, which was primarily
driven by
• 15.4% revenue CAGR to INR 51,324 cr in the coal segment due to a significant surge in
IRM volumes.
• 21.3% revenue CAGR to INR 2,527 cr in the solar manufacturing segment revenue to
due to a significant jump in the solar installation by EPC players
• Additional revenue of INR 2,517 cr from airport business (new business vertical started
in FY20).
• 33.7% revenue CAGR in other businesses to INR 13,051 cr
EBITDA and PAT grew at a CAGR of 23.6% and 23.8% to INR 3,713 cr and INR 788 cr,
respectively. Both EBITDA and PAT margins improved by 47bps to 5.3% and 11bps to 1.1%
respectively due to the improving contribution from the high-margin new business verticals.
An increase in PAT improved the RoE from 2.7% in FY19 to 2.9% in FY22, however, a rise in the
net debt from INR 8,239 cr in FY19 to INR 37,045 cr in FY22 impacted the RoIC performance.
As a result, RoIC declined from 6.8% in FY19 to 3.9% in FY22.
FY22-25E: Strong potential of the new business segments
Over FY22-25E, AEL’s sales are expected to grow at a CAGR of 19.5% to INR 1,18,612 cr, due to
• 5.5% CAGR decline estimated in coal segment revenue to INR 43,503 cr due to the
higher base of FY22, when commodity prices were at their peak. We believe that coal
prices may decline over a period of time.
• 63.9% CAGR growth estimated in airport segment revenue to INR 11,086 cr due to the
rise in passenger traffic in new airports from 40.4 mn in FY22 to 105.9 mn in FY25
• 53.7% CAGR growth estimated in defence segment revenue to INR 2,392 cr due to
increased sourcing from MoD and defence PSUs
• Total incremental revenue of INR 61,631 cr from the upcoming businesses such as INR
12,725 cr from the road, INR 19,647 cr from ANIL, INR 415 cr from the data centre, INR
25,492 cr from copper and INRN 3,352 cr from PVC business.
EBITDA and net profit are expected to grow at a CAGR of 80.7% and 107.3% to INR 21,903 cr
and INR 6,917 cr, respectively, while EBITDA and net margins are expected to improve by
1312bps to 18.5% and 471bps to 5.8% respectively due to the rise in contribution from the
new high margin businesses. Subsequently, return ratios – RoE & RoIC – are expected to
improve by 1135bps to 14.8% and 374bps to 7.9%, respectively.

17 | P a g e ( 5 t h J u l 2 0 2 2 )
For any further query, please email us on [email protected]
AEL’s Capital Management

18 | P a g e ( 5 t h J u l 2 0 2 2 )
For any further query, please email us on [email protected]
AEL’s Capital Management
Over the past 9 years, the Adani group has significantly expanded its presence across various
verticals. The group has become India’s largest private port operator, coal importer, private
thermal power producer, green energy producer, power transmitter & distributor, city gas
distributor and importer of edible oils and it has also expanded into airports, roads, defence
and aerospace. This growth has been aided by
• Buying projects from other companies,
• Starting new businesses and
• Investing in existing ones
This business expansion delivered a strong CAGR growth of 20.3% in its RR EBITDA (run-rate
EBITDA) during the last 9 years from INR 69 bn in FY13 to INR 365 bn in FY22, while the net
debt has grown has a CAGR of 11.1% from INR 521 bn in FY13 to INR 1,344 bn in FY22 over the
same period, which resulted in a decline in net debt-to-RR EBITDA over the same period.
Adani group has been reducing short-term debt in the overall debt mix
Source: Company Reports
The net debt/RR EBITDA has been reducing over the years
Source: Company Reports
FY13 FY16 FY22
RatingHighest Asset
Rating was AA
Highest Asset
Rating was AA+
Overall Group
Rating - AA
RR EBITDA INR 69 Bn INR 183 Bn INR 365 Bn
Net Debt INR 521 Bn INR 732 Bn INR1,344 Bn
Debt (% age ) 100% 86% 39%
69
183
365
7.6x
4.0x3.7x
0
2
4
6
8
0
50
100
150
200
250
300
350
400
FY13 FY16 FY22
RR EBIDTA Net Debt/ RR EBIDTA

19 | P a g e ( 5 t h J u l 2 0 2 2 )
For any further query, please email us on [email protected]
How did Adani group manage to reduce pressure on its balance sheet while
expanding in capex-heavy businesses?
The Adani group philosophy before undertaking an investment in infrastructure projects is
summed up by the following 5 stages:
• Origination: In this stage, the company undertakes market intelligence and analysis of
the viability of the project and the strategic value of the asset.
• Site development: In this stage, the group acquires the site post-taking concessions
and regulatory requirements.
• Construction: In this stage, the company undertakes the engineering and designing of
the project and decides on the equity and debt funding for the project.
• Operations: The Company plans for the lifecycle O&M of the project. For example, for
its power business, Adani group has built the Energy Network Operation Centre (ENOC)
which enables centralized continuous monitoring of projects and installations on a
single cloud-based platform.
• Capital management: In this stage, AEL undertakes to redesign the capital structure of
the asset in such a way that the operational phase funding of the project is consistent
with the life of the asset.
Adani Group: Repeatable & proven transformative investment model
Source: Company Reports

20 | P a g e ( 5 t h J u l 2 0 2 2 )
For any further query, please email us on [email protected]
Internally, the group focuses a lot on capital management and reviews periodically its capital
requirement and how the cost of the same can be brought down. In order to bring down the
cost of funds, the group has laid down the following strategy:
• Tapping international markets to broadbase sourcing of funds – To gain funds at
competitive pricing, the group envisages the issuance of various green bonds,
especially for its renewable energy business. The bonds are issued for longer-term (>15
years) and in a way that the coupon payments are in tandem with the cash flow
generation of the underlying asset for which the money is raised.
Adani Group: Repeatable & proven transformative investment model
Source: Company Reports
• Focus on ESG – Being ESG compliant has become foremost requirement of global
funds. High ESG compliant projects are able to tap international funds at cheap rates.
In order to attract international capital, AEL has focused on enhancing its ESG score.
AEL has improved its ESG score while RIL’s score remained flat
Source: Bloomberg
PSU Banks, 55 Private
Banks, 31
Bonds, 14
2016
PSU Banks, 18
Private Banks, 8
Bonds, 37
DII, 6
Global Banks, 25
PSU Capex LC, 6
2022
27 28 27 27
31 31
35 35 36
50 51
54 56
49
58
49 51
52
FY13 FY14 FY15 FY16 FY17 FY18 FY19 FY20 FY21
AEL Reliance

21 | P a g e ( 5 t h J u l 2 0 2 2 )
For any further query, please email us on [email protected]
Since FY13, AEL has worked on ESG parameters and disclosures, which has improved
its overall Bloomberg ESG score from 27 in FY13 to 36 in FY21. AEL aligned its ESG
reporting standards with the Global Reporting Initiative (GRI), increased its public
disclosures in the annual report, management systems and business excellence
initiatives, and remains committed to improving its ESG performance by further
refining its policies and practices, as well as strengthening information disclosure
procedures. This has helped the company is getting foreign funding for its new
projects.
Further, we believe that in order to enhance its ESG commitment there is every
possibility that the coal business may be completely hived off once the incubator
businesses become cash flow positive.
• Partnerships with industry leaders – The group has partnerships with TotalEnergies
for its various businesses like green energy, city gas distribution, and green H2.
Especially for its green hydrogen business, ANIL will issue shares to TotalEnergies
representing 25% of its share capital. The partnership is a win-win situation for both
the investors as Adani group will contribute its knowledge of the Indian market,
execution capabilities, operations excellence and capital management philosophy
while TotalEnergies will bring its understanding of the global market, credit
enhancement and financial strength to lower the financing costs (we estimate the
finance costs to come down by atleast 150-200bps) along with expertise in underlying
technologies.
The complementary strengths of both partners will help ANIL deliver the largest green
H2 ecosystem in the world, which, in turn, will deliver the lowest cost of green H2 to
the consumer and help accelerate the global energy transition. It is to be noted that
ANIL’s ambition is to invest over USD 50 bn over the next 10 years in green H2 and
associated ecosystem. In the initial phase, ANIL will develop green H2 production
capacity of 1 MMMTPA before 2030.
With the help of its well planned capital management policy, Adani group has been able to
expand its business operations by taking measured risk. Over time, the group has been able to
completely de-risk 46% of its equity value (with thermal) & 37% (without thermal) from tenure
and other capital related risk.

22 | P a g e ( 5 t h J u l 2 0 2 2 )
For any further query, please email us on [email protected]
46% of group’s equity value (with thermal) is fully protected from tenure and rate of capital employed risk
Source: Company Reports
37% of group’s equity value (without thermal) is fully protected from tenure and rate of capital employed risk
Source: Company Reports

23 | P a g e ( 5 t h J u l 2 0 2 2 )
For any further query, please email us on [email protected]
How Adani group is applying its capital management policy to grow its green energy
portfolio?
The efficacy of capital management philosophy of Adani group can be seen in Adani Green
Energy Limited (AGEL). As per management, the total capital outlay for AGEL to attain its target
of 45GW will only be to the tune of cost of setting up 20GW installation of solar energy. The
revenues and net earnings of this 20GW will be locked up via PPA’s. Once the earnings are
locked, the cash flows from the same would be used in following priority:
• Debt repayment of initial 20GW portfolio.
• Growth capital of remaining 25GW portfolio.
Once the commissioning of whole 45GW is completed, the whole cash flow can be used for
debt repayment. In this way, the management will be able to fund its growth plan and also
keep debt levels in check.
AGEL is expected to fund >50% of its expansion through internal accruals due to its disciplined capital mgmt.
Source: Company Reports, Ventura reseach
Numbers in box represent GW installation estimates, Internal target of AGEL is to build 45GW by FY30 although we have assumed the same only post FY35
-10
-5
0
5
10
15
20
25
30
35
40
(40,000)
(30,000)
(20,000)
(10,000)
0
10,000
20,000
30,000
40,000
50,000
60,000
FY22 FY23E FY24E FY25E FY26E FY27E FY28E FY29E FY30E FY35E FY40E FY45E FY50E FY55E
CFO FCFF Net debt/EBITDA (x) -RHS RoE %- RHS
INR cr
5
.
5
7 13
33
20
23 26 29 32 35 43
49 55
61 67

24 | P a g e ( 5 t h J u l 2 0 2 2 )
For any further query, please email us on [email protected]
AEL’s Green Hydrogen Ecosystem

25 | P a g e ( 5 t h J u l 2 0 2 2 )
For any further query, please email us on [email protected]
Adani New Industries Ltd
Green hydrogen (H2) has been identified as one of the cleanest energy sources that is going to
replace the existing carbon-based energy usage. As a result, this essential energy source
promises to provide a significant business opportunity with a long runway of growth. However,
this opportunity is prone to high risk given the extremely capital-intensive nature and the
rapidly evolving technology.
AEL by virtue of its proven skills at building large-scale profitable businesses across diverse
sectors, superior execution and access to global capital is best placed to exploit this
opportunity. With a view to partake in this opportunity, AEL incorporated a new subsidiary,
Adani New Industries Ltd (ANIL).
ANIL integrated business verticals and capacities
Source: Company Reports
Adani New Industries Ltd
Supply Chain Products Manufacturing
Solar Panel
Current Capacity: 3,500 MW
FY30 Capacity: 10,000 MW
2.0 GW of mono-cristalline and 1.5 GW of multi-crystalline capacities.
Multi-crystalline will be replaced by TOPcon
Wind Turbine Generator
Current Capacity: 0 MW
FY30 Capacity: 7,500 MW
Battery
Current Capacity: 0 MWh
FY30 Capacity: 10,000 MWh
Other Ancillaries (Tracker, Glass, EVA, etc)
Renewable Energy Generation
Current Capacity: 0 GW
FY30 Capacity: 30 GW
Green Hydrogen Generation & its supply chain
Green Hydrogen Generation
Current Capacity: 0 MMTPA
FY30 Capacity: 3 MMTPA
Electrolysers
Current Capacity: 0 MW
FY30 Capacity: 5,000 MW
Fuel Cells
Current Capacity: 0 MW
FY30 Capacity: 1,000 MW
Green Hydrogen Downstream Products
Ammonia
Current Capacity: 0 MMTPA
FY30 Capacity: 6.5 MMTPA
Urea
Current Capacity: 0 MMTPA
FY30 Capacity: 4.2 MMTPA
Methanol
Current Capacity: 0 MMTPA
FY30 Capacity: 2.5 MMTPA

26 | P a g e ( 5 t h J u l 2 0 2 2 )
For any further query, please email us on [email protected]
ANIL envisages capturing the entire value chain of green H2
ANIL’s business plan and resource integration
Source: Company Reports
• Green H2 and its downstream products (ammonia, urea, methanol, ethanol, etc.)
which are part of the fully integrated green H2 ecosystem will be manufactured at
Khavda and Mundra SEZ.
o Power generation – ANIL’s Khavda site has a land bank of ~71,000 acres which
has a large-scale renewable deployment potential of 20 GW due to its high
wind & solar resource potential. The company is targeting to enhance the
renewable power capacity to 45 GW by FY30. The solar panels and windmills
will be manufactured and supplied from AEL’s Mundra SEZ.
o Electrolysis – The company will use the alkaline and PEM electrolysis process
to produce 2.5 mn tonnes of green H2 annually (by FY31). The electrolyzers,
used in the electrolysis process, will be manufactured and supplied from the
company’s Mundra SEZ facility.
o H2 supply and use – H2 will be supplied from Khavda to Mundra SEZ through
a 42” pipeline (a cost-effective way of transportation), where it will be used
for the production of downstream products.

27 | P a g e ( 5 t h J u l 2 0 2 2 )
For any further query, please email us on [email protected]
ANIL’s green H2 generation and supply
Source: Company Reports
ANIL’s integrated green H2 hub in Mundra
Source: Company Reports
• End-to-end manufacturing of the entire supply chain. There will be a complete
backward integration of solar manufacturing from polysilicon, ingots, wafers, and cells
to solar modules along with upcoming manufacturing facilities for wind turbine
generators, electrolyzers, batteries, etc. at the Mundra SEZ.
Khavda – 71,000 acres of land with a
capacity to generate RE power of 20
GW.
The company is targeting to enhance
the RE power capacity to 45 GW by
FY30.
Mundra SEZ – Manufacturing facility
for solar panels, electrolysers and wind
mill manufacturing facility. It is also
developing production facilities for
methanol, ethanol, ammonia and
urea.
28 | P a g e ( 5 t h J u l 2 0 2 2 )
For any further query, please email us on [email protected]
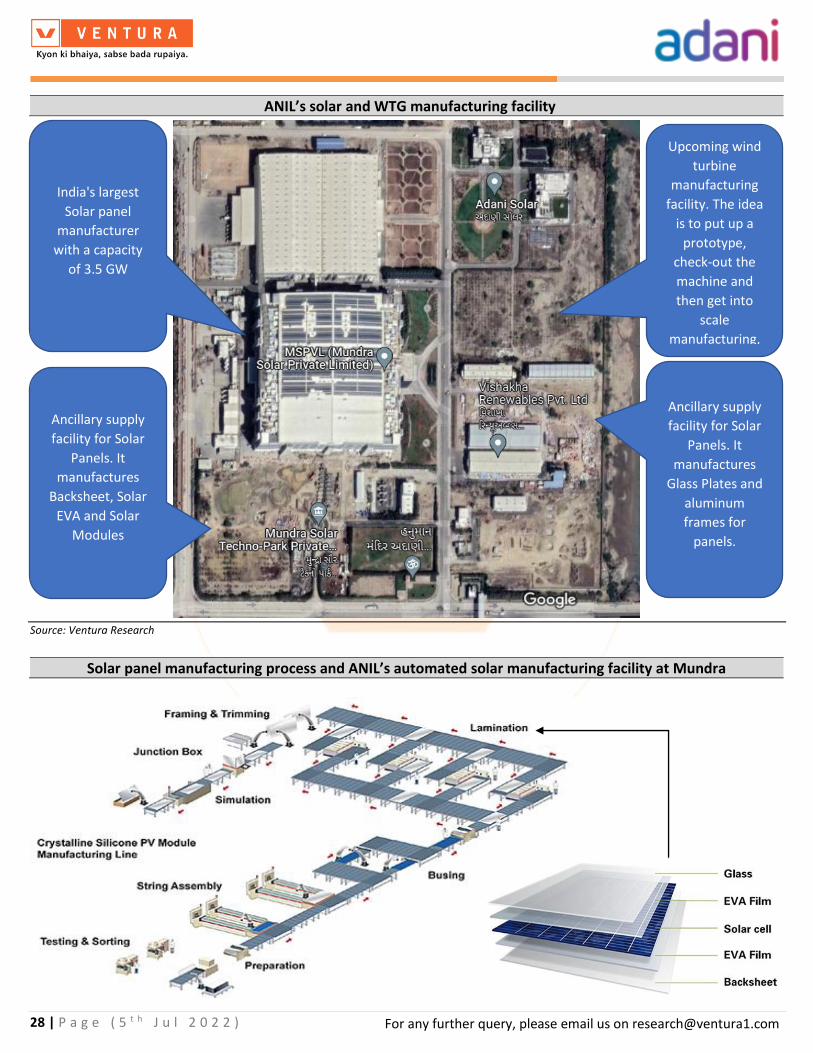
ANIL’s solar and WTG manufacturing facility
Source: Ventura Research
Solar panel manufacturing process and ANIL’s automated solar manufacturing facility at Mundra
India's largest
Solar panel
manufacturer
with a capacity
of 3.5 GW
Ancillary supply
facility for Solar
Panels. It
manufactures
Backsheet, Solar
EVA and Solar
Modules
Ancillary supply
facility for Solar
Panels. It
manufactures
Glass Plates and
aluminum
frames for
panels.
Upcoming wind
turbine
manufacturing
facility. The idea
is to put up a
prototype,
check-out the
machine and
then get into
scale
manufacturing,
for self-
consumption,
sales in India and
exports.

29 | P a g e ( 5 t h J u l 2 0 2 2 )
For any further query, please email us on [email protected]
Source: Industry Reports
• For supply chain assurance and cost efficiency from economies of scale, the company
is targeting full backward integration in solar and wind to
▪ reduce dependency on external supply chains,
▪ improve turnaround time and availability of ancillary parts, and
▪ reduce pressure on inventory and its carrying cost.
ANIL is building infrastructure from power generation for the electrolysis process to produce
green H2 and its downstream products.
ANIL’s readiness and complete integration of the renewable supply chain
Solar panel manufacturing facility at Mundra
Mundra Solar PV Ltd (MSPVL) (which in the future is expected to be subsumed into ANIL), is
the first and the largest vertically integrated solar company in the Indian market. Besides, it is
the first and only manufacturer from India to rank as the top performer for 4 consecutive years.
The quality of ANIL’s solar modules is amongst the best in the world and its products carry
Bloomberg’s tier-1 quality ratings. The current 3.5 GW of solar capacity includes
• Recently installed 2 GW monocrystalline capacity and
• 1.5 GW multi-crystalline technology, which is planned to be replaced with TOPCon.
Multi-crystalline is an old technology which is expected to get phased out slowly as there are
newer technologies with higher efficiencies. TOPCon is the latest technology being adopted
globally. The future capacity installations are likely to be HJT which is a fast-emerging
technology and offers a further improvement in efficiency.

30 | P a g e ( 5 t h J u l 2 0 2 2 )
For any further query, please email us on [email protected]
At this facility 3 types of solar panels (for rooftop and utility-scale projects) would be
manufactured:
• Monocrystalline Solar Panel: These panels are characterized by their black PV cells
with rounded edges. They have a higher conversion efficiency than polycrystalline
panels, which means they produce more units of electricity. These are mostly used for
limited spaces and are costlier than poly/multi-crystalline panels.
ANIL manufactures two series of mono facial solar modules– the
o Eternal PRIDE series with 132 cells and 610-650 Wp, and
o Eternal SHINE series with 144 cells and 520-545 Wp.
ANIL’s monocrystalline solar panel
Source: kenbrooksolar
• Poly/multi-crystalline Solar Panel: These panels have blue-hued PV cells with straight
edges. They have a lower efficiency compared with monocrystalline cells, which means
more panels are required to match the same power output. However, these panels
also have a lower price, since their manufacturing process is simpler.
ANIL manufactures the Encore series of multi-crystalline solar panels that are used for
utility-scale projects.

31 | P a g e ( 5 t h J u l 2 0 2 2 )
For any further query, please email us on [email protected]
ANIL’s multi/poly-crystalline solar panel
Source: kenbrooksolar
• Bifacial Solar Panel: These panels are designed in a way that they can generate
electricity using both surface areas. This means, that even the rear side of the module
which does not face the sun directly is light sensitive and can be utilized to generate
electricity from the module.
The panel top is equipped with solar cells facing the sun. This side of the panel works
similar to a common solar panel capturing the rays directly coming from the sun.
Whereas, the solar cells present on the other face, the bottom face, absorb the
reflected light off the ground. With proper installation, a great amount of sunlight is
captured which in turn increases the bifacial solar panel efficiency manifold.
How a bifacial solar panel works
Source: Kenbrooksolar

32 | P a g e ( 5 t h J u l 2 0 2 2 )
For any further query, please email us on [email protected]
Mundra Solar PV Ltd 5 years of performance
Source: Company Reports
Wind Turbine manufacturing at Mundra
ANIL is gearing up to put up a prototype of a 5.2 MW wind turbine at Mundra, Gujarat. When
it comes up, it would be the country’s biggest wind turbine and will count among the largest
on-shore wind mills in the world.
The machine will be built with technology from W2E Wind to Energy GmbH of Germany. The
idea is to install the prototype, monitor & measure its operational efficiencies, and
troubleshoot any operational challenges. Once the stability of the prototype is established and
then gets into scale manufacturing, for self-consumption, sales in India, and exports.
In the wind mill industry, turbines of a capacity above 4 MW to 14 MW are typically associated
with offshore installation. But onshore wind turbines of 5.2 MW are few globally and none
have been installed in India so far.
574 637
990
1,158 1,104
0
200
400
600
800
1,000
1,200
1,400
FY18 FY19 FY20 FY21 FY22
Solar volumes to improve with the rise in captive demand
Sales volume declined due to reduced EPC demand on
account of higher input cost
0
5
10
15
20
25
30
0
500
1,000
1,500
2,000
2,500
3,000
3,500
FY18 FY19 FY20 FY21 FY22
Per watt realization is expected to remain stable
Revenue (INR Cr) Revenue per Watt (INR)
0
10
20
30
40
50
60
0
100
200
300
400
500
600
700
800
900
FY18 FY19 FY20 FY21 FY22
Operating profitability to sustain at 15% in the long run
EBITDA (INR Cr) EBITDA Margin (%)
0
1
2
3
4
5
6
7
8
0
100
200
300
400
500
600
700
800
900
FY18 FY19 FY20 FY21 FY22
EBITDA per watt remained stable at 3-4 cents per watt
EBITDA (INR Cr) EBITDA per Watt (INR)

33 | P a g e ( 5 t h J u l 2 0 2 2 )
For any further query, please email us on [email protected]
Wind turbine capacities – current and future
Source: Renewable Energy World
The 5.2 MW wind mill has blades that cover a circle of 165 meters in diameter at a tower height
of 140 meters. It can work at wind speeds of 3 meters per second (mps, which is very low) and
up to 20 mps, reaching its optimum power production at 12 mps wind speeds.
This plant will be located adjacent to MSPVL and in the initial phase, it is expected to supply
windmills for its Khavda power generation facility and later will sell turbines to global
renewable energy players.
ANIL’s focus is to manufacture the entire windmill in one place
Source: Industry Reports
Globally wind turbine manufacturers are targeting 5.5 MW by 2035, ANIL is targeting to
achieve turbine capacities of 5.2 MW by 2024 which is a decade ahead of its peers.
ANIL is planning to setup a facility which
can produce entire windmill covering
tower, nacelle, generator, hub, blade,
etc. It will provide a complete control to
the company in terms of supply chain
and just-in-time availability of
components

34 | P a g e ( 5 t h J u l 2 0 2 2 )
For any further query, please email us on [email protected]
AEL’s JV with TotalEnergies would be a game-changer for ANIL
ANIL’s ambition is to invest ~$50 bn (funded through a mix of debt & equity) over the next 10
years in green H2 and its associated ecosystem. In the initial phase, ANIL will develop a green
H2 production capacity of 1.0 MMTPA before 2030 (the planned road map is 2.5 MMTPA).
To execute this ambitious plan, AEL has signed a partnership agreement with TotalEnergies
and has entered into a strategic alliance, in which TotalEnergies will acquire a 25% stake in
ANIL from AEL (valuation is yet to be decided). TotalEnergies involvement will give a significant
boost to achieving ANIL’s ambitious goal to manufacture 2.5 mn tonnes of green H2 capacity
by FY31.
Post this agreement, it will become the fourth partnership between TotalEnergies and the
Adani group
• In 2021, TotalEnergies picked up a 20% stake in Adani Green Energy Ltd (AGEL), the
renewable power company of the Adani group.
• In 2019, TotalEnergies had acquired 37.4% of Adani Gas Ltd and 50% of the group’s
Dhamra LNG project. The JV involved the development of various LNG regasification
terminals, including Dhamra LNG, and a retail network of 1,500 service stations over
10 years.
• In 2020, TotalEnergies and Adani formed a 50-50 JV at an enterprise value of INR
17,385 cr for 2.3 GW of solar assets.
AEL and TotalEnergies JV philosophy
Source: Ventura Research

35 | P a g e ( 5 t h J u l 2 0 2 2 )
For any further query, please email us on [email protected]
How this alliance will benefit ANIL
• Benefits from TotalEnergies to ANIL
o TotalEnergies is one of the largest players in the global energy industry and
hence the company can offer its thorough understanding of the global energy
markets, expertise in renewable technologies and large-scale industrial
projects for the development of ANIL’s green H2 capacities.
o TotalEnergies has over 20 years of experience in H2 retailing infrastructure.
The company is currently operating 120 H2 refuelling stations (HRS – 30 own
and 90 through strategic tie-ups with other fuel retailers) across Germany, the
Netherlands, Belgium and France. The company is planning to add 150 new
HRS across Europe by 2030 to further develop the H2 market for mobility in
Europe. For the seamless supply of H2, ANIL is expected to become a secured
steady source of H2 import.
To rollout HRS networks domestically, the strategic alliance with TotalEnergies
will help ANIL participate in this forthcoming opportunity.
o TotalEnergies is an active member of several H2 dedicated initiatives and
professional associations in Europe. The company is also an anchor sponsor of
the EUR 1.5 bn clean H2 infrastructure fund, which creates the blue H2
ecosystem in Europe.
ANIL is targeting the European market for the exports of its green H2, which
will generate high margin forex income. The strategic associations of
TotalEnergies in Europe could help ANIL in getting access to export its green
H2 in the European market.
o The AA rating of TotalEnergies is expected to help ANIL in raising low-cost
initial funding from the global market, which is expected to save 150-200 bps
in interest costs.
• Benefits from Adani Enterprises to ANIL
o AEL is known for its superior and time-bound execution of large-scale complex
projects in the areas of power, ports, logistics, infrastructure, etc. This
expertise will help in creating India’s largest green H2 ecosystem for ANIL
within the stipulated time.
o ANIL houses India’s largest solar manufacturing capacity with cell and module
manufacturing, which came as a legacy from AEL. The parent AEL has
significant experience in setting up and managing large renewable power
projects (AEL incubated AGEL and demerged in 2018) and their understanding
of India’s renewable sector dynamics is better than peers. It will help ANIL in
managing 45 GW of renewable hybrid power projects required for 2.5 mn
tonnes of green H2 production.
o Group company Adani Total Gas Ltd (ATGL) is currently operating 335 CNG
stations and it has committed 1,800 additional CNG stations in the 9th/10th/11th
round of CGD auctions.

36 | P a g e ( 5 t h J u l 2 0 2 2 )
For any further query, please email us on [email protected]
In addition, ATGL is supplying gas to >2,000 industrial units, and this network
is expected to expand significantly in the coming years due to strict NGT orders
to switch from polluting coal to natural gas. ANIL can also use this ready
infrastructure to distribute its green H2 for automotive and industrial usage.
Limitations in the H2 ecosystem and readiness of ANIL and RIL
India has set an ambitious target of manufacturing 5.0 MMTPA of green H2 by 2030. The launch
of the 1st phase of the green H2 policy on 17th Feb 2022 is a step toward this gargantuan goal.
However, India’s total H2 demand is expected to be more than 11 mn tonnes by 2030, which
is more than double the GOI’s target. This will ensure that there is significant room for growth
in green H2 manufacture in the future. The country’s thrust for green H2 manufacture is
attracting many players, however, there are significant challenges which need to be overcome
including:
• Lack of expertise in building large capacities of green H2, which is necessary for lower
cost of production.
• Limited access to low-cost funding (for initial capex) from the global market due to
weak credit rating
• Limited availability of captive green renewable power for water electrolysis, and
• Lack of expertise in the manufacturing of downstream products – green ammonia,
green urea and green ethanol.
We have discussed ANIL’s H2 ecosystem and upcoming opportunities for the company.
However, India’s most valuable company, Reliance Industries Ltd (RIL) is building its own story
in green H2 space and has taken several strategically important decisions in the past 1 year.
RIL’s green H2 vision and its preparedness
• RIL is targeting to install 100 GW of solar & wind capacity by 2030, which will be utilized
in the water electrolysis to produce green H2.
• RIL has planned 4 Giga factories to manufacture all critical components of its green H2
ecosystem across key value chains, such as a solar PV module factory, an energy
storage battery factory, an electrolyser factory and a fuel cell factory. In order to
rapidly scale up manufacturing, RIL has acquired companies globally
RIL’s acquisitions and partnerships for its green H2 plan
Source: Ventura Research
Target Company MonthStake (%)/
CollaborationAmount Segment
Ambri Inc Aug-21 Investment in preferred stock USD 50 mn Batteries
Stiesdal A/S Oct-21 Collaboration Undisclosed Electrolyzers
NexWafe Oct-21 Investment in preferred stock USD 29 mn Solar Wafers
REC Solar Oct-21 100 USD 771 mn Solar Panel
Sterling & Wilson Oct-21 40 INR 2,800 cr Solar Project EPC
Faradion Dec-21 100 USD 135 mn Batteries

37 | P a g e ( 5 t h J u l 2 0 2 2 )
For any further query, please email us on [email protected]
• With the complete integration, RIL is targeting a green H2 cost of USD 1/kg by 2030.
The company is planning to spend USD 10 bn on its new energy business in the next
three years towards achieving these targets.
• RIL has been working on
o Securing 4.5 lakh acres of ‘solar’ landbank in Gujarat to set up manufacturing
facilities and solar power installation
o Acquired REC Power, NexWafe and Sterling & Wilson to gain expertise in solar
module manufacturing and installation.
o Acquired Ambri Inc and Faradion to set up a large-scale battery manufacturing
and energy storage system in India.
o Partnered with Stiesdal A/S in Oct 2021 to develop and manufacture hydrogen
electrolysers
RIL is securing a landbank of 4.5 lakh acres to set up a renewable power capacity
RIL has started the process of securing land for its 100 GW renewable energy power project in
Gujarat. The company has requested 4.5 lakh acres of land in Kutch in Jan 2022, out of which
3.0-3.5 lakh acres will be utilized for the phase I of 100 GW renewable energy installation, while
the rest will be available for further expansion in phase II.
RIL acquires businesses in solar module manufacturing and installation
RIL is planning to set up a 4 GW of solar module manufacturing capacity in Dhirubhai Ambani
Green Energy Giga Complex, Jamnagar (a 5,000 acres complex). The company is targeting to
enhance this capacity to 10 GW by 2030. To gain the expertise, RIL acquired
• REC Solar in Oct 2021 for a total consideration of USD 771 mn from China National
Bluestar. REC Solar is the market leader in hetero junction technology (HJT) based solar
panels and has an annual production capacity of 1.8 GW. It has 3 manufacturing
facilities – two in Norway and one in Singapore. The company has to date installed
more than 14 GW of solar capacities globally.
• NexWafe in Oct 2021 for a total consideration of USD 29 mn. NexWafe is a German
manufacturer of silicon wafers for solar panels. Through this acquisition, RIL secured
access to NexWafe’s proprietary technology and plans to build large-scale solar wafer
manufacturing facilities in India using the NexWafe processes and technology.
RIL has also acquired Sterling & Wilson, a solar EPC firm, which will help RIL in the installation
and O&M of its 100 GW solar site.
RIL collaborated with the global battery manufacturers to setup energy storage systems
RIL acquired 42.3 mn preference shares in Ambri Inc for a total consideration of USD 50 mn.
Both the companies are in discussions for an exclusive collaboration to set up a battery
manufacturing facility in India.

38 | P a g e ( 5 t h J u l 2 0 2 2 )
For any further query, please email us on [email protected]
To further strengthen its position in the battery storage system, RIL acquired Faradion, a UK-
based startup developing sodium-ion batteries, for a total consideration of USD 135 mn. RIL
aims to produce sodium-ion batteries in India based on Faradion’s technology.
RIL collaborated with Stiesdal to develop an electrolyzer plant in its giga-factory
RIL has partnered with Danish company Stiesdal A/S in Oct 2021 to develop and manufacture
alkaline electrolysers for green H2 (these are the same electrolyzers that AEL is planning to use
and manufacture). Both the companies have also agreed to extend their collaboration to the
development and implementation of
• Offshore wind energy,
• Next-generation fuel cells for conversion of hydrogen to electricity for mobile and
static electricity generation,
• Long-duration energy storage, and
• Production of carbon-negative fuels.
Both AEL and RIL are ready with their green H2 plan and working emphatically to achieve their
ambitious targets, however, we believe that AEL has achieved a few milestones, which are yet
to be achieved in the case of RIL.
AEL’s readiness vs RIL’s ambition for green H2
Source: Ventura Research
Adani Enterprise Ltd Reliance Industries Ltd
Captive green power
4 GW of operational solar plate manufacturing
capacities. Building a new wind turbine capacity 7.5
GW
Instaling a hybrid capacity (solar + wind) of 22-23 GW
on a ready land parcel of 71,000 acres in Khavda
Acquired stakes in REC Solar and NexWafe for the
production of solar modules and also acquired
Sterling & Wilson for the solar installation and O&M.
Committed to develop an installed capacity of 100
GW by 2030. The company has identified 4,50,000
acres of land in Kutch and made a request to state
government.
ElectrolysisBuilding new capacities of electrolysers (5 GW by
FY30) and batteries (10 GWh by FY30)
Partnered with Stiesdal A/S and acquired stakes in
Ambri and Faradion to develop and manufacture
Alkaline Electolyzers and batteries in India
Forward integration for
downstream products
Building new capacities of Ammonia, Urea and
Methanol, which are to be produced from green H2
While no information is available on forward
integration RIL already has presence in downstream
product manufacturing and hence in our opinion
only the tweaking of the process is required for
building the capacities
Partnership with global
companies for green H2
distribution
AEL has partnered with TotalEnergies, who has over
20 years of experience in H2 distribution and sales
RIL is already exporting refined petroleum products
globally and hence it should have no issues in
marketing H2 globally
Balance Sheet Strength
AEL has a domestic credit rating of A+, however, it
has TotalEnergies as a partner, which will enable AEL
in getting low cost funds by 150-200 bps.
Domestic credit rating of AAA with a net debt free
balance sheet

39 | P a g e ( 5 t h J u l 2 0 2 2 )
For any further query, please email us on [email protected]
Green H2 plans of other companies
Source: Fortune India Story & Ventura Research
Company Name Project Details
JSW Energy LtdWorking with Australian Fortescue Future Industries to produce green H2 and utilize it for
making green steel, green ammonia and other industrial applications
Bharat Petroleum Corp LtdSetting up a 20 MW electrolyzer at Bina refinery in Madhya Pradesh to produce green H2,
which will be sold through BPCL fuel stations as a transportation fuel
Hindustan Petroleum Corp Ltd Setting up a 370 tonnes green H2 pilot plant at its Vizag refinery
GAIL India Ltd
Setting up a PEM electolyzer plant at Guna in Madhya Pradesh to produce green H2 by the
end of 2023
Setting up a pilot project on H2 blending with natural gas in the CGD network
Oil India Ltd Setting up 100 KW electrolyzer plant in Jorhat, Assam to produce green H2
NTPC Ltd
Setting up a pilot project on H2 blending with natural gas in the CGD network
Setting up a standalone fuel cell based micro grid with H2 production using electrolyzers at
NTPC Simhadri
Setting up a green H2 fuelling station at Leh and will operate five H2 fuel cell powered
vehicles for the Indian Army
GreenkoTeamed up with a Belgian alkaline electrolyzer maker John Cockerill to make electrolyzers in
India
ACME SolarSetting up a 7 GW of renewable power and green ammonia production facilities worth $6
bn in Tamil Nadu
Ohmium InternationalCurrently manufacturing PEM electrolyzers in Bengaluru (500 MW/annum capacity) and
supplying it to the US. The company is planning to enhance the capacity to 2 GW
Larsen & Toubro Ltd
Entered into an MoU with ReNew Power to develop, own, execute and operate green H2
projects in India
Signed an MoU with Norway's HydrogenPro to setup a JV for the manufacturing of alkaline
water electrolyser
Indian Oil Corp Ltd
Setting up a green H2 plant in Mathura and Panipat
Has teamed up with Larsen & Toubro and ReNew Power for setting up a green H2 plant

40 | P a g e ( 5 t h J u l 2 0 2 2 )
For any further query, please email us on [email protected]
Key growth drivers for the adoption of the Indian green H2 market
Fossil fuels and renewables alone cannot fulfil the rising energy demand of India,
green H2 is a clean solution for future
In line with GOI’s stated objectives at COP26, phasing out of fossil fuels and replacing them
completely with a zero-carbon footprint, can be achieved only with green H2 and other non-
carbon sources like hydro and nuclear (which are again a limiting resource). Green H2
essentially would serve to decarbonize the industrial usage of energy while renewable sources,
solar and wind, would be replacing electricity consumption.
India energy consumption and mix of sources
Source: NITI Aayog
-8
-6
-4
-2
0
2
4
6
8
10
0
2,000
4,000
6,000
8,000
10,000
12,000
14,000
16,000
CY
90
CY
91
CY
92
CY
93
CY
94
CY
95
CY
96
CY
97
CY
98
CY
99
CY
00
CY
01
CY
02
CY
03
CY
04
CY
05
CY
06
CY
07
CY
08
CY
09
CY
10
CY
11
CY
12
CY
13
CY
14
CY
15
CY
16
CY
17
CY
18
CY
19
CY
20
CY
21
E
CY
22
E
CY
23
E
CY
24
E
CY
25
E
CY
26
E
CY
27
E
CY
28
E
CY
29
E
CY
30
E
India energy consumption - historical and forecast
Energy Consumption (TWh) YoY Growth (%)
TWh %
0.3 0.4 0.5 0.6 0.6 0.9 1.1 0.8 1.3 2.9 3.3 7.2 9.6 8.1 7.2 5.8 5.7 4.6 4.3 4.3 4.6 3.8 3.3
0.8 0.7 1.2 1.0 1.0 1.2 1.2 1.2 1.2 1.2
5.1 6.1 6.8 7.5 9.5 6.0 6.3 6.7 11.3
14.9
55.8 55.4 51.5 53.7 54.3 58.0 55.1 55.1 46.4 40.3
30.3 30.6 34.5 31.4 29.5 28.7 29.6 28.4 28.6 27.0
0.6 2.7
CY90 CY95 CY00 CY05 CY10 CY15 CY19 CY20 CY25E CY30E
India energy mix - Significant improvement for clean fuels
Biofuels & Geo Biomass Solar & Wind Hydro Nuclear Natural Gas Coal Crude Oil Green Hydrogen

41 | P a g e ( 5 t h J u l 2 0 2 2 )
For any further query, please email us on [email protected]
India’s H2 demand in CY21 was 8.5 mn tonnes, which is expected to increase to 9.1 mn tonnes
by CY22 and to 11.0 mn tonnes by CY30. Currently, all the H2 consumed in India is produced
using fossil fuels with high emission intensities (11 kg CO2 per kg H2 through steam methane
reforming and 20 kg CO2 per kg H2 through coal gasification). Green H2 consumption of 11 mn
tonnes in CY30 will displace 24-25 mn tonnes of natural gas (76 mn tonnes of CO2) or 55 mn
tonnes of coal (125 MT of CO2).
India’s green H2 demand outlook
Source: Industry Reports & Ventura Research
Policy targets by GOI – India's consumption outlook for H2
Source: NITI Aayog
0.3
2.1
3.9
5.8
7.6
9.4
11.2
CY24 CY25 CY26 CY27 CY28 CY29 CY30
Data in mn tonnes
3.0 5.0 5.0 5.0
3.0
4.5 5.0 5.5
0.1
0.3
1.4 2.5
0.4
0.8
4.7
8.5 3.3
6.5
1.0
2.0
3.0
3.8
4.5
0
10
20
30
40
50
60
70
80
90
100
0
5
10
15
20
25
30
35
40
2020 2030 2040 2050
Refinery Ammonia Methanol Steel
Heavy Vehicles Power CGD Share of green H2 (%)
Mn Tonnes %

42 | P a g e ( 5 t h J u l 2 0 2 2 )
For any further query, please email us on [email protected]
Development of new industrial corridors in India to fuel demand for green H2
The Indian government has approved the development of eleven Industrial Corridors with 32
Projects to be developed in four phases in the country as part of the National Industrial
Corridor Programme (NICP) which is under various stages of conceptualization/ development
/ implementation.
These industrial corridors are aimed at the development of futuristic industrial cities in India
which can compete with the best manufacturing and investment destinations in the world. The
same will create significant opportunities for clean energy infrastructure, leading to higher
sourcing of green H2 and its downstream products.
Industrial Corridors in India
Source: Ministry of Commerce & Industry
Industries need heat for various processes. Industrial heat can be classified as high, medium or
low, with
• High-temperature heat above 1000°C for blast furnace (BF), cement and glass
industries,
• Medium-temperature heat between 500°C and 1000°C for steam methane reforming
(SMR) and OEMs and
• Low-temperature heat below 500°C for paper, ammonia synthesis, textiles and other
allied industries.
Many decarbonized solutions exist today to produce low and medium-temperature heat. H2
combustion is the only solution which produces high-grade heat that meets almost all heavy

43 | P a g e ( 5 t h J u l 2 0 2 2 )
For any further query, please email us on [email protected]
industrial applications. More than 85% of industrial heat is consumed in iron and steel,
chemicals and cement.
Around 95% of the high-temperature heat is currently provided by the combustion of fossil
fuels or combustible by-products. Small amounts of biomass are used in specific sectors, such
as in the pulp and paper industry.
Working temperature for selected fuels and temperature requirements of sectors
Source: IRENA 2021 Annual Report on H2
South Korea’s Posco and Adani Group have agreed to jointly build a USD 5 bn integrated steel
plant at Mundra SEZ in Gujarat. As part of an initial non-binding agreement between Posco and
Adani Group, the environment-friendly steel mill would be built, which will use green H2 as a
key fuel.
Posco intends to reduce its carbon dioxide emissions by 20% by 2030, 50% by 2040 and 100%
by 2050 compared with the average total emitted by the company’s South Korean units from
2017-2019. The company is planning to gradually move away from fossil-fuel-powered BF and
use green H2 to fuel existing furnaces. Collaboration with Adani Group is part of Posco’s green
H2 plan.

44 | P a g e ( 5 t h J u l 2 0 2 2 )
For any further query, please email us on [email protected]
Traditional and green methods of steel production
Source: IRENA 2021 annual report on H2
Both Posco and Adani plan to further collaborate at the group level in other sectors such as
renewable energy and logistics.
Significant growth opportunities for green H2 in India’s city gas distribution (CGD)
network
With the completion of PNGRB’s 11th round of CGD auction by PNGRB, CGD coverage will now
encompass over 600 districts in 28 states/UT, covering ~86% of India’s geographical spread
and reaching ~96% of its population.
This gargantuan expansion in the CGD coverage represents a ready market for decarbonization
by replacing natural gas with green H2. As a first step, the government is planning to blend
15% green hydrogen with piped natural gas (PNG) for domestic, commercial and industrial
consumption. This move is in line with India's ambitious targets for reducing greenhouse gas
emissions and becoming carbon neutral by 2070.

45 | P a g e ( 5 t h J u l 2 0 2 2 )
For any further query, please email us on [email protected]
In line with the government’s mandate, the PSU gas transmission and distribution companies
have already taken initiatives which are various stages of development
• GAIL India Ltd commenced India’s first-of-its-kind project of mixing grey and blue H2
into its natural gas supply for the city of Indore, Madhya Pradesh. This H2-blended gas
will be supplied for retailing CNG to automobiles and PNG to households and
commercial setups.
• NTPC Ltd has inked a pact with Gujarat Gas Ltd for an initiative to blend green H2 with
the CNG and PNG supplied by the latter. Green H2 will be produced by using electricity
from the existing 1 MW floating solar project of NTPC Kawas.
Group company Adani Total Gas Ltd (ATGL) can also use the green H2 produced from ANIL.
ATGL is currently operating 335 CNG stations and it has committed 1,800 additional CNG
stations in the 9th/10th/11th round of CGD auctions. In addition, ATGL is supplying gas to
>2,000 industrial units, and this network is expected to expand significantly in the coming years
due to strict NGT orders to switch from polluting coal to natural gas. ANIL can also use this
ready infrastructure to distribute its green H2 for automotive and industrial usage.
Supply chain of blending green H2 in natural gas network
Source: US Office of Efficiency & Renewable Energy
With the large-scale production plans and advancements in technology, the cost of green H2
is expected to come down in India from $6.2/kg in 2021 to $4.5/kg in 2030. However,
considering the recent surge in solar and wind installation by AGEL and ANIL along with

46 | P a g e ( 5 t h J u l 2 0 2 2 )
For any further query, please email us on [email protected]
strong backward integration, ANIL is targeting $2.4/kg in FY24, which is expected to further
come down to $1.5/kg by FY30. It will make the blended gas (green H2 + natural gas)
affordable to the end consumer.
Green H2 demand from Europe will be a game-changer for ANIL
Geopolitical tension in Europe following soaring energy prices has hastened Europe’s transition
from a fossil fuel energy-dependent market to a non-fossil one. To decarbonize the industrial
and transportation sectors and reduce dependency on Russian gas and coal supplies, European
Union (EU) presented the REPowerEU strategy in May 2022, which is a blueprint to put an end
to the imports of fossil fuels from Russia and a complete ban on the usage of polluting coal by
the year 2030.
The REPowerEU will focus on:
• Diversifying the EU energy supply,
• Increasing energy savings, and
• Accelerating the green energy transition, especially to solar, wind and green H2. The
focus would be limited to nuclear power.
EU’s total annual energy requirement in the year 2030 is estimated to be in the range of 17,800
TWh to 18,000 TWh, which is 7.5% higher (in the absolute term) than the year 2019 energy
demand of 16,623 TWh.
EU energy consumption and mix of sources
17
,35
1
17
,26
7
16
,93
5
16
,79
6
16
,72
7
17
,14
1
17
,66
9
17
,58
9
17
,76
6
17
,68
0
17
,80
5
18
,15
2
18
,02
9
18
,37
0
18
,60
4
18
,60
0
18
,72
1
18
,46
9
18
,37
2
17
,25
0
17
,88
6
17
,33
3
17
,10
3
16
,94
3
16
,31
7
16
,52
4
16
,71
1
16
,92
3
16
,91
8
16
,62
3
15
,23
3
16
,66
0
17
,07
0
17
,17
0
17
,27
0
17
,37
0
17
,47
0
17
,57
0
17
,67
0
17
,77
0
17
,87
0
-10-8-6-4-2024681012
14,000
14,500
15,000
15,500
16,000
16,500
17,000
17,500
18,000
18,500
19,000
CY
90
CY
91
CY
92
CY
93
CY
94
CY
95
CY
96
CY
97
CY
98
CY
99
CY
00
CY
01
CY
02
CY
03
CY
04
CY
05
CY
06
CY
07
CY
08
CY
09
CY
10
CY
11
CY
12
CY
13
CY
14
CY
15
CY
16
CY
17
CY
18
CY
19
CY
20
CY
21
E
CY
22
E
CY
23
E
CY
24
E
CY
25
E
CY
26
E
CY
27
E
CY
28
E
CY
29
E
CY
30
E
EU energy consumption - historical and forecast
Energy Consumption (TWh) YoY Growth (%)
TWh %

47 | P a g e ( 5 t h J u l 2 0 2 2 )
For any further query, please email us on [email protected]
Source: Company Reports
EU’s green H2 demand outlook
Source: Industry Reports & Ventura Research
To achieve 18,000 TWh capacity and a complete shift from dirty coal, the EU is
• Aiming to 4X its solar power capacity from the current 150 GW to 600 GW by 2030,
which is expected to generate 1,600 TWh of energy annually.
• Targeting 20-25 mn tonnes of green H2 usage by 2030, which will be fulfilled by 10 mn
tonnes of domestic green H2 production and 10-15 mn tonnes of green H2 imports. A
total of 750-800 TWh of green energy is expected to be generated annually.
• Expected to sustain its nuclear power capacity at 1,900 TWh in the next 8-10 years.
Although nuclear is a proven source of low-carbon energy, the sector today faces
0.1 0.2 0.2 0.5 1.4 1.9 2.1 2.3 2.3 2.5 0.1 0.3 1.0 2.4 5.6 7.3 8.8 15.3
24.6
4.6 5.3 5.6 4.4 5.4 5.1 4.7 5.5
4.9
4.8
11.7 12.8 13.4 13.3 12.5
12.0 11.4 11.1 10.9
10.6
16.8 18.4 20.2 22.5
23.6 21.0 23.5 24.9
21.6
19.6 26.2 21.4 18.5 17.4
16.2 16.8 12.2 10.8 8.8 0.1
40.7 41.9 41.8 40.8 38.5 37.6 38.7 36.5 34.5 33.6
0.0 0.0 0.0 0.0 0.0 0.0 0.0 0.0 1.6 4.3
CY90 CY95 CY00 CY05 CY10 CY15 CY19 CY20 CY25E CY30E
Significant changes in EU's energy mix, in the favour of green fuel
Biofuels & Geo Biomass Solar & Wind Hydro Nuclear Natural Gas Coal Crude Oil Green Hydrogen
2.9
5.8
8.6
11.5
14.4
17.3
20.2
23.0
CY23 CY24 CY25 CY26 CY27 CY28 CY29 CY30
Data in mn tonnes

48 | P a g e ( 5 t h J u l 2 0 2 2 )
For any further query, please email us on [email protected]
major challenges within the EU. Some member states are strongly anti-nuclear, and
energy markets are often structured in response to populist support for renewables.
We believe that post-2030, nuclear energy output in the EU will decline, due to the
closure of some reactors – either because they have reached the end of their operating
lifetimes or due to political interference, and the energy demand will be replaced by
solar/wind and green H2.
• Planning to reduce its energy sourcing from oil & gas. Currently, the segment generates
10,500 TWh of energy, which is expected to decline to 9,500 TWh by 2030, which will
be mostly fulfilled by the imports from North America and Africa.
• Gradually improving its hydro, biofuel and biomass capacities, which is expected to
increase from the current 1,200 TWh to 1,300 TWh by 2030
Import of green H2 will be an economical option for EU overproduction
Lower heat radiations and higher capex costs to set up hybrid renewable projects for the
electrolysis of water to produce green H2 will be capital intensive and inefficient compared to
imported green H2. It is expected to create a pricing gap between domestically produced green
H2 and imported green H2.
European infrastructure map for green H2 sourcing
Source: European Commission May 2022 report

49 | P a g e ( 5 t h J u l 2 0 2 2 )
For any further query, please email us on [email protected]
As per the Rocky Mountain Institute (RMI), EU cost for imported green H2 would be ~$3.8/kg
in 2024, which will further reduce to $2.0/kg by 2030, while domestically produced green H2
is expected to cost around $4.0/kg in 2024 and $2.5/kg by 2030. In 2030, green H2 (imported
or domestic) is expected to be far more economical than blue or grey H2
To facilitate the import of up to 10 mn tonnes of renewable H2, the EU will support the
development of three major H2 import corridors via the Mediterranean, the North Sea area
and, as soon as conditions allow, Ukraine. Other forms of fossil-free H2, notably nuclear-based,
also play a role in substituting natural gas.
ANIL is targeting to sell ~40% of its annual green H2 production (by FY31) and with the
predicted export opportunity of this green fuel in Europe, we are expecting the EU to become
an export destination for the company. This is expected to generate a significant long-term
forex income for the company.

50 | P a g e ( 5 t h J u l 2 0 2 2 )
For any further query, please email us on [email protected]
What is H2 and how is it produced?
H2 is envisaged to be the fuel of the future and it will replace fossil fuels in the years to come.
H2 production is an energy-intensive activity and based on the source of energy H2 is classified
as
• Grey hydrogen
• Blue hydrogen
• Green hydrogen
Widely used forms of hydrogen
Source: Company Reports
Other forms of hydrogen
Source: Energyeducation.ca
Bituminous coal is used to make black hydrogen
Brown coal (lignite) is used to make brown hydrogen
Biomass is used to make red hydrogen
Nuclear power is used to make pink hydrogen
Renewable power along with electrical grid are used to make yellow hydrogen.
Methane pyrolysis is used to make turquoise hydrogen.
Naturally occurring geological hydrogen is called
white hydrogen.

51 | P a g e ( 5 t h J u l 2 0 2 2 )
For any further query, please email us on [email protected]
Comparison of H2 with alternate energy sources
Source: US Dept of Energies
Petrol Diesel Biodiesel LPG CNG LNG Ethanol Methanol Hydrogen Electricity
Fuel Material
(Feedstock)
Crude Oil (85%
import
dependency)
Crude Oil (85%
import
dependency)
Fats and oils
from sources
such as
soybeans,
waste cooking
oil, animal fats
and rapeseeds
A byproduct of
petroleum
refining or
natural gas
processing
Natural Gas
Natural Gas
(100%
imported)
Corn, Grains,
Sugarcane and
agricultural
waste
Hydrogen,
Natural Gas,
Coal and
Woody biomas
Natural Gas,
Coal, Nuclear
Energy and
Water
Electrolysis
Natural Gas,
Coal, Wind,
Solar and
Nuclear Energy
Pump Octane
Number (Fuel
quality -
higher is
better)
84 to 93 Not Applicable Not Applicable 105+ 120+ 120+ 110 112 130+ Not applicable
Autoignition
Temperature
(in degree F,
higher is
better)
495 600 300 900 1000 1000 800 900 1080 Not applicable
Gasoline
Gallon
Equivalent
1 gallon = 1
GGE
1 gallon = 1.12
GGE
1 gallon = 1.05
GGE
1 gallon = 0.74
GGE1 lb = 0.18 GGE 1 lb = 0.19 GGE
1 gallon = 0.67
GGE
1 gallon = 0.50
GGE1 lb = 0.45 GGE
1 KWh = 0.030
GGE
Diesel Gallon
Equivalent
1 gallon = 0.88
DGE
1 gallon = 1
DGE
1 gallon = 0.93
DGE
1 gallon = 0.66
DGE1 lb = 0.16 DGE 1 lb = 0.17 DGE
1 gallon = 0.59
DGE
1 gallon = 0.45
DGE1 lb = 0.40 DGE
1 KWh = 0.027
DGE
Energy
Content (low
heating value)
1,15,000
Btu/gallon
1,28,500
Btu/gallon
1,23,500
Btu/gallon
84,250
Btu/gallon
20,160
Btu/lb
21,240
Btu/lb
76,330
Btu/gallon
57,250
Btu/gallon
51,600
Btu/lb
3,414
Btu/KWh
Energy
Content (high
heating value)
1,22,400
Btu/gallon
1,38,500
Btu/gallon
1,28,000
Btu/gallon
91,420
Btu/gallon
22,450
Btu/lb
23,730
Btu/lb
84,530
Btu/gallon
65,200
Btu/gallon
61,000
Btu/lb
3,414
Btu/KWh
Energy
Security
Impacts
A significant
portion is
domestically
produced from
the imported
crude oil.
Transportation
accounts for
30% of the
total cost
A significant
portion is
domestically
produced from
the imported
crude oil.
Transportation
accounts for
30% of the
total cost
Domestically
produced
A significant
portion is
domestically
produced from
the imported
crude oil.
Transportation
accounts for
30% of the
total cost
Domestically
produced from
domestic
Natural Gas.
Transportation
accounts for
30% of the
total cost
Imported.
Transportation
accounts for
30% of the
total cost
Domestically
produced
Blue H2 is
based on
Natual Gas, but
green H2 is
domestically
produced
Domestically
produced
Domestically
produced

52 | P a g e ( 5 t h J u l 2 0 2 2 )
For any further query, please email us on [email protected]
H2 roadmap of leading countries
Source: NITI Aayog
CountriesCurrent H2
demandPolicy target demand Capital Allocated (US$) Focused H2 Source Demand Focus
Export /
Import Focus
European Union
6 GW capacity by 2024, 40
GW by 2030
10 MMTPA green H2 by 2030
609 BnLow Carbon - Blue &
Green
Chemical feedstock, Refining
and TransportationImport
Germany 1.65 MMTPA 2.7-3.3 MMTPA by 2030 15-20 BnLow Carbon - Blue &
Green
Steel, Chemical feedstock,
Refining and TransportationImport
France 0.9 MMTPA6.5 GW via electrolysis by
2030>7 Bn
Low Carbon - Blue &
Green
Steel, Chemical feedstock,
Refining and TransportationExport
Netherlands 1.5 MMTPA Not Available 40-50 mn per yearLow Carbon - Blue &
Green
Steel, Chemical feedstock,
Refining, Transportation and
Heating
EU Export /
Import Hub
Hungary 160 KTPA36 KTPA low carbon + 138
KTPA grey by 2030450 Mn
Low Carbon - Blue &
Green
Chemical feedstock, Refining,
Transportation and HeatingExport
Portugal 150 KTPA
2.0-2.5 GW via electrolysis by
2030
400 KTPA overall by 2030
No dedicated capital Green
Steel, Chemical feedstock,
Refining, Transportation and
Heating
Export
Spain 0.5 MMTPA 4 GW via electrolysis by 2030 No details GreenChemical feedstock and
RefiningExport
United Kingdom 0.7 MMTPA5 GW electrolysis capacity by
20302 Bn
Low Carbon - Blue &
Green
Steel, Chemical feedstock,
Transportation, Heating and
Power
Export
Norway 23 Mn GreenChemical feedstock and
Maritime
Japan 2 MMTPA3 MMTPA by 2030 and 20
MMTPA by 2050935 Mn per year Blue
Transportation, Heating and
PowerImport
South Korea 220 KTPA3.9 MMTPA by 2030 and 27
MMTPA by 2050653 Mn per year
Low Carbon - Blue &
GreenTransportation and Power Import
United States 10 MMTPA >15 BnLow Carbon - Blue &
Green
Refining, Transportation,
Heating and Power
Canada 3 MMTPA 20 MMTPA by 2050 1.2 BnLow Carbon - Blue &
Green
Steel, Chemical feedstock,
Refining, Transportation and
Heating
Export
Australia 650 KTPA 278 Mn per yearLow Carbon - Blue &
Green
Chemica feedstock,
Transportation and HeatingExport
Chile 59 KTPA5 GW by 2025 and 25 GW by
205050 Mn Green
Chemica feedstock, Refining,
Transportation and HeatingExport
China 22 MMTPA35 MMTPA by 2030 and 160
MMTPA by 205013 Mn Green Transportation and Power
Russia 2-4 MMTPA7 MMTPA by 2035 and 33
MMTPA by 20501.2 Bn
Low Carbon - Blue &
GreenRefining & Transportation Export
India 8-9 MMTPA5 MMTPA by 2030 and 35
MMTPA by 2050No details Green
Steel, Chemical feedstock
and RefiningExport

53 | P a g e ( 5 t h J u l 2 0 2 2 )
For any further query, please email us on [email protected]
Why H2 is better than other fuels available in India
Hydrogen fuel cell technology presents several advantages over other power sources,
including:
• H2 is easy to store and transport due to its high auto-ignition temperature. It is the
lowest temperature in which any substance spontaneously ignites in a normal
atmosphere without an external source of ignition.
• H2 has the highest pump octane level (higher is better), which is a standard measure
of a fuel's ability to withstand compression in an IC engine without detonating.
• Unlike petrol, diesel and LPG, which are either imported directly or extracted from the
imported crude oil, green H2 is produced through water electrolysis, hence it has zero
import dependency.
• In terms of energy output, H2 is more efficient compared to any other fuel. 1 kg of H2
is equivalent to
o 3.76 litres of petrol. At the current petrol prices of INR 96.72/litre in Delhi, 3.76
litres of petrol (or 1.0 kg of H2) cost INR 364 or USD 4.66 (at INR 78 per USD).
o 3.34 litres of diesel. At the current diesel price of INR 89.62/litre in Delhi, 3.34
litres of diesel (or 1.0 kg of H2) costs INR 299 or USD 3.84 (at INR 78 per USD).
o 2.50 kg of CNG. At the current petrol prices of INR 75.61/kg in Delhi, 2.50 kg of
CNG (or 1.0 kg of H2) costs INR 189 or USD 2.42 (at INR 78 per USD).
Hence at the current market price of petrol, diesel and CNG in India, the minimum and
maximum range for H2 is ranging between USD 2.42 – USD 4.66 per kg, which is
significantly higher than the target of USD 1.0 per kg, set by ANIL and RIL.
• Unlike petrol, diesel and LPG, which are either imported directly or extracted from the
imported crude oil, green H2 is produced through water electrolysis, hence it has zero
import dependency.

54 | P a g e ( 5 t h J u l 2 0 2 2 )
For any further query, please email us on [email protected]
Green H2: A zero carbon and a clean fuel for the future
Green H2 is produced through the electrolysis of water, which is the technique that splits water
(H2O) into H2 and oxygen (O2), by using electricity from clean energy sources – Solar and Wind.
Green H2 production process
Source: Fuel Cell & Hydrogen Energy Association
There are four main types of electrolyzers:
• Proton exchange membrane (PEM) Electrolyzers,
• Alkaline Electrolyzers,
• Solid Oxide Electrolyzers (SOEC) and
• Anion Exchange Membrane (AEM) Electrolyzers
Proton Exchange Membrane (PEM) Electrolyzers – PEM Electrolyzers use a Proton Exchange
Membrane with a solid polymer electrolyte. When current is applied to the cell stack, the water
splits into H2 and O2 and the H2 protons pass through the membrane to form H2 gas on the
cathode side.
Alkaline Electrolyzers – In Alkaline Electrolyzers, a reaction occurs between two electrodes in
a solution composed of water and liquid electrolyte. When sufficient voltage is applied, water
molecules take electrons to make OH⁻ ions and an H2 molecule.
Solid Oxide Electrolyzers (SOEC) – Under applied electrical potential, a solid oxide electrolyser
cell (SOEC) splits water into H2 by transferring oxygen ions (O2-) through a solid ionic
conductive membrane that after are recombining with electrons to form oxygen molecules.
Anion Exchange Membrane (AEM) Electrolyzers – In AEM electrolysis, a KOH electrolyte
solution, with water molecules carrying OH– ions, is circulated to the anode side of the
electrolyser. The liquid electrolyte hydrates the membrane and the catalyst layer on the GDL
without an additional supply of (excess) water.
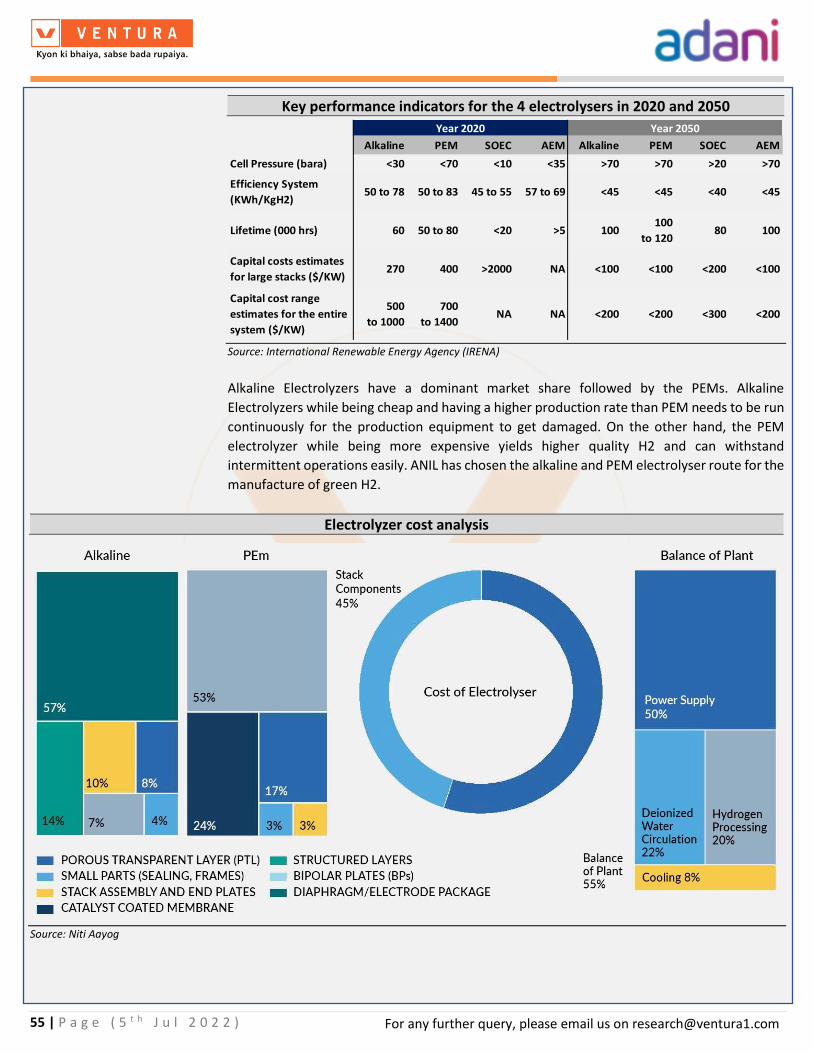
55 | P a g e ( 5 t h J u l 2 0 2 2 )
For any further query, please email us on [email protected]
Key performance indicators for the 4 electrolysers in 2020 and 2050
Source: International Renewable Energy Agency (IRENA)
Alkaline Electrolyzers have a dominant market share followed by the PEMs. Alkaline
Electrolyzers while being cheap and having a higher production rate than PEM needs to be run
continuously for the production equipment to get damaged. On the other hand, the PEM
electrolyzer while being more expensive yields higher quality H2 and can withstand
intermittent operations easily. ANIL has chosen the alkaline and PEM electrolyser route for the
manufacture of green H2.
Electrolyzer cost analysis
Source: Niti Aayog
Year 2020 Year 2050
Alkaline PEM SOEC AEM Alkaline PEM SOEC AEM
Cell Pressure (bara) <30 <70 <10 <35 >70 >70 >20 >70
Efficiency System
(KWh/KgH2)50 to 78 50 to 83 45 to 55 57 to 69 <45 <45 <40 <45
Lifetime (000 hrs) 60 50 to 80 <20 >5 100100
to 12080 100
Capital costs estimates
for large stacks ($/KW)270 400 >2000 NA <100 <100 <200 <100
Capital cost range
estimates for the entire
system ($/KW)
500
to 1000
700
to 1400NA NA <200 <200 <300 <200

56 | P a g e ( 5 t h J u l 2 0 2 2 )
For any further query, please email us on [email protected]
Innovation is crucial to reduce costs and improve the performance of the electrolyser. The
ultimate goals are to:
• Reduce cost by standardising and simplifying manufacturing and design to allow for
industrialisation and scale-up;
• Improve efficiency to reduce the amount of electricity required to produce one unit of
H2; and
• Increase durability to extend the equipment lifetime and spread the cost of the
electrolyser facility over a larger H2 production volume.
The main challenge to the development of green H2 is its production cost, which is higher than
grey and blue H2 (produced using natural gas).
H2 production cost analysis (add $ sign)
Source: EIA & Industry Reports
Cost economics of H2 production – Green vs Grey vs Brown vs Blue
Source: NITI Aayog
LCOH – Levelized Cost of Hydrogen
The average production cost of green H2 is higher than grey & blue H2. However, as per
industry analysis, the green H2 is expected to reduce this gap by 2026 worldwide and many
breakthroughs are expected within the market in years to come, driven by increased support
from investors and government policies.
FuelQnty required to
produce 1kWhQnty Unit
Qnty required to
produce 50,000
kWh
Fuel PriceCost of 1,000 kg
H2 Production
Natural Gas 7.43 Cubic Feet 3,71,500 $7 per mmbtu 2,697
Coal 1.13 Pounds 56,500 $250 per MT 6,407
Solar 3,700
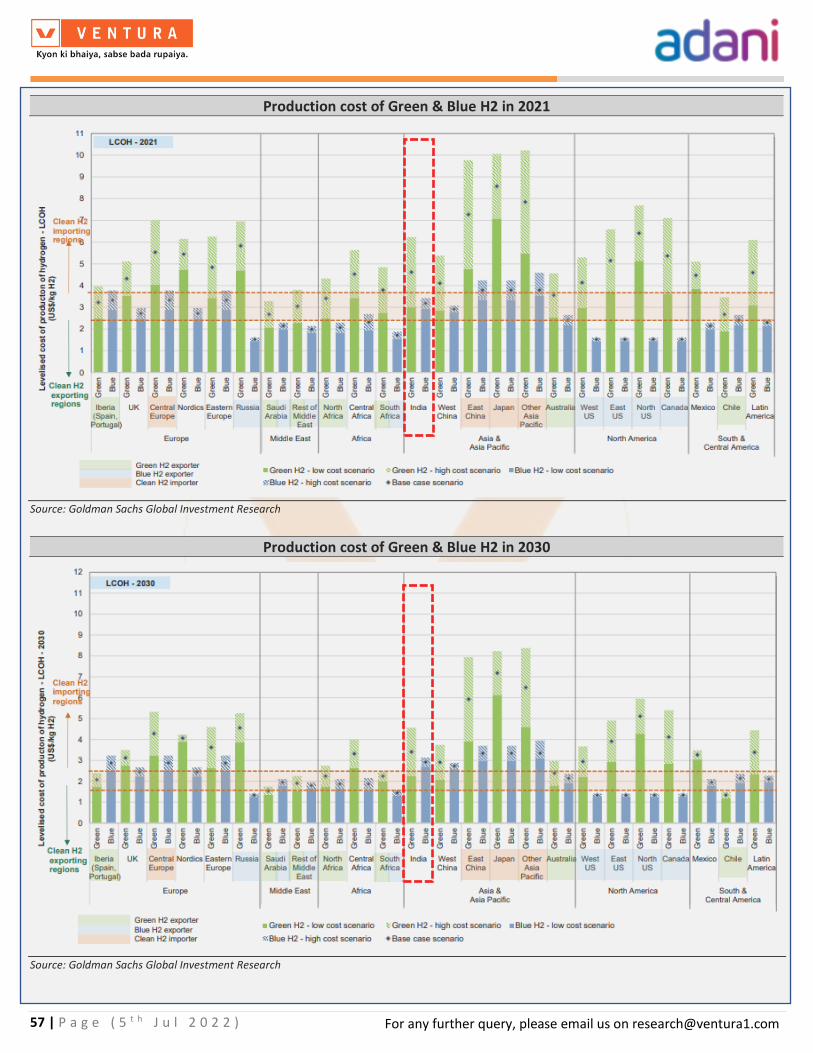
57 | P a g e ( 5 t h J u l 2 0 2 2 )
For any further query, please email us on [email protected]
Production cost of Green & Blue H2 in 2021
Source: Goldman Sachs Global Investment Research
Production cost of Green & Blue H2 in 2030
Source: Goldman Sachs Global Investment Research

58 | P a g e ( 5 t h J u l 2 0 2 2 )
For any further query, please email us on [email protected]
A combination of cost reductions in electricity and electrolysers, combined with increased
efficiency and operating lifetime, can deliver an 80% reduction in H2 cost.
Green H2 cost reduction with efficiency and scale
Source: International Renewable Energy Agency (IRENA)
Projected price trajectory of green H2
Source: NITI Aayog
MENA, Chile, India, and Australia could emerge as key clean H2 exporting regions while Japan,
Korea, Central Europe, and potentially parts of East China could become clean H2 importing
regions, depending on the scale and importance of clean H2 in their respective economies.
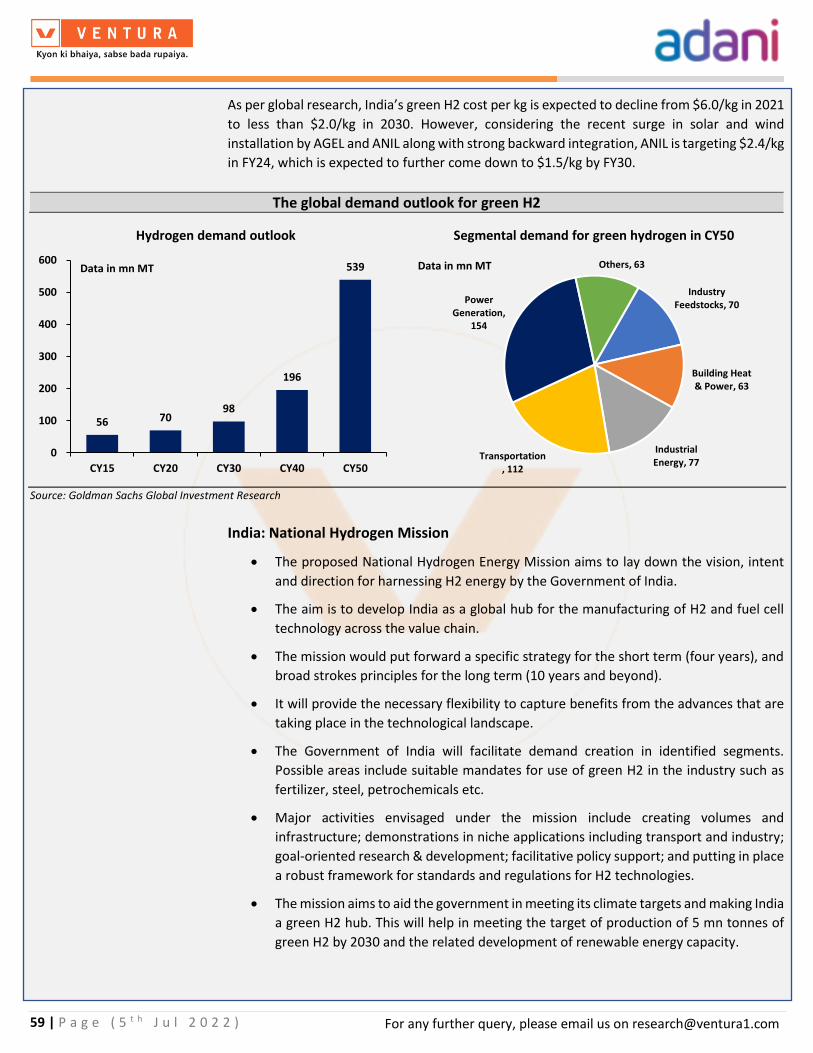
59 | P a g e ( 5 t h J u l 2 0 2 2 )
For any further query, please email us on [email protected]
As per global research, India’s green H2 cost per kg is expected to decline from $6.0/kg in 2021
to less than $2.0/kg in 2030. However, considering the recent surge in solar and wind
installation by AGEL and ANIL along with strong backward integration, ANIL is targeting $2.4/kg
in FY24, which is expected to further come down to $1.5/kg by FY30.
The global demand outlook for green H2
Source: Goldman Sachs Global Investment Research
India: National Hydrogen Mission
• The proposed National Hydrogen Energy Mission aims to lay down the vision, intent
and direction for harnessing H2 energy by the Government of India.
• The aim is to develop India as a global hub for the manufacturing of H2 and fuel cell
technology across the value chain.
• The mission would put forward a specific strategy for the short term (four years), and
broad strokes principles for the long term (10 years and beyond).
• It will provide the necessary flexibility to capture benefits from the advances that are
taking place in the technological landscape.
• The Government of India will facilitate demand creation in identified segments.
Possible areas include suitable mandates for use of green H2 in the industry such as
fertilizer, steel, petrochemicals etc.
• Major activities envisaged under the mission include creating volumes and
infrastructure; demonstrations in niche applications including transport and industry;
goal-oriented research & development; facilitative policy support; and putting in place
a robust framework for standards and regulations for H2 technologies.
• The mission aims to aid the government in meeting its climate targets and making India
a green H2 hub. This will help in meeting the target of production of 5 mn tonnes of
green H2 by 2030 and the related development of renewable energy capacity.
56 70 98
196
539
0
100
200
300
400
500
600
CY15 CY20 CY30 CY40 CY50
Hydrogen demand outlook
Data in mn MT
Industry Feedstocks, 70
Building Heat & Power, 63
Industrial Energy, 77
Transportation, 112
Power Generation,
154
Others, 63
Segmental demand for green hydrogen in CY50
Data in mn MT

60 | P a g e ( 5 t h J u l 2 0 2 2 )
For any further query, please email us on [email protected]
India’s progress toward Green H2
• India aims to become an energy-independent nation by 2047 where green H2 will play
an active role as an alternate fuel to petroleum/ fossil-based products.
• In 2020, India’s H2 demand stood at 6 mn tonnes per year, which is expected to see a
fivefold jump to 28 MT by 2050 where 80% of the demand is expected to be for green
H2.
• Some of the prominent companies such as AEL, Reliance Industries, GAIL, NTPC, Indian
Oil Corp and L&T plan to foray into the green H2 space. RIL plans to become a net-
carbon zero firm by 2035 and invest nearly INR 750 bn over the next three years in RE.
• India has declared its ambition to become an exporter of H2 to Japan, South Korea,
and Europe.
• Various H2-powered vehicles have been developed and demonstrated under projects
supported by the government. These include 6 Cell buses by Tata Motors., 50 H2-
enriched CNG (H-CNG) buses in Delhi by Indian Oil Corp in collaboration with Govt. of
NCT of Delhi, two H2 fueled Internal Combustion Engine buses (by IIT Delhi in
collaboration with M&M).
Applications of green H2
H2 is already widely used in some industries, but it has not yet realized its potential to support
clean energy transitions. Ambitious, targeted and near-term action is needed to further
overcome barriers and reduce costs.
• H2 use today is dominated by heavy industries, such as oil refining, ammonia
production, methanol production and steel production. Virtually all of this H2 is
supplied using fossil fuels, so there is significant potential for emissions reductions
from green H2.
• In transport, the competitiveness of H fuel c2ell cars depends on fuel cell costs and
refuelling stations while for trucks the priority is to reduce the delivered price of H2.
Shipping and aviation have limited low-carbon fuel options available and represent an
opportunity for H2-based fuels.
• In buildings and real estate, H2 could be blended into existing natural gas networks,
with the highest potential in multifamily and commercial buildings, particularly in
dense cities while longer-term prospects could include the direct use of H2 in H2
boilers or fuel cells.
• In power generation, H2 is one of the leading options for storing renewable energy,
and H2 and ammonia can be used in gas turbines to increase power system flexibility.
Ammonia could also be used in coal-fired power plants to reduce emissions.
• H2 can be used for the manufacturing of ammonia, urea and methanol

61 | P a g e ( 5 t h J u l 2 0 2 2 )
For any further query, please email us on [email protected]
Downstream products and their production process
Green H2 from the electrolysis process and Nitrogen (N2) from the air is fed into the Haber-Bosch Process, powered by a
sustainable flow of green energy. In the process, H2 and N2 are reacted together at high temperatures and pressures to
produce ammonia. Then, ammonia is reacted with CO2 into the urea product.
Green H2 is reacted with CO2 to produce green methanol.
Source: Goldman Sachs Global Investment Research
Potential application of green H2 in India
Source: NITI Aayog
Green H2
(1.0 KTPA)
Green Ammonia
(5.6 KTPA)
Green Urea
(10.0 TPA)
CO2 from factories
(4.4 TPA)
N2 from air
(4.6 KTPA)
Green H2
(1.0 KTPA)
Green Methanol
(5.2 KTPA)
CO2 from factories
(4.2 KTPA)

62 | P a g e ( 5 t h J u l 2 0 2 2 )
For any further query, please email us on [email protected]
Sector wise demand for H2 and share of green H2 in total demand
Source: NITI Aayog
Aspirational targets by India for the usage of green H2 in various sectors
Source: NITI Aayog
Segment
Current
annual H2
demand
(mn tonnes)
Current
contribution
of green H2
(%)
Annual H2
demand by
2030 (mn
tonnes)
Contribution
of green H2
by 2030 (%)
Annual H2
demand by
2040 (mn
tonnes)
Contribution
of green H2
by 2040 (%)
Annual H2
demand by
2050 (mn
tonnes)
Contribution
of geen H2 by
2050 (%)
Refinery 3.0 0.0 5.0 20.0 5.0 60.0 5.0 100.0
Ammonia 3.0 0.0 4.5 15.0 5.0 55.0 5.5 95.0
Methanol 0.1 0.0 0.3 0.0 1.4 17.5 2.5 35.0
Iron & Steel 0.4 0.0 0.8 15.0 4.7 57.5 8.5 100.0
Heavy duty road freight 0.0 0.0 0.0 0.0 3.3 50.0 6.5 100.0
Power 0.0 0.0 0.0 0.0 1.0 50.0 2.0 100.0
City Gas Distribution 0.0 0.0 3.0 90.0 3.8 95.0 4.5 100.0
TOTAL 6.5 0.0 13.6 33.1 24.1 59.7 34.5 94.5
Sector Category Targets
Old PlantsFleet level carbon intensity by 2035 should be less than 2 tonnes of CO2 per tonne
of steel
New CapacitiesAt least 20 mn tonnes of green H2 based green steel to be made in India primarily
for exports
City Gas Distribution Pilot and subsequent scale-up 10% blending by 2025 and 20% by 2030
Green Ammonia Exports25 mn tonnes of exports to countries such as Japan, Korea, and the European
Union
Heavy Duty Vehicles Pilots on specific routes1,000 trucks, 50 boats, and 10 aircrafts to be piloted by 2030. Three H2 corridors to
be developed across the country based on state grand challenge.
Power Allow participation in RTC tendersWhere economics makes sense, allow H2 to compete with other storage
technologies in Round the Clock tenders by SECI.
Steel
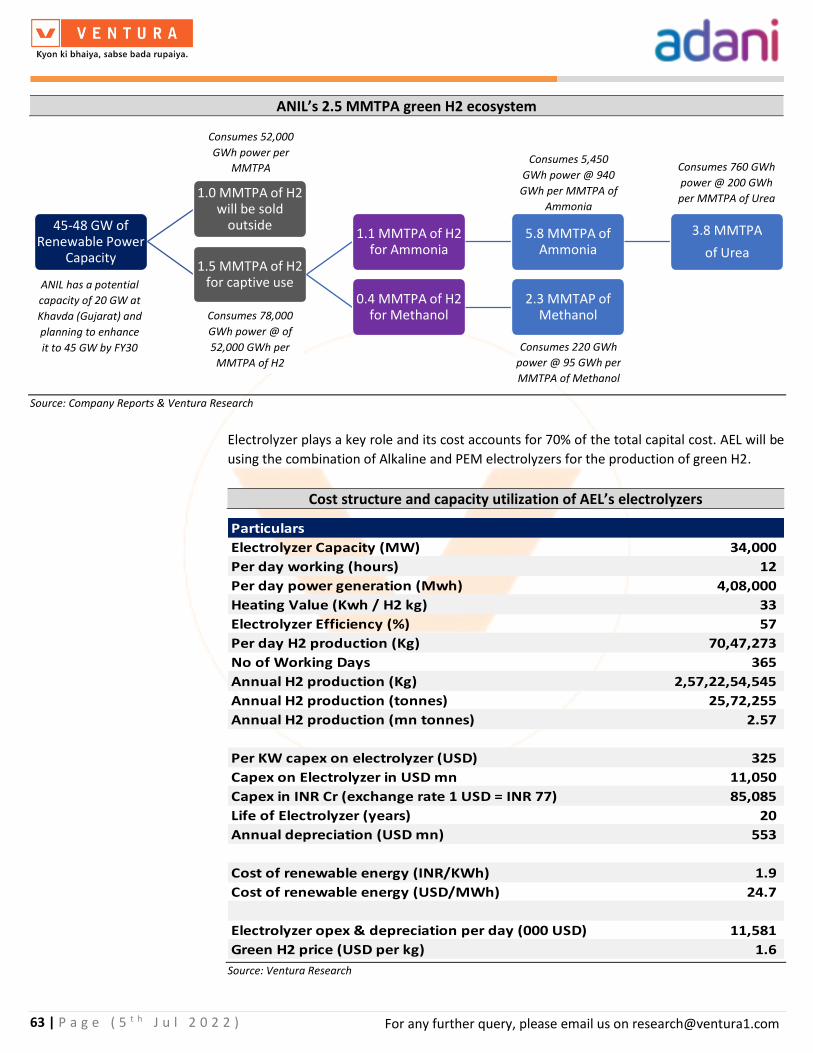
63 | P a g e ( 5 t h J u l 2 0 2 2 )
For any further query, please email us on [email protected]
ANIL’s 2.5 MMTPA green H2 ecosystem
Source: Company Reports & Ventura Research
Electrolyzer plays a key role and its cost accounts for 70% of the total capital cost. AEL will be
using the combination of Alkaline and PEM electrolyzers for the production of green H2.
Cost structure and capacity utilization of AEL’s electrolyzers
Source: Ventura Research
45-48 GW of Renewable Power
Capacity
1.0 MMTPA of H2 will be sold
outside
1.5 MMTPA of H2 for captive use
1.1 MMTPA of H2 for Ammonia
5.8 MMTPA of Ammonia
3.8 MMTPA
of Urea
0.4 MMTPA of H2 for Methanol
2.3 MMTAP of Methanol
Particulars
Electrolyzer Capacity (MW) 34,000
Per day working (hours) 12
Per day power generation (Mwh) 4,08,000
Heating Value (Kwh / H2 kg) 33
Electrolyzer Efficiency (%) 57
Per day H2 production (Kg) 70,47,273
No of Working Days 365
Annual H2 production (Kg) 2,57,22,54,545
Annual H2 production (tonnes) 25,72,255
Annual H2 production (mn tonnes) 2.57
Per KW capex on electrolyzer (USD) 325
Capex on Electrolyzer in USD mn 11,050
Capex in INR Cr (exchange rate 1 USD = INR 77) 85,085
Life of Electrolyzer (years) 20
Annual depreciation (USD mn) 553
Cost of renewable energy (INR/KWh) 1.9
Cost of renewable energy (USD/MWh) 24.7
Electrolyzer opex & depreciation per day (000 USD) 11,581
Green H2 price (USD per kg) 1.6
Consumes 78,000
GWh power @ of
52,000 GWh per
MMTPA of H2
Consumes 220 GWh
power @ 95 GWh per
MMTPA of Methanol
Consumes 5,450
GWh power @ 940
GWh per MMTPA of
Ammonia
Consumes 760 GWh
power @ 200 GWh
per MMTPA of Urea
Consumes 52,000
GWh power per
MMTPA
ANIL has a potential
capacity of 20 GW at
Khavda (Gujarat) and
planning to enhance
it to 45 GW by FY30

64 | P a g e ( 5 t h J u l 2 0 2 2 )
For any further query, please email us on [email protected]
Currently, green H2 is a relatively expensive fuel as compared to conventional alternatives.
However, the increasing penetration of renewable energy in power generation, and
technological and cost improvements in electrolyzer technology collectively have the potential
to substantially alter this pricing structure favourably.
We have done a cost sensitivity analysis on the electrolyzer capex and energy cost to get the
per kg price of green H2 in the different scenarios. Our calculations are based on the above
table – ‘Cost structure and capacity utilization of AEL’s electrolyzers’
Sensitivity to Electricity Cost and Electrolyzer Capex for per kg H2 price
Electolyzer Capex ($/KW)
Source: Ventura Research
ANIL’s infrastructure requirements for green H2 production
Source: Ventura Research
ANIL has 71,000 acres of leased land in Khavda, which would be sufficient for a 20 GW of
renewable capacity. However, this capacity will become insufficient to fulfil the energy
requirement in FY27. ANIL is expected to work on two options
• ANIL will source additional renewable power from Adani Green Energy Ltd (AGEL) or
• ANIL will acquire additional ~65,000 acres of land to install new solar & wind capacities.
Like Khavda, we believe that ANIL will require land near its Mundra SEZ to manufacture
renewable energy.
1.6 325 375 425 475 525 575 625
10 0.79 0.83 0.86 0.89 0.93 0.96 0.99
15 1.08 1.12 1.15 1.18 1.22 1.25 1.28
20 1.37 1.41 1.44 1.47 1.50 1.54 1.57
25 1.66 1.70 1.73 1.76 1.79 1.83 1.86
30 1.95 1.98 2.02 2.05 2.08 2.12 2.15
35 2.24 2.27 2.31 2.34 2.37 2.41 2.44
40 2.53 2.56 2.60 2.63 2.66 2.70 2.73
Particulars Unit FY26 FY27 FY28 FY29 FY30 FY31
Sales Volumes
H2 Tonnes 0.2 0.5 1.0 1.5 2.0 2.5
Ammonia Tonnes 0.7 1.5 2.2 2.9 4.4 5.8
Urea Tonnes 1.3 1.3 1.3 2.5 2.5 3.8
Methanol Tonnes 0.0 0.0 0.8 1.5 2.3 2.3
Power Required
H2 GWh 8,760 26,280 52,560 78,840 1,05,120 1,31,400
Ammonia GWh 683 1,367 2,050 2,733 4,100 5,458
Urea GWh 254 254 254 508 508 761
Methanol GWh 0 0 71 143 214 214
Total Power Required GWh 9,697 27,901 54,935 82,224 1,09,941 1,37,833
PLF % 35.0 35.0 35.0 35.0 35.0 35.0
Required Power Capacity GW 3.2 9.1 17.9 26.8 35.9 45.0
Land required to produce 1 MW of hybrid renewable power Acres 3.0 3.0 3.0 3.0 3.0 3.0
Land required to install power capacity Acres 9,489 27,300 53,753 80,454 1,07,575 1,34,866
Re
ne
wab
le E
ne
rgy
Co
st
($/M
Wh
)

65 | P a g e ( 5 t h J u l 2 0 2 2 )
For any further query, please email us on [email protected]
-10
0
10
20
30
40
50
60
70
80
0
10,000
20,000
30,000
40,000
50,000
60,000
70,000
80,000
90,000
FY24 FY25 FY26 FY27 FY28 FY29 FY30 FY31
H2 & downstream products to accelerate revenue growth in the next 8-10 years
Total Operating Revenue YoY Growth (%)
INR Cr %
12 22 27 28 29 29 26 24
88 66 53 38 31 26 23 21
0 8
6
6 4 5
5 4
0 0 2
5 7 6
5 5
0 0 1
7 11 14 14 18
0 0 0 6 9 8 14 17
0 0 6 4 3 6 5 7 0 4 5 6 5 4 3 0
FY24 FY25 FY26 FY27 FY28 FY29 FY30 FY31
A well diversified portfolio of H2, ammonia, urea and RE power
Wind Mfg Poly-Module Electrolyzer
Fuel Cell Battery Hydrogen
Ammonia Urea Methanol
Renewable Power
20
30
40
50
60
70
80
0
10,000
20,000
30,000
40,000
50,000
60,000
70,000
FY24 FY25 FY26 FY27 FY28 FY29 FY30 FY31
Operating margins to improve on higher capacity utilization
EBITDA Margin (%)
INR Cr %
0
5
10
15
20
25
30
35
40
0
5,000
10,000
15,000
20,000
25,000
30,000
FY24 FY25 FY26 FY27 FY28 FY29 FY30 FY31
Higher operating profits and faster debt repayments to improve bottom-line
PAT Margin (%)
INR Cr %
7
8
9
10
11
12
13
14
0
50,000
1,00,000
1,50,000
2,00,000
2,50,000
FY24 FY25 FY26 FY27 FY28 FY29 FY30 FY31
Higher net profit to deliver strong ROE in the coming years
Net Worth Return on Equity (%)
INR Cr %
8
9
10
11
12
13
14
0
50,000
1,00,000
1,50,000
2,00,000
2,50,000
3,00,000
3,50,000
4,00,000
FY24 FY25 FY26 FY27 FY28 FY29 FY30 FY31
Improvement in operating profits to stablize RoIC
Invested Capital Return on Invested Capital (%)
INR Cr %
ANIL Story in Charts

66 | P a g e ( 5 t h J u l 2 0 2 2 )
For any further query, please email us on [email protected]
Source: Ventura Research
20
30
40
50
60
70
80
90
100
0
10,000
20,000
30,000
40,000
50,000
60,000
FY24 FY25 FY26 FY27 FY28 FY29 FY30 FY31
Operating cash flow to improve on higher EBITDA margins
Cash Flow from Operations CFO to EBITDA (%)
INR Cr %
-500
-400
-300
-200
-100
0
100
-40,000
-30,000
-20,000
-10,000
0
10,000
20,000
FY24 FY25 FY26 FY27 FY28 FY29 FY30 FY31
FCF to become positive after initial periods of higher capex
Free Cash Flow to Firm FCFF to Cash Profit (%)
INR Cr %
-0.2
0.0
0.2
0.4
0.6
0.8
1.0
-20,000
0
20,000
40,000
60,000
80,000
1,00,000
1,20,000
1,40,000
1,60,000
FY24 FY25 FY26 FY27 FY28 FY29 FY30 FY31
Higher operating cash flow to be utilized for faster repayment of debt
Net Debt Net Debt to Equity (X)
INR Cr %
-1
-1
0
1
1
2
2
3
3
4
-20,000
0
20,000
40,000
60,000
80,000
1,00,000
1,20,000
1,40,000
1,60,000
FY24 FY25 FY26 FY27 FY28 FY29 FY30 FY31
Faster repayment of debt to signifianctly improve debt to EBITDA ratio
Net Debt Net Debt to EBITDA (X)
INR Cr %

67 | P a g e ( 5 t h J u l 2 0 2 2 )
For any further query, please email us on [email protected]
ANIL’s Financial Summary
Source: Ventura Research
Fig in INR Cr, unless specified FY23 FY24 FY25 FY26 FY27 FY28 FY29 FY30 FY31
Wind Mill 0 1,800 5,856 9,912 13,968 18,024 20,281 20,281 20,281
Poly Module 6,026 13,134 17,188 19,272 19,203 18,866 18,531 18,197 17,542
Electrolyzer 0 0 2,183 2,189 2,868 2,767 3,697 3,569 3,392
Fuel Cell 0 0 0 0 0 310 1,037 1,550 1,606
Battery 0 0 0 764 2,670 4,110 4,303 4,094 3,974
Hydrogen 0 0 0 430 3,489 6,694 9,906 11,228 14,725
Ammonia 0 0 0 24 2,813 5,482 5,500 11,169 14,297
Urea 0 0 0 2,090 2,045 2,001 3,998 4,076 6,260
Methanol 0 0 0 0 0 495 990 1,514 1,551
Renewable Power 0 0 970 1,940 2,999 2,992 2,877 2,637 0
Total Operating Revenue 6,026 14,934 26,196 36,619 50,054 61,741 71,118 78,315 83,628
YoY Growth (%) 147.9 75.4 39.8 36.7 23.3 15.2 10.1 6.8
Operating Expenses 4,820 11,476 19,985 22,069 27,423 29,592 29,010 26,360 23,883
OPEX to Sales (%) 80.0 76.8 76.3 60.3 54.8 47.9 40.8 33.7 28.6
EBITDA 1,205 3,458 6,211 14,550 22,632 32,150 42,107 51,954 59,745
Margin (%) 20.0 23.2 23.7 39.7 45.2 52.1 59.2 66.3 71.4
Depreciation & Amortization 346 824 1,586 3,212 5,162 7,363 9,551 11,519 12,315
EBIT 859 2,634 4,625 11,339 17,469 24,786 32,557 40,436 47,430
Margin (%) 14.3 17.6 17.7 31.0 34.9 40.1 45.8 51.6 56.7
Other Income 13 33 91 198 315 446 574 684 745
CSR Expenses 5 13 31 76 128 191 255 327 412
CSR Expenses to Sales (%) 0.1 0.1 0.1 0.2 0.3 0.3 0.4 0.4 0.5
Finance Cost 377 97 610 2,369 4,746 7,325 10,116 12,475 13,410
PBT 491 2,557 4,076 9,091 12,911 17,716 22,760 28,318 34,353
Margin (%) 8.1 17.1 15.6 24.8 25.8 28.7 32.0 36.2 41.1
Tax 83 435 693 1,545 2,195 3,012 3,869 4,814 5,840
Tax Rate (%) 17.0 17.0 17.0 17.0 17.0 17.0 17.0 17.0 17.0
PAT 407 2,122 3,383 7,545 10,716 14,704 18,891 23,504 28,513
Margin (%) 6.8 14.2 12.9 20.6 21.4 23.8 26.6 30.0 34.1
Net Worth 11,299 24,712 40,368 60,894 85,162 1,13,077 1,44,816 1,79,641 2,17,586
Return on Equity (%) 3.6 8.6 8.4 12.4 12.6 13.0 13.0 13.1 13.1
Capital Employed 11,920 26,527 53,805 1,06,682 1,58,019 2,23,350 2,87,446 3,48,894 3,83,577
Return on Capital Employed (%) 0.1 0.1 0.1 0.1 0.1 0.1 0.1 0.1 0.1
Invested Capital 6,471 22,643 49,091 93,757 1,46,185 2,10,121 2,71,511 3,29,582 3,68,508
Return on Invested Capital (%) 13.3 11.6 9.4 12.1 12.0 11.8 12.0 12.3 12.9
Cash Flow from Operations 302 1,452 3,416 9,992 17,865 26,171 35,415 45,332 51,921
Cash Flow from Investing -5,989 -15,404 -25,871 -44,744 -54,832 -68,077 -67,798 -67,424 -48,924
Cash Flow from Financing 11,136 12,388 23,285 42,962 35,875 43,302 35,089 25,470 -7,240
Net Cash Flow 5,449 -1,565 830 8,211 -1,091 1,395 2,706 3,378 -4,243
Free Cash Flow to Firm -5,375 -13,871 -21,948 -32,785 -33,028 -35,827 -23,987 -11,737 14,127
CFO to EBITDA (%) 25.0 42.0 55.0 68.7 78.9 81.4 84.1 87.3 86.9
FCFF to Cash Profit (%) -713.4 -470.8 -441.7 -304.8 -208.0 -162.4 -84.3 -33.5 34.6
Capex 0 -9,415 -19,882 -38,755 -48,843 -62,088 -61,809 -61,435 -42,935
Total Debt 621 1,815 13,437 45,788 72,857 1,10,273 1,42,629 1,69,254 1,65,991
Net Debt -4,827 -2,069 8,723 32,863 61,023 97,044 1,26,695 1,49,941 1,50,922
Net Debt to Equity (X) -0.4 -0.1 0.2 0.5 0.7 0.9 0.9 0.8 0.7
Net Debt to EBITDA (X) -4.0 -0.6 1.4 2.3 2.7 3.0 3.0 2.9 2.5

68 | P a g e ( 5 t h J u l 2 0 2 2 )
For any further query, please email us on [email protected]
Valuation
ANIL is expected to emerge as India’s largest green H2 player. We have used the DCF valuation
methodology and discounted back the future cash flows to FY25 and value ANIL at INR 2,405
per share.
DCF Valuation for ANIL
Source: Ventura Research
With the completion of the 2.5 mn tonnes of green H2 planned capacities in FY31, ANIL is
expected to achieve steady-state EBITDA of INR 59,701 cr in FY32.
While the roadmap for ANIL is to reach 2.5 MMTPA of green H2 capacity, the recent
partnership agreement signed with TotalEnergies is for 1.0 MMTPA. If we consider only 1.0
MMTPA of green H2 capacity then the DCF valuation for ANIL works out to INR 1,750 (FY25
equity value of INR 2,07,397 cr).
Cost of Equity (%) 11.2
Cost of Debt (%) 6.6
WACC (%) 8.5
Terminal Value Growth (%) 3.0
Particulars FY25 FY26 FY27 FY28 FY29 FY30 FY31 FY32 FY33 FY34 FY35 FY36 FY37 FY38 FY39 FY40
FCFF (INR Cr) -21,948 -32,785 -33,028 -35,827 -23,987 -11,737 14,127 62,042 59,141 56,589 54,014 50,654 48,367 46,693 45,033 43,398
Discount Factor (X) 0.92 0.85 0.78 0.72 0.67 0.61 0.57 0.52 0.48 0.44 0.41 0.38 0.35 0.32 0.30 0.27
Discounted FCFF (INR Cr) -20,238 -27,875 -25,893 -25,899 -15,989 -7,214 8,007 32,422 28,498 25,143 22,129 19,136 16,848 14,998 13,337 11,852
Total of Discounted FCFF (INR Cr) 69,261
Terminal Value (INR Cr) 8,20,129
PV of Terminal Value (INR Cr) 2,23,970
Value of Operations (INR Cr) 2,93,230
FY25 Net Debt (INR Cr) 8,723
FY25 Value of Equity (INR Cr) 2,84,507
Value per share (INR) 2,401

69 | P a g e ( 5 t h J u l 2 0 2 2 )
For any further query, please email us on [email protected]
AEL’s Coal Business

70 | P a g e ( 5 t h J u l 2 0 2 2 )
For any further query, please email us on [email protected]
Adani Coal Business
Unless renewable energy becomes a source of stable base-load power through proven and
economically viable technologies, coal will continue to be a key contributor to India's energy.
The primary reason: it is affordable, accessible, and easily stored and transported, making it
well suited to meeting the energy needs of industrializing economies.
AEL is one of the largest coal mining and resource management companies in India. It operates
its coal business under three verticals –
• Integrated Resource Management (IRM),
• Mine Developer & Operator (MDO) and
• Commercial Mining.
Adani’s coal business verticals
Source: Company Reports

71 | P a g e ( 5 t h J u l 2 0 2 2 )
For any further query, please email us on [email protected]
Commercial Mining
AEL forayed into the mining business in 2010 through its wholly-owned subsidiary, Adani
Mining Pvt Ltd, in Australia which owns a 100% stake in the Carmichael mine in the Galilee
Basin in Queensland, Australia. The mine was initially planned to produce 60 MMT of coal per
year, however, funding difficulties resulted in downsizing the planned production to 10 MMT
per year. This is expected to be increased to 15 MMT by FY24. At 11% ash content and weighted
average calorific value of 5,000–5,500 kcal/kg Charmichael is a superior quality coal and
expected to command premium pricing.
Carmichael Mine Project in Australia
Source: Company Reports
A brief history of the Carmichael mine project
• Carmichael is a thermal coal mine, which has been approved by the Queensland and federal governments.
• AEL had initially planned the project in 2010 with an investment of A$16.5 bn but later scaled it down to A$2 bn. This was
one of the biggest investments by an Indian company in Australia.
• The opposition to the project was so fierce that for several years, banks refused to fund it. In addition, it will increase
shipping traffic through the Great Barrier Reef heritage area and add around 4.7 bn tonnes of carbon pollution to the
atmosphere over its 60-year lifespan. The opposition grew so strong that over the years several banks refused to fund it.
• The group, however, went ahead with the project which included the construction of a new railway line connecting an
Australian port to the mine – situated 300 km away in Queensland.
• The project was given the final go-ahead in June 2019 and construction activities commenced later that year and the first
cargo dispatch started in Q4FY22.
• As per AEL, Carmichael will produce 14-15 MMTPA of thermal coal per annum at a peak capacity.

72 | P a g e ( 5 t h J u l 2 0 2 2 )
For any further query, please email us on [email protected]
AEL’s Carmichael Mine Financial Summary
Source: Ventura Research
Over FY23-25, revenues from Carmichael mines are expected to grow at 10.7% CAGR mainly
due to the commencement of mines & increase in demand for coal. The EBITDA/tn is expected
to be at A$ 5.6/tn by FY25, while the absolute EBITDA is expected to grow at 7.7% CAGR to A$
81 mn over the same period with EBITDA margins expected to be at 7.2%.
Carmichael Mine (fig in A$ mn, unless specified) FY22 FY23 FY24 FY25 FY26 FY27 FY28 FY29 FY30
Coal Volume (000 tonnes) 3,876 11,705 14,399 14,465 14,926 15,048 14,974 14,894 14,868
YoY Growth (%) 202.0 23.0 0.5 3.2 0.8 -0.5 -0.5 -0.2
Avg Price Realization (A$/tonne) 83.5 78.3 74.8 77.7 82.1 84.1 87.2 89.8 91.6
Revenue 323 917 1,077 1,123 1,225 1,265 1,306 1,337 1,362
YoY Growth (%) 183.4 17.5 4.3 9.1 3.3 3.2 2.4 1.8
Royalties 20 58 68 71 78 81 83 85 87
Mine Cost 152 410 482 490 521 510 479 468 470
Rail Costs 90 264 331 341 360 370 339 344 351
Port Costs 34 86 99 102 109 113 115 117 119
Linc Royalty 9 29 36 37 39 40 41 41 42
EBITDA 18 70 61 81 120 151 248 281 293
EBITDA per tonne ($A) 5 6 4 6 8 10 17 19 20
EBITDA Margin (%) 5.5 7.6 5.7 7.2 9.8 11.9 19.0 21.0 21.5
Depreciation & Amortisation 62 88 92 91 89 86 84 82 80
EBIT -44 -18 -31 -10 31 65 164 199 213
EBIT Margin (%) -13.7 -1.9 -2.9 -0.9 2.5 5.1 12.6 14.9 15.6
Interest on deferred govt royalty 0 0 0 0 0 1 4 4 4
DSRA Interest -0 -0 -0 -0 -0 -0 -0 -0 -0
Withholding taxes - non-residents 0 0 0 0 0 0 0 0 0
Reversal of deferred revenue -25 -60 -53 0 0 0 0 0 0
Translation gains / (losses) 0 0 0 0 0 0 0 -0 0
Interest expense - Equipment lease 5 8 10 9 8 7 5 4 2
Interest expense - Working capital facility 0 0 0 0 0 0 0 0 0
Interest expense - CHPP 0 0 0 0 0 0 0 0 0
Interest expense - Other debt 10 22 24 23 21 20 18 16 14
Shareholders Loan Interest 0 0 0 0 0 0 0 0 0
PBT -34 12 -12 -42 1 37 137 175 193
PBT Margin (%) -10.6 1.3 -1.1 -3.8 0.1 2.9 10.5 13.1 14.2
Tax expense 0 3 0 0 0 9 34 44 48
Tax Rate (%) 0.0 25.0 0.0 0.0 25.0 25.0 25.0 25.0 25.0
Net Profit -34 9 -12 -42 1 28 102 131 145
Net Margin (%) -10.6 0.9 -1.1 -3.8 0.1 2.2 7.8 9.8 10.6
Net Worth 1,414 1,426 1,414 1,372 1,373 1,351 1,266 1,210 1,159
Return on Equity (%) -2.4 0.6 -0.8 -3.1 0.1 2.1 8.1 10.8 12.5
Capital Employed 1,949 2,111 2,096 1,997 1,931 1,858 1,701 1,567 1,435
Return on Capital Employed (%) -2.3 -0.6 -1.5 -0.5 1.2 2.6 7.2 9.5 11.1
Invested Capital 1,773 1,860 1,844 1,774 1,740 1,699 1,575 1,477 1,383
Return on Invested Capital -2.5 -1.0 -1.7 -0.5 1.8 3.8 10.4 13.5 15.4
Total Debt 535 685 682 625 558 507 435 357 276
Net Debt 359 434 429 402 366 348 309 266 224
Net Debt to EBITDA (X) 20.0 6.2 7.0 4.9 3.1 2.3 1.2 0.9 0.8
Net Debt to Equity (X) 0.3 0.3 0.3 0.3 0.3 0.3 0.2 0.2 0.2

73 | P a g e ( 5 t h J u l 2 0 2 2 )
For any further query, please email us on [email protected]
Domestic coal mining
India opened up coal mining to the private sector for the first time in 2020, after years of
lobbying by coal consumers. AEL won bids for the coal block development and production for
the following mines in India:
• Dhirauli (Madhya Pradesh) – It is AEL’s first commercial domestic mine with a proven
reserve of 302.6 mn tonnes (MT) and an estimated additional reserves of 283.8 MT.
The mine is yet to start operations, which is pending for final approval. The mine has a
target annual capacity of 5.0 MTPA.
• Gondulpara (Jharkhand) – It is AEL’s second domestic commercial mine with proven
reserves of 302.6 MT and estimated additional reserves of 283.8 MT (MT). The mine is
yet to start operations, which is pending for final approval. The mine has a target
annual capacity of 4.0 MTPA (open cast mine).
• Jhigador (Chhattisgarh) – Acquired in 2021, it has proven reserves of 250 MT. The mine
is in various stages of development
• Khargaon (Chhattisgarh) – The mine is under various stages of development
AEL’s Commercial Mining in India
Source: Ventura Research
Khargone
Dhirauli
Jhigador
Gondulpara

74 | P a g e ( 5 t h J u l 2 0 2 2 )
For any further query, please email us on [email protected]
Financials and cash flow details of AEL’s Indian mines are yet to be disclosed, therefore we
have not considered it in our valuations. Further, to enhance its coal sourcing, AEL also
increased its coal volumes across its IRM and MDO verticals.
Integrated Resource Management (IRM) business
Domestic coal consumption has consistently outstripped domestic production, necessitating
the need for substantial imports. ~25% of the domestic consumption during FY18-21 was
imported from Indonesia, Australia and South Africa (which contribute to ~80% of our total
imports).
AEL ventured into coal management in 1999 to address the gap in the requirement of coal at
thermal power plants. Over the past 20 years, AEL has emerged as the largest domestic coal
supplier and importer in India. It is India’s largest non-coking coal importer from Indonesia,
South Africa and USA. The company has also enhanced its presence in the growing coal markets
of Sri Lanka, Thailand, Vietnam, China and Dubai.
Under this division, AEL provides complete logistics solutions which include:
• Sourcing resources from suppliers,
• Managing sea-borne logistics,
• Providing an intermediate holding facility at discharge ports, and
• Delivering resources to customers.
AEL’s IRM Global Footprints
Source: Company Presentation

75 | P a g e ( 5 t h J u l 2 0 2 2 )
For any further query, please email us on [email protected]
While the primary customers for the IRM business consist of state or central-owned Electricity
Boards, AEL has over the years diversified to other businesses like steel, cement and other
metals to derisk its dependence. Currently, the IRM business has more than 600 customers
across various downstream industries and is a market leader.
India’s growing appetite for coal is set to add 130 MT to the coal demand over CY21-24. As per
EIA estimates, coal consumption in India is expected to increase at an average annual rate of
3.9%, to reach 1,185 MT in 2024.
India’s long term coal demand from different sectors (mn tonnes)
Source: NITI Aayog & Ventura Research
Global growth in coal consumption 2021-2024
Source: IEA Coal 2021 Report
As displayed in the above chart, coal usage in India is expected to only rise in contrast to
stagnation in other parts of the world, including China. India is also set to overtake China as
the world’s largest metallurgical coal importer due to the rising demand for coal from thermal
power plants and heavy industries.
Sector 2024 2030 2035 2040
Utility electricity
generation770-790 850-870
May increase
slowly from 2030
levels
Most likely lower
than 2035 levels
Industrial demand
(ex-captive)280-300 300-320
Continues to
increase334-420
Captive electricity
generation110-120 130-140
Continues to
increase 161-200
3.9
1.1
-5.3
-8.5
1.50.7 0.5
-10
-8
-6
-4
-2
0
2
4
6
India China USA EU Russia Africa World
CAGR %

76 | P a g e ( 5 t h J u l 2 0 2 2 )
For any further query, please email us on [email protected]
Over FY22-25E, AEL’s IRM volumes are expected to grow at a CAGR of 2.0% to 68 mn tonnes
given that the business is more or less in a mature phase. However, revenues are expected to
decline at 13.8% CAGR to INR 912 cr due to the expected correction in the global coal prices
after the recent peak.
We have not considered any hikes in contract pricing in our forecasts and this remains an
upside risk to our revenue estimates. In terms of operating profits, we expect the same to
decline at 19.0% CAGR over the same period with FY25 margins at 2.9%.
AEL’s IRM Financial Summary
Source: Company Presentation
Mine Developer and Operator (MDO) business
AEL pioneered the concept of MDO in India. The MDO vertical undertakes mining operations
on a turnkey basis (from mine owners). These contracts are on a take-or-pay basis and
therefore secure AEL’s cash flow.
IRM Business (fig in INR Cr, unless specified) FY19 FY20 FY21 FY22 FY23 FY24 FY25 FY26 FY27 FY28 FY29 FY30
Coal Volumes (MMT) 67 79 63 64 66 67 68 70 71 73 74 75
YoY Growth (%) 16.8 -19.5 1.6 2.0 2.0 2.0 2.0 2.0 2.0 2.0 1.9
Total Revenue 31,764 30,903 24,280 33,227 30,245 30,848 31,463 32,091 32,730 33,383 34,049 34,728
YoY Growth (%) -2.7 -21.4 36.8 -9.0 2.0 2.0 2.0 2.0 2.0 2.0 2.0
Revenue per MT (INR) 4,709 3,922 3,830 5,159 4,604 4,603 4,603 4,603 4,603 4,605 4,606 4,608
Operating Cost 30,651 29,620 23,403 31,769 29,372 29,956 30,551 31,158 31,779 32,412 33,058 33,716
Operating EBIDTA 1,113 1,283 877 1,458 873 892 912 933 952 971 991 1,012
EBITDA per MT (INR) 165 163 138 226 133 133 133 134 134 134 134 134
EBITDA Margin (%) 3.5 4.2 3.6 4.4 2.9 2.9 2.9 2.9 2.9 2.9 2.9 2.9
Depreciation 23 28 28 28 28 28 0 0 0 0 0 0
EBIT 1,090 1,255 849 1,430 845 864 912 933 952 971 991 1,012
EBIT Margin (%) 3.4 4.1 3.5 4.3 2.8 2.8 2.9 2.9 2.9 2.9 2.9 2.9
Other Income 77 46 99 99 99 99 99 99 99 99 99 99
Finance Cost 539 534 330 309 310 305 296 287 279 270 262 254
PBT 628 767 618 1,220 634 658 715 744 772 800 828 856
PBT Margin (%) 2.0 2.5 2.5 3.7 2.1 2.1 2.3 2.3 2.4 2.4 2.4 2.5
Tax 19 40 28 115 57 59 64 67 70 73 76 78
Tax Rate (%) 3.0 5.2 4.5 9.5 8.9 9.0 9.0 9.0 9.1 9.1 9.1 9.2
PAT 609 727 590 1,105 577 599 651 677 702 727 753 778
PAT Margin (%) 1.9 2.4 2.4 3.3 1.9 1.9 2.1 2.1 2.1 2.2 2.2 2.2
Net Worth 12,673 13,111 14,465 15,503 16,013 16,543 17,124 17,729 18,360 19,015 19,696 20,402
Return on Equity (%) 4.8 5.5 4.1 7.1 3.6 3.6 3.8 3.8 3.8 3.8 3.8 3.8
Capital Employed 18,215 18,437 18,533 19,929 20,439 20,837 21,288 21,769 22,278 22,816 23,383 23,978
Return on Capital Employed (%) 6.2 7.2 4.8 7.9 4.5 4.5 4.7 4.7 4.7 4.6 4.6 4.6
Invested Capital 17,154 16,319 17,599 18,990 19,271 19,675 20,167 20,458 20,449 20,438 20,427 20,414
Return on Invested Capital (%) 6.4 7.7 4.8 7.5 4.4 4.4 4.5 4.6 4.7 4.8 4.9 5.0
Total Debt 5,542 5,326 4,068 4,426 4,426 4,293 4,164 4,039 3,918 3,801 3,687 3,576
Net Debt 4,481 3,208 3,134 3,486 3,257 3,131 3,043 2,729 2,089 1,423 731 12
Net Debt to Equity (X) 0.4 0.2 0.2 0.2 0.2 0.2 0.2 0.2 0.1 0.1 0.0 0.0
Net Debt to EBITDA (X) 4.0 2.5 3.6 2.4 3.7 3.5 3.3 2.9 2.2 1.5 0.7 0.0

77 | P a g e ( 5 t h J u l 2 0 2 2 )
For any further query, please email us on [email protected]
The company has also set up its own Mineral Resource Exploration Division, which provides
complete mining solutions for surveying, coal block exploration and grading assessment. The
mining division manages exploration activity for the group in addition to providing services to
other companies.
AEL is a frontrunner in the domestic MDO business
Source: Company Presentation
Over FY22-25E, AEL’s MDO volumes are expected to grow at a CAGR of 38.5% to 72 mn tonnes,
while revenues are expected to grow at 38.8% CAGR to INR 5,749 cr. Similarly, EBITDA and PAT
are expected to grow at a CAGR of 45.9% to INR 2,481 cr and 43.9% to INR 1,581 cr respectively.
AEL’s MDO Valuation
Source: Ventura Research
MDO Business FY19 FY20 FY21 FY22 FY23 FY24 FY25 FY26 FY27 FY28 FY29 FY30
ROM (Run of mine) Volume (MT) 15 16 18 30 57 64 79 89 97 107 115 124
Washed coal Volume (MT) 12 14 15 27 51 58 72 82 90 99 107 115
YoY Growth (%) 15.7 7.1 80.7 88.0 14.3 23.7 13.9 10.0 10.0 7.5 7.5
Reject Volume (MT) 2.9 1.5 2.5 3.3 5.8 5.7 6.5 6.5 7.2 7.9 8.5 9.1
Rejections as % of ROM 19.3 9.7 14.3 11.0 10.2 8.9 8.3 7.4 7.4 7.4 7.4 7.4
Total Revenue (INR Cr) 1,586 1,911 2,059 2,152 3,975 4,608 5,749 7,009 8,088 8,897 9,564 10,281
YoY Growth (%) 20.5 7.7 4.5 84.7 15.9 24.8 21.9 15.4 10.0 7.5 7.5
Revenue / Ton (Washed Coal) (INR) 1,311 1,365 1,373 794 780 791 798 854 896 896 896 896
Operating Cost (INR Cr) 605 967 916 1,354 2,605 2,878 3,268 3,929 4,448 4,893 5,069 5,449
Operating Cost / Ton (INR) 500 691 611 500 511 494 454 479 493 493 475 475
Operating EBIDTA (INR Cr) 981 944 1,143 798 1,371 1,730 2,481 3,080 3,640 4,003 4,495 4,832
Operating EBIDTA / Ton (INR) 811 674 762 295 269 297 344 375 403 403 421 421
EBITDA Margin (%) 61.9 49.4 55.5 37.1 34.5 37.5 43.2 43.9 45.0 45.0 47.0 47.0

78 | P a g e ( 5 t h J u l 2 0 2 2 )
For any further query, please email us on [email protected]
AEL’s coal segment financial summary
Source: Ventura Research
Fig in INR Cr, unless specified FY23 FY24 FY25 FY26 FY27 FY28 FY29 FY30
Revenue from Commercial Mining 5,133.2 6,032.4 6,290.6 6,862.8 7,085.9 7,315.7 7,489.9 7,626.2
YoY Growth (%) 17.5 4.3 9.1 3.3 3.2 2.4 1.8
Revenue share of Mining 13.0 14.5 14.5 14.9 14.8 14.8 14.7 14.5
Revenue from IRM 30,245.5 30,848.4 31,463.4 32,090.7 32,730.5 33,383.1 34,048.8 34,727.8
YoY Growth (%) 2.0 2.0 2.0 2.0 2.0 2.0 2.0
Reveneu share of IRM 76.9 74.4 72.3 69.8 68.3 67.3 66.6 66.0
Revenue from MDO 3,975.4 4,607.8 5,749.3 7,008.9 8,087.8 8,896.6 9,563.8 10,281.1
YoY Growth (%) 15.9 24.8 21.9 15.4 10.0 7.5 7.5
Revenue share of MDO 10.1 11.1 13.2 15.2 16.9 17.9 18.7 19.5
Total Revenue from Coal 39,354.1 41,488.6 43,503.3 45,962.4 47,904.2 49,595.3 51,102.5 52,635.0
YoY Growth (%) 5.4 4.9 5.7 4.2 3.5 3.0 3.0
Total Expenses 36,717.8 38,524.1 39,654.4 41,280.1 42,466.9 43,229.3 44,041.9 45,151.0
Expenses to Sales (%) 93.3 92.9 91.2 89.8 88.6 87.2 86.2 85.8
EBITDA 2,636.3 2,964.5 3,848.8 4,682.2 5,437.3 6,366.0 7,060.7 7,484.0
EBITDA Margin (%) 6.7 7.1 8.8 10.2 11.4 12.8 13.8 14.2
Depreciation 692.0 767.2 773.0 817.8 834.5 857.8 866.0 873.4
EBIT 1,944.3 2,197.2 3,075.8 3,864.4 4,602.8 5,508.2 6,194.6 6,610.7
EBIT Margin (%) 4.9 5.3 7.1 8.4 9.6 11.1 12.1 12.6
Net Profit 1,464.0 1,567.5 1,995.4 2,746.0 3,345.4 4,040.7 4,604.8 4,957.2
Net Margin (%) 3.7 3.8 4.6 6.0 7.0 8.1 9.0 9.4
Cash Profit 2,156.0 2,334.7 2,768.5 3,563.8 4,179.9 4,898.5 5,470.8 5,830.5
Cash Profit Margin (%) 5.5 5.6 6.4 7.8 8.7 9.9 10.7 11.1
Net Worth 25,956.7 27,190.5 28,978.5 31,664.1 33,093.1 34,633.3 35,918.0 37,248.9
Return on Equity (%) 5.6 5.8 6.9 8.7 10.1 11.7 12.8 13.3
Capital Employed 39,205.3 41,196.5 43,798.7 46,602.9 47,185.2 48,018.6 48,318.0 48,666.3
Return on Capital Employed (%) 5.0 5.3 7.0 8.3 9.8 11.5 12.8 13.6
Invested Capital 36,631.2 38,622.3 41,431.2 44,219.8 44,464.3 44,938.2 44,856.4 44,809.2
Return on Invested Capital (%) 5.3 5.7 7.4 8.7 10.4 12.3 13.8 14.8
Cash Flow from Operations 2,144.8 2,026.4 2,225.9 1,956.3 2,764.1 3,930.2 3,216.1 3,335.8
Free Cash Flow to Firm 127.2 760.9 1,427.6 1,701.7 2,430.3 3,229.3 2,830.6 2,931.0
CFO to EBITDA (%) 81.4 68.4 57.8 41.8 50.8 61.7 45.5 44.6
FCFF to Cash Profit (%) 5.9 32.6 51.6 47.7 58.1 65.9 51.7 50.3
Net Capex 2,017.5 1,265.5 798.3 254.6 333.8 700.9 385.5 404.8
Net Capex to Sales (%) 5.1 3.1 1.8 0.6 0.7 1.4 0.8 0.8
Total Debt 13,248.6 14,006.1 14,820.2 14,938.8 14,092.1 13,385.4 12,400.0 11,417.4
Net Debt 10,674.5 11,431.8 12,452.7 12,555.7 11,371.2 10,304.9 8,938.4 7,560.3
Net Debt Equity (X) 0.4 0.4 0.4 0.4 0.3 0.3 0.2 0.2
Net Debt EBITDA (X) 4.0 3.9 3.2 2.7 2.1 1.6 1.3 1.0

79 | P a g e ( 5 t h J u l 2 0 2 2 )
For any further query, please email us on [email protected]
Source: Ventura Research
2
3
4
5
6
0
10,000
20,000
30,000
40,000
50,000
60,000
FY23 FY24 FY25 FY26 FY27 FY28 FY29 FY30
Consistent revenue performance is expected to sustain due to rising domestic coal demand
Commercial Mining IRM
MDO YoY Growth (%)
13 15 14 15 15 15 15 14
77 74 72 70 68 67 67 66
10 11 13 15 17 18 19 20
FY23 FY24 FY25 FY26 FY27 FY28 FY29 FY30
Revenue share of MDO and commercial mining to pickup in the coming years
Revenue share of Mining Reveneu share of IRM
Revenue share of MDO
0
2
4
6
8
10
12
14
16
0
1,000
2,000
3,000
4,000
5,000
6,000
7,000
8,000
FY23 FY24 FY25 FY26 FY27 FY28 FY29 FY30
Better capacity utilization of mines to improve operating profitability
EBITDA Net Profit
EBITDA Margin (%) Net Margin (%)
4
6
8
10
12
14
16
20,000
25,000
30,000
35,000
40,000
45,000
50,000
FY23 FY24 FY25 FY26 FY27 FY28 FY29 FY30
Retrun ratios to follow profitability and improve in the coming years
Net Worth Invested Capital
RoE (%) RoIC (%)
0
20
40
60
80
100
0
1,000
2,000
3,000
4,000
5,000
FY23 FY24 FY25 FY26 FY27 FY28 FY29 FY30
Higher operating profitability to improve operating cash flow and FCF
CFO FCFF
CFO to EBITDA (%) FCFF to Cash Profit (%)
0
1
2
3
4
5
6,000
8,000
10,000
12,000
14,000
16,000
FY23 FY24 FY25 FY26 FY27 FY28 FY29 FY30
Better operating cash flows would be utilized to repay the existing debt
Total Debt Net Debt
Net Debt Equity (X) Net Debt EBITDA (X)
Adani Coal Story in Charts

80 | P a g e ( 5 t h J u l 2 0 2 2 )
For any further query, please email us on [email protected]
Valuation
AEL is expected to become one of the largest players in the coal mining and trading business
in India. With the capability to procure or extract coal from multiple sources, the company has
de-risked its coal business model. We have used the DCF valuation methodology and
discounted back the future cash flows to FY25 and value the business at INR 173 per share.
DCF Valuation for AEL’s coal business
Source: Ventura Research
Cost of Equity (%) 12.8
Cost of Debt (%) 7.5
WACC (%) 10.5
Terminal Value Growth (%) 0.0
Particulars FY25 FY26 FY27 FY28 FY29 FY30
FCFF (INR Cr) 1,428 1,702 2,430 3,229 2,831 2,931
Discount Factor (X) 0.91 0.82 0.74 0.67 0.61 0.55
Discounted FCFF (INR Cr) 1,292 1,394 1,802 2,167 1,719 1,611
Total of Discounted FCFF (INR Cr) 9,984
Terminal Value (INR Cr) 27,935
PV of Terminal Value (INR Cr) 15,351
Value of Operations (INR Cr) 25,335
FY25 Net Debt (INR Cr) 12,453
FY25 Value of Equity (INR Cr) 12,882
Value per share (INR) 109

81 | P a g e ( 5 t h J u l 2 0 2 2 )
For any further query, please email us on [email protected]
AEL’s Road Construction Business

82 | P a g e ( 5 t h J u l 2 0 2 2 )
For any further query, please email us on [email protected]
Adani is a late entrant to the high-growth road sector
Even though Adani group’s vision was always to be the largest infrastructure player in India, it
had stayed away from the roads sector. Since contracts were only awarded only on an EPC
basis it did not evoke any interest from the group. However, the group was continuously on
the lookout for ruminated opportunities and continue to evaluating and monitoring the road
projects.
It was only in 2018 when NHAI started awarding contracts on HAM (Hybrid-Annuity Mode),
BOT (Build-Operate-Transfer) and TOT (Toll-Operate-Transfer) basis that the company started
focusing on the road sector.
AEL will primarily focus on HAM, BOT and TOT
Source: Ventura Research
AEL has every intent to become a giant domestic player in the roads vertical and is currently in
phase two of its growth strategy.
Items HAM BOT TOT EPC OMT Tolling
DescriptionMix of EPC & BOT
Design
Build – Finance –
Operate – Transfer
Right to collect user
fees or tolls on
highway stretches
Developer to lay roads
with no role in
ownership
Right to collect user
fees or tolls on
highway stretches
Concession
Period
Construction Period (2
– 2.5 years) + Fixed
Operations Period of 15
Construction Period (2
– 2.5 years) +
Operations Period of
20 years N/A 3-5 years
Revenue AnnuityToll collection /
AnnuityToll collection Based on Project Value Toll collection
Funding by
Developer
For funding 60% of Bid
Project Cost (BPC)
(Govt. Grant- 40%)
For funding 100%
project cost
For funding 100%
upfront Concession Fee
+ 100% augmentation
Working Capital based
on milestones
For funding 100%
Concession Fee in
installments
Financing
Risks
Concessionaire &
Authority. 40% of BPC
funded by Authority
Concessionaire Concessionaire Authority Concessionaire
O&M Risk Concessionaire Concessionaire Concessionaire Authority Concessionaire
Revenue
Risk Authority
BOT Toll –
Concessionaire BOT
Annuity - Authority
Concessionaire Authority Concessionaire
Award of
Contract
Lowest Bid NPV (NPV
of Bid Project Cost & 15
years O&M)
BOT Toll – Lowest Grant
/ Highest Premium BOT
Annuity – Lowest
Highest Upfront
Concession Fee
Lowest Construction
Cost
Highest 1st year
concession fee or
minimum O&M support

83 | P a g e ( 5 t h J u l 2 0 2 2 )
For any further query, please email us on [email protected]
Strategic roadmap for roads business
Source: Ventura Research
The business enjoys a pan-India presence with current projects in the sates of Chhattisgarh,
Telangana, Andhra Pradesh, Kerala, Orissa, Gujarat and West Bengal. As a developer, AEL’s
strategy will be to primarily target PPP projects structured on the lines BOT/ TOT/ HAM models.
As far as EPC projects are concerned, AEL will only take those projects that can offer scale and
complexity, marked by relatively low competition.
AEL’s portfolio of road projects
Source: Ventura Research

84 | P a g e ( 5 t h J u l 2 0 2 2 )
For any further query, please email us on [email protected]
The roads and highway business of AEL is expected to benefit from Bharatmala Pariyojana
Phase I. As per this 24,800 kms of national highways and 10,000 kms of residual road works
under National Highways Development Project (NHDP) are planned.
Bharatmala Yojna Phase I
Scheme Length kms Cost in INR cr
Economic corridors 9,000 120,000
Inter corridors and feeder roads 6,000 80,000
National corridor efficiency improvement 5,000 100,000
Border/International connectivity 2,000 25,000
Coastal and port connectivity 2,000 20,000
Expressways 800 40,000
Ongoing projects including NHDP 10,000 150,000
Total 34,800 535,000
Source: Company Reports
AEL expects portfolio of 12,000 lane Kms by 2026 from 450+kms currently
Source: Ventura Research

85 | P a g e ( 5 t h J u l 2 0 2 2 )
For any further query, please email us on [email protected]
Roads division project financing and debt tie ups for AEL
Source: Ventura Research
The roads division has also acquired a 49% stake in Maharashtra Border Checkpost Network
Ltd (MBCPNL) from Sadbhav Infrastructure Project Ltd at an enterprise value of INR 1,680 cr
(7x EBITDA), with an option to acquire additional stake, subject to approvals. With this
acquisition, AEL will get exclusive fee-collection rights from CVs at 24 entry points to
Maharashtra.
MBCPNL check posts - 18 operational, 5 near completion & 1 under construction
Source: Company Reports
Project Name Type Lane km CounterpartyAppointed
Date
Project
Cost
NHAI
Grant
Equity
Contr. Debt Lenders
Equity
infused till
date
BPRPL HAM 213 NHAI 8-Mar-19 1,115 413 210 491 L&T, BOI 195
SKRPL HAM 235 NHAI 27-Dec-19 1,564 626 338 600 L&T, BOI 338
MRRPL HAM 168 NHAI 17-Aug-20 1,357 543 264 550 Axis, Canara,
PFS, KBL, IB 264
VBPPL HAM 107 NHAI 7-Aug-21 1,546 618 279 649 Axis 147
NPRPL HAM 190 NHAI 7-Oct-21 867 347 160 360 Axis 85
AVRPL HAM 247 NHAI 30-Oct-21 1,803 735 321 747 Canara 87
KKRPL HAM 127 NHAI 15-Jan-22 1,040 416 187 437 Canara 95
BKRPL HAM 285 NHAI 13-Apr-22 1,169 467 211 491 Canara 4
PPRPL BOT 407 NHAI 2-Apr-22 2,600 0 900 1,700 L&T 138
PRSTPL TOT 352 NHAI 25-Nov-21 1,295 0 453 842 SBI 376
Sub Total (a) 2,331 14,356 4,165 3,323 6,867 1,729
Project Name Type Lane km CounterpartyAppointed
Date
Project
Cost
UPEIDA
Grant
Equity
Contr. Debt Lenders
Equity
infused till
date
BHRPL BOT 912 UPEIDA - 7,442 1,720 1,717 4,006 - -
HURPL BOT 936 UPEIDA - 7,670 2,177 1,648 3,845 - -
UPRPL BOT 942 UPEIDA - 7,951 2,099 1,756 4,096 - -
Sub Total (b) 2,790 23,063 5,996 5,121 11,947 -
MBCPNL BOT 24 BCP MSRDC, GoM Operational 1,562 1,147 ICICI, YBL,
RBL-
Sub Total (c) 2,790 1,562 1,147 -
Total (a+b+c) 5,116 38,981 10,161 8,425 19,961
NHAI projects - financing tie-ups and construction debt (INR Crs)
State projects - financing tie-ups and construction debt (INR Crs)

86 | P a g e ( 5 t h J u l 2 0 2 2 )
For any further query, please email us on [email protected]
NMP can accelerate the growth prospects for Road/Highways and airports business
Recently the government announced National asset monetization program (NMP). Under this
the strategic objective is to unlock the value of investments in brownfield public sector assets
by tapping institutional and long-term patient capital, which can thereafter be leveraged for
further public investments.
It is to be noted that under NMP only rights over asset will be transferred while ownership will
rest with the government. Thus the asset will be handed back to the government at the end of
the transaction life.
NMP Framework
Source: PIB & Ventura Research
The aggregate asset pipeline under NMP over FY22-25 is valued at INR 6.0 lakh cr of which
• Roads will constitute ~27% at INR 1.6 lakh cr
• Airports constitute ~3.5% at INR 0.2 lakh crore.
The monetization includes more than 20 asset classes totally besides roads & airports like
ports, railways, warehousing, gas & product pipeline, power generation and transmission,
mining, telecom, stadium, hospitality and housing.
The assets under the NMP are expected to be rolled out through public private partnership
concessions as well as capital market instruments such as InvIT’s.
The choice of instrument will be determined by
• the sector,
• nature of asset,
• timing of transactions (including market considerations),
• target investor profile, and
• the level of operational/investment control envisaged to be retained by the asset
owner etc.

87 | P a g e ( 5 t h J u l 2 0 2 2 )
For any further query, please email us on [email protected]
NMP estimates an aggregate monetization potential of Rs 6.0 lakh cr
Source: Ventura Research
NMP envisages monetization of assets worth INR 6 lakh cr
Source: PIB & Ventura Research
88,190
1,62,422
1,79,544 1,67,345
-
20,000
40,000
60,000
80,000
1,00,000
1,20,000
1,40,000
1,60,000
1,80,000
2,00,000
FY22 FY23 FY24 FY25
INR cr

88 | P a g e ( 5 t h J u l 2 0 2 2 )
For any further query, please email us on [email protected]
Source: Company Reports & Ventura Research
6,061
8,231
9,829 10,855
10,237
13,298
5,835
-
2,000
4,000
6,000
8,000
10,000
12,000
14,000
FY16 FY17 FY18 FY19 FY20 FY21 FY22*
Highway Construction in India (Kms)
52,500
49,700 42,600
47,889
48,883
66,613
78,109
98,204
1,10,815
-
20,000
40,000
60,000
80,000
1,00,000
1,20,000
FY11 FY12 FY13 FY14 FY15 FY16 FY17 FY18 FY22F
Number of construction equipment units sold
873
422
209
505450
0
100
200
300
400
500
600
700
800
900
1000
FY16 FY17 FY18 FY19 FY22T
Projects awarded to BOT private players (in kms)
Roads, 55.2%
Others, 44.8%
Total PPP Projects in India (FY21)
7.10
17.03
12.9014.22
15.4813.14
14.85
26.04
0
5
10
15
20
25
30
FY16 FY17 FY18 FY19 FY20 FY21 FY22 FY23
Outlay for roads under the respective Union Budgets (USD bn)
9.18
2.25
10.65
1.23 0.76 0.12 0.10 0.54 0.22 0.61 0.27
25.93
0
5
10
15
20
25
30
FY01-11 FY13 FY15 FY17 FY19 FY21
FDI Inflow (USD bn)
Road Sector Story in Charts

89 | P a g e ( 5 t h J u l 2 0 2 2 )
For any further query, please email us on [email protected]
Source: Ventura Research
213
403
954 800
414
1,120
880
1,767
0
200
400
600
800
1,000
1,200
1,400
1,600
1,800
2,000
FY22E FY23E FY24E FY25E
Annual Lane km Addition
Annuity Traffic
-50
0
50
100
150
200
250
0
2,000
4,000
6,000
8,000
10,000
12,000
14,000
FY22E FY23E FY24E FY25E
Segmentwise revenue breakup
Revenue - Annuity Projects Revenue - Traffic Projects
Annuity YoY Growth (%)-RHS Traffic YoY Growth (%)-RHS
INR cr
(5)
0
5
10
15
20
25
30
35
(1,000)
0
1,000
2,000
3,000
4,000
5,000
FY22E FY23E FY24E FY25E
EBITDA margins are expected to improve from hereon
EBITDA Net Profit
EBITDA Margin (%)- RHS Net Margin (%)- RHS
INR cr
(30)
(20)
(10)
0
10
20
30
40
50
60
(4,000)
(2,000)
0
2,000
4,000
6,000
8,000
FY22E FY23E FY24E FY25E
We expect EBITDA from BOT projects to be negative initially
EBIDTA - Annuity Proj EBIDTA - Traffic Proj
Annuity EBITDA (%)-RHS Traffic EBITDA (%)-RHS
INR cr
0
20
40
60
80
100
120
0
500
1,000
1,500
2,000
2,500
3,000
3,500
4,000
FY22E FY23E FY24E FY25E
We expect healthy cash flow generation over the forecasted period
CFO CFO to EBITDA (%)-RHS
CFO to Revenue (%)-RHS
INR cr
(2)(1)0123456789
0
10,000
20,000
30,000
40,000
50,000
60,000
70,000
80,000
90,000
FY22E FY23E FY24E FY25E
Return Ratios trajectory
Net Worth Capital Employed
RoE (%)-RHS RoCE (%)- RHS
INR Cr
Adani Road Story in Charts

90 | P a g e ( 5 t h J u l 2 0 2 2 )
For any further query, please email us on [email protected]
AEL’s road business financial summary
Source: Company Reports & Ventura Research
Fig in INR Cr (unless specified) FY22E FY23E FY24E FY25E FY26E FY27E FY28E FY29E FY30E
Annual Lane km addition 627.6 2,150.1 3,984.2 6,550.7 11,295.7 12,615.7 13,695.7 14,575.7 14,575.7
Annuity 213.2 402.5 954.1 800.0 600.0 600.0 600.0 400.0 0.0
Traffic 414.4 1,120.0 880.0 1,766.5 4,145.0 720.0 480.0 480.0 0.0
Cummulative Lane km 627.6 2,150.1 3,984.2 6,550.7 11,295.7 12,615.7 13,695.7 14,575.7 14,575.7
Annuity 213.2 615.7 1,569.8 2,369.8 2,969.8 3,569.8 4,169.8 4,569.8 4,569.8
Traffic 414.4 1,534.4 2,414.4 4,180.9 8,325.9 9,045.9 9,525.9 10,005.9 10,005.9
Revenue - Annuity Projects 2,525.3 7,694.1 12,282.9 10,544.6 10,720.6 11,019.2 8,143.0 3,809.3 3,142.7
YoY Growth (%) 204.7 59.6 -14.2 1.7 2.8 -26.1 -53.2 -17.5
Revenue - Traffic Projects 442.6 1,141.0 1,748.9 2,649.0 4,298.6 6,156.1 7,721.0 8,967.0 10,146.8
YoY Growth (%) 157.8 53.3 51.5 62.3 43.2 25.4 16.1 13.2
Total Revenue 2,967.9 8,835.2 14,031.9 13,193.6 15,019.2 17,175.2 15,864.0 12,776.3 13,289.6
YoY Growth (%) 2.0 0.6 (0.1) 0.1 0.1 (0.1) (0.2) 0.0
Operating Expenses 2,322.2 6,797.4 11,014.6 9,274.6 9,336.6 9,587.9 6,866.2 2,817.4 2,213.4
Operating Exp to Sales (%) 78.2 76.9 78.5 70.3 62.2 55.8 43.3 22.1 16.7
EBITDA 645.7 2,037.8 3,017.3 3,919.0 5,682.6 7,587.3 8,997.8 9,958.9 11,076.1
EBIDTA - Annuity Projects 424.4 2,951.3 6,350.2 6,105.5 6,431.6 6,774.6 5,737.6 3,264.4 2,615.3
EBIDTA - Traffic Projects 221.3 (913.1) (3,332.1) (2,185.4) (747.6) 814.4 3,262.0 6,696.4 8,462.7
Depreciation 106.1 460.0 777.5 1,575.8 2,918.2 3,760.1 4,327.1 4,841.8 5,109.0
EBIT 539.6 1,577.8 2,239.8 2,343.2 2,764.3 3,827.2 4,670.7 5,117.1 5,967.1
Margin(%) 18.2 17.9 16.0 17.8 18.4 22.3 29.4 40.1 44.9
Finance Cost 202.8 774.5 1,358.2 2,405.1 4,439.8 5,575.7 6,057.7 6,396.4 6,408.2
Other Income 5.8 11.4 18.2 29.7 54.6 78.8 103.1 123.7 137.2
Profit Before Tax 342.6 814.8 899.8 (32.1) (1,620.9) (1,669.7) (1,283.9) (1,155.6) (303.8)
Margin (%) 11.5 9.2 6.4 (0.2) (10.8) (9.7) (8.1) (9.0) (2.3)
Tax Expense 94.5 255.2 325.4 221.5 235.1 266.2 256.9 202.8 223.0
Tax Rate (%) 27.6 31.3 36.2 (688.9) (14.5) (15.9) (20.0) (17.5) (73.4)
PAT 248.0 559.5 574.4 (253.6) (1,856.0) (1,935.9) (1,540.8) (1,358.4) (526.9)
Margin (%) 8.4 6.3 4.1 (1.9) (12.4) (11.3) (9.7) (10.6) (4.0)
YoY Growth (%) 125.6 2.7 (144.2) 631.8 4.3 (20.4) (11.8) (61.2)
Net Block 4,731.9 12,195.2 21,877.8 39,884.3 74,714.3 82,642.2 89,003.1 92,855.4 87,746.4
Net Worth 3,208.4 7,594.7 12,842.2 21,496.8 24,395.6 25,298.3 24,623.3 23,239.7 22,668.4
Return on Equity (%) 7.7 7.4 4.5 (1.2) (7.6) (7.7) (6.3) (5.8) (2.3)
Capital Employed 9,198.1 26,110.7 52,671.1 78,322.3 93,427.4 102,584.7 106,138.0 103,567.5 99,033.3
Return on Capital Employed (%) 2.7 2.1 1.1 (0.3) (2.0) (1.9) (1.5) (1.3) (0.5)
Cash Flow from Operations 726.7 2,205.4 3,148.7 3,784.3 5,787.7 7,837.4 9,122.4 10,147.2 11,554.7
Cash Flow from Investing (7,097.6) (17,110.7) (26,874.5) (26,348.2) (17,131.3) (12,117.9) (7,131.7) (1,443.8) 0.0
Cash Flow from Financing 6,706.2 15,148.9 24,120.3 22,962.9 11,445.9 4,713.1 (1,101.5) (7,819.3) (10,749.3)
Net Cash Flow 335.3 243.6 394.5 399.0 102.3 432.6 889.3 884.1 805.3
CFO to Revenue (%) 24.5 25.0 22.4 28.7 38.5 45.6 57.5 79.4 86.9
CFO to EBITDA (%) 112.5 108.2 104.4 96.6 101.9 103.3 101.4 101.9 104.3
CFO to Net Profit (%) 293.0 394.2 548.2 (1,492.1) (311.8) (404.8) (592.1) (747.0) (2,193.1)
CFO to Net Worth (%) 22.6 29.0 24.5 17.6 23.7 31.0 37.0 43.7 51.0

91 | P a g e ( 5 t h J u l 2 0 2 2 )
For any further query, please email us on [email protected]
Valuation
AEL has every intent to become a giant domestic player in the roads vertical and is currently in
phase two of its growth strategy. AEL has been late entrant and it was only in 2018 when NHAI
started awarding contracts on HAM, BOT and TOT basis that the company started focusing on
the road sector. However, since then there has been no looking backward for the roads division
and the business has been scaled up very quickly.
We have valued the roads business by discounting the terminal value at the end of FY35
(arrived using EV/EBITDA multiple of 15x) and the interim period free cash flows at WACC of
11% and arrived at value of INR 330 per share.
DCF valuation of AEL’s road business
Source: Company Reports & Ventura Research
Cost of Equity (%) 12.5
Cost of Debt (%) 8.0
WACC (%) 11.0
Particulars FY25 FY26 FY27 FY28 FY29 FY30 FY31 FY32 FY33 FY34 FY35
FCFF (INR Cr) -12,473 -6,953 -5,489 -2,293 2,868 5,572 6,532 7,629 8,561 9,252 9,771
Discount Factor (INR Cr) 0.90 0.81 0.73 0.66 0.59 0.53 0.48 0.43 0.39 0.35 0.32
Discounted FCFF (INR Cr) -11,237 -5,643 -4,013 -1,510 1,702 2,979 3,146 3,310 3,347 3,258 3,100
Total of Discounted FCFF (INR Cr) -1,561
FY35 EBITDA (INR Cr) 14,484
EV/EBITDA multiple (x) 15
Terminal EV (INR Cr) 2,17,253
Discounted Terminal value (INR Cr) 76,513
Value of operations (INR Cr) 74,952
FY25 Net debt (INR Cr) 40,211
FY25 Value of equity (INR Cr) 34,742
Value per share (INR) 293

92 | P a g e ( 5 t h J u l 2 0 2 2 )
For any further query, please email us on [email protected]
AEL’s Data Center Business

93 | P a g e ( 5 t h J u l 2 0 2 2 )
For any further query, please email us on [email protected]
Data Centres though at a nascent stage have high growth prospects
The Indian data centre industry is expected to double and exceed 1 GW by 2023 given the
increased data consumption driven by:
• Laws pertaining to data localization within India
• Significant usage of social media and messaging services.
• Increased use of smart devices like smartphones, tablets, smart home solutions, etc.
• Increased adoption of IoT and cloud services by corporates. Make in India and China+1
will attract more corporates to set up facilities in India, which is expected to improve
demand for IoT and cloud services.
Data consumption trends in India
Source: TRAI Reports
COVID19 led travel restrictions and work from home has accelerated the data usage resulting
in increased demand for bandwidth as well as storage capacities. Although India has emerged
as one of the largest data consumers in the world, the number of data centres and their
capacities are significantly lower than in the US and China.
India’s data center market size and growth opportunities
Source: Company Reports & Ventura Research
141 152
178
200
30 37 44 55
2 3 5 7
CY14 CY16 CY18 CY20
Data center market size (USD Bn)
Global APAC India
4.35
10.09
0
2
4
6
8
10
12
2021 2027
India's data center market size outlook

94 | P a g e ( 5 t h J u l 2 0 2 2 )
For any further query, please email us on [email protected]
Why data centers will boom within India
• Data localization laws
• Data localization will reduce latency and increase the response speed of apps and
other online programs. This will benefit the end consumers and improve internet
usage.
• Data centres consume significant power and other resources and therefore, many
countries have paused the new construction of data centres to divert power supply for
other basic needs, and to focus on environmental sustainability. India is a natural fit
for global data centre operators looking at their expansion due to:
o The large domestic consumer base
o Significant scaling up of renewable power capacities, which will reduce the
reliance on thermal power for data centres.
Global majors have already started moving into India
Major investments announced in 2020 & 2021 besides Edge Connex and AEL JV:
• Carlyle bought a 25% stake in Extra Data (a wholly-owned subsidiary of Airtel) for the
USD 235 mn in July 2020.
• Equinix announced the acquisition of the India business of GPX Global Systems for USD
161 mn in August 2020.
• Iron Mountain agreed to form a joint venture with Indian colocation Data Centre
provider WebWerks. Iron Mountain expects to invest USD 150 million over the next
two years.
AEL entered into the data centre business in a JV with EdgeConneX, a company with a decade
of experience in serving global cloud service providers in mature markets.

95 | P a g e ( 5 t h J u l 2 0 2 2 )
For any further query, please email us on [email protected]
India’s data center market size and growth opportunities
Source: Company Reports & Ventura Research
AEL will leverage the vast quantum of data generated by the company’s various consumer-
facing businesses – airports, electricity distribution, edible oils, household gas connections, etc.
– that interface every single day with millions of customers and are expected to cover an
estimated 500 mn consumers by 2025. Initially, the plan is to build data centres in Delhi/NCR,
Mumbai, Chennai, Vizag & Hyderabad.
Current capacity of data centers in India is relegated to the Top 7 cities
Source: Cushman and Wakefield
Total Capacity % Share Total Sft
Bengaluru 162 MW 25 1.74 mn
Mumbai 289 MW 44 3.60 mn
Delhi 72 MW 11 1.05 mn
Pune 32 MW 5 0.44 mn
Chennai 57 MW 8 0.92 mn
Hyderabad 38 MW 6 0.71 mn
Kolkata 5 MW 1 0.07 mn
Total 655 MW 100

96 | P a g e ( 5 t h J u l 2 0 2 2 )
For any further query, please email us on [email protected]
Local data centre firms have received a considerable amount of financial backing from global
investment groups as each has looked at India as an attractive growth market. This backing will
enable each firm to scale across new markets and expand currently operating campuses to
respond to local demand. Investment has rapidly accelerated over the past two years, with
continued rumours of further new players coming soon.
Local data center players and tie-ups
Source: Cushman and Wakefield
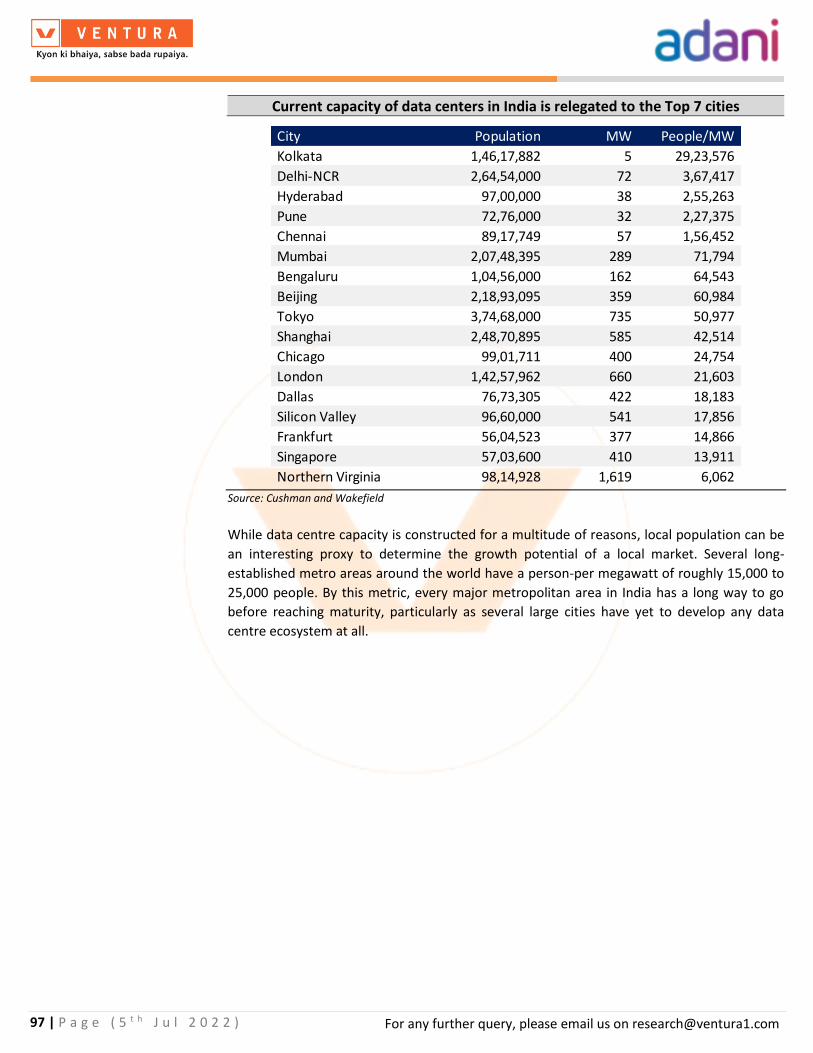
97 | P a g e ( 5 t h J u l 2 0 2 2 )
For any further query, please email us on [email protected]
Current capacity of data centers in India is relegated to the Top 7 cities
Source: Cushman and Wakefield
While data centre capacity is constructed for a multitude of reasons, local population can be
an interesting proxy to determine the growth potential of a local market. Several long-
established metro areas around the world have a person-per megawatt of roughly 15,000 to
25,000 people. By this metric, every major metropolitan area in India has a long way to go
before reaching maturity, particularly as several large cities have yet to develop any data
centre ecosystem at all.
City Population MW People/MW
Kolkata 1,46,17,882 5 29,23,576
Delhi-NCR 2,64,54,000 72 3,67,417
Hyderabad 97,00,000 38 2,55,263
Pune 72,76,000 32 2,27,375
Chennai 89,17,749 57 1,56,452
Mumbai 2,07,48,395 289 71,794
Bengaluru 1,04,56,000 162 64,543
Beijing 2,18,93,095 359 60,984
Tokyo 3,74,68,000 735 50,977
Shanghai 2,48,70,895 585 42,514
Chicago 99,01,711 400 24,754
London 1,42,57,962 660 21,603
Dallas 76,73,305 422 18,183
Silicon Valley 96,60,000 541 17,856
Frankfurt 56,04,523 377 14,866
Singapore 57,03,600 410 13,911
Northern Virginia 98,14,928 1,619 6,062

98 | P a g e ( 5 t h J u l 2 0 2 2 )
For any further query, please email us on [email protected]
Source: Ventura Research
8
0 0 0 0 0 0
17
4 3
6 6
2 0
17
10
6
20
25
10 10
0
5
10
15
20
25
30
Ch
en
nai
NM
1
NM
2
No
ida1
No
ida2
Hyd
era
bad
Pu
ne
Sales in MW across locations
FY23E FY24E FY25E
59.0
340.8
829.8
0
100
200
300
400
500
600
0
100
200
300
400
500
600
700
800
900
FY23E FY24E FY25E
Revenues are expected to commence meaningfully from FY24
Revenue from operations YoY growth % (RHS)
INR cr
44.1
271.2
644.1
11.2 38.8
(10.6) (10)
0
10
20
30
40
50
60
70
80
90
(100)
0
100
200
300
400
500
600
700
FY23E FY24E FY25E
Data centre business is expected to be highly profitable with high margins
EBITDA PAT
EBITDA margin % -RHS PAT Margin (%)- RHS
INR cr
2,826.9
5,665.7
7,756.0
0.0
0.2
0.4
0.6
0.8
1.0
1.2
1.4
1.6
1.8
2.0
0
1,000
2,000
3,000
4,000
5,000
6,000
7,000
8,000
9,000
FY23E FY24E FY25E
Debt is expected to be at elevated levels
Debt o/s Interest Coverage Ratio (X)- RHS
INR cr
(1,606.1)
4,935.5
6,437.5
(3,000)
(2,500)
(2,000)
(1,500)
(1,000)
(500)
0
500
1,000
1,500
2,000
(3,000)
(2,000)
(1,000)
0
1,000
2,000
3,000
4,000
5,000
6,000
7,000
FY23E FY24E FY25E
NWC is expected to be high initially
Net working capital Net Working to Sales (%)
INR cr
4,440.1
7,740.4
10,108.5
0.00
0.01
0.02
0.03
0.04
0.05
0.06
0.07
0.08
0.09
0
2,000
4,000
6,000
8,000
10,000
12,000
FY23E FY24E FY25E
Net fixed asset turnover is expected to be low initially
Net fixed assets Net fixed Asset Turnover (x)
INR cr
Adani Data Center Story in Charts

99 | P a g e ( 5 t h J u l 2 0 2 2 )
For any further query, please email us on [email protected]
AEL’s data center financial summary
Source: Company Reports & Ventura Research
Fig in INR Cr (unless specified) FY23E FY24E FY25E FY26E FY27E FY28E FY29E FY30E
Sales plan (MW)
Chennai 8.0 17.0 17.0 17.0 17.0 17.0 17.0 17.0
NM1 0.0 4.2 10.0 30.0 50.0 50.0 50.0 50.0
NM2 0.0 2.5 6.0 6.0 6.0 6.0 6.0 6.0
Noida1 0.0 5.8 20.0 30.0 40.0 50.0 50.0 50.0
Noida2 0.0 5.8 25.0 25.0 25.0 25.0 25.0 25.0
Hyderabad 0.0 1.7 10.0 20.0 40.0 60.0 100.0 100.0
Pune 0.0 0.0 9.8 19.6 29.4 39.2 49.0 49.0
Edge 0.0 0.0 0.0 10.0 10.0 10.0 10.0 10.0
Chennai 2 0.0 0.0 0.0 10.0 16.0 16.0 16.0 16.0
Revenue from operations 59.0 340.8 829.8 1,268.6 1,700.3 2,015.5 2,461.9 2,544.4
YoY Growth (%) 477.8 143.5 52.9 34.0 18.5 22.1 3.4
EBITDA 44.1 271.2 644.1 947.2 1,248.2 1,481.0 1,823.6 1,899.7
EBITDA Margin (%) 74.7 79.6 77.6 74.7 73.4 73.5 74.1 74.7
Depreciation 15.3 83.1 196.3 286.7 370.4 428.6 482.4 484.8
As a % of revenue 25.9 24.4 23.7 22.6 21.8 21.3 19.6 19.1
EBIT 28.8 188.1 447.8 660.4 877.8 1,052.4 1,341.2 1,414.9
As a % of revenue 48.8 69.4 54.0 52.1 51.6 52.2 54.5 55.6
Interest 16.3 103.2 358.1 487.5 592.6 675.7 719.1 706.7
As a % of revenue 27.6 30.3 43.2 38.4 34.9 33.5 29.2 27.8
Other finance costs 1.3 46.2 100.3 130.5 173.4 207.6 234.4 224.3
As a % of revenue 2.2 13.5 12.1 10.3 10.2 10.3 9.5 8.8
PBT 11.2 38.8 (10.6) 42.4 111.8 169.2 387.7 483.9
As a % of revenue 19.0 11.4 (1.3) 3.3 6.6 8.4 15.8 19.0
Tax 0.0 0.0 0.0 0.0 0.0 0.0 0.1 3.5
As a % of PBT 0.0 0.0 0.0 0.0 0.0 0.0 0.0 0.7
PAT 11.2 38.8 (10.6) 42.4 111.8 169.2 387.7 480.4
As a % of revenue 19.0 11.4 (1.3) 3.3 6.6 8.4 15.7 18.9
Net working capital (1,606.1) 4,935.5 6,437.5 7,819.2 8,384.7 8,813.8 7,898.3 6,979.5
As a % of revenue (2,723.1) 1,448.4 775.8 616.4 493.1 437.3 320.8 274.3
Debt O/s 2,826.9 5,665.7 7,756.0 9,732.5 10,919.2 11,972.8 11,636.1 11,667.5
Net fixed assets 4,440.1 7,740.4 10,108.5 12,193.2 13,281.9 14,268.0 13,834.8 13,400.9

100 | P a g e ( 5 t h J u l 2 0 2 2 )
For any further query, please email us on [email protected]
Valuation
The data centre business is in the nascent stage and is expected to commence operations in
FY23. However, post FY23 the business is expected to scale up rapidly. Also, being a new age
business we have assumed a terminal growth at 5.5% and hence arrive at FY25 value of INR 71
per share for AEL.
AEL’s data center DCF valuation
Source: Ventura Research
Cost of Equity (%) 13.5
Cost of Debt (%) 8.0
WACC (%) 12.0
Terminal Value Growth (%) 5.5
Particularls FY25 FY26 FY27 FY28 FY29 FY30 FY31 FY32 FY33
FCFF (INR Cr) -3,422 -2,806 -776 -363 2,690 2,757 2,738 2,706 2,692
Discount Factor (X) 0.89 0.80 0.71 0.64 0.57 0.51 0.45 0.40 0.36
Discounted FCFF (INR Cr) -3,056 -2,237 -553 -231 1,526 1,397 1,238 1,093 971
Total of discounted FCFF 150
Terminal value 43,690
Discounted Terminal value 15,755
Value of operations 15,905
FY25 Net debt 5,558
FY25 Value of Equity 10,346
Value per share (INR) 87

101 | P a g e ( 5 t h J u l 2 0 2 2 )
For any further query, please email us on [email protected]
AEL’s Airport Business

102 | P a g e ( 5 t h J u l 2 0 2 2 )
For any further query, please email us on [email protected]
Business structure of Adani Airports Holdings Limited (AAHL)
Through the Airports Authority of India’s globally competitive tendering process, Adani
Airports Holdings Limited (AAHL) won the mandate to modernize and operate six airports in
2019 – Ahmedabad, Lucknow, Mangaluru, Jaipur, Guwahati and Thiruvananthapuram.
AAHL will operate, manage and develop all these airports for 50 years.
Airport wise start and end date
Airport Start date End date
Ahmedabad 14-Feb-20 14-Feb-70
Mangalore 14-Feb-20 14-Feb-70
Lucknow 14-Feb-20 14-Feb-70
Jaipur 19-Jan-21 19-Jan-71
Guwahati 19-Jan-21 19-Jan-71
Trivandrum 19-Jan-21 19-Jan-71
Mumbai 4-Apr-06 4-Apr-66
Navi Mumbai 8-Jan-18 8-Jan-68
Source: Company Reports & Ventura Research
Besides the above airports' portfolio, the company has acquired a 74% stake in Mumbai
International Airport Limited (MIAL), a JV with the Airports Authority of India (by acquiring GVK
group’s 50.5% stake, 10% stake from the Airport Company of South Africa and 13.5% stake
from Bidvest).
Further, by acquiring the majority stake in MIAL, the company has gained direct control of the
upcoming Navi Mumbai airport as MIAL holds a 74% stake in the same.
Current capacity of data centers in India is relegated to the Top 7 cities
Source: Company Reports & Ventura Research

103 | P a g e ( 5 t h J u l 2 0 2 2 )
For any further query, please email us on [email protected]
Why the airport traffic in India is set to boom
The underpenetrated Indian market provides significant headroom for growth for
Airports
As per the International Air Transport Association (IATA), India is expected to overtake China
and the United States to become the world's third-largest air passenger market by 2030. Yet,
as measured by the Seat per Capita, India remains one of the most underpenetrated markets,
suggesting significant headroom for growth.
Seat per capita is low in India as compared to other countries
Source: Company Reports & Ventura Research
India’s growing middle class, rapid urbanization and increase in economic activity coupled with
its emerging status as an alternative to China's manufacturing augurs well for the growth of
the sector.
3.2
3.0
1.8
1.2
1.1
1.1
1.1
0.8
0.7
0.7
0.7
0.6
0.6
0.5
0.5
0.5
0.4
0.4
0.3
0.1
0.0 0.5 1.0 1.5 2.0 2.5 3.0 3.5
Australia
United States
Canada
Japan
Malaysia
Spain
Saudi Arabia
Turkey
Thailand
South Korea
Italy
Brazil
Indonesia
Russia
China
Mexico
Germany
Vietnam
Philippines
India
Top 20 Domestic Markets
16.7
14.9
12.4
8.5
5.3
4.4
4.4
3.0
3.0
2.4
2.4
2.2
2.0
1.6
1.3
1.0
0.9
0.6
0.1
0.1
0.0 3.0 6.0 9.0 12.0 15.0 18.0
UAE
Singapore
Hong Kong
Switzerland
Netherlands
United Kingdom
Spain
Taiwan
Germany
Italy
France
Canada
South Korea
Thailand
Turkey
Japan
United States
Russia
China
India
Top 20 International Markets

104 | P a g e ( 5 t h J u l 2 0 2 2 )
For any further query, please email us on [email protected]
India is expected to be 2nd fastest growing market in APAC
Source: Company Reports & Ventura Research
After the Regional connectivity scheme (UDAN) provided the initial boost to the airport
business, the draft new tourism policy is expected to usher in sustainable long-term growth.
Under the Regional connectivity scheme, the underserved airports are connected to key
airports through flights that were costing INR 2,500 for per hour flight. Since the introduction
of UDAN, air travel affordability got a boost along with air transport infrastructure
development.
UDAN has lead to better connectivity resulting in increase in flights to non-metro
Source: Company Reports & Ventura Research
89 106 122 116 122 139169
206243
275 275
3438
41 43 4751
55
59
65
69 67
0
50
100
150
200
250
300
350
400
FY10 FY11 FY12 FY13 FY14 FY15 FY16 FY17 FY18 FY19 FY20
India –Fastest growing aviation market over last decade
Domestic International
mn passengers
6.1% 6.2%
5.3% 5.2%
4.7%4.4%
0%
1%
2%
3%
4%
5%
6%
7%
India Vietnam Phillipines Indonesia China Malaysia
Passenger CAGR (2018-2040)
236268
357389 403
0
50
100
150
200
250
300
350
400
450
Dec,19 Aug,20 June,21 Oct,21 Jan,22
No of flights to non metros

105 | P a g e ( 5 t h J u l 2 0 2 2 )
For any further query, please email us on [email protected]
UDAN policy impact on Indian airports
Source: Company Reports & Ventura Research
The draft tourism policy aspires to make India one of the top five global destinations by 2030.
As per the policy, five key areas are to be given significant focus in the next 10 years:
• green tourism,
• digital tourism,
• destination management,
• skilling the hospitality sector and
• supporting tourism-related MSMEs
While we believe that in the short run international traffic to India will lag domestic traffic
growth owing to the geopolitical conflict (post the Ukraine war), the increase in the number of
flights to non-metro routes will help improve domestic connectivity and in turn traffic growth.
In the long run, the adoption of the new tourism policy will help improve the perception of
India as a safe and preferred travel destination which will help in increasing international traffic
growth also.

106 | P a g e ( 5 t h J u l 2 0 2 2 )
For any further query, please email us on [email protected]
Adoption of new tourism policy will promote international traffic although same will remain lower in short run
Source: Company Reports & Ventura Research
India’s economic development to boost international travel
India is the only large market which is expected to sustain high GDP growth. This coupled with
the explosion in the merchandise EXIM trade and services due to
• PLI schemes across various sectors
• China +1 policies
• Make in India
is expected to improve international business travel in the long run.
High growth projections and a rise in EXIM trade augurs well for the airport sector
Particulars Trade Type Mar 2022 (USD bn)
Mar 2021 (USD bn)
Mar 2020 (USD bn)
Growth vis-a-vis
Mar 2021 (%)
Growth vis-a-vis
Mar 2020 (%)
Merchandise Exports 42.2 35.3 21.5 19.8 96.5
Imports 60.7 48.9 31.5 24.2 93.0
Trade Balance -18.5 -13.6 -10.0 -35.7 -85.5
Services Exports 22.5 20.8 17.6 8.3 28.3
Imports 13.2 12.3 10.1 7.3 30.5
Net of Services 9.4 8.5 7.5 9.7 25.3
Overall Trade Exports 64.8 56.1 39.1 15.5 65.8
Imports 73.9 61.2 41.6 20.8 77.8
Trade Balance -9.2 -5.1 -2.5 -79.2 -265.1
Source: Company Reports & Ventura Research
265
308344 340
115
181
310
416
476
0
50
100
150
200
250
300
350
400
450
500
FY17 FY18 FY19 FY20 FY21 FY22 FY23E FY24E FY25E
Air traffic in mn pax p.a
80% 81%91% 94% 93% 87%
20% 19%9% 6% 7% 13%
FY19 FY20 FY21 FY22 FY23 FY24
Internation traffic to lag due to geopolitical conflicts
Domestic International
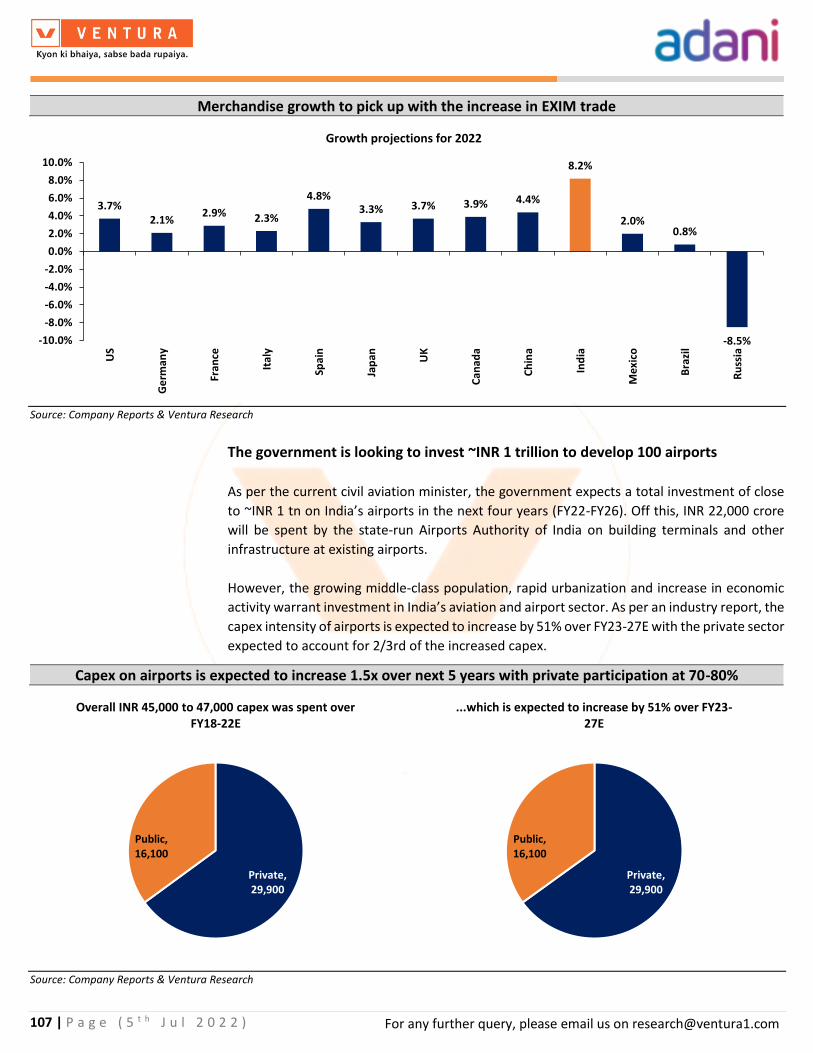
107 | P a g e ( 5 t h J u l 2 0 2 2 )
For any further query, please email us on [email protected]
Merchandise growth to pick up with the increase in EXIM trade
Source: Company Reports & Ventura Research
The government is looking to invest ~INR 1 trillion to develop 100 airports
As per the current civil aviation minister, the government expects a total investment of close
to ~INR 1 tn on India’s airports in the next four years (FY22-FY26). Off this, INR 22,000 crore
will be spent by the state-run Airports Authority of India on building terminals and other
infrastructure at existing airports.
However, the growing middle-class population, rapid urbanization and increase in economic
activity warrant investment in India’s aviation and airport sector. As per an industry report, the
capex intensity of airports is expected to increase by 51% over FY23-27E with the private sector
expected to account for 2/3rd of the increased capex.
Capex on airports is expected to increase 1.5x over next 5 years with private participation at 70-80%
Source: Company Reports & Ventura Research
3.7%2.1%
2.9% 2.3%
4.8%3.3% 3.7% 3.9% 4.4%
8.2%
2.0%0.8%
-8.5%-10.0%
-8.0%
-6.0%
-4.0%
-2.0%
0.0%
2.0%
4.0%
6.0%
8.0%
10.0%
US
Ge
rman
y
Fran
ce
Ital
y
Spai
n
Jap
an UK
Can
ada
Ch
ina
Ind
ia
Mex
ico
Bra
zil
Ru
ssia
Growth projections for 2022
Private, 29,900
Public, 16,100
Overall INR 45,000 to 47,000 capex was spent over FY18-22E
Private, 29,900
Public, 16,100
...which is expected to increase by 51% over FY23-27E
108 | P a g e ( 5 t h J u l 2 0 2 2 )
For any further query, please email us on [email protected]
Inclusion of ATF under GST is expected to lower airfare boosting air travel
To lessen the burden of increasing fuel prices, the government is planning to bring jet fuel
under the purview of the GST regime. In the meantime, the states have been requested to
lower VAT on the same.
The airports business is at an inflexion point given the expectation of high GDP
growth
As per research conducted by the International Air Transport Association (IATA), countries like
Norway and Switzerland average above two flights per capita per year while there are also
countries like Uganda where less than 1% of the population flies once a year. However, the
most significant point that came out of the IATA research was that countries on the higher end
of the spectrum in terms of flights per capita were also more economically developed than
countries with lower flights per capita.
As per an industry report, the number of passengers at airports grows at a rate of about 1.5x
that of GDP. We believe that the airport business of AEL is now at an inflexion point given the
expectation of a high GDP growth rate for India as compared to other advanced economies
which should ultimately lead to an increase in passenger traffic due to high business travel and
an increase in disposable income.
NMIAL is not expected to cannibalise the traffic of MIAL but will only help in the
acceleration of traffic growth
As per the management, the upcoming NMIAL (Navi Mumbai airport) is not expected to
cannibalise traffic of the existing MIAL airport given:
• Optimal utilization of MIAL prior to Covid-19 outbreak,
• Phase-wise commencement of capacity at NMIAL,
• Impact of traffic diversion assumed by independent consultant mitigate the traffic
diversion risk to a large extent.

109 | P a g e ( 5 t h J u l 2 0 2 2 )
For any further query, please email us on [email protected]
Understanding the revenue mechanism of Airports business in India
An airport operator in India has two sources of revenue
• Aero revenues, and
• Non-aero revenues.
Aero revenues primarily comprise of:
• Landing and parking charges,
• Aero bridge charges, and
• User development fees.
The aero charges are regulated by an independent regulatory body - AERA (Airports Economic
regulatory authority). The creation of AERA has ensured that a well-defined Model Regulatory
environment is put in place for establishing a well-defined Tariff implementation process that
promotes efficiency and stability.
The non-aero revenue is unregulated and consists of food & beverages, retail, duty-free
shopping, cargo and ground handling etc.
The return on the regulated aero assets (RAB) is worked out using a hybrid till tariff structure
involving true-up/ true-down of the revenue takes care of the traffic fluctuations at the time
of the next tariff determination process thereby rendering visibility to the revenue stream.
Airport sector in India operates in a fairly regulated environment with assured returns
Source: Company Reports & Ventura Research

110 | P a g e ( 5 t h J u l 2 0 2 2 )
For any further query, please email us on [email protected]
How AEL expects to improve aero revenues
The AEL management developed a four-pronged strategy to increase aero revenues in the long
term. It includes the following:
• Increasing network strength
o Leveraging network synergies to increase market competitiveness.
o Route development strategy to leverage the international gateway and
regional footprint.
• Asset utilization
o Slot planning to work cohesively with route development strategy.
o Optimizing slot planning to provide efficient service to airlines.
• Stakeholder Management
o Establishing long-term partnerships with anchor airlines to enable sharing of
data.
o Creating a market-pull mechanism to feed into airport infrastructure planning.
• Aero operational efficiency
o Minimizing turnaround time for airlines.
o Ensuring the highest level of safety.
o Providing full suite services to airlines.
How AEL expects to improve non-aero revenues
In order to increase non-aero revenues, AEL envisages converting the business model from B2B
to B2C. This is on the lines of the successes achieved at the Changi airport. This is to be
developed on the lines of Changi airport which houses several fancy shopping malls,
restaurants & world’s largest indoor waterfall.
Non Aero revenues for Indian airports still below developed world airports
Source: Company Reports & Ventura Research
# It is to be noted that the 7 airports (Navi Mumbai excluded) touch ~25% of India’s total air traffic consumer base of >300 mn people.
71
251
0
50
100
150
200
250
300
2017 2020
Non aero avg spend increased by 254% in 2020 over 2017
INR
1.6 1.7 1.81.6
1.8 1.6
3.8 3.7 3.7 3.8 3.74
0.0
0.5
1.0
1.5
2.0
2.5
3.0
3.5
4.0
4.5
2014 2015 2016 2017 2018 2019
Non-aeronautical revenues per passenger (USD)
AAI airports PPP airports
65 64 60 57 56 50 49 45
35 36 40 43 44 50 51 55
AT
L
DA
A
AD
P
HK
G
SIN
DFW AD
L
Ind
ian
PP
P
…% contribution of non-aero revenues lower than key
international airports
Non Aero Aero

111 | P a g e ( 5 t h J u l 2 0 2 2 )
For any further query, please email us on [email protected]
AAHL plans to increase passenger footfall and provide a network effect in the following ways:
• Establish first-rate infrastructure on the air and land sides of the airport to enhance
quality travel time for passengers.
• Creating locally relevant architecture in and around airports to attract foreign tourists
and domestic passengers.
• Developing entertainment destinations (airport villages, hotels and malls, among
others).
• Enhancing domestic airline connectivity with new and under-prioritised locations.
• Raise the number of international flights; reducing the delay between two flights.
The 7 airports handle ~25% of India’s air traffic consumer base of >30 cr
Source: Company Reports & Ventura Research
Non-aero strategy of airports business
Source: Company Reports & Ventura Research
45.9
11.4
5.5 5.4 3.91.9
5.0
0
5
10
15
20
25
30
35
40
45
50
Mumbai Ahmedabad Guwahati Lucknow Trivandram Mangaluru Jaipur
Passenger footfalls in mn in FY20

112 | P a g e ( 5 t h J u l 2 0 2 2 )
For any further query, please email us on [email protected]
AEL’s airport revenue structure
Source: Company Reports & Ventura Research

113 | P a g e ( 5 t h J u l 2 0 2 2 )
For any further query, please email us on [email protected]
Case study of Changi airport
Singapore Changi International Airport received the World's Best Airport from Skytrax for the 8th consecutive year. According
to the Changi Airport Group (Changi Airport Group), the airport reported a 5.2% growth in passenger movement (66.3 mn
passengers) as of FY19. This number is a nearly 80% increase compared to when Changi was corporatized ten years ago.
The cargo traffic has been steady and was reported at 2.14 million tons, while commercial flights were steadily rising, with
386,000 flights as of the end of March 2019. However, what made Changi unique is the 10 points as defined under the Canvas
framework:
Customer Segments: There are several customer segments involving airport operations. They can be classified into the
aeronautical customer segments:
• Airline
• Airports
• passengers and
• nonaeronautical customer segments.
Thus, an airport should be considered a multiple-sided platform.
Customer segments of Changi airport
Source: Company Reports & Ventura Research
The Changi airport serves businesses and passengers and pays attention to residents of all ages as Changi regards itself as
operating as a transportation platform and performing as a destination. The business activities beyond aircraft taking-off and
landing, such as special events and holiday activities are held to attract diverse customer segments. For example, the Changi
Love Kid project is arranged to serve the family segment. Such projects encourage residents to stay within airport areas.

114 | P a g e ( 5 t h J u l 2 0 2 2 )
For any further query, please email us on [email protected]
Value proposition: Singapore International Airport offers value propositions such as airport performance, customization, design
and usability to each customer segment. Daily airport operations and airside management serve thousands of aircraft taking off
and landing every day. Aprons, taxiways, baggage belts, safety inspections, and other tasks relevant to in-and-out airport areas
are delivered to the airlines. Creating passengers’ experiences is the heart of the value proposition.
The airport arranges attractions for children to adult passengers and residents. Everything is laid out in green environments.
They include event spaces, indoor gardens, community spaces with seating areas, activities for the family, an inflatable
playground, entertainment zones, movie theatres, and lounges.
Channels: To propose retail businesses' values, the airport connects passengers, Singaporean residents and travellers through
the highly interactive website and iShop Changi. The e-commerce portal represents an attempt to enhance the digital
experiences and ecosystem for linking the passengers with resident touch points. This platform is also redesigned to tailor and
personalized customer preferences through various other services. Correspondingly, Changi Rewards, the loyalty program, has
been developed to introduce several member benefits as after-sale services.
Website of iShop Changi
Source: Company Reports & Ventura Research
Customer relationships: There are many types of customer relationships provided at this airport. Self-services are available
throughout the process. With the automated FAST System (Fast and Seamless Travel), passengers can check in, drop off their
baggage, and pass through immigration and the boarding gate seamlessly.
Revenue streams: There are many types of customer relationships provided at this airport. Self-services are available throughout
the process. With the automated FAST System (Fast and Seamless Travel), passengers can check in, drop off their baggage, and
pass through immigration and the boarding gate seamlessly.
The airport also created the Changi Airport Growth Initiative (CAGi) for its customers. This program collaborates with airline
customers to drive the traffic connectivity to Singapore Changi International Airport. It encourages customers to pursue business
growth and especially helps airlines to strengthen their long-haul connections, which are key to the airport’s success. This
program also offers rebates to offset the incremental aeronautical charges.

115 | P a g e ( 5 t h J u l 2 0 2 2 )
For any further query, please email us on [email protected]
Key resources: The key resources involve the sources of value propositions. Singapore Changi International Airport always
focuses on how to manage the talents in its organization. The airport values people’s development as the key success factor.
Through a series of talent pools via several engaging and training programs, Changi Airport Group creates a conducive culture,
a sense of belonging in the workplace through the CAG Home Project; internal communications via the CAG social-networking
application; a revamped company intranet; a collaborative and open atmosphere through crowdsourcing, personal
development and growth; an Employee-Engagement Survey; and skills training for the fast-changing environments.
Key activities: The airport’s development in the form of a multi-sided platform is a key activity to propose the values for all
stakeholders. Such development includes the FAST system in Terminal 4, the completion of 3 runways for sufficient capacity
management in the future, and the Jewel Changi Project.
The airport-development activities of the Jewel Changi Airport offer transit and department malls. To create fresh, green, and
exciting experiences for passengers and residents, the Jewel areas comprise four main iconic destinations – the HSBC Rain
Vortex, the Shiseido Forest Valley, Canopy Park, and the Changi Experience Studio.
Key Partnerships: The airport maintains charges for its airline and air cargo partners to ensure its position as an aviation hub.
The airport also facilitates quality input to support the needs for growth and future expansion. Changi Airport Group cooperates
with the Singapore Tourism Board (STB) and Costa Cruises to participate in a tripartite partnership to develop the airport as a
cruise destination in Southeast Asia.
Cost structure: The cost structure of the airport mostly comes from the depreciation, amortization, and service and security-
related fees of approximately 26% and 24%. As of the 2018/2019 financial year, the costs incurred from several airport
developments, such as capacity investments, additional human-resources planning, and terminal expansion, support the various
projects, whereas the new regulatory measures also contribute to an increase in operating costs.
Sustainability: Changi also focuses on sustainability. The airport pays attention to Sustainable Development Goals (SDGs) in
compliance with the United Nations. The Sustainability Working Group and Changi Foundation were established to initiate
social- responsibility programs across the country.

116 | P a g e ( 5 t h J u l 2 0 2 2 )
For any further query, please email us on [email protected]
Airport business is expected to create strategic benefit for the group as per Group
Chairman
As per Mr Gautam Adani, the airport business will provide a transformational platform that
will help shape and create strategic adjacencies for other B2B businesses of the Adani group.
He expects Mumbai airport to not only be India’s leading airport, but a key domestic and
international hub as well on the back of air passenger traffic in the country growing five-fold
and the expectation of 200 new airports being built to handle over 1 billion domestic and
international passengers across tier-I, tier-II and tier-III cities—most of which will connect with
Mumbai.
We expect AEL to make further inroads in the airport business by participating in upcoming
bids for the privation of airports.
Upcoming airports for privatization
Privatization Plan
Till FY22 FY23 FY24 FY25
Triupati Bhubaneshwar Calicut Chennai Imphal
Kushinagar Varanasi Coimbatore Vijaywada Agartala
Kangra Amritsar Nagpur Triupati Udaipur
Aurangabad Trichy Patna Vadodara Dehradun
Jabulpur Indore Madurai Bhopal Rajamundhry
Hubli Raipur Surat Hubli
Gaya Ranchi Jodhpur
Source: Company Reports, Bloomberg & Ventura Research

117 | P a g e ( 5 t h J u l 2 0 2 2 )
For any further query, please email us on [email protected]
977.0 1,060.0
2,341.0
5,360.4 5,750.7
0
1,000
2,000
3,000
4,000
5,000
6,000
7,000
FY21 FY22E FY23E FY24E FY25E
Aero rev in INR cr
INR cr
778.5
1,247.1
2,619.5
4,045.7
4,976.5
0
1,000
2,000
3,000
4,000
5,000
6,000
FY21 FY22E FY23E FY24E FY25E
Non Aero rev in INR cr
INR cr
12.1 24.4 26.7
86.7
299.7
0
50
100
150
200
250
300
350
FY21 FY22E FY23E FY24E FY25E
Rentals in INR cr
INR cr 104.5
19.8
31.4
45.1
59.1
0
20
40
60
80
100
120
FY21 FY22E FY23E FY24E FY25E
Other operating revenues in INR crINR cr
249.4
(47.2)
1,262.6
4,818.3
5,888.6
-10
0
10
20
30
40
50
60
-1,000
0
1,000
2,000
3,000
4,000
5,000
6,000
7,000
FY21 FY22E FY23E FY24E FY25E
Chart Title
EBITDA EBITDA margin % - RHS
INR cr
(1,391.9)
(1,976.0)
(935.7)
2,176.1 2,251.1
-100
-80
-60
-40
-20
0
20
40
-2,500
-2,000
-1,500
-1,000
-500
0
500
1,000
1,500
2,000
2,500
FY21 FY22E FY23E FY24E FY25E
Chart Title
PAT PAT margin % - RHS
INR cr
Adani Airport Story in Charts

118 | P a g e ( 5 t h J u l 2 0 2 2 )
For any further query, please email us on [email protected]
Source: Ventura Research
4.95.6
7.3
9.0 9.1
3.4
1.6 1.8 1.9 2.2 2.3
0.2
0.0
1.0
2.0
3.0
4.0
5.0
6.0
7.0
8.0
9.0
10.0
FY16 FY17 FY18 FY19 FY20 FY21
Ahmedabad traffic data in mn
Domestic international
1.0 1.0
1.5 1.5
1.3
0.5
0.7 0.70.8 0.7
0.6
0.2
0.0
0.2
0.4
0.6
0.8
1.0
1.2
1.4
1.6
FY16 FY17 FY18 FY19 FY20 FY21
Mangaluru traffic data in mn
Domestic international
2.7
3.3
4.0
4.7 4.7
2.0
0.6 0.7 0.7 0.8 0.70.4
0.0
0.5
1.0
1.5
2.0
2.5
3.0
3.5
4.0
4.5
5.0
FY16 FY17 FY18 FY19 FY20 FY21
Lucknow traffic data in mn
Domestic international
45.1
51.3
58.562.1 60.3
0.5
17.1 18.4
0.8
21.318.8
2.6
0.0
10.0
20.0
30.0
40.0
50.0
60.0
70.0
FY16 FY17 FY18 FY19 FY20 FY21
AAHL traffic data in mn
Domestic international

119 | P a g e ( 5 t h J u l 2 0 2 2 )
For any further query, please email us on [email protected]
AEL’s airport financial summary
Source: Company Reports & Ventura Research
Fig in INR Cr (unless specified) FY21 FY22 FY23E FY24E FY25E FY26E FY27E FY28E FY29E FY30E
Revenue from operations 1,872.0 2,351.3 5,018.5 9,538.0 11,086.0 15,288.1 17,671.9 20,576.3 23,940.6 25,258.4
YoY Growth (%) 26% 113% 90% 16% 38% 16% 16% 16% 6%
Aeronautical revenues 977.0 1,060.0 2,341.0 5,360.4 5,750.7 8,469.7 9,384.0 10,857.5 12,539.4 12,228.5
YoY Growth (%) 8% 121% 129% 7% 47% 11% 16% 15% -2%
Non-Aeronautical revenues 778.5 1,247.1 2,619.5 4,045.7 4,976.5 6,241.0 7,490.9 8,643.4 10,034.1 11,385.6
YoY Growth (%) 60% 110% 54% 23% 25% 20% 15% 16% 13%
Rentals from development 12.1 24.4 26.7 86.7 299.7 510.5 726.8 1,005.1 1,299.0 1,570.4
Other operating income 104.5 19.8 31.4 45.1 59.1 66.9 70.2 70.3 68.0 73.9
Operating expenses (1,622.6) (2,398.5) (3,756.0) (4,719.7) (5,197.4) (6,364.2) (7,207.2) (8,055.2) (9,056.2) (9,550.5)
Operating expenses to Sales (%) (86.7) (102.0) (74.8) (49.5) (46.9) (41.6) (40.8) (39.1) (37.8) (37.8)
EBITDA 249.4 (47.2) 1,262.6 4,818.3 5,888.6 8,923.9 10,464.7 12,521.1 14,884.4 15,707.9
EBITDA Margin (%) 13.3 (2.0) 25.2 50.5 53.1 58.4 59.2 60.9 62.2 62.2
YoY Growth (%) (118.9) (2,774.3) 281.6 22.2 51.5 17.3 19.7 18.9 5.5
Depreciation (770.0) (773.4) (1,039.0) (1,076.7) (1,322.1) (2,140.5) (2,366.6) (3,064.6) (3,092.4) (3,202.2)
EBIT (520.6) (820.6) 223.6 3,741.6 4,566.5 6,783.4 8,098.1 9,456.5 11,792.1 12,505.7
Margin(%) (27.8) (34.9) 4.5 39.2 41.2 44.4 45.8 46.0 49.3 49.5
Finance Cost (871.3) (1,150.2) (1,067.4) (1,392.3) (2,126.3) (3,260.4) (3,552.2) (4,098.9) (4,539.7) (4,887.7)
Profit Before Tax (1,391.9) (1,970.8) (843.8) 2,349.2 2,440.2 3,523.0 4,545.9 5,357.6 7,252.4 7,618.0
Margin (%) (74.4) (83.8) (16.8) 24.6 22.0 23.0 25.7 26.0 30.3 30.2
Tax Expense 0.0 (5.2) (91.9) (173.2) (189.1) (282.0) (404.1) (571.5) (762.2) (1,141.4)
Tax Rate (%) 0.0 0.3 10.9 (7.4) (7.7) (8.0) (8.9) (10.7) (10.5) (15.0)
PAT (1,391.9) (1,976.0) (935.7) 2,176.1 2,251.1 3,241.0 4,141.8 4,786.1 6,490.2 6,476.7
Margin (%) (74.4) (84.0) (18.6) 22.8 20.3 21.2 23.4 23.3 27.1 25.6
YoY Growth (%) 42.0 (52.6) (332.5) 3.5 44.0 27.8 15.6 35.6 (0.2)
Net Block 8,094.0 9,833.1 15,158.2 22,906.2 43,844.8 52,350.8 53,508.3 63,048.2 61,594.3 64,852.4
Net Working Capital 320.6 329.9 598.6 1,033.5 1,173.3 1,515.2 1,697.1 1,946.1 2,229.5 2,359.3
Net Worth 3.7 (1,583.9) 2,495.3 4,618.1 6,871.5 9,841.9 13,195.3 17,285.1 22,685.8 28,235.9
Return on Equity (%) (38,079.8) 124.8 (37.5) 47.1 32.8 32.9 31.4 27.7 28.6 22.9
Capital Employed 14,420.5 26,050.8 36,281.2 50,227.0 59,722.4 69,388.2 79,538.0 87,995.1 97,979.4 109,605.1
Return on Capital Employed (%) (3.6) (3.2) 0.6 7.4 7.6 9.8 10.2 10.7 12.0 11.4
Cash Flow from Operations 1,192.3 (692.0) 899.2 4,207.5 5,557.0 8,297.4 9,876.9 11,700.2 13,838.3 14,436.3
Cash Flow from Investing (5,224.4) (8,502.6) (13,166.4) (12,146.1) (7,661.3) (7,432.0) (7,324.7) (6,707.3) (5,072.4) (9,094.4)
Cash Flow from Financing 4,160.2 11,968.2 11,409.5 11,144.1 5,622.0 2,784.6 3,670.5 876.4 22.0 1,218.4
Net Cash Flow 128.0 2,773.5 (857.6) 3,205.5 3,517.7 3,650.0 6,222.8 5,869.4 8,787.9 6,560.3
Free Cash Flow (655.8) (6,350.3) (12,148.2) (8,038.5) (2,266.3) 607.1 2,238.0 4,556.2 8,289.2 4,610.1
FCF to Revenue (%) (35.0) (270.1) (242.1) (84.3) (20.4) 4.0 12.7 22.1 34.6 18.3
FCF to EBITDA (%) (263.0) 13,450.7 (962.2) (166.8) (38.5) 6.8 21.4 36.4 55.7 29.3
FCF to Net Profit (%) 47.1 321.4 1,298.2 (369.4) (100.7) 18.7 54.0 95.2 127.7 71.2
FCF to Net Worth (%) (17,940.6) 400.9 (486.8) (174.1) (33.0) 6.2 17.0 26.4 36.5 16.3
Total Debt 14,416.9 27,634.7 33,785.9 45,609.0 52,851.0 59,546.3 66,342.7 70,710.1 75,293.6 81,369.1
Net Debt 13,895.1 23,858.5 30,647.6 44,620.3 51,406.4 58,000.7 64,656.4 68,966.8 73,412.7 79,319.3
Net Debt to Equity (X) 3,801.4 (15.1) 12.3 9.7 7.5 5.9 4.9 4.0 3.2 2.8
Net Debt to EBITDA (X) 55.7 (505.4) 24.3 9.3 8.7 6.5 6.2 5.5 4.9 5.0

120 | P a g e ( 5 t h J u l 2 0 2 2 )
For any further query, please email us on [email protected]
Valuation
We have valued the airport business using DCF methodology for 6 airports namely
Ahmedabad, Mangaluru, Lucknow, Guwahati, Trivandrum and Jaipur. For MIAL and NMIAL ,
we have applied an EV/EBITDA multiple of 15x.
DCF valuation of Airport business
Source: Ventura Research
Valuation of 6 airports (excluding MIAL and NMIAL)
Cost of Equity (%) 12.5
Cost of Debt (%) 8.0
WACC (%) 11.0
Particulars FY25 FY30 FY35 FY40 FY45 FY50 FY55 FY60 FY65 FY70
FCFF (INR Cr) (327) 2,597 9,894 12,366 16,445 19,056 22,093 25,676 25,660 31,302
Discount Factor (X) 0.90 0.53 0.32 0.19 0.11 0.07 0.04 0.02 0.01 0.01
Discounted FCFF (INR Cr) (294.4) 1,541.5 3,484.5 2,584.5 2,039.8 1,402.7 965.1 665.6 394.8 285.8
Total of Discounted FCFF (INR Cr) 74,445
FY25 Net Debt (INR Cr) 11,749
FY25 Value of Equity (INR Cr) 62,697
Valuation of MIAL
FY30 EBITDA (INR Cr) 2,441
EV/EBITDA multiple (X) 15
MIAL Enterprise Value FY30 (INR Cr) 36,622
FY25 Discounted EV (INR Cr) 21,733
FY25 Net debt (INR Cr) 8,238
FY25 Equity value (INR Cr) 13,495
Valuation of NMIAL
FY30 EBITDA (INR Cr) 5,228
EV/EBITDA multiple (X) 15
MIAL Enterprise Value FY30 (INR Cr) 78,418
FY25 Discounted EV (INR Cr) 46,537
FY25 Net debt (INR Cr) 12,068
FY25 Equity value (INR Cr) 34,469
Equity value of 8 airports (INR Cr) 1,10,660
Value per share (INR) 934

121 | P a g e ( 5 t h J u l 2 0 2 2 )
For any further query, please email us on [email protected]
AEL’s FMCG Business

122 | P a g e ( 5 t h J u l 2 0 2 2 )
For any further query, please email us on [email protected]
Understanding how the AWL business is structured
Except for dairy products, Adani Wilmar is one of the few large FMCG food companies in India
to offer most of the essential kitchen commodities such as edible oils, wheat flour, rice, pulses,
sugar, etc.
Comprehensive B2C packaged consumer product portfolio
Source: Company Reports
All of its products are offered under a diverse range of brands, ‘Fortune’ being the flagship
brand, across a broad spectrum of prices to cater to different customer groups.
The company’s portfolio spans across three categories namely,
• Edible Oils,
• FMCG and Packaged Food, and
• Industry Essentials
FY21 sales volume break-up
Source: Company Reports
Industry Essentials, 25%
Food & FMCG, 11%Edible Oils, 65%
FY21 sales volume: 4.5MT

123 | P a g e ( 5 t h J u l 2 0 2 2 )
For any further query, please email us on [email protected]
Transformation to a Food FMCG company
Source: Company Reports
Segment Offerings based on sales volume as of FY21
Source: Company RHP; 1) includes ricebran, groundnut, cotton seed, and coconut oil; 2) includes maida & suji; 3) VAP means value added products, includes
sugar as well; 4) includes soaps, sanitizers and handwashes; 5) includes de-oiled cakes, Palm Stearin and Palm Fatty Acid, etc.
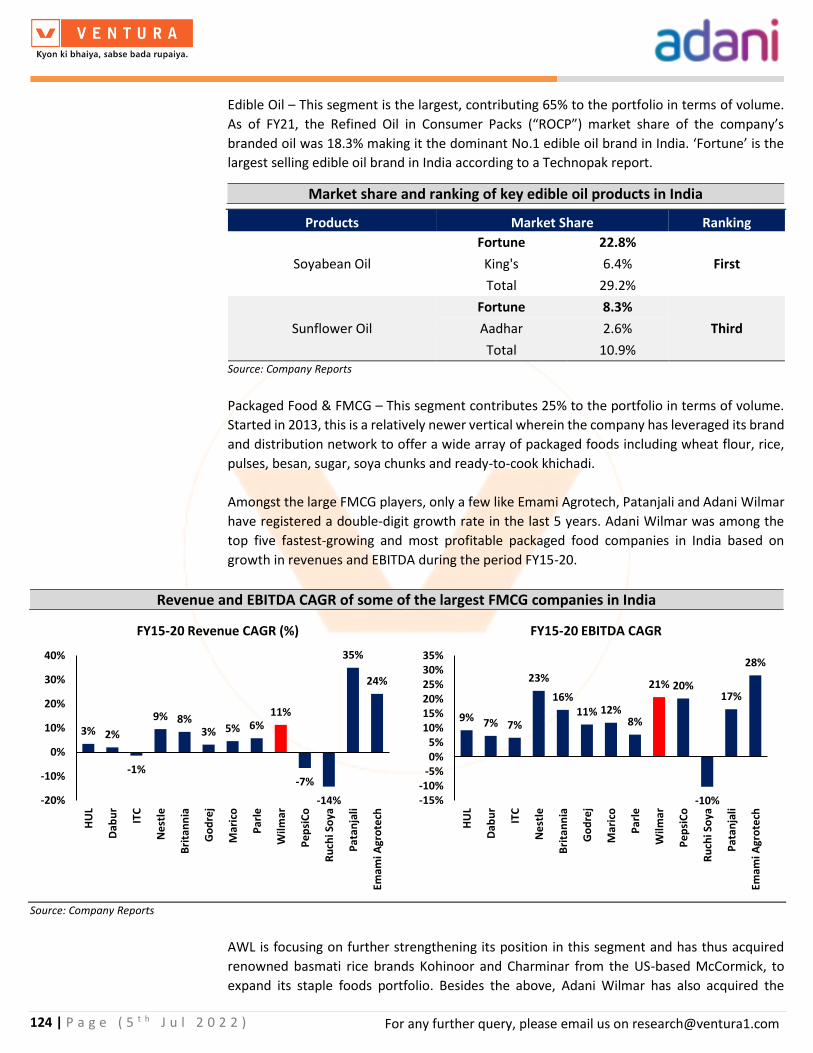
124 | P a g e ( 5 t h J u l 2 0 2 2 )
For any further query, please email us on [email protected]
Edible Oil – This segment is the largest, contributing 65% to the portfolio in terms of volume.
As of FY21, the Refined Oil in Consumer Packs (“ROCP”) market share of the company’s
branded oil was 18.3% making it the dominant No.1 edible oil brand in India. ‘Fortune’ is the
largest selling edible oil brand in India according to a Technopak report.
Market share and ranking of key edible oil products in India
Products Market Share Ranking
Soyabean Oil
Fortune 22.8%
First King's 6.4%
Total 29.2%
Sunflower Oil
Fortune 8.3%
Third Aadhar 2.6%
Total 10.9% Source: Company Reports
Packaged Food & FMCG – This segment contributes 25% to the portfolio in terms of volume.
Started in 2013, this is a relatively newer vertical wherein the company has leveraged its brand
and distribution network to offer a wide array of packaged foods including wheat flour, rice,
pulses, besan, sugar, soya chunks and ready-to-cook khichadi.
Amongst the large FMCG players, only a few like Emami Agrotech, Patanjali and Adani Wilmar
have registered a double-digit growth rate in the last 5 years. Adani Wilmar was among the
top five fastest-growing and most profitable packaged food companies in India based on
growth in revenues and EBITDA during the period FY15-20.
Revenue and EBITDA CAGR of some of the largest FMCG companies in India
Source: Company Reports
AWL is focusing on further strengthening its position in this segment and has thus acquired
renowned basmati rice brands Kohinoor and Charminar from the US-based McCormick, to
expand its staple foods portfolio. Besides the above, Adani Wilmar has also acquired the
3% 2%
-1%
9% 8%3% 5% 6%
11%
-7%
-14%
35%
24%
-20%
-10%
0%
10%
20%
30%
40%
HU
L
Dab
ur
ITC
Ne
stle
Bri
tan
nia
Go
dre
j
Mar
ico
Par
le
Wilm
ar
Pe
psi
Co
Ru
chi S
oya
Pat
anja
li
Emam
i Agr
ote
ch
FY15-20 Revenue CAGR (%)
9% 7% 7%
23%
16%11% 12%
8%
21% 20%
-10%
17%
28%
-15%-10%
-5%0%5%
10%15%20%25%30%35%
HU
L
Dab
ur
ITC
Ne
stle
Bri
tan
nia
Go
dre
j
Mar
ico
Par
le
Wilm
ar
Pe
psi
Co
Ru
chi S
oya
Pat
anja
li
Emam
i Agr
ote
ch
FY15-20 EBITDA CAGR

125 | P a g e ( 5 t h J u l 2 0 2 2 )
For any further query, please email us on [email protected]
Trophy brand which is popular in the HoReCa segment and accessed rights over Kohinoor’s
ready-to-eat curries and meals portfolio. While the total deal value is unknown, the purchase
is financed from the IPO proceeds.
Over FY22-25 we expect AWL to grow its revenues at a CAGR of 9.8% to reach INR 71,820 cr
by FY25. This is to be spearheaded by the FMCG vertical which is set to grow at a CAGR of
39.6% to reach INR 7,132.2 cr by FY25. The edible oil vertical is expected to grow at 8.0% CAGR
to INR 57,187 cr and the industry essentials segment is forecasted to grow at 6.6% CAGR to
INR 7,500 cr by FY25.
Industry Essentials – This segment contributes ~25% to the portfolio in terms of volume. It
includes oleochemicals, castor oil and its derivatives and de-oiled cakes. AWL enjoys a market-
leading position in this segment as well. India is the largest producer of Castor Seed by value
and AWL had a #1 market rank with a 26% market share in the category as of FY20. It has a
1,100 MT/day crushing capacity and 600 MT/day refining capacity. The market is expected to
grow at 8.1% CAGR to reach INR 129 bn by FY25.
Castor Seed Production in India in Value terms (INR bn)
Source: Company Reports
Castor Seed Production in India in Value terms (INR bn)
Source: Company Reports
50
87
129
0
20
40
60
80
100
120
140
FY15 FY20 FY25p

126 | P a g e ( 5 t h J u l 2 0 2 2 )
For any further query, please email us on [email protected]
The oleochemical market volume is expected to grow at 5.9% CAGR to reach INR 2.131 MT by
FY25. AWL enjoys a #1 market rank in Stearic Acid and Glycerin with 32% and 23% market
shares respectively. It has a 9% market share in soap noodles. The company has 800 MT/day
oleochemicals capacity in the Mundra facility.
Castor Seed Production in India in Value terms (INR bn)
Source: Company Reports
Presence across primary kitchen commodities
Over the years, primary kitchen commodities such as edible oils, wheat flour, rice, pulses, sugar
and dairy have been largely handled by players focussed within a specific segment. Among the
large FMCG players, limited players like Adani and Patanjali have entered into multiple
categories in primary kitchen commodities. Adani Wilmar is present in most categories through
its brand ‘Fortune’. The company’s brand architecture using a single brand identity for multi
categories optimizes the marketing costs and enhances brand equity.
Presence of large FMCG companies across essential kitchen commodities
Edible Oils
Wheat Flour
Rice Pulses Sugar Dairy
HUL ✓ Dabur
ITC ✓ ✓
Nestle
Britannia Godrej
Marico ✓ Parle
Wilmar ✓ ✓ ✓ ✓ ✓ PepsiCo
Ruchi Soya ✓ ✓
Patanjali ✓ ✓ ✓ ✓ ✓ Emami Agrotech ✓
Source: Company Reports

127 | P a g e ( 5 t h J u l 2 0 2 2 )
For any further query, please email us on [email protected]
The spend on primary kitchen commodities accounts for 23% of total spending on food and
grocery estimated to be INR 39,45,000 cr thereby presenting an opportunity size of INR
9,00,000 cr for any player in the primary kitchen commodity segments. Within these edible
oils, wheat flour, rice, pulses, sugar etc account for 66% i.e., INR 6,00,000 cr and the balance
comprises dairy products.
Key Growth Drivers
Underpenetrated market with significant potential for growth –
The penetration rate of packaged foods in India remains low, which provides significant
potential for growth for packaged edible oil and food products. This is further supported by
the favourable demographics with urbanization and rise in middle-class population, gradual
expansion of modern retail including e-commerce, convenience and healthy eating trends.
Annual per capita spend on packaged foods (‘000 INR)
Source: Company Reports
113
16
5
0
20
40
60
80
100
120
USA China India

128 | P a g e ( 5 t h J u l 2 0 2 2 )
For any further query, please email us on [email protected]
Growth of the Indian Packaged Food Market
Source: Company Reports
The packaged food market is growing at almost double the pace of the overall food category
and is expected to gain a market share of 17% by the fiscal year 2025 from a market share of
14% in the fiscal year 2015.
Shift of consumers towards branded products resulting in immense market potential
Select categories have seen a very strong shift from loose to branded.
Growth of the Indian Packaged Food Market
Source: Company Reports
With the onset of trends like
• urbanisation and rise in middle-class population,
• expansion of modern retail including e-commerce,
• increased in-home consumption due to Covid-19,
• government policies supporting food processing,
• convenience and healthy eating,
• consumers across the spectrum moving towards premium products,
3,760
6,020
10,130
14%
15%
17%
12%
13%
14%
15%
16%
17%
18%
0
2,000
4,000
6,000
8,000
10,000
12,000
FY15 FY20 FY25P
India's packaged food retail market (INR bn) % of total food & grocery retail market

129 | P a g e ( 5 t h J u l 2 0 2 2 )
For any further query, please email us on [email protected]
a broader set of categories are expected to experience a similar shift toward branded products
–
Growth of the Indian Packaged Food Market
Source: Company Reports
Leadership position in Branded Edible Oil and Packaged Food Business –
The company has a sustained market leadership position in Edible Oil – It has clear leadership
in a fragmented market with a market share of more than 2x of the next competitor. It has
huge potential to consolidate market share given that ~50% share is held by regional brands.
Growth of the Indian Packaged Food Market
Source: Company Reports
Others, 60%
Adani Wilmar, 17%
Ruchi Soya, 8%
Emami, 6%
Cargill, 4%
Bunge, 3%
Marico, 1%
AWL has the largest market share in edible oil among branded players in FY20

130 | P a g e ( 5 t h J u l 2 0 2 2 )
For any further query, please email us on [email protected]
Ranking of AWL according to Market Share by Value
Source: Company Reports
It has also demonstrated the ability to rapidly gain market share in new categories like Rice,
Soya Chunks and Wheat Flour. It has been leveraging the fortune brand to launch new products
with an increasing focus on value-added products and an aim to diversify revenue streams and
generate high-profit margins.
Growth of the Indian Packaged Food Market
Source: Company Report; Source 1: Technopak Report, Source 2: Nielsen Retail Index, Note 3: Market share by value,
Note 4: Market share by volume

131 | P a g e ( 5 t h J u l 2 0 2 2 )
For any further query, please email us on [email protected]
Ranking of AWL according to Market Share by Value
Source: Company Reports
AWL intends to expand its business based on this integrated business model and develop
additional integrated manufacturing facilities in the near future. Further, it plans to establish
additional food processing units at existing crushing units or refineries. The details of its capex
plans are given below.

132 | P a g e ( 5 t h J u l 2 0 2 2 )
For any further query, please email us on [email protected]
Growth of the Indian Packaged Food Market
Source: Company Report
Expansion of distribution network with an omni channel approach –
From FY19-21, the number of distributors grew by 33%. As of March 31, 2021, the company
had 5,566 distributors located in 28 states and eight union territories throughout India catering
to over 1.6 mn retail outlets, representing approximately 35 % of the retail outlets in India.
The company strives to expand this network to further penetrate the market and increase
sales. It aims to expand its online reach from the current 20 cities to 100 cities in the next few
years and have more than 40 Fortune Mart stores opened across India in the next few years.
Location
Haldia, WB
Paradip, Odisha
Bundi, Rajasthan
Mantralayam, AP
Shujalpur, MP
Kadi, Gujrat
Neemuch, MP
Kolkata, WB
Gohana, Haryana
500 TPD oil mill
Setting up packing section with warehouse of 4,000 square meter
Nagpur, MH
Soya value added products plants, namely, (a) Soya Crushing Plants - seed cleaning
and dehulling section – 500 TPD, extraction section – 500 TPD, Silos & Conveying
system, and Meal Grading System, b) soya flour mill - 150 TPD, and (c) Flour Packing
- 100 TPD (Nagpur 2)
240 TPD chana dal plant (Nagpur 3)
300 TPD solvent extraction plant, revamp of solvent extraction process, and
warehouse for de-oiled cake
Developing new manufacturing facilities
250 TPD wheat flour plant
Integrated manufacturing including 12 TPH x 2 Line P2R and 8 TPH R2R x 2 lines, 400
TPD rice bran oil extraction, 100 TPD Rice bran oil refinery, 500 TPD mustard oil mill
and 200 TPD wheat flour plant
240 TPD dal plant
240 TPD dal plant and 150 TPD besan plant
200 TPD organic soya meal plant
Description
50 TPD soya nugget plant with BP and CP packing (Nagpur 1)
1,500 TPD palm oil refinery, 400 TPD neutralization plant, 300 kilo liters per day
(“KLD”) effluent treatment plant (“ETP”), 500 TPD fractionation plant, and suitable
expansion in acid oil
Expansion at manufacturing facilities
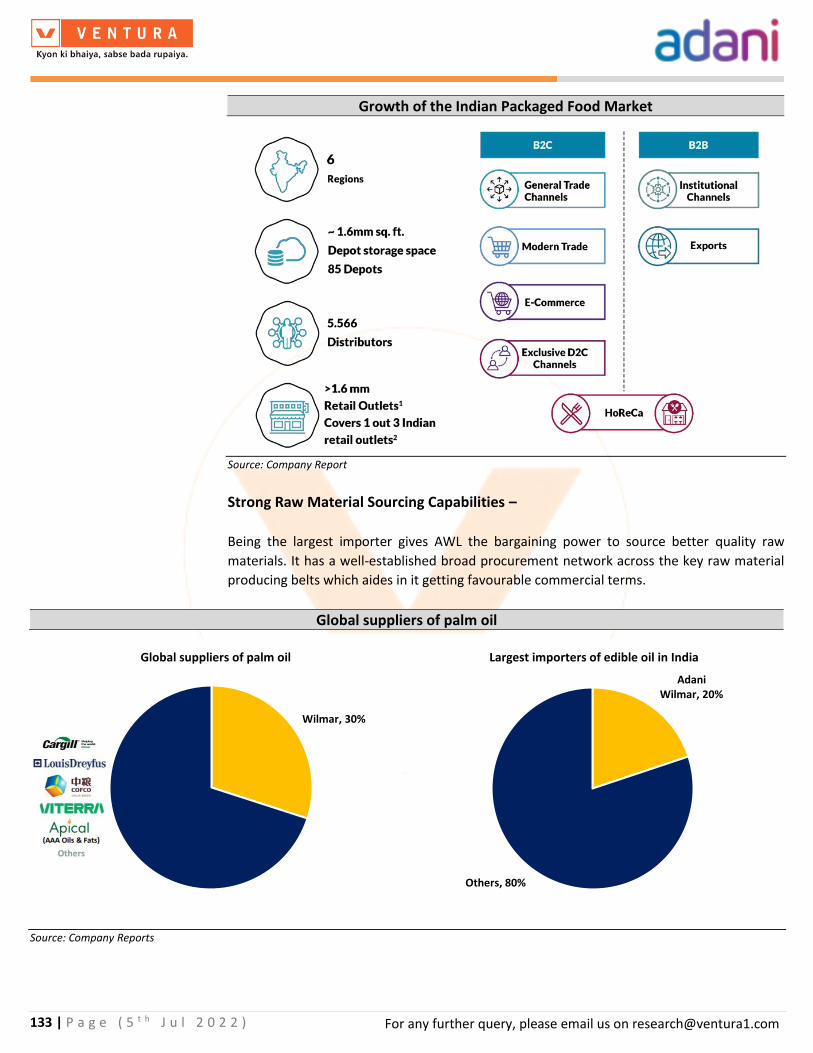
133 | P a g e ( 5 t h J u l 2 0 2 2 )
For any further query, please email us on [email protected]
Growth of the Indian Packaged Food Market
Source: Company Report
Strong Raw Material Sourcing Capabilities –
Being the largest importer gives AWL the bargaining power to source better quality raw
materials. It has a well-established broad procurement network across the key raw material
producing belts which aides in it getting favourable commercial terms.
Global suppliers of palm oil
Source: Company Reports
Wilmar, 30%
Global suppliers of palm oil
Adani Wilmar, 20%
Others, 80%
Largest importers of edible oil in India

134 | P a g e ( 5 t h J u l 2 0 2 2 )
For any further query, please email us on [email protected]
Source: Ventura Research
23,477 30,498
45,401 48,579 52,465
57,187
1,953
1,907
2,621 3,801
5,283
7,132
4,322
4,711
6,192
6,935
7,212
7,500
0
5
10
15
20
25
30
5,000
15,000
25,000
35,000
45,000
55,000
65,000
75,000
85,000
FY20 FY21 FY22 FY23E FY24E FY25E
Strong revenue growth on cards
Edible Oil FMCG
Industry Essentials YoY growth % (RHS)
INR cr
29,657
37,090
54,214
59,314
64,960
71,820
0
5
10
15
20
25
30
10,000
20,000
30,000
40,000
50,000
60,000
70,000
80,000
FY20 FY21 FY22 FY23E FY24E FY25E
Revenue- LHS YoY Growth (%) (RHS)
INR cr
0.0
0.5
1.0
1.5
2.0
2.5
3.0
3.5
4.0
4.5
5.0
250
750
1,250
1,750
2,250
2,750
FY20 FY21 FY22 FY23E FY24E FY25E
Net margins set to increase
EBITDA- LHS Net Profit- LHS
EBITDA Margin (%) (RHS) Net Margin (%) (RHS)
INR cr
-3.0
-2.0
-1.0
0.0
1.0
-8,000
-6,000
-4,000
-2,000
0
2,000
4,000
FY20 FY21 FY22 FY23E FY24E FY25E
AWL is net debt free
Total Debt- LHS
Net Debt- LHS
Net Debt to Equity (x) (RHS)
Net Debt to EBITDA (x)(RHS)
INR cr
2,5713,298
7,6068,625
9,997
11,650
3,6464,138
6,236 5,940 5,764 5,684
5
10
15
20
25
30
35
500
2,500
4,500
6,500
8,500
10,500
12,500
FY20 FY21 FY22 FY23E FY24E FY25E
Return ratios are set to expand from here
Net Worth Invested Capital
RoE (%) (RHS) RoIC (%) (RHS)
INR cr
781926
1,160
2,337 2,389 2,424
463204 182
1,111 1,171
1,566
0
20
40
60
80
100
120
140
0
500
1,000
1,500
2,000
2,500
3,000
FY20 FY21 FY22 FY23E FY24E FY25E
Strong cash flow generation expected
CFO FCF
CFO to EBITDA (%) (RHS) FCF to Net Profit (%) (RHS)
INR cr
Adani Wilmar Story in Charts
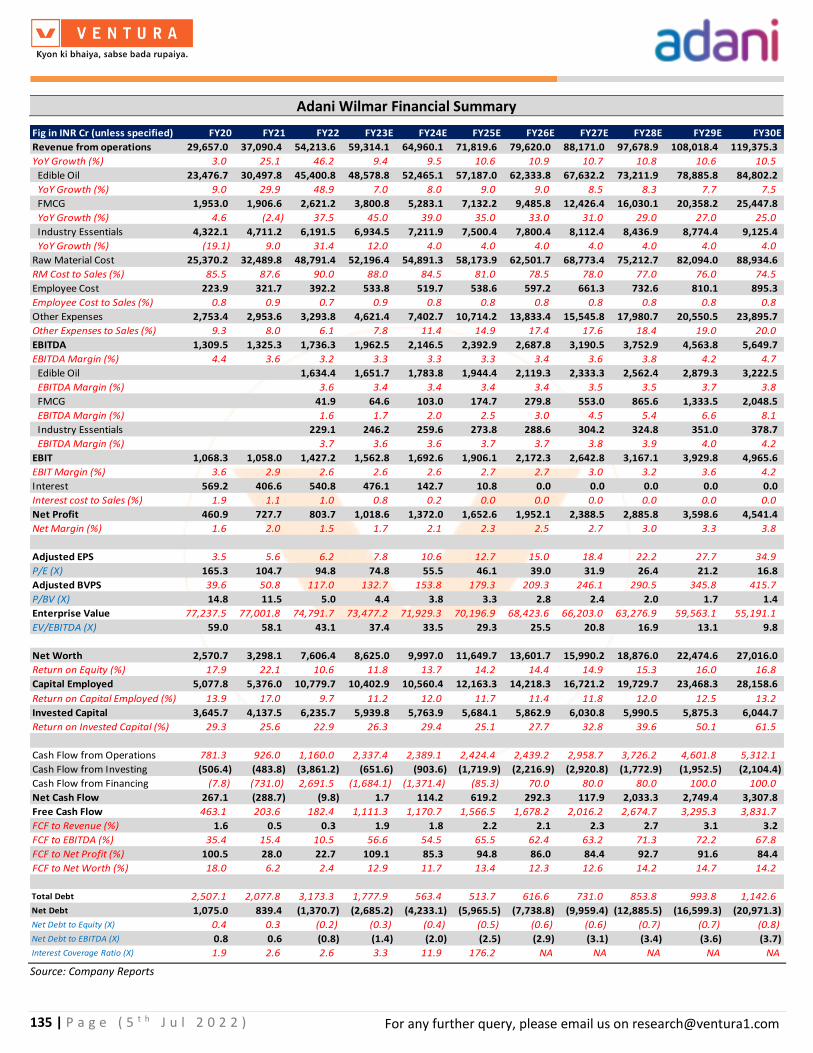
135 | P a g e ( 5 t h J u l 2 0 2 2 )
For any further query, please email us on [email protected]
Adani Wilmar Financial Summary
Source: Company Reports
Fig in INR Cr (unless specified) FY20 FY21 FY22 FY23E FY24E FY25E FY26E FY27E FY28E FY29E FY30E
Revenue from operations 29,657.0 37,090.4 54,213.6 59,314.1 64,960.1 71,819.6 79,620.0 88,171.0 97,678.9 108,018.4 119,375.3
YoY Growth (%) 3.0 25.1 46.2 9.4 9.5 10.6 10.9 10.7 10.8 10.6 10.5
Edible Oil 23,476.7 30,497.8 45,400.8 48,578.8 52,465.1 57,187.0 62,333.8 67,632.2 73,211.9 78,885.8 84,802.2
YoY Growth (%) 9.0 29.9 48.9 7.0 8.0 9.0 9.0 8.5 8.3 7.7 7.5
FMCG 1,953.0 1,906.6 2,621.2 3,800.8 5,283.1 7,132.2 9,485.8 12,426.4 16,030.1 20,358.2 25,447.8
YoY Growth (%) 4.6 (2.4) 37.5 45.0 39.0 35.0 33.0 31.0 29.0 27.0 25.0
Industry Essentials 4,322.1 4,711.2 6,191.5 6,934.5 7,211.9 7,500.4 7,800.4 8,112.4 8,436.9 8,774.4 9,125.4
YoY Growth (%) (19.1) 9.0 31.4 12.0 4.0 4.0 4.0 4.0 4.0 4.0 4.0
Raw Material Cost 25,370.2 32,489.8 48,791.4 52,196.4 54,891.3 58,173.9 62,501.7 68,773.4 75,212.7 82,094.0 88,934.6
RM Cost to Sales (%) 85.5 87.6 90.0 88.0 84.5 81.0 78.5 78.0 77.0 76.0 74.5
Employee Cost 223.9 321.7 392.2 533.8 519.7 538.6 597.2 661.3 732.6 810.1 895.3
Employee Cost to Sales (%) 0.8 0.9 0.7 0.9 0.8 0.8 0.8 0.8 0.8 0.8 0.8
Other Expenses 2,753.4 2,953.6 3,293.8 4,621.4 7,402.7 10,714.2 13,833.4 15,545.8 17,980.7 20,550.5 23,895.7
Other Expenses to Sales (%) 9.3 8.0 6.1 7.8 11.4 14.9 17.4 17.6 18.4 19.0 20.0
EBITDA 1,309.5 1,325.3 1,736.3 1,962.5 2,146.5 2,392.9 2,687.8 3,190.5 3,752.9 4,563.8 5,649.7
EBITDA Margin (%) 4.4 3.6 3.2 3.3 3.3 3.3 3.4 3.6 3.8 4.2 4.7
Edible Oil 1,634.4 1,651.7 1,783.8 1,944.4 2,119.3 2,333.3 2,562.4 2,879.3 3,222.5
EBITDA Margin (%) 3.6 3.4 3.4 3.4 3.4 3.5 3.5 3.7 3.8
FMCG 41.9 64.6 103.0 174.7 279.8 553.0 865.6 1,333.5 2,048.5
EBITDA Margin (%) 1.6 1.7 2.0 2.5 3.0 4.5 5.4 6.6 8.1
Industry Essentials 229.1 246.2 259.6 273.8 288.6 304.2 324.8 351.0 378.7
EBITDA Margin (%) 3.7 3.6 3.6 3.7 3.7 3.8 3.9 4.0 4.2
EBIT 1,068.3 1,058.0 1,427.2 1,562.8 1,692.6 1,906.1 2,172.3 2,642.8 3,167.1 3,929.8 4,965.6
EBIT Margin (%) 3.6 2.9 2.6 2.6 2.6 2.7 2.7 3.0 3.2 3.6 4.2
Interest 569.2 406.6 540.8 476.1 142.7 10.8 0.0 0.0 0.0 0.0 0.0
Interest cost to Sales (%) 1.9 1.1 1.0 0.8 0.2 0.0 0.0 0.0 0.0 0.0 0.0
Net Profit 460.9 727.7 803.7 1,018.6 1,372.0 1,652.6 1,952.1 2,388.5 2,885.8 3,598.6 4,541.4
Net Margin (%) 1.6 2.0 1.5 1.7 2.1 2.3 2.5 2.7 3.0 3.3 3.8
Adjusted EPS 3.5 5.6 6.2 7.8 10.6 12.7 15.0 18.4 22.2 27.7 34.9
P/E (X) 165.3 104.7 94.8 74.8 55.5 46.1 39.0 31.9 26.4 21.2 16.8
Adjusted BVPS 39.6 50.8 117.0 132.7 153.8 179.3 209.3 246.1 290.5 345.8 415.7
P/BV (X) 14.8 11.5 5.0 4.4 3.8 3.3 2.8 2.4 2.0 1.7 1.4
Enterprise Value 77,237.5 77,001.8 74,791.7 73,477.2 71,929.3 70,196.9 68,423.6 66,203.0 63,276.9 59,563.1 55,191.1
EV/EBITDA (X) 59.0 58.1 43.1 37.4 33.5 29.3 25.5 20.8 16.9 13.1 9.8
Net Worth 2,570.7 3,298.1 7,606.4 8,625.0 9,997.0 11,649.7 13,601.7 15,990.2 18,876.0 22,474.6 27,016.0
Return on Equity (%) 17.9 22.1 10.6 11.8 13.7 14.2 14.4 14.9 15.3 16.0 16.8
Capital Employed 5,077.8 5,376.0 10,779.7 10,402.9 10,560.4 12,163.3 14,218.3 16,721.2 19,729.7 23,468.3 28,158.6
Return on Capital Employed (%) 13.9 17.0 9.7 11.2 12.0 11.7 11.4 11.8 12.0 12.5 13.2
Invested Capital 3,645.7 4,137.5 6,235.7 5,939.8 5,763.9 5,684.1 5,862.9 6,030.8 5,990.5 5,875.3 6,044.7
Return on Invested Capital (%) 29.3 25.6 22.9 26.3 29.4 25.1 27.7 32.8 39.6 50.1 61.5
Cash Flow from Operations 781.3 926.0 1,160.0 2,337.4 2,389.1 2,424.4 2,439.2 2,958.7 3,726.2 4,601.8 5,312.1
Cash Flow from Investing (506.4) (483.8) (3,861.2) (651.6) (903.6) (1,719.9) (2,216.9) (2,920.8) (1,772.9) (1,952.5) (2,104.4)
Cash Flow from Financing (7.8) (731.0) 2,691.5 (1,684.1) (1,371.4) (85.3) 70.0 80.0 80.0 100.0 100.0
Net Cash Flow 267.1 (288.7) (9.8) 1.7 114.2 619.2 292.3 117.9 2,033.3 2,749.4 3,307.8
Free Cash Flow 463.1 203.6 182.4 1,111.3 1,170.7 1,566.5 1,678.2 2,016.2 2,674.7 3,295.3 3,831.7
FCF to Revenue (%) 1.6 0.5 0.3 1.9 1.8 2.2 2.1 2.3 2.7 3.1 3.2
FCF to EBITDA (%) 35.4 15.4 10.5 56.6 54.5 65.5 62.4 63.2 71.3 72.2 67.8
FCF to Net Profit (%) 100.5 28.0 22.7 109.1 85.3 94.8 86.0 84.4 92.7 91.6 84.4
FCF to Net Worth (%) 18.0 6.2 2.4 12.9 11.7 13.4 12.3 12.6 14.2 14.7 14.2
Total Debt 2,507.1 2,077.8 3,173.3 1,777.9 563.4 513.7 616.6 731.0 853.8 993.8 1,142.6
Net Debt 1,075.0 839.4 (1,370.7) (2,685.2) (4,233.1) (5,965.5) (7,738.8) (9,959.4) (12,885.5) (16,599.3) (20,971.3)
Net Debt to Equity (X) 0.4 0.3 (0.2) (0.3) (0.4) (0.5) (0.6) (0.6) (0.7) (0.7) (0.8)
Net Debt to EBITDA (X) 0.8 0.6 (0.8) (1.4) (2.0) (2.5) (2.9) (3.1) (3.4) (3.6) (3.7)
Interest Coverage Ratio (X) 1.9 2.6 2.6 3.3 11.9 176.2 NA NA NA NA NA

136 | P a g e ( 5 t h J u l 2 0 2 2 )
For any further query, please email us on [email protected]
Valuation
Amongst the large FMCG players, only a few like Emami Agrotech, Patanjali and Adani Wilmar
have registered a double-digit growth rate in the last 5 years. Adani Wilmar was among the
top five fastest-growing and most profitable packaged food companies in India based on
growth in revenues and EBITDA during the period FY15-20. We expect AWL to increase its sales
by 10.7% over FY22-30 and post that we have assumed a terminal growth rate of 5% at 9.9%
WACC to arrive at per share price of INR 556.
Adani Wilmar DCF Valuation
Source: Ventura Research
Cost of Equity (%) 10.0
Cost of Debt (%) 6.0
WACC (%) 9.9
Terminal Value Growth (%) 5.0
Particulars FY25 FY26 FY27 FY28 FY29 FY30
FCFF (INR Cr) 1,566 1,678 2,016 2,675 3,295 3,832
Discount Factor (X) 0.91 0.83 0.75 0.69 0.62 0.57
Discounted FCFF (INR Cr) 1,426 1,390 1,521 1,836 2,059 2,179
Total of Discounted FCFF (INR Cr) 10,411
Terminal Value (INR Cr) 82,747
PV of Terminal Value (INR Cr) 47,061
Value of Operations (INR Cr) 57,472
FY25 Net Debt -5,966
FY25 Value of Equity (INR Cr) 63,438
Value per share (INR) 556

137 | P a g e ( 5 t h J u l 2 0 2 2 )
For any further query, please email us on [email protected]
AEL’s Defence & Aerospace Business

138 | P a g e ( 5 t h J u l 2 0 2 2 )
For any further query, please email us on [email protected]
Adani Defence and Aerospace Ltd (ADAL)
ADAL’s Defence Business
ADAL is the Tier 1 supplier to the Ministry of Defence (MoD), DRDO, ISRO, HAL, BEL and the
Israel-based Elbit Systems. Through its comprehensive ecosystem of Tier I & Tier II capabilities
across the defence supply chain, ADAL is well-positioned to facilitate the integration of larger
platforms. The company is developing Tier-1 capabilities in
• Avionics & systems,
• Optoelectronics,
• Aero-structure & precision components,
• Aerospace composites
• Radar and electronic warfare systems.
ADAL Business Verticals
Source: Company Reports

139 | P a g e ( 5 t h J u l 2 0 2 2 )
For any further query, please email us on [email protected]
ADEL is operating on four key objectives
• Focus on platforms and technologies of critical importance to meet the emerging
security & defence needs of India, and further leverage capabilities for the civil domain.
• Set up an ecosystem of capabilities through investment in MSMEs and start-ups in
India, with unique products and technologies which will help absorb and build
technologies. ADEL has amalgamated an integrated solution with heterogeneous
capabilities through its global partners and MSMEs in India including Comprotech,
AutoTEC, Alpha Tocol, and Alpha Design Technologies.
• Collaborate with credible and committed global partners for India and international
markets, who are willing to transfer true technology to India.
• Set up facilities and capabilities which are global, facilitating exports and furthering the
objective of reducing the net current account deficit for India and bringing India on the
global export map.
ADAL pan-India network
Source: Company Reports

140 | P a g e ( 5 t h J u l 2 0 2 2 )
For any further query, please email us on [email protected]
Defence business product profile
Unmanned Systems – UAV, Drone and counter Drone/UAV systems
ADEL entered into a JV with Elbit Systems of Isreal in Feb 2018 to set up India’s first private
UAV manufacturing facility at Adani Aerospace Park in Hyderabad. The JV is currently
producing Hermes 900, Hermes 450, Sky Striker and Skylark 3, which has applications for civil,
defence and homeland security requirements.
ADAL UAV and Drone products
Source: Company Reports
Except for the engine components, 70% of the production of the UAVs is being produced in the
company’s Hyderabad aerospace manufacturing facility (50,000 sq ft state-of-the-art facility),
which includes the UAV body of carbon fibre composites, avionics and integration of payloads
in collaboration with Bharat Electronics Ltd. The Rotex Engines which are currently used in
these UAVs are not yet produced in India, however, ADEL is targeting it as the next level of
development and working on the engine production plans.
ADEL has not started manufacturing drones yet. The company is sourcing the components from
the partners and supplying them to defence, which is a niche market. To explore opportunities
in the agriculture and civil market, which is a mass market, ADEL acquired a 50% stake in
General Aeronautics Ltd (Bengaluru-based startup) in Apr 2022. With this acquisition, ADEL is
planning to leverage its military drone and AI/machine learning capabilities to provide

141 | P a g e ( 5 t h J u l 2 0 2 2 )
For any further query, please email us on [email protected]
solutions for the agricultural sector. The company is exploring two revenue models for drone
services in the agricultural sector:
• Dealer-based – The equipment will be sold to the customers through the dealer
network
• Service-based – The equipment will be provided for various services for a fee in
partnership with a local entrepreneur or an institution
To diversify its drone product portfolio, the company is also promoting startups in the drone
sector and is looking at manufacturing a logistics drone which can carry a payload of up to 120
kg, which we believe could be a game-changer in express parcel and last-mile delivery segment.
Such products could also find applications in power transmission, oil & gas, mining and
construction.
In Mar 2021, ADEL got the government approval to set up counter-drone/counter-UAV
systems at all airports across India to halt the flight of rogue drones in no-fly zones. With this,
the ADEL became the first company to implement such systems at Indian airports.
The vertical – Anti-drone and anti-UAV systems
Source: Ministry of Defence, Industry Reports and Ventura Research

142 | P a g e ( 5 t h J u l 2 0 2 2 )
For any further query, please email us on [email protected]
PLI for the drone sector:
About:
• It covers a wide variety of drone components, including airframe, propulsion systems, power systems, batteries, inertial
measurement unit, flight control module, ground control station, communication systems, cameras, sensors, spraying
systems, and emergency recovery system, and trackers.
• It is expected to bring fresh investments of over INR 5,000 cr and incremental production of over INR 1,500 cr and create
additional employment of about 10,000 jobs.
Significance:
• It will encourage entrepreneurs to strive toward building drones, components, and software for the global market. It
will also open many more verticals for the utilisation of drones.
• It will help reduce imports. At present 90 %of the drones in India are imported.
• The government intends to make India a global drone hub by 2030.
Additional schemes for drones to enhance their areas of application
• The Union Budget pushed for the promotion of drones through startups and skilling at Industrial Training Institutes (ITIs).
• Startups will be promoted to facilitate ‘Drone Shakti’ through varied applications and for Drone-As-A-Service (DrAAS).
Courses for skilling will also be started in selected ITIs across all States.
• DrAAS allows enterprises to avail of various services from drone companies, removing the need for them to invest in
drone hardware or software, pilots, and training programmes.
• Sectors, where drones can be employed, are endless. These include photography, agriculture, mining, telecom,
insurance, telecom, oil & gas, construction, transport, disaster management, geo-spatial mapping, forest and wildlife,
defence and law enforcement to name a few.
• Drones will also be promoted for crop assessment, digitisation of land records, and spraying of insecticides and nutrients
(Kisan Drones).
• The drone services industry is expected to grow to over Rs 30,000 crore in the next three years and generate over five
lakh jobs.
Adani's small arms and ammunition
ADAL acquired a 51% stake in PLR Systems in Sep 2020 and forayed into the small arms
segment. The rest 49% is with Israel Weapon Industries (IWI), Israel, which is the manufacturer
of TAVOR Assault Rifle, X95 Assault Rifle, GALIL Sniper Rifle and NEGEV Light Machine Gun
which are used by special forces.
In response to the ‘Make in India’ initiative, PLR Systems established a small arms
manufacturing facility at Malanpur Industrial Area, Gwalior, Madhya Pradesh and became the
first private sector company that was granted a license by the government for manufacturing
small arms and ammunition for Indian Army and police forces.

143 | P a g e ( 5 t h J u l 2 0 2 2 )
For any further query, please email us on [email protected]
ADAL small arms used by Indian Army and Para Military Forces
Source: Company Reports
ADEL has also announced an investment of INR 1,500 cr to set up South Asia’s largest
integrated ammunition manufacturing complex in the defence industrial corridor in Kanpur,
Uttar Pradesh. The complex spread over more than 250 acres will have state-of-the-art
technology across small and medium calibre ammunition, along with short-range air defence
missiles.
Government thrust for ‘Make in India’ and indigenization of defence
procurement to significantly boost ADAL’s defence segment
In the defence budget, the finance minister allocated INR 1,52,369 cr for capital expenditure
in FY23 which includes purchasing new weapons, aircraft, warships and other military
hardware. The capital outlay is an increase of around 10% compared to the revised estimate
of INR 1,38,850 cr for FY22.
The defence procurement procedure is governed by the Defence Acquisition Procedure (DAP,
which started in Oct 2020). The six main defence procurement strategies are differentiated
based on whether the equipment is being manufactured by a domestic player or a foreign
company.

144 | P a g e ( 5 t h J u l 2 0 2 2 )
For any further query, please email us on [email protected]
Key defence procurement categories in Defence Acquisition Procedure
Source: Company Reports
Around 68% of this capital procurement has been allocated toward local procurement. It is in
line with the 'Vocal for Local' push and it will certainly boost the domestic defence industries.
ADAL, with its technological capabilities and execution capabilities, qualifies for the first three
categories of defence procurement, and therefore, is expected to remain a key beneficiary of
‘Make in India’ in the defence segment.
India’s defence procurement and indigenization
Source: Ministry of Defence, Industry Reports and Ventura Research
• 1st priority given to Indian vendors with indigenous design
Buy from Indian IDDM
• 2nd priority given to Indian vendors who are using foreign design
Buy from Indian Company
• 3rd priority given to Indian vendors who remains in lead and form a JV with foreign partner
Buy the desing from outside and make in India
• Incentive for foreign vendors to tie up with Indian company for domestic manufacturing
Buy from Indian manufacturer of foreign equipments
• Incentive for foreign vendors manufacturing in India
Buy from foreign company manufacting in India
• Incentives to Indian vendors contributing at least 30% domestic components
Buy from foreign company
50
55
60
65
70
75
0
20,000
40,000
60,000
80,000
1,00,000
1,20,000
1,40,000
1,60,000
FY15 FY16 FY17 FY18 FY19 FY20 FY21 FY22E FY23E
Domestic Import Localization (%), RHS

145 | P a g e ( 5 t h J u l 2 0 2 2 )
For any further query, please email us on [email protected]
ADAL’s aircraft services and MRO
AEL operates 7 airports in India and to strengthen its position and improve its offerings in the
civil aviation industry, ADEL started aircraft maintenance and MRO services.
ADAL offerings under aircraft services and MRO
Source: Company Reports
In May 2022, the company announced the acquisition of Air Works Group, which is India’s
largest independent aircraft maintenance, repair and overhaul organization. With this
acquisition, ADEL will get services contracts for Lufthansa, Turkish Airlines, FlyDubai, Etihad,
Virgin Atlantic, IndiGo, GoAir and Vistara. In addition, ADEL has also signed an MoU with Airbus
India to explore opportunities for collaboration in the area of aircraft services for the Indian
and South Asian markets.
MRO opportunities in India
India is the 7th largest civil aviation market in the world and it is set to become the world’s 3rd
largest by 2026, representing a significant scope for MRO facilities in India. About 90% of MRO
requirements in India are met through imports and therefore India’s indigenous MRO sector is
at a nascent stage and hence offers significant growth potential for domestic players.
The Indian MRO industry size is expected to increase from USD 1.7 bn in 2021 to USD 4.0 bn
by 2031, representing a CAGR growth of 8.9% compared with the expected global CAGR of
5.6% (from USD 68.4 bn in 2021 to USD117.7 bn in 2031) over the same period.
With more than 1,000 aircraft currently on order, India is likely to become the 3rd largest buyer
of commercial passenger planes globally, after the US and China. This translates into demand
for 200–300 major maintenance checks annually. Replacing ageing aircraft in the fleets of
several airlines also creates scope for MRO. In addition, with the procurement of new fighter
Structural Maintenance
• Base & Heavy Maintenance Checks
• Airframe Maintenance
• One stop fleet maintenance
• Building infrastructure for the highest quality & turn-around times
• Civil & Defence Aircrafts
Component Maintenance
• Landing gears
• Avionics
• Digital control harness
• Electrical components
• Mechanical Components
Engine Maintenance
• One-stop tailored engine solutions
• Wide-ranging in-house repair
• Cost-effective alternatives to full replacement
• Deep working relationship with OEMs
• Ensuring maximum hours in the air
Paintiing Maintenance
• Commercial aircraft finish
• Parts and components painting
• High quality painting under ambient conditions
• Quick turnaround time

146 | P a g e ( 5 t h J u l 2 0 2 2 )
For any further query, please email us on [email protected]
jets, military transport aircraft and spy planes by the Indian Airforce for its ageing fleet, India
is also poised to become a large defence aircraft market, propelling demand for military MRO
capabilities as well.
MRO opportunities – Global vs India
Source: Delloite Report on MRO in India
MRO opportunities – Global vs India
Source: Deloitte Report on MRO in India
16.4 22.4
28.7
56.5 12.3
21.2
10.9
17.7
2021 2031
Airframes Engines Components Line Maintenance
68.4
117.7
0.3 0.6
0.8
2.0
0.3
0.8
0.3
0.6
2021 2031
Airframes Engines Components Line Maintenance
1.7
4.0

147 | P a g e ( 5 t h J u l 2 0 2 2 )
For any further query, please email us on [email protected]
In India, airlines operate aircraft built by global players, such as Boeing, Airbus, ATR, Embraer,
and Dornier. Therefore, most aircraft are sent abroad for major MRO services, which is costly
and sometimes increases the turnaround time. Though the cost of an MRO workforce in India
ranges between USD 30-35 per hour, which is almost 60% lower than that in Europe and the
US, however, lack of government support and a limited number of large OEMs reduced the
scope for MRO opportunities in India.
Key initiatives taken by the government to support the Indian MRO industry
In the next 20 years, India will need 1,750–2,100 aircraft valued at more than US$ 290 billion,
with an estimated 100 deliveries each year, valued at about US$ 5 billion of financing each
year, according to predictions of Airbus and Boeing. The government is making concerted
efforts to attract new business into India through aircraft leasing, financing, and MRO
operations and therefore have taken various steps to enhance business for MRO services -
• Liberalised land rentals – In Sept 2021, under the Aatmanirbhar Bharat Abhiyan, the
Airports Authority of India (AAI) introduced an MRO policy with highly liberalised land
rentals and abolished royalties (revenue share payments to AAI).
• Changes in land allotment policies – Entities setting up MRO facilities will be allotted
land for 30 years instead of the current three-to-five years. Under the new policy, the
lease rental rate would be decided through bidding instead of the current pre-
determined rates set by AAI. The land will be allotted through open tenders, not
through allotment based on an entity's request. There will also be changes in the
renewal of contracts of existing leaseholders. On the expiry of existing contracts, land
provided to MROs would be allotted through a bidding process.
• Concession GST on MRO services – In Apr 2020, the central government lowered the
GST rate from 18% to 5% on MRO services in respect of aircraft, aircraft engines, and
other aircraft components/parts.
• Supporting infrastructure – To encourage multinational companies to invest in India
and source their maintenance services in India, the government has permitted 100%
foreign direct investment in MRO via the automatic route. It has also liberalised the
policy for borrowing and lending in foreign currency and rupees on competitive terms
for MRO service providers. Additionally, the government has extended the stay of
foreign aircraft in India for the entire duration of MRO work or six months, whichever
is shorter.
With the favourable policies in place and with the entry of large OEMs like Tata and AEL in this
space, the segment is expected to become more competitive and localization of services are
likely improved.

148 | P a g e ( 5 t h J u l 2 0 2 2 )
For any further query, please email us on [email protected]
Source: Ventura Research
Financial Performance
ADEL is expected to witness revenue CAGR of 48.3% to INR 2,392 cr during FY22-25E, while
EBITDA and PAT are expected to grow at a CAGR of 78.9% to INR 1,527 cr and 306.1% to INR
268 cr respectively over the same period. EBITDA and PAT margins are expected to expand by
1084bps to 25.1% and 1065bps to 11.2% respectively by FY25. Subsequently, return ratios –
RoE and RoIC – are expected to improve by 1281bps to 13.1% and 1488bps to 16.5%
respectively by FY25.
0
10
20
30
40
50
60
70
80
0
500
1,000
1,500
2,000
2,500
3,000
FY22 FY23 FY24 FY25 FY26
Revenue growth to remain strong due to indigenization in defence
Revenue YoY Growth
0
5
10
15
20
25
30
0
100
200
300
400
500
600
700
800
FY22 FY23 FY24 FY25 FY26
Profitability is expected to improve with business diversification
EBITDA PAT Margin (%) Margin (%)
0
5
10
15
20
25
0
500
1,000
1,500
2,000
2,500
FY22 FY23 FY24 FY25 FY26
Return ratios to follow profitability in the coming years
Net Worth Invested Capital
RoE (%) RoIC (%)
-2.0
-1.0
0.0
1.0
2.0
3.0
4.0
-600
-400
-200
0
200
400
600
800
FY22 FY23 FY24 FY25 FY26
Higher operating profitability to improve balance sheet health
Total Debt Net Debt
Net Debt to Equity Net Debt to EBITDA
ADAL Story in Charts
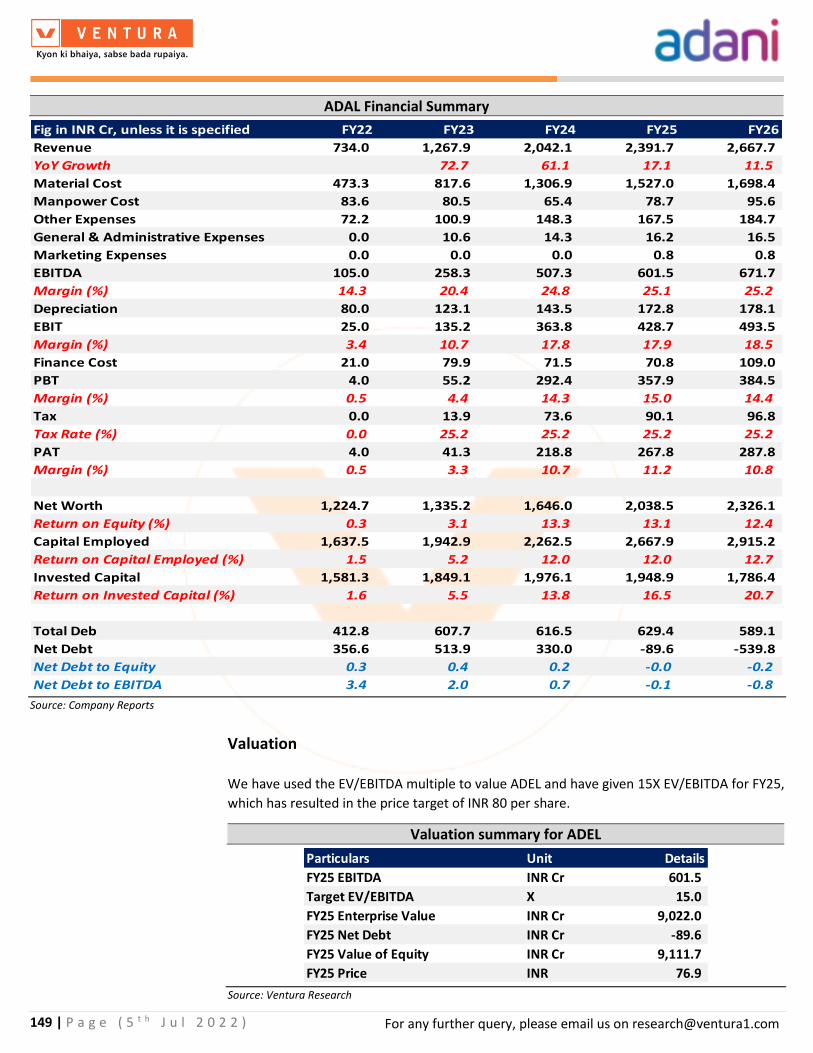
149 | P a g e ( 5 t h J u l 2 0 2 2 )
For any further query, please email us on [email protected]
ADAL Financial Summary
Source: Company Reports
Valuation
We have used the EV/EBITDA multiple to value ADEL and have given 15X EV/EBITDA for FY25,
which has resulted in the price target of INR 80 per share.
Valuation summary for ADEL
Source: Ventura Research
Fig in INR Cr, unless it is specified FY22 FY23 FY24 FY25 FY26
Revenue 734.0 1,267.9 2,042.1 2,391.7 2,667.7
YoY Growth 72.7 61.1 17.1 11.5
Material Cost 473.3 817.6 1,306.9 1,527.0 1,698.4
Manpower Cost 83.6 80.5 65.4 78.7 95.6
Other Expenses 72.2 100.9 148.3 167.5 184.7
General & Administrative Expenses 0.0 10.6 14.3 16.2 16.5
Marketing Expenses 0.0 0.0 0.0 0.8 0.8
EBITDA 105.0 258.3 507.3 601.5 671.7
Margin (%) 14.3 20.4 24.8 25.1 25.2
Depreciation 80.0 123.1 143.5 172.8 178.1
EBIT 25.0 135.2 363.8 428.7 493.5
Margin (%) 3.4 10.7 17.8 17.9 18.5
Finance Cost 21.0 79.9 71.5 70.8 109.0
PBT 4.0 55.2 292.4 357.9 384.5
Margin (%) 0.5 4.4 14.3 15.0 14.4
Tax 0.0 13.9 73.6 90.1 96.8
Tax Rate (%) 0.0 25.2 25.2 25.2 25.2
PAT 4.0 41.3 218.8 267.8 287.8
Margin (%) 0.5 3.3 10.7 11.2 10.8
Net Worth 1,224.7 1,335.2 1,646.0 2,038.5 2,326.1
Return on Equity (%) 0.3 3.1 13.3 13.1 12.4
Capital Employed 1,637.5 1,942.9 2,262.5 2,667.9 2,915.2
Return on Capital Employed (%) 1.5 5.2 12.0 12.0 12.7
Invested Capital 1,581.3 1,849.1 1,976.1 1,948.9 1,786.4
Return on Invested Capital (%) 1.6 5.5 13.8 16.5 20.7
Total Deb 412.8 607.7 616.5 629.4 589.1
Net Debt 356.6 513.9 330.0 -89.6 -539.8
Net Debt to Equity 0.3 0.4 0.2 -0.0 -0.2
Net Debt to EBITDA 3.4 2.0 0.7 -0.1 -0.8
Particulars Unit Details
FY25 EBITDA INR Cr 601.5
Target EV/EBITDA X 15.0
FY25 Enterprise Value INR Cr 9,022.0
FY25 Net Debt INR Cr -89.6
FY25 Value of Equity INR Cr 9,111.7
FY25 Price INR 76.9

150 | P a g e ( 5 t h J u l 2 0 2 2 )
For any further query, please email us on [email protected]
AEL’s Copper Business

151 | P a g e ( 5 t h J u l 2 0 2 2 )
For any further query, please email us on [email protected]
Adani Copper Business
AEL intends to set up a greenfield copper refinery project at APSEZ Mundra port at an
investment of INR 10,000 cr. The proposed greenfield copper refinery project would produce
1.0 MMTPA of copper cathode, 3.0 MMTPA of sulphuric acid, 0.5 MMTPA of copper wire rod
96,000 TPM of oxygen plant, 50 TPA of gold, 500 TPA of silver, 0.5 MMTPA of phosphoric acid
and 30,000 TPA of aluminum fluoride. Phase I copper cathode capacity of 0.5 MMTPA is
expected to be ready by FY24 and the production is anticipated to start from FY25, while the
development timeline of Phase II of an additional 0.5 MMTPA is yet to be decided.
Details of AEL’s copper and allied product capacities
Source: Environment Clearance Department report 2021
Copper Smelting & Refining Process
Source: Environment Clearance Department report 2021
Products Units Phase I Phase II Total Capacity
Key Products
Copper Cathode TPA 5,00,000 5,00,000 10,00,000
Sulphuric Acid TPA 15,00,000 15,00,000 30,00,000
Continuous Cast Copper Wire Rod TPA 2,50,000 2,50,000 5,00,000
Gold TPA 25 25 50
Silver TPA 250 250 500
Phosphoric Acid TPA 2,50,000 2,50,000 5,00,000
Aluminum Floride TPA 15,000 15,000 30,000
By Products
Anode Slime TPM 250 250 500
Selenium TPM 12 12 24
PGM Concentrate TPM 3 3 6
Copper Slag TPM 92,500 92,500 1,85,000
Phosphogypsum TPM 1,04,167 1,04,167 2,08,334
Hydro Fluro Silicic Acid TPM 1,250 1,250 2,500
Copper Telluride TPM 21 21 42
Tellurium TPM 4 4 8
Nickel TPM 8 8 16
Bismuth Bisulphate TPM 60 60 120
Calomel (Mercury Chloride) TPM 9 9 18
Mercury TPM 8 8 16
CCR Mill Scale TPM 25 25 50
Raw Material Unit Phase I Phase II Total QuantitySource of
transportMode of transport
Source
distance from
plant site (Km)
Copper Concentrate TPA 16,00,000 16,00,000 32,00,000 Local & Import Road & Pipe Conveyor 12
Silica TPA 1,60,000 1,60,000 3,20,000 Local Road 500
Limestone TPA 40,000 40,000 80,000 Local Road 150
Quartz TPA 72,000 72,000 1,44,000 Local Road 500
Quick Lime TPA 30,000 30,000 60,000 Local & Import Road 12
Copper Scrap & E-scrap TPA 1,00,000 1,00,000 2,00,000 Local & Import Sea & Road 12
Rock Phosphate TPA 8,75,000 8,75,000 17,50,000 Local & Import Road & Pipe Conveyor 12
Aluminum Hydrate TPA 18,750 18,750 37,500 Local Sea & Road 12

152 | P a g e ( 5 t h J u l 2 0 2 2 )
For any further query, please email us on [email protected]
AEL’s copper input-output along with its smelting & refining process
Source: Environment Clearance Department report 2021
Key Raw Materials Products
Copper Concentrate KTPA 1,600 Copper Cathode KTPA 500
Silica KTPA 160 Sulphuric Acid (>98%) KTPA 1,500
Lime Stone KTPA 40 Continous Cast Copper Wire Rod KTPA 250
Quartz KTPA 72 Oxygen (Technical) KTPA 48
Quick Lime KTPA 30 Gold TPA 25
Copper Scrap & E-Scrap KTPA 100 Silver TPA 250
Rock Phosphate KTPA 875 Phosphoric Acid (as 100% P2O5) KTPA 250
Alumina Hydrate KTPA 19 Aluminium Fluoride KTPA 15
Fuel Byproducts
High Speed Diesel TPA 25 Anode Slime TPM 250
Furnace Oil TPA 150 Selenium TPM 12
LPG TPA 50 PGM Concentrate TPM 3
Coal/ Pet Coke TPA 50 Ferro Sand/ Iron Silicate KTPM 93
Met Coke TPA 50 Phosphogypsum KTPM 104
Hydro Fluro Silicic Acid TPM 1,250
Copper Telluride TPM 21
Tellurium TPM 4
Waste Nickel TPM 8
ETP Waste Sludge & Scrubber Waste TPM 9,000 Bismuth Bisulphate TPM 60
Nickle Sludge TPM 265 Calomel (Mercury Chloride) TPM 9
Arsenic Bearing Sludge TPM 111 Mercury TPM 8
Used Oil KL / year 100 CCR Mill Scale TPM 25
Oil Sludge TPA 25 Waste Heat Recovery TPM 20
Spent Catalyst KL / year 200
Spent Resins KL / year 10
ETP Treated Water KL / day 2,516
Input to Reverse Osmosis Plant KL / day 356
Rejects from Multi Effect Evaporator KL / day 28
OUTPUT
WASTE
INPUT

153 | P a g e ( 5 t h J u l 2 0 2 2 )
For any further query, please email us on [email protected]
The total land required for the proposed project is about 256.58 ha (634 acres), of which
154.18 ha (381 acres) of identified land for this project belongs to the APSEZ and is already
designated for industrial purposes. Further, forest land of 102.38 ha (253 acres) is also involved
which will be converted for industrial use. The necessary Forest Clearance has also been
obtained. There is no Resettlement and Rehabilitation involved in the project.
The total estimated power requirement for the proposed project is 300 MW out of which 40
MW would be generated from internal process steam and a balance of 260 MW power would
be sourced from APSEZ Ltd. The water and power will be sourced from APSEZ Limited, through
Mundra Utility Private Limited (MUL, a subsidiary of Adani Transmission Ltd).
AEL’s copper segment financial summary
Source: Company Reports
Fig in INR Cr, unless specified FY25 FY26 FY27 FY28 FY29 FY30 FY31 FY32 FY33 FY34 FY35 FY36 FY37 FY38 FY39 FY40
Sales Volume (tonnes)
Copper Cathode 3,20,000 3,37,500 3,50,000 3,25,000 3,00,000 2,75,000 2,50,000 2,50,000 2,50,000 2,50,000 2,50,000 2,50,000 2,50,000 2,50,000 2,50,000 2,50,000
Copper Rods 80,000 1,12,500 1,50,000 1,75,000 2,00,000 2,25,000 2,50,000 2,50,000 2,50,000 2,50,000 2,50,000 2,50,000 2,50,000 2,50,000 2,50,000 2,50,000
Gold 8.5 9.6 10.7 10.7 10.7 10.7 10.7 10.7 10.7 10.7 10.7 10.7 10.7 10.7 10.7 10.7
Silver 169.4 191.6 214.1 214.1 214.1 214.1 214.1 214.1 214.1 214.1 214.1 214.1 214.1 214.1 214.1 214.1
Revenue (INR Cr)
Copper Cathode 15,634.8 16,522.6 17,168.6 15,973.9 14,774.3 13,569.8 12,360.5 12,360.5 12,360.5 12,360.5 12,360.5 12,360.5 12,360.5 12,360.5 12,360.5 12,360.5
Copper Cathode share in sales (%) 61.3 57.5 53.6 49.8 45.9 42.1 38.3 38.3 38.3 38.3 38.3 38.3 38.3 38.3 38.3 38.3
Copper Rods 3,952.4 5,569.8 7,442.0 8,700.6 9,964.4 11,233.4 12,507.7 12,507.7 12,507.7 12,507.7 12,507.7 12,507.7 12,507.7 12,507.7 12,507.7 12,507.7
Copper Rods share in sales (%) 15.5 19.4 23.2 27.1 31.0 34.8 38.7 38.7 38.7 38.7 38.7 38.7 38.7 38.7 38.7 38.7
Gold 3,679.4 4,150.0 4,623.1 4,623.1 4,623.1 4,623.1 4,623.1 4,623.1 4,623.1 4,623.1 4,623.1 4,623.1 4,623.1 4,623.1 4,623.1 4,623.1
Gold share in sales (%) 14.4 14.4 14.4 14.4 14.4 14.3 14.3 14.3 14.3 14.3 14.3 14.3 14.3 14.3 14.3 14.3
Silver 919.2 1,039.8 1,161.7 1,161.7 1,161.7 1,161.7 1,161.7 1,161.7 1,161.7 1,161.7 1,161.7 1,161.7 1,161.7 1,161.7 1,161.7 1,161.7
Silver share in sales (%) 3.6 3.6 3.6 3.6 3.6 3.6 3.6 3.6 3.6 3.6 3.6 3.6 3.6 3.6 3.6 3.6
Others 1,306.7 1,475.8 1,647.7 1,647.7 1,647.7 1,647.7 1,647.7 1,647.7 1,647.7 1,647.7 1,647.7 1,647.7 1,647.7 1,647.7 1,647.7 1,647.7
Other share in sales (%) 5.1 5.1 5.1 5.1 5.1 5.1 5.1 5.1 5.1 5.1 5.1 5.1 5.1 5.1 5.1 5.1
Avg per kg realization (INR per kg)
Copper Cathode 488.6 489.6 490.5 491.5 492.5 493.4 494.4 494.4 494.4 494.4 494.4 494.4 494.4 494.4 494.4 494.4
Copper Rods 494.1 495.1 496.1 497.2 498.2 499.3 500.3 500.3 500.3 500.3 500.3 500.3 500.3 500.3 500.3 500.3
Gold 43,40,788 43,40,788 43,40,788 43,40,788 43,40,788 43,40,788 43,40,788 43,40,788 43,40,788 43,40,788 43,40,788 43,40,788 43,40,788 43,40,788 43,40,788 43,40,788
Silver 54,259.8 54,259.8 54,259.8 54,259.8 54,259.8 54,259.8 54,259.8 54,259.8 54,259.8 54,259.8 54,259.8 54,259.8 54,259.8 54,259.8 54,259.8 54,259.8
Total Revenue 25,492.4 28,758.0 32,043.2 32,107.0 32,171.2 32,235.8 32,300.7 32,300.7 32,300.7 32,300.7 32,300.7 32,300.7 32,300.7 32,300.7 32,300.7 32,300.7
YoY Growth (%) 12.8 11.4 0.2 0.2 0.2 0.2 0.0 0.0 0.0 0.0 0.0 0.0 0.0 0.0 0.0
Raw Material Cost 21,853.1 24,517.6 27,148.0 27,148.0 27,148.0 27,148.0 27,148.0 27,148.0 27,148.0 27,148.0 27,148.0 27,148.0 27,148.0 27,148.0 27,148.0 27,148.0
RM Cost to Sales (%) 85.7 85.3 84.7 84.6 84.4 84.2 84.0 84.0 84.0 84.0 84.0 84.0 84.0 84.0 84.0 84.0
Rock Phosphate 548.6 619.6 691.9 691.9 691.9 691.9 691.9 691.9 691.9 691.9 691.9 691.9 691.9 691.9 691.9 691.9
Rock Phosphate Cost to Sales (%) 2.2 2.2 2.2 2.2 2.2 2.1 2.1 2.1 2.1 2.1 2.1 2.1 2.1 2.1 2.1 2.1
Operating Expenses 1,033.9 1,134.0 1,244.7 1,251.2 1,257.6 1,264.1 1,273.6 1,273.6 1,273.6 1,273.6 1,273.6 1,273.6 1,273.6 1,273.6 1,273.6 1,273.6
Operating Cost to Sales (%) 4.1 3.9 3.9 3.9 3.9 3.9 3.9 3.9 3.9 3.9 3.9 3.9 3.9 3.9 3.9 3.9
Overhead Expenses 244.6 243.3 243.7 269.0 279.9 242.0 266.8 241.6 278.1 266.5 240.2 239.6 303.5 240.0 239.4 265.1
Overhead Exp to Sales (%) 1.0 0.8 0.8 0.8 0.9 0.8 0.8 0.7 0.9 0.8 0.7 0.7 0.9 0.7 0.7 0.8
EBITDA 1,812.3 2,243.5 2,714.9 2,747.0 2,793.8 2,889.8 2,920.4 2,945.6 2,909.1 2,920.8 2,947.0 2,947.7 2,883.7 2,947.2 2,947.8 2,922.1
Margin (%) 7.1 7.8 8.5 8.6 8.7 9.0 9.0 9.1 9.0 9.0 9.1 9.1 8.9 9.1 9.1 9.0
Depreciation 343.8 343.8 343.8 343.8 343.8 343.8 326.4 326.4 326.4 326.4 326.4 326.4 326.4 326.4 326.4 326.4
EBIT 1,468.5 1,899.7 2,371.1 2,403.2 2,450.0 2,546.0 2,594.1 2,619.3 2,582.7 2,594.4 2,620.7 2,621.3 2,557.4 2,620.8 2,621.5 2,595.7
Margin (%) 5.8 6.6 7.4 7.5 7.6 7.9 8.0 8.1 8.0 8.0 8.1 8.1 7.9 8.1 8.1 8.0
Interest Cost 729.7 800.2 803.4 777.1 739.5 695.7 645.7 590.1 528.2 460.2 386.0 348.9 348.9 348.9 348.9 348.9
PBT 738.8 1,099.5 1,567.8 1,626.1 1,710.5 1,850.3 1,948.3 2,029.2 2,054.5 2,134.2 2,234.7 2,272.4 2,208.5 2,271.9 2,272.6 2,246.8
Margin (%) 2.9 3.8 4.9 5.1 5.3 5.7 6.0 6.3 6.4 6.6 6.9 7.0 6.8 7.0 7.0 7.0
Tax 5.8 96.0 200.0 229.8 261.0 299.2 325.0 349.1 362.1 383.1 406.5 417.2 409.6 424.3 427.7 426.0
Tax Rate (%) 0.8 8.7 12.8 14.1 15.3 16.2 16.7 17.2 17.6 18.0 18.2 18.4 18.5 18.7 18.8 19.0
PAT 733.0 1,003.5 1,367.8 1,396.3 1,449.5 1,551.1 1,623.3 1,680.1 1,692.4 1,751.1 1,828.1 1,855.2 1,798.8 1,847.6 1,844.9 1,820.9
Margin (%) 2.9 3.5 4.3 4.3 4.5 4.8 5.0 5.2 5.2 5.4 5.7 5.7 5.6 5.7 5.7 5.6
Free Cash Flow -2,378.5 -1,061.4 -1,679.3 355.0 4,320.9 4,450.2 5,214.1 4,921.5 4,939.5 5,254.4 4,964.0 4,919.5 4,864.0 4,927.8 4,921.0 4,839.3
FCF to Net Profit (%) -324.5 -105.8 -122.8 25.4 298.1 286.9 321.2 292.9 291.9 300.1 271.5 265.2 270.4 266.7 266.7 265.8
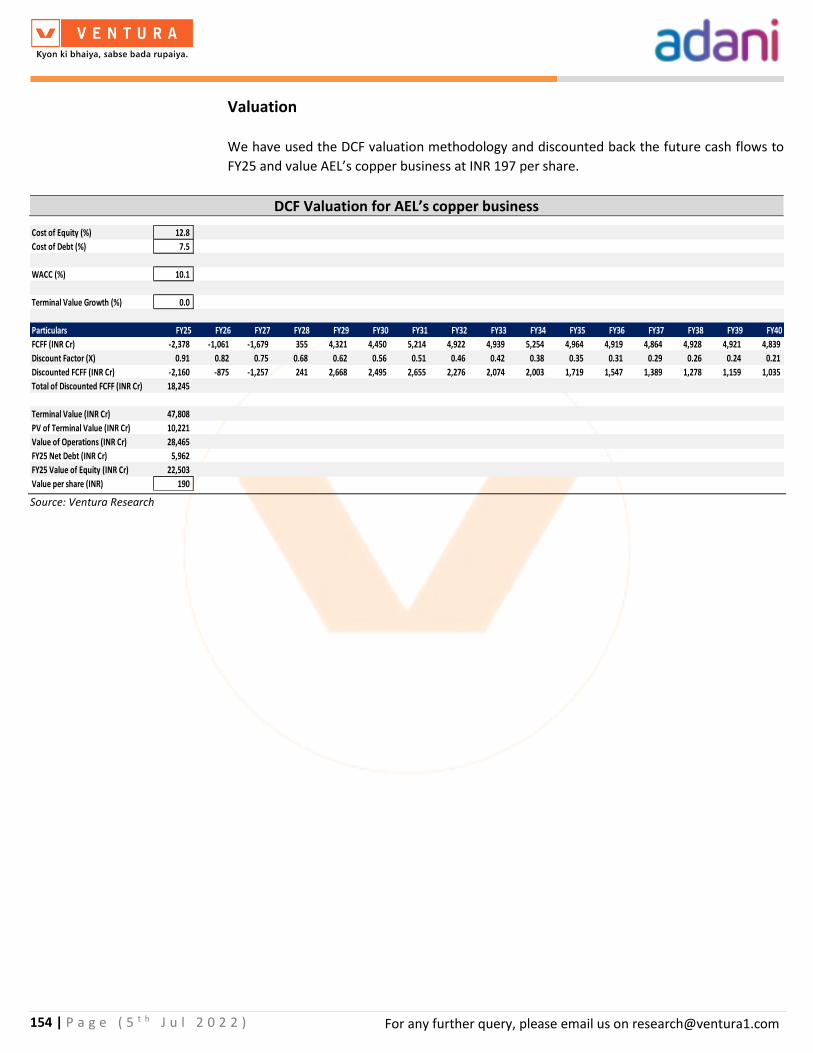
154 | P a g e ( 5 t h J u l 2 0 2 2 )
For any further query, please email us on [email protected]
Valuation
We have used the DCF valuation methodology and discounted back the future cash flows to
FY25 and value AEL’s copper business at INR 197 per share.
DCF Valuation for AEL’s copper business
Source: Ventura Research
Cost of Equity (%) 12.8
Cost of Debt (%) 7.5
WACC (%) 10.1
Terminal Value Growth (%) 0.0
Particulars FY25 FY26 FY27 FY28 FY29 FY30 FY31 FY32 FY33 FY34 FY35 FY36 FY37 FY38 FY39 FY40
FCFF (INR Cr) -2,378 -1,061 -1,679 355 4,321 4,450 5,214 4,922 4,939 5,254 4,964 4,919 4,864 4,928 4,921 4,839
Discount Factor (X) 0.91 0.82 0.75 0.68 0.62 0.56 0.51 0.46 0.42 0.38 0.35 0.31 0.29 0.26 0.24 0.21
Discounted FCFF (INR Cr) -2,160 -875 -1,257 241 2,668 2,495 2,655 2,276 2,074 2,003 1,719 1,547 1,389 1,278 1,159 1,035
Total of Discounted FCFF (INR Cr) 18,245
Terminal Value (INR Cr) 47,808
PV of Terminal Value (INR Cr) 10,221
Value of Operations (INR Cr) 28,465
FY25 Net Debt (INR Cr) 5,962
FY25 Value of Equity (INR Cr) 22,503
Value per share (INR) 190

155 | P a g e ( 5 t h J u l 2 0 2 2 )
For any further query, please email us on [email protected]
AEL’s PVC Business

156 | P a g e ( 5 t h J u l 2 0 2 2 )
For any further query, please email us on [email protected]
Adani PVC Business
AEL is setting up a 2.0 MMTPA (1.0 MMPTA by FY25 and another 1.0 MMTPA by FY30) coal to
PVC project at Mundra, Gujarat with an estimated investment of INR 29,200 cr. PVC grades
such as suspension PVC(Resin), Chlorinated PVC (C-PVC) and Emulsion PVC (paste) would be
produced along with several by-products such as Caustic Soda (1.3 MMTPA), Caustic Potash
(130 KTPA), Sodium Hypochlorite (16 KTPA), Tar (9 KTPA), Crude Benzene (26 KTPA),
Ammonium Sulphate (2.7 KTPA), Hydrated lime (3300 KTPA) are expected to be generated.
The project would be located in three separate land pockets with a total area of 688.9 acres.
The main raw materials for the proposed project (of 2.0 MMTPA) are Salt (2.0 MMTPA),
Limestone (5.0 MMTPA), Coal/Coke (3.1 MMTPA), and potassium Chloride (180 KTPA). Coal
and Coke required for the project would be imported or sourced indigenously. The limestone
required for the project will be sourced from Adani Cementation Ltd (ACL), a group company
which has secured a limestone mine through bidding in Gujarat and from other domestic
sources. Salt required for the project would be sourced from salt manufacturing units in
Gujarat. Potassium Chloride required for the project would be imported.
Process flow and the input-output ratio of AEL’s PVC project
Source: Environment Clearance Department report 2021
During the operation phase, the total power consumption of the facility is 1850 MW. The steam
required for the PVC complex is catered through a 4X200 TPH Steam Boiler. Co-generation
Facility associated with a steam boiler generates power to the tune of 100 MW. The remaining
power requirement of 1750 MW will be given by DISCOM from APSEZ (MUL sold to Adani
Transmission Ltd).

157 | P a g e ( 5 t h J u l 2 0 2 2 )
For any further query, please email us on [email protected]
Using coal as a chemical feedstock to produce PVC is less polluting as compared to
conventional methods such as petrochemical refineries and ethylene crackers. Both processes
demand the use of carbon atoms as feed. While conventional methods source the carbon atom
from oil, sourcing it from coal does not produce CO2. Further, PVC is not toxic or single-use
plastic, but an infrastructure material with a life span of several decades. AEL will use
renewable energy to produce PVC which will further make the entire process a low carbon-
intensive.
Crude Oil to PVC and Coal to PVC manufacturing processes
Source: Environment Clearance Department report 2021
PVC and caustic soda are two basic segments of the Indian industry which facilitate a chain of
downstream industries such as agriculture, infrastructure, housing and sanitation and other
similar industries. India currently imports more than 50% of its PVC requirements and these
imports are expected to rise further with no recent new capacity additions. PVC produced from
the facility will cater to the domestic market and will replace imports.

158 | P a g e ( 5 t h J u l 2 0 2 2 )
For any further query, please email us on [email protected]
AEL’s PVC segment financial summary
Source: Company Reports
Fig in INR Cr, unless specified FY25 FY26 FY27 FY28 FY29 FY30 FY31 FY32 FY33 FY34 FY35 FY36 FY37 FY38 FY39 FY40
Volume
50wt% NaOH Export (tonnes) 90,000 2,40,000 2,70,000 3,00,000 3,00,000 3,00,000 3,00,000 3,00,000 3,00,000 3,00,000 3,00,000 3,00,000 3,00,000 3,00,000 3,00,000 3,00,000
Flake Export (tonnes) 30,000 80,000 90,000 1,00,000 1,00,000 1,00,000 1,00,000 1,00,000 1,00,000 1,00,000 1,00,000 1,00,000 1,00,000 1,00,000 1,00,000 1,00,000
50wt% NaOH (tonnes) 51,531 1,03,062 1,03,062 1,03,062 1,03,062 1,03,062 1,03,062 1,03,062 1,03,062 1,03,062 1,03,062 1,03,062 1,03,062 1,03,062 1,03,062 1,03,062
Flake (tonnes) 1,00,000 2,00,000 2,00,000 2,00,000 2,00,000 2,00,000 2,00,000 2,00,000 2,00,000 2,00,000 2,00,000 2,00,000 2,00,000 2,00,000 2,00,000 2,00,000
PVC (tonnes) 5,00,000 10,00,000 10,00,000 10,00,000 10,00,000 10,00,000 10,00,000 10,00,000 10,00,000 10,00,000 10,00,000 10,00,000 10,00,000 10,00,000 10,00,000 10,00,000
Sodium sulfate (tonnes) 18,282 36,564 36,564 36,564 36,564 36,564 36,564 36,564 36,564 36,564 36,564 36,564 36,564 36,564 36,564 36,564
Medium temperature tar (tonnes) 91,630 1,83,260 1,83,260 1,83,260 1,83,260 1,83,260 1,83,260 1,83,260 1,83,260 1,83,260 1,83,260 1,83,260 1,83,260 1,83,260 1,83,260 1,83,260
Ammonium sulfate (tonnes) 4,277 8,554 8,554 8,554 8,554 8,554 8,554 8,554 8,554 8,554 8,554 8,554 8,554 8,554 8,554 8,554
Crude benzene (tonnes) 4,229 8,458 8,458 8,458 8,458 8,458 8,458 8,458 8,458 8,458 8,458 8,458 8,458 8,458 8,458 8,458
Sulphur cream (tonnes) 1,155 2,310 2,310 2,310 2,310 2,310 2,310 2,310 2,310 2,310 2,310 2,310 2,310 2,310 2,310 2,310
Coking gas (mn m3) 340 680 680 680 680 680 680 680 680 680 680 680 680 680 680 680
Carbide slag (tonnes) 14,23,550 28,47,100 28,47,100 28,47,100 28,47,100 28,47,100 28,47,100 28,47,100 28,47,100 28,47,100 28,47,100 28,47,100 28,47,100 28,47,100 28,47,100 28,47,100
Dichloroethane (tonnes) 2,406 4,812 4,812 4,812 4,812 4,812 4,812 4,812 4,812 4,812 4,812 4,812 4,812 4,812 4,812 4,812
Revenue in INR cr
50wt% NaOH Export 333 905 1,039 1,177 1,201 1,225 1,249 1,274 1,300 1,326 1,352 1,379 1,407 1,435 1,464 1,493
Flake Export 111 302 346 392 400 408 416 425 433 442 451 460 469 478 488 498
50wt% NaOH 114 305 343 381 381 381 381 381 381 381 381 381 381 381 381 381
Flake 222 592 666 740 740 740 740 740 740 740 740 740 740 740 740 740
PVC 2,293 6,236 7,156 8,110 8,272 8,438 8,607 8,779 8,954 9,133 9,316 9,502 9,693 9,886 10,084 10,286
Sodium sulfate 7 19 21 23 23 23 23 23 23 23 23 23 23 23 23 23
Medium temperature tar 135 359 404 449 449 449 449 449 449 449 449 449 449 449 449 449
Ammonium sulfate 1 3 4 4 4 4 4 4 4 4 4 4 4 4 4 4
Crude benzene 9 23 26 29 29 29 29 29 29 29 29 29 29 29 29 29
Sulphur cream 0 1 1 2 2 2 2 2 2 2 2 2 2 2 2 2
Coking gas 82 218 245 272 272 272 272 272 272 272 272 272 272 272 272 272
Carbide slag 43 114 128 142 142 142 142 142 142 142 142 142 142 142 142 142
Dichloroethane 3 9 10 11 11 11 11 11 11 11 11 11 11 11 11 11
Per Unit Realization
50wt% NaOH Export (INR/tn) 37.0 37.7 38.5 39.2 40.0 40.8 41.6 42.5 43.3 44.2 45.1 46.0 46.9 47.8 48.8 49.8
Flake Export (INR/tn) 37.0 37.7 38.5 39.2 40.0 40.8 41.6 42.5 43.3 44.2 45.1 46.0 46.9 47.8 48.8 49.8
50wt% NaOH (INR/tn) 22.2 29.6 33.3 37.0 37.0 37.0 37.0 37.0 37.0 37.0 37.0 37.0 37.0 37.0 37.0 37.0
Flake (INR/tn) 22.2 29.6 33.3 37.0 37.0 37.0 37.0 37.0 37.0 37.0 37.0 37.0 37.0 37.0 37.0 37.0
PVC (INR/tn) 45.9 62.4 71.6 81.1 82.7 84.4 86.1 87.8 89.5 91.3 93.2 95.0 96.9 98.9 100.8 102.9
Sodium sulfate (INR/tn) 3.8 5.1 5.8 6.4 6.4 6.4 6.4 6.4 6.4 6.4 6.4 6.4 6.4 6.4 6.4 6.4
Medium temperature tar (INR/tn) 14.7 19.6 22.1 24.5 24.5 24.5 24.5 24.5 24.5 24.5 24.5 24.5 24.5 24.5 24.5 24.5
Ammonium sulfate (INR/tn) 2.9 3.9 4.4 4.9 4.9 4.9 4.9 4.9 4.9 4.9 4.9 4.9 4.9 4.9 4.9 4.9
Crude benzene (INR/tn) 20.4 27.2 30.6 34.0 34.0 34.0 34.0 34.0 34.0 34.0 34.0 34.0 34.0 34.0 34.0 34.0
Sulphur cream (INR/tn) 4.1 5.4 6.1 6.8 6.8 6.8 6.8 6.8 6.8 6.8 6.8 6.8 6.8 6.8 6.8 6.8
Coking gas (INR/Nm3) 2.4 3.2 3.6 4.0 4.0 4.0 4.0 4.0 4.0 4.0 4.0 4.0 4.0 4.0 4.0 4.0
Carbide slag (INR/tn) 0.3 0.4 0.5 0.5 0.5 0.5 0.5 0.5 0.5 0.5 0.5 0.5 0.5 0.5 0.5 0.5
Dichloroethane (INR/tn) 13.5 18.0 20.3 22.5 22.5 22.5 22.5 22.5 22.5 22.5 22.5 22.5 22.5 22.5 22.5 22.5
Total Revenue 3,352 9,085 10,388 11,732 11,926 12,124 12,325 12,530 12,740 12,954 13,172 13,394 13,621 13,852 14,088 14,329
YoY Growth (%) 171.0 14.3 12.9 1.7 1.7 1.7 1.7 1.7 1.7 1.7 1.7 1.7 1.7 1.7 1.7
EBITDA 1,225 3,607 4,224 4,867 4,967 4,682 4,786 4,892 4,999 5,105 5,214 5,324 5,435 5,547 5,658 5,771
Margin % 36.5 39.7 40.7 41.5 41.6 38.6 38.8 39.0 39.2 39.4 39.6 39.7 39.9 40.0 40.2 40.3
Depreciation 547.0 1,094.0 1,094.0 1,094.0 1,094.0 1,094.0 980.9 952.7 952.7 952.7 942.7 942.7 942.7 942.7 942.7 942.7
EBIT 678.0 2,512.7 3,129.7 3,772.9 3,872.9 3,587.6 3,805.4 3,939.6 4,046.5 4,152.1 4,271.1 4,381.3 4,492.4 4,604.5 4,714.8 4,828.7
Margin % 20.2 27.7 30.1 32.2 32.5 29.6 30.9 31.4 31.8 32.1 32.4 32.7 33.0 33.2 33.5 33.7
Finance Cost 562 1,367 1,322 1,227 1,126 1,025 924 823 722 621 521 420 319 219 118 69
PBT 116 1,146 1,807 2,546 2,747 2,563 2,882 3,117 3,324 3,531 3,750 3,961 4,173 4,386 4,597 4,760
Margin % 3.5 12.6 17.4 21.7 23.0 21.1 23.4 24.9 26.1 27.3 28.5 29.6 30.6 31.7 32.6 33.2
Tax 0 0 0 243 556 573 679 776 867 951 1,031 1,107 1,180 1,250 1,317 1,367
Tax Rate (%) 0.0 0.0 0.0 9.5 20.2 22.4 23.6 24.9 26.1 26.9 27.5 27.9 28.3 28.5 28.6 28.7
PAT 116 1,146 1,807 2,303 2,191 1,990 2,203 2,340 2,458 2,580 2,719 2,854 2,993 3,136 3,280 3,393
Margin % 3.5 12.6 17.4 19.6 18.4 16.4 17.9 18.7 19.3 19.9 20.6 21.3 22.0 22.6 23.3 23.7
Free Cash Flow -6,633 3,283 3,951 4,207 3,959 3,664 3,660 3,677 3,705 3,743 3,792 3,847 3,907 3,972 4,039 4,112
FCF to Net Profit (%) -5,714.3 286.5 218.6 182.7 180.7 184.2 166.2 157.1 150.8 145.1 139.4 134.8 130.5 126.7 123.2 121.2

159 | P a g e ( 5 t h J u l 2 0 2 2 )
For any further query, please email us on [email protected]
Valuation
We have used the DCF valuation methodology and discounted back the future cash flows to
FY25 and value AEL’s PVC business at INR 130 per share.
DCF Valuation for AEL’s PVC business
Source: Ventura Research
Cost of Equity (%) 12.8
Cost of Debt (%) 7.5
WACC (%) 10.1
Terminal Value Growth (%) 0.0
Particulars FY25 FY26 FY27 FY28 FY29 FY30 FY31 FY32 FY33 FY34 FY35 FY36 FY37 FY38 FY39 FY40
FCFF (INR Cr) -6,633 3,283 3,951 4,207 3,959 3,664 3,660 3,677 3,705 3,743 3,792 3,847 3,907 3,972 4,039 4,112
Discount Factor (X) 0.91 0.82 0.75 0.68 0.62 0.56 0.51 0.46 0.42 0.38 0.35 0.31 0.29 0.26 0.24 0.21
Discounted FCFF (INR Cr) -6,023 2,707 2,958 2,861 2,445 2,055 1,864 1,700 1,556 1,427 1,313 1,209 1,116 1,030 951 879
Total of Discounted FCFF (INR Cr) 20,046
Terminal Value (INR Cr) 40,618
PV of Terminal Value (INR Cr) 8,684
Value of Operations (INR Cr) 28,729
FY25 Net Debt (INR Cr) 13,943
FY25 Value of Equity (INR Cr) 14,787
Value per share (INR) 125

160 | P a g e ( 5 t h J u l 2 0 2 2 )
For any further query, please email us on [email protected]
AEL’s Digital Strategy

161 | P a g e ( 5 t h J u l 2 0 2 2 )
For any further query, please email us on [email protected]
Adani Digital strategy and the development of a SuperApp
Building a robust digital platform and a SuperApp is a long-term play which requires heavy
investments, partnerships and strategic collaborations. Globally, SuperApps have been
modelled around groceries, last-mile deliveries, social media, messaging, fintech (money
transfer & online shopping) and mobility.
To design a SuperApp, a company requires:
• Multiple businesses and consumer-centric products, which could provide
opportunities to cross-sell different products to the same consumer,
• Strong and diversified user base,
• High-frequency use case and resources
In Sept 2021, AEL set up a wholly-owned subsidiary, Adani Digital Labs, to transform its
consumer businesses into digital-first businesses by creating an omnichannel, integrated
platform enabling customers to interact with all B2C businesses of the Adani Group. AEL is
working on a strategy to integrate all of its consumer-facing businesses in a single super app
and leverage its network effect.
The partnership of AEL with WebEngage could be a game-changer
Adani group has over 400 mn consumers (through its subsidiaries) that engage with multiple
levels of Adani Group products & services, and can better avail opportunities of cross-selling
for its various businesses. This consumer base is growing at a CAGR of 15% and if every Adani
consumer is onboarded on its digital platform (or SuperApp), then its digital consumer base is
expected to cross 1.0 bn consumers before 2030.
Through a robust digital platform and a SuperApp in place, Adani Group will be able to analyze
the behavioural pattern of consumers by using various data science patterns and offer
customized solutions. To consolidate the data and information from various consumer-facing
businesses, AEL has formed a strategic partnership with WebEngage in May 2022, which is a
full-stack Retention Operating System.
WebEngage will power Adani Group’s all six consumer-facing businesses in their digital
transformation journey. The companies include Adani Airports, Adani Total Gas, Adani
Electricity Mumbai, Adani Wilmar, Adani Realty and Adani Capital. Aligned to this, WebEngage
will work closely with Adani Digital Labs to help the group companies organise customer data,
develop analytical dashboards and drive 1:1 personalised engagement to deliver the intended
customer experience across the web and mobile applications.

162 | P a g e ( 5 t h J u l 2 0 2 2 )
For any further query, please email us on [email protected]
The strengths of Adani Group’s consumer-centric businesses
Adani Group is currently serving over 400 mn customers on multiple levels across the
company's products and services. As per the management, the number is expected to cross
1.0 bn. AEL has built its B2C empire for its SuperApp through the businesses of its subsidiaries
and group companies –
• Adani Electricity Mumbai Ltd (AEML, a subsidiary of Adani Transmission Ltd - ATL) is
supplying electricity to ~3.1 mn households in Mumbai (~12 mn people), which gives
access to the power consumption pattern of households. AEML is also planning to
cross-sell consumer appliances to these customers to improve its engagement with
the households.
Coverage area and network of Adani Electricity Mumbai Ltd
Source: Company Reports
ATL is also planning to install and take the O&M contract for ~20 mn smart meters in
and outside its electricity distribution areas of the company. It will give access to the
household data to the company.
• Adani Total Gas Ltd (ATGL) is supplying natural gas to ~5.6 lakh households. The
company has also committed to add
o 46.1 lakh PNG domestic connections in the 9th round by FY27,
o 2.6 lakh connections in the 10th round by FY28 and
o 65.0 lakh connections in the 11th round by FY29.
With this run rate, ATGL will have more than 50 lakh PNG domestic connections (more
than 20 mn people) by FY27, 60 lakh connections (more than 25 mn people) by FY28

163 | P a g e ( 5 t h J u l 2 0 2 2 )
For any further query, please email us on [email protected]
and 70 lakh connections (more than 30 mn people) by FY29. In line with ATL, ATGL is
also planning to install gas smart meters in its GAs which will give access to the
household data to the company.
Coverage area and network of Adani Total Gas Ltd
Source: Company Reports
• Adani Group formed a strategic partnership with Flipkart (now a Walmart group
company), in which Flipkart will work with Adani Logistics Ltd (ALL) to strengthen its
supply chain infrastructure and Flipkart will also set up its 3rd data centre with Adani
Connex.
Both the companies are in advanced talks to expand their partnership beyond supply
chain and data centre into new domains of e-commerce, groceries and household
goods.
• Flipkart acquired 100% holding of Cleartrip in Apr 2021, and in Oct 2021 AEL bought a
20% minority stake in the same. The recent partnership with Flipkart and the
acquisition of a minority stake in Cleartrip will strengthen AEL’s position in the fast-
growing online travel and tourism market.
Consumers will be able to book online travel tickets in a single app. Further, they will
also be able to shop online through the Flipkart e-commerce platform across various
airports.

164 | P a g e ( 5 t h J u l 2 0 2 2 )
For any further query, please email us on [email protected]
Coverage area and network of Adani Airports
Source: Company Reports
• Adani Wilmar Ltd (AWL), which offers a range of edible oils and food products under
the Fortune brand, has launched a mobile app for customers to order the products
online from their homes. AWL’s consumers will be able to buy various groceries online
and based on their buying patterns, the company will be able to judge their
preferences and offer additional products accordingly.
Adani Wilmar fulfilment centres
Source: Company Reports & Ventura Research

165 | P a g e ( 5 t h J u l 2 0 2 2 )
For any further query, please email us on [email protected]
Ventura Business Quality Score
Key Criteria Score Risk Comments
Management & Leadership
Management Quality 8 Low The management is of high quality. It has been able to deliver guidance; investor-friendly with timely updates on developments
Promoters Holding Pledge 6 Low The promoter holding stands at 72.3% and there is a pledge of 3.76% against this holding as of 31st Mar 2022
Board of Directors Profile 8 Low The average experience of directors is >30 years with significant experience in their respective sectors and expert areas
Industry Consideration
Industry Growth 8 Low AEL has a mix of old and new-age businesses, except its coal business, all other businesses such as airports, roads, defence & FMCG are evolving in India, while data centres & green H2 have significant growth prospects.
Regulatory Environment or Risk 8 Low Govt policies are in the favour of green hydrogen, data centres, defence, airports and roads. Import substitution for copper and PVC is expected to be favourable for the overall economy.
Entry Barriers / Competition 8 Low Most of AEL’s businesses are B2B and are long-term in nature. Corporates do not change their suppliers frequently due to the customization of products and quality checks. This is a strong moat.
Business Prospects
New Business / Client Potential 8 Low The category of products which AEL is offering come under Make in India, China+1 and PLI schemes, which is expected to provide significant scope for new business.
Business Diversification 8 Low AEL is either operating or working on around 6 business verticals, which represents a well-diversified portfolio
Market Share Potential 8 Low AEL’s business verticals have shown significant growth in their respective fields and gained market share, which is expected to continue in future due to the company’s superior execution skills.
Margin Expansion Potential 8 Low With new businesses in the investment phase, profit metrics are in the nascent stage and do not reflect steady-state run rates. However, given its past records, we believe that the AEL will manage to expand its margins.
Earnings Growth 8 Low
AEL’s business growth is expected to be strong, due to the revenue recognition from new businesses such as defence, roads & airports, and upcoming businesses such as data centres, green H2, copper & PVC. Existing businesses such as FMCG and coal will continue to sustain momentum.
Valuation and Risk
Balance Sheet Strength 5 Medium AEL has done foreign tie-ups to get the benefits of its strong balance sheet for the project funding, which has improved its balance sheet strength.
Debt Profile 3 High
AEL is the fastest-growing incubator in India, which has conceived, grown, matured and demerged many successful businesses. This growth has been driven by debt funding. However, the company has been working on various methods of debt financing to reduce the burden on P&L.
FCF Generation 3 High Higher capex on new businesses has been impacting the overall FCF.
Dividend Policy 3 High AEL has been paying a dividend in the range of 10-15% of its net profit, which is very low. The company is using its cash flow in capex and the development of new businesses, that’s why its dividend payout is low.
Total Score
Ventura Score (%)
100
67 Low
The overall risk profile of the company is good and we consider it as a LOW risk company for investments
Source: Company Reports & Ventura Research

166 | P a g e ( 5 t h J u l 2 0 2 2 )
For any further query, please email us on [email protected]
Annual Report Analysis
We analyzed the FY21 annual report of AEL and our key observations are as follows:
Key takeaways & outlook on various businesses:
• Mining – Intends to emerge as one of the largest and most diversified mining groups
in the world. It is expected that the Carmichael mine in Australia could commence
operations in FY22. AEL will operationalise at least three mines in India in FY22.
• Solar – AEL is in line to expand its installed capacity to 3.5 GW/year with a probable
backward integration into the manufacture of ingots, wafers and polysilicon. AEL will
focus on the development of ancillaries in the EMC cluster for ensuring the timely
localisation of raw materials & will align with the government's focus on the
solarisation of agricultural pumps and increasing rooftop solar installations across the
country.
• Airports – The outlook for the airport infrastructure business is positive on account of
the government’s decision to progressively divest ownership stakes in Indian airports
in favour of private operators. The Company intends to re-define India’s airports
infrastructure sector through gateway development, regional footprint growth, focus
on consumers and non-passengers and deeper investment in digital technology
interventions.
• Roads/Highways – Will seek mergers and acquisitions that enhance access to superior
assets that maximise cash flows.
• Water – Scope of big players like AEL is widened given India’s water infrastructure
sector is marked by a larger number of projects coupled with a higher value of most
projects.
• Data centres – India’s digital economy is expected to touch USD 1 Trn by 2025. India
possesses one of the world’s largest data subscriber populations. There is a growing
appetite for reliable infrastructure to support Cloud, Content, Network, IoT, 5G, AI and
enterprise requirements. India’s Data Centre Policy encourages companies to build
data centre parks (providing infrastructure status) through incentives.
• Packaged food and edible oil – Adani Wilmar intends to widen its foods platform
across different segments addressing the needs of a growing India. The growing
optimism with regard to the consumption of hygienic, branded and packages food
products, a trend that has deepened following the pandemic, is now being viewed as
irreversible and holds out attractive multi-year prospects.
• Agro products – The share of the organized retail (market size INR 7,050 Bn) at 11.9%
provides a large headroom for multi-decade growth. Interestingly, the organised share
of the food & grocery space is only 4.50% and projected to grow at 22% annually to
around 9% retail penetration by 2025.
• Defence – AEL plans to create a tiered vendor base to catalyse indigenisation and
localization. Further, it seeks to commission a final assembly and integration line
including MRO facilities by incorporating technology transfer to support products
during their lifecycle.

167 | P a g e ( 5 t h J u l 2 0 2 2 )
For any further query, please email us on [email protected]
Board meetings
During the FY21 the Board of Directors met 4 times on 6th May 2020, 6th Aug 2020, 4th Nov
2020 and 3rd Feb 2021 and the gap between any two Board Meetings did not exceed 120 days
as required by the Companies Act. The attendance of all the members was satisfactory.
Board member attendance has been excellent
Name of director Board
meetings Meetings attended % attendance
Gautam Adani 4 7 100% Rajesh Adani 4 4 100% Pranav Adani 4 4 100% Vinay Prakash 4 4 100% Hemant Nerurkar 4 4 100% V Subramanian 4 4 100% Vijaylakshmi Joshi 4 4 100% Narendra Mairpady 4 4 100% Total attendance 32 32 100%
Source: Company Reports
Remuneration to KMP
The remuneration is commensurate with the size of the company and operating performance.
However, remuneration of independent directors is miniscule given the size of the company.
Remuneration of top management has more or less followed performance
FY19 FY20 FY21
Chairman 2.1 2.2 2.2
As a % of PBT 0.4 0.2 0.2
MD 4.2 4.3 4.5
As a % of PBT 0.8 0.4 0.4
Executive Directors 18.8 18.7 25.3
As a % of PBT 3.7 1.7 2.3
Independent Directors 0.7 0.8 1.0
As a % of PBT 0.1 0.1 0.1
Total 25.8 25.9 33.1
As a % of PBT 5.1 2.3 3.0
Source: Company Reports
Auditor qualifications
Shah Dhandharia & Co LLP is the auditor. However, given the size of the company, appointment
of a bigger audit firm would have provided more comfort. No audit qualifications have been
given on financial statements.

168 | P a g e ( 5 t h J u l 2 0 2 2 )
For any further query, please email us on [email protected]
Related Party Transactions
Related party transactions are high given the complex business structure and multiple
businesses.
Due to the very nature of business, related party transactions are too high
Source: Company Reports
Contingent Liabilities
Contingent liabilities as a % of networth are 38.8% of total networth as on FY21 However, 74%
of the same is on account of guarantees and LCs.
Contingent liabilities are high but consists mostly of guarantees
Source: Company Reports
Fig in INR cr
FY20 FY21 FY20 FY21 FY20 FY21 FY20 FY21 FY20 FY21
Sale of goods 29.7 1,218.6 267.9 - 4,004.2 2,399.1 - - 4,301.8 3,617.7
As a % of revenue 0.1% 3.1% 0.6% 0.0% 9.2% 6.1% 0.0% 0.0% 9.9% 9.2%
Purchase of goods 0.0 0.0 - - 2,275.9 3,243.9 - - 2,276.0 3,243.9
As a % of RM cost 0.0% 0.0% 0.0% 0.0% 6.6% 10.7% 0.0% 0.0% 6.6% 10.7%
Loans given 1,096.4 5,379.1 255.5 76.4 4,308.9 7,155.8 - - 5,660.8 12,611.4
As a % of total assets 4.7% 17.9% 1.1% 0.3% 18.5% 23.8% 0.0% 0.0% 24.3% 41.9%
Loans taken 1,611.0 2,621.9 50.3 151.4 6,292.8 10,213.1 - - 7,954.1 12,986.4
As a % of total assets 6.9% 8.7% 0.2% 0.5% 27.0% 33.9% 0.0% 0.0% 34.1% 43.2%
Others 1,110.9 96.6 2.7 2.6 1,599.8 2,102.1 40.3 59.6 2,753.7 2,261.0
As a % of revenue 2.6% 0.2% 0.0% 0.0% 3.7% 5.3% 0.1% 0.2% 6.3% 5.7%
Jointly controlled
entitiesAssociates Other related parties KMP Total
INR cr FY20 FY21
Claims 4.0 4.3
Tax 1,776.3 1,739.7
Guarantee 3,925.8 3,843.0
LC 696.2 1,062.2
Total 6,402.2 6,649.1
As a % of networth 37.8% 38.8%

169 | P a g e ( 5 t h J u l 2 0 2 2 )
For any further query, please email us on [email protected]
Management Team
Key Person Designation Details
Gautam Adani Chairman He has > 33 years of business experience. Under his leadership, Adani Group has emerged as a global integrated infrastructure player with interest across Resources, Logistics and Energy verticals.
Rajesh Adani MD He has been associated with Adani Group since its inception. He is in charge of the operations of the Group and has been responsible for developing its business relationships.
Pranav Adani Director He has been active in the group since 1999. He has spearheaded the JV with the Wilmar Group of Singapore and transformed it from a single refinery edible oil business into a pan India Food Company.
Vinay Prakash Director He has nurtured the Natural Resources business of the Group since its inception and oversees its diversification and expansion in India and abroad.
Hemant Nerurkar Independent and Non-
Executive Director
He has over 35 years of experience in steel industry in various functions. Mr. Nerurkar is an executive with multifaceted experience ranging from Project Execution, Manufacturing, Quality Control, Supply Chain and Marketing.
V. Subramanian Independent and Non-
Executive Director
He was the Secretary to the Government of India with the Ministry of New and Renewable Energy (MNRE) where he pioneered important initiatives for reforms and development of the renewable energy sector, including the introduction of the "Feed-in Tariff" concept.
Vijaylaxmi Joshi Independent and Non-
Executive Director
She is a 1980 batch IAS officer of the Gujarat cadre. She had served in various posts in the State and in the Centre. She had been Joint and Additional secretary in the Commerce Ministry between 2011 to 2014.
Narendra Mairpady
Independent and Non-Executive Director
He is an eminent banking professional having more than 40 years of wide experience and exposure. He was appointed as Chairman and Managing Director of Indian Overseas Bank in 2010 and retired as CMD in 2014.
Source: Company Reports
Key Risks & Concerns
• Low ESG score: While AEL has put in place definite ESG targets, the company's ESG
score remains low due to the very nature of the mining business. This can affect the
investments into other businesses of the company by global funds/ strategic partners
who are now required to invest only in strict ESG compliant companies.
• Foreign Exchange Risk: AEL is exposed to risks resulting from exchange rate fluctuation
and interest rate movements. It manages its exposure to these risks through derivative
financial instruments.
• Commodity price risk: Being in infrastructure business, the rise in price of commodities
always affect margins as not all costs are pass through.
• Debt: AEL is expected to embark on a huge capex over the next 3-4 years and hence
net debt is expected to increase considerably.

170 | P a g e ( 5 t h J u l 2 0 2 2 )
For any further query, please email us on [email protected]
Summary of management commentary and quarterly performance over last few quarters
Key Criteria View Comments Q1FY22
Business Performance POSITIVE
Revenue grew at a YoY rate of 138.9% YoY to INR 12,579 cr, while EBITDA and net profit grew at a YoY rate of 1145.4% to INR 796 cr and 811.2% to INR 271 cr respectively.
The company operationalize the Kurmitar Iron Ore mine in Orissa during the quarter.
Outlook & Strategy POSITIVE The company is targeting its airport segment as a B2C business and the management has indicated increasing non-aero revenues rather than just focusing on aero revenues.
Q2FY22
Business Performance POSITIVE
Revenue and EBITDA grew at a YoY rate of 44.8% to INR 13,218 cr and 17.5% to INR 883 cr respectively, however, net profit declined YoY rate of 41.4% to INR 212 cr due to higher depreciation and a rise in interest cost.
In H2 FY22, the mining production volumes increased by 91% YoY to 10.9 mn tonnes, while mining dispatch increased by 77% YoY to 9.9 mn tonnes.
Outlook & Strategy POSITIVE
The Board of directors has approved the formation of a corporate responsibility committee with 100% independent directors.
The committee’s primary objective is to assure ESG commitments.
Q3FY22
Business Performance POSITIVE Revenue and EBITDA grew at a YoY rate of 61.4% to INR 18,758 cr and 0.4% to INR 772 cr respectively, however, the company reported a net loss of INR 12 cr.
Outlook & Strategy POSITIVE
Airports achieved 67% passenger volumes to pre-COVID levels and the company also won contracts for Jaipur, Guwahati and Trivandrum airports in Oct 2021.
The company set up a new entity – Adani New Industries Ltd (ANIL) to undertake green H2 business.
Q4FY22
Business Performance POSITIVE Revenue grew at a YoY rate of 83.8% to INR 24,866 cr, while EBITDA and PAT grew at a YoY rate of 39.7% to INR 1,262 cr and 30.1% to INR 304 cr respectively
Outlook & Strategy POSITIVE
The company completed the financial closure for the Greenfield Navi Mumbai International Airport project with SBI for the entire debt capital of INR 12,770 cr. The company also completed the refinance program for MIAL of USD 750 mn.
Road segment received LOA for Kagal-Satara road of 67 km in Maharashtra on a BOT basis with the project cost of INR 2,000 cr. The company has also signed a concession agreement for the construction and maintenance of 3 greenfield Ganga Expressway projects of INR 464 km.
Solar cell and modular line capacity expansion to 3.5 GW will be completed by Q2FY23 while the windmill and wind turbine setup has started in Mundra.
Source: Company Reports & Ventura Research

171 | P a g e ( 5 t h J u l 2 0 2 2 )
For any further query, please email us on [email protected]
AEL’s Financial Analysis & Projections
We have consolidated 75% of ANIL and 50% of AdaniConnex financials in our estimated numbers
Fig in INR Cr (unless specified) FY21 FY22 FY23E FY24E FY25E Fig in INR Cr (unless specified) FY21 FY22 FY23E FY24E FY25E
Income Statement Per share data & Yields
Revenue 39,537 69,420 58,656 78,084 1,18,612 Adjusted EPS (INR) 7.8 6.6 12.8 51.7 58.4
YoY Growth (%) -8.9 75.6 -15.5 33.1 51.9 Adjusted Cash EPS (INR) 12.3 17.1 33.9 79.9 108.3
Other Expenses 5,955 10,809 9,074 12,002 18,112 Adjusted BVPS (INR) 159.6 227.3 289.7 388.2 488.6
Other Exp to Sales (%) 15.1 15.6 15.5 15.4 15.3 Adjusted CFO per share (INR) 34.5 11.7 50.5 69.0 44.3
EBITDA 2,505 3,713 6,835 13,738 21,903 CFO Yield (%) 1.5 0.5 2.2 3.1 2.0
Margin (%) 6.3 5.3 11.7 17.6 18.5
YoY Growth (%) 9.7 48.2 84.1 101.0 59.4 Solvency Ratio (X)
Depreciation & Amortization 537 1,248 2,501 3,340 5,920 Total Debt to Equity 0.8 1.5 1.9 2.4 2.7
EBIT 1,968 2,465 4,333 10,398 15,983 Net Debt to Equity 0.7 1.4 1.9 2.3 2.7
Margin (%) 5.0 3.6 7.4 13.3 13.5 Net Debt to EBITDA 5.7 10.0 9.3 7.8 7.1
YoY Growth (%) 8.6 25.3 75.8 139.9 53.7
Other Income 754 1,013 651 1,628 409 Return Ratios (%)
Finance Cost 1,377 2,526 3,178 5,236 8,633 Return on Equity 5.4 3.5 5.5 16.7 14.8
Interest Coverage (X) 1.4 1.0 1.4 2.0 1.9 Return on Capital Employed 4.1 1.9 2.8 5.8 6.3
Exceptional Item -259 0 0 0 0 Return on Invested Capital 6.3 4.2 4.7 7.2 7.9
PBT 1,086 952 1,807 6,790 7,759
Margin (%) 2.7 1.4 3.1 8.7 6.5 Working Capital Ratios
YoY Growth (%) -3.2 -12.3 89.8 275.8 14.3 Payable Days (Nos) 109 93 80 70 60
Tax Expense 340 477 738 1,272 1,569 Inventory Days (Nos) 16 36 40 50 60
Tax Rate (%) 31.3 50.1 40.8 18.7 20.2 Receivable Days (Nos) 111 72 80 90 100
PAT 746 475 1,069 5,518 6,190 Net Working Capital Days (Nos) 18 15 40 70 100
Margin (%) 1.9 0.7 1.8 7.1 5.2 Net Working Capital to Sales (%) 5.0 4.1 11.0 19.2 27.4
YoY Growth (%) -6.5 -36.3 124.9 416.2 12.2
Min Int/Sh of Assoc 176 301 448 604 727 Valuation (X)
Net Profit 923 777 1,517 6,122 6,917 P/E 288.3 342.6 175.3 43.5 38.5
Margin (%) 2.3 1.1 2.6 7.8 5.8 P/BV 14.1 9.9 7.7 5.8 4.6
YoY Growth (%) -18.9 -15.8 95.4 303.5 13.0 EV/EBITDA 111.9 81.6 48.3 27.1 19.3
EV/Sales 7.1 4.4 5.6 4.8 3.6
Balance Sheet
Share Capital 110 114 116 117 119 Cash Flow Statement
Total Reserves 18,800 26,818 34,214 45,886 57,776 PBT 1,086 952 1,807 6,790 7,759
Shareholders Fund 18,910 26,932 34,330 46,003 57,895 Adjustments 1,435 1,779 8,485 11,203 16,576
Long Term Borrowings 9,523 20,803 44,728 70,088 99,546 Change in Working Capital 1,912 -869 -3,575 -8,547 -17,521
Deferred Tax Liabilities 409 2,606 2,202 2,932 4,453 Less: Tax Paid -340 -477 -738 -1,272 -1,569
Other Long Term Liabilities 1,624 7,293 6,728 7,842 9,877 Cash Flow from Operations 4,094 1,385 5,979 8,174 5,245
Long Term Provisions 77 279 208 240 308 Net Capital Expenditure -3,359 -13,493 -31,172 -46,857 -46,803
Total Liabilities 30,543 57,914 88,196 1,27,105 1,72,080 Change in Investments -4,543 -3,994 -73 -2,225 -1,789
Net Block 10,838 30,076 58,747 1,02,264 1,43,146 Cash Flow from Investing -7,902 -17,487 -31,245 -49,082 -48,592
Capital Work in Progress 8,686 19,564 19,564 19,564 19,564 Change in Borrowings 4,435 18,505 28,026 46,728 52,867
Intangible assets under development 139 3,980 3,980 3,980 3,980 Less: Finance Cost -1,377 -2,526 -3,178 -5,236 -8,633
Non Current Investments 5,473 4,276 6,363 8,570 10,323 Dividend Paid 0 -78 -152 -612 -692
Long Term Loans & Advances 5,201 9,209 8,495 9,902 12,472 Cash flow from Financing 3,059 15,901 24,696 40,880 43,542
Other Non Current Assets 1,265 3,535 3,261 3,801 4,788 Net Cash Flow -750 -201 -570 -28 194
Deferred Tax Assets 459 174 147 196 297 Forex Effect -708 447 0 0 0
Net Current Assets -1,520 -12,900 -12,361 -21,172 -22,491 Opening Balance of Cash 2,125 666 916 347 319
Total Assets 30,543 57,914 88,196 1,27,105 1,72,080 Closing Balance of Cash 666 912 347 319 513

172 | P a g e ( 5 t h J u l 2 0 2 2 )
For any further query, please email us on [email protected]
Disclosures and Disclaimer
Ventura Securities Limited (VSL) is a SEBI registered intermediary offering broking, depository and portfolio management services to clients. VSL is member of BSE, NSE
and MCX-SX. VSL is a depository participant of NSDL. VSL states that no disciplinary action whatsoever has been taken by SEBI against it in last five years except
administrative warning issued in connection with technical and venial lapses observed while inspection of books of accounts and records. Ventura Commodities Limited,
Ventura Guaranty Limited, Ventura Insurance Brokers Limited and Ventura Allied Services Private Limited are associates of VSL. Research Analyst (RA) involved in the
preparation of this research report and VSL disclose that neither RA nor VSL nor its associates (i) have any financial interest in the company which is the subject matter
of this research report (ii) holds ownership of one percent or more in the securities of subject company (iii) have any material conflict of interest at the time of
publication of this research report (iv) have received any compensation from the subject company in the past twelve months (v) have managed or co-managed public
offering of securities for the subject company in past twelve months (vi) have received any compensation for investment banking merchant banking or brokerage
services from the subject company in the past twelve months (vii) have received any compensation for product or services from the subject company in the past twelve
months (viii) have received any compensation or other benefits from the subject company or third party in connection with the research report. RA involved in the
preparation of this research report discloses that he / she has not served as an officer, director or employee of the subject company. RA involved in the preparation of
this research report and VSL discloses that they have not been engaged in the market making activity for the subject company. Our sales people, dealers, traders and
other professionals may provide oral or written market commentary or trading strategies to our clients that reflect opinions that are contrary to the opinions expressed
herein. We may have earlier issued or may issue in future reports on the companies covered herein with recommendations/ information inconsistent or different those
made in this report. In reviewing this document, you should be aware that any or all of the foregoing, among other things, may give rise to or potential conflicts of
interest. We may rely on information barriers, such as "Chinese Walls" to control the flow of information contained in one or more areas within us, or other areas, units,
groups or affiliates of VSL. This report is for information purposes only and this document/material should not be construed as an offer to sell or the solicitation of an
offer to buy, purchase or subscribe to any securities, and neither this document nor anything contained herein shall form the basis of or be relied upon in connection
with any contract or commitment whatsoever. This document does not solicit any action based on the material contained herein. It is for the general information of the
clients / prospective clients of VSL. VSL will not treat recipients as clients by virtue of their receiving this report. It does not constitute a personal recommendation or
take into account the particular investment objectives, financial situations, or needs of clients / prospective clients. Similarly, this document does not have regard to
the specific investment objectives, financial situation/circumstances and the particular needs of any specific person who may receive this document. The securities
discussed in this report may not be suitable for all investors. The appropriateness of a particular investment or strategy will depend on an investor's individual
circumstances and objectives. Persons who may receive this document should consider and independently evaluate whether it is suitable for his/ her/their particular
circumstances and, if necessary, seek professional/financial advice. And such person shall be responsible for conducting his/her/their own investigation and analysis of
the information contained or referred to in this document and of evaluating the merits and risks involved in the securities forming the subject matter of this document.
The projections and forecasts described in this report were based upon a number of estimates and assumptions and are inherently subject to significant uncertainties
and contingencies. Projections and forecasts are necessarily speculative in nature, and it can be expected that one or more of the estimates on which the projections
and forecasts were based will not materialize or will vary significantly from actual results, and such variances will likely increase over time. All projections and forecasts
described in this report have been prepared solely by the authors of this report independently of the Company. These projections and forecasts were not prepared with
a view toward compliance with published guidelines or generally accepted accounting principles. No independent accountants have expressed an opinion or any other
form of assurance on these projections or forecasts. You should not regard the inclusion of the projections and forecasts described herein as a representation or
warranty by VSL, its associates, the authors of this report or any other person that these projections or forecasts or their underlying assumptions will be achieved. For
these reasons, you should only consider the projections and forecasts described in this report after carefully evaluating all of the information in this report, including
the assumptions underlying such projections and forecasts. The price and value of the investments referred to in this document/material and the income from them
may go down as well as up, and investors may realize losses on any investments. Past performance is not a guide for future performance. Future returns are not
guaranteed and a loss of original capital may occur. Actual results may differ materially from those set forth in projections. Forward-looking statements are not
predictions and may be subject to change without notice. We do not provide tax advice to our clients, and all investors are strongly advised to consult regarding any
potential investment. VSL, the RA involved in the preparation of this research report and its associates accept no liabilities for any loss or damage of any kind arising out
of the use of this report. This report/document has been prepared by VSL, based upon information available to the public and sources, believed to be reliable. No
representation or warranty, express or implied is made that it is accurate or complete. VSL has reviewed the report and, in so far as it includes current or historical
information, it is believed to be reliable, although its accuracy and completeness cannot be guaranteed. The opinions expressed in this document/material are subject
to change without notice and have no obligation to tell you when opinions or information in this report change. This report or recommendations or information
contained herein do/does not constitute or purport to constitute investment advice in publicly accessible media and should not be reproduced, transmitted or published
by the recipient. The report is for the use and consumption of the recipient only. This publication may not be distributed to the public used by the public media without
the express written consent of VSL. This report or any portion hereof may not be printed, sold or distributed without the written consent of VSL. This document does
not constitute an offer or invitation to subscribe for or purchase or deal in any securities and neither this document nor anything contained herein shall form the basis
of any contract or commitment whatsoever. This document is strictly confidential and is being furnished to you solely for your information, may not be distributed to
the press or other media and may not be reproduced or redistributed to any other person. The opinions and projections expressed herein are entirely those of the
author and are given as part of the normal research activity of VSL and are given as of this date and are subject to change without notice. Any opinion estimate or
projection herein constitutes a view as of the date of this report and there can be no assurance that future results or events will be consistent with any such opinions,
estimate or projection. This document has not been prepared by or in conjunction with or on behalf of or at the instigation of, or by arrangement with the company or
any of its directors or any other person. Information in this document must not be relied upon as having been authorized or approved by the company or its directors
or any other person. Any opinions and projections contained herein are entirely those of the authors. None of the company or its directors or any other person accepts
any liability whatsoever for any loss arising from any use of this document or its contents or otherwise arising in connection therewith. The information contained herein
is not intended for publication or distribution or circulation in any manner whatsoever and any unauthorized reading, dissemination, distribution or copying of this
communication is prohibited unless otherwise expressly authorized. Please ensure that you have read “Risk Disclosure Document for Capital Market and Derivatives
Segments” as prescribed by Securities and Exchange Board of India before investing in Securities Market.
Ventura Securities Limited - SEBI Registration No.: INH000001634
Corporate Office: I-Think Techno Campus, 8th Floor, ‘B’ Wing, Off Pokhran Road No 2, Eastern Express Highway, Thane (W) – 400608


