Embed Size (px)
Citation preview
International Journal of Mathematical Education inScience and Technology, Vol. 42, No. 4, 15 June 2011, 481–495
Adapting the mathematical task framework to design online
didactic objects
Janet Bowersa*, Nadine Bezukb and Karen Aguilarc
aDepartment of Mathematics and Statistics, San Diego State University, 5500 CampanileDr, San Diego, CA 92182, USA; bSchool of Teacher Education, Center for Research
in Mathematics Education, San Diego State University, 6475 Alvarado Road, San Diego,CA 92120, USA; cDepartment of Mathematics, Hoover High School, 4474 El
Cajon Boulevard, San Diego, CA 92115-4397, USA
(Received 17 August 2010)
Designing didactic objects involves imagining how students can conceive ofspecific mathematical topics and then imagining what types of classroomdiscussions could support these mental constructions. This study investi-gated whether it was possible to design Java applets that might serve asdidactic objects to support online learning where ‘discussions’ are broadlydefined as the conversations students have with themselves as they interactwith the dynamic mathematical representations on the screen. Eighty-fourpre-service elementary teachers enrolled in hybrid mathematics courseswere asked to interact with a series of applets designed to support theirunderstanding of qualitative graphing. The results of the surveys indicatethat various design features of the applets did in fact cause perturbationsand opportunities for resolutions that enabled the users to ‘discuss’ theirlearning by reflecting on their in-class discussions and online activities.The discussion includes four design features for guiding future appletcreation.
Keywords: didactic objects; online learning; applet creation
1. Introduction
Although web-based computer applets have been used by businesses to increaseonline sales and website usability for the last 15 years, their use in education isrelatively new. Our experience in classrooms indicates that the proliferation ofadvanced technologies such as digital white boards and netbooks has created a newdemand for well-designed applets that can enhance whole-class and small groupdiscussions [1]. For example, teachers may want to demonstrate a topic such asgraphing constant motion using a digital whiteboard, or they may want groups ofstudents to use netbooks to engage in interactive explorations. The goal of thisarticle is to discuss how we adapted a classroom-based design framework to create aseries of mathematical applets that could be used for in-class demonstrations or withsmall group or individual explorations that would complement their in-classdiscussions.
*Corresponding author. Email: [email protected]
ISSN 0020–739X print/ISSN 1464–5211 online
� 2011 Taylor & Francis
DOI: 10.1080/0020739X.2010.550941
http://www.informaworld.com
2. Design perspective
2.1. Creating didactic objects to support classroom-based learning
The design perspective we have adopted is based on constructivist views of learning.As von Glasersfeld notes, this perspective suggests that learners construct knowledgethrough successive cycles of action, perturbation and reflection [2]. In classrooms,the sources of these perturbations may come from any number of social catalystsincluding the teacher, activity, textbook, other students, etc. In all of these cases,students are challenged to resolve the conflict between their own expectations andthe particular outcome or discussion experienced through whole-class and small-group discussions. Thompson [3] suggests that classroom teachers can support thisequilibration process by creating thought-provoking questions that will form thebasis for reflection and discussion – what he calls didactic objects. His view is thatwhen a teacher skilfully poses a well-planned series of questions based on thesedidactic objects, he or she can support shifts in students’ constructions of theunderlying mathematical ideas. This study examines the degree to which a set of well-designed didactic objects designed for online use might be able to support ananalogous shift in students’ mathematical ideas.
According to Thompson, didactic objects can range from simple drawings tomore complicated computer simulations. The critical issue is not the object itself – infact Thompson argues that an object is not didactic in and of itself – it is the way thatit is used to support students’ constructions of increasingly complex cognitivestructures. Thus, the key to designing such objects lies in creating a conceptualanalysis to imagine ‘What mental operations must be carried out to see the presentedsituation in the particular way one is seeing it?’ [2, pp. 78, 3, 196].
Given that Thompson’s theories are deeply rooted in the social setting of theclassroom, it may seem overreaching to adapt the theory of didactic objects to thedesign of online learning activities – especially if learners are working at home or atindividual computers. In order to resolve this dilemma, we found Sfard’s [4,5]commognitive perspective to be helpful. Sfard coined this term to suggest thateducational researchers may do well to dispel the distinction between interpersonalcommunication and intrapersonal cognition. In her view, ‘. . .thinking is defined asthe individualized version of interpersonal communication – as a communicativeinteraction in which one person plays the roles of all interlocutors’ [4, p. iv (italics inoriginal)]. The implication for online learning is that if students are thinking aboutwhat they are viewing on the screen and making action choices based on theirthinking, then they are engaging in a type of interpersonal communication. Ourhypothesis is that during this communication, a self-negotiation process occurs inwhich students revise their current actions and perceptions.
2.2. Adapting didactic objects to the online environment
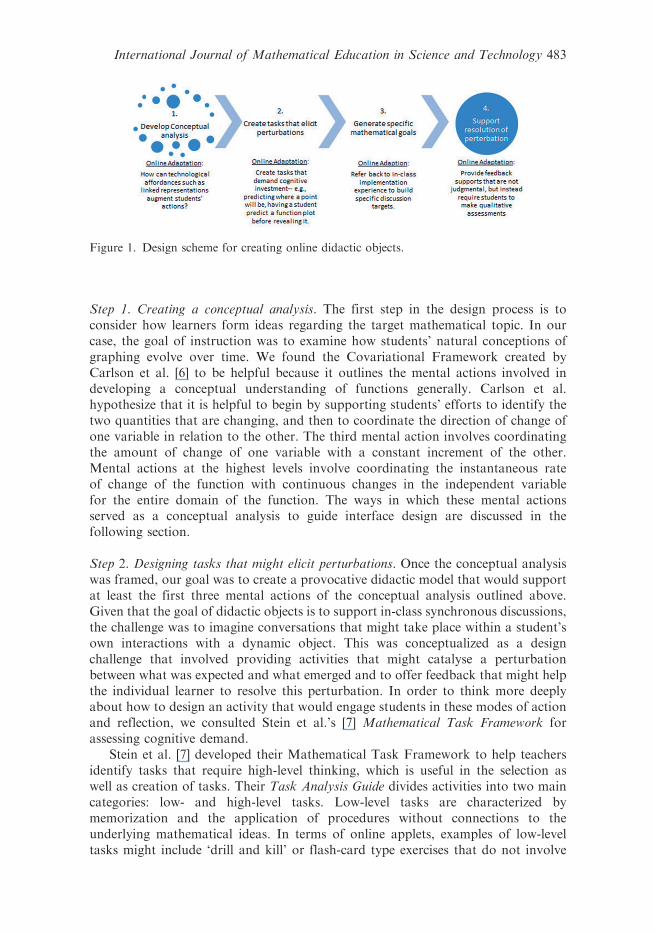
Although not a linear process, we can illustrate the process of designing didacticobjects – and our adaptation of them to online environments as shown in Figure 1.In what follows, we describe Steps 1–3 of this framework. We then describe theresults of our study to analyse Step 4: implementation. We focus on the example ofqualitative graphing to illustrate one of the ways this process may play out for aparticular topic.
482 J. Bowers et al.
Step 1. Creating a conceptual analysis. The first step in the design process is toconsider how learners form ideas regarding the target mathematical topic. In ourcase, the goal of instruction was to examine how students’ natural conceptions ofgraphing evolve over time. We found the Covariational Framework created byCarlson et al. [6] to be helpful because it outlines the mental actions involved indeveloping a conceptual understanding of functions generally. Carlson et al.hypothesize that it is helpful to begin by supporting students’ efforts to identify thetwo quantities that are changing, and then to coordinate the direction of change ofone variable in relation to the other. The third mental action involves coordinatingthe amount of change of one variable with a constant increment of the other.Mental actions at the highest levels involve coordinating the instantaneous rateof change of the function with continuous changes in the independent variablefor the entire domain of the function. The ways in which these mental actionsserved as a conceptual analysis to guide interface design are discussed in thefollowing section.
Step 2. Designing tasks that might elicit perturbations. Once the conceptual analysiswas framed, our goal was to create a provocative didactic model that would supportat least the first three mental actions of the conceptual analysis outlined above.Given that the goal of didactic objects is to support in-class synchronous discussions,the challenge was to imagine conversations that might take place within a student’sown interactions with a dynamic object. This was conceptualized as a designchallenge that involved providing activities that might catalyse a perturbationbetween what was expected and what emerged and to offer feedback that might helpthe individual learner to resolve this perturbation. In order to think more deeplyabout how to design an activity that would engage students in these modes of actionand reflection, we consulted Stein et al.’s [7] Mathematical Task Framework forassessing cognitive demand.
Stein et al. [7] developed their Mathematical Task Framework to help teachersidentify tasks that require high-level thinking, which is useful in the selection aswell as creation of tasks. Their Task Analysis Guide divides activities into two maincategories: low- and high-level tasks. Low-level tasks are characterized bymemorization and the application of procedures without connections to theunderlying mathematical ideas. In terms of online applets, examples of low-leveltasks might include ‘drill and kill’ or flash-card type exercises that do not involve
Figure 1. Design scheme for creating online didactic objects.
International Journal of Mathematical Education in Science and Technology 483
making novel conceptual connections or deep mathematical thinking. It is
important to note that these programmes have been shown to improve skills
such as fact recall [8], but are not designed to challenge users to think about the
underlying mathematics or how the mathematical arguments might play out in a
classroom discussion. Therefore, they do not help develop mathematical reasoning
and higher order thinking.Higher demand cognitive tasks involve the development of novel procedures that
have connections to the underlying mathematics. These tasks are designed to focus
students’ attention on the use of procedures for developing deeper levels of
understanding and require some degree of cognitive effort. Tasks at the highest level
require a student to apply non-algorithmic thinking and demand self-monitoring or
self-regulation of one’s own cognitive processes.It is important to note that perceived task difficulty is not necessarily correlated
with cognitive demand. In fact, a task can be quite easy in terms of execution, but
still cognitively demanding. For example, one could argue that the quadratic formula
may be difficult to memorize, but restating it is a memorization task, and using it
without connections keeps it at a low level of cognitive demand. On the other hand,
finding the area of an irregularly shaped object may not be arithmetically difficult,
but it can be cognitively demanding to mentally manipulate and break down the
shape into more familiar simpler shapes for which the area is easier to find. In both
these cases, the focus is placed on the intended nature of the solution strategy, not
the procedural component of executing it.One example of a high-cognitive demand task for graphing is to ask groups of
students to walk in front of a motion detector to create various target position-time
graphs [9]. This activity is very powerful for helping students begin to focus on how
the dependent variable – distance from the motion detector – can be identified as a
measured quantity that is tracked over time. The target graphs serve as didactic
objects if they are sequenced in a way that supports group conversations involving
planning, executing and reflecting on the resultant graphs for resolution.Although this task has high-cognitive demand, it has some drawbacks that an
online activity could supplant. First, it cannot be easily revisited in later classes once
the motion detectors are put away (not to mention the fact that these devices are not
always readily available in schools). In contrast, applets are more easily accessible at
any time and can be used at the students’ leisure and pace. Second, it can be difficult
for students to produce ‘perfect’ graphs using the motion detector because graphs
generated from empirical data have bumps or distracting marks that students may
conflate with the actual concepts the instructor hopes they will construct. In contrast,
computer applets can be designed to provide ‘cartoon worlds’ in which objects can
move at mathematically accurate rates, thus producing more ‘perfect’ position-time
graphs [10,11].
Step 3. Generating specific mathematical goals. The genesis for the series of applets we
designed emerged over the course of 3 years of professional development experience.
The original task, which was adapted from Bassarear [12] had been presented to
teachers in many in-service workshops via pencil and paper.Based on our classroom experience using this task during face-to-face workshops
with in-service teachers, we developed the following four goals and four successive
online applets.
484 J. Bowers et al.
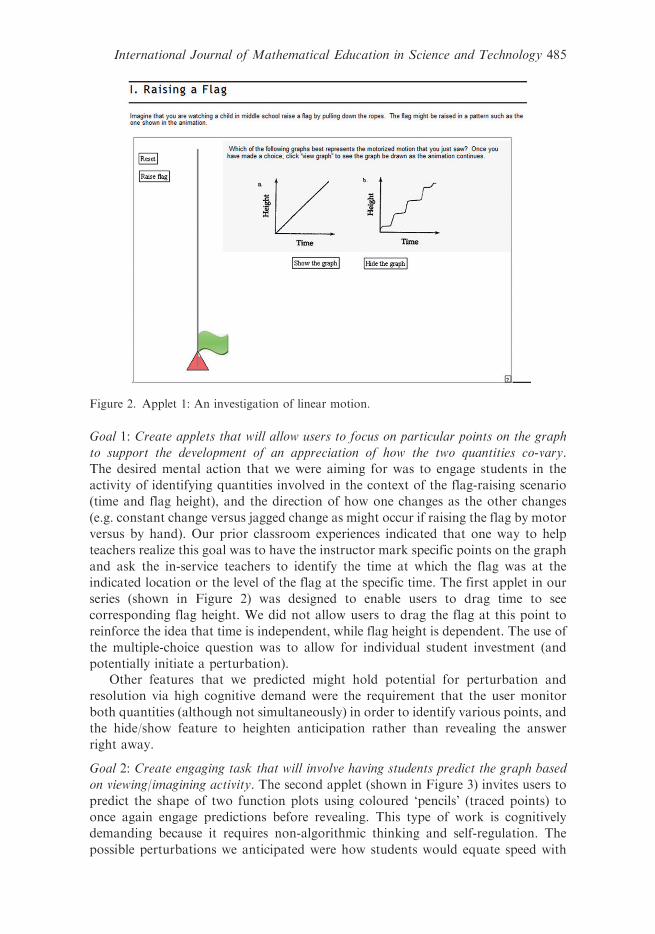
Goal 1: Create applets that will allow users to focus on particular points on the graph
to support the development of an appreciation of how the two quantities co-vary.
The desired mental action that we were aiming for was to engage students in the
activity of identifying quantities involved in the context of the flag-raising scenario
(time and flag height), and the direction of how one changes as the other changes
(e.g. constant change versus jagged change as might occur if raising the flag by motor
versus by hand). Our prior classroom experiences indicated that one way to help
teachers realize this goal was to have the instructor mark specific points on the graph
and ask the in-service teachers to identify the time at which the flag was at the
indicated location or the level of the flag at the specific time. The first applet in our
series (shown in Figure 2) was designed to enable users to drag time to see
corresponding flag height. We did not allow users to drag the flag at this point to
reinforce the idea that time is independent, while flag height is dependent. The use of
the multiple-choice question was to allow for individual student investment (and
potentially initiate a perturbation).Other features that we predicted might hold potential for perturbation and
resolution via high cognitive demand were the requirement that the user monitor
both quantities (although not simultaneously) in order to identify various points, and
the hide/show feature to heighten anticipation rather than revealing the answer
right away.
Goal 2: Create engaging task that will involve having students predict the graph based
on viewing/imagining activity. The second applet (shown in Figure 3) invites users to
predict the shape of two function plots using coloured ‘pencils’ (traced points) to
once again engage predictions before revealing. This type of work is cognitively
demanding because it requires non-algorithmic thinking and self-regulation. The
possible perturbations we anticipated were how students would equate speed with
Figure 2. Applet 1: An investigation of linear motion.
International Journal of Mathematical Education in Science and Technology 485
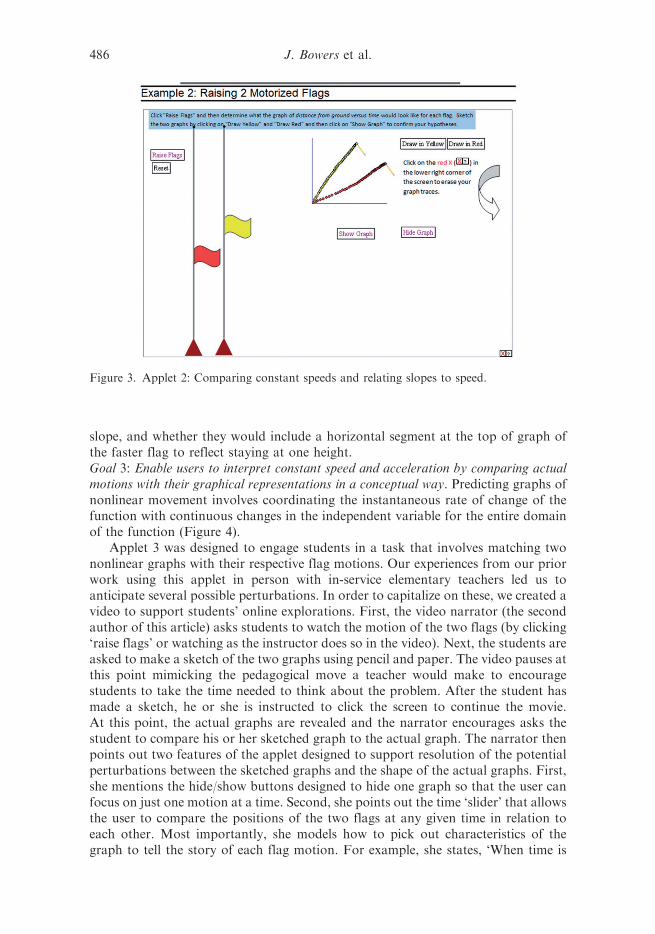
slope, and whether they would include a horizontal segment at the top of graph ofthe faster flag to reflect staying at one height.Goal 3: Enable users to interpret constant speed and acceleration by comparing actualmotions with their graphical representations in a conceptual way. Predicting graphs ofnonlinear movement involves coordinating the instantaneous rate of change of thefunction with continuous changes in the independent variable for the entire domainof the function (Figure 4).
Applet 3 was designed to engage students in a task that involves matching twononlinear graphs with their respective flag motions. Our experiences from our priorwork using this applet in person with in-service elementary teachers led us toanticipate several possible perturbations. In order to capitalize on these, we created avideo to support students’ online explorations. First, the video narrator (the secondauthor of this article) asks students to watch the motion of the two flags (by clicking‘raise flags’ or watching as the instructor does so in the video). Next, the students areasked to make a sketch of the two graphs using pencil and paper. The video pauses atthis point mimicking the pedagogical move a teacher would make to encouragestudents to take the time needed to think about the problem. After the student hasmade a sketch, he or she is instructed to click the screen to continue the movie.At this point, the actual graphs are revealed and the narrator encourages asks thestudent to compare his or her sketched graph to the actual graph. The narrator thenpoints out two features of the applet designed to support resolution of the potentialperturbations between the sketched graphs and the shape of the actual graphs. First,she mentions the hide/show buttons designed to hide one graph so that the user canfocus on just one motion at a time. Second, she points out the time ‘slider’ that allowsthe user to compare the positions of the two flags at any given time in relation toeach other. Most importantly, she models how to pick out characteristics of thegraph to tell the story of each flag motion. For example, she states, ‘When time is
Figure 3. Applet 2: Comparing constant speeds and relating slopes to speed.
486 J. Bowers et al.
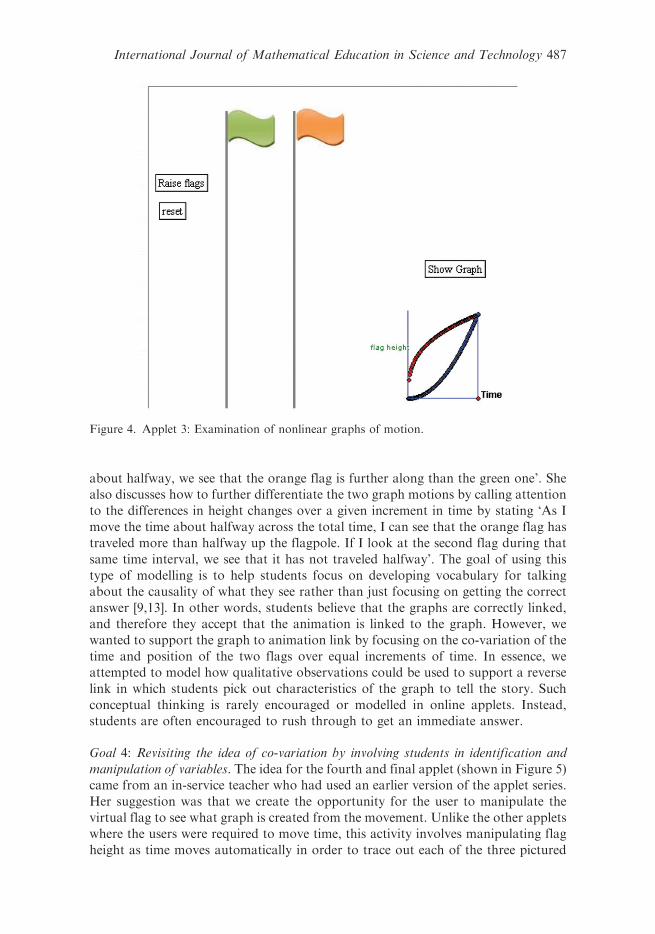
about halfway, we see that the orange flag is further along than the green one’. Shealso discusses how to further differentiate the two graph motions by calling attention
to the differences in height changes over a given increment in time by stating ‘As I
move the time about halfway across the total time, I can see that the orange flag hastraveled more than halfway up the flagpole. If I look at the second flag during that
same time interval, we see that it has not traveled halfway’. The goal of using this
type of modelling is to help students focus on developing vocabulary for talkingabout the causality of what they see rather than just focusing on getting the correct
answer [9,13]. In other words, students believe that the graphs are correctly linked,and therefore they accept that the animation is linked to the graph. However, we
wanted to support the graph to animation link by focusing on the co-variation of the
time and position of the two flags over equal increments of time. In essence, weattempted to model how qualitative observations could be used to support a reverse
link in which students pick out characteristics of the graph to tell the story. Such
conceptual thinking is rarely encouraged or modelled in online applets. Instead,students are often encouraged to rush through to get an immediate answer.
Goal 4: Revisiting the idea of co-variation by involving students in identification and
manipulation of variables. The idea for the fourth and final applet (shown in Figure 5)came from an in-service teacher who had used an earlier version of the applet series.
Her suggestion was that we create the opportunity for the user to manipulate the
virtual flag to see what graph is created from the movement. Unlike the other appletswhere the users were required to move time, this activity involves manipulating flag
height as time moves automatically in order to trace out each of the three pictured
Figure 4. Applet 3: Examination of nonlinear graphs of motion.
International Journal of Mathematical Education in Science and Technology 487
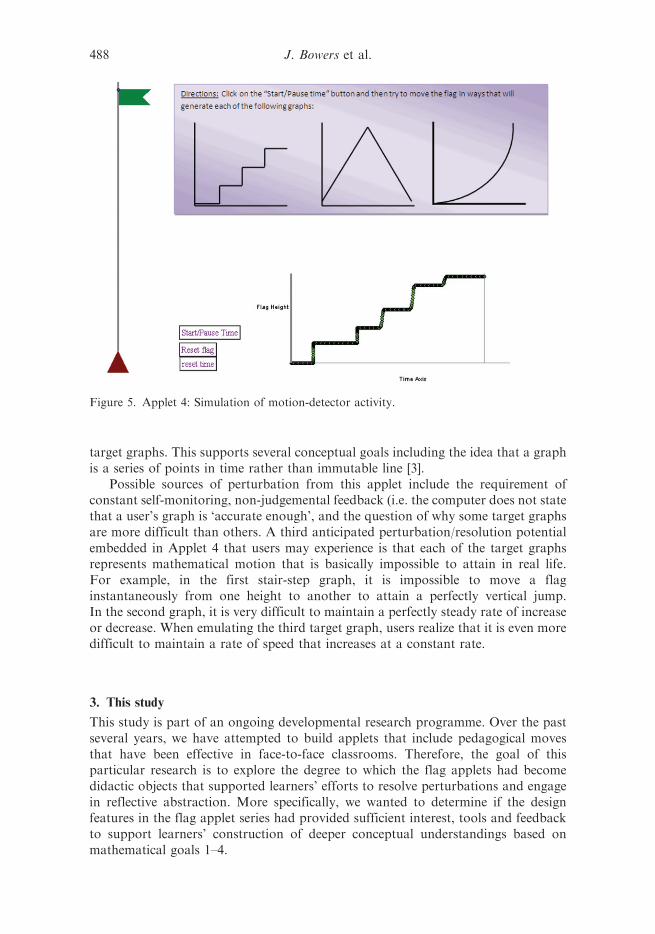
target graphs. This supports several conceptual goals including the idea that a graphis a series of points in time rather than immutable line [3].
Possible sources of perturbation from this applet include the requirement ofconstant self-monitoring, non-judgemental feedback (i.e. the computer does not statethat a user’s graph is ‘accurate enough’, and the question of why some target graphsare more difficult than others. A third anticipated perturbation/resolution potentialembedded in Applet 4 that users may experience is that each of the target graphsrepresents mathematical motion that is basically impossible to attain in real life.For example, in the first stair-step graph, it is impossible to move a flaginstantaneously from one height to another to attain a perfectly vertical jump.In the second graph, it is very difficult to maintain a perfectly steady rate of increaseor decrease. When emulating the third target graph, users realize that it is even moredifficult to maintain a rate of speed that increases at a constant rate.
3. This study
This study is part of an ongoing developmental research programme. Over the pastseveral years, we have attempted to build applets that include pedagogical movesthat have been effective in face-to-face classrooms. Therefore, the goal of thisparticular research is to explore the degree to which the flag applets had becomedidactic objects that supported learners’ efforts to resolve perturbations and engagein reflective abstraction. More specifically, we wanted to determine if the designfeatures in the flag applet series had provided sufficient interest, tools and feedbackto support learners’ construction of deeper conceptual understandings based onmathematical goals 1–4.
Figure 5. Applet 4: Simulation of motion-detector activity.
488 J. Bowers et al.
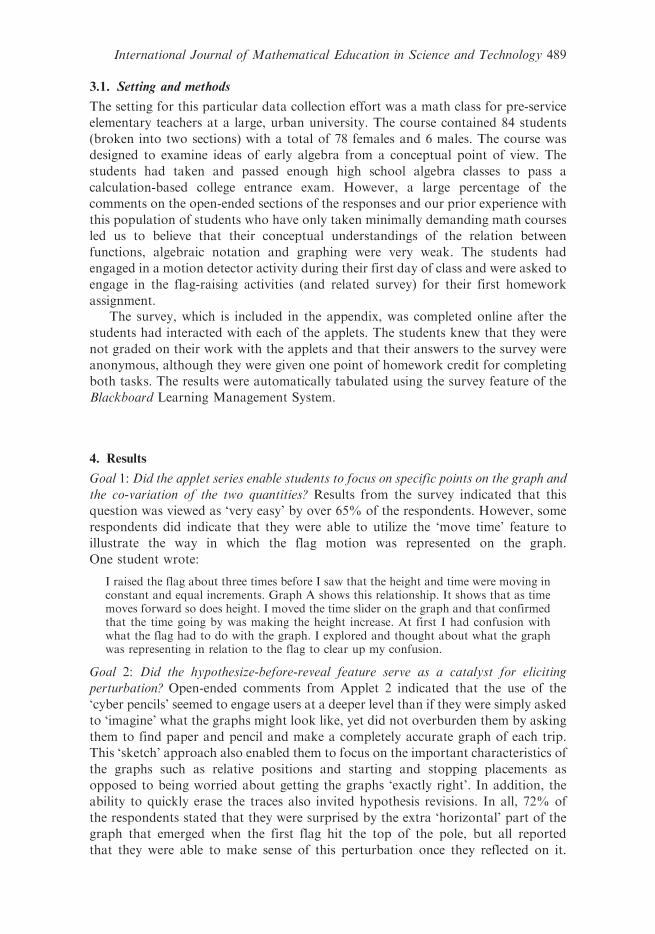
3.1. Setting and methods
The setting for this particular data collection effort was a math class for pre-serviceelementary teachers at a large, urban university. The course contained 84 students
(broken into two sections) with a total of 78 females and 6 males. The course wasdesigned to examine ideas of early algebra from a conceptual point of view. The
students had taken and passed enough high school algebra classes to pass a
calculation-based college entrance exam. However, a large percentage of thecomments on the open-ended sections of the responses and our prior experience with
this population of students who have only taken minimally demanding math coursesled us to believe that their conceptual understandings of the relation between
functions, algebraic notation and graphing were very weak. The students hadengaged in a motion detector activity during their first day of class and were asked to
engage in the flag-raising activities (and related survey) for their first homework
assignment.The survey, which is included in the appendix, was completed online after the
students had interacted with each of the applets. The students knew that they were
not graded on their work with the applets and that their answers to the survey wereanonymous, although they were given one point of homework credit for completing
both tasks. The results were automatically tabulated using the survey feature of theBlackboard Learning Management System.
4. Results
Goal 1: Did the applet series enable students to focus on specific points on the graph and
the co-variation of the two quantities? Results from the survey indicated that thisquestion was viewed as ‘very easy’ by over 65% of the respondents. However, some
respondents did indicate that they were able to utilize the ‘move time’ feature toillustrate the way in which the flag motion was represented on the graph.
One student wrote:
I raised the flag about three times before I saw that the height and time were moving inconstant and equal increments. Graph A shows this relationship. It shows that as timemoves forward so does height. I moved the time slider on the graph and that confirmedthat the time going by was making the height increase. At first I had confusion withwhat the flag had to do with the graph. I explored and thought about what the graphwas representing in relation to the flag to clear up my confusion.
Goal 2: Did the hypothesize-before-reveal feature serve as a catalyst for eliciting
perturbation? Open-ended comments from Applet 2 indicated that the use of the
‘cyber pencils’ seemed to engage users at a deeper level than if they were simply askedto ‘imagine’ what the graphs might look like, yet did not overburden them by asking
them to find paper and pencil and make a completely accurate graph of each trip.This ‘sketch’ approach also enabled them to focus on the important characteristics of
the graphs such as relative positions and starting and stopping placements asopposed to being worried about getting the graphs ‘exactly right’. In addition, the
ability to quickly erase the traces also invited hypothesis revisions. In all, 72% of
the respondents stated that they were surprised by the extra ‘horizontal’ part of thegraph that emerged when the first flag hit the top of the pole, but all reported
that they were able to make sense of this perturbation once they reflected on it.
International Journal of Mathematical Education in Science and Technology 489
Two examples of comments reflecting how the tools supported their efforts to resolvetheir perturbations follow:
The drawing pencils didn’t work as accurate as I wanted them to, but they still helped tomore or less draw an idea of what I had in mind. I didn’t quite expect for the red flag tobe graphed at such a constant rate but the line drawn had a constant slope. I thinkseeing both flags raised at the same time made me compare the two instead of looking atthem individually and drawing them that way. It makes sense after looking at the flagsindividually.
I was able to use the drawing pencils to sketch a graph. This was helpful because insteadof just picturing the graph in my head, I was able to look at the flag motion and rightaway put results down. I didn’t really understand why the yellow graph had not slopetowards the end [sic]. After resetting the flag a couple more times and using the movetime, I was able to understand the flat line at the top of the yellow graph. The flat linerepresents the time which the yellow flag had already reach the top of the flag pole whilethe red flag still needed more time to reach the top of the flag pole. I really liked thisactivity. Once getting the hang of all the apps [sic], I was able to manipulate the graphsand take a deeper look and making connections.
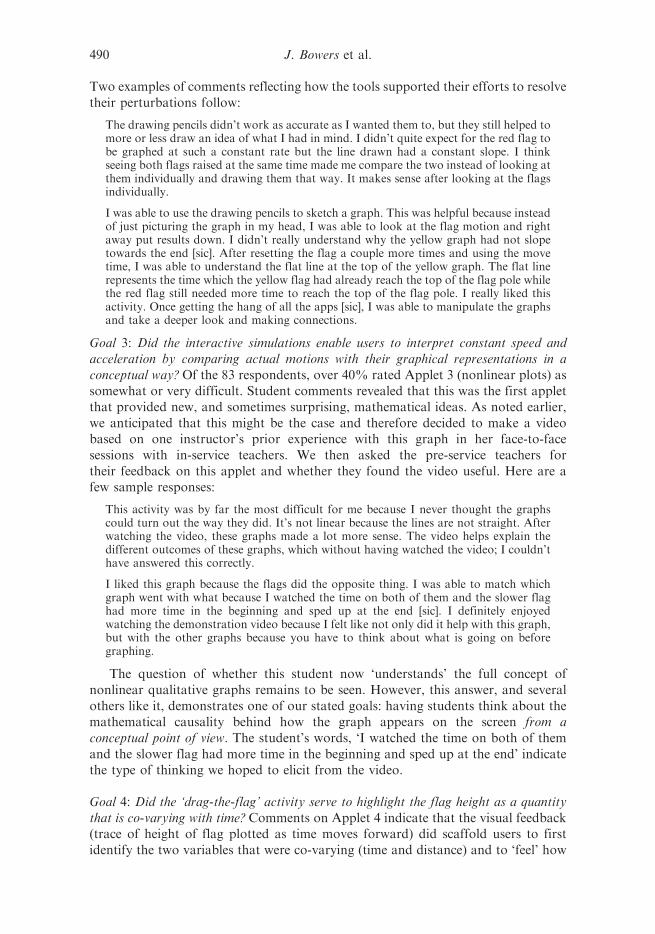
Goal 3: Did the interactive simulations enable users to interpret constant speed andacceleration by comparing actual motions with their graphical representations in aconceptual way? Of the 83 respondents, over 40% rated Applet 3 (nonlinear plots) assomewhat or very difficult. Student comments revealed that this was the first appletthat provided new, and sometimes surprising, mathematical ideas. As noted earlier,we anticipated that this might be the case and therefore decided to make a videobased on one instructor’s prior experience with this graph in her face-to-facesessions with in-service teachers. We then asked the pre-service teachers fortheir feedback on this applet and whether they found the video useful. Here are afew sample responses:
This activity was by far the most difficult for me because I never thought the graphscould turn out the way they did. It’s not linear because the lines are not straight. Afterwatching the video, these graphs made a lot more sense. The video helps explain thedifferent outcomes of these graphs, which without having watched the video; I couldn’thave answered this correctly.
I liked this graph because the flags did the opposite thing. I was able to match whichgraph went with what because I watched the time on both of them and the slower flaghad more time in the beginning and sped up at the end [sic]. I definitely enjoyedwatching the demonstration video because I felt like not only did it help with this graph,but with the other graphs because you have to think about what is going on beforegraphing.
The question of whether this student now ‘understands’ the full concept ofnonlinear qualitative graphs remains to be seen. However, this answer, and severalothers like it, demonstrates one of our stated goals: having students think about themathematical causality behind how the graph appears on the screen from aconceptual point of view. The student’s words, ‘I watched the time on both of themand the slower flag had more time in the beginning and sped up at the end’ indicatethe type of thinking we hoped to elicit from the video.
Goal 4: Did the ‘drag-the-flag’ activity serve to highlight the flag height as a quantitythat is co-varying with time? Comments on Applet 4 indicate that the visual feedback(trace of height of flag plotted as time moves forward) did scaffold users to firstidentify the two variables that were co-varying (time and distance) and to ‘feel’ how
490 J. Bowers et al.
their co-variation represented speed [14] and how this speed was reflected in the three
different target graphs. Participants indicated that this activity was particularly
insightful because it caused them to shift perspective. Instead of thinking about what
the graph would look like, they had to get inside the motion to appreciate how the
graph correlated position at any given time. For example, one participant stated, ‘It
took me a couple of tries to get the speed close on the second graph. That was the
most difficult for me. I had to find the right speed and stop to continue that speed
back’. Another student commented on her self-monitoring process:
This was an interesting activity because I was moving the flag and making the graphaccording to the movements. Mimicking the graph with the stairs was a littlechallenging, but I figured out that if you paused the flag for a moment that it wouldmake a horizontal line because you are not traveling at any speed over a certain amountof time. After I worked through the graph I had no problems. The pyramid-lookinggraph meant that the flag’s increase in speed at the same rate of decreasing speed. Iunderstood what the graph was representing so it wasn’t too hard to copy although mymanipulation of the flag was a little more rounder at the top then the pyramid’s peak.
Several others noted that the motion-detector activity that preceded this activity was
very helpful. For example,
I believe the motion detector on the first day of class was very helpful because it allowedme to really understand the graph. Usually, I just know what the graph is saying, butthere is no real meaning behind it. With this activity, I saw WHY the graph made sense.The homework activity was very helpful as well. It was good practice and allowed me tosee how different graphs were created.
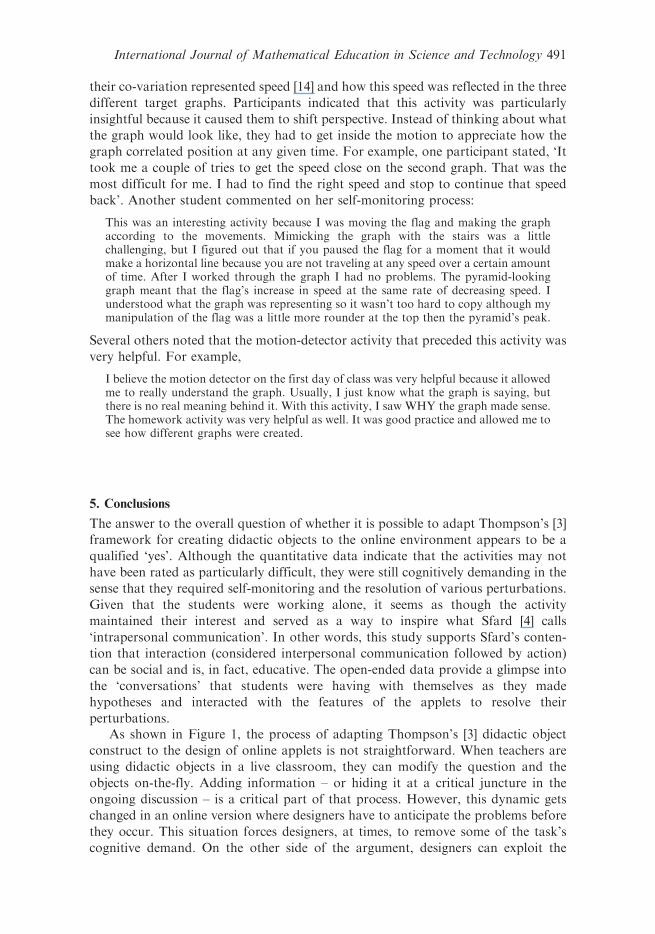
5. Conclusions
The answer to the overall question of whether it is possible to adapt Thompson’s [3]
framework for creating didactic objects to the online environment appears to be a
qualified ‘yes’. Although the quantitative data indicate that the activities may not
have been rated as particularly difficult, they were still cognitively demanding in the
sense that they required self-monitoring and the resolution of various perturbations.
Given that the students were working alone, it seems as though the activity
maintained their interest and served as a way to inspire what Sfard [4] calls
‘intrapersonal communication’. In other words, this study supports Sfard’s conten-
tion that interaction (considered interpersonal communication followed by action)
can be social and is, in fact, educative. The open-ended data provide a glimpse into
the ‘conversations’ that students were having with themselves as they made
hypotheses and interacted with the features of the applets to resolve their
perturbations.As shown in Figure 1, the process of adapting Thompson’s [3] didactic object
construct to the design of online applets is not straightforward. When teachers are
using didactic objects in a live classroom, they can modify the question and the
objects on-the-fly. Adding information – or hiding it at a critical juncture in the
ongoing discussion – is a critical part of that process. However, this dynamic gets
changed in an online version where designers have to anticipate the problems before
they occur. This situation forces designers, at times, to remove some of the task’s
cognitive demand. On the other side of the argument, designers can exploit the
International Journal of Mathematical Education in Science and Technology 491
interactive nature of the feedback to engage the user in some of the assessment tasksthe teacher would normally use to gauge next steps and feedback.
We conclude by listing some of our critical findings regarding specific designconsiderations.
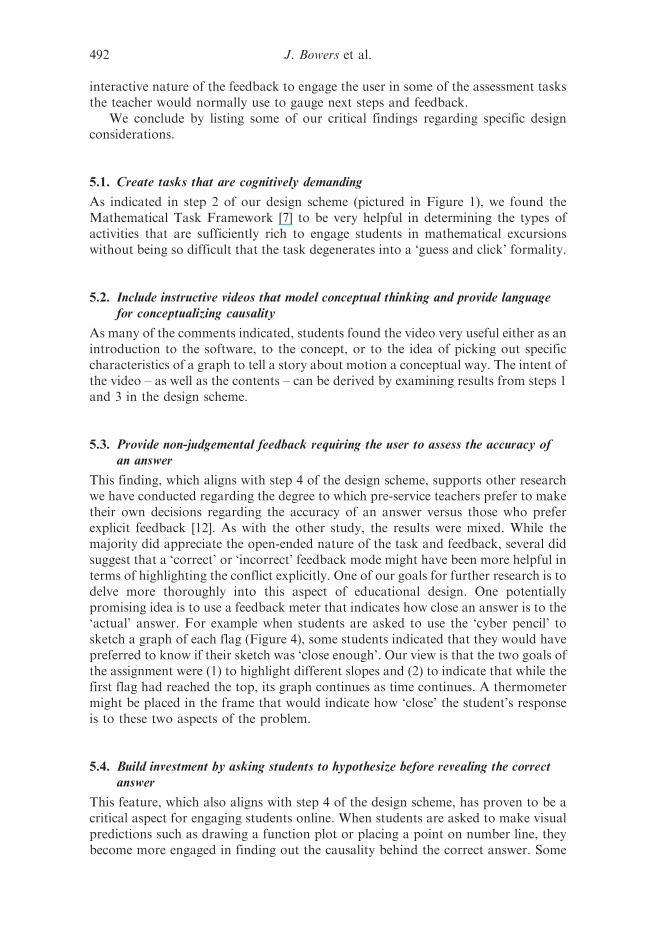
5.1. Create tasks that are cognitively demanding
As indicated in step 2 of our design scheme (pictured in Figure 1), we found theMathematical Task Framework [7] to be very helpful in determining the types ofactivities that are sufficiently rich to engage students in mathematical excursionswithout being so difficult that the task degenerates into a ‘guess and click’ formality.
5.2. Include instructive videos that model conceptual thinking and provide languagefor conceptualizing causality
As many of the comments indicated, students found the video very useful either as anintroduction to the software, to the concept, or to the idea of picking out specificcharacteristics of a graph to tell a story about motion a conceptual way. The intent ofthe video – as well as the contents – can be derived by examining results from steps 1and 3 in the design scheme.
5.3. Provide non-judgemental feedback requiring the user to assess the accuracy ofan answer
This finding, which aligns with step 4 of the design scheme, supports other researchwe have conducted regarding the degree to which pre-service teachers prefer to maketheir own decisions regarding the accuracy of an answer versus those who preferexplicit feedback [12]. As with the other study, the results were mixed. While themajority did appreciate the open-ended nature of the task and feedback, several didsuggest that a ‘correct’ or ‘incorrect’ feedback mode might have been more helpful interms of highlighting the conflict explicitly. One of our goals for further research is todelve more thoroughly into this aspect of educational design. One potentiallypromising idea is to use a feedback meter that indicates how close an answer is to the‘actual’ answer. For example when students are asked to use the ‘cyber pencil’ tosketch a graph of each flag (Figure 4), some students indicated that they would havepreferred to know if their sketch was ‘close enough’. Our view is that the two goals ofthe assignment were (1) to highlight different slopes and (2) to indicate that while thefirst flag had reached the top, its graph continues as time continues. A thermometermight be placed in the frame that would indicate how ‘close’ the student’s responseis to these two aspects of the problem.
5.4. Build investment by asking students to hypothesize before revealing the correctanswer
This feature, which also aligns with step 4 of the design scheme, has proven to be acritical aspect for engaging students online. When students are asked to make visualpredictions such as drawing a function plot or placing a point on number line, theybecome more engaged in finding out the causality behind the correct answer. Some
492 J. Bowers et al.
of the applets that we have designed require students to input an initial answer beforeone is revealed while others (such as this flag series) do not. We chose to allow for areveal then hypothesize action to support students who have no conception of what isexpected but want to work backwards from the revealed answer. This process alsosupports the idea of having a conversation and resolution with oneself to constructnew understandings.
We conclude with a caveat: we firmly maintain that online didactic objects willnever be able to replace the spontaneity and generativity of a well-conceived, whole-class discussion. For example, many of the more subtle ideas, such as the fact that agraph is a locus of points rather than a set line [14] – which could have been broughtout in a synchronous classroom discussion – did appear to elude students’ attention.However, we are inspired to continue with future efforts to design online didacticobjects that will involve creating cognitively demanding tasks that have features suchas hypothesize before reveal buttons, non-judgemental feedback and questions thatrequire monitoring of one’s own physical actions (as opposed to just mental actions),such as the processes involved in Applet 4. This type of bodily engagement reflectsNemirovsky’s [15] claim that engaging students in gesturing and body movementmay further support cognitive development. Regardless of the technology on whichit is delivered, the critical question for us is to continue to research how variousdesign features that engage today’s ‘digital natives’ in the process of driving theirown learning.
References
[1] S. Kennewell and G. Beauchamp, The features of interactive whiteboards and their
influences on learning, Learn. Media Technol. 32 (2007), pp. 227–241.
[2] E. Von Glasersfeld, Radical Constructivism: A Way of Knowing and Learning, Falmer
Press, Bristol, PA, 1995.[3] P. Thompson, Didactic objects and didactic models in radical constructivism, in Symbolizing,
Modeling and Tool Use in Mathematics Education, R.L.K. Gravemeijer, R. Lehrer, H. van
Oers, and L. Verschaffel, eds., Kluwer Academic Publishers, The Netherlands, 2002,
pp. 197–220.[4] A. Sfard, Thinking as Communicating: Human Development, the Growth of Discourses, and
Mathematizing, Cambridge University Press, Cambridge, 2008.
[5] A. Sfard, What’s all the fuss about gestures? A commentary, Educ. Stud. Math. 70 (2009),
pp. 191–200.[6] M. Carlson, S. Jacobs, E. Coe, S. Larsen, and E. Hsu, Applying covariational reasoning
while modeling dynamic events: A framework and a study, J. Res. Math. Educ. 33(5) (2002),
pp. 352–378.[7] M.K. Stein, M.S. Smith, M.A. Henningsen, and E.A. Silver, Implementing Standards-based
Mathematics Instruction: A Casebook for Professional Development, Teachers College
Press, New York, 2000.
[8] N. Etuk, Educational Gaming – From edutainment to bona fide 21st-centry teaching tool.
Multimedia & Internet@Schools Magazine. Available at http://www.mmischools.com/
Articles/ReadArticle.aspx?ArticleID=59693
[9] J. Bowers, K. Aguilar, N. Bezuk, and S. Klass, A framework for designing and analyzing
the cognitive demand of online applets in teacher professional development, Paper to be
presented at the Annual Meeting of the American Educational Research Association,
San Diego, CA.
International Journal of Mathematical Education in Science and Technology 493
[10] J.Olive and J.Lobato,The learning of rational number concepts using technology, inResearch
on Technology and the Teaching and Learning of Mathematics: Volume I, K. Heid and
G. Blume, eds., Information Age Publishing, Inc., Charlotte, NC, 2008, pp. 1–54.[11] J. Roschelle and J. Kaput, SimCalc Mathworlds for the mathematics of change, Commun.
ACM 39 (1996), pp. 97–99.[12] T. Bassarear, Mathematics for Elementary School Teachers, Houghton Mifflin, Boston,
MA, 2007.[13] J. Bowers, N. Bezuk, K. Aguilar, and S. Klass, How can digital didactic objects be
designed to support the learning of mathematics? in Proceedings of Society for
Information Technology and Teacher Education International Conference 2010,
D. Gibson and B. Dodge, eds., Chesapeake, VA, 2010, pp. 345–352.
[14] A.G. Thompson and P.W. Thompson, Talking about rates conceptually, Part II:
Mathematical knowledge for teaching, J. Res. Math. Educ. 27(1) (1996), pp. 2–24.
[15] R. Nemirovsky, Mathematical narratives, modeling and algebra, in Approaches to
Algebra, C.K.N. Bednarz, ed., Kluwer Academic Publishers, The Netherlands, 1996,
pp. 197–220.
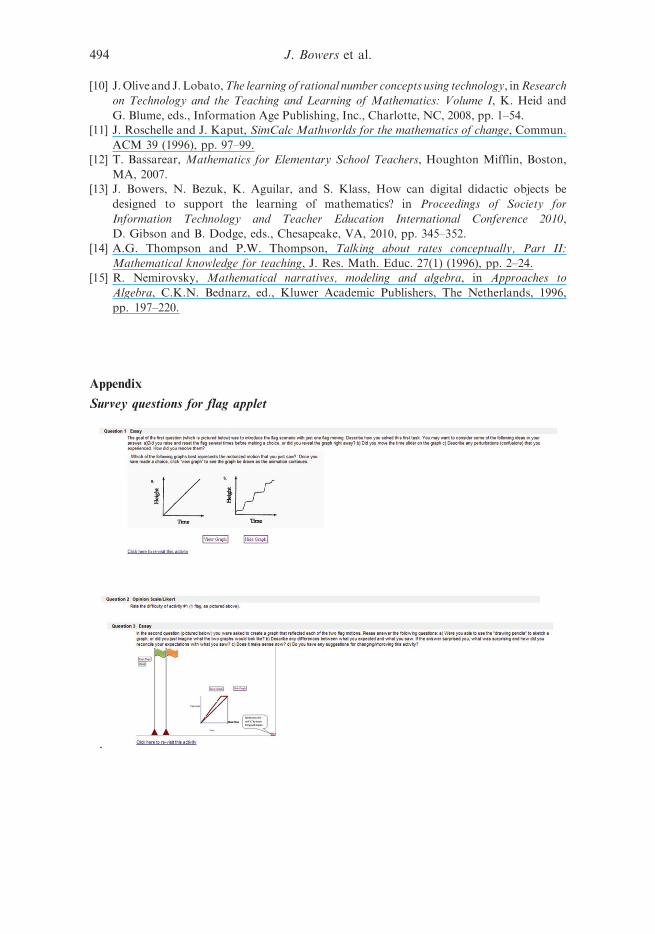
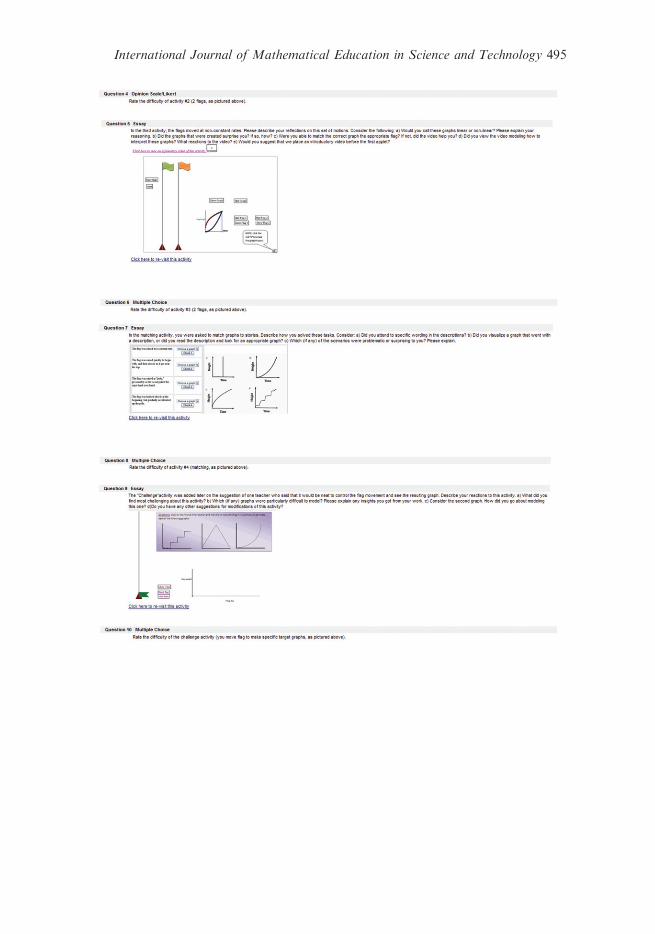
Appendix
Survey questions for flag applet
494 J. Bowers et al.
International Journal of Mathematical Education in Science and Technology 495

Copyright of International Journal of Mathematical Education in Science & Technology is the property of
Taylor & Francis Ltd and its content may not be copied or emailed to multiple sites or posted to a listserv
without the copyright holder's express written permission. However, users may print, download, or email
articles for individual use.


