Embed Size (px)
Citation preview

Int. J. Radiation Oncology Biol. Phys.. Vol. 38, No. 1, pp. 197-206, 1997 Copyright 0 1997 Elsevier Science Inc.
Printed in the USA. All rights reserved 0360.3016/97 $17.00 + .OO
ELSEVIER
l Physics Contribution
PI1 SO360-3016( 97)00229-O
ADAPTIVE MODIFICATION OF TREATMENT PLANNING TO MINIMIZE THE DELETERIOUS EFFECTS OF TREATMENT SETUP ERRORS
DI YAN, D.Sc ., * JOHN WONG, PH.D., * FRANK VICINI, M.D., * JEFF MICHALSKI, M.D. + CHENG PAN, PH.D., * ARTHUR FRAZIER, M.D., * ERIC HORWITZ, M.D. *
AND ALVARO MARTINEZ, M.D., F.A.C.R.* * Department of Radiation Oncology, William Beaumont Hospital, Royal Oak, MI; and ’ Mallinckrodt Institute of Radiology.
Washington University, School of Medicine, St. Louis, MO
Purpose: Using daily setup variation measured from an electronic portal imaging device (EPID), radiation treat- ment of the individual patient can he adaptively reoptimized during the course of therapy. In this study, daily portal images were retrospectively examined to: (a) determine the number of initial days of portal imaging required to give adequate prediction of the systematic and random setup errors; and (b) explore the potential of using the prediction as feedback to reoptimize the individual treatment part-way through the treatment course. Methods and Materials: Daily portal images of 64 cancer patients, whose treatment position was not adjusted during the course of treatment, were obtained from two independent clinics with similar setup procedures. Sys- tematic and random setup errors for each patient were predicted using different numbers of initial portal mea- surements. The statistical confidence of the predictions was tested to determine the number of daily portal mea- surements needed to give reasonable predictions. Two treatment processes were simulated to examine the potential opportunity for setup margin reduction and dose escalation. The first process mimicked a conventional treatment. A constant margin was assigned to each treatment field to compensate for the average setup error of the patient population. A treatment dose was then prescribed with reference to a fixed normal tissue tolerance, and then fixed in the entire course of treatment. In the second process, the same treatment fields and prescribed dose were used only for the initial plan and treatment. After several initial days of treatments, the treatment field shape and position were assumed to be adaptively modified using a computer-controlled multileaf collimator (MLC) in light of the predicted systematic and random setup errors. The prescribed dose was then escalated until the same normal tissue tolerance, as determined in the first treatment process, was reached. Results: The systematic setup error and the random setup error were predicted to be within ?l mm for the former and *OS mm for the latter at a 2 95% confidence level using 5 9 initial daily portal measurements. In the study, a large number of patients could be treated using a smaller field margin if the adaptive modification process were used. Simulation of the adaptive modification process for prostate treatment demonstrates that additional treatment dose could be safely applied to 64% of patients. Conclusion: The adaptive modification process represents a diierent approach for use of on-line portal images. The portal imaging information from the initial treatments is used as feedback for reopthnization of the treatment plan, rather than adjustment of the treatment setup. Results from the retrospective study show that the treatment of indi- vidual patient can be improved with the adaptive mod&&ion process. 0 1997 Elsevier Science Inc.
Adaptive radiation therapy, Treatment setup error, Conformal therapy and dose escalation.
INTRODUCTION The success of conformal radiation therapy relies on the accurate delivery of radiation dose. Unfortunately, treat- ment position variation inevitably exists. Errors in patient positioning, intertreatment and intratreatment variation of organ position, and uncertainty in target localization result in variation of the dose delivered. Although it is difficult, if not impossible, to completely eliminate all sources of variation, clearly, all efforts must be made to minimize their effects whenever possible.
A major source of treatment variation is the variability in the daily setup of the patient. The common practice to
minimize setup error by weekly evaluation of port film is helpful, but insufficient (20). The use of immobilization devices is also common and should, in theory, enhance the reproducibility of daily patient setup. However, studies of their effectiveness for patients given treatment on tho- racic and abdominal regions have produced variable re- sults and are unsatisfactory (7, 16, 17, 21).
Two new approaches to compensate for, or reduce the magnitude of, treatment setup error are being developed. The first incorporates generic setup error, characterized from measurements made of the patient population, into the initial treatment planning (6, 10, 11, 19). The vari-
Reprint requests to: Di Yan, D.Sc., Department of Radiation Mile Road, Royal Oak, MI 48073-6769. Oncology, William Beaumont Hospital, 3601 West Thirteen Accepted for publication 10 December 1996.
197

198
1 l/13/96
I. J. Radiation Oncology 0 Biology 0 Physics Volume 38, Number 1, 1997
e Modification 25
-3 --
a-
,’ : ;r
LJ q Systmdic Erras
12 heal& neckPdialtr
Fig. 1. The systematic and random setup errors in the anterior-posterior direction for the 12 head and neck patients.
ability of the dose distribution due to setup error is pre- sented to the clinician such that compromises can be made prior to the initiation of treatment. In the second approach, decision rules for setup adjustment are implemented to reduce the magnitude of setup error, and to minimize the frequency of patient repositioning (3-5, 14, 15, 23). The decision rule approach requires more frequent portal im- aging and complements the use of electronic portal im- aging devices (EPIDs) . However, the setup adjustment is not based on treatment planning information, and the po- tential changes in the dose delivered to the individual pa- tient is not considered. More importantly, both approaches employ average values derived from population studies as criteria for plan evaluation or setup adjustment. With “population-averaged” parameters, the opportunities to
optimize treatment for each individual patient are not ex- ploited.
A case for adaptive radiation therapy Optimal treatment is best made on an individual-patient
basis. This assertion can be supported by the following analysis of measured setup error of a group of individual patients, and that of a patient population.
When a sequence of daily portal images have been ac- quired for the ith individual patient, setup error can be characterized in terms of the mean, mi, and the standard deviation, ai, of the daily setup error. The former repre- sents the “systematic error” and the latter the “random error’ ’ of the treatment setup. From a two-dimensional (2D) portal image, these parameters can be characterized
3.5
1.5
-2.5
Fig. 2. The systematic and random setup errors in the superior-inferior direction for the 12 head and neck patients.

Adaptive modification of treatment planning 0 D. YAN ef al. 199
d --
4- 27 lung pdientr
Fig. 3. The systematic and random setup errors in the lateral direction for the 27 lung patients.
on each of two coordinate directions. For example, for an anterior-to-posterior ( AP) treatment, the setup error would be measured along the lateral (LAT) and superior- to-inferior (SI) directions. If the analysis were performed for a group of individual patients for a specific treatment site, one could further calculate a mean, M( mi ) , and stan- dard deviation, a( mi ), of the systematic setup errors for these patients (see Appendix A). Similarly, M ( Oi ) and a( gi ) can be calculated to represent the root-mean-square and standard deviation of random setup errors for these patients.
When only a few portal images are available for each patient, as in the case with weekly port film exposure, it becomes necessary to pool the setup measurements of each individual patient into a larger data sample for anal- ysis. The setup error of the patient populations for a spe-
cific treatment site can then also be characterized on each of two coordinate axes by the mean, Mp, and the standard deviation, ap . It can be shown that (see Appendix A) the population mean, Mp, is exactly equal to M(m,), the mean systematic setup error for all individual patients. However, the population standard deviation of the setup error, up, is equal to [ M2 ( oi ) + U’ ( mi )] “‘. It includes not only the contribution from the root-mean-square of the random setup error of the individual patient, but also the standard deviation, or variability, of the systematic setup error of each patient. The latter, once detected, in theory, can be eliminated. It follows then that up gives a conser- vative overestimation of setup error of the individual. When it is used to design a margin for setup variability, as in the case with port film data, op is larger than nec- essary for the individual patient, provided that both sys-
mn
27lungpdients
q Systemdic Errors
WRa-dom Erras
Fig. 4. The systematic and random setup errors in the superior-inferior direction for the 27 lung patients.

200 I. J. Radiation Oncology 0 Biology 0 Physics Volume 38, Number 1, 1997
6 --
4 --
2 --
0 --
-2 --
d --
f%vstemdic Errors
25 pelvis patients
Fig. 5. The systematic and random setup errors in the lateral direction for the 2.5 pelvis patients.
tematic and random setup errors could be predicted, and the systematic error could be corrected during the course of treatment.
The above analysis shows that a major deficiency in the current approach to compensate for setup error is the lack of incorporation of individual patient variability. Setup er- ror of an individual patient could be either overcompen- sated or undercompensated in the initial treatment plan. As a result, outcome analyses from clinical trials of con- formal therapy and dose escalation may not be able to demonstrate noticeable gains in local control, but rather only an increase in major complications. It should not be assumed that every patient would be a suitable candidate for dose escalation. A patient whose treatment exhibits a highly reproducible setup and target position might be
such a candidate. Conversely, a patient with a large po- sition variation might be more suitable for conservative management. Unfortunately, much of the patient-specific variation is not known until after initiation of treatment. In this study, a new approach, called adaptive radiation therapy (ART), is introduced to minimize the deleterious effects of setup variation on each individual patient. A retrospective study was used to demonstrate the feasibility of the ART process. In this study, the treatment plan of the individual patient was adaptively modified part-way through the treatment based on the time-course of setup variation predicted from portal measurements made of the earlier treatment fractions. By taking advantage of a com- puter-controlled multileaf collimator (MLC) , an im- proved treatment plan was implemented by adjusting the
0 U” ”
-2 -- u u
4 -- 4 --
!
-a- 25 p&s @iarts
Fig. 6. The systematic and random setup errors in the superior-inferior direction for the 25 pelvis patients.

Adaptive modification of treatment planning 0 D. YAN ef al. 201
treatment field shape and prescription dose simulta- neously.
METHODS AND MATERIALS
The ART process proceeds as follows: (a) the patient’s initial three-dimensional (3D) treatment plan is first op- timized and delivered using a medical accelerator equipped with an MLC; (b) daily setup error is measured using an EPID and characterized early in the treatment course; (c) the treatment plan is evaluated incorporating the characterized setup error to decide if and what modi- fication is necessary; and (d) the treatment plan is modi- fied accordingly for the remaining treatments by reshaping the MLC field and adjusting the prescription dose.
Only those patients whose setup positions had not been adjusted during the course of treatment were considered. Daily portal images of 64 cancer patients ( 12 head and neck [H&N], 27 lung, and 25 pelvic region) were ob- tained from two independent clinics using similar setup procedures. Twenty-six patients were from the Mallinck- rodt Institute of Radiology and 38 patients were from the William Beaumont Hospital. The H&N patients were im- mobilized with masks fabricated from thermal plastic. The lung and pelvis patients were not immobilized. Only portal images of the right LAT fields of the H&N treatments, and only portal images of the AP fields of the lung and pelvis treatments were obtained. Between 13 and 30 daily portal images were acquired for each patient. Two-dimen- sional setup errors were delineated using a portal image- analysis tool (22). Setup errors were measured along the AP and SI directions for the H&N treatments, and the LAT and SI directions for the lung and pelvis treatments. The AP, SI, and LAT directions of each patient formed the three main axes of the 3D coordinates in this study, with the origin defined at the isocenter of the treatment plan. Translational setup errors on each axis were quan- tified separately.
Prediction of systematic and random setup errors A Kalman filter model and algorithm (23) were used
to predict the systematic and random setup errors and also the time-dependent drift of treatment setup for each pa- tient. This algorithm was recently implemented in our por- tal image analysis tool to automatically report temporal drifting of the treatment setup (see Appendix B ) . For the nondrifting treatment setup, the algorithm reduces to the Wiener filter or the adaptive maximum likelihood esti- mation (2, 14, 23). Assuming that the setup error of each individual patient is represented by a Gaussian distribu- tion, the Wiener filter provides the optimal prediction for the systematic error when only few initial measurements of daily setup are used (2, 14, 23).
To evaluate the prediction of the systematic and random setup errors of each patient. the statistical confidence level of the prediction was calculated using actual patient data as a function of the number of initial portal measurements
for each patient. The desired confidence interval was cho- sen to be to.5 mm for the random setup error and -+ 1 .O mm for the systematic setup error. These values were se- lected to reflect the uncertainty in the measurement of setup error, at about 1 mm, and the positioning tolerance of the MLC, at less than 0.3 mm for each leaf.
Simulation of adaptive radiation therapy for prostate cancer
The treatment of prostate cancer using the four-field box technique was considered. A 3D treatment plan for a single prostate patient, considered typical of most patients, was chosen as the study model. A PTV was defined by adding a uniform margin to the prostate or the clinical target volume (CTV) (8). The uniform margin was set equal to the larger of the lateral and the superior-inferior margins, as shown in Table 3. Only setup error was con- sidered in this study, and the contribution to the PTV from organ motion was ignored. However, the magnitude of the treatment margin was similar to those used in several pro- tocols for conformal therapy of the prostate ( 1, 13 ) .
The treatment courses of 25 patients were simulated by incorporating, fraction-by-fraction, the daily setup errors of 25 pelvis patients in 25 recalculations of the model plan. Because only 2D setup errors in the lateral and superior- inferior directions could be derived from the AP portal images, the distribution of setup error in the anterior-pos- terior direction of the pelvis patients was assumed to be equal to the distribution of setup error in the lateral direc- tion. This assmmption was reasonable according to results from other publications (3, 7, 10, 20).
Two planning and treatment strategies were examined retrospectively using the 25 simulated patient treatments. In the first conventional strategy, a treatment dose of 67 Gy was prescribed to cover the planning target volume (PTV) (8). The normal tissue complication probability (NTCP) of the rectum, calculated using the Lyman model (9, 12>, was to be kept at about 8%. Treatments were assumed to be delivered with fields shaped by an MLC.
In the second adaptive strategy, the same margin and prescription dose were used for the initial treatment plan of each patient. However, after the 8 initial days of treat- ment, the predicted setup errors from the Kalman filter analysis were used to modify the treatment plans for those patients whose treatment positions did not drift with time. The predicted systematic error was corrected by shifting the leaves of the MLC in a specific direction. The random error was compensated by changing the initial field margin to the “predicted uniform margin” plus 1 mm, where the l-mm extra margin was used to account for the tolerance of the prediction. The original MLC field was therefore reshaped according to the predicted systematic error and new field margin. For each patient, the treatment was mod- ified only once during the course of treatment. In addition, the opportunity to further escalate the prescription dose was pursued, provided that the rectal NTCP remained within the same tolerance level. For those patients whose

202 I. J. Radiation Oncology 0 Biology 0 Physics Volume 38, Number 1. 1997
Table 1. Characteristics of the treatment setup error, and the corresponding margin for the 12 head and neck patients
( 192 daily portal images)
Head and Neck (immobilized)
M(rq) + U(rni) Ma,) + da,) Mp -c CTp 1 Mp 1 + Xup = margin A was calculated to cover
95% of setup errors
Anterior- posterior
mm
-0.5 2 1.3 1.7 -+ 0.6
-0.5 2 2.1 (A = 2.1)
margin = 5
Superior- inferior (mm)
0.5 ? 2.0 1.4 ? 0.4 0.5 2 2.4 (A = 2.3)
margin = 6
setup errors drifted with time, setup corrections would have to be made periodically during the course of treat- ment and were therefore not included in the present sim- ulation.
For the two treatment strategies, the minimum dose to the CTV, the standard deviation of the target dose, and the rectal NTCP were compared. In addition, the percent- age of patients who could be treated at an escalated dose (or, conversely, those who could not) by the adaptive treatment process modification was evaluated.
RESULTS
Figures l-6 show histogram distributions of systematic and random setup errors for treatment of H&N, lung, and pelvis patients. The characteristics of the setup errors for each treatment site are also summarized in Tables 1-3. The variation in setup errors among patients is represented by a( mi ) and a( oi ) , denoting the standard deviations of the systematic setup errors and random setup errors of patients, respectively. The variation in setup errors differs along the different directions of the setup coordinates. Treatment field margins to compensate for the setup errors of the patient populations are listed in the last row of the tables. These were determined based on the actual portal measurements to compensate for 95% of the actual patient setup errors. The multiplicative factor, A, of the standard deviation that would achieve this confidence level (95% ) is also listed in the tables.
The percentage of patients whose initial setup margins could be reduced by applying the adaptive treatment pro- cess is shown in Table 4. These margins were calculated at the 95% confidence level and could be used to reshape the treatment field and escalate the treatment dose after initiation of treatment. The validity of the predicted mar- gins was verified by comparison with the setup errors mea- sured for the remaining treatment days. The results dem- onstrate that, even when large margins had to be used initially for both lung and pelvis treatments based on pop- ulation data, most could be reduced using the adaptive treatment process. A setup margin less than 6 mm could be used for at least 67% of the lung patients and 68% of the pelvis patients. Even more remarkable, a setup margin
Table 2. Characteristics of the treatment setup error, and the corresponding margin for the 27 lung patients
(43 1 daily portal images)
Lung (no immobilization)
Superior-inferior (mm)
Lateral 0-m)
M(w) + 4m> M(cri) -c ~(a~) Mp L up 1 Mp / + hap = margin A was calculated to cover
95% of setup errors
-0.6 ? 3.5 0.3 2 2.5 2.7 ? 0.8 2.3 2 0.8
-0.6 ? 4.4 0.3 -t 3.4 (A = 2.0) (A = 2.0)
margin = 9.5 margin = 7
of less than 4 mm could be used for almost one third of the lung and pelvis patients. For the H&N patients, the setup margin was smaller to begin with. Still, 33% of the setup margin could be reduced from 6 mm to 3 mm with the adaptive treatment process.
In 4 of the 27 lung patients and 8 of the 25 pelvis pa- tients, treatment positions demonstrated significant time- dependent drift. These drifts were automatically reported by the algorithm and were not included in the adaptive treatment study. For the remaining patients, the number of initial portal measurements required to achieve confi- dent predictions of both systematic and random setup er- rors are listed in Tables 5-7. Whereas the number of ini- tial portal measurements required for prediction would be dependent on the magnitude of the random setup error, it appears that nine were adequate for all patients in this study.
The results of the simulated adaptive treatment of the 25 pelvis patients are listed in Table 8. Of the 25 patients, 36% could have their dose escalated by an additional 9%, from 67 to 73 Gy; and 28% could have their dose escalated by an additional 15%, from 67 to 77 Gy.
DISCUSSION AND CONCLUSION
At present, strategies to compensate for setup variation have been based on average criteria derived from popu- lation studies. A common approach is to assign a generic treatment margin for all patients of the form Xap = X[a2(mi) + M~(D~)]"~, where A = 1.5 - 2.0. Becauseof
Table 3. Characteristics of the treatment setup error, and the corresponding margin for the 25 pelvis patients
(437 daily portal images)
Pelvis (no immobilization)
Superior-inferior (mm)
Lateral (mm)
M(m) * dm) -0.3 2 3.8 0.5 2 3.0 M(a,) ? da,) 3.0 t 1.5 3.5 ? 1.6 Mp 2 up -0.3 2 4.8 0.5 t 4.6 1 Mp 1 + Aup = margin (A = 2.4) (A = 2.1) A was calculated to cover
95% of setup errors margin = 12 margin = 10

Adaptive modification of treatment planning l D. YAN ef al.
Table 4. Percentage of the patients who qualify a reduced setup margin*
203
Head and neck 2- 3mm 3 -4mm 4-5mm 5 -6mm Patients 33% 42% 16% 9%
Lung 3 -4mm 4 -6mm 6- 8mm 8- 10 mm Patients 30% 37% 22% 11%
Pelvis 3 -4mm 4-6mm 6- 8mm 8- 10 mm 10 - 12 mm 12 - 15 mm Patients 28% 40% 12% 4% 4% 12%
* Margins were designed only to compensate for the random setup error of the individual patient.
Table 5. Confidence levels for prediction of both systematic and random errors with the numbers of portal measurements for the 12 head and neck patients*
Head and Neck- no. of portals
Superior-inferior
m, Confidence ci Confidence level (%) level (%)
Anterior-posterior
m, Confidence 0, Confidence level (%) level (%)
5 75 100 83 83 6 83 100 100 92 7 83 100 100 100 8 100 100 100 100 9 100 100 100 100
* Confidence intervals of 1 mm for systematic error, and the 0.5 mm for random error were used.
the large variability among patients, the formula produces an acceptable margin for the population, but does not al- low margin optimization for the individual patient. The generic approach is particularly troublesome for high dose conformal therapy where the reduced treatment margin may be inadequate for an appreciable number of patients. Clearly, a patient-specific treatment margin is much more desirable.
Results from our retrospective study indicate that much could be gained with the patient-specific ART approach to improve setup accuracy. Our simulated treatment of 25 patients with the ART method shows that about one third of the patients could have their prescription doses esca- lated by as much as 15%. As pointed out by Suit and Goitein ( 18), that amount of dose escalation could have significant clinical benefit. The observed gain in our dose
escalation simulation might be different if another con- formal treatment technique was used. However, the ART process will always benefit radiation treatment.
Equally important, our results show that a significant number of patients would not be qualified for a higher dose escalation due to the large position variation. This observation suggests that clinical protocols that escalate dose with a concomitant generic reduction of setup mar- gin might not produce the desired proof of efficacy of high dose conformal therapy. It also suggests that a more effective approach to implement high dose con- formal therapy would be to start off an individual pa- tient with a simpler treatment strategy, which would then be modified in accordance to the characteristics of the treatment variation measured during the early phase of the treatment course.
Table 6. Confidence levels for prediction of both systematic error and random error with the numbers of portal measurements for the 23 lung patients*
Lateral Superior-inferior
mi Confidence oi Confidence m, Confidence 0, Confidence Lung-no. of portals level (%) level (%) level (%) level (%)
5 83 74 65 74 6 87 83 70 83 7 87 96 78 83 8 91 96 87 87 9 96 96 96 96
10 100 96 96 96
* Confidence intervals of 1 mm for systematic error, and the 0.5 mm for random error were used.

204 I. J. Radiation Oncology 0 Biology 0 Physics Volume 38, Number 1, 1997
Table 7. Confidence levels for prediction of both systematic error and random error with the numbers of portal measurements for the 17 pelvis patients*
Lateral Superior-inferior
mi Confidence g, Confidence mi Confidence Us Confidence Pelvis-no. of portals level (%) level (%) level (%) level (%)
5 81 7.5 75 81 6 88 75 75 88 7 88 88 95 95 8 95 95 100 95 9 95 95 100 95
10 100 95 100 95
* Confidence intervals of 1 mm for systematic error, and the 0.5 mm for random error were used.
In our retrospective study, portal images from the ini- tial 4-9 days were needed for the prediction of setup error. In general, a confident prediction of setup error can be determined earlier if the random setup error is small. From our study, an empirical formula, IZ = min { 9,4 + 2 (U - 1) } , with n representing the number of treatment days and c the predicted random error cal- culated using at least 4 initial days of portal measure- ment, was tested and found to be adequate for the pre- diction at the confidence level of 95%. The efficacy of the ART process depends not only on the prediction of setup error, but also on accurate modification of treat- ment field position and shape. The reliability of the con- ventional approach of physically repositioning a patient to within few millimeters is questionable. On the other hand, reshaping a treatment field by recutting the cer- robend block would be a highly impractical procedure to adjust field margin. In our simulation, we propose
Table 8. Simulation results of treatment dose (minimum dose in the target) and the dose deviation (standard deviation)
in the target due to the adaptive modification of 25 prostate treatments*
Margin
4mm 6mm
Patients 28% 36% Minimum target dose (Gy) 77 73 Dose deviation in the target (Gy) 1.7 1.6 NTCP of the rectum 8.5% 8.3%
* Parameters: margin for the patient population = 12 mm; minimum target dose = 67 Gy; dose deviation in the target = 1.6 Gy; NTCP of the rectum = 8.2%.
that the computer-controlled MLC could be used to ac- curately and efficiently implement these adjustments. The MLC adjustment avoids disturbing the patient setup routine and is highly desirable for the ART process.
With the requirement of more frequent daily portal imaging for the prediction and verification of setup vari- ation, concern exists as to the practical utility of the ART process. Certainly, ART would be difficult to im- plement if films were used for portal imaging. However, with a network environment that integrates the func- tions of electronic portal imaging, portal image analy- sis, and MLC modification, it is conceivable that the ART process may actually be more efficient than the conventional approach of setup adjustment. Repeated patient repositioning and port film verification would thus be eliminated. Indeed, the development of the ART process is timely as it makes use of the many advantages of the EPID and MLC technologies that have not yet been fully exploited by the radiation therapy commu- nity. A prospective study is currently ongoing to eval- uate the efficacy of the combined use of an EPID and an MLC to facilitate ART as a routine clinical proce- dure.
In conclusion, an important step to maximize the ad- vantages of the new technologies in radiotherapy is to optimize treatment according the information specific to the individual patient. We propose the ART process as one possible approach. Results from our retrospec- tive study are promising. Prospective clinical studies need to be made to test our findings. Further research needs to be performed to extend our method of setup correction from the 2D to the 3D geometry. Inclusion of organ motion compensation represents the next major challenge in the refinement of the ART process.
REFERENCES
1. A phase I/II dose escalation study using three dimensional 2. Anderson, B. 0.; Moore, J. B. Optimal filtering, a informa- conformal radiation therapy for adenocarcinoma of the pros- tion and system science series. Englewood Cliffs, NJ: Pren- tate. 3D-CRT Oncology Group, 3D/OG 94-06; 1995. tice-Hall; 1979.

Adaptive modification of treatment planning l D. YAN et al. 205
3. Bel, A.; Van Herk, M.; Bartelink, H.; Lebesque, J. V. A verification procedure to improve patient setup accuracy us- ing portal images. Radio. Oncol. 29:253-260; 1993.
4. Denham, J. W.; Dally, M. J.; Hunter, K.; Wheat, J.; Leslie, G.; Fahey, P. P.; Hamilton, C. S. Objective decision-making following a portal film: The results of a pilot study. Int. J. Radiat. Oncol. Biol. Phys. 26:869-876; 1993.
5. Dutreix. A.; van der Schueren, E.; Leunens, L. Quality con- trol at the patient level: Action or retrospective introspec- tion? Radio. Oncol. 25: 146- 147; 1992.
6. Goitein, M. Calculation of the uncertainty in the dose delivered during radiation therapy. Med. Phys. 12:608-612; 1985.
7. Hunt, M. A.; Schultheiss, T. E.; Desobry, G. E.; Hakki, M.; Hanks, G. E. An evaluation of setup uncertainties for patients treated to pelvic sites. Int. J. Radiat. Oncol. Biol. Phys. 32:227-233; 1995.
8. ICRU Report 50. International Commission of Radiation Units and Measurements. Prescribing, recording and report- ing photon beam therapy; 1993.
9. Kutcher, G. J.; Burman, C. Calculation of complication prob- ability factors for non-uniform normal tissue irradiation: The effective volume method. Int. J. Radiat. Oncol. Biol. Phys. 16: 1623- 1630; 1989.
10. Kutcher, G. J.; Mageras, G. S.; Leibel, S. A. Control, cor- rection, and modeling of setup errors and organ motion. Sem. Radiat. Oncol. 5:134- 145; 1995.
11. Leong, J. Implementation of random positioning error in computerized radiation treatment planning systems as a re- sult of fractionation. Phys. Med. Biol. 32:327-334; 1987.
12. Lyman, J. T.; Wolbarst, A. B. Optimization of radiation ther- apy. III: A method of assessing complication probabilities from dose-volume histograms. Int. J. Radiat. Oncol. Biol. Phys. 13:103-109; 1987.
13. Roach, M.; Barby, P.; Rosenthal, S. A.; Verhey, L.; Phillips, T. L. Defining treatment margins for six field conformal ir- radiation of localization prostate cancer. Int. J. Radiat. On- col. Biol. Phys. 28~267-275, 1994.
14. Shalev, S.; Gluhchev, G. Interventional correction of patient setup using portal imaging : A comparison of decision rules
[abstract]. Int. J. Radiat. Oncol. Biol. Phys. 32( Suppl. 1):216; 1995.
15. Shalev, S.; Gluhchev, G. When and how to correct a patient setup. Proceedings of the XIth International Conference on Computers in Radiation Therapy, Manchester, UK, March 1994:274-275.
16. Soffen, E. M.; Hanks, G. E.; Hwang, C. C.; Chu, J. C. H. Conformal static field therapy for low volume low grade prostate cancer with rigid immobilization. Int. J. Radiat. On- col. Biol. Phys. 20: 141- 146; 1990.
17. Song, P. Y.; Washington, M.; Vaida, F.; Hamilton, R.; Spelbring, D.; Wyman, B.; Harrison, J.; Chen, G. T. Y.; Vijayakumar, S. A comparison of four patient immobili- zation devices in the treatment of prostate cancer patients with three-dimensional conformal radiotherapy. Int. J. Ra- diat. Oncol. Biol. Phys. 34:213-219; 1996.
18. Suit, H. D.; Goitein, M. Rationale for use of charged-particle and fast-neutron beams in radiation therapy. In: Meyn, R. E.; Withers, H. R., eds. Radiation biology in cancer research. New York: Raven Press: 1980:547-565.
19. Urie, M. M.; Goitein, M.; Doppke, K.; Kutcher, J. G.; LoSasso, T.; Mohan, R.; Munzenrider, J. E.; Sontag, M.; Wong, J. W. The role of uncertainty analysis in treatment planning. Int. J. Radiat. Oncol. Biol. Phys. 21:91- 107; 1991.
20. Valicenti, R. K.; Michalski, J. M.; Bosch, W. R.; Gerber, R.; Graham, M. V.; Cheng, A.; Purdy, J. M.; Perez, C. A. Is weekly port filming adequate for verifying patient position in modem radiation therapy? Int. J. Radiat. Oncol. Biol. Phys. 30:431-438; 1994.
21. Verhey, L. Immobilization and positioning patients for ra- diotherapy. Sem. Radiat. Oncol. 5: lOO- 114; 1995.
22. Wong, J.; Yan, D.; Michalski, J.; Graham, M.; Halverson, K.; Harm, W.; Purdy, J. The cumulative verification image analysis tool for off-line evaluation of portal images. Int. J. Radiat. Oncol. Biol. Phys. 33: 1301- 13 10; 1995.
23. Yan, D.; Wong, J.; Gustafson, G.; Martinez, A. A new model for “accept or reject” strategies in off-line and on-line megavoltage treatment evaluation. Int. J. Radiat. Oncol. Biol. Phys. 31:943-952; 1995.
APPENDIX A
Statistical quantijcation of treatment setup errors Let i be the index of M patients in a group with a specific
treatment site. Let Ni be the number of treatment fractions forpatienti,andP,,k= l,...,N,bethesetuperrorona specific coordinate direction on the kth treatment day. The mew mi = &=I,. . sr: PkINi , and the standard deviation, cr, = [C,,,. ..,, N,(Pk - mi)2/(Nj - 1)]“2, of the setup errors are calculated to represent the systematic setup error-and the random setup error, respectively, for the ith patient.
The mean and standard deviation of the individual systematic setup error (m,s) for all patients in the group, denoted M( mi ) and a( mi ), respectively, can be calcu- lated as:
dom setup error (ois) for the same group of patients, which can be calculated as:
M(ai) = [Zi=i,.,,,M(Ni - l)~fl(N- l)]“’
When patient population is considered, the mean and standard deviation of portal measurements of all patients in the group, denoted Mp and up, respectively, are cal- culated as:
M(mi > = &=I, ., ,wNimilN
a(m;> = [Ci=l, . . . . MNi(mi - M(mi))2/(N - l)]“’
MP = C;=I, . &=I, . . . . ,P,IN
Up = [Xi=, , &=I, . . . . N, (Pk - Mpj2/(N - l)]“* where N = C,,,, .MN, .
In same manner, M ( 0, ) and a( oi ) represent the root- mean-square and standard deviation of the individual ran-
It is trivial to show that Mp = M(mi). To show op = [02(mi) + M2(aZ)]“‘, considering:
206 I. J. Radiation Oncology l Biology l Physics Volume 38, Number 1, 1997
a’ + M’(Ui)
= X,=1, ,_, ,&fNi(mi - M(mi))‘I(N - 1)
+ &=I . .._. M(N - lbfl(N- 1)
+ ~k=l,..., N, (Pk - m)2)lw - 1)
= Ci,1,..., ,{N,m? - 2NimiMp
+ NiMp2 + Ck=l,..., N,PZ
(Note: C,=, ,..., N,Pk = Nim;.)
= &=l...., MI &=l,.._. Nip:
- ~C,=,.....N,P~MP + NiMp’ll(N- 1)
{ P: - 2P&fp + M2p = zi=l. _.. ,M~k=l.._. .Ni lf(N-- 1)
- 2ck=,, , N, P,mj + N,mf }l(N - 1) = ci=l,... . &=I ,_.., N,(Pk - Mp)‘l(N - 1) = op’.
APPENDIX B
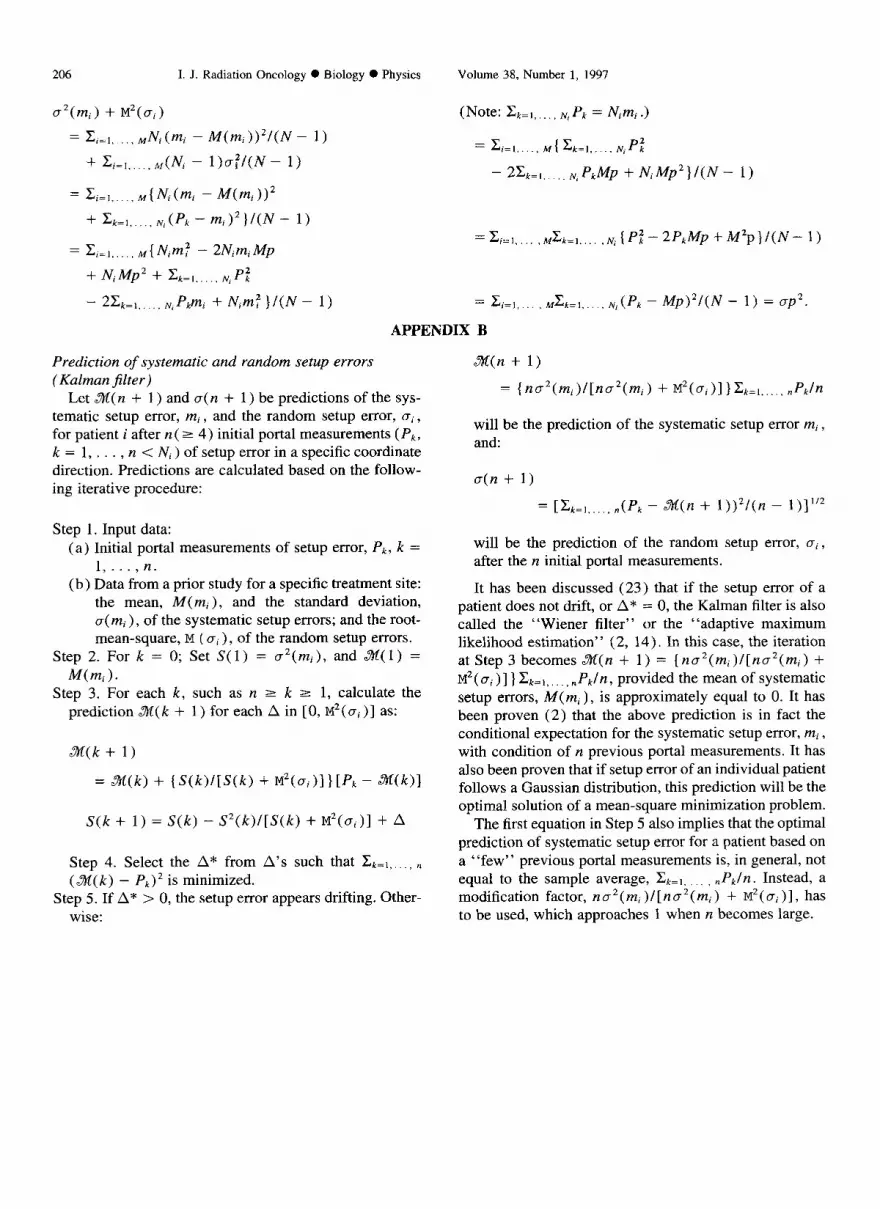
Prediction of systematic and random setup errors (Kalmun jilter)
Let nZ( n + 1) and g( n + 1) be predictions of the sys- tematic setup error, mi, and the random setup error, gi, for patient i after n( 2 4) initial portal measurements (Pk, k = 1, . . . , n < N, ) of setup error in a specific coordinate direction. Predictions are calculated based on the follow- ing iterative procedure:
Step 1. Input data: (a) Initial portal measurements of setup error, Pk, k =
l,...,n. (b) Data from a prior study for a specific treatment site:
the mean, M(mi), and the standard deviation, a( mi ), of the systematic setup errors; and the root- mean-square, M ( ci ) , of the random setup errors.
Step 2. For k = 0; Set S(1) = cr2(mi), and %(l) = M(m).
Step 3, For each k, such as n 2 k 2 1, calculate the prediction X( k + 1) for each A in [ 0, M2 (Ci )] as:
X(k + 1)
= X(k) + t S(k)f[S(k) + M’(a;)ll tPk - z(k)1
S(k + 1) = S(k) - S2(k)/[S(k) + M2(ai)] + A
Step 4. Select the A* from A’s such that C!+,,.. ., ,, (3bz( k) - Pk.’ is minimized.
Step 5. If A* > 0, the setup error appears drifting. Other- wise:
3kl(n + 1)
= {n~2(mi>/[n~2(mi) + M’(~i)]}~k=~,...,~Pk/n
will be the prediction of the systematic setup error m, , and:
a(n + 1)
= [CL=l...., n(Pk - X(n + 1))2/(n - l)]“’
will be the prediction of the random setup error, gi, after the n initial portal measurements.
It has been discussed (23) that if the setup error of a patient does not drift, or A * = 0, the Kalman filter is also called the “Wiener filter” or the “adaptive maximum likelihood estimation” (2, 14). In this case, the iteration at Step 3 becomes X(n + 1) = { na2(mi)l[na2(mj) + M2( pi )] ) C,=,, , “PJn, provided the mean of systematic setup errors, M(m,), is approximately equal to 0. It has been proven (2) that the above prediction is in fact the conditional expectation for the systematic setup error, mi, with condition of n previous portal measurements. It has also been proven that if setup error of an individual patient follows a Gaussian distribution, this prediction will be the optimal solution of a mean-square minimization problem.
The first equation in Step 5 also implies that the optimal prediction of systematic setup error for a patient based on a “few” previous portal measurements is, in general, not equal to the sample average, Ck=,, , .PJn. Instead, a modification factor, nD’(mi)l[na’(mi) + M’(ai)]> has to be used, which approaches I when n becomes large.


