Embed Size (px)
Citation preview
0
ADDIS ABABA UNIVERSITY
SCHOOL OF GRADUATE STUDIES
TECHNOLOGY INSTITUTE
DEPARTMENT OF CHEMICAL ENGINEERING EVALUATION OF ETHIOPIAN THYME (THYMUS SCHIMPERI R.)
ANTIOXIDANT ACTIVITY AND ITS PRESERVATIVE EFFECT ON SOME FOOD PRODUCTS
A Thesis submitted to the school of Graduate Studies of Addis Ababa University in partial fulfillment of the requirements for the Degree of Master of Science in
Chemical Engineering (Food Engineering) By:
Gebrehana Ashine
Advisor:
Dr. Eng. Shimelis Admasu (Associate Prof.)
June, 2012
Addis Ababa, Ethiopia
i
ADDIS ABABA UNIVERSITY
SCHOOL OF GRADUATE STUDIES
TECHNOLOGY INSTITUTE
DEPARTMENT OF CHEMICAL ENGINEERING EVALUATION OF ETHIOPIAN THYME (THYMUS SCHIMPERI R.)
ANTIOXIDANT ACTIVITY AND ITS PRESERVATIVE EFFECT ON SOME FOOD PRODUCTS
A Thesis submitted to the school of Graduate Studies of Addis Ababa University in partial fulfillment of the requirements for the Degree of Master of Science in Chemical Engineering (Food Engineering)
By
Gebrehana Ashine
Approved by the Examining Board
_________________________________ _____________ (Chairman, Department’s Graduate Committee) Dr.Eng. Shimelis Admassu (Associate Prof.) _________________________________ _____________ (Advisor)
_________________________________ _____________
(Internal Examiner)
_________________________________
(External Examiner)
_____________

ii
Acknowledgments
My first and foremost gratitude goes to my advisor, Dr. Eng. Shimelis Admasu, for his
unreserved advice and continuous encouragement, guidance and valuable suggestions in every
step of the thesis work. Without his kindness and understanding, this piece of work would not
have come into completion.
Further thanks are extended to the staff of chemical and food engineering School, Technology
Institute of Bahir Dar University, notably Ato Biresaw Demelash, Ato Tadele Andarige, and Ato
Mengistu Gizaw for their cooperation during laboratory work.
My sincere gratitude is due to Ato Mulugeta Belayihun, Ato Derese Mekonnen, Habtamu
Asimare, Tuamelisan Shumye and other friends for their encouragement and friendly support
during the course of the study. I am very grateful for my family members, Ato Alayu
Hailemariam and Ato Eshetu Adelahu for their encouragement and loving support. I highly
admire my fiancée Dr. Sosina Tarekegn and thank her for her encouragement throughout the
period of my study.
iii
Table of Contents
Chapter Title Pages
Title page i Acknowledgement ii Table of contents iii List of tables vi List of figures vii List of abbreviations
Abstract viii
ix 1 Introduction 1
1.1. Background 1
1.2. Statement of the problem 4
1.3. Objectives 6
1.4. Scope of the study 6
2 Literature Review 7
2.1. Distribution of thyme in Ethiopia 7
2.2. Chemical composition and use of thyme 7
2.3. The development of oxidative rancidity in foods 9
2.4. Antioxidants and their effects in food preservation 12
2.5. Antioxidants and health 13
2.6. Natural Antioxidants 14
2.6.1. Sources of natural antioxidants and their preparation 14
2.6.2. The use of natural antioxidants in food products 16
2.6.3. Measuring antioxidant activity 18
2.7. The regulation of antioxidants in food 24
3 Materials and Methods 25
3.1. Structure of thesis experiments 25
iv
3.2. Raw material collection, transportation and sample preparation 26
3.3. Extraction process 28
3.3.1. Setting extraction parameters 28
3.3.2. Preparation of thyme crude extract 28
3.4. Analysis Methods 29
3.4.1. Evaluation of thyme antioxidant activity 29
3.4.1.1. Rancimat Method 29
3.4.1.2. Schaal oven test 30
3.4.2. Preservative effect of thyme extract on some food products 32
3.4.2.1. Chemical Analysis 32
3.4.2.2. Microbiological Analysis 34
3.5. Statistical Analysis 35
4 Results and Discussion 36
4.1. Effect of extraction parameters on thyme antioxidant activity and its extract yield
36
4.2. Evaluation of thyme antioxidant activity on oil and butter 41
4.2.1. The Rancimat Method 41
4.2.2. Schaal Oven Test Method 43
4.2.3. Effect of thyme crude extract concentration on its antioxidant activity
45
4.3. Preservative effect of thyme on oil, butter and meat 47
4.3.1. Free Fatty Acids 47
4.3.2. Peroxide Value 49
4.3.3. Acid Value 51
4.3.4. Total Viable Count 52
v
4.3.5. Aerobic Mold and Yeast Count 54
4.3.6. Enterobacteriaceae Count 56
5 Suggesting Technology for the production of thyme crude extract 59
5.1. Production of thyme crude extract 59
5.2. Material and Energy balance on major unit operations 61
5.3. Economic Evaluation of the Plant 70
5.4. Plant Location 74
6 Conclusions and Recommendation 75
6.1. Conclusions 75
6.2. Recommendation 77
References 78
Appendices 84
vi
List of Tables
Table No. Title Page
4.1 Effect of extraction parameters on antioxidant activity of thyme 37
4.2 Effect of extraction parameters on the yield of thyme crude extract 39
4.3 Antioxidant activity of thyme evaluated by Rancimat on soybean oil
41
4.4 Antioxidant property of butter collected from different locations as determined by Rancimat
43
4.5 Peroxide value of thyme extract treated with soybean oil for evaluating thyme antioxidant activity using Schaal Oven Test
44
4.6 Correlation of thyme extract concentration and its antioxidant activity
46
4.7 Free fatty acid value of both soybean oil and butter treated by thyme crude extract
48
4.8 Peroxide value of soybean oil and butter of thyme crude extract treatments
50
4.9 Acid Value of soybean oil and butter treated by thyme crude extract 51
5.1 Plant capacity and production program 70
5.2 Purchased Equipment costs 70
5.3 Estimation of Direct and Indirect costs 71
5.4 Total production cost estimation 72
vii
List of Figures
Figure No. Title Page
2.1 Major antioxidants among thyme extract constituents 8
3.1 Experimental framework of the thesis 25
3.2 Rancimat apparatus for antioxidant activity evaluation 27
4.1 Aerobic plate count of butter and meat 53
4.2 Aerobic Mold and Yeast Count of butter and meat 55
4.3 Enterobacteriaceae count of both butter and meat 56
5.1 Basic steps for the production of thyme crude extract 59
5.2 Equipment layout of thyme crude extract production plant 60
viii
List of Abbreviations
AArefence Antioxidant Activity of reference
AAt Antioxidant Activity of thyme
ANOVA Analysis of Variance
AOAC Association of Official Analytical Chemists
AV Acid Value
BHA Butylated hydoxylanisole
BHT Butylated hydroxytoluene
Cfu Colony Forming Units
DPPH 2, 2-diphenyl-1-picrylhydrazyl
Dwb dry weigh basis
FFA
IT
Free Fatty Acids
Induction Time
JMP John’s Macintosh Project
mEq Milli Equivalent
OSI Oil Stability Index
PCA Plate Count Agar
PDA Potato Dextrose Agar
PF Protection Factor
PV Peroxide Value
TVC Total Viable Count
VRBA Violet Red Bile Agar
ix
Abstract
The study was conducted with the objective of evaluating antioxidant activity of Thymus
Schimperi and its preservative effect on oil, butter and meat. Thyme was prepared by
investigating the effect of ethanol concentration (0-97%), extraction time (180-240 min) and
extraction temperature (20-40℃) on its antioxidant activity and extract yield. Based on ANOVA
analysis, extraction parameters have significant effect (P<0.05) on thyme antioxidant activity
and its extract yield. The best levels of extraction parameters for higher antioxidant activity and
extract yield were distilled water (0% ethanol concentration) for 210 min at 20℃. Antioxidant
activity of thyme was evaluated by adding 0.1% thyme crude extract to refined soybean oil and
butter. For comparison, 0.05% α-Tocopherol was added as positive control and none thyme
extract was used as negative control. The results were expressed as induction time determined by
Rancimat (hr) and Schaal Oven Test (day) methods. Induction time of thyme was 3.25±0.02 hr
and six day when determined in soybean oil. But, α-Tocopherol has 4.98±0.10 hr and seven day
induction time. Thyme has 5.28±0.08 hr induction time when evaluated in butter. The
preservative effect of thyme was also studied by performing free fatty acid, Peroxide value, Acid
value (on oil and butter); Aerobic plate count, Aerobic Mold & Yeast count and
Enterobacteriaceae count on butter and meat. In the study, all samples were treated with 0, 0.1%
and 0.2% levels of thyme extract and analysis were performed in weekly basis. Compared to
thyme extract treated samples of oil and butter, control sample showed higher lipid oxidation
rate in each storage weeks. Highest microbial load was obtained in controlled samples of butter
and meat. Samples containing 0.2% thyme extract have lower count of total viable microbes,
mold & yeast and enterobacteriaceae. Based on the results, samples with 0.2% thyme extract
significantly (P<0.05) improved both the oxidative and microbial stability. Hence, Ethiopian
thyme has antioxidant activity and preservative effect as evaluated on soybean oil, butter and
meat. The preliminary techno-economic feasibility study also showed good profit margin and
financial feasibility for crude thyme extract production.
Keywords: antioxidant activity, induction time, thyme extract, thymus schimperi, preservative
effect, protection factor.
1
Chapter One
Introduction
1.1. Background Food products are now often sold in areas of far distant from their production sites and need
extended safety and storage stability. Many foods are perishable by nature and require protection
from spoilage during their preparation, storage and distribution to give them longer shelf-life.
The major cause of lipid-based food products deterioration is rancidity. Significant changes can
occur in product odor, taste, color, texture, nutritive value. Progressing oxidation results in
complete spoilage of foods. Use of antioxidants can postpone problems caused by rancidity thus
they are frequently used to retard oxidation processes in the food industry (Allen and Hamilton,
1994).
Antioxidants are an increasingly important feature in food processing. Their traditional role
involves, as their name suggests, inhibiting the development of oxidative rancidity in foods, like
meat, dairy products and fried foods. During recent years the most widely used definition of
antioxidants was proposed by Halliwell and Guteridge (2007): “A substance that, when present
at a low concentration compared with that of an oxidizable substrate, inhibits oxidation of the
substrate”.
In recent years there is a much focus on replacing synthetic food additives which might have
adverse effects with those of plant-based natural ones (Paradiso et al., 2008; Descalzo and
Sancho, 2008). Currently, the uses of natural antioxidants are becoming very popular in food and
preventive medicine due to the claims that they are safer and have disease–preventing and health
promoting attributes. It is well known that plants are the richest source of bioactive
phytochemicals and antioxidant nutrients (Elless et al., 2000). Spices and herbs provide foods
with flavors and food-preserving power, including antiseptic and antioxidant activity. The
increasing uses of herbal products demand extra attention with particular focus on their safety,
effectiveness and drug interactions. Over the last few decades, a substantial body of scientific
evidence is available demonstrating wide range of pharmacological and nutraceutical activities
of medicinal herbs (Burt, 2004; Celiktas et al., 2007; Edris, 2007). These include antioxidant,
antimicrobial, anticancer, anti-inflammatory activities.
2
The essential oils and herbs-derived extracts are gaining much recognition as a potential source
of natural and safer antioxidants and bio-actives (Burt et al., 2003; Burt, 2004). Essential oils of
some spices and herbs such as sage, oregano, thyme, and Satureja etc. have shown their
antioxidant potential (Ruberto and Baratta, 2000; Rota et al., 2004; Rota et al., 2008) and thus
can be used as natural antioxidants for the protection of fats/oils and related products (Burt,
2004; Sacchetti et al., 2005; Bozin et al., 2006). Many authors, in fact, have reported
antimicrobial, antifungal, antioxidant and radical-scavenging properties of spices and essential
oils and, in some cases; a direct food-related application has been tested. Literatures outline
different approaches within this trend and both the biological screening of new essential oils and
the evaluation of new properties of already marketed oils have been done (Fullas, 2003).
The antioxidant activities of herbs and spices extracted with solvents, such as methanol or
acetone, have been evaluated in various test systems, including hydrophilic and lipophilic
systems. So far, many investigations on the antioxidant activities of methanol extracts of
rosemary, sage, and thyme have been carried out in hydrophilic and lipophilic test systems. In
2006, Bozin B. et al found that ethanolic extract or essential oil of thyme has a significant rate of
antifungal and antimicrobial activities with strongly inhibited lipid peroxidation and high -OH
radical scavenging.
Numerous studies have been conducted on the antibacterial and antioxidant activity of herbs and
vegetable extracts and subsequent effect on the shelf life of different food products. It is of a
great interest to consumers and nutritionists to quantify the antioxidant of various foods because
antioxidants are clearly important to human life. There are many different methods for
determining antioxidant function which rely on different generators of free radicals, acting by
different mechanisms. In the literature, antioxidant properties are denoted as antioxidant capacity
(Jan and Michael, 2001).
Thymus is an aromatic plant belonging to the Lamiaceae family, used for medicinal and spice
purposes almost everywhere in the world. Many pharmacological in vitro experiments carried
out during the last decades revealed well defined pharmacological activities of both, the thyme
essential oil and its extracts. The non-medicinal use of thyme is worthy of attention, because
thyme is used in the food and aroma industries; it is widely used as culinary ingredient and it
3
serves as a preservative for foods especially because of its antioxidant effect. The major phenolic
components in thyme extracts, especially thymol and carvacrol, present higher antioxidant
activity than the well-known BHT (butylated hydroxytoluene) and α-tocopherol antioxidants
(Lee et al., 2005).
The antioxidative property of thyme is important in both the medicinal and non-medicinal
context. Several papers show that the essential oils and extracts of thyme exhibit antioxidative
property. The phenolic monoterpenes in thyme, thymol and carvacrol, are the primary
compounds which contribute to the characteristic aroma of its essential oil. They are also known
to inhibit lipid peroxidation. Thymus schimperi is rich in medicinally important constituents,
thymol and carvacrol (Dagne et al., 1998).
Even though, our country has considerably abundant of Lamiaceae family herb, wild growing
species of thyme (T. Schimperi), its antioxidant potential has not yet well studied on the shelf-
stability of fat-based food products. Therefore, the purpose of the research work was to evaluate
the antioxidant capacity of thyme extract using lipid oxidation inhibition system and determine
its preservative effect on butter, oil and meat food products.
4
1.2. Statement of the problem
The quality of food products are becoming deleterious after short storage by microbiological and
chemical changes which are the major factors affecting food sensory characteristics, safety,
quality and cost. Lipid oxidation is one of the most undesirable change that affect the quality of
foodstuff during storage due to deterioration of polyunsaturated fatty acids (Pazos et al., 2008).
Vegetable oils and fats are recognized as important components of our diet. Particularly,
oxidative deterioration of oils and fats is a great concern in the shelf stability of foods and
resulted in decreasing of safety and nutritional quality. Due to these changes, consumers do not
accept oxidized products and industries suffer from economic losses. The oil industry has to pay
special attention in this context, as oils, fats and fatty foods suffer stability problems (Wu and
Nawar, 1986). In order to overcome the stability problems of oils and fats, synthetic antioxidants,
such as butylated hydroxyanisole (BHA), butylated hydroxytoluene (BHT), ter-butyl
hydroquinone (TBHQ) have been used as food additives. But recent reports reveal that these
compounds may be implicated in many health risks, including cancer and carcinogenesis (Hou,
2003; Prior, 2004).
Due to these safety concerns, there is an increasing trend among food scientists to replace these
synthetic antioxidants with natural ones, which, in general, supposed to be safer. Investigating
for cheap and abundant sources of natural antioxidants is attracting worldwide interest since the
trends of consumers and many health-related industries these days tend to shift preferences to
natural sources. The use of spices, herbs as antioxidants in perishable foods is becoming of
increasing importance in the food industry.
Health protection and economic reasons have required investigation areas aimed at enhancing the
oxidation and microbiological stability of foods such as oil, butter and meat. Preservation of
butter, oil and meat is the main application area of natural antioxidant to prevent the rate of
oxidative rancidity. For instance, butters of various locations have different selling price.
Knowing the quality of butter regarding its antioxidant content was one among the aim of this
study.
5
Some plant extracts have been known as antimicrobials as well as antioxidants in food systems.
Thyme is the one among the potential herbs for extracting natural antioxidants. Lee et al. (2005)
reported that the major phenolic components in thyme extracts, especially thymol and carvacrol,
present higher antioxidant activity than the well-known BHT and α-tocopherol antioxidants. Our
country has abundant wild thyme (Thymus Schimperi) to extract natural antioxidant and
antimicrobial from this potential herb. However, it has not yet cultivated and exploited properly
for these purposes. Thus, the research was aimed at extraction of thyme crude extract and
evaluating its antioxidant activity antimicrobial effect in preservation of soybean oil, butter and
meat.
6
1.3. Objectives
General objective
The general objective of this thesis work was to evaluate the total antioxidant activity of thyme
(Thymus Schimperi) and study its preservative effect on oil, butter and meat to prevent the
challenge of lipid oxidation.
Specific Objectives
The specific objectives of this study were to:
Study the effect of extraction parameters on thyme antioxidant activity and its extract
yield
Evaluate the total antioxidant activity of T. Schimperi on soybean oil and butter
Examine the antioxidant content of butter samples collected from different locations
Study the preservative effect of thyme on butter, meat and oil food products
Conduct techno- economic feasibility analysis of the present work for thyme extraction
process
1.4. Scope of the study
The study was extended in collection of T. Schimperi species of thyme from North Shewa Zone;
Tarmaber. Drying and grinding it to appropriate size. Determinations of thyme crude extract
antioxidant activity by measuring induction period using oxidation inhibition system.
Application of the thyme extract on specified foods such as butter, meat and oil at different
concentration and study the thyme extract preservative effect. Chemical and microbiological
analyses were performed. Finally, the techno-economic feasibility study was done for crude
thyme extract production.
7
Chapter Two
Literature Review
2.1. Distribution of thyme in Ethiopia Thyme is mainly a temperate taxon and is uncommon in the African tropics. Ethiopia has
considerably abundant Lamiaceae family plants growing at different regions and possesses a
variety of the wild growing species of this family. Many species belonging to different genera
of the family Lamiaceae have been reported to found in different parts of the country. The two
species, T. Schimperi Ronniger and T. serrulatus Hochst.ex indigenous to Ethiopia (Demsew et
al., 1994; Asfaw et al., 2000) while T. vulgaris is a species, native to southern Europe. Thymus
Schimperi is comparatively widespread in Central, Eastern and Northern Ethiopia. It is locally
known as Tosign. Bale, Shewa, Gonder and Wollo are the major growing areas in Ethiopia
(Demsew, 1993; Asfaw et al., 2000). Wild thyme of T. Schimperi is harvested and dried by
people living close to the town of Dinsho and near Menz, put in plastic bags and sold to
travelers on buses.
2.2. Chemical Composition and use of thyme The principal components of thyme are thymol and carvacrol (up to 64% of oil), along with
linalool, p-cymol, cymene, hymene, α- pinene, apigenin, luteolin, and 6-hydroxyluteolin
glycosides, as well as di-, tri- and tetramethoxylated flavones, all substituted in the 6-position
(for example 5,4-dihydroxy-6,7-dimethoxyflavone, 5,4-dihydroxy-6,7,3-trimethoxyflavone) and
its 8-methoxylated derivative 5,6,4-trihydroxy-7,8,3-trimethoxyflavone. Thymol and γ-
terpinene are found to be the major constituents of T. vulgaris. Investigation of the chemical
compositions of the two thymus species in Ethiopia (T. schimperi R. and T. serrulatus Hochst.ex
Benth) was limited except for the volatile oil constituents by Dagne et al. (1998) for essential oil
constituents. It was found that oil obtained from T. Schimperi grown in Addis Ababa was rich in
carvacrol (66.2%), γ-terpinene (13.2%) while thymol (50%), γ-terpinene (12.1%) carvacrol
(10.1% and p-cymene (10.0%) were the major constituents in the same species from Dinshu.
The main uses of thyme in culinary and food processing are defined by the following properties
of thyme components: (i) Aroma and flavour, (ii) antioxidant and (iii) antimicrobial activities.
8
Thyme is prepared as infusion to treat spasmodic cough, laryngitis, bronchitis and urinary
infections. It is also used as a decongestant, as a cholagoge, to reduce flatulence and to fight
parasites. External uses of thyme include preparations to wash skin wounds or infections
(Asfaw et al., 2000). Researches conducted in the Ethiopian traditional medicine shows that the
plant has many medicinal applications. Some of the reported applications are for the treatment
of gonorrhea, cough, inflammation, spasm, thrombosis, urinary retention, mental illness, eye
disease, toothache, stomach problems, leprosy, lung TB, acne and ascaris (Peter, 2004).
Antimicrobial activity
Thyme essence, especially the phenolic components thymol and carvacrol, show antibacterial
activity against gram-positive and gram-negative bacteria, due to their effects on the bacterial
membrane. Since thymol and carvacrol are eliminated through the respiratory tract, these
compounds have respiratory antiseptic action. Because of its antibacterial activity, thyme is also
useful as an antiseptic for the urinary tract, mouth and skin wounds. Thyme water extract
showed significant in vitro inhibitory effects on the growth of Helicobacter pylori and its
powerful urease activity (Fullas, 2003).
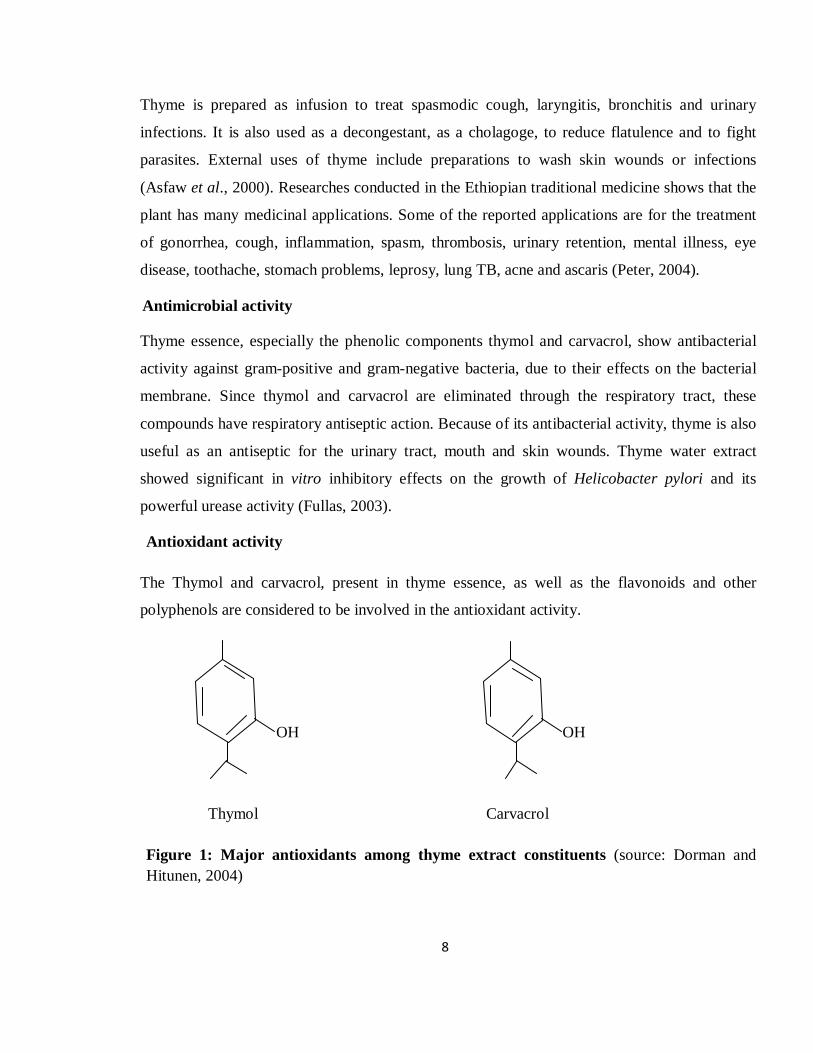
Antioxidant activity
The Thymol and carvacrol, present in thyme essence, as well as the flavonoids and other
polyphenols are considered to be involved in the antioxidant activity.
OH OH
Thymol Carvacrol
Figure 1: Major antioxidants among thyme extract constituents (source: Dorman and Hitunen, 2004)
9
Rosmarinic acid, hydroxycinnamic derivatives and flavonoid compounds showed important in
vitro antioxidant activity by inhibiting iron-induced superoxide anion formation and lipid
peroxidation in microsomal and mitochondrial systems. Furthermore, the thymol present in the
essential oil showed in vitro antioxidant activity by neutralizing the DPPH (diphenyl-
picrylhydrazyl) radical (Awraris Derbe, 2009).
2.3. The development of oxidative rancidity in foods
Fats, oils and lipid-based foods deteriorate through several degradation reactions both on heating
and on long term storage. The main deterioration processes are oxidation reactions and the
decomposition of oxidation products which result in decreased nutritional value and sensory
quality. The off-flavours that develop during lipid oxidation normally act as a warning that a
food is no longer edible, although this does not apply to polyunsaturated lipid supplements taken
in capsule form. Understanding of the mechanisms by which lipids deteriorate developed rapidly
during the twentieth century. Autoxidation reactions commonly show an induction period, which
is a period during which very little change occurs in the lipids. After the end of the induction
period, oxidative deterioration of the lipids occurs much more rapidly. Off-flavours become most
noticeable after the end of the induction period. Lipid oxidation is one of the major causes of
quality deterioration in muscle foods following storage at refrigerated or frozen temperatures.
Often seen in later stages of storage, quality losses are manifested through a variety of
mechanisms (Allen and Hamilton, 1994).
The two major components involved in lipid oxidation are unsaturated fatty acids and oxygen. In
this process, oxygen from the atmosphere is added to certain fatty acids, creating unstable
intermediates that eventually break down to form unpleasant flavor and aroma compounds.
Although enzymatic and photogenic oxidation may play a role, the most common and important
process by which unsaturated fatty acids and oxygen interact is a free radical mechanism
characterized by three main phases:
Initiation: Initiator (In) + RH → InH + R•
Propagation: R• + O2→ ROO•
ROO• + RH → R• + ROOH
10
Termination: 2ROO• → O 2 + ROOR
ROO• + R• → ROOR
Initiation occurs as hydrogen is abstracted from an unsaturated fatty acid, resulting in a lipid free
radical, which in turn reacts with molecular oxygen to form a lipid peroxyl radical. While
irradiation can directly abstract this hydrogen from lipids, initiation is frequently attributed in
most foods, including muscle foods, to reaction of the fatty acids with active oxygen species. The
propagation phase of oxidation is fostered by lipid–lipid interactions, whereby the lipid peroxyl
radical abstracts hydrogen from an adjacent molecule, resulting in a lipid hydroperoxide and a
new lipid free radical. Interactions of this type continue 10 to 100 times before two free radicals
combine to terminate the process. Additional magnification of lipid oxidation, however, occurs
through branching reactions (also known as secondary initiation). The radicals produced will
then proceed to abstract hydrogen from unsaturated fatty acids (Michael, 2001).
A. Initiation The direct reaction of a lipid molecule with a molecule of oxygen is highly improbable because
the lipid molecule is in a singlet electronic state and the oxygen molecule has a triplet ground
state. To avoid this spin restriction, oxygen can be activated by any of the following three
initiation mechanisms:
formation of singlet oxygen;
formation of partially reduced or activated oxygen species such as hydrogen peroxide,
superoxide anion, or hydroxyl radical; and/or
formation of active oxygen–iron complexes (ferryl iron or ferric–oxygen–ferrous
complex).
In addition, the oxidation of fatty acids may occur either directly or indirectly through the action
of enzyme systems, of which three major groups are involved: microsomal enzymes,
peroxidases, and dioxygenases, such as lipoxygenase or cyclooxygenase. Therefore, activated
oxygen species are likely to be present in the food item even before it is harvested, not just
produced during processing and storage.
11
B. Propagation Propagation reactions form the basis of the chain reaction process and in general include the
following:
Radical coupling with oxygen: R• + O2 → ROO•
Atom or group transfer: ROO• + RH → ROOH + R•
Fragmentation: ROO• → R• + O2
Rearrangement and Cyclization
Conditions that determine the chain propagation length include initiation rate, structures of
aggregates (increasing with increasing structure of the aggregates), temperature, presence of
antioxidants, and chain branching. Chain branching involves the breakdown of fatty acid
hydroperoxides to the lipid peroxyl or alkoxyl radical. Given the bond dissociation energies of
LOO–H (about 90kcal/mol) and LO–OH (about 44kcal/mol), spontaneous decomposition is
unlikely at refrigerated or freezing temperatures. Instead, breakdown of hydroperoxides would
be dominated by one-electron transfers from metal ions during low temperature storage. The
major contributors to decomposition of lipid hydroperoxides in food and biological systems
would be heme and non-heme iron, with reactions involving the ferrous ion occurring much
more quickly than those involving ferric ion.
C. Termination To break the repeating sequence of propagating steps, two types of termination reactions are
encountered: radical–radical coupling and radical–radical disproportionation, a process in which
two stable products are formed from two radicals by an atom or group transfer process. In both
cases, non-radical products are formed. However, the termination reactions are not always
efficient. Secondary and primary peroxyl radicals, on the other hand, terminate efficiently by a
mechanism in which the tetroxide decomposes to give molecular oxygen, an alcohol, and a
carbonyl compound.
12
The retardation of these oxidation processes is important for the food producer and, indeed, for
all persons involved in the entire food chain from the factory to the consumer. Oxidation may be
inhibited by various methods including prevention of oxygen access, use of lower temperature,
inactivation of enzymes catalyzing oxidation, reduction of oxygen pressure, and the use of
suitable packaging. Another method of protection against oxidation is to use specific additives
which inhibit oxidation. These are correctly called oxidation inhibitors, but nowadays are mostly
called antioxidants.
2.4. Antioxidants and their effects in food preservation Antioxidants in food may be defined as any substance which is capable of delaying, retarding or
preventing the development of rancidity in food or other flavour deterioration due to oxidation.
Antioxidants delay the development of off-flavours by extending the induction time. Addition of
antioxidants after the end of this period tends to be ineffective in retarding rancidity
development. The induction time (IT) is very sensitive to small concentrations of components
that shorten it; the pro-oxidants, or lengthen; antioxidants. Metal ions are the most important pro-
oxidants in foods, whereas antioxidants include compounds that act by radical scavenging, metal
chelating or other mechanisms (Michael, 2001).
Antioxidants can inhibit or retard oxidation in two ways: either by scavenging free radicals, in
which case the compound is described as a primary antioxidant, or by a mechanism that does not
involve direct scavenging of free radicals, in which case the compound is a secondary
antioxidant. Primary antioxidants include phenolic compounds such as vitamin E (α-tocopherol).
These components are consumed during the induction period. Secondary antioxidants operate by
a variety of mechanisms including binding of metal ions, scavenging oxygen, converting
hydroperoxides to non-radical species, absorbing UV radiation or deactivating singlet oxygen.
Normally, secondary antioxidants only show antioxidant activity when a second minor
component is present. This can be seen in the case of sequestering agents such as citric acid
which are effective only in the presence of metal ions, and reducing agents such as ascorbic acid
which are effective in the presence of tocopherols or other primary antioxidants (Michael, 2001).
13
The most important mechanism of antioxidants is their reaction with lipid free radicals, forming
inactive products. Additives with this mechanism are antioxidants in the proper sense. Usually,
they react with peroxy or alkoxy free radicals, formed by decomposition of lipid hydroperoxides.
Other inhibitors stabilize lipid hydroperoxides, preventing their decomposition into free radicals.
Some substances called synergists demonstrate no antioxidant activity in themselves, but they
may increase the activity of true antioxidants (Allen and Hamilton, 1994).
2.5. Antioxidants and health
Hence, food scientists often equate antioxidants with “inhibitors of lipid peroxidation and
consequent food deterioration.” By contrast, in the human gastrointestinal tract as well as within
the body tissues, oxidative damage to proteins and DNA is just as important as damage to lipids.
Indeed, oxidative DNA damage may be a major risk factor for the development of cancer, so that
dietary antioxidants able to decrease such damage in vivo would be expected to have an
anticancer effect (Halliwell and Gutteridge, 2007).
In the last few decades, several epidemiological studies have shown that a dietary intake of foods
rich in natural antioxidants correlates with reduced risk of coronary heart disease; particularly, a
negative association between consumption of polyphenol-rich foods and cardiovascular diseases
has been demonstrated. This association has been partially explained on the basis of the fact that
polyphenols interrupt lipid peroxidation induced by reactive oxygen species. A large body of
studies has shown that oxidative modification of the low-density fraction of lipoprotein is
implicated in the initiation of arteriosclerosis. More recently, alternative mechanisms have been
proposed for the activity of antioxidants in cardiovascular disease, which are different from the
simple shielding of low density lipoprotein from reactive oxygen species, induced damage.
Several polyphenols recognized for their antioxidant properties might significantly affect cellular
response to different stimuli, including cytokines and growth factors (Lester and Enrique, 2002).
Dietary consumption of polyphenols is associated with a lower risk of degenerative diseases. In
particular, protection of serum lipids from oxidation, which is a major step in the development of
arteriosclerosis, has been demonstrated. More recently, new avenues have been explored in the
capacity of polyphenols to interact with the expression of the human genetic potential. The
understanding of the interaction between this heterogeneous class of compounds and cellular
14
responses, due either to their ability to interplay in the cellular antioxidant network or directly to
affect gene expression has increased (Virgilli et al., 2001).
Foods rich in antioxidants may afford a degree of protection against free radical damage not only
in foods, but also in the human body, protecting against cardiovascular diseases, damage of
nucleic acids, and other deteriorative processes. The absorption of tocopherols and carotenoids
into the blood stream is well known, but much less has been published on the fate of other
antioxidants and their reaction products. Some antioxidants may not be absorbed in the intestinal
tract at all, even when they are active in foods (Lester and Enrique, 2002).
2.6. Natural antioxidants Antioxidants were first used before World War II for food preservation. These early antioxidants
were natural substances. They were, however, soon replaced by synthetic substances, which were
cheaper, of more consistent purity, and possessed more uniform antioxidant properties. Much
interest has developed during the last few decades in naturally occurring antioxidants because of
the adverse attention received by synthetic antioxidants and because of the world wide trend to
avoid or minimize the use of artificial food additives. The increased use of various synthetic food
additives was then challenged by consumer groups. Consumers wished to have these additives
replaced by natural materials, which were considered to be more acceptable as dietary
components. Industrial producers have tried to comply with consumers’ wishes, and have moved
to increased use of natural antioxidants. Most natural antioxidants are common food components,
and have been used in the diet for many thousands of years so that humans have adapted to their
consumption (Jan and Michael, 2001).
2.6.1. Sources of natural antioxidants and their preparation Herbs, spices and teas are one of the most important targets in the investigation of natural
antioxidants from safety the point of view. In the evaluation of spices as natural antioxidant,
some investigations have been carried out using the whole spice. Rosemary and sage were the
most effective antioxidants in lard and both spices were found to have a low redox potential in
sausages indicating antioxidative activity. However, in an oil-in-water emulsion, clove was the
most effective spice. In general, the stabilization factors obtained for the spices in the emulsions
15
were several times greater than those in lard, indicating a higher efficiency against oxidation in
the emulsion (Jan and Michael, 2001).
Thyme comes originally from the regions around the Mediterranean and is used as cough
medicine. The common English word ‘thyme’ covers both the genus and the species most widely
used, Thymus vulgaris L. (common thyme, garden thyme). Thymus vulgaris is native to southern
Europe, from Spain to Italy. It is commonly cultivated there as well as in most mild-temperate
and subtropical climates, which include southern and central Europe (Peter, 2004).
From the aromatic and medicinal points of view, thyme is indeed the most important herb and is
widely used as a flavouring agent, a culinary herb and as herbal medicine. The commercial
products that are obtained from thyme include essential oils, oleoresins, fresh and dried herbs.
The list of thyme applications includes almost all foods: beverages, cheese, fish, meat, salad
dressings, sauces, vegetables, egg dishes, poultry, soups and honey. Usually, owing to its sensory
characteristics, thyme is not suitable for sweet products (Peter, 2004).
There is a big difference between the preparation of synthetic antioxidants and natural
antioxidants for application in food products and processing. Synthetic antioxidants are produced
as pure substances of constant composition, and are applied as such or in well defined mixtures
with other pure substances. Application is thus relatively easy, requiring no substantial
modifications of the recipe and processing conditions. On the contrary, natural antioxidants are
available from raw materials of variable composition. Both the content of active substances
(usually a mixture of several compounds) and the content of various other compounds, either
inactive or possessing negligible activities, depend on the plant variety, agro-technology,
climatic conditions, degree of ripeness, and many other factors. Their composition should be
determined in every batch, and if necessary, the procedure of their preparation or application,
and the amount added to food products should be adapted according to analytical results. Some
nature-identical antioxidants, such as α-tocopherol or β-carotene, are available on the market in a
pure form or in defined solutions so that they can be added very easily in the amount desired.
Solutions of these compounds are prepared in the industry in order to improve the solubility of
the preparation in the food to be stabilized (Jan and Michael, 2001).
16
Many other food components possessing antioxidant activities are used in their natural form,
such as spices. The preliminary processing of such food components may be drying (in case of
leaves or stems), milling of dried material (such as seeds), or some other mechanical treatment.
Several ground spices (added in the amount of 5%) were found to be active in sunflower oil,
especially, sage, sumac and thyme. An alternative is to prepare a paste from soft, water-
containing substances, and to add it as a part of the recipe. These preparations are added to the
mass of components before processing, or they may be applied on the surface of food products
as it is exposed to heat and oxygen more than the inner layers. Rosemary oleoresin extract is
found to be efficient on application on the surface of muscle tissue from rainbow trout.
Sometimes, these ingredients are added after thermal processing, such as roasting, just to
prevent the destruction of antioxidants during the processing. The content of active
antioxidants in natural materials is usually rather low so that large additions would be
necessary to obtain a significant improvement in stability against oxidation. However, such
large additions could have a negative effect on the flavour or functional properties of the
product. It is often useful to prepare more concentrated materials. The easiest way is to remove
water by a suitable drying procedure and the next optimal procedure is extraction. The choice
of solvent is of crucial importance (Jan and Michael, 2001).
2.6.2. The use of natural antioxidants in food products Meat Control of oxidation in meat systems can occur in the raw or cooked meat system. In the raw
meat system, factors affecting the levels of endogenous antioxidants have been receiving a
great deal of attention in the literature in the 1990s. Most of the activity was focused on the
application of exogenous antioxidants during processing. Exogenous factors affecting the
oxidative stability of meats include the level of processing, cooking technique/time, pre- and
post-cooking storage time and temperature, packaging system, and/or use of antioxidants (Jan
and Michael, 2001).
Since about 1990, increasing the levels of tocopherols and carotenoids in muscle tissue via
dietary supplementation (endogenous antioxidants) has shown strong promise for increasing
the oxidative stability of muscle foods. Adding antioxidants during processing has been the
more traditional technique (exogenous antioxidants) used to control lipid oxidation in meats.
17
Some of the added compounds are found at low levels in meats, i.e. ascorbic acid and
carnosine, while others are derived from plants, i.e. phenolics/polyphenolics (Descalzo et al.,
2008).
Dairy product Milk is a very interesting and very perishable food system with a shelf-life affected by many
factors including microbial load, processing factors (such as agitation, temperature of
processing and/or storage prior to processing, exposure to light) (Jan and Michael, 2001).
The susceptibility of butter to oxidative reactions has been investigated. In 1986, Emmons
and his coworkers showed that butter held frozen (-18℃) and in the dark showed no evidence
of oxidation after 1 year of storage, but there was some loss of butter quality after 14 weeks
storage in the dark at 5°C. However, when (Luby et al, 1986) stored butter in light, either in
fluorescent in the cold (5°C) or daylight at 22°C, evidence of lipid oxidation (cholesterol oxide
production) was found. Their data showed that both singlet and free radical oxidation was
occurring.
Other researchers have looked at the potential for natural antioxidants to prevent lipid
oxidation in butter. In 1996, Zegarska and other researchers showed that an ethanolic extract of
rosemary increased the stability of butter against oxidation and that the effect was
concentration dependent. This study also evaluated the effectiveness of the rosemary extract in
inhibition of copper-catalyzed oxidation and found evidence that the extract was able to chelate
metals.
According to Farag et al. (1990) thyme and cumin essential oils could prevent oxidation in
butter stored at room temperature, and at 200ppm the essential oils were more effective than
BHT in inhibiting lipid oxidation in the butter. The researchers felt the preservative effect of
the essential oils from thyme and cumin was due to the phenols found in the oils. The phenolic
hydroxy group would be able to donate hydrogen to lipid.
18
Edible oil Lipids in foods of vegetable origin are usually more unsaturated than lipids of foods of animal
origin, therefore, the initiation rate of oxidation reactions is higher and natural antioxidants,
originally present in foods are more rapidly consumed than in lard or tallow and other animal
fats. The stabilization of products of vegetable origin against autoxidation is thus less efficient
than the stabilization of animal products. Protection factors of comparable antioxidants are
several times higher in lard than in edible oils (Jan and Michael, 2001).
Edible oils become rancid on storage, the type of rancid off-flavor depending on their fatty acid
composition (for example, it may become painty and fishy in oils containing linolenic acid,
such as rapeseed oil) and the presence of minor components (for example, in flavor-reverted
soybean oil). Edible oil producers try to prolong the shelf life of edible oils by different
techniques, including the addition of antioxidants. The presence of natural antioxidants should
always be taken into account, when appropriate levels of added antioxidants are considered
(Mariassvoya, 2006).
The antioxidative effect of an ethanol extract from savory (Satureja hortensis L.) in sunflower
oil was investigated during high temperature treatment (at 180°C). The extract improved the
oxidative stability of sunflower oil even after 50 hrs at 180 °C and inhibited the oxidative
processes more than the thermal processes under these conditions. Main components of the
extract are thymol and carvacrol, the former being more active than the latter (Beddows et al.,
2000).
2.6.3. Measuring antioxidant activity Antioxidants are used in a wide variety of food products, and their activity may vary depending
on the temperature, food composition, food structure and availability of oxygen. Temperatures
at which antioxidant activity may be required range from 180–200°C for frying oils, to about
5°C for products such as margarine or mayonnaise that are stored in the fridge. Besides the
processing and storage temperatures to which these products are exposed, the accompanying
constituents including water, proteins, carbohydrates, vitamins, minerals and other food
components vary, and the physical structure of the food also varies. This can cause big changes
in the activity of the antioxidant in different food systems. It is commonly observed that a non-
polar antioxidant such as α-tocopherol is relatively ineffective in oil but is strongly effective in
19
an oil-in-water emulsion. In contrast, a polar antioxidant such as ascorbic acid or trolox (a
water-soluble derivative of α-tocopherol) is more effective in oil than in an emulsion (Michael,
2001).
Normally, a more rapid measurement of antioxidant activity is required than would be obtained
by making the food product, storing it at ambient temperature and then measuring the oxidative
state of the food. Consequently, there are three decisions to be made:
The model food system used for antioxidant activity test
Most assessments of antioxidant activity have been performed in oil. This commonly gives
sensible predictions for the activity in oil or water-in-oil emulsions such as margarine, but the
data may be misleading for oil-in-water emulsions. Some information may be gained by the
use of a radical-scavenging test in an organic solvent.
Method of accelerating oxidation process
The most common methods of accelerating oxidation are to raise the temperature and to
increase the supply of oxygen. The combination of these effects can reduce the oxidative
stability by a large amount. Other factors affecting the oxidation rate include the content of
metal ions in the test sample, the oxidative state of the test sample before the addition of
antioxidant and exposure to UV light.
Monitoring method for oxidation process
In principle, one could consider measuring the loss of lipid starting material, i.e. fatty acids or
triglycerides, or the formation of oxidation products as a method of monitoring oxidative
deterioration or antioxidant activity. In practice, the formation of oxidation products is a much
more sensitive method of monitoring oxidation. However, the assessment of antioxidant
activity by monitoring the formation of oxidation products is not a simple task. Since a
complex mixture of oxidation products is formed and the relative amounts of these products
depend on a variety of variables including temperature, metal ion content, and other
components present such as water, deciding which components to monitor is an important
decision. Monitoring antioxidant activity under frying conditions may well require other
products to be monitored than if the activity is to be assessed under ambient conditions. Thus,
20
hexanal formation can be used to monitor oxidative deterioration in ambient stored products,
but not in used frying oils.
Antioxidant activity of a given compound is assessed as either resistance to oxidation of lipids
in the presence of that particular compound or free-radical scavenging capacity. Therefore,
most of the methods described and used to assess antioxidant activity follow oxidation and the
stages of oxidation of unsaturated lipid substrates. Many techniques have been developed to
determine the antioxidant efficacy of the compounds of interest, but all of these have to be
employed and interpreted carefully. In 1993, Frankel has listed the following parameters such
as Substrate, condition, analysis, concentration and calculation that are fairly important in
choosing methods to evaluate antioxidants.
An updated review by (Antolovich et al., 2002) discusses the methods of determining
antioxidant activity extensively. The methods used in measuring antioxidant activity may be
categorized into three groups, which directly or indirectly measure the rate or extent of the
following:
Decay of substrate, probing compound, or oxygen consumption
Formation of oxidation products by the oxidizing substrate
Formation or decay of probing free radicals for DPPH (radical scavenging methods)
The first two methods measure antioxidant activity as an inhibitory effect exerted by the test
compound on the extent or rate of consumption of reactants or the formation of oxidation
products. The antioxidant activity (AA) of a compound or a component mixture that is a
function of many parameters of the assay method employed may be defined using the
following mathematical expressions:
AA = f (time or rate; temperature; substrate; concentration of antioxidant; concentration of
other substances; partitioning behavior).
For a fixed set of assay conditions, AA could be defined independent of the test method. It
should be noted here that there are no standard units for reporting the antioxidant activity
because such activity (assay, capacity, efficiency, effectiveness, etc.) is independent of the test
procedure.
21
A. Radical scavenging method Radical scavenging is the main mechanism by which antioxidants act in foods. Several
methods have been developed in which the antioxidant activity is assessed by the scavenging
of synthetic radicals in polar organic solvents, e.g. methanol, at room temperature. Those used
include 2, 2-diphenyl-1-picrylhydrazyl (DPPH) and 2, 2'-azinobis (3-ethylbenzthiazoline-
sulphonic acid) (ABTS) radicals.
In the DPPH test, the scavenging of DPPH radicals is followed by monitoring the decrease in
absorbance at 515 nm which occurs due to reduction by the antioxidant (AH) or reaction with a
radical species (R·)
DPPH· + AH → DPPH–H + A·
DPPH· + R· → DPPH–R
Fast reaction of DPPH radicals occurs with some phenols e.g. α-tocopherol, but slow
secondary reactions may cause a progressive decrease in absorbance, so that the steady state
may not be reached for several hours. Most papers in which the DPPH method has been used
report the scavenging after 15 or 30 min reaction time. The data is commonly reported as
EC50, which is the concentration of antioxidant required for 50% scavenging of DPPH radicals
in the specified time period.
The ABTS radical cation is more reactive than the DPPH radical, and reaction of the ABTS
radical cation with an antioxidant is taken as complete within 1 min. The method of generation
of the radical cation has changed several times since the method was first described. The most
recent method describes the use of potassium per sulphate to oxidize ABTS to the radical
cation. The radical scavenging activity assessed by the ABTS method has been expressed as
the TEAC (trolox equivalent antioxidant capacity) value in most papers employing this
method. These methods may be useful for screening antioxidants, but antioxidant effectiveness
in foods must always be studied by other methods because their activity in foods is dependent
on a variety of factors including polarity, solubility, and metal-chelating activity (Antolovich et
al., 2002).
22
B. Inhibitory effect of antioxidant on lipid oxidation Some methods can be applied for assessing the current state of an oil or food sample. In order
to be applied in assessment of antioxidant effectiveness, an experiment must be designed in
which the antioxidant is incorporated into the food and the food is stored under controlled
conditions. The principles of these methods are described below.
I. Sensory analysis For the food industry, the detection of oxidative off-flavours by taste or smell is the main
method of deciding when a lipid-containing food is no longer fit for consumption.
Consequently, any antioxidant used in the food will ultimately be evaluated by its potential for
extending the time before this off-flavour can be detected. The ability of individuals to describe
the nature of the aroma is useful, and the sensitivity of a trained panel to oxidative off-flavours
may allow detection of oxidative deterioration. The main problems with sensory evaluation are
that different individuals vary in their sensitivity to these off-flavors, and their performance
may vary depending on their state of health and other variables. Trained panelists are much
more reliable than untrained panelists, but the reproducibility of sensory analysis is normally
worse than that of chemical or instrumental methods (Jan and Michael, 2001).
II. Peroxide Value (PV) The PV is still the most common chemical method of measuring oxidative deterioration of oils
and fats. Although hydroperoxides decompose to a mixture of volatile and non-volatile
products and they also react further to endoperoxides and other products, the PV measurement
is a useful method of monitoring oxidative deterioration of oils and fats, although it should
normally be combined with a method of monitoring secondary oxidation products to provide a
fuller picture of the progress of oxidation. The traditional method of determining PV involves a
titration of the oil and fat containing potassium iodide in a chloroform–acetic acid mixture. The
hydroperoxides oxidize the iodide to iodine, which is determined by titration with sodium
thiosulphate. In order to avoid the use of chloroform, the AOCS has developed an alternative
method which uses iso-octane as solvent, although the method is limited to PV less than 70meq
kg-1, as described in the AOCS guidelines (AOCS, 1989).
23
III. Thiobarbutric Acid Value (TBA)
Malonaldehyde may be formed from polyunsaturated fatty acids with at least three double
bonds. The concentration of this product may be assessed by reaction with thiobarbituric acid
which reacts with malonaldehyde to form red condensation products that absorb at 532–535nm
with molar absorptive of 27.5 absorbance units/µmol. However, the reaction is not specific, and
reaction with a wide variety of other products may contribute to the absorbance. Saturated
aldehydes normally absorb at lower wavelengths after reaction with TBA. The TBA test has
recently been reviewed. Several food components including proteins, Maillard browning
products and sugar degradation products affect the determination. In order to emphasize the lack
of specificity, the values obtained in the test are commonly described as TBARS (TBA reactive
substances) (Guillen-Sans and Guzman-Chozas, 1998).
C. Predictive methods
Oil stability Index (OSI) is predictive method in which samples are continuously monitored
during accelerated oxidation conditions. The OSI is an automated development of the AOM
(active oxygen method). In the AOM, the time for an oil to reach a PV of 100 meq kg-1 during
oxidation at 97.8°C, with an air flow of 2.33 ml per tube per second is determined. Instruments
for determining the OSI are the Rancimat, manufactured by Metrohm, Basel or the Oxidative
Stability Instrument, manufactured by Omnion, Rockland, USA. These instruments depend on
the increase in electrical conductivity, when effluent from oxidizing oils is passed through
water. The samples, assessed by the OSI methods, are held at 100°C, 110°C, 120°C, 130°C, or
140°C. The temperature may be adjusted to allow the oxidation time to fall within the range of
4–15 h. The sample size is 2.5 g or 5 g depending on the instrument used. Volatile carboxylic
acids are generated in the oxidizing oil and these cause the increase in electrical conductivity
(Jan and Michael, 2001).
Rancimat test is an accelerated method to assess oxidative stability of fats and oils. In this test,
the sample is subjected to an accelerated oxidative process (by heat in presence of oxygen),
where short-chain volatile acids are produced. The acids formed are measured by conductivity.
Mariassyova (2006) studied the antioxidant potential of natural antioxidant concentrates with
high contents of flavonoids, carotenoids, and phenolic acids using this method. The assay has
24
been used to evaluate the antioxidant activity of several food products, including herbs and
spices (Beddows et al., 2000).
Among these antioxidant activity measuring methods, the research was focused to use some of
them based on the availability of chemicals and equipments required for the study. The
antioxidant activity of thyme was studied using Inhibitory effect of antioxidant on lipid
oxidation such as predictive and peroxide value method. In other hand, these methods are called
Rancimat and Schaal Oven test methods which are mentioned a lot in this study.
2.7. The regulation of antioxidants in food
Since food is essential to life and can be improperly prepared or handled, it can threaten life. The
purveyor of food therefore has a duty to provide safe and wholesome products to every customer.
Given the fundamental importance of food, it is appropriate for any government to define and
enforce this ethical obligation and thereby protect what many would consider the right of every
individual to safe and wholesome food. From the legal point of view, antioxidants are substances
which prolong the shelf-life of foodstuffs by protecting them against deterioration caused by
oxidation, such as fat rancidity, color changes and loss of nutrient value. Antioxidants are
extensively tested for the absence of carcinogenity and other toxic effects in themselves, in their
oxidized forms, and in their reaction products with food constituents, for their effectiveness at
low concentrations, and for the absence of the ability to impart an unpleasant flavor to the food
in which they are used (Jan and Michael, 2001).
Antioxidants should satisfy several requirements before being accepted for incorporation into
food products. The use of antioxidants in food products is governed by regulatory laws of the
individual country or by internal standards. Even though many natural and synthetic compounds
have antioxidant properties, only a few of them have been accepted as generally recognized as
safe substances for use in food products by international bodies such as the Joint FAO Expert
Committee on Food Additives and the European Community’s Scientific Committee for Food.
Antioxidants can be added directly to vegetable oils, melted animal fats or other fat-containing or
polyphenol-containing systems. Food products can also be sprayed with, or dipped in solutions
or suspensions of, antioxidants, or they can be packed in films containing antioxidants.
25
Chapter Three Materials and Methods
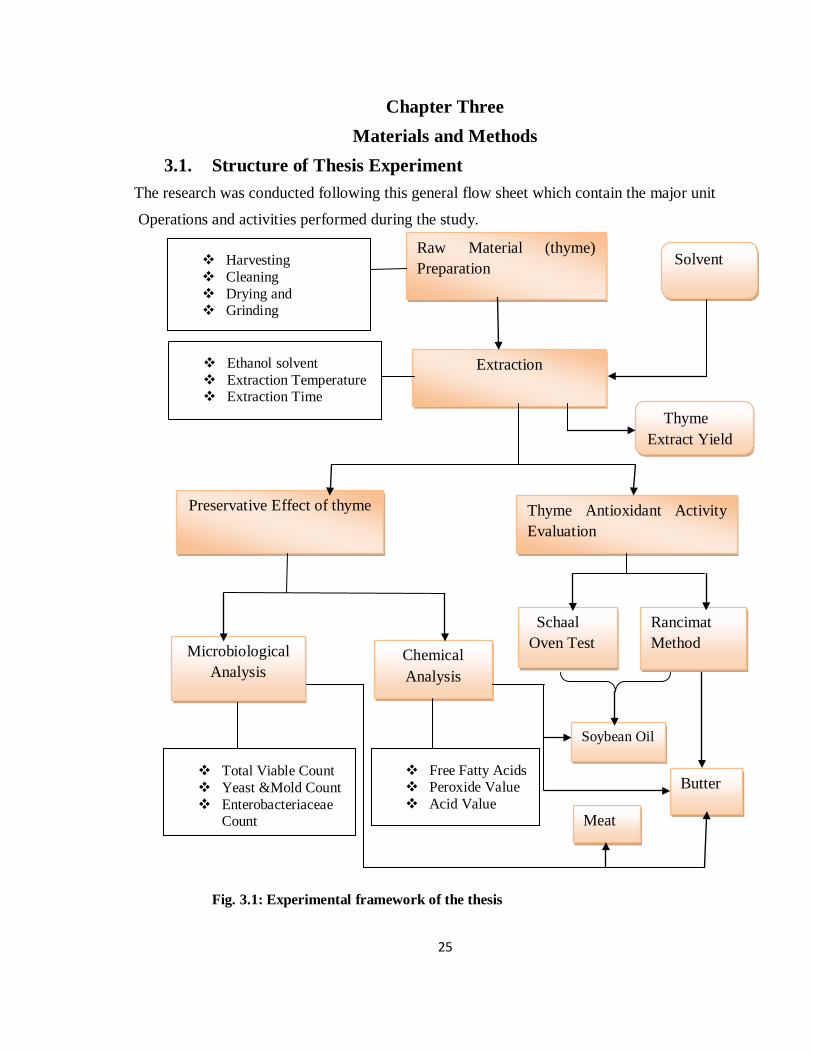
3.1. Structure of Thesis Experiment The research was conducted following this general flow sheet which contain the major unit
Operations and activities performed during the study.
Fig. 3.1: Experimental framework of the thesis
Raw Material (thyme) Preparation Harvesting
Cleaning Drying and Grinding
Extraction Ethanol solvent Extraction Temperature Extraction Time
Thyme Antioxidant Activity Evaluation
Schaal Oven Test
Rancimat Method
Butter
Soybean Oil
Preservative Effect of thyme
Chemical Analysis
Microbiological Analysis
Meat
Free Fatty Acids Peroxide Value Acid Value
Total Viable Count Yeast &Mold Count Enterobacteriaceae
Count
Solvent
Thyme Extract Yield
26
3.2. Raw material Collection, Transportation and Storage Thyme (Thymus Schimperi R.) was obtained from Tarmaber areas of North Shewa zone, 180km
away from Addis Ababa, where this thyme variety is found. Both leave and flower part of thyme
were manually collected and dried with natural sun drying system in protective and shaded way.
The dried thyme was packed in polyethylene plastic bags and taken to Bahir Dar University,
Technology Institute, Food Chemistry & Analysis Laboratory for further study. The thyme was
mill by a small scale commercial laboratory grinder to pass a sieve size of 500µm and retained
on 420µm to get uniformly sized thyme powder. The moisture content of dried thyme was
determined before extraction. It has a moisture content of 12.8% in wet weight basis.
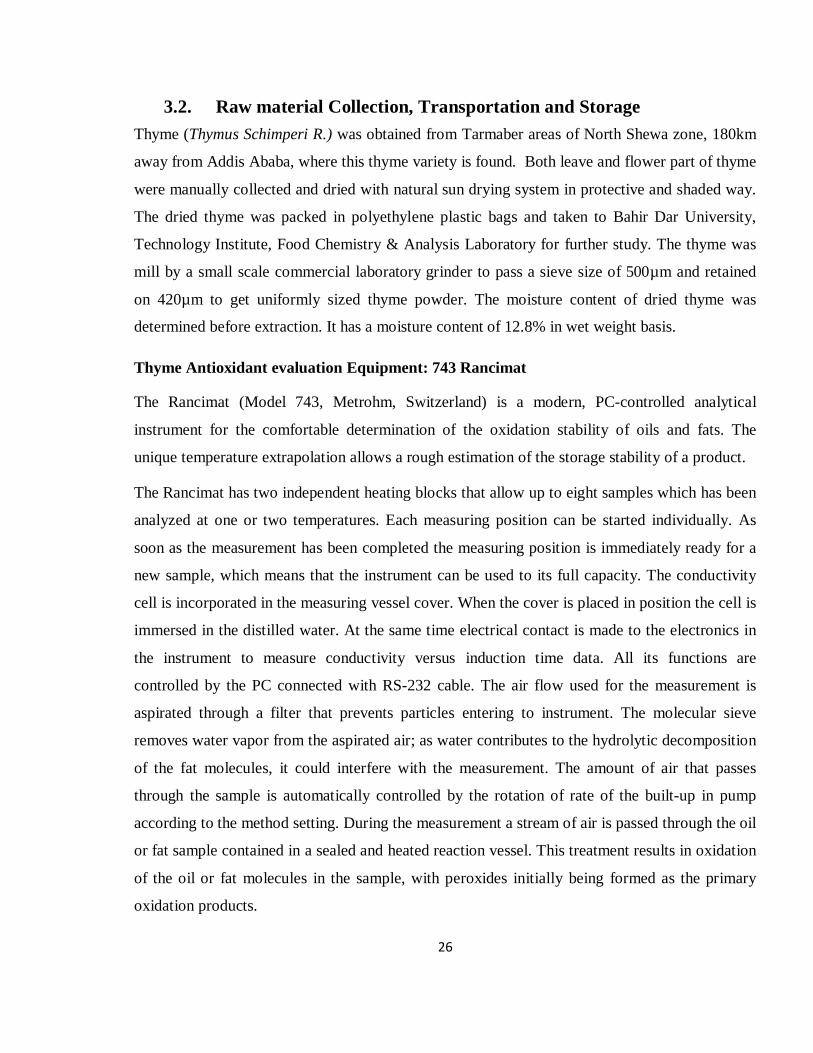
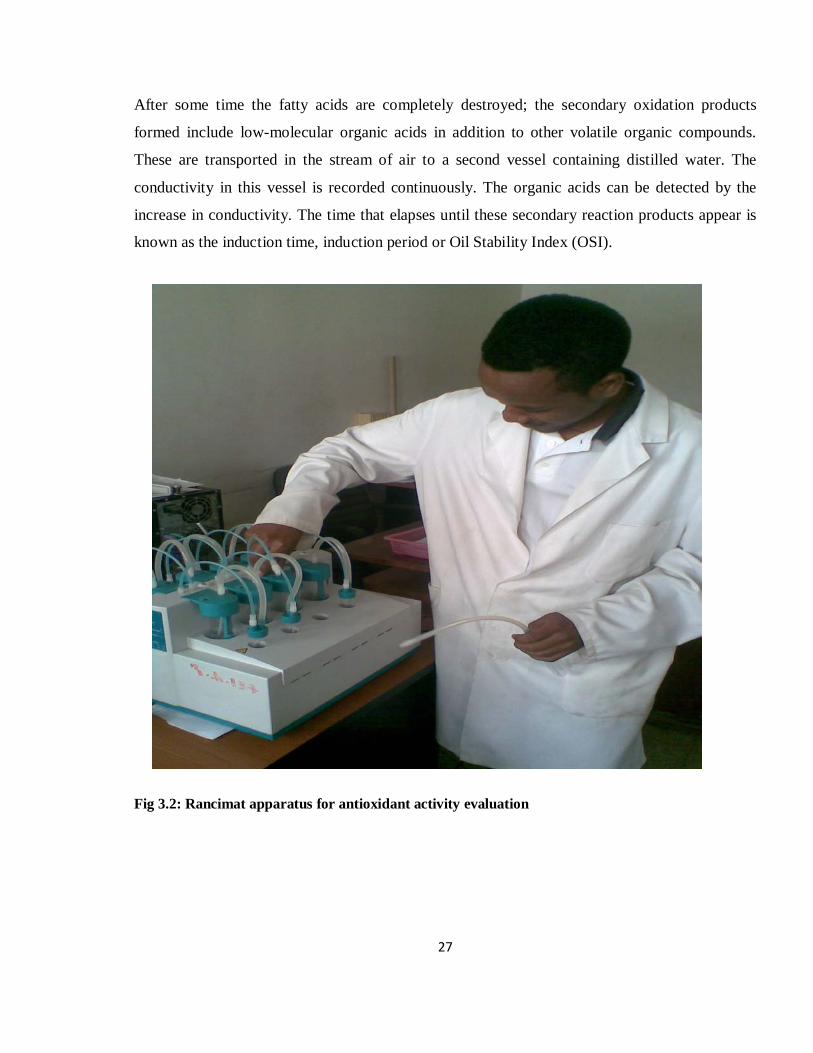
Thyme Antioxidant evaluation Equipment: 743 Rancimat
The Rancimat (Model 743, Metrohm, Switzerland) is a modern, PC-controlled analytical
instrument for the comfortable determination of the oxidation stability of oils and fats. The
unique temperature extrapolation allows a rough estimation of the storage stability of a product.
The Rancimat has two independent heating blocks that allow up to eight samples which has been
analyzed at one or two temperatures. Each measuring position can be started individually. As
soon as the measurement has been completed the measuring position is immediately ready for a
new sample, which means that the instrument can be used to its full capacity. The conductivity
cell is incorporated in the measuring vessel cover. When the cover is placed in position the cell is
immersed in the distilled water. At the same time electrical contact is made to the electronics in
the instrument to measure conductivity versus induction time data. All its functions are
controlled by the PC connected with RS-232 cable. The air flow used for the measurement is
aspirated through a filter that prevents particles entering to instrument. The molecular sieve
removes water vapor from the aspirated air; as water contributes to the hydrolytic decomposition
of the fat molecules, it could interfere with the measurement. The amount of air that passes
through the sample is automatically controlled by the rotation of rate of the built-up in pump
according to the method setting. During the measurement a stream of air is passed through the oil
or fat sample contained in a sealed and heated reaction vessel. This treatment results in oxidation
of the oil or fat molecules in the sample, with peroxides initially being formed as the primary
oxidation products.
27
After some time the fatty acids are completely destroyed; the secondary oxidation products
formed include low-molecular organic acids in addition to other volatile organic compounds.
These are transported in the stream of air to a second vessel containing distilled water. The
conductivity in this vessel is recorded continuously. The organic acids can be detected by the
increase in conductivity. The time that elapses until these secondary reaction products appear is
known as the induction time, induction period or Oil Stability Index (OSI).
Fig 3.2: Rancimat apparatus for antioxidant activity evaluation
28
3.3. Extraction Process
3.3.1. Setting Extraction Parameters A 23 Full-Factorial Experiment Design with a central point was used to identify the relationship
existing between the dependent responses (antioxidant activity and yield) and independent
process variables as well as to determine conditions that optimized the extraction process. The
three independent variables or factors studied were: extraction solvent (ethanol) concentration of
(97 and 0%), extraction temperature (20 and 40℃) and extraction time (3 and 4 hours) for actual
variable levels. For each factor, an experimental range was adjusted based on the results of
literature data and on the performance of preliminary experiment trials.
These three factors: extraction solvent concentration of ethanol, extraction temperature and
extraction time were selected as independent variables, because of their influence on antioxidant
properties of phenolic extracts in plant materials (Wettasinghe and Shahidi, 1999).
In this study, the particle size was controlled as constant by passing mill thyme through 500µm
and retaining on 420µm sieve openings. The 420-500µm sieve size is optimal for extraction,
while smaller particles may become slimy during extraction and create difficulty during filtration
(Sukhdev et al., 2008).
3.3.2. Preparation of thyme extract Samples of about 10g of the dried, mill and sieved thyme were extracted with 100mL of solvent.
The extraction process was performed using a magnetic stirrer with hot plate. After extraction,
the samples were filtered using 125 mm diameter filter paper (Whatman Ltd., England). The
solvent ethanol was separated from extracts using a rotary evaporator (Buchi Rota-vapor R-124
fitted with Buchi water bath B-480, Switzerland) under vacuum at 45℃ and then weighed to
measure thyme extraction yield. The concentrated thyme extract was stored at -18℃ till its
antioxidant activity was determined. Whereas, aqueous extract of thyme was further freeze dried
for antioxidant activity evaluation.
29
3.4. Analysis Methods 3.4.1. Evaluation of Thyme Antioxidant activity
The best combination of extraction parameters like extraction temperature, time and solvent
concentration for maximum thyme extract antioxidant activity and yield were taken for further
thyme antioxidant activity evaluation and its preservative effect study. The Antioxidant activity
of thyme extract was determined by Rancimat and Schaal Oven test method to get induction
period.
3.4.1.1. Rancimat Method The Rancimat method is an automated version of the active oxygen method for the determination
of induction time the so called stability time of food products. In this method, the highly volatile
organic acids produced by oxidation are absorbed in distilled water and used to indicate the
induction time.
Antioxidant activity of thyme was evaluated taking a real food model system (substrate) for lipid
oxidation analysis occurs in lipid foods. Refined soybean oil and butter were taken as model food
substrates. Favorable conditions for substrate oxidation were provided to accelerate rate of lipid
oxidation process in a controlled environment of Rancimat. The induction period for the
formation of oxidative products of oxidizing substrate were measured for antioxidant activity
evaluation.
Samples of thyme extracts were added to 5.0g refined soybean oil and butter at concentration of
0.1% (w/w). For comparison, vitamin E (α- tocopherol) was added to the oil and butter at 0.05%
(w/w) concentration. At the same time the induction time of samples without thyme extract was
determined as negative control to calculate the protection factor. The maximum level of synthetic
antioxidants concentration allowed to be added in food is 0.02% for the safety reasons. In the
case of natural antioxidants, higher concentrations (0.05–0.2%) are necessary because of their
lower activities and presumed lower toxicity (Frankel, 2007). The concentration of 0.1% was
studied as it is most often used in the research as a model substance representing natural
antioxidant.
Three parallel treatments are filled into the reaction vessels and introduced in the heating blocks.
The treatments were kept at stable temperature (130℃) and continuous air stream of 20L/hr
pumped through the samples. The induction time was detected by conductivity measurements
30
and recorded by computer. Antioxidant activity of thyme extract was expressed as a protection
factor. The protection factor (PF) was calculated as:
𝑃𝑃𝑃𝑃 =𝐼𝐼𝐼𝐼𝑆𝑆𝐼𝐼𝐼𝐼𝑂𝑂
According to (Altolovich et al., 2002), Antioxidant activity of thyme extract was calculated by
measuring induction time as independent variable.
𝐴𝐴𝐴𝐴𝑡𝑡 =(𝐼𝐼𝐼𝐼𝑆𝑆 − 𝐼𝐼𝐼𝐼𝑂𝑂)([𝐴𝐴𝐴𝐴])𝐼𝐼𝐼𝐼𝑂𝑂
Rearranged as:
𝐴𝐴𝐴𝐴𝑡𝑡 =[𝑃𝑃𝑃𝑃 − 1]
[𝐴𝐴𝐴𝐴]
Where: ITs = the induction time of the sample (oil/butter + extract) [hr]
ITo = the induction time of control soybean oil [hr]
AAt = antioxidant activity of thyme extract
[AH] = concentration of thyme extract added to the oil or butter
Based on the calculation result, the protection factor can be interpreted in three ways:
PF=1 or if ITs = ITo, the thyme extract does not have antioxidant activity
PF<1, the thyme extract shows pro-oxidant activity
PF>1, the thyme extract shows antioxidant activity
3.4.1.2. Schaal Oven Test The Schaal oven test was used to determine the antioxidant activity of thyme extract by
measuring the induction time in order to measure the oxidative stability of oil. In the Schaal oven
test, 40g of samples of refined soybean oil supplemented by 0.1% thyme extract were put in
50ml bottle and placed in a drying Oven at 60℃. For comparison, both positive (α-Tocopherol at
0.05%) and negative (without thyme extract) treatments were prepared and stored in the same
condition. For each treatment, the time required to reach at the targeted peroxide value of 20mEq
31
O2/kg soybean oil (the point at which soybean oil has poor quality) has taken as Induction Time
to evaluate thyme antioxidant activity.
The Peroxide Value was determined based on (AOAC, 2000) using official method 965.33 until
it reaches 20mEq active oxygen/Kg soybean oil. Five gram sample was accurately weighed (to
the nearest 0.001 g) into each two 250-ml glass-stoppered Erlenmeyer flasks. Following 30ml of
acetic acid-chloroform, 0.5 ml saturated KI (Potassium iodide) solution was added and allowed
for 1 min with occasional shaking. Samples were slowly titrated with 0.1 N sodium thiosulfate
solution, with vigorous shaking until yellow color was almost gone. The titration was continued
by adding 0.5 ml 1% starch solution shaking vigorously to release all iodine from chloroform
layer, until blue color just disappeared. The volume of titrant was recorded. In parallel, blank
sample was Prepared (omitting only the oil) and titrated. The volume of titrant for blank sample
was also recorded. Then, the peroxide value (PV) of the samples was calculated using the
formula:
PV = (S−B)W
N × 1000
Where:
PV= mEq peroxide per kg of sample
S = volume of titrant (ml) for sample
B = volume of titrant (ml) for blank
N = normality of Na2S2O3 solution (mEq/ml)
1000 = conversion of units (g/kg)
W = sample mass (g)
32
3.4.2. Evaluation of thyme antioxidant activity in butter Initially, the antioxidant activity of all butters collected from Tarmaber, Sheno, Bahir Dar, Rut &
Tsega Milk cows breeding dairy production & processing plc (Hirut dairy PLC) and Lame dairy
PLC, were determined by Rancimat without adding thyme extract. After that the antioxidant
activity of crude thyme extract was evaluated on butter bought from Lame Dairy PLC at the
concentration of 0.1% using Rancimat method as mentioned earlier in 3.4.1.1.
3.4.3. Preservative effect of Thyme on some food products Thyme extract was added to each test samples of meat, butter and oil at three different
concentration levels; 0, 0.1and 0.2% and the samples were stored for 7, 14 and 22 days.
A total of eighteen butter samples with 40g weigh, were separately stored for microbial and
chemical analysis in both microbiology and food chemistry & analysis laboratories at 4℃
refrigeration temperature. For each analysis three butter samples were treated as blank (without
thyme extract), the other six samples were treated with 0.1% and 0.2% crude thyme extract.
For microbiological analysis of meat, three treatments were prepared with 0, 0.1 and 0.2% crude
thyme extract. Each treatment has about100g of meat and stored at 4℃ refrigeration temperature.
In every week, about 25g sample was taken from each treatment for total viable count, mold and
yeast and pathogenic microbial count.
Preservative effect of thyme crude extract was also studied on soybean oil. Nine soybean oil
samples were prepared. Each has a weight of 40g and treated with 0, 0.1 & 0.2% crude thyme
extract. The samples were stored at room temperature in dark place for three consecutive weeks.
The rancidity parameters (free fatty acid, peroxide value and acid value) were evaluated for each
treated samples per each storage week.
3.4.3.1. Chemical Analysis method Butter of Lame dairy plc and refined soybean oil were used to study the preservative effect of
thyme by chemical analysis. Oxidative rancidity parameters in fat and oil were considered.
Among rancidity parameters such as peroxide value, free fatty acid (FFA) and acid value, only
Peroxide value has direct relation and is good indicator of fat and oil oxidative rancidity. FFA
and acid value indirectly show susceptibility of butter and oils for rancidity. These rancidity
33
parameters were determined in weekly basis following the recommended methods of AOAC.
Butter and oil are selected due to their highly use in food and easily can undergo rancidity.
Determination of Free Fatty Acids (Acid Value)
Free fatty Acid and Acid value of soybean oil and butter were determined according to (AOAC,
2000) Official method of 972.28. About five gram of melted oil and butter samples were placed
in 250ml Erlenmeyer flasks and 100ml of neutralized ethanol and 2ml of phenolphthalein
indicator were added. The mixture was vigorously shake and titrated with standard 0.1N NaOH
base until the endpoint reached when slight pink color can persist for 30 seconds. This was done
in duplicate and the volume the titrant was recorded for acid value/free fatty acid calculation.
Similarly, blank was prepared without adding oil or butter and the amount of titrant it took was
recorded. For each samples the free fatty acid was calculated with the formula:
%FFA (as oleic acid) =V × N × 28.2
W
Where,
%FFA = percent free fatty acid expressed as oleic acid
V = Volume of NaOH titrant (ml)
N = Normality of NaOH titrant (mol/ 1000 ml) and
W = Sample weight (g)
Determination of Peroxide Value
The Peroxide Value of butter and oil was determined using official method 965.33 based on
(AOAC, 2000) as mentioned in 3.4.1.2.
34
3.4.3.2. Microbiological analysis Aerobic Plat Count Microbiological analysis of butter and meat was done in terms of Total Viable Count (TVC)
following (NMKL, 2006). It involved addition of 225mL peptone saline to each stomacher bag
containing 25gram samples (0, 0.1 & 0.2% thyme crude extract treated butter and meat),
followed by homogenization for 1.5 minute using stomacher. Plate Count Agar (PCA) medium
was prepared, poured to each Petri dish, and allowed to solidify and inoculated with serial
diluted sample. Each Petri dish incubated at 30oC for 72 h before colonies count. Microbial
numbers on decimally diluted plates were converted into CFU cm-1 in a standard manner.
Aerobic Mold and Yeast Count The number of viable aerobic mould and yeast per gram or mililiter of product conducted
following (NMKL, 2005). A 25gram of each butter and meat samples (0, 0.1 & 0.2% thyme
crude extract treated) was added in 225ml peptone water and homogenized at 260 rpm for 1.5
minute. Each homogenate was mixed with a specified (18-20ml solidified Potato Dextrose Agar
(PDA)) agar medium. It was assumed that each viable mould/ yeast could multiply under these
conditions and give rise to a colony. Six consecutive serial dilutions were performed for each
sample taking 1ml from mixed homogenates to 9ml peptone water (labeled as 10-1). In the same
way, 1ml was added to the next 9ml peptone water and labeled 10-2. Similar procedure was
followed until 10-6 serial dilution was obtained. From each food sample 100μl was inoculated on
appropriately marked duplicate petri-dishes. Incubation was done for specific conditions of time
and temperature (at 30℃ for 48hrs).
Enterobacteriaceae count Enterobacteriaceae count of both meat and butter was performed according to (NMKL, 2005)
with little modification. A 25gram of each butter and meat sample (control, 0.1 & 0.2% thyme
crude extract treated) was added in 225ml peptone water and homogenized at 260 rpm for 1.5
minute. Each homogenate was mixed with a specified (18-20ml solidified Violet Red Bile Agar
(VRBA)) agar medium.
Six consecutive serial dilutions were performed for each sample 1ml from mixed homogenates to
9ml peptone water (labeled as 10-1). In the same way, 1ml was added to the next 9ml peptone
35
water and labeled10-2. Similar procedure was followed until 10-6 serial dilution was obtained.
From each food sample 200μl was inoculated on appropriately marked duplicate petri-dishes.
Incubation was done under anaerobic jar for specific conditions of time and temperature (at 35℃
for 48hrs).
3.5. Experimental Design and Statistical Analysis
A 23 Full-Factorial Experiment Design with a central point was used to study the effect of
extraction parameters on thyme antioxidant activity and its extract yield as clearly stated under
3.3.1. Data obtained from the experiment were analyzed using Analysis of Variance (One way
ANOVA) method in duplicate to compare the mean value with standard deviation at significant
level of (P<0.05) of treatments by JMP statistical Analysis software version 5.0 and Design
Expert Software Version 7.0.0.
36
Chapter Four
Results and Discussion
4.1. Effect of extraction parameters on thyme antioxidant activity and its
extract yield
In this study ethanol and water were selected as extraction solvent because they are safer and less
toxic as compared to acetone, methanol and other organic solvent. As materials and methods
part, these three extraction factors: ethanol solvent concentration, extraction temperature and
time were selected as independent variables, because of their influence on antioxidant properties
of phenolic extracts in plant materials (Wettasinghe and Shahidi, 1999). For each factor, an
experimental range was adjusted based on the results of literature data and on the performance of
preliminary experiment trials.
Antioxidant activity of ethanol and distilled water extract of thyme was determined. In Table 4.1,
the results of the Rancimat analysis were given as induction time, protection factor and
antioxidant activity of the thyme with respect to extraction parameters: solvent concentration,
extraction temperature and time that affect thyme antioxidant activity and its extract yield. The
particle size of mill thyme was taken constant since 420-500µm sieve size is optimal for thyme
extraction (Sukhdev et al., 2008). The experimental results showed a different trend in the
antioxidant activity of the ethanol and distilled water thyme extract using the Rancimat assay.
The induction time of thyme crude extract widely ranged from 2.62±0.16hr to 4.09±0.39hr. The
result of one-way ANOVA showed that the distilled water extract exhibited significantly higher
total antioxidant activity (P<0.05) than that of ethanol thyme crude extract. It could be concluded
that the different polarity of the extracts might contain different antioxidant constituents that
demonstrated a varying reactivity in the model food substrates used in this work.
Results in Table 4.1 also showed that the effects of ethanol concentration on antioxidant
capacities of thyme. In this study ethanol and water were selected as extraction solvent since they
are safer and less toxic as compared to acetone, methanol and other organic solvent. The result
showed that the extraction solvent had significant effect (p<0.05) on thyme antioxidant activity.
Kwon et al. (2003) noted that the ethanol concentration had critical role in the extraction of
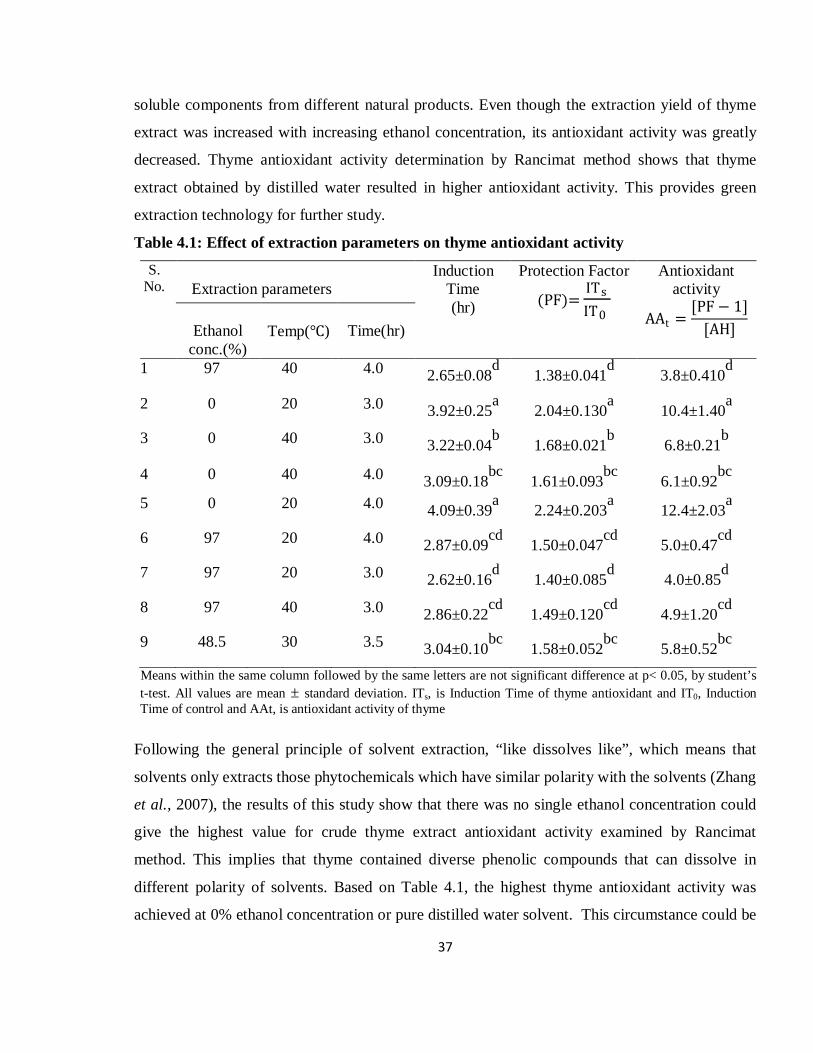
37
soluble components from different natural products. Even though the extraction yield of thyme
extract was increased with increasing ethanol concentration, its antioxidant activity was greatly
decreased. Thyme antioxidant activity determination by Rancimat method shows that thyme
extract obtained by distilled water resulted in higher antioxidant activity. This provides green
extraction technology for further study.
Table 4.1: Effect of extraction parameters on thyme antioxidant activity
S. No.
Extraction parameters
Induction Time (hr)
Protection Factor
(PF)= ITsIT0
Antioxidant activity
AAt =[PF − 1]
[AH] Ethanol
conc.(%)
Temp(℃)
Time(hr)
1 97 40 4.0 2.65±0.08d 1.38±0.041
d 3.8±0.410
d
2 0 20 3.0 3.92±0.25a 2.04±0.130
a 10.4±1.40
a
3 0 40 3.0 3.22±0.04b 1.68±0.021
b 6.8±0.21
b
4 0 40 4.0 3.09±0.18bc
1.61±0.093bc
6.1±0.92bc
5 0 20 4.0 4.09±0.39
a 2.24±0.203
a 12.4±2.03
a
6 97 20 4.0 2.87±0.09cd
1.50±0.047cd
5.0±0.47cd
7 97 20 3.0 2.62±0.16d 1.40±0.085
d 4.0±0.85
d
8 97 40 3.0 2.86±0.22cd
1.49±0.120cd
4.9±1.20cd
9 48.5 30 3.5 3.04±0.10bc
1.58±0.052bc
5.8±0.52bc
Means within the same column followed by the same letters are not significant difference at p< 0.05, by student’s t-test. All values are mean ± standard deviation. ITs, is Induction Time of thyme antioxidant and IT0, Induction Time of control and AAt, is antioxidant activity of thyme
Following the general principle of solvent extraction, “like dissolves like”, which means that
solvents only extracts those phytochemicals which have similar polarity with the solvents (Zhang
et al., 2007), the results of this study show that there was no single ethanol concentration could
give the highest value for crude thyme extract antioxidant activity examined by Rancimat
method. This implies that thyme contained diverse phenolic compounds that can dissolve in
different polarity of solvents. Based on Table 4.1, the highest thyme antioxidant activity was
achieved at 0% ethanol concentration or pure distilled water solvent. This circumstance could be
38
due to 100% ethanol was unable to extract polar phenolic compounds that had high antioxidant
capacity (Chirinos et al., 2007). Previous studies stated that antioxidant capacities of phenolic
compounds were associated with the availability of the phenolic compound acting as hydrogen-
donating radical scavengers (Karadeniz et al., 2005). Thus, it could be expected that there was a
high availability of phenolic compounds which can act as hydrogen-donating radical scavengers
in thyme extract obtained by distilled water.
The effects of extraction temperature on antioxidant activity (induction time) of thyme was also
shown in Table 4.1. Extraction temperature was found to be the most significant factor affecting
antioxidant activity of thyme at P < 0.05 level. Induction time was decreased with increased
thyme extraction temperature.
Based on the above result, antioxidant activity of thyme crude extract was increased
proportionally with the decreasing of extraction temperature, reaching maximum values at 20℃
(room temperature). As the extraction temperature increases, phenolic compounds of thyme
extract could be degraded and resulted in the loss of its antioxidant activity. According to Chan
et al. (2009); Liyana-Pathirana and Shahidi (2005), the loss in antioxidant capacities of plant
extracts at high extraction temperature was likely due to degradation of phenolic compounds
which were previously mobilized at low temperature. Similarly, Mueller-Harvey (2001) reported
that some phenolic compounds decomposed rapidly under high temperature and thus caused a
reduction in the antioxidant capacity of plant sample. Thus, it has been shown that the phenolic
compounds which were extracted under high temperature had lower antioxidant capacity as
compared to those which were extracted under low temperature. Based on Table 4.1, the highest
value of induction time was achieved at extraction temperature of 20℃.
Table 4.1 also shows the effects of extraction time on thyme antioxidant activity expressed as
induction time. Overall, extraction time had no significant effect (p>0.05) on antioxidant activity
of thyme. In general, the maximum thyme antioxidant activity was achieved at extraction time of
210 min (3.5 hour). After this point, thyme antioxidant capacity was decreased. It was believed
that prolonged extraction time would lead to exposure of more oxygen and thus increase the
chances for occurrence of oxidation on phenolic compounds (Naczk and Shahidi, 2004; Chirinos
et al., 2007). As stated by Naczk and Shahidi, prolonged extraction would increase the chance
for occurrence of oxidation of phenolic compounds.
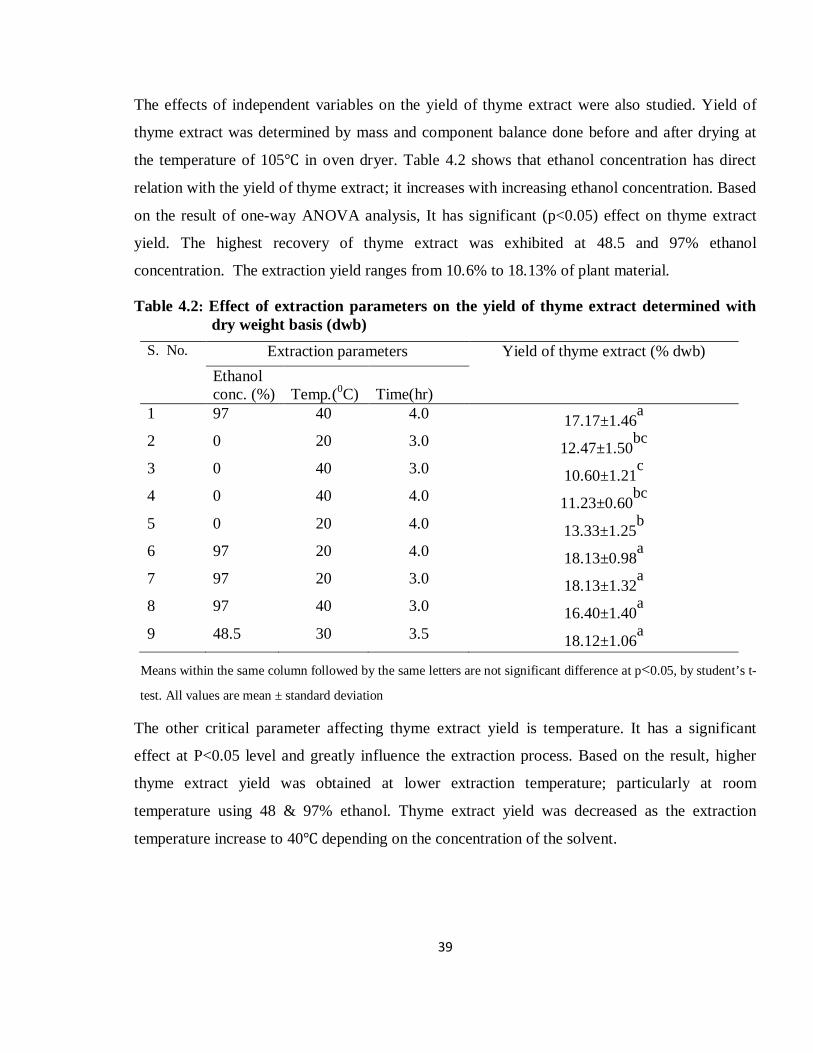
39
The effects of independent variables on the yield of thyme extract were also studied. Yield of
thyme extract was determined by mass and component balance done before and after drying at
the temperature of 105℃ in oven dryer. Table 4.2 shows that ethanol concentration has direct
relation with the yield of thyme extract; it increases with increasing ethanol concentration. Based
on the result of one-way ANOVA analysis, It has significant (p<0.05) effect on thyme extract
yield. The highest recovery of thyme extract was exhibited at 48.5 and 97% ethanol
concentration. The extraction yield ranges from 10.6% to 18.13% of plant material.
Table 4.2: Effect of extraction parameters on the yield of thyme extract determined with dry weight basis (dwb)
S. No. Extraction parameters Yield of thyme extract (% dwb) Ethanol conc. (%)
Temp.(0C)
Time(hr)
1 97 40 4.0 17.17±1.46a
2 0 20 3.0 12.47±1.50bc
3 0 40 3.0 10.60±1.21
c
4 0 40 4.0 11.23±0.60bc
5 0 20 4.0 13.33±1.25
b
6 97 20 4.0 18.13±0.98a
7 97 20 3.0 18.13±1.32a
8 97 40 3.0 16.40±1.40a
9 48.5 30 3.5 18.12±1.06a
Means within the same column followed by the same letters are not significant difference at p<0.05, by student’s t-
test. All values are mean ± standard deviation
The other critical parameter affecting thyme extract yield is temperature. It has a significant
effect at P<0.05 level and greatly influence the extraction process. Based on the result, higher
thyme extract yield was obtained at lower extraction temperature; particularly at room
temperature using 48 & 97% ethanol. Thyme extract yield was decreased as the extraction
temperature increase to 40℃ depending on the concentration of the solvent.
40
Extraction time has no significant (P>0.05) effect on the yield of thyme extract as shown in the
above Table 4.2. The impact of this factor could not be seen clearly on the extract yield at fixed
levels of the other parameters.
No significant association was found between the extraction yield and antioxidant activity of
crude thyme extract. Higher yield was obtained at solvent concentration of 97 and 48.5 % of
ethanol however; distilled water alone gives superior antioxidant activity of thyme. This implies
that water soluble components of thyme exhibit better antioxidant activity as evaluated using
Rancimat method and they may not soluble enough in ethanol solvent. The antioxidant activity
of thyme was not clearly shown in Schaal Oven Test method as compared to Rancimat due to
immiscibility of thyme extract and soybean oil and butter (model food substrates to evaluate
thyme antioxidant).
Interaction effects of extraction parameters (ethanol concentration, extraction temperature and
time) were analyzed using Design expert software version 7.0.0. In evaluation of thyme
antioxidant activity in terms of induction time; inhibition time of soybean oil and butter to
oxidative rancidity, there were significant interaction effects between ethanol concentration and
extraction temperature on antioxidant of thyme extract at P< 0.05 level. It was also observed that
the interaction between the extraction temperature and extraction time was significantly related
to antioxidant activity of crude thyme extract at P<0.05 level. However, all extraction parameters
did not have interaction effect on yield of crude thyme extract. Extraction time and ethanol
concentration have no interaction effect on both antioxidant and yield of thyme extract.
Extraction Parameter optimization was required for further analysis of thyme antioxidant activity
and its extract yield. Optimal extraction conditions for the extraction yield and cumulative
antioxidant activity of thyme were determined by statistical analysis of experiment data with
Design Expert 7.0.0 software and techno-economic considerations. Based on the analysis of
results, the software recommended that zero percent ethanol concentration (distilled water), at
room temperature (20℃) for 3.5hrs extraction temperature and time respectively as best
extraction condition to obtained maximum antioxidants of thyme and yield of its extract.
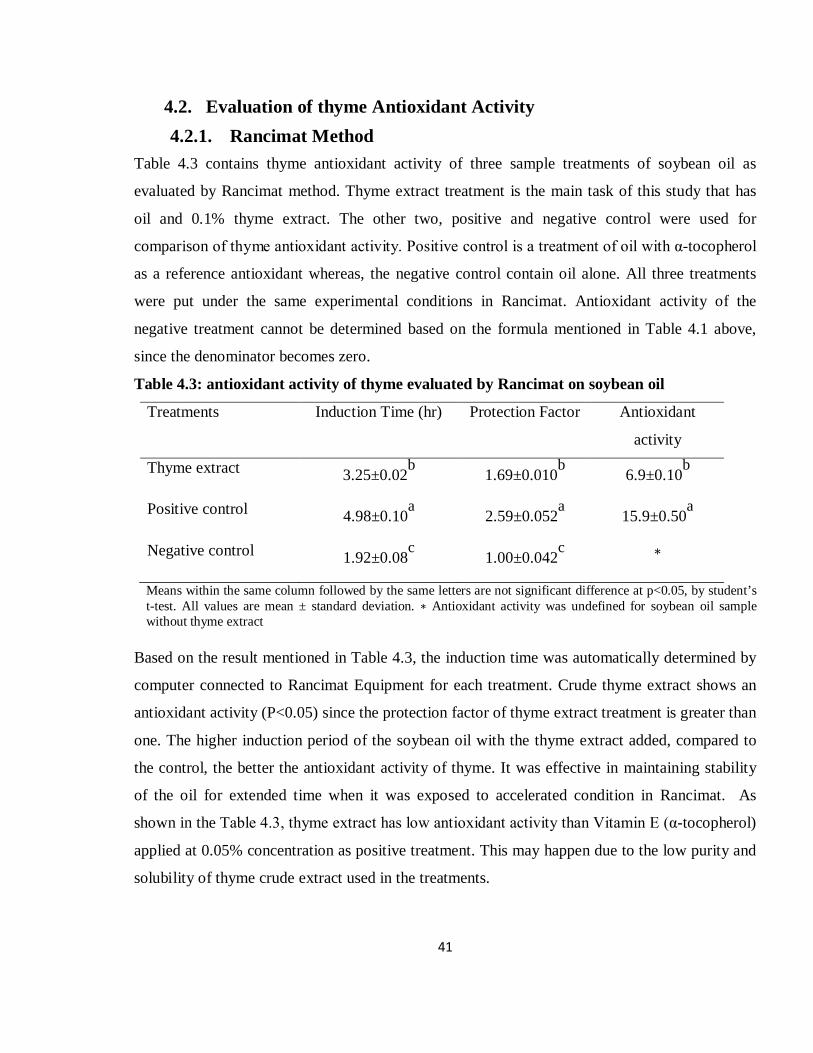
41
4.2. Evaluation of thyme Antioxidant Activity 4.2.1. Rancimat Method
Table 4.3 contains thyme antioxidant activity of three sample treatments of soybean oil as
evaluated by Rancimat method. Thyme extract treatment is the main task of this study that has
oil and 0.1% thyme extract. The other two, positive and negative control were used for
comparison of thyme antioxidant activity. Positive control is a treatment of oil with α-tocopherol
as a reference antioxidant whereas, the negative control contain oil alone. All three treatments
were put under the same experimental conditions in Rancimat. Antioxidant activity of the
negative treatment cannot be determined based on the formula mentioned in Table 4.1 above,
since the denominator becomes zero.
Table 4.3: antioxidant activity of thyme evaluated by Rancimat on soybean oil
Treatments Induction Time (hr) Protection Factor Antioxidant
activity
Thyme extract 3.25±0.02b 1.69±0.010
b 6.9±0.10
b
Positive control 4.98±0.10a 2.59±0.052
a 15.9±0.50
a
Negative control 1.92±0.08c 1.00±0.042
c ∗
Means within the same column followed by the same letters are not significant difference at p<0.05, by student’s t-test. All values are mean ± standard deviation. ∗ Antioxidant activity was undefined for soybean oil sample without thyme extract
Based on the result mentioned in Table 4.3, the induction time was automatically determined by
computer connected to Rancimat Equipment for each treatment. Crude thyme extract shows an
antioxidant activity (P<0.05) since the protection factor of thyme extract treatment is greater than
one. The higher induction period of the soybean oil with the thyme extract added, compared to
the control, the better the antioxidant activity of thyme. It was effective in maintaining stability
of the oil for extended time when it was exposed to accelerated condition in Rancimat. As
shown in the Table 4.3, thyme extract has low antioxidant activity than Vitamin E (α-tocopherol)
applied at 0.05% concentration as positive treatment. This may happen due to the low purity and
solubility of thyme crude extract used in the treatments.
42
Antioxidant activities of thyme largely depend on the composition and concentration of the
extracts as well as on the conditions of the test system and influenced by many factors.
Therefore, it was necessary in this study to perform more than one type of antioxidant activity
measurements to take into account the various mechanisms of the antioxidant action.
Dagne et al. (1998) found that essential oil obtained from Thymus Schimperi grown in Addis
Ababa was rich in carvarol (66.2%) and thymol (50%) which are responsible constituents of
thyme for its antioxidant activity. Similarly, Awraris Derbe (2009) stated that thymol and
carvacrol, present in thyme essence, as well as the flavonoids and other polyphenols are
considered to be involved in the antioxidant activity. He was also reported as thyme extract is
recommended to formulate cosmetic products aimed at the protection of skin and hair integrity
against oxidative processes.
Evaluation of thyme antioxidant activity in Butter
Data of Induction time and protection factor were presented in Table 4.4 for butter samples
collected from different locations. These butter samples were collected from Tarmaber, Sheno,
Bahir Dar, Hirut Dairy PLC and Lame Dairy PLC. All butter samples were treated under the
same way during transportation, storage and evaluation. This data table do not have antioxidant
activity column since all samples were determined without addition of thyme extract. In this
case, the study was intended examine thyme feed cows can provide butter enriched in
antioxidants and see the selling price of these butter in the market. On market, some butter have
higher selling price. This study wants to consider the perception regarding to the antioxidant
content of the butter.
The cumulative antioxidant activity of thyme was also evaluated in butter, collected from
Tarmaber, Sheno, Bahir Dar, Hirut dairy PLC and Lame dairy PLC to examine the quality of
butter related to its antioxidant content.
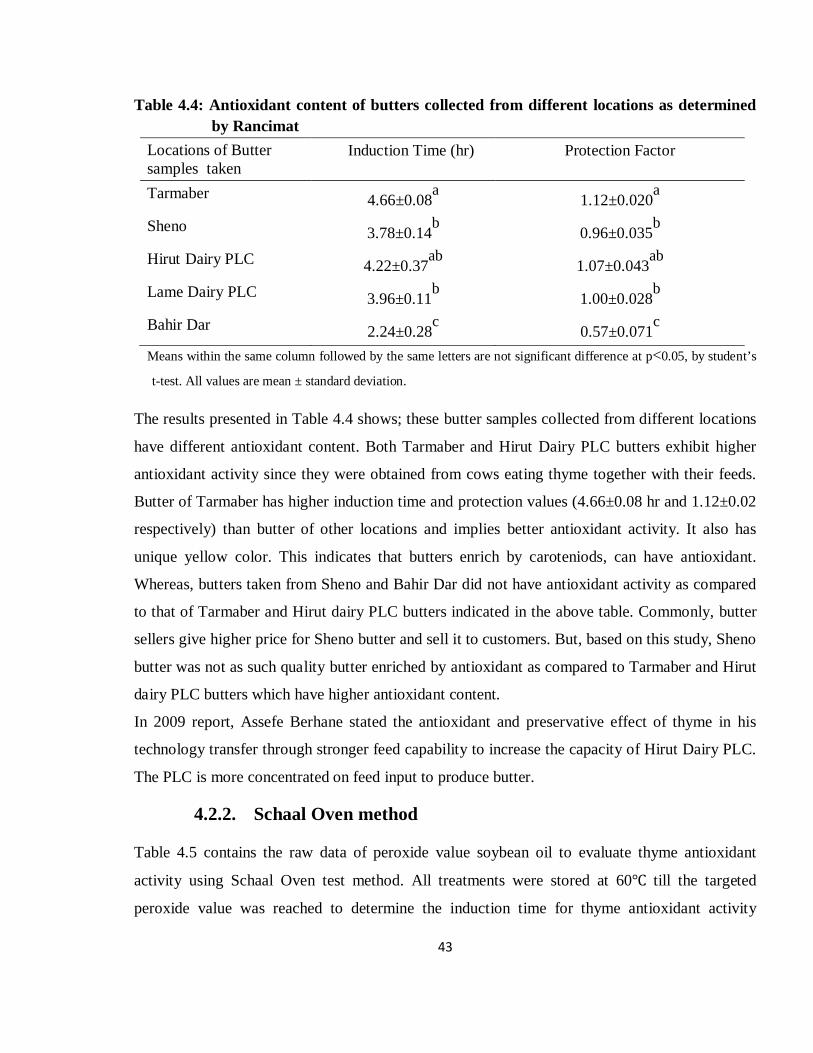
43
Table 4.4: Antioxidant content of butters collected from different locations as determined by Rancimat
Locations of Butter samples taken
Induction Time (hr) Protection Factor
Tarmaber 4.66±0.08a 1.12±0.020
a
Sheno 3.78±0.14b 0.96±0.035
b
Hirut Dairy PLC 4.22±0.37ab
1.07±0.043ab
Lame Dairy PLC 3.96±0.11
b 1.00±0.028
b
Bahir Dar 2.24±0.28c 0.57±0.071
c
Means within the same column followed by the same letters are not significant difference at p<0.05, by student’s
t-test. All values are mean ± standard deviation.
The results presented in Table 4.4 shows; these butter samples collected from different locations
have different antioxidant content. Both Tarmaber and Hirut Dairy PLC butters exhibit higher
antioxidant activity since they were obtained from cows eating thyme together with their feeds.
Butter of Tarmaber has higher induction time and protection values (4.66±0.08 hr and 1.12±0.02
respectively) than butter of other locations and implies better antioxidant activity. It also has
unique yellow color. This indicates that butters enrich by caroteniods, can have antioxidant.
Whereas, butters taken from Sheno and Bahir Dar did not have antioxidant activity as compared
to that of Tarmaber and Hirut dairy PLC butters indicated in the above table. Commonly, butter
sellers give higher price for Sheno butter and sell it to customers. But, based on this study, Sheno
butter was not as such quality butter enriched by antioxidant as compared to Tarmaber and Hirut
dairy PLC butters which have higher antioxidant content.
In 2009 report, Assefe Berhane stated the antioxidant and preservative effect of thyme in his
technology transfer through stronger feed capability to increase the capacity of Hirut Dairy PLC.
The PLC is more concentrated on feed input to produce butter.
4.2.2. Schaal Oven method
Table 4.5 contains the raw data of peroxide value soybean oil to evaluate thyme antioxidant
activity using Schaal Oven test method. All treatments were stored at 60℃ till the targeted
peroxide value was reached to determine the induction time for thyme antioxidant activity
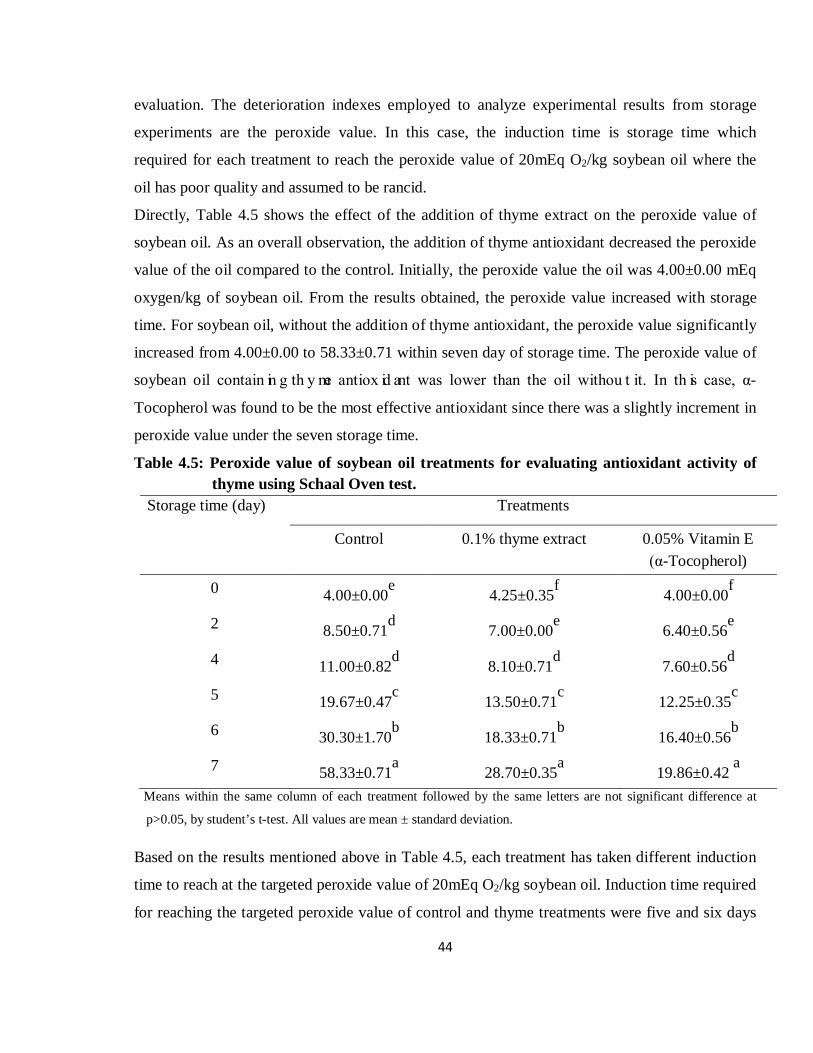
44
evaluation. The deterioration indexes employed to analyze experimental results from storage
experiments are the peroxide value. In this case, the induction time is storage time which
required for each treatment to reach the peroxide value of 20mEq O2/kg soybean oil where the
oil has poor quality and assumed to be rancid.
Directly, Table 4.5 shows the effect of the addition of thyme extract on the peroxide value of
soybean oil. As an overall observation, the addition of thyme antioxidant decreased the peroxide
value of the oil compared to the control. Initially, the peroxide value the oil was 4.00±0.00 mEq
oxygen/kg of soybean oil. From the results obtained, the peroxide value increased with storage
time. For soybean oil, without the addition of thyme antioxidant, the peroxide value significantly
increased from 4.00±0.00 to 58.33±0.71 within seven day of storage time. The peroxide value of
soybean oil contain in g th y me antiox id ant was lower than the oil withou t it. In th is case, α-
Tocopherol was found to be the most effective antioxidant since there was a slightly increment in
peroxide value under the seven storage time.
Table 4.5: Peroxide value of soybean oil treatments for evaluating antioxidant activity of thyme using Schaal Oven test.
Storage time (day) Treatments
Control 0.1% thyme extract 0.05% Vitamin E (α-Tocopherol)
0 4.00±0.00e 4.25±0.35
f 4.00±0.00
f
2 8.50±0.71d 7.00±0.00
e 6.40±0.56
e
4 11.00±0.82d 8.10±0.71
d 7.60±0.56
d
5 19.67±0.47c 13.50±0.71
c 12.25±0.35
c
6 30.30±1.70b 18.33±0.71
b 16.40±0.56
b
7 58.33±0.71a 28.70±0.35
a 19.86±0.42
a
Means within the same column of each treatment followed by the same letters are not significant difference at
p>0.05, by student’s t-test. All values are mean ± standard deviation.
Based on the results mentioned above in Table 4.5, each treatment has taken different induction
time to reach at the targeted peroxide value of 20mEq O2/kg soybean oil. Induction time required
for reaching the targeted peroxide value of control and thyme treatments were five and six days
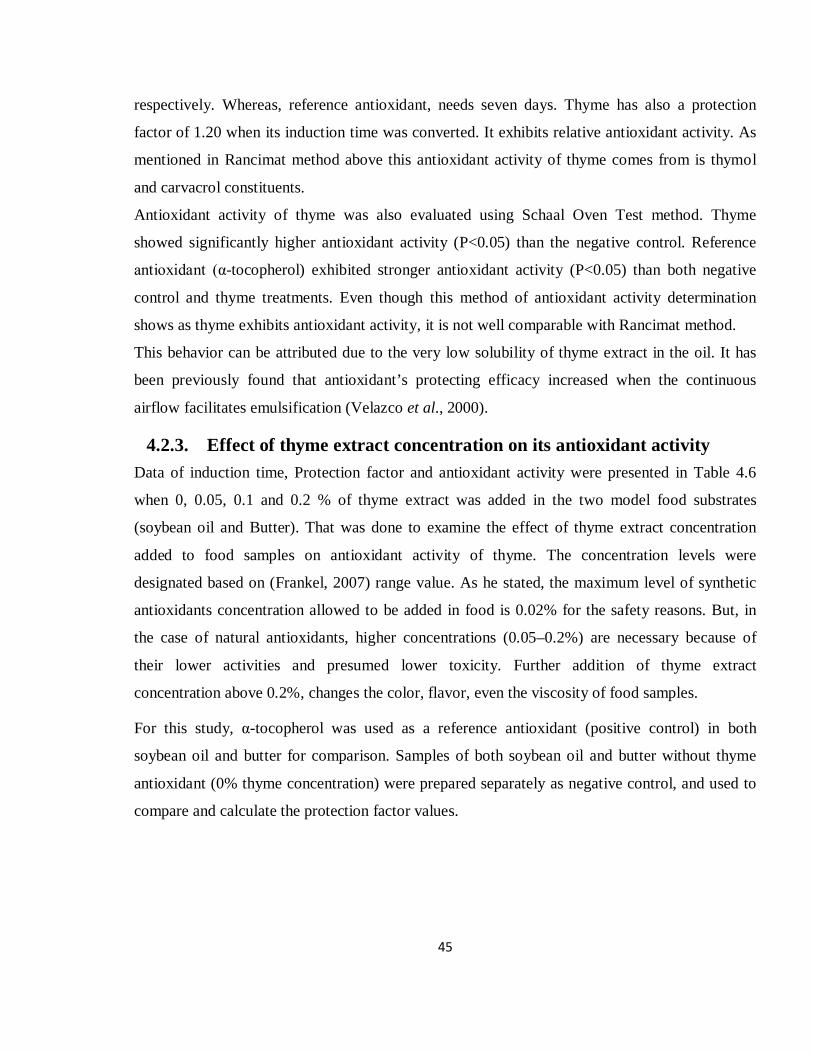
45
respectively. Whereas, reference antioxidant, needs seven days. Thyme has also a protection
factor of 1.20 when its induction time was converted. It exhibits relative antioxidant activity. As
mentioned in Rancimat method above this antioxidant activity of thyme comes from is thymol
and carvacrol constituents.
Antioxidant activity of thyme was also evaluated using Schaal Oven Test method. Thyme
showed significantly higher antioxidant activity (P<0.05) than the negative control. Reference
antioxidant (α-tocopherol) exhibited stronger antioxidant activity (P<0.05) than both negative
control and thyme treatments. Even though this method of antioxidant activity determination
shows as thyme exhibits antioxidant activity, it is not well comparable with Rancimat method.
This behavior can be attributed due to the very low solubility of thyme extract in the oil. It has
been previously found that antioxidant’s protecting efficacy increased when the continuous
airflow facilitates emulsification (Velazco et al., 2000).
4.2.3. Effect of thyme extract concentration on its antioxidant activity Data of induction time, Protection factor and antioxidant activity were presented in Table 4.6
when 0, 0.05, 0.1 and 0.2 % of thyme extract was added in the two model food substrates
(soybean oil and Butter). That was done to examine the effect of thyme extract concentration
added to food samples on antioxidant activity of thyme. The concentration levels were
designated based on (Frankel, 2007) range value. As he stated, the maximum level of synthetic
antioxidants concentration allowed to be added in food is 0.02% for the safety reasons. But, in
the case of natural antioxidants, higher concentrations (0.05–0.2%) are necessary because of
their lower activities and presumed lower toxicity. Further addition of thyme extract
concentration above 0.2%, changes the color, flavor, even the viscosity of food samples.
For this study, α-tocopherol was used as a reference antioxidant (positive control) in both
soybean oil and butter for comparison. Samples of both soybean oil and butter without thyme
antioxidant (0% thyme concentration) were prepared separately as negative control, and used to
compare and calculate the protection factor values.
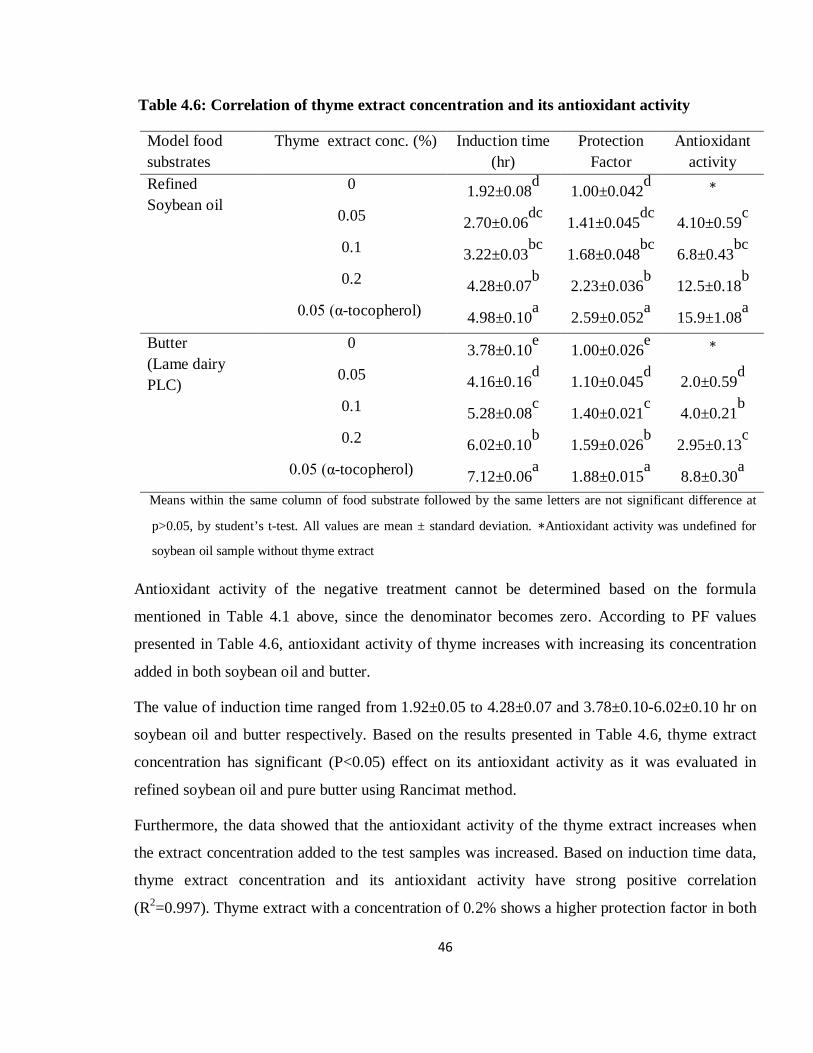
46
Table 4.6: Correlation of thyme extract concentration and its antioxidant activity
Model food substrates
Thyme extract conc. (%) Induction time (hr)
Protection Factor
Antioxidant activity
Refined Soybean oil
0 1.92±0.08d 1.00±0.042
d ∗
0.05 2.70±0.06dc
1.41±0.045dc
4.10±0.59c
0.1 3.22±0.03bc
1.68±0.048bc
6.8±0.43bc
0.2 4.28±0.07
b 2.23±0.036
b 12.5±0.18
b
0.05 (α-tocopherol) 4.98±0.10a 2.59±0.052
a 15.9±1.08
a
Butter (Lame dairy PLC)
0 3.78±0.10e 1.00±0.026
e ∗
0.05 4.16±0.16d 1.10±0.045
d 2.0±0.59
d
0.1 5.28±0.08c 1.40±0.021
c 4.0±0.21
b
0.2 6.02±0.10b 1.59±0.026
b 2.95±0.13
c
0.05 (α-tocopherol) 7.12±0.06a 1.88±0.015
a 8.8±0.30
a
Means within the same column of food substrate followed by the same letters are not significant difference at
p>0.05, by student’s t-test. All values are mean ± standard deviation. ∗Antioxidant activity was undefined for
soybean oil sample without thyme extract
Antioxidant activity of the negative treatment cannot be determined based on the formula
mentioned in Table 4.1 above, since the denominator becomes zero. According to PF values
presented in Table 4.6, antioxidant activity of thyme increases with increasing its concentration
added in both soybean oil and butter.
The value of induction time ranged from 1.92±0.05 to 4.28±0.07 and 3.78±0.10-6.02±0.10 hr on
soybean oil and butter respectively. Based on the results presented in Table 4.6, thyme extract
concentration has significant (P<0.05) effect on its antioxidant activity as it was evaluated in
refined soybean oil and pure butter using Rancimat method.
Furthermore, the data showed that the antioxidant activity of the thyme extract increases when
the extract concentration added to the test samples was increased. Based on induction time data,
thyme extract concentration and its antioxidant activity have strong positive correlation
(R2=0.997). Thyme extract with a concentration of 0.2% shows a higher protection factor in both
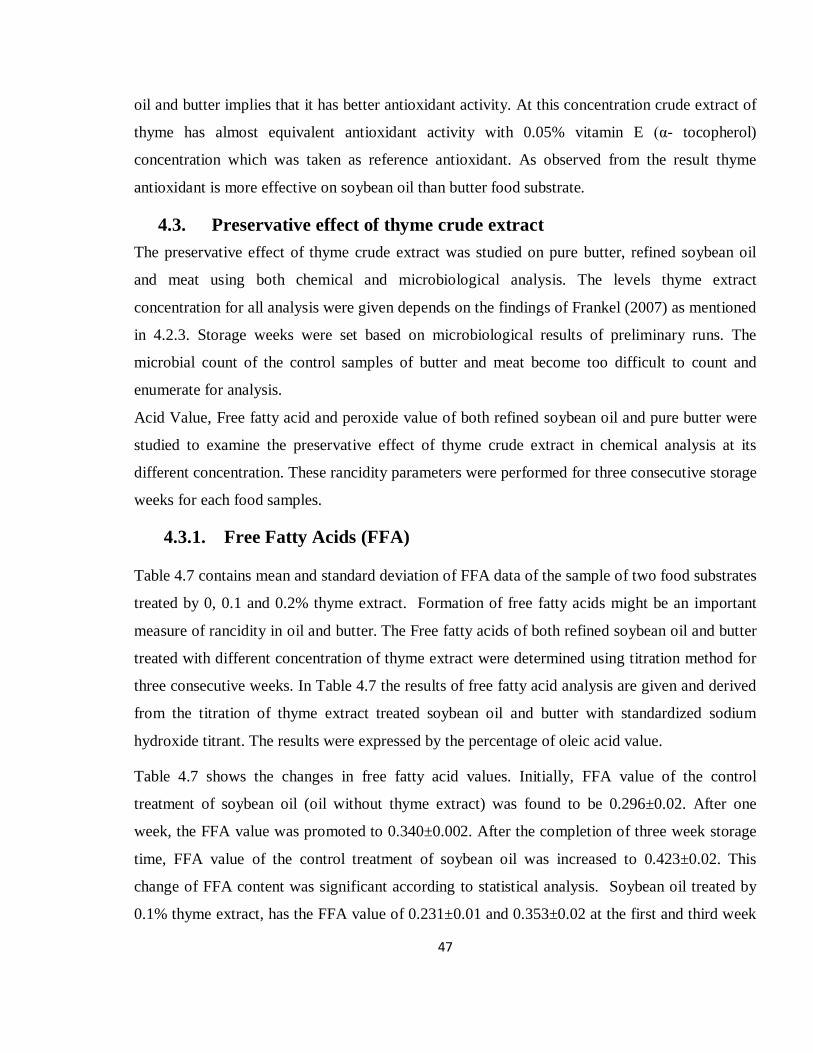
47
oil and butter implies that it has better antioxidant activity. At this concentration crude extract of
thyme has almost equivalent antioxidant activity with 0.05% vitamin E (α- tocopherol)
concentration which was taken as reference antioxidant. As observed from the result thyme
antioxidant is more effective on soybean oil than butter food substrate.
4.3. Preservative effect of thyme crude extract The preservative effect of thyme crude extract was studied on pure butter, refined soybean oil
and meat using both chemical and microbiological analysis. The levels thyme extract
concentration for all analysis were given depends on the findings of Frankel (2007) as mentioned
in 4.2.3. Storage weeks were set based on microbiological results of preliminary runs. The
microbial count of the control samples of butter and meat become too difficult to count and
enumerate for analysis.
Acid Value, Free fatty acid and peroxide value of both refined soybean oil and pure butter were
studied to examine the preservative effect of thyme crude extract in chemical analysis at its
different concentration. These rancidity parameters were performed for three consecutive storage
weeks for each food samples.
4.3.1. Free Fatty Acids (FFA)
Table 4.7 contains mean and standard deviation of FFA data of the sample of two food substrates
treated by 0, 0.1 and 0.2% thyme extract. Formation of free fatty acids might be an important
measure of rancidity in oil and butter. The Free fatty acids of both refined soybean oil and butter
treated with different concentration of thyme extract were determined using titration method for
three consecutive weeks. In Table 4.7 the results of free fatty acid analysis are given and derived
from the titration of thyme extract treated soybean oil and butter with standardized sodium
hydroxide titrant. The results were expressed by the percentage of oleic acid value.
Table 4.7 shows the changes in free fatty acid values. Initially, FFA value of the control
treatment of soybean oil (oil without thyme extract) was found to be 0.296±0.02. After one
week, the FFA value was promoted to 0.340±0.002. After the completion of three week storage
time, FFA value of the control treatment of soybean oil was increased to 0.423±0.02. This
change of FFA content was significant according to statistical analysis. Soybean oil treated by
0.1% thyme extract, has the FFA value of 0.231±0.01 and 0.353±0.02 at the first and third week
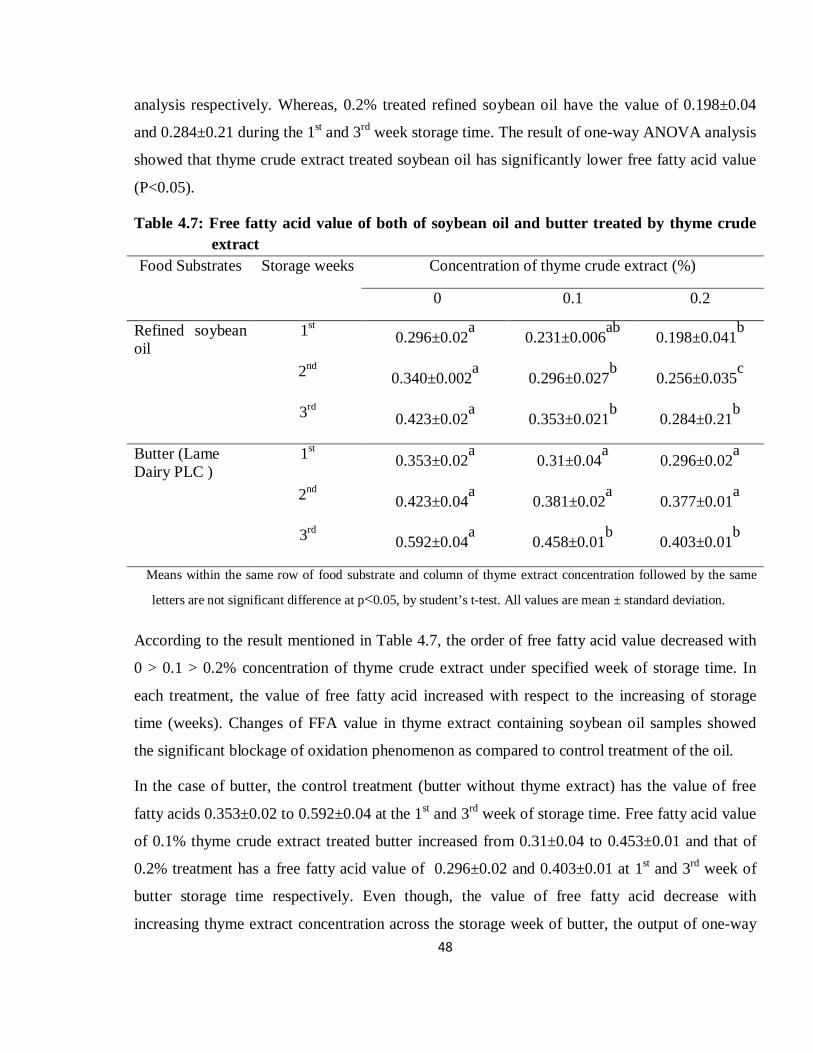
48
analysis respectively. Whereas, 0.2% treated refined soybean oil have the value of 0.198±0.04
and 0.284±0.21 during the 1st and 3rd week storage time. The result of one-way ANOVA analysis
showed that thyme crude extract treated soybean oil has significantly lower free fatty acid value
(P<0.05).
Table 4.7: Free fatty acid value of both of soybean oil and butter treated by thyme crude extract
Food Substrates Storage weeks Concentration of thyme crude extract (%)
0 0.1 0.2
Refined soybean oil
1st 0.296±0.02a 0.231±0.006
ab 0.198±0.041
b
2nd 0.340±0.002a 0.296±0.027
b 0.256±0.035
c
3rd 0.423±0.02a 0.353±0.021
b 0.284±0.21
b
Butter (Lame Dairy PLC )
1st 0.353±0.02a 0.31±0.04
a 0.296±0.02
a
2nd 0.423±0.04a 0.381±0.02
a 0.377±0.01
a
3rd 0.592±0.04a 0.458±0.01
b 0.403±0.01
b
Means within the same row of food substrate and column of thyme extract concentration followed by the same
letters are not significant difference at p<0.05, by student’s t-test. All values are mean ± standard deviation.
According to the result mentioned in Table 4.7, the order of free fatty acid value decreased with
0 > 0.1 > 0.2% concentration of thyme crude extract under specified week of storage time. In
each treatment, the value of free fatty acid increased with respect to the increasing of storage
time (weeks). Changes of FFA value in thyme extract containing soybean oil samples showed
the significant blockage of oxidation phenomenon as compared to control treatment of the oil.
In the case of butter, the control treatment (butter without thyme extract) has the value of free
fatty acids 0.353±0.02 to 0.592±0.04 at the 1st and 3rd week of storage time. Free fatty acid value
of 0.1% thyme crude extract treated butter increased from 0.31±0.04 to 0.453±0.01 and that of
0.2% treatment has a free fatty acid value of 0.296±0.02 and 0.403±0.01 at 1st and 3rd week of
butter storage time respectively. Even though, the value of free fatty acid decrease with
increasing thyme extract concentration across the storage week of butter, the output of one-way
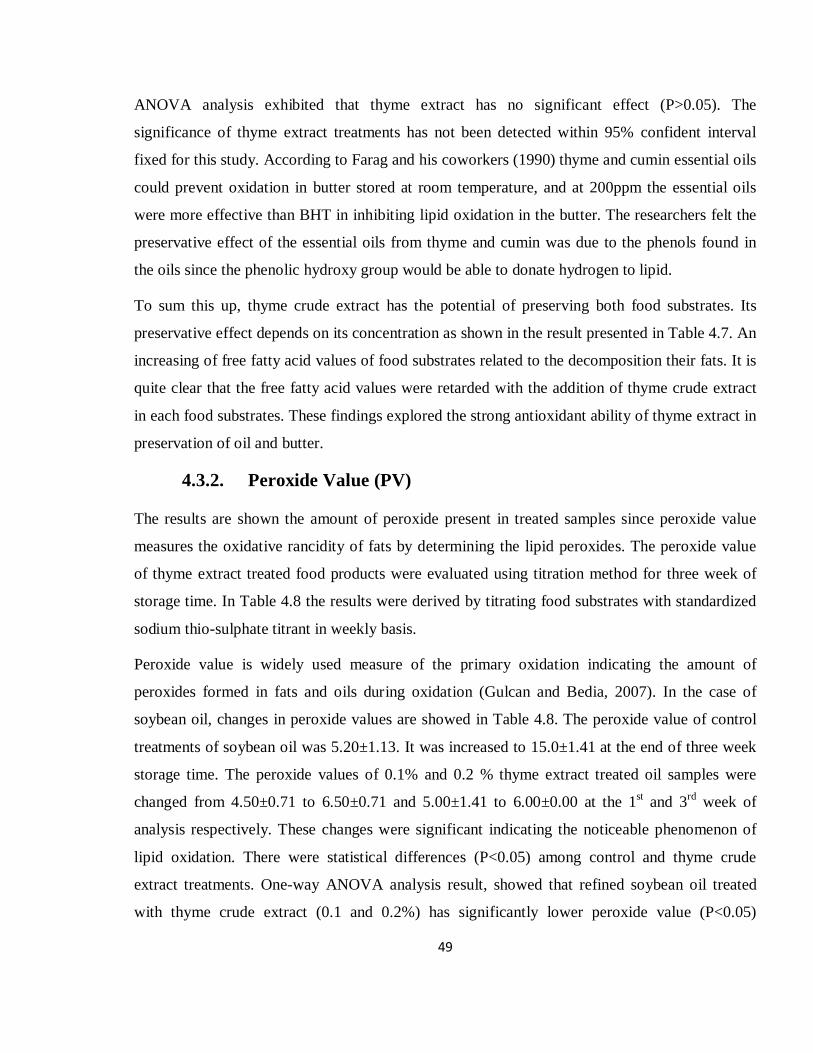
49
ANOVA analysis exhibited that thyme extract has no significant effect (P>0.05). The
significance of thyme extract treatments has not been detected within 95% confident interval
fixed for this study. According to Farag and his coworkers (1990) thyme and cumin essential oils
could prevent oxidation in butter stored at room temperature, and at 200ppm the essential oils
were more effective than BHT in inhibiting lipid oxidation in the butter. The researchers felt the
preservative effect of the essential oils from thyme and cumin was due to the phenols found in
the oils since the phenolic hydroxy group would be able to donate hydrogen to lipid.
To sum this up, thyme crude extract has the potential of preserving both food substrates. Its
preservative effect depends on its concentration as shown in the result presented in Table 4.7. An
increasing of free fatty acid values of food substrates related to the decomposition their fats. It is
quite clear that the free fatty acid values were retarded with the addition of thyme crude extract
in each food substrates. These findings explored the strong antioxidant ability of thyme extract in
preservation of oil and butter.
4.3.2. Peroxide Value (PV)
The results are shown the amount of peroxide present in treated samples since peroxide value
measures the oxidative rancidity of fats by determining the lipid peroxides. The peroxide value
of thyme extract treated food products were evaluated using titration method for three week of
storage time. In Table 4.8 the results were derived by titrating food substrates with standardized
sodium thio-sulphate titrant in weekly basis.
Peroxide value is widely used measure of the primary oxidation indicating the amount of
peroxides formed in fats and oils during oxidation (Gulcan and Bedia, 2007). In the case of
soybean oil, changes in peroxide values are showed in Table 4.8. The peroxide value of control
treatments of soybean oil was 5.20±1.13. It was increased to 15.0±1.41 at the end of three week
storage time. The peroxide values of 0.1% and 0.2 % thyme extract treated oil samples were
changed from 4.50±0.71 to 6.50±0.71 and 5.00±1.41 to 6.00±0.00 at the 1st and 3rd week of
analysis respectively. These changes were significant indicating the noticeable phenomenon of
lipid oxidation. There were statistical differences (P<0.05) among control and thyme crude
extract treatments. One-way ANOVA analysis result, showed that refined soybean oil treated
with thyme crude extract (0.1 and 0.2%) has significantly lower peroxide value (P<0.05)
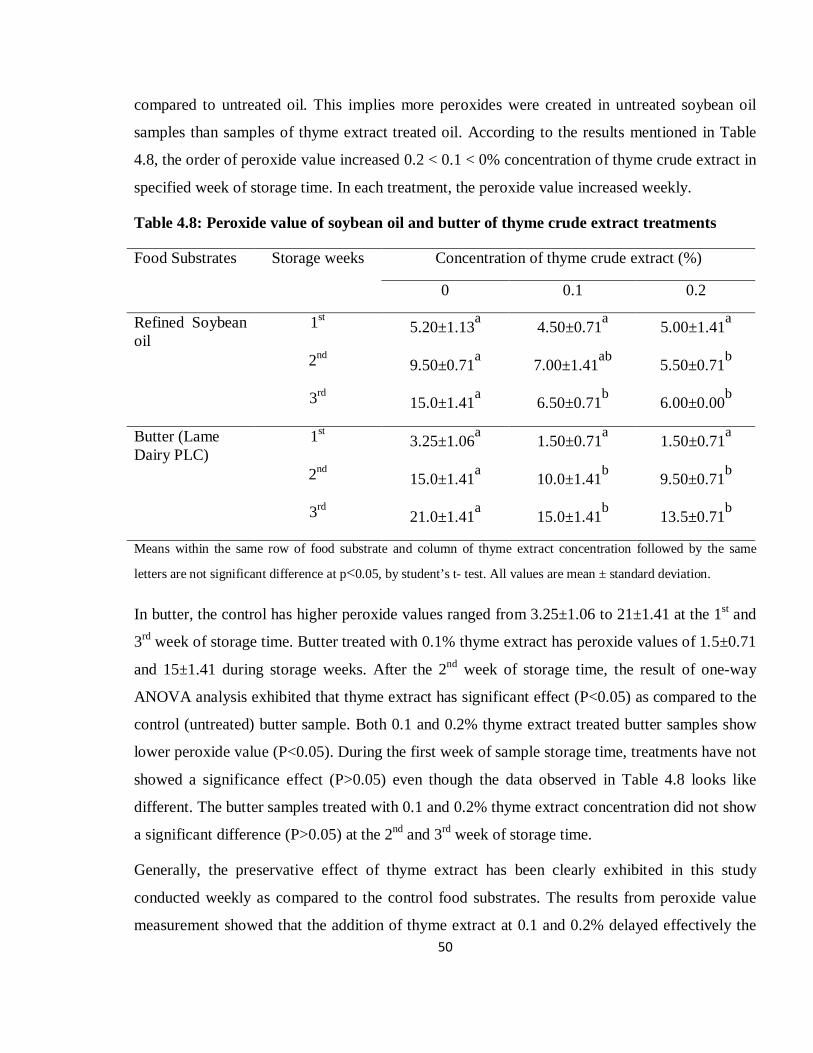
50
compared to untreated oil. This implies more peroxides were created in untreated soybean oil
samples than samples of thyme extract treated oil. According to the results mentioned in Table
4.8, the order of peroxide value increased 0.2 < 0.1 < 0% concentration of thyme crude extract in
specified week of storage time. In each treatment, the peroxide value increased weekly.
Table 4.8: Peroxide value of soybean oil and butter of thyme crude extract treatments
Food Substrates Storage weeks Concentration of thyme crude extract (%)
0 0.1 0.2
Refined Soybean oil
1st 5.20±1.13a 4.50±0.71a 5.00±1.41a
2nd 9.50±0.71a 7.00±1.41ab 5.50±0.71b
3rd 15.0±1.41a 6.50±0.71b 6.00±0.00b
Butter (Lame Dairy PLC)
1st 3.25±1.06a 1.50±0.71a 1.50±0.71a
2nd 15.0±1.41a 10.0±1.41b 9.50±0.71b
3rd 21.0±1.41a 15.0±1.41b 13.5±0.71b
Means within the same row of food substrate and column of thyme extract concentration followed by the same
letters are not significant difference at p<0.05, by student’s t- test. All values are mean ± standard deviation.
In butter, the control has higher peroxide values ranged from 3.25±1.06 to 21±1.41 at the 1st and
3rd week of storage time. Butter treated with 0.1% thyme extract has peroxide values of 1.5±0.71
and 15±1.41 during storage weeks. After the 2nd week of storage time, the result of one-way
ANOVA analysis exhibited that thyme extract has significant effect (P<0.05) as compared to the
control (untreated) butter sample. Both 0.1 and 0.2% thyme extract treated butter samples show
lower peroxide value (P<0.05). During the first week of sample storage time, treatments have not
showed a significance effect (P>0.05) even though the data observed in Table 4.8 looks like
different. The butter samples treated with 0.1 and 0.2% thyme extract concentration did not show
a significant difference (P>0.05) at the 2nd and 3rd week of storage time.
Generally, the preservative effect of thyme extract has been clearly exhibited in this study
conducted weekly as compared to the control food substrates. The results from peroxide value
measurement showed that the addition of thyme extract at 0.1 and 0.2% delayed effectively the
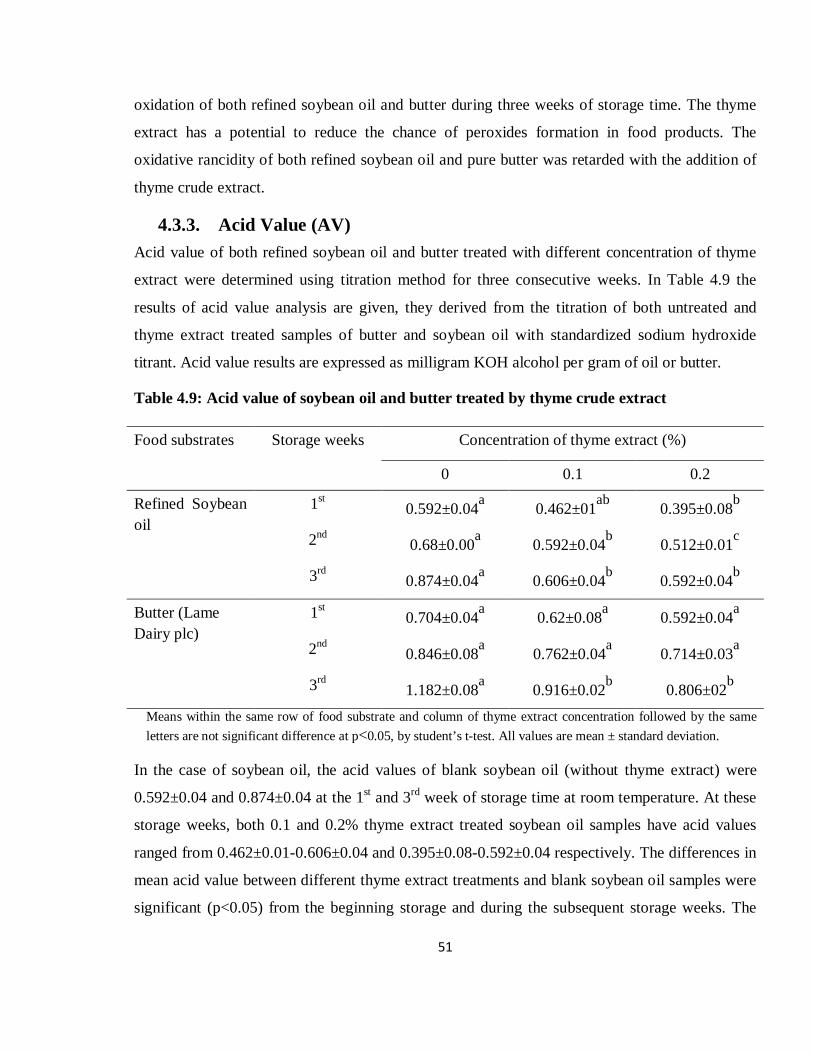
51
oxidation of both refined soybean oil and butter during three weeks of storage time. The thyme
extract has a potential to reduce the chance of peroxides formation in food products. The
oxidative rancidity of both refined soybean oil and pure butter was retarded with the addition of
thyme crude extract.
4.3.3. Acid Value (AV) Acid value of both refined soybean oil and butter treated with different concentration of thyme
extract were determined using titration method for three consecutive weeks. In Table 4.9 the
results of acid value analysis are given, they derived from the titration of both untreated and
thyme extract treated samples of butter and soybean oil with standardized sodium hydroxide
titrant. Acid value results are expressed as milligram KOH alcohol per gram of oil or butter.
Table 4.9: Acid value of soybean oil and butter treated by thyme crude extract
Food substrates Storage weeks Concentration of thyme extract (%)
0 0.1 0.2
Refined Soybean oil
1st 0.592±0.04a 0.462±01ab 0.395±0.08b
2nd 0.68±0.00a 0.592±0.04b 0.512±0.01c
3rd 0.874±0.04a 0.606±0.04b 0.592±0.04b
Butter (Lame Dairy plc)
1st 0.704±0.04a 0.62±0.08a 0.592±0.04a
2nd 0.846±0.08a 0.762±0.04a 0.714±0.03a
3rd 1.182±0.08a 0.916±0.02b 0.806±02b Means within the same row of food substrate and column of thyme extract concentration followed by the same letters are not significant difference at p<0.05, by student’s t-test. All values are mean ± standard deviation.
In the case of soybean oil, the acid values of blank soybean oil (without thyme extract) were
0.592±0.04 and 0.874±0.04 at the 1st and 3rd week of storage time at room temperature. At these
storage weeks, both 0.1 and 0.2% thyme extract treated soybean oil samples have acid values
ranged from 0.462±0.01-0.606±0.04 and 0.395±0.08-0.592±0.04 respectively. The differences in
mean acid value between different thyme extract treatments and blank soybean oil samples were
significant (p<0.05) from the beginning storage and during the subsequent storage weeks. The
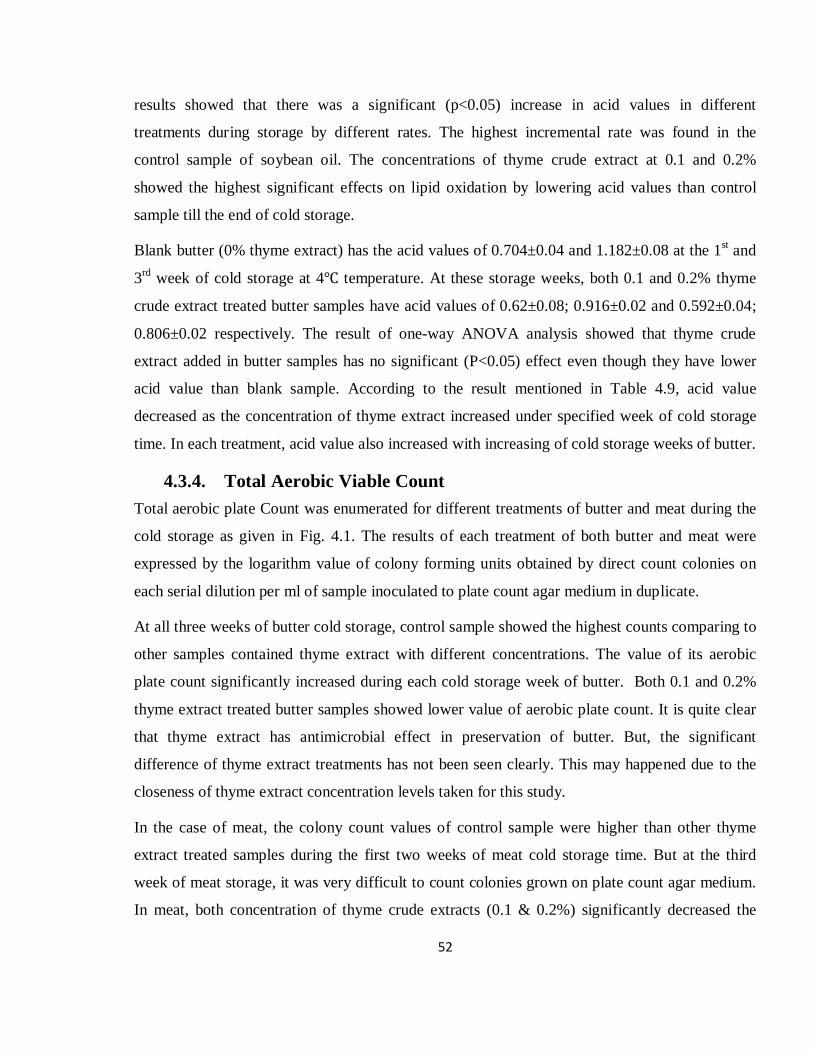
52
results showed that there was a significant (p<0.05) increase in acid values in different
treatments during storage by different rates. The highest incremental rate was found in the
control sample of soybean oil. The concentrations of thyme crude extract at 0.1 and 0.2%
showed the highest significant effects on lipid oxidation by lowering acid values than control
sample till the end of cold storage.
Blank butter (0% thyme extract) has the acid values of 0.704±0.04 and 1.182±0.08 at the 1st and
3rd week of cold storage at 4℃ temperature. At these storage weeks, both 0.1 and 0.2% thyme
crude extract treated butter samples have acid values of 0.62±0.08; 0.916±0.02 and 0.592±0.04;
0.806±0.02 respectively. The result of one-way ANOVA analysis showed that thyme crude
extract added in butter samples has no significant (P<0.05) effect even though they have lower
acid value than blank sample. According to the result mentioned in Table 4.9, acid value
decreased as the concentration of thyme extract increased under specified week of cold storage
time. In each treatment, acid value also increased with increasing of cold storage weeks of butter.
4.3.4. Total Aerobic Viable Count
Total aerobic plate Count was enumerated for different treatments of butter and meat during the
cold storage as given in Fig. 4.1. The results of each treatment of both butter and meat were
expressed by the logarithm value of colony forming units obtained by direct count colonies on
each serial dilution per ml of sample inoculated to plate count agar medium in duplicate.
At all three weeks of butter cold storage, control sample showed the highest counts comparing to
other samples contained thyme extract with different concentrations. The value of its aerobic
plate count significantly increased during each cold storage week of butter. Both 0.1 and 0.2%
thyme extract treated butter samples showed lower value of aerobic plate count. It is quite clear
that thyme extract has antimicrobial effect in preservation of butter. But, the significant
difference of thyme extract treatments has not been seen clearly. This may happened due to the
closeness of thyme extract concentration levels taken for this study.
In the case of meat, the colony count values of control sample were higher than other thyme
extract treated samples during the first two weeks of meat cold storage time. But at the third
week of meat storage, it was very difficult to count colonies grown on plate count agar medium.
In meat, both concentration of thyme crude extracts (0.1 & 0.2%) significantly decreased the
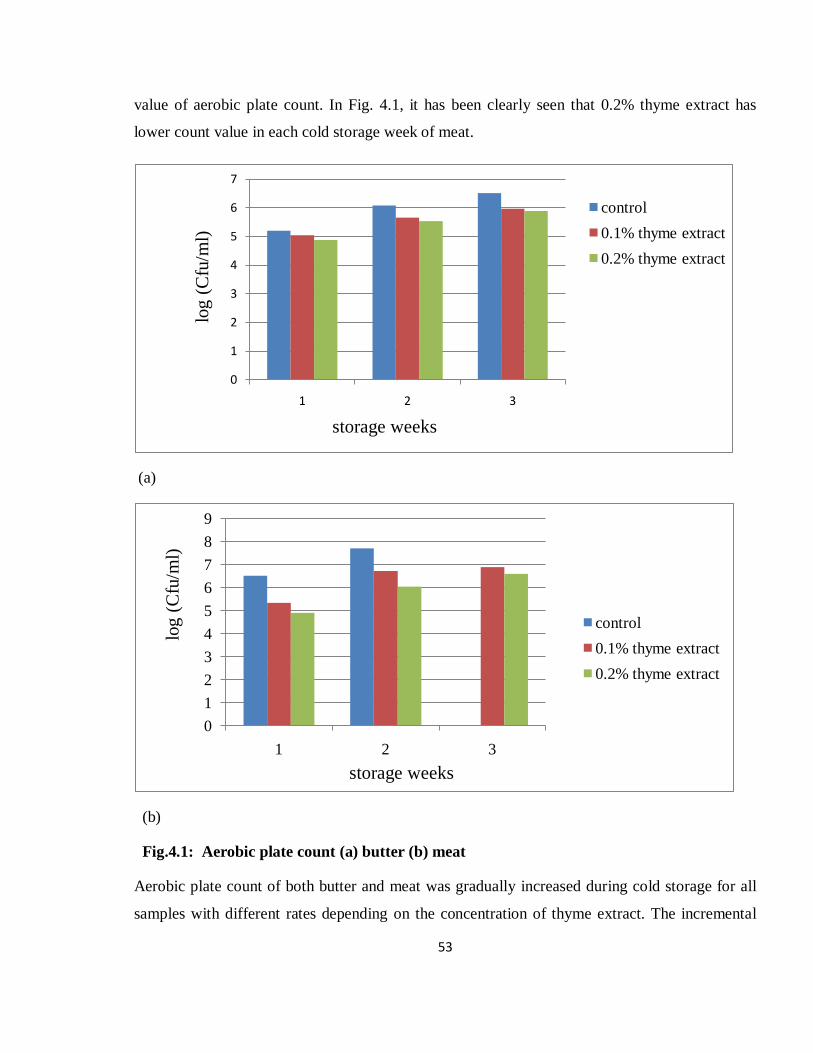
53
value of aerobic plate count. In Fig. 4.1, it has been clearly seen that 0.2% thyme extract has
lower count value in each cold storage week of meat.
(a)
(b)
Fig.4.1: Aerobic plate count (a) butter (b) meat
Aerobic plate count of both butter and meat was gradually increased during cold storage for all
samples with different rates depending on the concentration of thyme extract. The incremental
0
1
2
3
4
5
6
7
1 2 3
control0.1% thyme extract0.2% thyme extract
log
(Cfu
/ml)
storage weeks
0123456789
1 2 3
control0.1% thyme extract0.2% thyme extract
log
(Cfu
/ml)
storage weeks
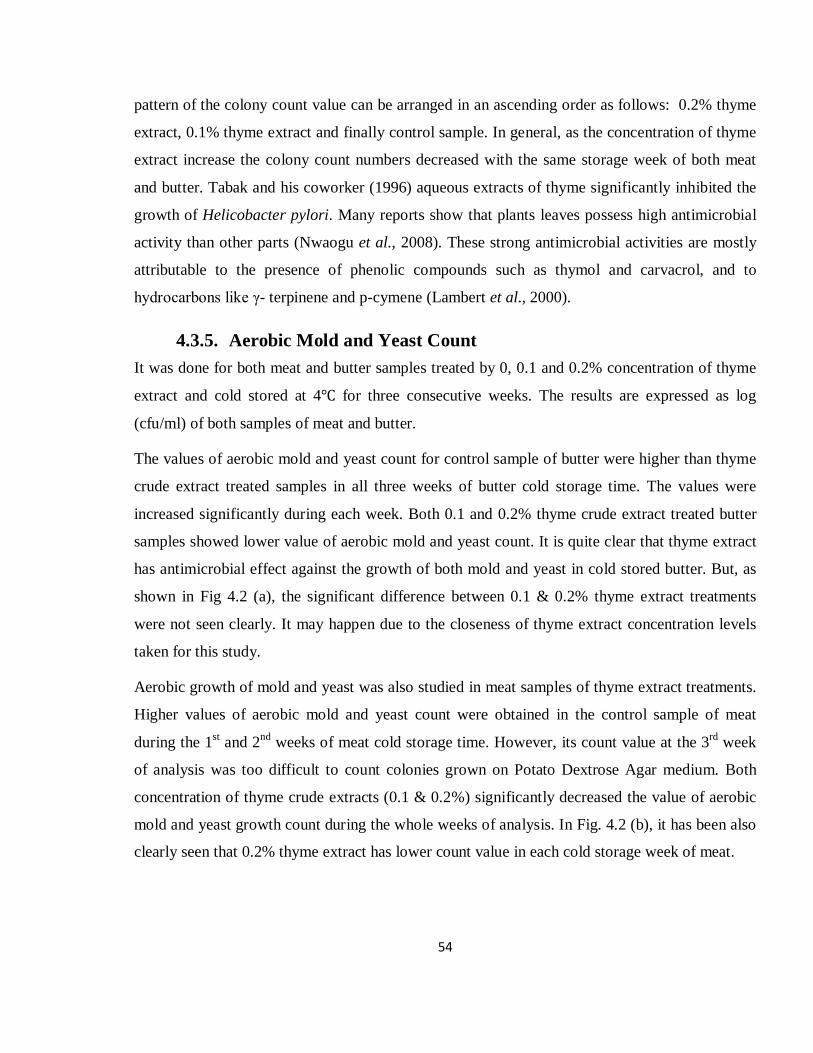
54
pattern of the colony count value can be arranged in an ascending order as follows: 0.2% thyme
extract, 0.1% thyme extract and finally control sample. In general, as the concentration of thyme
extract increase the colony count numbers decreased with the same storage week of both meat
and butter. Tabak and his coworker (1996) aqueous extracts of thyme significantly inhibited the
growth of Helicobacter pylori. Many reports show that plants leaves possess high antimicrobial
activity than other parts (Nwaogu et al., 2008). These strong antimicrobial activities are mostly
attributable to the presence of phenolic compounds such as thymol and carvacrol, and to
hydrocarbons like γ- terpinene and p-cymene (Lambert et al., 2000).
4.3.5. Aerobic Mold and Yeast Count It was done for both meat and butter samples treated by 0, 0.1 and 0.2% concentration of thyme
extract and cold stored at 4℃ for three consecutive weeks. The results are expressed as log
(cfu/ml) of both samples of meat and butter.
The values of aerobic mold and yeast count for control sample of butter were higher than thyme
crude extract treated samples in all three weeks of butter cold storage time. The values were
increased significantly during each week. Both 0.1 and 0.2% thyme crude extract treated butter
samples showed lower value of aerobic mold and yeast count. It is quite clear that thyme extract
has antimicrobial effect against the growth of both mold and yeast in cold stored butter. But, as
shown in Fig 4.2 (a), the significant difference between 0.1 & 0.2% thyme extract treatments
were not seen clearly. It may happen due to the closeness of thyme extract concentration levels
taken for this study.
Aerobic growth of mold and yeast was also studied in meat samples of thyme extract treatments.
Higher values of aerobic mold and yeast count were obtained in the control sample of meat
during the 1st and 2nd weeks of meat cold storage time. However, its count value at the 3rd week
of analysis was too difficult to count colonies grown on Potato Dextrose Agar medium. Both
concentration of thyme crude extracts (0.1 & 0.2%) significantly decreased the value of aerobic
mold and yeast growth count during the whole weeks of analysis. In Fig. 4.2 (b), it has been also
clearly seen that 0.2% thyme extract has lower count value in each cold storage week of meat.
55
(a)
(b)
Fig. 4.2: Aerobic mold and yeast count (a) butter (b) meat
In 2007, Omidbeygi and his coworkers evaluated the antifungal activity of three essential oils
(thyme, summer savory and clove) in culture medium and as a real system in tomato paste (in
vitro and in vivo). Results clearly showed that in vitro each essential oil had notable antifungal
activity. Thyme essential oil has the highest antifungal activity, followed by summer savory and
clove essential oils.
33.25
3.53.75
44.25
4.54.75
55.25
5.5
1 2 3
control0.1% thyme extract0.2% thyme extract
log
(Cfu
/ml)
storage weeks
4
4.5
5
5.5
6
6.5
7
1 2 3
control0.1% thyme extract0.2% thyme extract
log
(Cfu
/ml)
storage weeks
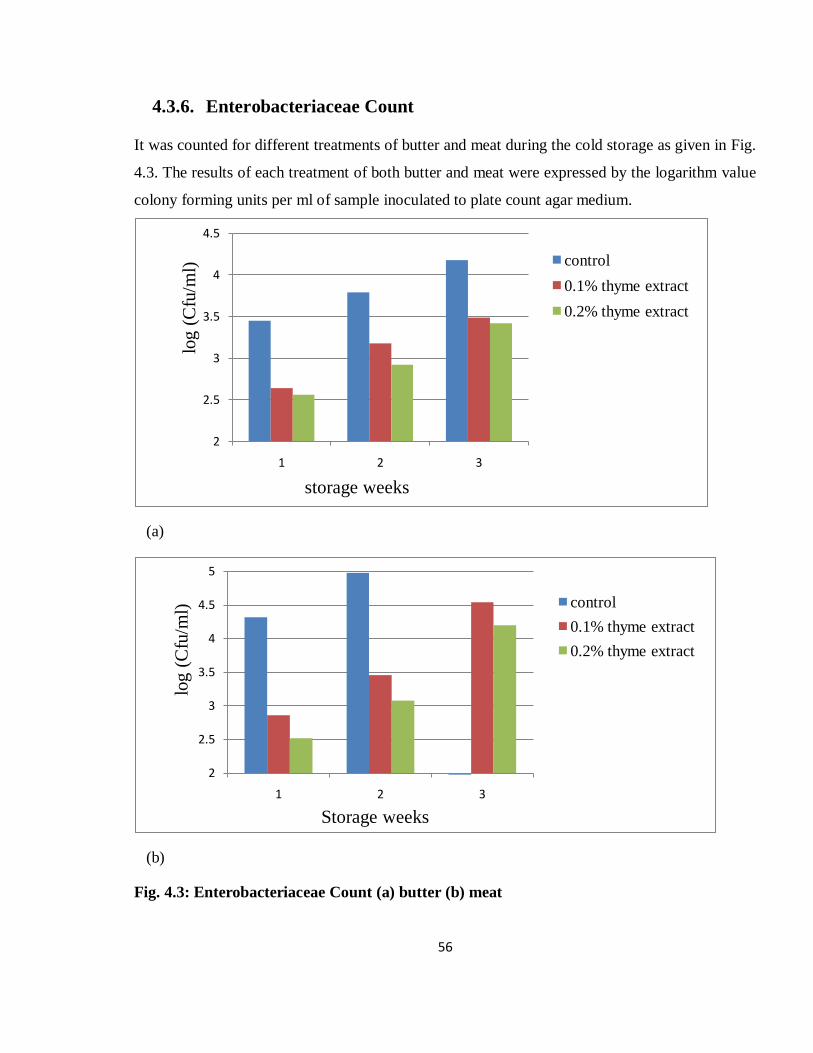
56
4.3.6. Enterobacteriaceae Count
It was counted for different treatments of butter and meat during the cold storage as given in Fig.
4.3. The results of each treatment of both butter and meat were expressed by the logarithm value
colony forming units per ml of sample inoculated to plate count agar medium.
(a)
(b)
Fig. 4.3: Enterobacteriaceae Count (a) butter (b) meat
2
2.5
3
3.5
4
4.5
1 2 3
control0.1% thyme extract0.2% thyme extract
log
(Cfu
/ml)
storage weeks
2
2.5
3
3.5
4
4.5
5
1 2 3
control0.1% thyme extract0.2% thyme extract
log
(Cfu
/ml)
Storage weeks
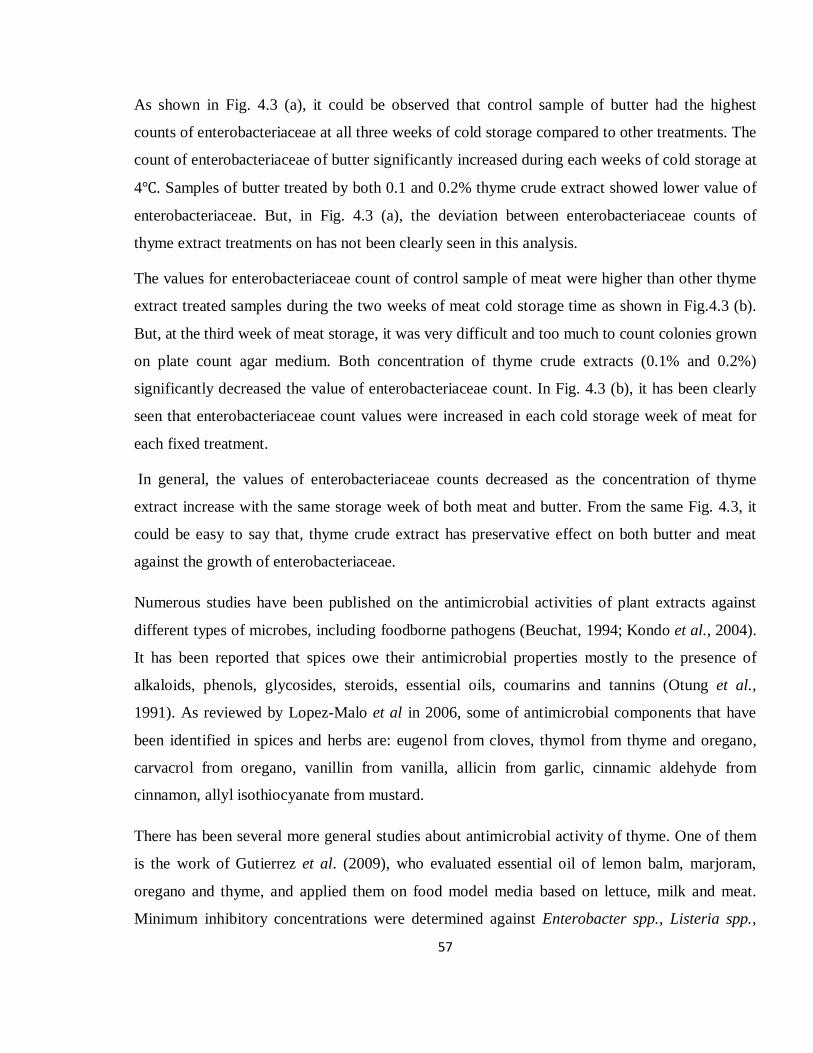
57
As shown in Fig. 4.3 (a), it could be observed that control sample of butter had the highest
counts of enterobacteriaceae at all three weeks of cold storage compared to other treatments. The
count of enterobacteriaceae of butter significantly increased during each weeks of cold storage at
4℃. Samples of butter treated by both 0.1 and 0.2% thyme crude extract showed lower value of
enterobacteriaceae. But, in Fig. 4.3 (a), the deviation between enterobacteriaceae counts of
thyme extract treatments on has not been clearly seen in this analysis.
The values for enterobacteriaceae count of control sample of meat were higher than other thyme
extract treated samples during the two weeks of meat cold storage time as shown in Fig.4.3 (b).
But, at the third week of meat storage, it was very difficult and too much to count colonies grown
on plate count agar medium. Both concentration of thyme crude extracts (0.1% and 0.2%)
significantly decreased the value of enterobacteriaceae count. In Fig. 4.3 (b), it has been clearly
seen that enterobacteriaceae count values were increased in each cold storage week of meat for
each fixed treatment.
In general, the values of enterobacteriaceae counts decreased as the concentration of thyme
extract increase with the same storage week of both meat and butter. From the same Fig. 4.3, it
could be easy to say that, thyme crude extract has preservative effect on both butter and meat
against the growth of enterobacteriaceae.
Numerous studies have been published on the antimicrobial activities of plant extracts against
different types of microbes, including foodborne pathogens (Beuchat, 1994; Kondo et al., 2004).
It has been reported that spices owe their antimicrobial properties mostly to the presence of
alkaloids, phenols, glycosides, steroids, essential oils, coumarins and tannins (Otung et al.,
1991). As reviewed by Lopez-Malo et al in 2006, some of antimicrobial components that have
been identified in spices and herbs are: eugenol from cloves, thymol from thyme and oregano,
carvacrol from oregano, vanillin from vanilla, allicin from garlic, cinnamic aldehyde from
cinnamon, allyl isothiocyanate from mustard.
There has been several more general studies about antimicrobial activity of thyme. One of them
is the work of Gutierrez et al. (2009), who evaluated essential oil of lemon balm, marjoram,
oregano and thyme, and applied them on food model media based on lettuce, milk and meat.
Minimum inhibitory concentrations were determined against Enterobacter spp., Listeria spp.,
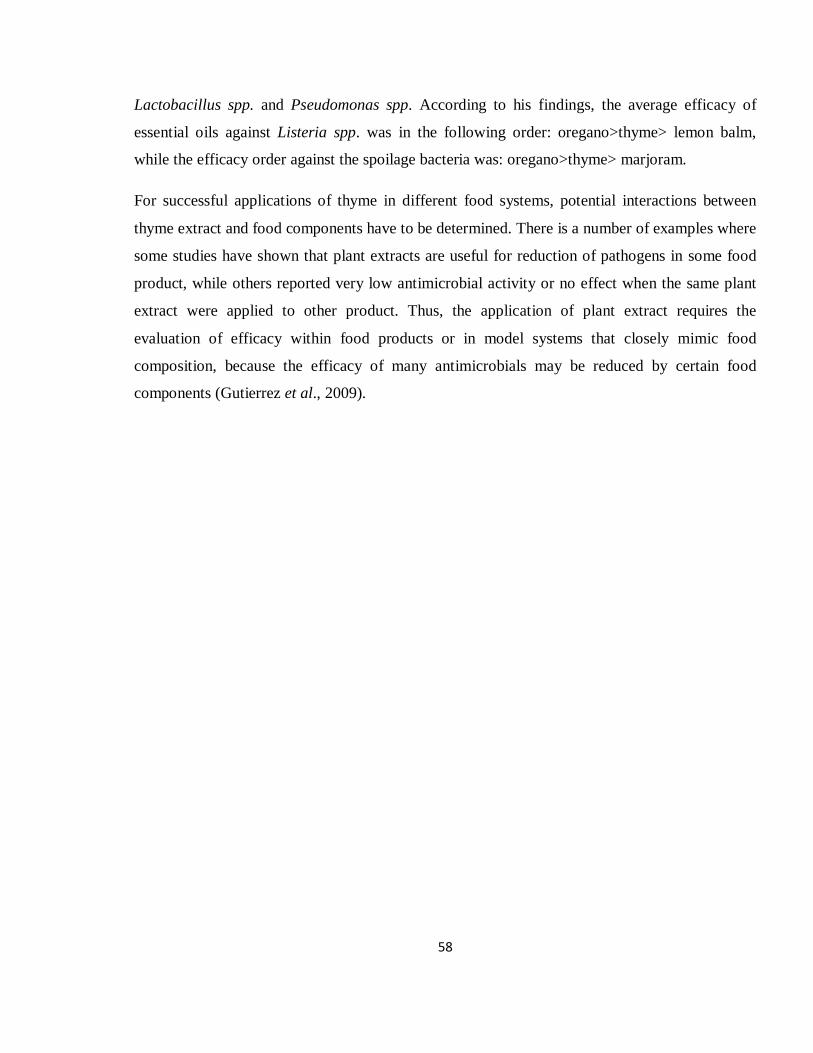
58
Lactobacillus spp. and Pseudomonas spp. According to his findings, the average efficacy of
essential oils against Listeria spp. was in the following order: oregano>thyme> lemon balm,
while the efficacy order against the spoilage bacteria was: oregano>thyme> marjoram.
For successful applications of thyme in different food systems, potential interactions between
thyme extract and food components have to be determined. There is a number of examples where
some studies have shown that plant extracts are useful for reduction of pathogens in some food
product, while others reported very low antimicrobial activity or no effect when the same plant
extract were applied to other product. Thus, the application of plant extract requires the
evaluation of efficacy within food products or in model systems that closely mimic food
composition, because the efficacy of many antimicrobials may be reduced by certain food
components (Gutierrez et al., 2009).
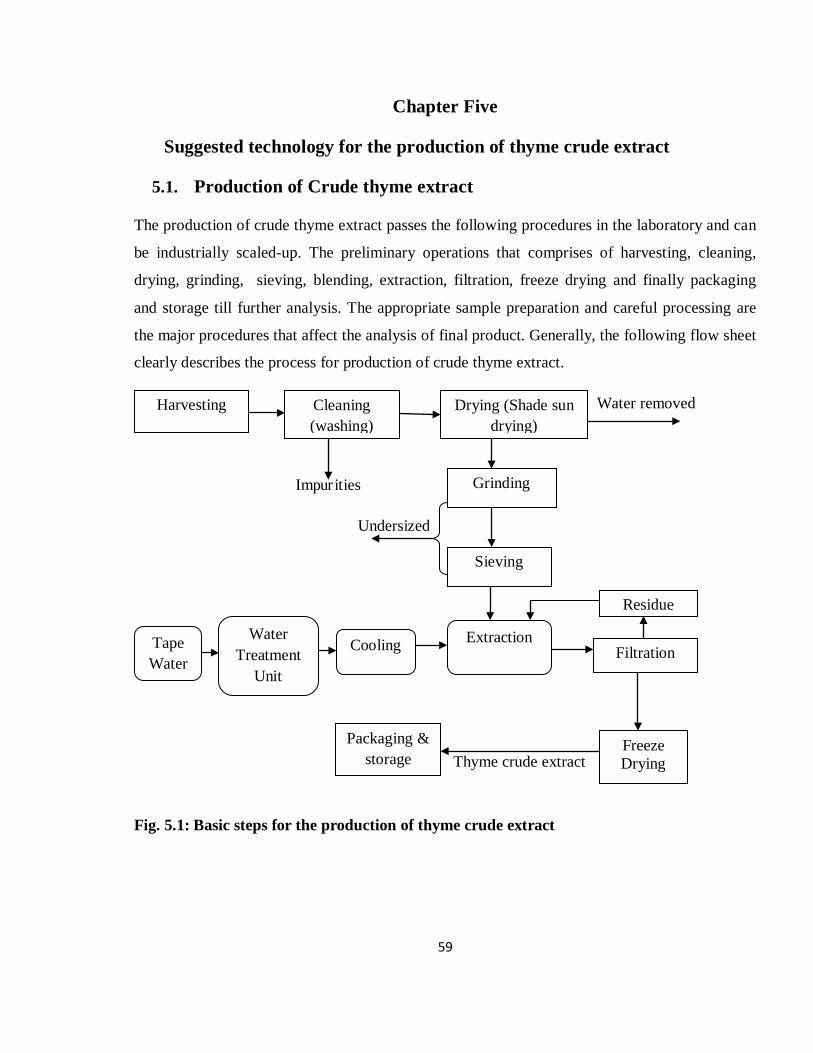
59
Chapter Five
Suggested technology for the production of thyme crude extract
5.1. Production of Crude thyme extract
The production of crude thyme extract passes the following procedures in the laboratory and can
be industrially scaled-up. The preliminary operations that comprises of harvesting, cleaning,
drying, grinding, sieving, blending, extraction, filtration, freeze drying and finally packaging
and storage till further analysis. The appropriate sample preparation and careful processing are
the major procedures that affect the analysis of final product. Generally, the following flow sheet
clearly describes the process for production of crude thyme extract.
Water removed
Impurities
Undersized
Thyme crude extract
Fig. 5.1: Basic steps for the production of thyme crude extract
Harvesting Cleaning (washing)
Packaging & storage
Drying (Shade sun drying)
Sieving
Grinding
Filtration Water
Treatment Unit
Tape Water
Cooling Extraction
Residue
Freeze Drying
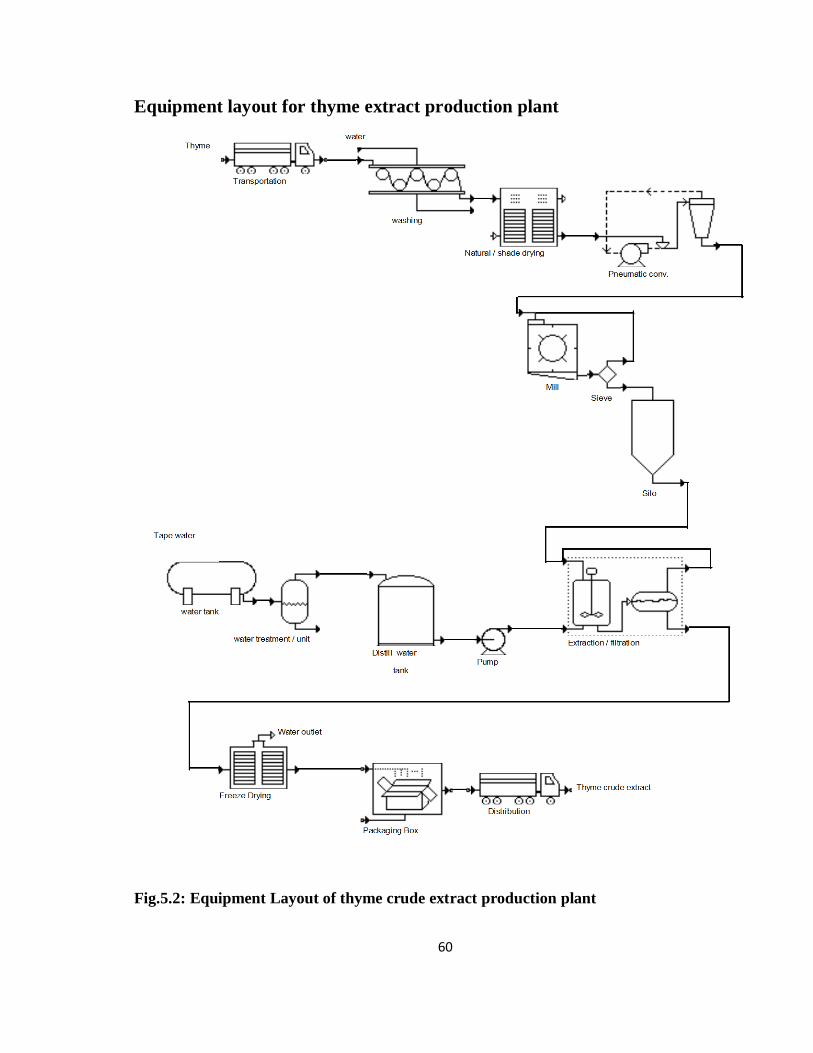
60
Equipment layout for thyme extract production plant
Fig.5.2: Equipment Layout of thyme crude extract production plant
61
5.2. Material and energy balance on major unit operations
Material balances are the basis of process design. A material balance taken over the complete
process will determine the quantities of raw materials required and products produced. Balances
over individual process units set the process stream flows and compositions. They are also useful
tools for the study of plant operation and trouble shooting. They can be used to check
performance against design; to extend the often limited data available from the plant
instrumentation; to check instrument calibrations; and to locate sources of material loss. On the
other hand, in process design, energy balances are made to determine the energy requirements of
the process: the heating, cooling and power required. In plant operation, an energy balance
(energy audit) on the plant will show the pattern of energy usage, and suggest areas for
conservation and savings (Coulson and Richardson, 2005).
In the case of this research, the need to conduct material and energy balances on major unit
operations was to scale up all the parameters used in the laboratory that resulted in the annual
production of the plant; in order to design the size of the equipment and / or for equipment
selection that helped in estimating purchased equipment cost. In addition to that they helped in
calculating the material, auxiliary and utility costs. Generally, they are needed to estimate
economic analysis; profitability and financial feasibility of the processing plant.
Data (Assumptions):
Based on the scale up experimental data, the plant will be assumed to have a capacity to
process 10Qtl (1000Kg) raw and cleaned thyme in batch process taking three days for
complete cycle.
The raw dried thyme is expected to have industrial quality fitting Quality Standard
Authority of Ethiopian (QSAE): maximum acceptable impurity is 5%.
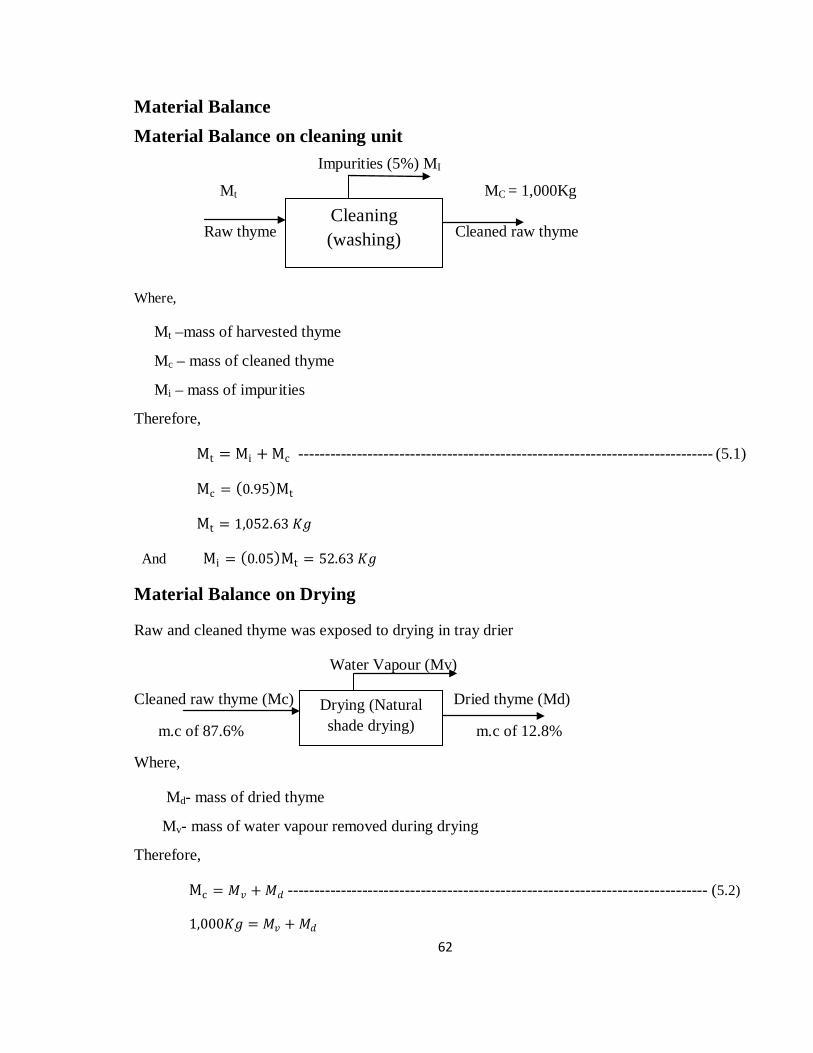
62
Material Balance Material Balance on cleaning unit Impurities (5%) MI
Mt MC = 1,000Kg
Raw thyme Cleaned raw thyme
Where,
Mt –mass of harvested thyme
Mc – mass of cleaned thyme
Mi – mass of impurities
Therefore,
Mt = Mi + Mc ------------------------------------------------------------------------------ (5.1)
Mc = (0.95)Mt
Mt = 1,052.63 𝐾𝐾𝐾𝐾
And Mi = (0.05)Mt = 52.63 𝐾𝐾𝐾𝐾
Material Balance on Drying
Raw and cleaned thyme was exposed to drying in tray drier
Water Vapour (Mv)
Cleaned raw thyme (Mc) Dried thyme (Md)
m.c of 87.6% m.c of 12.8%
Where,
Md- mass of dried thyme
Mv- mass of water vapour removed during drying
Therefore,
Mc = 𝑀𝑀𝑣𝑣 + 𝑀𝑀𝑑𝑑 ------------------------------------------------------------------------------- (5.2)
1,000𝐾𝐾𝐾𝐾 = 𝑀𝑀𝑣𝑣 + 𝑀𝑀𝑑𝑑
Cleaning (washing)
Drying (Natural shade drying)
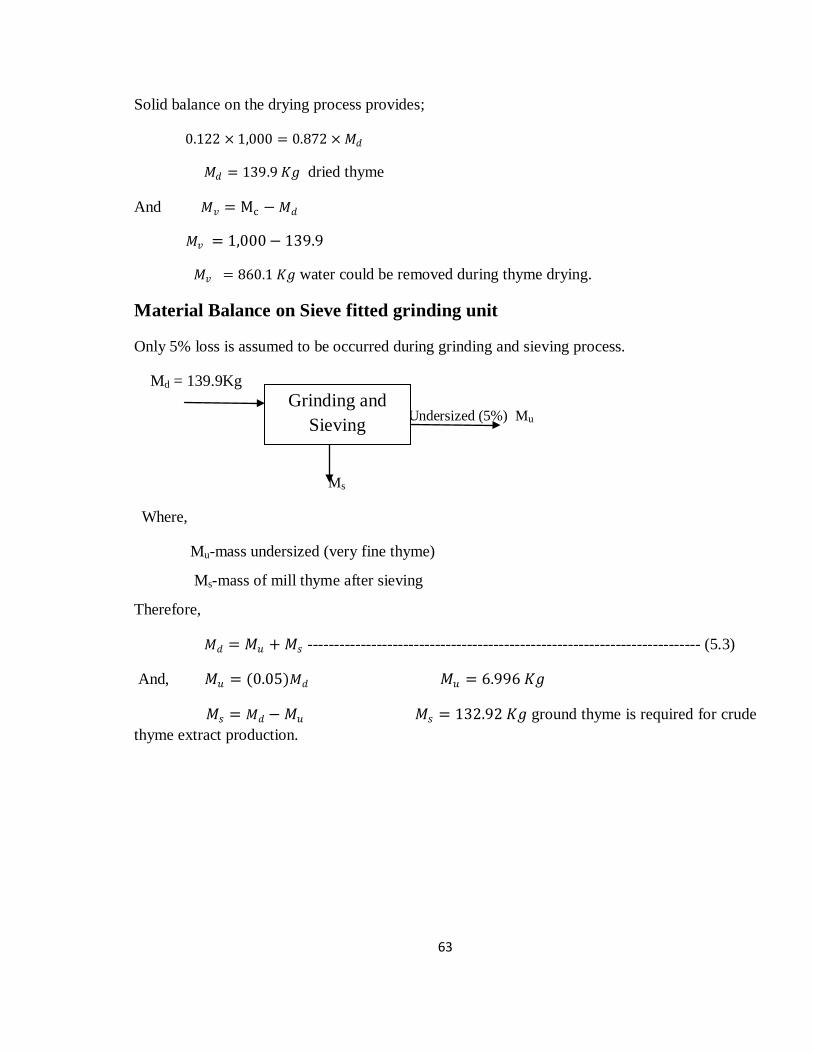
63
Solid balance on the drying process provides;
0.122 × 1,000 = 0.872 × 𝑀𝑀𝑑𝑑
𝑀𝑀𝑑𝑑 = 139.9 𝐾𝐾𝐾𝐾 dried thyme
And 𝑀𝑀𝑣𝑣 = Mc −𝑀𝑀𝑑𝑑
𝑀𝑀𝑣𝑣 = 1,000− 139.9
𝑀𝑀𝑣𝑣 = 860.1 𝐾𝐾𝐾𝐾 water could be removed during thyme drying.
Material Balance on Sieve fitted grinding unit
Only 5% loss is assumed to be occurred during grinding and sieving process.
Md = 139.9Kg
Undersized (5%) Mu
Ms
Where,
Mu-mass undersized (very fine thyme)
Ms-mass of mill thyme after sieving
Therefore,
𝑀𝑀𝑑𝑑 = 𝑀𝑀𝑢𝑢 + 𝑀𝑀𝑠𝑠 -------------------------------------------------------------------------- (5.3)
And, 𝑀𝑀𝑢𝑢 = (0.05)𝑀𝑀𝑑𝑑 𝑀𝑀𝑢𝑢 = 6.996 𝐾𝐾𝐾𝐾
𝑀𝑀𝑠𝑠 = 𝑀𝑀𝑑𝑑 − 𝑀𝑀𝑢𝑢 𝑀𝑀𝑠𝑠 = 132.92 𝐾𝐾𝐾𝐾 ground thyme is required for crude thyme extract production.
Grinding and Sieving
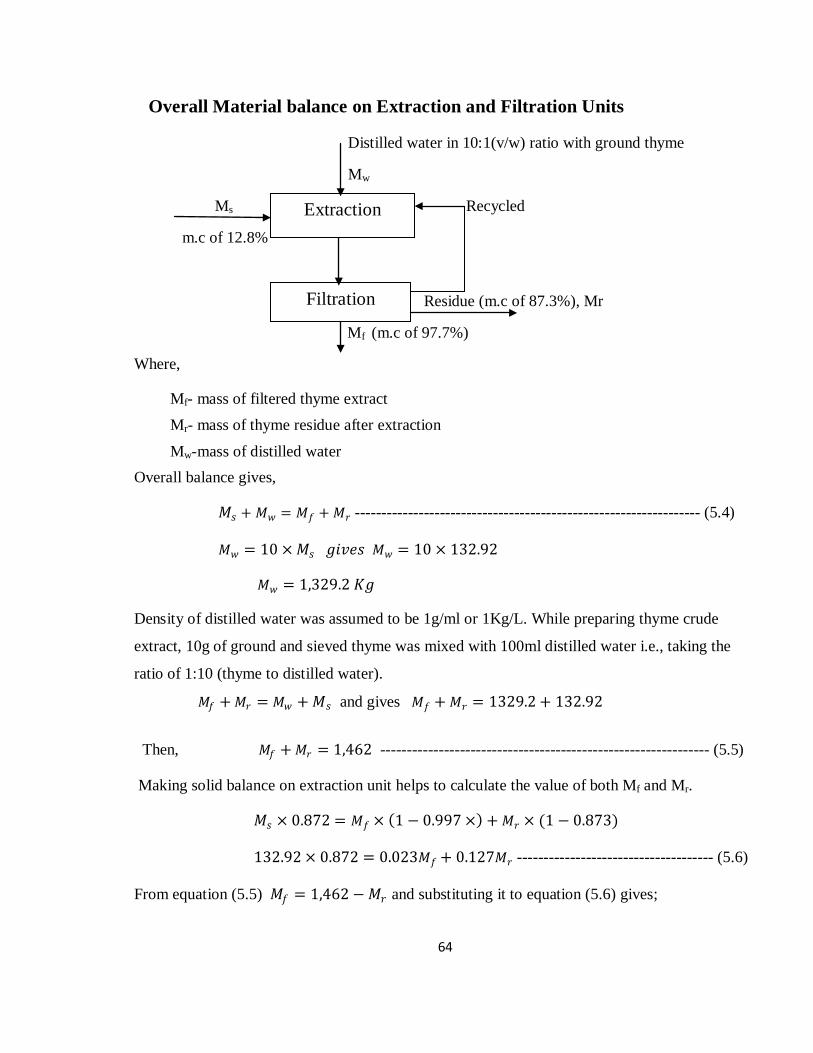
64
Overall Material balance on Extraction and Filtration Units
Distilled water in 10:1(v/w) ratio with ground thyme
Mw
Ms Recycled
m.c of 12.8%
Residue (m.c of 87.3%), Mr
Mf (m.c of 97.7%)
Where,
Mf- mass of filtered thyme extract Mr- mass of thyme residue after extraction
Mw-mass of distilled water Overall balance gives,
𝑀𝑀𝑠𝑠 + 𝑀𝑀𝑤𝑤 = 𝑀𝑀𝑓𝑓 + 𝑀𝑀𝑟𝑟 ----------------------------------------------------------------- (5.4)
𝑀𝑀𝑤𝑤 = 10 ×𝑀𝑀𝑠𝑠 𝐾𝐾𝑔𝑔𝑣𝑣𝑔𝑔𝑠𝑠 𝑀𝑀𝑤𝑤 = 10 × 132.92
𝑀𝑀𝑤𝑤 = 1,329.2 𝐾𝐾𝐾𝐾
Density of distilled water was assumed to be 1g/ml or 1Kg/L. While preparing thyme crude
extract, 10g of ground and sieved thyme was mixed with 100ml distilled water i.e., taking the
ratio of 1:10 (thyme to distilled water).
𝑀𝑀𝑓𝑓 +𝑀𝑀𝑟𝑟 = 𝑀𝑀𝑤𝑤 + 𝑀𝑀𝑠𝑠 and gives 𝑀𝑀𝑓𝑓 + 𝑀𝑀𝑟𝑟 = 1329.2 + 132.92
Then, 𝑀𝑀𝑓𝑓 +𝑀𝑀𝑟𝑟 = 1,462 -------------------------------------------------------------- (5.5)
Making solid balance on extraction unit helps to calculate the value of both Mf and Mr.
𝑀𝑀𝑠𝑠 × 0.872 = 𝑀𝑀𝑓𝑓 × (1 − 0.997 ×) + 𝑀𝑀𝑟𝑟 × (1 − 0.873)
132.92 × 0.872 = 0.023𝑀𝑀𝑓𝑓 + 0.127𝑀𝑀𝑟𝑟 ------------------------------------- (5.6)
From equation (5.5) 𝑀𝑀𝑓𝑓 = 1,462 −𝑀𝑀𝑟𝑟 and substituting it to equation (5.6) gives;
Extraction
Filtration
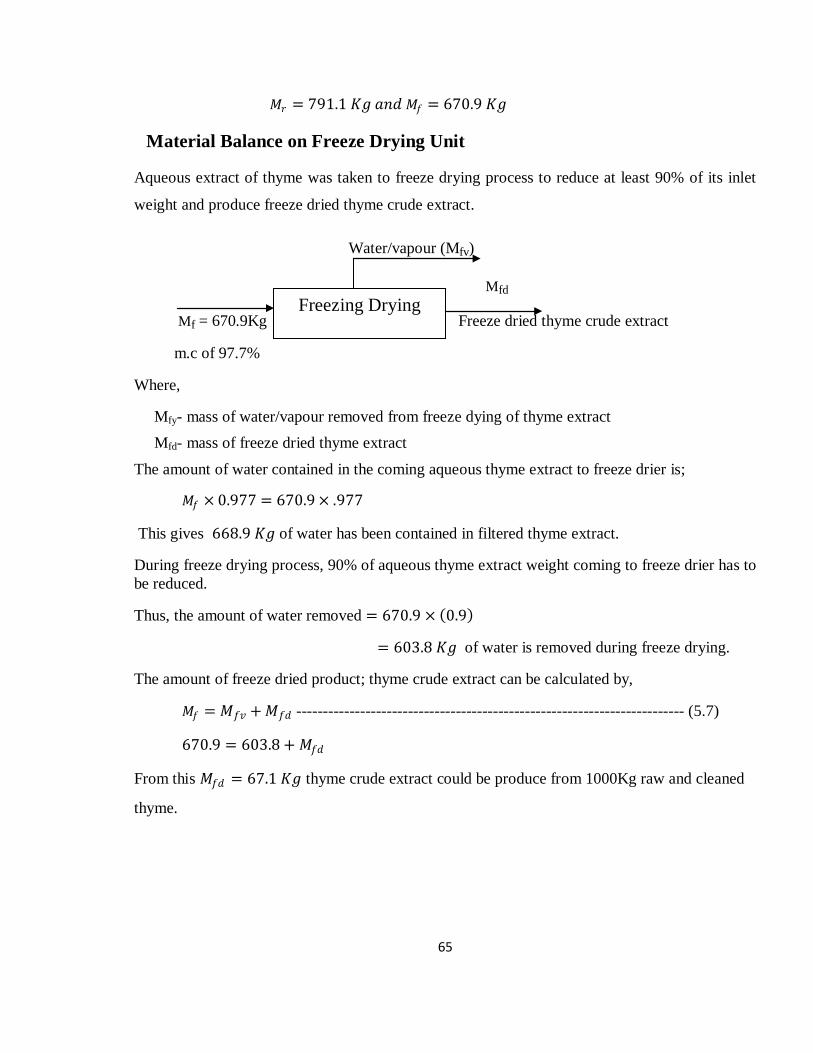
65
𝑀𝑀𝑟𝑟 = 791.1 𝐾𝐾𝐾𝐾 𝑎𝑎𝑎𝑎𝑑𝑑 𝑀𝑀𝑓𝑓 = 670.9 𝐾𝐾𝐾𝐾
Material Balance on Freeze Drying Unit
Aqueous extract of thyme was taken to freeze drying process to reduce at least 90% of its inlet
weight and produce freeze dried thyme crude extract.
Water/vapour (Mfv)
Mfd
Mf = 670.9Kg Freeze dried thyme crude extract
m.c of 97.7%
Where,
Mfy- mass of water/vapour removed from freeze dying of thyme extract Mfd- mass of freeze dried thyme extract
The amount of water contained in the coming aqueous thyme extract to freeze drier is;
𝑀𝑀𝑓𝑓 × 0.977 = 670.9 × .977
This gives 668.9 𝐾𝐾𝐾𝐾 of water has been contained in filtered thyme extract.
During freeze drying process, 90% of aqueous thyme extract weight coming to freeze drier has to be reduced.
Thus, the amount of water removed = 670.9 × (0.9)
= 603.8 𝐾𝐾𝐾𝐾 of water is removed during freeze drying.
The amount of freeze dried product; thyme crude extract can be calculated by,
𝑀𝑀𝑓𝑓 = 𝑀𝑀𝑓𝑓𝑣𝑣 +𝑀𝑀𝑓𝑓𝑑𝑑 ------------------------------------------------------------------------- (5.7)
670.9 = 603.8 + 𝑀𝑀𝑓𝑓𝑑𝑑
From this 𝑀𝑀𝑓𝑓𝑑𝑑 = 67.1 𝐾𝐾𝐾𝐾 thyme crude extract could be produce from 1000Kg raw and cleaned
thyme.
Freezing Drying
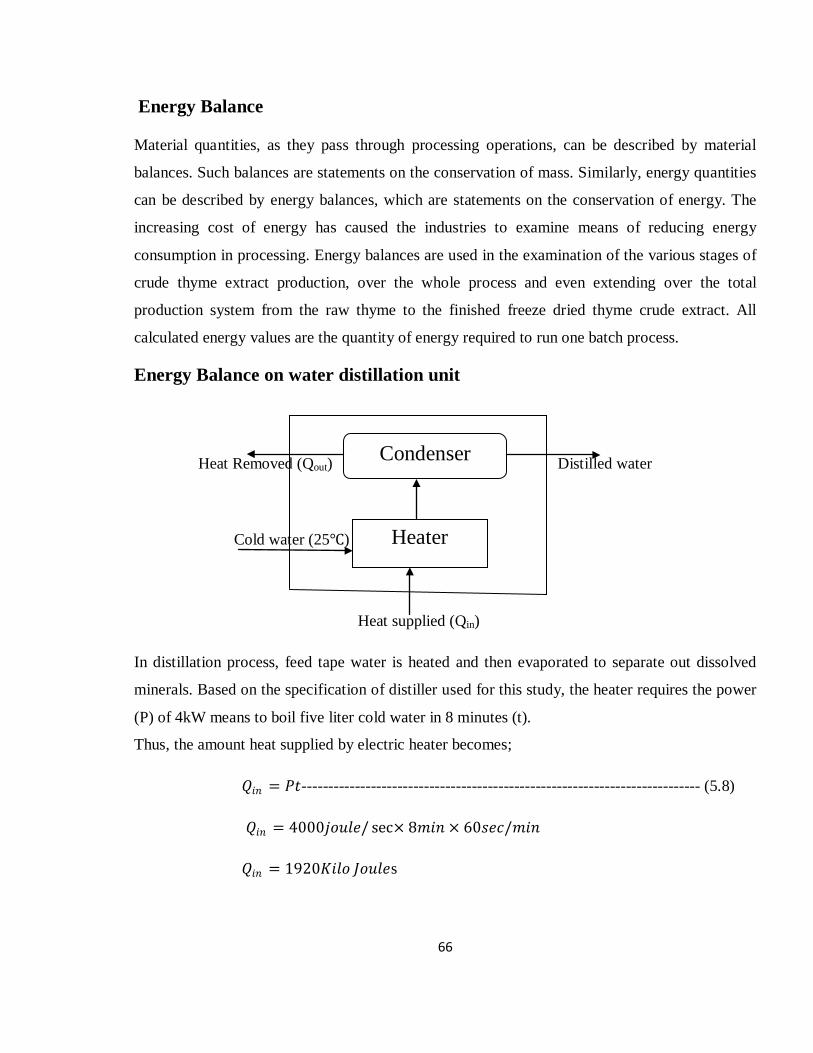
66
Energy Balance
Material quantities, as they pass through processing operations, can be described by material
balances. Such balances are statements on the conservation of mass. Similarly, energy quantities
can be described by energy balances, which are statements on the conservation of energy. The
increasing cost of energy has caused the industries to examine means of reducing energy
consumption in processing. Energy balances are used in the examination of the various stages of
crude thyme extract production, over the whole process and even extending over the total
production system from the raw thyme to the finished freeze dried thyme crude extract. All
calculated energy values are the quantity of energy required to run one batch process.
Energy Balance on water distillation unit
Heat Removed (Qout) Distilled water
Cold water (25℃)
Heat supplied (Qin)
In distillation process, feed tape water is heated and then evaporated to separate out dissolved
minerals. Based on the specification of distiller used for this study, the heater requires the power
(P) of 4kW means to boil five liter cold water in 8 minutes (t).
Thus, the amount heat supplied by electric heater becomes;
𝑄𝑄𝑔𝑔𝑎𝑎 = 𝑃𝑃𝑡𝑡--------------------------------------------------------------------------- (5.8)
𝑄𝑄𝑔𝑔𝑎𝑎 = 4000𝑗𝑗𝑗𝑗𝑢𝑢𝑗𝑗𝑔𝑔/ sec× 8𝑚𝑚𝑔𝑔𝑎𝑎 × 60𝑠𝑠𝑔𝑔𝑠𝑠/𝑚𝑚𝑔𝑔𝑎𝑎
𝑄𝑄𝑔𝑔𝑎𝑎 = 1920𝐾𝐾𝑔𝑔𝑗𝑗𝑗𝑗 𝐽𝐽𝑗𝑗𝑢𝑢𝑗𝑗𝑔𝑔s
Heater
Condenser
67
The quantity of heat gained by the water (Qw) in raising its temperature from 20℃ (room
temperature) to 100℃ is;
𝑄𝑄𝑤𝑤 = 𝑀𝑀𝐶𝐶𝑝𝑝∆𝐼𝐼------------------------------------------------------------------------- (5.9)
The mass of water is the product of its volume (5Lt) and density (1Kg/Lt) and gives 5Kg. The
specific heat capacity of water (Cp) is taken to be 4.187KJ/Kg. K.
𝑄𝑄𝑤𝑤 = 5 × 4.187(100− 20)
𝑄𝑄𝑤𝑤 = 1674.8𝐾𝐾𝑔𝑔𝑗𝑗𝑗𝑗 𝐽𝐽𝑗𝑗𝑢𝑢𝑗𝑗𝑔𝑔𝑠𝑠
The circulating cooling water is assumed to remove at least 85% of the heat gained by water and
condense the vapor coming from the heating unit.
𝑄𝑄𝑗𝑗𝑢𝑢𝑡𝑡 = 0.85(𝑄𝑄𝑤𝑤)
𝑄𝑄𝑗𝑗𝑢𝑢𝑡𝑡 = 0.85 × 1674.8 = 1423.6 𝐾𝐾𝑔𝑔𝑗𝑗𝑗𝑗 𝐽𝐽𝑗𝑗𝑢𝑢𝑗𝑗𝑔𝑔𝑠𝑠
The remaining 251.2 Kilo Joule heat energy is taken by distilled water.
Energy balance on Cooling and Freezing unit
Cooling and Freezing energy are required for filtered thyme extract prior to freeze drying
process. The ordinary refrigeration of thyme extract involves cooling only without any phase
change. The freezing of extract, on the other hand, involves three stages: cooling to the freezing
point (removing the sensible heat), freezing (removing the latent heat), and further cooling to the
desired subfreezing temperature (removing the sensible heat of frozen thyme extract).
After assuming that thyme extract is considered to be food, its thermal properties such as specific
heat and the latent heat of thyme extract are calculated with reasonable accuracy on the basis of
its water content alone. They are determined based on Siebel’s (1982) formula given by;
𝐶𝐶𝑝𝑝 , 𝑓𝑓𝑟𝑟𝑔𝑔𝑠𝑠ℎ = 3.35𝑎𝑎 + 0.48 ( 𝐾𝐾𝐽𝐽𝐾𝐾𝐾𝐾.℃
)------------------------------------------ (5.10)
𝐶𝐶𝑝𝑝 ,𝑓𝑓𝑟𝑟𝑗𝑗𝑓𝑓𝑔𝑔𝑎𝑎 = 1.26𝑎𝑎 + 0.84 ( 𝐾𝐾𝐽𝐽𝐾𝐾𝐾𝐾.℃
)---------------------------------------- (5.11)
Where, Cp, fresh and Cp, frozen are the specific heats of the thyme extract before and after
freezing, respectively; 𝑎𝑎 is the fraction of water content of the thyme extract.
The latent heat (h) of thyme extract during freezing is also depends on its water content and
given by;
ℎ = 334𝑎𝑎 (𝐾𝐾𝐽𝐽/𝐾𝐾𝐾𝐾)----------------------------------------------------------- (5.12)
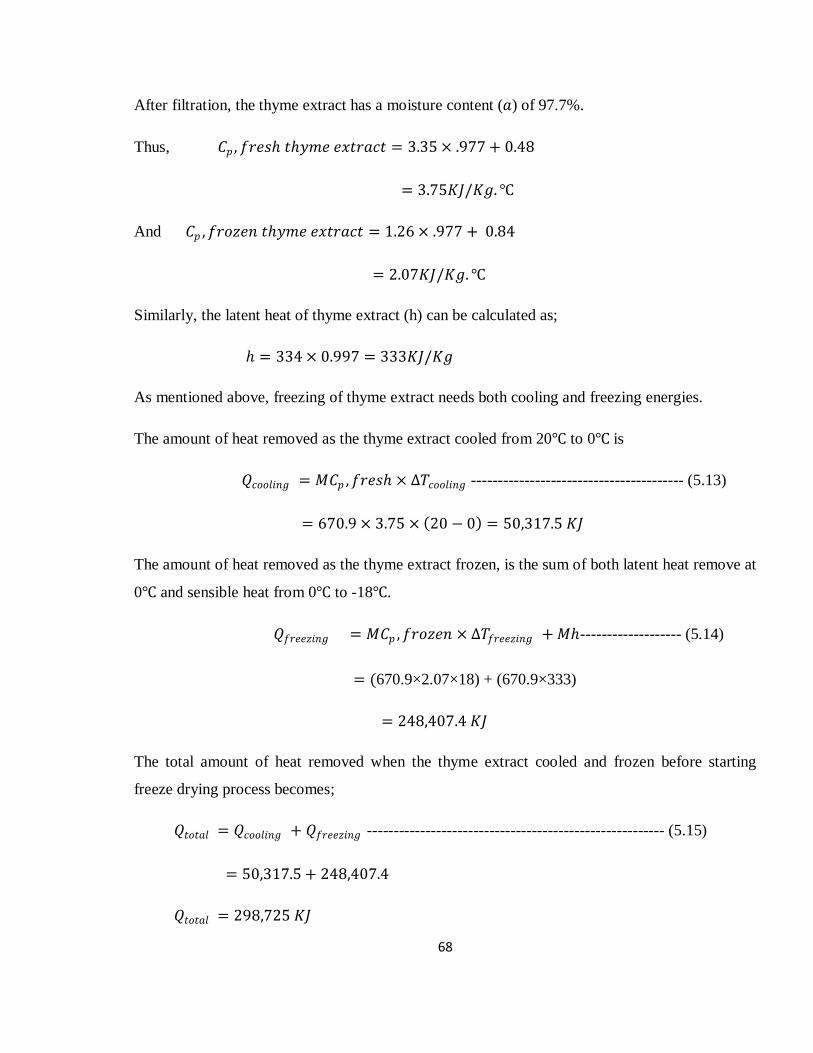
68
After filtration, the thyme extract has a moisture content (𝑎𝑎) of 97.7%.
Thus, 𝐶𝐶𝑝𝑝 , 𝑓𝑓𝑟𝑟𝑔𝑔𝑠𝑠ℎ 𝑡𝑡ℎ𝑦𝑦𝑚𝑚𝑔𝑔 𝑔𝑔𝑒𝑒𝑡𝑡𝑟𝑟𝑎𝑎𝑠𝑠𝑡𝑡 = 3.35 × .977 + 0.48
= 3.75𝐾𝐾𝐽𝐽/𝐾𝐾𝐾𝐾.℃
And 𝐶𝐶𝑝𝑝 ,𝑓𝑓𝑟𝑟𝑗𝑗𝑓𝑓𝑔𝑔𝑎𝑎 𝑡𝑡ℎ𝑦𝑦𝑚𝑚𝑔𝑔 𝑔𝑔𝑒𝑒𝑡𝑡𝑟𝑟𝑎𝑎𝑠𝑠𝑡𝑡 = 1.26 × .977 + 0.84
= 2.07𝐾𝐾𝐽𝐽/𝐾𝐾𝐾𝐾.℃
Similarly, the latent heat of thyme extract (h) can be calculated as;
ℎ = 334 × 0.997 = 333𝐾𝐾𝐽𝐽/𝐾𝐾𝐾𝐾
As mentioned above, freezing of thyme extract needs both cooling and freezing energies.
The amount of heat removed as the thyme extract cooled from 20℃ to 0℃ is
𝑄𝑄𝑠𝑠𝑗𝑗𝑗𝑗𝑗𝑗𝑔𝑔𝑎𝑎𝐾𝐾 = 𝑀𝑀𝐶𝐶𝑝𝑝 ,𝑓𝑓𝑟𝑟𝑔𝑔𝑠𝑠ℎ × ∆𝐼𝐼𝑠𝑠𝑗𝑗𝑗𝑗𝑗𝑗𝑔𝑔𝑎𝑎𝐾𝐾 ---------------------------------------- (5.13)
= 670.9 × 3.75 × (20 − 0) = 50,317.5 𝐾𝐾𝐽𝐽
The amount of heat removed as the thyme extract frozen, is the sum of both latent heat remove at
0℃ and sensible heat from 0℃ to -18℃.
𝑄𝑄𝑓𝑓𝑟𝑟𝑔𝑔𝑔𝑔𝑓𝑓𝑔𝑔𝑎𝑎𝐾𝐾 = 𝑀𝑀𝐶𝐶𝑝𝑝 ,𝑓𝑓𝑟𝑟𝑗𝑗𝑓𝑓𝑔𝑔𝑎𝑎 × ∆𝐼𝐼𝑓𝑓𝑟𝑟𝑔𝑔𝑔𝑔𝑓𝑓𝑔𝑔𝑎𝑎𝐾𝐾 + 𝑀𝑀ℎ------------------- (5.14)
= (670.9×2.07×18) + (670.9×333)
= 248,407.4 𝐾𝐾𝐽𝐽
The total amount of heat removed when the thyme extract cooled and frozen before starting
freeze drying process becomes;
𝑄𝑄𝑡𝑡𝑗𝑗𝑡𝑡𝑎𝑎𝑗𝑗 = 𝑄𝑄𝑠𝑠𝑗𝑗𝑗𝑗𝑗𝑗𝑔𝑔𝑎𝑎𝐾𝐾 + 𝑄𝑄𝑓𝑓𝑟𝑟𝑔𝑔𝑔𝑔𝑓𝑓𝑔𝑔𝑎𝑎𝐾𝐾 -------------------------------------------------------- (5.15)
= 50,317.5 + 248,407.4
𝑄𝑄𝑡𝑡𝑗𝑗𝑡𝑡𝑎𝑎𝑗𝑗 = 298,725 𝐾𝐾𝐽𝐽
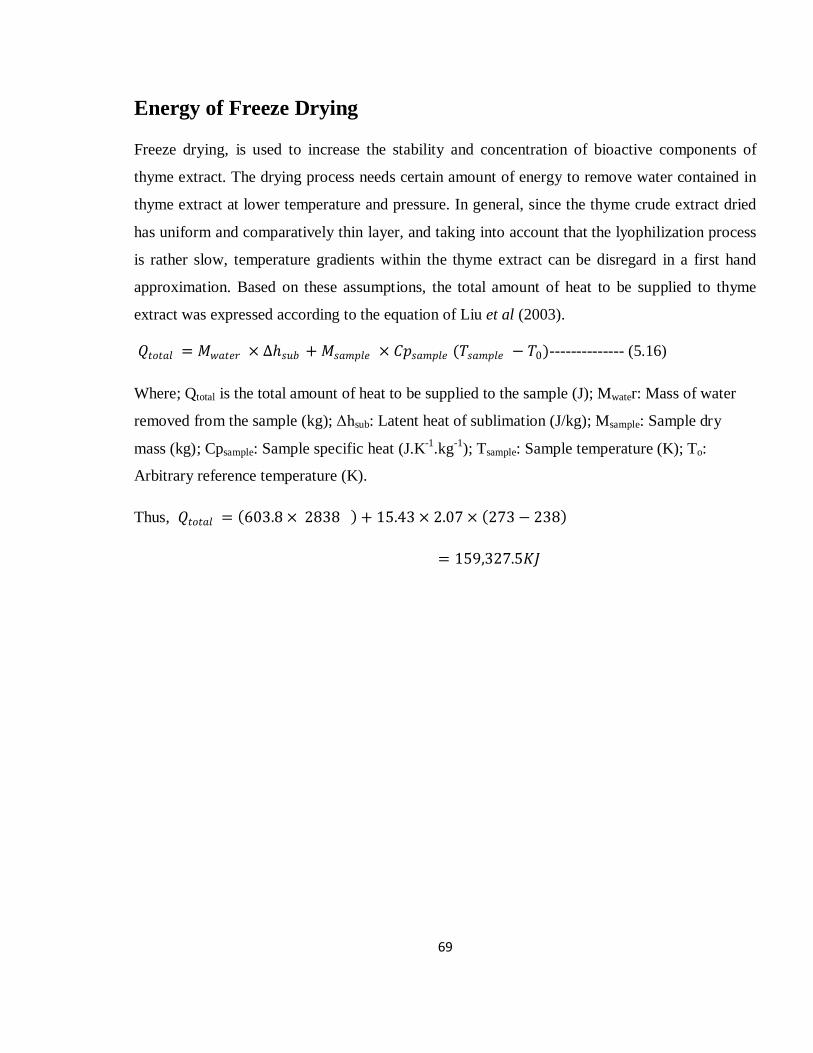
69
Energy of Freeze Drying
Freeze drying, is used to increase the stability and concentration of bioactive components of
thyme extract. The drying process needs certain amount of energy to remove water contained in
thyme extract at lower temperature and pressure. In general, since the thyme crude extract dried
has uniform and comparatively thin layer, and taking into account that the lyophilization process
is rather slow, temperature gradients within the thyme extract can be disregard in a first hand
approximation. Based on these assumptions, the total amount of heat to be supplied to thyme
extract was expressed according to the equation of Liu et al (2003).
𝑄𝑄𝑡𝑡𝑗𝑗𝑡𝑡𝑎𝑎𝑗𝑗 = 𝑀𝑀𝑤𝑤𝑎𝑎𝑡𝑡𝑔𝑔𝑟𝑟 × ∆ℎ𝑠𝑠𝑢𝑢𝑠𝑠 + 𝑀𝑀𝑠𝑠𝑎𝑎𝑚𝑚𝑝𝑝𝑗𝑗𝑔𝑔 × 𝐶𝐶𝑝𝑝𝑠𝑠𝑎𝑎𝑚𝑚𝑝𝑝𝑗𝑗𝑔𝑔 (𝐼𝐼𝑠𝑠𝑎𝑎𝑚𝑚𝑝𝑝𝑗𝑗𝑔𝑔 − 𝐼𝐼0)-------------- (5.16)
Where; Qtotal is the total amount of heat to be supplied to the sample (J); Mwater: Mass of water
removed from the sample (kg); Δhsub: Latent heat of sublimation (J/kg); Msample: Sample dry
mass (kg); Cpsample: Sample specific heat (J.K-1.kg-1); Tsample: Sample temperature (K); To:
Arbitrary reference temperature (K).
Thus, 𝑄𝑄𝑡𝑡𝑗𝑗𝑡𝑡𝑎𝑎𝑗𝑗 = (603.8 × 2838 ) + 15.43 × 2.07 × (273− 238)
= 159,327.5𝐾𝐾𝐽𝐽
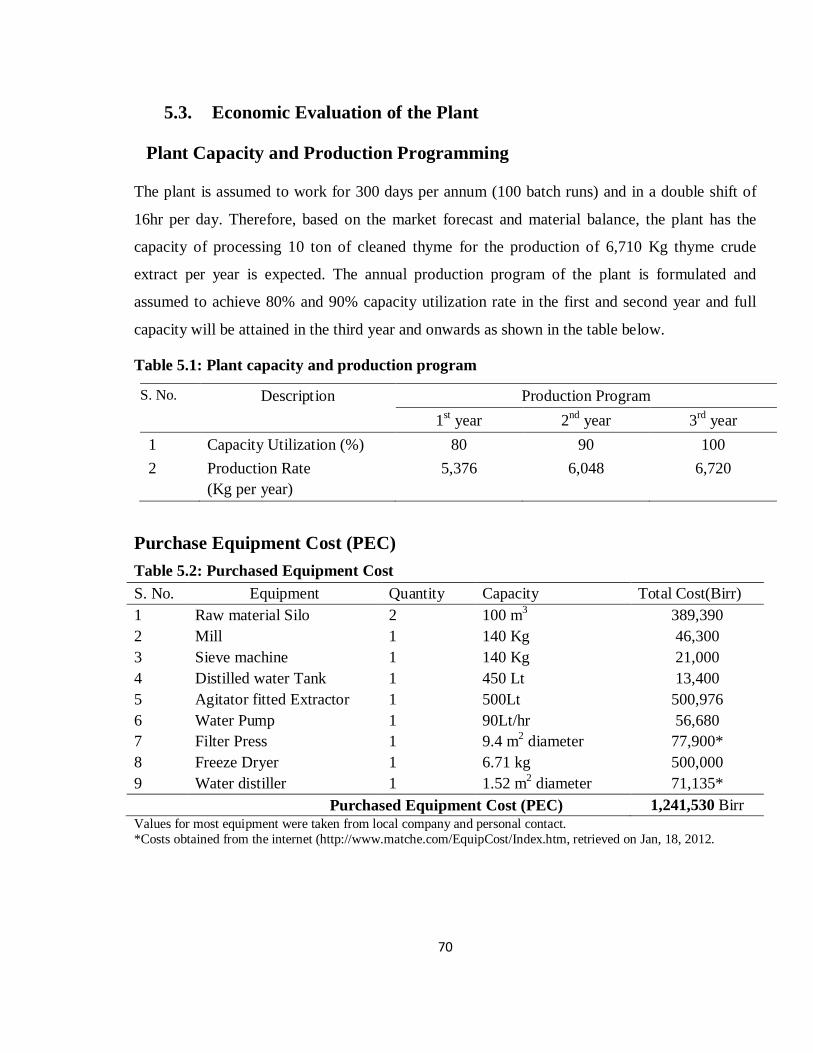
70
5.3. Economic Evaluation of the Plant
Plant Capacity and Production Programming
The plant is assumed to work for 300 days per annum (100 batch runs) and in a double shift of
16hr per day. Therefore, based on the market forecast and material balance, the plant has the
capacity of processing 10 ton of cleaned thyme for the production of 6,710 Kg thyme crude
extract per year is expected. The annual production program of the plant is formulated and
assumed to achieve 80% and 90% capacity utilization rate in the first and second year and full
capacity will be attained in the third year and onwards as shown in the table below.
Table 5.1: Plant capacity and production program
S. No. Description Production Program 1st year 2nd year 3rd year
1 Capacity Utilization (%) 80 90 100 2 Production Rate
(Kg per year) 5,376 6,048 6,720
Purchase Equipment Cost (PEC) Table 5.2: Purchased Equipment Cost S. No. Equipment Quantity Capacity Total Cost(Birr) 1 Raw material Silo 2 100 m3 389,390 2 Mill 1 140 Kg 46,300 3 Sieve machine 1 140 Kg 21,000 4 Distilled water Tank 1 450 Lt 13,400 5 Agitator fitted Extractor 1 500Lt 500,976 6 Water Pump 1 90Lt/hr 56,680 7 Filter Press 1 9.4 m2 diameter 77,900* 8 Freeze Dryer 1 6.71 kg 500,000 9 Water distiller 1 1.52 m2 diameter 71,135* Purchased Equipment Cost (PEC) 1,241,530 Birr Values for most equipment were taken from local company and personal contact. *Costs obtained from the internet (http://www.matche.com/EquipCost/Index.htm, retrieved on Jan, 18, 2012.
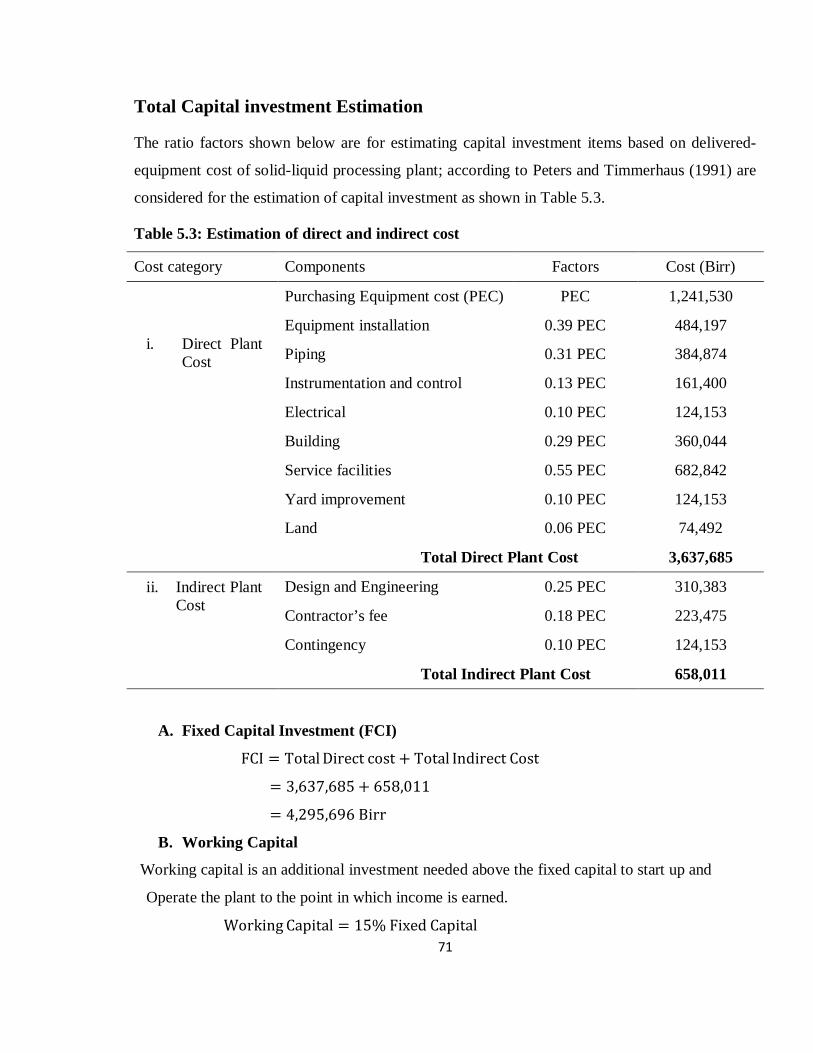
71
Total Capital investment Estimation
The ratio factors shown below are for estimating capital investment items based on delivered-
equipment cost of solid-liquid processing plant; according to Peters and Timmerhaus (1991) are
considered for the estimation of capital investment as shown in Table 5.3.
Table 5.3: Estimation of direct and indirect cost
Cost category Components Factors Cost (Birr)
i. Direct Plant Cost
Purchasing Equipment cost (PEC) PEC 1,241,530
Equipment installation 0.39 PEC 484,197
Piping 0.31 PEC 384,874
Instrumentation and control 0.13 PEC 161,400
Electrical 0.10 PEC 124,153
Building 0.29 PEC 360,044
Service facilities 0.55 PEC 682,842
Yard improvement 0.10 PEC 124,153
Land 0.06 PEC 74,492
Total Direct Plant Cost 3,637,685
ii. Indirect Plant Cost
Design and Engineering 0.25 PEC 310,383
Contractor’s fee 0.18 PEC 223,475
Contingency 0.10 PEC 124,153
Total Indirect Plant Cost 658,011
A. Fixed Capital Investment (FCI)
FCI = Total Direct cost + Total Indirect Cost
= 3,637,685 + 658,011
= 4,295,696 Birr
B. Working Capital
Working capital is an additional investment needed above the fixed capital to start up and
Operate the plant to the point in which income is earned.
Working Capital = 15% Fixed Capital
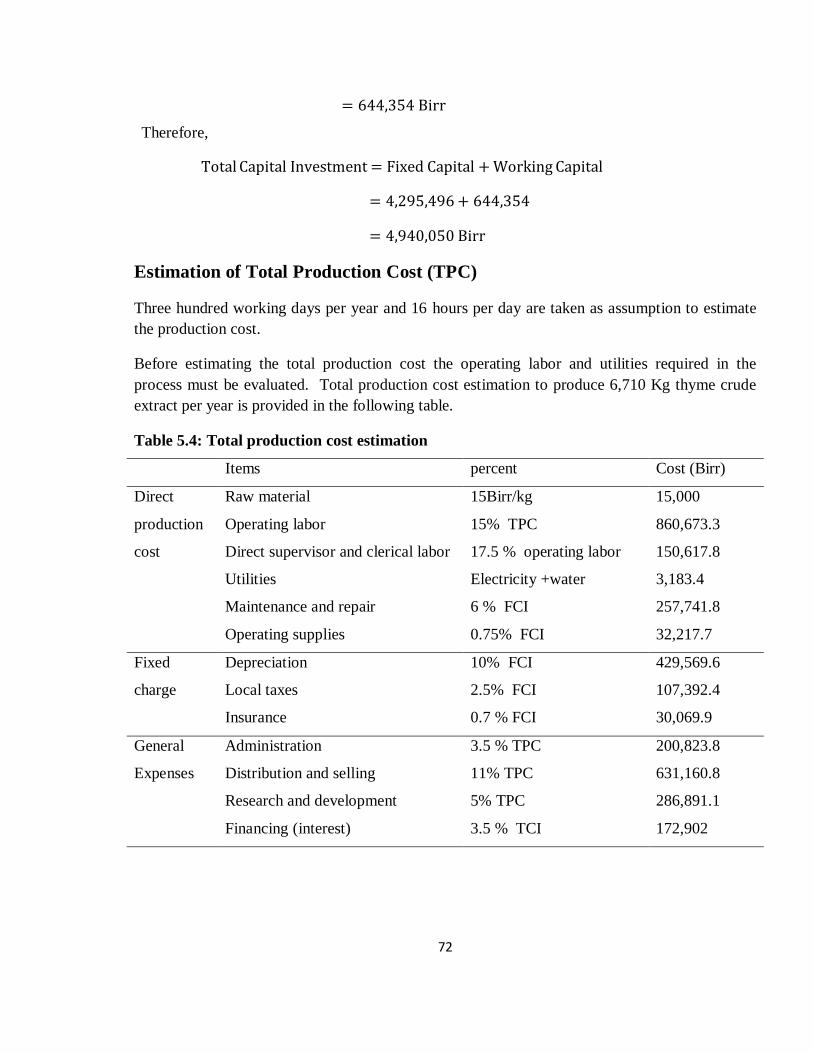
72
= 644,354 Birr Therefore,
Total Capital Investment = Fixed Capital + Working Capital
= 4,295,496 + 644,354
= 4,940,050 Birr
Estimation of Total Production Cost (TPC)
Three hundred working days per year and 16 hours per day are taken as assumption to estimate the production cost.
Before estimating the total production cost the operating labor and utilities required in the process must be evaluated. Total production cost estimation to produce 6,710 Kg thyme crude extract per year is provided in the following table.
Table 5.4: Total production cost estimation
Items percent Cost (Birr)
Direct
production
cost
Raw material 15Birr/kg 15,000
Operating labor 15% TPC 860,673.3
Direct supervisor and clerical labor 17.5 % operating labor 150,617.8
Utilities Electricity +water 3,183.4
Maintenance and repair 6 % FCI 257,741.8
Operating supplies 0.75% FCI 32,217.7
Fixed
charge
Depreciation 10% FCI 429,569.6
Local taxes 2.5% FCI 107,392.4
Insurance 0.7 % FCI 30,069.9
General
Expenses
Administration 3.5 % TPC 200,823.8
Distribution and selling 11% TPC 631,160.8
Research and development 5% TPC 286,891.1
Financing (interest) 3.5 % TCI 172,902
73
Total Production Cost (TPC) = Manufacturing Cost + General expenses
TPC = (Direct production cost + Fixed charge + plant overhead) + General expenses
TPC = (60%TPC + 10%FCI + 10%TPC) + (19.5%TPC + 3.5%TCI)
TPC − 0.895TPC = 0.1FCI + 0.035TCI
0.105TPC = 0.1 × 4,295,696 + 0.035 × 4,940,050
TPC = 5,737,822.3 Birr/year
The annual production rate of thyme crude extract is:
= 67.1Kgbatch
× 100batchyear
= 6,710 Kg thyme crude extract/year
Profitability evaluation
After estimating the total product cost, the attractiveness and profitability of proposed preliminary thyme crude extract production plant is evaluated in terms of rate of return on investment, payback time and present worth value.
Unit product cost =Total production cost
Annual production rate
= 5,737,822.36,710
= 855.1 Birr/kg thyme crude extract
The selling price of thyme crude extract with a minimum profit of 35% is 1,154.4 Birr per Kg of thyme crude extract.
Total Income =6,710Kg
year ×1,154.4 Birr
kg
= 7,745,958.2 Birr/year
i. Gross earning and Net earning
Gross earning (profit before tax) = Total Income− Total product Cost
= 7,745,958.2− 5,737,822.3
= 2,008,136Birr
Assuming that the income tax rate is 35% (the tax rate of Ethiopia);
74
Net annual earning = Gross earning − Income Tax
= 2,008,136 (1− 0.35)
= 1,305,288.3 Birr
ii. Return on Investment (ROI)
ROI = Net ProfitTotal capital investment
× 100
= 1,305,288.3/4,940,050 × 100 = 26.4%
iii. Payback Time
Payback Period is used to know when project’s initial investment will be fully recovered .The
investment cost and income statements are used to determine the pay-back period. The plant is
assumed to have depreciation of five years.
Payback period =FCI
Net profit + Depreciation
=4,295,696
1,305,288.3 + 859,139.2 = 1.98 years
Based on the preliminary economic evaluation, the suggested project has a return on investment
(ROI) of 26.4 % and payback period of 1.98 years. The evaluation shows that there is good profit
margin and the suggested project is financially feasible.
5.4. Plant Location To select proper locations and sites, certain key requirements or criteria should be set (i.e. raw
material proximity, Infrastructures, product market, human power) that would allow the
assessment of a number of potential locations. The remaining alternatives are subject to a more
in-depth qualitative and quantitative analysis of technical and financial criteria, including social,
environmental and economic aspects of location and site selection. For thyme crude extract
producing plant, based on proximity to market, availability of utilities such as water, electricity
and other infrastructures, ease of access and handling of human resource, Addis Ababa was
selected to locate the plant.
75
Chapter Six
Conclusions and Recommendation
6.1. Conclusions
Thyme is a potent source of polyphenols; thymol and carvacrol having both antioxidant and
antimicrobial properties. The aim of this study was to evaluate these properties of thyme applied
on certain foods like meat, oil and butter.
It is evident from the result of the present work and also the results of other researchers that
antioxidant of thyme crude extract depended on the extraction parameters (solvent concentration,
extraction temperature and extraction time), the kind of food substrate, concentration of the
extract being used in the substrate and the method of choice for antioxidant activity test. Higher
antioxidant activity and extract yield of thyme were found by distilled water extraction process at
20℃ extraction temperature for 3.5 hours.
The antioxidant activity of thyme has been well studied on refined soybean oil and butter using
both Rancimat and Schaal Oven Test methods at 0.1% concentration of thyme crude extract
added to these food model substrates. For comparison, 0.05% α-Tocopherol was added as
positive control and none thyme extract-negative control was also prepared and evaluated. The
results were expressed as Induction Time (IT) and Protection Factor (PF). Induction Time
(Protection Factor) of thyme and α-Tocopherol were 3.25±0.02 hrs (PF of 1.69) & six day (PF of
1.2) and 4.98±0.10 hr IT (PF of 2.59) & seven day (1.5PF) as determined by Rancimat and
Schaal Oven Test method in soybean oil respectively. Thyme also has 5.28±0.08 hrs IT (PF of
1.4) when evaluated in butter by Rancimat method. It may be concluded that thyme crude extract
could contain an effective antioxidant in stabilizing refined soybean oil and butter by both two
methods used for evaluation of antioxidant activity of thyme crude extract. The effectiveness of
the different treatments was strongly dependent on temperature and testing methods. Rancimat
method, exhibits more consistent and objective results of thyme antioxidant activity expressed as
induction time and protection factor than the Schaal Oven Test. At 0.2% thyme extract
concentration its antioxidant activity was also being comparable to natural reference antioxidant
Vitamin E (α-Tocopherol) used in this study.
76
The Preservative effect (chemical analysis) of thyme crude extract has been studied on refined
soybean oil and butter for three consecutive storage weeks. Free Fatty Acid value, Peroxide
value and Acid value of control treatments (without thyme extract) have increased for both butter
and oil during the three storage weeks. As the results show, both treatments of 0.1 and 0.2%
thyme extract significantly retard the values of these oxidative quality parameters of butter and
oil.
The results clearly indicated that supplementing 0.1% and 0.2% thyme crude extract has the
beneficial effect in controlling the microbial load (total aerobic plate count, total aerobic yeast &
mold and total count of Enterobacteriaceae) of both meat and butter during three weeks of
storage at 4℃. However, the control sample of both meat and butter showed higher microbial
load. Thyme crude extract applied at 0.2% has exhibited better capacity to delay the microbial
growth compared to other samples of both meat and butter.
In conclusion, this study provides an insight into understanding the behavior of added natural
antioxidants on soybean oil and butter oxidation. Based on the results, samples with 0.2% thyme
extract significantly (P<0.05) improved both the oxidative and microbial stability. Hence,
Ethiopian thyme has acceptable antioxidant activity and preservative effect as observed on thyme
extract treated food products.
77
6.2. Recommendation Extracts from natural materials are mixture of many components and the content of active
antioxidant is usually low so that large addition would be necessary to obtain significant
improvement against oxidation. However, such large addition may change the flavor and
functional properties of food products. Thus, active antioxidant content and composition of
thyme crude extract could be studied by high performance liquid chromatography (HPLC) and
Gas chromatography (GC).
Even though antioxidant activity cannot be measured directly rather indirectly by the effect of
the antioxidant in controlling the extent of oxidation in model food substrate, antioxidant activity
of thyme crude extract could also be determined using other antioxidant activity evaluation
methods like radical scavenging system.
In human food, its recommended that prior to thyme extraction it can be used in powder and leaf
form in preparing berbere, shiro, tea, butter, pizza and flour. Some of these applications of thyme
have already been used in the society. Due to antifungal property of thyme, it can be used in
preparing cosmetics for skin and hair.
These studies provide the basis for further research:
Develop purified natural antioxidant from this potential herb and others
Improve the quality of meat using thyme as animal feed.
Prepare agricultural pesticides and insecticides
Develop specific active packaging able to have antimicrobial property
Exploit new nutraceuticals safer for human health and more reliable for food industry
applications.
78
References
Alavi L., Barzegar M., Jabbari A., Naghdi Badi H. (2010). Effect of Heat Treatment on Chemical Composition and Antioxidant Property of Thymus daenensis Essential Oil. J. Medicinal Plants, 35: 129-136.
Allen J. C. and Hamilton R. J. (1994). Rancidity in Foods, 3rd edition., London, England.
Alonso E., Bourzeix M. and Revilla E. (1991). Suitability of water/ethanol mixture for the extraction of catechins and proanthocyanidins from Vitis vinifera seeds contained in a winery by product. J. Seed Sci. Technol., 19: 545–552.
Al-Tarawneh A.A. (2004). Study on Pseudomonas aeruginosa isolated from infected patients: copper uptake, hematological findings and effect of some medicinal plants. M.Sc. Thesis, Sudan University for Science and Technology, Sudan.
Aneta Wojdyło, Jan Oszmian´ski, Renata Czemerys (2007). Antioxidant activity and phenolic compounds in 32 selected herbs. J. Food Chem., 105: 940–949.
Antolovich M., Prenzyler P. D., Patslides E., McDonald S. and Robards K. (2002). Methods for testing antioxidant activity. Analyst, 127: 183-198.
AOAC. (2000). Association of Official Analytical Chemists. Official methods of Analysis (Vol. II 17th edition) of AOAC International. Washington, DC, USA.
AOCS. (1989). Official and Recommended Practices of the American Oil Chemists Society, 5th edition.
Arshad M., Ayoub Rashid, Zahid Qureshi M., Syed Ali Raza and William J. (2010). Quantitative Determination of Antioxidant Potential of Artemisia Persica. J. Food Chemi., 19: 23-30.
Asfaw N., Storesund H. J., Skattebol L., Tonnesen F., Aasen A. J., (2000). Volatile oil constituents of two Thymus species from Ethiopia, J. Flavor Fragr., 15: 123-125.
Ashrae.(1994). Handbook of Refrigeration. American Society of Heating, Refrigerating, and Air-Conditioning Engineers. SI version, Atlanta.
Awraris Derbe (2009). Investigation of the levels of selected metals in the leaves of thyme (T. schimperi and T. vulgaris) grown in Ethiopia. MSc.Thesis, Addis Ababa University Science Faculty, Ethiopia.
Beddows C.G., Jagait C. and Kelly M.J. (2000). Preservation of alpha-tocopherol in sunflower oil by herbs and spices. Int. J. Food Sci. Nutr., 51(5):327–339.
Beuchat, L.R. (1994). Antimicrobial properties of spices and their essential oils, in Natural Antimicrobial Systems and Food Preservation. CAB International, Oxon, pp. 167–179.
79
Bounatirou S., Smiti S., Miguel M.G., Faleiro L. Rejeb M.N. et al. (2007). Chemical composition, antioxidant and antibacterial activities of the essential oils isolated from Tunisian Thymus capitatus. Food Chem., 105: 146-155.
Bozin B., Mimica-Dukic N., Simin N. and Anackov G. (2006). Characterization of the volatile composition of essential oils of some lamiaceae species and the antimicrobial and antioxidant activities of the entire oils. J. Agric. Food Chem., 54: 1822-1828.
Burt S. (2004). Essential oils: their antimicrobial properties and potential application in foods-A review. Int. J. Food Microbiol., 94: 223-253.
Cacace J.E. and Mazza G. (2003). Optimization of extraction of anthocyanins from black currants with aqueous ethanol. J. Food Sci., 68: 240–248.
Celiktas O.Y., Kocabas E.E.H., Bedir E., Sukan F.V., Ozek T. et al. (2006). Antimicrobial activities of methanol extracts and essential oils of Rosmarinus officinalis, depending on location and seasonal variations. J. Food Chem., 100: 553-559.
Chan E.W.C., Lim Y.Y., Wong S.K., Lim K.K., Tan S.P. et al. (2009). Effects of different drying methods on the antioxidant properties of leaves and tea of ginger species. J. Food Chem., 113: 166–172.
Chirinos R., Rogez H., Campos D., Pedreschi R. and Larondelle, Y. (2007). Optimization of extraction conditions of antioxidant phenolic compounds from mashua (Tropaeolum tuberosum Ruíz and Pavón) tubers. J. Separation and Purification Technol., 55: 217-225.
Dagne Ermias, Hailu Solomon, Bisrat Daniel and Worku Tadel. (1998). Constituents of the Essential Oil of Thymus schimperi, Bull. Chem. Soc. Ethiop., 12: 79-82.
Demsew Sebsebe and Asfaw (1994). Some useful indigenous labiates from Ethiopia. Newsletter, 3, 5.
Demsew Sebsebe (1993). The Genus Thymus (Labiatae) in Ethiopia. Opera. Bot., 121: 57-60.
Descalzo A. M., and Sancho A. M. (2008). A review of natural antioxidants and their effects on oxidative status, odor and quality of fresh beef produced in Argentine. Meat Science. 79: 423-436.
Ebrahimi S.N., Hadian J., Mirjalili M.H., Sonboli A. and Yousefzadi M. (2008). Essential oil composition and antibacterial activity of Thymus caramanicus at different phenological stages. Food Chem., 110: 927- 931.
Edris A. E. (2007). Pharmaceutical and therapeutic potential of essential oils and their individual volatile constituents: A review. Phytotherapy Research. 21: 308-323.
Elless M. P., Blaylock M. J., Huang J. W. and Gussman C. D. (2000). Plants as a natural source of concentrated mineral nutritional supplements. Food Chem., 71: 181-188.
Fan M. and Chen J. (2001). Studies on antimicrobial activity of extracts from thyme. 41: 499-504.
80
Farag R. S., Ali M. N. and Taha S. H. (1990). Use of some essential oils as natural preservatives for butter. JAOCS, 68:188–91.
Frankel E. N. (1993). In search of better methods to evaluate natural antioxidants and oxidative stability in food lipids. Trends Food Sci. Technol. 4: 220-225
Frankel E.N. (2007). Antioxidants in Food and Biology: Facts and Fiction. The Oily Press, Bridgewater.
Fullas F. (2003). Spice plants in Ethiopia: their culinary and medicinal applications. Iowa, USA: Library Congress Cataloging.
Gianni et al. (2005). Comparative evaluation of 11 essential oils of different origin as functional antioxidants, antiradicals and antimicrobials in foods. J. Food Chem., 91: 621-632.
Guillen-Sans R. and Guzman-Chozas M. (1998). The thiobarbituric acid (TBA) reaction in foods: a review, Crit. Rev. Food Sci. and Nutr., 38: 315–30.
Gulcan O. and Bedia H. (2007). Antioxidant activities of Satureja cilicica essential oil in butter and in vitro. J. Food Engineering, 79: 1391-6.
Gutierrez J., Barry-Ryan C. and Bourke P. (2009). Antimicrobial activity of plant essential oils using food model media: Efficacy, synergistic potential and interactions with food components. Food Microbiol., 26: 142-150.
Halliwell B. and Gutteridge J. M. C. (2007). Free Radicals in Biology and Medicine. 3rd edition, Oxford University Press, Oxford.
Hara-Kudo Y., Kobayashi A., Sugita-Konishi Y. and Kondo K. (2004). Antibacterial activity of plants used in cooking for aroma and taste. J. Food Protect, 67:2820–2824.
Hou D. X. (2003). Potential mechanism of cancer chemoprevention by anthocyanin. Current Advancements in Molecular Medicines, 3: 149–159.
Iraj Rasooli (2007). Food Preservation – A Bio-preservative Approach. Global Science Books, Tehran, Iraq.
Iris Hinneburg, Damien Dorman H.J. and Raimo Hiltunen (2005). Antioxidant activities of extracts from selected culinary herbs and spices. J. food chem.., 97:122-129.
Jan P., Nedyalka Y. and Michael G. (2001). Antioxidants in food practical application. Woodhead Publishing Limited, Cambridge, England.
Joon Kwan Moon and Shibamoto T. (2009). Antioxidant Assays for Plant and Food Components. J. Agric. Food Chem., 57(5): 1655–1666.
Karadeniz F., Burdurlu H. S., Koca N. and Soyer Y. (2005). Antioxidant activity of selected fruits and vegetable grown in Turkey. Turkey J. Agric., 29: 297-303.
81
Kwang-geun Lee and Shibamoto T. (2002). Determination of Antioxidant Potential of Volatile Extracts Isolated from Various Herbs and Spices. J. Agric. Food Chem., 50: 4947-4952.
Kwon J.H., Lee G.D., Belanger J.M.R. and Pare J.R.J. (2003b). Effect of ethanol concentration on the efficiency of extraction of ginseng saponins when using a microwave- assisted extraction (MAP). Int. J. Food Sci. and Technol., 38: 615–622.
Lester P. and Enrique C. (2002). Handbook of antioxidants, 2nd edition, New York, Marcel Dekker.
Liu Z., Mudrew K., Wan R. and Elliot J. (2003). Measurement of freezing point depression of water in glass capillaries and the associated ice front shape, Physical Review.
Liyana-Pathirana C. and Shahidi, F. (2005). Optimization of extraction of phenolic compounds from wheat using response surface methodology. J. Food Chem., 93(1): 47-56.
Lopez-Malo A., Barreto-Valdivieso J., Palou E. and Martin F. S. (2006). Aspergillus flavus growth response to cinnamon extract and sodium benzoate mixtures. Food Control, 18: 1358−1362.
Luby J. M., Gray J. I. and Harte B. R. (1986). Effects of packaging and light source on the oxidative stability of cholesterol in butter. J. Food Sci. 51: 908–11.
Mariassyova M. (2006). Antioxidant activity of some herbal extracts in rapeseed and sunflower oils. J. Food Nutr. Res. 45(3):104–109.
Michael H. (2001). the development of oxidative rancidity. England
Milan C., Hana C., Petko D., Maria K., Anton S. et al. (2010). Different methods for control and comparison of the antioxidant properties of vegetables. Food Control, 21: 518–523.
Miura K., Kikuzaki H. and Nakatani N. (2002). Antioxidant activity of chemical components of sage (Salvia Officinalis L.) and thyme (Thymus Vulgaris L.) measured by the oil stability index method. J. Agric. Food Chem., 50: 1845–51.
Montgomery D.C. (2001). Design and Analysis of Experiments, 5th edition. New York: John Wiley and Sons.
Naczk M. and Shahidi F. (2004). Extraction and analysis of phenolics in food. J. Chormatography, 1054 (1-2): 95-111.
Negi P.S., Chauhan A.S., Sadia G.A., Rohinishree Y.S. and Ramteke R.S. (2005). Antioxidant and Antibacterial Activities of Various Seabuckthorn (Hippophae rhamnoides L.) Seed Extracts. Food Chem., 92: 119-124.
Nessrien M.N. Yasin and Mohamed Abou-Taleb (2007). Antioxidant and Antimicrobial effects of Marjoram and Thyme in Coated Refrigerated Semi Fried Mullet Fish Fillets. World J. Dairy & Food Sci., 2 (1): 01-09.
NMKL. (2006). The Nordic Committee on Food Analysis. 4th edition, No. 86: Aerobic microorganisms determination in foods.
82
NMKL .(2005). The Nordic Committee on Food Analysis. 4th edition, No. 98: Mold and Yeast determination in foods and feeds
NMKL .(2005). The Nordic Committee on Food Analysis. 3rd edition, No. 144: Enterobacteriaceae determination in foods and feeds
Nwaogu L.A., Alisi C.S., Igwe C.U. and Ujowundu C.O. (2008). A comparative study of the antimicrobial properties of the ethanolic extracts of Landolphia owariensis leaf and root. African J. Biotech., 7(4): 368- 372.
Omidbeygi M., Barzegar M., Hamidi Z. and Naghdibadi H. (2007). Antifungal activity of thyme, summer savory and clove essential oils against Aspergillus flavus in liquid medium and tomato paste. Food Control, 18: 1518–1523.
Paradiso V. M., Summo C., Trani A. and Caponio F. (2008). An effort to improve the shelf life of breakfast cereals using natural mixed tocopherols. J. Cereal Sci., 47: 322-330.
Parekh J., Jadeja D. and Chanda S. (2005). Efficacy of aqueous and methanol extracts of some medicinal plants for potential antibacterial activity. Turk. J. Bio., 29: 203-210.
Pazos M., Alonso A., Sanchez I. and Medina I. (2008). Hydroxytyrosol Prevents Oxidative Deterioration in Foodstuffs Rich in Fish Lipids. J. Agric. Food Chem., 56: 3334-3340.
Perry R.H. and Green D.W. (1999). Perry’s Chemical Engineers’ Handbook. McGraw-Hillcompanies.
Peter K. V. (2004). Handbook of herbs and spices. Volume 2, Woodhead Publishing Limited, Cambridge, England.
Peter M. S. and Timmerhaus K. D., (1991). Cost estimation. In: Plant Design and Economics for Chemical Engineers, 4th edition, Inc, New York, pp.150-295.
Prior R. L. (2004). Absorption and metabolism of anthocyanins: potential health effects. Phytochemicals: mechanisms of action, 1–19.
Rota C., Carraminana J. J., Burillo J. and Herrera A. (2004). In-vitro antimicrobial activity of essential oils from aromatic plants against selected foodborne pathogens. J. Food Protection, 67: 1252–1256.
Rota C., Herrera A., Martinez R. M., Sotomayor J. A. and Jordan M. J. (2008). Antimicrobial activity and chemical composition of Thymus vulgaris, Thymus zygis and Thymus hyemalis essential oils. Food Control, 19: 681-687.
Ruberto G. and Baratta M. T. (2000). Antioxidant activity of selected essential oil components in two lipid model systems. Food Chem., 69: 167–174.
Sacchetti G., Maitti M., Muzzoli M., Scaglianti M., Manfredini S. et al. (2005). Comparative evaluation of 11 essential oils of different origin as functional antioxidants, antiradicals and antimicrobials in food. Food Chem., 91: 621–632.
83
Salah Selmi and Saloua Sadok (2008). The effect of natural antioxidant (Thymus vulgaris Linnaeus) on flesh quality of tuna (Thunnus thynnus (Linnaeus)) during chilled storage. Pan-American J. Aquatic Sci., 3: 36-45.
Sukhdev S. H., Suman Preet S. K., Gennaro L. and Dev D. R. (2008). Extraction technologies for medicinal and Aromatic plants. International Centre for Science and High Technology, Trieste, Italy.
Tabak M., Armon R., Potasman I. and Neeman I. (1996). In vitro inhibition of Helicobacter pylori by extracts of thyme. J. Appl. Bacteriol., 80: 667-672.
Tea Kulisic, Verica Dragovi-Uzelac and Mladen Milo (2006). Antioxidant Activity of Aqueous Tea Infusions Prepared from Oregano, Thyme and Wild Thyme, J. Food Technol. and Biotechnol., 44: 485-492.
UNIDO and FAO (2005). Herbs, spices and essential oils Post-harvest operations in developing countries. Institute for Crop and Food Research Inc. New Zealand.
Usamas Jariyawaranugoon and Adisak Akesowan. (2010). Effect of Thyme and Lemongrass Extracts on Quality Characteristics of Thai Coconut Cream Dip during Storage. J. Appl. Sci. Research, 11: 1596-1602.
Velazco J., Dobarganes M.C. and Márquez-Ruiz. (2000). Application of the accelerated test Rancimat to evaluate oxidative stability of dried microencapsulated oils. 51(4): 261-267.
Villupanoor, Parthasarathy A. and Chempakam B. (2008). Chemistry of spices. Indian Institute of Spices Research Calicut, Kerala, India
Wangcharoen W. and Morasuk W. (2007). Antioxidant capacity and phenolic content of holy basil. J. Sci. Technol., 29: 1407-1415.
Wettasinghe M. and Shahidi F. (1999). Antioxidant and free radical-scavenging properties of ethanolic extracts of defatted borage (Borago officinalis L.) seeds. J. Food chem.., 67: 399–414.
Wu P. F. and Nawar W. W. (1986). A technique for monitoring the quality of used frying oils. J. American Oil Chemists Society, 63: 1363–1367.
Zegarska Z., Amarowicz R., Karmac M. and Rafalowski R.(1996). Antioxidative effect of rosemary ethanolic extract on butter. Milchwissenschaft, 51:195–8.
Zhang Z., Li D., Wang L., Ozkan N., Chen X.D., Mao Z. et al. (2007). Optimization of ethanol–water extraction of lignans from flaxseed. J. Separation and Purification Technol., 57(1): 17-24.
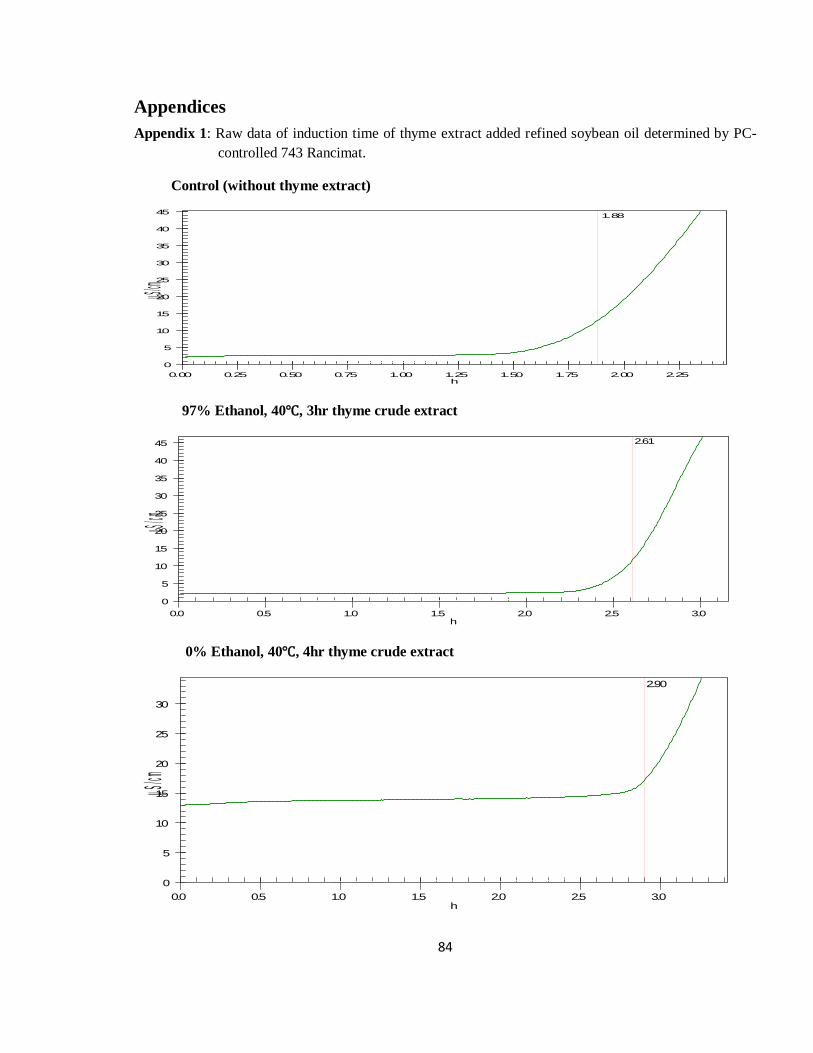
84
Appendices Appendix 1: Raw data of induction time of thyme extract added refined soybean oil determined by PC-
controlled 743 Rancimat.
Control (without thyme extract)
97% Ethanol, 40℃, 3hr thyme crude extract
0% Ethanol, 40℃, 4hr thyme crude extract
1.88
0
5
10
15
20
25
30
35
40
45
0.00 0.25 0.50 0.75 1.00 1.25 1.50 1.75 2.00 2.25
µS/cm
h
2.61
0
5
10
15
20
25
30
35
40
45
0.0 0.5 1.0 1.5 2.0 2.5 3.0
µS/cm
h
2.90
0
5
10
15
20
25
30
0.0 0.5 1.0 1.5 2.0 2.5 3.0
µS/cm
h
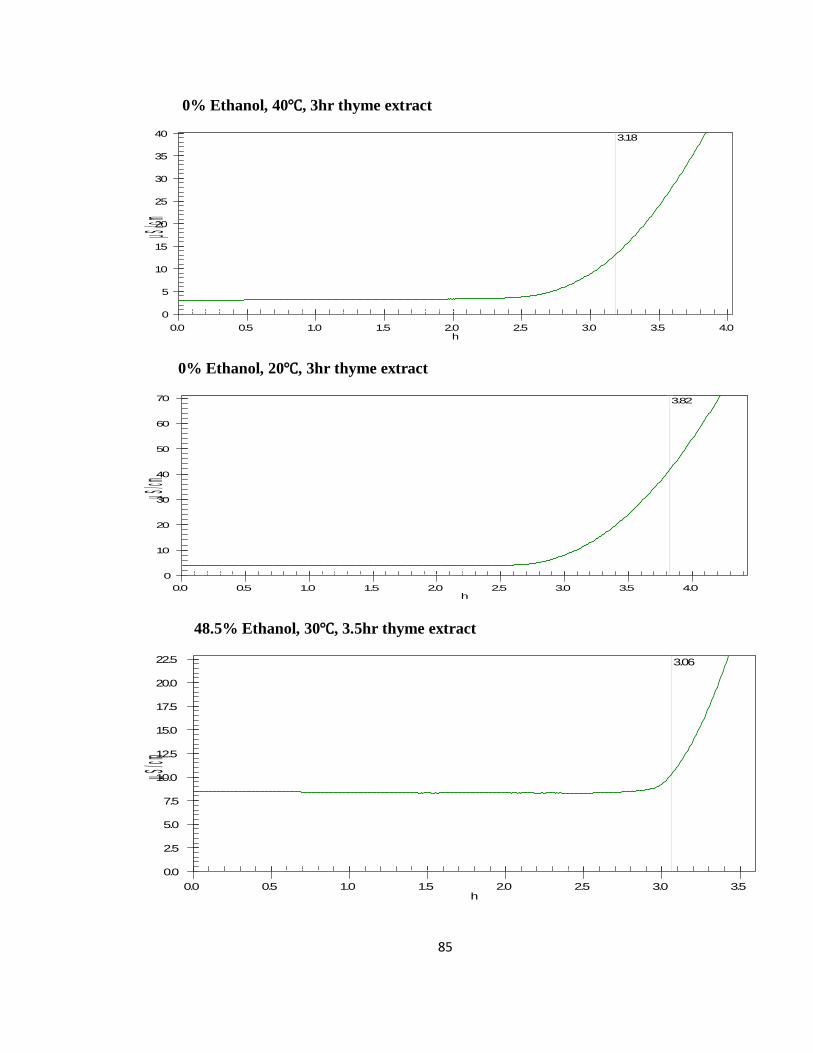
85
0% Ethanol, 40℃, 3hr thyme extract
0% Ethanol, 20℃, 3hr thyme extract
48.5% Ethanol, 30℃, 3.5hr thyme extract
3.18
0
5
10
15
20
25
30
35
40
0.0 0.5 1.0 1.5 2.0 2.5 3.0 3.5 4.0
µS/cm
h
3.82
0
10
20
30
40
50
60
70
0.0 0.5 1.0 1.5 2.0 2.5 3.0 3.5 4.0
µS/cm
h
3.06
0.0
2.5
5.0
7.5
10.0
12.5
15.0
17.5
20.0
22.5
0.0 0.5 1.0 1.5 2.0 2.5 3.0 3.5
µS/cm
h
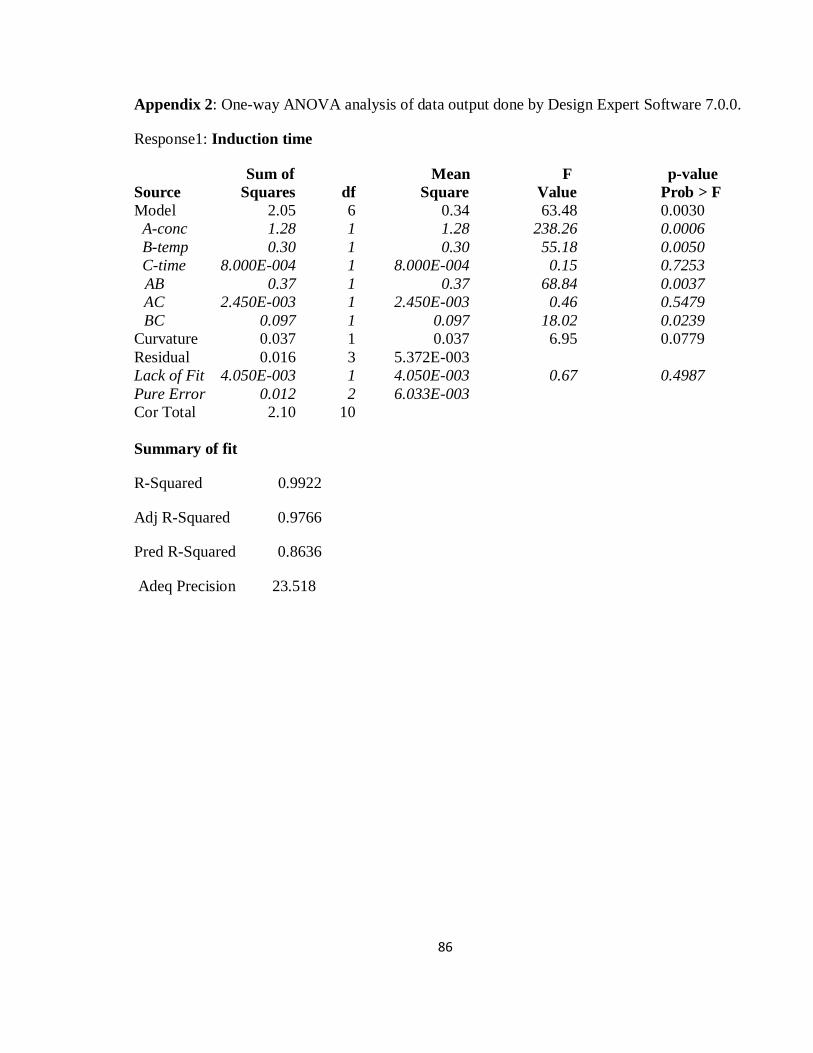
86
Appendix 2: One-way ANOVA analysis of data output done by Design Expert Software 7.0.0.
Response1: Induction time
Sum of Mean F p-value Source Squares df Square Value Prob > F Model 2.05 6 0.34 63.48 0.0030 A-conc 1.28 1 1.28 238.26 0.0006 B-temp 0.30 1 0.30 55.18 0.0050 C-time 8.000E-004 1 8.000E-004 0.15 0.7253 AB 0.37 1 0.37 68.84 0.0037 AC 2.450E-003 1 2.450E-003 0.46 0.5479 BC 0.097 1 0.097 18.02 0.0239 Curvature 0.037 1 0.037 6.95 0.0779 Residual 0.016 3 5.372E-003 Lack of Fit 4.050E-003 1 4.050E-003 0.67 0.4987 Pure Error 0.012 2 6.033E-003 Cor Total 2.10 10 Summary of fit
R-Squared 0.9922
Adj R-Squared 0.9766
Pred R-Squared 0.8636
Adeq Precision 23.518
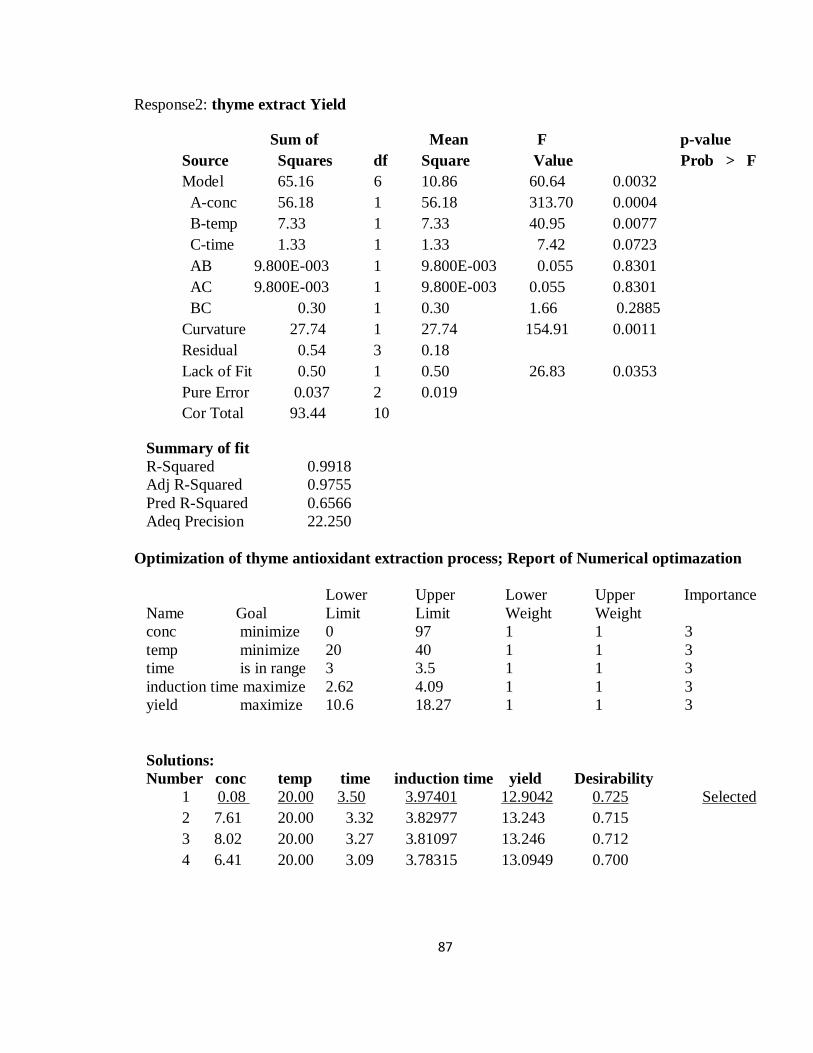
87
Response2: thyme extract Yield
Sum of Mean F p-value Source Squares df Square Value Prob > F Model 65.16 6 10.86 60.64 0.0032 A-conc 56.18 1 56.18 313.70 0.0004 B-temp 7.33 1 7.33 40.95 0.0077 C-time 1.33 1 1.33 7.42 0.0723 AB 9.800E-003 1 9.800E-003 0.055 0.8301 AC 9.800E-003 1 9.800E-003 0.055 0.8301 BC 0.30 1 0.30 1.66 0.2885 Curvature 27.74 1 27.74 154.91 0.0011 Residual 0.54 3 0.18 Lack of Fit 0.50 1 0.50 26.83 0.0353 Pure Error 0.037 2 0.019 Cor Total 93.44 10
Summary of fit R-Squared 0.9918 Adj R-Squared 0.9755 Pred R-Squared 0.6566 Adeq Precision 22.250 Optimization of thyme antioxidant extraction process; Report of Numerical optimazation Lower Upper Lower Upper Importance Name Goal Limit Limit Weight Weight conc minimize 0 97 1 1 3 temp minimize 20 40 1 1 3 time is in range 3 3.5 1 1 3 induction time maximize 2.62 4.09 1 1 3 yield maximize 10.6 18.27 1 1 3 Solutions: Number conc temp time induction time yield Desirability 1 0.08 20.00 3.50 3.97401 12.9042 0.725 Selected
2 7.61 20.00 3.32 3.82977 13.243 0.715 3 8.02 20.00 3.27 3.81097 13.246 0.712 4 6.41 20.00 3.09 3.78315 13.0949 0.700
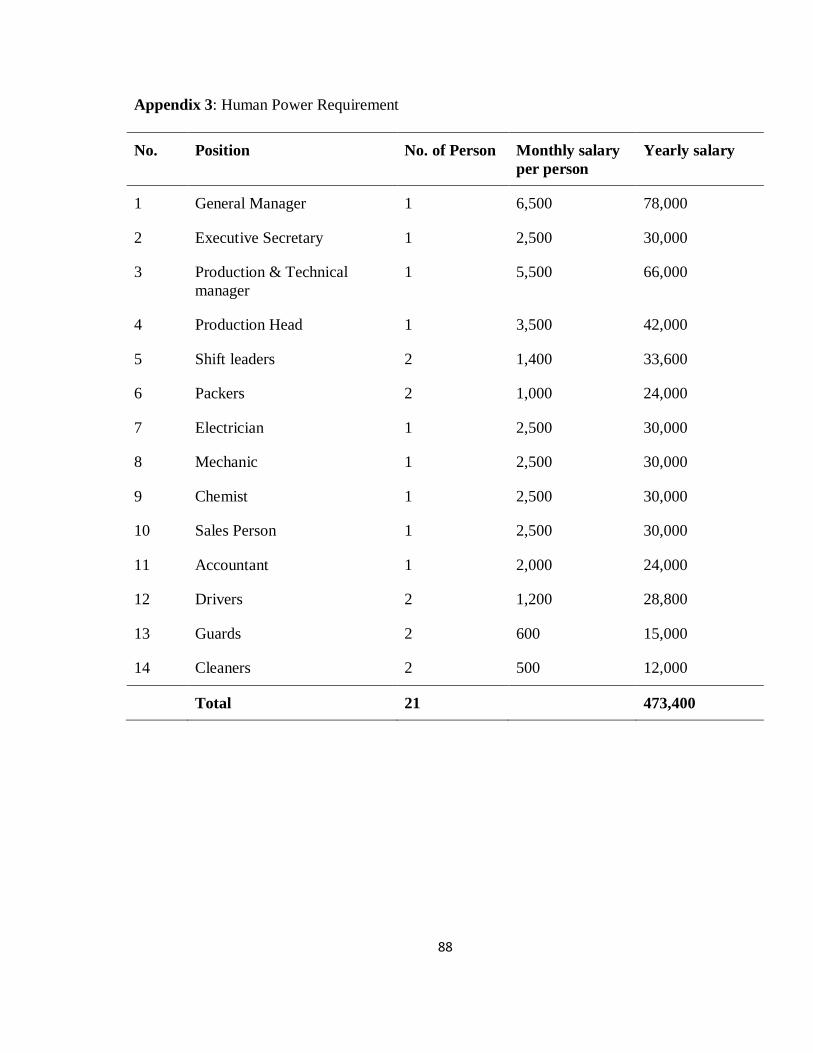
88
Appendix 3: Human Power Requirement
No. Position No. of Person Monthly salary per person
Yearly salary
1 General Manager 1 6,500 78,000
2 Executive Secretary 1 2,500 30,000
3 Production & Technical manager
1 5,500 66,000
4 Production Head 1 3,500 42,000
5 Shift leaders 2 1,400 33,600
6 Packers 2 1,000 24,000
7 Electrician 1 2,500 30,000
8 Mechanic 1 2,500 30,000
9 Chemist 1 2,500 30,000
10 Sales Person 1 2,500 30,000
11 Accountant 1 2,000 24,000
12 Drivers 2 1,200 28,800
13 Guards 2 600 15,000
14 Cleaners 2 500 12,000
Total 21 473,400
89
Declaration
I, the undersigned, declare that this thesis is my original work and has not been presented for a
degree in any other University, and that all sources of materials used for the thesis have been
duly acknowledged.
Name: Gebrehana Ashine Hailemariam
Signature: _________________________
Place: Addis Ababa, Ethiopia
Date of submission: __________________________
This thesis has been submitted for examination with my approval as University advisor.
Name: Dr. Eng. Shimelis Admasu (Associate Prof.)
Signature: _____________________________


