Embed Size (px)
Citation preview

Additional Information
Executive Summary
Credentials for All: An Imperative for SREB States
SouthernRegionalEducationBoard
SREB.orgFrom the report of the Southern Regional Education Board Commission on Career and Technical Education
Credentials for All: An Imperative for SREB States
The challenge: How do we help more young people earn the postsecondary credentials and degrees that matter in today’s economy?
SREB states and the nation are gaining ground on high school graduation rates. Eighty percent of American students now graduate on time from high school — continuing a decade of steady progress.1
However, the future looks bleak for young people with a high school diploma or less and no postsecondary credential of value in the workplace. The number of jobs available to those with a high school diploma or less has steadily declined for decades, and the Great Recession hit these individuals hard,4 particularly in SREB states.5 Workers with a high school diploma or less continue to lose jobs despite the economic recovery.6
For young people born into poverty, educational attainment may offer the only means of moving up the economic ladder. Research shows that 42 percent of young people born to families in the lowest fifth of income distribution will remain there7 — a considerably higher percentage than countries like Great Britain (about 30 percent) or northern European countries like Denmark, Finland and Sweden (about 15 percent).8 Even youth born to middle-income families are as likely to move down the economic ladder as they are to move up.9
The future looks brighter for young people with the right postsecondary credentials. Higher education attainment of any kind benefits individuals in the labor market. Post-recession, jobs for those with bachelor’s degrees have increased, and jobs for workers with some college or a postsecondary credential have mostly recovered.10
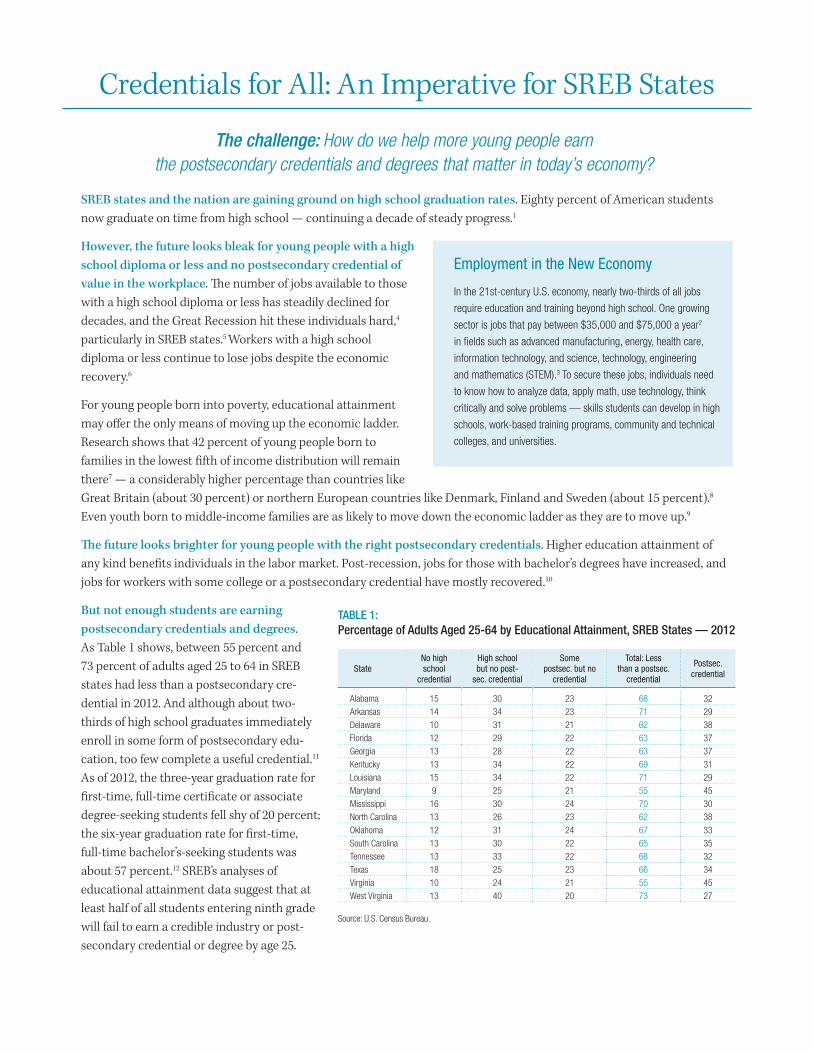
But not enough students are earning postsecondary credentials and degrees. As Table 1 shows, between 55 percent and 73 percent of adults aged 25 to 64 in SREB states had less than a postsecondary cre-dential in 2012. And although about two-thirds of high school graduates immediately enroll in some form of postsecondary edu- cation, too few complete a useful credential.11 As of 2012, the three-year graduation rate for first-time, full-time certificate or associate degree-seeking students fell shy of 20 percent; the six-year graduation rate for first-time, full-time bachelor’s-seeking students was about 57 percent.12 SREB’s analyses of educational attainment data suggest that at least half of all students entering ninth grade will fail to earn a credible industry or post-secondary credential or degree by age 25.
Employment in the New Economy
In the 21st-century U.S. economy, nearly two-thirds of all jobs
require education and training beyond high school. One growing
sector is jobs that pay between $35,000 and $75,000 a year2
in fields such as advanced manufacturing, energy, health care,
information technology, and science, technology, engineering
and mathematics (STEM).3 To secure these jobs, individuals need
to know how to analyze data, apply math, use technology, think
critically and solve problems — skills students can develop in high
schools, work-based training programs, community and technical
colleges, and universities.
TABLE 1: Percentage of Adults Aged 25-64 by Educational Attainment, SREB States — 2012
StateNo high school
credential
High school but no post-
sec. credential
Some postsec. but no
credential
Total: Less than a postsec.
credential
Postsec. credential
Alabama 15 30 23 68 32Arkansas 14 34 23 71 29Delaware 10 31 21 62 38Florida 12 29 22 63 37Georgia 13 28 22 63 37Kentucky 13 34 22 69 31Louisiana 15 34 22 71 29Maryland 9 25 21 55 45Mississippi 16 30 24 70 30North Carolina 13 26 23 62 38Oklahoma 12 31 24 67 33South Carolina 13 30 22 65 35Tennessee 13 33 22 68 32Texas 18 25 23 66 34Virginia 10 24 21 55 45West Virginia 13 40 20 73 27
Source: U.S. Census Bureau.
Low educational attainment harms individuals and the economy. At current rates of attainment, by 2020 the United States will fall 5 million workers short of industry demand for employees with some postsecondary education.13 Despite this substantial workforce gap, joblessness is persistently high, especially for minorities. According to U.S. Department of Labor data for adults aged 20 to 24 who were looking for work in 2013, unemployment was more than 11 percent for white young adults, almost 13 percent for Hispanic young adults and nearly 23 percent for black young adults.14 The economic out- look for young men is also poor. The age at which young men can expect to reach the median wage has shifted dramatically. In 1980, it was age 26; in 2010, it was age 30.15
Not enough students are earning credentials and degrees in the right fields for today’s economy. Many believe that a bachelor’s degree, regardless of major, is the best guarantee of a well-paying job. Yet after taking on debt, some recent college graduates find themselves with no work. As of 2012, the average unemployment rate for recent college graduates ages 22 to 26 with a bachelor’s degree was 7.5 percent.17 And according to one estimate, as many as 23 per- cent of recent college graduates may be underemployed, working in a job that requires less than a college degree.18
Overall, SREB’s analyses of educational and labor market data suggest that for many young adults, the 20s are a lost decade. After years of underemployment or unemployment, many return to school when they are nearly 30.19
Simply put, the bridge from high school to postsecondary attainment and career opportunities is broken. To solve this problem, more high school students must get into community and technical colleges — and on pathways to postsecondary attainment and career advancement — much sooner.
The challenge: How do we provide more young people with an education that connects the classroom with the workplace and prepares them to succeed in postsecondary education and 21st-century careers?
The solution:
l Transform education with rigorous, relevant career pathways that align secondary, postsecondary and workplace learning and lead to postsecondary credentials that help individuals secure good jobs.
l Double the percentage of young adults who earn postsecondary credentials by age 25 over the next decade. These credentials include advanced industry credentials and postsecondary certificates and degrees at the associate degree level or higher.
Members of SREB’s Commission on Career and Technical Education offer eight actions states can take to build rigorous, relevant career pathways.
These eight actions — supported by a set of policies and practices summarized below and described at length in the full report — can help states double the percentage of young adults earning valuable industry and postsecondary credentials.
“The new forgotten half [are] those youth who
do not complete college and find themselves
shut out of good jobs in the era of college for
all… Many youth who took society’s advice
to attend college, sacrificing time and often
incurring debts, have nothing to show for their
efforts in terms of credentials, employment, or
earnings.”
— William T. Grant Foundation16
Executive Summary
ACTION 1 — Build bridges from high school to postsecondary education and the workplace by creating rigorous, relevant career pathways driven by labor market demand. Such pathways:
A. Combine a college-ready academic core with challenging technical studies and require students to complete real-world assignments.
Require all students to complete a college-ready academic core and a concentration — for example, a four-course career pathway or a set of Advanced Placement or International Baccalaureate courses — that provide the foundational learning skills they need to earn credentials and secure good jobs.
B. Align three stages of learning — secondary, postsecondary and the workplace — through strategies like dual enrollment and work-based learning.
Leverage state and federal funds to incentivize school districts, community and technical colleges, and employers to develop career pathways that align with identified workforce needs in key state and regional industry sectors.
Promote structured dual enrollment programs for career pathways and establish uniform statewide policies so students can earn credits toward high school graduation that are automatically added to students’ transcripts at community and technical colleges.
Incentivize industry partners to expand ongoing, structured, progressively intensive work-based learning that engages students in authentic applications of academic, technical and workplace skills.
Develop policies with insurers, workforce commissions and other agencies to protect students and their employers in work-based learning experiences.
C. Create guidance systems that include career information, exploration and advisement and engage students in ongoing career and college counseling beginning in the middle grades.
Mandate career exploration courses and activities in the middle grades and high school and adopt distributed, curriculum-based career guidance systems that make career and college counseling the shared responsibility of every adult in the school.
Royce West, Texas State Senator
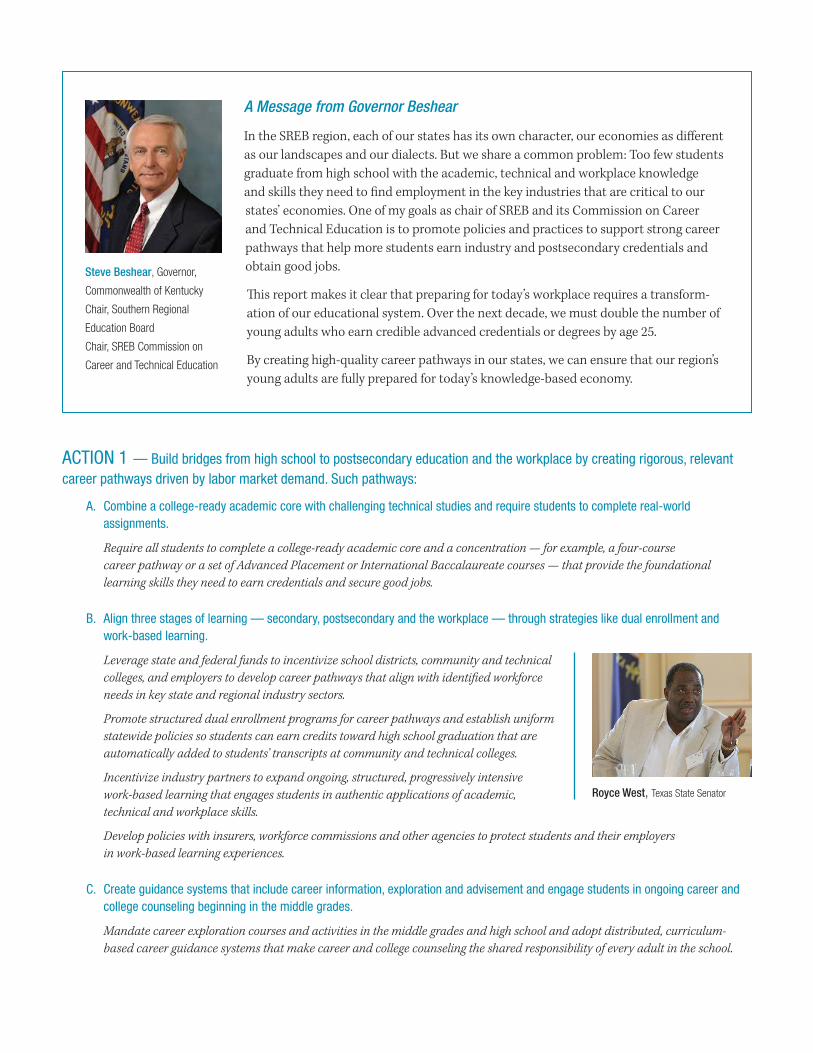
A Message from Governor Beshear
In the SREB region, each of our states has its own character, our economies as different as our landscapes and our dialects. But we share a common problem: Too few students graduate from high school with the academic, technical and workplace knowledge and skills they need to find employment in the key industries that are critical to our states’ economies. One of my goals as chair of SREB and its Commission on Career and Technical Education is to promote policies and practices to support strong career pathways that help more students earn industry and postsecondary credentials and obtain good jobs.
This report makes it clear that preparing for today’s workplace requires a transform-ation of our educational system. Over the next decade, we must double the number of young adults who earn credible advanced credentials or degrees by age 25.
By creating high-quality career pathways in our states, we can ensure that our region’s young adults are fully prepared for today’s knowledge-based economy.
Steve Beshear, Governor,
Commonwealth of Kentucky
Chair, Southern Regional
Education Board
Chair, SREB Commission on
Career and Technical Education
D. Allow students to choose accelerated learning options in settings that provide the extended time needed to earn advanced industry credentials.
Encourage school districts to offer career pathways in diverse settings — comprehensive high schools, shared-time technology centers, full-time technical high schools, early college high schools, career academies, and community and technical colleges — that allow students to earn advanced credentials and college credits while still participating in activities at their home high schools.
Incentivize districts, technology centers, and community and technical colleges to partner to create early advanced credential programs modeled after early college high schools. Early advanced credential programs allow students to graduate with a diploma plus an advanced industry certification, postsecondary credential or significant credits toward an associate degree.
E. Lead to further education and training and high-skill, high-wage jobs in high-demand industries.
Prioritize the investment of state and federal funds to develop rigorous, relevant career pathways that lead to employment in state and regional industry sectors with a shortage of skilled workers.
ACTION 2 — Expect all students to graduate academically ready for both college and careers.
Establish literacy- and math-readiness standards for non-STEM college majors and set benchmark cut scores on the assessments chosen to measure college readiness.
Collaborate with secondary, postsecondary and industry partners to establish foundational literacy and math readiness standards needed for advanced education and training, non-degree programs and the workplace. Establish cut scores for academic career readiness on multiple validated assessments (such as nationally normed assessments) that predict success in advanced training programs.
Use state-approved junior-year academic readiness assessments as a measure of students’ academic preparedness for college and advanced training programs. Work with community and technical colleges to adopt or develop senior-year transitional readiness courses in literacy and math that count as fourth English or math credits.
ACTION 3 — Select assessments of technical and workplace readiness standards that offer long-term value to individual students, employers and the economy; carry college credits; and are directly linked to more advanced certifications and further study.
Define technical career readiness in state policy, capturing the knowledge and skills students must master to enter postsecondary education and training programs and secure high-skill, high-wage jobs in high-demand fields.
Designate a state agency to work with secondary and postsecondary education agencies and employers to identify, evaluate and approve industry certification examinations, technical skills assessments, dual credit courses and end-of-course assessments that are part of a system of stackable credentials.
ACTION 4 — Provide all high school career pathway teachers, especially new teachers from industry, with the professional development and fast-track induction programs they need to meet high academic, technical and pedagogical standards and enhance students’ academic and technical readiness for college and careers.
Allocate funds for new teachers from industry to participate in fast-track induction programs that span the first 15 months of teaching and include two weeks to one month of paid employment in the summer before they enter the classroom.
Work with postsecondary and industry partners and external providers to deliver research-based professional development that teaches academic and CTE teachers how to design real-world, project-based instruction, assignments and assessments that integrate literacy, math and science with technical content.
ACTION 5 — Adopt a framework of strategies to restructure low-performing high schools around rigorous, relevant career pathways that accelerate learning and prepare students for postsecondary credentials and degrees.
Use federal, state and local funds to help low-performing high schools reorganize around theme-based career academies that feature rigorous, relevant career pathways.
ACTION 6 — Offer early advanced credential programs in shared-time technology centers, aligning their curricula, instruction and technology with home high schools and community and technical colleges.
Create the time needed for technology center students to earn advanced industry credentials by offering full-time study during students’ junior and senior years; extending the school year or the school day; creating 13th-year early advanced credential programs; converting some centers into full-time technical high schools or full-time regional magnets; or partnering with community and technical colleges to offer junior- and senior-year career pathway instruction.
ACTION 7 — Incentivize community and technical colleges and school districts to double the percentage of students who earn certificates, credentials and degrees by setting statewide readiness standards and aligning assessment and placement measures with those standards. Other strategies: Use the senior year of high school to reduce the number of students who need remediation, retool developmental education, adopt individualized support strategies for struggling students and improve affordability.
Use a combination of incentives and performance-based funding models to encourage community and technical colleges to work with school districts to increase the percentage of students who complete their programs and earn industry credentials and postsecondary certificates and degrees.
Increase the number of ways students can qualify for credit-bearing course work and developmental education. Establish multiple measures of postsecondary readiness, such as the grade point average (GPA), benchmark scores on nationally normed assessments and college placement exams.
ACTION 8 — Design accountability systems that recognize and reward districts, high schools, technology centers, and community and technical colleges that double the number of young adults who acquire postsecondary credentials and secure high-skill, high-wage jobs by age 25.
Allocate extra weight in state accountability systems for each high school student who meets both academic college-readiness standards and technical career-readiness standards. Ensure that the state accountability system values academic college readiness and academic and technical career readiness equally.
Allocate extra weight in state accountability systems for each high school student who completes an advanced industry credential in a critical industry sector.
Increase each year the percentage of high school students who demonstrate academic, technical and workplace readiness by:
a. completing capstone courses, senior portfolios, career and technical student organization competitions, or work-based learning experiences;
b. attaining advanced industry credentials;
c. earning dual credits for career pathway courses; and
d. passing end-of-course assessments for career pathway courses that generate extra weight toward the GPA or carry college credit.
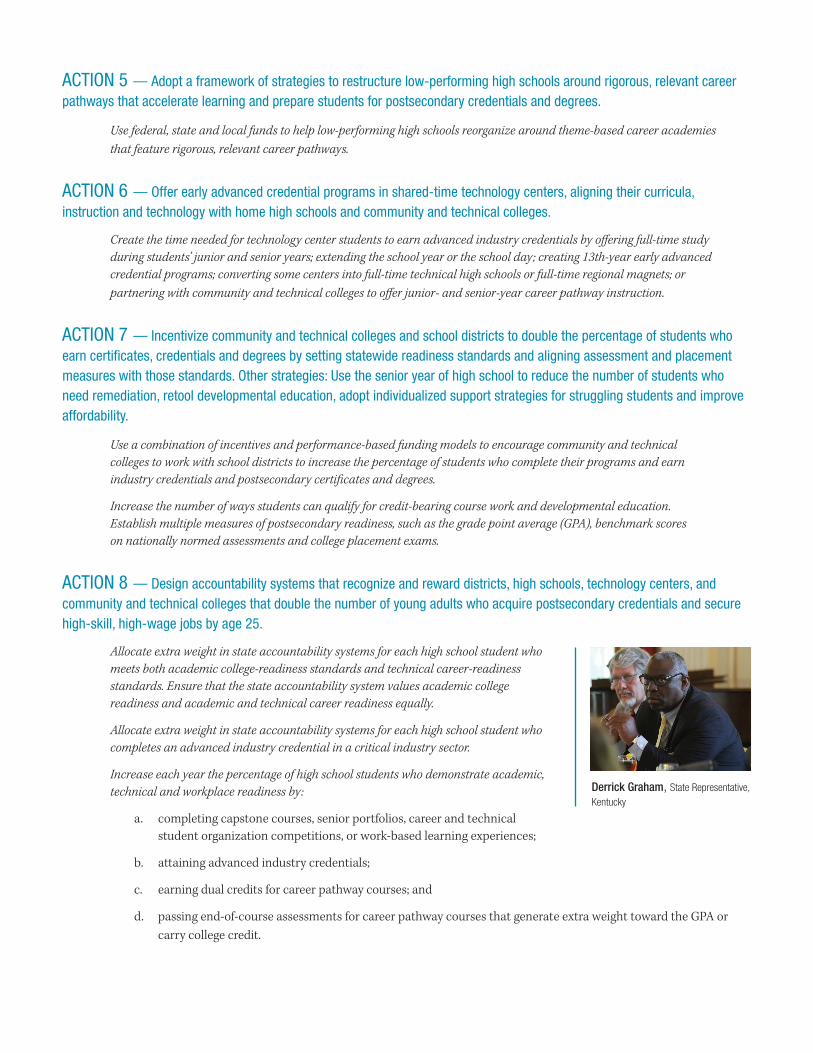
Derrick Graham, State Representative, Kentucky
Establish a multi-measure, college- and career-ready performance index to assess, track and report progress made by school districts, high schools, community and technical colleges, and employers delivering career pathways. Expect secondary and postsecondary partners to:
l Raise high school graduation rates to 90 percent or higher in all high schools within a decade or less and help schools with graduation rates of 70 percent or less raise their graduation rates to 80 percent or higher within five years.
l Increase the percentage of students who leave high school academically prepared for college and careers to 80 percent or higher.
l Increase each year the percentage of students who meet academic career-readiness benchmarks for the foundational literacy and math skills appropriate to their career pathways.
l Increase each year the percentage of high school students who complete a career pathway consisting of a college-ready academic core and at least four sequential CTE courses leading to further education and training and workforce opportunities.
l Increase each year the percentage of high school graduates who immediately enter some form of postsecondary education, including employer-sponsored work-based training programs.
l Double over the next decade the percentage of young people who complete advanced industry credentials, postsecondary certificates and degrees by age 25.
l Expand each year the number of secondary and postsecondary students who participate in employer-sponsored work-based experiences and learn-and-earn programs.
1 “Table 2: Public high school 4-year adjusted cohort graduation rate (ACGR), by race/ethnicity and selected demographics for the United States, the 50 states, the District of Columbia, and other jurisdictions: School year 2011—12.” U.S. Department of Education, National Center for Education Statistics (NCES), 2014. http://nces.ed.gov/ pubs2014/2014391/tables/table_02.asp.
2 Anthony P. Carnevale, Tamara Jayasundera and Andrew R. Hanson. Career and Technical Education: Five Ways that Pay along the Way to the B.A. Georgetown University Center on Education and the Workforce, 2012. See also Anthony P. Carnevale and Nicole Smith. A Decade Behind: Breaking Out of the Low-Skill Trap in the Southern Economy. Georgetown University Center on Education and the Workforce, 2012.
3 Carnevale and Smith, 2012. See also Rachael Unruh. Driving Innovation from the Middle: Middle-Skill Jobs in the American South’s Economy. National Skills Coalition, 2011.4 Carnevale, Jayasundera and Hanson, 2012.5 Carnevale and Smith, 2012.6 Jeff Gagne, Joan Lord and Michaela Corrente. Workforce Development in SREB States: The Role of Two-Year Colleges in Preparing Students for Middle-Skill Jobs. SREB, 2014.7 Julia B. Isaacs. Economic Mobility of Families Across Generations. Brookings Institution, 2007. 8 Markus Jäntti Bernt Bratsberg, Knut Røed Oddbjørn Raaum, Robin Naylor Eva Österbacka and Anders Björklund Tor Eriksson. American Exceptionalism in a New Light: A Comparison
of Intergenerational Earnings Mobility in the Nordic Countries, the United Kingdom and the United States. Institute for the Study of Labor, 2006.9 Isaacs, 2007.10 Gagne, Lord and Corrente, 2014.11 “Indicator 30: Immediate Transition to College. Figure 1: Percentage of high school completers who were enrolled in 2- or 4-year colleges by the October immediately following high
school completion, by level of institution: 1990- 2012.” The Condition of Education 2014. NCES, 2014.12 “Table 46: 150 Percent of Normal Time Graduation Rates in Public Universities and Colleges by Racial/Ethnic Groups.” SREB Fact Book on Education. SREB, 2014. Figures reported
are for the same cohort — Fall 2009 students at public two-year colleges and Fall 2006 students at public four-year colleges and universities. See http://info.sreb.org/DataLibrary/factbook/collegecompletion/FB14_45_46_47.xlsx.
13 Anthony P. Carnevale, Nicole Smith and Jeff Strohl. Recovery: Job Growth And Education Requirements Through 2020. Georgetown University Center on Education and the Workforce, 2013.
14 U.S. Department of Labor, Bureau of Labor Statistics.15 Anthony P. Carnevale, Andrew R. Hanson and Artem Gulish. Failure to Launch: Structural Shift and the New Lost Generation. Georgetown University Center on Education and the
Workforce, 2013.16 James Rosenbaum, Caitlin Ahearn, Kelly Becker and Janet Rosenbaum. The New Forgotten Half and Research Directions to Support Them. William T. Grant Foundation, 2015. 17 Anthony P. Carnevale and Ban Cheah. From Hard Times to Better Times: College Majors, Unemployment, and Earnings. Georgetown University Center on Education and the Workforce,
2015.18 Personal communication, Anthony P. Carnevale, Director, Georgetown University Center on Education and the Workforce, February 18, 2015.19 “Students at Community Colleges.” American Association of Community Colleges, 2014. See http://www.aacc.nche.edu/AboutCC/Trends/Pages/studentsatcommunitycolleges.aspx.
Southern Regional Education Board592 10th St., N.W.Atlanta, GA 30318-5776
(404) 875-9211
SREB.org
April 2015 (15V09)
SREB Commission on Career and Technical Education Commission Members*
Governor Steve Beshear, Commonwealth of Kentucky, Chair, Southern Regional Education Board, Chair, Commission on Career and Technical Education
June Atkinson, State Superintendent, Public Schools of North Carolina Alan Baker, State Representative, Alabama Tommy Bice, State Superintendent of Education, Alabama State Department of Education Hugh Blackwell, State Representative, North Carolina Jay Box, Chancellor, Kentucky Community & Technical College System Harry Ray Brooks, State Representative, Tennessee Terry Burton, State Senator, Mississippi Aneesh Chopra, Senior Advisor, The Advisory Board, Washington, D.C. Norman Conway, State Delegate, Maryland Elizabeth Creamer, Assistant Vice Chancellor, Career Pathways and Workforce Programs, Virginia Community College System Rod Duckworth, Chancellor, Division of Career and Adult Education, Florida Department of Education Gayle Flowers, Director, Career, Adult & Alternative Education, Caddo Parish Public Schools, Louisiana John Ford, State Senator, Oklahoma Derrick Graham, State Representative, Kentucky Steve Gratz, Director, Office of Career-Technical Education, Ohio Department of Education Teri Quinn Gray, President, Delaware State Board of Education Donald Griffith, Director, Teacher Training Program, University of South Carolina, School of Engineering and Computer Science Robert Gunter, Deputy Director, Division of Career and Technical Education, Arkansas Department of Career Technical Education Barbara Hampton, Chair, Georgia State Board of Education Greg Higdon, President & CEO, Kentucky Association of Manufacturers Terry Holliday, Commissioner of Education, Kentucky Department of Education Lloyd Jackson, State Board Member, West Virginia Board of Education Ronald Jackson, Commissioner, Technical College System of Georgia Johnny Key, State Senator, Arkansas John Legg, State Senator, Florida Jean Massey, Associate State Superintendent, Mississippi Department of Education Joe May, Chancellor, Dallas County Community College District, Texas Joseph U. Meyer, Former Secretary of Education and Workforce Development, Kentucky Danielle Mezera, Assistant Commissioner, Career and Technical Education, Tennessee Department of Education Sharon Morrissey, Vice Chancellor for Academic Services & Research, Virginia Community College System Katharine Oliver, Assistant State Superintendent, Maryland State Department of Education Phil Owens, State Representative, South Carolina Dennis Parker, Assistant Manager, Toyota Motor Engineering & Manufacturing, North America Production Support Center, Kentucky Robert Plymale, State Senator, West Virginia Tim Shaughnessy, Associate Provost for Academic Affairs, Gateway Community & Technical College, Kentucky David Sokola, State Senator, Delaware Robert Sommers, Secretary of Education and Workforce Development, State Director of Career and Technology Education, Oklahoma Royce West, State Senator, Texas J. Alvin Wilbanks, CEO and Superintendent, Gwinnett County Schools, Georgia Michael Williams, Commissioner of Education, Texas Education Agency Mike Wilson, State Senator, Kentucky
Consultants to the Commission
Anthony Carnevale, Research Professor and Director, Georgetown University Center on Education and the Workforce, Washington, D.C. Stephen Hamilton, Professor of Human Development, Director, Cornell Youth and Work Program, Cornell University, Ithaca, New York Gary Hoachlander, President, ConnectEd: The California Center for College and Career, Berkeley, California David Stern, Professor Emeritus, University of California, Berkeley, Berkeley, California James R. Stone III, Director, National Research Center for Career and Technical Education, Louisville, Kentucky Marc Tucker, President and CEO, National Center on Education and the Economy, Washington, D.C.
Guests of the Commission
Wesley Beddard, Associate Vice President for Student Learning and Success, North Carolina Community College System Michael Berry, Deputy Commissioner for Policy & Programs, Texas Education Agency Dale Winkler, Associate Commissioner, Office of Career and Technical Education, Kentucky Department of Education Tom Zawacki, Secretary, Education and Workforce Development Cabinet, Kentucky
* Titles as of the May 2014 meeting of the Commission.
Unprepared and UnawareUpskilling the Workforce for a Decade of Uncertainty
February 2019
SouthernRegionalEducationBoard
SREB.org

This report was prepared by Meagan Crowe, policy analyst, under the direction of Jeff Gagne, director of policy analysis, and Joan Lord, vice president of education data, policy research and programs.
Unprepared and Unaware — February 2019 | 1
Unprepared and Unaware Upskilling the Workforce for a Decade of Uncertainty
Executive SummaryAmerica is currently experiencing a dynamic shift in employment for many working-age adults. As companies automate basic retail and manufacturing jobs, they eliminate many of the low-skill jobs available to adults with low levels of education. But technological advancements also create new positions, many requiring education after high school. These middle-skill jobs, demanding more than a high school credential but less than a college degree, will continue to emerge at the same time low-skill jobs go away. Adult workers who raise their education levels to qualify for these jobs will be better prepared to benefit from the new labor market. Adults who do not raise their skills may not.
The question for state leaders isn’t whether there will be sufficient jobs in the future but whether there will be enough skilled workers to fill them. States will need to invest as always in helping low-skilled adults earn diplomas, but also in helping them keep up with technological advancements in the job market. Otherwise, they will become increasingly vulnerable to job loss, low pay and poor health outcomes. And their children will likely become low-skilled as well, creating a costly, multi-generational challenge for states and businesses.
A shortage of sufficiently trained workers makes it difficult for businesses to fill important jobs, so they will have to make greater investments in training their employees. Low-skilled adults are costly for states too, as they earn less and pay less in taxes. They are less likely to vote or volunteer for civic projects. States hoping to strengthen the chances for vulnerable workers to get and retain good jobs — or qualify for jobs that businesses need to fill — will have to provide effective adult education programs. Their efforts will require creativity and resourcefulness.
The 2014 reauthorization of the federal Workforce Innovation and Opportunity Act provides state leaders a clear roadmap for preparing undereducated adults for a better future. WIOA strengthens accountability standards and requires states to coordinate statewide and local efforts to address regional workforce needs. The legislation calls for a stronger focus on workers’ needs and challenges states to implement best instructional practices in adult education. It also requires that states adopt Integrated Education and Training programs, often led by separate instructors to help adults improve basic skills and earn a high school diploma while they prepare for specific occupations and work toward industry credentials.
States hoping to strengthen the
chances of vulnerable workers
getting and retaining good jobs
— or qualifying for jobs that
businesses need to fill —
will have to provide effective
adult education programs.
INSIDE How Technology Affects the Workforce 3
Where SREB States Stand 3
The High Cost of Undereducated Adults 6
Middle-Skill Jobs 7
How Adults Can Catch Up 9
What’s Affecting Enrollments 15
What States Can Do 17
How SREB Can Help 20
2 | Unprepared and Unaware — February 2019
The legislation stipulates that states incorporate six core programs — and allows them to incorporate up to 11 partner programs — into their state WIOA plans. One of these is Perkins V, or the Strengthening Career and Technical Education for the 21st Century Act. CTE programs prepare adults for middle-skill jobs by providing the advanced, industry-specific technical skills needed to fill such positions.
In improving adult education programs, states are also faced with decreased funding and enrollments. Funding for these programs fell sharply during the recession and has not fully recovered. States will need to bolster program funding and provide support services if they hope to enroll more adults in education programs. Industry investment could also help states enroll more adults and ensure that they earn credentials that can lead to employment.
The efforts that states make to help adults train for stable employment will improve outcomes for their children as well, leading to a healthier economy both now and in the long term. What can states do to help more adults — and their children — reach a middle-skills level?
1. Adopt the College and Career Readiness Standards for Adult Education to establish consistent learning expectations and foster partnerships with other education providers.
2. Use instructional practices and materials and implementation methods known to be successful.
3. Provide teachers adequate training and professional development opportunities.
4. Align CTE and integrative training education course offerings with specific workforce needs, focusing on skills, not tasks.
5. Require adult education performance measures that are both quantitative and qualitative.
SREB states need to be innovative and bold in preparing the current and future generation for ever-changing workforce demands. SREB is committed to supporting these efforts with data and policy analysis, to help states make informed decisions to improve adult education programs and ensure the livelihoods of their most vulnerable adults and their children.
Unprepared and Unaware — February 2019 | 3
How is technology affecting the workforce?America is experiencing a dynamic shift in employment for many working-age adults. Since the peak of manufacturing in 1979, the United States has lost more than 7 million factory jobs to automation and other technological advancements. The ones most likely to be automated today require physical and repetitive labor such as assembly line, customer service and clerical positions, jobs available to adults with a high school education or less. Restaurants, for instance, are replacing their cashiers and servers with self-ordering and self-paying kiosks. Chatbots now answer incoming sales calls. Computers are the new data entry clerks. Robots are assembling cars. There’s even a company developing a program to automate legal services — much as online tax services have automated the income tax business.
As technology continues to advance in the workplace, the employment gap between those with postsecondary education or credentials and those without is expected to grow. The McKinsey Global Institute estimates that by 2030 between 3 and 14 percent of the global workforce will need to be able to perform a completely different job function than the one they did in 2016. McKinsey estimates that all workers will need to adapt in some way to working more closely with machines and that if jobs are automated at a rapid pace the outcome could be dramatic: up to 44 percent of current work activities in the United States could be automated by 2030.
As companies automate their basic retail and manufacturing jobs, increasing their production rates and earnings, they are pushing low-skilled positions out of the labor market. As these low-skill jobs disappear, highly specialized jobs emerge in which people must operate and maintain the machines that are taking their places. These new middle-skill jobs require more than a high school credential but less than a college degree, and these too will become increasingly sophisticated as technology advances. So, adult workers who improve their education levels will find opportunities in the new labor market. For business owners and policymakers, the question isn’t whether there will be jobs. The question is whether there will be enough skilled workers to fill them.
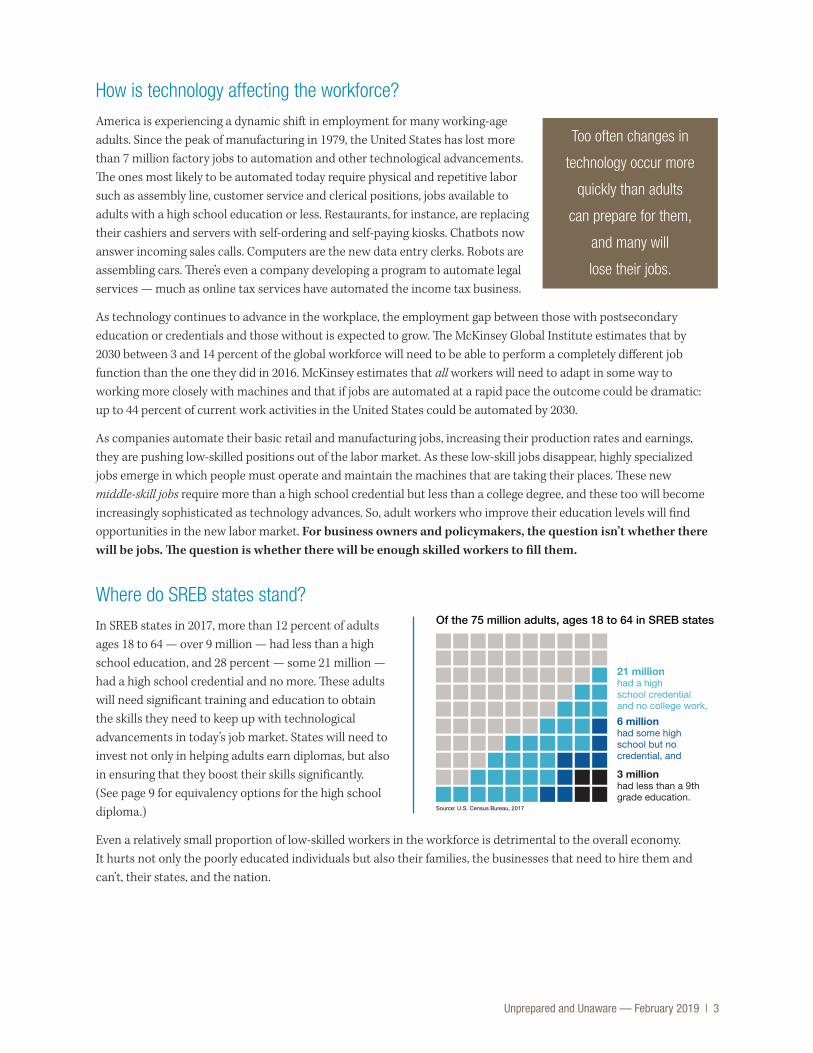
Where do SREB states stand? In SREB states in 2017, more than 12 percent of adults ages 18 to 64 — over 9 million — had less than a high school education, and 28 percent — some 21 million — had a high school credential and no more. These adults will need significant training and education to obtain the skills they need to keep up with technological advancements in today’s job market. States will need to invest not only in helping adults earn diplomas, but also in ensuring that they boost their skills significantly. (See page 9 for equivalency options for the high school diploma.)
Even a relatively small proportion of low-skilled workers in the workforce is detrimental to the overall economy. It hurts not only the poorly educated individuals but also their families, the businesses that need to hire them and can’t, their states, and the nation.
Too often changes in
technology occur more
quickly than adults
can prepare for them,
and many will
lose their jobs.
21 millionhad a highschool credential and no college work,
Of the 75 million adults, ages 18 to 64 in SREB states
Source: U.S. Census Bureau, 2017
6 million had some high school but no credential, and
3 million had less than a 9th grade education.
4 | Unprepared and Unaware — February 2019
States have made too little progress in helping these adults boost their academic and workplace skills. By 2017, the region still had nearly 3 million 18- to 64-year-old adults with less than a 9th grade education — an improvement of only 300,000 in nine years. In that same year, 6.3 million adults had reached high school but not graduated, compared with 7.1 million nine years earlier. Over half of these adults were between the ages of 25 and 44.
SREB reported that states were working to improve adult learning outcomes in its 2010 report, A Smart Move in Tough Times. But even then, enrollment growth in adult education programs was not keeping pace with workforce demands.
SREB’s 2015 commission report on career and technical education, Credentials for All, detailed the challenges facing young adults who do not earn postsecondary credentials. “For many young adults, the 20s are a lost decade,” the report found. “After years of underemployment or unemployment, many return to school when they are nearly 30.” As technology advances, this is — or will become — the reality for many more adults in SREB states than just those in their late 20s and early 30s. Four in 10 SREB adults will need to improve their skill levels if they hope to keep their jobs and earn good salaries.
These reports offered sound advice for SREB states to increase their residents’ educational attainment levels and meet workforce needs:
n Ensure that adult learning efforts are coordinated statewide
n Set statewide goals for adult learning
n Be wise and creative stewards of limited resources
n Create relevant pathways that align secondary, postsecondary and workplace learning
n Ensure that adults earn industry-recognized credentials or postsecondary certificates and degrees at the associate degree level or higher
Fulfilling these recommendations is vital for SREB states, now more than ever.
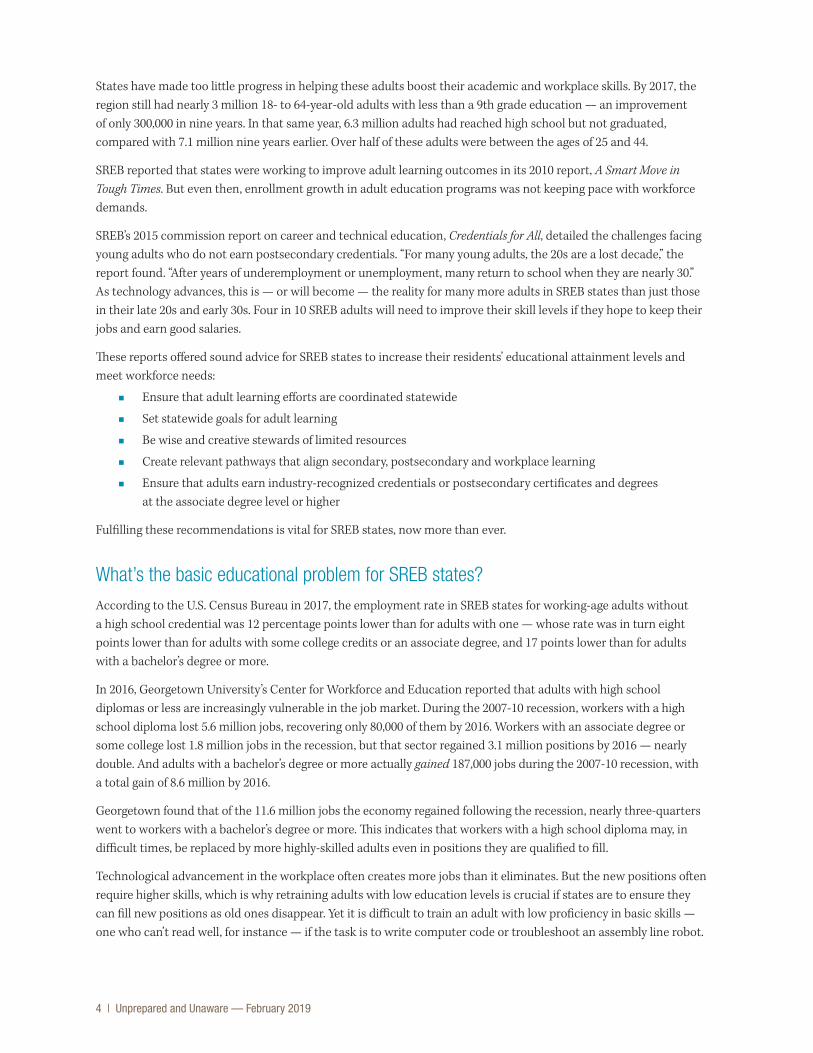
What’s the basic educational problem for SREB states?According to the U.S. Census Bureau in 2017, the employment rate in SREB states for working-age adults without a high school credential was 12 percentage points lower than for adults with one — whose rate was in turn eight points lower than for adults with some college credits or an associate degree, and 17 points lower than for adults with a bachelor’s degree or more.
In 2016, Georgetown University’s Center for Workforce and Education reported that adults with high school diplomas or less are increasingly vulnerable in the job market. During the 2007-10 recession, workers with a high school diploma lost 5.6 million jobs, recovering only 80,000 of them by 2016. Workers with an associate degree or some college lost 1.8 million jobs in the recession, but that sector regained 3.1 million positions by 2016 — nearly double. And adults with a bachelor’s degree or more actually gained 187,000 jobs during the 2007-10 recession, with a total gain of 8.6 million by 2016.
Georgetown found that of the 11.6 million jobs the economy regained following the recession, nearly three-quarters went to workers with a bachelor’s degree or more. This indicates that workers with a high school diploma may, in difficult times, be replaced by more highly-skilled adults even in positions they are qualified to fill.
Technological advancement in the workplace often creates more jobs than it eliminates. But the new positions often require higher skills, which is why retraining adults with low education levels is crucial if states are to ensure they can fill new positions as old ones disappear. Yet it is difficult to train an adult with low proficiency in basic skills — one who can’t read well, for instance — if the task is to write computer code or troubleshoot an assembly line robot.
Unprepared and Unaware — February 2019 | 5
Because employment rates are directly related to a person’s educational attainment, the Bureau of Labor Statistics uses attainment levels to track the employability of adults. BLS assigns occupations to one of eight categories using entry-level education requirements, from no formal educational credential to doctoral or professional degree.
From 2007 to 2016, BLS found that employment opportunities in the United States increased across all levels by 6 million, with 4 million requiring a bachelor’s or master’s degree. This shift in job requirements is expected to continue throughout the coming decade. Jobs requiring only a high school diploma are projected to grow at a rate of 5.1 percent between 2016 and 2026 — more slowly than the overall national projected rate of 7.4 percent.
Automation will accelerate in the coming years. Conservative estimates from researchers at McKinsey Global Institute show 23 percent of work activities in the United States being automated by 2030. If this estimate is accurate, 39 percent of jobs available in 2016 will be lost, with just as many new jobs created. Between 2016 and 2030, workers with a high school education or less will see more jobs lost than gained, while many more jobs will be created for workers with a bachelor’s degree or more.
The technological expansion throughout the U.S. job market means that working-age adults with lower levels of educational attainment will be increasingly likely to be unemployed. Fewer jobs requiring a high school diploma or less will be available, and those left will be lower paid and offer fewer chances for promotion. More adults with low proficiency levels will be stuck in jobs increasingly likely to be automated, and they may end up out of work altogether if they cannot increase their skills.
0 20 40 60 80 100
The Employment Rate Gap between adults without a high school credential and those with one
was 13 percent nationwide.
Note: Adults ages 25 to 64Source: U.S. Census Bureau, 2017
SREB
Alabama
Arkansas
Delaware
Florida
Georgia
Kentucky
Louisiana
Maryland
Mississippi
North Carolina
Oklahoma
South Carolina
Tennessee
Texas
Virginia
West Virginia
12%
12%
13%
13%
13%
13%
19%
24%
21%
18%
18%
17%
14%
9%
8%
12%
27%
6 | Unprepared and Unaware — February 2019
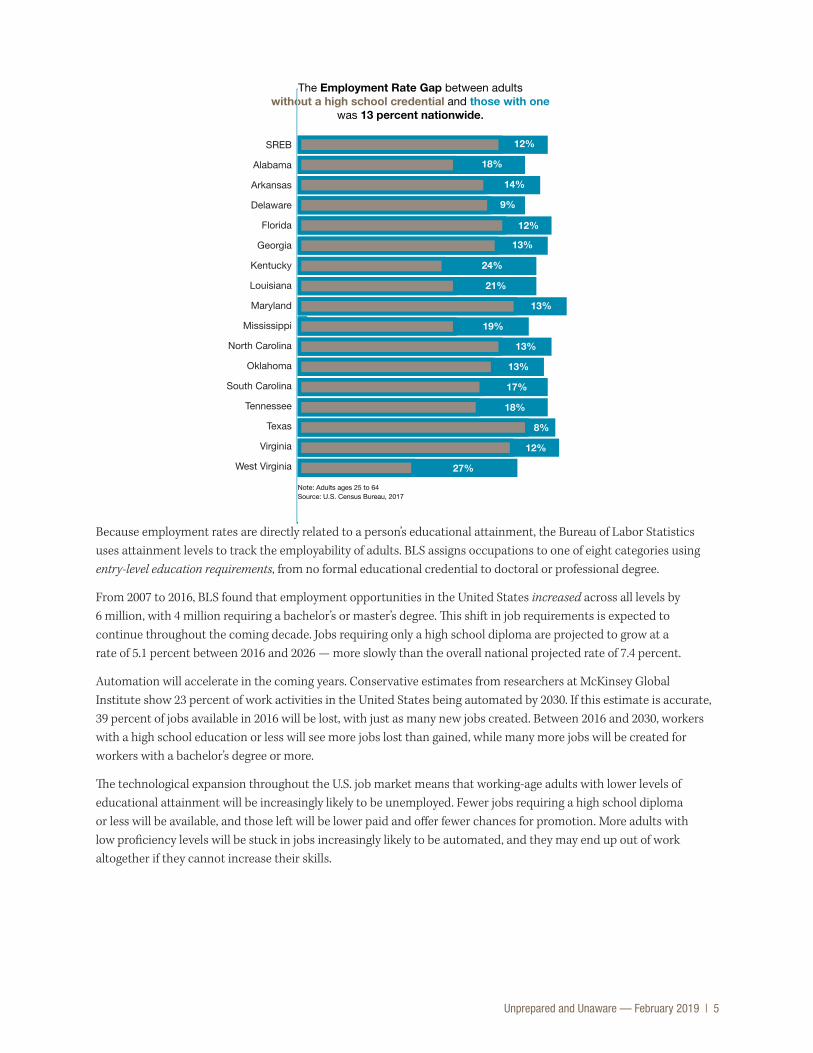
The High Cost of Undereducated AdultsThe consequences of an undereducated population compound at state and national levels. Adults with lower educational attainment are more likely to experience unemployment and poverty. By 2017, 66 percent of all working-age adults who had a high school credential were employed, compared with just 54 percent who did not. In that same year, 9.6 million adults in the SREB region earned incomes below the poverty level. Of these, two-thirds had a high school education or less. More than 26 percent of adults without a high school credential earned wages below the poverty level. That percentage drops to 15 for those with a high school credential.
Adults with less than a high school education also earn less and pay less in taxes. The Organisation for Economic Co-operation and Development estimates that 13 percent of the average variation in wages can be attributed to educational attainment. In 2017, the median income earned by working adults 25 and older who graduated from high school was $6,372 more than for those who did not have a high school diploma. Researchers at the College Board determined that adults with a high school credential pay $2,400 more in taxes than adults without one. So, adults who do not currently have a high school credential would likely contribute $122 billion more to the SREB region in state and federal taxes every year if they were able to earn a diploma.
In 2017, SREB states also ranked low on measures of both health and wellness, occupying the 10 lowest spots in the nation’s overall health rankings. As in earlier reports, adults with less than a high school credential are more likely than their more educated peers to have diabetes, heart disease, heart attacks and high blood pressure. Even now, working-age adults who have less than a high school credential are less likely to have private health insurance — if they have any at all. And public insurance is costly. In 2017, the SREB region spent almost $62 billion state-dollars on Medicaid alone.
Adults without a high school education are also less likely to vote and to volunteer for civic and service projects. Voter participation generally rises and falls with educational attainment. And adults with less than a high school credential volunteer half as often as those with one. With an estimated service value of $3,200 per volunteer, the value of these unrealized volunteer contributions across the SREB region was $4.7 billion in 2015.
Educational Attainment and Health Insurance Coverage Status for Adults, Ages 26 to 64
Unprepared and Unaware — February 2019 | 7
What are middle-skill jobs?Middle-skill jobs, which are typically defined by a person’s level of education, require more than a high school education but less than a bachelor’s degree. People with middle-skill jobs often have associate degrees, postsecondary vocational certificates, or significant on-the-job training. They earn mid-level incomes — usually between $35,000 and $75,000. Between 2014 and 2024, projected job growth for middle-skill jobs in the SREB region is 52 percent. The increasing number of middle-skill jobs and the declining number of low-skill jobs means fewer positions will be available for adults with low levels of attainment and skills, but more will be available for workers with middle skills.
In 2018, Georgetown University’s Center for Workforce and Education highlighted a shift among middle-skill jobs — away from more traditional blue-collar positions and toward more skilled technical jobs. By 2016, blue-collar occupations, such as manufacturing and construction jobs, made up 21 percent of employment in the U.S. work-force — down 7 percentage points from 1991. During that same time, middle-skill service jobs, such as healthcare, information technology and white-collar business services added 2.7 million positions — accounting for 77 percent of middle-skill job growth.
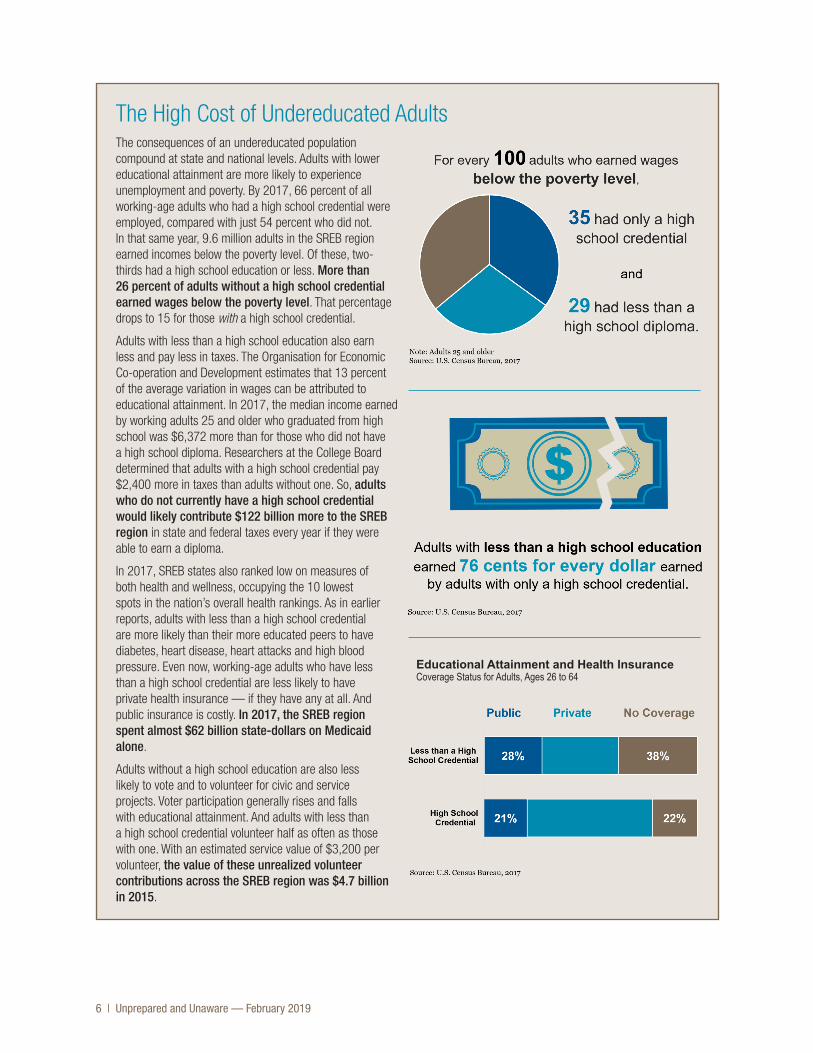
According to the National Skills Coalition, vacancies in middle-skill jobs will be the greatest threat to state economies in the South. Every high-skill job generally requires a team of middle-skilled supporters. Doctors, lawyers and scientists need teams of qualified, technically-trained workers to support their work, such as licensed nurses and paralegals. Manufacturing plants likewise need highly-skilled workers to support their technical equipment. In 2016, middle-skill jobs accounted for 54 percent of the U.S. labor market. But just 44 percent of working-age adults nationwide were trained to a middle-skill level.
The Middle-Skills Gap between workers with a middle-skill level and middle-skill jobs
available to them was 10 percent nationwide.
Note: Adults ages 25 to 64Source: National Skills Coalition, 2015
SREB
Alabama
Arkansas
Delaware
Florida
Georgia
Kentucky
Louisiana
Maryland
Mississippi
North Carolina
Oklahoma
South Carolina
Tennessee
Texas
Virginia
West Virginia
11%
12%
10%
10%
11%
11%
12%
13%
10%
8%
9%
8%
8%
8%
11%
14%
10%
8%
8 | Unprepared and Unaware — February 2019
How serious is the skills gap and why does it matter?
In 2007, the United States dropped off the list of nations with the highest percentage of adults ages 25 to 34 who hold a high school diploma, according to the Organisation for Economic Co-Operation and Development. Ten years later, the United States moved back into the ninth spot on the list. Still, by 2017, almost 8 million of the 64 million working-age adults in SREB states — one in eight — had not earned a high school credential. And while working-age adults in the region make up 37 percent of all U.S. working-age adults, 41 percent of those without a high school credential reside in SREB states.
Researchers at the OECD found that educational attainment — the highest level of education that an individual has completed — is the variable most strongly associated with skills proficiency. This remains true even after controlling for factors such as age, gender and family background. In the United States, however, more variation in proficiency exists at each level than for similarly educated adults in other countries. Quality differences among education systems nationwide are one of the major causes of this variation. In 2016, of the 34 participating countries and economies, the United States had the second largest proficiency rate gap at each educational attainment level — 26 points higher than the average. That’s even after accounting for additional sociodemographic characteristics.
Compared with other OECD countries, the proportion of U.S. adults who have earned a high school credential or less is relatively small. However, these adults have weaker basic skills than their similarly educated peers across the globe. More adults in the United States than in other countries who earned a high school credential or less have low skills — scoring below Level 2 on the OECD literacy and numeracy scales. But even adults with higher levels of education can be low-skilled. A substantial proportion — 16 percent — of U.S. adults scored at or below Level 1 in both literacy and numeracy. An additional 42 percent of all U.S. adults scored at or below Level 1 in numeracy alone, while another 5 percent scored at or below Level 1 in literacy alone.
Of the one in five adults with low literacy, just 56 percent are employed. Adults with low literacy are less likely to be employed than adults with higher literacy rates and are more likely to have left the workforce, costing the United States as much as $463 billion each year in lost productivity, crime, healthcare and tax revenues. SREB states are home to approximately 37 percent of adults nationwide. It follows then that the SREB region’s portion of this loss is roughly $171 billion annually — an amount it could potentially save every year if it improved its adult literacy levels.
Since an individual’s skill proficiency is strongly related to the educational attainment of his or her parent(s), an investment in one generation is also a boost for the next one. Of adults whose parents did not earn high school credentials, 30 percent scored at or below the lowest level on the OECD literacy assessment in 2016. Children whose parents have low literacy proficiency have skills far less developed than their peers and, on average, will have heard 30 million fewer words by the time they reach kindergarten. For children whose parents are unable to support their literacy development, the reading skill gap often becomes insurmountable. The results affect learning in all school subjects.
If states don’t help these adults develop middle skills now and earn credentials that lead to employability, states will have to make an even greater investment in the future to provide for these adults when they are underemployed or unemployed and to help their children catch up to their more advantaged peers. Many of these children will never catch up, perpetuating the cycle. The compounding impact of low educational attainment — from parents to children — makes investing in today’s adults a promise of gains for future generations.
The Proficiency Continuum
OECD literacy and numeracy
proficiency scales consist of
five levels on a continuum.
Proficiencies can fall
between levels depending
on how many tasks at each
level an individual can and
cannot perform.
Unprepared and Unaware — February 2019 | 9
Unfortunately, too many workers, students and parents are unaware of the career opportunities that middle-skill jobs provide.
n Parents and community members need to know about the new types of middle-skill jobs that are available, and states need to communicate the advantages these jobs will provide as technology evolves. States — and their biggest employers — need to be open about the incomes adults who hold middle-skill positions can expect to earn. Too many people still believe these jobs do not pay well, yet many of them do.
n States need to develop career pathway systems with stackable, industry-recognized credentials to help people qualify for these jobs. They need to provide incentives for adults to pursue professional growth. Earning a four-year degree is daunting for many people, but earning a series of related certificates may seem much more achievable.
How can adults who don’t have a high school diploma catch up? All SREB states provide adult education programs for adults who did not complete high school. Federal funding allocated through the American Education and Family Literacy Act helps states boost their residents’ basic literacy and math skills through Adult Basic Education programs. AEFLA funds also help adults improve their English language proficiency and help secondary education programs prepare adults for high school equivalency credentialing.
Adult secondary education programs, such as adult high schools and nontraditional diploma programs, are good options for adults who have at least some high school credits and wish to complete a regular high school diploma. These programs are generally available to people not currently enrolled in high school who are at least 16 or 17 years old, and who either dropped out before graduation or had difficulty passing a course or a high school exit exam. Many of these programs are run through state community and technical colleges. Adult high school programs require that enrollees have at least some — typically 10 — high school credits. Many of these programs award regular high school diplomas upon completion; others prepare students to take a high school equivalency exam.
In 2017, all SREB states offered one or more of three standard high school equivalency assessments: the High School Equivalency Test, the Test Assessing Secondary Completion and the GED. Some states offered more than one of these exams. The HiSET and TASC provide more testing formats than the GED and have lower testing fees.
Adults who do not have any high school credits or who have very low literacy levels must enroll in Adult Basic Education programs before they can work toward a high school credential. They may enter other secondary education programs if their literacy levels are at the high school level, but this linear method of acquiring basic skills and then working toward a credential is often very discouraging for adult learners. That’s where a new approach to basic adult education, introduced nationwide through the federal Workforce Innovation and Opportunity Act, comes in.
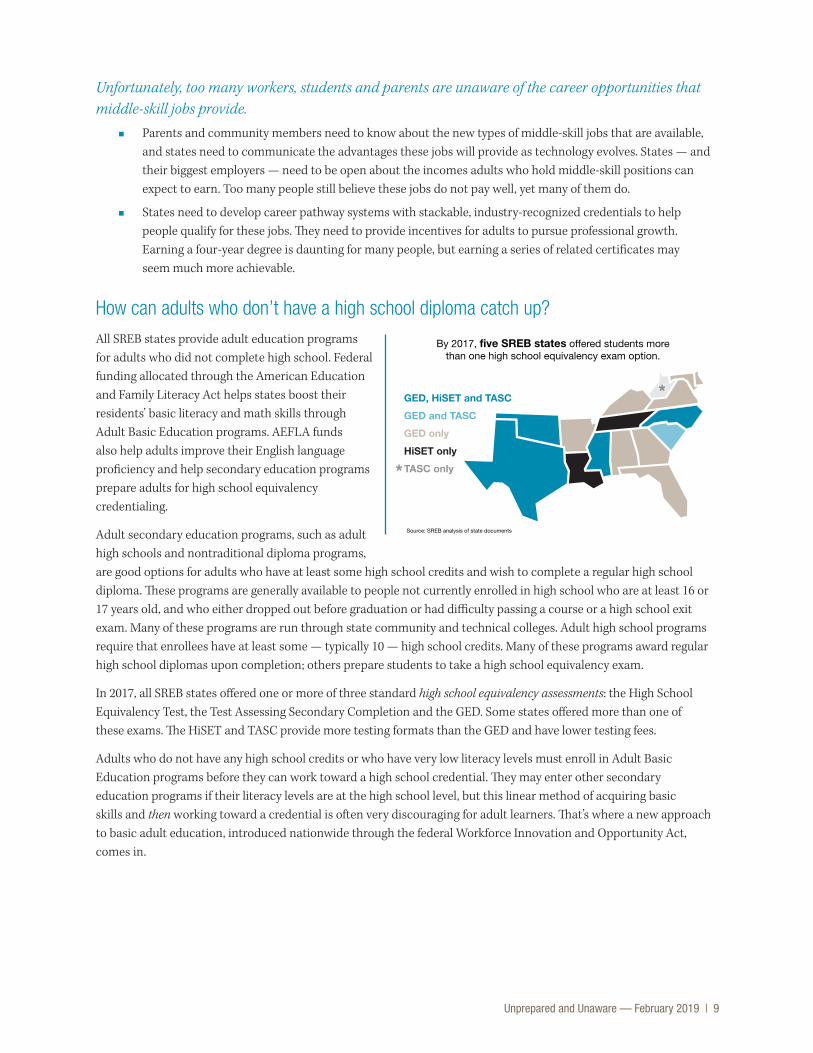
*
Source: SREB analysis of state documents
GED, HiSET and TASC
GED and TASC
GED only
HiSET only
TASC only
By 2017, five SREB states offered students more than one high school equivalency exam option.
*
10 | Unprepared and Unaware — February 2019
How has WIOA improved adult education? The 2014 reauthorization of the Workforce Innovation and Opportunity Act provides a clear roadmap to help states prepare their undereducated adults for a better future. WIOA calls for states to break with older models that require basic skills courses before employment-related instruction. And it calls for more technology-integrated basic-skills course offerings. WIOA strengthens accountability standards and requires states to coordinate statewide and local plans to address regional workforce needs. These new unified — or combined — state plans comprehensively address the needs of adult learners.
Integrated Education and Training ProgramsWIOA introduced requirements for states to offer Integrated Education and Training programs. These programs are creative, research-supported models for programming and instruction. Courses are often led using a team-teaching approach with dual instructors — one teaching basic skills and one with expertise in the program’s target industry or occupation.
Integrated programs are more efficient and more attractive for adults with the lowest levels of education. IET programs offer them the opportunity to improve their basic literacy, math or spoken language skills while earning a high school credential and being trained for a specific occupation, industry, or postsecondary credential. The approach is intended to meet both individual and labor market needs much more quickly.
Research conducted using data from the Washington State Board of Community and Technical Colleges found that just 30 percent of Adult Basic Education students, and 13 percent of English language learners, were able to earn any college credits within five years of attending traditional linear programs. On average, adult learners spend less than 100 hours a year in adult education programs, so program planners must make better use of instructional time in their course designs. IET programs are a break from traditional sequential instruction models, which require students to attend to non-credit basic skills first before they can enroll in courses related to their career interest. The simultaneous basic skills instruction and career training of IET programs enables participants to work toward completing two goals at the same time, resulting in greater engagement for students, quicker completion times for workers and a more robust labor force for states.
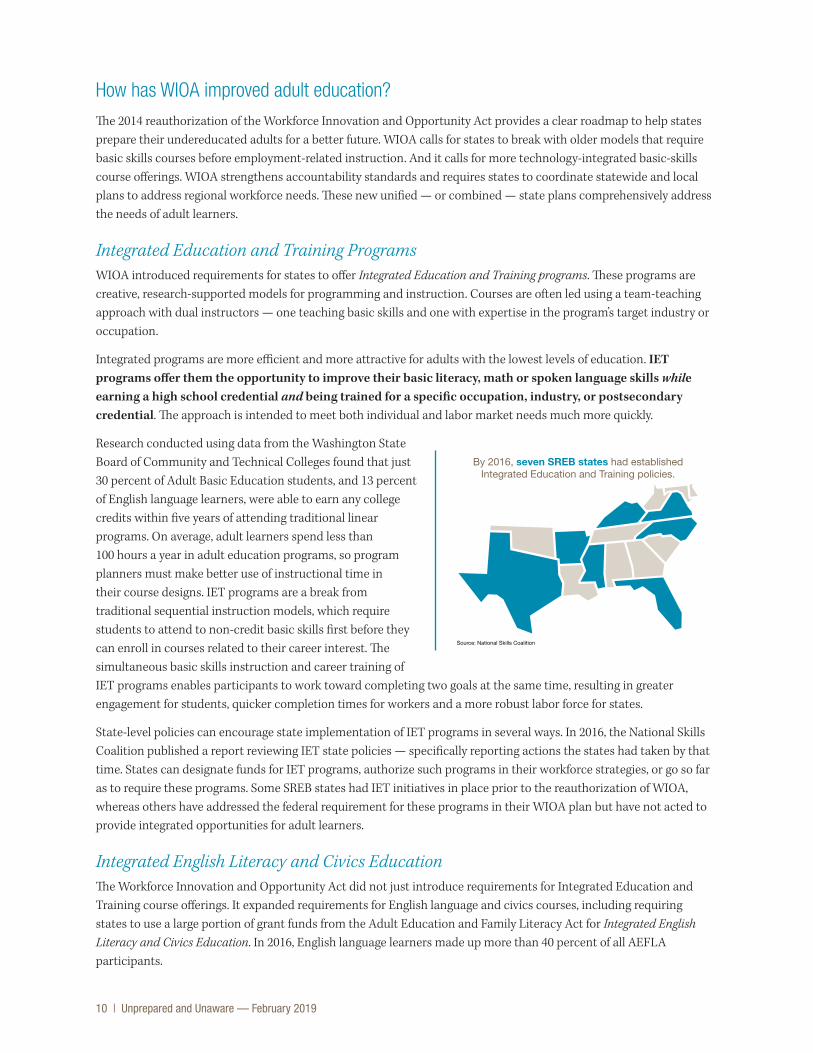
State-level policies can encourage state implementation of IET programs in several ways. In 2016, the National Skills Coalition published a report reviewing IET state policies — specifically reporting actions the states had taken by that time. States can designate funds for IET programs, authorize such programs in their workforce strategies, or go so far as to require these programs. Some SREB states had IET initiatives in place prior to the reauthorization of WIOA, whereas others have addressed the federal requirement for these programs in their WIOA plan but have not acted to provide integrated opportunities for adult learners.
Integrated English Literacy and Civics EducationThe Workforce Innovation and Opportunity Act did not just introduce requirements for Integrated Education and Training course offerings. It expanded requirements for English language and civics courses, including requiring states to use a large portion of grant funds from the Adult Education and Family Literacy Act for Integrated English Literacy and Civics Education. In 2016, English language learners made up more than 40 percent of all AEFLA participants.
Source: National Skills Coalition
By 2016, seven SREB states had established Integrated Education and Training policies.
Unprepared and Unaware — February 2019 | 11
Two States Making A Difference
North Carolina’s Basic Skills PlusThe North Carolina General Assembly introduced Basic Skills Plus in 2010 to help adults improve their basic skills while earning postsecondary credit and/or industry credentials. This concurrent enrollment program became law in 2015 as part of the North Carolina Community Colleges programs. Providers may use up to 20 percent of their adult literacy funding for instruction and training. They are encouraged to provide non-academic support such as transportation and daycare. BSKP students are co-enrolled in basic literacy and employability skills and occupational training courses. Enrollees earn an Adult High School diploma (or high school equivalency diploma) while receiving training in a high-demand industry that leads to a recognized credential or local industry certification. Eligible students may receive tuition and/or registration fee waivers from the State Board of Community Colleges.
The Basic Skills Plus program offers courses on career pathways that align with proven local and regional workforce needs. Approved courses include basic reading, writing, math, English, computer skills, and college-credit bearing courses only. The program does not include postsecondary remedial courses. For this reason, adult learners must take the National Reporting System-approved assessment and score at the Intermediate-High level (6.0 and above) in reading or math for entrance. Certain incarcerated individuals, English language learners, and students with disabilities who are pursuing a high school credential may also be eligible for the BSKP program.
Texas' Community Action, Inc.Community Action, Inc. serves about 1,000 ESOL/IELCE students in Austin, Texas and the surrounding area through its Career Pathways Program. This program offers several pathways that meet the needs of the adult learning community and the local workforce and has blossomed under WIOA. Offerings include Truck Driving, Plumbing, and Telecommunications. Recognizing that immigrants start a large majority of new businesses nationwide — and that owning a family business is an immigrant tradition — Community Action, Inc. began offering a career pathway in Entrepreneurship.
The Entrepreneurship pathway includes a nine-week business basics class, the training portion, and IELCE classes. The business basics class covers finances, budgeting, business plans, banking and marketing. IELCE classes incorporate basic English language and digital literacy instruction. The combination of occupational and basic literacy courses provides students the opportunity to strengthen many of the skills they need to run a business. They are given a Chromebook in their second class, which they can keep, provided they meet the terms of an attendance contract and complete all course requirements.
The Entrepreneurship pathway has been wildly popular and shows promise in advancing participants’ skills. Though it was designed for high-intermediate English language learners, Adult Basic Education students have requested permission to participate. Of the 86 students who completed the business basics class between the spring of 2016 and spring 2017, 75 percent advanced one or more levels on the Texas-approved ESL oral and/or literacy assessments. The course has been so popular that instructors are working to develop a second-level business basics class that will focus on building websites, social media marketing, and using accounting software.
The program attributes part of its success to the involvement of business and agency partnerships. For example, during the business planning portion of the classes, staff from the Legal Aid Services of Austin instruct students on formalized business structures such as Sole Proprietorships and Limited Liability Companies. Staff from the personal and business banking teams at the Randolph Brooks Federal Credit Union speak with students about banking and loan options and managing their personal finances. Staff from the Chamber of Commerce share their experiences in starting their own businesses. Students have the opportunity to learn from industry experts and anchor their training in the real world.
The Entrepreneurship pathway is funded completely by the IELCE portion of Texas’ WIOA Title II Adult Education grant and is overseen by the Texas Workforce Commission. For accountability, TWC looks closely at pre- and post-test measures of student abilities and at performance targets such as the number of completers, as required by WIOA. The pathway is operating as a WIOA-approved demonstration pilot but needs to be linked to an industry credential in the future. It currently awards students a Certificate of Completion. Program coordinators are working to link the pathway to a postsecondary credential or may find a partner to sponsor one.
12 | Unprepared and Unaware — February 2019
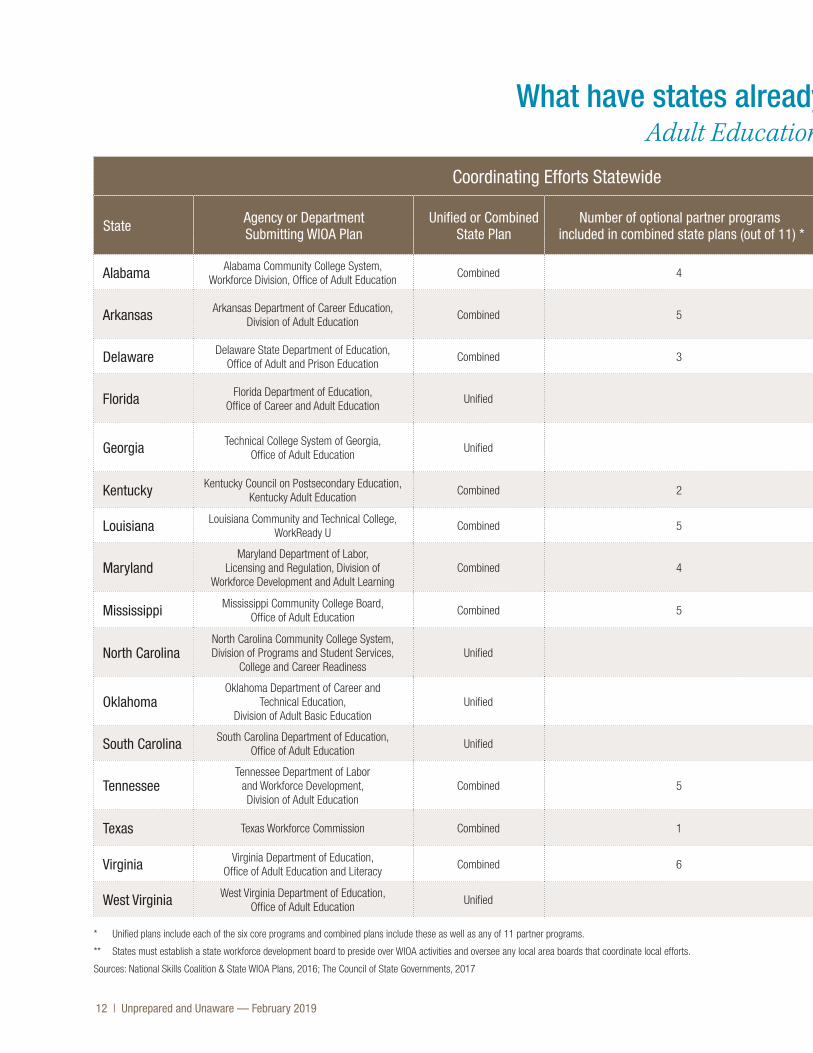
What have states already done to plan for WIOA? Adult Education in SREB States
* Unified plans include each of the six core programs and combined plans include these as well as any of 11 partner programs.
** States must establish a state workforce development board to preside over WIOA activities and oversee any local area boards that coordinate local efforts.
Sources: National Skills Coalition & State WIOA Plans, 2016; The Council of State Governments, 2017
Coordinating Efforts Statewide Statewide Policies and Initiatives
State Agency or Department Submitting WIOA Plan
Unified or Combined State Plan
Number of optional partner programs included in combined state plans (out of 11) *
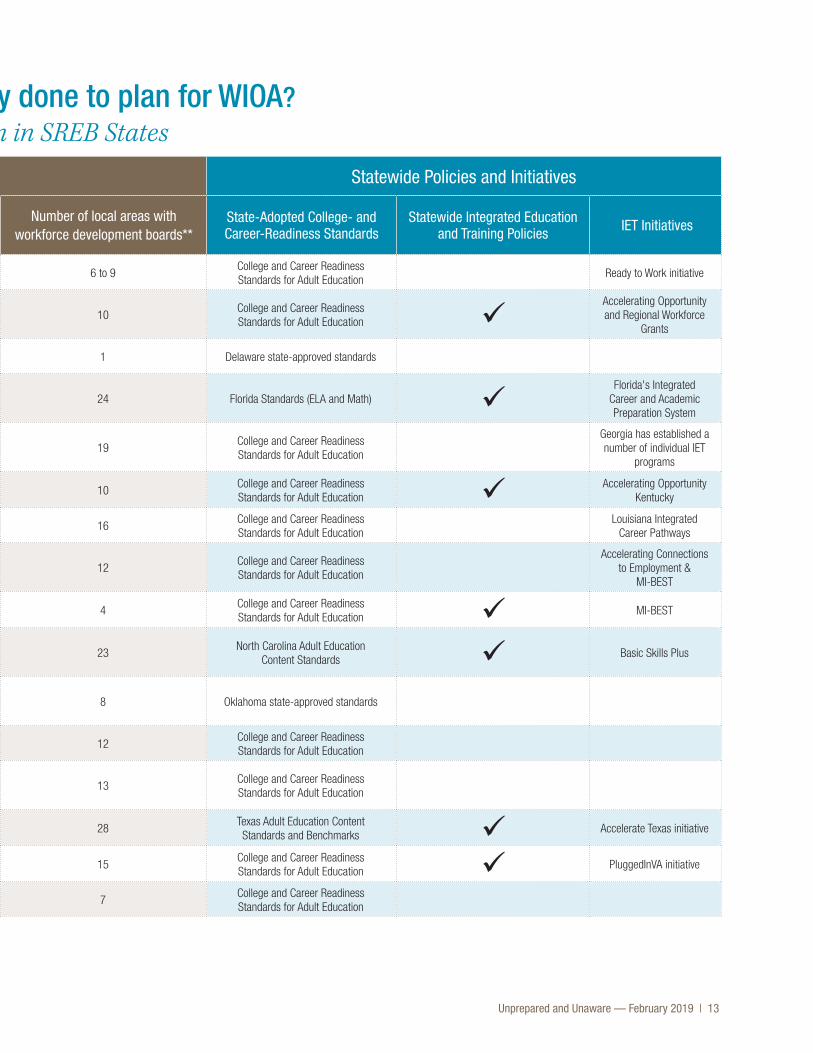
Number of local areas with workforce development boards**
State-Adopted College- and Career-Readiness Standards
Statewide Integrated Education and Training Policies IET Initiatives
Alabama Alabama Community College System, Workforce Division, Office of Adult Education
Combined 4 6 to 9College and Career Readiness Standards for Adult Education
Ready to Work initiative
Arkansas Arkansas Department of Career Education, Division of Adult Education
Combined 5 10College and Career Readiness Standards for Adult Education ü
Accelerating Opportunity and Regional Workforce
Grants
Delaware Delaware State Department of Education, Office of Adult and Prison Education
Combined 3 1 Delaware state-approved standards
Florida Florida Department of Education, Office of Career and Adult Education
Unified 24 Florida Standards (ELA and Math) üFlorida's Integrated
Career and Academic Preparation System
Georgia Technical College System of Georgia, Office of Adult Education
Unified 19College and Career Readiness Standards for Adult Education
Georgia has established a number of individual IET
programs
Kentucky Kentucky Council on Postsecondary Education, Kentucky Adult Education
Combined 2 10College and Career Readiness Standards for Adult Education ü Accelerating Opportunity
Kentucky
Louisiana Louisiana Community and Technical College, WorkReady U
Combined 5 16College and Career Readiness Standards for Adult Education
Louisiana Integrated Career Pathways
MarylandMaryland Department of Labor,
Licensing and Regulation, Division of Workforce Development and Adult Learning
Combined 4 12College and Career Readiness Standards for Adult Education
Accelerating Connections to Employment &
MI-BEST
Mississippi Mississippi Community College Board, Office of Adult Education
Combined 5 4College and Career Readiness Standards for Adult Education ü MI-BEST
North CarolinaNorth Carolina Community College System, Division of Programs and Student Services,
College and Career ReadinessUnified 23
North Carolina Adult Education Content Standards ü Basic Skills Plus
OklahomaOklahoma Department of Career and
Technical Education, Division of Adult Basic Education
Unified 8 Oklahoma state-approved standards
South Carolina South Carolina Department of Education, Office of Adult Education
Unified 12College and Career Readiness Standards for Adult Education
TennesseeTennessee Department of Labor
and Workforce Development, Division of Adult Education
Combined 5 13College and Career Readiness Standards for Adult Education
Texas Texas Workforce Commission Combined 1 28Texas Adult Education Content Standards and Benchmarks ü Accelerate Texas initiative
Virginia Virginia Department of Education, Office of Adult Education and Literacy
Combined 6 15College and Career Readiness Standards for Adult Education ü PluggedInVA initiative
West Virginia West Virginia Department of Education, Office of Adult Education
Unified 7College and Career Readiness Standards for Adult Education
Unprepared and Unaware — February 2019 | 13
What have states already done to plan for WIOA? Adult Education in SREB States
* Unified plans include each of the six core programs and combined plans include these as well as any of 11 partner programs.
** States must establish a state workforce development board to preside over WIOA activities and oversee any local area boards that coordinate local efforts.
Sources: National Skills Coalition & State WIOA Plans, 2016; The Council of State Governments, 2017
Coordinating Efforts Statewide Statewide Policies and Initiatives
State Agency or Department Submitting WIOA Plan
Unified or Combined State Plan
Number of optional partner programs included in combined state plans (out of 11) *
Number of local areas with workforce development boards**
State-Adopted College- and Career-Readiness Standards
Statewide Integrated Education and Training Policies IET Initiatives
Alabama Alabama Community College System, Workforce Division, Office of Adult Education
Combined 4 6 to 9College and Career Readiness Standards for Adult Education
Ready to Work initiative
Arkansas Arkansas Department of Career Education, Division of Adult Education
Combined 5 10College and Career Readiness Standards for Adult Education ü
Accelerating Opportunity and Regional Workforce
Grants
Delaware Delaware State Department of Education, Office of Adult and Prison Education
Combined 3 1 Delaware state-approved standards
Florida Florida Department of Education, Office of Career and Adult Education
Unified 24 Florida Standards (ELA and Math) üFlorida's Integrated
Career and Academic Preparation System
Georgia Technical College System of Georgia, Office of Adult Education
Unified 19College and Career Readiness Standards for Adult Education
Georgia has established a number of individual IET
programs
Kentucky Kentucky Council on Postsecondary Education, Kentucky Adult Education
Combined 2 10College and Career Readiness Standards for Adult Education ü Accelerating Opportunity
Kentucky
Louisiana Louisiana Community and Technical College, WorkReady U
Combined 5 16College and Career Readiness Standards for Adult Education
Louisiana Integrated Career Pathways
MarylandMaryland Department of Labor,
Licensing and Regulation, Division of Workforce Development and Adult Learning
Combined 4 12College and Career Readiness Standards for Adult Education
Accelerating Connections to Employment &
MI-BEST
Mississippi Mississippi Community College Board, Office of Adult Education
Combined 5 4College and Career Readiness Standards for Adult Education ü MI-BEST
North CarolinaNorth Carolina Community College System, Division of Programs and Student Services,
College and Career ReadinessUnified 23
North Carolina Adult Education Content Standards ü Basic Skills Plus
OklahomaOklahoma Department of Career and
Technical Education, Division of Adult Basic Education
Unified 8 Oklahoma state-approved standards
South Carolina South Carolina Department of Education, Office of Adult Education
Unified 12College and Career Readiness Standards for Adult Education
TennesseeTennessee Department of Labor
and Workforce Development, Division of Adult Education
Combined 5 13College and Career Readiness Standards for Adult Education
Texas Texas Workforce Commission Combined 1 28Texas Adult Education Content Standards and Benchmarks ü Accelerate Texas initiative
Virginia Virginia Department of Education, Office of Adult Education and Literacy
Combined 6 15College and Career Readiness Standards for Adult Education ü PluggedInVA initiative
West Virginia West Virginia Department of Education, Office of Adult Education
Unified 7College and Career Readiness Standards for Adult Education
14 | Unprepared and Unaware — February 2019
IELCE courses differ from English as a Second Language courses in that they must not only help learners achieve competency in reading, writing, speaking, and English language comprehension, but must also lead to a high school credential and a transition to either employment or postsecondary education and training. The U.S. Department of Education requires that these courses help learners acquire the skills needed to be effective parents, workers and U.S. citizens. As with IET program participants, English language learners can simultaneously work to improve their language skills and earn a high school or an industry credential.
How else is WIOA changing adult education? In addition to expanding program offerings that better meet individual and workforce needs, WIOA added several requirements paralleling SREB’s previous suggestions for adult educational programs:
1) Improve performance accountability: WIOA created a common set of performance measures. These include unsubsidized employment, receipt of secondary or recognized postsecondary credentials, and measurable skill gains for adult education participants. It also introduced a performance system that made all programs responsible for the same core metrics.
2) Enhance consistency between state and local programs: States are now required to submit a single, unified or combined state plan describing common strategies used by all core programs to meet individual and workforce needs. Unified plans include each of the six core programs, and combined plans include these as well as any of 11 partner programs. All local plans must align with the unified or combined state plan and address how local programs will meet regional labor market needs. States must also establish a workforce development board to preside over WIOA activities and oversee any local boards that coordinate local efforts.
3) Focus on worker needs and best practices: WIOA encouraged states to combine core and intensive services into career services models and to adopt or expand best practices, including career pathways for adult learners as well as industry and sector partnerships. WIOA also recognized the high demand for technical skills in the U.S. labor market and added digital literacy to its definition of workplace preparation.
4) Align federal education policies: The U.S. Department of Education required WIOA, the Every Student Succeeds Act and Perkins V legislation to use the same terminology. Using similar terms in these education policies helps states align their adult education, K-12 and career technical and education policies to serve students better.
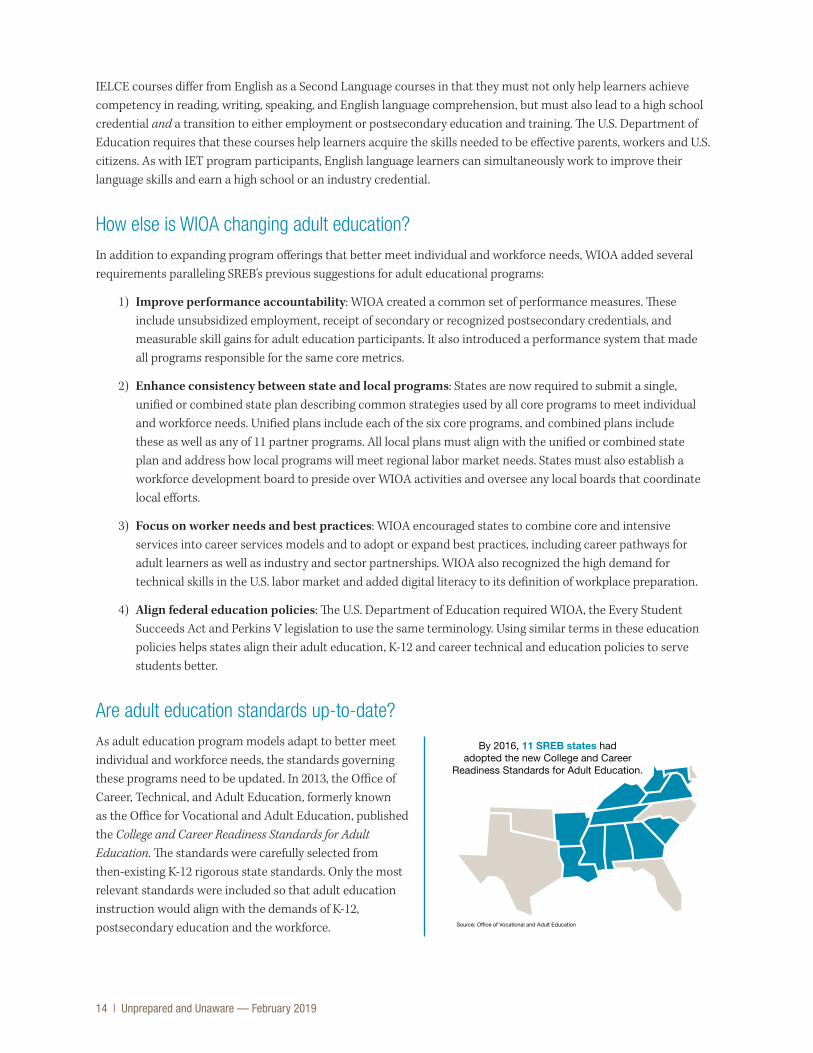
Are adult education standards up-to-date?As adult education program models adapt to better meet individual and workforce needs, the standards governing these programs need to be updated. In 2013, the Office of Career, Technical, and Adult Education, formerly known as the Office for Vocational and Adult Education, published the College and Career Readiness Standards for Adult Education. The standards were carefully selected from then-existing K-12 rigorous state standards. Only the most relevant standards were included so that adult education instruction would align with the demands of K-12, postsecondary education and the workforce.
Source: Office of Vocational and Adult Education
By 2016, 11 SREB states had adopted the new College and Career
Readiness Standards for Adult Education.
Unprepared and Unaware — February 2019 | 15
Adopting these standards benefits adult education programs by:
n developing common expectations for adult education that are consistent across states and with both K-12 and postsecondary education;
n encouraging partnerships between states and other adult education providers and facilitating the sharing of financial and informational resources; and
n ensuring that adult education programs better prepare students to perform well on assessments, including high school equivalency and postsecondary placement exams.
The standards are arranged in two large groupings: English language arts and literacy standards, and mathematics standards. Each group is organized into five grade-level bundles. The ELA and literacy standards were developed around four specific strands: reading, writing, speaking and listening, and language. These include standards that apply to history and social studies, science, and technological studies with a heavy focus on reading. The standards for math are broken down into skills required for using math in practice and for understanding math in different contexts.
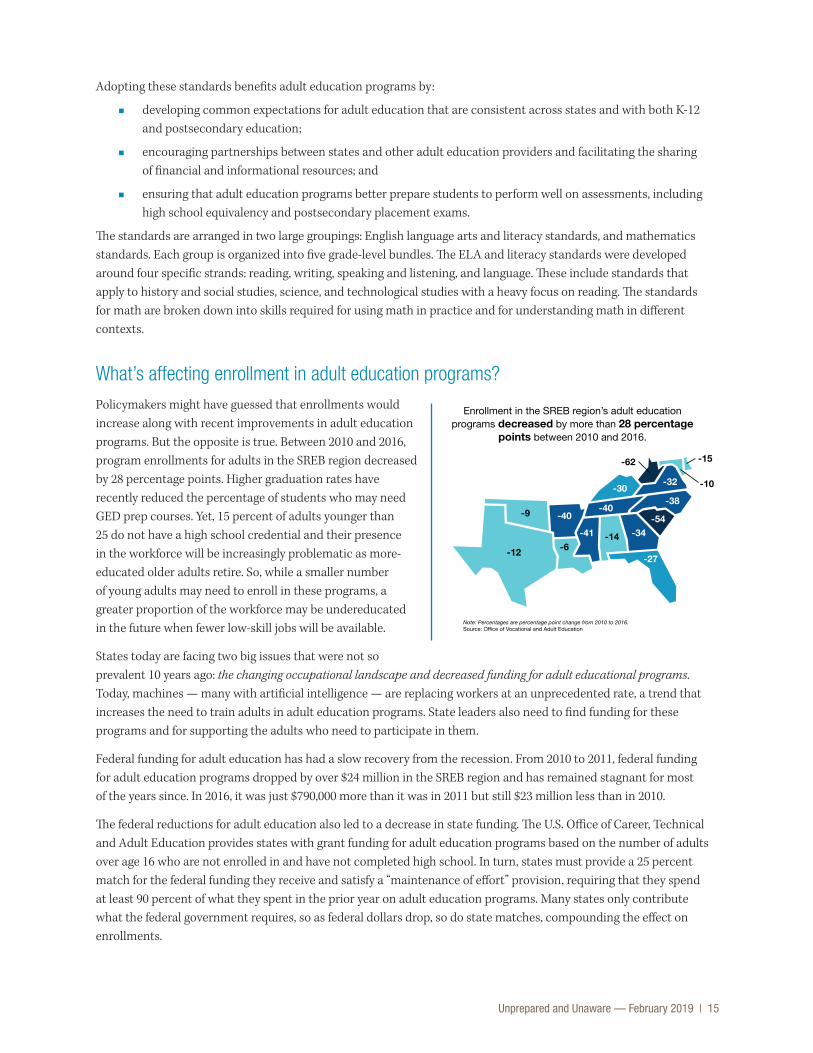
What’s affecting enrollment in adult education programs?Policymakers might have guessed that enrollments would increase along with recent improvements in adult education programs. But the opposite is true. Between 2010 and 2016, program enrollments for adults in the SREB region decreased by 28 percentage points. Higher graduation rates have recently reduced the percentage of students who may need GED prep courses. Yet, 15 percent of adults younger than 25 do not have a high school credential and their presence in the workforce will be increasingly problematic as more-educated older adults retire. So, while a smaller number of young adults may need to enroll in these programs, a greater proportion of the workforce may be undereducated in the future when fewer low-skill jobs will be available.
States today are facing two big issues that were not so prevalent 10 years ago: the changing occupational landscape and decreased funding for adult educational programs. Today, machines — many with artificial intelligence — are replacing workers at an unprecedented rate, a trend that increases the need to train adults in adult education programs. State leaders also need to find funding for these programs and for supporting the adults who need to participate in them.
Federal funding for adult education has had a slow recovery from the recession. From 2010 to 2011, federal funding for adult education programs dropped by over $24 million in the SREB region and has remained stagnant for most of the years since. In 2016, it was just $790,000 more than it was in 2011 but still $23 million less than in 2010.
The federal reductions for adult education also led to a decrease in state funding. The U.S. Office of Career, Technical and Adult Education provides states with grant funding for adult education programs based on the number of adults over age 16 who are not enrolled in and have not completed high school. In turn, states must provide a 25 percent match for the federal funding they receive and satisfy a “maintenance of effort” provision, requiring that they spend at least 90 percent of what they spent in the prior year on adult education programs. Many states only contribute what the federal government requires, so as federal dollars drop, so do state matches, compounding the effect on enrollments.
Note: Percentages are percentage point change from 2010 to 2016.Source: Office of Vocational and Adult Education
Enrollment in the SREB region’s adult education programs decreased by more than 28 percentage
points between 2010 and 2016.
-12 -6-14
-15
-10
-62
-9 -40-40
-41-54
-34
-38
-32
-27
-30
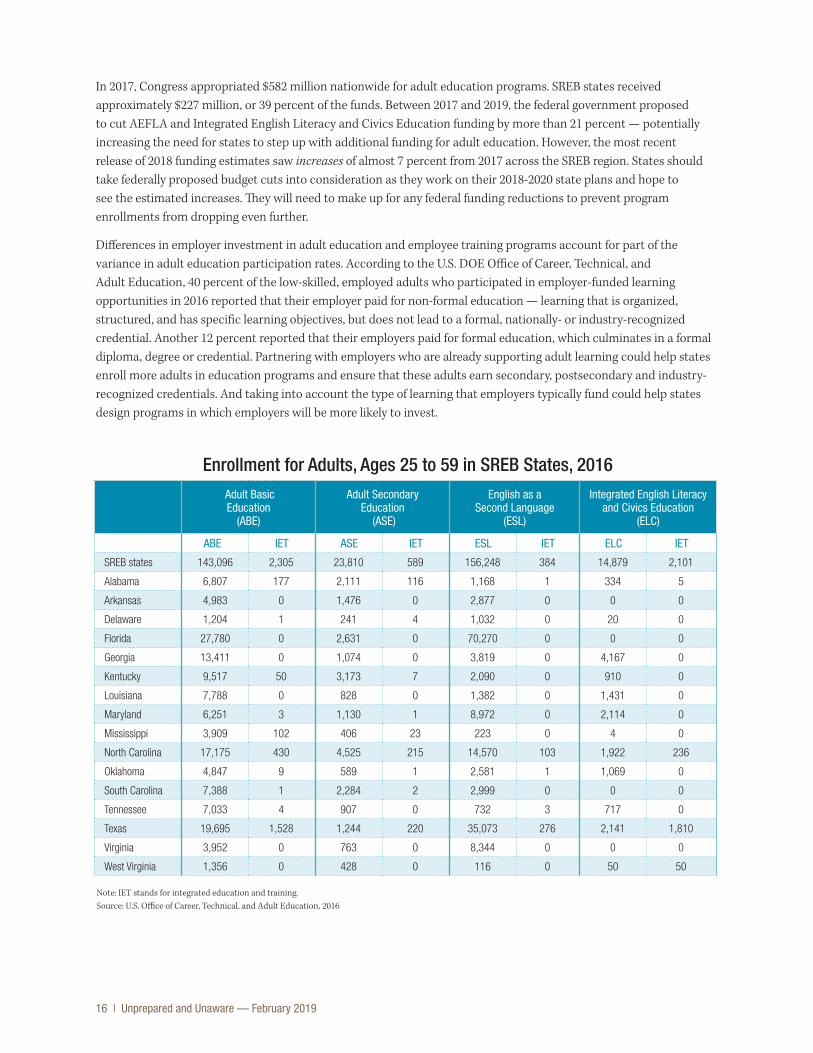
16 | Unprepared and Unaware — February 2019
In 2017, Congress appropriated $582 million nationwide for adult education programs. SREB states received approximately $227 million, or 39 percent of the funds. Between 2017 and 2019, the federal government proposed to cut AEFLA and Integrated English Literacy and Civics Education funding by more than 21 percent — potentially increasing the need for states to step up with additional funding for adult education. However, the most recent release of 2018 funding estimates saw increases of almost 7 percent from 2017 across the SREB region. States should take federally proposed budget cuts into consideration as they work on their 2018-2020 state plans and hope to see the estimated increases. They will need to make up for any federal funding reductions to prevent program enrollments from dropping even further.
Differences in employer investment in adult education and employee training programs account for part of the variance in adult education participation rates. According to the U.S. DOE Office of Career, Technical, and Adult Education, 40 percent of the low-skilled, employed adults who participated in employer-funded learning opportunities in 2016 reported that their employer paid for non-formal education — learning that is organized, structured, and has specific learning objectives, but does not lead to a formal, nationally- or industry-recognized credential. Another 12 percent reported that their employers paid for formal education, which culminates in a formal diploma, degree or credential. Partnering with employers who are already supporting adult learning could help states enroll more adults in education programs and ensure that these adults earn secondary, postsecondary and industry-recognized credentials. And taking into account the type of learning that employers typically fund could help states design programs in which employers will be more likely to invest.
Adult Basic Education
(ABE)
Adult Secondary Education
(ASE)
English as a Second Language
(ESL)
Integrated English Literacy and Civics Education
(ELC)
ABEE IET ASE IET ESL IET ELC IET
SREB states 143,096 2,305 23,810 589 156,248 384 14,879 2,101
Alabama 6,807 177 2,111 116 1,168 1 334 5
Arkansas 4,983 0 1,476 0 2,877 0 0 0
Delaware 1,204 1 241 4 1,032 0 20 0
Florida 27,780 0 2,631 0 70,270 0 0 0
Georgia 13,411 0 1,074 0 3,819 0 4,167 0
Kentucky 9,517 50 3,173 7 2,090 0 910 0
Louisiana 7,788 0 828 0 1,382 0 1,431 0
Maryland 6,251 3 1,130 1 8,972 0 2,114 0
Mississippi 3,909 102 406 23 223 0 4 0
North Carolina 17,175 430 4,525 215 14,570 103 1,922 236
Oklahoma 4,847 9 589 1 2,581 1 1,069 0
South Carolina 7,388 1 2,284 2 2,999 0 0 0
Tennessee 7,033 4 907 0 732 3 717 0
Texas 19,695 1,528 1,244 220 35,073 276 2,141 1,810
Virginia 3,952 0 763 0 8,344 0 0 0
West Virginia 1,356 0 428 0 116 0 50 50
Enrollment for Adults, Ages 25 to 59 in SREB States, 2016
Note: IET stands for integrated education and training.Source: U.S. Office of Career, Technical, and Adult Education, 2016
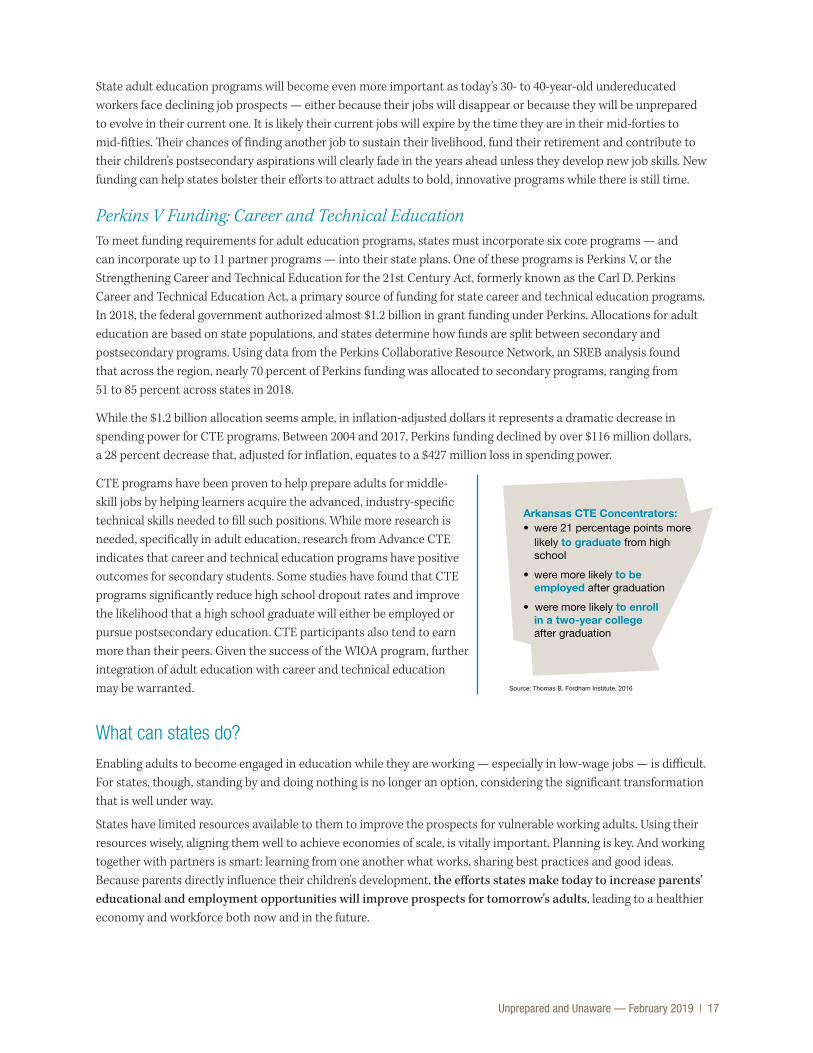
Unprepared and Unaware — February 2019 | 17
State adult education programs will become even more important as today’s 30- to 40-year-old undereducated workers face declining job prospects — either because their jobs will disappear or because they will be unprepared to evolve in their current one. It is likely their current jobs will expire by the time they are in their mid-forties to mid-fifties. Their chances of finding another job to sustain their livelihood, fund their retirement and contribute to their children’s postsecondary aspirations will clearly fade in the years ahead unless they develop new job skills. New funding can help states bolster their efforts to attract adults to bold, innovative programs while there is still time.
Perkins V Funding: Career and Technical EducationTo meet funding requirements for adult education programs, states must incorporate six core programs — and can incorporate up to 11 partner programs — into their state plans. One of these programs is Perkins V, or the Strengthening Career and Technical Education for the 21st Century Act, formerly known as the Carl D. Perkins Career and Technical Education Act, a primary source of funding for state career and technical education programs. In 2018, the federal government authorized almost $1.2 billion in grant funding under Perkins. Allocations for adult education are based on state populations, and states determine how funds are split between secondary and postsecondary programs. Using data from the Perkins Collaborative Resource Network, an SREB analysis found that across the region, nearly 70 percent of Perkins funding was allocated to secondary programs, ranging from 51 to 85 percent across states in 2018.
While the $1.2 billion allocation seems ample, in inflation-adjusted dollars it represents a dramatic decrease in spending power for CTE programs. Between 2004 and 2017, Perkins funding declined by over $116 million dollars, a 28 percent decrease that, adjusted for inflation, equates to a $427 million loss in spending power.
CTE programs have been proven to help prepare adults for middle- skill jobs by helping learners acquire the advanced, industry-specific technical skills needed to fill such positions. While more research is needed, specifically in adult education, research from Advance CTE indicates that career and technical education programs have positive outcomes for secondary students. Some studies have found that CTE programs significantly reduce high school dropout rates and improve the likelihood that a high school graduate will either be employed or pursue postsecondary education. CTE participants also tend to earn more than their peers. Given the success of the WIOA program, further integration of adult education with career and technical education may be warranted.
What can states do?Enabling adults to become engaged in education while they are working — especially in low-wage jobs — is difficult. For states, though, standing by and doing nothing is no longer an option, considering the significant transformation that is well under way.
States have limited resources available to them to improve the prospects for vulnerable working adults. Using their resources wisely, aligning them well to achieve economies of scale, is vitally important. Planning is key. And working together with partners is smart: learning from one another what works, sharing best practices and good ideas. Because parents directly influence their children's development, the efforts states make today to increase parents' educational and employment opportunities will improve prospects for tomorrow's adults, leading to a healthier economy and workforce both now and in the future.
Arkansas CTE Concentrators: • were 21 percentage points more likely to graduate from high school
• were more likely to be employed after graduation
• were more likely to enroll in a two-year college after graduation
Source: Thomas B. Fordham Institute, 2016
18 | Unprepared and Unaware — February 2019
States can begin by bolstering enrollment rates and improving the quality of their adult education programs. Using the opportunities that WIOA provides to build and implement a strong state plan, increasing funding allotments, and incorporating practices that have already improved such programs across the nation are good places to start.
The following ideas are just the beginning. States will need to continue to expand their thinking in developing creative solutions that are right for their economies and that help more adults — and their children — reach at least a middle-skills level.
n Incentivize adult education programs that use integrated education and training models.
Integrated Education and Training models combine basic skills instruction with workforce training. The IET model enables adults to complete programs more quickly and be better prepared to enter the workforce, saving states both time and resources. States have the challenge of drawing adults to these programs. Research conducted using data from the Washington State Board of Community and Technical Colleges shows that, even after five years in traditional adult education programs, most adult learners do not earn any college credit, let alone a postsecondary degree or credential.
n Provide support services for adults to help them be successful in adult education programs.
Programs will be most effective if they offer adequate support for adult learners. Often, adults enrolling in these programs have limited resources, competing time constraints and varied responsibilities. By considering these limitations, and providing services like childcare, flexible schedule options and financial support, states can ensure that more adults are able to complete programs.
n Use best practices, materials, and implementation methods that have already proven successful in other states’ programs.
l College and Career Readiness Standards for Adult Education
Good programs depend on high quality standards to guide instruction, materials selection and teacher professional development. Adult education standards were adapted by the Office of Career, Technical, and Adult Education from K-12. They focus on the basic reading, writing, math and computer skills adults need to be successful in the workforce. Using a common set of standards also lets states share information more easily, use resources more efficiently and get better results.
l Formative and summative assessments
As states change their adult learning programs to meet WIOA requirements, it is important that they measure student progress during courses and subject mastery upon course completion. Measuring student progress over time helps to uncover instructional and design issues that might otherwise go unnoticed. Evaluating students for both progress and mastery unmasks important details about the learning obstacles that students face.
l Instructional materials already aligned with the College and Career Readiness Standards for Adult Education
Using instructional materials already aligned with their state-adopted set of standards will ease sharing of textbooks, online- and technology-based resources and assessment tools between states. States can save funds by sharing course materials, which can help increase the availability of online repositories — a great benefit for teachers.
Unprepared and Unaware — February 2019 | 19
n Provide teachers adequate training and professional development opportunities.
Provide teacher training opportunities aligned with the College and Career Readiness Standards for Adult Education to help teachers become confident and effective. States could provide teacher training courses at community colleges or online. Create time for teachers to work with each other, sharing experiences and instructional methods and materials across different courses, programs, institutions and states.
n Align CTE and integrative training education course offerings with the specific workforce needs in each state, but focus on skills, not specific tasks, as the jobs we train for today may not be the same tomorrow.
Aligning course offerings with state workforce needs will help adult education graduates find good-paying jobs and create opportunities for local industries to partner with adult learning programs. Programs aligned with state workforce needs are more likely to be effective as the resources and expertise needed for occupational training are more readily available.
n Encourage partnerships between public education and training systems and private sector industries.
Partnerships between adult education programs and private sector industries benefit both parties. Adult education programs gain access to industry resources such as training facilities and equipment. Businesses gain access to qualified employees and may conserve resources by identifying potential job candidates within partner training programs. And partner programs can be very attractive to adults looking to enter the workforce quickly.
n Incentivize business partners to increase access to on-the-job training opportunities for adult learners.
Businesses that provide learning opportunities incentivize their employees to improve skills and grow in their positions. Businesses need to be flexible with workers’ schedules and allow adult learners to share time between work and training. Businesses that help their employees learn in their jobs will produce more highly skilled workers, increasing productivity and profitability.
n Design policies that require adult education performance measures to be both quantitative and qualitative.
Adult education programs should measure both how many adults have access to, enroll in, and successfully complete education and training courses and the quality of their skill and knowledge gains. States need to hold programs accountable for the college and career readiness of their adult learners just as they do their high school graduates — and they need to get a greater number of adults to complete these programs. Adult education programs need to work toward preparing many more low-skill adults for middle-skill positions. To ensure the greatest impact, adult education programs must be effective and accessible.
20 | Unprepared and Unaware — February 2019
How Can SREB Help?SREB is committed, now more than ever, to supporting states’ efforts as they seek answers to the questions currently facing adult education programs:
n How do we get more adults to enroll and be successful in adult education programs — to both increase their educational attainment and raise their skills?
n How can states find and maximize new resources to create solutions and implement them widely?
n How can states help foster relationships within the education community and with business and industry leaders to ensure that low-skilled adults get the support they need to become strong contributors in the workforce?
These and other questions will need to be answered if SREB states hope to ensure the livelihoods of their most vulnerable, low-skilled adults and their children. SREB stands ready to support states in improving adult learning outcomes, ensuring that more adults are prepared for current and impending technological advancements in the workplace. SREB consultants can provide the data, policy support and historical knowledge states need to make informed decisions as they address these issues. States need to be innovative and bold if they hope to prepare this and future generations for the ever-changing technological landscape.
In the next 10 years, SREB will support states in serving the region’s adults and children to meet developing workforce needs. This report, our work-based learning commission, and strengthened strategic partnerships are just the beginning. SREB will produce additional, related reports and work alongside states as they seek solutions to present and future questions. In the next few months, SREB will report on the potential economic impacts if states do not address the adult educational attainment issue, and the imperative alignment of state WIOA, ESSA, and Perkins V plans.
Unprepared and Unaware — February 2019 | 21
References Advance CTE. (February 2018). Funding Career Technical Education: An American Imperative. Retrieved from https://cte.careertech.org/sites/default/files/Funding_CTE_American_Imperative_2018.pdf
Advance CTE. (March 2018). FY2004-FY2018 Perkins Funding Levels. Retrieved from https://cte.careertech.org/sites/default/files/Federal_Appropriations_Career_Technical_Education_FY18_Update.pdf
Advance CTE. (October 2018). Investing in Career Technical Education: An American Imperative. Retrieved from https://careertech.org/fact-sheets
Anderson, T., Barnow, B., Kuehn, D., Lerman, R.I., & Eyster, L. ( June 2017). New Evidence on Integrated Career Pathways: Final Impact Report for Accelerating Opportunity. Urban Institute. Retrieved from http://www.jff.org/publications/new-evidence-integrated-career-pathways-final-impact-report-accelerating-opportunity
Bergson-Shilcock, A. (October 2016). Integrated Education and Training Policy Toolkit. National Skills Coalition. Retrieved from https://www.nationalskillscoalition.org/resources/publications/file/Integrated-Education-and-Training-Policy-Toolkit.pdf
Bergson-Shilcock, A. (December 2016). Integrated Education and Training Policy 50-State Scan. National Skills Coalition. Retrieved from https://www.nationalskillscoalition.org/resources/publications/file/Final-IET-Scan.pdf
Bottoms, G. & Sundell, K. (April 2015). Credentials for All: An Imperative for SREB States. Southern Regional Education Board: SREB Commission on Career and Technical Education.
Carnevale, A., Jayasunders, T., & Gulish, A. (2016). America’s Divided Recovery: College Haves and Have-Nots. Georgetown University Center on Education and the Workforce. Retrieved from https://cew.georgetown.edu/wp-content/uploads/Americas-Divided-Recovery-web.pdf
Carnevale, A.P., Strohl, J., Ridley, N., & Gulish, A. (2018). Three Educational Pathways to Good Jobs: High School, Middle Skills, and Bachelor’s Degree. Georgetown University Center on Education and the Workforce. Retrieved from https://1gyhoq479ufd3yna29x7ubjn-wpengine.netdna-ssl.com/wp-content/uploads/3ways-FR.pdf
Corporation for National and Community Service. (2017). Volunteering and Civic Life in America: National and State Profiles. Retrieved from https://www.nationalservice.gov/vcla/states
Counts, D. (April 14, 2017). Federal Funding for State Employment and Training Programs Covered by the WIOA. The Council for State Governments. Retrieved from http://knowledgecenter.csg.org/kc/content/federal-funding-state-employment-and-training-programs-covered-wioa
Dougherty, S. (April 2016). Career and Technical Education in High School: Does it Improve Student Outcomes? Thomas B. Fordham Institute. Retrieved from http://edex.s3-us-west-2.amazonaws.com/publication/pdfs/%282016.04.07%29%20Career%20and%20Technical%20Education%20in%20High%20School.pdf
Educational Testing Service. (2018). HiSET Requirements by State or Jurisdiction. Retrieved from https://hiset.ets.org/requirements/state/
Ghanbari, L. & McCall, M.D. (August 2016). Current Employment Statistics survey: 100 years of employment, hours, and earnings. U.S. Bureau of Labor Statistics Monthly Labor Review. Retrieved from http://doi.org/10.21916/mlr.2016.38
Grotlüschen, A., Mallows, D., Reder, S., & Sabatini, J. (2016). Adults with Low Proficiency in Literacy or Numeracy. OECD Education Working Papers, No. 131. OECD Publishing, Paris. Retrieved from http://dx.doi.org/10.1787/ 5jm0v44bnmnx-en
22 | Unprepared and Unaware — February 2019
Hanks, A. (October 24, 2014). Updated: Side-by-Side Comparison of WIA and WIOA. National Skills Coalition. Retrieved from https://www.nationalskillscoalition.org/news/blog/updated-side-by-side-comparison-of-wia- and-wioa
Lord, J., Blackmon, T., Chaloux, B., Weaver, C., & Street, S. (2010). A Smart Move in Tough Times: How SREB States Can Strengthen Adult Learning and the Work Force. Southern Regional Education Board. Retrieved from www.sreb.org
Ma, J., Pender, M., & Welch, M. (2016). Education Pays 2016: The Benefits of Higher Education for Individuals and Society. The College Board. Retrieved from https://trends.collegeboard.org/sites/default/files/education-pays-2016-full-report.pdf
Manyika, J., Lund, S., Chui, M., Bughin, J., Woetzel, J., Batra, P., …Sanghvi, S. (December 2017). Jobs Lost, Jobs Gained: Workforce Transitions in a Time of Automation. McKinsey Global Institute. Retrieved from www.mckinsey.com/mgi
Medicaid and CHIP Payment and Access Commission. (2018). Medicaid Spending by State, Category, and source of Funds, FY 2017. Retrieved from https://www.macpac.gov/publication/medicaid-spending-by-state-category-and-source-of-funds/
Morgan, K., Waite, P., & Diecuch, M. (2017). The Case for Investment in Adult Basic Education. ProLiteracy. Retrieved from https://www.proliteracy.org/Portals/0/Reder%20Research.pdf ?ver=2017-03-24-151533-647
Nash, A. & Hewett, E. (September 2017). Integrated Education and Training: Implementing Programs in Diverse Contexts. World Education, Inc. Retrieved from https://www.worlded.org/WEIInternet/inc/common/_download_pub.cfm?id=18643&lid=3
National Skills Coalition. (2017). Middle-Skill Job Fact Sheets. Retrieved from www.nationalskillscoalition.org
North Carolina Community Colleges. (May 2017). Basic Skills Plus Policies and Procedures Implementation Guide. Retrieved from https://www.nccommunitycolleges.edu/college-and-career-readiness/basic-skills-plus
OECD. (2009). Education at a Glance 2009: OECD Indicators. OECD Publishing, Paris. OECD Publishing, Paris. Retrieved from http://www.oecd.org/education/skills-beyond-school/educationataglance2009oecdindicators.htm
OECD. (2013). Time for the U.S. to Reskill? What the Survey of Adult Skills Says. OECD Publishing, Paris. Retrieved from http://dx.doi.org/10.1787/9789264273351-en
OECD. (2016). Skills Matter: Further Results from the Survey for Adult Skills. OECD Skills Studies. OECD Publishing, Paris. Retrieved from http://dx.doi.org/10.1787/9789264258051-en
OECD. (2017). OECD Skills Outlook 2017: Skills and Global Value Chains. OECD Publishing, Paris. Retrieved from http://dx.doi.org/10.1787/9789264273351-en
OECD. (2017). OECD Skills Studies 2017: Skills Matter: Further Results from the Survey of Adult Skills. OECD Publishing, Paris. Retrieved from http://dx.doi.org/10.1787/9789264258051-en
OECD. (2018). Education at a Glance 2018: OECD Indicators. OECD Publishing, Paris. Retrieved from https://doi.org/10.1787/eag-2018-en
Office of Career, Technical, and Adult Education National Reporting System. (2010). Participants by Program by Type and Age. Retrieved from https://wdcrobcolp01.ed.gov/CFAPPS/OVAE/NRS/tables/view.cfm?state=WV&year=2010&tableID=3
References continued
Unprepared and Unaware — February 2019 | 23
Office of Career, Technical, and Adult Education National Reporting System. (2016). Participants by Program by Type and Age. Retrieved from https://wdcrobcolp01.ed.gov/CFAPPS/OVAE/NRS/main.cfm
Office of Career, Technical, and Adult Educational National Reporting System. (2017). State Narrative Reports. Retrieved from https://www2.ed.gov/about/offices/list/ovae/pi/AdultEd/accountability-reporting.html
Online resources from websites at SREB state departments of education
Online statutory resources from websites at SREB state governments
Perkins Collaborative Resource Network. ( July 2018). Data Tool: State Profiles. Retrieved from https://cte.ed.gov/profiles/
Perin, D. (2016). Country profiles of formal and non-formal adult education opportunities in literacy, numeracy and other skills: USA. Global Education and Monitoring Report. Retrieved from http://unesdoc.unesco.or/images/0024/002475/ 247587e.pdf
Pimentel, S. (April 2013). College and Career Readiness Standards for Adult Education. U.S. Department of Education Office of Vocational and Adult Education [now the Office of Career, Technical, and Adult Education]. Retrieved from https://lincs.ed.gov/publications/pdf/CCRStandardsAdultEd.pdf
U.S. Bureau of Labor Statistics. (April 11, 2018). Occupations that Need More Education for Entry are Projected to Grow Faster than Average. Employment Projections program. Retrieved from https://www.bls.gov/emp/tables/education-summary.htm
U.S. Census Bureau. (2016). American Community Survey 1-Year Estimates. Retrieved from www.factfinder.census.gov
U.S. Census Bureau. (2010). Educational Attainment by Employment Status for the Population 25 to 64 Years. Retrieved from www.factfinder.census.gov
U.S. Census Bureau. (2016). Educational Attainment by Employment Status for the Population 25 to 64 Years. Retrieved from www.factfinder.census.gov
U.S. Census Bureau. (2015). Educational Attainment for Adults Ages 25 and Over. Retrieved from www.factfinder.census.gov
U.S. Census Bureau. (2016). Educational Attainment for Adults Ages 25 and Over. Retrieved from www.factfinder.census.gov
U.S. Census Bureau. (2016). Median Earnings in the Past 12 Months (In 2016 Inflation-adjusted dollars) by Sex by Educational Attainment for the Population 25 Years and Over. Retrieved from www.factfinder.census.gov
U.S. Census Bureau. (2010). Sex by Age and Educational Attainment for the Population 18 Years and Over. Retrieved from www.factfinder.census.gov
U.S. Census Bureau. (2016). Sex by Age and Educational Attainment for the Population 18 Years and Over. Retrieved from www.factfinder.census.gov
U.S. Department of Education, Office of Career, Technical and Adult Education. (2016). Adult Workers with Low Measured Skills: A 2016 Update. Retrieved from https://www2.ed.gov/about/offices/list/ovae/pi/AdultEd/factsh/adultworkerslowmeasuredskills.pdf
References continued
24 | Unprepared and Unaware — February 2019
U.S. Department of Education. (2016). Ed Data Express. Retrieved from www.eddataexpress.ed.gov
U.S. Department of Education. (2016). Workforce Innovation and Opportunity Act State Plans. Retrieved from https://www2.ed.gov/about/offices/list/osers/rsa/wioa/state-plans/index.html
U.S. Department of Education (2018). Fiscal Years 2017-19 State Tables for the U.S. Department of Education: Funds for State Formula-Allocated and Selected Student Aid Programs, by Program. Retrieved from https://www2.ed.gov/about/overview/budget/statetables/index.html
U.S. Department of Education Office of Career, Technical and Adult Education. (2017). Estimated Fiscal Year 2017 State Allocations Under the Carl D. Perkins Career and Technical Education Act of 2006. Retrieved from https://s3.amazonaws.com/PCRN/docs/Revised_Estimated_Perkins_State_Allocations-FY_2017-9-21-17.pdf
U.S. Department of Labor. (2016). Workforce Innovation and Opportunity Act: State WIOA Plans. Retrieved from https://doleta.gov/performance/results/AnnualReports/annual_report.cfm
United Health Foundation. (2017). America’s Health Rankings. Retrieved from www.unitedhealthfoundation.org
Uvin, J. ( January 11, 2016). Program Memorandum OCTAE/DAEL 15-7. United States Department of Education Office of Career, Technical and Adult Education. Retrieved from https://www2.ed.gov/about/offices/list/ovae/pi/AdultEd/octae-program-memo-15-7-ielce.pdf
Watson, A.L. (September 2017). Employment trends by typical entry-level education requirement. Monthly Labor Review: U.S. Bureau of Labor Statistics. Retrieved from https://doi.org/10.21916/mlr.2017.22
Wiseman, P. (November 2016). Why robots, not trade, are behind so many factory job losses. Associated Press News. Retrieved from https://apnews.com/265cd8fb02fb44a69cf0eaa2063e11d9
Young Adulllt. (2010). Education ( formal, non-formal, informal). Retrieved from http://www.young-adulllt.eu/glossary/listview.php?we_objectID=193
References continued

Southern Regional Education Board592 10th St., N.W.Atlanta, GA 30318-5776(404) 875-9211
SREB.org
February 2019 (19E02)
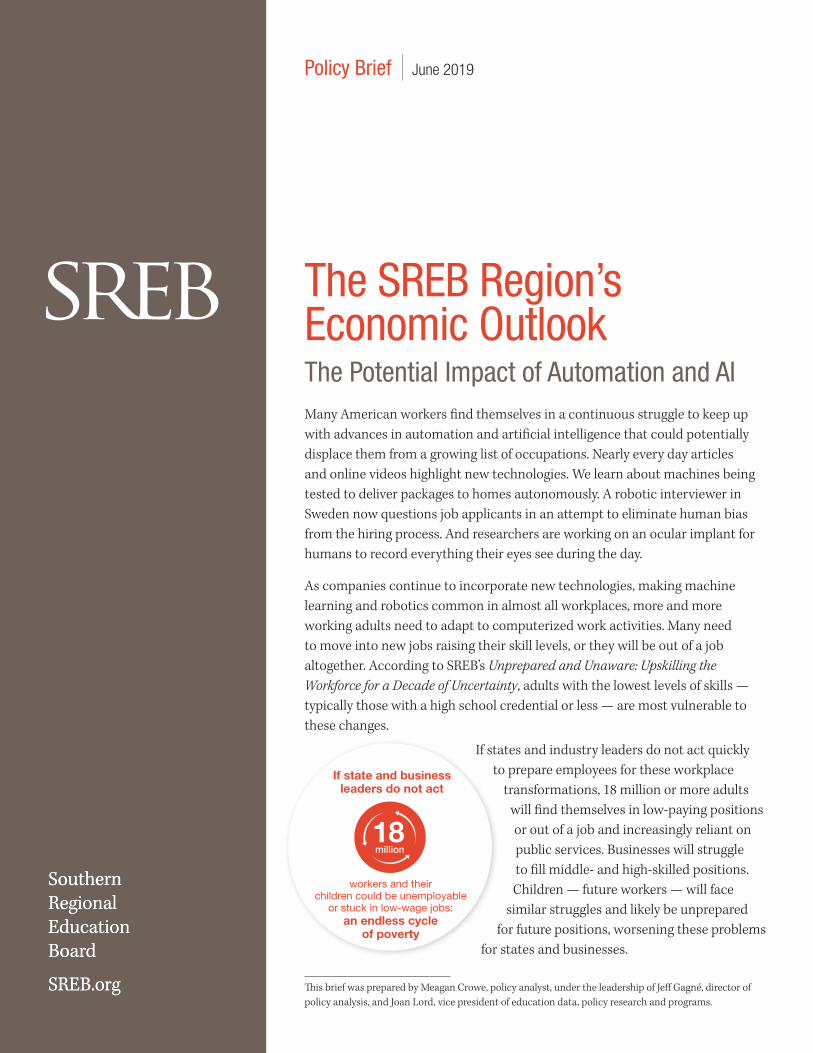
The SREB Region’s Economic OutlookThe Potential Impact of Automation and AI
This brief was prepared by Meagan Crowe, policy analyst, under the leadership of Jeff Gagné, director of policy analysis, and Joan Lord, vice president of education data, policy research and programs.
Policy Brief June 2019
SouthernRegionalEducationBoard
SREB.org
SouthernRegionalEducationBoard
SREB.org
Many American workers find themselves in a continuous struggle to keep up with advances in automation and artificial intelligence that could potentially displace them from a growing list of occupations. Nearly every day articles and online videos highlight new technologies. We learn about machines being tested to deliver packages to homes autonomously. A robotic interviewer in Sweden now questions job applicants in an attempt to eliminate human bias from the hiring process. And researchers are working on an ocular implant for humans to record everything their eyes see during the day.
As companies continue to incorporate new technologies, making machine learning and robotics common in almost all workplaces, more and more working adults need to adapt to computerized work activities. Many need to move into new jobs raising their skill levels, or they will be out of a job altogether. According to SREB’s Unprepared and Unaware: Upskilling the Workforce for a Decade of Uncertainty, adults with the lowest levels of skills — typically those with a high school credential or less — are most vulnerable to these changes.
workers and their children could be unemployable
or stuck in low-wage jobs:an endless cycle
of poverty
If state and business leaders do not act
18 million
If states and industry leaders do not act quickly to prepare employees for these workplace
transformations, 18 million or more adults will find themselves in low-paying positions or out of a job and increasingly reliant on public services. Businesses will struggle to fill middle- and high-skilled positions. Children — future workers — will face
similar struggles and likely be unprepared for future positions, worsening these problems
for states and businesses.
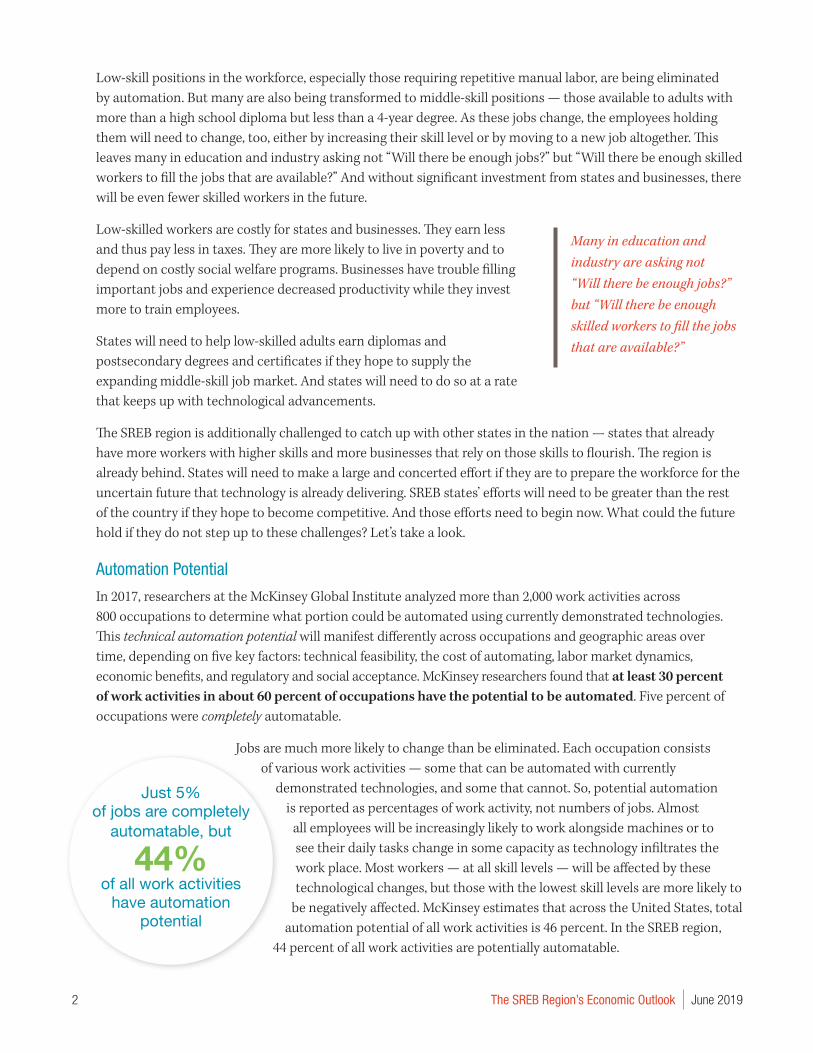
2 The SREB Region’s Economic Outlook June 2019
Low-skill positions in the workforce, especially those requiring repetitive manual labor, are being eliminated by automation. But many are also being transformed to middle-skill positions — those available to adults with more than a high school diploma but less than a 4-year degree. As these jobs change, the employees holding them will need to change, too, either by increasing their skill level or by moving to a new job altogether. This leaves many in education and industry asking not “Will there be enough jobs?” but “Will there be enough skilled workers to fill the jobs that are available?” And without significant investment from states and businesses, there will be even fewer skilled workers in the future.
Low-skilled workers are costly for states and businesses. They earn less and thus pay less in taxes. They are more likely to live in poverty and to depend on costly social welfare programs. Businesses have trouble filling important jobs and experience decreased productivity while they invest more to train employees.
States will need to help low-skilled adults earn diplomas and postsecondary degrees and certificates if they hope to supply the expanding middle-skill job market. And states will need to do so at a rate that keeps up with technological advancements.
The SREB region is additionally challenged to catch up with other states in the nation — states that already have more workers with higher skills and more businesses that rely on those skills to flourish. The region is already behind. States will need to make a large and concerted effort if they are to prepare the workforce for the uncertain future that technology is already delivering. SREB states’ efforts will need to be greater than the rest of the country if they hope to become competitive. And those efforts need to begin now. What could the future hold if they do not step up to these challenges? Let’s take a look.
Automation Potential
In 2017, researchers at the McKinsey Global Institute analyzed more than 2,000 work activities across 800 occupations to determine what portion could be automated using currently demonstrated technologies. This technical automation potential will manifest differently across occupations and geographic areas over time, depending on five key factors: technical feasibility, the cost of automating, labor market dynamics, economic benefits, and regulatory and social acceptance. McKinsey researchers found that at least 30 percent of work activities in about 60 percent of occupations have the potential to be automated. Five percent of occupations were completely automatable.
Jobs are much more likely to change than be eliminated. Each occupation consists of various work activities — some that can be automated with currently
demonstrated technologies, and some that cannot. So, potential automation is reported as percentages of work activity, not numbers of jobs. Almost
all employees will be increasingly likely to work alongside machines or to see their daily tasks change in some capacity as technology infiltrates the work place. Most workers — at all skill levels — will be affected by these technological changes, but those with the lowest skill levels are more likely to
be negatively affected. McKinsey estimates that across the United States, total automation potential of all work activities is 46 percent. In the SREB region,
44 percent of all work activities are potentially automatable.
Many in education and industry are asking not “Will there be enough jobs?” but “Will there be enough skilled workers to fill the jobs that are available?”
Just 5% of jobs are completely
automatable, but
44% of all work activities
have automation potential
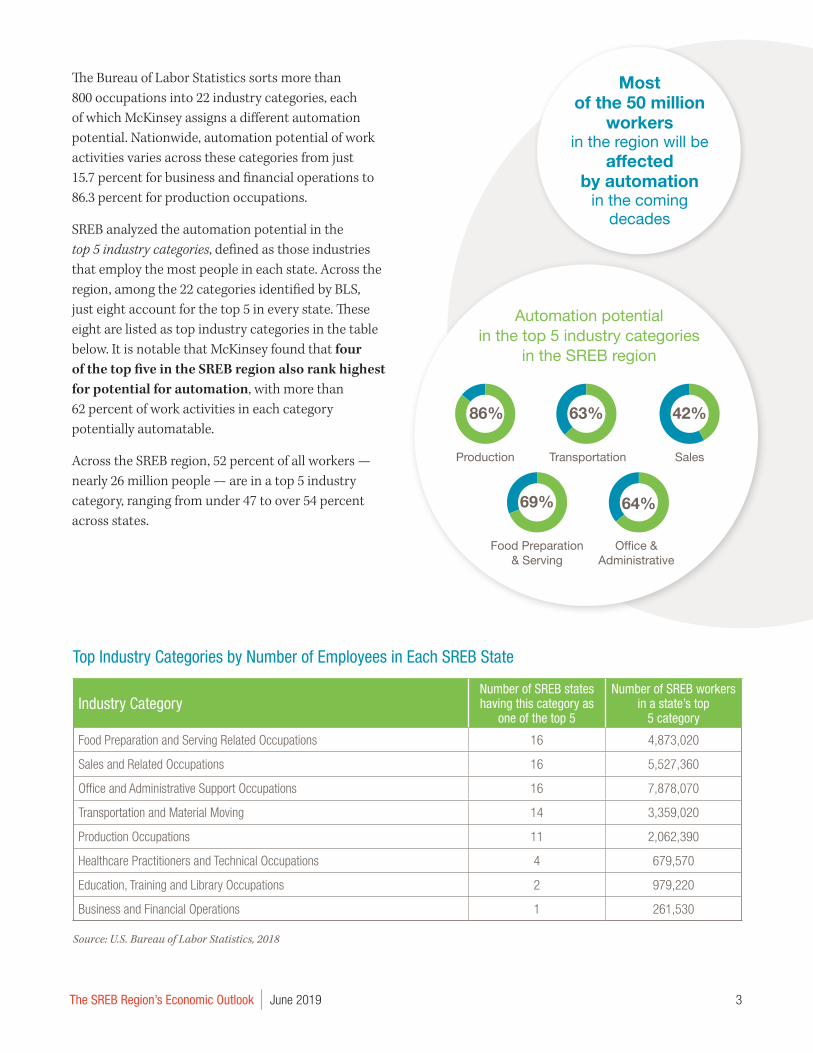
3The SREB Region’s Economic Outlook June 2019
The Bureau of Labor Statistics sorts more than 800 occupations into 22 industry categories, each of which McKinsey assigns a different automation potential. Nationwide, automation potential of work activities varies across these categories from just 15.7 percent for business and financial operations to 86.3 percent for production occupations.
SREB analyzed the automation potential in the top 5 industry categories, defined as those industries that employ the most people in each state. Across the region, among the 22 categories identified by BLS, just eight account for the top 5 in every state. These eight are listed as top industry categories in the table below. It is notable that McKinsey found that four of the top five in the SREB region also rank highest for potential for automation, with more than 62 percent of work activities in each category potentially automatable.
Across the SREB region, 52 percent of all workers — nearly 26 million people — are in a top 5 industry category, ranging from under 47 to over 54 percent across states.
Most of the 50 million
workers in the region will be
affected by automation
in the coming decades
Automation potential in the top 5 industry categories
in the SREB region
Production Transportation Sales
86% 63% 42%
Food Preparation& Serving
69%
Office & Administrative
64%
Top Industry Categories by Number of Employees in Each SREB State
Industry CategoryNumber of SREB states having this category as
one of the top 5
Number of SREB workers in a state’s top
5 category
Food Preparation and Serving Related Occupations 16 4,873,020
Sales and Related Occupations 16 5,527,360
Office and Administrative Support Occupations 16 7,878,070
Transportation and Material Moving 14 3,359,020
Production Occupations 11 2,062,390
Healthcare Practitioners and Technical Occupations 4 679,570
Education, Training and Library Occupations 2 979,220
Business and Financial Operations 1 261,530
Source: U.S. Bureau of Labor Statistics, 2018
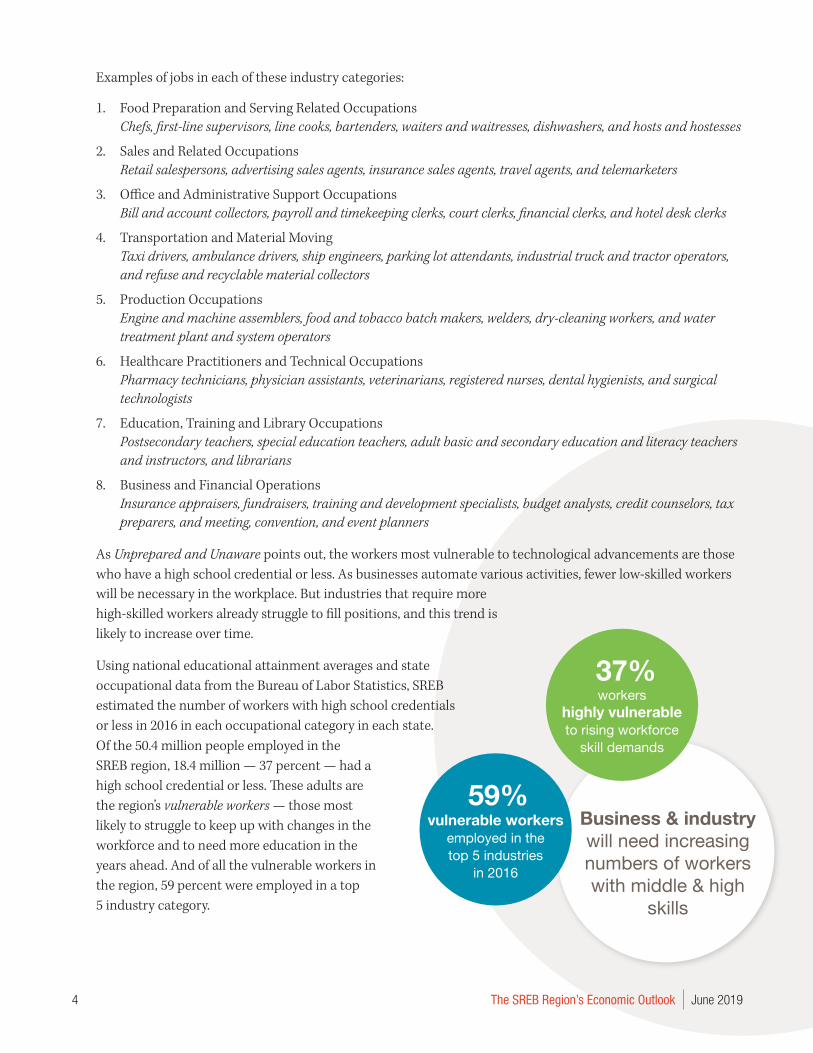
4 The SREB Region’s Economic Outlook June 2019
Examples of jobs in each of these industry categories:
1. Food Preparation and Serving Related Occupations Chefs, first-line supervisors, line cooks, bartenders, waiters and waitresses, dishwashers, and hosts and hostesses
2. Sales and Related Occupations Retail salespersons, advertising sales agents, insurance sales agents, travel agents, and telemarketers
3. Office and Administrative Support Occupations Bill and account collectors, payroll and timekeeping clerks, court clerks, financial clerks, and hotel desk clerks
4. Transportation and Material Moving Taxi drivers, ambulance drivers, ship engineers, parking lot attendants, industrial truck and tractor operators, and refuse and recyclable material collectors
5. Production Occupations Engine and machine assemblers, food and tobacco batch makers, welders, dry-cleaning workers, and water treatment plant and system operators
6. Healthcare Practitioners and Technical Occupations Pharmacy technicians, physician assistants, veterinarians, registered nurses, dental hygienists, and surgical technologists
7. Education, Training and Library Occupations Postsecondary teachers, special education teachers, adult basic and secondary education and literacy teachers and instructors, and librarians
8. Business and Financial Operations Insurance appraisers, fundraisers, training and development specialists, budget analysts, credit counselors, tax preparers, and meeting, convention, and event planners
As Unprepared and Unaware points out, the workers most vulnerable to technological advancements are those who have a high school credential or less. As businesses automate various activities, fewer low-skilled workers
37%workers
highly vulnerable to rising workforce
skill demands
59%vulnerable workers
employed in the top 5 industries
in 2016
Business & industrywill need increasing numbers of workers with middle & high
skills
will be necessary in the workplace. But industries that require more high-skilled workers already struggle to fill positions, and this trend is likely to increase over time.
Using national educational attainment averages and state occupational data from the Bureau of Labor Statistics, SREB estimated the number of workers with high school credentials or less in 2016 in each occupational category in each state. Of the 50.4 million people employed in the SREB region, 18.4 million — 37 percent — had a high school credential or less. These adults are the region’s vulnerable workers — those most likely to struggle to keep up with changes in the workforce and to need more education in the years ahead. And of all the vulnerable workers in the region, 59 percent were employed in a top 5 industry category.
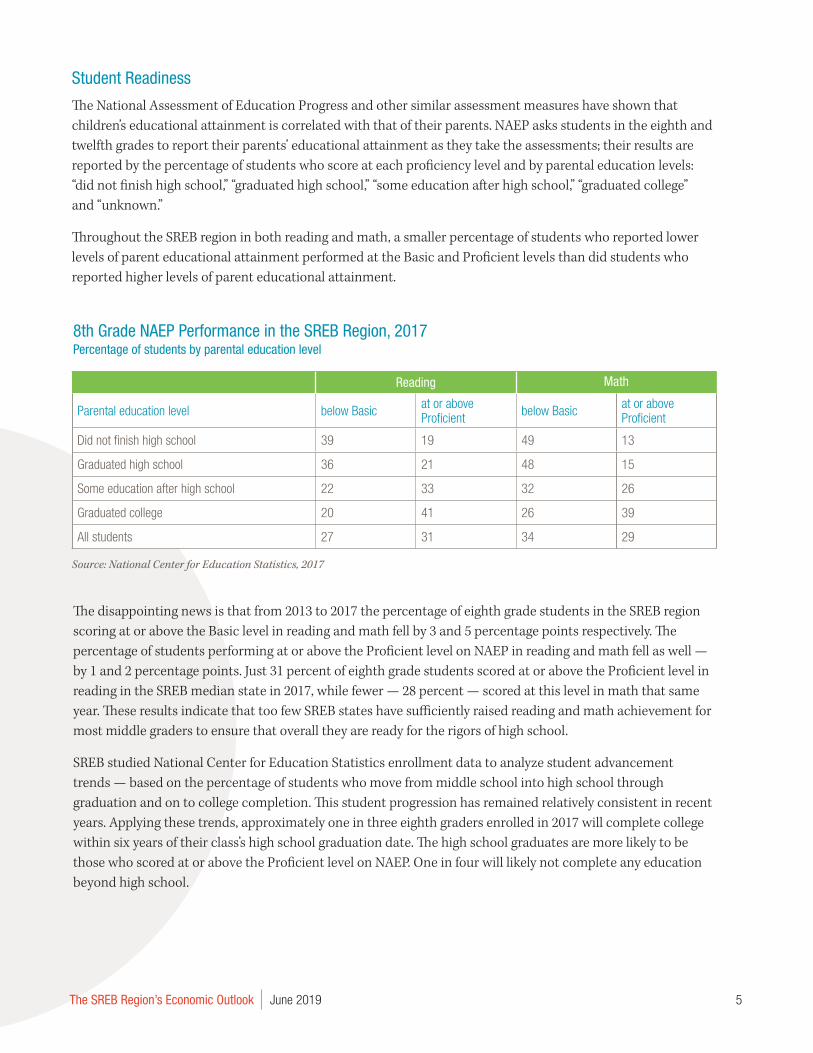
5The SREB Region’s Economic Outlook June 2019
Student Readiness
The National Assessment of Education Progress and other similar assessment measures have shown that children’s educational attainment is correlated with that of their parents. NAEP asks students in the eighth and twelfth grades to report their parents’ educational attainment as they take the assessments; their results are reported by the percentage of students who score at each proficiency level and by parental education levels: “did not finish high school,” “graduated high school,” “some education after high school,” “graduated college” and “unknown.”
Throughout the SREB region in both reading and math, a smaller percentage of students who reported lower levels of parent educational attainment performed at the Basic and Proficient levels than did students who reported higher levels of parent educational attainment.
8th Grade NAEP Performance in the SREB Region, 2017Percentage of students by parental education level
Reading Math
Parental education level below Basic at or above Proficient below Basic at or above
Proficient
Did not finish high school 39 19 49 13
Graduated high school 36 21 48 15
Some education after high school 22 33 32 26
Graduated college 20 41 26 39
All students 27 31 34 29
The disappointing news is that from 2013 to 2017 the percentage of eighth grade students in the SREB region scoring at or above the Basic level in reading and math fell by 3 and 5 percentage points respectively. The percentage of students performing at or above the Proficient level on NAEP in reading and math fell as well — by 1 and 2 percentage points. Just 31 percent of eighth grade students scored at or above the Proficient level in reading in the SREB median state in 2017, while fewer — 28 percent — scored at this level in math that same year. These results indicate that too few SREB states have sufficiently raised reading and math achievement for most middle graders to ensure that overall they are ready for the rigors of high school.
SREB studied National Center for Education Statistics enrollment data to analyze student advancement trends — based on the percentage of students who move from middle school into high school through graduation and on to college completion. This student progression has remained relatively consistent in recent years. Applying these trends, approximately one in three eighth graders enrolled in 2017 will complete college within six years of their class’s high school graduation date. The high school graduates are more likely to be those who scored at or above the Proficient level on NAEP. One in four will likely not complete any education beyond high school.
Source: National Center for Education Statistics, 2017
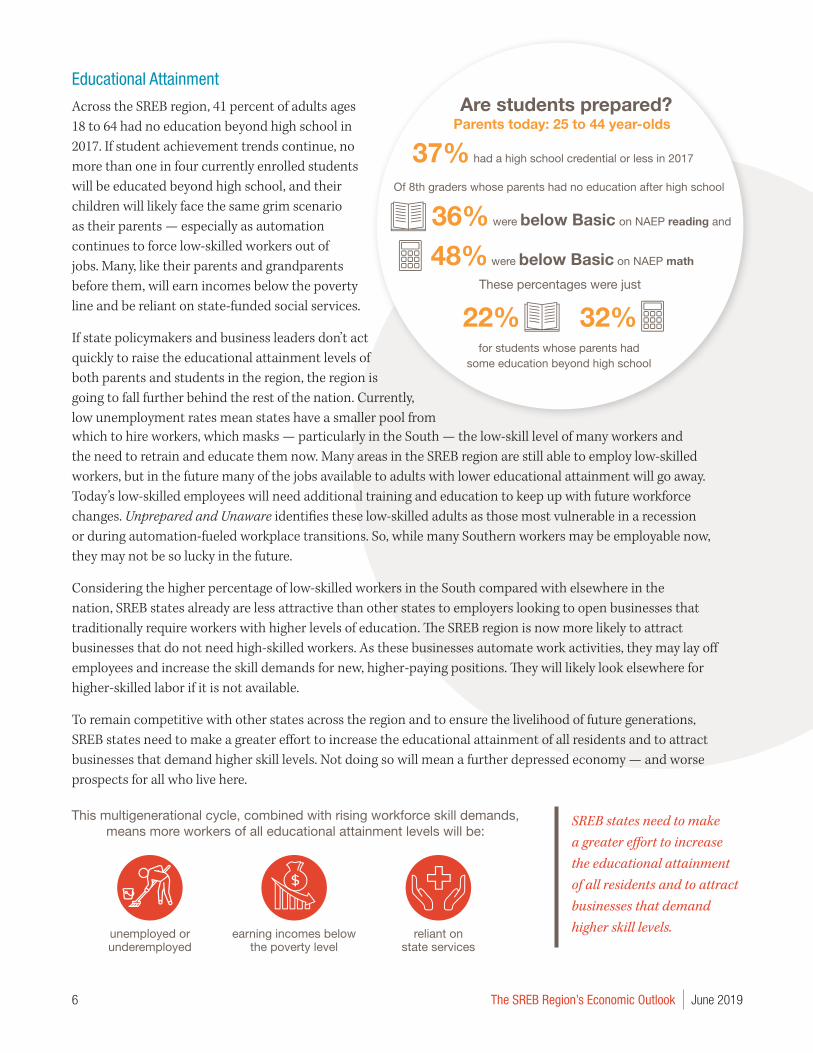
6 The SREB Region’s Economic Outlook June 2019
Educational Attainment
Across the SREB region, 41 percent of adults ages 18 to 64 had no education beyond high school in 2017. If student achievement trends continue, no more than one in four currently enrolled students will be educated beyond high school, and their children will likely face the same grim scenario as their parents — especially as automation continues to force low-skilled workers out of jobs. Many, like their parents and grandparents before them, will earn incomes below the poverty line and be reliant on state-funded social services.
If state policymakers and business leaders don’t act quickly to raise the educational attainment levels of both parents and students in the region, the region is going to fall further behind the rest of the nation. Currently, low unemployment rates mean states have a smaller pool from
SREB states need to make a greater effort to increase the educational attainment of all residents and to attract businesses that demand higher skill levels.
Are students prepared?
37% had a high school credential or less in 2017
Parents today: 25 to 44 year-olds
Of 8th graders whose parents had no education after high school
36% were below Basic on NAEP reading and
48% were below Basic on NAEP math
These percentages were just
22% 32%for students whose parents had
some education beyond high school
which to hire workers, which masks — particularly in the South — the low-skill level of many workers and the need to retrain and educate them now. Many areas in the SREB region are still able to employ low-skilled workers, but in the future many of the jobs available to adults with lower educational attainment will go away. Today’s low-skilled employees will need additional training and education to keep up with future workforce changes. Unprepared and Unaware identifies these low-skilled adults as those most vulnerable in a recession or during automation-fueled workplace transitions. So, while many Southern workers may be employable now, they may not be so lucky in the future.
Considering the higher percentage of low-skilled workers in the South compared with elsewhere in the nation, SREB states already are less attractive than other states to employers looking to open businesses that traditionally require workers with higher levels of education. The SREB region is now more likely to attract businesses that do not need high-skilled workers. As these businesses automate work activities, they may lay off employees and increase the skill demands for new, higher-paying positions. They will likely look elsewhere for higher-skilled labor if it is not available.
To remain competitive with other states across the region and to ensure the livelihood of future generations, SREB states need to make a greater effort to increase the educational attainment of all residents and to attract businesses that demand higher skill levels. Not doing so will mean a further depressed economy — and worse prospects for all who live here.
This multigenerational cycle, combined with rising workforce skill demands, means more workers of all educational attainment levels will be:
unemployed orunderemployed
earning incomes below the poverty level
reliant on state services
7The SREB Region’s Economic Outlook June 2019
References
Andreason, S., Bozarth, A., De Renzis, B., Johnson, M., Hirsch, R., & Pack, A. (2018). Building a Skilled Workforce for a Stronger Southern Economy. Federal Reserve Bank. Retrieved from https://www.frbatlanta.org/-/media/documents/community-development/publications/special/180612-building-a-skilled-workforce-for-a-stronger-southern-economy/report.pdf.
Crowe, M. (February 2019). Unprepared and Unaware: Upskilling the Workforce for a Decade of Uncertainty. Southern Regional Education Board. Retrieved from https://www.sreb.org/publication/unprepared-and-unaware.
Crowe, M., Durrance, S., Gagne, J., & Lord, J. ( June 2018). Looking Closer. Southern Regional Education Board. Retrieved from https://www.sreb.org/StateProgress.
Manyika, J., Chui, M., Miremadi, M., Bughin, J., George, K., Willmott, P. & Dewhurst, M. ( January 2017). A Future that Works: Automation, Employment and Productivity. McKinsey Global Institute. Retrieved from https://www.mckinsey.com/featured-insights/digital-disruption/harnessing-automation-for-a-future-that-works.
Manyika, J., Lund, S., Chui, M., Bughin, J., Woetzel, J., Batra, P., …Sanghvi, S. (December 2017). Jobs Lost, Jobs Gained: Workforce Transitions in a Time of Automation. McKinsey Global Institute. Retrieved from www.mckinsey.com/mgi.
McKinsey Global Institute. (October 1, 2018). Automation and US Jobs. Retrieved from https://public.tableau.com/profile/mckinsey.analytics#!/vizhome/AutomationandUSjobs/USAutomationlandscape.
U.S. Bureau of Labor Statistics. (May 2018). State Occupational Profiles, May 2017 data. Occupational Employment Statistics. Retrieved from https://www.bls.gov/oes/#data.
U.S. Bureau of Labor Statistics. (October 30, 2018). Table 5.3 Educational Attainment for Workers 25 Years and Older by Detailed Occupation, 2016-17. Retrieved from https://www.bls.gov/emp/tables/educational-attainment.htm.
U.S. Census Bureau. (2017). Sex by Age and Educational Attainment for the Population 18 Years and Over. Retrieved from https://factfinder.census.gov/faces/nav/jsf/pages/index.xhtml.
U.S. Department of Education, Institute of Education Sciences, National Center for Education Statistics, National Assessment of Educational Progress (NAEP). (2017) Math Assessment. Retrieved from https://www.nationsreportcard.gov/ndecore/xplore/NDE.
U.S. Department of Education, Institute of Education Sciences, National Center for Education Statistics, National Assessment of Educational Progress (NAEP). (2017) Reading Assessment. Retrieved from https://www.nationsreportcard.gov/ndecore/xplore/NDE.

Southern Regional Education Board592 10th St., N.W.Atlanta, GA 30318-5776(404) 875-9211
SREB.org
June 2019 (19E05)
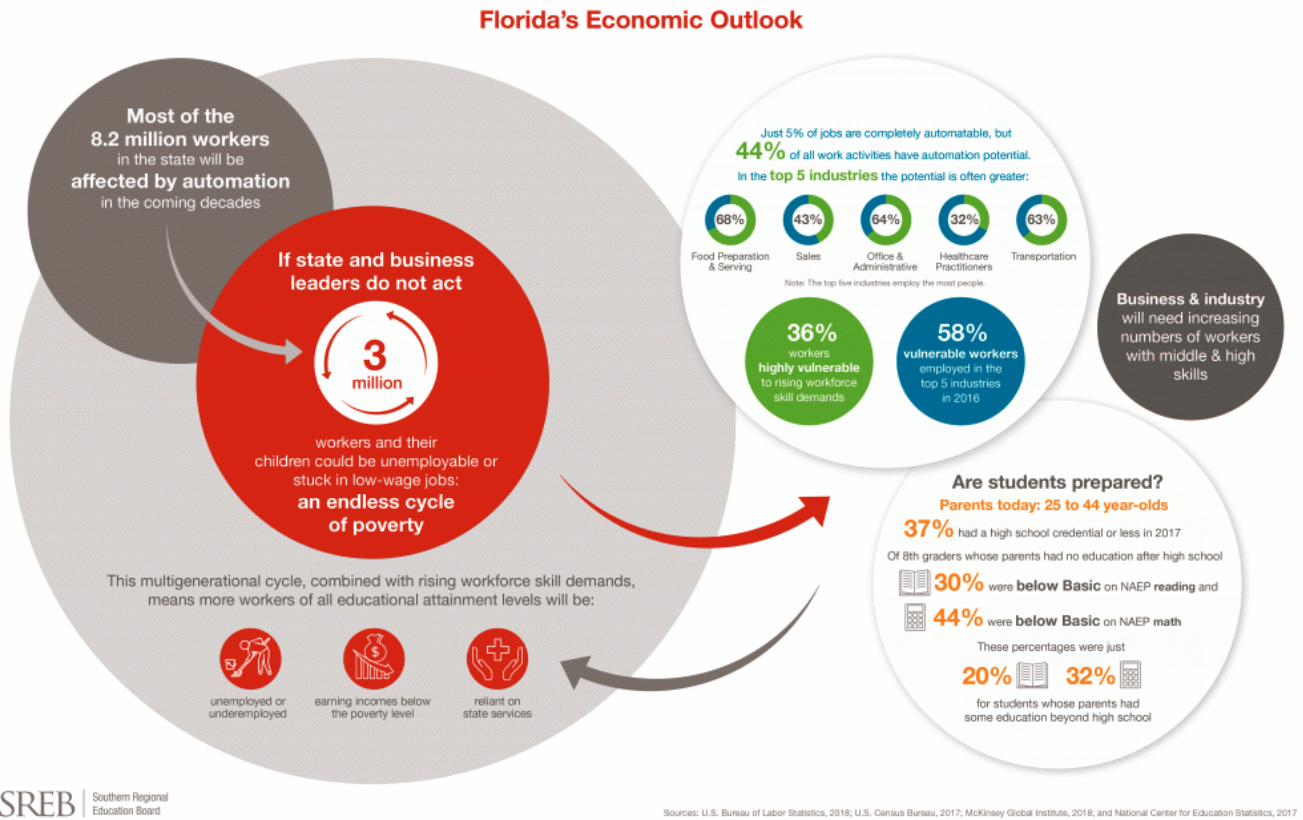
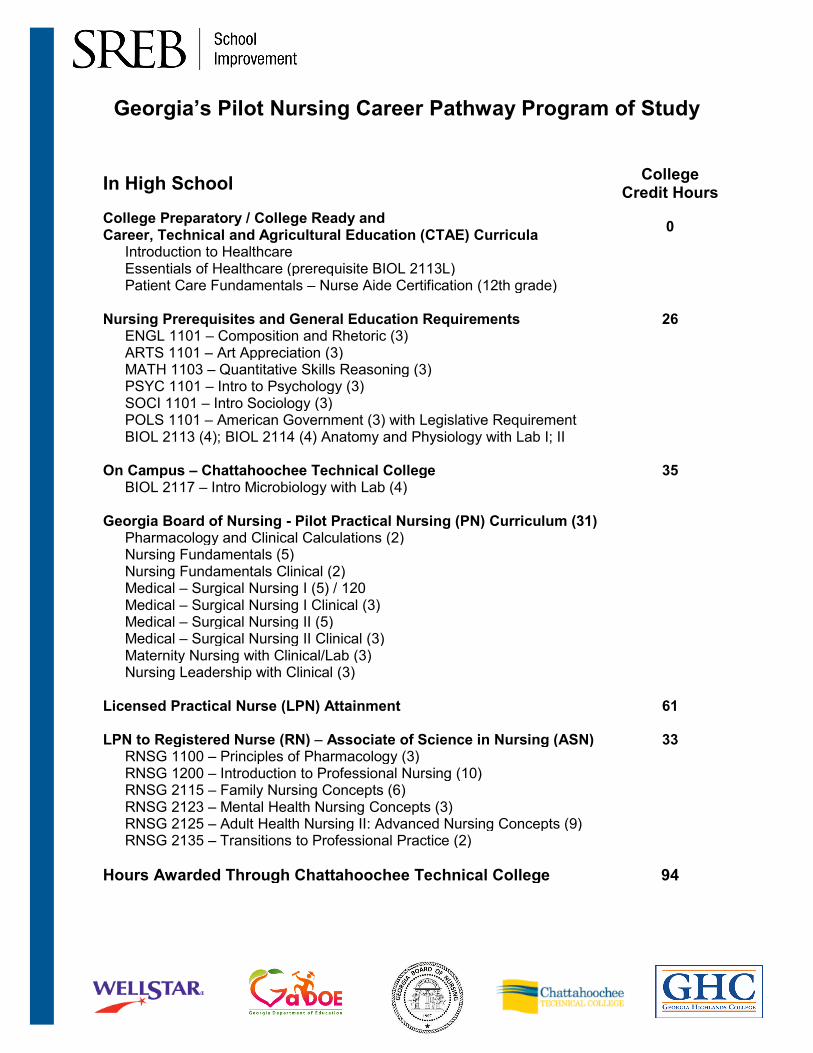
Georgia’s Pilot Nursing Career Pathway Program of Study
In High School College Credit Hours
College Preparatory / College Ready and Career, Technical and Agricultural Education (CTAE) Curricula 0
Introduction to Healthcare Essentials of Healthcare (prerequisite BIOL 2113L) Patient Care Fundamentals – Nurse Aide Certification (12th grade)
Nursing Prerequisites and General Education Requirements 26
ENGL 1101 – Composition and Rhetoric (3) ARTS 1101 – Art Appreciation (3) MATH 1103 – Quantitative Skills Reasoning (3) PSYC 1101 – Intro to Psychology (3) SOCI 1101 – Intro Sociology (3) POLS 1101 – American Government (3) with Legislative Requirement BIOL 2113 (4); BIOL 2114 (4) Anatomy and Physiology with Lab I; II
On Campus – Chattahoochee Technical College 35
BIOL 2117 – Intro Microbiology with Lab (4) Georgia Board of Nursing - Pilot Practical Nursing (PN) Curriculum (31)
Pharmacology and Clinical Calculations (2) Nursing Fundamentals (5) Nursing Fundamentals Clinical (2) Medical – Surgical Nursing I (5) / 120 Medical – Surgical Nursing I Clinical (3) Medical – Surgical Nursing II (5) Medical – Surgical Nursing II Clinical (3) Maternity Nursing with Clinical/Lab (3) Nursing Leadership with Clinical (3)
Licensed Practical Nurse (LPN) Attainment 61 LPN to Registered Nurse (RN) – Associate of Science in Nursing (ASN) 33
RNSG 1100 – Principles of Pharmacology (3) RNSG 1200 – Introduction to Professional Nursing (10) RNSG 2115 – Family Nursing Concepts (6) RNSG 2123 – Mental Health Nursing Concepts (3) RNSG 2125 – Adult Health Nursing II: Advanced Nursing Concepts (9) RNSG 2135 – Transitions to Professional Practice (2)
Hours Awarded Through Chattahoochee Technical College 94
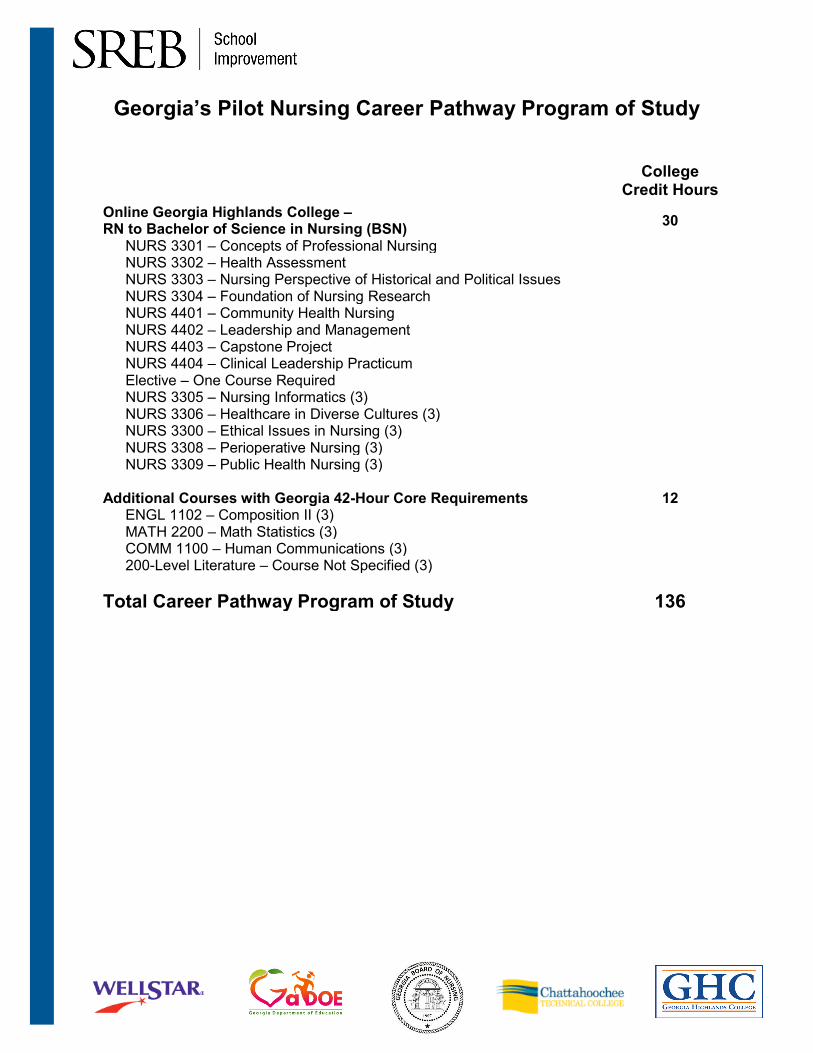
Georgia’s Pilot Nursing Career Pathway Program of Study
College Credit Hours
Online Georgia Highlands College – RN to Bachelor of Science in Nursing (BSN) 30
NURS 3301 – Concepts of Professional Nursing NURS 3302 – Health Assessment NURS 3303 – Nursing Perspective of Historical and Political Issues NURS 3304 – Foundation of Nursing Research NURS 4401 – Community Health Nursing NURS 4402 – Leadership and Management NURS 4403 – Capstone Project NURS 4404 – Clinical Leadership Practicum Elective – One Course Required NURS 3305 – Nursing Informatics (3) NURS 3306 – Healthcare in Diverse Cultures (3) NURS 3300 – Ethical Issues in Nursing (3) NURS 3308 – Perioperative Nursing (3) NURS 3309 – Public Health Nursing (3)
Additional Courses with Georgia 42-Hour Core Requirements 12
ENGL 1102 – Composition II (3) MATH 2200 – Math Statistics (3) COMM 1100 – Human Communications (3) 200-Level Literature – Course Not Specified (3)
Total Career Pathway Program of Study 136
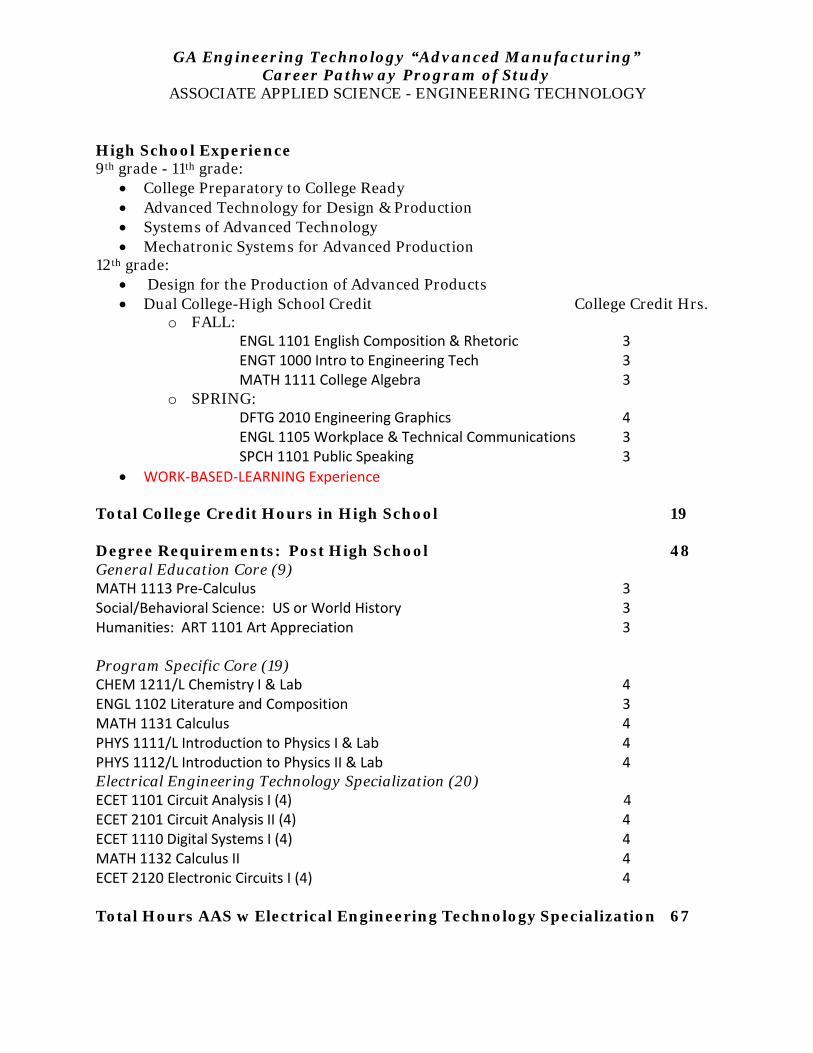
GA Engineering Technology “Advanced Manufacturing” Career Pathway Program of Study
ASSOCIATE APPLIED SCIENCE - ENGINEERING TECHNOLOGY High School Experience 9th grade - 11th grade:
• College Preparatory to College Ready • Advanced Technology for Design & Production • Systems of Advanced Technology • Mechatronic Systems for Advanced Production
12th grade: • Design for the Production of Advanced Products • Dual College-High School Credit College Credit Hrs.
o FALL: ENGL 1101 English Composition & Rhetoric 3 ENGT 1000 Intro to Engineering Tech 3 MATH 1111 College Algebra 3
o SPRING: DFTG 2010 Engineering Graphics 4 ENGL 1105 Workplace & Technical Communications 3
SPCH 1101 Public Speaking 3 • WORK-BASED-LEARNING Experience
Total College Credit Hours in High School 19
Degree Requirements: Post High School 48 General Education Core (9) MATH 1113 Pre-Calculus 3 Social/Behavioral Science: US or World History 3 Humanities: ART 1101 Art Appreciation 3 Program Specific Core (19) CHEM 1211/L Chemistry I & Lab 4 ENGL 1102 Literature and Composition 3 MATH 1131 Calculus 4 PHYS 1111/L Introduction to Physics I & Lab 4 PHYS 1112/L Introduction to Physics II & Lab 4 Electrical Engineering Technology Specialization (20) ECET 1101 Circuit Analysis I (4) 4 ECET 2101 Circuit Analysis II (4) 4 ECET 1110 Digital Systems I (4) 4 MATH 1132 Calculus II 4 ECET 2120 Electronic Circuits I (4) 4 Total Hours AAS w Electrical Engineering Technology Specialization 67

BY AMY ELLEN DUKE-BENFIELD, BRYAN WILSON, KERMIT KALEBA, JENNA LEVENTOFF
Defining Quality Non-Degree Credentials for States
September 2019
Expanding Opportunities

B EXPANDING OPPORTUNITIES: DEFINING QUALITY NON-DEGREE CREDENTIALS FOR STATES

EXPANDING OPPORTUNITIES: DEFINING QUALITY NON-DEGREE CREDENTIALS FOR STATES 1
Table of contents
Introduction and overview.............................................................................................3
A note on non-degree credentials and the future of work .....................4
What are non-degree credentials? ........................................................................6
Credentials and programs .....................................................................................6
Types of non-degree credentials ......................................................................6
Why quality assurance systems matter ............................................................... 7
Developing the criteria .....................................................................................................8
Summary of state quality assurance processes – Round one states .................................................................................. 10
Definition of a quality non-degree credential ............................................... 13
General principles ..................................................................................................... 13
Definition .......................................................................................................................... 14
Criteria ............................................................................................................................... 14
Setting performance standards for earnings ..................................................17
Quality non-degree credentials attainment state policy recommendations ................................................................................. 21
A. Codifying or regulating quality criteria ................................................ 21
B. State policies to support quality non-degree credential attainment ..................................................................................... 22
C. State policies to improve data, determine quality, and measure credential attainment ...................................................... 26
Endnotes .................................................................................................................................. 28
Funding for this report was made possible by Lumina Foundation.
The views expressed in this publication are those of the authors and do not necessarily represent those of Lumina Foundation, its officers, or employees.
About Lumina Foundation
Lumina Foundation is an independent, private foundation in Indianapolis that is committed to making opportunities for learning beyond high school available to all. The foundation envisions a system that is easy to navigate, delivers fair results, and meets the nation’s need for talent through a broad range of credentials. Lumina’s goal is to prepare people for informed citizen-ship and for success in a global economy.
The authors wish to thank governors’ and agency staff from the following states who participated in the project that led to this paper: Alabama, Colo-rado, Florida, Iowa, Louisiana, New Jersey, Oregon, Rhode Island, Tennessee, Virginia, Washington, and West Virginia.

2 EXPANDING OPPORTUNITIES: DEFINING QUALITY NON-DEGREE CREDENTIALS FOR STATES
EXPANDING OPPORTUNITIES: DEFINING QUALITY NON-DEGREE CREDENTIALS FOR STATES 3
Introduction and overviewMore than ever before, postsecondary education and train-ing has become essential to the nation’s economic mobility and growth. More than 80 percent of all jobs in today’s econ-omy require some form of education or training beyond high school,1 and virtually all new jobs created since 2008 have gone to workers with at least some postsecondary educa-tion.2 But as a nation, America is not keeping pace with these accelerating demands. Nationally, fewer than half of all Amer-icans have a postsecondary degree or credential, and in some states fewer than 40 percent of working-age adults have any form of postsecondary attainment.3 If America wants to build an inclusive economy where all workers and all businesses have the skills they need to stay competitive in a rapidly changing global marketplace, everyone must work together to expand access to and attainment of degrees and credentials of value.
State leaders have recognized the critical importance of postsecondary attainment in meeting economic and equity goals. Nearly every state has or is considering a postsecond-ary education attainment goal, which sets a threshold for the number of people within that state who hold some type of postsecondary credential at 55 percent or higher. These goals can drive policies that help more individuals attain postsecondary degrees and credentials that attract business and lead residents to good jobs.4 And states are increasingly recognizing that they will be unable to achieve these goals without focusing on student populations that have tradition-ally been underserved by higher education and other train-ing strategies. Thirty states have set goals to close racial eq-uity gaps or increase attainment for people of color,5 and a number of states have developed policies to expand access to degrees and credentials for adult learners and other non-traditional students.
Non-degree credentials (NDCs), such as certificates, industry certifications, apprenticeship certificates, and occupational licenses are a key component of state credential attainment goals, helping workers obtain better jobs and serving to reconnect them to further postsecondary education and training opportunities. NDCs are already a significant part of the education and training landscape. In 2016, the Adult Training and Education Survey (ATES) found that 27 per-cent of adults held a NDC, with 18 percent holding licenses, 8 percent holding postsecondary certificates, and 6 per-cent holding certifications.6 The percentage of individuals reporting a postsecondary certificate as their highest edu-cational attainment increased from less than 2 percent in 1984 to nearly 12 percent in 2009.7 The number of workers participating in registered apprenticeship programs in-creased by 56 percent between 2013 and 2018 — from 375,000 participants to 585,000 participants — and nearly 300,000 individuals completed apprenticeship programs over that timeframe.
If America wants to build an inclusive economy where all workers and all businesses have the skills they need to stay competitive in a rapidly changing global marketplace, everyone must work together to expand access to and attainment of degrees and credentials of value.
4 EXPANDING OPPORTUNITIES: DEFINING QUALITY NON-DEGREE CREDENTIALS FOR STATES
NDCs matter to workers and jobseekers because they have value in the labor market. Postsecondary certificate holders earn 30 percent more than individuals with a high school diploma alone, on average, and the wage premium for short-term programs in certain fields is often comparable to or higher than associate’s degrees and even some bachelor’s degrees.8 According to a Strada-Gallup Education Consumer Survey, among adults without a postsecondary degree, cer-tificate/certification holders enjoy an income premium com-pared to those who do not hold a certificate or certification ($45,000 median annual income versus $30,000). This in-come advantage exists at the top and bottom of the income distribution as well.9 Individuals who complete a registered apprenticeship program earn more than $300,000 in addi-tional wages and benefits than non-participants on average over their lifetimes, and have an employment rate 8.6 percent higher than non-participants.10 While non-degree credentials
generally do not have the same payoff as more traditional bachelor’s degrees, they do represent a crucial opportunity for millions of U.S. workers to increase their earnings and economic opportunities.
Yet, not all non-degree credentials are created equal. Some are higher quality than others, meaning they lead to further education and employment. Some connect individuals to good careers, while others have little or no economic payoff. It is essential that states have criteria to assess the quality of non-degree credentials in order to make sensible budget and policy decisions, advance equity, and put students on a path to success.
Quality assurance is particularly important given the role that NDCs play in providing opportunities for people of color and other underrepresented groups who have been historically underserved by postsecondary education and training. For example, Black Americans are more likely than their White counterparts to report certificates as their highest level of education. This reality reflects inequities in access to more advanced postsecondary education, but also the fact that shorter-term NDCs can be a valuable option for people who face financial or other barriers in accessing education and
While non-degree credentials generally do not have the same payoff as more traditional bachelor’s degrees, they do represent a crucial opportunity for millions of U.S. workers to increase their earnings and economic opportunities.
A NOTE ON NON-DEGREE CREDENTIALS AND THE FUTURE OF WORK
Workers and companies face an unprecedented acceleration of workplace technologies, with broad implications for the “future of work” in America. By most estimates, at least 60 percent of today’s jobs will be impacted by digitalization, automation, and/or artificial intelligence. That means over ninety million working Americans may have to acquire new skills just to stay in their jobs, let alone to advance in their industries. An additional 10-20 percent of jobs are likely to be eliminated and replaced with new types of higher-skilled positions, requiring broad-based reskilling support for millions of impacted workers as they develop new careers.12 Increasing access to and support of NDCs will build ladders to greater opportunity as the workplace changes.
A state quality NDC definition can assist state policymakers in identifying and investing in new and emerging credentials that can help workers upskill quickly in response to technological changes and can help displaced workers figure out the right next steps as they transition to new occupations or industries. The quality NDC definition and the process of industry validation may be of particular value with newer credentialing options, where there may not yet be broad understanding or acceptance by employers within that industry.

EXPANDING OPPORTUNITIES: DEFINING QUALITY NON-DEGREE CREDENTIALS FOR STATES 5
training. Across American society, people of color are dispro-portionately likely to face such barriers, while also contend-ing with broader racial inequities in educational attainment, employment, and income. These disparities result from de-cades of structurally racist policies, including those that have shaped postsecondary education and training. Addressing these disparities requires a multi-pronged strategy, potential-ly including setting credential attainment goals that specifi-cally target racial gaps in education and employment and increased access for workers of color to particular types of quality non-degree credentials (quality NDCs) that they have historically had less opportunity to pursue (e.g. apprentice-ships). While these approaches can help counter years of racist policies and decrease gaps in attainment, employ-ment, and income, they are insufficient on their own. Other policies — such as those that promote access to jobs that pay a family supporting wage — are also necessary to ultimately overcome wage and employment disparities.
In this paper, National Skills Coalition (NSC) lays out the im-portance of building robust quality assurance systems for NDCs. The paper proposes a consensus definition of quality
It is essential that states have criteria to assess the quality of non-degree credentials in order to make sensible budget and policy decisions, advance equity, and put students on a path to success.
NDCs and criteria developed in consultation with twelve leading states, that states can adopt for their own quality as-surance systems. These criteria should allow policymakers to be comfortable supporting these programs with public funds, students to be confident about selecting high-quality training, and employers to understand which programs are effectively preparing students for careers. The quality NDC criteria can also help states address racial and other equity gaps by providing more pathways into quality postsecond-ary education and training and good jobs for people of color. In conclusion, NSC provides a range of policy recommen-dations for states to consider to support increased attain-ment of quality NDCs.
6 EXPANDING OPPORTUNITIES: DEFINING QUALITY NON-DEGREE CREDENTIALS FOR STATES
What are non-degree credentials? Credentials and programsBefore turning to a discussion of quality assurance and NDCs, it is important to distinguish between types of creden-tials and how they are awarded, and whether we are focus-ing on the quality of credentials or the quality of programs.
NSC considered four types of non-degree credentials in developing the definition of quality: certificates, industry certifications, occupational licenses, and apprenticeship certificates.
Each specific credential (as opposed to type of credential) is awarded by a specific entity. For example, a certificate is awarded by an education institution and a license is award-ed by a state licensing agency. For instance, Virginia and Iowa plumber licenses are different credentials, and their quality must be separately analyzed because their quality may not be the same. This paper is about the quality of spe-cific credentials.
In addition, for certificates a credential signifies the comple-tion of a specific educational program, meaning the certifi-cate and program are tied together. To receive an education or apprenticeship certificate, an individual must complete a specific program. For example, a graduate receives a Clover Park Technical College Pharmacy Technician Certificate. For the purpose of this paper, analyzing the quality of a specific certificate and an individual educational program is one and the same.
In contrast, licenses and certifications are not tied to an in-dividual educational program. A licensing body may well re-quire applicants to complete a type of program. There could be multiple individual programs in a state that meet the licens-ing or certification requirements. Individuals may complete any of these programs in preparation for a license or a certifi-cation, receive a certificate, but never receive the license or certification for one reason or another. For analyzing quality, a license or certification is different than a program.11
TYPES OF NON-DEGREE CREDENTIALS
Certificates are credentials awarded by an education institution based on completion of all requirements for a program of study, including coursework and tests. They are not time limited and do not need to be renewed.
Apprenticeship certificates are credentials earned through work-based learning and postsecondary earn-and-learn models. They are applicable to industry trades and professions. Registered apprenticeship certificates meet national standards.
Industry certifications are credentials awarded by a certification body (not a school or government agency) based on an individual demonstrating, through an examination process, that he or she has acquired the designated knowledge, skills, and abilities to perform a specific occupation or skill. It is time-limited and may be renewed through a re-certification process.
Licenses are credentials that permit the holder to practice in a specified field. An occupational license is awarded by a government licensing agency based on pre-determined criteria. The criteria may include some combination of degree attainment, certifications, certificates, assessment, apprenticeship programs, or work experience. Licenses are time-limited and must be renewed periodically.
EXPANDING OPPORTUNITIES: DEFINING QUALITY NON-DEGREE CREDENTIALS FOR STATES 7
Why quality assurance systems matterWhile NDCs can and should be an important element of any state’s credential attainment goals, it is important for states to have clear processes and criteria in place for determining which NDCs provide value to workers, businesses, and other stakeholders.
For workers, a quality NDC definition and a quality assur-ance system can help save time and money. One estimate suggests that there are more than 330,000 unique creden-tials in the U.S., and it can be difficult for working adults and other non-traditional students to understand their options and the likely employment and earnings outcomes associat-ed with specific programs.12 Workers also need to evaluate how well a given program will meet their career goals while also balancing work, family, and other obligations. In some instances, a shorter program with an immediate labor market payoff may work better for that individual, but in other in-stances a longer program — including a program with op-portunities to learn and earn — may be more appropriate. In all cases, workers need to know if a given program or cre-dential is unlikely to deliver desired results. A well-designed quality assurance system can help individuals identify the right program and credential for their circumstances while avoiding low-quality or ineffective options, protecting stu-dents from being the victims of fraud and abuse. It can also help overcome the negative associations that employers may have regarding individuals with NDCs, making it easier for disadvantaged worker populations to enter and advance in employment.
For businesses, a quality NDC definition and quality assur-ance system can make it easier to identify talent and address emerging skill needs. Businesses can play a critical role in the development of a quality NDC definition, identifying the competencies and skills that they need to get the job done, and the credentials that they view as effectively communicat-ing mastery of those competencies. As skill requirements change in response to technological or economic shifts, em-ployers can help to determine whether current quality NDCs still have value and can help credential providers refine cur-ricula and program delivery to ensure continued alignment with evolving demands. A well-designed quality assurance system can help reduce the costs of hiring for businesses by clarifying which applicants have the necessary skills to be
successful from day one, and can help businesses plan for future talent development needs by identifying where cre-dentialing gaps may exist within their industry or their region.
For education and training providers, a quality NDC defi-nition and quality assurance system provides clear guidance on which credentials they should offer and how to think about designing new credentials or program offerings with an eye to both return on investment from program partici-pants and maximizing alignment with labor market needs. Where current credentialing options do not meet the criteria established under the state’s definition, providers have a framework for updating and improving those programs — or discontinuing if necessary.
For state policymakers, a quality NDC definition and quali-ty assurance system provide a range of options for improving economic opportunities for citizens and businesses alike. Policymakers can use the definition to set clear targets for NDC attainment, with a focus on increasing attainment of credentials where demand outstrips supply, supporting busi-ness growth, and expanding the state’s tax base by helping unemployed or underemployed workers fill in-demand jobs. A clear quality NDC definition can ensure that underrepre-sented worker populations are able to access credentials that prepare them for emerging career pathways. Policymak-ers can adopt a range of policies to boost attainment of qual-ity NDCs (see policy recommendations) and can transfer re-sources away from programs that aren’t providing good consumer or taxpayer value towards credentials that matter. By adopting a quality NDC definition, states can protect against increasing equity gaps by ensuring people of color, women, those with disabilities, and other underserved popu-lations are not steered toward low-quality NDCs.
A state quality NDC definition can also help state policymak-ers identify and invest in new and emerging credentials that can help workers upskill quickly in response to technological changes and can help displaced workers figure out the right next steps as they transition to new occupations or indus-tries. The quality NDC definition and the process of industry validation may be of particular value with newer credential-ing options, where there may not yet be broad understanding or acceptance by employers within that industry.

8 EXPANDING OPPORTUNITIES: DEFINING QUALITY NON-DEGREE CREDENTIALS FOR STATES
Establishing a definition of quality NDCs can help align and support performance accountability under federal work-force and education laws. Under the Workforce Innovation and Opportunity Act (WIOA), states are required to set per-formance levels for the percentage of individuals receiving a “recognized postsecondary credential” during participation or within one year of completing a funded program. A recog-nized postsecondary credential under WIOA is defined as a “credential consisting of an industry-recognized certificate or certification, a certificate of completion of an apprenticeship, a license recognized by the state involved or Federal Govern-ment, or an associate or baccalaureate degree.”13 The quality NDC definition can help states in defining which non-degree credentials they will consider as meeting this definition, and ensure that programs funded under WIOA are supporting at-tainment of these credentials. The WIOA definition of recog-nized postsecondary credential has been adopted in other federal laws — most notably in the recent reauthorization of the Carl D. Perkins Career and Technical Education Act (Per-kins Act) and the Trade Adjustment Assistance (TAA) pro-gram — and so states can utilize the quality NDC definition for evaluating performance and guiding programmatic and policy choices under those laws as well.
Developing the criteriaIn developing the criteria included in the quality NDC defini-tion, NSC specifically looked at how states are using employ-ment, earnings, and competencies to set quality standards for credentials, as NSC believes that these criteria likely most accurately reflect what jobseekers and businesses are seek-ing from NDCs and programs. However, one question states may wish to consider is whether they will apply these criteria to all NDCs offered within the state, or just certain kinds. Sev-eral types of NDCs do have specific quality assurance pro-cesses in place; for example, for-credit programs offered at institutions of higher education are generally subject to state and regional accreditation requirements, while apprentice-ship programs are usually registered through either the U.S. Department of Labor or a designated state agency or coun-cil, and state licensing requirements are set by state agen-cies or other bodies. States may decide that by meeting these requirements, the credentials received through successful completion of these programs should be deemed “quality” credentials without necessarily applying the criteria laid out in this paper. In practice, this would limit application of the criteria to non-credit programs offered through institutions of
EXPANDING OPPORTUNITIES: DEFINING QUALITY NON-DEGREE CREDENTIALS FOR STATES 9
higher education, industry certifications, and non-registered apprenticeships. However, because most of these other qual-ity assurance systems do not measure employment and earnings outcomes for participants — and may not measure specific competencies or “stack” well with other programs and credentials — states could also opt to require both com-pliance with the existing program approval requirements and the criteria in order to be counted towards overall credential attainment goals.
While the definition laid out in this paper is specifically in-tended to measure non-degree programs, it is worth noting that many individuals in degree programs are also interested in making sure that their program will support better employ-ment and earnings outcomes. States adopting the quality NDC definition may also wish to consider whether degree programs in the state are meeting the needs of both jobseek-ers and businesses and ensure that state investments are supporting degree attainment in ways that align with overall labor market demands.
While stakeholders within any given state can reap the re-wards of a good quality NDC definition at the individual state level, there would be even greater value if all states adopted consistent definitions of quality NDCs. A consistent nation-wide definition (or at least adoption of the criteria identified in the next section) would make it easier for workers and jobseekers to find and sustain employment, by ensuring that credentials of value in one state are also recognized in other states. This can be particularly true where differing occupa-tional licensing or similar requirements create barriers for workers moving from one state to another. A consistent na-tionwide definition would also be of value to businesses op-erating in multiple states, as they could rely on some level of uniformity in hiring and talent development strategies across state lines. Finally, a consistent nationwide definition would support investments in quality NDCs by federal and state policymakers, providing assurances that those investments were leading to credentials with value for workers, business-es, and taxpayers.
To achieve the goal of developing a consensus definition of quality NDCs, NSC engaged with states that had already es-tablished or were in the process of developing quality assur-ance criteria and processes for NDCs, and sought feedback from a range of national and state higher education and
workforce development officials and local practitioners. Ini-tially, NSC conducted a literature review of existing state quality assurance criteria and processes for NDCs and inter-viewed leaders from states that had already implemented such quality assurance processes. These Round 1 states were Alabama, Iowa, New Jersey, Tennessee, Virginia, and Washington and included leaders and staff from state de-partments of education, higher education, labor, and work-force development, as well as governors’ staff overseeing these policy areas. This part of the process culminated in a one-day meeting where leading states provided feedback on an initial definition, and discussed related issues, including racial equity and the future of work. This revised quality NDC
definition and criteria were vetted with a second round of state leaders from Colorado, Florida, Louisiana, Oregon, Rhode Island, and West Virginia. These states were either de-veloping a framework for identifying quality NDCs or had al-ready done so, in a more limited fashion than the Round 1 states. NSC also sought feedback from a set of key national research and advocacy organizations with expertise in high-er education and workforce policy, as well as local practi-tioners, including those with a racial equity mission.
In developing the consensus definition of quality NDCs, NSC chose to focus on individual economic outcomes, including employment and wage gains, and employer needs for a more skilled and diverse workforce. These were the principal goals state leaders cited for a desire to increase the number of individuals with quality NDCs and reflect what students themselves identify as a key purpose for enrolling in postsec-ondary education and training.14
A consistent nationwide definition would make it easier for workers and jobseekers to find and sustain employment, by ensuring that credentials of value in one state are also recognized in other states.
10 EXPANDING OPPORTUNITIES: DEFINING QUALITY NON-DEGREE CREDENTIALS FOR STATES
Summary of state quality assurance processes – Round one states
In developing the quality NDC definition, NSC began by consulting with six states who had undertaken significant policy efforts around defining or supporting quality standards for non-degree programs:
Alabama To make progress against Alabama’s postsecondary education attainment goal of adding 500,000 credential holders to the workforce by 2025, Alabama is establishing a committee of the Alabama Workforce Council (Alabama’s business investment council) called the Alabama Committee on Credentialing and Career Pathways (ACCCP). The ACCCP and technical advisory committees com-posed of business and industry members representing each sector will be responsible for evaluat-ing credentials and determining if they should be placed on the Alabama Compendium of Valuable Credentials—Alabama’s list of credentials of value. Eligible credentials must be (1) a. required by law, b. mandated by industry, or c. preferred by industry; (2) a. required to obtain a job (counts to-ward attainment goal and is an advanced credential on the compendium of valuable credentials); b. part of stackable sequence leading to a credential that is required for employment (included on the compendium of valuable credentials as a basic credential, but these credentials do not count towards the attainment goal); c. complementary credentials with skills that are affiliated with the career pathway but are not directly aligned to the credential sequence (can be included on the compendium of valuable credentials as a complementary credential but are not included in creden-tial sequences and do not count towards the attainment goal); 3) aligned to a career pathway on the ACCCP’s regional or state lists of in-demand career pathways; 4) sector or industry endorsed nationally or recognized by the foremost state sector or industry association (credentials that are either developed or endorsed by a nationally recognized industry association or organization and are sought or accepted by local companies within the sector for purposes of recruitment or hir-ing); (5) achievable by students in a secondary or postsecondary level of study; (6) earned after at least 130 hours of instruction time and are offered through a proctored examination; (7) stackable in a sequence of aligned competencies that progress along with the rigor of advanced training programs (A credential that is part of a sequence of credentials that can be accumulated over time to build up an individual’s qualifications is considered stackable.); (8) valuable by leading to at least a 20-percent wage premium over a high school diploma; (9) trackable by the ATLAS on Career Pathways; and (10) portable across or within an industry sector (credentials that are recognized and accepted as verifying the qualifications of an individual in other settings—either in other geograph-ic areas, at other educational institutions, or by other industries or employing companies—are con-sidered portable).
EXPANDING OPPORTUNITIES: DEFINING QUALITY NON-DEGREE CREDENTIALS FOR STATES 11
Iowa The Iowa Department of Education’s GAP Tuition Assistance Program provides need-based tuition assistance to applicants that complete non-credit postsecondary credentials tied to in-demand occupations. Applicants must have an income between 150 and 250 percent of the federal poverty line to qualify. The Iowa Department of Education has created a list of programs that students receiving GAP tuition assistance may enroll in using the grants, and the community colleges and industry partners will evaluate whether programs fit with evaluation criteria. Non-credit in-demand programs that meet the following criteria are eligible for assistance: (1) aligned with for-credit cer-tificates, diplomas, or degrees; (2) offers training in an in-demand occupation; and (3) either results in a state, national, or locally recognized credential; prepares students for professional exams or licensure; provides endorsement for existing credentials or licenses; represents the achievement of skills defined by industry; or offers similar credentials or training as a for-credit program.
New Jersey New Jersey wants to increase the number of residents with a postsecondary credential or degree and hopes to advance this goal by guiding the state’s investments towards effective job training programs that are aligned with industry demand. By 2021, the state hopes to dedicate at least 80 percent of its state funding to programs resulting in industry-valued credentials. To determine what credentials were industry valued, the New Jersey Department of Labor and Workforce Develop-ment created an industry-valued credentials list by conducting labor market research and survey-ing employers. To be included on the list, credentials must: (1) be valued by employers; (2) teach transferable skills; (3) potentially lead to opportunities for continued education and training; and (4) lead to higher wages, career advancement, and/or increased job security. Moving forward, the state plans to reconsider this process and criteria for identifying certifications valued by industry.
Tennessee As a part of its Every Student Succeeds Act (ESSA) district and school accountability framework, Tennessee has a “Ready Graduate Indicator” on which districts and schools are measured. A “ready graduate” is a student who is prepared to succeed after high school as demonstrated by either: (1) scoring a 21 or higher on the ACT; (2) completing four early postsecondary opportunities; (3) com-pleting two early postsecondary opportunities and earning an industry certification; or (4) complet-ing two early postsecondary opportunities and achieving a designated score on a military readi-ness exam.
In order to gauge which industry certifications should count towards being ready to succeed after high school, the Tennessee Department of Education created a list of promoted industry certifica-tions. Stakeholders, such as district and employer leaders, submit industry certifications for poten-tial inclusion. In order to be included on the list, the Department of Education must determine that the industry certification is: (1) industry recognized and valued (as determined through a relevant career cluster industry advisory council); (2) aligned to a state-promoted career and technical ed-ucation program of study; (3) stackable through articulated credit or hours at Tennessee Colleges of Applied Technology and/or Community Colleges; and (4) lead to high quality (beyond entry level) employment based on industry input and review of available labor data. Tennessee is consid-ering revising this process.
12 EXPANDING OPPORTUNITIES: DEFINING QUALITY NON-DEGREE CREDENTIALS FOR STATES
Virginia Through the New Economy Workforce Credential Grant Program, Virginia’s General Assembly has made available $13.5 million dollars that allow individuals to take short-term, non-credit training courses offered through Virginia’s community colleges, in high-demand industries that can help the state create and sustain a middle skills pipeline. In particular, FastForward programs focus on train-ing Virginian’s for high-demand industries with skills gaps. FastForward programs require the stu-dent to pay one-third of the tuition for the program. The state will pay an additional one-third upon program completion and the remainder upon certification or licensing.
The Virginia Community College System (VCCS) has created a process and identified criteria to determine what credentials associated with programs are eligible for FastForward funds. Eligible credentials must be: (1) based on standards developed or endorsed by employers; (2) portable across multiple employers, educational institutions, and geographic areas; (3) competency based; (4) third-party validated; (5) show evidence of being in-demand through labor market information; and (6) through direct employer engagement show evidence that employers are hiring credential holders. Credentials are reviewed according to these criteria by VCCS staff, and the VCCS chancel-lor and State Board for Community Colleges must provide final approval for those credentials that meet the criteria to be eligible for state funding.
WashingtonOn behalf of Washington State’s Governor, the Workforce Training and Education Coordinating Board (WTECB) maintains a policy to determine program eligibility for the state’s Eligible Training Provider List (ETPL). A training program must be on the ETPL to serve students/participants using a Workforce Innovation and Opportunity Act Title I Individual Training Account voucher, or a student receiving extended unemployment insurance benefits while they are in training through the state’s Training Benefits Program. The ETPL also serves as a guide to training under the state’s workers compensation program. Providers that want one or more of their programs to be on the ETPL must submit an application to the WTECB. Providers include community and technical colleges, four-year colleges and universities, private vocational schools, and apprenticeship programs.
Providers that are operating consistent with state laws and regulations may have their program(s) listed initially if they agree to provide the WTECB with required data about their program(s), includ-ing student-level records (they provide student level name, enrollment, completion, and SSN which the state matches to outcomes). There is an exception for registered apprenticeship programs which are all automatically eligible under WIOA. For programs other than registered apprentice-ships, subsequent eligibility is based on meeting program performance thresholds on three mea-sures: (1) completion rate; (2) post-program employment rate; and (3) earnings. In setting the thresholds, the WTECB takes into account student access to fields of study in each area of the state and student characteristics. WTECB periodically updates the thresholds, and program eligibility is determined annually. For WIOA, local workforce boards have the prerogative of limiting ETP-eligible programs.
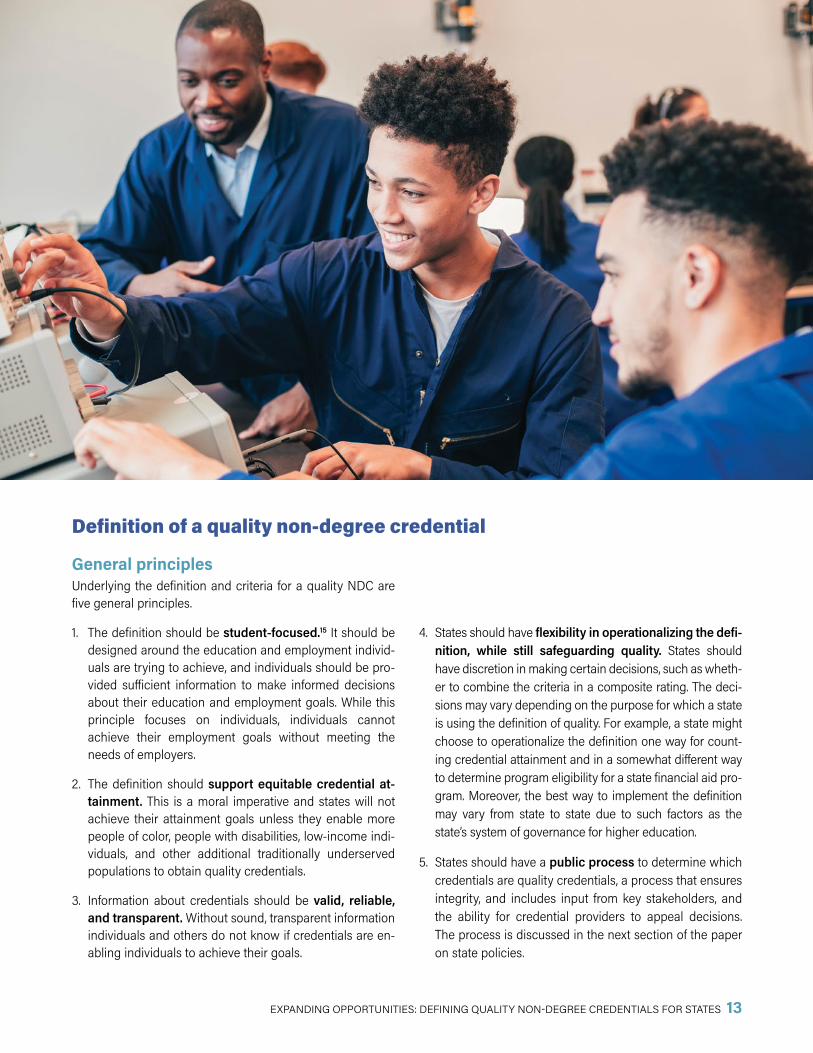
EXPANDING OPPORTUNITIES: DEFINING QUALITY NON-DEGREE CREDENTIALS FOR STATES 13
Definition of a quality non-degree credential
4. States should have flexibility in operationalizing the defi-nition, while still safeguarding quality. States should have discretion in making certain decisions, such as wheth-er to combine the criteria in a composite rating. The deci-sions may vary depending on the purpose for which a state is using the definition of quality. For example, a state might choose to operationalize the definition one way for count-ing credential attainment and in a somewhat different way to determine program eligibility for a state financial aid pro-gram. Moreover, the best way to implement the definition may vary from state to state due to such factors as the state’s system of governance for higher education.
5. States should have a public process to determine which credentials are quality credentials, a process that ensures integrity, and includes input from key stakeholders, and the ability for credential providers to appeal decisions. The process is discussed in the next section of the paper on state policies.
General principles Underlying the definition and criteria for a quality NDC are five general principles.
1. The definition should be student-focused.15 It should be designed around the education and employment individ-uals are trying to achieve, and individuals should be pro-vided sufficient information to make informed decisions about their education and employment goals. While this principle focuses on individuals, individuals cannot achieve their employment goals without meeting the needs of employers.
2. The definition should support equitable credential at-tainment. This is a moral imperative and states will not achieve their attainment goals unless they enable more people of color, people with disabilities, low-income indi-viduals, and other additional traditionally underserved populations to obtain quality credentials.
3. Information about credentials should be valid, reliable, and transparent. Without sound, transparent information individuals and others do not know if credentials are en-abling individuals to achieve their goals.
14 EXPANDING OPPORTUNITIES: DEFINING QUALITY NON-DEGREE CREDENTIALS FOR STATES
DefinitionA quality non-degree credential is:one that provides individuals with the means to equitably achieve their informed employment and educational goals. There must be valid, reliable, and transparent evidence that the credential satisfies the criteria that constitute quality.
CriteriaThere are four criteria that should be considered for a creden-tial to be identified as a quality credential. NSC recommends three criteria that should be required. NSC also recommends one criterion that is strongly preferred but need not always be in place. Each criterion stands not alone but as part of a pack-age. As discussed below, the criteria interact with one another. Additionally, it may be challenging for some credential provid-ers to offer immediately all the information the criteria require, so states may want to consider aspects of the criteria as goals and allow time for implementation.
1. Required: Substantial job opportunities There must be evidence of substantial job opportunities as-sociated with the credential. Evidence must include quantita-tive data and direct communication with employers.
Quantitative data should show that a substantial number of job openings are expected for the occupation(s) that the cre-dential is associated with. Sources of these data include but are not limited to: occupational employment projections de-veloped by the U.S. Bureau of Labor Statistics and state labor market information offices, projections and job postings data from private organizations, and state job vacancy surveys. It ’s important to include data on both current labor market de-mand and future projections since, for among other reasons, individuals at different ages have different time horizons for entering the labor market. States should have discretion to define “substantial,” since what is “substantial” may vary from one state to another and from one area of a state to another. Other factors beyond the sheer number of jobs may define “substantial.” States may want to consider economic develop-ment strategies, whether openings are due to employment growth or job turnover, creating opportunities for people of color and other underemployed populations, or expected oc-cupational demand exceeding supply. Demand may be mea-sured for the state, a labor market area, or a region. Consid-
eration should be given to demand in the catchment area of the provider and where individuals live or plan to live.
To identify the credentials associated with occupations, states may find information at the U.S. Department of Labor’s “Certification Finder,” and the U.S. Bureau of Labor Statistics’ “Occupational Outlook Handbook,” job posting data, or through employer focus groups or surveys, among other sources.
Information on expected job openings and the credentials associated with occupations should be substantiated through direct communication with employers. Among other things, employers may identify emerging job opportunities that are not yet reflected in quantitative labor market infor-mation. Sources of employer information include, but are not limited to trade associations, sector partnerships, other busi-ness associations, and regional or state career and technical education advisory councils. States should include informa-tion from minority and women-owned businesses. States should have some discretion as to how they obtain employer information so long as the employers are in position to con-firm that there are substantial job opportunities associated with the credential. The information should be more than an-ecdotal. The best sources of information may vary from one state to another. Employers must confirm that the credential is used in hiring, retention, or promotion decisions.
States should periodically update information on job oppor-tunities associated with credentials since labor market de-mand changes over time.
2. Required: Transparent evidence of the competencies mastered by credential holdersThere must be transparent evidence of the competencies mastered by credential holders; competencies that align with expected job opportunities.
Competencies are closely tied to the first criterion. A creden-tial is valued by employers when it signifies the competen-cies that employers need employees to have. Similarly, a cre-dential is associated with an occupation when the credential signifies the competencies required to perform the occupa-tion. The certificate program, apprenticeship, industry certifi-cation, or licensure must specify the competencies mastered by an individual who receives the credential, and there must be a process by which the individual demonstrates that mas-tery. That process may be determined by a state body, the certifying organization, or by a higher education institution. For example, a state licensing body establishes how an indi-
EXPANDING OPPORTUNITIES: DEFINING QUALITY NON-DEGREE CREDENTIALS FOR STATES 15
vidual demonstrates the competencies required for a license. The state apprenticeship agency may approve how an indi-vidual demonstrates the competencies required for an ap-prenticeship certificate. The process may include an exam or other demonstration of mastery. There may be a requirement that the demonstration is conducted or verified by a third party. These decisions are left to state discretion and may vary for different credentials. In line with this emphasis on competencies, the definition of a quality credential need not include any standard regarding length of time, such as clock hours, credit hours, “seat time,” or other calendar days that must be met. The appropriate length of time is how long it takes to master the competencies. Regardless, states and other authorized actors should exercise due diligence to en-sure that methods for demonstrating competencies do not result in racial or other biases.
The range of competencies, including general workplace skills that should be included, are beyond the scope of this paper and the subject of other national initiatives.16 But the range should be sufficient for employers, workers, and others to know whether or not the credential signifies the compe-tencies employers require to hire, retain, or promote individ-uals for an occupation(s). Mastery of a single competency or general workplace skills, while useful, should not count un-less by itself that mastery is sufficient for substantial employ-ment opportunities.
It should be acknowledged that this requirement can be a heavy lift for education and training providers and for em-ployers. (A requirement that is made more challenging be-cause competencies should be kept up to date). It requires the supply and demand sides to delineate the competencies they supply and demand. Some providers and employers have already done so, but many have not. Again, this is the subject of other national initiatives. But this criterion is critical and goes back to the underlying principles, including that a quality credential enables individuals to achieve their educa-tion goals. Individuals should be able to expect that a quality credential is not an empty shell, but means they have learned competencies demanded in the labor market.
Someday, our labor market information and exchange sys-tems may be based on competencies (or skills, knowledge, and abilities) rather than credentials or occupations. There are major national efforts underway to build that future.17 Un-til then, as credentials continue to be the proxy for competen-cies, employers, workers, education institutions, and others must know the competencies that are associated with cre-dentials to know if credentials are of value.
3. Required: Evidence of the employment and earnings outcomes of individuals after obtaining the credential Perhaps the ultimate test of whether a NDC is of value is whether credential holders obtain employment and how much they earn. This is not to say that economic value is the only value that matters. But improving one’s employment and earnings is the most common reason individuals enroll in postsecondary education or training, and this is particularly true of NDCs (other than personal enrichment classes). This criterion goes back to the underlying principle that a quality credential provides individuals with the means to achieve their employment goal. Unless there is evidence of the em-ployment and earnings outcomes associated with a creden-tial, individuals and others are not in position to know if a credential provides the means to achieve their goal.
Job quality beyond earnings is also an important part of indi-viduals’ employment goals. Whether a job provides health benefits, retirement benefits, paid sick leave, suitable and de-pendable hours, among other elements of job quality are im-portant. Unfortunately, there is no economic method for states to measure these employment outcomes at the indi-vidual-credential level.
There must be transparent evidence of the actual employ-ment and earnings outcomes of individuals after obtaining a credential and the data should be updated annually. The em-ployment and earnings data should be disaggregated by race, ethnicity, gender, disability status, and other character-istics in order to measure equitable progress. This paper does not discuss specific metrics; however, there are statuto-ry required metrics of employment and earnings in the WIOA and the Perkins Act. Evidence must meet standards of valid-ity and reliability, be auditable, and be provided through ad-
Perhaps the ultimate test of whether a non-degree credential is of value is whether credential holders obtain employment and how much they earn, as improving one’s employment and earnings is the most common reason individuals enroll in postsecondary education or training.

16 EXPANDING OPPORTUNITIES: DEFINING QUALITY NON-DEGREE CREDENTIALS FOR STATES
ministrative data (such as unemployment insurance wage records and tax records), surveys administered by third par-ties, or employer records.18 The evidence must be at the indi-vidual credential level, since the value of a certificate, for example, from a program of study at one institution may be very different than the value of a certificate in the same pro-gram of study at another institution.
The information on employment and earnings outcomes should be accompanied by contextual information that helps individuals and other stakeholders understand if the outcomes are equitable. Critical information includes the de-mographic characteristics of individuals obtaining the cre-dentials, including race, ethnicity, gender, disability status, and age. Other information includes the industry in which individuals are employed. It would also be useful to know whether individuals are employed in an occupation related to their education or training, but unfortunately, there is cur-rently no practical and economic data source for that infor-mation on a wide scale.19
Brand new credentials obviously do not have a track record of employment and earnings outcomes. States should establish a process, such as the initial eligibility
process for WIOA training providers, to classify credentials as quality on an interim basis until there has been enough time to measure actual labor market outcomes, between one and two years of when individuals first complete the credential. During the period of interim eligibility, the state process should include posting information on the typical earnings of workers in the credential’s related occupa-tion(s). Finally, as discussed in the next section of the pa-per, states should widely provide the information on em-ployment and earnings outcomes through multiple channels to reach individuals, which includes publishing online, creating student portals, and through career coun-selors and case managers who are well trained in how to understand and use the information.
States vary in their ability to measure and report employ-ment and earnings at the individual credential level, howev-er the tools to do so are available. Robust state longitudinal data systems are very useful for this purpose. It ’s mostly a matter of making the necessary policy decisions and taking action, such as adopting data sharing agreements. It will take some time for all credentials to satisfy this criterion.
EXPANDING OPPORTUNITIES: DEFINING QUALITY NON-DEGREE CREDENTIALS FOR STATES 17
Setting performance standards for earningsStates may want to set performance standards for the earnings level associated with quality credentials. Before deciding to set a threshold for earnings, states should consider the following questions.
What is an appropriate performance standard for earnings?Some thresholds are based on the principle that a quality postsecondary credential should provide earnings above the earnings typically achieved by individuals with a high school diploma as their highest level of educational attainment.20 The U.S. Department of Education estimates this is $28,000 per year among twenty-five to thirty-four year olds. The methodology used for Lumina Foundation’s “A Stronger Nation” report that tracks credential and degree attainment is in part based on a premium of 20 percent above the earnings of those at the high school diploma level, so approximately $33,600.21
Thresholds at these levels rule out credentials for many occupations that are paid relatively poorly in the labor market. There is limited ability for credentials to overcome labor market pricing. The lower threshold would usually rule out credentials for child care workers, teaching assistants, and home health aides, among other occupations.22 The higher threshold would also usually rule out credentials for pre-school teachers, pharmacy technicians, nursing assis-tants, and medical assistants. If the thresholds were expected to be achieved shortly after indi-viduals completed their credential, credentials for many additional occupations would be ruled out. Credential holders in these fields might achieve earnings that are normal, even good for their field, but the credential would not be considered a quality credential. Individuals might achieve their education and employment goals, but a higher threshold would negate the prin-ciple of focusing on the goals of individuals, which may, at times, include lower-paying jobs.
Is a threshold based on the average earnings achieved by those with a high school diploma the right way to think about this?
Individuals in non-degree credential programs are typically not 19-year-olds who just graduat-ed from high school. They are more likely to be older, working adults who earn very low in-comes, if they have any earnings. The median age of students at public community and tech-nical colleges is twenty-eight.23 While there is no national data source for pre-enrollment earnings of students in non-degree programs, one can look at state data. For example, two years after completion the median earnings of graduates from a California community college with a certificate in Administrative Medical Assisting is $25,606 per year, considerably below the above thresholds. But their median earnings two years prior to enrollment was $14,894.24 The students experienced a very large gain in earnings, but the credential would not be con-sidered a quality credential by a threshold based on achieving or exceeding what a typical high school graduate earns.
18 EXPANDING OPPORTUNITIES: DEFINING QUALITY NON-DEGREE CREDENTIALS FOR STATES
A credential should enable the credential holder to receive earnings that meet their economic needs, or stack to a credential that does. But it is challenging to use this principle to set an earnings threshold other than what is needed by a single individual in the local area. Economic needs of credential holders depend on their number of dependents, the number of wage earners in their household, and the cost of living in the local area, among other factors. A certificate program with ten students may have ten different levels of need. There are many tools available to help individuals assess how much income they need in their local area. States, institutions, and other providers should make these tools widely available and help individuals use these tools to make informed choices about their education and employment goals.
To protect individuals from “bad actors,” including some for-profit/proprietary institutions that offer low-quality credentials, states may want to set earnings thresholds below which there is obviously something wrong with the credential. To do so, states could analyze the earnings outcomes of cre-dentials to find a threshold that identifies outlying performers. This could be done for credentials in the aggregate or by field of study.
Before deciding to set a performance standard for earnings, there are other factors that should be considered. What is the return on investment? For instance, how do post-program earnings com-pare to costs, both the financial costs and amount of time that individuals invest in a credential? How will a state account for the fact that some programs serve large percentages of students with barriers to employment? Does the threshold acknowledge that labor markets within and between states vary in the earnings paid for occupations, with occupations in rural areas typically paying less? How will the threshold acknowledge there are fewer providers and program offerings in rural areas? Earnings thresholds might prevent access to any program for a field of study in a region of a state. What role does stackability play? A credential for a low-paying occupation might articulate with or otherwise lead to another credential for a higher-paying occupation, or commonly combine with other credentials in a valuable package.
SETTING PERFORMANCE STANDARDS FOR EARNINGS
NSC recommends that if a state establishes standards for the earnings level of quality credentials, the state should consider the following factors, and in some cases grant adjustments to the performance standards for individual credentials.
• Return on investment of money and time
• Appropriate earnings for the field of study
• Prior earnings of students
• Student characteristics
• Regional wage differences
• Regional access to education/training for the field of study
• Stackability with higher paying credentials
EXPANDING OPPORTUNITIES: DEFINING QUALITY NON-DEGREE CREDENTIALS FOR STATES 19
4. Strongly preferred: Stackability to additional education or training The gold standard is that credentials stack to additional edu-cation or training, and state and institutional policies should support stackability. States should consider requiring that credentials associated with low earnings stack to further ed-ucation and higher paying credentials. While states clearly see the value of stackability to further education and training, there is not a universal pathway to reach that standard and states agreed that it should not be an overarching required criterion in defining a quality credential. This is complicated work involving the agreement of government, academia, and employers.
It is preferable that all credentials articulate with or otherwise provide credit towards another postsecondary credential. The credential does not have to be in a sequence of creden-tials in a given industry, but rather, it is preferable that all cre-dentials articulate with or otherwise provide credit toward another postsecondary credentials. Examples of such stack-ability include, but are not limited to articulation agreements, direct transfer agreements, credit for prior learning, career pathways, and data demonstrating that a credential leads to continued education. Section 6 of this paper includes recom-mended policies to support stackability.
Stackable credentials can help individuals advance in edu-cation and employment and can be particularly important for people of color and others who have been traditionally un-derserved by higher education. Stackability can also be im-portant for workers who return to education after experienc-ing unemployment due to declining demand for their skills. States should support policies such as credit for prior learn-ing and widely provide information about these policies so that individuals, institutions, and others can navigate the op-tions for stackability.
While stackability is the desired outcome, the states agreed that stackability, however, should not be a universally re-quired criterion in defining a quality credential as there are currently limitations in implementation. Not all quality cre-
dentials align directly with longer-term educational path-ways. For example, a registered apprenticeship certificate is likely to be associated with substantial employment opportu-nities, clear competencies mastered by the certificate holder, and strong employment and earnings outcomes, each of which is evidence of a quality credential. Most states, howev-er, do not have a policy in place of stacking apprenticeships with additional education or training. The same can be said of many industry certifications and occupational licenses. These credentials may well satisfy the other criteria, but a state may have no provision for their stackability to addition-al education or training. States should have such policies, but the lack of such policies does not by itself mean that these credentials are not quality credentials.
The concept of stackability is also evolving. While early mod-els about stackable credentials assumed there was a specific sequence to earning credentials along a career ladder, most individuals have more distinctive pathways through the labor market, therefore requiring flexible credentials as they move between industries. For instance, many individuals may move in between retail and hospitality or do not follow estab-lished pathways from certified nursing assistant to licensed practical nurse.
There are also limitations in the data available to understand what credentials do result in recognition toward another postsecondary credential. Even in states where there are pol-icies that either require or incentivize stackability, most states do not collect information from education providers to un-derstand if credentials did indeed stack, or if stackability led to more equitable outcomes for individuals.
The states agreed there are too many questions and obvious exceptions (such as registered apprenticeships) to have the quality definition require stackability of all credentials. For credentials that satisfy the first three criteria—substantial em-ployment opportunities, transparent competencies, and re-ported employment and earnings—but the earnings are low, states should consider requiring that the credentials stack to credentials associated with higher earnings in order to be identified as quality credentials. States should consider the appropriate earnings thresholds and take into account the factors discussed in the previous section. States will also need to determine acceptable evidence of stackability.
Implementing the criteria using a composite ratingAs states consider implementing these criteria to determine quality NDCs, they may want to consider including the four criteria in a qualitative or quantitative composite rating. States could establish some way of quantifying a score on
The gold standard is that credentials stack to additional education or training, and state and institutional policies should support stackability.

20 EXPANDING OPPORTUNITIES: DEFINING QUALITY NON-DEGREE CREDENTIALS FOR STATES
each criterion and then combine the scores to create a composite rating. Or states might qualitatively consider the criteria and a credential’s strength in each before determining whether it is a quality credential. The rating might be expressed by a number of stars, or some other type of qualitative de-scription. The state should make transparent the rating on each criterion as well as the composite rating.
Composite ratings are useful when there are multiple related factors that each contribute to something having value. The four criteria are related to one another. For example, the earnings associated with a credential are also associated with the extent to which it signifies competencies that are in demand by employers. And each criterion contributes to a credential having value.
States may combine the criteria in a composite rating in a way that a weakness in one criterion might be offset by
strength in another. For example, there might be a relatively low number of employment opportunities expected for the holders of a credential, but the job opportunities pay quite well. Looking just at the demand numbers, a state might de-termine a credential is not quality, but when considering the earnings level, the state might decide to count it as a quality credential. In another example, a credential might be associ-ated with a low paying occupation, but perhaps it stacks to a credential associated with good earnings.
A state might also decide to weight the four criteria different-ly, depending on the state’s policy preferences and the pur-pose for which the definition of quality is being used. A state might want to emphasize certain criteria, for example, when determining eligibility for a state financial aid program, and emphasize other criteria when considering the state’s cre-dential attainment goal.
EXPANDING OPPORTUNITIES: DEFINING QUALITY NON-DEGREE CREDENTIALS FOR STATES 21
Quality NDC attainment state policy recommendationsEstablishing a state definition for quality NDCs can lead to a range of benefits for states, students, and other stakeholders. However, as noted in the previous section, states must make policy choices in adopting this definition, including the process to be used for setting the definition and the stake-holders responsible for shaping and administering the definition. States must also decide the pur-poses for which the definition will be used. While states may choose to utilize the definition simply to help identify credentials that count towards their state postsecondary attainment goals, the defi-nition can also be used to support performance accountability and other goals across different education, workforce, and human services programs. For example, the definition can help to inform racial equity goals that seek to ensure that all students have equitable access and the supports needed to earn high-quality credentials. States must also decide if they will adopt policies that seek affirmatively to increase attainment of quality NDCs as part of their overall educational attainment and economic development strategies.
A. Codifying or regulating quality criteria. One key set of policy decisions facing states is determining which programs or policies will be covered by the criteria, the entities within the state that are responsible for developing and imple-menting the criteria, and the process by which the criteria will be established.
States should begin with some consideration of what programs and policies the criteria will be used to support. Round 1 states developed their quality criteria for a range of different purposes, including eligibility for federal or state training funds, support for programmatic accountability systems, and for evaluating overall progress towards state attainment goals. However, in most cases these criteria are not being used to support multiple state policies or priorities. Adopting criteria that can be ap-plied across multiple programs and systems can support greater alignment between education, workforce, and human services investments, and can create efficiencies by reducing duplicative and sometimes burdensome reporting and compliance requirements for education and training providers participating in multiple programs. It can also ensure consistency for jobseekers and employers as they evaluate different education and training opportunities. Without consistency, states will have lists of quality credentials that vary from one purpose to another. States should weigh the confusion this could create with the benefits of tailoring criteria for different purposes.
Once the determination has been made about which programs will be covered by the criteria, a critical next step is determining which entity or entities within the states will be responsible for developing, implementing, and revising the criteria. For the Round 1 states, primary responsibility for establishing criteria generally rests either with a state educational agency or a state workforce agency. However, Round 1 states drew on expertise from a range of stakeholders, including partner agencies and employers in key industries. While the appropriate lead entity for development of the criteria may differ from state to state depending on intended uses for the criteria, it is strongly sug-gested that states adopt an inclusive process for the development and review of criteria. This pro-cess should include a significant and meaningful role for organizations that represent underserved or underrepresented worker and student populations to ensure that the criteria support broader equity and attainment goals. The governor’s office should also be engaged in the development of the criteria to ensure consistency with overall state educational and employment goals, and to fa-cilitate discussions between both internal and external partners, where appropriate. States should take steps to ensure the development and implementation of the definition is transparent to stake-holders, including education and training providers, consumers, and the general public.
In developing quality criteria, states may wish to consider adopting legislation or regulations that specifically authorize the establishment of a definition and allocates appropriate resources to sup-
22 EXPANDING OPPORTUNITIES: DEFINING QUALITY NON-DEGREE CREDENTIALS FOR STATES
port the development process. Legislating the establishment of a definition can help ensure that the definition is sustained as gubernatorial administrations change and can serve as an important signal to state agencies and other stakeholders about the importance of the definition as part of the state’s education policy framework.
Legislation to support the development and adoption of a quality NDC definition should provide adequate resources for implementation, including work that must be done to validate credentials and to track employment and earnings data, and ensure that data is collected in a way that allows for disaggregation by key demographic categories such as race and ethnicity. Legislation should also allow for sufficient flexibility to ensure that criteria can be utilized for the full range of programs, policies, and populations that a state seeks to cover through the criteria. For example, states should be cautious not to set requirements that may only apply to secondary school programs, or that may make it difficult for states to adjust criteria to respond to changing demographic or economic con-ditions. One option might be to require a periodic review of how the definition is implemented to ensure that it is keeping pace with changing labor market, demographic demands, and student protections.
B. State policies to support quality NDC attainment. Once a state has elected to adopt a quality NDC definition, there are a range of programmatic and policy opportunities that may be pursued to help increase attainment of these credentials and strengthen alignment across federal and state programs operating under the definition. These policies are also necessary to ensure equitable access to and success in completing quality credentials.
1. Expanding state financial aid and other training funds. One common use of quality NDC definitions is to guide decisions around institutional and
programmatic eligibility for tuition assistance and other public funding for job training. This can be particularly important for students and programs that might otherwise be excluded from such assistance. For example, both Virginia and Iowa provide financial aid for certain programs that fall outside the boundaries of federal Pell Grants, and utilize their quality NDC definitions to ensure that state dollars are used for programs that meet local and regional labor market demands. States that adopt quality NDC definitions should consider how they might create or expand state tuition assistance programs to align with these definitions, with a focus on addressing attainment and equity gaps, as affordability barriers can perpetuate access gaps.
States should also consider applying their quality NDC definition as part of their program-matic eligibility requirements for other federal or state job training funds. This could include, but is not limited to, programs supported under WIOA, SNAP Employment & Training, and the Temporary Assistance for Needy Families (TANF) program. States could consider setting requirements that education or training programs that culminate in a NDC demonstrate that such credentials meet the state quality NDC definition in order to qualify for funding.
2. Expanding non-tuition supportive services. NDC programs are often a good option for working adults and other non-traditional students,
providing flexibility and value where participation in more traditional educational pathways may be challenging due to economic or other factors. State tuition assistance and other funding models can help ensure these students have meaningful access to quality programs, but in many cases tuition supports alone are not sufficient to ensure that participants can successfully complete their program.
EXPANDING OPPORTUNITIES: DEFINING QUALITY NON-DEGREE CREDENTIALS FOR STATES 23
Community college students, for example, often must juggle school with work and family obligations. Sixty-two percent of full-time community college students (and 72 percent of part-time students) also work on a full- or part-time basis and 15 percent are single parents. These students can also face other cultural or structural barriers: 29 percent of community college students are the first to attend college in their families, and 20 percent of students have disabilities.25 In addition, the racial wealth gap has left many families of color with fewer resources to put toward educational attainment or related expenses, such as child care and transportation. Black and Latinx students spend a larger share of their income on college expenses, and non-White families are less able to financially invest in their children’s postsec-ondary education.26 Similarly, Black and Latinx students are more likely to take on student debt than White students and borrow greater sums than White borrowers.27
In order for all students to succeed — whether as part of a traditional degree program or in a quality non-degree program — states should establish policies that provide necessary sup-port services including, but not limited to, transportation, child care, and assistance in ac-cessing nutrition, housing, or other benefits for which students may qualify. These supports are essential for states that want to close equity gaps.
Supportive services can be an equally critical component of success for apprenticeship pro-grams and other training pathways. States should consider how to provide dedicated re-sources to help participants enter and complete quality programs, including through the establishment of “work-based learning support funds” that can cover both pre- and post-em-ployment periods for apprentices experiencing barriers to successful employment.
3. Expanding career counseling capacity. Career counseling and pathway navigation can be an effective tool for helping jobseekers
and students identify and make informed decisions about their professional goals, and the educational pathways that will help them achieve those goals. However, career counselors at both the secondary and postsecondary levels are often stretched thin and under-resourced, and in many cases they themselves lack adequate information about how non-degree cre-dentials offered through apprenticeships, community college certificate programs, and other training models can support career advancement.
State adoption of a quality NDC definition will allow counselors to provide students with critical and accurate information about employment and earnings opportunities associated with specific programs and, in those states that include a stackability criterion, will enable counselors and jobseekers to map out potential multi-step career pathways that can be pur-sued over time. It would be particularly beneficial for states to put information about pro-grams, credentials, employment, and earnings in an easy-to-understand online format that counselors can use to guide students.
While having better information is critical, it is insufficient without qualified professionals who can work with jobseekers to weigh their education and employment options. States should consider additional funding at both the secondary and postsecondary levels to provide pro-fessional development and tools to current counselors, to recruit and train the next genera-tion of counselors, and involve faculty, local employers, and others in providing career infor-mation. States should ensure that professional development opportunities are also made available to instructors on providing career information and to help align curriculum develop-ment and program delivery with industry demands. States can also support and encourage faculty and counselors to engage with local employers, through job shadowing and other strategies, to ensure that faculty and counselors are familiar with key industries in their local or regional economy.
24 EXPANDING OPPORTUNITIES: DEFINING QUALITY NON-DEGREE CREDENTIALS FOR STATES
4. Supporting development of industry partnerships. Industry or sector partnerships bring together multiple employers in a single industry along
with education providers and other stakeholders to develop short- and long-term talent de-velopment strategies. Long recognized as a best practice in workforce development, industry partnerships can play a vital role in the development and implementation of a state’s quality NDC definition. Employers within industry partnerships can help to identify current and fu-ture demands — both in terms of emerging occupations and needed skill sets — and validate the effectiveness of specific quality NDCs in meeting hiring and advancement requirements within an industry. Industry partnerships are also an effective way of organizing public train-ing investments to support industry growth, allowing small and mid-sized businesses to ag-gregate skill needs across their industry and allowing other partners (including labor organi-zations, postsecondary institutions, community-based organizations, and others) to develop and refine training strategies to help workers find and keep family-supporting jobs.
Industry partnerships can also help to close racial equity gaps, through strategies such as attracting partnership members who reflect the racial and ethnic communities that they serve; participating in diversity, equity, and inclusion training; modifying recruiting processes to attract and engage specific populations of color; and disaggregating performance data to better understand how effectively their partnerships are serving different populations.28 Pub-lic investment in these partnerships can be used to help bring in expert advisors to deliver training, and to help implement and scale these equity-advancing practices.29
Many federal policies, including WIOA and Perkins V, explicitly support the use of industry partnerships as an employer engagement strategy, and many states have adopted specific funding and policies to support the expansion of industry partnerships. States should consid-er how investments in industry partnerships could support both the evaluation of quality NDCs and increased attainment of quality NDCs in line with labor market demands.
5. Expanding apprenticeship and other work-based learning models. Apprenticeship is one of the best-known workforce development strategies that culminates
in a NDC, often referred to as a journeyperson’s card or certificate. While apprenticeship in the United States has long been associated with the construction and manufacturing indus-tries, a number of states and other stakeholders have been exploring innovative models to expand apprenticeship into newer industries — including health care, information technolo-gy, and financial services — and to diversify the pipeline of workers within apprenticeship pathways. Other work-based learning models, such as on-the-job training and paid intern-ships, have also attracted significant policy attention in recent years.
Increased state investments in apprenticeship and similar models can support greater attain-ment of quality NDCs while also creating meaningful pathways into the labor market for a broad range of jobseekers. States should consider providing resources to labor-management partnerships, community colleges, and other stakeholders to work with businesses on the development and expansion of apprenticeship strategies. States should ensure that new and existing apprenticeship programs are recruiting from traditionally underserved populations (and collect data to assess their success in doing so), including people of color, to ensure equitable employment opportunities in target sectors. States should also make sure that pro-gram sponsors and partners have the resources necessary to support apprentices and other working learners throughout the course of their training. Tax incentives for employers who create work-based learning opportunities — particularly for worker populations that are un-derrepresented in their industry — may also be considered as a strategy for expanding eco-nomic opportunities.
Increased state investments in apprenticeship and similar models can support greater attainment of quality NDCs while also creating meaningful pathways into the labor market for a broad range of jobseekers.
EXPANDING OPPORTUNITIES: DEFINING QUALITY NON-DEGREE CREDENTIALS FOR STATES 25
6. Supporting stackable credentials. States should support the stackability of credentials to facilitate education and economic
mobility. States can consider:
a. Investing in the development of career pathway models, with a focus on strategies that provide workers multiple entry and exit points to allow for flexibility in linking training op-portunities with work experience, as needed.
b. Adopting statewide policies for credit articulation, both within and between institu-tions, that can allow workers to keep the full value of prior educational or training experi-ences when they transfer into a new program or institution.
c. Establishing statewide policies requiring or incentivizing prior learning assess-ments and credit for prior learning so students need not repeat what they have already learned, no matter where it was learned.
d. Adopting performance funding models that reward education and training provid-ers for helping individuals obtain additional credentials in the same field of study. Howev-er, steps should be taken to ensure that such policies do not create perverse incentives for institutions to redesign programs and credentials for purposes of artificially increasing completion rates (e.g., by breaking up existing programs into smaller modules solely for purposes of boosting overall attainment numbers).
e. States should also ensure that institutions do not direct students with real or per-ceived barriers to success into shorter-term programs in order to inflate perfor-mance outcomes and unintentionally perpetuate racial inequities. Education tracking has been historically used to encourage students of color to enter occupational training programs that did not adequately connect them to jobs in high-demand fields or connect them to quality postsecondary credentials. Tracking has contributed to occupational seg-regation and racial income disparities. Career pathways, and related support services, can help address many challenges students of color face in completing postsecondary cre-dentials. Disaggregating and analyzing data by program and race, which is discussed in the next section, is another way to combat tracking.
7. Investing in Integrated education and training (IET) programs. According to recent Organisation for Economic Cooperation and Development data, 24 mil-
lion U.S. workers currently in the labor market have limited foundational skills — that is, liter-acy, numeracy, digital, or English language skills — which restricts their ability to advance their careers or transition to new sectors. IET programs are a proven model for equipping these workers to build their foundational skills while also training for a new role in a particu-lar occupation or industry. IET programs that result in a quality NDC provide a vital path to higher earnings.
Because IET models combine occupational instruction with foundational skills instruction, they accelerate the time to completion for a quality NDC. As a result, IET can be an effective alternative to the more traditional sequence where individuals with lower reading or math skills must first complete developmental or “remedial” courses before enrolling in their cho-sen program — a strategy that has long been shown to delay and hinder students’ success, and which has particularly regressive impacts for students of color.
IET strategies are authorized and encouraged under WIOA, but to date offerings have been uneven across states. State policies to expand adoption of these strategies can help ensure
26 EXPANDING OPPORTUNITIES: DEFINING QUALITY NON-DEGREE CREDENTIALS FOR STATES
that IET programs are prioritized. As states establish their credential attainment goals, they should analyze how many workers will need foundational skills assistance in order to obtain a postsecondary credential and provide adequate resources to ensure all eligible workers can access programming designed for their specific assets and needs.
C. State policies to improve data, determine quality, and measure credential attainment.Data are essential for states to determine the quality of NDCs and measure credential attainment. This paper calls upon states to utilize labor market data to determine substantial job opportunities and to use credential and wage records to find the employment and earnings outcomes of individ-uals after obtaining credentials. In order to have the appropriate data and infrastructure to do this, states should:
1. Collect broad data about all postsecondary programs. Data about all postsecondary programs is essential for understanding what credentials are
of value. While most states already have data about some postsecondary programs, this data is not comprehensive. Many public institutions do not report information about their non-cred-it courses to the state. Most states lack data about industry certifications because they do not regulate industry certifiers and cannot compel industry certification providers to submit data to the state. States often lack data about certificates that are awarded by private institutions. Although states usually license private for-profit institutions, and private institutions may be eligible for state financial aid or other state funding, relatively few states mandate that private schools share student-level data in exchange for authorization or aid. Thirty-four states par-ticipate in the U.S. Department of Labor. Registered Apprenticeship Partners Information Data System and can obtain individual-level data from the Department, but few states have done so. Only twenty-two states report they have individual-level data on most or all individ-uals who obtain an occupational license.30
States must focus on getting better data about NDCs and employment in order to truly deter-mine what credentials are of value in their states. Such data can also be used to weed out providers offering low-quality credentials with inadequate outcomes. To do this, states can consider providing technical assistance or staff capacity to institutions or other credential providers without the capacity to share data with their state’s unemployment insurance agency. States can also mandate that any institution receiving state authorization to operate or receiving financial aid dollars share information with the state. States could operationalize this for industry certifiers by paying for the certification exam for students — thereby giving them leverage to require that certifier to share data. This approach also helps eliminate one of the barriers that faces low-income individuals seeking certifications. States could also re-quire any entity seeking inclusion on the list of quality credentials to share data. Finally, states could seek voluntary data sharing agreements with each entity in the state, however, that process can be cumbersome.
EXPANDING OPPORTUNITIES: DEFINING QUALITY NON-DEGREE CREDENTIALS FOR STATES 27
2. Collect and use demographic data. Credential attainment in the United States is not traditionally equitable, but demographic
data can help policymakers to level the playing field. Thus, in addition to collecting data about programs, credentials, and employment, states should also collect demographic data about individuals, including race and ethnicity, gender, disability, age, low-income status, and veteran status. Collecting this information can help the state see if postsecondary attainment and career success are available to all residents. If education and career outcomes are not equitable, states can use these data to find the appropriate levers to fix inequities.
3. Match education and employment data across state lines. Linking data about credential holders to employment information can help stakeholders un-
derstand the outcomes of individuals completing credentials, and in fact, states can do this for most credential holders. States have employment and wage information about the large majority of workers working within the state through their Unemployment Insurance (UI) wage records, although these records do not include the self-employed, federal workers, or those who work in a different state. To obtain employment and wage data from other states, states can participate in the Census Bureau’s Postsecondary Employment Outcomes project and the DOL’s State Wage Interchange System (SWIS). States can also seek to link informa-tion about credential-holders with their state’s tax data in order to get information about the self-employed and others not included within UI wage records. Montana has successfully done this to measure the workforce outcomes of Montana’s college graduates.31
4. Develop and/or utilize a state longitudinal data system. States should also add all data collected to their state longitudinal data systems (SLDS),
which link information from different programs across time. Utilizing SLDS can help states get an unduplicated count of credential attainment (since they can see if an individual has earned multiple credentials), understand the outcomes of individuals completing credentials by linking credential data with employment data, and understand individual’s education and career pathways. States can also use their SLDS to answer questions about NDC attainment and employment outcomes for key demographics, including people of color, adult learners, veterans, and low-income individuals.
5. Produce a consumer information tool. States should get data about credentials into the hands of consumers and other stakeholders
in a format that is easy to understand. Consumer information tools ensure that individuals can understand the likely outcomes of a particular credential before enrolling. This can save in-dividuals time and money, by steering them away from credentials whose outcomes do not align with their goals. It is essential that consumers, counselors, case managers, and others know that these tools exist, and can use them easily. Information should be distilled in a way that provides clear and relevant information to consumers and states should take care to advertise the existence of their consumer information tools.32
28 EXPANDING OPPORTUNITIES: DEFINING QUALITY NON-DEGREE CREDENTIALS FOR STATES
Endnotes1 National Skills Coalition, 2017. https://www.nationalskillscoalition.org/resources/publications/2017-mid-
dle-skills-fact-sheets/file/United-States-MiddleSkills.pdf.
2 Anthony Carnevale, Tamara Jayasundera, and Artem Gulish. America’s Divided Recovery: College Haves and Have Nots. Georgetown University Center on Education and the Workforce, 2016. https://cew.georgetown.edu/cew-reports/americas-divided-recovery/.
3 Lumina Foundation, A Stronger Nation: Learning beyond high school builds American talent, 2019. http://strongernation.luminafoundation.org/report/2019/#nation.
4 Mary Fulton, Policy Snapshot: Attainment Goals and Plans, Education Commission of the States, 2017. https://www.ecs.org/wp-content/uploads/Attainment_Goals_and_Plans.pdf.
5 Tiffany Jones and Katie Berger. Aiming for Equity: A Guide to Statewide Attainment Goals for Racial Equity Advocates, The Education Trust, 2019. https://edtrust.org/resource/aiming-for-equity/.
6 Michelle Van Noy, Heather McKay, and Suzanne Michael. Non-Degree Credential Quality: A Conceptual Framework to Guide Measurement, Rutgers Education and Employment Center, 2019. https://smlr.rutgers.edu/sites/default/files/rutgerseerc_ndcquality_framework_full_paper_final.pdf.
7 Anthony Carnevale, Stephen Rose, Andrew Hanson. Certificates: Gateway to Gainful Employment and College Degrees, Georgetown University Center on Education and the Workforce, 2012. https://1gyho-q479ufd3yna29x7ubjn-wpengine.netdna-ssl.com/wp content/uploads/2014/11/Certificates.FullRe-port.061812.pdf.
8 Ibid.
9 Gallup, Inc. and Strada Education Network. Certified Value: When do Adults without Degrees Benefit from Earning Certificates and Certifications?, 2019. https://go.stradaeducation.org/certified-value.
10 Debbie Reed, Albert Yung-Hsu Liu, Rebecca Kleinman, et al. An Effectiveness Assessment and Cost-Ben-efit Analysis of Registered Apprenticeship in 10 States. Mathematica Policy Research, 2012. https://www.mathematica-mpr.com/download-media?MediaItemId=%7B96EFC004-5C8F-4EF8-A396-16E2EE00796F%7D.
11 Katie Spiker. CA Future of Work event aims to serve incumbent workers in a changing economy, National Skills Coalition blog, June 25, 2019. https://www.nationalskillscoalition.org/news/blog/ca-future-of-work-event-brings-together-workforce-experts-and-tech-industry-leaders.
12 https://credentialengine.org/.
13 Workforce Innovation and Opportunity Act, 2014.
14 Kathy Wyer. “Survey: More Freshmen than Ever Say They Go to College to Get Better Jobs, Make More Money.” January 23, 2013. UCLA Newswire. http://newsroom.ucla.edu/releases/heri-freshman-sur-vey-242619.
15 In this paper, the words “student” and “individual” are used interchangeably to refer to participants or potential participants in education or training.
16 Such as Credential Engine and the T3 Project led by the U.S. Chamber of Commerce Foundation.
17 Such as the Competency Based Education Network.
18 States may obtain data on out-of-state employment through the Longitudinal Employer-Household Dynamics project at the U.S. Bureau of the Census and the State Wage Interchange System (SWIS) at the U.S. Department of Labor. To obtain information through SWIS, providers must apply to be on their state’s Eligible Training Provider list under WIOA.
19 Unemployment insurance wage records, except in Alaska and Louisiana, do not include occupational data.
20 For example, see The Institute for College Access and Success, Of Metrics and Markets: Measuring Post-College Employment Success, 2018. https://ticas.org/accountability/metrics-and-markets/.
21 Lumina Foundation, A Stronger Nation. The methodology was developed by the Georgetown University Center on Education and the Workforce. http://strongernation.luminafoundation.org/report/2019/#nation.
22 Based on Bureau of Labor Statistics, “Occupational Outlook Handbook,” mean national earnings for all workers employed in an occupation.
23 American Association of Community Colleges, Fast Facts 2019. 2019. https://www.aacc.nche.edu/research-trends/fast-facts/.
24 Ibid.
25 Ibid.
26 Tatjana Meschede, et al. “Family Achievements?”: How a College Degree Accumulates Wealth for Whites and Not for Blacks, Federal Reserve Bank of St. Louis REVIEW, 2017, https://files.stlouisfed.org/files/htdocs/publications/review/2017-02-15/family-achievements-how-a-college-degree-accumulates-wealth-for-Whites-and-not-for-blacks.pdf.
27 Ibid.
28 Dazzie McKelvy, Sarah Oldmixon, and Heath Prince. Partnering for Equity: How Sector Partnerships are Tackling Workforce Disparities. Ray Marshall Center, University of Texas at Austin, LBJ School of Public Affairs, 2018. https://partneringforequity.org/wp-content/uploads/2018/05/PartneringForEquity_pa-genumbers.pdf.
29 Ibid.
30 Jenna Leventoff. Measuring Non-Degree Credential Attainment: 50-State Scan, National Skills Coalition, 2018. https://www.nationalskillscoalition.org/resources/publications/file/Measuring-Non-Degree-Creden-tial-Attainment-50-State-Scan.pdf.
31 Workforce Data Quality Campaign. How Montana is Using Data to Drive Policy, National Skills Coalition, 2018. https://www.nationalskillscoalition.org/resources/publications/file/How-Montana-is-using-data-to-drive-policy-change.pdf.
32 For example, see Minnesota’s Graduate Employment Outcomes, and Washington State’s Career Bridge.

D EXPANDING OPPORTUNITIES: DEFINING QUALITY NON-DEGREE CREDENTIALS FOR STATES
1250 Connecticut Avenue NW Suite 200
Washington DC 20036202.223.8991
nationalskillscoalition.org
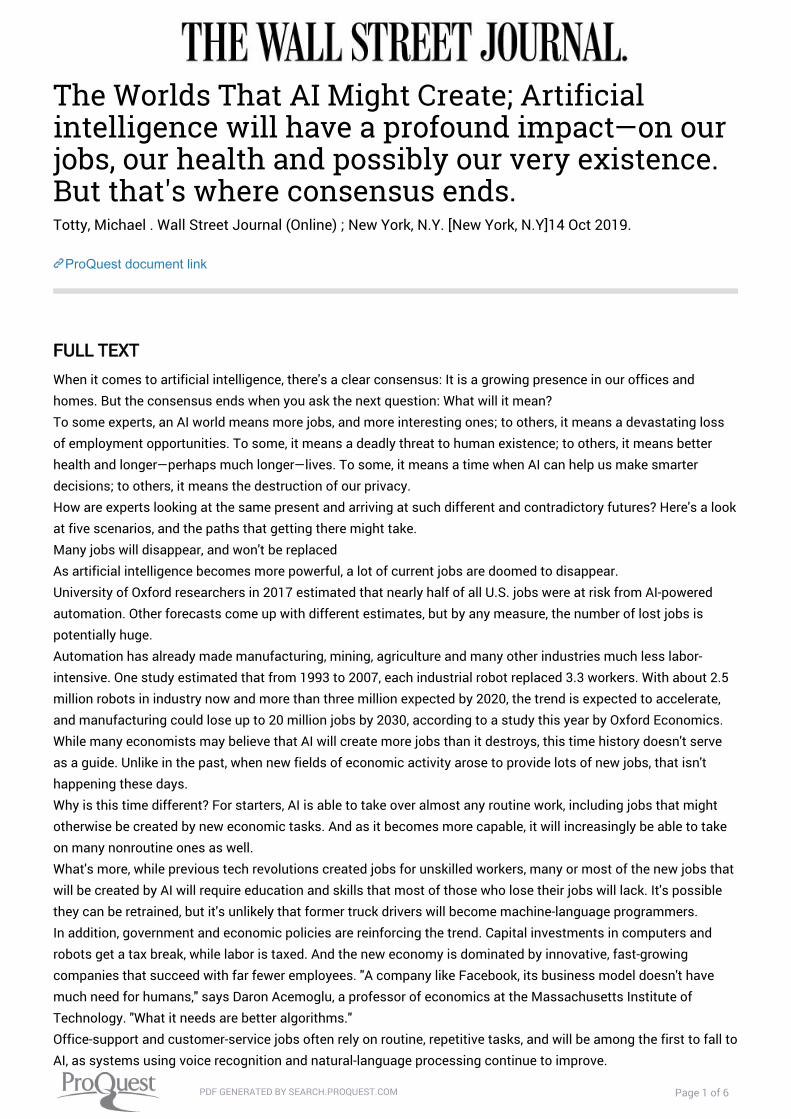
The Worlds That AI Might Create; Artificialintelligence will have a profound impact—on ourjobs, our health and possibly our very existence.But that's where consensus ends. Totty, Michael . Wall Street Journal (Online) ; New York, N.Y. [New York, N.Y]14 Oct 2019.
ProQuest document link
FULL TEXT When it comes to artificial intelligence, there's a clear consensus: It is a growing presence in our offices and
homes. But the consensus ends when you ask the next question: What will it mean?
To some experts, an AI world means more jobs, and more interesting ones; to others, it means a devastating loss
of employment opportunities. To some, it means a deadly threat to human existence; to others, it means better
health and longer—perhaps much longer—lives. To some, it means a time when AI can help us make smarter
decisions; to others, it means the destruction of our privacy.
How are experts looking at the same present and arriving at such different and contradictory futures? Here's a look
at five scenarios, and the paths that getting there might take.
Many jobs will disappear, and won't be replaced
As artificial intelligence becomes more powerful, a lot of current jobs are doomed to disappear.
University of Oxford researchers in 2017 estimated that nearly half of all U.S. jobs were at risk from AI-powered
automation. Other forecasts come up with different estimates, but by any measure, the number of lost jobs is
potentially huge.
Automation has already made manufacturing, mining, agriculture and many other industries much less labor-
intensive. One study estimated that from 1993 to 2007, each industrial robot replaced 3.3 workers. With about 2.5
million robots in industry now and more than three million expected by 2020, the trend is expected to accelerate,
and manufacturing could lose up to 20 million jobs by 2030, according to a study this year by Oxford Economics.
While many economists may believe that AI will create more jobs than it destroys, this time history doesn't serve
as a guide. Unlike in the past, when new fields of economic activity arose to provide lots of new jobs, that isn't
happening these days.
Why is this time different? For starters, AI is able to take over almost any routine work, including jobs that might
otherwise be created by new economic tasks. And as it becomes more capable, it will increasingly be able to take
on many nonroutine ones as well.
What's more, while previous tech revolutions created jobs for unskilled workers, many or most of the new jobs that
will be created by AI will require education and skills that most of those who lose their jobs will lack. It's possible
they can be retrained, but it's unlikely that former truck drivers will become machine-language programmers.
In addition, government and economic policies are reinforcing the trend. Capital investments in computers and
robots get a tax break, while labor is taxed. And the new economy is dominated by innovative, fast-growing
companies that succeed with far fewer employees. "A company like Facebook, its business model doesn't have
much need for humans," says Daron Acemoglu, a professor of economics at the Massachusetts Institute of
Technology. "What it needs are better algorithms."
Office-support and customer-service jobs often rely on routine, repetitive tasks, and will be among the first to fall to
AI, as systems using voice recognition and natural-language processing continue to improve.
PDF GENERATED BY SEARCH.PROQUEST.COM Page 1 of 6
Then there are jobs that robots can't take over completely but that have elements that could be easily automated.
McKinsey Global Institute estimates that about a third of the tasks in 60% of the occupations it studied fall into
this category. Many employers will cut their workforces and take the savings.
The jobs that will be the most difficult to automate are those that require empathy and "people skills." For instance,
"college professors can be replaced more easily than kindergarten teachers," says Jamais Cascio, an author and
futurist. "Heart surgeons can be replaced more easily than nurses. Clothing designers can be replaced more easily
than hairdressers."
In other words, because AI automates many cognitive chores, a college degree and a white collar won't be enough
to shield those jobs, either.
"Everyone has the bias that if you have education and skills, you're going to be protected from automation. That in
many cases is quite wrong," says Martin Ford, author of "Rise of the Robots: Technology and the Threat of a
Jobless Future." "It's not about skill. It's about the nature of the work."
There will be plenty of jobs (just different ones)
It's true that many jobs will be lost in the AI revolution, just as in previous waves of automation. But history is a
guide, and once again, even more jobs will be gained.
McKinsey has forecast that the equivalent of 400 million jobs world-wide could be automated by 2030. At the
same time, it projected that productivity gains and growing consumer demand would mean as many as 890 million
new jobs, more than enough to offset the losses.
That is, over the next several decades, AI not only will create the need for many new jobs and new types of jobs,
but it also will transform existing jobs in ways that make them easier, safer and more productive. What's more, the
increased productivity will make possible both more leisure time and the opportunity for more meaningful and
creative work.
"It will change the nature of jobs," says Peter Schwartz, a senior vice president of strategic planning at Salesforce.
"Some will go away, but we're going to create many more."
There are all sorts of reasons to expect AI to be responsible for a job boom. For one thing, developing and
implementing AI systems creates a growing demand for data scientists, roboticists, machine-learning specialists,
cybersecurity experts and other highly skilled workers. Just as nobody could have anticipated that the Industrial
Revolution would create millions of new jobs in factories, mills and mines, there will be millions of jobs that we
can't even imagine today that will spring from the AI revolution.
Artificial intelligence also requires a host of new companion jobs to "train, explain and sustain" AI systems, says
Jim Wilson, managing director of information technology and business research at Accenture Research. Tens of
thousands of workers around the world have full- or part-time jobs training machine-learning algorithms by
manually identifying pictures of cats or picking out tumors on radiology images. Those jobs are only a hint of
what's ahead.
Perhaps most important, rather than replace jobs, robots and other AI systems will work alongside humans and
enhance their knowledge and skills. Scientists at a bioscience company, Mr. Wilson says, use robotic lab
equipment to run experiments more precisely, enabling researchers to conduct in a single year tests that would
take them 100 years on their own. Such jobs will still need humans to handle tasks requiring creativity and
problem solving, such as designing new experiments, or for manual chores that require quickly adapting to
changing situations.
Even in highly automated factories, people and robots working together are more productive than either working
alone. There, cooperative robots, or "cobots," handle heavy lifting or repetitive tasks while their human co-workers
take care of duties that require dexterity, on-the-fly problem solving and mobility in unpredictable environments.
AI will also change many jobs beyond recognition. Truck driving, for example, is among those jobs at the greatest
risk once AI-powered autonomous vehicles hit the road, perhaps as early as the next decade. But despite what
doomsayers fear, jobs driving trucks won't go away. Even the most capable self-driving truck will have trouble
navigating city streets or suburban neighborhoods. For those situations, a driver in a remote control center—much
PDF GENERATED BY SEARCH.PROQUEST.COM Page 2 of 6
like drones are piloted now—might guide the vehicle in and out of the neighborhood and on to the freeway, where it
becomes almost fully autonomous. "The skill set now is Grand Theft Auto," Mr. Schwartz says.
Even as it transforms many jobs and creates millions more, there's no question that lots of workers will be
displaced in the process. But that doesn't have to lead to higher unemployment.
McKinsey forecasts that AI will contribute to a 2% increase in productivity over the next decade as goods and
services are produced at lower cost. The wealth created by that higher productivity could be used to boost
employment and salaries in teaching and child and elder care, which face a growing demand and require a
uniquely human touch. It could also go toward expanding investment in infrastructure improvements and in
making the economy more sustainable, adding millions of new jobs. "It's an incredible stimulus," says James
Manyika, chairman of the McKinsey Global Institute.
Higher productivity has another upside that's almost unimaginable in our workaholic society: more leisure time.
There's no reason three- or four-day workweeks and shorter workdays, with no loss in purchasing power, couldn't
be the norm.
"Why do we need to work five days a week if we could avoid it?" says Yvette Wohn, an assistant professor of
informatics at the New Jersey Institute of Technology.
Our very existence is threatened
Here's the truly nightmare scenario of artificial intelligence: It kills us all.
This isn't just a movie plot (though it is that, too). To many serious thinkers about AI, this is a real threat that those
developing AI systems need to plan for now.
The danger isn't from robots that will seek to control and destroy humans. No, it's more benign-sounding than that.
"The real risk isn't AI turning evil like in the movies, but turning competent and accomplishing goals that aren't
aligned with ours," says Max Tegmark, a professor of physics at the Massachusetts Institute of Technology and a
co-founder of the Future of Life Institute, which researches ways to make AI safer.
How might it happen? One possibility is that researchers succeed in creating a humanlike AI system—what is
called artificial general intelligence, or AGI—that is capable of learning on its own and that could then design itself
to be even more intelligent. In this event, which researchers refer to as the singularity, the machine could improve
so rapidly that it turns into a superintelligence that is beyond our ability to monitor or control.
Such a computer would be able to commandeer resources, such as automated factories or the computerized
financial system, to achieve its objectives with indifference to the consequences, and regardless of whether its
mission matches up with what humans want.
This difficulty in aligning AI and human values is akin towhat tripped up King Midas, the Sorcerer's Apprentice and
everyone in fairy tales who dealt with genies.
Stuart Russell, a professor of computer science at the University of California, Berkeley, imagines assigning a
super AI to quickly come up with a cure for cancer. The system digests all the existing literature on the disease and
comes up with millions of possible treatments—all of them untested. To test their effectiveness, the AI introduces
cancerous tumors in every person on Earth and begins medical trials, some safe and some not.
The problem, Prof. Russell says, is that it's almost impossible to anticipate every path a super AI might take to
achieve its objective. "If you leave anything out, the AI system will find a way to take that thing you left out and
shove it to infinity to help optimize the thing that you said you wanted," he says.
Couldn't we just turn off a superintelligent AI before it starts to do harm? It turns out that's not easy to do. Prof.
Russell notes that an AI that's hellbent on achieving its objectives would also realize that being shut down would
prevent its ability to succeed and would try to stop any effort to pull the plug. (See HAL in "2001: A Space
Odyssey.") Instead, he and others warn, it's necessary to build in safeguards long before a humanlike artificial
intelligence is created.
"If humanity unleashes superintelligence without careful safety engineering," Prof. Tegmark says, "the default
outcome is trouble."
We'll be healthier and live longer—maybe a lot longer
PDF GENERATED BY SEARCH.PROQUEST.COM Page 3 of 6
AI is going to become superintelligent and kill us? Not likely, many researchers say. Scientists not only don't know
how to create a humanlike AI, they aren't likely to figure it out soon, if ever.
No, the opposite is much more feasible: AI is going to make it possible to live longer, healthier lives. And perhaps a
lot, lot longer.
The reason is that instead of becoming our master, artificial intelligence will become our servant. By tapping the
power of artificial intelligence to find patterns in enormous amounts of data—about our health, our genes, our
environment and our lifestyles—doctors will be able to make better diagnoses and recommend more effective
treatments. Researchers will better understand how diseases work and devise more targeted and personalized
ways to treat them. And everyday users will have powerful diagnostic tools that can spot early warning signs of
illness.
"There is no area of medicine that will be spared from AI's impact," says Eric Topol, executive vice president and a
professor of molecular medicine at the Scripps Research Institute in La Jolla, Calif.
Start with the doctor's office. Physicians, in theory, already have access to previously unimaginable sources of
health information: electronic medical records, radiology and lab reports, the patients' fitness trackers and the
results of genetic tests. But by themselves, it's almost impossible for doctors to draw meaningful insights from all
that information.
AI systems will fill that gap.
They already have shown in various studies that they can analyze medical information and come up with a correct
diagnosis as well as or better than clinicians. And those diagnostic skills will get immeasurably better as our use
of AI systems improves.
Patients themselves will also get medical help from AI-powered "health personal assistants" that will advise—and
prod—users to take more healthy actions. For instance, Dr. Topol describes how diabetics could carry a virtual
medical coach that takes information from glucose monitors, sleep and activity trackers and other sources and
provides guidance on what they should be eating and what activities would help control blood sugar.
Finally, AI will help researchers identify new medical treatments and, perhaps, unlock the secrets of aging.
The body's decline as it ages is a complex biological and chemical process that involves nearly all its systems,
organs and cells. For longevity researchers to understand how these parts interact means crunching an enormous
amount of data, and sophisticated AI techniques are increasingly being put to the task.
"Our goal is to have everyone be young for as long as possible," says Alex Zhavoronkov, chief executive of Hong
Kong-based Insilico Medicine, which is using AI to try to solve the problem of aging.
AI will be a constant companion
It won't be long before AI will be following us everywhere.
The path to a ubiquitous AI isn't hard to imagine. Artificial intelligence is an all-pervasive, general-purpose
technology, more like electricity than, say, the airplane. Like electricity, it eventually will be integrated into all
aspects of our lives, homes, cars and offices, though in ways that are far more disruptive and far-reaching.
AI will drive us to work in our autonomous cars, and once we're there it will manage calendars, screen and
interview job candidates, run meetings, and even take on some management tasks such as forming work teams
and assigning projects. Back at home, smart devices will react automatically to changing temperatures, noise
levels and air quality, change lights and music to fit our mood and help children with their homework.
"At a certain point in the near term, referring to a building as AI-enabled would be as silly as referring to one as
electrified today," says Mr. Cascio.
Journal Report
* Read more at WSJ.com/AIreport
More in Artificial Intelligence
* Creating a Robot-Human Bond
* AI Learns to Write Fake News
* Relationship Help From an Algorithm
PDF GENERATED BY SEARCH.PROQUEST.COM Page 4 of 6

* Debate: Should You Be Able to Sell Your Personal Data?
Some people may find it hard to imagine that they will turn over all these things to AI. But they'll do it for a simple
reason: It will make our lives easier by managing all the scattered details we otherwise would have to pay attention
to ourselves. An AI assistant, for instance, would track any delays to your spouse's arriving flight and, taking
account of traffic to the airport, give you an alert to leave in five minutes—after reminding you the night before to
charge your electric car. "We're overwhelmed and looking for something to help us focus our attention in the most
fruitful way," Mr. Cascio says. "It's not so much laziness as it is triage."
We'll also trust that our AI companion will help us make better decisions, and more quickly. Partly that's because it
will have access to far more information than we can have, much as the Waze driving app knows there's traffic
congestion ahead. Even today, few people are likely to ignore their GPS instructions and decide they know best.
That will be more so—and about so many more things—in the future.
Imagine that you've just read about the latest unrest in the Middle East or a trade war with China and decide to
unload your stocks ahead of a possible financial meltdown. Your assistant, knowing that you're in the throes of a
temporary, irrational panic, would prevent you from executing the sale until you've had a chance to calm down.
It's easy to see this is where we're heading. The bigger question is, what will it mean? "What kind of life is it, when
more of these decisions are taken by the algorithms?" Yuval Noah Harari, an Israeli historian, asks in a TED
interview describing this scenario.
One possibility is that turning over decisions and actions to an AI assistant creates a "nanny world" that makes us
less and less able to act on our own. It's what one writer has called the "Jeeves effect" after the P.G. Wodehouse
butler character who is so capable that Bertie Wooster, his employer, can get by being completely incompetent.
A simple example most of us can identify with: Using GPS for directions can reduce our ability to find our way
around. "I used to pride myself on being able to navigate, but now that's slipping," says Patrick Lin, director of the
Ethics and Emerging Sciences Group at California Polytechnic State University. "It's hard to see the benefit of
offloading that ability to technology."
Then there's the threat to privacy. The more we rely on AI, the more personal information we're giving to the AI
software. "Anything with the word 'smart' in it needs data to learn from," says Azeem Azhar, who advises
companies on the impact of AI and who publishes the Exponential View newsletter. "As soon as you have a smart
something in your home, you have to start thinking very hard about what happens to your data."
Finally, in this future, how we interact with the world may very well change as we try to accommodate our behavior
to our indispensable, ever-present AI companions. Users describe "barking" commands to the Alexa voice-
controlled assistant; we could start barking to the people in our lives as well. Or consider that automated
customer-support systems require speaking in a mechanical voice and can be tripped up by accents and other
individual quirks.
"We need to be asking some very basic, fundamental questions," says Marina Gorbis, executive director of the
Institute for the Future, a Palo Alto, Calif., research and forecasting organization. "How do we shape these
machines to be more like humans rather than making us more machine-like?"
Mr. Totty, a former Journal Report news editor in San Francisco, can be reached at [email protected] .
Share Your Thoughts
Will the growth of artificial intelligence ultimately be a net positive or a negative outcome for humankind? Why?
Join the conversation below.
Credit: By Michael Totty DETAILS
Subject: Research; Robots; Productivity; Algorithms; Automation; Artificial intelligence;
Employment; Skills
PDF GENERATED BY SEARCH.PROQUEST.COM Page 5 of 6
LINKSLinking Service
Database copyright 2019 ProQuest LLC. All rights reserved. Terms and Conditions Contact ProQuest
Publication title: Wall Street Journal (Online); New York, N.Y.
Publication year: 2019
Publication date: Oct 14, 2019
column: Journal Reports: Technology
Section: Business
Publisher: Dow Jones &Company Inc
Place of publication: New York, N.Y.
Country of publication: United States, New York, N.Y.
Publication subject: Business And Economics
Source type: Newspapers
Language of publication: English
Document type: News
ProQuest document ID: 2304710620
Document URL: https://login.proxy.lib.fsu.edu/login?url=https://search.proquest.com/docview/2304
710620?accountid=4840
Copyright: Copyright 2019 Dow Jones &Company, Inc. All Rights Reserved.
Last updated: 2019-10-21
Database: The Wall Street Journal
PDF GENERATED BY SEARCH.PROQUEST.COM Page 6 of 6
1
How to Get a World-Class Education for Free on the Internet Whether you’re seeking new employment mid-career, or curious about alternatives to college, take advantage of these online resources. Quartz | Amy X. Wang As crucial as a university degree has become for working in the modern economy, it is not the only route forward into a wildly lucrative and satisfying career—just ask famous dropouts Bill Gates, Oprah Winfrey, Michael Dell, Steve Jobs, Mark Zuckerberg. In the future, a single bachelor’s degree in a particular subject will no longer suffice for many of us anyway. As robots and automation sweep the global workforce, hundreds of millions of people—the majority of whom do not have the time or money to go pick up a brand-new four-year degree—will have to “re-skill” in order to land new jobs. The question that employees and employers alike face is how to get that done quickly, efficiently, and, most importantly to many, cheaply. The internet, luckily, is already a booming resource. Whether you find yourself seeking new employment mid-career, curious about alternatives to a college education, or simply are interested in learning for learning’s sake, Quartz At Work has compiled some of the most dependable, high-quality materials you can access to learn anything on the internet. For a free liberal arts education: The first name in online course catalogs is Coursera, a juggernaut because of its pioneering of massive open online courses (MOOCs). Started in 2012, Coursera now has over 28 million users and over 2,000 courses—which can either be taken for free or for a small fee to earn an official certificate—from leading institutions like Harvard and Stanford. In recent years, the catalog has expanded far beyond traditional subjects like history and mathematics. “There’s been a lot of interest in courses that are more about personal and professional development—you’ll see courses on how to learn, how to reason, how to find happiness and fulfillment, as well as courses that are more skills-oriented,” Coursera co-founder Daphne Koller told Quartz in 2016. The platform’s most popular classes include:
• Machine Learning (Stanford University) • Learning How to Learn (University of California-San Diego) • Bitcoin and Cryptocurrency Technologies (Princeton University) • Financial Markets (Yale University) • Programming for Everybody (University of Michigan) • Seeing Through Photographs (The Museum of Modern Art) • Buddhism and Modern Psychology (Princeton University) • Introduction to Philosophy (University of Edinburgh)
There are several other MOOC providers, including Udacity and edX. Udacity tends to be a better resource for professionals looking to develop certain vocational skills, and edX—
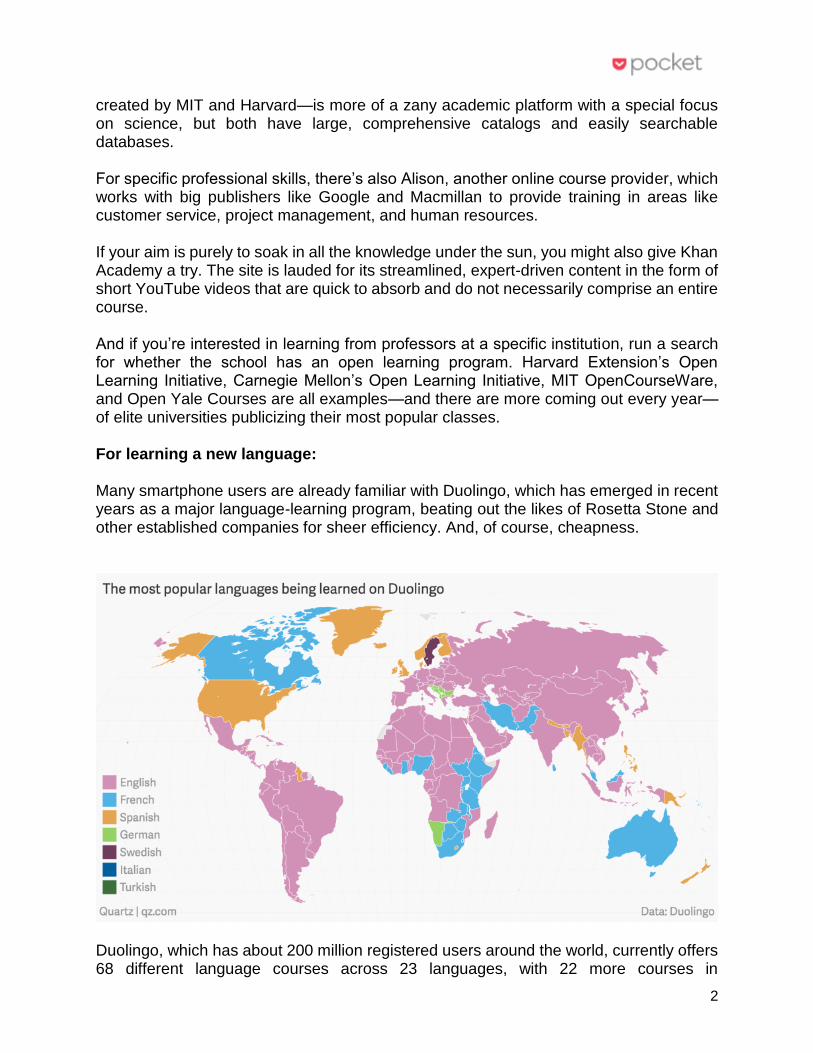
2
created by MIT and Harvard—is more of a zany academic platform with a special focus on science, but both have large, comprehensive catalogs and easily searchable databases. For specific professional skills, there’s also Alison, another online course provider, which works with big publishers like Google and Macmillan to provide training in areas like customer service, project management, and human resources. If your aim is purely to soak in all the knowledge under the sun, you might also give Khan Academy a try. The site is lauded for its streamlined, expert-driven content in the form of short YouTube videos that are quick to absorb and do not necessarily comprise an entire course. And if you’re interested in learning from professors at a specific institution, run a search for whether the school has an open learning program. Harvard Extension’s Open Learning Initiative, Carnegie Mellon’s Open Learning Initiative, MIT OpenCourseWare, and Open Yale Courses are all examples—and there are more coming out every year—of elite universities publicizing their most popular classes. For learning a new language: Many smartphone users are already familiar with Duolingo, which has emerged in recent years as a major language-learning program, beating out the likes of Rosetta Stone and other established companies for sheer efficiency. And, of course, cheapness.
Duolingo, which has about 200 million registered users around the world, currently offers 68 different language courses across 23 languages, with 22 more courses in

3
development. It operates a “freemium” model (think Spotify) which allows users to access the bulk of the app for free, and pay for certain additional features. Its genius lies primarily in its design, which has been praised as revolutionary and intuitive: Lessons integrate text translation, visuals, speaking, and sound into a comprehensive learning environment. For the euphoria of fiction: Reading, the most wonderful of leisurely pursuits, need not be costly at all. Start at Project Gutenberg, which offers over 56,000 free e-books. Open Library, a project of Internet Archive that is trying to catalog every book in existence, also offers plenty of free books. Join your local public library—or any public library—that offers OverDrive, an app that lets users borrow from a comprehensive catalog of free ebooks and audiobooks. Libby is another app that offers the same functionality with a better interface. Google Books has abandoned its once-lofty plans to digitize the world’s books, but it has a “free ebooks” feature you can toggle and is a useful site for academic texts or some more modern titles. Quartz has a complete guide to finding specific titles online. (If you’re a book novice, unsure of where to start, you might also take a look at Quartz’s guide to enjoying classic literature.) For the nitty-gritty of coding: Coding is one of the best skills to learn online—the work itself takes place entirely on a computer—but the quality of free teaching available ranges from expert-level to deeply flawed. Programmers tend to agree, though, that Codecademy, Free Code Camp, and HackerRank are all consistently well-designed and useful resources. Codecademy gently coaches novice coders through the basics of HTML and CSS, and into JavaScript and more complicated languages; Free Code Camp does the same with an added emphasis on building real-world projects for nonprofits. HackerRank offers code “challenges”—mini puzzles that are attention-engaging and educational without being explicitly instructive, providing a “learn by doing” approach that is ideal for people who prefer projects to lectures. If none of these three appeal, try this list of 49 vetted resources. For a jumpstart on the hard-to-grasp: Onerous is the idea of trying to learn more about the physical world without a good starting-off point. The following free resources, some of which live on a few of the open platforms mentioned above, offer a mix of interactive materials, quizzes, and videos, and are excellent inspiration for anyone interested in working in—or simply learning about—the sciences.
• Greatest Unsolved Mysteries of the Universe (Australian National University) • Understanding Einstein: The Special Theory of Relativity (Stanford University) • Introduction to Astrophysics (École Polytechnique Fédérale de Lausanne)
4
• Quantum Mechanics for Everyone (Georgetown University) • Math is Everywhere: Applications of Finite Math • BBC Learning: Science • Most Ambitious Science Projects (Highbrow) • Super-Earths and Life (Harvard University)
For a hefty dose of motivation: TED Talks are hardly a secret resource; you can easily find talks from stars in every industry from technology to agriculture. Another source of inspiration is MasterClass, which is not free—it costs around $180/year—but hosts a number of well-made videos led by celebrities. Judd Apatow can teach you comedy, Gordon Ramsay offers wisdom on cooking, and Diane von Furstenberg will share her tips for building a fashion brand. With these kinds of classes, the delivery platform is not as important so much as the idea of being inspired continually, by idols, icons, experts, or anyone that you feel can lead you to where you want to go, so that you maintain your energy and stay enthusiastic about the world around you. MasterClass CEO David Rogier says, “Schools teach you the underlying skills of what to learn, but now in the changing world it’s the default to change ourselves and continue to learn.” Thanks to the internet, that’s easier than ever. Quartz This article was originally published on March 2, 2018, by Quartz, and is republished here with permission.
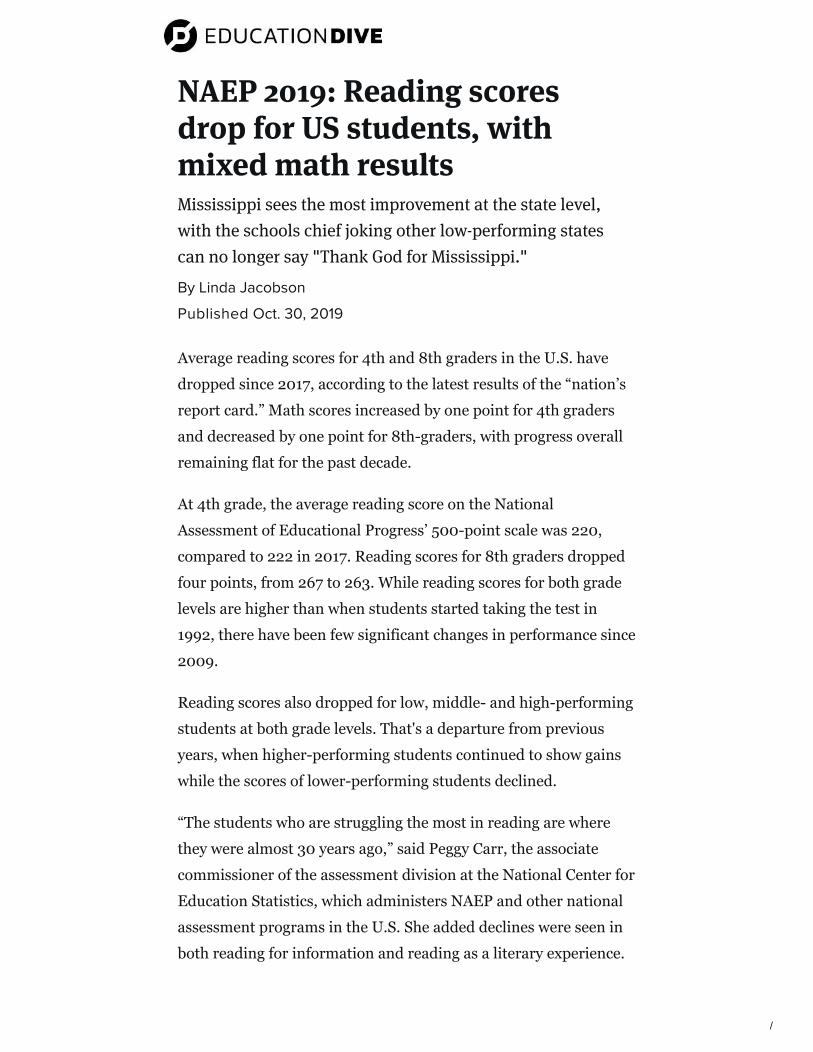
/
By Linda Jacobson
Published Oct. 30, 2019
Average reading scores for 4th and 8th graders in the U.S. have
dropped since 2017, according to the latest results of the “nation’s
report card.” Math scores increased by one point for 4th graders
and decreased by one point for 8th-graders, with progress overall
remaining flat for the past decade.
At 4th grade, the average reading score on the National
Assessment of Educational Progress’ 500-point scale was 220,
compared to 222 in 2017. Reading scores for 8th graders dropped
four points, from 267 to 263. While reading scores for both grade
levels are higher than when students started taking the test in
1992, there have been few significant changes in performance since
2009.
Reading scores also dropped for low, middle- and high-performing
students at both grade levels. That's a departure from previous
years, when higher-performing students continued to show gains
while the scores of lower-performing students declined.
“The students who are struggling the most in reading are where
they were almost 30 years ago,” said Peggy Carr, the associate
commissioner of the assessment division at the National Center for
Education Statistics, which administers NAEP and other national
assessment programs in the U.S. She added declines were seen in
both reading for information and reading as a literary experience.
NAEP 2019: Reading scores
drop for US students, with
mixed math resultsMississippi sees the most improvement at the state level,
with the schools chief joking other low-performing states
can no longer say "Thank God for Mississippi."
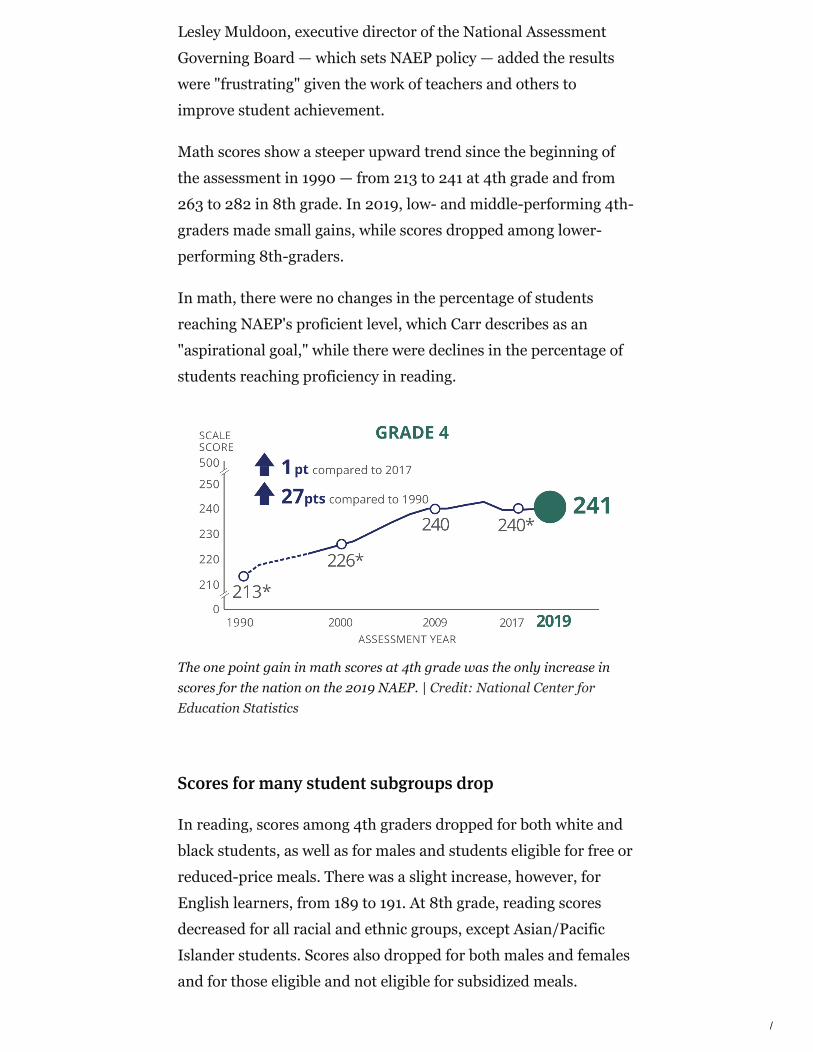
/
Lesley Muldoon, executive director of the National Assessment
Governing Board — which sets NAEP policy — added the results
were "frustrating" given the work of teachers and others to
improve student achievement.
Math scores show a steeper upward trend since the beginning of
the assessment in 1990 — from 213 to 241 at 4th grade and from
263 to 282 in 8th grade. In 2019, low- and middle-performing 4th-
graders made small gains, while scores dropped among lower-
performing 8th-graders.
In math, there were no changes in the percentage of students
reaching NAEP's proficient level, which Carr describes as an
"aspirational goal," while there were declines in the percentage of
students reaching proficiency in reading.
The one point gain in math scores at 4th grade was the only increase inscores for the nation on the 2019 NAEP. | Credit: National Center forEducation Statistics
Scores for many student subgroups drop
In reading, scores among 4th graders dropped for both white and
black students, as well as for males and students eligible for free or
reduced-price meals. There was a slight increase, however, for
English learners, from 189 to 191. At 8th grade, reading scores
decreased for all racial and ethnic groups, except Asian/Pacific
Islander students. Scores also dropped for both males and females
and for those eligible and not eligible for subsidized meals.

/
In math, there was a significant drop of six points for American
Indian/Alaska Native students in 8th grade. And while trends
show growth for other student subgroups over time, performance
among this group has remained stagnant. There were no
significant changes in scores for other racial and ethnic groups,
compared to 2017.
In 4th grade math, Hispanic students made small gains compared
to 2017 results, while there were no significant gains or losses for
other racial and ethnic subgroups. Math scores at 4th grade also
increased for males, English learners and for students eligible for
free or reduced-price lunch.
This year’s NAEP results also mirror the demographic changes
occurring in schools across the country. At 8th grade, the
percentage of Hispanic students taking both the math and reading
exams has steadily increased, while the percentage of white
students has declined since 1990. Similar shifts are seen in 4th
grade.
But Carr said changes in the racial makeup of the 600,000
students who took the test don't explain the declines in
performance, which she said were seen across most subgroups.
The results also show that nationally, there has been relatively no
change in the score gap between white and black students and
between white and Hispanic students in math at 4th or 8th grade.
In 4th grade reading, the white-Hispanic gap is slightly smaller
than it was in 2017 but similar to where it stood in 1992, while the
white-black gap has narrowed over time but remained the same as
last year.
No more ‘Thank God for Mississippi’
The disappointing national picture also continues at the state level,
with reading scores dropping for 4th graders in 17 states and for
8th graders in 31 states. "That is a very meaningful decline," Carr
said.
Only Mississippi saw a significant increase at 4th grade, and only
the District of Columbia saw gains in 8th grade.
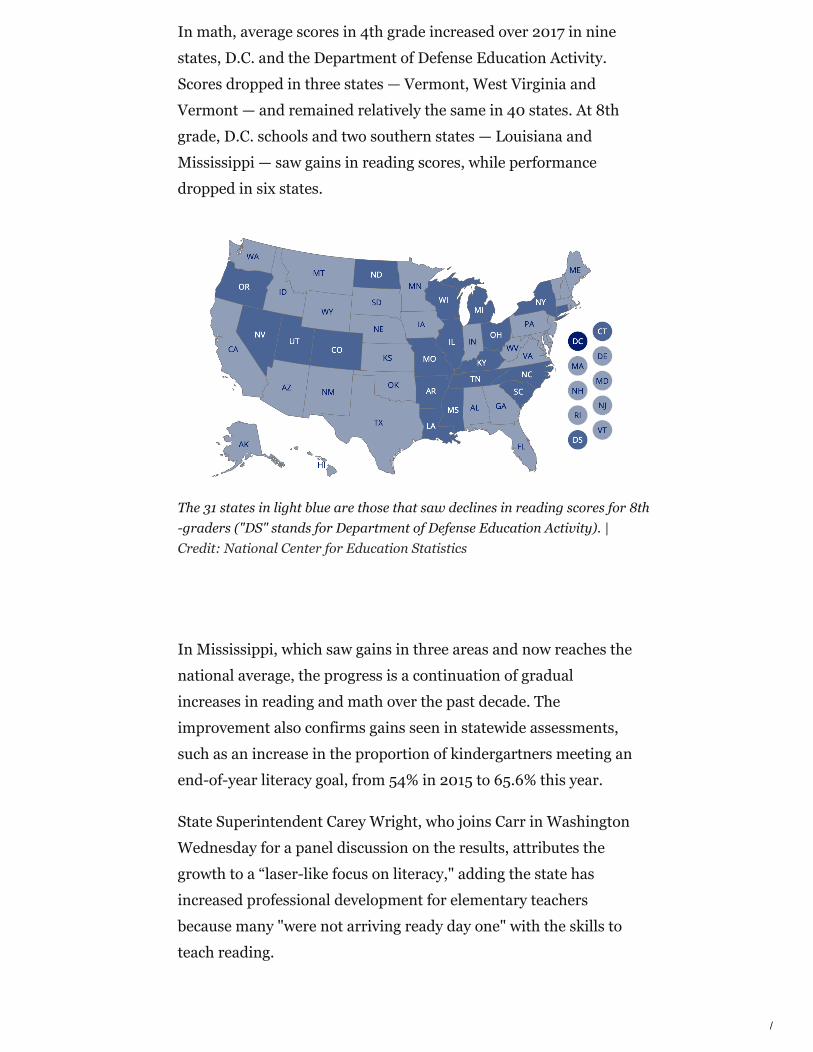
/
In math, average scores in 4th grade increased over 2017 in nine
states, D.C. and the Department of Defense Education Activity.
Scores dropped in three states — Vermont, West Virginia and
Vermont — and remained relatively the same in 40 states. At 8th
grade, D.C. schools and two southern states — Louisiana and
Mississippi — saw gains in reading scores, while performance
dropped in six states.
The 31 states in light blue are those that saw declines in reading scores for 8th-graders ("DS" stands for Department of Defense Education Activity). |Credit: National Center for Education Statistics
In Mississippi, which saw gains in three areas and now reaches the
national average, the progress is a continuation of gradual
increases in reading and math over the past decade. The
improvement also confirms gains seen in statewide assessments,
such as an increase in the proportion of kindergartners meeting an
end-of-year literacy goal, from 54% in 2015 to 65.6% this year.
State Superintendent Carey Wright, who joins Carr in Washington
Wednesday for a panel discussion on the results, attributes the
growth to a “laser-like focus on literacy," adding the state has
increased professional development for elementary teachers
because many "were not arriving ready day one" with the skills to
teach reading.
/
"It's all around the science of reading," she said. "That is really
paying off for us."
The state also sends literacy coaches to work with early-childhood
education teachers in underserved areas, Wright said.
In math, the state's focus has been on making sure teachers can
choose from high-quality instructional materials when planning
lessons.
"We can't dictate materials," Wright said, but the state can guide
teachers toward them. With support of the W.K. Kellogg
Foundation, the state also recruits teachers to design curriculum
and assessments.
Gaps between poor and non-poor students in the state are also
closing, Wright said, attributing the progress to confronting "a
culture of low expectations." She joked that other states with low
performance can no longer say "Thank God for Mississippi."
Among the 27 districts participating in NAEP’s Trial Urban District
Assessment, five school districts saw gains in 4th-grade math and
four saw gains at 8th grade. Hispanic students, who make up a
significant proportion of the enrollment in urban districts, also saw
gains at 4th grade.
In reading, the pattern at the state level was also reflected in
district results. Three districts saw declines in average scores at 4th
grade, and scores dropped in 11 districts at 8th grade. Only D.C.
students increased their performance at 8th grade, compared to
2017. The District of Columbia Public Schools has also been the
fastest-improving TUDA district over the history of the program,
Carr said.
Results worse than some predictions
Carr said that while NCES would be eager to examine the data to
better understand the results, the agency doesn't have "the
bandwidth." She urged researchers to look for reasons behind the
patterns in performance.

/
U.S. Secretary of Education Betsy DeVos called the results
"devastating" and used the release as a chance to promote her
school choice plan.
"By expanding education freedom, students can break out of the
one-size-fits all system and learn in the ways that will unlock their
full potential," she said in a statement. "They deserve it. Parents
demand it. And, it’s the only way to bring about the change our
country desperately needs."
Some experts predicted the scores would at least be stagnant. In an
Education Next article, Sandy Kress, a former education advisor in
the second Bush administration, said states have not made any
major changes under the Every Student Succeeds Act.
"I see no broad application of quality, research-based practices
proven to lift achievement," he wrote. "I see no alteration in
spending patterns to apply more dollars to activities or practices
proven to lift achievement. I see no meaningful, substantial, or
serious policies or practices that lead to a narrowing of
achievement gaps."
Michael Petrilli, president of the Thomas B. Fordham Institute,
said the recession is largely to blame, and Matthew Ladner, who
runs the choice-focused "RedefinED" blog, expected the teacher
strikes over the past year would have a negative effect.
“These strikes varied in length and breadth. Of course, we’ll never
know what the 2019 NAEP scores would have been if these strikes
had not occurred,” he wrote in the same article, but added “kids
learn more when they are in school than when they aren’t, and that
many schools adhere to ‘make up time’ rules in a half-hearted
fashion, if at all.”


