Embed Size (px)
Citation preview
obesity | VOLUME 16 NUMBER 11 | NOVEMBER 2008 2489
nature publishing group articlesepidemiology
Adiposity Measures and Oxidative Stress Among Police OfficersLuenda E. Charles1, Cecil M. Burchfiel1, John M. Violanti2, Desta Fekedulegn1, James E. Slaven1, Richard W. Browne2, Tara A. Hartley1 and Michael E. Andrew1
Our objective was to investigate associations between adiposity measures (BMI, waist circumference, waist-to-hip ratio, waist-to-height ratio, and abdominal height) and biomarkers of oxidative stress (glutathione (GSH), GSH peroxidase (GSH-Px), vitamin C, thiobarbituric acid reactive substances (TBARS), and trolox equivalent antioxidant capacity (TEAC)) among police officers. This cross-sectional study included randomly selected police officers (43 policewomen; 67 policemen) from Buffalo, New York. Adiposity measures were performed using standardized methods. Biomarkers were measured on fasting blood specimens. An oxidative stress score (OSS) was created as a composite of the biomarkers. ANOVAs were used to compare mean levels of biomarkers across tertiles of the adiposity measures. Officers were 26- to 61-years old. GSH was inversely associated with waist circumference (trend P = 0.030) and waist-to-hip ratio (trend P = 0.026). GSH-Px was inversely associated with BMI (trend P = 0.004) and with waist-to-height ratio (trend P = 0.017). No associations were observed for TEAC, TBARS, or OSS with any adiposity measure. Significant interactions were observed by physical activity status for GSH with waist circumference and waist-to-hip ratio and for vitamin C with waist circumference, waist-to-hip and waist-to-height ratios. The above associations were inversely related only among officers who reported engaging in physical activity. Inverse associations were observed for BMI and waist circumference with GSH, but only among women; the interaction with gender was significant. Larger indices of adiposity were associated with increased levels of oxidative stress and decreased levels of antioxidant defense.
Obesity (2008) 16, 2489–2497. doi:10.1038/oby.2008.395
introductionObesity is an epidemic in many industrialized and developing countries (1–6), and the groups with the highest BMI seem to be increasing at the fastest rates (3). In fact, unexpected find-ings have been reported for some developing countries indi-cating that the prevalence of overweight now exceeds that of underweight among women (6).
The association between obesity and various chronic dis-eases, including cardiovascular disease, is well documented in the scientific literature (7–9). Research scientists believe that oxidative stress and inflammation are biological mecha-nisms whereby obesity leads to cardiovascular disease and other chronic diseases (10–12). Oxidative stress is defined as an imbalance between the production and removal of reactive oxygen/nitrogen species (13,14). Measurement of thiobarbi-turic acid reactive substances (TBARS), even though nonspe-cific, is commonly used as an indicator of lipid peroxidation and oxidative stress (15). Trolox equivalent antioxidant capac-ity (TEAC) is a biomarker of the total antioxidant capacity of
peripheral blood plasma (16), and reduced antioxidant capacity can be an index of excessive oxidative stress. Glutathione (GSH) and vitamin C are antioxidants and, as such, they remove free radicals and suppress oxidative processes (14,17,18). GSH per-oxidase (GSH-Px) is an antioxidant enzyme which also plays an important role in counteracting oxidative stress by reducing hydrogen peroxide and alkyl hydroperoxides (18,19).
Prevalence of cardiovascular disease is at least as high in police officers as in the general population (20), yet there are few published studies that investigated the health of this occupa-tional cohort. The goal of this study was to investigate the cross-sectional association between several adiposity measures (BMI, waist circumference, waist-to-hip ratio, waist-to-height ratio, and abdominal height) and biomarkers of oxidative stress (GSH, GSH-Px, vitamin C, TBARS, TEAC) among police officers.
methods and proceduresData for this study were collected in 1999–2000 by the Center for Preventive Medicine, State University of New York (SUNY) at Buffalo,
1Biostatistics and Epidemiology Branch, Health Effects Laboratory Division, National Institute for Occupational Safety and Health, Centers for Disease Control and Prevention, Morgantown, West Virginia, USA; 2School of Public Health and Health Professions, Department of Social and Preventive Medicine, State University of New York at Buffalo, Buffalo, New York, USA. Correspondence: Luenda E. Charles ([email protected])
Received 6 February 2008; accepted 13 May 2008; published online 21 August 2008. doi:10.1038/oby.2008.395
2490 VOLUME 16 NUMBER 11 | NOVEMBER 2008 | www.obesityjournal.org
articlesepidemiology
School of Public Health and Health Professions, Buffalo, New York, using methods similar to those described in detail elsewhere (21). Informed consent was obtained from all participants, and this study was approved by the State University of New York at Buffalo’s Internal Review Board. During 1999–2000, a random sample of 115 police officers was selected from 934 officers employed by the Buffalo Police Department. All officers, including an oversample of women, agreed to participate in the study. Five officers who did not have information on several of the adiposity variables were excluded from the study resulting in a sample size of 110 officers (43 women and 67 men) ranging in age from 26 to 61 years.
assessment of oxidative stress biomarkersOfficers were instructed to fast for 12 h before blood collection. Analyses of five oxidative stress biomarkers (GSH, GSH-Px, vitamin C, TBARS, and TEAC) were performed on the blood specimens by research per-sonnel (R.W.B.) at the Center for Preventive Medicine, SUNY at Buffalo. Erythrocyte GSH was measured in whole blood with EDTA using the method by Browne and Armstrong after extraction and stabilization in meta-phosphoric acid within 1 h of phlebotomy (22). Clear supernatant was decanted and frozen at −76 °C. Results are expressed as milligrams of GSH per deciliter of packed red blood cells by applying the original whole blood hematocrit. GSH-Px was measured in heparinized plasma by enzyme kinetic assay on the Cobas Mira automated chemistry ana-lyzer using GSH reductase and NADPH (23). Measurements of vita-min C were performed on heparinized plasma by the 2,4-dinitrophenyl hydrazine method (24). Samples for analysis were stabilized by adding 0.5 ml heparin plasma to 2.0 ml 6% meta-phosphoric acid and cen-trifuging at 3,000g for 10 min. Clear supernatant was decanted and frozen at −76 °C. Sample pretreatment was carried out within 1 h of phlebotomy. TBARS were measured in EDTA plasma by a modification of the method of Armstrong and Browne and expressed in nmol/ml malondialdehyde equivalents (25). EDTA plasma was used to mea-sure TEAC by the method of Miller et al. and is expressed as a percent inhibition of the radical-generating reaction relative to the vitamin E analogue trolox (26).
assessment of adiposity measuresParticipants were weighed, and height was measured without shoes. BMI was calculated as weight in kilograms divided by height in meters squared. Although commonly used in epidemiologic studies, BMI is not the most ideal measure of obesity because larger muscle mass and body frame may influence this index. Therefore, other indices of adiposity such as waist circumference and abdominal height were included in this study. The waist and hip circumferences were measured with the participant standing and was taken (to the nearest 0.5 cm) after the person exhaled. Waist circumference divided by hip circumference and by height was expressed as waist-to-hip and waist-to-height ratios. Abdominal height was taken with the participant in a supine position. The participant was asked to gently inhale, exhale, and then relax at rest. A caliper was used to measure the midsection, one inch above the iliac crests. The caliper slightly touched, but did not compress, the abdomen. Three measurements of abdominal height (to the nearest 0.1 cm) were taken, and the average value was used as the participant’s abdominal height. All adiposity measures were categorized into tertiles to avoid very small sample sizes in certain groups. The tertiles of BMI were very similar to the cut points set by the World Health Organization of 18.50–24.99 kg/m2 (normal weight), ≥25.00 kg/m2 (overweight), and ≥30.00 kg/m2 (obese).
assessment of covariatesOfficers were given self- and interviewer-administered questionnaires to provide information on demographic characteristics, lifestyle behav-iors, and medical history. For educational status, they checked one of eight choices, from “<12 years of school” to “graduate degree.” These categories were collapsed into three levels to allow adequate numbers
in each category. Officers were asked how often they consumed alco-holic beverages with one drink defined as a 12-oz can or bottle of beer, one medium glass of wine, or one shot of liquor. The total number of drinks per month (of each type) was summed and then divided by 4 to give the approximate total number of drinks consumed per week. Officers reported their smoking status as current, former, or
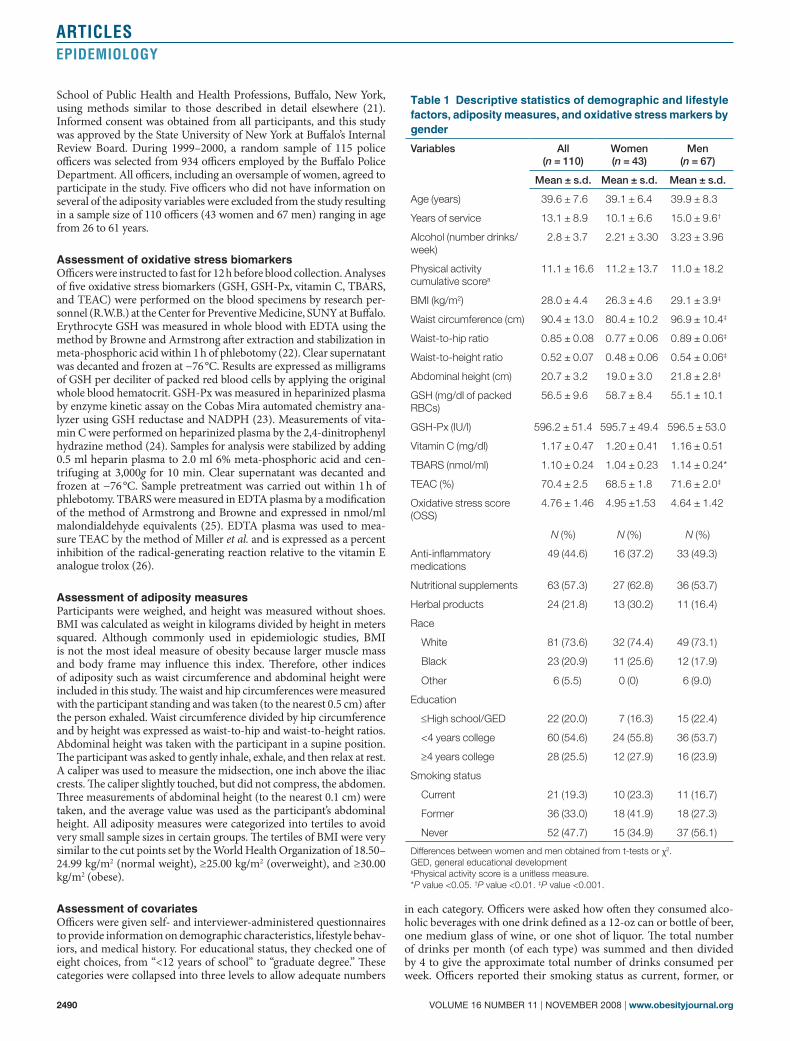
table 1 descriptive statistics of demographic and lifestyle factors, adiposity measures, and oxidative stress markers by gender
Variables All (n = 110)
Women (n = 43)
Men (n = 67)
Mean ± s.d. Mean ± s.d. Mean ± s.d.
Age (years) 39.6 ± 7.6 39.1 ± 6.4 39.9 ± 8.3
Years of service 13.1 ± 8.9 10.1 ± 6.6 15.0 ± 9.6†
Alcohol (number drinks/week)
2.8 ± 3.7 2.21 ± 3.30 3.23 ± 3.96
Physical activity cumulative scorea
11.1 ± 16.6 11.2 ± 13.7 11.0 ± 18.2
BMI (kg/m2) 28.0 ± 4.4 26.3 ± 4.6 29.1 ± 3.9‡
Waist circumference (cm) 90.4 ± 13.0 80.4 ± 10.2 96.9 ± 10.4‡
Waist-to-hip ratio 0.85 ± 0.08 0.77 ± 0.06 0.89 ± 0.06‡
Waist-to-height ratio 0.52 ± 0.07 0.48 ± 0.06 0.54 ± 0.06‡
Abdominal height (cm) 20.7 ± 3.2 19.0 ± 3.0 21.8 ± 2.8‡
GSH (mg/dl of packed RBCs)
56.5 ± 9.6 58.7 ± 8.4 55.1 ± 10.1
GSH-Px (IU/l) 596.2 ± 51.4 595.7 ± 49.4 596.5 ± 53.0
Vitamin C (mg/dl) 1.17 ± 0.47 1.20 ± 0.41 1.16 ± 0.51
TBARS (nmol/ml) 1.10 ± 0.24 1.04 ± 0.23 1.14 ± 0.24*
TEAC (%) 70.4 ± 2.5 68.5 ± 1.8 71.6 ± 2.0‡
Oxidative stress score (OSS)
4.76 ± 1.46 4.95 ±1.53 4.64 ± 1.42
N (%) N (%) N (%)
Anti-inflammatory medications
49 (44.6) 16 (37.2) 33 (49.3)
Nutritional supplements 63 (57.3) 27 (62.8) 36 (53.7)
Herbal products 24 (21.8) 13 (30.2) 11 (16.4)
Race
White 81 (73.6) 32 (74.4) 49 (73.1)
Black 23 (20.9) 11 (25.6) 12 (17.9)
Other 6 (5.5) 0 (0) 6 (9.0)
Education
≤High school/GED 22 (20.0) 7 (16.3) 15 (22.4)
<4 years college 60 (54.6) 24 (55.8) 36 (53.7)
≥4 years college 28 (25.5) 12 (27.9) 16 (23.9)
Smoking status
Current 21 (19.3) 10 (23.3) 11 (16.7)
Former 36 (33.0) 18 (41.9) 18 (27.3)
Never 52 (47.7) 15 (34.9) 37 (56.1)
Differences between women and men obtained from t-tests or χ2.GED, general educational developmentaPhysical activity score is a unitless measure.*P value <0.05. †P value <0.01. ‡P value <0.001.
obesity | VOLUME 16 NUMBER 11 | NOVEMBER 2008 2491
articlesepidemiology
never. Officers also reported the duration (hours per week, hours per weekend) and intensity (moderate, hard, very hard) of three types of physical activity (occupational, household, and sports) that they had engaged in during the previous 7 days. These data were used to create a total physical activity score that was computed by summing the three types (i.e., occupational, household, and sports) of physical activity performed during the weekday and the weekend, then multiplying by 1 for moderate, 2 for hard, and 3 for very hard intensity. Physical activ-ity scores were dichotomized as none vs. some physical activity, with scores above zero being classified as engaging in any level of physical activity. Officers were asked to bring in all medications (prescription and nonprescription), supplements, and herbs that they had taken within the past 30 days. Each medication/supplement was given a number. After identifying which medications were anti-inflammatory (through textbooks or use of Wikipedia) and which were vitamins/nutritional supplements or herbal products, we used SAS to create a variable for each product. If the officer had taken a vitamin, the vari-able was coded as 1 (i.e., used), otherwise it was coded as 0 (i.e., not used). The three variables were coded as used (1) or not used (0).
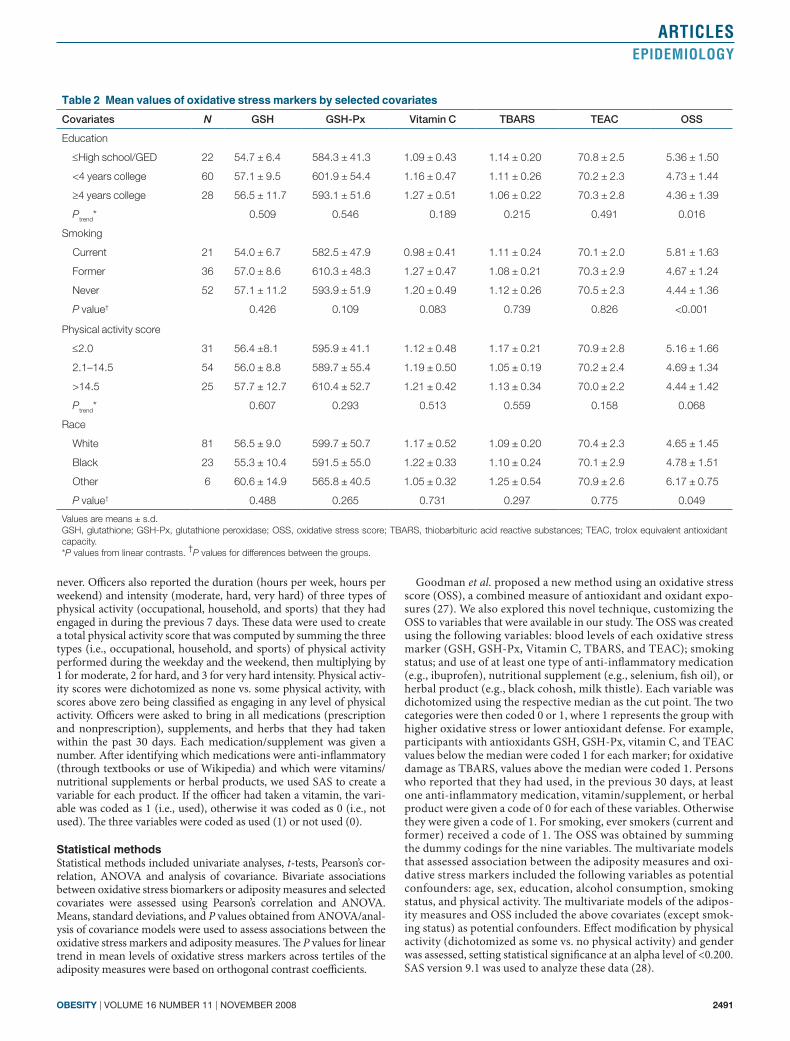
statistical methodsStatistical methods included univariate analyses, t-tests, Pearson’s cor-relation, ANOVA and analysis of covariance. Bivariate associations between oxidative stress biomarkers or adiposity measures and selected covariates were assessed using Pearson’s correlation and ANOVA. Means, standard deviations, and P values obtained from ANOVA/anal-ysis of covariance models were used to assess associations between the oxidative stress markers and adiposity measures. The P values for linear trend in mean levels of oxidative stress markers across tertiles of the adiposity measures were based on orthogonal contrast coefficients.
Goodman et al. proposed a new method using an oxidative stress score (OSS), a combined measure of antioxidant and oxidant expo-sures (27). We also explored this novel technique, customizing the OSS to variables that were available in our study. The OSS was created using the following variables: blood levels of each oxidative stress marker (GSH, GSH-Px, Vitamin C, TBARS, and TEAC); smoking status; and use of at least one type of anti-inflammatory medication (e.g., ibuprofen), nutritional supplement (e.g., selenium, fish oil), or herbal product (e.g., black cohosh, milk thistle). Each variable was dichotomized using the respective median as the cut point. The two categories were then coded 0 or 1, where 1 represents the group with higher oxidative stress or lower antioxidant defense. For example, participants with antioxidants GSH, GSH-Px, vitamin C, and TEAC values below the median were coded 1 for each marker; for oxidative damage as TBARS, values above the median were coded 1. Persons who reported that they had used, in the previous 30 days, at least one anti-inflammatory medication, vitamin/supplement, or herbal product were given a code of 0 for each of these variables. Otherwise they were given a code of 1. For smoking, ever smokers (current and former) received a code of 1. The OSS was obtained by summing the dummy codings for the nine variables. The multivariate models that assessed association between the adiposity measures and oxi-dative stress markers included the following variables as potential confounders: age, sex, education, alcohol consumption, smoking status, and physical activity. The multivariate models of the adipos-ity measures and OSS included the above covariates (except smok-ing status) as potential confounders. Effect modification by physical activity (dichotomized as some vs. no physical activity) and gender was assessed, setting statistical significance at an alpha level of <0.200. SAS version 9.1 was used to analyze these data (28).
table 2 mean values of oxidative stress markers by selected covariates
Covariates N GSH GSH-Px Vitamin C TBARS TEAC OSS
Education
≤High school/GED 22 54.7 ± 6.4 584.3 ± 41.3 1.09 ± 0.43 1.14 ± 0.20 70.8 ± 2.5 5.36 ± 1.50
<4 years college 60 57.1 ± 9.5 601.9 ± 54.4 1.16 ± 0.47 1.11 ± 0.26 70.2 ± 2.3 4.73 ± 1.44
≥4 years college 28 56.5 ± 11.7 593.1 ± 51.6 1.27 ± 0.51 1.06 ± 0.22 70.3 ± 2.8 4.36 ± 1.39
Ptrend* 0.509 0.546 0.189 0.215 0.491 0.016
Smoking
Current 21 54.0 ± 6.7 582.5 ± 47.9 0.98 ± 0.41 1.11 ± 0.24 70.1 ± 2.0 5.81 ± 1.63
Former 36 57.0 ± 8.6 610.3 ± 48.3 1.27 ± 0.47 1.08 ± 0.21 70.3 ± 2.9 4.67 ± 1.24
Never 52 57.1 ± 11.2 593.9 ± 51.9 1.20 ± 0.49 1.12 ± 0.26 70.5 ± 2.3 4.44 ± 1.36
P value† 0.426 0.109 0.083 0.739 0.826 <0.001
Physical activity score
≤2.0 31 56.4 ±8.1 595.9 ± 41.1 1.12 ± 0.48 1.17 ± 0.21 70.9 ± 2.8 5.16 ± 1.66
2.1–14.5 54 56.0 ± 8.8 589.7 ± 55.4 1.19 ± 0.50 1.05 ± 0.19 70.2 ± 2.4 4.69 ± 1.34
>14.5 25 57.7 ± 12.7 610.4 ± 52.7 1.21 ± 0.42 1.13 ± 0.34 70.0 ± 2.2 4.44 ± 1.42
Ptrend* 0.607 0.293 0.513 0.559 0.158 0.068
Race
White 81 56.5 ± 9.0 599.7 ± 50.7 1.17 ± 0.52 1.09 ± 0.20 70.4 ± 2.3 4.65 ± 1.45
Black 23 55.3 ± 10.4 591.5 ± 55.0 1.22 ± 0.33 1.10 ± 0.24 70.1 ± 2.9 4.78 ± 1.51
Other 6 60.6 ± 14.9 565.8 ± 40.5 1.05 ± 0.32 1.25 ± 0.54 70.9 ± 2.6 6.17 ± 0.75
P value† 0.488 0.265 0.731 0.297 0.775 0.049
Values are means ± s.d.GSH, glutathione; GSH-Px, glutathione peroxidase; OSS, oxidative stress score; TBARS, thiobarbituric acid reactive substances; TEAC, trolox equivalent antioxidant capacity.*P values from linear contrasts. †P values for differences between the groups.
2492 VOLUME 16 NUMBER 11 | NOVEMBER 2008 | www.obesityjournal.org
articlesepidemiology
The biomarkers showed no statistically significant correlations except for the positive correlation between TBARS and TEAC (r = 0.2155; P = 0.024) and the negative correlation between TEAC and GSH (r = −0.1979; P = 0.039).
Among all officers, mean levels of OSS decreased as edu-cational level increased, P for trend = 0.016 (Table 2). Also, current smokers had a significantly higher mean level of OSS (5.81 ± 1.63) compared with former (4.67 ± 1.24) and never smokers (4.44 ± 1.36; P < 0.001). As educational level increased, mean levels of vitamin C increased and mean levels of TBARS decreased monotonically, although the trends were not statisti-cally significant. After stratification by gender, the associations for education and smoking status with these oxidative stress markers were statistically significant among women only (data not shown). None of the oxidative stress markers was signifi-cantly associated with education or smoking among men. In addition, black women had consistently higher mean adiposity
resuLtsThe study sample included 43 policewomen and 67 policemen with a mean age of ~40 years (Table 1). The majority of partici-pants were white (73.6%) and had received some college edu-cation (80%). Of these officers, 19% percent reported that they were current smokers. The t-test analyses showed that mean levels of all five adiposity measures were significantly higher in men than in women. Women and men had similar levels of GSH, GSH-Px, vitamin C, and OSS, but men had significantly higher levels of TBARS (1.14 ± 0.24 vs. 1.04 ± 0.23; P = 0.028) and TEAC (71.6 ± 2.0 vs. 68.5 ± 1.8; P <0.0001) than women. Among women, strong negative correlations (all P < 0.05) were observed for GSH with BMI (r = −0.3908), waist circumfer-ence (r = −0.4716), waist-to-hip ratio (−0.3723), waist-to-height ratio (−0.4967), and abdominal height (r = −0.3088) (data not shown). Among men, BMI was negatively associ-ated with GSH-Px (r = −0.2615; P < 0.05) (data not shown).
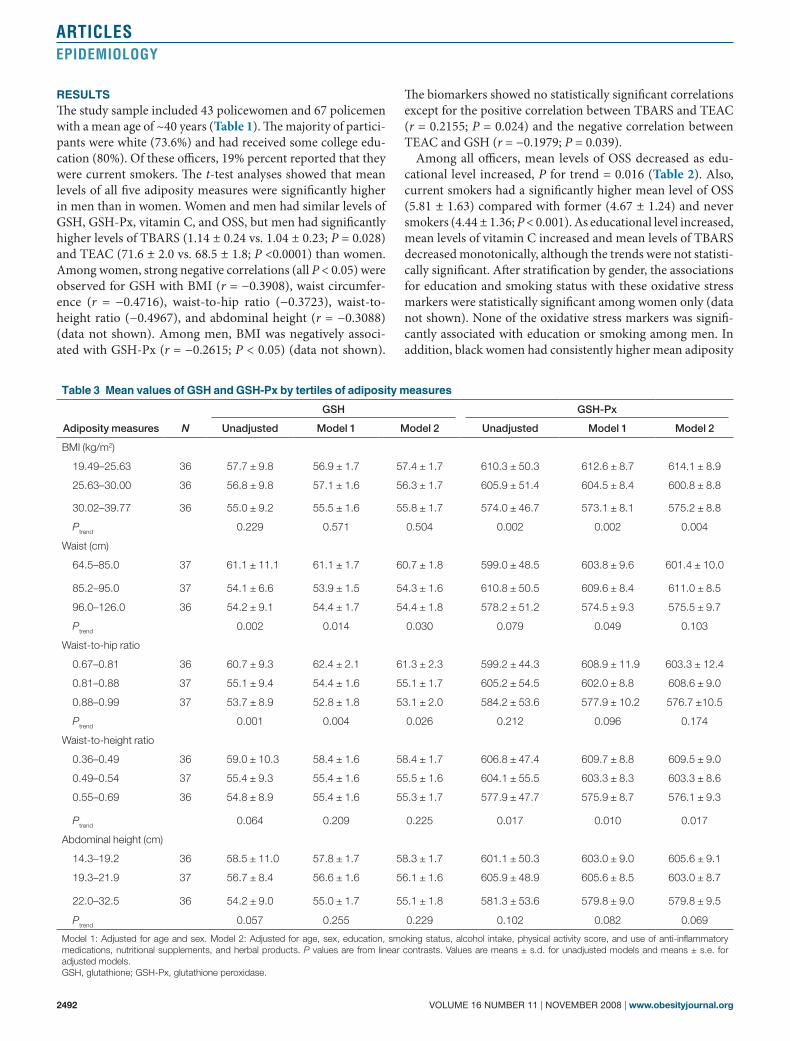
table 3 mean values of Gsh and Gsh-px by tertiles of adiposity measures
Adiposity measures N
GSH GSH-Px
Unadjusted Model 1 Model 2 Unadjusted Model 1 Model 2
BMI (kg/m2)
19.49–25.63 36 57.7 ± 9.8 56.9 ± 1.7 57.4 ± 1.7 610.3 ± 50.3 612.6 ± 8.7 614.1 ± 8.9
25.63–30.00 36 56.8 ± 9.8 57.1 ± 1.6 56.3 ± 1.7 605.9 ± 51.4 604.5 ± 8.4 600.8 ± 8.8
30.02–39.77 36 55.0 ± 9.2 55.5 ± 1.6 55.8 ± 1.7 574.0 ± 46.7 573.1 ± 8.1 575.2 ± 8.8
Ptrend 0.229 0.571 0.504 0.002 0.002 0.004
Waist (cm)
64.5–85.0 37 61.1 ± 11.1 61.1 ± 1.7 60.7 ± 1.8 599.0 ± 48.5 603.8 ± 9.6 601.4 ± 10.0
85.2–95.0 37 54.1 ± 6.6 53.9 ± 1.5 54.3 ± 1.6 610.8 ± 50.5 609.6 ± 8.4 611.0 ± 8.5
96.0–126.0 36 54.2 ± 9.1 54.4 ± 1.7 54.4 ± 1.8 578.2 ± 51.2 574.5 ± 9.3 575.5 ± 9.7
Ptrend 0.002 0.014 0.030 0.079 0.049 0.103
Waist-to-hip ratio
0.67–0.81 36 60.7 ± 9.3 62.4 ± 2.1 61.3 ± 2.3 599.2 ± 44.3 608.9 ± 11.9 603.3 ± 12.4
0.81–0.88 37 55.1 ± 9.4 54.4 ± 1.6 55.1 ± 1.7 605.2 ± 54.5 602.0 ± 8.8 608.6 ± 9.0
0.88–0.99 37 53.7 ± 8.9 52.8 ± 1.8 53.1 ± 2.0 584.2 ± 53.6 577.9 ± 10.2 576.7 ±10.5
Ptrend 0.001 0.004 0.026 0.212 0.096 0.174
Waist-to-height ratio
0.36–0.49 36 59.0 ± 10.3 58.4 ± 1.6 58.4 ± 1.7 606.8 ± 47.4 609.7 ± 8.8 609.5 ± 9.0
0.49–0.54 37 55.4 ± 9.3 55.4 ± 1.6 55.5 ± 1.6 604.1 ± 55.5 603.3 ± 8.3 603.3 ± 8.6
0.55–0.69 36 54.8 ± 8.9 55.4 ± 1.6 55.3 ± 1.7 577.9 ± 47.7 575.9 ± 8.7 576.1 ± 9.3
Ptrend 0.064 0.209 0.225 0.017 0.010 0.017
Abdominal height (cm)
14.3–19.2 36 58.5 ± 11.0 57.8 ± 1.7 58.3 ± 1.7 601.1 ± 50.3 603.0 ± 9.0 605.6 ± 9.1
19.3–21.9 37 56.7 ± 8.4 56.6 ± 1.6 56.1 ± 1.6 605.9 ± 48.9 605.6 ± 8.5 603.0 ± 8.7
22.0–32.5 36 54.2 ± 9.0 55.0 ± 1.7 55.1 ± 1.8 581.3 ± 53.6 579.8 ± 9.0 579.8 ± 9.5
Ptrend 0.057 0.255 0.229 0.102 0.082 0.069
Model 1: Adjusted for age and sex. Model 2: Adjusted for age, sex, education, smoking status, alcohol intake, physical activity score, and use of anti-inflammatory medications, nutritional supplements, and herbal products. P values are from linear contrasts. Values are means ± s.d. for unadjusted models and means ± s.e. for adjusted models.GSH, glutathione; GSH-Px, glutathione peroxidase.
obesity | VOLUME 16 NUMBER 11 | NOVEMBER 2008 2493
articlesepidemiology
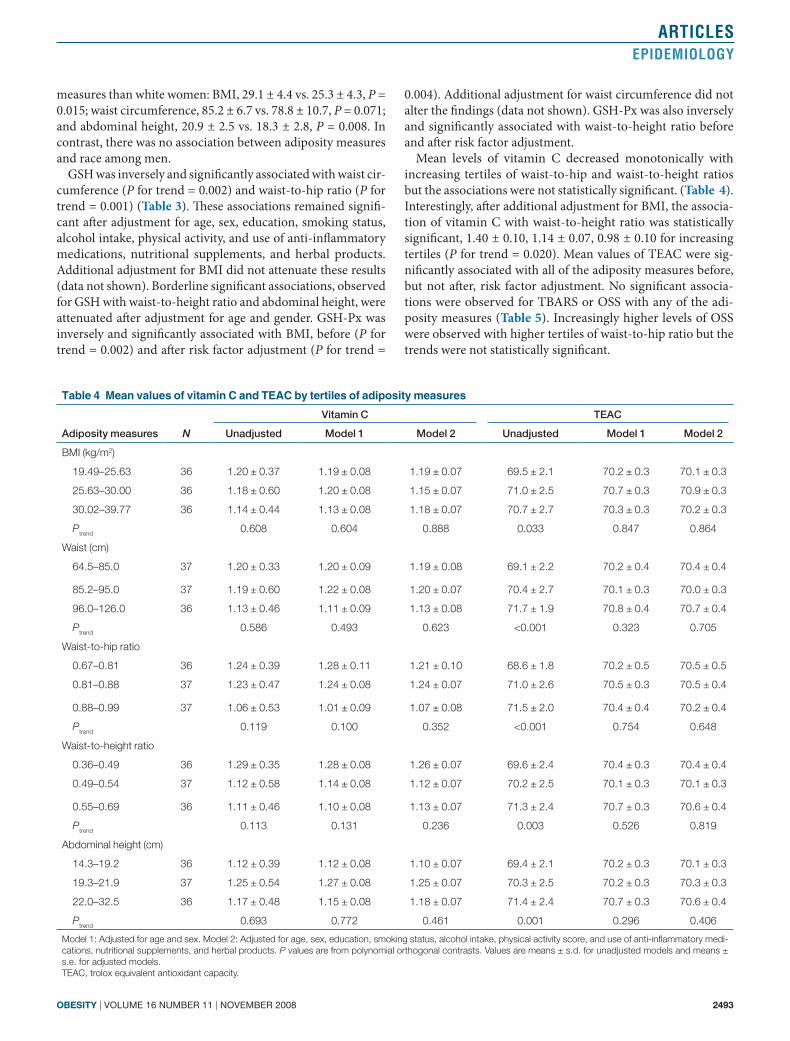
0.004). Additional adjustment for waist circumference did not alter the findings (data not shown). GSH-Px was also inversely and significantly associated with waist-to-height ratio before and after risk factor adjustment.
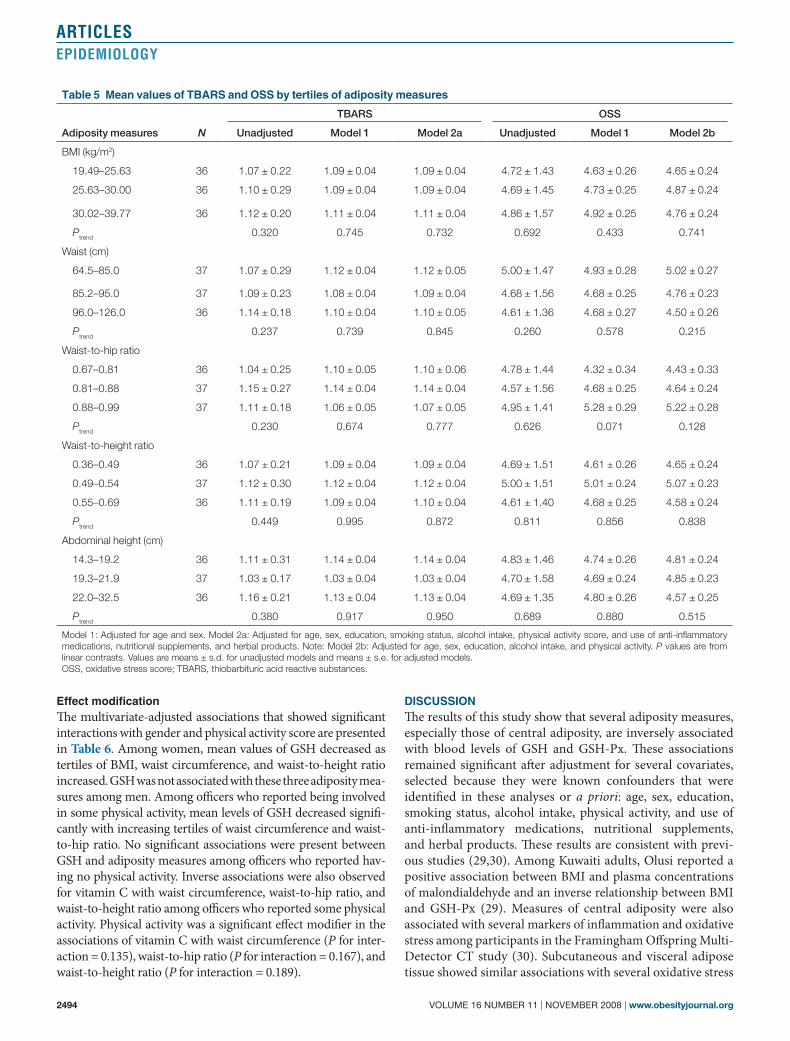
Mean levels of vitamin C decreased monotonically with increasing tertiles of waist-to-hip and waist-to-height ratios but the associations were not statistically significant. (Table 4). Interestingly, after additional adjustment for BMI, the associa-tion of vitamin C with waist-to-height ratio was statistically significant, 1.40 ± 0.10, 1.14 ± 0.07, 0.98 ± 0.10 for increasing tertiles (P for trend = 0.020). Mean values of TEAC were sig-nificantly associated with all of the adiposity measures before, but not after, risk factor adjustment. No significant associa-tions were observed for TBARS or OSS with any of the adi-posity measures (Table 5). Increasingly higher levels of OSS were observed with higher tertiles of waist-to-hip ratio but the trends were not statistically significant.
measures than white women: BMI, 29.1 ± 4.4 vs. 25.3 ± 4.3, P = 0.015; waist circumference, 85.2 ± 6.7 vs. 78.8 ± 10.7, P = 0.071; and abdominal height, 20.9 ± 2.5 vs. 18.3 ± 2.8, P = 0.008. In contrast, there was no association between adiposity measures and race among men.
GSH was inversely and significantly associated with waist cir-cumference (P for trend = 0.002) and waist-to-hip ratio (P for trend = 0.001) (Table 3). These associations remained signifi-cant after adjustment for age, sex, education, smoking status, alcohol intake, physical activity, and use of anti-inflammatory medications, nutritional supplements, and herbal products. Additional adjustment for BMI did not attenuate these results (data not shown). Borderline significant associations, observed for GSH with waist-to-height ratio and abdominal height, were attenuated after adjustment for age and gender. GSH-Px was inversely and significantly associated with BMI, before (P for trend = 0.002) and after risk factor adjustment (P for trend =
table 4 mean values of vitamin c and teac by tertiles of adiposity measures
Adiposity measures N
Vitamin C TEAC
Unadjusted Model 1 Model 2 Unadjusted Model 1 Model 2
BMI (kg/m2)
19.49–25.63 36 1.20 ± 0.37 1.19 ± 0.08 1.19 ± 0.07 69.5 ± 2.1 70.2 ± 0.3 70.1 ± 0.3
25.63–30.00 36 1.18 ± 0.60 1.20 ± 0.08 1.15 ± 0.07 71.0 ± 2.5 70.7 ± 0.3 70.9 ± 0.3
30.02–39.77 36 1.14 ± 0.44 1.13 ± 0.08 1.18 ± 0.07 70.7 ± 2.7 70.3 ± 0.3 70.2 ± 0.3
Ptrend 0.608 0.604 0.888 0.033 0.847 0.864
Waist (cm)
64.5–85.0 37 1.20 ± 0.33 1.20 ± 0.09 1.19 ± 0.08 69.1 ± 2.2 70.2 ± 0.4 70.4 ± 0.4
85.2–95.0 37 1.19 ± 0.60 1.22 ± 0.08 1.20 ± 0.07 70.4 ± 2.7 70.1 ± 0.3 70.0 ± 0.3
96.0–126.0 36 1.13 ± 0.46 1.11 ± 0.09 1.13 ± 0.08 71.7 ± 1.9 70.8 ± 0.4 70.7 ± 0.4
Ptrend 0.586 0.493 0.623 <0.001 0.323 0.705
Waist-to-hip ratio
0.67–0.81 36 1.24 ± 0.39 1.28 ± 0.11 1.21 ± 0.10 68.6 ± 1.8 70.2 ± 0.5 70.5 ± 0.5
0.81–0.88 37 1.23 ± 0.47 1.24 ± 0.08 1.24 ± 0.07 71.0 ± 2.6 70.5 ± 0.3 70.5 ± 0.4
0.88–0.99 37 1.06 ± 0.53 1.01 ± 0.09 1.07 ± 0.08 71.5 ± 2.0 70.4 ± 0.4 70.2 ± 0.4
Ptrend 0.119 0.100 0.352 <0.001 0.754 0.648
Waist-to-height ratio
0.36–0.49 36 1.29 ± 0.35 1.28 ± 0.08 1.26 ± 0.07 69.6 ± 2.4 70.4 ± 0.3 70.4 ± 0.4
0.49–0.54 37 1.12 ± 0.58 1.14 ± 0.08 1.12 ± 0.07 70.2 ± 2.5 70.1 ± 0.3 70.1 ± 0.3
0.55–0.69 36 1.11 ± 0.46 1.10 ± 0.08 1.13 ± 0.07 71.3 ± 2.4 70.7 ± 0.3 70.6 ± 0.4
Ptrend 0.113 0.131 0.236 0.003 0.526 0.819
Abdominal height (cm)
14.3–19.2 36 1.12 ± 0.39 1.12 ± 0.08 1.10 ± 0.07 69.4 ± 2.1 70.2 ± 0.3 70.1 ± 0.3
19.3–21.9 37 1.25 ± 0.54 1.27 ± 0.08 1.25 ± 0.07 70.3 ± 2.5 70.2 ± 0.3 70.3 ± 0.3
22.0–32.5 36 1.17 ± 0.48 1.15 ± 0.08 1.18 ± 0.07 71.4 ± 2.4 70.7 ± 0.3 70.6 ± 0.4
Ptrend 0.693 0.772 0.461 0.001 0.296 0.406
Model 1: Adjusted for age and sex. Model 2: Adjusted for age, sex, education, smoking status, alcohol intake, physical activity score, and use of anti-inflammatory medi-cations, nutritional supplements, and herbal products. P values are from polynomial orthogonal contrasts. Values are means ± s.d. for unadjusted models and means ± s.e. for adjusted models.TEAC, trolox equivalent antioxidant capacity.
2494 VOLUME 16 NUMBER 11 | NOVEMBER 2008 | www.obesityjournal.org
articlesepidemiology
discussionThe results of this study show that several adiposity measures, especially those of central adiposity, are inversely associated with blood levels of GSH and GSH-Px. These associations remained significant after adjustment for several covariates, selected because they were known confounders that were identified in these analyses or a priori: age, sex, education, smoking status, alcohol intake, physical activity, and use of anti- inflammatory medications, nutritional supplements, and herbal products. These results are consistent with previ-ous studies (29,30). Among Kuwaiti adults, Olusi reported a positive association between BMI and plasma concentrations of malondialdehyde and an inverse relationship between BMI and GSH-Px (29). Measures of central adiposity were also associated with several markers of inflammation and oxidative stress among participants in the Framingham Offspring Multi-Detector CT study (30). Subcutaneous and visceral adipose tissue showed similar associations with several oxidative stress
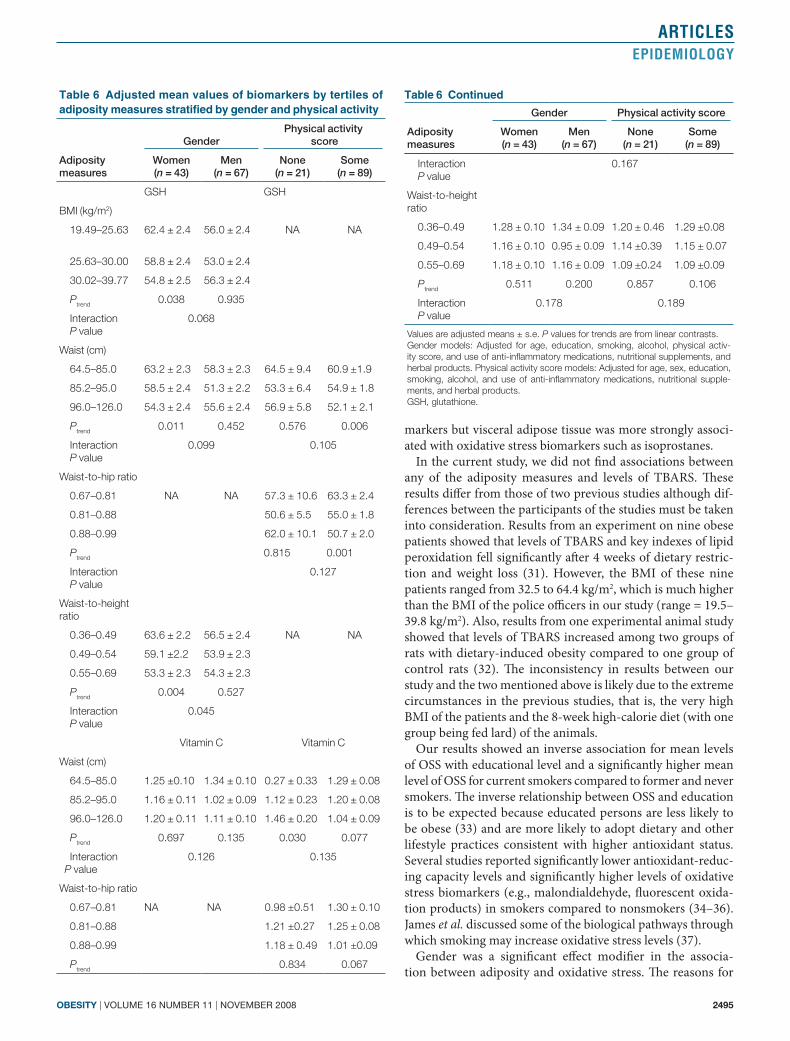
effect modificationThe multivariate-adjusted associations that showed significant interactions with gender and physical activity score are presented in Table 6. Among women, mean values of GSH decreased as tertiles of BMI, waist circumference, and waist-to-height ratio increased. GSH was not associated with these three adiposity mea-sures among men. Among officers who reported being involved in some physical activity, mean levels of GSH decreased signifi-cantly with increasing tertiles of waist circumference and waist-to-hip ratio. No significant associations were present between GSH and adiposity measures among officers who reported hav-ing no physical activity. Inverse associations were also observed for vitamin C with waist circumference, waist-to-hip ratio, and waist-to-height ratio among officers who reported some physical activity. Physical activity was a significant effect modifier in the associations of vitamin C with waist circumference (P for inter-action = 0.135), waist-to-hip ratio (P for interaction = 0.167), and waist-to-height ratio (P for interaction = 0.189).
table 5 mean values of tBars and oss by tertiles of adiposity measures
Adiposity measures N
TBARS OSS
Unadjusted Model 1 Model 2a Unadjusted Model 1 Model 2b
BMI (kg/m2)
19.49–25.63 36 1.07 ± 0.22 1.09 ± 0.04 1.09 ± 0.04 4.72 ± 1.43 4.63 ± 0.26 4.65 ± 0.24
25.63–30.00 36 1.10 ± 0.29 1.09 ± 0.04 1.09 ± 0.04 4.69 ± 1.45 4.73 ± 0.25 4.87 ± 0.24
30.02–39.77 36 1.12 ± 0.20 1.11 ± 0.04 1.11 ± 0.04 4.86 ± 1.57 4.92 ± 0.25 4.76 ± 0.24
Ptrend 0.320 0.745 0.732 0.692 0.433 0.741
Waist (cm)
64.5–85.0 37 1.07 ± 0.29 1.12 ± 0.04 1.12 ± 0.05 5.00 ± 1.47 4.93 ± 0.28 5.02 ± 0.27
85.2–95.0 37 1.09 ± 0.23 1.08 ± 0.04 1.09 ± 0.04 4.68 ± 1.56 4.68 ± 0.25 4.76 ± 0.23
96.0–126.0 36 1.14 ± 0.18 1.10 ± 0.04 1.10 ± 0.05 4.61 ± 1.36 4.68 ± 0.27 4.50 ± 0.26
Ptrend 0.237 0.739 0.845 0.260 0.578 0.215
Waist-to-hip ratio
0.67–0.81 36 1.04 ± 0.25 1.10 ± 0.05 1.10 ± 0.06 4.78 ± 1.44 4.32 ± 0.34 4.43 ± 0.33
0.81–0.88 37 1.15 ± 0.27 1.14 ± 0.04 1.14 ± 0.04 4.57 ± 1.56 4.68 ± 0.25 4.64 ± 0.24
0.88–0.99 37 1.11 ± 0.18 1.06 ± 0.05 1.07 ± 0.05 4.95 ± 1.41 5.28 ± 0.29 5.22 ± 0.28
Ptrend 0.230 0.674 0.777 0.626 0.071 0.128
Waist-to-height ratio
0.36–0.49 36 1.07 ± 0.21 1.09 ± 0.04 1.09 ± 0.04 4.69 ± 1.51 4.61 ± 0.26 4.65 ± 0.24
0.49–0.54 37 1.12 ± 0.30 1.12 ± 0.04 1.12 ± 0.04 5.00 ± 1.51 5.01 ± 0.24 5.07 ± 0.23
0.55–0.69 36 1.11 ± 0.19 1.09 ± 0.04 1.10 ± 0.04 4.61 ± 1.40 4.68 ± 0.25 4.58 ± 0.24
Ptrend 0.449 0.995 0.872 0.811 0.856 0.838
Abdominal height (cm)
14.3–19.2 36 1.11 ± 0.31 1.14 ± 0.04 1.14 ± 0.04 4.83 ± 1.46 4.74 ± 0.26 4.81 ± 0.24
19.3–21.9 37 1.03 ± 0.17 1.03 ± 0.04 1.03 ± 0.04 4.70 ± 1.58 4.69 ± 0.24 4.85 ± 0.23
22.0–32.5 36 1.16 ± 0.21 1.13 ± 0.04 1.13 ± 0.04 4.69 ± 1.35 4.80 ± 0.26 4.57 ± 0.25
Ptrend 0.380 0.917 0.950 0.689 0.880 0.515
Model 1: Adjusted for age and sex. Model 2a: Adjusted for age, sex, education, smoking status, alcohol intake, physical activity score, and use of anti-inflammatory medications, nutritional supplements, and herbal products. Note: Model 2b: Adjusted for age, sex, education, alcohol intake, and physical activity. P values are from linear contrasts. Values are means ± s.d. for unadjusted models and means ± s.e. for adjusted models.OSS, oxidative stress score; TBARS, thiobarbituric acid reactive substances.
obesity | VOLUME 16 NUMBER 11 | NOVEMBER 2008 2495
articlesepidemiology
markers but visceral adipose tissue was more strongly associ-ated with oxidative stress biomarkers such as isoprostanes.
In the current study, we did not find associations between any of the adiposity measures and levels of TBARS. These results differ from those of two previous studies although dif-ferences between the participants of the studies must be taken into consideration. Results from an experiment on nine obese patients showed that levels of TBARS and key indexes of lipid peroxidation fell significantly after 4 weeks of dietary restric-tion and weight loss (31). However, the BMI of these nine patients ranged from 32.5 to 64.4 kg/m2, which is much higher than the BMI of the police officers in our study (range = 19.5–39.8 kg/m2). Also, results from one experimental animal study showed that levels of TBARS increased among two groups of rats with dietary-induced obesity compared to one group of control rats (32). The inconsistency in results between our study and the two mentioned above is likely due to the extreme circumstances in the previous studies, that is, the very high BMI of the patients and the 8-week high-calorie diet (with one group being fed lard) of the animals.
Our results showed an inverse association for mean levels of OSS with educational level and a significantly higher mean level of OSS for current smokers compared to former and never smokers. The inverse relationship between OSS and education is to be expected because educated persons are less likely to be obese (33) and are more likely to adopt dietary and other lifestyle practices consistent with higher antioxidant status. Several studies reported significantly lower antioxidant-reduc-ing capacity levels and significantly higher levels of oxidative stress biomarkers (e.g., malondialdehyde, fluorescent oxida-tion products) in smokers compared to nonsmokers (34–36). James et al. discussed some of the biological pathways through which smoking may increase oxidative stress levels (37).
Gender was a significant effect modifier in the associa-tion between adiposity and oxidative stress. The reasons for
table 6 adjusted mean values of biomarkers by tertiles of adiposity measures stratified by gender and physical activity
Adiposity measures
GenderPhysical activity
score
Women (n = 43)
Men (n = 67)
None (n = 21)
Some (n = 89)
GSH GSH
BMI (kg/m2)
19.49–25.63 62.4 ± 2.4 56.0 ± 2.4 NA NA
25.63–30.00 58.8 ± 2.4 53.0 ± 2.4
30.02–39.77 54.8 ± 2.5 56.3 ± 2.4
Ptrend 0.038 0.935
Interaction P value
0.068
Waist (cm)
64.5–85.0 63.2 ± 2.3 58.3 ± 2.3 64.5 ± 9.4 60.9 ±1.9
85.2–95.0 58.5 ± 2.4 51.3 ± 2.2 53.3 ± 6.4 54.9 ± 1.8
96.0–126.0 54.3 ± 2.4 55.6 ± 2.4 56.9 ± 5.8 52.1 ± 2.1
Ptrend 0.011 0.452 0.576 0.006
Interaction P value
0.099 0.105
Waist-to-hip ratio
0.67–0.81 NA NA 57.3 ± 10.6 63.3 ± 2.4
0.81–0.88 50.6 ± 5.5 55.0 ± 1.8
0.88–0.99 62.0 ± 10.1 50.7 ± 2.0
Ptrend 0.815 0.001
Interaction P value
0.127
Waist-to-height ratio
0.36–0.49 63.6 ± 2.2 56.5 ± 2.4 NA NA
0.49–0.54 59.1 ±2.2 53.9 ± 2.3
0.55–0.69 53.3 ± 2.3 54.3 ± 2.3
Ptrend 0.004 0.527
Interaction P value
0.045
Vitamin C Vitamin C
Waist (cm)
64.5–85.0 1.25 ±0.10 1.34 ± 0.10 0.27 ± 0.33 1.29 ± 0.08
85.2–95.0 1.16 ± 0.11 1.02 ± 0.09 1.12 ± 0.23 1.20 ± 0.08
96.0–126.0 1.20 ± 0.11 1.11 ± 0.10 1.46 ± 0.20 1.04 ± 0.09
Ptrend 0.697 0.135 0.030 0.077
Interaction P value
0.126 0.135
Waist-to-hip ratio
0.67–0.81 NA NA 0.98 ±0.51 1.30 ± 0.10
0.81–0.88 1.21 ±0.27 1.25 ± 0.08
0.88–0.99 1.18 ± 0.49 1.01 ±0.09
Ptrend 0.834 0.067
Interaction P value
0.167
Waist-to-height ratio
0.36–0.49 1.28 ± 0.10 1.34 ± 0.09 1.20 ± 0.46 1.29 ±0.08
0.49–0.54 1.16 ± 0.10 0.95 ± 0.09 1.14 ±0.39 1.15 ± 0.07
0.55–0.69 1.18 ± 0.10 1.16 ± 0.09 1.09 ±0.24 1.09 ±0.09
Ptrend 0.511 0.200 0.857 0.106
Interaction P value
0.178 0.189
Values are adjusted means ± s.e. P values for trends are from linear contrasts.Gender models: Adjusted for age, education, smoking, alcohol, physical activ-ity score, and use of anti-inflammatory medications, nutritional supplements, and herbal products. Physical activity score models: Adjusted for age, sex, education, smoking, alcohol, and use of anti-inflammatory medications, nutritional supple-ments, and herbal products. GSH, glutathione.
table 6 continued
Adiposity measures
Gender Physical activity score
Women (n = 43)
Men (n = 67)
None (n = 21)
Some (n = 89)
2496 VOLUME 16 NUMBER 11 | NOVEMBER 2008 | www.obesityjournal.org
articlesepidemiology
waist-to-height ratios in this study was necessary to account for height and hip size. This standardization also served to attenuate the effect of normal phenotypic differences between men and women. In addition, we had precise and standardized measurements of the oxidative stress markers. We controlled for several important confounding factors and examined potential effect modification. We adjusted for education as a surrogate for socioeconomic status–related markers because socioeconomic status is associated with several lifestyle behav-iors (such as antioxidant intake) that affect both adiposity sta-tus and oxidative stress (42). A unique strength of our study was the incorporation of a summary variable of oxidative stress status (27), which included the antioxidants, TBARS, and use of supplements, herbs, and anti-inflammatory medications, which could influence the oxidant/antioxidant system. Finally, even though this study was conducted among police officers, these results may be generalizable to persons in many other settings.
In summary, the results of this study show that adiposity is significantly associated with several markers of oxidative stress and lower antioxidant defense. For future investigations on the association between adiposity and oxidative stress, use of larger sample sizes, prospective study designs, and additional biomarkers of lipid peroxidation such as isoprostanes would enhance the findings.
acknowLedGmentsThe findings and conclusions in this article are those of the authors and do not necessarily represent the views of the National Institute for Occupational Safety and Health.
discLosureThe authors declared no conflict of interest.
© 2008 The Obesity Society
reFerences1. Gregg EW, Cheng YJ, Cadwell BL et al. Secular trends in cardiovascular
disease risk factors according to body mass index in US adults. JAMA 2005;293:1868–1874.
2. Ogden CL, Carroll MD, Curtin LR et al. Prevalence of overweight and obesity in the United States, 1999–2004. JAMA 2006;295:1549–1555.
3. Sturm R. Increases in morbid obesity in the USA: 2000–2005. Public Health 2007;121:492–496.
4. Chhatwal J, Verma M, Riar SK. Obesity among pre-adolescent and adolescents of a developing country (India). Asia Pac J Clin Nutr 2004;13:231–235.
5. Cassels S. Overweight in the Pacific: links between foreign dependence, global food trade, and obesity in the Federated States of Micronesia. Global Health 2006;2:10.
6. Mendez MA, Monteiro CA, Popkin BM. Overweight exceeds underweight among women in most developing countries. Am J Clin Nutr 2005;81:714–721.
7. Dennis KE. Postmenopausal women and the health consequences of obesity. J Obstet Gynecol Neonatal Nurs 2007;36:511–517.
8. Jiang Y, Chen Y, Manuel D et al. Quantifying the impact of obesity category on major chronic diseases in Canada. Scientific World J 2007;17:1211–1221.
9. Van Meerhaeghe A, Andre S, Gilbert O, Delpire P, Moscariello A, Velkeniers B. Respiratory consequences of obesity—an overview. Acta Clin Belg 2007;62:170–175.
10. Himmelfarb J. Linking oxidative stress and inflammation in kidney disease: which is the chicken and which is the egg? Semin Dial 2004;17:449–454.
11. Furukawa S, Fujita T, Shimabukuro M et al. Increased oxidative stress in obesity and its impact on metabolic syndrome. J Clin Invest 2004;114:1752–1761.
different results between the genders regarding adiposity and oxidative stress are not clear and would require additional investigation. Physical activity was also a significant effect modifier in the association between adiposity and oxidative stress. Strong inverse associations for both GSH and vitamin C with central adiposity measures were seen among officers who reported that they engaged in physical activity, with positive or no associations being observed among those who reported no physical activity. However, exercise can also induce oxida-tive stress (38,39) with simultaneous lowering of plasma anti-oxidant levels, and this occurrence may be especially evident among persons with higher BMI. Further investigations that attempt to untangle other possible reasons for these associa-tions may be warranted.
Vincent and Taylor presented a review of several biological mechanisms that may be involved in the association of increased adiposity with oxidative stress (40). Possible contributions to oxidative stress include hyperglycemia, increased muscle activ-ity to carry excessive weight, elevated tissue lipid levels, chronic inflammation, endothelial reactive oxygen species production, and hyperleptinemia. Caloric restriction reduces the forma-tion of free radical and reactive oxygen species. The converse is also true, in that increased caloric intake increases the forma-tion of these agents, thereby elevating the accumulation of oxi-dative stress biomarkers. Inflammatory cytokines are released from adipocytes (41) and inflammation is associated with oxidative stress (10). In addition, obese persons may have an antioxidant deficit as a result of poor antioxidant intake and/or activities of the major antioxidant enzymes may be inadequate (40). Police officers are faced with multiple occupational stres-sors on a regular basis and, consequently, may be at increased risk of stress-related chronic diseases. Increased adiposity, by increasing oxidative stress levels, could further increase such risk. Utilization of wellness centers and weight management programs could be important interventions for police depart-ments across the United States.
Limitations in this study include the sample size and the cross-sectional design that precludes causal inferences. Our use of TBARS as the only marker of lipid peroxidation is also a limitation. Another limitation is that although we were able to adjust for several confounders, there may have been other poten-tial confounders that we did not adjust for due to data being unavailable. Also, the OSS variable that we created, although unique, is imperfect, as we did not have information on the spe-cific times (in relation to blood collection) that these substances were used, nor concerning the quantity of supplements, herbs, and anti-inflammatory medications taken by the participants. It is possible that persons with very different consumption pat-terns may have been included in the same group. If this had been the case, the effect of this nondifferential misclassification bias would have been to dilute any associations observed.
There are several strengths to this study. Our study is one of very few epidemiologic studies that obtained 100% par-ticipation of the population sample. Several measures of adi-posity, including waist circumference and abdominal height, were included in this study. The inclusion of waist-to-hip and
obesity | VOLUME 16 NUMBER 11 | NOVEMBER 2008 2497
articlesepidemiology
27. Goodman M, Bostick RM, Dash C, Flanders WD, Mandel JS. Hypothesis: Oxidative stress score as a combined measure of pro-oxidant and antioxidant exposures. Ann Epidemiol 2007;17:394–399.
28. SAS Institute Inc. SAS User’s Guide, version 9.1. SAS Institute, Cary, NC, 2001–2004.
29. Olusi SO. Obesity is an independent risk factor for plasma lipid peroxidation and depletion of erythrocyte cytoprotective enzymes in humans. Int J Obesity 2002;26:1159–1164.
30. Pou KM, Massaro JM, Hoffmann U et al. Visceral and subcutaneous adipose tissue volumes are cross-sectionally related to markers of inflammation and oxidative stress: The Framingham Heart Study. Circulation 2007;116:1234–1241.
31. Dandona P, Mohanty P, Ghanim h et al. The suppressive effect of dietary restriction and weight loss in the obese on the generation of reactive oxygen species by leukocytes, lipid peroxidation, and protein carbonylation. J Clin Endocrinol Metab 2001;86:355–362.
32. Beltowski J, Wojcicka G, Gorny D, Marciniak A. The effect of dietary-induced obesity on lipid peroxidation, antioxidant enzymes and total plasma antioxidant capacity. J Physiol Pharmacol 2000;51:883–896.
33. Winkleby MA, Kraemer HC, Ahn DK, Varady AN. Ethnic and socioeconomic differences in cardiovascular disease risk factors: findings for women from the Third National Health and Nutrition Examination Survey, 1988–1994. JAMA 1998;280:356–362.
34. Bloomer RJ. Decreased blood antioxidant capacity and increased lipid peroxidation in young cigarette smokers compared to nonsmokers: Impact of dietary intake. Nutr J 2007;6:39.
35. Isik B, Ceylan A, Isik R. Oxidative stress in smokers and non-smokers. Inhal Toxicol 2007; 19:767–769.
36. Wu T, Willett WC, Rifai N, Rimm EB. Plasma fluorescent oxidation products as potential markers of oxidative stress for epidemiologic studies. Am J Epidemiol 2007;166:552–560.
37. James RW, Leviev I, Righetti A. Smoking is associated with reduced paraoxonase activity and concentration in patients with coronary artery disease. Circulation 2000;101:2252–2257.
38. Magalhaes J, Ferreira R, Marques F et al. Indoor climbing elicits plasma oxidative stress. Med Sci Sports Exerc 2007;39:955–963.
39. Knez WL, Jenkins DG, Coombes JS. Oxidative stress in half and full Ironman triathletes. Med Sci Sports Exerc 2007;39:283–288.
40. Vincent HK, Taylor AG. Biomarkers and potential mechanisms of obesity-induced oxidant stress in humans. Int J Obesity 2006;30:400–418.
41. Mohamed-Ali V, Goodrick S, Rawesh A, et al. Subcutaneous adipose tissue releases interleukin-6, but not tumor necrosis factor-α, in vivo. J Clin Endocrinol Metab 1997;82:4196–4200.
42. Bolton-Smith C, Smith WCS, Woodward M, Tunstall-Pedoe H. Nutrient intakes of different social-class groups: results from the Scottish Heart Health Study (SHHS). Br J Nutr 1991;65:321–335.
12. Vincent HK, Innes KE, Vincent KR. Oxidative stress and potential interventions to reduce oxidative stress in overweight and obesity. Diabetes Obes Metab 2007;9:813–839.
13. Turrens JF. Mitochondrial formation of reactive oxygen species. J Physiol 2003;552(Pt 2):335–344.
14. Wu G, Fang YZ, Yang S, Lupton JR, Turner ND. Glutathione metabolism and its implication for health. J Nutr 2004;134:489–492.
15. Schisterman EF, Faraggi D, Browne R et al. TBARS and cardiovascular disease in a population-based sample. J Cardiovasc Risk 2001;8: 219–225.
16. Miller NJ, Rice-Evans C, Davies MJ, Gopinathan V, Milner A. A novel method for measuring antioxidant capacity and its application to monitoring the antioxidant status in premature neonates. Clin Sci 1993;84: 407–412.
17. McGregor GP, Biesalski HK. Rationale and impact of vitamin C in clinical nutrition. Curr Opin Clin Nutr Metab Care 2006;9:697–703.
18. Townsend DM, Tew KD, Tapiero H. The importance of glutathione in human disease. Biomed Pharmacother 2003;57:145–155.
19. Brigelius-Flohe R. Tissue-specific functions of individual glutathione peroxidases. Free Radic Biol Med 1999;27:951–965.
20. Franke WD, Ramey SL, Shelley MC II. Relationship between cardiovascular disease morbidity, risk factors, and stress in a law enforcement cohort. J Occup Environ Med 2002;44:1182–1189.
21. Violanti JM, Burchfiel CM, Miller DB et al. The Buffalo Cardio-Metabolic Occupational Police Stress (BCOPS) pilot study: methods and participant characteristics. Ann Epidemiol 2006;16:148–156.
22. Browne R, Armstrong D. Fluorometric determination of glutathione and glutathione disulfide. In: Armstrong D (ed). Methods in Molecular Biology, Free Radicals and Antioxidant Protocols. The Humana Press, Totowa, NJ, 1998., pp 347–352.
23. Pippenger CE, Browne R, Armstrong D. Regulatory antioxidant enzymes. In: Armstrong D (ed). Methods in Molecular Biology, Free Radicals and Antioxidant Protocols. The Humana Press, Totowa, NJ, 1998, pp 299–313.
24. Chalmers AH, McWhinney BC. Two spectrophotometric methods compared for measuring low concentrations of ascorbate in plasma and urine. Clin Chem 1986;32:1412–1413.
25. Armstrong D, Browne R. The analysis of free radicals, lipid peroxides, antioxidant enzymes and compounds related to oxidative stress as applied to the clinical chemistry laboratory. In: Armstrong D (ed). Free Radicals in Diagnostic Medicine: A Systems Approach to Laboratory Technology, Clinical Correlations and Antioxidant Therapy (Advances in Experimental Medicine and Biology), Vol. 366. Plenum Press: New York, 1994, pp 43–58.
26. Miller NJ, Rice-Evans C, Davies MJ, Gopinathan V, Milner A. A novel method for measuring antioxidant capacity and its application to monitoring the antioxidant status in premature neonates. Clin Sci 1993;84:407–412.


