Embed Size (px)
Citation preview
V3.2
Administrator guide
Page 1
Pandora FMS 3.2 Administrator guide
OpenOffice/PDF Version
1º Edition (Spanish), 20th December 2010.
© Artica Soluciones Tecnológicas 20052010
© Sancho Lerena Urrea
© David Villanueva Jiménez
© Jorge González González
© Julia Lerena Urrea (Traducción)
© Pablo de la Concepción
© Ramón Novoa
© Miguel de Dios
© Sergio Zarzuelo
© Darío Rodríguez
Other author contribution listed on http://pandorafms.org
Page 2
Index of contents1 Introduction to Pandora FMS ................................................................................................... 14
1.1. What is Pandora FMS? ......................................................................................................... 15 1.2. What Pandora FMS is not? ................................................................................................... 15 1.3. What else could Pandora FMS do? ........................................................................................ 16 1.4. Community around Pandora FMS ........................................................................................ 17 1.5. Pandora FMS Enterprise ....................................................................................................... 17
1.5.1. Open Update Manager connected to Ártica ................................................................... 17 1.5.2. Report programmer ........................................................................................................ 18 1.5.3. Dashboard ...................................................................................................................... 18 1.5.4. Agents remote configuration ......................................................................................... 18 1.5.5. Monitoring policy management .................................................................................... 18 1.5.6. Export Server ................................................................................................................. 18 1.5.7. Inventory Server ............................................................................................................ 18 1.5.8. Transactional WEB Monitoring .................................................................................... 18 1.5.9. Advanced SNMP traps monitoring ............................................................................... 19 1.5.10. Report wizard .............................................................................................................. 19 1.5.11. Metaconsole ................................................................................................................ 19 1.5.12. Enterprise Access Control Levels ............................................................................... 19 1.5.13. Monitorización de servicios ........................................................................................ 19
1.6. Quick Guides ........................................................................................................................ 19 1.7. Documentation's description ................................................................................................. 19 1.8. About Pandora FMS ............................................................................................................. 20
2 Pandora FMS's Architecture ..................................................................................................... 21 2.1. Pandora FMS Servers ........................................................................................................... 22
2.1.1. Data Server .................................................................................................................... 23 2.1.2. Network Server .............................................................................................................. 23 2.1.3. SNMP Server (a.k.a. SNMP Trap Console) ................................................................... 23 2.1.4. WMI Server .................................................................................................................... 23 2.1.5. Recognition Server ......................................................................................................... 24 2.1.6. Plugins Server ................................................................................................................ 24 2.1.7. Prediction Server ............................................................................................................ 24 2.1.8. WEB Test Server(Goliat) ............................................................................................... 24 2.1.9. Export Server ................................................................................................................. 24 2.1.10. Inventory Server ........................................................................................................... 24
2.2. Pandora FMS's Web Console ................................................................................................ 25 2.3. Pandora FMS's Database ...................................................................................................... 25 2.4. Pandora FMS's Software Agents ........................................................................................... 25
2.4.1. Agent ............................................................................................................................. 25 2.4.2. Software Agent .............................................................................................................. 26 2.4.3. XML Datafile ................................................................................................................ 27 2.4.4. Physical Agent .............................................................................................................. 28
3 Pandora FMS Installation .......................................................................................................... 29 3.1. Minimum Hardware Requirements ....................................................................................... 30
3.1.1. Console and Server Requirements ................................................................................. 30 3.2. Software Requirements .......................................................................................................... 30
3.2.1. Agent Requirement ....................................................................................................... 30
Page 3

3.2.2. Server Requirements ..................................................................................................... 30 3.2.3. Console Requirements .................................................................................................. 31 3.2.4. Requirements to Administer the Tool via WEB ........................................................... 31 3.2.5. Package Dependencies .................................................................................................. 31
3.3. Issues before installation ........................................................................................................ 31 3.3.1. Pandora FMS installation order ..................................................................................... 31
3.4. Installing on SUSE ................................................................................................................ 31 3.4.1. Configuring Software repositories ................................................................................ 31 3.4.2. Previous Dependencies Installation .............................................................................. 32 3.4.3. Agent Installation ........................................................................................................... 33 3.4.4. Server installation ......................................................................................................... 33 3.4.5. Console installation ....................................................................................................... 34 3.4.6. Installing the Enterprise version ................................................................................... 34 3.4.7. Updating packages with RPM ....................................................................................... 34 3.4.8. Installing the Keygen .................................................................................................... 35 3.4.9. Uninstalling Pandora FMS ............................................................................................ 35
3.5. Installation in Red Hat Enterprise Linux .............................................................................. 36 3.5.1. Previous Dependencies Installation .............................................................................. 36
3.6. Instalation in Debian/Ubuntu ................................................................................................ 36 3.6.1. Previous instalation of dependencies ............................................................................ 36 3.6.2. Pandora FMS installation with .DEB packages ............................................................ 37
3.7. Installation in FreeBSD ........................................................................................................ 37 3.7.1. Perl with ithread Installation ......................................................................................... 37 3.7.2. Previous Dependencies Installation .............................................................................. 38 3.7.3. Console installation ....................................................................................................... 38 3.7.4. Server installation ......................................................................................................... 39 3.7.5. Agent installation .......................................................................................................... 39
3.8. Manual Installation from Sources in Linux/Unix ................................................................. 40 3.8.1. Previous Installation of Necessary Software ................................................................ 40 3.8.2. Download from Sources ................................................................................................ 41 3.8.3. Agent Installation .......................................................................................................... 41
3.8.3.1. Custom agent installation ...................................................................................... 41 3.8.4. Console Installation ........................................................................................................ 42
3.8.4.1. Enterprise Versión ................................................................................................. 42 3.8.5. Server Installation ......................................................................................................... 42
3.8.5.1. Enterprise Version ................................................................................................. 43 3.8.5.2. Uninstallation / Manual wipe from server ............................................................. 43
3.8.6. Server Code Update:Compilation and Manual Installation of the Server ..................... 44 3.9. Windows Agent Installation ................................................................................................. 45
3.9.1. Windows Agent Unattended Installation ....................................................................... 49 3.9.2. Unattended Uninstallation ............................................................................................. 49 3.9.3. Windows Agent Manual Installation ............................................................................ 50
3.9.3.1. Using PandoraAgent.exe from the Commands Line ............................................. 50 3.9.3.2. Pandora FMS Window's Agent as Process ........................................................... 51
3.9.4. Pandora FMS for windows NT4 ................................................................................... 51 3.9.4.1. Installing the agent ................................................................................................ 51 3.9.4.2. Running the agent .................................................................................................. 52 3.9.4.3. Install as a service ................................................................................................... 52
4 Initial Configuration after Installing ......................................................................................... 53 4.1. Console Initial Configuration ............................................................................................... 54
Page 4

4.2. Server Initial and Basic Configuration ................................................................................. 57 4.3. Initial and Basic Configuration of the Agent ........................................................................ 57
5 Pandora FMS Interface .............................................................................................................. 58 5.1. Introduction ........................................................................................................................... 59 5.2. Pandora FMS start session screen ......................................................................................... 59 5.3. Pandora FMS Main Page ....................................................................................................... 59
5.3.1. The Operation Menu ...................................................................................................... 60 5.3.2. The Administration Menu .............................................................................................. 61 5.3.3. Links Menu .................................................................................................................... 62 5.3.4. The Header ..................................................................................................................... 62
5.4. Icons in Pandora FMS Interface ........................................................................................... 64 5.4.1. Help on line icon ........................................................................................................... 64 5.4.2. Suggestion/Advise Icon ................................................................................................ 64 5.4.3. Management Icon .......................................................................................................... 65 5.4.4. Full Screen Icon ............................................................................................................ 65 5.4.5. Magic Wand Icon (filter) ............................................................................................... 65 5.4.6. Remote Configuration Edit Icon ................................................................................... 65 5.4.7. Update Icon (forced) ...................................................................................................... 66 5.4.8. Refresh Icon (after a forced update action) .................................................................... 66 5.4.9. Alternative Texts in the icons/images when putting the mouse over ............................ 66
5.5. Images in Pandora FMS ........................................................................................................ 67 5.6. Data missing for agent's data lists ......................................................................................... 68 5.7. States and possible values of agents ..................................................................................... 68
6 Pandora FMS configuration ..................................................................................................... 70 6.1.1. Server ............................................................................................................................ 71
6.1.1.1. Configuration File Elements ................................................................................. 71 6.1.1.2. UDP notification of the System State .................................................................... 76 6.1.1.3. Snmptrapd configuration ....................................................................................... 77 6.1.1.4. Tentacle Configuration ........................................................................................... 77
6.1.2. WEB Console ................................................................................................................ 78 6.1.2.1. Configuration file config.php ................................................................................ 78
6.1.3. Pandora FMS software agents ....................................................................................... 79 6.1.3.1. What is an Agent ? ................................................................................................ 79 6.1.3.2. Introduction to the agent configuration ................................................................. 80 6.1.3.3. Agent General Parameters ...................................................................................... 80 6.1.3.4. Modules definition ................................................................................................ 85 6.1.3.5. Examples ............................................................................................................. 102 6.1.3.6. Advanced issues about software agents .............................................................. 103
7 Operation ................................................................................................................................. 113 7.1. Introduction ......................................................................................................................... 114
7.1.1. Agents at Pandora FMS .............................................................................................. 114 7.2. Monitoring with the software agent .................................................................................... 114
7.2.1. Kinds of modules ........................................................................................................ 115 7.2.2. How to ask agent for information on demand ............................................................. 117 7.2.3. Using software agent plugins ...................................................................................... 120
7.2.3.1. On Windows systems .......................................................................................... 121 7.2.3.2. On Unix systems ................................................................................................. 121
7.2.4. How to create your own agents plugins ...................................................................... 122 7.2.5. Using nagios plugins from the agent ........................................................................... 122
7.2.5.1. Example ............................................................................................................... 123
Page 5

7.3. Remote Monitoring ............................................................................................................. 124 7.3.1. Remote Network Modules .......................................................................................... 124 7.3.2. Generic Configuration of a Module for Network Monitoring .................................... 125 7.3.3. ICMP Monitoring ........................................................................................................ 128 7.3.4. TCP Monitoring .......................................................................................................... 128 7.3.5. SNMP Monitoring ....................................................................................................... 130
7.3.5.1. Introduction to the SNMP Monitoring ................................................................ 130 7.3.5.2. Monitoring SNMP from Agents ........................................................................... 131 7.3.5.3. Monitoring with Network Modules like SNMP .................................................. 132 7.3.5.4. MIB Study with External Tools and Integration in Pandora FMS ...................... 135 7.3.5.5. Common Advanced Features of the Network Modules ....................................... 136
7.3.6. Remote Windows Monitoring with WMI .................................................................... 137 7.3.7. WEB Monitoring (Goliat) ........................................................................................... 142
7.3.7.1. String Check in a Web page ................................................................................. 145 7.3.7.2. Form checking in a Web page .............................................................................. 146 7.3.7.3. Monitorización https ............................................................................................ 148
7.3.8. Monitoring with Plugins ............................................................................................. 149 7.3.8.1. Example #1: Plugin Module for MySQL ............................................................ 154
7.4. Predictive Monitoring .......................................................................................................... 156 7.5. Monitoring with KeepAlive ................................................................................................ 160 7.6. Status/Event monitoring ..................................................................................................... 161 7.7. Other Common Monitoring Parameters .............................................................................. 162
7.7.1. Historical ..................................................................................................................... 162 7.7.2. FF Threshold ............................................................................................................... 163
7.8. Service Monitoring .............................................................................................................. 163 7.8.1. Introduction .................................................................................................................. 163 7.8.2. Configuration ............................................................................................................... 165
8 Operation with SNMP traps ................................................................................................... 167 8.1. Introduction ......................................................................................................................... 168 8.2. Access to trap reception console ......................................................................................... 168
Trap Filtering ........................................................................................................................ 169 8.2.1. Trap Validation ............................................................................................................ 170 8.2.2. Trap Deletion ............................................................................................................... 170
8.3. Configuration of the SNMP trap reception console. ............................................................ 171 8.3.1. Associate an alert to a trap ........................................................................................... 171
8.3.1.1. Alert creation ........................................................................................................ 171 8.3.1.2. Alert Edition ......................................................................................................... 172 8.3.1.3. Alert Deletion ....................................................................................................... 173
8.3.2. Editing a Trap ............................................................................................................... 174 8.3.2.1. Trap Edition via Operation Menu ........................................................................ 174 8.3.2.2. Trap Editon via Administration Menu ................................................................. 175 8.3.2.3. Load the manufacturer's MIBs ............................................................................. 176
8.4. Trap association to the rest of Pandora alerts / SNMP Agent trap forwarding .................. 176 8.5. Trap Filtering in the Server .................................................................................................. 177 8.6. External SNMP Trap Handler ............................................................................................. 179
8.6.1. Practical Sample: ESX Monitoring using traps .......................................................... 181 8.6.1.1. Trap handler: esx_trap_manager.pl ..................................................................... 182 8.6.1.2. Step 2: Create the alert command ........................................................................ 183 8.6.1.3. Step 3: Create the alert action .............................................................................. 183 8.6.1.4. Step 4: Create the SNMP alert ............................................................................ 184
Page 6

8.6.1.5. Data visualization ................................................................................................ 184 9 Templates and Plugins ............................................................................................................. 185
9.1. Introduction .......................................................................................................................... 186 9.1.1. What is a component ? ................................................................................................ 187 9.1.2. What are the Template Components? ......................................................................... 187
9.2. Network components .......................................................................................................... 187 9.2.1. Create new network components ................................................................................ 188
9.3. Local components ............................................................................................................... 190 9.3.1. Create new local components ..................................................................................... 192
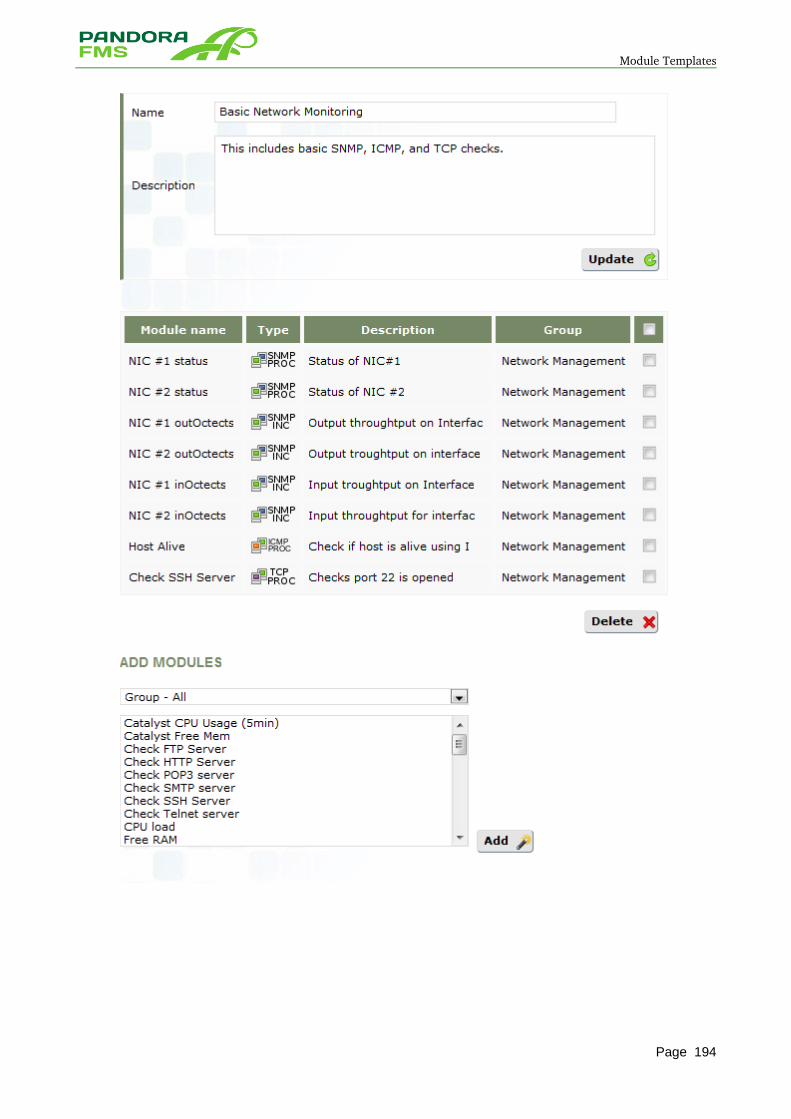
9.4. Module Templates ............................................................................................................... 192 9.4.1. Create new module templates ...................................................................................... 195 9.4.2. Apply a module template to an agent ........................................................................... 196
9.5. Component groups ............................................................................................................... 197 10 Alerts ..................................................................................................................................... 200
10.1. Introduction ........................................................................................................................ 201 10.2. Command ........................................................................................................................... 201
10.2.1. Command Creation for an Alert ................................................................................. 202 10.2.2. Edition of a command for an alert ............................................................................. 203 10.2.3. Delete an Alert Command .......................................................................................... 204 10.2.4. Predefined Commands ............................................................................................... 204 10.2.5. Examples of Commands ............................................................................................ 205
10.2.5.1. Integrating alerts with Jabber IM ...................................................................... 205 10.2.5.2. Sending emails with Expect .............................................................................. 206 10.2.5.3. Sending SMS with Gnokii .................................................................................. 207 10.2.5.4. Executing a Remote Command in Another System (UNIX) ............................ 208
10.3. Actions ............................................................................................................................... 208 10.3.1. Creating an action ..................................................................................................... 208 10.3.2. Editing an action ........................................................................................................ 210 10.3.3. Deleting an Action .................................................................................................... 211
10.4. Alert Template ................................................................................................................... 211 10.4.1. Creating a Template ................................................................................................... 211 10.4.2. Replaceable Macros in Field1, Field2 and Field3 ..................................................... 216
10.4.2.1. Orders for the replacement of the Macros and _field*_ fields .......................... 217 10.4.2.2. Complete example of alert with replacement macros ....................................... 217
10.4.3. Editing a Template ..................................................................................................... 218 10.4.4. Creating a duplicate of a Template ............................................................................ 219 10.4.5. Deleting a Template ................................................................................................... 219
10.5. Assigning Alert Templates to Modules ............................................................................. 220 10.5.1. Alert management from Alert submenu ..................................................................... 220
10.5.1.1. Assigning Alerts from Alert Submenu ............................................................... 220 10.5.1.2. Modifying alerts form the Alert Submenu ......................................................... 221 10.5.1.3. Deactivating Alerts from the Alert Submenu .................................................... 221 10.5.1.4. Deleting Alerts from the Alert Submenu .......................................................... 221
10.5.2. Managing Alerts from the Agent ............................................................................... 222 10.5.2.1. Alert assignment from the Agent ....................................................................... 222 10.5.2.2. Modifying Alerts from the Agent ....................................................................... 223 10.5.2.3. Deactivating Alerts from the Agent .................................................................. 223 10.5.2.4. Deleting Alerts from the Agent .......................................................................... 224
10.6. Scaling Alerts ..................................................................................................................... 224 10.7. Full alert examples ............................................................................................................ 224
Page 7
10.7.1. Sending SMS alerts ................................................................................................... 224 10.8. Correlation ......................................................................................................................... 229
10.8.1. Creating Correlated Alerts ........................................................................................ 229 10.8.2. Editing Correlated Alerts ........................................................................................... 233 10.8.3. Deactivating Correlated Alerts ................................................................................... 233 10.8.4. Deleting Correlated Alerts ......................................................................................... 234
10.9. Cascade Protection ............................................................................................................. 234 10.9.1. Examples .................................................................................................................... 235
11 Policies .................................................................................................................................. 237 11.1. Introduction ........................................................................................................................ 238 11.2. Adding a policy .................................................................................................................. 238 11.3. Configuring a Policy .......................................................................................................... 240
11.3.1. Modules ...................................................................................................................... 241 11.3.1.1. Creating a Data Server Module .......................................................................... 242 11.3.1.2. Creating a Network Server Module .................................................................... 243 11.3.1.3. Creating a Plugin Server Module ...................................................................... 245 11.3.1.4. Creating a WMI Server Module ........................................................................ 246 11.3.1.5. Create a Prediction Server Module ................................................................... 247 11.3.1.6. Creating a Web Server Module .......................................................................... 248 11.3.1.7. Modifying a Module already created ................................................................. 249 11.3.1.8. Deleting an Module Already Created ................................................................. 250 11.3.1.9. Using Plugins in Policies .................................................................................... 250
11.3.2. Alerts .......................................................................................................................... 251 11.3.2.1. Adding Alerts .................................................................................................... 251 11.3.2.2. Modifying Alerts ................................................................................................ 252 11.3.2.3. Deleting Alerts .................................................................................................. 252
11.3.3. Assigning agents ........................................................................................................ 252 11.3.3.1. Deleting agents .................................................................................................. 253 11.3.3.2. Spreading policies ............................................................................................. 253
11.3.4. Type of modules ......................................................................................................... 255 11.3.4.1. Adopted Modules ............................................................................................... 255 11.3.4.2. Linked Modules .................................................................................................. 256 11.3.4.3. Unlinked Modules .............................................................................................. 256
11.3.5. File collections ........................................................................................................... 256 11.3.5.1. File collections and policies .............................................................................. 259 11.3.5.2. Location of file collections in the agent ............................................................ 260
11.4. Modifying a Policy ........................................................................................................... 261 11.5. Deleting a policy ................................................................................................................ 261
12 Automatic Network Discovery with Recon Server ............................................................... 262 12.1. Introduction ........................................................................................................................ 263 12.2. Recon Tasks ....................................................................................................................... 263 12.3. Network Topology ............................................................................................................. 267 12.4. Example of use ................................................................................................................... 268
13 Recon Scripts ......................................................................................................................... 269 13.1. Introduction ........................................................................................................................ 270 13.2. Examples of use ................................................................................................................. 270
13.2.1. Use from the shell ...................................................................................................... 270 13.2.2. Use from the Pandora FMS console .......................................................................... 271
14 Inventory ............................................................................................................................... 273 14.1. Introduction ....................................................................................................................... 274
Page 8
14.2. Data collection for the inventory ....................................................................................... 274 14.2.1. Inventory Modules ..................................................................................................... 274 14.2.2. Remote Inventory ...................................................................................................... 274
14.2.2.1. Creating Remote Modules .................................................................................. 274 14.2.2.2. Editing Remote Modules ................................................................................... 276 14.2.2.3. Deleting Remote Modules ................................................................................. 278 14.2.2.4. Asigning Remote Modules ................................................................................. 278 14.2.2.5. Editing an Assigned Inventory Module .............................................................. 280 14.2.2.6. Deleting an Assigned Inventory Module ........................................................... 280
14.2.3. Local Inventory through Software Agents ................................................................ 280 14.2.3.1. Creating Local Modules .................................................................................... 280 14.2.3.2. Inventory Module in Windows Systems through Software Agents .................. 283 14.2.3.3. Inventory Module in Unix Systems through Software Agent. .......................... 285 14.2.3.4. Assigning Local Modules ................................................................................... 287
14.3. Data Display for the Inventory ......................................................................................... 287 14.3.1. Inventory Data Display in the Agent ......................................................................... 287 14.3.2. Inventory Data Display in the Inventory Menu ......................................................... 289 14.3.3. Exporting the Inventory Data to CSV ........................................................................ 291
15 Data Display:Graphs, Reports, Visual Maps and Module List ............................................. 292 15.1. Introduction ........................................................................................................................ 293 15.2. Graphs ................................................................................................................................ 293
15.2.1. Agent Graphs ............................................................................................................. 293 15.2.2. Combined Graphs ...................................................................................................... 296
15.2.2.1. Creating Combined Graphs ................................................................................ 296 15.2.2.2. Displaying Stored Combined Graphs ................................................................. 298 15.2.2.3. Deleting Combined Graphs that have been stored ............................................. 301
15.3. Reports ............................................................................................................................... 301 15.3.1. Creating a Report ....................................................................................................... 301 15.3.2. Editing a Report ......................................................................................................... 302 15.3.3. Deleting a Report ...................................................................................................... 303 15.3.4. Tabs ........................................................................................................................... 303
15.3.4.1. Main Tab ........................................................................................................... 303 15.3.4.2. List Items Tab .................................................................................................... 304 15.3.4.3. Item Editor Tab ................................................................................................. 304 15.3.4.4. Wizard Tab ......................................................................................................... 323 15.3.4.5. Advanced options Tab ....................................................................................... 324 15.3.4.6. Preview Tab ....................................................................................................... 325
15.3.5. Visualizing a Report ................................................................................................... 325 15.3.6. Automatic Report Sending by Email ......................................................................... 327
15.3.6.1. Configuration ...................................................................................................... 328 15.4. Visual Maps ....................................................................................................................... 329
15.4.1. Creating a Visual Map ............................................................................................... 329 15.4.2. Visualizing a Visual Map ........................................................................................... 330 15.4.3. Deleting a Visual Map .............................................................................................. 331 15.4.4. Tabs in the visual map editor .................................................................................... 331
15.4.4.1. Data ................................................................................................................... 331 15.4.4.2. Preview .............................................................................................................. 332 15.4.4.3. Wizard ................................................................................................................ 333 15.4.4.4. List of elements .................................................................................................. 333 15.4.4.5. Editor .................................................................................................................. 334
Page 9
15.4.5. Elements which can be used in a visualmap ............................................................. 337 15.4.5.1. Static Image ........................................................................................................ 337 15.4.5.2. Percentile Bar Options ....................................................................................... 339 15.4.5.3. Module Graph ..................................................................................................... 340 15.4.5.4. Simple Value ...................................................................................................... 342
15.5. Tree view .......................................................................................................................... 343 15.6. Mobile console .................................................................................................................. 343
16 Pandora GIS .......................................................................................................................... 348 16.1. Setup ................................................................................................................................. 349
16.1.1. Agent Configuration ................................................................................................. 349 16.1.2. Server Configuration ................................................................................................. 349 16.1.3. Console Configuration .............................................................................................. 350
16.1.3.1. GIS Connections ................................................................................................ 350 16.1.3.2. GIS Map builder ................................................................................................ 353
16.2. Operation .......................................................................................................................... 354 16.2.1. GIS Maps .................................................................................................................. 355
16.2.1.1. Move around the Map ....................................................................................... 355 16.2.1.2. Hide / Show / Select Layers .............................................................................. 355 16.2.1.3. Filters ................................................................................................................. 355 16.2.1.4. Map Refresh ...................................................................................................... 355 16.2.1.5. Map Edit and Full Screen .................................................................................. 355
16.2.2. Agent View ............................................................................................................... 356 16.2.2.1. GIS Historical View .......................................................................................... 356
16.2.3. Agent GIS Setup ....................................................................................................... 357 16.2.3.1. Ignore GIS data ................................................................................................. 358 16.2.3.2. Manual position of the agent ............................................................................. 358
16.3. Useful links ....................................................................................................................... 358 16.3.1. OpenLayers ............................................................................................................... 358 16.3.2. Mapnik ...................................................................................................................... 358 16.3.3. OpenStreetMap ......................................................................................................... 358 16.3.4. OS Geo ...................................................................................................................... 359 16.3.5. Geo Server ................................................................................................................. 359 16.3.6. PostgreSQL ............................................................................................................... 359 16.3.7. Blogs (Spanish only) ................................................................................................. 359
17 Dashboard ............................................................................................................................. 360 17.1. Introduction ....................................................................................................................... 361 17.2. Creating a Dashboard ........................................................................................................ 362
17.2.1. Adding Objects in the Dashboard ............................................................................. 363 17.2.1.1. Group Status Report .......................................................................................... 363 17.2.1.2. Graphs Defined by the User .............................................................................. 364 17.2.1.3. Last Events List .................................................................................................. 366 17.2.1.4. State of the System ............................................................................................. 367 17.2.1.5. Pandora FMS Welcome Message ....................................................................... 367 17.2.1.6. Agent Module Graph ......................................................................................... 368 17.2.1.7. Visual Maps Report ............................................................................................ 369 17.2.1.8. Network Map ..................................................................................................... 370 17.2.1.9. Visual Console Map .......................................................................................... 372
17.2.2. Putting Objects in the Dashboard ............................................................................... 373 17.2.3. Editing Objects on the Dashboard ............................................................................. 373 17.2.4. Deleting Objects on the Dashboard ........................................................................... 374
Page 10
17.3. Editing a Dahsboard ........................................................................................................... 374 17.4. Deleting a Dashboard ........................................................................................................ 375
18 Export Server ........................................................................................................................ 376 18.1. Introduction ....................................................................................................................... 377 18.2. Adding a Target Server ..................................................................................................... 378 18.3. Editing a Target Server ..................................................................................................... 380 18.4. Deleting a Target Server .................................................................................................... 381 18.5. Linking a Target Server to a Module ................................................................................ 381
19 Meta Console ........................................................................................................................ 383 19.1. Introduction ....................................................................................................................... 384 19.2. Configuration .................................................................................................................... 385
19.2.1. Use of the Delegated Authentication ......................................................................... 386 19.3. Visualization ...................................................................................................................... 387 19.4. Multiple Systems Simultaneous Management .................................................................. 390
20 Management of Pandora FMS .............................................................................................. 392 20.1. Introduction ....................................................................................................................... 393 20.2. Profiles, Users, Groups and ACL ..................................................................................... 393
20.2.1. Profiles in Pandora FMS ........................................................................................... 393 20.2.1.1. Adding a Profile ................................................................................................ 395 20.2.1.2. Editing a Profile ................................................................................................. 396 20.2.1.3. Deleting a Profile ............................................................................................... 396
20.2.2. Pandora FMS Groups ................................................................................................. 396 20.2.2.1. Adding a Group ................................................................................................. 397 20.2.2.2. Editing a Group ................................................................................................. 398 20.2.2.3. Deleting a Group ............................................................................................... 398
20.2.3. Users in Pandora FMS .............................................................................................. 398 20.2.3.1. Adding a User .................................................................................................... 399 20.2.3.2. Displaying a User .............................................................................................. 401 20.2.3.3. Editing the Own User Settings .......................................................................... 402 20.2.3.4. User Edition by the Administrator .................................................................... 403 20.2.3.5. Removing an User ............................................................................................. 403
20.3. The "All" Group ................................................................................................................. 403 20.4. New ACL System (Enterprise) ......................................................................................... 404 20.5. Messages ........................................................................................................................... 406
20.5.1. See Messages ............................................................................................................. 406 20.5.1.1. Sending Messages .............................................................................................. 407 20.5.1.2. Deleting Messages .............................................................................................. 408
20.6. Incidents ............................................................................................................................ 408 20.6.1. Seeing all Incidents ................................................................................................... 408 20.6.2. Incident Tracking ...................................................................................................... 409 20.6.3. Searching Incidents ................................................................................................... 412 20.6.4. Opening a New Incident ........................................................................................... 412 20.6.5. Changing the Owner of an Incident .......................................................................... 413 20.6.6. Deleting an Incident .................................................................................................. 413 20.6.7. Incident Statistic ........................................................................................................ 414 20.6.8. Self generated Incidents (servidor recon) ................................................................. 414
20.7. Events ................................................................................................................................ 414 20.7.1. Viewing Events ......................................................................................................... 415 20.7.2. Filtering Events ......................................................................................................... 417 20.7.3. Creating an Incident from an Event .......................................................................... 420
Page 11
20.7.4. Validating an Event ................................................................................................... 420 20.7.5. Deleting an Event ....................................................................................................... 421 20.7.6. Other ways of viewing events ................................................................................... 422
20.7.6.1. RSS Events ........................................................................................................ 422 20.7.6.2. Events in the Marquee ....................................................................................... 422 20.7.6.3. Sound Alerts ...................................................................................................... 422
20.7.7. Exporting Events to a CSV ....................................................................................... 425 20.7.8. Events Statistics ........................................................................................................ 425
20.8. Servers .............................................................................................................................. 426 20.9. Planned Downtime ............................................................................................................ 426
20.9.1. Alternatives to the Service Downtime Management in the Console ........................ 429 20.10. Audit Log ........................................................................................................................ 430
20.10.1. See the System Logs ................................................................................................ 430 20.10.2. Filtering the System Logs ....................................................................................... 431
20.11. Managing the Database from the Console. ...................................................................... 431 20.11.1. Getting Information from the Database .................................................................. 432
20.11.1.1. Obtaining General Information ........................................................................ 432 20.11.1.2. Getting Information about Agents and Modules .............................................. 433 20.11.1.3. Getting Information about Data by Date .......................................................... 435 20.11.1.4. Getting Data from the Audit Log .................................................................... 436 20.11.1.5. Getting Data about Events ................................................................................ 436
20.11.2. Purging the Database .............................................................................................. 436 20.11.2.1. Agent Data Purge by Date ............................................................................... 437 20.11.2.2. Purging Specific Data from a Module ............................................................. 437 20.11.2.3. Purging Audit Data .......................................................................................... 437 20.11.2.4. Purging Event Data .......................................................................................... 438
20.11.3. DDBB Maintenance ................................................................................................. 438 20.11.3.1. Sanitizing ......................................................................................................... 439 20.11.3.2. Purging Non Initialized Modules .................................................................... 439
21 Console Extensions ............................................................................................................... 441 21.1. Introduction ....................................................................................................................... 442 21.2. Update Manager ................................................................................................................ 442
21.2.1. Configuring Open Update Manager .......................................................................... 442 21.2.2. Working with Open Update Manager ....................................................................... 443 21.2.3. PHP Configuration for the OpenUpdate Manager .................................................... 443
21.3. Modules Group ................................................................................................................. 444 21.4. Cron Job ............................................................................................................................ 445 21.5. Tree view .......................................................................................................................... 446 21.6. Plugin Register .................................................................................................................. 446 21.7. DB Interface ...................................................................................................................... 447 21.8. Backup .............................................................................................................................. 447 21.9. CSV Import ....................................................................................................................... 448
22 High Availability .................................................................................................................. 449 22.1. Introduction ....................................................................................................................... 450
22.1.1. Data Server Balancing and HA ................................................................................. 450 22.1.1.1. Balancing in the Software Agents ...................................................................... 451
22.1.2. Balancing and HA of the Network Servers, WMI, Plugin, Web and Prediction ...... 452 22.1.2.1. Configuration at Servers .................................................................................... 453
22.1.3. Load Balancing in the DDBB .................................................................................... 454 22.1.4. Balancing and HA of the Recon Servers ................................................................... 454
Page 12

22.1.5. Balancing and HA of Pandora FMS console ............................................................. 454 22.2. Annex 1: HA implementation and Load Balancing with LVS and Keepalived ............... 455
22.2.1. Action when a node is down ..................................................................................... 455 22.3. Annex 2. LVS Balancer Configuration ............................................................................. 456 22.4. Annex 3. KeepAlived Configuration ................................................................................ 456
23 Pandora FMS Console Configuration ................................................................................... 458 23.1. Introduction ........................................................................................................................ 459 23.2. Setup .................................................................................................................................. 459 23.3. Visual styles ....................................................................................................................... 461 23.4. File Manager ...................................................................................................................... 462 23.5. Links .................................................................................................................................. 463 23.6. Site news ............................................................................................................................ 463 23.7. Updating Languages ......................................................................................................... 464
24 Pandora FMS Server maintenance ....................................................................................... 465 24.1. Database management ....................................................................................................... 466 24.2. Manual Execution of Maintenance Tool .......................................................................... 467 24.3. Database Backup ................................................................................................................ 468 24.4. Backup and Complete Recovery of Pandora FMS ........................................................... 468
24.4.1. Examples of Use ........................................................................................................ 470 24.5. Manual startup/shutdown for Pandora FMS servers ......................................................... 471 24.6. Watchdog implementation for Pandora FMS ................................................................... 471
24.6.1. /usr/bin/pandora_watchdog ....................................................................................... 471 24.6.2. /usr/bin/pandora_alert ............................................................................................... 473 24.6.3. Watchdog Startup ...................................................................................................... 473 24.6.4. Remarks .................................................................................................................... 473
24.7. History database ................................................................................................................ 474 24.7.1. Setting up a history database ..................................................................................... 474
25 Development and Extension .................................................................................................. 475 25.1. Cooperating with Pandora FMS project ........................................................................... 476 25.2. Subversion (SVN) ............................................................................................................. 476 25.3. Bugs / Failures .................................................................................................................. 476 25.4. Mailing Lists ..................................................................................................................... 476
26 Compiling Windows agent from sources ............................................................................. 477 26.1. Get the last source ............................................................................................................. 478 26.2. Windows ........................................................................................................................... 478 26.3. Cross-compiling from Linux ............................................................................................ 478
26.3.1. Installing MinGW for Linux ...................................................................................... 478 26.3.2. Installing the extra libraries needed by the agent ....................................................... 478 26.3.3. Compiling and linking ............................................................................................... 479
27 External API ......................................................................................................................... 480
Page 13

Introduction to Pandora FMS
1 INTRODUCTION TO PANDORA FMS
Page 14
What is Pandora FMS?
1.1. What is Pandora FMS?
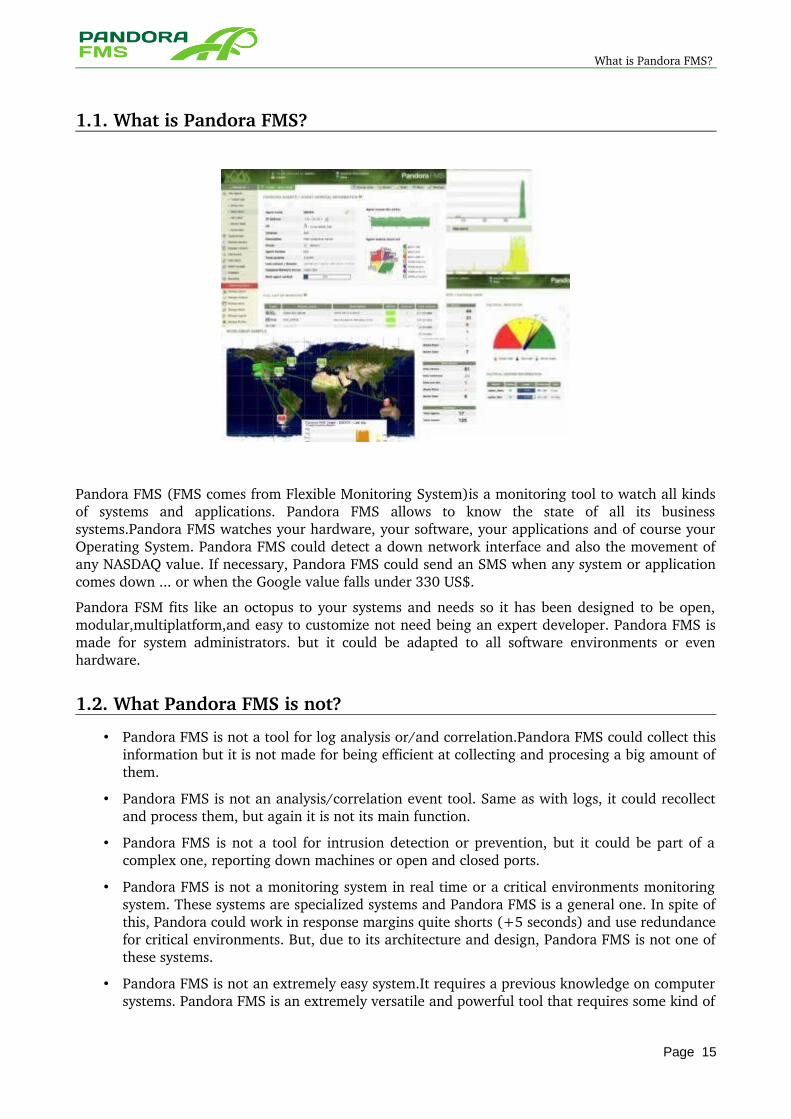
Pandora FMS (FMS comes from Flexible Monitoring System)is a monitoring tool to watch all kinds of systems and applications. Pandora FMS allows to know the state of all its business systems.Pandora FMS watches your hardware, your software, your applications and of course your Operating System. Pandora FMS could detect a down network interface and also the movement of any NASDAQ value. If necessary, Pandora FMS could send an SMS when any system or application comes down ... or when the Google value falls under 330 US$.
Pandora FSM fits like an octopus to your systems and needs so it has been designed to be open, modular,multiplatform,and easy to customize not need being an expert developer. Pandora FMS is made for system administrators. but it could be adapted to all software environments or even hardware.
1.2. What Pandora FMS is not?
• Pandora FMS is not a tool for log analysis or/and correlation.Pandora FMS could collect this information but it is not made for being efficient at collecting and procesing a big amount of them.
• Pandora FMS is not an analysis/correlation event tool. Same as with logs, it could recollect and process them, but again it is not its main function.
• Pandora FMS is not a tool for intrusion detection or prevention, but it could be part of a complex one, reporting down machines or open and closed ports.
• Pandora FMS is not a monitoring system in real time or a critical environments monitoring system. These systems are specialized systems and Pandora FMS is a general one. In spite of this, Pandora could work in response margins quite shorts (+5 seconds) and use redundance for critical environments. But, due to its architecture and design, Pandora FMS is not one of these systems.
• Pandora FMS is not an extremely easy system.It requires a previous knowledge on computer systems. Pandora FMS is an extremely versatile and powerful tool that requires some kind of
Page 15
What Pandora FMS is not?
previous ability, knowledge and experience in computers. If you do not have time to learn how to use it, then it is possible that you could suffer from some frustration at the beginning. Consider that the instruction manual has got almost 400 pages. But do not be afraid: lot of people have learned to used it reading only 10 pages!
1.3. What else could Pandora FMS do?
• Pandora FMS is a monitoring tool that not only measures if a parameter is right or not. Pandora FMS could evaluate the state (right, wrong and intermediate values) or store a value (numerical or alphanumerical) during months if it is necesary.
• Pandora FMS allows to measure outputs, to compare values between different systems and to establish alerts on thresholds.
• Pandora FMS works on a database, so it could generate reports, statistics, service adjustment levels (SLA) and measure any thing that gives or rejects a data.This means that Pandora FMS could measure any thing: operating systems, servers, hardware systems and applicationssuch us firewalls,proxies, databases, web servers, VPN,routers, switches, process, services, remote access to servers etc. All of these integrated in an open and distributed architecture.
• Pandora FMS could be set up on any operating system with specific agents for each plataform. It does already exist some agents for Windows (2000, XP, 2003, 2008, Vista, 7), Linux, Mac, Solaris, HPUX, BSD, AIX, IPSO, y OpenWRT.
• Pandora FMS does not only collect information through agents but through SNMP and network testing (TCP,ICMP) could monitor any hardware system with TCP/IP connectivity, such as load balancers,routers, switches, printers, etc.
People usually ask about which kind of things could be monitored so even when Pandora FMS could virtuallymonitor any thing, some times it is useful to give some specific examples. Pandora FMS could monitor any process or system that through a command returns a value and also any value inside a text register, the operating system, register file or similar.Some examples of already existing implementations coud be the following ones:
Through agents(Software that needs installation)
• Number of Checkpoint FW1 connections(log ins) • Number of Checkpoint FW1 NAT log ins. • Number of firewall connexions for GNU/Linux NetFilter/IPTables. • Number of packages registered at FW1. • Number of ruled out packages at FW1. • Number of accepted packages at FW1. • State of the FW1 NG high availability. • Last policy installed in a Firewall1 module. • State of the FW1 NG modules synchronization. • System CPU: idle, user and system. • Number of the system processing. • Temperature of a System CPU. • Value of a Windows register. • Queue processing of a generic dispatcher. • System memory:open,swap, kernel FW1, cache, etc • Free space in disk (by different partitions)
Page 16
What else could Pandora FMS do?
• Processed messages through a mail link gate Mensajes procesados por una puerta de enlace de correo.
• Existence of certain string in a text file. • IP traffic per IP address (filtering on firewall connections). • Hits in HTTP servers (Apache, iPlanet, IIS, etc.). • Percentage of corrupted packets in a gateway. • Established connections in a remote access server (RAS). • Size of a certain file. • Sessions opened by a VPN server.
1.4. Community around Pandora FMS
The Pandora FMS community organizes basically in the forums available in OpenIdeas.info. In these, users pose questions and get answers about Pandora FMS's operation, known and new errors, installation problems, monitoring, reports, uninstallation, etc.
In the forum, announces interesting for the community around Pandora FMS are made known, such as the launch of new releases, or CD versions and VmWare images.
The forum is a help point for learning how to integrate third party programs and devices with Pandora FMS.
1.5. Pandora FMS Enterprise
Pandora FMS has an Enterprise version released under a special commercial license, which provides plenty of additional features and make system administrator's life easier. The Enterprise version's license blocks redistribution, but allows access to code and its modification. The Enterprise version exists in order to get an economic benefit of Pandora FMS's development. The Enterprise version, includes professional support, upgrades and automatic manteinance through Open Update Manager system. For more information, please visit Pandora FMS's commercial site at http://pandorafms.com.
The difference between OpenSource version, licensed under GPL, which features almost 90% of the sourcecode, and the Enterprise version, under a special open source license, doesn't conflict with GPL, since the enterprise code was made from scratch, that is, it doesn't base on any previous code. It uses libraries from Pandora FMS, licensed under LGPL.
All Enterprise funtionalities are perfectly "delimited", which means that what today is OpenSource under GPL will ALWAYS be GPL (by the very nature of GPL license). So should not be any kind of worries about the future of the OpenSource version of Pandora FMS.
The unique features provided by de Pandora FMS's Enterprise version are listed here:
1.5.1. Open Update Manager connected to ÁrticaThe Open Update Manager connected to Artica server allows that Pandora FMS will be always updated with the new functionalities and patches. It also allows to have access to the manufacturer module library.
Page 17
Pandora FMS Enterprise
1.5.2. Report programmerPandora FMS Enterprise has a report programmer that can send any report to mail the specified day. The reports could be also recurrents and be sent every week, month, six weeks, etc. The report format that will be sent is the standard PDF.
1.5.3. DashboardThe Dashboard is a main screen throughly customizable, with several flaps and several customizable frameworks with information about the system and of the monitored equipments. The frameworks could be moved through the screen with the mouse, dragging them and dropping. Each user defines his own Dashboard.
1.5.4. Agents remote configuration In the Pandora FMS Enterprise version it's possible to modify the configuration of any to the agents installed from the Web Console. This allows to add or remove modules to the agent, change the Pandora FMS server IP address, the interval, the connection port and any other configuration option of it.
1.5.5. Monitoring policy management Thanks to the policies new feature, it is possible to create policies that gather monitoring (modules and alerts) for after apply them to an agent or a group of software agents, that would add those modules to its configuration to start given this information of the policy. By modifying a policy, these changes are done in a global way in all the agents that had agree to this policy, allow the uniformity of the monitoring policies in a big number of systems in an easy way.
1.5.6. Export ServerThe Export Server gives the data scaling functionality, so it would be possible an installation throughly distributed in a display at great scale between the same building, several headquarters and even at different countries. The different Pandora FMS installations collect data from a Central Pandora FMS that is in charge of the redistribution of the information at the installations that depends on it.
1.5.7. Inventory Server It is used to obtain, in a remote way or through agents, information of the agents inventory, such as the installed software, patches, execution services, RAM modules installed, network cards, hard disks, processors, etc.
1.5.8. Transactional WEB Monitoring This new feature is used to do complex verifications of web sites (Http and https). Thanks to these verifications that allow the use of credentials, GET/POST form parameters, and of course comprehensive transactional surfing(several consecutive steps to reach one point),allows two sorts of verifications:
• Validation: Checking that all steps are followed correctly and that we obtain the expected result.
• Load time: Checking the previous step and measuring the average response times in a simultaneous request set.
Page 18
Pandora FMS Enterprise
1.5.9. Advanced SNMP traps monitoring
• Traps forwarding to the agents • Traps redefinition through MIBS and manual redefinition of user.
1.5.10. Report wizard The new report editor, includes a enterprise section which allow users to define it's own first page, based on a richtext editor, which allow to include images and userdefined layout. This includes the autogeneration of a table of contents, and a wizard to add great ammounts of graphs, or any other information in a very easy and quick way.
1.5.11. Metaconsole The new metaconsole mode allow to operate several independent Pandora FMS from a single console, reviewing it's data on a centralized, summarized way, allowing also a simple "delegated" authentication. With this model, you can have an "array" of Pandora Fms, without limits of managed devices (thousands).
1.5.12. Enterprise Access Control Levels New Enterprise ACL system, to implement lowlevel access to each page/section of Pandora FMS console. This allow to define what exactly can view/do a user, even the own administrator.
1.5.13. Monitorización de servicios Service monitoring, based on a weighted ponderation of a list of individual monitors. This will allow to create new monitors based on the dynamic sum of a list of items depending of it's status.
1.6. Quick Guides
Quick guides are available to help in the set up of Pandora FMS and to start simple monitorings with the tool. Quick guides for installation of agent software are also available both for GNU/Linux and Windows. Check the quick guide page for more information about these guides.
1.7. Documentation's description
The documentation for Pandora FMS 3.x is structured for step by step learning of needed terms.
1. In the installation chapter, minimal requirements are mentioned, and it explains in detail how to install Pandora FMS in both Ubuntu/Debian and SUSE. Uninstalling process is also mentioned.
2. In the configuration chapter, the whole configuration processes for server, console and agents, are explained, being the latter more exhaustive.
3. The next chapters comment on how to monitor with Pandora FMS for each check, the tool is capable of verifying.
4. The alert chapter explains in detail what they are, how they work, how to configure them and how to assign them.
5. The policy chapter describes what this Pandora FMS Enterprise's new feature is and how it works.
Page 19
Documentation's description
6. The automatic network discovery chapter explains the automatic network recognition (recon) server.
7. The inventory chapter comments on what the inventory server is good for and how it works. 8. The Enterprise version's dashboard has its own chapter as well, where it's operation is
described. 9. The export server chapter describes the operation of this server, with data export examples. 10.The chapter dedicated to the management of Pandora FMS explains all tool's aspects,
needed to have an absolute control on it. Users, ACL, database management, incidents, events, menssages, system's audit log, etc.
11.There's also a chapter which comments on the extensions for Pandora FMS's console, explains the existing ones and provides some directions on development of new ones.
12.The tool's manteinance, for both, the history log and the database itself, is documented in its own chapter.
13.There's a specific chapter for Pandora FMS's configuration in high availability (HA) mode. 14.The last chapter is dedicated Pandora FMS's development and enhancement, with the
needed documentation for creating agent and server addons.
On top of that, there's an ample set of annexes, that will be enhanced in the future, specific to technical topics such as the fine tuning of MySQL's configuration, Plugin construction, etc.
1.8. About Pandora FMS
The original Pandora FMS project starts in year 2003. Nowadays therea are plenty working on it and the project is leaded and financed by Ártica Soluciones Tecnológicas. We'd like to thank for the collaboration of all people who help and helped in translation, graphic design, and bug hunting tasks, and those who provided ideas.
Please, visit the official project's WEB page [1] for a complete list of contributions.
Pandora FMS is open source, and is covered by GPL versión 2 license. To know the latest changes, please, visit the official PandoraFMS project's page at Sourceforge [2]
Page 20

About Pandora FMS
2 PANDORA FMS'S ARCHITECTURE
Page 21

Pandora FMS's Architecture
Global sketch of Pandora FMS 3.0's architecture:
Pandora FMS is extremely modular and decentralised. The most vital component and the place where everything is stored is the database (currently only MySQL is supported). All Pandora FMS components can be replicated and work in a pure HA (Active/Pasive) environment or in a clusterized (load blanced Active/Active) one. MySQL can also work in cluster mode.
Pandora FMS consists of diverse elements. Among them, the ones that take care of collecting and processing data are the servers. Servers, in turn, feed the collected and processed data into the database. The console is the part in charge of showing the data present in the database. The Agent Software are applications that run in the systems, and collect the information to send it to the servers.
Next, each component will be described in detail.
2.1. Pandora FMS Servers
The Pandora FMS servers are the elements in charge of performing the existing checks. They verify them and change their status depending on the results. They are also in charge of triggering the alerts established to control the status of data.
Pandora FMS's data server can work in high availability and/or load balancing modes. In a very large architecture, various Pandora FMS servers can be used at the same time, in order to handle large volumes of functionally or geographically distributed information.
Pandora FMS servers are always on and permanently verify if any element has any problem and it is defined as alert. If this happens, it will execute the action defined in the alarm, such as sending an SMS, an email, or triggering the execution of a script.
Simultaneous servers can coexist, one of them is the master server and the rest are slave servers. Despite the existance of a master server, all work simultaneously. The difference between those is that when a server of the same type crashes (e.g. a network server) the master server takes care of processing all data associated to the fallen server.
Page 22
Pandora FMS Servers
The server which gets the datafile from the agent, or which processes the information (if it is remote), is the one that triggers the alerts associated to these data it has just processed.
Pandora FMS automatically manages the status of each server, its load level and other parameters. The user can monitor the status of each server in the server status section of the web console.
There are ten different, specialised servers in Pandora FMS 3.x, in change of the previously mentioned tasks. All ten servers are integrated in one single application, generically named "Pandora Server" that is a multithread (multiprocess) application which executes in sepparated subprocesses (threads) each of the instances or Pandora FMS's specialised servers. Next, each one of Pandora FMS's specialized servers is described:
2.1.1. Data Server Processes the information sent by the software agents. The software agents send XML data to the server by means of different send methods (FTP, SSH, or Tentacle) and the server periodically verifies if it has new datafiles waiting to be processed. This process uses a directory in the hard drive as "queue" of elements to be processed.
Different data servers can be installed in different systems or in the same host (they will then be different virtual servers). Various servers can work together for very big environments in need of better leverage of hardware (e.g. in cases of multiCPU environments).
The dataserver as the rest of servers do accesses Pandora FMS's database, which is shared with the Web server, and which stores the chunks of processed data. The server executes as demon or service and processes the chunks stored in its file system. Despite its simplicity and scant resource consumption, the data server is one of the system's critical elements, since it processes all agent information, and generates alerts and system events according to these data. The data server only works with data arrived as XML from the software agents and doesn't perform any remote check.
2.1.2. Network ServerExecutes remote monitoring tasks through the network: ICMP tests (Ping, latency times), TCP requests and SNMP requests. When an agent is assigned to a server, it gets assigned to a network server, not a data server. So it is very important for machines executing network servers to have «network visibility» in order to be able to execute the network monitoring tasks assigned to them. That means that, if it is going to do pings to systems in a certain network, the network server needs to be able to reach that network:
For example, if a module is created to perform a ping check against 192.168.1.1 and this agent/module gets assigned to a 192.168.2.0/24 network server with no access to network 192.168.1.0/24 it will always return DOWN, since it cannot contact it.
2.1.3. SNMP Server (a.k.a. SNMP Trap Console)
This server uses the standard trap relocation system demon, snmptradp. This demon recieves SNMP traps and Pandora FMS's SNMP server processes them and stores them in the database. As it processes and analyses them, it can also trigger the alerts assigned in the SNMP console of Pandora FMS.
2.1.4. WMI ServerWMI is a Microsoft standard for obtaining information about the operating system and applications under Microsoft Windows environments. Pandora FMS has a dedicated server for submitting native
Page 23
Pandora FMS Servers
WMI calls in a centralised fashion. With it, data from Windows systems can be collected remotely and agentless.
2.1.5. Recognition ServerUsed for regular network exploration and detection of new working systems. The recon server can also apply a monitoring template for those systems recently detected, and automatically apply the default modules defined in that template in order to immediately enable them to be used for monitoring the new system. Using the system applications nmap, xprobe and traceroute, it is able to identify the systems by their operating system, depending on the open ports, and establish the network topology basing on the already known systems.
2.1.6. Plugins ServerPerforms complex user checks developed in any languaje and integrated in Pandora FMS's interface, and centrally managed. This enables the advanced user to define her own complex tests, developed by herself, and integrate them in the application so they can be used in a convenient and centralised manner from within Pandora FMS.
2.1.7. Prediction ServerIt is a small AI (artificial intelligence) component that implements in a statistical way a data prediction based in past data —with a depth of up to 30 days in four temporal references— and which allows to predict the values of a metric in an interval of 1015 minutes, and detect if a data is currently odd compared to its history. It basically builds up a dynamic baseline with a weekly profile.
2.1.8. WEB Test Server(Goliat)
(Only Enterprise version)
The WEB Test Server is used for load test. It does synthetic WEB checking, this is,full web checking, from the identification process of an user, parameter passing through form, checking of contents, surfing menues, etc. It is used to checking test (it works, doesn't work) and to obtain latency times of the surfing complete experience (including resources associated to the pages (images, full texts, etc).
2.1.9. Export Server
(Only Enterprise Version)
Pandora FMS export server allows to export data of a monitored device from one Pandora FMS installation to another one and this way to have the data replicated. This is specially useful when there is a big display, with several Pandora FMS installations and we want to have some specific information centralized at only one.
2.1.10. Inventory Server
(Only Enterprise version)
The inventory Server obtains and visualize information about the systems inventory: installed Software, installed patches, memory chips in hardware, hard disks, services running in the system, etc. You can obtain this information both in a remote way or in a local way , through Software Agents.
Page 24
Pandora FMS's Web Console
2.2. Pandora FMS's Web Console
It's Pandora FMS's user interface. This administration and operation console allows different users, with different privileges, to control the status of the agents, see statistical information, generate graphs and data tables as well as manage incidences with its integrated system. It is also capable of generating reports and centrally defining new modules, agents, alerts and creating further users and profiles.
The web console is coded in PHP and doesn't require the final user to install any other additional software: neither Java, nor ActiveX. Never the less, graphs are also available in FLASH and in order to display them in this format, the FLASH plugin for her browser will be necessary; it can be accessed from any modern plattform supporting HTML and CSS. Firefox 2.x or IE 7.x are recommended, since the user experience with browsers like IE6 is very poor and most of the advantages implemented in Pandora FMS 3.0's WEB Console get lost.
The web console in turn, can run on multiple servers, that is, we can have as many web consoles as we like, either for load balancing or to easy the access due to logistic problems (huge networks, many different user groups, geographical differences, administrative differences, etc.). Its single requirement is to be able to access to the data container where Pandora FMS stores everything: the database, and in case of enterprise version, synchronous access (via NFS) to the agents' configuration repository.
2.3. Pandora FMS's Database
Pandora FMS uses a MySQL database. Pandora FMS keeps an asynchronous database with all recieved data, performing a temporary cohession of all what it recieves and normalising all data from the diverse origin sources. Each data module of each agent generates an input for each packet, which means that a real production system can have about ten millons of «data», or information atoms.
These data are automatically managed by Pandora FMS, performing a periodic and automatic manteinance of the database. This enables Pandora FMS's to not require any kind of database administration nor any manual operator or administrator assisted process. This is achieved by means of a periodic data purge once a certain date is reached (90 days by default), as well as a compactation of data over a certain configurable age (30 days by default).
2.4. Pandora FMS's Software Agents
Whenever one talks of an agent in Pandora FMS one could mean three fundamental building blocks in data harvest:
• Agent • Software Agent (Software application, Pandora FMS Agent that runs in a machine). • Physial Agent (hardware)
2.4.1. Agent The "plain" Pandora FMS's agent is simply an organisational element created with the Pandora FMS's web console, that is associated with a group of modules (or individual monitoring elements). On top of that, this agent could (optionally) have one or more IP addresses associated.
The agent can have remote modules associated, obtained via network, WMI, Plugin, etc servers.
• Checks on wheather a machine in turned on or online (PING) • Checks on wheather any port is open or closed
Page 25
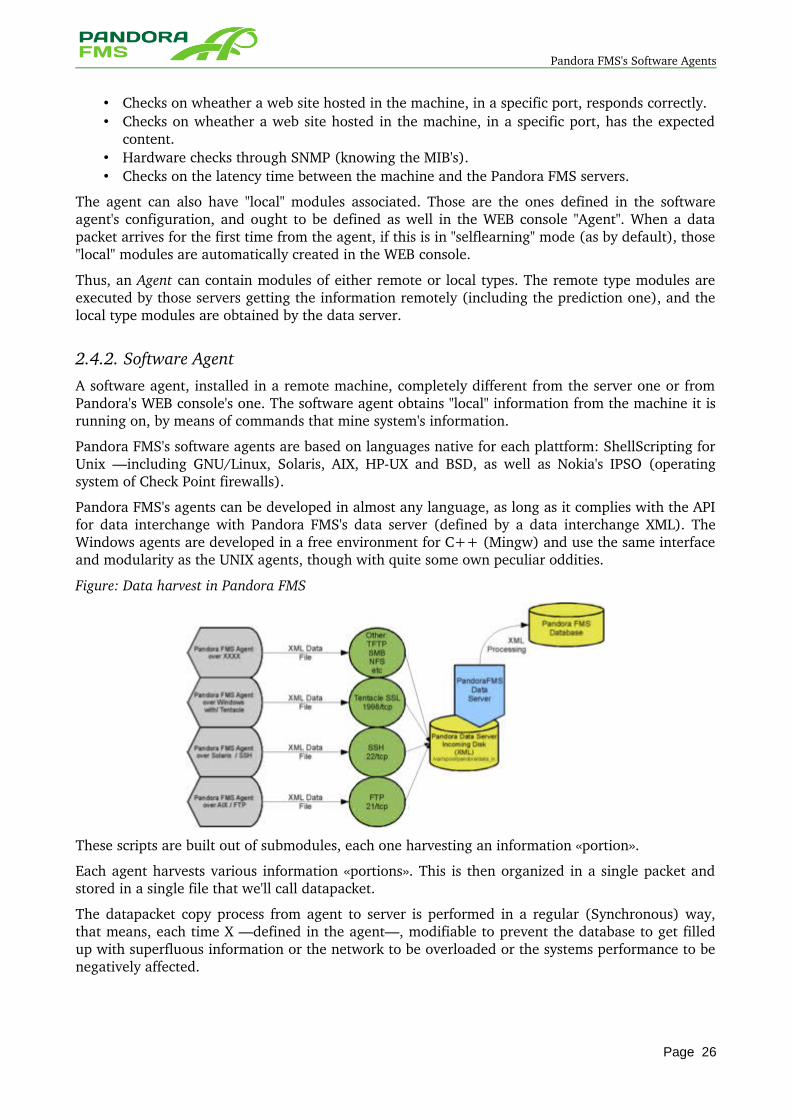
Pandora FMS's Software Agents
• Checks on wheather a web site hosted in the machine, in a specific port, responds correctly. • Checks on wheather a web site hosted in the machine, in a specific port, has the expected
content. • Hardware checks through SNMP (knowing the MIB's). • Checks on the latency time between the machine and the Pandora FMS servers.
The agent can also have "local" modules associated. Those are the ones defined in the software agent's configuration, and ought to be defined as well in the WEB console "Agent". When a data packet arrives for the first time from the agent, if this is in "selflearning" mode (as by default), those "local" modules are automatically created in the WEB console.
Thus, an Agent can contain modules of either remote or local types. The remote type modules are executed by those servers getting the information remotely (including the prediction one), and the local type modules are obtained by the data server.
2.4.2. Software AgentA software agent, installed in a remote machine, completely different from the server one or from Pandora's WEB console's one. The software agent obtains "local" information from the machine it is running on, by means of commands that mine system's information.
Pandora FMS's software agents are based on languages native for each plattform: ShellScripting for Unix —including GNU/Linux, Solaris, AIX, HPUX and BSD, as well as Nokia's IPSO (operating system of Check Point firewalls).
Pandora FMS's agents can be developed in almost any language, as long as it complies with the API for data interchange with Pandora FMS's data server (defined by a data interchange XML). The Windows agents are developed in a free environment for C++ (Mingw) and use the same interface and modularity as the UNIX agents, though with quite some own peculiar oddities.
Figure: Data harvest in Pandora FMS
These scripts are built out of submodules, each one harvesting an information «portion».
Each agent harvests various information «portions». This is then organized in a single packet and stored in a single file that we'll call datapacket.
The datapacket copy process from agent to server is performed in a regular (Synchronous) way, that means, each time X —defined in the agent—, modifiable to prevent the database to get filled up with superfluous information or the network to be overloaded or the systems performance to be negatively affected.
Page 26
Pandora FMS's Software Agents
The interval is set by deafault to 300 (seconds), which equals five minutes. Values under 100 (seconds) are disrecommended, since thay could affect the performance of the host system, on top of overloading the database and the central processing system.
The fact that Pandora FMS is no real time system should be kept in mind. It is a general pourpouse monitoring system for applications and systems in environments where criticity relies elsewhere to real time. Never the less Pandora FMS can indeed be tuned to work in environments of response time near to 35 seconds.
The packet transfers are performed through Tentacle protocol, but can as well be transferred using SSH or FTP.
The process can be made totally secure either with SSH as with Tentacle, since no passwords or unencrypted confidential data are sent through the network. Confidentiality, integrity and connection authentication of connections between agent and server are assured. The key generation process, needed for the automatic transfer via SCP (SSH) and also via Tentacle protocol, is described in detail in the documentation about installation and configuration of Agents and Server.
The transfer can also be performed via FTP or any other file transfer system. Tentacle was chosen due to the security this system offers, its user friendlyness and its multiple options.
Check the documentation annexes for configuration of transfers via other protocols.
Pandora FMS's agents are concieved for execution in the agent from which they harvest data, though agents can collect information from machines accesible to the host they are installed, this is called Satellite Agent.
A machine can also been configured to simultaneously have various Pandora FMS's agents. This is a rather strange case, it happens when for example, we have a software agent and a satellite agent. The standard software agent monitors the machine it runs on, whereas the satellite agents it may have installed (could have several) monitor remote systems, by means of Telnet, SNMP or other propietary commands.
2.4.3. XML Datafile The datafile has following syntaxis:
<nombredehost>.<nº de serie>.data
This datafile is an XML structure and its name is composed combining the host name where the agent resides, a serial number, unique for each datapacket and the extension .data which points out that this is a data packet.
<nombredehost>.<nº de serie>.checksum
The datafile is the one with extension .data. The verification file, with extension .checksum contains an MD5 hash of the datafile. This allows to perform a last verification to make sure that data haven't been altered in any way prior to be processed.
The XML datafile generated by the agent is the heart of Pandora FMS. It contains a data packet with the information collected by the Agent. This data packet has a compact, flexible and light design that enables any user to use the Pandora FMS's agents or her own developments to generate information and let it be processed by Pandora FMS. The datafile is an XML similar to the following:
<agent data os_name=”SunOS” os_version=”5.8” timestamp=”300” agent_name=”pdges01”
Page 27
Pandora FMS's Software Agents
version=”1.0”> <module> <name>FTP Daemon</name> <type>generic_proc</type> <data>0</data> </module> <module> <name>DiskFree</name> <type>generic_data</type> <data>5200000</data> </module> <module> <name>UsersConnected</name> <type>generic_data_inc</type> <data>119</data> </module> <module> <name>LastLogin</name> <type>generic_data_string</type> <data>slerena</data> </module> </agent_data>
2.4.4. Physical Agent Pandora FMS has a physical agent built on top of an Asus router and an Arduino automat. This tandem together with the plugged sensors, achieves, for the moment, to monitor following environmental properties:
• Humidity • Temperature • Environmental illumination • Presence
Being electronic, sensors are easily measurable, and their values are also easily processable by Pandora FMS.
The fact of the sensor being a wireless enabled router opens up a world of possibilities for this kind of sensors, already deployed in some enterprise DPC's (data processing centers) of Spain.
Page 28

Pandora FMS's Software Agents
3 PANDORA FMS INSTALLATION
Page 29
Minimum Hardware Requirements
3.1. Minimum Hardware Requirements
3.1.1. Console and Server Requirements
• Up to 500 agents or 5.000 modules: 2GB of RAM, a singlecore CPU at 2GHz clock, and a fast hard disk, 7200rpm or equivalent.
• Up to 2.000 agents or 10.000 modules: 4GB of RAM, a dual core CPU clock to 2.5GHz, and faster hard drive (7200 rpm or more).
• For more than 4.000 agents: 12GB of RAM, a quadcore CPU to 3GHZ and very fast hard drive (15,000 rpm or more).
3.2. Software Requirements
3.2.1. Agent Requirement The remote agent is able to run on any hardware that can run the minimum required operating system:
• Windows 2000 SP3 • Windows 2003 • Windows XP • Windows Vista • Windows 7 • Windows 2008 • SUSE Linux 10 • Ubuntu Linux 8.04 • Debian Linux • AIX 4.3.3 • HPUX 11.x • Solaris 2.6
It is known that the agent has been implemented successfully in other operating systems, but there is no official support. The agent does not work in Windows NT4. To monitor previous Windows systems, you can install Cygwin environment and install the agent for Linux, although the performance is much lower than native Windows agent.
3.2.2. Server Requirements Although you can work on any operating system with Perl 5.8 installed with iThreads enabled, it's recommended and is supported only on Linux, being the recommended distributions SUSE (SLES or OpenSuse) and Ubuntu / Debian. There have been people who have it working under BSD and Solaris systems.
Should be noted that Pandora FMS requires a MySQL server to store all information. This server can be installed on any platform supported by MySQL. This could be Windows, Linux, Solaris, etc.
It must have Perl 5.8 installed, at least for the server works well. In addition to the operating system SNMP packets (netsnmp) to use the Pandora FMS SNMP service, it also requires a database (MySQL). Also required nmap packages and optionally xprobe2 to use the advanced features of
Page 30
Software Requirements
reconserver and traceroute Perl libraries to be able to selfdiscovery network. It is also necessary, the WMI client binary for WMI queries against Windows systems. The client binary is part of the SAMBA project (v4) and can be compiled, not without some difficulty in any Unix environment.
3.2.3. Console Requirements As the server, we recommend its operation on Linux systems, but like the web interface it's a pure AMP application (Apache, MySQL and PHP), theoretically it could work on any system that supports Windows, Unix, etc..
3.2.4. Requirements to Administer the Tool via WEB It must have a web browser to install and verify operations of the console. To start it is not required flash plugin installed in your browser, although it is recommended to make use of interactive graphics in Flash.
3.2.5. Package Dependencies Pandora FMS has a big dependency of Linux operating system, but also needs additional packages that often are not installed by default. In the installation process there are a detailed list of package dependencies for Debian / Ubuntu and OpenSUSE.
3.3. Issues before installation
3.3.1. Pandora FMS installation orderYou should follow this order to install properly Pandora FMS:
1. Install console 2. Install server
The reason is because the MySQL database configuration is made during the Initial Configuration fase of the console installation and for be sure the properly work of the server is recommended do first the whole installation process of the console.
Also, Pandora FMS server and Pandora FMS console could be hosted in different machines, because you can configure the server to use a remote MySQL database through the server configuration file.
About the agent, you can install it before or after install the server and the console, because the agent works independently and it can be installed in any machine.
3.4. Installing on SUSE
3.4.1. Configuring Software repositories The installation of software on SLES is done via .RPM packets. These RPM packets can contain official software, provided by the manufacturer Novell , through the installation DVD/CD, HTTP / FTP repositories or other nonofficial repositories, maintained by the community of developers and users of SUSE (OpenSUSE). These repositories can only be accessed through the internet, but the individual RPM packages can be downloaded, copied to servers and installed manually by command line.
Page 31
Installing on SUSE
SLES uses a general management interface YAST for package management and software repositories. This interface is used to manage the entire system SLES: disk partition, install software, configure the network cards, etc... It can be used with graphical interface (X) or any console or remote session via SSH.
For this documentation we use the Zypper Suse tool, able to solve dependencies and download the packages directly from the repositories on the Internet. If you don't have Zypper installed, you should install it, is much more convenient and faster. If not, you will have to do all the manual installation of packages using YaST and SUSE installation CD.
3.4.2. Previous Dependencies Installation You have to install the following package dependencies, included in SUSE:
apache2 apache2-mod_php5 php5 php5-gd php5-gettext php5-json php5-mbstring php5-ldap php5-mysql php5-pear php5-snmp nmap perl-DBD-mysql perl-DBI perl-Date-Calc perl-Date-Manip perl-HTML-Parser perl-HTML-Encoding perl-HTML-Tree perl-IO-Socket-Multicast perl-Mail-Sendmail perl-NetAddr-IP perl-SNMP perl-TimeDate perl-XML-Simple perl-libwww-perl mysql-client mysql-Max mysql net-snmp xorg-x11-fonts-core php5-pear-db
To install all dependencies, run:
zypper install ..
Followed by the whole package list specified in the paragraph above. This will give you a screen like this:
Getting repositories data...Reading packets installed...perl-DBI already installed.perl-HTML-Parser already installed.perl-TimeDate already installed.perl-XML-Simple already installed.perl-libwww-perl already installed.xorg-x11-fonts-core already installed.Resolving dependencies...
Following NEW packages will be installed: apache2 apache2-mod_php5 apache2-prefork apache2-utils libapr1 libapr-util1 libdnet1 liblua5_1 libmm14 libmysqlclient15 mysql mysql-client mysql-Max net-snmp nmap perl-Bit-Vector perl-Carp-Clan perl-Data-ShowTable perl-Date-Calc perl-Date-Manip perl-DBD-mysql perl-HTML-Encoding perl-HTML-Tree perl-IO-Socket-Multicast perl-Mail-Sendmail perl-NetAddr-IP perl-SNMP php5 php5-ctype php5-dom php5-gd php5-gettext php5-hash php5-iconv php5-json php5-ldap php5-mbstring php5-mysql php5-openssl php5-pdo php5-pear php5-snmp php5-sqlite php5-tokenizer php5-xmlreader php5-xmlwriter php5-zlib t1lib
Total Size: 19.1 M. After the operation, additional 55.9 M will be used. Continue? [Yes / no]:
Page 32
Installing on SUSE
By clicking YES, Zypper start downloading and installing packages.
When finished, you need to install some extra packages. In OpenSuse not all packages you need for Pandora FMS exist, so they are provided some additional RPM to satisfy these dependencies, these files. Additional rpm are:
perl-time-format php-pear-xml_rpc wmic smstools
Optionaly and only if you will use Recon Server you should install these packages:
perl-net-traceroute perl-net-traceroute-pureperl xprobe2
These RPM files can be found on the official site of distribution of Pandora FMS software in a specific dependencies directory for OpenSuse.
NOTE: Be sure you download the correct packages for OpenSuse.
Place them in a directory, for example /tmp/extra. In that directory run the command:
rpm -i *.rpm
3.4.3. Agent InstallationYou should have download from our web site a RPM package similar to this one ( some version number or another details could be slightly different):
pandorafms_agent-3.0.0-1.noarch.rpm
In order to install it, simply execute this command:
rpm -i pandorafms_agent-3.0.0-1.noarch.rpm
If these phrases are shown:
Insserv:warning:script 'smsd' missing LSB tags and overrides Insserv:defaultstart undefined, assuming default start runlevel (s) for script 'smsd'.
Do not worry. It is only a warning message. It is not an error.
3.4.4. Server installation Same as with the agent.Execute:
rpm -i pandorafms_server-3.0.0-1.noarch.rpm
If you have previously installed the agent, then you will obtain the following not important warning:
useradd: Account `pandora' already exists.
Page 33
Installing on SUSE
3.4.5. Console installation
Same as before, execute the rpm installation tool for packages in order to install the package that contains the Pandora FMS console:
rpm -i pandorafms_console-3.0.0-1.noarch.rpm
If you have any trouble installing Pandora FMS console caused by a wrong package name, something like this:
error: Failed dependencies:php5-pear-db is needed by pandorafms_console-3.1-1.noarch
You can force the installation using the flag nodeps.
3.4.6. Installing the Enterprise version
Same way, execute the rpm package installing tool to install the package that contains the Enterprise version and the Pandora FMS Enterprise server:
rpm -i pandorafms_console_enterprise-3.0.0-1.noarch.rpmrpm -i pandorafms_server_enterprise-3.0.0-1.noarch.rpm
You should restart the Pandora FMS server in order to detect the Enterprise version new functionalities:
/etc/init.d/pandora_server restart
3.4.7. Updating packages with RPM First you should know if it's an update or a reinstall. For this, first check the package version that is installed in your system:
rpm -q -a | grep pandora
If you have installed pandora's packages, they will be shown as a list of the package name and version, e.g:
pandorafms_console-3.0.0-1
This means that you have the "pandorafms_console" package in version "3.0.01". If you want to install the same version that you have already installed, you can "reinstall" writting the command:
rpm -i --force <nombre_paquete.rpm>
Sometimes "updates" of version with the same name and same number are releases (so they are development corrections, etc). For this, you should have to reinstall, forcing the installation with force.
Page 34
Installing on SUSE
If it is the same package, but from a high version, you can update it with this command:
rpm -U <nombre_paquete.rpm>
To force an update of a version that you have already installed, same very similar to the reinstallation, but that will keep your original files if they have been modified and the new version will have the same version that the packages that you installed in first place, you can force the update:
rpm -U --force <nombre_paquete.rpm>
Be specially careful before reinstalling or updating any package and do security copies of:
• /etc/pandora/pandora_server.conf: En el caso del paquete del servidor de Pandora FMS. • /etc/pandora/pandora_agent.conf: En el caso del paquete del agente Pandora FMS.
3.4.8. Installing the Keygen The Keygen binary is needed to could use the automatic update feature of the Enterprise version. It consist on a binary that codes, using a GNUPG (PGP)key a list of data composed by their ID an the nº of agents that it has, sending them encoded to the Pandora FMS Open Update Manager central server to it validates its authenticity.It it is OK, then you Update Manager client will be able to download all the updates that he needs.
To install the keygen, you have only to install a package and configure your Pandora FMS console in order that it uses the keygen in this location:
/usr/share/pandora/keygen
To add the package, same as with the rest of packages:
rpm -i pandorafms_keygen-3.0.0-1.rpm
3.4.9. Uninstalling Pandora FMS You could uninstall any of Pandora FMS components with the following commands:
rpm -e pandorafms_agentrpm -e pandorafms_consolerpm -e pandorafms_server
Pandora FMS database will be not uninstalled if any of the Pandora FMS packages are unistalled. All files ( also the configuration ones) from any package will be eliminated.
Page 35
Installation in Red Hat Enterprise Linux
3.5. Installation in Red Hat Enterprise Linux
3.5.1. Previous Dependencies Installation When you finish installing all the dependencies, you should install some extra packages. In Red Hat there are not all the packages you need for PAndora FMS, so there are provided RPM's packages to satisfy these dependencies, the aditional .rpm files are:
perl-time-format perl-xml-simple perl-io-socket-multicast php-pear-xml_rpc php-pear-db wmic
Optionaly and only if you will use Recon Server you should install these packages:
perl-net-traceroute perl-net-traceroute-pureperl xprobe2
These RPM files can be found on the official site of distribution of Pandora FMS software in a specific dependencies directory for Red Hat Enterprise Linux.
NOTE: Be sure you download the correct packages for Red Hat Enterprise Linux.
Place them in a directory, for example /tmp/extra. In that directory run the command:
rpm -i *.rpm
3.6. Instalation in Debian/Ubuntu
3.6.1. Previous instalation of dependencies In Debian/Ubuntu the dependencies are the following ones:
Server:
snmp snmpd libtime-format-perl libxml-simple-perl libnetaddr-ip-perl libdbi-perl libxml-simple-perl libnetaddr-ip-perl libhtml-parser-perl wmi-client xprobe2 nmap libmail-sendmail-perl traceroute libio-socket-multicast-perl
Console
libapache2-mod-php5 apache2 mysql-server php5-gd php5-mysql php-pear php5-snmp php-db php-gettext graphviz php-pear php5-gettext mysql-client php-db php-xmlrpc
In order to install the Server package or the console one, you will have to fulfill the dependencies before. This should be done installing all the packages before mentioned with the commandaptget, having root priviledges, like this:
apt-get install snmp snmpd libtime-format-perl libxml-simple-perl libnetaddr-ip-perl libdbi-perl \libxml-simple-perl libnetaddr-ip-perl libhtml-parser-perl wmi-client xprobe2 nmap
Page 36
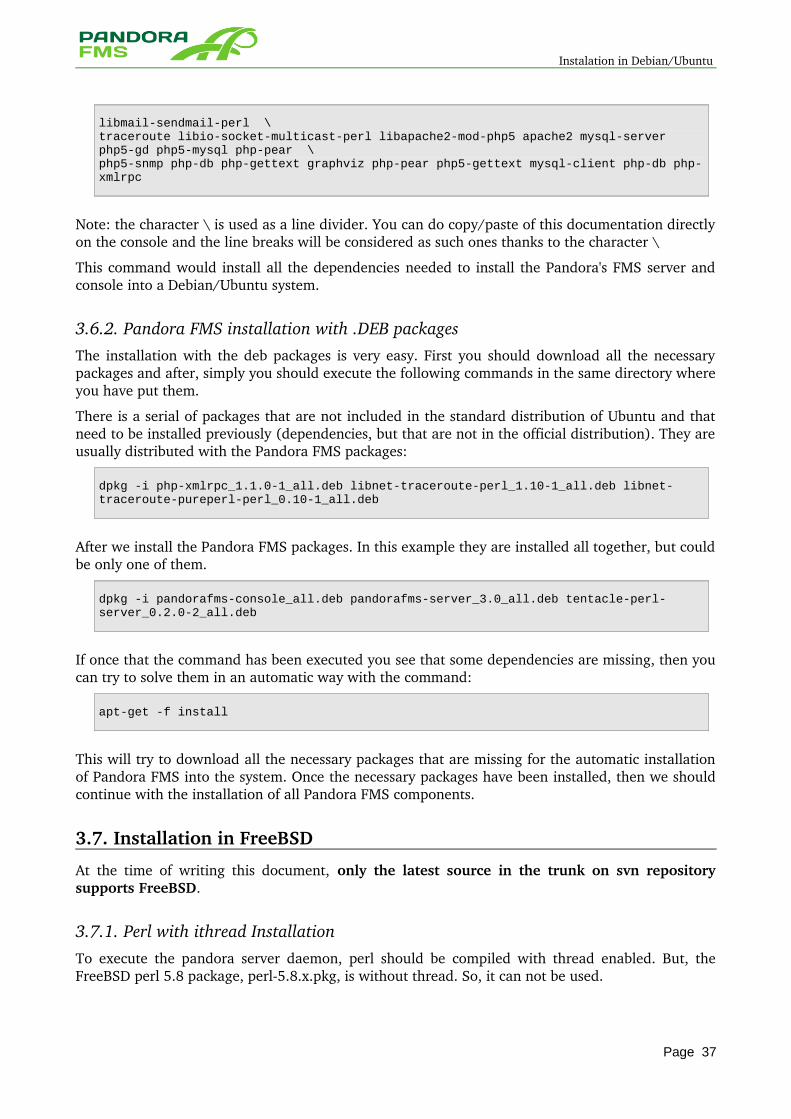
Instalation in Debian/Ubuntu
libmail-sendmail-perl \traceroute libio-socket-multicast-perl libapache2-mod-php5 apache2 mysql-server php5-gd php5-mysql php-pear \php5-snmp php-db php-gettext graphviz php-pear php5-gettext mysql-client php-db php-xmlrpc
Note: the character \ is used as a line divider. You can do copy/paste of this documentation directly on the console and the line breaks will be considered as such ones thanks to the character \
This command would install all the dependencies needed to install the Pandora's FMS server and console into a Debian/Ubuntu system.
3.6.2. Pandora FMS installation with .DEB packages The installation with the deb packages is very easy. First you should download all the necessary packages and after, simply you should execute the following commands in the same directory where you have put them.
There is a serial of packages that are not included in the standard distribution of Ubuntu and that need to be installed previously (dependencies, but that are not in the official distribution). They are usually distributed with the Pandora FMS packages:
dpkg -i php-xmlrpc_1.1.0-1_all.deb libnet-traceroute-perl_1.10-1_all.deb libnet-traceroute-pureperl-perl_0.10-1_all.deb
After we install the Pandora FMS packages. In this example they are installed all together, but could be only one of them.
dpkg -i pandorafms-console_all.deb pandorafms-server_3.0_all.deb tentacle-perl-server_0.2.0-2_all.deb
If once that the command has been executed you see that some dependencies are missing, then you can try to solve them in an automatic way with the command:
apt-get -f install
This will try to download all the necessary packages that are missing for the automatic installation of Pandora FMS into the system. Once the necessary packages have been installed, then we should continue with the installation of all Pandora FMS components.
3.7. Installation in FreeBSD
At the time of writing this document, only the latest source in the trunk on svn repository supports FreeBSD.
3.7.1. Perl with ithread Installation To execute the pandora server daemon, perl should be compiled with thread enabled. But, the FreeBSD perl 5.8 package, perl5.8.x.pkg, is without thread. So, it can not be used.
Page 37
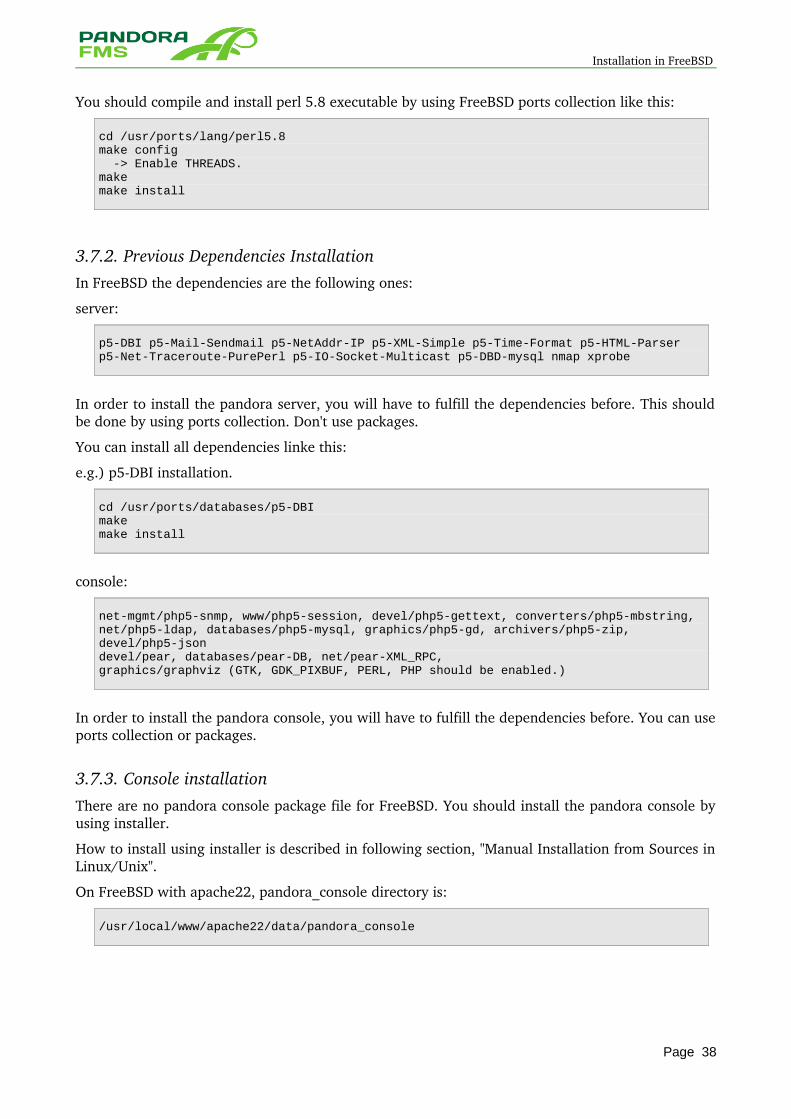
Installation in FreeBSD
You should compile and install perl 5.8 executable by using FreeBSD ports collection like this:
cd /usr/ports/lang/perl5.8make config -> Enable THREADS.makemake install
3.7.2. Previous Dependencies Installation In FreeBSD the dependencies are the following ones:
server:
p5-DBI p5-Mail-Sendmail p5-NetAddr-IP p5-XML-Simple p5-Time-Format p5-HTML-Parserp5-Net-Traceroute-PurePerl p5-IO-Socket-Multicast p5-DBD-mysql nmap xprobe
In order to install the pandora server, you will have to fulfill the dependencies before. This should be done by using ports collection. Don't use packages.
You can install all dependencies linke this:
e.g.) p5DBI installation.
cd /usr/ports/databases/p5-DBImakemake install
console:
net-mgmt/php5-snmp, www/php5-session, devel/php5-gettext, converters/php5-mbstring,net/php5-ldap, databases/php5-mysql, graphics/php5-gd, archivers/php5-zip, devel/php5-jsondevel/pear, databases/pear-DB, net/pear-XML_RPC, graphics/graphviz (GTK, GDK_PIXBUF, PERL, PHP should be enabled.)
In order to install the pandora console, you will have to fulfill the dependencies before. You can use ports collection or packages.
3.7.3. Console installation There are no pandora console package file for FreeBSD. You should install the pandora console by using installer.
How to install using installer is described in following section, "Manual Installation from Sources in Linux/Unix".
On FreeBSD with apache22, pandora_console directory is:
/usr/local/www/apache22/data/pandora_console
Page 38
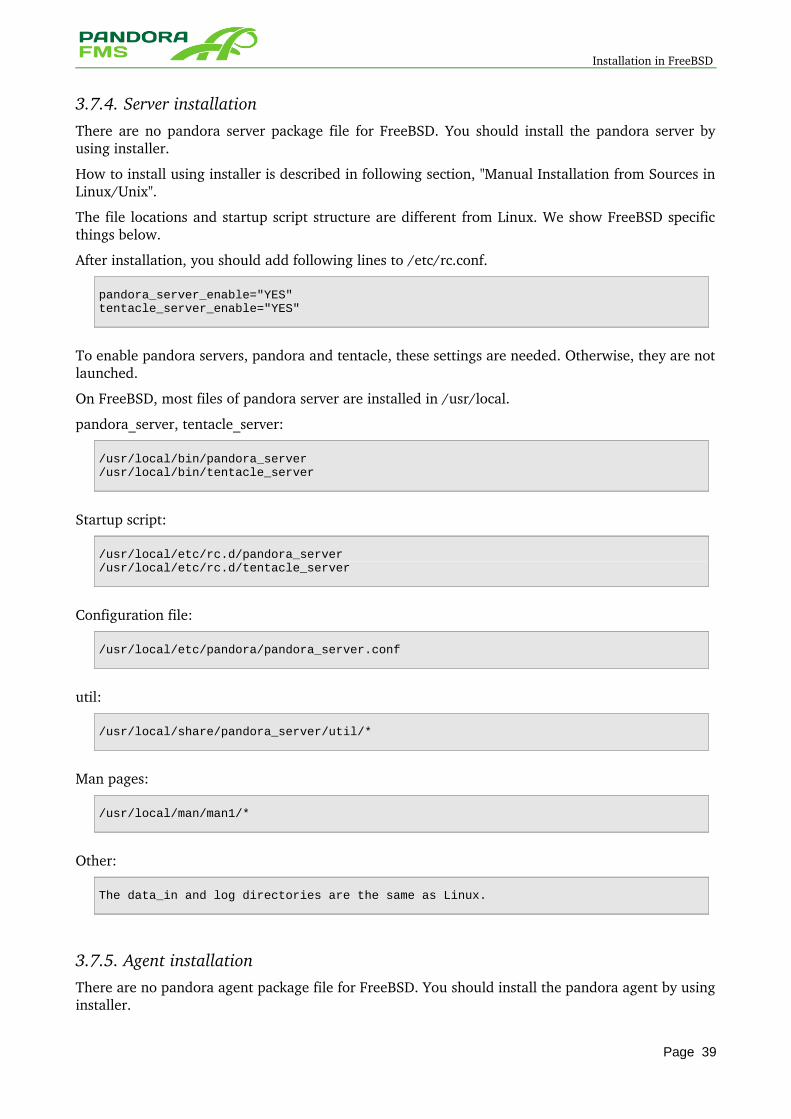
Installation in FreeBSD
3.7.4. Server installation There are no pandora server package file for FreeBSD. You should install the pandora server by using installer.
How to install using installer is described in following section, "Manual Installation from Sources in Linux/Unix".
The file locations and startup script structure are different from Linux. We show FreeBSD specific things below.
After installation, you should add following lines to /etc/rc.conf.
pandora_server_enable="YES"tentacle_server_enable="YES"
To enable pandora servers, pandora and tentacle, these settings are needed. Otherwise, they are not launched.
On FreeBSD, most files of pandora server are installed in /usr/local.
pandora_server, tentacle_server:
/usr/local/bin/pandora_server/usr/local/bin/tentacle_server
Startup script:
/usr/local/etc/rc.d/pandora_server/usr/local/etc/rc.d/tentacle_server
Configuration file:
/usr/local/etc/pandora/pandora_server.conf
util:
/usr/local/share/pandora_server/util/*
Man pages:
/usr/local/man/man1/*
Other:
The data_in and log directories are the same as Linux.
3.7.5. Agent installation There are no pandora agent package file for FreeBSD. You should install the pandora agent by using installer.
Page 39
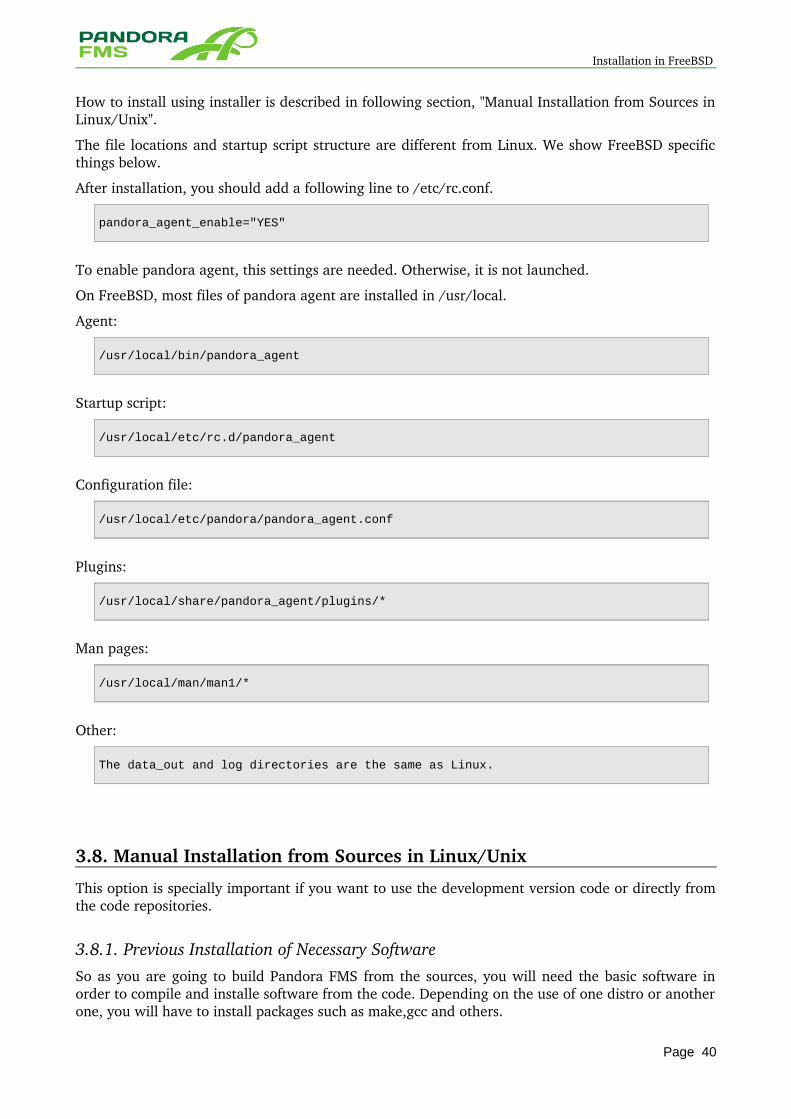
Installation in FreeBSD
How to install using installer is described in following section, "Manual Installation from Sources in Linux/Unix".
The file locations and startup script structure are different from Linux. We show FreeBSD specific things below.
After installation, you should add a following line to /etc/rc.conf.
pandora_agent_enable="YES"
To enable pandora agent, this settings are needed. Otherwise, it is not launched.
On FreeBSD, most files of pandora agent are installed in /usr/local.
Agent:
/usr/local/bin/pandora_agent
Startup script:
/usr/local/etc/rc.d/pandora_agent
Configuration file:
/usr/local/etc/pandora/pandora_agent.conf
Plugins:
/usr/local/share/pandora_agent/plugins/*
Man pages:
/usr/local/man/man1/*
Other:
The data_out and log directories are the same as Linux.
3.8. Manual Installation from Sources in Linux/Unix
This option is specially important if you want to use the development version code or directly from the code repositories.
3.8.1. Previous Installation of Necessary Software So as you are going to build Pandora FMS from the sources, you will need the basic software in order to compile and installe software from the code. Depending on the use of one distro or another one, you will have to install packages such as make,gcc and others.
Page 40
Manual Installation from Sources in Linux/Unix
In debian/ubuntu there is a metapackage that contains all of them:
apt-get install build-essentials subversion
In SUSE/Redhat/Fedora you should install several packages:
zypper install make automake subversion
3.8.2. Download from Sources The easiest way is to download the sources in "tarball" format (.tar.gz, .tgz o .tar.bz2) and decompress them. For it, you should go to Pandora official web site, download section at http://pandorafms.org.
Other interesting option if you want to keep well informed and use the latest code, stable or at development, is using the client from Subversion (svn)code version system.For it you could visit the development version at Pandora FMS official web site project FMS http://pandorafms.org/index.php?sec=community&sec2=development&lang=es.
To download the development version code using the commands line from the SVN client:
svn co https://pandora.svn.sourceforge.net/svnroot/pandora
3.8.3. Agent Installation The agent does not requires neither compilation nor preparation. Once we have the agent pandorafms_3.0_unix.tar.gz
1. Do root
su -
2. Copy to /tmp and at /tmp we should execute:
tar xvzf pandorafms_3.0_unix.tar.gz ./pandora_agent_installer --install
3. We start the agent manually
/etc/init.d/pandora_agent_daemon start
3.8.3.1. Custom agent installation
Starting with 3.1 version, the agent could be installed completely is a custom defined directory, like for example /opt/pandora. This custom defined directory will contain everything agent has: configuration files, logfiles, plugins, and even the man pages.
To use this method:
Page 41
Manual Installation from Sources in Linux/Unix
./pandora_agent_install --install /opt/pandora
The only file pandora will create outside it's defined directory is the main agent service launcher at /etc/init.d/pandora_agent_daemon (or equivalente in other unix kinds), and the startup level link, for example /etc/rc.d/rc2.d/S90pandora_agent_daemon.
3.8.4. Console Installation
Once we have the compressed file with the console that should be named pandorafms_console3.0.0.tar.gz o similar:
1. We do root
su -
2. We copy it to /tmp and at/tmp we execute:
tar xvzf pandorafms_console-3.0.0.tar.gz cd pandora_console./pandora_console_install --install
3.8.4.1. Enterprise Versión
Once we have the file compressed with the console, that will be called pandorafms_console_enterprise3.0.0.tar.gz or similar:
1. We do root
su -
2. We copy it to /tmp and in /tmp we execute:
tar xvzf pandorafms_console-3.0.0.tar.gz
And we copy it to the directory where is installed our Pandora FMS Opensource console, either /var/www/pandora_console for Debian or Ubuntu, or /srv/www/htdocs/pandora_console/ for SUSE, RH, Fedora, etc (or in another directory depending on your distribution).
cp -R enterprise /var/www/pandora_consolecp -R enterprise /var/www/htdocs/pandora_console
Changing the permissions in order that files would be for the web server user, for example wwwdata chown R wwwdata /var/www/pandora_console/enterprise
3.8.5. Server Installation
Once we have the compressed file with the server that will be called pandorafms_server3.0.0.tar.gzor similar:
Page 42
Manual Installation from Sources in Linux/Unix
1. We do root
su -
2. We copy it to /tmp and at y /tmp we execute:
tar xvzf pandorafms_server-3.0.0.tar.gz cd pandora_server./pandora_server_installer --install
If there are problems with dependencies, then we should have to solve them before trying the installation. We could force the installation ignoring the problem with dependencies, but Pandora FMS will not work right.
3.8.5.1. Enterprise Version
Once we have the file compressed with the server,that will be named pandorafms_server_enterprise3.0.0.tar.gz or similar:
1. We do root
su -
2. We copy it to /tmp and in /tmp we execute:
tar xvzf pandorafms_server_enterprise-3.0.0.tar.gz cd PandoraFMS-Enterprise/perl Makefile.PLmakemake install
If the installation has been done with a system with a Pandora FMS OpenSource that is already functioning and we want that it consider the new features or the Enterprise version, we only have to restart the Pandora FMS server:
/etc/init.d/pandora_server restart
If there are problems with dependencies, then we have to resolve them before trying the installation. We could force the installation ignoring the problem with the dependencies, but Pandora FMS will not work or will not work correctly.
3.8.5.2. Uninstallation / Manual wipe from server
If we have installed / updated several different versions, using different installation methods (RPM, Tarball), it could come to a point in which we have various versions mixed up that could be using wrong versions of libraries or of the server itself. The following procedure is aimed at detecting which versions are there and manually erase them:
Binaries should always be in /usr/local/bin, with a link to /usr/bin. To test this simply:
ls -la /usr/local/bin/pandora_serverls -la /usr/local/bin/tentacle_server
Page 43
Manual Installation from Sources in Linux/Unix
ls -la /usr/bin/tentacle_serverls -la /usr/bin/tentacle_server
Pandora's libraries depend on their distribution's version. The following command should allow to know where they are and whether there are various ones:
find / -name "WMIServer.pm"
This will display a complete path where Pandora's library is installed, for example:
/usr/local/share/perl/5.10.0/PandoraFMS/WMIServer.pm
It could happen that various paths are displayed:
/usr/local/share/perl/5.10.0/PandoraFMS/WMIServer.pm/usr/local/share/perl/PandoraFMS/WMIServer.pm
En such case we won't know which one is in use, so our best option is to remove the entire directories and reinstall Pandora FMS:
rm -Rf /usr/local/share/perl/5.10.0/PandoraFMS rm -Rf /usr/local/share/perl/PandoraFMS/
It is always a good idea to backup /etc/pandora/pandora_server.conf, just in case.
3.8.6. Server Code Update:Compilation and Manual Installation of the Server There is another way besides the generic installation script. You could "compile" the Pandora FMS code through the Perl interpreter of its system. This process simply install the libraries and the minimum executables, but does not touch the starting script system , maintenance scripts, configuration or any other thing besides the application and its libraries. This process is the indicated one when has to update the server code but without overwrite its configuration.
For it, decompress your server code in /tmp, such as it has been said in the previous step.
1. We do root
2. We copy to /tmp and in /tmp we execute:
tar xvzf pandorafms_server-3.0.0.tar.gz cd pandora_serverperl Makefile.PLmakemake install
Observe the error exit from the screen. If any dependency is missing or there is any other problem, then the system will notify to you. If you observe a message like this:
Warning: prerequisiete Mail::Sendmail 0 not foundWarning: prerequisiete Net::Traceroute::PurePerl 0 not found
Page 44
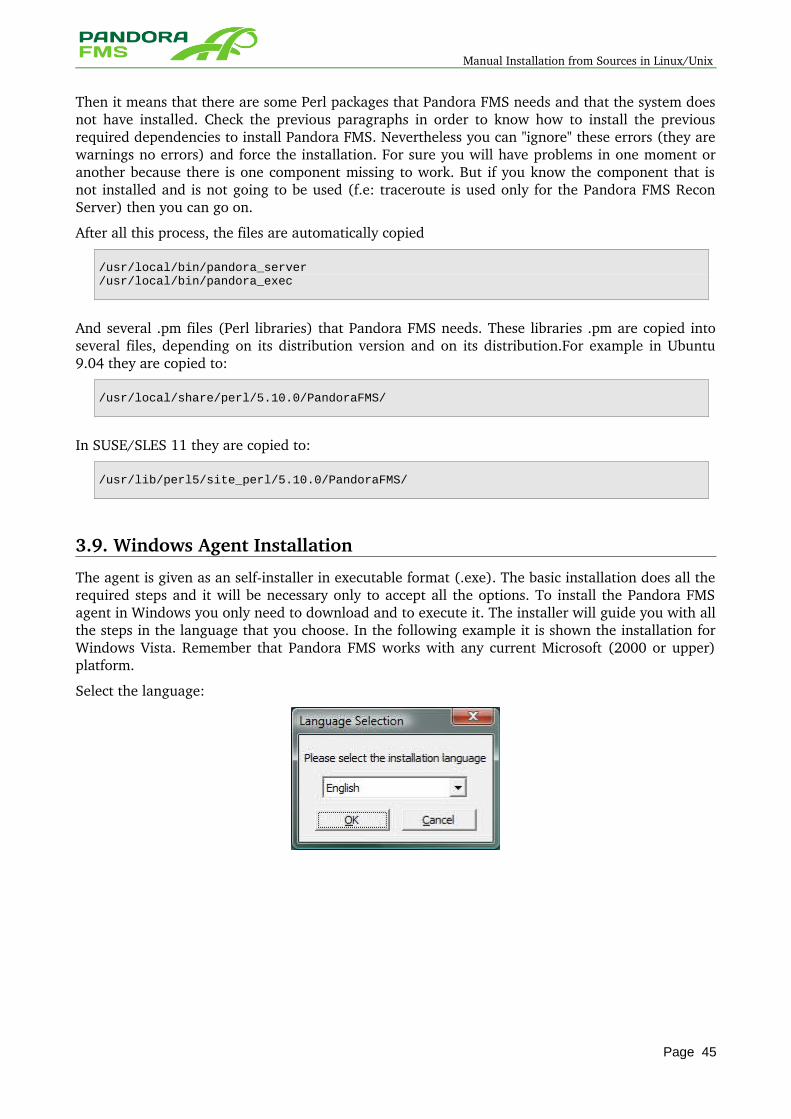
Manual Installation from Sources in Linux/Unix
Then it means that there are some Perl packages that Pandora FMS needs and that the system does not have installed. Check the previous paragraphs in order to know how to install the previous required dependencies to install Pandora FMS. Nevertheless you can "ignore" these errors (they are warnings no errors) and force the installation. For sure you will have problems in one moment or another because there is one component missing to work. But if you know the component that is not installed and is not going to be used (f.e: traceroute is used only for the Pandora FMS Recon Server) then you can go on.
After all this process, the files are automatically copied
/usr/local/bin/pandora_server/usr/local/bin/pandora_exec
And several .pm files (Perl libraries) that Pandora FMS needs. These libraries .pm are copied into several files, depending on its distribution version and on its distribution.For example in Ubuntu 9.04 they are copied to:
/usr/local/share/perl/5.10.0/PandoraFMS/
In SUSE/SLES 11 they are copied to:
/usr/lib/perl5/site_perl/5.10.0/PandoraFMS/
3.9. Windows Agent Installation
The agent is given as an selfinstaller in executable format (.exe). The basic installation does all the required steps and it will be necessary only to accept all the options. To install the Pandora FMS agent in Windows you only need to download and to execute it. The installer will guide you with all the steps in the language that you choose. In the following example it is shown the installation for Windows Vista. Remember that Pandora FMS works with any current Microsoft (2000 or upper) platform.
Select the language:
Page 45
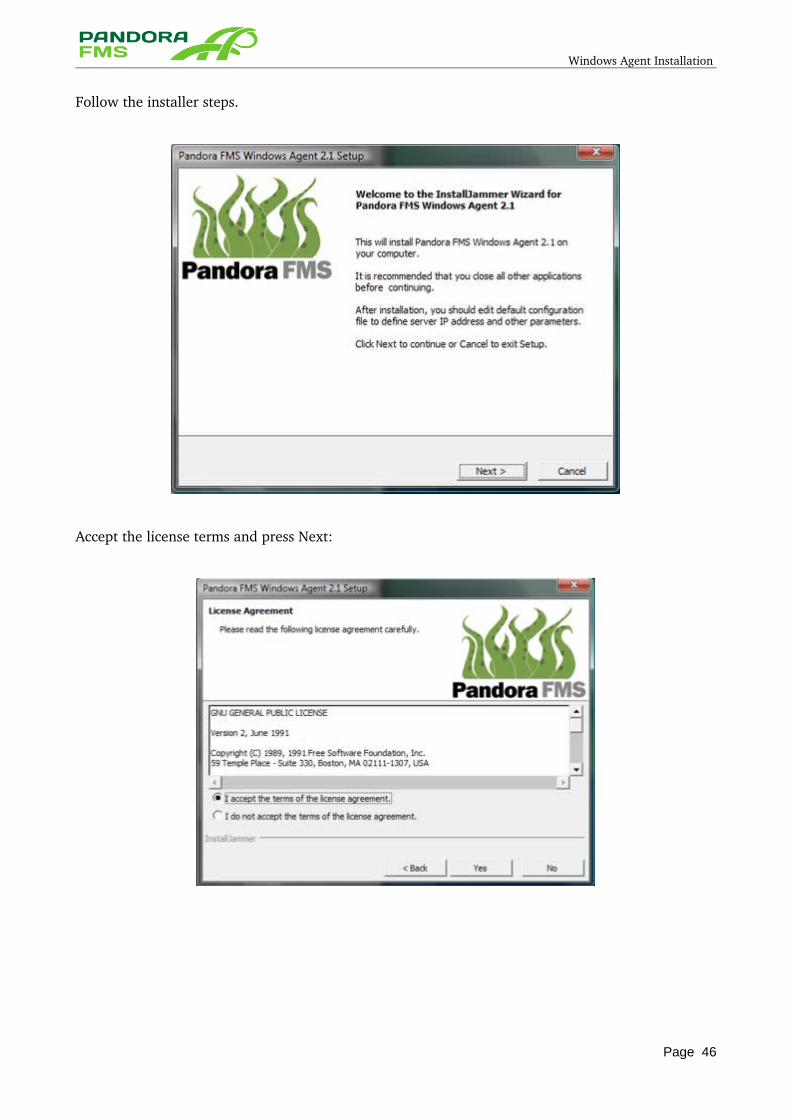
Windows Agent Installation
Follow the installer steps.
Accept the license terms and press Next:
Page 46
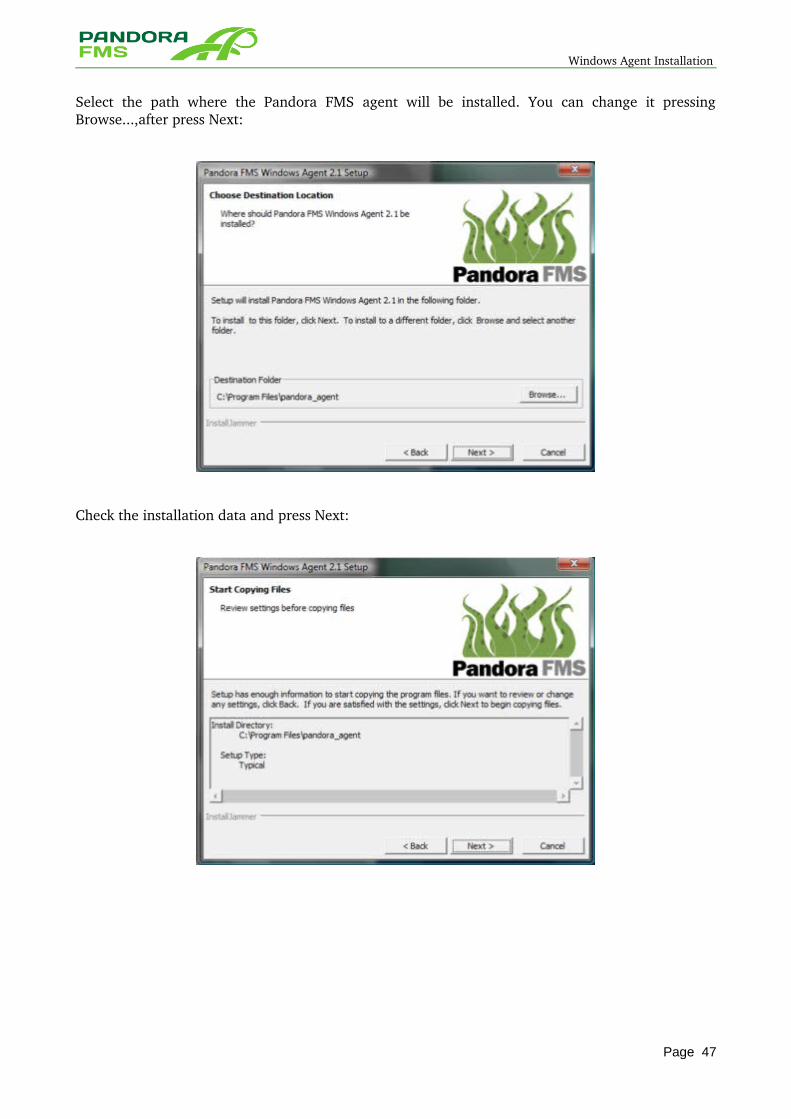
Windows Agent Installation
Select the path where the Pandora FMS agent will be installed. You can change it pressing Browse...,after press Next:
Check the installation data and press Next:
Page 47
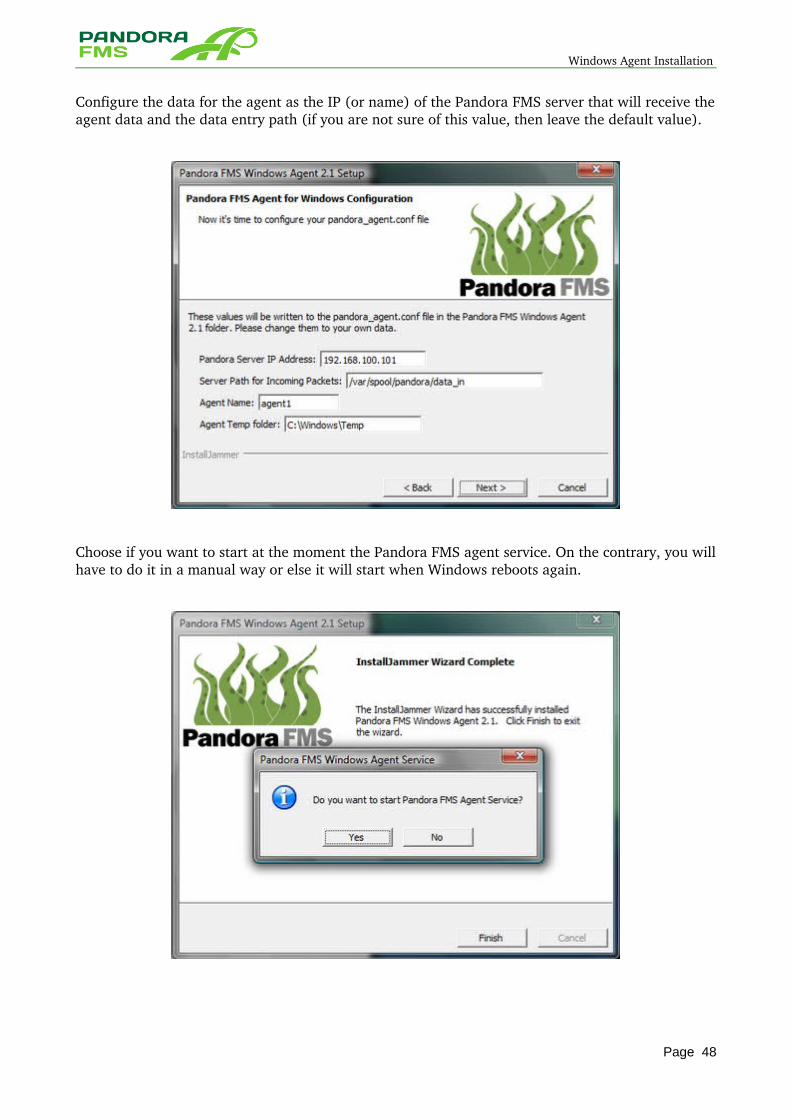
Windows Agent Installation
Configure the data for the agent as the IP (or name) of the Pandora FMS server that will receive the agent data and the data entry path (if you are not sure of this value, then leave the default value).
Choose if you want to start at the moment the Pandora FMS agent service. On the contrary, you will have to do it in a manual way or else it will start when Windows reboots again.
Page 48
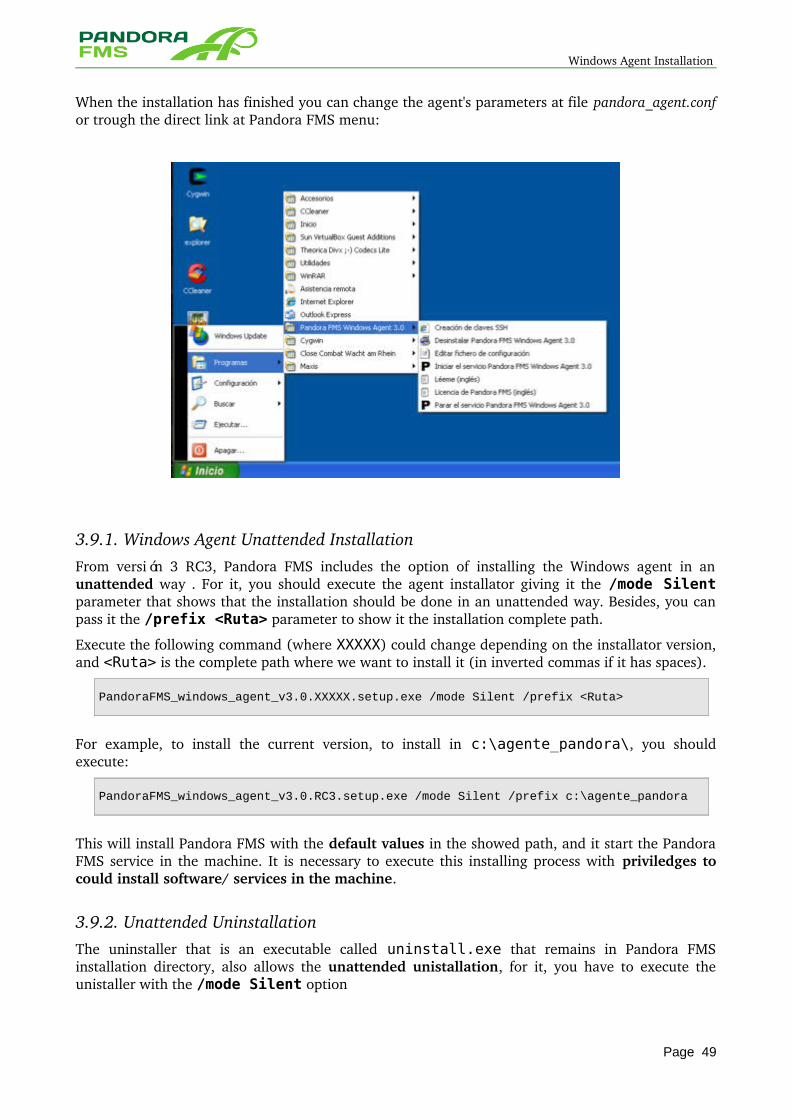
Windows Agent Installation
When the installation has finished you can change the agent's parameters at file pandora_agent.conf or trough the direct link at Pandora FMS menu:
3.9.1. Windows Agent Unattended InstallationFrom versión 3 RC3, Pandora FMS includes the option of installing the Windows agent in an unattended way . For it, you should execute the agent installator giving it the /mode Silent parameter that shows that the installation should be done in an unattended way. Besides, you can pass it the /prefix <Ruta> parameter to show it the installation complete path.
Execute the following command (where XXXXX) could change depending on the installator version, and <Ruta> is the complete path where we want to install it (in inverted commas if it has spaces).
PandoraFMS_windows_agent_v3.0.XXXXX.setup.exe /mode Silent /prefix <Ruta>
For example, to install the current version, to install in c:\agente_pandora\, you should execute:
PandoraFMS_windows_agent_v3.0.RC3.setup.exe /mode Silent /prefix c:\agente_pandora
This will install Pandora FMS with the default values in the showed path, and it start the Pandora FMS service in the machine. It is necessary to execute this installing process with priviledges to could install software/ services in the machine.
3.9.2. Unattended Uninstallation The uninstaller that is an executable called uninstall.exe that remains in Pandora FMS installation directory, also allows the unattended unistallation, for it, you have to execute the unistaller with the /mode Silent option
Page 49
Windows Agent Installation
For example, assuming that Pandora FMS is installed in the default path:
c:\archivos de programa\pandora_agent
You should execute:
“c:\archivos de programa\pandora_agent\uninstall.exe” /mode silent
3.9.3. Windows Agent Manual Installation The Window's agent could be installed in a manual way. To learn how the manual installation works serves also to understand how the Agent works at inside and to could reset later the installation of some parameters.
Assuming that all the agent's necessary files are obtained and also their directory structure, that summarizing is this one:
• PandoraAgent.exe: Pandora FMS service executable. We will see later that it accepts any parameters that could be very useful for us.
• pandora_agent.conf: the configuration main file
• libcurl.dll: library used by Pandora FMS to upload the files through FTP.
• libeay32.dll: library used by Pandora FMS to cypher connections (SSH y Tentacle).
• zlub1.dll: Library used by Pandora FMS to compress data.
• libodbc++.dll: library used by Pandora FMS for para ODBC checking
• pandora_agent.log: agent's main log
• pandora_debug.log: agent's main log (as debug )
• /util:In util directory there are several unix "typical" tools given to Win32, such as grep,gawk, wc, head,tail, etc.
There is also placed the tentacle client, "tentacle_client.exe" that is the one used to send the packages to the Pandora FMS server.
These files could be obtained from our code repository (subversion) at sourceforge, just as it's described in our website.
Another easier solution is to make a zip with the contents of a currently installed agent. Just zip contents of the directory c:\program files\pandora_agent and decompress into the destination system.
3.9.3.1. Using PandoraAgent.exe from the Commands Line
If we execute pandoraagent.exe help, it will show something like this:
Pandora agent for Windows. Version 3.0(Build 090924)Usage: pandoraagent.exe [OPTION]
Available options are: --install: Install the Pandora Agent service. --uninstall: Uninstall the Pandora Agent service. --test-ssh: Test the SSH Pandora Agent configuration.
Page 50
Windows Agent Installation
--test-ftp: Test the FTP Pandora Agent configuration. --process: Run the Pandora Agent as a user process instead of a service.
To install the service (if it is not installed), execute following command from the directory where is placed the .exe, like c:\program files\pandora_agent:
pandoraagent.exe --install
This will install the service in the machine building on the path where the .exe is located. If we want to remove it, it is the same process, but:
pandoraagent.exe --uninstall
Depending on the kind of Windows system that it would be it is possible that you should have to reboot the system after removing the service. In other systems the change is taken without having to reboot.
If you want to try a ftp or ssh connection from the command line, then you can use the options above mentioned.
3.9.3.2. Pandora FMS Window's Agent as Process
Is possible, for debugging reasons,tests and other unusual circunstances, to execute the agent in "Process" way. This is done executing it from the command line:
pandoraagent.exe --process
There are some restrictions in the execution to the process mode, so Pandora FMS is thought to execute as service and as a user SYSTEM. If you execute it with other user without privileges, then it will be functions that will not work properly.
3.9.4. Pandora FMS for windows NT4 This agent is a port of the Unix agent (in perl) compiled with ActiveState DevKit Perl compiler. This is a standalone EXE with all the tools it will need to run. It has the same features than the Unix agent, but running on a NT4 box. This means can execute commands and get the output to produce data for Pandora FMS.
Could be used on any Windows machine (NT4, Win95, Windows 20002008, and of course Windows 7), could be useful on windows embedded systems without WMI core, which makes standard Pandora FMS windows agent to do not run properly.
3.9.4.1. Installing the agent
Copy all contents on a directory of your choice, for example c:\pandora.
Edit pandora_agent.conf and set your parameters, including the log file and the temporal directory, should be something like c:\pandora\temp and c:\pandora\log. MAKE SURE that directories exists before trying to start Pandora agent.
Page 51

Windows Agent Installation
3.9.4.2. Running the agent
This agent does not run as a service, so you need to install in the startup menu or start by hand. The shortlink you create must have a parameter, which is where is the main Pandora FMS agent directory, in this scenario is c:\pandora, so the command to start will be :
c:\pandora\pandora_agent.exe c:\pandora
3.9.4.3. Install as a service
srvany.exe tool is provided to do this. Is a microsoft resource kit tool to be able to use any .exe as a service. Just read the documentation about how to use srvany (provided in this package).
Page 52

Windows Agent Installation
4 INITIAL CONFIGURATION AFTER INSTALLING
Page 53

Initial Configuration after Installing
The order you should follow after installing is:
1. Create the database through the Pandora FMS web console installation wizard. 2. Modify the server configuration including the access credentials to the BBDD that have been
generated by the previous step. 3. Start server Arrancar servidor. 4. Start local agent (if it is required). 5. Go to the Pandora FMS for first time to start using Pandora FMS.
4.1. Console Initial Configuration
Assuming we are going to execute all components (Database, Console, Server and Agent) on the same machine. If you have not done it already, then start the Mysql server and create an admin password (root).
/etc/init.d/mysql start
Now create the password, for example "pandora123" for your MYSQL root user:
mysqladmin password pandora123
Then start the Apache server in your server:
/etc/init.d/apache2 start
Now you can get to your server IP address trough web to do the Pandora FMS postinstallation trough web. This postinstallation serves to create the Pandora FMS database and to configure the access credentials (user password, BD name) in the Pandora server to the DDBB established by the user.
If your server IP is, for example,"192.168.5.54" put in your browser:
http://192.168.5.54/pandora_console/install.php
Page 54
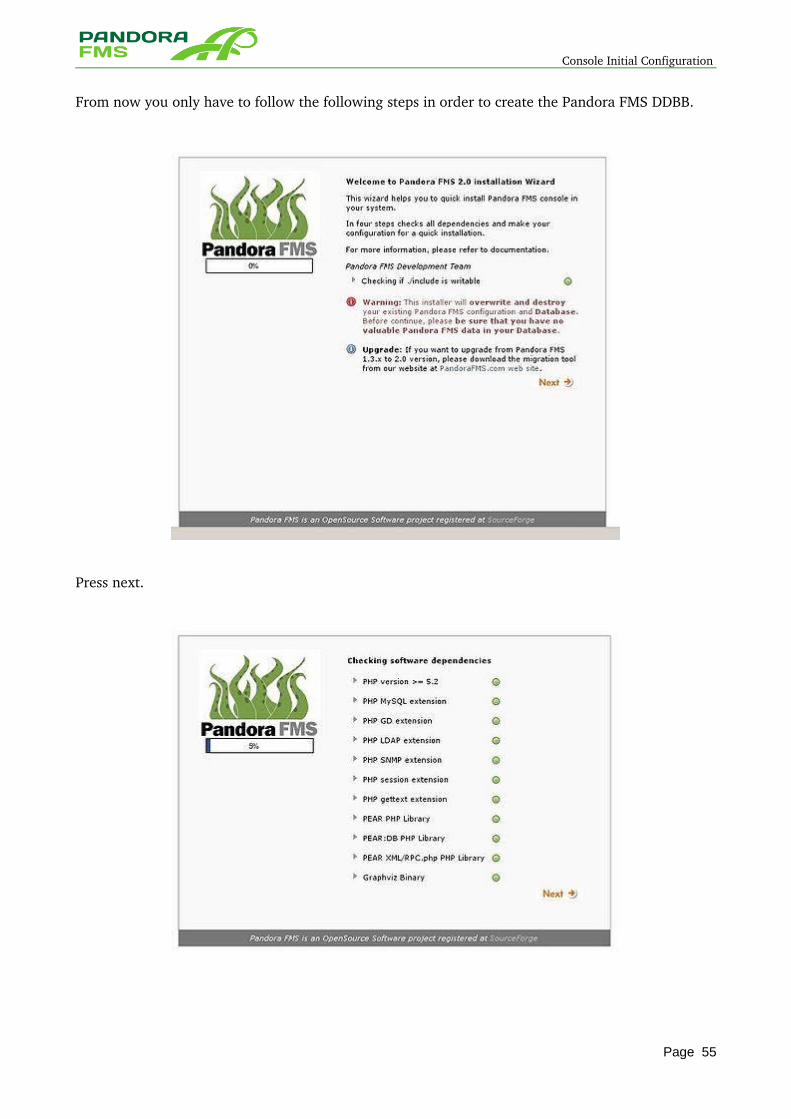
Console Initial Configuration
From now you only have to follow the following steps in order to create the Pandora FMS DDBB.
Press next.
Page 55
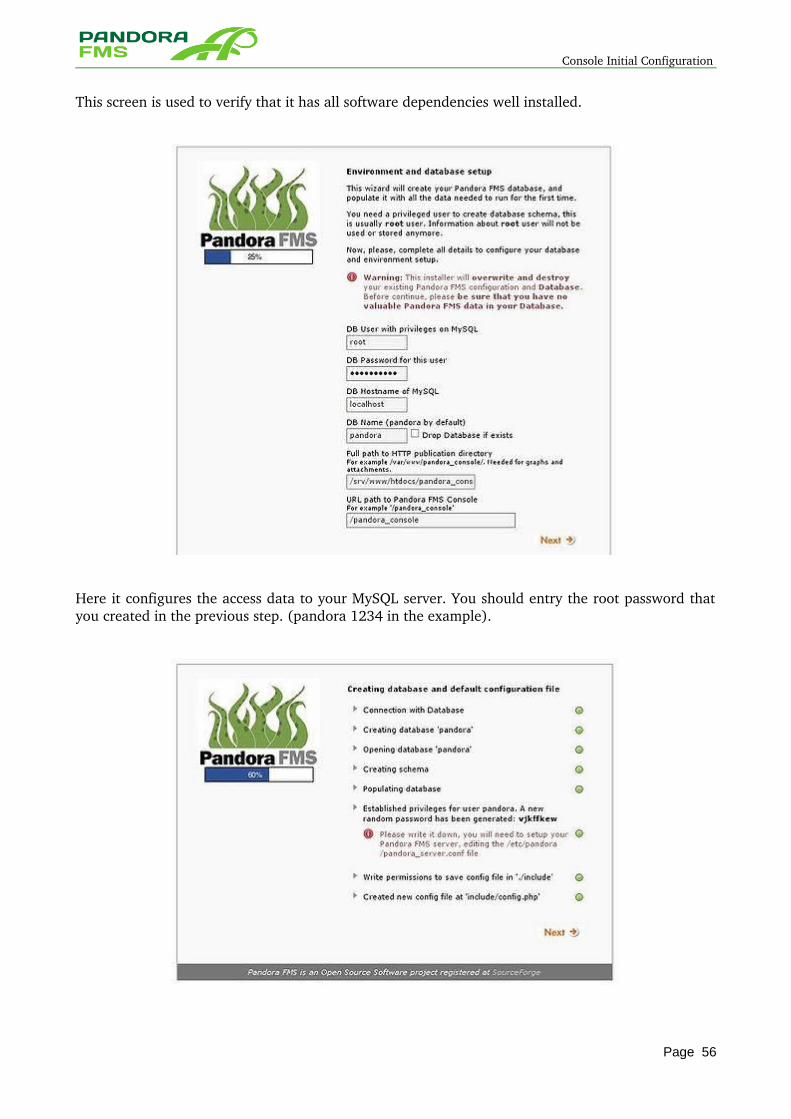
Console Initial Configuration
This screen is used to verify that it has all software dependencies well installed.
Here it configures the access data to your MySQL server. You should entry the root password that you created in the previous step. (pandora 1234 in the example).
Page 56
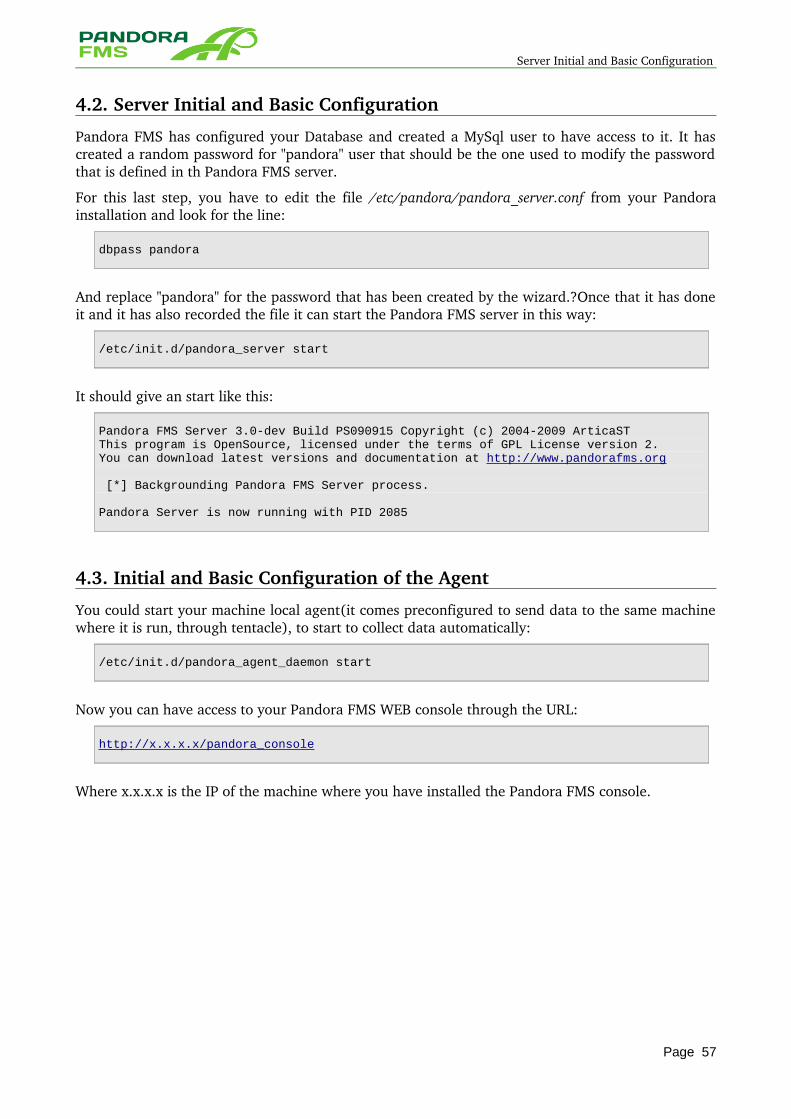
Server Initial and Basic Configuration
4.2. Server Initial and Basic Configuration
Pandora FMS has configured your Database and created a MySql user to have access to it. It has created a random password for "pandora" user that should be the one used to modify the password that is defined in th Pandora FMS server.
For this last step, you have to edit the file /etc/pandora/pandora_server.conf from your Pandora installation and look for the line:
dbpass pandora
And replace "pandora" for the password that has been created by the wizard.?Once that it has done it and it has also recorded the file it can start the Pandora FMS server in this way:
/etc/init.d/pandora_server start
It should give an start like this:
Pandora FMS Server 3.0-dev Build PS090915 Copyright (c) 2004-2009 ArticaSTThis program is OpenSource, licensed under the terms of GPL License version 2.You can download latest versions and documentation at http://www.pandorafms.org
[*] Backgrounding Pandora FMS Server process. Pandora Server is now running with PID 2085
4.3. Initial and Basic Configuration of the Agent
You could start your machine local agent(it comes preconfigured to send data to the same machine where it is run, through tentacle), to start to collect data automatically:
/etc/init.d/pandora_agent_daemon start
Now you can have access to your Pandora FMS WEB console through the URL:
http://x.x.x.x/pandora_console
Where x.x.x.x is the IP of the machine where you have installed the Pandora FMS console.
Page 57

Initial and Basic Configuration of the Agent
5 PANDORA FMS INTERFACE
Page 58
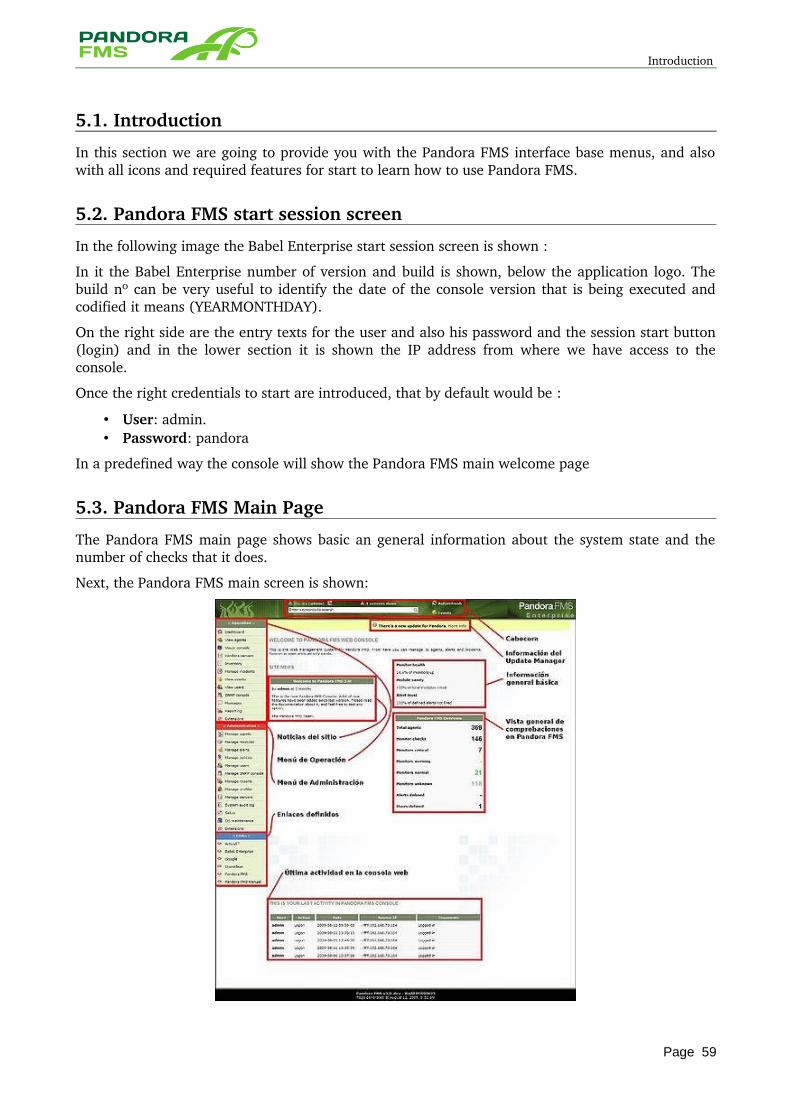
Introduction
5.1. Introduction
In this section we are going to provide you with the Pandora FMS interface base menus, and also with all icons and required features for start to learn how to use Pandora FMS.
5.2. Pandora FMS start session screen
In the following image the Babel Enterprise start session screen is shown :
In it the Babel Enterprise number of version and build is shown, below the application logo. The build nº can be very useful to identify the date of the console version that is being executed and codified it means (YEARMONTHDAY).
On the right side are the entry texts for the user and also his password and the session start button (login) and in the lower section it is shown the IP address from where we have access to the console.
Once the right credentials to start are introduced, that by default would be :
• User: admin. • Password: pandora
In a predefined way the console will show the Pandora FMS main welcome page
5.3. Pandora FMS Main Page
The Pandora FMS main page shows basic an general information about the system state and the number of checks that it does.
Next, the Pandora FMS main screen is shown:
Page 59
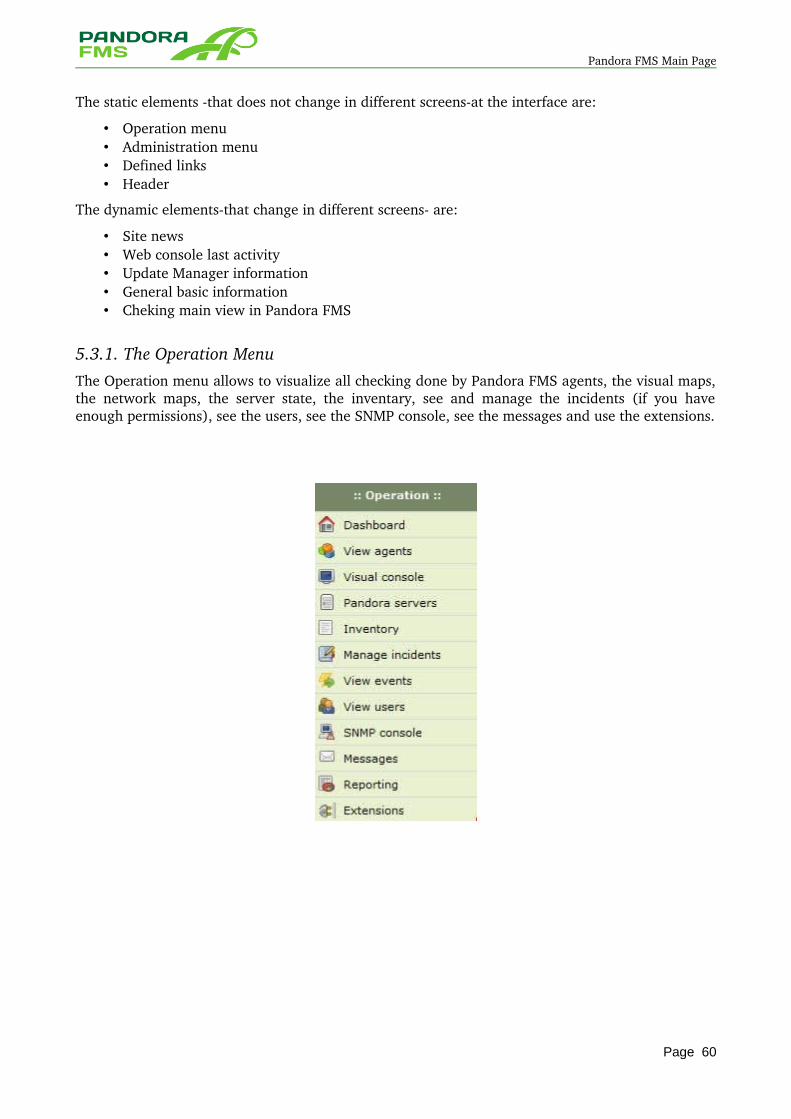
Pandora FMS Main Page
The static elements that does not change in different screensat the interface are:
• Operation menu • Administration menu • Defined links • Header
The dynamic elementsthat change in different screens are:
• Site news • Web console last activity • Update Manager information • General basic information • Cheking main view in Pandora FMS
5.3.1. The Operation MenuThe Operation menu allows to visualize all checking done by Pandora FMS agents, the visual maps, the network maps, the server state, the inventary, see and manage the incidents (if you have enough permissions), see the users, see the SNMP console, see the messages and use the extensions.
Page 60
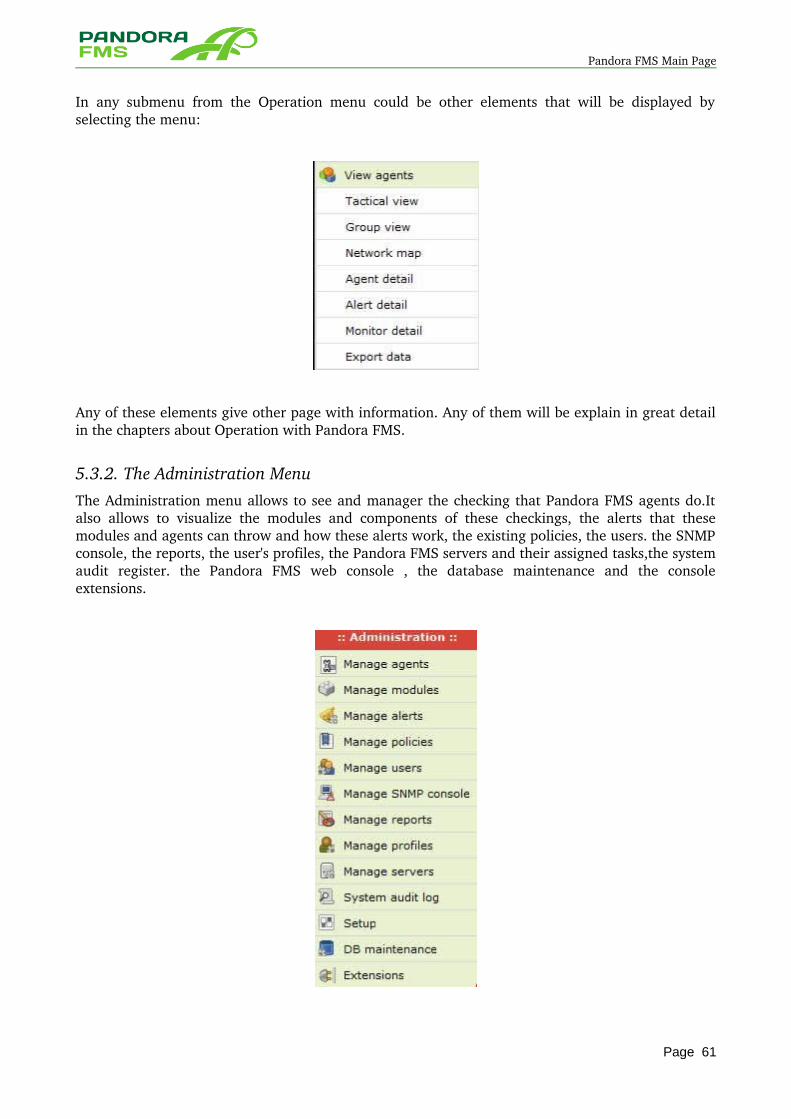
Pandora FMS Main Page
In any submenu from the Operation menu could be other elements that will be displayed by selecting the menu:
Any of these elements give other page with information. Any of them will be explain in great detail in the chapters about Operation with Pandora FMS.
5.3.2. The Administration MenuThe Administration menu allows to see and manager the checking that Pandora FMS agents do.It also allows to visualize the modules and components of these checkings, the alerts that these modules and agents can throw and how these alerts work, the existing policies, the users. the SNMP console, the reports, the user's profiles, the Pandora FMS servers and their assigned tasks,the system audit register. the Pandora FMS web console , the database maintenance and the console extensions.
Page 61
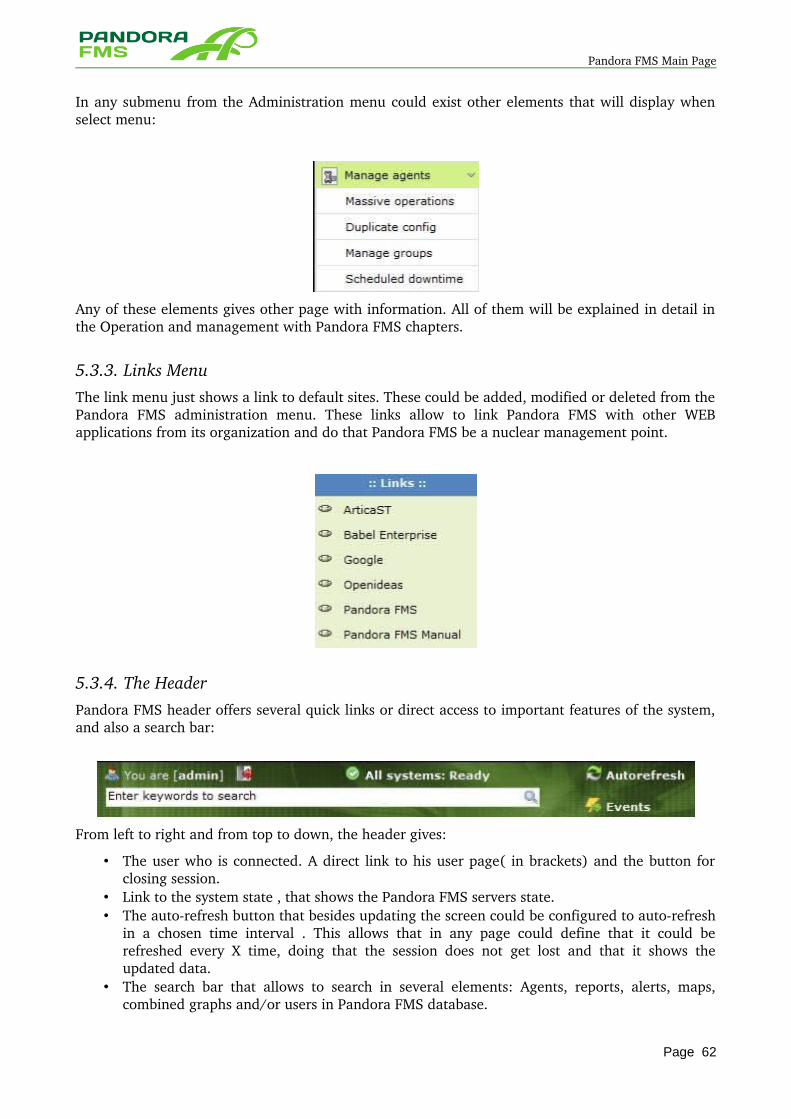
Pandora FMS Main Page
In any submenu from the Administration menu could exist other elements that will display when select menu:
Any of these elements gives other page with information. All of them will be explained in detail in the Operation and management with Pandora FMS chapters.
5.3.3. Links MenuThe link menu just shows a link to default sites. These could be added, modified or deleted from the Pandora FMS administration menu. These links allow to link Pandora FMS with other WEB applications from its organization and do that Pandora FMS be a nuclear management point.
5.3.4. The HeaderPandora FMS header offers several quick links or direct access to important features of the system, and also a search bar:
From left to right and from top to down, the header gives:
• The user who is connected. A direct link to his user page( in brackets) and the button for closing session.
• Link to the system state , that shows the Pandora FMS servers state. • The autorefresh button that besides updating the screen could be configured to autorefresh
in a chosen time interval . This allows that in any page could define that it could be refreshed every X time, doing that the session does not get lost and that it shows the updated data.
• The search bar that allows to search in several elements: Agents, reports, alerts, maps, combined graphs and/or users in Pandora FMS database.
Page 62
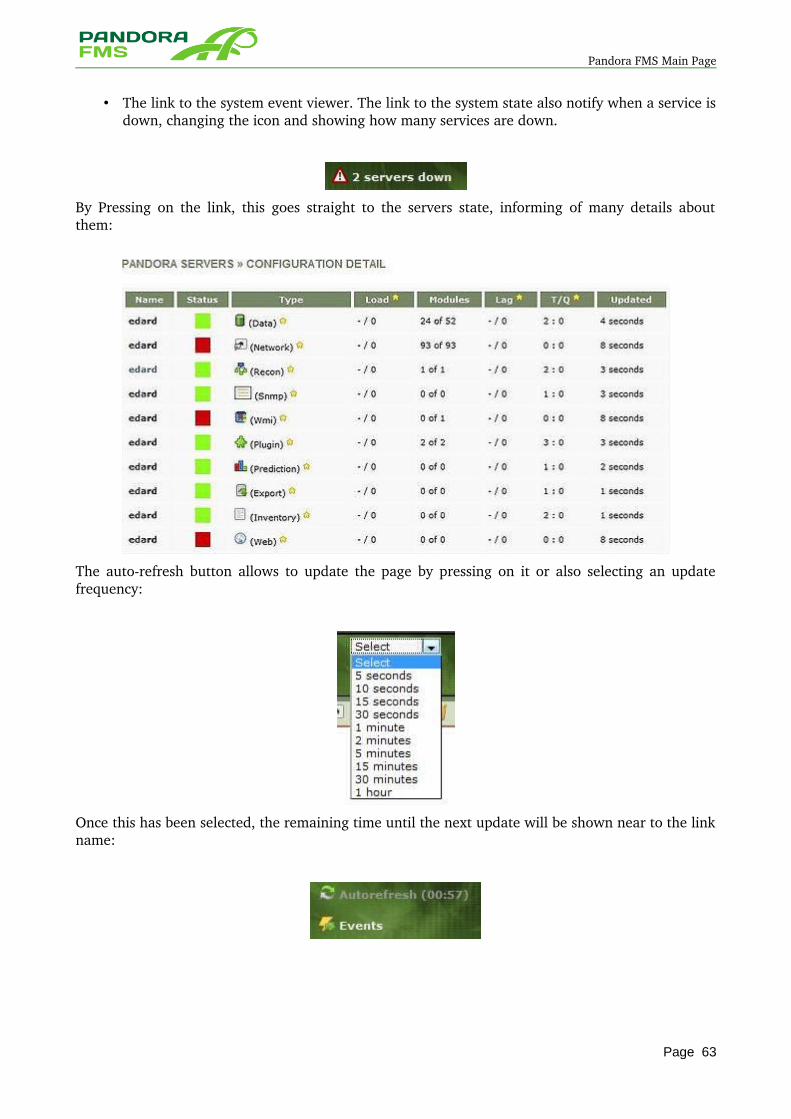
Pandora FMS Main Page
• The link to the system event viewer. The link to the system state also notify when a service is down, changing the icon and showing how many services are down.
By Pressing on the link, this goes straight to the servers state, informing of many details about them:
The autorefresh button allows to update the page by pressing on it or also selecting an update frequency:
Once this has been selected, the remaining time until the next update will be shown near to the link name:
Page 63
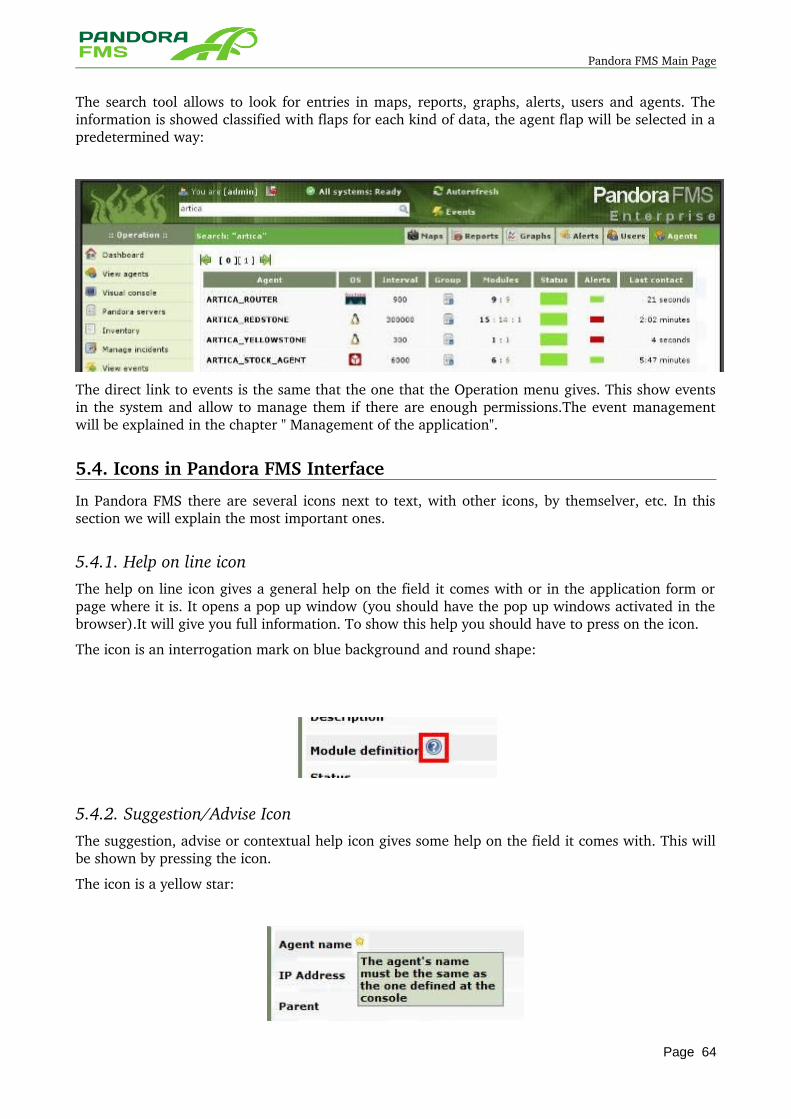
Pandora FMS Main Page
The search tool allows to look for entries in maps, reports, graphs, alerts, users and agents. The information is showed classified with flaps for each kind of data, the agent flap will be selected in a predetermined way:
The direct link to events is the same that the one that the Operation menu gives. This show events in the system and allow to manage them if there are enough permissions.The event management will be explained in the chapter " Management of the application".
5.4. Icons in Pandora FMS Interface
In Pandora FMS there are several icons next to text, with other icons, by themselver, etc. In this section we will explain the most important ones.
5.4.1. Help on line icon The help on line icon gives a general help on the field it comes with or in the application form or page where it is. It opens a pop up window (you should have the pop up windows activated in the browser).It will give you full information. To show this help you should have to press on the icon.
The icon is an interrogation mark on blue background and round shape:
5.4.2. Suggestion/Advise Icon The suggestion, advise or contextual help icon gives some help on the field it comes with. This will be shown by pressing the icon.
The icon is a yellow star:
Page 64
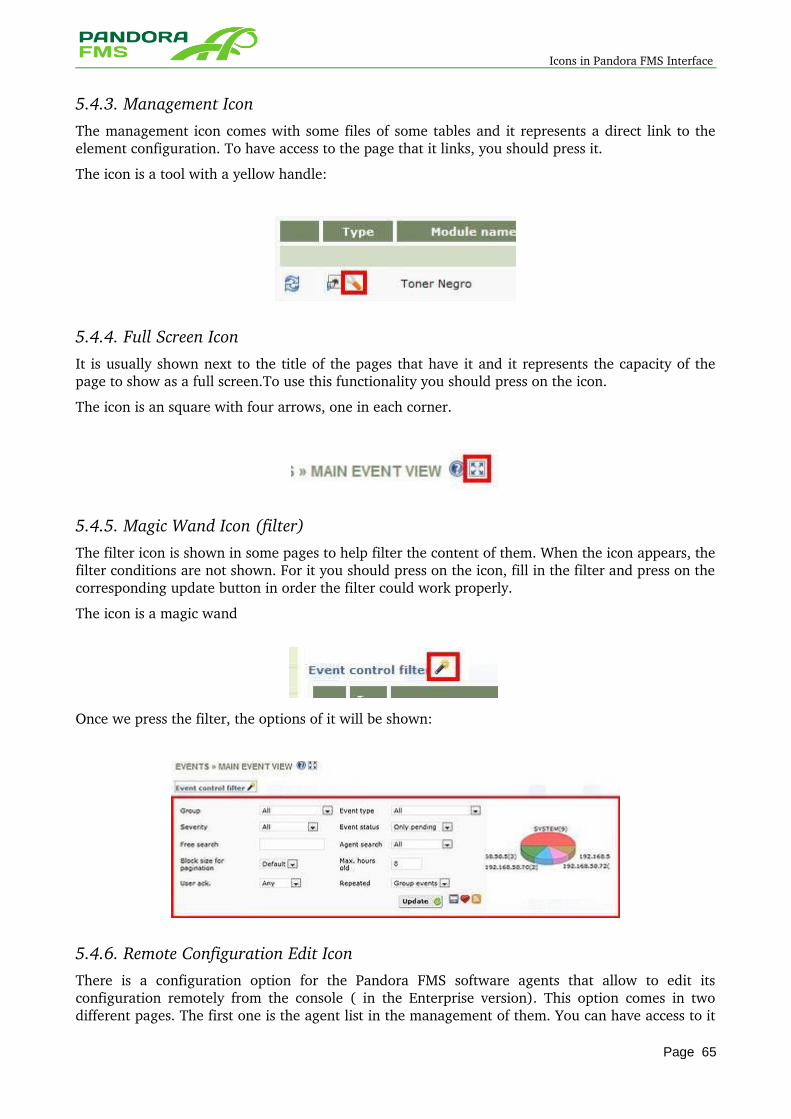
Icons in Pandora FMS Interface
5.4.3. Management Icon The management icon comes with some files of some tables and it represents a direct link to the element configuration. To have access to the page that it links, you should press it.
The icon is a tool with a yellow handle:
5.4.4. Full Screen Icon It is usually shown next to the title of the pages that have it and it represents the capacity of the page to show as a full screen.To use this functionality you should press on the icon.
The icon is an square with four arrows, one in each corner.
5.4.5. Magic Wand Icon (filter)The filter icon is shown in some pages to help filter the content of them. When the icon appears, the filter conditions are not shown. For it you should press on the icon, fill in the filter and press on the corresponding update button in order the filter could work properly.
The icon is a magic wand
Once we press the filter, the options of it will be shown:
5.4.6. Remote Configuration Edit Icon There is a configuration option for the Pandora FMS software agents that allow to edit its configuration remotely from the console ( in the Enterprise version). This option comes in two different pages. The first one is the agent list in the management of them. You can have access to it
Page 65
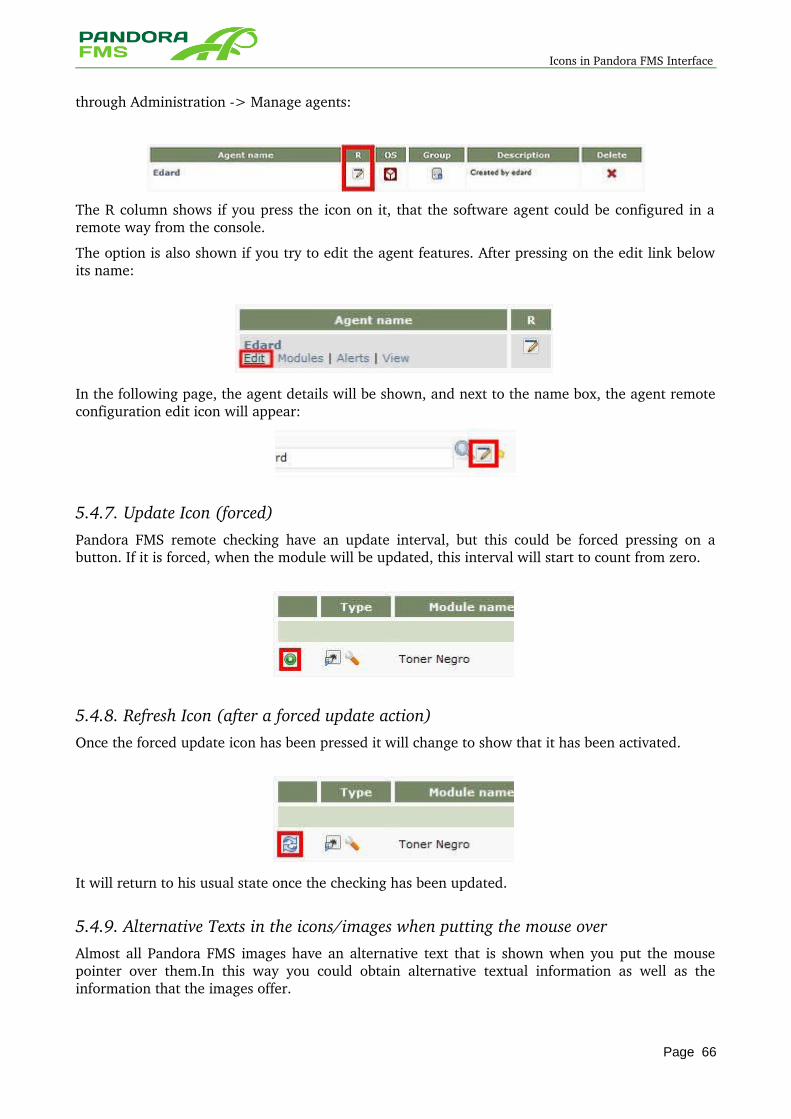
Icons in Pandora FMS Interface
through Administration > Manage agents:
The R column shows if you press the icon on it, that the software agent could be configured in a remote way from the console.
The option is also shown if you try to edit the agent features. After pressing on the edit link below its name:
In the following page, the agent details will be shown, and next to the name box, the agent remote configuration edit icon will appear:
5.4.7. Update Icon (forced)Pandora FMS remote checking have an update interval, but this could be forced pressing on a button. If it is forced, when the module will be updated, this interval will start to count from zero.
5.4.8. Refresh Icon (after a forced update action)Once the forced update icon has been pressed it will change to show that it has been activated.
It will return to his usual state once the checking has been updated.
5.4.9. Alternative Texts in the icons/images when putting the mouse over Almost all Pandora FMS images have an alternative text that is shown when you put the mouse pointer over them.In this way you could obtain alternative textual information as well as the information that the images offer.
Page 66
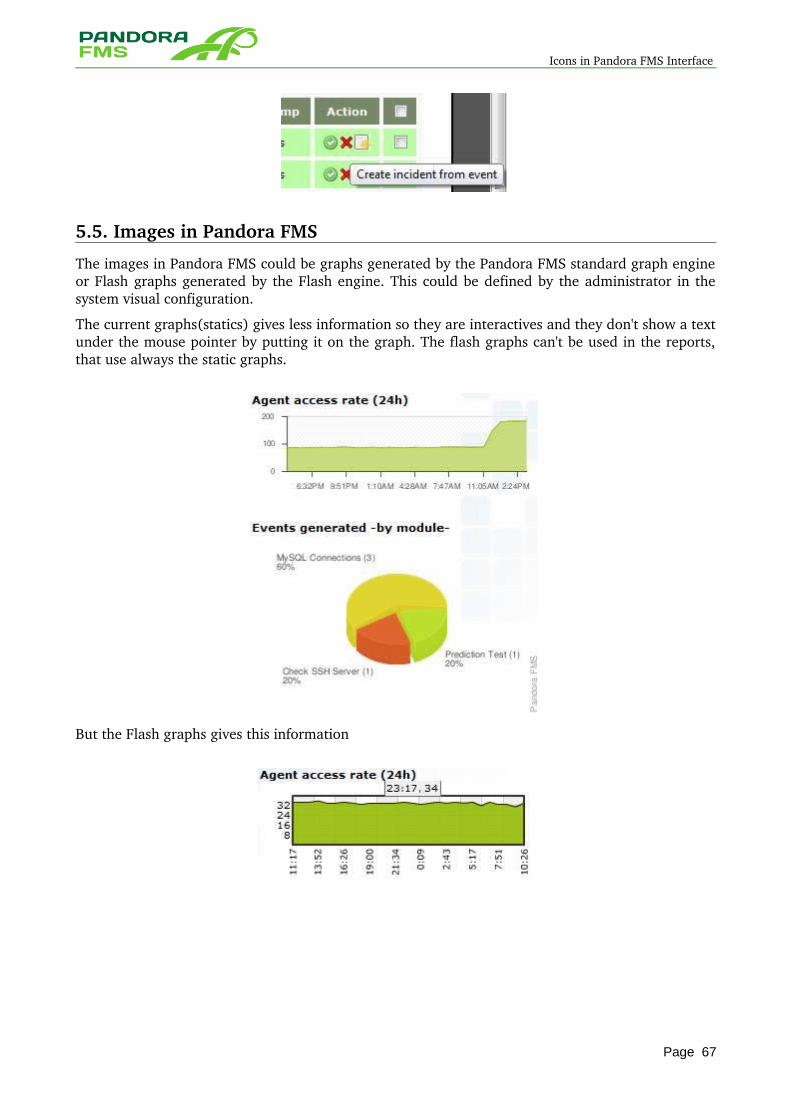
Icons in Pandora FMS Interface
5.5. Images in Pandora FMS
The images in Pandora FMS could be graphs generated by the Pandora FMS standard graph engine or Flash graphs generated by the Flash engine. This could be defined by the administrator in the system visual configuration.
The current graphs(statics) gives less information so they are interactives and they don't show a text under the mouse pointer by putting it on the graph. The flash graphs can't be used in the reports, that use always the static graphs.
But the Flash graphs gives this information
Page 67
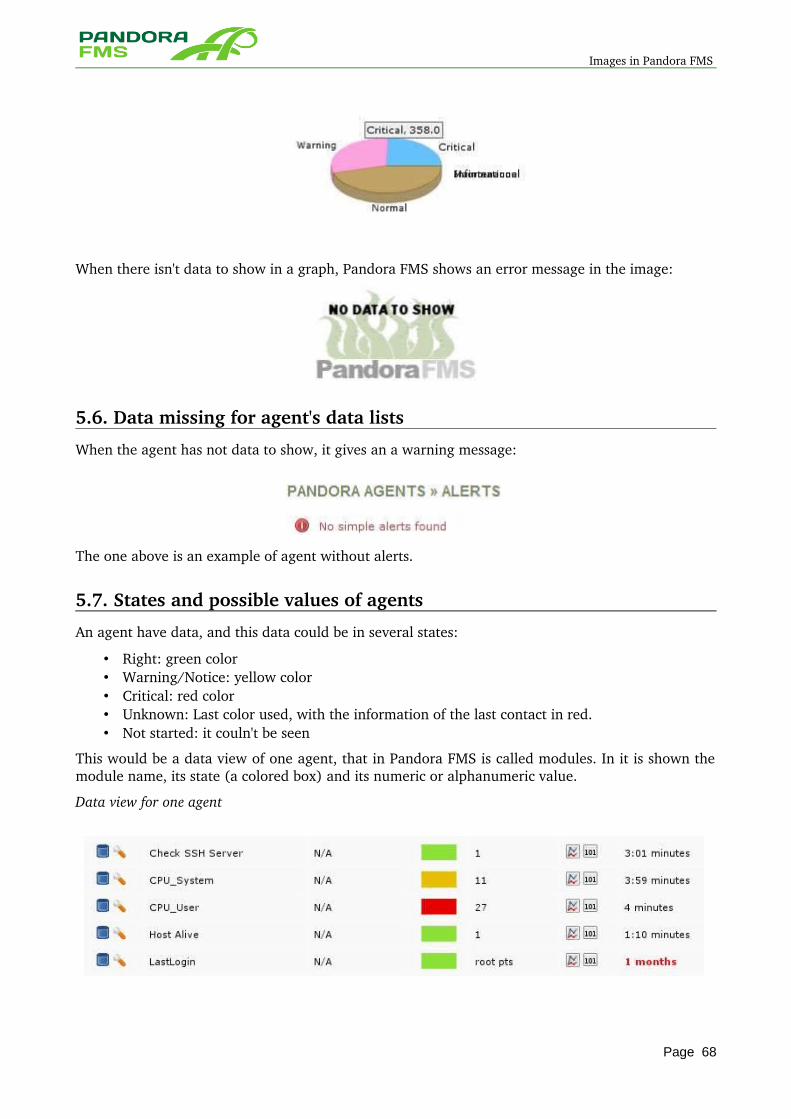
Images in Pandora FMS
When there isn't data to show in a graph, Pandora FMS shows an error message in the image:
5.6. Data missing for agent's data lists
When the agent has not data to show, it gives an a warning message:
The one above is an example of agent without alerts.
5.7. States and possible values of agents
An agent have data, and this data could be in several states:
• Right: green color • Warning/Notice: yellow color • Critical: red color • Unknown: Last color used, with the information of the last contact in red. • Not started: it couln't be seen
This would be a data view of one agent, that in Pandora FMS is called modules. In it is shown the module name, its state (a colored box) and its numeric or alphanumeric value.
Data view for one agent
Page 68
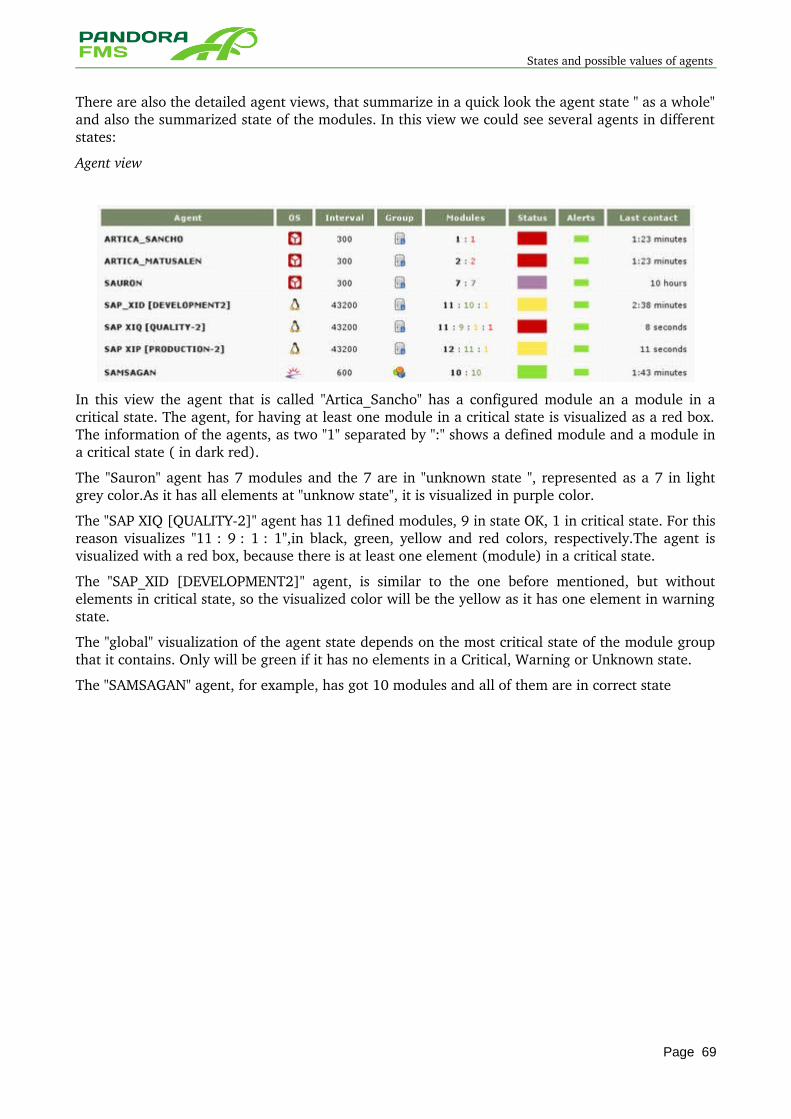
States and possible values of agents
There are also the detailed agent views, that summarize in a quick look the agent state " as a whole" and also the summarized state of the modules. In this view we could see several agents in different states:
Agent view
In this view the agent that is called "Artica_Sancho" has a configured module an a module in a critical state. The agent, for having at least one module in a critical state is visualized as a red box. The information of the agents, as two "1" separated by ":" shows a defined module and a module in a critical state ( in dark red).
The "Sauron" agent has 7 modules and the 7 are in "unknown state ", represented as a 7 in light grey color.As it has all elements at "unknow state", it is visualized in purple color.
The "SAP XIQ [QUALITY2]" agent has 11 defined modules, 9 in state OK, 1 in critical state. For this reason visualizes "11 : 9 : 1 : 1",in black, green, yellow and red colors, respectively.The agent is visualized with a red box, because there is at least one element (module) in a critical state.
The "SAP_XID [DEVELOPMENT2]" agent, is similar to the one before mentioned, but without elements in critical state, so the visualized color will be the yellow as it has one element in warning state.
The "global" visualization of the agent state depends on the most critical state of the module group that it contains. Only will be green if it has no elements in a Critical, Warning or Unknown state.
The "SAMSAGAN" agent, for example, has got 10 modules and all of them are in correct state
Page 69

States and possible values of agents
6 PANDORA FMS CONFIGURATION
Page 70
Pandora FMS configuration
Pandora FMS has three basic components that should be configured for a correct operation. The two first ones are the server and the web console, that should interact between them and the data base to could introduce, process and show the stored data. There are also the software agents that send the data to the Pandora FMS server.
In this chapter we are going to explain the configuration files of the three elements and also other elements that are important for a correct performance of the application components.
6.1.1. Server Pandora FMS server has a configuration file that allows to adjust several application parameters to obtain an excellent performace. The configuration file pandora_server.conf is located in a predetermined way at directorio /etc/pandora/.
6.1.1.1. Configuration File Elements
Pandora FMS configuration file is a Unix standard plain text where the variables that aren't used or the comments are preceded by a "#" character
Next we are going to explain all the configuration parameters.
servername
Pandora FMS server name. If it is commented, then we should use the name of the equipment or "host".
incomingdir
XML data packages Incoming Directory. By default is /var/spool/pandora/data_in/.
log_file
Pandora FMS record file (log). By default is /var/log/pandora/pandora_server.log.
snmp_logfile
Logfile of SNMP console of Pandora FMS. By default is /var/log/pandora/pandora_snmptrap.log
errorlog_file
Pandora FMS error registry file (log). By default is /var/log/pandora/pandora_server.error. In a predetermined way is
dbname
Name of database the server will connect to. By default is pandora.
dbuser
Username used in the Pandora database connection. By default is "pandora".
daemon
Shows if the Pandora server is executed as demon or not. If the server is launched with the option –D, then it is also executed as demon.
Page 71
Pandora FMS configuration
dbpass
Password for the connection against Pandora FMS Database
dbhost
Ip address or equipment name that host the Pandora FMS database. In reduced installations it is usually the same equipment where the server is, that is localhost.
verbosity
Detail level for the server and error messages, the register or log files. 0 is the predetermined one, 1 is the detailed, 2 is debugging, 310 noisy. When you have any problem with Pandora FMS put this value to 10 to get the maximun detail. High values here (like 10) are not intended to use in production because they have a great performance impact.
master
1 Say that is a master server, 0 that is an slave server that is part of a multiple server configuration (for HA environment, go to "HA" documentation chapter for more information).
checksum (deprecated)
0 Shows not to use a MD5 (hash) sum to verify the agent data packages. 1 indicates that it is used. This is not used from the Pandora FMS 2.0 version and the option follows by compatibility.
snmpconsole
1 Shows that the SNMP traps reception console is activated in the configuration.0 that it is not. The console depends on snmptrapd UNIX service.
networkserver
1 Shows that Pandora FMS network server is activated in the configuration. 0 that it is not.
dataserver
1 Shows that Pandora FMS data server is activated in the configuration. 0 that it is not.
reconserver
1 Shows that Pandora FMS network recon server is activated in the configuration. 0 that it is not.
pluginserver
1 Shows that Pandora FMS complement server is activated in the configuration.0 that it is not.
predictionserver
1 Shows that Pandora FMS prediction server is activated in the configuration.0 that it is not .
wmiserver
1 Shows that the Pandora FMS server of WMI is activated in the configuration.0 that it is not .
inventoryserver
1 Shows that Pandora FMS remote inventory server is activated in the configuration.0 that it is not. The inventory data sent by the agents are processed with the data server and there is no need to activate the remote inventory server.
Page 72
Pandora FMS configuration
exportserver
1 Shows that the Pandora FMS export server is activated in the configuration.0 that it is not.
webserver
1 To activate the checking WEB(webserver or also known as Goliat Server).0 that it is not.
network_timeout
Is the timeout in seconds for the network server connections on network ICMP modules. Default value is 2 seconds. If you are doing remote checks on WAN networks, you probably should increase this value to avoid false results.
server_keepalive
Time before classify the server as down. In seconds. By default its value is 45.
server_threshold
The number of seconds of the main loop, in seconds. By default its value is 5. This is a very important configuration token because it defines how many times Pandora FMS search in database or disk for new data to process. 5 is a good value for most cases, minimum value is 1, and if you set to 1, system CPU will be very high. You can set 1 on specific situations like, when your server has been down for a while and you need to process the pending XML files and Network modules as quick as system can. Set this to 1, wait to be finish processing all pending modules/XML, and set again to 5 or 10. This value, used in conjuntion with *server*_theads and max_queue_files are used to adjust the performance of your server.
network_threads
Number of threads for the network server. Shows how many checks can be done at the same time, but as it increases it needs much more processing capacity. Its predetermined value is 5.
icmp_checks
Defines the pings number to each icmp_proc kind of module. At least one of these ckecks must give back 1 to the module could be classified as correct. Its predetermined value is 1.
tcp_checks
Number of TCP reattempts if the first one fails. The predetermined value is 1.
tcp_timeout
Specific timeout for TCP connexions. The predetermined value is 30.
snmp_checks
Number of SNMP reattempts if the first one fails. The predetermined value is 1.
snmp_timeout
Specific expiration time for the SNMP connexions. The predetermined value is 3.
snmp_proc_deadresponse
Gives back DOWN if it is not possible to connect with a boolean SNMP module (proc) or if it gets NULL.If it is set to 0 then it should be ignored.
plugin_threads
Number of threads for the complement server. Shows how many checks could be done at the same time.Its predetermined value is 3.
Page 73
Pandora FMS configuration
plugin_timeout
Timeout for the checks with complements.After this time the module state will be shown as unknown. Its predetermined value is 5.
wmi_timeout
WMI checks timeout.After this time the module state will be shown as unknown. Its predetermined value is 10.
wmi_threads
Number of threads for the WMI server. It shows how many checks could be done at the same time. Its predetermined value is 2.
prediction_threads
Number of threads for the prediction server.
recon_threads
Number of threads for the network recon server. Shows how many checks could be done at the same time. Its predetermined value is 2.
dataserver_threads
Number of threads for the dataserver. Shows how many threads of the XML file processor are at the same time. Its predetermined value is 2.
inventory_threads
Number of threads assigned to the remote inventory server. It shows how many simultaneous threads are assigned to this component.
export_threads
Number of threads assigned to the export server. It shows how many simultaneous threads are assigned to this component.
web_threads
Number of threads assigned to the WEB test server. It shows how many simultaneous threads are assigned to his component.
mta_address
Mail Server IP address (Mail Transfer Agent)
mta_port
Mail server port
mta_user
Mail server user(if necessary)
mta_pass
Password for the mail server(if necessary)
Page 74
Pandora FMS configuration
mta_auth
Mail server authentication system( if necessary; the valid values are: LOGIN PLAIN CRAMMD5 DIGESTMD)
mta_from
Mail address from the mails will be send. In a predetermined way is pandora@localhost.
xprobe2
If it is given, is used to discover the operating system of the remote systems assigned to the agents,when a recon network task is launched.The predetermined path is /usr/bin/xprobe2.
snmpget
Needed for SNMP checks. In a predetermined way it is at /usr/bin/snmpget. It refers to the location for the snmp standard client of the system. It is recommended not to touch it unless you know exactly what to do.
nmap Needed for the recon server.In a predetermined way is at /usr/bin/nmap.It is recommended not to touch it unless you know exactly what to do.
plugin_exec
Shows the absolute path to a Pandora FMS tool that execute the plugins in a controlled way in time. By default is in /usr/local/bin/pandora_exec, and it is recommend not to touch unless you know exactly what to do.
autocreate_group
Identifier of the predetermined group for the new agents created with the data server through the datafile reception.The predetermined value is 2.
autocreate
If you put 1 then agents will be selfcreated when XML files are received for which there would be no agents. Is it is fix at 0 they will not be created.
max_log_size
Maximum size of Pandora FMS register file, in bytes. When this size is got, then the file should be moved topandora_server.log.old and go on working on the original one. The predetermined size is 65536Bytes.
mcast_status_port
Port to send data through multicast channels. See later.
mcast_status_group
Group to send data through multicast channels.See later.
mcast_change_port
Change of port to send data through multicast channels. See later.
mcast_change_group
Change of group to send data through multicast channels. See later.
Page 75
Pandora FMS configuration
max_queue_files
Maximum number of XML datafiles from the directory that contains them will be not read. To avoid overload the system. Although the directory don't be read it doesn't means that the files are not read and that they continue being processed.The predetermined value is 250.
use_xml_timestamp
Deactivated by default. If it is activated (value 1) use the XMLfile timestamp, generated with time and date of the server in the moment of the reception of it, instead of the timestamp that the XML file has internally and that was generated by the server. This is useful to deactivate globally the use of the dates generated by the agents and use the date/hour (timestamp)of the server as a reference for all data. In systems with problems with synchronization, systems with wrong date/hour, it's an option that could solve almost all problems.
auto_restart
Deactivated by default. If it is activated (value in seconds), it forces the server to do an internal restart each X seconds (1 day = 86400). This option is useful if you observe degradation or lost of control of any thread or specific server of Pandora FMS.
restart
By default 0. If set to 1 the server will restart on critical errors after a given number of seconds.
restart_delay
By default 60. Number of seconds the server will wait before restarting after a critical error if restart is enabled.
self_monitoring
The server now (v3.1) has a self monitoring flag, that creates a virtual agent in the server that monitors most of the important parameters of a Pandora FMS serve. To activate it the parameter self_monitoring must be set to 1.
# Pandora Server self-monitoring (embedded agent) (by default disabled)self_monitoring 1
update_parent
Also the sever has now (v3.1) a parameter to define if the agent can update it's parent by sending the parent name on the XML, if this parameter is not defined or is 0 the agent information is ignored, if not, when the server receives an XML with parent_name attribute, searches for an agent with this name and if it's found updates the parent of the agent from the XML.
# Update parent from the agent xmlupdate_parent 1
6.1.1.2. UDP notification of the System State
The Pandora FMS server Enterprise version allows to notify through UDP Multicast a state tree (XML).It also does an asynchronous notification (snapshot) in case of state change. By default the notification of all the tree of states is done every 30 seconds multiplied by the value server_threshold.Only the modules with a defined Custom ID are sent in the notification by UDP.
This would be an example of configuration to do the periodical notification of all the status trees through the port 22222 and do the notification of change (asynchronous) on the port 11111:
Page 76
Pandora FMS configuration
mcast_status_group 224.168.132.63 mcast_status_port 22222 mcast_change_group 224.168.132.63 mcast_change_port 11111
6.1.1.3. Snmptrapd configuration
Pandora FMS SNMP Console uses snmptrapd to grab SNMP traps. Snmptrapd is a standard tool, present on almost all UNIX systems, to grab traps and write a logfile. Pandora FMS configures snmptrapd to write a custom logfile and reads it every x seconds, executing alerts if defined.
Previously, snmptrapd will accept all incoming notifications, and log them automatically (even if no explicit configuration is provided). Starting with 5.3 release, access control checks will be applied to incoming notifications.
If snmptrapd is run without a suitable configuration file (or equivalent access control settings), then such traps will not be processed.
Probably you will need to configure your snmptrapd using the file /etc/snmp/snmptrapd.conf. If doesn't exist, check /var/log/pandora/pandora_snmp.log file for warnings or errors.
A basic snmptrapd.conf could be like:
authCommunity log public
If doesn't work on your linux distribution, please check your version syntax to enable the reception of traps in your snmptrapd daemon with
man snmptrapd.conf
6.1.1.4. Tentacle Configuration
By default, Pandora FMS software agents send the data packages to the server through the Tentacle protocol (port 41121/tcp assigned by IANA [1]). The agent could also be reconfigured to it send data through alternative ways: local transfer (NFS,SMB),SSH or FTP, etc. IF you want that they send the data packages through Tentacle protocol, then we should have to configure a Tentacle server where this data will be received. By default, when a Pandora FMS server is installed, a Tentacle server is also installed in the same machine.
If it would be necessary to adjust some parameters of the Tentacle server configuration, then it could be done modifying directly the script that launches the Tentacle Server daemon that is in:
/etc/init.d/tentacle_serverd
Next, there is a list of the different options for Tentacle Server configuration:
PANDORA_SERVER_PATH
Path to the entry directory of data. In a predetermined way is /var/spool/pandora/data_in
TENTACLE_DAEMON
Tentacle daemon. In a predetermined way is tentacle_server.
Page 77
Pandora FMS configuration
TENTACLE_PATH
Path to the Tentacle binary. In a predetermined way is /usr/bin.
TENTACLE_USER
User the Tentacle demon will be launched with. In a predetermined way is pandora.
TENTACLE_ADDR
Direction to listen the data packages. If you fix 0.0.0.0. it will be listened in all of them. In a predetermined way it is listen in all directions, this is , its value is 0.0.0.0.
TENTACLE_PORT
Listening port for the packages reception. By default it's 41121 (official port assigned by IANA).
TENTACLE_EXT_OPTS
Additional options for executing the Tentacle server.
6.1.2. WEB Console Pandora FMS web console has a configuration file that usually is created and configured when it's installed.If the installations is done through the DEB or RPM packages or from the Pandora FMS installation CD, then it is configured in an automatic way.If it is installed in a manual way,with the tarball package. It could be configured from the web assistant through http://ip_instalacion_consola/pandora_console/install.php
The configuration file config.php is at the directory/include/ in the console installation directory, that could be /var/www/pandora_console (Debian, Ubuntu) or /srv/www/htdocs/pandora_console/ (SUSE, RH, Fedora...), depending on the distribution.
6.1.2.1. Configuration file config.php
The configuration options in the file are in the header of it, and are these:
$config["dbname"]
Database name to connect to . In a predetermined way is pandora.
$config["dbuser"]
User name for the connexion against the Pandora database. In a predetermined way is pandora.
$config["dbpass"] Password for the conexion against Pandora FMS database.
$config["dbhost"]
Ip adress or equipment name that host Pandora FMS database. In reduced installation usually it is the same equipment where the server is, this is, localhost.
$config["homedir"]
Directory where the Pandora FMS web console is. It usually is /var/www/pandora_console o /srv/www/htdocs/pandora_console.
$config["homeurl"]
Base directory for Pandora FMS. It usually is /pandora_console.
Page 78
Pandora FMS configuration
Redirection to /pandora_console from /
If you only has one Pandora FMS in your Apache server, then, it's possible that you could benefit by readdressing automatically /pandora_console when users connect with the URL of their server. To do this, you could create the following file index.html and put it in the web server root directory (/var/www ó /srv/www/htdocs):
When users connect with the URL / of their server. For it you can create the following file index.html and put it in the web server root directory
<html> <head> <meta HTTP-EQUIV="REFRESH" content="0; url=pandora_console/index.php"> </head> </html>
6.1.3. Pandora FMS software agents
6.1.3.1. What is an Agent ?
Pandora FMS software agents collect all data from the systems. They are executed in each local system, but they also can collect remote information through the monitoring systems installation for the agent in several different machines.
They are developed to work with a fixed platform, using the specific tools of the language that is used:VBSCript/Windows scripting for Microsoft platforms (Windows 2000, Windows XP, Windows 2003 y Windows Vista), ShellScripting for UNIXincludes GNU/Linux, Solaris, AIX, HPUX y BSD, and also the Nokia IPSO. The Pandora FMS agents could be developed in any language, as long as it would be a system with an easy API and that it would be open code. There are modalities of the Pandora FMS project that has been started for the agents creation in Posix C, Perl and Java for those systems that require closed agents.
Pandora FMS are 100% open code, for example in the way the agents collect and send information is documented and could analyze and/or modify the code for it could suit to your needs. An agent could be created again in any programing language and could be easily updated to improve aspects of the program that had been cover completely.
This document describes the agent installation in machines that work with the Windows and UNIX operative systems.
Software Agents Generic Role
The Software Agents generic role is based on obtaining information about the operative system in which them are installed, collect this information and then send it to the server.
Pandora FMS software agents use the specific commands of the operative system in order to obtain the information.Pandora FMS data server keeps and processes the data generated by these commands and sent to the server in an XML file.
The information returned by these commands is kept in what is called «Module». f the agent has been added in «learning» mode, the modules that have been sent and that are not defined previously in the logical agent will be created automatically by the server.
Page 79
Pandora FMS configuration
6.1.3.2. Introduction to the agent configuration
The agent is controlled by an unique configuration file that has a syntax that is almost the same in UNIX systems and in Windows Systems, this file is named pandora_agent.conf and is located in the agent installation directory(in Windows Systems) and in /etc/pandora/pandora_agent.conf in Unix systems.
This configuration file is a plain file text with different options that could be modify by the administrator, to modify the performance or it, configure where data will be send, which things will monitor and how it will do.
Next we talk about the general parameters for the Software agent and the monitoring modules that are the ones that define how and what is monitored locally with the Software Agent.
6.1.3.3. Agent General Parameters
The Configuration of Agent General Parameters is defined in this section. Some of them are commons for all systems and others are specifics for Windows or Unix. The general parameters are:
server_ip
Is the IP address or the name of Pandora FMS server host, where all data will be kept. The server must be prepared to collect the data either by SSH (listening on port 22), Tentacle (port 41121), FTP (port 21), SMB or NFS.
server_path
The server path is the comprehensive file path where the server keeps all data sent by agent.Usually it is /var/spool/pandora/data_in.
temporal
This is the complete path of the folder where the agent keeps data locally before sending to the server.
Please consider that the data packages, by default,they are deleted once the agent tries to contact with the Pandora FMS server, not taking in account if the connection was successful or not ( though this performance could be changed, as we see later).
This is done to prevent an overload in the hard disc of the host system where the agent runs. The location of the local file changes depending on the architecture of the host system. In UNIX system is usually at n /var/spool/pandora/data_out, and in the Windows systems C:\program files\pandora_agent\temp.The Windows installer by default will create this directory depending on where decides to install Pandora FMS.
And in Windows systems the Windows installer will create this directory by default, depending on where it decides to install Pandora FMS.
description
Send the description of the agent in the XML and Pandora FMS imports this description when it creates the agent.
group
Send the name of the group we want the agent owns, and that is only used at creating the agent. Pandora FMS server will automatically use this group to put the agent in the selected group.
Page 80
Pandora FMS configuration
temporal_min_size
If the free space (at mega bytes) of the partition in which the temporary directory is located is smaller that this value, then it would continue generating data packages. In this way, it avoids that the disk would become full if under any circumstance the connexion with the server is lost during an extended interval.
logfile
The path to the Pandora FMS agent events record file. The file could be used to check the system and to investigate other things.
interval
This is the time interval "in seconds" in which the agent will collect data from the host system and will sent the data packages to the server. The ranks of recommended values are, from 300 (5 minutes) to 600 (10 minutes).This number could be greater, but it's important to consider the impact of a higher number in the database. The execution is not recommended if it's below 3060 seconds.
debug
This parameter is used to check the creation of data in the files, forcing the agent to not copy data from files for the server, so the data content of the files could be checked and also copy the XML files data manually. No data is destroyed when the process has been done, so the data of the files will be at the temporary directory. The activity is registered in the registry file. The registry file is pandora_agent.log (see logfile above).
agent_name
This is an alternative name for the host. This parameter is optional so this has not been declared but obtained directly from the system. The parameter could be used to overwrite the host name for another one in case of a conflict.
encoding
Install the kind of codification of the local system, such as iso885915, or utf8. This option is available for the UNIX and Windows agents from Pandora FMS 2.0.
server_port
This parameter allows to identify the remote port of the server that is waiting. By default it is 41121 for Tentacle. In case that Tentacle is not used or that the server would be installed in other port, is here where it should be changed.
transfer_mode
This parameter specifies the transfer mode we have to install in order send the agent data to the server. The available modes are SSH (using SCP), Tentacle, FTP o local. The local mode is only for systems where the agent is executed in the same machine that the server, because it is basically an copy between directories. The local mode is available only for GNU/Linux agents.
server_pwd
Specific for the password of Windows FTP and for the Tentacle transference mode, although the password at the last one is optional. Server password for authentication with password.
server_ssl
Specific for the Tentacle transfer mode. Allows to authorize (1) or deny(0) the connexions encrypt through SSL.
Page 81
Pandora FMS configuration
server_opts
Specific for the Tentacle transfer mode. Allows to give additional parameters to the Tentacle client for advanced configurations. They should be between "" (for example,"vr 5").
Coming with 3.2 agent version, tentacle supports optional use of a HTTP proxy (using CONNECT) mode to send information to server. This is implemented using an advanced option, like this:
server_opts -y user:[email protected]:8080
This will force tentacle client to use proxy.inet at port 8080 using "user" and "pass" for authentication, if you want to use a proxy in 192.168.1.2 with port 9000 without credentials, will be:
server_opts -y 192.168.1.2:9000
delayed_startup
This parameter allows to configure the Pandora FMS agent in order it start working after any specific time (in minutes) after having executed it manually. It could be useful for systems with a lot of load packages. By default it is deactivated, this is, the Pandora FMS agent will start to work from the moment it will be executed manually. This option is only valid for UNIX agents.
pandora_nice
This parameter allows to specify the priority that the Pandora FMS agent process will have in the system. It is only available for Unix/Linux agents.
autotime
If it is enabled (1) send a timestamp of special execution (AUTO) that makes that the server uses the server local date /hour to establish the data hour, not paying attention to the hour sent by the agent. This is necessary in those agents that by any reason have a wrong hour or a different hour from the server.
cron_mode
With this parameter is possible to do that the agent use the Linux crontab to execute itself in a specific interval instead of using the agent internal system to execute itself every certain time . It is deactivated by default and it is not recommended to use it unless it would be strictly necessary.
remote_config
This parameter controls if it is possible to configure the agent remotely from the console or not. 1: the remote configuration is activated, 0: the remote configuration is not allowed. By default is deactivated.
xml_buffer
By default 0. If set to 1 the agent will save any XML data files that could not be sent and try again later.
Page 82
Pandora FMS configuration
An example of the general parameters from a Unix configuration would be:
server_ip 192.168.1.1 server_path /var/spool/pandora/data_in temporal /var/spool/pandora/data_out logfile /var/log/pandora/pandora_agent.log interval 300 debug 0 agent_name box01 server_port 41121 transfer_mode tentacle remote_config 1
An example of the general parameters from a Windows configuration would be :
server_ip 192.168.1.1 server_path /var/spool/pandora/data_in temporal c:\archivos de programa\pandora_agent\templogfile c:\archivos de programa\pandora_agent\pandora_agent.log interval 300 debug 0 agent_name box01 server_port 41121 transfer_mode tentacle remote_config 1
timezone_offset
The agent now can set it's timezone offset with the server. This is very useful to have agents with a different timezone synchronized with the same time with a server on another timezone. Agents will sent the shifted timezone to the server.
# Timezone offset: Difference with the server timezonetimezone_offset 3
agent_parent_name
Also now it's possible (if the server allows it) to update the parent of an agent by sending in the XML the name of the parent agent.
parent_agent_name parent_name
As we can see, most of the parameters from a Windows and a Unix agent are the same.
Secondary Server
An special kind of general configuration parameter is the definition of a secondary server. This allow to define a server to which send data, in a complementary way to the server defined in an standard way. The secondary server mode works in two different ways:
• on_error: Send data to the secondary server only if it cold not send them to the primary. • always: Always send data to the secondary server, regardless if it can contact or not with the
main server.
Page 83
Pandora FMS configuration
Configuration example:
secondary_server_ip 192.168.1.123secondary_server_path /var/spool/pandora/data_insecondary_mode on_errorsecondary_transfer_mode tentaclesecondary_server_port 41121
UDP Server
Pandora FMS Windows agent allows to configure the agent for the listening of remote commands.This server listen in a UDP port that has been specified by the user, and allows to get orders from a remote system, ideally from the Pandora FMS, through the execution of alerts in the server.
There are several options to configure the UDP remote server. They are at pandora_agent.conf
• udp_server:To activate the UDP server put it at 1. It is deactivated by default. • udp_server_port: Port where it listen. • udp_server_auth_address:Authorized IP address to send orders. For security reasons,
restrict the access to this agent from a unique IP. • process_<name>_start <command>: Command that will start a process defined by the
user. • process_<name>_stop <command>: Command that will stop the process. • service_<name> 1: Allows that the service <name> could be stop or started remotely
from UDP server.
Configuration example:
udp_server 1udp_server_port 4321udp_server_auth_address 192.168.1.23process_firefox_start firefoxprocess_firefox_stop killall firefox service_messenger 1
The server accept the following commands:
* <START|STOP> SERVICE <name of the service>: Start or stop a service.* <START|STOP> PROCESS <nombre del proceso>: Start or stop a process.* REFRESH AGENT <nombre del agente>: Forces one execution of the agent, refreshing data.
For example:
STOP SERVICE messengerSTART PROCESS firefoxREFRESH AGENT 007
There is an script in the server at /util/udp_client.plthat is the used by the Pandora FMS Server as a command of an alert, to start process or services. It has this syntax.
./udp_client.pl <address> <port> <command>
Page 84
Pandora FMS configuration
For more information, please go to the Alert configuration section. ¡
6.1.3.4. Modules definition
Each piece of information that is collected should be perfectly defined in each module, using the most precise syntax. You can implement as many values as it would be necessary in order they could be collected, adding, at the end of the general parameters as many modules as the number of values to compile. Each module is composed by several directives. The list that appears bellow is a descriptive list of all available modules signals for UNIX agents (almost all of them could be also apply to the Window agent).
The general syntax is the following:
module_beginmodule_name NombreDelMódulomodule_type generic_data...module_description Ejecución del comandomodule_interval Númeromodule_end
There are different kinds of modules, with different suboptions, but all modules have an structure similar to this. The parameters module_interval and module_description are optionals and the rest completely compulsories. We are going to see first the common elements.
Common elements of all modules
6.1.3.4.1.1. module_begin
Defines the beginning of the module. Compulsory.
6.1.3.4.1.2. module_name <nombre>
Name of the module. This is the module ID. Choose a name without blanks and not too long. There is no specific limitation. (max.250 characters), but a short name would be easier to work with, this name CAN NOT be duplicated ' with a similar name in the same agent. This name could be duplicated with other modules in other agents. Same as with other things Pandora FMS is sensible to the difference between capital and small letters.
It is compulsory.
6.1.3.4.1.3. module_type
The data type that the module will use. There are several data types for agents:
• Numerical (generic_data). Simple numerical data, in floating comma or wholes. If the values are floating type, these will be cut to its whole value.
• Incremental (generic_data_inc). The whole numeric data equals to the differential being between the current value and the previous one. When this differential is negative, the value is fixed to 0.
• Alphanumeric (generic_data_string). Collect alphanumeric text strings.
• Monitors (generic_proc). Useful to evaluate the state of a process or service. This type of
Page 85
Pandora FMS configuration
data is called monitor because it assigns 0 to a «Wrong» state and any value higher to 1 to a «Right» state.
• Asynchronous Alphanumeric (async_string). Collect alphanumeric text string that could entry at any moment without a fixed periodicity. The rest of parameters (generic*) have a synchronous working, this is, they expect the data entry every XX time, and if they don't come then it's said that they are in an unknown state (unknown). The asynchronous modules can not be in this state.
• Asynchronous monitor (async_proc). Similar to the generic_proc but asynchronous.
• Asynchronous monitor (async_data). Similar to generic_data but asynchronous.
It is compulsory.
6.1.3.4.1.4. module_min <valor>
This is the minimum valid value to data generated in this module. If the module has not been defined yet in the web console, then this value would be taken from this directory. This order is not compulsory. This value does not eliminate the defined value in the agent. If the module does not exist in the dashboard, then it will created automatically when the learning mode is used.
6.1.3.4.1.5. module_max <value>
This is the maximum valid value for data generated in this module. If the module has not been defined in the web console, this value could be taken from this directory. This guideline is not compulsory and is not supported by the Windows agent. This value does not eliminate the defined value in the agent. If the module does not exist in the dashboard, then it will be created automatically when the learning mode is used.
6.1.3.4.1.6. module_description <texto>
This guideline will be employed to add a comment to the module. This guideline in not compulsory. This value does not overwrite the value defined by the agent. If the module does not exist in the dashboard, then it will be created automatically when the learning mode is employed.
6.1.3.4.1.7. module_interval <factor>
Since Pandora 1.2 introduced this new type, it is possible for each module to fix its own interval. This interval is calculated as a multiplier factor for the agent interval.For example, if the agent has interval 300 (5 minutes), and you want a module that will be processed only every 15 minutes, then you should add this line: module_interval 3. The, this module will be preocessed every 300sec x 3 = 900sec (15 minutos).
6.1.3.4.1.8. module_timeout <secs>
(Windows only)
In 3.1 version, Pandora FMS supports specifying in each module independently, the total of seconds, Agent will wait for the execution of the module, so if it takes more than XX seconds (or 15 seconds by default), it will abort the execution of the module (for avoid becoming "dead" in the implementation of a module). In version 3.1 it's only supported on Windows, but future versions will also be implemented for Unix agents.
Page 86
Pandora FMS configuration
6.1.3.4.1.9. module_postprocess <factor>
Same as in the definition of post processing of a module that is done from the console, here could be defined a numeric value of floating comma that will send this value to Pandora FMS in order the server will use it to multiply the received (raw) by the agent. If you want to multiply by 1024 the value that the agent returns, put here "1024". If you want to divide it by 1024, then put here 1 /1024, that is 0,000976563.
6.1.3.4.1.10. module_save <variable name>
From version 3.2 it's possible to save the module returned value in an environment mode variable, so it could be used later in other modules. It's important to consider that the values are updated after the modules are executed, that is, in the same order that they are defined.
For example:
module_beginmodule_name echo_1module_type generic_datamodule_exec echo 41121module_save ECHO_1module_end
module_beginmodule_name echo_2module_type generic_datamodule_exec echo $ECHO_1module_end
6.1.3.4.1.11. module_crontab <minute> <hour> <day> <month> <day of the week>
From version 3.2 it's possible to schedule modules in order they'll be executed in an specific date. To do this, you should have to define the module_crontab' using a similar format to that of the crontab file:(http://es.wikipedia.org/wiki/Cron_(Unix)#Sintaxis)
module_crontab <minute> <hour> <day> <month> <day of the week>
Being:
• Minute 059 • Hour 023 • Day of the month 131 • Month 112 • Day of the week 06 (0 is Sunday)
It's also possible to specify intervals using the character as divider.
For example, in order to one module will be executed every Monday between 12 and 15, we could use the following configuration:
module_beginmodule_name crontab_testmodule_type generic_datamodule_exec script.shmodule_crontab * 12-15 * * 1
Page 87
Pandora FMS configuration
module_end
The module will be executed once during the interval. If we want that it'll be executed while the interval is on, we could use the module_cron_interval 0 option in the following way:
module_beginmodule_name crontab_test2module_type generic_datamodule_exec script.shmodule_crontab * 12-15 * * 1module_cron_interval 0module_end
To execute a command every hour, in an hour and 10 minutes:
module_beginmodule_name crontab_test3module_type generic_datamodule_exec script.shmodule_crontab 10 * * * *module_cron_interval 0module_end
6.1.3.4.1.12. module_condition <operation> <command>
From version 3.2 it's possible to define commands that will be executed when the module returns some specific values. It's necessary to specify one of the following options:
• > [value]: Executes the command when the module value is higher that the given value.
• < [valor]: Executes the command when the module value is lower than the given value.
• = [valor]: Executes the command when the module value is the same as the given value.
• != [valor]: Executes the command when the module value is different to the given value.
• =~ [regular expression]: Executes the command when the module value coincides with the given regular expresion.
• (valor, valor): Executes the command when the module value is ranged between the given values.
It's possible to specify multiple conditions for the same module. For example:
module_beginmodule_name condition_testmodule_type generic_datamodule_exec echo 2.5module_condition (1, 3) script_1.shmodule_condition > 5.5 script_2.shmodule_end
Page 88
Pandora FMS configuration
Examples:
module_beginmodule_name MyProcessmodule_type generic_datamodule_exec tasklist | grep MyProcess | wc -lmodule_condition > 2 taskkill /IM MyProcess* /Fmodule_end
module_beginmodule_name PandoraLogSizemodule_type generic_datamodule_exec ls -la "c:\Archivos de programa\pandora_agent\pandora_agent.log" | gawk "{ print $5 }"module_condition > 10000 del "c:\Archivos de programa\pandora_agent\pandora_agent.log"module_end
module_beginmodule_name Service_Spoolermodule_type generic_procmodule_service Spoolermodule_condition = 0 net start Spoolermodule_end
6.1.3.4.1.13. module_end
Defines the end of the module. It is compulsory.
Specific guidelines to obtain information
Next there are the specific guidelines that could be specified for each module in order to obtain information. In each module only could be use one kind of them.
6.1.3.4.1.14. module_exec <comand>
This is the general guideline «command to execute». Both for the Unix agent and for the Windows agent.There is only one guideline to obtain data from a generic way, executing only one command (it can be use pipes to readdress the execution to other command). This guideline executes a command and keeps the returned value. This method is also available in the agents for Windows. This is the general purpose method for both agents.
For the agents there are more guidelines to obtain data. They are the following ones:
6.1.3.4.1.15. module_service <service>
Checks if an specific service is being executed at the machine. Remember to use the «" "» characters if the name of the service contains blanks.
module_beginmodule_name Service_Dhcpmodule_type generic_procmodule_service Dhcpmodule_description Service DHCP Clientmodule_end
Page 89
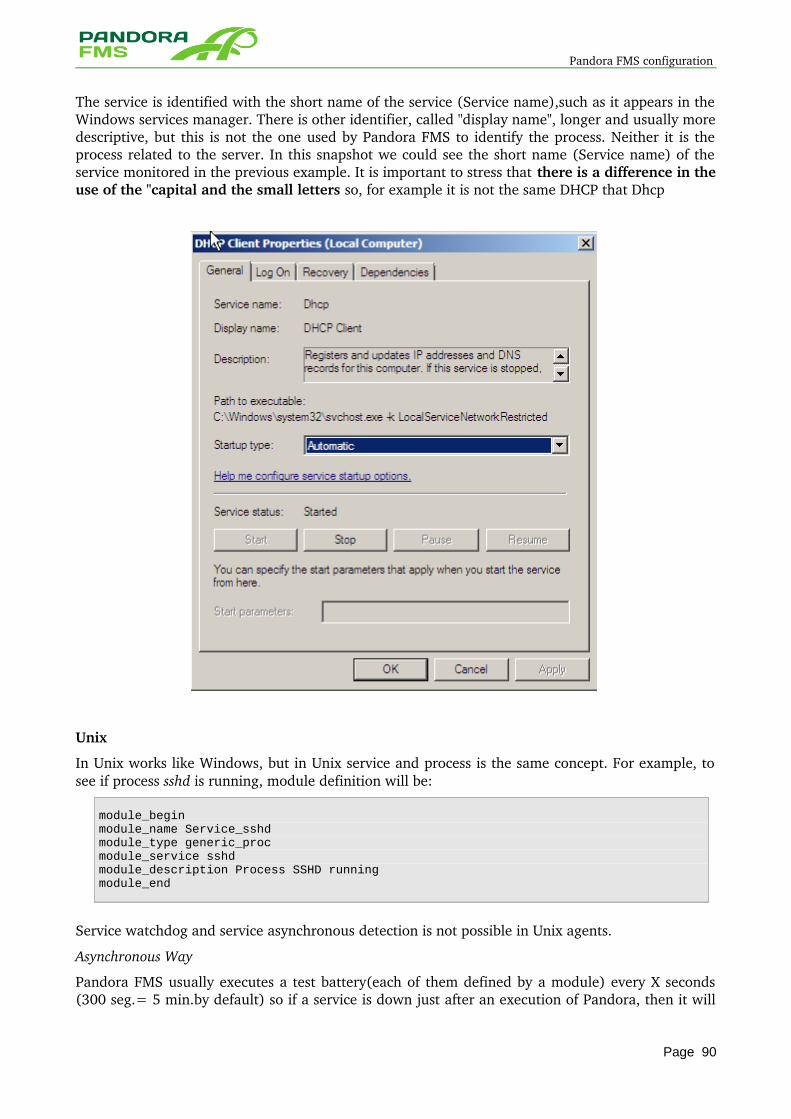
Pandora FMS configuration
The service is identified with the short name of the service (Service name),such as it appears in the Windows services manager. There is other identifier, called "display name", longer and usually more descriptive, but this is not the one used by Pandora FMS to identify the process. Neither it is the process related to the server. In this snapshot we could see the short name (Service name) of the service monitored in the previous example. It is important to stress that there is a difference in the use of the "capital and the small letters so, for example it is not the same DHCP that Dhcp
Unix
In Unix works like Windows, but in Unix service and process is the same concept. For example, to see if process sshd is running, module definition will be:
module_beginmodule_name Service_sshdmodule_type generic_procmodule_service sshdmodule_description Process SSHD runningmodule_end
Service watchdog and service asynchronous detection is not possible in Unix agents.
Asynchronous Way
Pandora FMS usually executes a test battery(each of them defined by a module) every X seconds (300 seg.= 5 min.by default) so if a service is down just after an execution of Pandora, then it will
Page 90
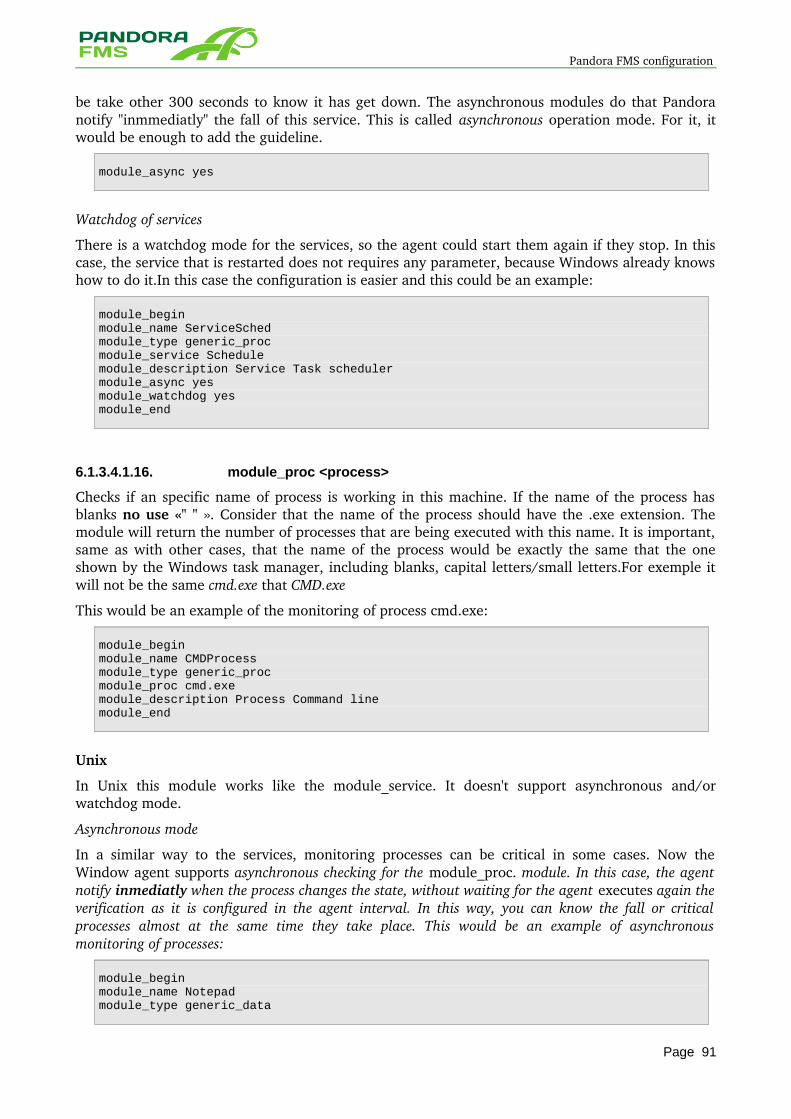
Pandora FMS configuration
be take other 300 seconds to know it has get down. The asynchronous modules do that Pandora notify "inmmediatly" the fall of this service. This is called asynchronous operation mode. For it, it would be enough to add the guideline.
module_async yes
Watchdog of services
There is a watchdog mode for the services, so the agent could start them again if they stop. In this case, the service that is restarted does not requires any parameter, because Windows already knows how to do it.In this case the configuration is easier and this could be an example:
module_beginmodule_name ServiceSchedmodule_type generic_procmodule_service Schedulemodule_description Service Task schedulermodule_async yesmodule_watchdog yesmodule_end
6.1.3.4.1.16. module_proc <process>
Checks if an specific name of process is working in this machine. If the name of the process has blanks no use «" " ». Consider that the name of the process should have the .exe extension. The module will return the number of processes that are being executed with this name. It is important, same as with other cases, that the name of the process would be exactly the same that the one shown by the Windows task manager, including blanks, capital letters/small letters.For exemple it will not be the same cmd.exe that CMD.exe
This would be an example of the monitoring of process cmd.exe:
module_beginmodule_name CMDProcessmodule_type generic_procmodule_proc cmd.exemodule_description Process Command linemodule_end
Unix
In Unix this module works like the module_service. It doesn't support asynchronous and/or watchdog mode.
Asynchronous mode
In a similar way to the services, monitoring processes can be critical in some cases. Now the Window agent supports asynchronous checking for the module_proc. module. In this case, the agent notify inmediatly when the process changes the state, without waiting for the agent executes again the verification as it is configured in the agent interval. In this way, you can know the fall or critical processes almost at the same time they take place. This would be an example of asynchronous monitoring of processes:
module_beginmodule_name Notepadmodule_type generic_data
Page 91
Pandora FMS configuration
module_proc notepad.exemodule_description Notepadmodule_async yesmodule_end
The difference is in the configuration token "module_async yes".
Processes Watchdog
A Watchdog is a system that allows to act immediately when an agent is down, usually picking up the process that is down . The Pandora FMS Windows agent could act as Watchdog when a process is down. This is called watchdog mode for the process:
Executing a process could need some parameters, so there are some additional configuration options for these kind of modules. It is important to say that the watchdog mode only works when the module type is asynchronous. Let's see an example of configuration of a module_proc with watchdog.
module_beginmodule_name Notepadmodule_type generic_datamodule_proc notepad.exemodule_description Notepadmodule_async yesmodule_watchdog yesmodule_start_command c:\windows\notepad.exemodule_startdelay 3000module_retrydelay 2000module_retries 5module_end
This is the definition of the additional parameters for module_proc with watchdog:
• module_retries:number of consecutive attempts for the module will try to start the process before deactivating the watchdog. If the limit is achieved , then the watchdog device for this module will be deactivated and will never try to start the process, even if the process is recovered by the user ( at last until the agent will be reboot). By default there is no limit for the nº of reattempts of the watchdog.
• module_startdelay:number of milliseconds the module will wait before starting the process by first time. If the process takes lot of time at starting , then it will be a great idea to order the agent through this parameter that it "wait" until start checking again if the process has got up. In this example wait 3 seconds.
• module_retrydelay: Similar to the previous one but for subsequent falls/reattempts, after having detect a fall. When Pandora detects a fall, relaunch the process, wait the nº of milliseconds pointed out in this parameter and check again if the process is already up.
It is important to say that Pandora FMS is executed as service and if you want to use the Watchdog functionality to execute processes that allow to interact with the desktop, then we should arrange, in the Pandora FMS service functionalities, the box "Interactive access with desktop", as it is shown in the following snapshot:
Page 92
Pandora FMS configuration
Same way, it is necessary to understand that Pandora FMS as service, is executed under the count "SYSTEM" and that the executed process will do it with this user and environment, so if it wants to execute an specific process that requires be used with an specific user,he should encapsulate in one script (.bat or similar) the previous processes for starting the environment, environment variables, etc) and execute this script as a watchdog action.
6.1.3.4.1.17. module_cpuproc <process>
(Unix only)
Return the CPU usage of a specific process.
module_beginmodule_name myserver_cpumodule_type generic_datamodule_cpuproc myservermodule_description Process Command linemodule_end
6.1.3.4.1.18. module_procmem <process>
(Unix only)
Return the memory used by a specific process.
Page 93
Pandora FMS configuration
module_beginmodule_name myserver_memmodule_type generic_datamodule_memproc myservermodule_description Process Command linemodule_end
6.1.3.4.1.19. module_freedisk <unit_letter:>|<volume>
This module works in Unix and Windows. It checks the free space in the disk unit (don't forget «":"» after the unit_letter) or the unix volume, p.e /var.
6.1.3.4.1.20. module_freepercentdisk <unit_letter:>|<volume>
This module returns the free disk percentage in a windows unit: (don't forget the ":") or on a Unix system, the volume, like /var.
module_begin module_name freepercentdisk module_type generic_data module_freepercentdisk C: module_end
module_beginmodule_name disk_varmodule_type generic_datamodule_freepercentdisk /varmodule_end
6.1.3.4.1.21. module_cpuusage <cpu id>
This works in Unix and Windows. It gives back the CPU usage in a CPU number. If there is only one CPU, let it blank. It is also possible to obtain the use average of all CPU in a multiprocessor system:
module_beginmodule_name SystemCPUmodule_type generic_datamodule_cpuusage module_description Average CPU use in systmemodule_end
To check CPU usage in CPU #1
module_beginmodule_name SystemCPU_1module_type generic_datamodule_cpuusage 1module_description Average CPU use in system for CPU #1module_end
Page 94
Pandora FMS configuration
6.1.3.4.1.22. module_freememory
Supported in Windows and Unix. Gives back the free memory in the whole system.
module_beginmodule_name FreeMemorymodule_type generic_datamodule_freememorymodule_description Non-used memory on systemmodule_end
6.1.3.4.1.23. module_freepercentmemory
Supported in Unix and Windows. This module gives back the free memory percentage in one system:
module_beginmodule_name freepercentmemorymodule_type generic_datamodule_freepercentmemorymodule_end
6.1.3.4.1.24. module_tcpcheck
(Windows only)
This module tries to connect with the IP and port specified.It returns 1 if it had success and 0 if it had other way.You should specify a time out.
module_beginmodule_name tcpcheckmodule_type generic_procmodule_tcpcheck www.artica.esmodule_port 80module_timeout 5module_end
6.1.3.4.1.25. module_regexp
(Windows only)
This module monitors a record file (log) looking for coincidences using regular expressions, ruling out the already existing lines when starting the monitoring . The data returned by the module depends on the module type:
• generic_data_string, async_string: Gives back all the lines that fit with the regular expression.
• generic_data: Gives back the number of lines that fit with the regular expression. • generic_proc: Gives back 1 if there is any coincidence, 0 if other way.
module_beginmodule_name regexpmodule_type generic_data_stringmodule_regexp C:\WINDOWS\my.logmodule_pattern ^\[error\].*module_end
Page 95
Pandora FMS configuration
To obtain more information about the syntax of the regular expressions, please have a look at this:[2]
6.1.3.4.1.26. module_wmiquery
(Windows only)
The WMI modules allow to execute locally any WMI query without using an external tool. It is configured through two parameters:
• module_wmiquery: WQL query used.Several lines could be obtained as a result, that will be placed as several data.
• module_wmicolumn: Name of the column that that is going to be used as a data source.
For example, we could obtain a list of the installed services.
module_beginmodule_name Servicesmodule_type generic_data_stringmodule_wmiquery Select Name from Win32_Servicemodule_wmicolumn Namemodule_end
Or of the current CPU load:
module_beginmodule_name CPU_speedmodule_type generic_datamodule_wmiquery SELECT LoadPercentage FROM Win32_Processormodule_wmicolumn LoadPercentagemodule_end
6.1.3.4.1.27. module_perfcounter
(Win32 only)
Obtains data from the performance counter through the PDH interface (the library pdh.dll should be installed in the system. PDH.DLL is a Windows library. If you have not installed it then you would have to install the Windows performance analysis tool (that usually is installed by default).
module_beginmodule_name perfcountermodule_type generic_datamodule_perfcounter \Memory\Pages/secmodule_end
The Windows performance monitor is a powerful tool that has hundreds of parameters that could be used to monitor. Each manufacturer also adds his owns monitors, so this is a powerful, versatile and easy to use tool to monitor the system parameters and also the devices that run on it.
The syntax of the perfcounter elements depends on the language, this is, in a German version ,Windows will have specific identification strings, and in an English version, Windows will have other ones. This makes difficult to use it at system with heterogeneous languages.
To explore the different values that could be used, you can use the the Windows tool "Performance" to see which strings of performance you could monitor.
Page 96
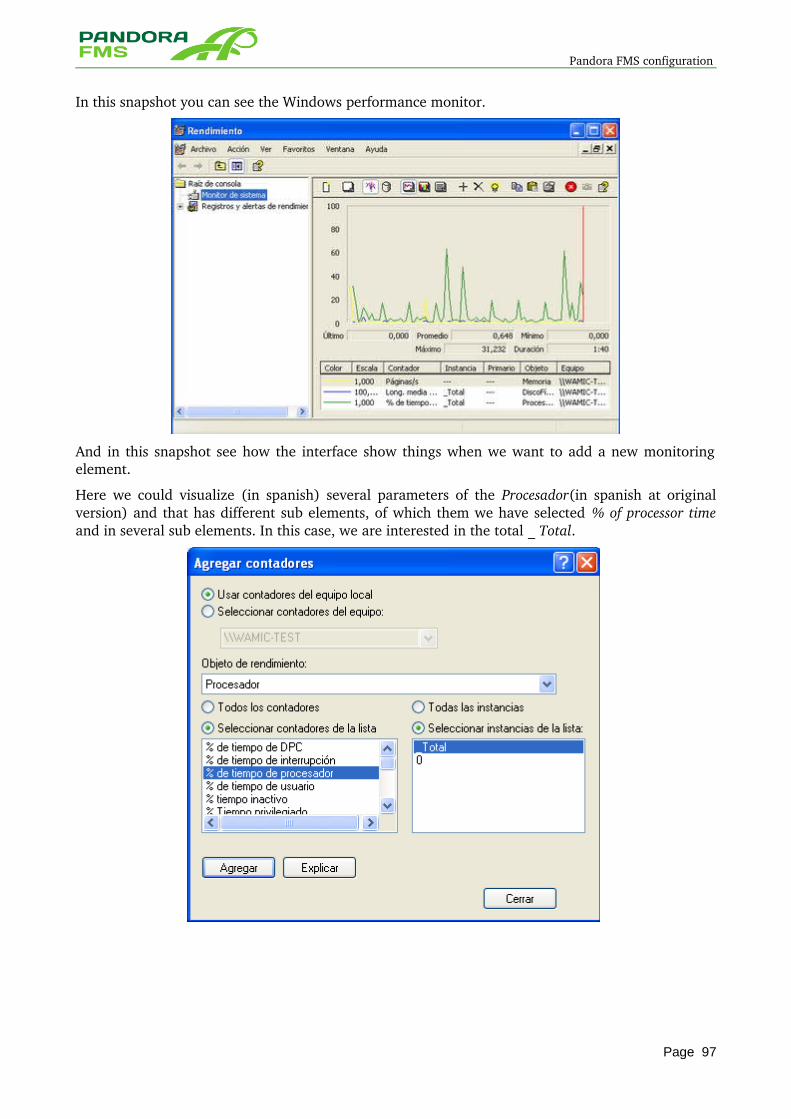
Pandora FMS configuration
In this snapshot you can see the Windows performance monitor.
And in this snapshot see how the interface show things when we want to add a new monitoring element.
Here we could visualize (in spanish) several parameters of the Procesador(in spanish at original version) and that has different sub elements, of which them we have selected % of processor time and in several sub elements. In this case, we are interested in the total _ Total.
Page 97
Pandora FMS configuration
In this way, surfing with the SO tool, we could get different elements of the system performance. For this specific example, the module would be:
module_beginmodule_name Processor_Timemodule_type generic_data_incmodule_perfcounter \Procesador(_Total)\% de tiempo de procesadormodule_end
Another example for other different example would be:
module_beginmodule_name Disk_E/S_Segmodule_type generic_datamodule_perfcounter \DiscoFísico(_Total)\E/S divididas por seg.module_end
Many of the data that it returns are counters, so you should use generic_data_inc as data type. It can also returns values in very high data scales (several millions), so you could reduce these values using the module post process, with values like 0.000001 or similar.
6.1.3.4.1.28. module_inventory
In Linux/Unix is implemented as agent plugin
Using predefined WMI consults and queries on the registry.This module obtains information about the different aspects of a machine. From software to hardware.
The module can get different parameters to mark the kind of information that it gets. Here is the parameter list and the kind of information that it gives:
• Cpu: Gets information about the system CPUs( processor name, watch frequency, and description).
• CDROM: Gets information about the CDROM(name, description and unity letter). • Video: Gets information about video cards(description, RAM, and processor). • HDs: Gets information about the hard disks(model, size and name in the system). • NICs: Gets information about the network interface controllers(description, MAC address
and IP address). • Patches: Gets information about the installed patches(identifier, description and
comments). • Software: Gets information about MSI packages installed(name and version). • RAM: Gets information about RAM modules(tag, capacity and name). • Services: Gets information about the installed services. The short name shown in the first
column is the name of the service that Pandora FMS uses to could monitor services.
Additional Module Parameters:
• module_interval: This module has an additional line to specify the interval, in days, where he can obtain the information for the module.
An example of the use of this module would be this:
module_beginmodule_name Inventorymodule_interval 7module_type generic_data_string
Page 98
Pandora FMS configuration
module_inventory RAM Patches Software Servicesmodule_description Inventorymodule_end
6.1.3.4.1.29. module_logevent
(Windows only)
This new module allows to obtain information from the Window event log file. It returns those elements that agree with a given pattern, allowing also to filter by the source and event type. The module that exists in version 2.0 has been improved, using now the Win32 native API to have access to the events from the file, instead of using the subsystem WMI (much slower). This method is quicker and allow to work in systems with many elements. The new implementation also allows to filter through much more fields that in the previous version. The standard format of the module is the following:
module_beginmodule_name MyEventmodule_type async_stringmodule_logeventmodule_source <logName>module_eventtype <event_type/level>module_eventcode <event_id>module_application <source>module_pattern <text substring to match>module_descriptionmodule_end
To avoid showing that has been already shown, we only consider those events that had taken place from the last time the agent was executed, as it happens with other modules (regexp, p.e).
module_logevent accepts the following parameters (all of them casesensitive):
• module_source: Event source (System, Application, Security). This field is compulsory. • module_eventtype: Event type(failure, information). It is an optional field. • module_pattern: Pattern to search (substring). It is an optional field. • module_eventcode: It is a numeric ID of the event, p.e: 5112. It is an optional field. • module_application: Application source of the event. Watch out not mistake with
module_source that shows the name or the source or log file where the events are looked for.
For example, for showing all events of an error type system we should define the following module:
module_beginmodule_name log_eventsmodule_type generic_data_stringmodule_description System errorsmodule_logeventmodule_source Systemmodule_eventtype errormodule_end
Page 99
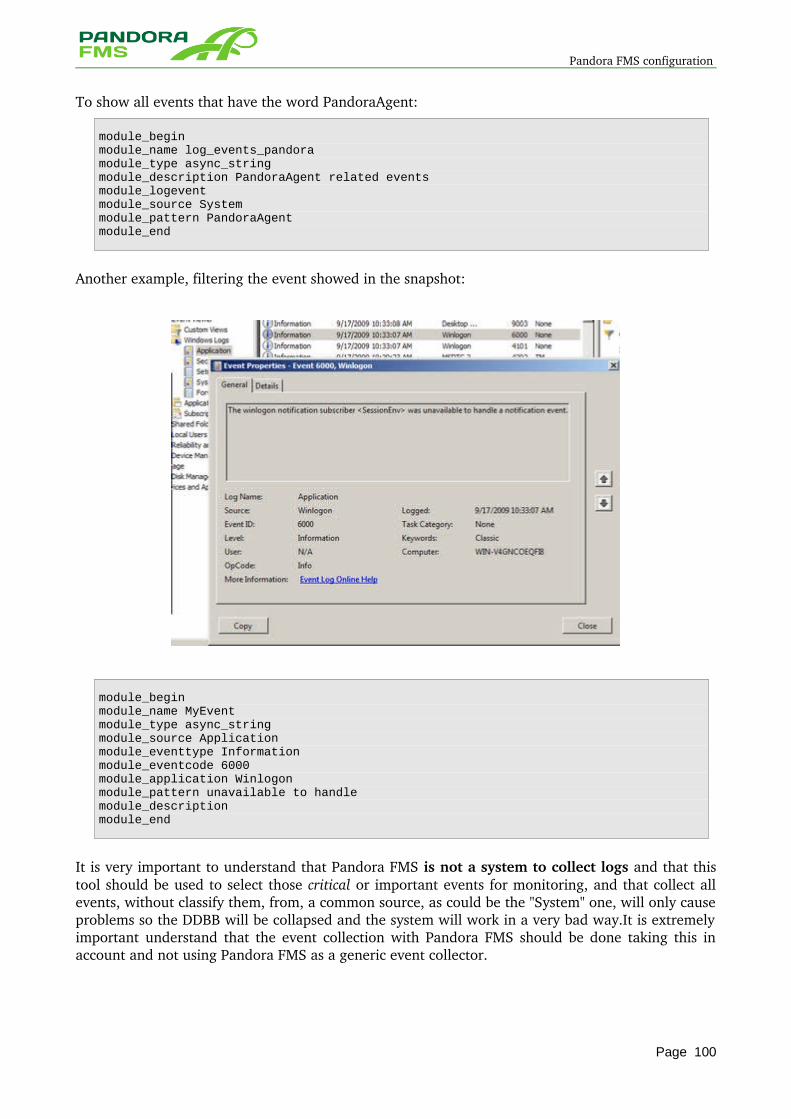
Pandora FMS configuration
To show all events that have the word PandoraAgent:
module_beginmodule_name log_events_pandoramodule_type async_stringmodule_description PandoraAgent related eventsmodule_logeventmodule_source Systemmodule_pattern PandoraAgentmodule_end
Another example, filtering the event showed in the snapshot:
module_beginmodule_name MyEventmodule_type async_stringmodule_source Applicationmodule_eventtype Informationmodule_eventcode 6000module_application Winlogonmodule_pattern unavailable to handlemodule_descriptionmodule_end
It is very important to understand that Pandora FMS is not a system to collect logs and that this tool should be used to select those critical or important events for monitoring, and that collect all events, without classify them, from, a common source, as could be the "System" one, will only cause problems so the DDBB will be collapsed and the system will work in a very bad way.It is extremely important understand that the event collection with Pandora FMS should be done taking this in account and not using Pandora FMS as a generic event collector.
Page 100
Pandora FMS configuration
6.1.3.4.1.30. module_odbc
(Windows only)
Generic module of access to the database through ODBC interface in Windows agent. This allow to do now SQL queries to the database servers that have this system, as Microsoft SQL Server, Oracle, MySQL or PostgreSQL between others.
In order to could use ODBC modules, first you have to define the ODBC connector in the main section of the agent configuration, with some lines like these:
# ODBC connections# Configuring "ExampleDSN" DSN. Notice that this DSN connection must be configured# under Control panel -> Administrative tools -> ODBC -> DSNodbc_ExampleDSN_username UserNameForDsnodbc_ExampleDSN_password Password1234
This create a "ExampleDSN" handler that we could use after in the modules. Let see an example of a module that uses the handler previously created.
# ODBC query example using ExampleDSN connection defined above.# This module gets the first row in example_table.module_beginmodule_name SQL query examplemodule_type generic_stringmodule_odbc ExampleDSNmodule_odbc_query SELECT * FROM example_tablemodule_description The first row of example_tablemodule_end
At present, the ODBC module only allows to return the first line of each query exit.
6.1.3.4.1.31. module_plugin
Is a parameter to define the data that is obtained as an exit of a plugin agent. It is an special case of module, that builds all its XML and that does not requires any other delimiter,such as type module_begin, module_type, etc.They follow this format:
module_plugin plugin_filename parámetro_1 parámetro_2 parámetro_3
Each plugin has its own syntax. We are going to describe one of the plugins that comes by default with the Agent, the regular expressions plugin:
module_plugin grep_log /var/log/syslog Syslog ssh
In this example, the name of the plugin is "grep_log "and will search in the file "/var/log/syslog" the regular expression "ssh" and will kept it in a module called "Syslog".
Another example in windows systems, (solo version 3.1 o superior)
module_plugin cscript.exe //B "%ProgramFiles%\Pandora_Agent\util\df_percent.vbs"
Page 101
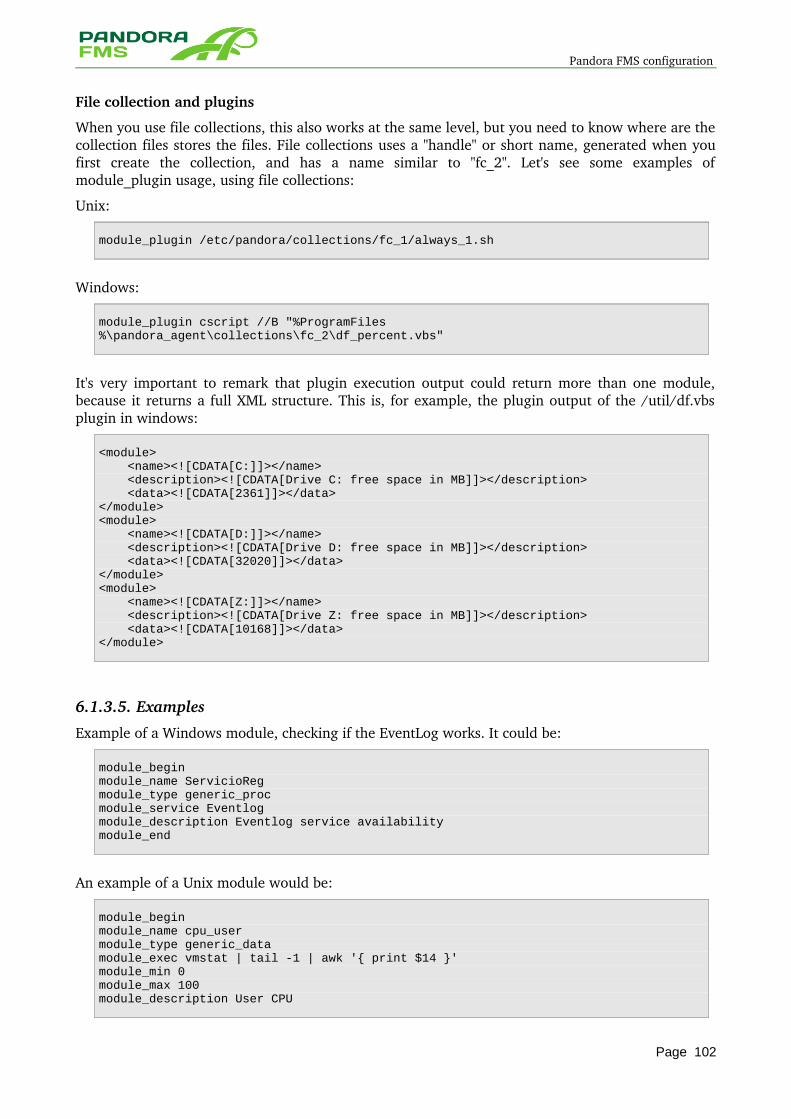
Pandora FMS configuration
File collection and plugins
When you use file collections, this also works at the same level, but you need to know where are the collection files stores the files. File collections uses a "handle" or short name, generated when you first create the collection, and has a name similar to "fc_2". Let's see some examples of module_plugin usage, using file collections:
Unix:
module_plugin /etc/pandora/collections/fc_1/always_1.sh
Windows:
module_plugin cscript //B "%ProgramFiles%\pandora_agent\collections\fc_2\df_percent.vbs"
It's very important to remark that plugin execution output could return more than one module, because it returns a full XML structure. This is, for example, the plugin output of the /util/df.vbs plugin in windows:
<module> <name><![CDATA[C:]]></name> <description><![CDATA[Drive C: free space in MB]]></description> <data><![CDATA[2361]]></data></module><module> <name><![CDATA[D:]]></name> <description><![CDATA[Drive D: free space in MB]]></description> <data><![CDATA[32020]]></data></module><module> <name><![CDATA[Z:]]></name> <description><![CDATA[Drive Z: free space in MB]]></description> <data><![CDATA[10168]]></data></module>
6.1.3.5. Examples
Example of a Windows module, checking if the EventLog works. It could be:
module_beginmodule_name ServicioRegmodule_type generic_procmodule_service Eventlogmodule_description Eventlog service availabilitymodule_end
An example of a Unix module would be:
module_beginmodule_name cpu_usermodule_type generic_datamodule_exec vmstat | tail -1 | awk '{ print $14 }'module_min 0module_max 100module_description User CPU
Page 102
Pandora FMS configuration
module_endTipos de agentes software
6.1.3.6. Advanced issues about software agents
With Pandora FMS it is possible to monitor any system. This could be done, either with a Software agent installed in the system, that collect data straigh from the system to be monitored, or using a "Satellite Agent" that consist of an agent that is executed in a server and monitor some parameters of systems that have adjacents, through SNMP or commands defined by the user.
The software agents could be Windows or UNIX agents. The agents could be installed using any of the agents described in the following lines. To use a satellite agent, it will be enough if you install a software agent and define configured modules to collect data from an external system, through, for example, the snmpget tool or through ping.
Unix/Linux Agents
Unix has several command line tools that allow that get data through commands would be a very simple thing.The Unix agents are based in this premise.There are two kinds of Unix agents:
• ShellScript: with a shellscript defined for each kind of SO, based on bash, ksh or csh. In the classic Unix Systems (Solaris, AIX, HPUX) all functionalities are not implemented. But in Linux and MAC they are.
• Perl: there is a unique multiplataform agent, based on Perl 5.8 that functions equally in all Unix systems. They should necessarily have a Perl 5.8 system or another higher to operate.
The shellscript agents have been designed to function even in the oldest UNIX versions: HPUX11.0, AIX 4.1, Solaris 6... They work, but are limited with some features, such as not having the Tentacle client and having to use the FTP system or SSH to upload the monitoring data to the server.
6.1.3.6.1.1. Pandora FMS Unix Agents Configuration
There is hardly any difference between AIX, Solaris and GNU/Linux. We are going to describe some of their most important parameters and paths.
After starting the installator, the agent main directory or "home" directory is /usr/share/pandora_agent/ where the Pandora FMS agent would be installed. In the system where this would be not possible by politic reasons, we recommend to create a link to this path from the installation real path,p.e /opt/pandora > /usr/share/pandora_agent
The other important folders are:
• /var/spool/pandora/data_out: Folder where the data collected by agents is kept
• /etc/pandora/pandora_agent.conf: Main agent configuration folder. Where the data that is collected is defined, with the command that will be used for the collection of data.
• /usr/local/bin/pandora_agent: the current Pandora FMS agent. This file is a shellscript that collects the configured data in the pandora_agent.conf files.It also send the data packages to the Pandora Server. It usually has a link to /usr/bin/pandora_agent
• /usr/local/bin/tentacle_client: The agent add the Tentacle client to could send the data files to the server.This is a client in Perl 5.8. Usually it has a link to /usr/bin/tentacle_client.
• /etc/init.d/pandora_agent_daemon: Script of start/ stop. This make a call to pandora_agent. This gives to options, start/stop. In the AIX systems the daemon is
Page 103
Pandora FMS configuration
/etc/rc.pandora_agent_daemon .
• /var/log/pandora/pandora_agent.log: Text file where the activity of the Pandora FMS agent is kept, when the agent is executed in depuration mode
• /etc/pandora/plugins: Directory that keps the agent plugins. It is link to directory /usr/share/pandora_agent/plugins
6.1.3.6.1.2. Initial Execution of Unix Agent
When you start the Pandora FMS agent, this should copy the data file to the Pandora FMS server through the dispatch system that is specified in the configuration file /etc/pandora/pandora_agent.conf. This dispatch system (Tentacle,SSh,FTP) should be configured previously.
To start the agent you need only to execute:
/etc/init.d/pandora_agent_daemon start
For IPSO systems the agent will be launched with a priority of 10, so it turns into the process with the lowest priority in the system CPU It will be executed when other processes with a higher priority will be waiting in the CPU system queue.The IPSO agent has an special parameter (harmless_mode ) for an special management of the CPU process at systems Checkpoint/NOKIA. This is a very special case.
In the BSD systems the highest priority is +20 and the lowest 20.
To stop the agent, execute:
/etc/init.d/pandora_agent_daemon stop
6.1.3.6.1.3. Advanced Configuration for the Unix Agent
The Pandora FMS's real power is on the agent capacity to start working the user defined scripts. This could be used to collect specific data or to make an operation that gives back any wanted value. This is the aim of the agent plugin structure. For more information check the Annex on Creating Agent plugins.
6.1.3.6.1.4. Examples of Implementation for Unix Agents
Example #1: calculate the number of displays at the Apache Web server main page (it could degrade the running of huge records):
module_beginmodule_name WEB_Hitsmodule_type generic_data_incmodule_exec cat /var/log/apache/access.log | grep "index" | wc -lmodule_end
Example #2: checks if the process of the DNS(named) is working or it is down:
module_beginmodule_name DNS_Daemonmodule_type generic_proc
Page 104
Pandora FMS configuration
module_exec ps -Af | grep named | grep -v "grep" | wc -lmodule_end
6.1.3.6.1.5. Altering the way Unix Agents obtain system information
This is only valid for Unix Perl agents (version 3.2 or higher).
There are some modules which works like "blackboxes", thus, make things and the user doesn't have to know what is really doing. These modules are:
• module_procmem • module_freedisk • module_freepercentdisk • module_cpuproc • module_proc • module_procmem • module_cpuusage • module_freememory • module_freepercentmemory
Modules like module_cpuusage, for example, return a % of current system CPU usage. But the user doesn't need to use a command, Pandora "already knows" what to do, on windows and in Unix systems.
Pandora Unix Agents have a "predefined" commands to do that, for example, to do this, is done in different ways depending on the OS:
linux => 'vmstat 1 2 | tail -1 | awk \'{ print $13 }\, solaris => 'vmstat 1 2 | tail -1 | awk \'{ print $21 }\, hpux => 'vmstat 1 2 | tail -1 | awk \'{ print $16 }\
Could happen that your system is slightly different from the tested system, and the command is not valid. You can use your own command with a simple module_exec or redefine internal pandora commands to do that. For that, you need to edit some lines of Pandora FMS Unix Agent code, but doesn't worry, is Perl code, and it's a very basic edition.
Pandora agent is usually in /usr/bin/pandora_agent. Edit with vi or nano (they are common text editors for console), and search for "Commands to retrieve" text. You should see something like:
# Commands to retrieve total memory information in kBuse constant TOTALMEMORY_CMDS => { linux => 'cat /proc/meminfo | grep MemTotal: | awk \'{ print $2 }\, solaris => 'MEM=`prtconf | grep Memory | awk \'{print $3}\'` bash -c \'echo $(( 1024 * $MEM ))\, hpux => 'swapinfo -t | grep memory | awk \'{print $2}\};
This is the piece of code which defines how pandora get information from system to get total memory. AIX is not defined because we don't have information on how to get this information in a AIX system. If you see a bit more below:
# Commands to retrieve partition information in kBuse constant PART_CMDS => {
Page 105
Pandora FMS configuration
# total, available, mount point linux => 'df -P | awk \'NR > 1 {print $2, $4, $6}\, solaris => 'df -k | awk \'NR > 1 {print $2, $4, $6}\, hpux => 'df -P | awk \'NR > 1 {print $2, $4, $6}\, aix => 'df -kP | awk \'NR > 1 {print $2, $4, $6}\};
These are the commands to get disk information in KB (total, free and mount point). To change any of predefined values to get information, just edit the command, but be careful with:
1. Check that lines ends with ";" 2. Check that commands are between ' ' symbols. 3. Check that any ' symbol you use, is escaped with \ symbol, for example this command:
df -P | awk 'NR > 1 {print $2, $4, $6}'
Will be
df -P | awk \'NR > 1 {print $2, $4, $6}\'
It's the same used above, so see how it is written in the code.
Pandora FMS Windows Agents
6.1.3.6.1.6. Checking of the Windows agent working
The exit of the Pandora FMS Windows agent can be checked at the file C:\archivos de programa\pandora_agent\pandora_agent.log,plain text file that includes information about the agent execution flow.
To check if Tentacle or SSH are working well, you can use the command tentacle_client or the parameter testssh on the binary.The first command will give an error so neither the address or the file to send is specified, but it checks that the Tentacle client, tentacleclient is in the system. The second one will force to Pandora FMS to connect using SSH internally and copy a file called ssh.test. Remember that you shoul configure SSH correctly if you want to use it, generating the needed keys and importing them in the server.
6.1.3.6.1.7. Checking of Pandora FMS Agent service
The Pandora FMS 3.0 version has been carefully checked and "debugged" in order to avoid all kinds of memory leaks, handles,of processes , files or TCP/IP ports. It is very stable and has been tested in all Windows platforms where it has to operate. Nevertheless, in some systems could happen that the service fall a few times. For it we have tried to give some solutions to those users that require a restart system or a supplementary control of the agent.
There are two ways of having more control over the agent. The first one is to force the restart of the agent every X days through the Windows internal programmer for tasks through the AT command.
Restart with AT
In English
To schedule a restart on Mondays and Fridays:
Page 106
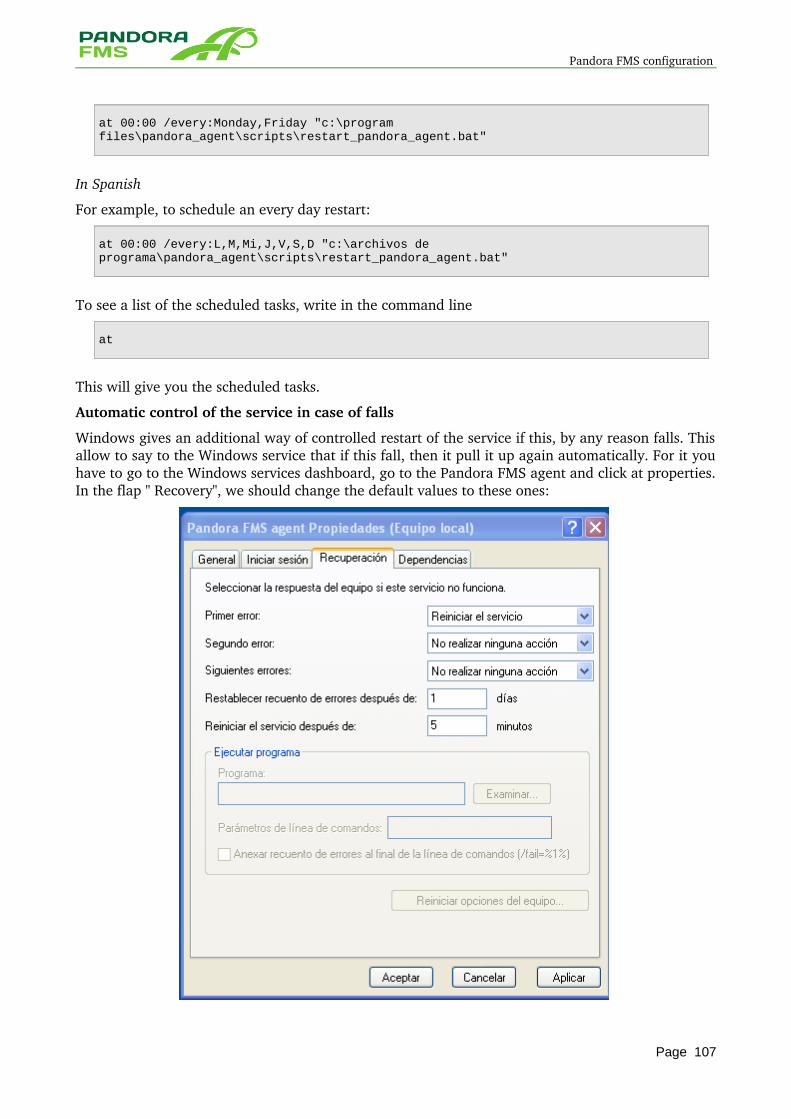
Pandora FMS configuration
at 00:00 /every:Monday,Friday "c:\program files\pandora_agent\scripts\restart_pandora_agent.bat"
In Spanish
For example, to schedule an every day restart:
at 00:00 /every:L,M,Mi,J,V,S,D "c:\archivos de programa\pandora_agent\scripts\restart_pandora_agent.bat"
To see a list of the scheduled tasks, write in the command line
at
This will give you the scheduled tasks.
Automatic control of the service in case of falls
Windows gives an additional way of controlled restart of the service if this, by any reason falls. This allow to say to the Windows service that if this fall, then it pull it up again automatically. For it you have to go to the Windows services dashboard, go to the Pandora FMS agent and click at properties. In the flap " Recovery", we should change the default values to these ones:
Page 107
Pandora FMS configuration
This does that if the service falls, it restart it automatically, but only once a day, so it falls more times it does not pull it up, avoiding by this that the system would be overload or forces the execution that downs too much and that could be caused by a problem in the system, because Pandora FMS should never be down,and of course, not so frequently. In any case, you can adjust these parameters to do that when the Pandora FMS service fall be controlled by the system and this way be sure that you will always have the agent running.
6.1.3.6.1.8. Configuration of Pandora FMS Windows Agent
The whole installation is done through file pandora_agent.conf. This file is a list of pairs of keys/values that have been described before. Here is an example of this file.
# General Parameters# ================== server_ip mypandoraserver.host.comserver_path /var/spool/pandora/data_intemporal "c:\windows\temp"interval 300agent_name myagent_name # Module Definition# ================= # Counting OpenedConnections (check language string)module_beginmodule_name OpenNetConnectionsmodule_type generic_datamodule_exec netstat -na | grep ESTAB | wc -l | tr -d " "module_description Conexiones abiertas (interval 2)module_interval 2module_end # Is Eventlog service running ?module_beginmodule_name ServicioRegmodule_type generic_procmodule_service Eventlogmodule_description Servicio Registro de sucesosmodule_end # Is lsass.exe process alive ?module_beginmodule_name Proc_lsassmodule_type generic_procmodule_proc lsass.exemodule_description LSASS.exe process.module_end # Received packets.# Please notice that "Paquetes recibidos" string must be replaced by# the correct string in your Windows system language.module_beginmodule_name ReceivedPacketsmodule_type generic_datamodule_exec netstat -s | grep "Paquetes recibidos " | tr -d " " | cut -f 2 -d "=" | tr -d "\n"module_description Conexiones abiertas (interval 2)module_end # Free space on diskmodule_begin
Page 108
Pandora FMS configuration
module_name FreeDiskCmodule_type generic_datamodule_freepercentdisk C:module_description Free space on drive C:module_end
module_beginmodule_name FreeMemorymodule_type generic_datamodule_freepercentmemorymodule_description Amount of free memory.module_end
6.1.3.6.1.9. Extending the agents functionality of agents with VBS code
Starting witn 3.1 version, Windows agents have plugins, like the Unix agents, but don't forget that they have also the possibility of executing the external scripts, based in VBScript as simple modules. See the VBS code that obtains the CPU total use of a system:
strComputer = "."Set objWMIService = GetObject("winmgmts:" _ & "{impersonationLevel=impersonate}!\\" _ & strComputer & "\root\cimv2")
Set object1 = objWMIService.Get( _ "Win32_PerfRawData_PerfOS_Processor.Name='_Total'") N1 = object1.PercentProcessorTime D1 = object1.TimeStamp_Sys100NS Wscript.Sleep(1000) set object2 = objWMIService.Get( _ "Win32_PerfRawData_PerfOS_Processor.Name='_Total'") N2 = object2.PercentProcessorTime D2 = object2.TimeStamp_Sys100NS
' CounterType - PERF_100NSEC_TIMER_INV ' Formula - (1- ((N2 - N1) / (D2 - D1))) x 100 PercentProcessorTime = (1 - ((N2 - N1)/(D2-D1)))*100
Wscript.Echo PercentProcessorTime
We keep it a file called "CPUTotal.vbs" and located at c:\program files\pandora_agent\util.
Now we create a new module tipe module_exec with this content:
cscript.exe /NoLogo c:\program_filespandora_agent\util\CPUTotal.vbs
We already have a new module that returns the CPU total use obtained through the external script in VB. There are plenty of things that can be obtained throug VBScript. Microsoft has an excellent documentation on line about VBS that you can check in MSDN [3].
Auto-upgrading Software Agents
Pandora FMS 3.2 has a new feature called "File collection". File collections are described in a few chapters below, they are a "centralized file distribution system" to copy files (binary, scripts, data) from the console to the agents running the Pandora FMS software agent.
Page 109
Pandora FMS configuration
Using that mechanism and a very special tool, we can provide a way to "autoupgrade" the software agents. This works in this way:
1. Agents receive new binaries in the filecollection incoming dir, for example:
c:\program files\pandora_agent\collections\fc_1\pandoraAgent.exe
2. The agent uses a special module to execute the pandora_update tool. This tool receives a single parameter, it's the FileCollection handle (or short name), in this scenario, is fc_1, and check for a file called pandoraagent.exe (or pandora_agent in unix) and see the size and contents (by using a HASH) of both files, the running pandora_agent and the binary provided in the file collection. If they are different, pandora_update stop the agent, replace the binary and restart the agent again, using the new binary.
3. Pandora_update also writes to a small log the update event, to be able to recover in the next execution and warn the user, by using a async_string module, about the agent update process.
This means that modules used to do the update process, could be configured to have a high interval.
Unix
module_beginmodule_name Pandora_Updatemodule_type async_stringmodule_interval 20module_exec nohup /etc/pandora/plugins/pandora_update fc_1 2> /dev/null && tail -1 nohup.out 2> /dev/nullmodule_description Module to check new version of pandora agent and update itselfmodule_end
NOTE: /etc/pandora/plugins/pandora_update could be in other path if it has installed it in a non standard directory at your system.
Windows
module_beginmodule_name Pandora_Updatemodule_type async_stringmodule_interval 20module_exec pandora_update.exe fc_1module_description Module to check new version of pandora agent and update itselfmodule_end
NOTE: At Unix, if it has the agent in a non "standard" path, it will have to modify some of the pandora_update utility values, specifically the following lines:
# Setup your particular paths / process settings here# [SETUP BEGIN] 12:46, 23 November 2010 (UTC)12:46, 23 November 2010 (UTC)12:46, 23 November 2010 (UTC)12:46, 23 November 2010 (UTC)12:46, 23 November 2010 (UTC)12:46, 23 November 2010 (UTC)12:46, 23 November 2010 (UTC)12:46, 23 November 2010 (UTC)12:46, 23 November 2010 (UTC)12:46, 23 November 2010 (UTC)# Location of binaries # Unix my $running_binary = "/usr/bin/pandora_agent";
Page 110
Pandora FMS configuration
my $updated_binary = "/etc/pandora/collections/$fc_path/pandora_agent";
# Unix style
my $start_pandora = "/etc/init.d/pandora_agent_daemon start";my $stop_pandora = "/etc/init.d/pandora_agent_daemon stop";
And fix manually the paths to the one that fits with your system.
Process to Auto_Upgrade Agents from versions Previous to the 3.2
The first thing is to get the runnables from the Pandora FMS agent and from the pandora_update tool (pandoraAgent.exe and pandora_update.exe in Windows and pandora_agent and pandora_update in Unix)
Many of the steps that we are giving here means the following things:
1. You have a way to copy files to the systems that you want to update. This is a feature that the Pandora FMS 3.2 version provides (File Collection) but just now you want to migrate to the 3.2 version, because it hasn't this feature. It's assumed that you have other alternative mechanism.
2. The agent configuration remote management is activated and working. This will be useful, and you should create several directories and configure a new module in your Pandora FMS agent configuration.
Windows Platforms
We should copy pandora_update to one directory of the system path or to the carpeta /util of our pandora (in Windows)
Supposing that we have Pandora FMS installed at:
C:\Archivos de programa\pandora_agent
We have to copy pandora_update.exe in the directory:
C:\Archivos de programa\pandora_agent\util
Then we create two directories:
C:\Archivos de programa\pandora_agent\collectionsC:\Archivos de programa\pandora_agent\collections\fc_1
And after this, we should copy the new agent binary to the last directory that we have created:
C:\Archivos de programa\pandora_agent\collections\fc_1\PandoraAgent.exe
We create one module in the agent as the one that follows:
module_beginmodule_name Pandora_Updatemodule_type async_stringmodule_interval 20
Page 111
Pandora FMS configuration
module_exec pandora_update.exe fc_1module_description Module to check new version of pandora agent and update itselfmodule_end
This special module that uses the pandora_update executable, executes an special tool (pandora_update) that compares the current executable with the one that already exist in the directory /collections/xxxx, where xxxx is a parameter that is passed to the module. This location is the one that is specified with the file_collections.After, using the 3.2 version, the distribution of the new .exe of the agents will be done through filecollections and this identifier will be necessary to "locate" in which File Collection is our executable.
UNIX Platforms
In a similar way to the Windows platforms, we have to copy the executable of the Unix agent and the pandora_update feature. If it has a non_standar installation and it has customized paths, then you should have to pay lot of attention to the previous paragraph, where it says which files should be modified.
You have to copy pandora_update in your agent plugins/folder:
/etc/pandora/plugins/pandora_update
And now create directories/collection/fc_1 on the base directory of your /etc/pandora
/etc/pandora/collections//etc/pandora/collections/fc_1
The call to pandora_update will be done on its system paths to the plugins, in this case, the standard is /etc/pandora/plugins/pandora_update
The module for the Unix case will be the following one:
module_beginmodule_name Pandora_Updatemodule_type async_stringmodule_interval 20module_exec nohup /etc/pandora/plugins/pandora_update fc_1 2> /dev/null && tail -1 nohup.out 2> /dev/nullmodule_description Module to check new version of pandora agent and update itselfmodule_end
NOTE: You should check that both pandora_update and pandora_agent have suitable permissions and owners. Executing permissions and the same user that the pandora_agent executable.
Page 112

Pandora FMS configuration
7 OPERATION
Page 113
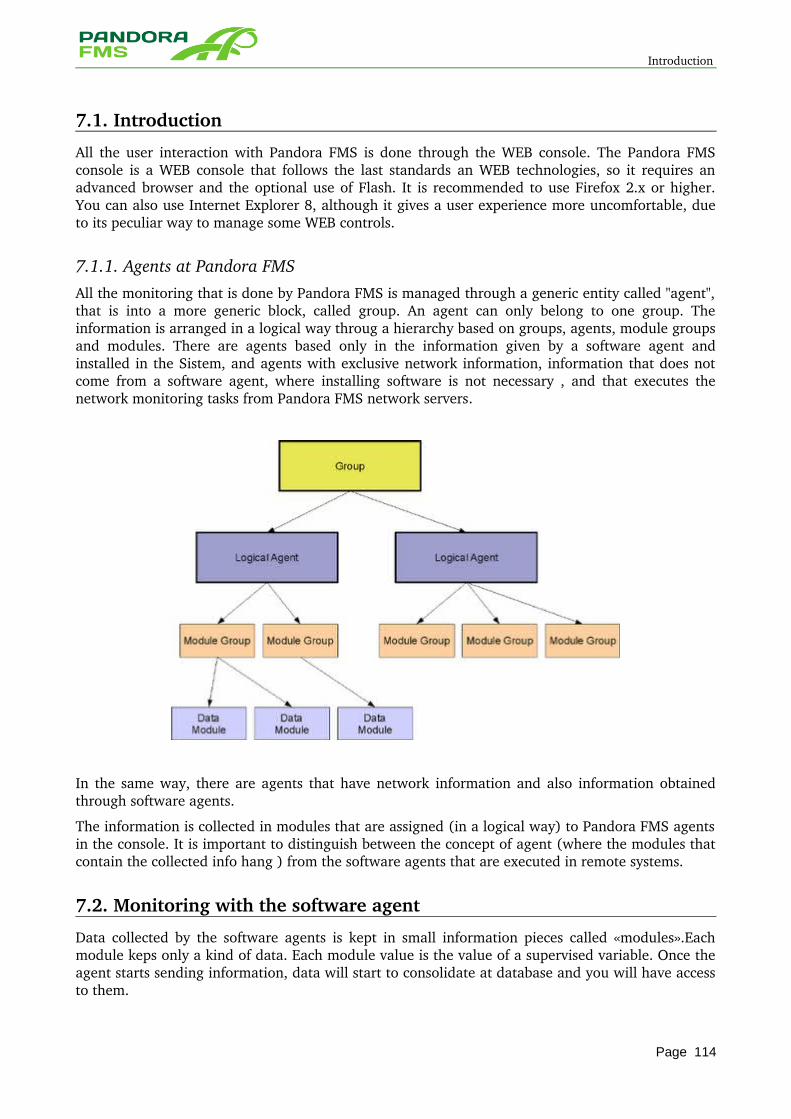
Introduction
7.1. Introduction
All the user interaction with Pandora FMS is done through the WEB console. The Pandora FMS console is a WEB console that follows the last standards an WEB technologies, so it requires an advanced browser and the optional use of Flash. It is recommended to use Firefox 2.x or higher. You can also use Internet Explorer 8, although it gives a user experience more uncomfortable, due to its peculiar way to manage some WEB controls.
7.1.1. Agents at Pandora FMS All the monitoring that is done by Pandora FMS is managed through a generic entity called "agent", that is into a more generic block, called group. An agent can only belong to one group. The information is arranged in a logical way throug a hierarchy based on groups, agents, module groups and modules. There are agents based only in the information given by a software agent and installed in the Sistem, and agents with exclusive network information, information that does not come from a software agent, where installing software is not necessary , and that executes the network monitoring tasks from Pandora FMS network servers.
In the same way, there are agents that have network information and also information obtained through software agents.
The information is collected in modules that are assigned (in a logical way) to Pandora FMS agents in the console. It is important to distinguish between the concept of agent (where the modules that contain the collected info hang ) from the software agents that are executed in remote systems.
7.2. Monitoring with the software agent
Data collected by the software agents is kept in small information pieces called «modules».Each module keps only a kind of data. Each module value is the value of a supervised variable. Once the agent starts sending information, data will start to consolidate at database and you will have access to them.
Page 114
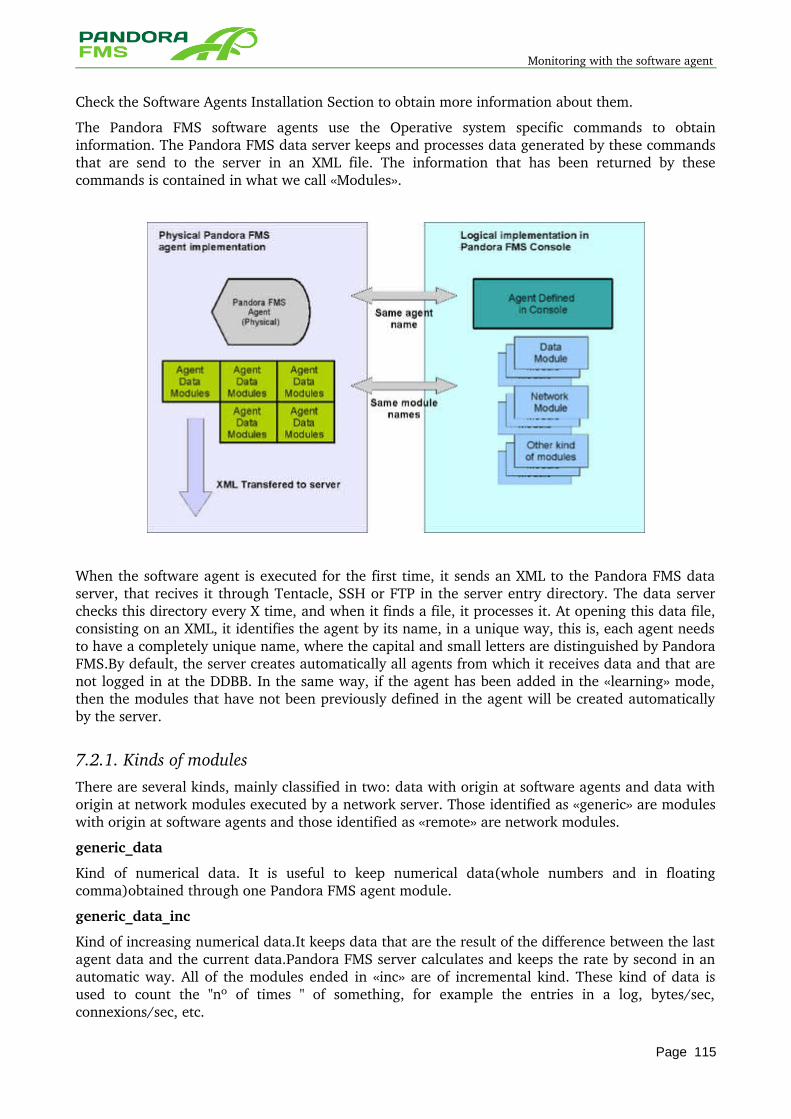
Monitoring with the software agent
Check the Software Agents Installation Section to obtain more information about them.
The Pandora FMS software agents use the Operative system specific commands to obtain information. The Pandora FMS data server keeps and processes data generated by these commands that are send to the server in an XML file. The information that has been returned by these commands is contained in what we call «Modules».
When the software agent is executed for the first time, it sends an XML to the Pandora FMS data server, that recives it through Tentacle, SSH or FTP in the server entry directory. The data server checks this directory every X time, and when it finds a file, it processes it. At opening this data file, consisting on an XML, it identifies the agent by its name, in a unique way, this is, each agent needs to have a completely unique name, where the capital and small letters are distinguished by Pandora FMS.By default, the server creates automatically all agents from which it receives data and that are not logged in at the DDBB. In the same way, if the agent has been added in the «learning» mode, then the modules that have not been previously defined in the agent will be created automatically by the server.
7.2.1. Kinds of modules There are several kinds, mainly classified in two: data with origin at software agents and data with origin at network modules executed by a network server. Those identified as «generic» are modules with origin at software agents and those identified as «remote» are network modules.
generic_data
Kind of numerical data. It is useful to keep numerical data(whole numbers and in floating comma)obtained through one Pandora FMS agent module.
generic_data_inc
Kind of increasing numerical data.It keeps data that are the result of the difference between the last agent data and the current data.Pandora FMS server calculates and keeps the rate by second in an automatic way. All of the modules ended in «inc» are of incremental kind. These kind of data is used to count the "nº of times " of something, for example the entries in a log, bytes/sec, connexions/sec, etc.
Page 115
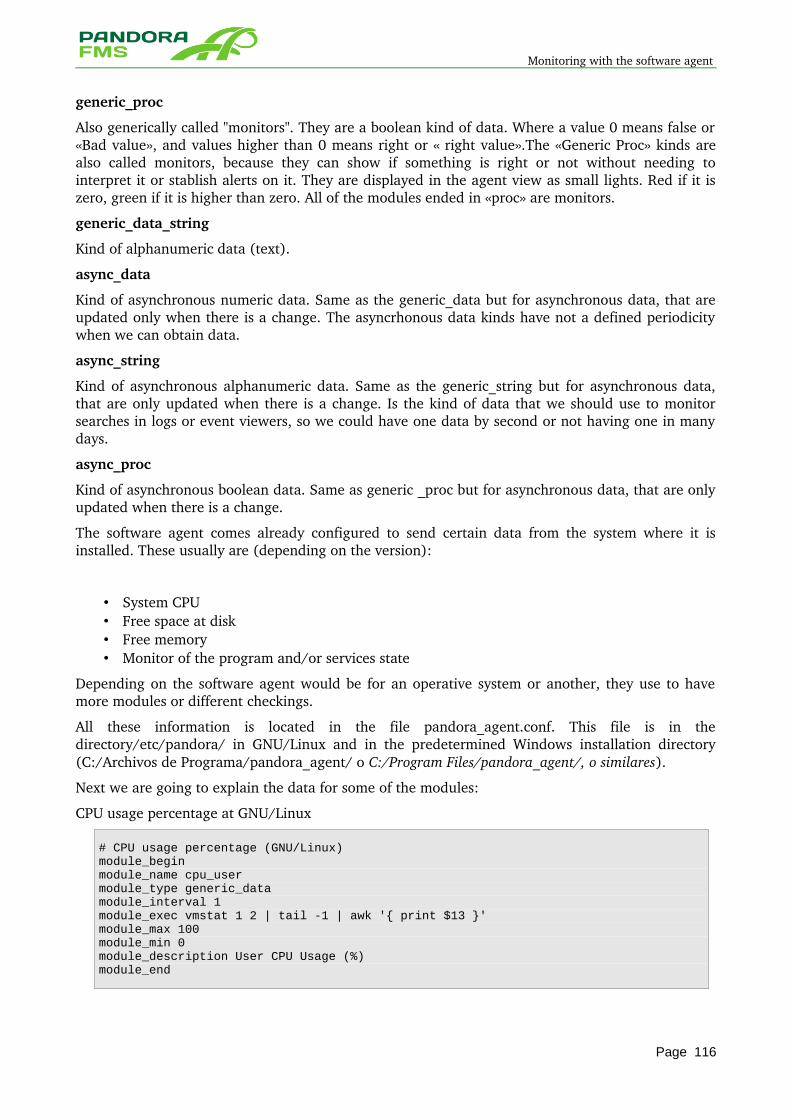
Monitoring with the software agent
generic_proc
Also generically called "monitors". They are a boolean kind of data. Where a value 0 means false or «Bad value», and values higher than 0 means right or « right value».The «Generic Proc» kinds are also called monitors, because they can show if something is right or not without needing to interpret it or stablish alerts on it. They are displayed in the agent view as small lights. Red if it is zero, green if it is higher than zero. All of the modules ended in «proc» are monitors.
generic_data_string
Kind of alphanumeric data (text).
async_data
Kind of asynchronous numeric data. Same as the generic_data but for asynchronous data, that are updated only when there is a change. The asyncrhonous data kinds have not a defined periodicity when we can obtain data.
async_string
Kind of asynchronous alphanumeric data. Same as the generic_string but for asynchronous data, that are only updated when there is a change. Is the kind of data that we should use to monitor searches in logs or event viewers, so we could have one data by second or not having one in many days.
async_proc
Kind of asynchronous boolean data. Same as generic _proc but for asynchronous data, that are only updated when there is a change.
The software agent comes already configured to send certain data from the system where it is installed. These usually are (depending on the version):
• System CPU • Free space at disk • Free memory • Monitor of the program and/or services state
Depending on the software agent would be for an operative system or another, they use to have more modules or different checkings.
All these information is located in the file pandora_agent.conf. This file is in the directory/etc/pandora/ in GNU/Linux and in the predetermined Windows installation directory (C:/Archivos de Programa/pandora_agent/ o C:/Program Files/pandora_agent/, o similares).
Next we are going to explain the data for some of the modules:
CPU usage percentage at GNU/Linux
# CPU usage percentage (GNU/Linux)module_beginmodule_name cpu_usermodule_type generic_datamodule_interval 1module_exec vmstat 1 2 | tail -1 | awk '{ print $13 }'module_max 100module_min 0module_description User CPU Usage (%)module_end
Page 116
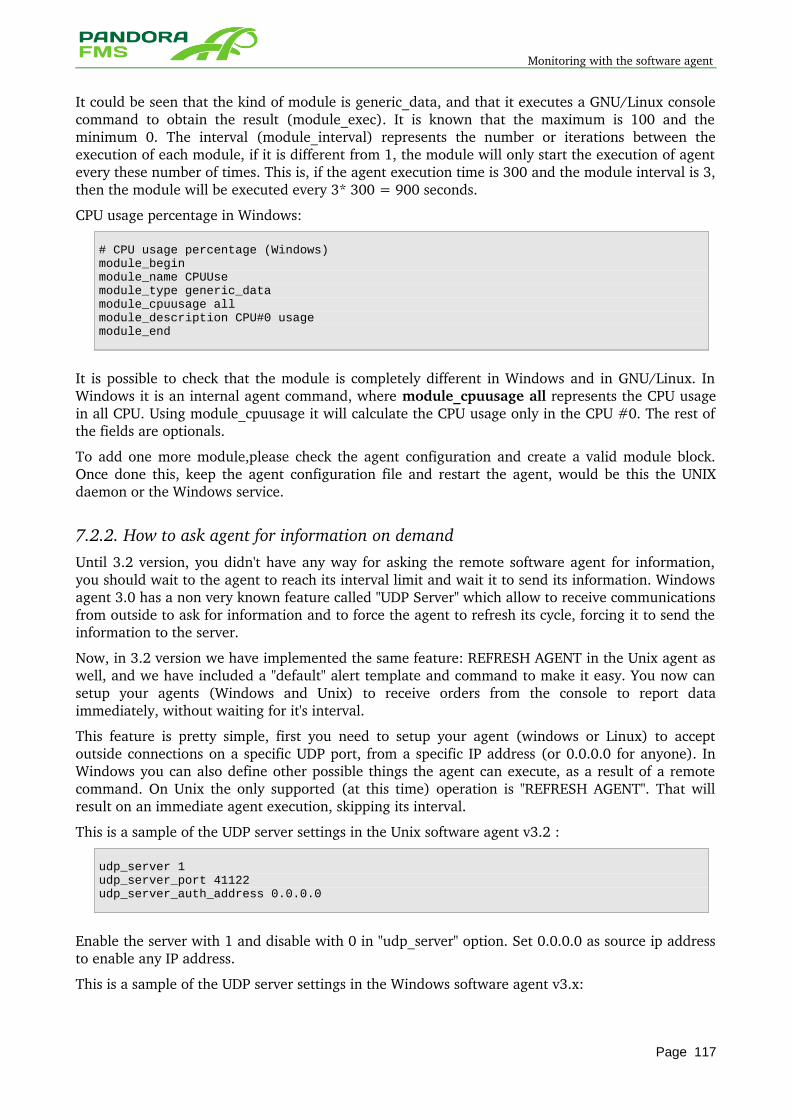
Monitoring with the software agent
It could be seen that the kind of module is generic_data, and that it executes a GNU/Linux console command to obtain the result (module_exec). It is known that the maximum is 100 and the minimum 0. The interval (module_interval) represents the number or iterations between the execution of each module, if it is different from 1, the module will only start the execution of agent every these number of times. This is, if the agent execution time is 300 and the module interval is 3, then the module will be executed every 3* 300 = 900 seconds.
CPU usage percentage in Windows:
# CPU usage percentage (Windows)module_beginmodule_name CPUUsemodule_type generic_datamodule_cpuusage allmodule_description CPU#0 usagemodule_end
It is possible to check that the module is completely different in Windows and in GNU/Linux. In Windows it is an internal agent command, where module_cpuusage all represents the CPU usage in all CPU. Using module_cpuusage it will calculate the CPU usage only in the CPU #0. The rest of the fields are optionals.
To add one more module,please check the agent configuration and create a valid module block. Once done this, keep the agent configuration file and restart the agent, would be this the UNIX daemon or the Windows service.
7.2.2. How to ask agent for information on demand Until 3.2 version, you didn't have any way for asking the remote software agent for information, you should wait to the agent to reach its interval limit and wait it to send its information. Windows agent 3.0 has a non very known feature called "UDP Server" which allow to receive communications from outside to ask for information and to force the agent to refresh its cycle, forcing it to send the information to the server.
Now, in 3.2 version we have implemented the same feature: REFRESH AGENT in the Unix agent as well, and we have included a "default" alert template and command to make it easy. You now can setup your agents (Windows and Unix) to receive orders from the console to report data immediately, without waiting for it's interval.
This feature is pretty simple, first you need to setup your agent (windows or Linux) to accept outside connections on a specific UDP port, from a specific IP address (or 0.0.0.0 for anyone). In Windows you can also define other possible things the agent can execute, as a result of a remote command. On Unix the only supported (at this time) operation is "REFRESH AGENT". That will result on an immediate agent execution, skipping its interval.
This is a sample of the UDP server settings in the Unix software agent v3.2 :
udp_server 1udp_server_port 41122udp_server_auth_address 0.0.0.0
Enable the server with 1 and disable with 0 in "udp_server" option. Set 0.0.0.0 as source ip address to enable any IP address.
This is a sample of the UDP server settings in the Windows software agent v3.x:
Page 117
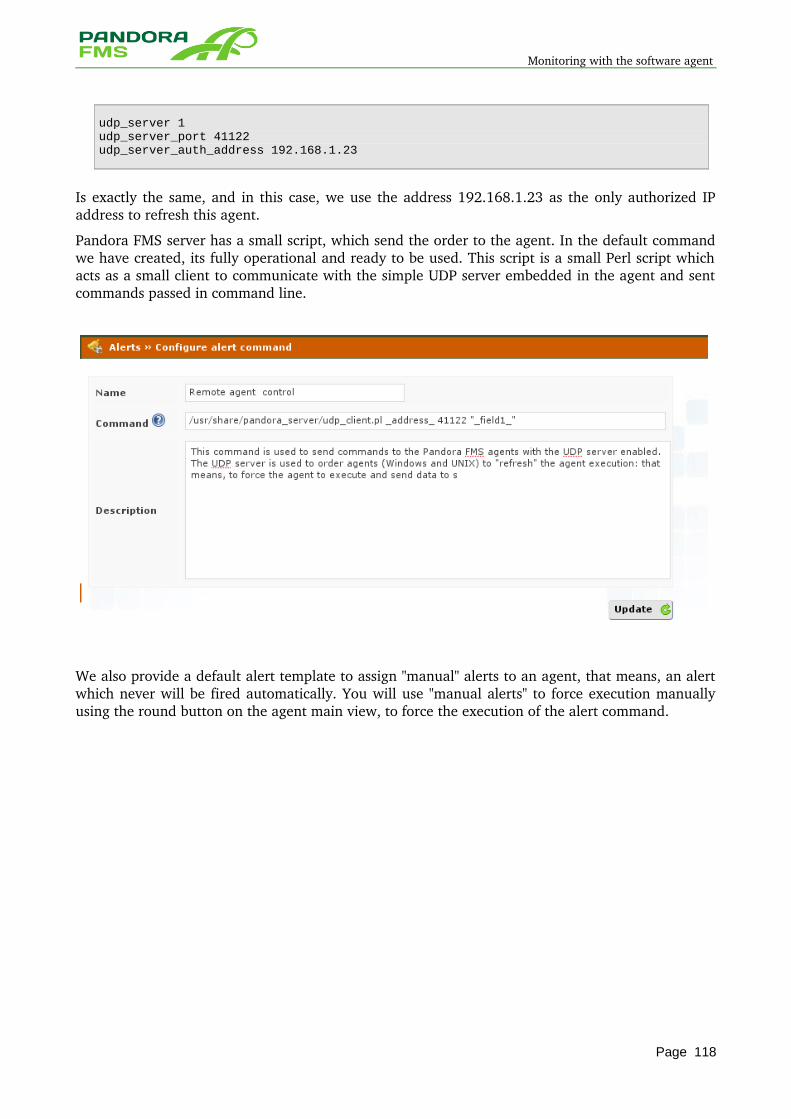
Monitoring with the software agent
udp_server 1udp_server_port 41122udp_server_auth_address 192.168.1.23
Is exactly the same, and in this case, we use the address 192.168.1.23 as the only authorized IP address to refresh this agent.
Pandora FMS server has a small script, which send the order to the agent. In the default command we have created, its fully operational and ready to be used. This script is a small Perl script which acts as a small client to communicate with the simple UDP server embedded in the agent and sent commands passed in command line.
We also provide a default alert template to assign "manual" alerts to an agent, that means, an alert which never will be fired automatically. You will use "manual alerts" to force execution manually using the round button on the agent main view, to force the execution of the alert command.
Page 118
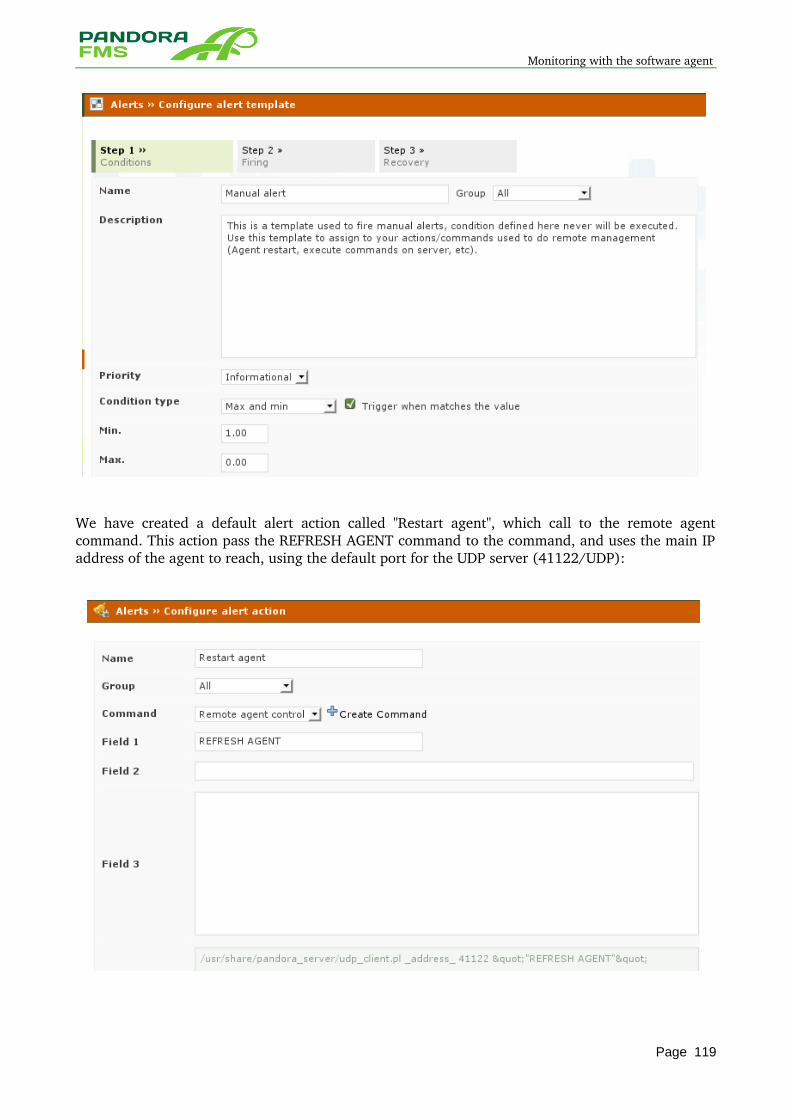
Monitoring with the software agent
We have created a default alert action called "Restart agent", which call to the remote agent command. This action pass the REFRESH AGENT command to the command, and uses the main IP address of the agent to reach, using the default port for the UDP server (41122/UDP):
Page 119
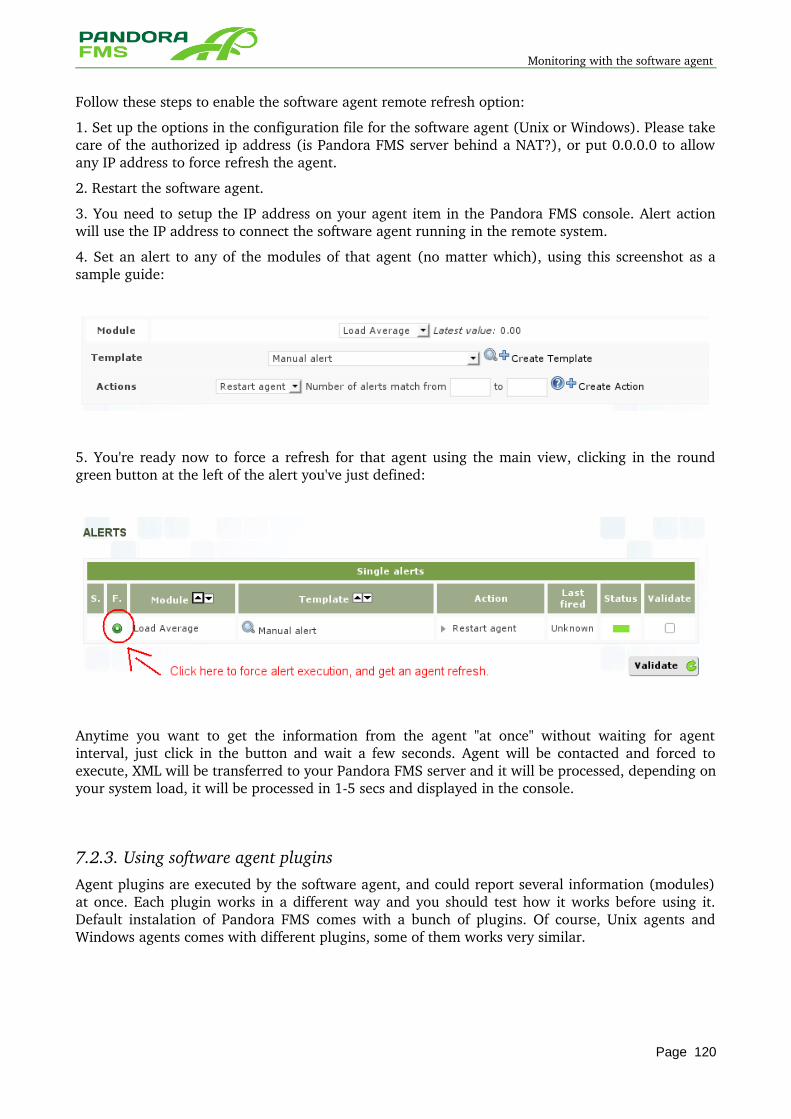
Monitoring with the software agent
Follow these steps to enable the software agent remote refresh option:
1. Set up the options in the configuration file for the software agent (Unix or Windows). Please take care of the authorized ip address (is Pandora FMS server behind a NAT?), or put 0.0.0.0 to allow any IP address to force refresh the agent.
2. Restart the software agent.
3. You need to setup the IP address on your agent item in the Pandora FMS console. Alert action will use the IP address to connect the software agent running in the remote system.
4. Set an alert to any of the modules of that agent (no matter which), using this screenshot as a sample guide:
5. You're ready now to force a refresh for that agent using the main view, clicking in the round green button at the left of the alert you've just defined:
Anytime you want to get the information from the agent "at once" without waiting for agent interval, just click in the button and wait a few seconds. Agent will be contacted and forced to execute, XML will be transferred to your Pandora FMS server and it will be processed, depending on your system load, it will be processed in 15 secs and displayed in the console.
7.2.3. Using software agent plugins Agent plugins are executed by the software agent, and could report several information (modules) at once. Each plugin works in a different way and you should test how it works before using it. Default instalation of Pandora FMS comes with a bunch of plugins. Of course, Unix agents and Windows agents comes with different plugins, some of them works very similar.
Page 120
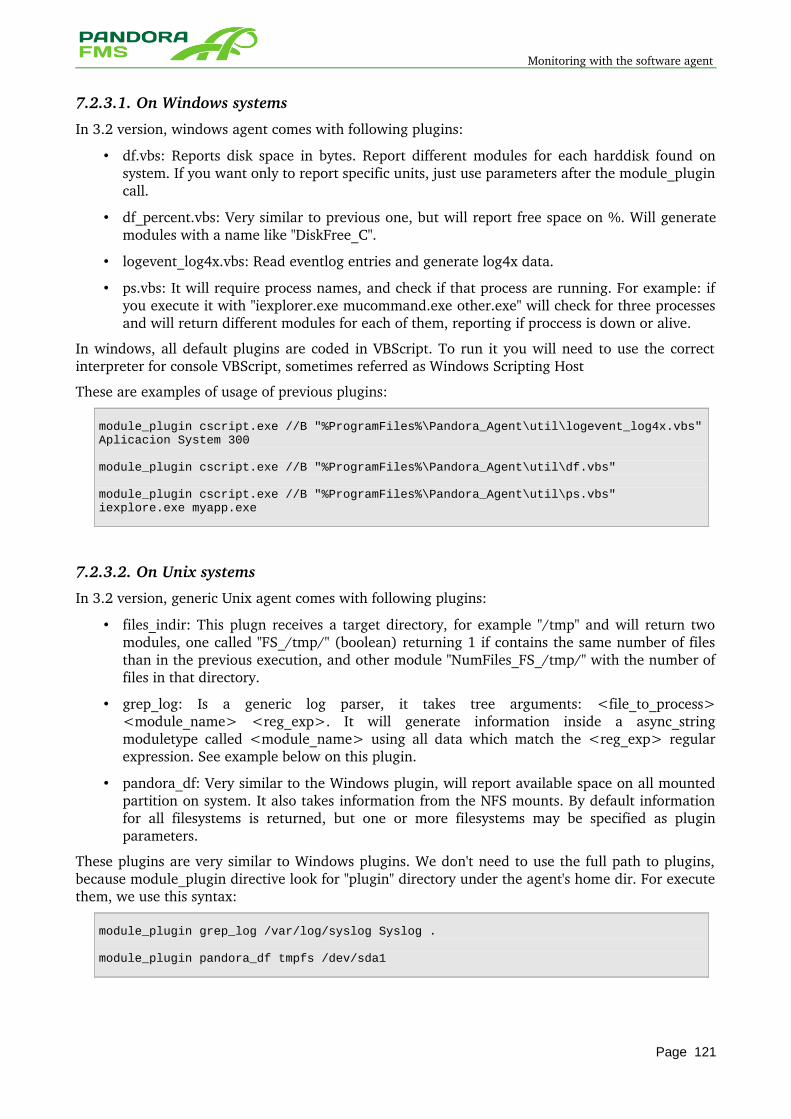
Monitoring with the software agent
7.2.3.1. On Windows systems
In 3.2 version, windows agent comes with following plugins:
• df.vbs: Reports disk space in bytes. Report different modules for each harddisk found on system. If you want only to report specific units, just use parameters after the module_plugin call.
• df_percent.vbs: Very similar to previous one, but will report free space on %. Will generate modules with a name like "DiskFree_C".
• logevent_log4x.vbs: Read eventlog entries and generate log4x data.
• ps.vbs: It will require process names, and check if that process are running. For example: if you execute it with "iexplorer.exe mucommand.exe other.exe" will check for three processes and will return different modules for each of them, reporting if proccess is down or alive.
In windows, all default plugins are coded in VBScript. To run it you will need to use the correct interpreter for console VBScript, sometimes referred as Windows Scripting Host
These are examples of usage of previous plugins:
module_plugin cscript.exe //B "%ProgramFiles%\Pandora_Agent\util\logevent_log4x.vbs" Aplicacion System 300
module_plugin cscript.exe //B "%ProgramFiles%\Pandora_Agent\util\df.vbs"
module_plugin cscript.exe //B "%ProgramFiles%\Pandora_Agent\util\ps.vbs" iexplore.exe myapp.exe
7.2.3.2. On Unix systems
In 3.2 version, generic Unix agent comes with following plugins:
• files_indir: This plugn receives a target directory, for example "/tmp" and will return two modules, one called "FS_/tmp/" (boolean) returning 1 if contains the same number of files than in the previous execution, and other module "NumFiles_FS_/tmp/" with the number of files in that directory.
• grep_log: Is a generic log parser, it takes tree arguments: <file_to_process> <module_name> <reg_exp>. It will generate information inside a async_string moduletype called <module_name> using all data which match the <reg_exp> regular expression. See example below on this plugin.
• pandora_df: Very similar to the Windows plugin, will report available space on all mounted partition on system. It also takes information from the NFS mounts. By default information for all filesystems is returned, but one or more filesystems may be specified as plugin parameters.
These plugins are very similar to Windows plugins. We don't need to use the full path to plugins, because module_plugin directive look for "plugin" directory under the agent's home dir. For execute them, we use this syntax:
module_plugin grep_log /var/log/syslog Syslog .
module_plugin pandora_df tmpfs /dev/sda1
Page 121
Monitoring with the software agent
And some special plugins working on Unix:
• nagios_plugin_wrapper: This is not really a "plugin"; this is just a wrapper used to execute a Nagios plugin and process the output to generate a pandora module. It takes the standard output and put the result in the module description and gets the errorlevel to process a module_proc (boolean) module with its results. Just call the nagios plugin as parameter to nagios_plugin_wrapper with all it's needed parameters and it will generate a Pandora Fms module.
• inventory: This is used in the inventory system. It will create a Inventory XML with information about the system, could be modified to gather different information, but default works only in Linux and gets packages, services in default runlevel and other options. Checkout the inventory documentation for more information.
• pandora_update: This is used to use the autoupdate feature on software agents, checkout the agent configuration section for more information.
7.2.4. How to create your own agents plugins It's very simple, you should have in mind this two main ideas:
• Whatever you want to do, it must be automatic (no interactive processing from the user), and must be done from the commandline (shell). You can use any kind of scripting language or compiled language, but in that case you must provide a standalone executable with all it's dependencies (libraries, dll, etc).
• Plugin must report the information to the standard output (just using echo, printf, or the equivalent in your language), and use the XML syntax for Pandora FMS agent information, this is an example of a generic_data (numerical information) XML:
<module><name><![CDATA[Sample_Module]]></name><type><![CDATA[generic_data]]></type><data><![CDATA[47]]></data><description><![CDATA[47]]></description></module>
The <![CDATA[xxx]]> are used to "enclose" data and protect the XML from nonvalid characters like <,>,& or %.
Before trying to create your own plugin, take a look at our Pandora FMS plugin library at http://pandorafms.org, and if you want to create your own, please upload to Pandora FMS public library to allow others use your plugin!.
7.2.5. Using nagios plugins from the agent Nagios has a lot of amazing plugins you can use with Pandora FMS. One way is to use remote plugins with the Plugin Server, using the nagios compatibility, but they only get it's status, doesnt use the descriptive output which some plugins for nagios have.
Using the wrapper for use nagios plugins in the software agent will solve this problem. The wrapper comes with default with 3.2 Unix agent. A equivalent plugin for Pandora FMS Windows agents can be downloaded from our website at http://pandorafms.org resource library at [1]).
What does the plugin wrapper for nagios plugins ?
Execute the nagios plugin, using it's native parameters, and converting the output in a data useful for Pandora FMS, it has two kind of information:
Page 122
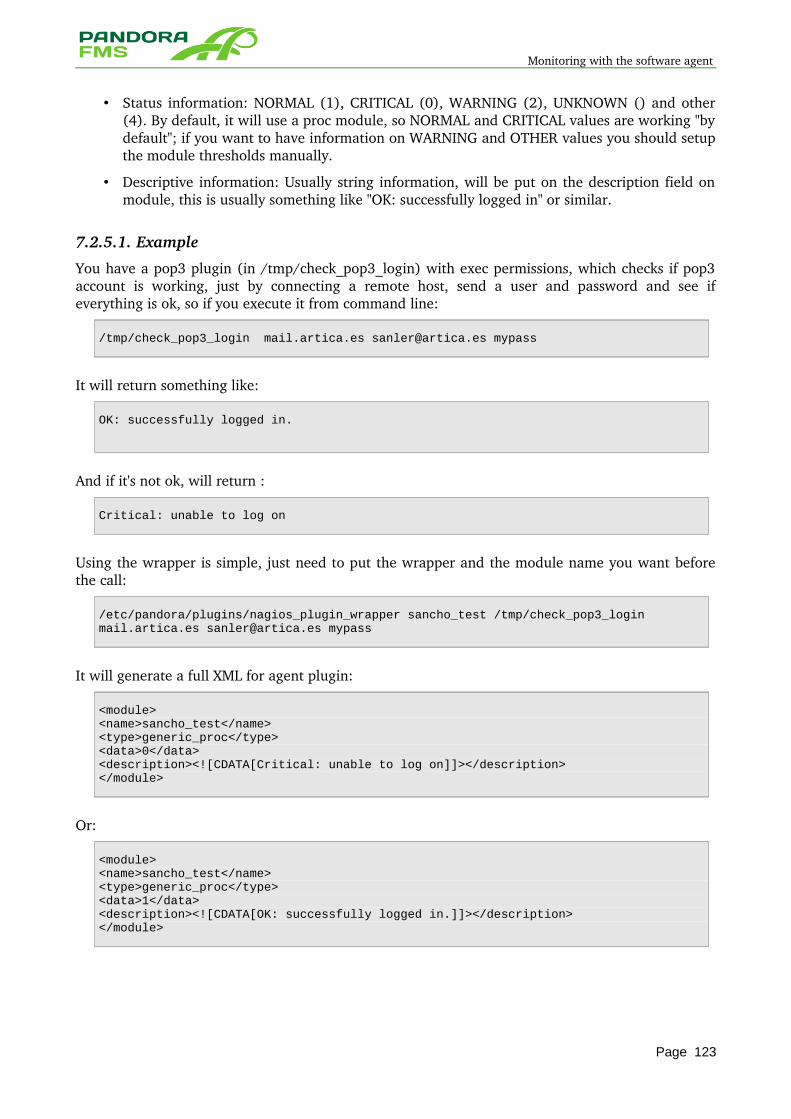
Monitoring with the software agent
• Status information: NORMAL (1), CRITICAL (0), WARNING (2), UNKNOWN () and other (4). By default, it will use a proc module, so NORMAL and CRITICAL values are working "by default"; if you want to have information on WARNING and OTHER values you should setup the module thresholds manually.
• Descriptive information: Usually string information, will be put on the description field on module, this is usually something like "OK: successfully logged in" or similar.
7.2.5.1. Example
You have a pop3 plugin (in /tmp/check_pop3_login) with exec permissions, which checks if pop3 account is working, just by connecting a remote host, send a user and password and see if everything is ok, so if you execute it from command line:
/tmp/check_pop3_login mail.artica.es [email protected] mypass
It will return something like:
OK: successfully logged in.
And if it's not ok, will return :
Critical: unable to log on
Using the wrapper is simple, just need to put the wrapper and the module name you want before the call:
/etc/pandora/plugins/nagios_plugin_wrapper sancho_test /tmp/check_pop3_login mail.artica.es [email protected] mypass
It will generate a full XML for agent plugin:
<module><name>sancho_test</name><type>generic_proc</type><data>0</data><description><![CDATA[Critical: unable to log on]]></description></module>
Or:
<module><name>sancho_test</name><type>generic_proc</type><data>1</data><description><![CDATA[OK: successfully logged in.]]></description></module>
Page 123
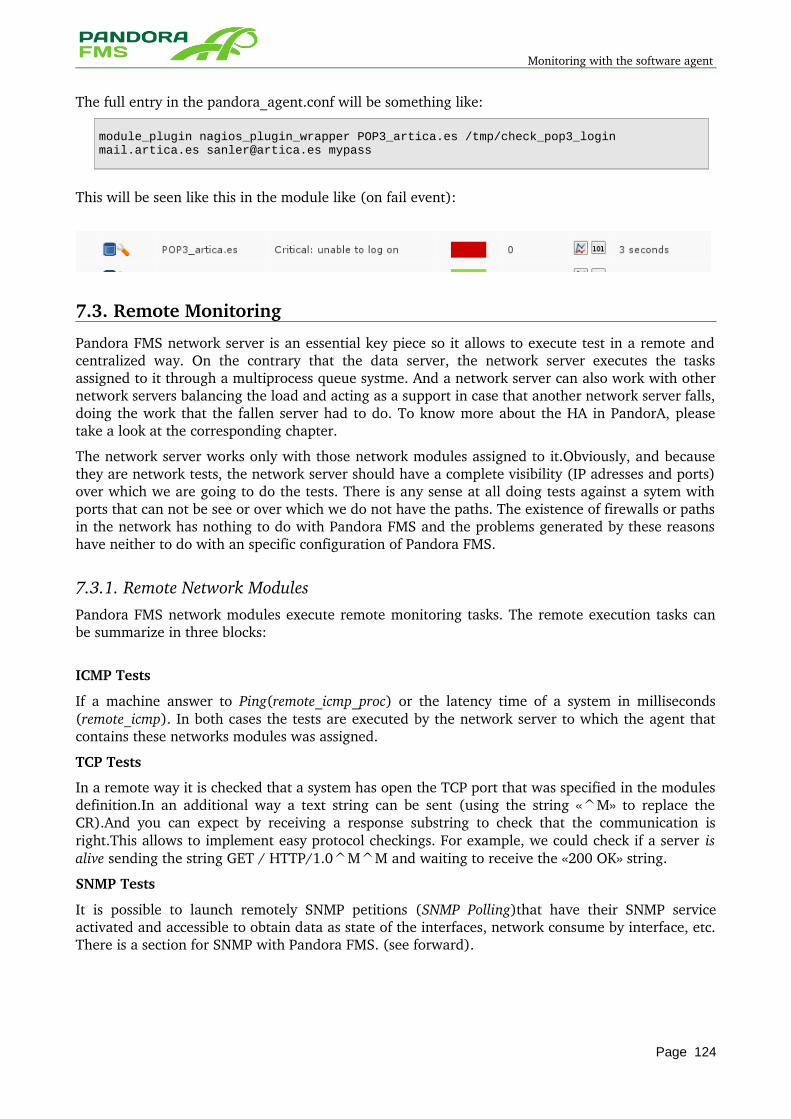
Monitoring with the software agent
The full entry in the pandora_agent.conf will be something like:
module_plugin nagios_plugin_wrapper POP3_artica.es /tmp/check_pop3_login mail.artica.es [email protected] mypass
This will be seen like this in the module like (on fail event):
7.3. Remote Monitoring
Pandora FMS network server is an essential key piece so it allows to execute test in a remote and centralized way. On the contrary that the data server, the network server executes the tasks assigned to it through a multiprocess queue systme. And a network server can also work with other network servers balancing the load and acting as a support in case that another network server falls, doing the work that the fallen server had to do. To know more about the HA in PandorA, please take a look at the corresponding chapter.
The network server works only with those network modules assigned to it.Obviously, and because they are network tests, the network server should have a complete visibility (IP adresses and ports) over which we are going to do the tests. There is any sense at all doing tests against a sytem with ports that can not be see or over which we do not have the paths. The existence of firewalls or paths in the network has nothing to do with Pandora FMS and the problems generated by these reasons have neither to do with an specific configuration of Pandora FMS.
7.3.1. Remote Network Modules Pandora FMS network modules execute remote monitoring tasks. The remote execution tasks can be summarize in three blocks:
ICMP Tests
If a machine answer to Ping(remote_icmp_proc) or the latency time of a system in milliseconds (remote_icmp). In both cases the tests are executed by the network server to which the agent that contains these networks modules was assigned.
TCP Tests
In a remote way it is checked that a system has open the TCP port that was specified in the modules definition.In an additional way a text string can be sent (using the string «^M» to replace the CR).And you can expect by receiving a response substring to check that the communication is right.This allows to implement easy protocol checkings. For example, we could check if a server is alive sending the string GET / HTTP/1.0^M^M and waiting to receive the «200 OK» string.
SNMP Tests
It is possible to launch remotely SNMP petitions (SNMP Polling)that have their SNMP service activated and accessible to obtain data as state of the interfaces, network consume by interface, etc. There is a section for SNMP with Pandora FMS. (see forward).
Page 124
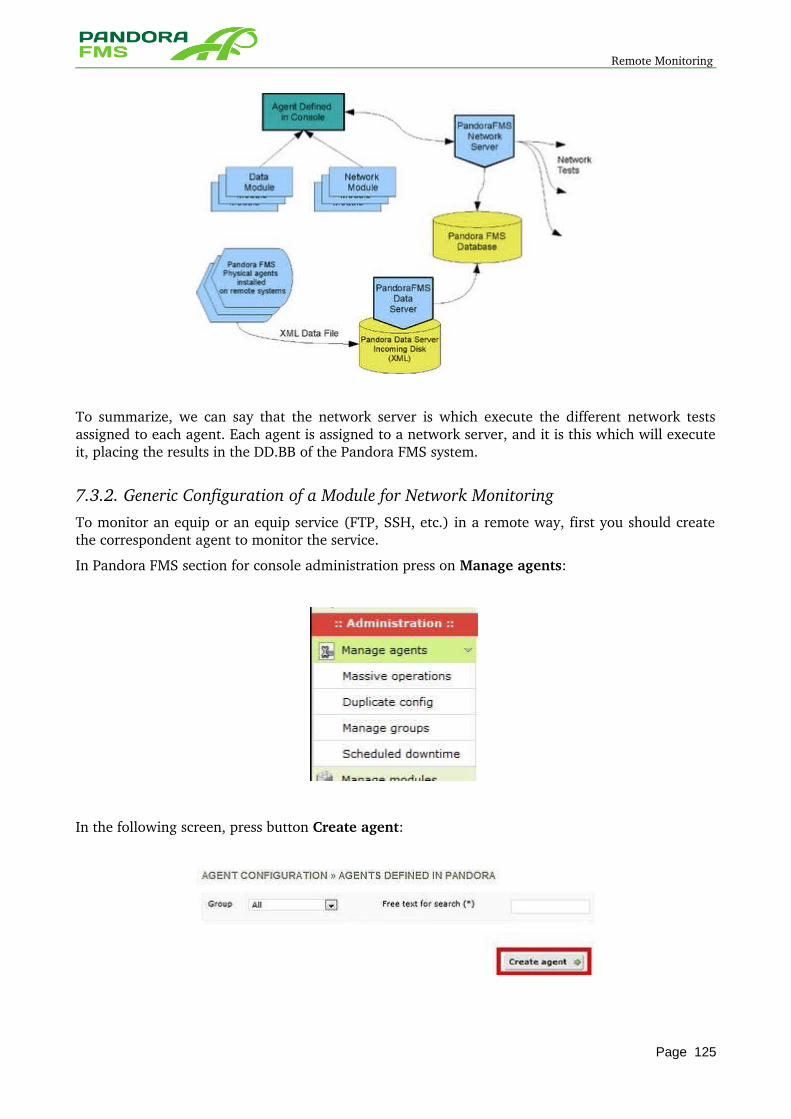
Remote Monitoring
To summarize, we can say that the network server is which execute the different network tests assigned to each agent. Each agent is assigned to a network server, and it is this which will execute it, placing the results in the DD.BB of the Pandora FMS system.
7.3.2. Generic Configuration of a Module for Network Monitoring To monitor an equip or an equip service (FTP, SSH, etc.) in a remote way, first you should create the correspondent agent to monitor the service.
In Pandora FMS section for console administration press on Manage agents:
In the following screen, press button Create agent:
Page 125
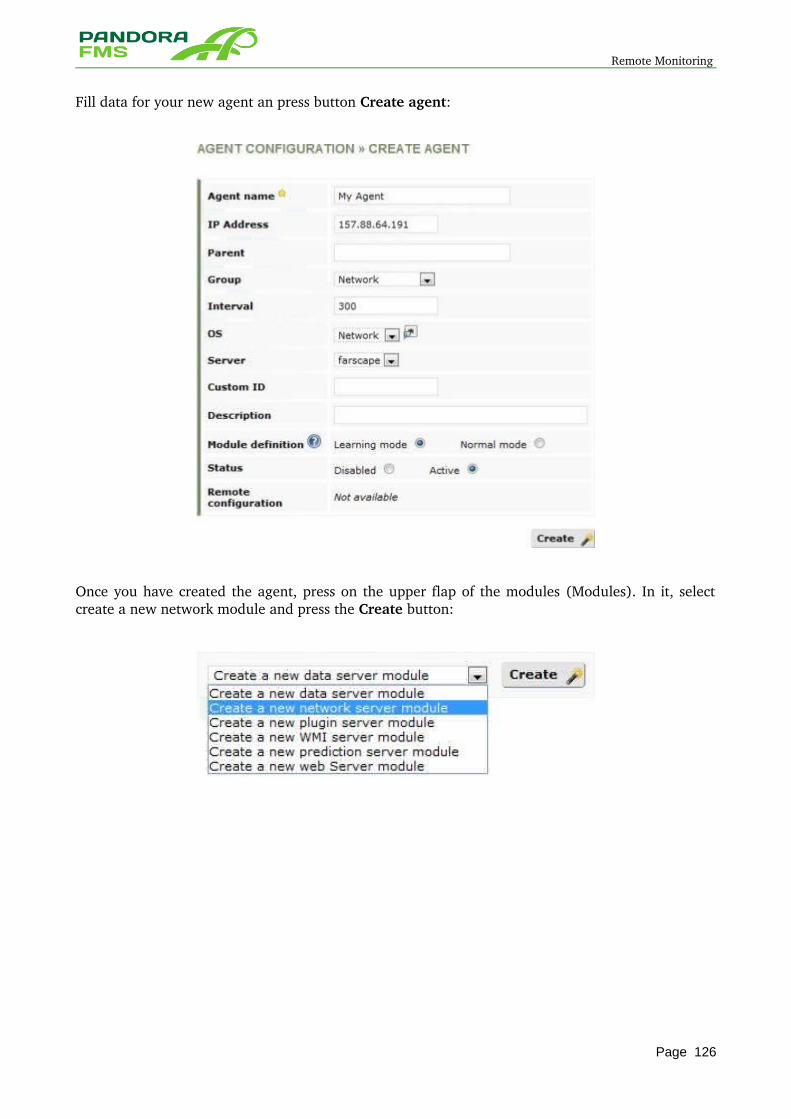
Remote Monitoring
Fill data for your new agent an press button Create agent:
Once you have created the agent, press on the upper flap of the modules (Modules). In it, select create a new network module and press the Create button:
Page 126
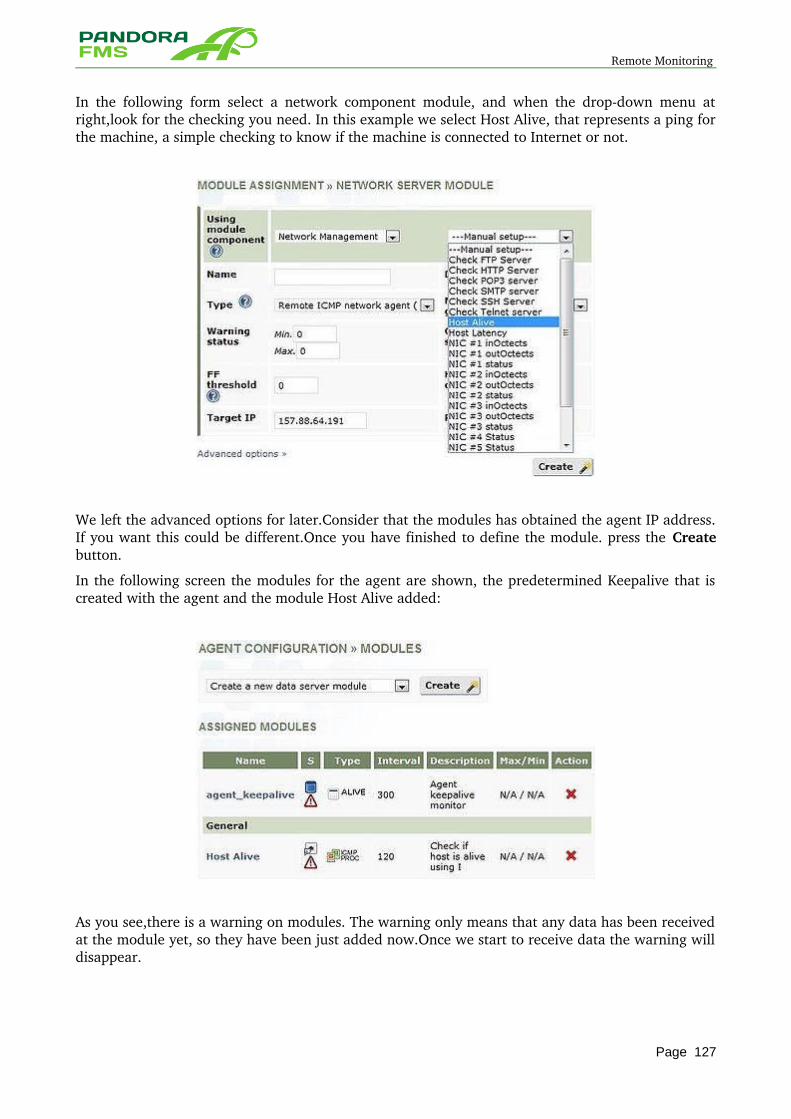
Remote Monitoring
In the following form select a network component module, and when the dropdown menu at right,look for the checking you need. In this example we select Host Alive, that represents a ping for the machine, a simple checking to know if the machine is connected to Internet or not.
We left the advanced options for later.Consider that the modules has obtained the agent IP address. If you want this could be different.Once you have finished to define the module. press the Create button.
In the following screen the modules for the agent are shown, the predetermined Keepalive that is created with the agent and the module Host Alive added:
As you see,there is a warning on modules. The warning only means that any data has been received at the module yet, so they have been just added now.Once we start to receive data the warning will disappear.
Page 127
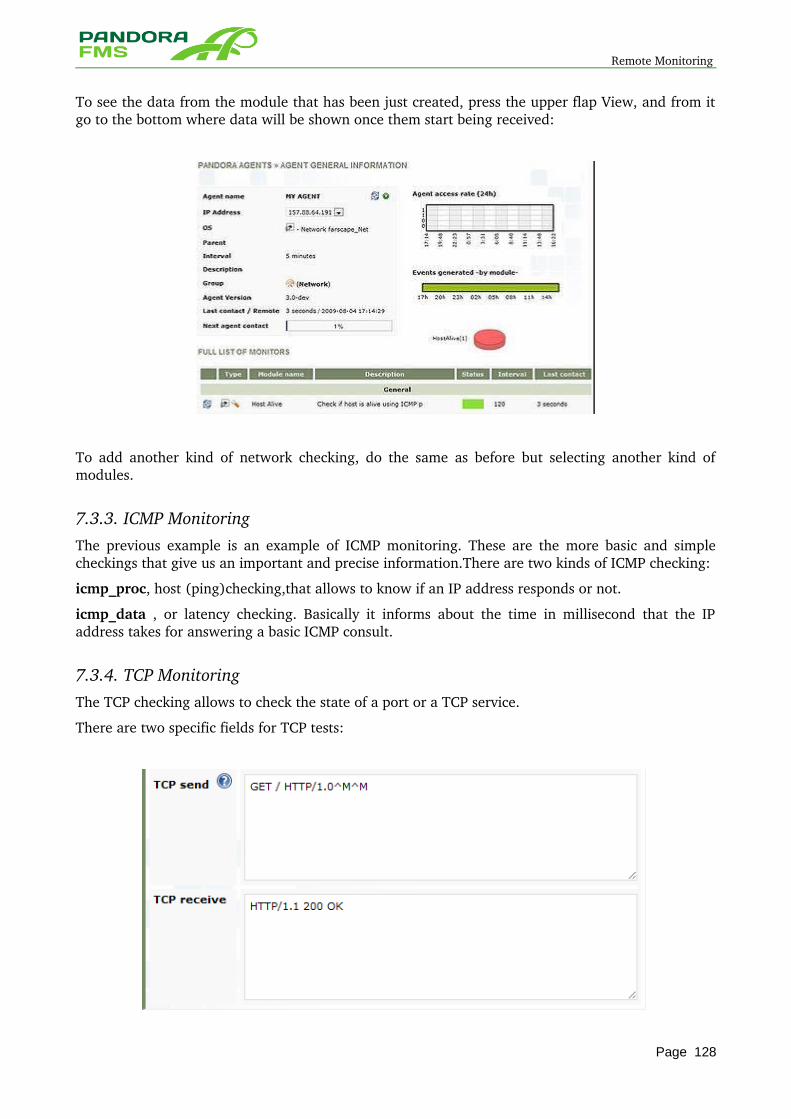
Remote Monitoring
To see the data from the module that has been just created, press the upper flap View, and from it go to the bottom where data will be shown once them start being received:
To add another kind of network checking, do the same as before but selecting another kind of modules.
7.3.3. ICMP Monitoring The previous example is an example of ICMP monitoring. These are the more basic and simple checkings that give us an important and precise information.There are two kinds of ICMP checking:
icmp_proc, host (ping)checking,that allows to know if an IP address responds or not.
icmp_data , or latency checking. Basically it informs about the time in millisecond that the IP address takes for answering a basic ICMP consult.
7.3.4. TCP Monitoring The TCP checking allows to check the state of a port or a TCP service.
There are two specific fields for TCP tests:
Page 128
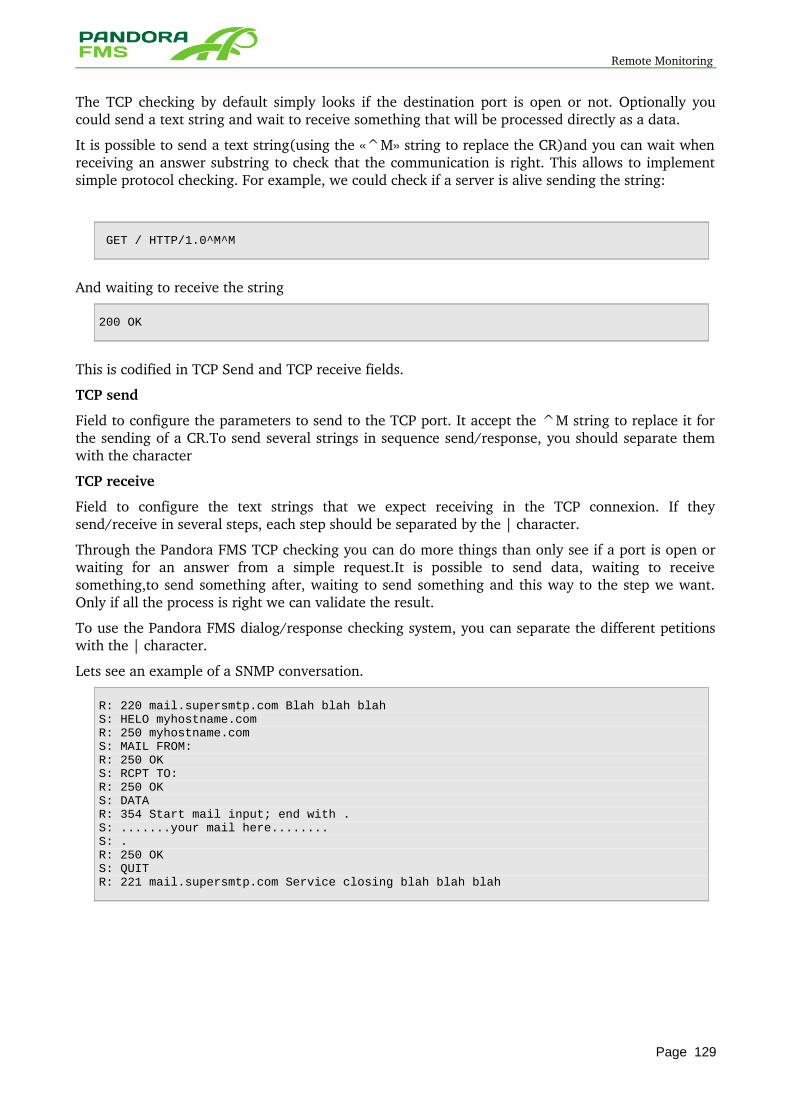
Remote Monitoring
The TCP checking by default simply looks if the destination port is open or not. Optionally you could send a text string and wait to receive something that will be processed directly as a data.
It is possible to send a text string(using the «^M» string to replace the CR)and you can wait when receiving an answer substring to check that the communication is right. This allows to implement simple protocol checking. For example, we could check if a server is alive sending the string:
GET / HTTP/1.0^M^M
And waiting to receive the string
200 OK
This is codified in TCP Send and TCP receive fields.
TCP send
Field to configure the parameters to send to the TCP port. It accept the ^M string to replace it for the sending of a CR.To send several strings in sequence send/response, you should separate them with the character
TCP receive
Field to configure the text strings that we expect receiving in the TCP connexion. If they send/receive in several steps, each step should be separated by the | character.
Through the Pandora FMS TCP checking you can do more things than only see if a port is open or waiting for an answer from a simple request.It is possible to send data, waiting to receive something,to send something after, waiting to send something and this way to the step we want. Only if all the process is right we can validate the result.
To use the Pandora FMS dialog/response checking system, you can separate the different petitions with the | character.
Lets see an example of a SNMP conversation.
R: 220 mail.supersmtp.com Blah blah blahS: HELO myhostname.comR: 250 myhostname.comS: MAIL FROM: R: 250 OKS: RCPT TO: R: 250 OKS: DATAR: 354 Start mail input; end with .S: .......your mail here........S: .R: 250 OKS: QUITR: 221 mail.supersmtp.com Service closing blah blah blah
Page 129
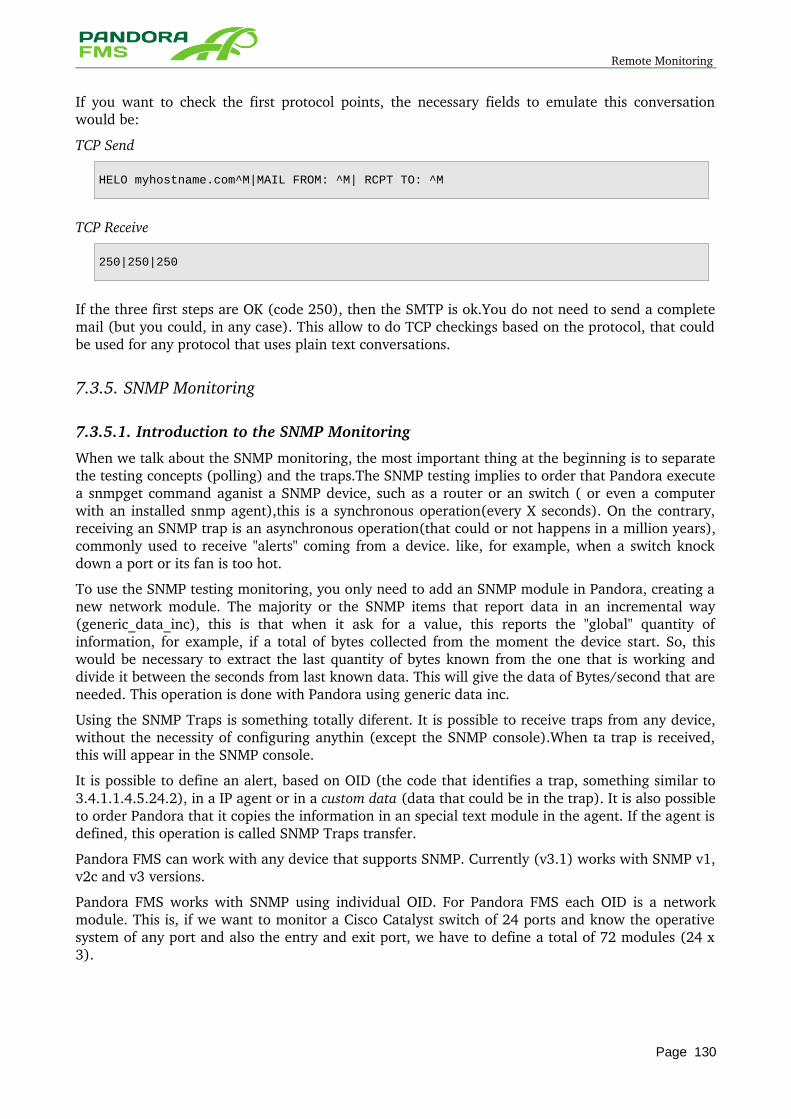
Remote Monitoring
If you want to check the first protocol points, the necessary fields to emulate this conversation would be:
TCP Send
HELO myhostname.com^M|MAIL FROM: ^M| RCPT TO: ^M
TCP Receive
250|250|250
If the three first steps are OK (code 250), then the SMTP is ok.You do not need to send a complete mail (but you could, in any case). This allow to do TCP checkings based on the protocol, that could be used for any protocol that uses plain text conversations.
7.3.5. SNMP Monitoring
7.3.5.1. Introduction to the SNMP Monitoring
When we talk about the SNMP monitoring, the most important thing at the beginning is to separate the testing concepts (polling) and the traps.The SNMP testing implies to order that Pandora execute a snmpget command aganist a SNMP device, such as a router or an switch ( or even a computer with an installed snmp agent),this is a synchronous operation(every X seconds). On the contrary, receiving an SNMP trap is an asynchronous operation(that could or not happens in a million years), commonly used to receive "alerts" coming from a device. like, for example, when a switch knock down a port or its fan is too hot.
To use the SNMP testing monitoring, you only need to add an SNMP module in Pandora, creating a new network module. The majority or the SNMP items that report data in an incremental way (generic_data_inc), this is that when it ask for a value, this reports the "global" quantity of information, for example, if a total of bytes collected from the moment the device start. So, this would be necessary to extract the last quantity of bytes known from the one that is working and divide it between the seconds from last known data. This will give the data of Bytes/second that are needed. This operation is done with Pandora using generic data inc.
Using the SNMP Traps is something totally diferent. It is possible to receive traps from any device, without the necessity of configuring anythin (except the SNMP console).When ta trap is received, this will appear in the SNMP console.
It is possible to define an alert, based on OID (the code that identifies a trap, something similar to 3.4.1.1.4.5.24.2), in a IP agent or in a custom data (data that could be in the trap). It is also possible to order Pandora that it copies the information in an special text module in the agent. If the agent is defined, this operation is called SNMP Traps transfer.
Pandora FMS can work with any device that supports SNMP. Currently (v3.1) works with SNMP v1, v2c and v3 versions.
Pandora FMS works with SNMP using individual OID. For Pandora FMS each OID is a network module. This is, if we want to monitor a Cisco Catalyst switch of 24 ports and know the operative system of any port and also the entry and exit port, we have to define a total of 72 modules (24 x 3).
Page 130
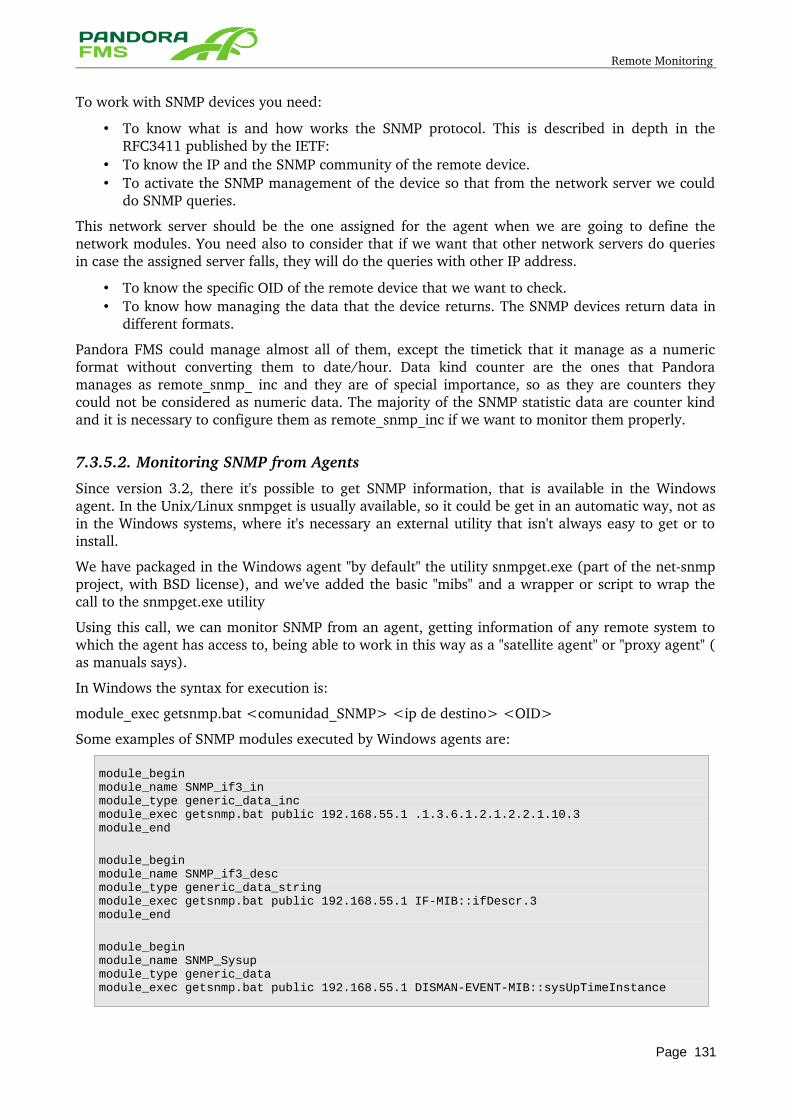
Remote Monitoring
To work with SNMP devices you need:
• To know what is and how works the SNMP protocol. This is described in depth in the RFC3411 published by the IETF:
• To know the IP and the SNMP community of the remote device. • To activate the SNMP management of the device so that from the network server we could
do SNMP queries.
This network server should be the one assigned for the agent when we are going to define the network modules. You need also to consider that if we want that other network servers do queries in case the assigned server falls, they will do the queries with other IP address.
• To know the specific OID of the remote device that we want to check. • To know how managing the data that the device returns. The SNMP devices return data in
different formats.
Pandora FMS could manage almost all of them, except the timetick that it manage as a numeric format without converting them to date/hour. Data kind counter are the ones that Pandora manages as remote_snmp_ inc and they are of special importance, so as they are counters they could not be considered as numeric data. The majority of the SNMP statistic data are counter kind and it is necessary to configure them as remote_snmp_inc if we want to monitor them properly.
7.3.5.2. Monitoring SNMP from Agents
Since version 3.2, there it's possible to get SNMP information, that is available in the Windows agent. In the Unix/Linux snmpget is usually available, so it could be get in an automatic way, not as in the Windows systems, where it's necessary an external utility that isn't always easy to get or to install.
We have packaged in the Windows agent "by default" the utility snmpget.exe (part of the netsnmp project, with BSD license), and we've added the basic "mibs" and a wrapper or script to wrap the call to the snmpget.exe utility
Using this call, we can monitor SNMP from an agent, getting information of any remote system to which the agent has access to, being able to work in this way as a "satellite agent" or "proxy agent" ( as manuals says).
In Windows the syntax for execution is:
module_exec getsnmp.bat <comunidad_SNMP> <ip de destino> <OID>
Some examples of SNMP modules executed by Windows agents are:
module_beginmodule_name SNMP_if3_inmodule_type generic_data_incmodule_exec getsnmp.bat public 192.168.55.1 .1.3.6.1.2.1.2.2.1.10.3module_end
module_beginmodule_name SNMP_if3_descmodule_type generic_data_stringmodule_exec getsnmp.bat public 192.168.55.1 IF-MIB::ifDescr.3module_end
module_beginmodule_name SNMP_Sysupmodule_type generic_datamodule_exec getsnmp.bat public 192.168.55.1 DISMAN-EVENT-MIB::sysUpTimeInstance
Page 131
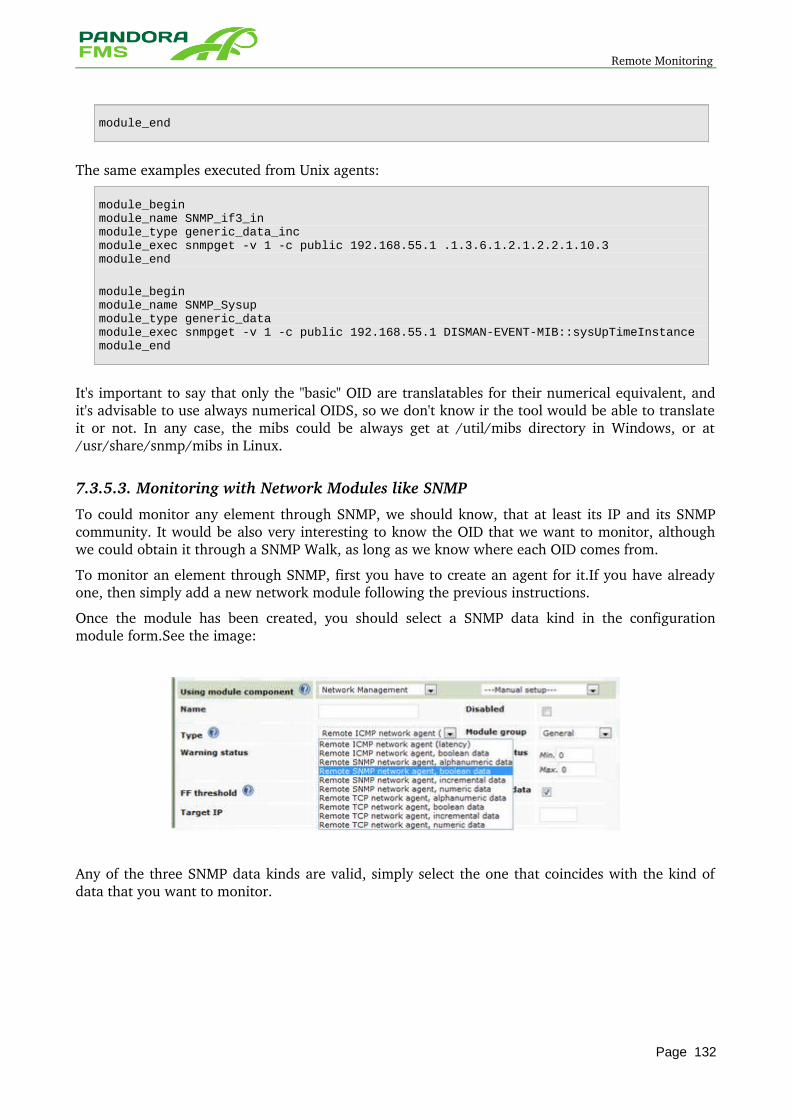
Remote Monitoring
module_end
The same examples executed from Unix agents:
module_beginmodule_name SNMP_if3_inmodule_type generic_data_incmodule_exec snmpget -v 1 -c public 192.168.55.1 .1.3.6.1.2.1.2.2.1.10.3module_end
module_beginmodule_name SNMP_Sysupmodule_type generic_datamodule_exec snmpget -v 1 -c public 192.168.55.1 DISMAN-EVENT-MIB::sysUpTimeInstancemodule_end
It's important to say that only the "basic" OID are translatables for their numerical equivalent, and it's advisable to use always numerical OIDS, so we don't know ir the tool would be able to translate it or not. In any case, the mibs could be always get at /util/mibs directory in Windows, or at /usr/share/snmp/mibs in Linux.
7.3.5.3. Monitoring with Network Modules like SNMP
To could monitor any element through SNMP, we should know, that at least its IP and its SNMP community. It would be also very interesting to know the OID that we want to monitor, although we could obtain it through a SNMP Walk, as long as we know where each OID comes from.
To monitor an element through SNMP, first you have to create an agent for it.If you have already one, then simply add a new network module following the previous instructions.
Once the module has been created, you should select a SNMP data kind in the configuration module form.See the image:
Any of the three SNMP data kinds are valid, simply select the one that coincides with the kind of data that you want to monitor.
Page 132
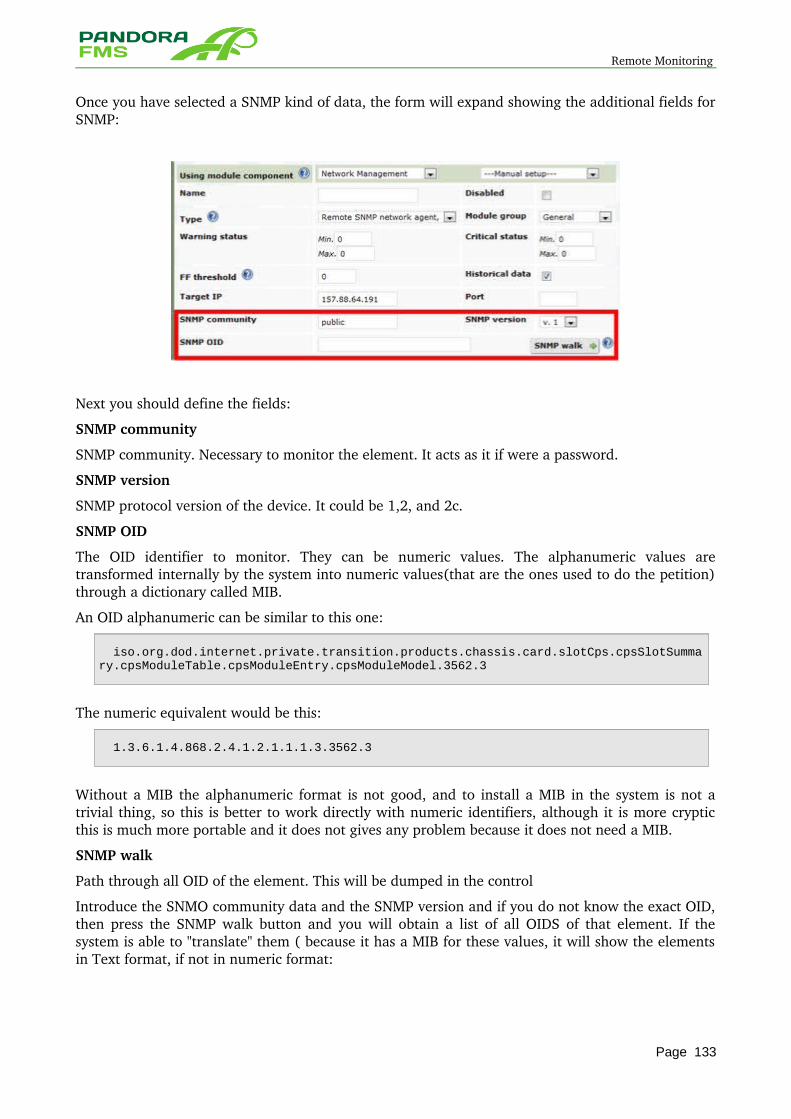
Remote Monitoring
Once you have selected a SNMP kind of data, the form will expand showing the additional fields for SNMP:
Next you should define the fields:
SNMP community
SNMP community. Necessary to monitor the element. It acts as it if were a password.
SNMP version
SNMP protocol version of the device. It could be 1,2, and 2c.
SNMP OID
The OID identifier to monitor. They can be numeric values. The alphanumeric values are transformed internally by the system into numeric values(that are the ones used to do the petition) through a dictionary called MIB.
An OID alphanumeric can be similar to this one:
iso.org.dod.internet.private.transition.products.chassis.card.slotCps.cpsSlotSummary.cpsModuleTable.cpsModuleEntry.cpsModuleModel.3562.3
The numeric equivalent would be this:
1.3.6.1.4.868.2.4.1.2.1.1.1.3.3562.3
Without a MIB the alphanumeric format is not good, and to install a MIB in the system is not a trivial thing, so this is better to work directly with numeric identifiers, although it is more cryptic this is much more portable and it does not gives any problem because it does not need a MIB.
SNMP walk
Path through all OID of the element. This will be dumped in the control
Introduce the SNMO community data and the SNMP version and if you do not know the exact OID, then press the SNMP walk button and you will obtain a list of all OIDS of that element. If the system is able to "translate" them ( because it has a MIB for these values, it will show the elements in Text format, if not in numeric format:
Page 133
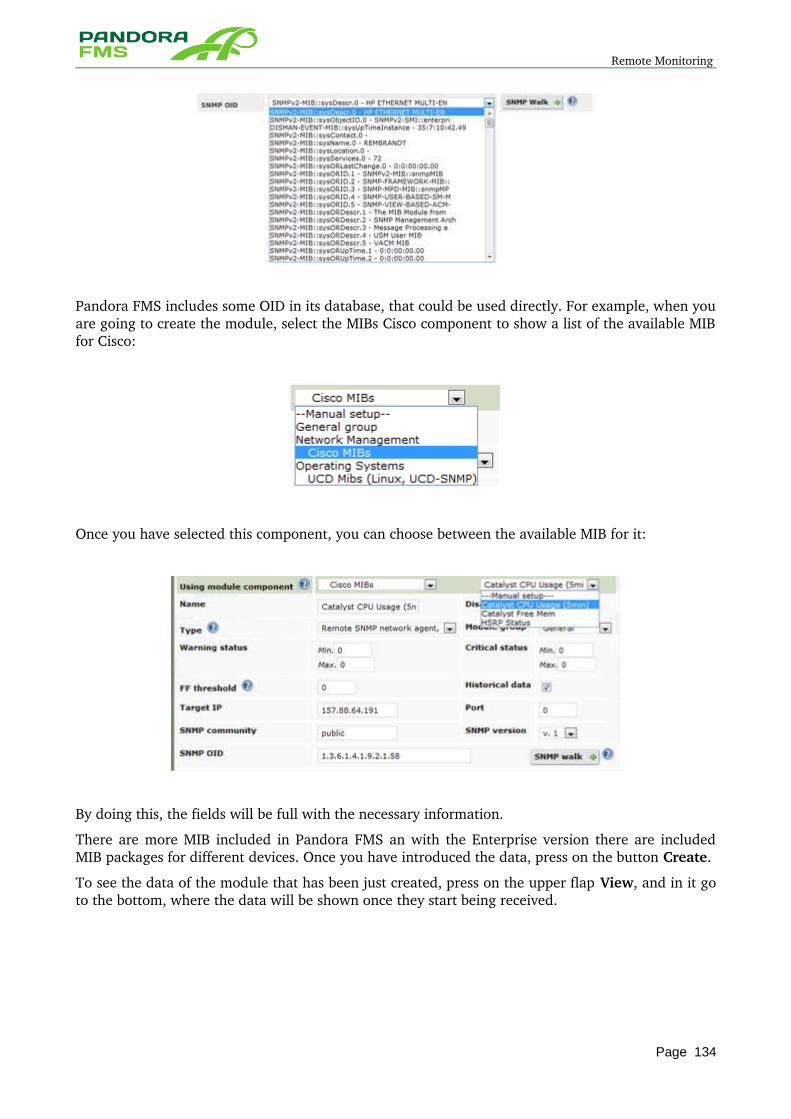
Remote Monitoring
Pandora FMS includes some OID in its database, that could be used directly. For example, when you are going to create the module, select the MIBs Cisco component to show a list of the available MIB for Cisco:
Once you have selected this component, you can choose between the available MIB for it:
By doing this, the fields will be full with the necessary information.
There are more MIB included in Pandora FMS an with the Enterprise version there are included MIB packages for different devices. Once you have introduced the data, press on the button Create.
To see the data of the module that has been just created, press on the upper flap View, and in it go to the bottom, where the data will be shown once they start being received.
Page 134
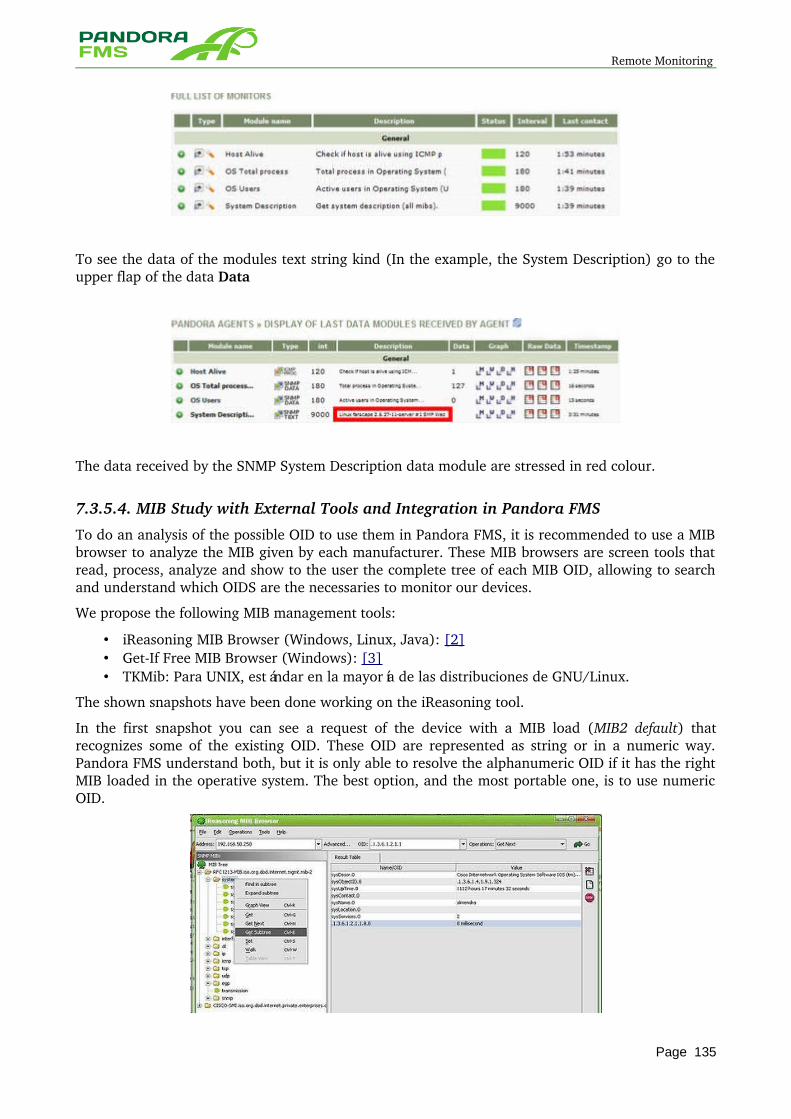
Remote Monitoring
To see the data of the modules text string kind (In the example, the System Description) go to the upper flap of the data Data
The data received by the SNMP System Description data module are stressed in red colour.
7.3.5.4. MIB Study with External Tools and Integration in Pandora FMS
To do an analysis of the possible OID to use them in Pandora FMS, it is recommended to use a MIB browser to analyze the MIB given by each manufacturer. These MIB browsers are screen tools that read, process, analyze and show to the user the complete tree of each MIB OID, allowing to search and understand which OIDS are the necessaries to monitor our devices.
We propose the following MIB management tools:
• iReasoning MIB Browser (Windows, Linux, Java): [2] • GetIf Free MIB Browser (Windows): [3] • TKMib: Para UNIX, estándar en la mayoría de las distribuciones de GNU/Linux.
The shown snapshots have been done working on the iReasoning tool.
In the first snapshot you can see a request of the device with a MIB load (MIB2 default) that recognizes some of the existing OID. These OID are represented as string or in a numeric way. Pandora FMS understand both, but it is only able to resolve the alphanumeric OID if it has the right MIB loaded in the operative system. The best option, and the most portable one, is to use numeric OID.
Page 135
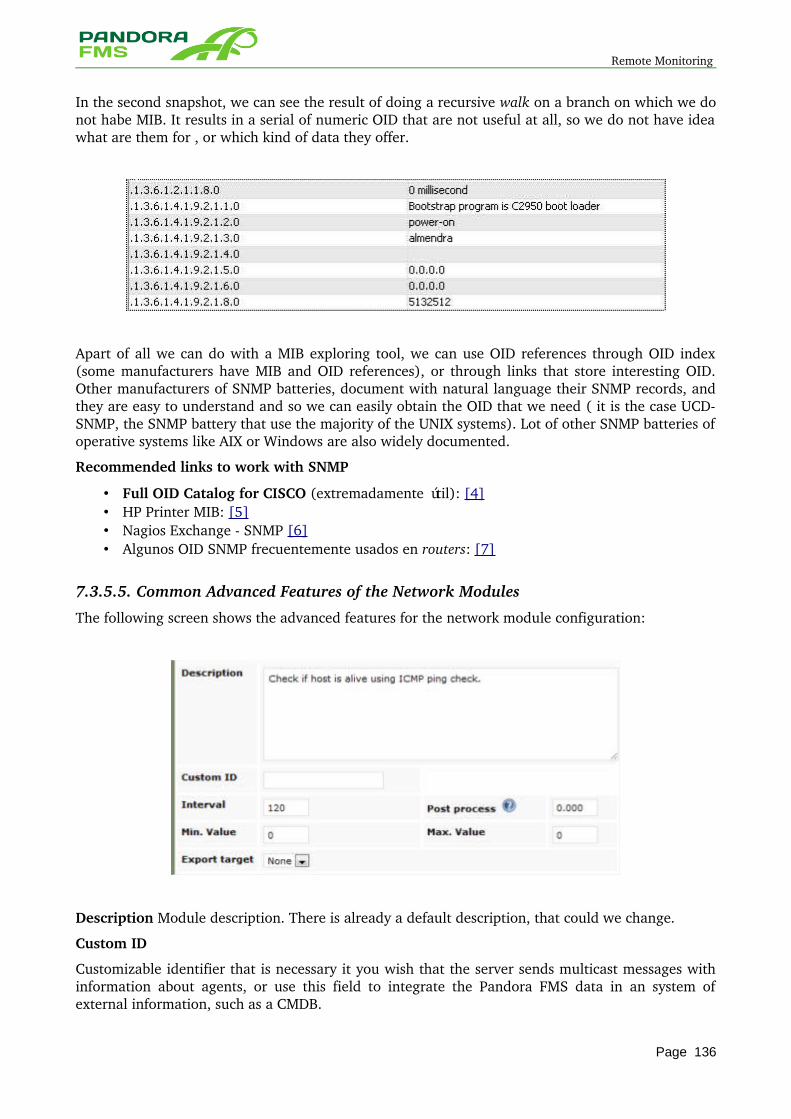
Remote Monitoring
In the second snapshot, we can see the result of doing a recursive walk on a branch on which we do not habe MIB. It results in a serial of numeric OID that are not useful at all, so we do not have idea what are them for , or which kind of data they offer.
Apart of all we can do with a MIB exploring tool, we can use OID references through OID index (some manufacturers have MIB and OID references), or through links that store interesting OID. Other manufacturers of SNMP batteries, document with natural language their SNMP records, and they are easy to understand and so we can easily obtain the OID that we need ( it is the case UCDSNMP, the SNMP battery that use the majority of the UNIX systems). Lot of other SNMP batteries of operative systems like AIX or Windows are also widely documented.
Recommended links to work with SNMP
• Full OID Catalog for CISCO (extremadamente útil): [4] • HP Printer MIB: [5] • Nagios Exchange SNMP [6] • Algunos OID SNMP frecuentemente usados en routers: [7]
7.3.5.5. Common Advanced Features of the Network Modules
The following screen shows the advanced features for the network module configuration:
Description Module description. There is already a default description, that could we change.
Custom ID
Customizable identifier that is necessary it you wish that the server sends multicast messages with information about agents, or use this field to integrate the Pandora FMS data in an system of external information, such as a CMDB.
Page 136
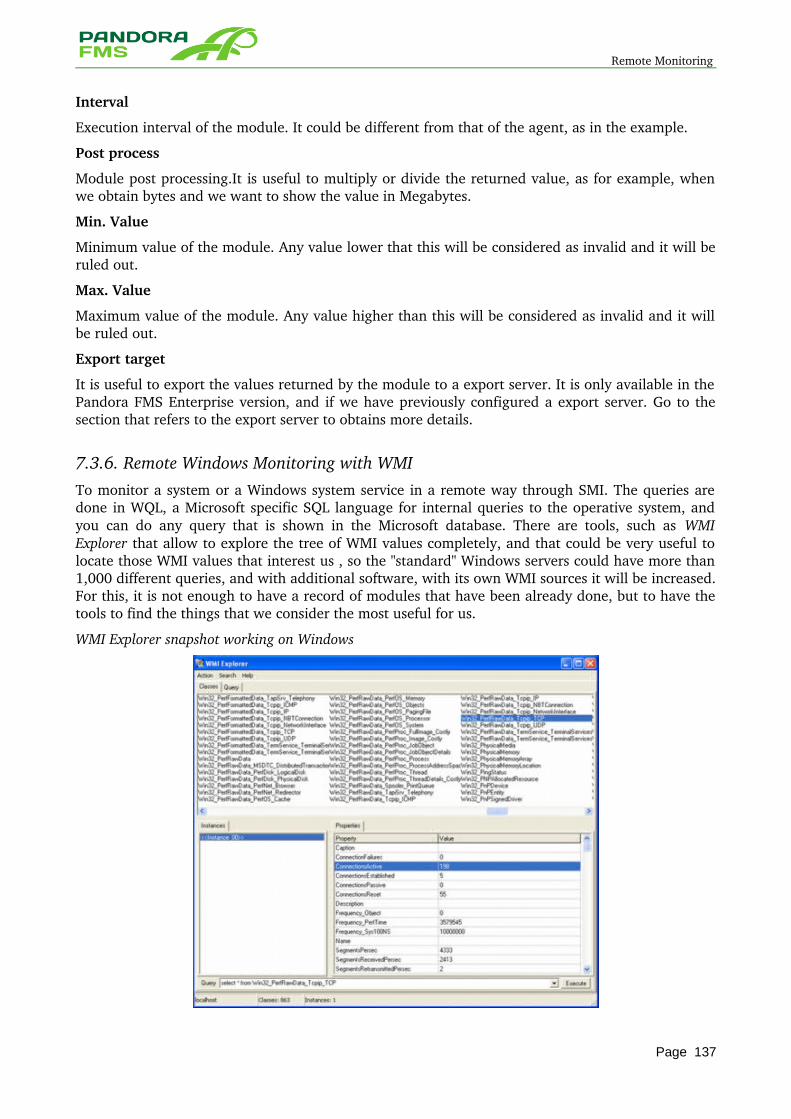
Remote Monitoring
Interval
Execution interval of the module. It could be different from that of the agent, as in the example.
Post process
Module post processing.It is useful to multiply or divide the returned value, as for example, when we obtain bytes and we want to show the value in Megabytes.
Min. Value
Minimum value of the module. Any value lower that this will be considered as invalid and it will be ruled out.
Max. Value
Maximum value of the module. Any value higher than this will be considered as invalid and it will be ruled out.
Export target
It is useful to export the values returned by the module to a export server. It is only available in the Pandora FMS Enterprise version, and if we have previously configured a export server. Go to the section that refers to the export server to obtains more details.
7.3.6. Remote Windows Monitoring with WMITo monitor a system or a Windows system service in a remote way through SMI. The queries are done in WQL, a Microsoft specific SQL language for internal queries to the operative system, and you can do any query that is shown in the Microsoft database. There are tools, such as WMI Explorer that allow to explore the tree of WMI values completely, and that could be very useful to locate those WMI values that interest us , so the "standard" Windows servers could have more than 1,000 different queries, and with additional software, with its own WMI sources it will be increased. For this, it is not enough to have a record of modules that have been already done, but to have the tools to find the things that we consider the most useful for us.
WMI Explorer snapshot working on Windows
Page 137
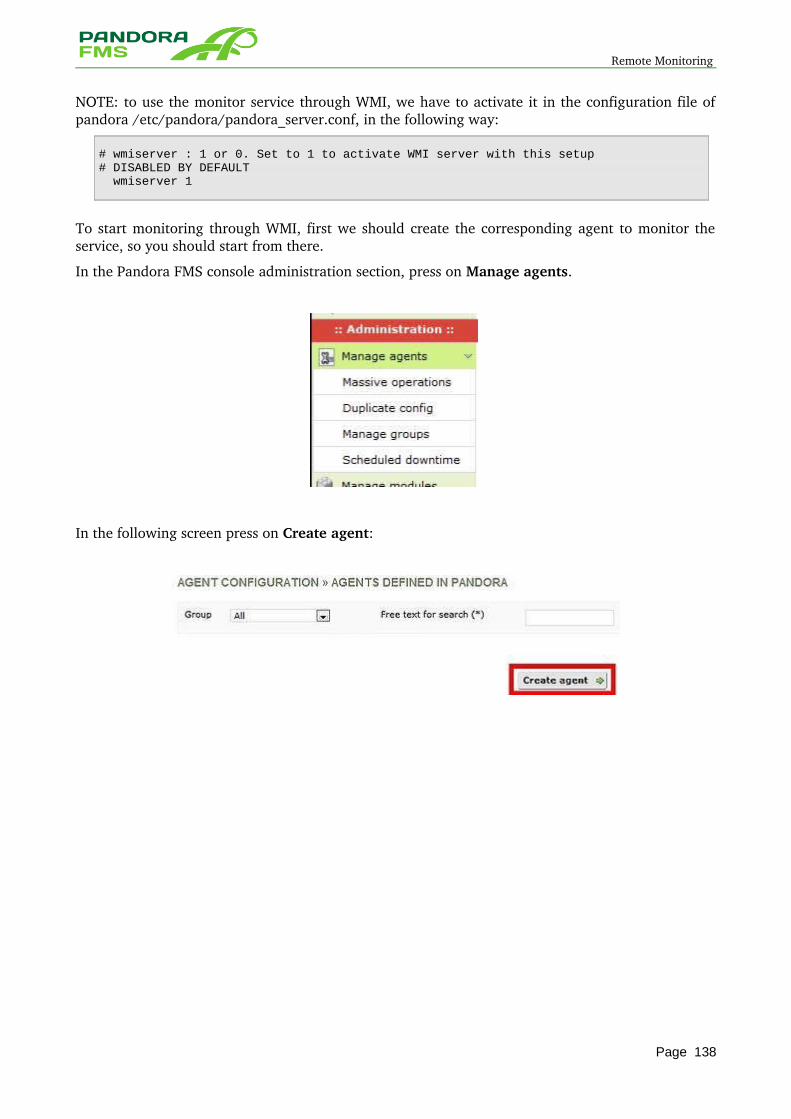
Remote Monitoring
NOTE: to use the monitor service through WMI, we have to activate it in the configuration file of pandora /etc/pandora/pandora_server.conf, in the following way:
# wmiserver : 1 or 0. Set to 1 to activate WMI server with this setup# DISABLED BY DEFAULT wmiserver 1
To start monitoring through WMI, first we should create the corresponding agent to monitor the service, so you should start from there.
In the Pandora FMS console administration section, press on Manage agents.
In the following screen press on Create agent:
Page 138
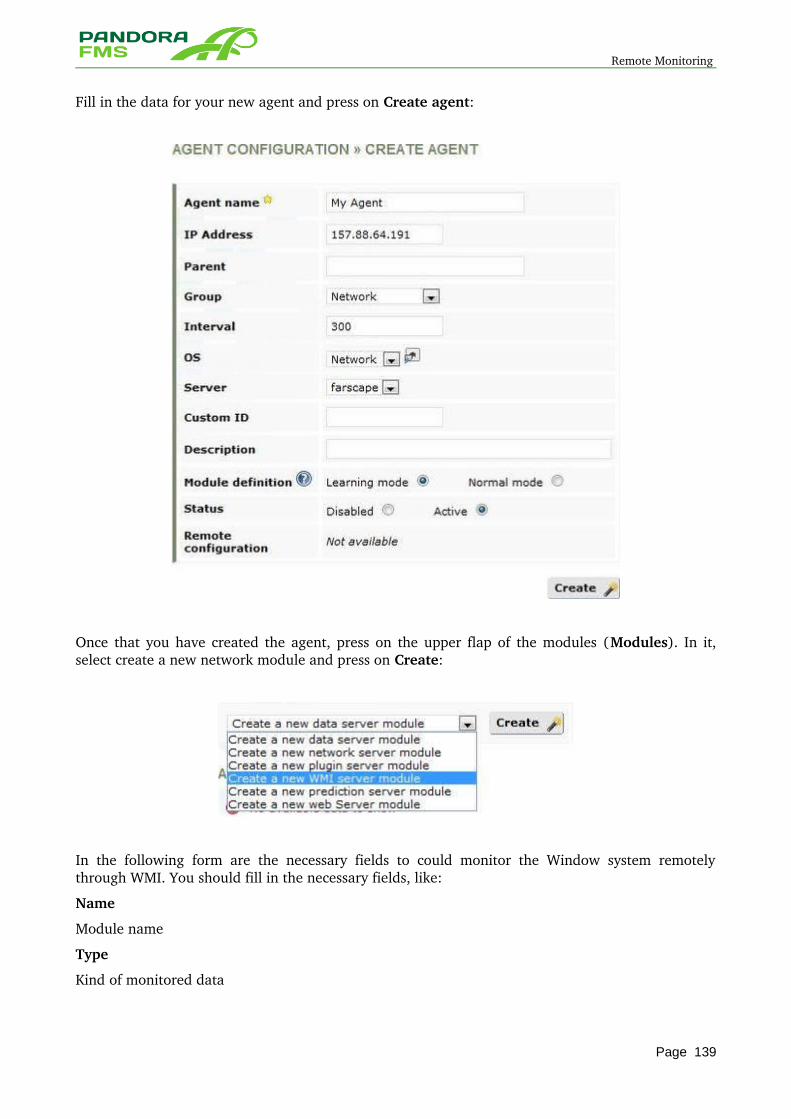
Remote Monitoring
Fill in the data for your new agent and press on Create agent:
Once that you have created the agent, press on the upper flap of the modules (Modules). In it, select create a new network module and press on Create:
In the following form are the necessary fields to could monitor the Window system remotely through WMI. You should fill in the necessary fields, like:
Name
Module name
Type
Kind of monitored data
Page 139
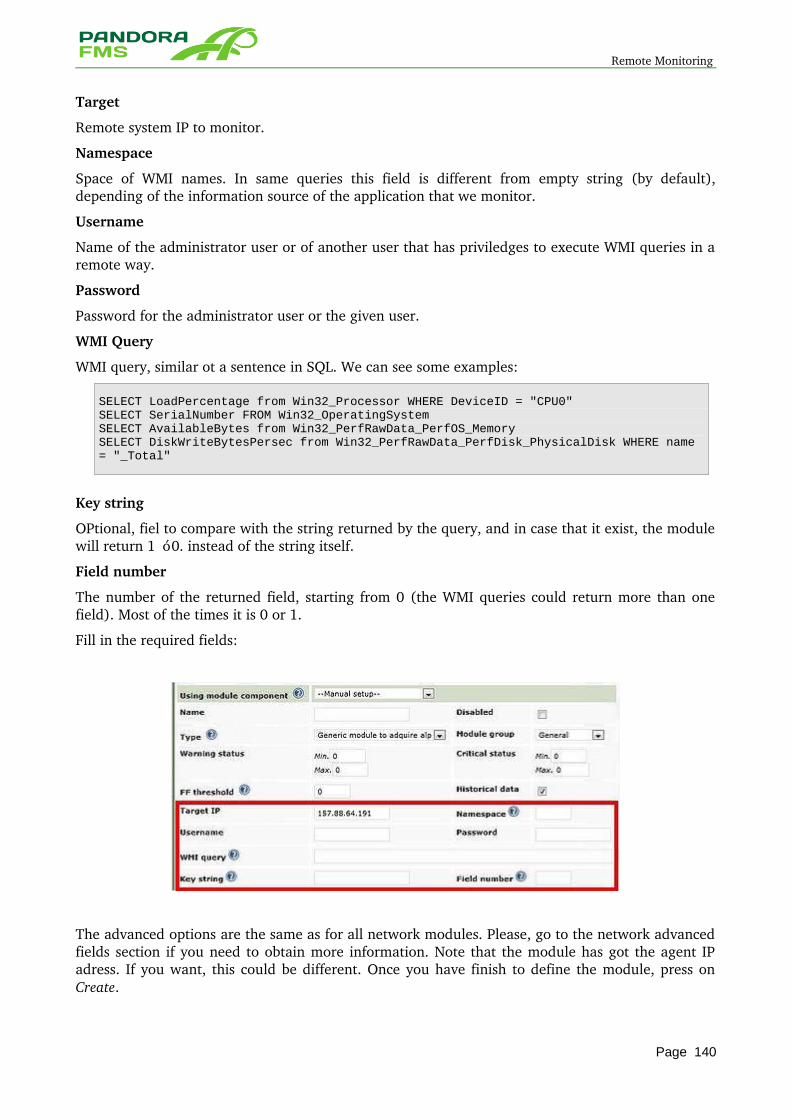
Remote Monitoring
Target
Remote system IP to monitor.
Namespace
Space of WMI names. In same queries this field is different from empty string (by default), depending of the information source of the application that we monitor.
Username
Name of the administrator user or of another user that has priviledges to execute WMI queries in a remote way.
Password
Password for the administrator user or the given user.
WMI Query
WMI query, similar ot a sentence in SQL. We can see some examples:
SELECT LoadPercentage from Win32_Processor WHERE DeviceID = "CPU0"SELECT SerialNumber FROM Win32_OperatingSystemSELECT AvailableBytes from Win32_PerfRawData_PerfOS_MemorySELECT DiskWriteBytesPersec from Win32_PerfRawData_PerfDisk_PhysicalDisk WHERE name = "_Total"
Key string
OPtional, fiel to compare with the string returned by the query, and in case that it exist, the module will return 1 ó 0. instead of the string itself.
Field number
The number of the returned field, starting from 0 (the WMI queries could return more than one field). Most of the times it is 0 or 1.
Fill in the required fields:
The advanced options are the same as for all network modules. Please, go to the network advanced fields section if you need to obtain more information. Note that the module has got the agent IP adress. If you want, this could be different. Once you have finish to define the module, press on Create.
Page 140
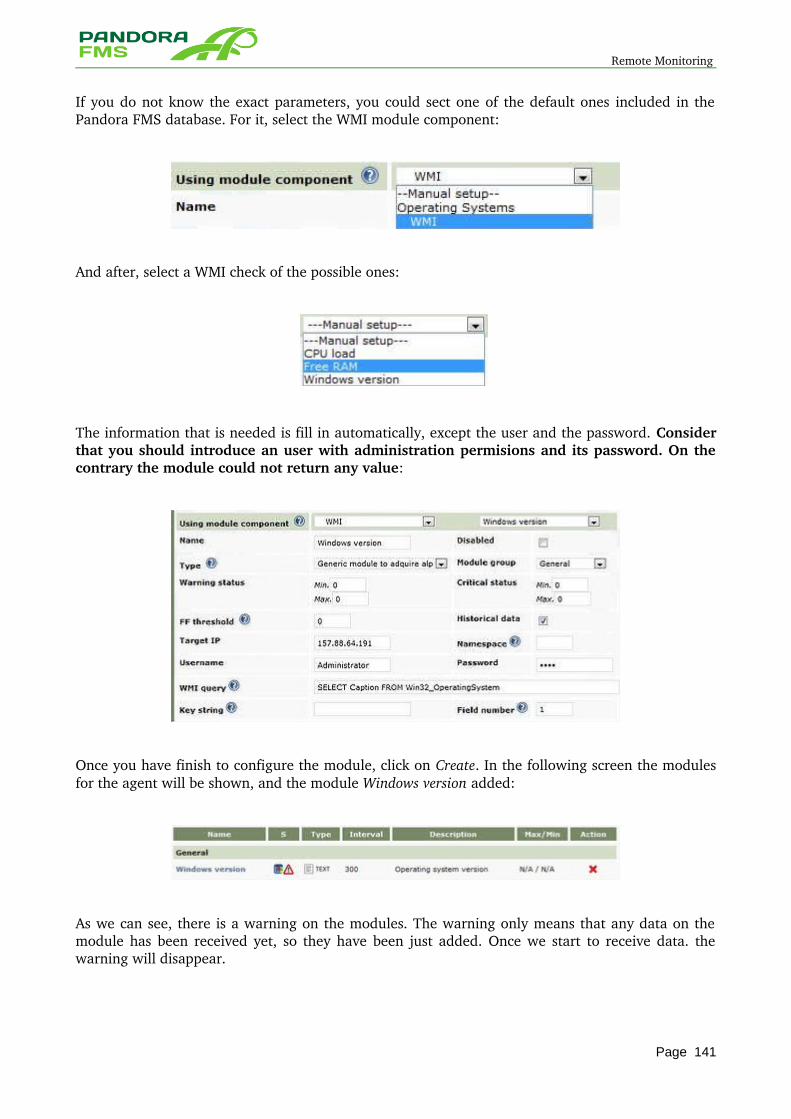
Remote Monitoring
If you do not know the exact parameters, you could sect one of the default ones included in the Pandora FMS database. For it, select the WMI module component:
And after, select a WMI check of the possible ones:
The information that is needed is fill in automatically, except the user and the password. Consider that you should introduce an user with administration permisions and its password. On the contrary the module could not return any value:
Once you have finish to configure the module, click on Create. In the following screen the modules for the agent will be shown, and the module Windows version added:
As we can see, there is a warning on the modules. The warning only means that any data on the module has been received yet, so they have been just added. Once we start to receive data. the warning will disappear.
Page 141
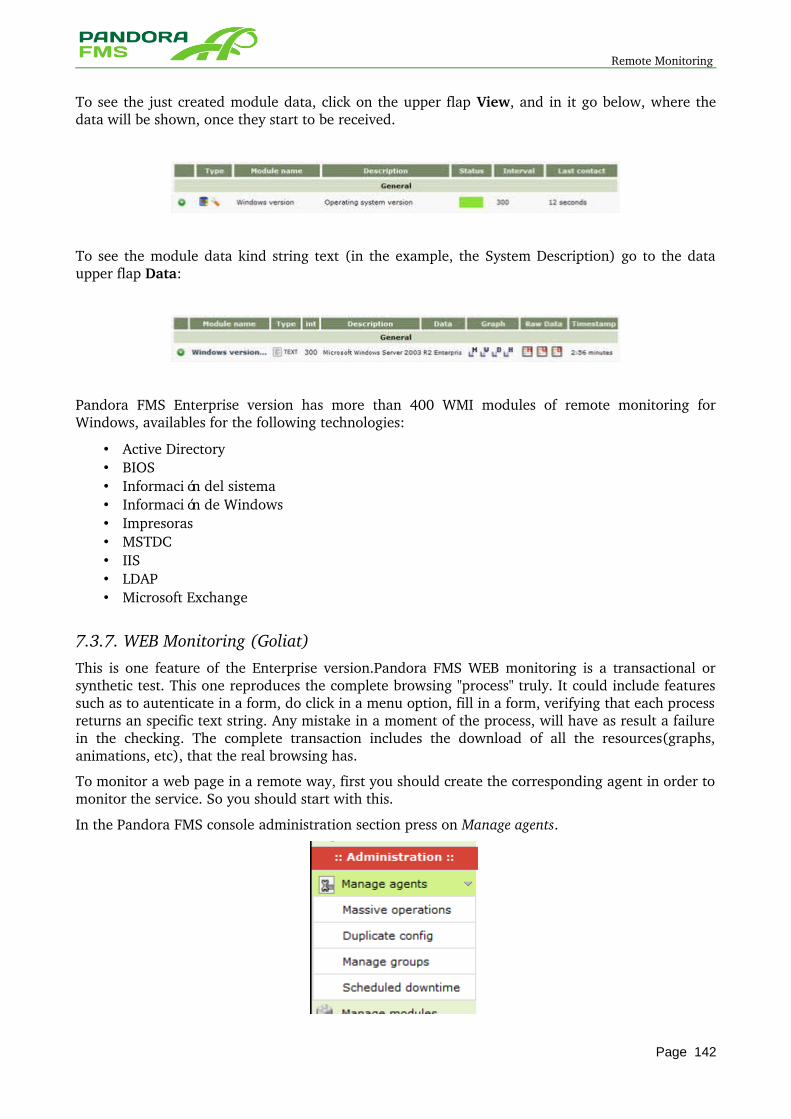
Remote Monitoring
To see the just created module data, click on the upper flap View, and in it go below, where the data will be shown, once they start to be received.
To see the module data kind string text (in the example, the System Description) go to the data upper flap Data:
Pandora FMS Enterprise version has more than 400 WMI modules of remote monitoring for Windows, availables for the following technologies:
• Active Directory • BIOS • Información del sistema • Información de Windows • Impresoras • MSTDC • IIS • LDAP • Microsoft Exchange
7.3.7. WEB Monitoring (Goliat) This is one feature of the Enterprise version.Pandora FMS WEB monitoring is a transactional or synthetic test. This one reproduces the complete browsing "process" truly. It could include features such as to autenticate in a form, do click in a menu option, fill in a form, verifying that each process returns an specific text string. Any mistake in a moment of the process, will have as result a failure in the checking. The complete transaction includes the download of all the resources(graphs, animations, etc), that the real browsing has.
To monitor a web page in a remote way, first you should create the corresponding agent in order to monitor the service. So you should start with this.
In the Pandora FMS console administration section press on Manage agents.
Page 142
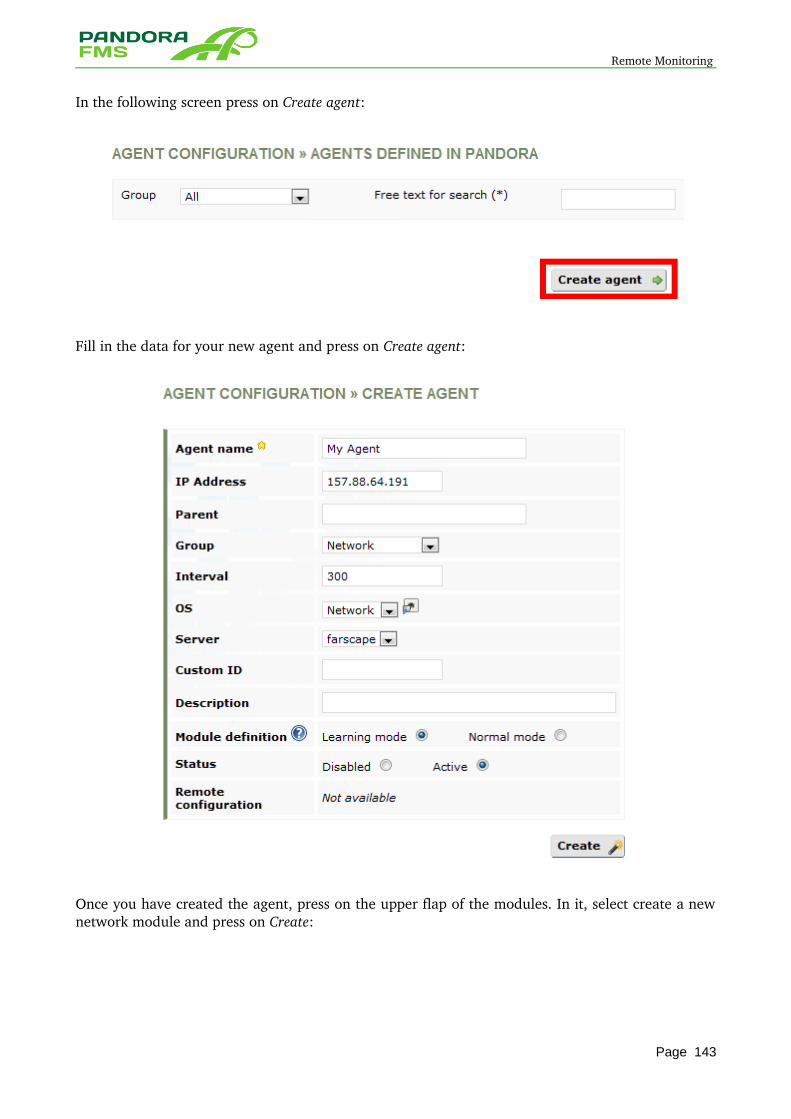
Remote Monitoring
In the following screen press on Create agent:
Fill in the data for your new agent and press on Create agent:
Once you have created the agent, press on the upper flap of the modules. In it, select create a new network module and press on Create:
Page 143
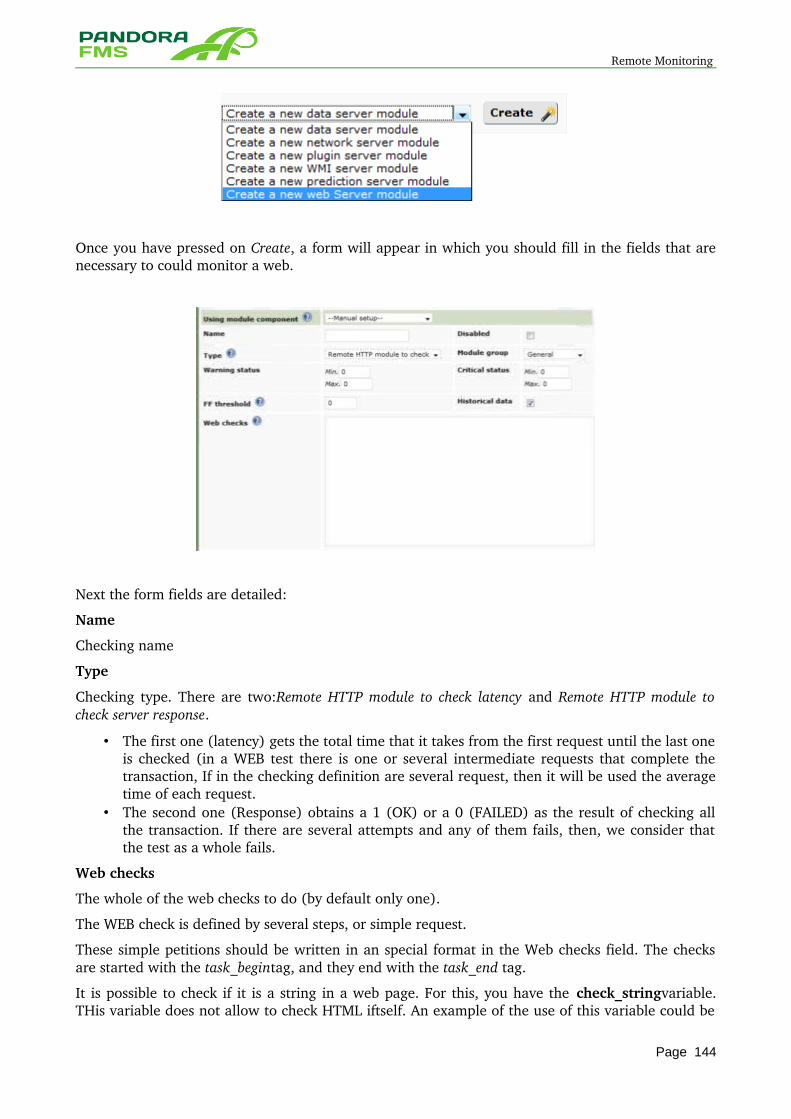
Remote Monitoring
Once you have pressed on Create, a form will appear in which you should fill in the fields that are necessary to could monitor a web.
Next the form fields are detailed:
Name
Checking name
Type
Checking type. There are two:Remote HTTP module to check latency and Remote HTTP module to check server response.
• The first one (latency) gets the total time that it takes from the first request until the last one is checked (in a WEB test there is one or several intermediate requests that complete the transaction, If in the checking definition are several request, then it will be used the average time of each request.
• The second one (Response) obtains a 1 (OK) or a 0 (FAILED) as the result of checking all the transaction. If there are several attempts and any of them fails, then, we consider that the test as a whole fails.
Web checks
The whole of the web checks to do (by default only one).
The WEB check is defined by several steps, or simple request.
These simple petitions should be written in an special format in the Web checks field. The checks are started with the task_begintag, and they end with the task_end tag.
It is possible to check if it is a string in a web page. For this, you have the check_stringvariable. THis variable does not allow to check HTML iftself. An example of the use of this variable could be
Page 144
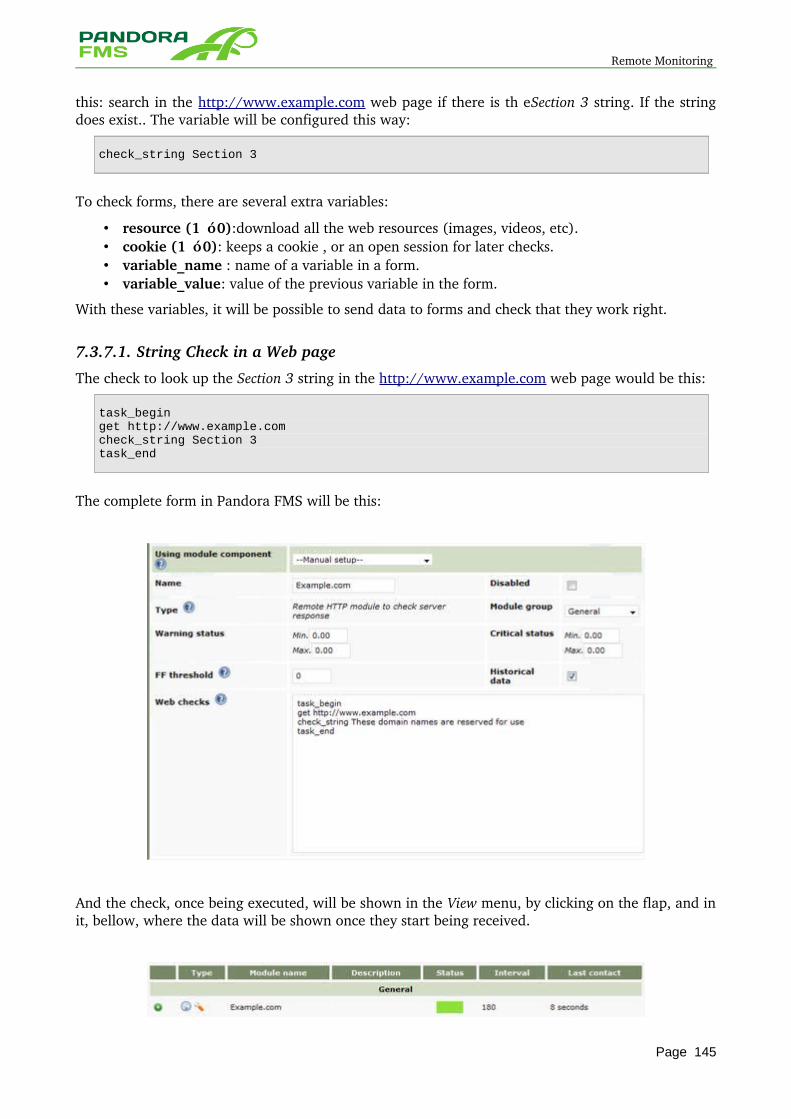
Remote Monitoring
this: search in the http://www.example.com web page if there is th eSection 3 string. If the string does exist.. The variable will be configured this way:
check_string Section 3
To check forms, there are several extra variables:
• resource (1 ó 0):download all the web resources (images, videos, etc). • cookie (1 ó 0): keeps a cookie , or an open session for later checks. • variable_name : name of a variable in a form. • variable_value: value of the previous variable in the form.
With these variables, it will be possible to send data to forms and check that they work right.
7.3.7.1. String Check in a Web page
The check to look up the Section 3 string in the http://www.example.com web page would be this:
task_beginget http://www.example.comcheck_string Section 3task_end
The complete form in Pandora FMS will be this:
And the check, once being executed, will be shown in the View menu, by clicking on the flap, and in it, bellow, where the data will be shown once they start being received.
Page 145
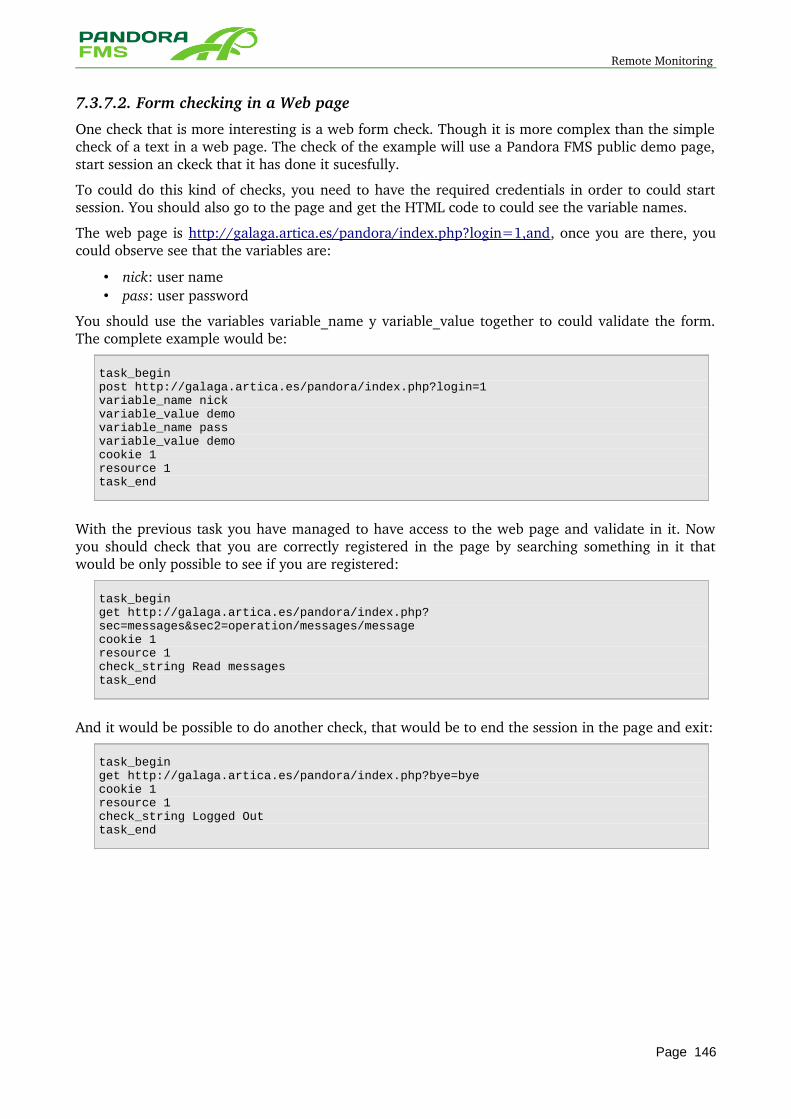
Remote Monitoring
7.3.7.2. Form checking in a Web page
One check that is more interesting is a web form check. Though it is more complex than the simple check of a text in a web page. The check of the example will use a Pandora FMS public demo page, start session an ckeck that it has done it sucesfully.
To could do this kind of checks, you need to have the required credentials in order to could start session. You should also go to the page and get the HTML code to could see the variable names.
The web page is http://galaga.artica.es/pandora/index.php?login=1,and, once you are there, you could observe see that the variables are:
• nick: user name • pass: user password
You should use the variables variable_name y variable_value together to could validate the form. The complete example would be:
task_beginpost http://galaga.artica.es/pandora/index.php?login=1variable_name nickvariable_value demovariable_name passvariable_value democookie 1resource 1task_end
With the previous task you have managed to have access to the web page and validate in it. Now you should check that you are correctly registered in the page by searching something in it that would be only possible to see if you are registered:
task_beginget http://galaga.artica.es/pandora/index.php?sec=messages&sec2=operation/messages/messagecookie 1resource 1check_string Read messagestask_end
And it would be possible to do another check, that would be to end the session in the page and exit:
task_beginget http://galaga.artica.es/pandora/index.php?bye=byecookie 1resource 1check_string Logged Outtask_end
Page 146
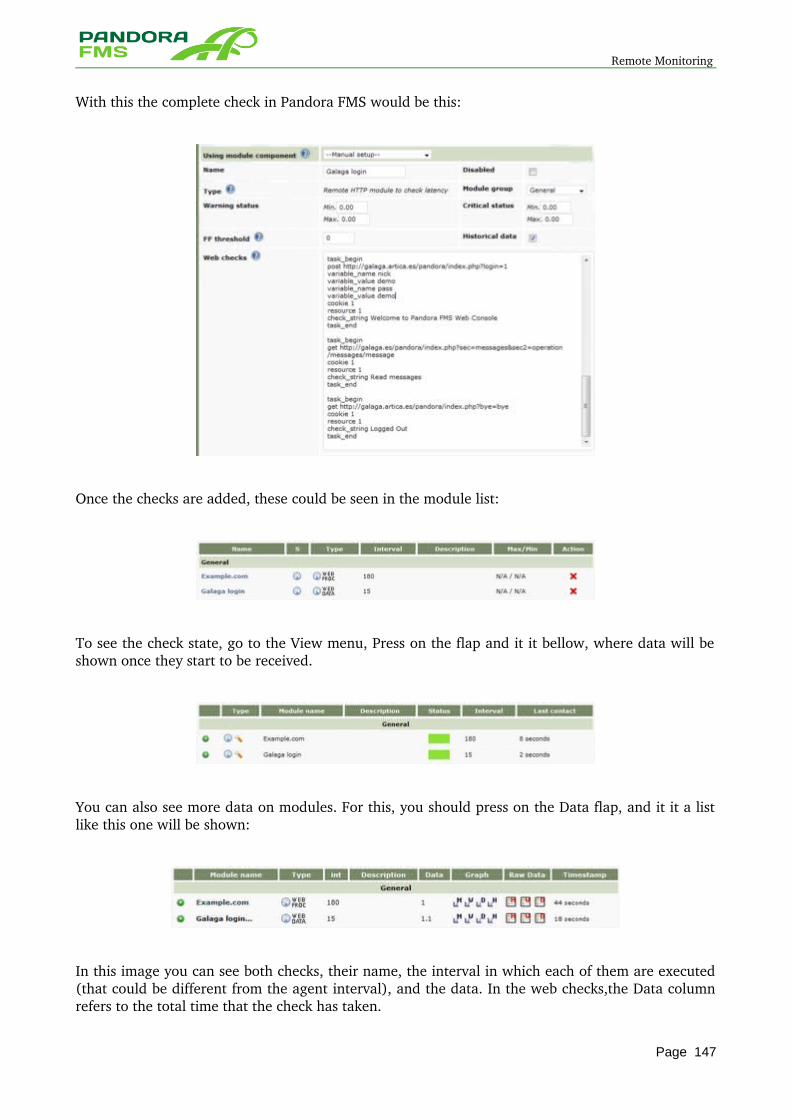
Remote Monitoring
With this the complete check in Pandora FMS would be this:
Once the checks are added, these could be seen in the module list:
To see the check state, go to the View menu, Press on the flap and it it bellow, where data will be shown once they start to be received.
You can also see more data on modules. For this, you should press on the Data flap, and it it a list like this one will be shown:
In this image you can see both checks, their name, the interval in which each of them are executed (that could be different from the agent interval), and the data. In the web checks,the Data column refers to the total time that the check has taken.
Page 147
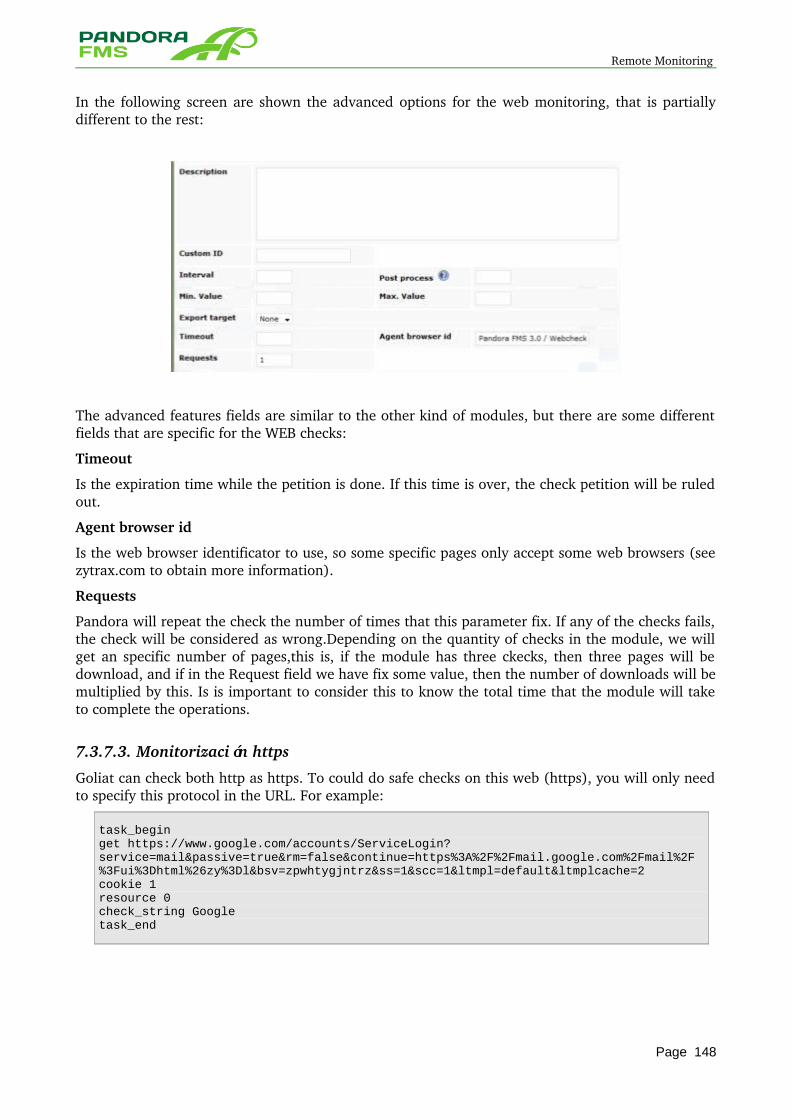
Remote Monitoring
In the following screen are shown the advanced options for the web monitoring, that is partially different to the rest:
The advanced features fields are similar to the other kind of modules, but there are some different fields that are specific for the WEB checks:
Timeout
Is the expiration time while the petition is done. If this time is over, the check petition will be ruled out.
Agent browser id
Is the web browser identificator to use, so some specific pages only accept some web browsers (see zytrax.com to obtain more information).
Requests
Pandora will repeat the check the number of times that this parameter fix. If any of the checks fails, the check will be considered as wrong.Depending on the quantity of checks in the module, we will get an specific number of pages,this is, if the module has three ckecks, then three pages will be download, and if in the Request field we have fix some value, then the number of downloads will be multiplied by this. Is is important to consider this to know the total time that the module will take to complete the operations.
7.3.7.3. Monitorización https
Goliat can check both http as https. To could do safe checks on this web (https), you will only need to specify this protocol in the URL. For example:
task_beginget https://www.google.com/accounts/ServiceLogin?service=mail&passive=true&rm=false&continue=https%3A%2F%2Fmail.google.com%2Fmail%2F%3Fui%3Dhtml%26zy%3Dl&bsv=zpwhtygjntrz&ss=1&scc=1<mpl=default<mplcache=2cookie 1resource 0check_string Googletask_end
Page 148
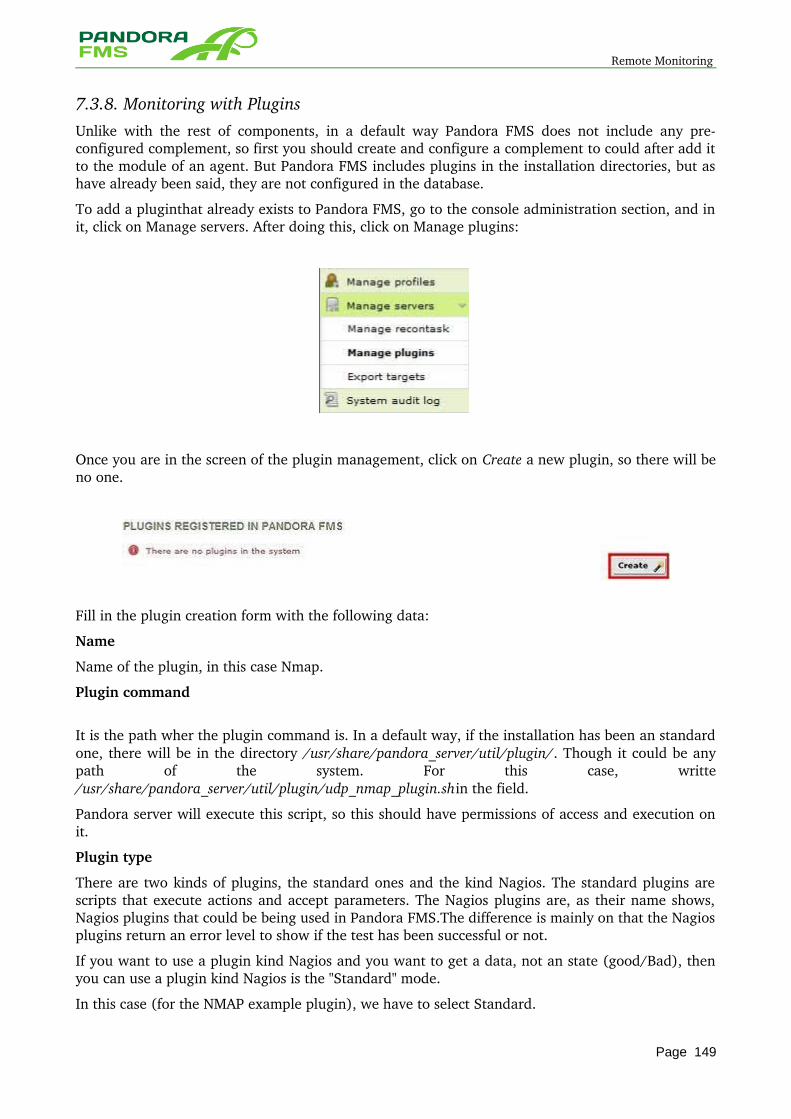
Remote Monitoring
7.3.8. Monitoring with Plugins Unlike with the rest of components, in a default way Pandora FMS does not include any preconfigured complement, so first you should create and configure a complement to could after add it to the module of an agent. But Pandora FMS includes plugins in the installation directories, but as have already been said, they are not configured in the database.
To add a pluginthat already exists to Pandora FMS, go to the console administration section, and in it, click on Manage servers. After doing this, click on Manage plugins:
Once you are in the screen of the plugin management, click on Create a new plugin, so there will be no one.
Fill in the plugin creation form with the following data:
Name
Name of the plugin, in this case Nmap.
Plugin command
It is the path wher the plugin command is. In a default way, if the installation has been an standard one, there will be in the directory /usr/share/pandora_server/util/plugin/. Though it could be any path of the system. For this case, writte /usr/share/pandora_server/util/plugin/udp_nmap_plugin.shin the field.
Pandora server will execute this script, so this should have permissions of access and execution on it.
Plugin type
There are two kinds of plugins, the standard ones and the kind Nagios. The standard plugins are scripts that execute actions and accept parameters. The Nagios plugins are, as their name shows, Nagios plugins that could be being used in Pandora FMS.The difference is mainly on that the Nagios plugins return an error level to show if the test has been successful or not.
If you want to use a plugin kind Nagios and you want to get a data, not an state (good/Bad), then you can use a plugin kind Nagios is the "Standard" mode.
In this case (for the NMAP example plugin), we have to select Standard.
Page 149
Remote Monitoring
Max. timeout
It is the time of expiration of the plugin. If you do not receive a response in this time, you should select the module as unknown, and its value will be not updated.It is a very important factor when implementing monitoring with plugins, so if the time it takes at executing the plugin is bigger than this number, we never could obtain values with it. This value should always be bigger than the time it takes usually to return a value the script/executable that is used as plugin. In there is nothing said, then you should used the value that in the configuration is named plugin_timeout.
In this case, we write 15.
IP address option
It is useful to define the crossing interface of the IP adress parameter that is given to the plugin. All plugins should get at least the destination IP adress of the test, that is given when we linked a module kind plugin to an agent.
In order that Pandora would known how to pass this parameter to the plugin, you should show it with which parameter it has to be pass, and this always depends on the plugin and its interface, in this case, it will be pass with h.
Port option
Same as in the previous case, it is necessary to define the interface that the plugin uses. In this case, the destination port of the test, that could be optional. In this example, we use p to pass the TCP destination port of the Nmap test.
Password option / User option
More interface parameters, used as fields user and password respectively. In this case we won't use it and left it blank.
'Description
Plugin description. Write a short description, as for example:Test # UDP open ports, and if it is possible, specify the complete interface of parameters to help to someone that will after check the plugin definition to know which parameters accept.
Page 150
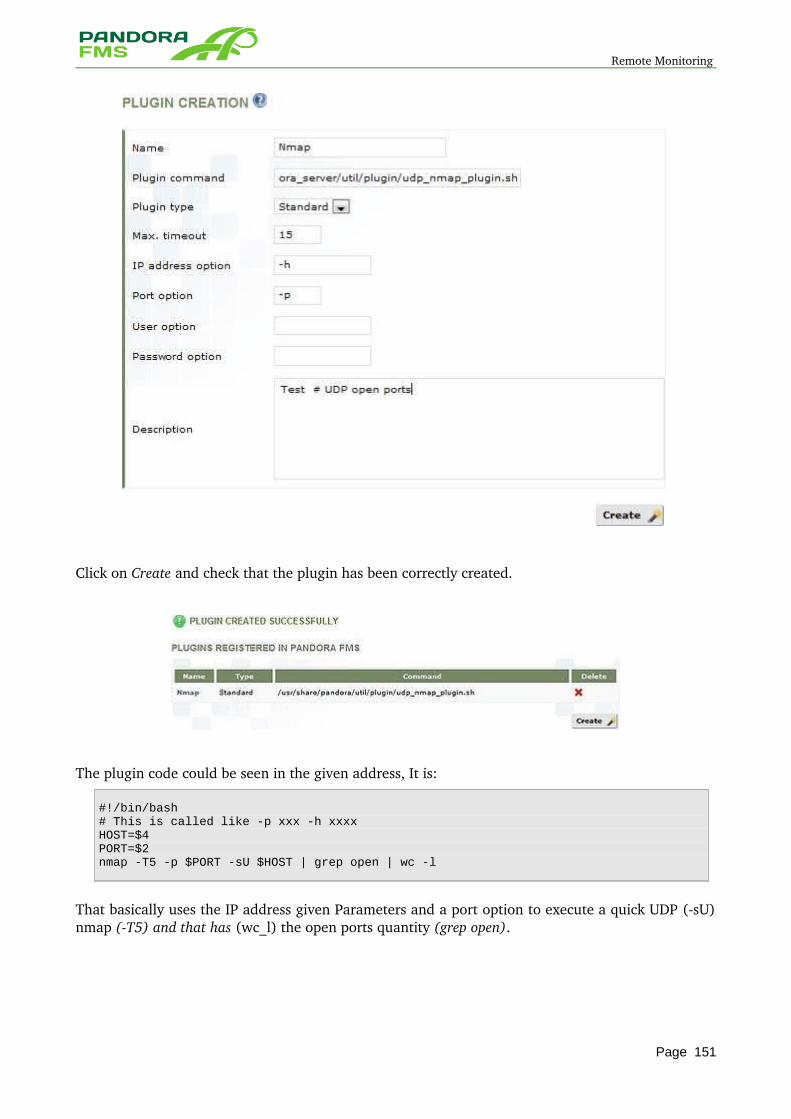
Remote Monitoring
Click on Create and check that the plugin has been correctly created.
The plugin code could be seen in the given address, It is:
#!/bin/bash# This is called like -p xxx -h xxxxHOST=$4PORT=$2nmap -T5 -p $PORT -sU $HOST | grep open | wc -l
That basically uses the IP address given Parameters and a port option to execute a quick UDP (sU) nmap (T5) and that has (wc_l) the open ports quantity (grep open).
Page 151
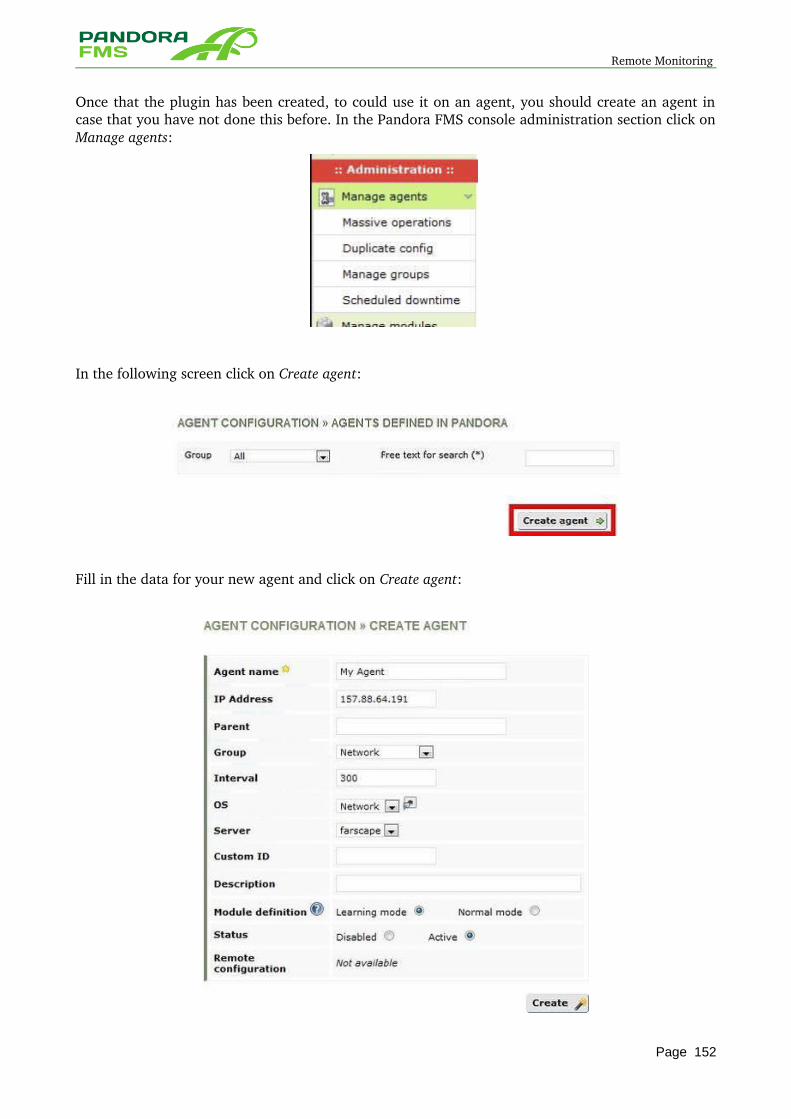
Remote Monitoring
Once that the plugin has been created, to could use it on an agent, you should create an agent in case that you have not done this before. In the Pandora FMS console administration section click on Manage agents:
In the following screen click on Create agent:
Fill in the data for your new agent and click on Create agent:
Page 152
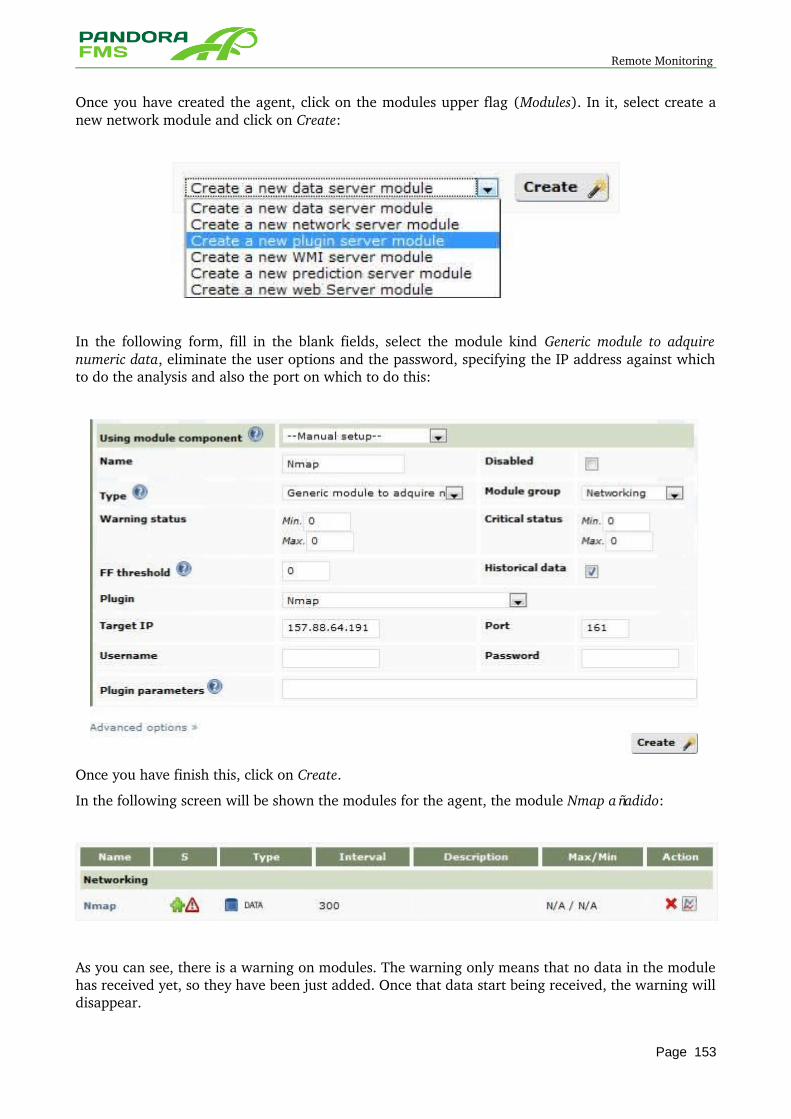
Remote Monitoring
Once you have created the agent, click on the modules upper flag (Modules). In it, select create a new network module and click on Create:
In the following form, fill in the blank fields, select the module kind Generic module to adquire numeric data, eliminate the user options and the password, specifying the IP address against which to do the analysis and also the port on which to do this:
Once you have finish this, click on Create.
In the following screen will be shown the modules for the agent, the module Nmap añadido:
As you can see, there is a warning on modules. The warning only means that no data in the module has received yet, so they have been just added. Once that data start being received, the warning will disappear.
Page 153
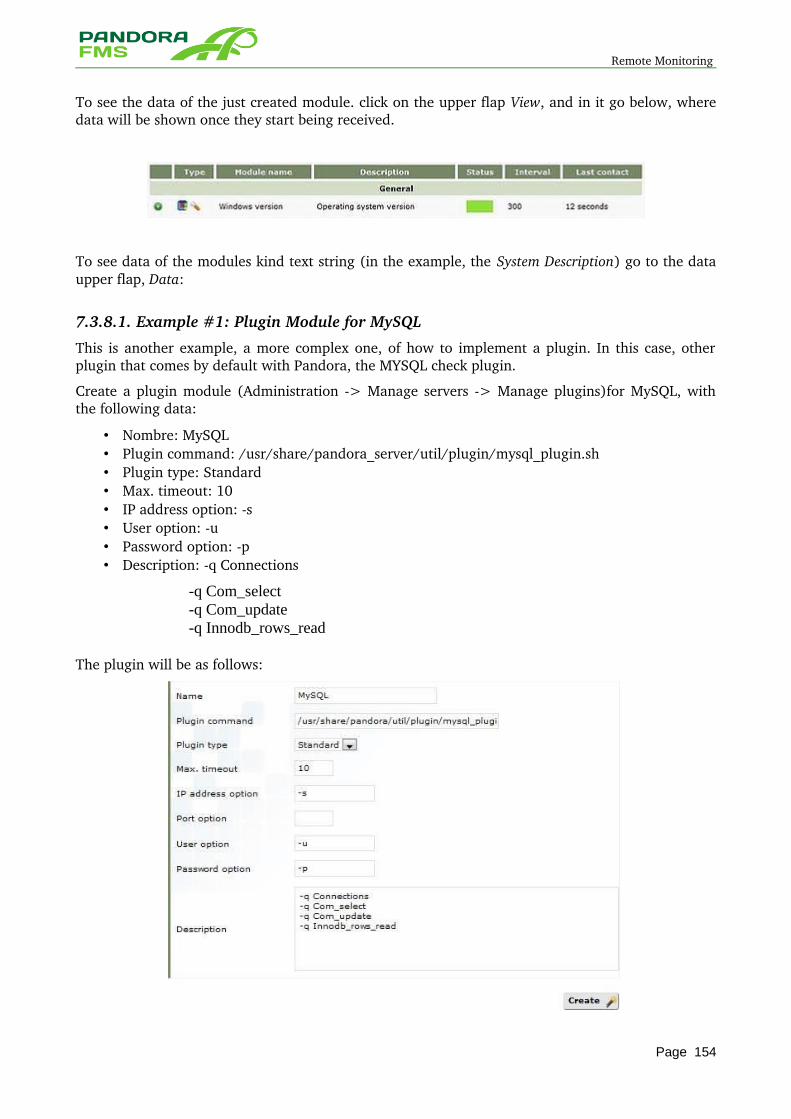
Remote Monitoring
To see the data of the just created module. click on the upper flap View, and in it go below, where data will be shown once they start being received.
To see data of the modules kind text string (in the example, the System Description) go to the data upper flap, Data:
7.3.8.1. Example #1: Plugin Module for MySQL
This is another example, a more complex one, of how to implement a plugin. In this case, other plugin that comes by default with Pandora, the MYSQL check plugin.
Create a plugin module (Administration > Manage servers > Manage plugins)for MySQL, with the following data:
• Nombre: MySQL • Plugin command: /usr/share/pandora_server/util/plugin/mysql_plugin.sh • Plugin type: Standard • Max. timeout: 10 • IP address option: s • User option: u • Password option: p • Description: q Connections
-q Com_select -q Com_update -q Innodb_rows_read
The plugin will be as follows:
Page 154
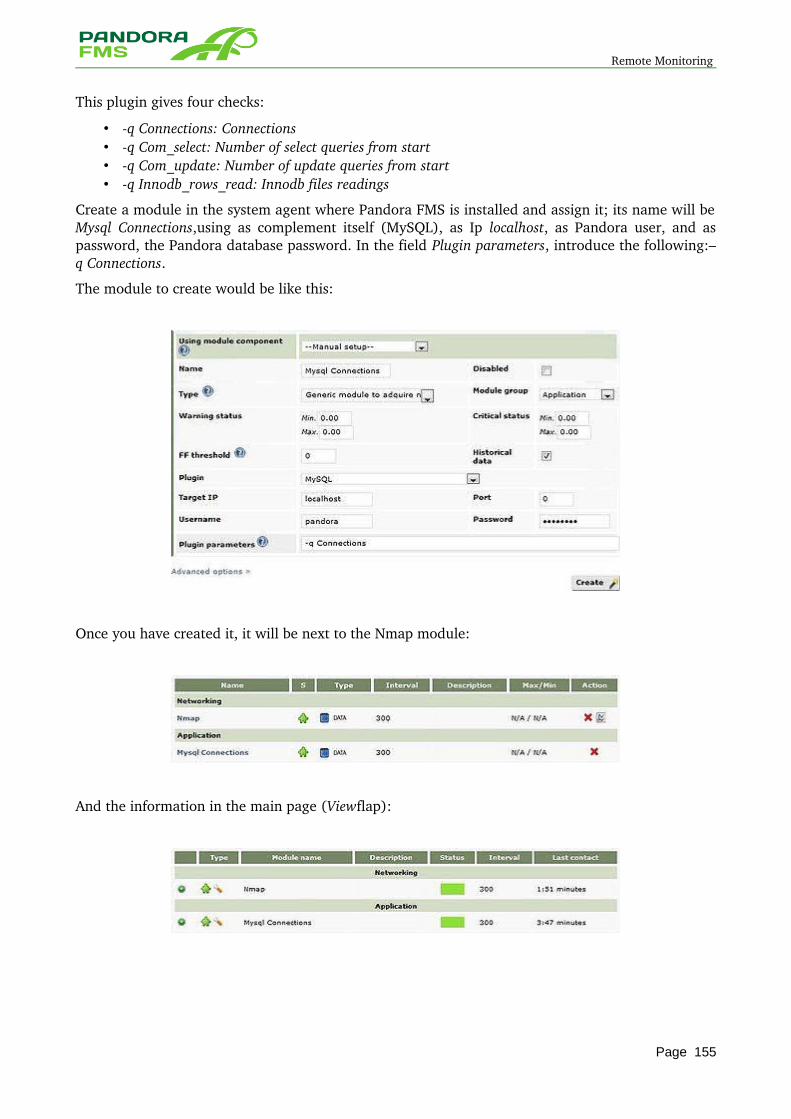
Remote Monitoring
This plugin gives four checks:
• q Connections: Connections • q Com_select: Number of select queries from start • q Com_update: Number of update queries from start • q Innodb_rows_read: Innodb files readings
Create a module in the system agent where Pandora FMS is installed and assign it; its name will be Mysql Connections,using as complement itself (MySQL), as Ip localhost, as Pandora user, and as password, the Pandora database password. In the field Plugin parameters, introduce the following:–q Connections.
The module to create would be like this:
Once you have created it, it will be next to the Nmap module:
And the information in the main page (Viewflap):
Page 155
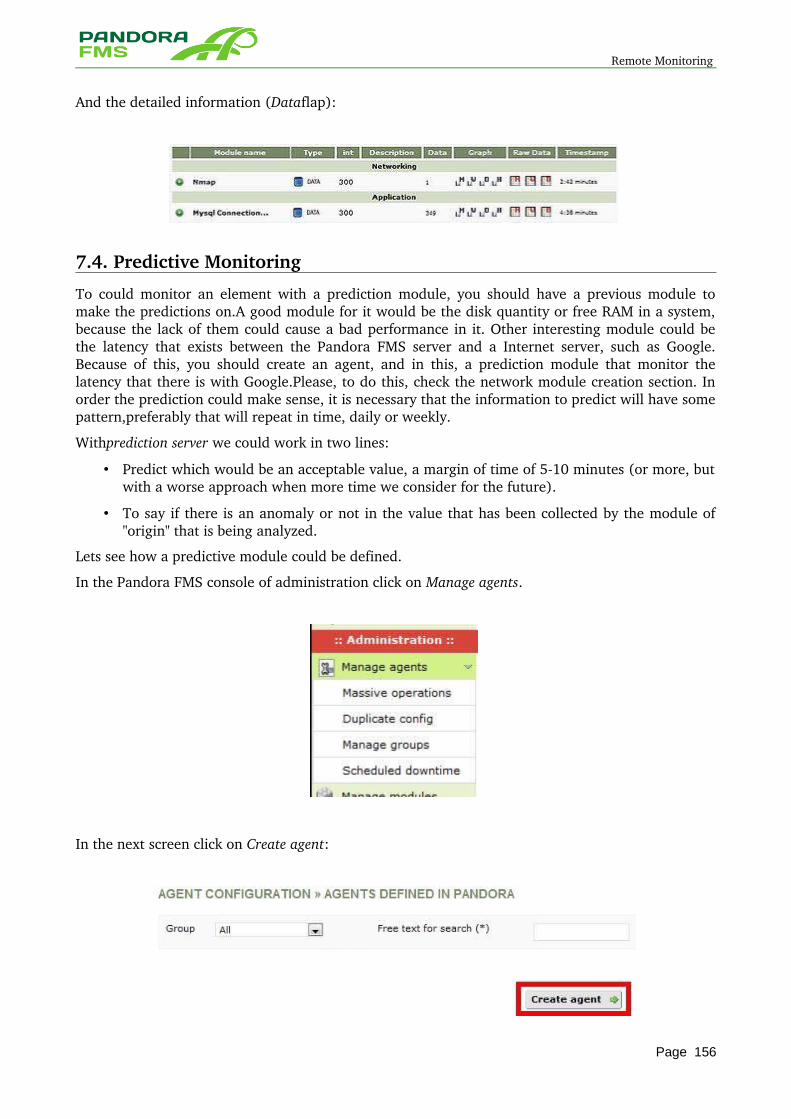
Remote Monitoring
And the detailed information (Dataflap):
7.4. Predictive Monitoring
To could monitor an element with a prediction module, you should have a previous module to make the predictions on.A good module for it would be the disk quantity or free RAM in a system, because the lack of them could cause a bad performance in it. Other interesting module could be the latency that exists between the Pandora FMS server and a Internet server, such as Google. Because of this, you should create an agent, and in this, a prediction module that monitor the latency that there is with Google.Please, to do this, check the network module creation section. In order the prediction could make sense, it is necessary that the information to predict will have some pattern,preferably that will repeat in time, daily or weekly.
Withprediction server we could work in two lines:
• Predict which would be an acceptable value, a margin of time of 510 minutes (or more, but with a worse approach when more time we consider for the future).
• To say if there is an anomaly or not in the value that has been collected by the module of "origin" that is being analyzed.
Lets see how a predictive module could be defined.
In the Pandora FMS console of administration click on Manage agents.
In the next screen click on Create agent:
Page 156
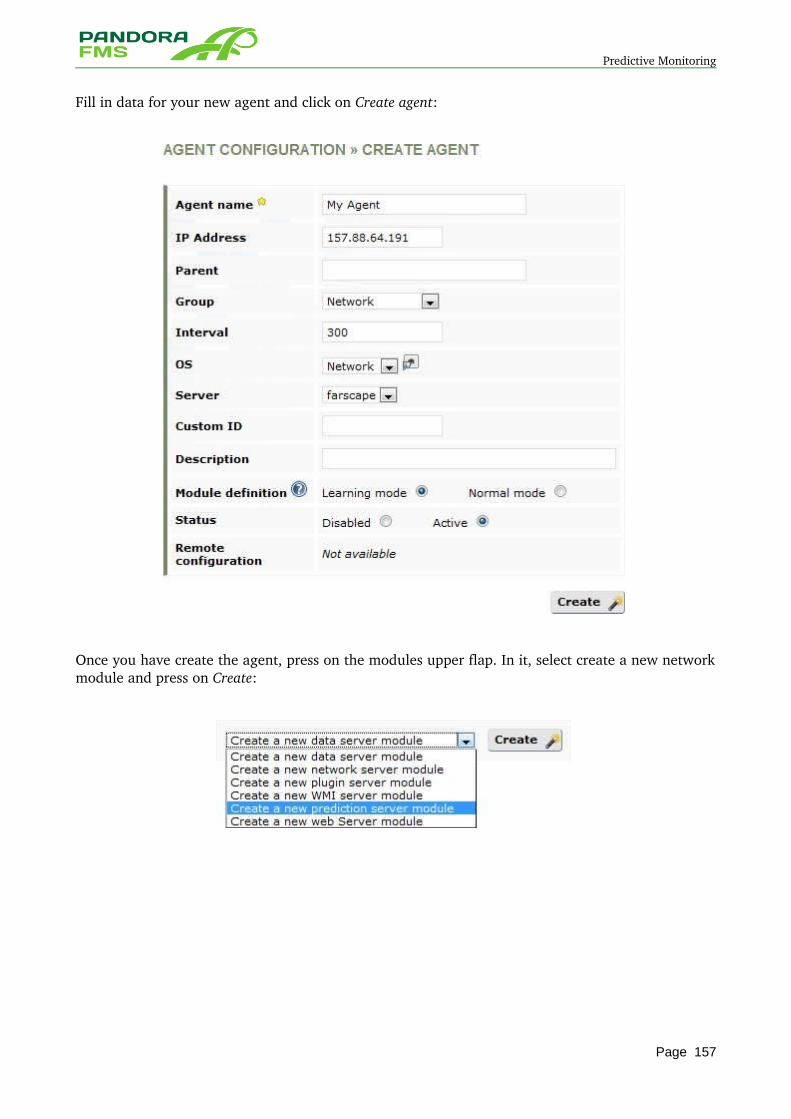
Predictive Monitoring
Fill in data for your new agent and click on Create agent:
Once you have create the agent, press on the modules upper flap. In it, select create a new network module and press on Create:
Page 157
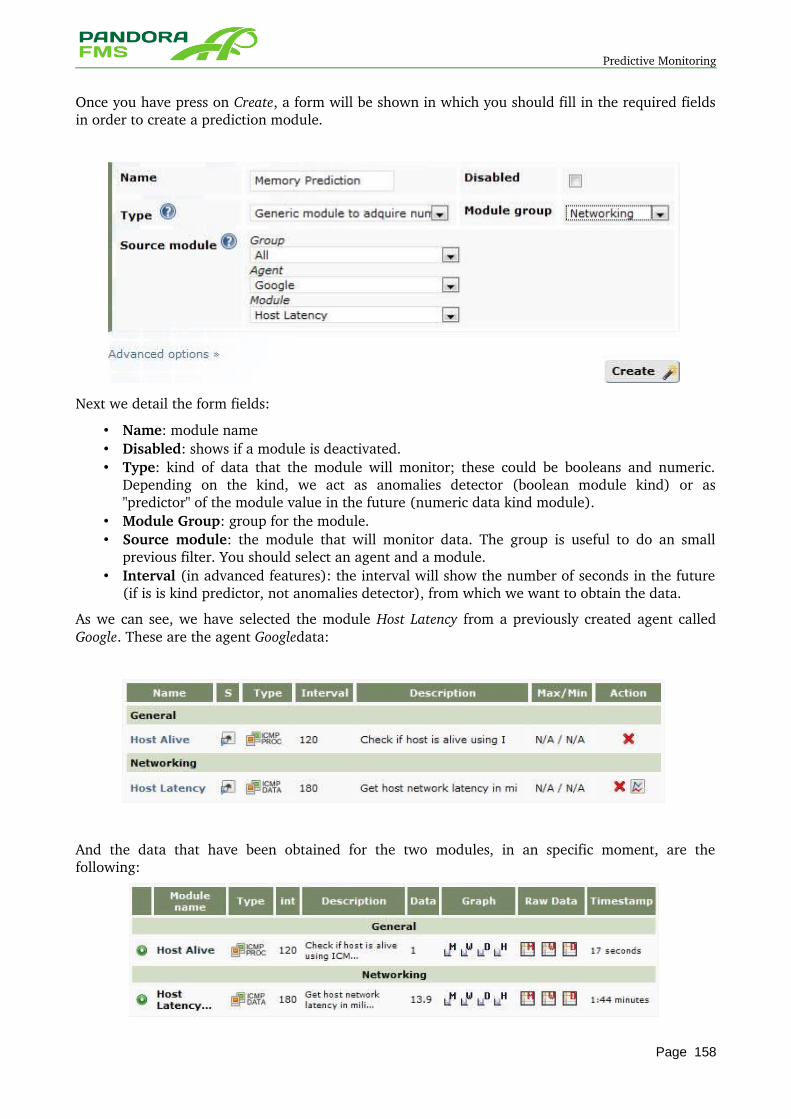
Predictive Monitoring
Once you have press on Create, a form will be shown in which you should fill in the required fields in order to create a prediction module.
Next we detail the form fields:
• Name: module name • Disabled: shows if a module is deactivated. • Type: kind of data that the module will monitor; these could be booleans and numeric.
Depending on the kind, we act as anomalies detector (boolean module kind) or as "predictor" of the module value in the future (numeric data kind module).
• Module Group: group for the module. • Source module: the module that will monitor data. The group is useful to do an small
previous filter. You should select an agent and a module. • Interval (in advanced features): the interval will show the number of seconds in the future
(if is is kind predictor, not anomalies detector), from which we want to obtain the data.
As we can see, we have selected the module Host Latency from a previously created agent called Google. These are the agent Googledata:
And the data that have been obtained for the two modules, in an specific moment, are the following:
Page 158
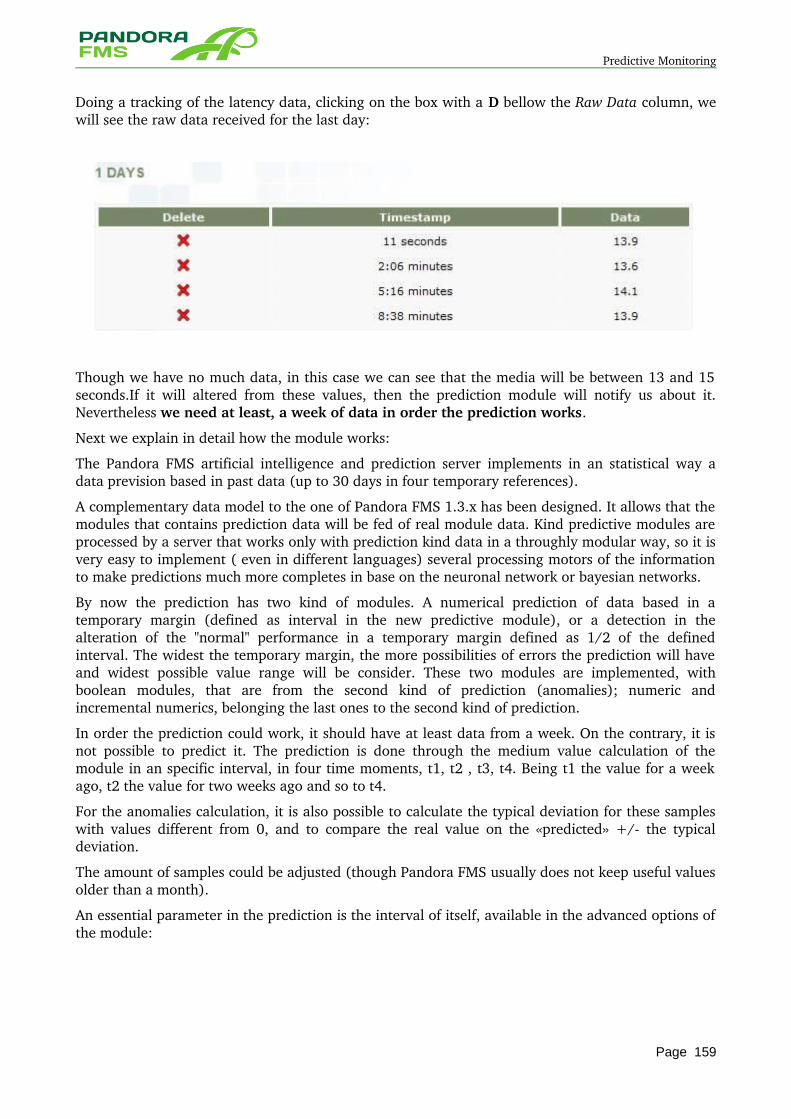
Predictive Monitoring
Doing a tracking of the latency data, clicking on the box with a D bellow the Raw Data column, we will see the raw data received for the last day:
Though we have no much data, in this case we can see that the media will be between 13 and 15 seconds.If it will altered from these values, then the prediction module will notify us about it. Nevertheless we need at least, a week of data in order the prediction works.
Next we explain in detail how the module works:
The Pandora FMS artificial intelligence and prediction server implements in an statistical way a data prevision based in past data (up to 30 days in four temporary references).
A complementary data model to the one of Pandora FMS 1.3.x has been designed. It allows that the modules that contains prediction data will be fed of real module data. Kind predictive modules are processed by a server that works only with prediction kind data in a throughly modular way, so it is very easy to implement ( even in different languages) several processing motors of the information to make predictions much more completes in base on the neuronal network or bayesian networks.
By now the prediction has two kind of modules. A numerical prediction of data based in a temporary margin (defined as interval in the new predictive module), or a detection in the alteration of the "normal" performance in a temporary margin defined as 1/2 of the defined interval. The widest the temporary margin, the more possibilities of errors the prediction will have and widest possible value range will be consider. These two modules are implemented, with boolean modules, that are from the second kind of prediction (anomalies); numeric and incremental numerics, belonging the last ones to the second kind of prediction.
In order the prediction could work, it should have at least data from a week. On the contrary, it is not possible to predict it. The prediction is done through the medium value calculation of the module in an specific interval, in four time moments, t1, t2 , t3, t4. Being t1 the value for a week ago, t2 the value for two weeks ago and so to t4.
For the anomalies calculation, it is also possible to calculate the typical deviation for these samples with values different from 0, and to compare the real value on the «predicted» +/ the typical deviation.
The amount of samples could be adjusted (though Pandora FMS usually does not keep useful values older than a month).
An essential parameter in the prediction is the interval of itself, available in the advanced options of the module:
Page 159
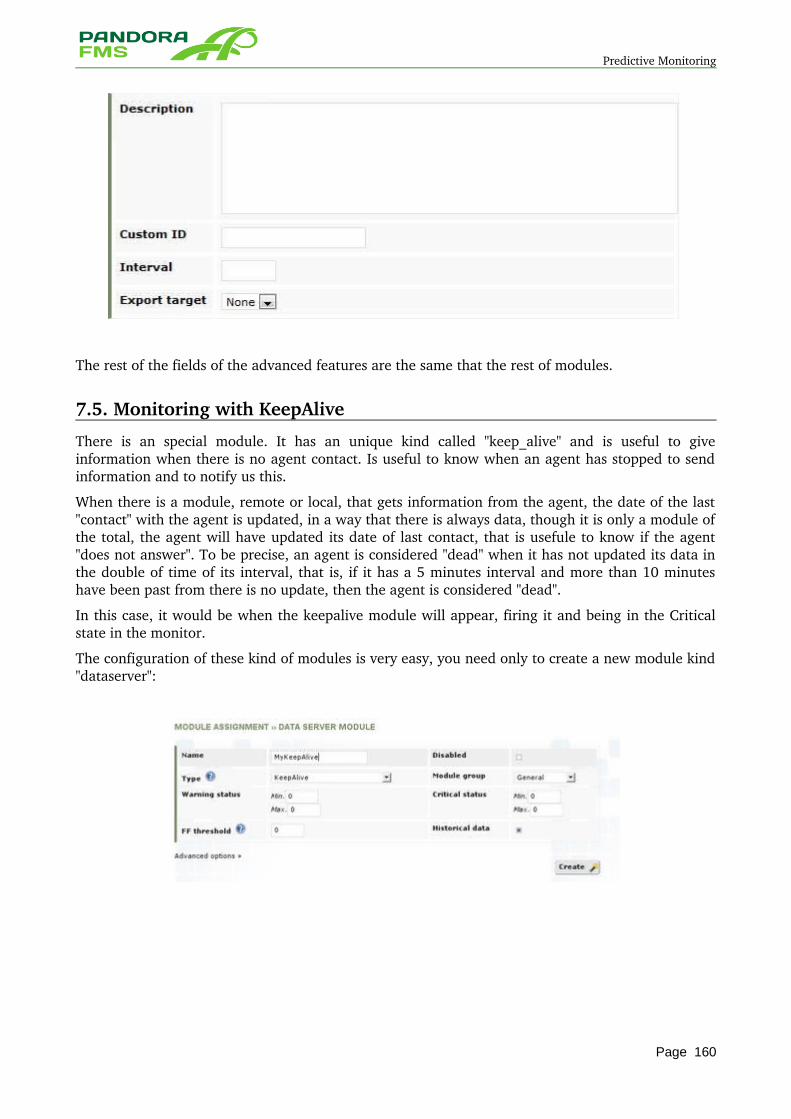
Predictive Monitoring
The rest of the fields of the advanced features are the same that the rest of modules.
7.5. Monitoring with KeepAlive
There is an special module. It has an unique kind called "keep_alive" and is useful to give information when there is no agent contact. Is useful to know when an agent has stopped to send information and to notify us this.
When there is a module, remote or local, that gets information from the agent, the date of the last "contact" with the agent is updated, in a way that there is always data, though it is only a module of the total, the agent will have updated its date of last contact, that is usefule to know if the agent "does not answer". To be precise, an agent is considered "dead" when it has not updated its data in the double of time of its interval, that is, if it has a 5 minutes interval and more than 10 minutes have been past from there is no update, then the agent is considered "dead".
In this case, it would be when the keepalive module will appear, firing it and being in the Critical state in the monitor.
The configuration of these kind of modules is very easy, you need only to create a new module kind "dataserver":
Page 160
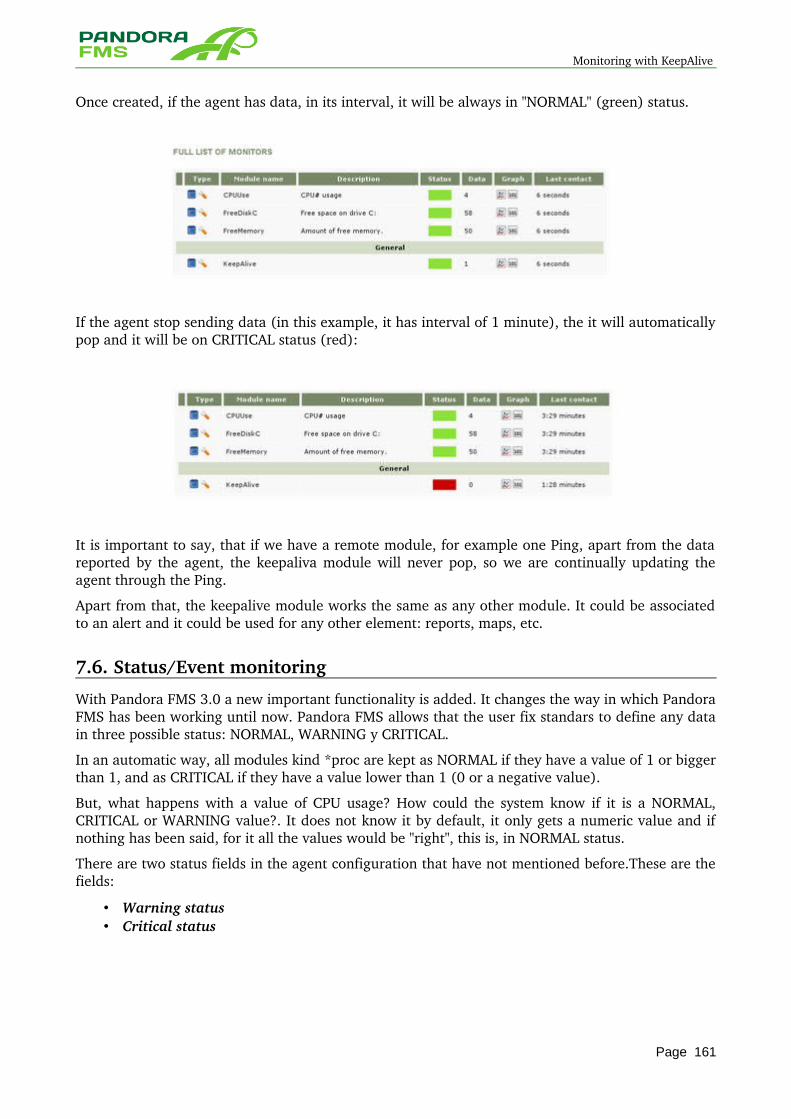
Monitoring with KeepAlive
Once created, if the agent has data, in its interval, it will be always in "NORMAL" (green) status.
If the agent stop sending data (in this example, it has interval of 1 minute), the it will automatically pop and it will be on CRITICAL status (red):
It is important to say, that if we have a remote module, for example one Ping, apart from the data reported by the agent, the keepaliva module will never pop, so we are continually updating the agent through the Ping.
Apart from that, the keepalive module works the same as any other module. It could be associated to an alert and it could be used for any other element: reports, maps, etc.
7.6. Status/Event monitoring
With Pandora FMS 3.0 a new important functionality is added. It changes the way in which Pandora FMS has been working until now. Pandora FMS allows that the user fix standars to define any data in three possible status: NORMAL, WARNING y CRITICAL.
In an automatic way, all modules kind *proc are kept as NORMAL if they have a value of 1 or bigger than 1, and as CRITICAL if they have a value lower than 1 (0 or a negative value).
But, what happens with a value of CPU usage? How could the system know if it is a NORMAL, CRITICAL or WARNING value?. It does not know it by default, it only gets a numeric value and if nothing has been said, for it all the values would be "right", this is, in NORMAL status.
There are two status fields in the agent configuration that have not mentioned before.These are the fields:
• Warning status • Critical status
Page 161
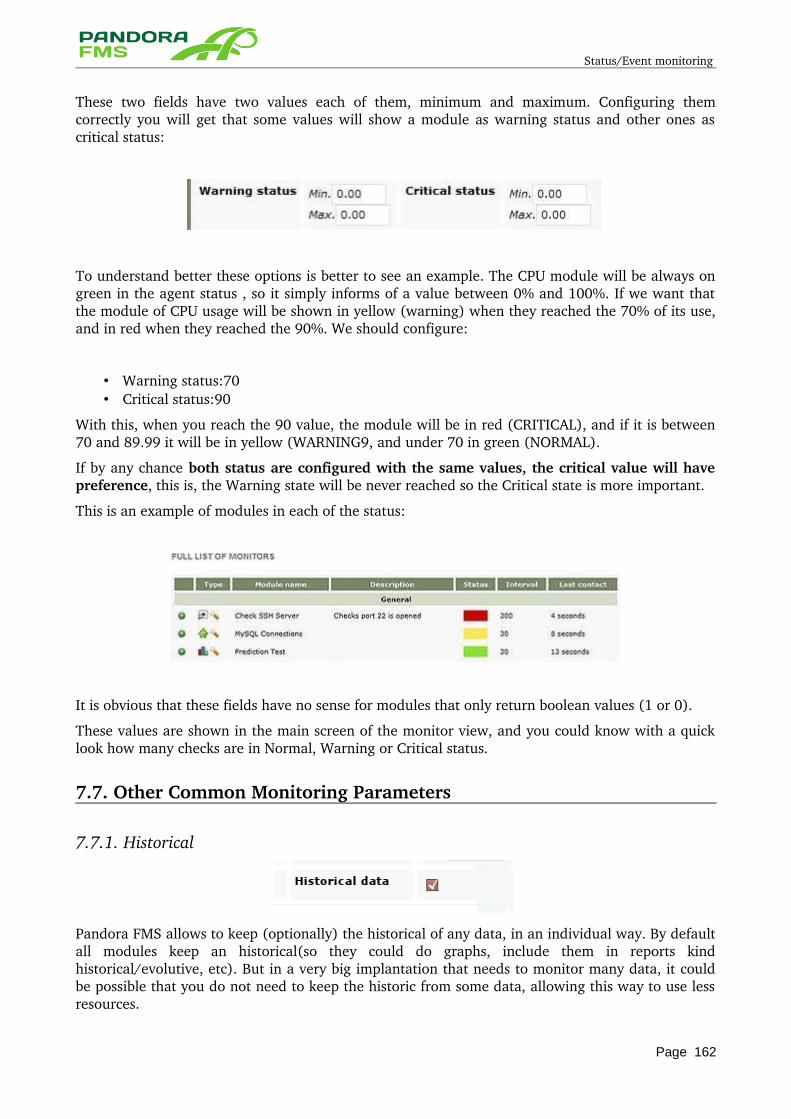
Status/Event monitoring
These two fields have two values each of them, minimum and maximum. Configuring them correctly you will get that some values will show a module as warning status and other ones as critical status:
To understand better these options is better to see an example. The CPU module will be always on green in the agent status , so it simply informs of a value between 0% and 100%. If we want that the module of CPU usage will be shown in yellow (warning) when they reached the 70% of its use, and in red when they reached the 90%. We should configure:
• Warning status:70 • Critical status:90
With this, when you reach the 90 value, the module will be in red (CRITICAL), and if it is between 70 and 89.99 it will be in yellow (WARNING9, and under 70 in green (NORMAL).
If by any chance both status are configured with the same values, the critical value will have preference, this is, the Warning state will be never reached so the Critical state is more important.
This is an example of modules in each of the status:
It is obvious that these fields have no sense for modules that only return boolean values (1 or 0).
These values are shown in the main screen of the monitor view, and you could know with a quick look how many checks are in Normal, Warning or Critical status.
7.7. Other Common Monitoring Parameters
7.7.1. Historical
Pandora FMS allows to keep (optionally) the historical of any data, in an individual way. By default all modules keep an historical(so they could do graphs, include them in reports kind historical/evolutive, etc). But in a very big implantation that needs to monitor many data, it could be possible that you do not need to keep the historic from some data, allowing this way to use less resources.
Page 162
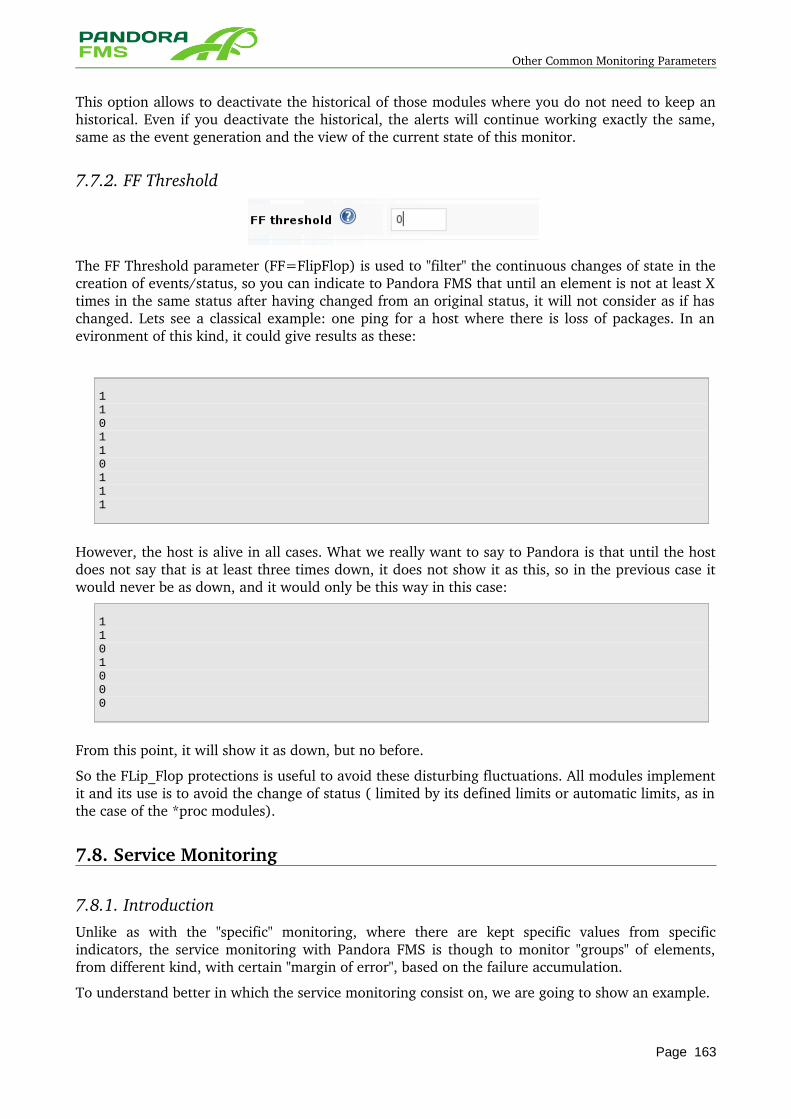
Other Common Monitoring Parameters
This option allows to deactivate the historical of those modules where you do not need to keep an historical. Even if you deactivate the historical, the alerts will continue working exactly the same, same as the event generation and the view of the current state of this monitor.
7.7.2. FF Threshold
The FF Threshold parameter (FF=FlipFlop) is used to "filter" the continuous changes of state in the creation of events/status, so you can indicate to Pandora FMS that until an element is not at least X times in the same status after having changed from an original status, it will not consider as if has changed. Lets see a classical example: one ping for a host where there is loss of packages. In an evironment of this kind, it could give results as these:
110110111
However, the host is alive in all cases. What we really want to say to Pandora is that until the host does not say that is at least three times down, it does not show it as this, so in the previous case it would never be as down, and it would only be this way in this case:
1101000
From this point, it will show it as down, but no before.
So the FLip_Flop protections is useful to avoid these disturbing fluctuations. All modules implement it and its use is to avoid the change of status ( limited by its defined limits or automatic limits, as in the case of the *proc modules).
7.8. Service Monitoring
7.8.1. IntroductionUnlike as with the "specific" monitoring, where there are kept specific values from specific indicators, the service monitoring with Pandora FMS is though to monitor "groups" of elements, from different kind, with certain "margin of error", based on the failure accumulation.
To understand better in which the service monitoring consist on, we are going to show an example.
Page 163

Service Monitoring
We want to monitor if the service that we are giving, through a WEB cluster, is "Ok". This cluster consist of the following elements:
• Two routers in HA. • Two switches in HA. • Twenty WEB Apache servers • Four Weblogic appliance servers • One MySQL cluster of two storage nodes and two SQL processing nodes
It's possible to monitor each element in an individual way and, in fact it's the first thing we will need to activate the service monitoring "globally". Each element included in the service should be an "standard" monitor of the ones monitored with Pandora, that is, it's something PREVIOUS to the service monitoring.
The need of monitoring services as something "abstract" appears when we ask ourselves this question: What happens when an element that initially is not critical? such as, for example, one of the twenty Apache servers. Firstly, we could not to warn, in fact, could be it has frequent falls, so there are 20 nodes, it shouldn't warn us for the fall of only one node ( let's imagine that this warning wake up someone who is sleeping. In fact, a service with so many redundance is for giving us more peace, not more work. It should only warn us if a more critical element is down (such as a router) or if "several" WEB servers are down, for example, four or five of them.
In this way, if we put "weights" to each element from our example:
• Switches and routers: 5 points for each one when there are in critical, and 3 points if they are in warning.
• WEB servers: 1.2 point for each one in critical. We don't consider the warning status. • WebLogic Servers: 2 points for each one in critical. • MySQL cluster: 5 points for each node, 3 points in warning.
We fix a warning threshold for the service of 4, and a critical threshold of 6. In this way, and supposing that all things are going ok the service would be "OK" if all the monitored elements are OK.
Now, suppose that ONE APACHE WEB server:
• 1 x Apache server in CRITICAL x 1.2 point = 1.2 so 1.2 < 4 (Warning), the service is still in the OK status
See what happens if a WEB server and a Weblogic are down:
• 1 x APache server in CRITICAL x 1.2 point = 1.2 • 1 x Weblogic server in CRITICAL x 2 = 2
Summarizing: 3,2 is still < 4, so the service is still in Ok status and without waking up the operator from the bed.
See what happens if two WEB servers and one Weblogic are down:
• 2 x Servidor Apache en CRITICAL x 1.2 point = 2.4 • 1 x Servidor Weblogic en CRITICAL x 2 = 2
Then, 4,4 is now > 4 and the service for the WARNING status. It's possible that a urgent SMS has not been received from the operator yet, but it's sure that at least someone will receive an email. Let's continue with the example.
Page 164
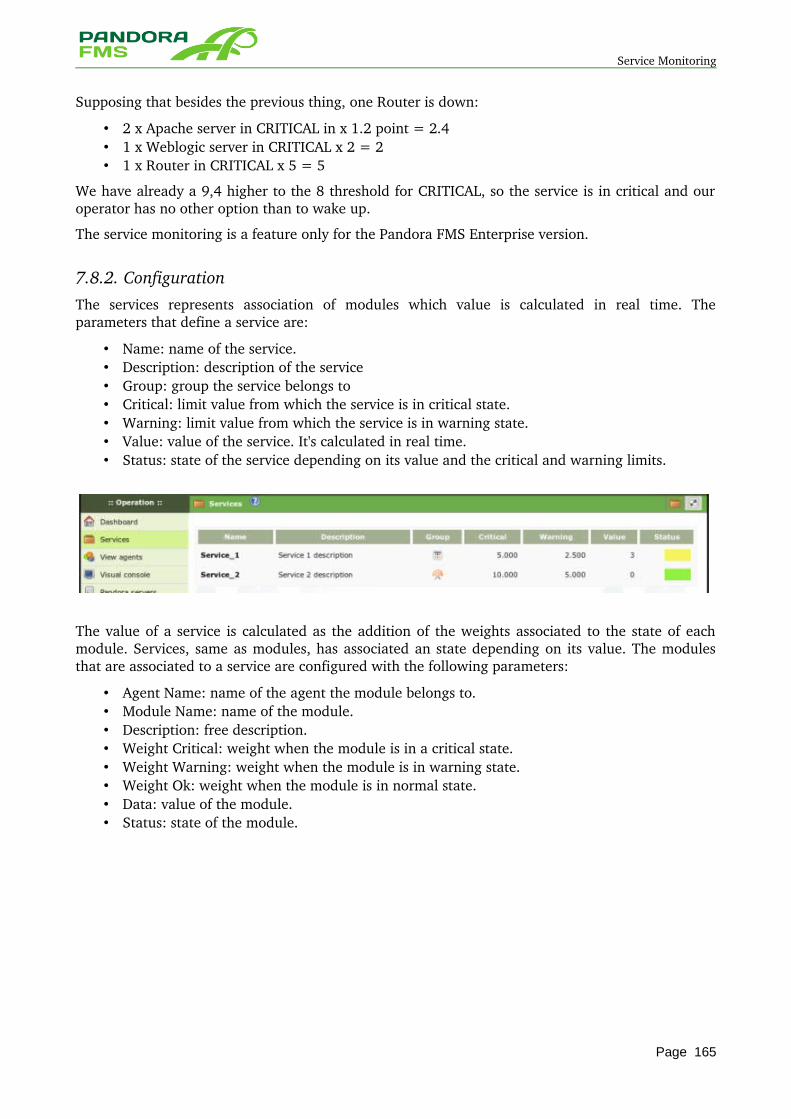
Service Monitoring
Supposing that besides the previous thing, one Router is down:
• 2 x Apache server in CRITICAL in x 1.2 point = 2.4 • 1 x Weblogic server in CRITICAL x 2 = 2 • 1 x Router in CRITICAL x 5 = 5
We have already a 9,4 higher to the 8 threshold for CRITICAL, so the service is in critical and our operator has no other option than to wake up.
The service monitoring is a feature only for the Pandora FMS Enterprise version.
7.8.2. ConfigurationThe services represents association of modules which value is calculated in real time. The parameters that define a service are:
• Name: name of the service. • Description: description of the service • Group: group the service belongs to • Critical: limit value from which the service is in critical state. • Warning: limit value from which the service is in warning state. • Value: value of the service. It's calculated in real time. • Status: state of the service depending on its value and the critical and warning limits.
The value of a service is calculated as the addition of the weights associated to the state of each module. Services, same as modules, has associated an state depending on its value. The modules that are associated to a service are configured with the following parameters:
• Agent Name: name of the agent the module belongs to. • Module Name: name of the module. • Description: free description. • Weight Critical: weight when the module is in a critical state. • Weight Warning: weight when the module is in warning state. • Weight Ok: weight when the module is in normal state. • Data: value of the module. • Status: state of the module.
Page 165
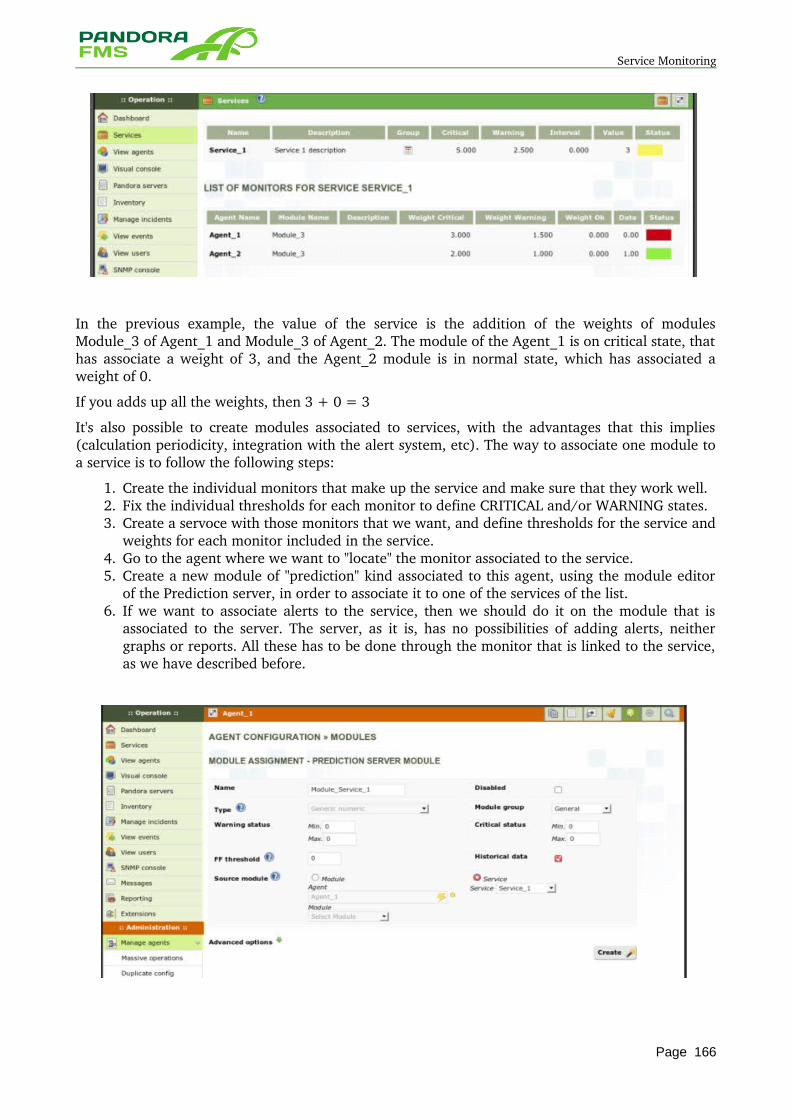
Service Monitoring
In the previous example, the value of the service is the addition of the weights of modules Module_3 of Agent_1 and Module_3 of Agent_2. The module of the Agent_1 is on critical state, that has associate a weight of 3, and the Agent_2 module is in normal state, which has associated a weight of 0.
If you adds up all the weights, then 3 + 0 = 3
It's also possible to create modules associated to services, with the advantages that this implies (calculation periodicity, integration with the alert system, etc). The way to associate one module to a service is to follow the following steps:
1. Create the individual monitors that make up the service and make sure that they work well. 2. Fix the individual thresholds for each monitor to define CRITICAL and/or WARNING states. 3. Create a servoce with those monitors that we want, and define thresholds for the service and
weights for each monitor included in the service. 4. Go to the agent where we want to "locate" the monitor associated to the service. 5. Create a new module of "prediction" kind associated to this agent, using the module editor
of the Prediction server, in order to associate it to one of the services of the list. 6. If we want to associate alerts to the service, then we should do it on the module that is
associated to the server. The server, as it is, has no possibilities of adding alerts, neither graphs or reports. All these has to be done through the monitor that is linked to the service, as we have described before.
Page 166

Service Monitoring
8 OPERATION WITH SNMP TRAPS
Page 167
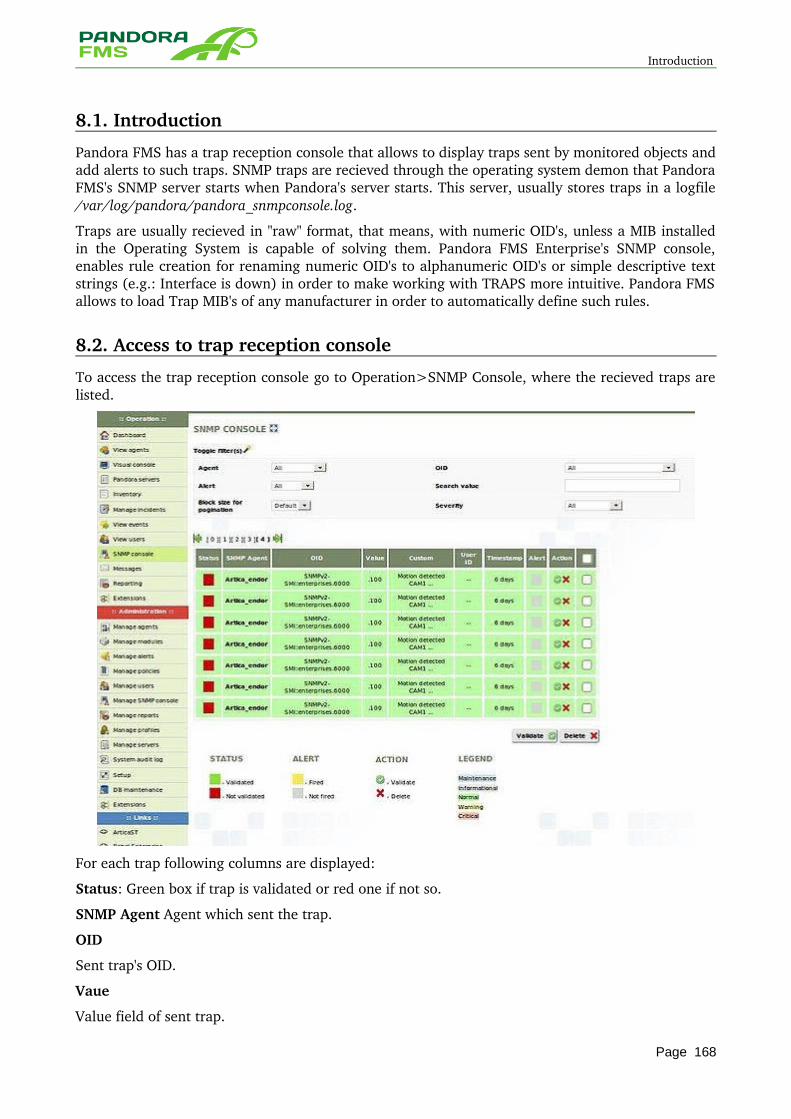
Introduction
8.1. Introduction
Pandora FMS has a trap reception console that allows to display traps sent by monitored objects and add alerts to such traps. SNMP traps are recieved through the operating system demon that Pandora FMS's SNMP server starts when Pandora's server starts. This server, usually stores traps in a logfile /var/log/pandora/pandora_snmpconsole.log.
Traps are usually recieved in "raw" format, that means, with numeric OID's, unless a MIB installed in the Operating System is capable of solving them. Pandora FMS Enterprise's SNMP console, enables rule creation for renaming numeric OID's to alphanumeric OID's or simple descriptive text strings (e.g.: Interface is down) in order to make working with TRAPS more intuitive. Pandora FMS allows to load Trap MIB's of any manufacturer in order to automatically define such rules.
8.2. Access to trap reception console
To access the trap reception console go to Operation>SNMP Console, where the recieved traps are listed.
For each trap following columns are displayed:
Status: Green box if trap is validated or red one if not so.
SNMP Agent Agent which sent the trap.
OID
Sent trap's OID.
Vaue
Value field of sent trap.
Page 168
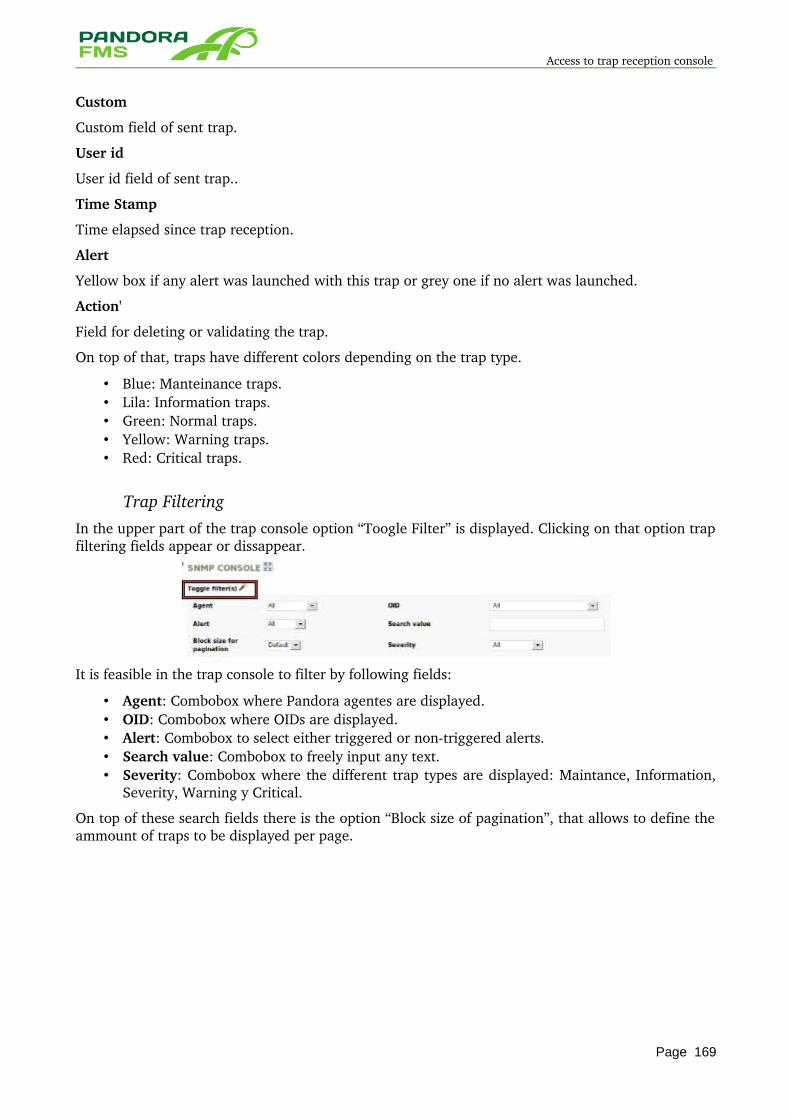
Access to trap reception console
Custom
Custom field of sent trap.
User id
User id field of sent trap..
Time Stamp
Time elapsed since trap reception.
Alert
Yellow box if any alert was launched with this trap or grey one if no alert was launched.
Action'
Field for deleting or validating the trap.
On top of that, traps have different colors depending on the trap type.
• Blue: Manteinance traps. • Lila: Information traps. • Green: Normal traps. • Yellow: Warning traps. • Red: Critical traps.
Trap FilteringIn the upper part of the trap console option “Toogle Filter” is displayed. Clicking on that option trap filtering fields appear or dissappear.
It is feasible in the trap console to filter by following fields:
• Agent: Combobox where Pandora agentes are displayed. • OID: Combobox where OIDs are displayed. • Alert: Combobox to select either triggered or nontriggered alerts. • Search value: Combobox to freely input any text. • Severity: Combobox where the different trap types are displayed: Maintance, Information,
Severity, Warning y Critical.
On top of these search fields there is the option “Block size of pagination”, that allows to define the ammount of traps to be displayed per page.
Page 169
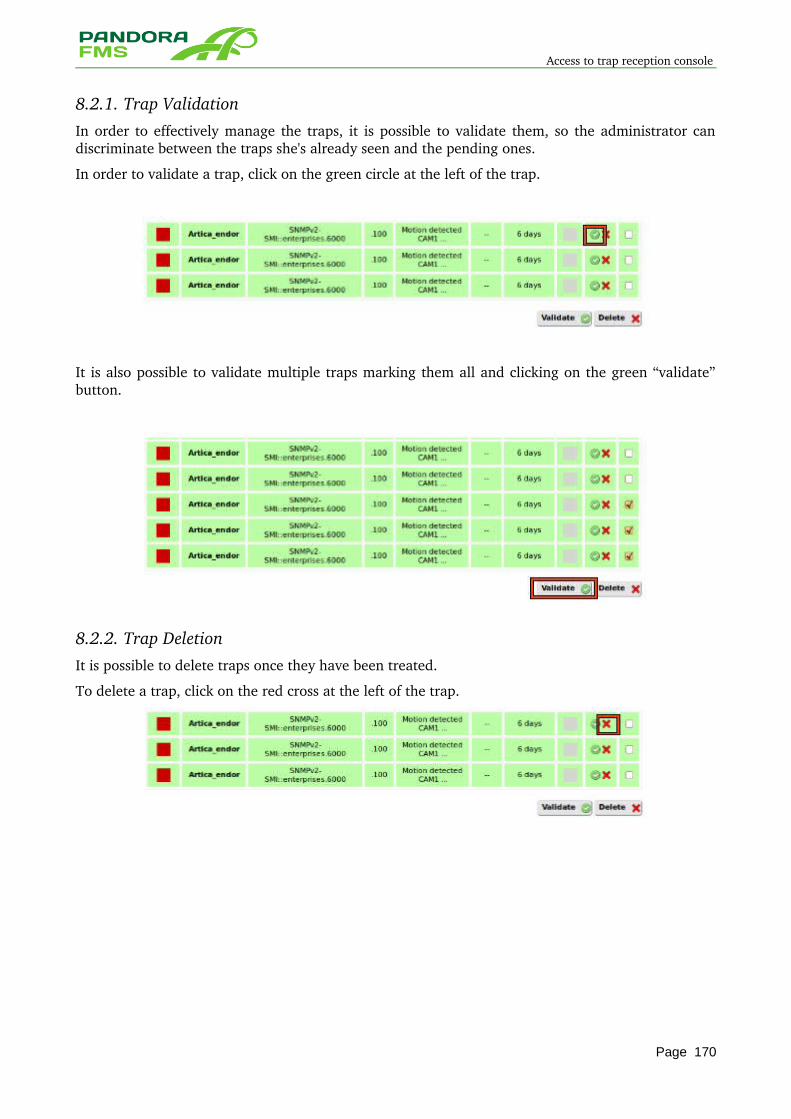
Access to trap reception console
8.2.1. Trap ValidationIn order to effectively manage the traps, it is possible to validate them, so the administrator can discriminate between the traps she's already seen and the pending ones.
In order to validate a trap, click on the green circle at the left of the trap.
It is also possible to validate multiple traps marking them all and clicking on the green “validate” button.
8.2.2. Trap DeletionIt is possible to delete traps once they have been treated.
To delete a trap, click on the red cross at the left of the trap.
Page 170
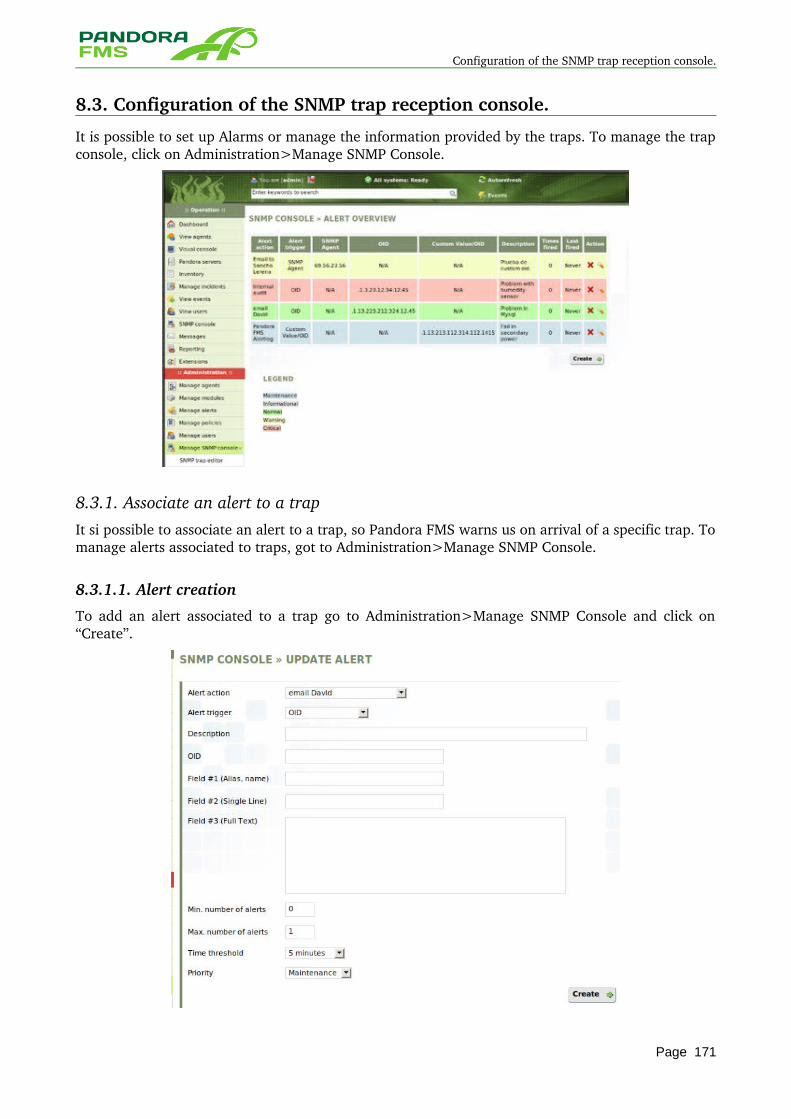
Configuration of the SNMP trap reception console.
8.3. Configuration of the SNMP trap reception console.
It is possible to set up Alarms or manage the information provided by the traps. To manage the trap console, click on Administration>Manage SNMP Console.
8.3.1. Associate an alert to a trapIt si possible to associate an alert to a trap, so Pandora FMS warns us on arrival of a specific trap. To manage alerts associated to traps, got to Administration>Manage SNMP Console.
8.3.1.1. Alert creation
To add an alert associated to a trap go to Administration>Manage SNMP Console and click on “Create”.
Page 171
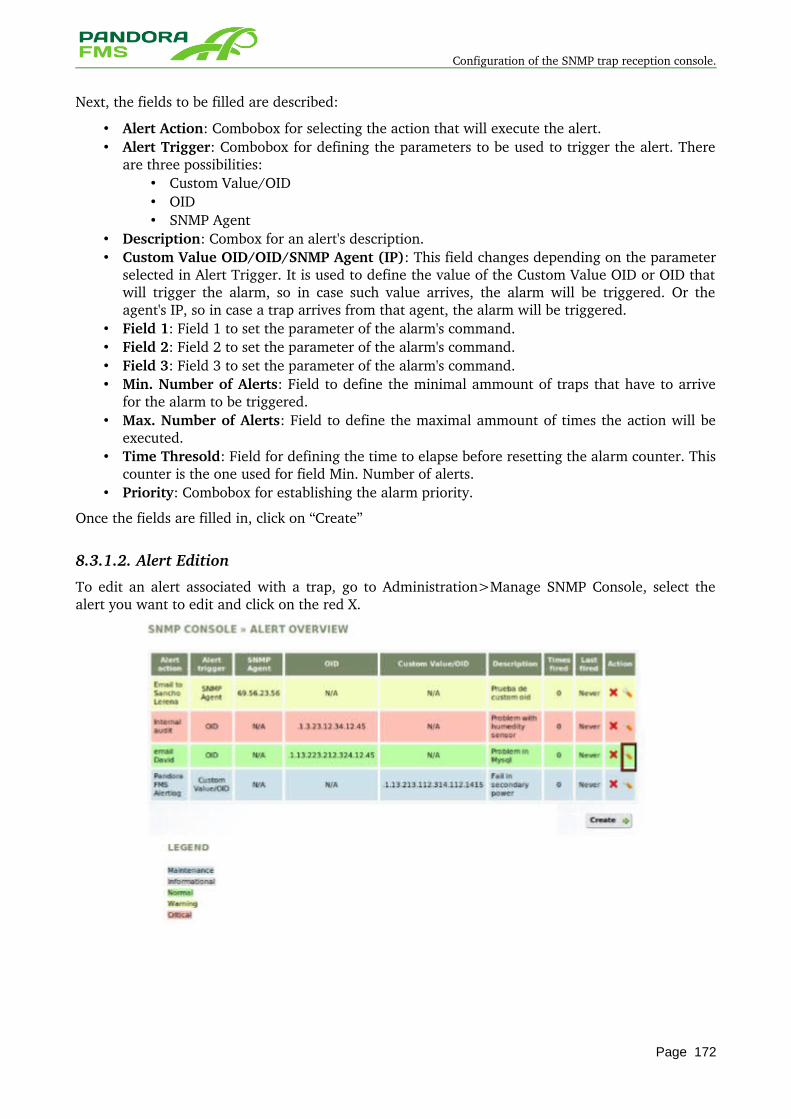
Configuration of the SNMP trap reception console.
Next, the fields to be filled are described:
• Alert Action: Combobox for selecting the action that will execute the alert. • Alert Trigger: Combobox for defining the parameters to be used to trigger the alert. There
are three possibilities: • Custom Value/OID • OID • SNMP Agent
• Description: Combox for an alert's description. • Custom Value OID/OID/SNMP Agent (IP): This field changes depending on the parameter
selected in Alert Trigger. It is used to define the value of the Custom Value OID or OID that will trigger the alarm, so in case such value arrives, the alarm will be triggered. Or the agent's IP, so in case a trap arrives from that agent, the alarm will be triggered.
• Field 1: Field 1 to set the parameter of the alarm's command. • Field 2: Field 2 to set the parameter of the alarm's command. • Field 3: Field 3 to set the parameter of the alarm's command. • Min. Number of Alerts: Field to define the minimal ammount of traps that have to arrive
for the alarm to be triggered. • Max. Number of Alerts: Field to define the maximal ammount of times the action will be
executed. • Time Thresold: Field for defining the time to elapse before resetting the alarm counter. This
counter is the one used for field Min. Number of alerts. • Priority: Combobox for establishing the alarm priority.
Once the fields are filled in, click on “Create”
8.3.1.2. Alert Edition
To edit an alert associated with a trap, go to Administration>Manage SNMP Console, select the alert you want to edit and click on the red X.
Page 172
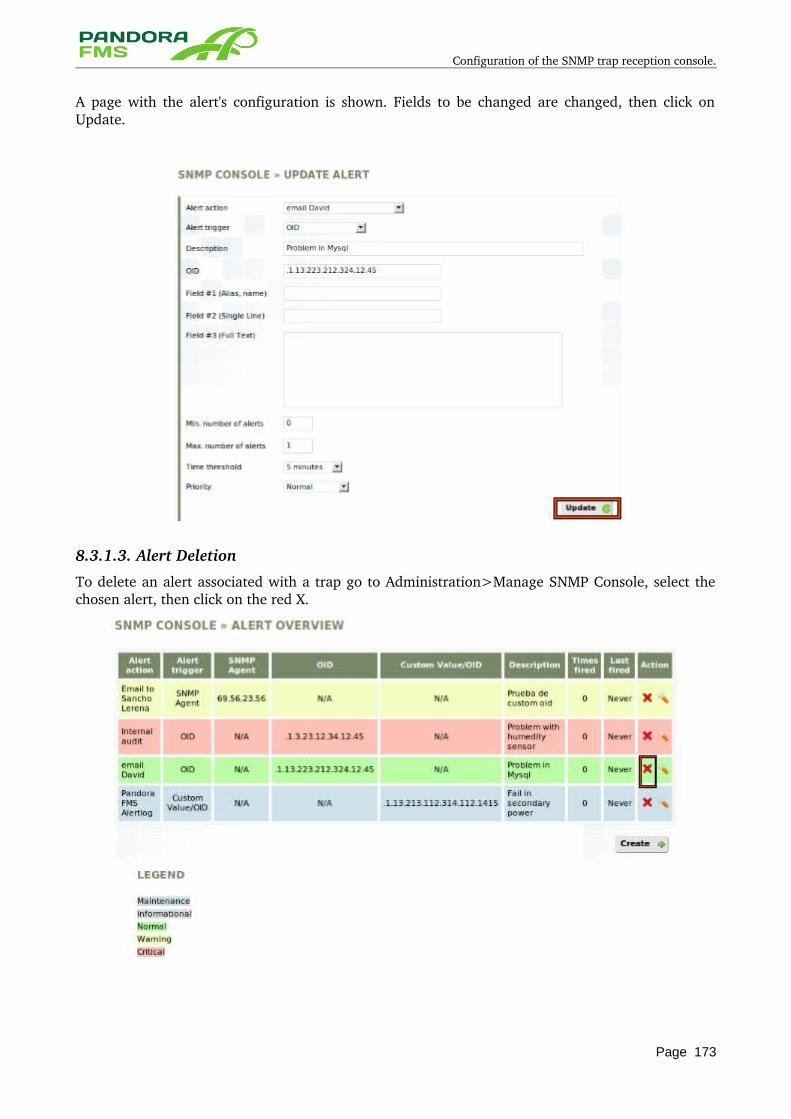
Configuration of the SNMP trap reception console.
A page with the alert's configuration is shown. Fields to be changed are changed, then click on Update.
8.3.1.3. Alert Deletion
To delete an alert associated with a trap go to Administration>Manage SNMP Console, select the chosen alert, then click on the red X.
Page 173
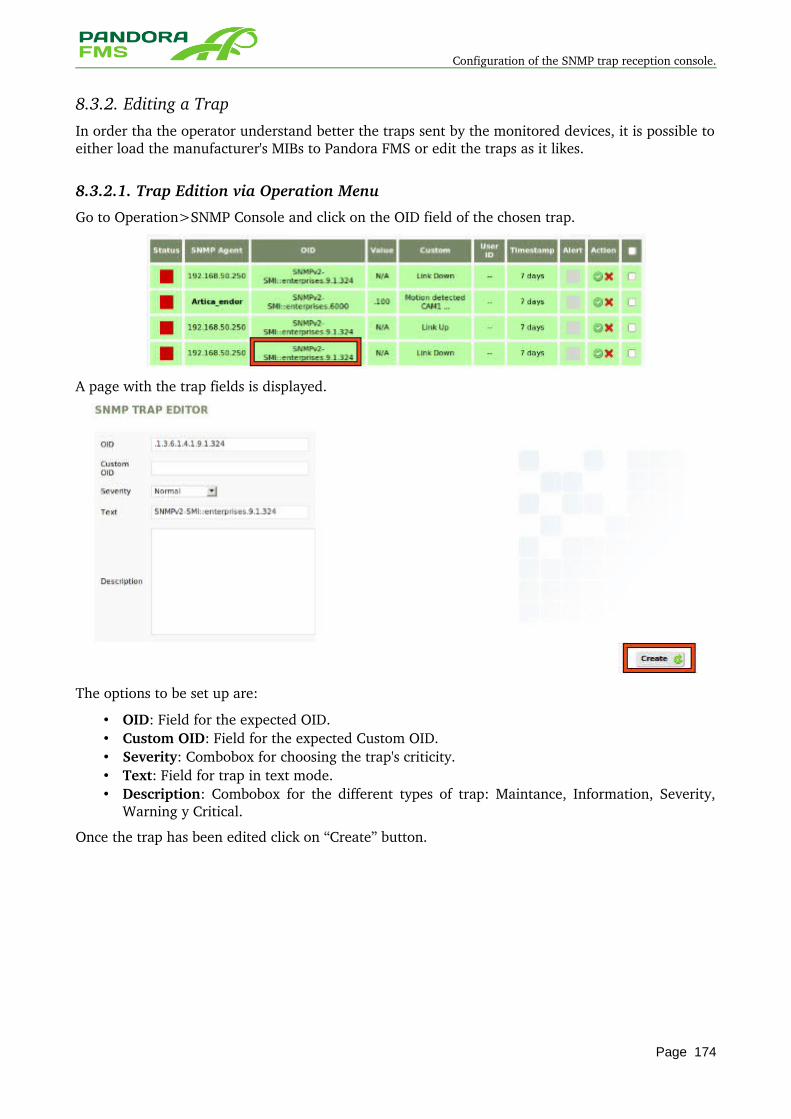
Configuration of the SNMP trap reception console.
8.3.2. Editing a TrapIn order tha the operator understand better the traps sent by the monitored devices, it is possible to either load the manufacturer's MIBs to Pandora FMS or edit the traps as it likes.
8.3.2.1. Trap Edition via Operation Menu
Go to Operation>SNMP Console and click on the OID field of the chosen trap.
A page with the trap fields is displayed.
The options to be set up are:
• OID: Field for the expected OID. • Custom OID: Field for the expected Custom OID. • Severity: Combobox for choosing the trap's criticity. • Text: Field for trap in text mode. • Description: Combobox for the different types of trap: Maintance, Information, Severity,
Warning y Critical.
Once the trap has been edited click on “Create” button.
Page 174
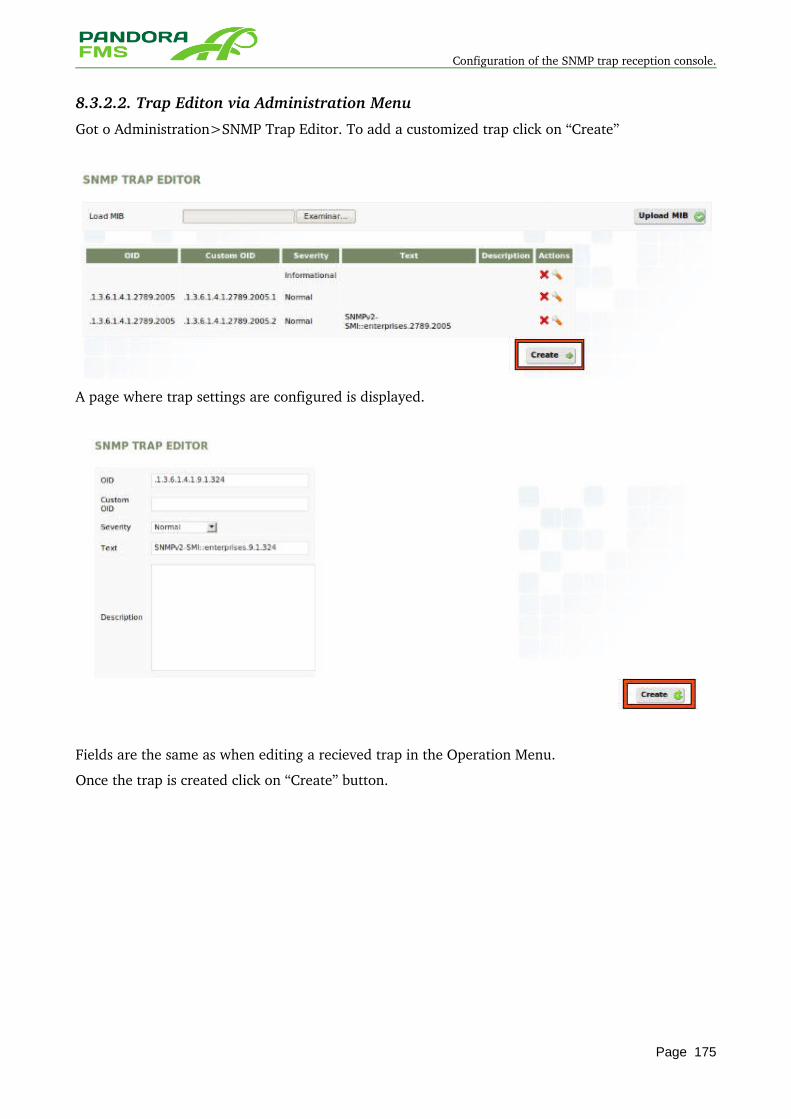
Configuration of the SNMP trap reception console.
8.3.2.2. Trap Editon via Administration Menu
Got o Administration>SNMP Trap Editor. To add a customized trap click on “Create”
A page where trap settings are configured is displayed.
Fields are the same as when editing a recieved trap in the Operation Menu.
Once the trap is created click on “Create” button.
Page 175
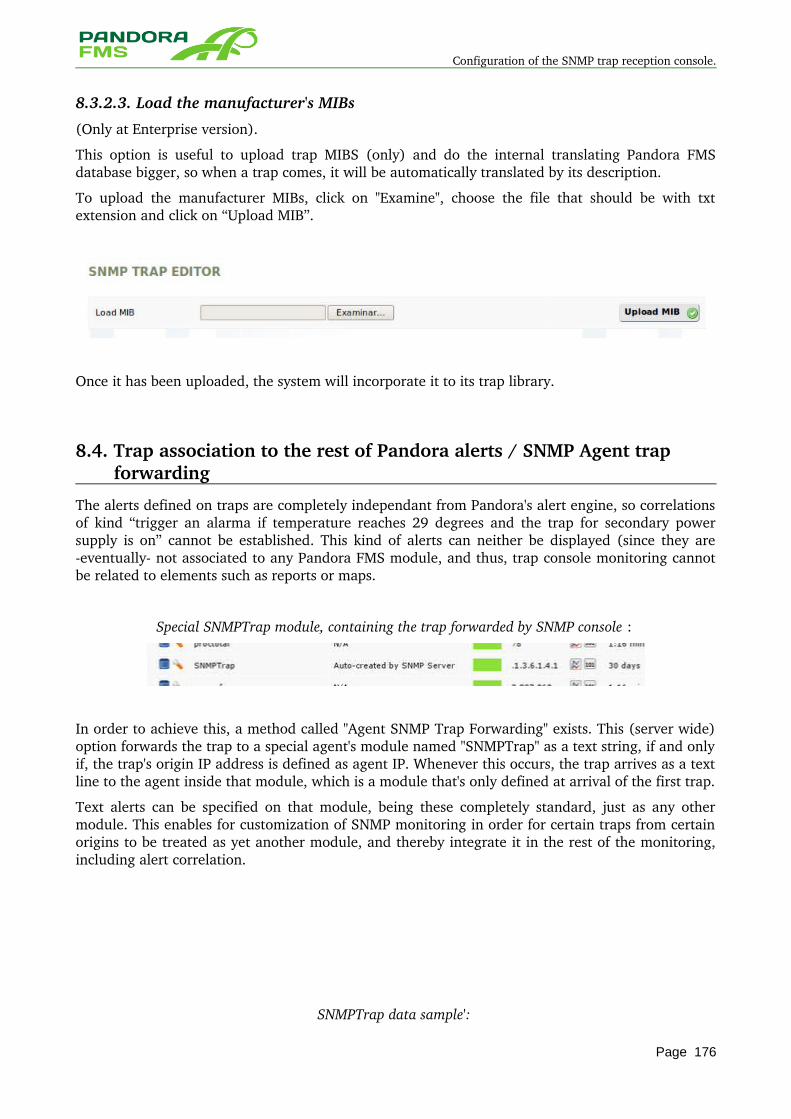
Configuration of the SNMP trap reception console.
8.3.2.3. Load the manufacturer's MIBs
(Only at Enterprise version).
This option is useful to upload trap MIBS (only) and do the internal translating Pandora FMS database bigger, so when a trap comes, it will be automatically translated by its description.
To upload the manufacturer MIBs, click on "Examine", choose the file that should be with txt extension and click on “Upload MIB”.
Once it has been uploaded, the system will incorporate it to its trap library.
8.4. Trap association to the rest of Pandora alerts / SNMP Agent trap forwarding
The alerts defined on traps are completely independant from Pandora's alert engine, so correlations of kind “trigger an alarma if temperature reaches 29 degrees and the trap for secondary power supply is on” cannot be established. This kind of alerts can neither be displayed (since they are eventually not associated to any Pandora FMS module, and thus, trap console monitoring cannot be related to elements such as reports or maps.
Special SNMPTrap module, containing the trap forwarded by SNMP console :
In order to achieve this, a method called "Agent SNMP Trap Forwarding" exists. This (server wide) option forwards the trap to a special agent's module named "SNMPTrap" as a text string, if and only if, the trap's origin IP address is defined as agent IP. Whenever this occurs, the trap arrives as a text line to the agent inside that module, which is a module that's only defined at arrival of the first trap.
Text alerts can be specified on that module, being these completely standard, just as any other module. This enables for customization of SNMP monitoring in order for certain traps from certain origins to be treated as yet another module, and thereby integrate it in the rest of the monitoring, including alert correlation.
SNMPTrap data sample':
Page 176
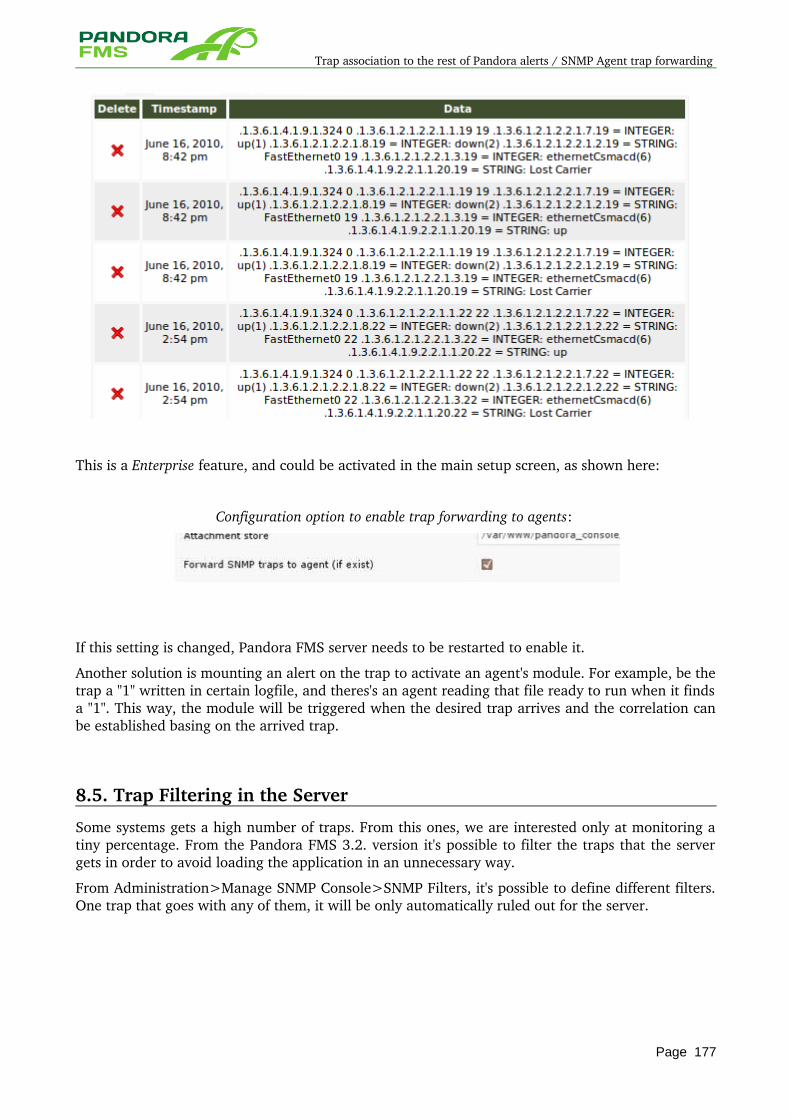
Trap association to the rest of Pandora alerts / SNMP Agent trap forwarding
This is a Enterprise feature, and could be activated in the main setup screen, as shown here:
Configuration option to enable trap forwarding to agents:
If this setting is changed, Pandora FMS server needs to be restarted to enable it.
Another solution is mounting an alert on the trap to activate an agent's module. For example, be the trap a "1" written in certain logfile, and theres's an agent reading that file ready to run when it finds a "1". This way, the module will be triggered when the desired trap arrives and the correlation can be established basing on the arrived trap.
8.5. Trap Filtering in the Server
Some systems gets a high number of traps. From this ones, we are interested only at monitoring a tiny percentage. From the Pandora FMS 3.2. version it's possible to filter the traps that the server gets in order to avoid loading the application in an unnecessary way.
From Administration>Manage SNMP Console>SNMP Filters, it's possible to define different filters. One trap that goes with any of them, it will be only automatically ruled out for the server.
Page 177
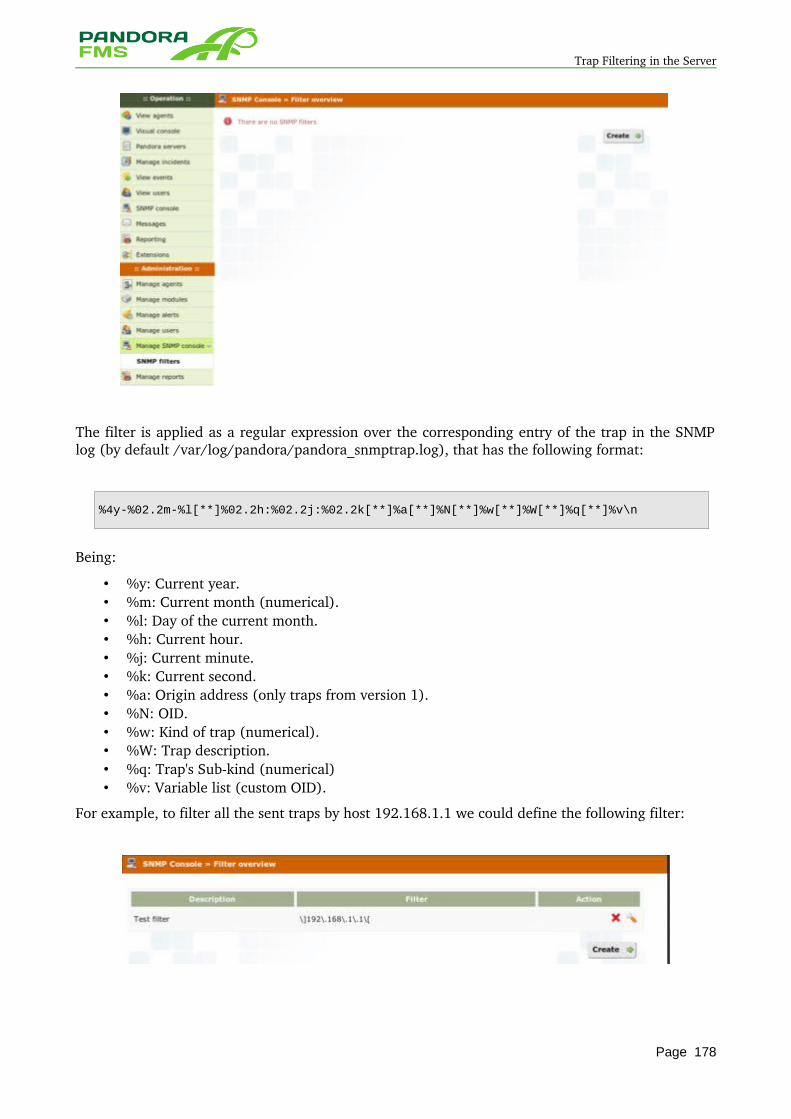
Trap Filtering in the Server
The filter is applied as a regular expression over the corresponding entry of the trap in the SNMP log (by default /var/log/pandora/pandora_snmptrap.log), that has the following format:
%4y-%02.2m-%l[**]%02.2h:%02.2j:%02.2k[**]%a[**]%N[**]%w[**]%W[**]%q[**]%v\n
Being:
• %y: Current year. • %m: Current month (numerical). • %l: Day of the current month. • %h: Current hour. • %j: Current minute. • %k: Current second. • %a: Origin address (only traps from version 1). • %N: OID. • %w: Kind of trap (numerical). • %W: Trap description. • %q: Trap's Subkind (numerical) • %v: Variable list (custom OID).
For example, to filter all the sent traps by host 192.168.1.1 we could define the following filter:
Page 178
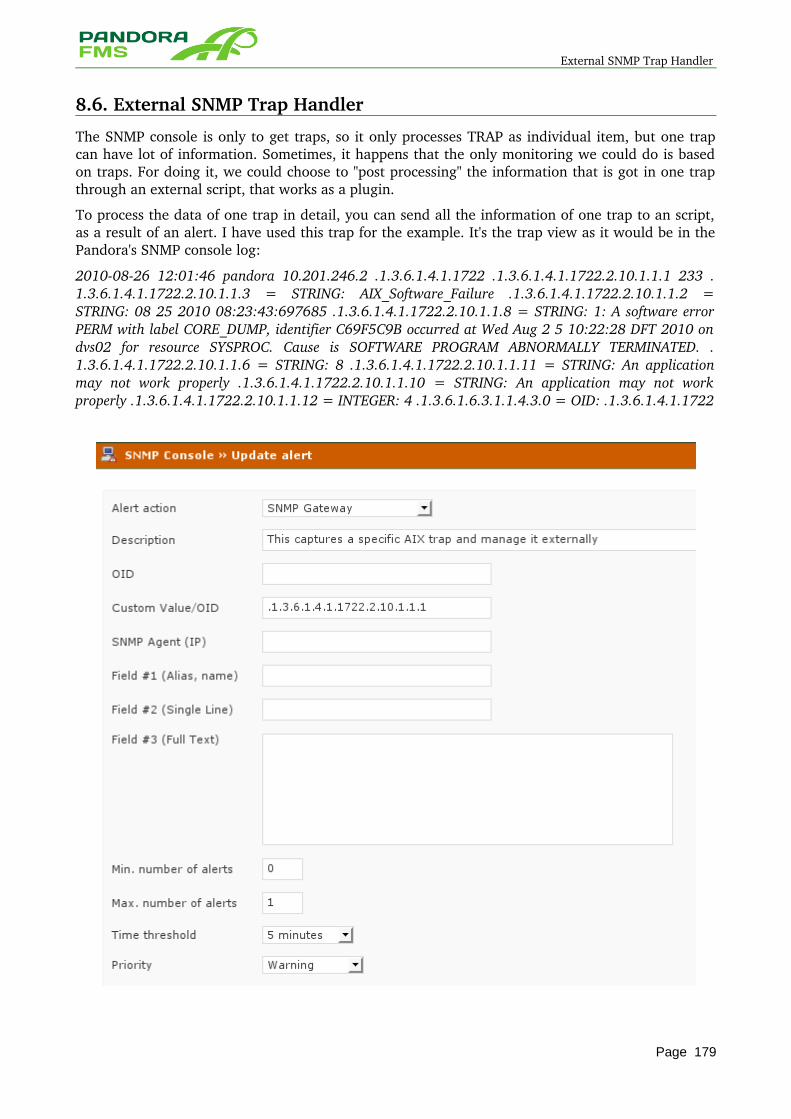
External SNMP Trap Handler
8.6. External SNMP Trap Handler
The SNMP console is only to get traps, so it only processes TRAP as individual item, but one trap can have lot of information. Sometimes, it happens that the only monitoring we could do is based on traps. For doing it, we could choose to "post processing" the information that is got in one trap through an external script, that works as a plugin.
To process the data of one trap in detail, you can send all the information of one trap to an script, as a result of an alert. I have used this trap for the example. It's the trap view as it would be in the Pandora's SNMP console log:
20100826 12:01:46 pandora 10.201.246.2 .1.3.6.1.4.1.1722 .1.3.6.1.4.1.1722.2.10.1.1.1 233 .1.3.6.1.4.1.1722.2.10.1.1.3 = STRING: AIX_Software_Failure .1.3.6.1.4.1.1722.2.10.1.1.2 = STRING: 08 25 2010 08:23:43:697685 .1.3.6.1.4.1.1722.2.10.1.1.8 = STRING: 1: A software error PERM with label CORE_DUMP, identifier C69F5C9B occurred at Wed Aug 2 5 10:22:28 DFT 2010 on dvs02 for resource SYSPROC. Cause is SOFTWARE PROGRAM ABNORMALLY TERMINATED. .1.3.6.1.4.1.1722.2.10.1.1.6 = STRING: 8 .1.3.6.1.4.1.1722.2.10.1.1.11 = STRING: An application may not work properly .1.3.6.1.4.1.1722.2.10.1.1.10 = STRING: An application may not work properly .1.3.6.1.4.1.1722.2.10.1.1.12 = INTEGER: 4 .1.3.6.1.6.3.1.1.4.3.0 = OID: .1.3.6.1.4.1.1722
Page 179
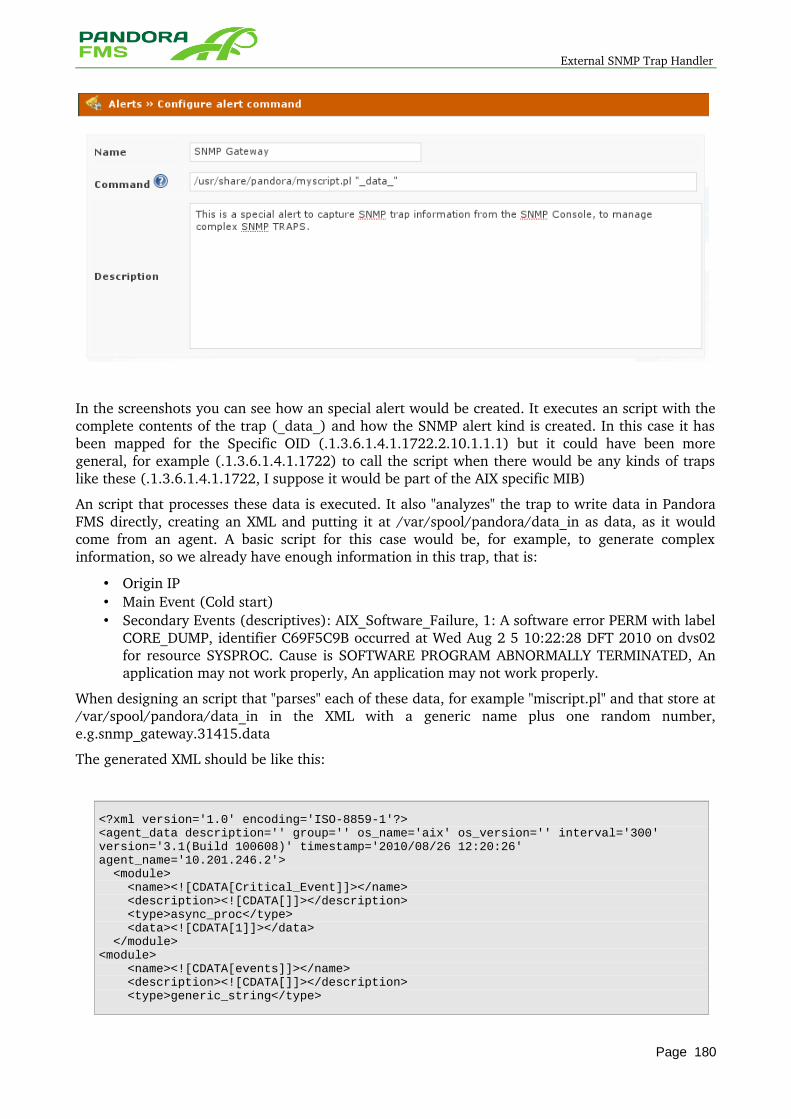
External SNMP Trap Handler
In the screenshots you can see how an special alert would be created. It executes an script with the complete contents of the trap (_data_) and how the SNMP alert kind is created. In this case it has been mapped for the Specific OID (.1.3.6.1.4.1.1722.2.10.1.1.1) but it could have been more general, for example (.1.3.6.1.4.1.1722) to call the script when there would be any kinds of traps like these (.1.3.6.1.4.1.1722, I suppose it would be part of the AIX specific MIB)
An script that processes these data is executed. It also "analyzes" the trap to write data in Pandora FMS directly, creating an XML and putting it at /var/spool/pandora/data_in as data, as it would come from an agent. A basic script for this case would be, for example, to generate complex information, so we already have enough information in this trap, that is:
• Origin IP • Main Event (Cold start) • Secondary Events (descriptives): AIX_Software_Failure, 1: A software error PERM with label
CORE_DUMP, identifier C69F5C9B occurred at Wed Aug 2 5 10:22:28 DFT 2010 on dvs02 for resource SYSPROC. Cause is SOFTWARE PROGRAM ABNORMALLY TERMINATED, An application may not work properly, An application may not work properly.
When designing an script that "parses" each of these data, for example "miscript.pl" and that store at /var/spool/pandora/data_in in the XML with a generic name plus one random number, e.g.snmp_gateway.31415.data
The generated XML should be like this:
<?xml version='1.0' encoding='ISO-8859-1'?><agent_data description='' group='' os_name='aix' os_version='' interval='300' version='3.1(Build 100608)' timestamp='2010/08/26 12:20:26' agent_name='10.201.246.2'> <module> <name><![CDATA[Critical_Event]]></name> <description><![CDATA[]]></description> <type>async_proc</type> <data><![CDATA[1]]></data> </module><module> <name><![CDATA[events]]></name> <description><![CDATA[]]></description> <type>generic_string</type>
Page 180
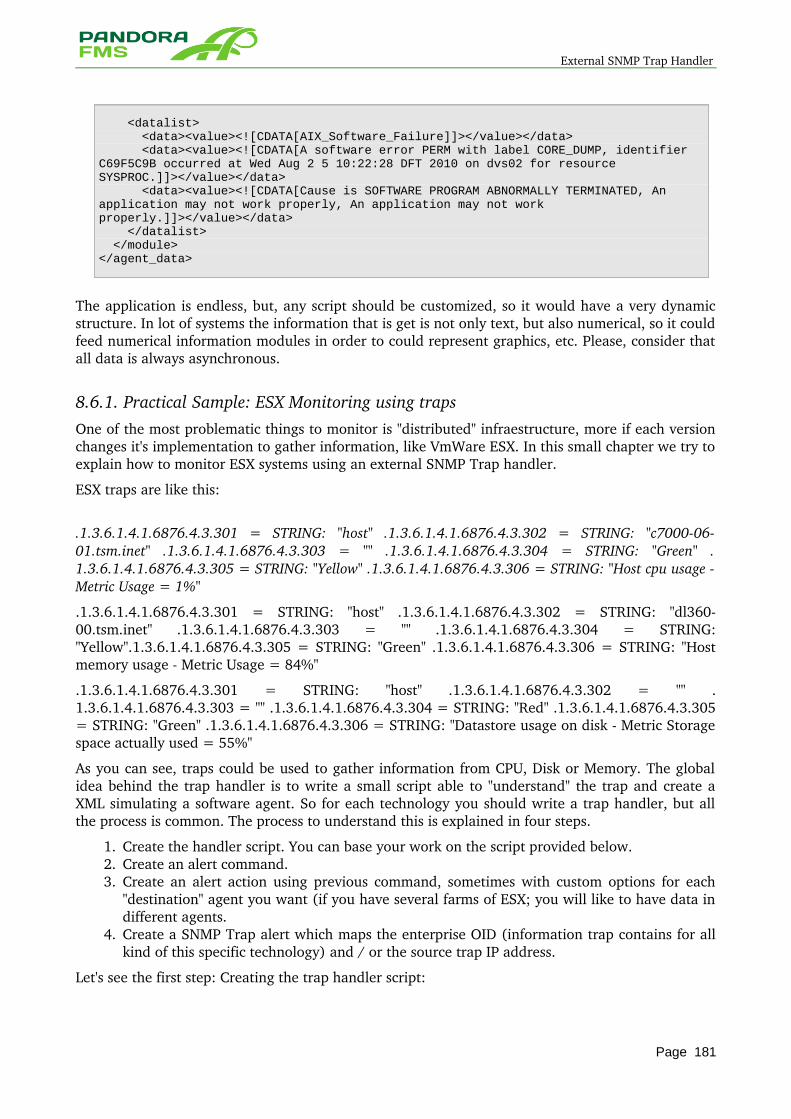
External SNMP Trap Handler
<datalist> <data><value><![CDATA[AIX_Software_Failure]]></value></data> <data><value><![CDATA[A software error PERM with label CORE_DUMP, identifier C69F5C9B occurred at Wed Aug 2 5 10:22:28 DFT 2010 on dvs02 for resource SYSPROC.]]></value></data> <data><value><![CDATA[Cause is SOFTWARE PROGRAM ABNORMALLY TERMINATED, An application may not work properly, An application may not work properly.]]></value></data> </datalist> </module></agent_data>
The application is endless, but, any script should be customized, so it would have a very dynamic structure. In lot of systems the information that is get is not only text, but also numerical, so it could feed numerical information modules in order to could represent graphics, etc. Please, consider that all data is always asynchronous.
8.6.1. Practical Sample: ESX Monitoring using traps One of the most problematic things to monitor is "distributed" infraestructure, more if each version changes it's implementation to gather information, like VmWare ESX. In this small chapter we try to explain how to monitor ESX systems using an external SNMP Trap handler.
ESX traps are like this:
.1.3.6.1.4.1.6876.4.3.301 = STRING: "host" .1.3.6.1.4.1.6876.4.3.302 = STRING: "c70000601.tsm.inet" .1.3.6.1.4.1.6876.4.3.303 = "" .1.3.6.1.4.1.6876.4.3.304 = STRING: "Green" .1.3.6.1.4.1.6876.4.3.305 = STRING: "Yellow" .1.3.6.1.4.1.6876.4.3.306 = STRING: "Host cpu usage Metric Usage = 1%"
.1.3.6.1.4.1.6876.4.3.301 = STRING: "host" .1.3.6.1.4.1.6876.4.3.302 = STRING: "dl36000.tsm.inet" .1.3.6.1.4.1.6876.4.3.303 = "" .1.3.6.1.4.1.6876.4.3.304 = STRING: "Yellow".1.3.6.1.4.1.6876.4.3.305 = STRING: "Green" .1.3.6.1.4.1.6876.4.3.306 = STRING: "Host memory usage Metric Usage = 84%"
.1.3.6.1.4.1.6876.4.3.301 = STRING: "host" .1.3.6.1.4.1.6876.4.3.302 = "" .1.3.6.1.4.1.6876.4.3.303 = "" .1.3.6.1.4.1.6876.4.3.304 = STRING: "Red" .1.3.6.1.4.1.6876.4.3.305 = STRING: "Green" .1.3.6.1.4.1.6876.4.3.306 = STRING: "Datastore usage on disk Metric Storage space actually used = 55%"
As you can see, traps could be used to gather information from CPU, Disk or Memory. The global idea behind the trap handler is to write a small script able to "understand" the trap and create a XML simulating a software agent. So for each technology you should write a trap handler, but all the process is common. The process to understand this is explained in four steps.
1. Create the handler script. You can base your work on the script provided below. 2. Create an alert command. 3. Create an alert action using previous command, sometimes with custom options for each
"destination" agent you want (if you have several farms of ESX; you will like to have data in different agents.
4. Create a SNMP Trap alert which maps the enterprise OID (information trap contains for all kind of this specific technology) and / or the source trap IP address.
Let's see the first step: Creating the trap handler script:
Page 181
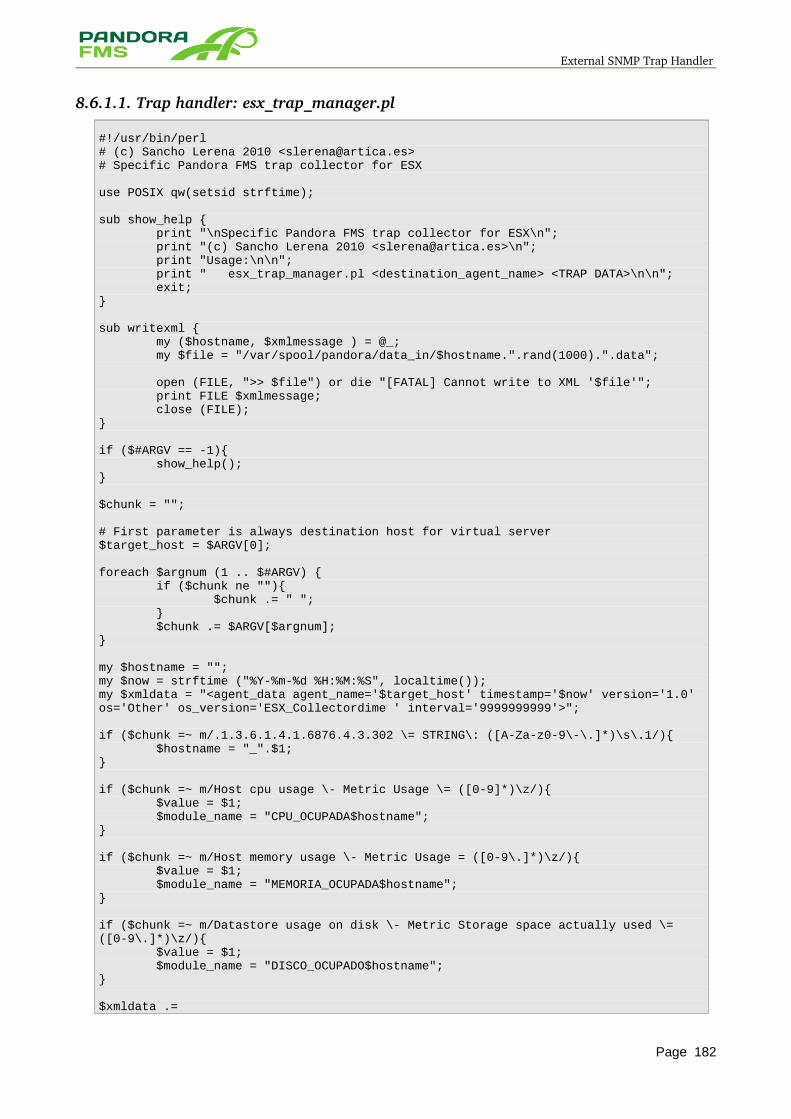
External SNMP Trap Handler
8.6.1.1. Trap handler: esx_trap_manager.pl
#!/usr/bin/perl# (c) Sancho Lerena 2010 <[email protected]># Specific Pandora FMS trap collector for ESX
use POSIX qw(setsid strftime);
sub show_help { print "\nSpecific Pandora FMS trap collector for ESX\n"; print "(c) Sancho Lerena 2010 <[email protected]>\n"; print "Usage:\n\n"; print " esx_trap_manager.pl <destination_agent_name> <TRAP DATA>\n\n"; exit;}
sub writexml { my ($hostname, $xmlmessage ) = @_; my $file = "/var/spool/pandora/data_in/$hostname.".rand(1000).".data";
open (FILE, ">> $file") or die "[FATAL] Cannot write to XML '$file'"; print FILE $xmlmessage; close (FILE);}
if ($#ARGV == -1){ show_help();}
$chunk = "";
# First parameter is always destination host for virtual server$target_host = $ARGV[0];
foreach $argnum (1 .. $#ARGV) { if ($chunk ne ""){ $chunk .= " "; } $chunk .= $ARGV[$argnum];}
my $hostname = "";my $now = strftime ("%Y-%m-%d %H:%M:%S", localtime());my $xmldata = "<agent_data agent_name='$target_host' timestamp='$now' version='1.0' os='Other' os_version='ESX_Collectordime ' interval='9999999999'>";
if ($chunk =~ m/.1.3.6.1.4.1.6876.4.3.302 \= STRING\: ([A-Za-z0-9\-\.]*)\s\.1/){ $hostname = "_".$1;}
if ($chunk =~ m/Host cpu usage \- Metric Usage \= ([0-9]*)\z/){ $value = $1; $module_name = "CPU_OCUPADA$hostname";}
if ($chunk =~ m/Host memory usage \- Metric Usage = ([0-9\.]*)\z/){ $value = $1; $module_name = "MEMORIA_OCUPADA$hostname";}
if ($chunk =~ m/Datastore usage on disk \- Metric Storage space actually used \= ([0-9\.]*)\z/){ $value = $1; $module_name = "DISCO_OCUPADO$hostname";}
$xmldata .=
Page 182
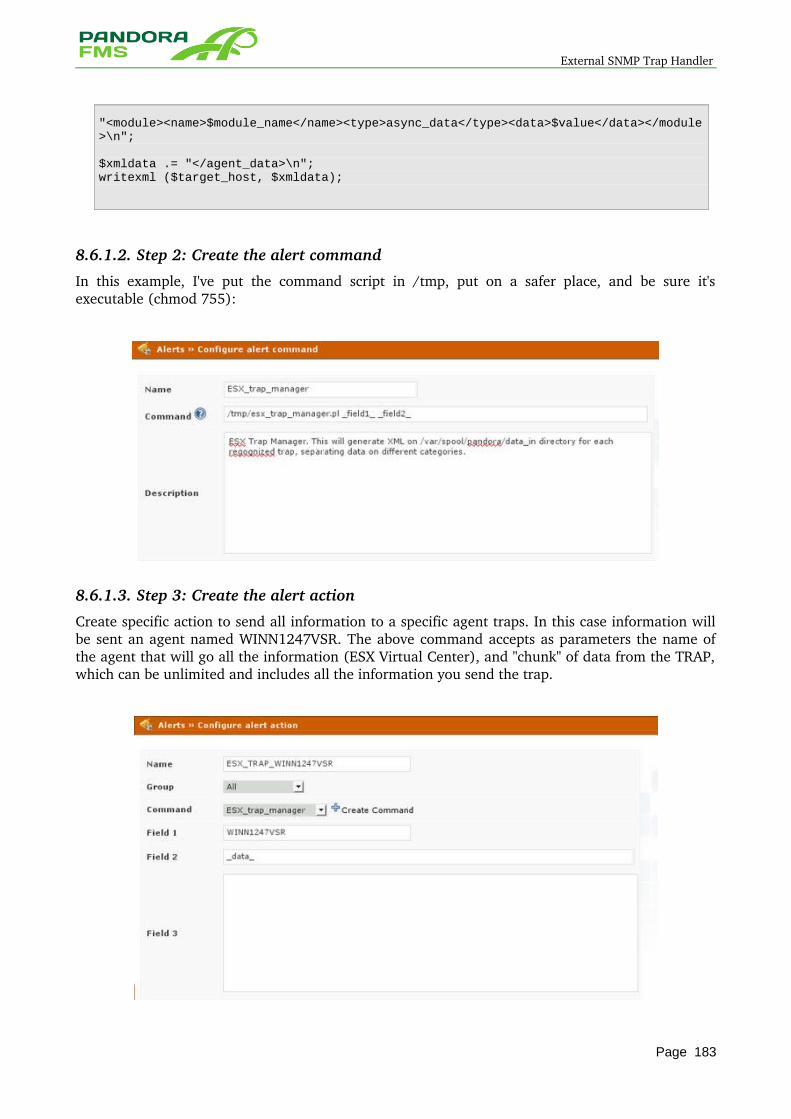
External SNMP Trap Handler
"<module><name>$module_name</name><type>async_data</type><data>$value</data></module>\n";
$xmldata .= "</agent_data>\n";writexml ($target_host, $xmldata);
8.6.1.2. Step 2: Create the alert command
In this example, I've put the command script in /tmp, put on a safer place, and be sure it's executable (chmod 755):
8.6.1.3. Step 3: Create the alert action
Create specific action to send all information to a specific agent traps. In this case information will be sent an agent named WINN1247VSR. The above command accepts as parameters the name of the agent that will go all the information (ESX Virtual Center), and "chunk" of data from the TRAP, which can be unlimited and includes all the information you send the trap.
Page 183
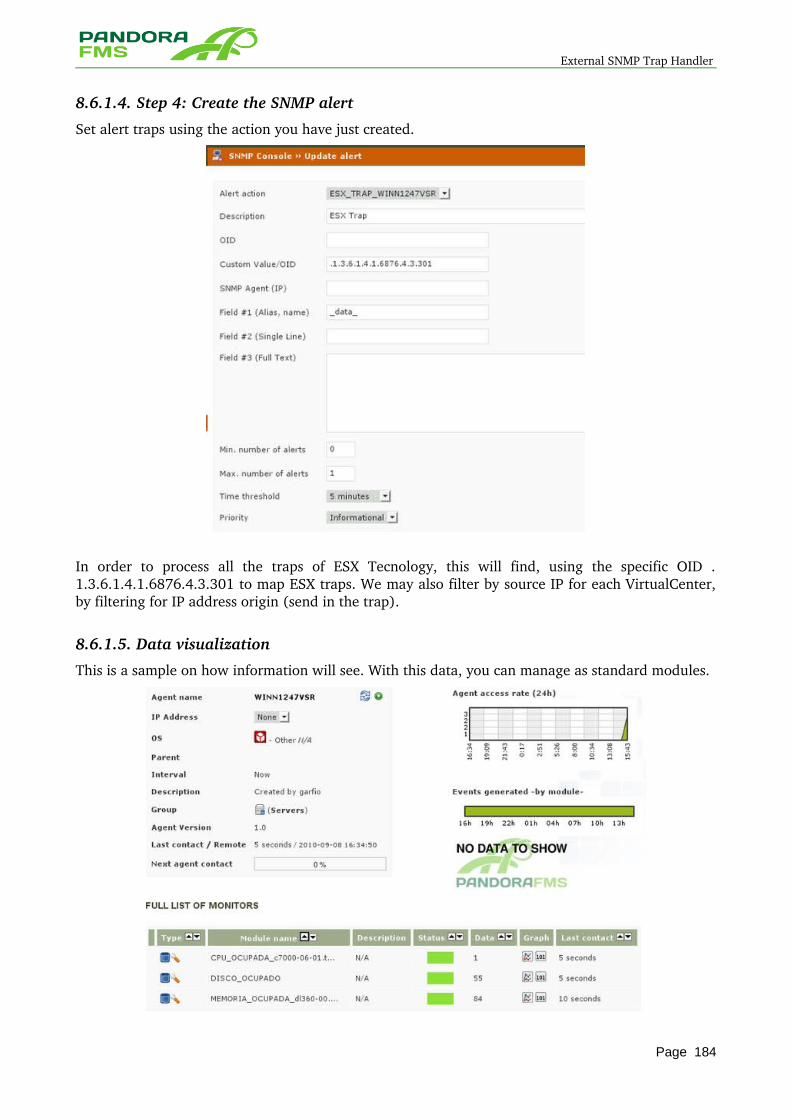
External SNMP Trap Handler
8.6.1.4. Step 4: Create the SNMP alert
Set alert traps using the action you have just created.
In order to process all the traps of ESX Tecnology, this will find, using the specific OID .1.3.6.1.4.1.6876.4.3.301 to map ESX traps. We may also filter by source IP for each VirtualCenter, by filtering for IP address origin (send in the trap).
8.6.1.5. Data visualization
This is a sample on how information will see. With this data, you can manage as standard modules.
Page 184

Templates and Plugins
9 TEMPLATES AND PLUGINS
Page 185
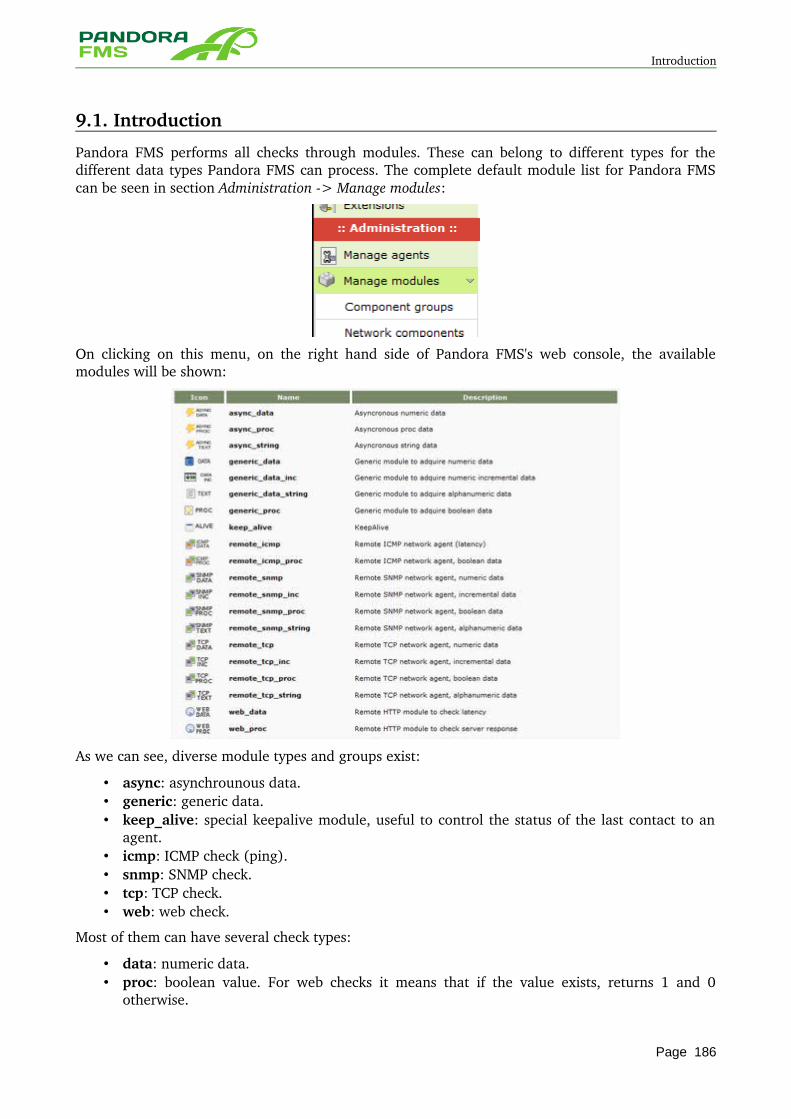
Introduction
9.1. Introduction
Pandora FMS performs all checks through modules. These can belong to different types for the different data types Pandora FMS can process. The complete default module list for Pandora FMS can be seen in section Administration > Manage modules:
On clicking on this menu, on the right hand side of Pandora FMS's web console, the available modules will be shown:
As we can see, diverse module types and groups exist:
• async: asynchrounous data. • generic: generic data. • keep_alive: special keepalive module, useful to control the status of the last contact to an
agent. • icmp: ICMP check (ping). • snmp: SNMP check. • tcp: TCP check. • web: web check.
Most of them can have several check types:
• data: numeric data. • proc: boolean value. For web checks it means that if the value exists, returns 1 and 0
otherwise.
Page 186
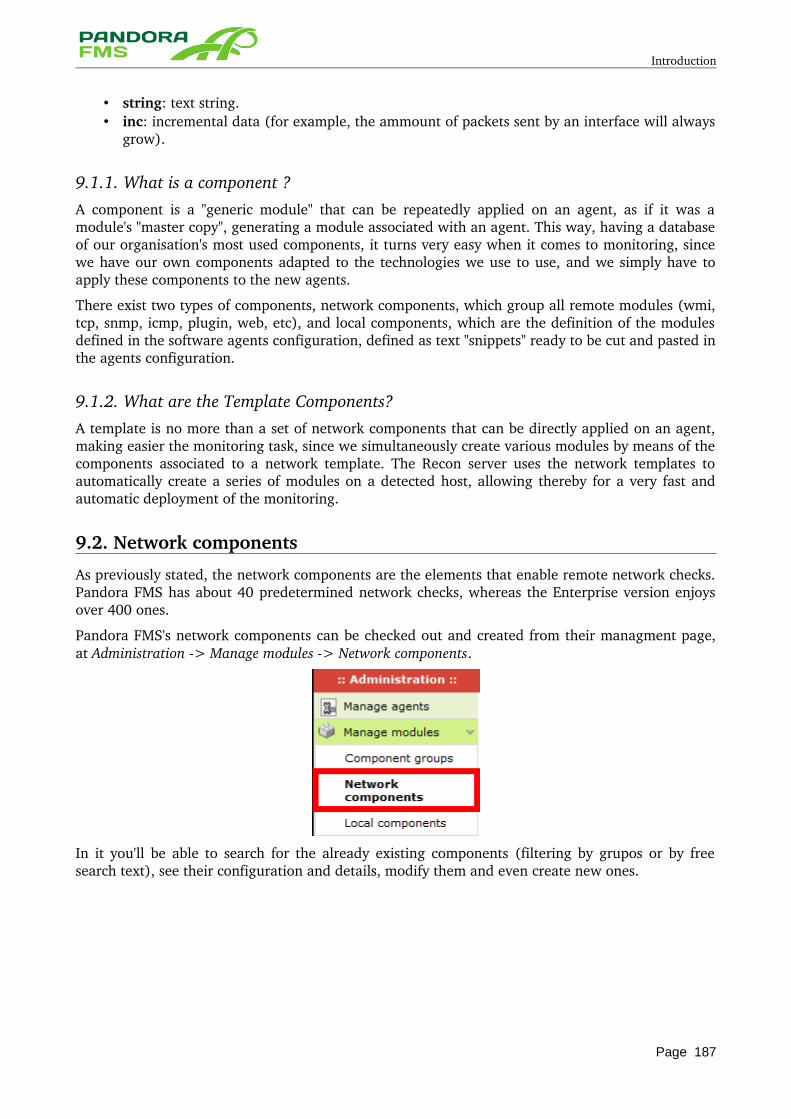
Introduction
• string: text string. • inc: incremental data (for example, the ammount of packets sent by an interface will always
grow).
9.1.1. What is a component ? A component is a "generic module" that can be repeatedly applied on an agent, as if it was a module's "master copy", generating a module associated with an agent. This way, having a database of our organisation's most used components, it turns very easy when it comes to monitoring, since we have our own components adapted to the technologies we use to use, and we simply have to apply these components to the new agents.
There exist two types of components, network components, which group all remote modules (wmi, tcp, snmp, icmp, plugin, web, etc), and local components, which are the definition of the modules defined in the software agents configuration, defined as text "snippets" ready to be cut and pasted in the agents configuration.
9.1.2. What are the Template Components? A template is no more than a set of network components that can be directly applied on an agent, making easier the monitoring task, since we simultaneously create various modules by means of the components associated to a network template. The Recon server uses the network templates to automatically create a series of modules on a detected host, allowing thereby for a very fast and automatic deployment of the monitoring.
9.2. Network components
As previously stated, the network components are the elements that enable remote network checks. Pandora FMS has about 40 predetermined network checks, whereas the Enterprise version enjoys over 400 ones.
Pandora FMS's network components can be checked out and created from their managment page, at Administration > Manage modules > Network components.
In it you'll be able to search for the already existing components (filtering by grupos or by free search text), see their configuration and details, modify them and even create new ones.
Page 187
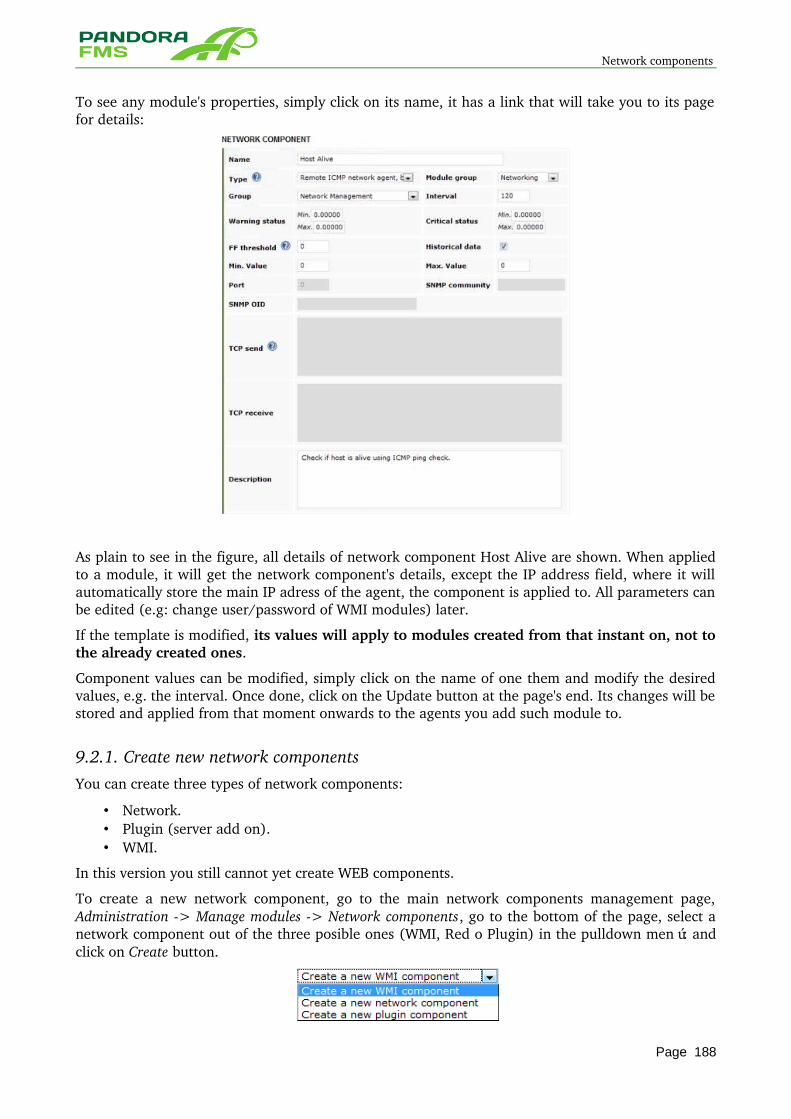
Network components
To see any module's properties, simply click on its name, it has a link that will take you to its page for details:
As plain to see in the figure, all details of network component Host Alive are shown. When applied to a module, it will get the network component's details, except the IP address field, where it will automatically store the main IP adress of the agent, the component is applied to. All parameters can be edited (e.g: change user/password of WMI modules) later.
If the template is modified, its values will apply to modules created from that instant on, not to the already created ones.
Component values can be modified, simply click on the name of one them and modify the desired values, e.g. the interval. Once done, click on the Update button at the page's end. Its changes will be stored and applied from that moment onwards to the agents you add such module to.
9.2.1. Create new network components You can create three types of network components:
• Network. • Plugin (server add on). • WMI.
In this version you still cannot yet create WEB components.
To create a new network component, go to the main network components management page, Administration > Manage modules > Network components, go to the bottom of the page, select a network component out of the three posible ones (WMI, Red o Plugin) in the pulldown menú: and click on Create button.
Page 188
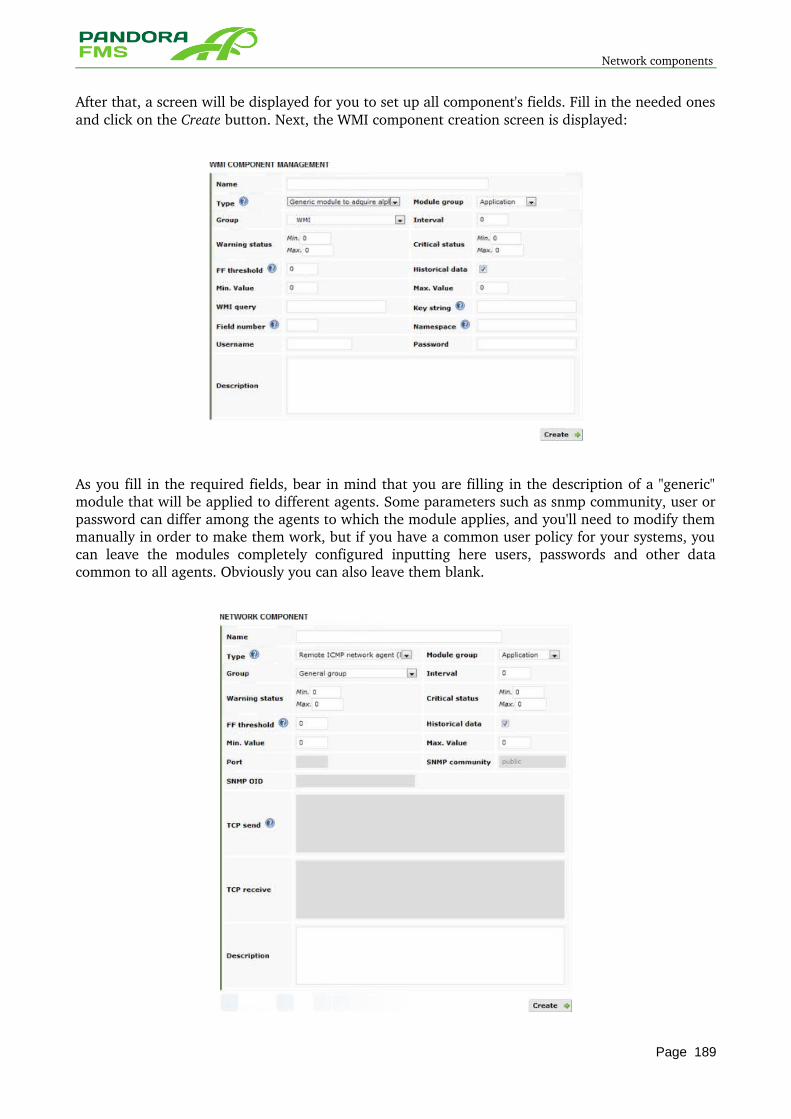
Network components
After that, a screen will be displayed for you to set up all component's fields. Fill in the needed ones and click on the Create button. Next, the WMI component creation screen is displayed:
As you fill in the required fields, bear in mind that you are filling in the description of a "generic" module that will be applied to different agents. Some parameters such as snmp community, user or password can differ among the agents to which the module applies, and you'll need to modify them manually in order to make them work, but if you have a common user policy for your systems, you can leave the modules completely configured inputting here users, passwords and other data common to all agents. Obviously you can also leave them blank.
Page 189
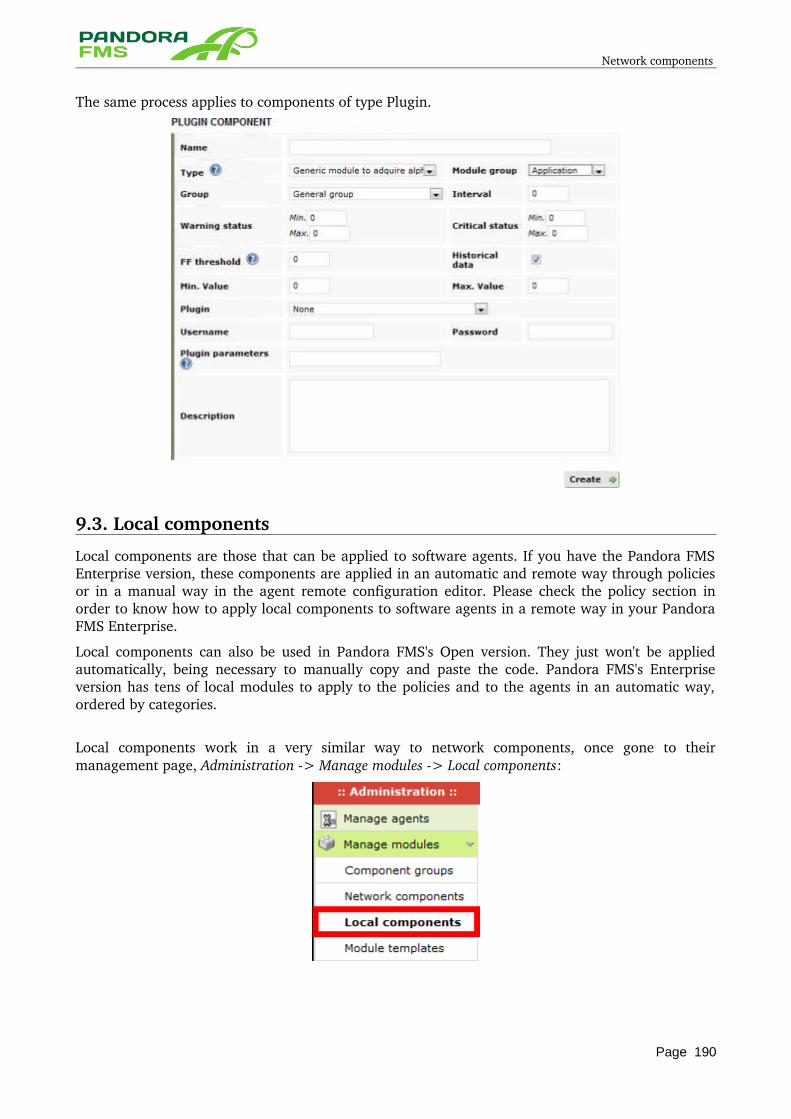
Network components
The same process applies to components of type Plugin.
9.3. Local components
Local components are those that can be applied to software agents. If you have the Pandora FMS Enterprise version, these components are applied in an automatic and remote way through policies or in a manual way in the agent remote configuration editor. Please check the policy section in order to know how to apply local components to software agents in a remote way in your Pandora FMS Enterprise.
Local components can also be used in Pandora FMS's Open version. They just won't be applied automatically, being necessary to manually copy and paste the code. Pandora FMS's Enterprise version has tens of local modules to apply to the policies and to the agents in an automatic way, ordered by categories.
Local components work in a very similar way to network components, once gone to their management page, Administration > Manage modules > Local components:
Page 190
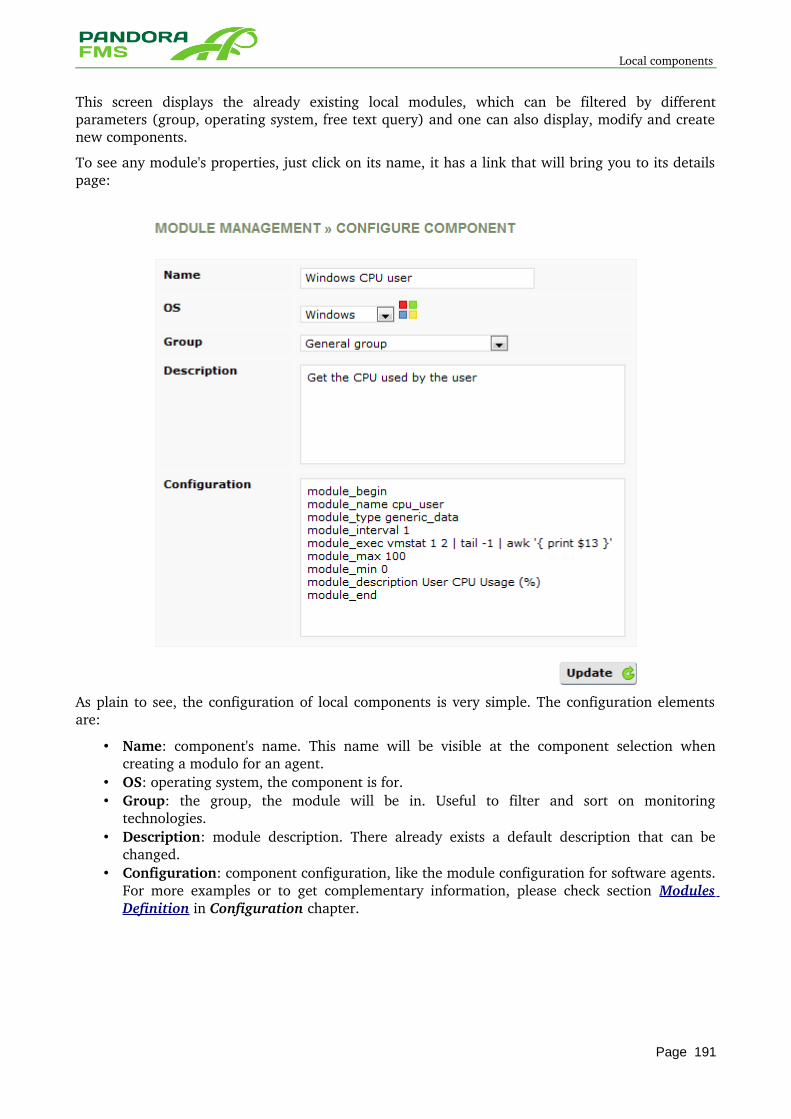
Local components
This screen displays the already existing local modules, which can be filtered by different parameters (group, operating system, free text query) and one can also display, modify and create new components.
To see any module's properties, just click on its name, it has a link that will bring you to its details page:
As plain to see, the configuration of local components is very simple. The configuration elements are:
• Name: component's name. This name will be visible at the component selection when creating a modulo for an agent.
• OS: operating system, the component is for. • Group: the group, the module will be in. Useful to filter and sort on monitoring
technologies. • Description: module description. There already exists a default description that can be
changed. • Configuration: component configuration, like the module configuration for software agents.
For more examples or to get complementary information, please check section Modules Definition in Configuration chapter.
Page 191
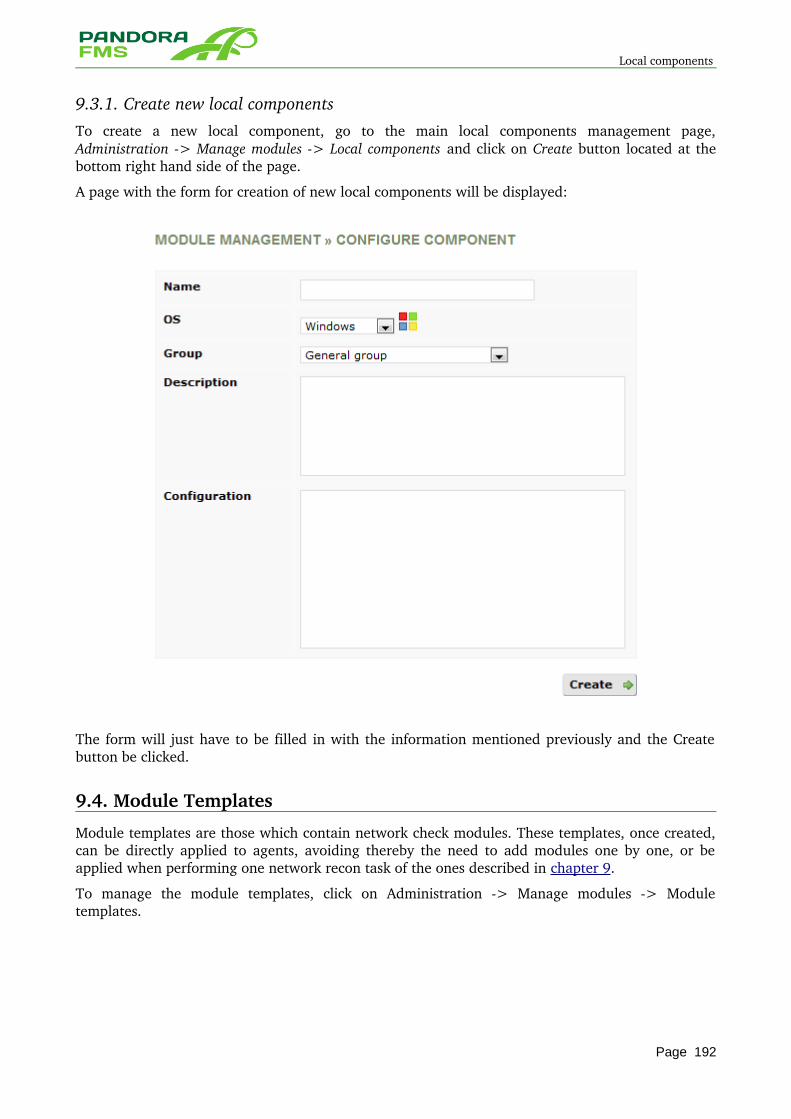
Local components
9.3.1. Create new local components To create a new local component, go to the main local components management page, Administration > Manage modules > Local components and click on Create button located at the bottom right hand side of the page.
A page with the form for creation of new local components will be displayed:
The form will just have to be filled in with the information mentioned previously and the Create button be clicked.
9.4. Module Templates
Module templates are those which contain network check modules. These templates, once created, can be directly applied to agents, avoiding thereby the need to add modules one by one, or be applied when performing one network recon task of the ones described in chapter 9.
To manage the module templates, click on Administration > Manage modules > Module templates.
Page 192
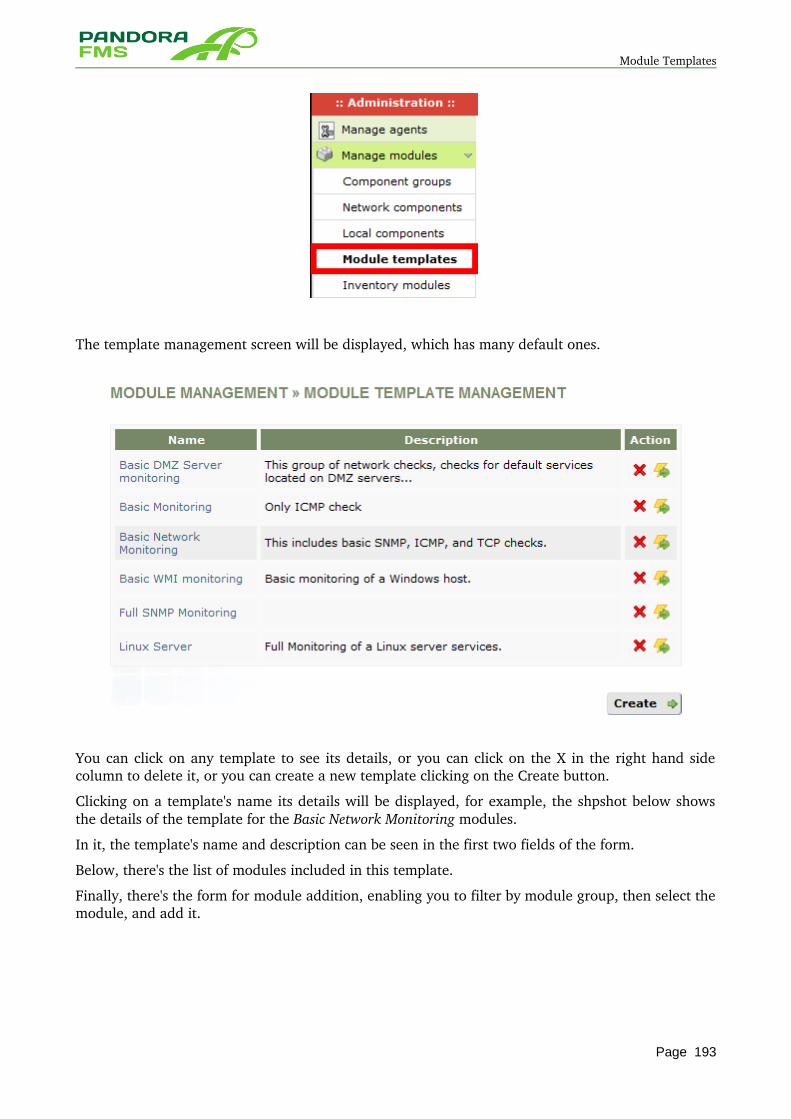
Module Templates
The template management screen will be displayed, which has many default ones.
You can click on any template to see its details, or you can click on the X in the right hand side column to delete it, or you can create a new template clicking on the Create button.
Clicking on a template's name its details will be displayed, for example, the shpshot below shows the details of the template for the Basic Network Monitoring modules.
In it, the template's name and description can be seen in the first two fields of the form.
Below, there's the list of modules included in this template.
Finally, there's the form for module addition, enabling you to filter by module group, then select the module, and add it.
Page 193
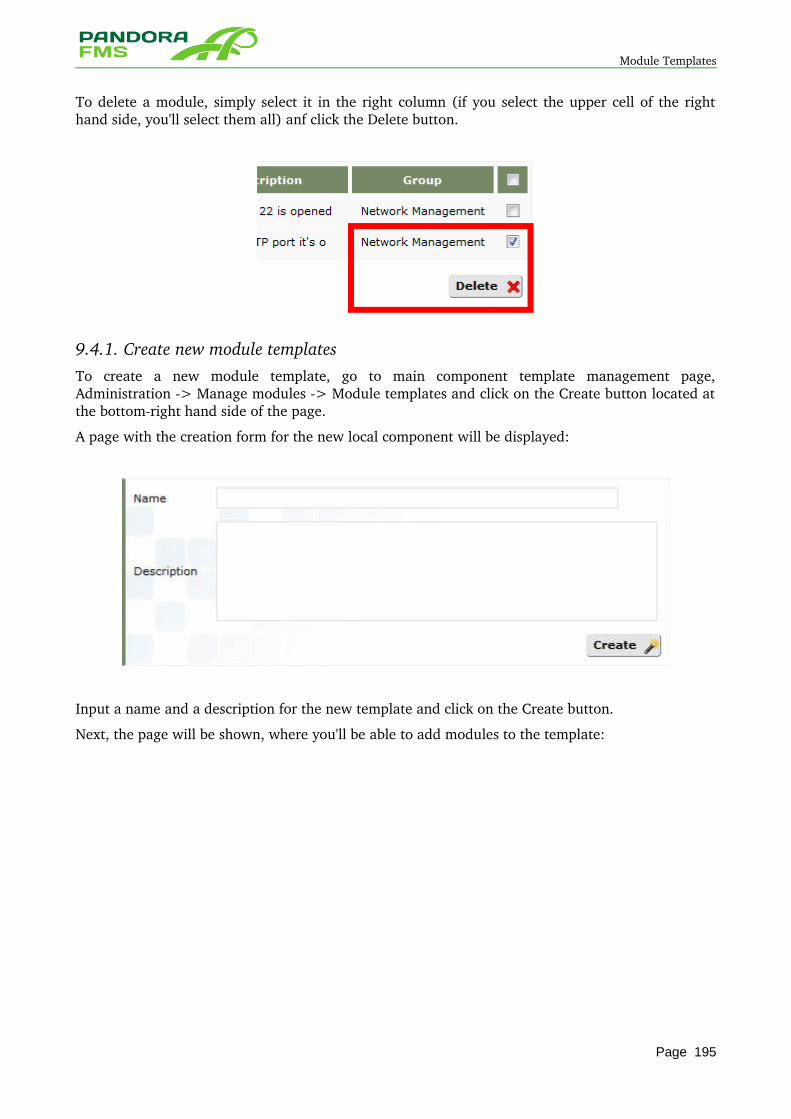
Module Templates
To delete a module, simply select it in the right column (if you select the upper cell of the right hand side, you'll select them all) anf click the Delete button.
9.4.1. Create new module templatesTo create a new module template, go to main component template management page, Administration > Manage modules > Module templates and click on the Create button located at the bottomright hand side of the page.
A page with the creation form for the new local component will be displayed:
Input a name and a description for the new template and click on the Create button.
Next, the page will be shown, where you'll be able to add modules to the template:
Page 195
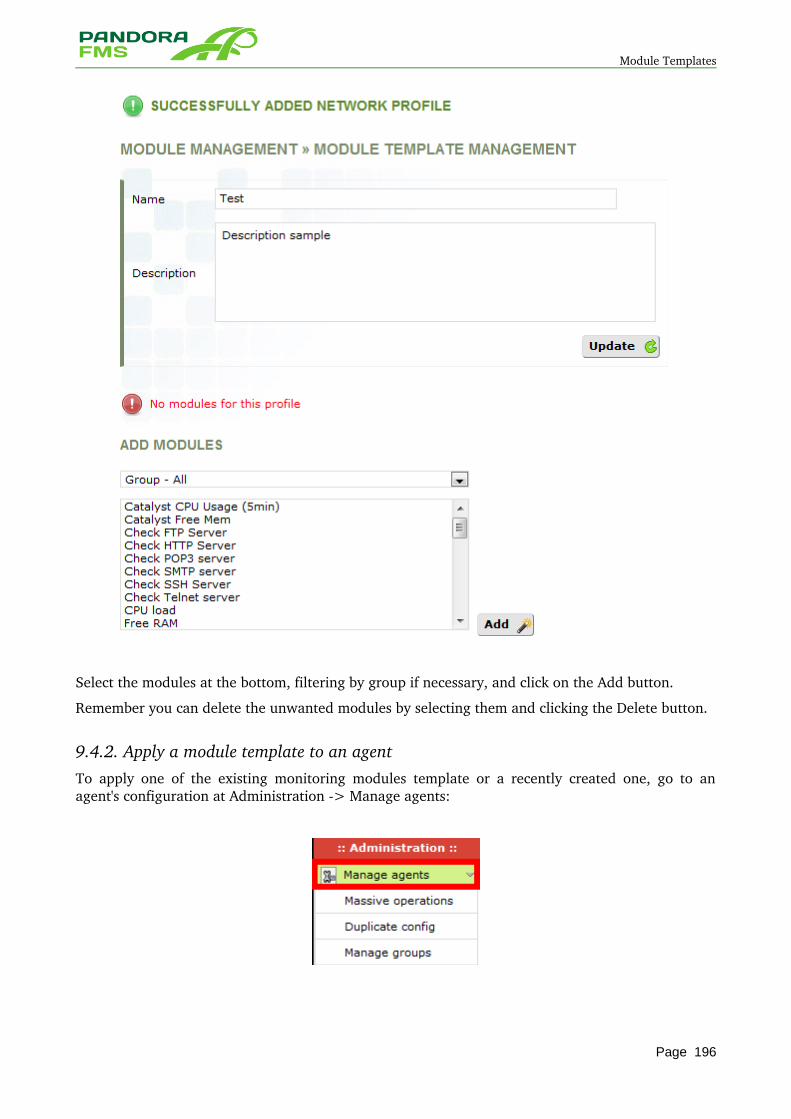
Module Templates
Select the modules at the bottom, filtering by group if necessary, and click on the Add button.
Remember you can delete the unwanted modules by selecting them and clicking the Delete button.
9.4.2. Apply a module template to an agentTo apply one of the existing monitoring modules template or a recently created one, go to an agent's configuration at Administration > Manage agents:
Page 196
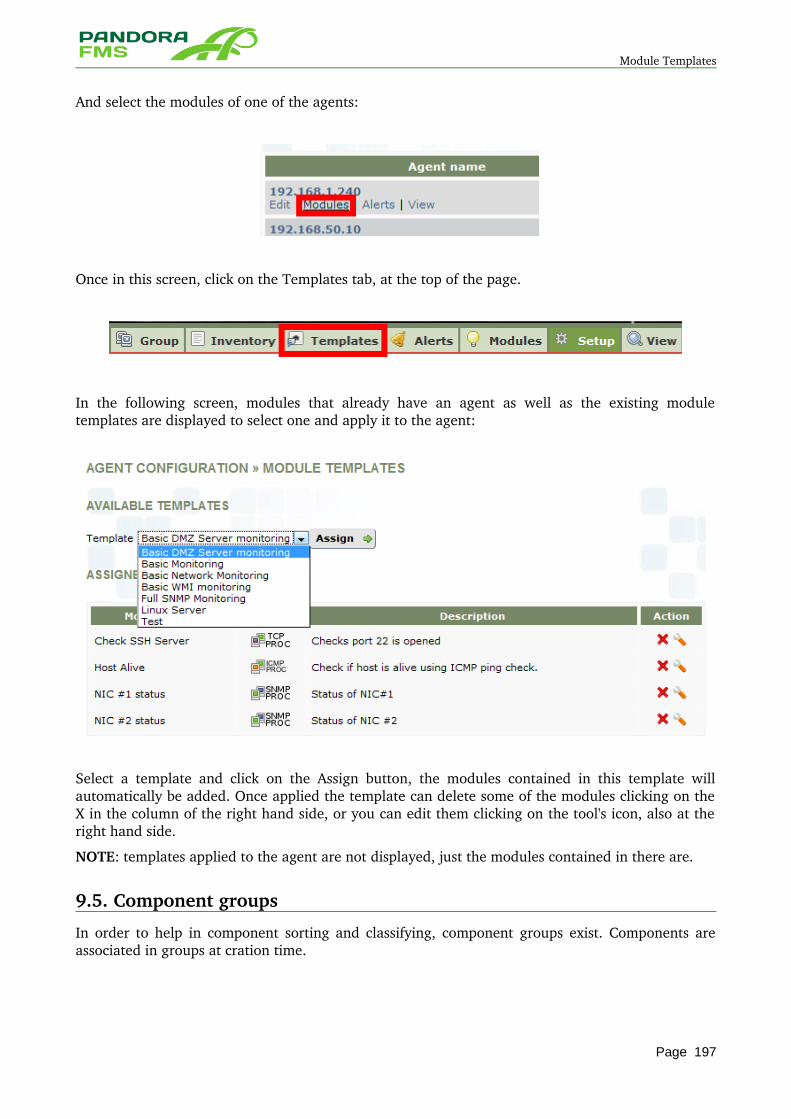
Module Templates
And select the modules of one of the agents:
Once in this screen, click on the Templates tab, at the top of the page.
In the following screen, modules that already have an agent as well as the existing module templates are displayed to select one and apply it to the agent:
Select a template and click on the Assign button, the modules contained in this template will automatically be added. Once applied the template can delete some of the modules clicking on the X in the column of the right hand side, or you can edit them clicking on the tool's icon, also at the right hand side.
NOTE: templates applied to the agent are not displayed, just the modules contained in there are.
9.5. Component groups
In order to help in component sorting and classifying, component groups exist. Components are associated in groups at cration time.
Page 197
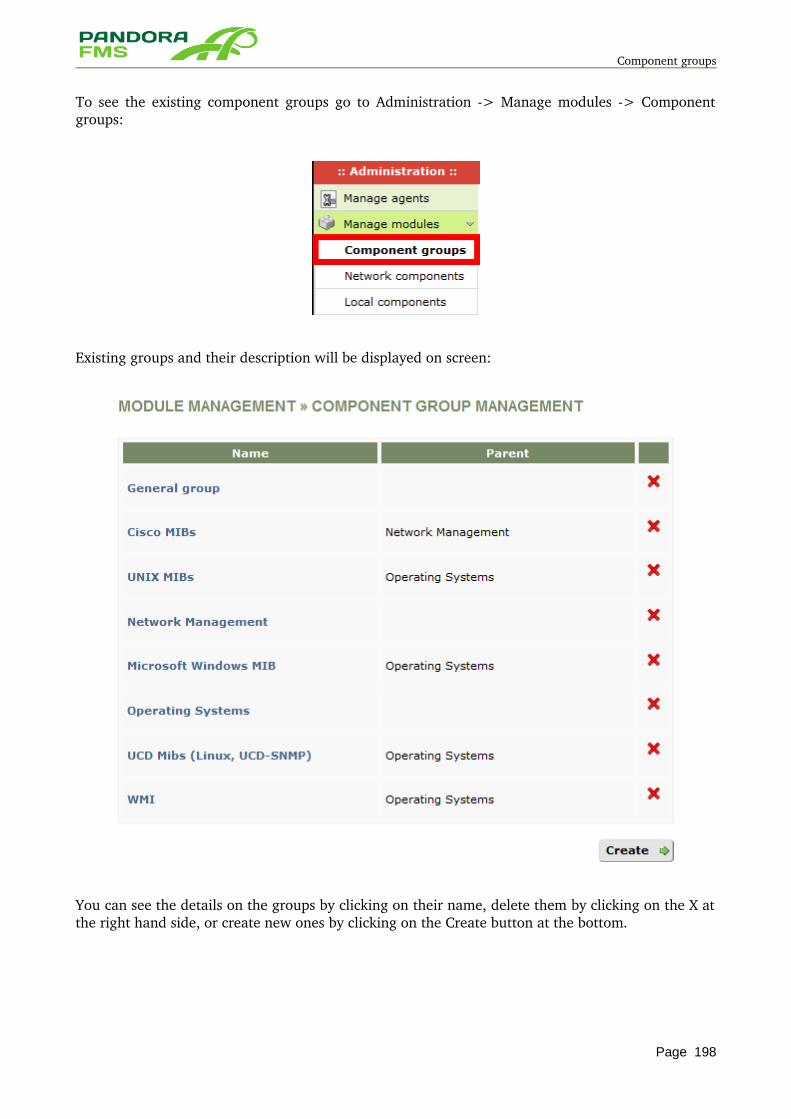
Component groups
To see the existing component groups go to Administration > Manage modules > Component groups:
Existing groups and their description will be displayed on screen:
You can see the details on the groups by clicking on their name, delete them by clicking on the X at the right hand side, or create new ones by clicking on the Create button at the bottom.
Page 198

Component groups
If you want to create a new components group, click on the Create button, and fill in the form fields:
You just need to provide a name for the group and select if it has a parent among the existing groups. Then click on the Create button.
Now you can add new components to your just created component group.
Page 199

Component groups
10 ALERTS
Page 200
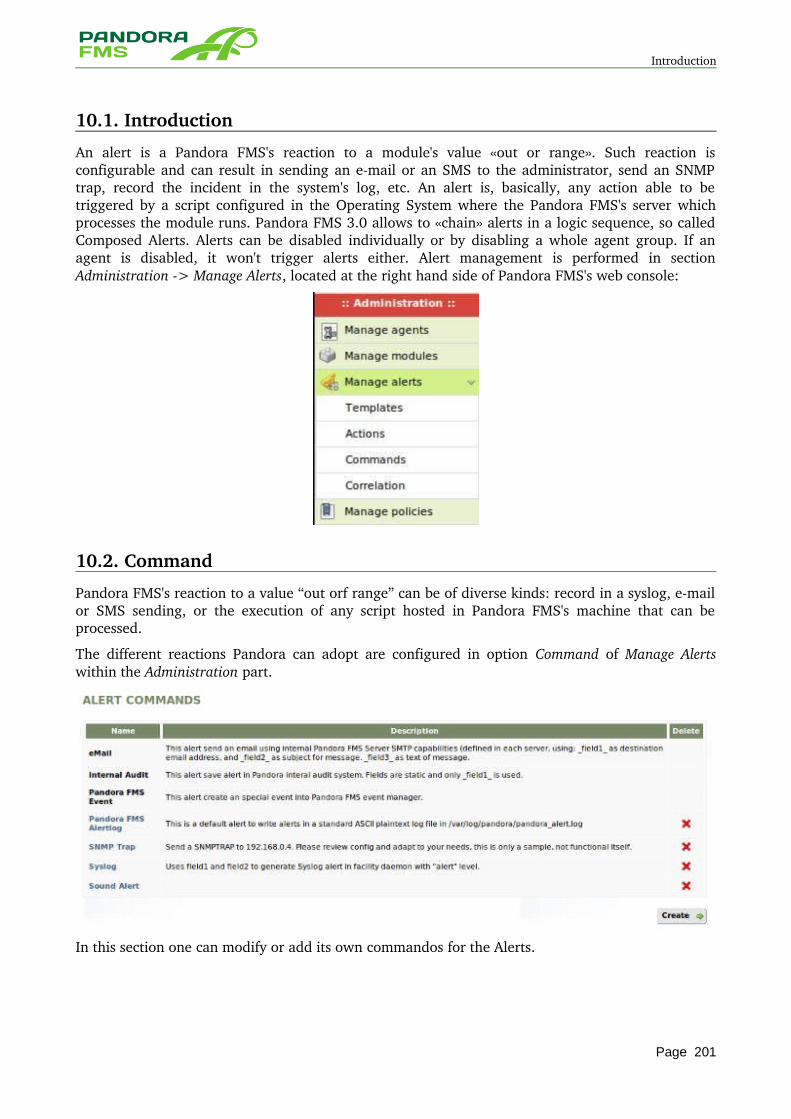
Introduction
10.1. Introduction
An alert is a Pandora FMS's reaction to a module's value «out or range». Such reaction is configurable and can result in sending an email or an SMS to the administrator, send an SNMP trap, record the incident in the system's log, etc. An alert is, basically, any action able to be triggered by a script configured in the Operating System where the Pandora FMS's server which processes the module runs. Pandora FMS 3.0 allows to «chain» alerts in a logic sequence, so called Composed Alerts. Alerts can be disabled individually or by disabling a whole agent group. If an agent is disabled, it won't trigger alerts either. Alert management is performed in section Administration > Manage Alerts, located at the right hand side of Pandora FMS's web console:
10.2. Command
Pandora FMS's reaction to a value “out orf range” can be of diverse kinds: record in a syslog, email or SMS sending, or the execution of any script hosted in Pandora FMS's machine that can be processed.
The different reactions Pandora can adopt are configured in option Command of Manage Alerts within the Administration part.
In this section one can modify or add its own commandos for the Alerts.
Page 201
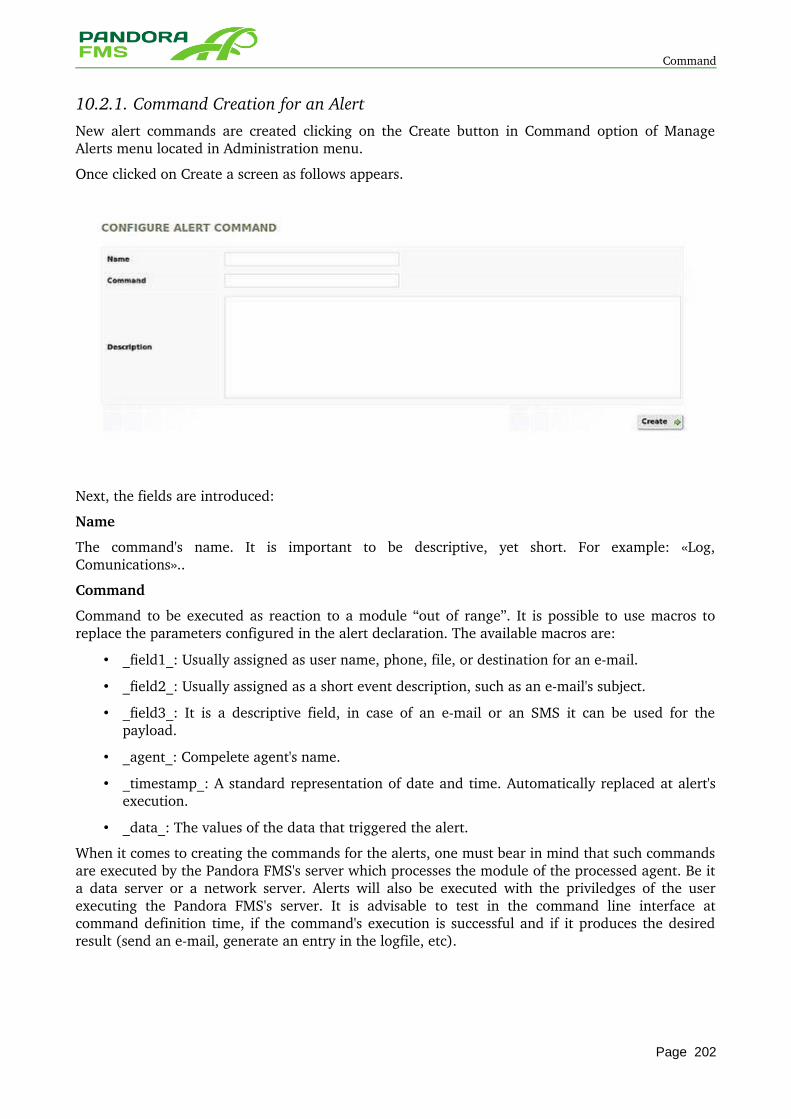
Command
10.2.1. Command Creation for an AlertNew alert commands are created clicking on the Create button in Command option of Manage Alerts menu located in Administration menu.
Once clicked on Create a screen as follows appears.
Next, the fields are introduced:
Name
The command's name. It is important to be descriptive, yet short. For example: «Log, Comunications»..
Command
Command to be executed as reaction to a module “out of range”. It is possible to use macros to replace the parameters configured in the alert declaration. The available macros are:
• _field1_: Usually assigned as user name, phone, file, or destination for an email.
• _field2_: Usually assigned as a short event description, such as an email's subject.
• _field3_: It is a descriptive field, in case of an email or an SMS it can be used for the payload.
• _agent_: Compelete agent's name.
• _timestamp_: A standard representation of date and time. Automatically replaced at alert's execution.
• _data_: The values of the data that triggered the alert.
When it comes to creating the commands for the alerts, one must bear in mind that such commands are executed by the Pandora FMS's server which processes the module of the processed agent. Be it a data server or a network server. Alerts will also be executed with the priviledges of the user executing the Pandora FMS's server. It is advisable to test in the command line interface at command definition time, if the command's execution is successful and if it produces the desired result (send an email, generate an entry in the logfile, etc).
Page 202
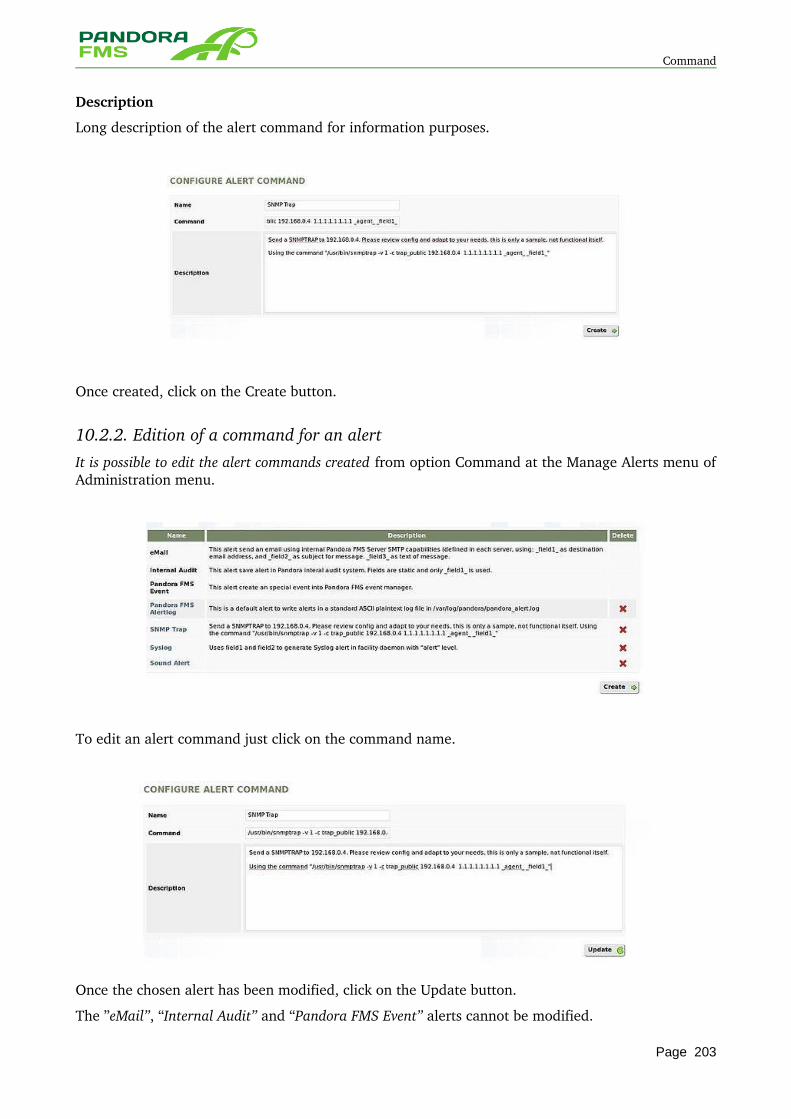
Command
Description
Long description of the alert command for information purposes.
Once created, click on the Create button.
10.2.2. Edition of a command for an alert
It is possible to edit the alert commands created from option Command at the Manage Alerts menu of Administration menu.
To edit an alert command just click on the command name.
Once the chosen alert has been modified, click on the Update button.
The ”eMail”, “Internal Audit” and “Pandora FMS Event” alerts cannot be modified.
Page 203
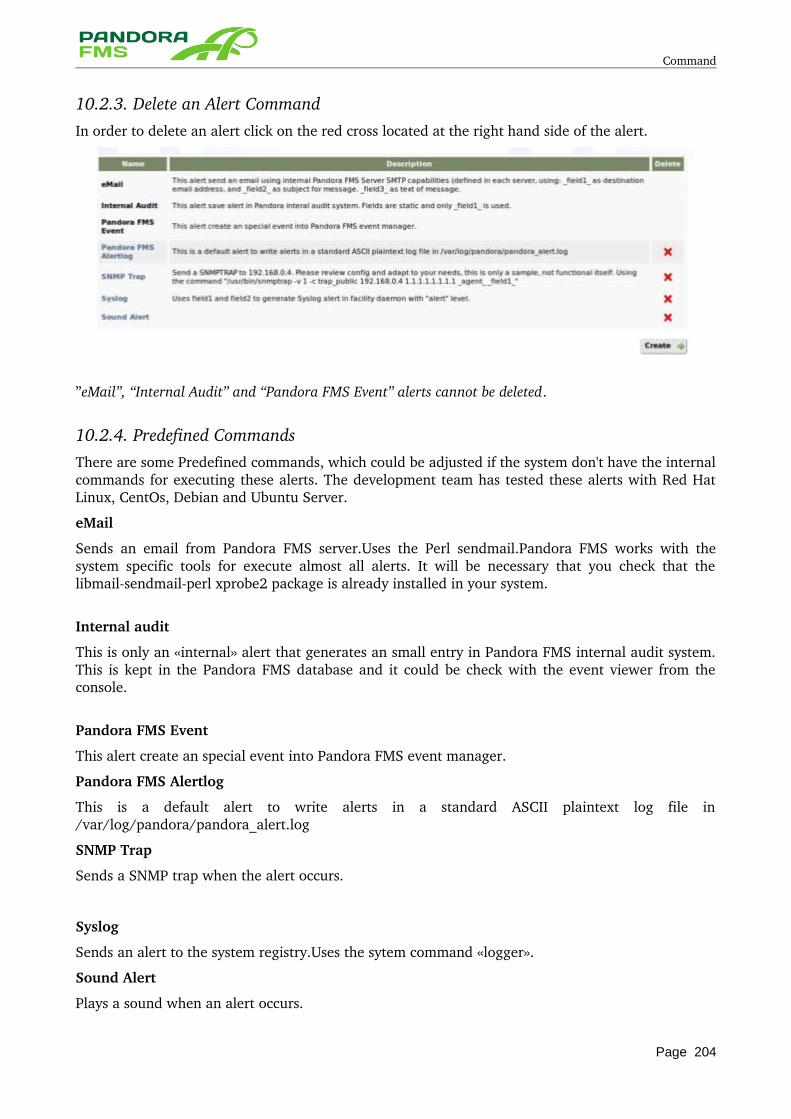
Command
10.2.3. Delete an Alert CommandIn order to delete an alert click on the red cross located at the right hand side of the alert.
”eMail”, “Internal Audit” and “Pandora FMS Event” alerts cannot be deleted.
10.2.4. Predefined CommandsThere are some Predefined commands, which could be adjusted if the system don't have the internal commands for executing these alerts. The development team has tested these alerts with Red Hat Linux, CentOs, Debian and Ubuntu Server.
Sends an email from Pandora FMS server.Uses the Perl sendmail.Pandora FMS works with the system specific tools for execute almost all alerts. It will be necessary that you check that the libmailsendmailperl xprobe2 package is already installed in your system.
Internal audit
This is only an «internal» alert that generates an small entry in Pandora FMS internal audit system. This is kept in the Pandora FMS database and it could be check with the event viewer from the console.
Pandora FMS Event
This alert create an special event into Pandora FMS event manager.
Pandora FMS Alertlog
This is a default alert to write alerts in a standard ASCII plaintext log file in /var/log/pandora/pandora_alert.log
SNMP Trap
Sends a SNMP trap when the alert occurs.
Syslog
Sends an alert to the system registry.Uses the sytem command «logger».
Sound Alert
Plays a sound when an alert occurs.
Page 204
Command
SMS Text
Sends an SMS to an specific mobil telephone. But, of course, it will need to define an alert before doing this possible, and also a gateway for sending configured and accesible SMS from Pandora FMS. It is also possible to install one using Gnokii to send SMS, directly by using a Nokia telephone with an USB wire. The process is described further on.
10.2.5. Examples of Commands
10.2.5.1. Integrating alerts with Jabber IM
It is very easy to set up Pandora FMS to send alerts through a Jabber server. Jabber can be a system to get real time alerts as well as a historic log, allowing a group of people to receive those alerts simultaneously.
Installing Jabber services
From the client side:
1. Install a Jabber client, like for example Gaim (now Pidgin). 2. Register an account (using Pidgin: configure the account clicking on "Accounts" tab). 3. Login that account.
From Pandora FMS Server side:
1. Install sendxmpp. With this tool your Pandora FMS server can send messages to Jabber services.
2. Create the file .sendxmpprc inside the folder /home. 3. Edit that file and insert the following text:
[email protected] password
1. Change that file permissions:
chmod 0600 .sendxmpprc
Now you can send private messages using the command line, for example:
$ echo "Hello" | sendxmpp -s pandora [email protected]
To register the alert at Pandora FMS Web Console, add a new command and configure its variables. It is a good idea to do as follows:
• Field_1: Jabber address. • Field_2: Text.
The alert will be defined as follows:
echo _field2_ | sendxmpp -s pandora _field1_
Page 205
Command
More examples of Jabber usage
Send a message to a chat room:
$ echo "Dinner Time" | sendxmpp -r TheCook --chatroom [email protected]
Send the log lines to a Jabber destination, as they appear:
$ tail -f /var/log/syslog | sendxmpp -i [email protected]
NOTA: Be careful not to flood public Jabber servers or you can be banned from them.
10.2.5.2. Sending emails with Expect
Sometimes it is necessary to use an authenticated SMTP to send emails. It will be probably easier and more versatile to use a simple EXPECT script instead to configure sendmail to use an authenticated SMTP. This is an exaple using EXPECT to send emails using an Exchange server.
Then, a file called /etc/snmp with the following content is created:
#!/usr/bin/expect -fset arg1 [lindex $argv 0] set arg2 [lindex $argv 1]set arg3 [lindex $argv 2]set timeout 1 spawn telnet myserver.com 25 expect "220"send "ehlo mymachine.mydomain.com\r"expect "250"send "AUTH login\r"expect "334"send "2342348werhkwjernsdf78sdf3w4rwe32wer=\r"expect "334"send "YRejewrhneruT==\r"expect "235"send "MAIL FROM: [email protected]\r"expect "Sender OK"send "RCPT TO: $arg1\r"expect "250"send "data\r"expect "354"send "Subject: $arg2\r"send "$arg3 \r\r"send ".\r"expect "delivery"send "quit"quit
The file permissions are changed to allow the execution.
chmod 700 /root/smtp
Before trying to use it, please make sure that /usr/bin/expect works right.
Page 206
Command
To use this with Pandora FMS, you will need to create a new command (or modify the one that already exists, this is, the email alert sending) and specify the following fields in the Pandora FMS Alert command definition, in the “Command” field. It will write:
/root/smtp _field1_ _field2_ _field3_
And of course,the script could be located in any place of the system.You will only need to consider that the alert script is launched by the server that processes the data: if it is a network data, then it will be the network server. If it is a data that comes from an agent, through an XML data file, then it will be the dataserver the one that will launch it.
If you have several physical servers, then it is possible that you will need to copy the same script in the same location, with the same permissions and the same user owner in all the systems where you have a Pandora FMS server that you want to execute this alert. Also consider that the Pandora FMS network servers need to be executed as root ( to could do ICMP latency tests) and the data server could be executed as a user without priviledges.
The alert will be executed by the user who is executing the process of the Pandora FMS server.
10.2.5.3. Sending SMS with Gnokii
You could use Gnokii, it is necessary to use a Nokia mobile or a mobile that should be compatible with Gnokii ( check the compatible hardware in the Gnokii project page). You will also need a USB data wire to which you have to connect the mobile phone and the Pandora FMS server you want to send SMS alerts.
Gnokii supports a large variety of Nokia phones ( and some from other manufacturers).
With Gnokii, you can send SMS from the command line. This way is very easy and quick to send SMS directly from a Pandora FMS server, avoiding the use of gateways sending SMS through the internet (not quite useful if the network is down) or GSM hardware solutions for sending messages that are very expensive.
Another alternative to the use of Gnokii is the Gammu project.
Example of SMS sending with Gnokii from the command line:
echo "PANDORA: Server XXXX is down at XXXXX" | gnokii --sendsms 555123123
Gnokii can not send SMS with attached images, but it can send a URL HTTP/Wap for it could be visualized when a message is received, such as:
echo "Image capture sample" | gnokii --sendsms 555123123 -w http://artica.homelinux.com/capture.jpg
It could send a URL from one image or a URL that leads to a light version of the console to have access to the console from the mobile device and analyze data.
The development team has tested SMS sending from a Nokia 6030 phone, sending SMS alerts when the internet connection was not possible. The Nokia 6030 phone uses the module 6510 definition in the gnokiirc file, and it takes about four seconds to send an SMS.
It is possible to install a much more powerful sending gateway using Gammu.
Page 207
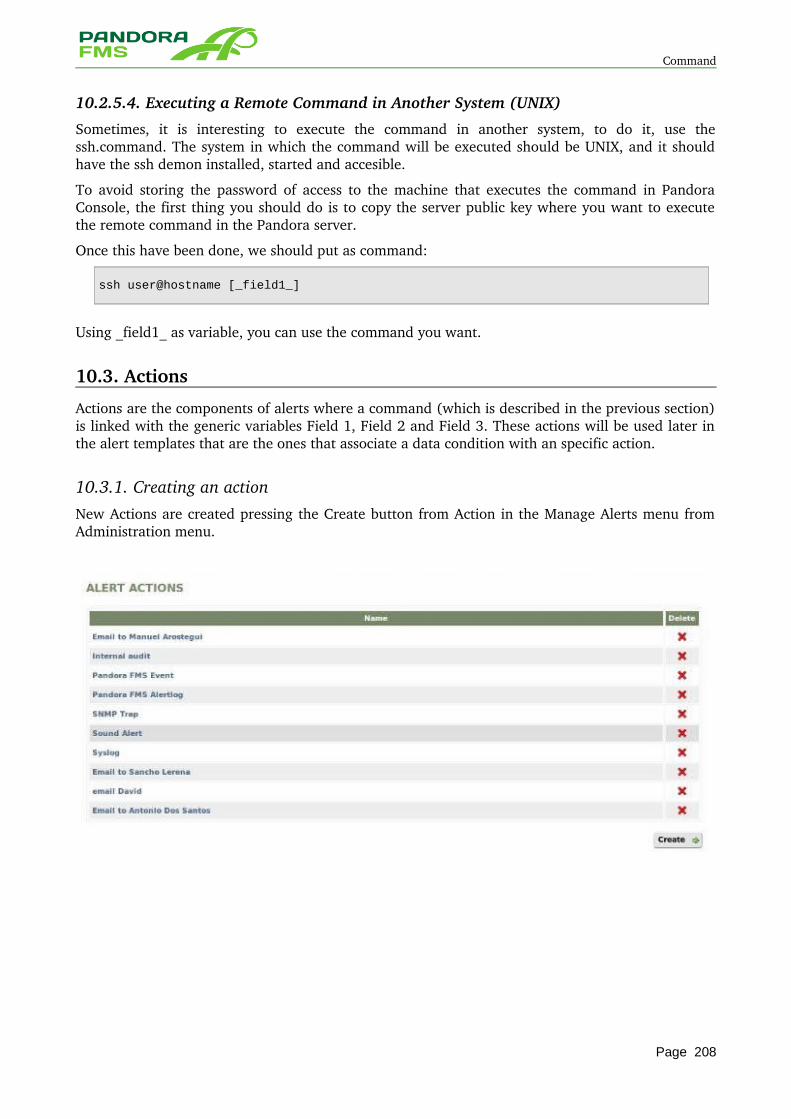
Command
10.2.5.4. Executing a Remote Command in Another System (UNIX)
Sometimes, it is interesting to execute the command in another system, to do it, use the ssh.command. The system in which the command will be executed should be UNIX, and it should have the ssh demon installed, started and accesible.
To avoid storing the password of access to the machine that executes the command in Pandora Console, the first thing you should do is to copy the server public key where you want to execute the remote command in the Pandora server.
Once this have been done, we should put as command:
ssh user@hostname [_field1_]
Using _field1_ as variable, you can use the command you want.
10.3. Actions
Actions are the components of alerts where a command (which is described in the previous section) is linked with the generic variables Field 1, Field 2 and Field 3. These actions will be used later in the alert templates that are the ones that associate a data condition with an specific action.
10.3.1. Creating an action New Actions are created pressing the Create button from Action in the Manage Alerts menu from Administration menu.
Page 208
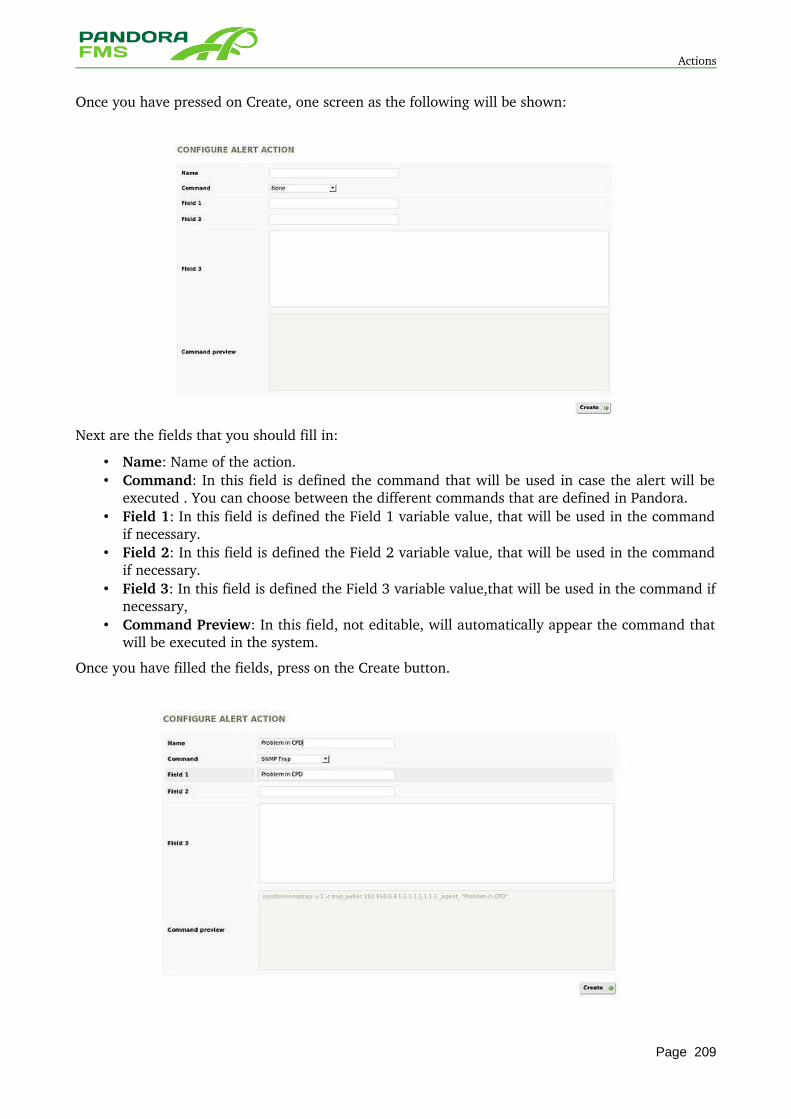
Actions
Once you have pressed on Create, one screen as the following will be shown:
Next are the fields that you should fill in:
• Name: Name of the action. • Command: In this field is defined the command that will be used in case the alert will be
executed . You can choose between the different commands that are defined in Pandora. • Field 1: In this field is defined the Field 1 variable value, that will be used in the command
if necessary. • Field 2: In this field is defined the Field 2 variable value, that will be used in the command
if necessary. • Field 3: In this field is defined the Field 3 variable value,that will be used in the command if
necessary, • Command Preview: In this field, not editable, will automatically appear the command that
will be executed in the system.
Once you have filled the fields, press on the Create button.
Page 209
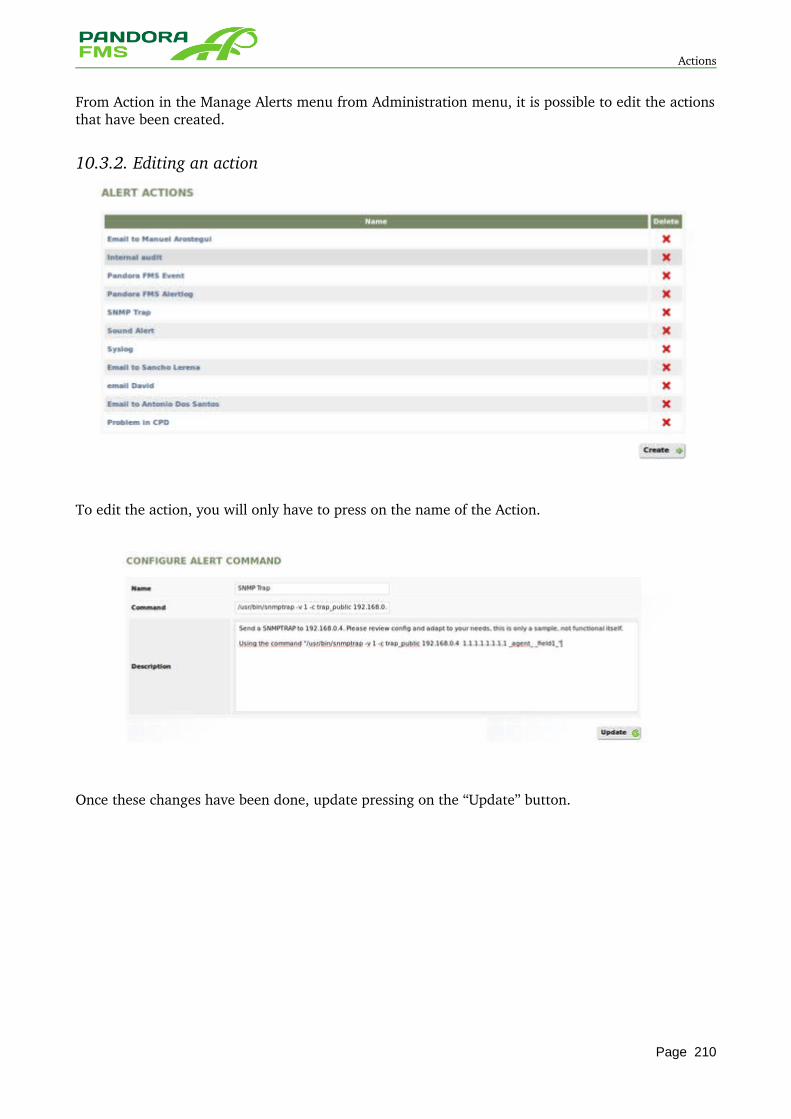
Actions
From Action in the Manage Alerts menu from Administration menu, it is possible to edit the actions that have been created.
10.3.2. Editing an action
To edit the action, you will only have to press on the name of the Action.
Once these changes have been done, update pressing on the “Update” button.
Page 210
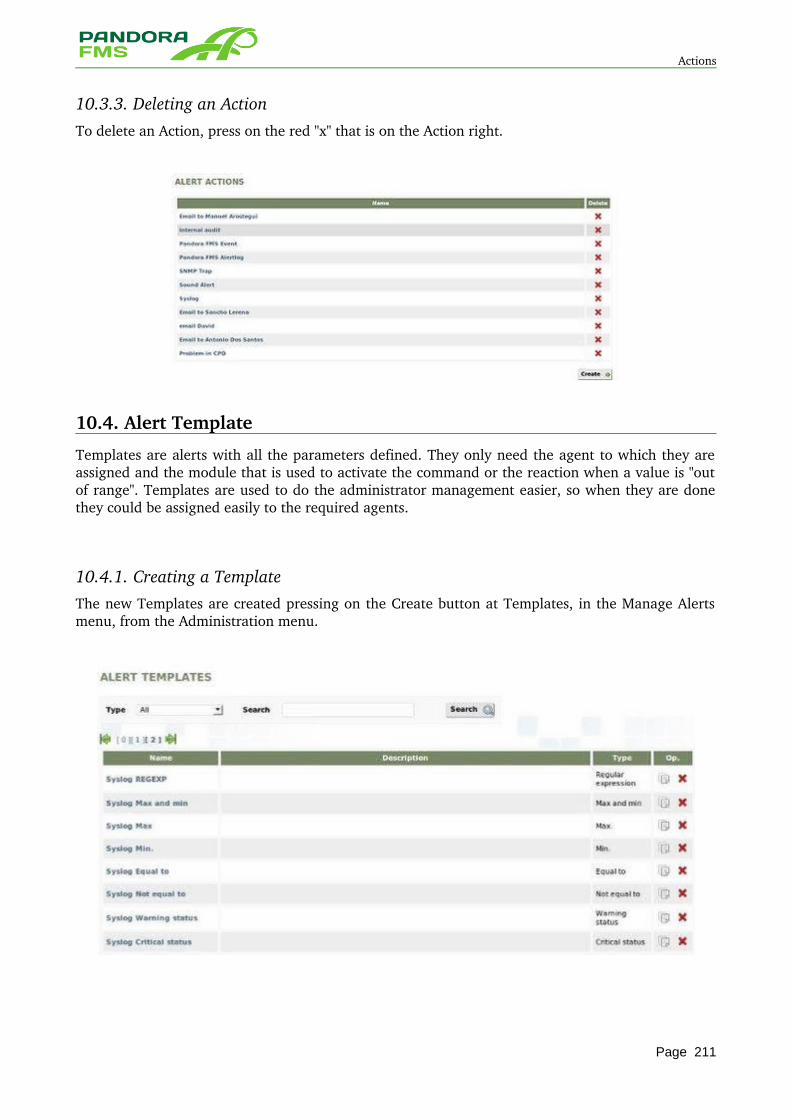
Actions
10.3.3. Deleting an Action To delete an Action, press on the red "x" that is on the Action right.
10.4. Alert Template
Templates are alerts with all the parameters defined. They only need the agent to which they are assigned and the module that is used to activate the command or the reaction when a value is "out of range". Templates are used to do the administrator management easier, so when they are done they could be assigned easily to the required agents.
10.4.1. Creating a TemplateThe new Templates are created pressing on the Create button at Templates, in the Manage Alerts menu, from the Administration menu.
Page 211
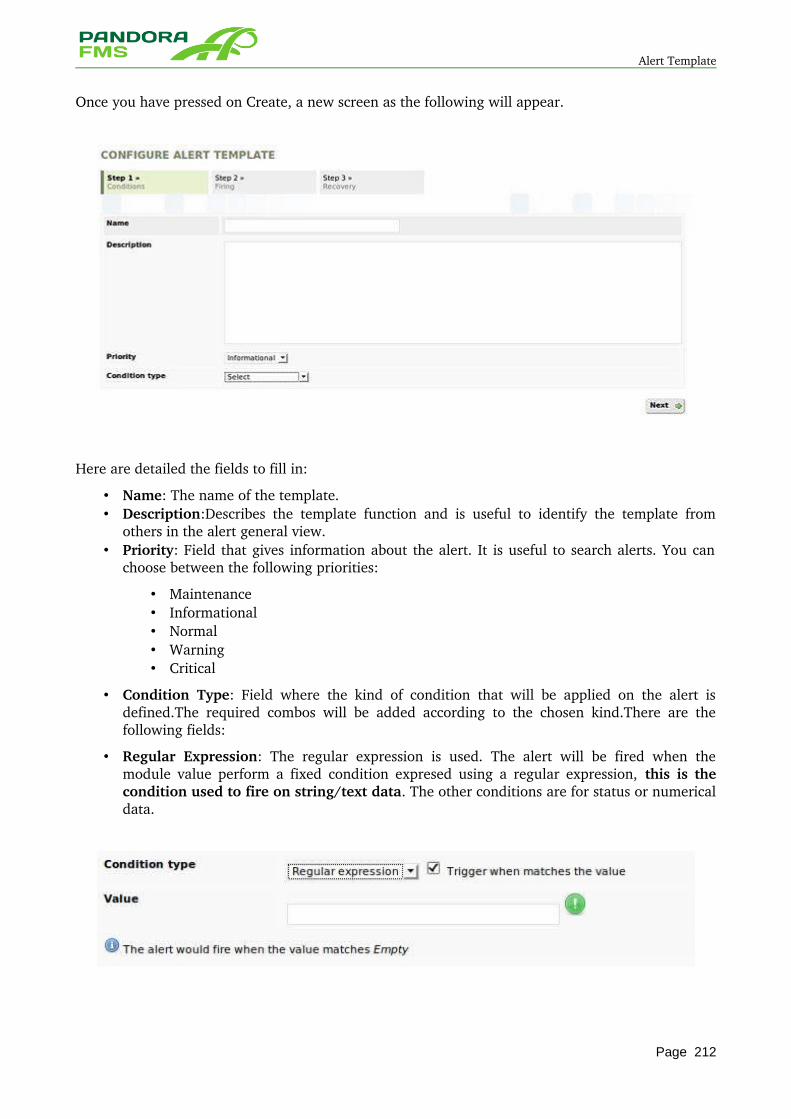
Alert Template
Once you have pressed on Create, a new screen as the following will appear.
Here are detailed the fields to fill in:
• Name: The name of the template. • Description:Describes the template function and is useful to identify the template from
others in the alert general view. • Priority: Field that gives information about the alert. It is useful to search alerts. You can
choose between the following priorities:
• Maintenance • Informational • Normal • Warning • Critical
• Condition Type: Field where the kind of condition that will be applied on the alert is defined.The required combos will be added according to the chosen kind.There are the following fields:
• Regular Expression: The regular expression is used. The alert will be fired when the module value perform a fixed condition expresed using a regular expression, this is the condition used to fire on string/text data. The other conditions are for status or numerical data.
Page 212
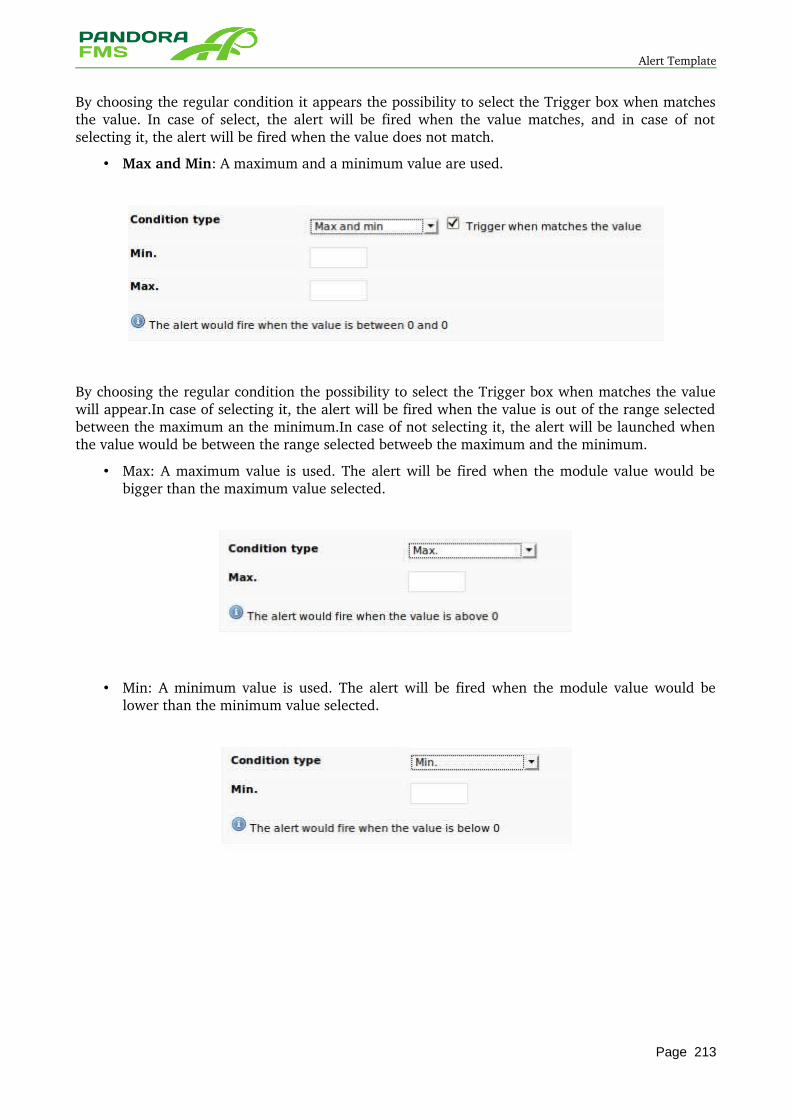
Alert Template
By choosing the regular condition it appears the possibility to select the Trigger box when matches the value. In case of select, the alert will be fired when the value matches, and in case of not selecting it, the alert will be fired when the value does not match.
• Max and Min: A maximum and a minimum value are used.
By choosing the regular condition the possibility to select the Trigger box when matches the value will appear.In case of selecting it, the alert will be fired when the value is out of the range selected between the maximum an the minimum.In case of not selecting it, the alert will be launched when the value would be between the range selected betweeb the maximum and the minimum.
• Max: A maximum value is used. The alert will be fired when the module value would be bigger than the maximum value selected.
• Min: A minimum value is used. The alert will be fired when the module value would be lower than the minimum value selected.
Page 213
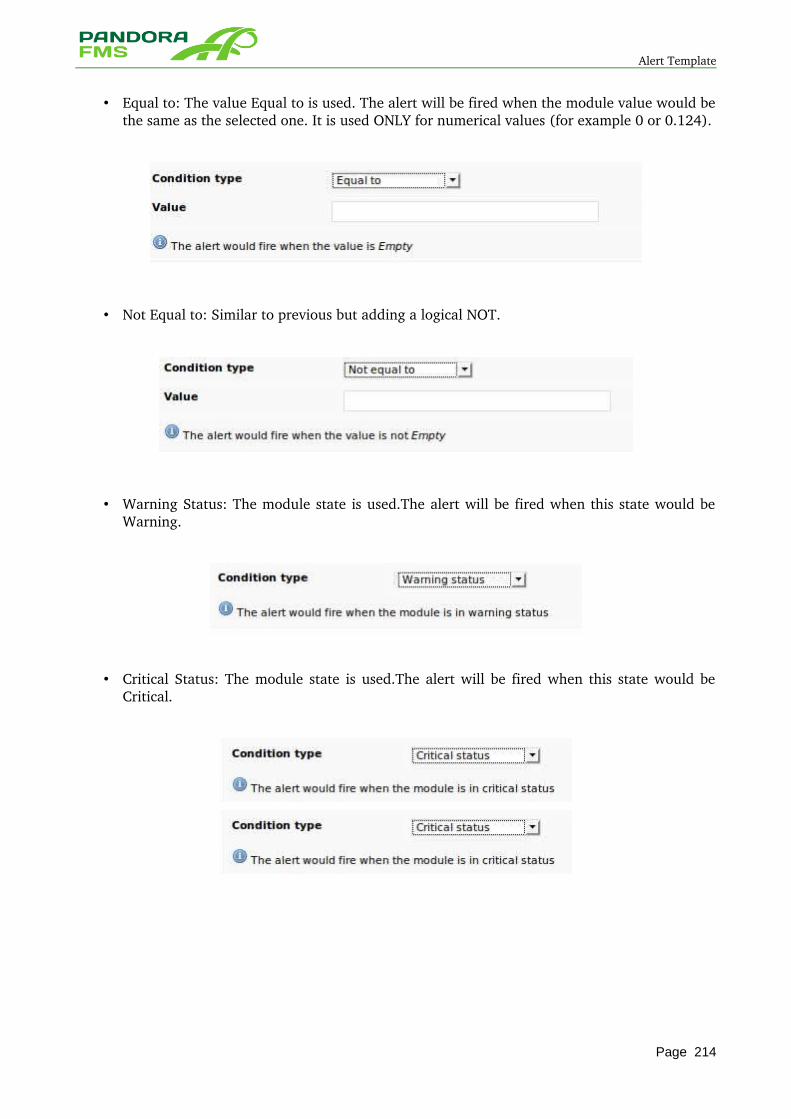
Alert Template
• Equal to: The value Equal to is used. The alert will be fired when the module value would be the same as the selected one. It is used ONLY for numerical values (for example 0 or 0.124).
• Not Equal to: Similar to previous but adding a logical NOT.
• Warning Status: The module state is used.The alert will be fired when this state would be Warning.
• Critical Status: The module state is used.The alert will be fired when this state would be Critical.
Page 214
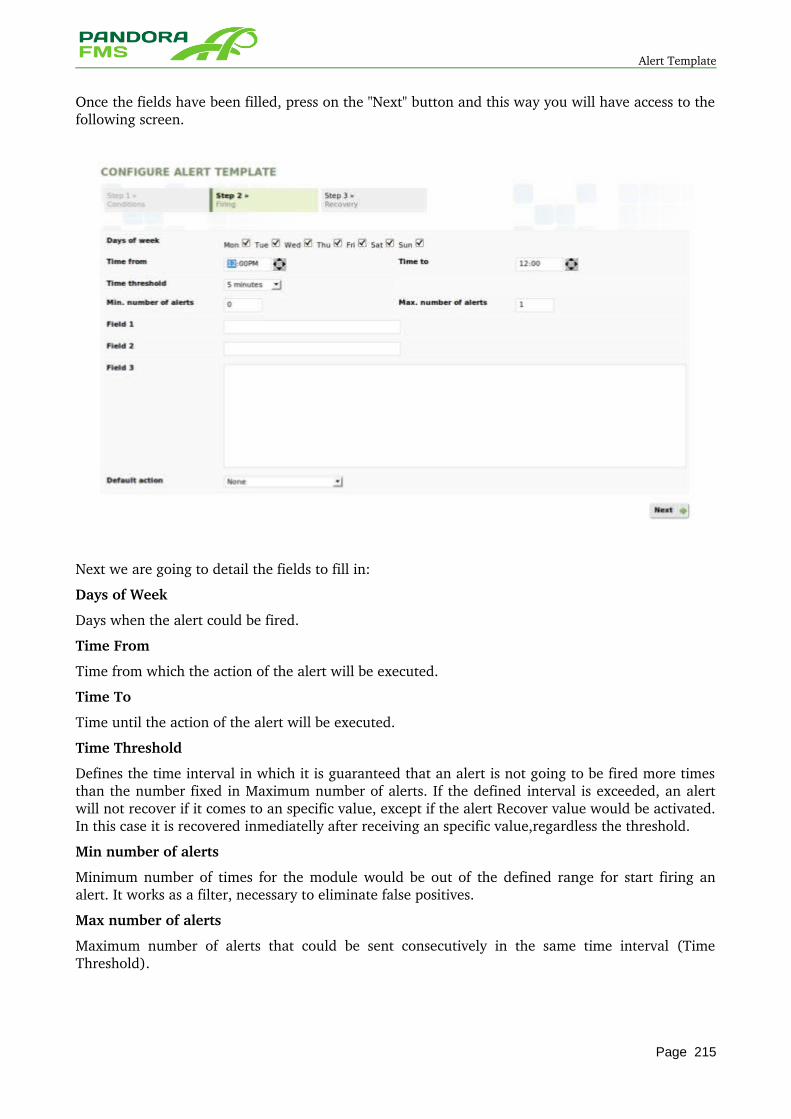
Alert Template
Once the fields have been filled, press on the "Next" button and this way you will have access to the following screen.
Next we are going to detail the fields to fill in:
Days of Week
Days when the alert could be fired.
Time From
Time from which the action of the alert will be executed.
Time To
Time until the action of the alert will be executed.
Time Threshold
Defines the time interval in which it is guaranteed that an alert is not going to be fired more times than the number fixed in Maximum number of alerts. If the defined interval is exceeded, an alert will not recover if it comes to an specific value, except if the alert Recover value would be activated. In this case it is recovered inmediatelly after receiving an specific value,regardless the threshold.
Min number of alerts
Minimum number of times for the module would be out of the defined range for start firing an alert. It works as a filter, necessary to eliminate false positives.
Max number of alerts
Maximum number of alerts that could be sent consecutively in the same time interval (Time Threshold).
Page 215
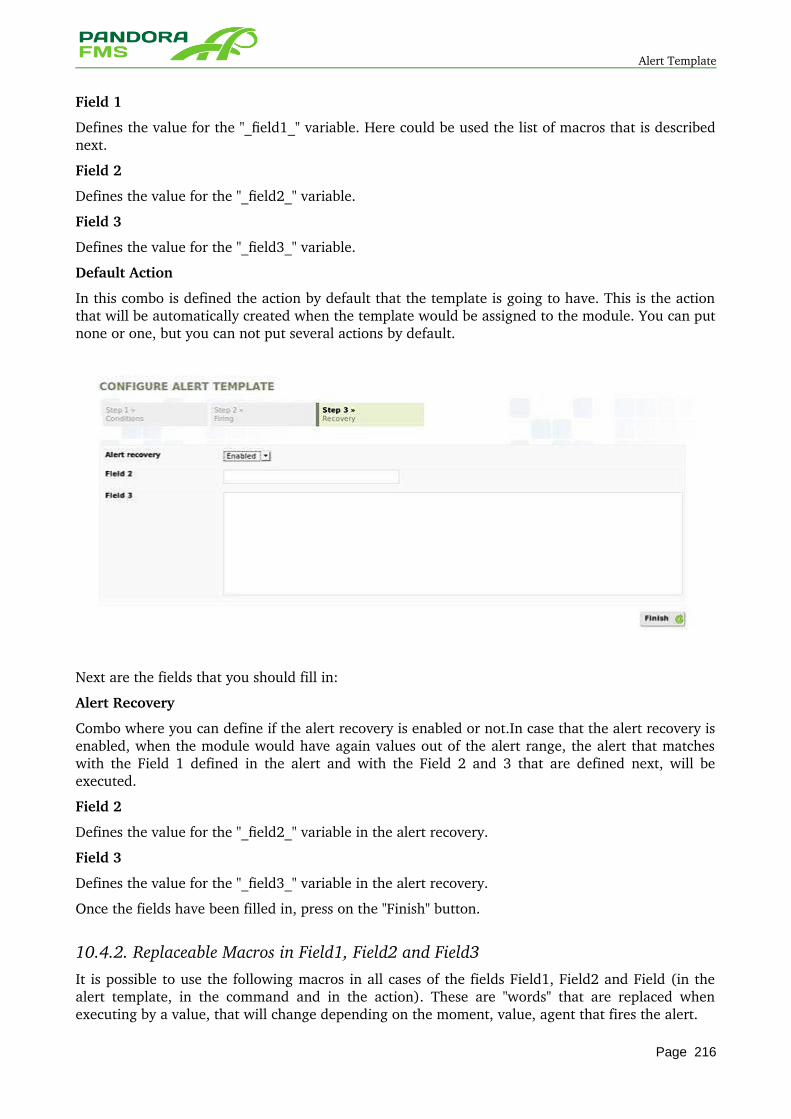
Alert Template
Field 1
Defines the value for the "_field1_" variable. Here could be used the list of macros that is described next.
Field 2
Defines the value for the "_field2_" variable.
Field 3
Defines the value for the "_field3_" variable.
Default Action
In this combo is defined the action by default that the template is going to have. This is the action that will be automatically created when the template would be assigned to the module. You can put none or one, but you can not put several actions by default.
Next are the fields that you should fill in:
Alert Recovery
Combo where you can define if the alert recovery is enabled or not.In case that the alert recovery is enabled, when the module would have again values out of the alert range, the alert that matches with the Field 1 defined in the alert and with the Field 2 and 3 that are defined next, will be executed.
Field 2
Defines the value for the "_field2_" variable in the alert recovery.
Field 3
Defines the value for the "_field3_" variable in the alert recovery.
Once the fields have been filled in, press on the "Finish" button.
10.4.2. Replaceable Macros in Field1, Field2 and Field3 It is possible to use the following macros in all cases of the fields Field1, Field2 and Field (in the alert template, in the command and in the action). These are "words" that are replaced when executing by a value, that will change depending on the moment, value, agent that fires the alert.
Page 216
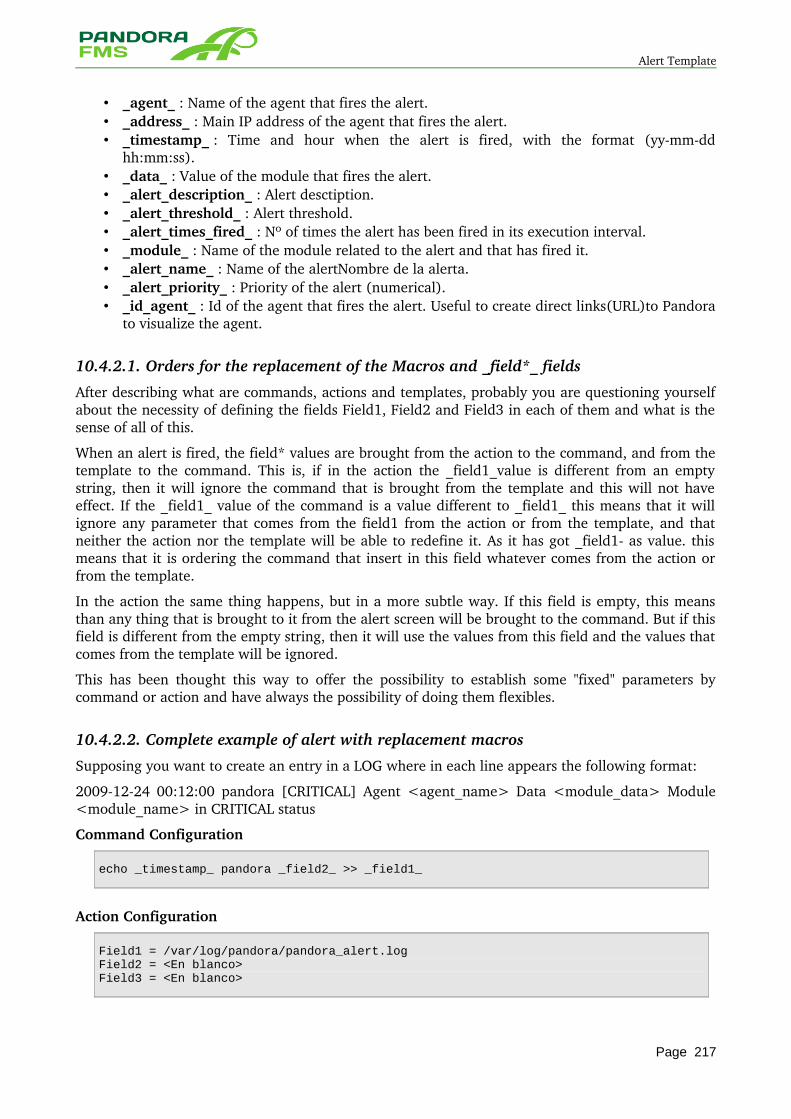
Alert Template
• _agent_ : Name of the agent that fires the alert. • _address_ : Main IP address of the agent that fires the alert. • _timestamp_ : Time and hour when the alert is fired, with the format (yymmdd
hh:mm:ss). • _data_ : Value of the module that fires the alert. • _alert_description_ : Alert desctiption. • _alert_threshold_ : Alert threshold. • _alert_times_fired_ : Nº of times the alert has been fired in its execution interval. • _module_ : Name of the module related to the alert and that has fired it. • _alert_name_ : Name of the alertNombre de la alerta. • _alert_priority_ : Priority of the alert (numerical). • _id_agent_ : Id of the agent that fires the alert. Useful to create direct links(URL)to Pandora
to visualize the agent.
10.4.2.1. Orders for the replacement of the Macros and _field*_ fields
After describing what are commands, actions and templates, probably you are questioning yourself about the necessity of defining the fields Field1, Field2 and Field3 in each of them and what is the sense of all of this.
When an alert is fired, the field* values are brought from the action to the command, and from the template to the command. This is, if in the action the _field1_value is different from an empty string, then it will ignore the command that is brought from the template and this will not have effect. If the _field1_ value of the command is a value different to _field1_ this means that it will ignore any parameter that comes from the field1 from the action or from the template, and that neither the action nor the template will be able to redefine it. As it has got _field1 as value. this means that it is ordering the command that insert in this field whatever comes from the action or from the template.
In the action the same thing happens, but in a more subtle way. If this field is empty, this means than any thing that is brought to it from the alert screen will be brought to the command. But if this field is different from the empty string, then it will use the values from this field and the values that comes from the template will be ignored.
This has been thought this way to offer the possibility to establish some "fixed" parameters by command or action and have always the possibility of doing them flexibles.
10.4.2.2. Complete example of alert with replacement macros
Supposing you want to create an entry in a LOG where in each line appears the following format:
20091224 00:12:00 pandora [CRITICAL] Agent <agent_name> Data <module_data> Module <module_name> in CRITICAL status
Command Configuration
echo _timestamp_ pandora _field2_ >> _field1_
Action Configuration
Field1 = /var/log/pandora/pandora_alert.logField2 = <En blanco>Field3 = <En blanco>
Page 217
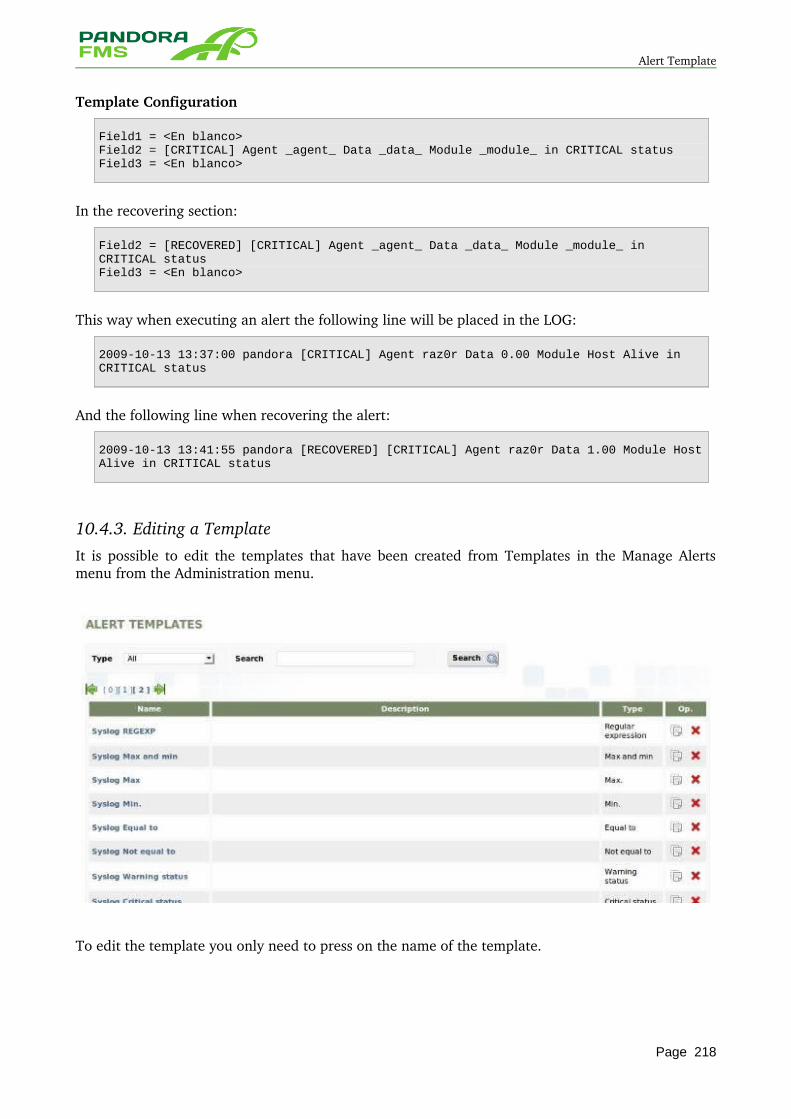
Alert Template
Template Configuration
Field1 = <En blanco>Field2 = [CRITICAL] Agent _agent_ Data _data_ Module _module_ in CRITICAL statusField3 = <En blanco>
In the recovering section:
Field2 = [RECOVERED] [CRITICAL] Agent _agent_ Data _data_ Module _module_ in CRITICAL statusField3 = <En blanco>
This way when executing an alert the following line will be placed in the LOG:
2009-10-13 13:37:00 pandora [CRITICAL] Agent raz0r Data 0.00 Module Host Alive in CRITICAL status
And the following line when recovering the alert:
2009-10-13 13:41:55 pandora [RECOVERED] [CRITICAL] Agent raz0r Data 1.00 Module Host Alive in CRITICAL status
10.4.3. Editing a TemplateIt is possible to edit the templates that have been created from Templates in the Manage Alerts menu from the Administration menu.
To edit the template you only need to press on the name of the template.
Page 218
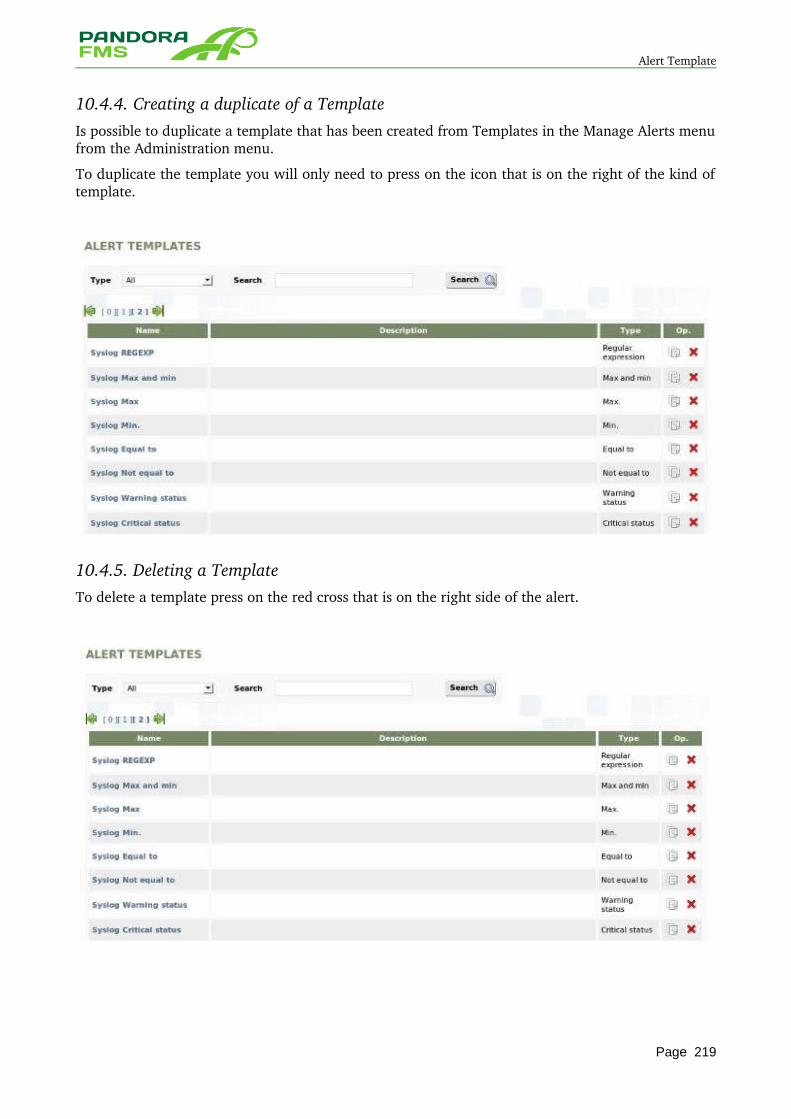
Alert Template
10.4.4. Creating a duplicate of a TemplateIs possible to duplicate a template that has been created from Templates in the Manage Alerts menu from the Administration menu.
To duplicate the template you will only need to press on the icon that is on the right of the kind of template.
10.4.5. Deleting a TemplateTo delete a template press on the red cross that is on the right side of the alert.
Page 219
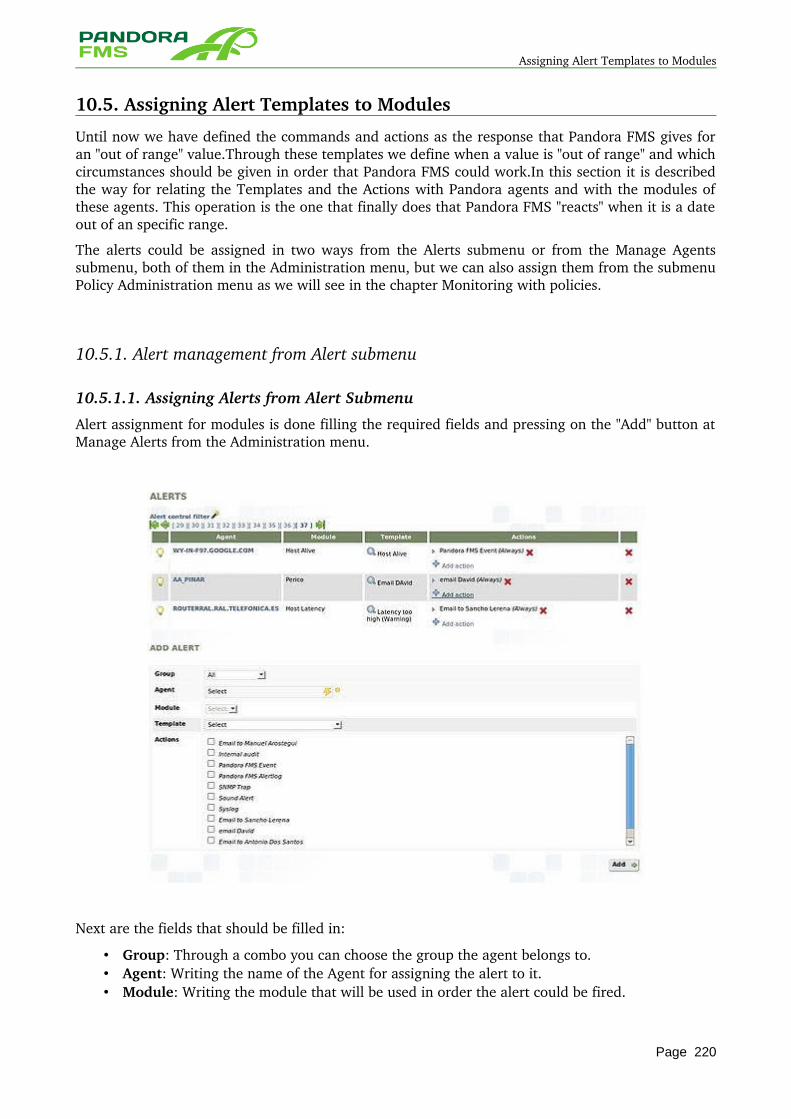
Assigning Alert Templates to Modules
10.5. Assigning Alert Templates to Modules
Until now we have defined the commands and actions as the response that Pandora FMS gives for an "out of range" value.Through these templates we define when a value is "out of range" and which circumstances should be given in order that Pandora FMS could work.In this section it is described the way for relating the Templates and the Actions with Pandora agents and with the modules of these agents. This operation is the one that finally does that Pandora FMS "reacts" when it is a date out of an specific range.
The alerts could be assigned in two ways from the Alerts submenu or from the Manage Agents submenu, both of them in the Administration menu, but we can also assign them from the submenu Policy Administration menu as we will see in the chapter Monitoring with policies.
10.5.1. Alert management from Alert submenu
10.5.1.1. Assigning Alerts from Alert Submenu
Alert assignment for modules is done filling the required fields and pressing on the "Add" button at Manage Alerts from the Administration menu.
Next are the fields that should be filled in:
• Group: Through a combo you can choose the group the agent belongs to. • Agent: Writing the name of the Agent for assigning the alert to it. • Module: Writing the module that will be used in order the alert could be fired.
Page 220
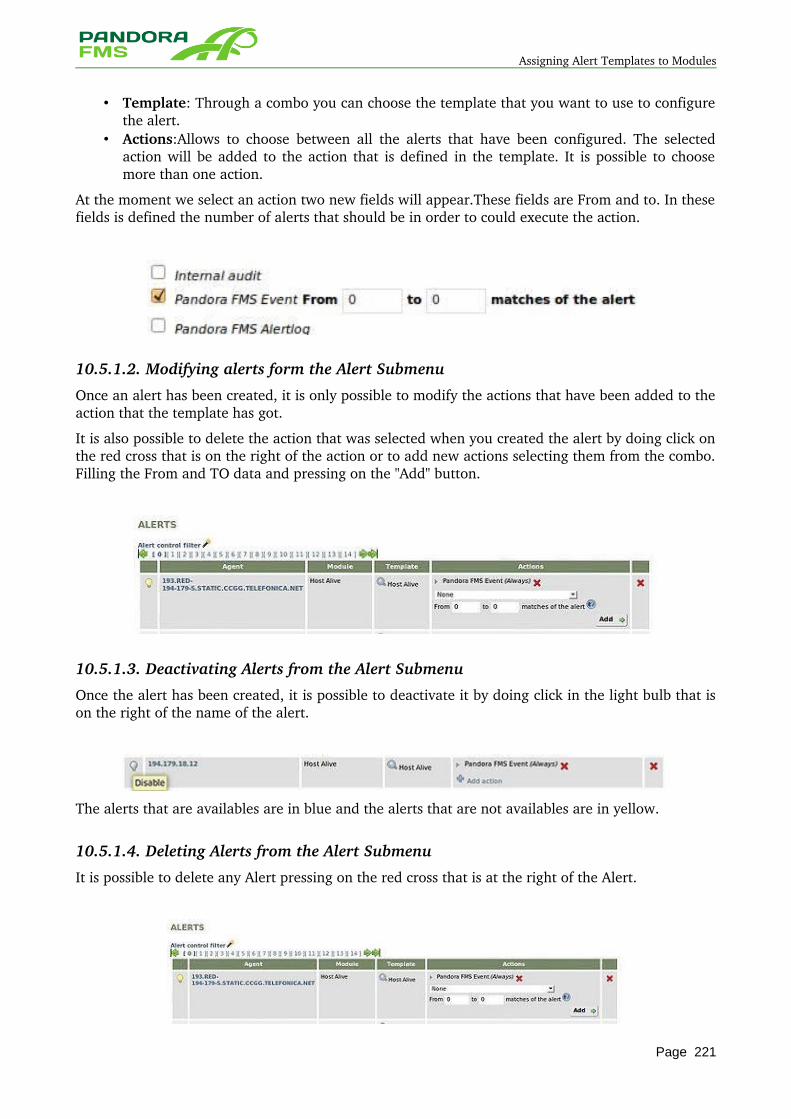
Assigning Alert Templates to Modules
• Template: Through a combo you can choose the template that you want to use to configure the alert.
• Actions:Allows to choose between all the alerts that have been configured. The selected action will be added to the action that is defined in the template. It is possible to choose more than one action.
At the moment we select an action two new fields will appear.These fields are From and to. In these fields is defined the number of alerts that should be in order to could execute the action.
10.5.1.2. Modifying alerts form the Alert Submenu
Once an alert has been created, it is only possible to modify the actions that have been added to the action that the template has got.
It is also possible to delete the action that was selected when you created the alert by doing click on the red cross that is on the right of the action or to add new actions selecting them from the combo. Filling the From and TO data and pressing on the "Add" button.
10.5.1.3. Deactivating Alerts from the Alert Submenu
Once the alert has been created, it is possible to deactivate it by doing click in the light bulb that is on the right of the name of the alert.
The alerts that are availables are in blue and the alerts that are not availables are in yellow.
10.5.1.4. Deleting Alerts from the Alert Submenu
It is possible to delete any Alert pressing on the red cross that is at the right of the Alert.
Page 221
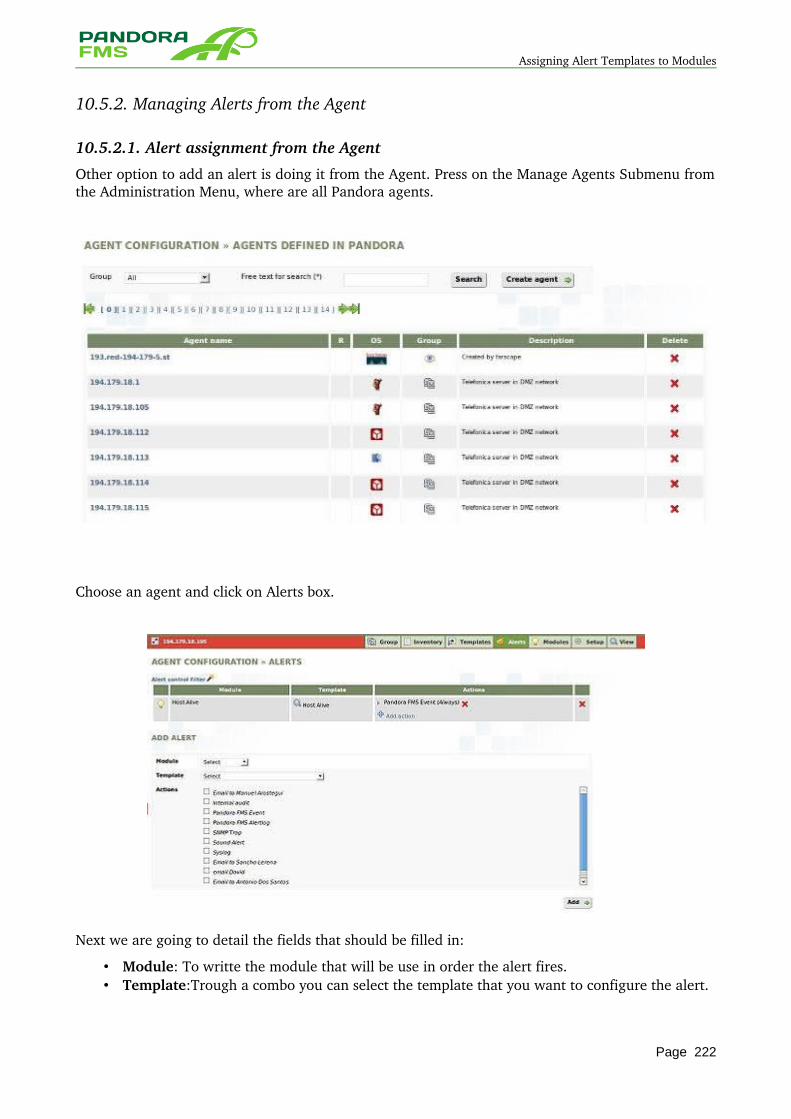
Assigning Alert Templates to Modules
10.5.2. Managing Alerts from the Agent
10.5.2.1. Alert assignment from the Agent
Other option to add an alert is doing it from the Agent. Press on the Manage Agents Submenu from the Administration Menu, where are all Pandora agents.
Choose an agent and click on Alerts box.
Next we are going to detail the fields that should be filled in:
• Module: To writte the module that will be use in order the alert fires. • Template:Trough a combo you can select the template that you want to configure the alert.
Page 222
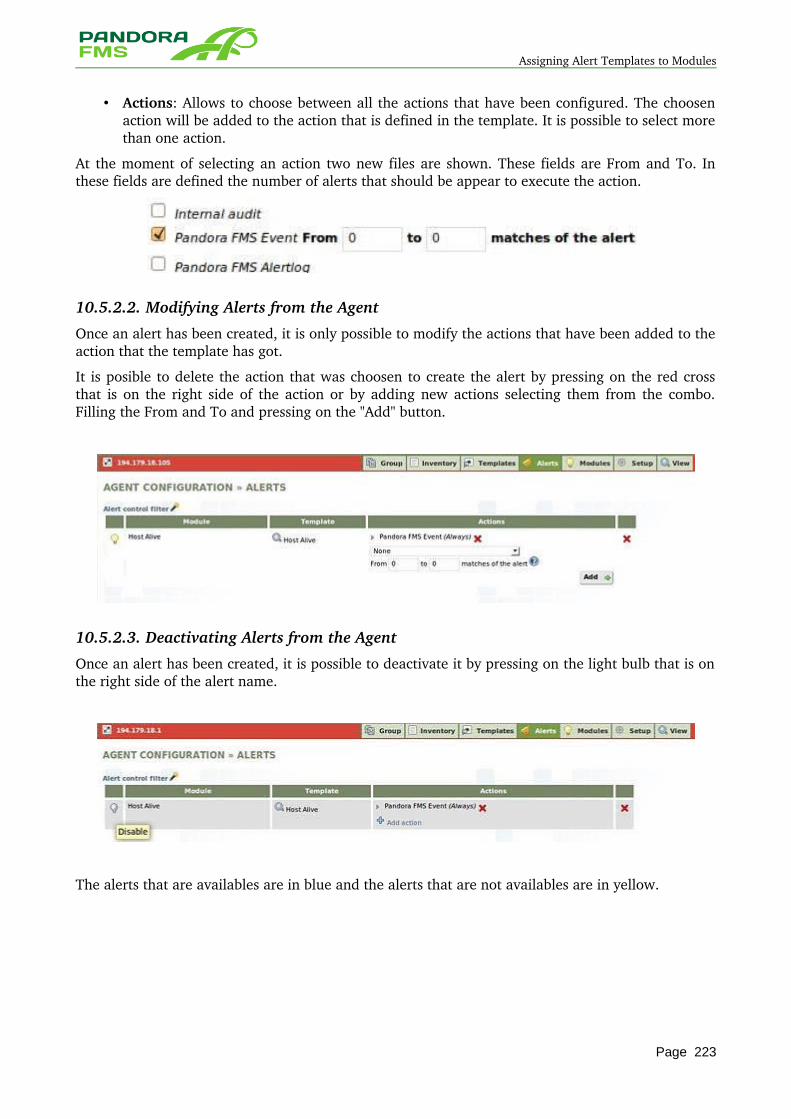
Assigning Alert Templates to Modules
• Actions: Allows to choose between all the actions that have been configured. The choosen action will be added to the action that is defined in the template. It is possible to select more than one action.
At the moment of selecting an action two new files are shown. These fields are From and To. In these fields are defined the number of alerts that should be appear to execute the action.
10.5.2.2. Modifying Alerts from the Agent
Once an alert has been created, it is only possible to modify the actions that have been added to the action that the template has got.
It is posible to delete the action that was choosen to create the alert by pressing on the red cross that is on the right side of the action or by adding new actions selecting them from the combo. Filling the From and To and pressing on the "Add" button.
10.5.2.3. Deactivating Alerts from the Agent
Once an alert has been created, it is possible to deactivate it by pressing on the light bulb that is on the right side of the alert name.
The alerts that are availables are in blue and the alerts that are not availables are in yellow.
Page 223
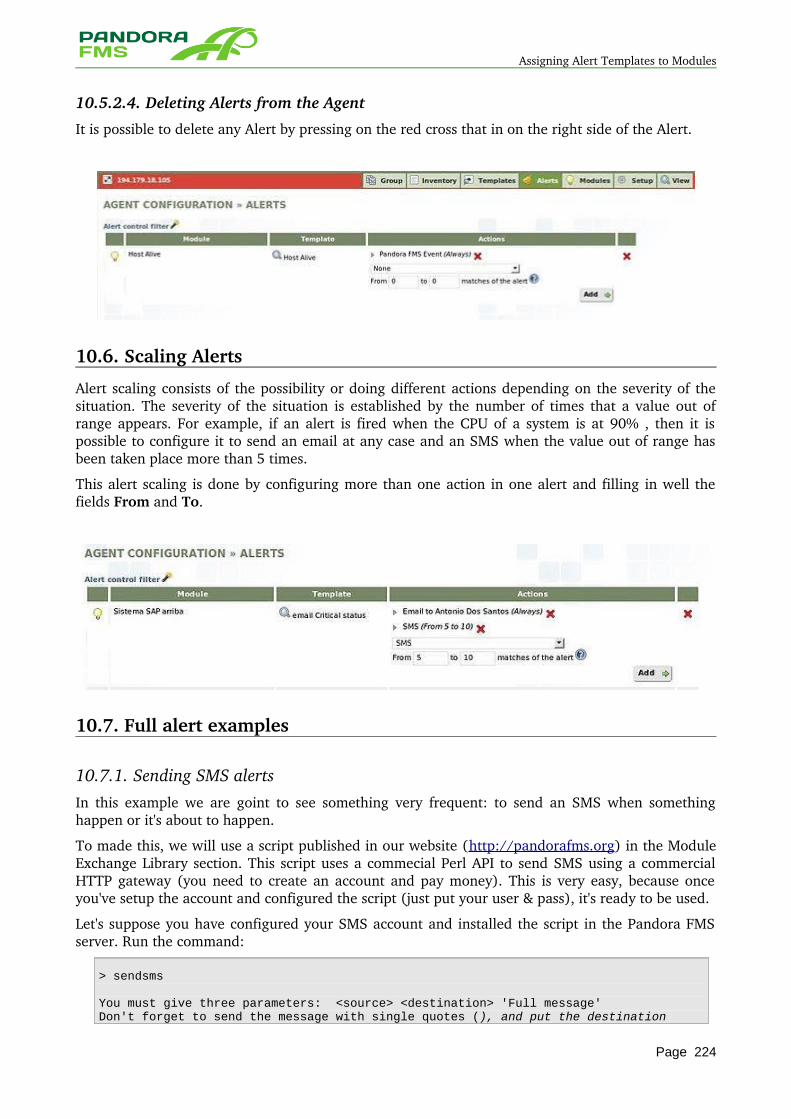
Assigning Alert Templates to Modules
10.5.2.4. Deleting Alerts from the Agent
It is possible to delete any Alert by pressing on the red cross that in on the right side of the Alert.
10.6. Scaling Alerts
Alert scaling consists of the possibility or doing different actions depending on the severity of the situation. The severity of the situation is established by the number of times that a value out of range appears. For example, if an alert is fired when the CPU of a system is at 90% , then it is possible to configure it to send an email at any case and an SMS when the value out of range has been taken place more than 5 times.
This alert scaling is done by configuring more than one action in one alert and filling in well the fields From and To.
10.7. Full alert examples
10.7.1. Sending SMS alerts In this example we are goint to see something very frequent: to send an SMS when something happen or it's about to happen.
To made this, we will use a script published in our website (http://pandorafms.org) in the Module Exchange Library section. This script uses a commecial Perl API to send SMS using a commercial HTTP gateway (you need to create an account and pay money). This is very easy, because once you've setup the account and configured the script (just put your user & pass), it's ready to be used.
Let's suppose you have configured your SMS account and installed the script in the Pandora FMS server. Run the command:
> sendsms
You must give three parameters: <source> <destination> 'Full message'Don't forget to send the message with single quotes (), and put the destination
Page 224
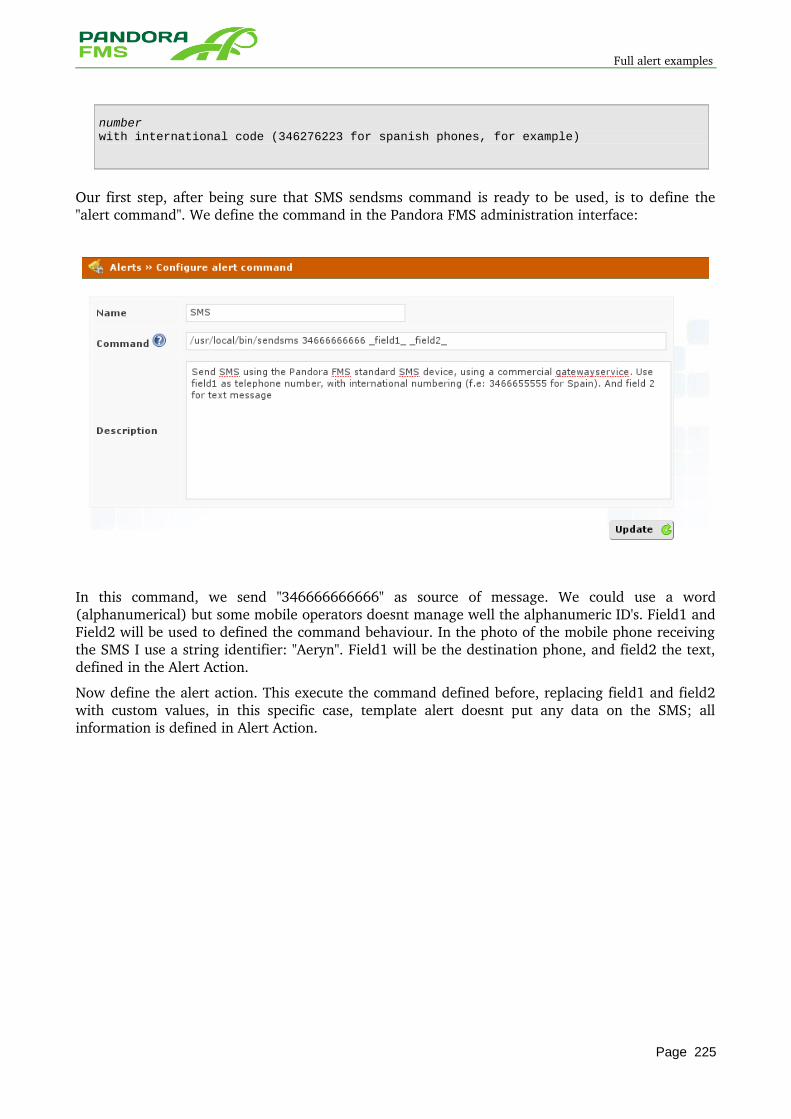
Full alert examples
number with international code (346276223 for spanish phones, for example)
Our first step, after being sure that SMS sendsms command is ready to be used, is to define the "alert command". We define the command in the Pandora FMS administration interface:
In this command, we send "346666666666" as source of message. We could use a word (alphanumerical) but some mobile operators doesnt manage well the alphanumeric ID's. Field1 and Field2 will be used to defined the command behaviour. In the photo of the mobile phone receiving the SMS I use a string identifier: "Aeryn". Field1 will be the destination phone, and field2 the text, defined in the Alert Action.
Now define the alert action. This execute the command defined before, replacing field1 and field2 with custom values, in this specific case, template alert doesnt put any data on the SMS; all information is defined in Alert Action.
Page 225
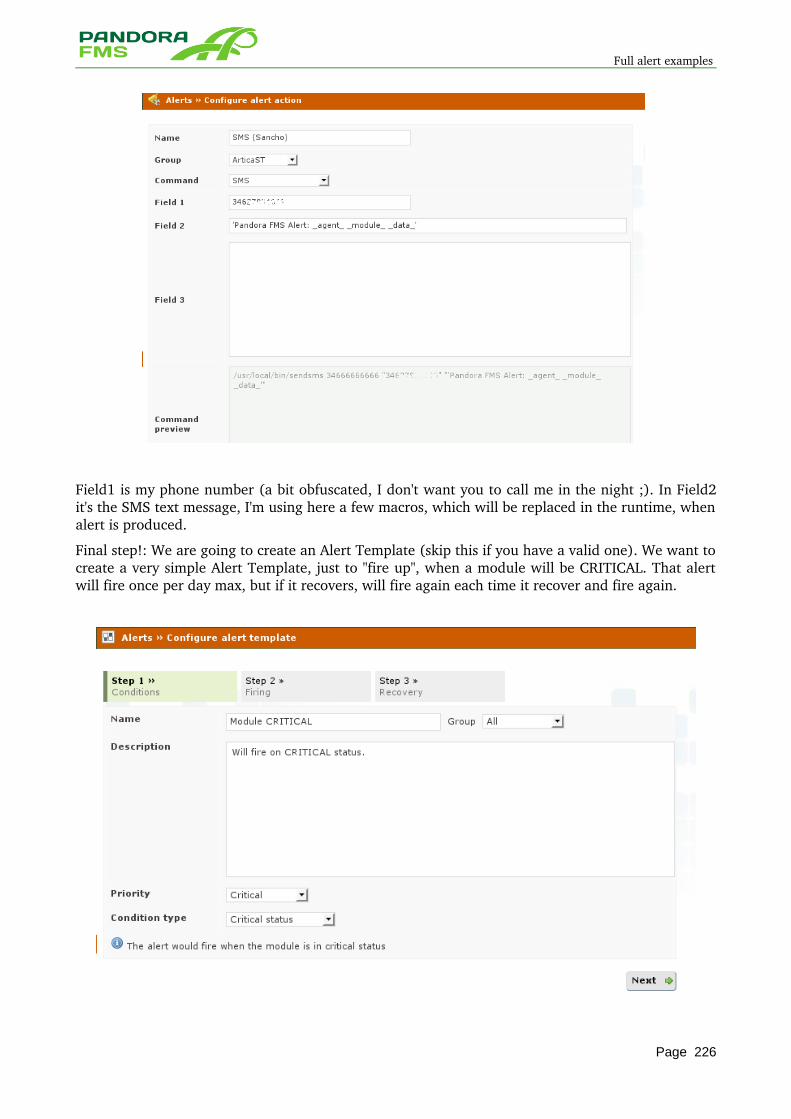
Full alert examples
Field1 is my phone number (a bit obfuscated, I don't want you to call me in the night ;). In Field2 it's the SMS text message, I'm using here a few macros, which will be replaced in the runtime, when alert is produced.
Final step!: We are going to create an Alert Template (skip this if you have a valid one). We want to create a very simple Alert Template, just to "fire up", when a module will be CRITICAL. That alert will fire once per day max, but if it recovers, will fire again each time it recover and fire again.
Page 226
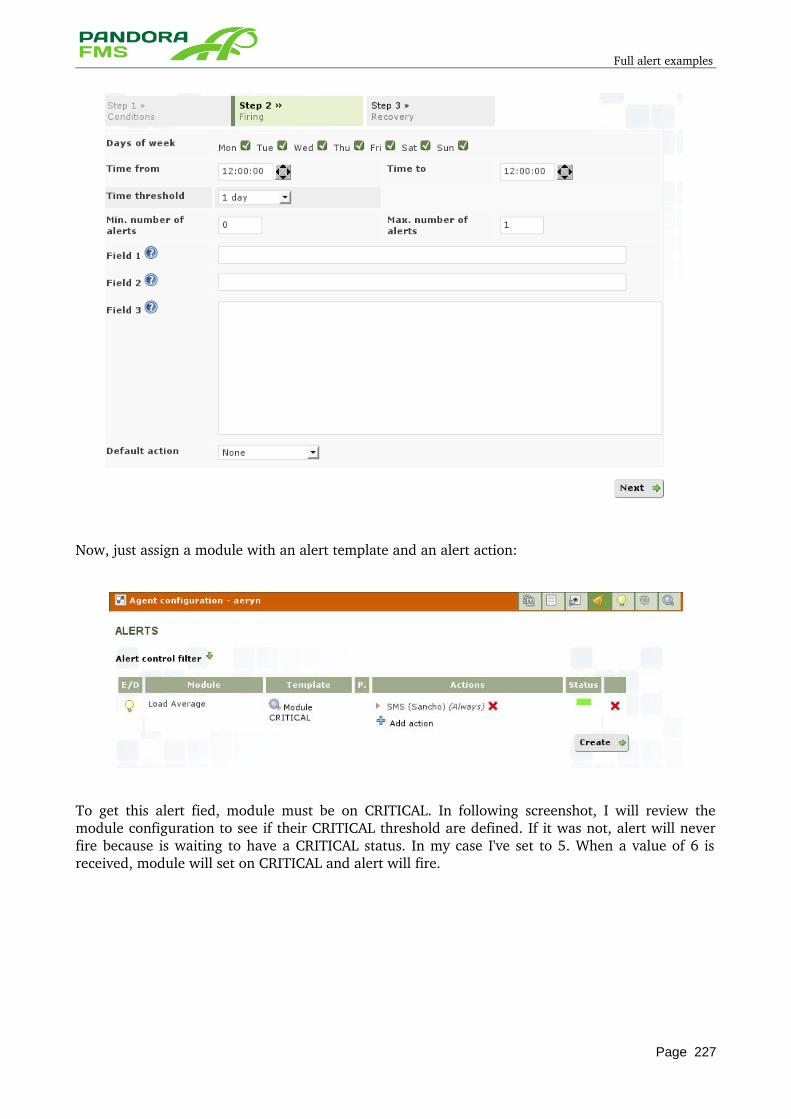
Full alert examples
Now, just assign a module with an alert template and an alert action:
To get this alert fied, module must be on CRITICAL. In following screenshot, I will review the module configuration to see if their CRITICAL threshold are defined. If it was not, alert will never fire because is waiting to have a CRITICAL status. In my case I've set to 5. When a value of 6 is received, module will set on CRITICAL and alert will fire.
Page 227
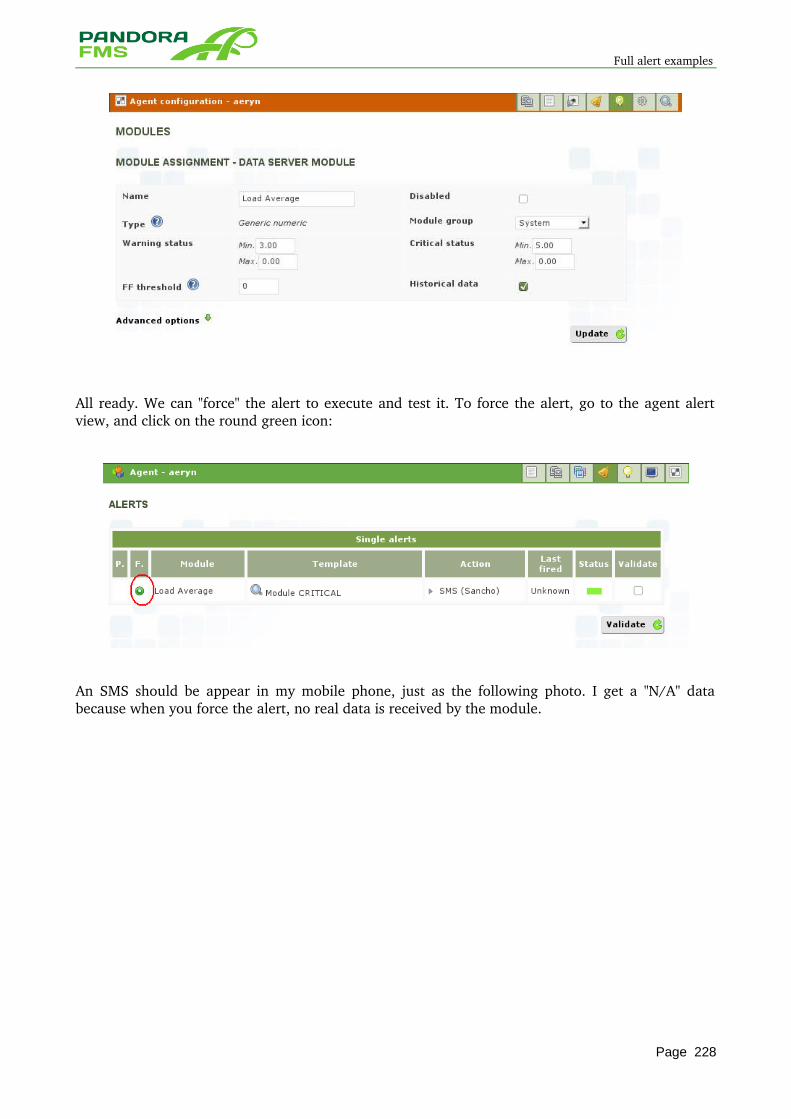
Full alert examples
All ready. We can "force" the alert to execute and test it. To force the alert, go to the agent alert view, and click on the round green icon:
An SMS should be appear in my mobile phone, just as the following photo. I get a "N/A" data because when you force the alert, no real data is received by the module.
Page 228
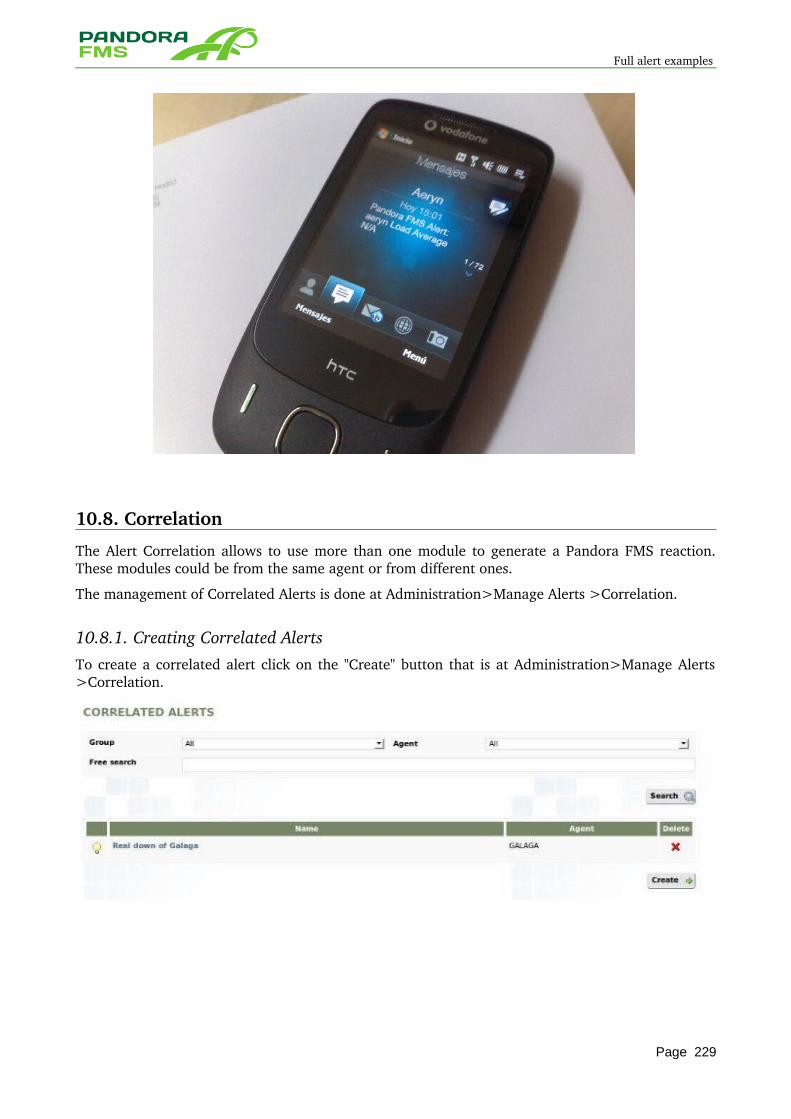
Full alert examples
10.8. Correlation
The Alert Correlation allows to use more than one module to generate a Pandora FMS reaction. These modules could be from the same agent or from different ones.
The management of Correlated Alerts is done at Administration>Manage Alerts >Correlation.
10.8.1. Creating Correlated Alerts To create a correlated alert click on the "Create" button that is at Administration>Manage Alerts >Correlation.
Page 229
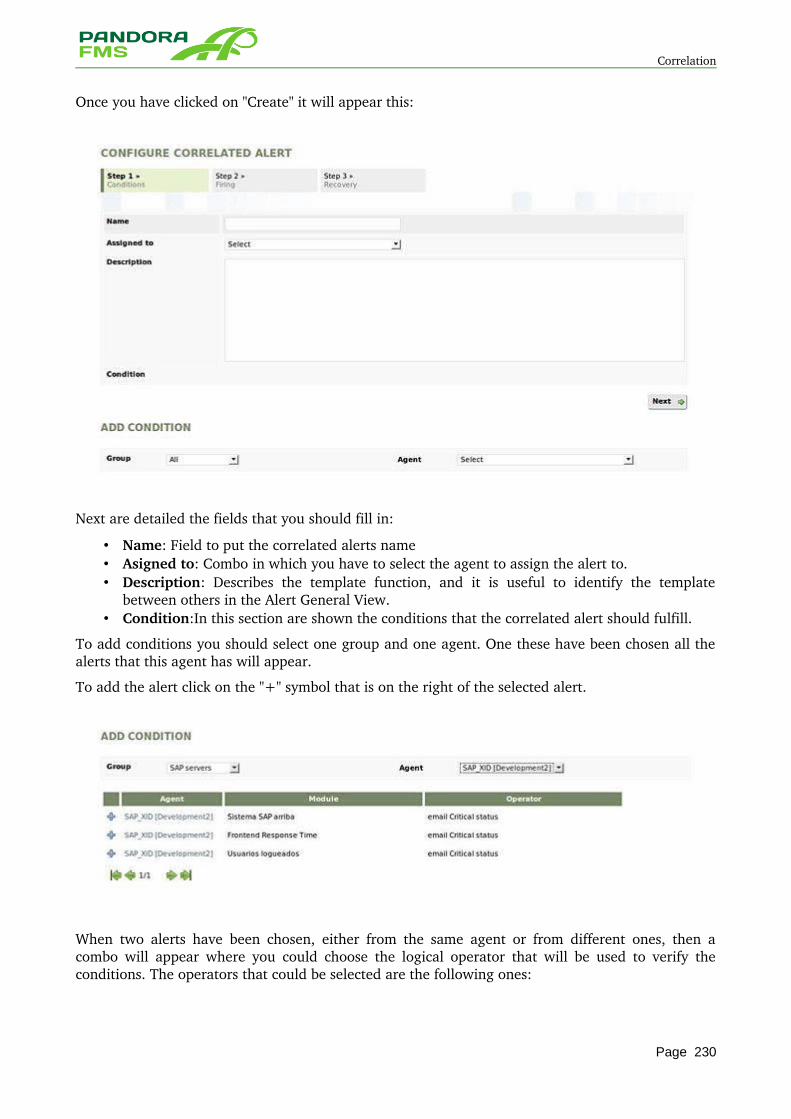
Correlation
Once you have clicked on "Create" it will appear this:
Next are detailed the fields that you should fill in:
• Name: Field to put the correlated alerts name • Asigned to: Combo in which you have to select the agent to assign the alert to. • Description: Describes the template function, and it is useful to identify the template
between others in the Alert General View. • Condition:In this section are shown the conditions that the correlated alert should fulfill.
To add conditions you should select one group and one agent. One these have been chosen all the alerts that this agent has will appear.
To add the alert click on the "+" symbol that is on the right of the selected alert.
When two alerts have been chosen, either from the same agent or from different ones, then a combo will appear where you could choose the logical operator that will be used to verify the conditions. The operators that could be selected are the following ones:
Page 230
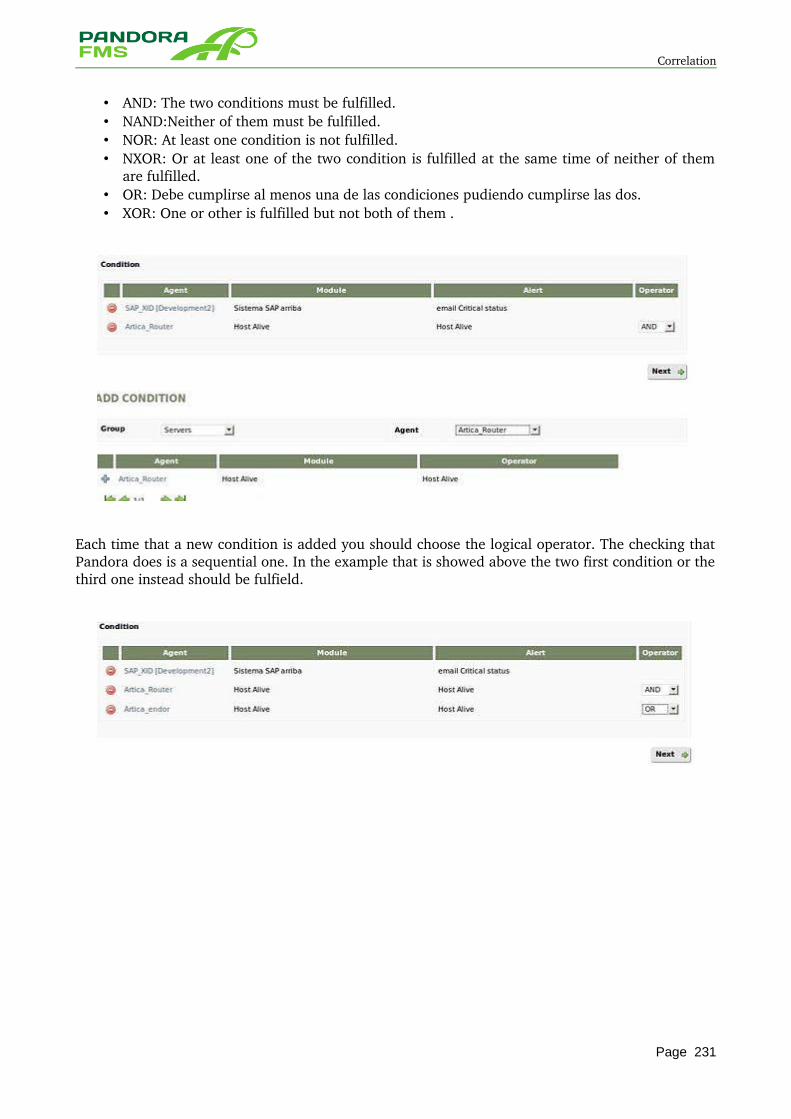
Correlation
• AND: The two conditions must be fulfilled. • NAND:Neither of them must be fulfilled. • NOR: At least one condition is not fulfilled. • NXOR: Or at least one of the two condition is fulfilled at the same time of neither of them
are fulfilled. • OR: Debe cumplirse al menos una de las condiciones pudiendo cumplirse las dos. • XOR: One or other is fulfilled but not both of them .
Each time that a new condition is added you should choose the logical operator. The checking that Pandora does is a sequential one. In the example that is showed above the two first condition or the third one instead should be fulfield.
Page 231
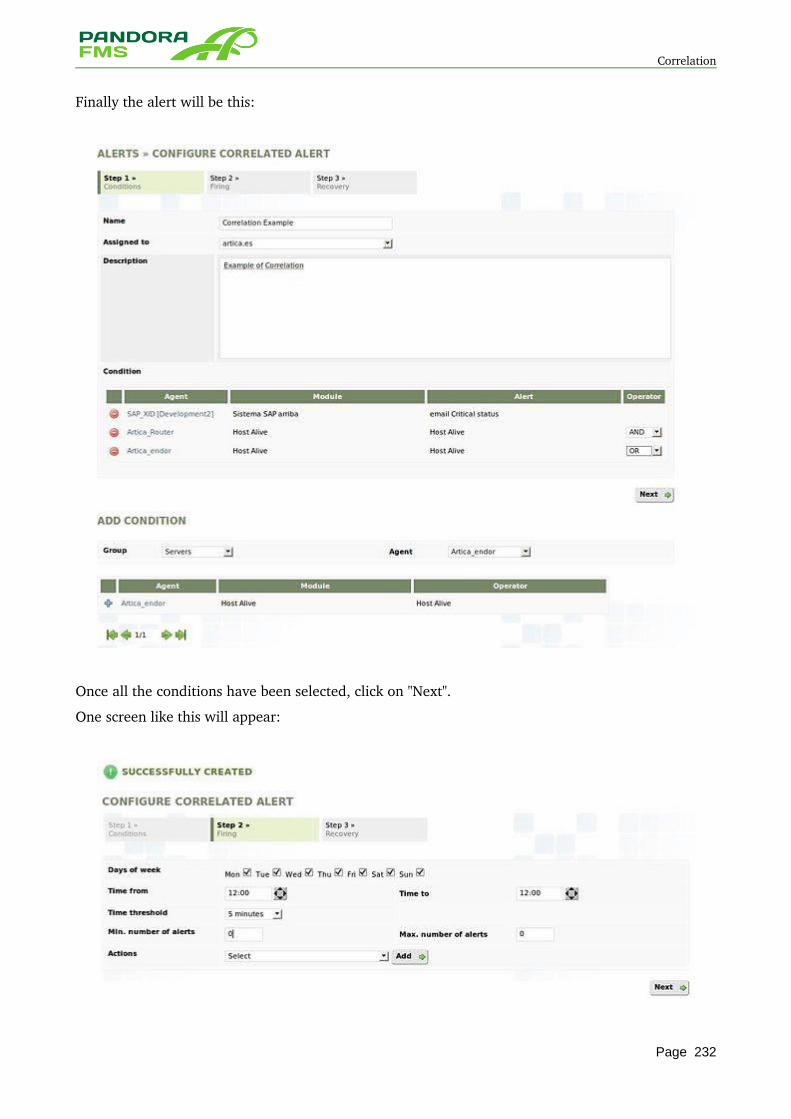
Correlation
Finally the alert will be this:
Once all the conditions have been selected, click on "Next".
One screen like this will appear:
Page 232
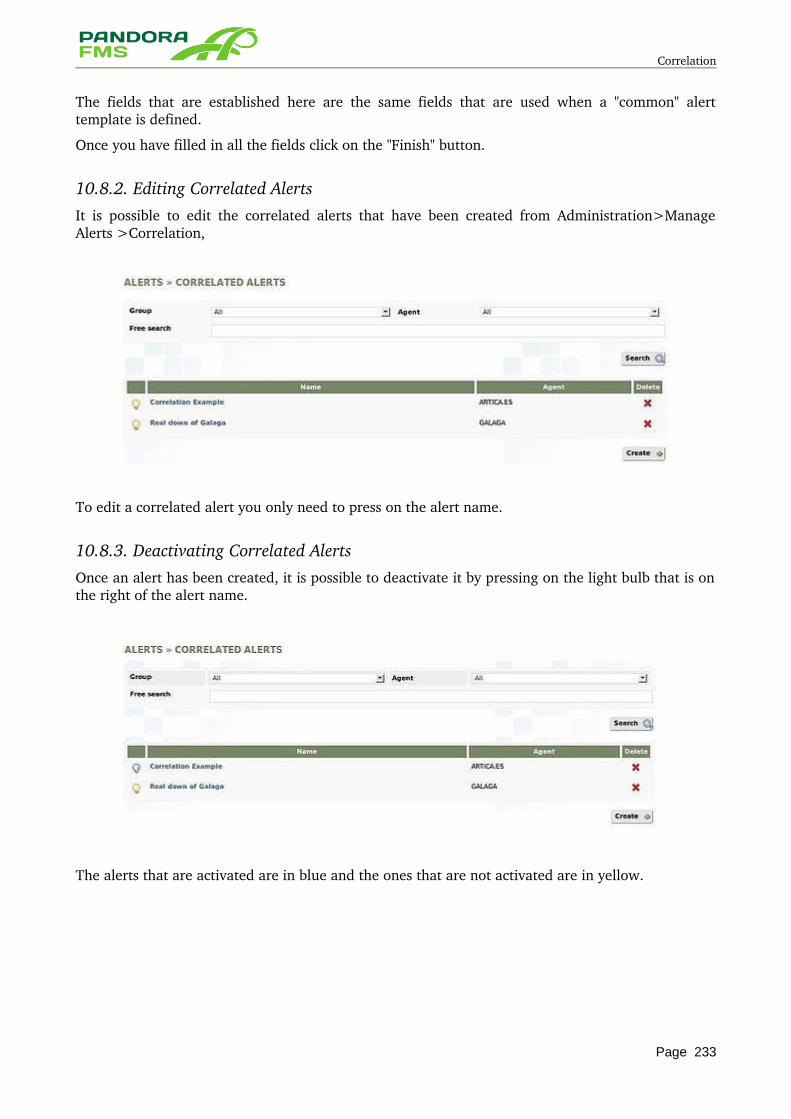
Correlation
The fields that are established here are the same fields that are used when a "common" alert template is defined.
Once you have filled in all the fields click on the "Finish" button.
10.8.2. Editing Correlated AlertsIt is possible to edit the correlated alerts that have been created from Administration>Manage Alerts >Correlation,
To edit a correlated alert you only need to press on the alert name.
10.8.3. Deactivating Correlated AlertsOnce an alert has been created, it is possible to deactivate it by pressing on the light bulb that is on the right of the alert name.
The alerts that are activated are in blue and the ones that are not activated are in yellow.
Page 233
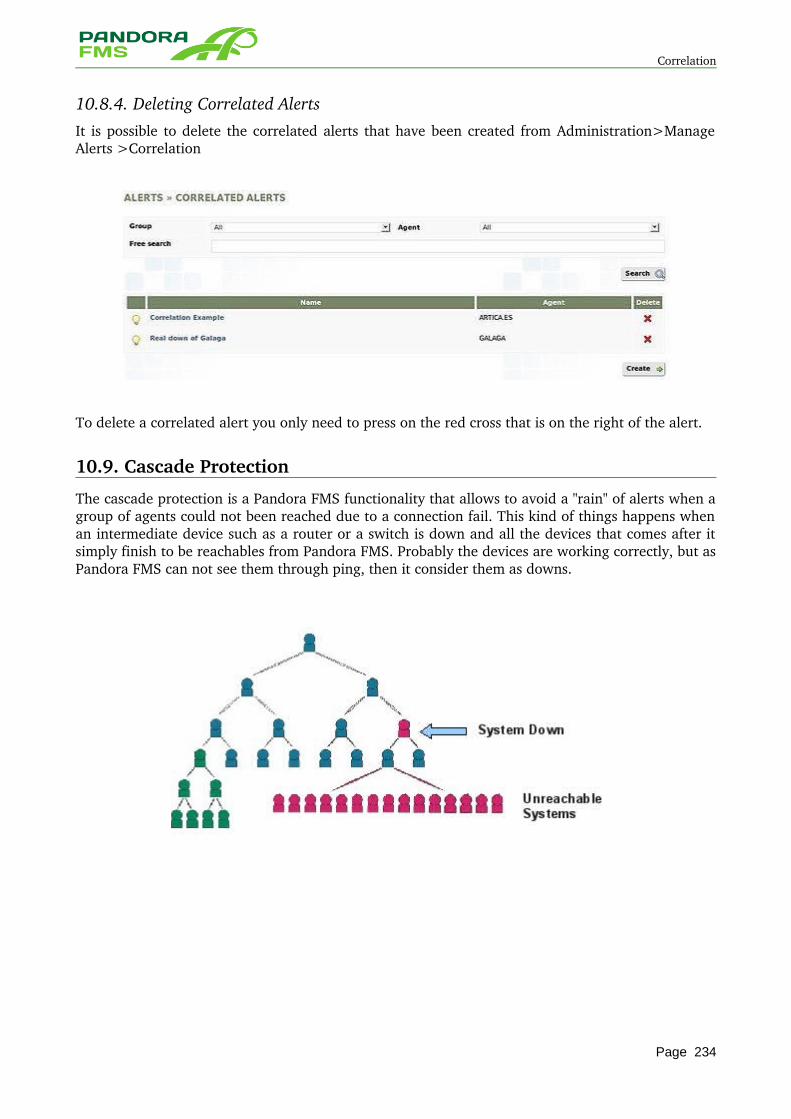
Correlation
10.8.4. Deleting Correlated AlertsIt is possible to delete the correlated alerts that have been created from Administration>Manage Alerts >Correlation
To delete a correlated alert you only need to press on the red cross that is on the right of the alert.
10.9. Cascade Protection
The cascade protection is a Pandora FMS functionality that allows to avoid a "rain" of alerts when a group of agents could not been reached due to a connection fail. This kind of things happens when an intermediate device such as a router or a switch is down and all the devices that comes after it simply finish to be reachables from Pandora FMS. Probably the devices are working correctly, but as Pandora FMS can not see them through ping, then it consider them as downs.
Page 234
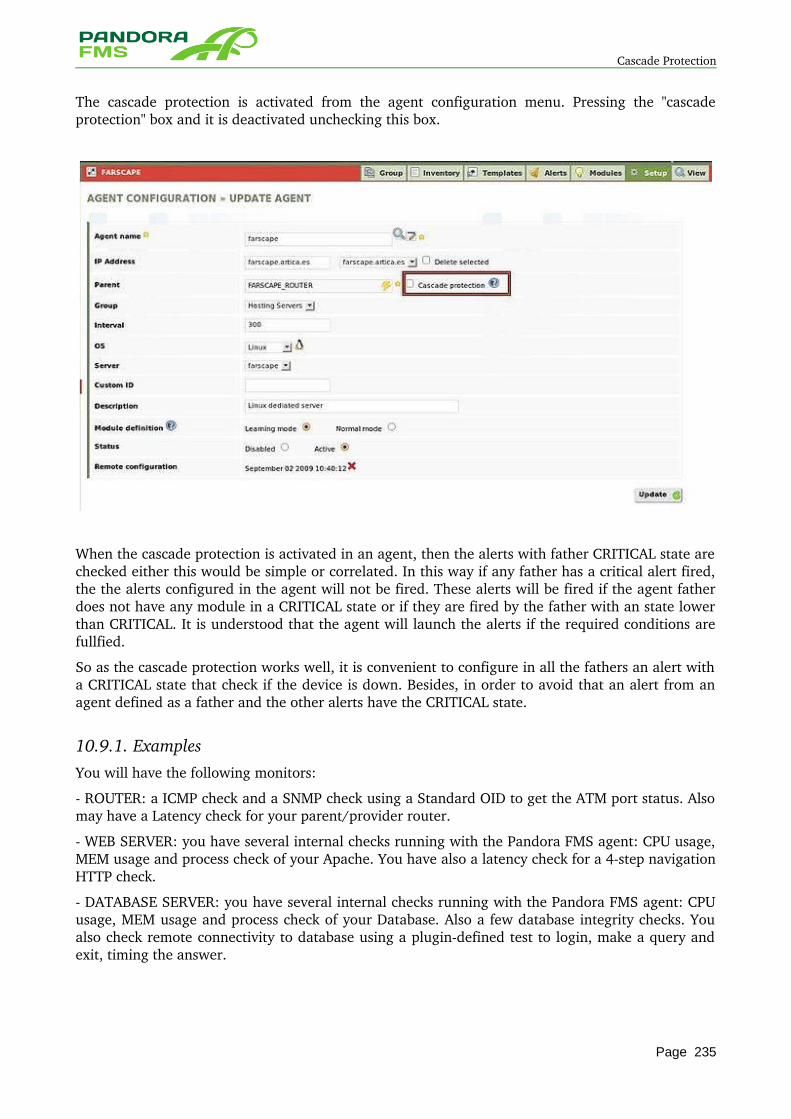
Cascade Protection
The cascade protection is activated from the agent configuration menu. Pressing the "cascade protection" box and it is deactivated unchecking this box.
When the cascade protection is activated in an agent, then the alerts with father CRITICAL state are checked either this would be simple or correlated. In this way if any father has a critical alert fired, the the alerts configured in the agent will not be fired. These alerts will be fired if the agent father does not have any module in a CRITICAL state or if they are fired by the father with an state lower than CRITICAL. It is understood that the agent will launch the alerts if the required conditions are fullfied.
So as the cascade protection works well, it is convenient to configure in all the fathers an alert with a CRITICAL state that check if the device is down. Besides, in order to avoid that an alert from an agent defined as a father and the other alerts have the CRITICAL state.
10.9.1. ExamplesYou will have the following monitors:
ROUTER: a ICMP check and a SNMP check using a Standard OID to get the ATM port status. Also may have a Latency check for your parent/provider router.
WEB SERVER: you have several internal checks running with the Pandora FMS agent: CPU usage, MEM usage and process check of your Apache. You have also a latency check for a 4step navigation HTTP check.
DATABASE SERVER: you have several internal checks running with the Pandora FMS agent: CPU usage, MEM usage and process check of your Database. Also a few database integrity checks. You also check remote connectivity to database using a plugindefined test to login, make a query and exit, timing the answer.
Page 235
Cascade Protection
Now you define several SINGLE alerts:
ROUTER: ICMP Check / CRITICAL > Action, send MAIL. SNMP Check / CRITICAL > Action, send MAIL. Latency > 200ms / WARNING > Action, none, just compound.
WEB SERVER
CPU / WARNING > Action, none, just compound. MEM / WARNING > Action, none, just compound. PROCESS / CRITICAL > Action, send MAIL. HTTP LATENCY / WARNING > Action, none, just compound.
DATABASE SERVER
CPU / WARNING > Action, none, just compound. MEM / WARNING > Action, none, just compound. PROCESS / CRITICAL > Action, send MAIL. SQL LATENCY / WARNING > Action, send MAIL.
You define ROUTER as parent for DATABASE and WEB servers. You enable the Cascade Protection in both agents (Database and Web).
You now define one correlation alert assigned to DATABASE:
Router ICMP Check NOT Fired AND Router SNMP Check NOT Fired AND WEB Server Process NOT Fired AND Database Server Process Critical
THEN Send MAIL: "Service DOWN: Database Failure" You now define one correlation alert assigned to DATABASE:
Router ICMP Check NOT Fired AND Router SNMP Check NOT Fired AND WEB Server Process Fired AND Database Server Process NOT Fired THEN Send MAIL: "Service DOWN: WebServer Failure"
And more complex alerts like: Router ICMP Check NOT Fired AND Router SNMP Check NOT Fired
AND
WEB Server HTTP Latency NOT Fired
AND
DATABASE Server SQL Latency Fired
AND
DATABASE Server CPU NOT fired
AND
DATABASE Server MEM Fired
THEN
Send MAIL: Database is getting exhausted. Please check it ASAP.
Page 236

Cascade Protection
11 POLICIES
Page 237
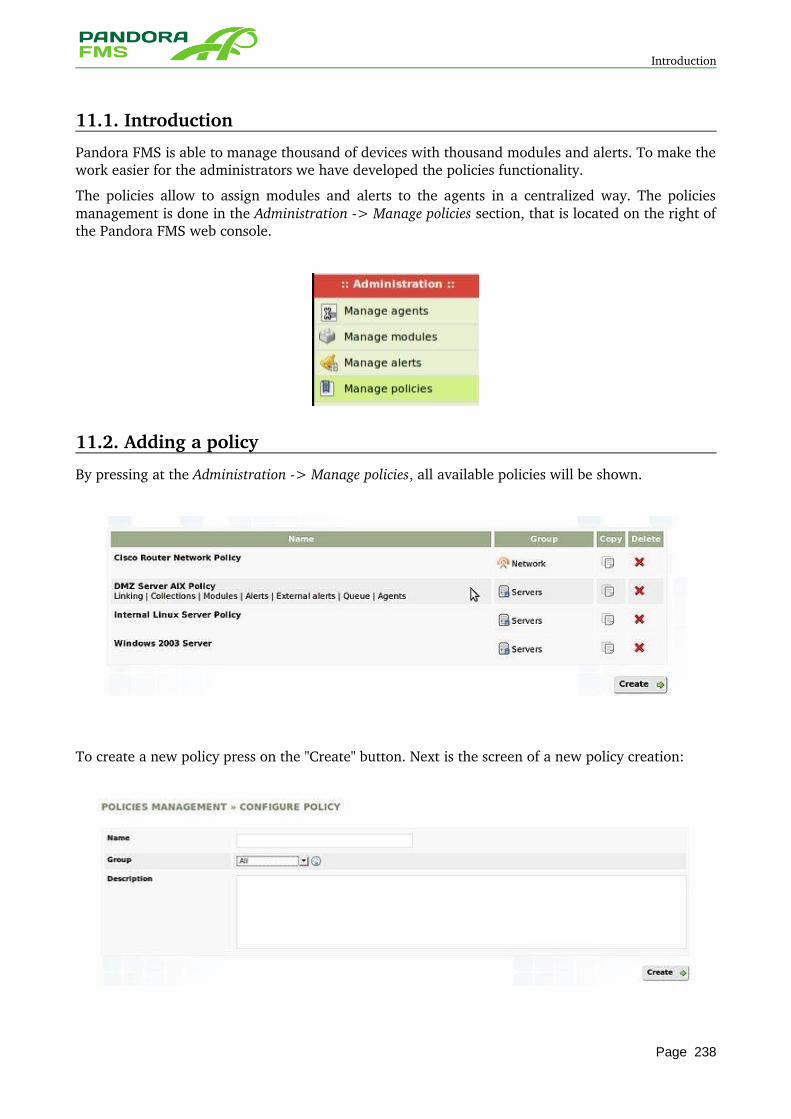
Introduction
11.1. Introduction
Pandora FMS is able to manage thousand of devices with thousand modules and alerts. To make the work easier for the administrators we have developed the policies functionality.
The policies allow to assign modules and alerts to the agents in a centralized way. The policies management is done in the Administration > Manage policies section, that is located on the right of the Pandora FMS web console.
11.2. Adding a policy
By pressing at the Administration > Manage policies, all available policies will be shown.
To create a new policy press on the "Create" button. Next is the screen of a new policy creation:
Page 238
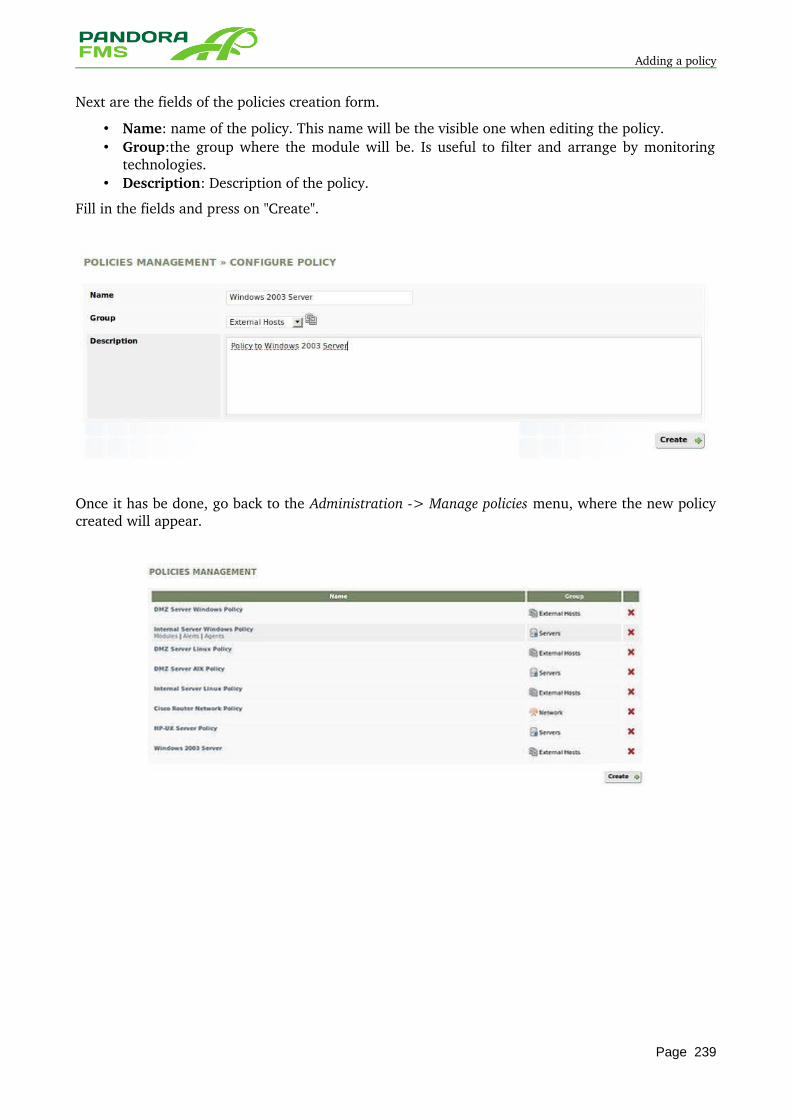
Adding a policy
Next are the fields of the policies creation form.
• Name: name of the policy. This name will be the visible one when editing the policy. • Group:the group where the module will be. Is useful to filter and arrange by monitoring
technologies. • Description: Description of the policy.
Fill in the fields and press on "Create".
Once it has be done, go back to the Administration > Manage policies menu, where the new policy created will appear.
Page 239
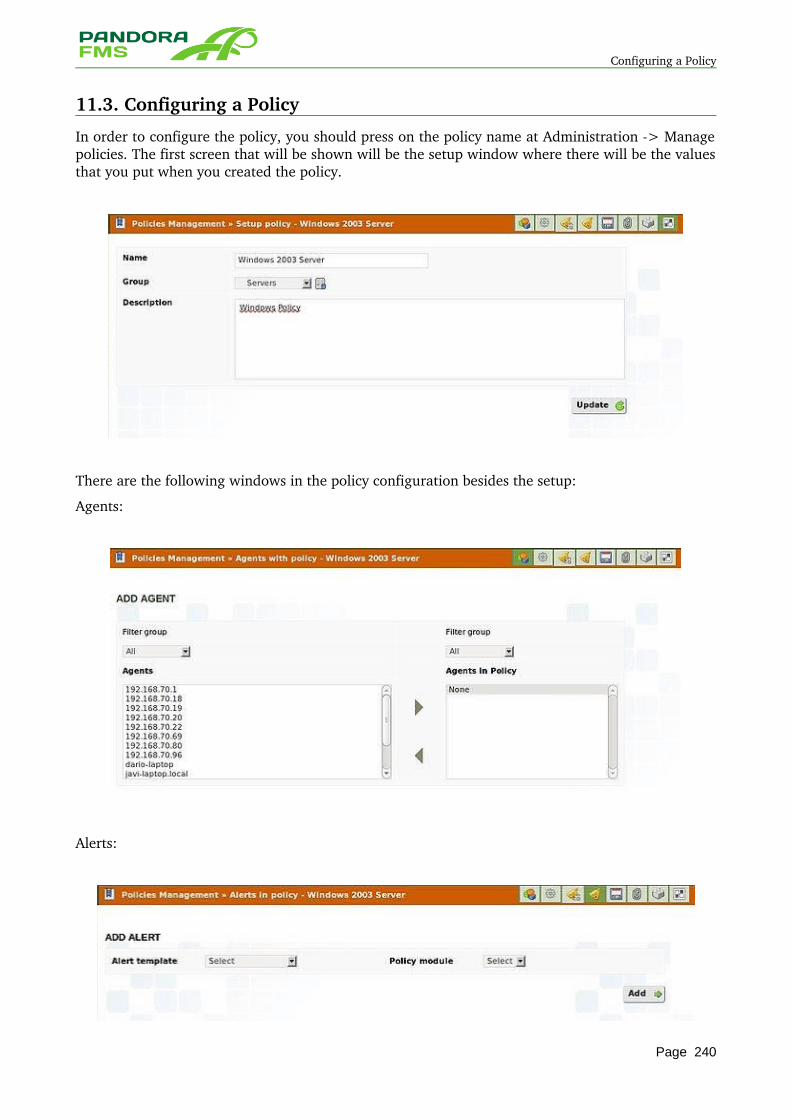
Configuring a Policy
11.3. Configuring a Policy
In order to configure the policy, you should press on the policy name at Administration > Manage policies. The first screen that will be shown will be the setup window where there will be the values that you put when you created the policy.
There are the following windows in the policy configuration besides the setup:
Agents:
Alerts:
Page 240
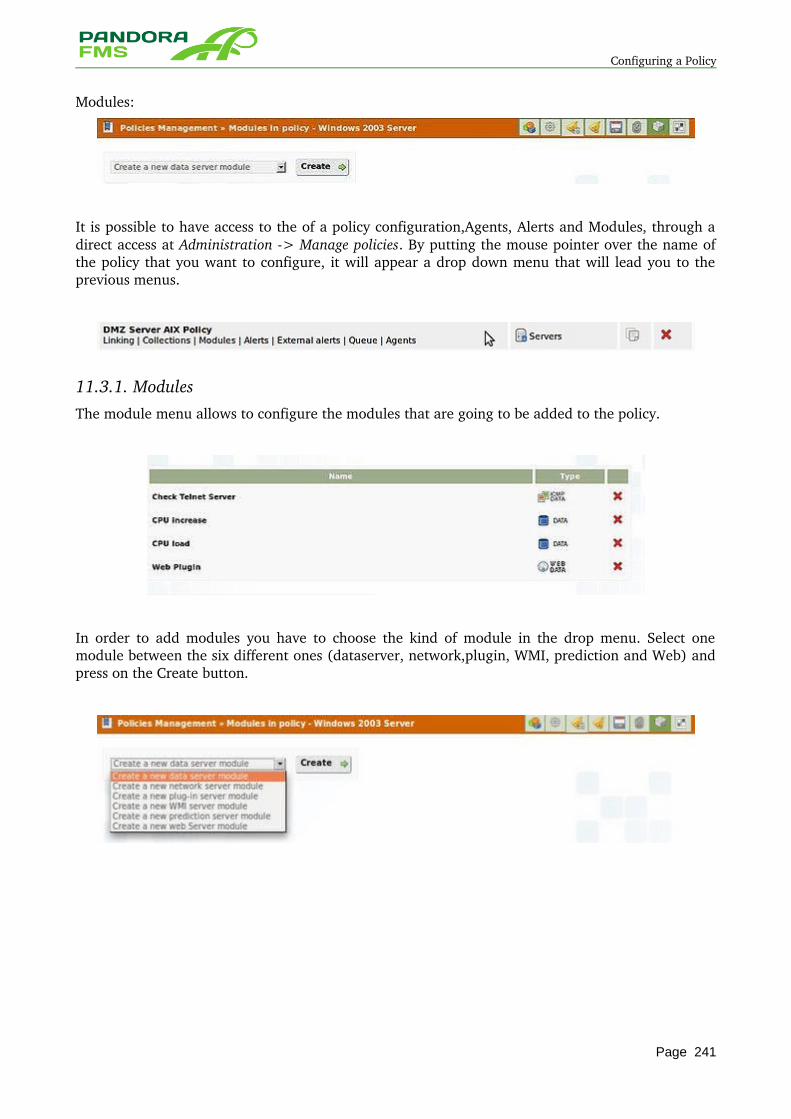
Configuring a Policy
Modules:
It is possible to have access to the of a policy configuration,Agents, Alerts and Modules, through a direct access at Administration > Manage policies. By putting the mouse pointer over the name of the policy that you want to configure, it will appear a drop down menu that will lead you to the previous menus.
11.3.1. ModulesThe module menu allows to configure the modules that are going to be added to the policy.
In order to add modules you have to choose the kind of module in the drop menu. Select one module between the six different ones (dataserver, network,plugin, WMI, prediction and Web) and press on the Create button.
Page 241
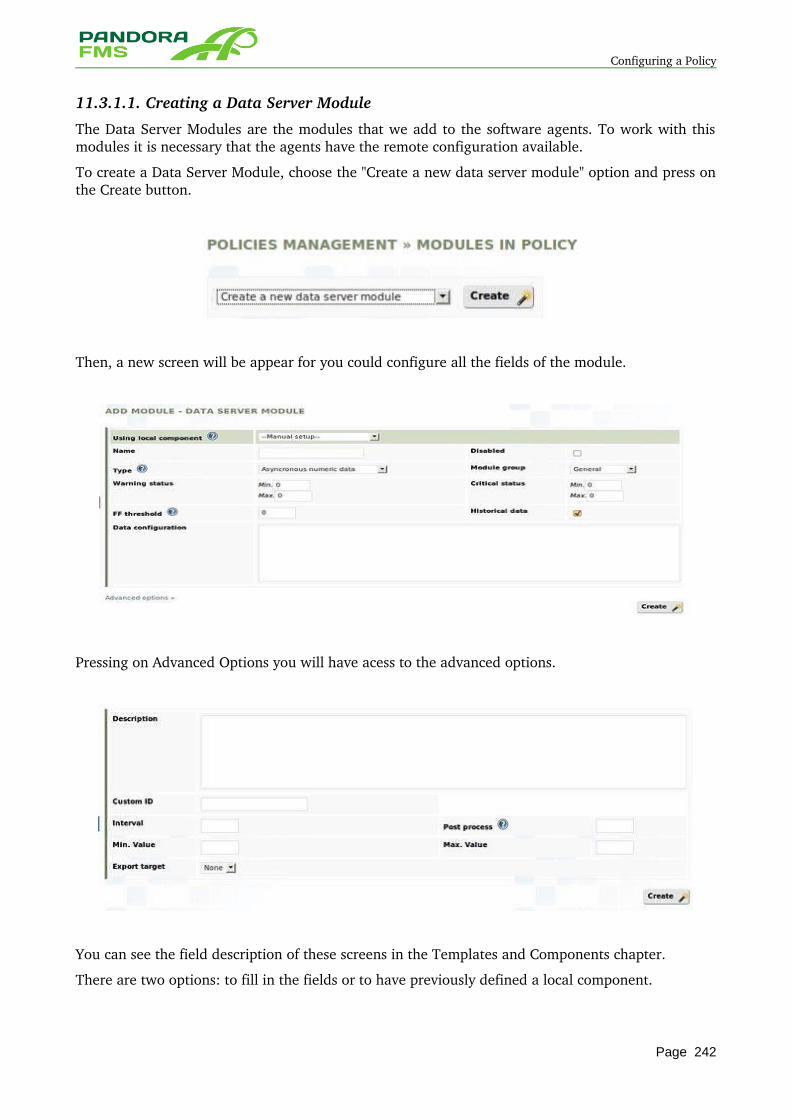
Configuring a Policy
11.3.1.1. Creating a Data Server Module
The Data Server Modules are the modules that we add to the software agents. To work with this modules it is necessary that the agents have the remote configuration available.
To create a Data Server Module, choose the "Create a new data server module" option and press on the Create button.
Then, a new screen will be appear for you could configure all the fields of the module.
Pressing on Advanced Options you will have acess to the advanced options.
You can see the field description of these screens in the Templates and Components chapter.
There are two options: to fill in the fields or to have previously defined a local component.
Page 242
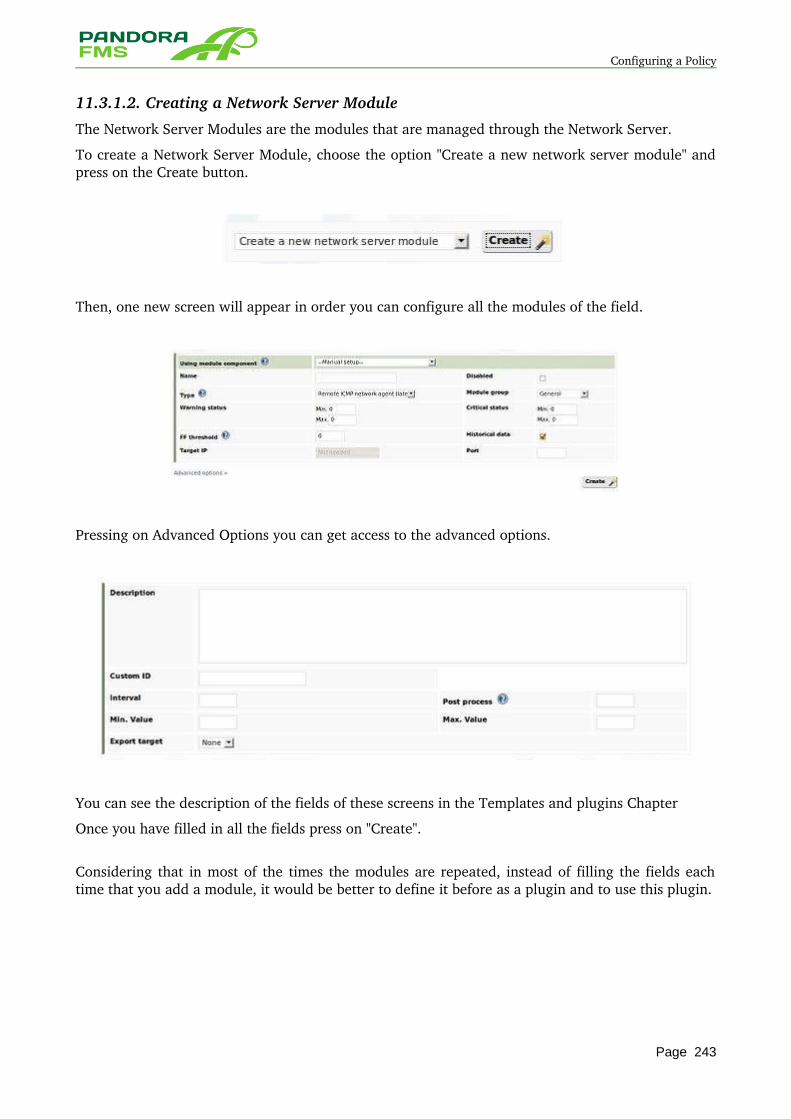
Configuring a Policy
11.3.1.2. Creating a Network Server Module
The Network Server Modules are the modules that are managed through the Network Server.
To create a Network Server Module, choose the option "Create a new network server module" and press on the Create button.
Then, one new screen will appear in order you can configure all the modules of the field.
Pressing on Advanced Options you can get access to the advanced options.
You can see the description of the fields of these screens in the Templates and plugins Chapter
Once you have filled in all the fields press on "Create".
Considering that in most of the times the modules are repeated, instead of filling the fields each time that you add a module, it would be better to define it before as a plugin and to use this plugin.
Page 243
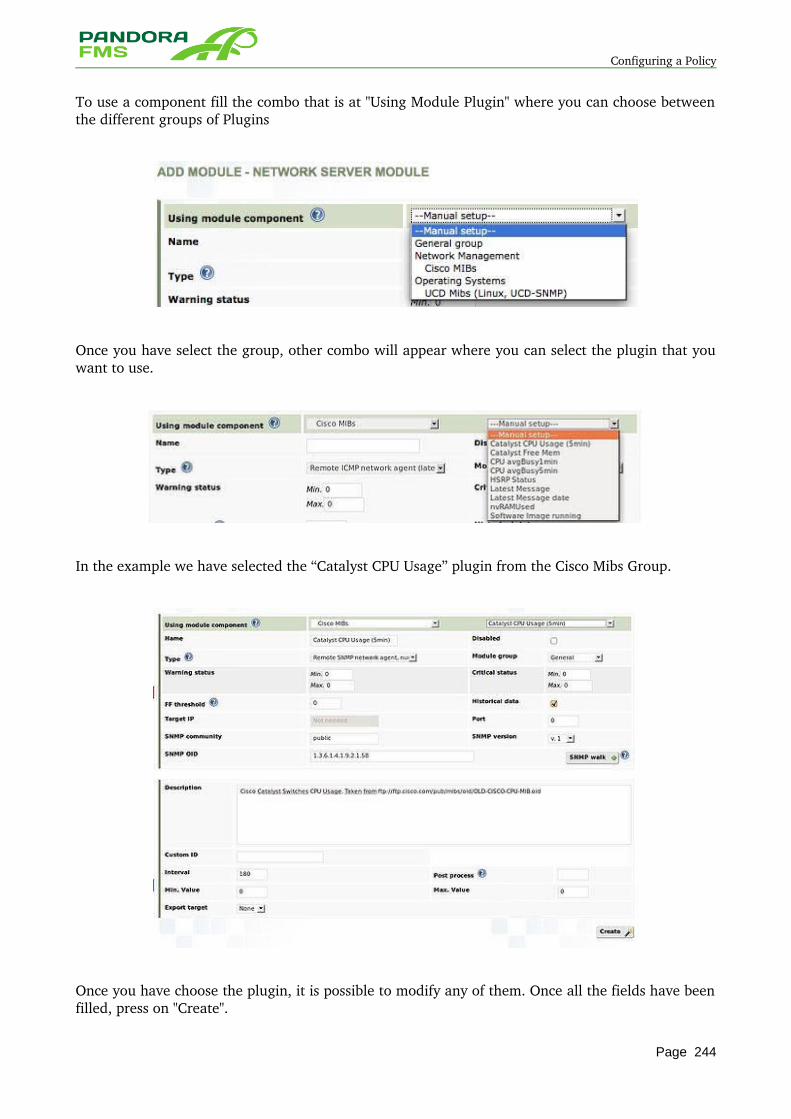
Configuring a Policy
To use a component fill the combo that is at "Using Module Plugin" where you can choose between the different groups of Plugins
Once you have select the group, other combo will appear where you can select the plugin that you want to use.
In the example we have selected the “Catalyst CPU Usage” plugin from the Cisco Mibs Group.
Once you have choose the plugin, it is possible to modify any of them. Once all the fields have been filled, press on "Create".
Page 244
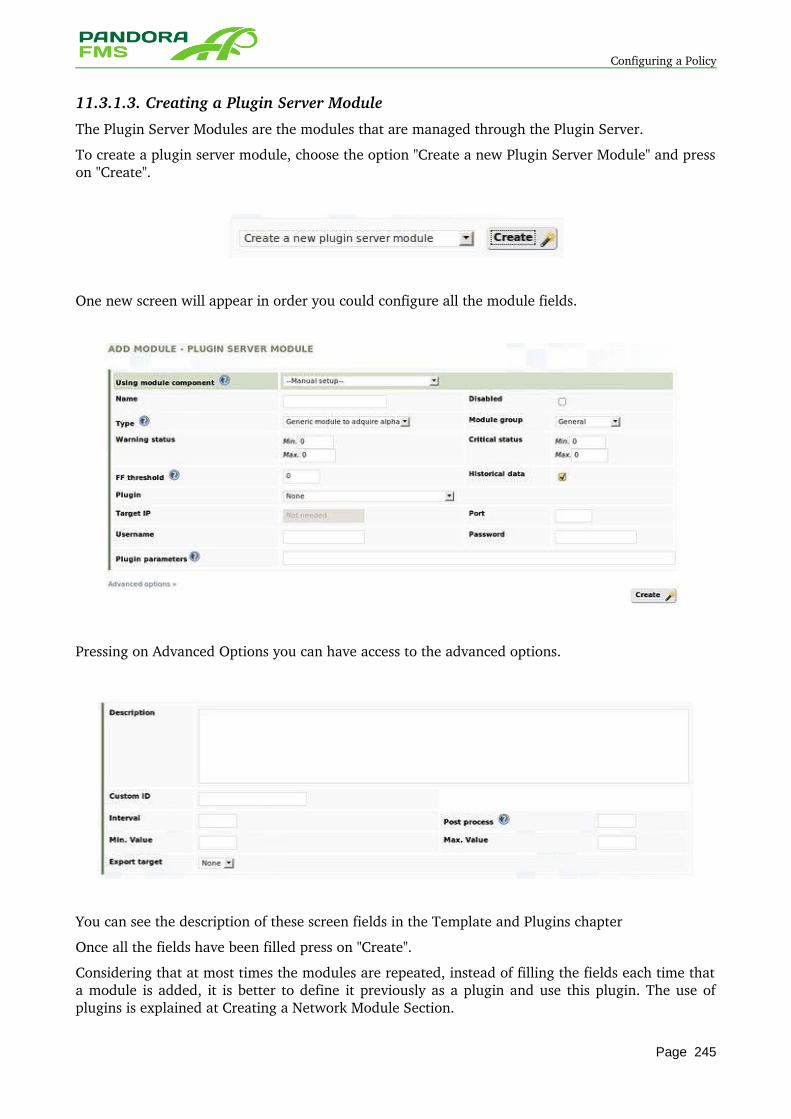
Configuring a Policy
11.3.1.3. Creating a Plugin Server Module
The Plugin Server Modules are the modules that are managed through the Plugin Server.
To create a plugin server module, choose the option "Create a new Plugin Server Module" and press on "Create".
One new screen will appear in order you could configure all the module fields.
Pressing on Advanced Options you can have access to the advanced options.
You can see the description of these screen fields in the Template and Plugins chapter
Once all the fields have been filled press on "Create".
Considering that at most times the modules are repeated, instead of filling the fields each time that a module is added, it is better to define it previously as a plugin and use this plugin. The use of plugins is explained at Creating a Network Module Section.
Page 245
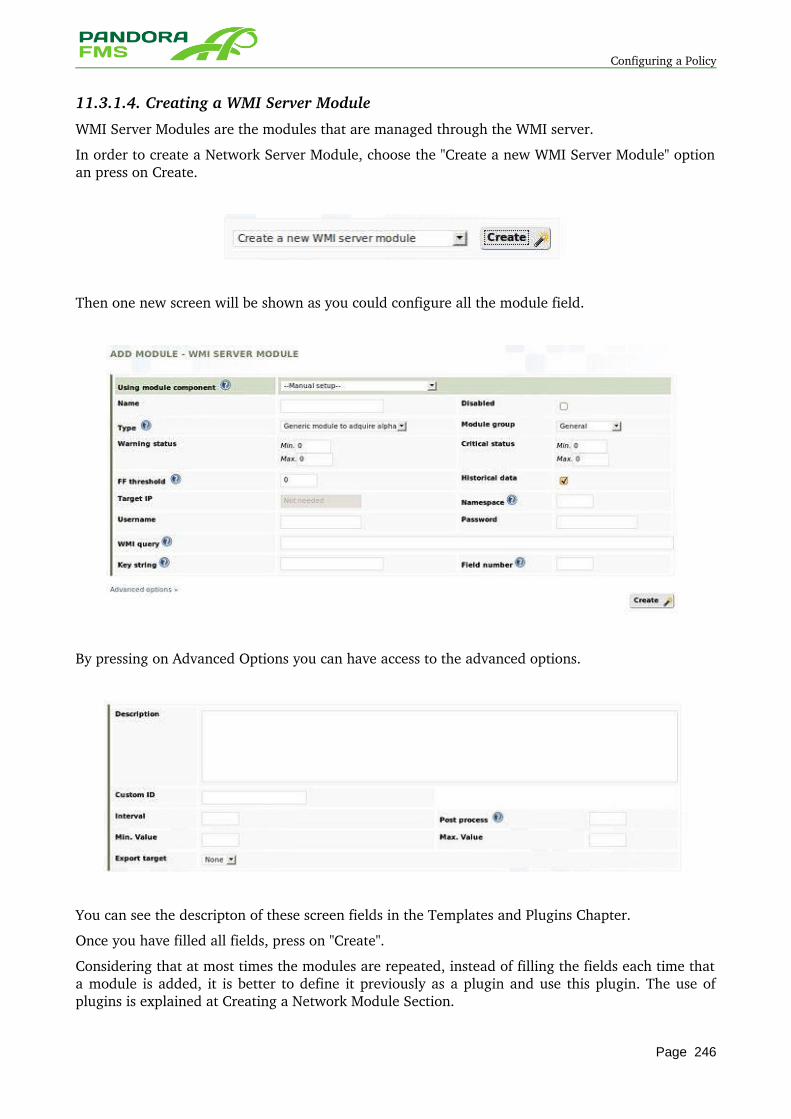
Configuring a Policy
11.3.1.4. Creating a WMI Server Module
WMI Server Modules are the modules that are managed through the WMI server.
In order to create a Network Server Module, choose the "Create a new WMI Server Module" option an press on Create.
Then one new screen will be shown as you could configure all the module field.
By pressing on Advanced Options you can have access to the advanced options.
You can see the descripton of these screen fields in the Templates and Plugins Chapter.
Once you have filled all fields, press on "Create".
Considering that at most times the modules are repeated, instead of filling the fields each time that a module is added, it is better to define it previously as a plugin and use this plugin. The use of plugins is explained at Creating a Network Module Section.
Page 246
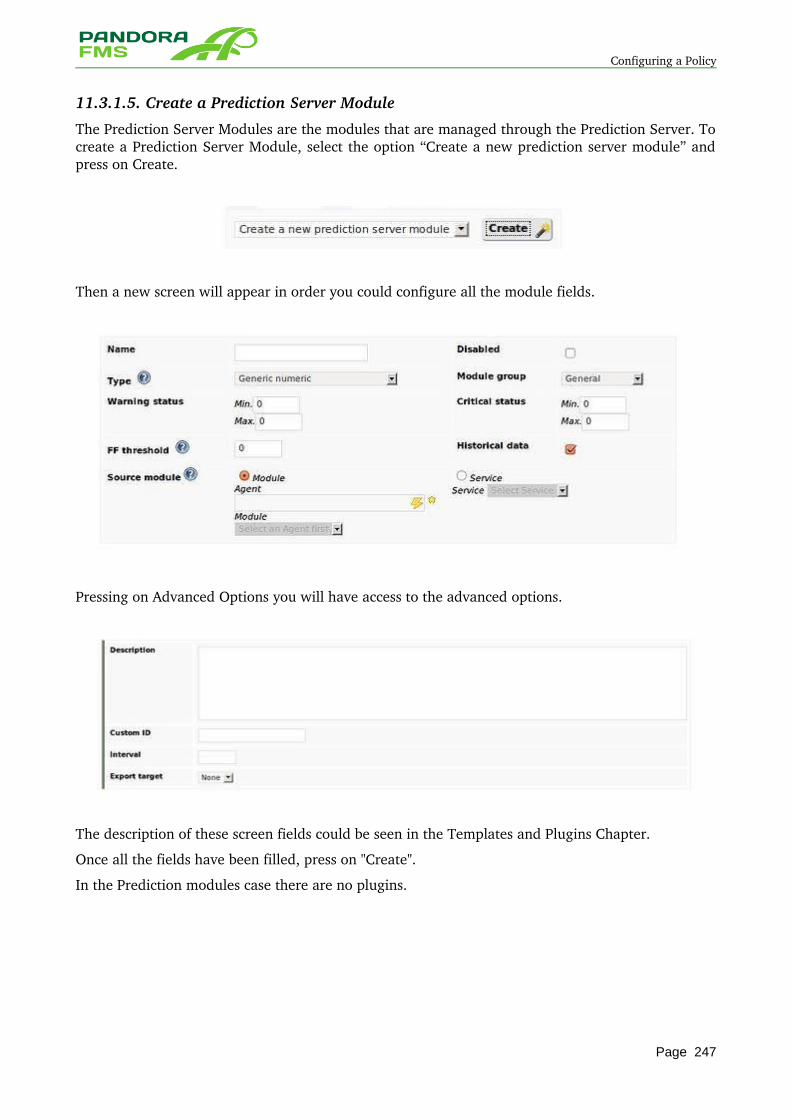
Configuring a Policy
11.3.1.5. Create a Prediction Server Module
The Prediction Server Modules are the modules that are managed through the Prediction Server. To create a Prediction Server Module, select the option “Create a new prediction server module” and press on Create.
Then a new screen will appear in order you could configure all the module fields.
Pressing on Advanced Options you will have access to the advanced options.
The description of these screen fields could be seen in the Templates and Plugins Chapter.
Once all the fields have been filled, press on "Create".
In the Prediction modules case there are no plugins.
Page 247
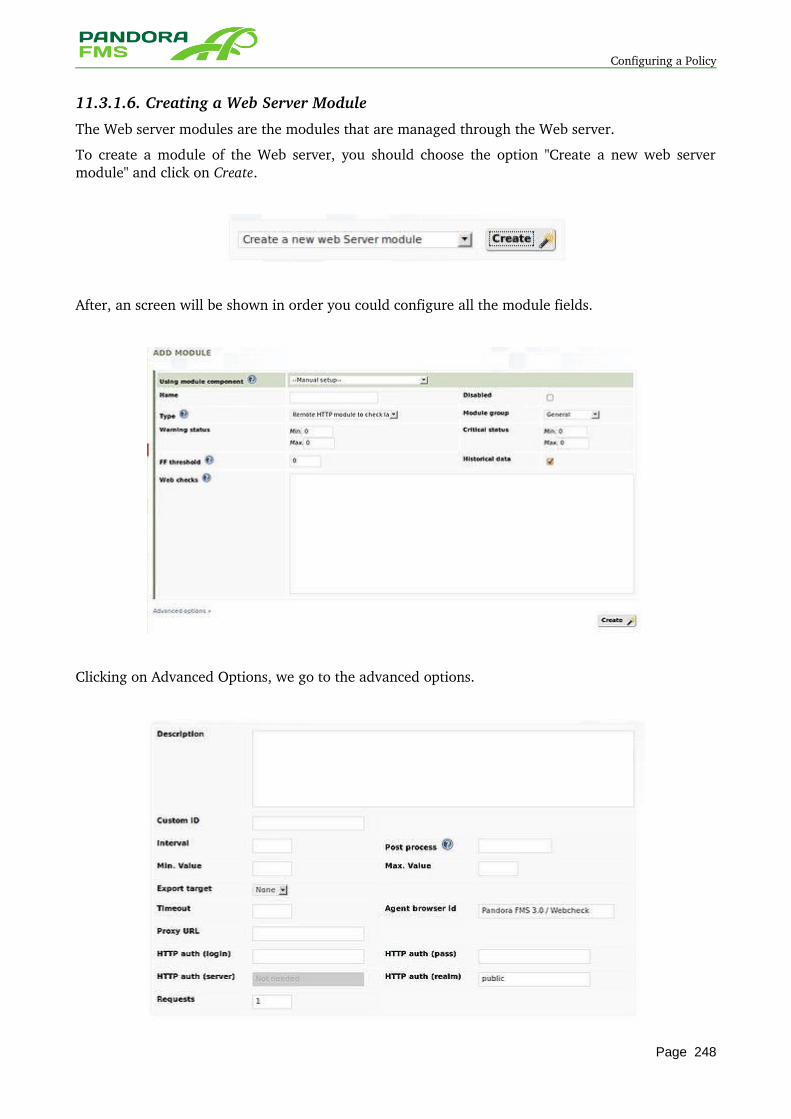
Configuring a Policy
11.3.1.6. Creating a Web Server Module
The Web server modules are the modules that are managed through the Web server.
To create a module of the Web server, you should choose the option "Create a new web server module" and click on Create.
After, an screen will be shown in order you could configure all the module fields.
Clicking on Advanced Options, we go to the advanced options.
Page 248
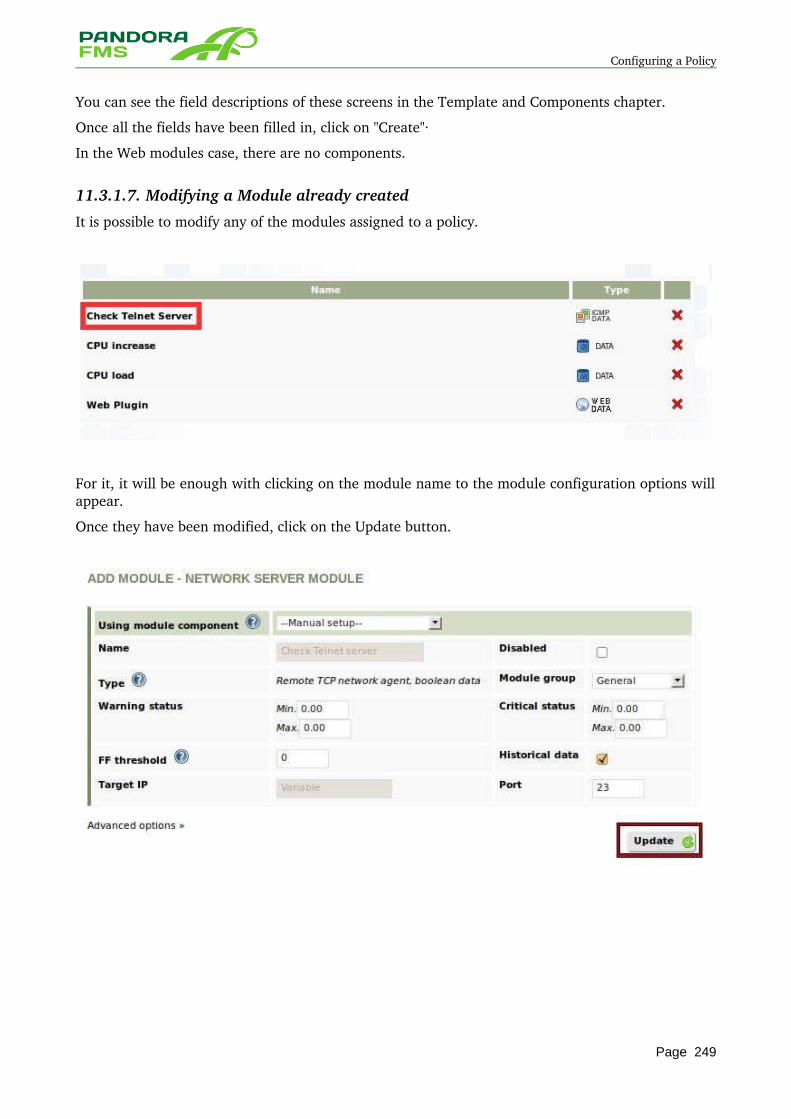
Configuring a Policy
You can see the field descriptions of these screens in the Template and Components chapter.
Once all the fields have been filled in, click on "Create"∙
In the Web modules case, there are no components.
11.3.1.7. Modifying a Module already created
It is possible to modify any of the modules assigned to a policy.
For it, it will be enough with clicking on the module name to the module configuration options will appear.
Once they have been modified, click on the Update button.
Page 249
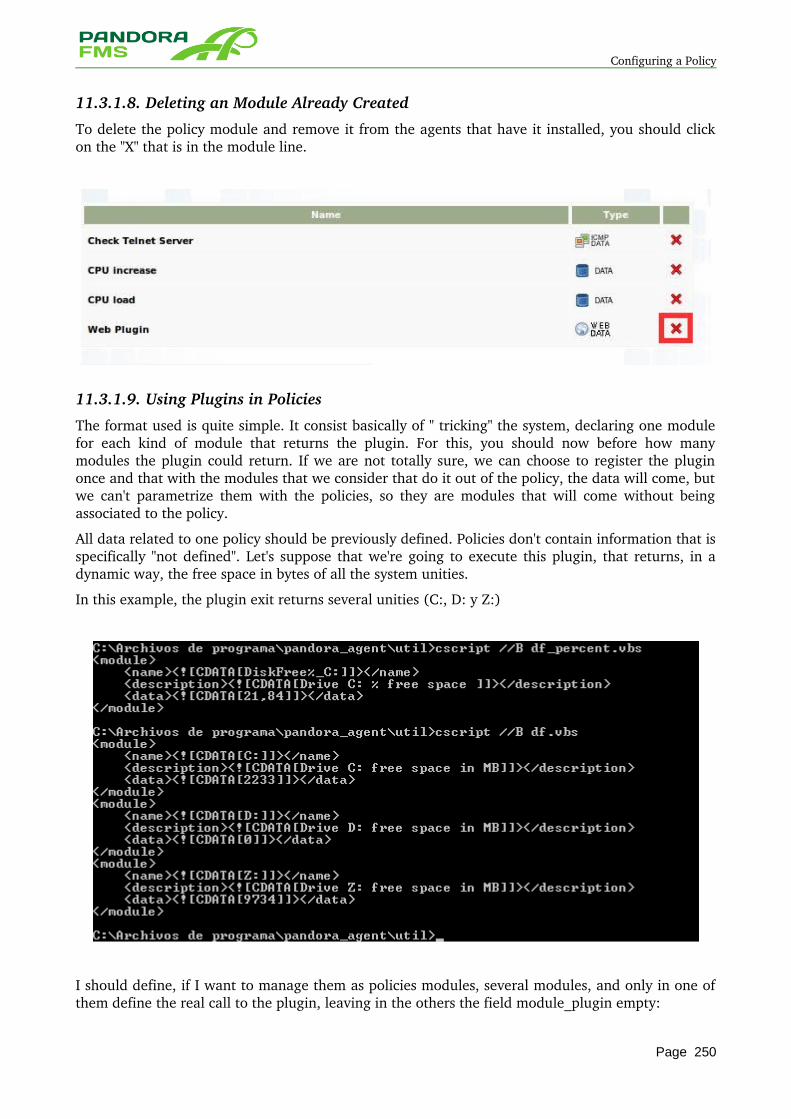
Configuring a Policy
11.3.1.8. Deleting an Module Already Created
To delete the policy module and remove it from the agents that have it installed, you should click on the "X" that is in the module line.
11.3.1.9. Using Plugins in Policies
The format used is quite simple. It consist basically of " tricking" the system, declaring one module for each kind of module that returns the plugin. For this, you should now before how many modules the plugin could return. If we are not totally sure, we can choose to register the plugin once and that with the modules that we consider that do it out of the policy, the data will come, but we can't parametrize them with the policies, so they are modules that will come without being associated to the policy.
All data related to one policy should be previously defined. Policies don't contain information that is specifically "not defined". Let's suppose that we're going to execute this plugin, that returns, in a dynamic way, the free space in bytes of all the system unities.
In this example, the plugin exit returns several unities (C:, D: y Z:)
I should define, if I want to manage them as policies modules, several modules, and only in one of them define the real call to the plugin, leaving in the others the field module_plugin empty:
Page 250
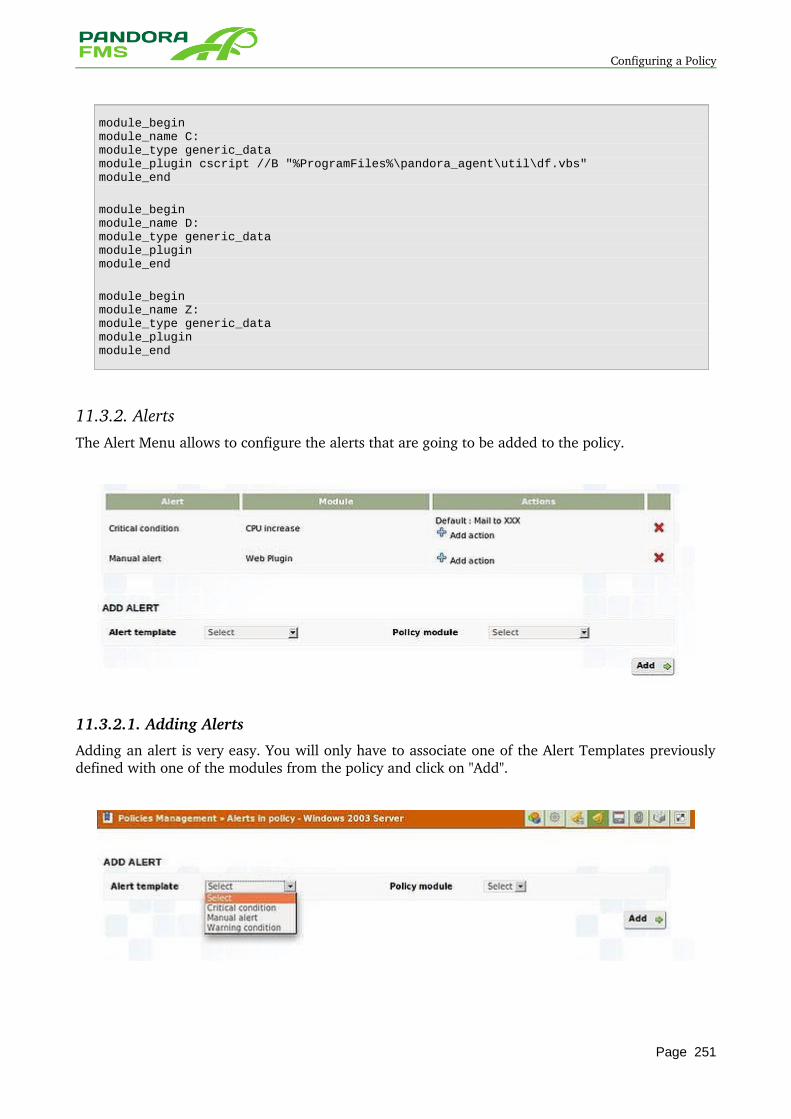
Configuring a Policy
module_beginmodule_name C:module_type generic_datamodule_plugin cscript //B "%ProgramFiles%\pandora_agent\util\df.vbs"module_end
module_beginmodule_name D:module_type generic_datamodule_plugin module_end
module_beginmodule_name Z:module_type generic_datamodule_plugin module_end
11.3.2. AlertsThe Alert Menu allows to configure the alerts that are going to be added to the policy.
11.3.2.1. Adding Alerts
Adding an alert is very easy. You will only have to associate one of the Alert Templates previously defined with one of the modules from the policy and click on "Add".
Page 251
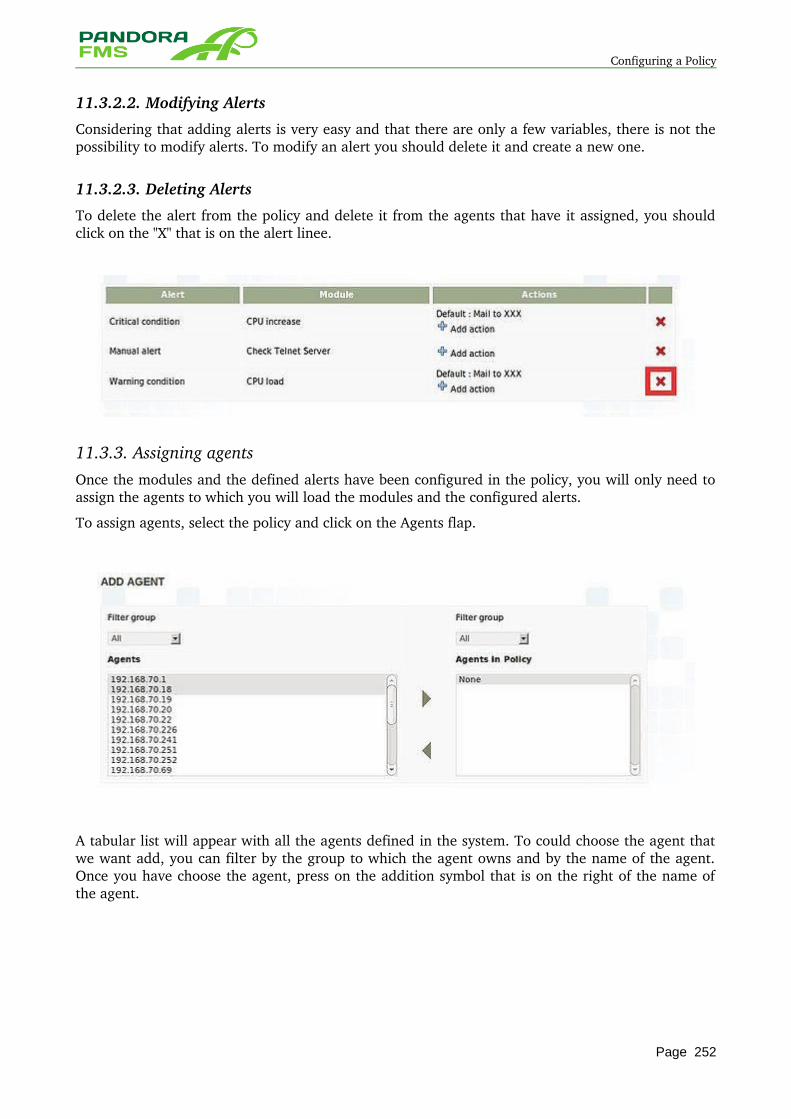
Configuring a Policy
11.3.2.2. Modifying Alerts
Considering that adding alerts is very easy and that there are only a few variables, there is not the possibility to modify alerts. To modify an alert you should delete it and create a new one.
11.3.2.3. Deleting Alerts
To delete the alert from the policy and delete it from the agents that have it assigned, you should click on the "X" that is on the alert linee.
11.3.3. Assigning agentsOnce the modules and the defined alerts have been configured in the policy, you will only need to assign the agents to which you will load the modules and the configured alerts.
To assign agents, select the policy and click on the Agents flap.
A tabular list will appear with all the agents defined in the system. To could choose the agent that we want add, you can filter by the group to which the agent owns and by the name of the agent. Once you have choose the agent, press on the addition symbol that is on the right of the name of the agent.
Page 252
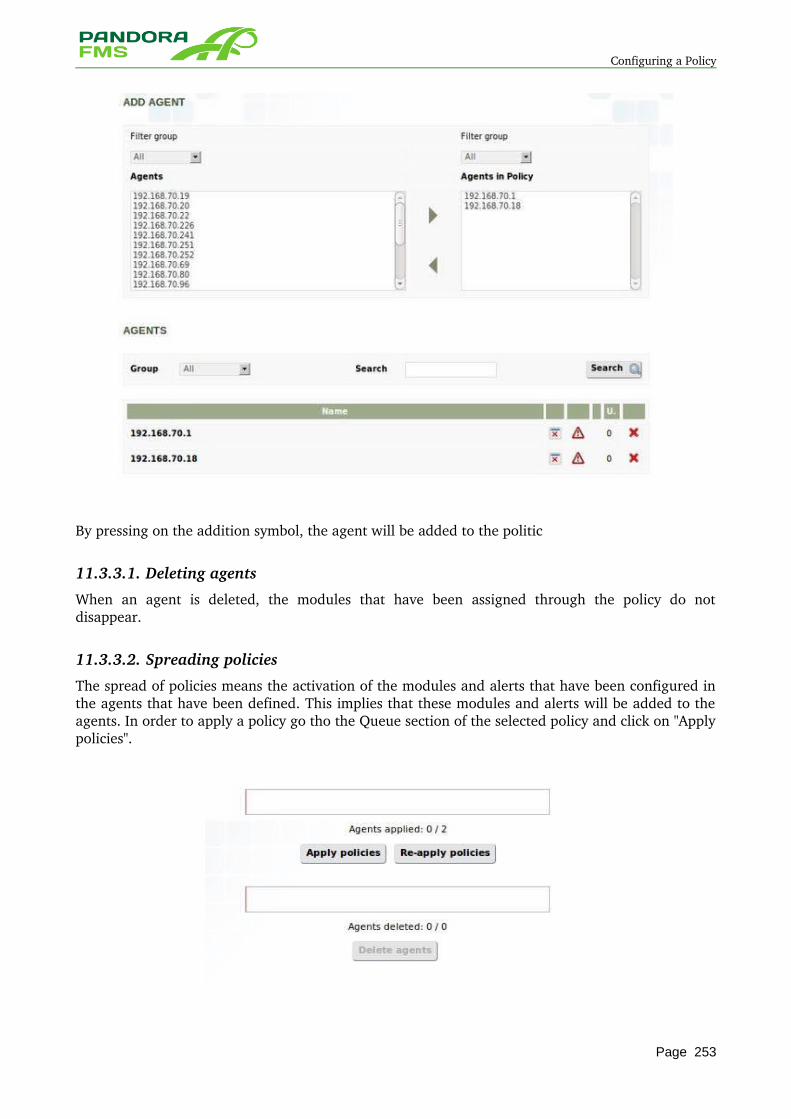
Configuring a Policy
By pressing on the addition symbol, the agent will be added to the politic
11.3.3.1. Deleting agents
When an agent is deleted, the modules that have been assigned through the policy do not disappear.
11.3.3.2. Spreading policies
The spread of policies means the activation of the modules and alerts that have been configured in the agents that have been defined. This implies that these modules and alerts will be added to the agents. In order to apply a policy go tho the Queue section of the selected policy and click on "Apply policies".
Page 253
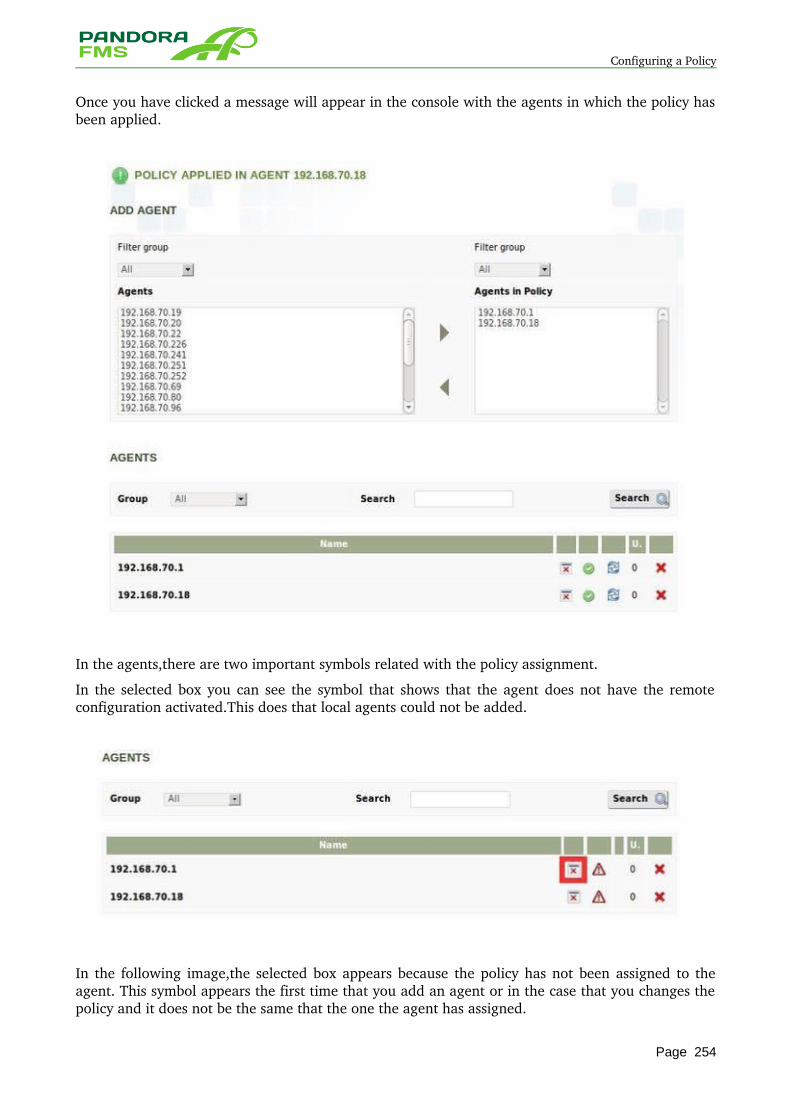
Configuring a Policy
Once you have clicked a message will appear in the console with the agents in which the policy has been applied.
In the agents,there are two important symbols related with the policy assignment.
In the selected box you can see the symbol that shows that the agent does not have the remote configuration activated.This does that local agents could not be added.
In the following image,the selected box appears because the policy has not been assigned to the agent. This symbol appears the first time that you add an agent or in the case that you changes the policy and it does not be the same that the one the agent has assigned.
Page 254
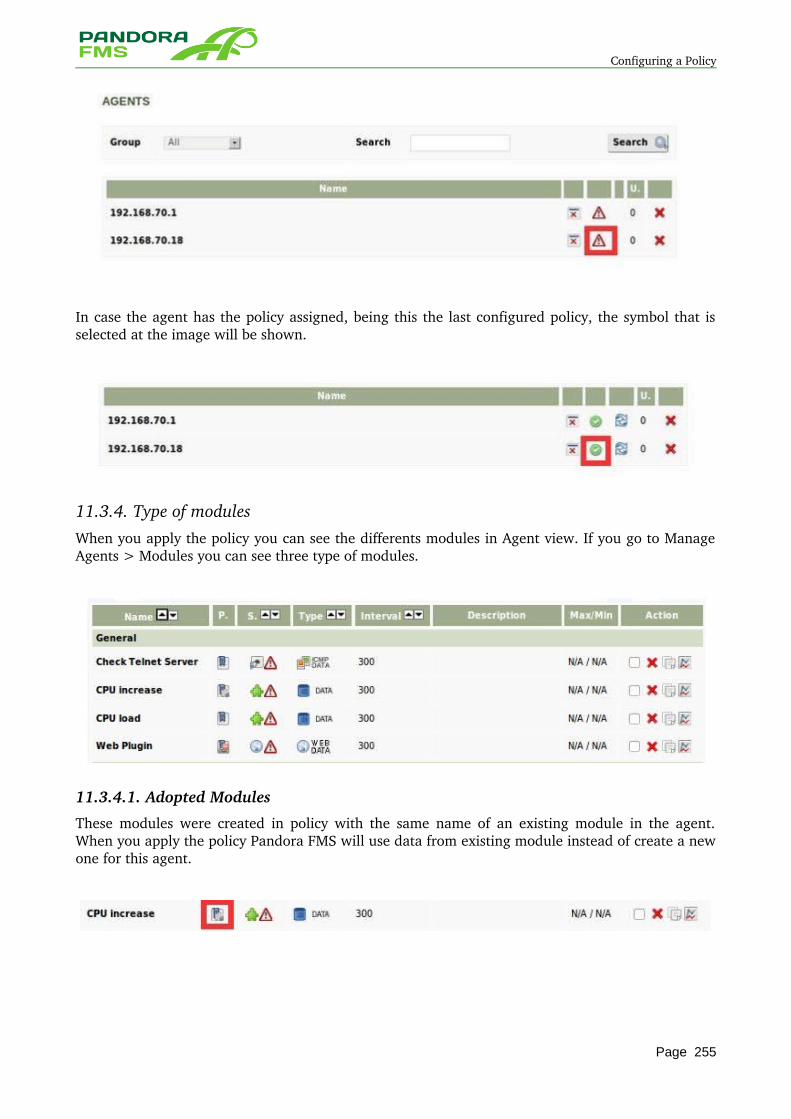
Configuring a Policy
In case the agent has the policy assigned, being this the last configured policy, the symbol that is selected at the image will be shown.
11.3.4. Type of modulesWhen you apply the policy you can see the differents modules in Agent view. If you go to Manage Agents > Modules you can see three type of modules.
11.3.4.1. Adopted Modules
These modules were created in policy with the same name of an existing module in the agent. When you apply the policy Pandora FMS will use data from existing module instead of create a new one for this agent.
Page 255
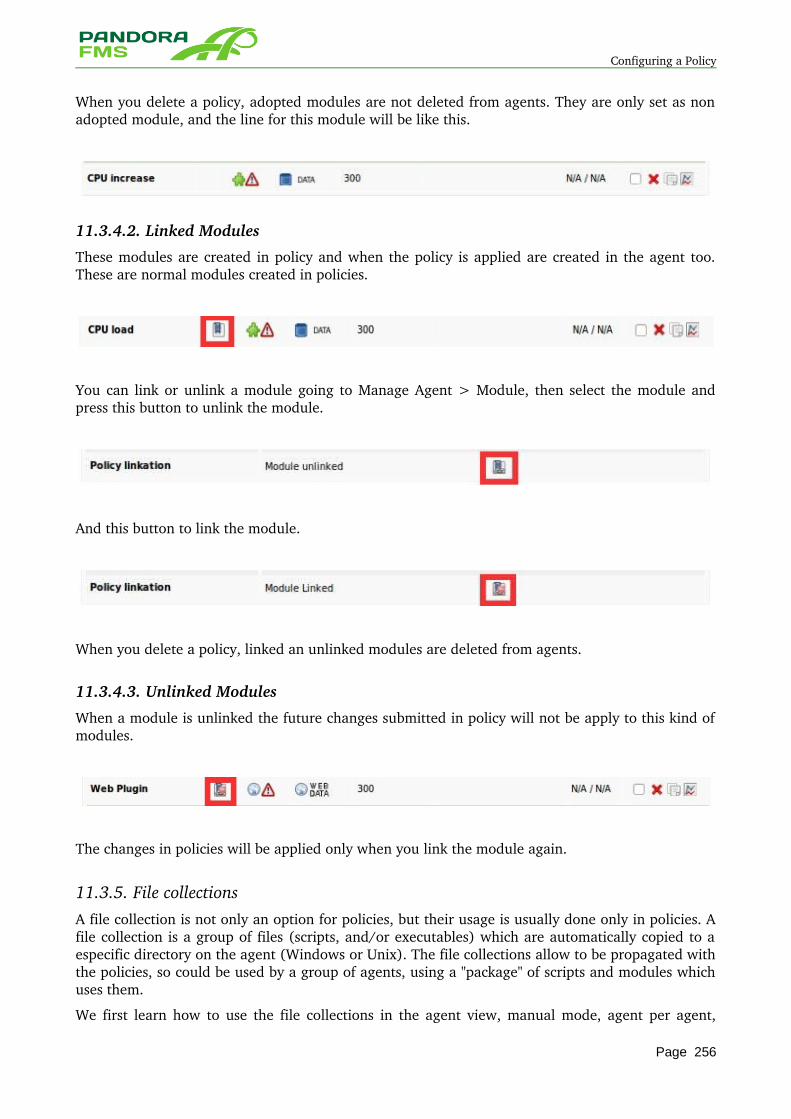
Configuring a Policy
When you delete a policy, adopted modules are not deleted from agents. They are only set as non adopted module, and the line for this module will be like this.
11.3.4.2. Linked Modules
These modules are created in policy and when the policy is applied are created in the agent too. These are normal modules created in policies.
You can link or unlink a module going to Manage Agent > Module, then select the module and press this button to unlink the module.
And this button to link the module.
When you delete a policy, linked an unlinked modules are deleted from agents.
11.3.4.3. Unlinked Modules
When a module is unlinked the future changes submitted in policy will not be apply to this kind of modules.
The changes in policies will be applied only when you link the module again.
11.3.5. File collectionsA file collection is not only an option for policies, but their usage is usually done only in policies. A file collection is a group of files (scripts, and/or executables) which are automatically copied to a especific directory on the agent (Windows or Unix). The file collections allow to be propagated with the policies, so could be used by a group of agents, using a "package" of scripts and modules which uses them.
We first learn how to use the file collections in the agent view, manual mode, agent per agent,
Page 256
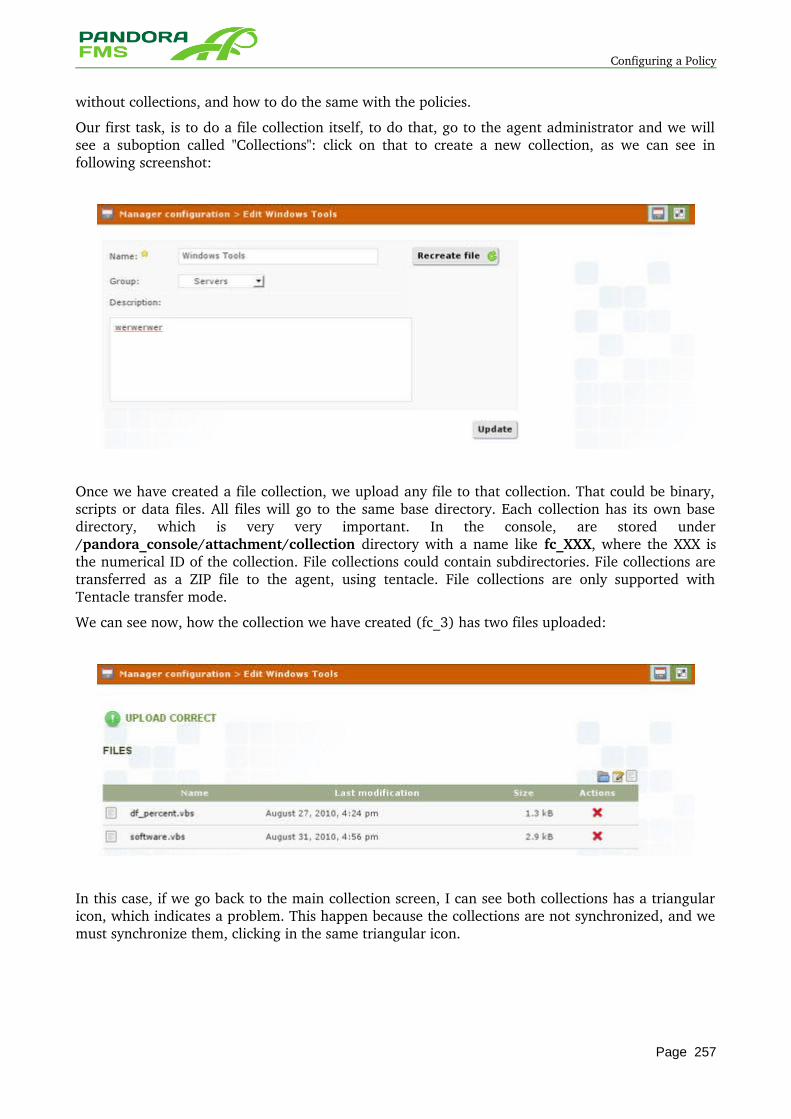
Configuring a Policy
without collections, and how to do the same with the policies.
Our first task, is to do a file collection itself, to do that, go to the agent administrator and we will see a suboption called "Collections": click on that to create a new collection, as we can see in following screenshot:
Once we have created a file collection, we upload any file to that collection. That could be binary, scripts or data files. All files will go to the same base directory. Each collection has its own base directory, which is very very important. In the console, are stored under /pandora_console/attachment/collection directory with a name like fc_XXX, where the XXX is the numerical ID of the collection. File collections could contain subdirectories. File collections are transferred as a ZIP file to the agent, using tentacle. File collections are only supported with Tentacle transfer mode.
We can see now, how the collection we have created (fc_3) has two files uploaded:
In this case, if we go back to the main collection screen, I can see both collections has a triangular icon, which indicates a problem. This happen because the collections are not synchronized, and we must synchronize them, clicking in the same triangular icon.
Page 257
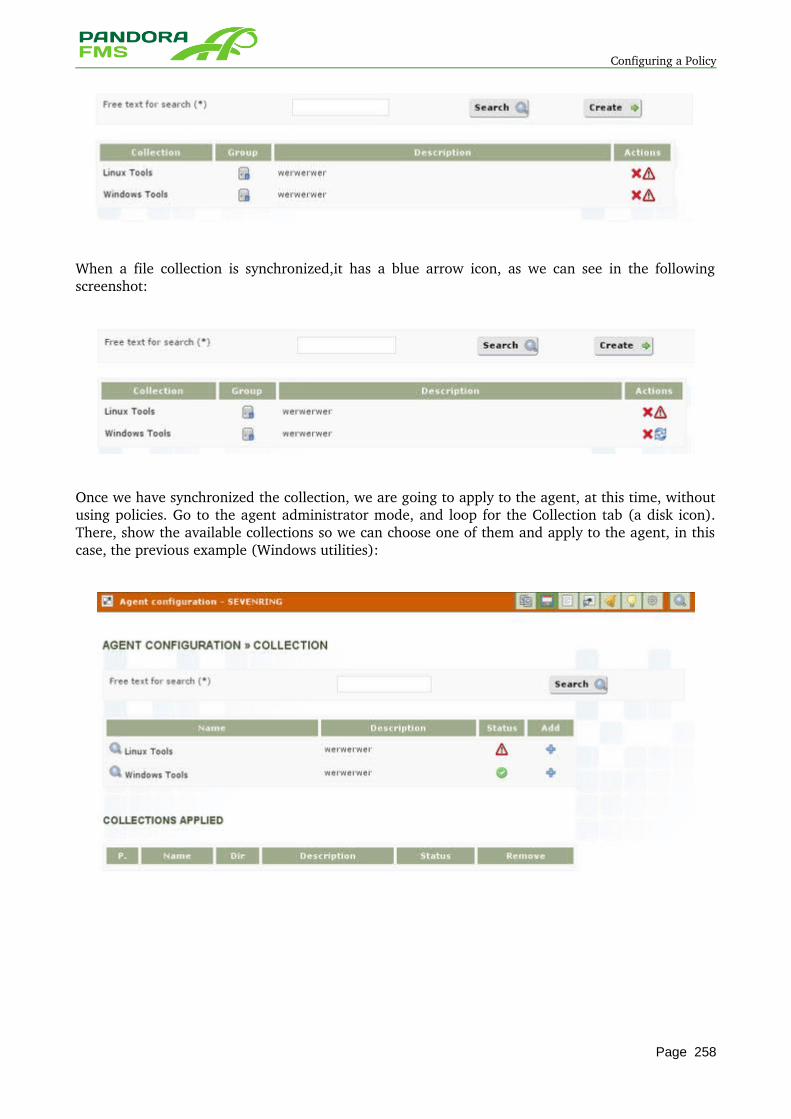
Configuring a Policy
When a file collection is synchronized,it has a blue arrow icon, as we can see in the following screenshot:
Once we have synchronized the collection, we are going to apply to the agent, at this time, without using policies. Go to the agent administrator mode, and loop for the Collection tab (a disk icon). There, show the available collections so we can choose one of them and apply to the agent, in this case, the previous example (Windows utilities):
Page 258
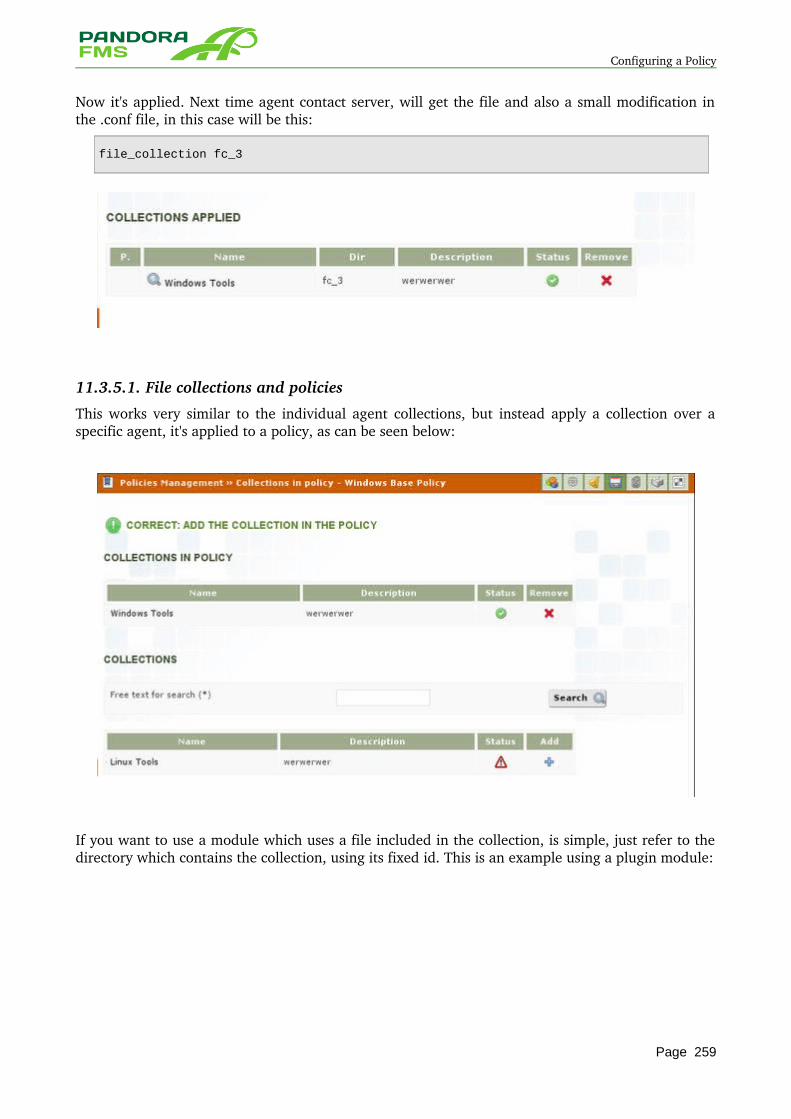
Configuring a Policy
Now it's applied. Next time agent contact server, will get the file and also a small modification in the .conf file, in this case will be this:
file_collection fc_3
11.3.5.1. File collections and policies
This works very similar to the individual agent collections, but instead apply a collection over a specific agent, it's applied to a policy, as can be seen below:
If you want to use a module which uses a file included in the collection, is simple, just refer to the directory which contains the collection, using its fixed id. This is an example using a plugin module:
Page 259
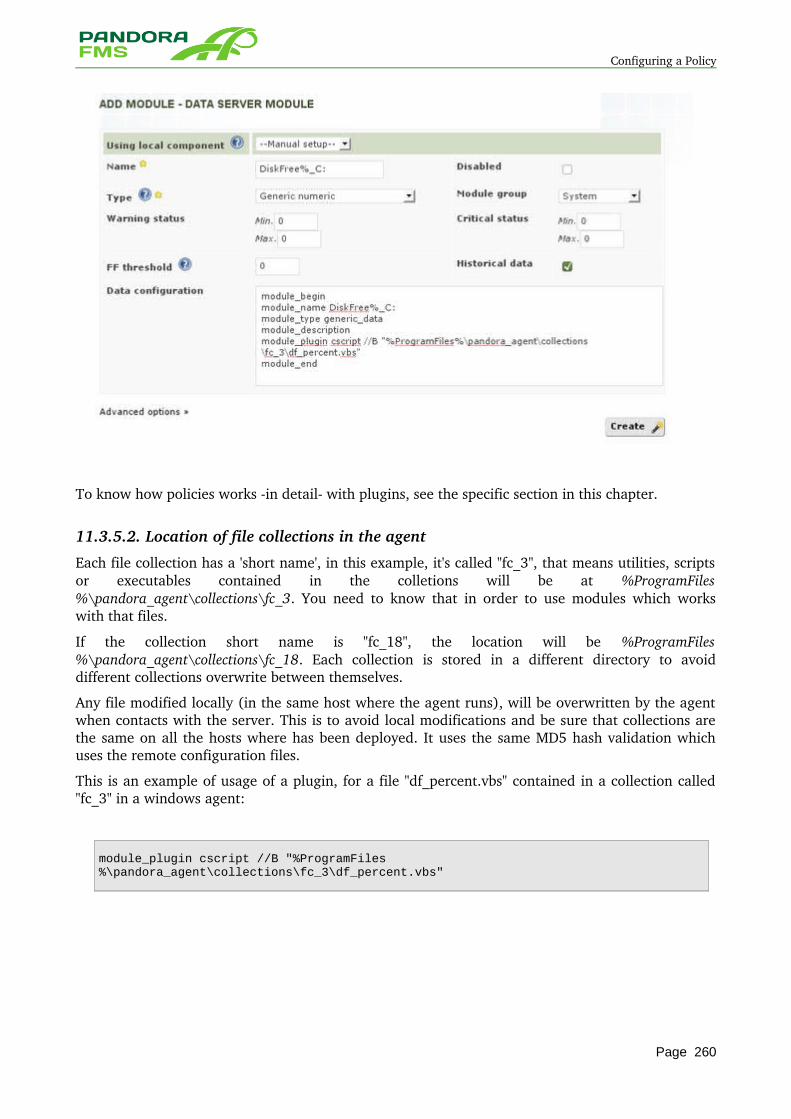
Configuring a Policy
To know how policies works in detail with plugins, see the specific section in this chapter.
11.3.5.2. Location of file collections in the agent
Each file collection has a 'short name', in this example, it's called "fc_3", that means utilities, scripts or executables contained in the colletions will be at %ProgramFiles%\pandora_agent\collections\fc_3. You need to know that in order to use modules which works with that files.
If the collection short name is "fc_18", the location will be %ProgramFiles%\pandora_agent\collections\fc_18. Each collection is stored in a different directory to avoid different collections overwrite between themselves.
Any file modified locally (in the same host where the agent runs), will be overwritten by the agent when contacts with the server. This is to avoid local modifications and be sure that collections are the same on all the hosts where has been deployed. It uses the same MD5 hash validation which uses the remote configuration files.
This is an example of usage of a plugin, for a file "df_percent.vbs" contained in a collection called "fc_3" in a windows agent:
module_plugin cscript //B "%ProgramFiles%\pandora_agent\collections\fc_3\df_percent.vbs"
Page 260
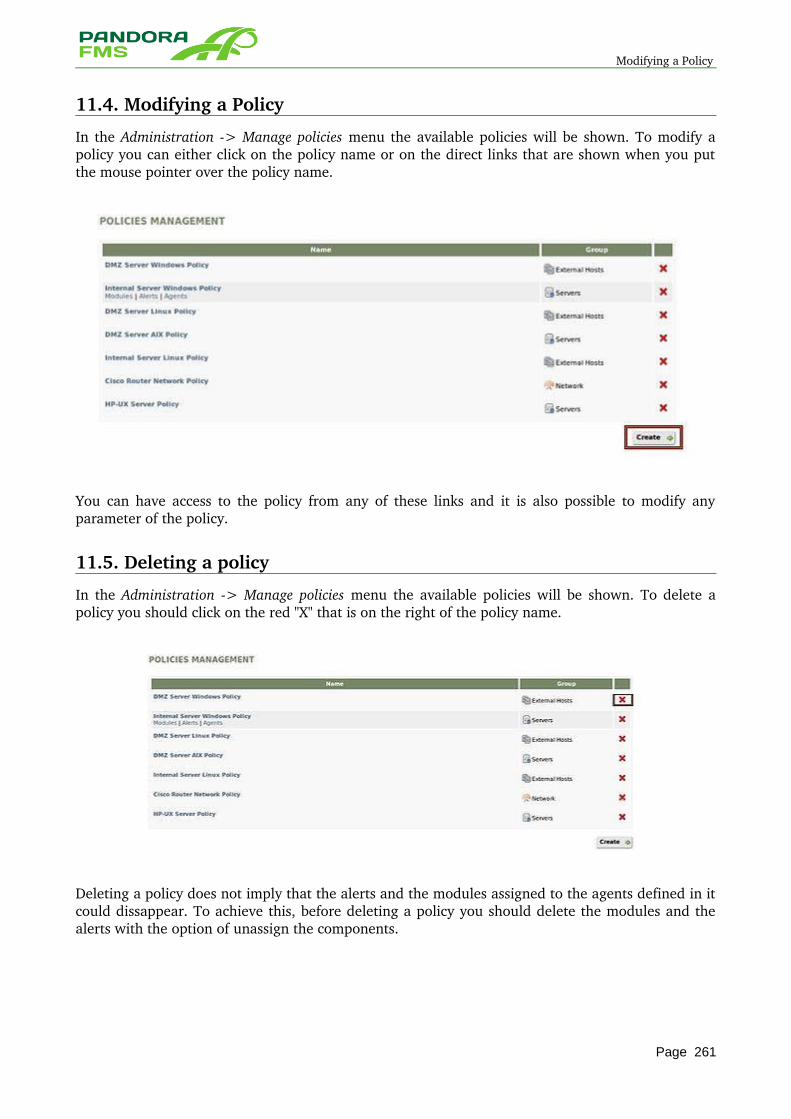
Modifying a Policy
11.4. Modifying a Policy
In the Administration > Manage policies menu the available policies will be shown. To modify a policy you can either click on the policy name or on the direct links that are shown when you put the mouse pointer over the policy name.
You can have access to the policy from any of these links and it is also possible to modify any parameter of the policy.
11.5. Deleting a policy
In the Administration > Manage policies menu the available policies will be shown. To delete a policy you should click on the red "X" that is on the right of the policy name.
Deleting a policy does not imply that the alerts and the modules assigned to the agents defined in it could dissappear. To achieve this, before deleting a policy you should delete the modules and the alerts with the option of unassign the components.
Page 261
Deleting a policy
12 AUTOMATIC NETWORK DISCOVERY WITH RECON SERVER
Page 262
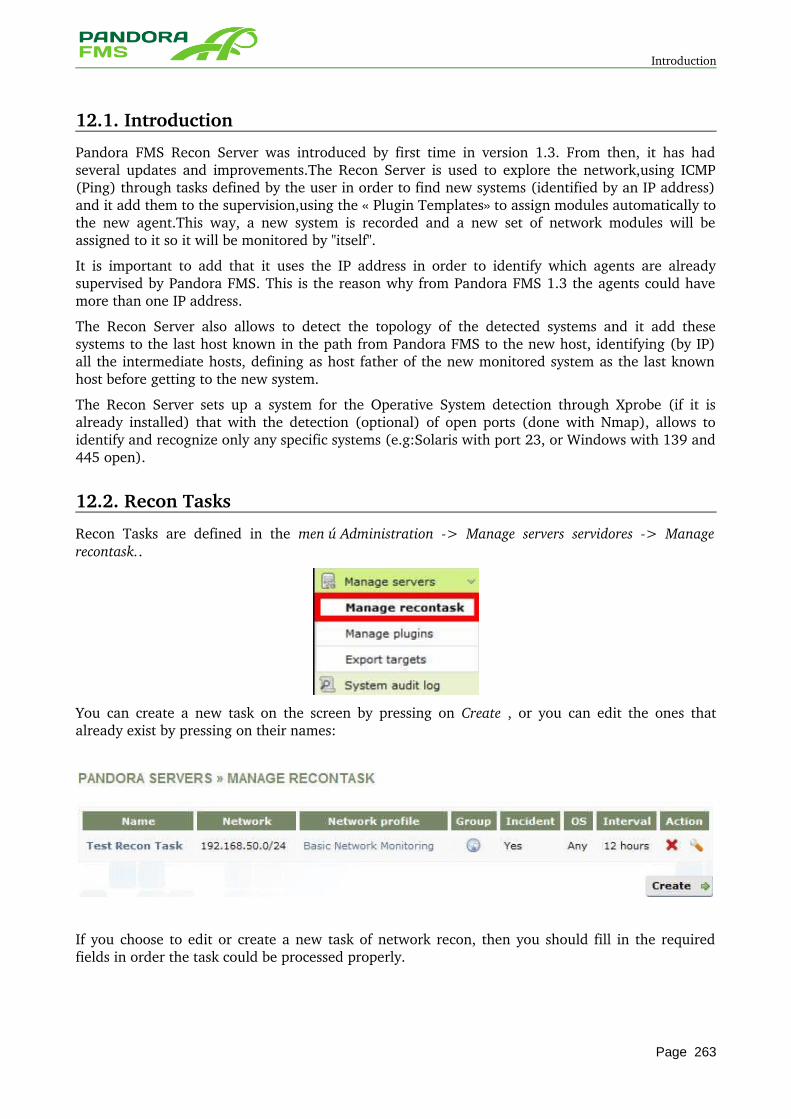
Introduction
12.1. Introduction
Pandora FMS Recon Server was introduced by first time in version 1.3. From then, it has had several updates and improvements.The Recon Server is used to explore the network,using ICMP (Ping) through tasks defined by the user in order to find new systems (identified by an IP address) and it add them to the supervision,using the « Plugin Templates» to assign modules automatically to the new agent.This way, a new system is recorded and a new set of network modules will be assigned to it so it will be monitored by "itself".
It is important to add that it uses the IP address in order to identify which agents are already supervised by Pandora FMS. This is the reason why from Pandora FMS 1.3 the agents could have more than one IP address.
The Recon Server also allows to detect the topology of the detected systems and it add these systems to the last host known in the path from Pandora FMS to the new host, identifying (by IP) all the intermediate hosts, defining as host father of the new monitored system as the last known host before getting to the new system.
The Recon Server sets up a system for the Operative System detection through Xprobe (if it is already installed) that with the detection (optional) of open ports (done with Nmap), allows to identify and recognize only any specific systems (e.g:Solaris with port 23, or Windows with 139 and 445 open).
12.2. Recon Tasks
Recon Tasks are defined in the menú Administration > Manage servers servidores > Manage recontask..
You can create a new task on the screen by pressing on Create , or you can edit the ones that already exist by pressing on their names:
If you choose to edit or create a new task of network recon, then you should fill in the required fields in order the task could be processed properly.
Page 263
Recon Tasks
Task name
Name of the discovery task. It's only a descriptive value to could distinguish the task in case it would have several of them with different values of filter or template.
Recon server
Recon Server assigned to the task. If you have several Recon Servers, then you have to select here which of them you want to do the recon task.
Network
Network where you want to do the recognition. Use the network format/ bits mask.For example 192.168.1.0/24 is a class C that includes the 192.168.1.0 to 192.168.1.255 adress.
Interval
Repetition interval of systems search. Do not use intervals very shorts so Recon explores a network sending one Ping to each address. If you use recon networks very larges (for example a class A) combined with very short intervals (6 hours) you will be doing that Pandora FMS will be always bomb the network with pings, overloading it and also Pandora FMS unnecessarily.
Module template
Plugins template to add to the discovered systems. When it detects a system that fits with the parameters for this task (OS, Ports), it will register it and will assign all the included modules in the defined plugin template.
OS
Operative system to recognize. If you select one instead of any (Any) it will only be added the systems with this operative system.Consider that in some circumstances Pandora FMS can make a mistake when detecting systems, so this kind of "guess" is done with statistic patterns, that depending on some other factors could fail (networks with filters, security software, modified versions of the systems).To could use this method with security, you should have installed Xprobe2 in your system.
Ports
Define some specific ports or an specific range, e.g: 22,23,21,8090,443,8080.If you use this field,only the detected hosts that will have at least one of the ports here mentioned will be detected and added to the system. If one host is detected but it has not at least one of the ports opened, then it will be ignored. This, along with the filter by OS kind allows to detect the systems that are interesting for us,e.g: detecting that it is a router because it has the ports 23 and 57 opened and the system detect it as a "BSD" kind.
Group
It is the group where we should add the discovered systems. It will must assign the new systems to one group. If it has already one specific group to locate the unclassified agents, then it could be a good idea to assign it there.
Incident
Shows if by discovering new systems it create an incident or not. It will create one incident by task, not one for detected machine,summarizing all the detected new systems, and it will create it automatically in the group previously defined.
Comments Comments about discovery network task.
Page 264
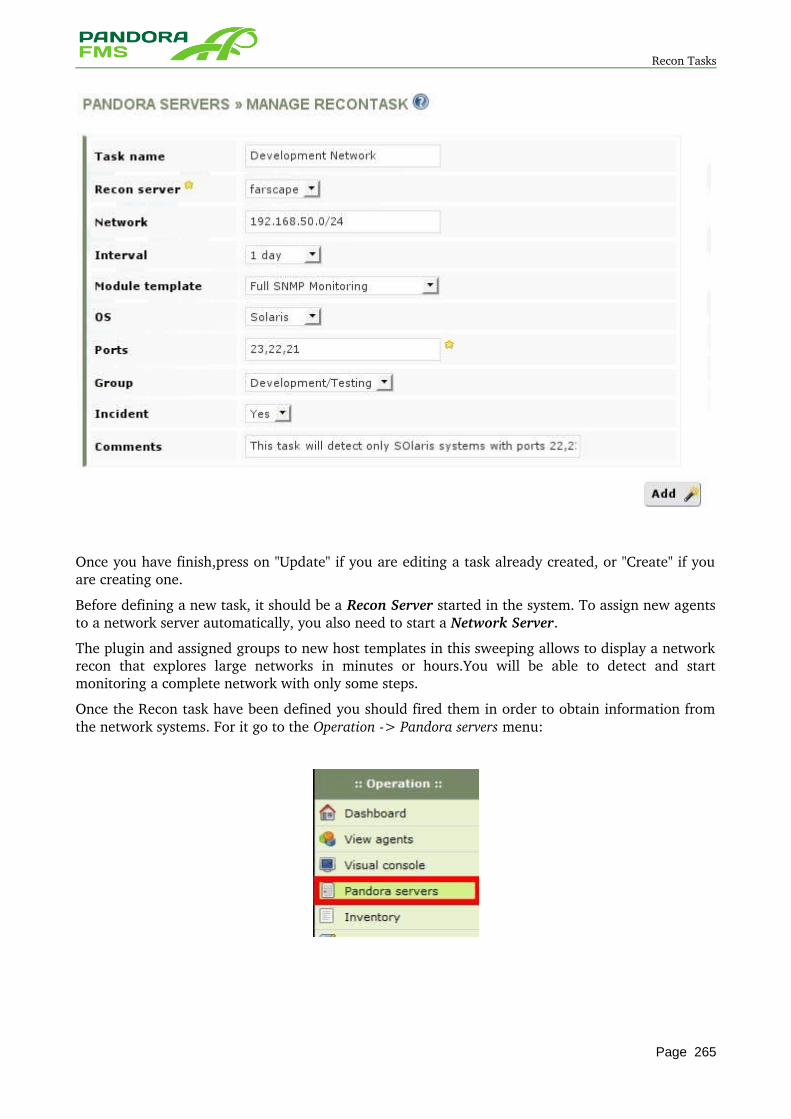
Recon Tasks
Once you have finish,press on "Update" if you are editing a task already created, or "Create" if you are creating one.
Before defining a new task, it should be a Recon Server started in the system. To assign new agents to a network server automatically, you also need to start a Network Server.
The plugin and assigned groups to new host templates in this sweeping allows to display a network recon that explores large networks in minutes or hours.You will be able to detect and start monitoring a complete network with only some steps.
Once the Recon task have been defined you should fired them in order to obtain information from the network systems. For it go to the Operation > Pandora servers menu:
Page 265
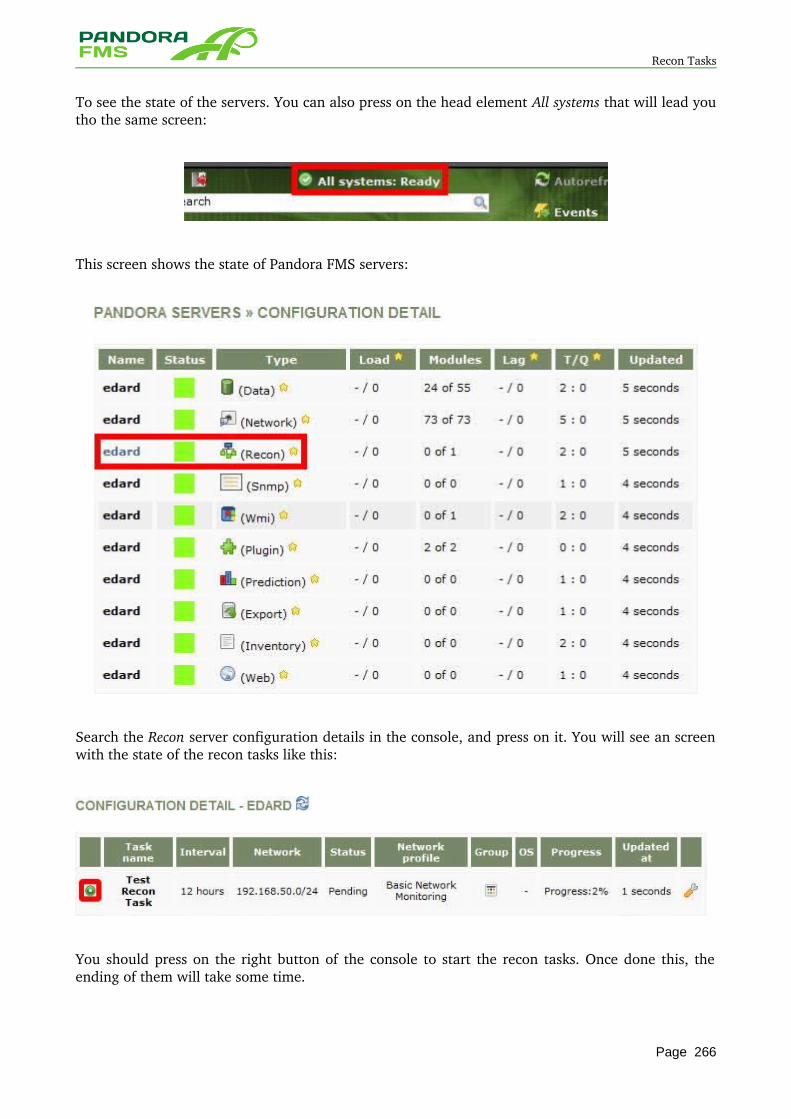
Recon Tasks
To see the state of the servers. You can also press on the head element All systems that will lead you tho the same screen:
This screen shows the state of Pandora FMS servers:
Search the Recon server configuration details in the console, and press on it. You will see an screen with the state of the recon tasks like this:
You should press on the right button of the console to start the recon tasks. Once done this, the ending of them will take some time.
Page 266
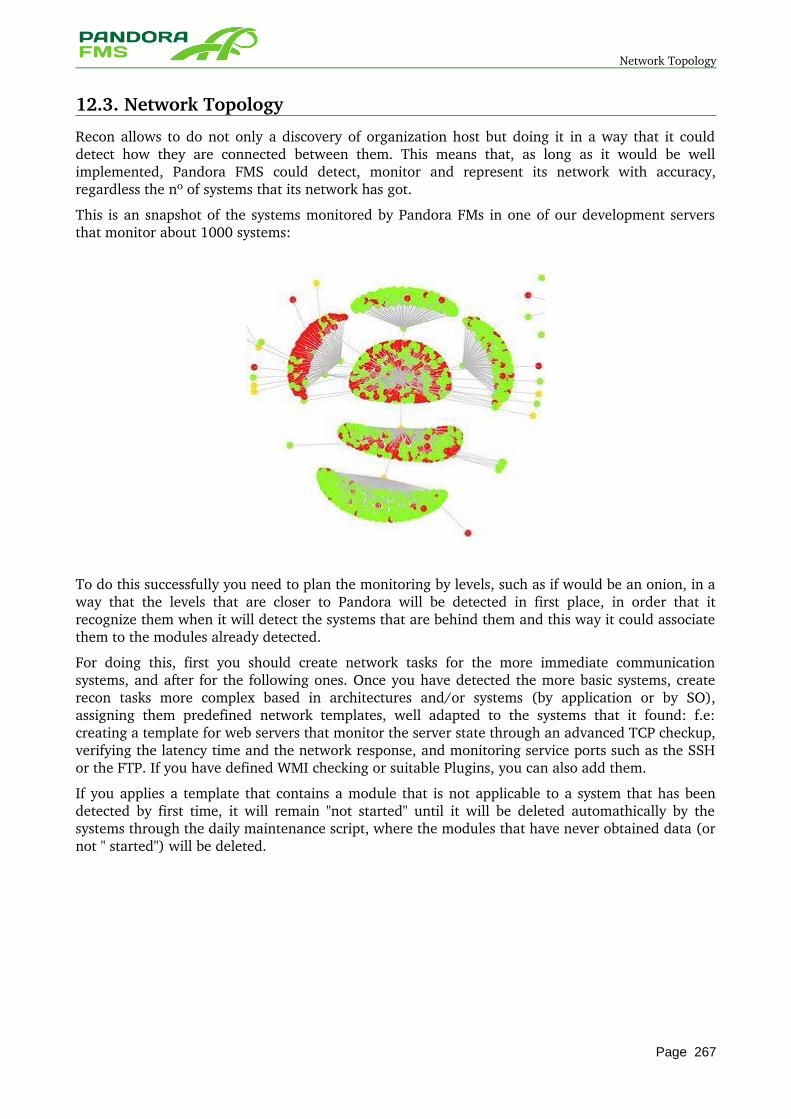
Network Topology
12.3. Network Topology
Recon allows to do not only a discovery of organization host but doing it in a way that it could detect how they are connected between them. This means that, as long as it would be well implemented, Pandora FMS could detect, monitor and represent its network with accuracy, regardless the nº of systems that its network has got.
This is an snapshot of the systems monitored by Pandora FMs in one of our development servers that monitor about 1000 systems:
To do this successfully you need to plan the monitoring by levels, such as if would be an onion, in a way that the levels that are closer to Pandora will be detected in first place, in order that it recognize them when it will detect the systems that are behind them and this way it could associate them to the modules already detected.
For doing this, first you should create network tasks for the more immediate communication systems, and after for the following ones. Once you have detected the more basic systems, create recon tasks more complex based in architectures and/or systems (by application or by SO), assigning them predefined network templates, well adapted to the systems that it found: f.e: creating a template for web servers that monitor the server state through an advanced TCP checkup, verifying the latency time and the network response, and monitoring service ports such as the SSH or the FTP. If you have defined WMI checking or suitable Plugins, you can also add them.
If you applies a template that contains a module that is not applicable to a system that has been detected by first time, it will remain "not started" until it will be deleted automathically by the systems through the daily maintenance script, where the modules that have never obtained data (or not " started") will be deleted.
Page 267
Example of use
12.4. Example of use
If there would be four C kinds for network servers and a B kind with several work stations, a «Plugin template» could will be defined for any of these five networks.
For example:
• Template number #1: is used for a Windows server. It could have five modules:
SNMP to know the CPU usage in the Windows server. SNMP to know the available memory in the Windows server. SNMP to know the network interface data entry. SNMP to know the network interface data exit. ICMP checks that it continues working.
• Template number #2:Is used to check the UNIX HTTP servers.
ICMP checks that it is working TCP checks that the port 80 is working and if it responds to the HTTP commands. TCP checks if the port 22 is working and responds to SSH. SNMP to know the CPU usage. SNMP to know the network interface data entry. SNMP to know the network interface data exit.
• Template number #3: used to check UNIX Oracle servers:
ICMP checks if it is working TCP checks ir an specific TCP port is working and responding to the Oracle commands. TCP checks if an specific port is open. SNMP to know the CPU usage. SNMP module to know the available memory.
• Template number #4: used to check CIFS Windows Servers:
ICMP checks if it is working. SNMP to know the CPU usage. SNMP module to know the available memory. Several TCP to check the CIFS availability. SNMP to know the network interface data entry. SNMP to know the network interface data exit.
• Template number #5: used to check the activity of all work stations:
ICMP check that it works TCP checks that the ports that are specifically «forbidden» are closed, such as the 21,22, 80, 8080, 5900, P2P etc.
Create five supervision tasks, four for each kind of server in each network or subnetwork assigned to this kind of servers. Assign each task to a different group and assign its network profile. The last one for the work station, assigns to the all B class and to another different group. Use a shorter analysis interval (half a day, one day) for the work stations and a longer one for the servers (23 days or one week).
The supervision servers use a ICMP internal analyzer to check if the machine works. When an agent is created, it tries to solve the IP address to put «hostname» as the name of the agent.
Page 268

Example of use
13 RECON SCRIPTS
Page 269
Introduction
13.1. Introduction
The "ReconScripts" new feature allows doing something much more flexible than the network monitoring and the automatic discovery that the classical recon server did. The recon scripts are developped in an individual way with completely specific targets, such as the network plugins or the agent plugins. Each ReconScript is different and has one purpose.
Its basic idea consist on "detect" things in the system it recognizes and automatically log in one monitoring (network, plugin or wmi) so in a completely customized way we could automatically log in requests in an Oracle database, new virtual host in a VmWare that is managed with VirtualCenter or we also can detect new requests in an WebLogic application Server. It is possible to do an script or application that does the task that are wanted and schedule its execution through the Recon Server.
Each ReconScript is customized and very specific, for only one technology. We have developped one that is completely OpenSource, and we call it SnmpDevices. This script can be found at /usr/share/pandora_server/util/plugin_reconserver/snmpdevices.pl.
This system allows to check a given IPs interval and create agents for each SNMP system that answer to it ( given a SNMP community) and also it will automatically create some network modules (SNMP) depending on the results that it gets, so for each host that it recognizes it will create four SNMP modules:
• SysUptime: System Uptime del sistema (nº of seconds from when the system started). • SysName: System name. • Local InReceives: Received Bytes in the system /seg. • Local OutRequests: Transmited Bytes from the system/seg.
And for each recognized interface (it will automatically detect the interface name) it will be created another three SNMP modules in a host:
• Status: Status (working or not). • Inbound bps: Entry Bytes in the interface/ seg. • Outbound bps: Exit Bytes in the interface / seg.
13.2. Examples of use
This script could be used in two different ways: from the Pandora FMS console and from the shell.
13.2.1. Use from the shellUsing syntax:
./snmpdevices.pl <task_id> <group_id> <create_incident_flag> <custom_field1> <custom_field2>
Example of use:
./snmpdevices.pl 3 8 0 192.168.100.0/24 community2010
Doing a recon task with ID 3 to which it'll be associated to. The created agents will be assigned to the group with Id 8 (Databases). The incident creation has been deactivated with the third parameter to 0. It will ve check on network 192.168.100.0 with mask 24, so it'll be checked from IP 192.168.100.1 to 192.168.100.254 and this check will be done with the community "community2000".
Page 270
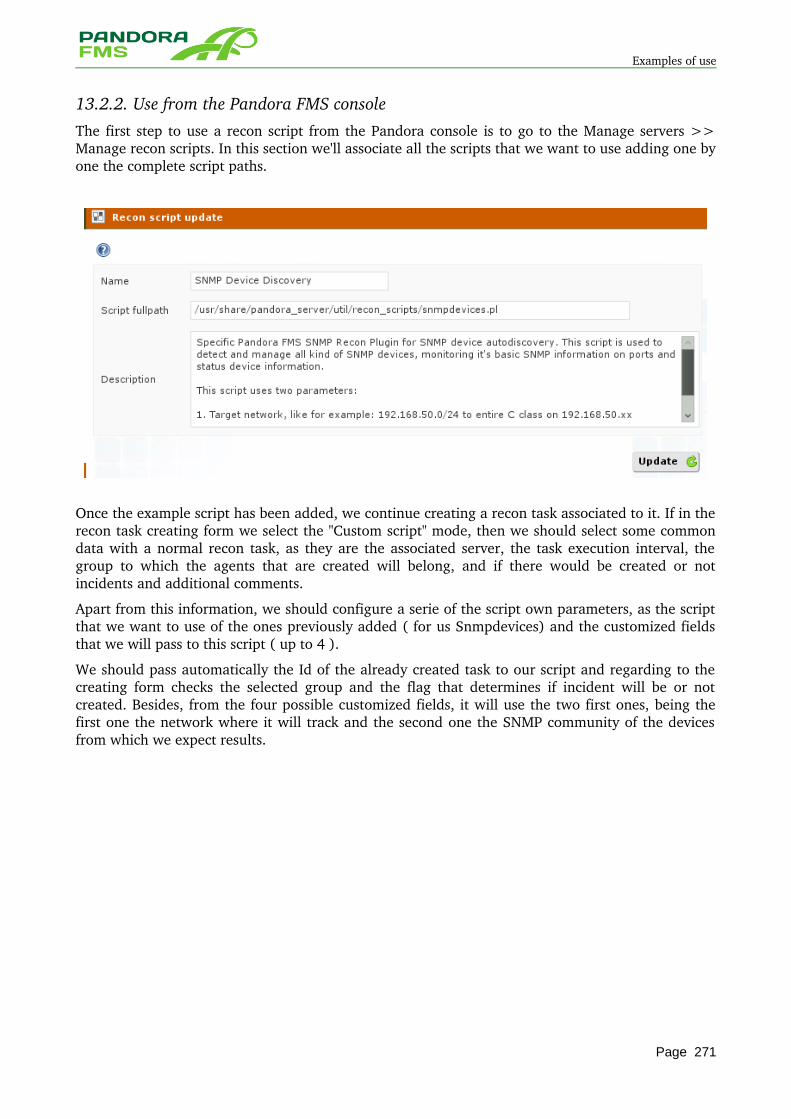
Examples of use
13.2.2. Use from the Pandora FMS consoleThe first step to use a recon script from the Pandora console is to go to the Manage servers >> Manage recon scripts. In this section we'll associate all the scripts that we want to use adding one by one the complete script paths.
Once the example script has been added, we continue creating a recon task associated to it. If in the recon task creating form we select the "Custom script" mode, then we should select some common data with a normal recon task, as they are the associated server, the task execution interval, the group to which the agents that are created will belong, and if there would be created or not incidents and additional comments.
Apart from this information, we should configure a serie of the script own parameters, as the script that we want to use of the ones previously added ( for us Snmpdevices) and the customized fields that we will pass to this script ( up to 4 ).
We should pass automatically the Id of the already created task to our script and regarding to the creating form checks the selected group and the flag that determines if incident will be or not created. Besides, from the four possible customized fields, it will use the two first ones, being the first one the network where it will track and the second one the SNMP community of the devices from which we expect results.
Page 271
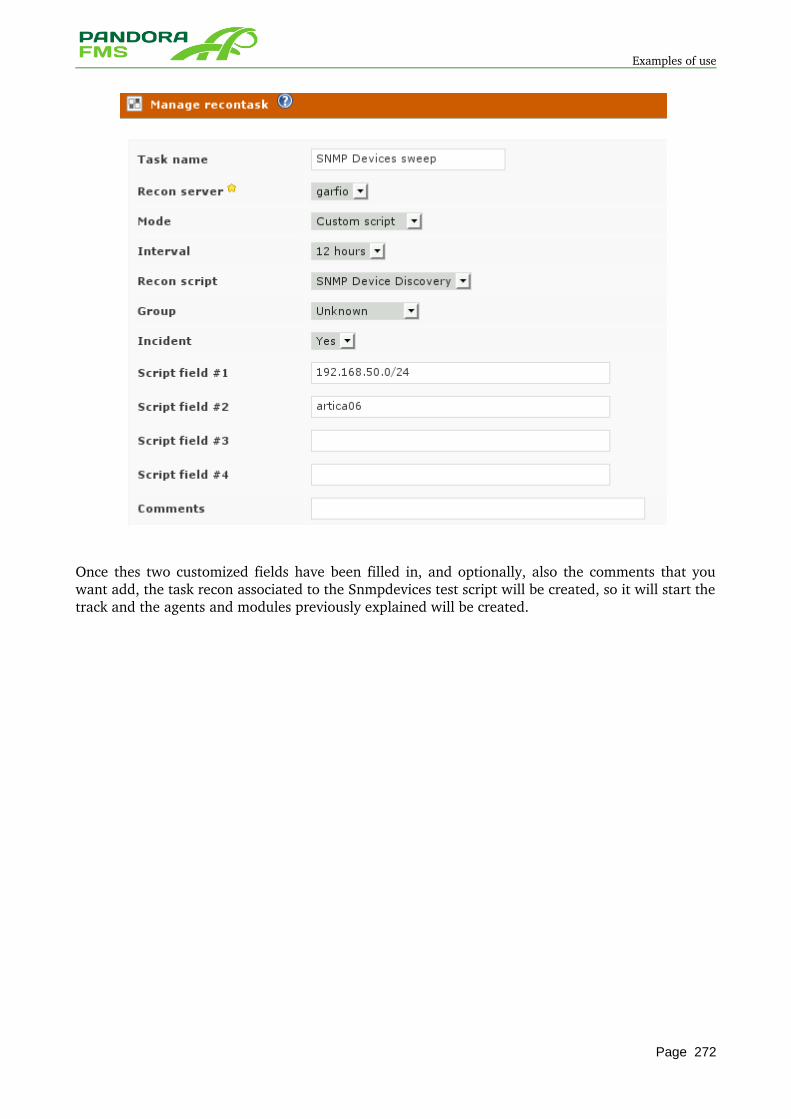
Examples of use
Once thes two customized fields have been filled in, and optionally, also the comments that you want add, the task recon associated to the Snmpdevices test script will be created, so it will start the track and the agents and modules previously explained will be created.
Page 272

Examples of use
14 INVENTORY
Page 273
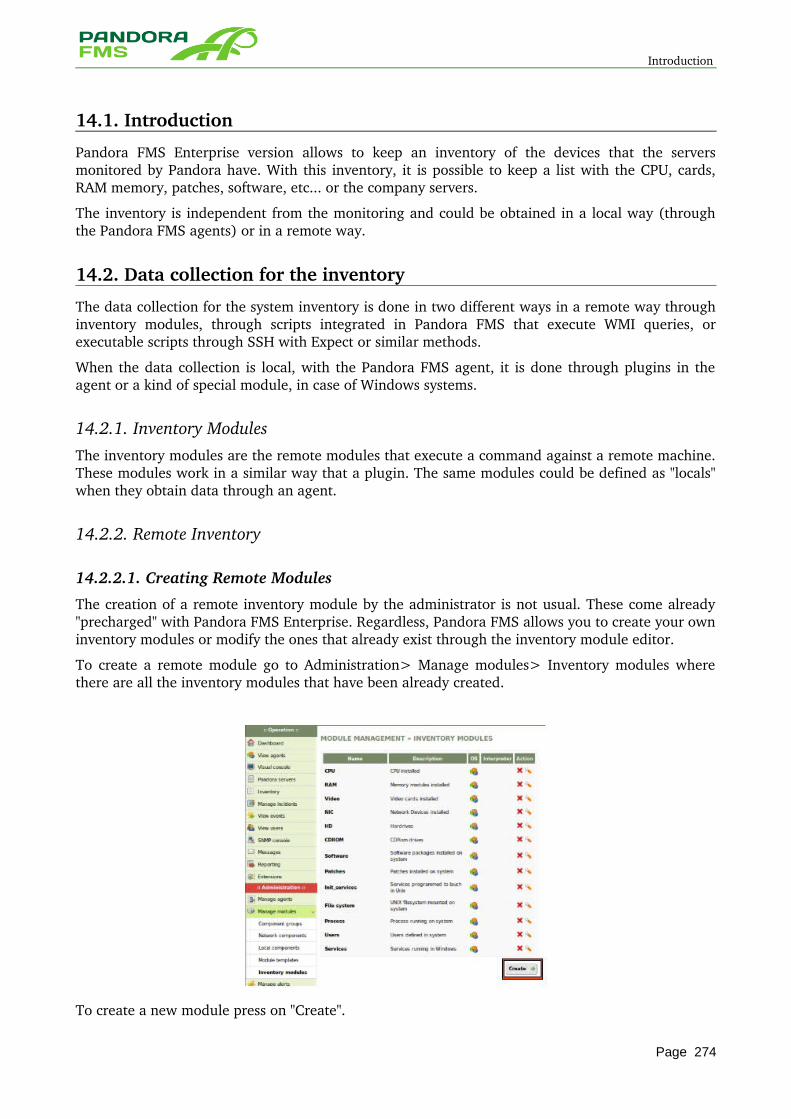
Introduction
14.1. Introduction
Pandora FMS Enterprise version allows to keep an inventory of the devices that the servers monitored by Pandora have. With this inventory, it is possible to keep a list with the CPU, cards, RAM memory, patches, software, etc... or the company servers.
The inventory is independent from the monitoring and could be obtained in a local way (through the Pandora FMS agents) or in a remote way.
14.2. Data collection for the inventory
The data collection for the system inventory is done in two different ways in a remote way through inventory modules, through scripts integrated in Pandora FMS that execute WMI queries, or executable scripts through SSH with Expect or similar methods.
When the data collection is local, with the Pandora FMS agent, it is done through plugins in the agent or a kind of special module, in case of Windows systems.
14.2.1. Inventory ModulesThe inventory modules are the remote modules that execute a command against a remote machine. These modules work in a similar way that a plugin. The same modules could be defined as "locals" when they obtain data through an agent.
14.2.2. Remote Inventory
14.2.2.1. Creating Remote Modules
The creation of a remote inventory module by the administrator is not usual. These come already "precharged" with Pandora FMS Enterprise. Regardless, Pandora FMS allows you to create your own inventory modules or modify the ones that already exist through the inventory module editor.
To create a remote module go to Administration> Manage modules> Inventory modules where there are all the inventory modules that have been already created.
To create a new module press on "Create".
Page 274
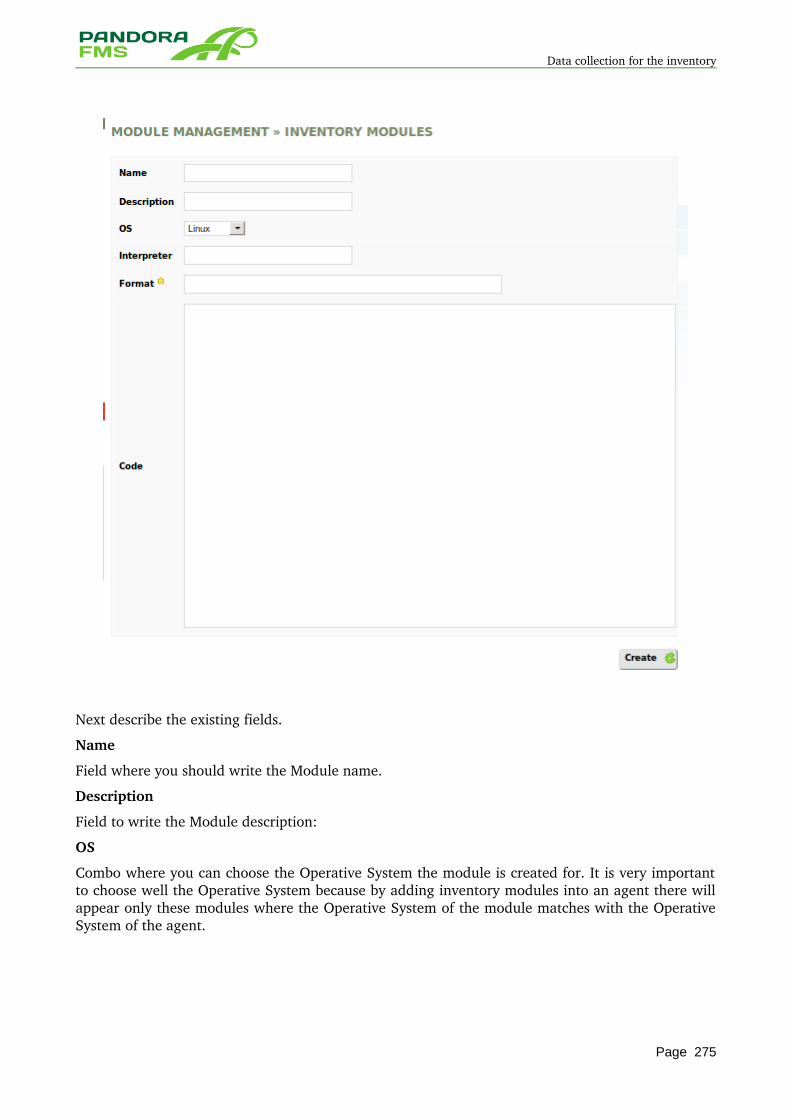
Data collection for the inventory
Next describe the existing fields.
Name
Field where you should write the Module name.
Description
Field to write the Module description:
OS
Combo where you can choose the Operative System the module is created for. It is very important to choose well the Operative System because by adding inventory modules into an agent there will appear only these modules where the Operative System of the module matches with the Operative System of the agent.
Page 275
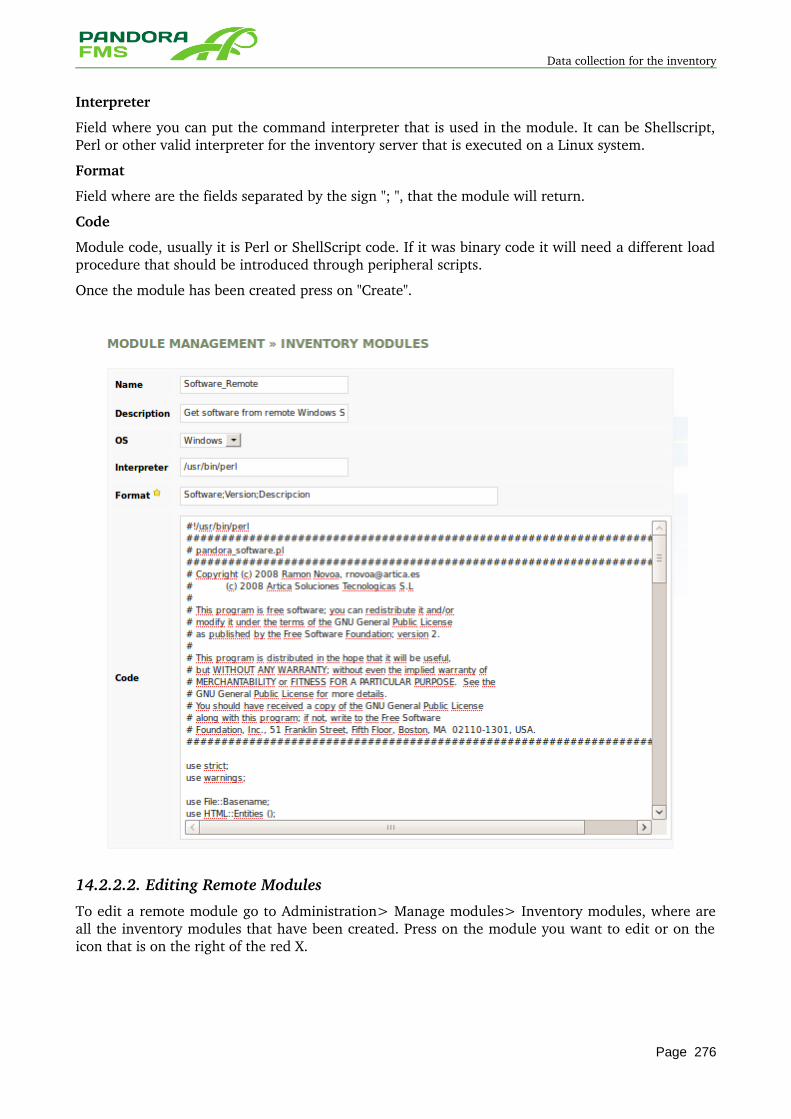
Data collection for the inventory
Interpreter
Field where you can put the command interpreter that is used in the module. It can be Shellscript, Perl or other valid interpreter for the inventory server that is executed on a Linux system.
Format
Field where are the fields separated by the sign "; ", that the module will return.
Code
Module code, usually it is Perl or ShellScript code. If it was binary code it will need a different load procedure that should be introduced through peripheral scripts.
Once the module has been created press on "Create".
14.2.2.2. Editing Remote Modules
To edit a remote module go to Administration> Manage modules> Inventory modules, where are all the inventory modules that have been created. Press on the module you want to edit or on the icon that is on the right of the red X.
Page 276
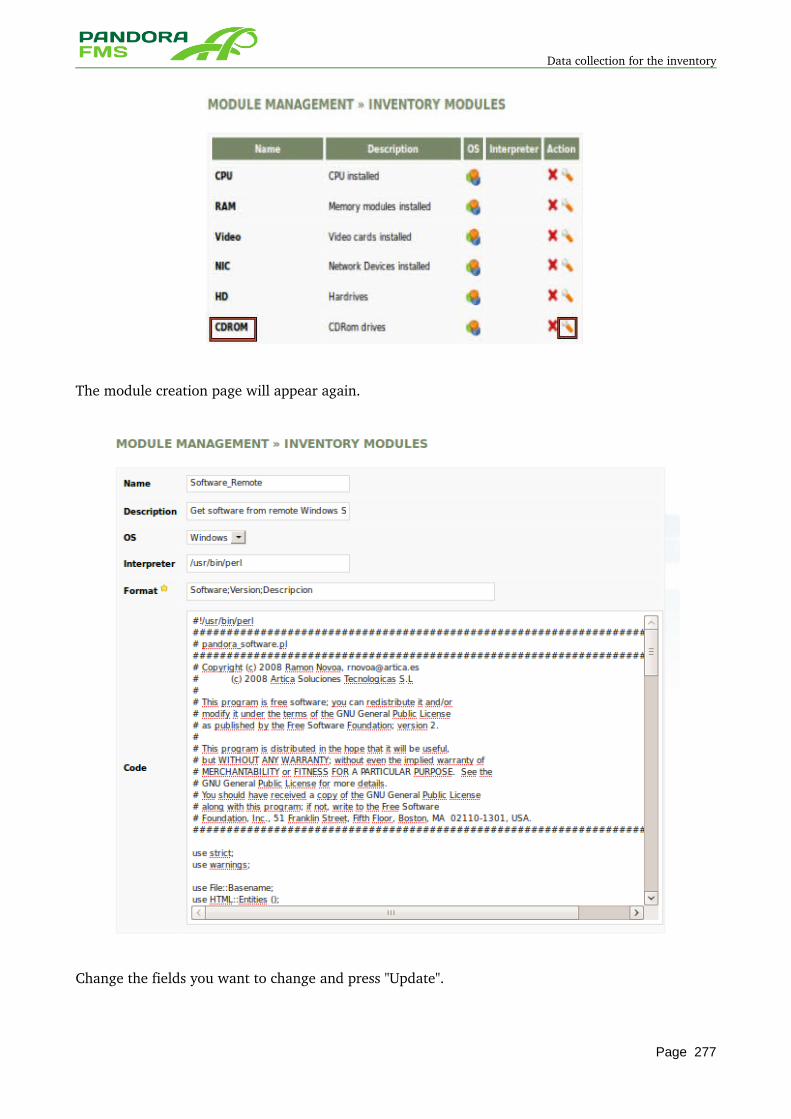
Data collection for the inventory
The module creation page will appear again.
Change the fields you want to change and press "Update".
Page 277
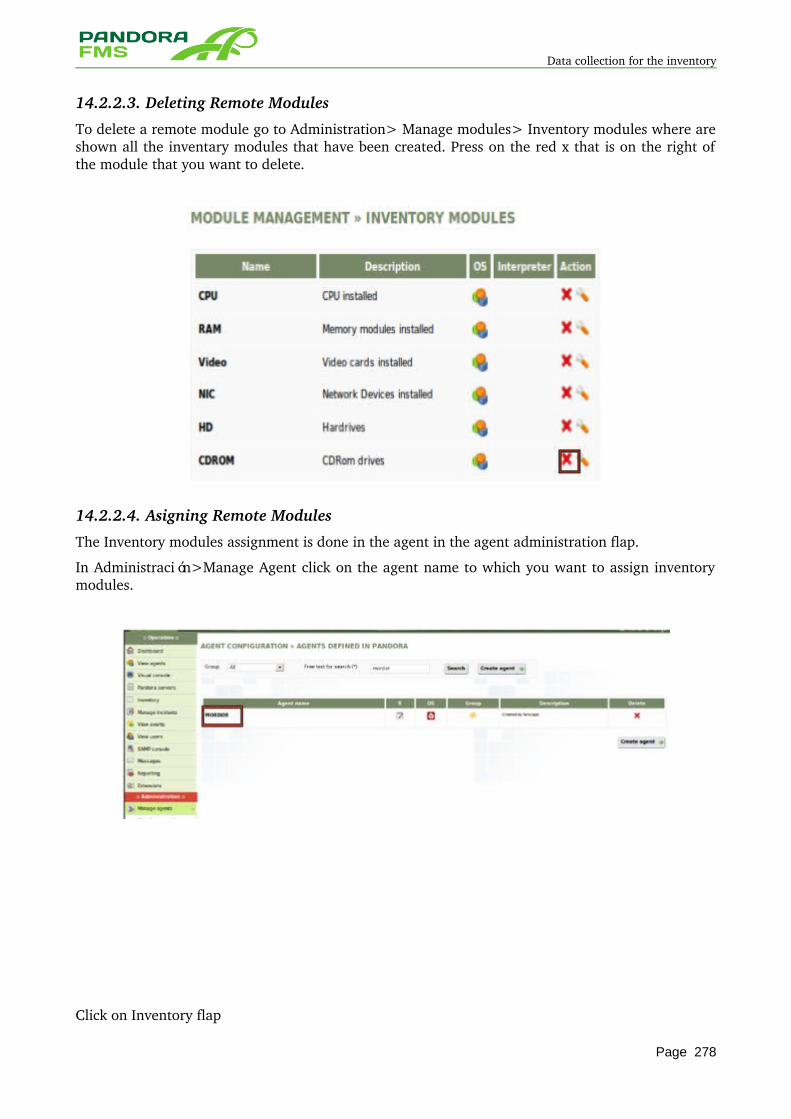
Data collection for the inventory
14.2.2.3. Deleting Remote Modules
To delete a remote module go to Administration> Manage modules> Inventory modules where are shown all the inventary modules that have been created. Press on the red x that is on the right of the module that you want to delete.
14.2.2.4. Asigning Remote Modules
The Inventory modules assignment is done in the agent in the agent administration flap.
In Administración>Manage Agent click on the agent name to which you want to assign inventory modules.
Click on Inventory flap
Page 278
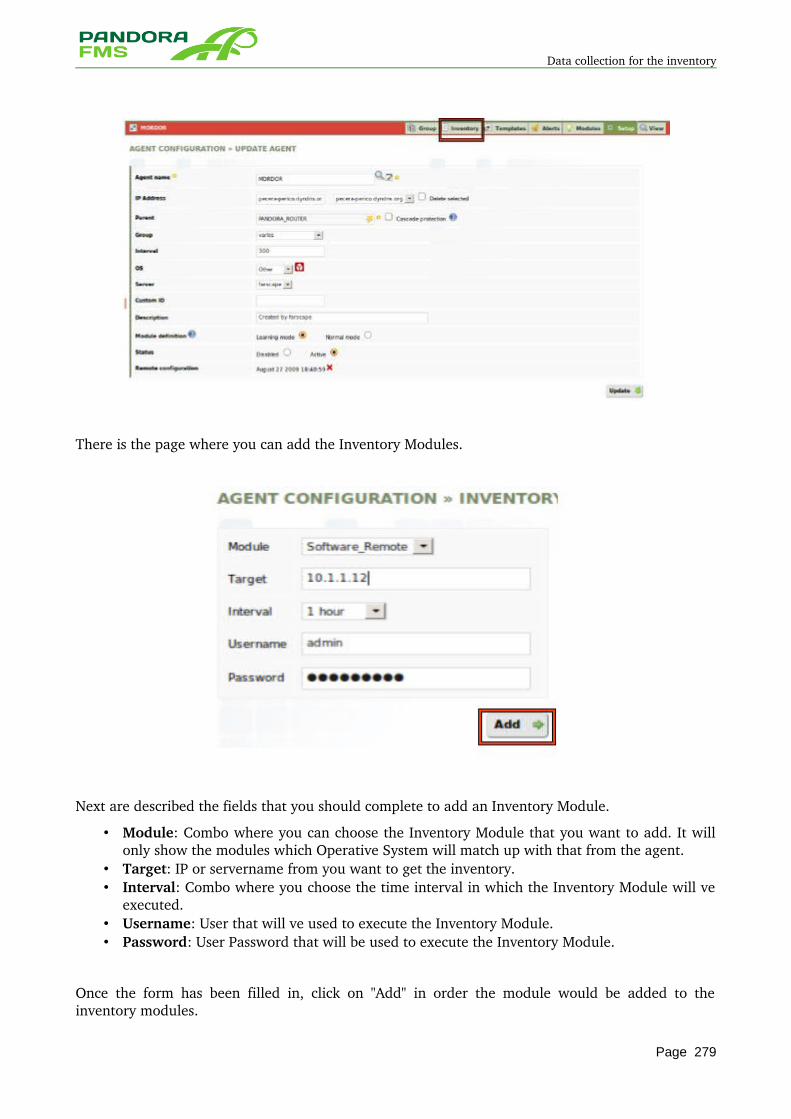
Data collection for the inventory
There is the page where you can add the Inventory Modules.
Next are described the fields that you should complete to add an Inventory Module.
• Module: Combo where you can choose the Inventory Module that you want to add. It will only show the modules which Operative System will match up with that from the agent.
• Target: IP or servername from you want to get the inventory. • Interval: Combo where you choose the time interval in which the Inventory Module will ve
executed. • Username: User that will ve used to execute the Inventory Module. • Password: User Password that will be used to execute the Inventory Module.
Once the form has been filled in, click on "Add" in order the module would be added to the inventory modules.
Page 279
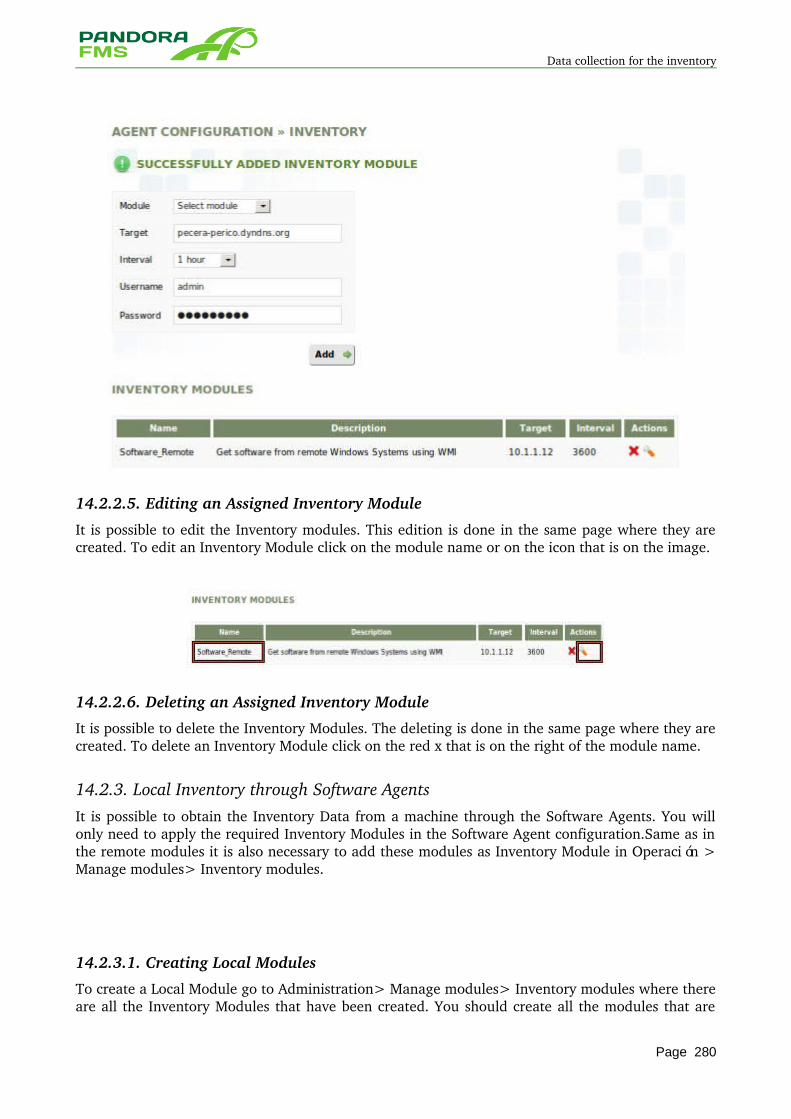
Data collection for the inventory
14.2.2.5. Editing an Assigned Inventory Module
It is possible to edit the Inventory modules. This edition is done in the same page where they are created. To edit an Inventory Module click on the module name or on the icon that is on the image.
14.2.2.6. Deleting an Assigned Inventory Module
It is possible to delete the Inventory Modules. The deleting is done in the same page where they are created. To delete an Inventory Module click on the red x that is on the right of the module name.
14.2.3. Local Inventory through Software Agents It is possible to obtain the Inventory Data from a machine through the Software Agents. You will only need to apply the required Inventory Modules in the Software Agent configuration.Same as in the remote modules it is also necessary to add these modules as Inventory Module in Operación > Manage modules> Inventory modules.
14.2.3.1. Creating Local Modules
To create a Local Module go to Administration> Manage modules> Inventory modules where there are all the Inventory Modules that have been created. You should create all the modules that are
Page 280
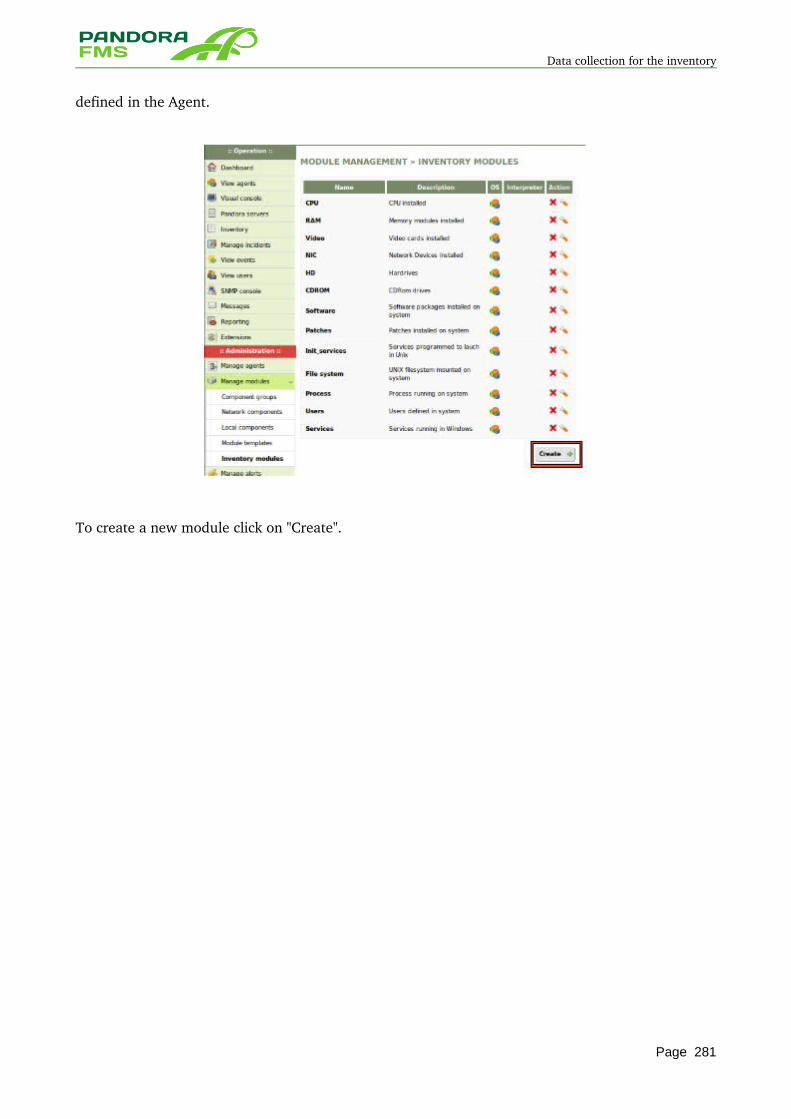
Data collection for the inventory
defined in the Agent.
To create a new module click on "Create".
Page 281
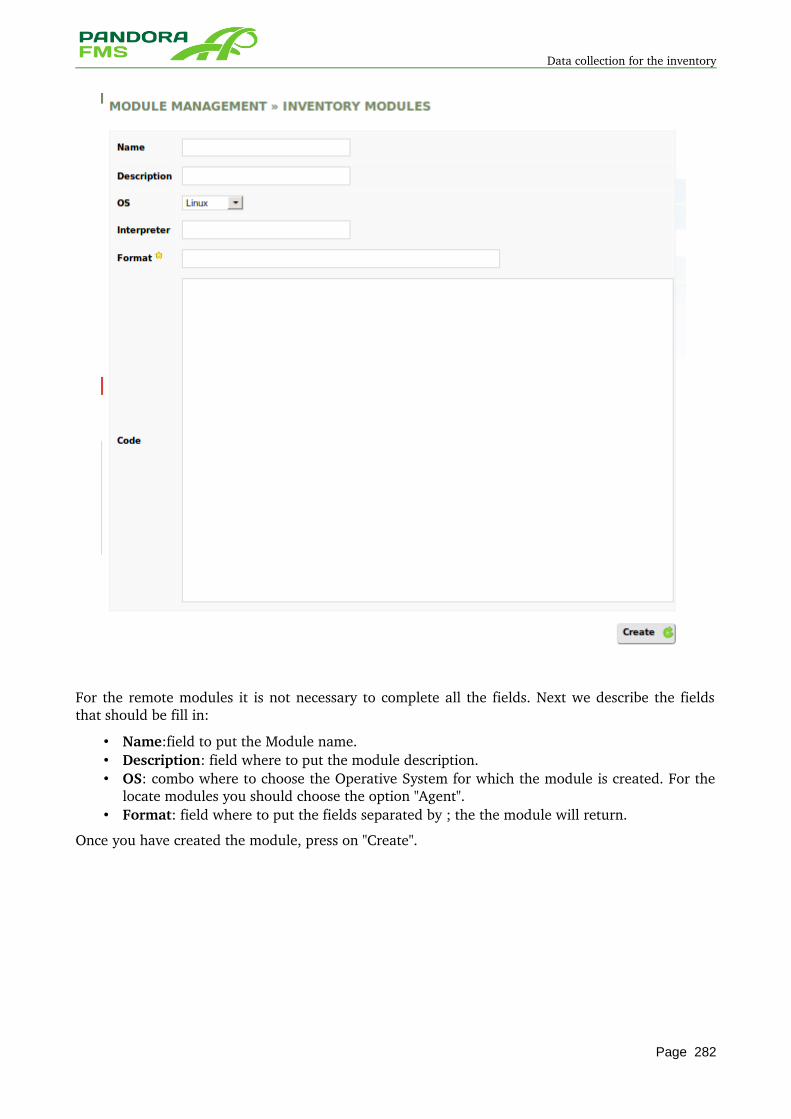
Data collection for the inventory
For the remote modules it is not necessary to complete all the fields. Next we describe the fields that should be fill in:
• Name:field to put the Module name. • Description: field where to put the module description. • OS: combo where to choose the Operative System for which the module is created. For the
locate modules you should choose the option "Agent". • Format: field where to put the fields separated by ; the the module will return.
Once you have created the module, press on "Create".
Page 282
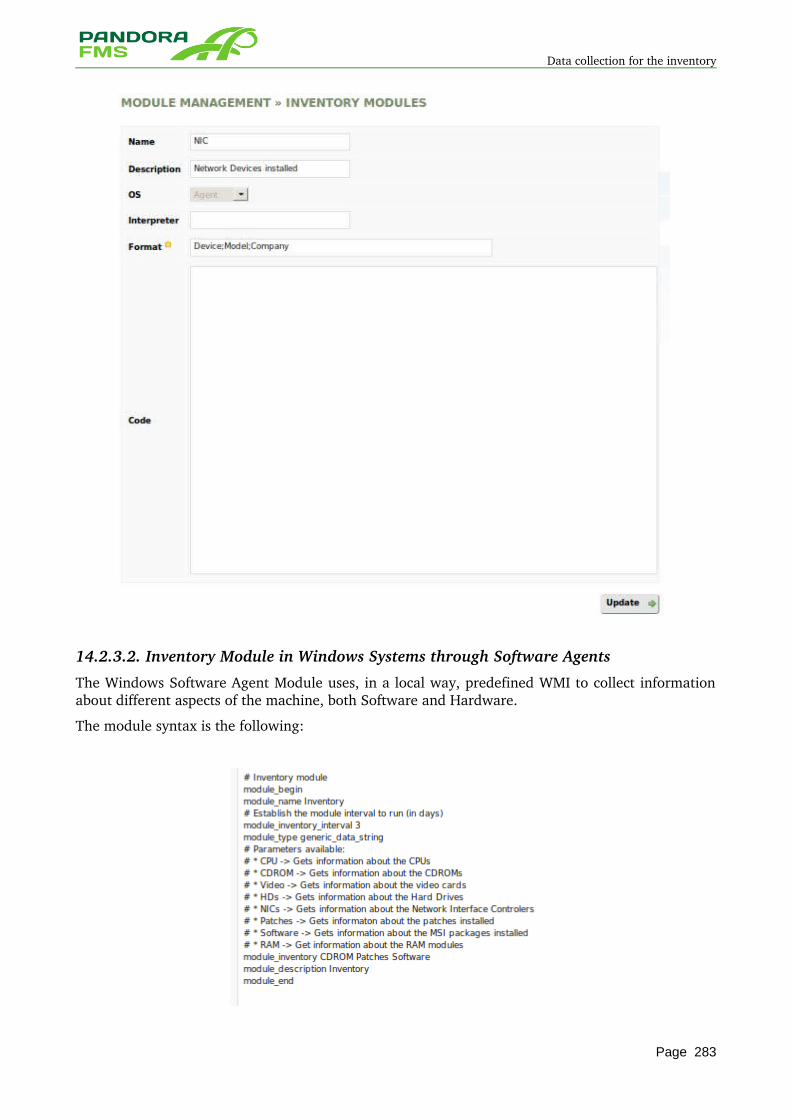
Data collection for the inventory
14.2.3.2. Inventory Module in Windows Systems through Software Agents
The Windows Software Agent Module uses, in a local way, predefined WMI to collect information about different aspects of the machine, both Software and Hardware.
The module syntax is the following:
Page 283
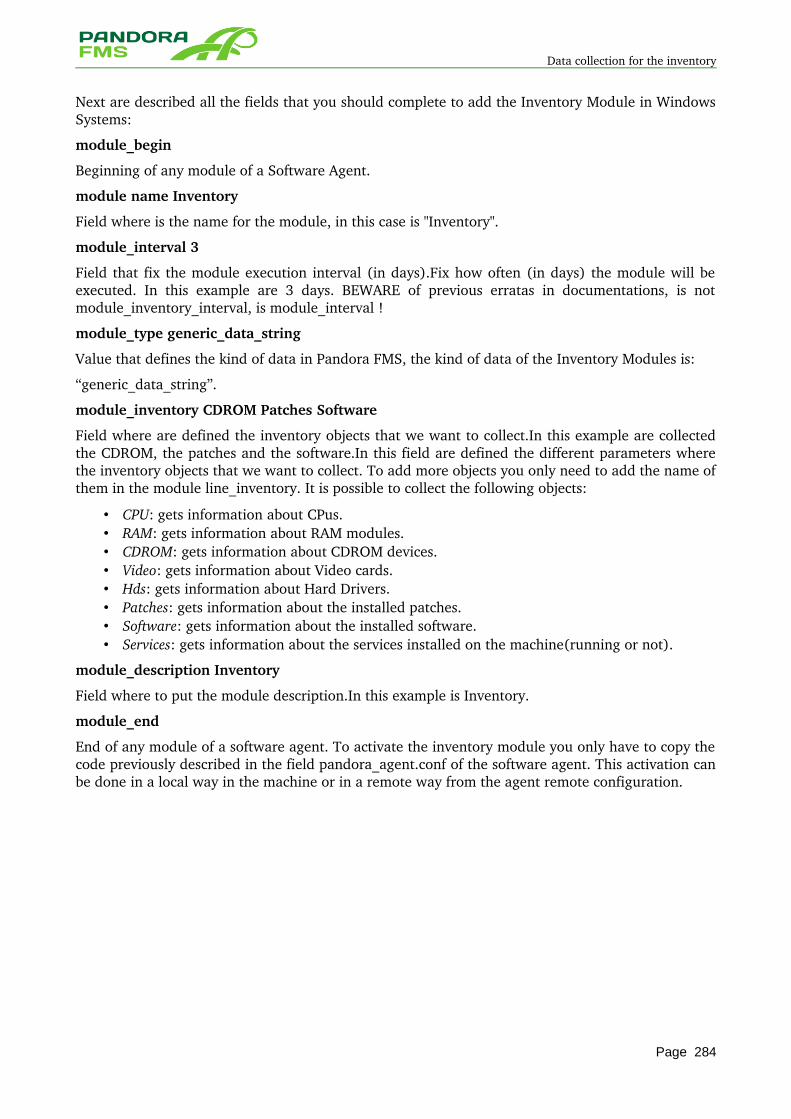
Data collection for the inventory
Next are described all the fields that you should complete to add the Inventory Module in Windows Systems:
module_begin
Beginning of any module of a Software Agent.
module name Inventory
Field where is the name for the module, in this case is "Inventory".
module_interval 3
Field that fix the module execution interval (in days).Fix how often (in days) the module will be executed. In this example are 3 days. BEWARE of previous erratas in documentations, is not module_inventory_interval, is module_interval !
module_type generic_data_string
Value that defines the kind of data in Pandora FMS, the kind of data of the Inventory Modules is:
“generic_data_string”.
module_inventory CDROM Patches Software
Field where are defined the inventory objects that we want to collect.In this example are collected the CDROM, the patches and the software.In this field are defined the different parameters where the inventory objects that we want to collect. To add more objects you only need to add the name of them in the module line_inventory. It is possible to collect the following objects:
• CPU: gets information about CPus. • RAM: gets information about RAM modules. • CDROM: gets information about CDROM devices. • Video: gets information about Video cards. • Hds: gets information about Hard Drivers. • Patches: gets information about the installed patches. • Software: gets information about the installed software. • Services: gets information about the services installed on the machine(running or not).
module_description Inventory
Field where to put the module description.In this example is Inventory.
module_end
End of any module of a software agent. To activate the inventory module you only have to copy the code previously described in the field pandora_agent.conf of the software agent. This activation can be done in a local way in the machine or in a remote way from the agent remote configuration.
Page 284
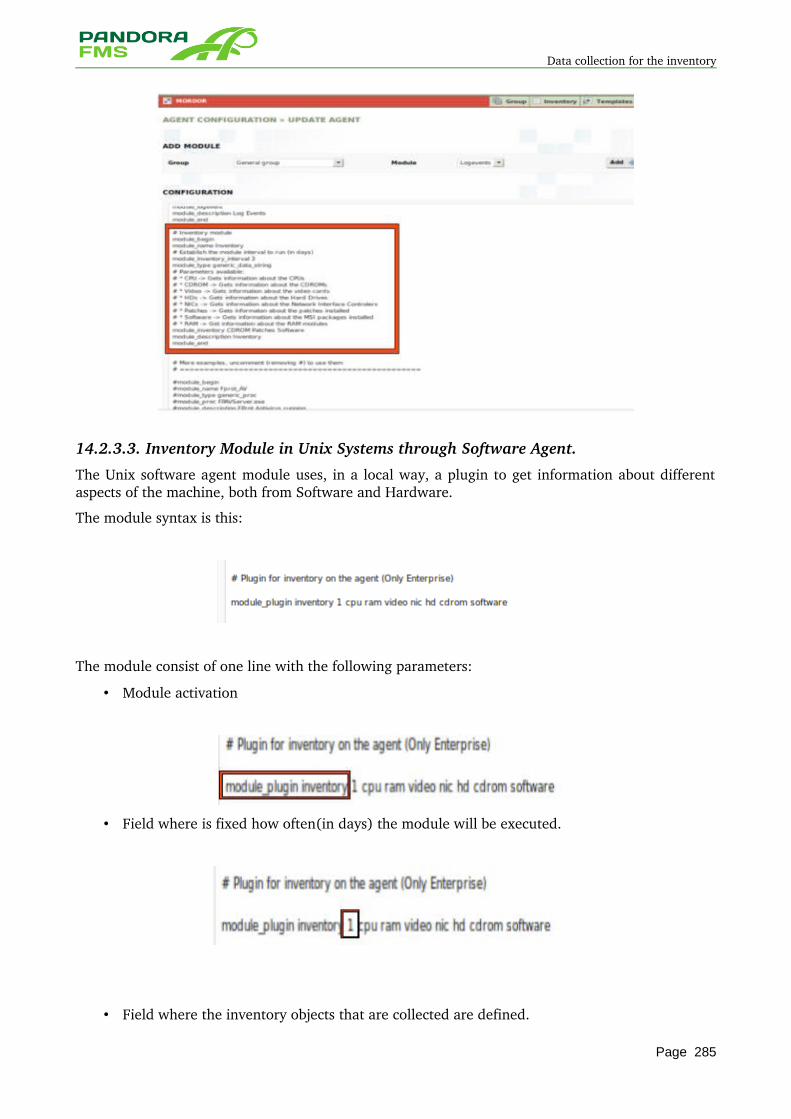
Data collection for the inventory
14.2.3.3. Inventory Module in Unix Systems through Software Agent.
The Unix software agent module uses, in a local way, a plugin to get information about different aspects of the machine, both from Software and Hardware.
The module syntax is this:
The module consist of one line with the following parameters:
• Module activation
• Field where is fixed how often(in days) the module will be executed.
• Field where the inventory objects that are collected are defined.
Page 285
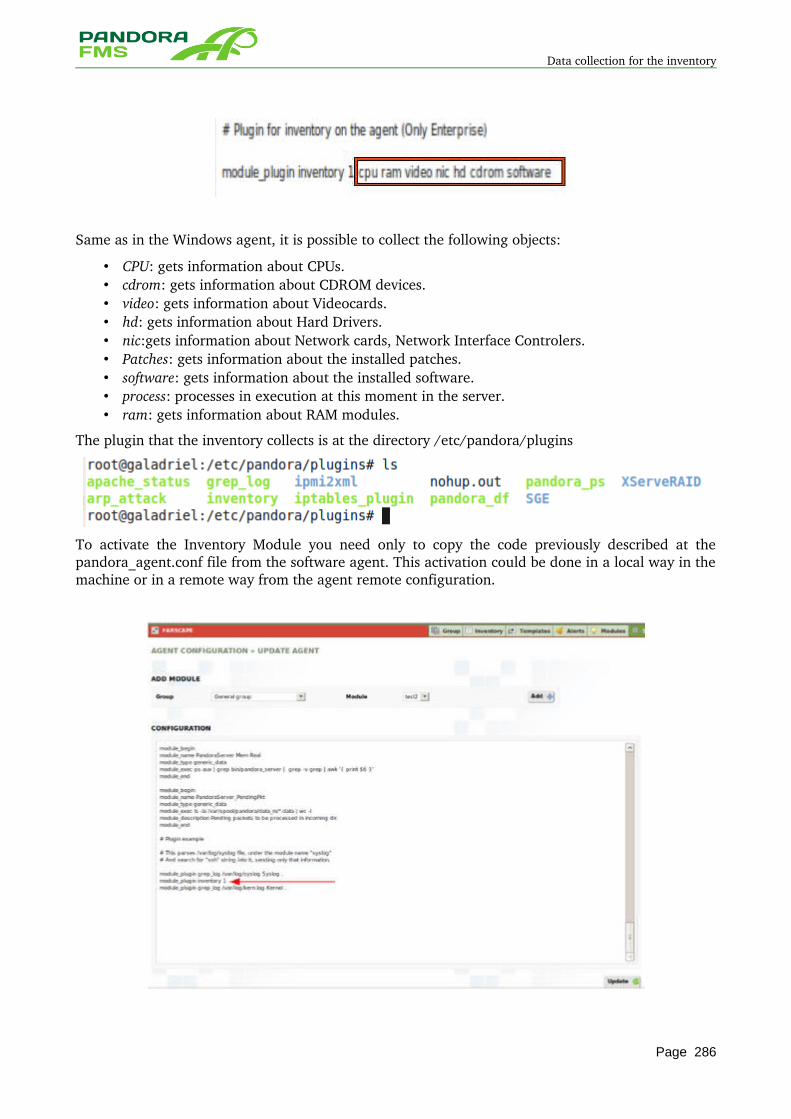
Data collection for the inventory
Same as in the Windows agent, it is possible to collect the following objects:
• CPU: gets information about CPUs. • cdrom: gets information about CDROM devices. • video: gets information about Videocards. • hd: gets information about Hard Drivers. • nic:gets information about Network cards, Network Interface Controlers. • Patches: gets information about the installed patches. • software: gets information about the installed software. • process: processes in execution at this moment in the server. • ram: gets information about RAM modules.
The plugin that the inventory collects is at the directory /etc/pandora/plugins
To activate the Inventory Module you need only to copy the code previously described at the pandora_agent.conf file from the software agent. This activation could be done in a local way in the machine or in a remote way from the agent remote configuration.
Page 286
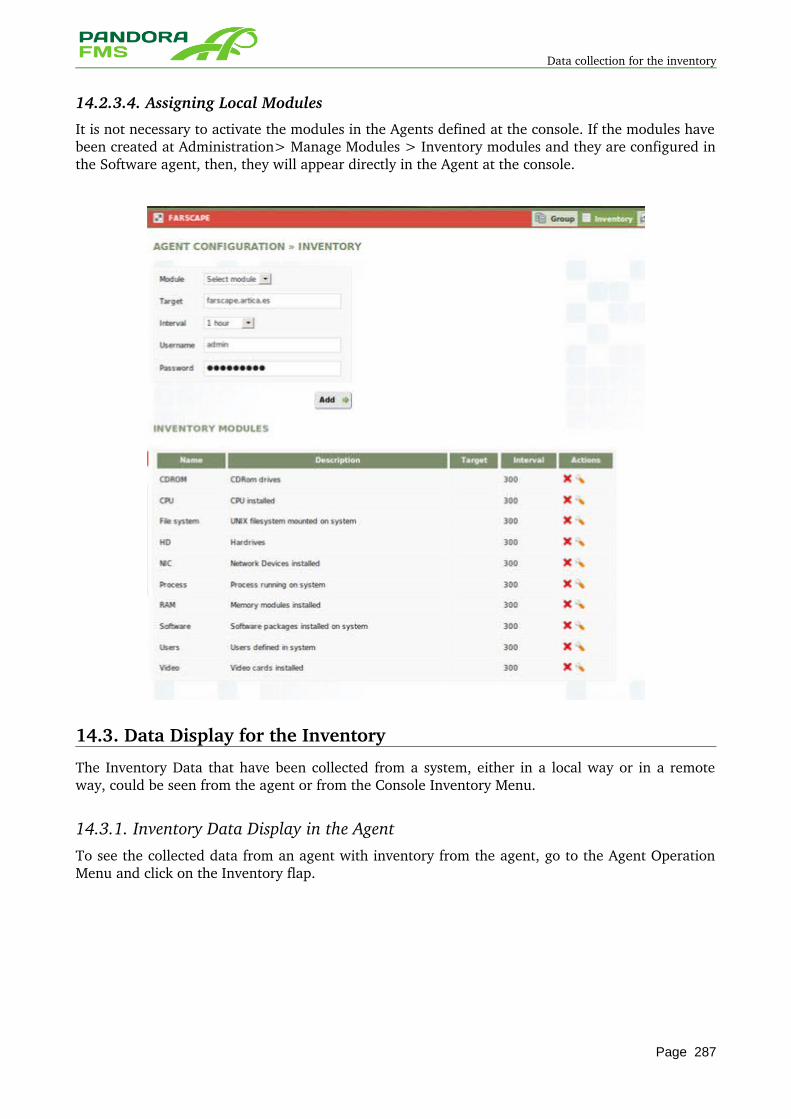
Data collection for the inventory
14.2.3.4. Assigning Local Modules
It is not necessary to activate the modules in the Agents defined at the console. If the modules have been created at Administration> Manage Modules > Inventory modules and they are configured in the Software agent, then, they will appear directly in the Agent at the console.
14.3. Data Display for the Inventory
The Inventory Data that have been collected from a system, either in a local way or in a remote way, could be seen from the agent or from the Console Inventory Menu.
14.3.1. Inventory Data Display in the AgentTo see the collected data from an agent with inventory from the agent, go to the Agent Operation Menu and click on the Inventory flap.
Page 287
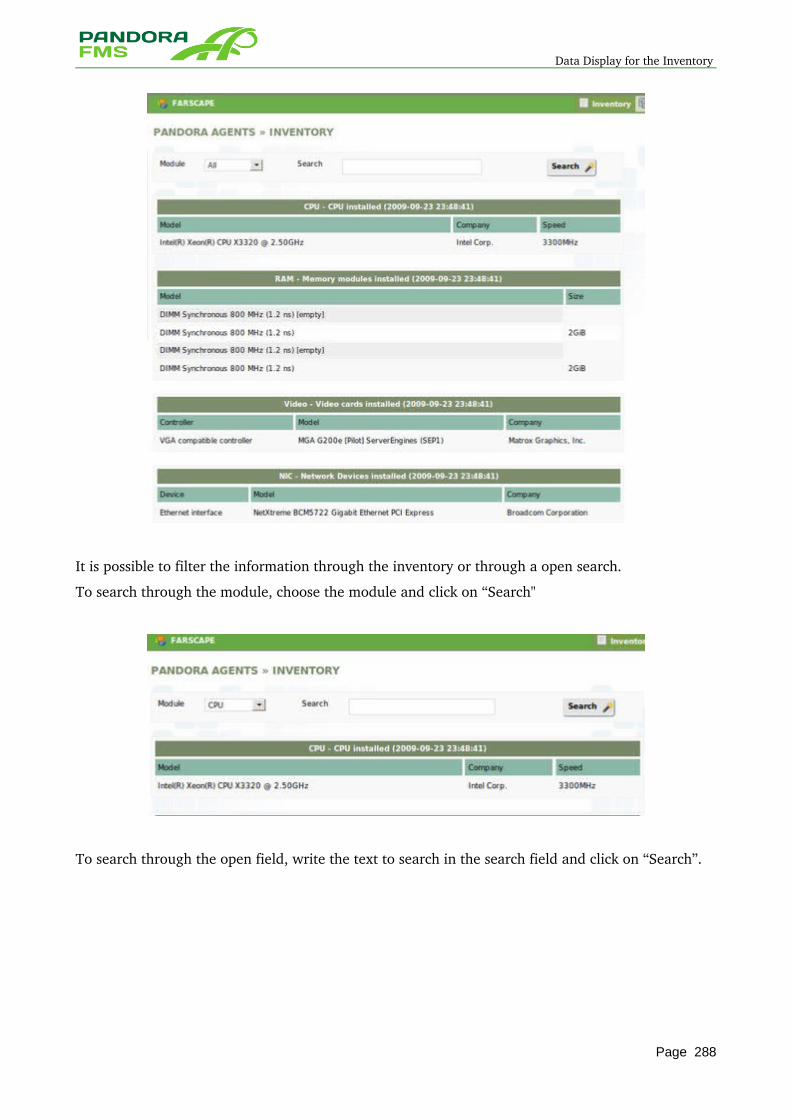
Data Display for the Inventory
It is possible to filter the information through the inventory or through a open search.
To search through the module, choose the module and click on “Search"
To search through the open field, write the text to search in the search field and click on “Search”.
Page 288
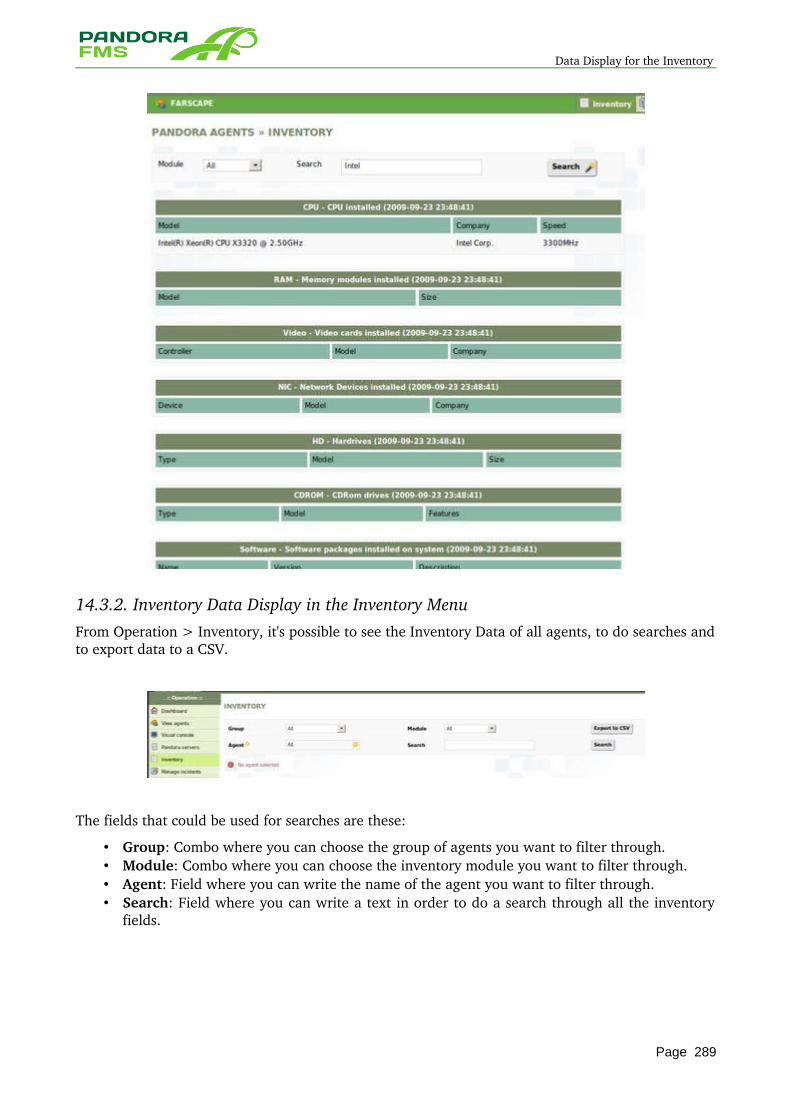
Data Display for the Inventory
14.3.2. Inventory Data Display in the Inventory MenuFrom Operation > Inventory, it's possible to see the Inventory Data of all agents, to do searches and to export data to a CSV.
The fields that could be used for searches are these:
• Group: Combo where you can choose the group of agents you want to filter through. • Module: Combo where you can choose the inventory module you want to filter through. • Agent: Field where you can write the name of the agent you want to filter through. • Search: Field where you can write a text in order to do a search through all the inventory
fields.
Page 289
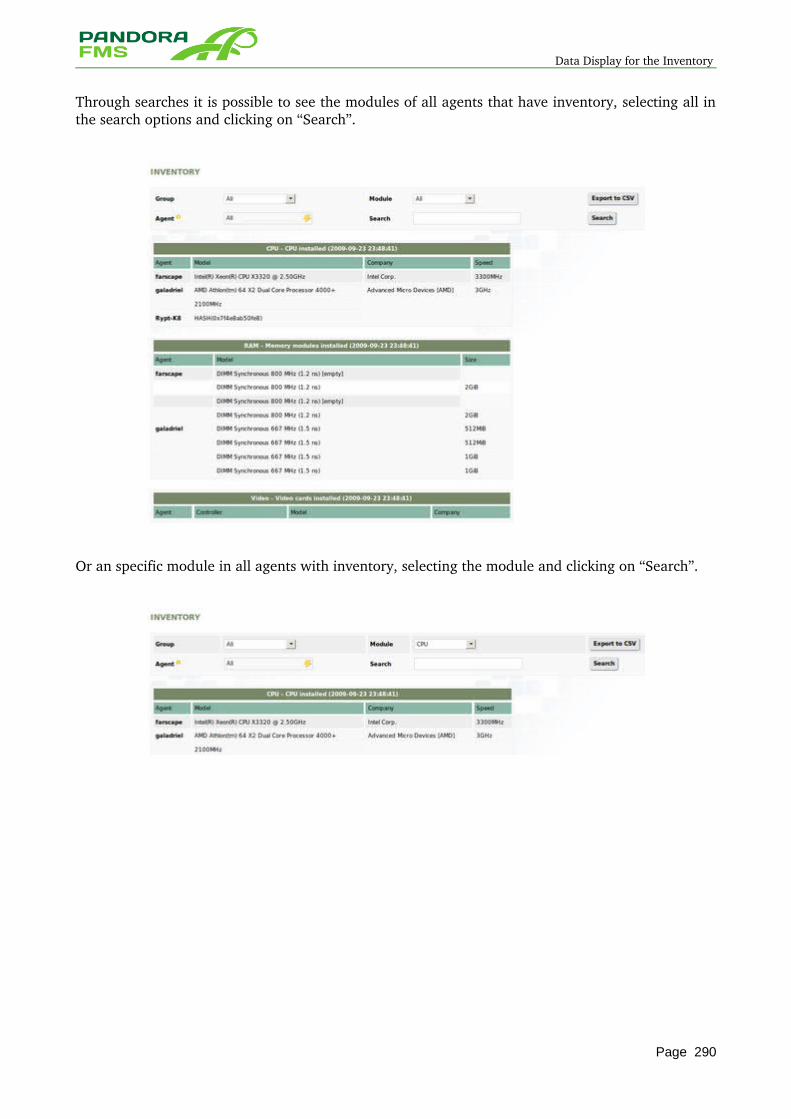
Data Display for the Inventory
Through searches it is possible to see the modules of all agents that have inventory, selecting all in the search options and clicking on “Search”.
Or an specific module in all agents with inventory, selecting the module and clicking on “Search”.
Page 290
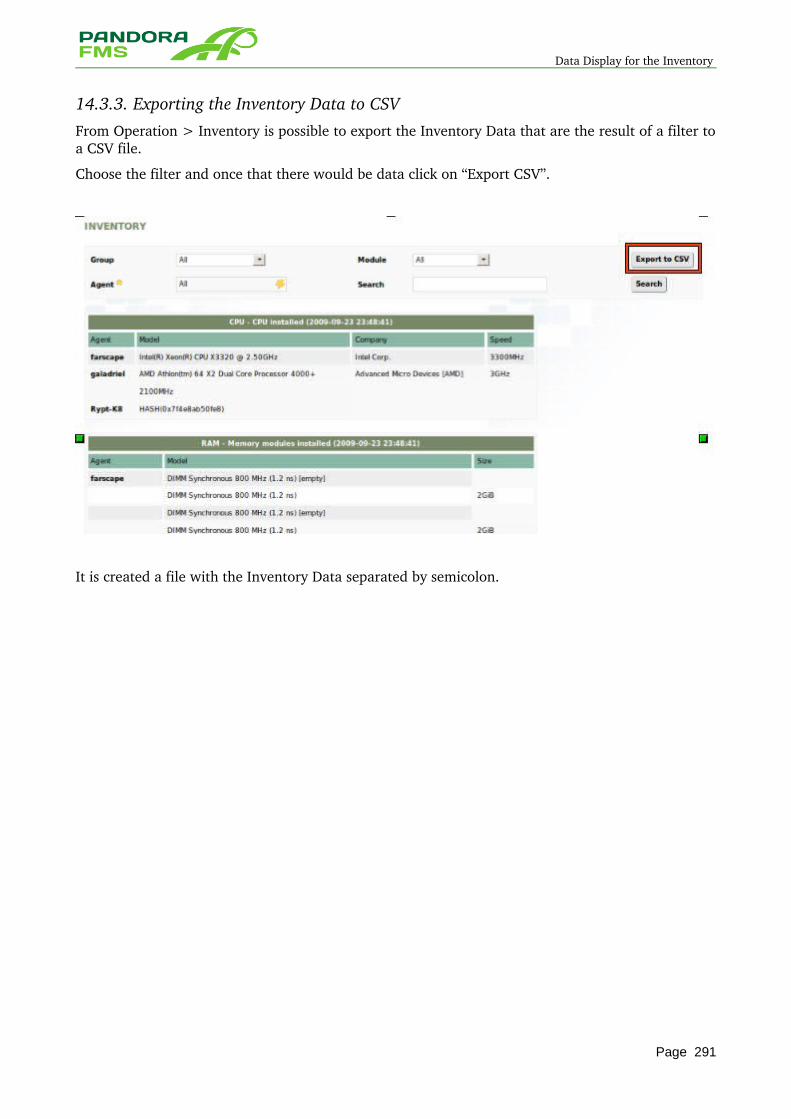
Data Display for the Inventory
14.3.3. Exporting the Inventory Data to CSVFrom Operation > Inventory is possible to export the Inventory Data that are the result of a filter to a CSV file.
Choose the filter and once that there would be data click on “Export CSV”.
It is created a file with the Inventory Data separated by semicolon.
Page 291

Data Display for the Inventory
15 DATA DISPLAY:GRAPHS, REPORTS, VISUAL MAPS AND MODULE LIST
Page 292
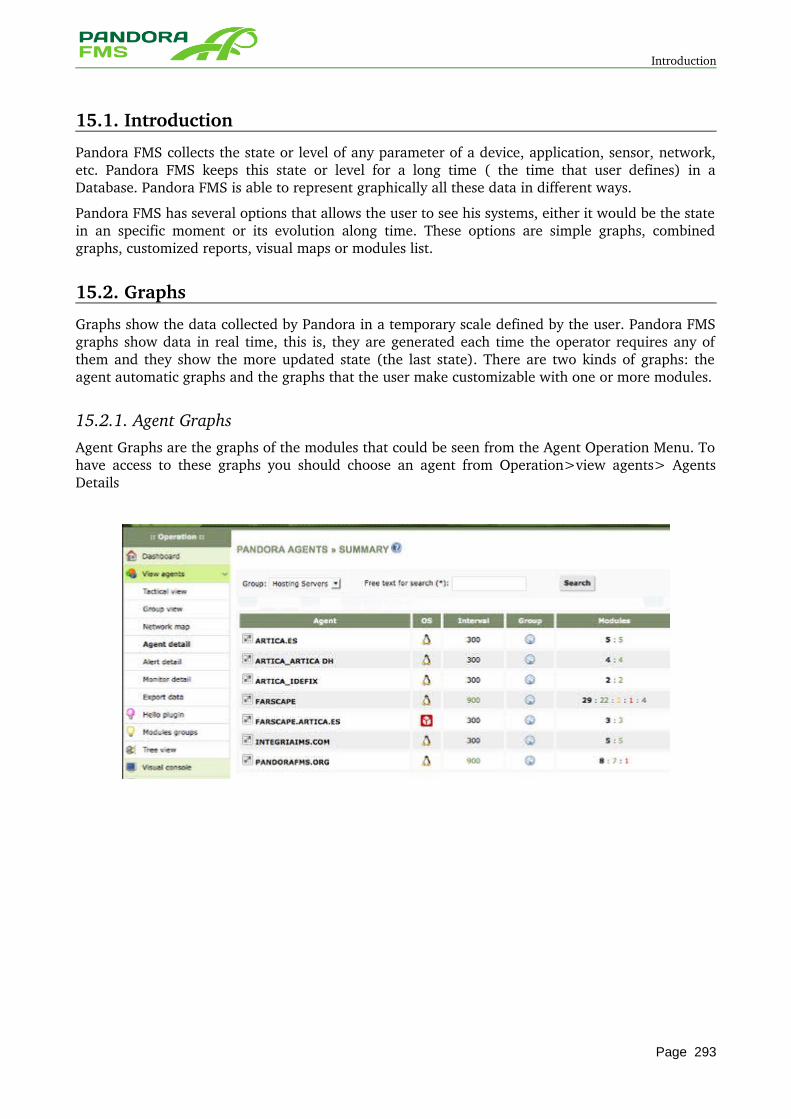
Introduction
15.1. Introduction
Pandora FMS collects the state or level of any parameter of a device, application, sensor, network, etc. Pandora FMS keeps this state or level for a long time ( the time that user defines) in a Database. Pandora FMS is able to represent graphically all these data in different ways.
Pandora FMS has several options that allows the user to see his systems, either it would be the state in an specific moment or its evolution along time. These options are simple graphs, combined graphs, customized reports, visual maps or modules list.
15.2. Graphs
Graphs show the data collected by Pandora in a temporary scale defined by the user. Pandora FMS graphs show data in real time, this is, they are generated each time the operator requires any of them and they show the more updated state (the last state). There are two kinds of graphs: the agent automatic graphs and the graphs that the user make customizable with one or more modules.
15.2.1. Agent GraphsAgent Graphs are the graphs of the modules that could be seen from the Agent Operation Menu. To have access to these graphs you should choose an agent from Operation>view agents> Agents Details
Page 293
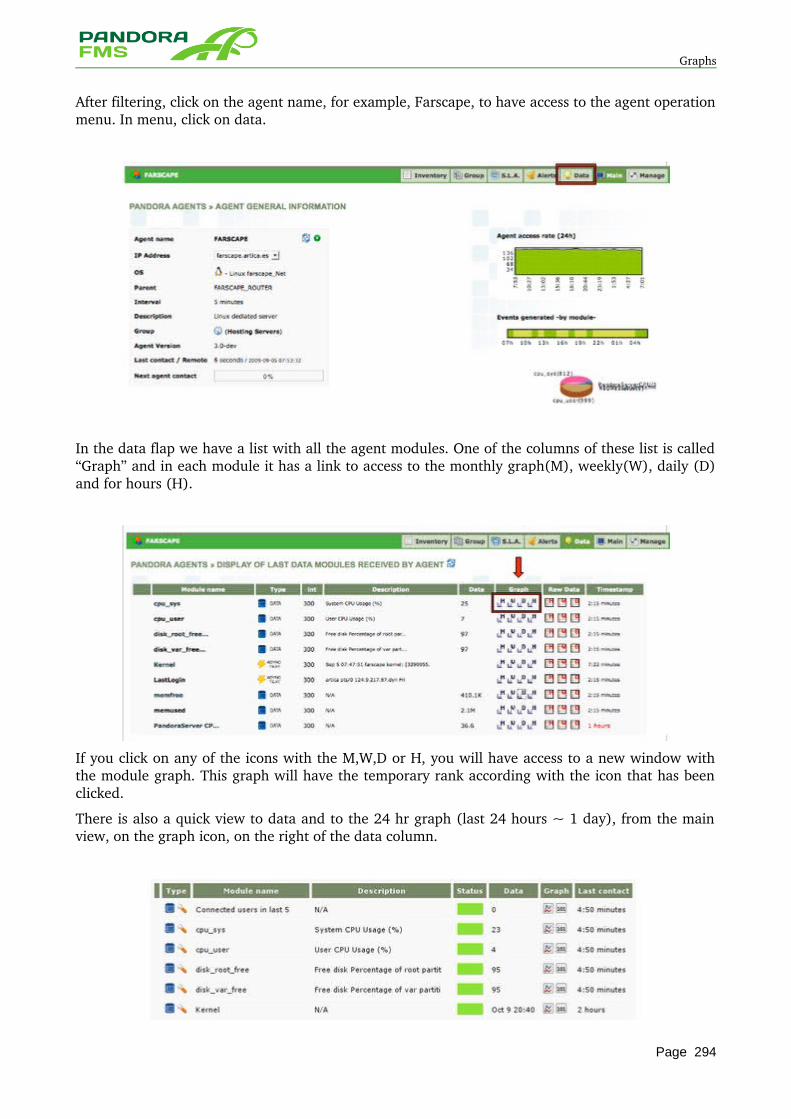
Graphs
After filtering, click on the agent name, for example, Farscape, to have access to the agent operation menu. In menu, click on data.
In the data flap we have a list with all the agent modules. One of the columns of these list is called “Graph” and in each module it has a link to access to the monthly graph(M), weekly(W), daily (D) and for hours (H).
If you click on any of the icons with the M,W,D or H, you will have access to a new window with the module graph. This graph will have the temporary rank according with the icon that has been clicked.
There is also a quick view to data and to the 24 hr graph (last 24 hours ~ 1 day), from the main view, on the graph icon, on the right of the data column.
Page 294
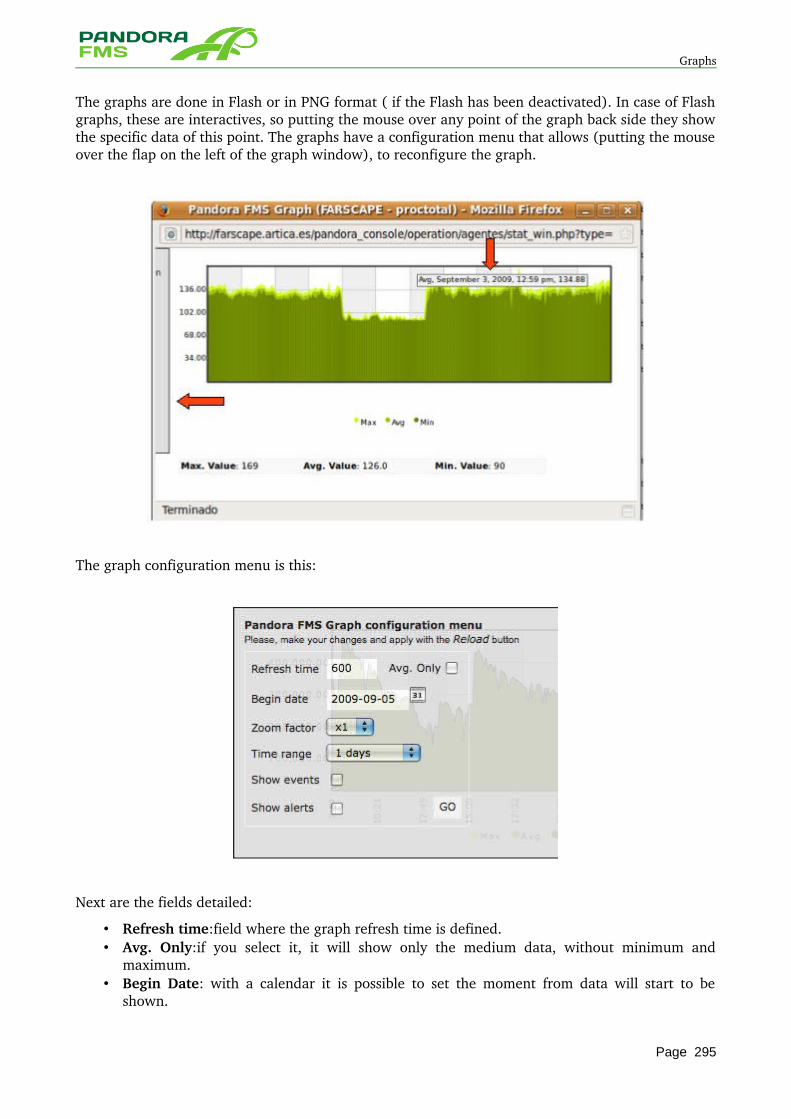
Graphs
The graphs are done in Flash or in PNG format ( if the Flash has been deactivated). In case of Flash graphs, these are interactives, so putting the mouse over any point of the graph back side they show the specific data of this point. The graphs have a configuration menu that allows (putting the mouse over the flap on the left of the graph window), to reconfigure the graph.
The graph configuration menu is this:
Next are the fields detailed:
• Refresh time:field where the graph refresh time is defined. • Avg. Only:if you select it, it will show only the medium data, without minimum and
maximum. • Begin Date: with a calendar it is possible to set the moment from data will start to be
shown.
Page 295
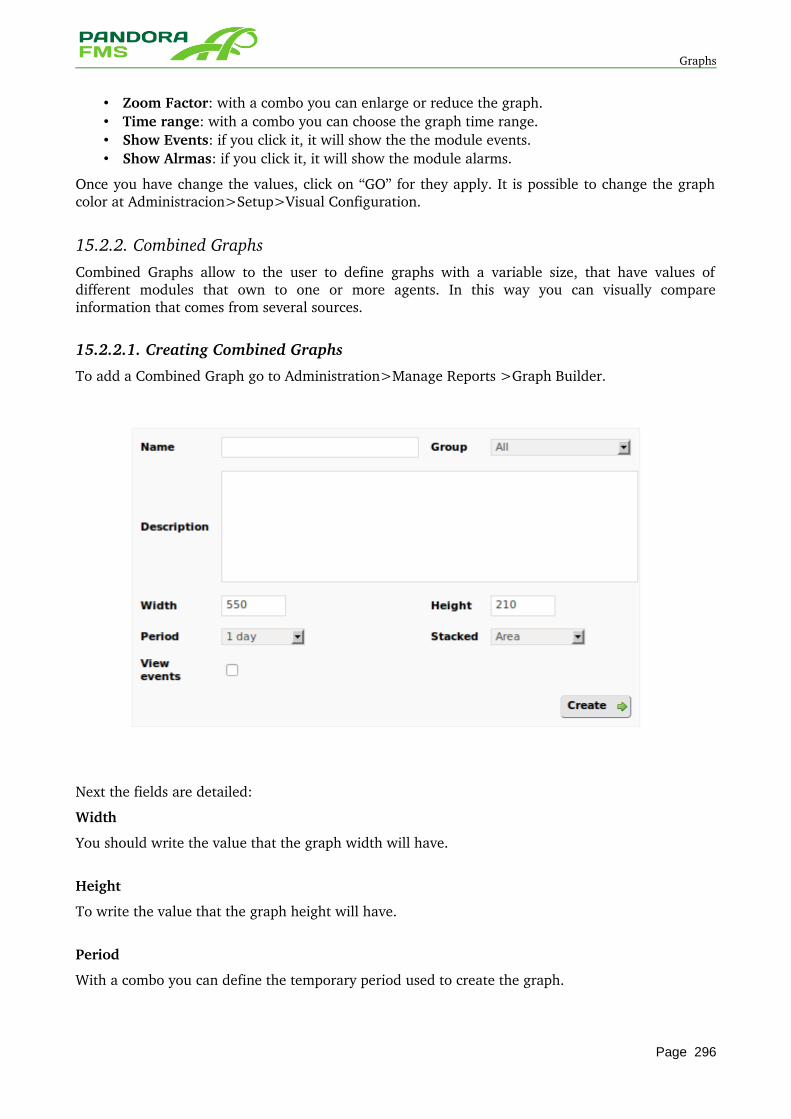
Graphs
• Zoom Factor: with a combo you can enlarge or reduce the graph. • Time range: with a combo you can choose the graph time range. • Show Events: if you click it, it will show the the module events. • Show Alrmas: if you click it, it will show the module alarms.
Once you have change the values, click on “GO” for they apply. It is possible to change the graph color at Administracion>Setup>Visual Configuration.
15.2.2. Combined GraphsCombined Graphs allow to the user to define graphs with a variable size, that have values of different modules that own to one or more agents. In this way you can visually compare information that comes from several sources.
15.2.2.1. Creating Combined Graphs
To add a Combined Graph go to Administration>Manage Reports >Graph Builder.
Next the fields are detailed:
Width
You should write the value that the graph width will have.
Height
To write the value that the graph height will have.
Period
With a combo you can define the temporary period used to create the graph.
Page 296
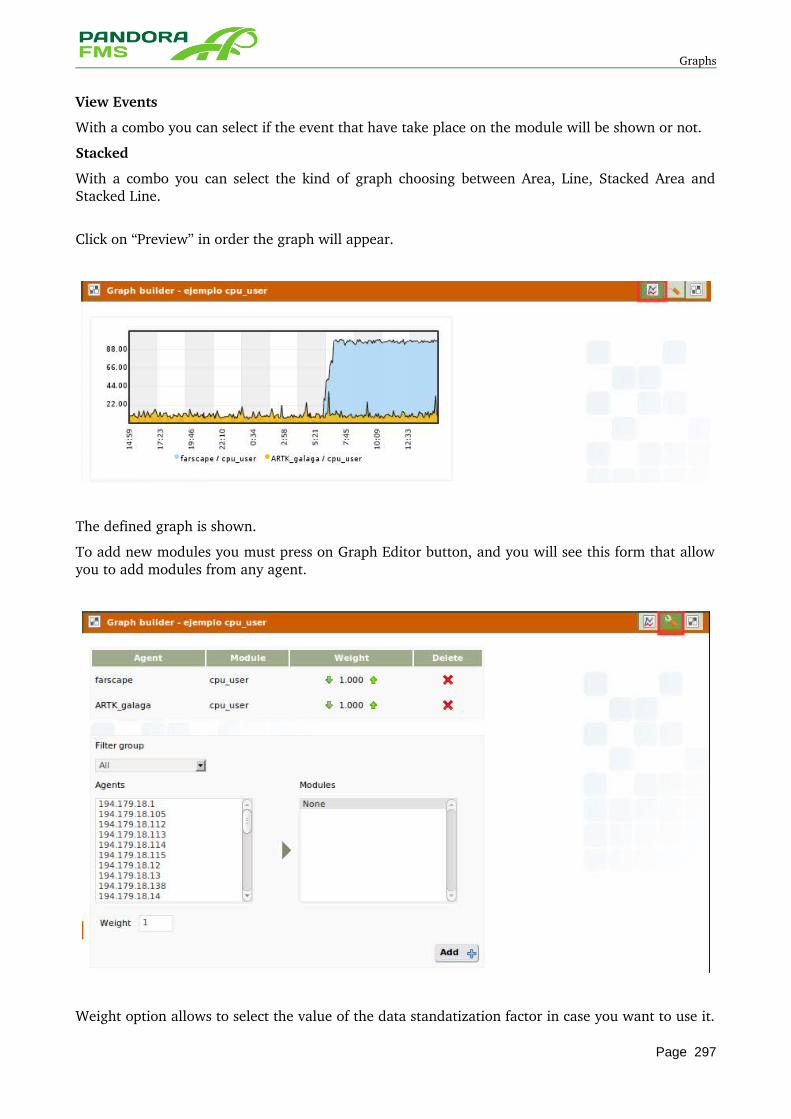
Graphs
View Events
With a combo you can select if the event that have take place on the module will be shown or not.
Stacked
With a combo you can select the kind of graph choosing between Area, Line, Stacked Area and Stacked Line.
Click on “Preview” in order the graph will appear.
The defined graph is shown.
To add new modules you must press on Graph Editor button, and you will see this form that allow you to add modules from any agent.
Weight option allows to select the value of the data standatization factor in case you want to use it.
Page 297
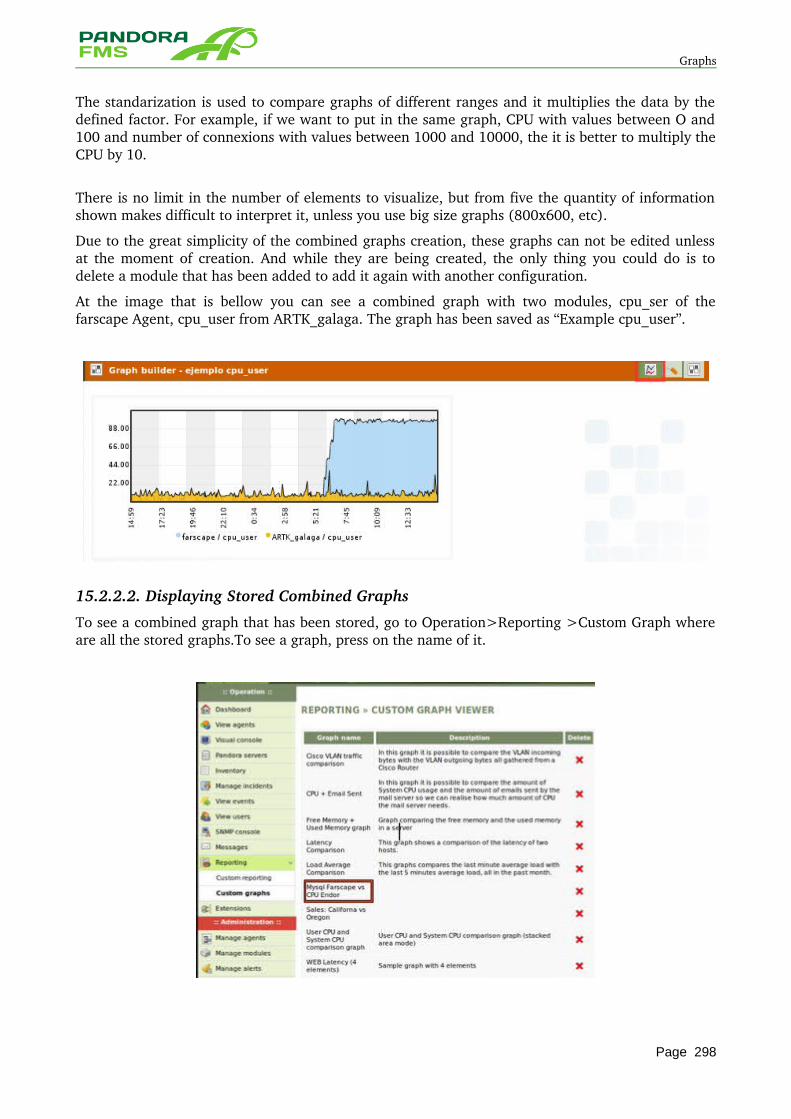
Graphs
The standarization is used to compare graphs of different ranges and it multiplies the data by the defined factor. For example, if we want to put in the same graph, CPU with values between O and 100 and number of connexions with values between 1000 and 10000, the it is better to multiply the CPU by 10.
There is no limit in the number of elements to visualize, but from five the quantity of information shown makes difficult to interpret it, unless you use big size graphs (800x600, etc).
Due to the great simplicity of the combined graphs creation, these graphs can not be edited unless at the moment of creation. And while they are being created, the only thing you could do is to delete a module that has been added to add it again with another configuration.
At the image that is bellow you can see a combined graph with two modules, cpu_ser of the farscape Agent, cpu_user from ARTK_galaga. The graph has been saved as “Example cpu_user”.
15.2.2.2. Displaying Stored Combined Graphs
To see a combined graph that has been stored, go to Operation>Reporting >Custom Graph where are all the stored graphs.To see a graph, press on the name of it.
Page 298
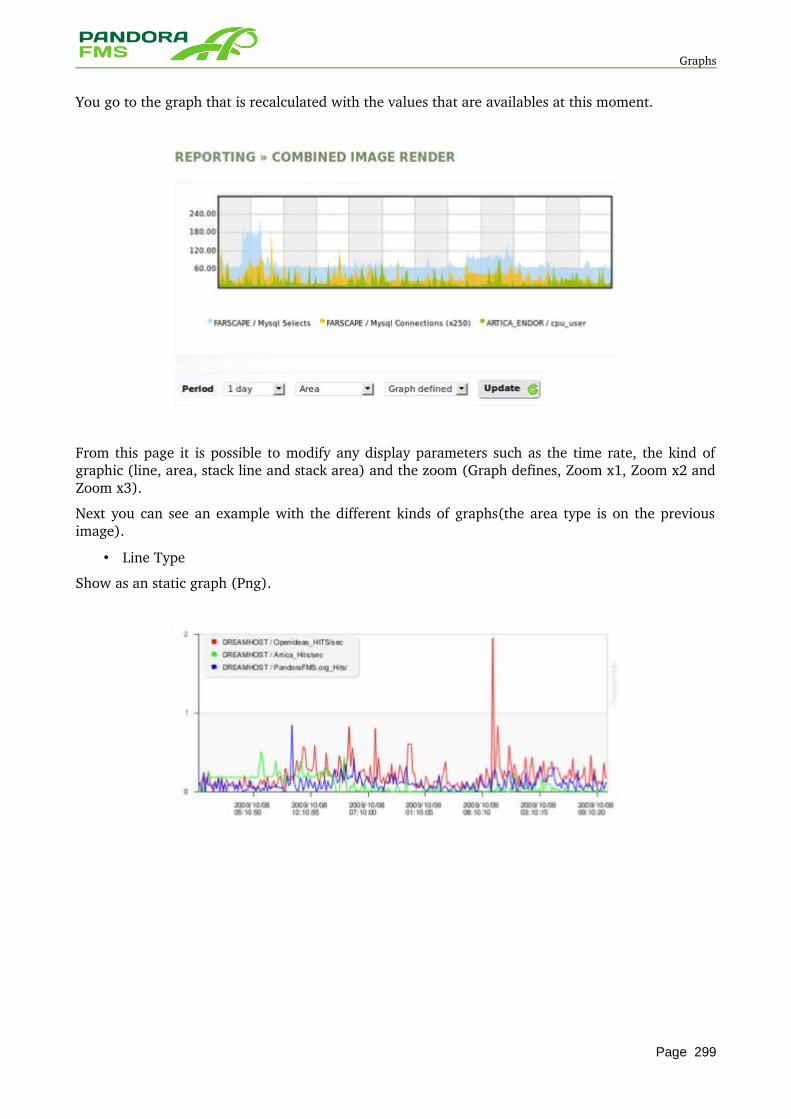
Graphs
You go to the graph that is recalculated with the values that are availables at this moment.
From this page it is possible to modify any display parameters such as the time rate, the kind of graphic (line, area, stack line and stack area) and the zoom (Graph defines, Zoom x1, Zoom x2 and Zoom x3).
Next you can see an example with the different kinds of graphs(the area type is on the previous image).
• Line Type
Show as an static graph (Png).
Page 299
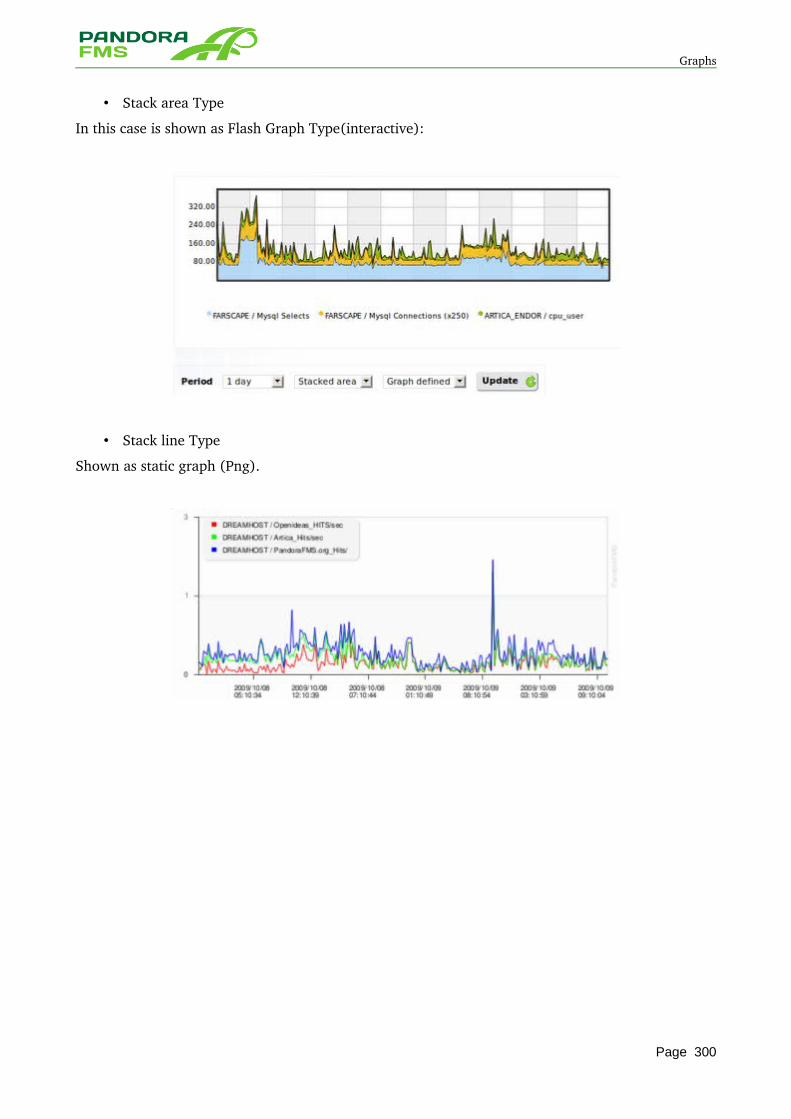
Graphs
• Stack area Type
In this case is shown as Flash Graph Type(interactive):
• Stack line Type
Shown as static graph (Png).
Page 300
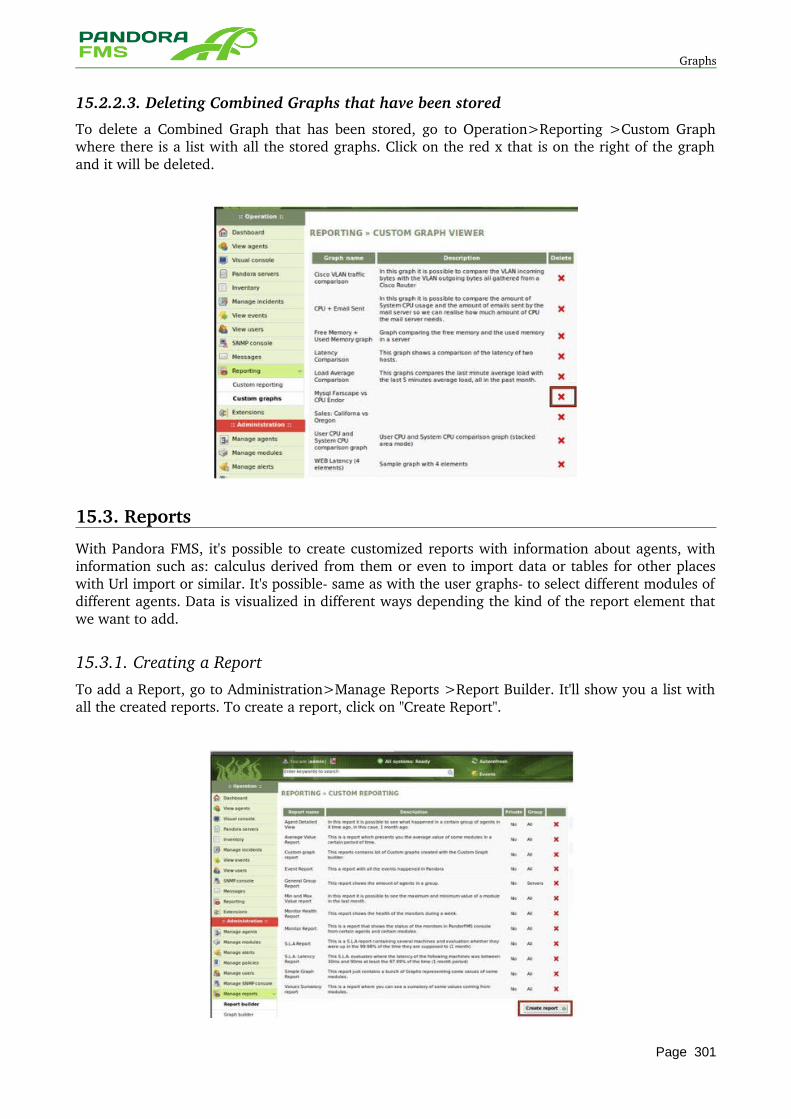
Graphs
15.2.2.3. Deleting Combined Graphs that have been stored
To delete a Combined Graph that has been stored, go to Operation>Reporting >Custom Graph where there is a list with all the stored graphs. Click on the red x that is on the right of the graph and it will be deleted.
15.3. Reports
With Pandora FMS, it's possible to create customized reports with information about agents, with information such as: calculus derived from them or even to import data or tables for other places with Url import or similar. It's possible same as with the user graphs to select different modules of different agents. Data is visualized in different ways depending the kind of the report element that we want to add.
15.3.1. Creating a ReportTo add a Report, go to Administration>Manage Reports >Report Builder. It'll show you a list with all the created reports. To create a report, click on "Create Report".
Page 301
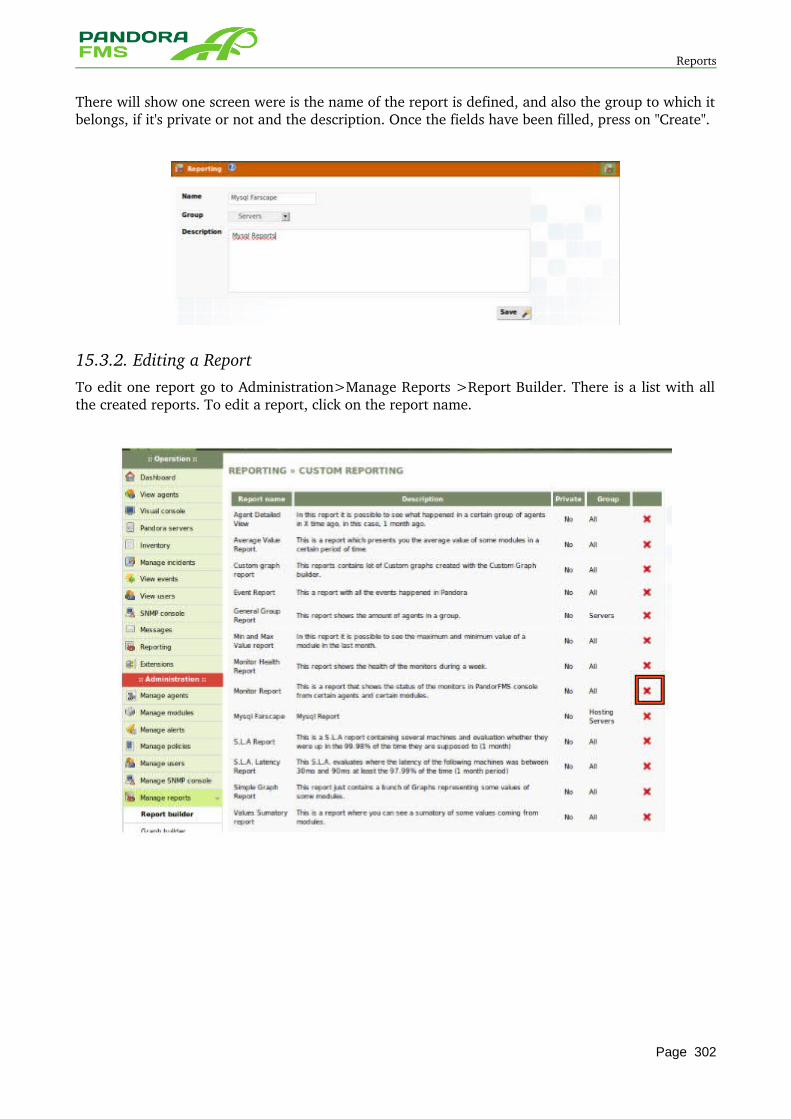
Reports
There will show one screen were is the name of the report is defined, and also the group to which it belongs, if it's private or not and the description. Once the fields have been filled, press on "Create".
15.3.2. Editing a ReportTo edit one report go to Administration>Manage Reports >Report Builder. There is a list with all the created reports. To edit a report, click on the report name.
Page 302
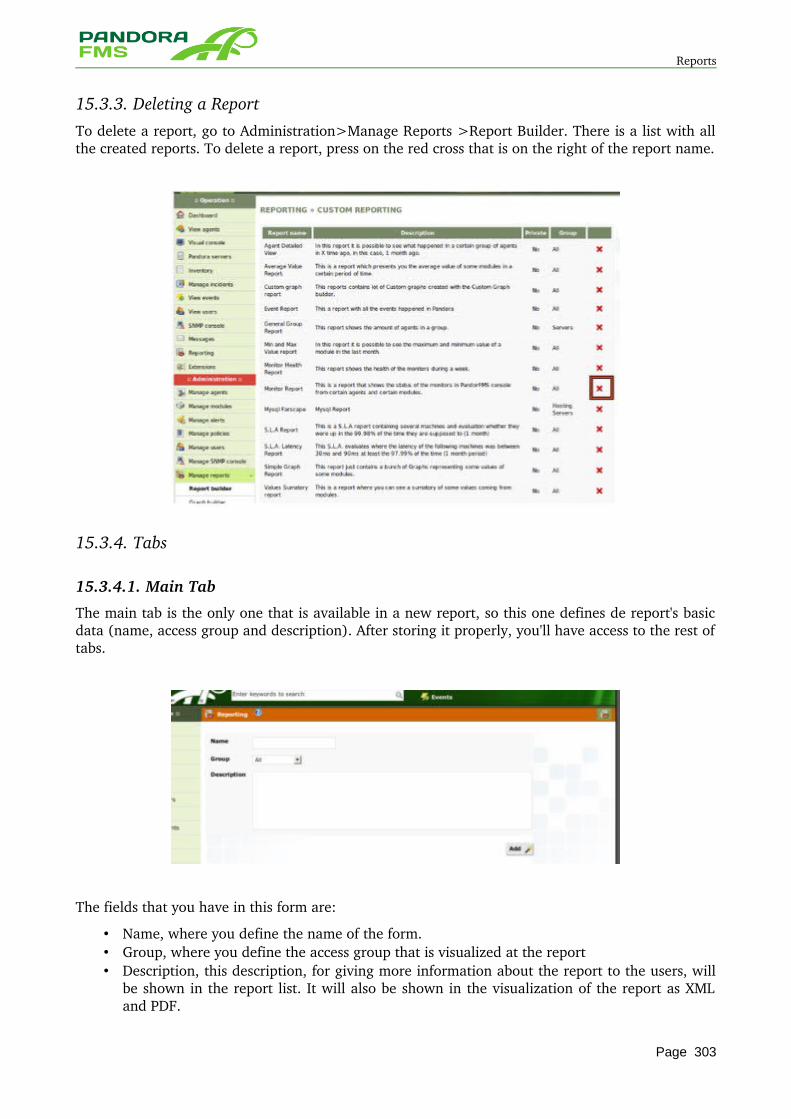
Reports
15.3.3. Deleting a Report To delete a report, go to Administration>Manage Reports >Report Builder. There is a list with all the created reports. To delete a report, press on the red cross that is on the right of the report name.
15.3.4. Tabs
15.3.4.1. Main Tab
The main tab is the only one that is available in a new report, so this one defines de report's basic data (name, access group and description). After storing it properly, you'll have access to the rest of tabs.
The fields that you have in this form are:
• Name, where you define the name of the form. • Group, where you define the access group that is visualized at the report • Description, this description, for giving more information about the report to the users, will
be shown in the report list. It will also be shown in the visualization of the report as XML and PDF.
Page 303
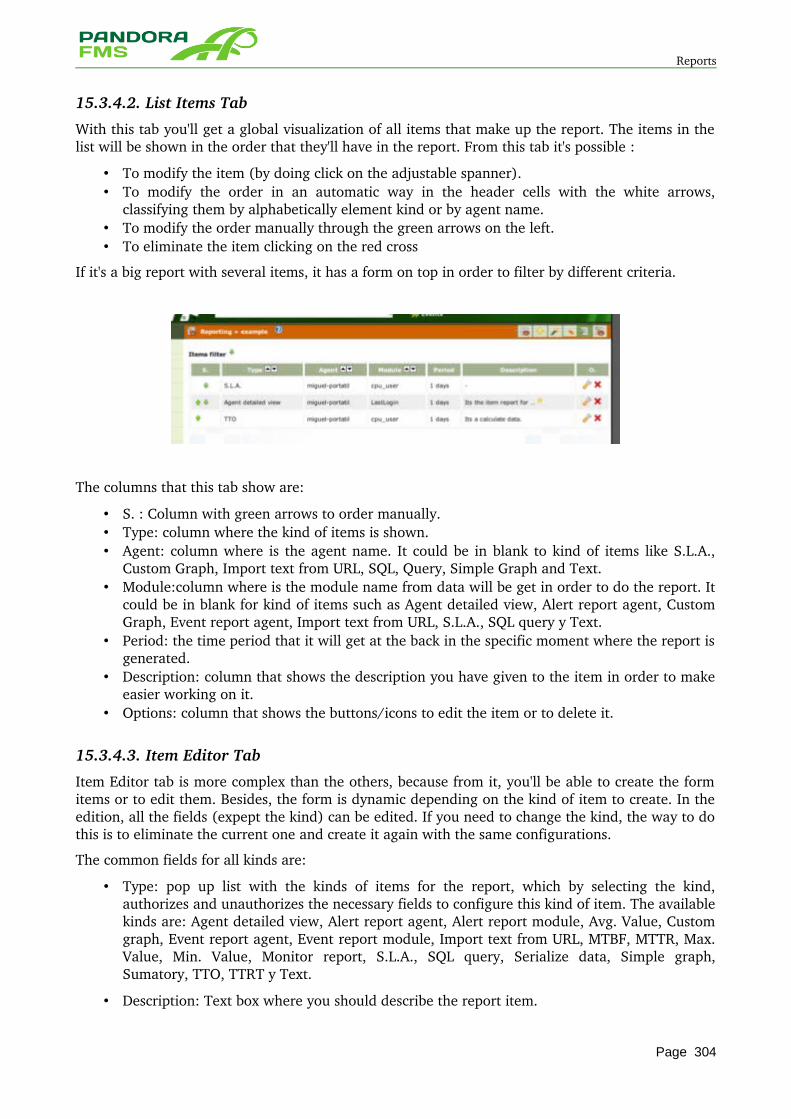
Reports
15.3.4.2. List Items Tab
With this tab you'll get a global visualization of all items that make up the report. The items in the list will be shown in the order that they'll have in the report. From this tab it's possible :
• To modify the item (by doing click on the adjustable spanner). • To modify the order in an automatic way in the header cells with the white arrows,
classifying them by alphabetically element kind or by agent name. • To modify the order manually through the green arrows on the left. • To eliminate the item clicking on the red cross
If it's a big report with several items, it has a form on top in order to filter by different criteria.
The columns that this tab show are:
• S. : Column with green arrows to order manually. • Type: column where the kind of items is shown. • Agent: column where is the agent name. It could be in blank to kind of items like S.L.A.,
Custom Graph, Import text from URL, SQL, Query, Simple Graph and Text. • Module:column where is the module name from data will be get in order to do the report. It
could be in blank for kind of items such as Agent detailed view, Alert report agent, Custom Graph, Event report agent, Import text from URL, S.L.A., SQL query y Text.
• Period: the time period that it will get at the back in the specific moment where the report is generated.
• Description: column that shows the description you have given to the item in order to make easier working on it.
• Options: column that shows the buttons/icons to edit the item or to delete it.
15.3.4.3. Item Editor Tab
Item Editor tab is more complex than the others, because from it, you'll be able to create the form items or to edit them. Besides, the form is dynamic depending on the kind of item to create. In the edition, all the fields (expept the kind) can be edited. If you need to change the kind, the way to do this is to eliminate the current one and create it again with the same configurations.
The common fields for all kinds are:
• Type: pop up list with the kinds of items for the report, which by selecting the kind, authorizes and unauthorizes the necessary fields to configure this kind of item. The available kinds are: Agent detailed view, Alert report agent, Alert report module, Avg. Value, Custom graph, Event report agent, Event report module, Import text from URL, MTBF, MTTR, Max. Value, Min. Value, Monitor report, S.L.A., SQL query, Serialize data, Simple graph, Sumatory, TTO, TTRT y Text.
• Description: Text box where you should describe the report item.
Page 304
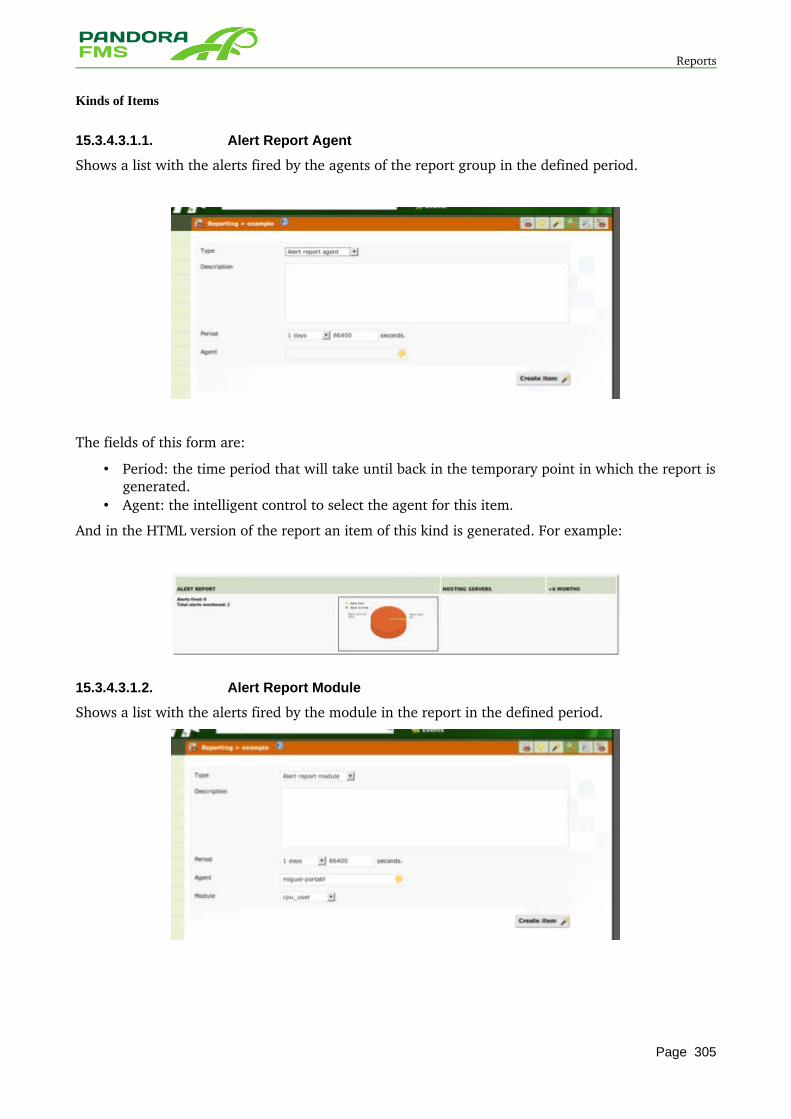
Reports
Kinds of Items
15.3.4.3.1.1. Alert Report Agent
Shows a list with the alerts fired by the agents of the report group in the defined period.
The fields of this form are:
• Period: the time period that will take until back in the temporary point in which the report is generated.
• Agent: the intelligent control to select the agent for this item.
And in the HTML version of the report an item of this kind is generated. For example:
15.3.4.3.1.2. Alert Report Module
Shows a list with the alerts fired by the module in the report in the defined period.
Page 305
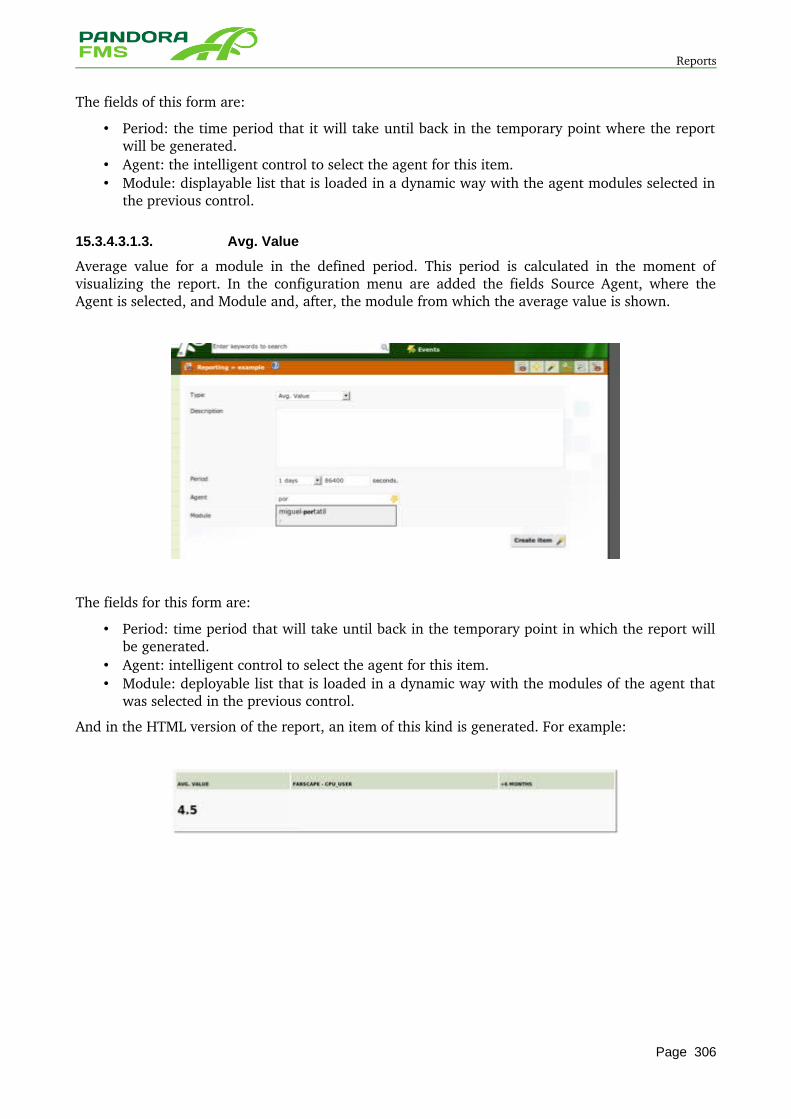
Reports
The fields of this form are:
• Period: the time period that it will take until back in the temporary point where the report will be generated.
• Agent: the intelligent control to select the agent for this item. • Module: displayable list that is loaded in a dynamic way with the agent modules selected in
the previous control.
15.3.4.3.1.3. Avg. Value
Average value for a module in the defined period. This period is calculated in the moment of visualizing the report. In the configuration menu are added the fields Source Agent, where the Agent is selected, and Module and, after, the module from which the average value is shown.
The fields for this form are:
• Period: time period that will take until back in the temporary point in which the report will be generated.
• Agent: intelligent control to select the agent for this item. • Module: deployable list that is loaded in a dynamic way with the modules of the agent that
was selected in the previous control.
And in the HTML version of the report, an item of this kind is generated. For example:
Page 306
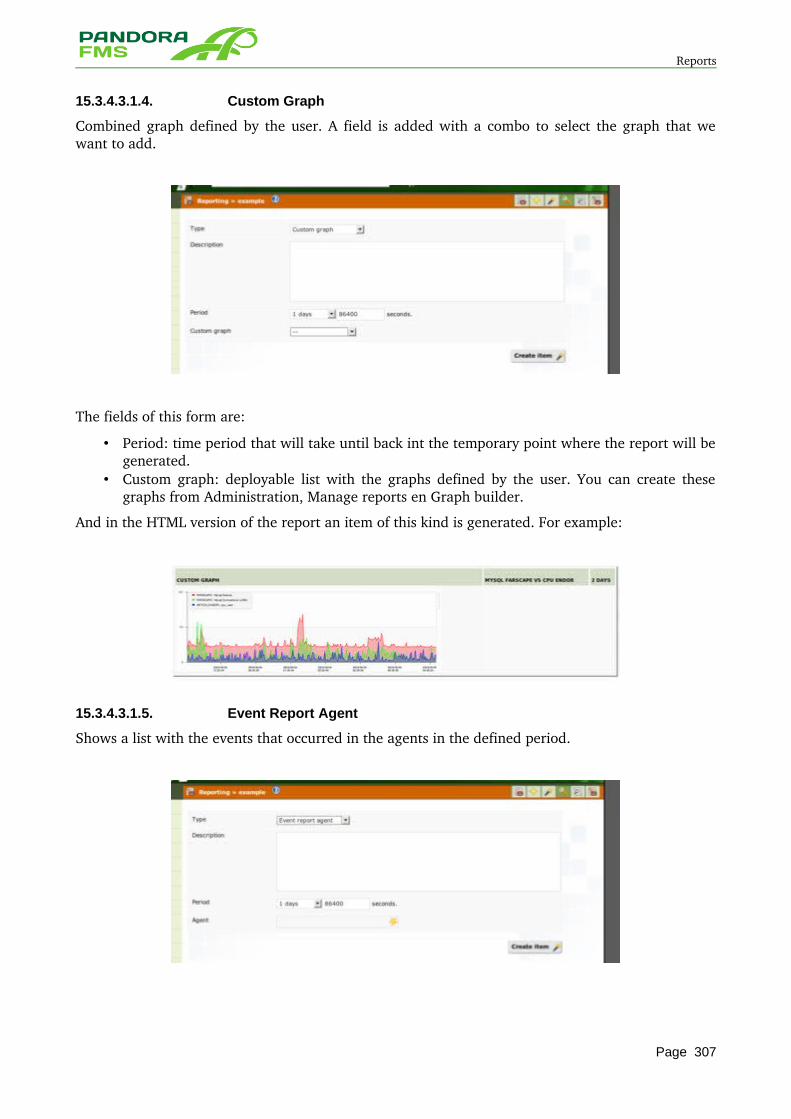
Reports
15.3.4.3.1.4. Custom Graph
Combined graph defined by the user. A field is added with a combo to select the graph that we want to add.
The fields of this form are:
• Period: time period that will take until back int the temporary point where the report will be generated.
• Custom graph: deployable list with the graphs defined by the user. You can create these graphs from Administration, Manage reports en Graph builder.
And in the HTML version of the report an item of this kind is generated. For example:
15.3.4.3.1.5. Event Report Agent
Shows a list with the events that occurred in the agents in the defined period.
Page 307
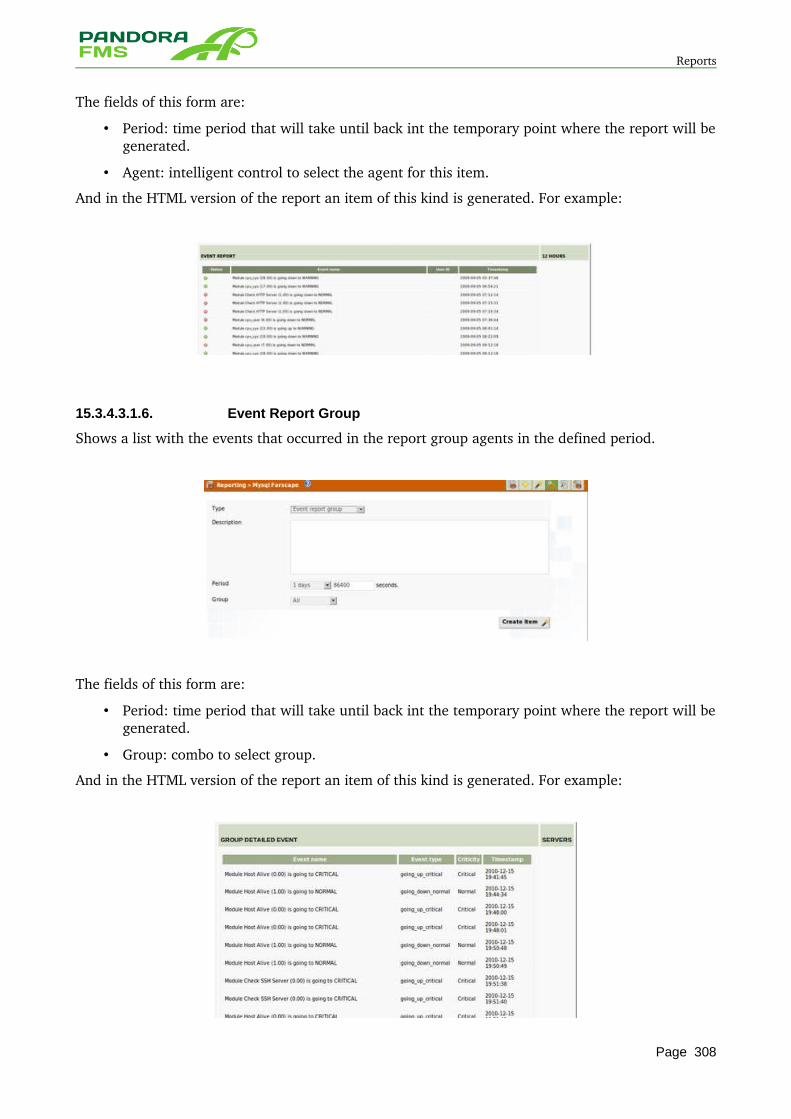
Reports
The fields of this form are:
• Period: time period that will take until back int the temporary point where the report will be generated.
• Agent: intelligent control to select the agent for this item.
And in the HTML version of the report an item of this kind is generated. For example:
15.3.4.3.1.6. Event Report Group
Shows a list with the events that occurred in the report group agents in the defined period.
The fields of this form are:
• Period: time period that will take until back int the temporary point where the report will be generated.
• Group: combo to select group.
And in the HTML version of the report an item of this kind is generated. For example:
Page 308
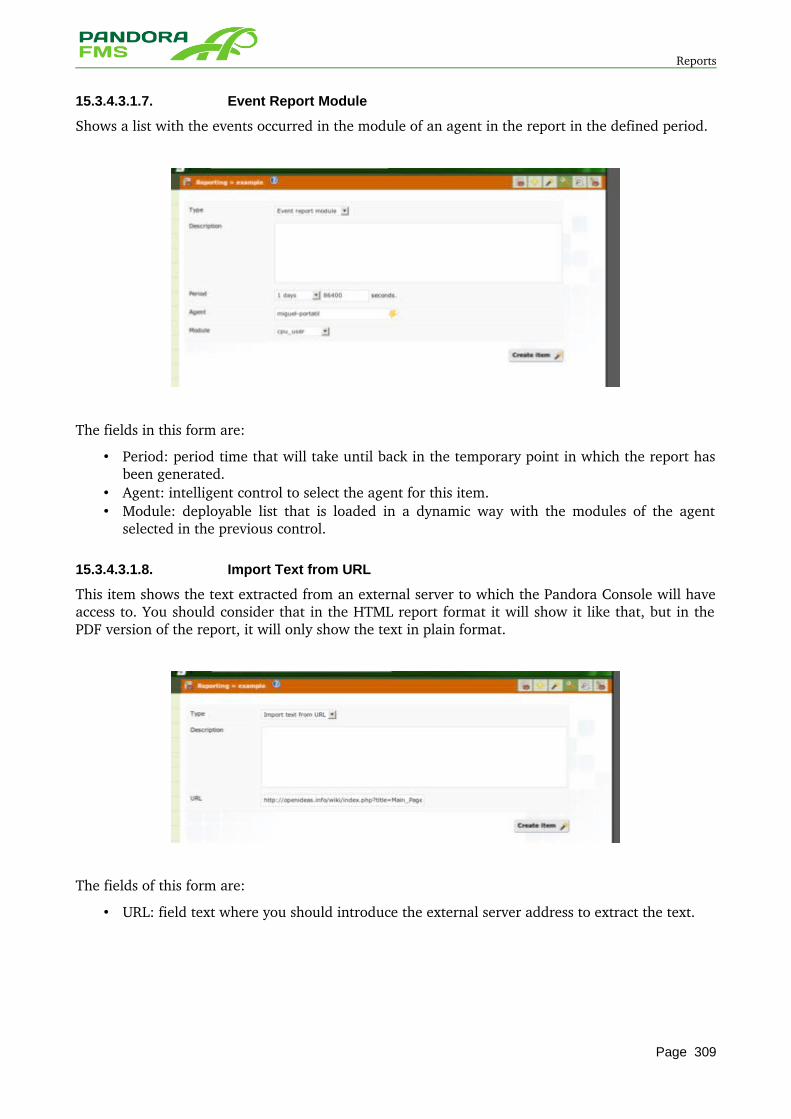
Reports
15.3.4.3.1.7. Event Report Module
Shows a list with the events occurred in the module of an agent in the report in the defined period.
The fields in this form are:
• Period: period time that will take until back in the temporary point in which the report has been generated.
• Agent: intelligent control to select the agent for this item. • Module: deployable list that is loaded in a dynamic way with the modules of the agent
selected in the previous control.
15.3.4.3.1.8. Import Text from URL
This item shows the text extracted from an external server to which the Pandora Console will have access to. You should consider that in the HTML report format it will show it like that, but in the PDF version of the report, it will only show the text in plain format.
The fields of this form are:
• URL: field text where you should introduce the external server address to extract the text.
Page 309
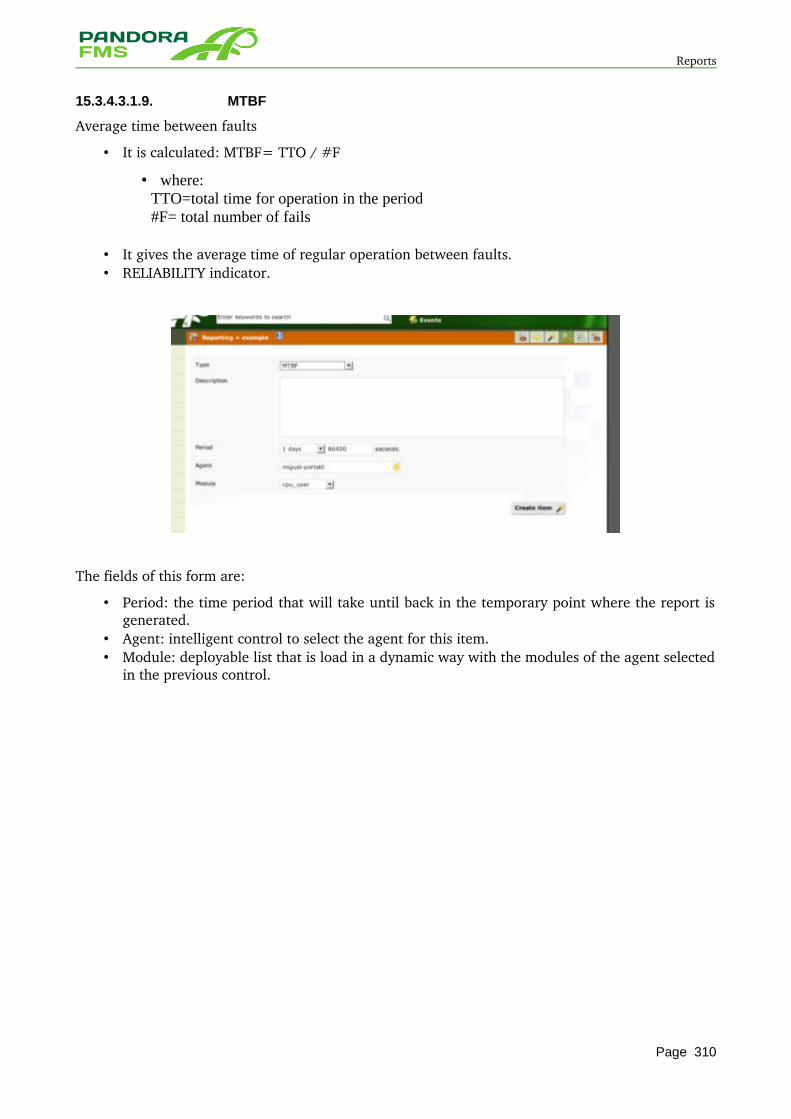
Reports
15.3.4.3.1.9. MTBF
Average time between faults
• It is calculated: MTBF= TTO / #F
• where: TTO=total time for operation in the period #F= total number of fails
• It gives the average time of regular operation between faults. • RELIABILITY indicator.
The fields of this form are:
• Period: the time period that will take until back in the temporary point where the report is generated.
• Agent: intelligent control to select the agent for this item. • Module: deployable list that is load in a dynamic way with the modules of the agent selected
in the previous control.
Page 310
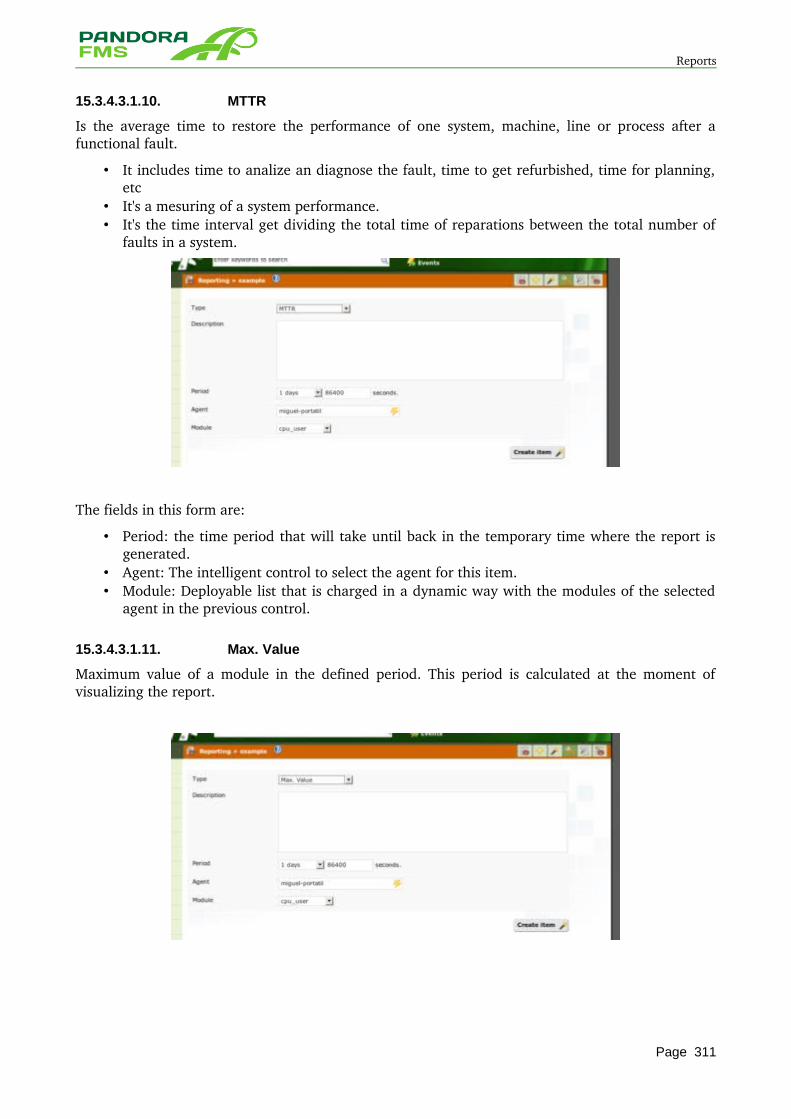
Reports
15.3.4.3.1.10. MTTR
Is the average time to restore the performance of one system, machine, line or process after a functional fault.
• It includes time to analize an diagnose the fault, time to get refurbished, time for planning, etc
• It's a mesuring of a system performance. • It's the time interval get dividing the total time of reparations between the total number of
faults in a system.
The fields in this form are:
• Period: the time period that will take until back in the temporary time where the report is generated.
• Agent: The intelligent control to select the agent for this item. • Module: Deployable list that is charged in a dynamic way with the modules of the selected
agent in the previous control.
15.3.4.3.1.11. Max. Value
Maximum value of a module in the defined period. This period is calculated at the moment of visualizing the report.
Page 311
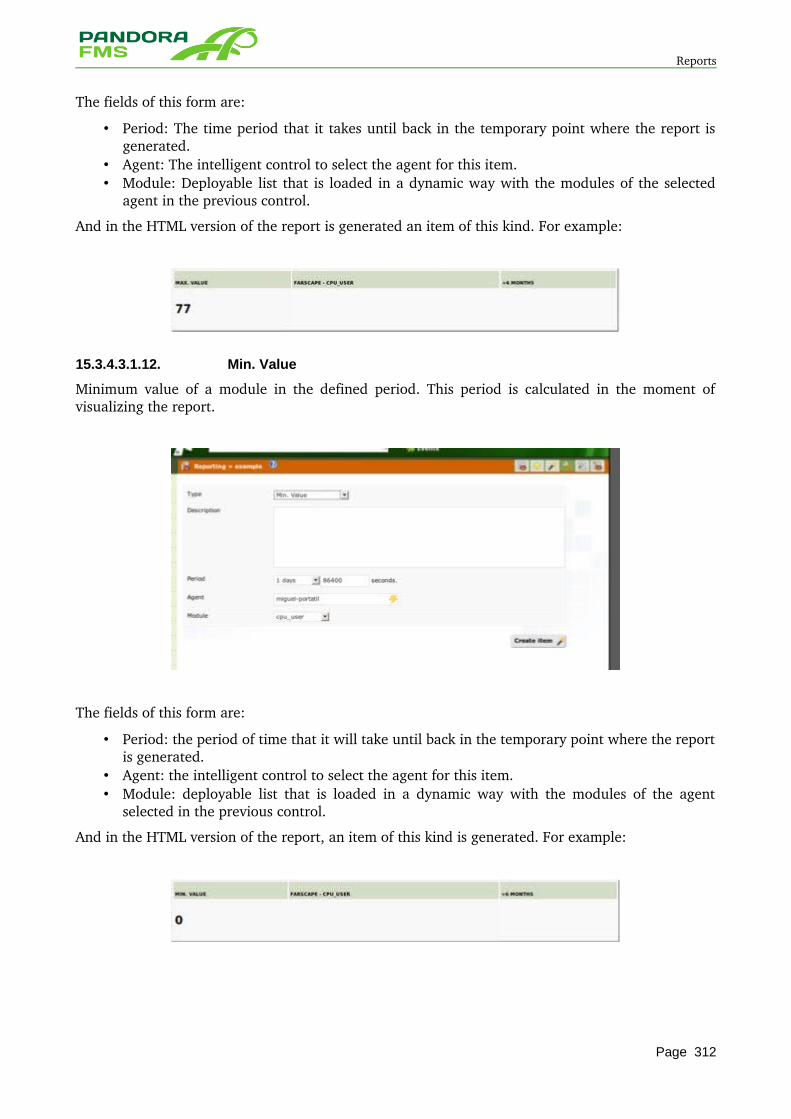
Reports
The fields of this form are:
• Period: The time period that it takes until back in the temporary point where the report is generated.
• Agent: The intelligent control to select the agent for this item. • Module: Deployable list that is loaded in a dynamic way with the modules of the selected
agent in the previous control.
And in the HTML version of the report is generated an item of this kind. For example:
15.3.4.3.1.12. Min. Value
Minimum value of a module in the defined period. This period is calculated in the moment of visualizing the report.
The fields of this form are:
• Period: the period of time that it will take until back in the temporary point where the report is generated.
• Agent: the intelligent control to select the agent for this item. • Module: deployable list that is loaded in a dynamic way with the modules of the agent
selected in the previous control.
And in the HTML version of the report, an item of this kind is generated. For example:
Page 312
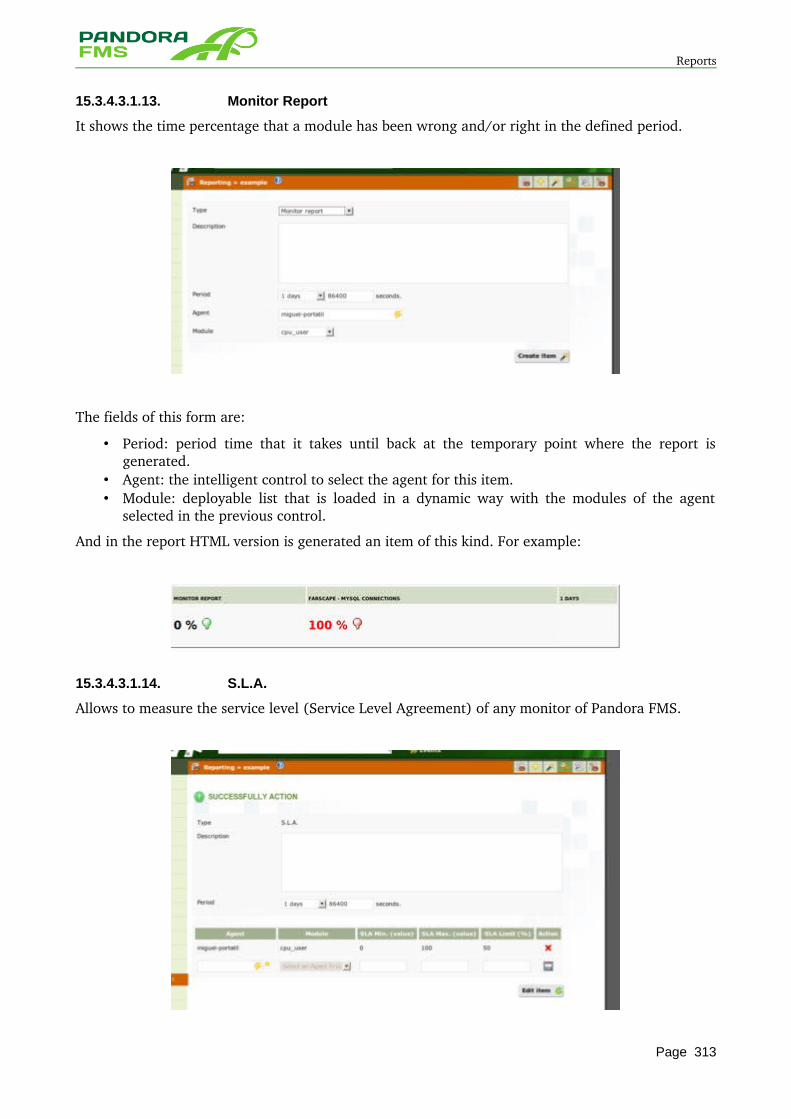
Reports
15.3.4.3.1.13. Monitor Report
It shows the time percentage that a module has been wrong and/or right in the defined period.
The fields of this form are:
• Period: period time that it takes until back at the temporary point where the report is generated.
• Agent: the intelligent control to select the agent for this item. • Module: deployable list that is loaded in a dynamic way with the modules of the agent
selected in the previous control.
And in the report HTML version is generated an item of this kind. For example:
15.3.4.3.1.14. S.L.A.
Allows to measure the service level (Service Level Agreement) of any monitor of Pandora FMS.
Page 313
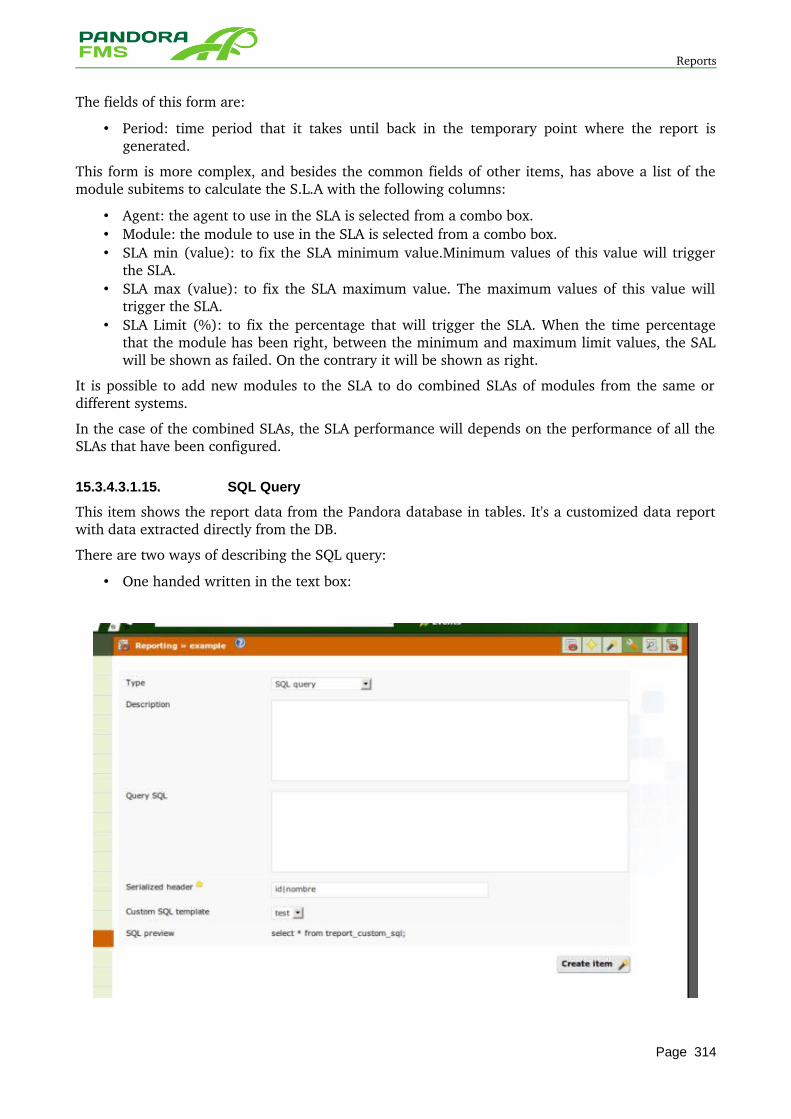
Reports
The fields of this form are:
• Period: time period that it takes until back in the temporary point where the report is generated.
This form is more complex, and besides the common fields of other items, has above a list of the module subitems to calculate the S.L.A with the following columns:
• Agent: the agent to use in the SLA is selected from a combo box. • Module: the module to use in the SLA is selected from a combo box. • SLA min (value): to fix the SLA minimum value.Minimum values of this value will trigger
the SLA. • SLA max (value): to fix the SLA maximum value. The maximum values of this value will
trigger the SLA. • SLA Limit (%): to fix the percentage that will trigger the SLA. When the time percentage
that the module has been right, between the minimum and maximum limit values, the SAL will be shown as failed. On the contrary it will be shown as right.
It is possible to add new modules to the SLA to do combined SLAs of modules from the same or different systems.
In the case of the combined SLAs, the SLA performance will depends on the performance of all the SLAs that have been configured.
15.3.4.3.1.15. SQL Query
This item shows the report data from the Pandora database in tables. It's a customized data report with data extracted directly from the DB.
There are two ways of describing the SQL query:
• One handed written in the text box:
Page 314
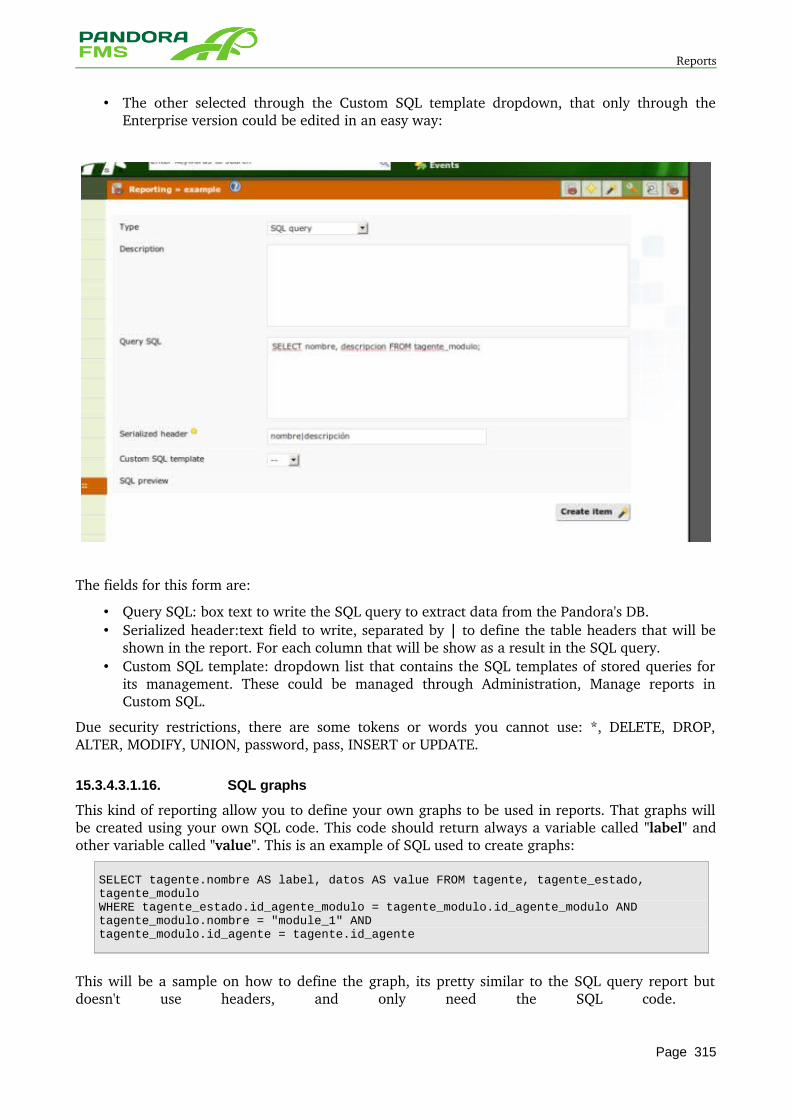
Reports
• The other selected through the Custom SQL template dropdown, that only through the Enterprise version could be edited in an easy way:
The fields for this form are:
• Query SQL: box text to write the SQL query to extract data from the Pandora's DB. • Serialized header:text field to write, separated by | to define the table headers that will be
shown in the report. For each column that will be show as a result in the SQL query. • Custom SQL template: dropdown list that contains the SQL templates of stored queries for
its management. These could be managed through Administration, Manage reports in Custom SQL.
Due security restrictions, there are some tokens or words you cannot use: *, DELETE, DROP, ALTER, MODIFY, UNION, password, pass, INSERT or UPDATE.
15.3.4.3.1.16. SQL graphs
This kind of reporting allow you to define your own graphs to be used in reports. That graphs will be created using your own SQL code. This code should return always a variable called "label" and other variable called "value". This is an example of SQL used to create graphs:
SELECT tagente.nombre AS label, datos AS value FROM tagente, tagente_estado, tagente_modulo WHERE tagente_estado.id_agente_modulo = tagente_modulo.id_agente_modulo AND tagente_modulo.nombre = "module_1" ANDtagente_modulo.id_agente = tagente.id_agente
This will be a sample on how to define the graph, its pretty similar to the SQL query report but doesn't use headers, and only need the SQL code.
Page 315
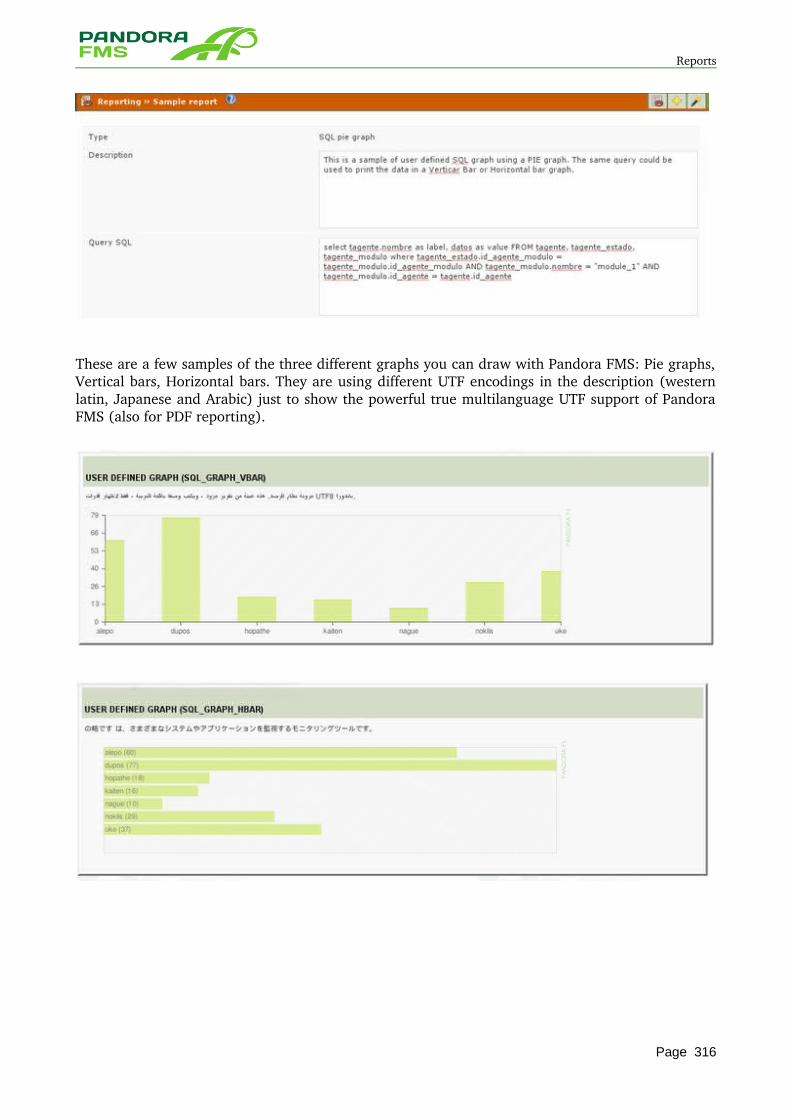
Reports
These are a few samples of the three different graphs you can draw with Pandora FMS: Pie graphs, Vertical bars, Horizontal bars. They are using different UTF encodings in the description (western latin, Japanese and Arabic) just to show the powerful true multilanguage UTF support of Pandora FMS (also for PDF reporting).
Page 316
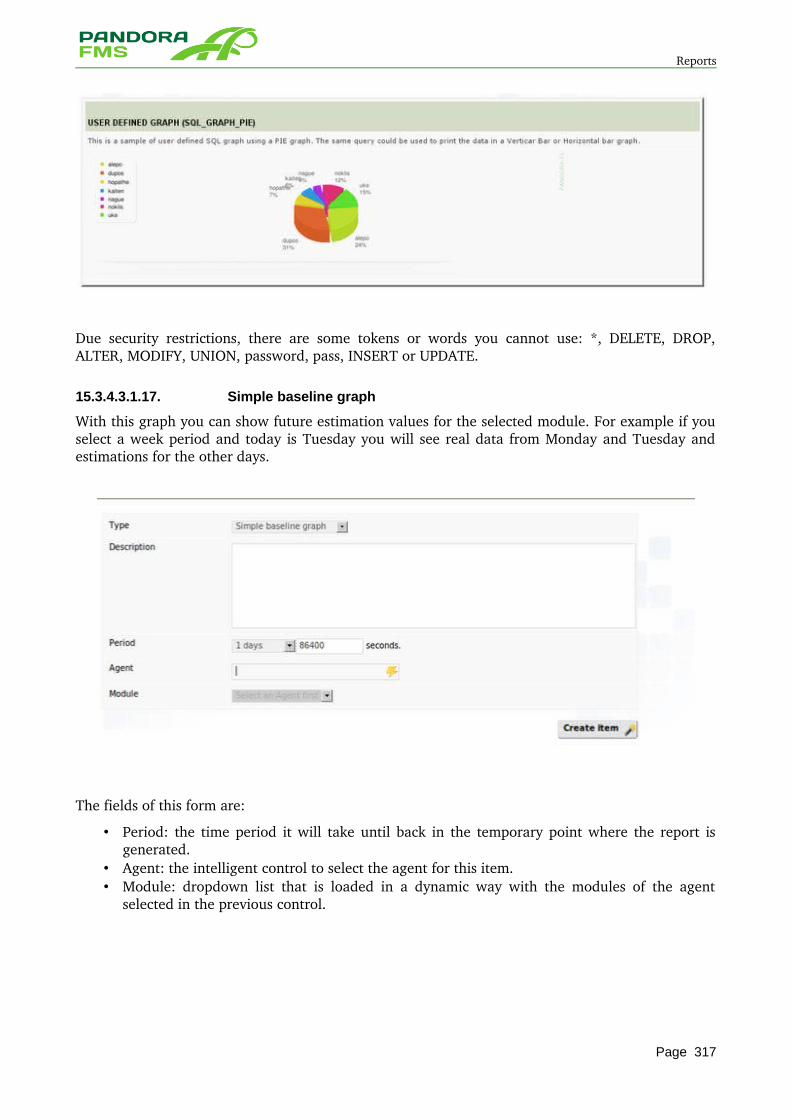
Reports
Due security restrictions, there are some tokens or words you cannot use: *, DELETE, DROP, ALTER, MODIFY, UNION, password, pass, INSERT or UPDATE.
15.3.4.3.1.17. Simple baseline graph
With this graph you can show future estimation values for the selected module. For example if you select a week period and today is Tuesday you will see real data from Monday and Tuesday and estimations for the other days.
The fields of this form are:
• Period: the time period it will take until back in the temporary point where the report is generated.
• Agent: the intelligent control to select the agent for this item. • Module: dropdown list that is loaded in a dynamic way with the modules of the agent
selected in the previous control.
Page 317
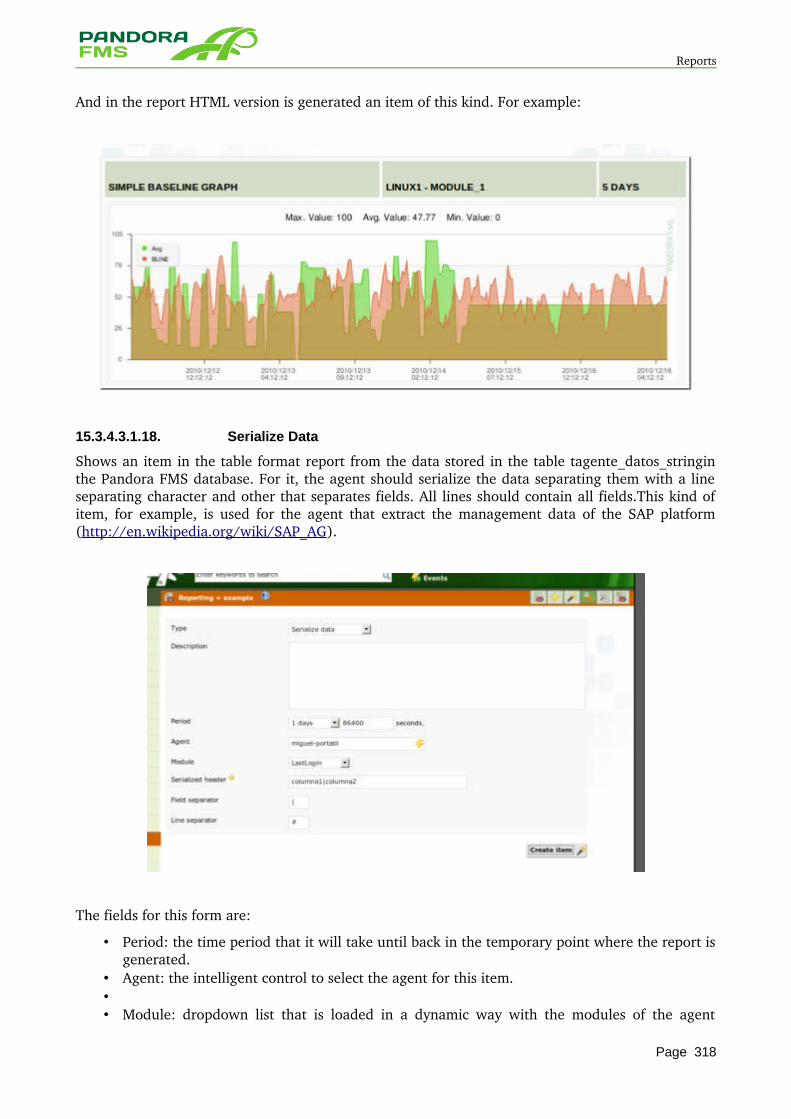
Reports
And in the report HTML version is generated an item of this kind. For example:
15.3.4.3.1.18. Serialize Data
Shows an item in the table format report from the data stored in the table tagente_datos_stringin the Pandora FMS database. For it, the agent should serialize the data separating them with a line separating character and other that separates fields. All lines should contain all fields.This kind of item, for example, is used for the agent that extract the management data of the SAP platform (http://en.wikipedia.org/wiki/SAP_AG).
The fields for this form are:
• Period: the time period that it will take until back in the temporary point where the report is generated.
• Agent: the intelligent control to select the agent for this item. •• Module: dropdown list that is loaded in a dynamic way with the modules of the agent
Page 318
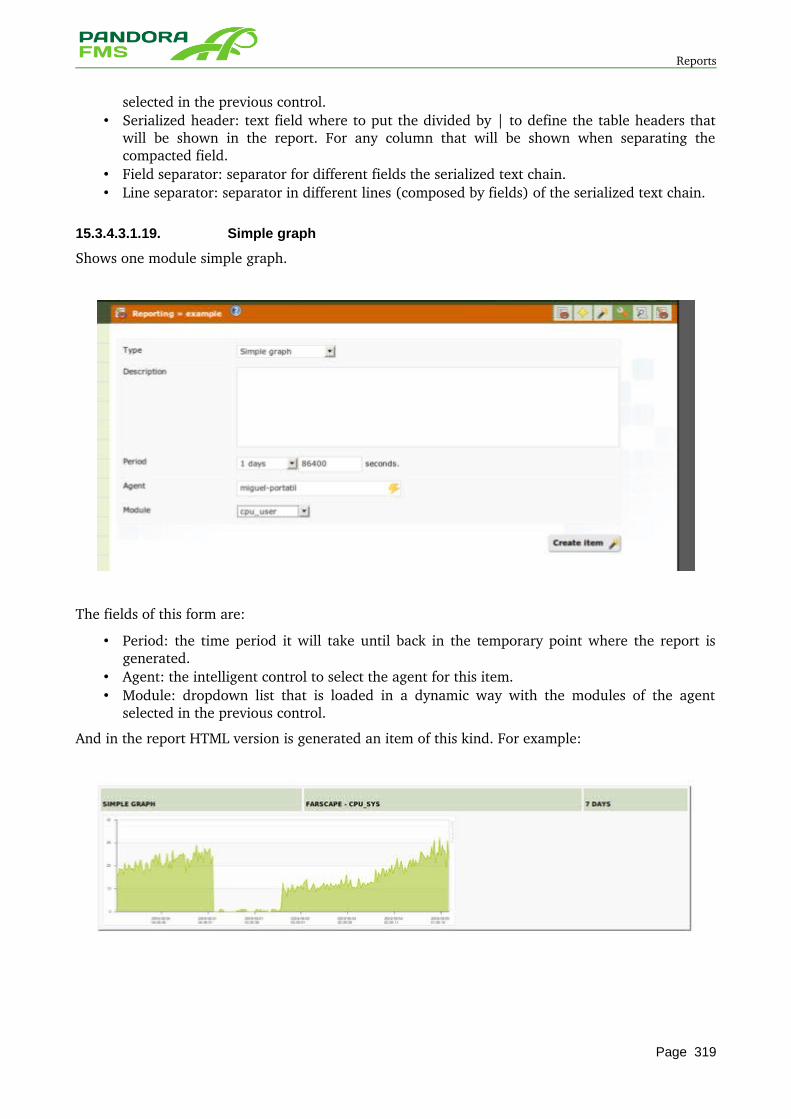
Reports
selected in the previous control. • Serialized header: text field where to put the divided by | to define the table headers that
will be shown in the report. For any column that will be shown when separating the compacted field.
• Field separator: separator for different fields the serialized text chain. • Line separator: separator in different lines (composed by fields) of the serialized text chain.
15.3.4.3.1.19. Simple graph
Shows one module simple graph.
The fields of this form are:
• Period: the time period it will take until back in the temporary point where the report is generated.
• Agent: the intelligent control to select the agent for this item. • Module: dropdown list that is loaded in a dynamic way with the modules of the agent
selected in the previous control.
And in the report HTML version is generated an item of this kind. For example:
Page 319
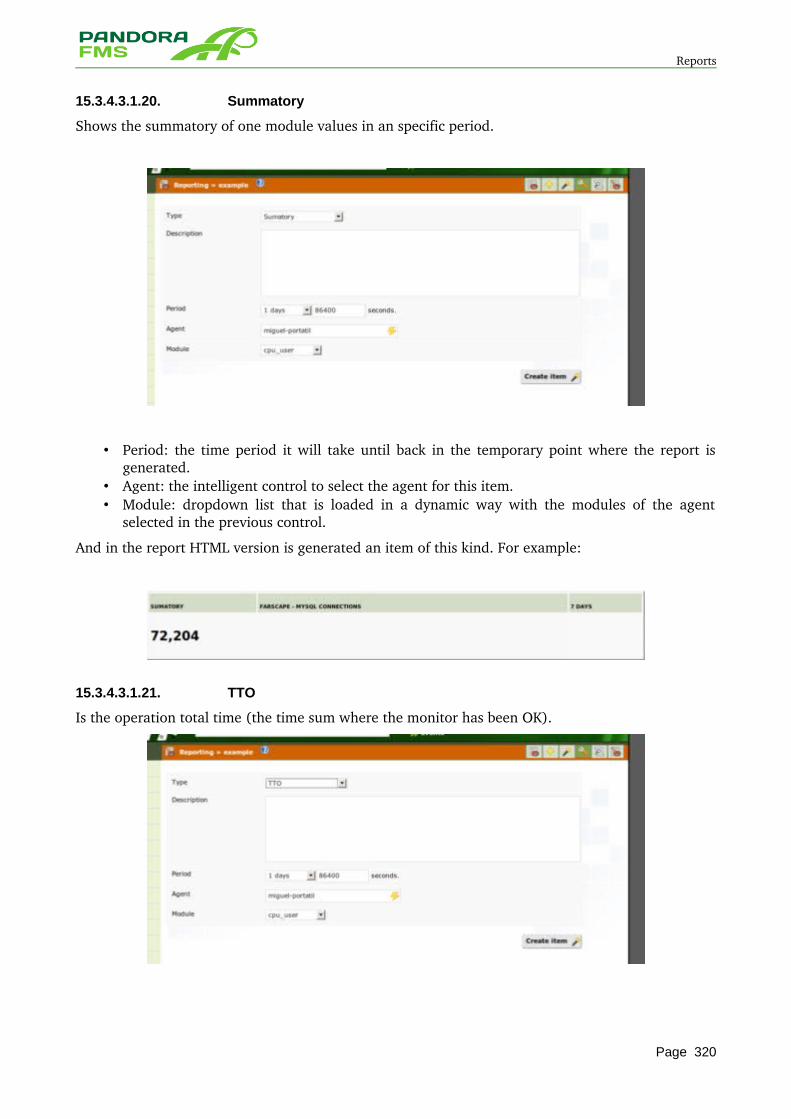
Reports
15.3.4.3.1.20. Summatory
Shows the summatory of one module values in an specific period.
• Period: the time period it will take until back in the temporary point where the report is generated.
• Agent: the intelligent control to select the agent for this item. • Module: dropdown list that is loaded in a dynamic way with the modules of the agent
selected in the previous control.
And in the report HTML version is generated an item of this kind. For example:
15.3.4.3.1.21. TTO
Is the operation total time (the time sum where the monitor has been OK).
Page 320
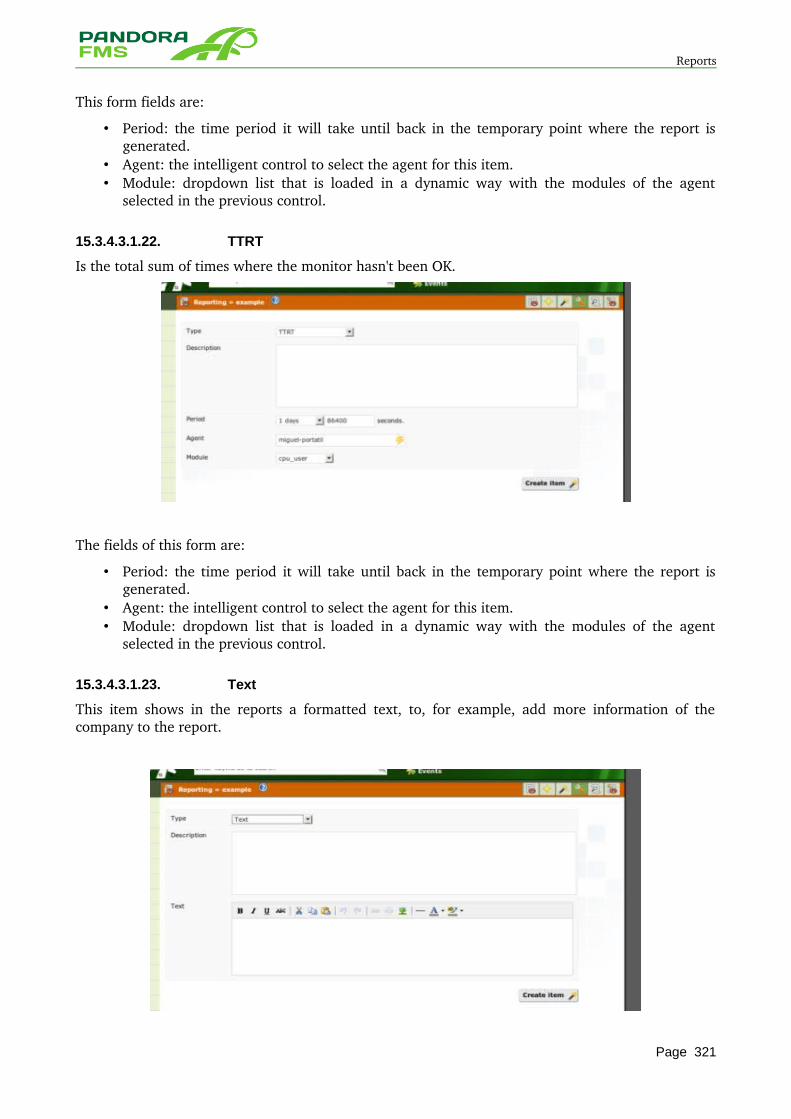
Reports
This form fields are:
• Period: the time period it will take until back in the temporary point where the report is generated.
• Agent: the intelligent control to select the agent for this item. • Module: dropdown list that is loaded in a dynamic way with the modules of the agent
selected in the previous control.
15.3.4.3.1.22. TTRT
Is the total sum of times where the monitor hasn't been OK.
The fields of this form are:
• Period: the time period it will take until back in the temporary point where the report is generated.
• Agent: the intelligent control to select the agent for this item. • Module: dropdown list that is loaded in a dynamic way with the modules of the agent
selected in the previous control.
15.3.4.3.1.23. Text
This item shows in the reports a formatted text, to, for example, add more information of the company to the report.
Page 321
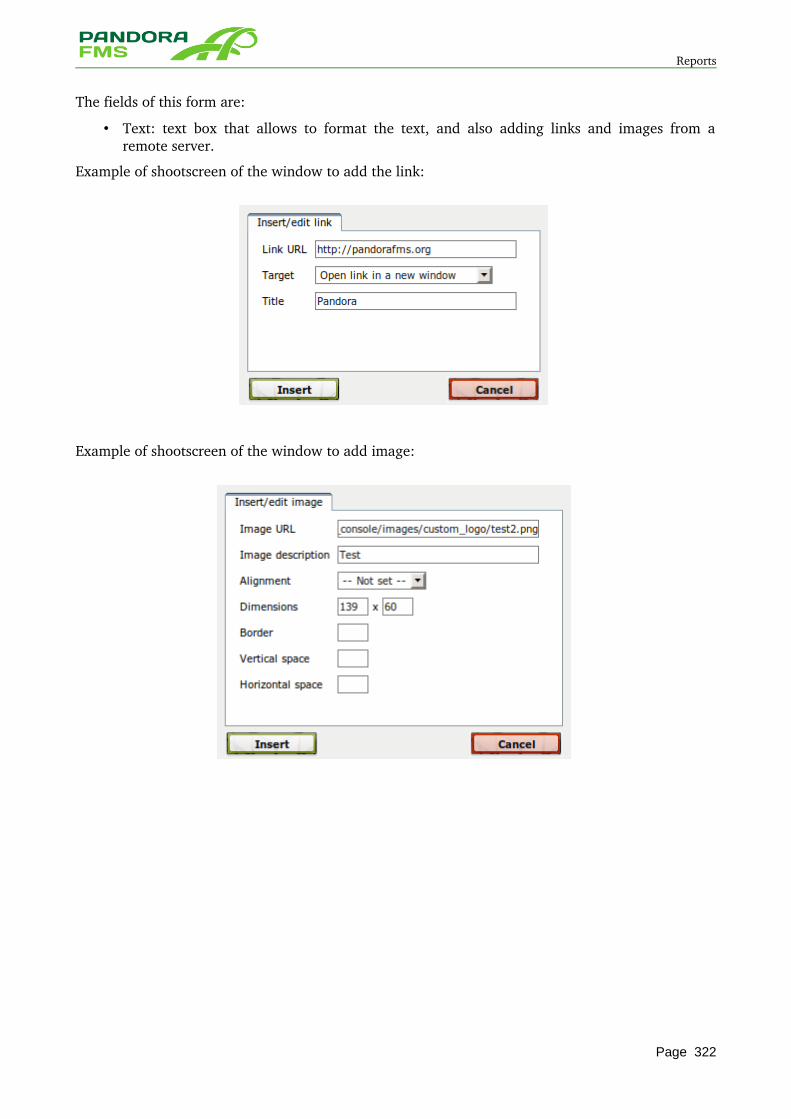
Reports
The fields of this form are:
• Text: text box that allows to format the text, and also adding links and images from a remote server.
Example of shootscreen of the window to add the link:
Example of shootscreen of the window to add image:
Page 322
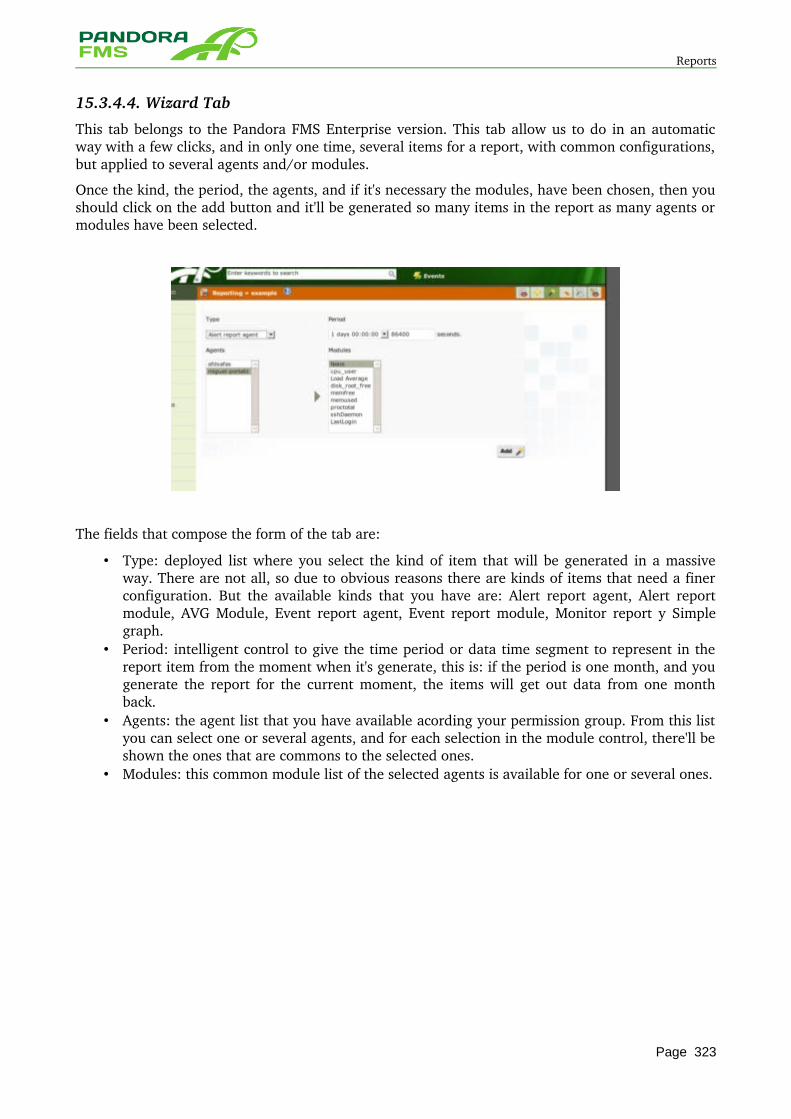
Reports
15.3.4.4. Wizard Tab
This tab belongs to the Pandora FMS Enterprise version. This tab allow us to do in an automatic way with a few clicks, and in only one time, several items for a report, with common configurations, but applied to several agents and/or modules.
Once the kind, the period, the agents, and if it's necessary the modules, have been chosen, then you should click on the add button and it'll be generated so many items in the report as many agents or modules have been selected.
The fields that compose the form of the tab are:
• Type: deployed list where you select the kind of item that will be generated in a massive way. There are not all, so due to obvious reasons there are kinds of items that need a finer configuration. But the available kinds that you have are: Alert report agent, Alert report module, AVG Module, Event report agent, Event report module, Monitor report y Simple graph.
• Period: intelligent control to give the time period or data time segment to represent in the report item from the moment when it's generate, this is: if the period is one month, and you generate the report for the current moment, the items will get out data from one month back.
• Agents: the agent list that you have available acording your permission group. From this list you can select one or several agents, and for each selection in the module control, there'll be shown the ones that are commons to the selected ones.
• Modules: this common module list of the selected agents is available for one or several ones.
Page 323
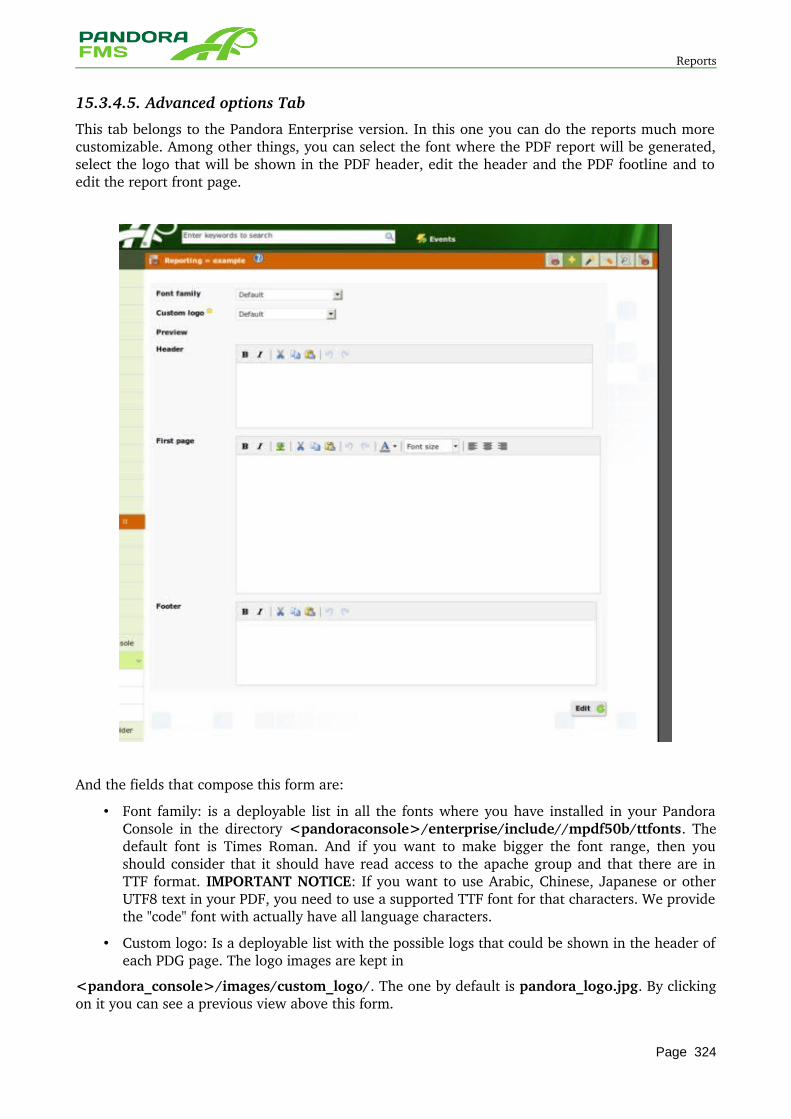
Reports
15.3.4.5. Advanced options Tab
This tab belongs to the Pandora Enterprise version. In this one you can do the reports much more customizable. Among other things, you can select the font where the PDF report will be generated, select the logo that will be shown in the PDF header, edit the header and the PDF footline and to edit the report front page.
And the fields that compose this form are:
• Font family: is a deployable list in all the fonts where you have installed in your Pandora Console in the directory <pandoraconsole>/enterprise/include//mpdf50b/ttfonts. The default font is Times Roman. And if you want to make bigger the font range, then you should consider that it should have read access to the apache group and that there are in TTF format. IMPORTANT NOTICE: If you want to use Arabic, Chinese, Japanese or other UTF8 text in your PDF, you need to use a supported TTF font for that characters. We provide the "code" font with actually have all language characters.
• Custom logo: Is a deployable list with the possible logs that could be shown in the header of each PDG page. The logo images are kept in
<pandora_console>/images/custom_logo/. The one by default is pandora_logo.jpg. By clicking on it you can see a previous view above this form.
Page 324
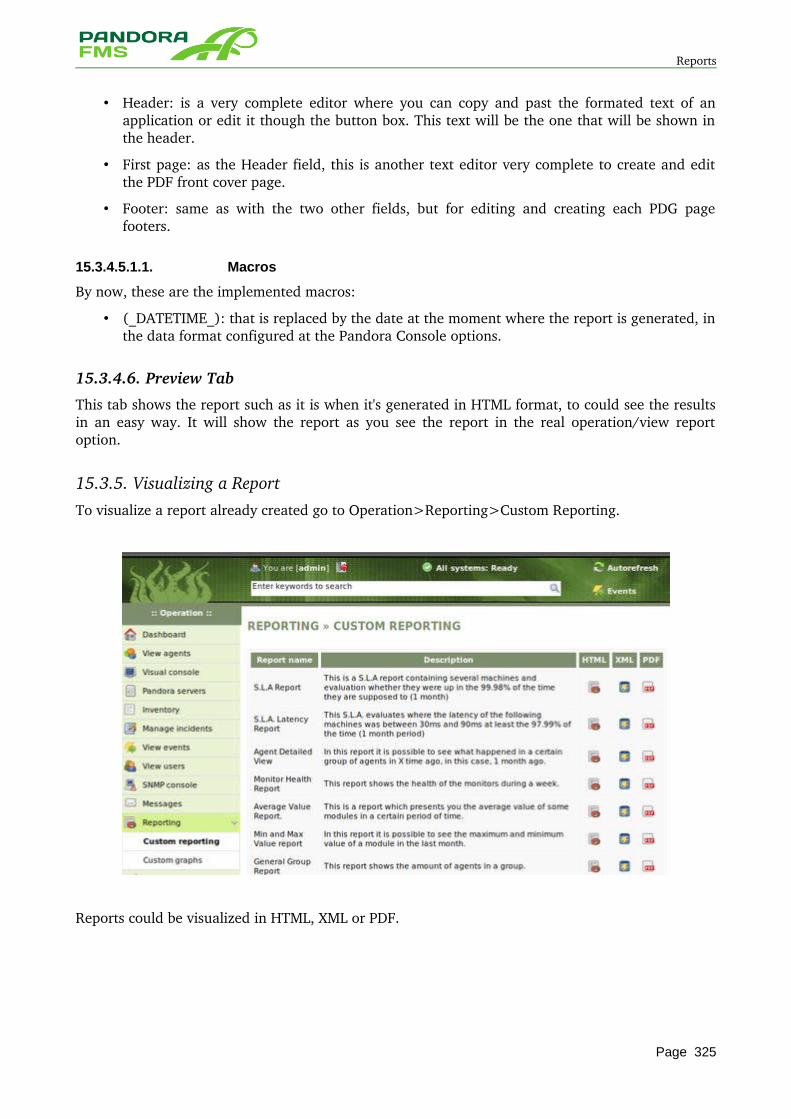
Reports
• Header: is a very complete editor where you can copy and past the formated text of an application or edit it though the button box. This text will be the one that will be shown in the header.
• First page: as the Header field, this is another text editor very complete to create and edit the PDF front cover page.
• Footer: same as with the two other fields, but for editing and creating each PDG page footers.
15.3.4.5.1.1. Macros
By now, these are the implemented macros:
• (_DATETIME_): that is replaced by the date at the moment where the report is generated, in the data format configured at the Pandora Console options.
15.3.4.6. Preview Tab
This tab shows the report such as it is when it's generated in HTML format, to could see the results in an easy way. It will show the report as you see the report in the real operation/view report option.
15.3.5. Visualizing a ReportTo visualize a report already created go to Operation>Reporting>Custom Reporting.
Reports could be visualized in HTML, XML or PDF.
Page 325
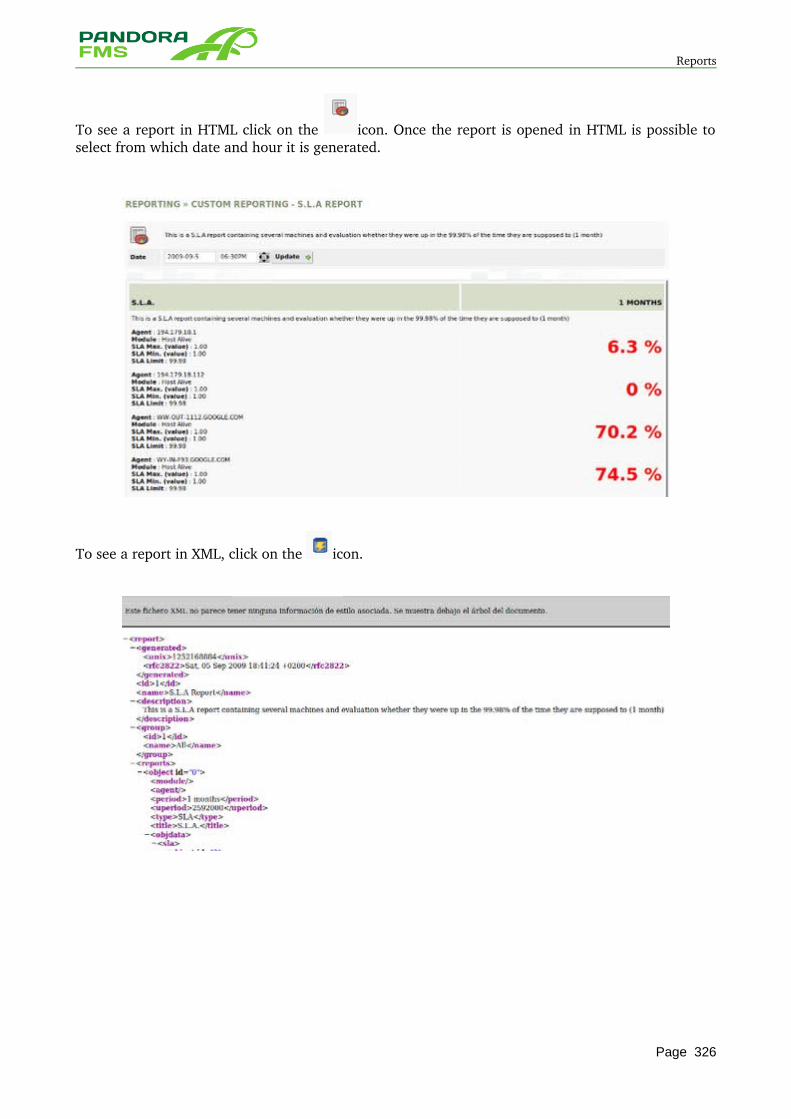
Reports
To see a report in HTML click on the icon. Once the report is opened in HTML is possible to select from which date and hour it is generated.
To see a report in XML, click on the icon.
Page 326
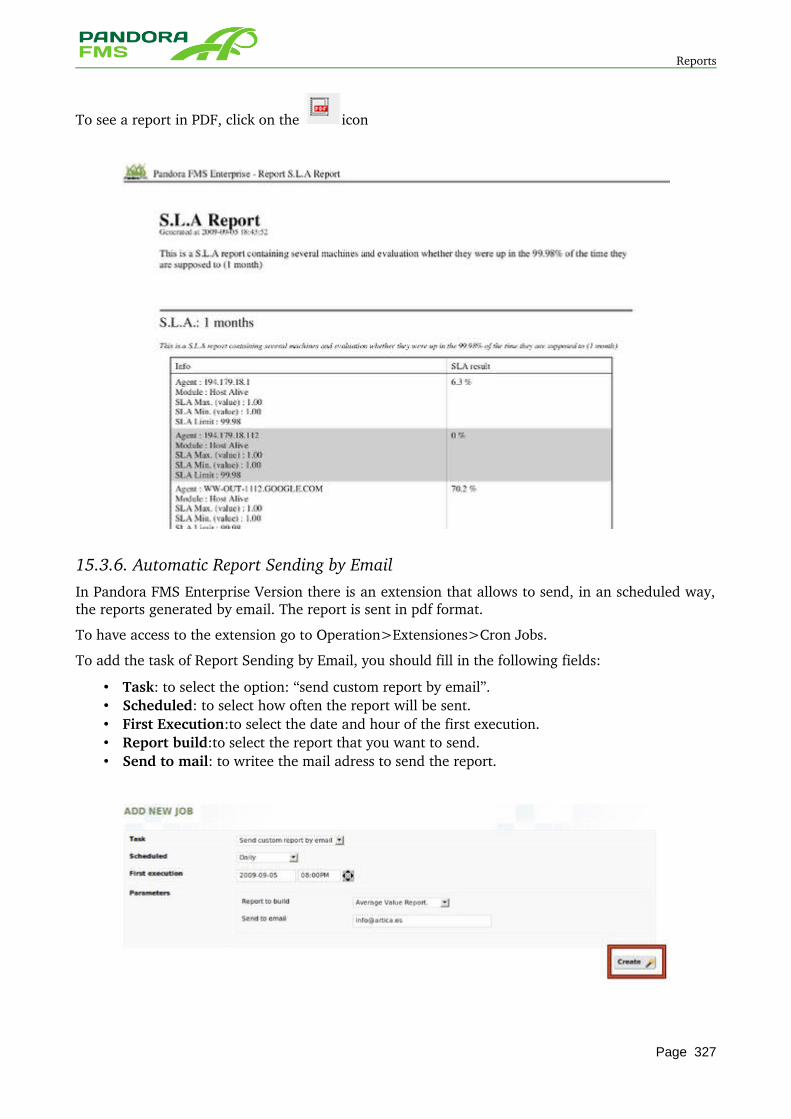
Reports
To see a report in PDF, click on the icon
15.3.6. Automatic Report Sending by EmailIn Pandora FMS Enterprise Version there is an extension that allows to send, in an scheduled way, the reports generated by email. The report is sent in pdf format.
To have access to the extension go to Operation>Extensiones>Cron Jobs.
To add the task of Report Sending by Email, you should fill in the following fields:
• Task: to select the option: “send custom report by email”. • Scheduled: to select how often the report will be sent. • First Execution:to select the date and hour of the first execution. • Report build:to select the report that you want to send. • Send to mail: to writee the mail adress to send the report.
Page 327
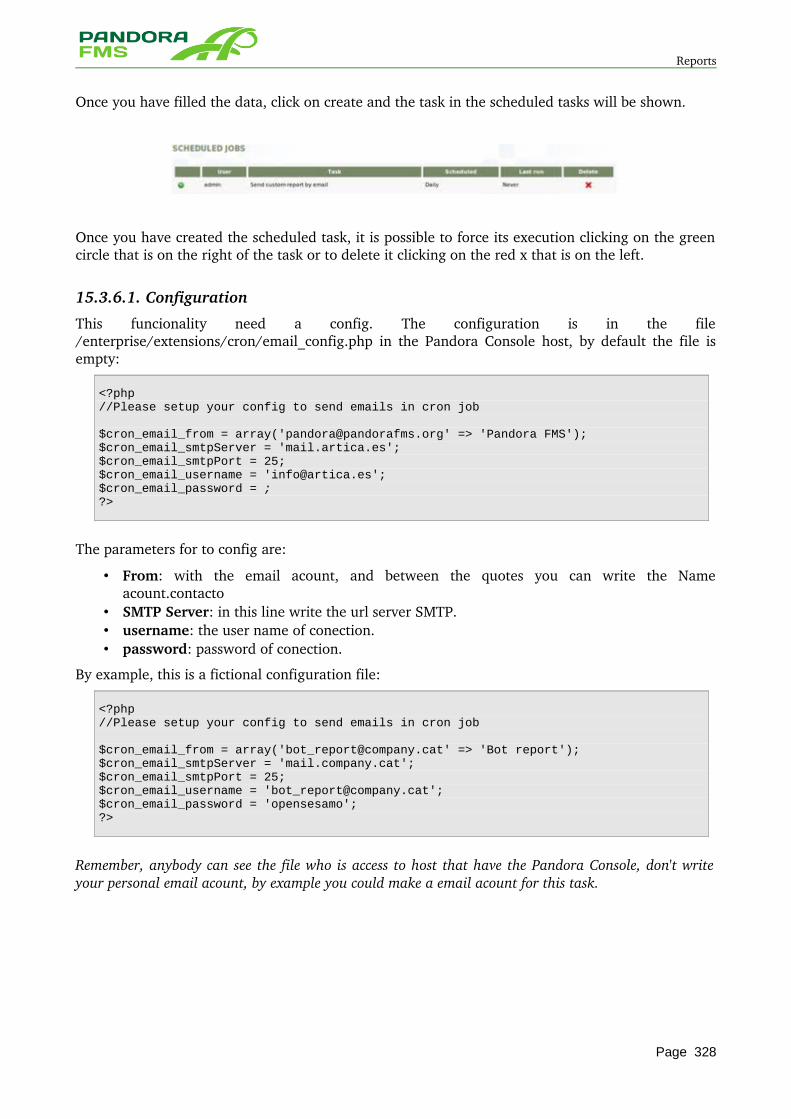
Reports
Once you have filled the data, click on create and the task in the scheduled tasks will be shown.
Once you have created the scheduled task, it is possible to force its execution clicking on the green circle that is on the right of the task or to delete it clicking on the red x that is on the left.
15.3.6.1. Configuration
This funcionality need a config. The configuration is in the file /enterprise/extensions/cron/email_config.php in the Pandora Console host, by default the file is empty:
<?php//Please setup your config to send emails in cron job
$cron_email_from = array('[email protected]' => 'Pandora FMS');$cron_email_smtpServer = 'mail.artica.es';$cron_email_smtpPort = 25;$cron_email_username = '[email protected]';$cron_email_password = ;?>
The parameters for to config are:
• From: with the email acount, and between the quotes you can write the Name acount.contacto
• SMTP Server: in this line write the url server SMTP. • username: the user name of conection. • password: password of conection.
By example, this is a fictional configuration file:
<?php//Please setup your config to send emails in cron job
$cron_email_from = array('[email protected]' => 'Bot report');$cron_email_smtpServer = 'mail.company.cat';$cron_email_smtpPort = 25;$cron_email_username = '[email protected]';$cron_email_password = 'opensesamo';?>
Remember, anybody can see the file who is access to host that have the Pandora Console, don't write your personal email acount, by example you could make a email acount for this task.
Page 328
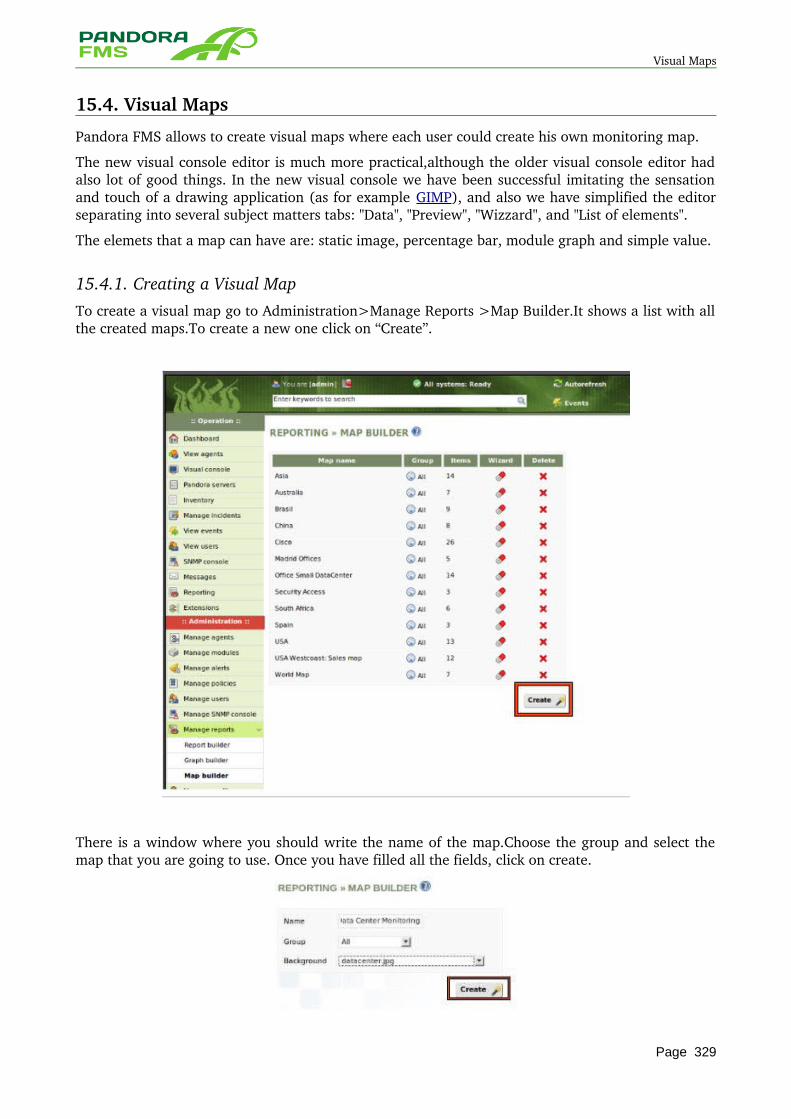
Visual Maps
15.4. Visual Maps
Pandora FMS allows to create visual maps where each user could create his own monitoring map.
The new visual console editor is much more practical,although the older visual console editor had also lot of good things. In the new visual console we have been successful imitating the sensation and touch of a drawing application (as for example GIMP), and also we have simplified the editor separating into several subject matters tabs: "Data", "Preview", "Wizzard", and "List of elements".
The elemets that a map can have are: static image, percentage bar, module graph and simple value.
15.4.1. Creating a Visual MapTo create a visual map go to Administration>Manage Reports >Map Builder.It shows a list with all the created maps.To create a new one click on “Create”.
There is a window where you should write the name of the map.Choose the group and select the map that you are going to use. Once you have filled all the fields, click on create.
Page 329
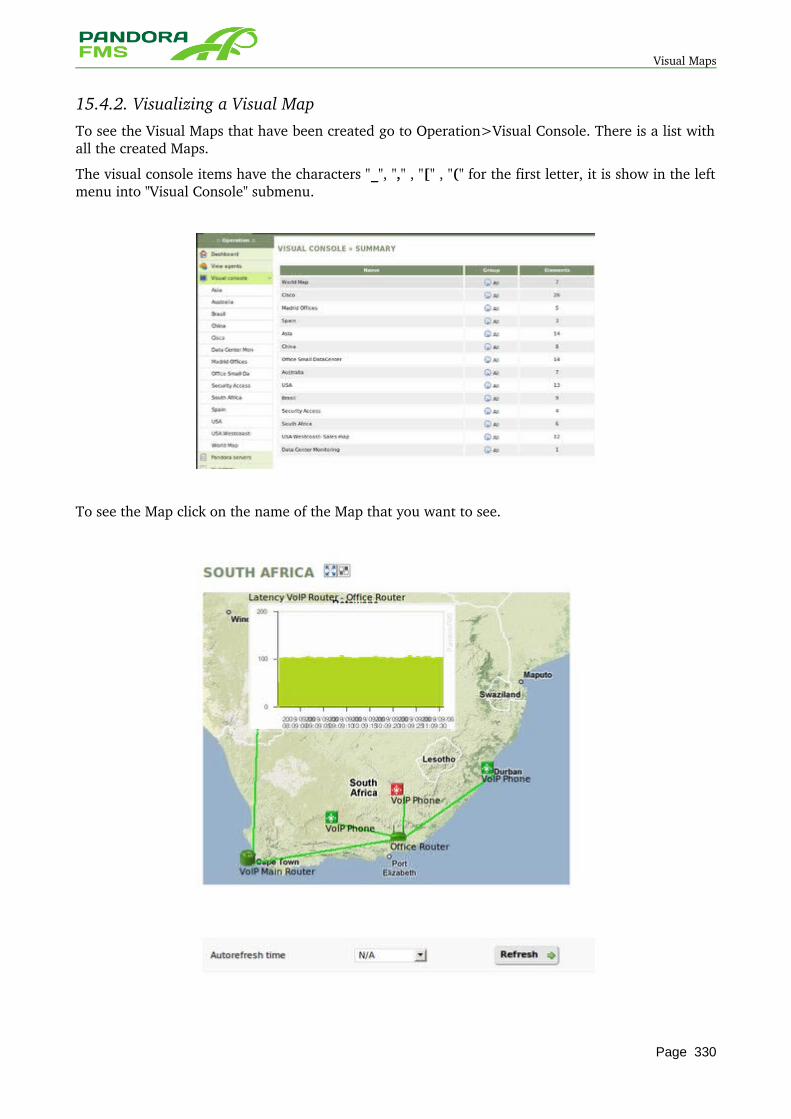
Visual Maps
15.4.2. Visualizing a Visual MapTo see the Visual Maps that have been created go to Operation>Visual Console. There is a list with all the created Maps.
The visual console items have the characters "_", "," , "[" , "(" for the first letter, it is show in the left menu into "Visual Console" submenu.
To see the Map click on the name of the Map that you want to see.
Page 330
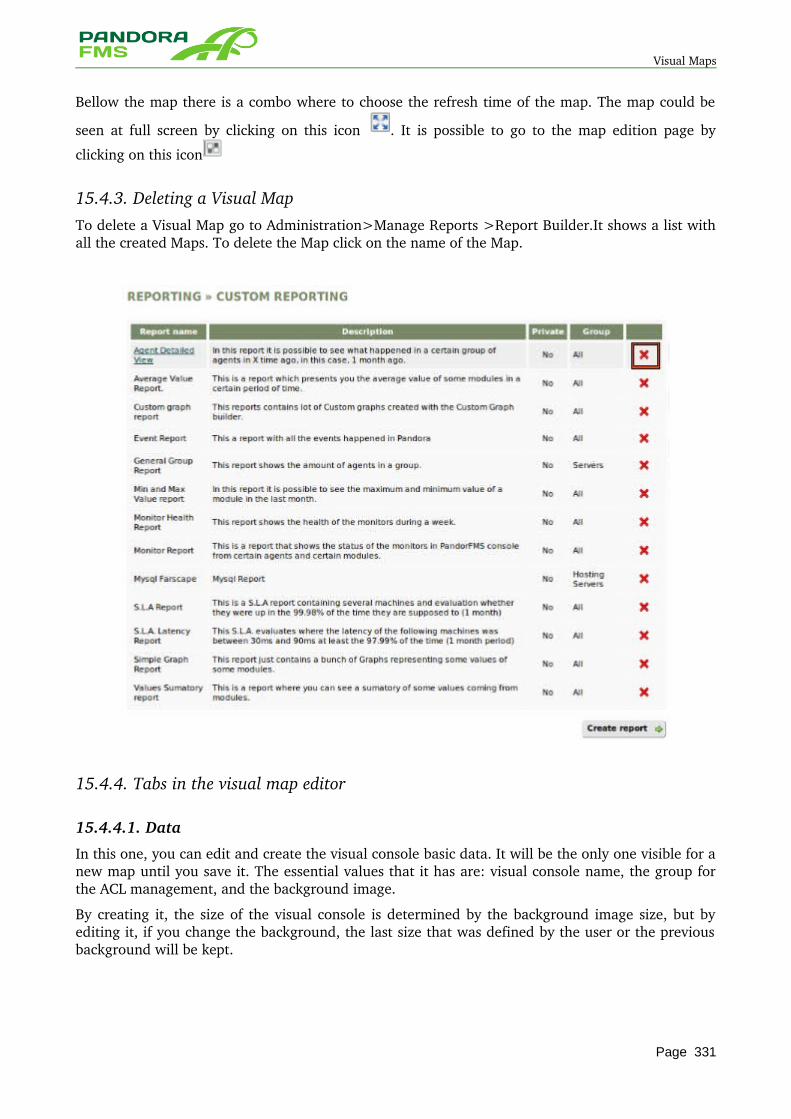
Visual Maps
Bellow the map there is a combo where to choose the refresh time of the map. The map could be
seen at full screen by clicking on this icon . It is possible to go to the map edition page by
clicking on this icon
15.4.3. Deleting a Visual Map To delete a Visual Map go to Administration>Manage Reports >Report Builder.It shows a list with all the created Maps. To delete the Map click on the name of the Map.
15.4.4. Tabs in the visual map editor
15.4.4.1. Data
In this one, you can edit and create the visual console basic data. It will be the only one visible for a new map until you save it. The essential values that it has are: visual console name, the group for the ACL management, and the background image.
By creating it, the size of the visual console is determined by the background image size, but by editing it, if you change the background, the last size that was defined by the user or the previous background will be kept.
Page 331
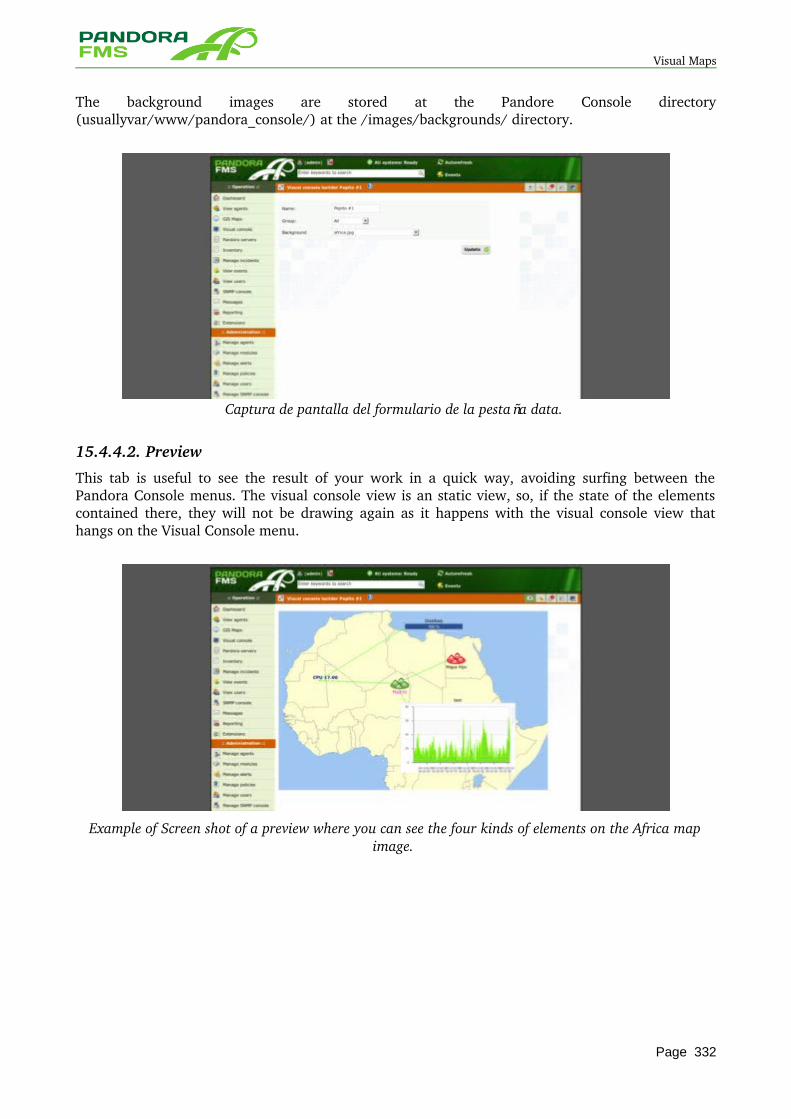
Visual Maps
The background images are stored at the Pandore Console directory (usuallyvar/www/pandora_console/) at the /images/backgrounds/ directory.
Captura de pantalla del formulario de la pestaña data.
15.4.4.2. Preview
This tab is useful to see the result of your work in a quick way, avoiding surfing between the Pandora Console menus. The visual console view is an static view, so, if the state of the elements contained there, they will not be drawing again as it happens with the visual console view that hangs on the Visual Console menu.
Example of Screen shot of a preview where you can see the four kinds of elements on the Africa map image.
Page 332
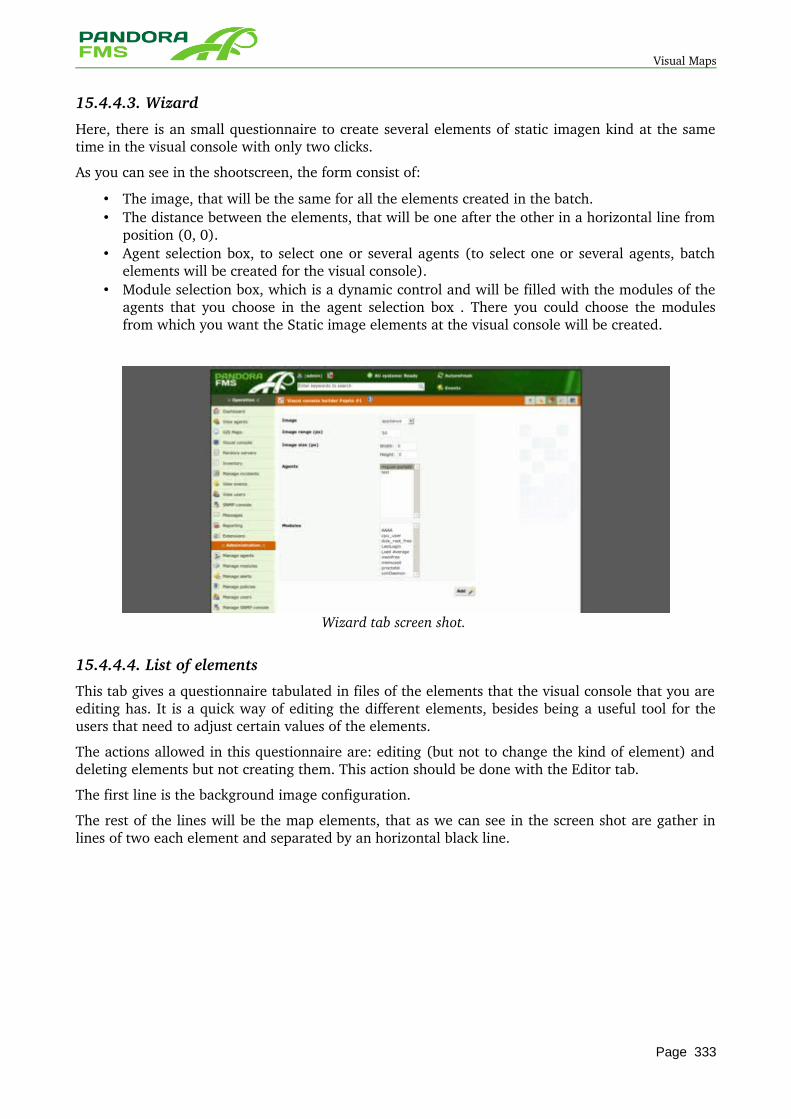
Visual Maps
15.4.4.3. Wizard
Here, there is an small questionnaire to create several elements of static imagen kind at the same time in the visual console with only two clicks.
As you can see in the shootscreen, the form consist of:
• The image, that will be the same for all the elements created in the batch. • The distance between the elements, that will be one after the other in a horizontal line from
position (0, 0). • Agent selection box, to select one or several agents (to select one or several agents, batch
elements will be created for the visual console). • Module selection box, which is a dynamic control and will be filled with the modules of the
agents that you choose in the agent selection box . There you could choose the modules from which you want the Static image elements at the visual console will be created.
Wizard tab screen shot.
15.4.4.4. List of elements
This tab gives a questionnaire tabulated in files of the elements that the visual console that you are editing has. It is a quick way of editing the different elements, besides being a useful tool for the users that need to adjust certain values of the elements.
The actions allowed in this questionnaire are: editing (but not to change the kind of element) and deleting elements but not creating them. This action should be done with the Editor tab.
The first line is the background image configuration.
The rest of the lines will be the map elements, that as we can see in the screen shot are gather in lines of two each element and separated by an horizontal black line.
Page 333
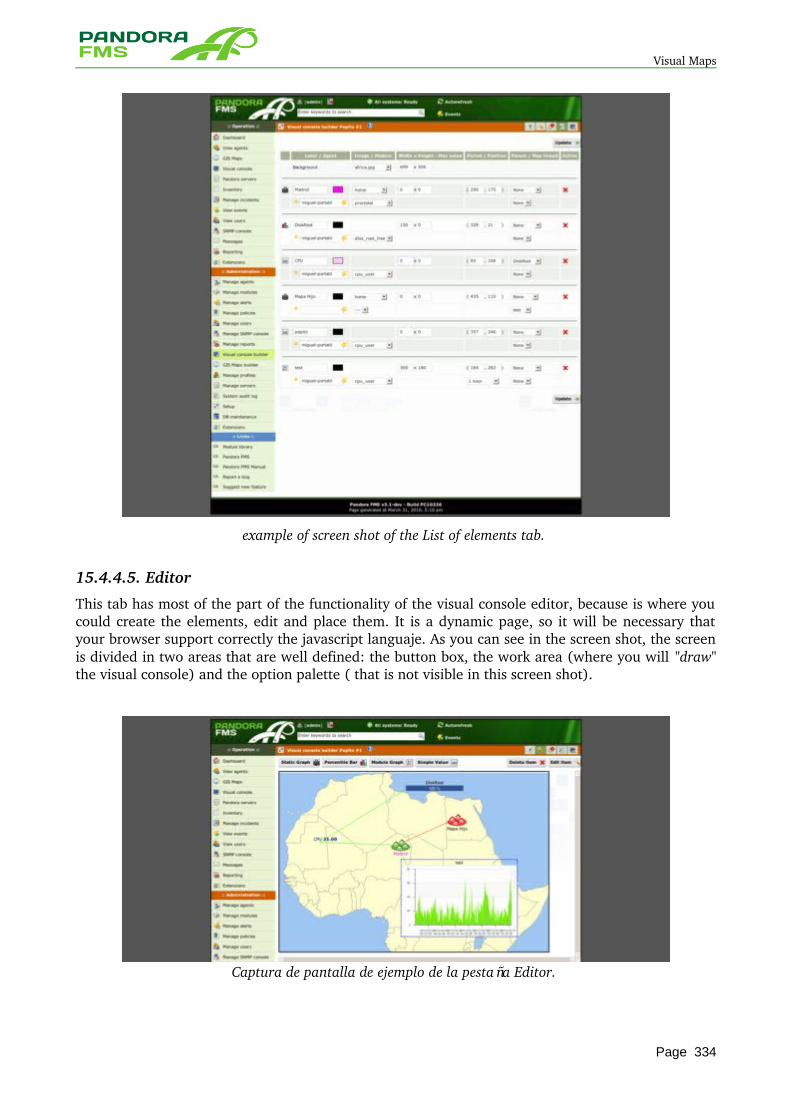
Visual Maps
example of screen shot of the List of elements tab.
15.4.4.5. Editor
This tab has most of the part of the functionality of the visual console editor, because is where you could create the elements, edit and place them. It is a dynamic page, so it will be necessary that your browser support correctly the javascript languaje. As you can see in the screen shot, the screen is divided in two areas that are well defined: the button box, the work area (where you will "draw" the visual console) and the option palette ( that is not visible in this screen shot).
Captura de pantalla de ejemplo de la pestaña Editor.
Page 334
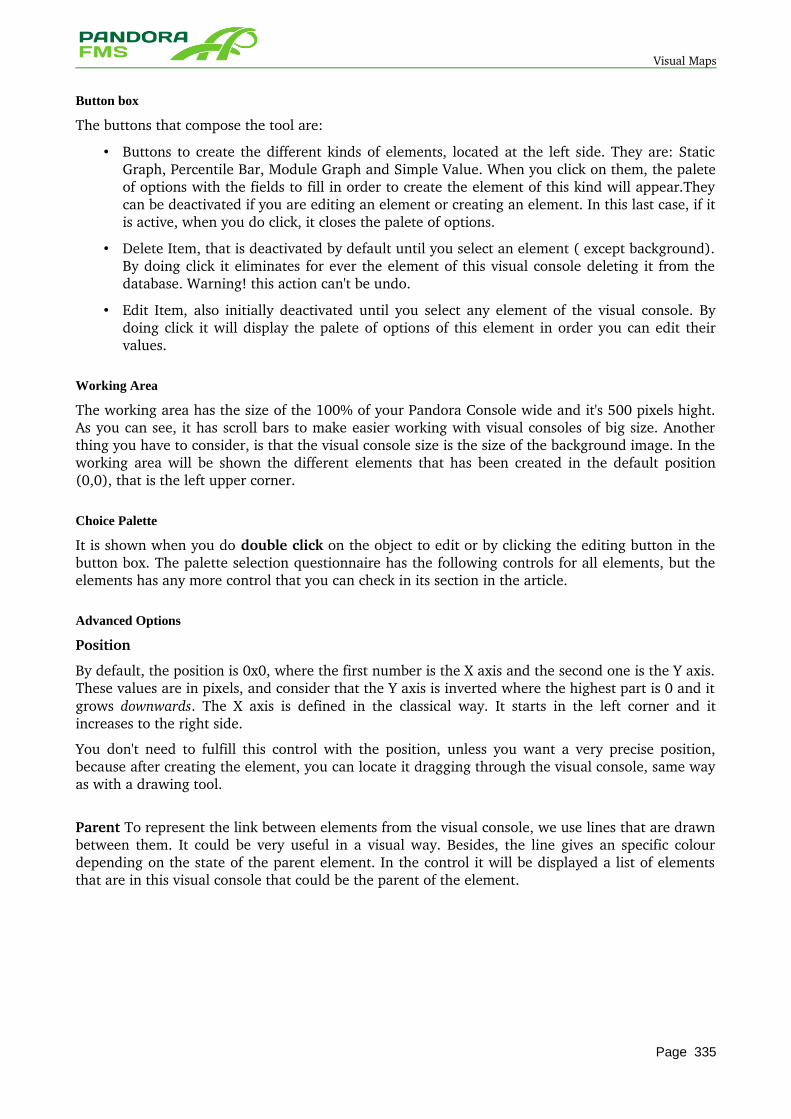
Visual Maps
Button box
The buttons that compose the tool are:
• Buttons to create the different kinds of elements, located at the left side. They are: Static Graph, Percentile Bar, Module Graph and Simple Value. When you click on them, the palete of options with the fields to fill in order to create the element of this kind will appear.They can be deactivated if you are editing an element or creating an element. In this last case, if it is active, when you do click, it closes the palete of options.
• Delete Item, that is deactivated by default until you select an element ( except background). By doing click it eliminates for ever the element of this visual console deleting it from the database. Warning! this action can't be undo.
• Edit Item, also initially deactivated until you select any element of the visual console. By doing click it will display the palete of options of this element in order you can edit their values.
Working Area
The working area has the size of the 100% of your Pandora Console wide and it's 500 pixels hight. As you can see, it has scroll bars to make easier working with visual consoles of big size. Another thing you have to consider, is that the visual console size is the size of the background image. In the working area will be shown the different elements that has been created in the default position (0,0), that is the left upper corner.
Choice Palette
It is shown when you do double click on the object to edit or by clicking the editing button in the button box. The palette selection questionnaire has the following controls for all elements, but the elements has any more control that you can check in its section in the article.
Advanced Options
Position
By default, the position is 0x0, where the first number is the X axis and the second one is the Y axis. These values are in pixels, and consider that the Y axis is inverted where the highest part is 0 and it grows downwards. The X axis is defined in the classical way. It starts in the left corner and it increases to the right side.
You don't need to fulfill this control with the position, unless you want a very precise position, because after creating the element, you can locate it dragging through the visual console, same way as with a drawing tool.
Parent To represent the link between elements from the visual console, we use lines that are drawn between them. It could be very useful in a visual way. Besides, the line gives an specific colour depending on the state of the parent element. In the control it will be displayed a list of elements that are in this visual console that could be the parent of the element.
Page 335
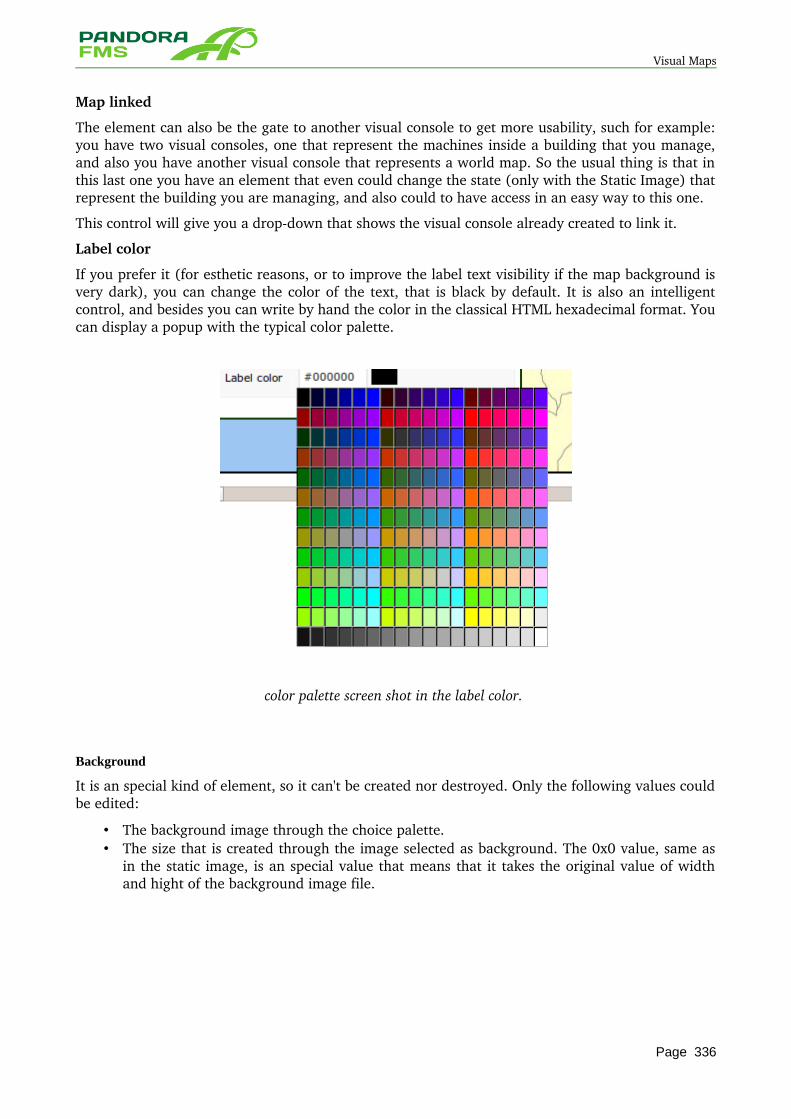
Visual Maps
Map linked
The element can also be the gate to another visual console to get more usability, such for example: you have two visual consoles, one that represent the machines inside a building that you manage, and also you have another visual console that represents a world map. So the usual thing is that in this last one you have an element that even could change the state (only with the Static Image) that represent the building you are managing, and also could to have access in an easy way to this one.
This control will give you a dropdown that shows the visual console already created to link it.
Label color
If you prefer it (for esthetic reasons, or to improve the label text visibility if the map background is very dark), you can change the color of the text, that is black by default. It is also an intelligent control, and besides you can write by hand the color in the classical HTML hexadecimal format. You can display a popup with the typical color palette.
color palette screen shot in the label color.
Background
It is an special kind of element, so it can't be created nor destroyed. Only the following values could be edited:
• The background image through the choice palette. • The size that is created through the image selected as background. The 0x0 value, same as
in the static image, is an special value that means that it takes the original value of width and hight of the background image file.
Page 336
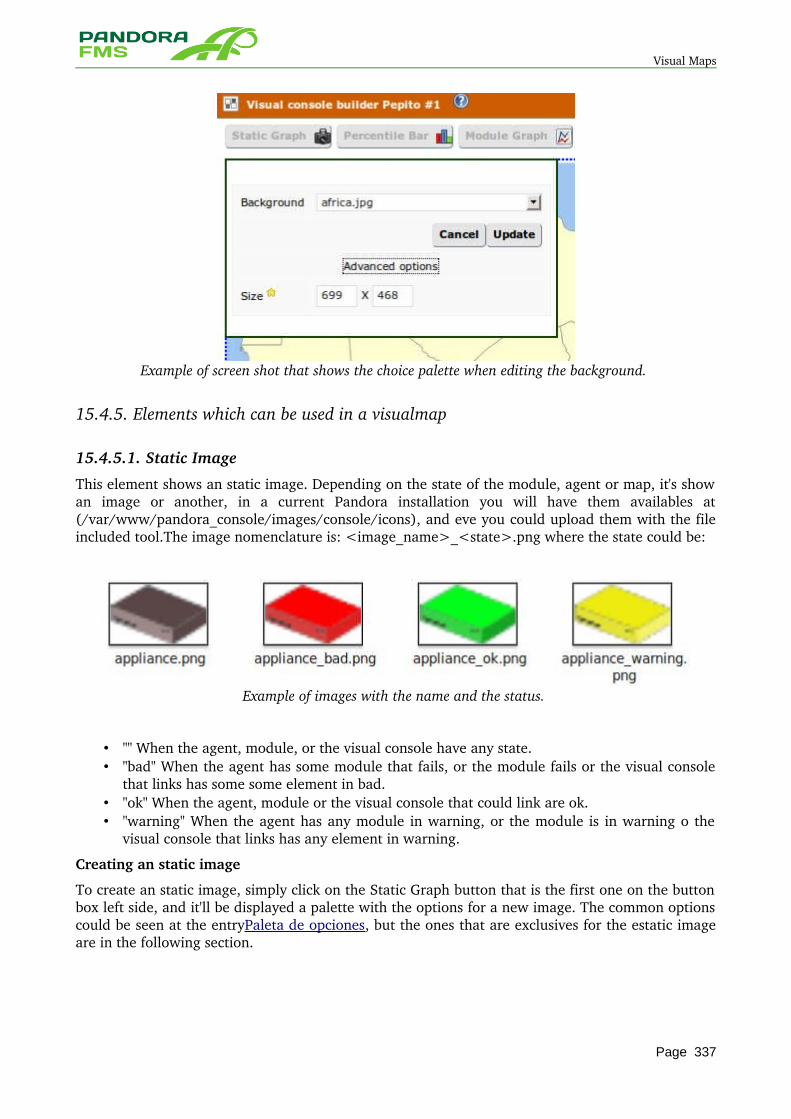
Visual Maps
Example of screen shot that shows the choice palette when editing the background.
15.4.5. Elements which can be used in a visualmap
15.4.5.1. Static Image
This element shows an static image. Depending on the state of the module, agent or map, it's show an image or another, in a current Pandora installation you will have them availables at (/var/www/pandora_console/images/console/icons), and eve you could upload them with the file included tool.The image nomenclature is: <image_name>_<state>.png where the state could be:
Example of images with the name and the status.
• "" When the agent, module, or the visual console have any state. • "bad" When the agent has some module that fails, or the module fails or the visual console
that links has some some element in bad. • "ok" When the agent, module or the visual console that could link are ok. • "warning" When the agent has any module in warning, or the module is in warning o the
visual console that links has any element in warning.
Creating an static image
To create an static image, simply click on the Static Graph button that is the first one on the button box left side, and it'll be displayed a palette with the options for a new image. The common options could be seen at the entryPaleta de opciones, but the ones that are exclusives for the estatic image are in the following section.
Page 337
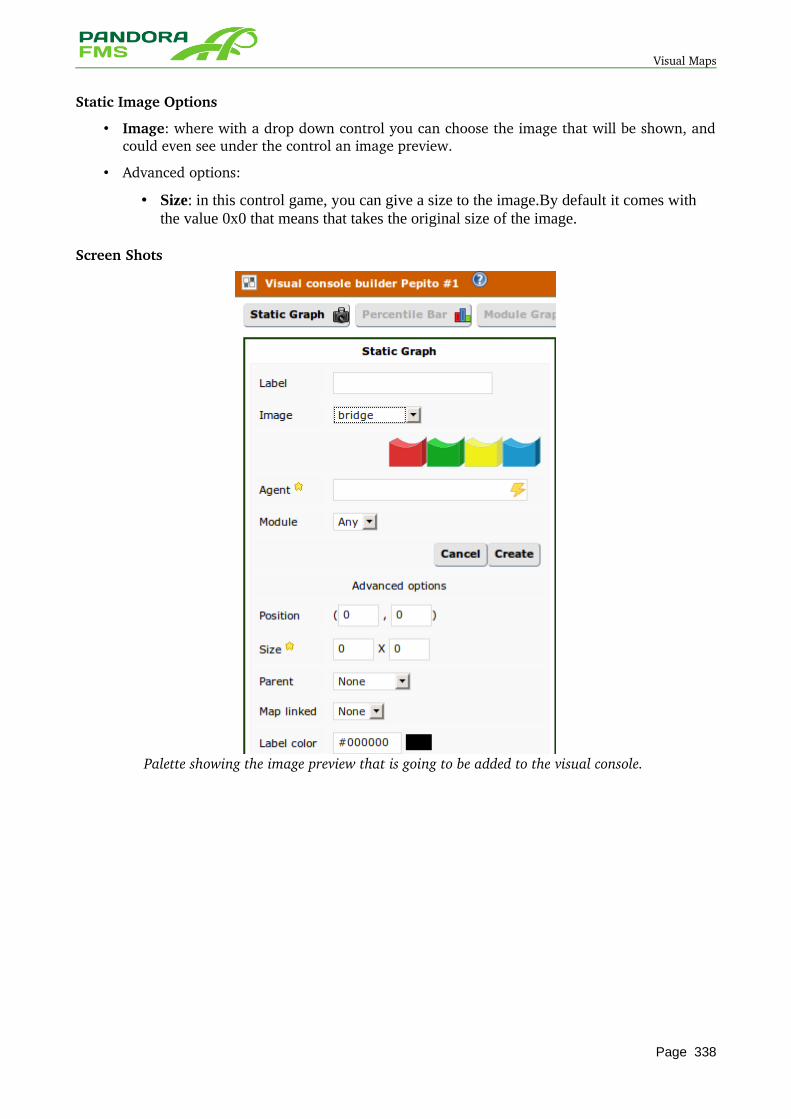
Visual Maps
Static Image Options
• Image: where with a drop down control you can choose the image that will be shown, and could even see under the control an image preview.
• Advanced options:
• Size: in this control game, you can give a size to the image.By default it comes with the value 0x0 that means that takes the original size of the image.
Screen Shots
Palette showing the image preview that is going to be added to the visual console.
Page 338
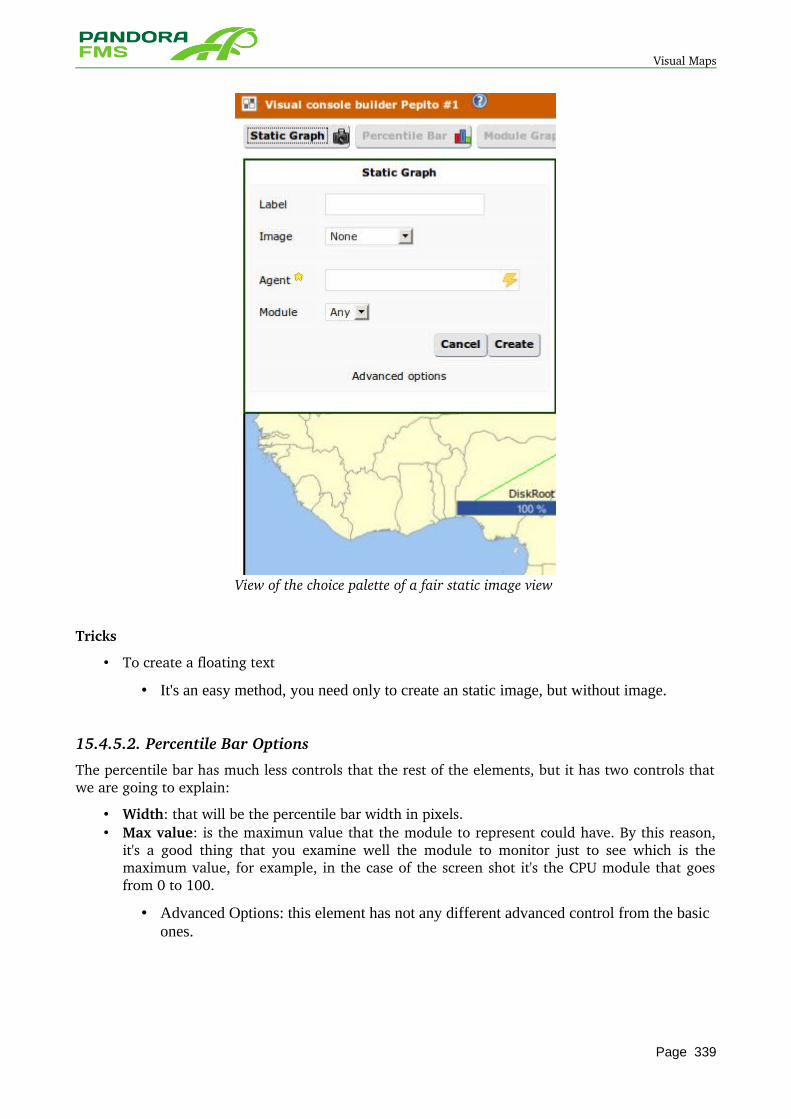
Visual Maps
View of the choice palette of a fair static image view
Tricks
• To create a floating text
• It's an easy method, you need only to create an static image, but without image.
15.4.5.2. Percentile Bar Options
The percentile bar has much less controls that the rest of the elements, but it has two controls that we are going to explain:
• Width: that will be the percentile bar width in pixels. • Max value: is the maximun value that the module to represent could have. By this reason,
it's a good thing that you examine well the module to monitor just to see which is the maximum value, for example, in the case of the screen shot it's the CPU module that goes from 0 to 100.
• Advanced Options: this element has not any different advanced control from the basic ones.
Page 339
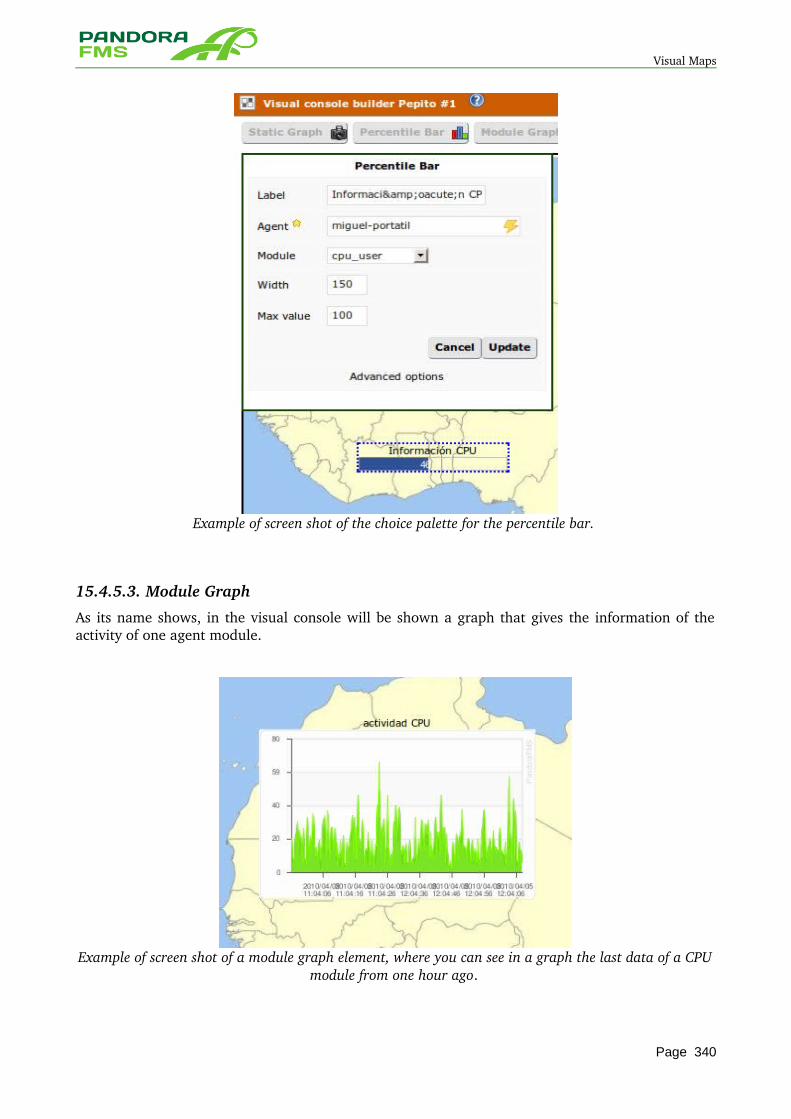
Visual Maps
Example of screen shot of the choice palette for the percentile bar.
15.4.5.3. Module Graph
As its name shows, in the visual console will be shown a graph that gives the information of the activity of one agent module.
Example of screen shot of a module graph element, where you can see in a graph the last data of a CPU module from one hour ago.
Page 340
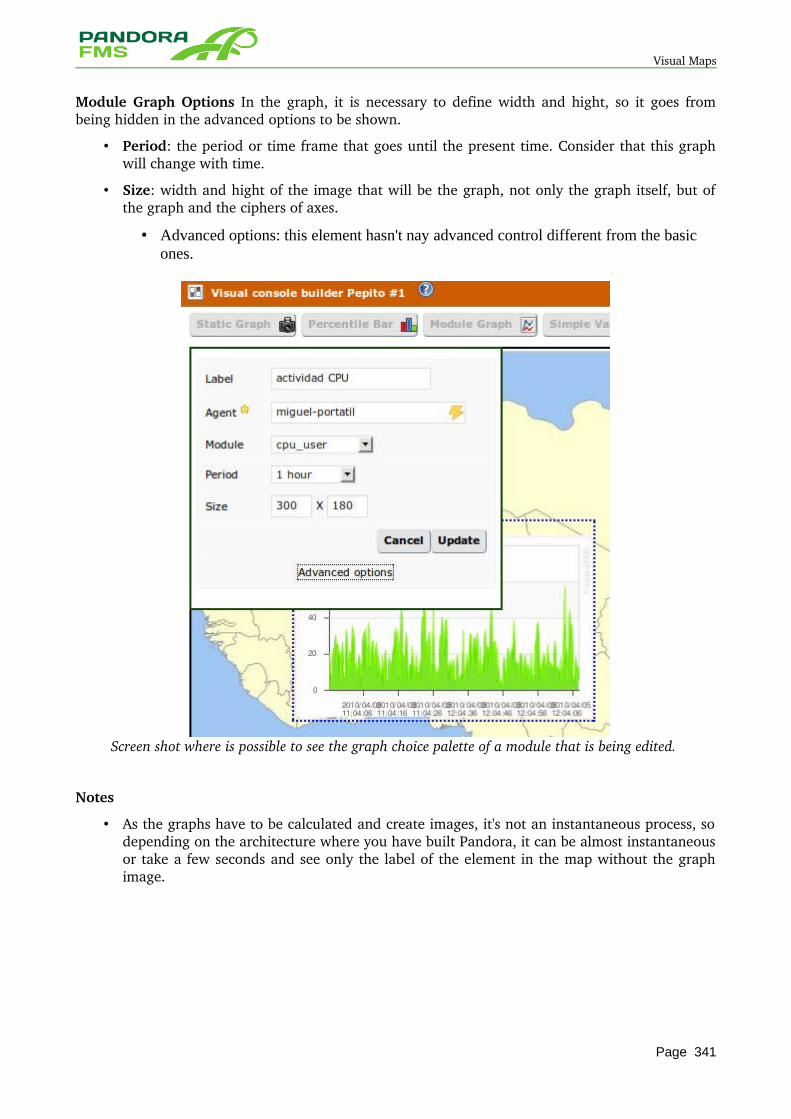
Visual Maps
Module Graph Options In the graph, it is necessary to define width and hight, so it goes from being hidden in the advanced options to be shown.
• Period: the period or time frame that goes until the present time. Consider that this graph will change with time.
• Size: width and hight of the image that will be the graph, not only the graph itself, but of the graph and the ciphers of axes.
• Advanced options: this element hasn't nay advanced control different from the basic ones.
Screen shot where is possible to see the graph choice palette of a module that is being edited.
Notes
• As the graphs have to be calculated and create images, it's not an instantaneous process, so depending on the architecture where you have built Pandora, it can be almost instantaneous or take a few seconds and see only the label of the element in the map without the graph image.
Page 341
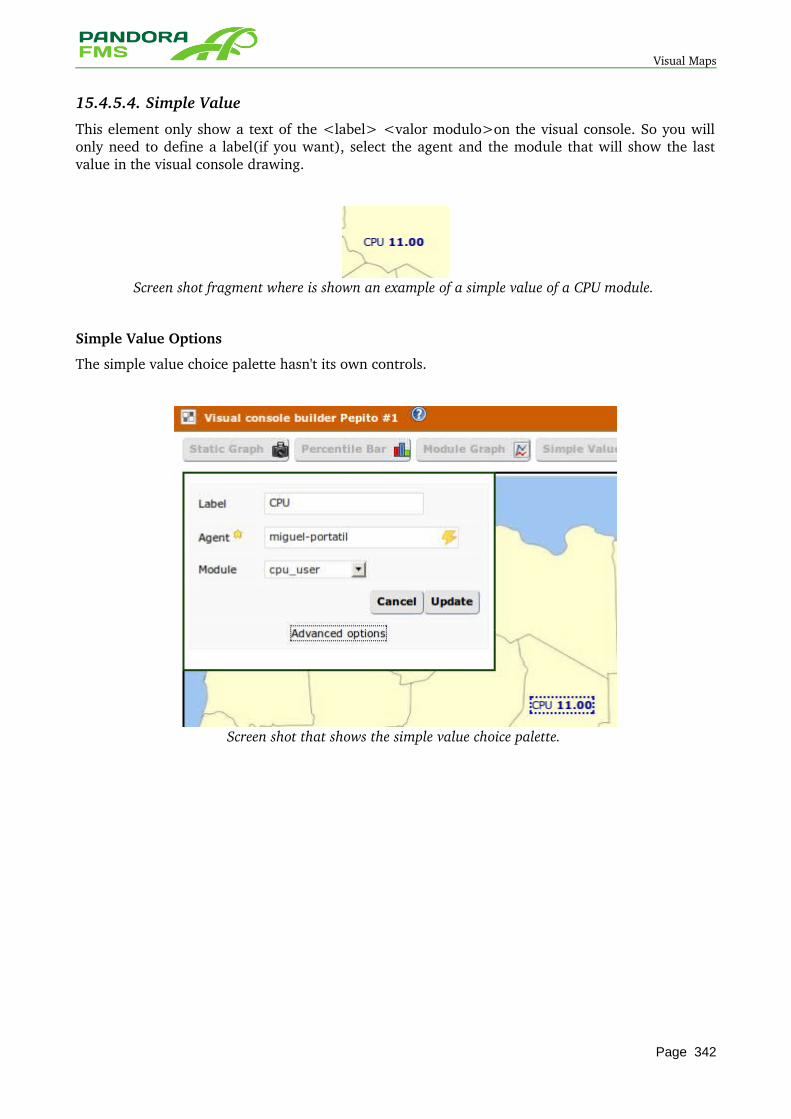
Visual Maps
15.4.5.4. Simple Value
This element only show a text of the <label> <valor modulo>on the visual console. So you will only need to define a label(if you want), select the agent and the module that will show the last value in the visual console drawing.
Screen shot fragment where is shown an example of a simple value of a CPU module.
Simple Value Options
The simple value choice palette hasn't its own controls.
Screen shot that shows the simple value choice palette.
Page 342
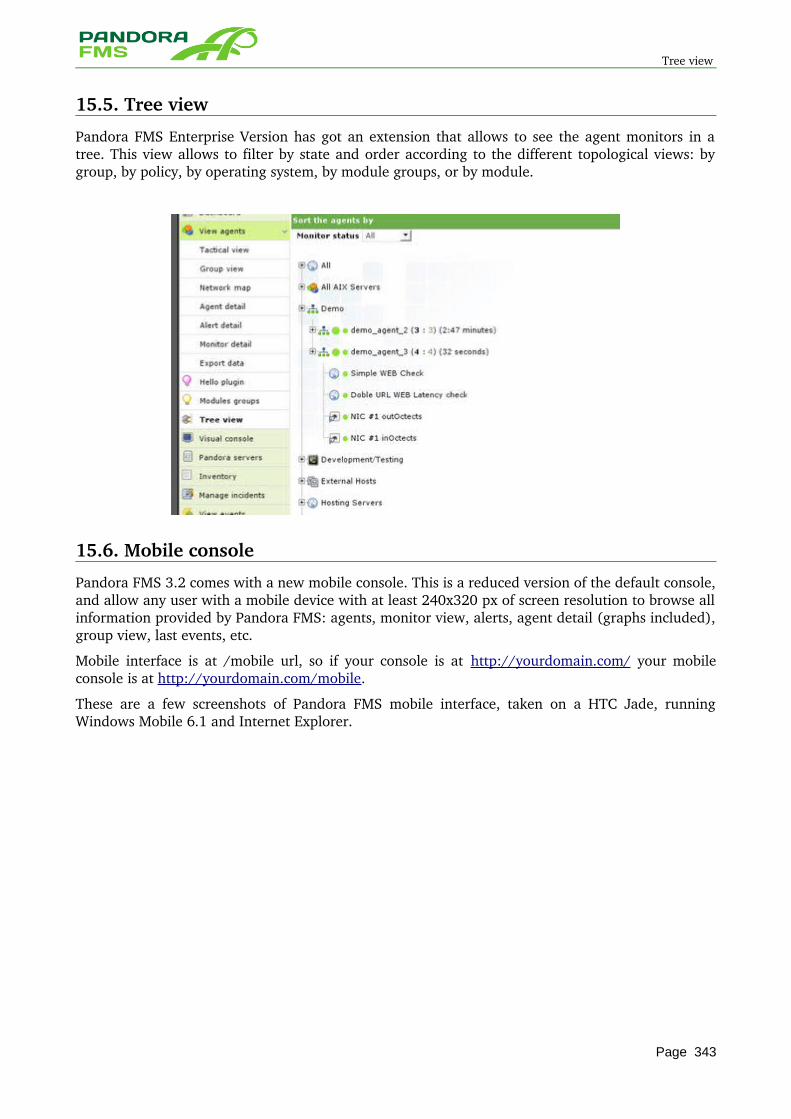
Tree view
15.5. Tree view
Pandora FMS Enterprise Version has got an extension that allows to see the agent monitors in a tree. This view allows to filter by state and order according to the different topological views: by group, by policy, by operating system, by module groups, or by module.
15.6. Mobile console
Pandora FMS 3.2 comes with a new mobile console. This is a reduced version of the default console, and allow any user with a mobile device with at least 240x320 px of screen resolution to browse all information provided by Pandora FMS: agents, monitor view, alerts, agent detail (graphs included), group view, last events, etc.
Mobile interface is at /mobile url, so if your console is at http://yourdomain.com/ your mobile console is at http://yourdomain.com/mobile.
These are a few screenshots of Pandora FMS mobile interface, taken on a HTC Jade, running Windows Mobile 6.1 and Internet Explorer.
Page 343
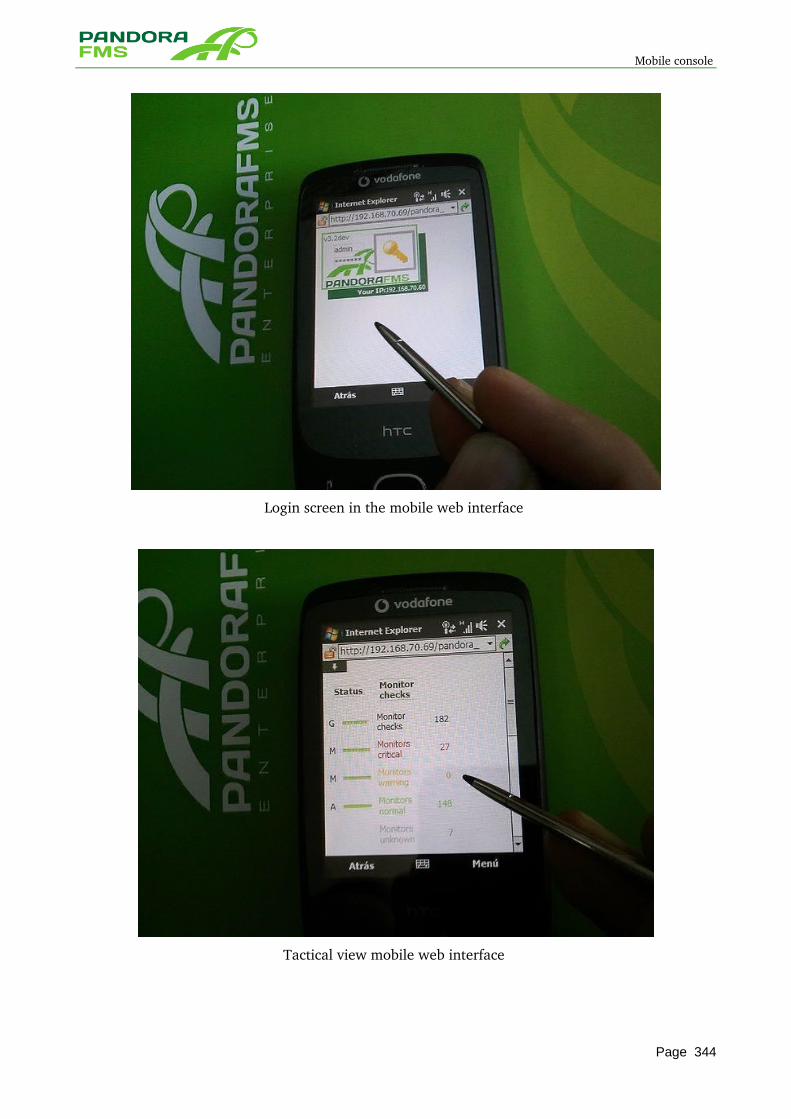
Mobile console
Login screen in the mobile web interface
Tactical view mobile web interface
Page 344
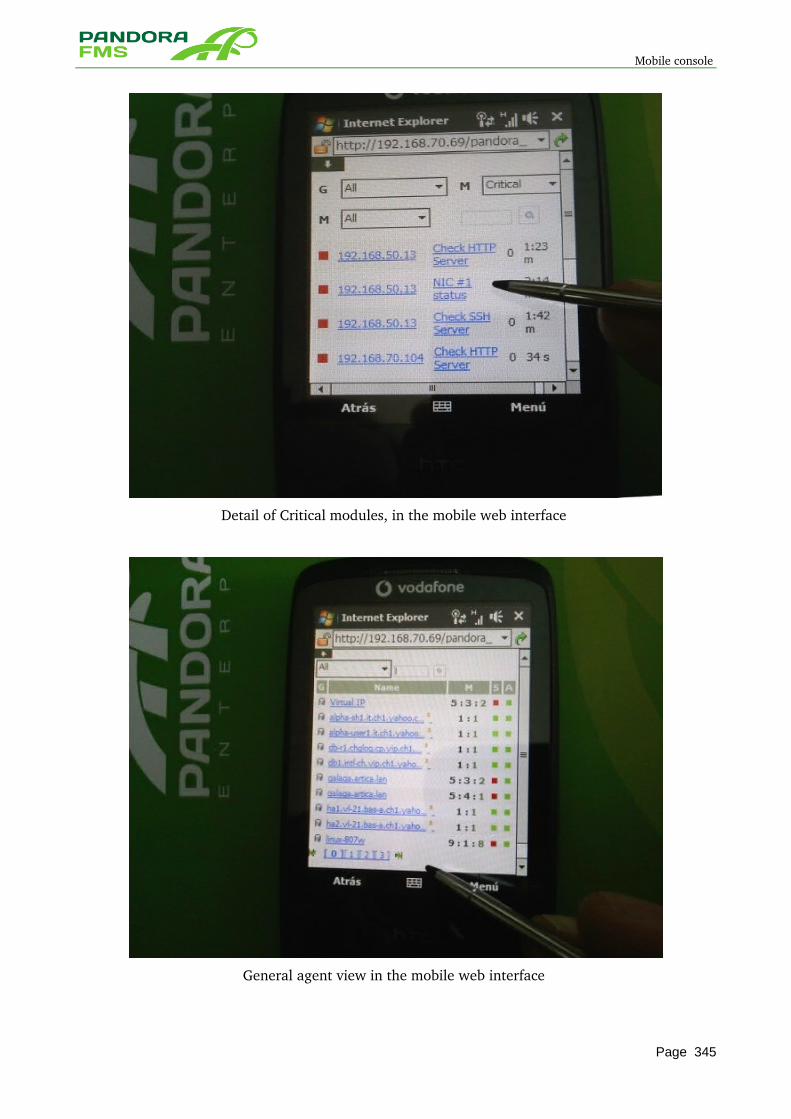
Mobile console
Detail of Critical modules, in the mobile web interface
General agent view in the mobile web interface
Page 345
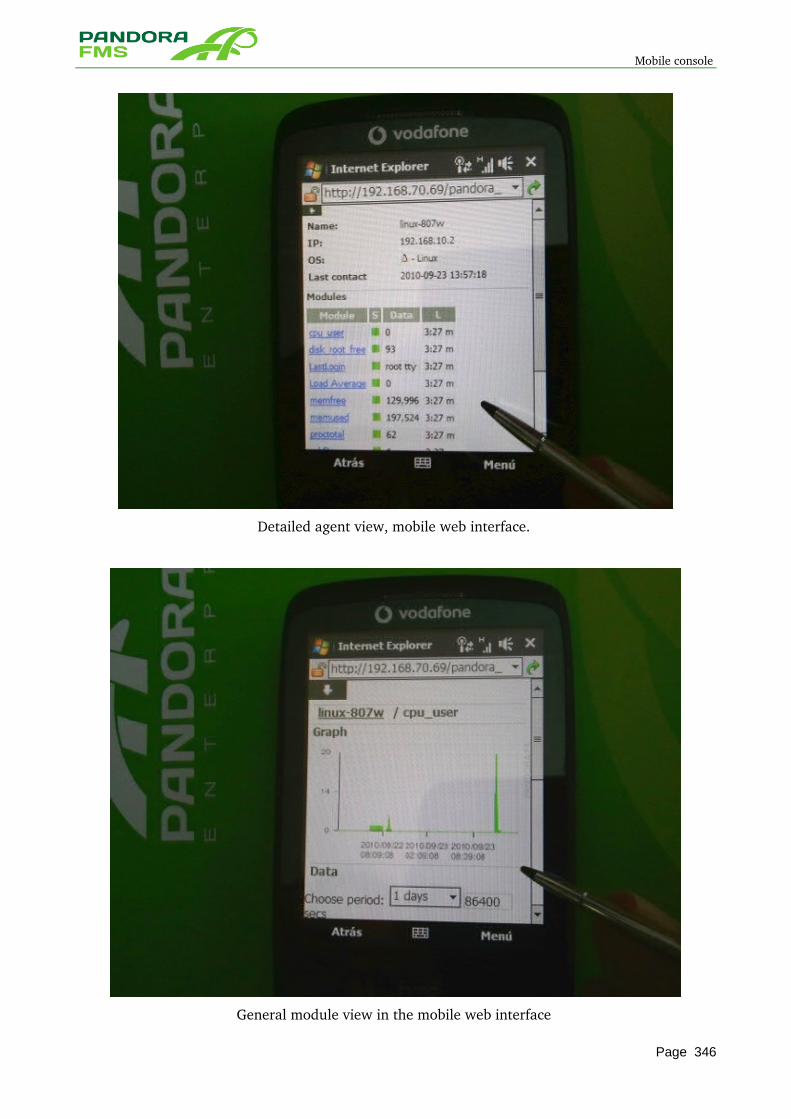
Mobile console
Detailed agent view, mobile web interface.
General module view in the mobile web interface
Page 346

Mobile console
Contextual menu, in the event view, mobile web interface
Page 347

Mobile console
16 PANDORA GIS
Page 348
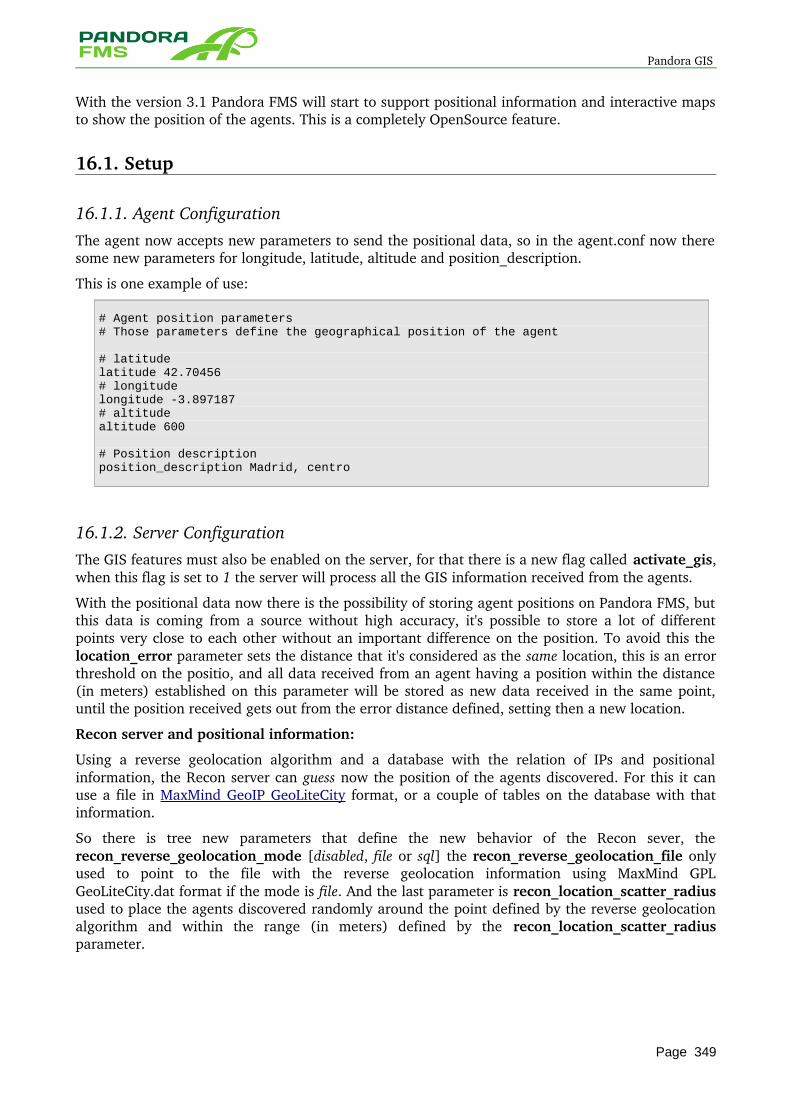
Pandora GIS
With the version 3.1 Pandora FMS will start to support positional information and interactive maps to show the position of the agents. This is a completely OpenSource feature.
16.1. Setup
16.1.1. Agent Configuration The agent now accepts new parameters to send the positional data, so in the agent.conf now there some new parameters for longitude, latitude, altitude and position_description.
This is one example of use:
# Agent position parameters# Those parameters define the geographical position of the agent
# latitude latitude 42.70456# longitudelongitude -3.897187 # altitudealtitude 600
# Position descriptionposition_description Madrid, centro
16.1.2. Server Configuration The GIS features must also be enabled on the server, for that there is a new flag called activate_gis, when this flag is set to 1 the server will process all the GIS information received from the agents.
With the positional data now there is the possibility of storing agent positions on Pandora FMS, but this data is coming from a source without high accuracy, it's possible to store a lot of different points very close to each other without an important difference on the position. To avoid this the location_error parameter sets the distance that it's considered as the same location, this is an error threshold on the positio, and all data received from an agent having a position within the distance (in meters) established on this parameter will be stored as new data received in the same point, until the position received gets out from the error distance defined, setting then a new location.
Recon server and positional information:
Using a reverse geolocation algorithm and a database with the relation of IPs and positional information, the Recon server can guess now the position of the agents discovered. For this it can use a file in MaxMind GeoIP GeoLiteCity format, or a couple of tables on the database with that information.
So there is tree new parameters that define the new behavior of the Recon sever, the recon_reverse_geolocation_mode [disabled, file or sql] the recon_reverse_geolocation_file only used to point to the file with the reverse geolocation information using MaxMind GPL GeoLiteCity.dat format if the mode is file. And the last parameter is recon_location_scatter_radius used to place the agents discovered randomly around the point defined by the reverse geolocation algorithm and within the range (in meters) defined by the recon_location_scatter_radius parameter.
Page 349
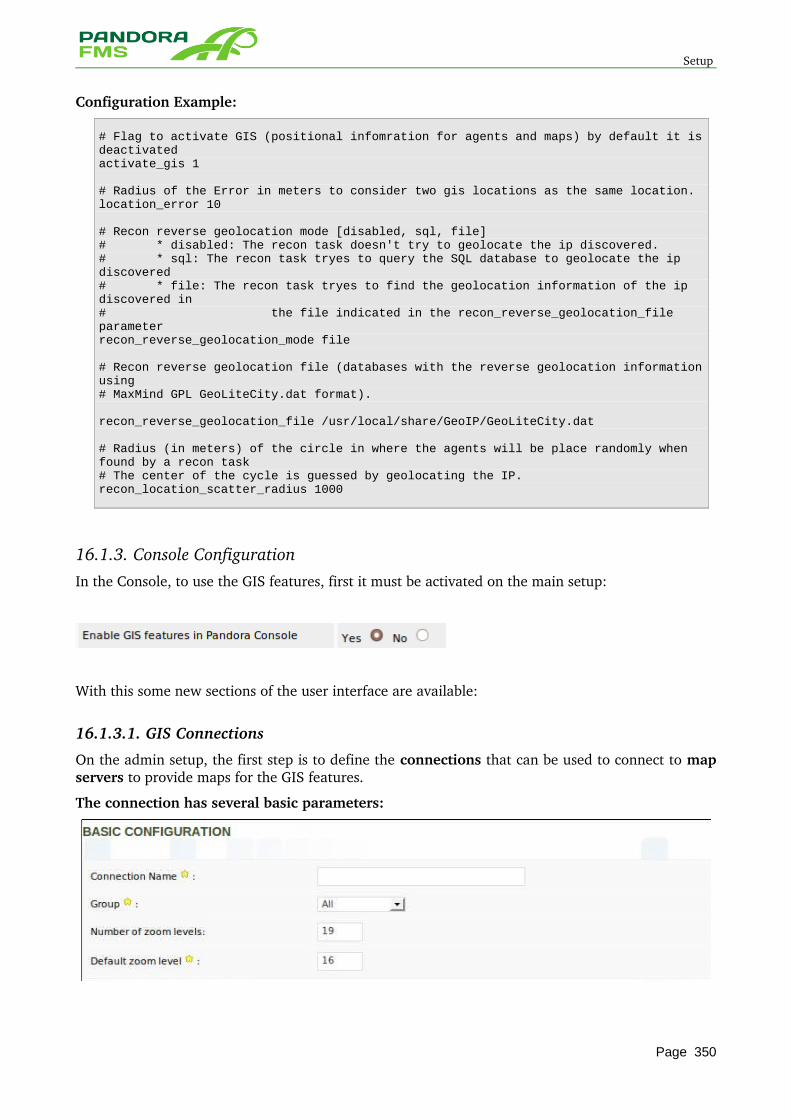
Setup
Configuration Example:
# Flag to activate GIS (positional infomration for agents and maps) by default it is deactivatedactivate_gis 1
# Radius of the Error in meters to consider two gis locations as the same location.location_error 10
# Recon reverse geolocation mode [disabled, sql, file]# * disabled: The recon task doesn't try to geolocate the ip discovered.# * sql: The recon task tryes to query the SQL database to geolocate the ip discovered# * file: The recon task tryes to find the geolocation information of the ip discovered in # the file indicated in the recon_reverse_geolocation_file parameter recon_reverse_geolocation_mode file
# Recon reverse geolocation file (databases with the reverse geolocation information using# MaxMind GPL GeoLiteCity.dat format).
recon_reverse_geolocation_file /usr/local/share/GeoIP/GeoLiteCity.dat
# Radius (in meters) of the circle in where the agents will be place randomly when found by a recon task# The center of the cycle is guessed by geolocating the IP.recon_location_scatter_radius 1000
16.1.3. Console Configuration In the Console, to use the GIS features, first it must be activated on the main setup:
With this some new sections of the user interface are available:
16.1.3.1. GIS Connections
On the admin setup, the first step is to define the connections that can be used to connect to map servers to provide maps for the GIS features.
The connection has several basic parameters:
Page 350
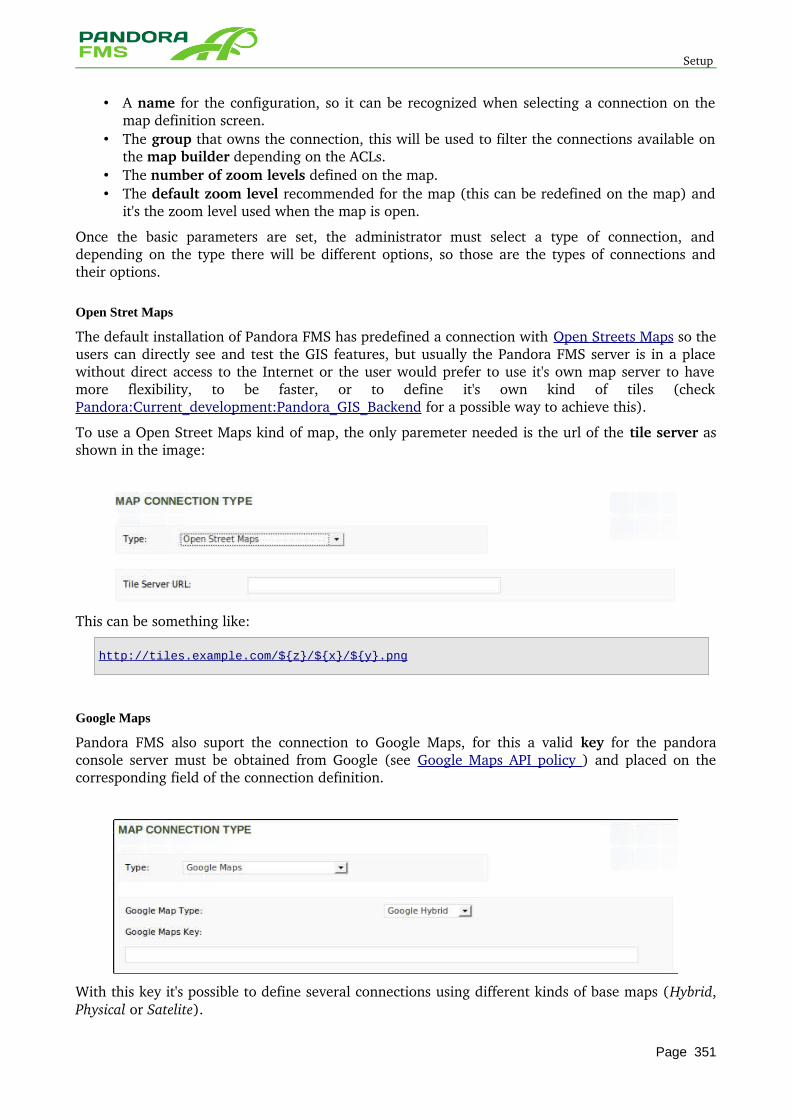
Setup
• A name for the configuration, so it can be recognized when selecting a connection on the map definition screen.
• The group that owns the connection, this will be used to filter the connections available on the map builder depending on the ACLs.
• The number of zoom levels defined on the map. • The default zoom level recommended for the map (this can be redefined on the map) and
it's the zoom level used when the map is open.
Once the basic parameters are set, the administrator must select a type of connection, and depending on the type there will be different options, so those are the types of connections and their options.
Open Stret Maps
The default installation of Pandora FMS has predefined a connection with Open Streets Maps so the users can directly see and test the GIS features, but usually the Pandora FMS server is in a place without direct access to the Internet or the user would prefer to use it's own map server to have more flexibility, to be faster, or to define it's own kind of tiles (check Pandora:Current_development:Pandora_GIS_Backend for a possible way to achieve this).
To use a Open Street Maps kind of map, the only paremeter needed is the url of the tile server as shown in the image:
This can be something like:
http://tiles.example.com/${z}/${x}/${y}.png
Google Maps
Pandora FMS also suport the connection to Google Maps, for this a valid key for the pandora console server must be obtained from Google (see Google Maps API policy ) and placed on the corresponding field of the connection definition.
With this key it's possible to define several connections using different kinds of base maps (Hybrid, Physical or Satelite).
Page 351
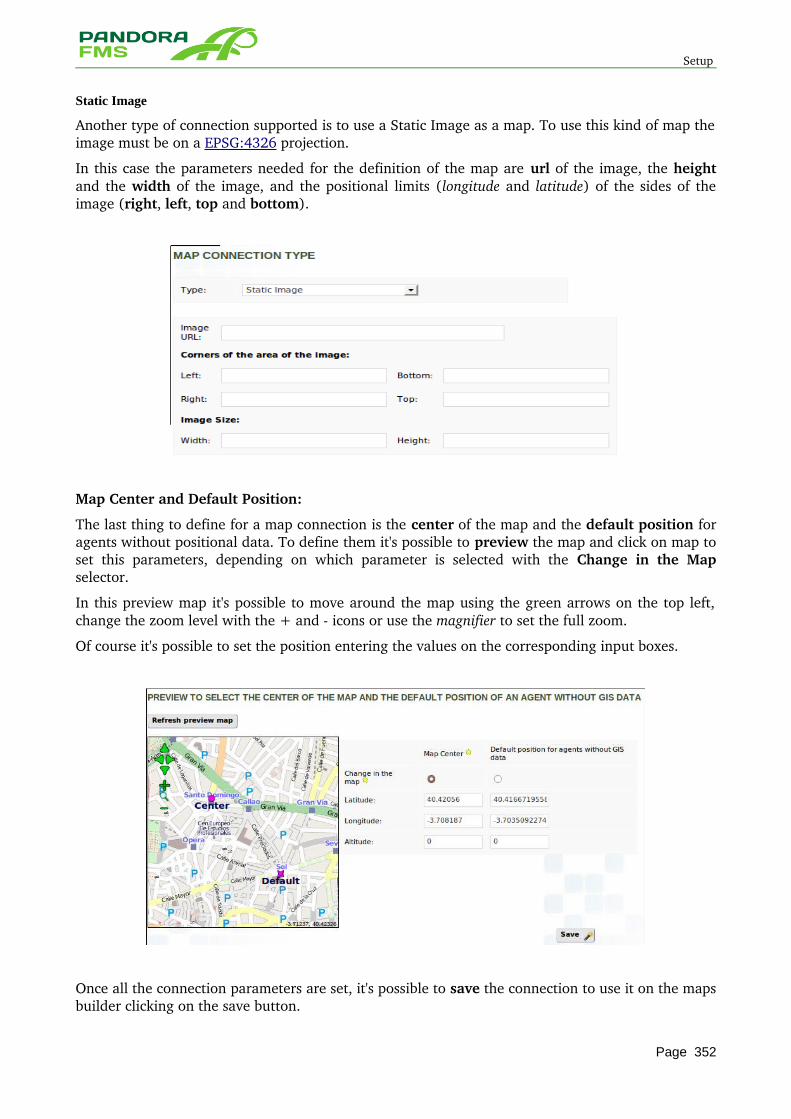
Setup
Static Image
Another type of connection supported is to use a Static Image as a map. To use this kind of map the image must be on a EPSG:4326 projection.
In this case the parameters needed for the definition of the map are url of the image, the height and the width of the image, and the positional limits (longitude and latitude) of the sides of the image (right, left, top and bottom).
Map Center and Default Position:
The last thing to define for a map connection is the center of the map and the default position for agents without positional data. To define them it's possible to preview the map and click on map to set this parameters, depending on which parameter is selected with the Change in the Map selector.
In this preview map it's possible to move around the map using the green arrows on the top left, change the zoom level with the + and icons or use the magnifier to set the full zoom.
Of course it's possible to set the position entering the values on the corresponding input boxes.
Once all the connection parameters are set, it's possible to save the connection to use it on the maps builder clicking on the save button.
Page 352
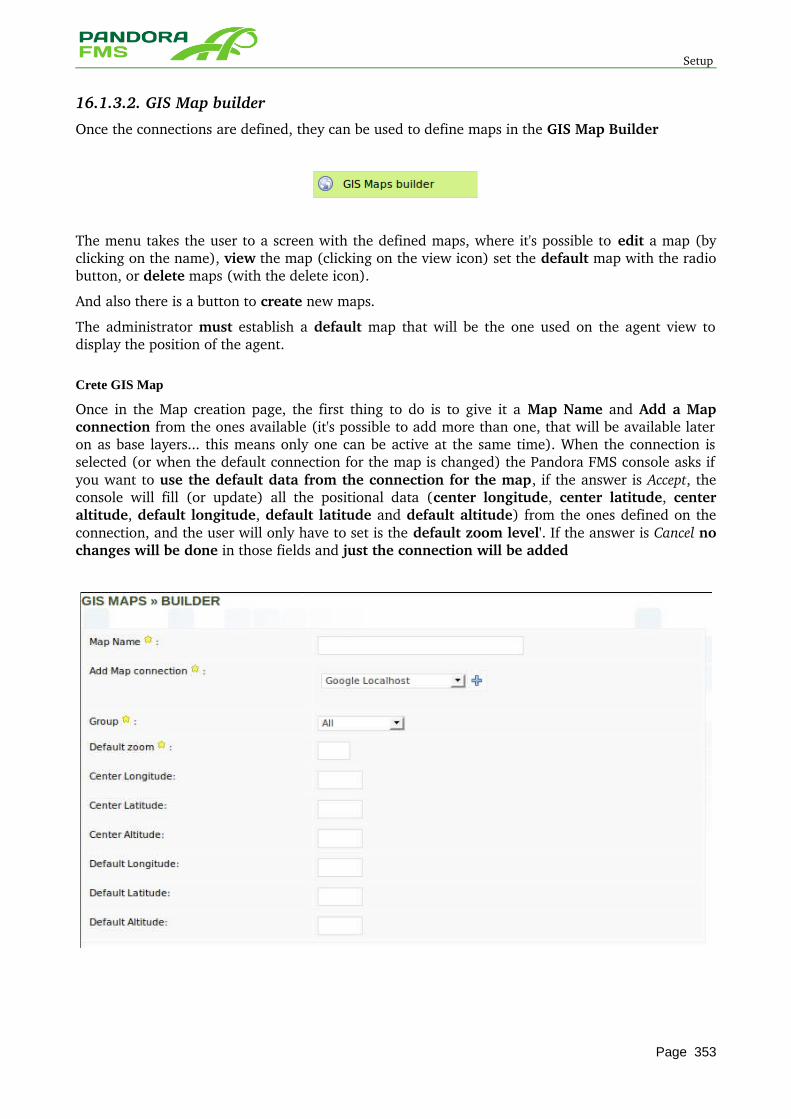
Setup
16.1.3.2. GIS Map builder
Once the connections are defined, they can be used to define maps in the GIS Map Builder
The menu takes the user to a screen with the defined maps, where it's possible to edit a map (by clicking on the name), view the map (clicking on the view icon) set the default map with the radio button, or delete maps (with the delete icon).
And also there is a button to create new maps.
The administrator must establish a default map that will be the one used on the agent view to display the position of the agent.
Crete GIS Map
Once in the Map creation page, the first thing to do is to give it a Map Name and Add a Map connection from the ones available (it's possible to add more than one, that will be available later on as base layers... this means only one can be active at the same time). When the connection is selected (or when the default connection for the map is changed) the Pandora FMS console asks if you want to use the default data from the connection for the map, if the answer is Accept, the console will fill (or update) all the positional data (center longitude, center latitude, center altitude, default longitude, default latitude and default altitude) from the ones defined on the connection, and the user will only have to set is the default zoom level'. If the answer is Cancel no changes will be done in those fields and just the connection will be added
Page 353
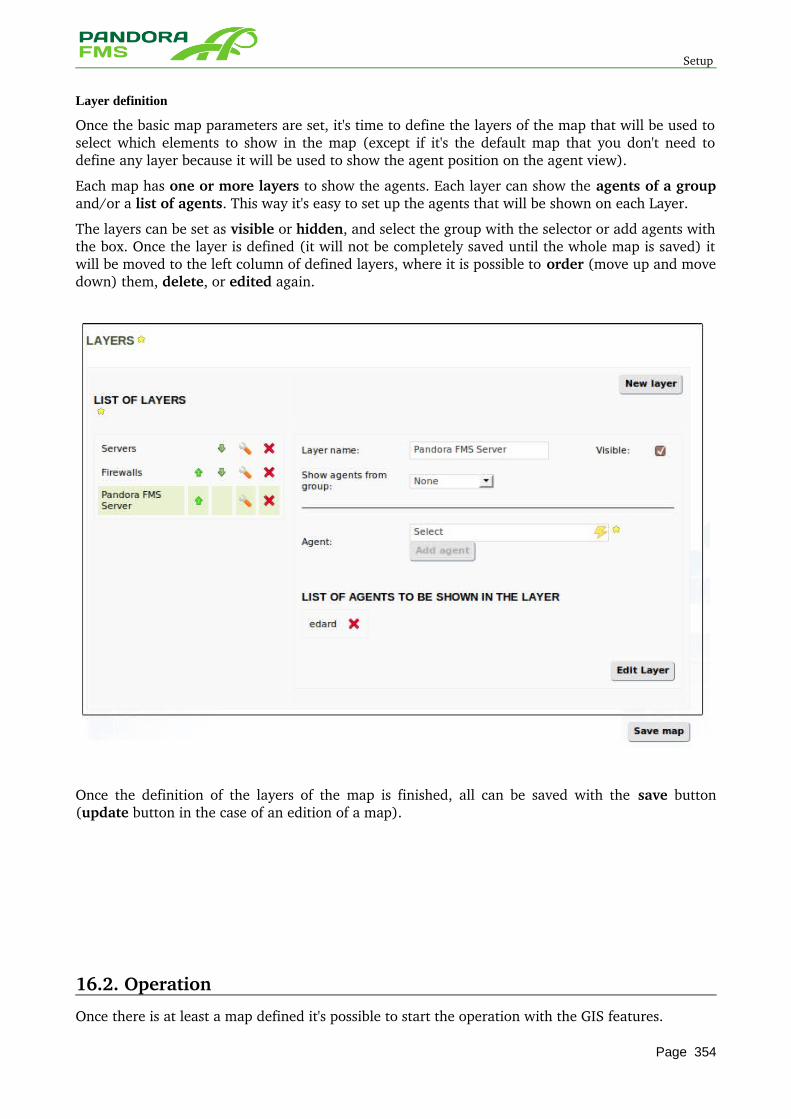
Setup
Layer definition
Once the basic map parameters are set, it's time to define the layers of the map that will be used to select which elements to show in the map (except if it's the default map that you don't need to define any layer because it will be used to show the agent position on the agent view).
Each map has one or more layers to show the agents. Each layer can show the agents of a group and/or a list of agents. This way it's easy to set up the agents that will be shown on each Layer.
The layers can be set as visible or hidden, and select the group with the selector or add agents with the box. Once the layer is defined (it will not be completely saved until the whole map is saved) it will be moved to the left column of defined layers, where it is possible to order (move up and move down) them, delete, or edited again.
Once the definition of the layers of the map is finished, all can be saved with the save button (update button in the case of an edition of a map).
16.2. Operation
Once there is at least a map defined it's possible to start the operation with the GIS features.
Page 354
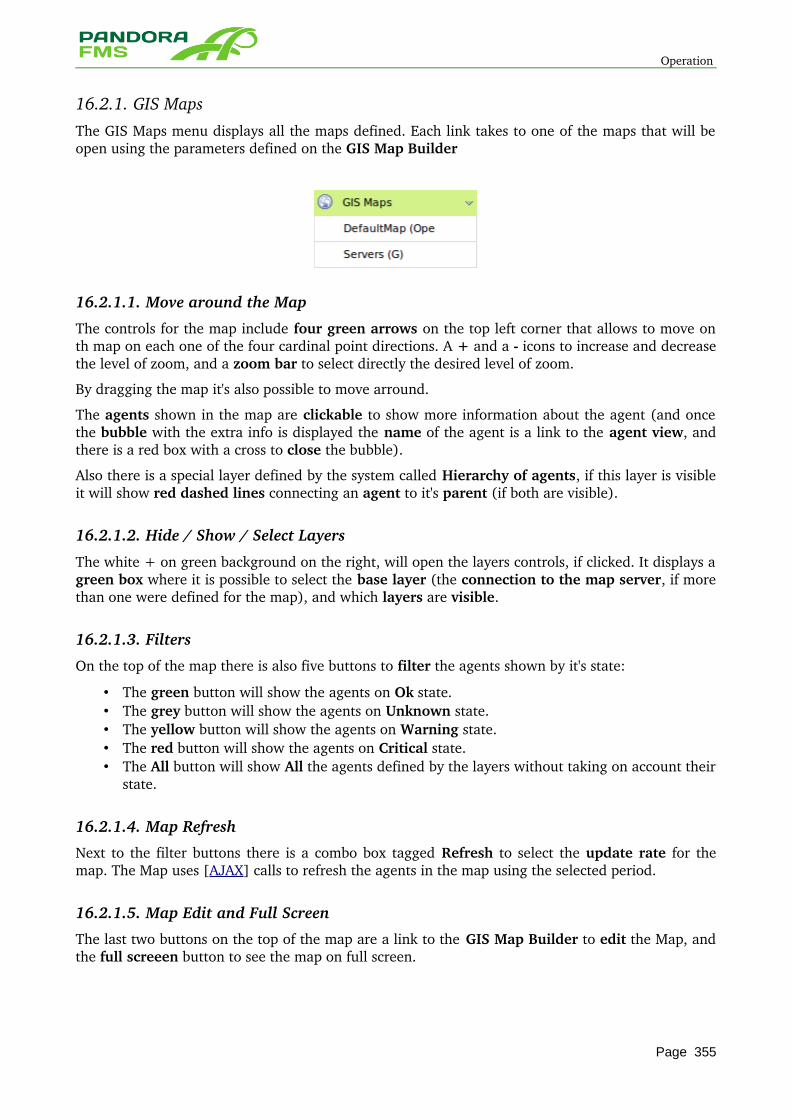
Operation
16.2.1. GIS Maps The GIS Maps menu displays all the maps defined. Each link takes to one of the maps that will be open using the parameters defined on the GIS Map Builder
16.2.1.1. Move around the Map
The controls for the map include four green arrows on the top left corner that allows to move on th map on each one of the four cardinal point directions. A + and a icons to increase and decrease the level of zoom, and a zoom bar to select directly the desired level of zoom.
By dragging the map it's also possible to move arround.
The agents shown in the map are clickable to show more information about the agent (and once the bubble with the extra info is displayed the name of the agent is a link to the agent view, and there is a red box with a cross to close the bubble).
Also there is a special layer defined by the system called Hierarchy of agents, if this layer is visible it will show red dashed lines connecting an agent to it's parent (if both are visible).
16.2.1.2. Hide / Show / Select Layers
The white + on green background on the right, will open the layers controls, if clicked. It displays a green box where it is possible to select the base layer (the connection to the map server, if more than one were defined for the map), and which layers are visible.
16.2.1.3. Filters
On the top of the map there is also five buttons to filter the agents shown by it's state:
• The green button will show the agents on Ok state. • The grey button will show the agents on Unknown state. • The yellow button will show the agents on Warning state. • The red button will show the agents on Critical state. • The All button will show All the agents defined by the layers without taking on account their
state.
16.2.1.4. Map Refresh
Next to the filter buttons there is a combo box tagged Refresh to select the update rate for the map. The Map uses [AJAX] calls to refresh the agents in the map using the selected period.
16.2.1.5. Map Edit and Full Screen
The last two buttons on the top of the map are a link to the GIS Map Builder to edit the Map, and the full screeen button to see the map on full screen.
Page 355
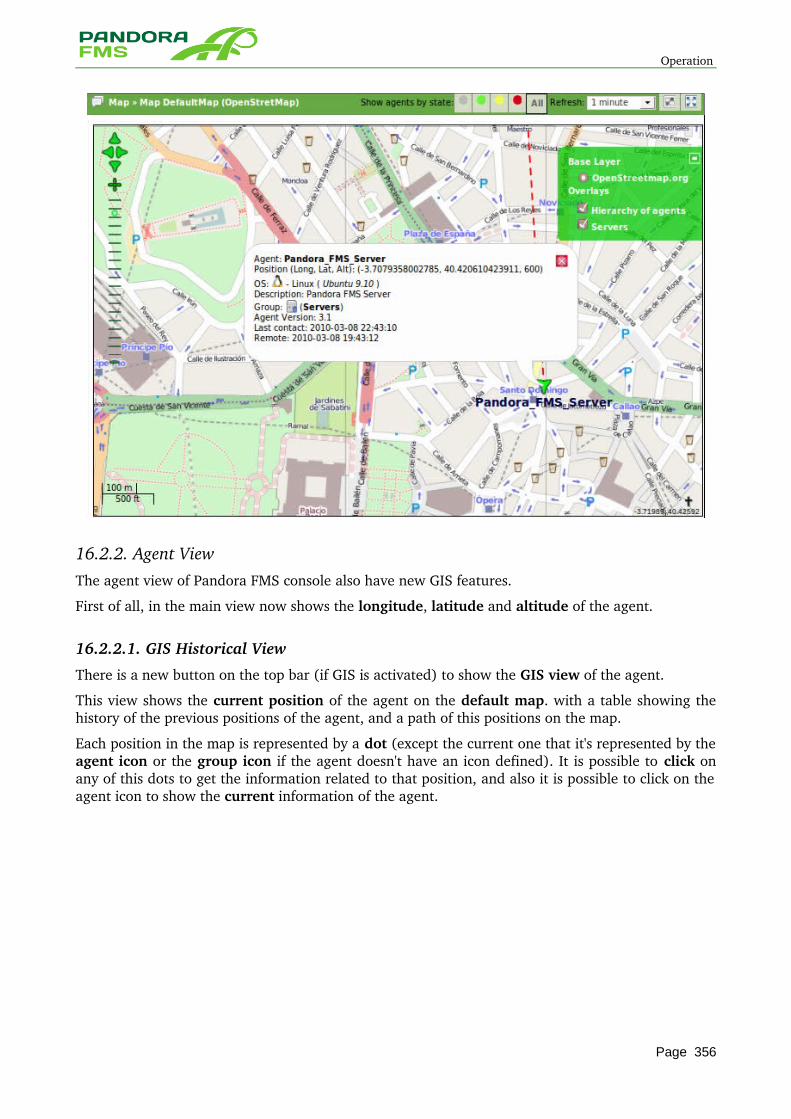
Operation
16.2.2. Agent View The agent view of Pandora FMS console also have new GIS features.
First of all, in the main view now shows the longitude, latitude and altitude of the agent.
16.2.2.1. GIS Historical View
There is a new button on the top bar (if GIS is activated) to show the GIS view of the agent.
This view shows the current position of the agent on the default map. with a table showing the history of the previous positions of the agent, and a path of this positions on the map.
Each position in the map is represented by a dot (except the current one that it's represented by the agent icon or the group icon if the agent doesn't have an icon defined). It is possible to click on any of this dots to get the information related to that position, and also it is possible to click on the agent icon to show the current information of the agent.
Page 356
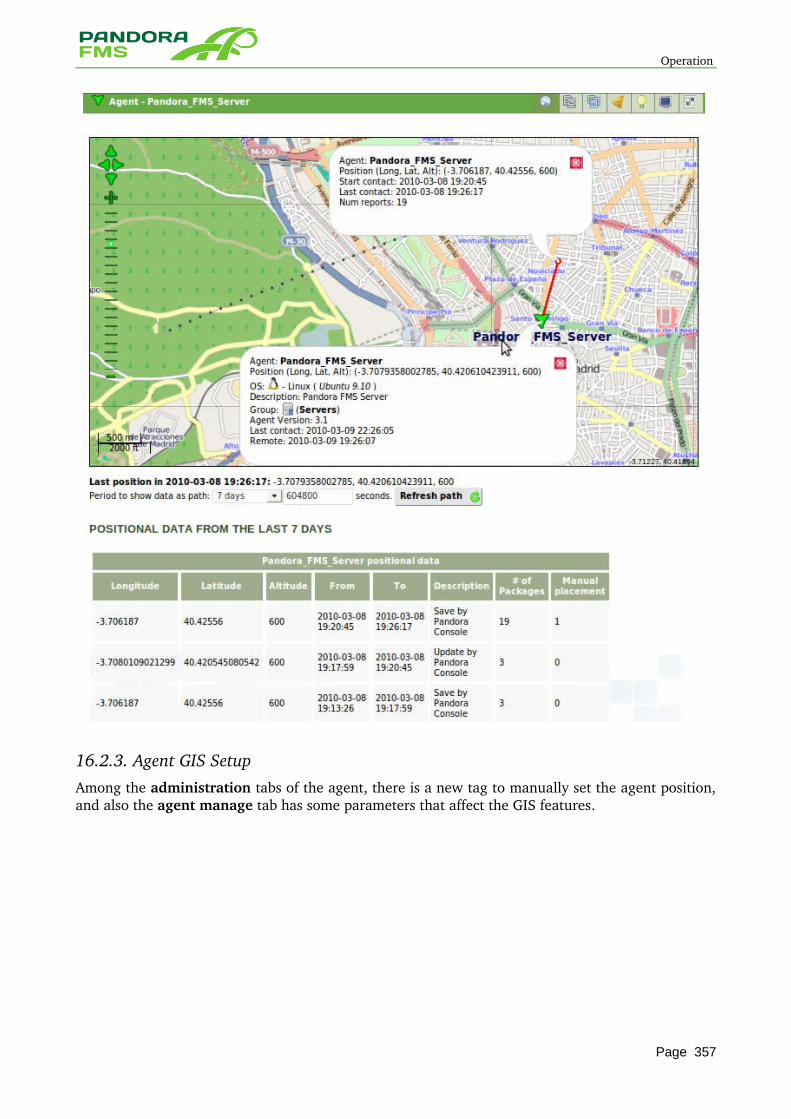
Operation
16.2.3. Agent GIS Setup Among the administration tabs of the agent, there is a new tag to manually set the agent position, and also the agent manage tab has some parameters that affect the GIS features.
Page 357
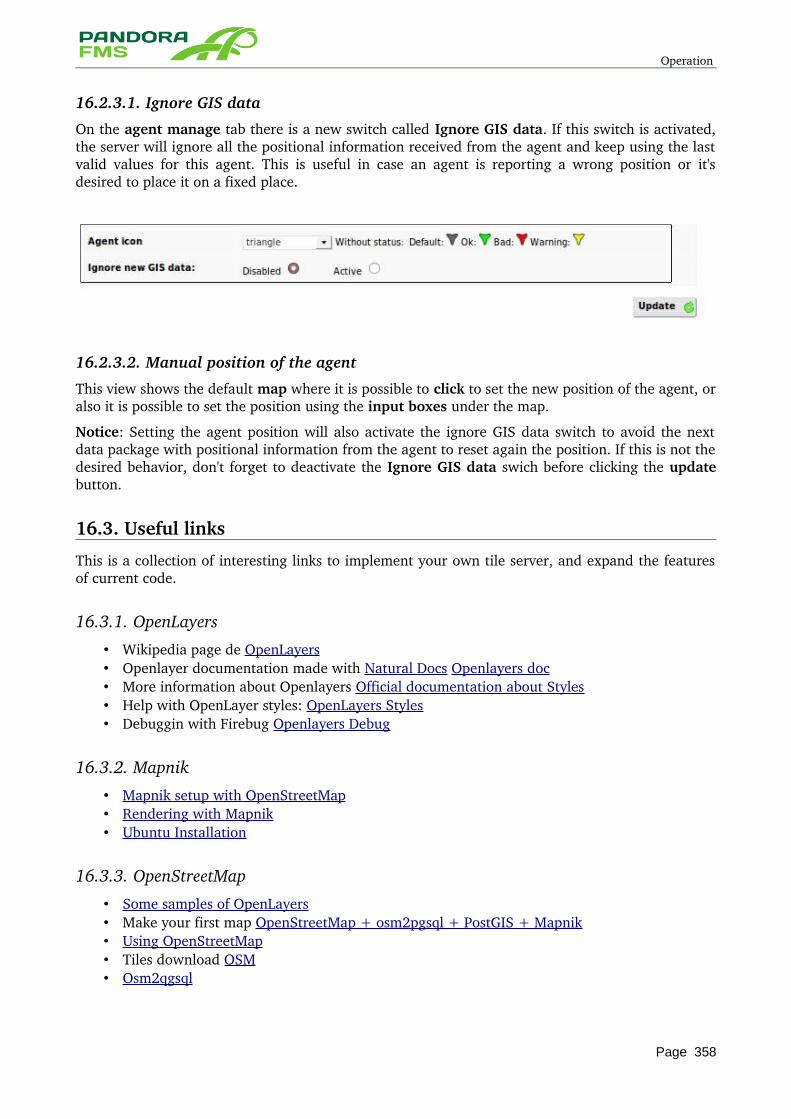
Operation
16.2.3.1. Ignore GIS data
On the agent manage tab there is a new switch called Ignore GIS data. If this switch is activated, the server will ignore all the positional information received from the agent and keep using the last valid values for this agent. This is useful in case an agent is reporting a wrong position or it's desired to place it on a fixed place.
16.2.3.2. Manual position of the agent
This view shows the default map where it is possible to click to set the new position of the agent, or also it is possible to set the position using the input boxes under the map.
Notice: Setting the agent position will also activate the ignore GIS data switch to avoid the next data package with positional information from the agent to reset again the position. If this is not the desired behavior, don't forget to deactivate the Ignore GIS data swich before clicking the update button.
16.3. Useful links
This is a collection of interesting links to implement your own tile server, and expand the features of current code.
16.3.1. OpenLayers
• Wikipedia page de OpenLayers • Openlayer documentation made with Natural Docs Openlayers doc • More information about Openlayers Official documentation about Styles • Help with OpenLayer styles: OpenLayers Styles • Debuggin with Firebug Openlayers Debug
16.3.2. Mapnik
• Mapnik setup with OpenStreetMap • Rendering with Mapnik • Ubuntu Installation
16.3.3. OpenStreetMap
• Some samples of OpenLayers • Make your first map OpenStreetMap + osm2pgsql + PostGIS + Mapnik • Using OpenStreetMap • Tiles download OSM • Osm2qgsql
Page 358
Useful links
16.3.4. OS Geo
• The Open Source Geospatial Foundation
16.3.5. Geo Server
• Main website geoserver.org • Stable version
16.3.6. PostgreSQL
• Documentation for GIS extensions for PostgreSQL 8.1
16.3.7. Blogs (Spanish only)
• GIS & Chips • Weait • Portal de GIS y Cartografía de la UPV CartoSIG
• Recursos sobre Cartografía y SIG • Imagen Virtual: OpenSUSE + Software de GIS • Cálculo de distancias teniendo en cuenta la curvatura terresre en Franchu's lair
Page 359

Useful links
17 DASHBOARD
Page 360

Introduction
17.1. Introduction
The dashboard is a Pandora FMS (Enterprise version) functionality that allows that any user could build his own monitoring page. It is possible to add more than a page and in it is possible to add monitoring maps, graphs, etc...
Dashboard configuration is done from the same place where it's possible to have access to them at Operation > Dashboards,on the right side of the Pandora FMS web console:
When you click on Dashboard the pages that the user have configured will be shown.
Page 361
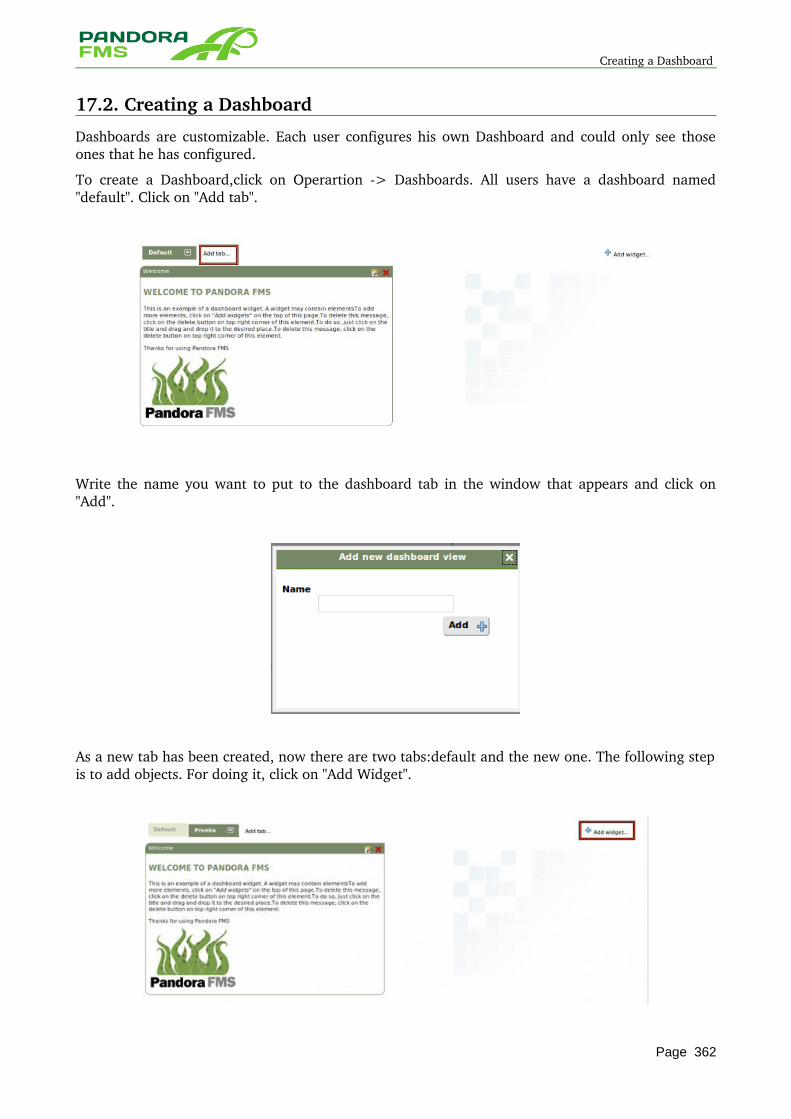
Creating a Dashboard
17.2. Creating a Dashboard
Dashboards are customizable. Each user configures his own Dashboard and could only see those ones that he has configured.
To create a Dashboard,click on Operartion > Dashboards. All users have a dashboard named "default". Click on "Add tab".
Write the name you want to put to the dashboard tab in the window that appears and click on "Add".
As a new tab has been created, now there are two tabs:default and the new one. The following step is to add objects. For doing it, click on "Add Widget".
Page 362
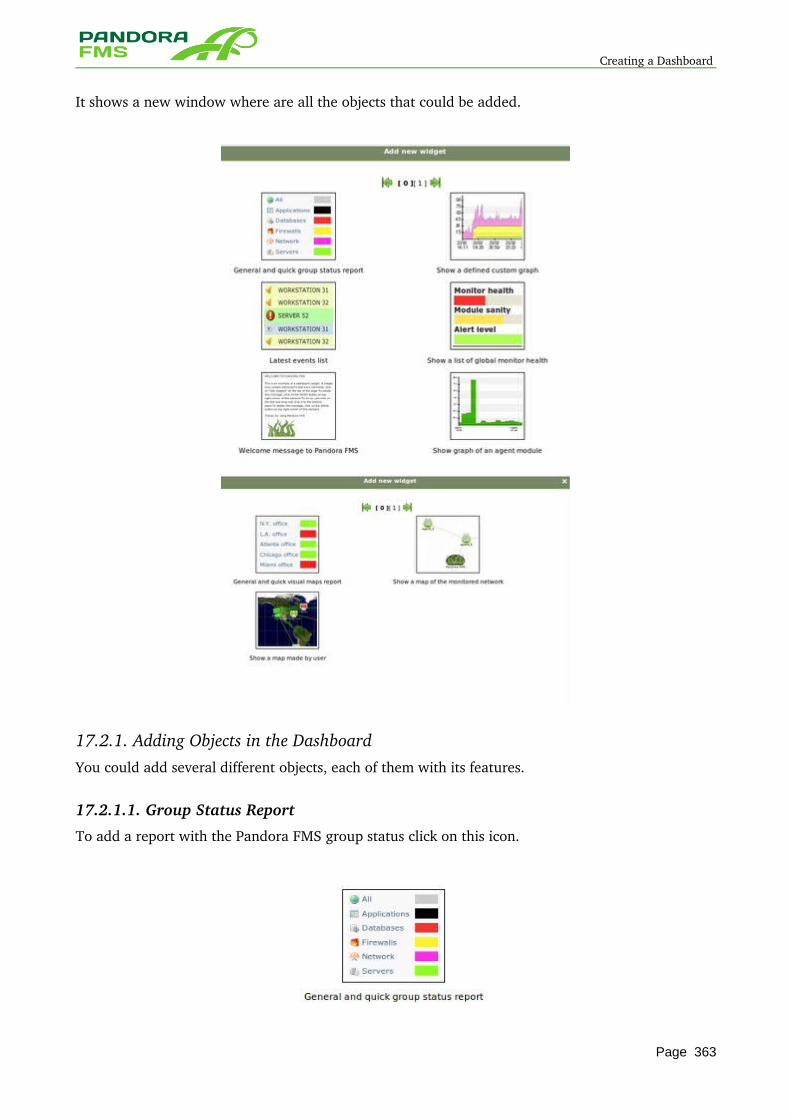
Creating a Dashboard
It shows a new window where are all the objects that could be added.
17.2.1. Adding Objects in the Dashboard You could add several different objects, each of them with its features.
17.2.1.1. Group Status Report
To add a report with the Pandora FMS group status click on this icon.
Page 363
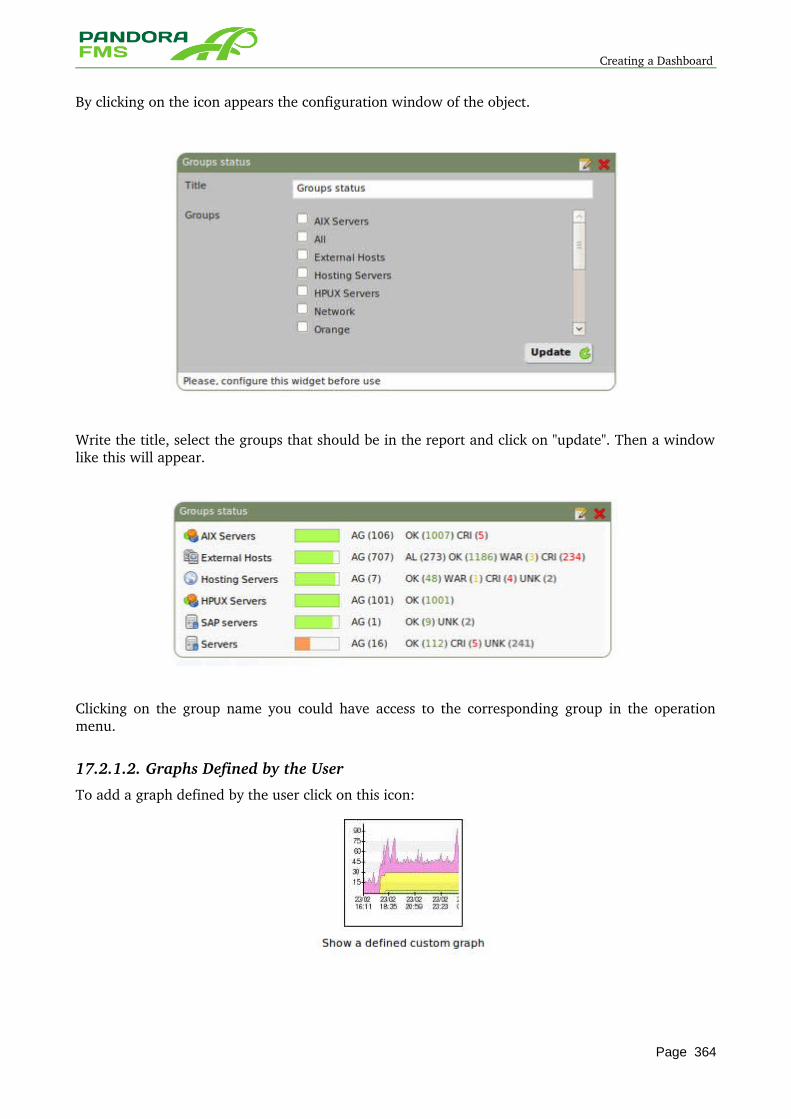
Creating a Dashboard
By clicking on the icon appears the configuration window of the object.
Write the title, select the groups that should be in the report and click on "update". Then a window like this will appear.
Clicking on the group name you could have access to the corresponding group in the operation menu.
17.2.1.2. Graphs Defined by the User
To add a graph defined by the user click on this icon:
Page 364
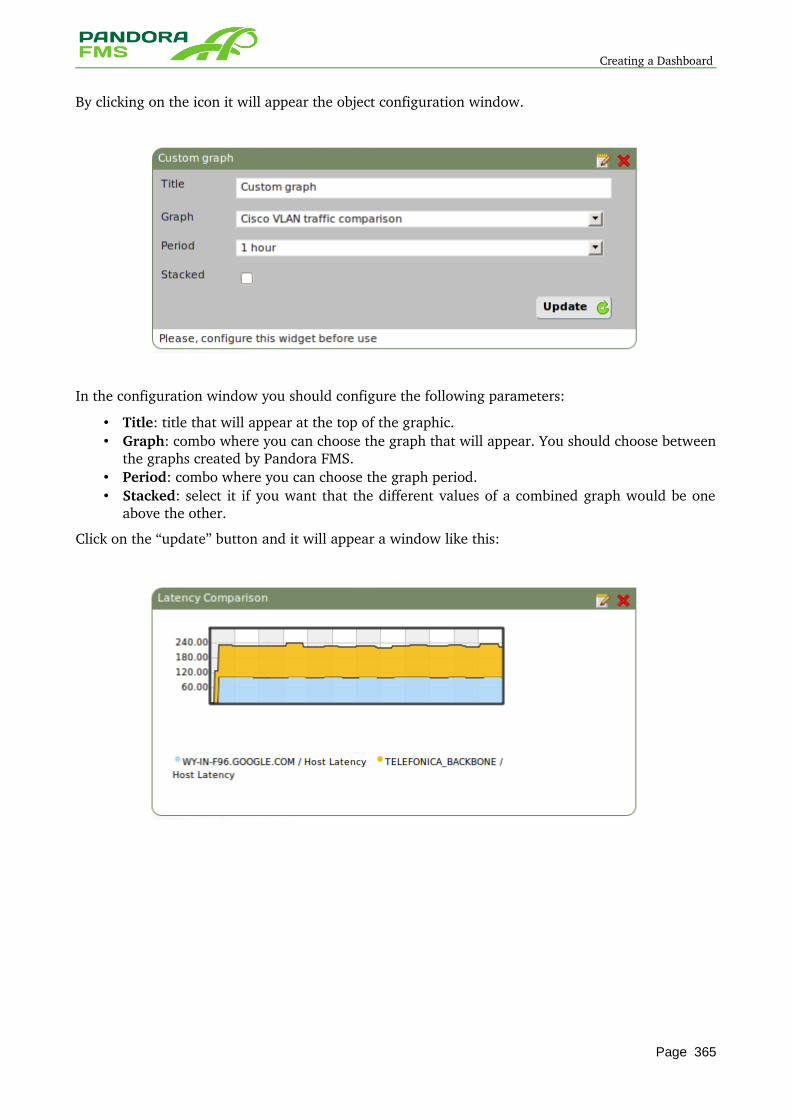
Creating a Dashboard
By clicking on the icon it will appear the object configuration window.
In the configuration window you should configure the following parameters:
• Title: title that will appear at the top of the graphic. • Graph: combo where you can choose the graph that will appear. You should choose between
the graphs created by Pandora FMS. • Period: combo where you can choose the graph period. • Stacked: select it if you want that the different values of a combined graph would be one
above the other.
Click on the “update” button and it will appear a window like this:
Page 365
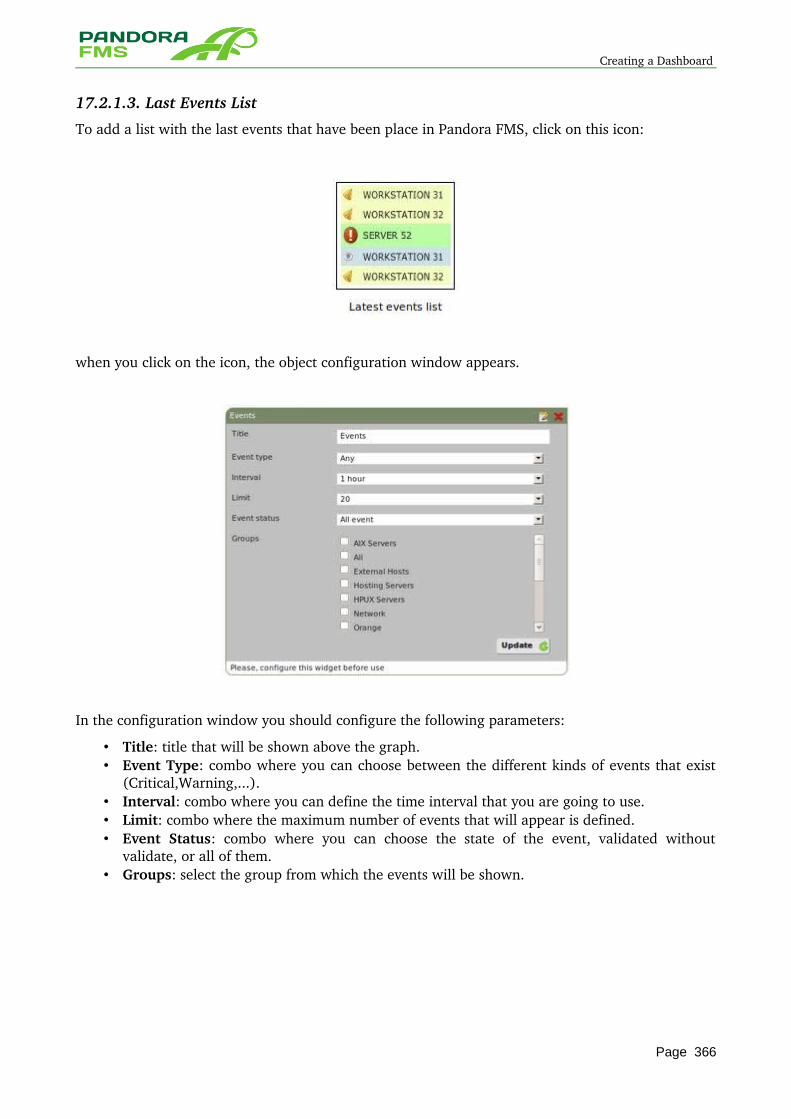
Creating a Dashboard
17.2.1.3. Last Events List
To add a list with the last events that have been place in Pandora FMS, click on this icon:
when you click on the icon, the object configuration window appears.
In the configuration window you should configure the following parameters:
• Title: title that will be shown above the graph. • Event Type: combo where you can choose between the different kinds of events that exist
(Critical,Warning,...). • Interval: combo where you can define the time interval that you are going to use. • Limit: combo where the maximum number of events that will appear is defined. • Event Status: combo where you can choose the state of the event, validated without
validate, or all of them. • Groups: select the group from which the events will be shown.
Page 366
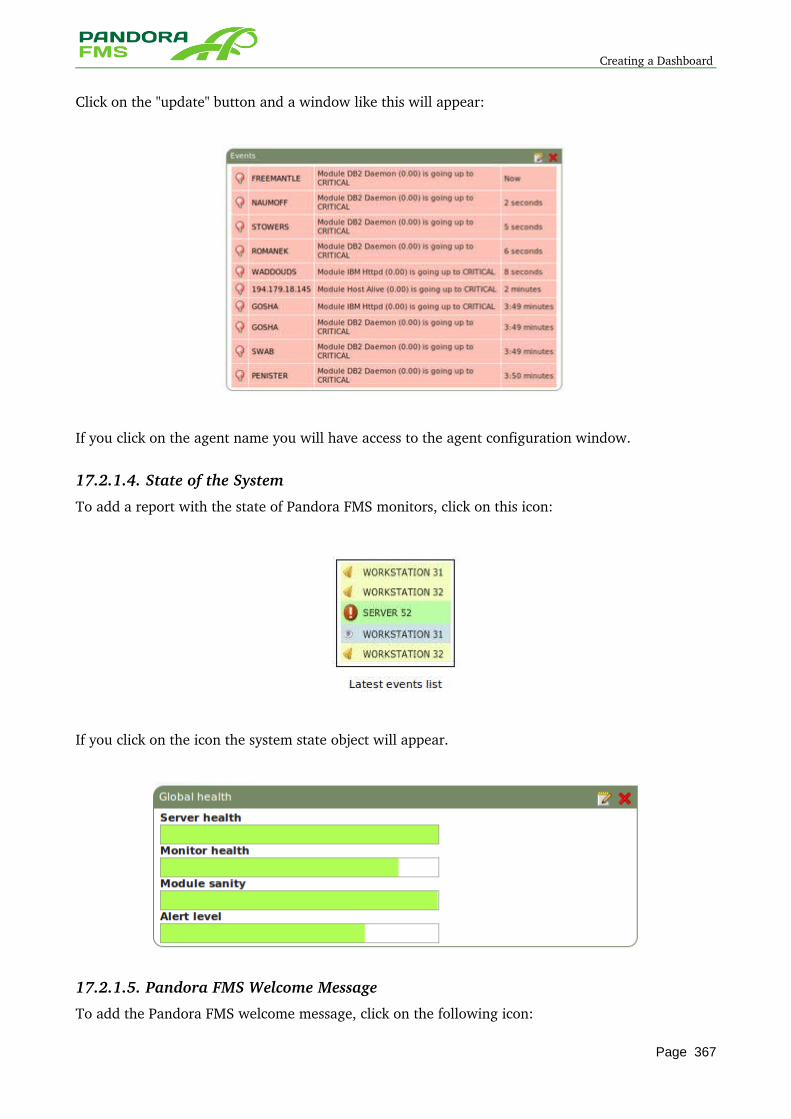
Creating a Dashboard
Click on the "update" button and a window like this will appear:
If you click on the agent name you will have access to the agent configuration window.
17.2.1.4. State of the System
To add a report with the state of Pandora FMS monitors, click on this icon:
If you click on the icon the system state object will appear.
17.2.1.5. Pandora FMS Welcome Message
To add the Pandora FMS welcome message, click on the following icon:
Page 367
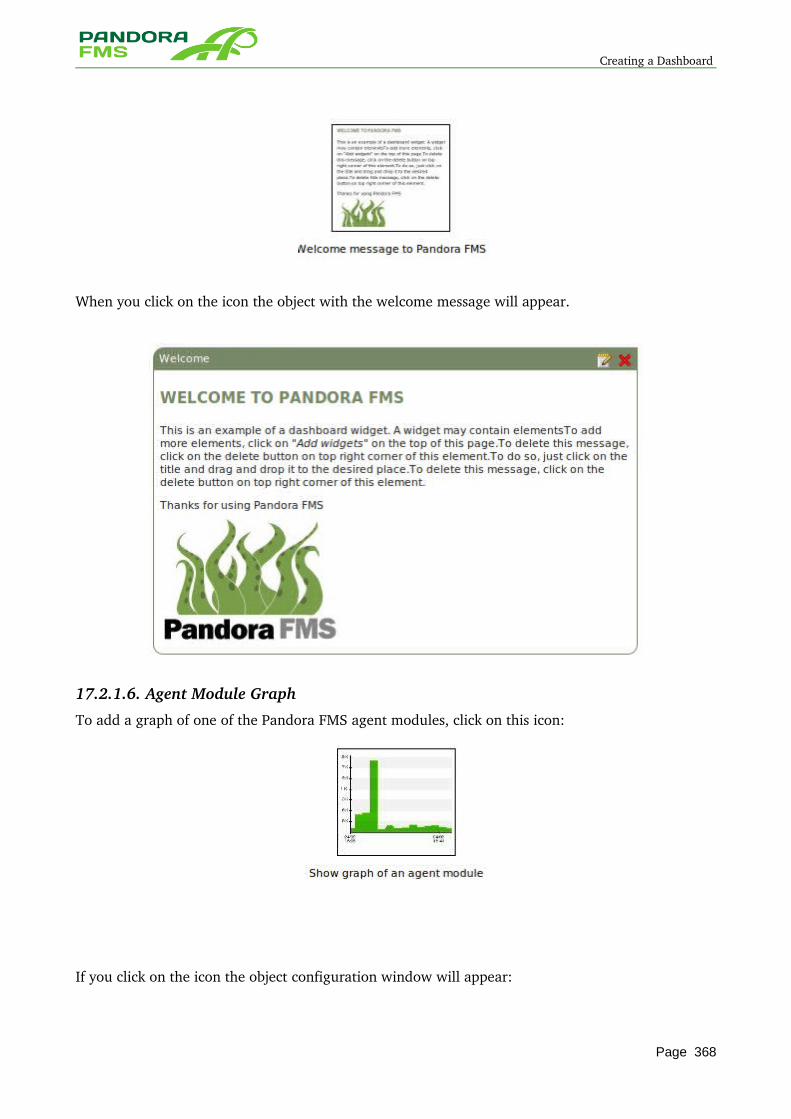
Creating a Dashboard
When you click on the icon the object with the welcome message will appear.
17.2.1.6. Agent Module Graph
To add a graph of one of the Pandora FMS agent modules, click on this icon:
If you click on the icon the object configuration window will appear:
Page 368
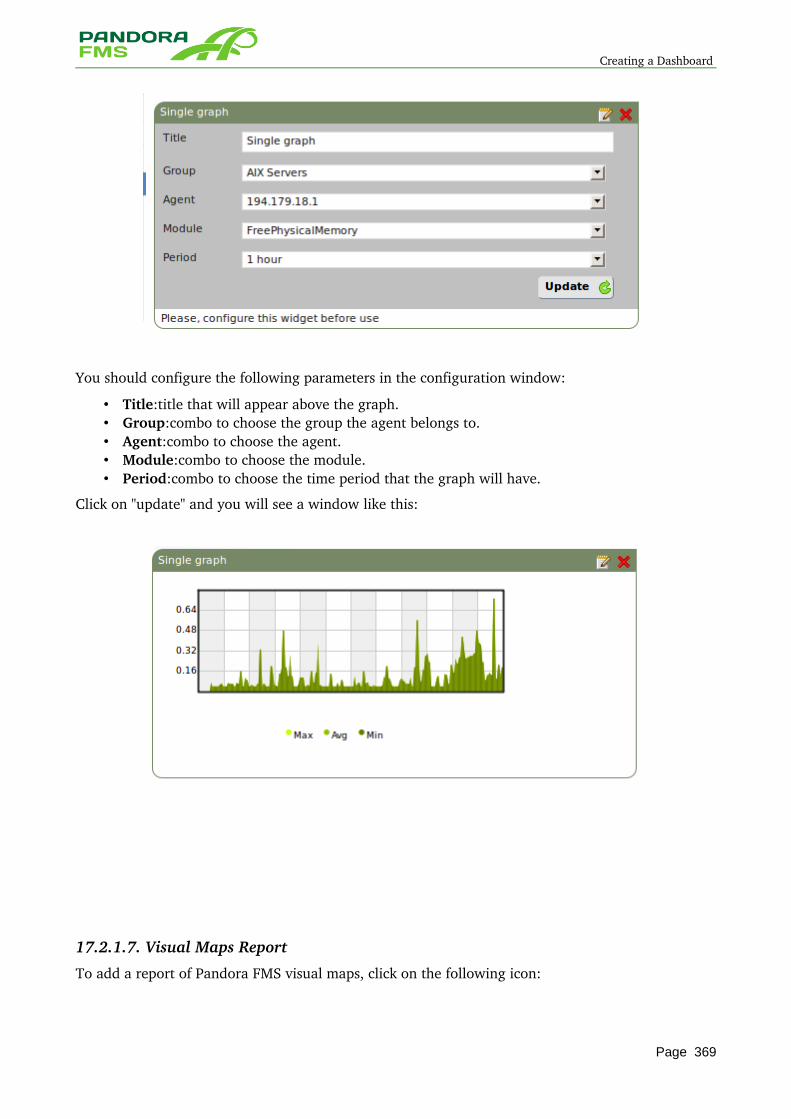
Creating a Dashboard
You should configure the following parameters in the configuration window:
• Title:title that will appear above the graph. • Group:combo to choose the group the agent belongs to. • Agent:combo to choose the agent. • Module:combo to choose the module. • Period:combo to choose the time period that the graph will have.
Click on "update" and you will see a window like this:
17.2.1.7. Visual Maps Report
To add a report of Pandora FMS visual maps, click on the following icon:
Page 369
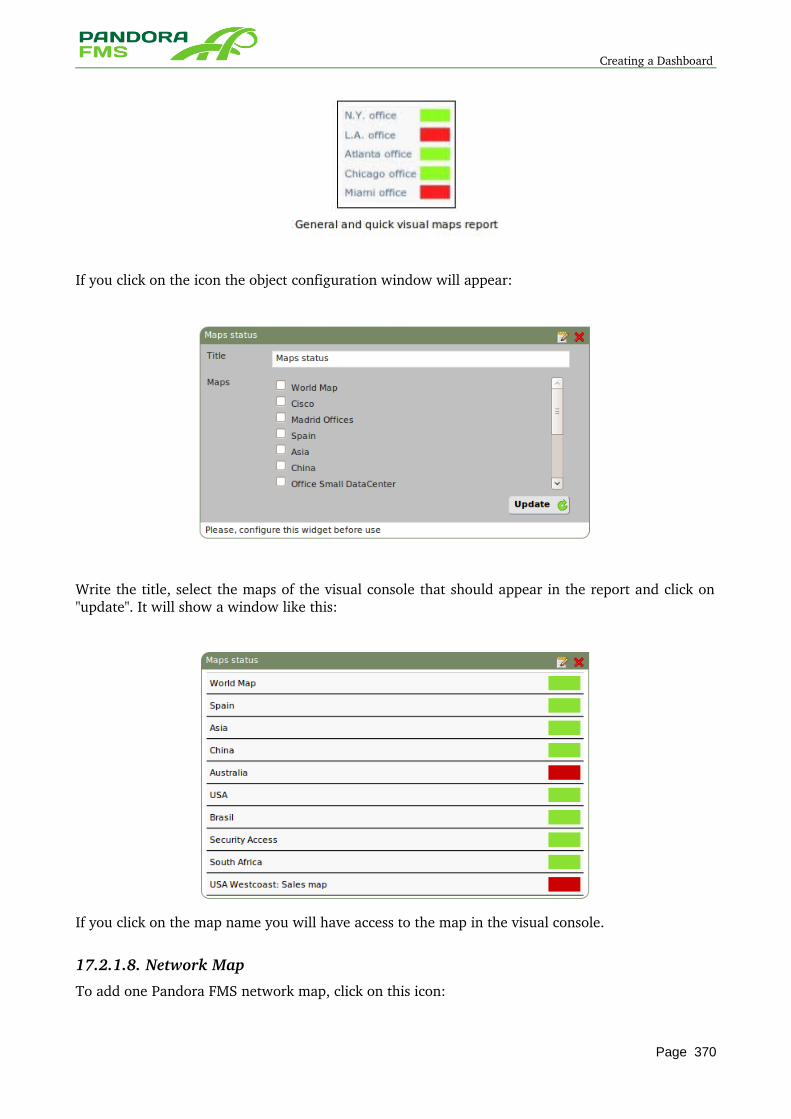
Creating a Dashboard
If you click on the icon the object configuration window will appear:
Write the title, select the maps of the visual console that should appear in the report and click on "update". It will show a window like this:
If you click on the map name you will have access to the map in the visual console.
17.2.1.8. Network Map
To add one Pandora FMS network map, click on this icon:
Page 370
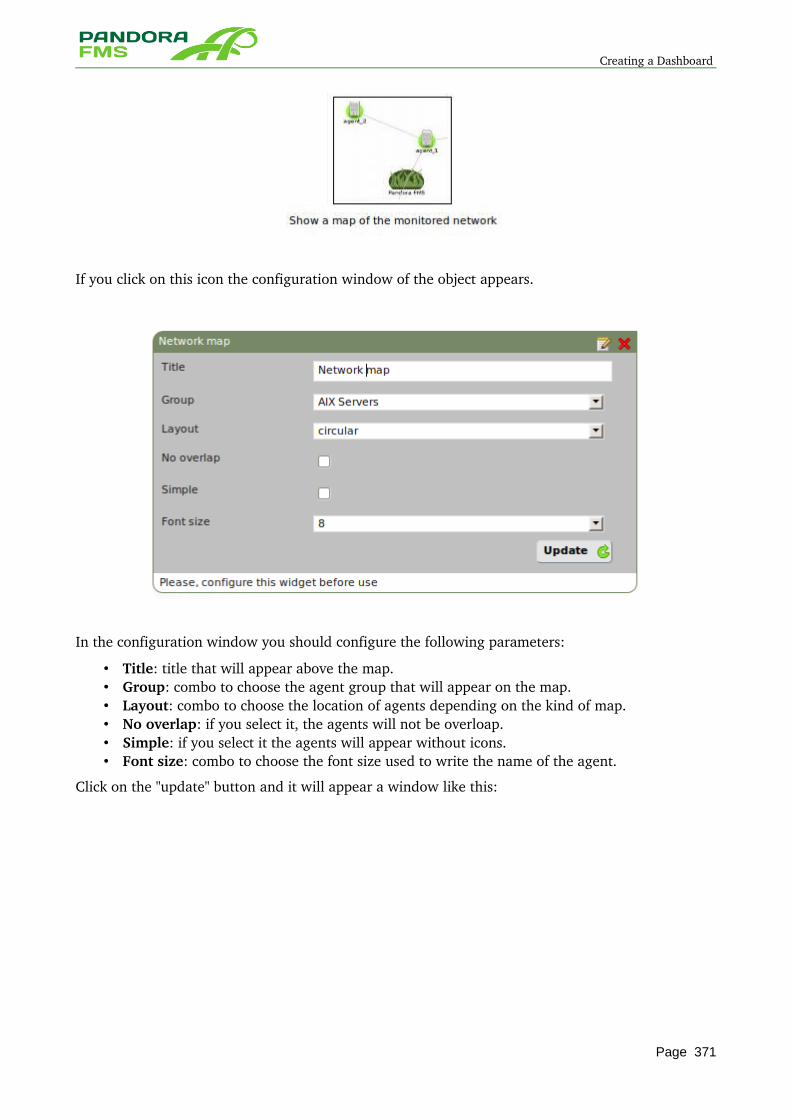
Creating a Dashboard
If you click on this icon the configuration window of the object appears.
In the configuration window you should configure the following parameters:
• Title: title that will appear above the map. • Group: combo to choose the agent group that will appear on the map. • Layout: combo to choose the location of agents depending on the kind of map. • No overlap: if you select it, the agents will not be overloap. • Simple: if you select it the agents will appear without icons. • Font size: combo to choose the font size used to write the name of the agent.
Click on the "update" button and it will appear a window like this:
Page 371
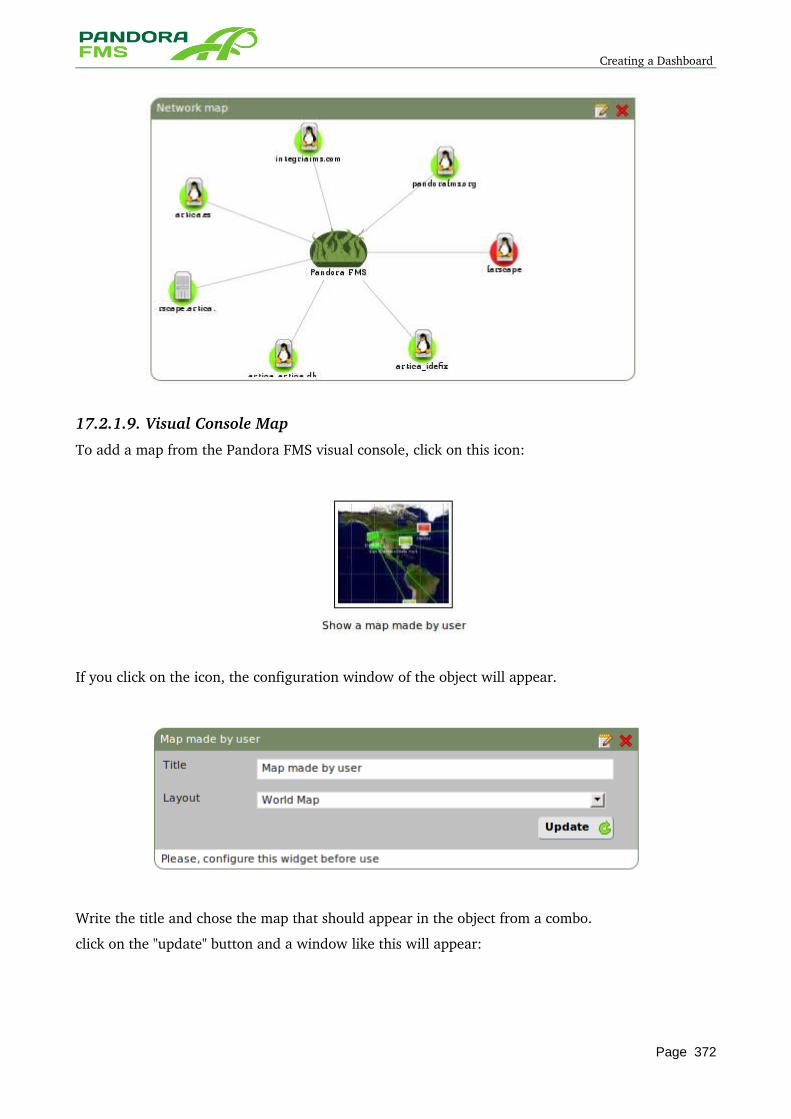
Creating a Dashboard
17.2.1.9. Visual Console Map
To add a map from the Pandora FMS visual console, click on this icon:
If you click on the icon, the configuration window of the object will appear.
Write the title and chose the map that should appear in the object from a combo.
click on the "update" button and a window like this will appear:
Page 372
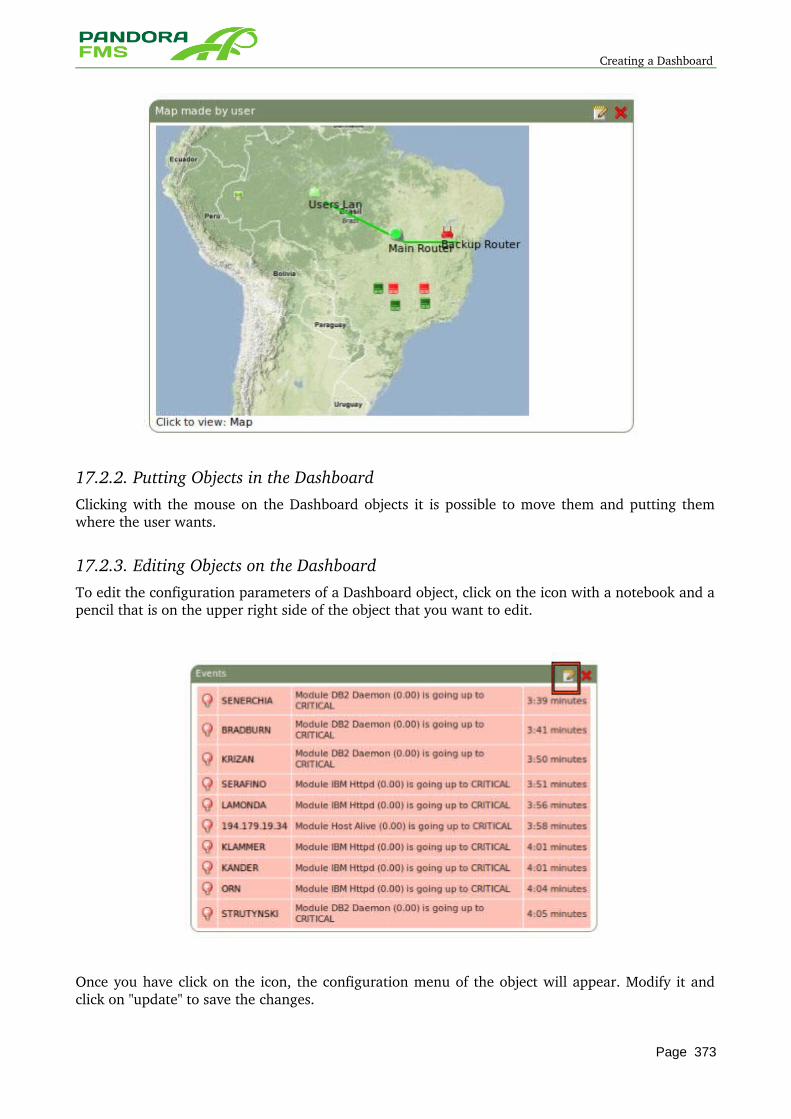
Creating a Dashboard
17.2.2. Putting Objects in the DashboardClicking with the mouse on the Dashboard objects it is possible to move them and putting them where the user wants.
17.2.3. Editing Objects on the DashboardTo edit the configuration parameters of a Dashboard object, click on the icon with a notebook and a pencil that is on the upper right side of the object that you want to edit.
Once you have click on the icon, the configuration menu of the object will appear. Modify it and click on "update" to save the changes.
Page 373
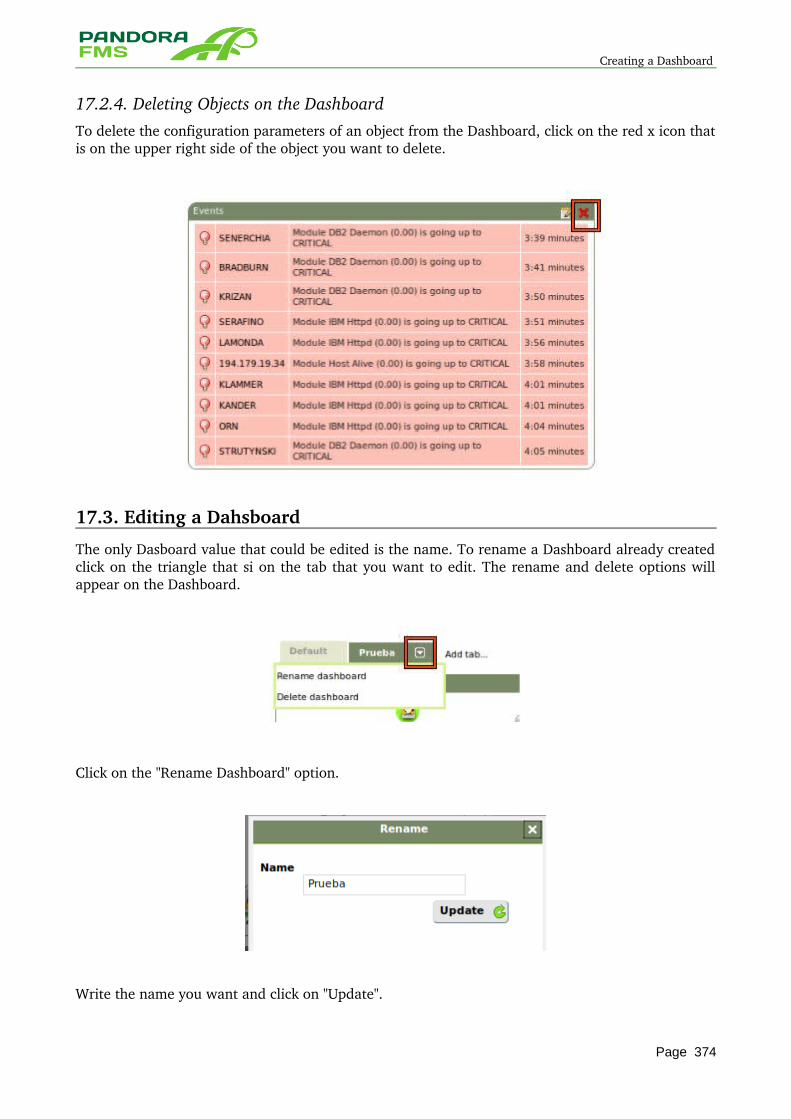
Creating a Dashboard
17.2.4. Deleting Objects on the DashboardTo delete the configuration parameters of an object from the Dashboard, click on the red x icon that is on the upper right side of the object you want to delete.
17.3. Editing a Dahsboard
The only Dasboard value that could be edited is the name. To rename a Dashboard already created click on the triangle that si on the tab that you want to edit. The rename and delete options will appear on the Dashboard.
Click on the "Rename Dashboard" option.
Write the name you want and click on "Update".
Page 374

Deleting a Dashboard
17.4. Deleting a Dashboard
To delete a Dashboard already created, press on the triangle that is on the tab you want to delete. It will show the rename and delete dashboard option.
Click on the "Delete Dashboard" option.
Page 375

Deleting a Dashboard
18 EXPORT SERVER
Page 376
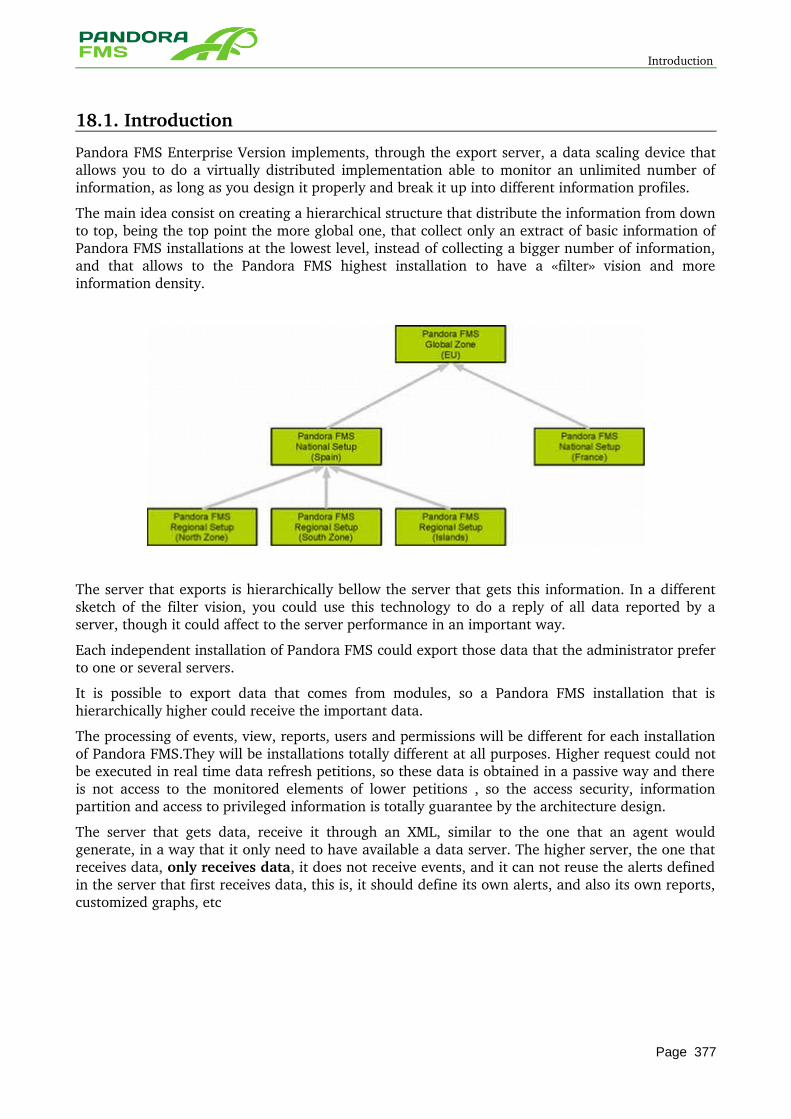
Introduction
18.1. Introduction
Pandora FMS Enterprise Version implements, through the export server, a data scaling device that allows you to do a virtually distributed implementation able to monitor an unlimited number of information, as long as you design it properly and break it up into different information profiles.
The main idea consist on creating a hierarchical structure that distribute the information from down to top, being the top point the more global one, that collect only an extract of basic information of Pandora FMS installations at the lowest level, instead of collecting a bigger number of information, and that allows to the Pandora FMS highest installation to have a «filter» vision and more information density.
The server that exports is hierarchically bellow the server that gets this information. In a different sketch of the filter vision, you could use this technology to do a reply of all data reported by a server, though it could affect to the server performance in an important way.
Each independent installation of Pandora FMS could export those data that the administrator prefer to one or several servers.
It is possible to export data that comes from modules, so a Pandora FMS installation that is hierarchically higher could receive the important data.
The processing of events, view, reports, users and permissions will be different for each installation of Pandora FMS.They will be installations totally different at all purposes. Higher request could not be executed in real time data refresh petitions, so these data is obtained in a passive way and there is not access to the monitored elements of lower petitions , so the access security, information partition and access to privileged information is totally guarantee by the architecture design.
The server that gets data, receive it through an XML, similar to the one that an agent would generate, in a way that it only need to have available a data server. The higher server, the one that receives data, only receives data, it does not receive events, and it can not reuse the alerts defined in the server that first receives data, this is, it should define its own alerts, and also its own reports, customized graphs, etc
Page 377
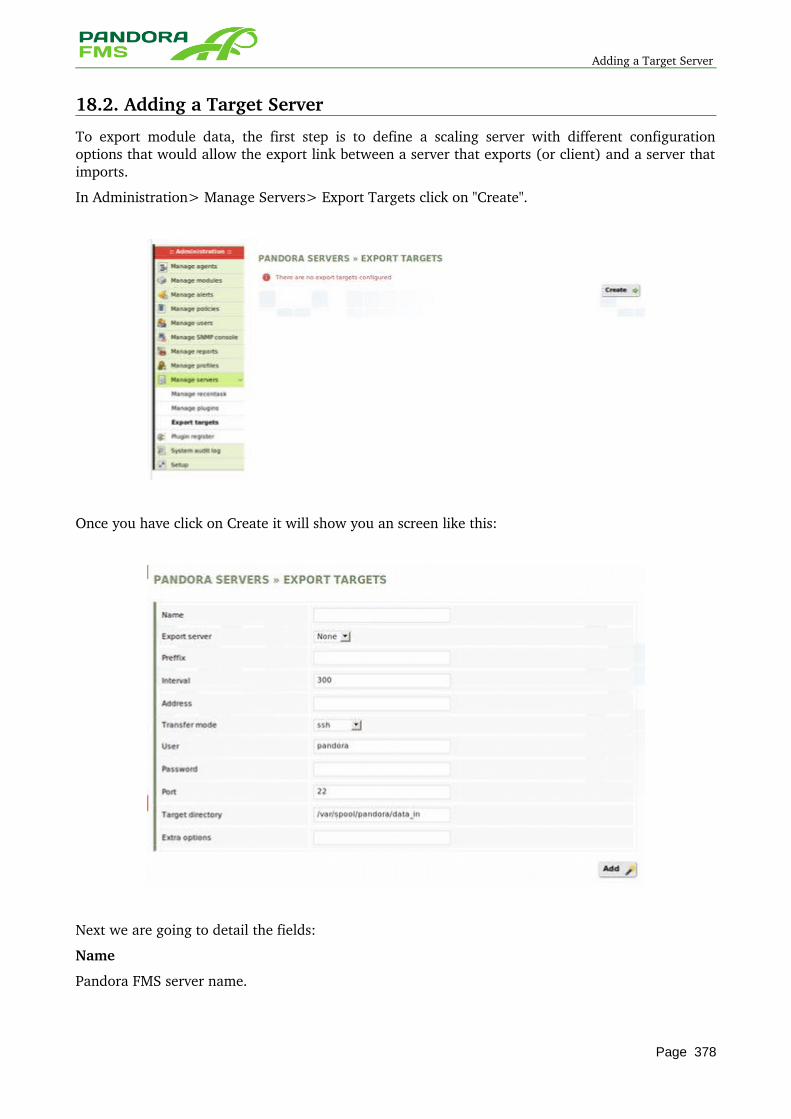
Adding a Target Server
18.2. Adding a Target Server
To export module data, the first step is to define a scaling server with different configuration options that would allow the export link between a server that exports (or client) and a server that imports.
In Administration> Manage Servers> Export Targets click on "Create".
Once you have click on Create it will show you an screen like this:
Next we are going to detail the fields:
Name
Pandora FMS server name.
Page 378
Adding a Target Server
Export Server
Combo to choose the server petition of export server that will be used to export the data.
Prefix
Prefix that is used to add to the agent name that send the data. For example, when the data of an agent named "Farscape" is resent, and its prefix in the export server is "EU01",the resent agent data will be seen in the destination server with the agent name EUO1Farscape. This allow to know the data origin in case of that in a server we receive different sources of information, coming from different Pandora FMS servers, so we force that there would be name duplicity. The server will always add the "_" character after the prefix , so though it would be empty , the "_" character will be put before the agent name in the destination server.
Interval
Define the time interval, and how often (in seconds) you want to send the data that is unresolved. Data will always be collected from the original source, this is: if an agent collect data every 300 seconds and here it configures 1000 seconds, it means that the server will send what it has collected until this moment. In this case, three packages from this agent with interval 300.
Target directory
It will be the target directory (used for SSH or FTP only), where it will leave remotely the data.
Address Data server address that is going to receive the data.
Transfer Mode: files transfer mode. You can choose between:
• Local:The server that receives the data is on the same machine that the server which export them.
• SSH: the transfer if made through SSH. It is necessary to copy the certificate of the server that export the data at the server that receives them.
• FTP: the transfer is made through FTP. • Tentacle: the transfer is made through Tentacle (recommended).
User
User for FTP
Password
FTP user password
Port
Port used in the files transfer. For Tentacle it is the 41121 standard port.
Extra options
Field for additional options such as the ones that Tentacle needs to work with certificates.
Page 379
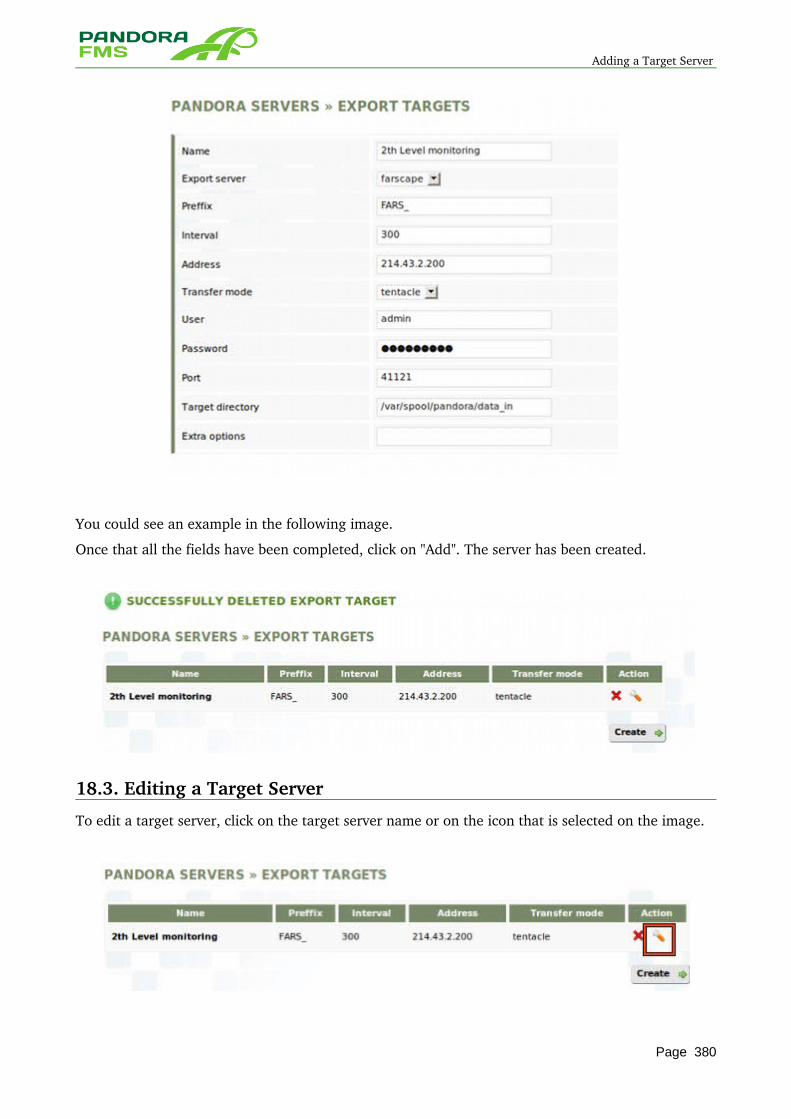
Adding a Target Server
You could see an example in the following image.
Once that all the fields have been completed, click on "Add". The server has been created.
18.3. Editing a Target Server
To edit a target server, click on the target server name or on the icon that is selected on the image.
Page 380
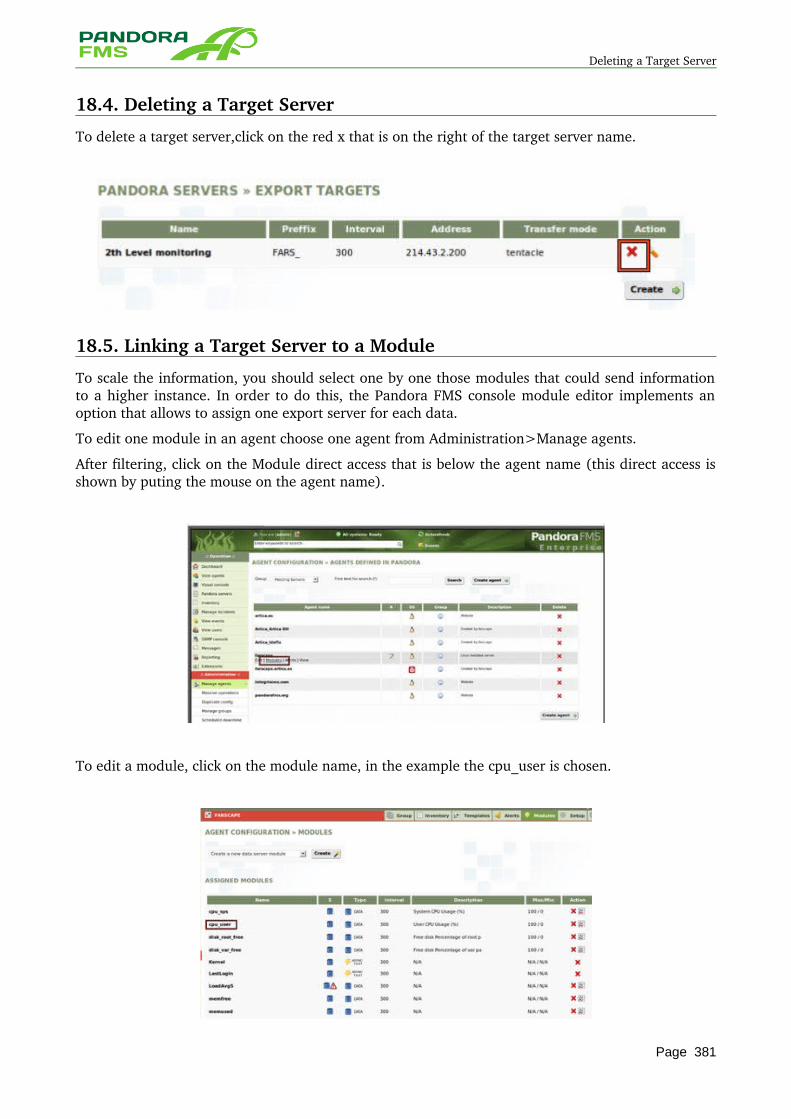
Deleting a Target Server
18.4. Deleting a Target Server
To delete a target server,click on the red x that is on the right of the target server name.
18.5. Linking a Target Server to a Module
To scale the information, you should select one by one those modules that could send information to a higher instance. In order to do this, the Pandora FMS console module editor implements an option that allows to assign one export server for each data.
To edit one module in an agent choose one agent from Administration>Manage agents.
After filtering, click on the Module direct access that is below the agent name (this direct access is shown by puting the mouse on the agent name).
To edit a module, click on the module name, in the example the cpu_user is chosen.
Page 381
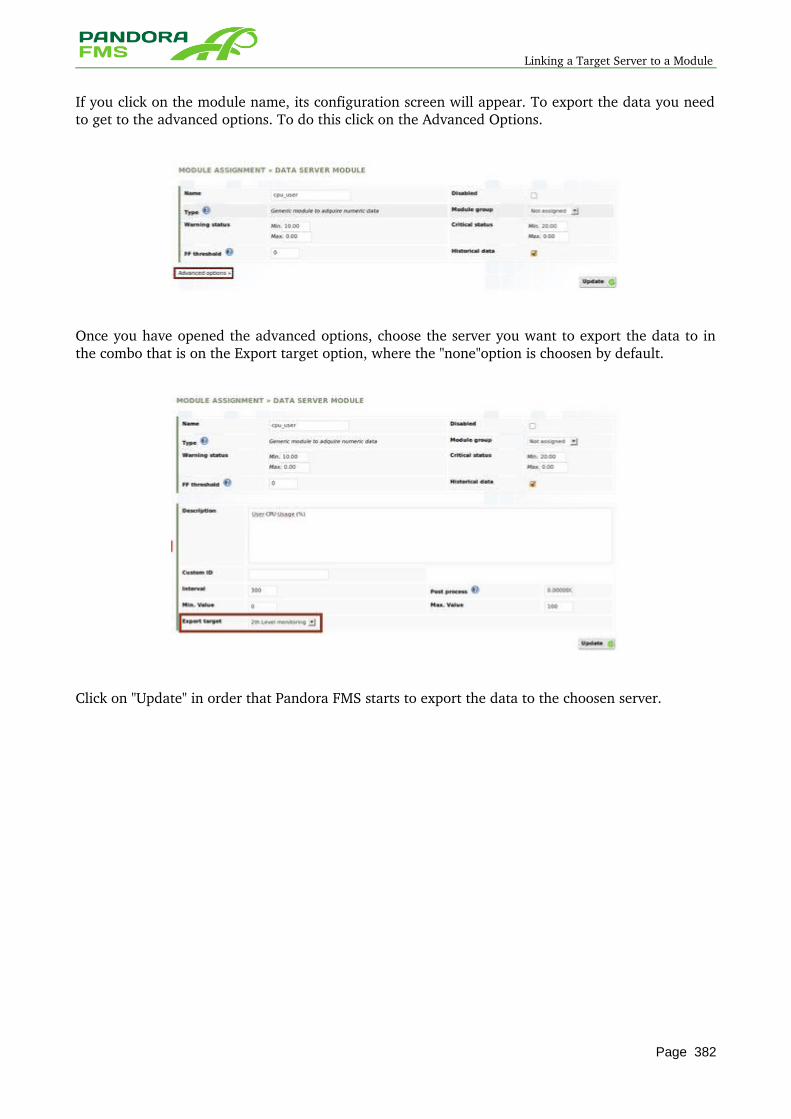
Linking a Target Server to a Module
If you click on the module name, its configuration screen will appear. To export the data you need to get to the advanced options. To do this click on the Advanced Options.
Once you have opened the advanced options, choose the server you want to export the data to in the combo that is on the Export target option, where the "none"option is choosen by default.
Click on "Update" in order that Pandora FMS starts to export the data to the choosen server.
Page 382

Linking a Target Server to a Module
19 META CONSOLE
Page 383
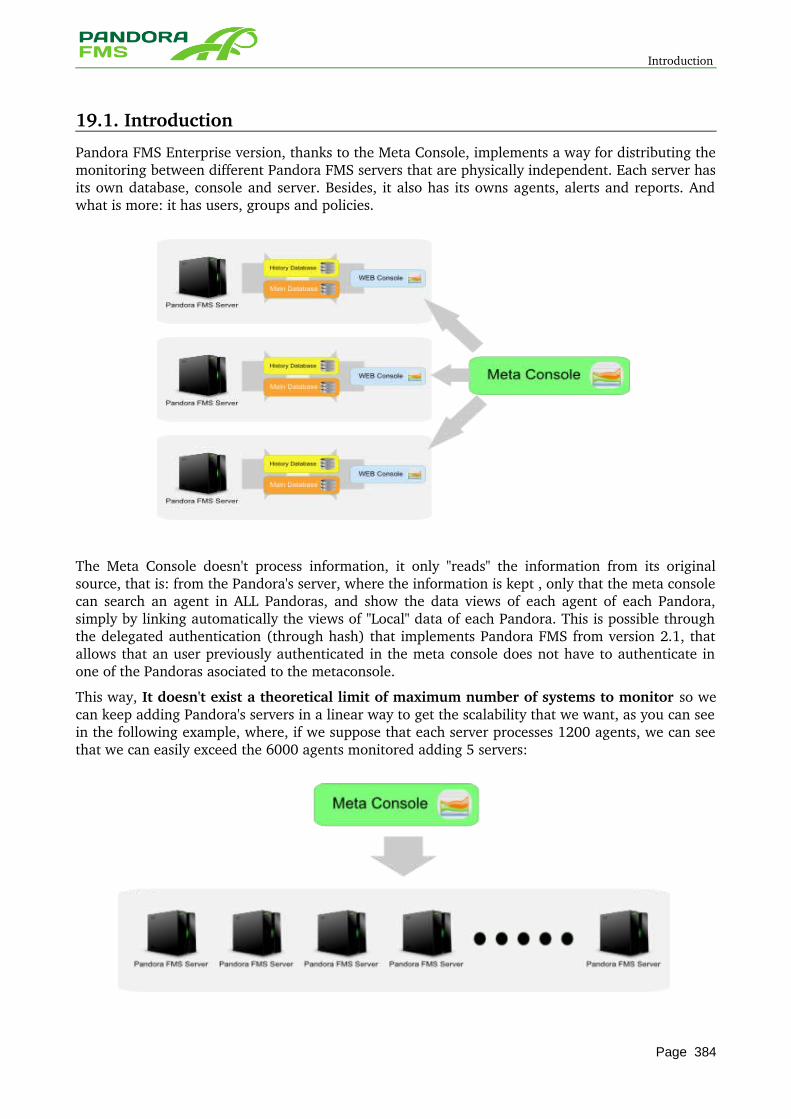
Introduction
19.1. Introduction
Pandora FMS Enterprise version, thanks to the Meta Console, implements a way for distributing the monitoring between different Pandora FMS servers that are physically independent. Each server has its own database, console and server. Besides, it also has its owns agents, alerts and reports. And what is more: it has users, groups and policies.
The Meta Console doesn't process information, it only "reads" the information from its original source, that is: from the Pandora's server, where the information is kept , only that the meta console can search an agent in ALL Pandoras, and show the data views of each agent of each Pandora, simply by linking automatically the views of "Local" data of each Pandora. This is possible through the delegated authentication (through hash) that implements Pandora FMS from version 2.1, that allows that an user previously authenticated in the meta console does not have to authenticate in one of the Pandoras asociated to the metaconsole.
This way, It doesn't exist a theoretical limit of maximum number of systems to monitor so we can keep adding Pandora's servers in a linear way to get the scalability that we want, as you can see in the following example, where, if we suppose that each server processes 1200 agents, we can see that we can easily exceed the 6000 agents monitored adding 5 servers:
Page 384
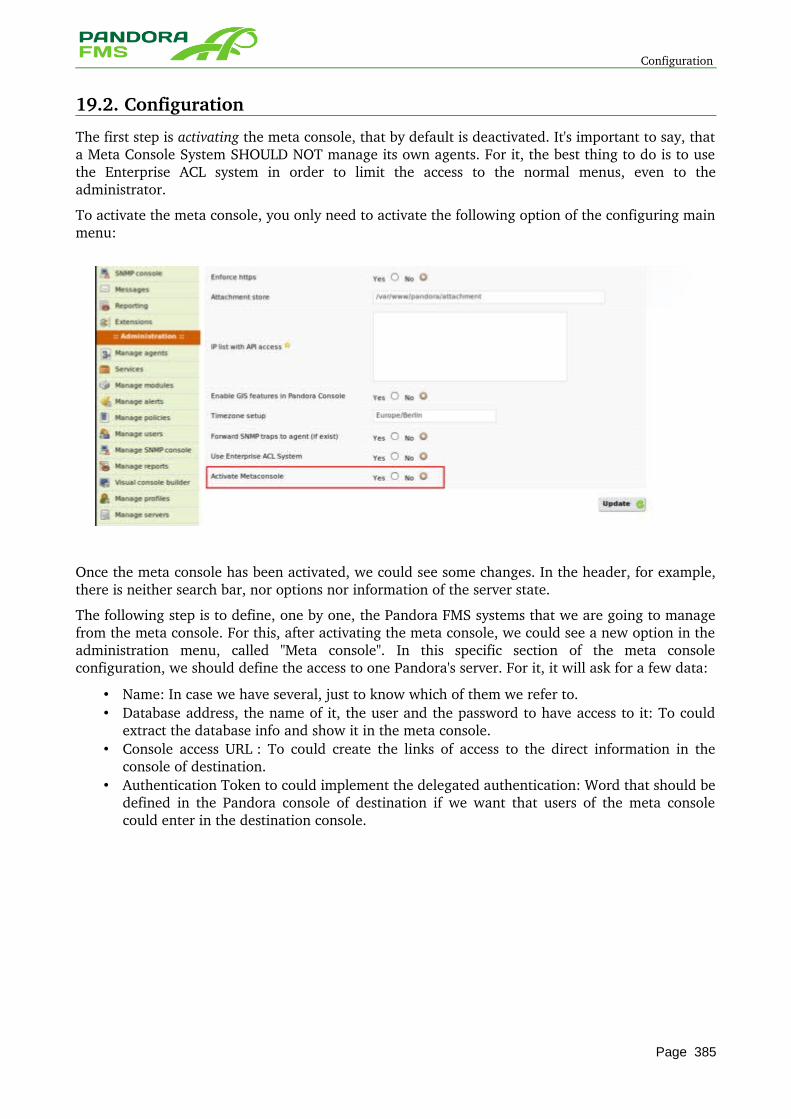
Configuration
19.2. Configuration
The first step is activating the meta console, that by default is deactivated. It's important to say, that a Meta Console System SHOULD NOT manage its own agents. For it, the best thing to do is to use the Enterprise ACL system in order to limit the access to the normal menus, even to the administrator.
To activate the meta console, you only need to activate the following option of the configuring main menu:
Once the meta console has been activated, we could see some changes. In the header, for example, there is neither search bar, nor options nor information of the server state.
The following step is to define, one by one, the Pandora FMS systems that we are going to manage from the meta console. For this, after activating the meta console, we could see a new option in the administration menu, called "Meta console". In this specific section of the meta console configuration, we should define the access to one Pandora's server. For it, it will ask for a few data:
• Name: In case we have several, just to know which of them we refer to. • Database address, the name of it, the user and the password to have access to it: To could
extract the database info and show it in the meta console. • Console access URL : To could create the links of access to the direct information in the
console of destination. • Authentication Token to could implement the delegated authentication: Word that should be
defined in the Pandora console of destination if we want that users of the meta console could enter in the destination console.
Page 385
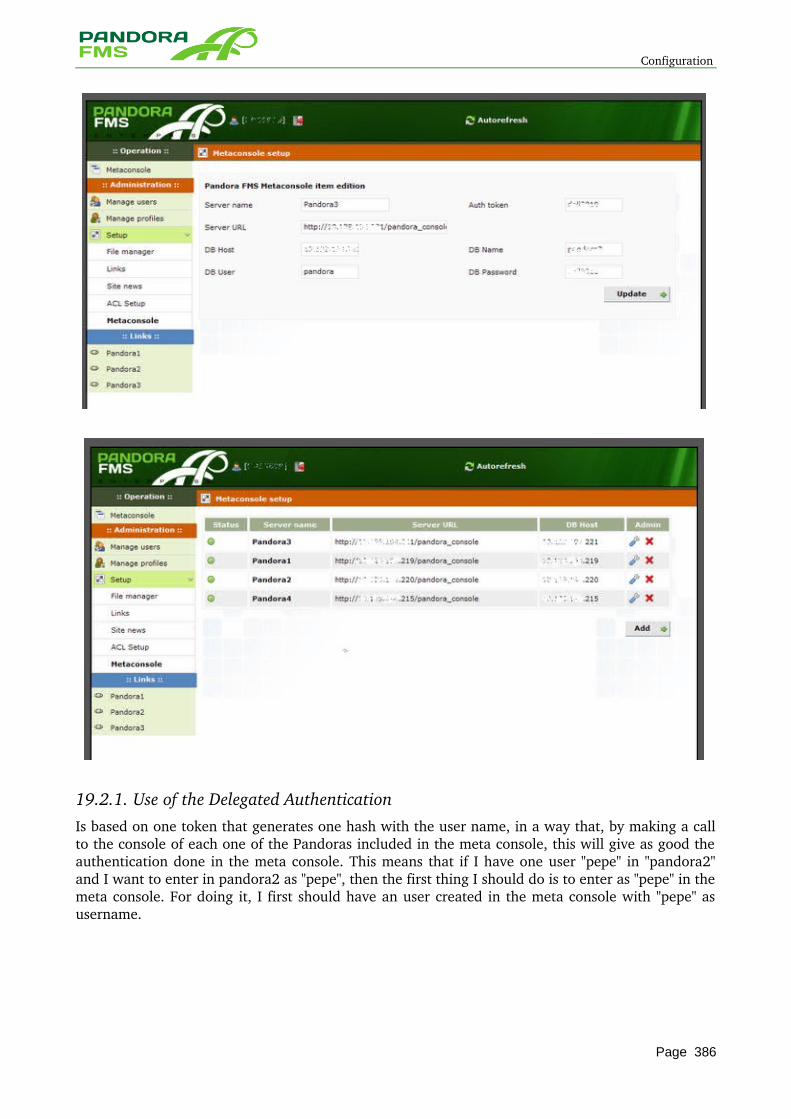
Configuration
19.2.1. Use of the Delegated AuthenticationIs based on one token that generates one hash with the user name, in a way that, by making a call to the console of each one of the Pandoras included in the meta console, this will give as good the authentication done in the meta console. This means that if I have one user "pepe" in "pandora2" and I want to enter in pandora2 as "pepe", then the first thing I should do is to enter as "pepe" in the meta console. For doing it, I first should have an user created in the meta console with "pepe" as username.
Page 386
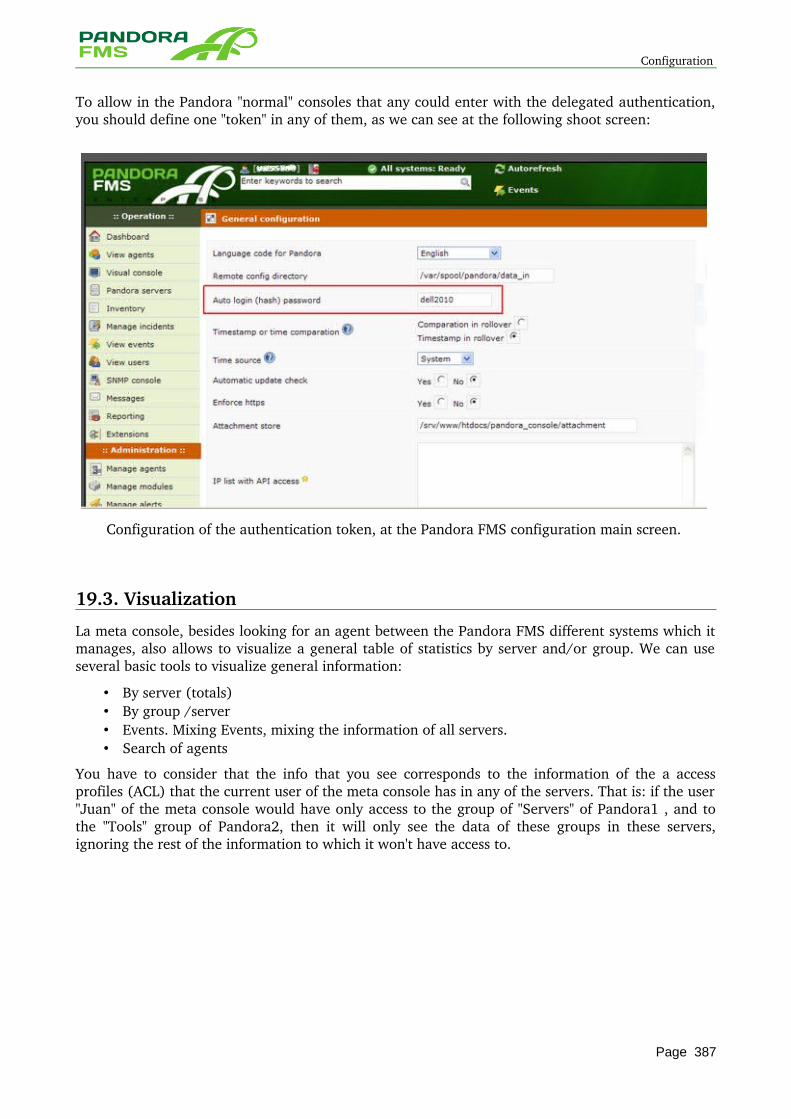
Configuration
To allow in the Pandora "normal" consoles that any could enter with the delegated authentication, you should define one "token" in any of them, as we can see at the following shoot screen:
Configuration of the authentication token, at the Pandora FMS configuration main screen.
19.3. Visualization
La meta console, besides looking for an agent between the Pandora FMS different systems which it manages, also allows to visualize a general table of statistics by server and/or group. We can use several basic tools to visualize general information:
• By server (totals) • By group /server • Events. Mixing Events, mixing the information of all servers. • Search of agents
You have to consider that the info that you see corresponds to the information of the a access profiles (ACL) that the current user of the meta console has in any of the servers. That is: if the user "Juan" of the meta console would have only access to the group of "Servers" of Pandora1 , and to the "Tools" group of Pandora2, then it will only see the data of these groups in these servers, ignoring the rest of the information to which it won't have access to.
Page 387
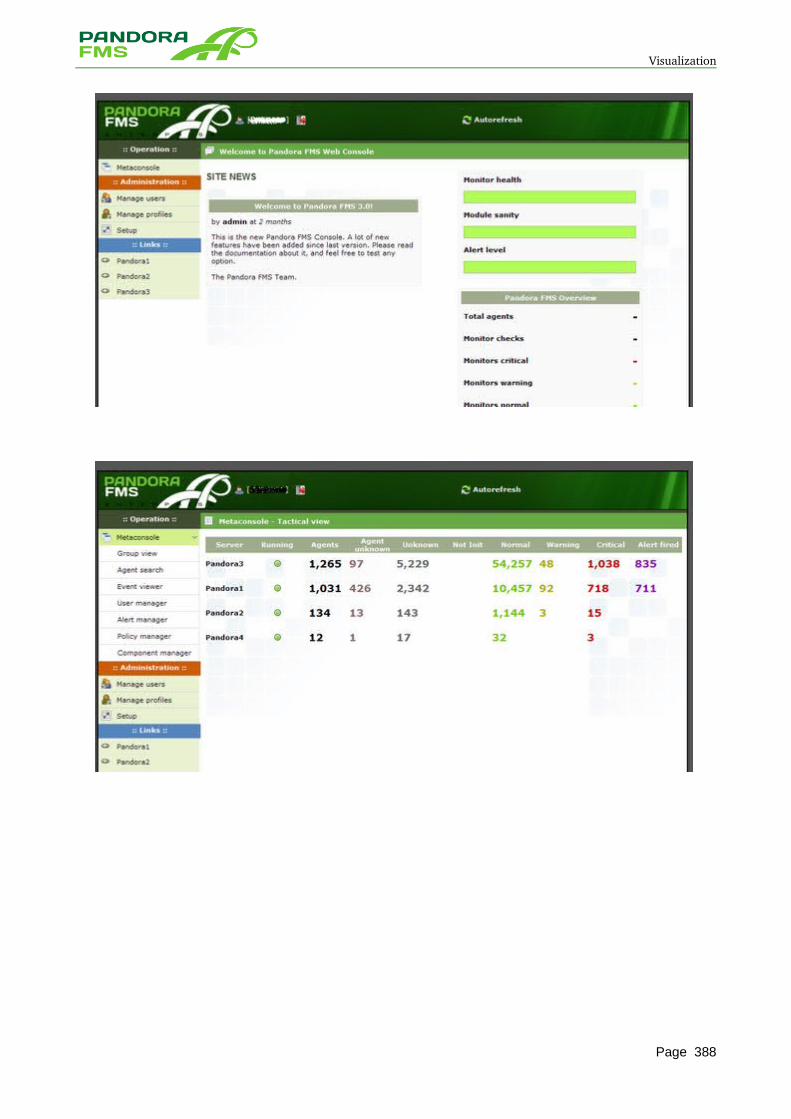
Visualization
Page 388
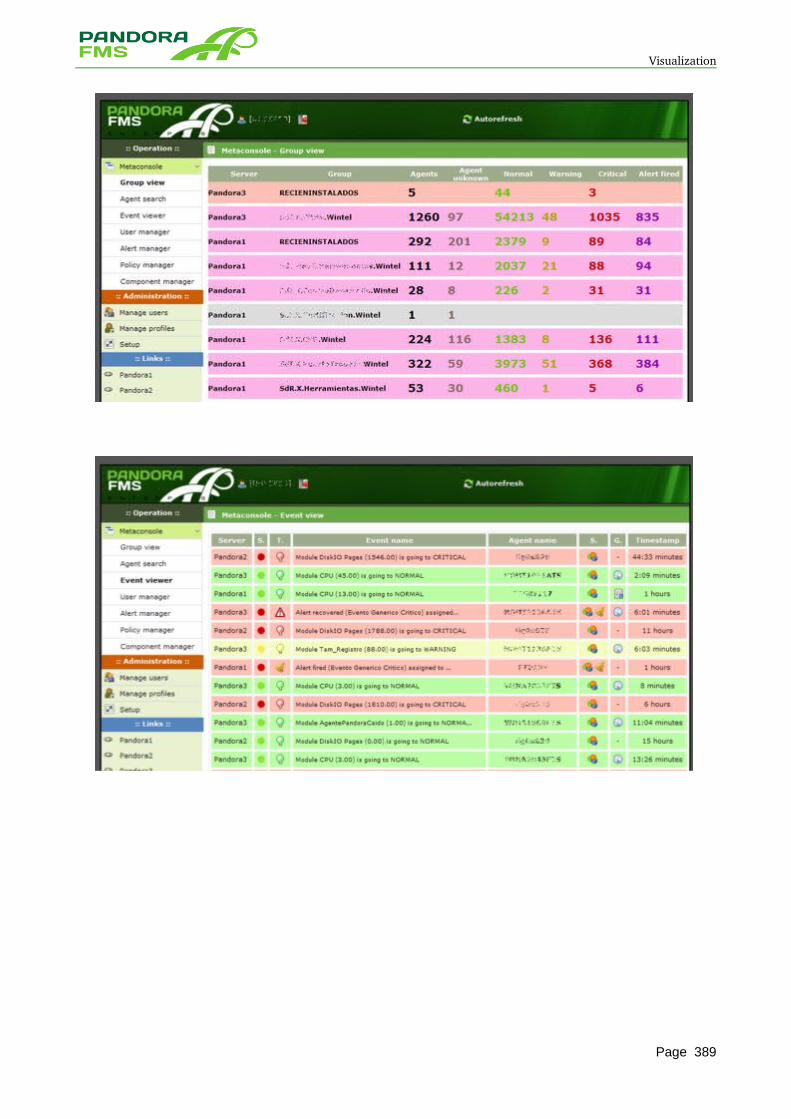
Visualization
Page 389
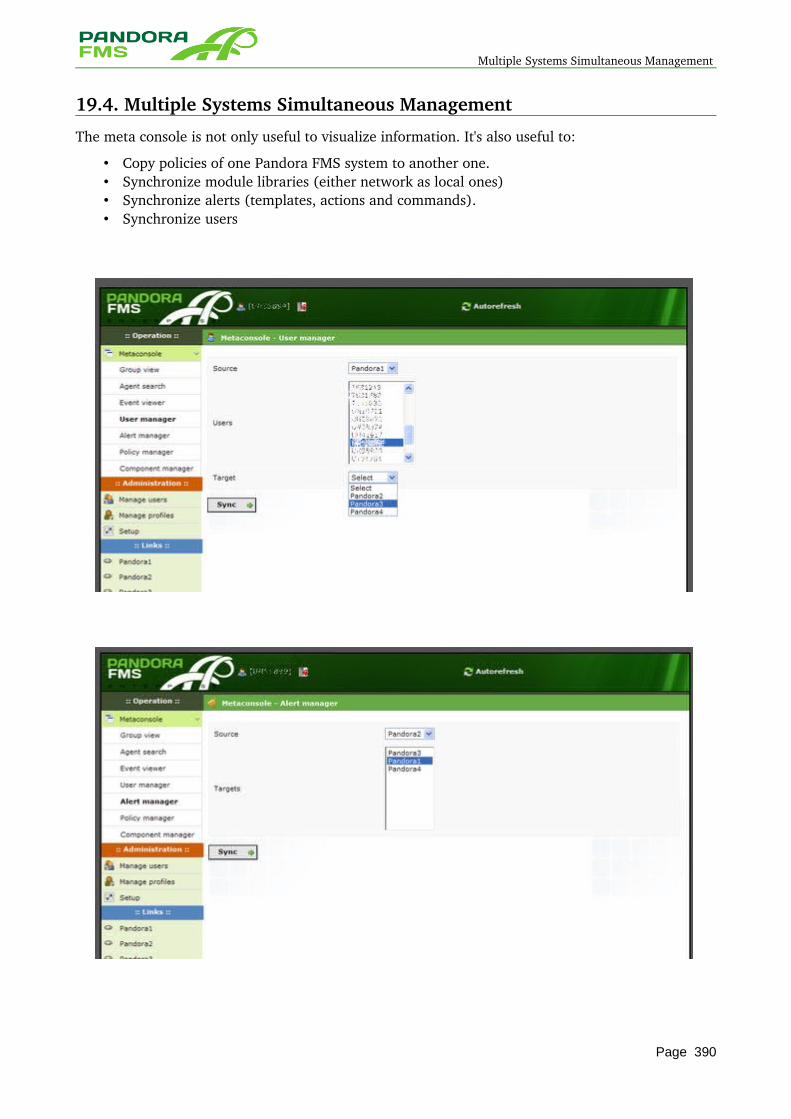
Multiple Systems Simultaneous Management
19.4. Multiple Systems Simultaneous Management
The meta console is not only useful to visualize information. It's also useful to:
• Copy policies of one Pandora FMS system to another one. • Synchronize module libraries (either network as local ones) • Synchronize alerts (templates, actions and commands). • Synchronize users
Page 390
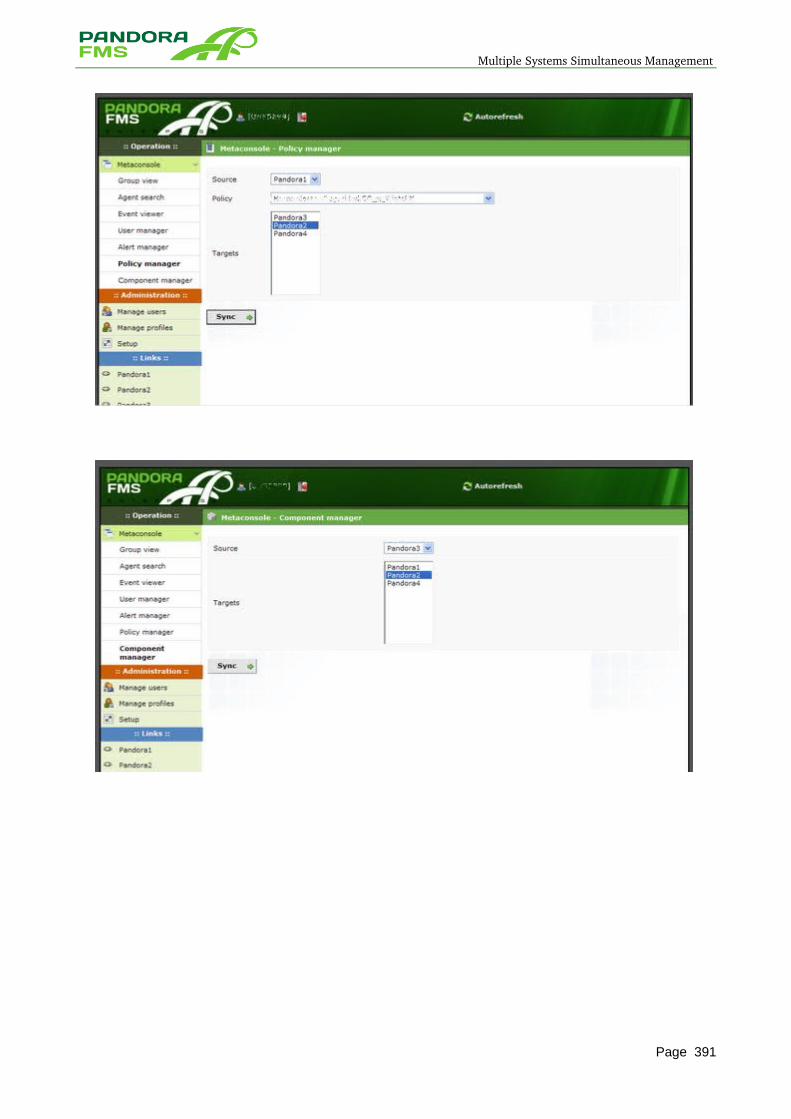
Multiple Systems Simultaneous Management
Page 391

Multiple Systems Simultaneous Management
20 MANAGEMENT OF PANDORA FMS
Page 392
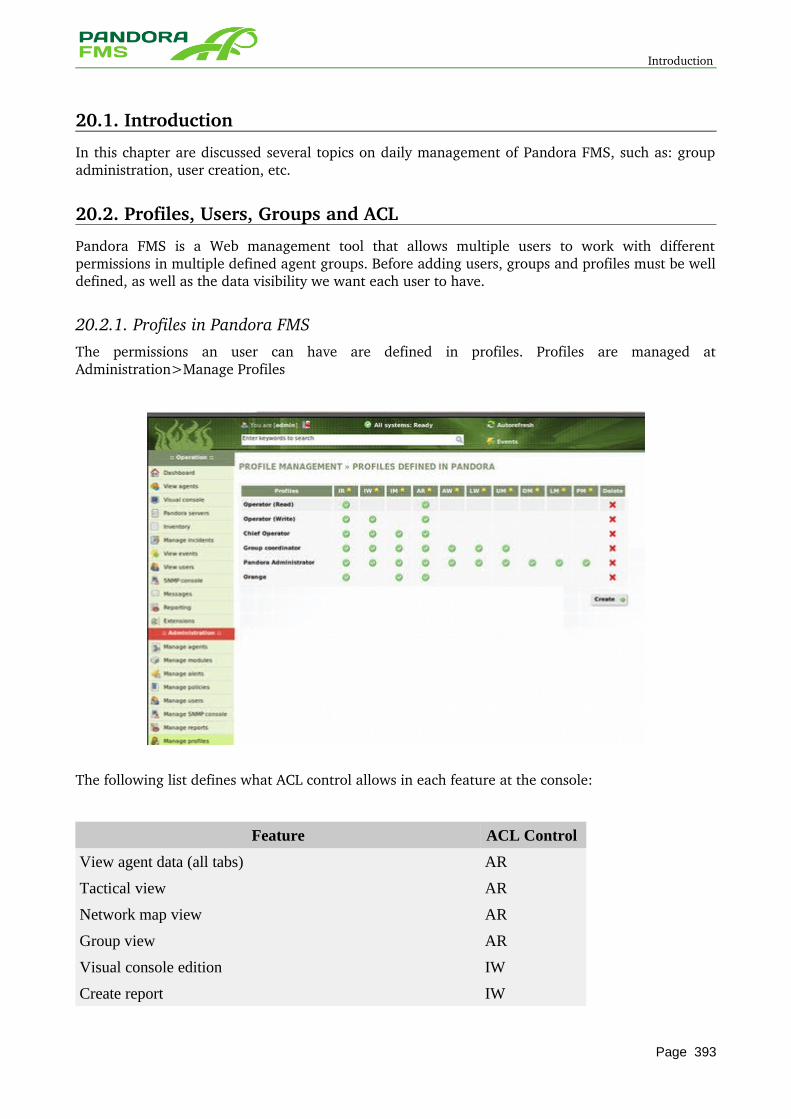
Introduction
20.1. Introduction
In this chapter are discussed several topics on daily management of Pandora FMS, such as: group administration, user creation, etc.
20.2. Profiles, Users, Groups and ACL
Pandora FMS is a Web management tool that allows multiple users to work with different permissions in multiple defined agent groups. Before adding users, groups and profiles must be well defined, as well as the data visibility we want each user to have.
20.2.1. Profiles in Pandora FMS The permissions an user can have are defined in profiles. Profiles are managed at Administration>Manage Profiles
The following list defines what ACL control allows in each feature at the console:
Feature ACL Control
View agent data (all tabs) AR
Tactical view AR
Network map view AR
Group view AR
Visual console edition IW
Create report IW
Page 393
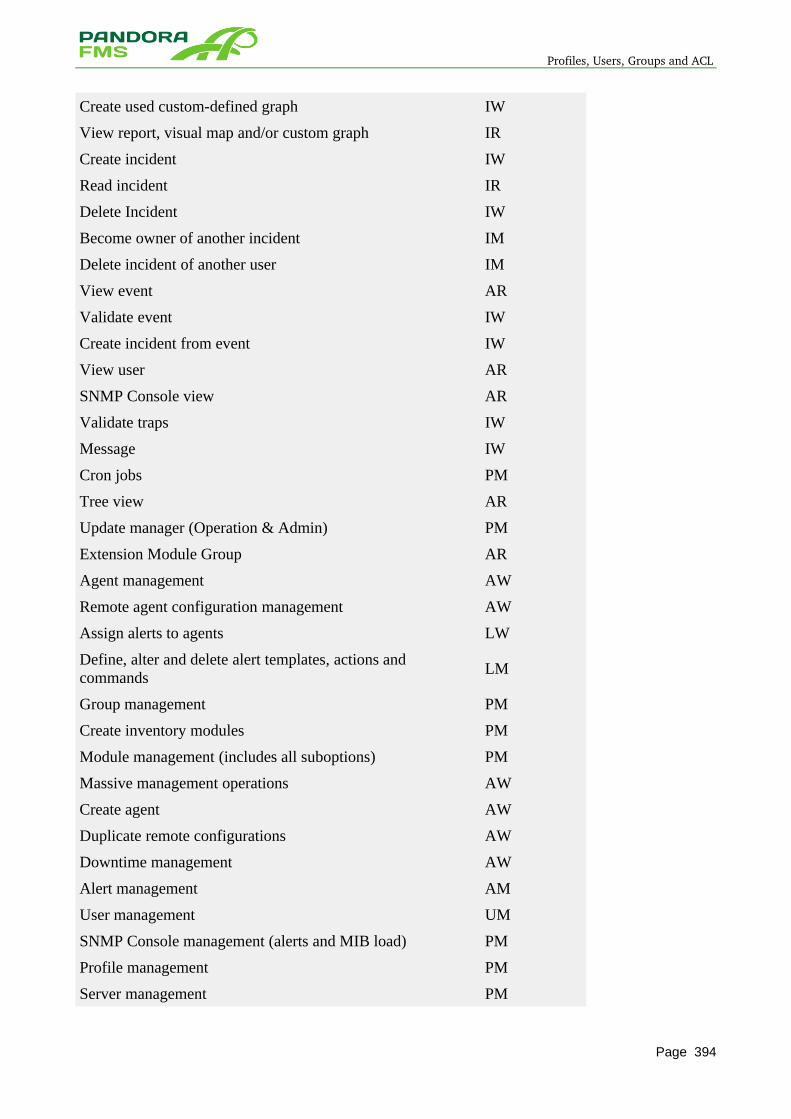
Profiles, Users, Groups and ACL
Create used custom-defined graph IW
View report, visual map and/or custom graph IR
Create incident IW
Read incident IR
Delete Incident IW
Become owner of another incident IM
Delete incident of another user IM
View event AR
Validate event IW
Create incident from event IW
View user AR
SNMP Console view AR
Validate traps IW
Message IW
Cron jobs PM
Tree view AR
Update manager (Operation & Admin) PM
Extension Module Group AR
Agent management AW
Remote agent configuration management AW
Assign alerts to agents LW
Define, alter and delete alert templates, actions and commands
LM
Group management PM
Create inventory modules PM
Module management (includes all suboptions) PM
Massive management operations AW
Create agent AW
Duplicate remote configurations AW
Downtime management AW
Alert management AM
User management UM
SNMP Console management (alerts and MIB load) PM
Profile management PM
Server management PM
Page 394
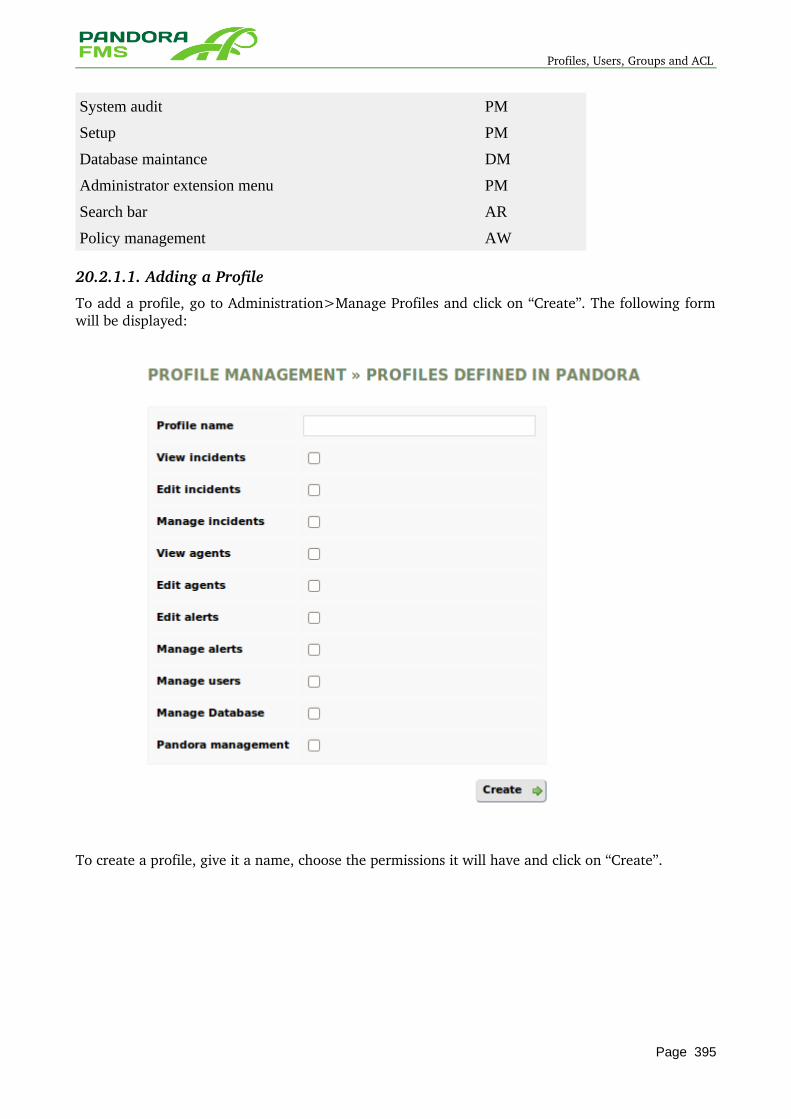
Profiles, Users, Groups and ACL
System audit PM
Setup PM
Database maintance DM
Administrator extension menu PM
Search bar AR
Policy management AW
20.2.1.1. Adding a Profile
To add a profile, go to Administration>Manage Profiles and click on “Create”. The following form will be displayed:
To create a profile, give it a name, choose the permissions it will have and click on “Create”.
Page 395
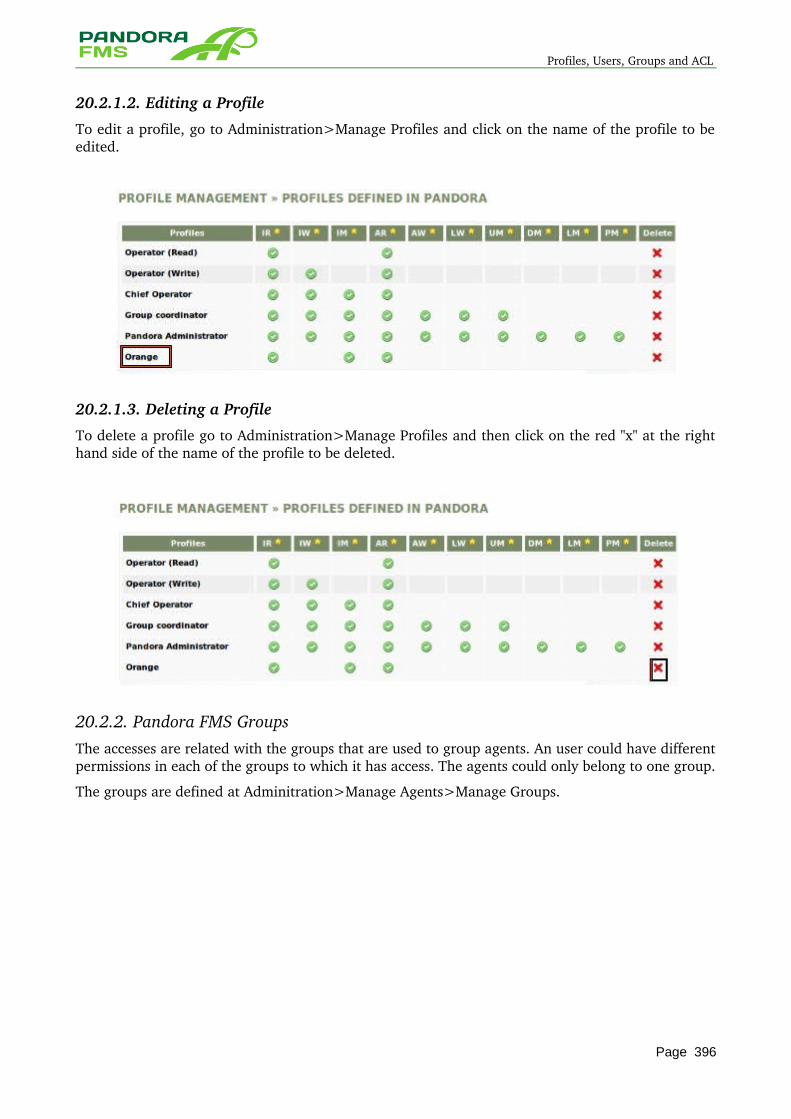
Profiles, Users, Groups and ACL
20.2.1.2. Editing a Profile
To edit a profile, go to Administration>Manage Profiles and click on the name of the profile to be edited.
20.2.1.3. Deleting a Profile
To delete a profile go to Administration>Manage Profiles and then click on the red "x" at the right hand side of the name of the profile to be deleted.
20.2.2. Pandora FMS GroupsThe accesses are related with the groups that are used to group agents. An user could have different permissions in each of the groups to which it has access. The agents could only belong to one group.
The groups are defined at Adminitration>Manage Agents>Manage Groups.
Page 396
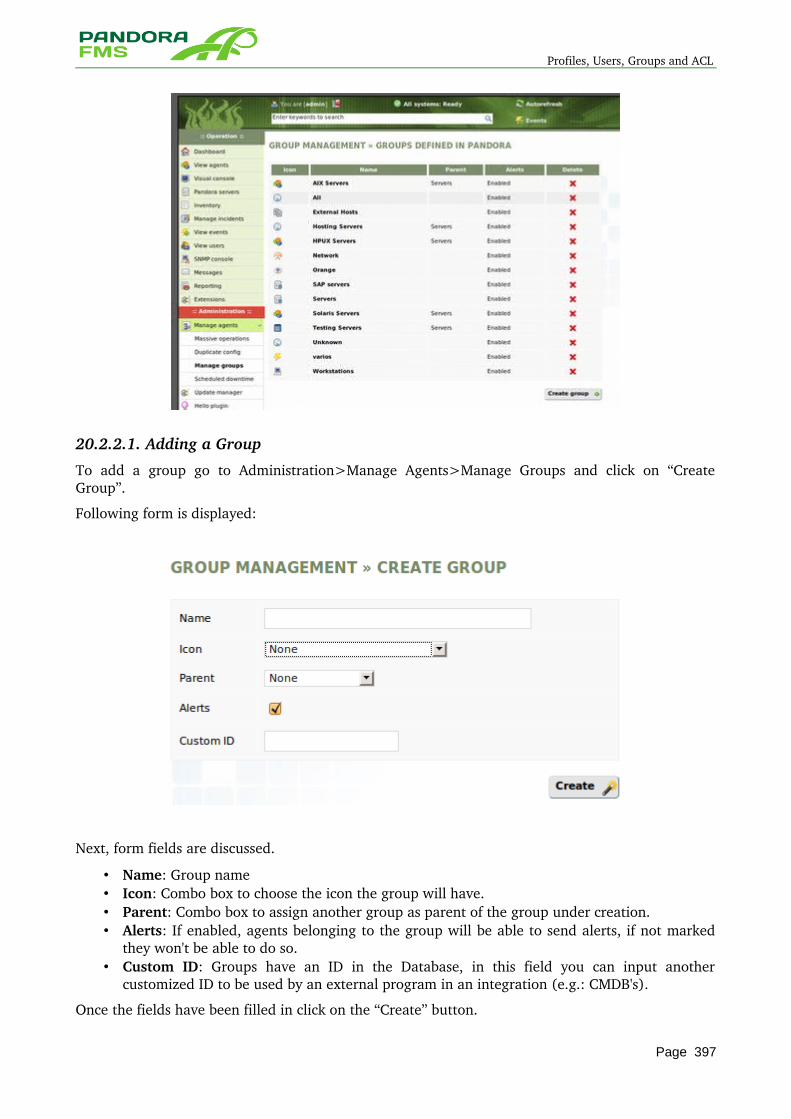
Profiles, Users, Groups and ACL
20.2.2.1. Adding a Group
To add a group go to Administration>Manage Agents>Manage Groups and click on “Create Group”.
Following form is displayed:
Next, form fields are discussed.
• Name: Group name • Icon: Combo box to choose the icon the group will have. • Parent: Combo box to assign another group as parent of the group under creation. • Alerts: If enabled, agents belonging to the group will be able to send alerts, if not marked
they won't be able to do so. • Custom ID: Groups have an ID in the Database, in this field you can input another
customized ID to be used by an external program in an integration (e.g.: CMDB's).
Once the fields have been filled in click on the “Create” button.
Page 397
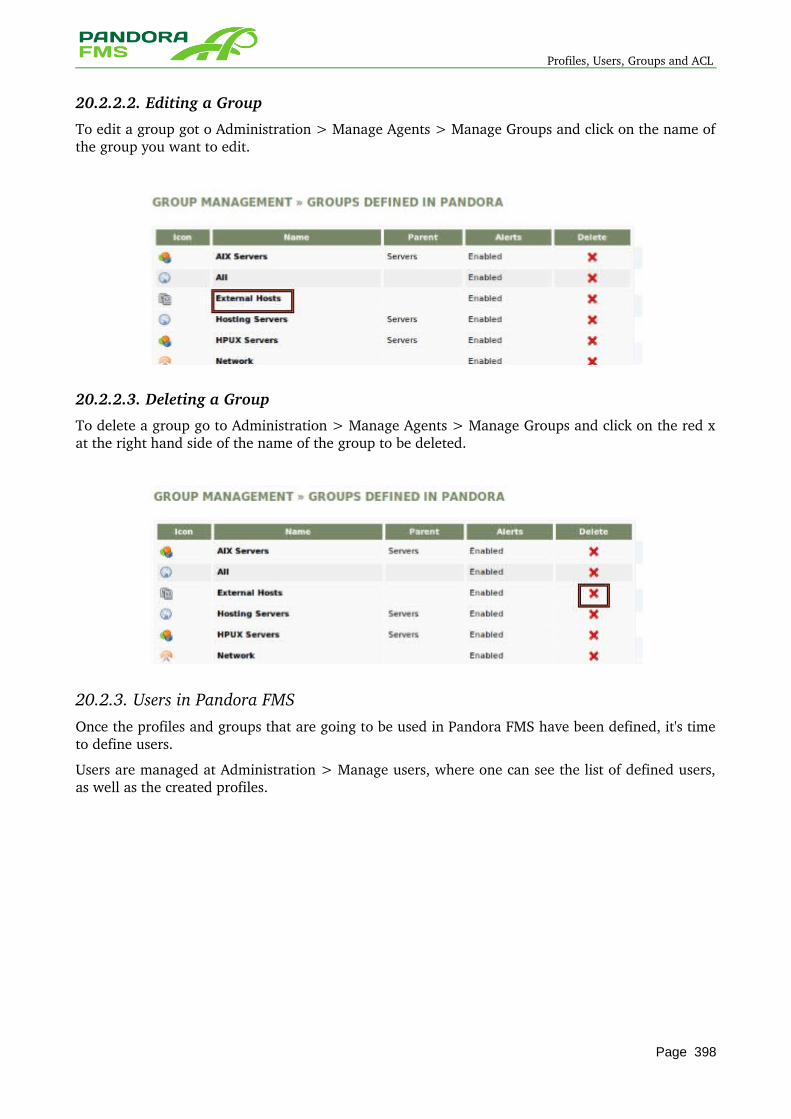
Profiles, Users, Groups and ACL
20.2.2.2. Editing a Group
To edit a group got o Administration > Manage Agents > Manage Groups and click on the name of the group you want to edit.
20.2.2.3. Deleting a Group
To delete a group go to Administration > Manage Agents > Manage Groups and click on the red x at the right hand side of the name of the group to be deleted.
20.2.3. Users in Pandora FMS Once the profiles and groups that are going to be used in Pandora FMS have been defined, it's time to define users.
Users are managed at Administration > Manage users, where one can see the list of defined users, as well as the created profiles.
Page 398
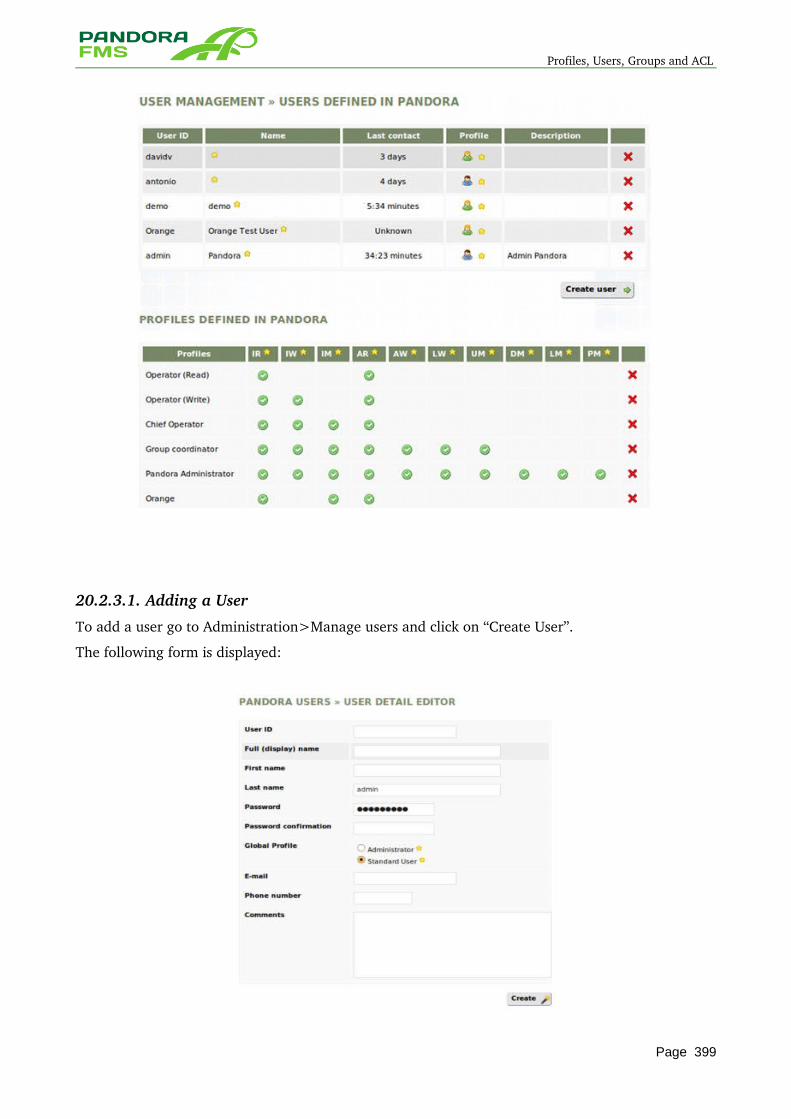
Profiles, Users, Groups and ACL
20.2.3.1. Adding a User
To add a user go to Administration>Manage users and click on “Create User”.
The following form is displayed:
Page 399
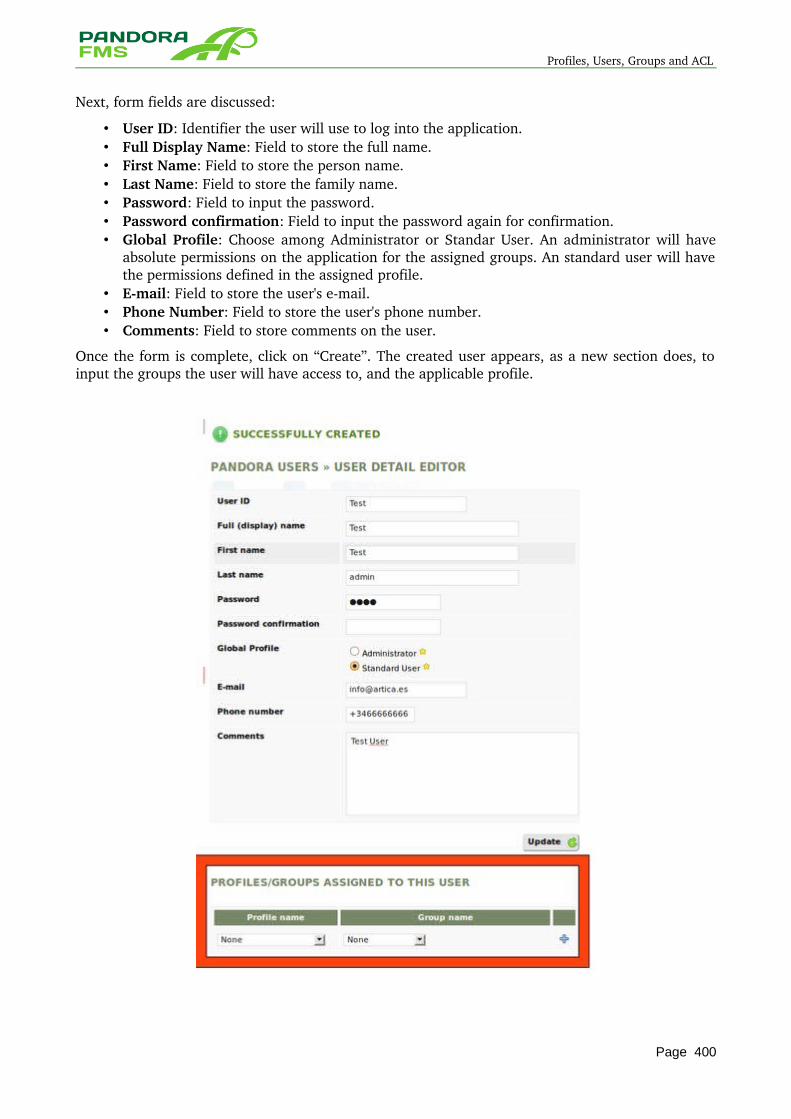
Profiles, Users, Groups and ACL
Next, form fields are discussed:
• User ID: Identifier the user will use to log into the application. • Full Display Name: Field to store the full name. • First Name: Field to store the person name. • Last Name: Field to store the family name. • Password: Field to input the password. • Password confirmation: Field to input the password again for confirmation. • Global Profile: Choose among Administrator or Standar User. An administrator will have
absolute permissions on the application for the assigned groups. An standard user will have the permissions defined in the assigned profile.
• Email: Field to store the user's email. • Phone Number: Field to store the user's phone number. • Comments: Field to store comments on the user.
Once the form is complete, click on “Create”. The created user appears, as a new section does, to input the groups the user will have access to, and the applicable profile.
Page 400
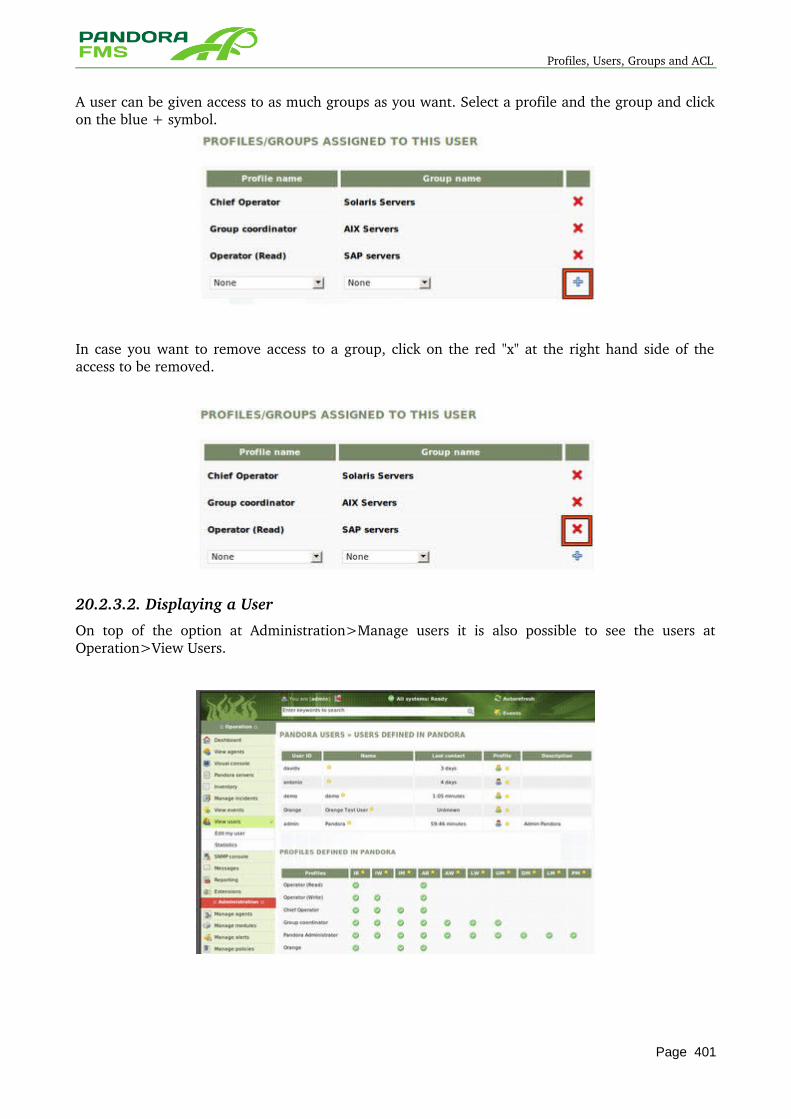
Profiles, Users, Groups and ACL
A user can be given access to as much groups as you want. Select a profile and the group and click on the blue + symbol.
In case you want to remove access to a group, click on the red "x" at the right hand side of the access to be removed.
20.2.3.2. Displaying a User
On top of the option at Administration>Manage users it is also possible to see the users at Operation>View Users.
Page 401
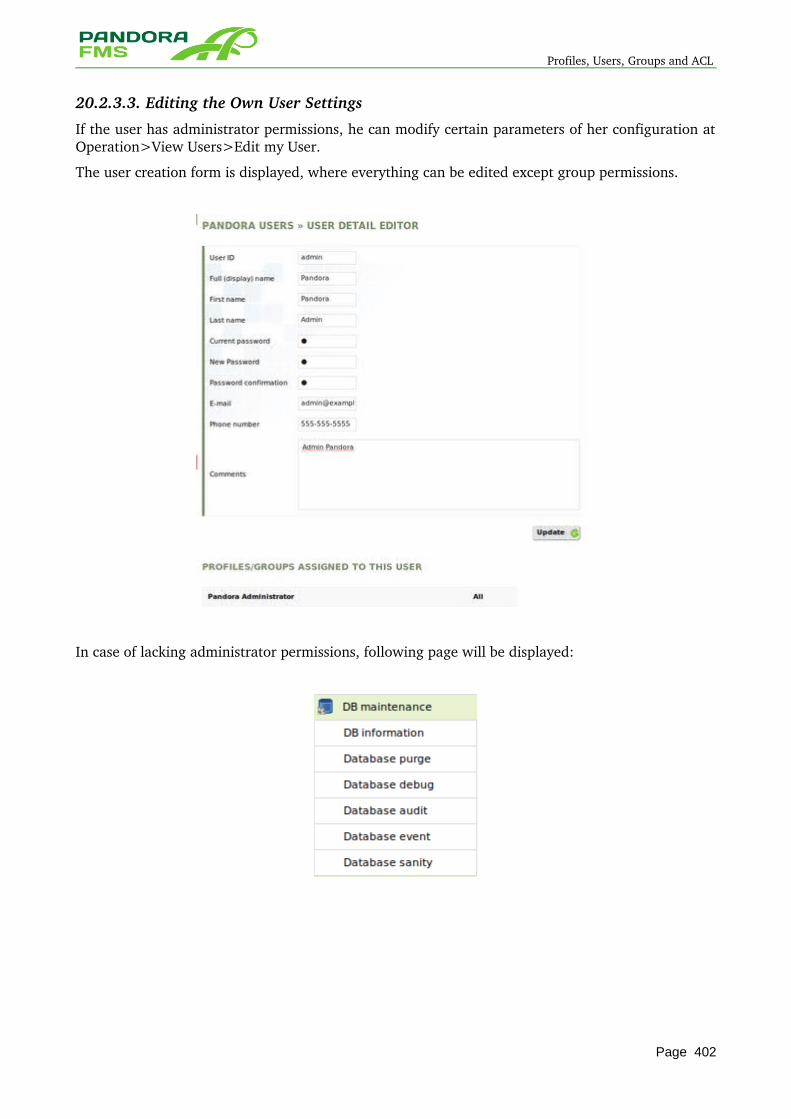
Profiles, Users, Groups and ACL
20.2.3.3. Editing the Own User Settings
If the user has administrator permissions, he can modify certain parameters of her configuration at Operation>View Users>Edit my User.
The user creation form is displayed, where everything can be edited except group permissions.
In case of lacking administrator permissions, following page will be displayed:
Page 402
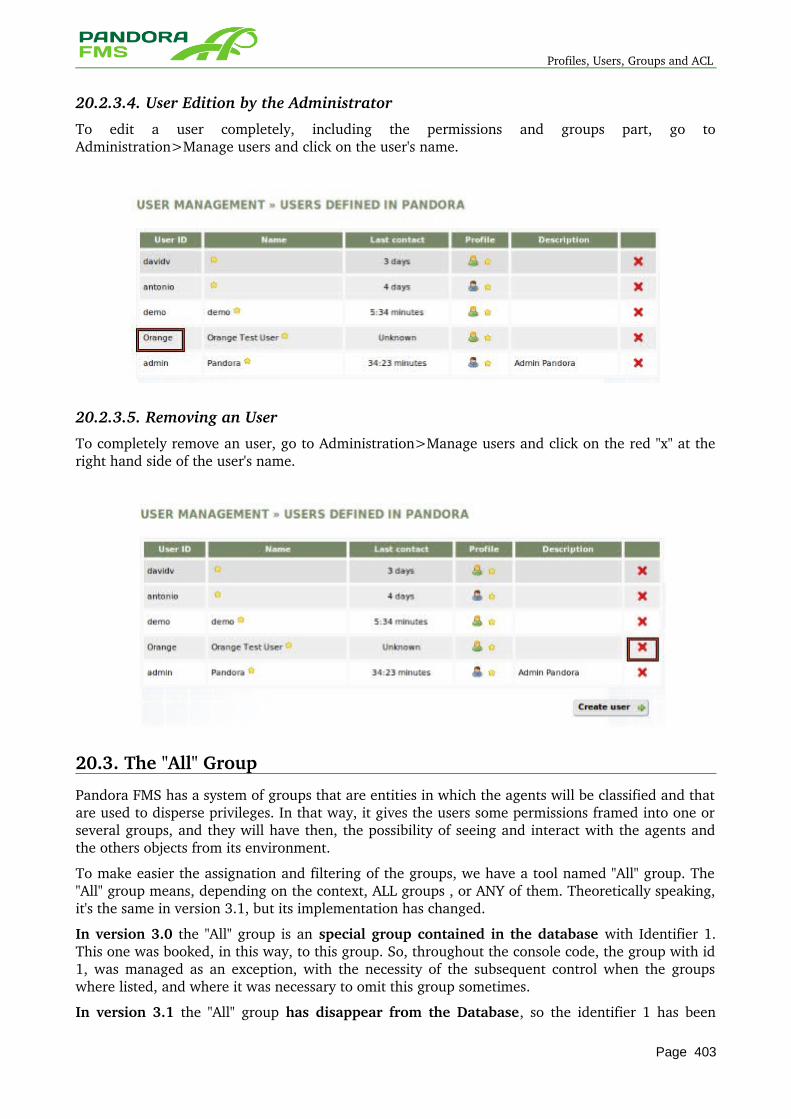
Profiles, Users, Groups and ACL
20.2.3.4. User Edition by the Administrator
To edit a user completely, including the permissions and groups part, go to Administration>Manage users and click on the user's name.
20.2.3.5. Removing an User
To completely remove an user, go to Administration>Manage users and click on the red "x" at the right hand side of the user's name.
20.3. The "All" Group
Pandora FMS has a system of groups that are entities in which the agents will be classified and that are used to disperse privileges. In that way, it gives the users some permissions framed into one or several groups, and they will have then, the possibility of seeing and interact with the agents and the others objects from its environment.
To make easier the assignation and filtering of the groups, we have a tool named "All" group. The "All" group means, depending on the context, ALL groups , or ANY of them. Theoretically speaking, it's the same in version 3.1, but its implementation has changed.
In version 3.0 the "All" group is an special group contained in the database with Identifier 1. This one was booked, in this way, to this group. So, throughout the console code, the group with id 1, was managed as an exception, with the necessity of the subsequent control when the groups where listed, and where it was necessary to omit this group sometimes.
In version 3.1 the "All" group has disappear from the Database, so the identifier 1 has been
Page 403

The "All" Group
released for the use of any normal group. Now, the identifier reserved for the "All" group is the 0, with the difference, that it is completely controlled through code, and there doesn't exist this group as before. Simply, now it's controlled that the objects associated with the 0 group will be associated to all groups, without needing to control if a group token out from the database is special or not.
When we take out the agents from a group or vice versa, there isn't any problem, so an agent belongs only to a group. But, for example, when extracting the groups to which an user belongs to or the users that belong to one group, you should consider that when we list the users that belongs to a group, we should show the ones that belong to all of them (group 0) and if we show the groups of an user, then we should show all of them in case that this user belongs to the "All" group (group 0)
20.4. New ACL System (Enterprise)
Several users reported that they want a more “flexible” ACL system, based not on groups of “things they can do”, based on every page a profile could see (and operate), item by item, page by page.
Current ACL model is based on “unix style” role/action/group/user (4 items).
The new system, implemented in version 3.1, will allow to define per profile, which pages (defined one by one or by “groups”) has user access. This will allow for example, to let a user view only “Group” view, and “Detailed” agent view, skipping pages as “Alert view” or “Monitor view”, grouped already in Pandora FMS classic ACL system as “AR” (Agent Read privileges).
This even allow to restrict administration per page. Very useful to let specific lowlevel operations allowed.
Both models are “paralel” and compatible, and this is an Enteprise feature only. Classic ACL system will continue to exist, and provides as now, a very easy ACL system for Pandora FMS.
In order to use the new ACL system, first this should be activated in setup. This option is only visible if you're running the enterprise version
Switch to activate Enteprise ACL rules
To use the Enterprise ACL system, go to the specific option for ACL Enterprise at Administration > Setup. In this screen you can add new items in the new ACL System and see the items defined by profile. You can also delete items from the Enterprise ACL system.
Page 404
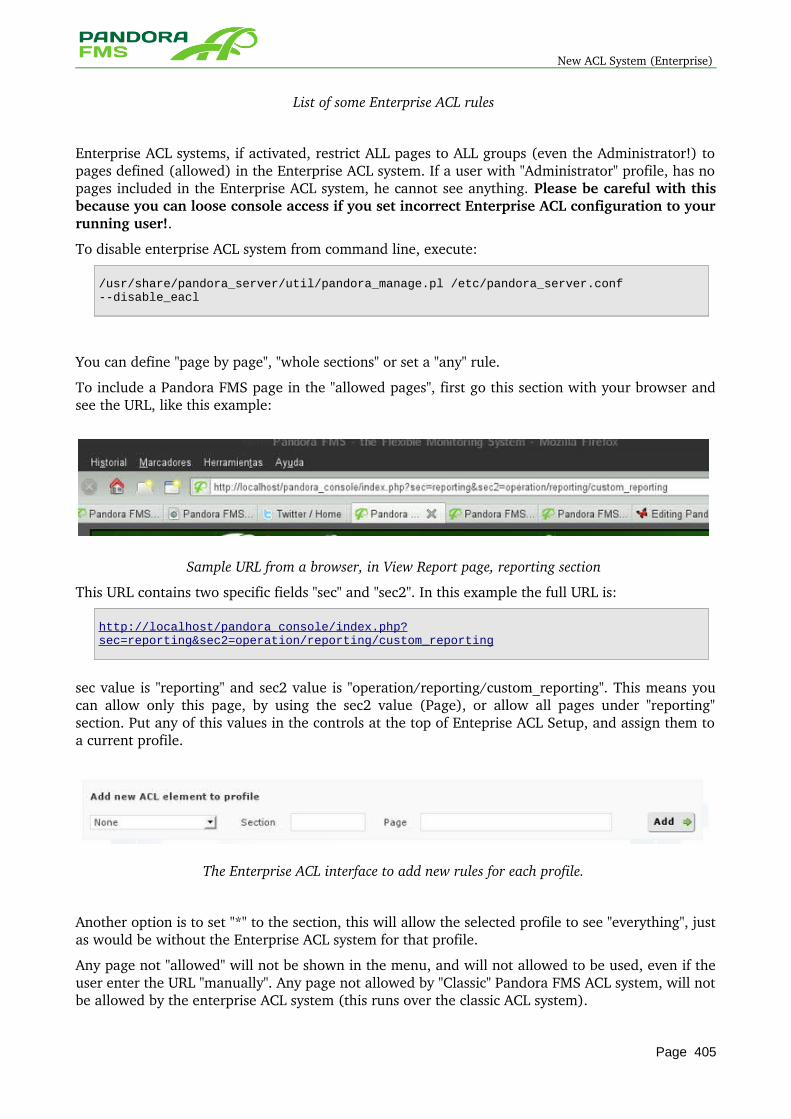
New ACL System (Enterprise)
List of some Enterprise ACL rules
Enterprise ACL systems, if activated, restrict ALL pages to ALL groups (even the Administrator!) to pages defined (allowed) in the Enterprise ACL system. If a user with "Administrator" profile, has no pages included in the Enterprise ACL system, he cannot see anything. Please be careful with this because you can loose console access if you set incorrect Enterprise ACL configuration to your running user!.
To disable enterprise ACL system from command line, execute:
/usr/share/pandora_server/util/pandora_manage.pl /etc/pandora_server.conf --disable_eacl
You can define "page by page", "whole sections" or set a "any" rule.
To include a Pandora FMS page in the "allowed pages", first go this section with your browser and see the URL, like this example:
Sample URL from a browser, in View Report page, reporting section
This URL contains two specific fields "sec" and "sec2". In this example the full URL is:
http://localhost/pandora_console/index.php?sec=reporting&sec2=operation/reporting/custom_reporting
sec value is "reporting" and sec2 value is "operation/reporting/custom_reporting". This means you can allow only this page, by using the sec2 value (Page), or allow all pages under "reporting" section. Put any of this values in the controls at the top of Enteprise ACL Setup, and assign them to a current profile.
The Enterprise ACL interface to add new rules for each profile.
Another option is to set "*" to the section, this will allow the selected profile to see "everything", just as would be without the Enterprise ACL system for that profile.
Any page not "allowed" will not be shown in the menu, and will not allowed to be used, even if the user enter the URL "manually". Any page not allowed by "Classic" Pandora FMS ACL system, will not be allowed by the enterprise ACL system (this runs over the classic ACL system).
Page 405
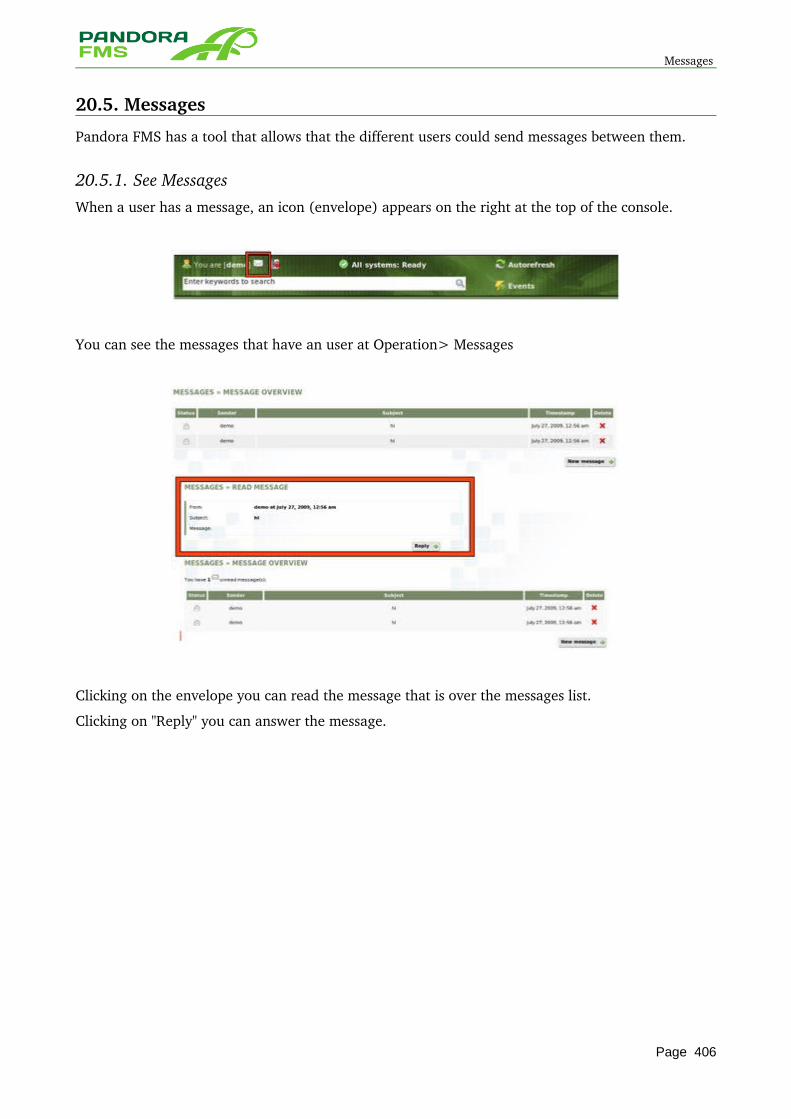
Messages
20.5. Messages
Pandora FMS has a tool that allows that the different users could send messages between them.
20.5.1. See MessagesWhen a user has a message, an icon (envelope) appears on the right at the top of the console.
You can see the messages that have an user at Operation> Messages
Clicking on the envelope you can read the message that is over the messages list.
Clicking on "Reply" you can answer the message.
Page 406
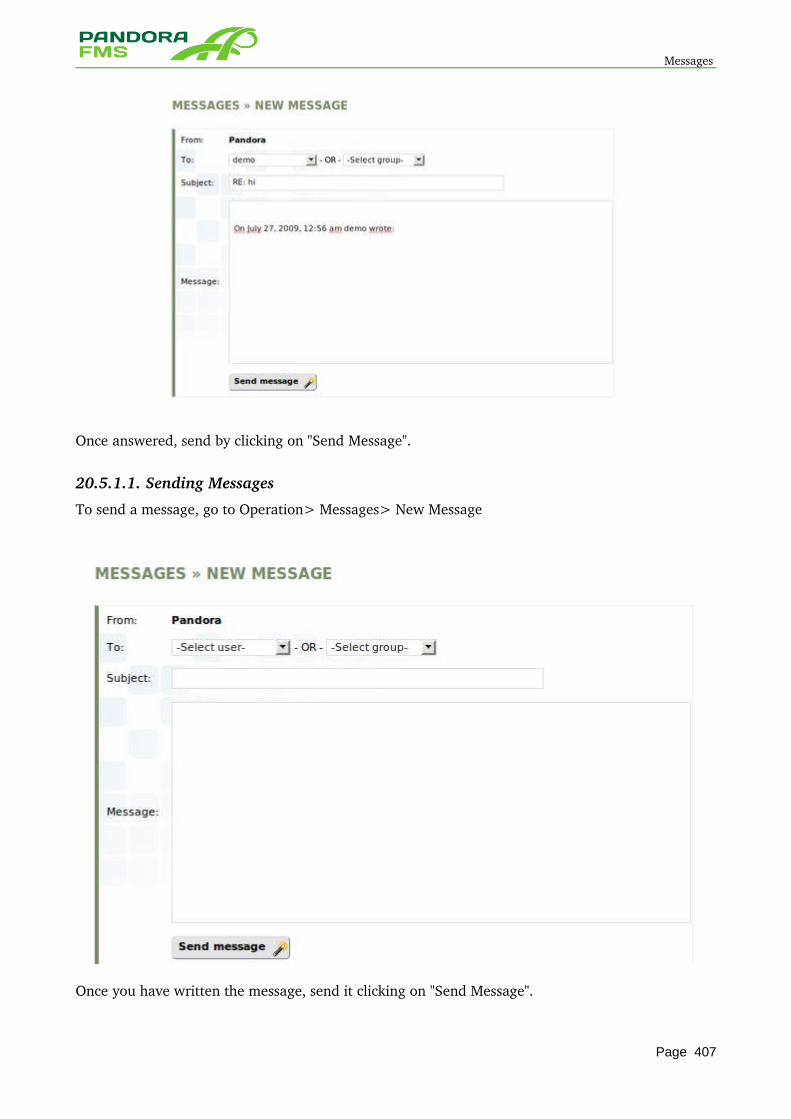
Messages
Once answered, send by clicking on "Send Message".
20.5.1.1. Sending Messages
To send a message, go to Operation> Messages> New Message
Once you have written the message, send it clicking on "Send Message".
Page 407
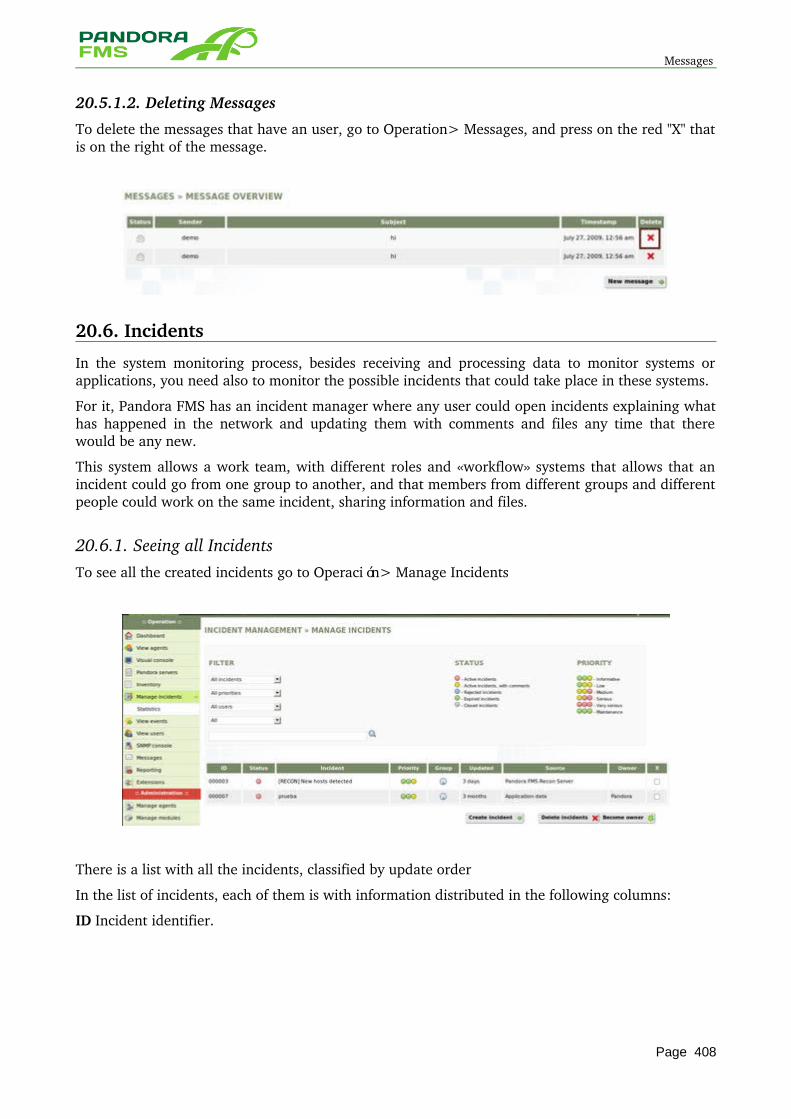
Messages
20.5.1.2. Deleting Messages
To delete the messages that have an user, go to Operation> Messages, and press on the red "X" that is on the right of the message.
20.6. Incidents
In the system monitoring process, besides receiving and processing data to monitor systems or applications, you need also to monitor the possible incidents that could take place in these systems.
For it, Pandora FMS has an incident manager where any user could open incidents explaining what has happened in the network and updating them with comments and files any time that there would be any new.
This system allows a work team, with different roles and «workflow» systems that allows that an incident could go from one group to another, and that members from different groups and different people could work on the same incident, sharing information and files.
20.6.1. Seeing all Incidents To see all the created incidents go to Operación> Manage Incidents
There is a list with all the incidents, classified by update order
In the list of incidents, each of them is with information distributed in the following columns:
ID Incident identifier.
Page 408
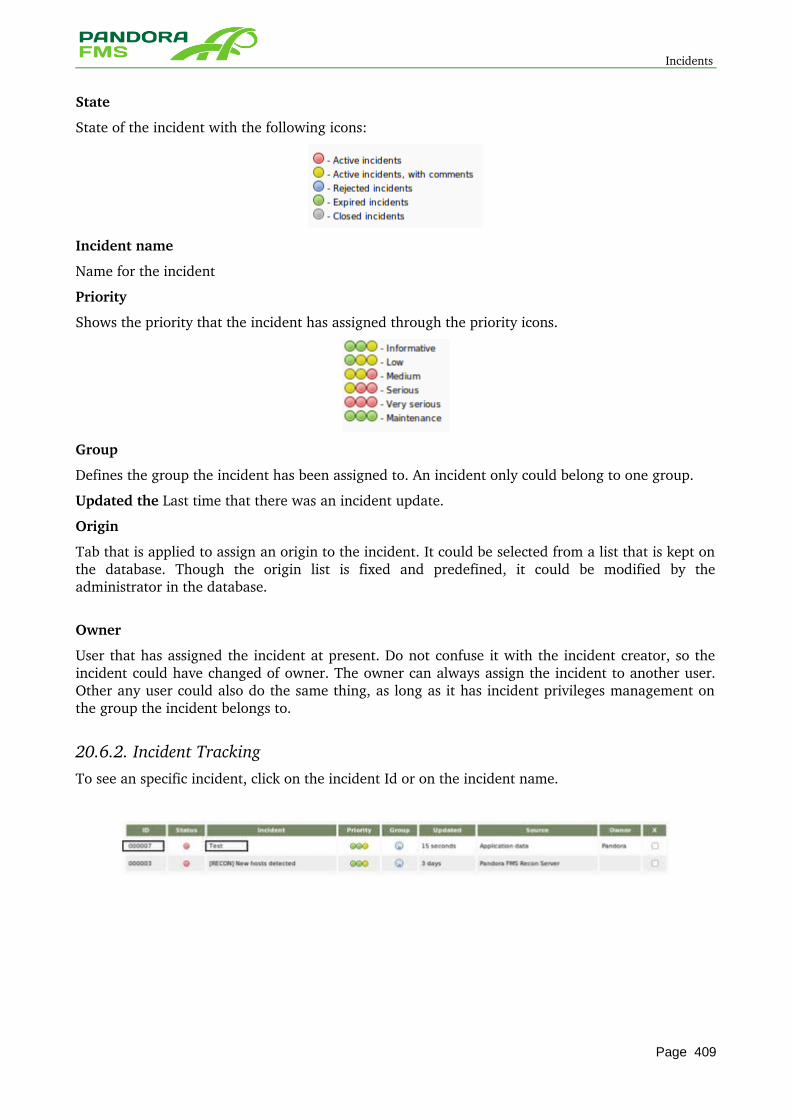
Incidents
State
State of the incident with the following icons:
Incident name
Name for the incident
Priority
Shows the priority that the incident has assigned through the priority icons.
Group
Defines the group the incident has been assigned to. An incident only could belong to one group.
Updated the Last time that there was an incident update.
Origin
Tab that is applied to assign an origin to the incident. It could be selected from a list that is kept on the database. Though the origin list is fixed and predefined, it could be modified by the administrator in the database.
Owner
User that has assigned the incident at present. Do not confuse it with the incident creator, so the incident could have changed of owner. The owner can always assign the incident to another user. Other any user could also do the same thing, as long as it has incident privileges management on the group the incident belongs to.
20.6.2. Incident Tracking To see an specific incident, click on the incident Id or on the incident name.
Page 409
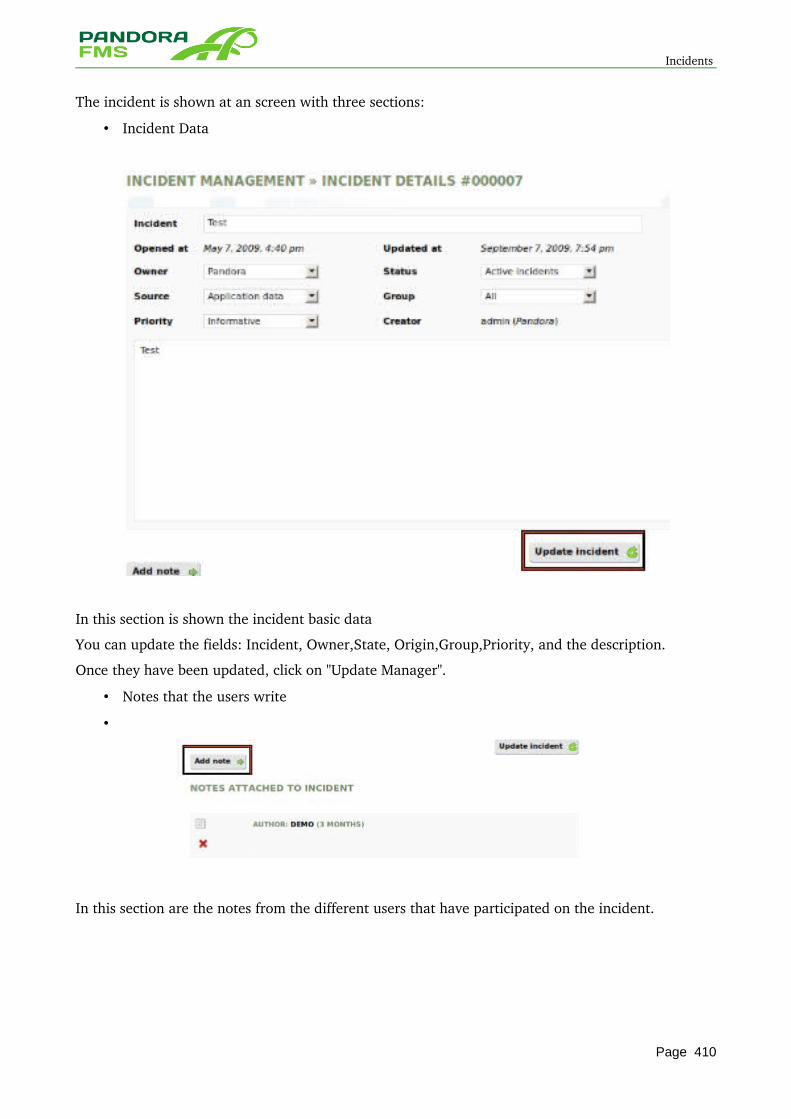
Incidents
The incident is shown at an screen with three sections:
• Incident Data
In this section is shown the incident basic data
You can update the fields: Incident, Owner,State, Origin,Group,Priority, and the description.
Once they have been updated, click on "Update Manager".
• Notes that the users write
•
In this section are the notes from the different users that have participated on the incident.
Page 410
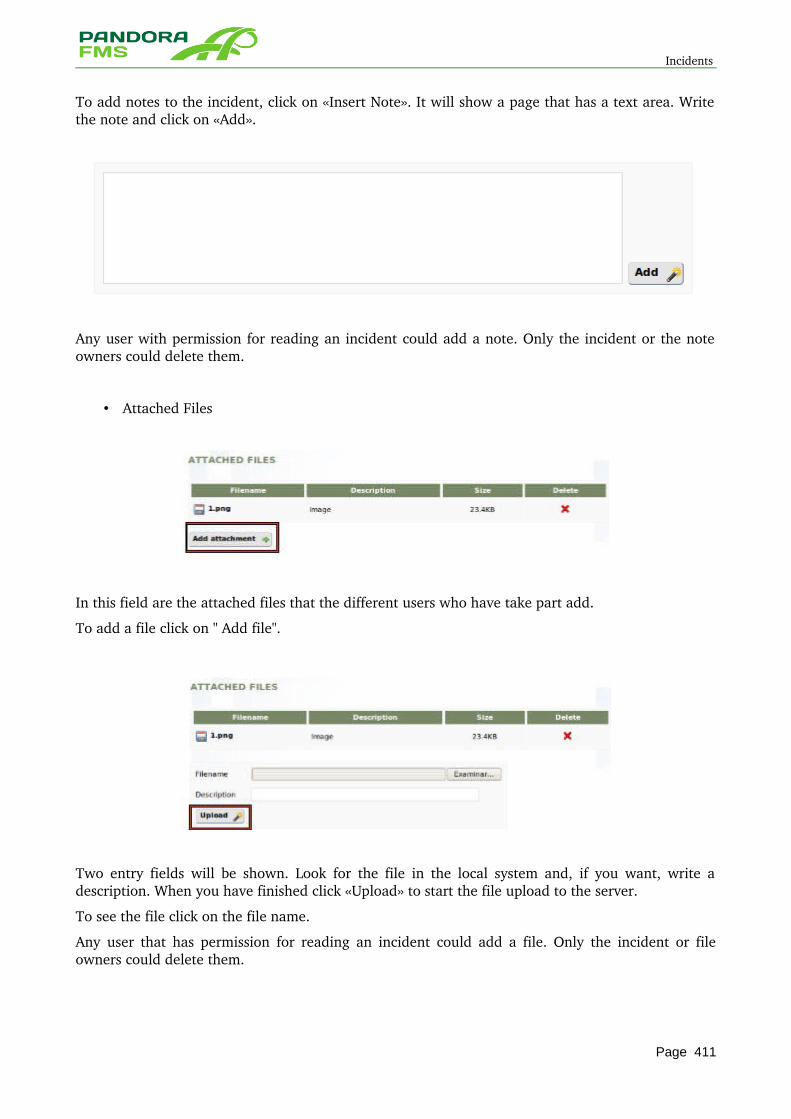
Incidents
To add notes to the incident, click on «Insert Note». It will show a page that has a text area. Write the note and click on «Add».
Any user with permission for reading an incident could add a note. Only the incident or the note owners could delete them.
• Attached Files
In this field are the attached files that the different users who have take part add.
To add a file click on " Add file".
Two entry fields will be shown. Look for the file in the local system and, if you want, write a description. When you have finished click «Upload» to start the file upload to the server.
To see the file click on the file name.
Any user that has permission for reading an incident could add a file. Only the incident or file owners could delete them.
Page 411
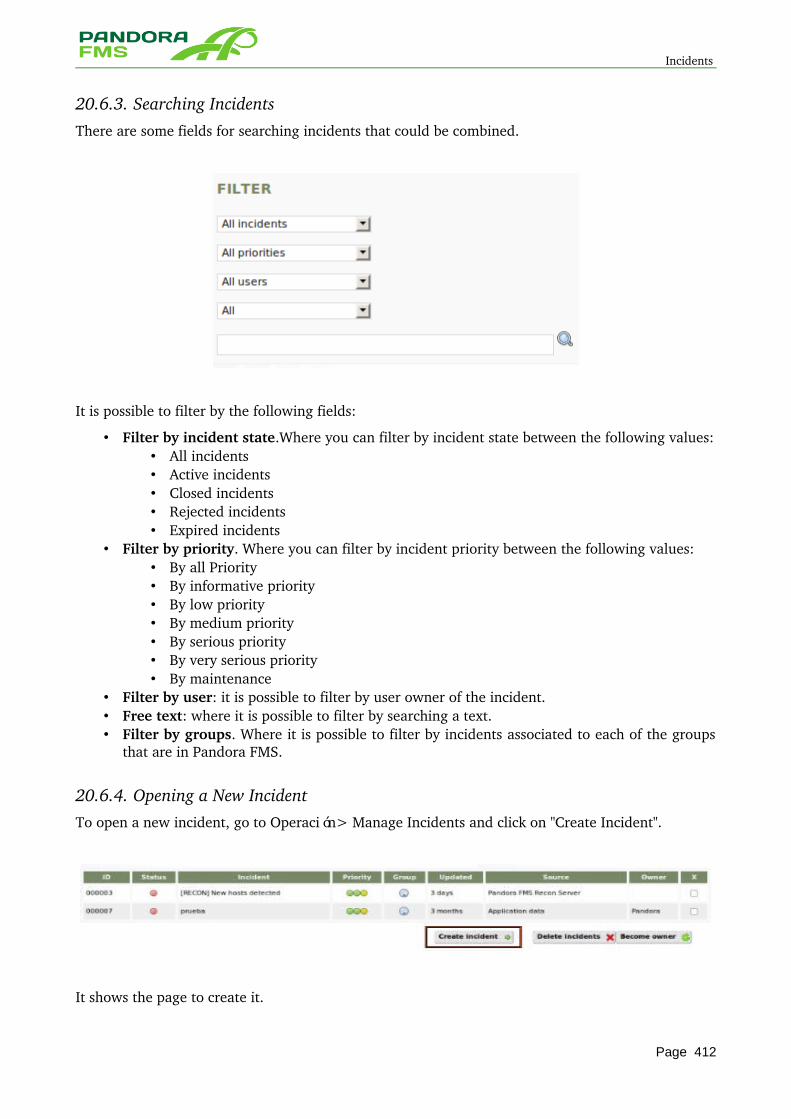
Incidents
20.6.3. Searching Incidents There are some fields for searching incidents that could be combined.
It is possible to filter by the following fields:
• Filter by incident state.Where you can filter by incident state between the following values: • All incidents • Active incidents • Closed incidents • Rejected incidents • Expired incidents
• Filter by priority. Where you can filter by incident priority between the following values: • By all Priority • By informative priority • By low priority • By medium priority • By serious priority • By very serious priority • By maintenance
• Filter by user: it is possible to filter by user owner of the incident. • Free text: where it is possible to filter by searching a text. • Filter by groups. Where it is possible to filter by incidents associated to each of the groups
that are in Pandora FMS.
20.6.4. Opening a New Incident To open a new incident, go to Operación> Manage Incidents and click on "Create Incident".
It shows the page to create it.
Page 412
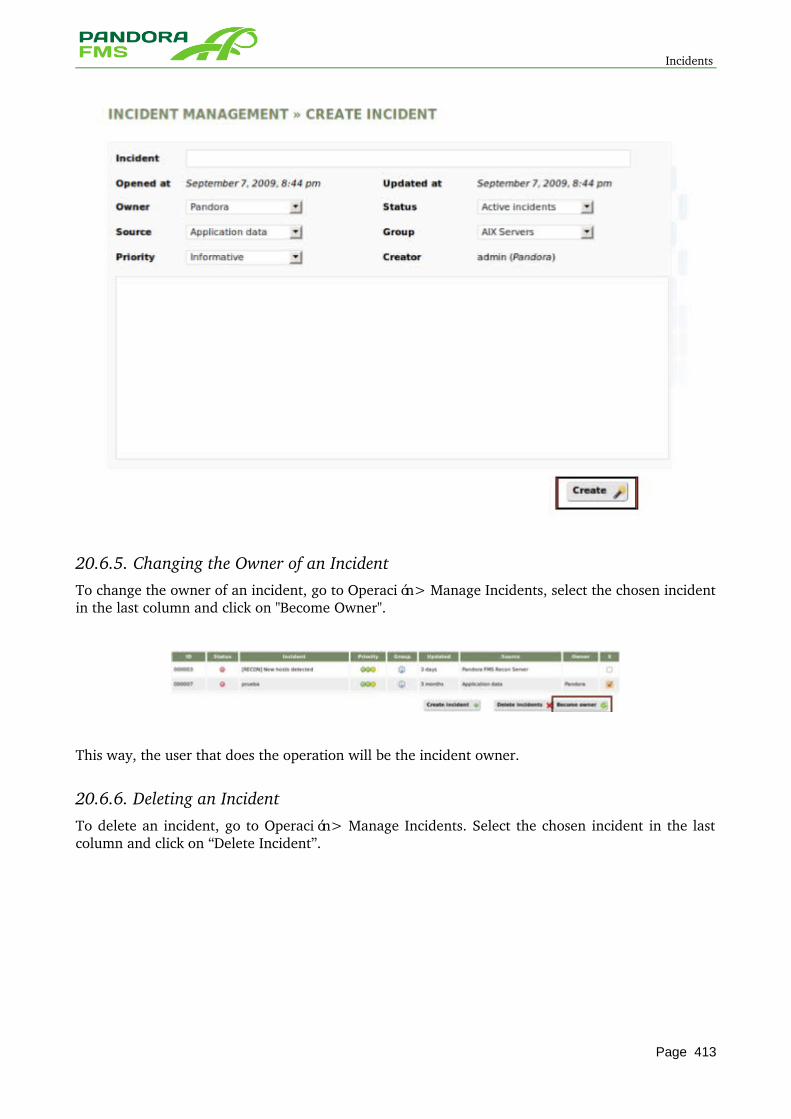
Incidents
20.6.5. Changing the Owner of an Incident To change the owner of an incident, go to Operación> Manage Incidents, select the chosen incident in the last column and click on "Become Owner".
This way, the user that does the operation will be the incident owner.
20.6.6. Deleting an Incident To delete an incident, go to Operación> Manage Incidents. Select the chosen incident in the last column and click on “Delete Incident”.
Page 413
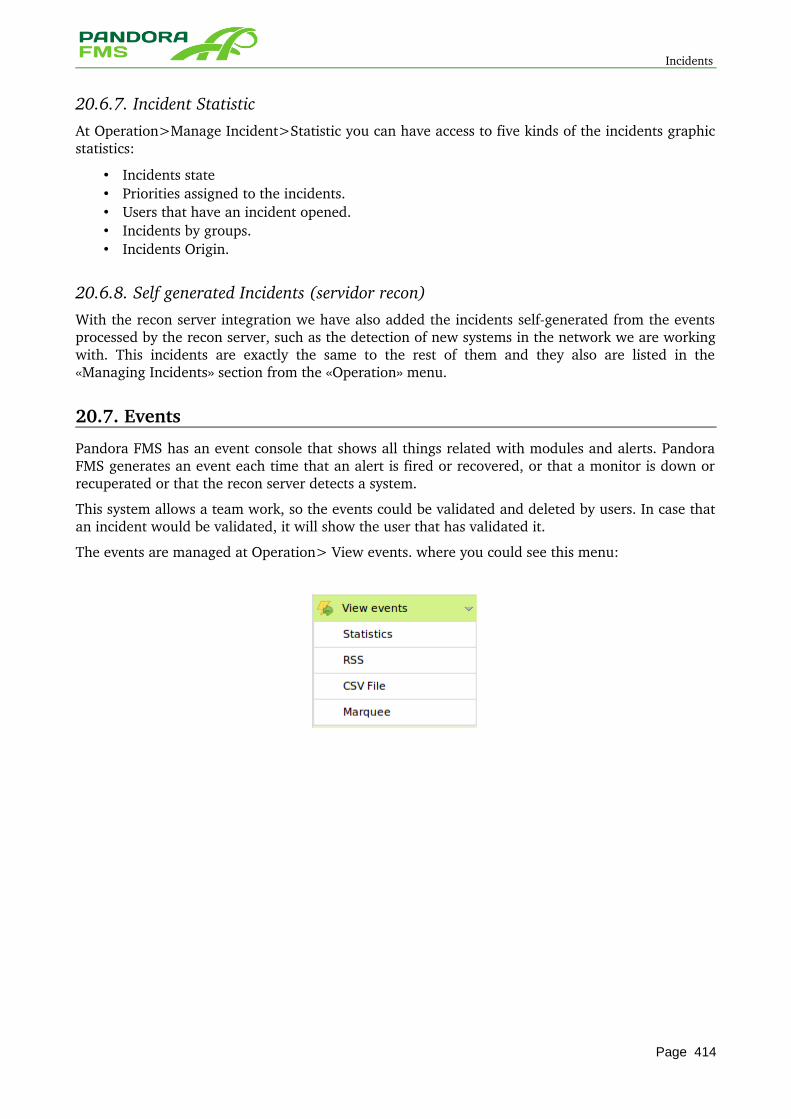
Incidents
20.6.7. Incident Statistic At Operation>Manage Incident>Statistic you can have access to five kinds of the incidents graphic statistics:
• Incidents state • Priorities assigned to the incidents. • Users that have an incident opened. • Incidents by groups. • Incidents Origin.
20.6.8. Self generated Incidents (servidor recon) With the recon server integration we have also added the incidents selfgenerated from the events processed by the recon server, such as the detection of new systems in the network we are working with. This incidents are exactly the same to the rest of them and they also are listed in the «Managing Incidents» section from the «Operation» menu.
20.7. Events
Pandora FMS has an event console that shows all things related with modules and alerts. Pandora FMS generates an event each time that an alert is fired or recovered, or that a monitor is down or recuperated or that the recon server detects a system.
This system allows a team work, so the events could be validated and deleted by users. In case that an incident would be validated, it will show the user that has validated it.
The events are managed at Operation> View events. where you could see this menu:
Page 414
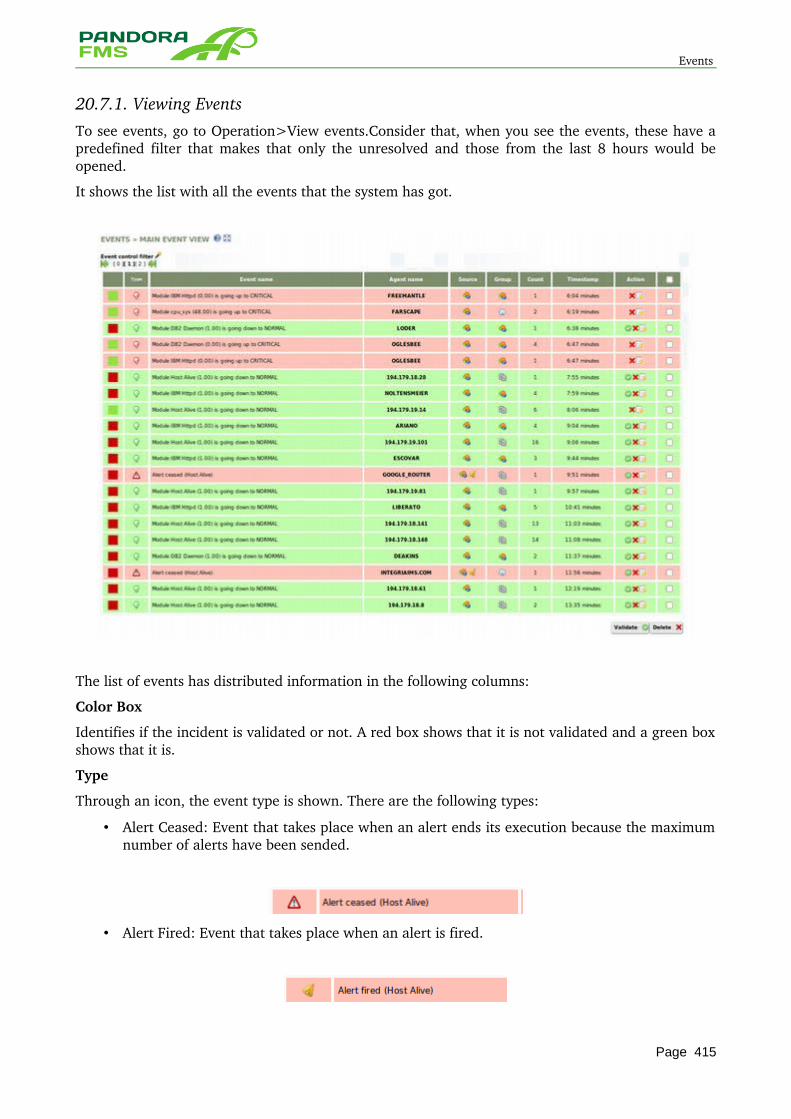
Events
20.7.1. Viewing Events To see events, go to Operation>View events.Consider that, when you see the events, these have a predefined filter that makes that only the unresolved and those from the last 8 hours would be opened.
It shows the list with all the events that the system has got.
The list of events has distributed information in the following columns:
Color Box
Identifies if the incident is validated or not. A red box shows that it is not validated and a green box shows that it is.
Type
Through an icon, the event type is shown. There are the following types:
• Alert Ceased: Event that takes place when an alert ends its execution because the maximum number of alerts have been sended.
• Alert Fired: Event that takes place when an alert is fired.
Page 415
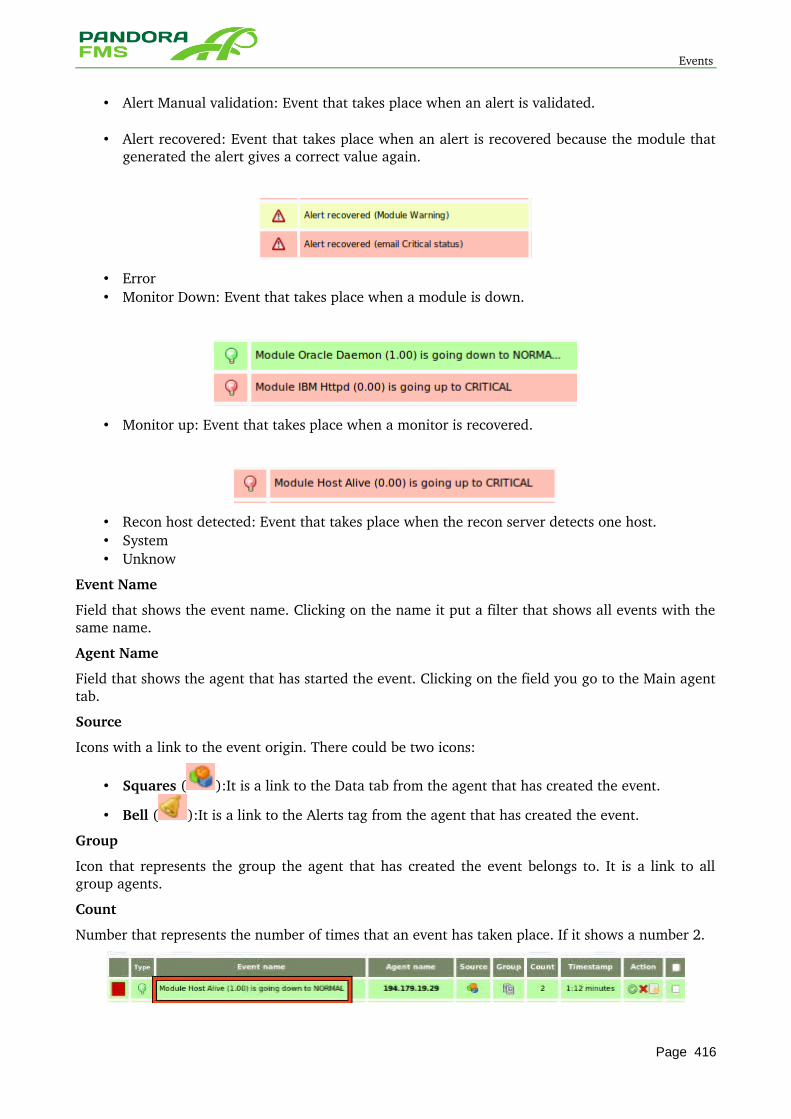
Events
• Alert Manual validation: Event that takes place when an alert is validated.
• Alert recovered: Event that takes place when an alert is recovered because the module that generated the alert gives a correct value again.
• Error • Monitor Down: Event that takes place when a module is down.
• Monitor up: Event that takes place when a monitor is recovered.
• Recon host detected: Event that takes place when the recon server detects one host. • System • Unknow
Event Name
Field that shows the event name. Clicking on the name it put a filter that shows all events with the same name.
Agent Name
Field that shows the agent that has started the event. Clicking on the field you go to the Main agent tab.
Source
Icons with a link to the event origin. There could be two icons:
• Squares ( ):It is a link to the Data tab from the agent that has created the event.
• Bell ( ):It is a link to the Alerts tag from the agent that has created the event.
Group
Icon that represents the group the agent that has created the event belongs to. It is a link to all group agents.
Count
Number that represents the number of times that an event has taken place. If it shows a number 2.
Page 416
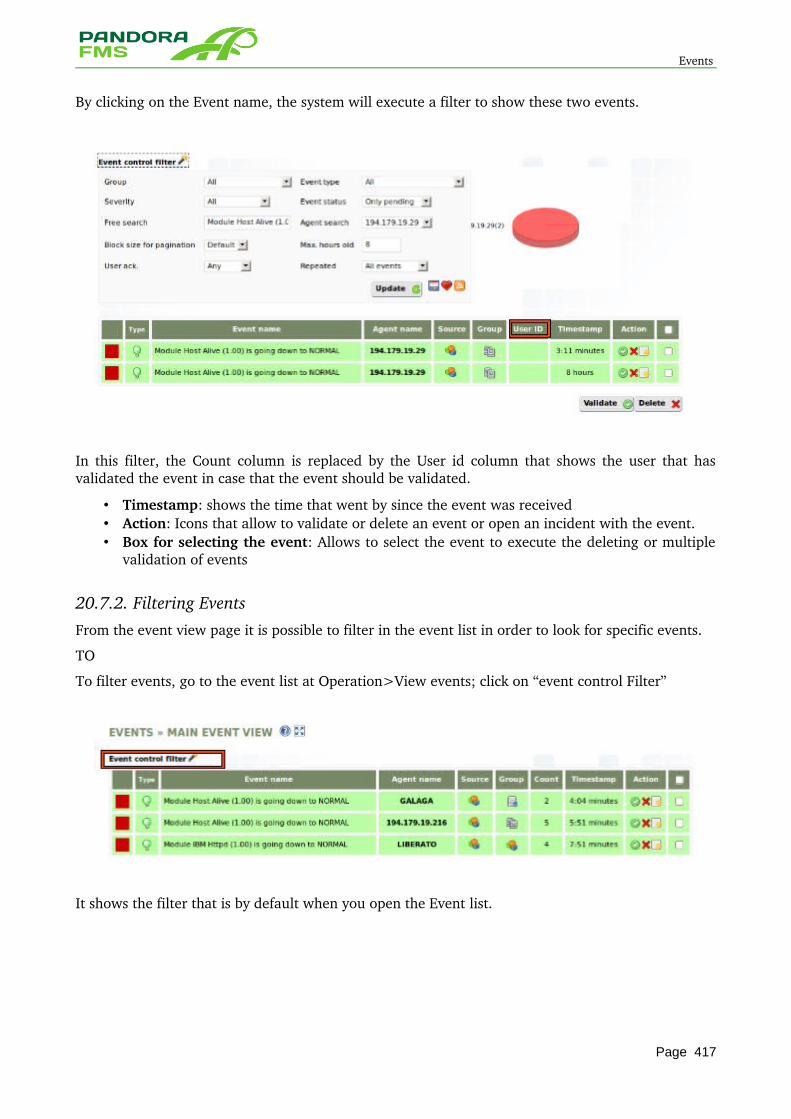
Events
By clicking on the Event name, the system will execute a filter to show these two events.
In this filter, the Count column is replaced by the User id column that shows the user that has validated the event in case that the event should be validated.
• Timestamp: shows the time that went by since the event was received • Action: Icons that allow to validate or delete an event or open an incident with the event. • Box for selecting the event: Allows to select the event to execute the deleting or multiple
validation of events
20.7.2. Filtering Events From the event view page it is possible to filter in the event list in order to look for specific events.
TO
To filter events, go to the event list at Operation>View events; click on “event control Filter”
It shows the filter that is by default when you open the Event list.
Page 417
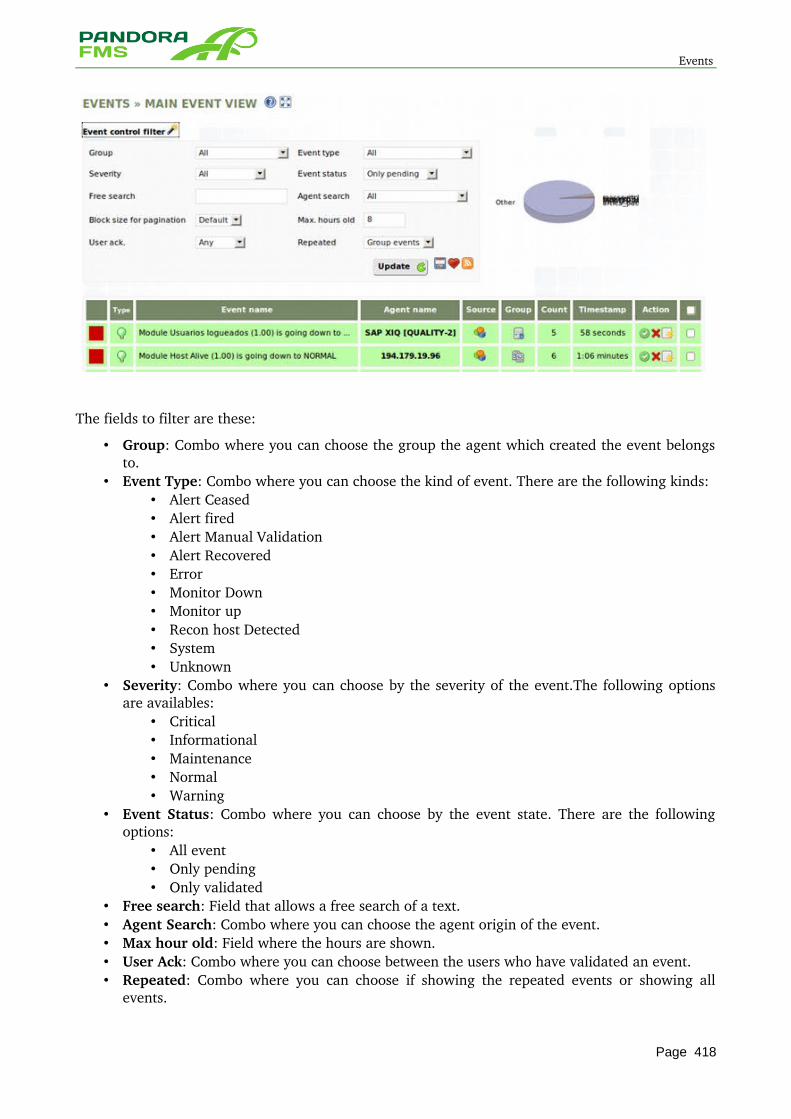
Events
The fields to filter are these:
• Group: Combo where you can choose the group the agent which created the event belongs to.
• Event Type: Combo where you can choose the kind of event. There are the following kinds: • Alert Ceased • Alert fired • Alert Manual Validation • Alert Recovered • Error • Monitor Down • Monitor up • Recon host Detected • System • Unknown
• Severity: Combo where you can choose by the severity of the event.The following options are availables:
• Critical • Informational • Maintenance • Normal • Warning
• Event Status: Combo where you can choose by the event state. There are the following options:
• All event • Only pending • Only validated
• Free search: Field that allows a free search of a text. • Agent Search: Combo where you can choose the agent origin of the event. • Max hour old: Field where the hours are shown. • User Ack: Combo where you can choose between the users who have validated an event. • Repeated: Combo where you can choose if showing the repeated events or showing all
events.
Page 418
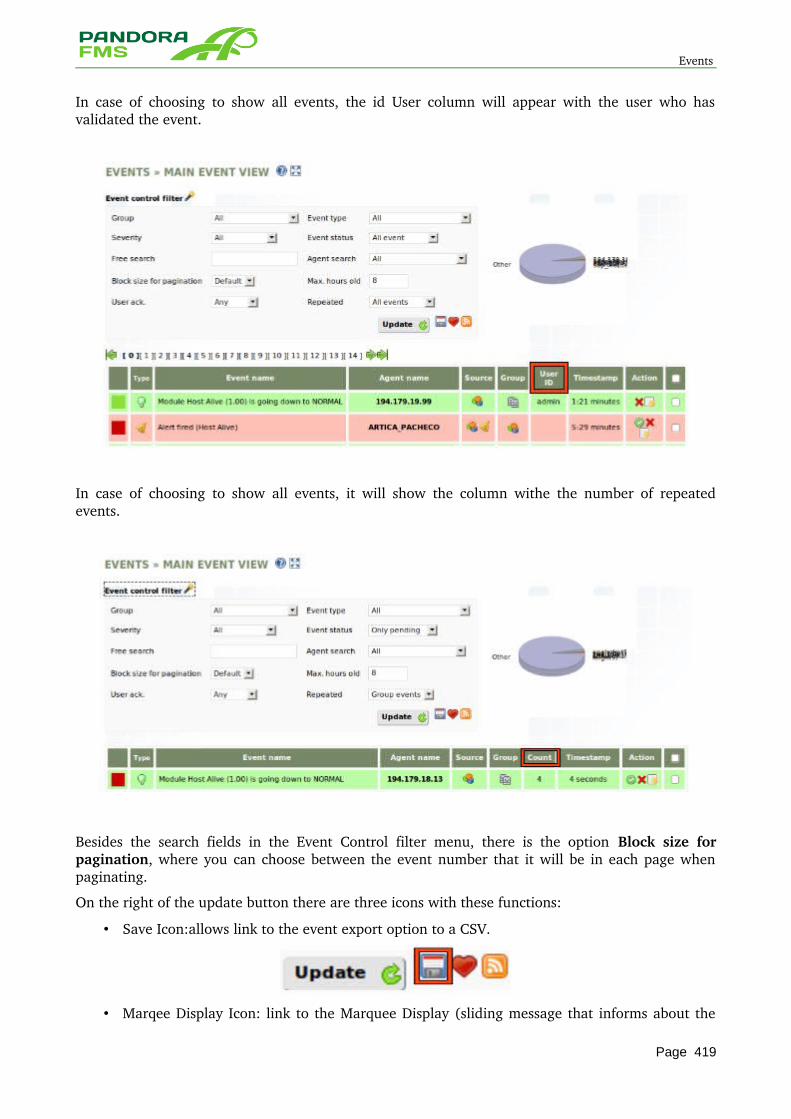
Events
In case of choosing to show all events, the id User column will appear with the user who has validated the event.
In case of choosing to show all events, it will show the column withe the number of repeated events.
Besides the search fields in the Event Control filter menu, there is the option Block size for pagination, where you can choose between the event number that it will be in each page when paginating.
On the right of the update button there are three icons with these functions:
• Save Icon:allows link to the event export option to a CSV.
• Marqee Display Icon: link to the Marquee Display (sliding message that informs about the
Page 419
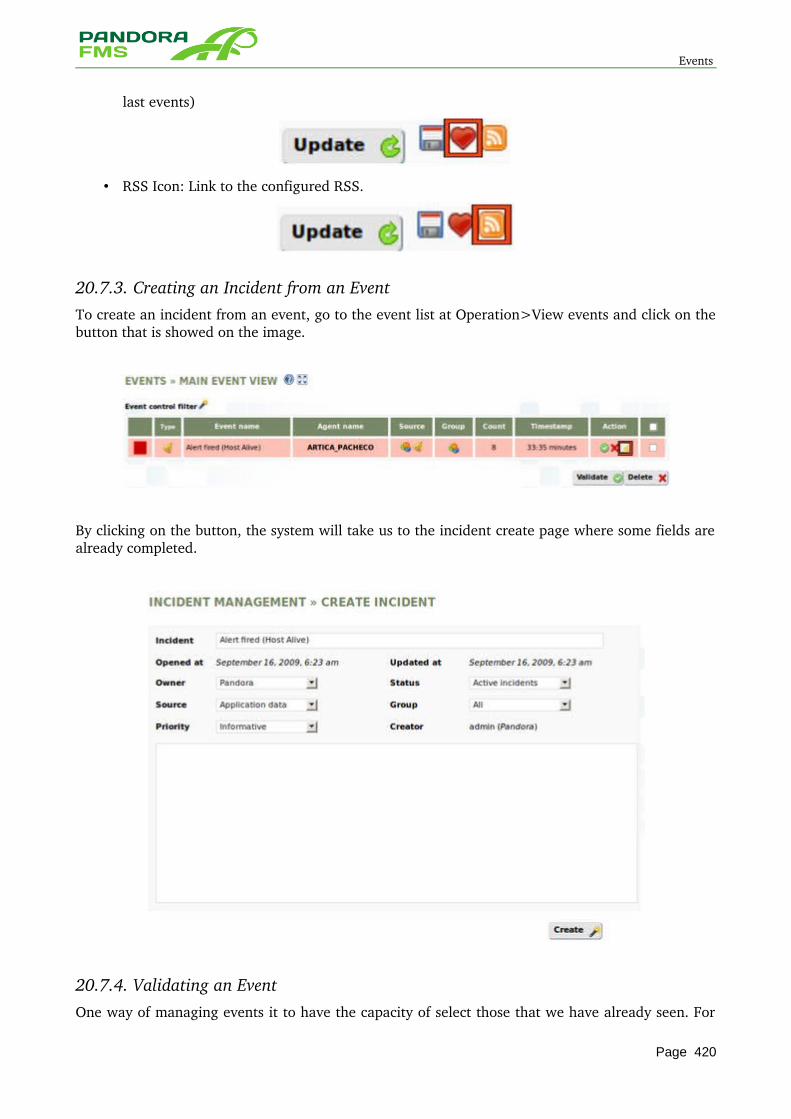
Events
last events)
• RSS Icon: Link to the configured RSS.
20.7.3. Creating an Incident from an Event To create an incident from an event, go to the event list at Operation>View events and click on the button that is showed on the image.
By clicking on the button, the system will take us to the incident create page where some fields are already completed.
20.7.4. Validating an Event One way of managing events it to have the capacity of select those that we have already seen. For
Page 420
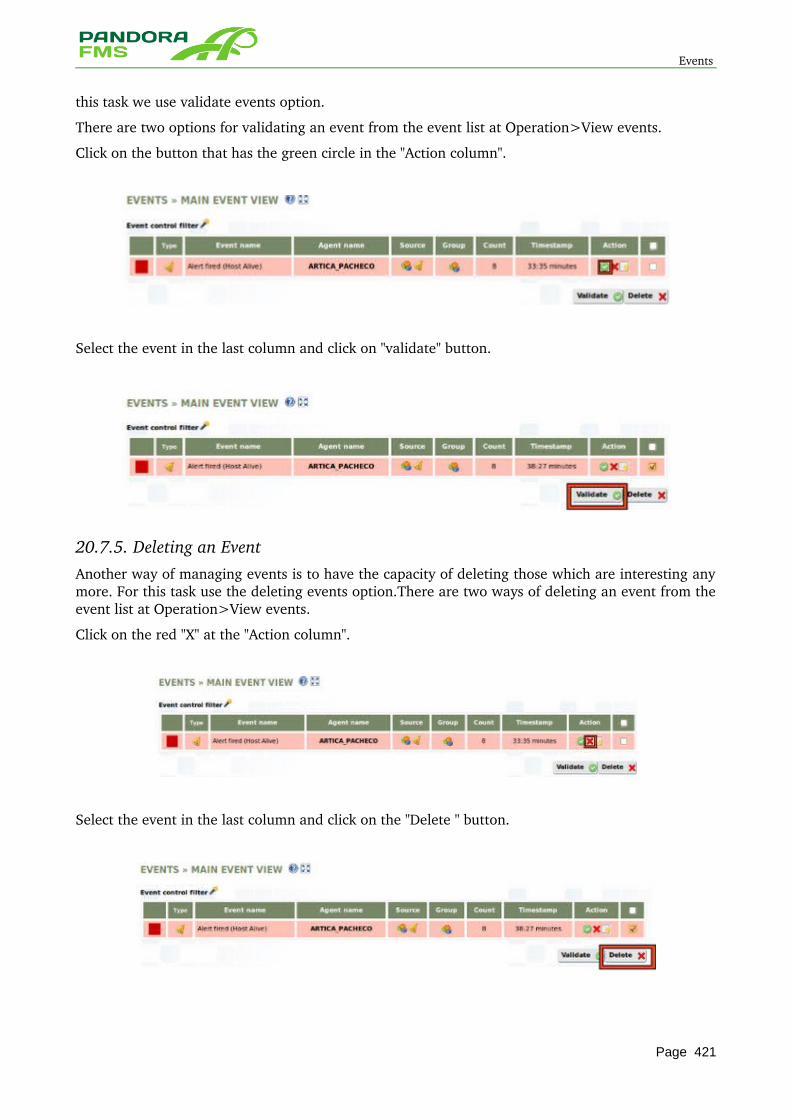
Events
this task we use validate events option.
There are two options for validating an event from the event list at Operation>View events.
Click on the button that has the green circle in the "Action column".
Select the event in the last column and click on "validate" button.
20.7.5. Deleting an EventAnother way of managing events is to have the capacity of deleting those which are interesting any more. For this task use the deleting events option.There are two ways of deleting an event from the event list at Operation>View events.
Click on the red "X" at the "Action column".
Select the event in the last column and click on the "Delete " button.
Page 421
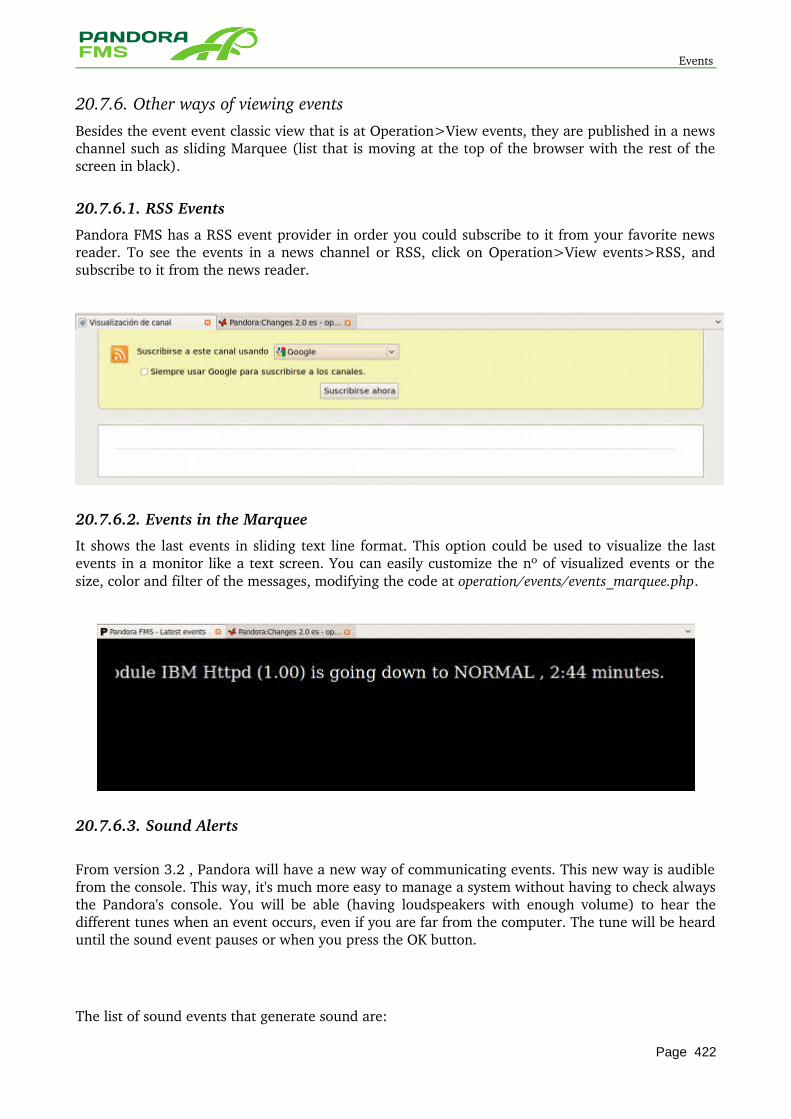
Events
20.7.6. Other ways of viewing events Besides the event event classic view that is at Operation>View events, they are published in a news channel such as sliding Marquee (list that is moving at the top of the browser with the rest of the screen in black).
20.7.6.1. RSS Events
Pandora FMS has a RSS event provider in order you could subscribe to it from your favorite news reader. To see the events in a news channel or RSS, click on Operation>View events>RSS, and subscribe to it from the news reader.
20.7.6.2. Events in the Marquee
It shows the last events in sliding text line format. This option could be used to visualize the last events in a monitor like a text screen. You can easily customize the nº of visualized events or the size, color and filter of the messages, modifying the code at operation/events/events_marquee.php.
20.7.6.3. Sound Alerts
From version 3.2 , Pandora will have a new way of communicating events. This new way is audible from the console. This way, it's much more easy to manage a system without having to check always the Pandora's console. You will be able (having loudspeakers with enough volume) to hear the different tunes when an event occurs, even if you are far from the computer. The tune will be heard until the sound event pauses or when you press the OK button.
The list of sound events that generate sound are:
Page 422
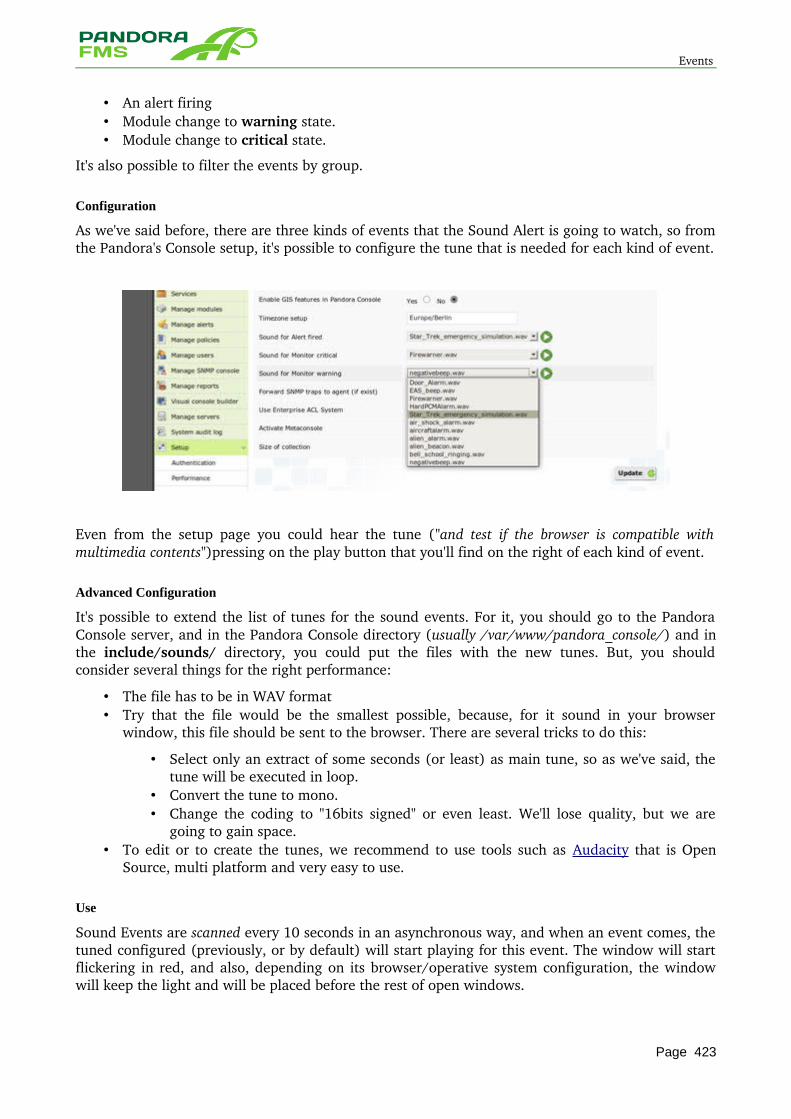
Events
• An alert firing • Module change to warning state. • Module change to critical state.
It's also possible to filter the events by group.
Configuration
As we've said before, there are three kinds of events that the Sound Alert is going to watch, so from the Pandora's Console setup, it's possible to configure the tune that is needed for each kind of event.
Even from the setup page you could hear the tune ("and test if the browser is compatible with multimedia contents")pressing on the play button that you'll find on the right of each kind of event.
Advanced Configuration
It's possible to extend the list of tunes for the sound events. For it, you should go to the Pandora Console server, and in the Pandora Console directory (usually /var/www/pandora_console/) and in the include/sounds/ directory, you could put the files with the new tunes. But, you should consider several things for the right performance:
• The file has to be in WAV format • Try that the file would be the smallest possible, because, for it sound in your browser
window, this file should be sent to the browser. There are several tricks to do this:
• Select only an extract of some seconds (or least) as main tune, so as we've said, the tune will be executed in loop.
• Convert the tune to mono. • Change the coding to "16bits signed" or even least. We'll lose quality, but we are
going to gain space. • To edit or to create the tunes, we recommend to use tools such as Audacity that is Open
Source, multi platform and very easy to use.
Use
Sound Events are scanned every 10 seconds in an asynchronous way, and when an event comes, the tuned configured (previously, or by default) will start playing for this event. The window will start flickering in red, and also, depending on its browser/operative system configuration, the window will keep the light and will be placed before the rest of open windows.
Page 423
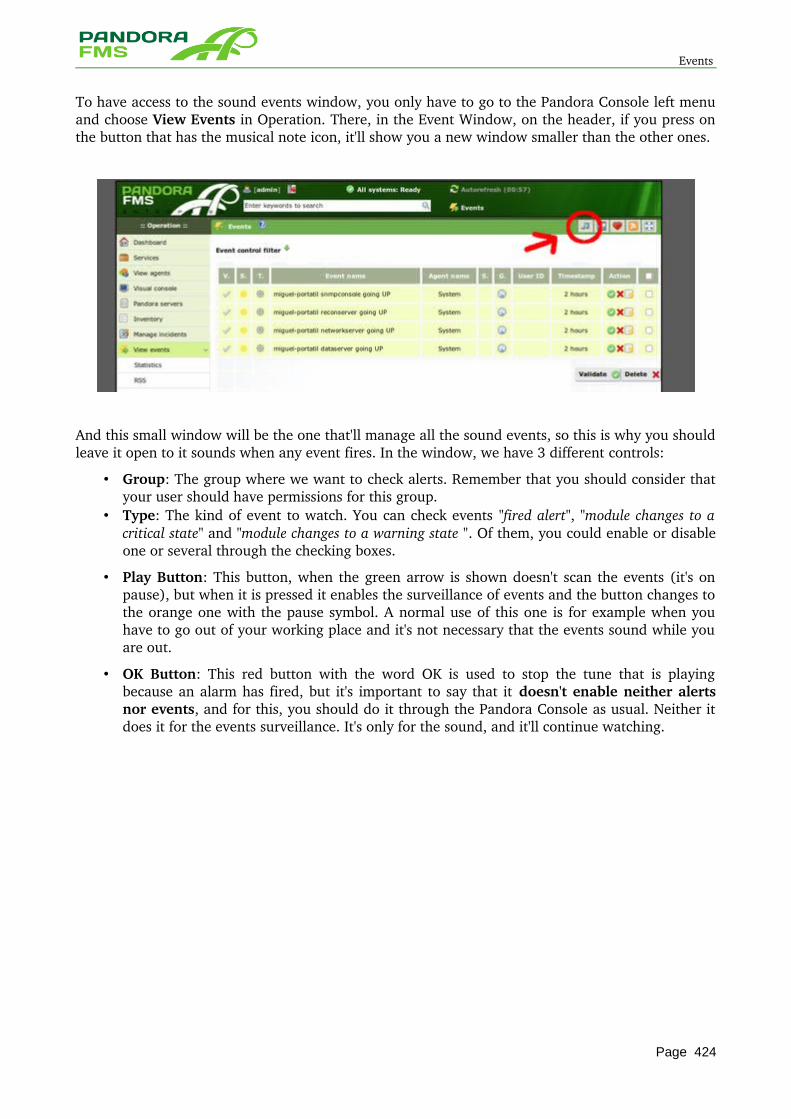
Events
To have access to the sound events window, you only have to go to the Pandora Console left menu and choose View Events in Operation. There, in the Event Window, on the header, if you press on the button that has the musical note icon, it'll show you a new window smaller than the other ones.
And this small window will be the one that'll manage all the sound events, so this is why you should leave it open to it sounds when any event fires. In the window, we have 3 different controls:
• Group: The group where we want to check alerts. Remember that you should consider that your user should have permissions for this group.
• Type: The kind of event to watch. You can check events "fired alert", "module changes to a critical state" and "module changes to a warning state ". Of them, you could enable or disable one or several through the checking boxes.
• Play Button: This button, when the green arrow is shown doesn't scan the events (it's on pause), but when it is pressed it enables the surveillance of events and the button changes to the orange one with the pause symbol. A normal use of this one is for example when you have to go out of your working place and it's not necessary that the events sound while you are out.
• OK Button: This red button with the word OK is used to stop the tune that is playing because an alarm has fired, but it's important to say that it doesn't enable neither alerts nor events, and for this, you should do it through the Pandora Console as usual. Neither it does it for the events surveillance. It's only for the sound, and it'll continue watching.
Page 424
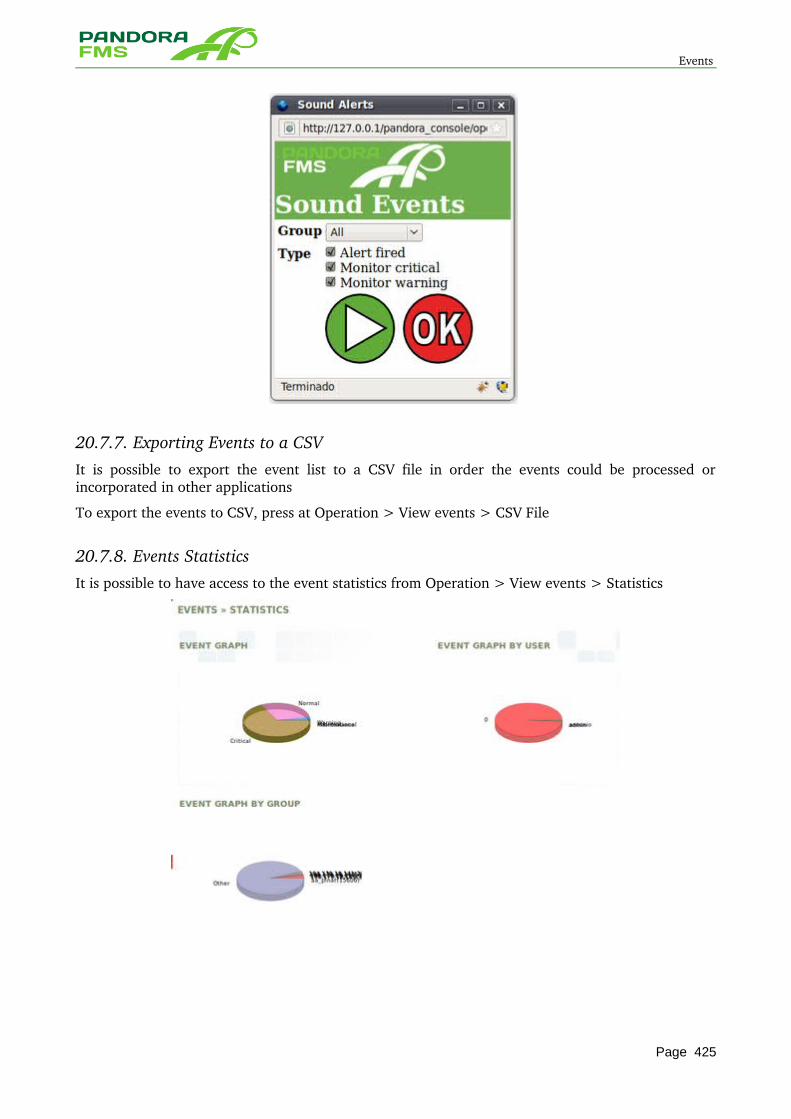
Events
20.7.7. Exporting Events to a CSV It is possible to export the event list to a CSV file in order the events could be processed or incorporated in other applications
To export the events to CSV, press at Operation > View events > CSV File
20.7.8. Events Statistics It is possible to have access to the event statistics from Operation > View events > Statistics
Page 425
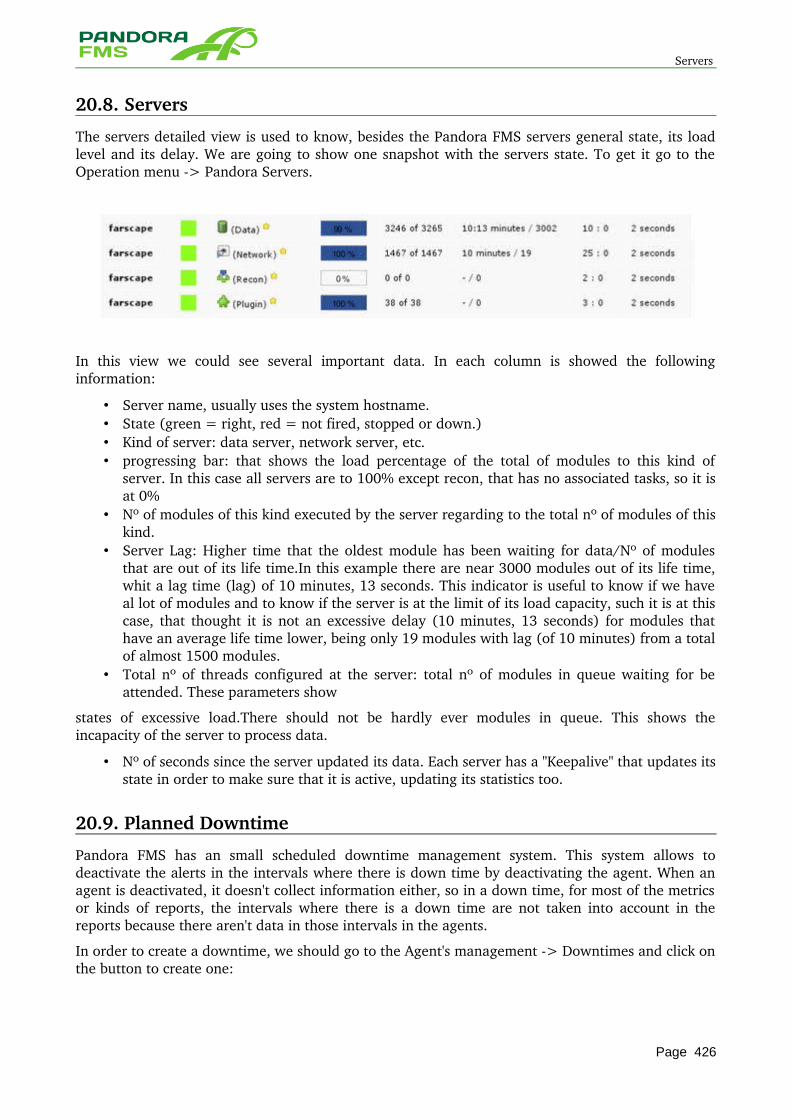
Servers
20.8. Servers
The servers detailed view is used to know, besides the Pandora FMS servers general state, its load level and its delay. We are going to show one snapshot with the servers state. To get it go to the Operation menu > Pandora Servers.
In this view we could see several important data. In each column is showed the following information:
• Server name, usually uses the system hostname. • State (green = right, red = not fired, stopped or down.) • Kind of server: data server, network server, etc. • progressing bar: that shows the load percentage of the total of modules to this kind of
server. In this case all servers are to 100% except recon, that has no associated tasks, so it is at 0%
• Nº of modules of this kind executed by the server regarding to the total nº of modules of this kind.
• Server Lag: Higher time that the oldest module has been waiting for data/Nº of modules that are out of its life time.In this example there are near 3000 modules out of its life time, whit a lag time (lag) of 10 minutes, 13 seconds. This indicator is useful to know if we have al lot of modules and to know if the server is at the limit of its load capacity, such it is at this case, that thought it is not an excessive delay (10 minutes, 13 seconds) for modules that have an average life time lower, being only 19 modules with lag (of 10 minutes) from a total of almost 1500 modules.
• Total nº of threads configured at the server: total nº of modules in queue waiting for be attended. These parameters show
states of excessive load.There should not be hardly ever modules in queue. This shows the incapacity of the server to process data.
• Nº of seconds since the server updated its data. Each server has a "Keepalive" that updates its state in order to make sure that it is active, updating its statistics too.
20.9. Planned Downtime
Pandora FMS has an small scheduled downtime management system. This system allows to deactivate the alerts in the intervals where there is down time by deactivating the agent. When an agent is deactivated, it doesn't collect information either, so in a down time, for most of the metrics or kinds of reports, the intervals where there is a down time are not taken into account in the reports because there aren't data in those intervals in the agents.
In order to create a downtime, we should go to the Agent's management > Downtimes and click on the button to create one:
Page 426
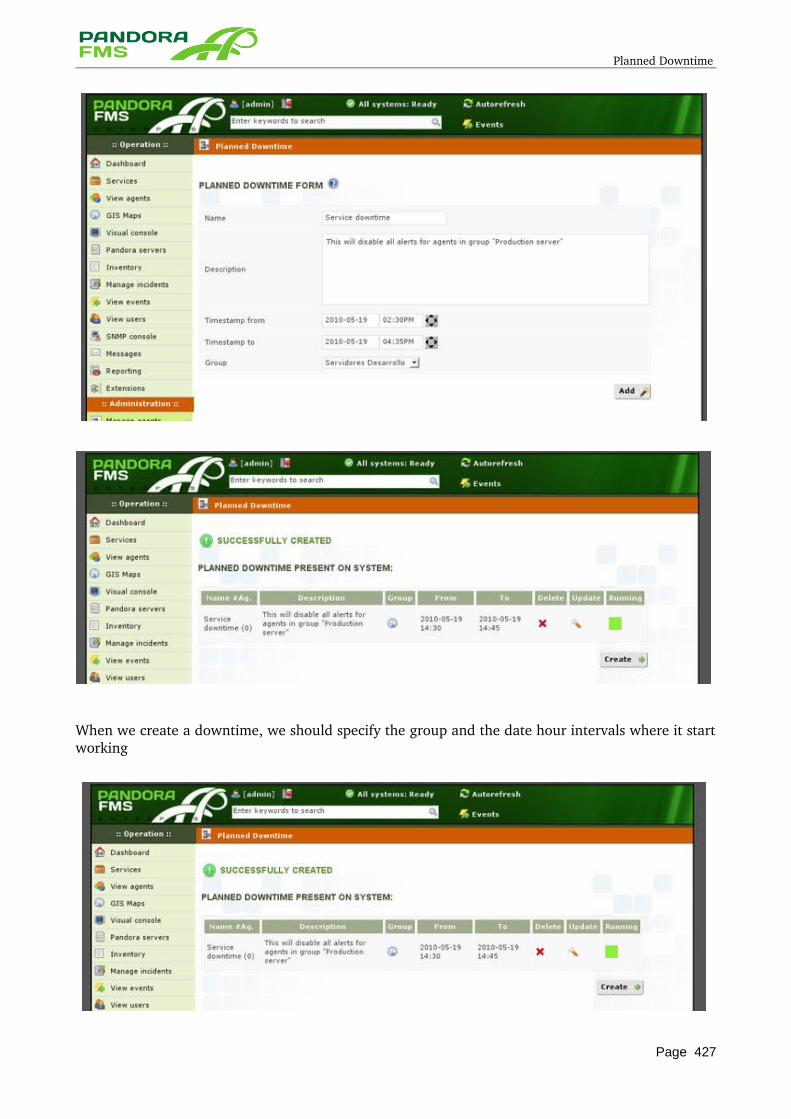
Planned Downtime
When we create a downtime, we should specify the group and the date hour intervals where it start working
Page 427
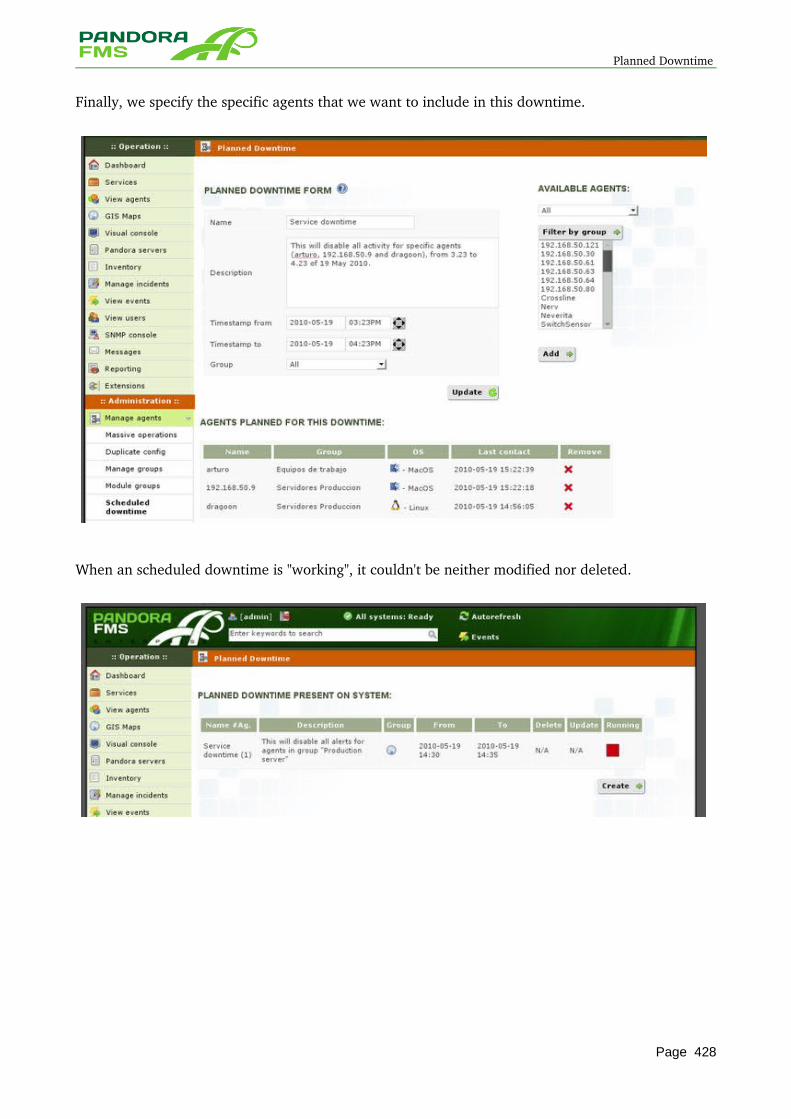
Planned Downtime
Finally, we specify the specific agents that we want to include in this downtime.
When an scheduled downtime is "working", it couldn't be neither modified nor deleted.
Page 428
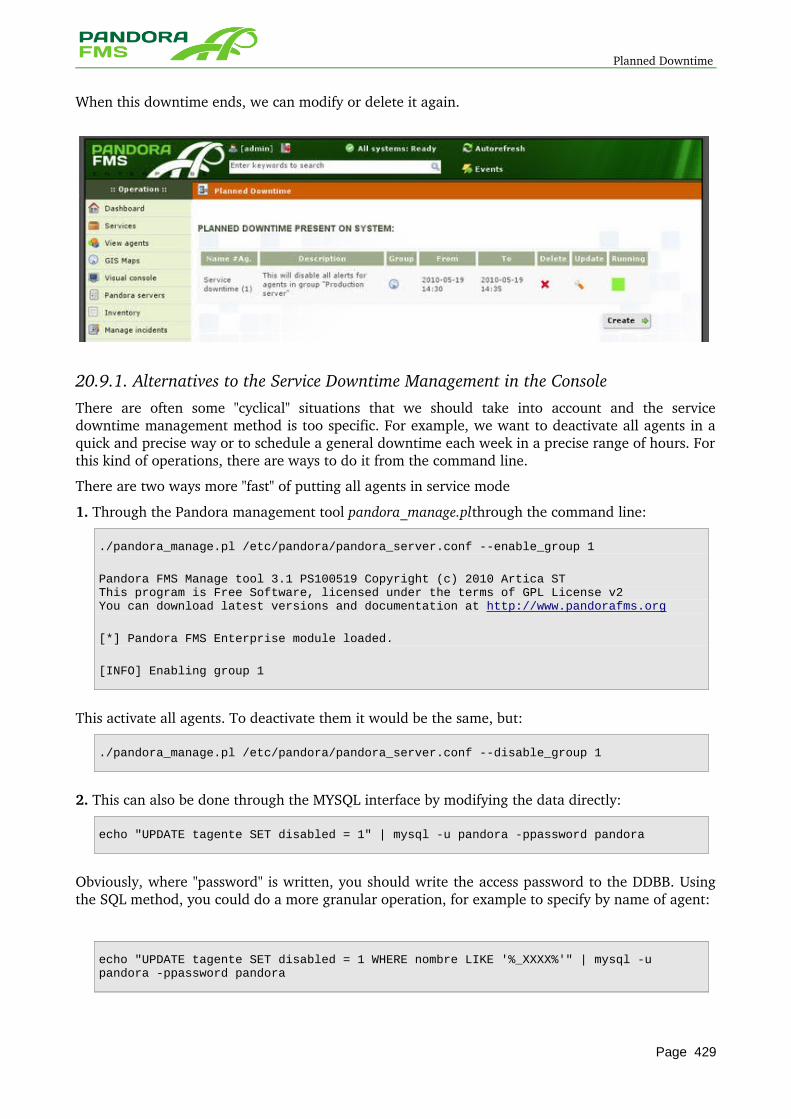
Planned Downtime
When this downtime ends, we can modify or delete it again.
20.9.1. Alternatives to the Service Downtime Management in the Console There are often some "cyclical" situations that we should take into account and the service downtime management method is too specific. For example, we want to deactivate all agents in a quick and precise way or to schedule a general downtime each week in a precise range of hours. For this kind of operations, there are ways to do it from the command line.
There are two ways more "fast" of putting all agents in service mode
1. Through the Pandora management tool pandora_manage.plthrough the command line:
./pandora_manage.pl /etc/pandora/pandora_server.conf --enable_group 1
Pandora FMS Manage tool 3.1 PS100519 Copyright (c) 2010 Artica STThis program is Free Software, licensed under the terms of GPL License v2You can download latest versions and documentation at http://www.pandorafms.org
[*] Pandora FMS Enterprise module loaded.
[INFO] Enabling group 1
This activate all agents. To deactivate them it would be the same, but:
./pandora_manage.pl /etc/pandora/pandora_server.conf --disable_group 1
2. This can also be done through the MYSQL interface by modifying the data directly:
echo "UPDATE tagente SET disabled = 1" | mysql -u pandora -ppassword pandora
Obviously, where "password" is written, you should write the access password to the DDBB. Using the SQL method, you could do a more granular operation, for example to specify by name of agent:
echo "UPDATE tagente SET disabled = 1 WHERE nombre LIKE '%_XXXX%'" | mysql -u pandora -ppassword pandora
Page 429
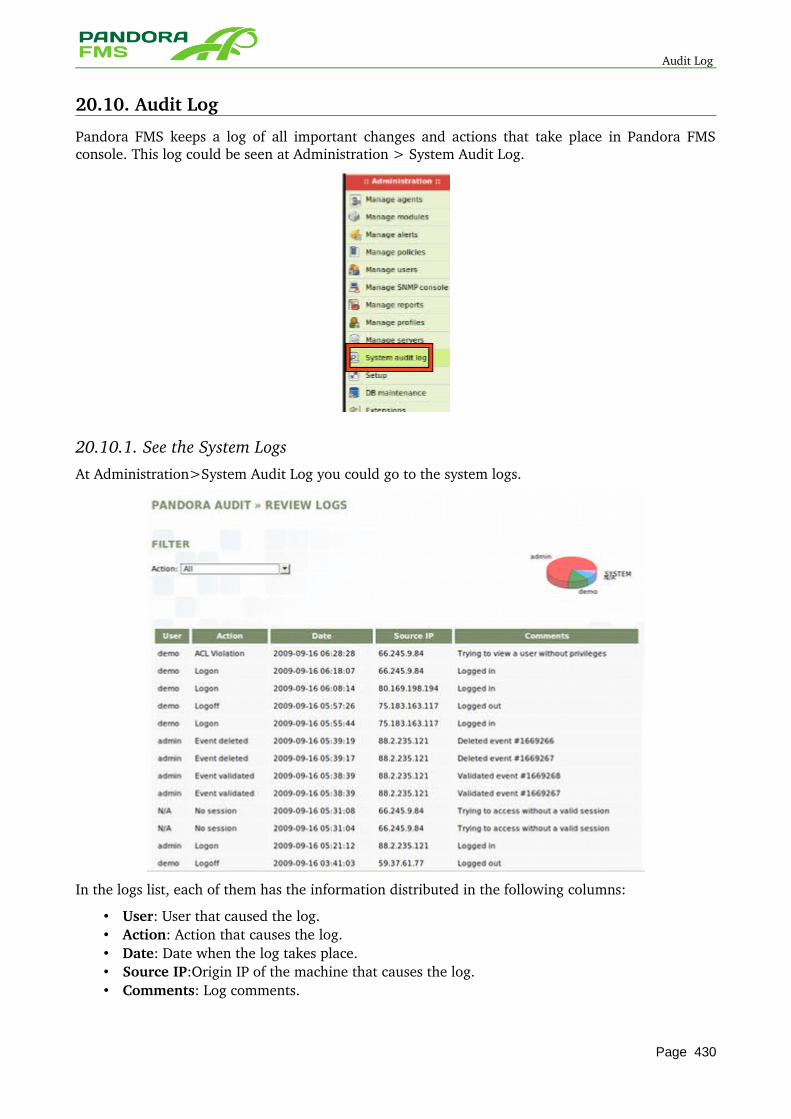
Audit Log
20.10. Audit Log
Pandora FMS keeps a log of all important changes and actions that take place in Pandora FMS console. This log could be seen at Administration > System Audit Log.
20.10.1. See the System LogsAt Administration>System Audit Log you could go to the system logs.
In the logs list, each of them has the information distributed in the following columns:
• User: User that caused the log. • Action: Action that causes the log. • Date: Date when the log takes place. • Source IP:Origin IP of the machine that causes the log. • Comments: Log comments.
Page 430
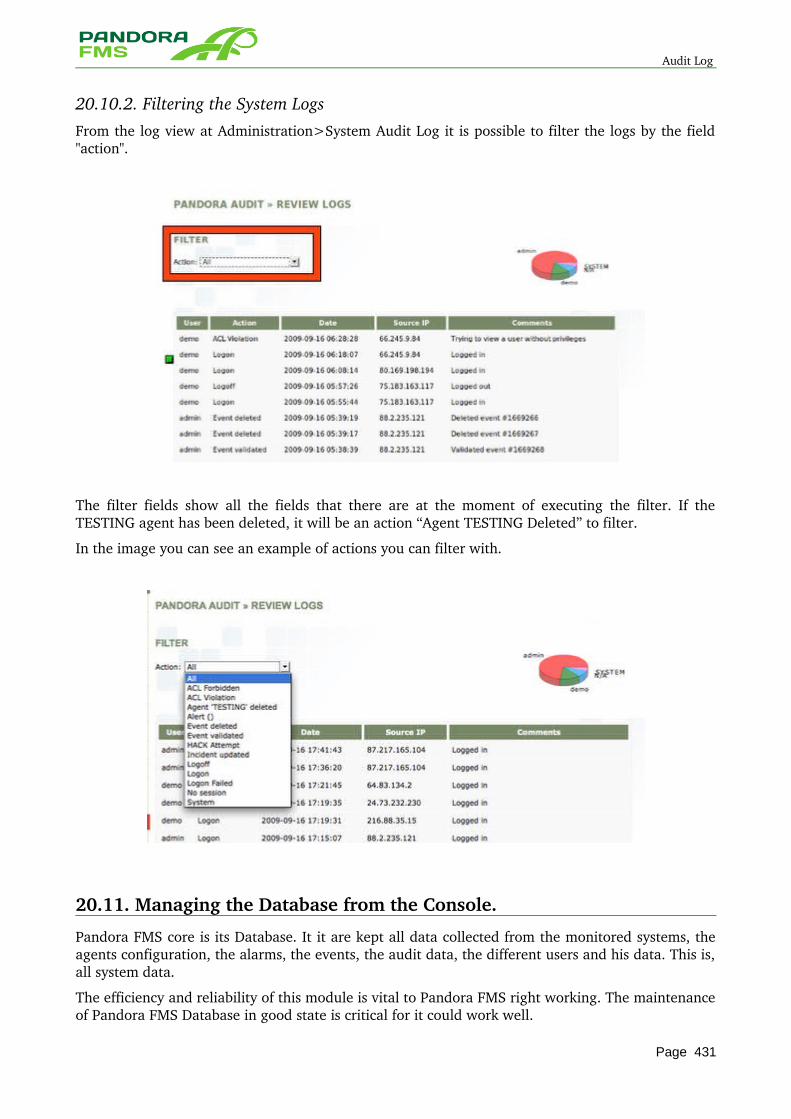
Audit Log
20.10.2. Filtering the System Logs From the log view at Administration>System Audit Log it is possible to filter the logs by the field "action".
The filter fields show all the fields that there are at the moment of executing the filter. If the TESTING agent has been deleted, it will be an action “Agent TESTING Deleted” to filter.
In the image you can see an example of actions you can filter with.
20.11. Managing the Database from the Console.
Pandora FMS core is its Database. It it are kept all data collected from the monitored systems, the agents configuration, the alarms, the events, the audit data, the different users and his data. This is, all system data.
The efficiency and reliability of this module is vital to Pandora FMS right working. The maintenance of Pandora FMS Database in good state is critical for it could work well.
Page 431
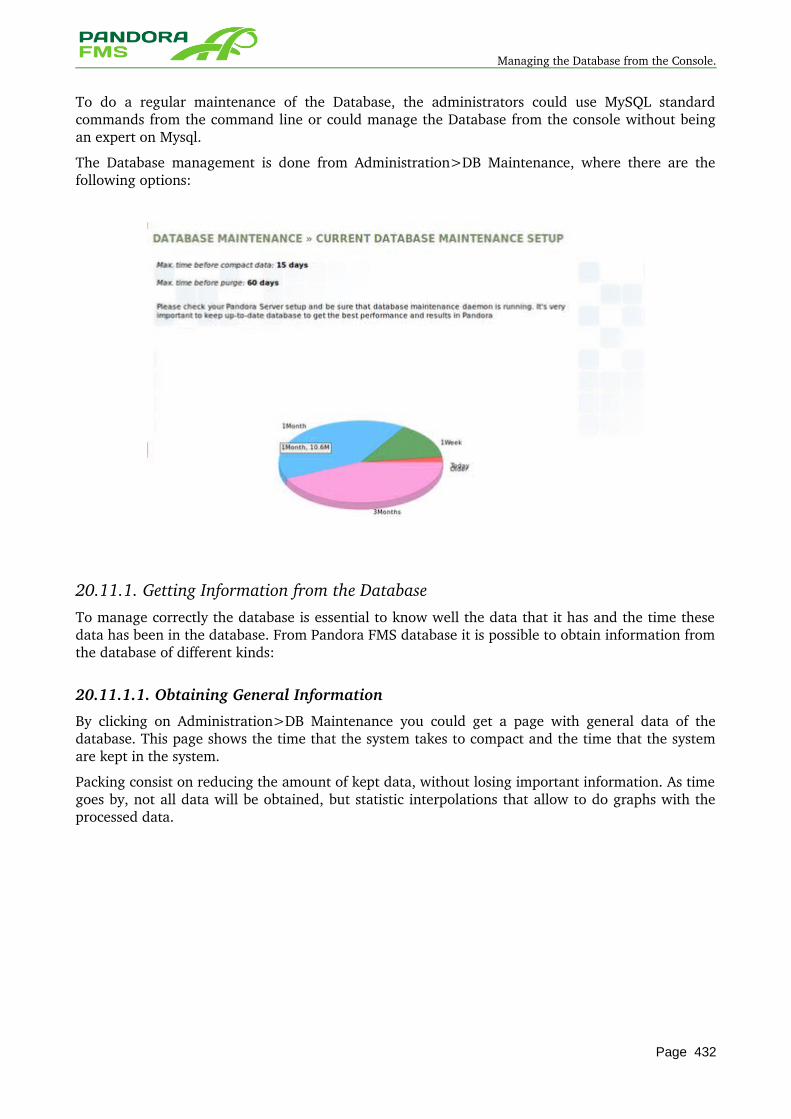
Managing the Database from the Console.
To do a regular maintenance of the Database, the administrators could use MySQL standard commands from the command line or could manage the Database from the console without being an expert on Mysql.
The Database management is done from Administration>DB Maintenance, where there are the following options:
20.11.1. Getting Information from the Database To manage correctly the database is essential to know well the data that it has and the time these data has been in the database. From Pandora FMS database it is possible to obtain information from the database of different kinds:
20.11.1.1. Obtaining General Information
By clicking on Administration>DB Maintenance you could get a page with general data of the database. This page shows the time that the system takes to compact and the time that the system are kept in the system.
Packing consist on reducing the amount of kept data, without losing important information. As time goes by, not all data will be obtained, but statistic interpolations that allow to do graphs with the processed data.
Page 432
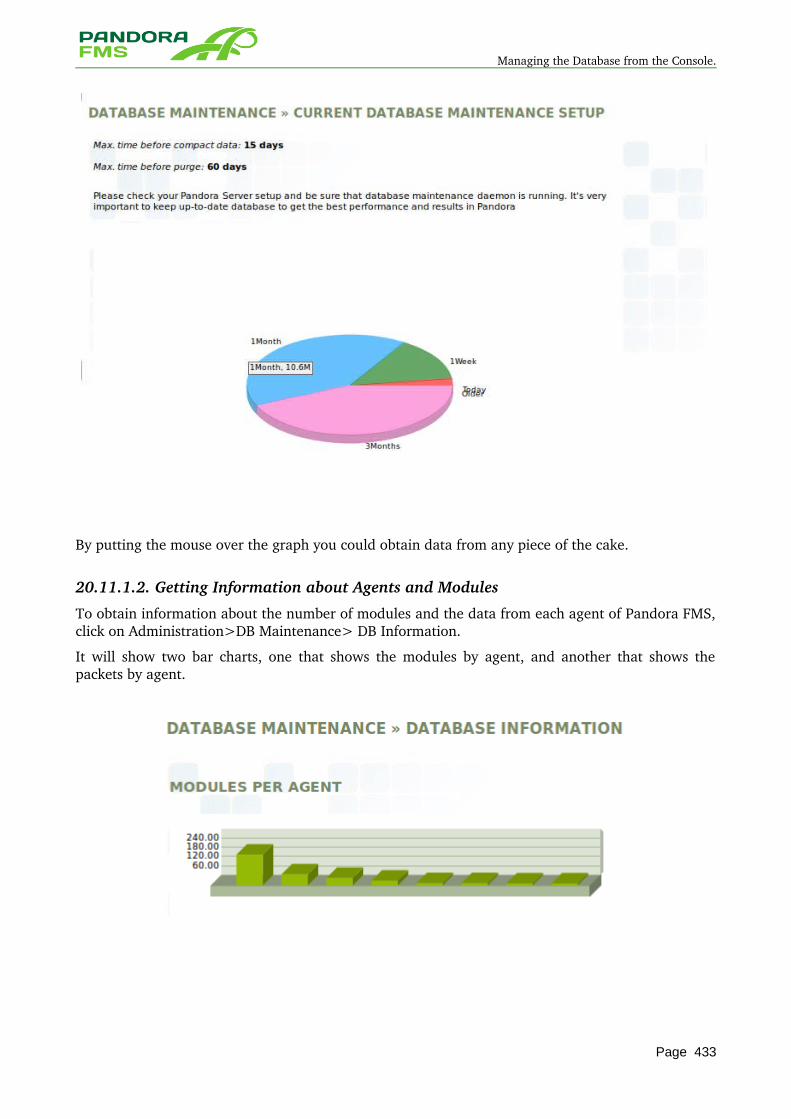
Managing the Database from the Console.
By putting the mouse over the graph you could obtain data from any piece of the cake.
20.11.1.2. Getting Information about Agents and Modules
To obtain information about the number of modules and the data from each agent of Pandora FMS, click on Administration>DB Maintenance> DB Information.
It will show two bar charts, one that shows the modules by agent, and another that shows the packets by agent.
Page 433
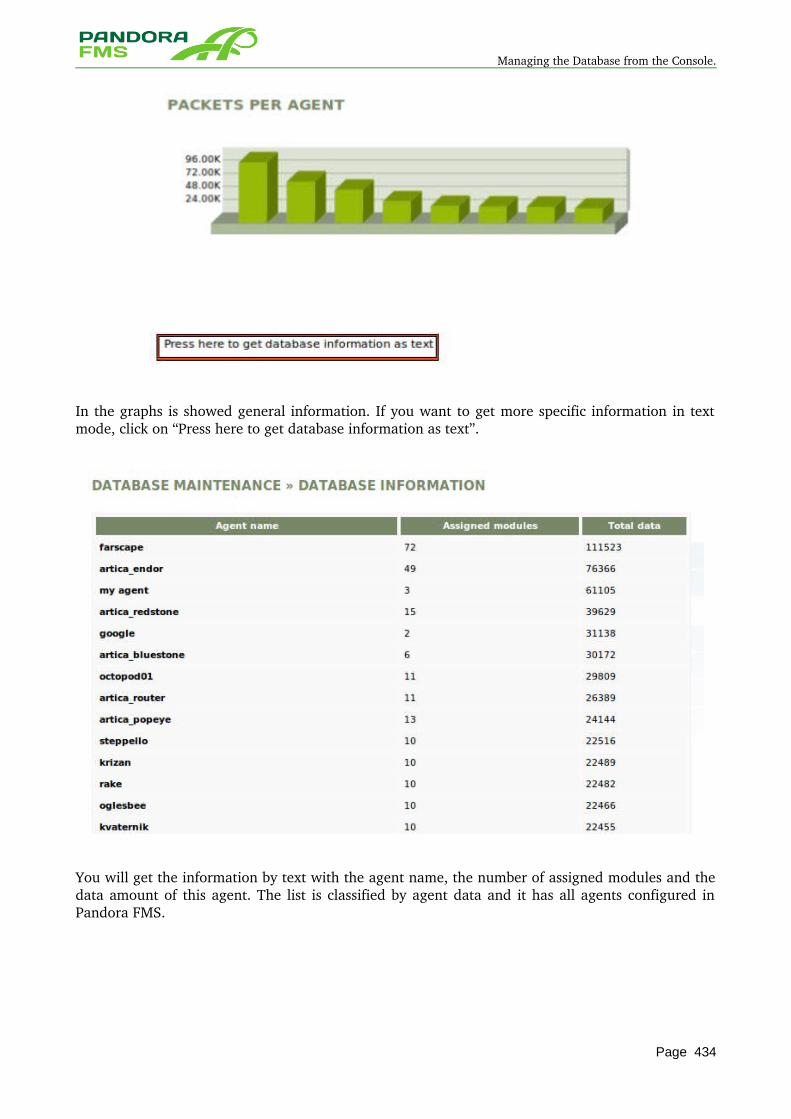
Managing the Database from the Console.
In the graphs is showed general information. If you want to get more specific information in text mode, click on “Press here to get database information as text”.
You will get the information by text with the agent name, the number of assigned modules and the data amount of this agent. The list is classified by agent data and it has all agents configured in Pandora FMS.
Page 434
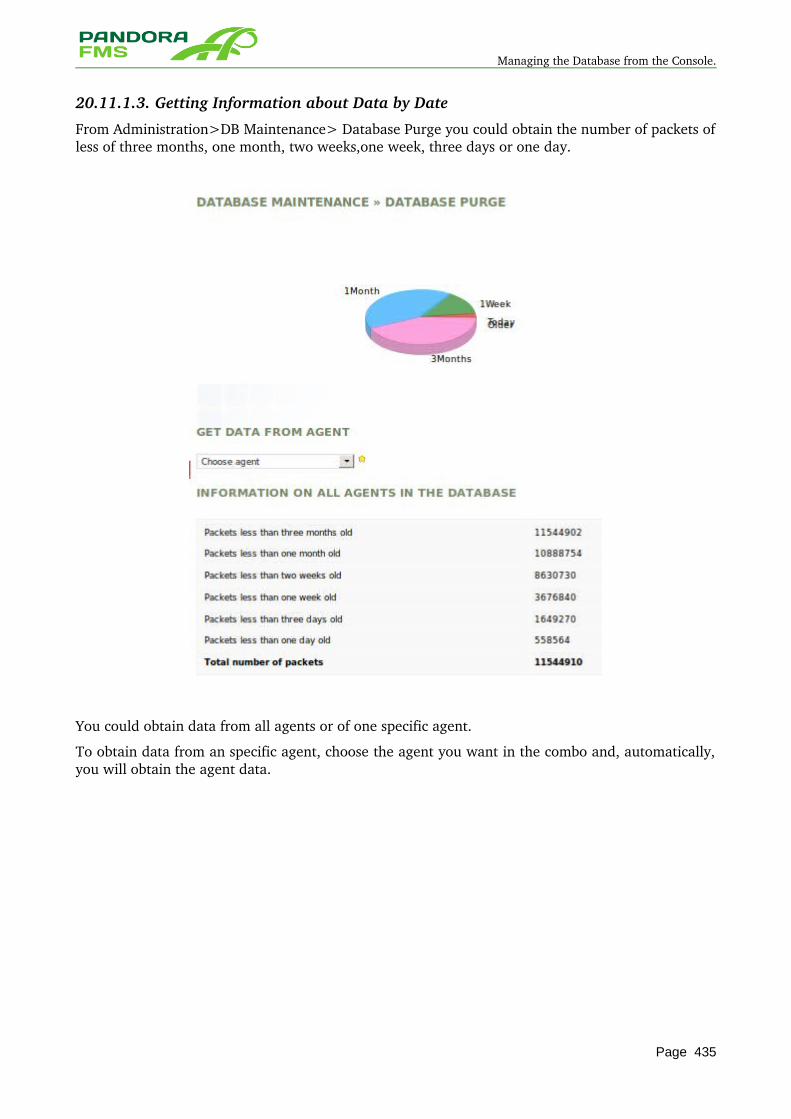
Managing the Database from the Console.
20.11.1.3. Getting Information about Data by Date
From Administration>DB Maintenance> Database Purge you could obtain the number of packets of less of three months, one month, two weeks,one week, three days or one day.
You could obtain data from all agents or of one specific agent.
To obtain data from an specific agent, choose the agent you want in the combo and, automatically, you will obtain the agent data.
Page 435
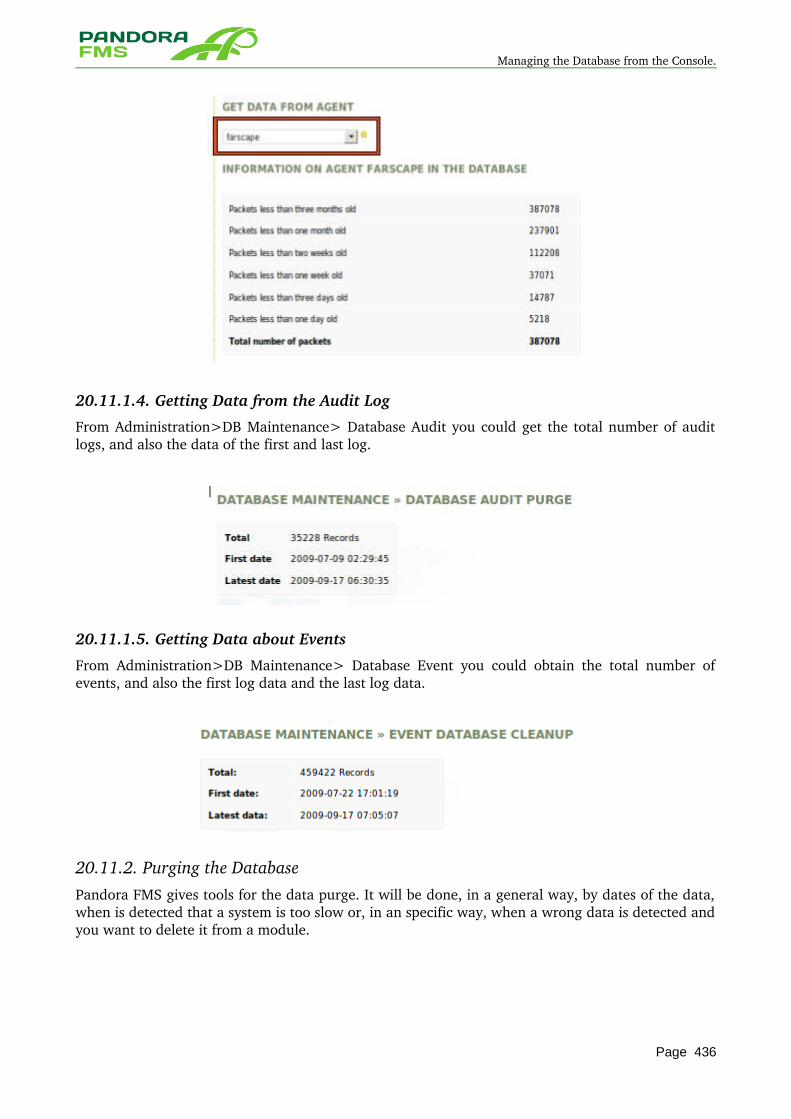
Managing the Database from the Console.
20.11.1.4. Getting Data from the Audit Log
From Administration>DB Maintenance> Database Audit you could get the total number of audit logs, and also the data of the first and last log.
20.11.1.5. Getting Data about Events
From Administration>DB Maintenance> Database Event you could obtain the total number of events, and also the first log data and the last log data.
20.11.2. Purging the Database Pandora FMS gives tools for the data purge. It will be done, in a general way, by dates of the data, when is detected that a system is too slow or, in an specific way, when a wrong data is detected and you want to delete it from a module.
Page 436
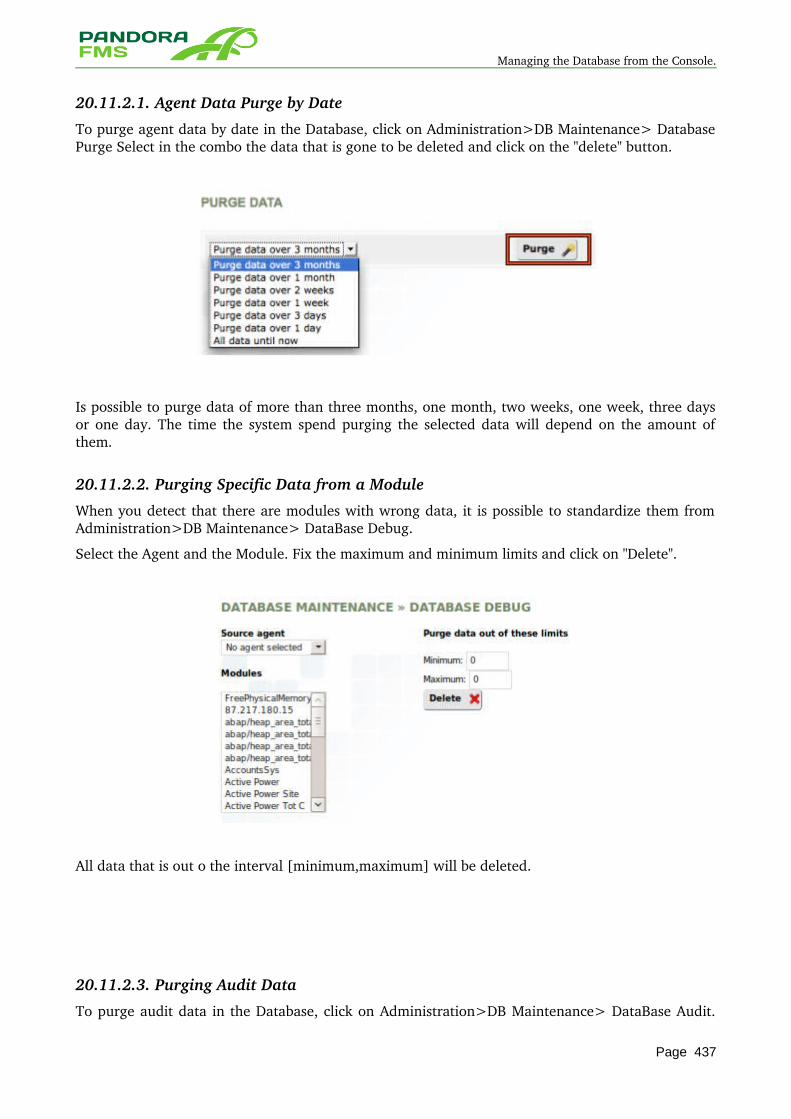
Managing the Database from the Console.
20.11.2.1. Agent Data Purge by Date
To purge agent data by date in the Database, click on Administration>DB Maintenance> Database Purge Select in the combo the data that is gone to be deleted and click on the "delete" button.
Is possible to purge data of more than three months, one month, two weeks, one week, three days or one day. The time the system spend purging the selected data will depend on the amount of them.
20.11.2.2. Purging Specific Data from a Module
When you detect that there are modules with wrong data, it is possible to standardize them from Administration>DB Maintenance> DataBase Debug.
Select the Agent and the Module. Fix the maximum and minimum limits and click on "Delete".
All data that is out o the interval [minimum,maximum] will be deleted.
20.11.2.3. Purging Audit Data
To purge audit data in the Database, click on Administration>DB Maintenance> DataBase Audit.
Page 437
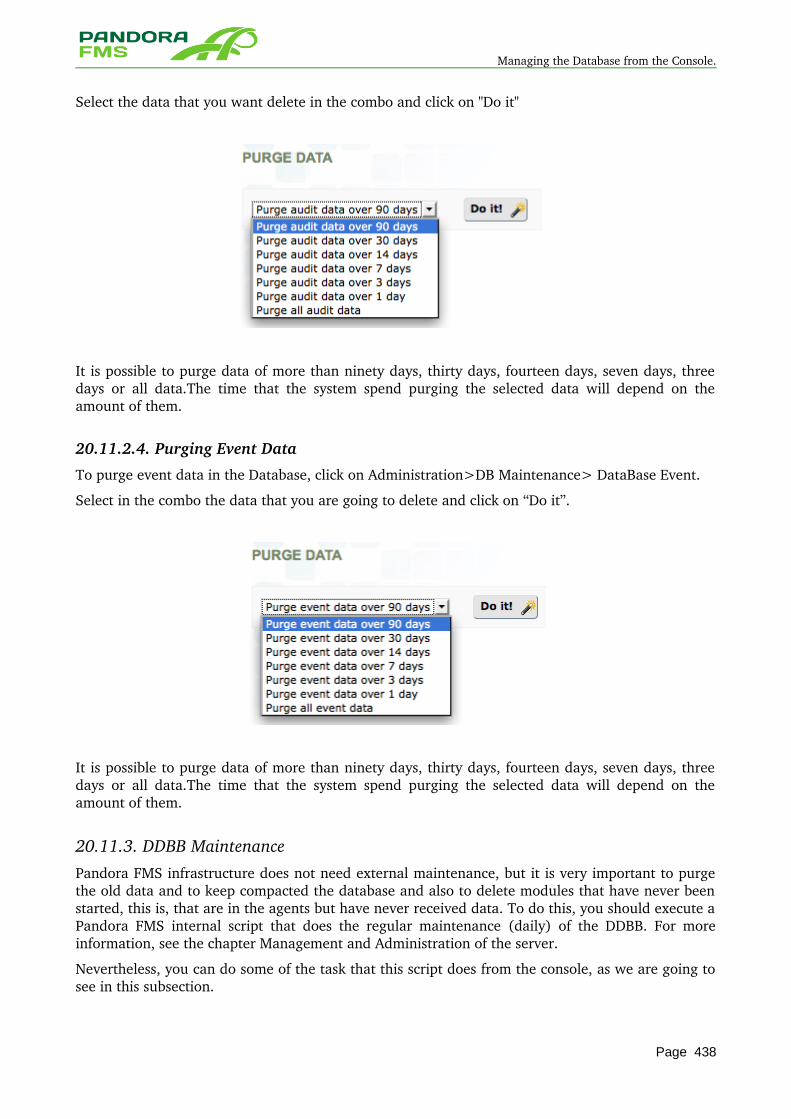
Managing the Database from the Console.
Select the data that you want delete in the combo and click on "Do it"
It is possible to purge data of more than ninety days, thirty days, fourteen days, seven days, three days or all data.The time that the system spend purging the selected data will depend on the amount of them.
20.11.2.4. Purging Event Data
To purge event data in the Database, click on Administration>DB Maintenance> DataBase Event.
Select in the combo the data that you are going to delete and click on “Do it”.
It is possible to purge data of more than ninety days, thirty days, fourteen days, seven days, three days or all data.The time that the system spend purging the selected data will depend on the amount of them.
20.11.3. DDBB MaintenancePandora FMS infrastructure does not need external maintenance, but it is very important to purge the old data and to keep compacted the database and also to delete modules that have never been started, this is, that are in the agents but have never received data. To do this, you should execute a Pandora FMS internal script that does the regular maintenance (daily) of the DDBB. For more information, see the chapter Management and Administration of the server.
Nevertheless, you can do some of the task that this script does from the console, as we are going to see in this subsection.
Page 438
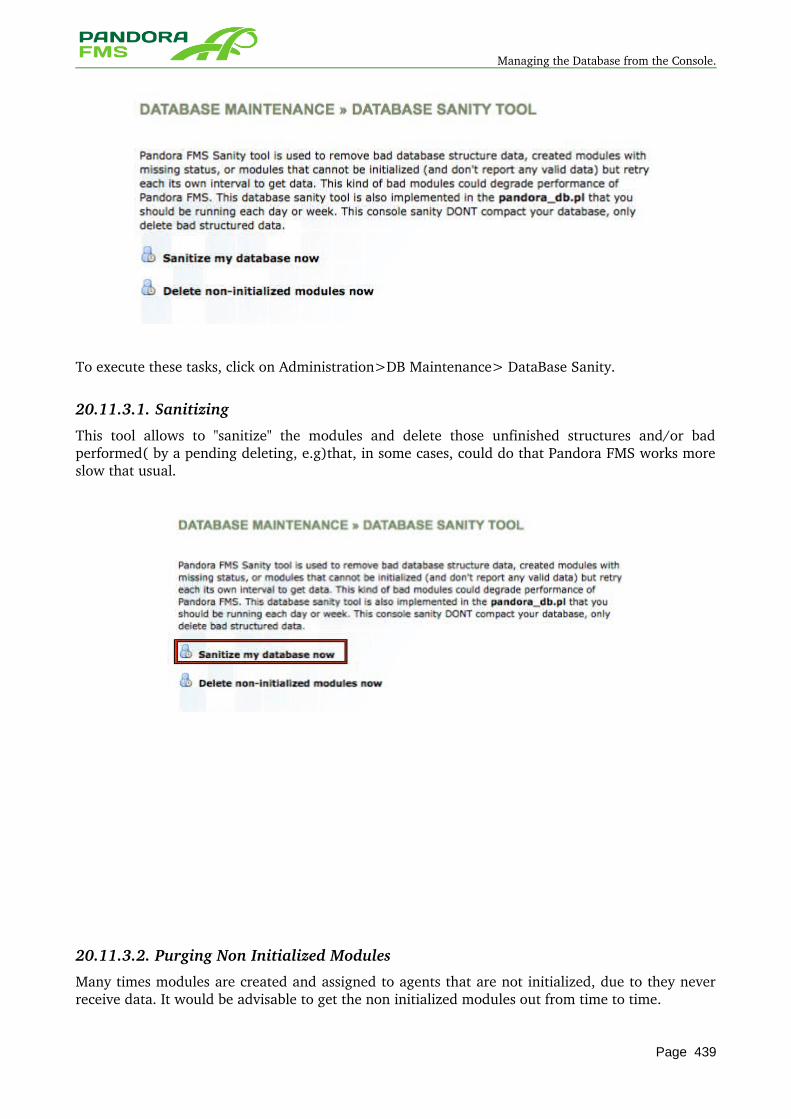
Managing the Database from the Console.
To execute these tasks, click on Administration>DB Maintenance> DataBase Sanity.
20.11.3.1. Sanitizing
This tool allows to "sanitize" the modules and delete those unfinished structures and/or bad performed( by a pending deleting, e.g)that, in some cases, could do that Pandora FMS works more slow that usual.
20.11.3.2. Purging Non Initialized Modules
Many times modules are created and assigned to agents that are not initialized, due to they never receive data. It would be advisable to get the non initialized modules out from time to time.
Page 439
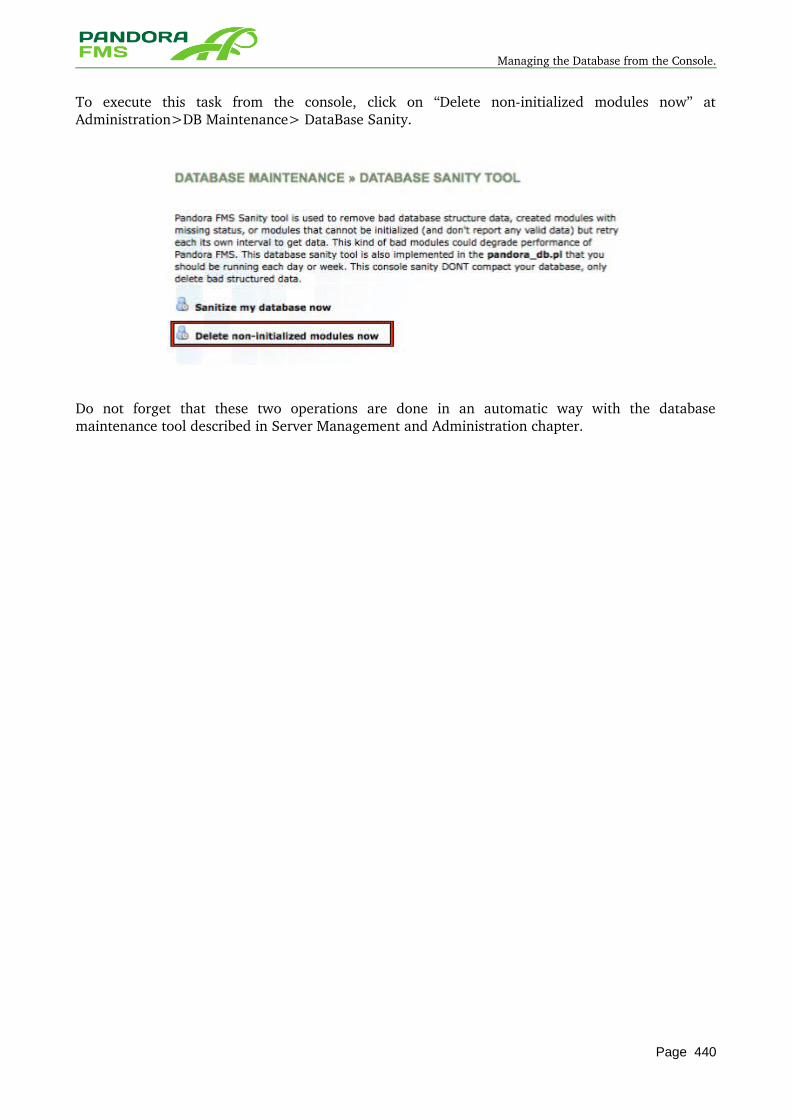
Managing the Database from the Console.
To execute this task from the console, click on “Delete noninitialized modules now” at Administration>DB Maintenance> DataBase Sanity.
Do not forget that these two operations are done in an automatic way with the database maintenance tool described in Server Management and Administration chapter.
Page 440

Managing the Database from the Console.
21 CONSOLE EXTENSIONS
Page 441
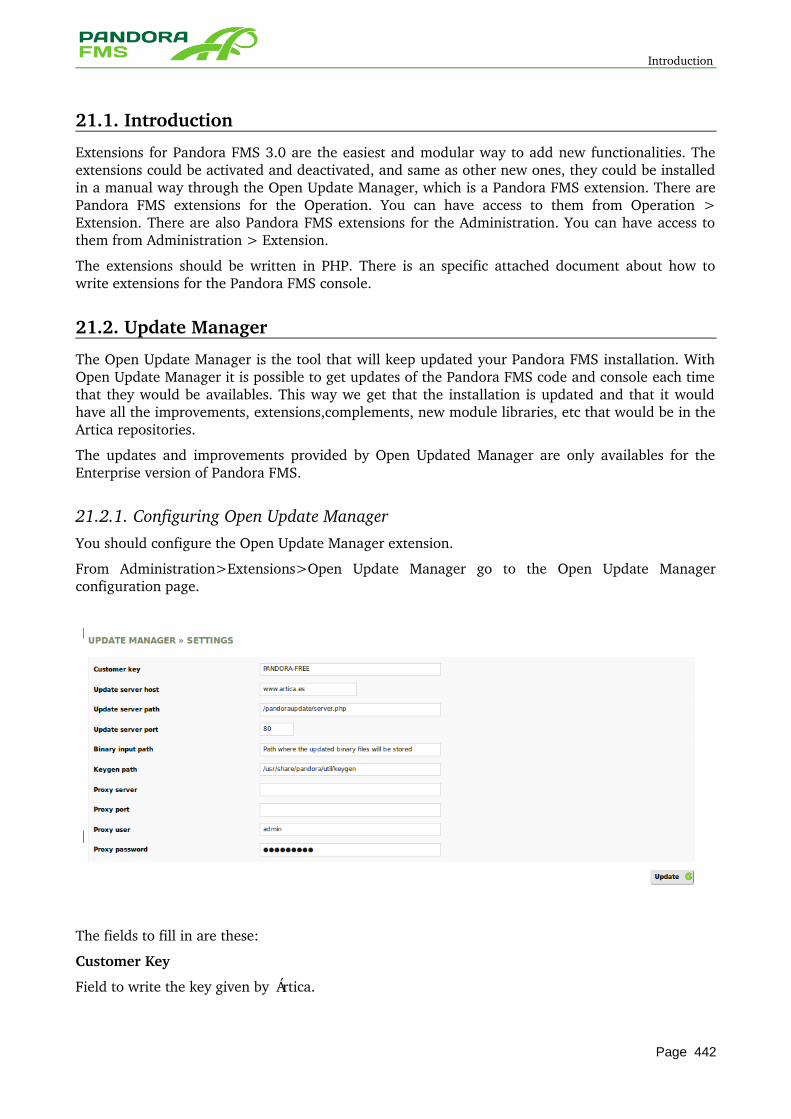
Introduction
21.1. Introduction
Extensions for Pandora FMS 3.0 are the easiest and modular way to add new functionalities. The extensions could be activated and deactivated, and same as other new ones, they could be installed in a manual way through the Open Update Manager, which is a Pandora FMS extension. There are Pandora FMS extensions for the Operation. You can have access to them from Operation > Extension. There are also Pandora FMS extensions for the Administration. You can have access to them from Administration > Extension.
The extensions should be written in PHP. There is an specific attached document about how to write extensions for the Pandora FMS console.
21.2. Update Manager
The Open Update Manager is the tool that will keep updated your Pandora FMS installation. With Open Update Manager it is possible to get updates of the Pandora FMS code and console each time that they would be availables. This way we get that the installation is updated and that it would have all the improvements, extensions,complements, new module libraries, etc that would be in the Artica repositories.
The updates and improvements provided by Open Updated Manager are only availables for the Enterprise version of Pandora FMS.
21.2.1. Configuring Open Update Manager You should configure the Open Update Manager extension.
From Administration>Extensions>Open Update Manager go to the Open Update Manager configuration page.
The fields to fill in are these:
Customer Key
Field to write the key given by Ártica.
Page 442
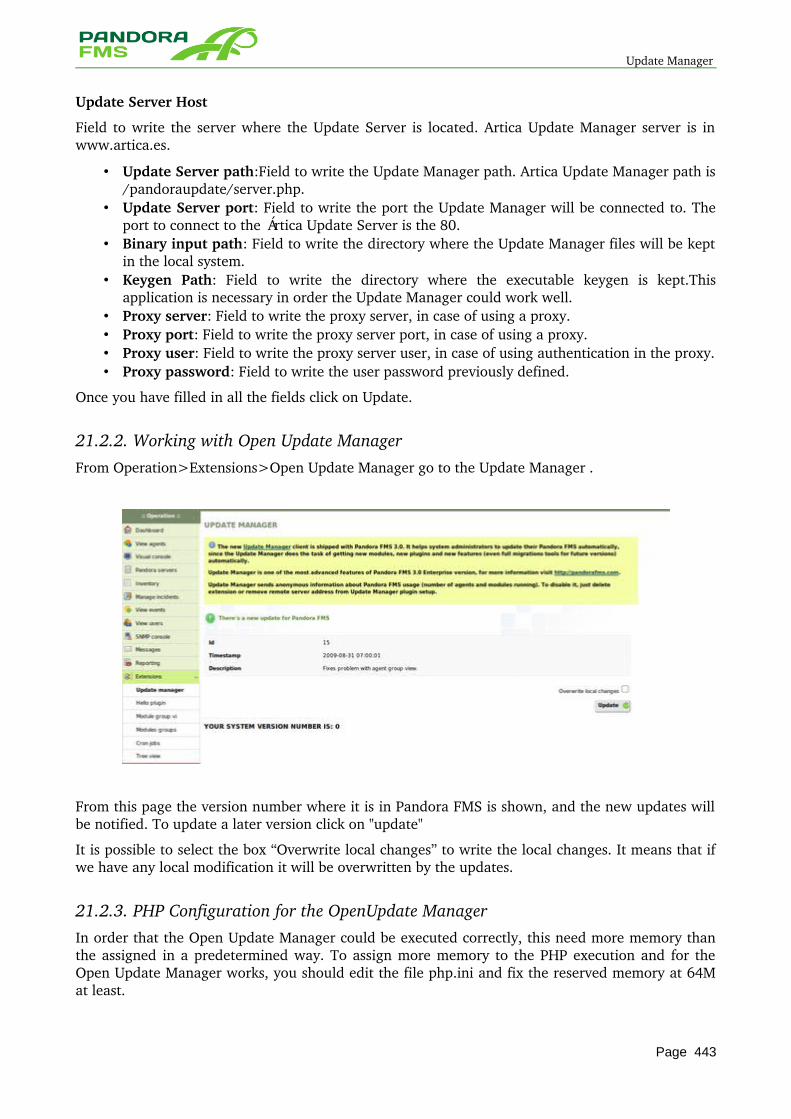
Update Manager
Update Server Host
Field to write the server where the Update Server is located. Artica Update Manager server is in www.artica.es.
• Update Server path:Field to write the Update Manager path. Artica Update Manager path is /pandoraupdate/server.php.
• Update Server port: Field to write the port the Update Manager will be connected to. The port to connect to the Ártica Update Server is the 80.
• Binary input path: Field to write the directory where the Update Manager files will be kept in the local system.
• Keygen Path: Field to write the directory where the executable keygen is kept.This application is necessary in order the Update Manager could work well.
• Proxy server: Field to write the proxy server, in case of using a proxy. • Proxy port: Field to write the proxy server port, in case of using a proxy. • Proxy user: Field to write the proxy server user, in case of using authentication in the proxy. • Proxy password: Field to write the user password previously defined.
Once you have filled in all the fields click on Update.
21.2.2. Working with Open Update Manager From Operation>Extensions>Open Update Manager go to the Update Manager .
From this page the version number where it is in Pandora FMS is shown, and the new updates will be notified. To update a later version click on "update"
It is possible to select the box “Overwrite local changes” to write the local changes. It means that if we have any local modification it will be overwritten by the updates.
21.2.3. PHP Configuration for the OpenUpdate Manager In order that the Open Update Manager could be executed correctly, this need more memory than the assigned in a predetermined way. To assign more memory to the PHP execution and for the Open Update Manager works, you should edit the file php.ini and fix the reserved memory at 64M at least.
Page 443
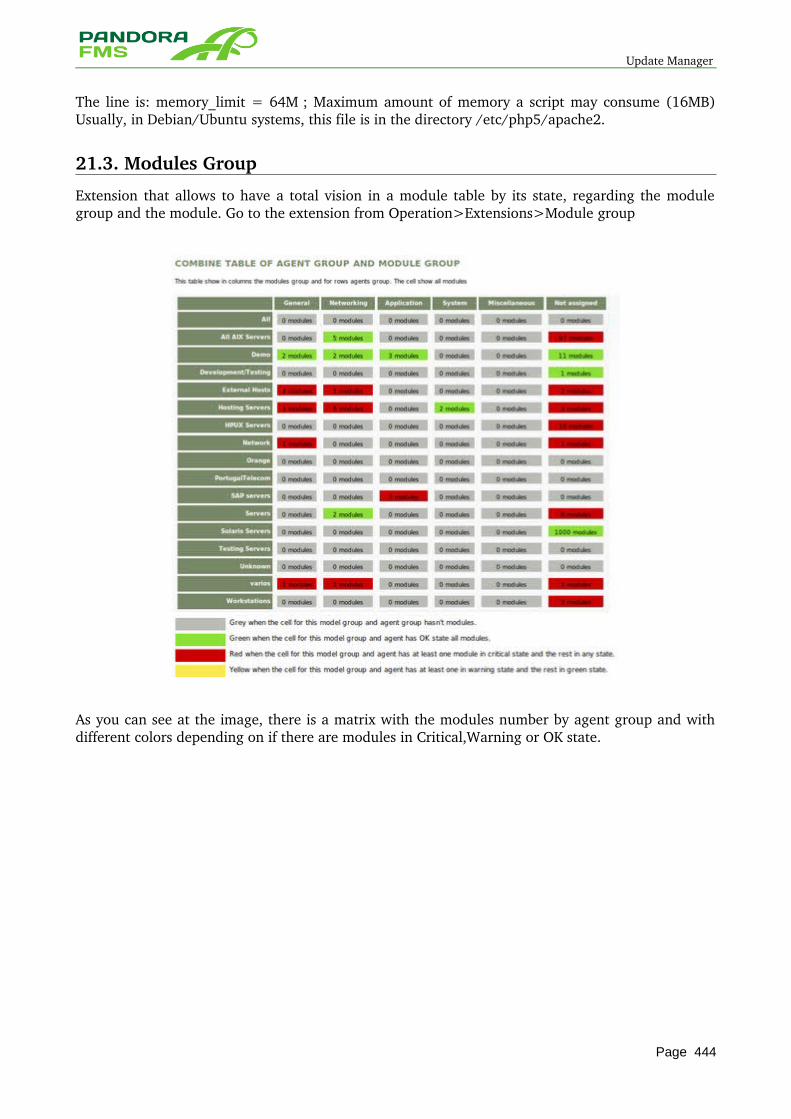
Update Manager
The line is: memory_limit = 64M ; Maximum amount of memory a script may consume (16MB) Usually, in Debian/Ubuntu systems, this file is in the directory /etc/php5/apache2.
21.3. Modules Group
Extension that allows to have a total vision in a module table by its state, regarding the module group and the module. Go to the extension from Operation>Extensions>Module group
As you can see at the image, there is a matrix with the modules number by agent group and with different colors depending on if there are modules in Critical,Warning or OK state.
Page 444
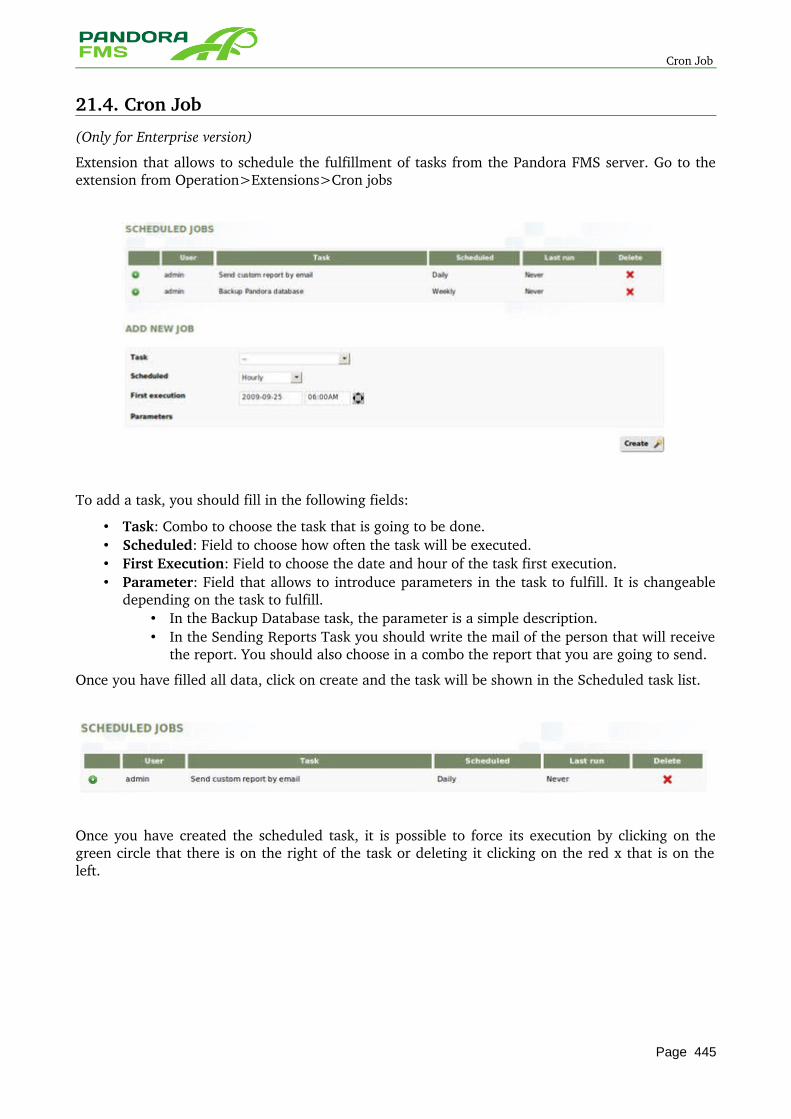
Cron Job
21.4. Cron Job
(Only for Enterprise version)
Extension that allows to schedule the fulfillment of tasks from the Pandora FMS server. Go to the extension from Operation>Extensions>Cron jobs
To add a task, you should fill in the following fields:
• Task: Combo to choose the task that is going to be done. • Scheduled: Field to choose how often the task will be executed. • First Execution: Field to choose the date and hour of the task first execution. • Parameter: Field that allows to introduce parameters in the task to fulfill. It is changeable
depending on the task to fulfill. • In the Backup Database task, the parameter is a simple description. • In the Sending Reports Task you should write the mail of the person that will receive
the report. You should also choose in a combo the report that you are going to send.
Once you have filled all data, click on create and the task will be shown in the Scheduled task list.
Once you have created the scheduled task, it is possible to force its execution by clicking on the green circle that there is on the right of the task or deleting it clicking on the red x that is on the left.
Page 445
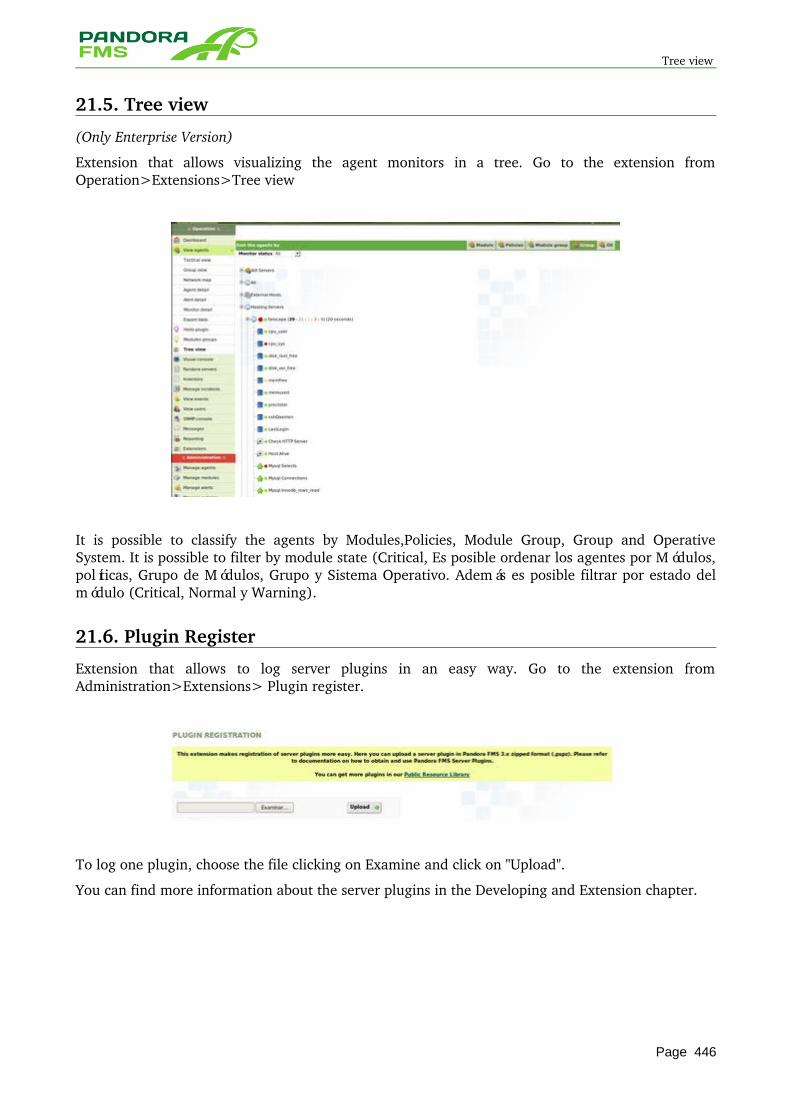
Tree view
21.5. Tree view
(Only Enterprise Version)
Extension that allows visualizing the agent monitors in a tree. Go to the extension from Operation>Extensions>Tree view
It is possible to classify the agents by Modules,Policies, Module Group, Group and Operative System. It is possible to filter by module state (Critical, Es posible ordenar los agentes por Módulos, políticas, Grupo de Módulos, Grupo y Sistema Operativo. Además es posible filtrar por estado del módulo (Critical, Normal y Warning).
21.6. Plugin Register
Extension that allows to log server plugins in an easy way. Go to the extension from Administration>Extensions> Plugin register.
To log one plugin, choose the file clicking on Examine and click on "Upload".
You can find more information about the server plugins in the Developing and Extension chapter.
Page 446
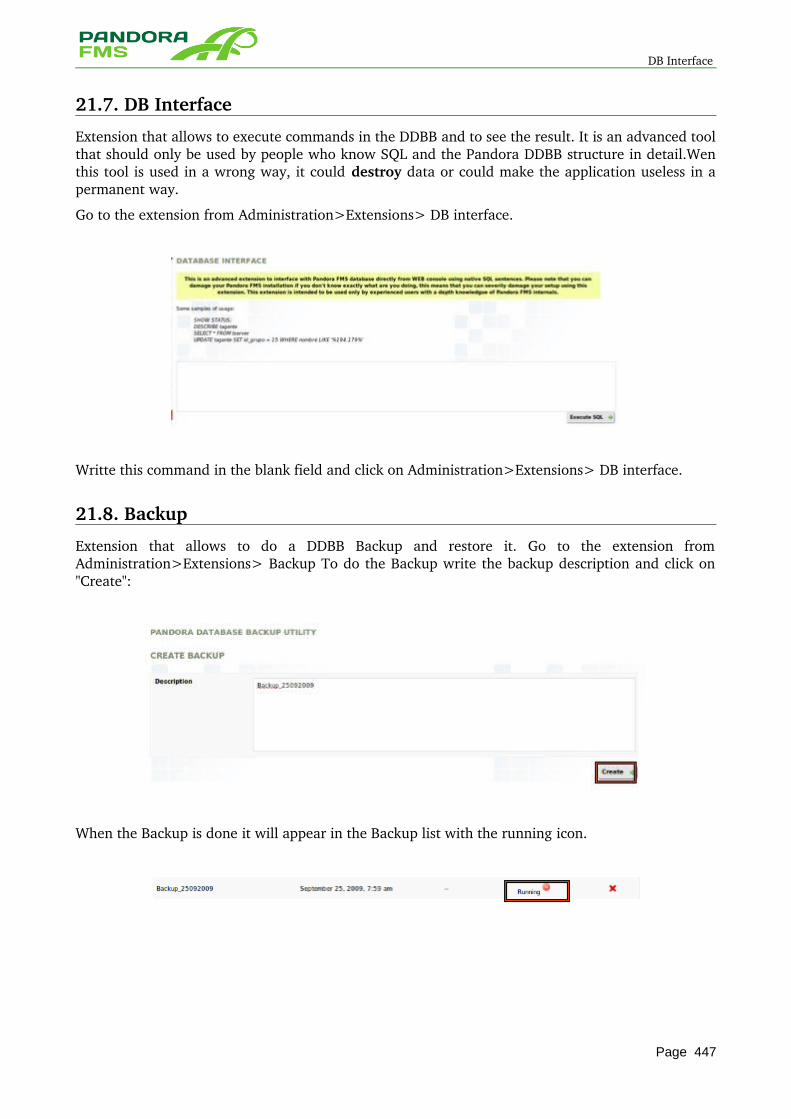
DB Interface
21.7. DB Interface
Extension that allows to execute commands in the DDBB and to see the result. It is an advanced tool that should only be used by people who know SQL and the Pandora DDBB structure in detail.Wen this tool is used in a wrong way, it could destroy data or could make the application useless in a permanent way.
Go to the extension from Administration>Extensions> DB interface.
Writte this command in the blank field and click on Administration>Extensions> DB interface.
21.8. Backup
Extension that allows to do a DDBB Backup and restore it. Go to the extension from Administration>Extensions> Backup To do the Backup write the backup description and click on "Create":
When the Backup is done it will appear in the Backup list with the running icon.
Page 447
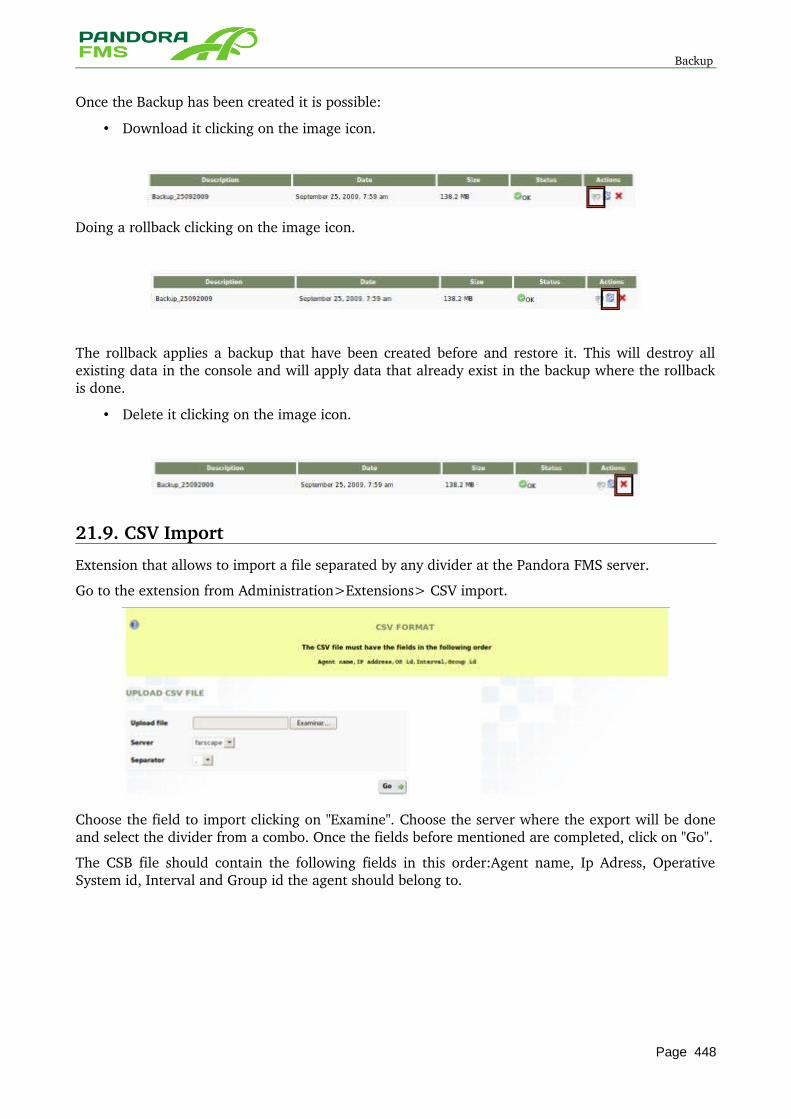
Backup
Once the Backup has been created it is possible:
• Download it clicking on the image icon.
Doing a rollback clicking on the image icon.
The rollback applies a backup that have been created before and restore it. This will destroy all existing data in the console and will apply data that already exist in the backup where the rollback is done.
• Delete it clicking on the image icon.
21.9. CSV Import
Extension that allows to import a file separated by any divider at the Pandora FMS server.
Go to the extension from Administration>Extensions> CSV import.
Choose the field to import clicking on "Examine". Choose the server where the export will be done and select the divider from a combo. Once the fields before mentioned are completed, click on "Go".
The CSB file should contain the following fields in this order:Agent name, Ip Adress, Operative System id, Interval and Group id the agent should belong to.
Page 448

CSV Import
22 HIGH AVAILABILITY
Page 449
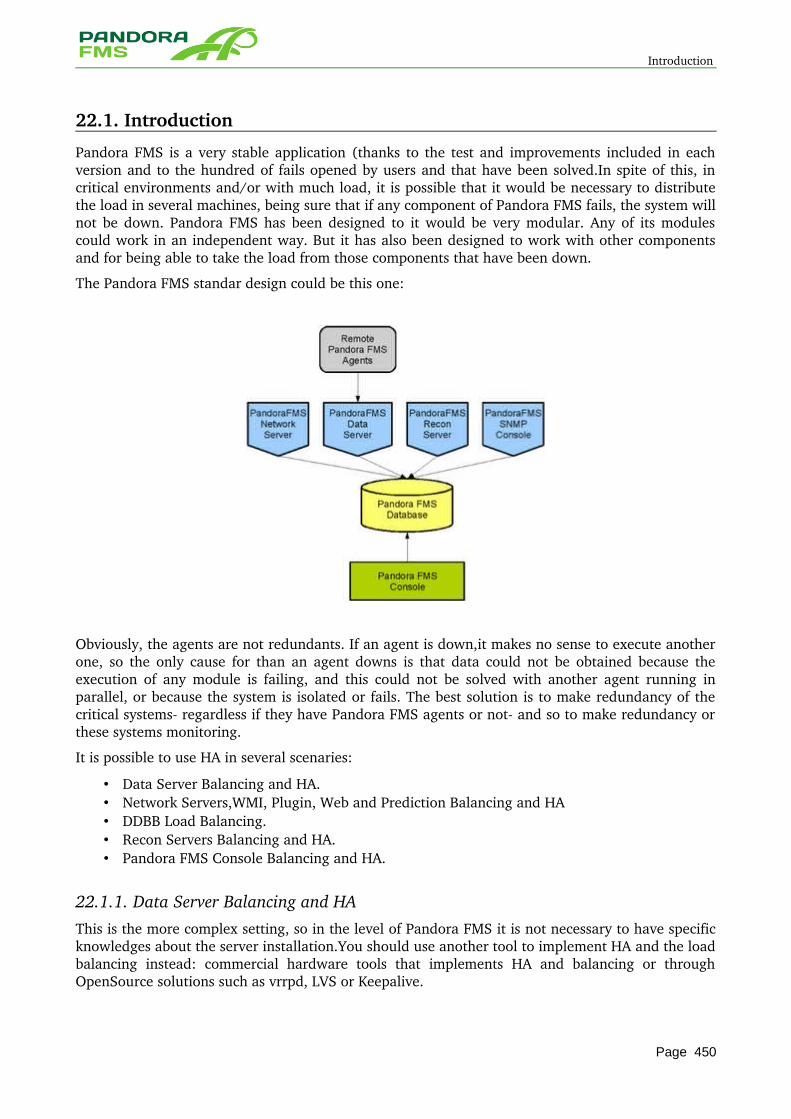
Introduction
22.1. Introduction
Pandora FMS is a very stable application (thanks to the test and improvements included in each version and to the hundred of fails opened by users and that have been solved.In spite of this, in critical environments and/or with much load, it is possible that it would be necessary to distribute the load in several machines, being sure that if any component of Pandora FMS fails, the system will not be down. Pandora FMS has been designed to it would be very modular. Any of its modules could work in an independent way. But it has also been designed to work with other components and for being able to take the load from those components that have been down.
The Pandora FMS standar design could be this one:
Obviously, the agents are not redundants. If an agent is down,it makes no sense to execute another one, so the only cause for than an agent downs is that data could not be obtained because the execution of any module is failing, and this could not be solved with another agent running in parallel, or because the system is isolated or fails. The best solution is to make redundancy of the critical systems regardless if they have Pandora FMS agents or not and so to make redundancy or these systems monitoring.
It is possible to use HA in several scenaries:
• Data Server Balancing and HA. • Network Servers,WMI, Plugin, Web and Prediction Balancing and HA • DDBB Load Balancing. • Recon Servers Balancing and HA. • Pandora FMS Console Balancing and HA.
22.1.1. Data Server Balancing and HA This is the more complex setting, so in the level of Pandora FMS it is not necessary to have specific knowledges about the server installation.You should use another tool to implement HA and the load balancing instead: commercial hardware tools that implements HA and balancing or through OpenSource solutions such as vrrpd, LVS or Keepalive.
Page 450
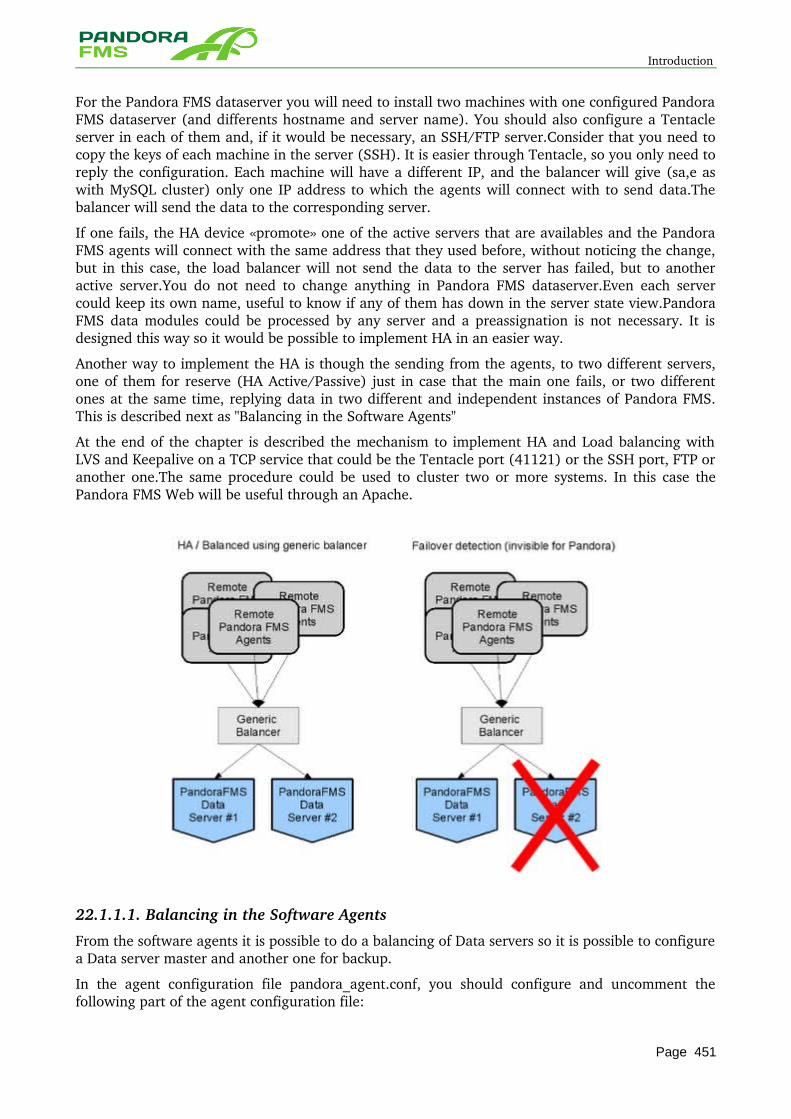
Introduction
For the Pandora FMS dataserver you will need to install two machines with one configured Pandora FMS dataserver (and differents hostname and server name). You should also configure a Tentacle server in each of them and, if it would be necessary, an SSH/FTP server.Consider that you need to copy the keys of each machine in the server (SSH). It is easier through Tentacle, so you only need to reply the configuration. Each machine will have a different IP, and the balancer will give (sa,e as with MySQL cluster) only one IP address to which the agents will connect with to send data.The balancer will send the data to the corresponding server.
If one fails, the HA device «promote» one of the active servers that are availables and the Pandora FMS agents will connect with the same address that they used before, without noticing the change, but in this case, the load balancer will not send the data to the server has failed, but to another active server.You do not need to change anything in Pandora FMS dataserver.Even each server could keep its own name, useful to know if any of them has down in the server state view.Pandora FMS data modules could be processed by any server and a preassignation is not necessary. It is designed this way so it would be possible to implement HA in an easier way.
Another way to implement the HA is though the sending from the agents, to two different servers, one of them for reserve (HA Active/Passive) just in case that the main one fails, or two different ones at the same time, replying data in two different and independent instances of Pandora FMS. This is described next as "Balancing in the Software Agents"
At the end of the chapter is described the mechanism to implement HA and Load balancing with LVS and Keepalive on a TCP service that could be the Tentacle port (41121) or the SSH port, FTP or another one.The same procedure could be used to cluster two or more systems. In this case the Pandora FMS Web will be useful through an Apache.
22.1.1.1. Balancing in the Software Agents
From the software agents it is possible to do a balancing of Data servers so it is possible to configure a Data server master and another one for backup.
In the agent configuration file pandora_agent.conf, you should configure and uncomment the following part of the agent configuration file:
Page 451
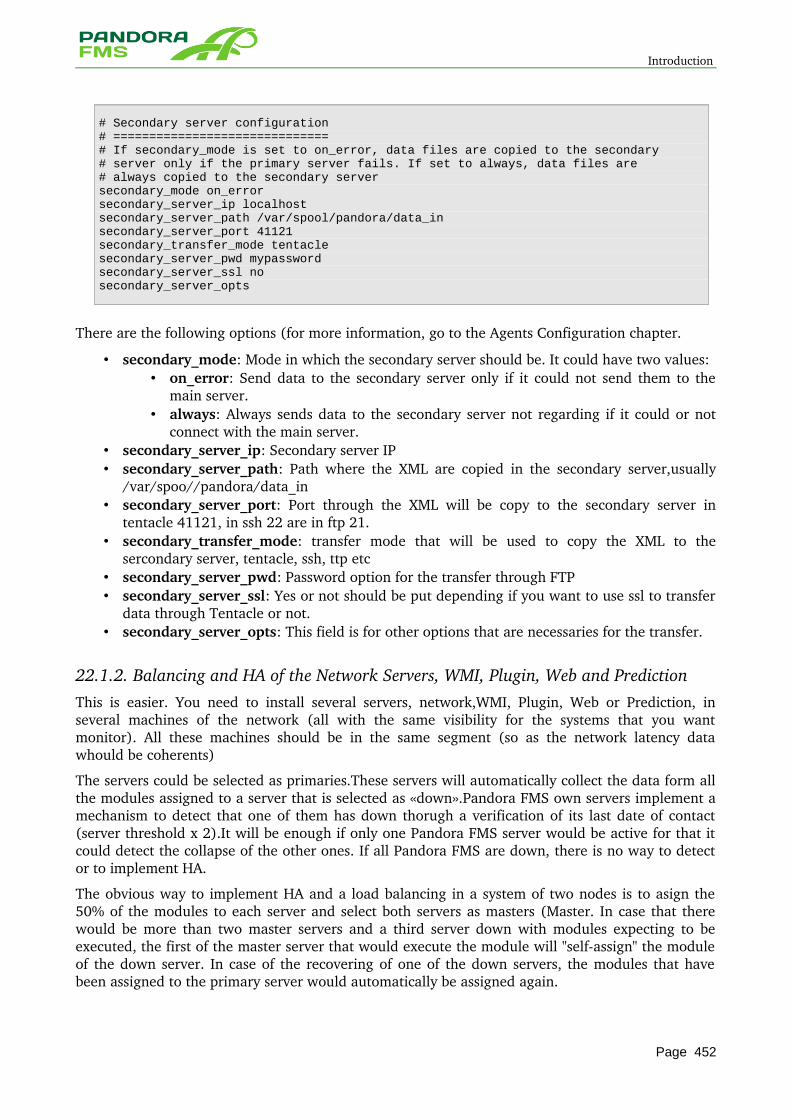
Introduction
# Secondary server configuration# ==============================# If secondary_mode is set to on_error, data files are copied to the secondary# server only if the primary server fails. If set to always, data files are# always copied to the secondary serversecondary_mode on_errorsecondary_server_ip localhostsecondary_server_path /var/spool/pandora/data_insecondary_server_port 41121secondary_transfer_mode tentaclesecondary_server_pwd mypasswordsecondary_server_ssl nosecondary_server_opts
There are the following options (for more information, go to the Agents Configuration chapter.
• secondary_mode: Mode in which the secondary server should be. It could have two values: • on_error: Send data to the secondary server only if it could not send them to the
main server. • always: Always sends data to the secondary server not regarding if it could or not
connect with the main server. • secondary_server_ip: Secondary server IP • secondary_server_path: Path where the XML are copied in the secondary server,usually
/var/spoo//pandora/data_in • secondary_server_port: Port through the XML will be copy to the secondary server in
tentacle 41121, in ssh 22 are in ftp 21. • secondary_transfer_mode: transfer mode that will be used to copy the XML to the
sercondary server, tentacle, ssh, ttp etc • secondary_server_pwd: Password option for the transfer through FTP • secondary_server_ssl: Yes or not should be put depending if you want to use ssl to transfer
data through Tentacle or not. • secondary_server_opts: This field is for other options that are necessaries for the transfer.
22.1.2. Balancing and HA of the Network Servers, WMI, Plugin, Web and Prediction This is easier. You need to install several servers, network,WMI, Plugin, Web or Prediction, in several machines of the network (all with the same visibility for the systems that you want monitor). All these machines should be in the same segment (so as the network latency data whould be coherents)
The servers could be selected as primaries.These servers will automatically collect the data form all the modules assigned to a server that is selected as «down».Pandora FMS own servers implement a mechanism to detect that one of them has down thorugh a verification of its last date of contact (server threshold x 2).It will be enough if only one Pandora FMS server would be active for that it could detect the collapse of the other ones. If all Pandora FMS are down, there is no way to detect or to implement HA.
The obvious way to implement HA and a load balancing in a system of two nodes is to asign the 50% of the modules to each server and select both servers as masters (Master. In case that there would be more than two master servers and a third server down with modules expecting to be executed, the first of the master server that would execute the module will "selfassign" the module of the down server. In case of the recovering of one of the down servers, the modules that have been assigned to the primary server would automatically be assigned again.
Page 452
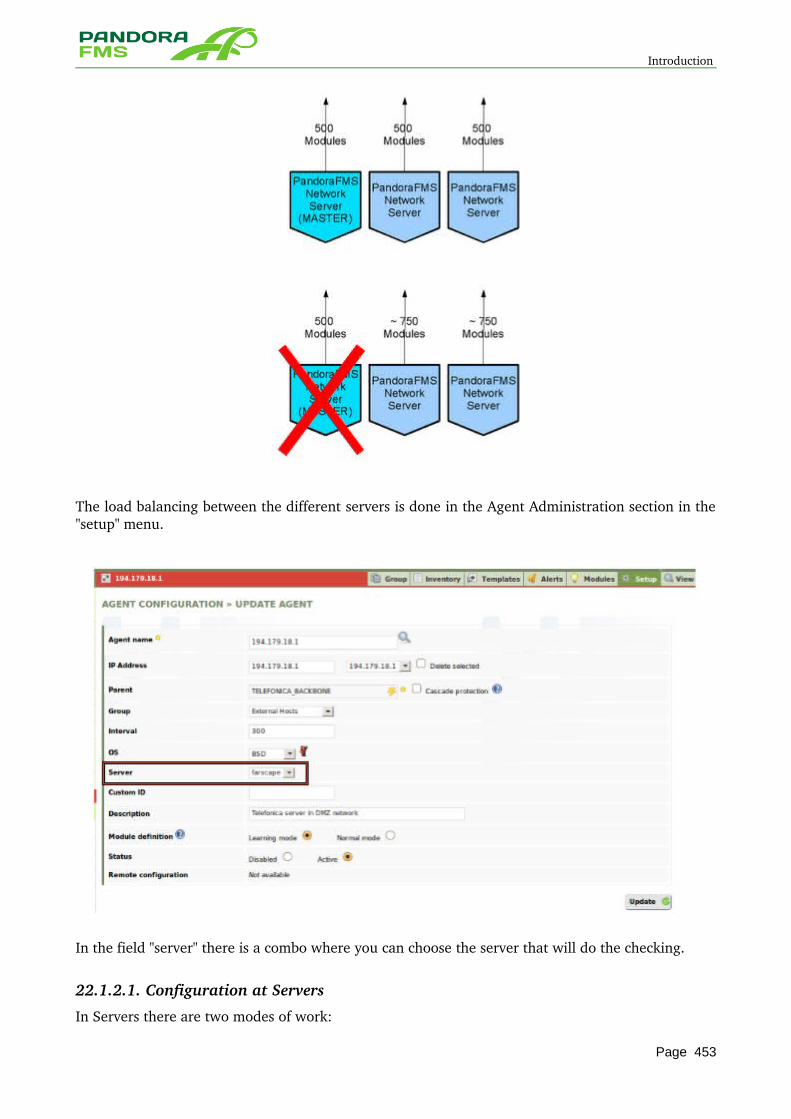
Introduction
The load balancing between the different servers is done in the Agent Administration section in the "setup" menu.
In the field "server" there is a combo where you can choose the server that will do the checking.
22.1.2.1. Configuration at Servers
In Servers there are two modes of work:
Page 453
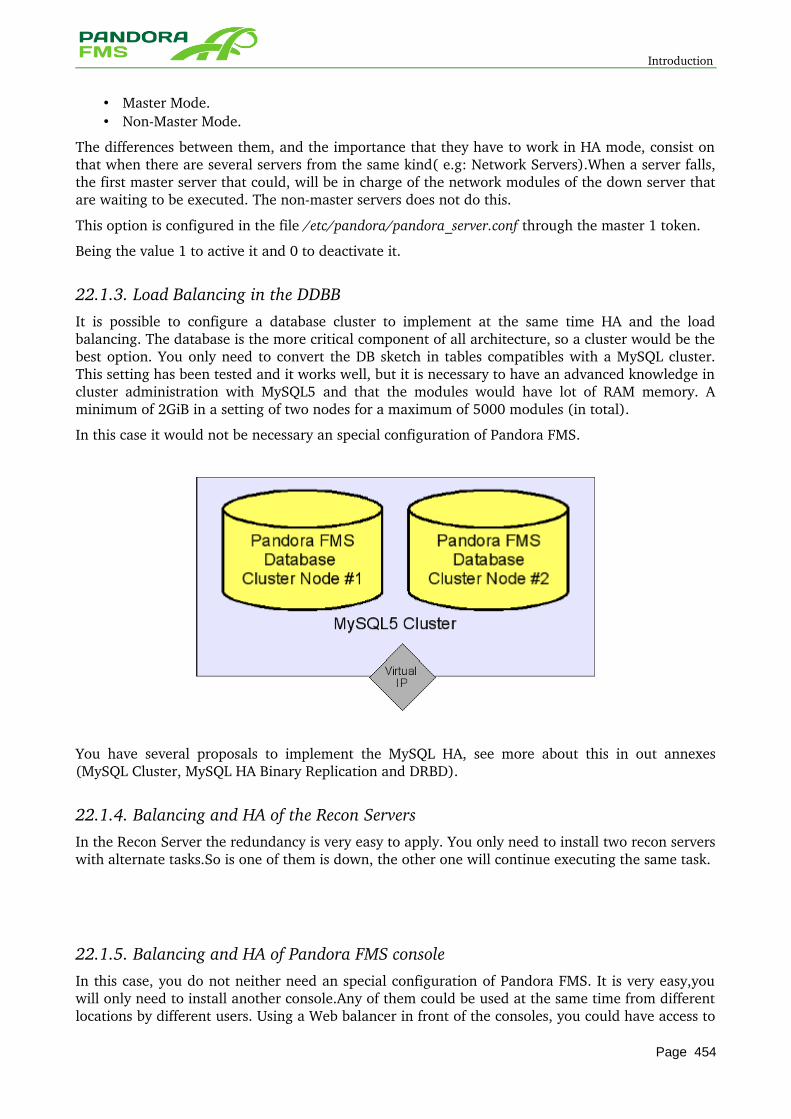
Introduction
• Master Mode. • NonMaster Mode.
The differences between them, and the importance that they have to work in HA mode, consist on that when there are several servers from the same kind( e.g: Network Servers).When a server falls, the first master server that could, will be in charge of the network modules of the down server that are waiting to be executed. The nonmaster servers does not do this.
This option is configured in the file /etc/pandora/pandora_server.conf through the master 1 token.
Being the value 1 to active it and 0 to deactivate it.
22.1.3. Load Balancing in the DDBBIt is possible to configure a database cluster to implement at the same time HA and the load balancing. The database is the more critical component of all architecture, so a cluster would be the best option. You only need to convert the DB sketch in tables compatibles with a MySQL cluster. This setting has been tested and it works well, but it is necessary to have an advanced knowledge in cluster administration with MySQL5 and that the modules would have lot of RAM memory. A minimum of 2GiB in a setting of two nodes for a maximum of 5000 modules (in total).
In this case it would not be necessary an special configuration of Pandora FMS.
You have several proposals to implement the MySQL HA, see more about this in out annexes (MySQL Cluster, MySQL HA Binary Replication and DRBD).
22.1.4. Balancing and HA of the Recon ServersIn the Recon Server the redundancy is very easy to apply. You only need to install two recon servers with alternate tasks.So is one of them is down, the other one will continue executing the same task.
22.1.5. Balancing and HA of Pandora FMS consoleIn this case, you do not neither need an special configuration of Pandora FMS. It is very easy,you will only need to install another console.Any of them could be used at the same time from different locations by different users. Using a Web balancer in front of the consoles, you could have access to
Page 454

Introduction
them without knowing exactly to which one are you having access into, so the performaces system is managed through cookies and this will be kept in the browser. The balancing procedure implementing LVS and the HA using KeepAlived is described after.
22.2. Annex 1: HA implementation and Load Balancing with LVS and Keepalived
For the load balancing we advise to use Linux Virtual Server (LVS). To manage the High Availability (HA) between the services, we advise to use Keepalived.
LVS
At present, the main function of the LVS project is to develop an advanced IP system of load balancing through software (IPVS), load balancing through software at application level and components for the management of a services cluster.
IPVS
Advanced IP system of load balancing through software implemented in the Linux own kernel and that has been already included in versions 2.4 and 2.6.
Keepalived It is used to manage the LVS. Keepalived is being used in the cluster to make sure that the SSH servers, both Nodo 1 and Nodo2 are alive, if any of them falls, Keepalive show to the LVS that one of the two nodes is down and it should to readdress the petitions to the node that is alive.
We have chosen Keepalived as HA service so it allows to keep a persistence of session between the servers. This is, if any of the modules falls, the users that are working on this node will be conduced to the other module that is alive, but these will be exactly in the same place that they were before, doing that the fall will be fully transparent to its work and sessions ( in the case of SSH it will not work due to the SSH encrypting logic, but in simple TCP sessions, such as Tentacle without SSL or FTP, they will work without problem).With Tentacle/SSH the communication should be try again and this way the information of the data packet will not be lost.
The configuration file and the orders for use of KeepAlived are in the Annex 2.
Load Balancing Algorithm Algorithm
The two more used algorithms nowadays are:«Round Robin» and «Weight Round Robin». They are very similar and they are based on an assignment of work by turns.
In the case of the «Round Robin»,it is one of the process planning algorithms more simple in an Operative System that assigns to each proccess an equitable and ordered time share, considering all processes with the same priority.
On the other hand, the «Weight Round Robin» algorithm allows to assign load to the machines inside the cluster so as a number of specific petitions will go to one or other node, depending on its weight inside the cluster.
This has no sense in the topology that we consider here, so both machines have exactly the same hardware features. For all these we have decided to use «Round Robin» as load balancing algorithm.
22.2.1. Action when a node is down Keepalived will detect is one of the services is down. So, if it happens it will eliminated the module that have failed from the LVS active modules to the node that has failed, so all the petitions to the node that have failed will be readdressed to the active node.
Page 455
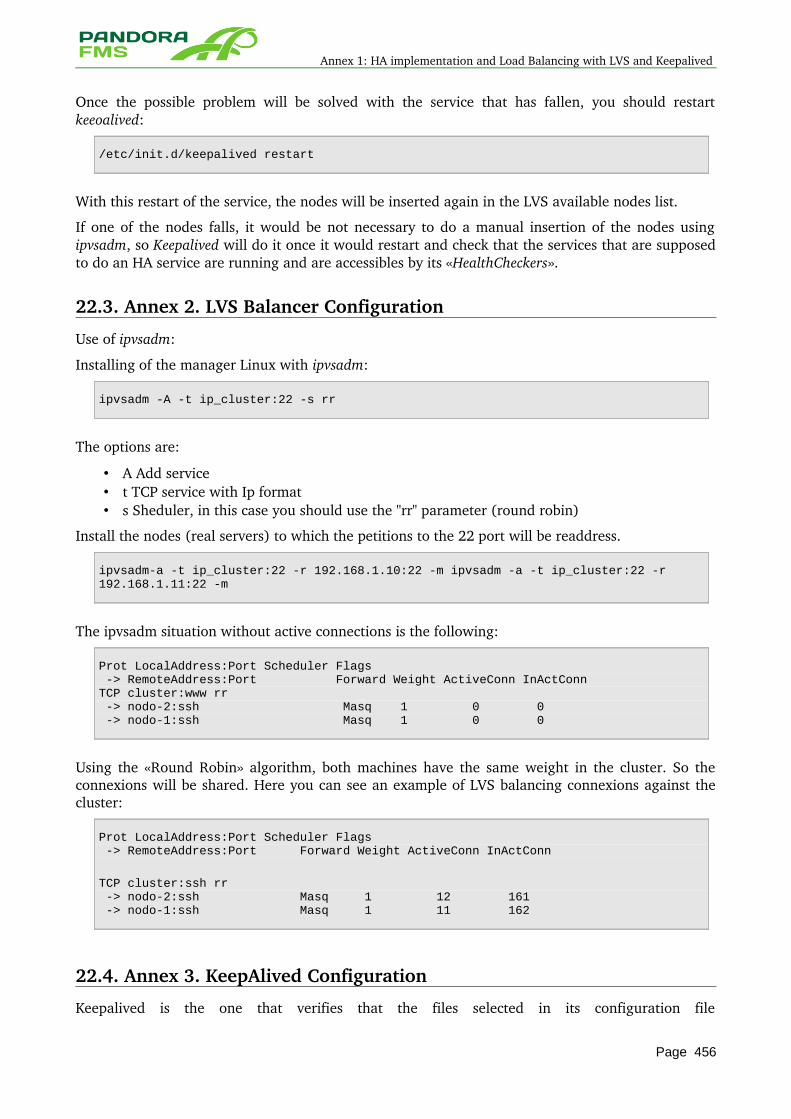
Annex 1: HA implementation and Load Balancing with LVS and Keepalived
Once the possible problem will be solved with the service that has fallen, you should restart keeoalived:
/etc/init.d/keepalived restart
With this restart of the service, the nodes will be inserted again in the LVS available nodes list.
If one of the nodes falls, it would be not necessary to do a manual insertion of the nodes using ipvsadm, so Keepalived will do it once it would restart and check that the services that are supposed to do an HA service are running and are accessibles by its «HealthCheckers».
22.3. Annex 2. LVS Balancer Configuration
Use of ipvsadm:
Installing of the manager Linux with ipvsadm:
ipvsadm -A -t ip_cluster:22 -s rr
The options are:
• A Add service • t TCP service with Ip format • s Sheduler, in this case you should use the "rr" parameter (round robin)
Install the nodes (real servers) to which the petitions to the 22 port will be readdress.
ipvsadm-a -t ip_cluster:22 -r 192.168.1.10:22 -m ipvsadm -a -t ip_cluster:22 -r 192.168.1.11:22 -m
The ipvsadm situation without active connections is the following:
Prot LocalAddress:Port Scheduler Flags -> RemoteAddress:Port Forward Weight ActiveConn InActConnTCP cluster:www rr -> nodo-2:ssh Masq 1 0 0 -> nodo-1:ssh Masq 1 0 0
Using the «Round Robin» algorithm, both machines have the same weight in the cluster. So the connexions will be shared. Here you can see an example of LVS balancing connexions against the cluster:
Prot LocalAddress:Port Scheduler Flags -> RemoteAddress:Port Forward Weight ActiveConn InActConn
TCP cluster:ssh rr -> nodo-2:ssh Masq 1 12 161 -> nodo-1:ssh Masq 1 11 162
22.4. Annex 3. KeepAlived Configuration
Keepalived is the one that verifies that the files selected in its configuration file
Page 456
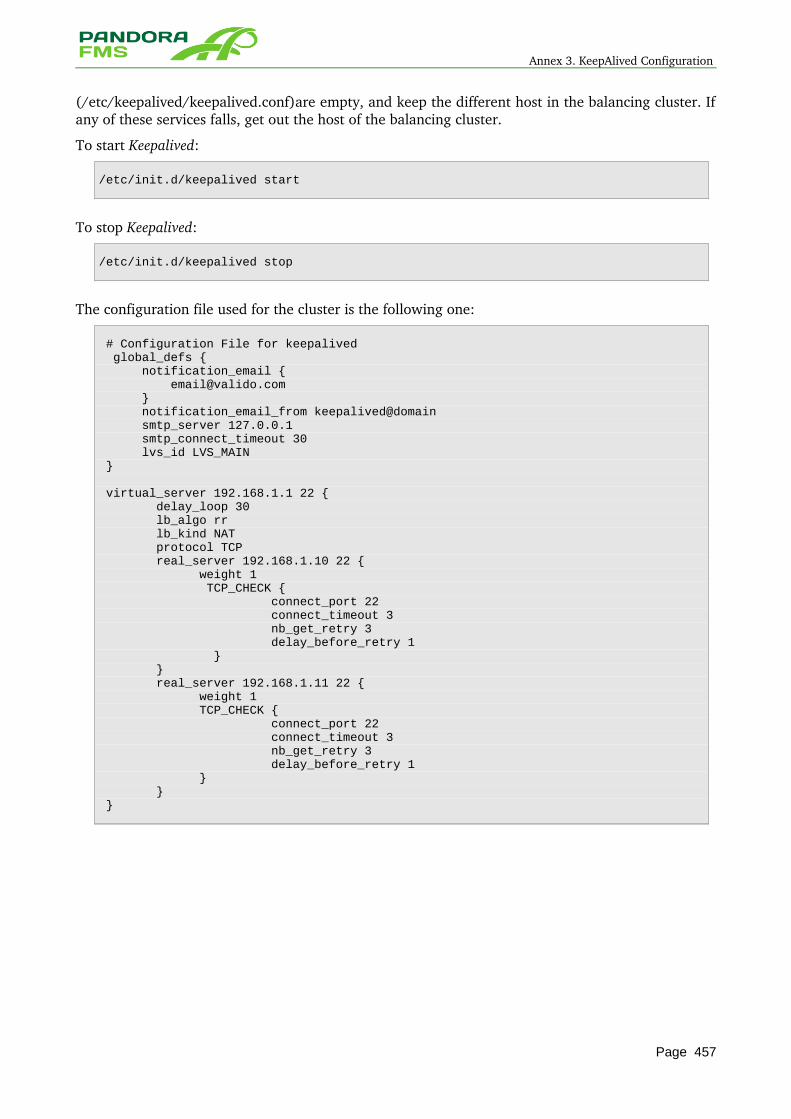
Annex 3. KeepAlived Configuration
(/etc/keepalived/keepalived.conf)are empty, and keep the different host in the balancing cluster. If any of these services falls, get out the host of the balancing cluster.
To start Keepalived:
/etc/init.d/keepalived start
To stop Keepalived:
/etc/init.d/keepalived stop
The configuration file used for the cluster is the following one:
# Configuration File for keepalived global_defs { notification_email { [email protected] } notification_email_from keepalived@domain smtp_server 127.0.0.1 smtp_connect_timeout 30 lvs_id LVS_MAIN } virtual_server 192.168.1.1 22 { delay_loop 30 lb_algo rr lb_kind NAT protocol TCP real_server 192.168.1.10 22 { weight 1 TCP_CHECK { connect_port 22 connect_timeout 3 nb_get_retry 3 delay_before_retry 1 } } real_server 192.168.1.11 22 { weight 1 TCP_CHECK { connect_port 22 connect_timeout 3 nb_get_retry 3 delay_before_retry 1 } } }
Page 457

Annex 3. KeepAlived Configuration
23 PANDORA FMS CONSOLE CONFIGURATION
Page 458
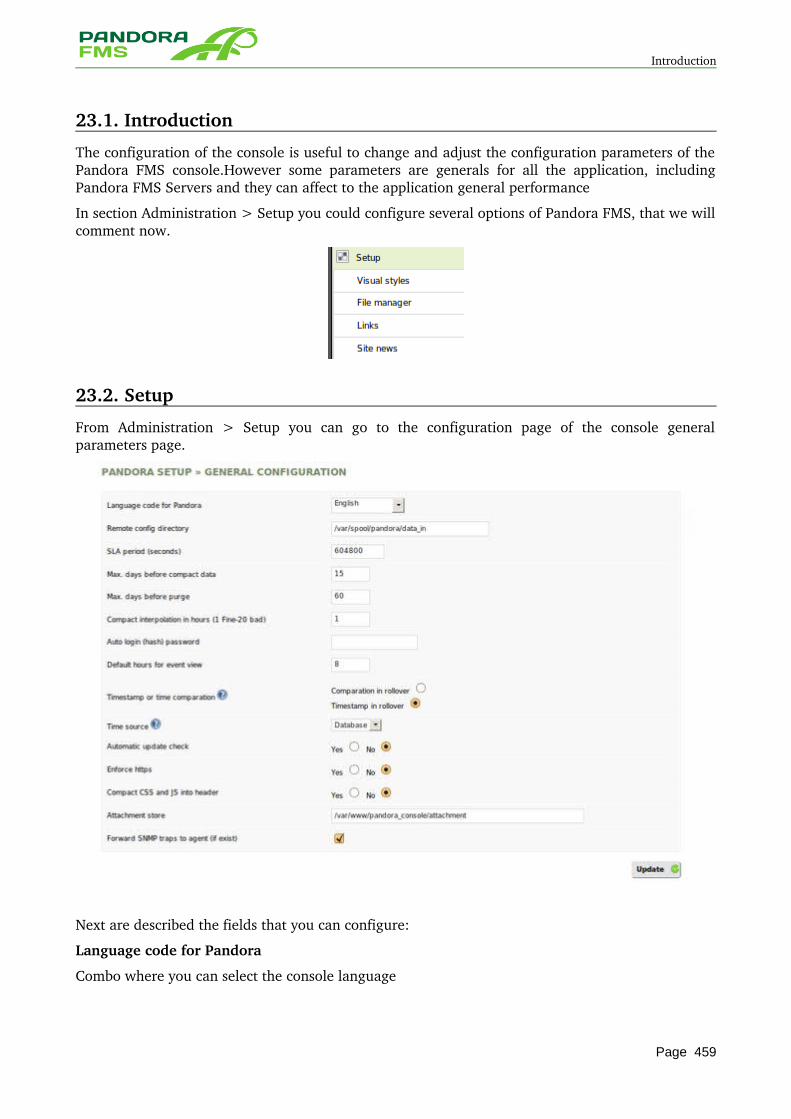
Introduction
23.1. Introduction
The configuration of the console is useful to change and adjust the configuration parameters of the Pandora FMS console.However some parameters are generals for all the application, including Pandora FMS Servers and they can affect to the application general performance
In section Administration > Setup you could configure several options of Pandora FMS, that we will comment now.
23.2. Setup
From Administration > Setup you can go to the configuration page of the console general parameters page.
Next are described the fields that you can configure:
Language code for Pandora
Combo where you can select the console language
Page 459

Setup
Remote config directory
Field to identify the directory where the remote configuration of agents is kept. By default is /var/spool/pandora/data_in. This only make sense in the Pandora FMS version.
SLA period (seconds)
The time by default to calculate the SLA view in the SLA flap from the agent view. It calculates automatically the SLA of the Monitors that are defined in this agent in the interval in seconds that is given, distinguishing the Critical and Normal values.
Max. days before compact data
Field where you can define the maximum number of days before compacting data.
Max. days before purge
Field where are defined the maximum number of days before deleting data.
Compact interpolation in hours (1 Fine20 bad)
Field where is defined the interpolation grade, where 1 is the best fix, and 20 the worst. It is recommended to use 1 or values next to one.
Auto login (hash) password
Defines an static and symmetrical password, used to create a hash and to make possible the automatic validation through URL. It is used to incorporate Pandora in other WEB application that gives it as parameter a user name and that using a hash generated by the user name. This password should allow the automatic validation in Pandora FMS, without needing to introduce a password. To see an example of this integration see the file /extras/sample_login.php from Pandora FMS console.
Default hours for event view
Field where is defined the field hours by default in the event view. If by default is 24, the event view will show only the events that have taken place in the last 24 hours.
Timestamp or time comparison
Field to define which date and hour you are going to use.There are two options:the comparison with the Database, where you should select "Comparison in rollover", that is generally used when the DDBB is in a system that is different from the console, or the system timestamp, for which you should click on "Timestamp in rollover".
Time source
Combo where you can select the origin of the date and hour between database and system. The first one is used when the DDBB is in a system that is different from the console.
Automatic update check
Field where is configured the automatic update check in the Open Update Manager. This does that the console contact each time that you start session with the Pandora FMS update provider (Artica ST), sending anonimous information about the Pandora FMS (nº of agents) usage.
Enforce https
Field that allows to force the readdress to https. If you enable it, you must activate the use of Pandora FMS with https in your WEB server. If you have enabled it and you have not configured your Apache to uses HTTPS you cannot access WEB console again, and you will to disable off this option again going straight to the database through MySQL and using following SQL syntax:
Page 460
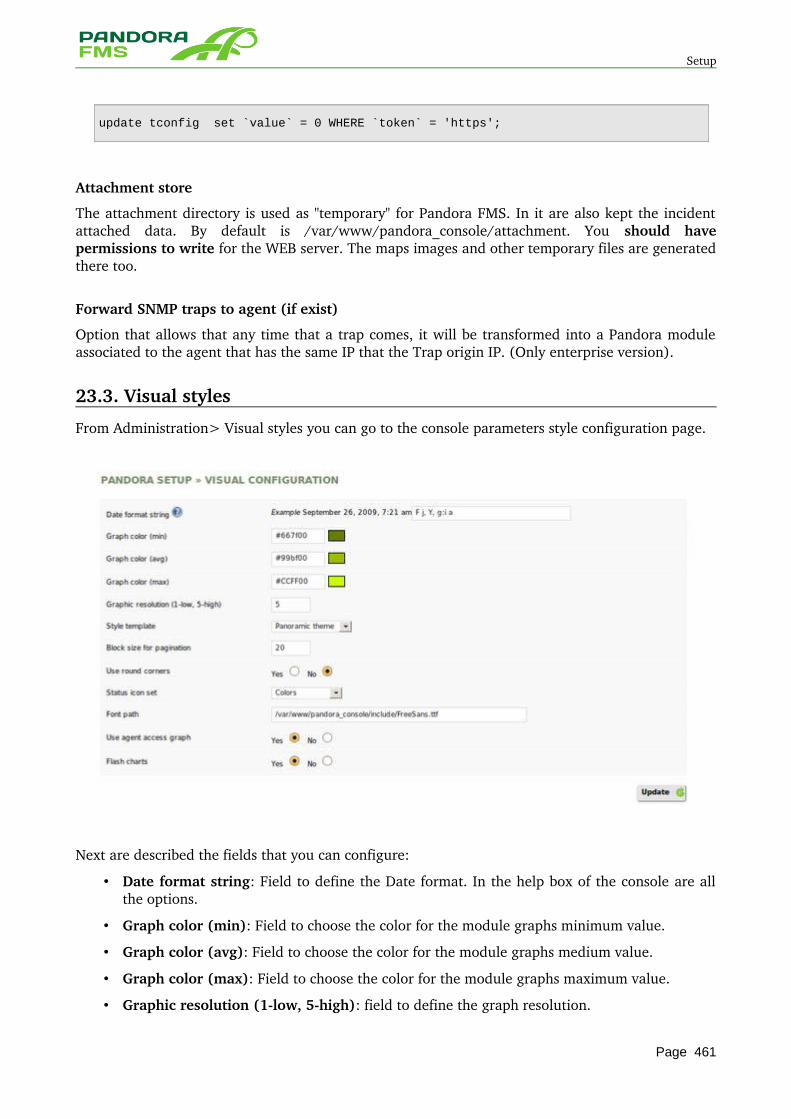
Setup
update tconfig set `value` = 0 WHERE `token` = 'https';
Attachment store
The attachment directory is used as "temporary" for Pandora FMS. In it are also kept the incident attached data. By default is /var/www/pandora_console/attachment. You should have permissions to write for the WEB server. The maps images and other temporary files are generated there too.
Forward SNMP traps to agent (if exist)
Option that allows that any time that a trap comes, it will be transformed into a Pandora module associated to the agent that has the same IP that the Trap origin IP. (Only enterprise version).
23.3. Visual styles
From Administration> Visual styles you can go to the console parameters style configuration page.
Next are described the fields that you can configure:
• Date format string: Field to define the Date format. In the help box of the console are all the options.
• Graph color (min): Field to choose the color for the module graphs minimum value.
• Graph color (avg): Field to choose the color for the module graphs medium value.
• Graph color (max): Field to choose the color for the module graphs maximum value.
• Graphic resolution (1low, 5high): field to define the graph resolution.
Page 461
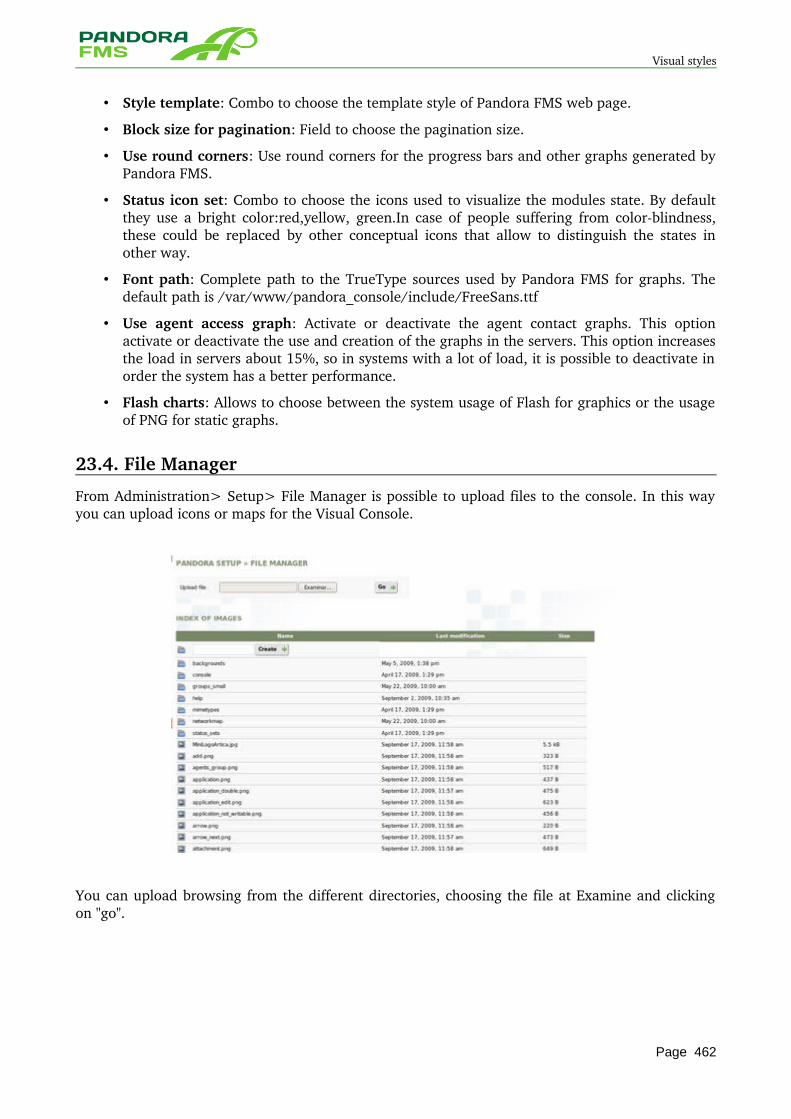
Visual styles
• Style template: Combo to choose the template style of Pandora FMS web page.
• Block size for pagination: Field to choose the pagination size.
• Use round corners: Use round corners for the progress bars and other graphs generated by Pandora FMS.
• Status icon set: Combo to choose the icons used to visualize the modules state. By default they use a bright color:red,yellow, green.In case of people suffering from colorblindness, these could be replaced by other conceptual icons that allow to distinguish the states in other way.
• Font path: Complete path to the TrueType sources used by Pandora FMS for graphs. The default path is /var/www/pandora_console/include/FreeSans.ttf
• Use agent access graph: Activate or deactivate the agent contact graphs. This option activate or deactivate the use and creation of the graphs in the servers. This option increases the load in servers about 15%, so in systems with a lot of load, it is possible to deactivate in order the system has a better performance.
• Flash charts: Allows to choose between the system usage of Flash for graphics or the usage of PNG for static graphs.
23.4. File Manager
From Administration> Setup> File Manager is possible to upload files to the console. In this way you can upload icons or maps for the Visual Console.
You can upload browsing from the different directories, choosing the file at Examine and clicking on "go".
Page 462
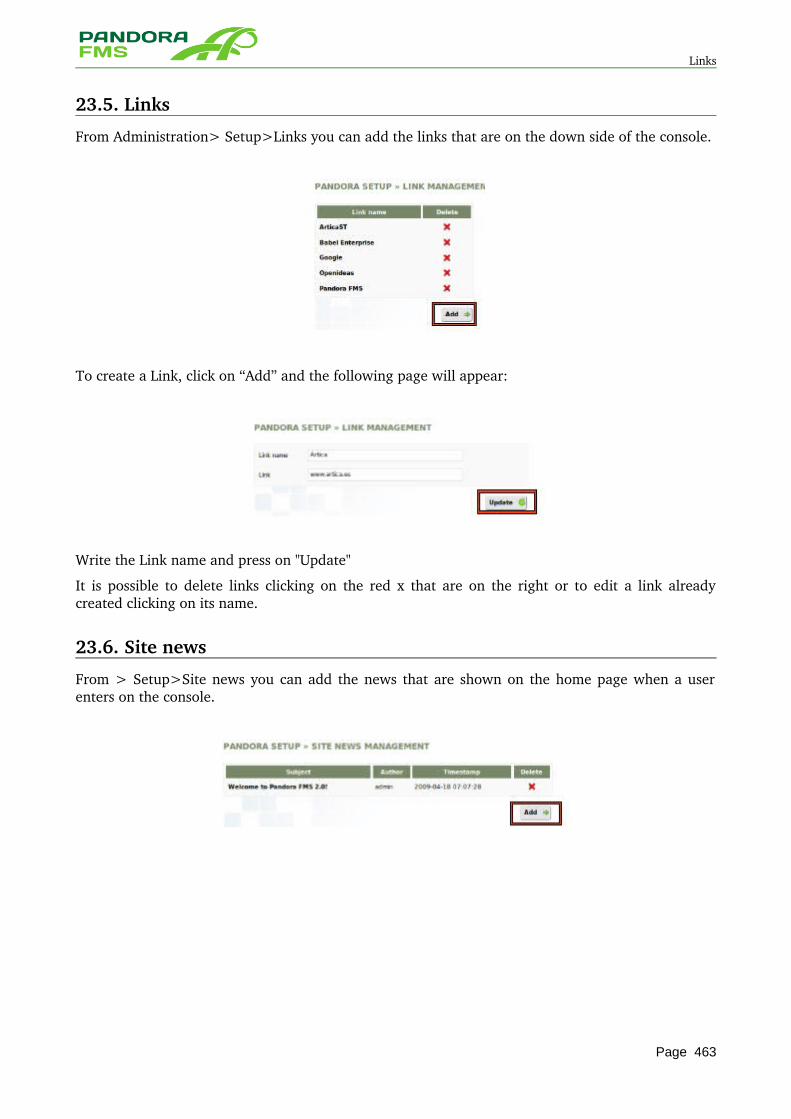
Links
23.5. Links
From Administration> Setup>Links you can add the links that are on the down side of the console.
To create a Link, click on “Add” and the following page will appear:
Write the Link name and press on "Update"
It is possible to delete links clicking on the red x that are on the right or to edit a link already created clicking on its name.
23.6. Site news
From > Setup>Site news you can add the news that are shown on the home page when a user enters on the console.
Page 463
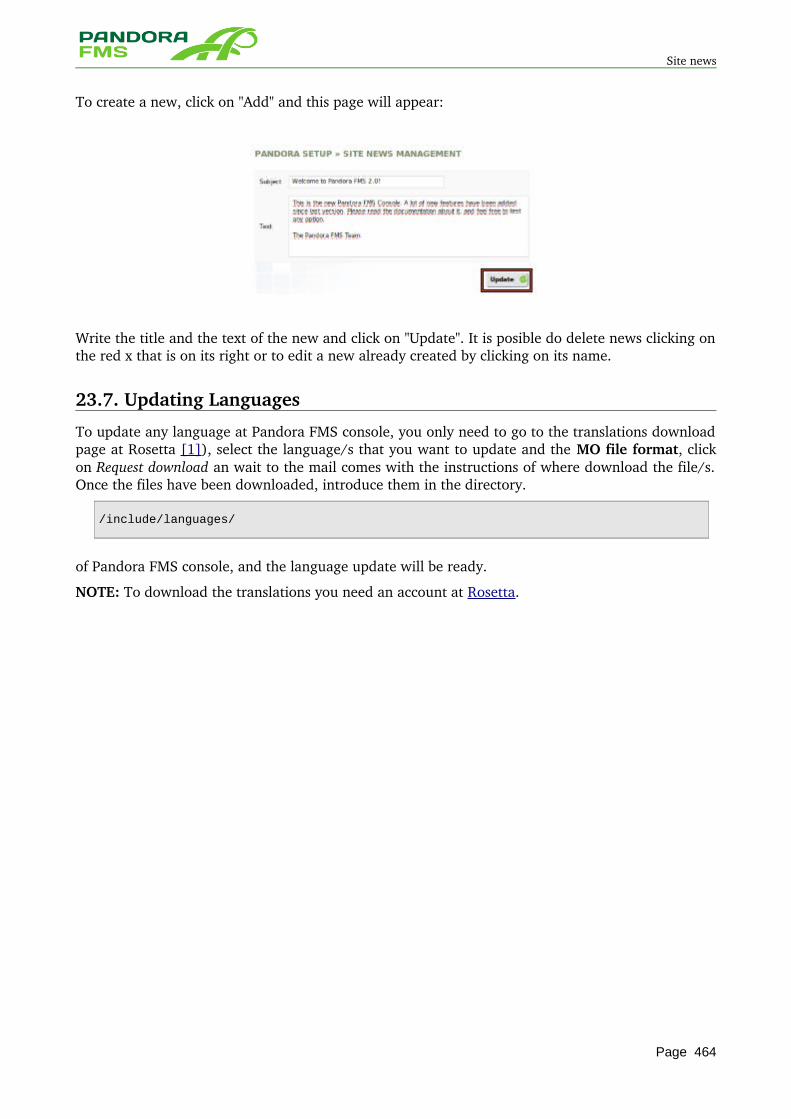
Site news
To create a new, click on "Add" and this page will appear:
Write the title and the text of the new and click on "Update". It is posible do delete news clicking on the red x that is on its right or to edit a new already created by clicking on its name.
23.7. Updating Languages
To update any language at Pandora FMS console, you only need to go to the translations download page at Rosetta [1]), select the language/s that you want to update and the MO file format, click on Request download an wait to the mail comes with the instructions of where download the file/s. Once the files have been downloaded, introduce them in the directory.
/include/languages/
of Pandora FMS console, and the language update will be ready.
NOTE: To download the translations you need an account at Rosetta.
Page 464

Updating Languages
24 PANDORA FMS SERVER MAINTENANCE
Page 465
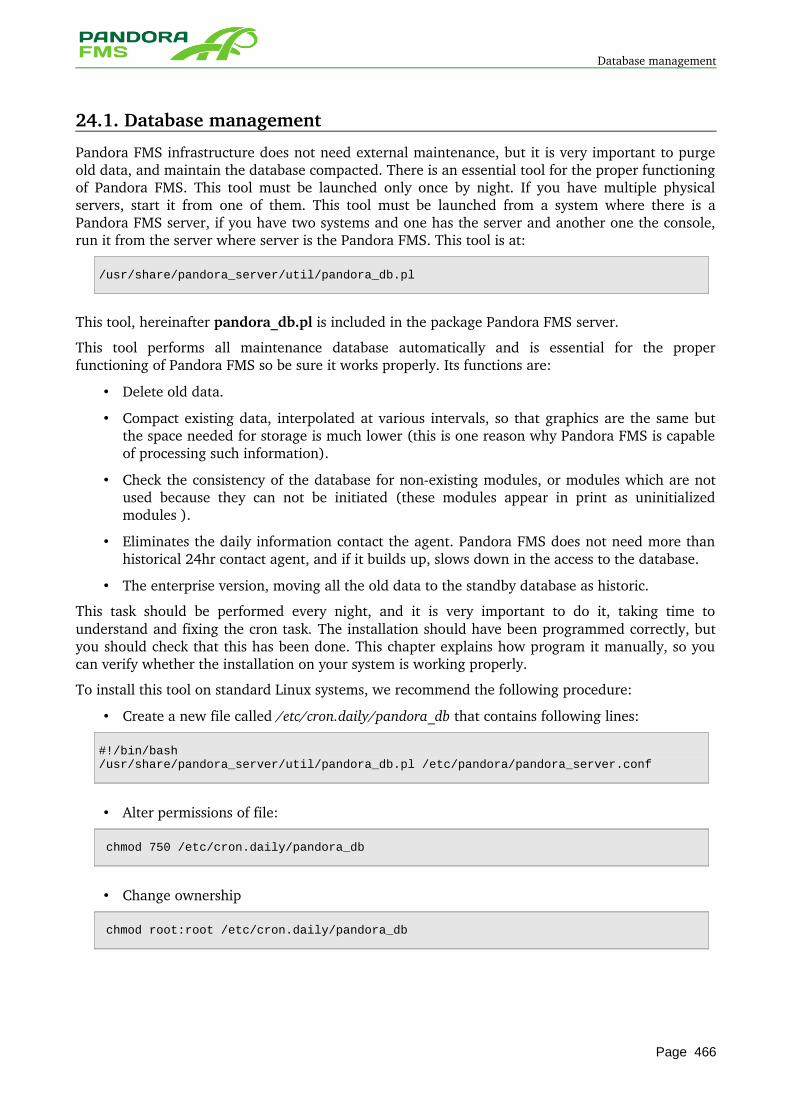
Database management
24.1. Database management
Pandora FMS infrastructure does not need external maintenance, but it is very important to purge old data, and maintain the database compacted. There is an essential tool for the proper functioning of Pandora FMS. This tool must be launched only once by night. If you have multiple physical servers, start it from one of them. This tool must be launched from a system where there is a Pandora FMS server, if you have two systems and one has the server and another one the console, run it from the server where server is the Pandora FMS. This tool is at:
/usr/share/pandora_server/util/pandora_db.pl
This tool, hereinafter pandora_db.pl is included in the package Pandora FMS server.
This tool performs all maintenance database automatically and is essential for the proper functioning of Pandora FMS so be sure it works properly. Its functions are:
• Delete old data.
• Compact existing data, interpolated at various intervals, so that graphics are the same but the space needed for storage is much lower (this is one reason why Pandora FMS is capable of processing such information).
• Check the consistency of the database for nonexisting modules, or modules which are not used because they can not be initiated (these modules appear in print as uninitialized modules ).
• Eliminates the daily information contact the agent. Pandora FMS does not need more than historical 24hr contact agent, and if it builds up, slows down in the access to the database.
• The enterprise version, moving all the old data to the standby database as historic.
This task should be performed every night, and it is very important to do it, taking time to understand and fixing the cron task. The installation should have been programmed correctly, but you should check that this has been done. This chapter explains how program it manually, so you can verify whether the installation on your system is working properly.
To install this tool on standard Linux systems, we recommend the following procedure:
• Create a new file called /etc/cron.daily/pandora_db that contains following lines:
#!/bin/bash/usr/share/pandora_server/util/pandora_db.pl /etc/pandora/pandora_server.conf
• Alter permissions of file:
chmod 750 /etc/cron.daily/pandora_db
• Change ownership
chmod root:root /etc/cron.daily/pandora_db
Page 466
Database management
• Reload cron configuration
/etc/init.d/cron reload
From now on, every night it will run the maintenance tool database Pandora FMS, ensuring that the database is always in optimum condition.
Finally, to ensure that you have left everything up correctly, or to ensure that the system, after installing the tool has been programmed correctly, manually run it once:
/etc/cron.daily/pandora_db
It should show a message like this (perhaps with less information, depending on their level of verbosity in the configuration file of Pandora FMS):
Pandora FMS DB Tool 3.0-dev PS090930 Copyright (c) 2004-2008 Artica STThis program is Free Software, licensed under the terms of GPL License v2You can download latest versions and documentation at http://www.pandorafms.orgPandora DB now initialized and running (PURGE=60 days, COMPACT=15 days, STEP=1) ...
Starting at 2009/10/10 02:02:18[PURGE] Deleting old event data (More than 60 days)... [PURGE] Deleting old data... [PURGE] Delete old data (string) ... [PURGE] Delete pending deleted modules (data table)...[PURGE] Delete pending deleted modules (data string table)...[PURGE] Delete pending deleted modules (data inc table)...[PURGE] Delete pending deleted modules (status, module table)...[PURGE] Delete old session data [PURGE] Delete old data from SNMP Traps [PURGE] Deleting old access data (More than 24hr) [CHECKDB] Deleting non-init data... [CHECKDB] Checking database consistency (Missing status)... [CHECKDB] Checking database consistency (Missing module)... [CHECKDB] Deleting non-existing module 1189 in state table [CHECKDB] Deleting non-existing module 1190 in state table [COMPACT] Compacting data until 2009092502:02:18Ending at 2009/10/10 02:02:31
24.2. Manual Execution of Maintenance Tool
It is possible to execute manually the maintenance tool once the script has been created. Its use is very easy. From a shell console, execute:
NOTE: in installed systems this could take hours. It is recommended to leave the process in second level .
/usr/share/pandora_server/util/pandora_db.pl /etc/pandora/pandora_server.conf
To execute manually the maintenance tool and leave it in second level, execute:
nohup /usr/share/pandora_server/util/pandora_db.pl /etc/pandora/pandora_server.conf
Page 467
Manual Execution of Maintenance Tool
The process will take some time until it load throughly in second level. After, you could close the shell console window without problems, while the process will continue executing.
NOTE: in some installations the tool directory could change. The most common one is:
/usr/share/pandora_server/util/
In Pandora FMS previous versions, it could be find at:
/usr/share/pandora/util/
It is very important that you make sure to use the current version of the tool, and not the one from a previous version. If you execute the program without arguments, it will show the tool version at the head of the message.
24.3. Database Backup
A simple command mysqldump, will do a dump of the database contents.To restore data it will be necessary an empty database with the same name that the original one (usually Pandora).
Doing the Backup
mysqldump -u root -p pandora > /backup/pandoradb_backup.sql
Restore the Backup
mysql -u root -pcreate database pandora;use pandora;source /backup/pandoradb_backup.sql
Probably, it will be also necessary to create new permissions to the console user:
grant all privileges on pandora.* to pandora@localhost identified by 'mypassword';
If you want to do a complete backup of the system, do not forget to do a backup of the whole directory /etc/pandora, to keep the information of the configuration of the local agents and the servers.
It is important to emphasize that this ONLY do a backup/restoration of the database files.
24.4. Backup and Complete Recovery of Pandora FMS
There is an script in the Pandora FMS server distribution that is useful to do a backup and a complete restoration of all Pandora FMS.This script is though to do copies and restoration in systems where the server and the console are located in the same machine. If in your environment there are several components, then you should use the tool with the most adequate parameters for its use or modify them so they could be adapted to their circumstances.
In order it could do its tasks, this script needs to be executed as root.
Page 468
Backup and Complete Recovery of Pandora FMS
This script is located at:
/usr/share/pandora_server/util/pandora_backup.sh
If we execute it without parameters, it will give us some help:
Pandora FMS Command line backup tool. http://www.pandorafms.org(c) 2009 Sancho Lerena <[email protected]>, Artica Soluciones Tecnologicas
Syntax: -c Path to Pandora FMS console, p.e: /srv/www/htdocs/pandora_console -d Destination path for backup file. p.e: /tmp -s Source filename for backup restore. p.e: /tmp/pandorafms -f Restore also files -q Quiet. No output message (used for scripts/cron) -b No database backup/restore
Please BE SURE TO USE RESTORE (-s) option. This will OVERWRITE ALL yourPandoraFMS install, including files, configuration and data. Please backup first!
This script is designed to do security copies and restoration of the following components:
• Server Configuration File(s). • Files waiting for execution, and also agent remote configuration files. • Complete DB. • Complete WEB Console.
Origin and Destination Options of the Copy
This script obtains the credentials to have access to the DB directly from the WEB console configuration. Is because of this that you should go, with the cparameter the complete path to the WEB console. This same parameter is used also to show it where it will find the WEB console to do its backup.
The backup destination is specified with the d parameter. In this path, it will leave the backup file compressed, with a name similar to pandorafms_backup_xxxxxxx.tar.gz.
The source origin of the restoration is the complete name and path of the backup generated file by this same tool.
File Restoration, not only Data Restoration
The f option also allows to restore the files (overwriting the current ones) of a security copy, not restoring the data from the database. As overwriting the current configuration files could have serious consequences, it is necessary to use f if we want to do a backup recovery and we want to it restore all the Pandora files (Console and Server).
File Restoration, without Data
Same as with the previous option, we could restore only the files, without dumping the data. To do it, use the boption.
Data Restoration, without Files
It is the default option. For doing this, you will not have to use neither the b option nor the f option.
Page 469
Backup and Complete Recovery of Pandora FMS
24.4.1. Examples of UseCreate backup
Execute as root:
/usr/share/pandora_server/util/pandora_backup.sh -c /var/www/pandora3 -d /tmp/
It will return something similar to this:
Backup completed and placed in /tmp//pandorafms_backup_2009-10-10-01-35-31.tar.gz
This means that the backup is at /tmp//pandorafms_backup_20091010013531.tar.gz
Restoring Backup
To restore the backup in an automatic way, you are supposed to have a console with the authentication credentials on the DDBB correctly defined.
Execute as root:
/usr/share/pandora_server/util/pandora_backup.sh -c /var/www/pandora3_broken/ -s /tmp/pandorafms_backup_2009-10-10-01-35-31.tar.gz
It will give back something similar to:
Detected Pandora FMS backup at /tmp/pandorafms_backup_2009-10-10-01-35-31.tar.gz, please wait...Dropping current databaseRestoring backup databaseRestoring files and configurationDone. Backup in /tmp/pandorafms_backup_2009-10-10-01-35-31.tar.gz restored
Restoring Backup in case of disaster
If you have lost the Pandora FMS console but you have a backup generated by this tool,then, first you will have to restore the console directory. For it, decompress manually its backup:
cd /tmptar xvzf pandorafms_backup_2009-10-10-0
This will unpack your WEB console complete directory in /tmp. In the case of the generated backup of the previous example, it creates a directory named:
/tmp/var/www/pandora3/
Copy the content of all this directory to to your web publication directory, that could change depending on the distribution you use:
cp -R var/www/pandora3 /var/www
Then restore the backup as usual.
Page 470
Manual startup/shutdown for Pandora FMS servers
24.5. Manual startup/shutdown for Pandora FMS servers
To start and / or stop the server manually Pandora FMS is running the following in a console shell':
Stop daemon:
/etc/init.d/pandora_server stop
Start daemon:
/etc/init.d/pandora_server start
Restart daemon:
/etc/init.d/pandora_server restart
24.6. Watchdog implementation for Pandora FMS
In the repository there is a small script that is used as a "watchdog" (Watchdog). This script performs a monitoring Pandora (who monitors who monitored?). Thus we can perform a recovery operation (trying to lift Pandora), and if that fails, we can tell the event.
24.6.1. /usr/bin/pandora_watchdog
#!/bin/bash# Copyright (c) 2005-2009 Artica ST# Author: Sancho Lerena <[email protected]> 2009# Licence: GPL2## daemon_watchdog## Generic watchdog to detect if a daemon is running. If cannot restart, execute# a custom-user defined command to notify daemon is down and continues in# standby (without notifying / checking) until daemon is alive again.
# Default configuration is for Pandora FMS Server daemon
# =====================================================================# Configuration begins here. Please use "" if data contain blank spaces
export DAEMON_WATCHDOG=daemon_watchdog# DAEMON_WATCHDOG: Name of this script. Used to check if its running already
export DAEMON_CHECK="/usr/local/bin/pandora_server /etc/pandora/pandora_server.conf"# DAEMON_CHECK: Daemon monitored, please use full path and parameters like# are shown doing a ps aux of ps -Alf
export DAEMON_RESTART="/etc/init.d/pandora_server restart"# DAEMON_RESTART: Command to try to restart the daemon
export DAEMON_DEADWAIT=120# DAEMON_DEADWAIT: Time this script checks after detect that# daemon is down before to consider is really down. This
export DAEMON_ALERT="/usr/bin/pandora_alert"# DAEMON_ALERT: Command/Script executed if after detecting daemon is down,
Page 471
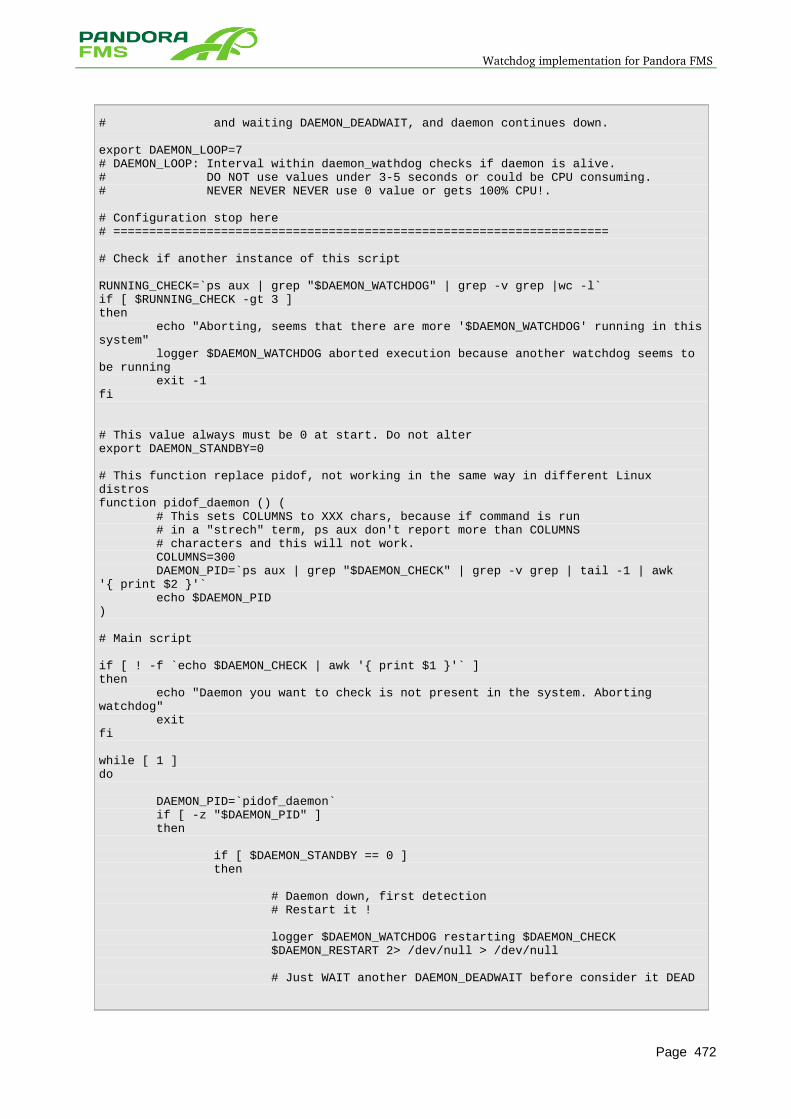
Watchdog implementation for Pandora FMS
# and waiting DAEMON_DEADWAIT, and daemon continues down.
export DAEMON_LOOP=7# DAEMON_LOOP: Interval within daemon_wathdog checks if daemon is alive.# DO NOT use values under 3-5 seconds or could be CPU consuming.# NEVER NEVER NEVER use 0 value or gets 100% CPU!.
# Configuration stop here# =====================================================================
# Check if another instance of this script
RUNNING_CHECK=`ps aux | grep "$DAEMON_WATCHDOG" | grep -v grep |wc -l`if [ $RUNNING_CHECK -gt 3 ]then echo "Aborting, seems that there are more '$DAEMON_WATCHDOG' running in this system" logger $DAEMON_WATCHDOG aborted execution because another watchdog seems to be running exit -1fi
# This value always must be 0 at start. Do not alterexport DAEMON_STANDBY=0
# This function replace pidof, not working in the same way in different Linux distrosfunction pidof_daemon () ( # This sets COLUMNS to XXX chars, because if command is run # in a "strech" term, ps aux don't report more than COLUMNS # characters and this will not work. COLUMNS=300 DAEMON_PID=`ps aux | grep "$DAEMON_CHECK" | grep -v grep | tail -1 | awk '{ print $2 }'` echo $DAEMON_PID)
# Main script
if [ ! -f `echo $DAEMON_CHECK | awk '{ print $1 }'` ]then echo "Daemon you want to check is not present in the system. Aborting watchdog" exitfi
while [ 1 ]do
DAEMON_PID=`pidof_daemon` if [ -z "$DAEMON_PID" ] then
if [ $DAEMON_STANDBY == 0 ] then
# Daemon down, first detection # Restart it !
logger $DAEMON_WATCHDOG restarting $DAEMON_CHECK $DAEMON_RESTART 2> /dev/null > /dev/null
# Just WAIT another DAEMON_DEADWAIT before consider it DEAD
Page 472
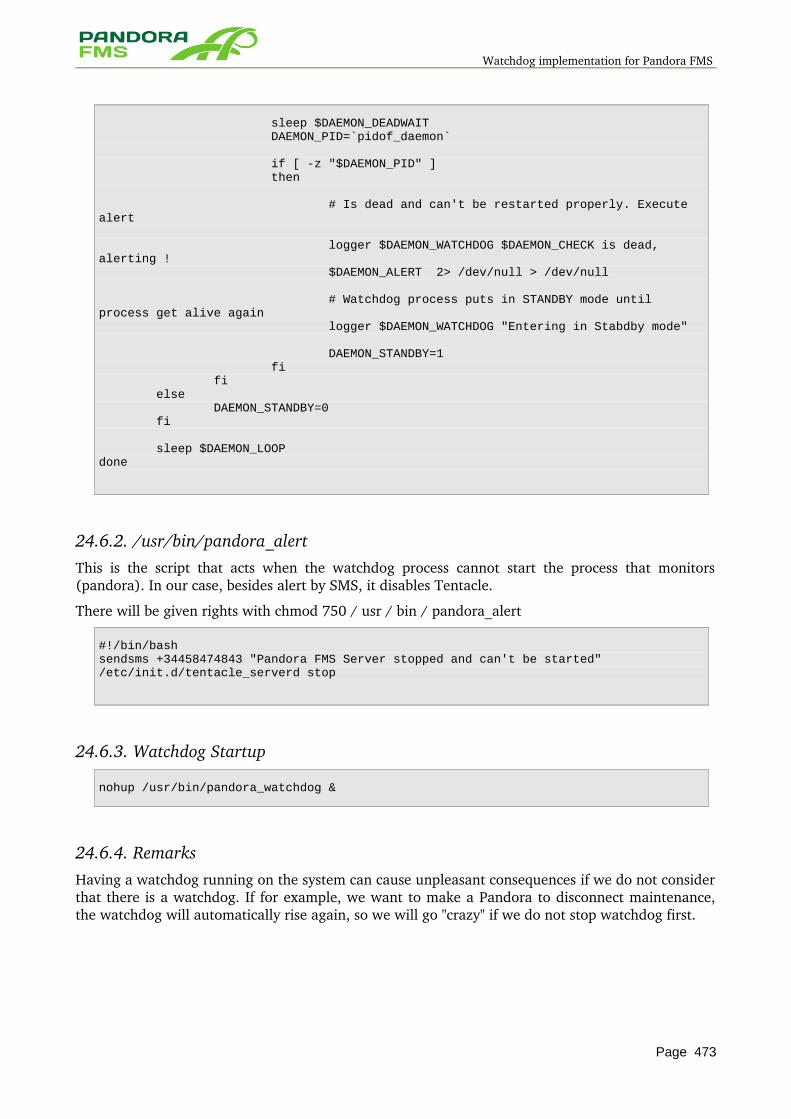
Watchdog implementation for Pandora FMS
sleep $DAEMON_DEADWAIT DAEMON_PID=`pidof_daemon`
if [ -z "$DAEMON_PID" ] then
# Is dead and can't be restarted properly. Execute alert
logger $DAEMON_WATCHDOG $DAEMON_CHECK is dead, alerting ! $DAEMON_ALERT 2> /dev/null > /dev/null
# Watchdog process puts in STANDBY mode until process get alive again logger $DAEMON_WATCHDOG "Entering in Stabdby mode"
DAEMON_STANDBY=1 fi fi else DAEMON_STANDBY=0 fi
sleep $DAEMON_LOOPdone
24.6.2. /usr/bin/pandora_alert This is the script that acts when the watchdog process cannot start the process that monitors (pandora). In our case, besides alert by SMS, it disables Tentacle.
There will be given rights with chmod 750 / usr / bin / pandora_alert
#!/bin/bashsendsms +34458474843 "Pandora FMS Server stopped and can't be started"/etc/init.d/tentacle_serverd stop
24.6.3. Watchdog Startup
nohup /usr/bin/pandora_watchdog &
24.6.4. Remarks Having a watchdog running on the system can cause unpleasant consequences if we do not consider that there is a watchdog. If for example, we want to make a Pandora to disconnect maintenance, the watchdog will automatically rise again, so we will go "crazy" if we do not stop watchdog first.
Page 473
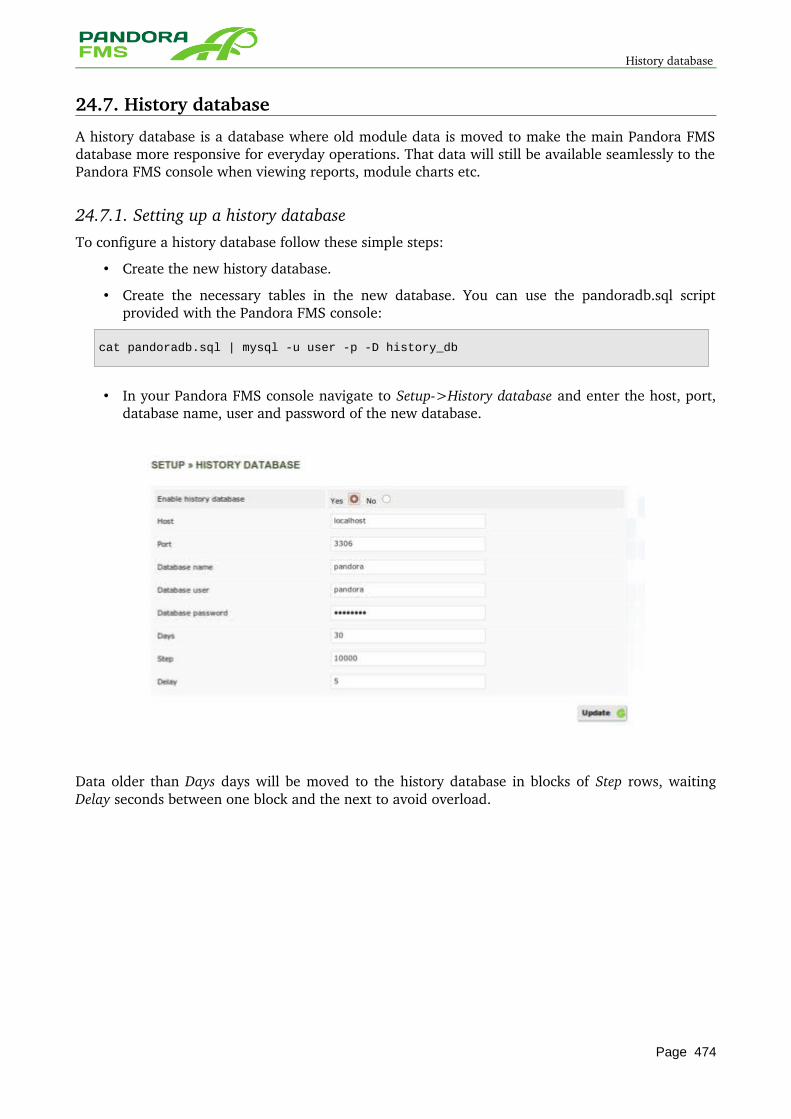
History database
24.7. History database
A history database is a database where old module data is moved to make the main Pandora FMS database more responsive for everyday operations. That data will still be available seamlessly to the Pandora FMS console when viewing reports, module charts etc.
24.7.1. Setting up a history database To configure a history database follow these simple steps:
• Create the new history database.
• Create the necessary tables in the new database. You can use the pandoradb.sql script provided with the Pandora FMS console:
cat pandoradb.sql | mysql -u user -p -D history_db
• In your Pandora FMS console navigate to Setup>History database and enter the host, port, database name, user and password of the new database.
Data older than Days days will be moved to the history database in blocks of Step rows, waiting Delay seconds between one block and the next to avoid overload.
Page 474

History database
25 DEVELOPMENT AND EXTENSION
Page 475
Development and Extension
Most of extensions have been described as independent index, specific for the creation of: server plugin, Unix agent plugin and console extensions.In this chapter is described how to collaborate in Pandora FMS and how to compile the Window agent from the sources. In the future, any other subject related with the development hat has not an specific index, will be in this chapter.
25.1. Cooperating with Pandora FMS project
This project is supported by voluntary developers that support the project. New developers,documentation editors, or people who want to cooperate is always welcome. A good way to start is to subscribe to our mail list and/or to the forum.
25.2. Subversion (SVN)
Pandora FMS development is done through SVN (code revision control system).You can find more information about how to enter in the SVN repositories at: OpenIdeas Wiki. Our SVN system is a public one, and is located in Sourceforge:
• Navigating: http://pandora.svn.sourceforge.net/viewvc/pandora/ • Download: https://pandora.svn.sourceforge.net/svnroot/pandora
Using the SVN client command line:
svn co https://pandora.svn.sourceforge.net/svnroot/pandora
25.3. Bugs / Failures
Reporting errors help us to improve Pandora FMS. Please, before sending an error report, check our database for bugs and in case of detect a non reported one, send it using the fine Sourceforge tool for tracking and report of errors in the Project WEB:http://sourceforge.net/projects/pandora/
25.4. Mailing Lists
Mailing Lists are good, and they are also an easy way of being uptodate by mail. We have a public mail list for users and news (with low traffic) and a developer mail list for technical debates and notifications (sometimes daily) of the development through our SVN (code version control system) automatic notification system.
Page 476

Mailing Lists
26 COMPILING WINDOWS AGENT FROM SOURCES
Page 477
Get the last source
26.1. Get the last source
To get the last source from our repository, you will need a Subversion client. Then execute this:
svn co https://svn.sourceforge.net/svnroot/pandora pandora
26.2. Windows
In order to build from sources, you will need the latest DevCpp IDE version, with the MinGW tools. Download it from here.
Open PandoraAgent.dev with DevCpp and construct the project. Everything should compile fine in a default installation.
If you found any problem when building from source, please contact us by email ([email protected]) or the SourceForge project web.
26.3. Crosscompiling from Linux
To crosscompile the Pandora FMS Windows Agent from Linux follow this steps:
26.3.1. Installing MinGW for LinuxFor Ubuntu/Debian:
sudo aptitude install mingw32
For SUSE or RPM compatible environments (with Zypper of manually) from this URL
http://download.opensuse.org/repositories/CrossToolchain:/mingw/openSUSE_11.1/
26.3.2. Installing the extra libraries needed by the agent
• win32api • odbc++ • curl • openssl • zlib • Boost C++ libraries (http://sourceforge.net/projects/boost/files/)
For example, to install Openssl package:
Go to http://sourceforge.net/projects/devpaks/files and download the file
openssl-0.9.8e-1cm.DevPak
Uncompress the file openssl0.9.8e1cm.DevPak:
tar jxvf openssl-0.9.8e-1cm.DevPak
Page 478
Crosscompiling from Linux
Copy the libraries and include files to your crossed compiled environment with MinGW:
cp lib/*.a /usr/i586-mingw32msvc/lib/cp -r include/* /usr/i586-mingw32msvc/include/
There is a faster alternative, but you need to solve problems with dependencies/libraries yourself: We have made a tarball with all needed libraries and included files and put on official Pandora FMS project download site. This is called mingw_pandorawin32_libraries_9Oct2009.tar.gz
26.3.3. Compiling and linkingAfter installing compiler, includes and libraries, go to the Pandora FMS Agent source directory and run:
./configure --host=i586-mingw32msvc && make
This should create the .exe executable, ready to be used.
Page 479

Crosscompiling from Linux
27 EXTERNAL API
Page 480

External API
There is an external API Pandora FMS in order to link other applications with Pandora FMS, both to obtain information from Pandora FMS and to enter information into Pandora FMS. All this documentation is at Pandora FMS External API
Page 481