Embed Size (px)
Citation preview

The Government Finance Officers Association of the United States and Canada (GFOA)presented a Distinguished Budget Presentation Award to San Diego County, Californiafor its annual budget for the fiscal year beginning July 1, 2012. In order to receive thisaward, a governmental unit must publish a budget document that meets programcriteria as a policy document, as an operations guide, as a financial plan and as acommunications device.
This award is valid for a period of one year only. The County believes the current budgetcontinues to conform to program requirements, and will submit it to GFOA to determineits eligibility for another award.

Published October 2013Office of Financial Planning
Ebony Shelton, Director
Table of Contents
County of San Diego Board of Supervisors ...................................................................3Organizational Chart ....................................................................4Message from the Chief Administrative Officer ...........................52013-14 Adopted Budget at a Glance .........................................7Mission and Vision .....................................................................11San Diego County Facts and Figures ........................................12San Diego County Profile and Economic Indicators ..................16Governmental Structure and Budget Process ...........................27
Governmental Structure ..........................................................27The General Management System ..........................................27Operational Plan ......................................................................30
Financial Planning Calendar 2013-14 Target Dates ..................33Operational Plan Format ............................................................34All Funds: Total Appropriations .................................................39All Funds: Total Staffing .............................................................52All Funds: Total Funding Sources ..............................................58Summary of General Fund Financing Sources ..........................64General Purpose Revenue .........................................................75Summary of Financial Policies ...................................................86Capital Projects ..........................................................................92Reserves and Resources ...........................................................93Debt Management Policies and Obligations .............................96
Debt Management ...................................................................96Long-Term Obligation Policy ...................................................96Credit Ratings ..........................................................................97Long-Term Obligations ..........................................................100Short-Term Obligations .........................................................103
Excellence in Governing ..........................................................105
Public Safety Group Public Safety Group & Executive Office ..................................113District Attorney .......................................................................121Sheriff .......................................................................................127Child Support Services ............................................................137Citizens’ Law Enforcement Review Board ...............................143Emergency Services ................................................................147Medical Examiner ....................................................................153Probation .................................................................................157Public Defender .......................................................................165San Diego County Fire Authority .............................................173
County of San Diego Adopted Operational Plan Fiscal Years 2013-2014 and 2014-2015 i
Table of Contents
Health and Human Services Agency Health and Human Services Agency Summary .......................181Regional Operations ................................................................187Strategic Planning and Operational Support ...........................199Aging & Independence Services ..............................................205Behavioral Health Services ......................................................213Child Welfare Services .............................................................221Public Health Services .............................................................227Public Administrator/Public Guardian ......................................233Administrative Support ............................................................237
Land Use and Environment Group Land Use and Environment Group & Executive Office ............247Agriculture, Weights and Measures ........................................255Air Pollution Control District .....................................................263Environmental Health ...............................................................271Farm and Home Advisor ..........................................................279Parks and Recreation ...............................................................285Planning and Land Use ............................................................293Planning and Development Services .......................................299Public Works ............................................................................305
Community Services Group Community Services Group & Executive Office ......................319Animal Services .......................................................................323County Library .........................................................................329General Services ......................................................................335Housing and Community Development ...................................343Purchasing and Contracting ....................................................351County of San Diego Successor Agency .................................357Registrar of Voters ...................................................................361
Finance and General GovernmentGroup
Finance and General Government Group & Executive Office ..371Board of Supervisors ...............................................................379Assessor/Recorder/County Clerk ............................................385Treasurer-Tax Collector ...........................................................391Chief Administrative Office ......................................................399Auditor and Controller ..............................................................411County Technology Office .......................................................419Civil Service Commission ........................................................425Clerk of the Board of Supervisors ............................................429County Counsel .......................................................................435San Diego County Grand Jury .................................................441Human Resources ...................................................................443County Communications Office ...............................................447
ii County of San DiegoAdopted Operational Plan Fiscal Years 2013-2014 and 2014-2015
Table of Contents
Capital Program Capital Program .......................................................................455Capital Appropriations .............................................................458Operating Impact of Capital Program ......................................462Capital Program Summary .......................................................470Capital Outlay Fund .................................................................473County Health Complex Fund ..................................................489Justice Facility Construction Fund ...........................................490Library Projects Fund ...............................................................493Multiple Species Conservation Program Fund ........................495Edgemoor Development Fund .................................................497Lease Payments .......................................................................499Outstanding Capital Projects by Group/Agency ......................503
Finance Other Finance Other ...........................................................................511
Appendices Appendix A: All Funds—Budget Summary ..............................519Appendix B: Budget Summary & Changes in Fund Balance ...531Appendix C: General Fund Budget Summary ..........................546Appendix D: Health & Human Services—General Fund ..........551Appendix E: Operational Plan Acronyms and Abbreviations ...553Appendix F: Glossary of Operational Plan Terms ....................555
Index Index ........................................................................................563
County of San Diego Adopted Operational Plan Fiscal Years 2013-2014 and 2014-2015 iii

County of San Diego
County of San DiegoBoard of Supervisors 3
Organizational Chart 4
Message from the Chief Administrative Officer 5
2013-14 Adopted Budget at a Glance 7
Mission and Vision 11
San Diego County Facts and Figures 12
San Diego County Profile and Economic Indicators 16
Governmental Structure and Budget Documents 27
Financial Planning Calendar - 2013-14 Target Dates 33
Operational Plan Format 34
All Funds: Total Appropriations 39
All Funds: Total Staffing 52
All Funds: Total Funding Sources 58
Summary of General Fund Financing Sources 64
General Purpose Revenue 75
Summary of Financial Policies 86
Capital Projects 92
Reserves and Resources 93
Debt Management Policies and Obligations 96
Excellence in Governing 105

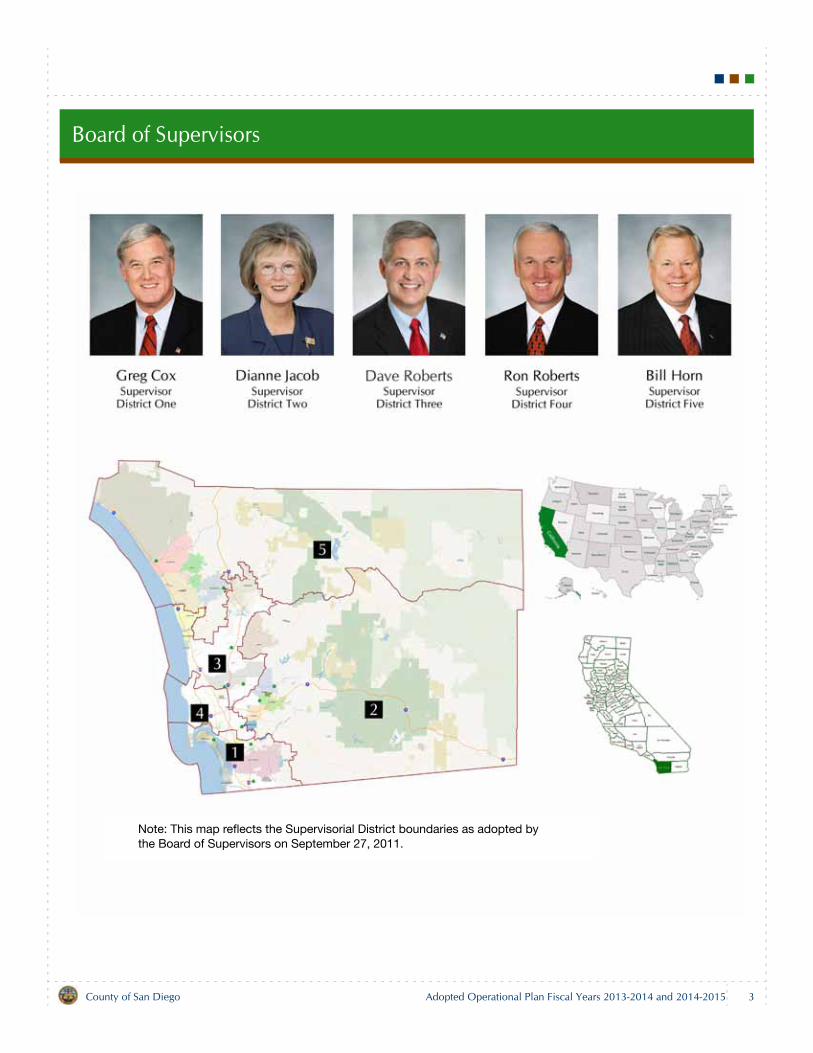
Board of Supervisors
Note: This map reflects the Supervisorial District boundaries as adopted bythe Board of Supervisors on September 27, 2011.
County of San Diego Adopted Operational Plan Fiscal Years 2013-2014 and 2014-2015 3
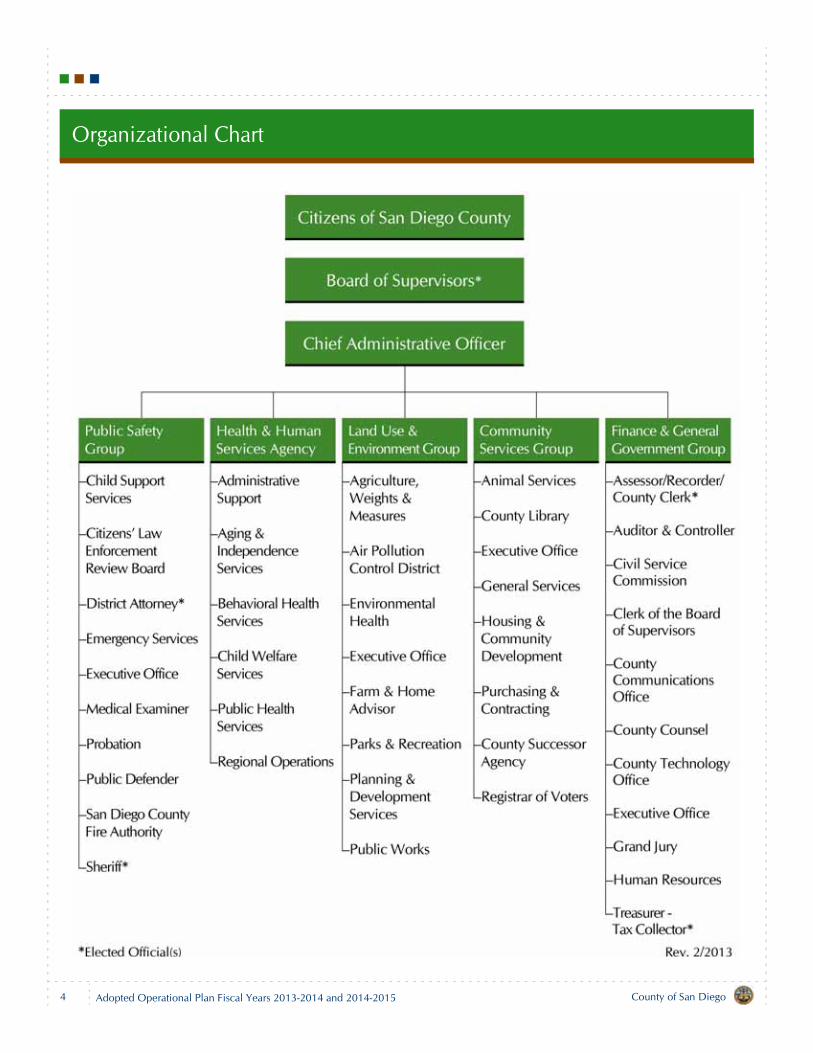
Organizational Chart
4 County of San DiegoAdopted Operational Plan Fiscal Years 2013-2014 and 2014-2015
County of San Diego Adopted Operational Plan Fiscal Years 2013-2014 and 2014-2015 5
Message from the Chief Administrative Officer
One year ago this was a very different County of San Diego. As we look ahead, Iam reminded of the saying that, “the more things change, the more they remain thesame.”
The past fiscal year brought the County an evolution in leadership, unprecedented new responsibilities asthe State of California continues to reshape the way counties deliver essential services, and an economy nolonger in free fall—even the landscape of the historic 1930s-era County Administration Center is getting anoverhaul. That we operate in an environment of constant change has never been more apparent.
As we enter a new fiscal year, the County of San Diego remains confident in our ability to overcome thechallenges ahead, thanks to the sound leadership of the Board of Supervisors and a steadfast commitment tothe proven success of the General Management System as our guide to running an efficient, effective, award-winning government. With the County's Strategic Plan charting the course, we also rely upon the vision forcommunity health, safety and well-being laid out in the strategies of Live Well San Diego.
Accordingly, the Adopted Operational Plan for Fiscal Years 2013-15 reflects modest growth, primarily fromthe addition of staff to address new responsibilities of counties in the areas of public safety and health, as wellas increasing retirement costs. The Adopted Operational Plan for Fiscal Year 2013-14 totals $4.98 billion, anincrease of 2.7% over the prior fiscal year, and includes 16,627 staff years, representing 3.8% growth in theCounty workforce.
Yet it is not the size of the County's budget that matters, but rather how we plan to use these public dol-lars to serve and improve the region which we call home, and to position the County for continued excellencein the decades to come.
This Adopted Operational Plan includes the County's response to new challenges. We continue toadvance a coordinated strategy to keep communities safe in the new paradigm of County responsibility forcriminal offenders with the implementation of Assembly Bill 109, Public Safety Realignment (2011). TheCounty has been a Statewide model of collaboration and leadership in this area. Also, as the nation lookstoward the implementation of healthcare reform through the federal Patient Protection and Affordable CareAct, the County is increasing capacity to manage the transition of low-income children from the State'sHealthy Families to Medi-Cal health insurance plans.
We also look forward to new opportunities. The County continues to earn grant funding for innovative pro-grams to improve service to the public, such as the Community Based Care Transitions Program which seeksto reduce costs while improving outcomes for patients with chronic health conditions. And, we'll ensure excel-lence in facilities to serve future generations by maintaining commitment to the County's capital programthrough improvements to trails, parks and libraries across the County and opening critical new facilitiesincluding the expanded San Diego County Women's Detention and Reentry Facility and the East Mesa Reen-try Facility.
Message from the Chief Administrative Officer
This Operational Plan also maintains the County's commitment to excellence and efficiency in carrying outour continued responsibilities to taxpayers. First and foremost we will maintain the fiscal discipline and pru-dent use of resources that have earned the County strong credit ratings year after year. We will maintain ourcommitment to the highest standards of service, continually improving our business for responsiveness tocustomer needs such as the reorganization of the County's land use process and creation of the new Depart-ment of Planning and Development Services, as envisioned by the Board of Supervisors. And we'll continuesupporting growth in the skills of employees and progress on the journey toward wellness, never losing focuson our organizational culture of integrity and ethical conduct.
It is the County's hallmark of stability and fiscal discipline, combined with our increasing ability to adapt,improve and innovate that are reflected in the goals we've set for the coming year. Looking further out, the Fis-cal Year 2013-14 budget also prepares the County to address continually growing retirement costs whilemaintaining the ability to face the challenges that lie ahead.
For the County, as in life, change is inevitable. What will never waver is the County of San Diego's commit-ment to excellence in all that we do for the good of the people we serve. I invite you to read more about theCounty's plans for continued excellence and innovation included throughout this document.
Helen N. Robbins-Meyer, Chief Administrative Officer
6 County of San DiegoAdopted Operational Plan Fiscal Years 2013-2014 and 2014-2015
2013-14 Adopted Budget at a Glance
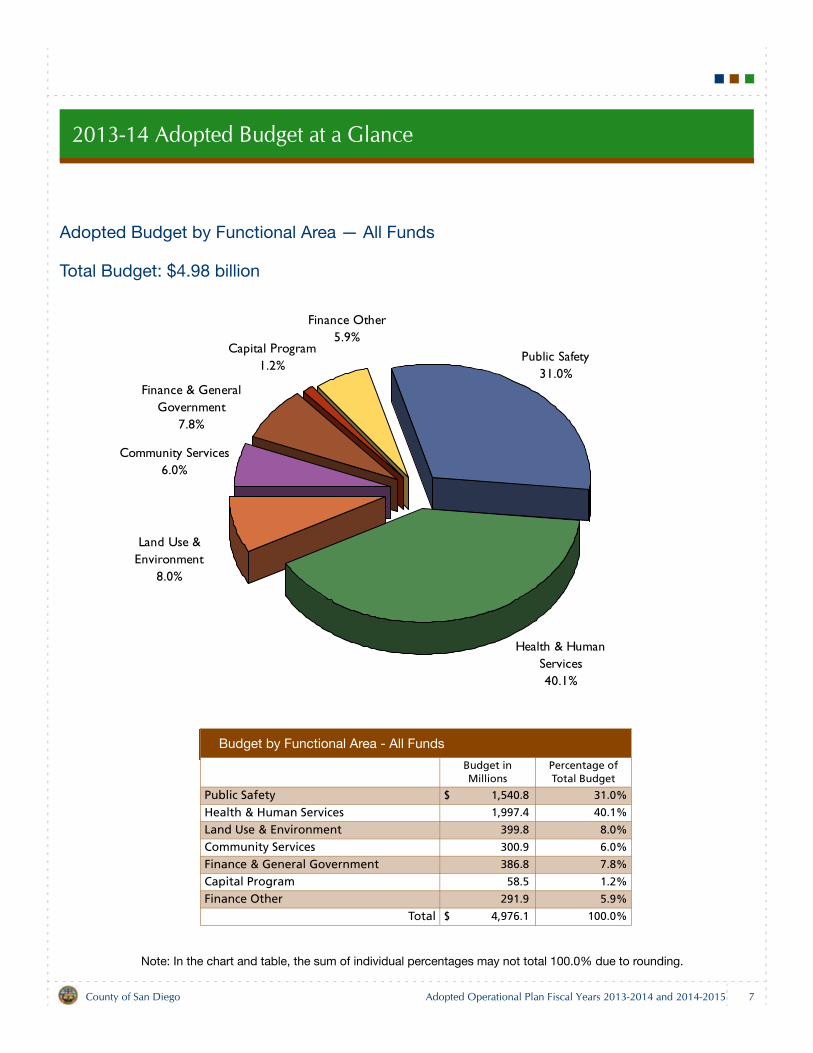
Adopted Budget by Functional Area — All Funds
Total Budget: $4.98 billion
Note: In the chart and table, the sum of individual percentages may not total 100.0% due to rounding.
Budget by Functional Area - All Funds
Budget in Millions
Percentage of Total Budget
Public Safety $ 1,540.8 31.0%
Health & Human Services 1,997.4 40.1%
Land Use & Environment 399.8 8.0%
Community Services 300.9 6.0%
Finance & General Government 386.8 7.8%
Capital Program 58.5 1.2%
Finance Other 291.9 5.9%
Total $ 4,976.1 100.0%
Finance Other5.9%
Capital Program1.2%
Finance & General Government
7.8%
Community Services6.0%
Land Use &Environment
8.0%
Health & Human Services40.1%
Public Safety31.0%
County of San Diego Adopted Operational Plan Fiscal Years 2013-2014 and 2014-2015 7
2013-14 Adopted Budget at a Glance
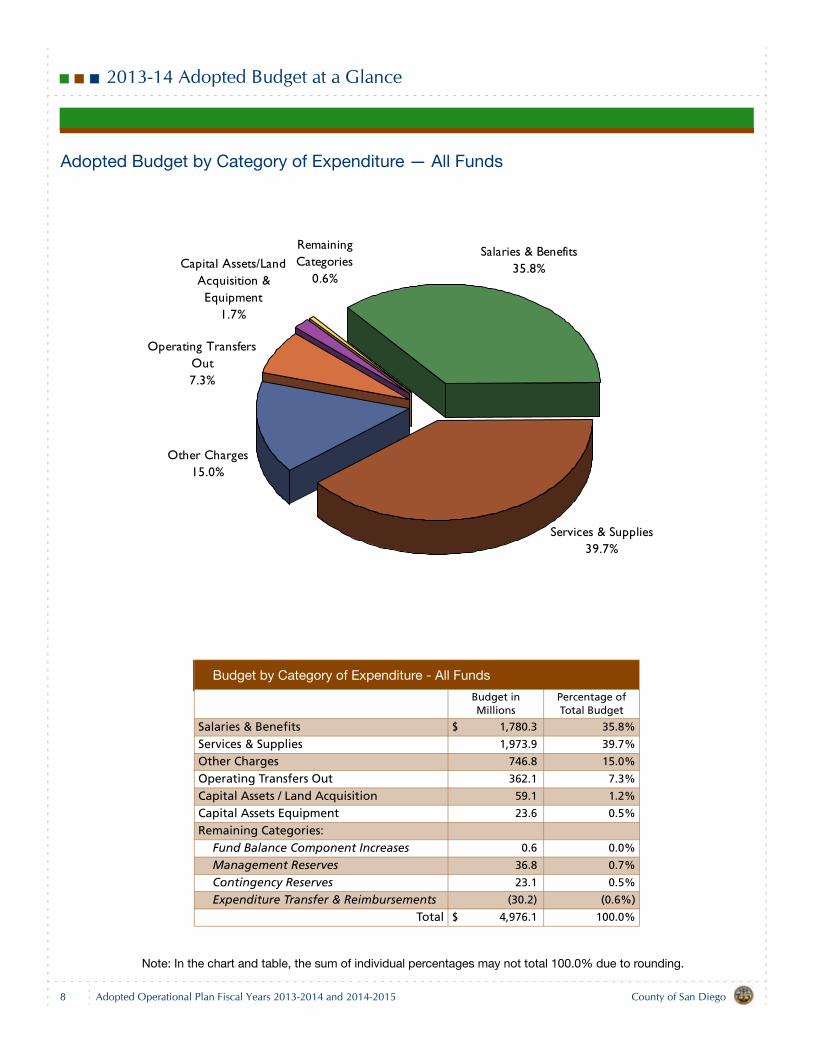
Adopted Budget by Category of Expenditure — All Funds
Note: In the chart and table, the sum of individual percentages may not total 100.0% due to rounding.
Budget by Category of Expenditure - All Funds
Budget in Millions
Percentage of Total Budget
Salaries & Benefits $ 1,780.3 35.8%
Services & Supplies 1,973.9 39.7%
Other Charges 746.8 15.0%
Operating Transfers Out 362.1 7.3%
Capital Assets / Land Acquisition 59.1 1.2%
Capital Assets Equipment 23.6 0.5%
Remaining Categories:Fund Balance Component Increases 0.6 0.0%
Management Reserves 36.8 0.7%
Contingency Reserves 23.1 0.5%
Expenditure Transfer & Reimbursements (30.2) (0.6%)
Total $ 4,976.1 100.0%
RemainingCategories
0.6%Capital Assets/Land
Acquisition & Equipment
1.7%
Operating Transfers Out7.3%
Other Charges15.0%
Services & Supplies39.7%
Salaries & Benefits35.8%
8 County of San DiegoAdopted Operational Plan Fiscal Years 2013-2014 and 2014-2015
2013-14 Adopted Budget at a Glance
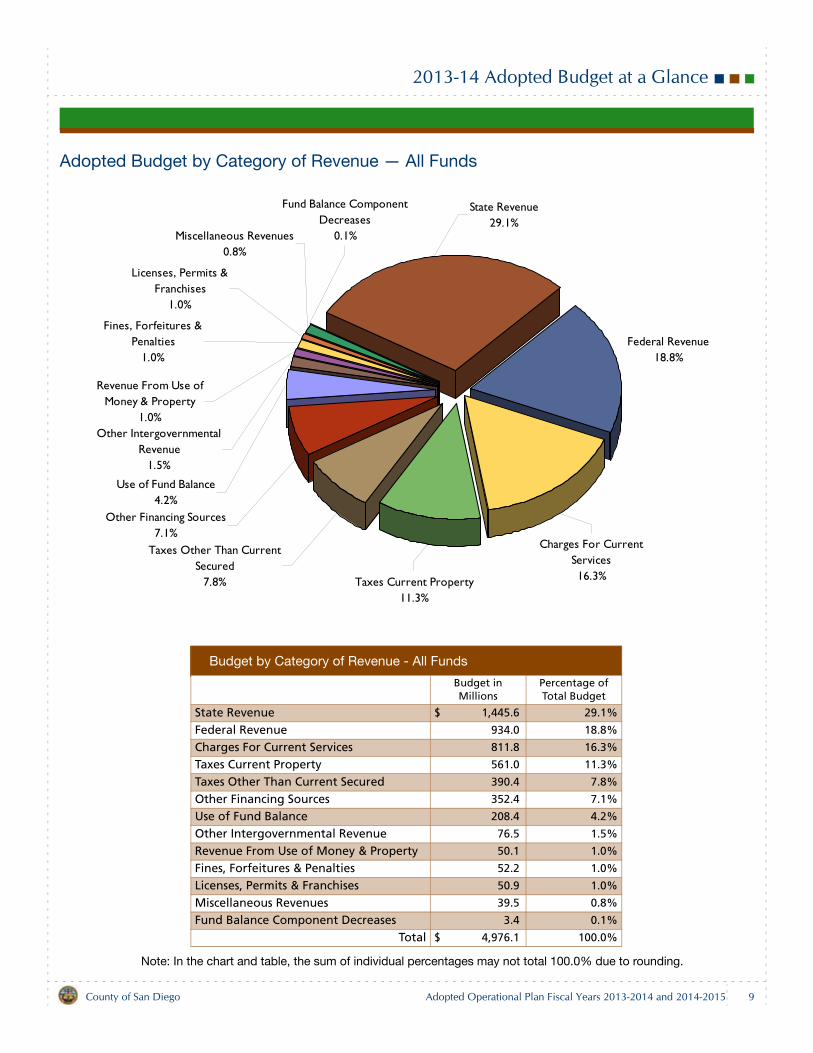
Adopted Budget by Category of Revenue — All Funds
Note: In the chart and table, the sum of individual percentages may not total 100.0% due to rounding.
Budget by Category of Revenue - All Funds
Budget in Millions
Percentage of Total Budget
State Revenue $ 1,445.6 29.1%
Federal Revenue 934.0 18.8%
Charges For Current Services 811.8 16.3%
Taxes Current Property 561.0 11.3%
Taxes Other Than Current Secured 390.4 7.8%
Other Financing Sources 352.4 7.1%
Use of Fund Balance 208.4 4.2%
Other Intergovernmental Revenue 76.5 1.5%
Revenue From Use of Money & Property 50.1 1.0%
Fines, Forfeitures & Penalties 52.2 1.0%
Licenses, Permits & Franchises 50.9 1.0%
Miscellaneous Revenues 39.5 0.8%
Fund Balance Component Decreases 3.4 0.1%
Total $ 4,976.1 100.0%
Fund Balance Component Decreases
0.1%Miscellaneous Revenues0.8%
Licenses, Permits & Franchises
1.0%
Fines, Forfeitures & Penalties
1.0%
Revenue From Use of Money & Property
1.0%Other Intergovernmental
Revenue1.5%
Use of Fund Balance4.2%
Other Financing Sources7.1%
Taxes Other Than Current Secured
7.8% Taxes Current Property11.3%
Charges For Current Services16.3%
Federal Revenue18.8%
State Revenue29.1%
County of San Diego Adopted Operational Plan Fiscal Years 2013-2014 and 2014-2015 9
2013-14 Adopted Budget at a Glance
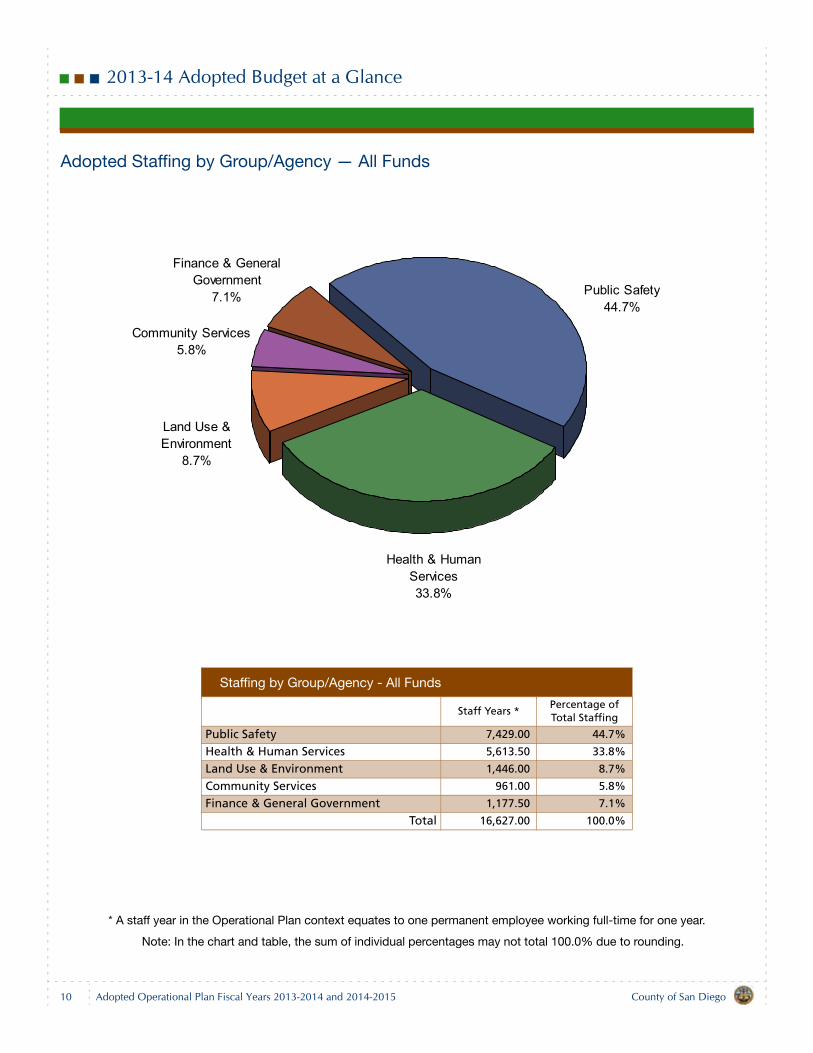
Adopted Staffing by Group/Agency — All Funds
* A staff year in the Operational Plan context equates to one permanent employee working full-time for one year.
Note: In the chart and table, the sum of individual percentages may not total 100.0% due to rounding.
Staffing by Group/Agency - All Funds
Staff Years *Percentage of Total Staffing
Public Safety 7,429.00 44.7%
Health & Human Services 5,613.50 33.8%
Land Use & Environment 1,446.00 8.7%
Community Services 961.00 5.8%
Finance & General Government 1,177.50 7.1%
Total 16,627.00 100.0%
Community Services5.8%
Finance & General Government
7.1%
Land Use & Environment
8.7%
Health & Human Services33.8%
Public Safety44.7%
10 County of San DiegoAdopted Operational Plan Fiscal Years 2013-2014 and 2014-2015
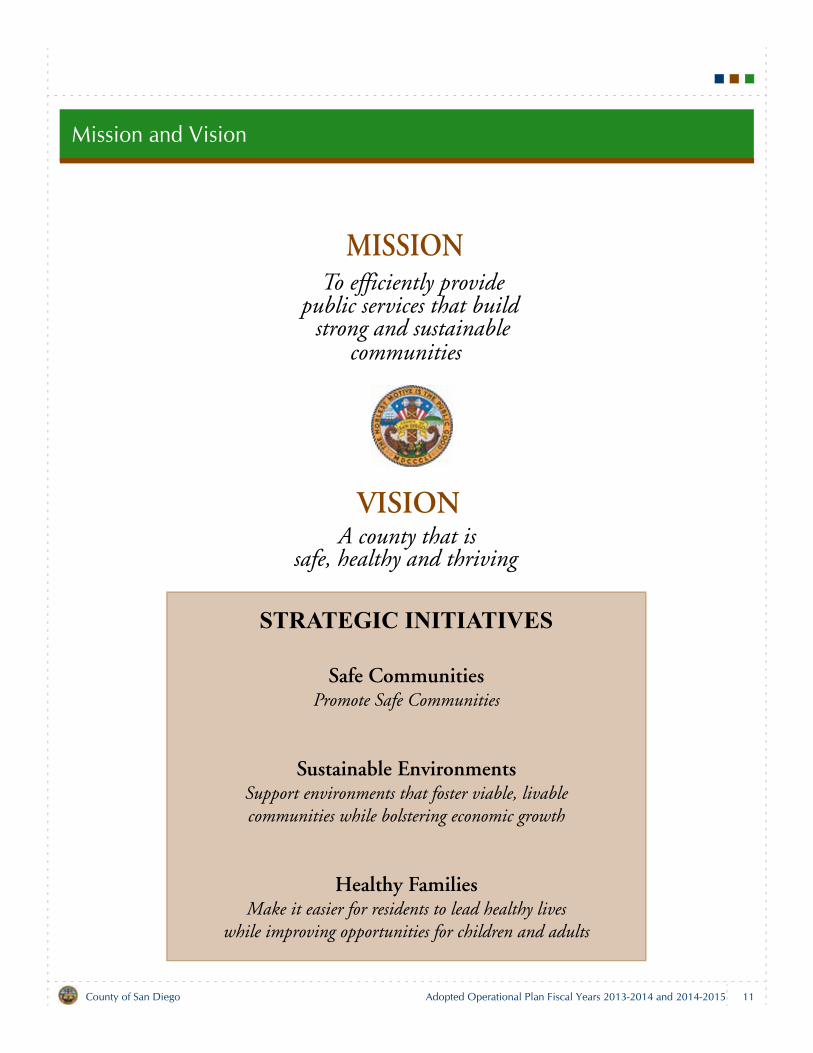
Mission and Vision
STRATEGIC INITIATIVES
Safe CommunitiesPromote Safe Communities
Sustainable EnvironmentsSupport environments that foster viable, livablecommunities while bolstering economic growth
Healthy FamiliesMake it easier for residents to lead healthy lives
while improving opportunities for children and adults
MISSIONTo efficiently provide
public services that buildstrong and sustainable
communities
VISIONA county that is
safe, healthy and thriving
County of San Diego Adopted Operational Plan Fiscal Years 2013-2014 and 2014-2015 11
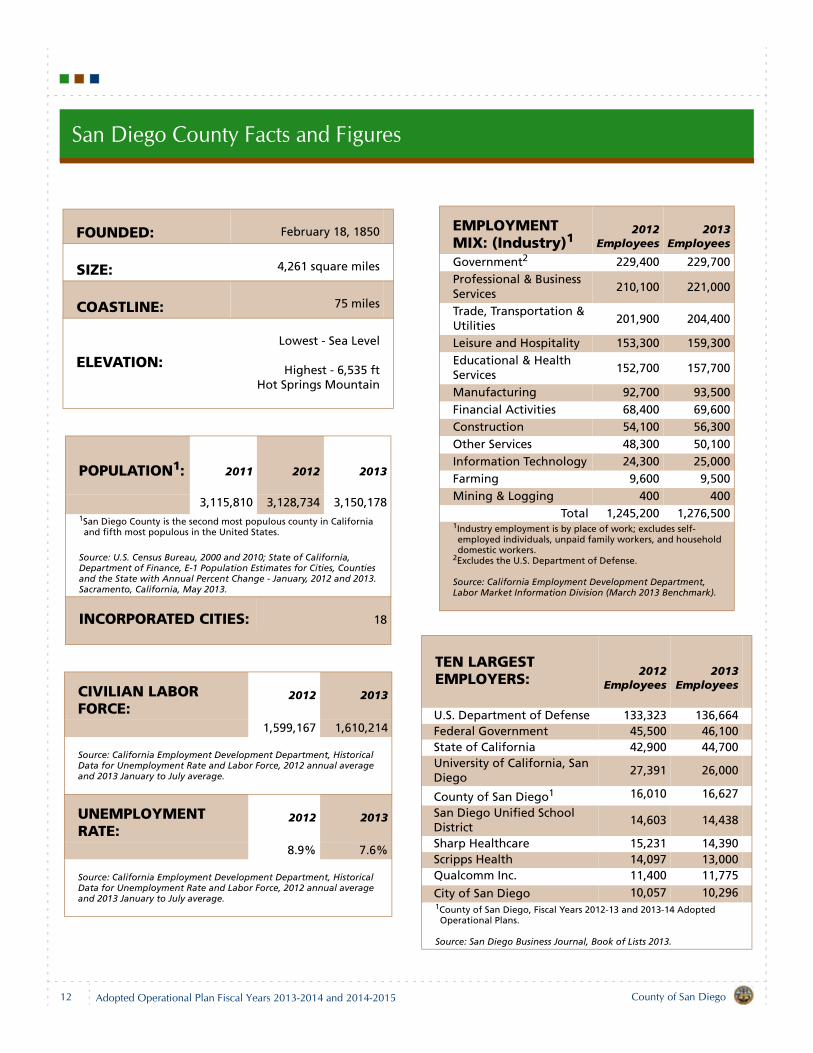
San Diego County Facts and Figures
FOUNDED: February 18, 1850
SIZE: 4,261 square miles
COASTLINE: 75 miles
ELEVATION:
Lowest - Sea Level
Highest - 6,535 ftHot Springs Mountain
POPULATION1: 2011 2012 2013
3,115,810 3,128,734 3,150,1781San Diego County is the second most populous county in California and fifth most populous in the United States.
Source: U.S. Census Bureau, 2000 and 2010; State of California, Department of Finance, E-1 Population Estimates for Cities, Counties and the State with Annual Percent Change - January, 2012 and 2013. Sacramento, California, May 2013.
INCORPORATED CITIES: 18
CIVILIAN LABOR FORCE:
2012 2013
1,599,167 1,610,214
Source: California Employment Development Department, Historical Data for Unemployment Rate and Labor Force, 2012 annual average and 2013 January to July average.
UNEMPLOYMENT RATE:
2012 2013
8.9% 7.6%
Source: California Employment Development Department, Historical Data for Unemployment Rate and Labor Force, 2012 annual average and 2013 January to July average.
EMPLOYMENT MIX: (Industry)1
2012Employees
2013Employees
Government2 229,400 229,700Professional & Business Services 210,100 221,000
Trade, Transportation & Utilities 201,900 204,400
Leisure and Hospitality 153,300 159,300Educational & Health Services 152,700 157,700
Manufacturing 92,700 93,500Financial Activities 68,400 69,600Construction 54,100 56,300Other Services 48,300 50,100Information Technology 24,300 25,000Farming 9,600 9,500Mining & Logging 400 400
Total 1,245,200 1,276,5001Industry employment is by place of work; excludes self-employed individuals, unpaid family workers, and household domestic workers.
2Excludes the U.S. Department of Defense.
Source: California Employment Development Department, Labor Market Information Division (March 2013 Benchmark).
TEN LARGEST EMPLOYERS:
2012Employees
2013Employees
U.S. Department of Defense 133,323 136,664Federal Government 45,500 46,100State of California 42,900 44,700University of California, San Diego
27,391 26,000
County of San Diego1 16,010 16,627
San Diego Unified SchoolDistrict
14,603 14,438
Sharp Healthcare 15,231 14,390Scripps Health 14,097 13,000Qualcomm Inc. 11,400 11,775
City of San Diego 10,057 10,2961County of San Diego, Fiscal Years 2012-13 and 2013-14 Adopted Operational Plans.
Source: San Diego Business Journal, Book of Lists 2013.
12 County of San DiegoAdopted Operational Plan Fiscal Years 2013-2014 and 2014-2015
San Diego County Facts and Figures
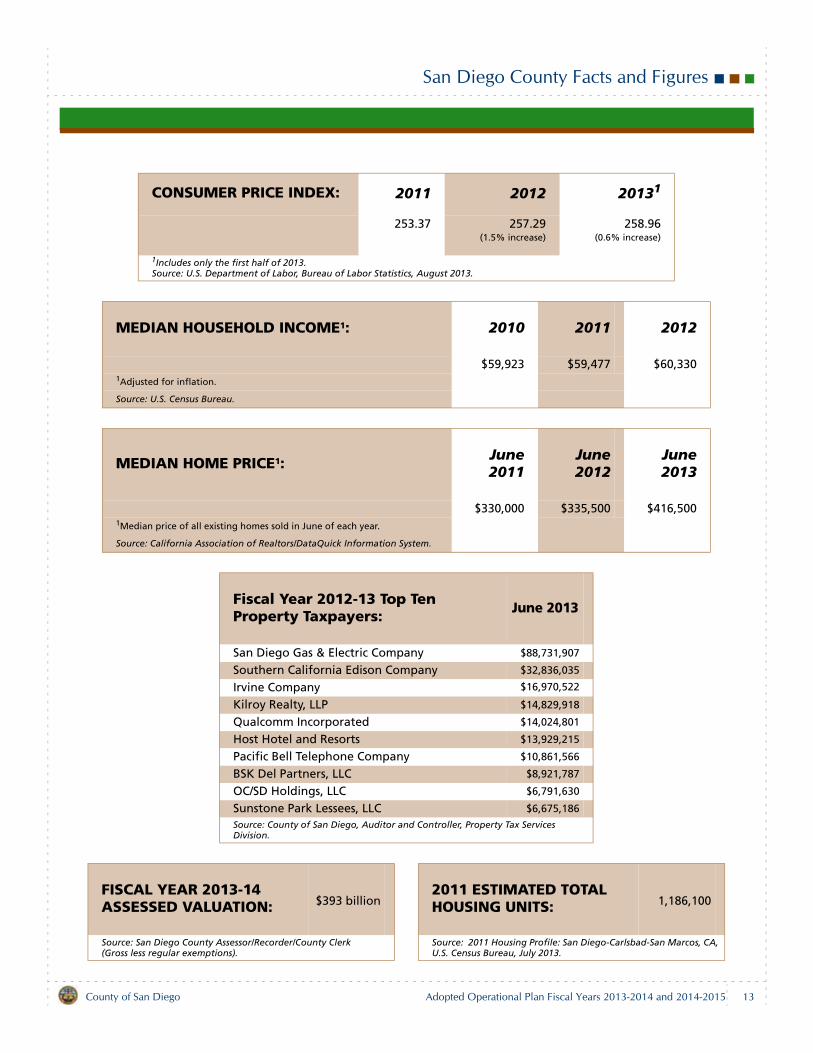
CONSUMER PRICE INDEX: 2011 2012 20131
253.37 257.29(1.5% increase)
258.96(0.6% increase)
1Includes only the first half of 2013.Source: U.S. Department of Labor, Bureau of Labor Statistics, August 2013.
MEDIAN HOUSEHOLD INCOME1: 2010 2011 2012
$59,923 $59,477 $60,3301Adjusted for inflation.
Source: U.S. Census Bureau.
MEDIAN HOME PRICE1: June2011
June2012
June2013
$330,000 $335,500 $416,5001Median price of all existing homes sold in June of each year.
Source: California Association of Realtors/DataQuick Information System.
Fiscal Year 2012-13 Top Ten Property Taxpayers: June 2013
San Diego Gas & Electric Company $88,731,907
Southern California Edison Company $32,836,035
Irvine Company $16,970,522
Kilroy Realty, LLP $14,829,918
Qualcomm Incorporated $14,024,801
Host Hotel and Resorts $13,929,215
Pacific Bell Telephone Company $10,861,566
BSK Del Partners, LLC $8,921,787
OC/SD Holdings, LLC $6,791,630
Sunstone Park Lessees, LLC $6,675,186Source: County of San Diego, Auditor and Controller, Property Tax Services Division.
FISCAL YEAR 2013-14 ASSESSED VALUATION: $393 billion
2011 ESTIMATED TOTAL HOUSING UNITS: 1,186,100
Source: San Diego County Assessor/Recorder/County Clerk(Gross less regular exemptions).
Source: 2011 Housing Profile: San Diego-Carlsbad-San Marcos, CA, U.S. Census Bureau, July 2013.
County of San Diego Adopted Operational Plan Fiscal Years 2013-2014 and 2014-2015 13
San Diego County Facts and Figures
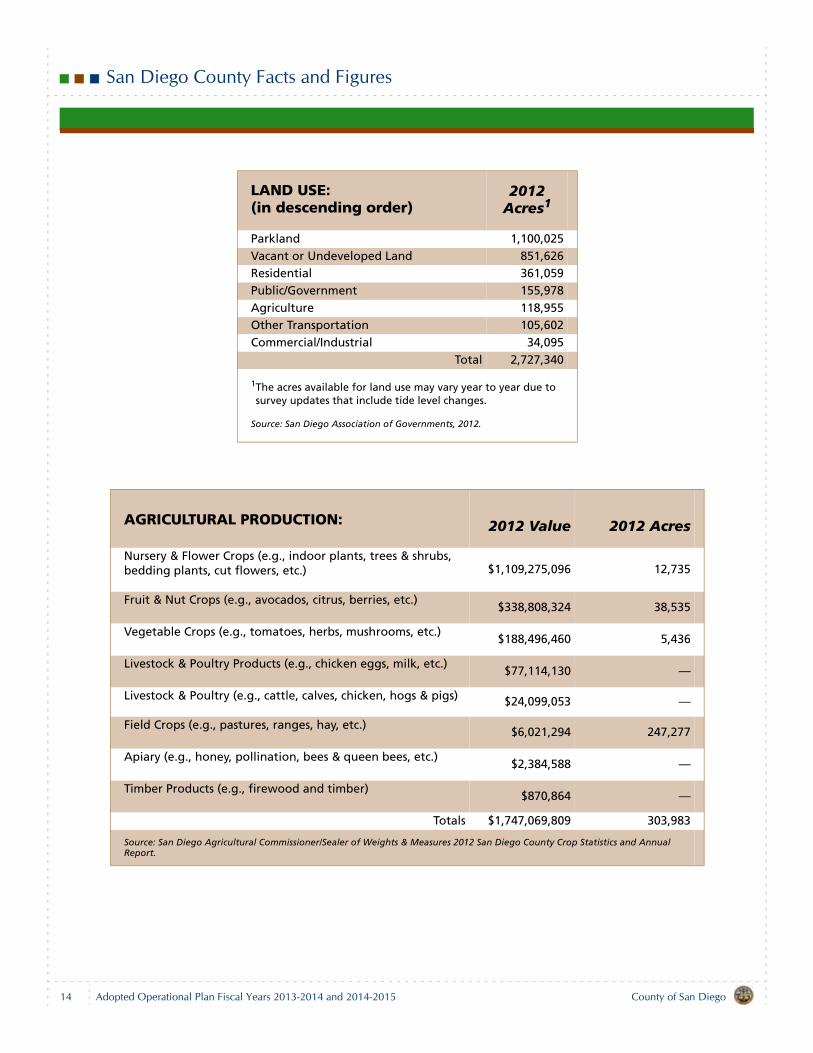
LAND USE:(in descending order)
2012Acres1
Parkland 1,100,025Vacant or Undeveloped Land 851,626Residential 361,059Public/Government 155,978Agriculture 118,955Other Transportation 105,602Commercial/Industrial 34,095
Total 2,727,340
1The acres available for land use may vary year to year due to survey updates that include tide level changes.
Source: San Diego Association of Governments, 2012.
AGRICULTURAL PRODUCTION: 2012 Value 2012 Acres
Nursery & Flower Crops (e.g., indoor plants, trees & shrubs, bedding plants, cut flowers, etc.) $1,109,275,096 12,735
Fruit & Nut Crops (e.g., avocados, citrus, berries, etc.)$338,808,324 38,535
Vegetable Crops (e.g., tomatoes, herbs, mushrooms, etc.)$188,496,460 5,436
Livestock & Poultry Products (e.g., chicken eggs, milk, etc.)$77,114,130 —
Livestock & Poultry (e.g., cattle, calves, chicken, hogs & pigs) $24,099,053 —
Field Crops (e.g., pastures, ranges, hay, etc.) $6,021,294 247,277
Apiary (e.g., honey, pollination, bees & queen bees, etc.)$2,384,588 —
Timber Products (e.g., firewood and timber)$870,864 —
Totals $1,747,069,809 303,983
Source: San Diego Agricultural Commissioner/Sealer of Weights & Measures 2012 San Diego County Crop Statistics and Annual Report.
14 County of San DiegoAdopted Operational Plan Fiscal Years 2013-2014 and 2014-2015
San Diego County Facts and Figures
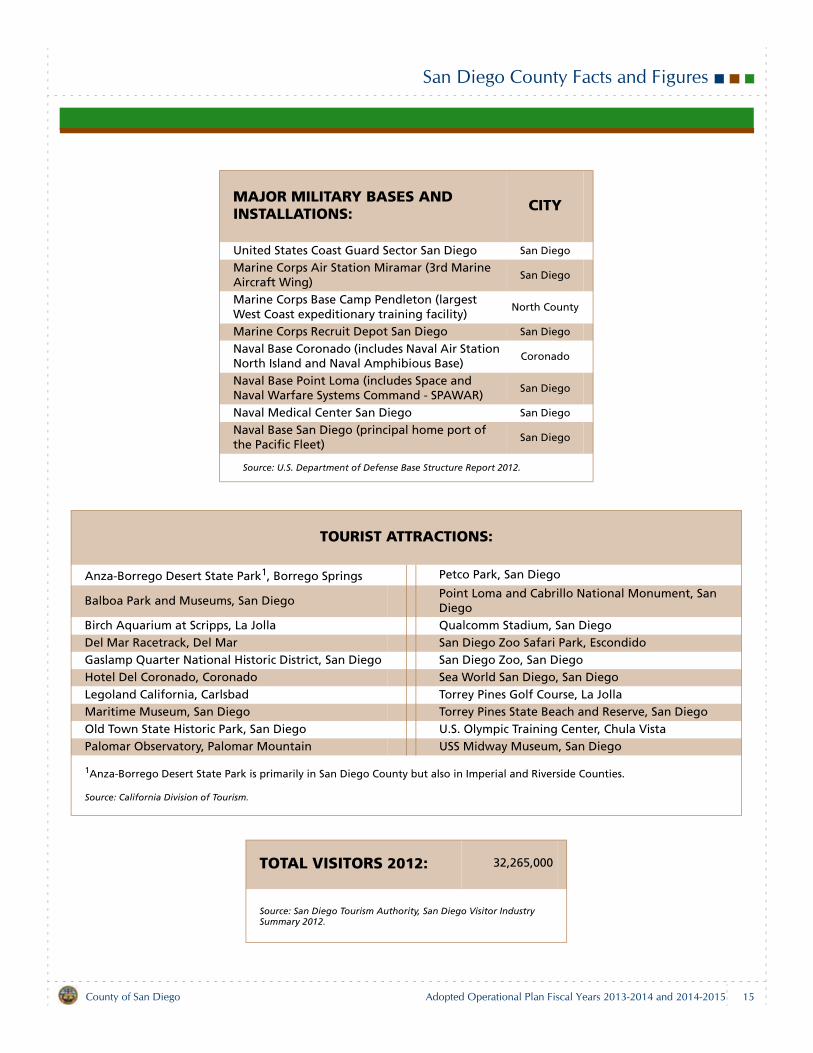
MAJOR MILITARY BASES AND INSTALLATIONS: CITY
United States Coast Guard Sector San Diego San Diego
Marine Corps Air Station Miramar (3rd Marine Aircraft Wing)
San Diego
Marine Corps Base Camp Pendleton (largest West Coast expeditionary training facility)
North County
Marine Corps Recruit Depot San Diego San Diego
Naval Base Coronado (includes Naval Air Station North Island and Naval Amphibious Base)
Coronado
Naval Base Point Loma (includes Space and Naval Warfare Systems Command - SPAWAR)
San Diego
Naval Medical Center San Diego San Diego
Naval Base San Diego (principal home port of the Pacific Fleet)
San Diego
Source: U.S. Department of Defense Base Structure Report 2012.
TOURIST ATTRACTIONS:
Anza-Borrego Desert State Park1, Borrego Springs Petco Park, San Diego
Balboa Park and Museums, San DiegoPoint Loma and Cabrillo National Monument, San Diego
Birch Aquarium at Scripps, La Jolla Qualcomm Stadium, San DiegoDel Mar Racetrack, Del Mar San Diego Zoo Safari Park, EscondidoGaslamp Quarter National Historic District, San Diego San Diego Zoo, San DiegoHotel Del Coronado, Coronado Sea World San Diego, San DiegoLegoland California, Carlsbad Torrey Pines Golf Course, La JollaMaritime Museum, San Diego Torrey Pines State Beach and Reserve, San DiegoOld Town State Historic Park, San Diego U.S. Olympic Training Center, Chula VistaPalomar Observatory, Palomar Mountain USS Midway Museum, San Diego
1Anza-Borrego Desert State Park is primarily in San Diego County but also in Imperial and Riverside Counties.
Source: California Division of Tourism.
TOTAL VISITORS 2012: 32,265,000
Source: San Diego Tourism Authority, San Diego Visitor Industry Summary 2012.
County of San Diego Adopted Operational Plan Fiscal Years 2013-2014 and 2014-2015 15
San Diego County Profile and Economic Indicators
History & Geography
San Diego County became one of California's original 27counties on February 18, 1850, shortly after Californiabecame the 31st State in the Union. The County functionsunder a Charter adopted in 1933, including subsequentamendments. At the time of its creation, San Diego Countycomprised much of the southern section of California. Theoriginal boundaries included San Diego, along with portionsof what are now Imperial, Riverside, San Bernardino andInyo counties.
The original territory of nearly 40,000 square miles wasgradually reduced until 1907, when the present boundarieswere established. Today, San Diego County covers 4,261square miles, approximately the size of the state of Con-necticut, extending 75 miles along the Pacific Coast fromMexico to Orange County and inland 75 miles to ImperialCounty along the international border shared with Mexico.Riverside and Orange counties form the northern border. Itis the southwesternmost county in the contiguous 48states.
For thousands of years, Native Americans have lived in thisarea. The four tribal groupings that make up the indigenousAmerican Indians of San Diego County are the Kumeyaay(also referred to as Diegueño or Mission Indians), theLuiseño, the Cupeño and the Cahuilla. San Diego Countyhas the largest number of Indian reservations (19) of anycounty in the United States. However, the reservations arevery small, with total land holdings of an estimated 193square miles.
The Spanish explorer Juan Rodriguez Cabrillo arrived bysea in the region on September 28, 1542. Although henamed the area San Miguel, it was renamed 60 years laterby Spaniard Sebastian Vizcaino. He chose the name SanDiego in honor of his flagship and, it is said, his favoritesaint, San Diego de Alcala.
San Diego County enjoys a wide variety of climate and ter-rain, from coastal plains and fertile inland valleys to moun-tain ranges and the Anza-Borrego Desert in the east. TheCleveland National Forest occupies much of the interiorportion of the county. The climate is equable in the coastaland valley regions where most resources and populationare located. The average annual rainfall is only 10 inches forthe coastal regions, so the county is highly reliant onimported water.
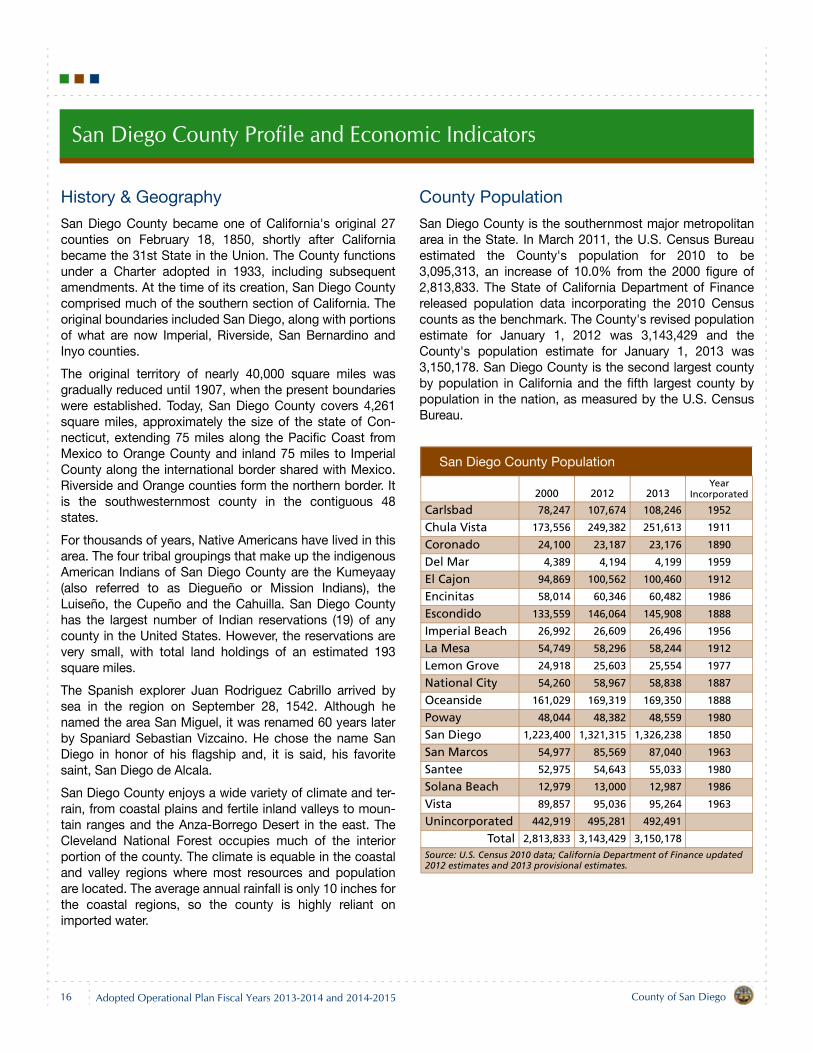
County Population
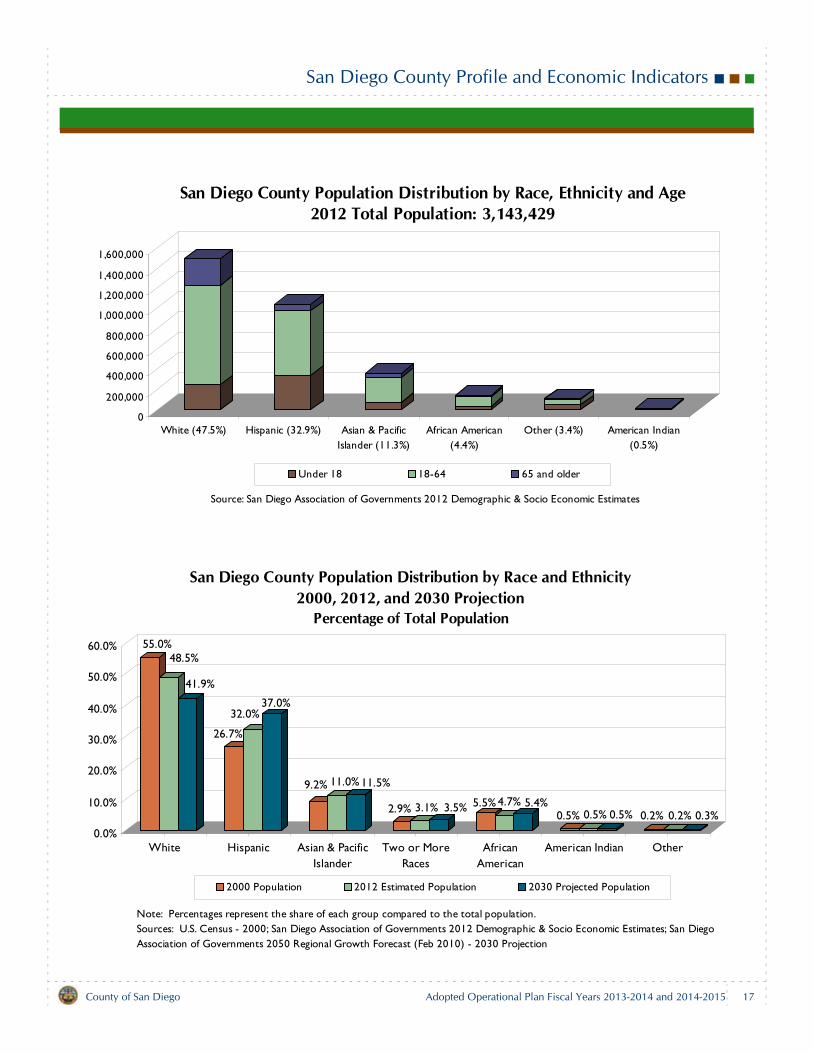
San Diego County is the southernmost major metropolitanarea in the State. In March 2011, the U.S. Census Bureauestimated the County's population for 2010 to be3,095,313, an increase of 10.0% from the 2000 figure of2,813,833. The State of California Department of Financereleased population data incorporating the 2010 Censuscounts as the benchmark. The County's revised populationestimate for January 1, 2012 was 3,143,429 and theCounty's population estimate for January 1, 2013 was3,150,178. San Diego County is the second largest countyby population in California and the fifth largest county bypopulation in the nation, as measured by the U.S. CensusBureau.
San Diego County Population
2000 2012 2013Year
Incorporated
Carlsbad 78,247 107,674 108,246 1952
Chula Vista 173,556 249,382 251,613 1911
Coronado 24,100 23,187 23,176 1890
Del Mar 4,389 4,194 4,199 1959
El Cajon 94,869 100,562 100,460 1912
Encinitas 58,014 60,346 60,482 1986
Escondido 133,559 146,064 145,908 1888
Imperial Beach 26,992 26,609 26,496 1956
La Mesa 54,749 58,296 58,244 1912
Lemon Grove 24,918 25,603 25,554 1977
National City 54,260 58,967 58,838 1887
Oceanside 161,029 169,319 169,350 1888
Poway 48,044 48,382 48,559 1980
San Diego 1,223,400 1,321,315 1,326,238 1850
San Marcos 54,977 85,569 87,040 1963
Santee 52,975 54,643 55,033 1980
Solana Beach 12,979 13,000 12,987 1986
Vista 89,857 95,036 95,264 1963
Unincorporated 442,919 495,281 492,491
Total 2,813,833 3,143,429 3,150,178
Source: U.S. Census 2010 data; California Department of Finance updated 2012 estimates and 2013 provisional estimates.
16 County of San DiegoAdopted Operational Plan Fiscal Years 2013-2014 and 2014-2015
San Diego County Profile and Economic Indicators
55.0% 48.5%
41.9%
26.7%
32.0% 37.0%
9.2% 11.0% 11.5%
2.9% 3.1% 3.5% 5.5% 4.7% 5.4% 0.5% 0.5% 0.5% 0.2% 0.2% 0.3%
0.0%
10.0%
20.0%
30.0%
40.0%
50.0%
60.0%
White Hispanic Asian & PacificIslander
Two or MoreRaces
AfricanAmerican
American Indian Other
San Diego County Population Distribution by Race and Ethnicity 2000, 2012, and 2030 Projection
Percentage of Total Population
2000 Population 2012 Estimated Population 2030 Projected Population
Note: Percentages represent the share of each group compared to the total population.Sources: U.S. Census - 2000; San Diego Association of Governments 2012 Demographic & Socio Economic Estimates; San Diego Association of Governments 2050 Regional Growth Forecast (Feb 2010) - 2030 Projection
0
200,000
400,000
600,000
800,000
1,000,000
1,200,000
1,400,000
1,600,000
White (47.5%) Hispanic (32.9%) Asian & PacificIslander (11.3%)
African American(4.4%)
Other (3.4%) American Indian(0.5%)
San Diego County Population Distribution by Race, Ethnicity and Age2012 Total Population: 3,143,429
Under 18 18-64 65 and older
Source: San Diego Association of Governments 2012 Demographic & Socio Economic Estimates
County of San Diego Adopted Operational Plan Fiscal Years 2013-2014 and 2014-2015 17
San Diego County Profile and Economic Indicators
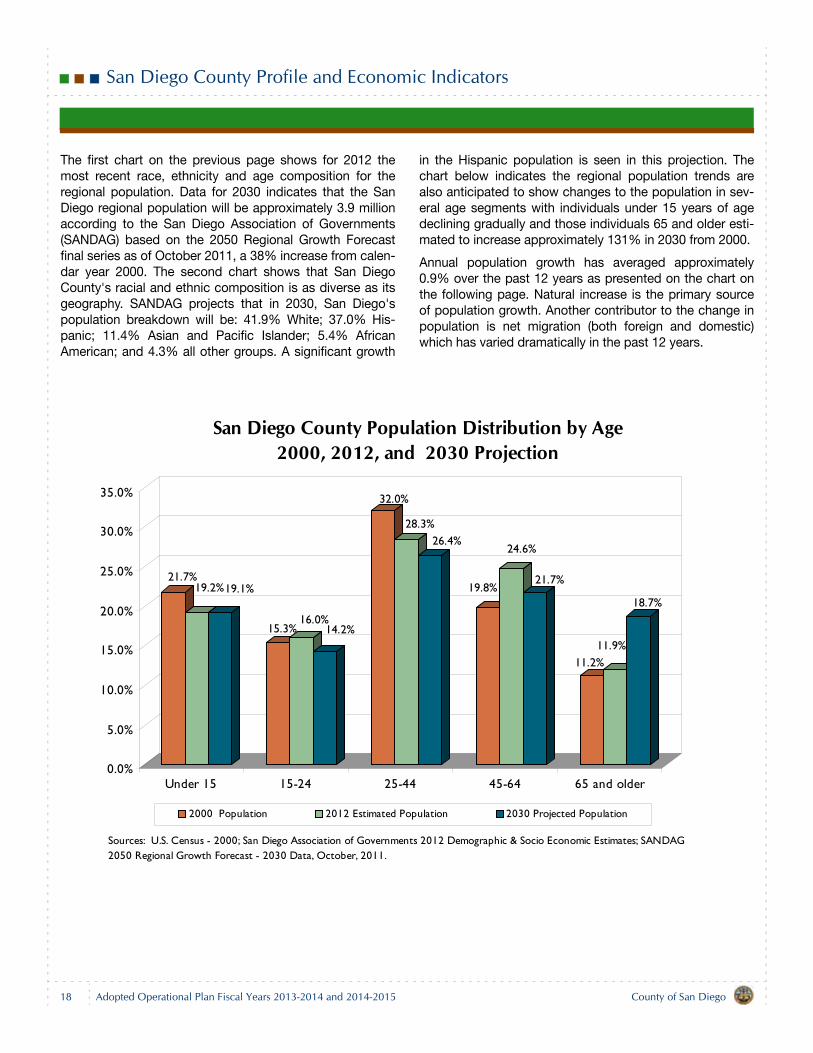
The first chart on the previous page shows for 2012 themost recent race, ethnicity and age composition for theregional population. Data for 2030 indicates that the SanDiego regional population will be approximately 3.9 millionaccording to the San Diego Association of Governments(SANDAG) based on the 2050 Regional Growth Forecastfinal series as of October 2011, a 38% increase from calen-dar year 2000. The second chart shows that San DiegoCounty's racial and ethnic composition is as diverse as itsgeography. SANDAG projects that in 2030, San Diego'spopulation breakdown will be: 41.9% White; 37.0% His-panic; 11.4% Asian and Pacific Islander; 5.4% AfricanAmerican; and 4.3% all other groups. A significant growth
in the Hispanic population is seen in this projection. Thechart below indicates the regional population trends arealso anticipated to show changes to the population in sev-eral age segments with individuals under 15 years of agedeclining gradually and those individuals 65 and older esti-mated to increase approximately 131% in 2030 from 2000.
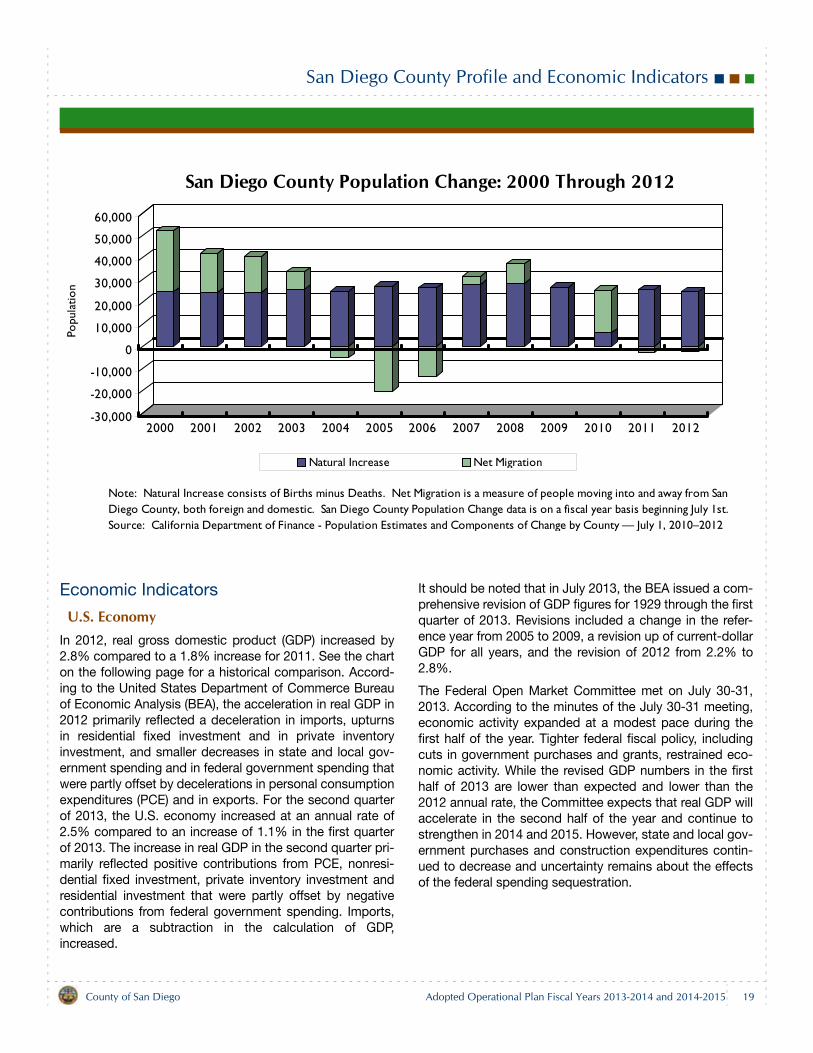
Annual population growth has averaged approximately0.9% over the past 12 years as presented on the chart onthe following page. Natural increase is the primary sourceof population growth. Another contributor to the change inpopulation is net migration (both foreign and domestic)which has varied dramatically in the past 12 years.
21.7%19.2%19.1%
15.3%16.0%
14.2%
32.0%
28.3%26.4%
19.8%
24.6%
21.7%
11.2%11.9%
18.7%
0.0%
5.0%
10.0%
15.0%
20.0%
25.0%
30.0%
35.0%
Under 15 15-24 25-44 45-64 65 and older
San Diego County Population Distribution by Age 2000, 2012, and 2030 Projection
2000 Population 2012 Estimated Population 2030 Projected Population
Sources: U.S. Census - 2000; San Diego Association of Governments 2012 Demographic & Socio Economic Estimates; SANDAG 2050 Regional Growth Forecast - 2030 Data, October, 2011.
18 County of San DiegoAdopted Operational Plan Fiscal Years 2013-2014 and 2014-2015
San Diego County Profile and Economic Indicators
Economic Indicators
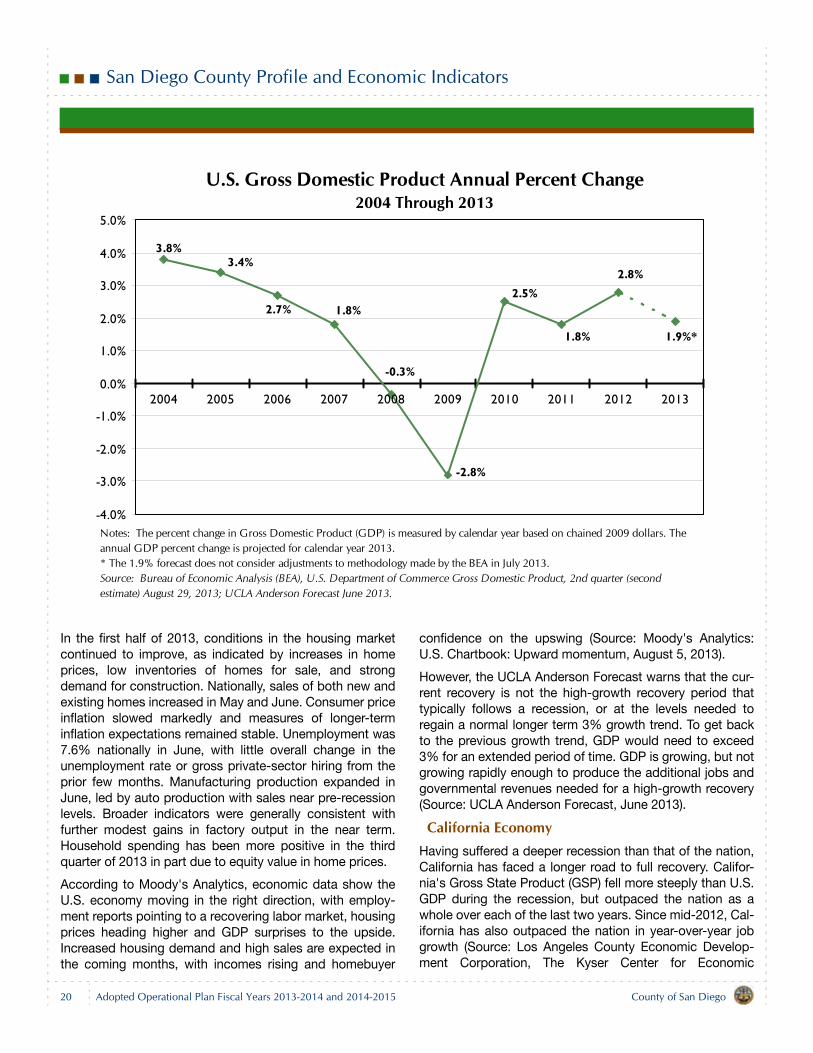
U.S. Economy In 2012, real gross domestic product (GDP) increased by2.8% compared to a 1.8% increase for 2011. See the charton the following page for a historical comparison. Accord-ing to the United States Department of Commerce Bureauof Economic Analysis (BEA), the acceleration in real GDP in2012 primarily reflected a deceleration in imports, upturnsin residential fixed investment and in private inventoryinvestment, and smaller decreases in state and local gov-ernment spending and in federal government spending thatwere partly offset by decelerations in personal consumptionexpenditures (PCE) and in exports. For the second quarterof 2013, the U.S. economy increased at an annual rate of2.5% compared to an increase of 1.1% in the first quarterof 2013. The increase in real GDP in the second quarter pri-marily reflected positive contributions from PCE, nonresi-dential fixed investment, private inventory investment andresidential investment that were partly offset by negativecontributions from federal government spending. Imports,which are a subtraction in the calculation of GDP,increased.
It should be noted that in July 2013, the BEA issued a com-prehensive revision of GDP figures for 1929 through the firstquarter of 2013. Revisions included a change in the refer-ence year from 2005 to 2009, a revision up of current-dollarGDP for all years, and the revision of 2012 from 2.2% to2.8%.
The Federal Open Market Committee met on July 30-31,2013. According to the minutes of the July 30-31 meeting,economic activity expanded at a modest pace during thefirst half of the year. Tighter federal fiscal policy, includingcuts in government purchases and grants, restrained eco-nomic activity. While the revised GDP numbers in the firsthalf of 2013 are lower than expected and lower than the2012 annual rate, the Committee expects that real GDP willaccelerate in the second half of the year and continue tostrengthen in 2014 and 2015. However, state and local gov-ernment purchases and construction expenditures contin-ued to decrease and uncertainty remains about the effectsof the federal spending sequestration.
-30,000
-20,000
-10,000
0
10,000
20,000
30,000
40,000
50,000
60,000
Popu
latio
n
2000 2001 2002 2003 2004 2005 2006 2007 2008 2009 2010 2011 2012
San Diego County Population Change: 2000 Through 2012
Natural Increase Net Migration
Note: Natural Increase consists of Births minus Deaths. Net Migration is a measure of people moving into and away from San Diego County, both foreign and domestic. San Diego County Population Change data is on a fiscal year basis beginning July 1st. Source: California Department of Finance - Population Estimates and Components of Change by County — July 1, 2010–2012
County of San Diego Adopted Operational Plan Fiscal Years 2013-2014 and 2014-2015 19
San Diego County Profile and Economic Indicators
In the first half of 2013, conditions in the housing marketcontinued to improve, as indicated by increases in homeprices, low inventories of homes for sale, and strongdemand for construction. Nationally, sales of both new andexisting homes increased in May and June. Consumer priceinflation slowed markedly and measures of longer-terminflation expectations remained stable. Unemployment was7.6% nationally in June, with little overall change in theunemployment rate or gross private-sector hiring from theprior few months. Manufacturing production expanded inJune, led by auto production with sales near pre-recessionlevels. Broader indicators were generally consistent withfurther modest gains in factory output in the near term.Household spending has been more positive in the thirdquarter of 2013 in part due to equity value in home prices.
According to Moody's Analytics, economic data show theU.S. economy moving in the right direction, with employ-ment reports pointing to a recovering labor market, housingprices heading higher and GDP surprises to the upside.Increased housing demand and high sales are expected inthe coming months, with incomes rising and homebuyer
confidence on the upswing (Source: Moody's Analytics:U.S. Chartbook: Upward momentum, August 5, 2013).
However, the UCLA Anderson Forecast warns that the cur-rent recovery is not the high-growth recovery period thattypically follows a recession, or at the levels needed toregain a normal longer term 3% growth trend. To get backto the previous growth trend, GDP would need to exceed3% for an extended period of time. GDP is growing, but notgrowing rapidly enough to produce the additional jobs andgovernmental revenues needed for a high-growth recovery(Source: UCLA Anderson Forecast, June 2013).
California Economy Having suffered a deeper recession than that of the nation,California has faced a longer road to full recovery. Califor-nia's Gross State Product (GSP) fell more steeply than U.S.GDP during the recession, but outpaced the nation as awhole over each of the last two years. Since mid-2012, Cal-ifornia has also outpaced the nation in year-over-year jobgrowth (Source: Los Angeles County Economic Develop-ment Corporation, The Kyser Center for Economic
U.S. Gross Domestic Product Annual Percent Change 2004 Through 2013
3.8%3.4%
2.7% 1.8%
-0.3%
-2.8%
2.5%
1.8%
2.8%
1.9%*
-4.0%
-3.0%
-2.0%
-1.0%
0.0%
1.0%
2.0%
3.0%
4.0%
5.0%
2004 2005 2006 2007 2008 2009 2010 2011 2012 2013
Notes: The percent change in Gross Domestic Product (GDP) is measured by calendar year based on chained 2009 dollars. The annual GDP percent change is projected for calendar year 2013.* The 1.9% forecast does not consider adjustments to methodology made by the BEA in July 2013.Source: Bureau of Economic Analysis (BEA), U.S. Department of Commerce Gross Domestic Product, 2nd quarter (second estimate) August 29, 2013; UCLA Anderson Forecast June 2013.
20 County of San DiegoAdopted Operational Plan Fiscal Years 2013-2014 and 2014-2015
San Diego County Profile and Economic Indicators
Research: 2013-2014 Economic Forecast and Industry Out-look, February 2013 and Mid-Year Forecast, July 2013). TheState unemployment rate continued to improve and fellmodestly from a revised 11.8% in 2011 to 10.5% in 2012.The July 2013 unemployment rate showed continuedimprovement to 8.9%. Comparing July 2012 to July 2013,nonfarm payroll employment in California increased by236,400, a 1.6% increase. Four categories (mining and log-ging; manufacturing; other services; and government)reported job declines (Source: California EmploymentDevelopment Department, News Release, August 16,2013).
In the first five months of 2013, Aerospace and Technologyemployment added 34,700 jobs. Agriculture jobs remainedrelatively unchanged from a year earlier. International tradecontinues to play an important role in the State's economy.California ranks as the second largest exporting State in thecountry, with imports outweighing exports by a two-to-onemargin. Tourism and hospitality jobs increased as all of themajor California metropolitan areas experienced gains inboth occupancy rates and average daily rates. Construc-
tion activity and employment have both experienced note-worthy gains in 2013 after struggling for several years. Newhome permits are expected to show gains of 37.5% in 2013from weak 2012 levels (Source: Los Angeles County Eco-nomic Development Corporation, The Kyser Center forEconomic Research: 2013-2014 Mid-Year Economic Fore-cast and Industry Outlook, July 2013).
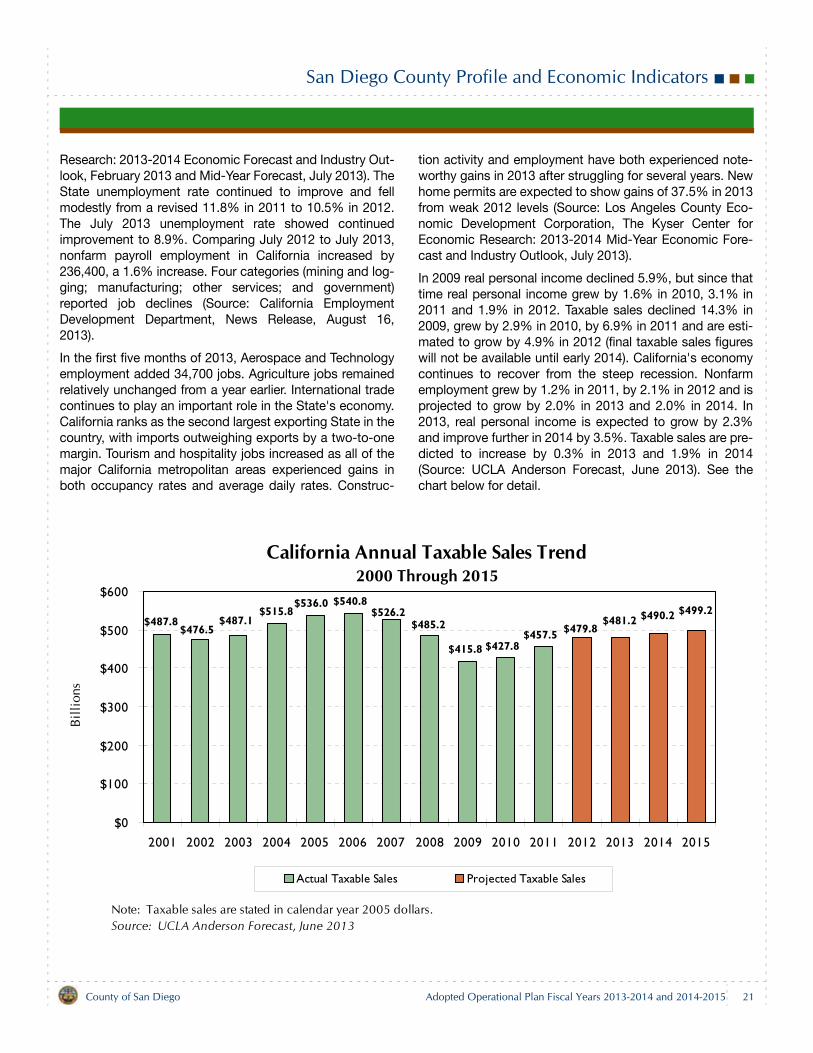
In 2009 real personal income declined 5.9%, but since thattime real personal income grew by 1.6% in 2010, 3.1% in2011 and 1.9% in 2012. Taxable sales declined 14.3% in2009, grew by 2.9% in 2010, by 6.9% in 2011 and are esti-mated to grow by 4.9% in 2012 (final taxable sales figureswill not be available until early 2014). California's economycontinues to recover from the steep recession. Nonfarmemployment grew by 1.2% in 2011, by 2.1% in 2012 and isprojected to grow by 2.0% in 2013 and 2.0% in 2014. In2013, real personal income is expected to grow by 2.3%and improve further in 2014 by 3.5%. Taxable sales are pre-dicted to increase by 0.3% in 2013 and 1.9% in 2014(Source: UCLA Anderson Forecast, June 2013). See thechart below for detail.
California Annual Taxable Sales Trend2000 Through 2015
$415.8
$487.8$476.5
$487.1$515.8
$536.0 $540.8$526.2
$485.2
$427.8$457.5 $479.8
$481.2 $490.2 $499.2
$0
$100
$200
$300
$400
$500
$600
2001 2002 2003 2004 2005 2006 2007 2008 2009 2010 2011 2012 2013 2014 2015
Bil
lion
s
Actual Taxable Sales Projected Taxable Sales
Note: Taxable sales are stated in calendar year 2005 dollars.Source: UCLA Anderson Forecast, June 2013
County of San Diego Adopted Operational Plan Fiscal Years 2013-2014 and 2014-2015 21
San Diego County Profile and Economic Indicators
San Diego EconomySan Diego's recent relative economic stability has beenbased on its increasing diversification of economic activity.The region is a thriving hub for the biotech and telecommu-nications industries. San Diego is also an important manu-facturing center and a popular travel destination. Since theend of the Cold War, the military's presence has diminishedbut remains an important driver of the region's economy.
San Diego certainly shared the pain of the recession along
with the rest of Southern California. However, San Diego'seconomy is moving in the right direction. Job creation inSan Diego will occur in 2013 across all private industry sec-tors (Source: Los Angeles County Economic DevelopmentCorporation, The Kyser Center for Economic Research:2013-2014 Economic Forecast and Industry Outlook, July2013). Federal defense budget cuts are a cause for concernfor San Diego's defense and military sectors. The loss ofgovernment jobs is expected to continue this year and next.
$0.0
$2.0
$4.0
$6.0
$8.0
$10.0
$12.0
$14.0
$16.0
Mill
ions
General Retail Food Related BuildingMaterials
AutomotiveRelated
Business andPersonalServices*
All OtherOutlets
San Diego County Taxable Sales by Category2005 Through 2011
2005 2006 2007 2008 2009 2010 2011
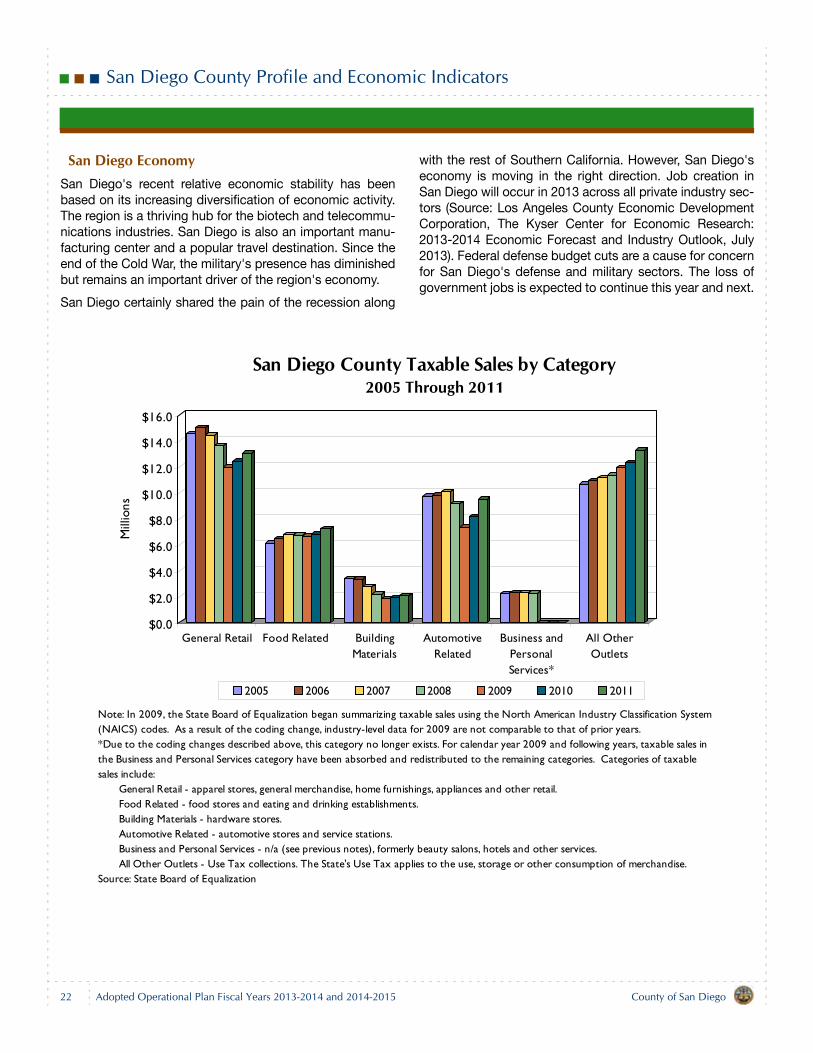
Note: In 2009, the State Board of Equalization began summarizing taxable sales using the North American Industry Classification System (NAICS) codes. As a result of the coding change, industry-level data for 2009 are not comparable to that of prior years.*Due to the coding changes described above, this category no longer exists. For calendar year 2009 and following years, taxable sales in the Business and Personal Services category have been absorbed and redistributed to the remaining categories. Categories of taxable sales include: General Retail - apparel stores, general merchandise, home furnishings, appliances and other retail. Food Related - food stores and eating and drinking establishments. Building Materials - hardware stores. Automotive Related - automotive stores and service stations. Business and Personal Services - n/a (see previous notes), formerly beauty salons, hotels and other services. All Other Outlets - Use Tax collections. The State's Use Tax applies to the use, storage or other consumption of merchandise.Source: State Board of Equalization
22 County of San DiegoAdopted Operational Plan Fiscal Years 2013-2014 and 2014-2015
San Diego County Profile and Economic Indicators
Another indicator of economic health is county taxablesales. Taxable sales began to decline overall in the countyin 2007 and that trend continued in 2008 and 2009. In 2010,taxable sales showed moderate growth which continued in
2011. Sales tax revenues for the region in 2012 have showncontinued improvement. Growth in taxable sales isexpected to continue in 2013 and 2014.
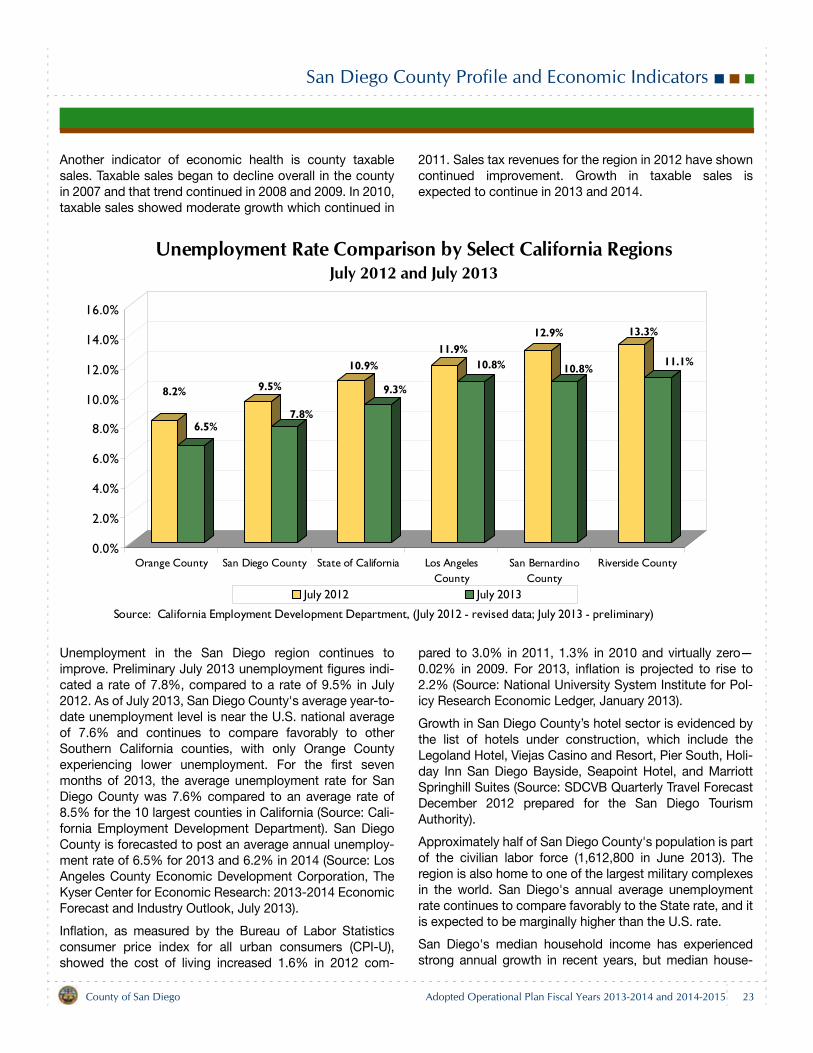
Unemployment in the San Diego region continues toimprove. Preliminary July 2013 unemployment figures indi-cated a rate of 7.8%, compared to a rate of 9.5% in July2012. As of July 2013, San Diego County's average year-to-date unemployment level is near the U.S. national averageof 7.6% and continues to compare favorably to otherSouthern California counties, with only Orange Countyexperiencing lower unemployment. For the first sevenmonths of 2013, the average unemployment rate for SanDiego County was 7.6% compared to an average rate of8.5% for the 10 largest counties in California (Source: Cali-fornia Employment Development Department). San DiegoCounty is forecasted to post an average annual unemploy-ment rate of 6.5% for 2013 and 6.2% in 2014 (Source: LosAngeles County Economic Development Corporation, TheKyser Center for Economic Research: 2013-2014 EconomicForecast and Industry Outlook, July 2013).
Inflation, as measured by the Bureau of Labor Statisticsconsumer price index for all urban consumers (CPI-U),showed the cost of living increased 1.6% in 2012 com-
pared to 3.0% in 2011, 1.3% in 2010 and virtually zero—0.02% in 2009. For 2013, inflation is projected to rise to2.2% (Source: National University System Institute for Pol-icy Research Economic Ledger, January 2013).
Growth in San Diego County’s hotel sector is evidenced bythe list of hotels under construction, which include theLegoland Hotel, Viejas Casino and Resort, Pier South, Holi-day Inn San Diego Bayside, Seapoint Hotel, and MarriottSpringhill Suites (Source: SDCVB Quarterly Travel ForecastDecember 2012 prepared for the San Diego TourismAuthority).
Approximately half of San Diego County's population is partof the civilian labor force (1,612,800 in June 2013). Theregion is also home to one of the largest military complexesin the world. San Diego's annual average unemploymentrate continues to compare favorably to the State rate, and itis expected to be marginally higher than the U.S. rate.
San Diego's median household income has experiencedstrong annual growth in recent years, but median house-
8.2%
6.5%
9.5%
7.8%
10.9%
9.3%
11.9%10.8%
12.9%
10.8%
13.3%
11.1%
0.0%
2.0%
4.0%
6.0%
8.0%
10.0%
12.0%
14.0%
16.0%
Orange County San Diego County State of California Los AngelesCounty
San BernardinoCounty
Riverside County
Unemployment Rate Comparison by Select California RegionsJuly 2012 and July 2013
July 2012 July 2013
Source: California Employment Development Department, (July 2012 - revised data; July 2013 - preliminary)
County of San Diego Adopted Operational Plan Fiscal Years 2013-2014 and 2014-2015 23
San Diego County Profile and Economic Indicators
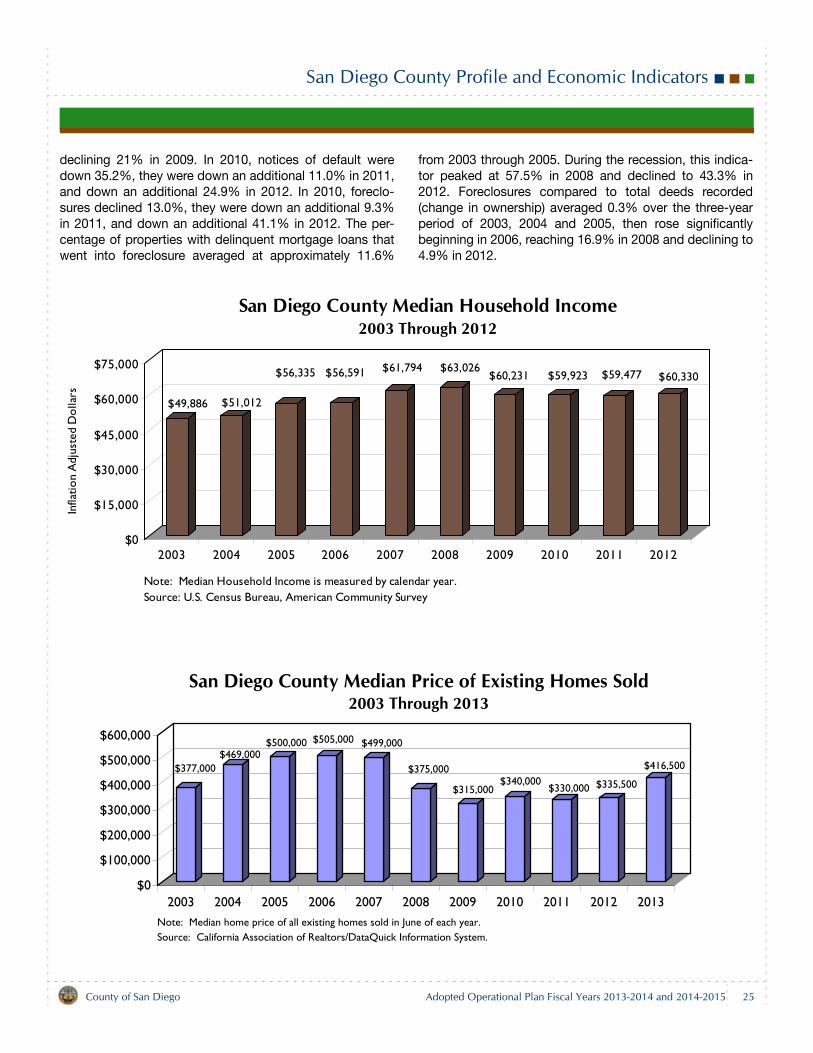
hold income actually declined in 2009, 2010 and 2011 dueto high unemployment and constrained consumer spend-ing. Median household income for 2012 is estimated to be1.4% higher than 2011. See the chart on the following pagefor detail.
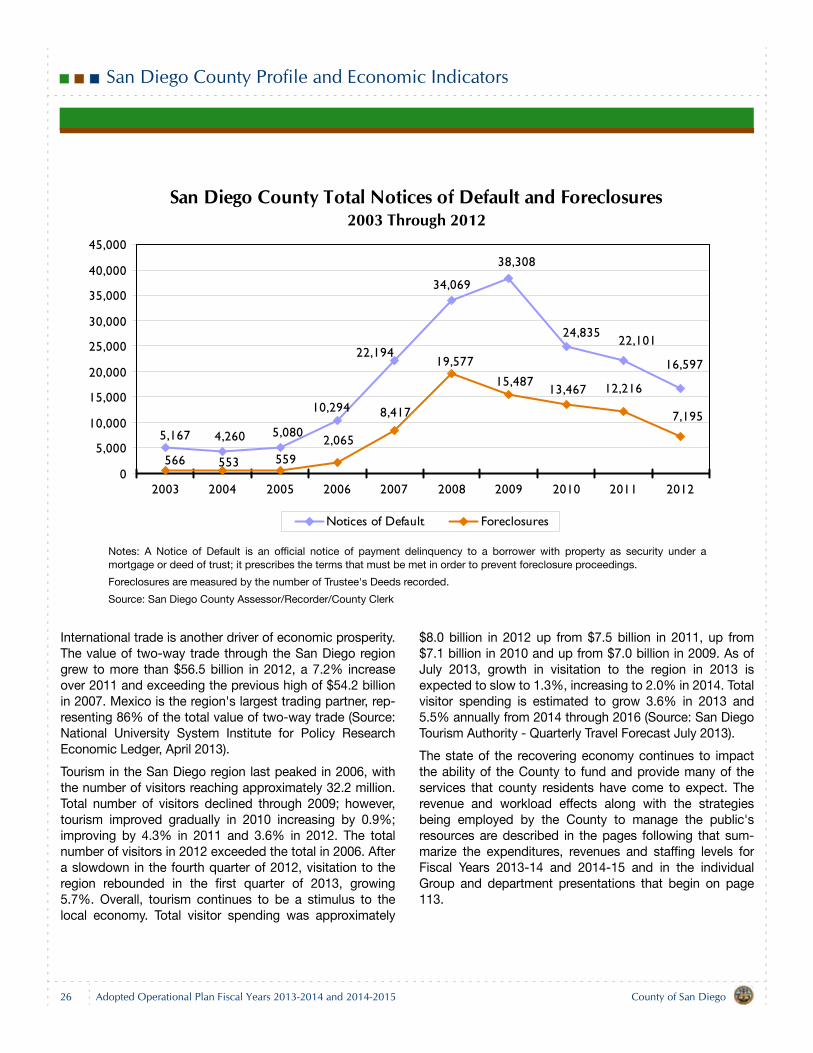
San Diego County's residential real estate market is on themend. Over the year, the median price for an existing sin-gle-family home rose significantly (see the chart on the fol-lowing page) and the number of foreclosures on the markethas declined. New home building has yet to gain traction,but the pace of new construction will pick up significantly in2013 and accelerate in 2014. As employment expands,commercial real estate should improve as construction per-mits transition from alteration to new construction of retail,office industrial and hotel space (Source: Los AngelesCounty Economic Development Corporation, The KyserCenter for Economic Research: 2013-2014 Economic Fore-cast and Industry Outlook, July 2013).
An unintended consequence of the housing market's tur-moil and past recession has been the improvement in hous-ing affordability during this period. However, with the recentrebound in home prices, the percentage of home buyerswho could afford to purchase a median-priced, existing sin-gle-family home in San Diego dropped to 32% in the sec-ond quarter of 2013, from 44% in second quarter of 2012
(Source: California Association of Realtors affordabilityindex). The rate of first-time buyers in March 2013 was 57%compared to 67% in December 2011. Despite thesedecreases, the percentage of households that could affordto buy an entry-level home in San Diego is still up signifi-cantly from 27% in December 2006. The median homeprice of existing homes sold also fluctuated with the hous-ing related turmoil. During 2009 and 2010, median homesales started to rebound from the low experienced at theend of 2008 and early 2009. Median home prices declinedmarginally in 2011 but show significant improvement inJune 2013 compared to June 2012.
Another measure of the downturn in housing is the rate offoreclosures, as well as the companion indices notices ofloan default and deeds recorded (changes in ownership).The number of total deeds recorded has fallen significantlysince 2003 from 223,087 to a low 115,540 in 2008. ThroughDecember 2012, total deeds recorded have started toimprove with a total 146,829 recorded for the calendar yearcompared to 119,933 in 2011 evidence of improvement inthe housing market overall.
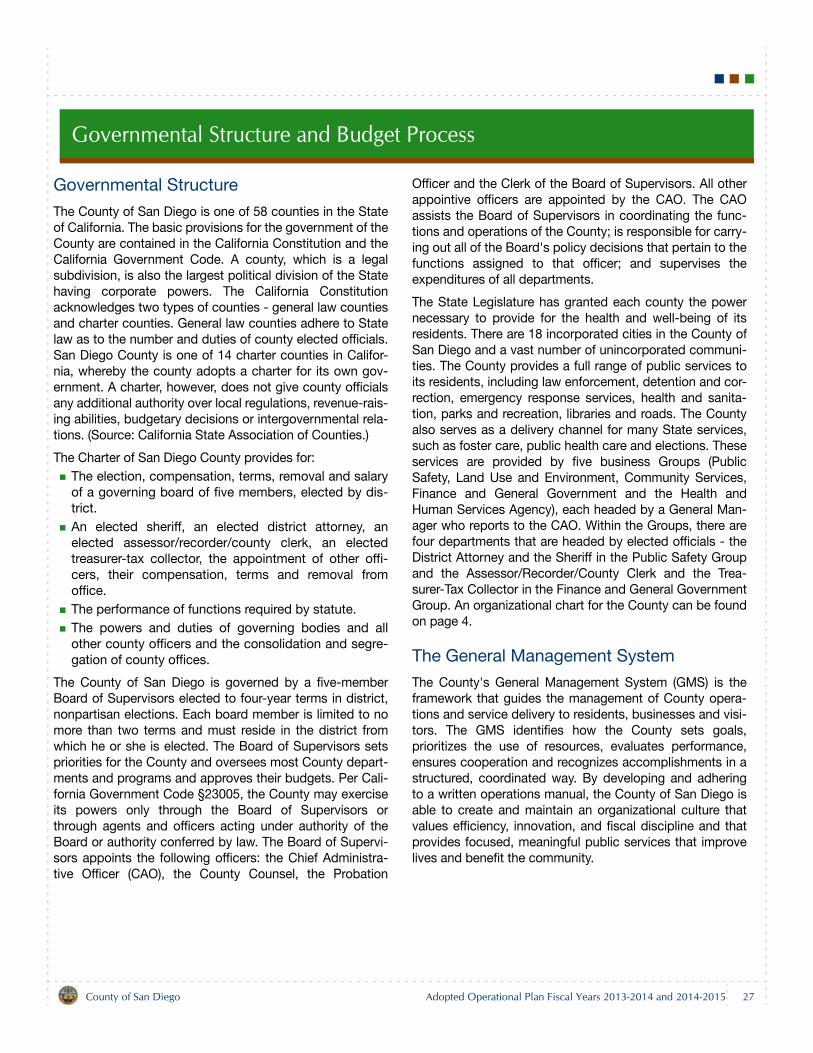
In San Diego County, notices from lenders to property own-ers that they were in default on their mortgage loansincreased markedly from 2003 through 2009, and foreclo-sures rose dramatically from 2003 through 2008 before
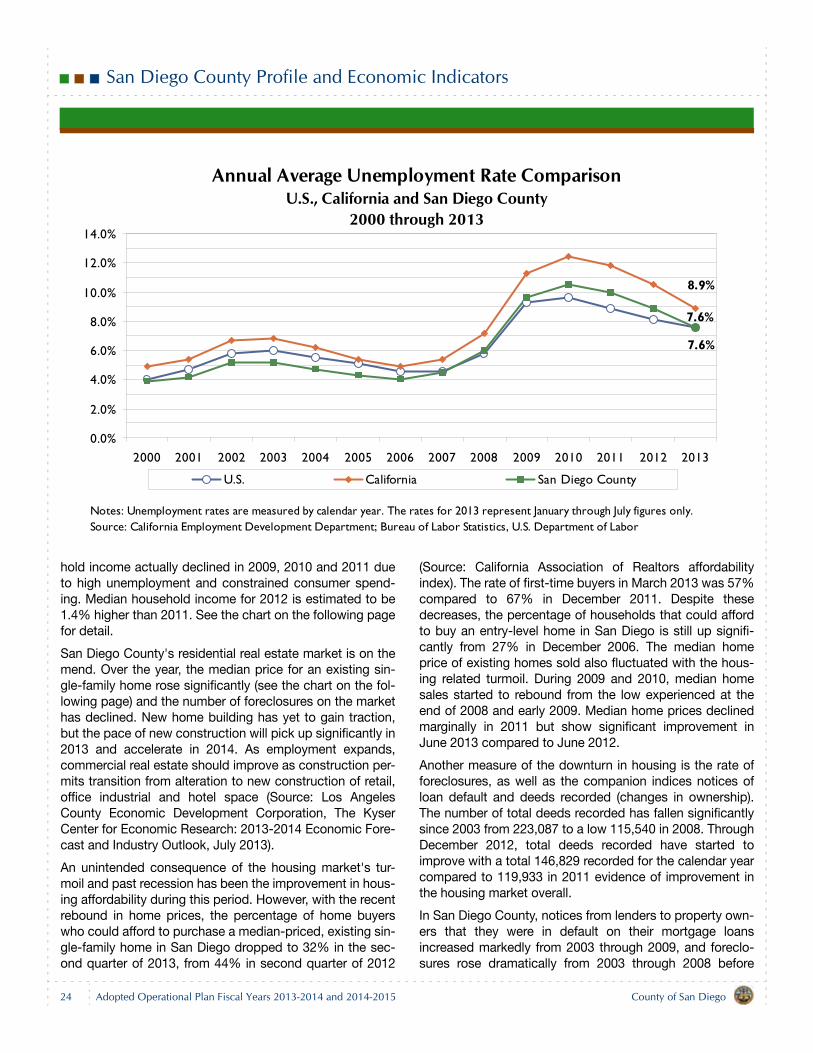
Annual Average Unemployment Rate ComparisonU.S., California and San Diego County
2000 through 2013
7.6%
8.9%
7.6%
0.0%
2.0%
4.0%
6.0%
8.0%
10.0%
12.0%
14.0%
2000 2001 2002 2003 2004 2005 2006 2007 2008 2009 2010 2011 2012 2013
U.S. California San Diego County
Notes: Unemployment rates are measured by calendar year. The rates for 2013 represent January through July figures only.Source: California Employment Development Department; Bureau of Labor Statistics, U.S. Department of Labor
24 County of San DiegoAdopted Operational Plan Fiscal Years 2013-2014 and 2014-2015
San Diego County Profile and Economic Indicators
declining 21% in 2009. In 2010, notices of default weredown 35.2%, they were down an additional 11.0% in 2011,and down an additional 24.9% in 2012. In 2010, foreclo-sures declined 13.0%, they were down an additional 9.3%in 2011, and down an additional 41.1% in 2012. The per-centage of properties with delinquent mortgage loans thatwent into foreclosure averaged at approximately 11.6%
from 2003 through 2005. During the recession, this indica-tor peaked at 57.5% in 2008 and declined to 43.3% in2012. Foreclosures compared to total deeds recorded(change in ownership) averaged 0.3% over the three-yearperiod of 2003, 2004 and 2005, then rose significantlybeginning in 2006, reaching 16.9% in 2008 and declining to4.9% in 2012.
$49,886 $51,012
$56,335 $56,591 $61,794 $63,026$60,231 $59,923 $59,477 $60,330
$0
$15,000
$30,000
$45,000
$60,000
$75,000
Infla
tion
Adj
uste
d D
olla
rs
2003 2004 2005 2006 2007 2008 2009 2010 2011 2012
San Diego County Median Household Income2003 Through 2012
Note: Median Household Income is measured by calendar year.Source: U.S. Census Bureau, American Community Survey
$377,000$469,000
$500,000 $505,000 $499,000
$375,000
$315,000$340,000
$330,000 $335,500
$416,500
$0
$100,000
$200,000
$300,000
$400,000
$500,000
$600,000
2003 2004 2005 2006 2007 2008 2009 2010 2011 2012 2013
San Diego County Median Price of Existing Homes Sold2003 Through 2013
Note: Median home price of all existing homes sold in June of each year.Source: California Association of Realtors/DataQuick Information System.
County of San Diego Adopted Operational Plan Fiscal Years 2013-2014 and 2014-2015 25
San Diego County Profile and Economic Indicators
Notes: A Notice of Default is an official notice of payment delinquency to a borrower with property as security under amortgage or deed of trust; it prescribes the terms that must be met in order to prevent foreclosure proceedings.
Foreclosures are measured by the number of Trustee's Deeds recorded.
Source: San Diego County Assessor/Recorder/County Clerk
International trade is another driver of economic prosperity.The value of two-way trade through the San Diego regiongrew to more than $56.5 billion in 2012, a 7.2% increaseover 2011 and exceeding the previous high of $54.2 billionin 2007. Mexico is the region's largest trading partner, rep-resenting 86% of the total value of two-way trade (Source:National University System Institute for Policy ResearchEconomic Ledger, April 2013).
Tourism in the San Diego region last peaked in 2006, withthe number of visitors reaching approximately 32.2 million.Total number of visitors declined through 2009; however,tourism improved gradually in 2010 increasing by 0.9%;improving by 4.3% in 2011 and 3.6% in 2012. The totalnumber of visitors in 2012 exceeded the total in 2006. Aftera slowdown in the fourth quarter of 2012, visitation to theregion rebounded in the first quarter of 2013, growing5.7%. Overall, tourism continues to be a stimulus to thelocal economy. Total visitor spending was approximately
$8.0 billion in 2012 up from $7.5 billion in 2011, up from$7.1 billion in 2010 and up from $7.0 billion in 2009. As ofJuly 2013, growth in visitation to the region in 2013 isexpected to slow to 1.3%, increasing to 2.0% in 2014. Totalvisitor spending is estimated to grow 3.6% in 2013 and5.5% annually from 2014 through 2016 (Source: San DiegoTourism Authority - Quarterly Travel Forecast July 2013).
The state of the recovering economy continues to impactthe ability of the County to fund and provide many of theservices that county residents have come to expect. Therevenue and workload effects along with the strategiesbeing employed by the County to manage the public'sresources are described in the pages following that sum-marize the expenditures, revenues and staffing levels forFiscal Years 2013-14 and 2014-15 and in the individualGroup and department presentations that begin on page113.
San Diego County Total Notices of Default and Foreclosures2003 Through 2012
5,167 4,260 5,080
10,294
22,194
34,069
38,308
24,83522,101
16,597
566 553 559
2,065
8,417
19,577
15,48713,467 12,216
7,195
0
5,000
10,000
15,000
20,000
25,000
30,000
35,000
40,000
45,000
2003 2004 2005 2006 2007 2008 2009 2010 2011 2012
Notices of Default Foreclosures
26 County of San DiegoAdopted Operational Plan Fiscal Years 2013-2014 and 2014-2015
Governmental Structure and Budget Process
Governmental Structure
The County of San Diego is one of 58 counties in the Stateof California. The basic provisions for the government of theCounty are contained in the California Constitution and theCalifornia Government Code. A county, which is a legalsubdivision, is also the largest political division of the Statehaving corporate powers. The California Constitutionacknowledges two types of counties - general law countiesand charter counties. General law counties adhere to Statelaw as to the number and duties of county elected officials.San Diego County is one of 14 charter counties in Califor-nia, whereby the county adopts a charter for its own gov-ernment. A charter, however, does not give county officialsany additional authority over local regulations, revenue-rais-ing abilities, budgetary decisions or intergovernmental rela-tions. (Source: California State Association of Counties.)
The Charter of San Diego County provides for:The election, compensation, terms, removal and salaryof a governing board of five members, elected by dis-trict.An elected sheriff, an elected district attorney, anelected assessor/recorder/county clerk, an electedtreasurer-tax collector, the appointment of other offi-cers, their compensation, terms and removal fromoffice.The performance of functions required by statute.The powers and duties of governing bodies and allother county officers and the consolidation and segre-gation of county offices.
The County of San Diego is governed by a five-memberBoard of Supervisors elected to four-year terms in district,nonpartisan elections. Each board member is limited to nomore than two terms and must reside in the district fromwhich he or she is elected. The Board of Supervisors setspriorities for the County and oversees most County depart-ments and programs and approves their budgets. Per Cali-fornia Government Code §23005, the County may exerciseits powers only through the Board of Supervisors orthrough agents and officers acting under authority of theBoard or authority conferred by law. The Board of Supervi-sors appoints the following officers: the Chief Administra-tive Officer (CAO), the County Counsel, the Probation
Officer and the Clerk of the Board of Supervisors. All otherappointive officers are appointed by the CAO. The CAOassists the Board of Supervisors in coordinating the func-tions and operations of the County; is responsible for carry-ing out all of the Board's policy decisions that pertain to thefunctions assigned to that officer; and supervises theexpenditures of all departments.
The State Legislature has granted each county the powernecessary to provide for the health and well-being of itsresidents. There are 18 incorporated cities in the County ofSan Diego and a vast number of unincorporated communi-ties. The County provides a full range of public services toits residents, including law enforcement, detention and cor-rection, emergency response services, health and sanita-tion, parks and recreation, libraries and roads. The Countyalso serves as a delivery channel for many State services,such as foster care, public health care and elections. Theseservices are provided by five business Groups (PublicSafety, Land Use and Environment, Community Services,Finance and General Government and the Health andHuman Services Agency), each headed by a General Man-ager who reports to the CAO. Within the Groups, there arefour departments that are headed by elected officials - theDistrict Attorney and the Sheriff in the Public Safety Groupand the Assessor/Recorder/County Clerk and the Trea-surer-Tax Collector in the Finance and General GovernmentGroup. An organizational chart for the County can be foundon page 4.
The General Management System
The County's General Management System (GMS) is theframework that guides the management of County opera-tions and service delivery to residents, businesses and visi-tors. The GMS identifies how the County sets goals,prioritizes the use of resources, evaluates performance,ensures cooperation and recognizes accomplishments in astructured, coordinated way. By developing and adheringto a written operations manual, the County of San Diego isable to create and maintain an organizational culture thatvalues efficiency, innovation, and fiscal discipline and thatprovides focused, meaningful public services that improvelives and benefit the community.
County of San Diego Adopted Operational Plan Fiscal Years 2013-2014 and 2014-2015 27
Governmental Structure and Budget Process
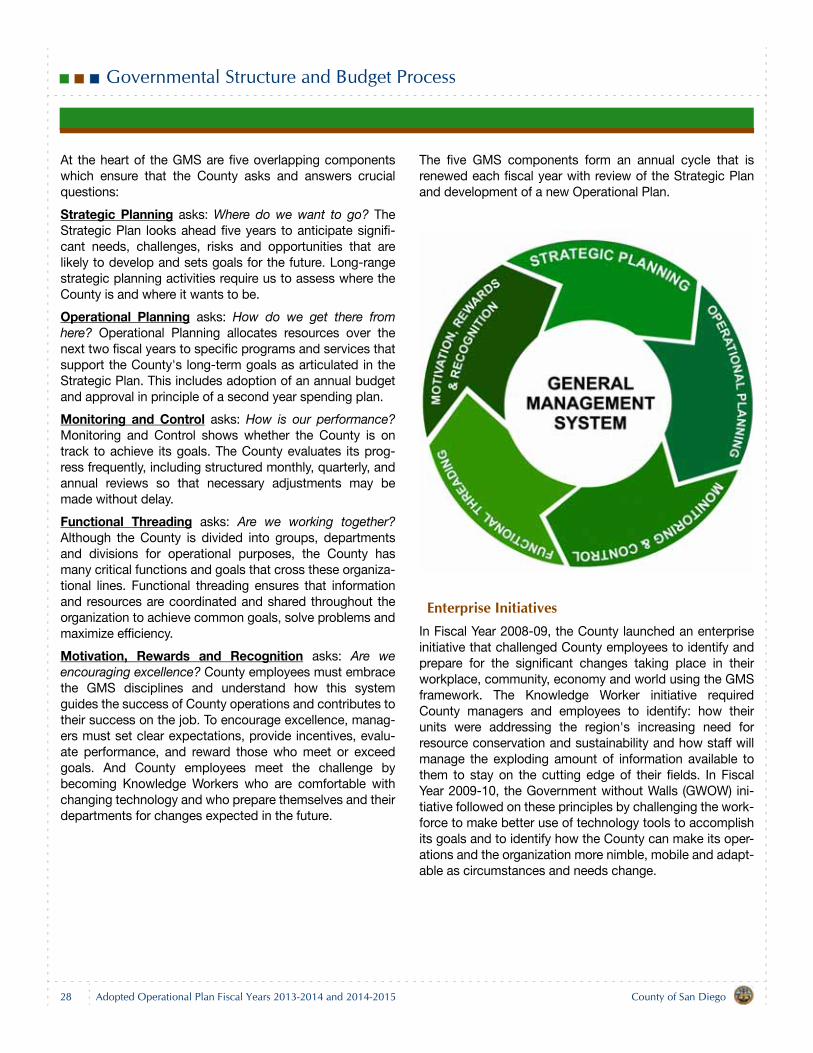
At the heart of the GMS are five overlapping componentswhich ensure that the County asks and answers crucialquestions:
Strategic Planning asks: Where do we want to go? TheStrategic Plan looks ahead five years to anticipate signifi-cant needs, challenges, risks and opportunities that arelikely to develop and sets goals for the future. Long-rangestrategic planning activities require us to assess where theCounty is and where it wants to be.
Operational Planning asks: How do we get there fromhere? Operational Planning allocates resources over thenext two fiscal years to specific programs and services thatsupport the County's long-term goals as articulated in theStrategic Plan. This includes adoption of an annual budgetand approval in principle of a second year spending plan.
Monitoring and Control asks: How is our performance?Monitoring and Control shows whether the County is ontrack to achieve its goals. The County evaluates its prog-ress frequently, including structured monthly, quarterly, andannual reviews so that necessary adjustments may bemade without delay.
Functional Threading asks: Are we working together?Although the County is divided into groups, departmentsand divisions for operational purposes, the County hasmany critical functions and goals that cross these organiza-tional lines. Functional threading ensures that informationand resources are coordinated and shared throughout theorganization to achieve common goals, solve problems andmaximize efficiency.
Motivation, Rewards and Recognition asks: Are weencouraging excellence? County employees must embracethe GMS disciplines and understand how this systemguides the success of County operations and contributes totheir success on the job. To encourage excellence, manag-ers must set clear expectations, provide incentives, evalu-ate performance, and reward those who meet or exceedgoals. And County employees meet the challenge bybecoming Knowledge Workers who are comfortable withchanging technology and who prepare themselves and theirdepartments for changes expected in the future.
The five GMS components form an annual cycle that isrenewed each fiscal year with review of the Strategic Planand development of a new Operational Plan.
Enterprise InitiativesIn Fiscal Year 2008-09, the County launched an enterpriseinitiative that challenged County employees to identify andprepare for the significant changes taking place in theirworkplace, community, economy and world using the GMSframework. The Knowledge Worker initiative requiredCounty managers and employees to identify: how theirunits were addressing the region's increasing need forresource conservation and sustainability and how staff willmanage the exploding amount of information available tothem to stay on the cutting edge of their fields. In FiscalYear 2009-10, the Government without Walls (GWOW) ini-tiative followed on these principles by challenging the work-force to make better use of technology tools to accomplishits goals and to identify how the County can make its oper-ations and the organization more nimble, mobile and adapt-able as circumstances and needs change.
28 County of San DiegoAdopted Operational Plan Fiscal Years 2013-2014 and 2014-2015
Governmental Structure and Budget Process
Enterprise initiatives emphasize that everyone in the Countyworkforce shares responsibility for helping the organizationadapt to change and move forward in this fast-pacedworld. Examples of how County employees are embracingthese enterprise initiatives and what they have accom-plished are now reflected throughout the enterprise. Inkeeping with the GMS disciplines and our commitment tocontinuous improvement, the County will continue to lookahead and aggressively embrace, adapt to and use theincreasingly fast pace of change to ensure that County ser-vices meet residents' needs and provide the best value totaxpayers.
Context for Strategic and Operational PlanningTo be effective, the goals that the County sets and theresources that are allocated are consistent with the purposeof the organization. The context for all strategic and opera-tional planning is provided by the County's Vision and Mis-sion. First and foremost, the Strategic Plan sets the coursefor accomplishing the County's Vision:
A county that is safe, healthy and thriving
By establishing a clear Vision, the County can articulate thestrategies and approaches it will take to carry out its Mis-sion. The Mission reflects the County's commitment toidentify, understand and respond to the critical issues thataffect county residents as well as to provide services thathelp make San Diego County an enjoyable area in which tolive. The County's Mission:
To efficiently provide public services that build strong and sustainable communities
The County recognizes that "The noblest motive is the pub-lic good." As such, there is an ethical obligation and com-mitment to uphold basic standards as we conductoperations to realize a shared Vision. The County embracesthe following values:
Integrity - We are dedicated to the highest ethical stan-dards.Stewardship - We will ensure responsible stewardshipof all that is entrusted to us.Commitment - We are committed to excellence in allthat we do.
Strategic PlanAs noted on the previous page, the GMS outlines howCounty government will operate to ensure that services areprovided in an efficient, effective manner. The first thing theCounty does to ensure that it operates efficiently and effec-tively is to develop a long-term (five-year) Strategic Plan
that sets forth the County's priorities and what it willaccomplish with its resources. The Strategic Plan articu-lates the organization's external and internal priorities andthe goals it will achieve in that period.
The Strategic Plan is developed by the Chief AdministrativeOfficer and the County Executive Team, based on the poli-cies and priorities set by the Board of Supervisors and anenterprisewide review of the issues, risks and opportunitiesfacing the region and the County organization. All Countyprograms support at least one of these three Strategic Ini-tiatives or the Required Disciplines for Excellence that makeachievement of the initiatives possible:
Safe Communities (Promote safe communities), Sustainable Environments (Support environmentsthat foster viable, livable communities while bolsteringeconomic growth), and Healthy Families (Make it easier for residents to leadhealthy lives while improving opportunities for childrenand adults).
The Strategic Plan also commits the organization to adhereto eight key internal organizational disciplines that are nec-essary to maintain a high level of operational excellenceand accomplish the Strategic Initiatives. These RequiredDisciplines for Excellence are:
Fiscal Stability - Maintain fiscal stability to ensure ser-vices that customers rely on, in good times and in bad.Customer Satisfaction - Ensure customers are pro-vided with superior services.Regional Leadership - As a regional leader, theCounty forges cooperative partnerships and leveragesadditional resources for residents.Skilled, Adaptable and Diverse Workforce - Developa committed, skilled, adaptable and diverse workforcethat turns plans and resources into achievement andsuccess.Essential Infrastructure - Provide the essential infra-structure to ensure superior service delivery to our resi-dents.Accountability, Transparency and Ethical Conduct -Ensure accountability to ourselves and the public byrequiring that County business be conducted as openlyas possible, resulting in the efficient and ethical use ofpublic funds.Continuous Improvement and Innovation - Achieveoperational efficiency through continuous efforts toimprove and innovate, thereby maximizing value fortaxpayers.
County of San Diego Adopted Operational Plan Fiscal Years 2013-2014 and 2014-2015 29
Governmental Structure and Budget Process
Information Services - The County of San Diego willbe the center of Information Services innovation foradvancing the delivery of County services, anytime andanywhere.
To ensure that the Strategic Plan incorporates a fiscal per-spective, the CAO, ACAO/Chief Operating Officer and Gen-eral Managers annually assess the long-term fiscal health ofthe County and review a five-year forecast of revenues andexpenditures to which all departments contribute. This pro-cess leads to the development of preliminary short andmedium-term operational objectives and the resource allo-cations necessary to achieve them.
Operational Plan
The Operational Plan provides the County's financial planfor the next two fiscal years (e.g., July 1, 2013 through June30, 2015). However, pursuant to Government Code §29000et seq., State law allows the Board of Supervisors to for-mally adopt only the first year of the Operational Plan as theCounty's budget. The Board approves the second year ofthe plan in principle for planning purposes. To demonstratethat resources are allocated to support the County's Strate-gic Plan goals, all program objectives in the OperationalPlan and department performance measures are alignedwith the Strategic Plan Initiatives and/or the Required Disci-plines for Excellence.
The five business groups and their respective departmentsdevelop specific objectives as part of the preparation of theOperational Plan. Objectives are clear discussions of antici-pated levels of achievement for the next two years. Theycommunicate the entity's core services and organizationalpriorities. The objectives include measurable targets foraccomplishing specific goals plus a discussion of theresources necessary to meet those goals. The OperationalPlan also details each department's major accomplish-ments during the past fiscal year as related to achievementof the goals laid out in the County's five-year Strategic Plan.
Performance MeasurementSince Fiscal Year 2005-06, the County has undertaken anextensive effort to demonstrate performance to citizensthrough reporting meaningful and uncomplicated perfor-mance measures. The focus was shifted from reporting onwhat was happening to the organization, to what is happen-ing in the lives of residents, customers and stakeholders
because of County services. This effort remains a priorityand each department is required to measure performancein terms of outcomes, or how they affect peoples' lives, notjust a count of the activities they perform. The most signifi-cant measures are reflected in this document as part of therespective narrative section of each department's budgetpresentation.
Budget Process and Budget DocumentsThe budget process begins annually with submittal of theCAO Recommended Operational Plan, referred to as theCAO Proposed Operational Plan prior to Fiscal Year 2013-14. This document is a comprehensive overview of theChief Administrative Officer's (CAO) recommended plan forthe County's operations for the next two fiscal years. It issubmitted to the Board of Supervisors in May of each year.It includes:
Summary tables outlining financing sources andexpenditures for all County funds, plus an overview ofstaffing levels;A summary of the County's projected reserves, debtmanagement policies and short-term and long-termfinancial obligations;A detailed section by group/agency and department/program describing each entity's functions, mission,current fiscal year anticipated accomplishments, oper-ating objectives for the two upcoming fiscal years, per-formance measures; and budget tables for staffing byprogram, expenditures by category, and revenueamounts and sources; An explanation of the capital program planning processalong with a description of the capital projects withnew appropriations recommended, the operatingimpact of the capital projects scheduled for completionduring the next two fiscal years, and budget summariesfor capital projects by fund; andOther supporting material including budget summaries,a glossary and an index.
Public Review and Hearings—Prior to adopting a budget,the Board of Supervisors conducts public hearings for 10calendar days. Pursuant to California Government Code§29081, budget hearings may be continued from day to dayuntil concluded, but not to exceed a total of 14 calendardays. This process commences with presentations by com-munity organizations that have applied for grant funds
30 County of San DiegoAdopted Operational Plan Fiscal Years 2013-2014 and 2014-2015
Governmental Structure and Budget Process
available through the Community Enhancement Program.Public hearings on the Operational Plan begin during thefirst half of June.
All requests for increases to the CAO Recommended Oper-ational Plan, whether from members of the Board of Super-visors, County staff, County advisory boards or members ofthe public, must be submitted to the Clerk of the Board inwriting by the close of public hearings.
Change Letters are recommended changes to the CAORecommended Operational Plan submitted by the CAOand members of the Board of Supervisors. The CAOChange Letter updates the CAO Recommended Opera-tional Plan with information that becomes available after thelatter document is presented to the Board of Supervisors.Such modifications may be due to Board actions thatoccurred subsequent to the submission of the CAO Rec-ommended Operational Plan or as a result of recentchanges in State or federal funding. The CAO Change Let-ter typically contains a schedule of revisions by departmentalong with explanatory text.
Referrals to Budget are items on which the Board ofSupervisors has deferred action during the current fiscalyear so that they may be considered in the context of theoverall budget. Each business group tracks their referrals tobudget. As Budget Deliberations approach, the status ofeach referral is updated and included in a compilation of allthe referrals made throughout the year. This document issubmitted to the Board of Supervisors for review and actionduring Budget Deliberations.
Citizen Advisory Board Statements are the comments ofcitizen committees on the CAO Recommended OperationalPlan.
Budget Deliberations occur after the conclusion of publichearings when the Board of Supervisors discusses the CAORecommended Operational Plan, any requested amend-ments and public testimony with the CAO and other Countyofficials as necessary. Based on these discussions, theBoard gives direction to the CAO regarding the expenditureand revenue levels to be included in the Adopted Opera-tional Plan. Once Budget Deliberations conclude, the Boardgives approval, by majority vote, to operate pending theadoption of the budget for the coming fiscal year. Board ofSupervisors Budget Deliberations are usually completed bythe end of June.
Referrals from Budget are requests made by the Board ofSupervisors during Budget Deliberations for additionalinformation to assist them in making decisions during the
fiscal year. The applicable business group is responsible forproviding the requested information to the Board of Super-visors. Any changes to the approved budget prior to adop-tion require a four-fifths vote of approval by the Board.
Budget Adoption occurs at a separate public hearing fol-lowing the Board’s Budget Deliberations. The budget, asfinally determined, is adopted by resolution requiring amajority vote of the Board of Supervisors. Any changes tothe adopted budget require a four-fifths vote of approval bythe Board. Budget adoption typically occurs in August.
The Adopted Operational Plan shows the Board of Super-visors' adopted budget for the immediate fiscal year andthe plan approved in principle for the following year. TheAdopted Operational Plan is an update of the CAO Recom-mended Operational Plan reflecting revisions made by theBoard of Supervisors during Budget Deliberations. Unlikethe CAO Recommended Operational Plan, which displaysthe two prior fiscal years' adopted budgets and the recom-mended amounts for the two upcoming fiscal years, theAdopted Operational Plan provides perspective by display-ing actual expenditures and revenue at the group/agencyand department level for the two prior fiscal years, as wellas the adopted and amended budget for the immediateprior fiscal year. The amended budget for each departmentis the budget at the end of the fiscal year. It reflects theadopted budget plus any amounts carried forward from theprevious year through the encumbrance process and anychanges that were authorized during the year. Any budget-to-actual comparisons are best made using the amendedbudget as a base.
Note on Actual General Purpose Revenue and Use of FundBalance in departmental tables: Each department's budgettable shows the funding sources for its programs for theindicated budget years, including various categories of pro-gram revenues, fund balance, fund balance componentdecreases and General Purpose Revenue allocation. Forany given budget year, the amount of the General PurposeRevenue allocation is intended to be fixed, meaning thatthe amount is anticipated to be the same for the adoptedbudget, the amended budget and the actuals. Exceptionsare made due to unique one-time events. In the case of theuse of fund balance, the amount in the actual column maybe either positive or negative. The sum of the actual fundbalance, any fund balance component decreases and theGeneral Purpose Revenue allocation equals the totalamount of non-program revenue funding sources used tosupport the actual expenditures of the department.
County of San Diego Adopted Operational Plan Fiscal Years 2013-2014 and 2014-2015 31
Governmental Structure and Budget Process
Budget Modifications—State Law permits modificationsto the adopted budget during the year with approval by theBoard of Supervisors or, in certain instances, by the Auditorand Controller. There are two options for requesting a mid-year budget adjustment from the Board of Supervisors:
Board of Supervisors Regular Agenda Process—Budget modifications are generally made due tounforeseen and program-specific changes. In compli-ance with Government Code §29130, increases inappropriations require a four-fifths vote of approval bythe Board of Supervisors after the budget is adopted.Such changes could include requests for additionalappropriations as a result of additional revenues forspecific programs, or a contract modification. Items
placed on the agenda that have a fiscal or budgetaryimpact are reviewed and approved by the Chief Finan-cial Officer. Contract modifications also require theapproval of the Purchasing Agent. County Counselreviews and approves all Board agenda items.Quarterly Status Reports—The CAO provides a quar-terly budget status report to the Board of Supervisorsthat may also recommend changes to appropriations toaddress unanticipated needs or make technical adjust-ments to the budget. These reports are placed on theBoard of Supervisors regular agenda and are alsoposted on the Auditor and Controller's website.
32 County of San DiegoAdopted Operational Plan Fiscal Years 2013-2014 and 2014-2015
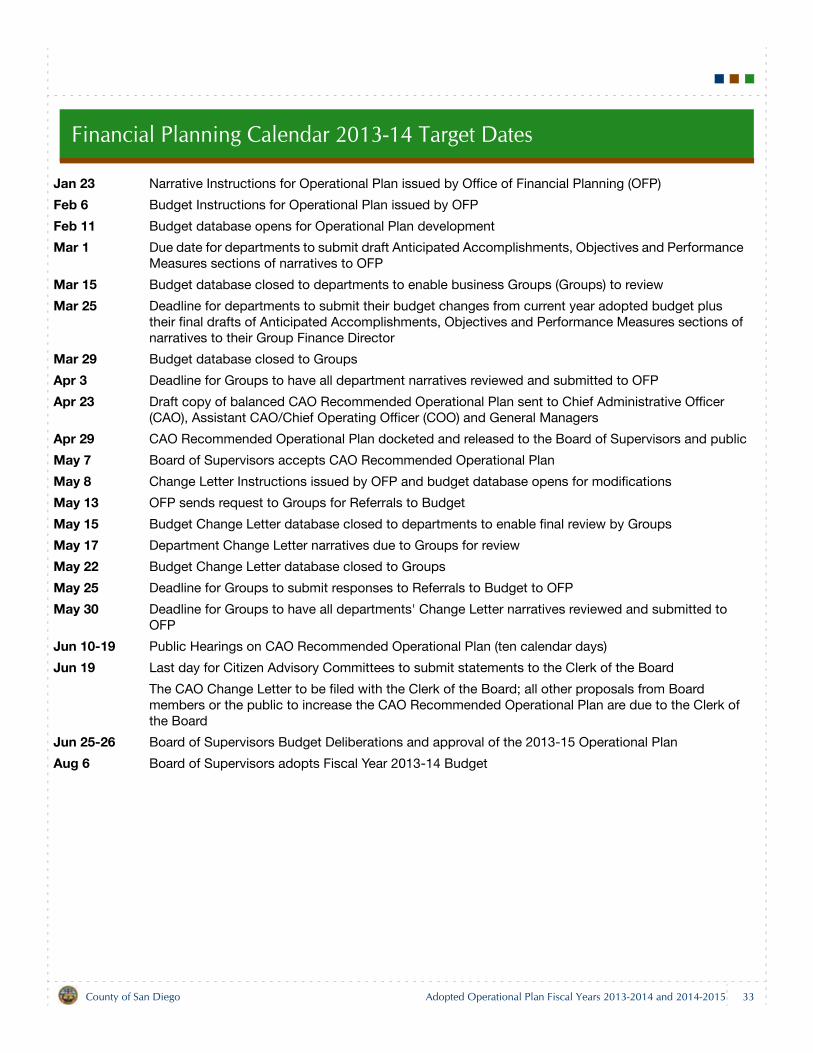
Financial Planning Calendar 2013-14 Target Dates
Jan 23 Narrative Instructions for Operational Plan issued by Office of Financial Planning (OFP)
Feb 6 Budget Instructions for Operational Plan issued by OFP
Feb 11 Budget database opens for Operational Plan development
Mar 1 Due date for departments to submit draft Anticipated Accomplishments, Objectives and Performance Measures sections of narratives to OFP
Mar 15 Budget database closed to departments to enable business Groups (Groups) to review
Mar 25 Deadline for departments to submit their budget changes from current year adopted budget plus their final drafts of Anticipated Accomplishments, Objectives and Performance Measures sections of narratives to their Group Finance Director
Mar 29 Budget database closed to Groups
Apr 3 Deadline for Groups to have all department narratives reviewed and submitted to OFP
Apr 23 Draft copy of balanced CAO Recommended Operational Plan sent to Chief Administrative Officer (CAO), Assistant CAO/Chief Operating Officer (COO) and General Managers
Apr 29 CAO Recommended Operational Plan docketed and released to the Board of Supervisors and public
May 7 Board of Supervisors accepts CAO Recommended Operational Plan
May 8 Change Letter Instructions issued by OFP and budget database opens for modifications
May 13 OFP sends request to Groups for Referrals to Budget
May 15 Budget Change Letter database closed to departments to enable final review by Groups
May 17 Department Change Letter narratives due to Groups for review
May 22 Budget Change Letter database closed to Groups
May 25 Deadline for Groups to submit responses to Referrals to Budget to OFP
May 30 Deadline for Groups to have all departments' Change Letter narratives reviewed and submitted to OFP
Jun 10-19 Public Hearings on CAO Recommended Operational Plan (ten calendar days)
Jun 19 Last day for Citizen Advisory Committees to submit statements to the Clerk of the Board
The CAO Change Letter to be filed with the Clerk of the Board; all other proposals from Board members or the public to increase the CAO Recommended Operational Plan are due to the Clerk of the Board
Jun 25-26 Board of Supervisors Budget Deliberations and approval of the 2013-15 Operational Plan
Aug 6 Board of Supervisors adopts Fiscal Year 2013-14 Budget
County of San Diego Adopted Operational Plan Fiscal Years 2013-2014 and 2014-2015 33
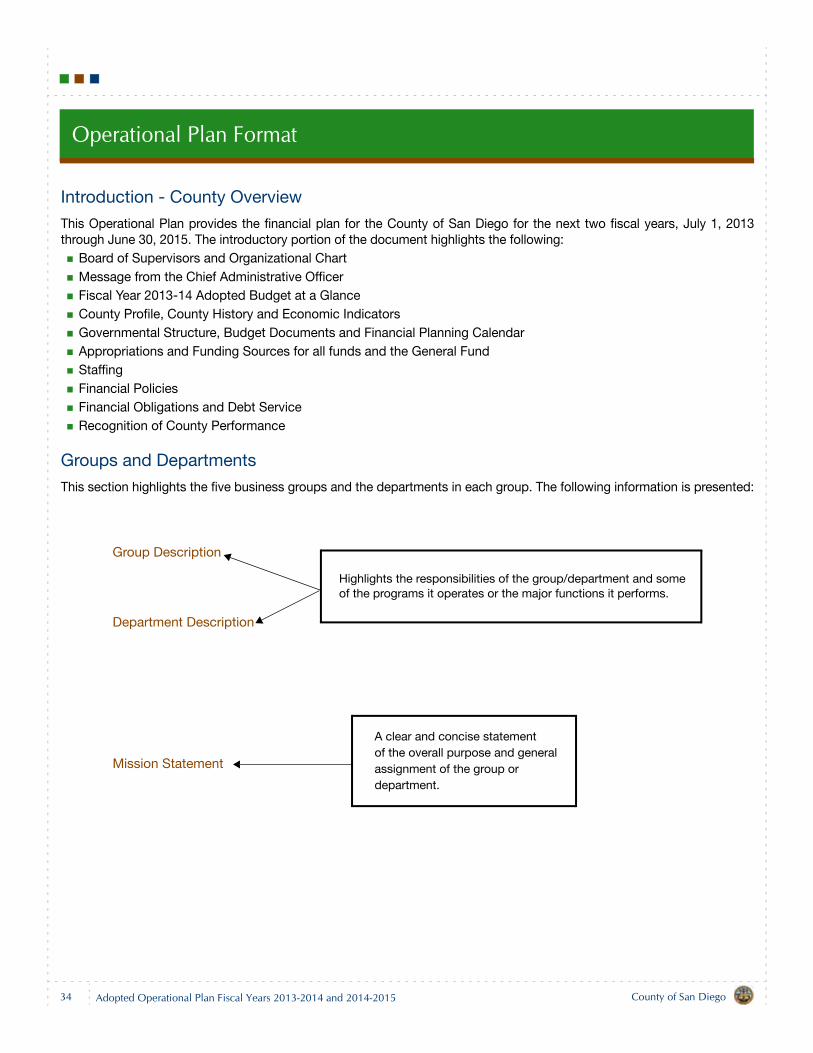
Operational Plan Format
Introduction - County Overview
This Operational Plan provides the financial plan for the County of San Diego for the next two fiscal years, July 1, 2013through June 30, 2015. The introductory portion of the document highlights the following:
Board of Supervisors and Organizational ChartMessage from the Chief Administrative OfficerFiscal Year 2013-14 Adopted Budget at a GlanceCounty Profile, County History and Economic IndicatorsGovernmental Structure, Budget Documents and Financial Planning CalendarAppropriations and Funding Sources for all funds and the General FundStaffingFinancial PoliciesFinancial Obligations and Debt ServiceRecognition of County Performance
Groups and Departments
This section highlights the five business groups and the departments in each group. The following information is presented:
Group Description
Department Description
Mission Statement
A clear and concise statementof the overall purpose and generalassignment of the group or department.
Highlights the responsibilities of the group/department and someof the programs it operates or the major functions it performs.
34 County of San DiegoAdopted Operational Plan Fiscal Years 2013-2014 and 2014-2015
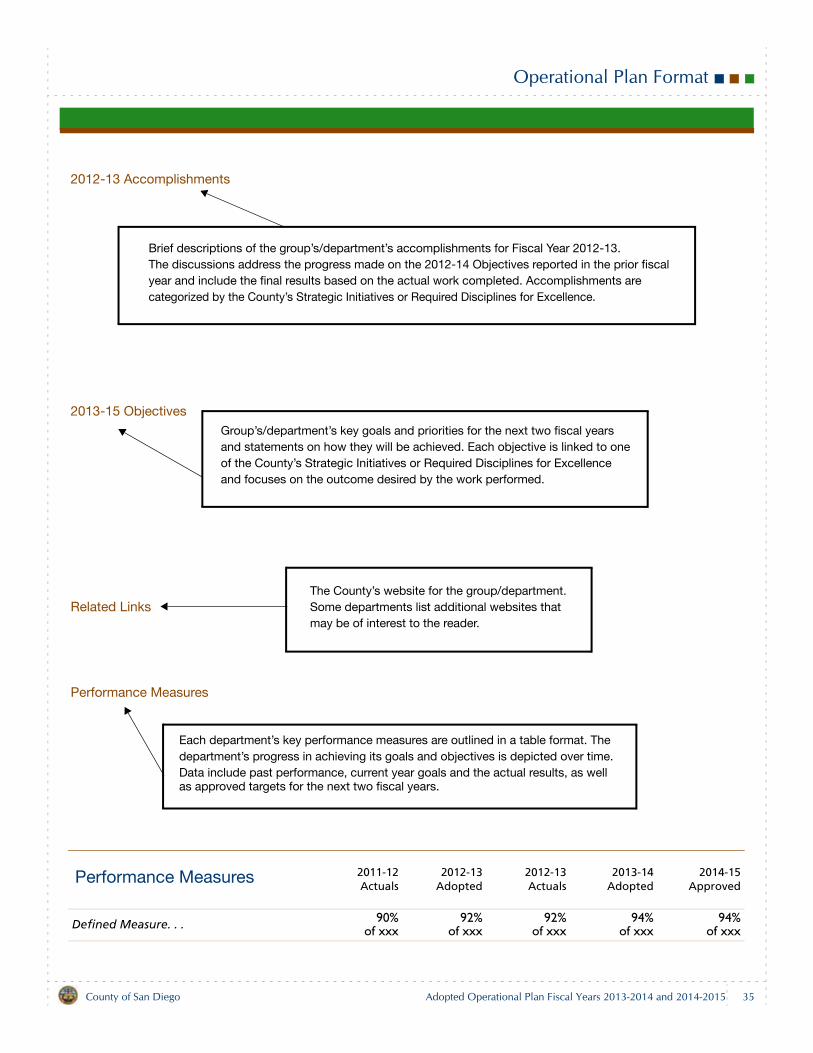
Operational Plan Format
Performance Measures 2011-12Actuals
2012-13Adopted
2012-13Actuals
2013-14Adopted
2014-15Approved
Defined Measure. . . 90%of xxx
92%of xxx
92%of xxx
94%of xxx
94%of xxx
Brief descriptions of the group’s/department’s accomplishments for Fiscal Year 2012-13. The discussions address the progress made on the 2012-14 Objectives reported in the prior fiscalyear and include the final results based on the actual work completed. Accomplishments are categorized by the County’s Strategic Initiatives or Required Disciplines for Excellence.
2012-13 Accomplishments
Group’s/department’s key goals and priorities for the next two fiscal yearsand statements on how they will be achieved. Each objective is linked to oneof the County’s Strategic Initiatives or Required Disciplines for Excellenceand focuses on the outcome desired by the work performed.
2013-15 Objectives
The County’s website for the group/department.Some departments list additional websites thatmay be of interest to the reader.
Related Links
Performance Measures
Each department’s key performance measures are outlined in a table format. Thedepartment’s progress in achieving its goals and objectives is depicted over time.Data include past performance, current year goals and the actual results, as wellas approved targets for the next two fiscal years.
County of San Diego Adopted Operational Plan Fiscal Years 2013-2014 and 2014-2015 35
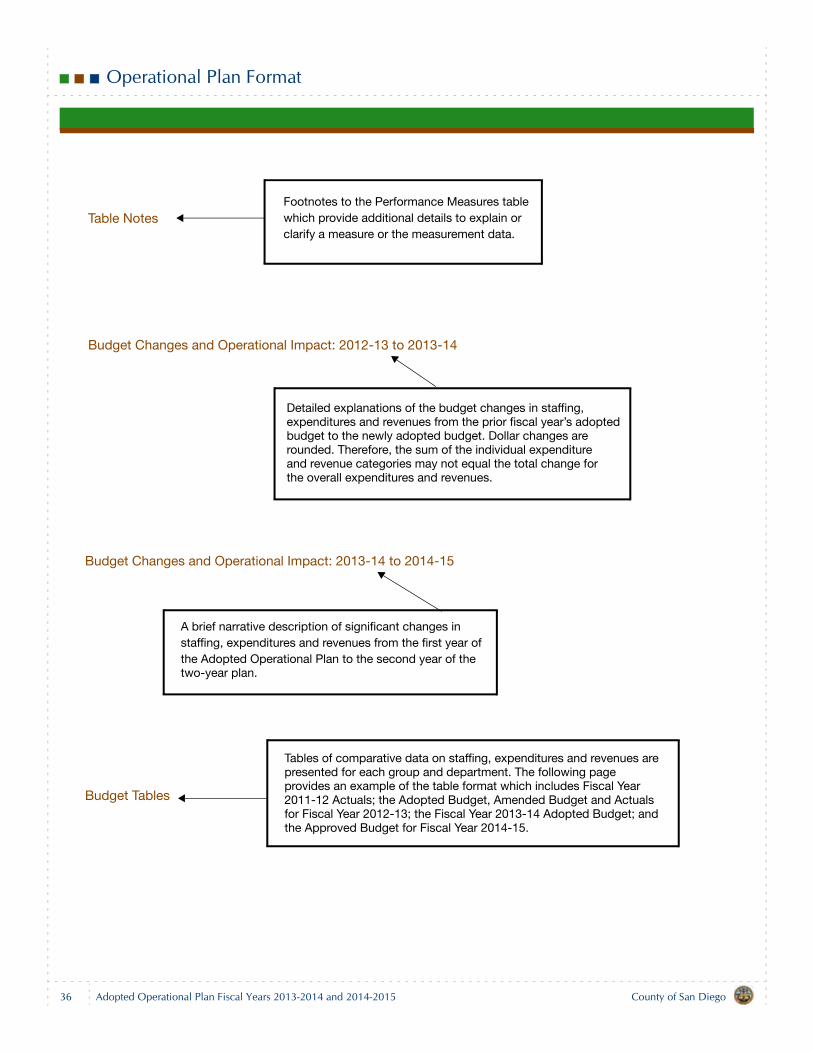
Operational Plan Format
Footnotes to the Performance Measures tablewhich provide additional details to explain or clarify a measure or the measurement data.
Table Notes
Budget Changes and Operational Impact: 2012-13 to 2013-14
Detailed explanations of the budget changes in staffing,
budget to the newly adopted budget. Dollar changes are rounded. Therefore, the sum of the individual expenditureand revenue categories may not equal the total change forthe overall expenditures and revenues.
expenditures and revenues from the prior fiscal year’s adopted
Budget Changes and Operational Impact: 2013-14 to 2014-15
A brief narrative description of significant changes instaffing, expenditures and revenues from the first year ofthe Adopted Operational Plan to the second year of thetwo-year plan.
provides an example of the table format which includes Fiscal Year
the Approved Budget for Fiscal Year 2014-15.for Fiscal Year 2012-13; the Fiscal Year 2013-14 Adopted Budget; and2011-12 Actuals; the Adopted Budget, Amended Budget and Actuals
presented for each group and department. The following pageTables of comparative data on staffing, expenditures and revenues are
Budget Tables
36 County of San DiegoAdopted Operational Plan Fiscal Years 2013-2014 and 2014-2015
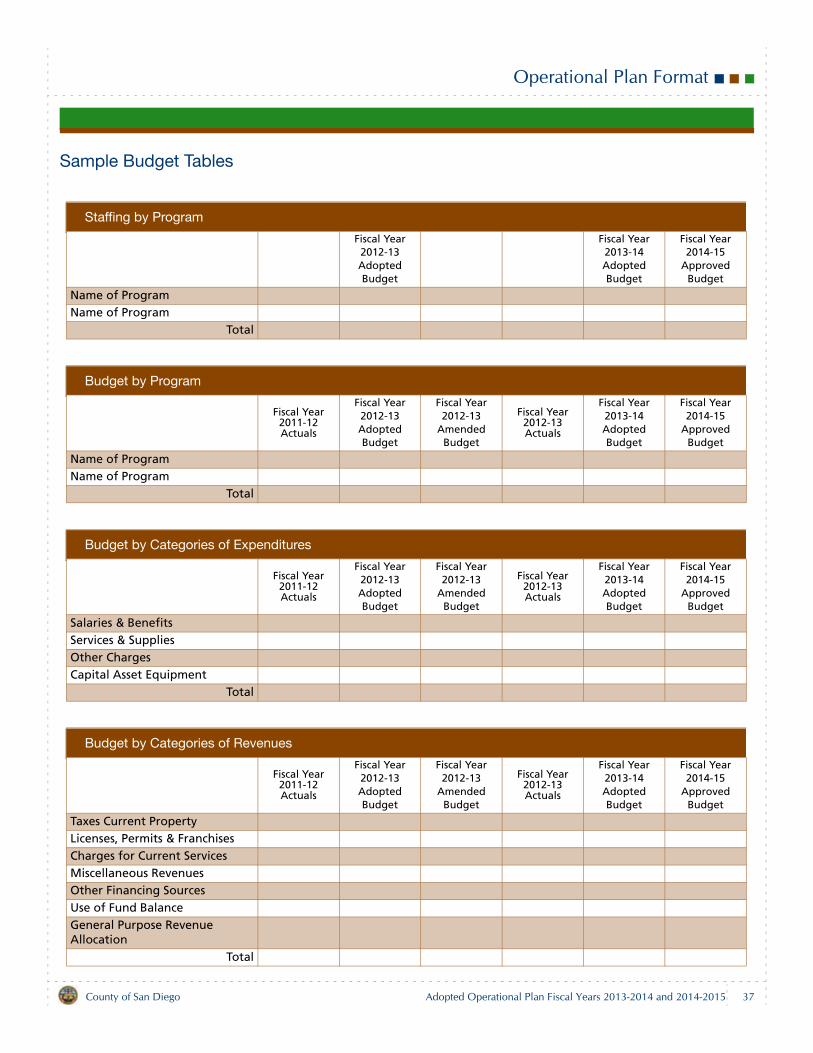
Operational Plan Format
Sample Budget Tables
Staffing by Program
Fiscal Year 2012-13 Adopted Budget
Fiscal Year 2013-14 Adopted Budget
Fiscal Year 2014-15
Approved Budget
Name of ProgramName of Program
Total
Budget by Program
Fiscal Year 2011-12 Actuals
Fiscal Year 2012-13 Adopted Budget
Fiscal Year 2012-13
Amended Budget
Fiscal Year 2012-13 Actuals
Fiscal Year 2013-14 Adopted Budget
Fiscal Year 2014-15
Approved Budget
Name of ProgramName of Program
Total
Budget by Categories of Expenditures
Fiscal Year 2011-12 Actuals
Fiscal Year 2012-13 Adopted Budget
Fiscal Year 2012-13
Amended Budget
Fiscal Year 2012-13 Actuals
Fiscal Year 2013-14 Adopted Budget
Fiscal Year 2014-15
Approved Budget
Salaries & BenefitsServices & SuppliesOther ChargesCapital Asset Equipment
Total
Budget by Categories of Revenues
Fiscal Year 2011-12 Actuals
Fiscal Year 2012-13 Adopted Budget
Fiscal Year 2012-13
Amended Budget
Fiscal Year 2012-13 Actuals
Fiscal Year 2013-14 Adopted Budget
Fiscal Year 2014-15
Approved Budget
Taxes Current PropertyLicenses, Permits & FranchisesCharges for Current ServicesMiscellaneous RevenuesOther Financing SourcesUse of Fund BalanceGeneral Purpose Revenue Allocation
Total
County of San Diego Adopted Operational Plan Fiscal Years 2013-2014 and 2014-2015 37
Operational Plan Format
Capital Program
This section of the Operational Plan discusses the County's Capital Program - its structure, funds, policies and procedures.Details are provided for the following:
Capital Appropriations - Discusses new appropriations to the capital budget for Fiscal Years 2013-15, including theamount and purpose of each capital item.Operating Impact of Capital Program - A summary of the potential impact on the operating budget is presented for ahandful of capital projects that are scheduled for completion during Fiscal Years 2013-15.Tables summarizing the Capital Program budget, including the budget by fund, by categories of expenditures and rev-enues, and the revenue detail. Data includes Fiscal Year 2011-12 Actuals; Fiscal Year 2012-13 Adopted Budget,Amended Budget and Actuals; Fiscal Year 2013-14 Adopted Budget; and the Fiscal Year 2014-15 Approved Budget.
Tables are presented for each fund within the Capital Program that has budgeted appropriations for the fiscal yearspresented, which may include any or all of the following funds: Capital Outlay, County Health Complex, JusticeFacility Construction, Multiple Species Conservation Program, Library Projects and Edgemoor Development.Information includes: Budget by Categories of Expenditures; Project Details listing each capital project by nameand number; and Funding Source which includes all funding sources and lists each project funded by each source.Data includes Fiscal Year 2011-12 Actuals; Fiscal Year 2012-13 Adopted Budget, Amended Budget and Actuals;Fiscal Year 2013-14 Adopted Budget; and the Fiscal Year 2014-15 Approved Budget.
Lease Payments - Details lease payments budget by expenditures, revenues and funding sources for the same fiscalyears as described above.Outstanding Capital Projects by Group/Agency - Tables for each of the five business groups outline the total appropri-ations and the remaining balance for each capital project and the fiscal year the project was established.
Finance Other
This component of the document highlights miscellaneous funds and programs that are predominantly Countywide innature, have no staffing associated with them or exist for proper budgetary accounting purposes.
Appendices
Appendices A, B and C present tables of data which includes Fiscal Year 2011-12 Actuals; Fiscal Year 2012-13Adopted Budget, Amended Budget and Actuals; Fiscal Year 2013-14 Adopted Budget; and the Fiscal Year 2014-15Approved Budget.
Appendix A: All Funds - Budget Summary - Tables outline staff years and expenditures and revenues by categoryfor the total County and by each business group, the Capital Program and Finance Other.Appendix B: Budget Summary of All Funds - Tables of Countywide appropriations by fund type and appropriationsby fund type within each business group, the Capital Program and Finance Other.Appendix C: General Fund Budget Summary - Tables of General Fund expenditures by department within eachbusiness group and for Finance Other; also provided are financing sources by category for the total General Fund.
Appendix D: Health & Human Services Agency (HHSA) - General Fund - Tables depict staff years and summarizesHHSA’s general fund budget by operations and assistance payments.Appendix E: Operational Plan Abbreviations and Acronyms - Common abbreviations and acronyms referenced.Appendix F: Glossary of Operational Plan Terms - Explanations of key terms used in the document and during thebudget process.Index: An alphabetical listing of key topics and the page reference for each.
38 County of San DiegoAdopted Operational Plan Fiscal Years 2013-2014 and 2014-2015
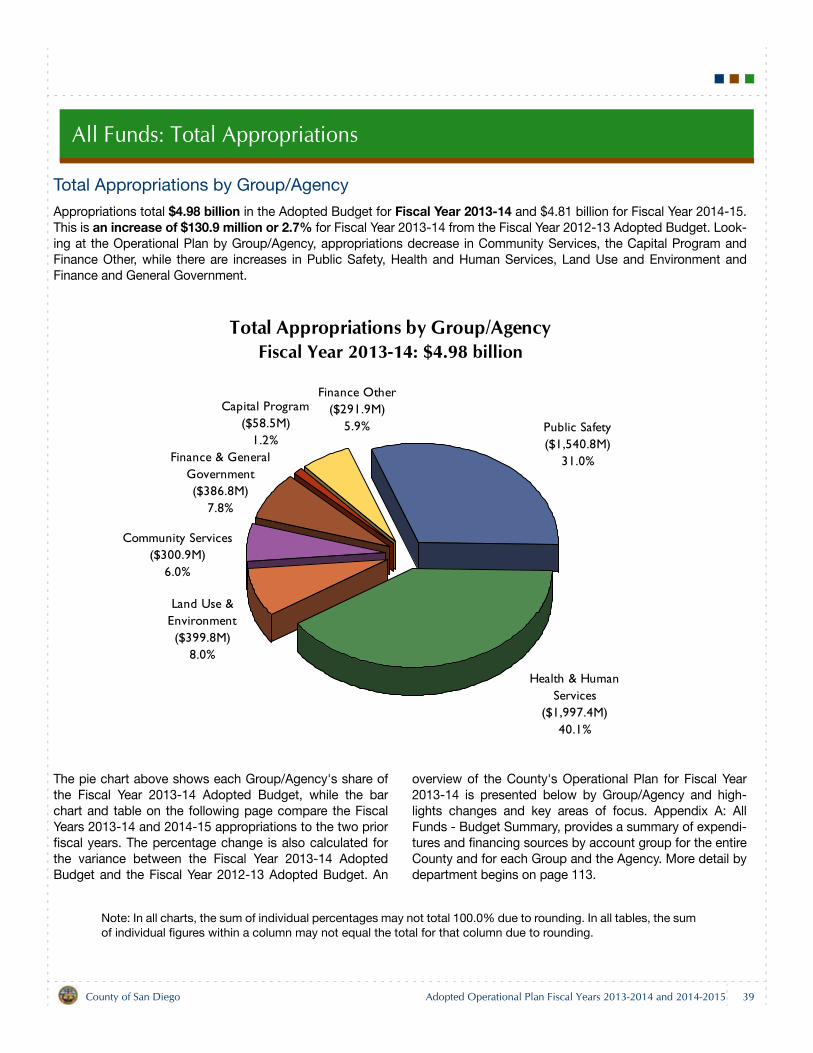
All Funds: Total Appropriations
Total Appropriations by Group/Agency
Appropriations total $4.98 billion in the Adopted Budget for Fiscal Year 2013-14 and $4.81 billion for Fiscal Year 2014-15.This is an increase of $130.9 million or 2.7% for Fiscal Year 2013-14 from the Fiscal Year 2012-13 Adopted Budget. Look-ing at the Operational Plan by Group/Agency, appropriations decrease in Community Services, the Capital Program andFinance Other, while there are increases in Public Safety, Health and Human Services, Land Use and Environment andFinance and General Government.
The pie chart above shows each Group/Agency's share ofthe Fiscal Year 2013-14 Adopted Budget, while the barchart and table on the following page compare the FiscalYears 2013-14 and 2014-15 appropriations to the two priorfiscal years. The percentage change is also calculated forthe variance between the Fiscal Year 2013-14 AdoptedBudget and the Fiscal Year 2012-13 Adopted Budget. An
overview of the County's Operational Plan for Fiscal Year2013-14 is presented below by Group/Agency and high-lights changes and key areas of focus. Appendix A: AllFunds - Budget Summary, provides a summary of expendi-tures and financing sources by account group for the entireCounty and for each Group and the Agency. More detail bydepartment begins on page 113.
Note: In all charts, the sum of individual percentages may not total 100.0% due to rounding. In all tables, the sum of individual figures within a column may not equal the total for that column due to rounding.
Total Appropriations by Group/AgencyFiscal Year 2013-14: $4.98 billion
Finance Other ($291.9M)
5.9%
Capital Program ($58.5M)
1.2%Finance & General
Government ($386.8M)
7.8%
Community Services ($300.9M)
6.0%
Land Use & Environment ($399.8M)
8.0%
Health & Human Services
($1,997.4M)40.1%
Public Safety ($1,540.8M)
31.0%
County of San Diego Adopted Operational Plan Fiscal Years 2013-2014 and 2014-2015 39
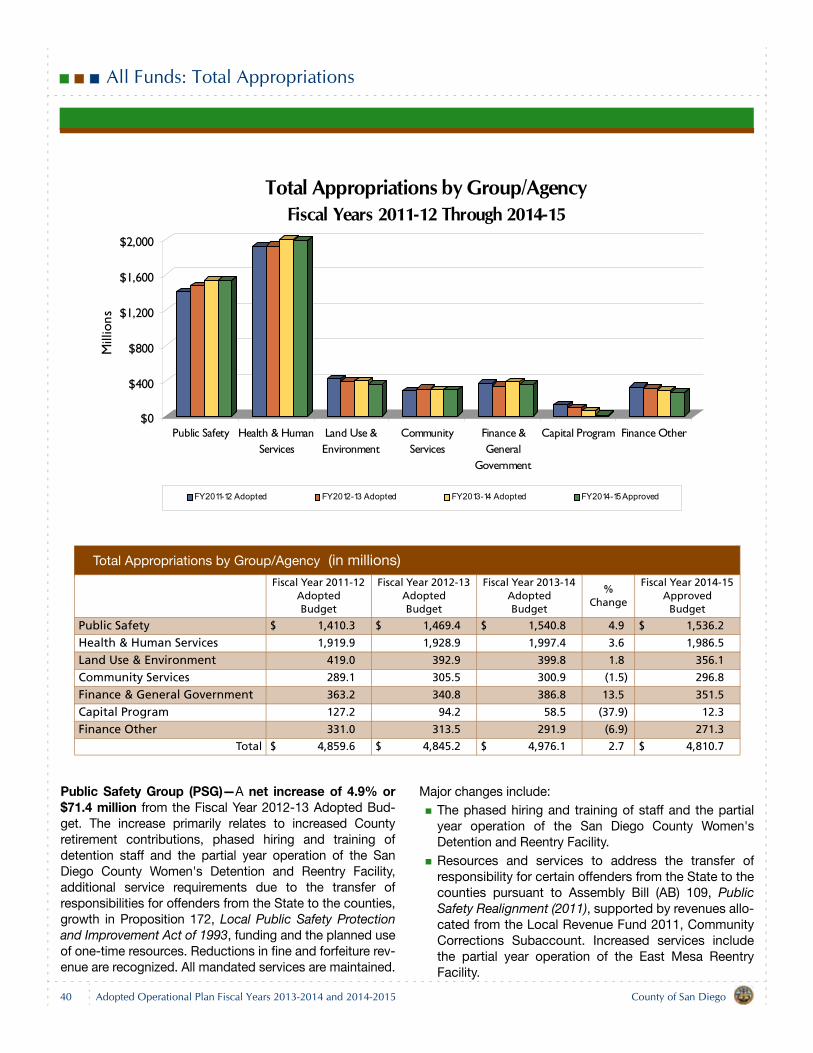
All Funds: Total Appropriations
Public Safety Group (PSG)—A net increase of 4.9% or$71.4 million from the Fiscal Year 2012-13 Adopted Bud-get. The increase primarily relates to increased Countyretirement contributions, phased hiring and training ofdetention staff and the partial year operation of the SanDiego County Women's Detention and Reentry Facility,additional service requirements due to the transfer ofresponsibilities for offenders from the State to the counties,growth in Proposition 172, Local Public Safety Protectionand Improvement Act of 1993, funding and the planned useof one-time resources. Reductions in fine and forfeiture rev-enue are recognized. All mandated services are maintained.
Major changes include:The phased hiring and training of staff and the partialyear operation of the San Diego County Women'sDetention and Reentry Facility.Resources and services to address the transfer ofresponsibility for certain offenders from the State to thecounties pursuant to Assembly Bill (AB) 109, PublicSafety Realignment (2011), supported by revenues allo-cated from the Local Revenue Fund 2011, CommunityCorrections Subaccount. Increased services includethe partial year operation of the East Mesa ReentryFacility.
Total Appropriations by Group/Agency (in millions)Fiscal Year 2011-12
AdoptedBudget
Fiscal Year 2012-13 Adopted Budget
Fiscal Year 2013-14 Adopted Budget
% Change
Fiscal Year 2014-15 Approved
Budget
Public Safety $ 1,410.3 $ 1,469.4 $ 1,540.8 4.9 $ 1,536.2
Health & Human Services 1,919.9 1,928.9 1,997.4 3.6 1,986.5
Land Use & Environment 419.0 392.9 399.8 1.8 356.1
Community Services 289.1 305.5 300.9 (1.5) 296.8
Finance & General Government 363.2 340.8 386.8 13.5 351.5
Capital Program 127.2 94.2 58.5 (37.9) 12.3
Finance Other 331.0 313.5 291.9 (6.9) 271.3
Total $ 4,859.6 $ 4,845.2 $ 4,976.1 2.7 $ 4,810.7
$0
$400
$800
$1,200
$1,600
$2,000
Mill
ions
Public Safety Health & HumanServices
Land Use &Environment
CommunityServices
Finance &General
Government
Capital Program Finance Other
Total Appropriations by Group/AgencyFiscal Years 2011-12 Through 2014-15
FY2011-12 Adopted FY2012-13 Adopted FY2013-14 Adopted FY2014-15 Approved
40 County of San DiegoAdopted Operational Plan Fiscal Years 2013-2014 and 2014-2015
All Funds: Total Appropriations
Increases in staff to enhance information-led policingand increases in sworn staff in the Sheriff's Departmentfor the Homicide Division and Emergency Planning,support for the Civil Division and for financial manage-ment, facility operations, for human resources andsafety programs and for operations in support of theRegional Communications System.Resources to support electronic discovery and activi-ties related to document imaging solutions. Reductions in amounts allocated for one-time expendi-tures in the previous fiscal year.
The Public Safety Group will align activities with the keyoutcomes of the County's Live Well San Diego Living Safelystrategy, support the County's strategic initiatives andoperate an efficient and responsive criminal justice system.
Key areas of focus include:Promoting and implementing strategies that protectresidents from crime or abuse, including information-led policing and monitoring of offenders subject tocommunity supervision.Promoting strategies that prevent crime and makeneighborhoods safe to work, live and play. Reducing recidivism by implementing strategies andproviding services to help offenders successfully reen-ter society. Continuing to strengthen the County's and communi-ties' ability to prepare for, respond to and recover fromdisasters. Leveraging technology innovations to improve servicedelivery and operational efficiency.
Health and Human Services Agency (HHSA)—A netincrease of 3.6% or $68.5 million from the Fiscal Year2012-13 Adopted Budget. The increase relates to anincrease in staff years, increased County retirement contri-butions, and costs associated with contracted services andclient payments. Reductions in funding and caseloads arealso recognized.
Major changes include:Increase to support the transition of California'sHealthy Families recipients to the Medi-Cal program. Increase in Aging and Independence Services to sup-port the Community Based Care Transitions Program(CCTP). Increase associated with Aid to Adoptive Children pay-ments and the expansion of services to emancipatedyouth under the Transitional Housing Program.
Increase to support the Supplemental Nutrition Assis-tance Program Education (SNAP-Ed) project.Increase due to the passage of AB 12, California Fos-tering Connections to Success Act (2010), whichextends foster care until age 21.Increase associated with the North County Short TermAcute Residential Treatment (START) program andLong Term Care (LTC) for increased capacity for resi-dents with mental diseases.
A major goal in the development of HHSA's operationalplan is to advance the Live Well San Diego initiative. In thatendeavor, HHSA has pursued and acquired grants that willhelp improve the health and well-being of San Diego'scommunities and residents. As in the past, HHSA continuesto work with advisory boards and other key stakeholders inthese efforts.
Key areas of focus include:Building a better service delivery system that is innova-tive and outcome driven.
Provide public health nurse home visits toparticipants in the CCTP to help them proactivelymanage their chronic medical conditions. Implement the multiyear Community TransformationGrant (CTG) to support public health efforts toreduce chronic diseases, promote healthier lifestyles,reduce health disparities, and decrease health carecosts. Co-locate Child Welfare Services staff with staff fromcommunity-based organizations to improve serviceintegration.
Supporting positive choices that empower residents totake responsibility for their own health and well-being.
Implement the multi-year Supplemental NutritionAssistance Program Education (SNAP-Ed) project topromote nutrition education and obesity preventionservices to low-income families in the regions thatare potentially eligible for the federally fundedCalFresh food assistance program. Implement a program for individuals with severemental illness to take required medications andtreatment.
Pursuing policy and environmental changes that makeit easier for people to engage in healthy and safebehaviors.
Implement regional community health improvementplans through the participation or leadership ofResident Leadership Academy (RLA) graduates. Thepurpose of RLA is to build community capacity forhealth improvement in local neighborhoods.
County of San Diego Adopted Operational Plan Fiscal Years 2013-2014 and 2014-2015 41
All Funds: Total Appropriations
Advance operational excellence by ensuring fiscal sta-bility, customer service, leadership, accountability andtransparency, continuous improvement, and workforceexcellence.
Transition Healthy Families and Low Income HealthProgram participants into appropriate healthprograms to promote continuity of care and amedical home, providing patient-centered,comprehensive, and coordinated care.Pursue voluntary Public Health Accreditation statusto promote accountability and continuousimprovement.
Land Use and Environment Group (LUEG)—A netincrease of 1.8% or $6.9 million from the Fiscal Year2012-13 Adopted Budget. Significant increases are in: one-time funding for inactive waste site projects; increasedCounty retirement contributions; increases in various roadcapital improvement projects, equipment maintenance inthe San Diego County Sanitation District; one-time costs forinformation technology and business process reengineeringprojects and the addition of staff years to meet operationalneeds related to additional regulatory responsibilities.
Major changes include:On September 25, 2012, the Board of Supervisorsestablished the Department of Planning and Develop-ment Services (PDS). PDS combines the land use func-tions that used to be divided among various Countydepartments - Planning and Land Use, Public Works,and Parks and Recreation. As a result, the Departmentof Planning and Land Use was dissolved. PDS is abrand new department with a new approach to servingcustomers. The new department creates a seamlessland use process that works efficiently and maintainsthe highest quality review standards. Additional staff years for operational needs pertainingto the Asian Citrus Psyllid (ACP) citrus grove abate-ment activities and in Agricultural Water Quality (AWQ)inspections due to revisions in the Regional MunicipalSeparate Storm Sewer (MS4) Permit.One-time funds for inactive waste projects.Increase one-time funding for major maintenance proj-ects at park facilities identified in the facility conditionsassessment program. Decrease in one-time funds due to completion of theMobile Source Emission Reduction Incentive Pro-grams.Increase in one-time funding for the Rancho San DiegoPump Station Improvement project and the IndustryRoad Interceptor Sewer Phase I Replacement, Ha-Hana Road project.
Key areas of focus include:Improving the overall land development process, aswell as the associated customer experience andstreamlining permit processing.Continuing business process reengineering efforts todevelop new online tools that will streamline processesand improve customer service.Protecting public health and helping to prevent diseasethrough education and awareness of vector-borne dis-eases and proper disposal of household hazardous,electronic and universal waste. Protecting San Diego County's $1.75 billion agriculturalindustry from damaging pests, noxious non-nativeweeds and diseases.Awarding and managing construction contracts forroad improvement projects in various county communi-ties to enhance safety and improve traffic flow.Expanding and protecting park resources, improvinginfrastructure and acquiring additional parklandthroughout the county.Preserving and enhancing the quality of life for countyresidents by implementing habitat conservation pro-grams such as the Multiple Species Conservation Pro-gram, Special Area Management Plan and ResourceManagement Plans.Completing required toxic air contaminant emissionhealth risk assessments to verify compliance of newand expanding businesses with health risk standards.Protecting and preserving the county's water qualityand watersheds.
Community Services Group (CSG)—A net decrease of1.7% or $4.6 million from the Fiscal Year 2012-13 AdoptedBudget. The decrease is due to non-recurring one-timeprior year expenditures, federal HOME funding for projectcosts and State CalHome funding for residential rehabilita-tion loans. Partially offsetting increases include increasedCounty retirement contributions, increased books andmaterials and branch library improvement projects in theCounty Library, an overall increase in utility costs due to anincreased number of County facilities, and higher costs forcontracted and routine maintenance services in Countyfacilities.
Major changes include:One-time projects for energy efficiency in County proj-ects, an infrastructure condition assessment of Countyparks, and an information technology project for facili-ties data management.Increased purchases of library books and materials inresponse to customer demand.
42 County of San DiegoAdopted Operational Plan Fiscal Years 2013-2014 and 2014-2015
All Funds: Total Appropriations
Increased costs of major maintenance and energy-effi-ciency projects, routine maintenance and contractedservices for County-owned facilities.
Key areas of focus include:Maintaining library hours to provide patron access tolibrary materials and services.Planning and design activities for new libraries in Alpineand Imperial Beach and the new Assessor/Recorder/County Clerk Branch Office Building in El Cajon.Providing resources to homeless families and veteransexiting from transitional housing.Savings in the purchase and contracting of goods andservices for all County departments through innovativeprocurement methods.Construction of capital improvements for the new SanDiego County Women's Detention and Reentry Facility,the County Administration Center Waterfront Park andrelated new parking structure at Cedar and Kettnerstreets in downtown San Diego, and the new RanchoSan Diego Sheriff's Station.Improving animal shelters and the medical treatment ofanimals to make them adoptable sooner.Conducting the June 2014 Primary Election.
Finance and General Government Group (FGG)—A netincrease of 13.5% or $46.0 million from the Fiscal Year2012-13 Adopted Budget. The increase is due primarily toone-time Countywide information technology (IT) projectsand support as well as increased County retirement contri-butions.
Major changes include:An increase in planned IT services for a number ofCounty departments through the County's informationtechnology outsourcing contract, including:
Upgrade of PeopleSoft, the County's humanresources information system.Upgrades and licensing of multiple IT systemsincluding the system used to produce the County'sComprehensive Annual Financial Report (CAFR).Increase in data center services and IT hardware andsoftware.Continue implementation of the County's newIntegrated Property Tax System (IPTS).
Major maintenance projects for the County Administra-tion Center.An increase in staff years for administration ofemployee benefits, departmental legal support ser-vices, and management of the County's enterprisetechnology platforms.
Key areas of focus include:Maintaining the County's fiscal stability through activemonitoring of economic conditions, sound accounting,auditing, budgetary practices and management disci-pline, including continued assurance of accountabilityand transparency in the use of State and federal funds.Maintaining a qualified, robust, diverse and adaptableworkforce.Aggressively pursuing opportunities to restructure theCounty's debt portfolio to maximize taxpayer savings.Maintaining a strong Treasurer's Investment Pool.Maintaining an investment in modern information tech-nology.
Continuing implementation of the new IPTS.Completing upgrades to the County's keyinformation technology systems, including thehuman resources information system, theconstituent relationship management system, andseveral of the County's main websites.
Providing the highest quality legal services to the Boardof Supervisors and County departments.
Capital Program—A net decrease of 37.9% or $35.7 mil-lion from the Fiscal Year 2012-13 Adopted Budget. Theamount budgeted in the Capital Program for Capital Proj-ects can vary significantly from year to year based on thesize and scope of capital needs in the coming years. TheFiscal Year 2013-14 Capital Program includes $48.7 millionfor the following capital projects:
$10.0 million for the Multiple Species ConservationProgram (MSCP);$9.8 million for the Alpine Library;$8.4 million for the Imperial Beach Library;$7.5 million for the Assessor/Recorder/County Clerk(ARCC) El Cajon Branch Office Building;$3.1 million for the San Luis Rey River Park Acquisition;$2.5 million for the 4S Ranch Synthetic Turf South BallFields;$2.0 million for the Lake Morena Electrical Upgrade;$1.9 million for Tijuana River Valley Trails Construction/Habitat Restoration;$1.8 million for the San Elijo Gateway Property Acquisi-tion; $1.0 million for the San Diego Botanic Garden Expan-sion;$0.2 million for the Jess Martin Multi-Use Ball Fields; $0.2 million for Don Dussault Park Improvements;$0.2 million for the 4S Ranch Shade Structure - Boysand Girls Club; and
County of San Diego Adopted Operational Plan Fiscal Years 2013-2014 and 2014-2015 43
All Funds: Total Appropriations
$0.1 million for the 4S Ranch Shade Structure - SportsPark.
The Capital Program also includes $9.8 million for theEdgemoor Development Fund to pay debt service on the2005 and 2006 Edgemoor Certificates of Participation andother costs to improve the Edgemoor property.
In Fiscal Year 2014-15, appropriations decrease by $46.2million from Fiscal Year 2013-14, and the program includesfunding of $2.5 million for the MSCP.
Finance Other—A net decrease of 6.9% or $21.6 millionfrom the Fiscal Year 2012-13 Adopted Budget. Many of theappropriations in this group vary little from year to year, butsome appropriations reported here are one-time and canfluctuate significantly. One-time appropriations in FiscalYear 2012-13 included $27.6 million for a loan for the EastMesa Reentry Facility, $8.0 million for the County Opera-
tions Center (COC) Redevelopment Annex Occupant Relo-cation, and $2.0 million for the Agua Caliente Park Water,Sewer and Electrical Line Replacement.
In the Fiscal Year 2013-14 adopted budget, the GeneralFund contribution to the Capital Program includes appro-priations for MSCP of $10.0 million, for a new Alpine Libraryof $9.8 million, for a new Imperial Beach Library and toimprove the connectivity with the Imperial Beach Commu-nity Center of $8.4 million, for the Lake Morena ElectricalUpgrade of $2.0 million, for acquisition related to the SanLuis Rey River Park of $3.1 million, for the ARCC El CajonBranch Office Building to replace the existing facility of $5.0million, for the San Elijo Gateway Property Acquisition of$1.8 million, for the San Diego Botanic Garden Expansionof $1.0 million, for the 4S Ranch Synthetic Turf South BallFields of $2.5 million, for the 4S Ranch Shade Structure -Boys and Girls Club of $0.2 million and for the 4S RanchShade Structure - Sports Park $0.1 million. In addition,lease payments for certain long-term lease obligations havedecreased by $4.6 million as a result of decreases in certainscheduled leases partially offset by the start of a lease pay-ment for the 2012 Cedar and Kettner parking structure. Seepage 511 for the details of the budget for Finance Other.
44 County of San DiegoAdopted Operational Plan Fiscal Years 2013-2014 and 2014-2015
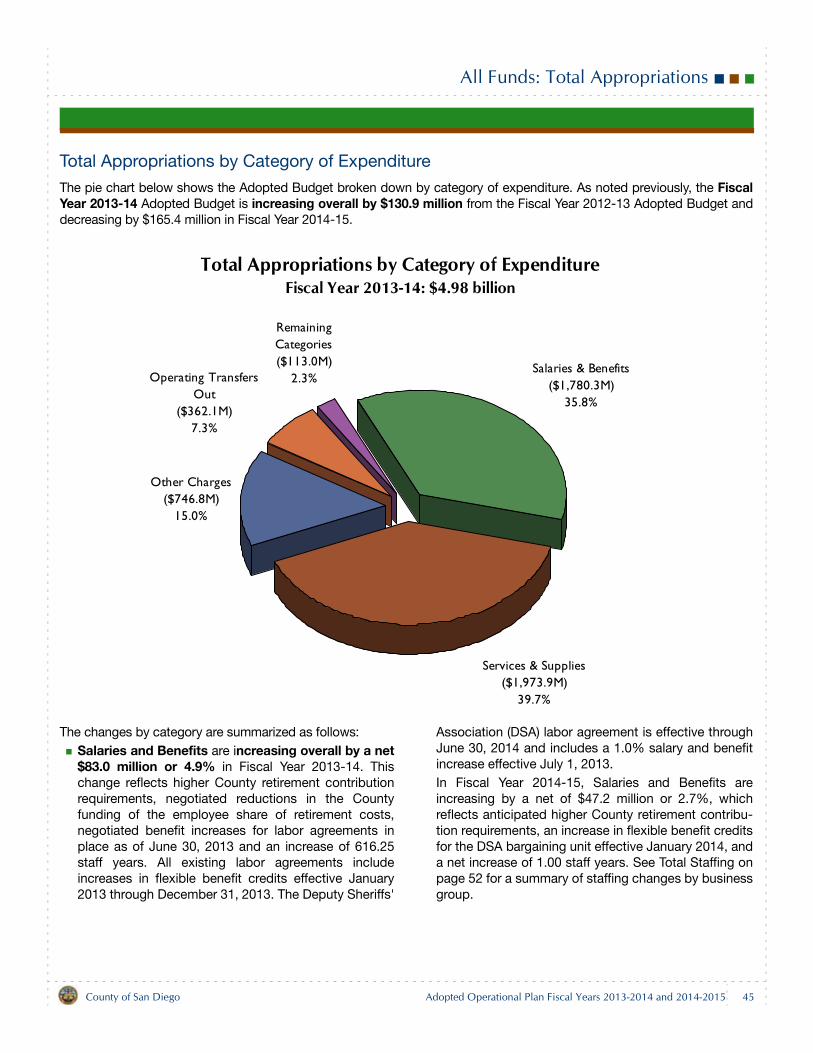
County of San Diego Adopted Operational Plan Fiscal Years 2013-2014 and 2014-2015 45
All Funds: Total Appropriations
Total Appropriations by Category of Expenditure
The pie chart below shows the Adopted Budget broken down by category of expenditure. As noted previously, the FiscalYear 2013-14 Adopted Budget is increasing overall by $130.9 million from the Fiscal Year 2012-13 Adopted Budget anddecreasing by $165.4 million in Fiscal Year 2014-15.
The changes by category are summarized as follows:Salaries and Benefits are increasing overall by a net$83.0 million or 4.9% in Fiscal Year 2013-14. Thischange reflects higher County retirement contributionrequirements, negotiated reductions in the Countyfunding of the employee share of retirement costs,negotiated benefit increases for labor agreements inplace as of June 30, 2013 and an increase of 616.25staff years. All existing labor agreements includeincreases in flexible benefit credits effective January2013 through December 31, 2013. The Deputy Sheriffs'
Association (DSA) labor agreement is effective throughJune 30, 2014 and includes a 1.0% salary and benefitincrease effective July 1, 2013.In Fiscal Year 2014-15, Salaries and Benefits areincreasing by a net of $47.2 million or 2.7%, whichreflects anticipated higher County retirement contribu-tion requirements, an increase in flexible benefit creditsfor the DSA bargaining unit effective January 2014, anda net increase of 1.00 staff years. See Total Staffing onpage 52 for a summary of staffing changes by businessgroup.
Total Appropriations by Category of ExpenditureFiscal Year 2013-14: $4.98 billion
Remaining Categories ($113.0M)
2.3%Operating Transfers Out
($362.1M)7.3%
Other Charges ($746.8M)
15.0%
Services & Supplies ($1,973.9M)
39.7%
Salaries & Benefits ($1,780.3M)
35.8%
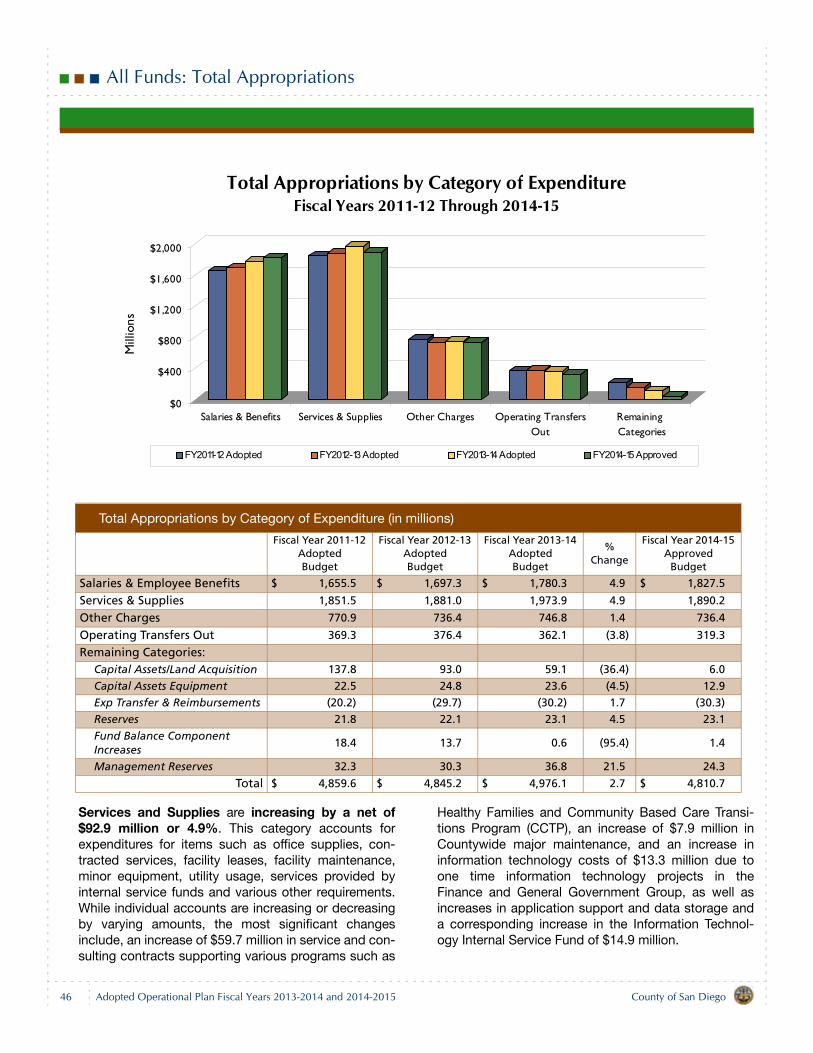
All Funds: Total Appropriations
Services and Supplies are increasing by a net of$92.9 million or 4.9%. This category accounts forexpenditures for items such as office supplies, con-tracted services, facility leases, facility maintenance,minor equipment, utility usage, services provided byinternal service funds and various other requirements.While individual accounts are increasing or decreasingby varying amounts, the most significant changesinclude, an increase of $59.7 million in service and con-sulting contracts supporting various programs such as
Healthy Families and Community Based Care Transi-tions Program (CCTP), an increase of $7.9 million inCountywide major maintenance, and an increase ininformation technology costs of $13.3 million due toone time information technology projects in theFinance and General Government Group, as well asincreases in application support and data storage anda corresponding increase in the Information Technol-ogy Internal Service Fund of $14.9 million.
Total Appropriations by Category of Expenditure (in millions)
Fiscal Year 2011-12 Adopted Budget
Fiscal Year 2012-13 Adopted Budget
Fiscal Year 2013-14 AdoptedBudget
% Change
Fiscal Year 2014-15 Approved
Budget
Salaries & Employee Benefits $ 1,655.5 $ 1,697.3 $ 1,780.3 4.9 $ 1,827.5
Services & Supplies 1,851.5 1,881.0 1,973.9 4.9 1,890.2
Other Charges 770.9 736.4 746.8 1.4 736.4
Operating Transfers Out 369.3 376.4 362.1 (3.8) 319.3
Remaining Categories:Capital Assets/Land Acquisition 137.8 93.0 59.1 (36.4) 6.0
Capital Assets Equipment 22.5 24.8 23.6 (4.5) 12.9Exp Transfer & Reimbursements (20.2) (29.7) (30.2) 1.7 (30.3)Reserves 21.8 22.1 23.1 4.5 23.1
Fund Balance Component Increases
18.4 13.7 0.6 (95.4) 1.4
Management Reserves 32.3 30.3 36.8 21.5 24.3
Total $ 4,859.6 $ 4,845.2 $ 4,976.1 2.7 $ 4,810.7
$0
$400
$800
$1,200
$1,600
$2,000
Mill
ions
Salaries & Benefits Services & Supplies Other Charges Operating TransfersOut
Remaining Categories
Total Appropriations by Category of ExpenditureFiscal Years 2011-12 Through 2014-15
FY2011-12 Adopted FY2012-13 Adopted FY2013-14 Adopted FY2014-15 Approved
46 County of San DiegoAdopted Operational Plan Fiscal Years 2013-2014 and 2014-2015
All Funds: Total Appropriations
A decrease of $83.7 million or 4.2% in Fiscal Year2014-15, is primarily due to completion of one-time ini-tiatives in Fiscal Year 2013-14.Other Charges are increasing by $10.4 million or1.4%. This category includes items such as aid pay-ments, debt service payments, interest expenses,right-of-way easement purchases and various otherpayments including contributions to trial courts andgrants to organizations participating in the CommunityEnhancement and the Neighborhood ReinvestmentPrograms. The increase is primarily due to one-timefunding for one time projects supported by the Environ-mental Trust Fund and Aid for Adopted Children. A net decrease of $10.5 million or 1.4% is projected inFiscal Year 2014-15 due to decreases in certain sched-uled lease payments and non-recurrence of one-timeitems from prior year.Operating Transfers Out, the accounting vehicle fortransferring the resources of one fund to pay for activi-ties in another, is decreasing by $14.3 million or3.8%. The most significant decreases are in Commu-nity Services Group largely in Purchasing and Con-tracting for non-recurring one-time costs for theDocumentum 6.7 version upgrade which was transi-tioned to the Chief Technology Office; in Finance Otherdue to the nonrecurrence of one-time funding in theprior year for the Registrar of Voter's Relocation, EastMesa Reentry Facility, and Agua Caliente Park Water,Sewer and Electrical Line Replacement capital projectspartially offset by resources to support recommendedcapital initiatives in Fiscal Year 2013-14 including newprojects included in the capital program described inthe Capital Assets/Land Acquisition below.A decrease of $42.8 million or 11.8% is projected forFiscal Year 2014-15, and is primarily due to the nonre-currence of one-time items from the prior year, includ-ing a $41.4 million decrease for funding future capitalprojects.Capital Assets/Land Acquisition, which includescapital improvement projects and property acquisi-tions, is decreasing by $33.9 million or 36.4% fromFiscal Year 2012-13. Appropriations vary from year toyear depending upon the cost of the projects beingfunded. Of the $59.1 million budgeted for Fiscal Year2013-14, $48.7 million is for projects in the Capital Pro-gram, with the remainder for projects in the AirportEnterprise Fund and in the San Diego County Sanita-tion District. The Fiscal Year 2013-14 Capital Programof $48.0 million includes $7.5 million for the Assessor/Recorder/County Clerk El Cajon Branch Office Build-
ing, $9.8 million for the Alpine Branch Library, $8.4 mil-lion for the Imperial Beach Library, $1.9 million for theTijuana River Valley Trails Construction/Habitat Resto-ration, $1.8 million for San Elijo Lagoon Gateway Prop-erty Acquisition, $1.0 million for the San Diego BotanicGarden Expansion, $3.1 million for the San Luis ReyRiver Park Acquisition, $2.5 million for the 4S RanchSynthetic Turf South Ball Fields, $10.0 million for landacquisition for Multiple Species Conservation Program(MSCP), $2.0 million for the Lake Morena Electrical andSewer Upgrades project, $0.2 million for Jess MartinMulti-Use Ball Fields Irrigation, $0.2 million for DonDussault Park Improvements, $0.2 million for the 4SRanch Shade Structure - Boys and Girls Club and $0.1million for the 4S Ranch Shade Structure - Sports Park. A decrease of $53.1 million or 89.9% is projected forFiscal Year 2014-15 due to the removal of appropria-tions to support the one time projects above andreflects the redirection of ongoing resources used tosupport these projects in Fiscal Year 2013-14 whichwill be used to address increased County retirementcontributions. $2.5 million is planned for MSCP landacquisition.Capital Assets Equipment is decreasing by $1.1 mil-lion or 4.5% from last year. This account primarilyincludes routine internal service fund purchases ofreplacement vehicles and heavy equipment. It may alsoinclude appropriations for information technology hard-ware and communications equipment. Amounts mayvary from year to year. A decrease of $10.7 million isexpected for Fiscal Year 2014-15.Expenditure Transfers and Reimbursements areincreasing by $0.5 million or 1.7%. Activity in thisaccount reflects the transfer of expenses to anotherdepartment within the same fund for services provided.A transfer can occur because a department's fundingsource requires the expenses to be recorded in thatdepartment for revenue claiming purposes, althoughthe actual services are being provided by anotherdepartment. The Expenditure Transfers and Reimbursementaccounts are negative amounts to avoid the duplicationof expenditures. One example is the agreementbetween the Health and Human Services Agency(HHSA) and the District Attorney for Public AssistanceFraud investigation services. The District Attorneyinvestigates and prosecutes suspected fraudulent pub-lic assistance cases for HHSA. The District Attorneyoffsets the budgeted expenses with a negative amountin the Expenditure Transfers and Reimbursements
County of San Diego Adopted Operational Plan Fiscal Years 2013-2014 and 2014-2015 47
All Funds: Total Appropriations
account. HHSA budgets the expense for that activity ina Services and Supplies account offset by the appro-priate State or federal revenue account.Contingency Reserves are appropriations that are setaside for unanticipated needs during the year. In FiscalYear 2013-14, three funds have a contingency reserve.The General Fund contingency reserve remains at$20.0 million. See the discussion of the General FundContingency Reserve in the Finance Other section onpage 511. The Employee Benefits Internal ServiceFund contingency reserve increased to $3.0 millionfrom $2.0 million in Fiscal Year 2013-14. The FleetInternal Service Fund contingency reserve is budgetedat $0.1 million, which is unchanged from Fiscal Year2012-13.
Fund Balance Component Increases can vary fromyear to year depending upon the need to set aside fundbalance for specific future uses. In Fiscal Year 2013-14,fund balance has been committed toward the replace-ment/upgrade of fire apparatus and equipment forregional support for the San Diego County Fire Author-ity ($0.3 million), and for reserves for building mainte-nance and replacement for the Air Pollution ControlDistrict ($0.3 million). Management Reserves are increasing by $6.5 mil-lion or 21.5%. The level of Management Reserves canvary from year to year. They are used to fund one-timeprojects or to serve as a prudent mitigation for revenueand economic uncertainties at the business group ordepartment level.
48 County of San DiegoAdopted Operational Plan Fiscal Years 2013-2014 and 2014-2015
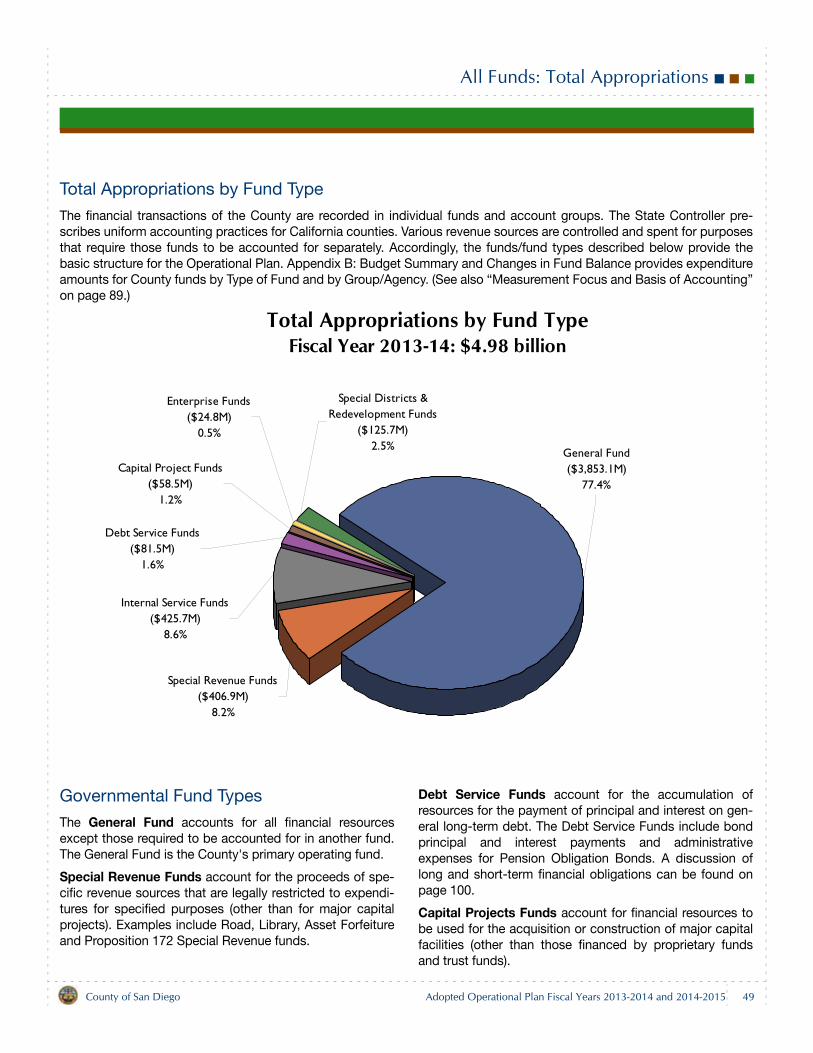
All Funds: Total Appropriations
All Funds: Total Appropriations
Total Appropriations by Fund Type
The financial transactions of the County are recorded in individual funds and account groups. The State Controller pre-scribes uniform accounting practices for California counties. Various revenue sources are controlled and spent for purposesthat require those funds to be accounted for separately. Accordingly, the funds/fund types described below provide thebasic structure for the Operational Plan. Appendix B: Budget Summary and Changes in Fund Balance provides expenditureamounts for County funds by Type of Fund and by Group/Agency. (See also “Measurement Focus and Basis of Accounting”on page 89.)
Governmental Fund Types
The General Fund accounts for all financial resourcesexcept those required to be accounted for in another fund.The General Fund is the County's primary operating fund.
Special Revenue Funds account for the proceeds of spe-cific revenue sources that are legally restricted to expendi-tures for specified purposes (other than for major capitalprojects). Examples include Road, Library, Asset Forfeitureand Proposition 172 Special Revenue funds.
Debt Service Funds account for the accumulation ofresources for the payment of principal and interest on gen-eral long-term debt. The Debt Service Funds include bondprincipal and interest payments and administrativeexpenses for Pension Obligation Bonds. A discussion oflong and short-term financial obligations can be found onpage 100.
Capital Projects Funds account for financial resources tobe used for the acquisition or construction of major capitalfacilities (other than those financed by proprietary fundsand trust funds).
Total Appropriations by Fund TypeFiscal Year 2013-14: $4.98 billion
Special Districts & Redevelopment Funds
($125.7M)2.5%
Enterprise Funds ($24.8M)
0.5%
Capital Project Funds ($58.5M)
1.2%
Debt Service Funds ($81.5M)
1.6%
Internal Service Funds ($425.7M)
8.6%
Special Revenue Funds ($406.9M)
8.2%
General Fund ($3,853.1M)
77.4%
County of San Diego Adopted Operational Plan Fiscal Years 2013-2014 and 2014-2015 49
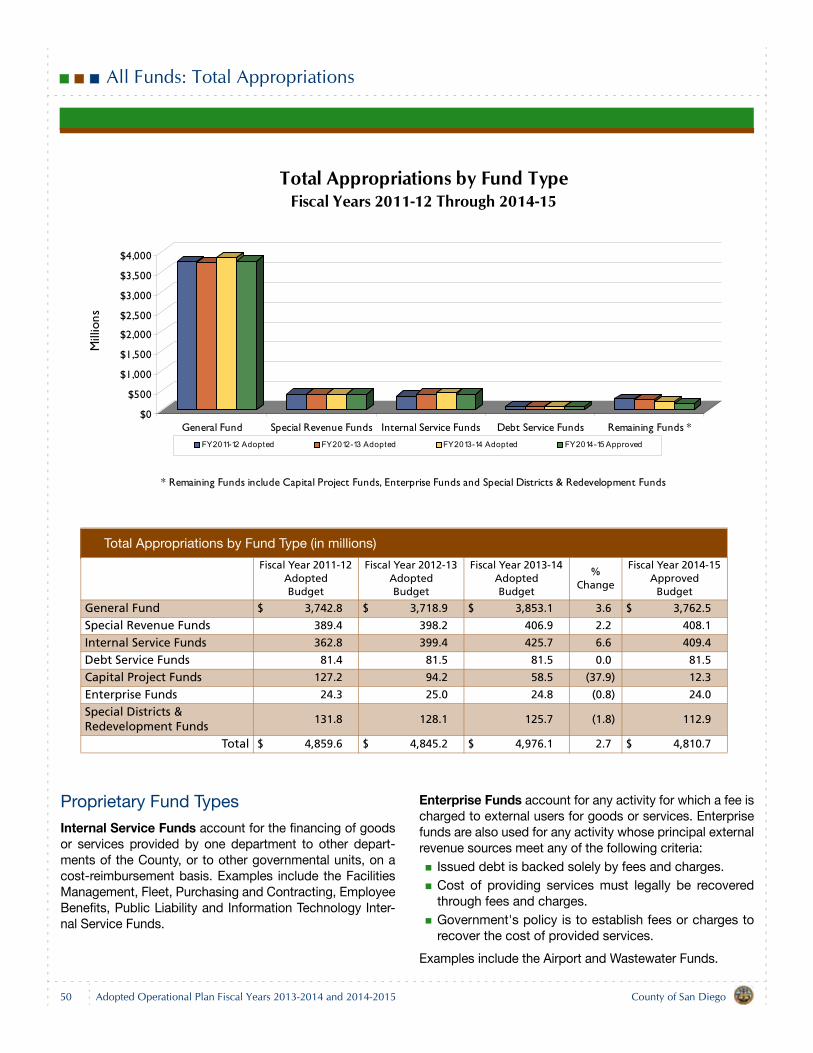
All Funds: Total Appropriations
Proprietary Fund Types
Internal Service Funds account for the financing of goodsor services provided by one department to other depart-ments of the County, or to other governmental units, on acost-reimbursement basis. Examples include the FacilitiesManagement, Fleet, Purchasing and Contracting, EmployeeBenefits, Public Liability and Information Technology Inter-nal Service Funds.
Enterprise Funds account for any activity for which a fee ischarged to external users for goods or services. Enterprisefunds are also used for any activity whose principal externalrevenue sources meet any of the following criteria:
Issued debt is backed solely by fees and charges.Cost of providing services must legally be recoveredthrough fees and charges.Government's policy is to establish fees or charges torecover the cost of provided services.
Examples include the Airport and Wastewater Funds.
Total Appropriations by Fund Type (in millions)
Fiscal Year 2011-12 Adopted Budget
Fiscal Year 2012-13 Adopted Budget
Fiscal Year 2013-14 AdoptedBudget
% Change
Fiscal Year 2014-15 Approved
Budget
General Fund $ 3,742.8 $ 3,718.9 $ 3,853.1 3.6 $ 3,762.5
Special Revenue Funds 389.4 398.2 406.9 2.2 408.1
Internal Service Funds 362.8 399.4 425.7 6.6 409.4
Debt Service Funds 81.4 81.5 81.5 0.0 81.5
Capital Project Funds 127.2 94.2 58.5 (37.9) 12.3
Enterprise Funds 24.3 25.0 24.8 (0.8) 24.0
Special Districts & Redevelopment Funds
131.8 128.1 125.7 (1.8) 112.9
Total $ 4,859.6 $ 4,845.2 $ 4,976.1 2.7 $ 4,810.7
$0
$500
$1,000
$1,500
$2,000
$2,500
$3,000
$3,500
$4,000
Mill
ions
General Fund Special Revenue Funds Internal Service Funds Debt Service Funds Remaining Funds *
Total Appropriations by Fund TypeFiscal Years 2011-12 Through 2014-15
FY2011-12 Adopted FY2012-13 Adopted FY2013-14 Adopted FY2014-15 Approved
* Remaining Funds include Capital Project Funds, Enterprise Funds and Special Districts & Redevelopment Funds
50 County of San DiegoAdopted Operational Plan Fiscal Years 2013-2014 and 2014-2015
All Funds: Total Appropriations
Special Districts & Successor Agency Funds
Special Districts are separate legal entities governed bythe Board of Supervisors that provide for specialized publicimprovements and services deemed to benefit propertiesand residents financed by specific taxes and assessments.The special districts provide authorized services such as airpollution control, sanitation, flood control, road, park, light-ing maintenance, fire protection or ambulance service tospecific areas in the county.
Successor Agency Funds are used to pay the outstandingobligations of the dissolved Redevelopment Agencies andtaxing entities where the County is the Successor Agency.Redevelopment Agencies were originally established toaccount for the proceeds of redevelopment area incremen-tal taxes, interest revenues and temporary loans whichwere used to eliminate slums and blighted areas, improvehousing, expand employment opportunities and provide anenvironment for the social, economic and psychologicalgrowth and well-being of all citizens of the county. TheState of California, through the passage of Assembly Bill X126, Community Redevelopment Dissolution, dissolved allredevelopment agencies as of February 1, 2012. As arequirement of the dissolution process, all funds, assetsand obligations of the redevelopment agencies were trans-ferred to a successor agency for payment or disbursement.
Appropriations Limits
Spending limits for the County are governed by the 1979passage of California Proposition 4, Limitation of Govern-ment Appropriations (Article XIII B of the California Consti-tution, commonly known as the Gann initiative or GannLimit). Proposition 4 places an appropriations limit on mostspending from tax proceeds.
The limit for each year is equal to the prior year's spendingwith upward adjustments allowed for changes in populationand the cost of living. Most appropriations are subject tothe limit. However, Proposition 4 and subsequently Propo-sition 99 (1988), Tobacco Tax and Health Protection Act,Proposition 10 (1998), California Children and Families FirstAct and Proposition 111 (1990), Traffic Congestion Reliefand Spending Limitations Act, exempt certain appropria-tions from the limit. These exemptions include capital out-lay, debt service, local government subventions, newtobacco taxes, appropriations supported by increased gastaxes, and appropriations resulting from national disasters.
When the limit is exceeded, Proposition 4 requires the sur-plus to be returned to the taxpayers within two years.Appropriations in the two-year period can be averagedbefore becoming subject to the excess revenue provisionsof the Gann Limit. As shown in the following table, theCounty continues to be far below the Gann Limit.
San Diego County Appropriation Limit (in millions)
Fiscal Year 2006-07
Fiscal Year 2007-08
Fiscal Year 2008-09
Fiscal Year 2009-10
Fiscal Year 2010-11
Fiscal Year 2011-12
Fiscal Year 2012-13
Fiscal Year 2013-14
Gann Limit $ 3,433 $ 3,619 $ 3,825 $ 3,897 $ 3,852 $ 3,977 $ 4,164 $ 4,465
Appropriations subject to the limit
$ 1,002 $ 1,287 $ 1,340 $ 1,309 $ 1,264 $ 1,255 $ 1,527 $ 1,683
County of San Diego Adopted Operational Plan Fiscal Years 2013-2014 and 2014-2015 51
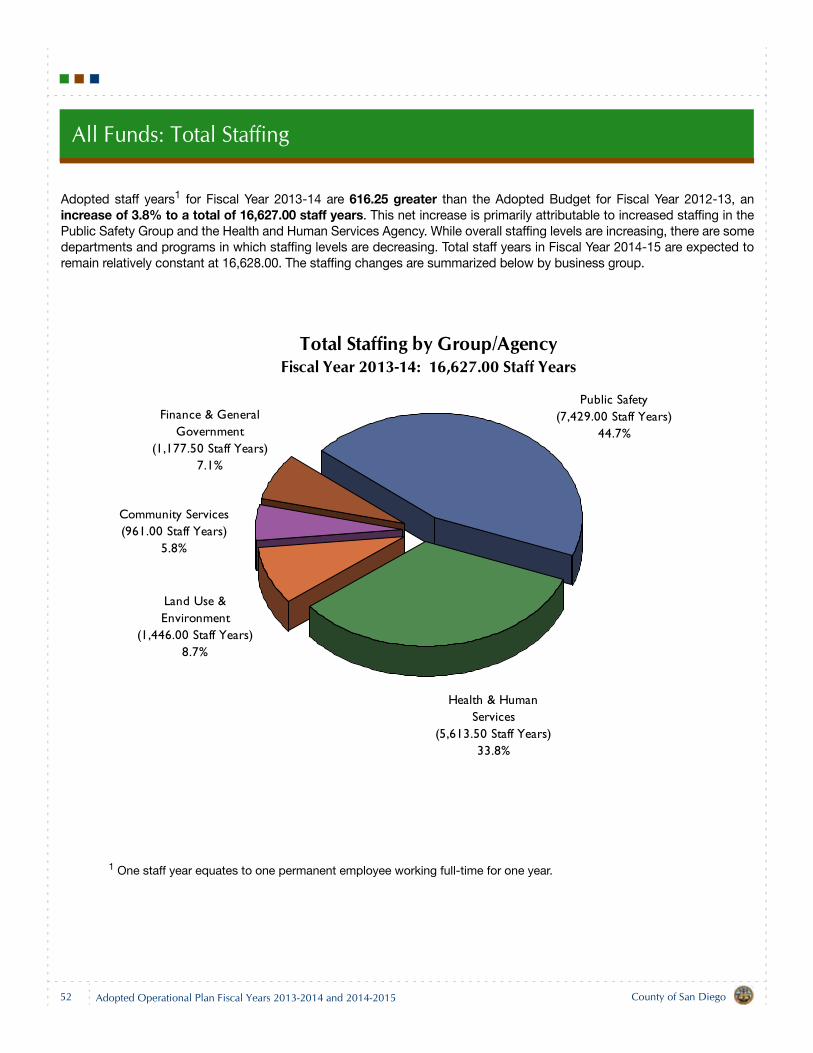
All Funds: Total Staffing
Adopted staff years1 for Fiscal Year 2013-14 are 616.25 greater than the Adopted Budget for Fiscal Year 2012-13, anincrease of 3.8% to a total of 16,627.00 staff years. This net increase is primarily attributable to increased staffing in thePublic Safety Group and the Health and Human Services Agency. While overall staffing levels are increasing, there are somedepartments and programs in which staffing levels are decreasing. Total staff years in Fiscal Year 2014-15 are expected toremain relatively constant at 16,628.00. The staffing changes are summarized below by business group.
1 One staff year equates to one permanent employee working full-time for one year.
Total Staffing by Group/AgencyFiscal Year 2013-14: 16,627.00 Staff Years
Finance & General Government
(1,177.50 Staff Years)7.1%
Community Services (961.00 Staff Years)
5.8%
Land Use & Environment
(1,446.00 Staff Years)8.7%
Health & Human Services
(5,613.50 Staff Years)33.8%
Public Safety(7,429.00 Staff Years)
44.7%
52 County of San DiegoAdopted Operational Plan Fiscal Years 2013-2014 and 2014-2015
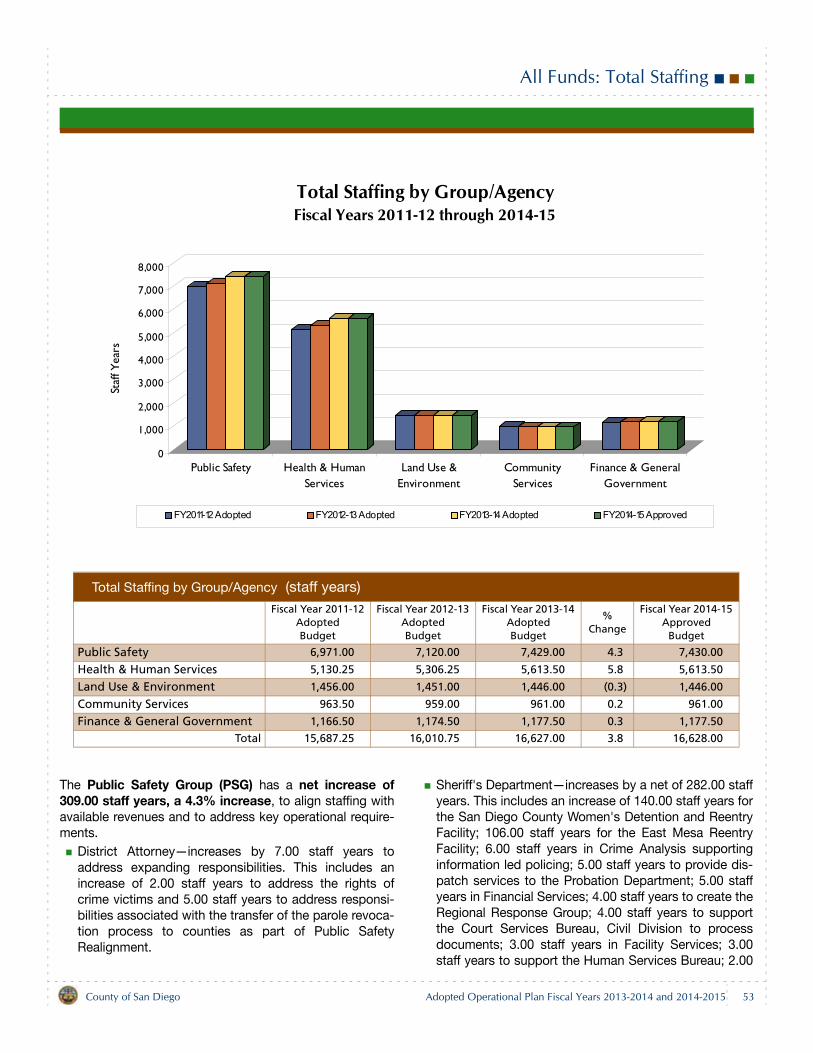
All Funds: Total Staffing
The Public Safety Group (PSG) has a net increase of309.00 staff years, a 4.3% increase, to align staffing withavailable revenues and to address key operational require-ments.
District Attorney—increases by 7.00 staff years toaddress expanding responsibilities. This includes anincrease of 2.00 staff years to address the rights ofcrime victims and 5.00 staff years to address responsi-bilities associated with the transfer of the parole revoca-tion process to counties as part of Public SafetyRealignment.
Sheriff's Department—increases by a net of 282.00 staffyears. This includes an increase of 140.00 staff years forthe San Diego County Women's Detention and ReentryFacility; 106.00 staff years for the East Mesa ReentryFacility; 6.00 staff years in Crime Analysis supportinginformation led policing; 5.00 staff years to provide dis-patch services to the Probation Department; 5.00 staffyears in Financial Services; 4.00 staff years to create theRegional Response Group; 4.00 staff years to supportthe Court Services Bureau, Civil Division to processdocuments; 3.00 staff years in Facility Services; 3.00staff years to support the Human Services Bureau; 2.00
Total Staffing by Group/Agency (staff years)Fiscal Year 2011-12
Adopted Budget
Fiscal Year 2012-13 Adopted Budget
Fiscal Year 2013-14 AdoptedBudget
% Change
Fiscal Year 2014-15 Approved
Budget
Public Safety 6,971.00 7,120.00 7,429.00 4.3 7,430.00
Health & Human Services 5,130.25 5,306.25 5,613.50 5.8 5,613.50
Land Use & Environment 1,456.00 1,451.00 1,446.00 (0.3) 1,446.00
Community Services 963.50 959.00 961.00 0.2 961.00
Finance & General Government 1,166.50 1,174.50 1,177.50 0.3 1,177.50
Total 15,687.25 16,010.75 16,627.00 3.8 16,628.00
0
1,000
2,000
3,000
4,000
5,000
6,000
7,000
8,000
Staf
f Yea
rs
Public Safety Health & HumanServices
Land Use &Environment
CommunityServices
Finance & GeneralGovernment
Total Staffing by Group/AgencyFiscal Years 2011-12 through 2014-15
FY2011-12 Adopted FY2012-13 Adopted FY2013-14 Adopted FY2014-15 Approved
County of San Diego Adopted Operational Plan Fiscal Years 2013-2014 and 2014-2015 53
All Funds: Total Staffing
staff years in Homicide to address increased caseload;2.00 staff years for the Wireless Services Division; 1.00staff year to support emergency planning; 1.00 staff yearin the Regional Crime Laboratory to support the growingnumber of investigations; 1.00 staff year for the RegionalAuto Theft Task Force and 1.00 staff year to review localprison sentences; and a decrease of 2.00 staff years asrequested by law by contract cities.Medical Examiner—increases by 2.00 staff years to pro-vide support for investigations and to respond to sub-poenas and court orders received by the department.Probation Department—increases by a net of 8.00 staffyears. This includes an increase of 7.00 staff years toprovide transitional reentry services at the East MesaReentry Facility and the San Diego County Women'sDetention and Reentry Facility and 1.00 staff year tosupport evidence-based supervision strategies toimprove outcomes of probationers as part of the SmartProbation Project. Public Defender—increases by a net of 11.00 staffyears to address increased case responsibilities andactivities related to Public Safety Realignment.Child Support Services—net decrease by 1.00 staff yearto support shifting funds to a reclassified position withinthe program.
In Fiscal Year 2014-15, the Public Safety Group anticipatesincreasing by 1.00 staff year in the Sheriff's Department tosupport the regional communication system.
The Health and Human Services Agency (HHSA) has anincrease of 307.25 staff years or 5.8%. The increaseincludes the addition of 265.00 staff years to supportHealthy Families program transition to Medi-Cal; 20.00 staffyears for the Community Based Care Transitions Program(CCTP); 10.25 staff years related to the passage of Assem-bly Bill (AB) 12, California Fostering Connections to Suc-cess Act (2010); 4.00 staff years to support theSupplemental Nutrition Assistance Program Education(SNAP-Ed) program as well as a net of 8.00 staff years tomeet operational needs.
Regional Operations—increases by 406.00 staff years tosupport the Healthy Families program transition to Medi-Cal and to enhance quality control in eligibility services.The increase is due to the addition of staff years as wellas transfers from other divisions/departments withinHHSA.Administrative Support—increases by 62.00 staff yearsto support the Healthy Families program transition toMedi-Cal and HHSA's strategy and innovation efforts.The increase is due to the addition of staff years as well
as transfers from other divisions/departments withinHHSA.Aging and Independence Services—increases by 87.50staff years to support the CCTP and to form the PublicAdministrator/Guardian/Conservator. The increase isdue to the addition of staff years as well as transfersfrom other divisions/departments within HHSA.Child Welfare Services—increases by 34.50 staff yearsrelated to the passage of AB 12, California FosteringConnections to Success Act (2010) and based on oper-ational needs. The increase is due to the addition ofstaff years and transfers from other divisions/depart-ments within HHSA.Public Health Services—increases by 0.75 staff yearsto support SNAP-Ed, offset by transfers to other divi-sions/departments within HHSA.Strategic Planning and Operational Support—decreasesby 211.00 staff years due to the dissolution of this divi-sion and transfer of operations to the Regional Opera-tions and Administrative Support divisions/departments. Behavioral Health Services—decreases by 38.50 staffyears due to the transfer of staff years from the Behav-ioral Health, Conservator Unit to Aging and Indepen-dence Services to form the Public Administrator/Guardian/Conservator unit, and transfers to other divi-sions/departments based on operational needs.Public Administrator/Public Guardian—decreases by34.00 staff years due to the transfer of staff to Agingand Independence Services.
In Fiscal Year 2014-15, there is no change in staffing.
The Land Use and Environment Group (LUEG) has adecrease of 5.00 staff years or 0.3%.
Environmental Health—decreases by 1.00 staff year dueto workload reduction in the Community Health Divisionrelated to changes in x-ray machine inspection method-ology.Farm and Home Advisor—decreases by 2.00 staff yearsas a result of operational changes and consolidation ofduties.Public Works—decreases by a net of 24.00 staff yearsdue to a departmentwide decrease of 11.00 staff yearsas a result of decreased workload and the decrease of17.00 staff years due to a mid-year transfer of the LandDevelopment Project Management program to Planningand Development Services (PDS). This is offset by anincrease of 4.00 staff years (2.00 staff years in InactiveWaste Landfill program and 2.00 staff years in theDepartment of Public Works (DPW) General Fund Water-
54 County of San DiegoAdopted Operational Plan Fiscal Years 2013-2014 and 2014-2015
All Funds: Total Staffing
shed Protection Program) to meet operational needsand additional regulatory responsibilities.Planning and Land Use—decreases by 160.00 staffyears due to the reduction of 2.00 staff years due todecreased workload and the transfer of 158.00 staffyears from the Department of Planning and Land Use(DPLU) to PDS. Planning and Development Services—increases by175.00 staff years due to the transfer of 158.00 staffyears from DPLU and the transfer of 17.00 staff yearsfrom DPW due to the consolidation of land developmentservices to PDS as approved by the Board of Supervi-sors on September 25, 2012.Agriculture, Weights and Measures—increases by 7.00staff years due to operational needs related to additionalregulatory responsibilities in the Agricultural Water Qual-ity (AWQ) and Asian Citrus Psyllid (ACP) citrus groveabatement activities programs, including the transfer of2.00 positions from Farm and Home Advisor due tooperational changes.
In Fiscal Year 2014-15, there is no change in staffing.
The Community Services Group (CSG) has an increaseof 2.00 staff years or 0.2%.
General Services—increases by 2.00 staff years for ded-icated property management services to oversee theadministrative support requirements at the CountyOperations Center and the County Administration Cen-ter campuses.
In Fiscal Year 2014-15, there is no change in staffing.
The Finance and General Government Group (FGG) hasan increase of 3.00 staff years or 0.3%.
County Counsel—increases by 1.00 staff year. The staff-ing increase results from the addition of a Senior DeputyCounty Counsel position to address an increase inHHSA legal services workload.County Technology Office—increases by 1.00 staff year.The staffing increase results from the addition of a Tech-nology Manager position to support the centralizedmanagement of multiple enterprise platforms. Department of Human Resources—increases by 1.00staff year. The staffing increase results from the additionof a Human Resource Analyst position in the EmployeeBenefits Division to provide customer service and oper-ational activities for two new high deductible medicalplans, Health Savings Accounts and limited purposeflexible spending accounts.Finance and General Government Group ExecutiveOffice—increases by 14.00 staff years. The staffingincrease results from the transfer of positions describedin the Auditor and Controller section below.Auditor and Controller—decreases by 14.00 staff years.The staffing decrease reflects the transfer of the Officeof Financial Planning to the Finance and General Gov-ernment Group Executive Office, including all 13.00 staffyears. An additional staff year will also be transferredfrom the Auditor and Controller Administration Divisionto the Finance and General Government Group Execu-tive Office for administrative support.
In Fiscal Year 2014-15, there is no change in staffing.
More detail on staff year changes can be found in theGroup/Agency section that begins on page113.
County of San Diego Adopted Operational Plan Fiscal Years 2013-2014 and 2014-2015 55
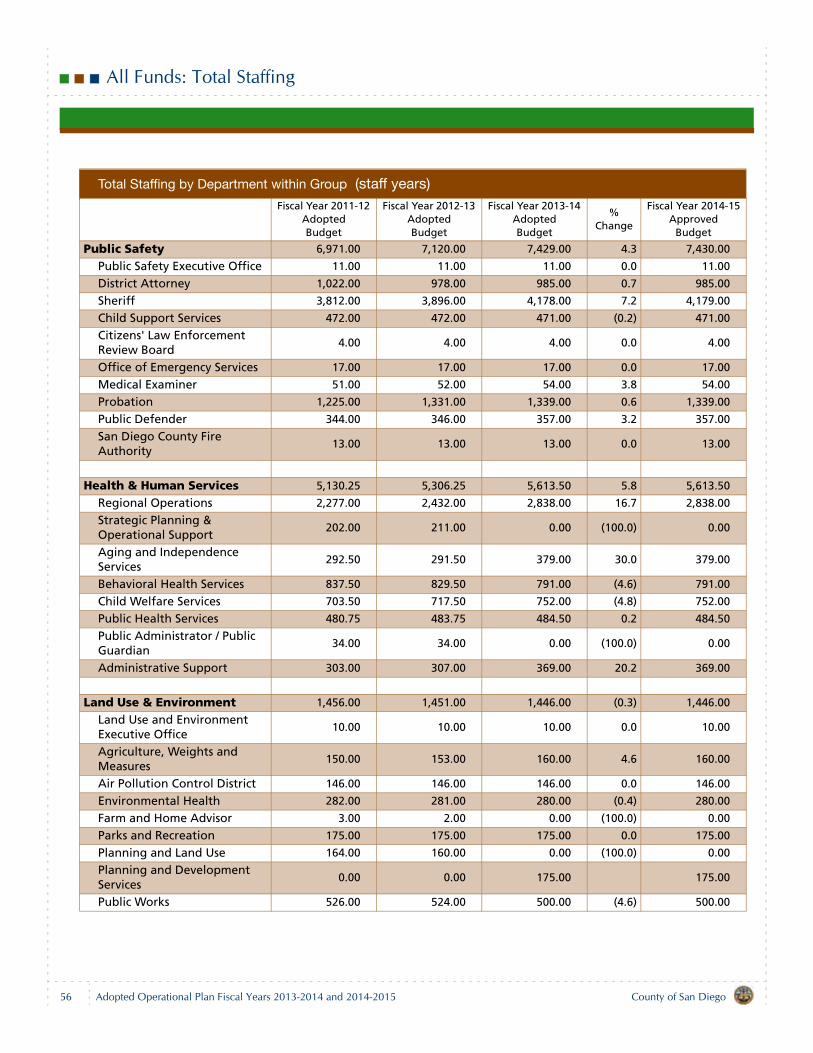
All Funds: Total Staffing
Total Staffing by Department within Group (staff years)Fiscal Year 2011-12
Adopted Budget
Fiscal Year 2012-13 AdoptedBudget
Fiscal Year 2013-14 AdoptedBudget
% Change
Fiscal Year 2014-15Approved
Budget
Public Safety 6,971.00 7,120.00 7,429.00 4.3 7,430.00
Public Safety Executive Office 11.00 11.00 11.00 0.0 11.00
District Attorney 1,022.00 978.00 985.00 0.7 985.00
Sheriff 3,812.00 3,896.00 4,178.00 7.2 4,179.00
Child Support Services 472.00 472.00 471.00 (0.2) 471.00
Citizens' Law Enforcement Review Board
4.00 4.00 4.00 0.0 4.00
Office of Emergency Services 17.00 17.00 17.00 0.0 17.00
Medical Examiner 51.00 52.00 54.00 3.8 54.00
Probation 1,225.00 1,331.00 1,339.00 0.6 1,339.00
Public Defender 344.00 346.00 357.00 3.2 357.00
San Diego County Fire Authority
13.00 13.00 13.00 0.0 13.00
Health & Human Services 5,130.25 5,306.25 5,613.50 5.8 5,613.50
Regional Operations 2,277.00 2,432.00 2,838.00 16.7 2,838.00
Strategic Planning & Operational Support
202.00 211.00 0.00 (100.0) 0.00
Aging and Independence Services
292.50 291.50 379.00 30.0 379.00
Behavioral Health Services 837.50 829.50 791.00 (4.6) 791.00
Child Welfare Services 703.50 717.50 752.00 (4.8) 752.00
Public Health Services 480.75 483.75 484.50 0.2 484.50
Public Administrator / Public Guardian
34.00 34.00 0.00 (100.0) 0.00
Administrative Support 303.00 307.00 369.00 20.2 369.00
Land Use & Environment 1,456.00 1,451.00 1,446.00 (0.3) 1,446.00
Land Use and Environment Executive Office
10.00 10.00 10.00 0.0 10.00
Agriculture, Weights and Measures
150.00 153.00 160.00 4.6 160.00
Air Pollution Control District 146.00 146.00 146.00 0.0 146.00
Environmental Health 282.00 281.00 280.00 (0.4) 280.00
Farm and Home Advisor 3.00 2.00 0.00 (100.0) 0.00
Parks and Recreation 175.00 175.00 175.00 0.0 175.00
Planning and Land Use 164.00 160.00 0.00 (100.0) 0.00
Planning and Development Services
0.00 0.00 175.00 175.00
Public Works 526.00 524.00 500.00 (4.6) 500.00
56 County of San DiegoAdopted Operational Plan Fiscal Years 2013-2014 and 2014-2015
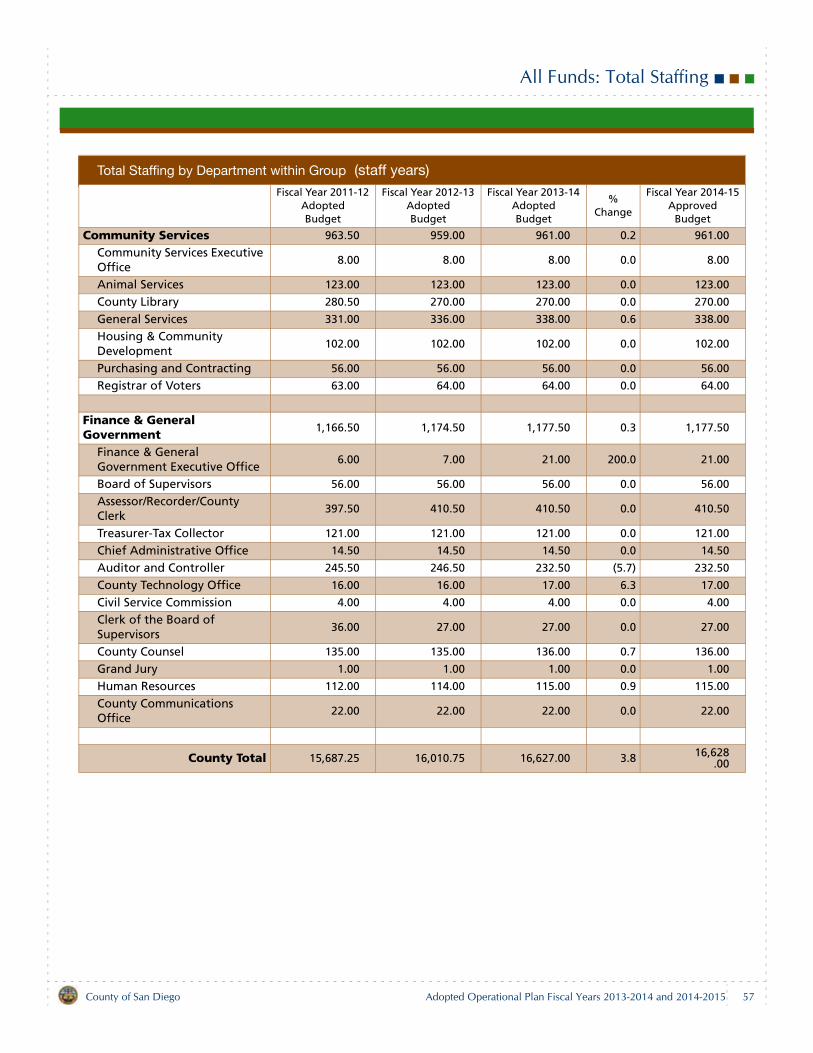
All Funds: Total Staffing
Community Services 963.50 959.00 961.00 0.2 961.00
Community Services Executive Office
8.00 8.00 8.00 0.0 8.00
Animal Services 123.00 123.00 123.00 0.0 123.00
County Library 280.50 270.00 270.00 0.0 270.00
General Services 331.00 336.00 338.00 0.6 338.00
Housing & Community Development
102.00 102.00 102.00 0.0 102.00
Purchasing and Contracting 56.00 56.00 56.00 0.0 56.00
Registrar of Voters 63.00 64.00 64.00 0.0 64.00
Finance & General Government
1,166.50 1,174.50 1,177.50 0.3 1,177.50
Finance & General Government Executive Office
6.00 7.00 21.00 200.0 21.00
Board of Supervisors 56.00 56.00 56.00 0.0 56.00
Assessor/Recorder/County Clerk
397.50 410.50 410.50 0.0 410.50
Treasurer-Tax Collector 121.00 121.00 121.00 0.0 121.00
Chief Administrative Office 14.50 14.50 14.50 0.0 14.50
Auditor and Controller 245.50 246.50 232.50 (5.7) 232.50
County Technology Office 16.00 16.00 17.00 6.3 17.00
Civil Service Commission 4.00 4.00 4.00 0.0 4.00
Clerk of the Board of Supervisors
36.00 27.00 27.00 0.0 27.00
County Counsel 135.00 135.00 136.00 0.7 136.00
Grand Jury 1.00 1.00 1.00 0.0 1.00
Human Resources 112.00 114.00 115.00 0.9 115.00
County Communications Office
22.00 22.00 22.00 0.0 22.00
County Total 15,687.25 16,010.75 16,627.00 3.8 16,628.00
Total Staffing by Department within Group (staff years)Fiscal Year 2011-12
Adopted Budget
Fiscal Year 2012-13 AdoptedBudget
Fiscal Year 2013-14 AdoptedBudget
% Change
Fiscal Year 2014-15Approved
Budget
County of San Diego Adopted Operational Plan Fiscal Years 2013-2014 and 2014-2015 57
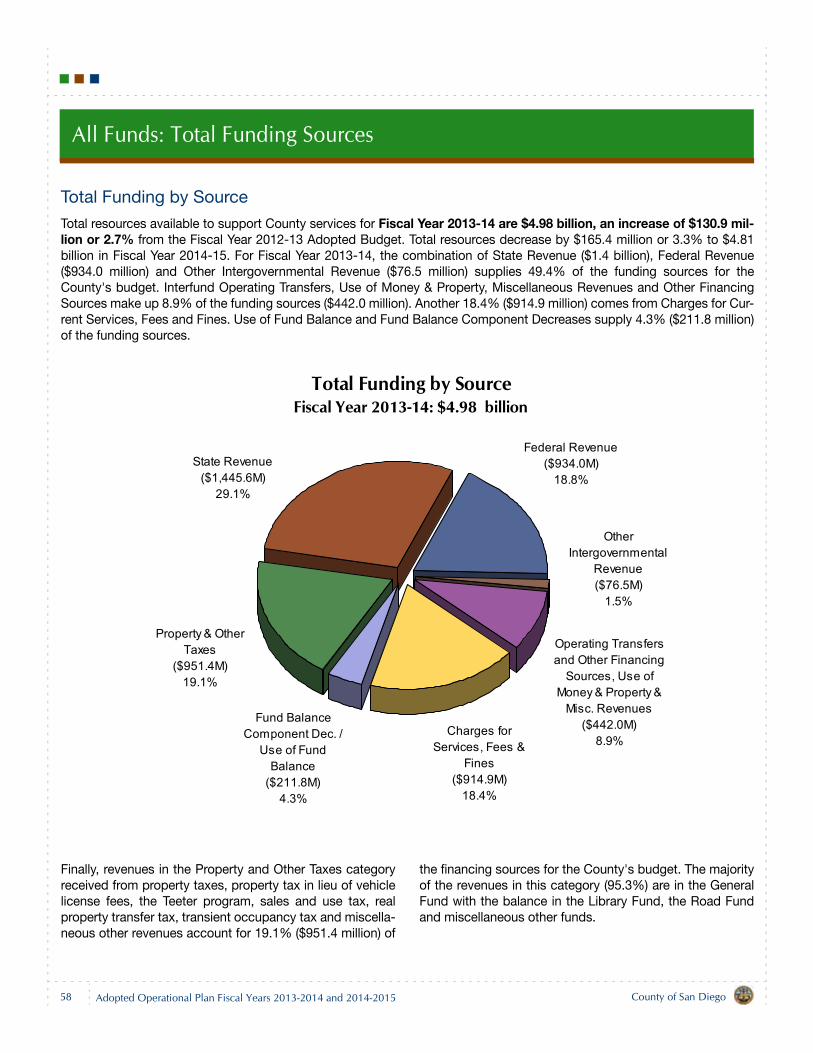
All Funds: Total Funding Sources
Total Funding by Source
Total resources available to support County services for Fiscal Year 2013-14 are $4.98 billion, an increase of $130.9 mil-lion or 2.7% from the Fiscal Year 2012-13 Adopted Budget. Total resources decrease by $165.4 million or 3.3% to $4.81billion in Fiscal Year 2014-15. For Fiscal Year 2013-14, the combination of State Revenue ($1.4 billion), Federal Revenue($934.0 million) and Other Intergovernmental Revenue ($76.5 million) supplies 49.4% of the funding sources for theCounty's budget. Interfund Operating Transfers, Use of Money & Property, Miscellaneous Revenues and Other FinancingSources make up 8.9% of the funding sources ($442.0 million). Another 18.4% ($914.9 million) comes from Charges for Cur-rent Services, Fees and Fines. Use of Fund Balance and Fund Balance Component Decreases supply 4.3% ($211.8 million)of the funding sources.
Finally, revenues in the Property and Other Taxes categoryreceived from property taxes, property tax in lieu of vehiclelicense fees, the Teeter program, sales and use tax, realproperty transfer tax, transient occupancy tax and miscella-neous other revenues account for 19.1% ($951.4 million) of
the financing sources for the County's budget. The majorityof the revenues in this category (95.3%) are in the GeneralFund with the balance in the Library Fund, the Road Fundand miscellaneous other funds.
Total Funding by SourceFiscal Year 2013-14: $4.98 billion
State Revenue ($1,445.6M)
29.1%
Federal Revenue ($934.0M)
18.8%
Other Intergovernmental
Revenue($76.5M)
1.5%
Operating Transfers and Other Financing
Sources, Use of Money & Property &
Misc. Revenues ($442.0M)
8.9%Charges for
Services, Fees & Fines
($914.9M)18.4%
Fund Balance Component Dec. /
Use of Fund Balance
($211.8M)4.3%
Property & Other Taxes
($951.4M)19.1%
58 County of San DiegoAdopted Operational Plan Fiscal Years 2013-2014 and 2014-2015
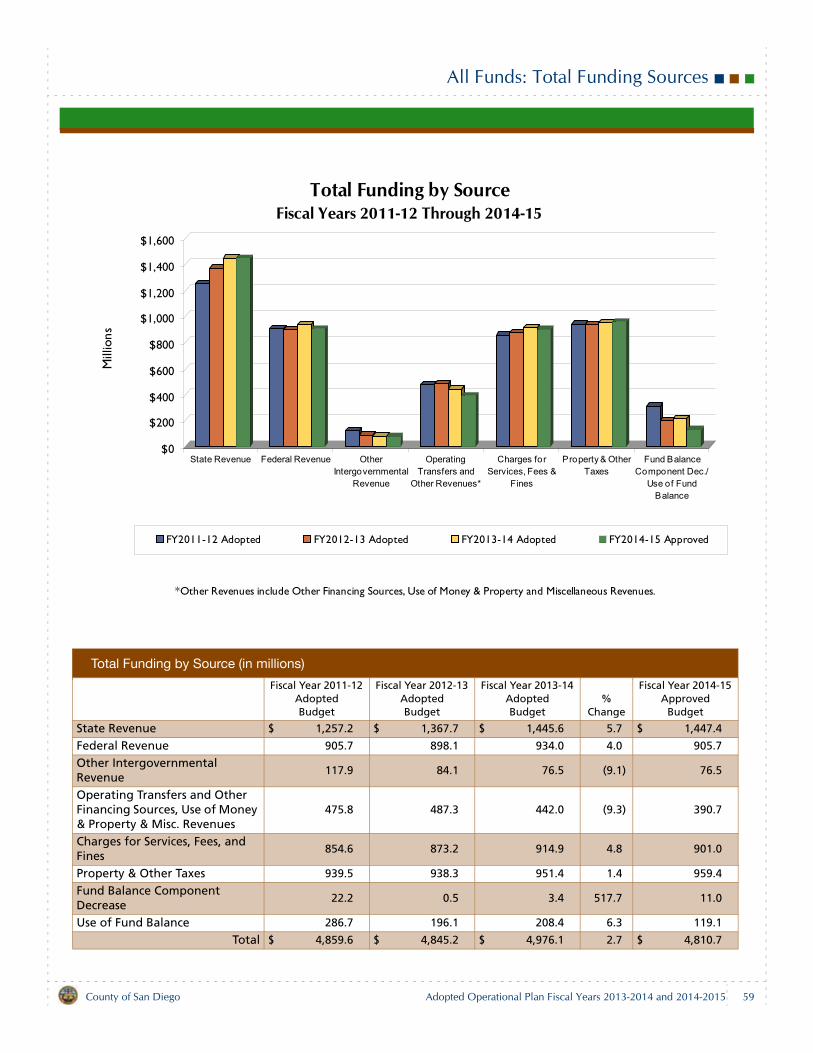
All Funds: Total Funding Sources
Total Funding by Source (in millions)
Fiscal Year 2011-12 Adopted Budget
Fiscal Year 2012-13 Adopted Budget
Fiscal Year 2013-14 AdoptedBudget
% Change
Fiscal Year 2014-15 Approved
Budget
State Revenue $ 1,257.2 $ 1,367.7 $ 1,445.6 5.7 $ 1,447.4
Federal Revenue 905.7 898.1 934.0 4.0 905.7
Other Intergovernmental Revenue
117.9 84.1 76.5 (9.1) 76.5
Operating Transfers and Other Financing Sources, Use of Money & Property & Misc. Revenues
475.8 487.3 442.0 (9.3) 390.7
Charges for Services, Fees, and Fines
854.6 873.2 914.9 4.8 901.0
Property & Other Taxes 939.5 938.3 951.4 1.4 959.4
Fund Balance Component Decrease
22.2 0.5 3.4 517.7 11.0
Use of Fund Balance 286.7 196.1 208.4 6.3 119.1
Total $ 4,859.6 $ 4,845.2 $ 4,976.1 2.7 $ 4,810.7
*Other Revenues include Other Financing Sources, Use of Money & Property and Miscellaneous Revenues.*Other Revenues include Other Financing Sources, Use of Money & Property and Miscellaneous Revenues.
$0
$200
$400
$600
$800
$1,000
$1,200
$1,400
$1,600
Mill
ions
State Revenue Federal Revenue OtherIntergovernmental
Revenue
OperatingTransfers and
Other Revenues*
Charges forServices, Fees &
Fines
Property & OtherTaxes
Fund BalanceComponent Dec./
Use of FundBalance
Total Funding by SourceFiscal Years 2011-12 Through 2014-15
FY2011-12 Adopted FY2012-13 Adopted FY2013-14 Adopted FY2014-15 Approved
*Other Revenues include Other Financing Sources, Use of Money & Property and Miscellaneous Revenues.
County of San Diego Adopted Operational Plan Fiscal Years 2013-2014 and 2014-2015 59
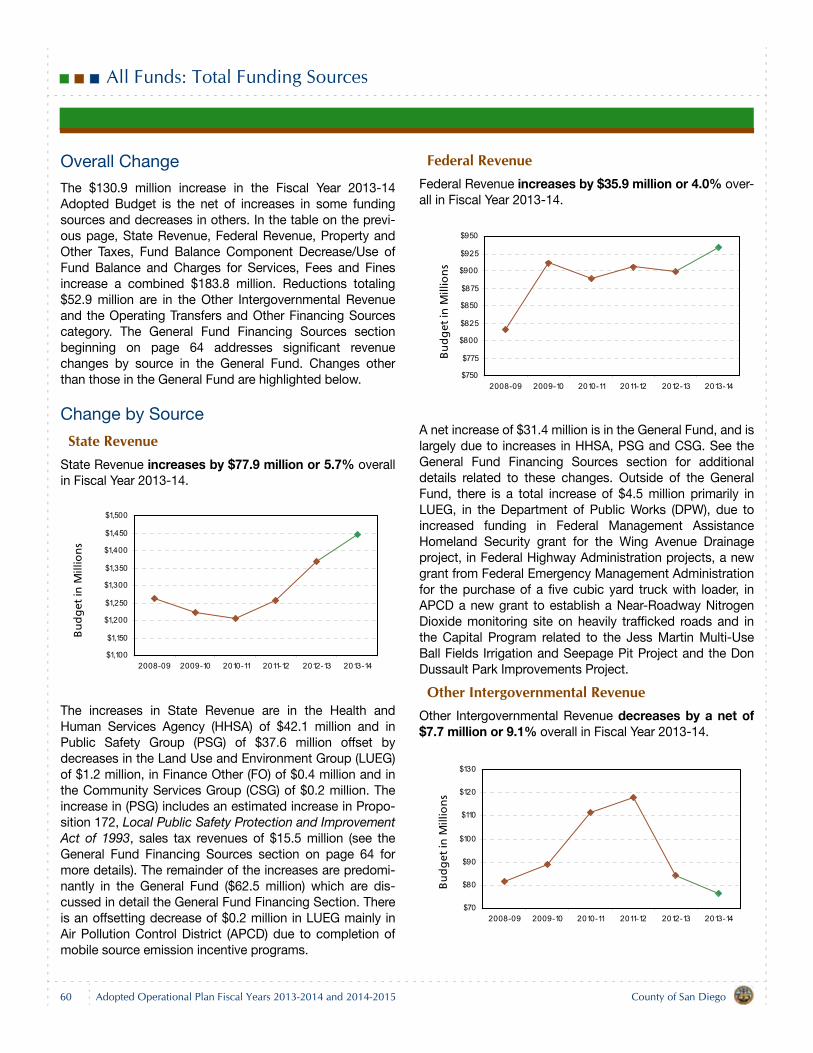
All Funds: Total Funding Sources
Overall Change
The $130.9 million increase in the Fiscal Year 2013-14Adopted Budget is the net of increases in some fundingsources and decreases in others. In the table on the previ-ous page, State Revenue, Federal Revenue, Property andOther Taxes, Fund Balance Component Decrease/Use ofFund Balance and Charges for Services, Fees and Finesincrease a combined $183.8 million. Reductions totaling$52.9 million are in the Other Intergovernmental Revenueand the Operating Transfers and Other Financing Sourcescategory. The General Fund Financing Sources sectionbeginning on page 64 addresses significant revenuechanges by source in the General Fund. Changes otherthan those in the General Fund are highlighted below.
Change by Source
State RevenueState Revenue increases by $77.9 million or 5.7% overallin Fiscal Year 2013-14.
The increases in State Revenue are in the Health andHuman Services Agency (HHSA) of $42.1 million and inPublic Safety Group (PSG) of $37.6 million offset bydecreases in the Land Use and Environment Group (LUEG)of $1.2 million, in Finance Other (FO) of $0.4 million and inthe Community Services Group (CSG) of $0.2 million. Theincrease in (PSG) includes an estimated increase in Propo-sition 172, Local Public Safety Protection and ImprovementAct of 1993, sales tax revenues of $15.5 million (see theGeneral Fund Financing Sources section on page 64 formore details). The remainder of the increases are predomi-nantly in the General Fund ($62.5 million) which are dis-cussed in detail the General Fund Financing Section. Thereis an offsetting decrease of $0.2 million in LUEG mainly inAir Pollution Control District (APCD) due to completion ofmobile source emission incentive programs.
Federal RevenueFederal Revenue increases by $35.9 million or 4.0% over-all in Fiscal Year 2013-14.
A net increase of $31.4 million is in the General Fund, and islargely due to increases in HHSA, PSG and CSG. See theGeneral Fund Financing Sources section for additionaldetails related to these changes. Outside of the GeneralFund, there is a total increase of $4.5 million primarily inLUEG, in the Department of Public Works (DPW), due toincreased funding in Federal Management AssistanceHomeland Security grant for the Wing Avenue Drainageproject, in Federal Highway Administration projects, a newgrant from Federal Emergency Management Administrationfor the purchase of a five cubic yard truck with loader, inAPCD a new grant to establish a Near-Roadway NitrogenDioxide monitoring site on heavily trafficked roads and inthe Capital Program related to the Jess Martin Multi-UseBall Fields Irrigation and Seepage Pit Project and the DonDussault Park Improvements Project.
Other Intergovernmental Revenue Other Intergovernmental Revenue decreases by a net of$7.7 million or 9.1% overall in Fiscal Year 2013-14.
$1,100
$1,150
$1,200
$1,250
$1,300
$1,350
$1,400
$1,450
$1,500
2008-09 2009-10 2010-11 2011-12 2012-13 2013-14
Bu
dg
et in
Mill
ion
s
$750
$775
$800
$825
$850
$875
$900
$925
$950
2008-09 2009-10 2010-11 2011-12 2012-13 2013-14
Bu
dg
et in
Mill
ion
s
$70
$80
$90
$100
$110
$120
$130
2008-09 2009-10 2010-11 2011-12 2012-13 2013-14
Bu
dg
et in
Mill
ion
s
60 County of San DiegoAdopted Operational Plan Fiscal Years 2013-2014 and 2014-2015
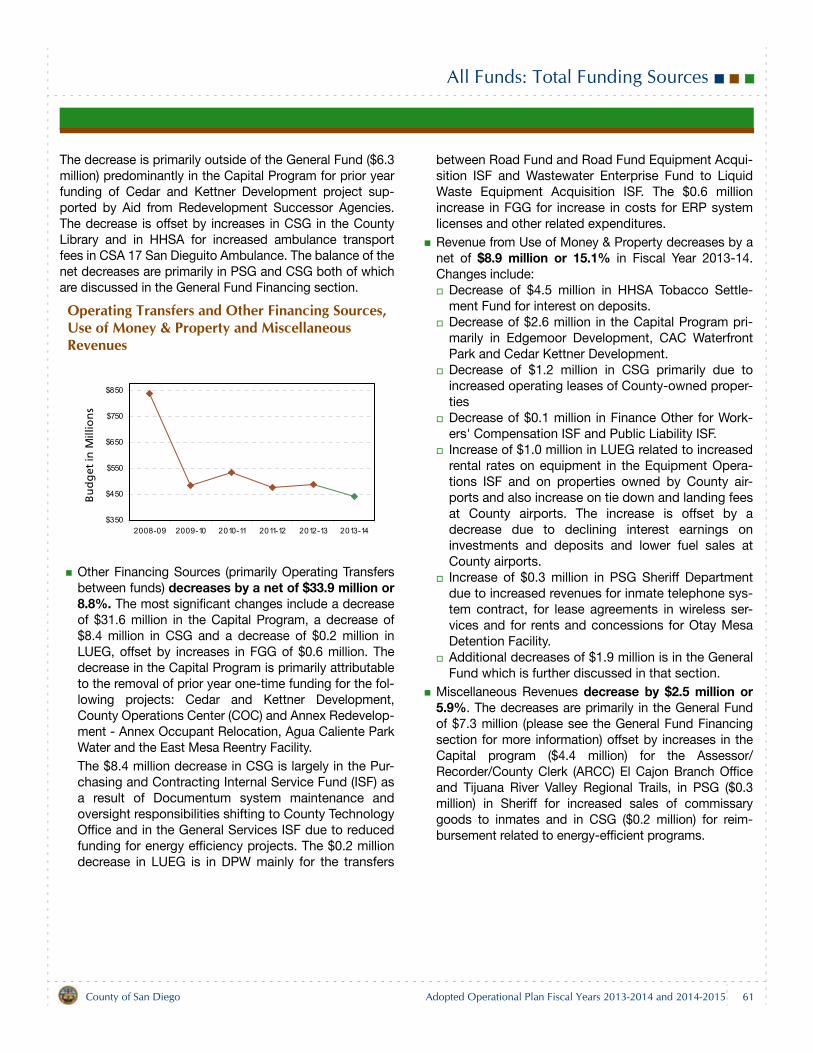
All Funds: Total Funding Sources
The decrease is primarily outside of the General Fund ($6.3million) predominantly in the Capital Program for prior yearfunding of Cedar and Kettner Development project sup-ported by Aid from Redevelopment Successor Agencies.The decrease is offset by increases in CSG in the CountyLibrary and in HHSA for increased ambulance transportfees in CSA 17 San Dieguito Ambulance. The balance of thenet decreases are primarily in PSG and CSG both of whichare discussed in the General Fund Financing section.
Operating Transfers and Other Financing Sources, Use of Money & Property and Miscellaneous Revenues
Other Financing Sources (primarily Operating Transfersbetween funds) decreases by a net of $33.9 million or8.8%. The most significant changes include a decreaseof $31.6 million in the Capital Program, a decrease of$8.4 million in CSG and a decrease of $0.2 million inLUEG, offset by increases in FGG of $0.6 million. Thedecrease in the Capital Program is primarily attributableto the removal of prior year one-time funding for the fol-lowing projects: Cedar and Kettner Development,County Operations Center (COC) and Annex Redevelop-ment - Annex Occupant Relocation, Agua Caliente ParkWater and the East Mesa Reentry Facility.The $8.4 million decrease in CSG is largely in the Pur-chasing and Contracting Internal Service Fund (ISF) asa result of Documentum system maintenance andoversight responsibilities shifting to County TechnologyOffice and in the General Services ISF due to reducedfunding for energy efficiency projects. The $0.2 milliondecrease in LUEG is in DPW mainly for the transfers
between Road Fund and Road Fund Equipment Acqui-sition ISF and Wastewater Enterprise Fund to LiquidWaste Equipment Acquisition ISF. The $0.6 millionincrease in FGG for increase in costs for ERP systemlicenses and other related expenditures.Revenue from Use of Money & Property decreases by anet of $8.9 million or 15.1% in Fiscal Year 2013-14.Changes include:
Decrease of $4.5 million in HHSA Tobacco Settle-ment Fund for interest on deposits.Decrease of $2.6 million in the Capital Program pri-marily in Edgemoor Development, CAC WaterfrontPark and Cedar Kettner Development.Decrease of $1.2 million in CSG primarily due toincreased operating leases of County-owned proper-ties Decrease of $0.1 million in Finance Other for Work-ers' Compensation ISF and Public Liability ISF. Increase of $1.0 million in LUEG related to increasedrental rates on equipment in the Equipment Opera-tions ISF and on properties owned by County air-ports and also increase on tie down and landing feesat County airports. The increase is offset by adecrease due to declining interest earnings oninvestments and deposits and lower fuel sales atCounty airports. Increase of $0.3 million in PSG Sheriff Departmentdue to increased revenues for inmate telephone sys-tem contract, for lease agreements in wireless ser-vices and for rents and concessions for Otay MesaDetention Facility.Additional decreases of $1.9 million is in the GeneralFund which is further discussed in that section.
Miscellaneous Revenues decrease by $2.5 million or5.9%. The decreases are primarily in the General Fundof $7.3 million (please see the General Fund Financingsection for more information) offset by increases in theCapital program ($4.4 million) for the Assessor/Recorder/County Clerk (ARCC) El Cajon Branch Officeand Tijuana River Valley Regional Trails, in PSG ($0.3million) in Sheriff for increased sales of commissarygoods to inmates and in CSG ($0.2 million) for reim-bursement related to energy-efficient programs.
$350
$450
$550
$650
$750
$850
2008-09 2009-10 2010-11 2011-12 2012-13 2013-14
Bu
dg
et in
Mill
ion
s
County of San Diego Adopted Operational Plan Fiscal Years 2013-2014 and 2014-2015 61
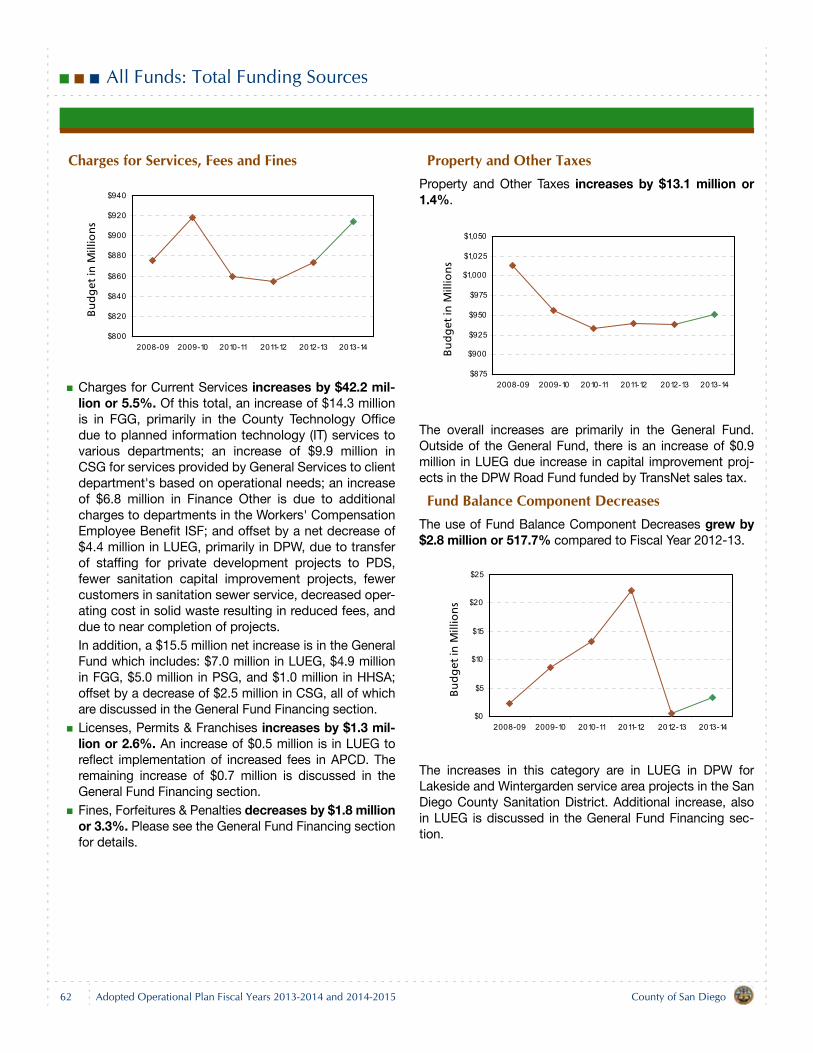
All Funds: Total Funding Sources
Charges for Services, Fees and Fines
Charges for Current Services increases by $42.2 mil-lion or 5.5%. Of this total, an increase of $14.3 millionis in FGG, primarily in the County Technology Officedue to planned information technology (IT) services tovarious departments; an increase of $9.9 million inCSG for services provided by General Services to clientdepartment's based on operational needs; an increaseof $6.8 million in Finance Other is due to additionalcharges to departments in the Workers' CompensationEmployee Benefit ISF; and offset by a net decrease of$4.4 million in LUEG, primarily in DPW, due to transferof staffing for private development projects to PDS,fewer sanitation capital improvement projects, fewercustomers in sanitation sewer service, decreased oper-ating cost in solid waste resulting in reduced fees, anddue to near completion of projects.In addition, a $15.5 million net increase is in the GeneralFund which includes: $7.0 million in LUEG, $4.9 millionin FGG, $5.0 million in PSG, and $1.0 million in HHSA;offset by a decrease of $2.5 million in CSG, all of whichare discussed in the General Fund Financing section.Licenses, Permits & Franchises increases by $1.3 mil-lion or 2.6%. An increase of $0.5 million is in LUEG toreflect implementation of increased fees in APCD. Theremaining increase of $0.7 million is discussed in theGeneral Fund Financing section.Fines, Forfeitures & Penalties decreases by $1.8 millionor 3.3%. Please see the General Fund Financing sectionfor details.
Property and Other TaxesProperty and Other Taxes increases by $13.1 million or1.4%.
The overall increases are primarily in the General Fund.Outside of the General Fund, there is an increase of $0.9million in LUEG due increase in capital improvement proj-ects in the DPW Road Fund funded by TransNet sales tax.
Fund Balance Component DecreasesThe use of Fund Balance Component Decreases grew by$2.8 million or 517.7% compared to Fiscal Year 2012-13.
The increases in this category are in LUEG in DPW forLakeside and Wintergarden service area projects in the SanDiego County Sanitation District. Additional increase, alsoin LUEG is discussed in the General Fund Financing sec-tion.
$800
$820
$840
$860
$880
$900
$920
$940
2008-09 2009-10 2010-11 2011-12 2012-13 2013-14
Bu
dg
et in
Mill
ion
s
$875
$900
$925
$950
$975
$1,000
$1,025
$1,050
2008-09 2009-10 2010-11 2011-12 2012-13 2013-14
Bu
dg
et in
Mill
ion
s
$0
$5
$10
$15
$20
$25
2008-09 2009-10 2010-11 2011-12 2012-13 2013-14
Bu
dg
et in
Mill
ion
s
62 County of San DiegoAdopted Operational Plan Fiscal Years 2013-2014 and 2014-2015
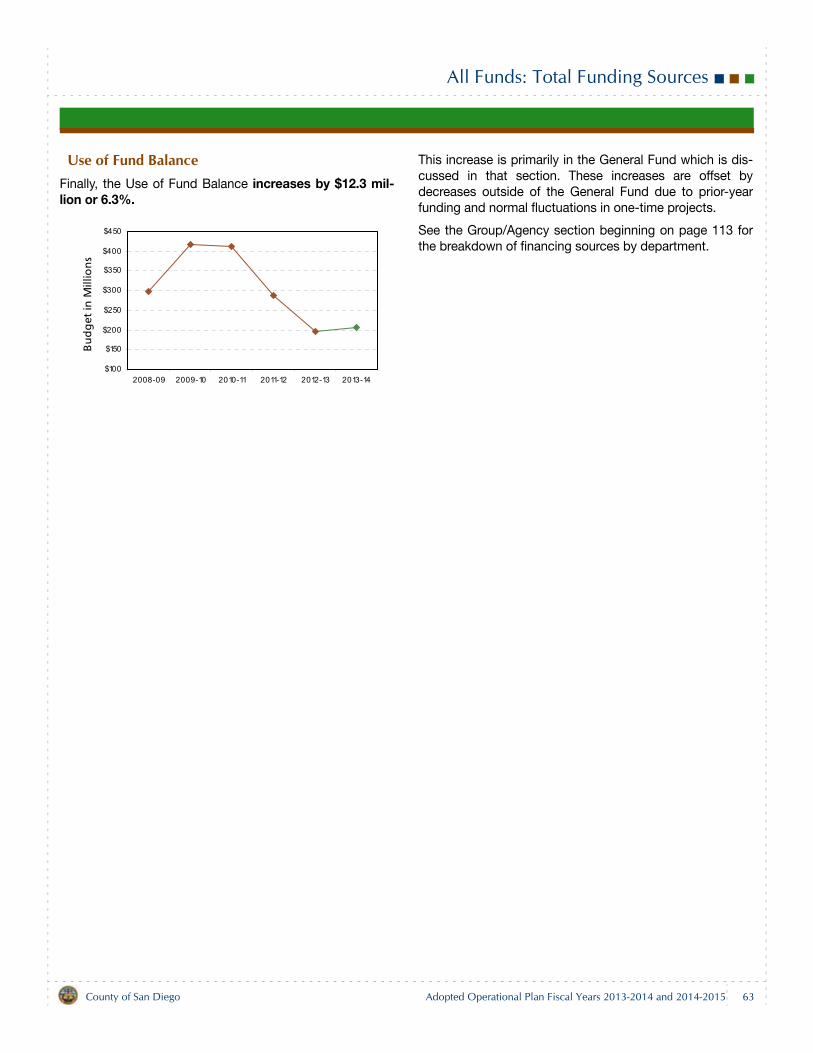
All Funds: Total Funding Sources
Use of Fund BalanceFinally, the Use of Fund Balance increases by $12.3 mil-lion or 6.3%.
This increase is primarily in the General Fund which is dis-cussed in that section. These increases are offset bydecreases outside of the General Fund due to prior-yearfunding and normal fluctuations in one-time projects.
See the Group/Agency section beginning on page 113 forthe breakdown of financing sources by department.
$100
$150
$200
$250
$300
$350
$400
$450
2008-09 2009-10 2010-11 2011-12 2012-13 2013-14
Bu
dg
et in
Mill
ion
s
County of San Diego Adopted Operational Plan Fiscal Years 2013-2014 and 2014-2015 63
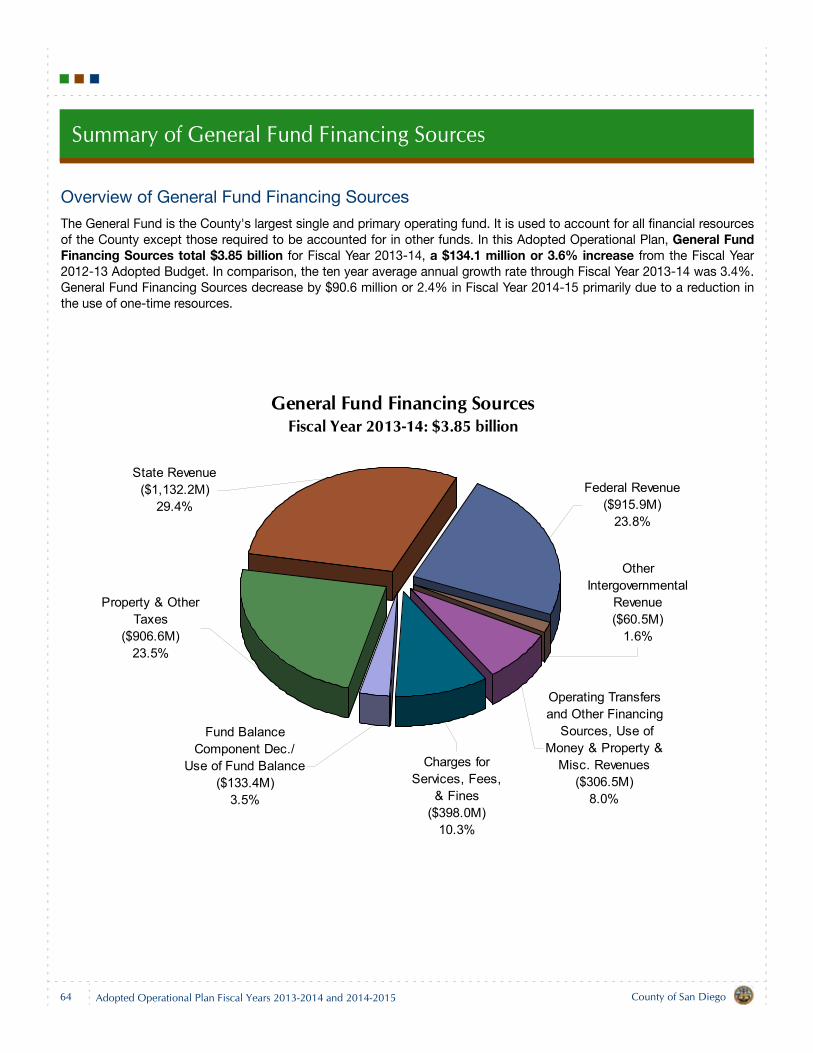
Summary of General Fund Financing Sources
Overview of General Fund Financing Sources
The General Fund is the County's largest single and primary operating fund. It is used to account for all financial resourcesof the County except those required to be accounted for in other funds. In this Adopted Operational Plan, General FundFinancing Sources total $3.85 billion for Fiscal Year 2013-14, a $134.1 million or 3.6% increase from the Fiscal Year2012-13 Adopted Budget. In comparison, the ten year average annual growth rate through Fiscal Year 2013-14 was 3.4%.General Fund Financing Sources decrease by $90.6 million or 2.4% in Fiscal Year 2014-15 primarily due to a reduction inthe use of one-time resources.
General Fund Financing SourcesFiscal Year 2013-14: $3.85 billion
State Revenue($1,132.2M)
29.4%Federal Revenue
($915.9M)23.8%
OtherIntergovernmental
Revenue($60.5M)
1.6%
Operating Transfersand Other Financing
Sources, Use ofMoney & Property &
Misc. Revenues($306.5M)
8.0%
Charges forServices, Fees,
& Fines($398.0M)
10.3%
Fund BalanceComponent Dec./
Use of Fund Balance($133.4M)
3.5%
Property & Other Taxes
($906.6M)23.5%
64 County of San DiegoAdopted Operational Plan Fiscal Years 2013-2014 and 2014-2015
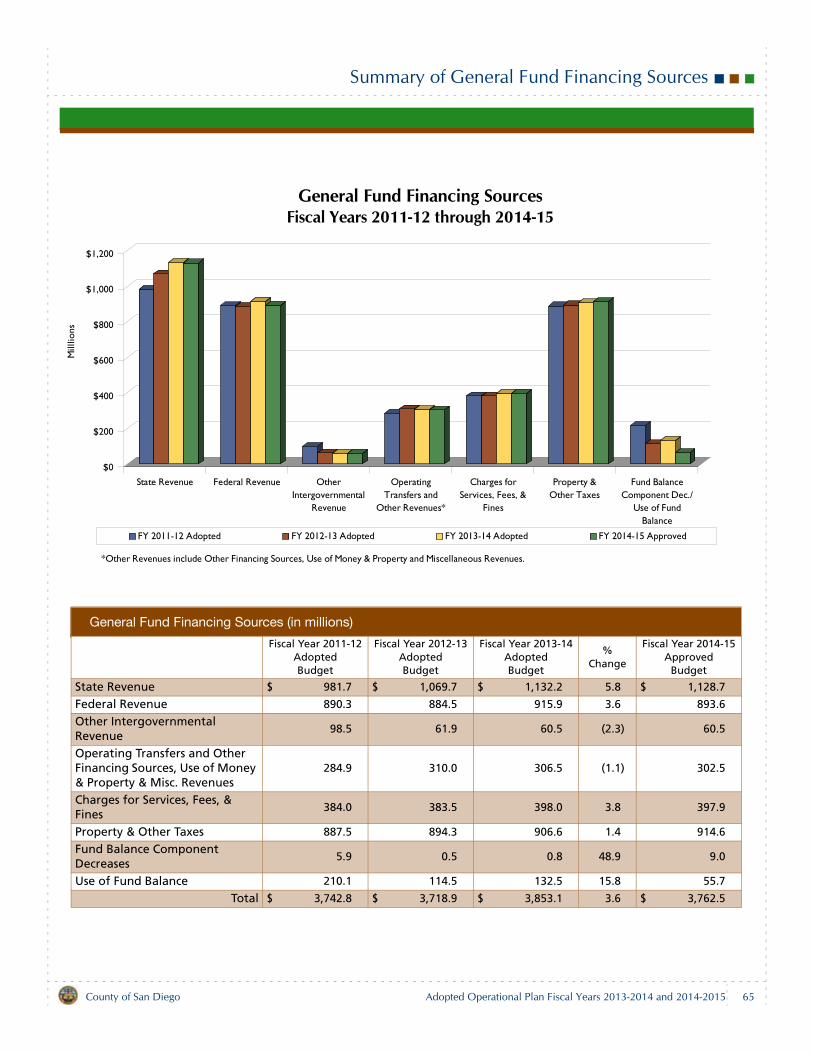
Summary of General Fund Financing Sources
$0
$200
$400
$600
$800
$1,000
$1,200
Mill
lions
State Revenue Federal Revenue OtherIntergovernmental
Revenue
OperatingTransfers and
Other Revenues*
Charges forServices, Fees, &
Fines
Property &Other Taxes
Fund BalanceComponent Dec./
Use of FundBalance
General Fund Financing SourcesFiscal Years 2011-12 through 2014-15
FY 2011-12 Adopted FY 2012-13 Adopted FY 2013-14 Adopted FY 2014-15 Approved
*Other Revenues include Other Financing Sources, Use of Money & Property and Miscellaneous Revenues.
General Fund Financing Sources (in millions)
Fiscal Year 2011-12AdoptedBudget
Fiscal Year 2012-13AdoptedBudget
Fiscal Year 2013-14AdoptedBudget
%Change
Fiscal Year 2014-15Approved
Budget
State Revenue $ 981.7 $ 1,069.7 $ 1,132.2 5.8 $ 1,128.7
Federal Revenue 890.3 884.5 915.9 3.6 893.6
Other Intergovernmental Revenue
98.5 61.9 60.5 (2.3) 60.5
Operating Transfers and Other Financing Sources, Use of Money & Property & Misc. Revenues
284.9 310.0 306.5 (1.1) 302.5
Charges for Services, Fees, & Fines
384.0 383.5 398.0 3.8 397.9
Property & Other Taxes 887.5 894.3 906.6 1.4 914.6
Fund Balance Component Decreases
5.9 0.5 0.8 48.9 9.0
Use of Fund Balance 210.1 114.5 132.5 15.8 55.7
Total $ 3,742.8 $ 3,718.9 $ 3,853.1 3.6 $ 3,762.5
County of San Diego Adopted Operational Plan Fiscal Years 2013-2014 and 2014-2015 65
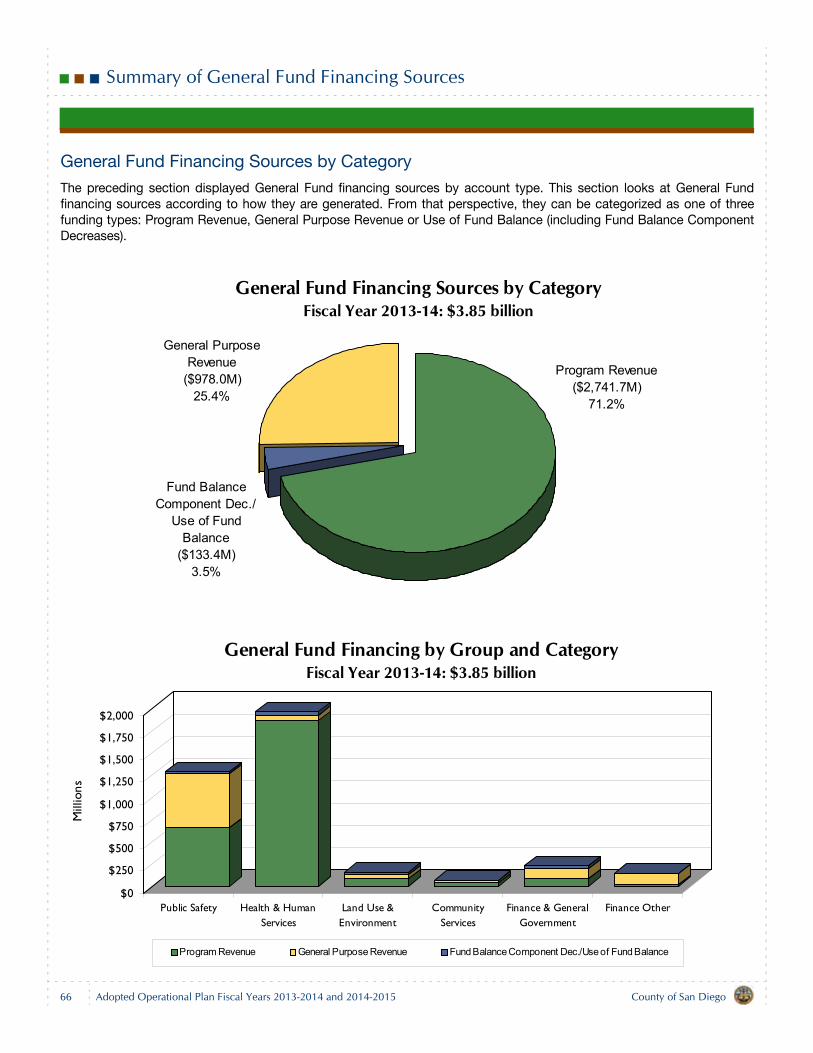
Summary of General Fund Financing Sources
General Fund Financing Sources by Category
The preceding section displayed General Fund financing sources by account type. This section looks at General Fundfinancing sources according to how they are generated. From that perspective, they can be categorized as one of threefunding types: Program Revenue, General Purpose Revenue or Use of Fund Balance (including Fund Balance ComponentDecreases).
General Fund Financing Sources by CategoryFiscal Year 2013-14: $3.85 billion
Program Revenue ($2,741.7M)
71.2%
Fund Balance Component Dec./
Use of Fund Balance
($133.4M)3.5%
General Purpose Revenue
($978.0M)25.4%
$0
$250
$500
$750
$1,000
$1,250
$1,500
$1,750
$2,000
Mill
ions
Public Safety Health & HumanServices
Land Use &Environment
CommunityServices
Finance & GeneralGovernment
Finance Other
General Fund Financing by Group and CategoryFiscal Year 2013-14: $3.85 billion
Program Revenue General Purpose Revenue Fund Balance Component Dec./Use of Fund Balance
66 County of San DiegoAdopted Operational Plan Fiscal Years 2013-2014 and 2014-2015
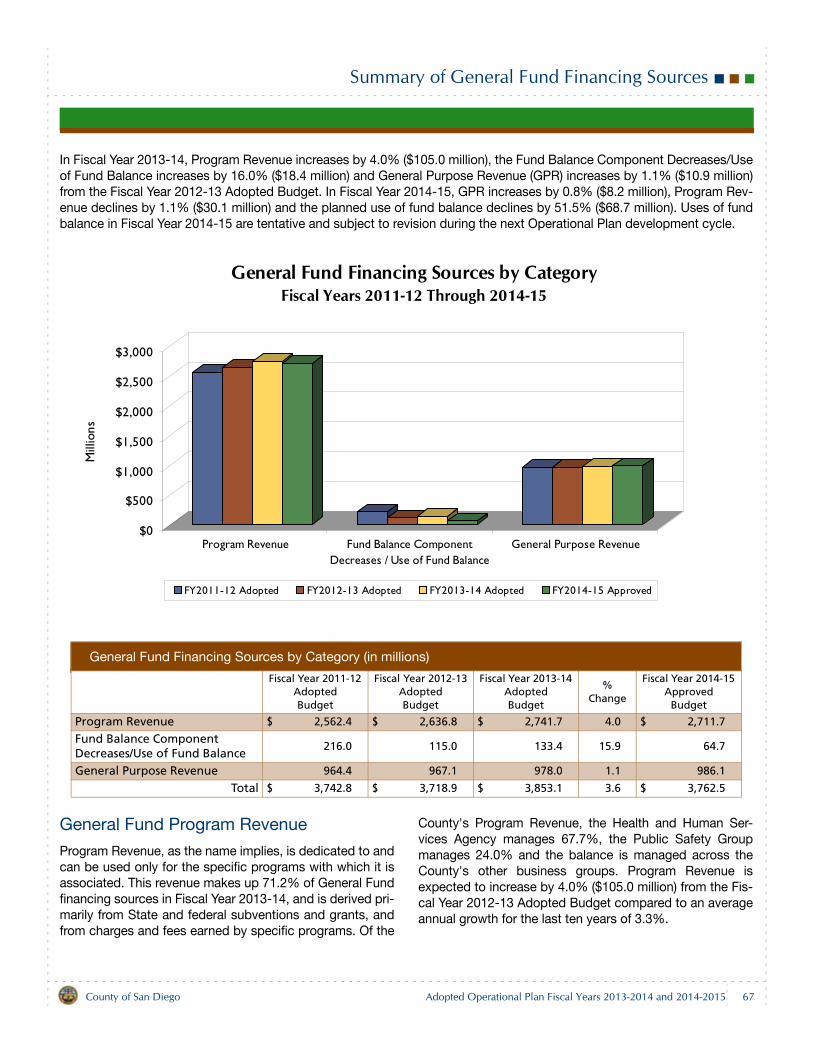
Summary of General Fund Financing Sources
In Fiscal Year 2013-14, Program Revenue increases by 4.0% ($105.0 million), the Fund Balance Component Decreases/Useof Fund Balance increases by 16.0% ($18.4 million) and General Purpose Revenue (GPR) increases by 1.1% ($10.9 million)from the Fiscal Year 2012-13 Adopted Budget. In Fiscal Year 2014-15, GPR increases by 0.8% ($8.2 million), Program Rev-enue declines by 1.1% ($30.1 million) and the planned use of fund balance declines by 51.5% ($68.7 million). Uses of fundbalance in Fiscal Year 2014-15 are tentative and subject to revision during the next Operational Plan development cycle.
General Fund Program Revenue
Program Revenue, as the name implies, is dedicated to andcan be used only for the specific programs with which it isassociated. This revenue makes up 71.2% of General Fundfinancing sources in Fiscal Year 2013-14, and is derived pri-marily from State and federal subventions and grants, andfrom charges and fees earned by specific programs. Of the
County's Program Revenue, the Health and Human Ser-vices Agency manages 67.7%, the Public Safety Groupmanages 24.0% and the balance is managed across theCounty's other business groups. Program Revenue isexpected to increase by 4.0% ($105.0 million) from the Fis-cal Year 2012-13 Adopted Budget compared to an averageannual growth for the last ten years of 3.3%.
General Fund Financing Sources by Category (in millions)
Fiscal Year 2011-12 AdoptedBudget
Fiscal Year 2012-13AdoptedBudget
Fiscal Year 2013-14 AdoptedBudget
% Change
Fiscal Year 2014-15 Approved
Budget
Program Revenue $ 2,562.4 $ 2,636.8 $ 2,741.7 4.0 $ 2,711.7
Fund Balance Component Decreases/Use of Fund Balance
216.0 115.0 133.4 15.9 64.7
General Purpose Revenue 964.4 967.1 978.0 1.1 986.1
Total $ 3,742.8 $ 3,718.9 $ 3,853.1 3.6 $ 3,762.5
$0
$500
$1,000
$1,500
$2,000
$2,500
$3,000
Mill
ions
Program Revenue Fund Balance ComponentDecreases / Use of Fund Balance
General Purpose Revenue
General Fund Financing Sources by CategoryFiscal Years 2011-12 Through 2014-15
FY2011-12 Adopted FY2012-13 Adopted FY2013-14 Adopted FY2014-15 Approved
County of San Diego Adopted Operational Plan Fiscal Years 2013-2014 and 2014-2015 67
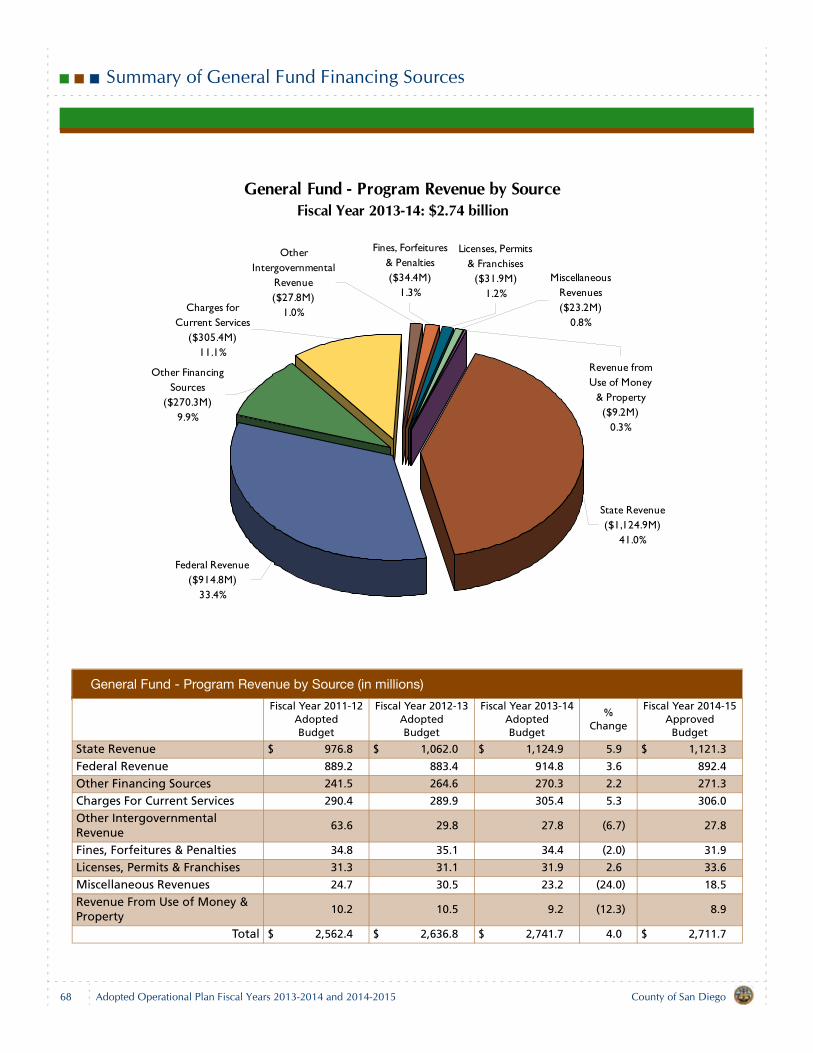
Summary of General Fund Financing Sources
General Fund - Program Revenue by Source (in millions)
Fiscal Year 2011-12AdoptedBudget
Fiscal Year 2012-13AdoptedBudget
Fiscal Year 2013-14AdoptedBudget
% Change
Fiscal Year 2014-15Approved
Budget
State Revenue $ 976.8 $ 1,062.0 $ 1,124.9 5.9 $ 1,121.3
Federal Revenue 889.2 883.4 914.8 3.6 892.4
Other Financing Sources 241.5 264.6 270.3 2.2 271.3
Charges For Current Services 290.4 289.9 305.4 5.3 306.0
Other Intergovernmental Revenue
63.6 29.8 27.8 (6.7) 27.8
Fines, Forfeitures & Penalties 34.8 35.1 34.4 (2.0) 31.9
Licenses, Permits & Franchises 31.3 31.1 31.9 2.6 33.6
Miscellaneous Revenues 24.7 30.5 23.2 (24.0) 18.5
Revenue From Use of Money & Property
10.2 10.5 9.2 (12.3) 8.9
Total $ 2,562.4 $ 2,636.8 $ 2,741.7 4.0 $ 2,711.7
General Fund - Program Revenue by SourceFiscal Year 2013-14: $2.74 billion
State Revenue($1,124.9M)
41.0%
Federal Revenue($914.8M)
33.4%
Other FinancingSources
($270.3M)9.9%
Charges forCurrent Services
($305.4M)11.1%
Other Intergovernmental
Revenue($27.8M)
1.0%
Fines, Forfeitures& Penalties($34.4M)
1.3%
Licenses, Permits& Franchises
($31.9M)1.2%
MiscellaneousRevenues($23.2M)
0.8%
Revenue fromUse of Money
& Property($9.2M)
0.3%
68 County of San DiegoAdopted Operational Plan Fiscal Years 2013-2014 and 2014-2015
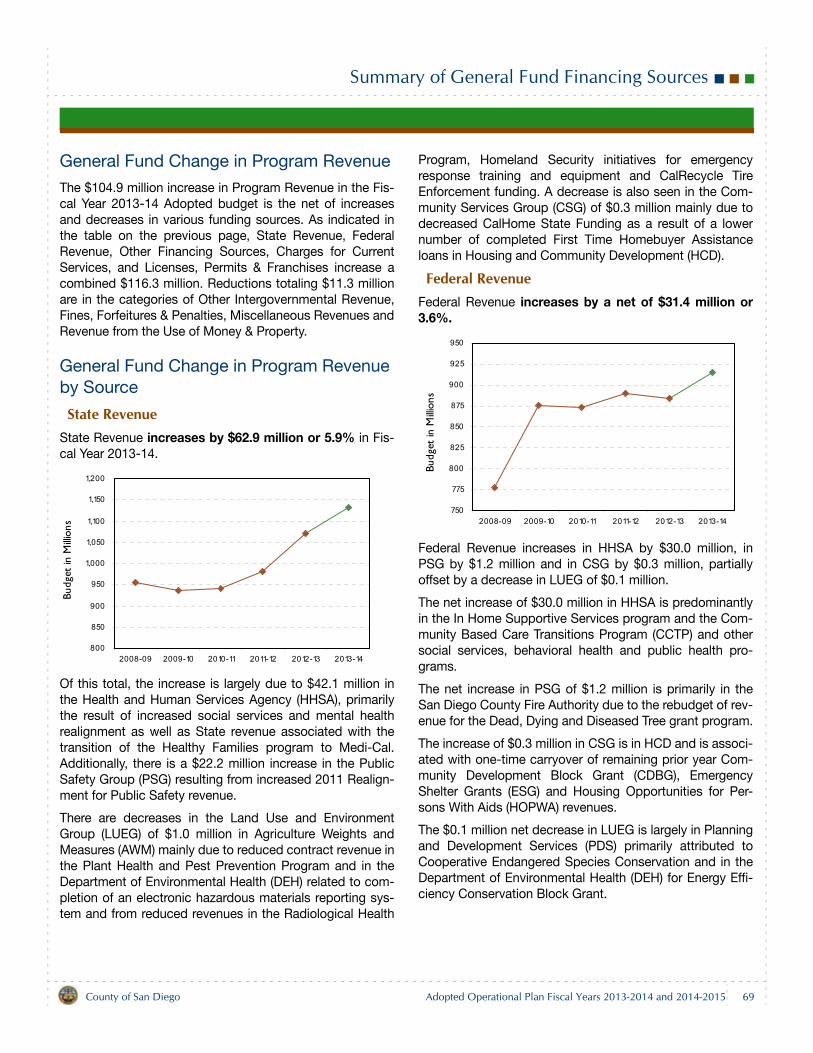
Summary of General Fund Financing Sources
General Fund Change in Program Revenue
The $104.9 million increase in Program Revenue in the Fis-cal Year 2013-14 Adopted budget is the net of increasesand decreases in various funding sources. As indicated inthe table on the previous page, State Revenue, FederalRevenue, Other Financing Sources, Charges for CurrentServices, and Licenses, Permits & Franchises increase acombined $116.3 million. Reductions totaling $11.3 millionare in the categories of Other Intergovernmental Revenue,Fines, Forfeitures & Penalties, Miscellaneous Revenues andRevenue from the Use of Money & Property.
General Fund Change in Program Revenue by Source
State RevenueState Revenue increases by $62.9 million or 5.9% in Fis-cal Year 2013-14.
Of this total, the increase is largely due to $42.1 million inthe Health and Human Services Agency (HHSA), primarilythe result of increased social services and mental healthrealignment as well as State revenue associated with thetransition of the Healthy Families program to Medi-Cal.Additionally, there is a $22.2 million increase in the PublicSafety Group (PSG) resulting from increased 2011 Realign-ment for Public Safety revenue.
There are decreases in the Land Use and EnvironmentGroup (LUEG) of $1.0 million in Agriculture Weights andMeasures (AWM) mainly due to reduced contract revenue inthe Plant Health and Pest Prevention Program and in theDepartment of Environmental Health (DEH) related to com-pletion of an electronic hazardous materials reporting sys-tem and from reduced revenues in the Radiological Health
Program, Homeland Security initiatives for emergencyresponse training and equipment and CalRecycle TireEnforcement funding. A decrease is also seen in the Com-munity Services Group (CSG) of $0.3 million mainly due todecreased CalHome State Funding as a result of a lowernumber of completed First Time Homebuyer Assistanceloans in Housing and Community Development (HCD).
Federal RevenueFederal Revenue increases by a net of $31.4 million or3.6%.
Federal Revenue increases in HHSA by $30.0 million, inPSG by $1.2 million and in CSG by $0.3 million, partiallyoffset by a decrease in LUEG of $0.1 million.
The net increase of $30.0 million in HHSA is predominantlyin the In Home Supportive Services program and the Com-munity Based Care Transitions Program (CCTP) and othersocial services, behavioral health and public health pro-grams.
The net increase in PSG of $1.2 million is primarily in theSan Diego County Fire Authority due to the rebudget of rev-enue for the Dead, Dying and Diseased Tree grant program.
The increase of $0.3 million in CSG is in HCD and is associ-ated with one-time carryover of remaining prior year Com-munity Development Block Grant (CDBG), EmergencyShelter Grants (ESG) and Housing Opportunities for Per-sons With Aids (HOPWA) revenues.
The $0.1 million net decrease in LUEG is largely in Planningand Development Services (PDS) primarily attributed toCooperative Endangered Species Conservation and in theDepartment of Environmental Health (DEH) for Energy Effi-ciency Conservation Block Grant.
800
850
900
950
1,000
1,050
1,100
1,150
1,200
2008-09 2009-10 2010-11 2011-12 2012-13 2013-14
Budg
et in
Milli
ons
750
775
800
825
850
875
900
925
950
2008-09 2009-10 2010-11 2011-12 2012-13 2013-14
Budg
et in
Milli
ons
County of San Diego Adopted Operational Plan Fiscal Years 2013-2014 and 2014-2015 69
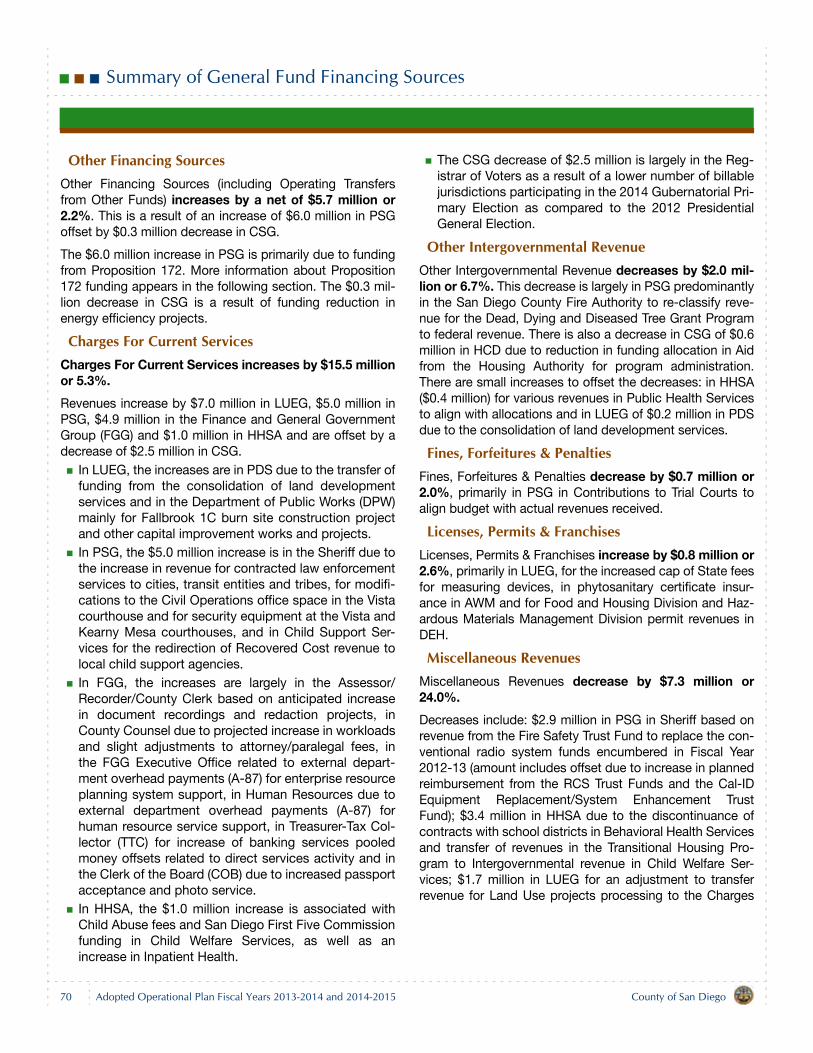
Summary of General Fund Financing Sources
Other Financing SourcesOther Financing Sources (including Operating Transfersfrom Other Funds) increases by a net of $5.7 million or2.2%. This is a result of an increase of $6.0 million in PSGoffset by $0.3 million decrease in CSG.
The $6.0 million increase in PSG is primarily due to fundingfrom Proposition 172. More information about Proposition172 funding appears in the following section. The $0.3 mil-lion decrease in CSG is a result of funding reduction inenergy efficiency projects.
Charges For Current ServicesCharges For Current Services increases by $15.5 millionor 5.3%.
Revenues increase by $7.0 million in LUEG, $5.0 million inPSG, $4.9 million in the Finance and General GovernmentGroup (FGG) and $1.0 million in HHSA and are offset by adecrease of $2.5 million in CSG.
In LUEG, the increases are in PDS due to the transfer offunding from the consolidation of land developmentservices and in the Department of Public Works (DPW)mainly for Fallbrook 1C burn site construction projectand other capital improvement works and projects.In PSG, the $5.0 million increase is in the Sheriff due tothe increase in revenue for contracted law enforcementservices to cities, transit entities and tribes, for modifi-cations to the Civil Operations office space in the Vistacourthouse and for security equipment at the Vista andKearny Mesa courthouses, and in Child Support Ser-vices for the redirection of Recovered Cost revenue tolocal child support agencies.In FGG, the increases are largely in the Assessor/Recorder/County Clerk based on anticipated increasein document recordings and redaction projects, inCounty Counsel due to projected increase in workloadsand slight adjustments to attorney/paralegal fees, inthe FGG Executive Office related to external depart-ment overhead payments (A-87) for enterprise resourceplanning system support, in Human Resources due toexternal department overhead payments (A-87) forhuman resource service support, in Treasurer-Tax Col-lector (TTC) for increase of banking services pooledmoney offsets related to direct services activity and inthe Clerk of the Board (COB) due to increased passportacceptance and photo service.In HHSA, the $1.0 million increase is associated withChild Abuse fees and San Diego First Five Commissionfunding in Child Welfare Services, as well as anincrease in Inpatient Health.
The CSG decrease of $2.5 million is largely in the Reg-istrar of Voters as a result of a lower number of billablejurisdictions participating in the 2014 Gubernatorial Pri-mary Election as compared to the 2012 PresidentialGeneral Election.
Other Intergovernmental RevenueOther Intergovernmental Revenue decreases by $2.0 mil-lion or 6.7%. This decrease is largely in PSG predominantlyin the San Diego County Fire Authority to re-classify reve-nue for the Dead, Dying and Diseased Tree Grant Programto federal revenue. There is also a decrease in CSG of $0.6million in HCD due to reduction in funding allocation in Aidfrom the Housing Authority for program administration.There are small increases to offset the decreases: in HHSA($0.4 million) for various revenues in Public Health Servicesto align with allocations and in LUEG of $0.2 million in PDSdue to the consolidation of land development services.
Fines, Forfeitures & PenaltiesFines, Forfeitures & Penalties decrease by $0.7 million or2.0%, primarily in PSG in Contributions to Trial Courts toalign budget with actual revenues received.
Licenses, Permits & FranchisesLicenses, Permits & Franchises increase by $0.8 million or2.6%, primarily in LUEG, for the increased cap of State feesfor measuring devices, in phytosanitary certificate insur-ance in AWM and for Food and Housing Division and Haz-ardous Materials Management Division permit revenues inDEH.
Miscellaneous RevenuesMiscellaneous Revenues decrease by $7.3 million or24.0%.
Decreases include: $2.9 million in PSG in Sheriff based onrevenue from the Fire Safety Trust Fund to replace the con-ventional radio system funds encumbered in Fiscal Year2012-13 (amount includes offset due to increase in plannedreimbursement from the RCS Trust Funds and the Cal-IDEquipment Replacement/System Enhancement TrustFund); $3.4 million in HHSA due to the discontinuance ofcontracts with school districts in Behavioral Health Servicesand transfer of revenues in the Transitional Housing Pro-gram to Intergovernmental revenue in Child Welfare Ser-vices; $1.7 million in LUEG for an adjustment to transferrevenue for Land Use projects processing to the Charges
70 County of San DiegoAdopted Operational Plan Fiscal Years 2013-2014 and 2014-2015
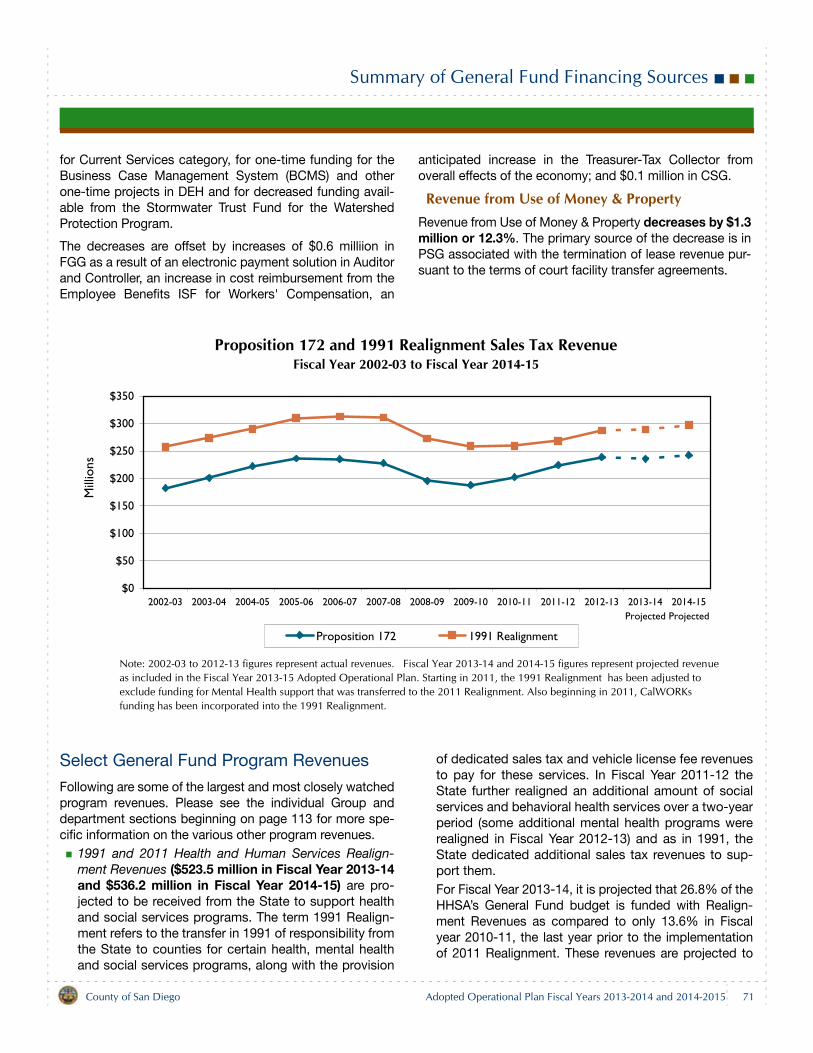
Summary of General Fund Financing Sources
for Current Services category, for one-time funding for theBusiness Case Management System (BCMS) and otherone-time projects in DEH and for decreased funding avail-able from the Stormwater Trust Fund for the WatershedProtection Program.
The decreases are offset by increases of $0.6 milliion inFGG as a result of an electronic payment solution in Auditorand Controller, an increase in cost reimbursement from theEmployee Benefits ISF for Workers' Compensation, an
anticipated increase in the Treasurer-Tax Collector fromoverall effects of the economy; and $0.1 million in CSG.
Revenue from Use of Money & PropertyRevenue from Use of Money & Property decreases by $1.3million or 12.3%. The primary source of the decrease is inPSG associated with the termination of lease revenue pur-suant to the terms of court facility transfer agreements.
Select General Fund Program Revenues
Following are some of the largest and most closely watchedprogram revenues. Please see the individual Group anddepartment sections beginning on page 113 for more spe-cific information on the various other program revenues.
1991 and 2011 Health and Human Services Realign-ment Revenues ($523.5 million in Fiscal Year 2013-14and $536.2 million in Fiscal Year 2014-15) are pro-jected to be received from the State to support healthand social services programs. The term 1991 Realign-ment refers to the transfer in 1991 of responsibility fromthe State to counties for certain health, mental healthand social services programs, along with the provision
of dedicated sales tax and vehicle license fee revenuesto pay for these services. In Fiscal Year 2011-12 theState further realigned an additional amount of socialservices and behavioral health services over a two-yearperiod (some additional mental health programs wererealigned in Fiscal Year 2012-13) and as in 1991, theState dedicated additional sales tax revenues to sup-port them. For Fiscal Year 2013-14, it is projected that 26.8% of theHHSA’s General Fund budget is funded with Realign-ment Revenues as compared to only 13.6% in Fiscalyear 2010-11, the last year prior to the implementationof 2011 Realignment. These revenues are projected to
Proposition 172 and 1991 Realignment Sales Tax RevenueFiscal Year 2002-03 to Fiscal Year 2014-15
$0
$50
$100
$150
$200
$250
$300
$350
2002-03 2003-04 2004-05 2005-06 2006-07 2007-08 2008-09 2009-10 2010-11 2011-12 2012-13 2013-14Projected
2014-15Projected
Mill
ions
Proposition 172 1991 Realignment
Note: 2002-03 to 2012-13 figures represent actual revenues. Fiscal Year 2013-14 and 2014-15 figures represent projected revenue as included in the Fiscal Year 2013-15 Adopted Operational Plan. Starting in 2011, the 1991 Realignment has been adjusted to exclude funding for Mental Health support that was transferred to the 2011 Realignment. Also beginning in 2011, CalWORKs funding has been incorporated into the 1991 Realignment.
County of San Diego Adopted Operational Plan Fiscal Years 2013-2014 and 2014-2015 71
Summary of General Fund Financing Sources
increase by 11.3% ($53.5 million) compared to FiscalYear 2012-13. A modest growth of 4.0% is anticipatedfor Fiscal Year 2014-15. The chart above shows the realized revenues for 1991Health and Social Services Realignment for Fiscal Years2002-03 through 2012-13 and projected levels for FiscalYears 2013-14 through 2014-15.2011 Public Safety Realignment Revenues ($131.3 mil-lion in Fiscal Year 2013-14 and $130.1 million in Fis-cal Year 2014-15) are projected to be received fromthe State to support criminal justice programs. The rev-enue source is a dedicated portion of State sales taxand State and local Vehicle License Fees (VLF). Therevenues provided for realignment are deposited intothe Local Revenue Fund 2011 and allocated to specificaccounts and subaccounts by statute. Funds allocatedto the Community Corrections Subaccount will supportservices required to address the transfer of responsibil-ity for certain offenders from the State to the countiespursuant to Assembly Bill (AB) 109, Public SafetyRealignment (2011), including supervision of offenders,costs associated with the custody of offenders includ-ing food and medical costs and equipment and furnish-ings for the East Mesa Reentry Facility, and resourcesfor services including mental health treatment, sub-stance abuse treatment, and vocational and behavioralservices. These revenues are projected to increase by23.1% ($24.6 million) compared to Fiscal Year 2012-13.A decrease of 0.9% ($1.2 million) is anticipated for Fis-cal Year 2014-15.2011 Realignment for Public Safety includes the follow-ing subaccounts: Enhancing Law Enforcement Activi-ties (various programs), Trial Court Security,Community Corrections (AB 109), District Attorney andPublic Defender (AB 109) and Juvenile Justice (YouthfulOffender Block Grant and Juvenile Reentry).Proposition 172 - Public Safety Sales Tax Revenues($236.0 million in Fiscal Year 2013-14 and $242.6million in Fiscal Year 2014-15) support region-widepublic safety services provided by three Public SafetyGroup departments - the Sheriff, District Attorney andProbation. The revenue source is a dedicated one-halfcent of the Statewide sales tax that was approved byvoters in 1993 and is distributed to counties based onthe relative levels of taxable sales in each county to thetotal taxable sales in all qualified counties. In turn,counties distribute a portion of the Proposition 172receipts to local cities according to ratios establishedpursuant to the Government Code.
Between Fiscal Years 2005-06 and 2009-10, revenuesfell by 20.4% ($48.2 million). For Fiscal Year 2013-14,these revenues are 7.0% ($15.5 million) above the Fis-cal Year 2012-13 budgeted amount, nearly reachingthe level last received in Fiscal Year 2005-06. It is antic-ipated that these revenues will grow modestly in FiscalYear 2014-15. The chart on the preceding page showsthe realized revenues for Proposition 172 for FiscalYears 2002-03 through 2011-12 and projected levelsfor Fiscal Years 2012-13 through 2014-15.Tobacco Settlement Revenues ($32.2 million in FiscalYear 2013-14 and $24.2 million in Fiscal Year 2014-15) by Board of Supervisors Policy E-14, Expenditureof Tobacco Settlement Revenue in San Diego County,are dedicated to healthcare-based programs. Theserevenues are the result of the historic Master Settle-ment Agreement in 1998 between the California Attor-ney General and several other states and the four majortobacco companies. The agreement provided morethan $206 billion in Tobacco Settlement Payments over25 years in exchange for the release of all past, presentand future claims related to the use of tobacco prod-ucts. California agreed to distribute its share of the set-tlement to its counties based on population.To reduce the risk of non-receipt of the Tobacco Settle-ment Payments, some counties and states opted tosecuritize these payments. Securitization is a processwhereby the owner of the receivable sells the right tothat income stream to a third party in exchange for anup-front payment. The County of San Diego helped topioneer this process and deposited the net proceeds of$412.0 million into the Tobacco Securitization Endow-ment Fund on a total securitization of $466.8 million inJanuary 2002 in exchange for its Tobacco SettlementPayments. These funds are spent pursuant to theBoard of Supervisors Policy.In May 2006, the County securitized additional antici-pated receipts and added $123.5 million to the endow-ment fund. These proceeds will enable the County tofund approximately $27.5 million of health care pro-grams annually through approximately year 2034. The$32.2 million budgeted in Fiscal Year 2013-14 reflects$8.0 million in one-time, non-securitized Tobacco Set-tlement funds and $24.2 million in Securitized Tobaccofunds. Another $3.3 million is budgeted and retained inthe Tobacco Securitization Special Revenue Fund. $3.1million is set aside as an unallocated reserve and $0.2million is budgeted for processing costs in Fiscal Year2013-14. A request will be submitted to the Board ofSupervisors if additional resources are needed.
72 County of San DiegoAdopted Operational Plan Fiscal Years 2013-2014 and 2014-2015
Summary of General Fund Financing Sources
General Fund - General Purpose Revenue
General Purpose Revenue (GPR) makes up 25.4% of theGeneral Fund Financing Sources. Please see the separatediscussion of GPR in the following section.
General Fund - Use of Fund Balance/Fund Balance Component Decreases (previously Designations)
Use of Fund Balance, including Fund Balance ComponentDecreases, ($133.4 million in Fiscal Year 2013-14 and$64.7 million in Fiscal Year 2014-15), represents 3.5% ofGeneral Fund Financing Sources in Fiscal Year 2013-14.Fund Balance is the result of careful management ofresources Countywide in past years. It is both a resourcethat can be used for one-time expenses and one thatserves as a mitigation for unexpected events or require-ments. By its nature, fund balance is not suitable for thesupport of ongoing operations.
The following list details the various General Fund - Use ofFund Balance/Fund Balance Component Decreases bud-geted for Fiscal Year 2013-14:
Management reserves.San Diego County Women’s Detention and ReentryFacility startup costs for furniture, vehicles and equip-ment.Sheriff equipment replacement and equipment to outfitthe new Rancho San Diego station.Sheriff Vista station Neighborhood Reinvestment Pro-gram grant for equipment rebudget.Narcotics Task Force support rebudget.District Attorney's Office facility maintenance andupgrades.Medical Examiner equipment replacement.Fire Protection and Emergency Medical Services GrantProgram for one-time capital needs for volunteer fireprotection districts.San Diego County Fire Authority one-time funding forincreased volunteer station equipment, fuel costs, andcontract costs.San Diego County Fire Authority training academy.Aerial Fire Suppression “Call When Needed” support.Fire engine acquisition matching funds for Indian Gam-ing grant.Refurbish two fire engines.Contract services related to Community Facilities Dis-trict formation rebudget.
Radio communication equipment for the ProbationDepartment.Support costs for Probation program dispatchers.Defense of special circumstance cases rebudget. Graduate law clerks and temporary staff for the PublicDefender.Public Defender support for the remaining term of cer-tain lease costs associated with the discontinued con-tract for Family Dependency Services.San Diego County Fire Authority equipment replacementcommitment and various equipment for fire preventionand emergency response activities.One-time major maintenance.Support for temporary recruitment activities associatedwith AB 109, Public Safety Realignment (2011).Relocation costs for furniture and equipment related tothe County Operations Center capital project.Health and Human Services Juvenile Diversion Programsupport.Health and Human Services reserves to mitigate Statebudget uncertainties.Grand Avenue clinic sale proceeds commitment forPublic Health.One time train the trainer courses to train staff and com-munity members in leadership and community planningskills to assist with assessing, selecting and implement-ing improvement projects.One time resources to host a Grandparents RaisingGrandchildren symposium.One time cultural consultant services to enhance childsafety and family stability in the Child Welfare system.Health and Human Services technological advance-ments to support Live Well San Diego. Vehicle purchases to meet Agricultural Water Qualityinspection requirements.Development of an onsite wastewater treatment pro-gram in compliance with AB 885, Onsite Sewage Treat-ment Systems (2000), rebudget.Tribal liaison consultant and support rebudget.Firestorm 2007 rebuilding permit fee waiver rebudget.Environmental Health support for beach water qualitymonitoring rebudget.Green Building Program and Homeowner Relief Act FeeWaivers.Multiple Species Conservation Program (MSCP) (North)Resource Management Plans to protect biological andcultural resources.
County of San Diego Adopted Operational Plan Fiscal Years 2013-2014 and 2014-2015 73
Summary of General Fund Financing Sources
Land Use General Plan amendments for property-spe-cific requests.Land Use rebudgets for Purchase of Agriculture Conser-vation Easements (PACE) program support, zoning ordi-nance update, Greenhouse Gas Guidelines Phase I, andcode enforcement abatements.Land Use continuous improvement program customerservice and cultural awareness training.One time Environmental Trust Fund (capital/mainte-nance) projects.Sand and sandbag distribution for pre-storm prepara-tion.Public Works rebudgets for Integrated Regional WaterManagement data management system grant match,and Proctor Valley Road closure.One time Countywide water efficiency projects.Smart Building retrofits. Housing and Community Development funding forsequestration cutbacks to allow orderly transition tochanged service delivery and redevelopment housingSuccessor Agency transition activities.Temporary help for contract monitoring activities.Upgrade audio-visual systems in two conference roomsat Housing and Community Development.Parks condition assessments.Minor equipment tracking requirements study.Completion of County Administration Center asbestosabatement and lighting upgrades.County Administration Center maintenance includingrepairs and/or upgrades to the roof, fire sprinkler sys-tem, heating, ventilation, and air conditioning (HVAC)system and development of a master plan for codecompliance upgrades.Instructor certifications for employee development,training room equipment, and contracting assistancecosts.Management intern program.Various information technology projects, including:
Business Process Reengineering initiatives.Digitizing records and one-time information technol-ogy projects in the District Attorney's Office.Electronic medical record system in the ProbationDepartment.Probation Case Management System.Health and Human Services Agency pre-hospitalinformation system assessment.Public Health lab information management system.
Business Case Management System rebudget -Accela upgrade mobile office implementation, useracceptance testing, reporting tools and training.Documentum upgrade and recording for Environ-mental Health.Asset Management application.Geographic Information Systems (GIS) infrastructureupgrade, Parcel Genealogy, Business Intelligencecontract Phase III rebudgets.Planning and Development Services electronic docu-ment review/submittal automation rebudget.Public GIS server rebuild.Mobile applications and web portal design.Building information modeling system - software andhardware, training, consultant, input to T9 facilitiessystem of record.Data imaging project rebudget.Q-matic System Upgrade - Customer Routing inLand Development Process.Justice Electronic Library System scanning, storageand devices.Public website redesign, enterprise signatures andapprovals architecture, and DocVault implementa-tion.QBIS upgrade/replacement.Fusion middleware application.T360 enhancement due to legacy system retirement.OBI data warehouse upgrade.SharePoint platform upgrade.Parallel Documentum environment.Documentum environment licenses.Constituent Relationship Management platformupgrade and application implementation.Payment processing system imaging upgrade.eGov application development.Automate employee contributions to health savingsaccounts.PeopleSoft application upgrade.Kronos application upgrade.Poll worker internet site.Learning Management System database upgrade.Enterprise Resource Planning (ERP) disaster recov-ery project and data services.Oracle Identity and Access Management (IDAM)license final payment
Workforce Academy for Youth (WAY) program.Grants provided to community organizations.Capital projects including the Assessor/Recorder/County Clerk El Cajon Branch Office Building.
74 County of San DiegoAdopted Operational Plan Fiscal Years 2013-2014 and 2014-2015
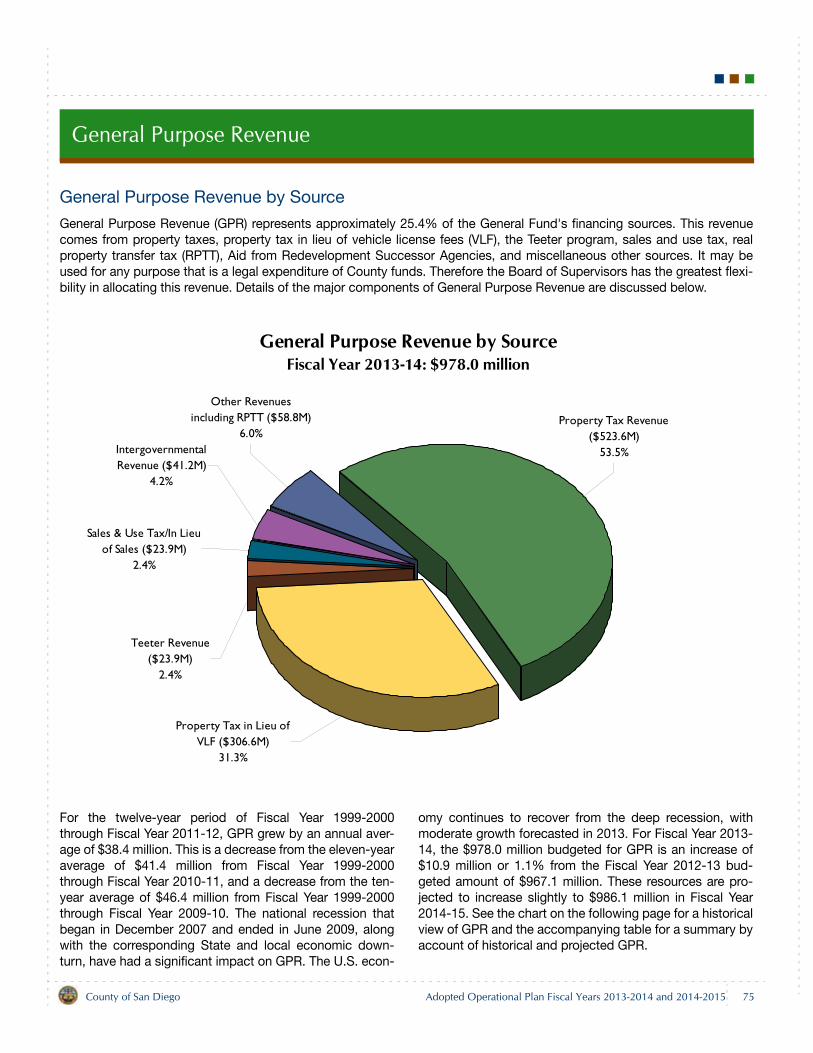
General Purpose Revenue
General Purpose Revenue by Source
General Purpose Revenue (GPR) represents approximately 25.4% of the General Fund's financing sources. This revenuecomes from property taxes, property tax in lieu of vehicle license fees (VLF), the Teeter program, sales and use tax, realproperty transfer tax (RPTT), Aid from Redevelopment Successor Agencies, and miscellaneous other sources. It may beused for any purpose that is a legal expenditure of County funds. Therefore the Board of Supervisors has the greatest flexi-bility in allocating this revenue. Details of the major components of General Purpose Revenue are discussed below.
For the twelve-year period of Fiscal Year 1999-2000through Fiscal Year 2011-12, GPR grew by an annual aver-age of $38.4 million. This is a decrease from the eleven-yearaverage of $41.4 million from Fiscal Year 1999-2000through Fiscal Year 2010-11, and a decrease from the ten-year average of $46.4 million from Fiscal Year 1999-2000through Fiscal Year 2009-10. The national recession thatbegan in December 2007 and ended in June 2009, alongwith the corresponding State and local economic down-turn, have had a significant impact on GPR. The U.S. econ-
omy continues to recover from the deep recession, withmoderate growth forecasted in 2013. For Fiscal Year 2013-14, the $978.0 million budgeted for GPR is an increase of$10.9 million or 1.1% from the Fiscal Year 2012-13 bud-geted amount of $967.1 million. These resources are pro-jected to increase slightly to $986.1 million in Fiscal Year2014-15. See the chart on the following page for a historicalview of GPR and the accompanying table for a summary byaccount of historical and projected GPR.
General Purpose Revenue by SourceFiscal Year 2013-14: $978.0 million
Property Tax Revenue ($523.6M)
53.5%
Property Tax in Lieu of VLF ($306.6M)
31.3%
Teeter Revenue ($23.9M)
2.4%
Sales & Use Tax/In Lieu of Sales ($23.9M)
2.4%
Intergovernmental Revenue ($41.2M)
4.2%
Other Revenues including RPTT ($58.8M)
6.0%
County of San Diego Adopted Operational Plan Fiscal Years 2013-2014 and 2014-2015 75
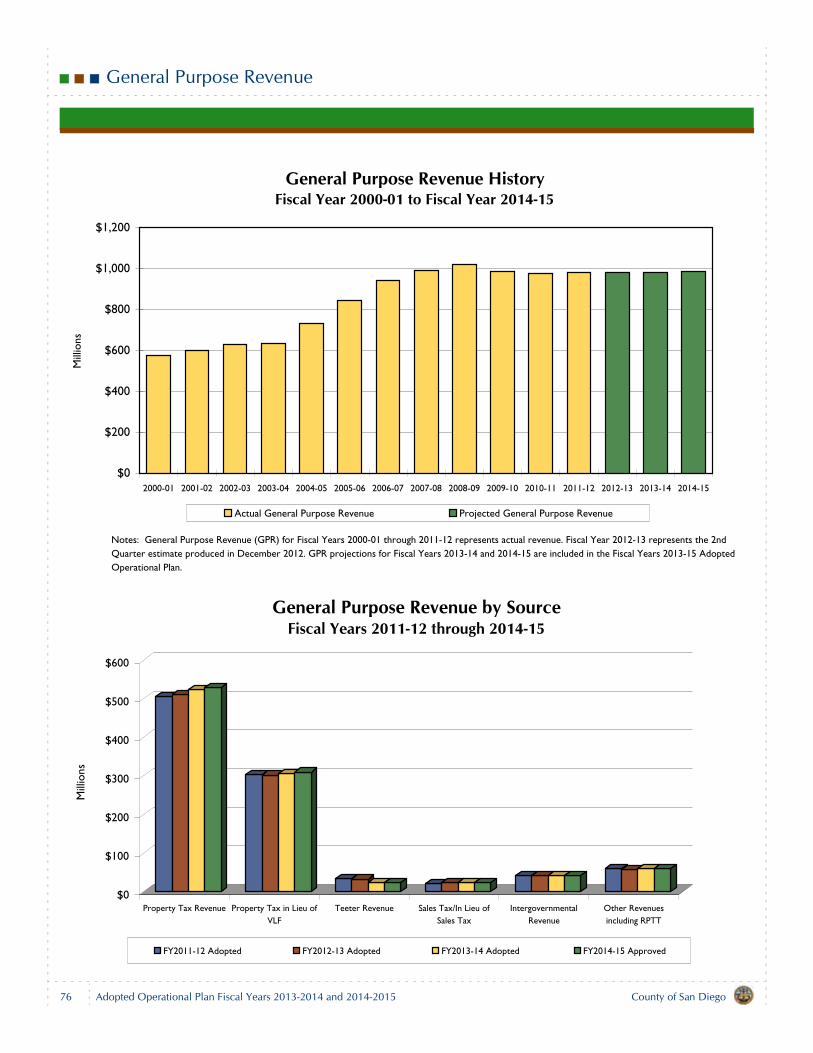
General Purpose Revenue
General Purpose Revenue HistoryFiscal Year 2000-01 to Fiscal Year 2014-15
$0
$200
$400
$600
$800
$1,000
$1,200
2000-01 2001-02 2002-03 2003-04 2004-05 2005-06 2006-07 2007-08 2008-09 2009-10 2010-11 2011-12 2012-13 2013-14 2014-15
Mill
ions
Actual General Purpose Revenue Projected General Purpose Revenue
Notes: General Purpose Revenue (GPR) for Fiscal Years 2000-01 through 2011-12 represents actual revenue. Fiscal Year 2012-13 represents the 2nd Quarter estimate produced in December 2012. GPR projections for Fiscal Years 2013-14 and 2014-15 are included in the Fiscal Years 2013-15 Adopted Operational Plan.
$0
$100
$200
$300
$400
$500
$600
Mill
ions
Property Tax Revenue Property Tax in Lieu ofVLF
Teeter Revenue Sales Tax/In Lieu ofSales Tax
IntergovernmentalRevenue
Other Revenuesincluding RPTT
General Purpose Revenue by SourceFiscal Years 2011-12 through 2014-15
FY2011-12 Adopted FY2012-13 Adopted FY2013-14 Adopted FY2014-15 Approved
76 County of San DiegoAdopted Operational Plan Fiscal Years 2013-2014 and 2014-2015
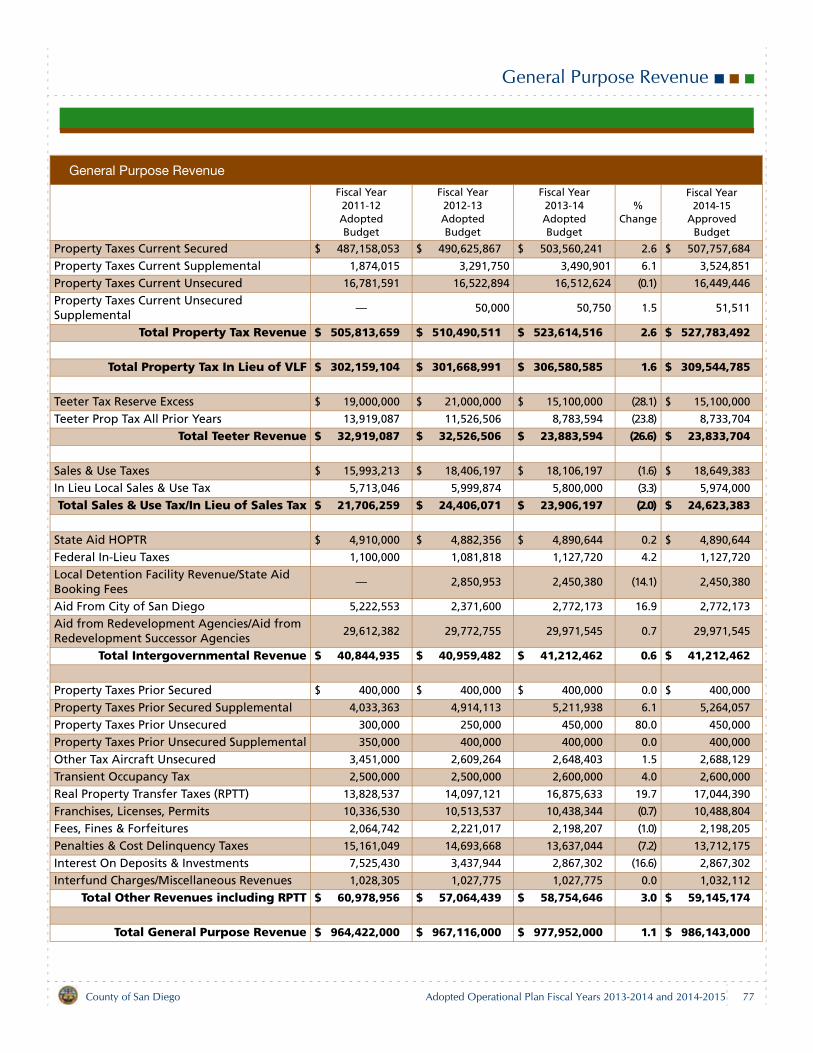
General Purpose Revenue
General Purpose Revenue
Fiscal Year2011-12AdoptedBudget
Fiscal Year2012-13AdoptedBudget
Fiscal Year2013-14AdoptedBudget
% Change
Fiscal Year2014-15
ApprovedBudget
Property Taxes Current Secured $ 487,158,053 $ 490,625,867 $ 503,560,241 2.6 $ 507,757,684
Property Taxes Current Supplemental 1,874,015 3,291,750 3,490,901 6.1 3,524,851
Property Taxes Current Unsecured 16,781,591 16,522,894 16,512,624 (0.1) 16,449,446
Property Taxes Current Unsecured Supplemental
— 50,000 50,750 1.5 51,511
Total Property Tax Revenue $ 505,813,659 $ 510,490,511 $ 523,614,516 2.6 $ 527,783,492
Total Property Tax In Lieu of VLF $ 302,159,104 $ 301,668,991 $ 306,580,585 1.6 $ 309,544,785
Teeter Tax Reserve Excess $ 19,000,000 $ 21,000,000 $ 15,100,000 (28.1) $ 15,100,000
Teeter Prop Tax All Prior Years 13,919,087 11,526,506 8,783,594 (23.8) 8,733,704
Total Teeter Revenue $ 32,919,087 $ 32,526,506 $ 23,883,594 (26.6) $ 23,833,704
Sales & Use Taxes $ 15,993,213 $ 18,406,197 $ 18,106,197 (1.6) $ 18,649,383
In Lieu Local Sales & Use Tax 5,713,046 5,999,874 5,800,000 (3.3) 5,974,000
Total Sales & Use Tax/In Lieu of Sales Tax $ 21,706,259 $ 24,406,071 $ 23,906,197 (2.0) $ 24,623,383
State Aid HOPTR $ 4,910,000 $ 4,882,356 $ 4,890,644 0.2 $ 4,890,644
Federal In-Lieu Taxes 1,100,000 1,081,818 1,127,720 4.2 1,127,720
Local Detention Facility Revenue/State Aid Booking Fees
— 2,850,953 2,450,380 (14.1) 2,450,380
Aid From City of San Diego 5,222,553 2,371,600 2,772,173 16.9 2,772,173
Aid from Redevelopment Agencies/Aid from Redevelopment Successor Agencies
29,612,382 29,772,755 29,971,545 0.7 29,971,545
Total Intergovernmental Revenue $ 40,844,935 $ 40,959,482 $ 41,212,462 0.6 $ 41,212,462
Property Taxes Prior Secured $ 400,000 $ 400,000 $ 400,000 0.0 $ 400,000
Property Taxes Prior Secured Supplemental 4,033,363 4,914,113 5,211,938 6.1 5,264,057
Property Taxes Prior Unsecured 300,000 250,000 450,000 80.0 450,000
Property Taxes Prior Unsecured Supplemental 350,000 400,000 400,000 0.0 400,000
Other Tax Aircraft Unsecured 3,451,000 2,609,264 2,648,403 1.5 2,688,129
Transient Occupancy Tax 2,500,000 2,500,000 2,600,000 4.0 2,600,000
Real Property Transfer Taxes (RPTT) 13,828,537 14,097,121 16,875,633 19.7 17,044,390
Franchises, Licenses, Permits 10,336,530 10,513,537 10,438,344 (0.7) 10,488,804
Fees, Fines & Forfeitures 2,064,742 2,221,017 2,198,207 (1.0) 2,198,205
Penalties & Cost Delinquency Taxes 15,161,049 14,693,668 13,637,044 (7.2) 13,712,175
Interest On Deposits & Investments 7,525,430 3,437,944 2,867,302 (16.6) 2,867,302
Interfund Charges/Miscellaneous Revenues 1,028,305 1,027,775 1,027,775 0.0 1,032,112
Total Other Revenues including RPTT $ 60,978,956 $ 57,064,439 $ 58,754,646 3.0 $ 59,145,174
Total General Purpose Revenue $ 964,422,000 $ 967,116,000 $ 977,952,000 1.1 $ 986,143,000
County of San Diego Adopted Operational Plan Fiscal Years 2013-2014 and 2014-2015 77
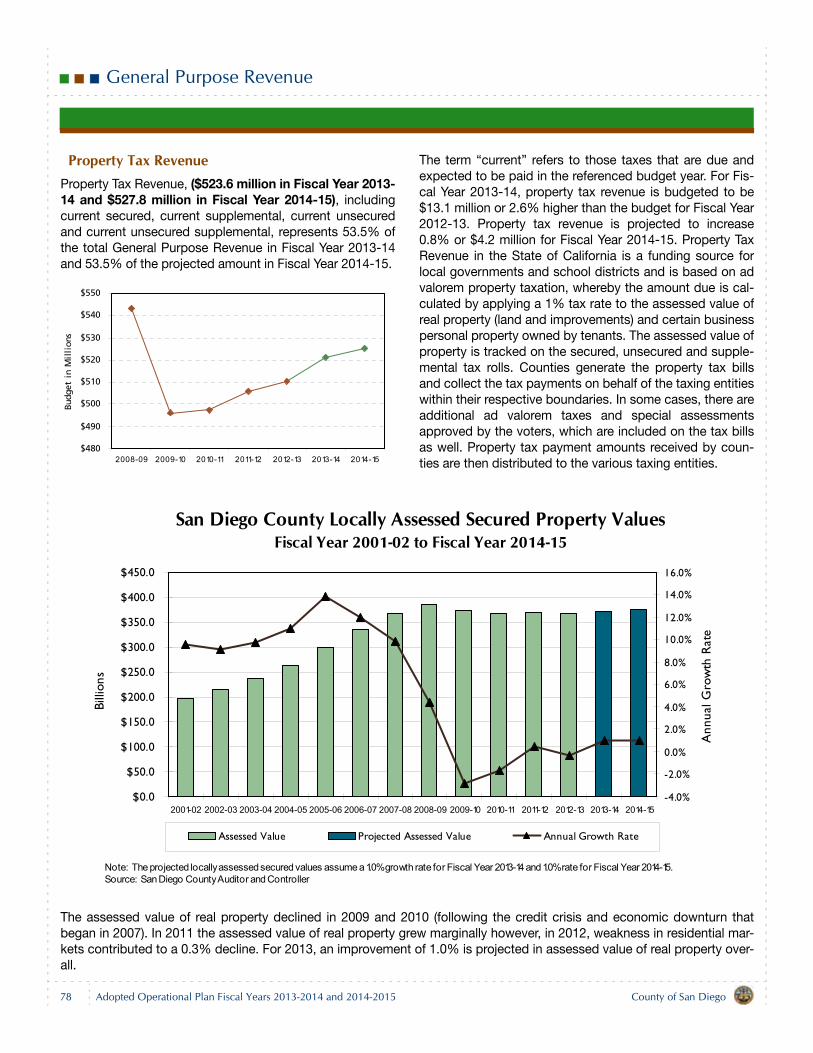
General Purpose Revenue
Property Tax RevenueProperty Tax Revenue, ($523.6 million in Fiscal Year 2013-14 and $527.8 million in Fiscal Year 2014-15), includingcurrent secured, current supplemental, current unsecuredand current unsecured supplemental, represents 53.5% ofthe total General Purpose Revenue in Fiscal Year 2013-14and 53.5% of the projected amount in Fiscal Year 2014-15.
The term “current” refers to those taxes that are due andexpected to be paid in the referenced budget year. For Fis-cal Year 2013-14, property tax revenue is budgeted to be$13.1 million or 2.6% higher than the budget for Fiscal Year2012-13. Property tax revenue is projected to increase0.8% or $4.2 million for Fiscal Year 2014-15. Property TaxRevenue in the State of California is a funding source forlocal governments and school districts and is based on advalorem property taxation, whereby the amount due is cal-culated by applying a 1% tax rate to the assessed value ofreal property (land and improvements) and certain businesspersonal property owned by tenants. The assessed value ofproperty is tracked on the secured, unsecured and supple-mental tax rolls. Counties generate the property tax billsand collect the tax payments on behalf of the taxing entitieswithin their respective boundaries. In some cases, there areadditional ad valorem taxes and special assessmentsapproved by the voters, which are included on the tax billsas well. Property tax payment amounts received by coun-ties are then distributed to the various taxing entities.
The assessed value of real property declined in 2009 and 2010 (following the credit crisis and economic downturn thatbegan in 2007). In 2011 the assessed value of real property grew marginally however, in 2012, weakness in residential mar-kets contributed to a 0.3% decline. For 2013, an improvement of 1.0% is projected in assessed value of real property over-all.
$480
$490
$500
$510
$520
$530
$540
$550
2008-09 2009-10 2010-11 2011-12 2012-13 2013-14 2014-15
Budg
et i
n M
illi
ons
San Diego County Locally Assessed Secured Property ValuesFiscal Year 2001-02 to Fiscal Year 2014-15
$0.0
$50.0
$100.0
$150.0
$200.0
$250.0
$300.0
$350.0
$400.0
$450.0
2001-02 2002-03 2003-04 2004-05 2005-06 2006-07 2007-08 2008-09 2009-10 2010-11 2011-12 2012-13 2013-14 2014-15
Billi
ons
-4.0%
-2.0%
0.0%
2.0%
4.0%
6.0%
8.0%
10.0%
12.0%
14.0%
16.0%
Ann
ual G
row
th R
ate
Assessed Value Projected Assessed Value Annual Growth Rate
Note: The projected locally assessed secured values assume a 1.0% growth rate for Fiscal Year 2013-14 and 1.0% rate for Fiscal Year 2014-15.Source: San Diego County Auditor and Controller
78 County of San DiegoAdopted Operational Plan Fiscal Years 2013-2014 and 2014-2015
General Purpose Revenue
Current Secured property tax revenue ($503.6 million inFiscal Year 2013-14 and $507.8 million in Fiscal Year2014-15) is expected to increase by $12.9 million in Fis-cal Year 2013-14 from the adopted level for Fiscal Year2012-13.This revenue is generated from the secured tax roll,that part of the roll containing real property, includingresidential and commercial property as well as State-assessed public utilities. The Fiscal Year 2013-14 reve-nue amount assumes an increase of 1.0% in the localsecured assessed value compared to the actual currentlocal secured assessed value amount for 2012-13(which was an approximate 0.3% decrease from theprior year), but it also makes certain assumptionsregarding the County's share of countywide propertytax revenues, the delinquency rate and the amount oftax roll corrections and refunds on prior year assess-ments.In Fiscal Year 2013-14, refunds and corrections com-bined are projected to decline to $6.9 million comparedto the Fiscal Year 2010-11 actual level of $19.4 million,the Fiscal Year 2011-12 actual level of $16.6 million andthe Fiscal Year 2012-13 projected level of $12.7 millionas of the Fiscal Year 2012-13 Second Quarter Opera-tional Plan Status Report and Budget Adjustments let-ter. While refunds and corrections are expected todecline, there is a risk that refunds and corrections mayexceed budgeted levels due to assessment reviewscurrently in progress. The anticipated reduction inrefunds and corrections will only marginally increasecurrent secured revenue as refunds and correctionswere budgeted at $7.5 million in Fiscal Year 2012-13.The timing and amount of these potential resultantrefunds is unknown and will be monitored closely.The expected increase in current secured revenue of$12.9 million or 2.6% is the result of the decrease inrefunds and corrections compared to budget, theincrease in the budgeted current local securedassessed value amount, an improvement in the delin-quency rate, and the assessed value assumption usedto develop the budget in Fiscal Year 2012-13. Specifi-cally, the Fiscal Year 2012-13 current secured revenueassumed a 1.0% decrease in the local securedassessed value over the actual local secured assessedvalue amount for Fiscal Year 2011-12. However, theactual current local secured assessed value declinedby only 0.3% (gross less regular exemptions) in FiscalYear 2012-13. Further, as noted above, for Fiscal Year2013-14, local secured assessed value is budgeted toincrease by 1.0%. For Fiscal Year 2014-15, local
secured assessed value is assumed to grow by 1.0%and the County's share of total property tax revenues isexpected to increase based on this anticipated growth.Current Supplemental property tax revenue ($3.5 millionin Fiscal Year 2013-14 and $3.5 million in Fiscal Year2014-15) is budgeted to increase by $0.2 million in Fis-cal Year 2013-14 from the adopted level in Fiscal Year2012-13. This revenue is derived from net increases tothe secured tax roll from either new construction orchanges in ownership that occur subsequent to the Jan-uary 1 lien date and are therefore more difficult to pre-dict. These actions are captured on the supplementaltax roll. The slowdown in new construction and thedecline in real estate prices have been acutely felt insupplemental property tax revenues. In many change ofownership transactions, instead of a property ownerbeing billed for an additional amount of property taxbecause the value of the property after the transaction ishigher than the value as of the lien date, the propertyowner receives a refund because the value is lower thanit was on the lien date.In Fiscal Year 2005-06, supplemental refunds county-wide totaled $4.0 million. They increased to $6.2 millionin Fiscal Year 2006-07, to $15.0 million in Fiscal Year2007-08, and exceeded $38.3 million in Fiscal Year2008-09. Supplemental refunds dropped to $21.6 mil-lion in Fiscal Year 2009-10 and further declined to$15.3 million in Fiscal Year 2010-11. In Fiscal Year2011-12, supplemental refunds increased to $18.3 mil-lion. Through February 2013, supplemental refundstotaled $10.6 million. They are anticipated to continueto decline gradually over time as residential and com-mercial assessed values improve.Current supplemental property tax revenues were$29.5 million in Fiscal Year 2005-06. They dropped to$23.4 million in Fiscal Year 2006-07, to $14.0 million inFiscal Year 2007-08, to $2.4 million in Fiscal Year 2008-09, and to $1.9 million in Fiscal Year 2009-10. In FiscalYear 2010-11, Current supplemental property tax reve-nues were $3.9 million, and $3.5 million in Fiscal Year2011-12. The budget assumes that this weakness willcontinue through the next two fiscal years with the Fis-cal Year 2013-14 amount budgeted at $3.5 million, fol-lowed by $3.5 million in Fiscal Year 2014-15.Current Unsecured property tax revenue ($16.5 millionin Fiscal Year 2013-14 and $16.4 million in Fiscal Year2014-15) is not based on a lien on real property. Theunsecured tax roll is that part of the assessment rollconsisting largely of business personal property ownedby tenants. The roll is forecasted based on trends and
County of San Diego Adopted Operational Plan Fiscal Years 2013-2014 and 2014-2015 79
General Purpose Revenue
available information at the time the budget is devel-oped. A marginally more conservative projection is usedfor Fiscal Year 2014-15.Current Unsecured Supplemental property tax revenue($0.1 million in Fiscal Year 2013-14 and $0.1 million inFiscal Year 2014-15) is derived from supplemental billsthat are transferred to the unsecured tax roll when achange in ownership occurs and a tax payment is duefrom the prior owner. Or, there may be a subsequentchange in ownership following the initial change in own-ership which occurs prior to the mailing of the initial sup-plemental tax bill. When this occurs, the bill is proratedand a portion of the original supplemental tax bill that isattributable to the initial change in ownership or comple-tion of new construction becomes an unsecured supple-mental tax bill.
Property Tax in Lieu of Vehicle License Fees (VLF)Property Tax in Lieu of Vehicle License Fees (VLF) com-prises 31.3% ($306.6 million) of the General PurposeRevenue amount in Fiscal Year 2013-14 and 31.4% ofthe projected amount ($309.5 million) in Fiscal Year2014-15.
Beginning in Fiscal Year 2004-05, this revenue sourcereplaced the previous distribution of vehicle license fees tolocal governments. Per the implementing legislation, reve-nue levels for this funding source are based on the growthor reduction in net taxable unsecured and local securedassessed value. With a projected and budgeted 1.0%increase in the combined taxable unsecured and localsecured assessed value in Fiscal Year 2013-14, revenuesare anticipated to be $4.9 million higher than budgeted forFiscal Year 2012-13. The increase is partially associatedwith the change in actual assessed value in Fiscal Year2012-13 which declined by only 0.3% compared to a bud-geted reduction of 1.0%. The Fiscal Year 2014-15 revenueis estimated using a 1.0% assessed value growth calcula-tion.
Teeter RevenueTeeter Revenue ($23.9 million in Fiscal Year 2013-14 and$23.8 million in Fiscal Year 2014-15) represents approxi-mately 2.4% of General Purpose Revenue in Fiscal Year2013-14 and 2.4% of the projected amount in Fiscal Year2014-15. For Fiscal Year 2013-14, Teeter Revenue is $8.6million or 26.6% less than the budget for Fiscal Year 2012-13.
In Fiscal Year 1993-94, the County adopted the alternativemethod of secured property tax apportionment availableunder Chapter 3, Part 8, Division 1, of the Revenue andTaxation Code of the State of California (also known as the“Teeter Plan,” named after its author.) This alternativemethod provides for funding each taxing entity included inthe Teeter Plan with its total secured property taxes andspecial assessments during the year for which the taxes arelevied, regardless of whether all taxes due were paid by theproperty owner in that year. Under this plan, the Countyadvances funds to these taxing entities to cover the unpaid(delinquent) taxes (the “Teetered taxes.”) The County's gen-eral fund benefits from this plan by being entitled to futurecollections of penalties and interest that are due once thedelinquent taxes are paid.
Teeter Revenue is projected based on the anticipated col-lection of the County's portion of the Teetered taxes from allprior years as well as the interest and penalty payments,which appear in the Teeter Tax Loss Reserve Excessaccount. See the table on page 77 for the amount of reve-nue pertaining to these components. A legal requirement ofthe Teeter Plan requires the County to maintain a tax lossreserve fund to cover losses that may occur if delinquenttaxes are not paid and the property goes into default and issold for less than the amount of outstanding taxes andassessments. Throughout the year, all interest and penaltiescollected on Teetered secured and supplemental propertytaxes are first deposited into the Teeter Tax Loss ReserveFund. Any excess amounts above 25% of the total delin-quent secured taxes and assessments may be transferredto the general fund.
For Fiscal Year 2013-14, collections from previous years'receivables are budgeted to decrease by $2.7 million basedon the size of the outstanding annual receivables, antici-pated collection trends and market conditions.
In Fiscal Year 2013-14, excess amounts from the Teeter TaxLoss Reserve Fund are budgeted to decrease from $21.0million in the Fiscal Year 2012-13 budget to $15.1 milliondue to the size of the outstanding annual receivables andmarket conditions. Excess amounts from the Teeter Tax
$280
$290
$300
$310
$320
$330
$340
2008-09 2009-10 2010-11 2011-12 2012-13 2013-14 2014-15
Budg
et i
n M
illi
ons
80 County of San DiegoAdopted Operational Plan Fiscal Years 2013-2014 and 2014-2015
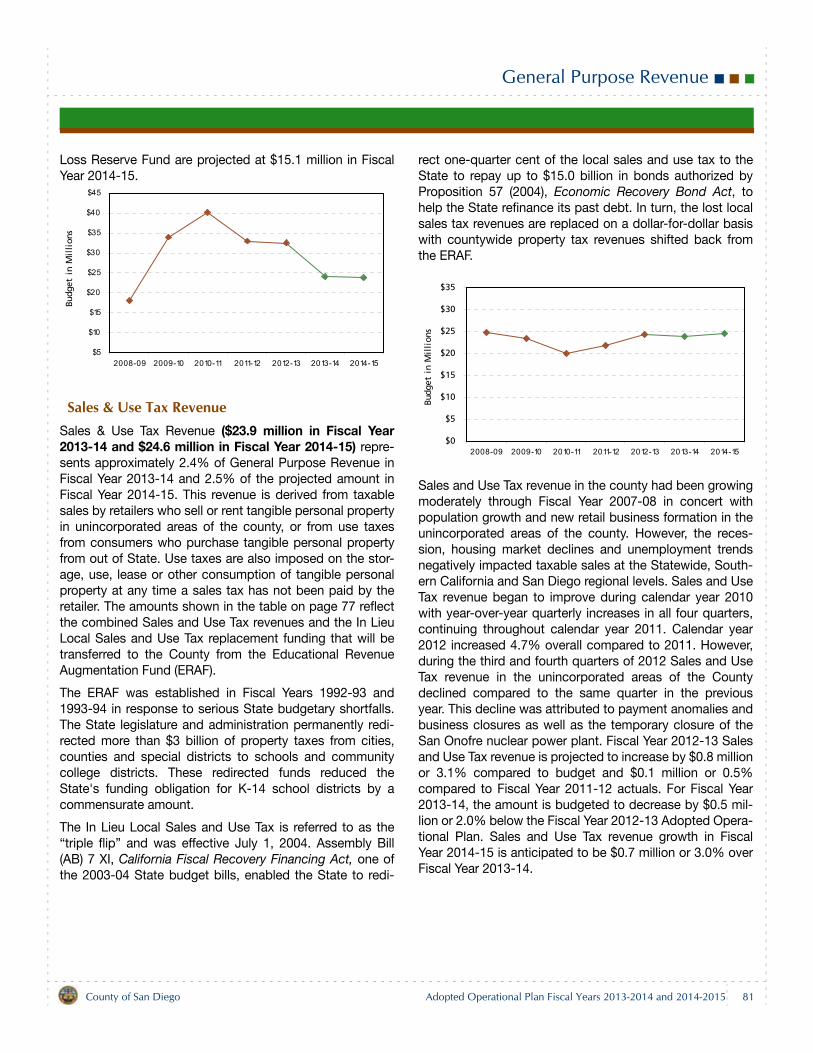
General Purpose Revenue
Loss Reserve Fund are projected at $15.1 million in FiscalYear 2014-15.
Sales & Use Tax RevenueSales & Use Tax Revenue ($23.9 million in Fiscal Year2013-14 and $24.6 million in Fiscal Year 2014-15) repre-sents approximately 2.4% of General Purpose Revenue inFiscal Year 2013-14 and 2.5% of the projected amount inFiscal Year 2014-15. This revenue is derived from taxablesales by retailers who sell or rent tangible personal propertyin unincorporated areas of the county, or from use taxesfrom consumers who purchase tangible personal propertyfrom out of State. Use taxes are also imposed on the stor-age, use, lease or other consumption of tangible personalproperty at any time a sales tax has not been paid by theretailer. The amounts shown in the table on page 77 reflectthe combined Sales and Use Tax revenues and the In LieuLocal Sales and Use Tax replacement funding that will betransferred to the County from the Educational RevenueAugmentation Fund (ERAF).
The ERAF was established in Fiscal Years 1992-93 and1993-94 in response to serious State budgetary shortfalls.The State legislature and administration permanently redi-rected more than $3 billion of property taxes from cities,counties and special districts to schools and communitycollege districts. These redirected funds reduced theState's funding obligation for K-14 school districts by acommensurate amount.
The In Lieu Local Sales and Use Tax is referred to as the“triple flip” and was effective July 1, 2004. Assembly Bill(AB) 7 XI, California Fiscal Recovery Financing Act, one ofthe 2003-04 State budget bills, enabled the State to redi-
rect one-quarter cent of the local sales and use tax to theState to repay up to $15.0 billion in bonds authorized byProposition 57 (2004), Economic Recovery Bond Act, tohelp the State refinance its past debt. In turn, the lost localsales tax revenues are replaced on a dollar-for-dollar basiswith countywide property tax revenues shifted back fromthe ERAF.
Sales and Use Tax revenue in the county had been growingmoderately through Fiscal Year 2007-08 in concert withpopulation growth and new retail business formation in theunincorporated areas of the county. However, the reces-sion, housing market declines and unemployment trendsnegatively impacted taxable sales at the Statewide, South-ern California and San Diego regional levels. Sales and UseTax revenue began to improve during calendar year 2010with year-over-year quarterly increases in all four quarters,continuing throughout calendar year 2011. Calendar year2012 increased 4.7% overall compared to 2011. However,during the third and fourth quarters of 2012 Sales and UseTax revenue in the unincorporated areas of the Countydeclined compared to the same quarter in the previousyear. This decline was attributed to payment anomalies andbusiness closures as well as the temporary closure of theSan Onofre nuclear power plant. Fiscal Year 2012-13 Salesand Use Tax revenue is projected to increase by $0.8 millionor 3.1% compared to budget and $0.1 million or 0.5%compared to Fiscal Year 2011-12 actuals. For Fiscal Year2013-14, the amount is budgeted to decrease by $0.5 mil-lion or 2.0% below the Fiscal Year 2012-13 Adopted Opera-tional Plan. Sales and Use Tax revenue growth in FiscalYear 2014-15 is anticipated to be $0.7 million or 3.0% overFiscal Year 2013-14.
$5
$10
$15
$20
$25
$30
$35
$40
$45
2008-09 2009-10 2010-11 2011-12 2012-13 2013-14 2014-15
Budg
et i
n M
illi
ons
$0
$5
$10
$15
$20
$25
$30
$35
2008-09 2009-10 2010-11 2011-12 2012-13 2013-14 2014-15
Budg
et i
n M
illi
ons
County of San Diego Adopted Operational Plan Fiscal Years 2013-2014 and 2014-2015 81
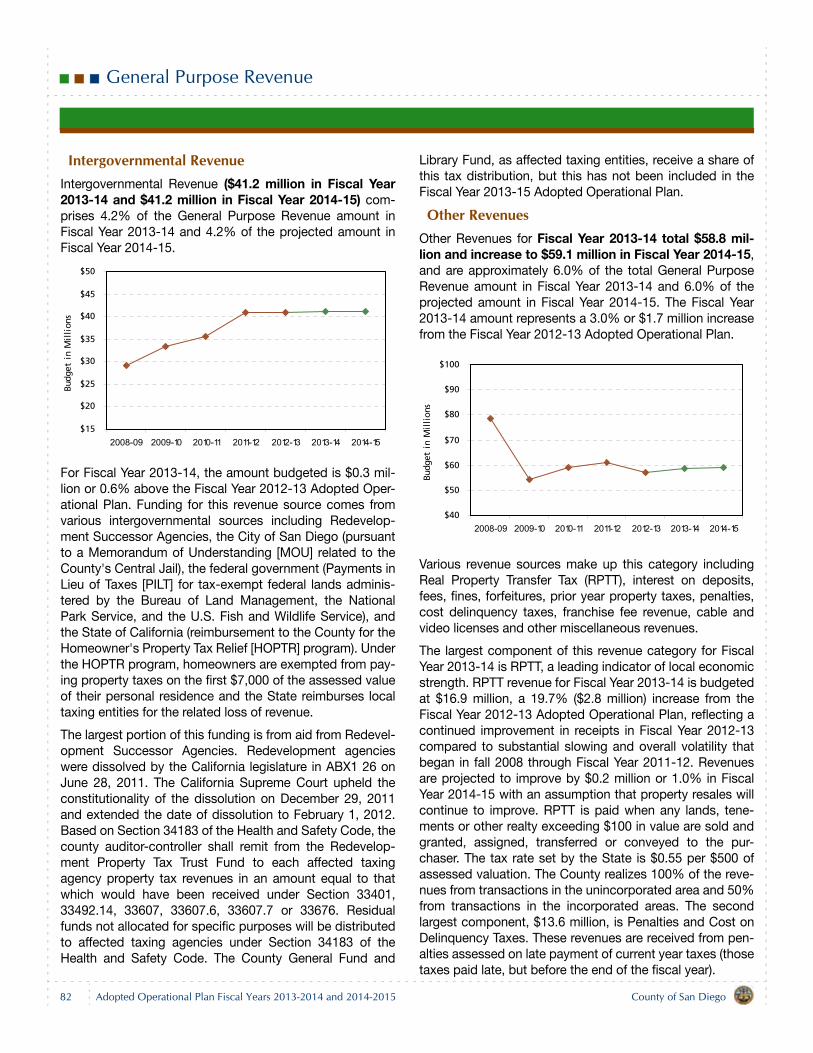
General Purpose Revenue
Intergovernmental RevenueIntergovernmental Revenue ($41.2 million in Fiscal Year2013-14 and $41.2 million in Fiscal Year 2014-15) com-prises 4.2% of the General Purpose Revenue amount inFiscal Year 2013-14 and 4.2% of the projected amount inFiscal Year 2014-15.
For Fiscal Year 2013-14, the amount budgeted is $0.3 mil-lion or 0.6% above the Fiscal Year 2012-13 Adopted Oper-ational Plan. Funding for this revenue source comes fromvarious intergovernmental sources including Redevelop-ment Successor Agencies, the City of San Diego (pursuantto a Memorandum of Understanding [MOU] related to theCounty's Central Jail), the federal government (Payments inLieu of Taxes [PILT] for tax-exempt federal lands adminis-tered by the Bureau of Land Management, the NationalPark Service, and the U.S. Fish and Wildlife Service), andthe State of California (reimbursement to the County for theHomeowner's Property Tax Relief [HOPTR] program). Underthe HOPTR program, homeowners are exempted from pay-ing property taxes on the first $7,000 of the assessed valueof their personal residence and the State reimburses localtaxing entities for the related loss of revenue.
The largest portion of this funding is from aid from Redevel-opment Successor Agencies. Redevelopment agencieswere dissolved by the California legislature in ABX1 26 onJune 28, 2011. The California Supreme Court upheld theconstitutionality of the dissolution on December 29, 2011and extended the date of dissolution to February 1, 2012.Based on Section 34183 of the Health and Safety Code, thecounty auditor-controller shall remit from the Redevelop-ment Property Tax Trust Fund to each affected taxingagency property tax revenues in an amount equal to thatwhich would have been received under Section 33401,33492.14, 33607, 33607.6, 33607.7 or 33676. Residualfunds not allocated for specific purposes will be distributedto affected taxing agencies under Section 34183 of theHealth and Safety Code. The County General Fund and
Library Fund, as affected taxing entities, receive a share ofthis tax distribution, but this has not been included in theFiscal Year 2013-15 Adopted Operational Plan.
Other RevenuesOther Revenues for Fiscal Year 2013-14 total $58.8 mil-lion and increase to $59.1 million in Fiscal Year 2014-15,and are approximately 6.0% of the total General PurposeRevenue amount in Fiscal Year 2013-14 and 6.0% of theprojected amount in Fiscal Year 2014-15. The Fiscal Year2013-14 amount represents a 3.0% or $1.7 million increasefrom the Fiscal Year 2012-13 Adopted Operational Plan.
Various revenue sources make up this category includingReal Property Transfer Tax (RPTT), interest on deposits,fees, fines, forfeitures, prior year property taxes, penalties,cost delinquency taxes, franchise fee revenue, cable andvideo licenses and other miscellaneous revenues.
The largest component of this revenue category for FiscalYear 2013-14 is RPTT, a leading indicator of local economicstrength. RPTT revenue for Fiscal Year 2013-14 is budgetedat $16.9 million, a 19.7% ($2.8 million) increase from theFiscal Year 2012-13 Adopted Operational Plan, reflecting acontinued improvement in receipts in Fiscal Year 2012-13compared to substantial slowing and overall volatility thatbegan in fall 2008 through Fiscal Year 2011-12. Revenuesare projected to improve by $0.2 million or 1.0% in FiscalYear 2014-15 with an assumption that property resales willcontinue to improve. RPTT is paid when any lands, tene-ments or other realty exceeding $100 in value are sold andgranted, assigned, transferred or conveyed to the pur-chaser. The tax rate set by the State is $0.55 per $500 ofassessed valuation. The County realizes 100% of the reve-nues from transactions in the unincorporated area and 50%from transactions in the incorporated areas. The secondlargest component, $13.6 million, is Penalties and Cost onDelinquency Taxes. These revenues are received from pen-alties assessed on late payment of current year taxes (thosetaxes paid late, but before the end of the fiscal year).
$15
$20
$25
$30
$35
$40
$45
$50
2008-09 2009-10 2010-11 2011-12 2012-13 2013-14 2014-15
Budg
et i
n M
illi
ons
$40
$50
$60
$70
$80
$90
$100
2008-09 2009-10 2010-11 2011-12 2012-13 2013-14 2014-15
Budg
et i
n M
illi
ons
82 County of San DiegoAdopted Operational Plan Fiscal Years 2013-2014 and 2014-2015
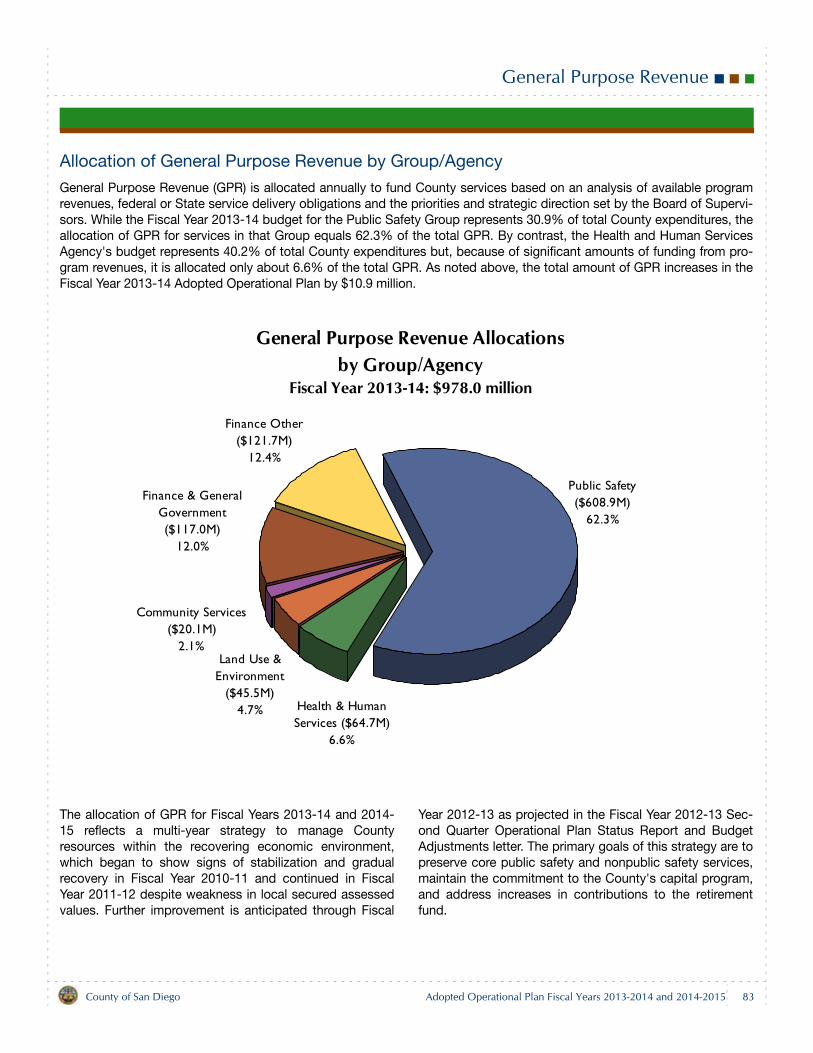
General Purpose Revenue
Allocation of General Purpose Revenue by Group/Agency
General Purpose Revenue (GPR) is allocated annually to fund County services based on an analysis of available programrevenues, federal or State service delivery obligations and the priorities and strategic direction set by the Board of Supervi-sors. While the Fiscal Year 2013-14 budget for the Public Safety Group represents 30.9% of total County expenditures, theallocation of GPR for services in that Group equals 62.3% of the total GPR. By contrast, the Health and Human ServicesAgency's budget represents 40.2% of total County expenditures but, because of significant amounts of funding from pro-gram revenues, it is allocated only about 6.6% of the total GPR. As noted above, the total amount of GPR increases in theFiscal Year 2013-14 Adopted Operational Plan by $10.9 million.
The allocation of GPR for Fiscal Years 2013-14 and 2014-15 reflects a multi-year strategy to manage Countyresources within the recovering economic environment,which began to show signs of stabilization and gradualrecovery in Fiscal Year 2010-11 and continued in FiscalYear 2011-12 despite weakness in local secured assessedvalues. Further improvement is anticipated through Fiscal
Year 2012-13 as projected in the Fiscal Year 2012-13 Sec-ond Quarter Operational Plan Status Report and BudgetAdjustments letter. The primary goals of this strategy are topreserve core public safety and nonpublic safety services,maintain the commitment to the County's capital program,and address increases in contributions to the retirementfund.
General Purpose Revenue Allocationsby Group/Agency
Fiscal Year 2013-14: $978.0 million
Public Safety ($608.9M)
62.3%
Health & Human Services ($64.7M)
6.6%
Land Use & Environment
($45.5M)4.7%
Community Services ($20.1M)
2.1%
Finance & General Government ($117.0M)
12.0%
Finance Other ($121.7M)
12.4%
County of San Diego Adopted Operational Plan Fiscal Years 2013-2014 and 2014-2015 83
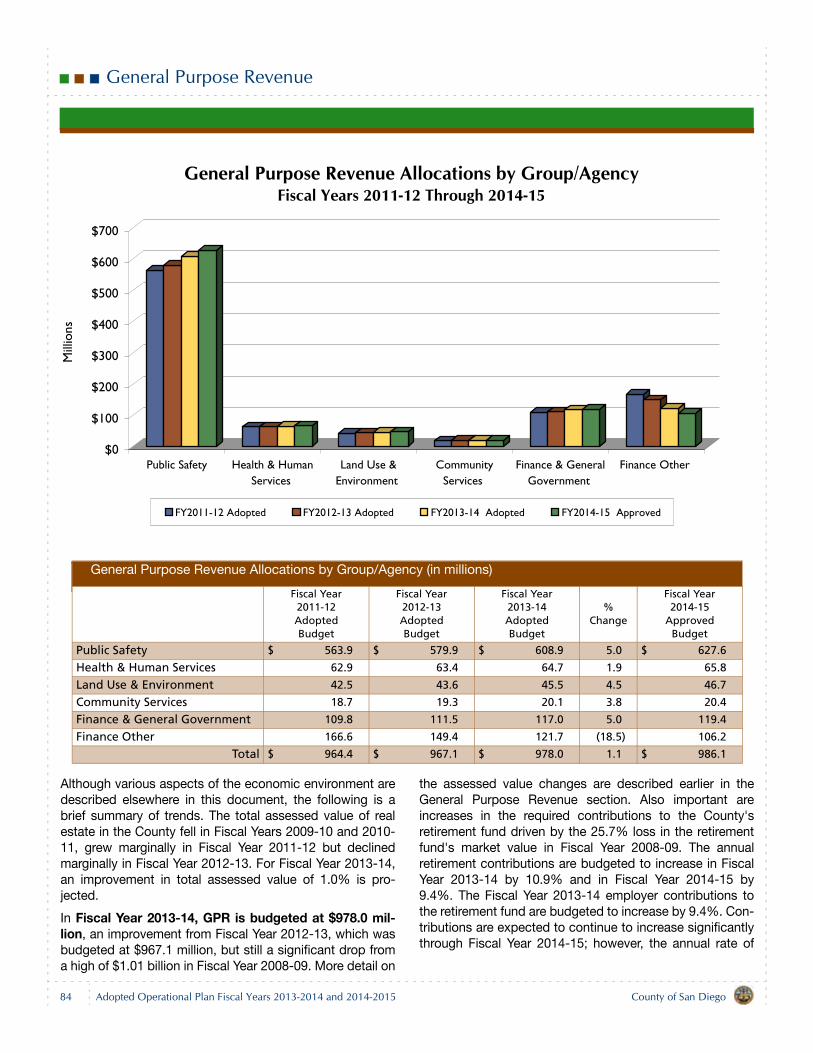
General Purpose Revenue
Although various aspects of the economic environment aredescribed elsewhere in this document, the following is abrief summary of trends. The total assessed value of realestate in the County fell in Fiscal Years 2009-10 and 2010-11, grew marginally in Fiscal Year 2011-12 but declinedmarginally in Fiscal Year 2012-13. For Fiscal Year 2013-14,an improvement in total assessed value of 1.0% is pro-jected.
In Fiscal Year 2013-14, GPR is budgeted at $978.0 mil-lion, an improvement from Fiscal Year 2012-13, which wasbudgeted at $967.1 million, but still a significant drop froma high of $1.01 billion in Fiscal Year 2008-09. More detail on
the assessed value changes are described earlier in theGeneral Purpose Revenue section. Also important areincreases in the required contributions to the County'sretirement fund driven by the 25.7% loss in the retirementfund's market value in Fiscal Year 2008-09. The annualretirement contributions are budgeted to increase in FiscalYear 2013-14 by 10.9% and in Fiscal Year 2014-15 by9.4%. The Fiscal Year 2013-14 employer contributions tothe retirement fund are budgeted to increase by 9.4%. Con-tributions are expected to continue to increase significantlythrough Fiscal Year 2014-15; however, the annual rate of
$0
$100
$200
$300
$400
$500
$600
$700
Mill
ions
Public Safety Health & HumanServices
Land Use &Environment
CommunityServices
Finance & GeneralGovernment
Finance Other
General Purpose Revenue Allocations by Group/AgencyFiscal Years 2011-12 Through 2014-15
FY2011-12 Adopted FY2012-13 Adopted FY2013-14 Adopted FY2014-15 Approved
General Purpose Revenue Allocations by Group/Agency (in millions)
Fiscal Year2011-12AdoptedBudget
Fiscal Year2012-13AdoptedBudget
Fiscal Year2013-14AdoptedBudget
% Change
Fiscal Year2014-15
ApprovedBudget
Public Safety $ 563.9 $ 579.9 $ 608.9 5.0 $ 627.6
Health & Human Services 62.9 63.4 64.7 1.9 65.8
Land Use & Environment 42.5 43.6 45.5 4.5 46.7
Community Services 18.7 19.3 20.1 3.8 20.4
Finance & General Government 109.8 111.5 117.0 5.0 119.4
Finance Other 166.6 149.4 121.7 (18.5) 106.2
Total $ 964.4 $ 967.1 $ 978.0 1.1 $ 986.1
84 County of San DiegoAdopted Operational Plan Fiscal Years 2013-2014 and 2014-2015
County of San Diego Adopted Operational Plan Fiscal Years 2013-2014 and 2014-2015 85
General Purpose Revenue
increase beyond Fiscal Year 2013-14 is not certain. Futurecontribution rates will be driven by actual market perfor-mance of the retirement fund and actuarial assumptions.
The resource management strategy to address these issuesover the next two years is summarized as follows:
Fiscal Year 2013-14 of the Adopted Operational Planassumes salaries will remain at the Fiscal Year 2012-13levels except for changes due to step or meritincreases and previously negotiated changes in laboragreements through June 30, 2013 and for the DeputySheriffs’ Association (DSA) through June 30, 2014. Fiscal Year 2013-14 shifts $24.6 million from the pen-sion stabilization fund to the County's five businessgroups to fund the cost increase in required retirementfund contributions.
The Fiscal Year 2014-15 Approved Budget assumes nonegotiated salary and benefit increases.Fiscal Year 2014-15 shifts $23.7 million from the pen-sion stabilization fund to the County's five businessgroups to fund the net cost increase in required retire-ment fund contributions.
Further detail on GPR allocations is provided in the Groupand department sections that begin on page 113. The pre-vious charts and table show the amount of General Pur-pose Revenue allocated to support each Group/Agency forFiscal Years 2013-14 and 2014-15 compared to the twoprior fiscal years.
Summary of Financial Policies
Background
The County of San Diego has long been recognized for itsstrong financial management practices. The GovernmentFinance Officers Association has recognized the County forits annual financial report with the Certificate of Achieve-ment for Excellence in Financial Reporting and for its bud-get document with the Distinguished Budget PresentationAward. The following is an overview of various policies thatthe County adheres to in its financial management prac-tices and guide the County's budgetary decision makingprocess.
Financial Planning and Budget
The County is actively engaged in financial and strategicplanning activities. As discussed previously, the GeneralManagement System is the framework that guides Countyoperations as set forth in Board of Supervisors Policy A-136, Use of County of San Diego General ManagementSystem for Administration of County Operations.
With the GMS as a guide for fiscal management prac-tices, the County will:
Maintain fiscal stability to ensure the ability to pro-vide services that customers rely on, in good timesand in bad. All departments share in the responsibil-ity of ensuring fiscal stability for the County.Ensure that the financial management activities ofthe County support structural balance betweenongoing revenues and expenditures.Use the Strategic Plan as a guide to develop anannual five-year financial forecast to review primarycost drivers, service needs and available fundingsources, which will lay the foundation for the upcom-ing Operational Plan.Annually develop a structurally-balanced two-yearOperational Plan, the first year of which is formallyadopted by the Board of Supervisors as the County'sbudget and the second year is accepted as a tenta-tive plan.
California Government Code §29009 requires abalanced budget, defined as “the fundingsources shall equal the financing uses,” in therecommended, adopted and final budgets.A structurally balanced budget means thatongoing, not one-time, resources are used tofund ongoing costs.
Conduct quarterly financial reporting processes toallow County managers to appropriately addresschanges in the external economic or internal financialconditions of the organization. At no time shall totalexpenditures exceed total appropriations; a budgetamendment must be submitted and approved by theBoard of Supervisors.Develop and use performance measures to monitorprogress and ensure that the County is on track toachieve its goals.
RevenuesAs a political subdivision of the State of California, theCounty has all the powers specifically stated and neces-sarily implied in general law and the County Charter,including the power to assess, levy and collect taxes.The County shall review and evaluate revenues from allsources in order to maximize these revenues withinexisting legal provisions. Per the County of San DiegoAdministrative Manual 0030-22, Revenue Manage-ment: Auditor and Controller Responsibilities, the Audi-tor and Controller will:
Devise and monitor the goals and objectives of a rev-enue management program within policy guidelinesprescribed by the Board of Supervisors. Thisincludes a periodic review of the County's financialcondition in order to ensure that the County's finan-cial sources (revenues) are sufficient to meet antici-pated obligations.Develop annual revenue estimates for the develop-ment of the Operational Plan relating to revenuesunder control of the Chief Administrative Officer.Ensure that full cost is recovered from fees, grantsand revenue contracts to the extent legally possible.If not, the reasons for recovery of less than full costwill be documented and disclosed.
All revenues received by the County identified as “one-time” revenues will only be appropriated for “one-time”expenditures per the County of San Diego Administra-tive Manual 0030-14, Use of One-Time Revenues.County departments will seek to recover the full cost ofall services provided to agencies or individuals outsidethe County of San Diego organization on a contractualor fee basis or when obtaining grant funding. Exceptionsto this policy require specific Board of Supervisorsapproval for the nonreimbursed costs as set forth inBoard of Supervisors Policy B-29, Fees, Grants, Reve-
86 County of San DiegoAdopted Operational Plan Fiscal Years 2013-2014 and 2014-2015
Summary of Financial Policies
nue Contracts - Department Responsibility for CostRecovery.
Full cost is defined as the sum of direct costs plusdepartmental overhead costs plus external indirectcosts as calculated pursuant to the federal Office ofManagement and Budget Circular A-87 cost plan forthe County.All proposed grant funding requests must be certifiedby the department head as being worthy of fundingwith County resources if external financing wasunavailable.Funding sources that will require a revenue matchfrom the County General Fund shall be limited to thedesignated match level mandated as a condition offunding.The establishment of fees, and subsequent changesto fees, will be done by ordinance at regularly sched-uled meetings of the Board of Supervisors. Fees areto be deposited or paid in advance of delivery orcompletion of services. All fee schedules will bereviewed annually or more frequently if warranted, toallow for full cost recovery.The Chief Administrative Officer shall review all pro-posed new or changed fee schedules, grant applica-tions and revenue contracts from an overall policyperspective before they are submitted to the Boardof Supervisors for action. County Counsel shallreview all revenue contracts to ensure that theCounty's interests are protected.
During the budget development process, selecteddepartments may be asked to analyze services, eitherCounty operated or contracted, to determine if the qual-ity, economy and productivity are equal to that of analternative delivery method, including other govern-ment agencies, and to determine how the revenues canbe maximized so the highest level or volume of servicescan be provided as set forth in Board of SupervisorsPolicy B-63, Competitive Determination of OptimumService Delivery Method.There are three basic categories of funding sources forCounty programs and services - Program Revenue,General Purpose Revenue and fund balance.
Program Revenue may be received in the form offees paid by customers for a particular service ormay be received as a subvention or grant from theState or federal government based on qualifying ser-vices being provided to local residents. For purposesof constructing the Operational Plan, Program Reve-nue is defined to also include all revenue received byspecial funds.
General Purpose Revenue may be used to providefor any service that is within the legal purview of theCounty. It is used to match federal or State programrevenues where required and to fund mandated anddiscretionary services where either no program reve-nue or insufficient program revenue is received. Gen-eral Purpose Revenue shall be budgeted only afterall other funding sources for those services are takeninto account.Fund balance results from an excess of revenuesover expenditures in prior fiscal years. Fund balanceis used to support one-time projects only, not ongo-ing services.
Revenue received from the Tobacco Master SettlementAgreement (1998) shall be allocated to support a com-prehensive tobacco control strategy, to increase fundingfor health care-based programs, and to supplement, butnot replace, existing health care revenue pursuant toBoard of Supervisors Policy E-14, Expenditure ofTobacco Settlement Revenue in San Diego County.All County funds shall be established according to theprocedures set forth in County of San Diego Adminis-trative Manual 0030-18, Establishing Funds and Trans-fer of Excess Cash Balances to the General Fund.Interest earned on all funds is deposited to the GeneralFund, unless specific legislation, codes or Board ofSupervisors action directs otherwise.
ExpendituresPursuant to the Charter of the County of San Diego,Article VII, §703.4, the Chief Administrative Officersupervises the expenditures of all departments andreports to the Board of Supervisors whether thoseexpenditures are necessary.Changes during the year to the adopted budget are per-mitted by State law with approval by the Board ofSupervisors or, in certain instances, by the Auditor andController.Appropriation transfers of any amount between objectswithin a budget unit may be processed by the Auditorand Controller except when the transfer would haveactual or potential programmatic impacts or is to or fromCapital Projects, Road Projects or Operating Transfersbetween departmental budget units. Programmaticimpact is defined as a change in program emphasis(e.g., due to shifts in workload or new opportunities),staffing or method of service delivery from the adoptedbudget. Appropriation transfer requests that fall withinthe exception categories require approval from the
County of San Diego Adopted Operational Plan Fiscal Years 2013-2014 and 2014-2015 87
Summary of Financial Policies
Board of Supervisors pursuant to County of San DiegoAdministrative Manual 0030-10, Transfers of Appropri-ations between Objects within a Budget Unit.As a general practice, the County does not backfill pro-grammatic funding eliminated by the State of California.Contracts for services, when properly issued and admin-istered, are an approved method to accomplish Countyprogram objectives. Pursuant to the Charter of theCounty of San Diego §703.10 and §916, the Countymay employ an independent contractor if it is deter-mined that the services can be provided more economi-cally and efficiently than by persons employed in theClassified Service. The County may enter into contractsfor services based upon conditions and methods setforth in Board of Supervisors Policy A-81, Procure-ment of Contract Services.The County shall procure items or services on a compet-itive basis unless it is in the County's best interests notto use the competitive procurement process. The com-petitive procurement requirements may be satisfiedthrough conducting either (a) formal bidding or (b) com-petitive negotiated procurement. Definitions and guide-lines for exemptions and exceptions are outlined inBoard of Supervisors Policy A-87, Competitive Pro-curement.The County will establish appropriations for the Commu-nity Enhancement Program at a level approximatelyequal to the amount of Transient Occupancy Tax reve-nues estimated to be collected each fiscal year. Each ofthe five Board of Supervisors office is allocated 20% ofthe total program amount for purposes of recommend-ing grant awards to community organizations based oneligibility criteria and application guidelines included inBoard of Supervisors Policy B-58, Funding of theCommunity Enhancement Program.All appropriations available for the Neighborhood Rein-vestment Program will be included annually in theCounty's Operational Plan. Resources available mayvary and may range up to $10.0 million, distributedevenly among the five Board of Supervisors districts,subject to the budget priorities of the Board of Supervi-sors as detailed in Board of Supervisors Policy B-72,Neighborhood Reinvestment Program.
ReservesThe County provides a wide variety of services that arefunded by a number of revenue sources. The Countymust be prepared for unforeseen events or economicuncertainties that could result in additional expenditurerequirements or loss of revenue by establishing andmaintaining prudent levels of fund balance and reserves.Pursuant to Board of Supervisors Policy B-71, FundBalance and Reserves, the County will maintain fundbalances and reserves in the General Fund to supportfiscal health and stability including:
Fund Balance Committed for Unforeseen Cata-strophic Events General Fund Contingency ReserveGeneral Fund Minimum Fund Balance for economicuncertainty
The Board of Supervisors may waive the requirement tomaintain fund balance and reserve amounts at the tar-geted levels if it finds that it is in the best interest of theresidents of the County to do so.In the event that the Fund Balance Committed forUnforeseen Catastrophic Events, the ContingencyReserve or General Fund Minimum Fund Balance foreconomic uncertainty falls below targeted levels, theChief Administrative Officer will present a plan to theBoard of Supervisors for restoration to those targetedlevels.For additional details on County Reserves, refer to page93, Reserves and Resources.
Debt ManagementThe County adopted Board of Supervisors Policy B-65, Long-Term Financial Obligation Management Policy,to ensure sound financial management. The Policy gov-erns the County's entry into financial obligations thatexceed one fiscal year.The County may issue Tax and Revenue AnticipationNotes (TRANs) as a short-term financing instrument toovercome temporary shortfalls in cash due to the timingof expenditures and receipt of revenues.For additional details on the County's debt manage-ment policy, refer to page 96, Debt Management Poli-cies and Obligations section.
88 County of San DiegoAdopted Operational Plan Fiscal Years 2013-2014 and 2014-2015
Summary of Financial Policies
InvestmentsThe San Diego County Treasurer-Tax Collector isresponsible for the collection, banking, investment, dis-bursement and accountability of public funds, excludingpension funds. Accordingly, the County Treasurer shallannually prepare an Investment Policy that will bereviewed and monitored by the County Treasury Over-sight Committee, established by the Board of Supervi-sors pursuant to California Government Code§§27130-27137.The monies entrusted to the County Treasurer (the Fund)will comprise an actively managed portfolio. This meansthat the Treasurer and his staff will observe, review andreact to changing conditions that affect the Fund.The San Diego County Treasurer's Pooled Money FundInvestment Policy shall be annually reviewed andapproved at a public hearing by the Board of Super-visors. When investing, reinvesting, purchasing, acquir-ing, exchanging, selling and managing public funds:
The primary objective shall be to safeguard the prin-cipal of the funds under the County Treasurer's con-trol.The secondary objective shall be to meet the liquidityneeds of the participants.The third objective shall be to achieve an investmentreturn on the funds under control of the Treasurerwithin the parameters of prudent risk management.
The Treasurer shall prepare a monthly investment reportto be posted on the Treasurer-Tax Collector's website(www.sdtreastax.com/treasury.html).The Treasurer shall provide to the Treasury OversightCommittee an annual independent review by an externalauditor to assure compliance with policies and proce-dures set forth by the California Government Code.
Capital ImprovementsThe County Board of Supervisors has jurisdiction overthe acquisition, use and disposal of County-owned realproperty and County-leased property under the author-ity of California Government Code §23004.The need for capital improvements is assessed annually.Board of Supervisors Policy B-37, Use of the CapitalProgram Funds, establishes funding methods, adminis-tration and control, and allowable uses of the CapitalProgram Funds. The physical assets of the County are extensive; thus itis essential that the County follows an effective strategyto manage and plan for current and long-term capitaland space needs. The Department of General Services
shall be the responsible agency to manage the capitalfacilities planning and space needs of the County. Thedepartment is responsible for establishing the generalobjectives and standards for the location, design andoccupancy of County-owned or leased facilities, as wellas serving as the steward of a Countywide master planand individual campus plans per Board of SupervisorsPolicy G-16, Capital Facilities and Space Planning. Additional details on the County's Capital Program maybe found on page 455.
Measurement Focus and Basis of Accounting
Governmentwide, proprietary and fiduciary fund financialstatements are reported using the economic resourcesmeasurement focus and the accrual basis of accounting.Revenues are recorded when earned and expenses arerecorded when a liability is incurred, regardless of the tim-ing of related cash flows. Property taxes are recognized asrevenue in the fiscal year for which the taxes are levied.Grants and similar items are recognized as revenue as soonas all eligibility requirements imposed by the provider havebeen met.
Governmental Funds are reported using the current finan-cial resources measurement focus and the modified accrualbasis of accounting. Under this method, revenues are rec-ognized when measurable and available. Sales taxes,investment income, State and federal grants and chargesfor services are accrued at the end of the fiscal year if theirreceipt is anticipated within 180 days. Property taxes areaccrued if they are collectible within 60 days after the endof the accounting period. Expenditures are generallyrecorded when a liability is incurred, as under accrualaccounting. However, debt service expenditures, as well asexpenditures related to compensated absences, claims andjudgments, are recorded only when payment is due. Gen-eral capital asset acquisitions and general principal pay-ments are reported as expenditures in governmental funds.Proceeds of general long-term debt and capital leases arereported as other financing sources.
Proprietary Funds distinguish operating revenues andexpenses from nonoperating items. Operating revenuesand expenses generally result from providing services andproducing and delivering goods in connection with a propri-etary fund's principal ongoing operations. The principaloperating revenues of the County's enterprise funds andinternal service funds are charges to customers for ser-vices. Operating expenses for enterprise funds and internalservice funds include the costs of services, administrative
County of San Diego Adopted Operational Plan Fiscal Years 2013-2014 and 2014-2015 89
Summary of Financial Policies
expenses and depreciation on capital assets. All revenuesand expenses not meeting this definition are reported asnonoperating revenues and expenses.
For governmentwide (governmental and business-typeactivities) and proprietary fund activities, the County appliesall applicable Governmental Accounting Standards Board(GASB) pronouncements, as well as any applicable pro-nouncement of the Financial Accounting Standards Board(FASB), the Accounting Principles Board, or any AccountingResearch Bulletins issued on or before November 30, 1989,unless those pronouncements conflict with or contradictGASB pronouncements. The County has elected not toapply the FASB standards issued subsequent to November30, 1989, in reporting business-type activities and proprie-tary funds. The GASB periodically updates its codificationof the existing Governmental Accounting and FinancialReporting Standards, which, along with subsequent GASBpronouncements (Statements and Interpretations), consti-tutes Generally Accepted Accounting Principles (GAAP) forgovernment agencies.
Financial Statement Presentation
For governmental funds only, current assets, current liabili-ties and fund balances are generally included on the bal-ance sheet. The statement of revenues, expenditures andchanges in fund balances - governmental funds presentincreases (i.e., revenues and other financing sources),decreases (i.e., expenditures and other financing uses) andthe net change in fund balances.
For proprietary funds and fiduciary funds, all assets and allliabilities associated with the operation of these funds areincluded on the statement of net assets. Net assets for theproprietary funds are segregated into “invested in capitalassets, net of related debt” and “unrestricted net assets” inthe County's Comprehensive Annual Financial Report(CAFR). The net assets for the fiduciary funds are describedas “held in trust for other pool participants” and “held intrust for individual investment accounts” in the CAFR. Pro-prietary funds statement of revenues, expenses andchanges in fund net assets present increases (i.e., operat-ing revenues and non-operating revenue), decreases (i.e.,operating expenses and non-operating expenses), income/loss before capital contributions and transfers, and thechange in net assets.
Differences Between Budgetary and Financial Reports
Governmental Funds — An operating budget is adoptedeach fiscal year by the Board of Supervisors for the govern-mental funds. The annual resolution adopts the budget atthe object level of expenditure within departments andauthorizes the carry forward of appropriations and relatedfunding for prior year encumbrances. Certain annual appro-priations are budgeted on a project or program basis. Ifsuch projects or programs are not completed at the end ofthe fiscal year, unexpended appropriations, includingencumbered funds, are carried forward to the following yearwith the approval of the Board of Supervisors. Any budgetamendments are approved by the Group and departmentmanagers or the Board of Supervisors.
The schedule of revenues, expenditures and changes infund balance - budget and actual - is presented asRequired Supplementary Information in the CAFR and isprepared in accordance with GAAP. This statement includesthe following columns:
The Original Budget column consists of the adoptedbudget plus the encumbrances carried forward from theprior fiscal year. The County adopts its budget subse-quent to the start of the new fiscal year.The Final Budget column consists of the Original Budgetcolumn plus amendments to the budget occurring dur-ing the fiscal year.The Actual column represents the actual amounts of rev-enues and expenditures reported on a GAAP basiswhich is the same basis that is used to present theaforementioned original and final budget.
Proprietary Funds — The Board of Supervisors approvesan annual spending plan for proprietary funds. Although theadopted expense estimates are not appropriations, theirbudgetary controls are the same as those of the govern-mental funds. Because these funds collect fees and reve-nues generally to cover the cost of the goods and servicesthey provide, their accounting and budgeting bases arecloser to commercial models.
All Funds/GASB 54 — The Governmental AccountingStandards Board (GASB) issued GASB Statement No. 54,Fund Balance Reporting and Governmental Fund Type Def-initions, which structures the fund balance components tofocus financial reporting on planned use of funds and con-straints on the specific purposes for which funds can bespent.
90 County of San DiegoAdopted Operational Plan Fiscal Years 2013-2014 and 2014-2015
Summary of Financial Policies
The five components of fund balance are:Nonspendable fund balance: inherently nonspendable.Restricted fund balance: externally enforceable limita-tions on use.Committed fund balance: self-imposed limitations set inplace prior to the end of the period.Assigned fund balance: limitation resulting fromintended use.
Unassigned fund balance - residual net resources.
Fund Balance Component Increases are shown as appro-priations (expenditures) and Fund Balance ComponentDecreases are shown as revenues when used as a fundingsource. These two categories are only used for adjustmentsto Restricted, Committed or Assigned fund balance. Theterm “Use of Fund Balance” indicates that budgetary fundbalance available for use is being applied as a fundingsource.
County of San Diego Adopted Operational Plan Fiscal Years 2013-2014 and 2014-2015 91
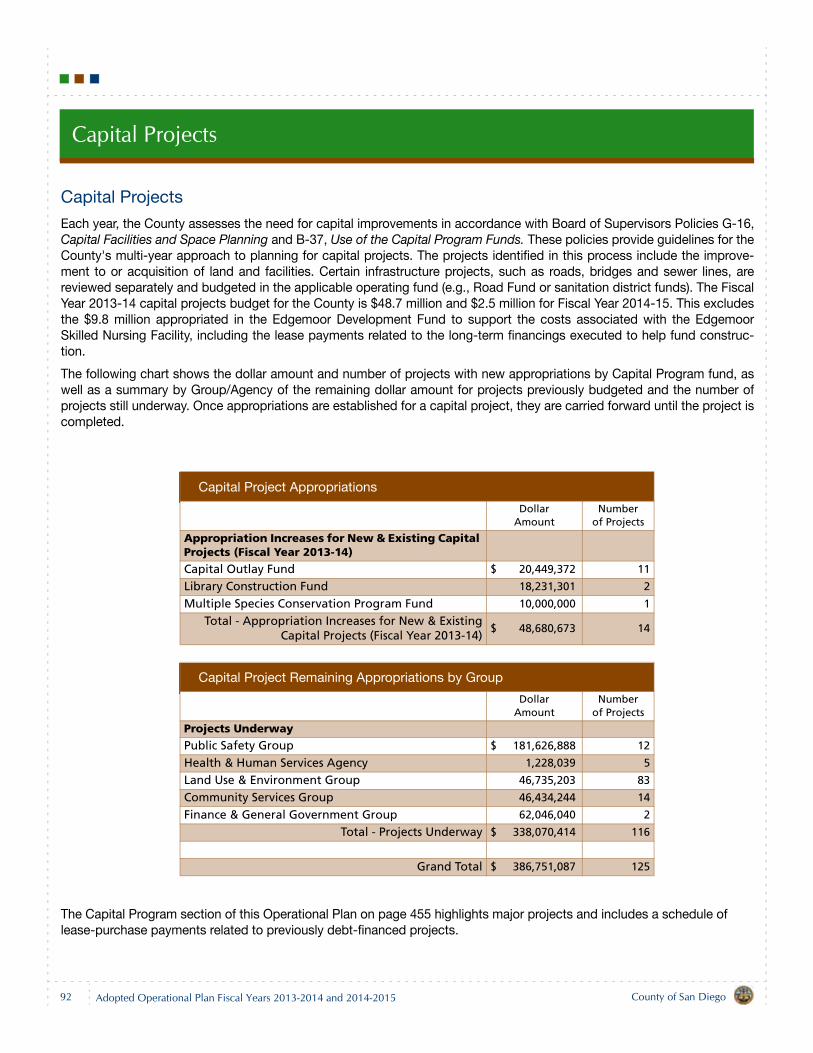
Capital Projects
Capital Projects
Each year, the County assesses the need for capital improvements in accordance with Board of Supervisors Policies G-16,Capital Facilities and Space Planning and B-37, Use of the Capital Program Funds. These policies provide guidelines for theCounty's multi-year approach to planning for capital projects. The projects identified in this process include the improve-ment to or acquisition of land and facilities. Certain infrastructure projects, such as roads, bridges and sewer lines, arereviewed separately and budgeted in the applicable operating fund (e.g., Road Fund or sanitation district funds). The FiscalYear 2013-14 capital projects budget for the County is $48.7 million and $2.5 million for Fiscal Year 2014-15. This excludesthe $9.8 million appropriated in the Edgemoor Development Fund to support the costs associated with the EdgemoorSkilled Nursing Facility, including the lease payments related to the long-term financings executed to help fund construc-tion.
The following chart shows the dollar amount and number of projects with new appropriations by Capital Program fund, aswell as a summary by Group/Agency of the remaining dollar amount for projects previously budgeted and the number ofprojects still underway. Once appropriations are established for a capital project, they are carried forward until the project iscompleted.
The Capital Program section of this Operational Plan on page 455 highlights major projects and includes a schedule of lease-purchase payments related to previously debt-financed projects.
Capital Project Appropriations
DollarAmount
Numberof Projects
Appropriation Increases for New & Existing Capital Projects (Fiscal Year 2013-14)
Capital Outlay Fund $ 20,449,372 11
Library Construction Fund 18,231,301 2
Multiple Species Conservation Program Fund 10,000,000 1
Total - Appropriation Increases for New & ExistingCapital Projects (Fiscal Year 2013-14)
$ 48,680,673 14
Capital Project Remaining Appropriations by Group
DollarAmount
Numberof Projects
Projects Underway
Public Safety Group $ 181,626,888 12
Health & Human Services Agency 1,228,039 5
Land Use & Environment Group 46,735,203 83
Community Services Group 46,434,244 14
Finance & General Government Group 62,046,040 2
Total - Projects Underway $ 338,070,414 116
Grand Total $ 386,751,087 125
92 County of San DiegoAdopted Operational Plan Fiscal Years 2013-2014 and 2014-2015
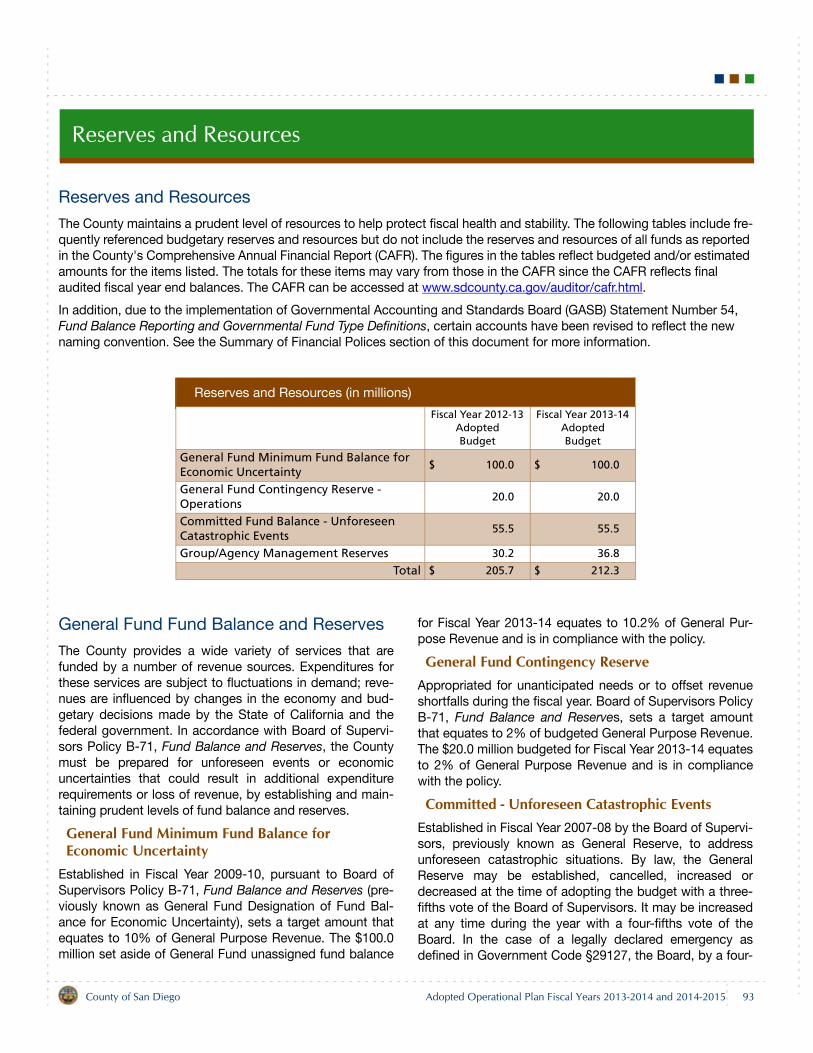
Reserves and Resources
Reserves and Resources
The County maintains a prudent level of resources to help protect fiscal health and stability. The following tables include fre-quently referenced budgetary reserves and resources but do not include the reserves and resources of all funds as reported in the County's Comprehensive Annual Financial Report (CAFR). The figures in the tables reflect budgeted and/or estimated amounts for the items listed. The totals for these items may vary from those in the CAFR since the CAFR reflects final audited fiscal year end balances. The CAFR can be accessed at www.sdcounty.ca.gov/auditor/cafr.html.
In addition, due to the implementation of Governmental Accounting and Standards Board (GASB) Statement Number 54, Fund Balance Reporting and Governmental Fund Type Definitions, certain accounts have been revised to reflect the new naming convention. See the Summary of Financial Polices section of this document for more information.
General Fund Fund Balance and Reserves
The County provides a wide variety of services that arefunded by a number of revenue sources. Expenditures forthese services are subject to fluctuations in demand; reve-nues are influenced by changes in the economy and bud-getary decisions made by the State of California and thefederal government. In accordance with Board of Supervi-sors Policy B-71, Fund Balance and Reserves, the Countymust be prepared for unforeseen events or economicuncertainties that could result in additional expenditurerequirements or loss of revenue, by establishing and main-taining prudent levels of fund balance and reserves.
General Fund Minimum Fund Balance for Economic Uncertainty
Established in Fiscal Year 2009-10, pursuant to Board ofSupervisors Policy B-71, Fund Balance and Reserves (pre-viously known as General Fund Designation of Fund Bal-ance for Economic Uncertainty), sets a target amount thatequates to 10% of General Purpose Revenue. The $100.0million set aside of General Fund unassigned fund balance
for Fiscal Year 2013-14 equates to 10.2% of General Pur-pose Revenue and is in compliance with the policy.
General Fund Contingency ReserveAppropriated for unanticipated needs or to offset revenueshortfalls during the fiscal year. Board of Supervisors PolicyB-71, Fund Balance and Reserves, sets a target amountthat equates to 2% of budgeted General Purpose Revenue.The $20.0 million budgeted for Fiscal Year 2013-14 equatesto 2% of General Purpose Revenue and is in compliancewith the policy.
Committed - Unforeseen Catastrophic EventsEstablished in Fiscal Year 2007-08 by the Board of Supervi-sors, previously known as General Reserve, to addressunforeseen catastrophic situations. By law, the GeneralReserve may be established, cancelled, increased ordecreased at the time of adopting the budget with a three-fifths vote of the Board of Supervisors. It may be increasedat any time during the year with a four-fifths vote of theBoard. In the case of a legally declared emergency asdefined in Government Code §29127, the Board, by a four-
Reserves and Resources (in millions)
Fiscal Year 2012-13 AdoptedBudget
Fiscal Year 2013-14 AdoptedBudget
General Fund Minimum Fund Balance for Economic Uncertainty
$ 100.0 $ 100.0
General Fund Contingency Reserve - Operations
20.0 20.0
Committed Fund Balance - Unforeseen Catastrophic Events
55.5 55.5
Group/Agency Management Reserves 30.2 36.8
Total $ 205.7 $ 212.3
County of San Diego Adopted Operational Plan Fiscal Years 2013-2014 and 2014-2015 93
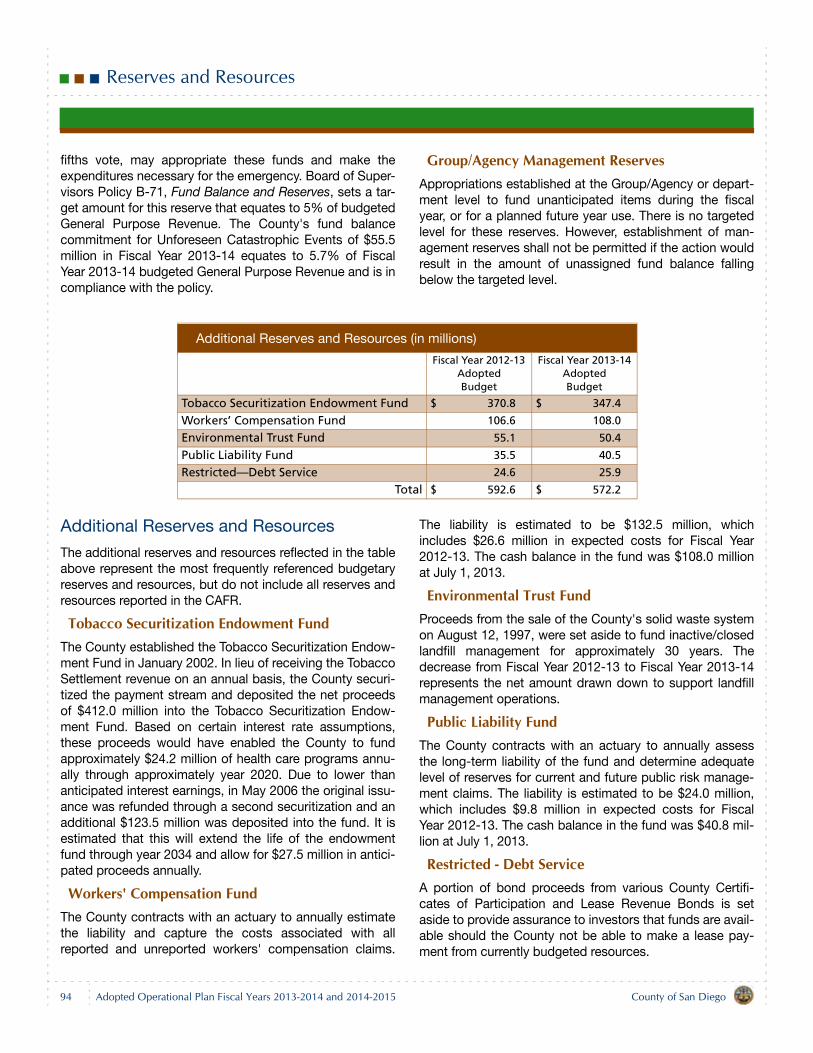
Reserves and Resources
fifths vote, may appropriate these funds and make theexpenditures necessary for the emergency. Board of Super-visors Policy B-71, Fund Balance and Reserves, sets a tar-get amount for this reserve that equates to 5% of budgetedGeneral Purpose Revenue. The County's fund balancecommitment for Unforeseen Catastrophic Events of $55.5million in Fiscal Year 2013-14 equates to 5.7% of FiscalYear 2013-14 budgeted General Purpose Revenue and is incompliance with the policy.
Group/Agency Management ReservesAppropriations established at the Group/Agency or depart-ment level to fund unanticipated items during the fiscalyear, or for a planned future year use. There is no targetedlevel for these reserves. However, establishment of man-agement reserves shall not be permitted if the action wouldresult in the amount of unassigned fund balance fallingbelow the targeted level.
Additional Reserves and Resources
The additional reserves and resources reflected in the tableabove represent the most frequently referenced budgetaryreserves and resources, but do not include all reserves andresources reported in the CAFR.
Tobacco Securitization Endowment FundThe County established the Tobacco Securitization Endow-ment Fund in January 2002. In lieu of receiving the TobaccoSettlement revenue on an annual basis, the County securi-tized the payment stream and deposited the net proceedsof $412.0 million into the Tobacco Securitization Endow-ment Fund. Based on certain interest rate assumptions,these proceeds would have enabled the County to fundapproximately $24.2 million of health care programs annu-ally through approximately year 2020. Due to lower thananticipated interest earnings, in May 2006 the original issu-ance was refunded through a second securitization and anadditional $123.5 million was deposited into the fund. It isestimated that this will extend the life of the endowmentfund through year 2034 and allow for $27.5 million in antici-pated proceeds annually.
Workers' Compensation FundThe County contracts with an actuary to annually estimatethe liability and capture the costs associated with allreported and unreported workers' compensation claims.
The liability is estimated to be $132.5 million, whichincludes $26.6 million in expected costs for Fiscal Year2012-13. The cash balance in the fund was $108.0 millionat July 1, 2013.
Environmental Trust FundProceeds from the sale of the County's solid waste systemon August 12, 1997, were set aside to fund inactive/closedlandfill management for approximately 30 years. Thedecrease from Fiscal Year 2012-13 to Fiscal Year 2013-14represents the net amount drawn down to support landfillmanagement operations.
Public Liability FundThe County contracts with an actuary to annually assessthe long-term liability of the fund and determine adequatelevel of reserves for current and future public risk manage-ment claims. The liability is estimated to be $24.0 million,which includes $9.8 million in expected costs for FiscalYear 2012-13. The cash balance in the fund was $40.8 mil-lion at July 1, 2013.
Restricted - Debt ServiceA portion of bond proceeds from various County Certifi-cates of Participation and Lease Revenue Bonds is setaside to provide assurance to investors that funds are avail-able should the County not be able to make a lease pay-ment from currently budgeted resources.
Additional Reserves and Resources (in millions)
Fiscal Year 2012-13 AdoptedBudget
Fiscal Year 2013-14AdoptedBudget
Tobacco Securitization Endowment Fund $ 370.8 $ 347.4
Workers’ Compensation Fund 106.6 108.0
Environmental Trust Fund 55.1 50.4
Public Liability Fund 35.5 40.5
Restricted—Debt Service 24.6 25.9
Total $ 592.6 $ 572.2
94 County of San DiegoAdopted Operational Plan Fiscal Years 2013-2014 and 2014-2015
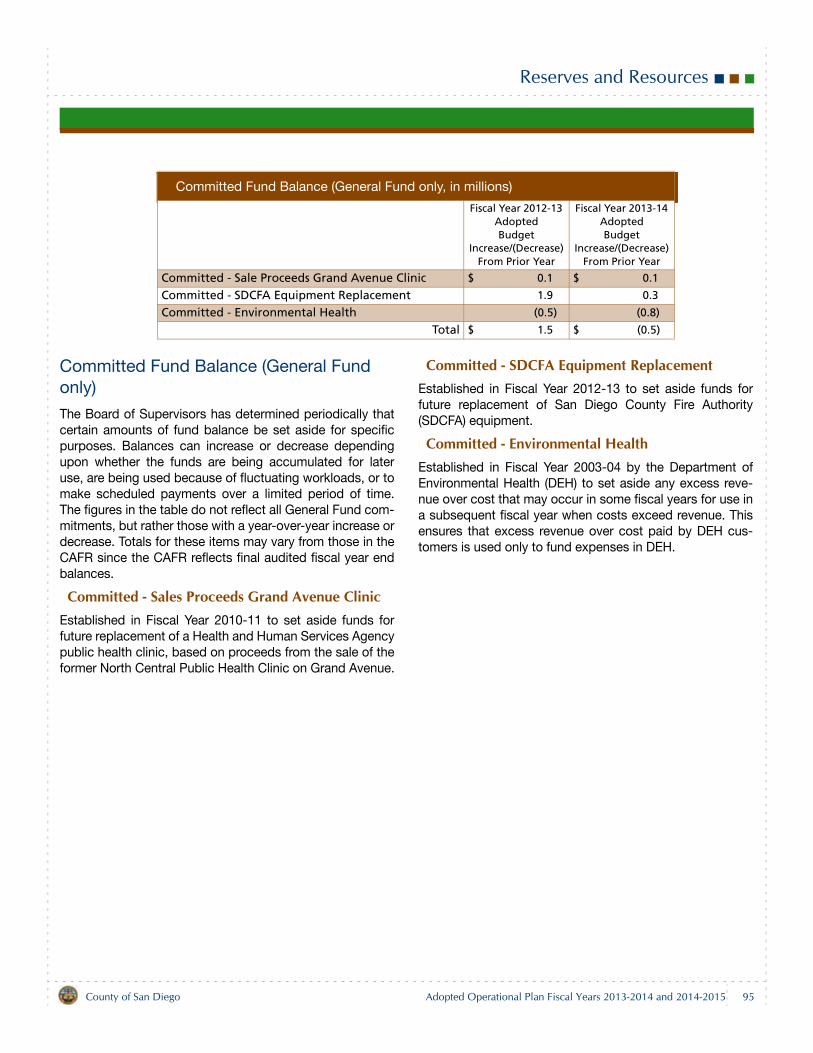
Reserves and Resources
Committed Fund Balance (General Fund only)
The Board of Supervisors has determined periodically thatcertain amounts of fund balance be set aside for specificpurposes. Balances can increase or decrease dependingupon whether the funds are being accumulated for lateruse, are being used because of fluctuating workloads, or tomake scheduled payments over a limited period of time.The figures in the table do not reflect all General Fund com-mitments, but rather those with a year-over-year increase ordecrease. Totals for these items may vary from those in theCAFR since the CAFR reflects final audited fiscal year endbalances.
Committed - Sales Proceeds Grand Avenue ClinicEstablished in Fiscal Year 2010-11 to set aside funds forfuture replacement of a Health and Human Services Agencypublic health clinic, based on proceeds from the sale of theformer North Central Public Health Clinic on Grand Avenue.
Committed - SDCFA Equipment ReplacementEstablished in Fiscal Year 2012-13 to set aside funds forfuture replacement of San Diego County Fire Authority(SDCFA) equipment.
Committed - Environmental HealthEstablished in Fiscal Year 2003-04 by the Department ofEnvironmental Health (DEH) to set aside any excess reve-nue over cost that may occur in some fiscal years for use ina subsequent fiscal year when costs exceed revenue. Thisensures that excess revenue over cost paid by DEH cus-tomers is used only to fund expenses in DEH.
Committed Fund Balance (General Fund only, in millions)
Fiscal Year 2012-13 AdoptedBudget
Increase/(Decrease)From Prior Year
Fiscal Year 2013-14 AdoptedBudget
Increase/(Decrease)From Prior Year
Committed - Sale Proceeds Grand Avenue Clinic $ 0.1 $ 0.1
Committed - SDCFA Equipment Replacement 1.9 0.3
Committed - Environmental Health (0.5) (0.8)
Total $ 1.5 $ (0.5)
County of San Diego Adopted Operational Plan Fiscal Years 2013-2014 and 2014-2015 95
Debt Management Policies and Obligations
Debt Management
The County of San Diego uses debt financing to: (i) fundcertain capital assets that support the provision of servicesby the County; (ii) achieve savings in meeting its financialobligations, including existing long-term financings andpension requirements; and (iii) provide for short-term cashflow requirements. The decision to use debt financing isgoverned by several factors including the nature of the proj-ect to be financed, availability of other financing, and debtaffordability. The County enters into both long-term andshort-term financings, which undergo the scrutiny of thecredit rating agencies. The County's long-term financingsadhere to a Board of Supervisors approved policy. This pol-icy, the County's current credit ratings and the variousforms of debt financing utilized by the County are describedin more detail below. The term debt is used to refer to cer-tain financial obligations of the County that are sold in thecapital markets, including its bonds, certificates of partici-pation and notes.
Long-Term Obligation Policy
The foundation of any well-managed debt programincludes a comprehensive and fiscally prudent policy thatsets forth parameters for issuing debt and managing theoutstanding debt portfolio and provides guidance to deci-sion makers. Adherence to a long-term financial strategyand policy is important to ensure that the County maintainsa sound debt position and that credit quality is protected.The County Board of Supervisors adopted Board Policy B-65, Long-Term Financial Obligation Management Policy, onAugust 11, 1998, and periodically reviews and updates it asnecessary. Policy B-65, along with the rating agencies'analyses, have been the foundation for managing theCounty's debt program. For purposes of this policy, long-term financial obligations are those that exceed one fiscalyear.
Long-Term Obligation LimitsAll long-term financings shall comply with federal, Stateand County Charter requirements.All long-term obligations must be approved by theBoard of Supervisors after approval and recommen-dation by the Debt Advisory Committee, which is com-posed of the Chief Financial Officer (CFO), the Auditorand Controller and the Treasurer-Tax Collector.Prior to its recommendation, the Debt Advisory Commit-tee shall assess the ability of the County to repay theobligation, identify the funding source of repayment,
evaluate the impact of the ongoing obligation on thecurrent budget and future budgets, assess the mainte-nance and operational requirements of the project to befinanced, and consider the impact on the County'scredit rating.The term of the long-term obligation will not exceed theuseful life or the average life of the project or projectsbeing financed.Annual principal and interest payments on long-termobligations of the General Fund will not exceed 5% ofGeneral Fund revenue.
Uses of Long-Term ObligationsLong-term financial obligations will not be used tofinance current operations or recurring needs.The Board of Supervisors may consider long-term finan-cial obligations for the purpose of providing office spaceor operational facilities to County departments or agen-cies, upon recommendation of the Debt Advisory Com-mittee. Capital projects identified as candidates for debtfinancing first should have been identified and prioritizedduring the development of the County's multi-year Cap-ital Improvement Needs Assessment. If the Debt Advi-sory Committee deems that the financing is feasible,financially and economically prudent, coincides with theCounty's objectives and does not impair the County'screditworthiness, then it will be forwarded to the Boardof Supervisors for consideration.
Structuring PracticesVariable rate obligations shall not exceed 15% of thetotal amount of the County's outstanding long-term obli-gations.Derivative products, such as interest rate swaps, will beconsidered only if they meet the economic goals andpolicy objectives of the County as outlined in the SwapPolicy of the Debt Advisory Committee.Long-term obligations taken on by organizations utilizingthe County as a conduit issuer must qualify for aninvestment grade rating by one of the nationally recog-nized rating agencies (either with or without alternativecredit enhancement). An exception to this requirementwould be private placements subject to approval by theDebt Advisory Committee.
Management PracticesThe County shall encourage and maintain good relationswith credit rating agencies, investors in the County'slong-term financial obligations, and those in the financial
96 County of San DiegoAdopted Operational Plan Fiscal Years 2013-2014 and 2014-2015
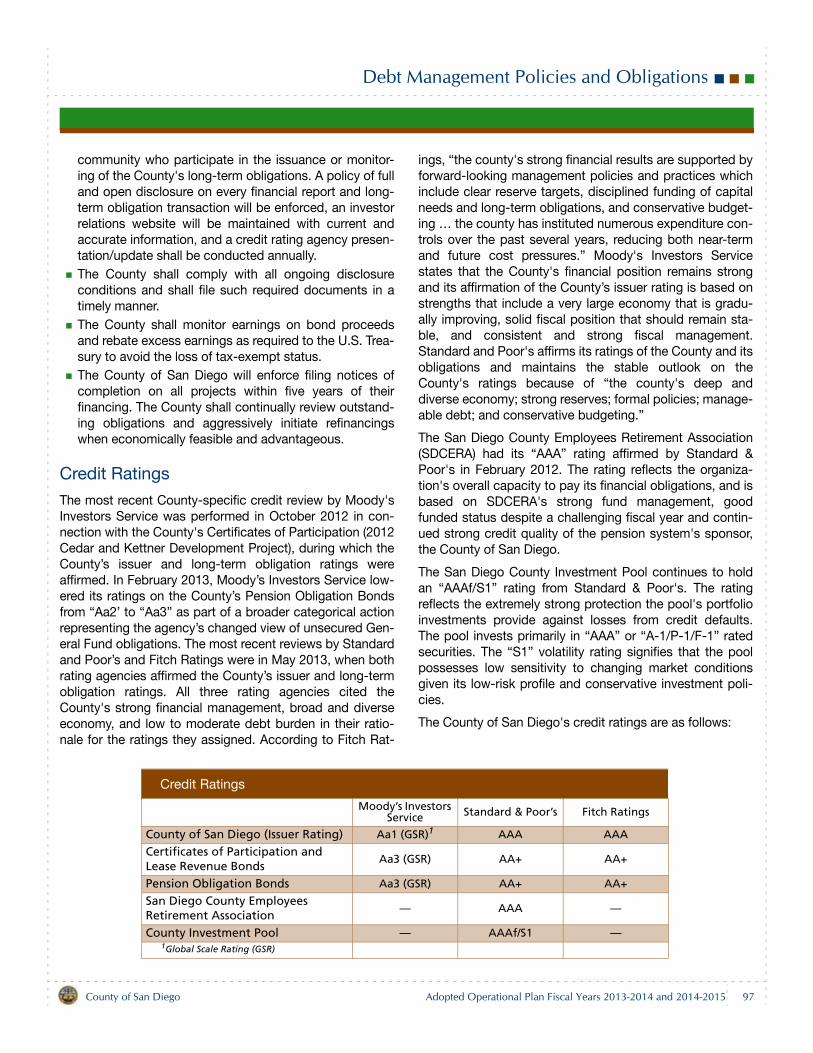
Debt Management Policies and Obligations
community who participate in the issuance or monitor-ing of the County's long-term obligations. A policy of fulland open disclosure on every financial report and long-term obligation transaction will be enforced, an investorrelations website will be maintained with current andaccurate information, and a credit rating agency presen-tation/update shall be conducted annually.The County shall comply with all ongoing disclosureconditions and shall file such required documents in atimely manner.The County shall monitor earnings on bond proceedsand rebate excess earnings as required to the U.S. Trea-sury to avoid the loss of tax-exempt status.The County of San Diego will enforce filing notices ofcompletion on all projects within five years of theirfinancing. The County shall continually review outstand-ing obligations and aggressively initiate refinancingswhen economically feasible and advantageous.
Credit Ratings
The most recent County-specific credit review by Moody'sInvestors Service was performed in October 2012 in con-nection with the County's Certificates of Participation (2012Cedar and Kettner Development Project), during which theCounty’s issuer and long-term obligation ratings wereaffirmed. In February 2013, Moody’s Investors Service low-ered its ratings on the County’s Pension Obligation Bondsfrom “Aa2’ to “Aa3” as part of a broader categorical actionrepresenting the agency’s changed view of unsecured Gen-eral Fund obligations. The most recent reviews by Standardand Poor’s and Fitch Ratings were in May 2013, when bothrating agencies affirmed the County’s issuer and long-termobligation ratings. All three rating agencies cited theCounty's strong financial management, broad and diverseeconomy, and low to moderate debt burden in their ratio-nale for the ratings they assigned. According to Fitch Rat-
ings, “the county's strong financial results are supported byforward-looking management policies and practices whichinclude clear reserve targets, disciplined funding of capitalneeds and long-term obligations, and conservative budget-ing … the county has instituted numerous expenditure con-trols over the past several years, reducing both near-termand future cost pressures.” Moody's Investors Servicestates that the County's financial position remains strongand its affirmation of the County’s issuer rating is based onstrengths that include a very large economy that is gradu-ally improving, solid fiscal position that should remain sta-ble, and consistent and strong fiscal management.Standard and Poor's affirms its ratings of the County and itsobligations and maintains the stable outlook on theCounty's ratings because of “the county's deep anddiverse economy; strong reserves; formal policies; manage-able debt; and conservative budgeting.”
The San Diego County Employees Retirement Association(SDCERA) had its “AAA” rating affirmed by Standard &Poor's in February 2012. The rating reflects the organiza-tion's overall capacity to pay its financial obligations, and isbased on SDCERA's strong fund management, goodfunded status despite a challenging fiscal year and contin-ued strong credit quality of the pension system's sponsor,the County of San Diego.
The San Diego County Investment Pool continues to holdan “AAAf/S1” rating from Standard & Poor's. The ratingreflects the extremely strong protection the pool's portfolioinvestments provide against losses from credit defaults.The pool invests primarily in “AAA” or “A-1/P-1/F-1” ratedsecurities. The “S1” volatility rating signifies that the poolpossesses low sensitivity to changing market conditionsgiven its low-risk profile and conservative investment poli-cies.
The County of San Diego's credit ratings are as follows:
Credit Ratings
Moody’s Investors Service Standard & Poor’s Fitch Ratings
County of San Diego (Issuer Rating) Aa1 (GSR)1 AAA AAA
Certificates of Participation and Lease Revenue Bonds
Aa3 (GSR) AA+ AA+
Pension Obligation Bonds Aa3 (GSR) AA+ AA+
San Diego County Employees Retirement Association
— AAA —
County Investment Pool — AAAf/S1 — 1Global Scale Rating (GSR)
County of San Diego Adopted Operational Plan Fiscal Years 2013-2014 and 2014-2015 97
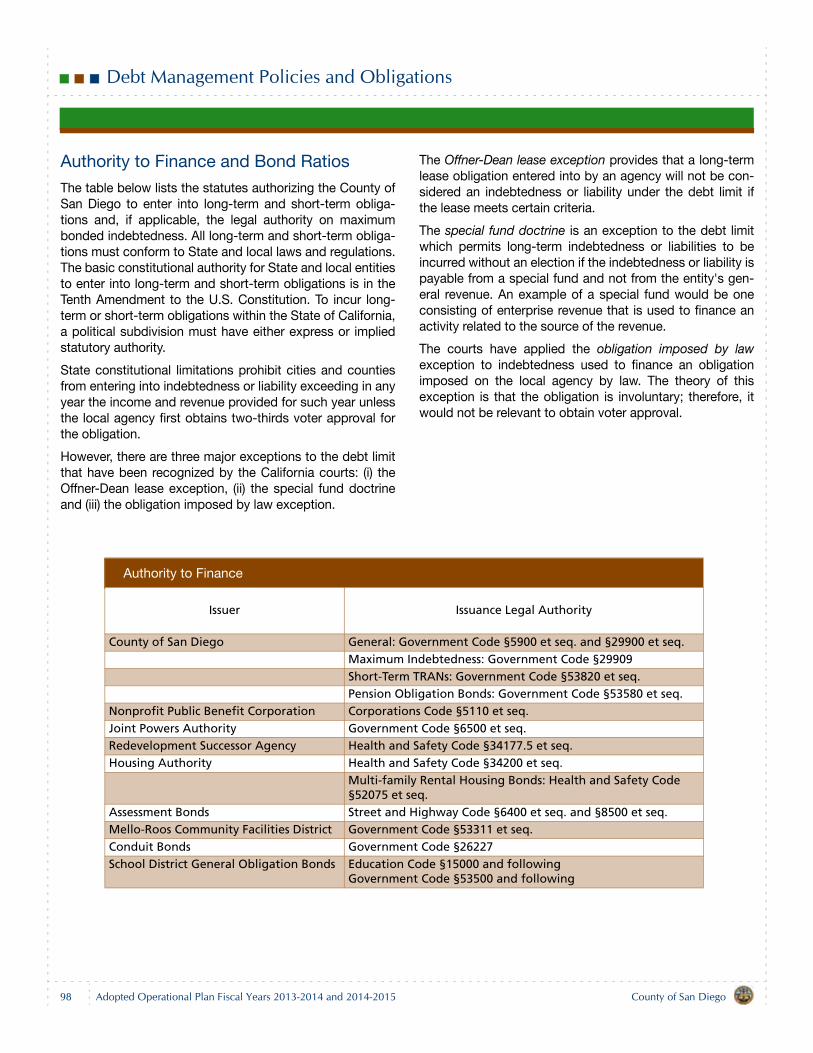
Debt Management Policies and Obligations
Authority to Finance and Bond Ratios
The table below lists the statutes authorizing the County ofSan Diego to enter into long-term and short-term obliga-tions and, if applicable, the legal authority on maximumbonded indebtedness. All long-term and short-term obliga-tions must conform to State and local laws and regulations.The basic constitutional authority for State and local entitiesto enter into long-term and short-term obligations is in theTenth Amendment to the U.S. Constitution. To incur long-term or short-term obligations within the State of California,a political subdivision must have either express or impliedstatutory authority.
State constitutional limitations prohibit cities and countiesfrom entering into indebtedness or liability exceeding in anyyear the income and revenue provided for such year unlessthe local agency first obtains two-thirds voter approval forthe obligation.
However, there are three major exceptions to the debt limitthat have been recognized by the California courts: (i) theOffner-Dean lease exception, (ii) the special fund doctrineand (iii) the obligation imposed by law exception.
The Offner-Dean lease exception provides that a long-termlease obligation entered into by an agency will not be con-sidered an indebtedness or liability under the debt limit ifthe lease meets certain criteria.
The special fund doctrine is an exception to the debt limitwhich permits long-term indebtedness or liabilities to beincurred without an election if the indebtedness or liability ispayable from a special fund and not from the entity's gen-eral revenue. An example of a special fund would be oneconsisting of enterprise revenue that is used to finance anactivity related to the source of the revenue.
The courts have applied the obligation imposed by lawexception to indebtedness used to finance an obligationimposed on the local agency by law. The theory of thisexception is that the obligation is involuntary; therefore, itwould not be relevant to obtain voter approval.
Authority to Finance
Issuer Issuance Legal Authority
County of San Diego General: Government Code §5900 et seq. and §29900 et seq.Maximum Indebtedness: Government Code §29909Short-Term TRANs: Government Code §53820 et seq.Pension Obligation Bonds: Government Code §53580 et seq.
Nonprofit Public Benefit Corporation Corporations Code §5110 et seq.Joint Powers Authority Government Code §6500 et seq.Redevelopment Successor Agency Health and Safety Code §34177.5 et seq.Housing Authority Health and Safety Code §34200 et seq.
Multi-family Rental Housing Bonds: Health and Safety Code §52075 et seq.
Assessment Bonds Street and Highway Code §6400 et seq. and §8500 et seq.Mello-Roos Community Facilities District Government Code §53311 et seq.Conduit Bonds Government Code §26227School District General Obligation Bonds Education Code §15000 and following
Government Code §53500 and following
98 County of San DiegoAdopted Operational Plan Fiscal Years 2013-2014 and 2014-2015
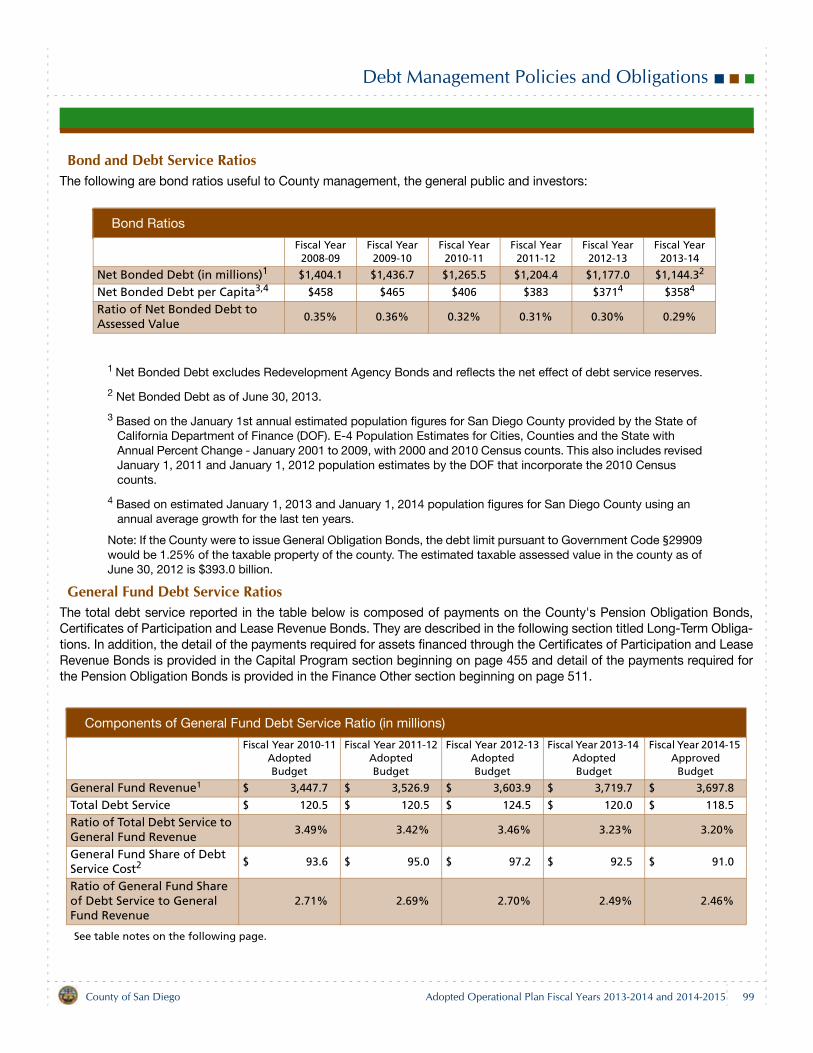
Debt Management Policies and Obligations
Bond and Debt Service RatiosThe following are bond ratios useful to County management, the general public and investors:
1 Net Bonded Debt excludes Redevelopment Agency Bonds and reflects the net effect of debt service reserves.
2 Net Bonded Debt as of June 30, 2013.
3 Based on the January 1st annual estimated population figures for San Diego County provided by the State of California Department of Finance (DOF). E-4 Population Estimates for Cities, Counties and the State with Annual Percent Change - January 2001 to 2009, with 2000 and 2010 Census counts. This also includes revised January 1, 2011 and January 1, 2012 population estimates by the DOF that incorporate the 2010 Census counts.
4 Based on estimated January 1, 2013 and January 1, 2014 population figures for San Diego County using an annual average growth for the last ten years.
Note: If the County were to issue General Obligation Bonds, the debt limit pursuant to Government Code §29909 would be 1.25% of the taxable property of the county. The estimated taxable assessed value in the county as of June 30, 2012 is $393.0 billion.
General Fund Debt Service RatiosThe total debt service reported in the table below is composed of payments on the County's Pension Obligation Bonds,Certificates of Participation and Lease Revenue Bonds. They are described in the following section titled Long-Term Obliga-tions. In addition, the detail of the payments required for assets financed through the Certificates of Participation and LeaseRevenue Bonds is provided in the Capital Program section beginning on page 455 and detail of the payments required forthe Pension Obligation Bonds is provided in the Finance Other section beginning on page 511.
See table notes on the following page.
Bond Ratios
Fiscal Year 2008-09
Fiscal Year 2009-10
Fiscal Year 2010-11
Fiscal Year 2011-12
Fiscal Year 2012-13
Fiscal Year2013-14
Net Bonded Debt (in millions)1 $1,404.1 $1,436.7 $1,265.5 $1,204.4 $1,177.0 $1,144.32
Net Bonded Debt per Capita3,4 $458 $465 $406 $383 $3714 $3584
Ratio of Net Bonded Debt to Assessed Value
0.35% 0.36% 0.32% 0.31% 0.30% 0.29%
Components of General Fund Debt Service Ratio (in millions)
Fiscal Year 2010-11AdoptedBudget
Fiscal Year 2011-12AdoptedBudget
Fiscal Year 2012-13AdoptedBudget
Fiscal Year 2013-14 AdoptedBudget
Fiscal Year 2014-15 Approved
Budget
General Fund Revenue1 $ 3,447.7 $ 3,526.9 $ 3,603.9 $ 3,719.7 $ 3,697.8
Total Debt Service $ 120.5 $ 120.5 $ 124.5 $ 120.0 $ 118.5
Ratio of Total Debt Service to General Fund Revenue
3.49% 3.42% 3.46% 3.23% 3.20%
General Fund Share of Debt Service Cost2 $ 93.6 $ 95.0 $ 97.2 $ 92.5 $ 91.0
Ratio of General Fund Share of Debt Service to General Fund Revenue
2.71% 2.69% 2.70% 2.49% 2.46%
County of San Diego Adopted Operational Plan Fiscal Years 2013-2014 and 2014-2015 99
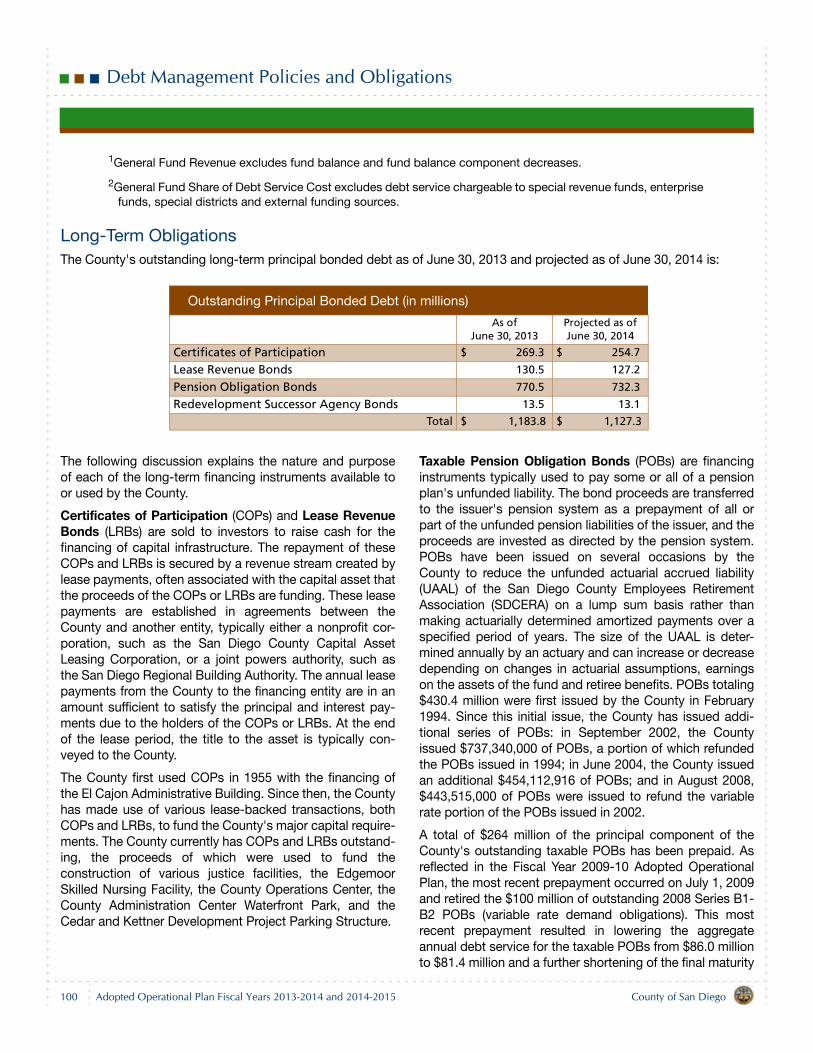
Debt Management Policies and Obligations
1General Fund Revenue excludes fund balance and fund balance component decreases.
2General Fund Share of Debt Service Cost excludes debt service chargeable to special revenue funds, enterprise funds, special districts and external funding sources.
Long-Term ObligationsThe County's outstanding long-term principal bonded debt as of June 30, 2013 and projected as of June 30, 2014 is:
The following discussion explains the nature and purposeof each of the long-term financing instruments available toor used by the County.
Certificates of Participation (COPs) and Lease RevenueBonds (LRBs) are sold to investors to raise cash for thefinancing of capital infrastructure. The repayment of theseCOPs and LRBs is secured by a revenue stream created bylease payments, often associated with the capital asset thatthe proceeds of the COPs or LRBs are funding. These leasepayments are established in agreements between theCounty and another entity, typically either a nonprofit cor-poration, such as the San Diego County Capital AssetLeasing Corporation, or a joint powers authority, such asthe San Diego Regional Building Authority. The annual leasepayments from the County to the financing entity are in anamount sufficient to satisfy the principal and interest pay-ments due to the holders of the COPs or LRBs. At the endof the lease period, the title to the asset is typically con-veyed to the County.
The County first used COPs in 1955 with the financing ofthe El Cajon Administrative Building. Since then, the Countyhas made use of various lease-backed transactions, bothCOPs and LRBs, to fund the County's major capital require-ments. The County currently has COPs and LRBs outstand-ing, the proceeds of which were used to fund theconstruction of various justice facilities, the EdgemoorSkilled Nursing Facility, the County Operations Center, theCounty Administration Center Waterfront Park, and theCedar and Kettner Development Project Parking Structure.
Taxable Pension Obligation Bonds (POBs) are financinginstruments typically used to pay some or all of a pensionplan's unfunded liability. The bond proceeds are transferredto the issuer's pension system as a prepayment of all orpart of the unfunded pension liabilities of the issuer, and theproceeds are invested as directed by the pension system.POBs have been issued on several occasions by theCounty to reduce the unfunded actuarial accrued liability(UAAL) of the San Diego County Employees RetirementAssociation (SDCERA) on a lump sum basis rather thanmaking actuarially determined amortized payments over aspecified period of years. The size of the UAAL is deter-mined annually by an actuary and can increase or decreasedepending on changes in actuarial assumptions, earningson the assets of the fund and retiree benefits. POBs totaling$430.4 million were first issued by the County in February1994. Since this initial issue, the County has issued addi-tional series of POBs: in September 2002, the Countyissued $737,340,000 of POBs, a portion of which refundedthe POBs issued in 1994; in June 2004, the County issuedan additional $454,112,916 of POBs; and in August 2008,$443,515,000 of POBs were issued to refund the variablerate portion of the POBs issued in 2002.
A total of $264 million of the principal component of theCounty's outstanding taxable POBs has been prepaid. Asreflected in the Fiscal Year 2009-10 Adopted OperationalPlan, the most recent prepayment occurred on July 1, 2009and retired the $100 million of outstanding 2008 Series B1-B2 POBs (variable rate demand obligations). This mostrecent prepayment resulted in lowering the aggregateannual debt service for the taxable POBs from $86.0 millionto $81.4 million and a further shortening of the final maturity
Outstanding Principal Bonded Debt (in millions)
As of June 30, 2013
Projected as of June 30, 2014
Certificates of Participation $ 269.3 $ 254.7
Lease Revenue Bonds 130.5 127.2
Pension Obligation Bonds 770.5 732.3
Redevelopment Successor Agency Bonds 13.5 13.1
Total $ 1,183.8 $ 1,127.3
100 County of San DiegoAdopted Operational Plan Fiscal Years 2013-2014 and 2014-2015
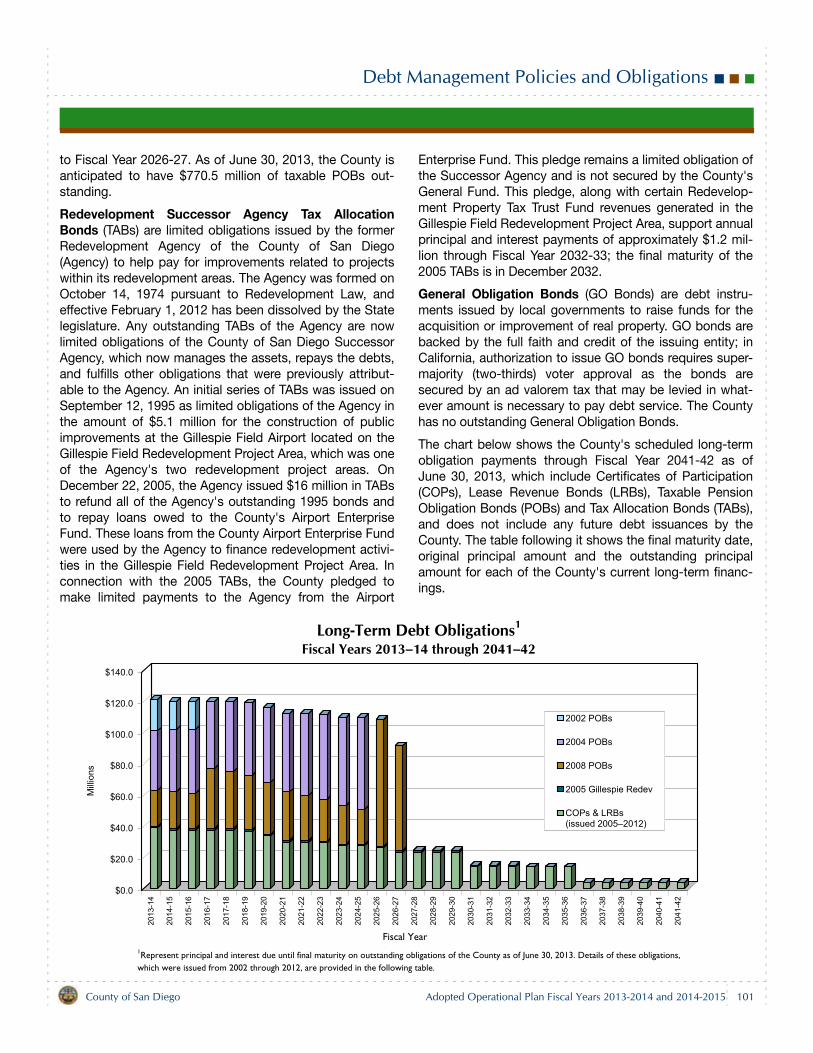
Debt Management Policies and Obligations
to Fiscal Year 2026-27. As of June 30, 2013, the County isanticipated to have $770.5 million of taxable POBs out-standing.
Redevelopment Successor Agency Tax AllocationBonds (TABs) are limited obligations issued by the formerRedevelopment Agency of the County of San Diego(Agency) to help pay for improvements related to projectswithin its redevelopment areas. The Agency was formed onOctober 14, 1974 pursuant to Redevelopment Law, andeffective February 1, 2012 has been dissolved by the Statelegislature. Any outstanding TABs of the Agency are nowlimited obligations of the County of San Diego SuccessorAgency, which now manages the assets, repays the debts,and fulfills other obligations that were previously attribut-able to the Agency. An initial series of TABs was issued onSeptember 12, 1995 as limited obligations of the Agency inthe amount of $5.1 million for the construction of publicimprovements at the Gillespie Field Airport located on theGillespie Field Redevelopment Project Area, which was oneof the Agency's two redevelopment project areas. OnDecember 22, 2005, the Agency issued $16 million in TABsto refund all of the Agency's outstanding 1995 bonds andto repay loans owed to the County's Airport EnterpriseFund. These loans from the County Airport Enterprise Fundwere used by the Agency to finance redevelopment activi-ties in the Gillespie Field Redevelopment Project Area. Inconnection with the 2005 TABs, the County pledged tomake limited payments to the Agency from the Airport
Enterprise Fund. This pledge remains a limited obligation ofthe Successor Agency and is not secured by the County'sGeneral Fund. This pledge, along with certain Redevelop-ment Property Tax Trust Fund revenues generated in theGillespie Field Redevelopment Project Area, support annualprincipal and interest payments of approximately $1.2 mil-lion through Fiscal Year 2032-33; the final maturity of the2005 TABs is in December 2032.
General Obligation Bonds (GO Bonds) are debt instru-ments issued by local governments to raise funds for theacquisition or improvement of real property. GO bonds arebacked by the full faith and credit of the issuing entity; inCalifornia, authorization to issue GO bonds requires super-majority (two-thirds) voter approval as the bonds aresecured by an ad valorem tax that may be levied in what-ever amount is necessary to pay debt service. The Countyhas no outstanding General Obligation Bonds.
The chart below shows the County's scheduled long-termobligation payments through Fiscal Year 2041-42 as ofJune 30, 2013, which include Certificates of Participation(COPs), Lease Revenue Bonds (LRBs), Taxable PensionObligation Bonds (POBs) and Tax Allocation Bonds (TABs),and does not include any future debt issuances by theCounty. The table following it shows the final maturity date,original principal amount and the outstanding principalamount for each of the County's current long-term financ-ings.
$0.0
$20.0
$40.0
$60.0
$80.0
$100.0
$120.0
$140.0
Mill
ions
2013
-14
2014
-15
2015
-16
2016
-17
2017
-18
2018
-19
2019
-20
2020
-21
2021
-22
2022
-23
2023
-24
2024
-25
2025
-26
2026
-27
2027
-28
2028
-29
2029
-30
2030
-31
2031
-32
2032
-33
2033
-34
2034
-35
2035
-36
2036
-37
2037
-38
2038
-39
2039
-40
2040
-41
2041
-42
Fiscal Year
Long-Term Debt Obligations1
Fiscal Years 2013–14 through 2041–42
2002 POBs
2004 POBs
2008 POBs
2005 Gillespie Redev
COPs & LRBs(issued 2005–2012)
1Represent principal and interest due until final maturity on outstanding obligations of the County as of June 30, 2013. Details of these obligations, which were issued from 2002 through 2012, are provided in the following table.
County of San Diego Adopted Operational Plan Fiscal Years 2013-2014 and 2014-2015 101
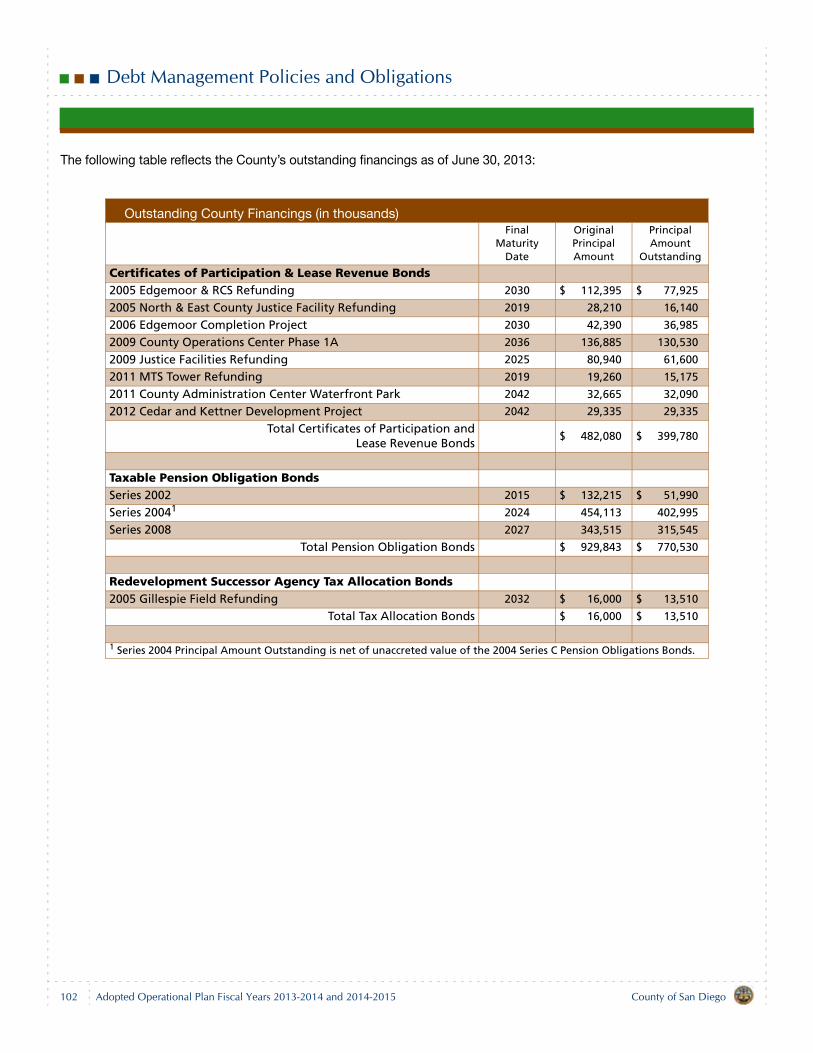
Debt Management Policies and Obligations
The following table reflects the County’s outstanding financings as of June 30, 2013:
Outstanding County Financings (in thousands)Final
MaturityDate
OriginalPrincipalAmount
PrincipalAmount
Outstanding
Certificates of Participation & Lease Revenue Bonds2005 Edgemoor & RCS Refunding 2030 $ 112,395 $ 77,925
2005 North & East County Justice Facility Refunding 2019 28,210 16,140
2006 Edgemoor Completion Project 2030 42,390 36,985
2009 County Operations Center Phase 1A 2036 136,885 130,530
2009 Justice Facilities Refunding 2025 80,940 61,600
2011 MTS Tower Refunding 2019 19,260 15,175
2011 County Administration Center Waterfront Park 2042 32,665 32,090
2012 Cedar and Kettner Development Project 2042 29,335 29,335
Total Certificates of Participation andLease Revenue Bonds
$ 482,080 $ 399,780
Taxable Pension Obligation BondsSeries 2002 2015 $ 132,215 $ 51,990
Series 20041 2024 454,113 402,995
Series 2008 2027 343,515 315,545
Total Pension Obligation Bonds $ 929,843 $ 770,530
Redevelopment Successor Agency Tax Allocation Bonds2005 Gillespie Field Refunding 2032 $ 16,000 $ 13,510
Total Tax Allocation Bonds $ 16,000 $ 13,510
1 Series 2004 Principal Amount Outstanding is net of unaccreted value of the 2004 Series C Pension Obligations Bonds.
102 County of San DiegoAdopted Operational Plan Fiscal Years 2013-2014 and 2014-2015
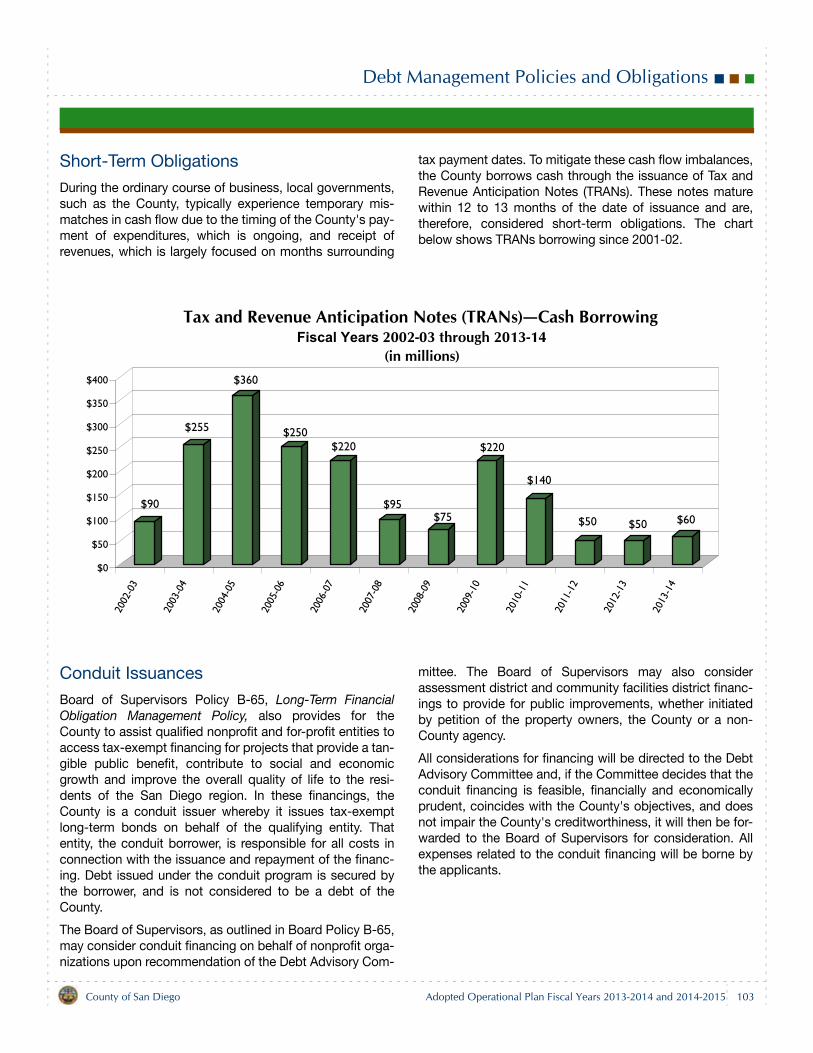
Debt Management Policies and Obligations
Short-Term Obligations
During the ordinary course of business, local governments,such as the County, typically experience temporary mis-matches in cash flow due to the timing of the County's pay-ment of expenditures, which is ongoing, and receipt ofrevenues, which is largely focused on months surrounding
tax payment dates. To mitigate these cash flow imbalances,the County borrows cash through the issuance of Tax andRevenue Anticipation Notes (TRANs). These notes maturewithin 12 to 13 months of the date of issuance and are,therefore, considered short-term obligations. The chartbelow shows TRANs borrowing since 2001-02.
Conduit Issuances
Board of Supervisors Policy B-65, Long-Term FinancialObligation Management Policy, also provides for theCounty to assist qualified nonprofit and for-profit entities toaccess tax-exempt financing for projects that provide a tan-gible public benefit, contribute to social and economicgrowth and improve the overall quality of life to the resi-dents of the San Diego region. In these financings, theCounty is a conduit issuer whereby it issues tax-exemptlong-term bonds on behalf of the qualifying entity. Thatentity, the conduit borrower, is responsible for all costs inconnection with the issuance and repayment of the financ-ing. Debt issued under the conduit program is secured bythe borrower, and is not considered to be a debt of theCounty.
The Board of Supervisors, as outlined in Board Policy B-65,may consider conduit financing on behalf of nonprofit orga-nizations upon recommendation of the Debt Advisory Com-
mittee. The Board of Supervisors may also considerassessment district and community facilities district financ-ings to provide for public improvements, whether initiatedby petition of the property owners, the County or a non-County agency.
All considerations for financing will be directed to the DebtAdvisory Committee and, if the Committee decides that theconduit financing is feasible, financially and economicallyprudent, coincides with the County's objectives, and doesnot impair the County's creditworthiness, it will then be for-warded to the Board of Supervisors for consideration. Allexpenses related to the conduit financing will be borne bythe applicants.
$90
$255
$360
$250$220
$95$75
$220
$140
$50 $50 $60
$0
$50
$100
$150
$200
$250
$300
$350
$400
2002
-03
2003
-04
2004
-05
2005
-06
2006
-07
2007
-08
2008
-09
2009
-10
2010
-11
2011
-12
2012
-13
2013
-14
Tax and Revenue Anticipation Notes (TRANs)—Cash BorrowingFiscal Years 2002-03 through 2013-14
(in millions)
County of San Diego Adopted Operational Plan Fiscal Years 2013-2014 and 2014-2015 103
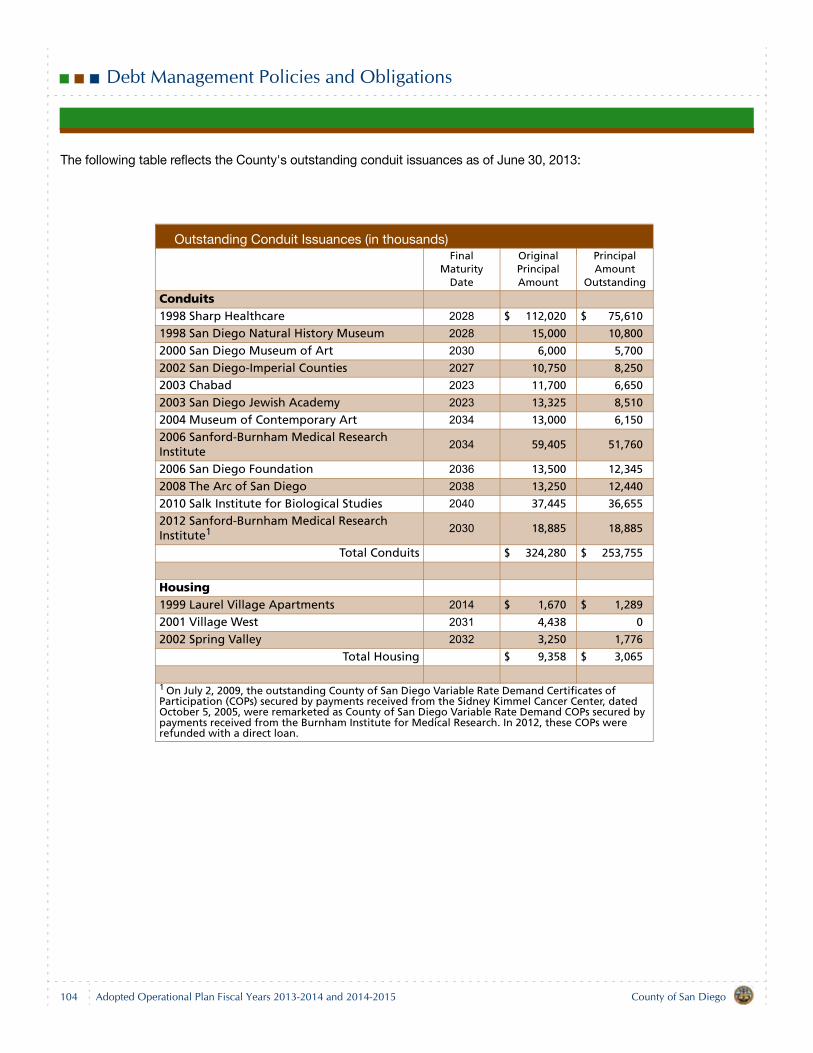
Debt Management Policies and Obligations
The following table reflects the County's outstanding conduit issuances as of June 30, 2013:
Outstanding Conduit Issuances (in thousands)Final
Maturity Date
OriginalPrincipalAmount
PrincipalAmount
Outstanding
Conduits1998 Sharp Healthcare 2028 $ 112,020 $ 75,610
1998 San Diego Natural History Museum 2028 15,000 10,800
2000 San Diego Museum of Art 2030 6,000 5,700
2002 San Diego-Imperial Counties 2027 10,750 8,250
2003 Chabad 2023 11,700 6,650
2003 San Diego Jewish Academy 2023 13,325 8,510
2004 Museum of Contemporary Art 2034 13,000 6,150
2006 Sanford-Burnham Medical Research Institute
2034 59,405 51,760
2006 San Diego Foundation 2036 13,500 12,345
2008 The Arc of San Diego 2038 13,250 12,440
2010 Salk Institute for Biological Studies 2040 37,445 36,655
2012 Sanford-Burnham Medical Research Institute1 2030 18,885 18,885
Total Conduits $ 324,280 $ 253,755
Housing1999 Laurel Village Apartments 2014 $ 1,670 $ 1,289
2001 Village West 2031 4,438 0
2002 Spring Valley 2032 3,250 1,776
Total Housing $ 9,358 $ 3,065
1 On July 2, 2009, the outstanding County of San Diego Variable Rate Demand Certificates of Participation (COPs) secured by payments received from the Sidney Kimmel Cancer Center, dated October 5, 2005, were remarketed as County of San Diego Variable Rate Demand COPs secured by payments received from the Burnham Institute for Medical Research. In 2012, these COPs were refunded with a direct loan.
104 County of San DiegoAdopted Operational Plan Fiscal Years 2013-2014 and 2014-2015
Excellence in Governing
Recognitions of Excellence
The County of San Diego continually looks to improve bystreamlining operations, leveraging technology, maximizingefficiency and expanding the public services and informa-tion available online and through social media, amongmany other innovations. The County remains dedicated tomaintaining its standing as a best practices organization,offering programs that improve the lives of residents inways that are relevant and measurable.
The County is proud that its leadership and operationalexcellence continue to be recognized. Awards receivedfrom the State and national organizations representingcounty governments are highlighted below:
The County of San Diego received Statewide recognitionfrom the California State Association of Counties(CSAC) in 2013. Three programs, described in the fol-lowing section, were honored with Merit Awards. CSACawards highlight creative programs of California's coun-ties, recognizing leadership and results that improve ser-vice to residents and save time and money.In 2013, the County again earned recognition from theNational Association of Counties (NACo). Twenty-fourprograms, each described in the following section,received Achievement Awards for excellence. Nation-wide, only one other county received more awards.These awards in 21 categories recognize innovative pro-grams that modernize county government and increaseservices to residents. The award-winning programsoperate within all five County business groups andinclude programs that serve children, youth and seniors,promote environmental protection, enhance publicsafety and reflect efficient, effective county administra-tion.
Descriptions of these awards and additional recognitions ofexcellence that honor the County's progress in meeting itsstrategic goals appear in the following section:
Strategic Initiative: Safe CommunitiesThe San Diego County Taxpayers Association recog-nized the County of San Diego with its highest honor asthe winner of the 2013 Grand Golden WatchdogAward for the Sheriff's Department Multi-DisciplineGraffiti Abatement Program. This innovative and collab-
orative program allows law enforcement or public worksstaff of partnering agencies to centralize graffiti “tags” ina single database in order to link various graffiti through-out the county to specific individuals. The County's Juvenile Forensic Assistance for Stabiliza-tion and Treatment Program (JFAST), a collaborativecourt program to help juvenile offenders with mentalhealth needs, was awarded the 2012 Juvenile Justice“At Large” Award by the County Juvenile JusticeCommission.The Medical Examiner's Office was recognized by theSan Diego Police Department (SDPD) and Lifeshar-ing, a federally-designated organ and tissue recoveryorganization, for efforts to support crime victims. Theoffice was instrumental in helping slain SDPD OfficerJeremy Henwood fulfill his wish to donate his organsafter death, despite an ongoing homicide investigation.The organizations recognized the contributions of theMedical Examiner's Office toward making Henwood ahero in death as in life.The Office of Emergency Services (OES) received a 2012Digital Government Achievement Award from theCenter for Digital Government for the County's webportal to access emergency information atwww.sdcountyemergency.com.The California Emergency Services Associationselected two communications programs of OES for theirGold Award for outstanding service in emergency man-agement. Programs honored include the AccessibleAlertSanDiego mass notification system which deliversemergency messages to the hearing- and visually-impaired, and the ReadySanDiego Partner Connection,a social network that helps improve emergency pre-paredness in the business community.The Department of Parks and Recreation (DPR) earnedthe 2012 Recreation Facility/Park Design Achieve-ment Award from the California Park and RecreationSociety District 12 for the Sellers-Keever EducationalActivity Center in Imperial Beach. Named for CharlieKeever and Jonathan Sellers, two boys who were killedin the area in 1993, the center was designed with helpfrom the boys' mothers and was honored for excellencein design of facilities that promote recreation andstrengthen community, safety and security.
County of San Diego Adopted Operational Plan Fiscal Years 2013-2014 and 2014-2015 105
Excellence in Governing
NACo 2013 Achievement AwardsEstablishing Local Assistance Centers—improvedthe County's planning to help the region recover froma disaster by pre-designating and training staff.Graffiti Tracker—increased graffiti tracking, prosecu-tion and cost recovery using a web-based programand GPS-enabled cameras coordinated among 13participating public agencies.Forensic Pathology Residency Training and AutopsyOrientation Program—an effort to train medical stu-dents and pathology residents in the value of theautopsy and autopsy technique in the practice ofclinical medicine.JFAST: Juvenile Forensic Assistance for Stabilizationand Treatment Program—a program for juvenileoffenders with mental health needs that helps youngpeople manage their mental health, end delinquentbehaviors and engage in positive activities with plansfor a positive future.San Diego Clean Slate Expungement Clinic—amonthly Saturday self-help clinic that offers informa-tion and assistance from the Public Defender to resi-dents who want to expunge their criminal records, animportant step toward rehabilitation and successfulreentry into the local community. San Diego Emergency Smart Phone Application—enables residents to receive emergency notificationson their mobile phones, access disaster informationduring a fire or other event and prepare for a disaster.Sheriff's Analysis-Driven Law Enforcement—employspredictive policing techniques and analysis for moreeffective and efficient crime fighting in unincorpo-rated San Diego County.
Strategic Initiative: Healthy FamiliesThe Fallbrook Community Center received the Lightson Award from the San Diego County Office of Edu-cation for the After School Education and Safety Pro-gram which provides tutoring, nutrition education,mentoring and other positive activities for kindergartenthrough sixth grade students.The San Diego Hunger Coalition honored the Healthand Human Services Agency's (HHSA’s) South RegionFamily Resource Center with two CalFresh Task Forceawards. CalFresh is California's name for the federalSupplemental Nutrition Assistance Program, formerlyknown as food stamps.
The Liaison of the Year award recognized a partner-ship with the Chula Vista Community Collaborative toassist families with CalFresh and Medi-Cal enroll-ment.
The CalFresh Community & County Partnership ofthe Year award honored efforts to conduct inter-views for CalFresh enrollment via web cam.
2-1-1 San Diego and HHSA Central Region ACCESSCustomer Service Center received a Community &County Partnership of the Year award from the SanDiego Hunger Coalition honoring the creation of a211-ACCESS email line. This service has allowed com-munity partners to better determine the status of a cli-ent's case.The Developmental Screening and Enhancement Pro-gram supported by First 5 San Diego and provided byRady Children's Hospital earned a Hospital CharitableService Award from Jackson Healthcare honoringthe program's efforts to provide developmental andsocial-emotional screenings for children under age fivewho enter foster care, and to offer follow-up supportfor foster children with special needs.The Department of Child Support Services (DCSS)earned recognition from peers with the ProgramAwareness Award at the Child Support Director'sAssociation of California for two innovative programsthat help explain the child support process, webinarsfor employers and a friendly and widely-emailed elec-tronic newsletter for parents.CSAC 2013 Merit Awards
Blueprint: Comprehensive Services for HomelessMentally Ill—provides a combination of services,housing and community support using a teamapproach to reduce homelessness among thementally ill.Live Well San Diego—an ongoing plan to steerpeople away from a state of chronic disease andspiraling health care costs by promoting health,safety and a thriving region. Technology & Aging Coalition—a partnership withnonprofit and for-profit organizations to help educateolder adults about technology, reduce isolation byconnecting seniors with email and the internet, andeducate technology companies about the needs ofolder adults.
NACo 2013 Achievement AwardsChild Support Customer E-Message—a quarterly e-message series that connects DCSS with caseparticipants in order to better serve as a resource forparents in providing financial and medical support totheir children.ICARE: Integrated Physical Health Care Resourcesfor Mental Health Clients—an innovative pilot projectfor individuals with serious mental illness tocentralize care management, support self-
106 County of San DiegoAdopted Operational Plan Fiscal Years 2013-2014 and 2014-2015
Excellence in Governing
management, increase access to physical healthcare and reduce the stigma associated with seekingmental health treatment.A Look at Poverty - Making a Difference Training—aneffort to remove perceived barriers that impedeparticipation in CalFresh by training staff on issuesrelated to poverty. The training helped add more than50,000 children and seniors to the CalFresh program.Low Income Health Program Pay-For-Performance—improves the overall quality of health and health carefor enrollees in the Low Income Health Programusing a pay-for-performance model that encouragesproviders to meet established goals for health caredelivery and improve integration of mental healthcare at community health centers.More on the Menu (MOM) - Fresh Produce forHomebound Seniors—provides a weekly delivery offresh fruits and vegetables and nutrition education tolow-income, homebound and frail older adultsfunded entirely by community donations.Neighborhoods for Kids - Bella Vista CommunityEngagement Project—a creative team field internshipfor social workers to reduce child abuse, increasesafety and family well-being, and build a strongersense of community among residents in a 150-unitapartment complex.Responsible Parenting Initiative—a partnership withlocal community-based organizations andfatherhood networks to identify non-custodialparents and help resolve child support paymentissues to become financially self-sufficient.
Strategic Initiative: Sustainable Environments
San Diego County Library was honored as the 2012Library of the Year by the educational publishing com-pany Gale and Library Journal magazine, recognizingoutstanding service to the community, creativity andleadership. The County Library's unprecedentedgrowth in recent years, strategic budget allocation andinnovative programming all helped to earn the award.The San Diego County Flood Control District received a2012 Award for Excellence from the Floodplain Man-agement Association for the San Luis Rey FloodForecast Program, recognizing outstanding work indeveloping this unique flood forecast tool to increasewarning time and to minimize damage and risk tohuman life. Flood forecast information is available at:www2.sdcounty.ca.gov/lu/flood_control/index.shtml.
The completed Valley Center Road Bridge projectreceived the 2012 Project of the Year Award from theAmerican Public Works Association (APWA) and the2012 Transportation Project Achievement Awardfrom the Construction Management Association ofAmerica.The completed Black Canyon Road Bridge projectreceived a 2012 Honor Award from APWA and a 2012Outstanding Bridge Award from the American Soci-ety of Civil Engineers.The City of San Diego Environmental ServicesDepartment recognized the County as an environmen-tal leader with its Director's Recycling Award for theCounty's food and waste recycling. The County recy-cles 18 tons of food waste per year at the PolinskyChildren's Center and two employee cafeterias.DPR earned a 2012 Award of Excellence from theCalifornia Park and Recreation Society for an inno-vative public service announcement video promotingcamping and other recreational activities that aired inlocal movie theaters and on television.NACo 2013 Achievement Awards
Putting the “WOW” factor into Educational Out-reach—provides awe-inspiring interactive educa-tional outreach to elementary, middle and highschool age students that demonstrates how Environ-mental Health Specialists use science on the job tomotivate students to continue their education andconsider a career in environmental health.1st Grade @ the Library—a program with participat-ing elementary schools that encourages first gradersand their families to read together and become life-long library users.
Operational Excellence Awards
The awards listed below recognize programs or accom-plishments that support the County's Required Disciplinesfor Excellence outlined in the County's Strategic Plan:
The County Communications Office (CCO) was honoredwith three regional Emmy awards from the NationalAcademy of Television Arts & Sciences' PacificSouthwest region for video pieces including “The EightSigns of Terrorism,” produced in partnership with OES,the Sheriff's Department and local public safety agen-cies to educate the public about how to report suspi-cious behavior; “Safety Stickler,” which focused onCounty regulation of tattoo parlors; and “Solar Cars,”which followed middle school students as they com-peted in a solar car design competition.
County of San Diego Adopted Operational Plan Fiscal Years 2013-2014 and 2014-2015 107
Excellence in Governing
The CCO’s County News Center (CNC) received a STARAward for Overall Excellence in government program-ming from the States of California and Nevada chap-ter of the National Association ofTelecommunications Officers and Advisors. CNCearned four additional First Place STAR awards for bestwebsite, magazine show and two documentaries as wellas Second Place STAR honors for an instructional videoseries and a public service announcement.The redevelopment of the County Operations Centergarnered a 2012 People's Choice Orchid Award fromthe San Diego Architectural Foundation, a nonprofitorganization dedicated to education and the promotionof outstanding architecture, planning and urban designthroughout the San Diego region. This was the secondconsecutive year the County was recognized with thisaward, having earned one in 2011 for the FallbrookLibrary.The County Operations Center was selected by the SanDiego/Imperial Chapter of the APWA as the 2013Outstanding Sustainable Project in the over $75 mil-lion category.DCSS received 2012's Most Improved County Pro-gram from the National Child Support EnforcementAssociation and the California Department of ChildSupport Services for improvements in collectionsresulting from process improvements and for developingrelationships with participants.DCSS earned recognition from the California Depart-ment of Child Support Services in 2012 for Top Over-all Performance among large California county childsupport services departments. This is the third time infour years that San Diego County had been the top per-former among the State's large counties.The Justice Electronic Library System (JELS), a CountyTechnology Office initiative in partnership with the Pro-bation Department, District Attorney and PublicDefender, earned a Digital Government AchievementAward from the Center for Digital Government chosenfrom among many other outstanding programs submit-ted by international governments. JELS is used in Juve-nile Court to improve electronic file sharing.Two programs of the Department of Housing and Com-munity Development, serving as the Housing Authorityof the County of San Diego, received Certificates ofExcellence from the U.S. Department of Housing andUrban Development (HUD). The Section 8 programearned a High Performer designation for the 7th con-secutive year for demonstrating a high level of compe-tency in 14 areas including quality control. The Public
Housing program earned High Performer status for thesecond consecutive year, recognizing excellence infacilities, financial condition and management.For the 12th consecutive year, the Department of Pur-chasing & Contracting received the Achievement inExcellence in Procurement from a group of organiza-tions including the National Procurement Institute.The County was one of 40 government agencies in Cali-fornia and one of 41 counties in the U.S. to receive thisaward that recognizes innovation, professionalism, e-procurement, productivity and leadership attributes ofthe procurement function.For the sixth consecutive year the Department of Gen-eral Services (DGS) was recognized by the CaliforniaCounties Facilities Services Association with anAward of Excellence for exceptional dedication to facil-ities excellence and outstanding leadership in programsthat extend the life of public facilities.Government Fleet Magazine named the DGS FleetManagement Division in the Top 20 Government Fleetsof about 38,000 public sector fleet operations in NorthAmerica, based on performance in 12 categories includ-ing accountability, technology use, resource steward-ship and competitive pricing. The County operates afleet of approximately 3,900 vehicles and mobile equip-ment.For the 11th consecutive year, the GovernmentFinance Officers Association (GFOA) recognized theCounty with the Distinguished Budget PresentationAward for the Adopted Operational Plan Fiscal Years2012-2013 & 2013-2014 and named the document Out-standing as an Operations Guide. This award is a sig-nificant achievement for the County, reflecting acommitment to the highest standards of governmentalbudgeting.The County received the Certificate of Achievementfor Excellence in Financial Reporting from the GFOAfor its Fiscal Year 2011-12 Comprehensive AnnualFinancial Report (CAFR). This certificate is the highestform of recognition for governmental accounting andfinancial reporting.NACo 2013 Achievement Awards
Design-Build Project Development—improved theCounty's process for Design-Build proposals byreducing cost and complexity, in response to build-ing industry concerns.HHSA Long-Term Leaves Program - Process andTracking—streamlined the process used by HHSA tomanage employees on long-term unpaid leaves of
108 County of San DiegoAdopted Operational Plan Fiscal Years 2013-2014 and 2014-2015
Excellence in Governing
absence and improve compliance with Compensa-tion Ordinances allowing more efficient use of bud-geted positions.Lean Six Sigma Capacity Building Initiative—devel-oped HHSA staff expertise in the Lean Six Sigmamanagerial method to eliminate waste in servicesand improve quality and results.Mentor Partnership Program—a structured mentor-ing program that pairs an experienced County leaderwith an aspiring employee to help achieve individualcareer goals.New Homeowners Property Tax Guide - English/Spanish—designed to assist English and Spanishspeaking homeowners on the property tax process inorder to empower and educate new homeowners ontheir real estate purchase.
San Diego Investment Pool Temporary Transfer FundProgram—provided financial relief to eligible schooldistricts and other entities by clarifying the processfor the temporary transfer of funds from the Trea-surer's Investment Pool.School-Based Mental Health Worker Career PathwayProgram—an innovative approach to workforcedevelopment aimed at recruiting culturally and lin-guistically diverse high school students for futurecareers as mental health workers.Treasurer-Tax Collector Property Tax Checks OnlyProcess—more efficiently identifies and appliesproperty tax payments submitted without a paymentstub from more than 50,000 taxpayers who use anonline banking service.
County of San Diego Adopted Operational Plan Fiscal Years 2013-2014 and 2014-2015 109

County of San Diego
Public Safety Group
Public Safety Group & Executive Office 113
District Attorney 121
Sheriff 127
Child Support Services 137
Citizens' Law Enforcement Review Board 143
Office of Emergency Services 147
Medical Examiner 153
Probation 157
Public Defender 165
San Diego County Fire Authority 173

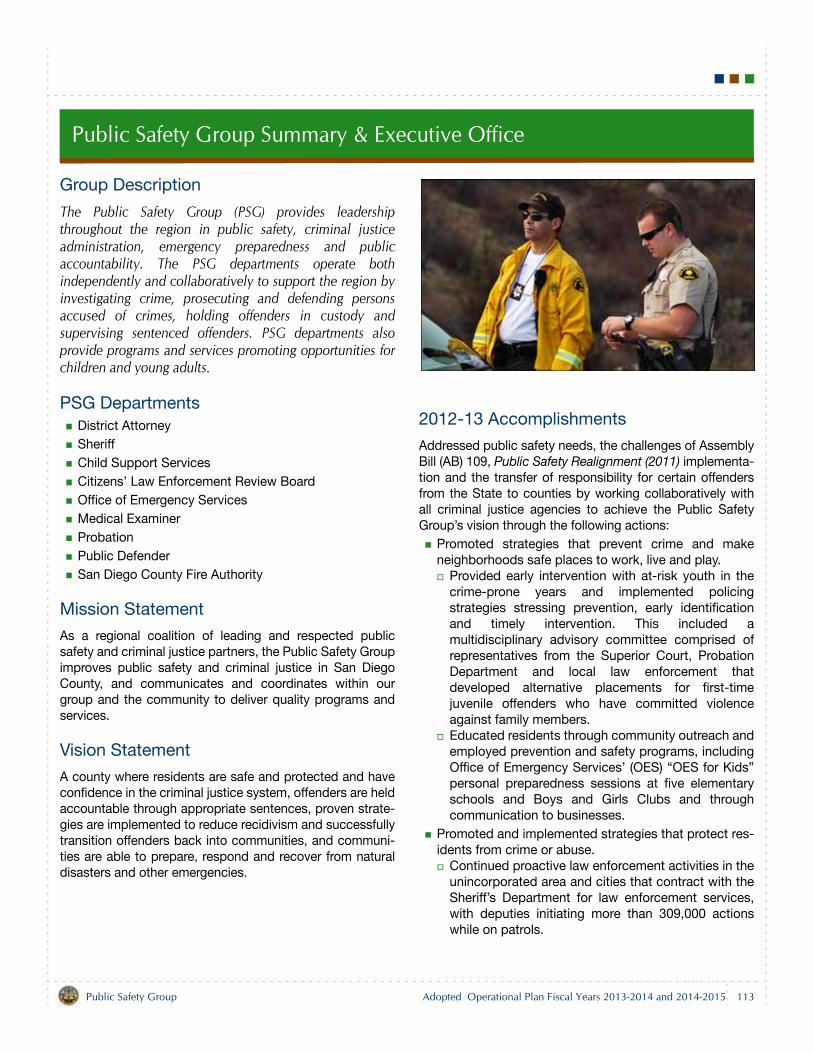
Public Safety Group Summary & Executive Office
Group Description
The Public Safety Group (PSG) provides leadershipthroughout the region in public safety, criminal justiceadministration, emergency preparedness and publicaccountability. The PSG departments operate bothindependently and collaboratively to support the region byinvestigating crime, prosecuting and defending personsaccused of crimes, holding offenders in custody andsupervising sentenced offenders. PSG departments alsoprovide programs and services promoting opportunities forchildren and young adults.
PSG DepartmentsDistrict AttorneySheriffChild Support ServicesCitizens’ Law Enforcement Review BoardOffice of Emergency ServicesMedical ExaminerProbationPublic DefenderSan Diego County Fire Authority
Mission Statement
As a regional coalition of leading and respected publicsafety and criminal justice partners, the Public Safety Groupimproves public safety and criminal justice in San DiegoCounty, and communicates and coordinates within ourgroup and the community to deliver quality programs andservices.
Vision Statement
A county where residents are safe and protected and haveconfidence in the criminal justice system, offenders are heldaccountable through appropriate sentences, proven strate-gies are implemented to reduce recidivism and successfullytransition offenders back into communities, and communi-ties are able to prepare, respond and recover from naturaldisasters and other emergencies.
2012-13 Accomplishments
Addressed public safety needs, the challenges of AssemblyBill (AB) 109, Public Safety Realignment (2011) implementa-tion and the transfer of responsibility for certain offendersfrom the State to counties by working collaboratively withall criminal justice agencies to achieve the Public SafetyGroup’s vision through the following actions:
Promoted strategies that prevent crime and makeneighborhoods safe places to work, live and play.
Provided early intervention with at-risk youth in thecrime-prone years and implemented policingstrategies stressing prevention, early identificationand timely intervention. This included amultidisciplinary advisory committee comprised ofrepresentatives from the Superior Court, ProbationDepartment and local law enforcement thatdeveloped alternative placements for first-timejuvenile offenders who have committed violenceagainst family members.Educated residents through community outreach andemployed prevention and safety programs, includingOffice of Emergency Services’ (OES) “OES for Kids”personal preparedness sessions at five elementaryschools and Boys and Girls Clubs and throughcommunication to businesses.
Promoted and implemented strategies that protect res-idents from crime or abuse.
Continued proactive law enforcement activities in theunincorporated area and cities that contract with theSheriff’s Department for law enforcement services,with deputies initiating more than 309,000 actionswhile on patrols.
113Public Safety Group Adopted Operational Plan Fiscal Years 2013-2014 and 2014-2015
Public Safety Group Summary & Executive Office
Monitored offenders subject to communitysupervision to mitigate new crime offenses, resultingin 64% of supervised adult offenders completingtheir term of supervision with no convictions for anew crime.Employed information-led policing strategies toaddress crime problems at the local and regionallevel, including expanding the Tracking KnownOffender program to all Sheriff stations.
Provided for a strong, collaborative criminal justice sys-tem that holds offenders accountable.
Collaborated with the local courts to ensureoffenders were appropriately detained or sanctioned,including participation in Offender Reentry Court,Adult and Juvenile Drug Court, and Homeless Court. Employed appropriate sanctions that are balancedwith rehabilitation opportunities, where appropriate.Introduced a Residential Reentry Center to providework readiness training to certain in-custodyoffenders.Provided quality investigation and crime analysis thatled to successful identification and prosecution ofoffenders. Deployed the San Diego Regional SexOffender Management System as an investigativetool available to the Sexual Assault FelonyEnforcement (S.A.F.E) Task Force to 100% of locallaw enforcement agencies.
Reduced recidivism by implementing treatment strate-gies that help offenders successfully reenter society.
Advanced the provision of treatment and diversionprograms while adult offenders are in jail, addressingboth health and behavioral health needs with thecreation of the Reentry Services Division within theSheriff’s Detention Services Bureau. Employed transitional services for offenders as theyexit out of detention facilities. Established aCommunity Transition Center to engage returningpost release community supervision offenders totreatment and services.Integrated evidence-based practices and principlesin collaboration with community and justice partners,including training 741 Deputy Probation Officers inresearch-supported methods of offender caseplanning and intervention strategies.
Continued to strengthen the County’s and communi-ties’ ability to prepare for, respond to and recover fromdisasters.
Collaborated with regional fire service agencies toimprove fire protection and emergency responseservices, including the introduction of additionaltraining opportunities for volunteer firefighters.
Engaged residents, the private sector and localjurisdictions through community outreach events andemergency readiness planning, including training for100 regional partners on the proper use of theAlertSanDiego mass notification system.
Leveraged technology innovations to improve servicedelivery and operational efficiency.
Continued implementation of technologies, includinga paperless litigation file used in child support casesand the eDiscovery system to streamline thedissemination of discovery materials to defensecounsel.Developed the SD Emergency mobile application toimprove service delivery and enhance the flow ofinformation to the public through providinginteractive access to local disaster information.
2013-15 Objectives
Align activities of the Public Safety Group with the key out-comes of the County’s Live Well San Diego Living Safelystrategy; addressing the incidence of crime and injury andthe community experience of overall safety. The key out-comes are: Residents are protected from crime andabuse; Neighborhoods are safe to work, live and play; andCommunities are resilient to disasters and emergencies.These objectives facilitate collaborative policy developmentacross various public agencies, with private sector partnersand support the key outcomes of the Live Well San DiegoLiving Safely strategy.
Strategic Initiative – Safe CommunitiesResidents are protected from crime or abuse.
Monitor offenders subject to community supervisionto mitigate new crimes.
Employ information-led policing strategies tocrime problems at the local and regional levels. Reduce recidivism through evidence-basedpractices and services in collaboration withcommunity and justice partners.
Continue proactive law enforcement activities in theunincorporated area and in cities that contract withthe Sheriff’s Department for law enforcementservices.Expand services to offenders in custody andincrease detention capacity; support the opening ofPhase I of the San Diego County Women’s Detentionand Reentry Facility and begin the operation of theEast Mesa Reentry Facility.
Communities are resilient to disasters and emergen-cies.
114 Public Safety GroupAdopted Operational Plan Fiscal Years 2013-2014 and 2014-2015
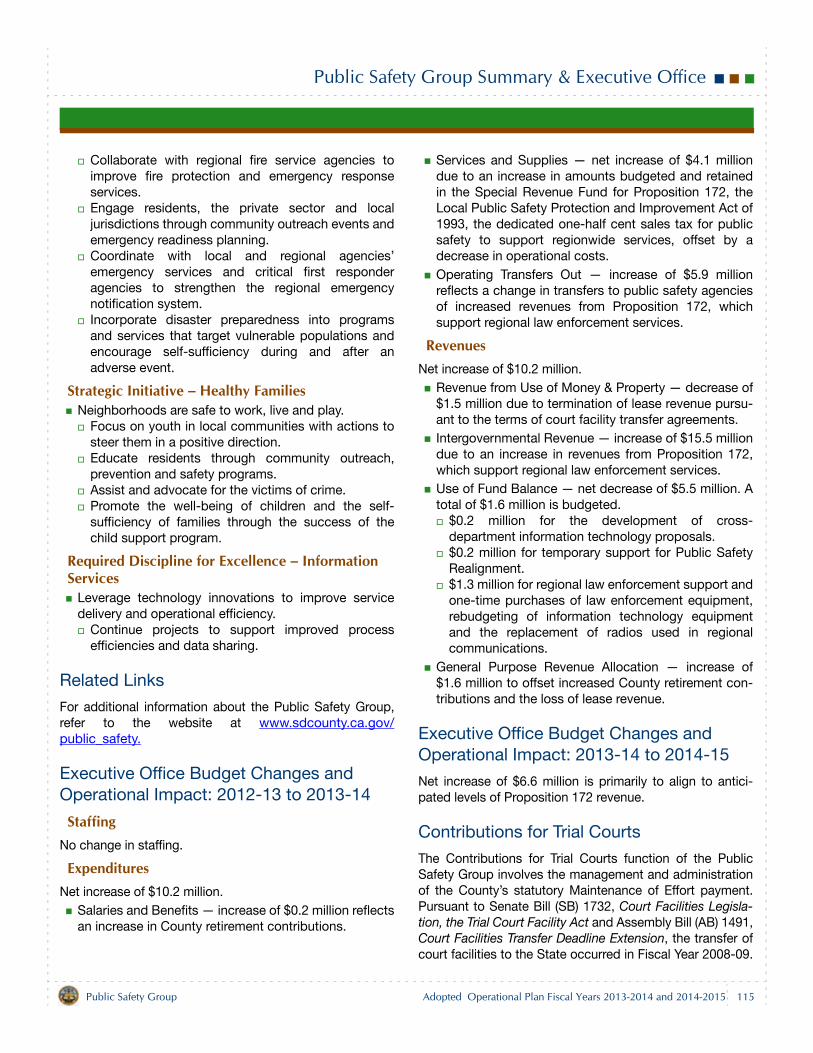
Public Safety Group Summary & Executive Office
Collaborate with regional fire service agencies toimprove fire protection and emergency responseservices. Engage residents, the private sector and localjurisdictions through community outreach events andemergency readiness planning. Coordinate with local and regional agencies’emergency services and critical first responderagencies to strengthen the regional emergencynotification system.Incorporate disaster preparedness into programsand services that target vulnerable populations andencourage self-sufficiency during and after anadverse event.
Strategic Initiative – Healthy FamiliesNeighborhoods are safe to work, live and play.
Focus on youth in local communities with actions tosteer them in a positive direction.Educate residents through community outreach,prevention and safety programs.Assist and advocate for the victims of crime. Promote the well-being of children and the self-sufficiency of families through the success of thechild support program.
Required Discipline for Excellence – Information Services
Leverage technology innovations to improve servicedelivery and operational efficiency.
Continue projects to support improved processefficiencies and data sharing.
Related Links
For additional information about the Public Safety Group,refer to the website at www.sdcounty.ca.gov/public_safety.
Executive Office Budget Changes and Operational Impact: 2012-13 to 2013-14
StaffingNo change in staffing.
ExpendituresNet increase of $10.2 million.
Salaries and Benefits — increase of $0.2 million reflectsan increase in County retirement contributions.
Services and Supplies — net increase of $4.1 milliondue to an increase in amounts budgeted and retainedin the Special Revenue Fund for Proposition 172, theLocal Public Safety Protection and Improvement Act of1993, the dedicated one-half cent sales tax for publicsafety to support regionwide services, offset by adecrease in operational costs. Operating Transfers Out — increase of $5.9 millionreflects a change in transfers to public safety agenciesof increased revenues from Proposition 172, whichsupport regional law enforcement services.
RevenuesNet increase of $10.2 million.
Revenue from Use of Money & Property — decrease of$1.5 million due to termination of lease revenue pursu-ant to the terms of court facility transfer agreements.Intergovernmental Revenue — increase of $15.5 milliondue to an increase in revenues from Proposition 172,which support regional law enforcement services. Use of Fund Balance — net decrease of $5.5 million. Atotal of $1.6 million is budgeted.
$0.2 million for the development of cross-department information technology proposals.$0.2 million for temporary support for Public SafetyRealignment.$1.3 million for regional law enforcement support andone-time purchases of law enforcement equipment,rebudgeting of information technology equipmentand the replacement of radios used in regionalcommunications.
General Purpose Revenue Allocation — increase of$1.6 million to offset increased County retirement con-tributions and the loss of lease revenue.
Executive Office Budget Changes and Operational Impact: 2013-14 to 2014-15
Net increase of $6.6 million is primarily to align to antici-pated levels of Proposition 172 revenue.
Contributions for Trial Courts
The Contributions for Trial Courts function of the PublicSafety Group involves the management and administrationof the County’s statutory Maintenance of Effort payment.Pursuant to Senate Bill (SB) 1732, Court Facilities Legisla-tion, the Trial Court Facility Act and Assembly Bill (AB) 1491,Court Facilities Transfer Deadline Extension, the transfer ofcourt facilities to the State occurred in Fiscal Year 2008-09.
115Public Safety Group Adopted Operational Plan Fiscal Years 2013-2014 and 2014-2015
Public Safety Group Summary & Executive Office
County financial responsibility for facility maintenance costswill continue as a statutorily required County Facility Pay-ment. The detailed changes in the State and County finan-cial and management responsibilities are included in theJoint Occupancy Agreements.
Budget Changes and Operational Impact: 2012-13 to 2013-14
ExpendituresNet decrease of $0.6 million.
Other Charges — decrease of $0.7 million to align toactual levels of expenditures.Services and Supplies — increase of $0.1 million dueto increased operational costs.
RevenuesNet decrease of $0.6 million.
Fines, Forfeitures and Penalties — decrease of $0.5million to align to actual levels of revenue received.Charges for Current Services — decrease of $0.7 mil-lion to align to actual levels of revenue received.General Purpose Revenue Allocation — increase of$0.6 million to offset the decline in revenues supportingthe statutorily required payments described above.
Budget Changes and Operational Impact: 2013-14 to 2014-15
No significant changes.
116 Public Safety GroupAdopted Operational Plan Fiscal Years 2013-2014 and 2014-2015
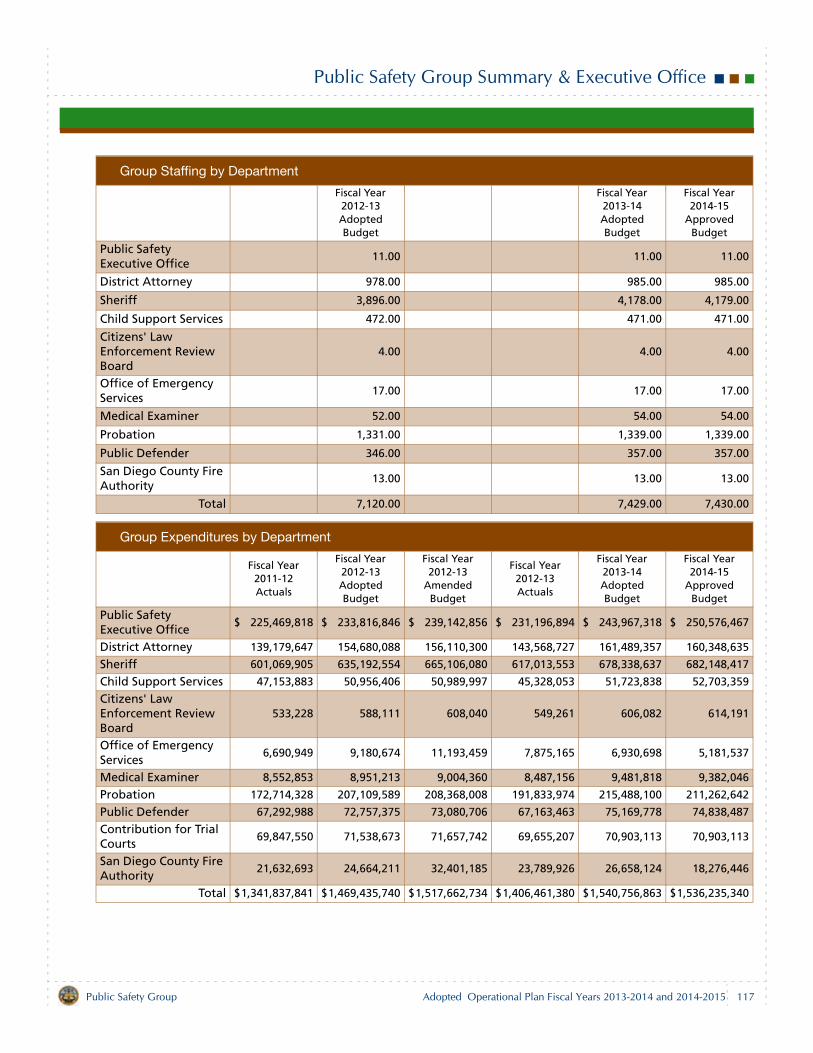
Public Safety Group Summary & Executive Office
Group Staffing by Department
Fiscal Year 2012-13 Adopted Budget
Fiscal Year 2013-14 Adopted Budget
Fiscal Year 2014-15
Approved Budget
Public Safety Executive Office
11.00 11.00 11.00
District Attorney 978.00 985.00 985.00
Sheriff 3,896.00 4,178.00 4,179.00
Child Support Services 472.00 471.00 471.00
Citizens' Law Enforcement Review Board
4.00 4.00 4.00
Office of Emergency Services
17.00 17.00 17.00
Medical Examiner 52.00 54.00 54.00
Probation 1,331.00 1,339.00 1,339.00
Public Defender 346.00 357.00 357.00
San Diego County Fire Authority
13.00 13.00 13.00
Total 7,120.00 7,429.00 7,430.00
Group Expenditures by Department
Fiscal Year 2011-12 Actuals
Fiscal Year 2012-13 Adopted Budget
Fiscal Year 2012-13
Amended Budget
Fiscal Year 2012-13 Actuals
Fiscal Year 2013-14 Adopted Budget
Fiscal Year 2014-15
Approved Budget
Public Safety Executive Office
$ 225,469,818 $ 233,816,846 $ 239,142,856 $ 231,196,894 $ 243,967,318 $ 250,576,467
District Attorney 139,179,647 154,680,088 156,110,300 143,568,727 161,489,357 160,348,635
Sheriff 601,069,905 635,192,554 665,106,080 617,013,553 678,338,637 682,148,417
Child Support Services 47,153,883 50,956,406 50,989,997 45,328,053 51,723,838 52,703,359
Citizens' Law Enforcement Review Board
533,228 588,111 608,040 549,261 606,082 614,191
Office of Emergency Services
6,690,949 9,180,674 11,193,459 7,875,165 6,930,698 5,181,537
Medical Examiner 8,552,853 8,951,213 9,004,360 8,487,156 9,481,818 9,382,046
Probation 172,714,328 207,109,589 208,368,008 191,833,974 215,488,100 211,262,642
Public Defender 67,292,988 72,757,375 73,080,706 67,163,463 75,169,778 74,838,487
Contribution for Trial Courts
69,847,550 71,538,673 71,657,742 69,655,207 70,903,113 70,903,113
San Diego County Fire Authority
21,632,693 24,664,211 32,401,185 23,789,926 26,658,124 18,276,446
Total $1,341,837,841 $1,469,435,740 $1,517,662,734 $1,406,461,380 $1,540,756,863 $1,536,235,340
117Public Safety Group Adopted Operational Plan Fiscal Years 2013-2014 and 2014-2015
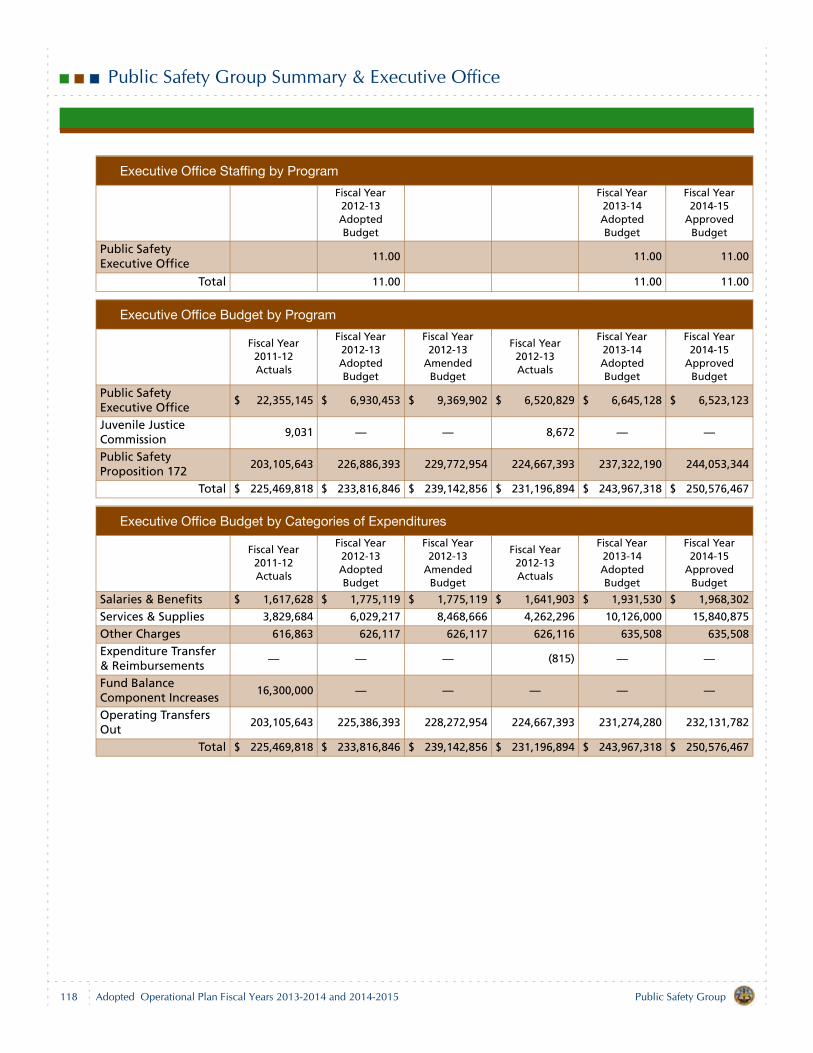
Public Safety Group Summary & Executive Office
Executive Office Staffing by Program
Fiscal Year 2012-13 Adopted Budget
Fiscal Year 2013-14 Adopted Budget
Fiscal Year 2014-15
Approved Budget
Public Safety Executive Office
11.00 11.00 11.00
Total 11.00 11.00 11.00
Executive Office Budget by Program
Fiscal Year 2011-12 Actuals
Fiscal Year 2012-13 Adopted Budget
Fiscal Year 2012-13
Amended Budget
Fiscal Year 2012-13 Actuals
Fiscal Year 2013-14 Adopted Budget
Fiscal Year 2014-15
Approved Budget
Public Safety Executive Office
$ 22,355,145 $ 6,930,453 $ 9,369,902 $ 6,520,829 $ 6,645,128 $ 6,523,123
Juvenile Justice Commission
9,031 — — 8,672 — —
Public Safety Proposition 172
203,105,643 226,886,393 229,772,954 224,667,393 237,322,190 244,053,344
Total $ 225,469,818 $ 233,816,846 $ 239,142,856 $ 231,196,894 $ 243,967,318 $ 250,576,467
Executive Office Budget by Categories of Expenditures
Fiscal Year 2011-12 Actuals
Fiscal Year 2012-13 Adopted Budget
Fiscal Year 2012-13
Amended Budget
Fiscal Year 2012-13 Actuals
Fiscal Year 2013-14 Adopted Budget
Fiscal Year 2014-15
Approved Budget
Salaries & Benefits $ 1,617,628 $ 1,775,119 $ 1,775,119 $ 1,641,903 $ 1,931,530 $ 1,968,302
Services & Supplies 3,829,684 6,029,217 8,468,666 4,262,296 10,126,000 15,840,875
Other Charges 616,863 626,117 626,117 626,116 635,508 635,508
Expenditure Transfer & Reimbursements
— — — (815) — —
Fund Balance Component Increases
16,300,000 — — — — —
Operating Transfers Out
203,105,643 225,386,393 228,272,954 224,667,393 231,274,280 232,131,782
Total $ 225,469,818 $ 233,816,846 $ 239,142,856 $ 231,196,894 $ 243,967,318 $ 250,576,467
118 Public Safety GroupAdopted Operational Plan Fiscal Years 2013-2014 and 2014-2015

Public Safety Group Summary & Executive Office
Executive Office Budget by Categories of Revenues
Fiscal Year 2011-12 Actuals
Fiscal Year 2012-13 Adopted Budget
Fiscal Year 2012-13
Amended Budget
Fiscal Year 2012-13 Actuals
Fiscal Year 2013-14 Adopted Budget
Fiscal Year 2014-15
Approved Budget
Revenue From Use of Money & Property
$ 3,734,052 $ 1,876,914 $ 1,876,914 $ 3,793,483 $ 424,032 $ —
Intergovernmental Revenues
224,286,416 220,536,681 219,817,681 235,009,549 236,027,012 242,583,166
Charges For Current Services
708,029 708,000 708,000 708,016 708,000 708,000
Miscellaneous Revenues
477,315 24,554 24,554 — — —
Use of Fund Balance (7,218,904) 7,084,873 13,129,883 (11,899,978) 1,605,982 3,582,722
General Purpose Revenue Allocation
3,482,910 3,585,824 3,585,824 3,585,824 5,202,292 3,702,579
Total $ 225,469,818 $ 233,816,846 $ 239,142,856 $ 231,196,894 $ 243,967,318 $ 250,576,467
119Public Safety Group Adopted Operational Plan Fiscal Years 2013-2014 and 2014-2015

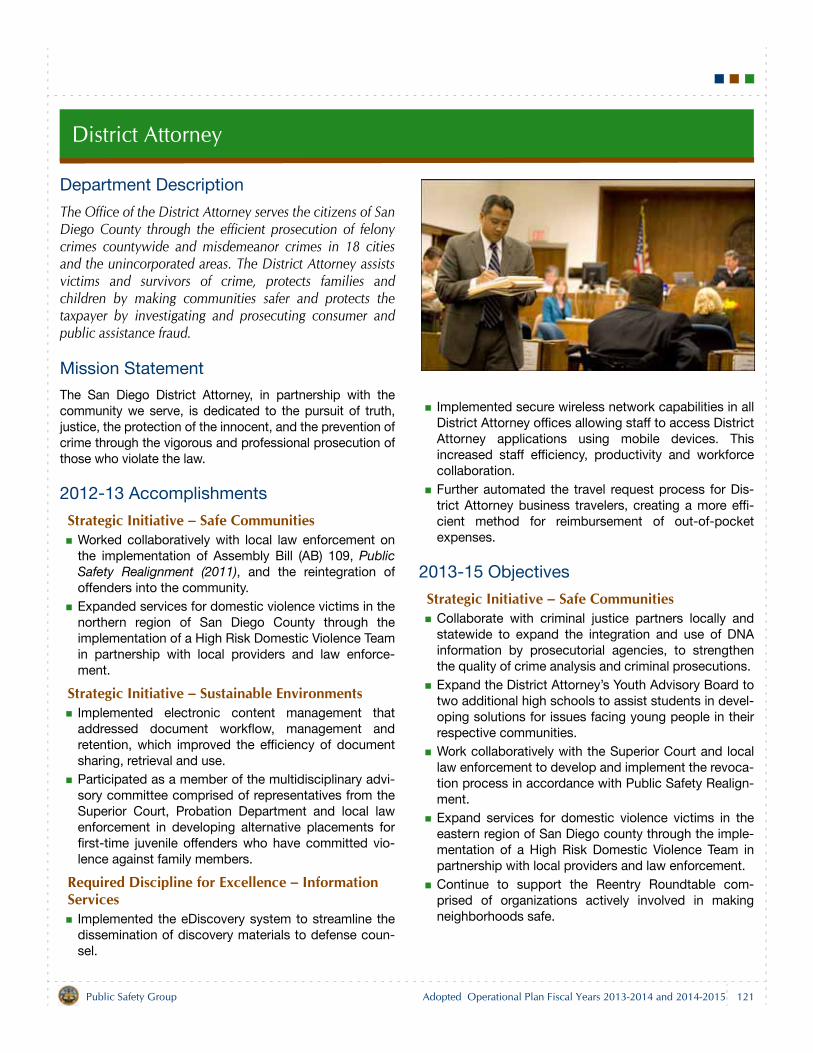
District Attorney
Department Description
The Office of the District Attorney serves the citizens of SanDiego County through the efficient prosecution of felonycrimes countywide and misdemeanor crimes in 18 citiesand the unincorporated areas. The District Attorney assistsvictims and survivors of crime, protects families andchildren by making communities safer and protects thetaxpayer by investigating and prosecuting consumer andpublic assistance fraud.
Mission Statement
The San Diego District Attorney, in partnership with thecommunity we serve, is dedicated to the pursuit of truth,justice, the protection of the innocent, and the prevention ofcrime through the vigorous and professional prosecution ofthose who violate the law.
2012-13 Accomplishments
Strategic Initiative – Safe CommunitiesWorked collaboratively with local law enforcement onthe implementation of Assembly Bill (AB) 109, PublicSafety Realignment (2011), and the reintegration ofoffenders into the community.Expanded services for domestic violence victims in thenorthern region of San Diego County through theimplementation of a High Risk Domestic Violence Teamin partnership with local providers and law enforce-ment.
Strategic Initiative – Sustainable EnvironmentsImplemented electronic content management thataddressed document workflow, management andretention, which improved the efficiency of documentsharing, retrieval and use.Participated as a member of the multidisciplinary advi-sory committee comprised of representatives from theSuperior Court, Probation Department and local lawenforcement in developing alternative placements forfirst-time juvenile offenders who have committed vio-lence against family members.
Required Discipline for Excellence – Information Services
Implemented the eDiscovery system to streamline thedissemination of discovery materials to defense coun-sel.
Implemented secure wireless network capabilities in allDistrict Attorney offices allowing staff to access DistrictAttorney applications using mobile devices. Thisincreased staff efficiency, productivity and workforcecollaboration.Further automated the travel request process for Dis-trict Attorney business travelers, creating a more effi-cient method for reimbursement of out-of-pocketexpenses.
2013-15 Objectives
Strategic Initiative – Safe CommunitiesCollaborate with criminal justice partners locally andstatewide to expand the integration and use of DNAinformation by prosecutorial agencies, to strengthenthe quality of crime analysis and criminal prosecutions. Expand the District Attorney’s Youth Advisory Board totwo additional high schools to assist students in devel-oping solutions for issues facing young people in theirrespective communities. Work collaboratively with the Superior Court and locallaw enforcement to develop and implement the revoca-tion process in accordance with Public Safety Realign-ment.Expand services for domestic violence victims in theeastern region of San Diego county through the imple-mentation of a High Risk Domestic Violence Team inpartnership with local providers and law enforcement. Continue to support the Reentry Roundtable com-prised of organizations actively involved in makingneighborhoods safe.
121Public Safety Group Adopted Operational Plan Fiscal Years 2013-2014 and 2014-2015
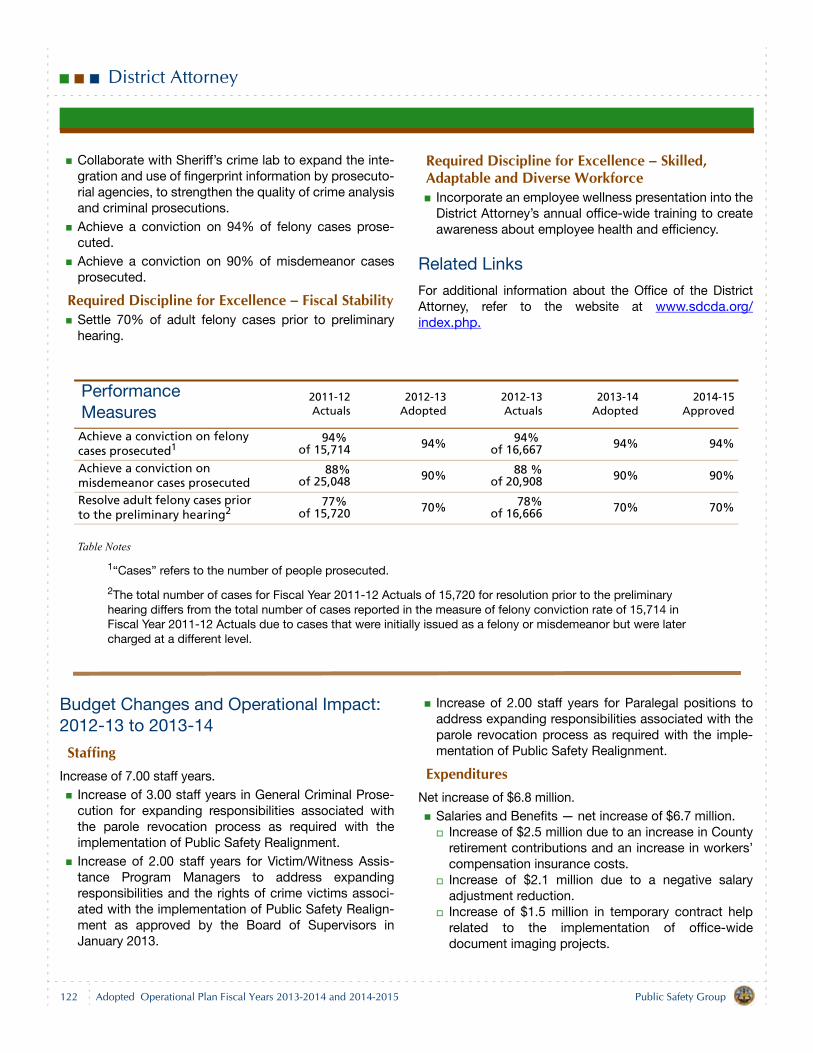
District Attorney
Collaborate with Sheriff’s crime lab to expand the inte-gration and use of fingerprint information by prosecuto-rial agencies, to strengthen the quality of crime analysisand criminal prosecutions.Achieve a conviction on 94% of felony cases prose-cuted.Achieve a conviction on 90% of misdemeanor casesprosecuted.
Required Discipline for Excellence – Fiscal StabilitySettle 70% of adult felony cases prior to preliminaryhearing.
Required Discipline for Excellence – Skilled, Adaptable and Diverse Workforce
Incorporate an employee wellness presentation into theDistrict Attorney’s annual office-wide training to createawareness about employee health and efficiency.
Related Links
For additional information about the Office of the DistrictAttorney, refer to the website at www.sdcda.org/index.php.
Table Notes
1“Cases” refers to the number of people prosecuted.
2The total number of cases for Fiscal Year 2011-12 Actuals of 15,720 for resolution prior to the preliminary hearing differs from the total number of cases reported in the measure of felony conviction rate of 15,714 in Fiscal Year 2011-12 Actuals due to cases that were initially issued as a felony or misdemeanor but were later charged at a different level.
Budget Changes and Operational Impact: 2012-13 to 2013-14
StaffingIncrease of 7.00 staff years.
Increase of 3.00 staff years in General Criminal Prose-cution for expanding responsibilities associated withthe parole revocation process as required with theimplementation of Public Safety Realignment.Increase of 2.00 staff years for Victim/Witness Assis-tance Program Managers to address expandingresponsibilities and the rights of crime victims associ-ated with the implementation of Public Safety Realign-ment as approved by the Board of Supervisors inJanuary 2013.
Increase of 2.00 staff years for Paralegal positions toaddress expanding responsibilities associated with theparole revocation process as required with the imple-mentation of Public Safety Realignment.
ExpendituresNet increase of $6.8 million.
Salaries and Benefits — net increase of $6.7 million.Increase of $2.5 million due to an increase in Countyretirement contributions and an increase in workers’compensation insurance costs.Increase of $2.1 million due to a negative salaryadjustment reduction. Increase of $1.5 million in temporary contract helprelated to the implementation of office-widedocument imaging projects.
Performance Measures
2011-12Actuals
2012-13Adopted
2012-13Actuals
2013-14Adopted
2014-15Approved
Achieve a conviction on felony cases prosecuted1
94% of 15,714 94% 94%
of 16,667 94% 94%
Achieve a conviction on misdemeanor cases prosecuted
88% of 25,048 90% 88 %
of 20,908 90% 90%
Resolve adult felony cases prior to the preliminary hearing2
77% of 15,720 70% 78%
of 16,666 70% 70%
122 Public Safety GroupAdopted Operational Plan Fiscal Years 2013-2014 and 2014-2015
District Attorney
Increase of $0.6 million due to the addition of 7.00staff years as described above.
Other Charges — net decrease of $0.3 million primarilydue to a reduction in the High Technology Theft Appre-hension and Prosecution (CATCH) Program and theexpiration of funding through the American Recoveryand Reinvestment Act (ARRA) of 2009 for the Jurisdic-tions Unified for Drug Gang Enforcement (JUDGE) Pro-gram.Operating Transfers Out — decrease of $0.1 milliondue to the reduction in the use of Federal Asset Forfei-ture Funds for overtime costs.Management Reserves — increase of $0.5 million for atotal budget of $4.0 million for facility maintenance,renovation and ergonomic upgrades ($3.0 million) anddocument management and imaging projects ($1.0million).
Revenue Net increase of $6.8 million.
Intergovernmental Revenues — net increase of $0.9million.
Decrease of $0.2 million in the U.S. Department ofJustice, Office on Violence Against Women, Grantsto Encourage Arrest Policies and Enforcement ofProtection Orders Program.Decrease of $0.2 million in the CATCH Program.Decrease of $0.1 million in the State of CaliforniaChild Abduction and Recovery Program.Increase of $1.2 million in State revenue allocatedfrom the Local Revenue Fund 2011, CommunityCorrections Subaccount.
Increase of $0.2 million in State of CaliforniaDepartment of Insurance programs.
Other Financing Sources — increase of $0.6 milliondue to projected receipts from Proposition 172, theLocal Public Safety Protection and Improvement Act of1993, which support regional law enforcement ser-vices. Proposition 172 revenues are applied, in part, tocompleting a multiyear strategy to mitigate previousreductions in Proposition 172 revenues.Use of Fund Balance —increase of $3.3 million. A totalof $8.5 million is budgeted for multiyear projectsrelated to facility maintenance, renovation and ergo-nomic upgrades, information technology refresh andupgrades, electronic discovery and activities related todocument imaging solutions to reduce offsite storagecosts and Federal Asset Forfeiture Funds to supportlaw enforcement purposes.General Purpose Revenue Allocation — increase of$2.0 million for increased County retirement contribu-tions.
Budget Changes and Operational Impact: 2013-14 to 2014-15
Net decrease of $1.1 million. A decrease of $5.0 million inCapital Assets and Management Reserves combined is dueto the anticipated completion of one-time projects, partiallyoffset by an increase of $3.9 million in Salaries and Benefitsdue to an increase in County retirement contributions.
123Public Safety Group Adopted Operational Plan Fiscal Years 2013-2014 and 2014-2015
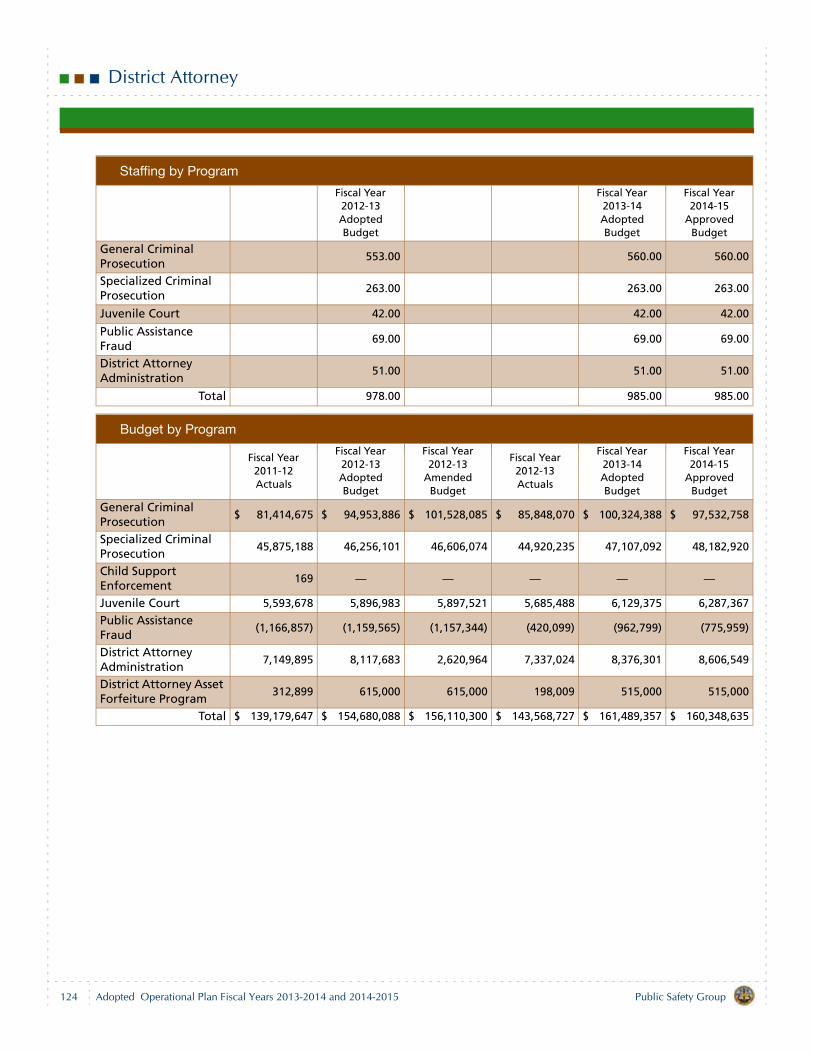
District Attorney
Staffing by Program
Fiscal Year 2012-13 Adopted Budget
Fiscal Year 2013-14 Adopted Budget
Fiscal Year 2014-15
Approved Budget
General Criminal Prosecution
553.00 560.00 560.00
Specialized Criminal Prosecution
263.00 263.00 263.00
Juvenile Court 42.00 42.00 42.00
Public Assistance Fraud
69.00 69.00 69.00
District Attorney Administration
51.00 51.00 51.00
Total 978.00 985.00 985.00
Budget by Program
Fiscal Year 2011-12 Actuals
Fiscal Year 2012-13 Adopted Budget
Fiscal Year 2012-13
Amended Budget
Fiscal Year 2012-13 Actuals
Fiscal Year 2013-14 Adopted Budget
Fiscal Year 2014-15
Approved Budget
General Criminal Prosecution
$ 81,414,675 $ 94,953,886 $ 101,528,085 $ 85,848,070 $ 100,324,388 $ 97,532,758
Specialized Criminal Prosecution
45,875,188 46,256,101 46,606,074 44,920,235 47,107,092 48,182,920
Child Support Enforcement
169 — — — — —
Juvenile Court 5,593,678 5,896,983 5,897,521 5,685,488 6,129,375 6,287,367
Public Assistance Fraud
(1,166,857) (1,159,565) (1,157,344) (420,099) (962,799) (775,959)
District Attorney Administration
7,149,895 8,117,683 2,620,964 7,337,024 8,376,301 8,606,549
District Attorney Asset Forfeiture Program
312,899 615,000 615,000 198,009 515,000 515,000
Total $ 139,179,647 $ 154,680,088 $ 156,110,300 $ 143,568,727 $ 161,489,357 $ 160,348,635
124 Public Safety GroupAdopted Operational Plan Fiscal Years 2013-2014 and 2014-2015
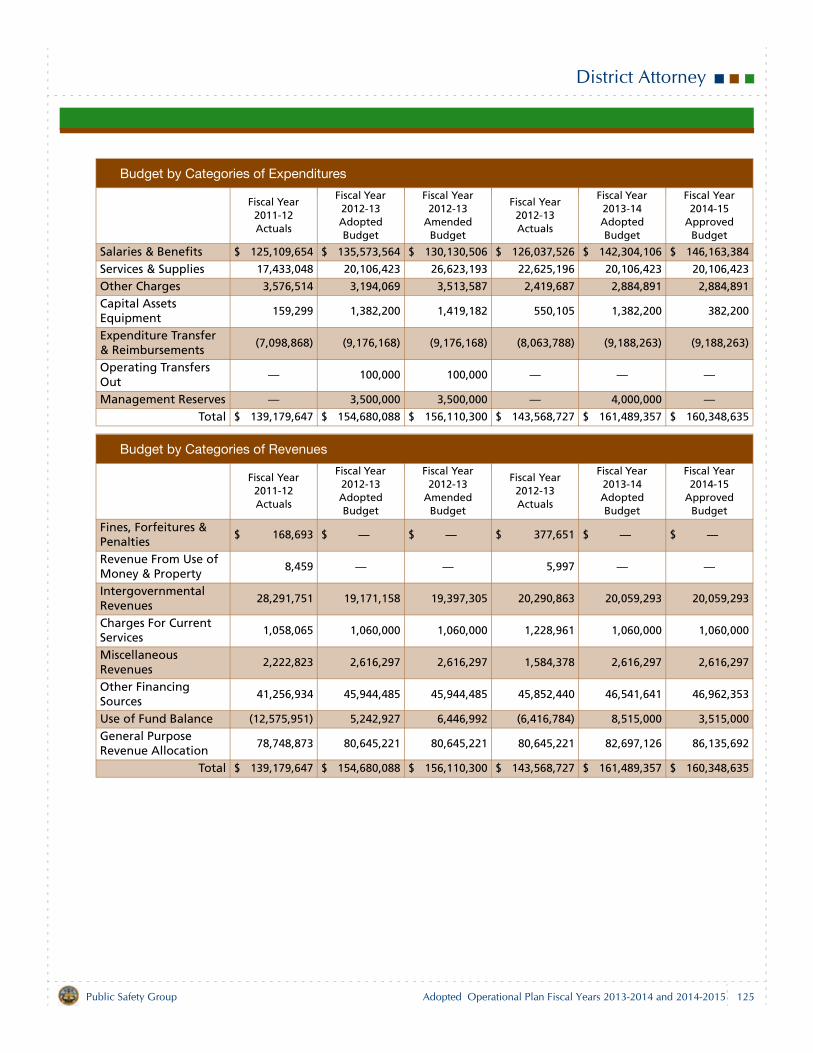
District Attorney
Budget by Categories of Expenditures
Fiscal Year 2011-12 Actuals
Fiscal Year 2012-13 Adopted Budget
Fiscal Year 2012-13
Amended Budget
Fiscal Year 2012-13 Actuals
Fiscal Year 2013-14 Adopted Budget
Fiscal Year 2014-15
Approved Budget
Salaries & Benefits $ 125,109,654 $ 135,573,564 $ 130,130,506 $ 126,037,526 $ 142,304,106 $ 146,163,384
Services & Supplies 17,433,048 20,106,423 26,623,193 22,625,196 20,106,423 20,106,423
Other Charges 3,576,514 3,194,069 3,513,587 2,419,687 2,884,891 2,884,891
Capital Assets Equipment
159,299 1,382,200 1,419,182 550,105 1,382,200 382,200
Expenditure Transfer & Reimbursements
(7,098,868) (9,176,168) (9,176,168) (8,063,788) (9,188,263) (9,188,263)
Operating Transfers Out
— 100,000 100,000 — — —
Management Reserves — 3,500,000 3,500,000 — 4,000,000 —Total $ 139,179,647 $ 154,680,088 $ 156,110,300 $ 143,568,727 $ 161,489,357 $ 160,348,635
Budget by Categories of Revenues
Fiscal Year 2011-12 Actuals
Fiscal Year 2012-13 Adopted Budget
Fiscal Year 2012-13
Amended Budget
Fiscal Year 2012-13 Actuals
Fiscal Year 2013-14 Adopted Budget
Fiscal Year 2014-15
Approved Budget
Fines, Forfeitures & Penalties
$ 168,693 $ — $ — $ 377,651 $ — $ —
Revenue From Use of Money & Property
8,459 — — 5,997 — —
Intergovernmental Revenues
28,291,751 19,171,158 19,397,305 20,290,863 20,059,293 20,059,293
Charges For Current Services
1,058,065 1,060,000 1,060,000 1,228,961 1,060,000 1,060,000
Miscellaneous Revenues
2,222,823 2,616,297 2,616,297 1,584,378 2,616,297 2,616,297
Other Financing Sources
41,256,934 45,944,485 45,944,485 45,852,440 46,541,641 46,962,353
Use of Fund Balance (12,575,951) 5,242,927 6,446,992 (6,416,784) 8,515,000 3,515,000
General Purpose Revenue Allocation
78,748,873 80,645,221 80,645,221 80,645,221 82,697,126 86,135,692
Total $ 139,179,647 $ 154,680,088 $ 156,110,300 $ 143,568,727 $ 161,489,357 $ 160,348,635
125Public Safety Group Adopted Operational Plan Fiscal Years 2013-2014 and 2014-2015

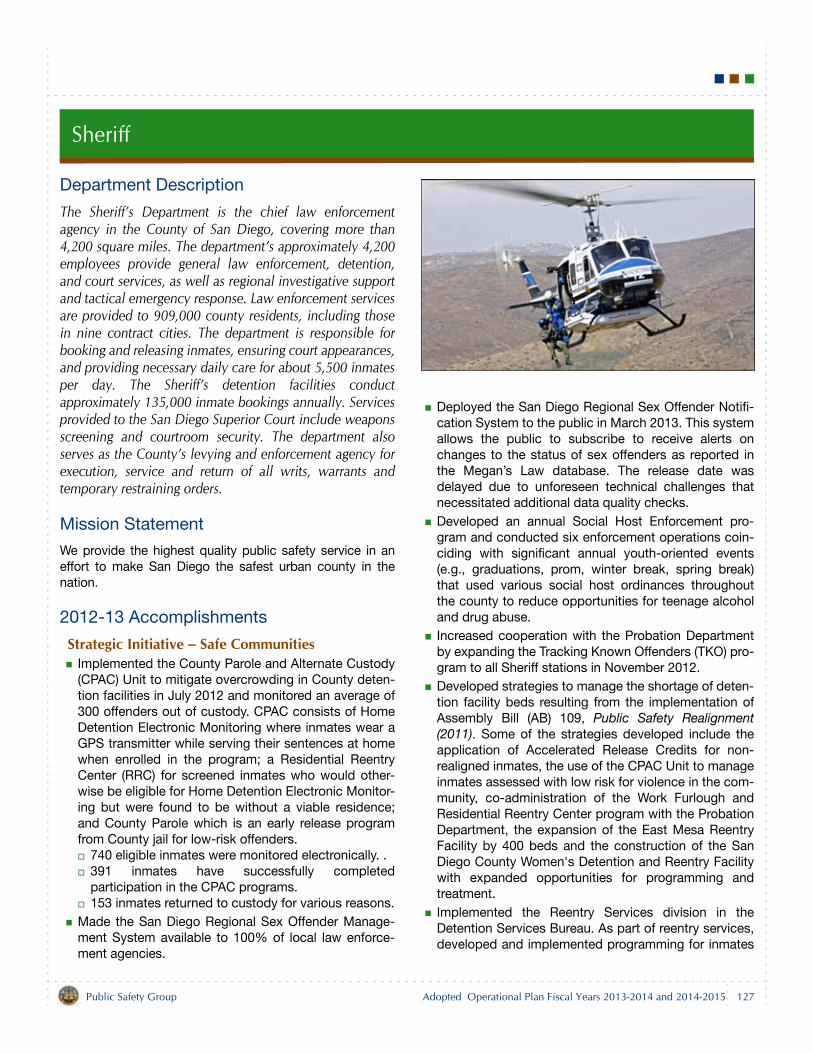
Sheriff
Department Description
The Sheriff’s Department is the chief law enforcementagency in the County of San Diego, covering more than4,200 square miles. The department’s approximately 4,200employees provide general law enforcement, detention,and court services, as well as regional investigative supportand tactical emergency response. Law enforcement servicesare provided to 909,000 county residents, including thosein nine contract cities. The department is responsible forbooking and releasing inmates, ensuring court appearances,and providing necessary daily care for about 5,500 inmatesper day. The Sheriff’s detention facilities conductapproximately 135,000 inmate bookings annually. Servicesprovided to the San Diego Superior Court include weaponsscreening and courtroom security. The department alsoserves as the County’s levying and enforcement agency forexecution, service and return of all writs, warrants andtemporary restraining orders.
Mission Statement
We provide the highest quality public safety service in aneffort to make San Diego the safest urban county in thenation.
2012-13 Accomplishments
Strategic Initiative – Safe CommunitiesImplemented the County Parole and Alternate Custody(CPAC) Unit to mitigate overcrowding in County deten-tion facilities in July 2012 and monitored an average of300 offenders out of custody. CPAC consists of HomeDetention Electronic Monitoring where inmates wear aGPS transmitter while serving their sentences at homewhen enrolled in the program; a Residential ReentryCenter (RRC) for screened inmates who would other-wise be eligible for Home Detention Electronic Monitor-ing but were found to be without a viable residence;and County Parole which is an early release programfrom County jail for low-risk offenders.
740 eligible inmates were monitored electronically. .391 inmates have successfully completedparticipation in the CPAC programs.153 inmates returned to custody for various reasons.
Made the San Diego Regional Sex Offender Manage-ment System available to 100% of local law enforce-ment agencies.
Deployed the San Diego Regional Sex Offender Notifi-cation System to the public in March 2013. This systemallows the public to subscribe to receive alerts onchanges to the status of sex offenders as reported inthe Megan’s Law database. The release date wasdelayed due to unforeseen technical challenges thatnecessitated additional data quality checks. Developed an annual Social Host Enforcement pro-gram and conducted six enforcement operations coin-ciding with significant annual youth-oriented events(e.g., graduations, prom, winter break, spring break)that used various social host ordinances throughoutthe county to reduce opportunities for teenage alcoholand drug abuse.Increased cooperation with the Probation Departmentby expanding the Tracking Known Offenders (TKO) pro-gram to all Sheriff stations in November 2012.Developed strategies to manage the shortage of deten-tion facility beds resulting from the implementation ofAssembly Bill (AB) 109, Public Safety Realignment(2011). Some of the strategies developed include theapplication of Accelerated Release Credits for non-realigned inmates, the use of the CPAC Unit to manageinmates assessed with low risk for violence in the com-munity, co-administration of the Work Furlough andResidential Reentry Center program with the ProbationDepartment, the expansion of the East Mesa ReentryFacility by 400 beds and the construction of the SanDiego County Women's Detention and Reentry Facilitywith expanded opportunities for programming andtreatment.Implemented the Reentry Services division in theDetention Services Bureau. As part of reentry services,developed and implemented programming for inmates
127Public Safety Group Adopted Operational Plan Fiscal Years 2013-2014 and 2014-2015
Sheriff
sentenced to custody for longer than one year. Thereentry program will be housed in the expansion of theEast Mesa Reentry Facility by June 2014.Completed an upgrade of the Regional Communica-tions System (RCS) core by the goal date of March2013 with funding awarded from 2009 and 2011 UrbanArea Security Initiative (UASI) grants. The upgradedcore will help extend the useful life of the existing sys-tem until a new system can be funded, procured andinstalled.Continued planning efforts for the RCS replacementsystem, including the development of a Memorandumof Understanding to facilitate a commitment of partici-pation from the RCS participating agencies.
Required Discipline for Excellence – Essential Infrastructure
Completed construction of the Rancho San Diego Sta-tion in conjunction with the Department of General Ser-vices by November 2013.Continued planning efforts related to the San DiegoCounty Women's Detention and Reentry Facility. Brokeground for roads and infrastructure in July 2012 andbegan construction in March 2013.
Required Discipline for Excellence – Skilled, Adaptable and Diverse Workforce
Conducted 7 academies with 94 Detention/Court Ser-vices and 85 Law Enforcement cadets completingtraining in order to maintain adequate detention facilitystaffing at 90% of authorized positions by June 2013.Fewer cadets completed training than projected. Thisanomaly in higher attrition appears to be related tocadet injuries and personal cadet preparation. TheSheriff’s Department has joined forces with the Depart-ment of Human Resources Risk Management Divisionto implement positive steps to improve cadet retentionand academy completion rates.
2013-15 Objectives
Strategic Initiative – Safe CommunitiesFully implement information-led policing throughoutthe department as the primary philosophy used toaddress crime trends in order to establish San Diego asthe safest urban county in the country.
Implement the Information Managed PolicingAddressing Community Threats (IMPACT) program atevery station and substation.Increase the use of analytical staff providinginformation to field operations.
Build regional partnerships with other lawenforcement agencies and the community to shareinformation, including the creation of CommunityAdvisory Groups to discuss crime trends and publicsafety concerns with residents and businesses.Expand the use of technology to disseminateinformation at every station and use facialrecognition software to identify criminals in thecommunity.Reduce crime in San Diego County by 2%.
Improve the ability of deputies to work with mentally illsubjects by ensuring that 100% of deputies in the LawEnforcement Services Bureau complete eight-hourPsychiatric Evaluation Response Team training by May2014.Continue to focus on youth in local communities usinga three prong approach of education, awareness andenforcement to engage and steer youth in a positivedirection by:
Increasing the use of social host enforcementoperations by 40% in order to reduce opportunitiesfor teenage alcohol and drug abuse. Providing Start SMART driving education classesthroughout the year for newly licensed drivers.Providing Sober Graduation enforcement programsin the months of May and June throughout thecounty.Implementing a juvenile traffic citation diversionprogram.Establishing a juvenile leadership/mentoring campprogram.Establishing Youth Community Advisory Groups.
Evaluate using body scanning equipment to increasecapabilities of detecting contraband (e.g., drugs, weap-ons, etc.) as it is smuggled into detention facilities. Complete the update of the Superior Court contract forservices that improves the fiscal health of the contractover a five-year period.Complete Phase 1 of building improvements for theSan Diego County Women's Detention and ReentryFacility by June 2014. Phase 2 of the project willinclude the demolition of the existing jail and will becompleted in November 2015. The East Mesa Reentry Facility construction began inJune 2013 and is expected to be complete by May2014. The expansion project will consist of two newhousing units, a new intake area and classrooms toprovide services for 400 inmates.
128 Public Safety GroupAdopted Operational Plan Fiscal Years 2013-2014 and 2014-2015

Sheriff
The new Rancho San Diego Station will provide lawenforcement services to the unincorporated areas eastof Lemon Grove. Construction of the new 25,000square foot station has begun and is expected to becompleted by November 2013.The new Pine Valley Substation is scheduled to beginconstruction in June 2013 on a one acre site adjacentto the County's park and library and is scheduled foroccupancy in April 2014.
Required Discipline for Excellence – Skilled, Adaptable and Diverse Workforce
Increase hiring to meet department goals of openingthe East Mesa Reentry Facility, the San Diego CountyWomen's Detention and Reentry Facility and achieving99% staffing of the Emergency Services Dispatcherclassification.
Achieve a higher number of female recruits in eachacademy class (eight females per academy class) toachieve department goals for staffing the San DiegoCounty Women's Detention and Reentry Facility.
Work with other County departments to improve healthand academy readiness of new recruits/cadets andreduce injuries at the Regional Academy. Develop aDepartment Wellness Committee and work withCounty Risk Management to develop employee well-ness programs and increase employee attendance.
Related Links
For additional information about the Sheriff’s Department,refer to the website at www.sdsheriff.net.
Table Notes
1A slight increase is projected for Rural Response time in Fiscal Year 2013-14. This reflects an emphasis on safe driving practices while continuing to respond appropriately to all calls aided by information-led policing strategies.
2The daily average number of inmates anticipated for Fiscal Year 2013-14 includes the availability of 400 additional reentry beds to be constructed at the East Mesa Reentry Facility.
Performance Measures
2011-12Actuals
2012-13Adopted
2012-13Actuals
2013-14Adopted
2014-15Approved
Priority 1 & 2 Response Times:— Incorporated Response Times (in minutes)
9.5 9.5 10.2 9.4 9.4
— Unincorporated Response Times (in minutes)
12.9 13.1 12.9 13.2 13.2
— Rural Response Times (in minutes)1
21.9 22.6 22.2 22.9 22.9
Public Calls for Service 211,282 196,504 213,800 188,184 188,184
Deputy Initiated Actions (DIA) 300,774 302,367 309,604 294,318 294,318
Daily Average – Number of Inmates
4,846 5,500 5,274 5,9002 6,100
— Number of Inmates serving one year or more3 N/A 400 7164 790 790
Number of Jail Bookings 130,044 135,000 126,836 138,000 138,000
Bank Garnishment Civil Unit Processing
8 Days 8.5 Days 7.5 Days 7.5 Days 7.5 Days
Warrants Cleared5 4,213 3,000 3,2896 3,000 3,000
129Public Safety Group Adopted Operational Plan Fiscal Years 2013-2014 and 2014-2015
Sheriff
3The number of inmates serving one year or more was a new Performance Measure identified for Fiscal Year 2012-13. The number is expected to increase in Fiscal Year 2013-14 due to the implementation of Public Safety Realignment.
4The actual number of inmates serving one year or more in Fiscal Year 2012-13 was higher than projected due to limited experience with the effect of Public Safety Realignment on inmate population.
5The number of warrants cleared is expected to decrease in Fiscal Year 2013-14 as detention facility capacity is exceeded.
6The number of warrants cleared was expected to decrease in Fiscal Year 2012-13 as jail capacity was reached due to the implementation of Public Safety Realignment. However, since the jails did not meet their maximum capacity as rapidly as projected, the number of warrants cleared exceeded the goal of 3,000 as arrestees were booked into available jail space.
Budget Changes and Operational Impact: 2012-13 to 2013-14
StaffingNet increase of 282.00 staff years.
Net increase of 243.00 staff years in the Detention Ser-vices Bureau.
Increase of 140.00 staff years for the San DiegoCounty Women's Detention and Reentry Facility.Increase of 106.00 staff years for the East MesaReentry Facility Decrease of 3.00 staff years as a result of transfers tothe Law Enforcement Services Bureau and from theHuman Resource Services Bureau for operationalneeds.
Net increase of 22.00 staff years in the Law Enforce-ment Services Bureau.
Increase of 6.00 staff years in Crime Analysis toincrease the department's ability to use the proveneffectiveness of information-led policing and performrequired analytical work.Increase of 5.00 staff years for a two-year pilotprogram to provide dispatch services to theProbation Department.Increase of 4.00 staff years to create the RegionalRealignment Response Group.Increase of 2.00 staff years in Homicide to addressan increased caseload.Increase of 1.00 staff year in Emergency Planning toassist the department's efforts in emergencypreparedness and disaster response.Increase of 1.00 staff year in the San Diego Sheriff'sRegional Crime Laboratory for a forensic computerand digital media examiner to support the growingnumber of investigations involving these devices.
Increase of 1.00 staff year for the Regional Auto TheftTask Force to perform investigations of auto theftthroughout the region. Increase of 4.00 staff years due to transfers from theDetention Services Bureau and the Human ResourceServices Bureau and to the Office of the Sheriff foroperational needs.Decrease of 2.00 staff years due to a reduction in lawenforcement services requested by contract cities.
Increase of 4.00 staff years in the Court ServicesBureau for the Civil Division to process documents.Net increase of 1.00 staff year in the Human ResourceServices Bureau.
Increase of 1.00 staff year to coordinate thedepartment’s safety and health programs.Increase of 1.00 staff year in Personnel to addresshiring needs of the department.Increase of 1.00 staff year to create multimediatraining materials in support of the Training Division. Decrease of 2.00 staff years due to transfers to theDetention Services Bureau and the Law EnforcementServices Bureau for operational needs.
Net increase of 7.00 staff years in the ManagementServices Bureau.
Increase of 5.00 staff years in the Financial ServicesDivision including 1.00 staff year to process travelrequests, 2.00 staff years to provide cost analysisand fee development or review and 2.00 staff yearsin detentions accounting to support the anticipatedincrease in inmate accounts due to jail capacityincreases related to the San Diego County Women'sDetention and Reentry Facility and the East MesaReentry Facility.
130 Public Safety GroupAdopted Operational Plan Fiscal Years 2013-2014 and 2014-2015
Sheriff
Increase of 2.00 staff years in Wireless ServicesDivision including 1.00 staff year to coordinate andmanage remote radio sites and 1.00 staff year tosupport the Regional Communications Systemreplacement project.
Increase of 3.00 staff years in the Sheriff's Internal Ser-vice Fund/Information Technology (ISF/IT) Bureau.
Increase of 3.00 staff years in Facility Servicesincluding 2.00 staff years to support the San DiegoCounty Women's Detention and Reentry Facility andEast Mesa Reentry Facility and 1.00 staff year tocoordinate and manage facility projects that impactmultiple divisions within the Sheriff's Department.
Increase of 2.00 staff years in the Office of the SheriffBureau.
Increase of 1.00 staff year to review local prisonsentences.Increase of 1.00 staff year due to a transfer from theLaw Enforcement Services Bureau based onoperational needs.
ExpendituresNet increase of $43.1 million.
Salaries and Benefits — net increase of $35.3 million.Increase of $14.9 million reflects negotiated laboragreements and an increase in County retirementcontributions.Increase of $21.5 million due to the addition of282.00 staff years as described above. This includesstaffing for the East Mesa Reentry Facility ($8.1million) and the San Diego County Women'sDetention and Reentry Facility ($10.3 million) toreflect phased hiring and training for partial yearoperation of both facilities in Fiscal Year 2013-14 andother staffing as described above ($3.1 million). Increase of $2.3 million in overtime related to the SanDiego County Women's Detention and ReentryFacility, the East Mesa Reentry Facility, DetentionServices and Law Enforcement Services.Decrease of $3.0 in salary adjustments to reflect alower rate of staff turnover and unfilled positions inFiscal Year 2013-14 compared to Fiscal Year 2012-13 as well as to reflect partial year funding for staffingof the San Diego County Women's Detention andReentry Facility and the East Mesa Reentry Facility.Decrease of $0.4 million due a one-time negotiatedsalary adjustment from Fiscal Year 2012-13.
Services and Supplies — net increase of $4.4 million.
Increase of $3.3 million to support the San DiegoCounty Women's Detention and Reentry Facility,including start-up costs for additional staff asdescribed above, operational costs for an increasednumber of inmates and furniture, fixtures andequipment.Increase of $2.9 million for communication tower siterelocations and tower replacements to bereimbursed from the RCS Trust Fund.Increase of $1.9 million to support the East MesaReentry Facility to include start-up costs foradditional staff as described above and operationalcosts for an increased number of inmates.Increase of $1.0 million for the Regional RealignmentResponse Group to reimburse allied law enforcementagencies for their participation in enforcementoperations.Increase of $1.0 million for costs including safetyequipment and clothing, inmate bedding costs,operational equipment and supplies for variousstations and divisions.Increase of $0.7 million in grant funds that supportState and federal homeland security initiatives.Decrease of $5.7 million due to funds encumbered toreplace the conventional radio system in Fiscal Year2012-13. Decrease of $0.7 million for the regional lawenforcement records management system (NetRMS)maintenance agreement due to delays in thecontract final milestone acceptance.
Other Charges — Increase of $4.0 million for increasedinmate medical costs due to additional detentioncapacity at the San Diego County Women's Detentionand Reentry Facility and the East Mesa Reentry Facilityand an increased number of inmates as a result of Pub-lic Safety Realignment.Capital Assets Equipment — net decrease of $0.8 mil-lion.
Decrease of $2.6 million due to one-time projectsand purchases completed in Fiscal Year 2012-13.Decrease of $1.4 million in grant funds that supportState and federal homeland security.Increase of $1.9 million for a Realignment DataCollection and Analysis technology project due tothe implementation of Public Safety Realignment.Increase of $0.8 million for the purchase oftransportation equipment supporting the San DiegoCounty Women's Detention and Reentry Facility.Increase of $0.5 million to replace equipment at theCentral Food Production Center.
131Public Safety Group Adopted Operational Plan Fiscal Years 2013-2014 and 2014-2015
Sheriff
Expenditure Transfers and Reimbursements – increaseof $0.1 million in cost applied expenditure transfers(reimbursement) for food services provided to the Pro-bation Department. Since this is a reimbursement, ithas the effect of a $0.1 million increase in expenditures.Operating Transfers Out — net increase of $0.4 milliondue to transfers among Inmate Welfare, Asset Forfei-ture, Jail Stores and the General Fund.
RevenuesNet increase of $43.1 million.
Fines, Forfeitures and Penalties — increase of $0.1 mil-lion in Writ Disbursement Trust Fund revenue associ-ated with increased vehicle maintenance costs.Revenue From Use of Money & Property — increase of$0.5 million in Rents and Concessions due to increasedrevenue ($0.1 million) based on the agreement with theCorrections Corporation of America (CCA) for the leaseof the Otay Mesa Detention Facility; increased revenue($0.3 million) based on the inmate telephone systemcontract; and increased revenue ($0.1 million) in Wire-less Services due to new lease agreements.Intergovernmental Revenues — net increase of $12.3million.
Increase of $12.1 million in State revenue allocatedfrom the Local Revenue Fund 2011, CommunityCorrections Subaccount as a result of Public SafetyRealignment due to increased costs to supportadditional staff, start-up costs and operational costsfor the increase of inmates at the East Mesa ReentryFacility, costs to create the Regional RealignmentResponse Group and to offset the Realignment DataCollection and Analysis project.Increase of $1.5 million in State revenue allocatedfrom the Local Revenue Fund 2011, Enhancing LawEnforcement Activities Subaccount to providereimbursement for booking and processing fees.Increase of $0.5 million in revenue from the Board ofState and Community Corrections Police grant fundsfor overtime costs.Increase of $0.1 million in State revenue to supportthe Regional Auto Theft Task Force.Decrease of $0.6 million in various revenue accountsrelated to grant funds that will not be rebudgeted.Net decrease of $0.9 million in State and federalgrant revenues due to a decrease in the Urban AreasSecurity Initiative Grant, Port Security Grant, andState Homeland Security Grant Program offset by anincrease in the Operation Stonegarden GrantProgram.
Decrease of $0.4 million for the federal State CriminalAlien Assistance Program (SCAAP), which providesfederal reimbursement to states and localities thatincur correctional salary costs for incarceratingundocumented criminal aliens.
Charges for Current Services — net increase of $4.6million.
Increase of $4.4 million in Contract City Revenue torecover costs of negotiated salary and benefitincreases and service adjustments for the contractedlaw enforcement services provided to the ninecontract cities, transit entities and tribes.Increase of $0.2 million from the Civil AutomationTrust Fund for modifications to the Civil Operationsoffice space in the Vista courthouse.Increase of $0.2 million from the Vehicle InspectionFee Trust Fund for security equipment at the Vistaand Kearny Mesa courthouses. Decrease of $0.2 million in various revenuesincluding false alarm fees and civil service processfees.
Miscellaneous Revenues — decrease of $2.7 million.Decrease of $5.7 million from the Fire Safety TrustFund to replace the conventional radio system due tothe funds encumbered in Fiscal Year 2012-13.Increase of $2.2 million due to an increase in plannedexpenditures to be reimbursed from the RCS TrustFund revenue.Increase of $0.5 million due to an increase in plannedexpenditures to be reimbursed from the Cal-IDEquipment Replacement/System Enhancement TrustFund.Increase of $0.3 million due to increased sales ofcommissary goods to inmates.
Other Financing Sources — increase of $4.2 million.Increase of $3.8 million due to projected receipts anduse of Special Revenue Fund fund balance fromProposition 172, the Local Public Safety Protectionand Improvement Act of 1993, which supportsregional law enforcement and detention services.Increase of $0.2 million due to an increase in fundstransferred from the Inmate Welfare Fund to theGeneral Fund.Increase of $0.1 million due to an increase in thefunds transferred from the Jail Stores ISF to theInmate Welfare Fund.Increase of $0.1 million due to an increase in thefunds transferred from the Asset Forfeiture Fund tothe General Fund.
132 Public Safety GroupAdopted Operational Plan Fiscal Years 2013-2014 and 2014-2015
Sheriff
Use of Fund Balance — increase of $3.1 million. A totalof $4.5 million is budgeted.
$2.9 million to offset one-time start-up costs foradditional staff, furniture, fixtures and equipment andtransportation equipment related to the Women'sDetention Facility.$1.0 million to offset costs related to equipmentreplacement ($0.6 million), new equipment for theNarcotics Task Force ($0.1 million) and equipment tooutfit the new Rancho San Diego station ($0.3million).$0.4 million to offset costs to provide dispatchservices to the Probation Department. $0.2 million in Inmate Welfare Fund fund balance tooffset Grossmont Union High School Districtcontracted educational services ($0.1 million) and inOperating Transfers Out due to a transfer from theInmate Welfare fund in support of positions for theEast Mesa Reentry Facility ($0.1 million).
General Purpose Revenue Allocation — increase of$21.1 million to offset the costs of increased Countyretirement contributions and to support the San DiegoCounty Women's Detention and Reentry Facility withpartial year funding.
Budget Changes and Operational Impact: 2013-14 to 2014-15
Increase of 1.00 staff year to provide information technol-ogy technical expertise to support the Transmission ControlProtocol/Internet Protocol (TCP/IP) demands for the nextgeneration RCS microwave system. A net increase of $3.8million is primarily due to an increase in Salaries and Bene-fits for County retirement contributions and full year staffingfor the San Diego County Women's Detention and ReentryFacility and the East Mesa Reentry Facility as describedabove, increases in Other Charges for medical costs relatedto an increase in the number of inmates associated with theSan Diego County Women's Detention and Reentry Facilityand the East Mesa Reentry Facility, and an increase inOperating Transfers Out for a full year of staffing fundedthrough Inmate Welfare. These increases are partially offsetby reductions in Services and Supplies and Capital AssetsEquipment due to the completion of one time projects.
133Public Safety Group Adopted Operational Plan Fiscal Years 2013-2014 and 2014-2015
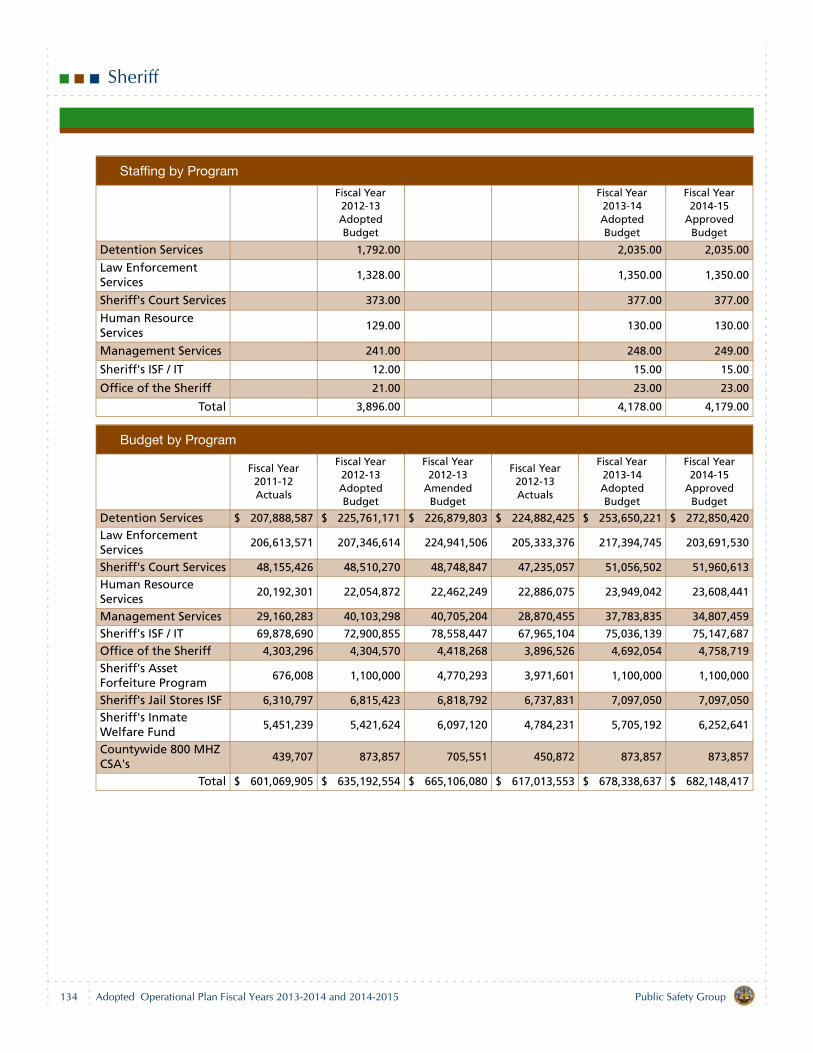
Sheriff
Staffing by Program
Fiscal Year 2012-13 Adopted Budget
Fiscal Year 2013-14 Adopted Budget
Fiscal Year 2014-15
Approved Budget
Detention Services 1,792.00 2,035.00 2,035.00
Law Enforcement Services
1,328.00 1,350.00 1,350.00
Sheriff's Court Services 373.00 377.00 377.00
Human Resource Services
129.00 130.00 130.00
Management Services 241.00 248.00 249.00
Sheriff's ISF / IT 12.00 15.00 15.00
Office of the Sheriff 21.00 23.00 23.00
Total 3,896.00 4,178.00 4,179.00
Budget by Program
Fiscal Year 2011-12 Actuals
Fiscal Year 2012-13 Adopted Budget
Fiscal Year 2012-13
Amended Budget
Fiscal Year 2012-13 Actuals
Fiscal Year 2013-14 Adopted Budget
Fiscal Year 2014-15
Approved Budget
Detention Services $ 207,888,587 $ 225,761,171 $ 226,879,803 $ 224,882,425 $ 253,650,221 $ 272,850,420
Law Enforcement Services
206,613,571 207,346,614 224,941,506 205,333,376 217,394,745 203,691,530
Sheriff's Court Services 48,155,426 48,510,270 48,748,847 47,235,057 51,056,502 51,960,613
Human Resource Services
20,192,301 22,054,872 22,462,249 22,886,075 23,949,042 23,608,441
Management Services 29,160,283 40,103,298 40,705,204 28,870,455 37,783,835 34,807,459
Sheriff's ISF / IT 69,878,690 72,900,855 78,558,447 67,965,104 75,036,139 75,147,687
Office of the Sheriff 4,303,296 4,304,570 4,418,268 3,896,526 4,692,054 4,758,719
Sheriff's Asset Forfeiture Program
676,008 1,100,000 4,770,293 3,971,601 1,100,000 1,100,000
Sheriff's Jail Stores ISF 6,310,797 6,815,423 6,818,792 6,737,831 7,097,050 7,097,050
Sheriff's Inmate Welfare Fund
5,451,239 5,421,624 6,097,120 4,784,231 5,705,192 6,252,641
Countywide 800 MHZ CSA's
439,707 873,857 705,551 450,872 873,857 873,857
Total $ 601,069,905 $ 635,192,554 $ 665,106,080 $ 617,013,553 $ 678,338,637 $ 682,148,417
134 Public Safety GroupAdopted Operational Plan Fiscal Years 2013-2014 and 2014-2015
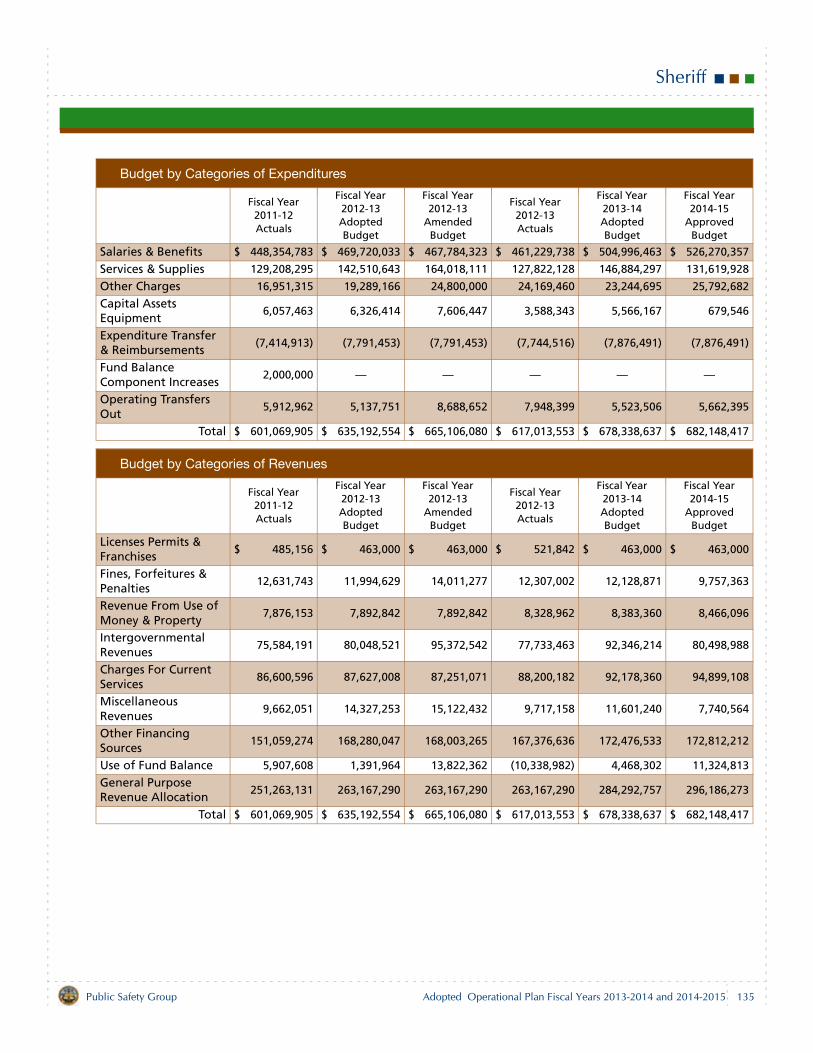
Sheriff
Budget by Categories of Expenditures
Fiscal Year 2011-12 Actuals
Fiscal Year 2012-13 Adopted Budget
Fiscal Year 2012-13
Amended Budget
Fiscal Year 2012-13 Actuals
Fiscal Year 2013-14 Adopted Budget
Fiscal Year 2014-15
Approved Budget
Salaries & Benefits $ 448,354,783 $ 469,720,033 $ 467,784,323 $ 461,229,738 $ 504,996,463 $ 526,270,357
Services & Supplies 129,208,295 142,510,643 164,018,111 127,822,128 146,884,297 131,619,928
Other Charges 16,951,315 19,289,166 24,800,000 24,169,460 23,244,695 25,792,682
Capital Assets Equipment
6,057,463 6,326,414 7,606,447 3,588,343 5,566,167 679,546
Expenditure Transfer & Reimbursements
(7,414,913) (7,791,453) (7,791,453) (7,744,516) (7,876,491) (7,876,491)
Fund Balance Component Increases
2,000,000 — — — — —
Operating Transfers Out
5,912,962 5,137,751 8,688,652 7,948,399 5,523,506 5,662,395
Total $ 601,069,905 $ 635,192,554 $ 665,106,080 $ 617,013,553 $ 678,338,637 $ 682,148,417
Budget by Categories of Revenues
Fiscal Year 2011-12 Actuals
Fiscal Year 2012-13 Adopted Budget
Fiscal Year 2012-13
Amended Budget
Fiscal Year 2012-13 Actuals
Fiscal Year 2013-14 Adopted Budget
Fiscal Year 2014-15
Approved Budget
Licenses Permits & Franchises
$ 485,156 $ 463,000 $ 463,000 $ 521,842 $ 463,000 $ 463,000
Fines, Forfeitures & Penalties
12,631,743 11,994,629 14,011,277 12,307,002 12,128,871 9,757,363
Revenue From Use of Money & Property
7,876,153 7,892,842 7,892,842 8,328,962 8,383,360 8,466,096
Intergovernmental Revenues
75,584,191 80,048,521 95,372,542 77,733,463 92,346,214 80,498,988
Charges For Current Services
86,600,596 87,627,008 87,251,071 88,200,182 92,178,360 94,899,108
Miscellaneous Revenues
9,662,051 14,327,253 15,122,432 9,717,158 11,601,240 7,740,564
Other Financing Sources
151,059,274 168,280,047 168,003,265 167,376,636 172,476,533 172,812,212
Use of Fund Balance 5,907,608 1,391,964 13,822,362 (10,338,982) 4,468,302 11,324,813
General Purpose Revenue Allocation
251,263,131 263,167,290 263,167,290 263,167,290 284,292,757 296,186,273
Total $ 601,069,905 $ 635,192,554 $ 665,106,080 $ 617,013,553 $ 678,338,637 $ 682,148,417
135Public Safety Group Adopted Operational Plan Fiscal Years 2013-2014 and 2014-2015

Child Support Services
Department Description
The Department of Child Support Services (DCSS) is thelocal agency responsible for administering the federal andState Title IV-D child support program. Federal and Statelaw governs the department with oversight by the CaliforniaDepartment of Child Support Services. DCSS providescounty residents with services such as establishingpaternity, establishing and enforcing financial and medicalsupport orders, and facilitating the collection anddisbursement of child and spousal support paymentsthrough the State Disbursement Unit.
Mission Statement
Enhance the lives and well-being of children and promotefamily self-sufficiency by establishing and enforcing sup-port orders.
2012-13 Accomplishments
Strategic Initiative – Healthy FamiliesInitiated legal action to determine parentage andobtained fair and appropriate child support and/ormedical support in a timely manner.
Increased the percentage of open cases with anenforceable order to 87% (67,500 of 77,300),exceeding the goal of 85%.Ensured parentage was established in 95% (56,900of 60,200) of cases, exceeding the goal of 90%.
Maximized compliance with support orders by promot-ing, enabling and ensuring payment for families. Col-lected reimbursement for public assistance programs.
Increased the percentage of current supportcollected to current support owed to 67% ($84.4million of $126.4 million), exceeding the goal of 63%.Increased the percentage of arrears cases with acollection to 65% (38,600 of 59,200), exceeding thegoal of 64%.Collected $178.1 million in child support duringFiscal Year 2012-13 below the goal of $179.0 million.Actual total collections were less than estimated dueto a reduction in collections from sources includingthe Internal Revenue Service and UnemploymentIncome Benefits.
Informed and educated the community about childsupport services through proactive media relations andcommunity outreach.
The goal to reach custodial parents, noncustodialparents and employers with video meetings wasreplaced by an effort to reach more of the targetaudience through a quarterly e-newsletter andeducational videos. DCSS designed, published anddistributed the e-newsletter to 47,000 child supportcustomers, leading to high readership and increasedviews of a new educational video for custodialparents produced by DCSS and posted on itswebsite. In addition to the e-newsletter, one videomeeting was conducted to educate employers aboutchild support services.
Required Discipline for Excellence – Accountability, Transparency and Ethical Conduct
Exceeded the federal performance measure goal of$3.50 for every $1.00 spent on operations, which mea-sures program cost effectiveness, by collecting $3.88for every $1.00 spent on operations.
Required Discipline for Excellence – Continuous Improvement and Innovation
Developed and implemented a paperless litigation filefor use in court. Since its deployment in late February2013, this new process has resulted in a reduction ofapproximately 114,700 pieces of paper and more than900 staff hours.Collaborated with the San Diego Law Library to provideservice to child support customers on Saturdays atLaw Library locations in the county. DCSS staff con-ducted 114 case resolution meetings with non-custo-dial parents. Of these cases, 43% resulted in anagreed-upon child support order, eliminating the needfor participants to go to court.
137Public Safety Group Adopted Operational Plan Fiscal Years 2013-2014 and 2014-2015
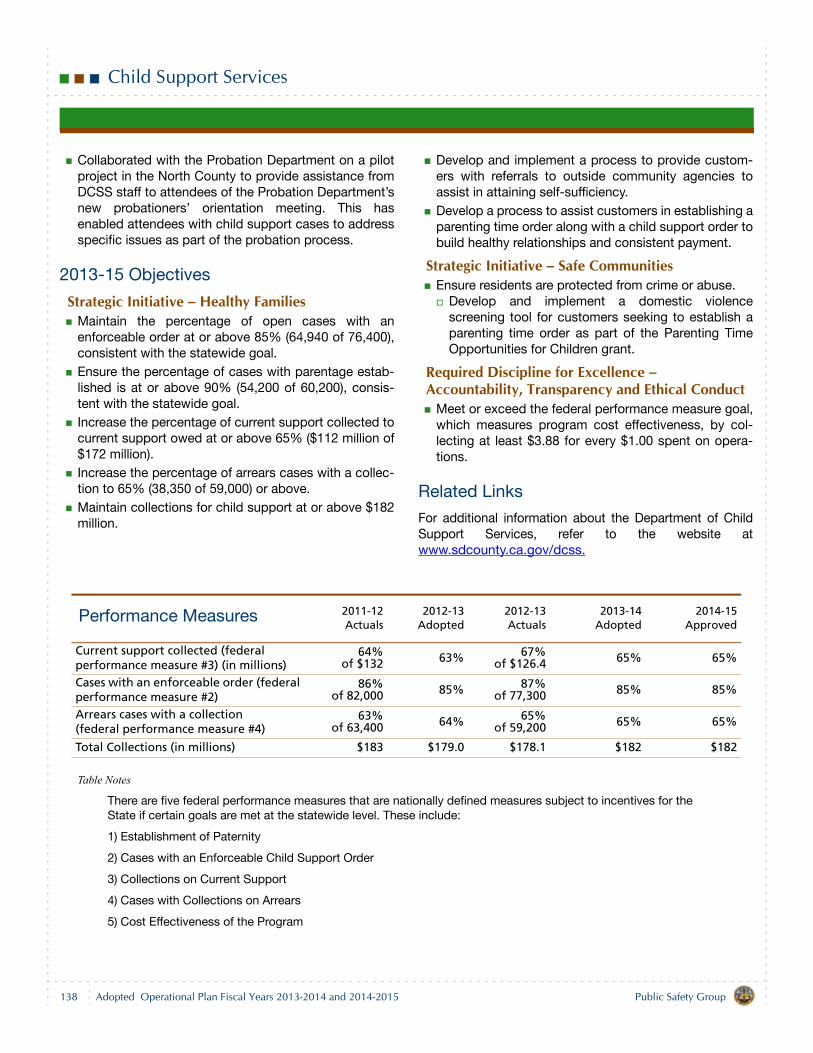
Child Support Services
Collaborated with the Probation Department on a pilotproject in the North County to provide assistance fromDCSS staff to attendees of the Probation Department’snew probationers’ orientation meeting. This hasenabled attendees with child support cases to addressspecific issues as part of the probation process.
2013-15 Objectives
Strategic Initiative – Healthy FamiliesMaintain the percentage of open cases with anenforceable order at or above 85% (64,940 of 76,400),consistent with the statewide goal.Ensure the percentage of cases with parentage estab-lished is at or above 90% (54,200 of 60,200), consis-tent with the statewide goal.Increase the percentage of current support collected tocurrent support owed at or above 65% ($112 million of$172 million).Increase the percentage of arrears cases with a collec-tion to 65% (38,350 of 59,000) or above.Maintain collections for child support at or above $182million.
Develop and implement a process to provide custom-ers with referrals to outside community agencies toassist in attaining self-sufficiency.Develop a process to assist customers in establishing aparenting time order along with a child support order tobuild healthy relationships and consistent payment.
Strategic Initiative – Safe CommunitiesEnsure residents are protected from crime or abuse.
Develop and implement a domestic violencescreening tool for customers seeking to establish aparenting time order as part of the Parenting TimeOpportunities for Children grant.
Required Discipline for Excellence – Accountability, Transparency and Ethical Conduct
Meet or exceed the federal performance measure goal,which measures program cost effectiveness, by col-lecting at least $3.88 for every $1.00 spent on opera-tions.
Related Links
For additional information about the Department of ChildSupport Services, refer to the website atwww.sdcounty.ca.gov/dcss.
Table Notes
There are five federal performance measures that are nationally defined measures subject to incentives for the State if certain goals are met at the statewide level. These include:
1) Establishment of Paternity
2) Cases with an Enforceable Child Support Order
3) Collections on Current Support
4) Cases with Collections on Arrears
5) Cost Effectiveness of the Program
Performance Measures 2011-12Actuals
2012-13Adopted
2012-13Actuals
2013-14Adopted
2014-15Approved
Current support collected (federal performance measure #3) (in millions)
64%of $132 63% 67%
of $126.4 65% 65%
Cases with an enforceable order (federal performance measure #2)
86%of 82,000 85% 87%
of 77,300 85% 85%
Arrears cases with a collection (federal performance measure #4)
63%of 63,400 64% 65%
of 59,200 65% 65%
Total Collections (in millions) $183 $179.0 $178.1 $182 $182
138 Public Safety GroupAdopted Operational Plan Fiscal Years 2013-2014 and 2014-2015
Child Support Services
Budget Changes and Operational Impact: 2012-13 to 2013-14
StaffingNet decrease of 1.00 staff year.
Decrease of 47.00 staff years in the Staff DevelopmentDivision. These staff years were transferred to LegalServices.Decrease of 9.00 staff years in Quality Assurance.These staff years were transferred to Production Oper-ations.Decrease of 1.00 staff year in Administrative Services.The decrease supports shifting funds to a reclassifiedposition within the program.Increase of 9.00 staff years in Production Operations.These staff years were transferred from Quality Assur-ance.Increase of 47.00 staff years in Legal Services. Thesestaff years were transferred from the Staff DevelopmentDivision.
ExpendituresIncrease of $0.8 million in Salaries and Benefits due to anincrease in County retirement contributions.
RevenuesNet increase of $0.8 million.
Intergovernmental Revenues — increase of $0.2 milliondue to an increase in claimable expenditures.Charges for Current Services — increase of $1.1 milliondue to the redirection of Recovered Cost revenue tolocal child support agencies.Use of Fund Balance — decrease of $0.6 million due tothe redirection of Recovered Cost revenue to local childsupport agencies.
Budget Changes and Operational Impact: 2013-14 to 2014-15
Increase of $1.0 million due to an increase in County retire-ment contributions.
139Public Safety Group Adopted Operational Plan Fiscal Years 2013-2014 and 2014-2015
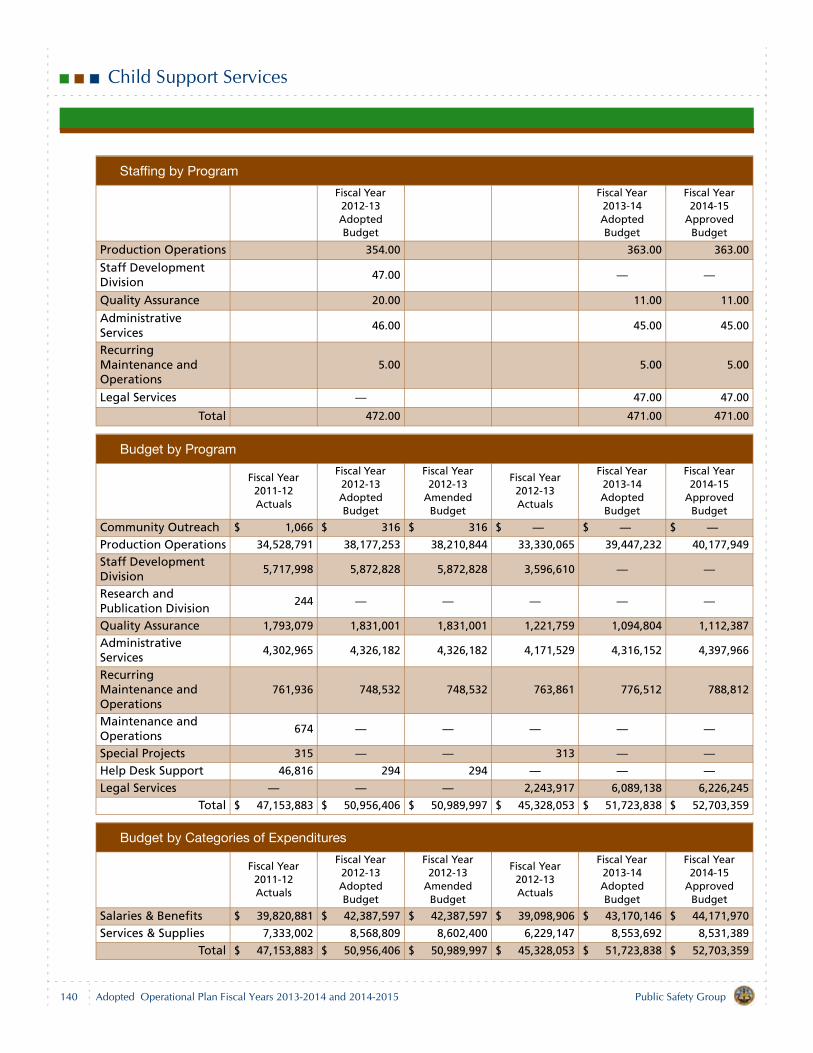
Child Support Services
Staffing by Program
Fiscal Year 2012-13 Adopted Budget
Fiscal Year 2013-14 Adopted Budget
Fiscal Year 2014-15
Approved Budget
Production Operations 354.00 363.00 363.00
Staff Development Division
47.00 — —
Quality Assurance 20.00 11.00 11.00
Administrative Services
46.00 45.00 45.00
Recurring Maintenance and Operations
5.00 5.00 5.00
Legal Services — 47.00 47.00
Total 472.00 471.00 471.00
Budget by Program
Fiscal Year 2011-12 Actuals
Fiscal Year 2012-13 Adopted Budget
Fiscal Year 2012-13
Amended Budget
Fiscal Year 2012-13 Actuals
Fiscal Year 2013-14 Adopted Budget
Fiscal Year 2014-15
Approved Budget
Community Outreach $ 1,066 $ 316 $ 316 $ — $ — $ —Production Operations 34,528,791 38,177,253 38,210,844 33,330,065 39,447,232 40,177,949
Staff Development Division
5,717,998 5,872,828 5,872,828 3,596,610 — —
Research and Publication Division
244 — — — — —
Quality Assurance 1,793,079 1,831,001 1,831,001 1,221,759 1,094,804 1,112,387
Administrative Services
4,302,965 4,326,182 4,326,182 4,171,529 4,316,152 4,397,966
Recurring Maintenance and Operations
761,936 748,532 748,532 763,861 776,512 788,812
Maintenance and Operations
674 — — — — —
Special Projects 315 — — 313 — —Help Desk Support 46,816 294 294 — — —Legal Services — — — 2,243,917 6,089,138 6,226,245
Total $ 47,153,883 $ 50,956,406 $ 50,989,997 $ 45,328,053 $ 51,723,838 $ 52,703,359
Budget by Categories of Expenditures
Fiscal Year 2011-12 Actuals
Fiscal Year 2012-13 Adopted Budget
Fiscal Year 2012-13
Amended Budget
Fiscal Year 2012-13 Actuals
Fiscal Year 2013-14 Adopted Budget
Fiscal Year 2014-15
Approved Budget
Salaries & Benefits $ 39,820,881 $ 42,387,597 $ 42,387,597 $ 39,098,906 $ 43,170,146 $ 44,171,970
Services & Supplies 7,333,002 8,568,809 8,602,400 6,229,147 8,553,692 8,531,389
Total $ 47,153,883 $ 50,956,406 $ 50,989,997 $ 45,328,053 $ 51,723,838 $ 52,703,359
140 Public Safety GroupAdopted Operational Plan Fiscal Years 2013-2014 and 2014-2015
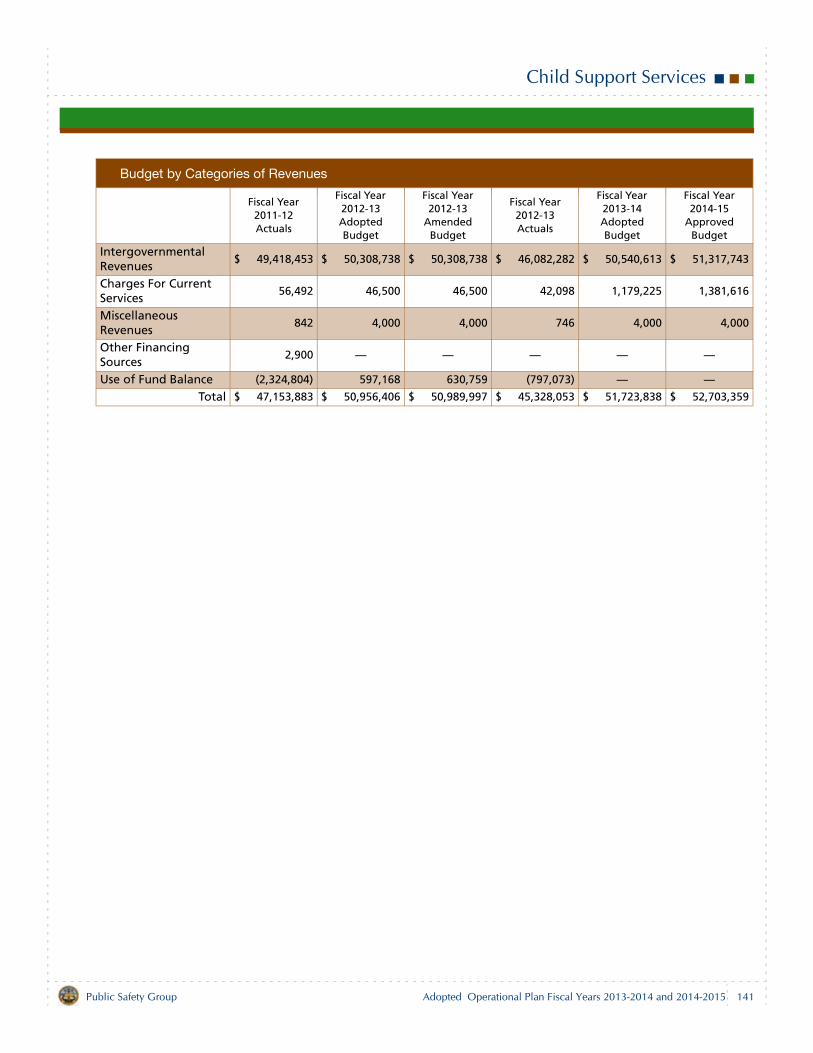
Child Support Services
Budget by Categories of Revenues
Fiscal Year 2011-12 Actuals
Fiscal Year 2012-13 Adopted Budget
Fiscal Year 2012-13
Amended Budget
Fiscal Year 2012-13 Actuals
Fiscal Year 2013-14 Adopted Budget
Fiscal Year 2014-15
Approved Budget
Intergovernmental Revenues
$ 49,418,453 $ 50,308,738 $ 50,308,738 $ 46,082,282 $ 50,540,613 $ 51,317,743
Charges For Current Services
56,492 46,500 46,500 42,098 1,179,225 1,381,616
Miscellaneous Revenues
842 4,000 4,000 746 4,000 4,000
Other Financing Sources
2,900 — — — — —
Use of Fund Balance (2,324,804) 597,168 630,759 (797,073) — —Total $ 47,153,883 $ 50,956,406 $ 50,989,997 $ 45,328,053 $ 51,723,838 $ 52,703,359
141Public Safety Group Adopted Operational Plan Fiscal Years 2013-2014 and 2014-2015

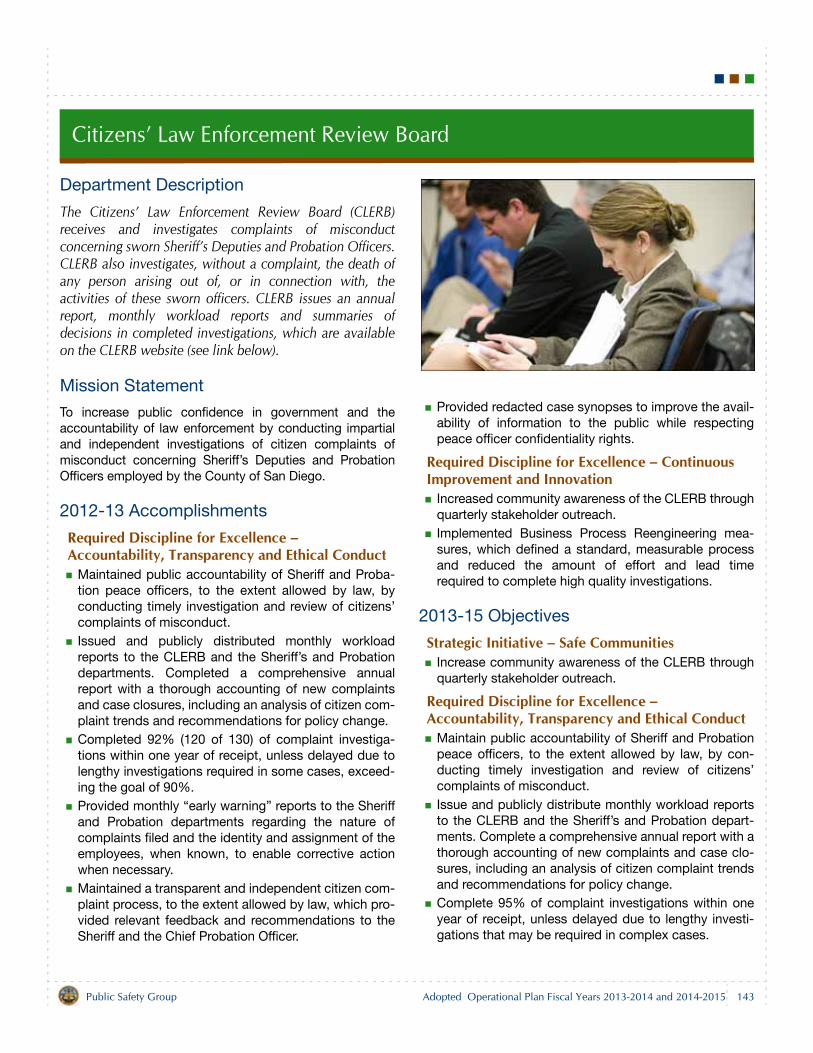
Citizens’ Law Enforcement Review Board
Department Description
The Citizens’ Law Enforcement Review Board (CLERB)receives and investigates complaints of misconductconcerning sworn Sheriff’s Deputies and Probation Officers.CLERB also investigates, without a complaint, the death ofany person arising out of, or in connection with, theactivities of these sworn officers. CLERB issues an annualreport, monthly workload reports and summaries ofdecisions in completed investigations, which are availableon the CLERB website (see link below).
Mission Statement
To increase public confidence in government and theaccountability of law enforcement by conducting impartialand independent investigations of citizen complaints ofmisconduct concerning Sheriff’s Deputies and ProbationOfficers employed by the County of San Diego.
2012-13 Accomplishments
Required Discipline for Excellence – Accountability, Transparency and Ethical Conduct
Maintained public accountability of Sheriff and Proba-tion peace officers, to the extent allowed by law, byconducting timely investigation and review of citizens’complaints of misconduct.Issued and publicly distributed monthly workloadreports to the CLERB and the Sheriff’s and Probationdepartments. Completed a comprehensive annualreport with a thorough accounting of new complaintsand case closures, including an analysis of citizen com-plaint trends and recommendations for policy change.Completed 92% (120 of 130) of complaint investiga-tions within one year of receipt, unless delayed due tolengthy investigations required in some cases, exceed-ing the goal of 90%.Provided monthly “early warning” reports to the Sheriffand Probation departments regarding the nature ofcomplaints filed and the identity and assignment of theemployees, when known, to enable corrective actionwhen necessary.Maintained a transparent and independent citizen com-plaint process, to the extent allowed by law, which pro-vided relevant feedback and recommendations to theSheriff and the Chief Probation Officer.
Provided redacted case synopses to improve the avail-ability of information to the public while respectingpeace officer confidentiality rights.
Required Discipline for Excellence – Continuous Improvement and Innovation
Increased community awareness of the CLERB throughquarterly stakeholder outreach.Implemented Business Process Reengineering mea-sures, which defined a standard, measurable processand reduced the amount of effort and lead timerequired to complete high quality investigations.
2013-15 Objectives
Strategic Initiative – Safe CommunitiesIncrease community awareness of the CLERB throughquarterly stakeholder outreach.
Required Discipline for Excellence – Accountability, Transparency and Ethical Conduct
Maintain public accountability of Sheriff and Probationpeace officers, to the extent allowed by law, by con-ducting timely investigation and review of citizens’complaints of misconduct.Issue and publicly distribute monthly workload reportsto the CLERB and the Sheriff’s and Probation depart-ments. Complete a comprehensive annual report with athorough accounting of new complaints and case clo-sures, including an analysis of citizen complaint trendsand recommendations for policy change.Complete 95% of complaint investigations within oneyear of receipt, unless delayed due to lengthy investi-gations that may be required in complex cases.
143Public Safety Group Adopted Operational Plan Fiscal Years 2013-2014 and 2014-2015
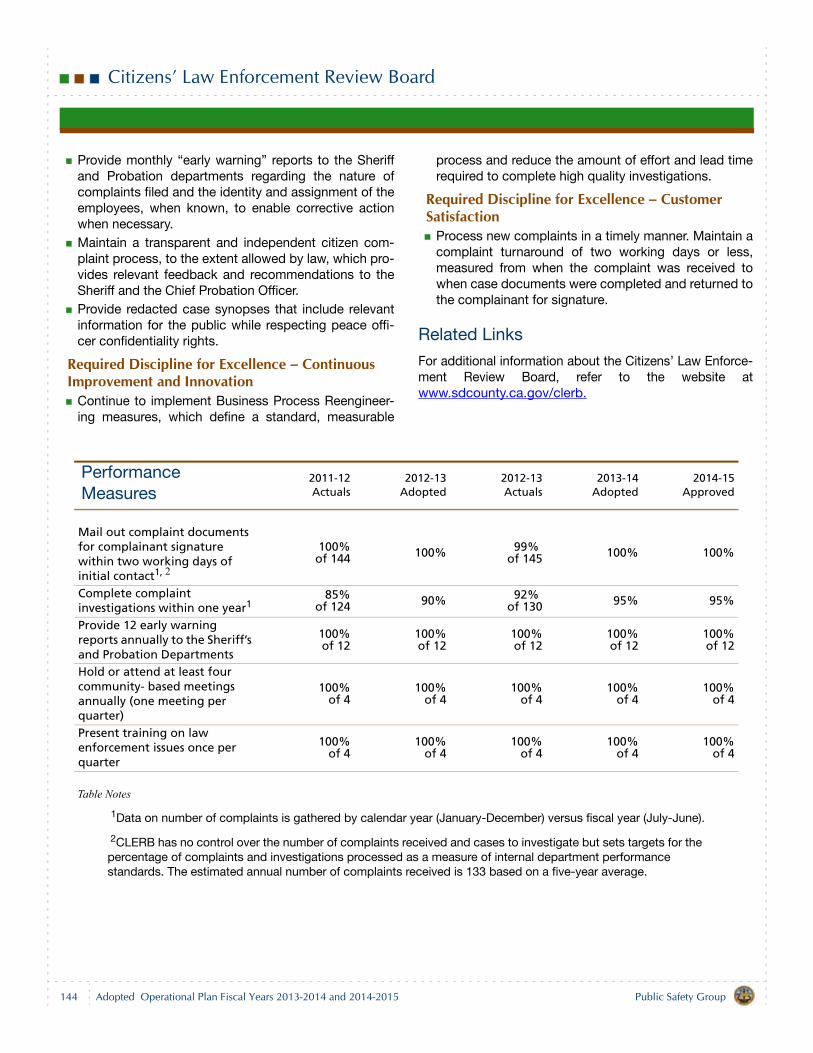
Citizens’ Law Enforcement Review Board
Provide monthly “early warning” reports to the Sheriffand Probation departments regarding the nature ofcomplaints filed and the identity and assignment of theemployees, when known, to enable corrective actionwhen necessary.Maintain a transparent and independent citizen com-plaint process, to the extent allowed by law, which pro-vides relevant feedback and recommendations to theSheriff and the Chief Probation Officer.Provide redacted case synopses that include relevantinformation for the public while respecting peace offi-cer confidentiality rights.
Required Discipline for Excellence – Continuous Improvement and Innovation
Continue to implement Business Process Reengineer-ing measures, which define a standard, measurable
process and reduce the amount of effort and lead timerequired to complete high quality investigations.
Required Discipline for Excellence – Customer Satisfaction
Process new complaints in a timely manner. Maintain acomplaint turnaround of two working days or less,measured from when the complaint was received towhen case documents were completed and returned tothe complainant for signature.
Related Links
For additional information about the Citizens’ Law Enforce-ment Review Board, refer to the website atwww.sdcounty.ca.gov/clerb.
Table Notes
1Data on number of complaints is gathered by calendar year (January-December) versus fiscal year (July-June).
2CLERB has no control over the number of complaints received and cases to investigate but sets targets for the percentage of complaints and investigations processed as a measure of internal department performance standards. The estimated annual number of complaints received is 133 based on a five-year average.
Performance Measures
2011-12Actuals
2012-13Adopted
2012-13Actuals
2013-14Adopted
2014-15Approved
Mail out complaint documents for complainant signature within two working days of initial contact1, 2
100%of 144 100% 99%
of 145 100% 100%
Complete complaint investigations within one year1
85%of 124 90% 92%
of 130 95% 95%
Provide 12 early warning reports annually to the Sheriff’s and Probation Departments
100%of 12
100%of 12
100% of 12
100% of 12
100%of 12
Hold or attend at least four community- based meetings annually (one meeting per quarter)
100%of 4
100%of 4
100%of 4
100%of 4
100%of 4
Present training on law enforcement issues once per quarter
100%of 4
100%of 4
100%of 4
100%of 4
100%of 4
144 Public Safety GroupAdopted Operational Plan Fiscal Years 2013-2014 and 2014-2015
Citizens’ Law Enforcement Review Board
Budget Changes and Operational Impact: 2012-13 to 2013-14
StaffingNo change in staffing.
ExpendituresNet increase of $18,000 in Salaries and Benefits due to anincrease in County retirement contributions.
RevenuesNet increase of $18,000 in General Purpose Revenue Allo-cation to offset an increase in County retirement contribu-tions.
Budget Changes and Operational Impact: 2013-14 to 2014-15
Increase of $8,000 primarily due to an increase in Countyretirement contributions.
145Public Safety Group Adopted Operational Plan Fiscal Years 2013-2014 and 2014-2015
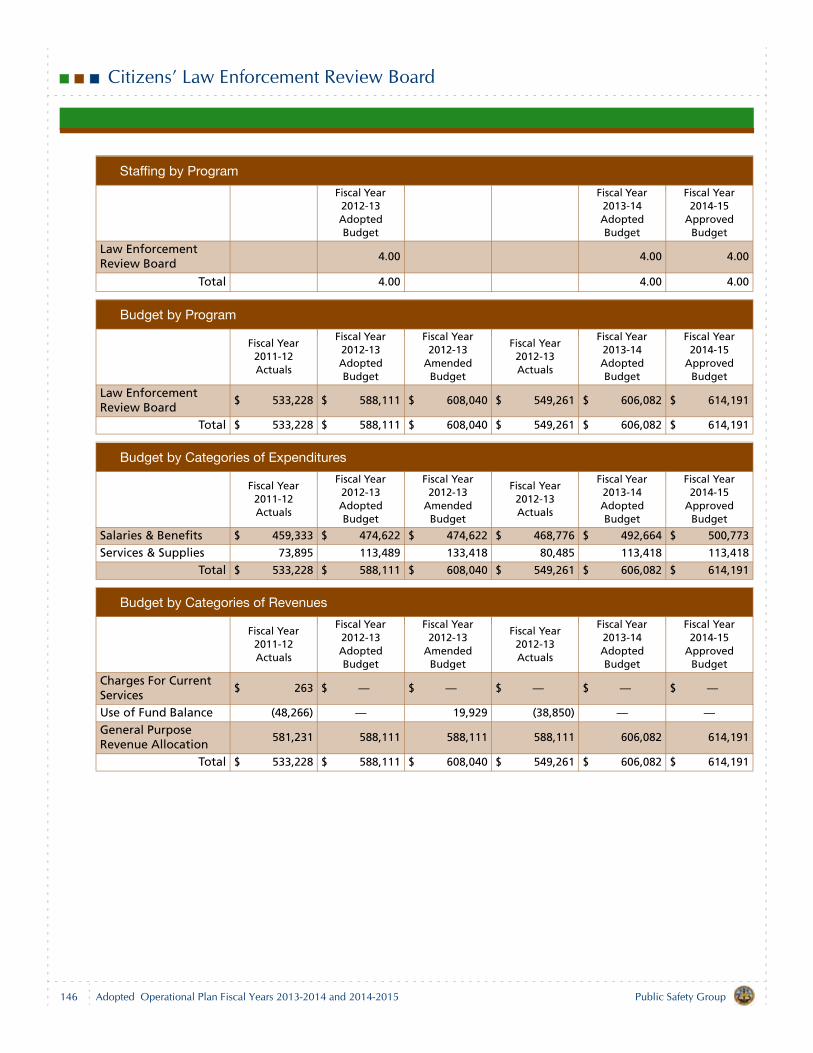
Citizens’ Law Enforcement Review Board
Staffing by Program
Fiscal Year 2012-13 Adopted Budget
Fiscal Year 2013-14 Adopted Budget
Fiscal Year 2014-15
Approved Budget
Law Enforcement Review Board
4.00 4.00 4.00
Total 4.00 4.00 4.00
Budget by Program
Fiscal Year 2011-12 Actuals
Fiscal Year 2012-13 Adopted Budget
Fiscal Year 2012-13
Amended Budget
Fiscal Year 2012-13 Actuals
Fiscal Year 2013-14 Adopted Budget
Fiscal Year 2014-15
Approved Budget
Law Enforcement Review Board
$ 533,228 $ 588,111 $ 608,040 $ 549,261 $ 606,082 $ 614,191
Total $ 533,228 $ 588,111 $ 608,040 $ 549,261 $ 606,082 $ 614,191
Budget by Categories of Expenditures
Fiscal Year 2011-12 Actuals
Fiscal Year 2012-13 Adopted Budget
Fiscal Year 2012-13
Amended Budget
Fiscal Year 2012-13 Actuals
Fiscal Year 2013-14 Adopted Budget
Fiscal Year 2014-15
Approved Budget
Salaries & Benefits $ 459,333 $ 474,622 $ 474,622 $ 468,776 $ 492,664 $ 500,773
Services & Supplies 73,895 113,489 133,418 80,485 113,418 113,418
Total $ 533,228 $ 588,111 $ 608,040 $ 549,261 $ 606,082 $ 614,191
Budget by Categories of Revenues
Fiscal Year 2011-12 Actuals
Fiscal Year 2012-13 Adopted Budget
Fiscal Year 2012-13
Amended Budget
Fiscal Year 2012-13 Actuals
Fiscal Year 2013-14 Adopted Budget
Fiscal Year 2014-15
Approved Budget
Charges For Current Services
$ 263 $ — $ — $ — $ — $ —
Use of Fund Balance (48,266) — 19,929 (38,850) — —General Purpose Revenue Allocation
581,231 588,111 588,111 588,111 606,082 614,191
Total $ 533,228 $ 588,111 $ 608,040 $ 549,261 $ 606,082 $ 614,191
146 Public Safety GroupAdopted Operational Plan Fiscal Years 2013-2014 and 2014-2015
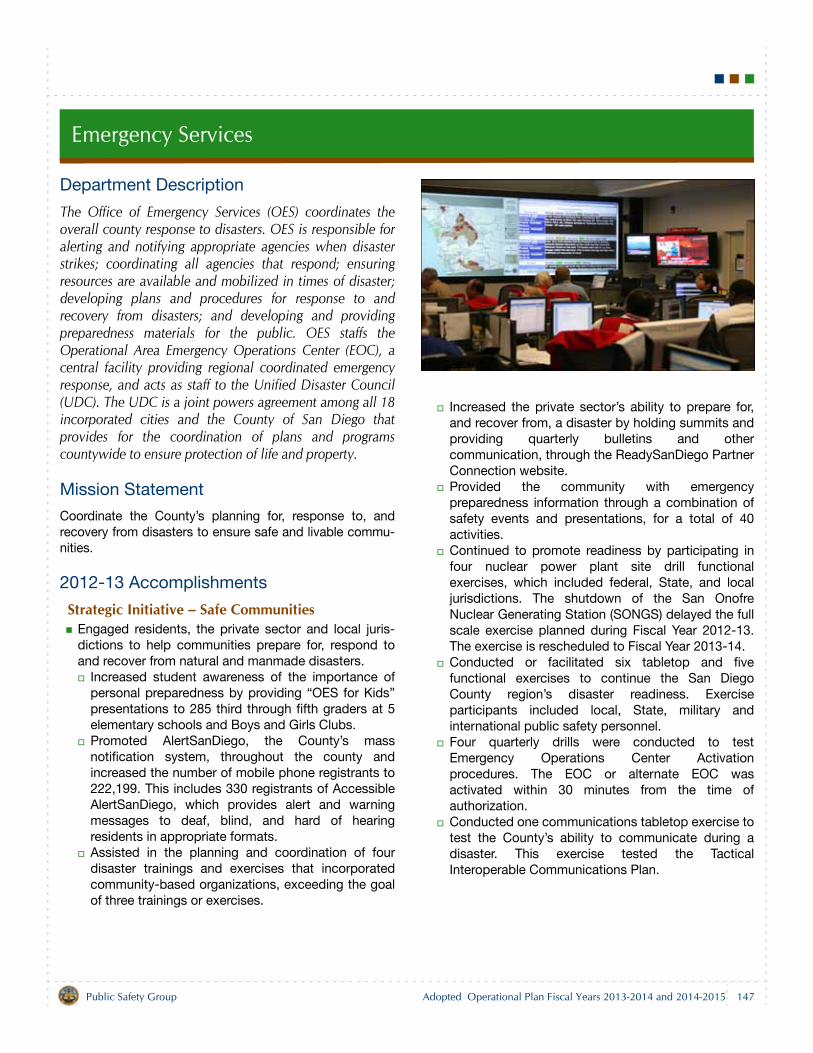
Emergency Services
Department Description
The Office of Emergency Services (OES) coordinates theoverall county response to disasters. OES is responsible foralerting and notifying appropriate agencies when disasterstrikes; coordinating all agencies that respond; ensuringresources are available and mobilized in times of disaster;developing plans and procedures for response to andrecovery from disasters; and developing and providingpreparedness materials for the public. OES staffs theOperational Area Emergency Operations Center (EOC), acentral facility providing regional coordinated emergencyresponse, and acts as staff to the Unified Disaster Council(UDC). The UDC is a joint powers agreement among all 18incorporated cities and the County of San Diego thatprovides for the coordination of plans and programscountywide to ensure protection of life and property.
Mission Statement
Coordinate the County’s planning for, response to, andrecovery from disasters to ensure safe and livable commu-nities.
2012-13 Accomplishments
Strategic Initiative – Safe CommunitiesEngaged residents, the private sector and local juris-dictions to help communities prepare for, respond toand recover from natural and manmade disasters.
Increased student awareness of the importance ofpersonal preparedness by providing “OES for Kids”presentations to 285 third through fifth graders at 5elementary schools and Boys and Girls Clubs.Promoted AlertSanDiego, the County’s massnotification system, throughout the county andincreased the number of mobile phone registrants to222,199. This includes 330 registrants of AccessibleAlertSanDiego, which provides alert and warningmessages to deaf, blind, and hard of hearingresidents in appropriate formats.Assisted in the planning and coordination of fourdisaster trainings and exercises that incorporatedcommunity-based organizations, exceeding the goalof three trainings or exercises.
Increased the private sector’s ability to prepare for,and recover from, a disaster by holding summits andproviding quarterly bulletins and othercommunication, through the ReadySanDiego PartnerConnection website.Provided the community with emergencypreparedness information through a combination ofsafety events and presentations, for a total of 40activities.Continued to promote readiness by participating infour nuclear power plant site drill functionalexercises, which included federal, State, and localjurisdictions. The shutdown of the San OnofreNuclear Generating Station (SONGS) delayed the fullscale exercise planned during Fiscal Year 2012-13.The exercise is rescheduled to Fiscal Year 2013-14.Conducted or facilitated six tabletop and fivefunctional exercises to continue the San DiegoCounty region’s disaster readiness. Exerciseparticipants included local, State, military andinternational public safety personnel.Four quarterly drills were conducted to testEmergency Operations Center Activationprocedures. The EOC or alternate EOC wasactivated within 30 minutes from the time ofauthorization. Conducted one communications tabletop exercise totest the County’s ability to communicate during adisaster. This exercise tested the TacticalInteroperable Communications Plan.
147Public Safety Group Adopted Operational Plan Fiscal Years 2013-2014 and 2014-2015
Emergency Services
Required Discipline for Excellence – Regional Leadership
Represented the needs and interests of residents, busi-nesses and local jurisdictions by leveraging resourcesand creating innovative opportunities and best prac-tices to prepare for, respond to and recover from anytype of disaster.
Designed and produced preparedness materials invarious formats including print, video, audio andonline.Coordinated and expanded the region’s Access andFunctional Needs Working Group to includeadditional representatives from the disabledcommunity, for a total of 59 members. The groupconducted one tabletop exercise to evaluate thecapabilities throughout the region to respond todisasters impacting residents with access andfunctional needs.Implemented and trained 100 regional partners onthe proper use of the AlertSanDiego massnotification system.Promoted WebEOC automated management systemtraining and implementation to regional partners.Coordinated the development of advance recoverypre-approved vendor classifications to addressneeds and gaps in the procurement of services thathave impacted the timely stabilization of theCounty’s response to a disaster. Managed and administered Homeland SecurityGrant program funds as the manager of pass-through funds that are distributed throughout theSan Diego region to 18 cities, 58 special districts,and other agencies to improve preparedness,response to and advanced recovery from terroristand catastrophic events.Developed the SD Emergency application for mobiledevices, which has been downloaded on more than27,000 devices and provides interactive access tolocal disaster information.
2013-15 Objectives
Strategic Initiative – Safe CommunitiesIncrease public awareness of the importance of per-sonal preparedness by providing presentations andattending safety events for children and adults, for atotal of 20 events.
Promote the SD Emergency application for mobiledevices to increase the number of downloads by con-ducting 10 public service outreach events. SD Emer-gency provides interactive access to local disasterinformation throughout the county.Ensure communities are resilient to disasters andemergencies.
Promote AlertSanDiego, the County’s massnotification system, including AccessibleAlertSanDiego, which targets individuals with accessand functional needs, throughout the County toincrease the number of registrants by conducting 10public service outreach events.Develop a regional preparedness guide for childcarefacilities and conduct outreach to 5,000 registeredchildcare facilities. The preparedness guide willincrease the ability of regional childcare facilities toready their staff and families for emergencies. Maintain and enhance comprehensive continuity ofoperations plans and site evacuation plans for allCounty facilities. These plans ensure the safety ofthe public while visiting a County facility andcontinuity of County core services following adisaster.Assist in the planning and coordination of threedisaster trainings, summits or exercises thatincorporate community-based organizations. Provide quarterly information, such as bulletins orother communications, through the ReadySanDiegoPartner Connection website.
Ensure readiness in the region by participating in onenuclear power plant exercise, which will examine theregion’s ability to respond to an event at SONGS. Par-ticipants will include federal, State, and local jurisdic-tions and private sector partners.
Required Discipline for Excellence – Regional Leadership
Translate recently developed preparedness materialsinto Spanish, Tagalog, and Vietnamese languages toassist in the outreach to diverse populations in thecounty.Continue to promote and implement training forregional partners on emergency-related technology.
Adapt curriculum, refine the standards for use andconduct at least one training for regional partners onthe proper use of the AlertSanDiego massnotification system. Conduct quarterly WebEOC training for regionalpartners. WebEOC provides online communicationtools for responders during a crisis.
148 Public Safety GroupAdopted Operational Plan Fiscal Years 2013-2014 and 2014-2015
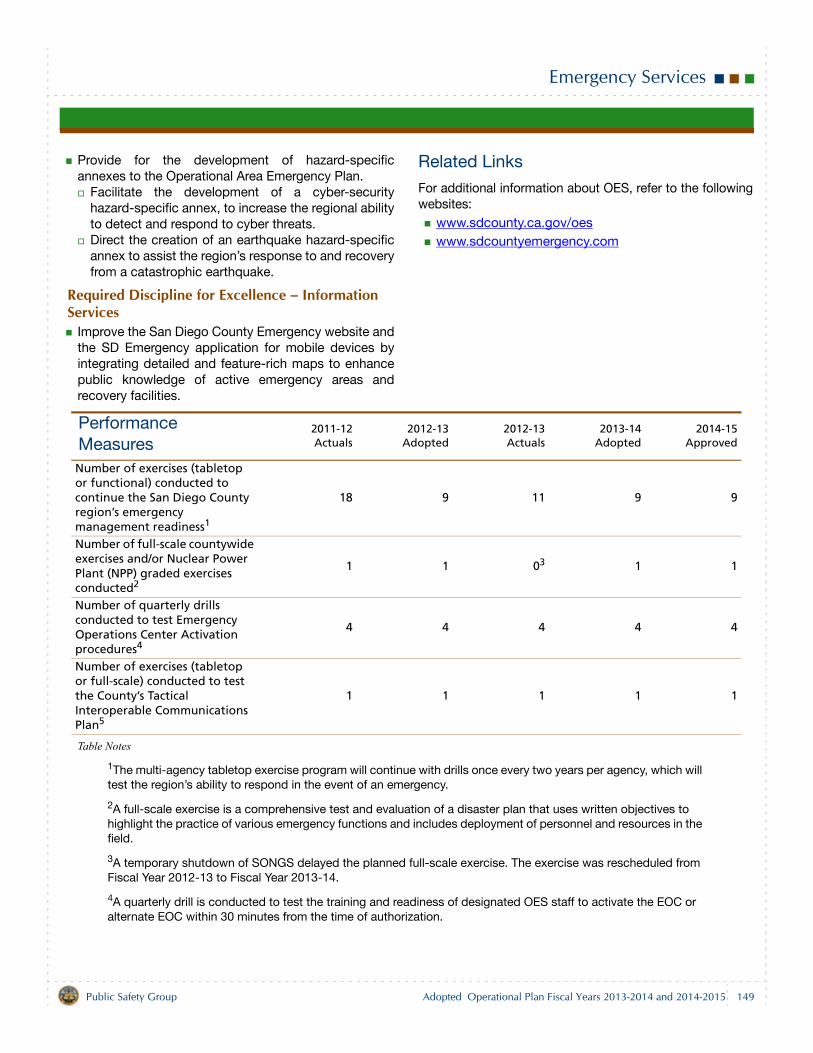
Emergency Services
Provide for the development of hazard-specificannexes to the Operational Area Emergency Plan.
Facilitate the development of a cyber-securityhazard-specific annex, to increase the regional abilityto detect and respond to cyber threats.Direct the creation of an earthquake hazard-specificannex to assist the region’s response to and recoveryfrom a catastrophic earthquake.
Required Discipline for Excellence – Information Services
Improve the San Diego County Emergency website andthe SD Emergency application for mobile devices byintegrating detailed and feature-rich maps to enhancepublic knowledge of active emergency areas andrecovery facilities.
Related Links
For additional information about OES, refer to the followingwebsites:
www.sdcounty.ca.gov/oeswww.sdcountyemergency.com
Table Notes
1The multi-agency tabletop exercise program will continue with drills once every two years per agency, which will test the region’s ability to respond in the event of an emergency.
2A full-scale exercise is a comprehensive test and evaluation of a disaster plan that uses written objectives to highlight the practice of various emergency functions and includes deployment of personnel and resources in the field.
3A temporary shutdown of SONGS delayed the planned full-scale exercise. The exercise was rescheduled from Fiscal Year 2012-13 to Fiscal Year 2013-14.
4A quarterly drill is conducted to test the training and readiness of designated OES staff to activate the EOC or alternate EOC within 30 minutes from the time of authorization.
Performance Measures
2011-12Actuals
2012-13Adopted
2012-13Actuals
2013-14Adopted
2014-15Approved
Number of exercises (tabletop or functional) conducted to continue the San Diego County region’s emergency management readiness1
18 9 11 9 9
Number of full-scale countywide exercises and/or Nuclear Power Plant (NPP) graded exercises conducted2
1 1 03 1 1
Number of quarterly drills conducted to test Emergency Operations Center Activation procedures4
4 4 4 4 4
Number of exercises (tabletop or full-scale) conducted to test the County’s Tactical Interoperable Communications Plan5
1 1 1 1 1
149Public Safety Group Adopted Operational Plan Fiscal Years 2013-2014 and 2014-2015
Emergency Services
5The Tactical Interoperable Communications Plan (TICP) is a requirement of the U.S. Department of Homeland Security to document coordination of interoperable communications, or public safety radio communications, within the region.
Budget Changes and Operational Impact: 2012-13 to 2013-14
StaffingNo change in staffing.
ExpendituresNet decrease of $2.2 million.
Salaries and Benefits — decrease of $0.1 million intemporary help due to a reduction in grant funds.Services and Supplies — increase of $0.6 million dueto increases in contracted services for regional emer-gency disaster planning projects.Other Charges — decrease of $2.7 million due to adecrease of $2.5 million in the State Homeland SecurityGrant Program which provides pass-through funds toother agencies and a decrease of $0.2 million associ-ated with the transfer of the Fire and Emergency Medi-cal Services program to the San Diego County FireAuthority.
RevenuesNet decrease of $2.2 million.
Intergovernmental Revenues — decrease of $2.2 mil-lion due to reductions in the State Homeland SecurityGrant Program. Use of Fund Balance — decrease of $0.2 million. Atotal of $0.3 million is budgeted to support the “CallWhen Needed” program to access fire suppression air-craft. General Purpose Revenue Allocation — increase of$0.1 million to offset the costs of an increase in Countyretirement contributions and increases in facility andinformation technology costs.
Budget Changes and Operational Impact: 2013-14 to 2014-15
Net decrease of $1.7 million primarily due to reductions inState Homeland Security Grant Program funds. OES willapply for future State Homeland Security and EmergencyManagement grants.
150 Public Safety GroupAdopted Operational Plan Fiscal Years 2013-2014 and 2014-2015
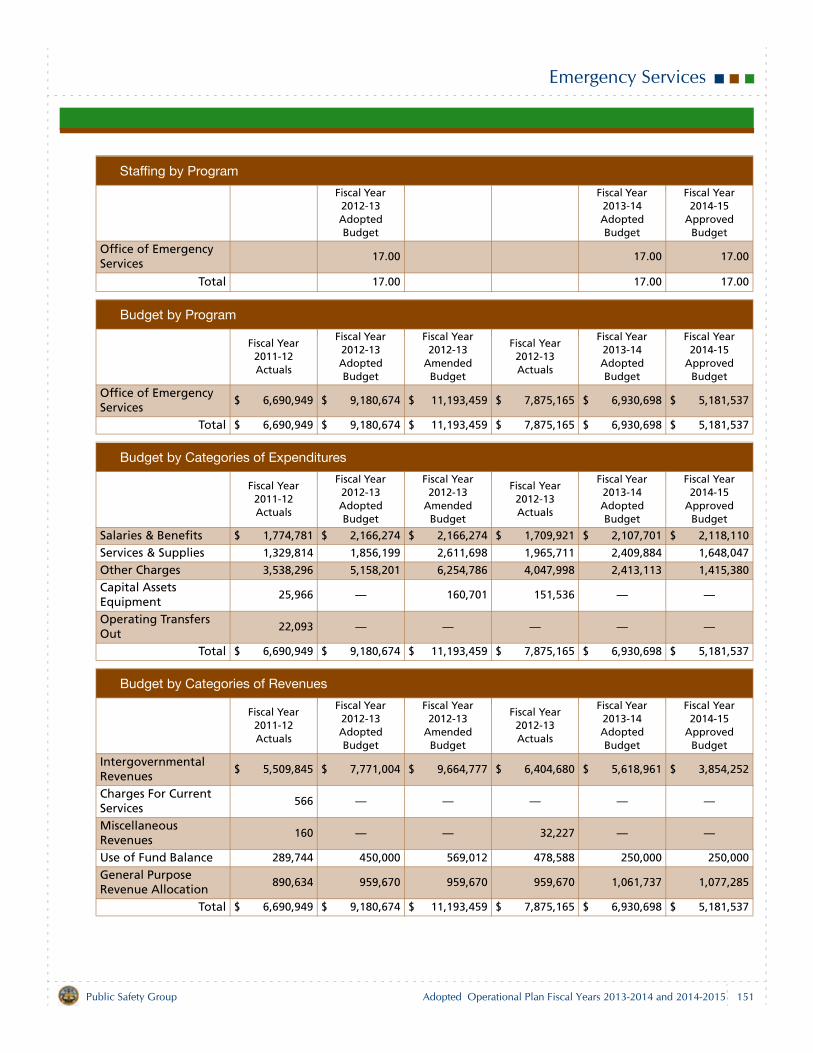
Emergency Services
Staffing by Program
Fiscal Year 2012-13 Adopted Budget
Fiscal Year 2013-14 Adopted Budget
Fiscal Year 2014-15
Approved Budget
Office of Emergency Services
17.00 17.00 17.00
Total 17.00 17.00 17.00
Budget by Program
Fiscal Year 2011-12 Actuals
Fiscal Year 2012-13 Adopted Budget
Fiscal Year 2012-13
Amended Budget
Fiscal Year 2012-13 Actuals
Fiscal Year 2013-14 Adopted Budget
Fiscal Year 2014-15
Approved Budget
Office of Emergency Services
$ 6,690,949 $ 9,180,674 $ 11,193,459 $ 7,875,165 $ 6,930,698 $ 5,181,537
Total $ 6,690,949 $ 9,180,674 $ 11,193,459 $ 7,875,165 $ 6,930,698 $ 5,181,537
Budget by Categories of Expenditures
Fiscal Year 2011-12 Actuals
Fiscal Year 2012-13 Adopted Budget
Fiscal Year 2012-13
Amended Budget
Fiscal Year 2012-13 Actuals
Fiscal Year 2013-14 Adopted Budget
Fiscal Year 2014-15
Approved Budget
Salaries & Benefits $ 1,774,781 $ 2,166,274 $ 2,166,274 $ 1,709,921 $ 2,107,701 $ 2,118,110
Services & Supplies 1,329,814 1,856,199 2,611,698 1,965,711 2,409,884 1,648,047
Other Charges 3,538,296 5,158,201 6,254,786 4,047,998 2,413,113 1,415,380
Capital Assets Equipment
25,966 — 160,701 151,536 — —
Operating Transfers Out
22,093 — — — — —
Total $ 6,690,949 $ 9,180,674 $ 11,193,459 $ 7,875,165 $ 6,930,698 $ 5,181,537
Budget by Categories of Revenues
Fiscal Year 2011-12 Actuals
Fiscal Year 2012-13 Adopted Budget
Fiscal Year 2012-13
Amended Budget
Fiscal Year 2012-13 Actuals
Fiscal Year 2013-14 Adopted Budget
Fiscal Year 2014-15
Approved Budget
Intergovernmental Revenues
$ 5,509,845 $ 7,771,004 $ 9,664,777 $ 6,404,680 $ 5,618,961 $ 3,854,252
Charges For Current Services
566 — — — — —
Miscellaneous Revenues
160 — — 32,227 — —
Use of Fund Balance 289,744 450,000 569,012 478,588 250,000 250,000
General Purpose Revenue Allocation
890,634 959,670 959,670 959,670 1,061,737 1,077,285
Total $ 6,690,949 $ 9,180,674 $ 11,193,459 $ 7,875,165 $ 6,930,698 $ 5,181,537
151Public Safety Group Adopted Operational Plan Fiscal Years 2013-2014 and 2014-2015

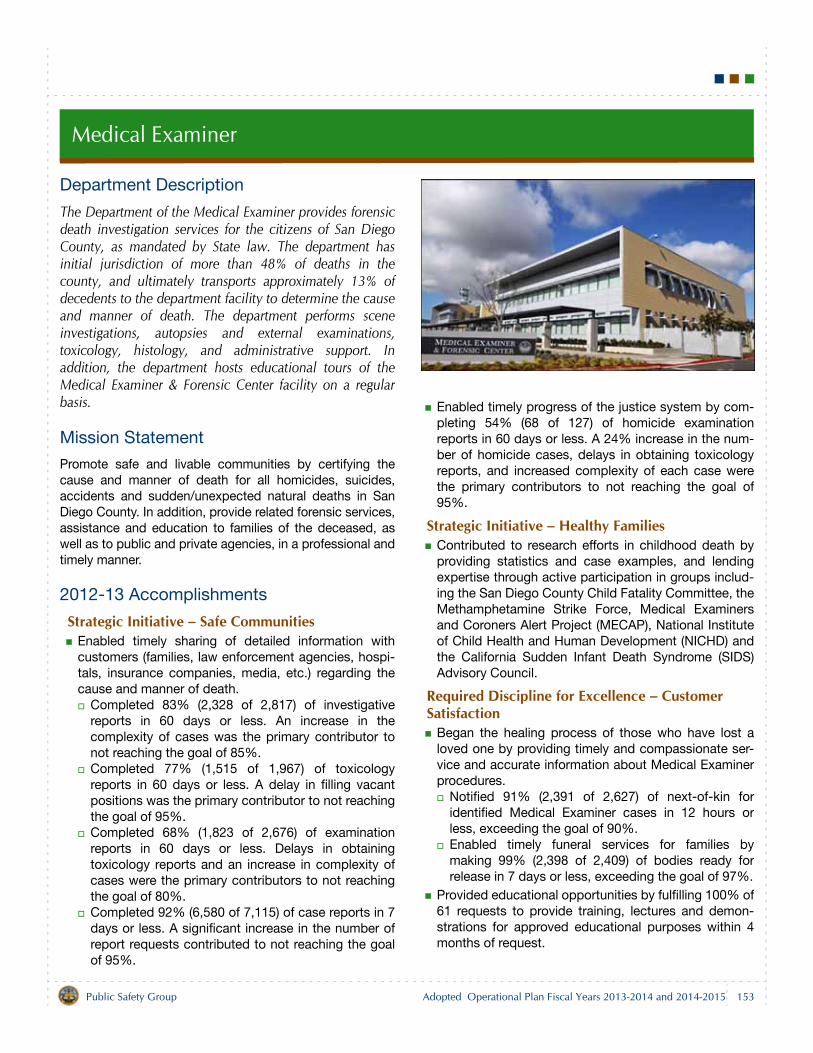
Medical Examiner
Department Description
The Department of the Medical Examiner provides forensicdeath investigation services for the citizens of San DiegoCounty, as mandated by State law. The department hasinitial jurisdiction of more than 48% of deaths in thecounty, and ultimately transports approximately 13% ofdecedents to the department facility to determine the causeand manner of death. The department performs sceneinvestigations, autopsies and external examinations,toxicology, histology, and administrative support. Inaddition, the department hosts educational tours of theMedical Examiner & Forensic Center facility on a regularbasis.
Mission Statement
Promote safe and livable communities by certifying thecause and manner of death for all homicides, suicides,accidents and sudden/unexpected natural deaths in SanDiego County. In addition, provide related forensic services,assistance and education to families of the deceased, aswell as to public and private agencies, in a professional andtimely manner.
2012-13 Accomplishments
Strategic Initiative – Safe CommunitiesEnabled timely sharing of detailed information withcustomers (families, law enforcement agencies, hospi-tals, insurance companies, media, etc.) regarding thecause and manner of death.
Completed 83% (2,328 of 2,817) of investigativereports in 60 days or less. An increase in thecomplexity of cases was the primary contributor tonot reaching the goal of 85%.Completed 77% (1,515 of 1,967) of toxicologyreports in 60 days or less. A delay in filling vacantpositions was the primary contributor to not reachingthe goal of 95%.Completed 68% (1,823 of 2,676) of examinationreports in 60 days or less. Delays in obtainingtoxicology reports and an increase in complexity ofcases were the primary contributors to not reachingthe goal of 80%.Completed 92% (6,580 of 7,115) of case reports in 7days or less. A significant increase in the number ofreport requests contributed to not reaching the goalof 95%.
Enabled timely progress of the justice system by com-pleting 54% (68 of 127) of homicide examinationreports in 60 days or less. A 24% increase in the num-ber of homicide cases, delays in obtaining toxicologyreports, and increased complexity of each case werethe primary contributors to not reaching the goal of95%.
Strategic Initiative – Healthy FamiliesContributed to research efforts in childhood death byproviding statistics and case examples, and lendingexpertise through active participation in groups includ-ing the San Diego County Child Fatality Committee, theMethamphetamine Strike Force, Medical Examinersand Coroners Alert Project (MECAP), National Instituteof Child Health and Human Development (NICHD) andthe California Sudden Infant Death Syndrome (SIDS)Advisory Council.
Required Discipline for Excellence – Customer Satisfaction
Began the healing process of those who have lost aloved one by providing timely and compassionate ser-vice and accurate information about Medical Examinerprocedures.
Notified 91% (2,391 of 2,627) of next-of-kin foridentified Medical Examiner cases in 12 hours orless, exceeding the goal of 90%.Enabled timely funeral services for families bymaking 99% (2,398 of 2,409) of bodies ready forrelease in 7 days or less, exceeding the goal of 97%.
Provided educational opportunities by fulfilling 100% of61 requests to provide training, lectures and demon-strations for approved educational purposes within 4months of request.
153Public Safety Group Adopted Operational Plan Fiscal Years 2013-2014 and 2014-2015
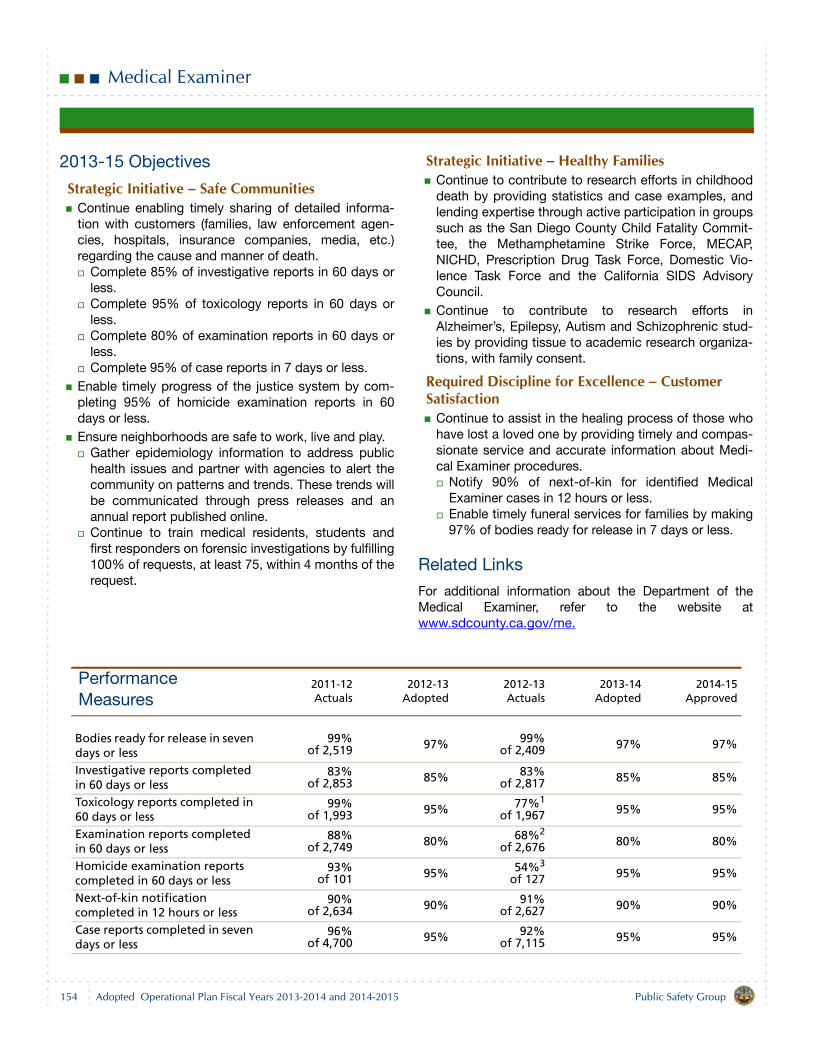
Medical Examiner
2013-15 Objectives
Strategic Initiative – Safe CommunitiesContinue enabling timely sharing of detailed informa-tion with customers (families, law enforcement agen-cies, hospitals, insurance companies, media, etc.)regarding the cause and manner of death.
Complete 85% of investigative reports in 60 days orless.Complete 95% of toxicology reports in 60 days orless.Complete 80% of examination reports in 60 days orless.Complete 95% of case reports in 7 days or less.
Enable timely progress of the justice system by com-pleting 95% of homicide examination reports in 60days or less.Ensure neighborhoods are safe to work, live and play.
Gather epidemiology information to address publichealth issues and partner with agencies to alert thecommunity on patterns and trends. These trends willbe communicated through press releases and anannual report published online.Continue to train medical residents, students andfirst responders on forensic investigations by fulfilling100% of requests, at least 75, within 4 months of therequest.
Strategic Initiative – Healthy FamiliesContinue to contribute to research efforts in childhooddeath by providing statistics and case examples, andlending expertise through active participation in groupssuch as the San Diego County Child Fatality Commit-tee, the Methamphetamine Strike Force, MECAP,NICHD, Prescription Drug Task Force, Domestic Vio-lence Task Force and the California SIDS AdvisoryCouncil.Continue to contribute to research efforts inAlzheimer’s, Epilepsy, Autism and Schizophrenic stud-ies by providing tissue to academic research organiza-tions, with family consent.
Required Discipline for Excellence – Customer Satisfaction
Continue to assist in the healing process of those whohave lost a loved one by providing timely and compas-sionate service and accurate information about Medi-cal Examiner procedures.
Notify 90% of next-of-kin for identified MedicalExaminer cases in 12 hours or less.Enable timely funeral services for families by making97% of bodies ready for release in 7 days or less.
Related Links
For additional information about the Department of theMedical Examiner, refer to the website atwww.sdcounty.ca.gov/me.
Performance Measures
2011-12Actuals
2012-13Adopted
2012-13Actuals
2013-14Adopted
2014-15Approved
Bodies ready for release in seven days or less
99%of 2,519 97% 99%
of 2,409 97% 97%
Investigative reports completed in 60 days or less
83%of 2,853 85% 83%
of 2,817 85% 85%
Toxicology reports completed in 60 days or less
99%of 1,993 95% 77%1
of 1,967 95% 95%
Examination reports completed in 60 days or less
88%of 2,749 80% 68%2
of 2,676 80% 80%
Homicide examination reports completed in 60 days or less
93%of 101 95% 54%3
of 127 95% 95%
Next-of-kin notification completed in 12 hours or less
90%of 2,634 90% 91%
of 2,627 90% 90%
Case reports completed in seven days or less
96%of 4,700 95% 92%
of 7,115 95% 95%
154 Public Safety GroupAdopted Operational Plan Fiscal Years 2013-2014 and 2014-2015
Medical Examiner
Table Notes
Note: Data on number of deaths is gathered by calendar year (January-December) versus fiscal year (July–June.)
1A delay in filling vacant positions was the primary contributor in not reaching the goal of 95%.
2Delays in obtaining toxicology reports and an increase in complexity of cases were the primary contributors to not reaching the goal of 80%.
3A 24% increase in the number of homicide cases, delays in obtaining the toxicology reports, and an increase in the complexity of each case were the primary contributors to not reaching the goal of 95%.
Budget Changes and Operational Impact: 2012-13 to 2013-14
StaffingIncrease of 2.00 staff years to provide support for investiga-tions and to respond to subpoenas and court ordersreceived by the department.
ExpendituresIncrease of $0.5 million.
Salaries and Benefits — increase of $0.3 million due tothe addition of 2.00 staff years as described above, therestoration of funding for a Forensic Pathology Fellow,and an increase in County retirement contributions.Services and Supplies — increase of $0.1 million dueto the increased operational costs of the MedicalExaminer & Forensic Center.Capital Assets Equipment — increase of $0.1 milliondue to planned one-time purchases.
RevenuesNet increase of $0.5 million.
Intergovernmental Revenues — increase of $0.1 milliondue to the reinstatement of a federal grant to fund aForensic Pathology Fellow.Charges for Current Services — increase of $0.1 milliondue to an increase in fees effective in Fiscal Year 2011-12.Use of Fund Balance — increase of $0.1 million. A totalof $0.2 million is budgeted to support one-time costsfor equipment replacement. General Purpose Revenue Allocation — increase of$0.2 million reflects an increase in County retirementcontributions and increased facility costs.
Budget Changes and Operational Impact: 2013-14 to 2014-15
Net decrease of $0.1 million due to a reduction in one-timeexpenditures, partially offset by an increase in Countyretirement contributions.
155Public Safety Group Adopted Operational Plan Fiscal Years 2013-2014 and 2014-2015

Medical Examiner
Staffing by Program
Fiscal Year 2012-13 Adopted Budget
Fiscal Year 2013-14 Adopted Budget
Fiscal Year 2014-15
Approved Budget
Decedent Investigations
52.00 54.00 54.00
Total 52.00 54.00 54.00
Budget by Program
Fiscal Year 2011-12 Actuals
Fiscal Year 2012-13 Adopted Budget
Fiscal Year 2012-13
Amended Budget
Fiscal Year 2012-13 Actuals
Fiscal Year 2013-14 Adopted Budget
Fiscal Year 2014-15
Approved Budget
Decedent Investigations
$ 8,552,853 $ 8,951,213 $ 9,004,360 $ 8,487,156 $ 9,481,818 $ 9,382,046
Total $ 8,552,853 $ 8,951,213 $ 9,004,360 $ 8,487,156 $ 9,481,818 $ 9,382,046
Budget by Categories of Expenditures
Fiscal Year 2011-12 Actuals
Fiscal Year 2012-13 Adopted Budget
Fiscal Year 2012-13
Amended Budget
Fiscal Year 2012-13 Actuals
Fiscal Year 2013-14 Adopted Budget
Fiscal Year 2014-15
Approved Budget
Salaries & Benefits $ 6,209,848 $ 6,676,323 $ 6,529,823 $ 6,247,840 $ 7,015,951 $ 7,076,179
Services & Supplies 2,429,671 2,324,890 2,501,037 2,339,316 2,405,867 2,405,867
Capital Assets Equipment
13,334 50,000 73,500 — 160,000 —
Expenditure Transfer & Reimbursements
(100,000) (100,000) (100,000) (100,000) (100,000) (100,000)
Total $ 8,552,853 $ 8,951,213 $ 9,004,360 $ 8,487,156 $ 9,481,818 $ 9,382,046
Budget by Categories of Revenues
Fiscal Year 2011-12 Actuals
Fiscal Year 2012-13 Adopted Budget
Fiscal Year 2012-13
Amended Budget
Fiscal Year 2012-13 Actuals
Fiscal Year 2013-14 Adopted Budget
Fiscal Year 2014-15
Approved Budget
Intergovernmental Revenues
$ 114,569 $ — $ — $ — $ 111,477 $ —
Charges For Current Services
1,043,663 775,903 775,903 995,878 841,332 841,332
Miscellaneous Revenues
103,672 53,460 53,460 101,116 86,460 86,460
Other Financing Sources
3,664 — — — — —
Use of Fund Balance (729,033) 62,500 115,647 (669,188) 160,000 —General Purpose Revenue Allocation
8,016,318 8,059,350 8,059,350 8,059,350 8,282,549 8,454,254
Total $ 8,552,853 $ 8,951,213 $ 9,004,360 $ 8,487,156 $ 9,481,818 $ 9,382,046
156 Public Safety GroupAdopted Operational Plan Fiscal Years 2013-2014 and 2014-2015
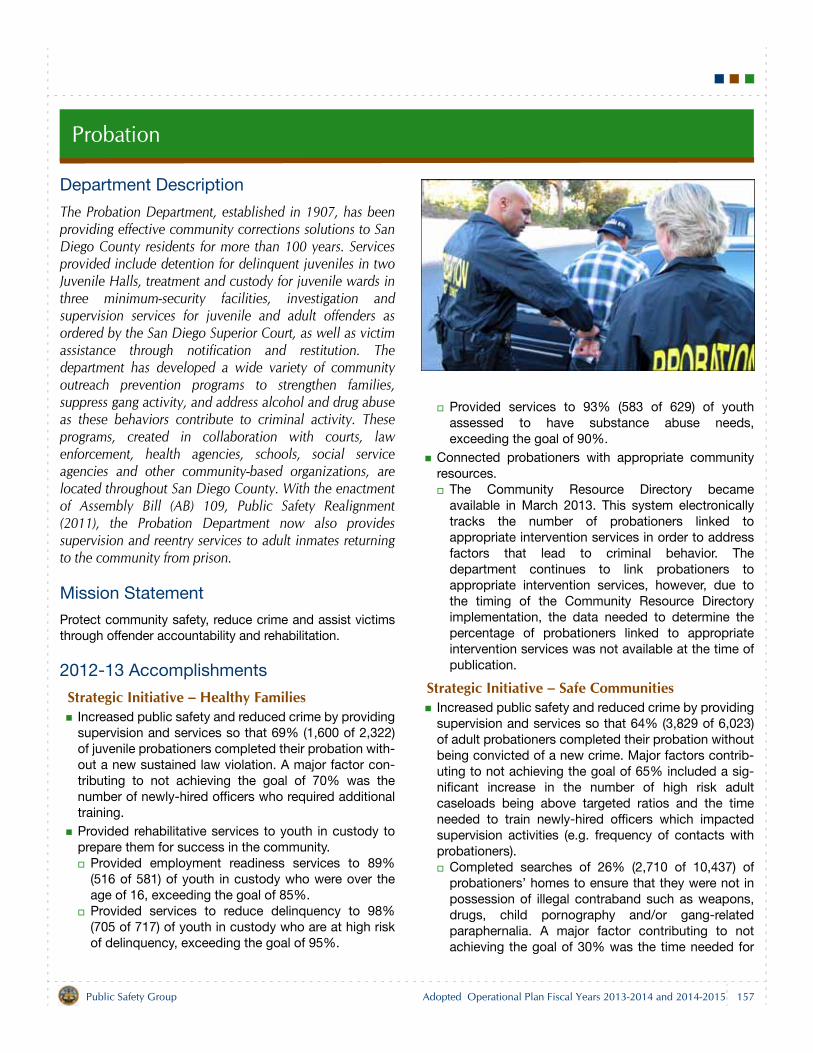
Probation
Department Description
The Probation Department, established in 1907, has beenproviding effective community corrections solutions to SanDiego County residents for more than 100 years. Servicesprovided include detention for delinquent juveniles in twoJuvenile Halls, treatment and custody for juvenile wards inthree minimum-security facilities, investigation andsupervision services for juvenile and adult offenders asordered by the San Diego Superior Court, as well as victimassistance through notification and restitution. Thedepartment has developed a wide variety of communityoutreach prevention programs to strengthen families,suppress gang activity, and address alcohol and drug abuseas these behaviors contribute to criminal activity. Theseprograms, created in collaboration with courts, lawenforcement, health agencies, schools, social serviceagencies and other community-based organizations, arelocated throughout San Diego County. With the enactmentof Assembly Bill (AB) 109, Public Safety Realignment(2011), the Probation Department now also providessupervision and reentry services to adult inmates returningto the community from prison.
Mission Statement
Protect community safety, reduce crime and assist victimsthrough offender accountability and rehabilitation.
2012-13 Accomplishments
Strategic Initiative – Healthy FamiliesIncreased public safety and reduced crime by providingsupervision and services so that 69% (1,600 of 2,322)of juvenile probationers completed their probation with-out a new sustained law violation. A major factor con-tributing to not achieving the goal of 70% was thenumber of newly-hired officers who required additionaltraining.Provided rehabilitative services to youth in custody toprepare them for success in the community.
Provided employment readiness services to 89%(516 of 581) of youth in custody who were over theage of 16, exceeding the goal of 85%.Provided services to reduce delinquency to 98%(705 of 717) of youth in custody who are at high riskof delinquency, exceeding the goal of 95%.
Provided services to 93% (583 of 629) of youthassessed to have substance abuse needs,exceeding the goal of 90%.
Connected probationers with appropriate communityresources.
The Community Resource Directory becameavailable in March 2013. This system electronicallytracks the number of probationers linked toappropriate intervention services in order to addressfactors that lead to criminal behavior. Thedepartment continues to link probationers toappropriate intervention services, however, due tothe timing of the Community Resource Directoryimplementation, the data needed to determine thepercentage of probationers linked to appropriateintervention services was not available at the time ofpublication.
Strategic Initiative – Safe CommunitiesIncreased public safety and reduced crime by providingsupervision and services so that 64% (3,829 of 6,023)of adult probationers completed their probation withoutbeing convicted of a new crime. Major factors contrib-uting to not achieving the goal of 65% included a sig-nificant increase in the number of high risk adultcaseloads being above targeted ratios and the timeneeded to train newly-hired officers which impactedsupervision activities (e.g. frequency of contacts withprobationers).
Completed searches of 26% (2,710 of 10,437) ofprobationers’ homes to ensure that they were not inpossession of illegal contraband such as weapons,drugs, child pornography and/or gang-relatedparaphernalia. A major factor contributing to notachieving the goal of 30% was the time needed for
157Public Safety Group Adopted Operational Plan Fiscal Years 2013-2014 and 2014-2015
Probation
additional field training of newly-hired officers whichimpacted supervision activities (e.g. the amount ofhome searches).
Partnered with local, State and federal law enforcementagencies to monitor high-risk offenders.
Participated in 276 multi-agency operations,including gang operations, truancy sweeps,probation and parole sweeps, and sobrietycheckpoints, exceeding the goal of 250 operations.
Provided rehabilitative opportunities to adult probation-ers in order to reduce future criminal offenses.
Encouraged offender behavior change by linking22% (576 of 2,589) of adult offenders on high-riskcaseloads to employment services. Major factorscontributing to not achieving the goal of 30%included the time needed to train newly-hiredofficers, high caseloads being above targeted ratiosand limited employment opportunities whichimpacted supervision activities (e.g. providingemployment services).
Educated crime victims of their constitutional rightsand provided victim input to the court regarding sen-tencing, restitution and other conditions of probation.
Contacted 99% (13,237 of 13,342) of availablevictims and informed them of their right to restitutionand a victim impact statement.Maximized the amount of adult restitution at a totalof $2,547,364 to increase services for crime victims.
Achieved early terminations in 160 probation cases inorder to motivate probationers, increase successfuloutcomes and manage department workload.Recommended summary probation in 367 low-riskcases for which the department recommended infor-mal probation to the court in order to more effectivelymanage department workload. Recommended alternative custody (i.e., work furlough,work projects, electronic monitoring or any combina-tion of custody with these) in 74 cases to efficiently usejail capacity and ensure an appropriate level ofaccountability is placed on offenders.Addressed the challenges of Public Safety Realignmentand the transfer of responsibility for certain offendersfrom the State to counties and worked collaborativelywith all criminal justice, health and social servicesagencies.
Created the Post Release Offender Division tosupervise the realigned population.Trained adult probation officers in motivationalinterviewing, and cognitive and behavioral therapytechniques to reduce recidivism.
Collaboratively established the Community TransitionCenter to support engaging returning post releasecommunity supervision offenders with treatment andintervention services.Established a Residential Reentry Center for in-custody offenders to provide work readiness trainingand facilitate their transition into the community.Worked with criminal justice partners to implement amandatory supervision plan targeting mandatorysupervision offenders who are completing theirprison terms in the community.Successfully supervised and linked 443 post releaseoffenders to treatment and intervention services whocompleted at least 6 months of supervision withoutbeing convicted of a new crime.
Required Discipline for Excellence – Skilled, Adaptable and Diverse Workforce
Supported initiatives that enhanced the skills of theworkforce in expanding the use of evidence-basedpractices and techniques.
Trained 86% (741 of 863) of Deputy ProbationOfficers in a new Integrated Behavioral InterventionStrategies model that combines motivationalinterviewing skills with cognitive behavioralinterventions to increase officer effectiveness whenworking with offenders, exceeding goal of training80%.Provided educational training to prevent sexualmisconduct to 100% (574) of available departmentstaff in juvenile institutions and day treatment centersto comply with requirements of the Prison RapeElimination Act of 2003.
2013-15 Objectives
Strategic Initiative – Healthy FamiliesIncrease public safety and reduce crime by providingsupervision and services so that 70% of juvenile proba-tioners complete their probation without a new sus-tained law violation.Provide rehabilitative services to youth in custody toprepare them for success in the community.
Continue to provide employment readiness servicesto at least 85% of youth in custody who are over theage of 16.Continue to provide services to reduce delinquencyin at least 95% of youth in custody who are at highrisk of delinquency.
158 Public Safety GroupAdopted Operational Plan Fiscal Years 2013-2014 and 2014-2015
Probation
Continue to provide substance abuse services to atleast 90% of youth assessed to have substanceabuse needs.
Provide rehabilitative opportunities in order to reducefuture criminal offenses by connecting adult and juve-nile offenders with appropriate community resources.
Link high-risk juvenile probationers to community-based services associated with the juvenile’sassessed need.Link high-risk adult offenders under supervision toappropriate intervention services to address factorsthat lead to criminal behavior.
Increase the number of adult offenders on high-risksupervision who are employed from 25% to 30%.
Strategic Initiative – Safe CommunitiesResidents are protected from crime and abuse.
Increase public safety and reduce crime by providingsupervision and services using evidence-based andbest practices to adults under supervision. Sixty-five percent of adult probationers will completetheir probation without being convicted of a newcrime.Expand the number of post release offenders whocomplete their supervision without being convictedof a new crime. Maximize the number of searches on probationers byconducting at least 6,300 searches to ensure thatprobationers are in compliance with their terms ofsupervision and not in possession of illegalcontraband such as weapons, drugs, childpornography and/or gang-related paraphernalia.
Partner with local, State and federal law enforcementagencies to monitor high-risk offenders.
Increase the percentage of participation in multi-agency operations including gang operations,truancy sweeps, probation and parole sweeps, andsobriety checkpoints by 5% to at least 285operations.
Educate crime victims of their constitutional rights andprovide victim input to the court regarding sentencing,restitution and other conditions of probation.
Contact 99% of available victims and inform them oftheir right to restitution and a victim impactstatement.Increase the percentage of restitution collected fromadult probationers by 20% to a total ofapproximately $2.5 million to increase services forcrime victims.
Required Discipline for Excellence – Continuous Improvement and Innovation
Ensure continuous improvement and innovation byimproving processes.
Expand the use of the Community ResourceDirectory to juvenile supervision, which supports abalanced approach by providing access tocommunity resources based on offender needs.Develop a web-based enrollment for work projects toimprove efficiency.
Related Links
For additional information about the Probation Department,refer to the website at www.sdcounty.ca.gov/probation.
159Public Safety Group Adopted Operational Plan Fiscal Years 2013-2014 and 2014-2015
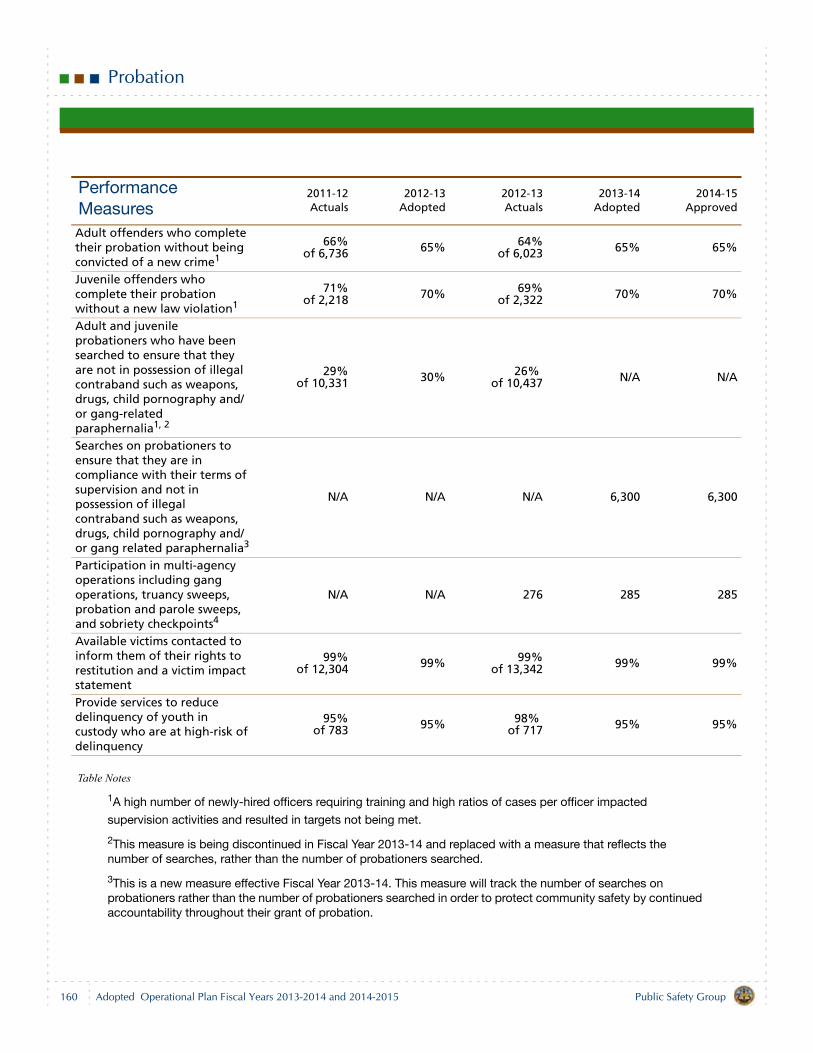
Probation
Table Notes
1A high number of newly-hired officers requiring training and high ratios of cases per officer impacted
supervision activities and resulted in targets not being met.
2This measure is being discontinued in Fiscal Year 2013-14 and replaced with a measure that reflects the number of searches, rather than the number of probationers searched.
3This is a new measure effective Fiscal Year 2013-14. This measure will track the number of searches on probationers rather than the number of probationers searched in order to protect community safety by continued accountability throughout their grant of probation.
Performance Measures
2011-12Actuals
2012-13Adopted
2012-13Actuals
2013-14Adopted
2014-15Approved
Adult offenders who complete their probation without being convicted of a new crime1
66%of 6,736 65% 64%
of 6,023 65% 65%
Juvenile offenders who complete their probation without a new law violation1
71%of 2,218 70% 69%
of 2,322 70% 70%
Adult and juvenile probationers who have been searched to ensure that they are not in possession of illegal contraband such as weapons, drugs, child pornography and/or gang-related paraphernalia1, 2
29%of 10,331 30% 26%
of 10,437 N/A N/A
Searches on probationers to ensure that they are in compliance with their terms of supervision and not in possession of illegal contraband such as weapons, drugs, child pornography and/or gang related paraphernalia3
N/A N/A N/A 6,300 6,300
Participation in multi-agency operations including gang operations, truancy sweeps, probation and parole sweeps, and sobriety checkpoints4
N/A N/A 276 285 285
Available victims contacted to inform them of their rights to restitution and a victim impact statement
99%of 12,304 99% 99%
of 13,342 99% 99%
Provide services to reduce delinquency of youth in custody who are at high-risk of delinquency
95%of 783 95% 98%
of 717 95% 95%
160 Public Safety GroupAdopted Operational Plan Fiscal Years 2013-2014 and 2014-2015
Probation
4This is a new measure effective Fiscal Year 2013-14 where the Probation Department projects to increase the number of multi-agency operations. In Fiscal Year 2012-13 the department participated in 276 multi-agency operations exceeding the goal of 250. Increased participation in multi-agency operations combines resources to more efficiently protect community safety.
Budget Changes and Operational Impact: 2012-13 to 2013-14
StaffingNet increase of 8.00 staff years.
Adult Field Services net increase of 31.00 staff years.Increase of 7.00 staff years due to transitional reentryservices that will be provided to offenders at the EastMesa Reentry Facility and the San Diego CountyWomen’s Detention and Reentry Facility.Increase of 28.00 staff years due to the transfer ofWork Projects and Work Furlough Programs fromInstitutional Services to realign services.Decrease of 4.00 staff years due to the transfer ofstaff to Department Administration and toInstitutional Services to realign services.
Institutional Services net decrease of 27.00 staff years.Decrease of 28.00 staff years due to the transfer ofWork Project and Work Furlough Programs to AdultField Services to realign services.Increase of 1.00 staff year due to the transfer of stafffrom Adult Field Services to realign services.
Department Administration net increase of 4.00 staffyears.
Increase of 3.00 staff years due to the transfer ofstaff from Adult Field Services to realign services.Increase of 1.00 staff year, supported by the FederalBureau of Justice Assistance, Second Chance Actfor the Smart Probation Project, which will providefor implementation of evidence-based supervisionstrategies to improve outcomes of probationers asapproved by the Board of Supervisors in September2012.
ExpendituresNet increase of $8.4 million.
Salaries and Benefits — increase of $2.4 million due tothe addition of 8.0 staff years as described above, anincrease in County retirement contributions and anincrease in workers’ compensation insurance costs.
Services and Supplies — increase of $6.0 million dueto contracted residential reentry services provided tooffenders, the rebudget of funds allocated to pilot aprogram for housing services and increases related tomajor maintenance projects in department facilities.
RevenuesNet increase of $8.4 million.
Intergovernmental Revenues — net increase of $5.6million.
Increase of $6.0 million due to the addition of 7.0staff years as described above and contractedresidential reentry services, as well as a rebudget ofState revenue allocated from the Local RevenueFund 2011, Community Corrections Subaccount fora pilot program for housing services to offenderswho became the responsibility of the County as partof Public Safety Realignment. Increase of $0.3 million in the Second Chance Act forSmart Project due to the addition of 1.0 staff yeardescribed above to implement evidence-basedsupervision strategies to improve outcomes forprobationers. Increase of $0.4 million in State revenue allocatedfrom the Local Revenue Fund 2011, Enhancing LawEnforcement Activities Subaccount for JuvenileProbation and Camp Funding (JPCF) based on Stateestimates of available revenues.Decrease of $1.1 million due to the expiration ofAmerican Recovery and Reinvestment Act (ARRA) of2009 funding for the Evidence-Based Program andJuvenile Assistance Grant Program.
Other Financing Sources — increase of $1.4 milliondue to projected receipts from Proposition 172, theLocal Public Safety Protection and Improvement Act of1993, which support regional law enforcement ser-vices.Use of Fund Balance — increase of $0.4 million. A totalof $2.5 million is budgeted.
$1.1 million rebudgeted for a case managementsystem enhancement.$1.0 million for major maintenance projects.$0.3 million for the replacement of 800 MHz radios.$0.1 million for an electronic medical record system.
161Public Safety Group Adopted Operational Plan Fiscal Years 2013-2014 and 2014-2015
Probation
General Purpose Revenue Allocation — increase of$1.0 million to offset an increase in County retirementcontributions.
Budget Changes and Operational Impact: 2013-14 to 2014-15
Net decrease of $4.2 million. A net decrease of $7.8 millionin Services and Supplies is primarily due to the anticipatedcompletion of one-time projects including the pilot project
for housing offenders. This is partially offset by an increaseof $3.6 million in Salaries and Benefits due to an increase inCounty retirement contributions.
162 Public Safety GroupAdopted Operational Plan Fiscal Years 2013-2014 and 2014-2015
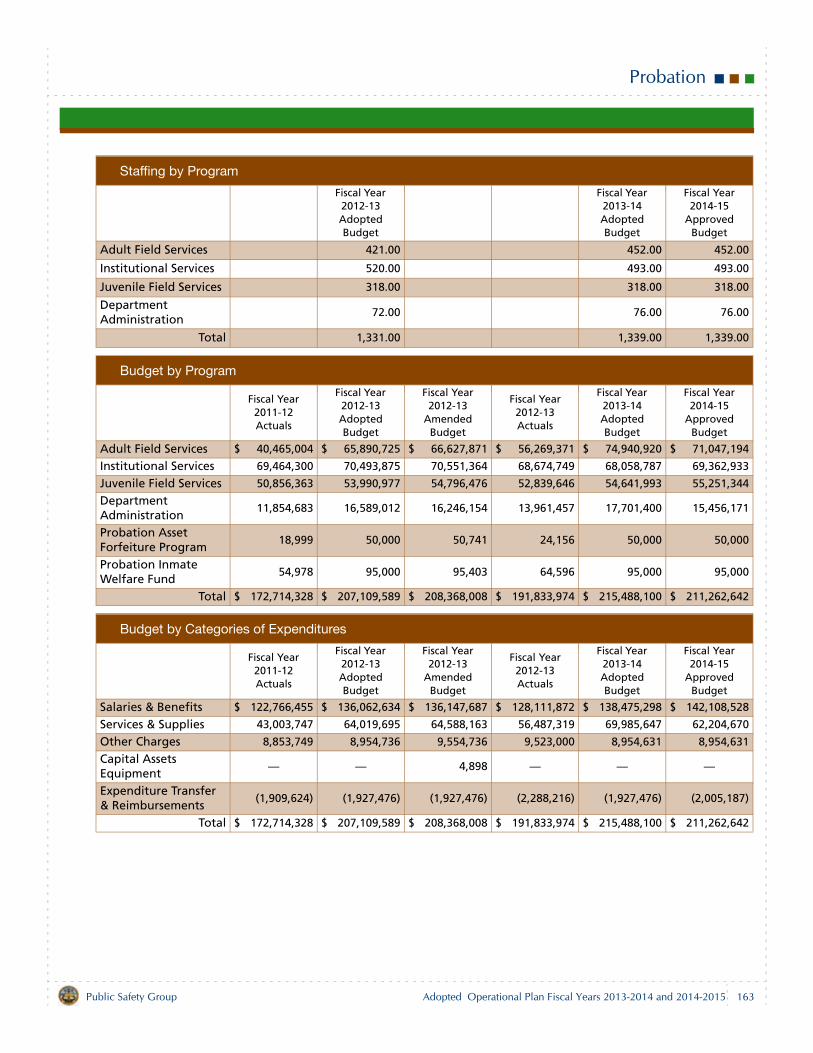
Probation
Staffing by Program
Fiscal Year 2012-13 Adopted Budget
Fiscal Year 2013-14 Adopted Budget
Fiscal Year 2014-15
Approved Budget
Adult Field Services 421.00 452.00 452.00
Institutional Services 520.00 493.00 493.00
Juvenile Field Services 318.00 318.00 318.00
Department Administration
72.00 76.00 76.00
Total 1,331.00 1,339.00 1,339.00
Budget by Program
Fiscal Year 2011-12 Actuals
Fiscal Year 2012-13 Adopted Budget
Fiscal Year 2012-13
Amended Budget
Fiscal Year 2012-13 Actuals
Fiscal Year 2013-14 Adopted Budget
Fiscal Year 2014-15
Approved Budget
Adult Field Services $ 40,465,004 $ 65,890,725 $ 66,627,871 $ 56,269,371 $ 74,940,920 $ 71,047,194
Institutional Services 69,464,300 70,493,875 70,551,364 68,674,749 68,058,787 69,362,933
Juvenile Field Services 50,856,363 53,990,977 54,796,476 52,839,646 54,641,993 55,251,344
Department Administration
11,854,683 16,589,012 16,246,154 13,961,457 17,701,400 15,456,171
Probation Asset Forfeiture Program
18,999 50,000 50,741 24,156 50,000 50,000
Probation Inmate Welfare Fund
54,978 95,000 95,403 64,596 95,000 95,000
Total $ 172,714,328 $ 207,109,589 $ 208,368,008 $ 191,833,974 $ 215,488,100 $ 211,262,642
Budget by Categories of Expenditures
Fiscal Year 2011-12 Actuals
Fiscal Year 2012-13 Adopted Budget
Fiscal Year 2012-13
Amended Budget
Fiscal Year 2012-13 Actuals
Fiscal Year 2013-14 Adopted Budget
Fiscal Year 2014-15
Approved Budget
Salaries & Benefits $ 122,766,455 $ 136,062,634 $ 136,147,687 $ 128,111,872 $ 138,475,298 $ 142,108,528
Services & Supplies 43,003,747 64,019,695 64,588,163 56,487,319 69,985,647 62,204,670
Other Charges 8,853,749 8,954,736 9,554,736 9,523,000 8,954,631 8,954,631
Capital Assets Equipment
— — 4,898 — — —
Expenditure Transfer & Reimbursements
(1,909,624) (1,927,476) (1,927,476) (2,288,216) (1,927,476) (2,005,187)
Total $ 172,714,328 $ 207,109,589 $ 208,368,008 $ 191,833,974 $ 215,488,100 $ 211,262,642
163Public Safety Group Adopted Operational Plan Fiscal Years 2013-2014 and 2014-2015
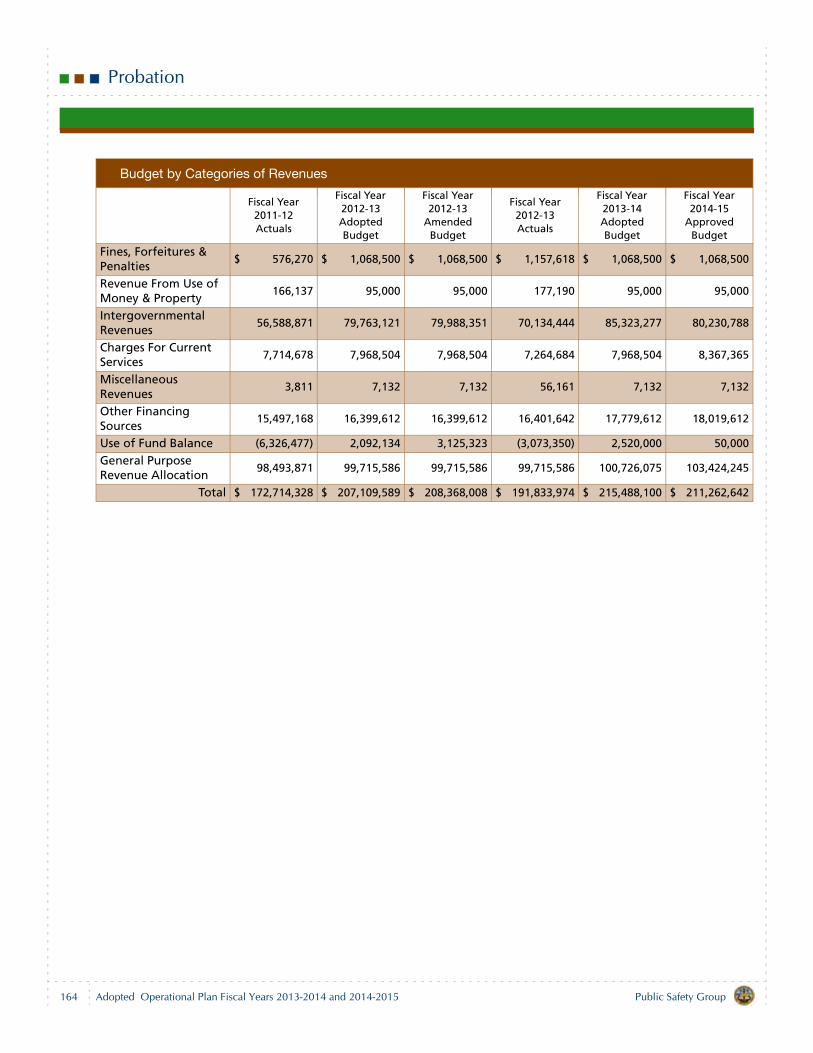
Probation
Budget by Categories of Revenues
Fiscal Year 2011-12 Actuals
Fiscal Year 2012-13 Adopted Budget
Fiscal Year 2012-13
Amended Budget
Fiscal Year 2012-13 Actuals
Fiscal Year 2013-14 Adopted Budget
Fiscal Year 2014-15
Approved Budget
Fines, Forfeitures & Penalties
$ 576,270 $ 1,068,500 $ 1,068,500 $ 1,157,618 $ 1,068,500 $ 1,068,500
Revenue From Use of Money & Property
166,137 95,000 95,000 177,190 95,000 95,000
Intergovernmental Revenues
56,588,871 79,763,121 79,988,351 70,134,444 85,323,277 80,230,788
Charges For Current Services
7,714,678 7,968,504 7,968,504 7,264,684 7,968,504 8,367,365
Miscellaneous Revenues
3,811 7,132 7,132 56,161 7,132 7,132
Other Financing Sources
15,497,168 16,399,612 16,399,612 16,401,642 17,779,612 18,019,612
Use of Fund Balance (6,326,477) 2,092,134 3,125,323 (3,073,350) 2,520,000 50,000
General Purpose Revenue Allocation
98,493,871 99,715,586 99,715,586 99,715,586 100,726,075 103,424,245
Total $ 172,714,328 $ 207,109,589 $ 208,368,008 $ 191,833,974 $ 215,488,100 $ 211,262,642
164 Public Safety GroupAdopted Operational Plan Fiscal Years 2013-2014 and 2014-2015
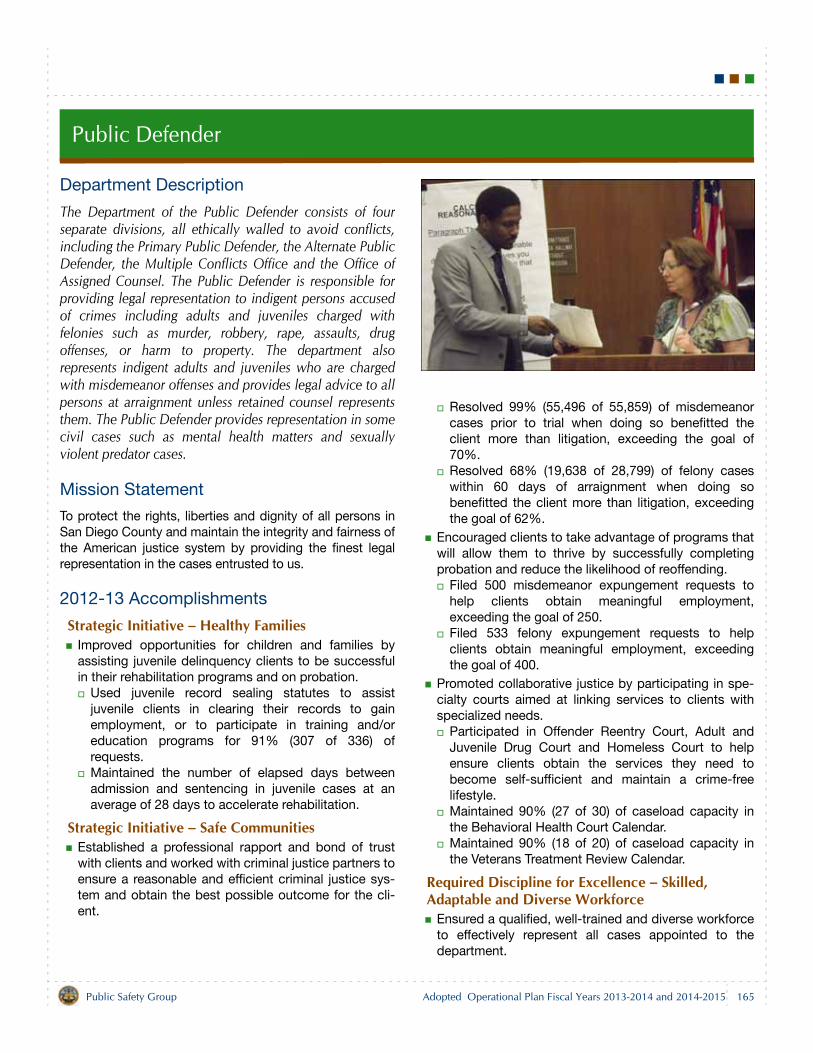
Public Defender
Department Description
The Department of the Public Defender consists of fourseparate divisions, all ethically walled to avoid conflicts,including the Primary Public Defender, the Alternate PublicDefender, the Multiple Conflicts Office and the Office ofAssigned Counsel. The Public Defender is responsible forproviding legal representation to indigent persons accusedof crimes including adults and juveniles charged withfelonies such as murder, robbery, rape, assaults, drugoffenses, or harm to property. The department alsorepresents indigent adults and juveniles who are chargedwith misdemeanor offenses and provides legal advice to allpersons at arraignment unless retained counsel representsthem. The Public Defender provides representation in somecivil cases such as mental health matters and sexuallyviolent predator cases.
Mission Statement
To protect the rights, liberties and dignity of all persons inSan Diego County and maintain the integrity and fairness ofthe American justice system by providing the finest legalrepresentation in the cases entrusted to us.
2012-13 Accomplishments
Strategic Initiative – Healthy FamiliesImproved opportunities for children and families byassisting juvenile delinquency clients to be successfulin their rehabilitation programs and on probation.
Used juvenile record sealing statutes to assistjuvenile clients in clearing their records to gainemployment, or to participate in training and/oreducation programs for 91% (307 of 336) ofrequests.Maintained the number of elapsed days betweenadmission and sentencing in juvenile cases at anaverage of 28 days to accelerate rehabilitation.
Strategic Initiative – Safe CommunitiesEstablished a professional rapport and bond of trustwith clients and worked with criminal justice partners toensure a reasonable and efficient criminal justice sys-tem and obtain the best possible outcome for the cli-ent.
Resolved 99% (55,496 of 55,859) of misdemeanorcases prior to trial when doing so benefitted theclient more than litigation, exceeding the goal of70%.Resolved 68% (19,638 of 28,799) of felony caseswithin 60 days of arraignment when doing sobenefitted the client more than litigation, exceedingthe goal of 62%.
Encouraged clients to take advantage of programs thatwill allow them to thrive by successfully completingprobation and reduce the likelihood of reoffending.
Filed 500 misdemeanor expungement requests tohelp clients obtain meaningful employment,exceeding the goal of 250.Filed 533 felony expungement requests to helpclients obtain meaningful employment, exceedingthe goal of 400.
Promoted collaborative justice by participating in spe-cialty courts aimed at linking services to clients withspecialized needs.
Participated in Offender Reentry Court, Adult andJuvenile Drug Court and Homeless Court to helpensure clients obtain the services they need tobecome self-sufficient and maintain a crime-freelifestyle.Maintained 90% (27 of 30) of caseload capacity inthe Behavioral Health Court Calendar.Maintained 90% (18 of 20) of caseload capacity inthe Veterans Treatment Review Calendar.
Required Discipline for Excellence – Skilled, Adaptable and Diverse Workforce
Ensured a qualified, well-trained and diverse workforceto effectively represent all cases appointed to thedepartment.
165Public Safety Group Adopted Operational Plan Fiscal Years 2013-2014 and 2014-2015
Public Defender
Achieved 15 hours of annual continuing legaleducation for all 210 attorneys.Achieved 8 hours of annual investigation-relatedtraining for all 44 investigators.
Required Discipline for Excellence – Regional Leadership
Developed and maintained partnerships with educa-tional and community organizations to leverageresources and address common needs.
Volunteers provided 125,327 hours of service to thedepartment, exceeding the goal of 90,000.Participated in four community outreach eventsthrough the Public Defender’s Community OutreachProgram.Trained 771 non-staff attorneys concurrently withstaff attorneys to build relationships and strengthenthe criminal justice system. While this number isbelow the goal to train approximately 800 non-staffattorneys, the department continues to expand thenumber of non-staff attorneys trained by using webstreaming., Provided 148 streaming video trainings to branchoffices and other indigent defense agencies,exceeding the goal of 25.
2013-15 Objectives
Strategic Initiative – Safe CommunitiesResidents are protected from crime or abuse.
Reduce recidivism and help offenders successfullyreenter society by encouraging clients to takeadvantage of programs that will allow them to thriveby successfully completing probation and reduce thelikelihood of reoffending.
File approximately 350 misdemeanorexpungement requests to help clients obtainmeaningful employment.File approximately 400 felony expungementrequests to help clients obtain meaningfulemployment.Represent approximately 250 prison inmates withlife sentences who qualify for a sentence recalland resentence under Proposition 36, which wasapproved by voters in November 2012.
Promote collaborative justice by establishing a profes-sional rapport and bond of trust with clients and workwith criminal justice partners to ensure a reasonableand efficient criminal justice system and obtain thebest possible outcome for the client.
Resolve 70% of misdemeanor cases prior to trialwhen doing so benefits the client more thanlitigation.Resolve 62% of felony cases within 60 days ofarraignment when doing so benefits the client morethan litigation.
Promote collaborative justice by participating in spe-cialty courts aimed at linking services to clients withspecialized needs.
Participate in Offender Reentry Court, Adult andJuvenile Drug Court, and Homeless Court to helpensure clients obtain the services they need tobecome self-sufficient and maintain a crime-freelifestyle.Maintain 90% of caseload capacity in the BehavioralHealth Court Calendar.Maintain 90% of caseload capacity in the VeteransTreatment Review Calendar.
Strategic Initiative – Healthy FamiliesImprove opportunities for children and families byassisting juvenile delinquency clients to be successfulin their rehabilitation programs and on probation.
Use juvenile record sealing statutes to assist juvenileclients in clearing their records to gain employmentor to participate in training and/or educationprograms, for 80% of requests.Maintain the number of elapsed days betweenadmission and sentencing in juvenile cases at anaverage of 28 days to accelerate rehabilitation.
Required Discipline for Excellence – Continuous Improvement and Innovation
Improve the efficiency and cost-effectiveness of ser-vices by storing case-related information electronically.
Receive discovery electronically on 65% of incomingadult felony cases.
Required Discipline for Excellence – Skilled, Adaptable and Diverse Workforce
Ensure a qualified, well-trained and diverse workforceto effectively represent all cases appointed to thedepartment.
Achieve 15 hours of annual continuing legaleducation for all attorneys.Achieve eight hours of annual investigation-relatedtraining for all investigators.
166 Public Safety GroupAdopted Operational Plan Fiscal Years 2013-2014 and 2014-2015
Public Defender
Required Discipline for Excellence – Regional Leadership
Develop and maintain partnerships with educationaland community organizations to leverage resourcesand address common needs.
Maintain at least 90,000 hours provided byvolunteers.Participate in four community outreach eventsthrough the Public Defender’s Community OutreachProgram.
Train approximately 725 non-staff attorneysconcurrently with staff attorneys to buildrelationships and strengthen the criminal justicesystem.Provide 50 streaming video trainings to thedepartment’s branch offices and other indigentdefense agencies.
Related Links
For additional information about the Public Defender, referto the website at www.sdcounty.ca.gov/public_defender.
167Public Safety Group Adopted Operational Plan Fiscal Years 2013-2014 and 2014-2015
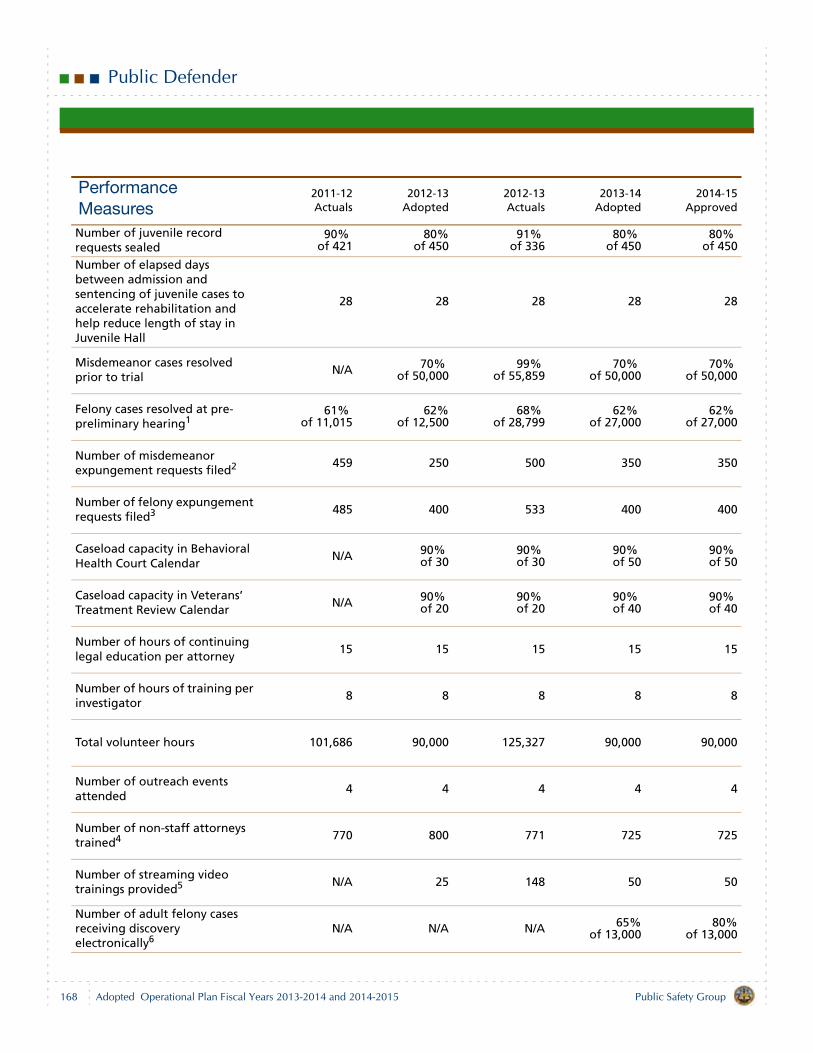
Public Defender
Performance Measures
2011-12Actuals
2012-13Adopted
2012-13Actuals
2013-14Adopted
2014-15Approved
Number of juvenile record requests sealed
90% of 421
80%of 450
91% of 336
80% of 450
80% of 450
Number of elapsed days between admission and sentencing of juvenile cases to accelerate rehabilitation and help reduce length of stay in Juvenile Hall
28 28 28 28 28
Misdemeanor cases resolved prior to trial
N/A 70% of 50,000
99% of 55,859
70% of 50,000
70% of 50,000
Felony cases resolved at pre-preliminary hearing1
61% of 11,015
62%of 12,500
68% of 28,799
62% of 27,000
62% of 27,000
Number of misdemeanor expungement requests filed2 459 250 500 350 350
Number of felony expungement requests filed3 485 400 533 400 400
Caseload capacity in Behavioral Health Court Calendar
N/A 90% of 30
90% of 30
90% of 50
90% of 50
Caseload capacity in Veterans’ Treatment Review Calendar
N/A 90% of 20
90% of 20
90% of 40
90% of 40
Number of hours of continuing legal education per attorney
15 15 15 15 15
Number of hours of training per investigator
8 8 8 8 8
Total volunteer hours 101,686 90,000 125,327 90,000 90,000
Number of outreach events attended
4 4 4 4 4
Number of non-staff attorneys trained4 770 800 771 725 725
Number of streaming video trainings provided5 N/A 25 148 50 50
Number of adult felony cases receiving discovery electronically6
N/A N/A N/A 65%of 13,000
80%of 13,000
168 Public Safety GroupAdopted Operational Plan Fiscal Years 2013-2014 and 2014-2015
Public Defender
Table Notes
1Figures for Fiscal Year 2011-12 Actuals reflect the number of felony cases resolved solely by the central branch of the division of the Primary Public Defender.
2A new baseline of 350 misdemeanor expungements will be implemented in Fiscal Year 2013-14. Fiscal Year 2012-13 Actuals exceeded the goal because the department, in conjunction with community and county partners, created and opened the Clean Slate Reentry Expungement Clinic in April 2012. The clinic allows the department to accept and process a high volume of expungement requests.
3The figure reported for Fiscal Year 2012-13 Actuals includes 305 felony expungement requests filed and 228 requests for felonies to be reduced to misdemeanors followed by expungement. Fiscal Year 2012-13 Actuals exceeded the goal because the department, in conjunction with community and county partners, created and opened the Clean Slate Reentry Expungement Clinic in April 2012. The clinic allows the department to accept
and process a high volume of expungement requests.
4The performance goal to concurrently train non-staff attorneys first took effect in Fiscal Year 2011-12, and that year’s target of 450 non-staff attorneys was greatly exceeded once the department implemented web streaming to deliver the training courses. Although the Fiscal Year 2012-13 goal of training 800 non-staff attorneys was not met, the number of non-staff attorneys trained continues to reflect the department’s ability to reach a large audience through web streaming.
5This is a new measure effective Fiscal Year 2012-13 that tracks the extensiveness of the department’s streaming video program. Fiscal Year 2012-13 Actuals exceeded the goal because this was a new activity that began in Fiscal Year 2012-13.
6This is a new measure effective Fiscal Year 2013-14 that tracks the department’s transition to paperless case files.
Budget Changes and Operational Impact: 2012-13 to 2013-14
StaffingNet increase of 11.00 staff years.
Increase of 12.00 staff years in the Primary PublicDefender to address increased case responsibilitiesand activities related to Assembly Bill (SB) 109, PublicSafety Realignment (2011).Decrease of 1.00 staff year in Administration as a resultof a transfer to the Primary Public Defender to provideinvestigative support.
ExpendituresNet increase of $2.4 million.
Salaries and Benefits — net increase of $3.0 million.Increase of $1.3 million due to an increase in Countyretirement contributions.Increase of $1.3 million due to the addition of 11.00staff years as described above.Increase of $0.4 million due to an increased need fortemporary help associated with representing clientsrequesting resentencing hearings under Proposition36 approved by voters in November 2012.
Services and Supplies — net decrease of $0.6 milliondue to the realignment of resources to support salaryand benefit costs.
RevenuesNet increase of $2.4 million.
Fines, Forfeitures and Penalties — decrease of $0.1million in State revenue as a result of a decrease inCriminal Justice Facility Penalty funds.Intergovernmental Revenues — increase of $0.9 millionin State revenue allocated from the Local RevenueFund 2011, District Attorney/Public Defender Subac-count ($0.2 million) and the Community CorrectionsSubaccount ($0.7 million)Use of Fund Balance — net increase of $0.3 million. Atotal of $3.0 million is budgeted.
$1.9 million to support costs associated withtemporary staff and the costs of representing clientseligible for resentencing hearings associated withProposition 36.$1.0 million rebudgeted to support costs associatedwith the defense of special circumstances cases.$0.1 million for the remaining term of certain leasecosts associated with the discontinued FamilyDependency Services program.
169Public Safety Group Adopted Operational Plan Fiscal Years 2013-2014 and 2014-2015
Public Defender
General Purpose Revenue Allocation — increase of$1.3 million to offset an increase in County retirementcontributions.
Budget Changes and Operational Impact: 2013-14 to 2014-15
Decrease of $0.3 million due to a reduction in one-timeexpenditures of temporary salaries and benefits. In FiscalYear 2013-14 the department received an additional $0.3
million in fund balance for temporary employees that areneeded to represent approximately 250 prison inmates.These inmates have life sentences and qualify for a possi-ble sentence recall and resentence under Proposition 36,State Three Strikes Law, which was approved by voters inNovember 2012. This is a one-time activity that is projectedto be completed in Fiscal Year 2013-14.
170 Public Safety GroupAdopted Operational Plan Fiscal Years 2013-2014 and 2014-2015
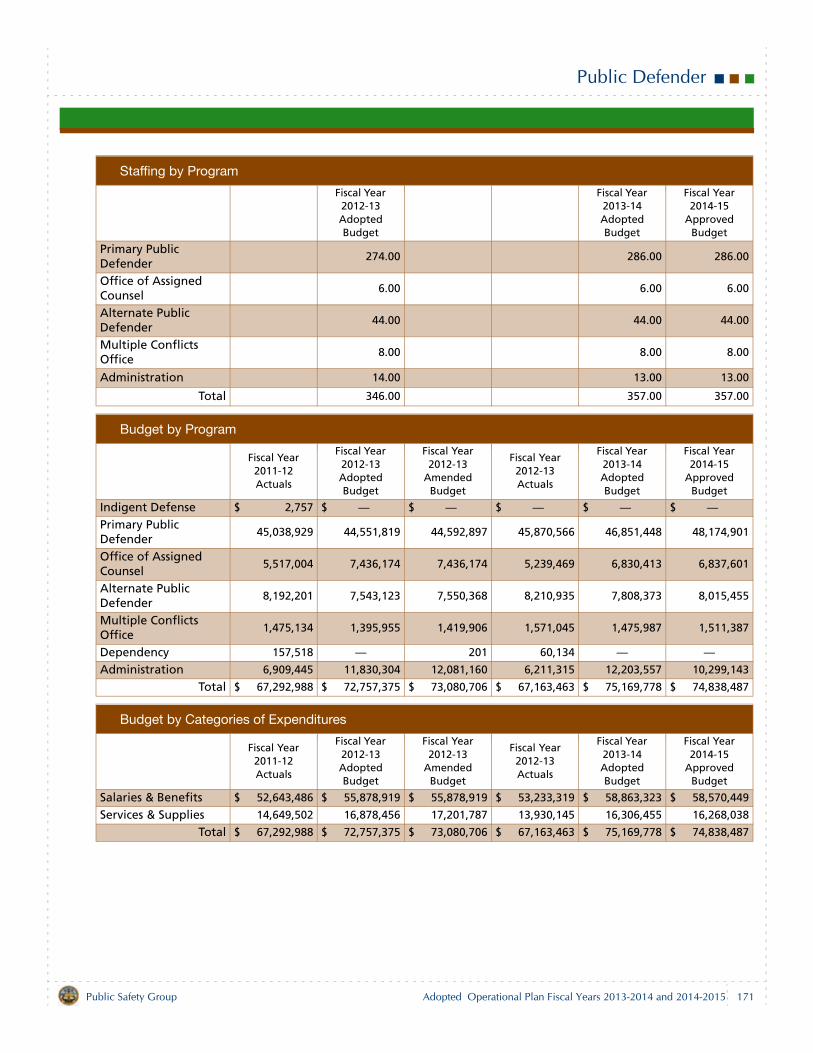
Public Defender
Staffing by Program
Fiscal Year 2012-13 Adopted Budget
Fiscal Year 2013-14 Adopted Budget
Fiscal Year 2014-15
Approved Budget
Primary Public Defender
274.00 286.00 286.00
Office of Assigned Counsel
6.00 6.00 6.00
Alternate Public Defender
44.00 44.00 44.00
Multiple Conflicts Office
8.00 8.00 8.00
Administration 14.00 13.00 13.00
Total 346.00 357.00 357.00
Budget by Program
Fiscal Year 2011-12 Actuals
Fiscal Year 2012-13 Adopted Budget
Fiscal Year 2012-13
Amended Budget
Fiscal Year 2012-13 Actuals
Fiscal Year 2013-14 Adopted Budget
Fiscal Year 2014-15
Approved Budget
Indigent Defense $ 2,757 $ — $ — $ — $ — $ —Primary Public Defender
45,038,929 44,551,819 44,592,897 45,870,566 46,851,448 48,174,901
Office of Assigned Counsel
5,517,004 7,436,174 7,436,174 5,239,469 6,830,413 6,837,601
Alternate Public Defender
8,192,201 7,543,123 7,550,368 8,210,935 7,808,373 8,015,455
Multiple Conflicts Office
1,475,134 1,395,955 1,419,906 1,571,045 1,475,987 1,511,387
Dependency 157,518 — 201 60,134 — —Administration 6,909,445 11,830,304 12,081,160 6,211,315 12,203,557 10,299,143
Total $ 67,292,988 $ 72,757,375 $ 73,080,706 $ 67,163,463 $ 75,169,778 $ 74,838,487
Budget by Categories of Expenditures
Fiscal Year 2011-12 Actuals
Fiscal Year 2012-13 Adopted Budget
Fiscal Year 2012-13
Amended Budget
Fiscal Year 2012-13 Actuals
Fiscal Year 2013-14 Adopted Budget
Fiscal Year 2014-15
Approved Budget
Salaries & Benefits $ 52,643,486 $ 55,878,919 $ 55,878,919 $ 53,233,319 $ 58,863,323 $ 58,570,449
Services & Supplies 14,649,502 16,878,456 17,201,787 13,930,145 16,306,455 16,268,038
Total $ 67,292,988 $ 72,757,375 $ 73,080,706 $ 67,163,463 $ 75,169,778 $ 74,838,487
171Public Safety Group Adopted Operational Plan Fiscal Years 2013-2014 and 2014-2015
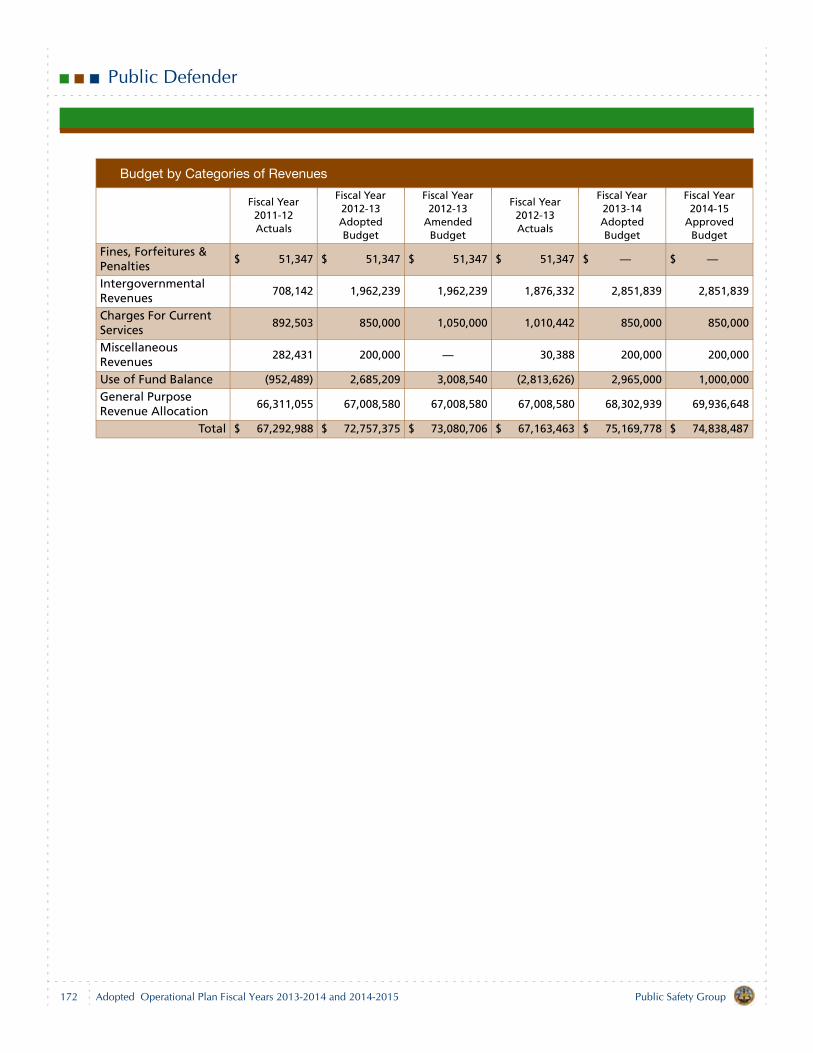
Public Defender
Budget by Categories of Revenues
Fiscal Year 2011-12 Actuals
Fiscal Year 2012-13 Adopted Budget
Fiscal Year 2012-13
Amended Budget
Fiscal Year 2012-13 Actuals
Fiscal Year 2013-14 Adopted Budget
Fiscal Year 2014-15
Approved Budget
Fines, Forfeitures & Penalties
$ 51,347 $ 51,347 $ 51,347 $ 51,347 $ — $ —
Intergovernmental Revenues
708,142 1,962,239 1,962,239 1,876,332 2,851,839 2,851,839
Charges For Current Services
892,503 850,000 1,050,000 1,010,442 850,000 850,000
Miscellaneous Revenues
282,431 200,000 — 30,388 200,000 200,000
Use of Fund Balance (952,489) 2,685,209 3,008,540 (2,813,626) 2,965,000 1,000,000
General Purpose Revenue Allocation
66,311,055 67,008,580 67,008,580 67,008,580 68,302,939 69,936,648
Total $ 67,292,988 $ 72,757,375 $ 73,080,706 $ 67,163,463 $ 75,169,778 $ 74,838,487
172 Public Safety GroupAdopted Operational Plan Fiscal Years 2013-2014 and 2014-2015
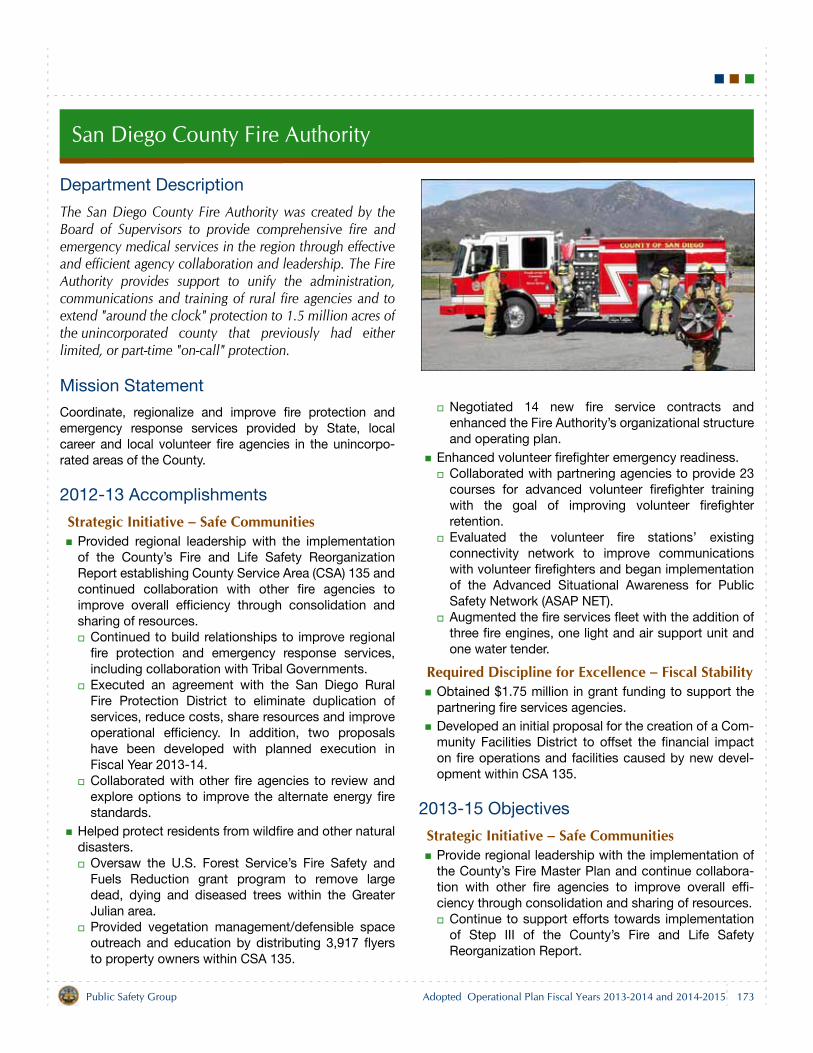
San Diego County Fire Authority
Department Description
The San Diego County Fire Authority was created by theBoard of Supervisors to provide comprehensive fire andemergency medical services in the region through effectiveand efficient agency collaboration and leadership. The FireAuthority provides support to unify the administration,communications and training of rural fire agencies and toextend "around the clock" protection to 1.5 million acres ofthe unincorporated county that previously had eitherlimited, or part-time "on-call" protection.
Mission Statement
Coordinate, regionalize and improve fire protection andemergency response services provided by State, localcareer and local volunteer fire agencies in the unincorpo-rated areas of the County.
2012-13 Accomplishments
Strategic Initiative – Safe CommunitiesProvided regional leadership with the implementationof the County’s Fire and Life Safety ReorganizationReport establishing County Service Area (CSA) 135 andcontinued collaboration with other fire agencies toimprove overall efficiency through consolidation andsharing of resources.
Continued to build relationships to improve regionalfire protection and emergency response services,including collaboration with Tribal Governments.Executed an agreement with the San Diego RuralFire Protection District to eliminate duplication ofservices, reduce costs, share resources and improveoperational efficiency. In addition, two proposalshave been developed with planned execution inFiscal Year 2013-14. Collaborated with other fire agencies to review andexplore options to improve the alternate energy firestandards.
Helped protect residents from wildfire and other naturaldisasters.
Oversaw the U.S. Forest Service’s Fire Safety andFuels Reduction grant program to remove largedead, dying and diseased trees within the GreaterJulian area. Provided vegetation management/defensible spaceoutreach and education by distributing 3,917 flyersto property owners within CSA 135.
Negotiated 14 new fire service contracts andenhanced the Fire Authority’s organizational structureand operating plan.
Enhanced volunteer firefighter emergency readiness.Collaborated with partnering agencies to provide 23courses for advanced volunteer firefighter trainingwith the goal of improving volunteer firefighterretention.Evaluated the volunteer fire stations’ existingconnectivity network to improve communicationswith volunteer firefighters and began implementationof the Advanced Situational Awareness for PublicSafety Network (ASAP NET).Augmented the fire services fleet with the addition ofthree fire engines, one light and air support unit andone water tender.
Required Discipline for Excellence – Fiscal StabilityObtained $1.75 million in grant funding to support thepartnering fire services agencies.Developed an initial proposal for the creation of a Com-munity Facilities District to offset the financial impacton fire operations and facilities caused by new devel-opment within CSA 135.
2013-15 Objectives
Strategic Initiative – Safe CommunitiesProvide regional leadership with the implementation ofthe County’s Fire Master Plan and continue collabora-tion with other fire agencies to improve overall effi-ciency through consolidation and sharing of resources.
Continue to support efforts towards implementationof Step III of the County’s Fire and Life SafetyReorganization Report.
173Public Safety Group Adopted Operational Plan Fiscal Years 2013-2014 and 2014-2015
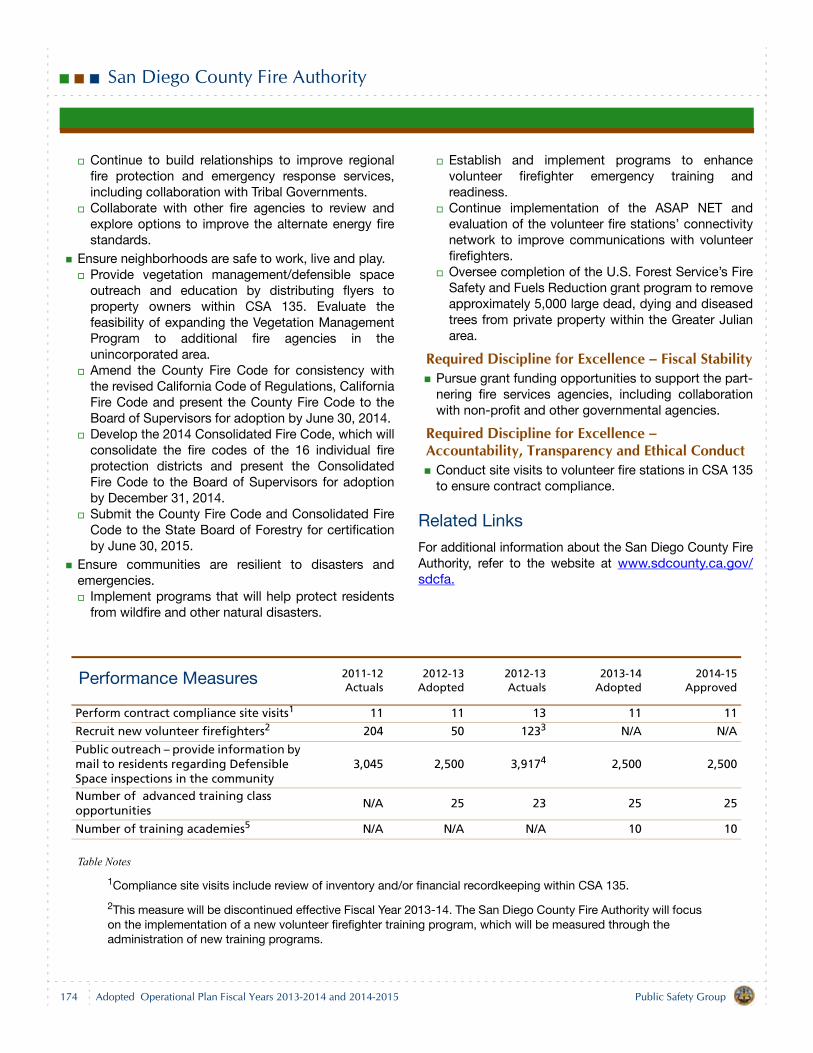
San Diego County Fire Authority
Continue to build relationships to improve regionalfire protection and emergency response services,including collaboration with Tribal Governments.Collaborate with other fire agencies to review andexplore options to improve the alternate energy firestandards.
Ensure neighborhoods are safe to work, live and play. Provide vegetation management/defensible spaceoutreach and education by distributing flyers toproperty owners within CSA 135. Evaluate thefeasibility of expanding the Vegetation ManagementProgram to additional fire agencies in theunincorporated area.Amend the County Fire Code for consistency withthe revised California Code of Regulations, CaliforniaFire Code and present the County Fire Code to theBoard of Supervisors for adoption by June 30, 2014. Develop the 2014 Consolidated Fire Code, which willconsolidate the fire codes of the 16 individual fireprotection districts and present the ConsolidatedFire Code to the Board of Supervisors for adoptionby December 31, 2014. Submit the County Fire Code and Consolidated FireCode to the State Board of Forestry for certificationby June 30, 2015.
Ensure communities are resilient to disasters andemergencies.
Implement programs that will help protect residentsfrom wildfire and other natural disasters.
Establish and implement programs to enhancevolunteer firefighter emergency training andreadiness.Continue implementation of the ASAP NET andevaluation of the volunteer fire stations’ connectivitynetwork to improve communications with volunteerfirefighters.Oversee completion of the U.S. Forest Service’s FireSafety and Fuels Reduction grant program to removeapproximately 5,000 large dead, dying and diseasedtrees from private property within the Greater Julianarea.
Required Discipline for Excellence – Fiscal StabilityPursue grant funding opportunities to support the part-nering fire services agencies, including collaborationwith non-profit and other governmental agencies.
Required Discipline for Excellence – Accountability, Transparency and Ethical Conduct
Conduct site visits to volunteer fire stations in CSA 135to ensure contract compliance.
Related Links
For additional information about the San Diego County FireAuthority, refer to the website at www.sdcounty.ca.gov/sdcfa.
Table Notes
1Compliance site visits include review of inventory and/or financial recordkeeping within CSA 135.
2This measure will be discontinued effective Fiscal Year 2013-14. The San Diego County Fire Authority will focus on the implementation of a new volunteer firefighter training program, which will be measured through the administration of new training programs.
Performance Measures 2011-12Actuals
2012-13Adopted
2012-13Actuals
2013-14Adopted
2014-15Approved
Perform contract compliance site visits1 11 11 13 11 11
Recruit new volunteer firefighters2 204 50 1233 N/A N/A
Public outreach – provide information by mail to residents regarding Defensible Space inspections in the community
3,045 2,500 3,9174 2,500 2,500
Number of advanced training class opportunities
N/A 25 23 25 25
Number of training academies5 N/A N/A N/A 10 10
174 Public Safety GroupAdopted Operational Plan Fiscal Years 2013-2014 and 2014-2015
San Diego County Fire Authority
3The number of new volunteer firefighters exceeded the goal due to a higher than anticipated number of qualified applicants.
4 The actual number of Defensible Space notifications varies each year as a result of ongoing assessments of properties in high-risk areas.
5This is a new measure effective Fiscal Year 2013-14. This measure is intended to better represent efforts to improve volunteer firefighter retention and enhance the overall emergency readiness of the volunteer program. Training academies include basic, driver-operator and State-certified academies.
Budget Changes and Operational Impact: 2012-13 to 2013-14
StaffingNo change in staffing.
ExpendituresNet increase of $2.0 million.
Salaries and Benefits — increase of $0.1 million due tocosts associated with temporary staff.Services and Supplies — increase of $3.6 million dueto an increase in fire and emergency medical servicecontracts, rebudget of the Dead, Dying and DiseasedTree Grant Program and equipment costs. Capital Assets Equipment — increase of $0.1 millionfor the purchase of fire apparatus. Fund Balance Component Increases — decrease of$1.6 million due to a one-time contribution toward thereplacement or upgrade of fire apparatus and regionalsupport equipment. Operating Transfers Out — net decrease of $0.2 milliondue to a transfer to CSA 135 for contracted fire andemergency medical services.
RevenuesNet increase of $2.0 million.
Intergovernmental Revenues — increase of $1.9 milliondue to a rebudget of revenue for the Dead, Dying andDiseased Tree Grant Program and award of the Com-munity Development Block Grant and Indian GamingLocal Community Benefit Committee program fundsfor the purchase of fire apparatus and equipment.
Miscellaneous Revenues — increase of $0.1 milliondue to the rebudget of funds for the purchase of infor-mation technology related to the Advanced SituationalAwareness Public Safety Network (ASAP NET). Other Financing Sources — decrease of $0.2 million asa result of the transfer of funds to CSA 135 for con-tracted fire and emergency medical services. Use of Fund Balance — decrease of $0.7 million. Atotal of $2.3 million is budgeted.
$0.5 million for fire apparatus for regional support. $0.5 million for safety clothing, minor equipment,fixed assets and contracted services.$0.3 million to provide for equipment and automaintenance; increased volunteer station equipmentand fuel costs; and increased contract costs.$0.3 million for a new volunteer firefighter trainingacademy.$0.3 million for the replacement/upgrades of fireapparatus and equipment for regional support. $0.2 million to support the Fire Protection andEmergency Medical Services program.$0.2 million for costs associated with temporary staffand the rebudget of contracted services.
General Purpose Revenue Allocation — increase of$1.0 million due to an increase in operational and con-tract costs.
Budget Changes and Operational Impact: 2013-14 to 2014-15
A net decrease of $8.4 million primarily due to a decrease of$7.1 million in Services and Supplies associated with thecompletion of the Dead, Dying and Diseased Tree GrantProgram and $1.3 million combined in all other accountsdue to the completion of one-time projects.
175Public Safety Group Adopted Operational Plan Fiscal Years 2013-2014 and 2014-2015
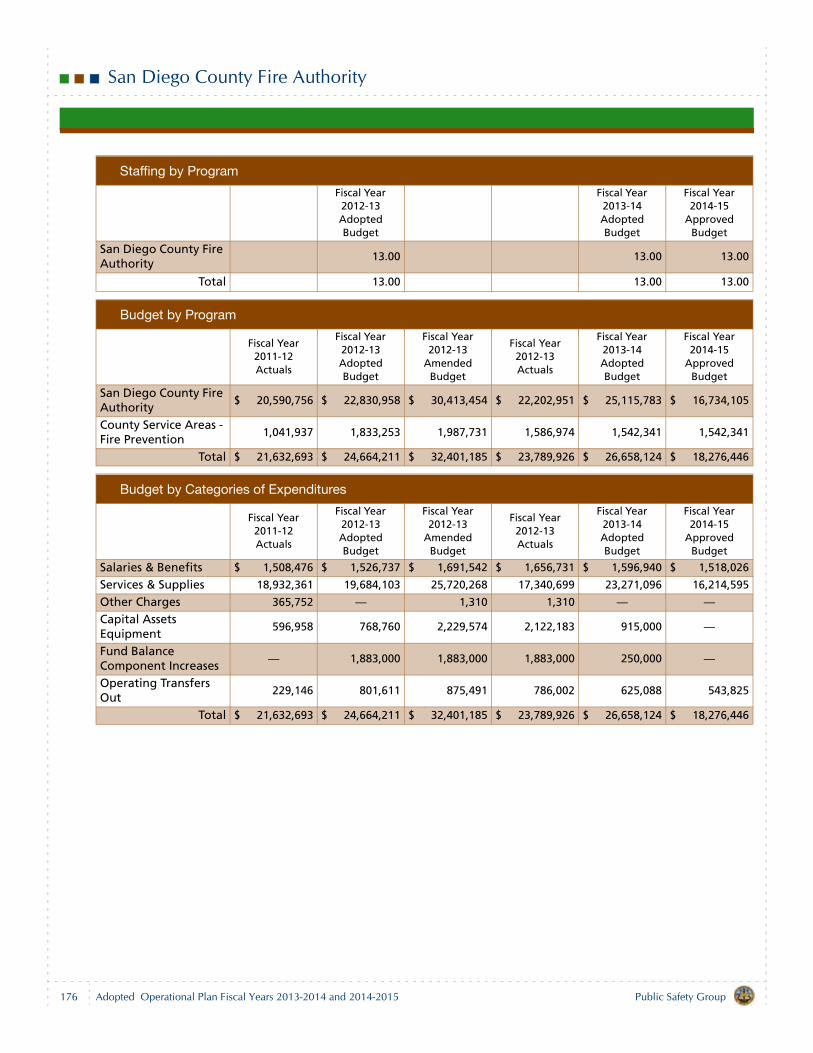
San Diego County Fire Authority
Staffing by Program
Fiscal Year 2012-13 Adopted Budget
Fiscal Year 2013-14 Adopted Budget
Fiscal Year 2014-15
Approved Budget
San Diego County Fire Authority
13.00 13.00 13.00
Total 13.00 13.00 13.00
Budget by Program
Fiscal Year 2011-12 Actuals
Fiscal Year 2012-13 Adopted Budget
Fiscal Year 2012-13
Amended Budget
Fiscal Year 2012-13 Actuals
Fiscal Year 2013-14 Adopted Budget
Fiscal Year 2014-15
Approved Budget
San Diego County Fire Authority
$ 20,590,756 $ 22,830,958 $ 30,413,454 $ 22,202,951 $ 25,115,783 $ 16,734,105
County Service Areas - Fire Prevention
1,041,937 1,833,253 1,987,731 1,586,974 1,542,341 1,542,341
Total $ 21,632,693 $ 24,664,211 $ 32,401,185 $ 23,789,926 $ 26,658,124 $ 18,276,446
Budget by Categories of Expenditures
Fiscal Year 2011-12 Actuals
Fiscal Year 2012-13 Adopted Budget
Fiscal Year 2012-13
Amended Budget
Fiscal Year 2012-13 Actuals
Fiscal Year 2013-14 Adopted Budget
Fiscal Year 2014-15
Approved Budget
Salaries & Benefits $ 1,508,476 $ 1,526,737 $ 1,691,542 $ 1,656,731 $ 1,596,940 $ 1,518,026
Services & Supplies 18,932,361 19,684,103 25,720,268 17,340,699 23,271,096 16,214,595
Other Charges 365,752 — 1,310 1,310 — —Capital Assets Equipment
596,958 768,760 2,229,574 2,122,183 915,000 —
Fund Balance Component Increases
— 1,883,000 1,883,000 1,883,000 250,000 —
Operating Transfers Out
229,146 801,611 875,491 786,002 625,088 543,825
Total $ 21,632,693 $ 24,664,211 $ 32,401,185 $ 23,789,926 $ 26,658,124 $ 18,276,446
176 Public Safety GroupAdopted Operational Plan Fiscal Years 2013-2014 and 2014-2015

San Diego County Fire Authority
Budget by Categories of Revenues
Fiscal Year 2011-12 Actuals
Fiscal Year 2012-13 Adopted Budget
Fiscal Year 2012-13
Amended Budget
Fiscal Year 2012-13 Actuals
Fiscal Year 2013-14 Adopted Budget
Fiscal Year 2014-15
Approved Budget
Taxes Current Property $ 485,318 $ 580,615 $ 580,615 $ 500,438 $ 573,491 $ 573,491
Taxes Other Than Current Secured
3,971 — — 4,643 — —
Licenses Permits & Franchises
(10,799) — — — — —
Revenue From Use of Money & Property
62,141 43,710 43,710 64,000 43,710 43,710
Intergovernmental Revenues
1,819,216 4,139,652 8,266,897 2,099,883 6,007,626 —
Charges For Current Services
481,283 543,472 543,472 499,333 505,140 505,140
Miscellaneous Revenues
35,913 — 756,524 313,853 100,000 —
Other Financing Sources
1,325,171 665,456 739,336 671,222 420,000 420,000
Use of Fund Balance 1,760,479 2,997,868 5,777,193 3,943,116 2,302,138 —General Purpose Revenue Allocation
15,670,000 15,693,438 15,693,438 15,693,438 16,706,019 16,734,105
Total $ 21,632,693 $ 24,664,211 $ 32,401,185 $ 23,789,926 $ 26,658,124 $ 18,276,446
177Public Safety Group Adopted Operational Plan Fiscal Years 2013-2014 and 2014-2015

County of San Diego
Health and Human Services Agency
Health and Human Services Agency Summary 181
Regional Operations 187
Strategic Planning & Operational Support 199
Aging and Independence Services 205
Behavioral Health Services 213
Child Welfare Services 221
Public Health Services 227
Public Administrator/Public Guardian 233
Administrative Support 237

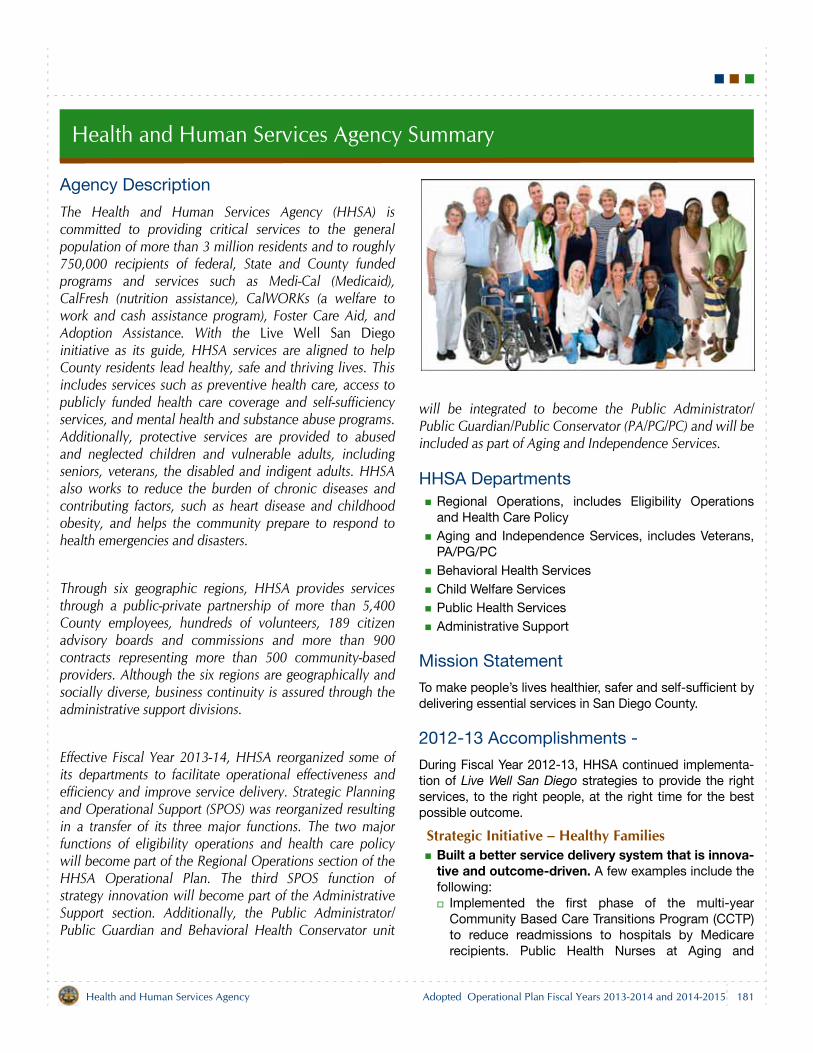
Health and Human Services Agency Summary
Agency Description
The Health and Human Services Agency (HHSA) iscommitted to providing critical services to the generalpopulation of more than 3 million residents and to roughly750,000 recipients of federal, State and County fundedprograms and services such as Medi-Cal (Medicaid),CalFresh (nutrition assistance), CalWORKs (a welfare towork and cash assistance program), Foster Care Aid, andAdoption Assistance. With the Live Well San Diegoinitiative as its guide, HHSA services are aligned to helpCounty residents lead healthy, safe and thriving lives. Thisincludes services such as preventive health care, access topublicly funded health care coverage and self-sufficiencyservices, and mental health and substance abuse programs.Additionally, protective services are provided to abusedand neglected children and vulnerable adults, includingseniors, veterans, the disabled and indigent adults. HHSAalso works to reduce the burden of chronic diseases andcontributing factors, such as heart disease and childhoodobesity, and helps the community prepare to respond tohealth emergencies and disasters.
Through six geographic regions, HHSA provides servicesthrough a public-private partnership of more than 5,400County employees, hundreds of volunteers, 189 citizenadvisory boards and commissions and more than 900contracts representing more than 500 community-basedproviders. Although the six regions are geographically andsocially diverse, business continuity is assured through theadministrative support divisions.
Effective Fiscal Year 2013-14, HHSA reorganized some ofits departments to facilitate operational effectiveness andefficiency and improve service delivery. Strategic Planningand Operational Support (SPOS) was reorganized resultingin a transfer of its three major functions. The two majorfunctions of eligibility operations and health care policywill become part of the Regional Operations section of theHHSA Operational Plan. The third SPOS function ofstrategy innovation will become part of the AdministrativeSupport section. Additionally, the Public Administrator/Public Guardian and Behavioral Health Conservator unit
will be integrated to become the Public Administrator/Public Guardian/Public Conservator (PA/PG/PC) and will beincluded as part of Aging and Independence Services.
HHSA DepartmentsRegional Operations, includes Eligibility Operationsand Health Care PolicyAging and Independence Services, includes Veterans,PA/PG/PCBehavioral Health ServicesChild Welfare ServicesPublic Health ServicesAdministrative Support
Mission Statement
To make people’s lives healthier, safer and self-sufficient bydelivering essential services in San Diego County.
2012-13 Accomplishments -
During Fiscal Year 2012-13, HHSA continued implementa-tion of Live Well San Diego strategies to provide the rightservices, to the right people, at the right time for the bestpossible outcome.
Strategic Initiative – Healthy FamiliesBuilt a better service delivery system that is innova-tive and outcome-driven. A few examples include thefollowing:
Implemented the first phase of the multi-yearCommunity Based Care Transitions Program (CCTP)to reduce readmissions to hospitals by Medicarerecipients. Public Health Nurses at Aging and
181Health and Human Services Agency Adopted Operational Plan Fiscal Years 2013-2014 and 2014-2015
Health and Human Services Agency Summary
Independence Services are receiving referrals from13 participating private and public hospitalsthroughout the county. CCTP improves the quality ofcare for more than 21,000 high-risk, high-cost, fee-for-service Medicare patients as they transition fromthe acute care hospital to other care providers in thecommunity, and reduces the risk of an avoidablehospital readmission which results in improvedquality of life for the participants and reduced coststo taxpayers. Evaluated data from the two pilot programsintegrating physical and behavioral health services.Two programs established with one providingcomprehensive counseling and mental healthservices for children and adults (ICARE), and thesecond program adding psychiatric consultations tosupport primary care providers (SmartCare).Established Extended Foster Care program, anoutcome from Assembly Bill (AB) 12, the CaliforniaFostering Connections to Success Act (2010), whichextends the age limit of foster care to 21 years ofage. More than 500 youth received transitionalservices in the first year, assisting them to becomeself-sufficient adults.Implemented Legacy Corps, a new Aging andIndependence Services/Veteran’s Services programthat provides free respite services to family membersproviding care for veterans of any age.
Supported positive choices that empower residentsto take responsibility for their own health and well-being. A few examples include the following:
Implemented the multi-year Community NutritionEducation Program grant to provide nutritioneducation and promote access to healthy foods to3,432 at-risk, low-income individuals who receive orare potentially eligible to receive CalFresh nutritionassistance. Implemented the multi-year CommunityTransformation Grant (CTG) in support of publichealth efforts to reduce chronic diseases, promotehealthier lifestyles, reduce health disparities, anddecrease health care costs for the region. Keyaccomplishments to date include procurements fortobacco-free living activities, promotion of activemodes of transportation including walking andbicycling, and services that increase access tohealthy food and beverages.Piloted a program, which received 576 referrals, forhigh-risk individuals with severe mental illness tohelp them take required medication and participatein treatment.
Pursued policy and environmental changes thatmade it easier for people to engage in healthy andsafe behaviors. A few examples include the following:
Developed six regional Live Well San DiegoNeighborhood-based plans by using a standardizedprocess for engaging community partners andaligning efforts in advancing a public-privatepartnership. Partnered with the Escondido Union School Districton a successful proposal for the Paving the Way forSafe Routes to School State grant that will invest$375,000 over two years to improve the safety ofwalking and bicycling by school-aged children andtheir families in the neighborhoods surroundingseveral Escondido schools.Partnered with the San Diego Association ofGovernments (SANDAG) and San Diego StateUniversity on a project to install bicycle counters instreets and along bike paths throughout the countyto encourage healthy lifestyles and activities toprevent obesity.
Improved the culture from within by increasingemployees’ knowledge of health and safety. A fewexamples include the following:
Partnered with health care providers on the secondannual Love Your Heart campaign, to provide morethan 2,000 free blood pressure screenings to thepublic on February 14.Supported employee-oriented campaigns such aswalking clubs, weight loss challenges and onsitepopular exercise programs, such as Zumba, thatpromote an active, healthy lifestyle.Deployed online employee training to raiseawareness about the symptoms and signs of traumaso that employees can seek help if they, or someonein their presence, is experiencing trauma.
Required Discipline for Excellence – Continuous Improvement
Advanced operational excellence in service deliveryand operational effectiveness by creating the Opera-tions Eligibility Division to focus primarily on programand regional support of self-sufficiency programs suchas Medi-Cal, CalFresh, and CalWORKs.Completed consolidation and co-location of the PublicAdministrator/Public Guardian and the BehavioralHealth Conservator unit to improve service coordina-tion.
182 Health and Human Services AgencyAdopted Operational Plan Fiscal Years 2013-2014 and 2014-2015
Health and Human Services Agency Summary
Required Discipline for Excellence – Customer Satisfaction
Implemented eligibility improvements to improve cus-tomer service in self-sufficiency programs
Established video interviews for customers who havedifficulty visiting a Family Resource Center.Continued upgrades to Family Resource Centerfacilities in order to enhance services and efficiency.Identified a new ACCESS Customer Service Centerfacility to accommodate the increase of staffnecessary to respond to call volume.
Required Discipline for Excellence – Information Services
Began multi-year Supplemental Nutrition AssistanceProgram (SNAP) grant activities to implement a systemfor electronic documents conversion and tracking, andto help streamline reduce processing time.Building on the completion of the first phase (Readi-ness Assessment) in Fiscal Year 2011-12, began thesecond phase of the Knowledge Integration Project(KIP) to develop the foundation for informationexchange across multiple disciplines to improve theinformation available and coordinate services forshared HHSA customers.
2013-15 Objectives
Ensure integration and achievement of Live Well San Diegostrategies to provide the right services, to the right people,at the right time for the best possible outcome.
Strategic Initiative - Healthy FamiliesBuilt a better service delivery system that is innova-tive, impactful, and outcome driven. A few examplesinclude the following:
Provide public health nurse home visits to CCTPparticipants to help them proactively manage theirchronic medical conditions and avoid costly hospitalreadmissions. Continue implementation of the multi-yearCommunity Transformation Grant to support publichealth efforts to reduce chronic diseases, promotehealthier lifestyles, reduce health disparities, anddecrease health care costs.
Strengthen Child Welfare Services by implementing/expanding trauma-informed practices to and co-locating with staff from community basedorganizations to improve outcomes such as timelyreunification and stable out-of-home placements.
Support positive choices that empower residents totake responsibility for their own health and well-being. A few examples include the following:
Continue implementation of the multi-yearSupplemental Nutrition Assistance ProgramEducation (SNAP-Ed) grant to promote nutritioneducation and obesity prevention services to low-income families that are potentially eligible for thefederally funded CalFresh food assistance program.This project is a continuation of the grant formerlyknown as the Community Nutrition Educationprogram.Implement a program for high-risk individuals withsevere mental illness to take required medicationsand participate in treatment.
Pursue policy and environmental changes thatmake it easier for people to engage in healthy andsafe behaviors. A few examples include the following:
Implement regional community health improvementplans through the participation or leadership ofResident Leadership Academy (RLA) graduates. Thepurpose of RLA is to build community capacity forhealth improvement in local neighborhoods. Support Department of Human Resources wellnessinitiatives that promote healthy and safe behaviors inthe workplace.
Required Discipline for Excellence – Customer Satisfaction
Continue transition of Healthy Families and LowIncome Health Program participants into appropriatehealth programs to promote continuity of care and amedical home, providing patient-centered, comprehen-sive, and coordinated care.
Required Discipline for Excellence – Accountability and Transparency
Pursue voluntary Public Health Accreditation status topromote accountability and continuous improvement. Continue electronic information exchange activitiesincluding Beacon Health Information Exchange withhospitals and KIP procurement efforts.
183Health and Human Services Agency Adopted Operational Plan Fiscal Years 2013-2014 and 2014-2015
Health and Human Services Agency Summary
Related Links
For additional information on the programs offered by theHealth and Human Services Agency, refer to the websitewww.sdcounty.ca.gov/hhsa.
Budget Changes and Operational Impact: 2012-13 to 2013-14
OverviewThe Health and Human Services Agency’s Fiscal Year 2013-14 budget includes appropriations of $2.0 billion, anincrease of $68.2 million.
Significant changes to the Operational Plan include anincrease of 307.25 staff years to support expansion of newand existing programs: Healthy Families, the CommunityBased Care Transitions Program (CCTP), the SNAP-Edproject, changes to the Foster Care system due to the pas-sage of AB 12 and additional positions to support opera-tional needs.
The 2012-13 California Budget called for the transition ofHealthy Families program recipients Statewide to the Medi-Cal program. On April 23, 2013, the Board of Supervisorsapproved the addition of 265.00 staff years to support thetransition of California’s Healthy Families recipients to theMedi-Cal program. Historically, the Healthy Families pro-gram has provided low cost health insurance for childrenwho do not have insurance and do not qualify for zero shareof cost Medi-Cal. The Medi-Cal program provides basichealth care safety net services to qualified, low-income res-idents of California.
On October 30, 2012, the Board of Supervisors approvedthe addition of 20.00 staff years to support the CCTP inAging and Independence Services. Through a partnershipbetween AIS and area hospitals, CCTP will improve thequality of care for high-risk, fee-for-service Medicarepatients as they transition from the acute care hospital to
other care providers in the community and reduce the riskof an avoidable hospital readmission to reduce costs to tax-payers.
On October 9, 2012, the Board of Supervisors approved theaddition of 4.00 staff years to support the SNAP-Ed projectwhich provides nutrition education and obesity preventionservices to low-income families in the regions that arepotentially eligible for the federally funded CalFresh foodassistance program.
The passage of AB 12 changed the foster care system byextending foster care until age 21. With this change, HHSAhas seen an increase in clients wanting these extended ser-vices. To meet this need, HHSA is adding 15.50 staff yearsto this program.
HHSA increased appropriations in AIS for contracted ser-vices associated with the CCTP program. Additional appro-priations are included for Aid to Adoptive Childrenpayments, due to projected case increases, and for theTransitional Housing Program, to expand services to eman-cipated youth as well as an increase for the North CountyShort Term Acute Residential Treatment (START) programand for Long Term Care (LTC) for increased capacity for res-idents with severe mental diseases.
The County is required to administer State and federal pro-grams. There continues to be uncertainty and challengesabout the future roles and responsibilities of HHSA. One ofthe main issues is the pending implementation of Medicaidexpansion. For example, the State intends to roll-out Cal-HEERs, an automated eligibility and enrollment system thatwill be used by California’s Health Benefits Exchange board(Covered California) to enroll participants in Medi-Cal orone of the health exchange plans. Implementation of thiseffort will be challenging and will require additional staff.Additionally, the federal financial impacts of sequestrationand other budget reductions are uncertain. The full impactof any changes is dependent on additional federal andState action and also on the ongoing economic situation.Moving forward, HHSA will return to the Board of Supervi-sors and adjust its budget as needed to align ongoing fund-ing with core, essential services. HHSA will continue to
184 Health and Human Services AgencyAdopted Operational Plan Fiscal Years 2013-2014 and 2014-2015
Health and Human Services Agency Summary
work with its citizen advisory boards, the County Office ofStrategy and Intergovernmental Affairs and other key stake-holders in these efforts.
Tobacco Settlement FundsTobacco settlement payments were first securitized in Fis-cal Year 2001-02 to allow a stable funding stream for healthand human services programs. The Special Revenue fundreflects $27.5 million for Fiscal Year 2013-14. No change isproposed between years.
Budget Changes and Operational Impact: 2013-14 to 2014-15
Net decrease of $11.0 million due to a $22.5 milliondecrease in Services and Supplies due primarily to theelimination of one-time projects from the prior year, offsetby an increase of $11.5 million in Salaries and Benefits dueto an increase in County retirement contributions.
185Health and Human Services Agency Adopted Operational Plan Fiscal Years 2013-2014 and 2014-2015
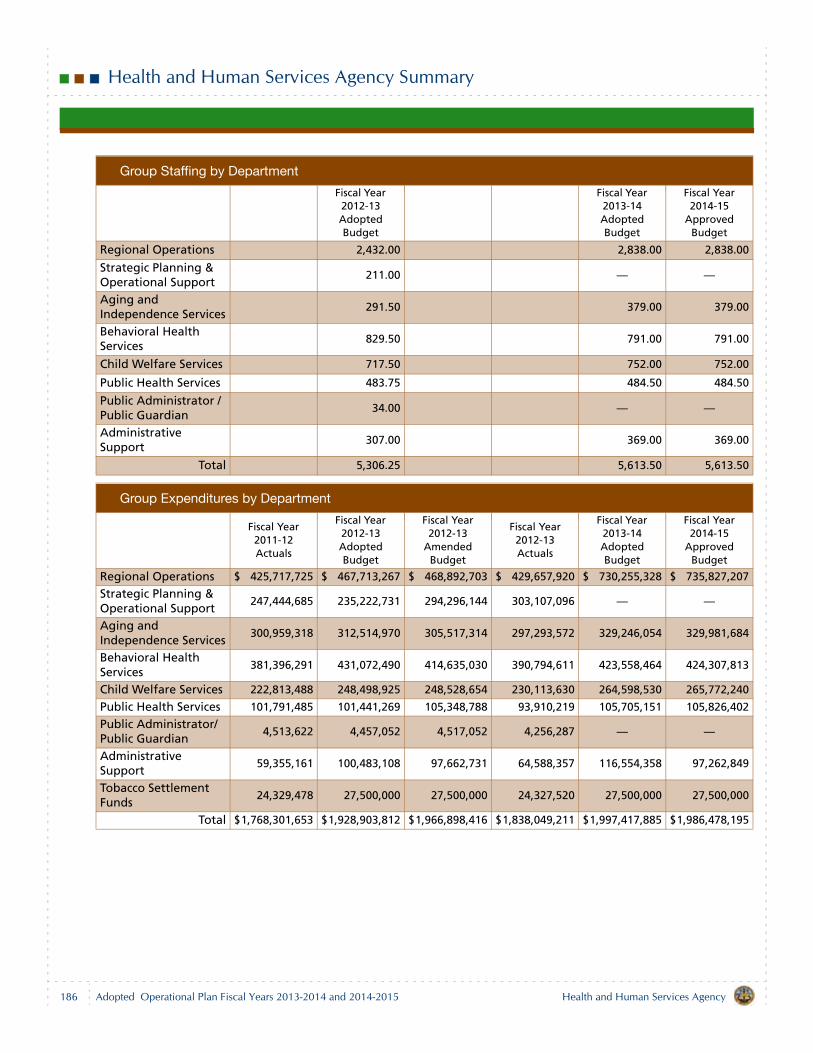
Health and Human Services Agency Summary
Group Staffing by Department
Fiscal Year 2012-13 Adopted Budget
Fiscal Year 2013-14 Adopted Budget
Fiscal Year 2014-15
Approved Budget
Regional Operations 2,432.00 2,838.00 2,838.00
Strategic Planning & Operational Support
211.00 — —
Aging and Independence Services
291.50 379.00 379.00
Behavioral Health Services
829.50 791.00 791.00
Child Welfare Services 717.50 752.00 752.00
Public Health Services 483.75 484.50 484.50
Public Administrator / Public Guardian
34.00 — —
Administrative Support
307.00 369.00 369.00
Total 5,306.25 5,613.50 5,613.50
Group Expenditures by Department
Fiscal Year 2011-12 Actuals
Fiscal Year 2012-13 Adopted Budget
Fiscal Year 2012-13
Amended Budget
Fiscal Year 2012-13 Actuals
Fiscal Year 2013-14 Adopted Budget
Fiscal Year 2014-15
Approved Budget
Regional Operations $ 425,717,725 $ 467,713,267 $ 468,892,703 $ 429,657,920 $ 730,255,328 $ 735,827,207
Strategic Planning & Operational Support
247,444,685 235,222,731 294,296,144 303,107,096 — —
Aging and Independence Services
300,959,318 312,514,970 305,517,314 297,293,572 329,246,054 329,981,684
Behavioral Health Services
381,396,291 431,072,490 414,635,030 390,794,611 423,558,464 424,307,813
Child Welfare Services 222,813,488 248,498,925 248,528,654 230,113,630 264,598,530 265,772,240
Public Health Services 101,791,485 101,441,269 105,348,788 93,910,219 105,705,151 105,826,402
Public Administrator/Public Guardian
4,513,622 4,457,052 4,517,052 4,256,287 — —
Administrative Support
59,355,161 100,483,108 97,662,731 64,588,357 116,554,358 97,262,849
Tobacco Settlement Funds
24,329,478 27,500,000 27,500,000 24,327,520 27,500,000 27,500,000
Total $1,768,301,653 $1,928,903,812 $1,966,898,416 $1,838,049,211 $1,997,417,885 $1,986,478,195
186 Health and Human Services AgencyAdopted Operational Plan Fiscal Years 2013-2014 and 2014-2015
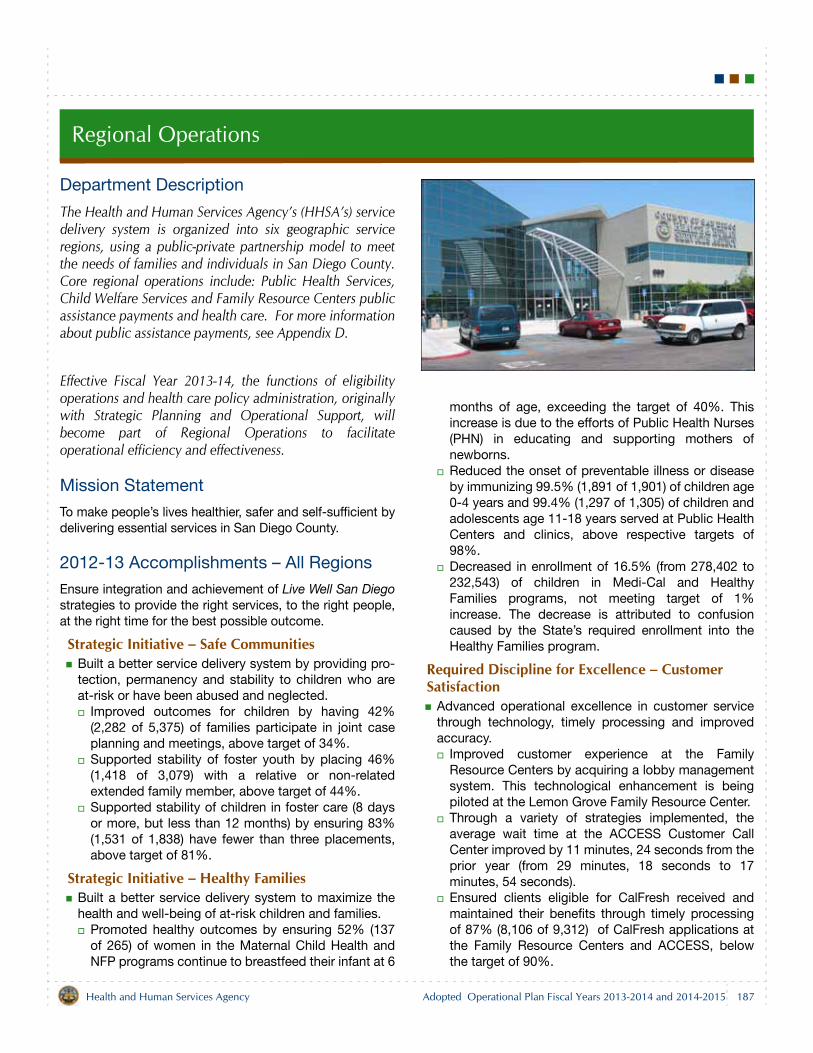
Regional Operations
Department Description
The Health and Human Services Agency’s (HHSA’s) servicedelivery system is organized into six geographic serviceregions, using a public-private partnership model to meetthe needs of families and individuals in San Diego County.Core regional operations include: Public Health Services,Child Welfare Services and Family Resource Centers publicassistance payments and health care. For more informationabout public assistance payments, see Appendix D.
Effective Fiscal Year 2013-14, the functions of eligibilityoperations and health care policy administration, originallywith Strategic Planning and Operational Support, willbecome part of Regional Operations to facilitateoperational efficiency and effectiveness.
Mission Statement
To make people’s lives healthier, safer and self-sufficient bydelivering essential services in San Diego County.
2012-13 Accomplishments – All Regions
Ensure integration and achievement of Live Well San Diegostrategies to provide the right services, to the right people,at the right time for the best possible outcome.
Strategic Initiative – Safe CommunitiesBuilt a better service delivery system by providing pro-tection, permanency and stability to children who areat-risk or have been abused and neglected.
Improved outcomes for children by having 42%(2,282 of 5,375) of families participate in joint caseplanning and meetings, above target of 34%.Supported stability of foster youth by placing 46%(1,418 of 3,079) with a relative or non-relatedextended family member, above target of 44%.Supported stability of children in foster care (8 daysor more, but less than 12 months) by ensuring 83%(1,531 of 1,838) have fewer than three placements,above target of 81%.
Strategic Initiative – Healthy FamiliesBuilt a better service delivery system to maximize thehealth and well-being of at-risk children and families.
Promoted healthy outcomes by ensuring 52% (137of 265) of women in the Maternal Child Health andNFP programs continue to breastfeed their infant at 6
months of age, exceeding the target of 40%. Thisincrease is due to the efforts of Public Health Nurses(PHN) in educating and supporting mothers ofnewborns.Reduced the onset of preventable illness or diseaseby immunizing 99.5% (1,891 of 1,901) of children age0-4 years and 99.4% (1,297 of 1,305) of children andadolescents age 11-18 years served at Public HealthCenters and clinics, above respective targets of98%.Decreased in enrollment of 16.5% (from 278,402 to232,543) of children in Medi-Cal and HealthyFamilies programs, not meeting target of 1%increase. The decrease is attributed to confusioncaused by the State’s required enrollment into theHealthy Families program.
Required Discipline for Excellence – Customer Satisfaction
Advanced operational excellence in customer servicethrough technology, timely processing and improvedaccuracy.
Improved customer experience at the FamilyResource Centers by acquiring a lobby managementsystem. This technological enhancement is beingpiloted at the Lemon Grove Family Resource Center.Through a variety of strategies implemented, theaverage wait time at the ACCESS Customer CallCenter improved by 11 minutes, 24 seconds from theprior year (from 29 minutes, 18 seconds to 17minutes, 54 seconds). Ensured clients eligible for CalFresh received andmaintained their benefits through timely processingof 87% (8,106 of 9,312) of CalFresh applications atthe Family Resource Centers and ACCESS, belowthe target of 90%.
187Health and Human Services Agency Adopted Operational Plan Fiscal Years 2013-2014 and 2014-2015
Regional Operations
Implemented a pilot at three Family ResourceCenters to improve timely processing. Results will beevaluated for rollout to other Family ResourceCenters.Implemented plan to improve accuracy of paymentand valid decisions of CalFresh benefits.Restructured operations for quality assurance,quality control and corrective action in order toimprove processes and data analysis.
2013-15 Objectives – All Regions
Ensure integration and achievement of Live Well San Diegostrategies to provide the right services, to the right people,at the right time for the best possible outcome.
Strategic Initiative – Safe CommunitiesBuild a better service delivery system by providing pro-tection, permanency and stability to children who areat-risk or have been abused and neglected.
Improve outcomes for children by having 44% (2,442of 5,550) of families participate in joint case planningand meetings.Support stability of foster youth by placing 49%(1,421 of 2,900) with a relative or non-relatedextended family member.Support stability of children in foster care (8 days ormore, but less than 12 months) by ensuring 83%(1,718 of 2,070) have fewer than three placements.
Strategic Initiative – Healthy Families Build a better service delivery system to maximize thehealth and well-being of at-risk children and families,and vulnerable adults.
Promote healthy outcomes by ensuring 41% (31 of75) of women in the Maternal Child Health and NFPprograms continue to breastfeed their infant at 6months of age.Reduce the onset of preventable illness or diseaseby immunizing 98% (1,583 of 1,615) of children age0-4 years and 98% (1,470 of 1,500) of children andadolescents age 11-18 years served at Public HealthCenters and clinics.Enroll 80% (98,320 of 122,900) of Health CareOptions attendees in a managed care plan of theirchoice.
Required Discipline for Excellence – Customer Satisfaction
Advance operational excellence in customer servicethrough technology, timely processing and improvedaccuracy.
Implement plan to enroll newly eligible Medi-Calrecipients anticipated from the federal AffordableCare Act.Implement technological enhancements to improvecustomer service at the Family Resource Centers.Implement plan to improve accuracy and timelyprocessing of CalFresh benefits.Increase by 20% (from 52 to 62) the number ofACCESS call center agents trained to performeligibility determinations for more than two publicassistance programs.Ensure timely processing of 91% (of 12,000) ofCalFresh applications at the Family ResourceCenters and the ACCESS call center.
South RegionThe South Region has four cities and seven communitiesand is bordered in the south by Mexico. HHSA staff fromthe South Region provide regional services, lead theHealthy Eating Active Communities (HEAC) project, andmanage the South Region NFP and Families as Partners(FAP). HEAC aims to prevent childhood obesity and ensurehealthy adulthood by reducing health risks associated withobesity. NFP is an evidence-based program that helps first-time, high-risk, low-income mothers. FAP is a public-privatepartnership that will provide a community safety net forSouth Region’s children and youth who are at risk of enter-ing foster care or who are currently in the system.
2012-13 Accomplishments
Strategic Initiative – Safe CommunitiesBuilt a better service delivery system by improving carecoordination and communication.
Deployed the South Region Referral Pathway Toolsto the 2-1-1 San Diego web directory for pregnantand postpartum women. The tool provides easyaccess and real time, updated information for referralagencies and community residents.Established a referral and communication processfor families served through South Region ChildWelfare System, Public Health Maternal Child HealthProgram and NFP Program. Best practices wereidentified for increasing awareness amongst allPublic Health and Child Welfare Services staff.Strengthened the community safety net to supportstability for children at risk of entering protectivecustody by increasing service providers participatingin FAP from 30 to 42.
188 Health and Human Services AgencyAdopted Operational Plan Fiscal Years 2013-2014 and 2014-2015
Regional Operations
Required Discipline for Excellence – Customer Satisfaction
Advanced operational excellence in customer serviceby improving access to public assistance programs byincreasing the number of video interview clients by61% (from 275 to 442), exceeding the target of 5% dueto service expansion by community partners at multiplelocations.
2013-15 Objectives
Strategic Initiative – Safe CommunitiesPromote stability and permanency by developing andimplementing a strategic plan for the Neighborhood forKids initiative using data, to keep abused andneglected children in safe, familiar environments suchas schools.
Required Discipline for Excellence – Customer Satisfaction
Improve customer service and operational efficienciesby increasing the number of customers using the web-based online appointment scheduling system by 40%(from 46 to 64) for accessing Public Health services.
Central RegionThe Central Region encompasses San Diego city’s urbancore consisting of 50 neighborhoods with a multitude ofdiverse culture and population. Central Region is borderedto the North by Interstate 8, extending eastward to the cit-ies of Lemon Grove and La Mesa, continuing south toNational City, and westward to the San Diego Bay. HHSAstaff from the Central Region provides regional services andlead countywide efforts such as a pilot on eliminating dis-parities of African-American children in Child Welfare andkey initiatives on improving access and outcomes for thehomeless population. Effective Fiscal Year 2013-14, theACCESS Customer Service Center, an extension of theCounty of San Diego’s Family Resource Centers will bereported under Central Region. ACCESS serves residents,providers and other agencies related to self-sufficiency pro-grams and services.
2012-13 Accomplishments
Strategic Initiative – Safe CommunitiesSupported positive choices for pregnant and parentingfoster youth through the creation of a referral andtracking system that connects to PHN services.
Strategic Initiative – Healthy FamiliesBuilt a better service delivery system to support thehealth of the children who seek routine immunizationsat the ‘Vaccines are Important for Preschoolers’ clinic,by connecting them to a certified application assistantfor health care coverage.
2013-15 Objectives
Strategic Initiative – Safe CommunitiesPromote stability and permanency by developing andimplementing a strategic plan for the Neighborhood forKids initiative using data, to keep abused andneglected children in safe, familiar environments suchas schools.
Required Discipline for Excellence – Customer Satisfaction
Improve customer service and access to public assis-tance benefits by establishing video interviewing in aSoutheast community in Central Region.
North Central RegionThe North Central Region comprises the central-westernportions of the County, 38 diverse communities that extendfrom coastal to inland, stretching from Del Mar in the north,to Point Loma in the south, and east to Scripps Ranch andMira Mesa. Interstate 8 marks the regions southern border.Also within the region are three military installations and twomajor universities. HHSA staff support the large militarypopulation found in North Central Region by participating inefforts through multiple venues and access points, such asengaging in efforts through the Healthy Start Military Clus-ter and San Diego Military Family Collaborative includingthe North Central Live Well San Diego initiative. EffectiveFiscal Year 2013-14, the Health Coverage Access programwill be reported under North Central Region. This programassists clients with accessing healthcare at more than 35sites including hospitals and mental/physical health clinics.
2012-13 Accomplishments
Strategic Initiative – Healthy FamiliesBuilt a better service delivery system through NFP,resulting in healthy outcomes for children of NFP par-ticipants.
100% (119) of NFP participants initiated breastfeeding, above target of 90%.96% (52 of 54) of children enrolled in the NFPprogram received their required immunizations by 6months of age, above target of 90%.
189Health and Human Services Agency Adopted Operational Plan Fiscal Years 2013-2014 and 2014-2015
Regional Operations
Promoted safe and healthy living by supporting militaryfamilies through effective community relationships.
Promoted the Live Well San Diego initiative withMilitary Family collaborative and at the annualMilitary Services Providers Conference.Held a Military Resource Fair to provide healtheducation and outreach to military families.
Required Discipline for Excellence – Customer Satisfaction
Advanced operational excellence through customerservice by ensuring timely service to clients by main-taining an average wait time of 11 days for CountyMedical Services eligibility appointments, exceedingthe target of 30 days or less.
2013-15 Objectives
Strategic Initiative – Healthy FamiliesBuild a better service delivery system through NFP,resulting in healthy outcomes for children of NFP par-ticipants.
90% (124 of 138) of NFP participants will initiatebreast feeding.90% (66 of 73) of children enrolled in the NFPprogram will receive their required immunizations by6 months of age.
Support community involvement and participation bydeveloping leaders and making positive changes to thequality of life in neighborhoods by encouraging partici-pation in the Resident Leadership Academies (RLA)and the Communities of Excellence projects. The pur-pose of the RLA is to build community capacity forhealth improvement in local neighborhoods.
Required Discipline for Excellence – Customer Satisfaction
Advance operational excellence through customer ser-vice.
Enhance customer experience by makingimprovements to lobby and application process.Expand outreach activities and sites to acceptCalFresh applications thereby increasing access tonutritious food.
East RegionThe East Region is a mixture of urban, suburban and ruralcommunities, including several Native American reserva-tions and a large Iraqi refugee population. East Region wasthe first region to administer NFP, an evidence-based pro-gram helping first-time, low-income mothers to succeed.
East Region also administers Neighborhoods for Kids, aninitiative that strives to keep abused and neglected childrenin safe, familiar environments and in their same schools.East Region houses the Document Processing Centerwhich supports Family Resources Centers in all regions byconverting documents to electronic records.
2012-13 Accomplishments
Strategic Initiative – Safe CommunitiesBuilt a better service delivery system that promotesstability and permanency of at-risk children through theNeighborhood for Kids initiative.
72% (197 of 273) of children will be placed in afamiliar environment, such as protective custody witha relative or family friend, or a school, below target of75%.49% (78 of 160) of children will be placed with theirparents within 12 months, below target of 75%. Thetarget was not met due to a State change tocompare the number of all children taken intocustody instead of the number of children who arereunified. The new State target is 48%.
Strategic Initiative – Healthy FamiliesSupported positive choices for healthy living of NFPparticipants and their children.
95% (704 of 744) of NFP participants initiated breastfeeding, above target of 91%. The numbersrepresent all participants in East Region’s NFPprogram since inception. 26% (11 of 43) of NFP parents decreased smoking,below target of 32%, but exceeds State and nationalresults of 18% and 16% respectively.
Supported positive choices by linking culturally appro-priate service providers to refugee families to promoteself-sufficiency.
Collaborated with stakeholders to minimize gaps inservices, build language capacity and addressedservice demands. This included the implementationof a program that uses a health literacy curriculumand community mentors to teach English as asecond language.
2013-15 Objectives
Strategic Initiative – Safe CommunitiesBuild a better service delivery system that promotesstability and permanency of at-risk children through theNeighborhood for Kids initiative.
190 Health and Human Services AgencyAdopted Operational Plan Fiscal Years 2013-2014 and 2014-2015
Regional Operations
75% (236 of 315) of children will be placed in afamiliar environment, such as protective custody witha relative or family friend, or a school.48% (72 of 150) of children will be placed with theirparents within 12 months.
Strategic Initiative – Healthy FamiliesSupport positive choices for healthy living of NFP par-ticipants and their children.
92% (782 of 850) of NFP participants will initiatebreast-feeding.33% (13 of 40) of NFP parents will decreasesmoking.
Promote healthy living of children in protective custodyby ensuring they are up to date on health exams.
90% (222 of 247) of children in protective custodyare current on annual medical exams.90% (142 of 158) of children in protective custodyare current on annual dental exams.
Support positive choices by linking culturally appropri-ate service providers to refugee families to promoteself-sufficiency by supporting community involvementand participation.Develop leaders through participation in the RLA andCommunities of Excellence projects.
North Inland RegionThe North Inland Region includes four cities, remote desertcommunities, historic mountain towns, rural homes andfarms, and numerous Native American reservations. Theregion’s eastern border is the Imperial County line. In addi-tion to providing core regional services, North InlandRegion facilitates the Rural Health Network and NorthCounty Cares. The Rural Health Network is a forum thatbrings together government and community service provid-ers to collaborate and leverage health resources for ruralSan Diego County communities. North County Cares is acollaboration of the HHSA, community partners, families,and child welfare services working together to improve out-comes for North County children and their families.
2012-13 Accomplishments
Strategic Initiative – Safe CommunitiesBuilt a better service delivery system for vulnerablechildren through implementing the first year of a two-year Neighborhoods for Kids model implementationplan which supports stability and educational growth of
children coming into protective custody by placing chil-dren in a home where they can attend their school oforigin.
Strategic Initiative – Healthy FamiliesBuilt a better service delivery system through NFP,improving health outcomes for NFP children. First yearimplementation outcomes include:
96% (26 of 27) of NFP graduates’ children wereimmunized by 24 months of age, above target of91%.96% (65 of 68) of NFP participants initiatedbreastfeeding, above the 91% target.
Required Discipline for Excellence – Customer Satisfaction
Advanced operational excellence in customer serviceby improving access to public assistance programs byincreasing the number of video interview clients by77% (from 635 to 1,126), exceeding the target of 5%due to efforts between staff and the communities.
2013-15 Objectives
Strategic Initiative – Safe CommunitiesBuild a better service delivery system by implementingthe second year of the Neighborhood for Kids model.
Strategic Initiative – Healthy FamiliesBuild a better service delivery system through NFP,improving health outcomes for NFP children.
91% (58 of 64) of NFP participants’ children will becurrent with immunizations.91% (67 of 74) of NFP participants will initiatebreastfeeding.
Required Discipline for Excellence – Customer Satisfaction
Advance operational excellence in customer service byimproving access to public assistance programs byincreasing the number of video interview clients by 5%(from 1,000 to 1,050).
North Coastal RegionThe North Coastal Region consists of six cities, CampPendleton and more than a dozen communities. Theregion’s northern border is the Orange County line. In addi-tion to providing core regional services, HHSA staff fromthe North Coastal Region facilitates HealthLink NorthCounty and North County Cares. HealthLink North Countyis a school health-focused, public-private partnership toimprove health and education outcomes for North County's
191Health and Human Services Agency Adopted Operational Plan Fiscal Years 2013-2014 and 2014-2015
Regional Operations
school children. North County Cares is a collaboration ofthe HHSA, community partners, families, and child welfareservices working together to improve outcomes for NorthCounty children and their families.
2012-13 Accomplishments
Strategic Initiative – Safe CommunitiesBuilt a better service delivery system by providing PHNservices and implementing the first year of a two-yearNeighborhood for Kids model implementation plan.
Provided 627 monthly PHN service contacts tomilitary families, building effective communityrelationships for the safety and protection of childrenand military families, above the target of 600.Implemented the first year of the Neighborhood forKids model which supports stability and educationalgrowth of children coming into protective custody byplacing children in a home where they can attendtheir school of origin.
Strategic Initiative – Healthy FamiliesBuilt a better service delivery system through NFP,improving health outcomes for NFP children.
83% (5 of 6) of NFP graduates’ children wereimmunized by 24 months of age, below target of91%.100% (40) of NFP participants initiatedbreastfeeding, above target of 91%.
2013-15 Objectives
Strategic Initiative – Safe CommunitiesBuild a better service delivery system by providingPHN services and implementing the second year of theNeighborhood for Kids model.
Provide at least 640 PHN service contacts to militaryfamilies, in order to support the safety and protectionof children and military families.Implement the second year of the Neighborhood forKids model which will support stability andeducational growth of children coming intoprotective custody by placing these children in ahome where they can attend their school of origin.
Strategic Initiative – Healthy FamiliesBuild a better service delivery system through NFP,improving health outcomes for vulnerable children.
91% (30 of 33) of NFP participants’ children will becurrent with their immunizations.91% (31 of 34) of NFP participants will initiatebreastfeeding.
Related Links
For detailed information about the health and characteris-tics of the people living in each Region, go towww.sdhealthstatistics.com.
For additional information on the programs offered by theHealth and Human Services HHSA, refer to the website atwww.sdcounty.ca.gov/hhsa.
192 Health and Human Services AgencyAdopted Operational Plan Fiscal Years 2013-2014 and 2014-2015
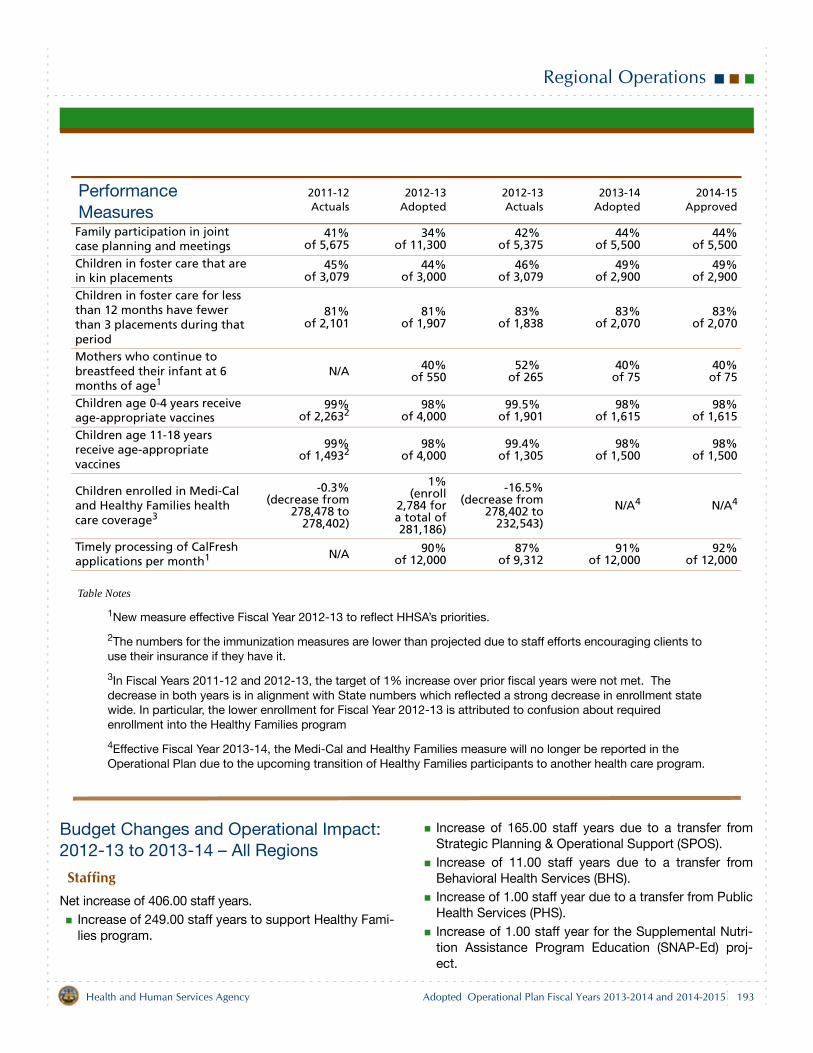
Regional Operations
193Health and Human Services Agency Adopted Operational Plan Fiscal Years 2013-2014 and 2014-2015
Table Notes
1New measure effective Fiscal Year 2012-13 to reflect HHSA’s priorities.
2The numbers for the immunization measures are lower than projected due to staff efforts encouraging clients to use their insurance if they have it.
3In Fiscal Years 2011-12 and 2012-13, the target of 1% increase over prior fiscal years were not met. The decrease in both years is in alignment with State numbers which reflected a strong decrease in enrollment state wide. In particular, the lower enrollment for Fiscal Year 2012-13 is attributed to confusion about required enrollment into the Healthy Families program
4Effective Fiscal Year 2013-14, the Medi-Cal and Healthy Families measure will no longer be reported in the Operational Plan due to the upcoming transition of Healthy Families participants to another health care program.
Budget Changes and Operational Impact: 2012-13 to 2013-14 – All Regions
Staffing
Net increase of 406.00 staff years.Increase of 249.00 staff years to support Healthy Fami-lies program.
Increase of 165.00 staff years due to a transfer fromStrategic Planning & Operational Support (SPOS).Increase of 11.00 staff years due to a transfer fromBehavioral Health Services (BHS).Increase of 1.00 staff year due to a transfer from PublicHealth Services (PHS).Increase of 1.00 staff year for the Supplemental Nutri-tion Assistance Program Education (SNAP-Ed) proj-ect.
Performance Measures
2011-12Actuals
2012-13Adopted
2012-13Actuals
2013-14Adopted
2014-15Approved
Family participation in joint case planning and meetings
41%of 5,675
34%of 11,300
42% of 5,375
44%of 5,500
44%of 5,500
Children in foster care that are in kin placements
45%of 3,079
44%of 3,000
46% of 3,079
49%of 2,900
49%of 2,900
Children in foster care for less than 12 months have fewer than 3 placements during that period
81%of 2,101
81%of 1,907
83% of 1,838
83%of 2,070
83%of 2,070
Mothers who continue to breastfeed their infant at 6 months of age1
N/A 40%of 550
52% of 265
40%of 75
40%of 75
Children age 0-4 years receive age-appropriate vaccines
99%of 2,2632
98%of 4,000
99.5% of 1,901
98%of 1,615
98%of 1,615
Children age 11-18 years receive age-appropriate vaccines
99%of 1,4932
98%of 4,000
99.4% of 1,305
98%of 1,500
98%of 1,500
Children enrolled in Medi-Cal and Healthy Families health care coverage3
-0.3%(decrease from
278,478 to278,402)
1%(enroll
2,784 fora total of281,186)
-16.5%(decrease from
278,402 to232,543)
N/A4 N/A4
Timely processing of CalFresh applications per month1 N/A 90%
of 12,00087%
of 9,31291%
of 12,00092%
of 12,000
Regional Operations
Decrease of 7.00 staff years due to a transfer to Admin-istrative Support.
The following breakdown shows the same net change instaffing presented by program.
Increase of 225.00 staff years in Regional Self Suffi-ciency Eligibility (RSSE) due to the addition of 229.00staff years to support Healthy Families program, thetransfer in of 12.00 staff years from SPOS, transfer in of3.00 staff years from North Coastal Region, transfer inof 1.00 staff year from Mental Health Services (MHS),transfer in of 1.00 staff year from Foster Care offset bythe transfer out of 13.00 staff years to Eligibility Opera-tions Administration, transfer out of 5.00 staff years toNorth Central Region, transfer out of 1.00 staff year toManagement Support, transfer out of 1.00 staff year toOffice of Strategy and Innovation (OSI) and transfer out1.00 staff year to Child Welfare Services (CWS) for pro-grammatic needs. Decrease of 16.00 staff years in Regional Child WelfareServices due to the transfer out of 16.00 staff years toCWS primarily to support AB12 and transfer out of 1.00staff year to Human Resources for programmaticneeds, offset by the transfer in of 1.00 staff year fromFoster Care for programmatic needs.Increase of 6.00 staff years in Central Region due to thetransfer in of 10.00 staff years from SPOS, transfer in of1.00 staff year from Office of Legislative Affairs, transferin of 1.00 staff year from BHS, addition of 1.00 staffyear to support Healthy Families, addition of 1.00 staffyear for the SNAP-Ed project offset by the transfer outof 8.00 staff years to Community Action Partnership(CAP) due to reorganization of the program. Decrease of 1.00 staff year in East Region due to thetransfer of 1.00 staff year to North Central Region tosupport Health Promotions program.Increase of 12.00 staff years in North Central Regiondue to addition of 1.00 staff year to support HealthyFamilies, transfer in of 5.00 staff years from RSSE,transfer in of 2.00 staff years from Inpatient Health Ser-vices (IHS), transfer in of 2.00 staff years from MHS,transfer in of 1.00 staff year from CWS, and transfer inof 1.00 staff year from East Region to support HealthCoverage Access (HCA).Decrease of 3.00 staff years in North Coastal Regiondue to the transfer out of 3.00 staff years to RSSE,transfer out of 1.00 staff year to North Inland Regionoffset by the addition of 1.00 staff year to supportHealthy Families.
Increase of 1.00 staff year in North Inland Region dueto the transfer of 1.00 staff year from North CoastalRegion to support Public Health Services clinics.Increase of 147.00 staff years in Eligibility Operationsdue to the addition of 17.00 staff years to supportHealthy Families, transfer in of 110.00 staff years fromSPOS, transfer in of 13.00 staff years from RSSE,transfer in of 2.00 staff years from BHS, transfer in of3.00 staff years from MHS, transfer in of 1.00 staff yearfrom the HHSA Agency Executive Office (AEO), andtransfer in of 1.00 staff year from Management Supportto support Eligibility Operations and Healthy Familiesprogram.Increase of 35.00 staff years in Health Care PolicyAdministration (HCPA) due to the transfer in of 33.00staff years from SPOS, transfer in of 1.00 staff yearfrom PHS, and transfer in of 1.00 staff year from AEO.
ExpendituresIncrease of $262.5 million
Salaries and Benefits — increase of $32.5 million dueto the addition of 406.00 staff years and an increase inCounty retirement contributions.Services and Supplies — increase of $229.7 million.
Increase of $197.1 million in contracted servicesprimarily for contracts transferring from SPOS toEligibility Operations Administration and Health CarePolicy Administration. Increase of $10.5 million associated with CaliforniaHealthcare Eligibility, Enrollment and RetentionSystem (CalHEERS) to provide access to health carecoverage under the federal Affordable Care Act.Increase of $9.2 million related to the MOU with theDistrict Attorney for Public Assistance Fraud due tothe transfer from SPOS. Increase of $5.2 million in IT primarily due to thetransfer from SPOS.Increase of $3.7 million in rents primarily due to theaddition of staff to support Healthy Families.Increase of $4.0 million in various services andsupplies primarily related to basic supplies andcomputers for additional staff.
Other Charges — increase of $0.3 million in GeneralRelief assistance payments to align with caseload.
RevenuesNet increase of $262.5 million
Fines, Forfeitures & Penalties — increase of $3.3 millionfor Emergency Medical Services (EMS) Penalty due totransfer from SPOS.
194 Health and Human Services AgencyAdopted Operational Plan Fiscal Years 2013-2014 and 2014-2015
Regional Operations
Revenue From Use of Money & Property — increase of$1.0 million due to transfer from SPOS for EMS Penaltyfees to HCPA.Intergovernmental Revenues — net increase of $219.7million primarily related to the transfer from SPOS andthe addition of 255.00 staff years.
Increase of $76.3 million of Health Coverage Initiativerevenue related to the transfer from SPOS. Increase of $71.2 million in Social Servicesadministrative revenue related to the transfer fromSPOS. Increase of $46.3 million in Realignment revenue forvarious social services programs primarily due to thetransfer of HCPA from SPOS. Increase of $18.9 million Social Servicesadministrative revenue due to the addition of staff tosupport the Healthy Families program.Increase of $9.8 million associated with CaliforniaHealthcare Eligibility, Enrollment and RetentionSystem (CalHEERS) to provide access to health carecoverage under the federal Affordable Care Act.Increase of $0.9 million in SNAP-Ed revenue.Decrease of $3.5 million CAP revenue due to thetransfer to Administrative Support. Decrease of $0.2 million in Regional Public HealthClinic revenue.
Charges for Current Services — increase of $9.0 milliondue to the transfer from SPOS.
Miscellaneous Revenue — decrease of $0.07 millionassociated with the elimination of a one-time privatedonation.Other Financing Sources — increase of $20.6 millionfor Operating Transfer from Tobacco Securitization dueto the transfer from SPOS.Use of Fund Balance — decrease of $2.4 million due to$1.2 million of prior year one-time Salary and Benefitpay out and $1.2 million for Juvenile Diversion to sup-port community based strategies that strengthen indi-viduals and families to foster healthy relationships.General Purpose Revenue Allocation — increase of$11.4 million due to the transfer of $11.0 million fromSPOS to HCPA, an increase of $0.3 million due to Gen-eral Relief assistance payments and increase of $0.1million to cover operating cost.
Budget Changes and Operational Impact: 2013-14 to 2014-15 – All Regions
Net increase of $5.6 million is the result of an increase of$6.2 million in Salaries and Benefits due to the increase inCounty retirement contributions, offset by a decrease of$0.6 million in Services and Supplies due to the eliminationof one-time projects.
195Health and Human Services Agency Adopted Operational Plan Fiscal Years 2013-2014 and 2014-2015
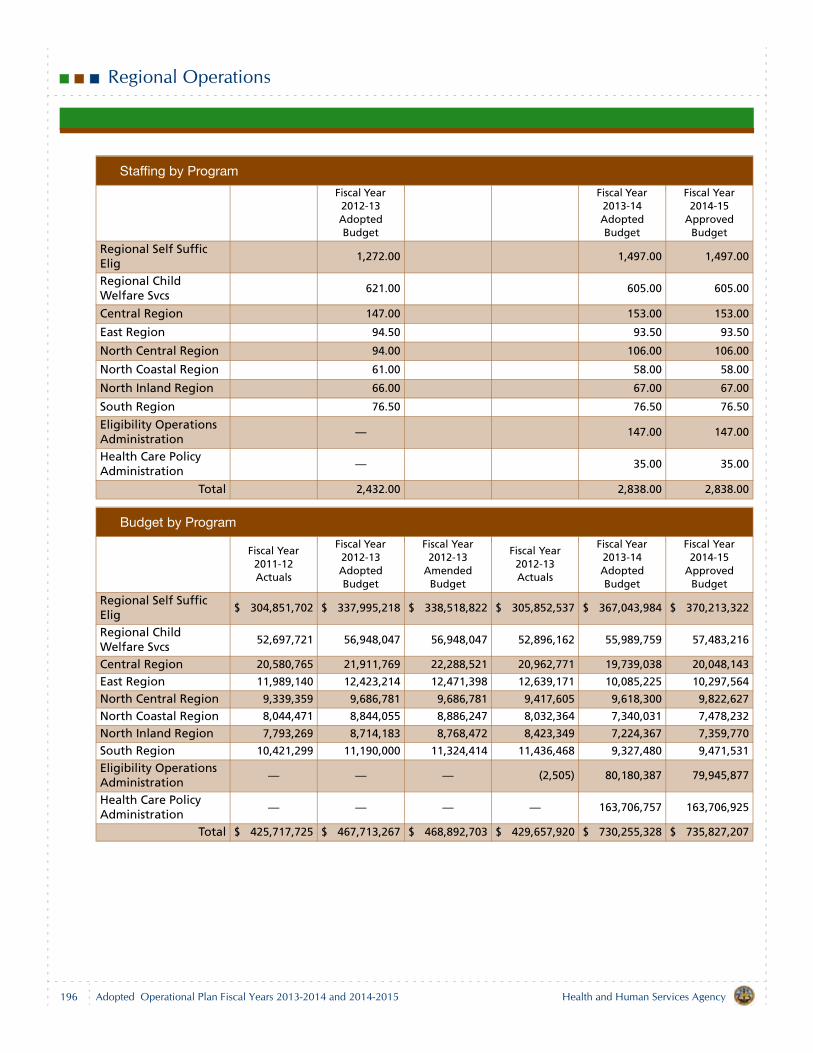
Regional Operations
Staffing by Program
Fiscal Year 2012-13 Adopted Budget
Fiscal Year 2013-14 Adopted Budget
Fiscal Year 2014-15
Approved Budget
Regional Self Suffic Elig
1,272.00 1,497.00 1,497.00
Regional Child Welfare Svcs
621.00 605.00 605.00
Central Region 147.00 153.00 153.00
East Region 94.50 93.50 93.50
North Central Region 94.00 106.00 106.00
North Coastal Region 61.00 58.00 58.00
North Inland Region 66.00 67.00 67.00
South Region 76.50 76.50 76.50
Eligibility Operations Administration
— 147.00 147.00
Health Care Policy Administration
— 35.00 35.00
Total 2,432.00 2,838.00 2,838.00
Budget by Program
Fiscal Year 2011-12 Actuals
Fiscal Year 2012-13 Adopted Budget
Fiscal Year 2012-13
Amended Budget
Fiscal Year 2012-13 Actuals
Fiscal Year 2013-14 Adopted Budget
Fiscal Year 2014-15
Approved Budget
Regional Self Suffic Elig
$ 304,851,702 $ 337,995,218 $ 338,518,822 $ 305,852,537 $ 367,043,984 $ 370,213,322
Regional Child Welfare Svcs
52,697,721 56,948,047 56,948,047 52,896,162 55,989,759 57,483,216
Central Region 20,580,765 21,911,769 22,288,521 20,962,771 19,739,038 20,048,143
East Region 11,989,140 12,423,214 12,471,398 12,639,171 10,085,225 10,297,564
North Central Region 9,339,359 9,686,781 9,686,781 9,417,605 9,618,300 9,822,627
North Coastal Region 8,044,471 8,844,055 8,886,247 8,032,364 7,340,031 7,478,232
North Inland Region 7,793,269 8,714,183 8,768,472 8,423,349 7,224,367 7,359,770
South Region 10,421,299 11,190,000 11,324,414 11,436,468 9,327,480 9,471,531
Eligibility Operations Administration
— — — (2,505) 80,180,387 79,945,877
Health Care Policy Administration
— — — — 163,706,757 163,706,925
Total $ 425,717,725 $ 467,713,267 $ 468,892,703 $ 429,657,920 $ 730,255,328 $ 735,827,207
196 Health and Human Services AgencyAdopted Operational Plan Fiscal Years 2013-2014 and 2014-2015
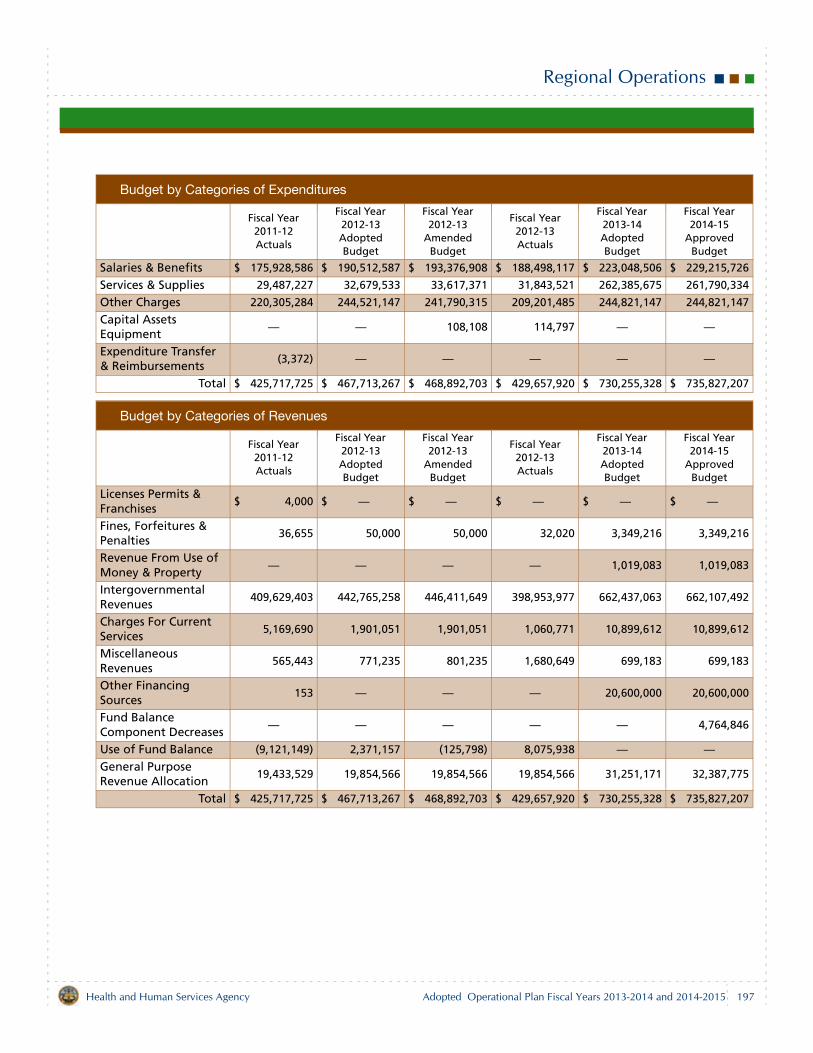
Regional Operations
Budget by Categories of Expenditures
Fiscal Year 2011-12 Actuals
Fiscal Year 2012-13 Adopted Budget
Fiscal Year 2012-13
Amended Budget
Fiscal Year 2012-13 Actuals
Fiscal Year 2013-14 Adopted Budget
Fiscal Year 2014-15
Approved Budget
Salaries & Benefits $ 175,928,586 $ 190,512,587 $ 193,376,908 $ 188,498,117 $ 223,048,506 $ 229,215,726
Services & Supplies 29,487,227 32,679,533 33,617,371 31,843,521 262,385,675 261,790,334
Other Charges 220,305,284 244,521,147 241,790,315 209,201,485 244,821,147 244,821,147
Capital Assets Equipment
— — 108,108 114,797 — —
Expenditure Transfer & Reimbursements
(3,372) — — — — —
Total $ 425,717,725 $ 467,713,267 $ 468,892,703 $ 429,657,920 $ 730,255,328 $ 735,827,207
Budget by Categories of Revenues
Fiscal Year 2011-12 Actuals
Fiscal Year 2012-13 Adopted Budget
Fiscal Year 2012-13
Amended Budget
Fiscal Year 2012-13 Actuals
Fiscal Year 2013-14 Adopted Budget
Fiscal Year 2014-15
Approved Budget
Licenses Permits & Franchises
$ 4,000 $ — $ — $ — $ — $ —
Fines, Forfeitures & Penalties
36,655 50,000 50,000 32,020 3,349,216 3,349,216
Revenue From Use of Money & Property
— — — — 1,019,083 1,019,083
Intergovernmental Revenues
409,629,403 442,765,258 446,411,649 398,953,977 662,437,063 662,107,492
Charges For Current Services
5,169,690 1,901,051 1,901,051 1,060,771 10,899,612 10,899,612
Miscellaneous Revenues
565,443 771,235 801,235 1,680,649 699,183 699,183
Other Financing Sources
153 — — — 20,600,000 20,600,000
Fund Balance Component Decreases
— — — — — 4,764,846
Use of Fund Balance (9,121,149) 2,371,157 (125,798) 8,075,938 — —General Purpose Revenue Allocation
19,433,529 19,854,566 19,854,566 19,854,566 31,251,171 32,387,775
Total $ 425,717,725 $ 467,713,267 $ 468,892,703 $ 429,657,920 $ 730,255,328 $ 735,827,207
197Health and Human Services Agency Adopted Operational Plan Fiscal Years 2013-2014 and 2014-2015

Strategic Planning and Operational Support
Department Description
Strategic Planning and Operational Support (SPOS)supports implementation of self-sufficiency programs,ensures program integrity, and in collaboration with thecommunity, delivers essential services including eligibility,enrollment, and indigent health care in order to advanceLive Well San Diego. Additionally, SPOS provides strategicplanning and support for continuous improvementthroughout the Health and Human Services Agency(HHSA).
Effective Fiscal Year 2013-14, HHSA reorganized SPOS tofacilitate operational effectiveness and efficiency in order toimprove service delivery to clients. Two major functions,eligibility operations and health care policy will be part ofRegional Operations. The remaining function, strategyinnovation will be part of Administrative Support.
Mission Statement
To make people’s lives healthier, safer and self-sufficient bydelivering essential services in San Diego County.
2012-13 Accomplishments
Ensured integration and achievement of Live Well SanDiego strategies to provide the right services, to the rightpeople, at the right time for the best possible outcome.
Strategic Initiative – Healthy FamiliesBuilt a better service delivery system to support self-sufficiency among clients eligible for public assistanceprograms.
25% (2,416 of 9,739) of Welfare to Work participantshad paid employment, moving them closer to self-sufficiency, below the target of 30%.68% (1,813 of 2,649) of enrollees referred for casemanagement participated in case managementservices, strengthening care and treatment for theindigent health program enrollees, below target of85%. The target was not met due to severalcontributing factors such as an unusually hightransient population and unexpected staff turnover.
80% (5,347 of 6,718) of Low Income Health Program(LIHP) enrollees, who entered the program through aLIHP Mental Health Clinic, accessed physical healthcare services through a LIHP community clinic,above target of 70%.
Supported positive choices among eligible participantsin CalFresh, a public assistance nutrition program, byenrolling 100% (29,000) of eligible participants in theFebruary 2013 launch of the CalFresh RestaurantMeals Program, above target of 90% enrollment.
Required Discipline for Excellence – Accountability, Transparency and Ethical Conduct
Advanced operational excellence through accountabil-ity by supporting program integrity and ensuring ser-vices are accurately authorized by conducting 1,432unannounced In-Home Supportive Services home vis-its, below the target of 2,000 due to unexpected staff-ing changes.
Required Discipline for Excellence – Continuous Improvement and Innovation
Advanced operational excellence by enhancing thecapability to measure, analyze, review and improveprocesses and performance, while ensuring theseimprovements are aligned with priorities, through thefollowing continuous improvement projects for HHSA.
Identified opportunities to increase efficiency andeffectiveness in the Eligibility Appeals process whileadhering to due processes and state hearingrequirements for approximately 900 clients permonth.
199Health and Human Services Agency Adopted Operational Plan Fiscal Years 2013-2014 and 2014-2015
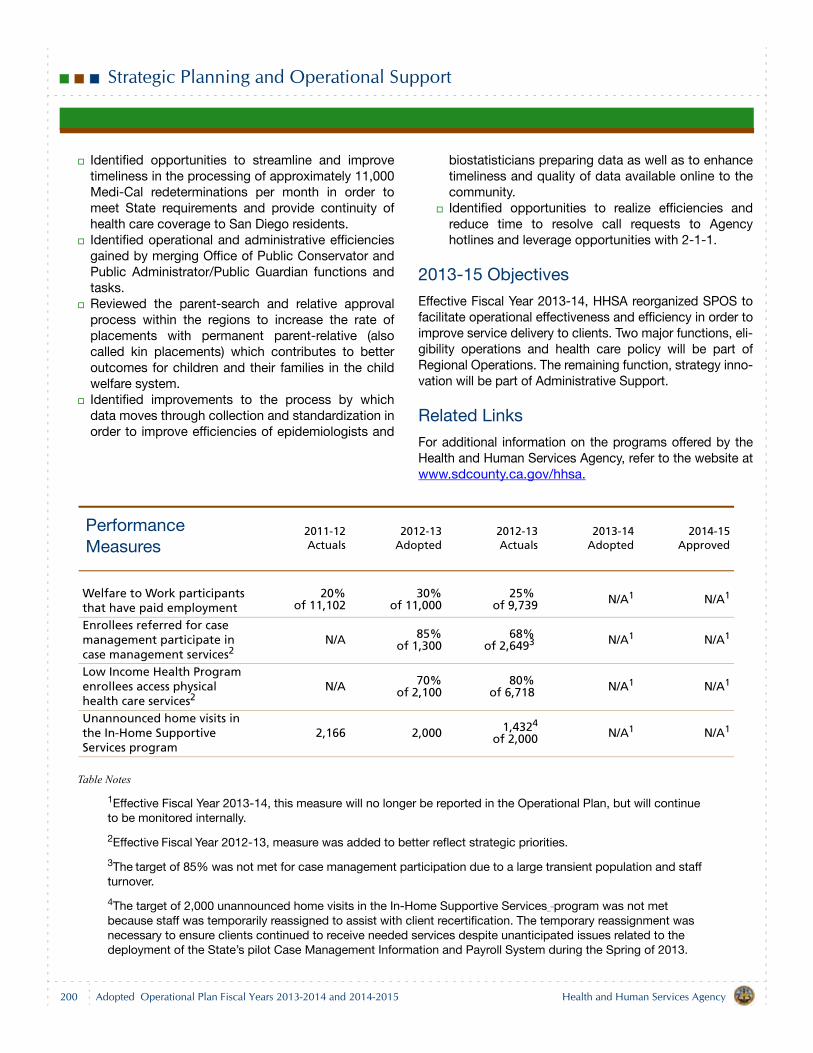
Strategic Planning and Operational Support
Identified opportunities to streamline and improvetimeliness in the processing of approximately 11,000Medi-Cal redeterminations per month in order tomeet State requirements and provide continuity ofhealth care coverage to San Diego residents.Identified operational and administrative efficienciesgained by merging Office of Public Conservator andPublic Administrator/Public Guardian functions andtasks.Reviewed the parent-search and relative approvalprocess within the regions to increase the rate ofplacements with permanent parent-relative (alsocalled kin placements) which contributes to betteroutcomes for children and their families in the childwelfare system.Identified improvements to the process by whichdata moves through collection and standardization inorder to improve efficiencies of epidemiologists and
biostatisticians preparing data as well as to enhancetimeliness and quality of data available online to thecommunity.Identified opportunities to realize efficiencies andreduce time to resolve call requests to Agencyhotlines and leverage opportunities with 2-1-1.
2013-15 Objectives
Effective Fiscal Year 2013-14, HHSA reorganized SPOS tofacilitate operational effectiveness and efficiency in order toimprove service delivery to clients. Two major functions, eli-gibility operations and health care policy will be part ofRegional Operations. The remaining function, strategy inno-vation will be part of Administrative Support.
Related Links
For additional information on the programs offered by theHealth and Human Services Agency, refer to the website atwww.sdcounty.ca.gov/hhsa.
Table Notes
1Effective Fiscal Year 2013-14, this measure will no longer be reported in the Operational Plan, but will continue to be monitored internally.
2Effective Fiscal Year 2012-13, measure was added to better reflect strategic priorities.
3The target of 85% was not met for case management participation due to a large transient population and staff turnover.
4The target of 2,000 unannounced home visits in the In-Home Supportive Services program was not met because staff was temporarily reassigned to assist with client recertification. The temporary reassignment was necessary to ensure clients continued to receive needed services despite unanticipated issues related to the deployment of the State’s pilot Case Management Information and Payroll System during the Spring of 2013.
Performance Measures
2011-12Actuals
2012-13Adopted
2012-13Actuals
2013-14Adopted
2014-15Approved
Welfare to Work participants that have paid employment
20%of 11,102
30%of 11,000
25% of 9,739 N/A1 N/A1
Enrollees referred for case management participate in case management services2
N/A 85%of 1,300
68% of 2,6493 N/A1 N/A1
Low Income Health Program enrollees access physical health care services2
N/A 70%of 2,100
80% of 6,718 N/A1 N/A1
Unannounced home visits in the In-Home Supportive Services program
2,166 2,000 1,4324
of 2,000 N/A1 N/A1
200 Health and Human Services AgencyAdopted Operational Plan Fiscal Years 2013-2014 and 2014-2015
Strategic Planning and Operational Support
Budget Changes and Operational Impact: 2012-13 to 2013-14
With the dissolution of SPOS, the staff years, expenditureappropriations and revenues have been transferred toRegional Operations and Administrative Support.
StaffingDecrease of 211.00 staff years.
ExpendituresDecrease of $235.2 million.
RevenuesDecrease of $235.2 million.
201Health and Human Services Agency Adopted Operational Plan Fiscal Years 2013-2014 and 2014-2015
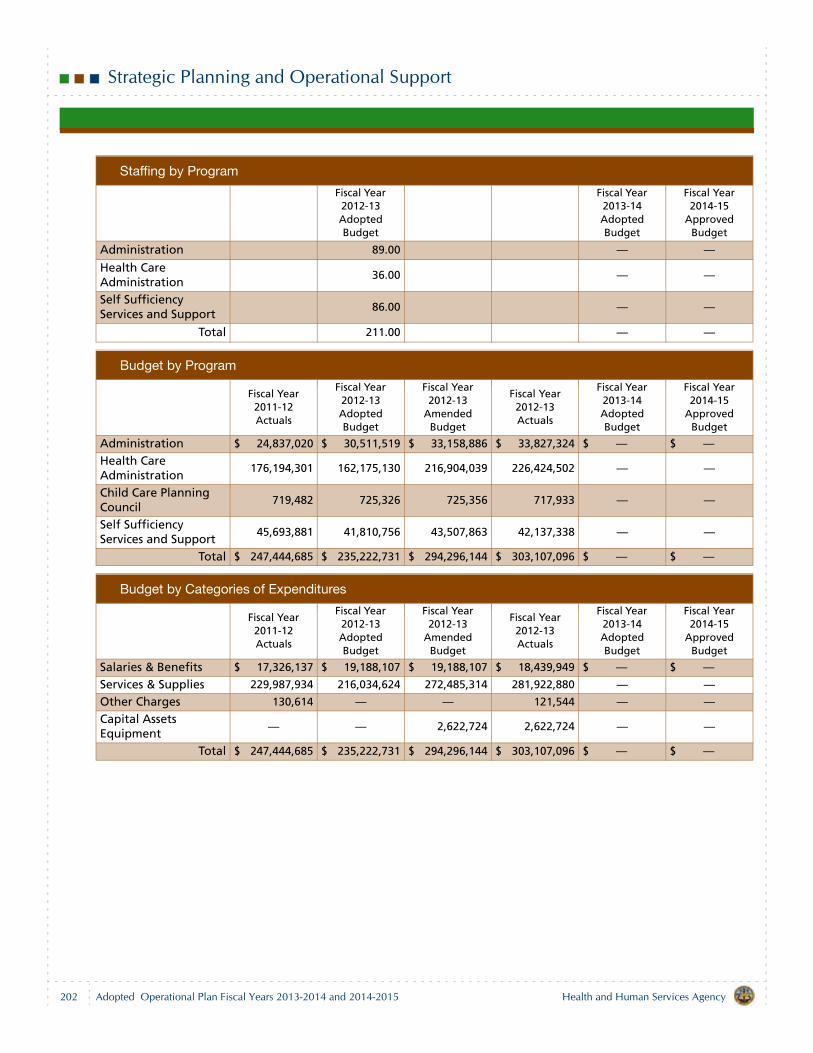
Strategic Planning and Operational Support
Staffing by Program
Fiscal Year 2012-13 Adopted Budget
Fiscal Year 2013-14 Adopted Budget
Fiscal Year 2014-15
Approved Budget
Administration 89.00 — —Health Care Administration
36.00 — —
Self Sufficiency Services and Support
86.00 — —
Total 211.00 — —
Budget by Program
Fiscal Year 2011-12 Actuals
Fiscal Year 2012-13 Adopted Budget
Fiscal Year 2012-13
Amended Budget
Fiscal Year 2012-13 Actuals
Fiscal Year 2013-14 Adopted Budget
Fiscal Year 2014-15
Approved Budget
Administration $ 24,837,020 $ 30,511,519 $ 33,158,886 $ 33,827,324 $ — $ —
Health Care Administration
176,194,301 162,175,130 216,904,039 226,424,502 — —
Child Care Planning Council
719,482 725,326 725,356 717,933 — —
Self Sufficiency Services and Support
45,693,881 41,810,756 43,507,863 42,137,338 — —
Total $ 247,444,685 $ 235,222,731 $ 294,296,144 $ 303,107,096 $ — $ —
Budget by Categories of Expenditures
Fiscal Year 2011-12 Actuals
Fiscal Year 2012-13 Adopted Budget
Fiscal Year 2012-13
Amended Budget
Fiscal Year 2012-13 Actuals
Fiscal Year 2013-14 Adopted Budget
Fiscal Year 2014-15
Approved Budget
Salaries & Benefits $ 17,326,137 $ 19,188,107 $ 19,188,107 $ 18,439,949 $ — $ —
Services & Supplies 229,987,934 216,034,624 272,485,314 281,922,880 — —Other Charges 130,614 — — 121,544 — —Capital Assets Equipment
— — 2,622,724 2,622,724 — —
Total $ 247,444,685 $ 235,222,731 $ 294,296,144 $ 303,107,096 $ — $ —
202 Health and Human Services AgencyAdopted Operational Plan Fiscal Years 2013-2014 and 2014-2015
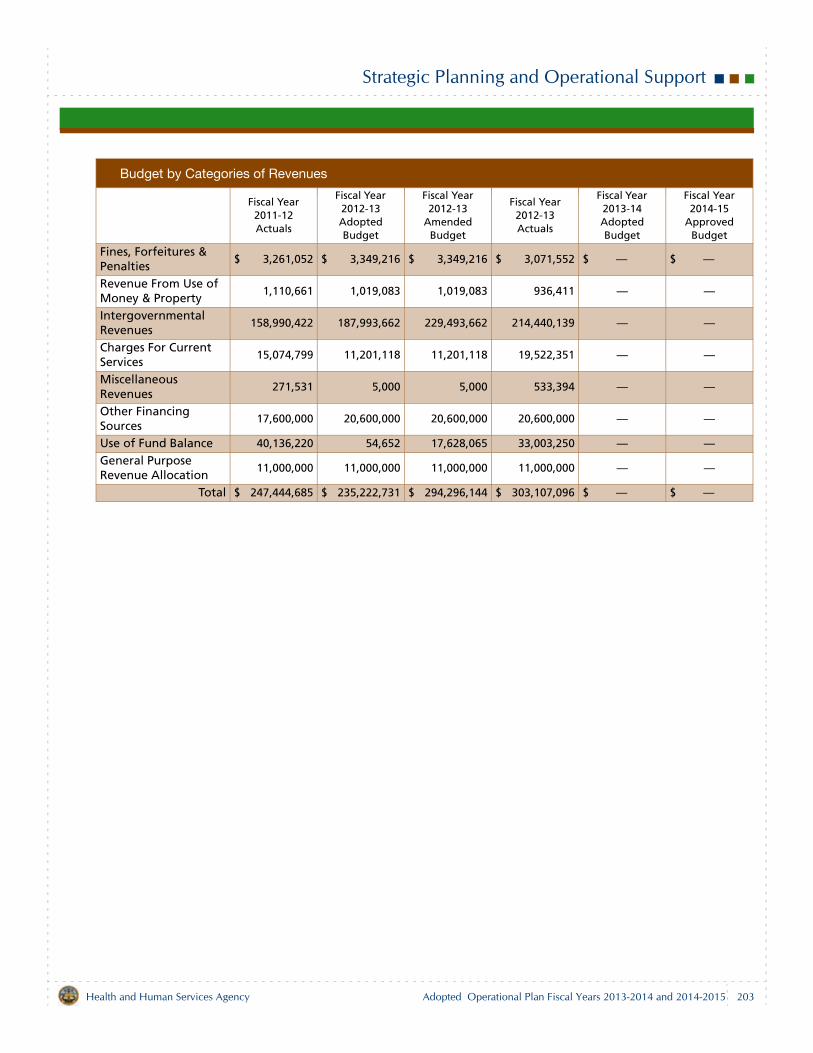
Strategic Planning and Operational Support
Budget by Categories of Revenues
Fiscal Year 2011-12 Actuals
Fiscal Year 2012-13 Adopted Budget
Fiscal Year 2012-13
Amended Budget
Fiscal Year 2012-13 Actuals
Fiscal Year 2013-14 Adopted Budget
Fiscal Year 2014-15
Approved Budget
Fines, Forfeitures & Penalties
$ 3,261,052 $ 3,349,216 $ 3,349,216 $ 3,071,552 $ — $ —
Revenue From Use of Money & Property
1,110,661 1,019,083 1,019,083 936,411 — —
Intergovernmental Revenues
158,990,422 187,993,662 229,493,662 214,440,139 — —
Charges For Current Services
15,074,799 11,201,118 11,201,118 19,522,351 — —
Miscellaneous Revenues
271,531 5,000 5,000 533,394 — —
Other Financing Sources
17,600,000 20,600,000 20,600,000 20,600,000 — —
Use of Fund Balance 40,136,220 54,652 17,628,065 33,003,250 — —General Purpose Revenue Allocation
11,000,000 11,000,000 11,000,000 11,000,000 — —
Total $ 247,444,685 $ 235,222,731 $ 294,296,144 $ 303,107,096 $ — $ —
203Health and Human Services Agency Adopted Operational Plan Fiscal Years 2013-2014 and 2014-2015

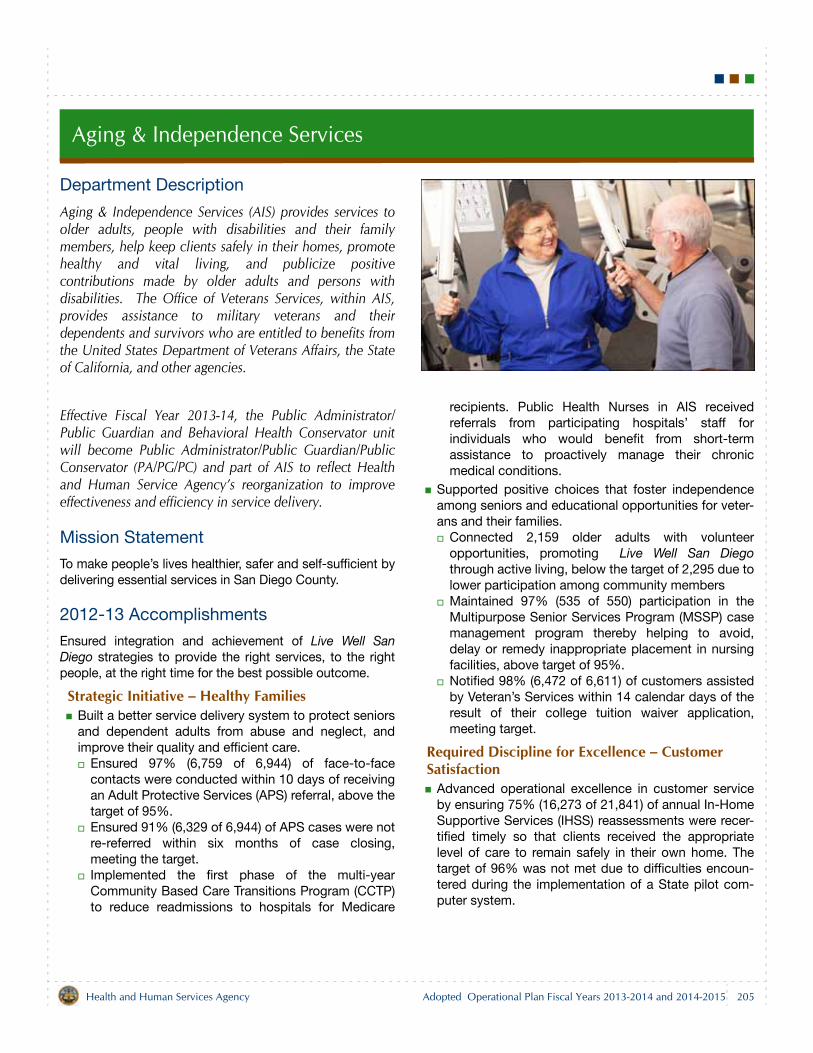
Aging & Independence Services
Department Description
Aging & Independence Services (AIS) provides services toolder adults, people with disabilities and their familymembers, help keep clients safely in their homes, promotehealthy and vital living, and publicize positivecontributions made by older adults and persons withdisabilities. The Office of Veterans Services, within AIS,provides assistance to military veterans and theirdependents and survivors who are entitled to benefits fromthe United States Department of Veterans Affairs, the Stateof California, and other agencies.
Effective Fiscal Year 2013-14, the Public Administrator/Public Guardian and Behavioral Health Conservator unitwill become Public Administrator/Public Guardian/PublicConservator (PA/PG/PC) and part of AIS to reflect Healthand Human Service Agency’s reorganization to improveeffectiveness and efficiency in service delivery.
Mission Statement
To make people’s lives healthier, safer and self-sufficient bydelivering essential services in San Diego County.
2012-13 Accomplishments
Ensured integration and achievement of Live Well SanDiego strategies to provide the right services, to the rightpeople, at the right time for the best possible outcome.
Strategic Initiative – Healthy FamiliesBuilt a better service delivery system to protect seniorsand dependent adults from abuse and neglect, andimprove their quality and efficient care.
Ensured 97% (6,759 of 6,944) of face-to-facecontacts were conducted within 10 days of receivingan Adult Protective Services (APS) referral, above thetarget of 95%.Ensured 91% (6,329 of 6,944) of APS cases were notre-referred within six months of case closing,meeting the target.Implemented the first phase of the multi-yearCommunity Based Care Transitions Program (CCTP)to reduce readmissions to hospitals for Medicare
recipients. Public Health Nurses in AIS receivedreferrals from participating hospitals’ staff forindividuals who would benefit from short-termassistance to proactively manage their chronicmedical conditions.
Supported positive choices that foster independenceamong seniors and educational opportunities for veter-ans and their families.
Connected 2,159 older adults with volunteeropportunities, promoting Live Well San Diegothrough active living, below the target of 2,295 due tolower participation among community membersMaintained 97% (535 of 550) participation in theMultipurpose Senior Services Program (MSSP) casemanagement program thereby helping to avoid,delay or remedy inappropriate placement in nursingfacilities, above target of 95%.Notified 98% (6,472 of 6,611) of customers assistedby Veteran’s Services within 14 calendar days of theresult of their college tuition waiver application,meeting target.
Required Discipline for Excellence – Customer Satisfaction
Advanced operational excellence in customer serviceby ensuring 75% (16,273 of 21,841) of annual In-HomeSupportive Services (IHSS) reassessments were recer-tified timely so that clients received the appropriatelevel of care to remain safely in their own home. Thetarget of 96% was not met due to difficulties encoun-tered during the implementation of a State pilot com-puter system.
205Health and Human Services Agency Adopted Operational Plan Fiscal Years 2013-2014 and 2014-2015
Aging & Independence Services
2013-15 Objectives
Ensure integration and achievement of Live Well San Diegostrategies to provide the right services, to the right people,at the right time for the best possible outcome.
Strategic Initiative – Safe CommunitiesBuild a better service delivery system by safeguardingand protecting vulnerable adults from neglect andabuse, including financial, physical and emotional.
96% (7,200 of 7,500) of face-to-face contacts areconducted within 10 days of receiving an APSreferral. 91% (6,825 of 7,500) of APS cases are not re-referred within six months of case closing.Ensure that 100% (1,230) of conservatorshipinvestigations for Public Guardian (PG) and PublicConservator (PC) begin within two business days ofassignment to an investigator as mandated by theOmnibus Conservatorship and Guardianship ReformAct.Complete 95% (119 of 125) of follow-up face-to-facevisits with conservatees living in San Diego Countywithin 30 days of previous date of face–to-face visit.Begin 96% (480 of 500) of all bank inquiries withintwo business days to safeguard and protect theassets and resources of clients.Submit 100% (10) of Inventory and Appraisal reportsof all estate cases in the PG Program within 90 daysof receiving letters of conservatorship to the Court.Ensure 95% (998 of 1,050) of Public Administrator(PA) investigations are begun within two businessdays of a referral being assigned for investigation.Submit 100% (20) Inventory and Appraisal reports ofall formal probate cases in the PA Program within120 days of receiving letters of Administration to theCourt. A formal probate case is an estate valued atmore than $150,000 and is under court supervision.
Strategic Initiative – Healthy FamiliesBuild a better service delivery system to improve qual-ity and efficient care for vulnerable adults ensuring90% (3,111 of 3,457) of high-risk CCTP Medicare fee-for-service beneficiaries who receive a Care TransitionsIntervention (CTI) or CTI Care Enhancement interven-
tion by AIS, will have a home visit completed withinthree calendar days of discharge from a partner AcuteCare Hospital or Skilled Nursing Facility.Support positive choices that foster independenceamong seniors and educational opportunities for veter-ans and their families.
Connect 2,318 older adults with volunteeropportunities, promoting Live Well San Diegothrough active living. Maintain 96% (528 of 550) participation in the MSSPcase management program helping to avoid, delayor remedy inappropriate placement in nursingfacilities. Notify 99% (4,950 of 5,000) of customers assisted byVeteran’s Services within 14 calendar days of theresult of their college tuition waiver application.
Required Discipline for Excellence – Customer Satisfaction
Advance operational excellence in customer service byensuring 96% (15,840 of 16,500) of annual IHSS reas-sessments are recertified timely so that clients receivethe appropriate level of care to remain safely in theirown home.
Required Discipline for Excellence – Skilled, Adaptable and Diverse Workforce
Advance operational excellence of a skilled workforceby maintaining 100% (19) mandated California StatePA/PG certification for applicable PA/PG staff in orderto improve services to conservatees and families ofdecedents.
Related Links
A resource guide for seniors, adults with disabilities, veter-ans and professionals is available through Network of Careat www.sandiego.networkofcare.org.
For additional information on the programs offered by Aging& Independence Services, refer to the website atwww.sdcounty.ca.gov/hhsa/programs/ais.
For additional information on the programs offered by theHealth and Human Services Agency, refer to the website atwww.sdcounty.ca.gov/hhsa.
206 Health and Human Services AgencyAdopted Operational Plan Fiscal Years 2013-2014 and 2014-2015
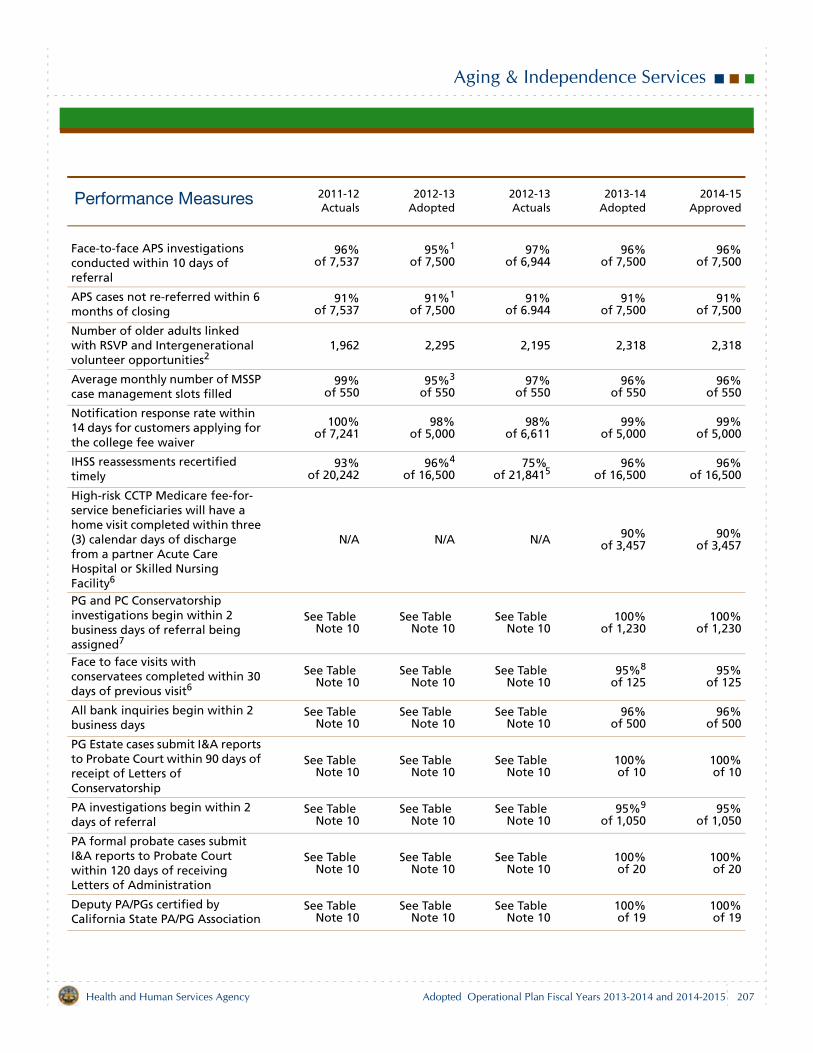
Aging & Independence Services
Performance Measures 2011-12Actuals
2012-13Adopted
2012-13Actuals
2013-14Adopted
2014-15Approved
Face-to-face APS investigations conducted within 10 days of referral
96%of 7,537
95%1
of 7,50097%
of 6,94496%
of 7,50096%
of 7,500
APS cases not re-referred within 6 months of closing
91%of 7,537
91%1
of 7,50091%
of 6.94491%
of 7,50091%
of 7,500
Number of older adults linked with RSVP and Intergenerational volunteer opportunities2
1,962 2,295 2,195 2,318 2,318
Average monthly number of MSSP case management slots filled
99%of 550
95%3
of 55097%
of 55096%
of 55096%
of 550
Notification response rate within 14 days for customers applying for the college fee waiver
100%of 7,241
98%of 5,000
98%of 6,611
99%of 5,000
99%of 5,000
IHSS reassessments recertified timely
93%of 20,242
96%4
of 16,50075%
of 21,841596%
of 16,50096%
of 16,500
High-risk CCTP Medicare fee-for-service beneficiaries will have a home visit completed within three (3) calendar days of discharge from a partner Acute Care Hospital or Skilled Nursing Facility6
N/A N/A N/A 90%of 3,457
90%of 3,457
PG and PC Conservatorship investigations begin within 2 business days of referral being assigned7
See Table Note 10
See Table Note 10
See Table Note 10
100%of 1,230
100%of 1,230
Face to face visits with conservatees completed within 30 days of previous visit6
See Table Note 10
See Table Note 10
See Table Note 10
95%8
of 12595%
of 125
All bank inquiries begin within 2 business days
See Table Note 10
See Table Note 10
See Table Note 10
96%of 500
96%of 500
PG Estate cases submit I&A reports to Probate Court within 90 days of receipt of Letters of Conservatorship
See Table Note 10
See Table Note 10
See Table Note 10
100%of 10
100%of 10
PA investigations begin within 2 days of referral
See Table Note 10
See Table Note 10
See Table Note 10
95%9
of 1,05095%
of 1,050
PA formal probate cases submit I&A reports to Probate Court within 120 days of receiving Letters of Administration
See Table Note 10
See Table Note 10
See Table Note 10
100%of 20
100%of 20
Deputy PA/PGs certified by California State PA/PG Association
See Table Note 10
See Table Note 10
See Table Note 10
100%of 19
100%of 19
207Health and Human Services Agency Adopted Operational Plan Fiscal Years 2013-2014 and 2014-2015
Aging & Independence Services
Table Notes
1Effective Fiscal Year 2012-13,the target has been revised to more accurately reflect staffing capacity and efforts. In Fiscal Year 2012-13, the number of reports to APS have increased by more than 10% despite a reduction in staff due to budget constraints. There has been an overall workload increase for APS investigators of 13% since staffing was reduced. All efficiencies have been explored and staff are working at the highest level possible without placing the County and clients at risk.
2Effective Fiscal Year 2011-12, this measure has been revised to “maintain” the number of older adults linked with the Retired Senior Volunteer Program (RSVP) and Intergenerational volunteer opportunities.
3Effective Fiscal Year 2012-13, the target for monthly number of MSSP case management slots has been revised
to reflect the State contract obligation of 95%.
4Effective Fiscal Year 2012-13,the target has been revised to better accurately reflect staffing capacity and efforts. The State mandated target for IHSS reassessments recertified timely is 90%.
5During Fiscal Year 2012-13, the IHSS program launched a new computer system as a pilot county, Case Management Information and Payroll System (CMIPS) II to track this measure. The reporting feature for the new system has been extremely problematic and the data produced has not been accurate. Staff are working with CMIPS II State personnel on a way to more accurately capture this information for Fiscal Year 2013-14 and beyond. Additionally, the introduction of this new system has resulted in a work slowdown for staff, resulting in the need for additional time to complete all required paperwork and impacting their ability to complete timely reassessments.
6Effective Fiscal Year 2013-14, this is a new measure to reflect strategic priorities.
7Effective Fiscal Year 2013-14, this was measure was expanded to include Public Convservator thus increasing the total number of referrals being investigated.
8Effective Fiscal Year 2013-14, the target goal for this measure was increased from 85% to 95% to align with staffs’ high performance rate; the target goal of 85% was established as a baseline for the first year the measure was introduced. To minimize risk to our clients and to provide quality customer service, careful monitoring and regular feedback to staff to emphasize the importance of these activities resulted in a significant increase in timely visits.
9Effective Fiscal Year 2013-14, the target goal for this measure was increased from 80% to 95% to align with staffs’ high performance rate; the target goal of 80% was established as a baseline for the first year the measure was introduced. To minimize risk to our clients and to safeguard estate assets, careful monitoring and regular feedback to staff to emphasize the importance of these activities resulted in a significant increase in the initiation of PA Investigations.
10Prior to Fiscal Year 2013-14, these measures were reported in the Public Administrator/Public Guardian section of the Operational Plan.
Budget Changes and Operational Impact: 2012-13 to 2013-14
Staffing Net increase of 87.50 staff years.
Increase of 20.00 staff years for the Community BasedCare Transitions Program (CCTP).Increase of 55.00 staff years due to the transfer of Pub-lic Administrator/Public Guardian/Public Conservator(PA/PG/PC) to AIS.
Increase of 9.00 staff years due to a transfer from Stra-tegic Planning and Operational Support (SPOS). Increase of 1.00 staff year for the Dementia Supportprogram. Increase of 2.50 staff years due to operational needs.
The following breakdown shows the same net change instaffing presented by program.
Increase of 10.00 staff years in In-Home SupportiveServices (IHSS) due to the transfer in of 9.00 staff fromSPOS, Fraud and Integrity unit to support IHSS anti-
208 Health and Human Services AgencyAdopted Operational Plan Fiscal Years 2013-2014 and 2014-2015
Aging & Independence Services
fraud activities and addition of 2.00 staff years for theCCTP, offset by 1.00 staff year transferred to Adult Pro-tective Services.Increase of 16.00 staff years in Senior Health andSocial Services due to addition of 18.00 staff years forCCTP, offset by 2.00 staff years transferred out to AdultProtective Services.Increase of 5.50 staff years in Adult Protective Servicesincluding the addition of 2.50 staff years due to opera-tional need and the transfer in of 2.00 staff year fromthe Senior Health and Social Services and transfer in of1.00 staff year from IHSS due to operational needs. Increase of 56.00 staff years in PA/PG/PC due to themove of PA/PG Division, 33.00 staff years, and Conser-vator Unit, 22.00 staff years, and the addition of 1.00staff year for the Dementia Support program.
ExpendituresNet increase of $16.7 million
Salaries and Benefits — increase of $8.6 million primar-ily due to the addition of 87.50 staff years and anincrease in County retirement contributions.Services and Supplies — increase of $7.8 million.
Increase of $5.9 million in contracted services for theCCTP.Increase of $1.9 million in various services andsupplies primarily related to the transfer ofappropriations from PA/PG and Conservator Unit toPA/PG/PC.
Other Charges — increase of $0.3 million due to trans-fer of appropriations for indigent burial costs from PA/PG to PA/PG/PC.
RevenuesNet increase of $16.7 million
Licenses, Permit and Franchises — increase of $0.05million related to the transfer of the Conservator unit toPA/PG/PC.
Revenues From Use of Money and Property —increase of $0.04 million related to the transfer of theConservator unit to PA/PG/PC.Intergovernmental Revenues — increase of $11.9 mil-lion.
Increase of $7.7 million in CCTP revenue.Increase of $2.5 million in Realignment related to thetransfer of $2.3 million from Conservator unit to PA/PG/PC, and $0.2 million for the Dementia Supportprogram.Increase of $1.1 million in IHSS administrativerevenue. Increase of $0.6 million in various other revenues toalign with allocations.
Charges for Current Services — increase of $0.9 millionin estate fees related to the transfer of PA/PG to PA/PG/PC.Miscellaneous Revenue — increase of $0.06 million pri-marily related to the transfer of the Conservator unit toPA/PG/PC.Use of Fund Balance — decrease of $0.03 million. Atotal of $0.06 million budgeted to fund the Grandpar-ents Raising Grandchildren symposium.General Purpose Revenue Allocation — increase of$3.8 million related to the transfer of PA/PG to PA/PG/PC.
Budget Changes and Operational Impact: 2013-14 to 2014-15
Net increase of $0.7 million is the result of an increase of$0.8 million in Salaries and Benefits due to an increase inCounty retirement contributions, offset by a decrease of$0.1 million in Services and Supplies due to the completionof one-time contracted services.
209Health and Human Services Agency Adopted Operational Plan Fiscal Years 2013-2014 and 2014-2015
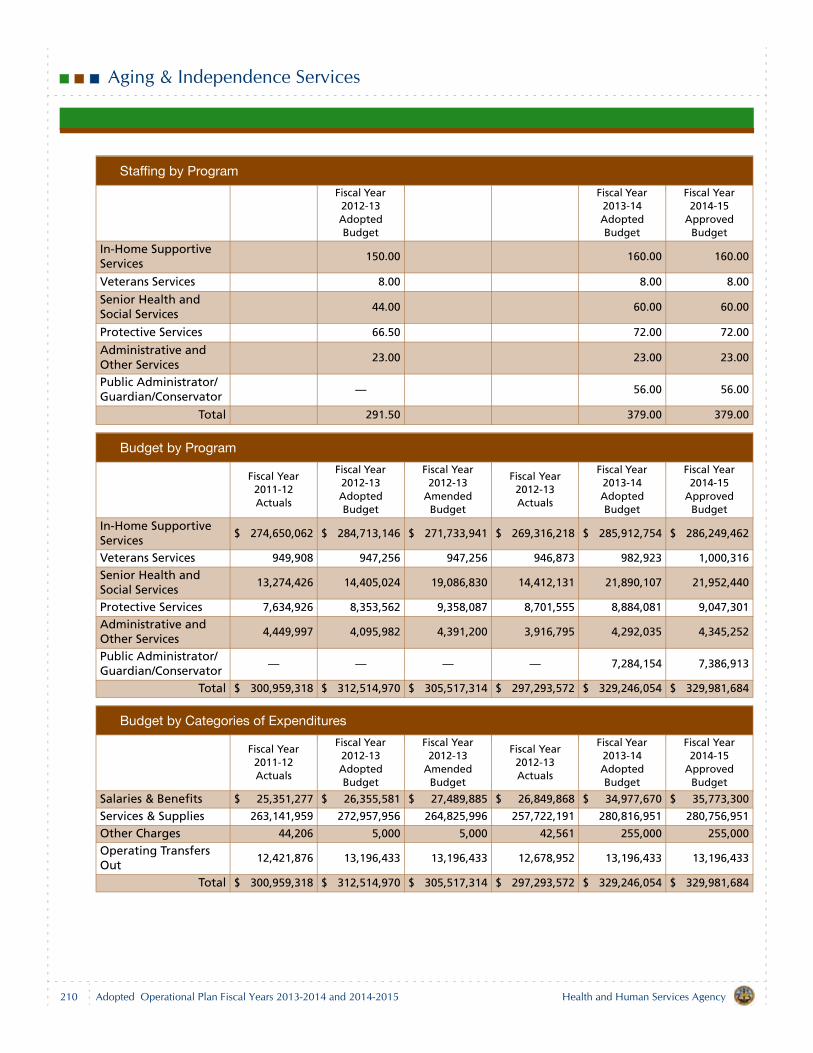
Aging & Independence Services
Staffing by Program
Fiscal Year 2012-13 Adopted Budget
Fiscal Year 2013-14 Adopted Budget
Fiscal Year 2014-15
Approved Budget
In-Home Supportive Services
150.00 160.00 160.00
Veterans Services 8.00 8.00 8.00
Senior Health and Social Services
44.00 60.00 60.00
Protective Services 66.50 72.00 72.00
Administrative and Other Services
23.00 23.00 23.00
Public Administrator/Guardian/Conservator
— 56.00 56.00
Total 291.50 379.00 379.00
Budget by Program
Fiscal Year 2011-12 Actuals
Fiscal Year 2012-13 Adopted Budget
Fiscal Year 2012-13
Amended Budget
Fiscal Year 2012-13 Actuals
Fiscal Year 2013-14 Adopted Budget
Fiscal Year 2014-15
Approved Budget
In-Home Supportive Services
$ 274,650,062 $ 284,713,146 $ 271,733,941 $ 269,316,218 $ 285,912,754 $ 286,249,462
Veterans Services 949,908 947,256 947,256 946,873 982,923 1,000,316
Senior Health and Social Services
13,274,426 14,405,024 19,086,830 14,412,131 21,890,107 21,952,440
Protective Services 7,634,926 8,353,562 9,358,087 8,701,555 8,884,081 9,047,301
Administrative and Other Services
4,449,997 4,095,982 4,391,200 3,916,795 4,292,035 4,345,252
Public Administrator/Guardian/Conservator
— — — — 7,284,154 7,386,913
Total $ 300,959,318 $ 312,514,970 $ 305,517,314 $ 297,293,572 $ 329,246,054 $ 329,981,684
Budget by Categories of Expenditures
Fiscal Year 2011-12 Actuals
Fiscal Year 2012-13 Adopted Budget
Fiscal Year 2012-13
Amended Budget
Fiscal Year 2012-13 Actuals
Fiscal Year 2013-14 Adopted Budget
Fiscal Year 2014-15
Approved Budget
Salaries & Benefits $ 25,351,277 $ 26,355,581 $ 27,489,885 $ 26,849,868 $ 34,977,670 $ 35,773,300
Services & Supplies 263,141,959 272,957,956 264,825,996 257,722,191 280,816,951 280,756,951
Other Charges 44,206 5,000 5,000 42,561 255,000 255,000
Operating Transfers Out
12,421,876 13,196,433 13,196,433 12,678,952 13,196,433 13,196,433
Total $ 300,959,318 $ 312,514,970 $ 305,517,314 $ 297,293,572 $ 329,246,054 $ 329,981,684
210 Health and Human Services AgencyAdopted Operational Plan Fiscal Years 2013-2014 and 2014-2015
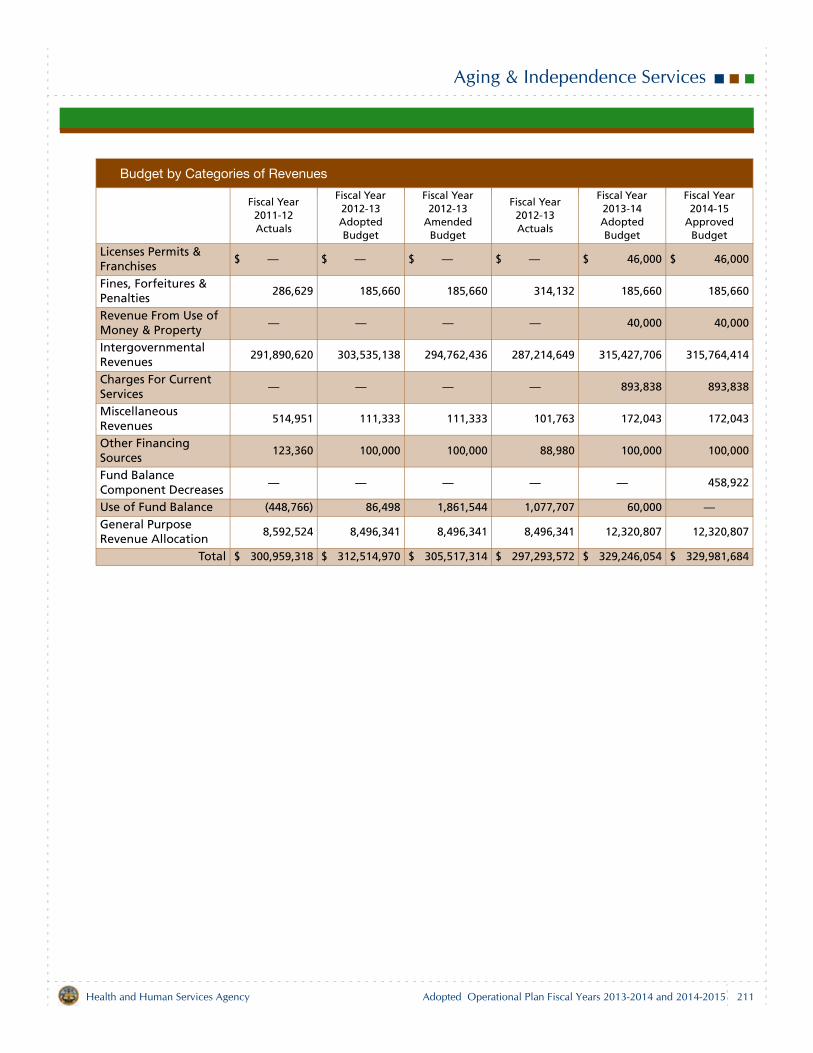
Aging & Independence Services
Budget by Categories of Revenues
Fiscal Year 2011-12 Actuals
Fiscal Year 2012-13 Adopted Budget
Fiscal Year 2012-13
Amended Budget
Fiscal Year 2012-13 Actuals
Fiscal Year 2013-14 Adopted Budget
Fiscal Year 2014-15
Approved Budget
Licenses Permits & Franchises
$ — $ — $ — $ — $ 46,000 $ 46,000
Fines, Forfeitures & Penalties
286,629 185,660 185,660 314,132 185,660 185,660
Revenue From Use of Money & Property
— — — — 40,000 40,000
Intergovernmental Revenues
291,890,620 303,535,138 294,762,436 287,214,649 315,427,706 315,764,414
Charges For Current Services
— — — — 893,838 893,838
Miscellaneous Revenues
514,951 111,333 111,333 101,763 172,043 172,043
Other Financing Sources
123,360 100,000 100,000 88,980 100,000 100,000
Fund Balance Component Decreases
— — — — — 458,922
Use of Fund Balance (448,766) 86,498 1,861,544 1,077,707 60,000 —General Purpose Revenue Allocation
8,592,524 8,496,341 8,496,341 8,496,341 12,320,807 12,320,807
Total $ 300,959,318 $ 312,514,970 $ 305,517,314 $ 297,293,572 $ 329,246,054 $ 329,981,684
211Health and Human Services Agency Adopted Operational Plan Fiscal Years 2013-2014 and 2014-2015

Behavioral Health Services
Department Description
Behavioral Health Services (BHS) provides a range ofmental health, alcohol and other drug programs, promotingrecovery and well-being through prevention, treatment andinterventions. Services are integrated for clients with co-occurring mental illness and alcohol and drug issues. BHSworks in partnership with the community to provideevidence-based services to achieve effective outcomes.Inpatient Health Services are offered at the San DiegoCounty Psychiatric Hospital (SDCPH) and at the EdgemoorDistinct Part Skilled Nursing Facility (DPSNF), whichoperates under the licensure of the SDCPH.
Effective Fiscal Year 2013-14, the Conservator unit will beintegrated with Public Administrator/Public Guardianwhich in turn will become part of Aging and IndependenceServices.
Mission Statement
To make people’s lives healthier, safer and self-sufficient bydelivering essential services in San Diego County.
2012-13 Accomplishments
Ensure integration and achievement of Live Well San Diegostrategies to provide the right services, to the right people,at the right time for the best possible outcome.
Strategic Initiative – Healthy FamiliesBuilt a better service delivery system for children andadults with behavioral and physical health needs.
Provided timely intervention to children who havecomplex behavioral/emotional needs through theKidSTART program by serving 250 children ages 0-5years, exceeding the target of 100 children served.Improved quality and efficient care by integratingphysical and behavioral health services with twomodified service delivery system pilot programs,ICARE and SmartCare. The ICARE program providedcomprehensive counseling and mental healthservices for children and adults. The SmartCareprogram added psychiatric consultation services tosupport primary care providers in serving childrenand adults with mental health challenges.
Supported positive choices among participants in alco-hol and drug treatment programs.
Supported educational growth and overall well-beingof adolescents who completed alcohol and drugtreatment by ensuring 95% (554 of 581) eithercompleted high school (or the equivalent) or wereenrolled in an educational setting, above the target of90%. Supported healthy and safe living by ensuring42% (5,576 of 13,148) of participants completedalcohol and drug treatment, above the target of 35%.
Pursued policy and environmental changes by increas-ing use and efficiency at outpatient mental health clin-ics by reducing the number of adults who canceled orfailed to show by 5% (from 18,137 to 17,230), belowthe target of a 10% reduction.
Required Discipline for Excellence – Customer Satisfaction
Advanced operational excellence in customer servicethrough timely and improved access to services.
Ensured access to outpatient mental healthassessments for at-risk children and youth bymaintaining an average wait time of four days, betterthan the target of five days average wait time.Ensured access to care and treatment innonresidential alcohol and drug treatment programsfor adolescents by admitting 99% (1,156 of 1,172)within 14 days, exceeding the target of 85%. Thistarget was exceeded because the Teen RecoveryCenters’ were able to admit quickly and efficiently,resulting in no wait list for services.Monitored access to outpatient mental healthservices to older adults; 16% fewer clients wereserved (from 5,662 to 4,757), below the target of a5% increase. The decrease in number of outpatientclients is attributed to the successful linkages ofclients to their primary care providers and the mentalhealth anti-stigma campaign, It’s Up to Us!.
213Health and Human Services Agency Adopted Operational Plan Fiscal Years 2013-2014 and 2014-2015
Behavioral Health Services
Implemented the County’s In Home Outreach Team(IHOT). This voluntary pilot program assists patientswith severe mental illness who have been resistant totreatment with taking their required medications,participating in treatment and linking to appropriatecommunity services.
Required Discipline for Excellence – Accountability, Transparency and Ethical Conduct
Advanced operational excellence by demonstratingaccountability and commitment to outstanding patientcare.
Maintained full accreditation with the JointCommission Standards Compliance for SDCPH.Maintained a State rating of substantial compliancefor Edgemoor DPSNF.The national benchmark of 1.78 occurrences or lessper 1,000 patient days for the use of mechanical ormanual restraints at SDCPH was not met, with 6.67occurrences per 1,000 patient days, due toincreased acuity of new patients entering SDCPH.
2013-15 Objectives
Ensure integration and achievement of Live Well San Diegostrategies to provide the right services, to the right people,at the right time for the best possible outcome.
Strategic Initiative – Healthy FamiliesBuild a better service delivery system for children andadults with behavioral and physical health needs byproviding timely intervention to children who have com-plex behavioral/emotional needs through the KidSTARTprogram by serving 250 children ages 0-5 years.Build a better service delivery system through the inte-gration of physical and behavioral health services withtwo modified service delivery system programs.
ICARE program.Maintain baseline of 3% (6 of 200) of participantsreporting inpatient hospitalization for physicalhealth reasons.Maintain baseline of 20% (40 of 200) ofparticipants reporting an emergency room visit.Maintain current levels of program satisfactionamong participants.
SmartCare program.Continue enhancement of psychiatricconsultation services.Increase the use of the wellness blog in the onlinenewspaper Ramona Patch that serves the ruralcommunity.Maintain 90% (270 of 300) client satisfaction with
the integrated care model.Support positive choices among participants in alcoholand drug treatment programs.
Support educational growth and overall well-being ofadolescents who complete alcohol and drugtreatment by ensuring 90% (833 of 925) eithercomplete high school (or the equivalent) or areenrolled in an educational setting. Support healthy and safe living by ensuring that 35%(4,550 of 13,000) of participants complete alcoholand drug treatment.
Required Discipline for Excellence – Customer Satisfaction
Advance operational excellence in customer servicethrough timely and improved access to services.
Ensure access to outpatient mental healthassessments for at-risk children and youth bymaintaining an average wait time of five days or less.Ensure access to care and treatment innonresidential alcohol and drug treatment programsfor adolescents by admitting 85% (1,224 of 1,440)within 14 days.Improve access for older adults by serving anadditional 5% (from 5,832 to 6,123), includingthrough senior-focused prevention, earlyintervention, and treatment services.
Required Discipline for Excellence – Accountability, Transparency and Ethical Conduct
Advance operational excellence by demonstratingaccountability and commitment to outstanding patientcare.
Maintain full accreditation with the Joint CommissionStandards Compliance for SDCPH.Maintain a State rating of substantial compliance forEdgemoor DPSNF.Maintain a readmission rate at SDCPH that is lowerthan the readmission rate for fee-for-servicehospitals of 26.56% for Fiscal Year 2012-13.
Related Links
For information about mental illness, how to recognizesymptoms, use local resources and access assistance, goto www.up2sd.org.
For information about the Network of Care for BehavioralHealth, go to www.sandiego.networkofcare.org.
For additional information on the programs offered by theHealth and Human Services Agency, refer to the websitewww.sdcounty.ca.gov/hhsa.
214 Health and Human Services AgencyAdopted Operational Plan Fiscal Years 2013-2014 and 2014-2015
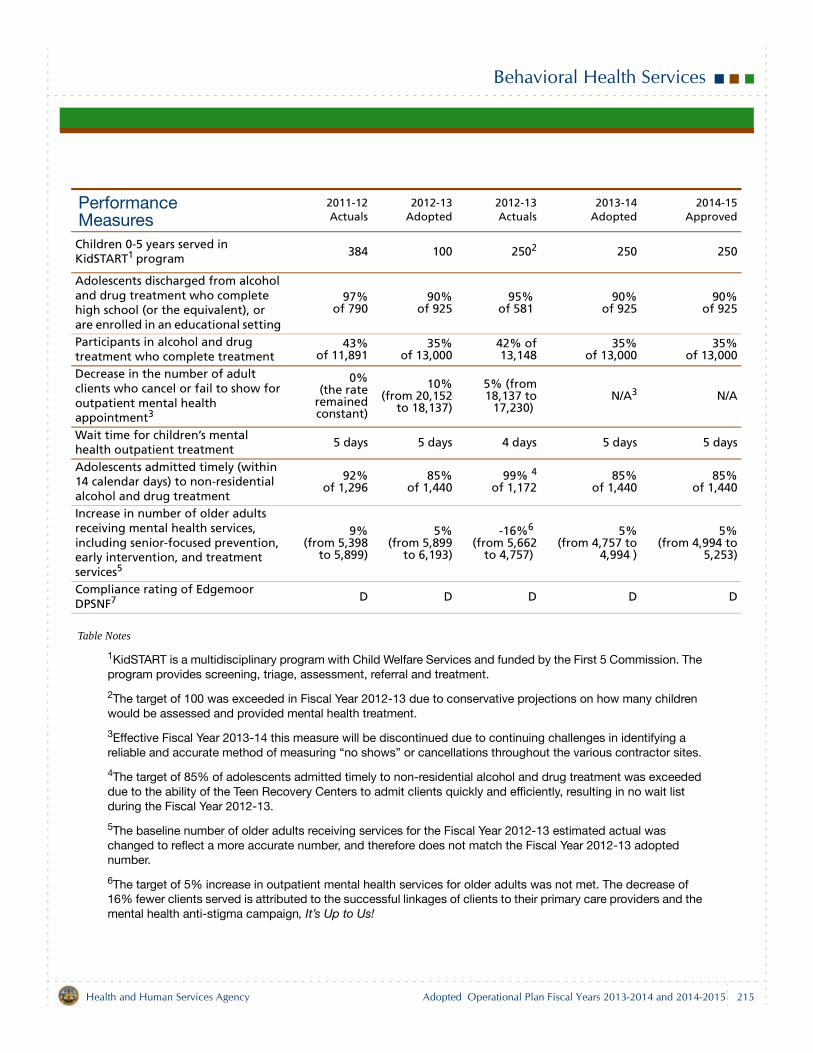
Behavioral Health Services
215Health and Human Services Agency Adopted Operational Plan Fiscal Years 2013-2014 and 2014-2015
Table Notes
1KidSTART is a multidisciplinary program with Child Welfare Services and funded by the First 5 Commission. The program provides screening, triage, assessment, referral and treatment.
2The target of 100 was exceeded in Fiscal Year 2012-13 due to conservative projections on how many children would be assessed and provided mental health treatment.
3Effective Fiscal Year 2013-14 this measure will be discontinued due to continuing challenges in identifying a reliable and accurate method of measuring “no shows” or cancellations throughout the various contractor sites.
4The target of 85% of adolescents admitted timely to non-residential alcohol and drug treatment was exceeded due to the ability of the Teen Recovery Centers to admit clients quickly and efficiently, resulting in no wait list during the Fiscal Year 2012-13.
5The baseline number of older adults receiving services for the Fiscal Year 2012-13 estimated actual was changed to reflect a more accurate number, and therefore does not match the Fiscal Year 2012-13 adopted number.
6The target of 5% increase in outpatient mental health services for older adults was not met. The decrease of 16% fewer clients served is attributed to the successful linkages of clients to their primary care providers and the mental health anti-stigma campaign, It’s Up to Us!
Performance Measures
2011-12Actuals
2012-13Adopted
2012-13Actuals
2013-14Adopted
2014-15Approved
Children 0-5 years served in KidSTART1 program
384 100 2502 250 250
Adolescents discharged from alcohol and drug treatment who complete high school (or the equivalent), or are enrolled in an educational setting
97%of 790
90%of 925
95% of 581
90%of 925
90%of 925
Participants in alcohol and drug treatment who complete treatment
43%of 11,891
35%of 13,000
42% of13,148
35%of 13,000
35%of 13,000
Decrease in the number of adult clients who cancel or fail to show for outpatient mental health appointment3
0%(the rate
remainedconstant)
10%(from 20,152
to 18,137)
5% (from18,137 to
17,230) N/A3 N/A
Wait time for children’s mental health outpatient treatment
5 days 5 days 4 days 5 days 5 days
Adolescents admitted timely (within 14 calendar days) to non-residential alcohol and drug treatment
92%of 1,296
85%of 1,440
99% 4of 1,172
85%of 1,440
85%of 1,440
Increase in number of older adults receiving mental health services, including senior-focused prevention, early intervention, and treatment services5
9%(from 5,398
to 5,899)
5%(from 5,899
to 6,193)
-16%6 (from 5,662
to 4,757)
5%(from 4,757 to
4,994 )
5%(from 4,994 to
5,253)
Compliance rating of Edgemoor DPSNF7 D D D D D
Behavioral Health Services
7The rating of “D” is the highest possible rating. The rating comes from an annual survey, in adherence to Title 22 statute, and looks at more than 2,000 requirements. It indicates substantial compliance as defined by the California Department of Public Health Services Licensing and Certification Program, which means there are no widespread deficiencies and minimal physical, mental and/or psychological discomfort to the residents. There are facilities (out of 91) with a zero deficiency in San Diego County.
Budget Changes and Operational Impact: 2012-13 to 2013-14
StaffingNet decrease of 38.50 staff years.
Decrease of 22.00 staff years due to a transfer from theConservator unit to Aging and Independence Services(AIS).Decrease of 11.00 staff years due to a transfer toRegional Operations.Decrease of 5.00 staff years due to a transfer to Admin-istrative Support.Decrease of 5.00 staff years due to a transfer to ChildWelfare Services (CWS) to support Assembly Bill (AB)12, the California Fostering Connections to SuccessAct (2010).Increase 1.00 staff year due to a transfer from StrategicPlanning and Operational Support (SPOS).Increase of 1.00 staff year to support Healthy Families.Increase of 2.50 staff years for programmatic needs.
The following breakdown shows the same net change instaffing presented by program:
Decrease of 6.00 staff years in Alcohol and Drug Ser-vices (ADS) due to transfer of staff to Behavioral HealthServices Administration.Decrease of 62.00 staff years in Mental Health Services(MHS) due to the transfer out of 22.00 staff years fromthe Conservator unit to AIS, transfer out of 17.00 staffyears to Inpatient Health Services, transfer out of 9.00staff years to Behavioral Health Services Administra-tion, transfer out of 3.00 staff years to Eligibility Opera-tions Administration, transfer out of 2.00 staff years toNorth Central Region, transfer out of 1.00 staff years toRegional Self Sufficiency, transfer out of 4.50 staffyears to CWS, transfer out of 1.00 staff year to HHSAHuman Resources, transfer out of 1.00 staff year toProposition 10, transfer out of 2.00 staff years to Officeof Strategy and Innovation (OSI) offset by the additionof 0.50 staff year for programmatic needs.
Increase of 16.50 staff years in Inpatient Health Ser-vices, which decreases the use of temporary agencystaff, accommodates the increased acuity of patients,ensures continuity of care and manages associatedrisks by having direct supervision of staff (as opposedto temporary agency supervision), due to the transfer inof 17.00 staff years from Mental Health Services andthe addition of 2.00 staff years for programmatic needsoffset by the transfer out of 2.00 staff years to NorthCentral Region and transfer out of 0.50 staff year toCWS. Increase of 13.00 staff years in Behavioral Health Ser-vices Administration, resulting from reorganization andto increase operational efficiency, due to the transfer inof 9.00 staff years from MHS, the transfer in of 6.00staff years from ADS, the transfer in of 1.00 staff yearfrom SPOS and the addition of 1.00 staff year to sup-port Healthy Families, offset by the transfer out of 2.00staff years to Eligibility Operations Administration, thetransfer out of 1.00 staff year to Central Region and thetransfer out of 1.00 staff year to OSI.
ExpendituresNet decrease of $7.5 million
Salaries and Benefits — net decrease of $4.1 milliondue to the reduction of 38.50 staff years and anincrease in County retirement contributions.Services and Supplies — net decrease of $4.6 million.
Decrease of $6.5 million in Mental Health Servicescontracted services due to a reduction of $6.2 millionrelated to the transfer of the Wraparound program toCWS and a $3.0 million reduction to align withallocations, offset by an increase of $1.7 million forthe North County Short Term Acute ResidentialTreatment (START) program and an increase of $1.0million for Long Term Care (LTC). Decrease of $0.7 million in various services andsupplies including information technology costs andrent and lease decreases.Decrease of $0.4 million due to the transfer of theConservator unit to AIS.
216 Health and Human Services AgencyAdopted Operational Plan Fiscal Years 2013-2014 and 2014-2015
Behavioral Health Services
Increase of $3.0 million in ADS contracts forSubstance Abuse and Prevention Treatmentprograms.
Other Charges — increase of $1.2 million due to anincrease of State hospital rates set by the State of Cali-fornia.
RevenuesDecrease of $7.5 million
Intergovernmental Revenues — decrease of $7.2 mil-lion.
Decrease of $3.2 million in Short Doyle Medi-Calrevenue due to the transfer of $1.8 million inwraparound revenue related to the transfer of theWraparound program to CWS and a reduction of$1.4 million to align with program trends.Decrease of $2.6 million in Mental Health ServicesAct revenue related to the transfer of the Wraparoundprogram to CWS.Decrease of $1.9 million in Mental HealthRealignment due to a $2.3 million reduction relatedto the transfer of the Conservator unit to AIS offsetby an increase of $0.4 million to align with programtrends.Decrease of $1.8 million in CWS wraparoundrevenue related to the transfer of the Wraparoundprogram to CWS.
Decrease of $1.4 million in Drug Medi-Cal revenuesrelated to a redesign of the Narcotics TreatmentProgram revenue structure. Increase of $3.0 million in Substance Abuse andPrevention Treatment revenue due to increasedcontracts.Increase of $0.7 million in CalWORKs SubstanceAbuse revenue to align with the State allocation.
Charges for Current Services — increase of $1.3 millionfor Inpatient Health Services. Miscellaneous Revenues — decrease of $1.7 milliondue to discontinuance of contracts with the school dis-tricts.Use of Fund Balance — increase of $0.1 million. A totalof $0.3 million is budgeted to fund one-time the KRO-NOS Workforce Scheduler project.
Budget Changes and Operational Impact: 2013-14 to 2014-15
Increase of $0.7 million is the result of an increase of $1.2million in Salaries and Benefits due to an increase in Countyretirement contributions, offset by a decrease of $0.5 mil-lion in Services and Supplies.
217Health and Human Services Agency Adopted Operational Plan Fiscal Years 2013-2014 and 2014-2015
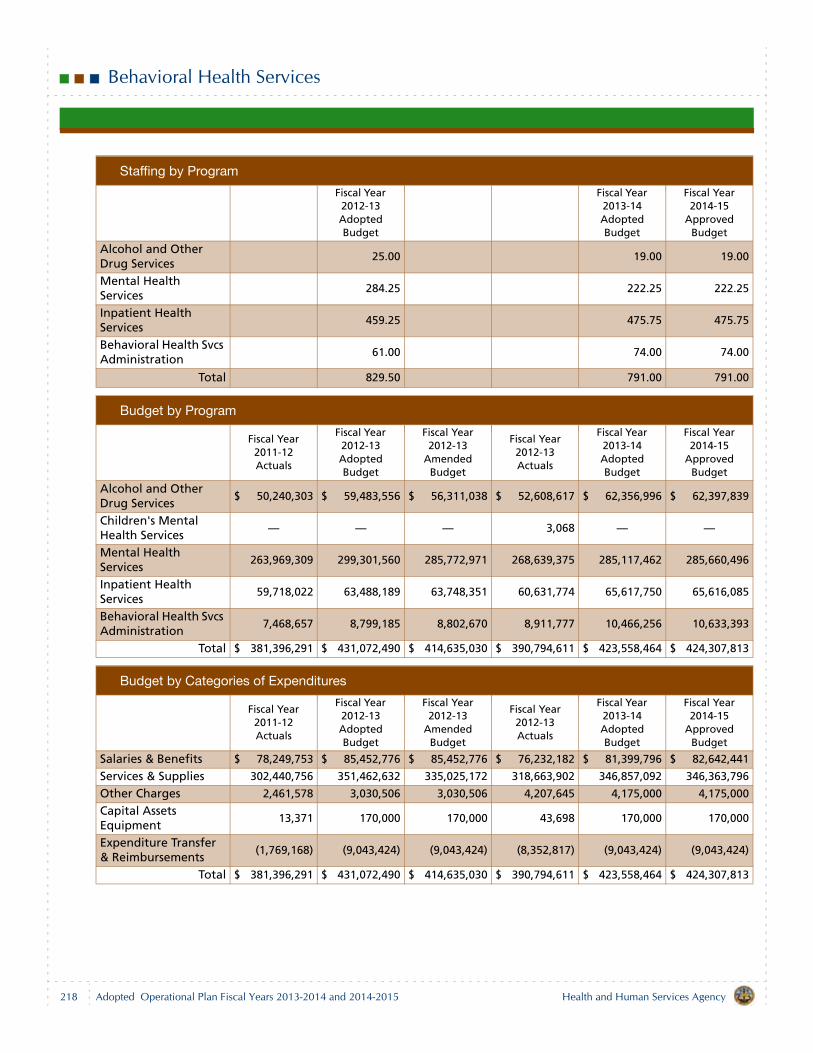
Behavioral Health Services
Staffing by Program
Fiscal Year 2012-13 Adopted Budget
Fiscal Year 2013-14 Adopted Budget
Fiscal Year 2014-15
Approved Budget
Alcohol and Other Drug Services
25.00 19.00 19.00
Mental Health Services
284.25 222.25 222.25
Inpatient Health Services
459.25 475.75 475.75
Behavioral Health Svcs Administration
61.00 74.00 74.00
Total 829.50 791.00 791.00
Budget by Program
Fiscal Year 2011-12 Actuals
Fiscal Year 2012-13 Adopted Budget
Fiscal Year 2012-13
Amended Budget
Fiscal Year 2012-13 Actuals
Fiscal Year 2013-14 Adopted Budget
Fiscal Year 2014-15
Approved Budget
Alcohol and Other Drug Services
$ 50,240,303 $ 59,483,556 $ 56,311,038 $ 52,608,617 $ 62,356,996 $ 62,397,839
Children's Mental Health Services
— — — 3,068 — —
Mental Health Services
263,969,309 299,301,560 285,772,971 268,639,375 285,117,462 285,660,496
Inpatient Health Services
59,718,022 63,488,189 63,748,351 60,631,774 65,617,750 65,616,085
Behavioral Health Svcs Administration
7,468,657 8,799,185 8,802,670 8,911,777 10,466,256 10,633,393
Total $ 381,396,291 $ 431,072,490 $ 414,635,030 $ 390,794,611 $ 423,558,464 $ 424,307,813
Budget by Categories of Expenditures
Fiscal Year 2011-12 Actuals
Fiscal Year 2012-13 Adopted Budget
Fiscal Year 2012-13
Amended Budget
Fiscal Year 2012-13 Actuals
Fiscal Year 2013-14 Adopted Budget
Fiscal Year 2014-15
Approved Budget
Salaries & Benefits $ 78,249,753 $ 85,452,776 $ 85,452,776 $ 76,232,182 $ 81,399,796 $ 82,642,441
Services & Supplies 302,440,756 351,462,632 335,025,172 318,663,902 346,857,092 346,363,796
Other Charges 2,461,578 3,030,506 3,030,506 4,207,645 4,175,000 4,175,000
Capital Assets Equipment
13,371 170,000 170,000 43,698 170,000 170,000
Expenditure Transfer & Reimbursements
(1,769,168) (9,043,424) (9,043,424) (8,352,817) (9,043,424) (9,043,424)
Total $ 381,396,291 $ 431,072,490 $ 414,635,030 $ 390,794,611 $ 423,558,464 $ 424,307,813
218 Health and Human Services AgencyAdopted Operational Plan Fiscal Years 2013-2014 and 2014-2015
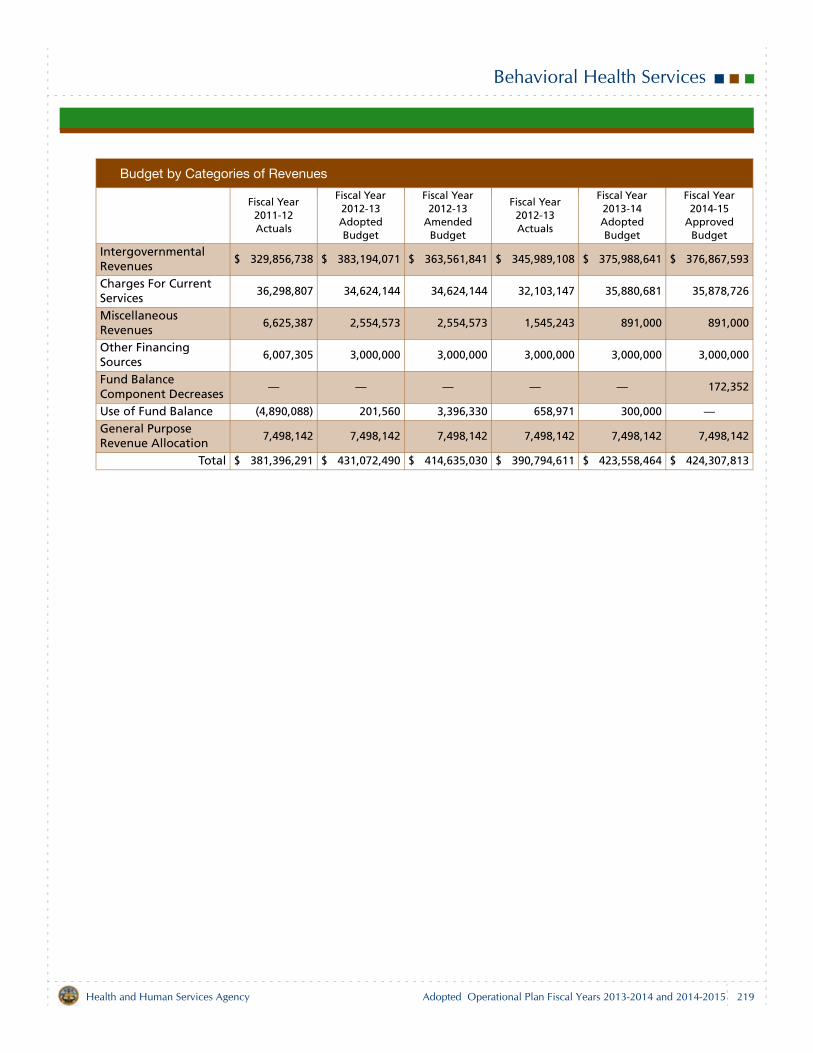
Behavioral Health Services
Budget by Categories of Revenues
Fiscal Year 2011-12 Actuals
Fiscal Year 2012-13 Adopted Budget
Fiscal Year 2012-13
Amended Budget
Fiscal Year 2012-13 Actuals
Fiscal Year 2013-14 Adopted Budget
Fiscal Year 2014-15
Approved Budget
Intergovernmental Revenues
$ 329,856,738 $ 383,194,071 $ 363,561,841 $ 345,989,108 $ 375,988,641 $ 376,867,593
Charges For Current Services
36,298,807 34,624,144 34,624,144 32,103,147 35,880,681 35,878,726
Miscellaneous Revenues
6,625,387 2,554,573 2,554,573 1,545,243 891,000 891,000
Other Financing Sources
6,007,305 3,000,000 3,000,000 3,000,000 3,000,000 3,000,000
Fund Balance Component Decreases
— — — — — 172,352
Use of Fund Balance (4,890,088) 201,560 3,396,330 658,971 300,000 —General Purpose Revenue Allocation
7,498,142 7,498,142 7,498,142 7,498,142 7,498,142 7,498,142
Total $ 381,396,291 $ 431,072,490 $ 414,635,030 $ 390,794,611 $ 423,558,464 $ 424,307,813
219Health and Human Services Agency Adopted Operational Plan Fiscal Years 2013-2014 and 2014-2015

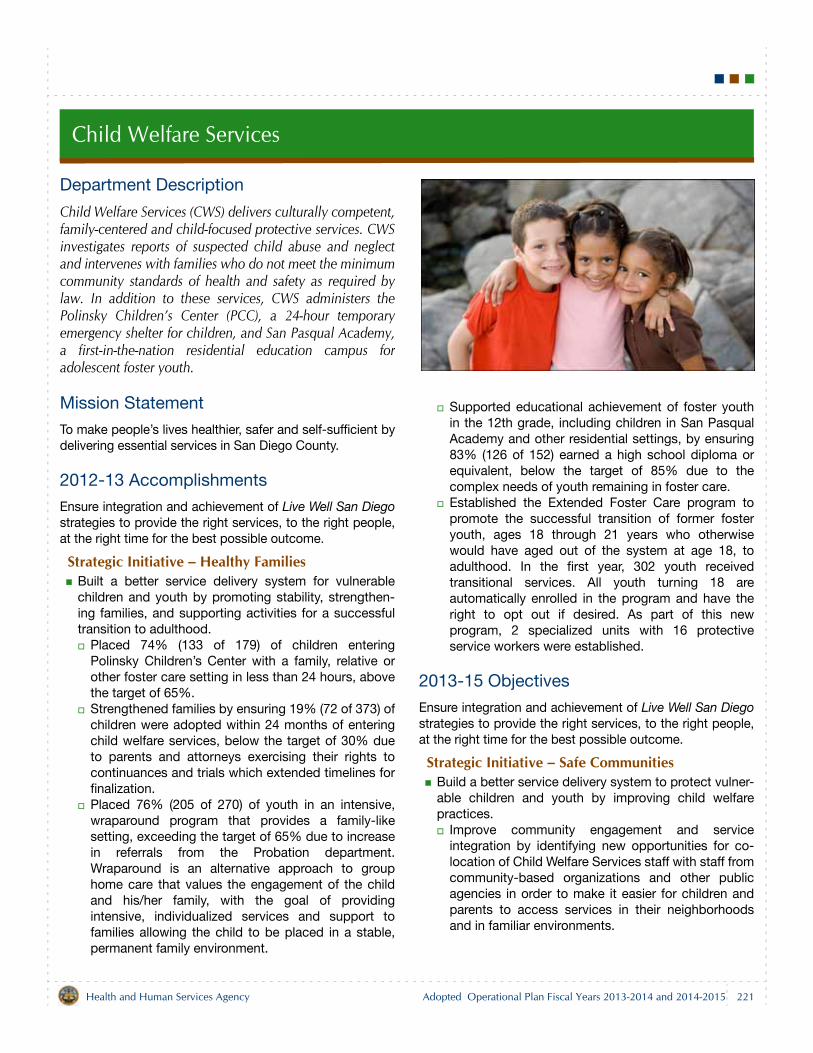
Child Welfare Services
Department Description
Child Welfare Services (CWS) delivers culturally competent,family-centered and child-focused protective services. CWSinvestigates reports of suspected child abuse and neglectand intervenes with families who do not meet the minimumcommunity standards of health and safety as required bylaw. In addition to these services, CWS administers thePolinsky Children’s Center (PCC), a 24-hour temporaryemergency shelter for children, and San Pasqual Academy,a first-in-the-nation residential education campus foradolescent foster youth.
Mission Statement
To make people’s lives healthier, safer and self-sufficient bydelivering essential services in San Diego County.
2012-13 Accomplishments
Ensure integration and achievement of Live Well San Diegostrategies to provide the right services, to the right people,at the right time for the best possible outcome.
Strategic Initiative – Healthy FamiliesBuilt a better service delivery system for vulnerablechildren and youth by promoting stability, strengthen-ing families, and supporting activities for a successfultransition to adulthood.
Placed 74% (133 of 179) of children enteringPolinsky Children’s Center with a family, relative orother foster care setting in less than 24 hours, abovethe target of 65%.Strengthened families by ensuring 19% (72 of 373) ofchildren were adopted within 24 months of enteringchild welfare services, below the target of 30% dueto parents and attorneys exercising their rights tocontinuances and trials which extended timelines forfinalization.Placed 76% (205 of 270) of youth in an intensive,wraparound program that provides a family-likesetting, exceeding the target of 65% due to increasein referrals from the Probation department.Wraparound is an alternative approach to grouphome care that values the engagement of the childand his/her family, with the goal of providingintensive, individualized services and support tofamilies allowing the child to be placed in a stable,permanent family environment.
Supported educational achievement of foster youthin the 12th grade, including children in San PasqualAcademy and other residential settings, by ensuring83% (126 of 152) earned a high school diploma orequivalent, below the target of 85% due to thecomplex needs of youth remaining in foster care.Established the Extended Foster Care program topromote the successful transition of former fosteryouth, ages 18 through 21 years who otherwisewould have aged out of the system at age 18, toadulthood. In the first year, 302 youth receivedtransitional services. All youth turning 18 areautomatically enrolled in the program and have theright to opt out if desired. As part of this newprogram, 2 specialized units with 16 protectiveservice workers were established.
2013-15 Objectives
Ensure integration and achievement of Live Well San Diegostrategies to provide the right services, to the right people,at the right time for the best possible outcome.
Strategic Initiative – Safe CommunitiesBuild a better service delivery system to protect vulner-able children and youth by improving child welfarepractices.
Improve community engagement and serviceintegration by identifying new opportunities for co-location of Child Welfare Services staff with staff fromcommunity-based organizations and other publicagencies in order to make it easier for children andparents to access services in their neighborhoodsand in familiar environments.
221Health and Human Services Agency Adopted Operational Plan Fiscal Years 2013-2014 and 2014-2015
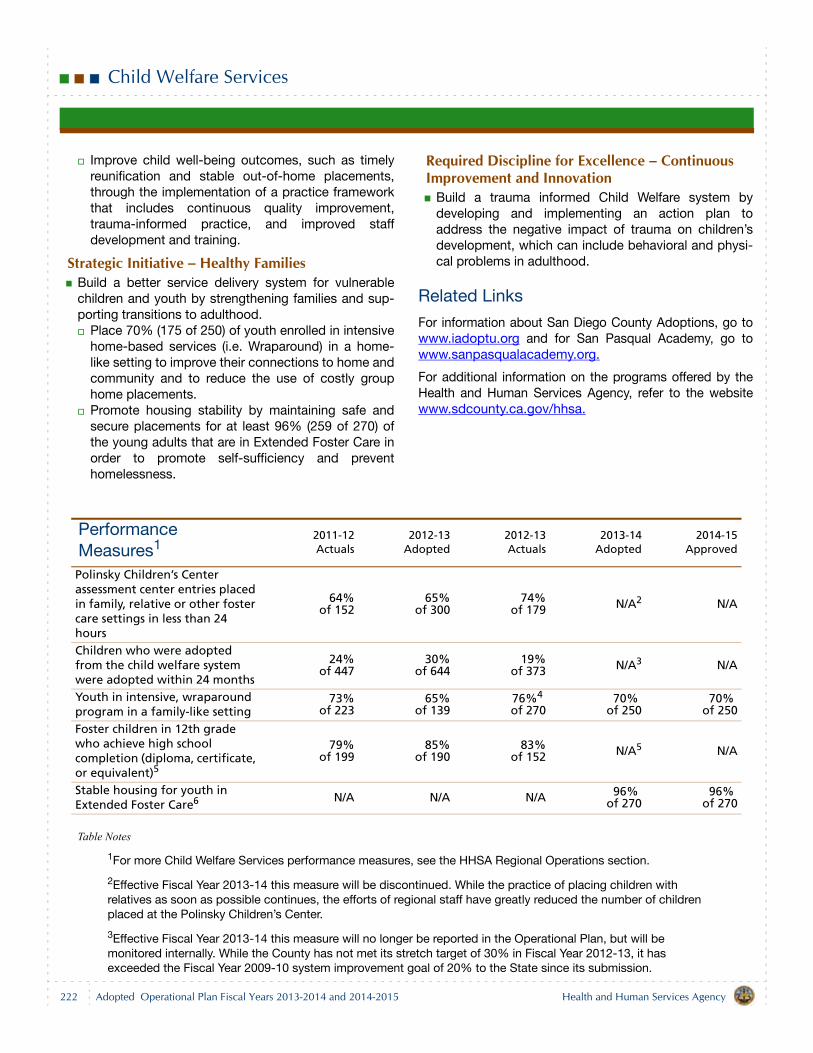
Child Welfare Services
Improve child well-being outcomes, such as timelyreunification and stable out-of-home placements,through the implementation of a practice frameworkthat includes continuous quality improvement,trauma-informed practice, and improved staffdevelopment and training.
Strategic Initiative – Healthy FamiliesBuild a better service delivery system for vulnerablechildren and youth by strengthening families and sup-porting transitions to adulthood.
Place 70% (175 of 250) of youth enrolled in intensivehome-based services (i.e. Wraparound) in a home-like setting to improve their connections to home andcommunity and to reduce the use of costly grouphome placements.Promote housing stability by maintaining safe andsecure placements for at least 96% (259 of 270) ofthe young adults that are in Extended Foster Care inorder to promote self-sufficiency and preventhomelessness.
Required Discipline for Excellence – Continuous Improvement and Innovation
Build a trauma informed Child Welfare system bydeveloping and implementing an action plan toaddress the negative impact of trauma on children’sdevelopment, which can include behavioral and physi-cal problems in adulthood.
Related Links
For information about San Diego County Adoptions, go towww.iadoptu.org and for San Pasqual Academy, go towww.sanpasqualacademy.org.
For additional information on the programs offered by theHealth and Human Services Agency, refer to the websitewww.sdcounty.ca.gov/hhsa.
Table Notes
1For more Child Welfare Services performance measures, see the HHSA Regional Operations section.
2Effective Fiscal Year 2013-14 this measure will be discontinued. While the practice of placing children with relatives as soon as possible continues, the efforts of regional staff have greatly reduced the number of children placed at the Polinsky Children’s Center.
3Effective Fiscal Year 2013-14 this measure will no longer be reported in the Operational Plan, but will be monitored internally. While the County has not met its stretch target of 30% in Fiscal Year 2012-13, it has exceeded the Fiscal Year 2009-10 system improvement goal of 20% to the State since its submission.
Performance Measures1
2011-12Actuals
2012-13Adopted
2012-13Actuals
2013-14Adopted
2014-15Approved
Polinsky Children’s Center assessment center entries placed in family, relative or other foster care settings in less than 24 hours
64%of 152
65%of 300
74%of 179 N/A2 N/A
Children who were adopted from the child welfare system were adopted within 24 months
24%of 447
30%of 644
19%of 373 N/A3 N/A
Youth in intensive, wraparound program in a family-like setting
73%of 223
65%of 139
76%4 of 270
70% of 250
70% of 250
Foster children in 12th grade who achieve high school completion (diploma, certificate, or equivalent)5
79%of 199
85%of 190
83%of 152 N/A5 N/A
Stable housing for youth in Extended Foster Care6 N/A N/A N/A 96%
of 27096%
of 270
222 Health and Human Services AgencyAdopted Operational Plan Fiscal Years 2013-2014 and 2014-2015
Child Welfare Services
4The increase in youth in the wraparound program is due to the increase in referrals from the Probation department.
5Effective Fiscal Year 2013-14 this measure will no longer be reported in the Operational Plan, but will be monitored internally. Foster care graduation rates in the State and nation range from 50% to 80%.
6This is a new measure effective Fiscal Year 2013-14 to replace the measure for “foster care graduation.”
Budget Changes and Operational Impact: 2012-13 to 2013-14
StaffingNet increase of 34.50 staff years.
Increase of 10.25 staff years related to the passage ofAssembly Bill (AB) 12, the California Fostering Connec-tions to Success Act.Increase of 14.00 staff years due to a transfer fromRegional Operations.Increase of 5.00 staff years due to a transfer fromBehavioral Health Services (BHS).Increase of 3.25 staff years due to a transfer from Pub-lic Health Services (PHS).Increase of 1.00 staff year due to a transfer from Strate-gic Planning and Operational Support (SPOS).Increase of 1.00 staff year due to a transfer fromAdministrative Support.
The following breakdown shows the same net change instaffing presented by program.
Increase of 34.50 staff years in Child Welfare Services.Increase 15.50 staff years related to the passage ofAB 12 the addition of 6.25 staff years, the transfer inof 4.00 staff years from BHS, the transfer in of 3.25staff years from PHS and the transfer in of 2.00 staffyears from Regional Child Welfare Services (RCWS).Increase of 19.00 staff years due to the transfer in of14.00 staff years from RCWS, the transfer in of 1.00staff year from Regional Self Sufficiency Eligibility(RSSE), the transfer in of 1.00 staff year from BHS,the transfer in of 1.00 staff year from HHSA HumanResources, the transfer in of 1.00 staff year fromFoster Care, the transfer in of 1.00 staff year fromAdoptions and the transfer in of 1.00 staff year fromSPOS, offset by the transfer out of 1.00 staff year toNorth Central region due to programmatic needs.
Increase of 1.00 staff year in Foster Care due to theaddition of 4.00 staff years related to the passage ofAB 12, offset by the transfer out of 1.00 staff year to
Child Welfare Services, the transfer out of 1.00 staffyear to RSSE and the transfer out of 1.00 staff year toRCWS.Decrease of 1.00 staff year in Adoptions due to thetransfer out of 1.00 staff year to Child Welfare Services.
ExpendituresNet increase of $16.1 million.
Salaries and Benefits — increase of $3.9 million due tothe addition of 34.50 staff years and an increase inCounty retirement contributions.Services and Supplies — increase of $9.7 million.
Increase of $6.2 million due to the transfer ofWraparound contracts from Behavioral HealthServices.Increase of $1.3 million for the expansion of theTransitional Housing Program to serve emancipatedyouth. Increase of $1.1 million in Child Abuse FoundationCommission contracts from Strategic Planning andOperational Support. Increase of $0.2 million for the Kinship SupportServices to serve the increasing number of relativecaregivers for foster children.Increase of $0.2 million for the Cultural Brokercontract to enhance child safety and family stabilityoutcomes for children.Increase of $0.6 million in various services andsupplies primarily related to the increase in staffyears including rents and leases, internal servicefunds charges, and information technology costs.
Other Charges — increase of $2.6 million.Increase of $4.6 million in Aid for Adopted Childrento align with caseload trends.Decrease of $2.0 million in Foster Care to align withcaseload trends.
RevenuesNet increase of $16.1 million.
Intergovernmental Revenues — increase of $17.6 mil-lion.
223Health and Human Services Agency Adopted Operational Plan Fiscal Years 2013-2014 and 2014-2015
Child Welfare Services
Increase of $9.1 million in Realignment revenues.Increase of $4.2 million in funding associated withthe transfer of the Wraparound program fromBehavioral Health Services (BHS).Increase of $1.5 million in Behavioral HealthRealignment associated with the transfer of theWraparound program from BHS.Increase of $2.1 million due to an anticipatedincrease in Aid for Adopted Children payments.Increase of $1.2 million in Wraparound revenue dueto an increase of $0.7 million associated with theexpansion of the Transitional Housing Program and$0.5 million due to the transfer of the Wraparoundprogram from BHS.Increase of $0.5 million in Realignment revenuesassociated with Domestic Violence contracts.Increase of $0.1 million in federal funding related tothe transfer in of the Child Abuse FoundationCommission contracts.Decrease of $1.0 million due to a reduction in FosterCare.Decrease of $0.1 million due to a reduction in FamilyIntegrated Treatment grant funding.
Charges for Current Services — increase of $0.3 mil-lion.
Increase of $1.0 million in Child Abuse fees related tothe transfer in of the Child Abuse FoundationCommission contracts.
Increase of $0.4 million in Developmental Screeningand Enhancement Program (DSEP) contracts withthe addition of Healthy Development Services, a First5 funded service.Decrease of $1.1 million due to the reduction of theKidSTART program which was transferred to First 5San Diego.
Miscellaneous Revenues — decrease of $1.7 millionrelated to Transitional Housing Program revenue, whichis now realized in Intergovernmental Revenues.Use of Fund Balance — decrease of $0.2 million. Atotal of $0.2 million is budgeted for the Cultural Brokercontract to enhance the child safety and family stabilityoutcomes for children.General Purpose Revenue Allocation — increase of$0.04 million to cover operating costs.
Budget Changes and Operational Impact: 2013-14 to 2014-15
Net increase of $1.2 million is the result of an increase of$1.4 million in Salaries and Benefits due to an increase inCounty retirement contributions, offset by $0.2 milliondecrease in Services and Supplies.
224 Health and Human Services AgencyAdopted Operational Plan Fiscal Years 2013-2014 and 2014-2015
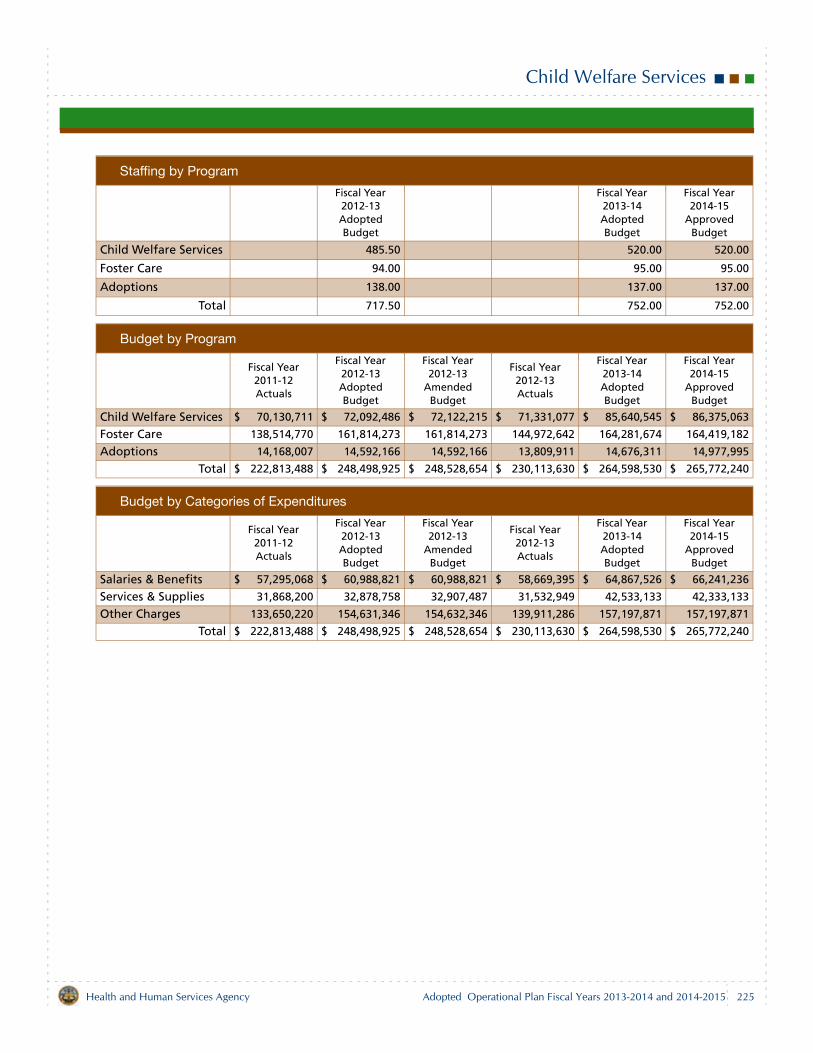
Child Welfare Services
Staffing by Program
Fiscal Year 2012-13 Adopted Budget
Fiscal Year 2013-14 Adopted Budget
Fiscal Year 2014-15
Approved Budget
Child Welfare Services 485.50 520.00 520.00
Foster Care 94.00 95.00 95.00
Adoptions 138.00 137.00 137.00
Total 717.50 752.00 752.00
Budget by Program
Fiscal Year 2011-12 Actuals
Fiscal Year 2012-13 Adopted Budget
Fiscal Year 2012-13
Amended Budget
Fiscal Year 2012-13 Actuals
Fiscal Year 2013-14 Adopted Budget
Fiscal Year 2014-15
Approved Budget
Child Welfare Services $ 70,130,711 $ 72,092,486 $ 72,122,215 $ 71,331,077 $ 85,640,545 $ 86,375,063
Foster Care 138,514,770 161,814,273 161,814,273 144,972,642 164,281,674 164,419,182
Adoptions 14,168,007 14,592,166 14,592,166 13,809,911 14,676,311 14,977,995
Total $ 222,813,488 $ 248,498,925 $ 248,528,654 $ 230,113,630 $ 264,598,530 $ 265,772,240
Budget by Categories of Expenditures
Fiscal Year 2011-12 Actuals
Fiscal Year 2012-13 Adopted Budget
Fiscal Year 2012-13
Amended Budget
Fiscal Year 2012-13 Actuals
Fiscal Year 2013-14 Adopted Budget
Fiscal Year 2014-15
Approved Budget
Salaries & Benefits $ 57,295,068 $ 60,988,821 $ 60,988,821 $ 58,669,395 $ 64,867,526 $ 66,241,236
Services & Supplies 31,868,200 32,878,758 32,907,487 31,532,949 42,533,133 42,333,133
Other Charges 133,650,220 154,631,346 154,632,346 139,911,286 157,197,871 157,197,871
Total $ 222,813,488 $ 248,498,925 $ 248,528,654 $ 230,113,630 $ 264,598,530 $ 265,772,240
225Health and Human Services Agency Adopted Operational Plan Fiscal Years 2013-2014 and 2014-2015
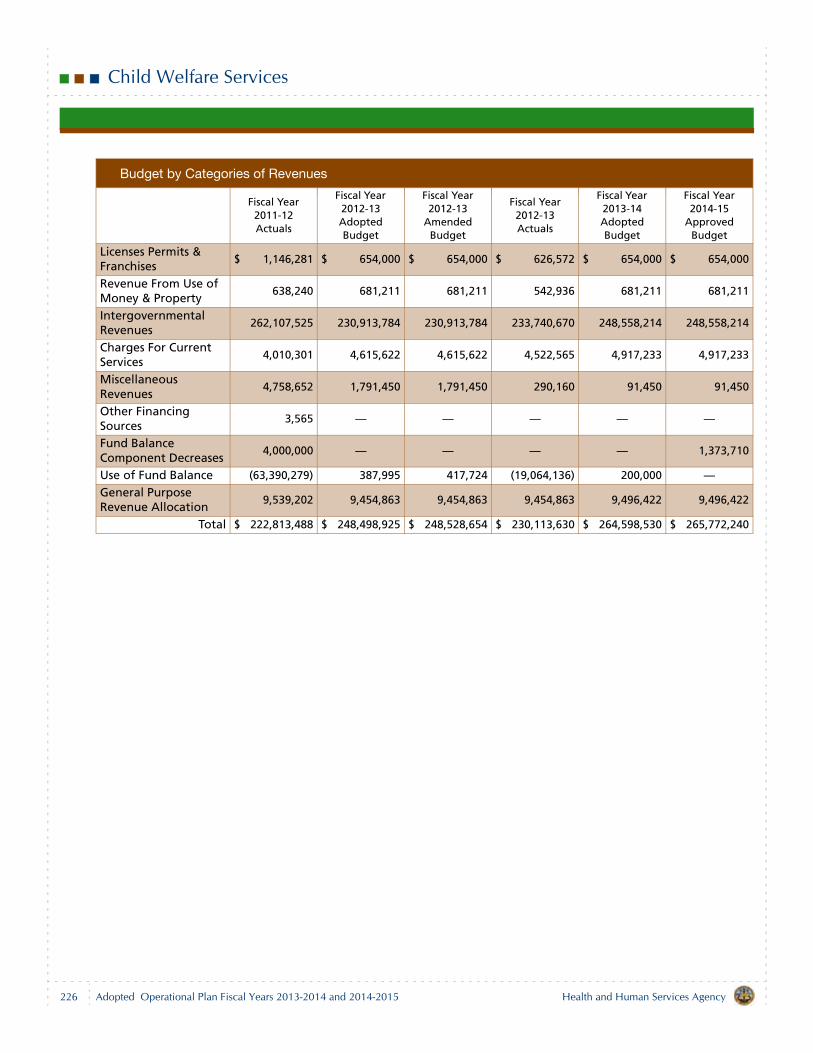
Child Welfare Services
Budget by Categories of Revenues
Fiscal Year 2011-12 Actuals
Fiscal Year 2012-13 Adopted Budget
Fiscal Year 2012-13
Amended Budget
Fiscal Year 2012-13 Actuals
Fiscal Year 2013-14 Adopted Budget
Fiscal Year 2014-15
Approved Budget
Licenses Permits & Franchises
$ 1,146,281 $ 654,000 $ 654,000 $ 626,572 $ 654,000 $ 654,000
Revenue From Use of Money & Property
638,240 681,211 681,211 542,936 681,211 681,211
Intergovernmental Revenues
262,107,525 230,913,784 230,913,784 233,740,670 248,558,214 248,558,214
Charges For Current Services
4,010,301 4,615,622 4,615,622 4,522,565 4,917,233 4,917,233
Miscellaneous Revenues
4,758,652 1,791,450 1,791,450 290,160 91,450 91,450
Other Financing Sources
3,565 — — — — —
Fund Balance Component Decreases
4,000,000 — — — — 1,373,710
Use of Fund Balance (63,390,279) 387,995 417,724 (19,064,136) 200,000 —General Purpose Revenue Allocation
9,539,202 9,454,863 9,454,863 9,454,863 9,496,422 9,496,422
Total $ 222,813,488 $ 248,498,925 $ 248,528,654 $ 230,113,630 $ 264,598,530 $ 265,772,240
226 Health and Human Services AgencyAdopted Operational Plan Fiscal Years 2013-2014 and 2014-2015
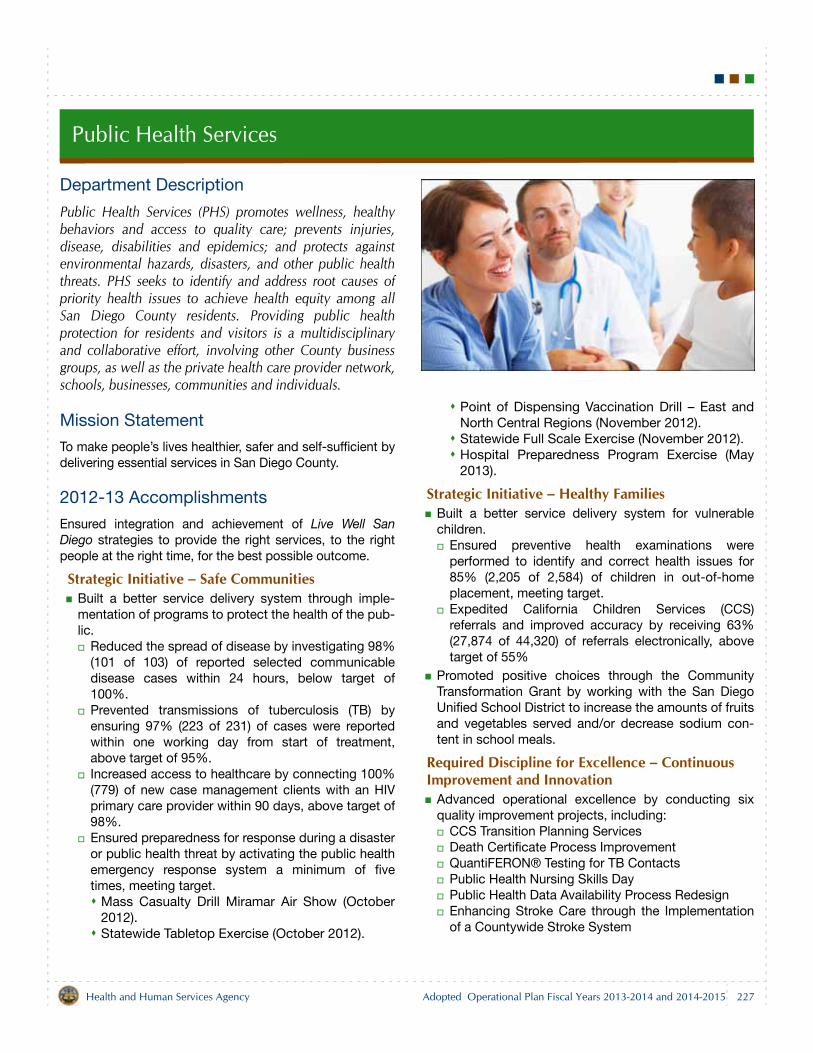
Public Health Services
Department Description
Public Health Services (PHS) promotes wellness, healthybehaviors and access to quality care; prevents injuries,disease, disabilities and epidemics; and protects againstenvironmental hazards, disasters, and other public healththreats. PHS seeks to identify and address root causes ofpriority health issues to achieve health equity among allSan Diego County residents. Providing public healthprotection for residents and visitors is a multidisciplinaryand collaborative effort, involving other County businessgroups, as well as the private health care provider network,schools, businesses, communities and individuals.
Mission Statement
To make people’s lives healthier, safer and self-sufficient bydelivering essential services in San Diego County.
2012-13 Accomplishments
Ensured integration and achievement of Live Well SanDiego strategies to provide the right services, to the rightpeople at the right time, for the best possible outcome.
Strategic Initiative – Safe CommunitiesBuilt a better service delivery system through imple-mentation of programs to protect the health of the pub-lic.
Reduced the spread of disease by investigating 98%(101 of 103) of reported selected communicabledisease cases within 24 hours, below target of100%.Prevented transmissions of tuberculosis (TB) byensuring 97% (223 of 231) of cases were reportedwithin one working day from start of treatment,above target of 95%.Increased access to healthcare by connecting 100%(779) of new case management clients with an HIVprimary care provider within 90 days, above target of98%.Ensured preparedness for response during a disasteror public health threat by activating the public healthemergency response system a minimum of fivetimes, meeting target.
Mass Casualty Drill Miramar Air Show (October2012).Statewide Tabletop Exercise (October 2012).
Point of Dispensing Vaccination Drill – East andNorth Central Regions (November 2012).Statewide Full Scale Exercise (November 2012).Hospital Preparedness Program Exercise (May2013).
Strategic Initiative – Healthy FamiliesBuilt a better service delivery system for vulnerablechildren.
Ensured preventive health examinations wereperformed to identify and correct health issues for85% (2,205 of 2,584) of children in out-of-homeplacement, meeting target.Expedited California Children Services (CCS)referrals and improved accuracy by receiving 63%(27,874 of 44,320) of referrals electronically, abovetarget of 55%
Promoted positive choices through the CommunityTransformation Grant by working with the San DiegoUnified School District to increase the amounts of fruitsand vegetables served and/or decrease sodium con-tent in school meals.
Required Discipline for Excellence – Continuous Improvement and Innovation
Advanced operational excellence by conducting sixquality improvement projects, including:
CCS Transition Planning Services Death Certificate Process ImprovementQuantiFERON® Testing for TB ContactsPublic Health Nursing Skills DayPublic Health Data Availability Process Redesign Enhancing Stroke Care through the Implementationof a Countywide Stroke System
227Health and Human Services Agency Adopted Operational Plan Fiscal Years 2013-2014 and 2014-2015
Public Health Services
2013-15 Objectives
Ensure integration and achievement of Live Well San Diegostrategies to provide the right services, to the right peopleat the right time, for the best possible outcome.
Strategic Initiative – Safe CommunitiesBuild a better service delivery system through imple-mentation of programs to protect the health of the pub-lic.
Reduce the spread of disease by investigating 99%(130) of reported selected communicable diseasecases within 24 hours.Prevent transmission of tuberculosis (TB) by ensuring96% (250 of 260) of cases are reported within oneworking day from start of treatment.Increase access to healthcare by connecting 98%(980 of 1,000) of new case management clients withan HIV primary care provider within 90 days.Ensure preparedness for response during a disasteror public health threat by activating the public healthemergency response system a minimum of fivetimes.Support Health and Human Services Agency (HHSA)regions in the implementation and monitoring of LiveWell San Diego Community Health ImprovementPlans.
Strategic Initiative – Healthy FamiliesBuild a better service delivery system for vulnerablechildren.
Ensure preventive health examinations areperformed to identify and correct health issues for86% (2,580 of 3,000) of children in out-of-homeplacement.
Expedite CCS referrals and improve accuracy byreceiving 60% (27,000 of 45,000) of referralselectronically.
Promote positive nutrition choices throughout thecounty.
Work with the San Diego Unified School District tochange procurement practices that will lead toimproved school meals that incorporate more freshfruits and vegetables and decrease sodium contentas part of the Community Transformation Grantactivities.
Implement the first year of the Supplemental NutritionAssistance Program Education (SNAP-Ed) activities, toprovide nutrition education and obesity prevention ser-vices to low-income families who are potentially eligiblefor the federally funded CalFresh food assistance pro-gram.
Required Discipline for Excellence – Continuous Improvement and Innovation
Advance operational excellence through continuousimprovement.
Conduct a minimum of six quality improvementprojects.
Apply to the Public Health Accreditation Board fornational public health accreditation.
Related Links
For health statistics that describe health behaviors, dis-eases and injuries for specific populations, health trendsand comparison to national targets, go to www.sdhealthstatistics.com.
For additional information about the programs offered bythe Health and Human Services Agency, refer to the web-site www.sdcounty.ca.gov/hhsa.
228 Health and Human Services AgencyAdopted Operational Plan Fiscal Years 2013-2014 and 2014-2015
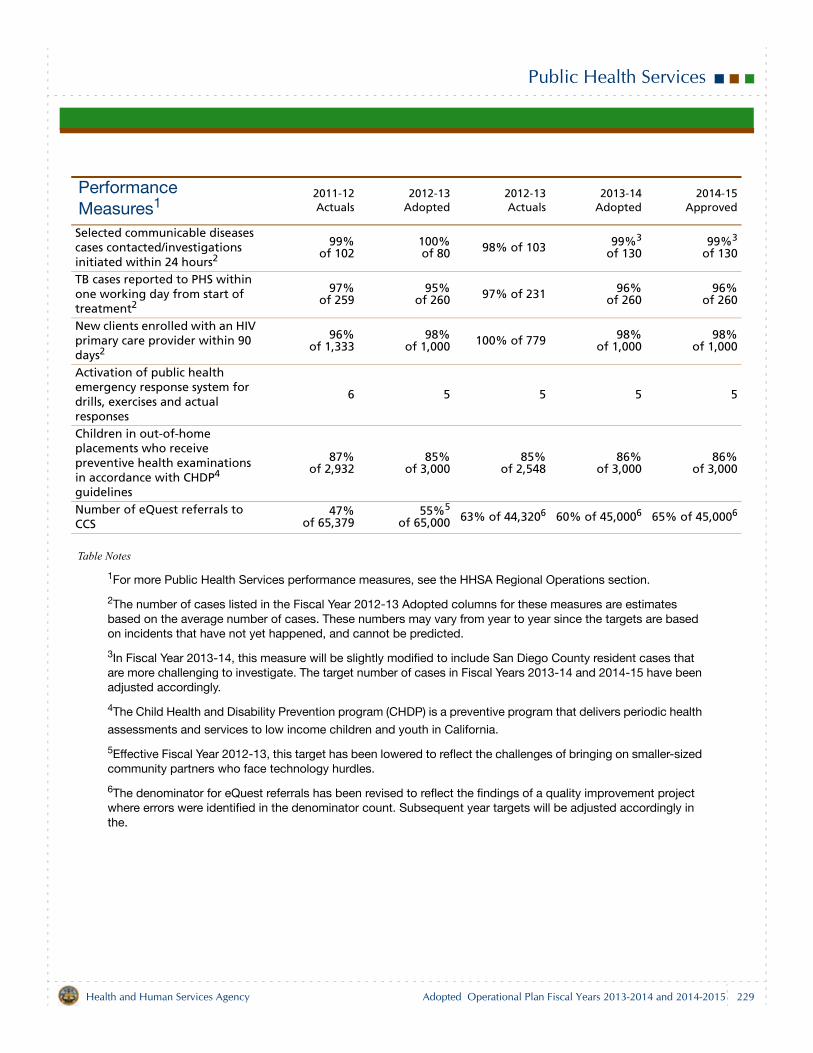
Public Health Services
Table Notes
1For more Public Health Services performance measures, see the HHSA Regional Operations section.
2The number of cases listed in the Fiscal Year 2012-13 Adopted columns for these measures are estimates based on the average number of cases. These numbers may vary from year to year since the targets are based on incidents that have not yet happened, and cannot be predicted.
3In Fiscal Year 2013-14, this measure will be slightly modified to include San Diego County resident cases that are more challenging to investigate. The target number of cases in Fiscal Years 2013-14 and 2014-15 have been adjusted accordingly.
4The Child Health and Disability Prevention program (CHDP) is a preventive program that delivers periodic health
assessments and services to low income children and youth in California.
5Effective Fiscal Year 2012-13, this target has been lowered to reflect the challenges of bringing on smaller-sized community partners who face technology hurdles.
6The denominator for eQuest referrals has been revised to reflect the findings of a quality improvement project where errors were identified in the denominator count. Subsequent year targets will be adjusted accordingly in the.
Performance Measures1
2011-12Actuals
2012-13Adopted
2012-13Actuals
2013-14Adopted
2014-15Approved
Selected communicable diseases cases contacted/investigations initiated within 24 hours2
99%of 102
100%of 80 98% of 103 99%3
of 13099%3
of 130
TB cases reported to PHS within one working day from start of treatment2
97%of 259
95%of 260 97% of 231 96%
of 26096%
of 260
New clients enrolled with an HIV primary care provider within 90 days2
96%of 1,333
98%of 1,000 100% of 779 98%
of 1,00098%
of 1,000
Activation of public health emergency response system for drills, exercises and actual responses
6 5 5 5 5
Children in out-of-home placements who receive preventive health examinations in accordance with CHDP4
guidelines
87%of 2,932
85%of 3,000
85% of 2,548
86%of 3,000
86%of 3,000
Number of eQuest referrals to CCS
47%of 65,379
55%5
of 65,000 63% of 44,3206 60% of 45,0006 65% of 45,0006
229Health and Human Services Agency Adopted Operational Plan Fiscal Years 2013-2014 and 2014-2015
Public Health Services
Budget Changes and Operational Impact: 2012-13 to 2013-14
StaffingNet increase of 0.75 staff years.
Increase of 3.00 staff years for SNAP-Ed project.Increase of 1.00 staff year in the Sexually TransmittedDisease Control unitIncrease of 1.00 staff year due to a transfer from Strate-gic Planning and Operational Support (SPOS). Decrease of 3.25 staff years due to a transfer to ChildWelfare Services (CWS) to support Assembly Bill (AB)12, the California Fostering Connections to SuccessAct (2010).Decrease of 1.00 staff year due to a transfer to HealthCare Policy Administration (HCPA).
The following breakdown shows the same net change instaffing presented by program.
Increase of 1.00 staff year in Administration and OtherServices due to the transfer in of 2.00 staff years fromInfectious Disease Control, offset by the transfer out of1.00 staff year to Prevention Services.Increase of 1.00 staff year in Emergency Medical Ser-vices due to the transfer in of 1.00 staff year fromSPOS.Decrease of 1.00 staff year in Infectious Disease Con-trol due to the transfer out of 2.00 staff years to Admin-istration and Other Services and offset by the transferin of 1.00 staff year from Prevention Services.Increase of 4.00 staff years in Prevention Services dueto the addition of 3.00 staff years for the SNAP-Ed proj-ect, the addition of 1.00 staff year in the Sexually Trans-mitted Disease Control unit to maintain services asmandated by law and the transfer in of 1.00 staff yearfrom Administration and Other Services, offset by thetransfer out of 1.00 staff year to Infectious Disease. Decrease of 4.25 staff years in CSS due to the transferout of 3.25 staff years to CWS to support AB 12 andthe transfer out of 1.00 staff year to HCPA.
ExpendituresNet increase of $4.3 million.
Salaries and Benefits — increase of $1.2 million primar-ily due to an increase in County retirement contribu-tions.Services and Supplies — net increase of $3.0 million.
Increase of $2.3 million for SNAP-Ed contractedservices.
Increase of $0.5 million for the San Diego BeaconCommunity Project.Increase of $0.4 million in one-time informationtechnology (IT) costs for the Lab InformationManagement System (LIMS) and PrehospitalInformation System Assessment.Increase of $0.3 million in annual user license costsfor the Web Referral & Census Track system.Increase of $0.3 million in various other services andsupplies.Decrease of $0.7 million in contracts and laboratoryservices related to the Expanded HIV Testing inHealthcare Settings program.
RevenuesNet increase of $4.3 million.
Intergovernmental Revenues — increase of $3.7 mil-lion.
Increase of $2.6 million for SNAP-Ed services.Increase of $1.5 million in Realignment.Increase of $0.3 million in federal Medi-CalAdministrative Activities/Targeted Case Management(MAA/TCM) Medicaid funding.Increase of $0.4 million in various other revenues toalign with allocations. Decrease of 0.7 million in Federal HIV Prevention andCare funding primarily associated with the end of theHIV Testing in Healthcare Settings program.Decrease of $0.4 million in federal AmericanRecovery and Reinvestment Act of 2009Communities Putting Prevention to Work funding.
Charges for Current Services — increase of $0.3 millionrelated to increased State fees for certified copies, theFirst 5 Rapid Digit Dialing grant and increased revenuefor non-resident transport fees for County Service Area17.Miscellaneous Revenues — decrease of $0.1 million.Use of Fund Balance — increase of $0.4 million to fundone-time technology projects. A total of $0.5 million isbudgeted to fund one-time projects related to ITupgrades.
Budget Changes and Operational Impact: 2013-14 to 2014-15
Net increase of $0.1 million is the result of an increase of$1.1 million in Salaries and Benefits due to an increase inCounty retirement contributions, offset by a decrease of$1.0 million in Services and Supplies.
230 Health and Human Services AgencyAdopted Operational Plan Fiscal Years 2013-2014 and 2014-2015
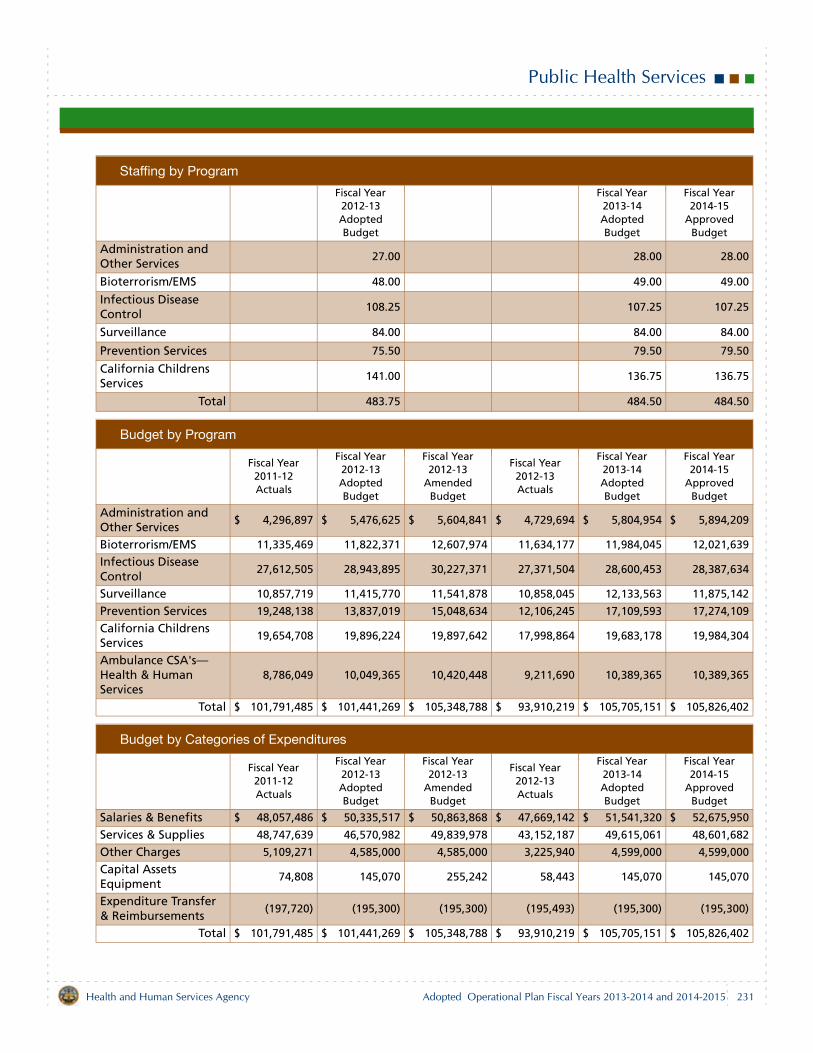
Public Health Services
Staffing by Program
Fiscal Year 2012-13 Adopted Budget
Fiscal Year 2013-14 Adopted Budget
Fiscal Year 2014-15
Approved Budget
Administration and Other Services
27.00 28.00 28.00
Bioterrorism/EMS 48.00 49.00 49.00
Infectious Disease Control
108.25 107.25 107.25
Surveillance 84.00 84.00 84.00
Prevention Services 75.50 79.50 79.50
California Childrens Services
141.00 136.75 136.75
Total 483.75 484.50 484.50
Budget by Program
Fiscal Year 2011-12 Actuals
Fiscal Year 2012-13 Adopted Budget
Fiscal Year 2012-13
Amended Budget
Fiscal Year 2012-13 Actuals
Fiscal Year 2013-14 Adopted Budget
Fiscal Year 2014-15
Approved Budget
Administration and Other Services
$ 4,296,897 $ 5,476,625 $ 5,604,841 $ 4,729,694 $ 5,804,954 $ 5,894,209
Bioterrorism/EMS 11,335,469 11,822,371 12,607,974 11,634,177 11,984,045 12,021,639
Infectious Disease Control
27,612,505 28,943,895 30,227,371 27,371,504 28,600,453 28,387,634
Surveillance 10,857,719 11,415,770 11,541,878 10,858,045 12,133,563 11,875,142
Prevention Services 19,248,138 13,837,019 15,048,634 12,106,245 17,109,593 17,274,109
California Childrens Services
19,654,708 19,896,224 19,897,642 17,998,864 19,683,178 19,984,304
Ambulance CSA's—Health & Human Services
8,786,049 10,049,365 10,420,448 9,211,690 10,389,365 10,389,365
Total $ 101,791,485 $ 101,441,269 $ 105,348,788 $ 93,910,219 $ 105,705,151 $ 105,826,402
Budget by Categories of Expenditures
Fiscal Year 2011-12 Actuals
Fiscal Year 2012-13 Adopted Budget
Fiscal Year 2012-13
Amended Budget
Fiscal Year 2012-13 Actuals
Fiscal Year 2013-14 Adopted Budget
Fiscal Year 2014-15
Approved Budget
Salaries & Benefits $ 48,057,486 $ 50,335,517 $ 50,863,868 $ 47,669,142 $ 51,541,320 $ 52,675,950
Services & Supplies 48,747,639 46,570,982 49,839,978 43,152,187 49,615,061 48,601,682
Other Charges 5,109,271 4,585,000 4,585,000 3,225,940 4,599,000 4,599,000
Capital Assets Equipment
74,808 145,070 255,242 58,443 145,070 145,070
Expenditure Transfer & Reimbursements
(197,720) (195,300) (195,300) (195,493) (195,300) (195,300)
Total $ 101,791,485 $ 101,441,269 $ 105,348,788 $ 93,910,219 $ 105,705,151 $ 105,826,402
231Health and Human Services Agency Adopted Operational Plan Fiscal Years 2013-2014 and 2014-2015
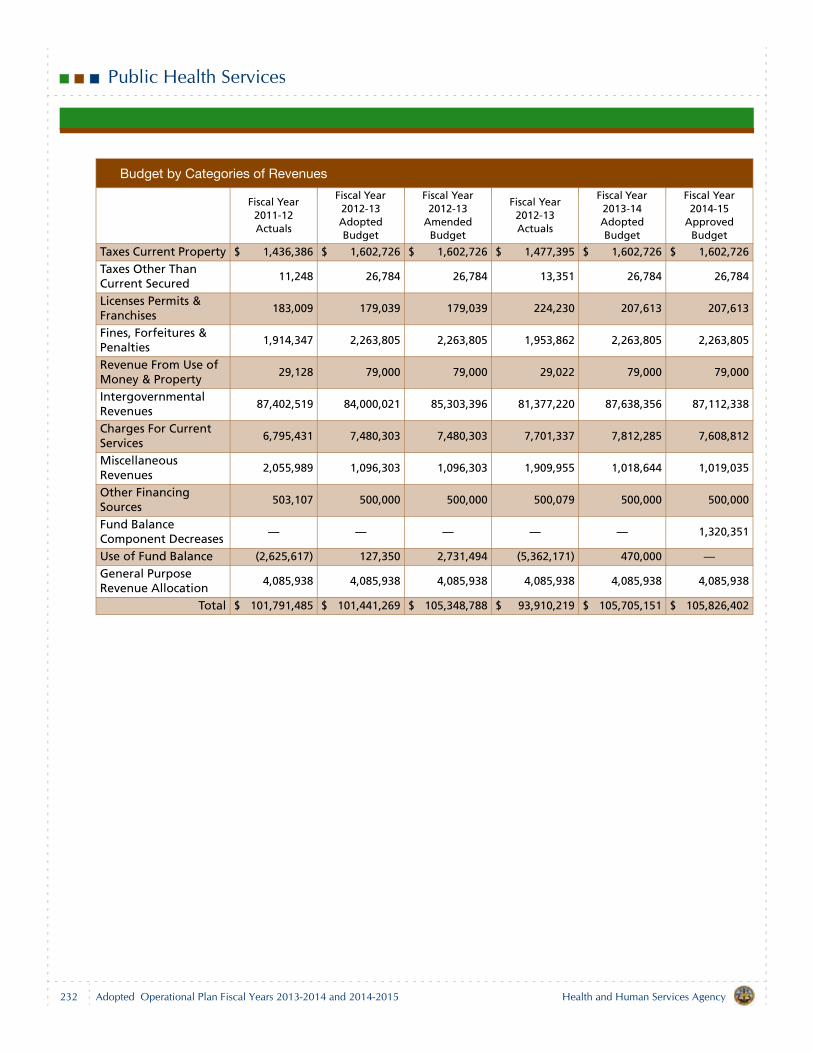
Public Health Services
Budget by Categories of Revenues
Fiscal Year 2011-12 Actuals
Fiscal Year 2012-13 Adopted Budget
Fiscal Year 2012-13
Amended Budget
Fiscal Year 2012-13 Actuals
Fiscal Year 2013-14 Adopted Budget
Fiscal Year 2014-15
Approved Budget
Taxes Current Property $ 1,436,386 $ 1,602,726 $ 1,602,726 $ 1,477,395 $ 1,602,726 $ 1,602,726
Taxes Other Than Current Secured
11,248 26,784 26,784 13,351 26,784 26,784
Licenses Permits & Franchises
183,009 179,039 179,039 224,230 207,613 207,613
Fines, Forfeitures & Penalties
1,914,347 2,263,805 2,263,805 1,953,862 2,263,805 2,263,805
Revenue From Use of Money & Property
29,128 79,000 79,000 29,022 79,000 79,000
Intergovernmental Revenues
87,402,519 84,000,021 85,303,396 81,377,220 87,638,356 87,112,338
Charges For Current Services
6,795,431 7,480,303 7,480,303 7,701,337 7,812,285 7,608,812
Miscellaneous Revenues
2,055,989 1,096,303 1,096,303 1,909,955 1,018,644 1,019,035
Other Financing Sources
503,107 500,000 500,000 500,079 500,000 500,000
Fund Balance Component Decreases
— — — — — 1,320,351
Use of Fund Balance (2,625,617) 127,350 2,731,494 (5,362,171) 470,000 —General Purpose Revenue Allocation
4,085,938 4,085,938 4,085,938 4,085,938 4,085,938 4,085,938
Total $ 101,791,485 $ 101,441,269 $ 105,348,788 $ 93,910,219 $ 105,705,151 $ 105,826,402
232 Health and Human Services AgencyAdopted Operational Plan Fiscal Years 2013-2014 and 2014-2015
Public Administrator/Public Guardian
Department Description
The Public Administrator/Public Guardian provides servicesto protect and manage the estates of decedents and at-riskindividuals who are unable to make decisions forthemselves. The Public Administrator (PA) administersestates of persons who die without a will or an appropriateperson to act as an administrator, protects the decedent’sproperty from waste, loss or theft and ensures the estate isadministered according to the decedent’s wishes. ThePublic Guardian (PG) serves as the legally appointedguardian or conservator for persons found by the courts tobe unable to take care of themselves or their assets -generally older, frail and vulnerable adults who are at riskor have been a victim of abuse or neglect.
Effective Fiscal Year 2013-14, Public Administrator/PublicGuardian, along with the Behavioral Health Conservatorunit, will become part of Aging & Independence Services toreflect the reorganization of the Health and Human ServiceAgency (HHSA), to improve effectiveness and efficiency inservice delivery.
Mission Statement
To make people’s lives healthier, safer and self-sufficient bydelivering essential services in San Diego County.
2012-13 Accomplishments
Ensured integration and achievement of Live Well SanDiego strategies to provide the right services, to the rightpeople, at the right time for the best possible outcome.
Strategic Initiative – Safe CommunitiesBuilt a better service delivery system by safeguardingand protecting vulnerable adults from financial, physi-cal and emotional abuse.
Ensured 100% (239) of conservatorshipinvestigations began within two business days ofreferral being assigned to an investigator asmandated by the Omnibus Conservatorship andGuardianship Reform Act, meeting target.Completed 99% (450 of 453) of face-to-face visitswith conservatees living in San Diego County within30 days of the date of their previous face-to-face
visit, exceeding the target of 85%, due to theimplementation of recommendations from anoperational review to mitigate risk to clients.Initiated 100% (495) of all bank inquiries within twobusiness days to safeguard and protect the assetsand resources of clients, above the target of 95%.Submitted 100% (6) of Inventory and Appraisalreports of all estate cases in the PG Program within90 days of receiving letters of conservatorship to thecourt, meeting target.Ensured 97% (1,085 of 1,114 ) of PA investigationsbegan within two business days of a referralassigned for investigation, exceeding the target of85%, due to focused efforts by management andstaff.Submitted 100% (16 Inventory and Appraisal reportsof all formal probate cases in the PA Program within120 days of receiving letters of Administration to theCourt. A formal probate case is an estate valued atmore than $150,000 and is under court supervision.
Required Discipline for Excellence – Skilled, Adaptable and Diverse Workforce
Advanced operational excellence of a skilled workforceby maintaining 100% (16) of mandated California StatePA/PG certification for applicable PA/PG staff in orderto improve services to conservatees and families ofdecedents.
Required Discipline for Excellence – Customer Satisfaction
Advanced operational excellence through service coor-dination by completing co-location with the MentalHealth Conservator Office to improve coordination ofservices with shared clients.
233Health and Human Services Agency Adopted Operational Plan Fiscal Years 2013-2014 and 2014-2015
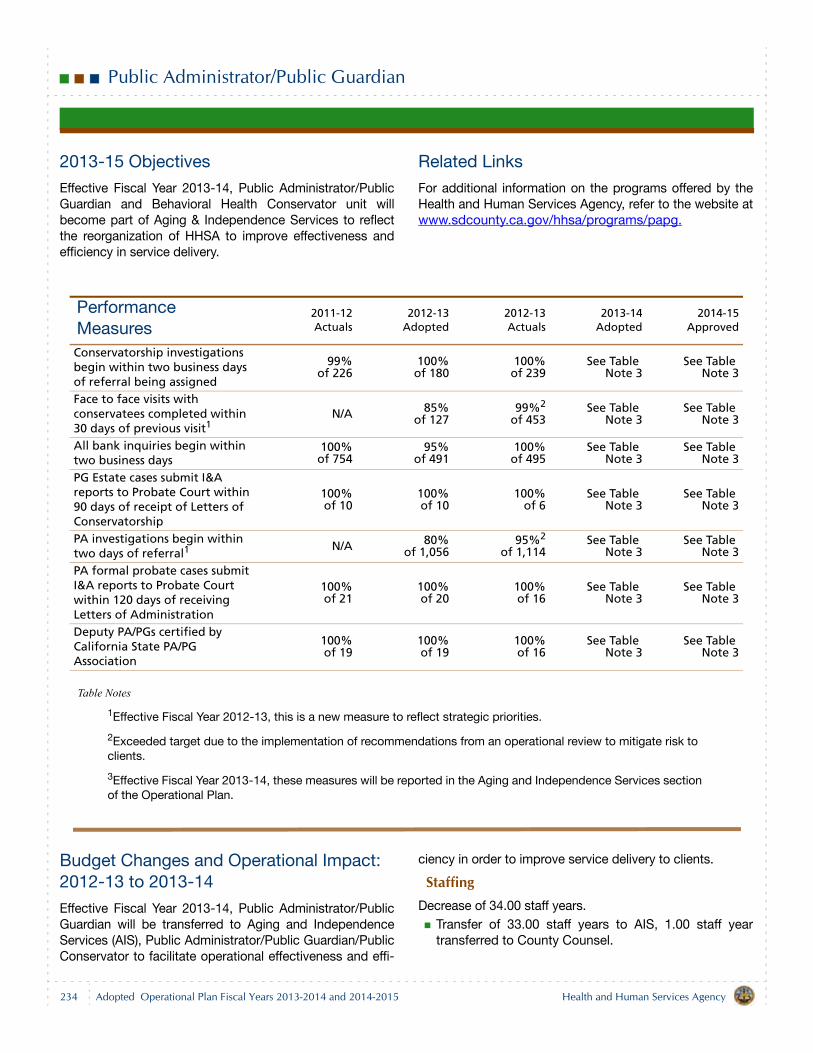
Public Administrator/Public Guardian
2013-15 Objectives
Effective Fiscal Year 2013-14, Public Administrator/PublicGuardian and Behavioral Health Conservator unit willbecome part of Aging & Independence Services to reflectthe reorganization of HHSA to improve effectiveness andefficiency in service delivery.
Related Links
For additional information on the programs offered by theHealth and Human Services Agency, refer to the website atwww.sdcounty.ca.gov/hhsa/programs/papg.
Table Notes
1Effective Fiscal Year 2012-13, this is a new measure to reflect strategic priorities.
2Exceeded target due to the implementation of recommendations from an operational review to mitigate risk to clients.
3Effective Fiscal Year 2013-14, these measures will be reported in the Aging and Independence Services section of the Operational Plan.
Budget Changes and Operational Impact: 2012-13 to 2013-14
Effective Fiscal Year 2013-14, Public Administrator/PublicGuardian will be transferred to Aging and IndependenceServices (AIS), Public Administrator/Public Guardian/PublicConservator to facilitate operational effectiveness and effi-
ciency in order to improve service delivery to clients.
StaffingDecrease of 34.00 staff years.
Transfer of 33.00 staff years to AIS, 1.00 staff yeartransferred to County Counsel.
Performance Measures
2011-12Actuals
2012-13Adopted
2012-13Actuals
2013-14Adopted
2014-15Approved
Conservatorship investigations begin within two business days of referral being assigned
99% of 226
100%of 180
100%of 239
See Table Note 3
See Table Note 3
Face to face visits with conservatees completed within 30 days of previous visit1
N/A 85%of 127
99%2
of 453See Table
Note 3See Table
Note 3
All bank inquiries begin within two business days
100%of 754
95%of 491
100%of 495
See Table Note 3
See Table Note 3
PG Estate cases submit I&A reports to Probate Court within 90 days of receipt of Letters of Conservatorship
100%of 10
100%of 10
100%of 6
See Table Note 3
See Table Note 3
PA investigations begin within two days of referral1
N/A 80%of 1,056
95%2
of 1,114See Table
Note 3See Table
Note 3
PA formal probate cases submit I&A reports to Probate Court within 120 days of receiving Letters of Administration
100%of 21
100%of 20
100%of 16
See Table Note 3
See Table Note 3
Deputy PA/PGs certified by California State PA/PG Association
100%of 19
100%of 19
100%of 16
See Table Note 3
See Table Note 3
234 Health and Human Services AgencyAdopted Operational Plan Fiscal Years 2013-2014 and 2014-2015
Public Administrator/Public Guardian
ExpendituresDecrease of $4.5 million.
RevenuesDecrease of $4.5 million.
235Health and Human Services Agency Adopted Operational Plan Fiscal Years 2013-2014 and 2014-2015
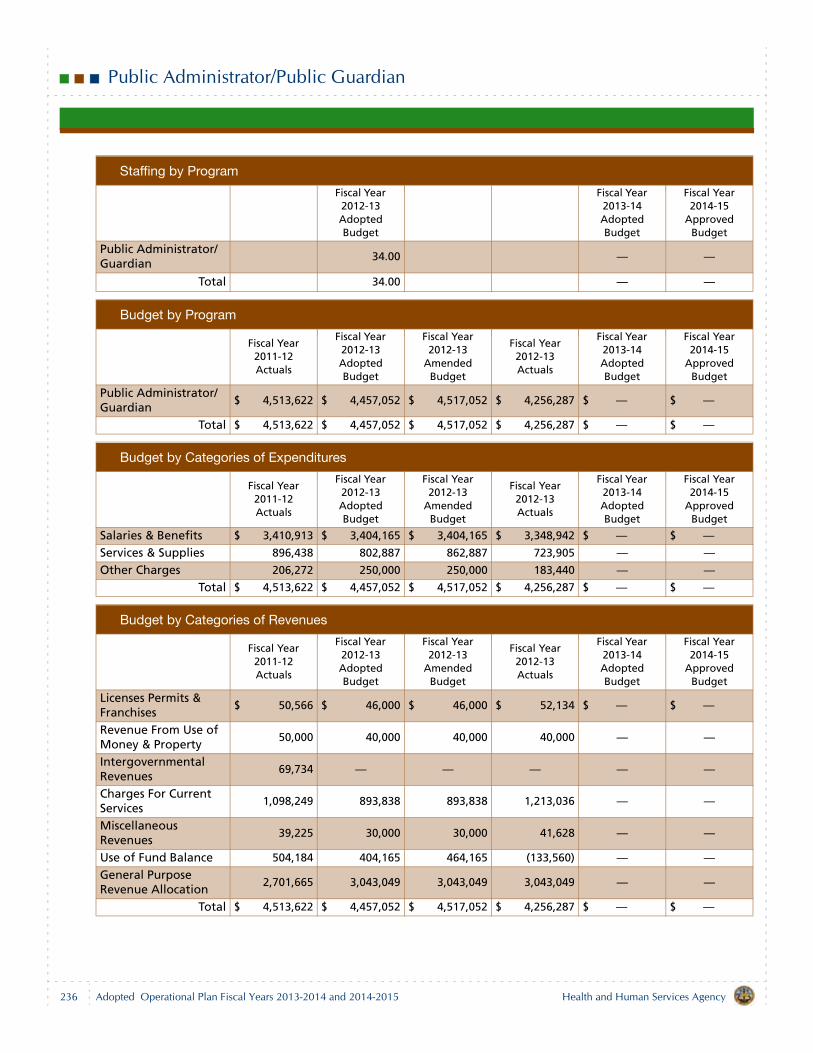
Public Administrator/Public Guardian
Staffing by Program
Fiscal Year 2012-13 Adopted Budget
Fiscal Year 2013-14 Adopted Budget
Fiscal Year 2014-15
Approved Budget
Public Administrator/Guardian
34.00 — —
Total 34.00 — —
Budget by Program
Fiscal Year 2011-12 Actuals
Fiscal Year 2012-13 Adopted Budget
Fiscal Year 2012-13
Amended Budget
Fiscal Year 2012-13 Actuals
Fiscal Year 2013-14 Adopted Budget
Fiscal Year 2014-15
Approved Budget
Public Administrator/Guardian
$ 4,513,622 $ 4,457,052 $ 4,517,052 $ 4,256,287 $ — $ —
Total $ 4,513,622 $ 4,457,052 $ 4,517,052 $ 4,256,287 $ — $ —
Budget by Categories of Expenditures
Fiscal Year 2011-12 Actuals
Fiscal Year 2012-13 Adopted Budget
Fiscal Year 2012-13
Amended Budget
Fiscal Year 2012-13 Actuals
Fiscal Year 2013-14 Adopted Budget
Fiscal Year 2014-15
Approved Budget
Salaries & Benefits $ 3,410,913 $ 3,404,165 $ 3,404,165 $ 3,348,942 $ — $ —
Services & Supplies 896,438 802,887 862,887 723,905 — —Other Charges 206,272 250,000 250,000 183,440 — —
Total $ 4,513,622 $ 4,457,052 $ 4,517,052 $ 4,256,287 $ — $ —
Budget by Categories of Revenues
Fiscal Year 2011-12 Actuals
Fiscal Year 2012-13 Adopted Budget
Fiscal Year 2012-13
Amended Budget
Fiscal Year 2012-13 Actuals
Fiscal Year 2013-14 Adopted Budget
Fiscal Year 2014-15
Approved Budget
Licenses Permits & Franchises
$ 50,566 $ 46,000 $ 46,000 $ 52,134 $ — $ —
Revenue From Use of Money & Property
50,000 40,000 40,000 40,000 — —
Intergovernmental Revenues
69,734 — — — — —
Charges For Current Services
1,098,249 893,838 893,838 1,213,036 — —
Miscellaneous Revenues
39,225 30,000 30,000 41,628 — —
Use of Fund Balance 504,184 404,165 464,165 (133,560) — —General Purpose Revenue Allocation
2,701,665 3,043,049 3,043,049 3,043,049 — —
Total $ 4,513,622 $ 4,457,052 $ 4,517,052 $ 4,256,287 $ — $ —
236 Health and Human Services AgencyAdopted Operational Plan Fiscal Years 2013-2014 and 2014-2015
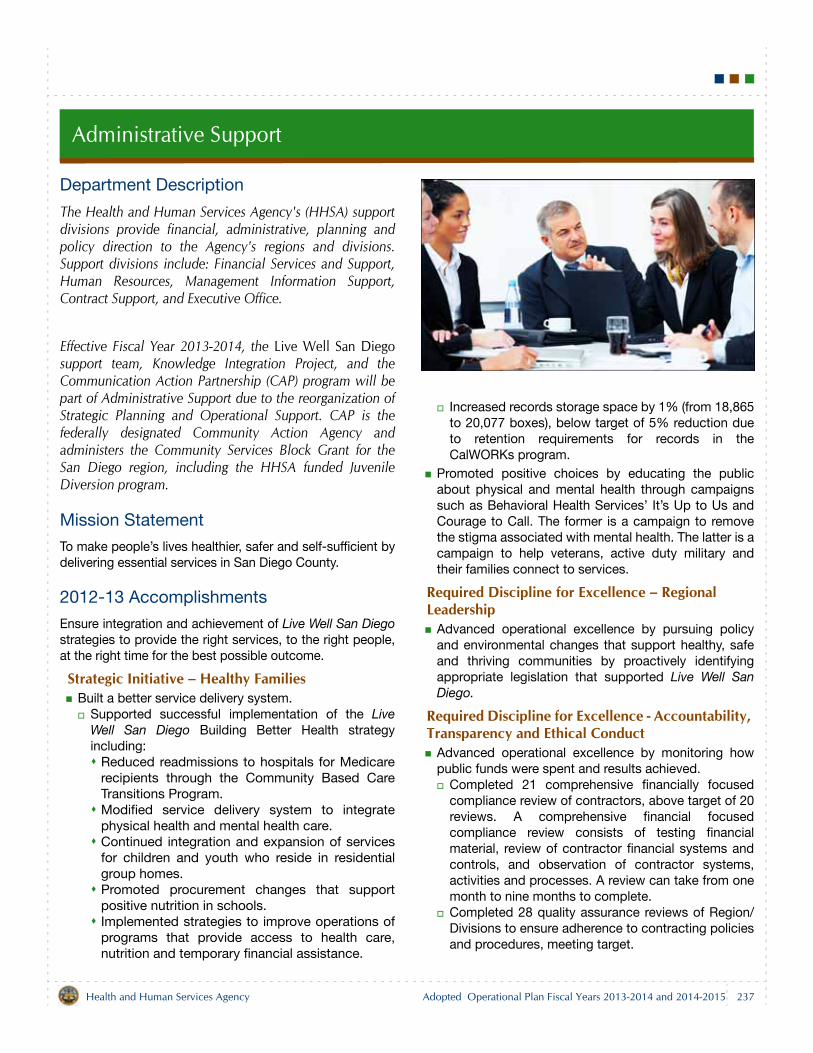
Administrative Support
Department Description
The Health and Human Services Agency's (HHSA) supportdivisions provide financial, administrative, planning andpolicy direction to the Agency's regions and divisions.Support divisions include: Financial Services and Support,Human Resources, Management Information Support,Contract Support, and Executive Office.
Effective Fiscal Year 2013-2014, the Live Well San Diegosupport team, Knowledge Integration Project, and theCommunication Action Partnership (CAP) program will bepart of Administrative Support due to the reorganization ofStrategic Planning and Operational Support. CAP is thefederally designated Community Action Agency andadministers the Community Services Block Grant for theSan Diego region, including the HHSA funded JuvenileDiversion program.
Mission Statement
To make people’s lives healthier, safer and self-sufficient bydelivering essential services in San Diego County.
2012-13 Accomplishments
Ensure integration and achievement of Live Well San Diegostrategies to provide the right services, to the right people,at the right time for the best possible outcome.
Strategic Initiative – Healthy FamiliesBuilt a better service delivery system.
Supported successful implementation of the LiveWell San Diego Building Better Health strategyincluding:
Reduced readmissions to hospitals for Medicarerecipients through the Community Based CareTransitions Program. Modified service delivery system to integratephysical health and mental health care.Continued integration and expansion of servicesfor children and youth who reside in residentialgroup homes. Promoted procurement changes that supportpositive nutrition in schools. Implemented strategies to improve operations ofprograms that provide access to health care,nutrition and temporary financial assistance.
Increased records storage space by 1% (from 18,865to 20,077 boxes), below target of 5% reduction dueto retention requirements for records in theCalWORKs program.
Promoted positive choices by educating the publicabout physical and mental health through campaignssuch as Behavioral Health Services’ It’s Up to Us andCourage to Call. The former is a campaign to removethe stigma associated with mental health. The latter is acampaign to help veterans, active duty military andtheir families connect to services.
Required Discipline for Excellence – Regional Leadership
Advanced operational excellence by pursuing policyand environmental changes that support healthy, safeand thriving communities by proactively identifyingappropriate legislation that supported Live Well SanDiego.
Required Discipline for Excellence - Accountability, Transparency and Ethical Conduct
Advanced operational excellence by monitoring howpublic funds were spent and results achieved.
Completed 21 comprehensive financially focusedcompliance review of contractors, above target of 20reviews. A comprehensive financial focusedcompliance review consists of testing financialmaterial, review of contractor financial systems andcontrols, and observation of contractor systems,activities and processes. A review can take from onemonth to nine months to complete.Completed 28 quality assurance reviews of Region/Divisions to ensure adherence to contracting policiesand procedures, meeting target.
237Health and Human Services Agency Adopted Operational Plan Fiscal Years 2013-2014 and 2014-2015
Administrative Support
Required Discipline for Excellence – Information Services
Advanced operational excellence through technologyby supporting improvements in HHSA’s technologicalframework to help HHSA build a better service deliverysystem.
Began the process of enhancing or replacing legacyinformation technology (IT) systems so they will becapable of interfacing with the Enterprise InformationExchange (EIE) technology. EIE will allow various ITsystems that could not interact to be able toexchange information.Ensured any new IT systems met the criteria forinterfacing with EIE by evaluating all newapplications and presenting to the HHSA InformationManagement Steering Committee for review andapproval.
Required Discipline for Excellence – Skilled, Adaptable and Diverse Workforce
Advanced operational excellence through a skilledworkforce by implementing the second phase of thesuccession plan to advance the Live Well San Diegoinitiative. This phase incorporates the Department ofHuman Resources countywide succession plan.
2013-15 Objectives
Ensure integration and achievement of Live Well San Diegostrategies to provide the right services, to the right people,at the right time for the best possible outcome.
Strategic Initiative – Safe CommunitiesSupport positive choices by ensuring 50% (650 of1,300) of youth participating in a juvenile diversion pro-gram do not enter, or reenter, the system.
Required Discipline for Excellence – Skilled, Adaptable and Diverse Workforce
Support operational excellence in the workforce byimplementing a comprehensive ergonomic plan,including a thorough assessment of new employeeswithin 90 days of their start date.
Required Discipline for Excellence – Accountability, Transparency and Ethical Conduct
Advance operational excellence by ensuring publicfunds are used in accordance with funding require-ments.
Complete 21 comprehensive financially focusedcompliance reviews of contractors. A comprehensivefinancial focused compliance review consists of
testing financial material, review of contractorfinancial systems and controls, and observation ofcontractor systems, activities and processes. Areview can take from one month to nine months tocomplete. Complete 15 quality assurance reviews of Region/Divisions to ensure adherence to contracting policiesand procedures. Beginning Fiscal Year 2013-14, theselection methodology for review has been revisedto reflect integration of administrative efforts withinHHSA. All departments with contracts will receiveone integrated quality assurance review report.Departments, such as Behavioral Health Services(BHS) and Public Health Services (PHS), both withmore than 100 contracts will receive two integratedquality assurance review reports. Conduct 15 internal reviews of offices with pettycash to ensure appropriate controls are in place.
Required Discipline for Excellence – Continuous Improvement and Innovation
Advance operational excellence by supporting imple-mentation of Live Well San Diego through efforts suchas the Resident Leadership Academy (RLA). The pur-pose of RLA is to build community capacity for healthimprovement in local neighborhoods.
Required Discipline for Excellence – Information Services
Advance operational excellence by supportingimprovements in HHSA’s technological framework tohelp HHSA build a better service delivery system.
Establish policies and practices to improve access toquality data and information so that services aredelivered efficiently and effectively.Identify and move program information to moreefficient and cost-effective IT systems. Implement second phase of Knowledge IntegrationProject to procure vendor for electronic informationexchange system.Establish an operations research unit and usediscipline to analyze and improve services to thecommunity.
Related Links
For additional information on the programs offered by theHealth and Human Services Agency, refer to the websitewww.sdcounty.ca.gov/hhsa.
238 Health and Human Services AgencyAdopted Operational Plan Fiscal Years 2013-2014 and 2014-2015
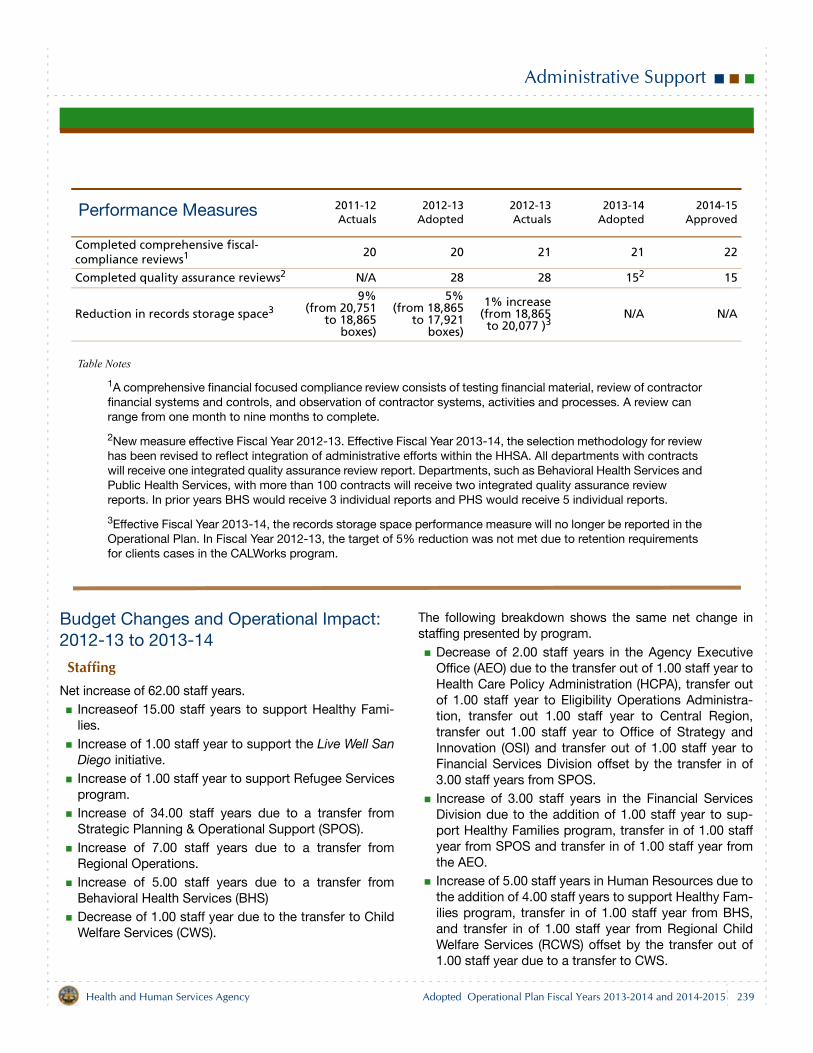
Administrative Support
Table Notes
1A comprehensive financial focused compliance review consists of testing financial material, review of contractor financial systems and controls, and observation of contractor systems, activities and processes. A review can range from one month to nine months to complete.
2New measure effective Fiscal Year 2012-13. Effective Fiscal Year 2013-14, the selection methodology for review has been revised to reflect integration of administrative efforts within the HHSA. All departments with contracts will receive one integrated quality assurance review report. Departments, such as Behavioral Health Services and Public Health Services, with more than 100 contracts will receive two integrated quality assurance review reports. In prior years BHS would receive 3 individual reports and PHS would receive 5 individual reports.
3Effective Fiscal Year 2013-14, the records storage space performance measure will no longer be reported in the Operational Plan. In Fiscal Year 2012-13, the target of 5% reduction was not met due to retention requirements for clients cases in the CALWorks program.
Budget Changes and Operational Impact: 2012-13 to 2013-14
StaffingNet increase of 62.00 staff years.
Increaseof 15.00 staff years to support Healthy Fami-lies.Increase of 1.00 staff year to support the Live Well SanDiego initiative.Increase of 1.00 staff year to support Refugee Servicesprogram.Increase of 34.00 staff years due to a transfer fromStrategic Planning & Operational Support (SPOS).Increase of 7.00 staff years due to a transfer fromRegional Operations. Increase of 5.00 staff years due to a transfer fromBehavioral Health Services (BHS) Decrease of 1.00 staff year due to the transfer to ChildWelfare Services (CWS).
The following breakdown shows the same net change instaffing presented by program.
Decrease of 2.00 staff years in the Agency ExecutiveOffice (AEO) due to the transfer out of 1.00 staff year toHealth Care Policy Administration (HCPA), transfer outof 1.00 staff year to Eligibility Operations Administra-tion, transfer out 1.00 staff year to Central Region,transfer out 1.00 staff year to Office of Strategy andInnovation (OSI) and transfer out of 1.00 staff year toFinancial Services Division offset by the transfer in of3.00 staff years from SPOS.Increase of 3.00 staff years in the Financial ServicesDivision due to the addition of 1.00 staff year to sup-port Healthy Families program, transfer in of 1.00 staffyear from SPOS and transfer in of 1.00 staff year fromthe AEO.Increase of 5.00 staff years in Human Resources due tothe addition of 4.00 staff years to support Healthy Fam-ilies program, transfer in of 1.00 staff year from BHS,and transfer in of 1.00 staff year from Regional ChildWelfare Services (RCWS) offset by the transfer out of1.00 staff year due to a transfer to CWS.
Performance Measures 2011-12Actuals
2012-13Adopted
2012-13Actuals
2013-14Adopted
2014-15Approved
Completed comprehensive fiscal-compliance reviews1 20 20 21 21 22
Completed quality assurance reviews2 N/A 28 28 152 15
Reduction in records storage space39%
(from 20,751to 18,865
boxes)
5%(from 18,865
to 17,921boxes)
1% increase(from 18,865to 20,077 )3
N/A N/A
239Health and Human Services Agency Adopted Operational Plan Fiscal Years 2013-2014 and 2014-2015
Administrative Support
Increase of 4.00 staff years in Management Supportdue to the addition of 3.00 staff years to supportHealthy Families program, transfer in of 1.00 staff yearfrom SPOS and transfer in of 1.00 staff year from RSSEoffset by the transfer out of 1.00 staff year to EligibilityOperations Administration.Increase of 2.00 staff years in Proposition 10 due to theaddition of 1.00 staff year to support Healthy Familiesprogram and transfer in of 1.00 staff year from BHS.Increase of 38.00 staff years in Office of Strategy andInnovation (OSI) due to the transfer in of 27.00 staffyears from SPOS, addition of 5.00 staff years to sup-port Healthy Families program, transfer in of 3.00 staffyears from BHS, transfer in of 1.00 staff year from theAEO, transfer in of 1.00 staff year from RSSE and theaddition of 1.00 staff year to support the Live Well SanDiego initiative. Increase of 12.00 staff years in Community Action Part-nership (CAP) due to the transfer in of 8.00 staff yearsdue to the move of CAP from Central Region, transferin of 2.00 staff years from SPOS, addition of 1.00 staffyear to support Healthy Families and the addition of1.00 staff year to support Refugee Services program.
ExpendituresNet increase of $16.1 million
Salaries and Benefits — increase of $7.6 million due tothe addition of 62.00 staff years and an increase inCounty retirement contributions.Services and Supplies — increase of $8.5 million.
Increase of $6.9 million in contracted servicesincluding $5.6 million for CAP due to the transfer ofCAP from Strategic Planning and OperationalSupport to Administrative Support, and $1.3 millionin Office of Strategy and Innovation for variouscontracts related to Live Well San Diego, theChildren’s initiative and related InformationTechnology contracts. Increase of $1.8 million for information technologyassociated with additional server costs andincreased rates.Increase of $1.0 million in major maintenance tosupport planned facility projects.Increase of $0.4 million for facility lease costs.Increase of $0.3 million in Public Liability InsurancePremium.
Increase of $0.3 million for printing costs.Increase of $0.2 million in reimbursementsassociated with County Counsel costs.Increase of $0.1 million for background costs.Decrease of $2.5 million for one-time costsassociated with peripheral relocations related to theCounty Operations Center (COC) capital project.
RevenuesNet increase of $16.1 million
Revenue from Fines, Forfeitures and Penalties —increase of $0.1 million related to the transfer of CAPfrom Strategic Planning and Operational Support toAdministrative Support.Intergovernmental Revenues — increase of $15.1 mil-lion.
Increase of $10.5 million in Realignment revenue andSocial Services Administrative revenue.Increase of $4.6 million in Community Services BlockGrant and Supplemental Nutrition AssistanceProgram grants related to the transfer of CAP.
Charges for Current Services — increase of $1.4 millionincluding $0.9 million due to the transfer of CAP and$0.5 million for the First Five Commission. Miscellaneous Revenue — increase of $0.1 million dueto the transfer of CAP.Use of Fund Balance — decrease of $0.6 million. Atotal of $38.1 million is budgeted.
$20.0 million in management reserves due to theuncertainty of the economy.$6.0 million for major maintenance projects.$5.0 million to transition from any future State andfederal budget issues.$5.0 million for technological advancements whichsupport the Live Well San Diego initiative.$1.2 million for Juvenile Diversion to supportcommunity based strategies that strengthenindividuals and families to foster healthyrelationships.$0.7 million to fund one-time information technologycosts.$0.1 million for the Resident Leadership AcademyTrain-the-Trainer courses.$0.1 million to commit Grand Avenue clinic saleproceeds.
240 Health and Human Services AgencyAdopted Operational Plan Fiscal Years 2013-2014 and 2014-2015
Administrative Support
Budget Changes and Operational Impact: 2013-14 to 2014-15
Net decrease of $19.3 million is the result of a reduction of$20.1 million in Services and Supplies due to the elimina-tion of one-time projects from the prior year, partially offsetby an increase of $0.8 million in Salaries and Benefits dueto an increase in retirement contributions.
241Health and Human Services Agency Adopted Operational Plan Fiscal Years 2013-2014 and 2014-2015
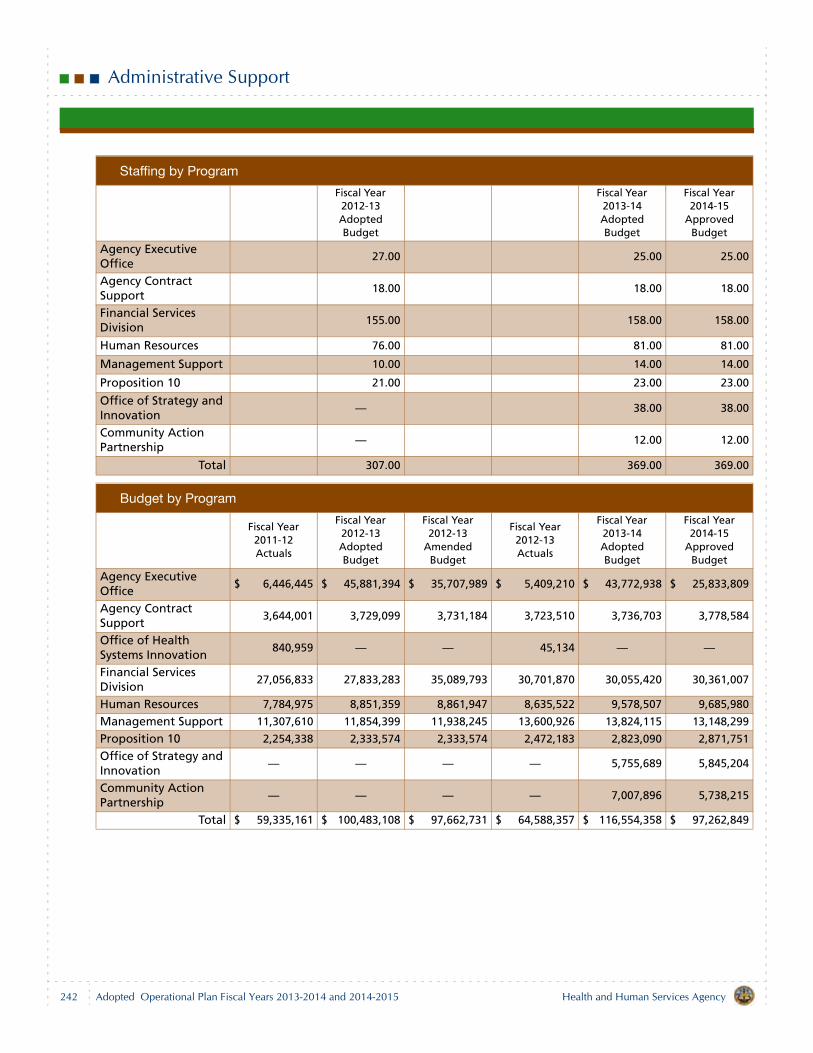
Administrative Support
Staffing by Program
Fiscal Year 2012-13 Adopted Budget
Fiscal Year 2013-14 Adopted Budget
Fiscal Year 2014-15
Approved Budget
Agency Executive Office
27.00 25.00 25.00
Agency Contract Support
18.00 18.00 18.00
Financial Services Division
155.00 158.00 158.00
Human Resources 76.00 81.00 81.00
Management Support 10.00 14.00 14.00
Proposition 10 21.00 23.00 23.00
Office of Strategy and Innovation
— 38.00 38.00
Community Action Partnership
— 12.00 12.00
Total 307.00 369.00 369.00
Budget by Program
Fiscal Year 2011-12 Actuals
Fiscal Year 2012-13 Adopted Budget
Fiscal Year 2012-13
Amended Budget
Fiscal Year 2012-13 Actuals
Fiscal Year 2013-14 Adopted Budget
Fiscal Year 2014-15
Approved Budget
Agency Executive Office
$ 6,446,445 $ 45,881,394 $ 35,707,989 $ 5,409,210 $ 43,772,938 $ 25,833,809
Agency Contract Support
3,644,001 3,729,099 3,731,184 3,723,510 3,736,703 3,778,584
Office of Health Systems Innovation
840,959 — — 45,134 — —
Financial Services Division
27,056,833 27,833,283 35,089,793 30,701,870 30,055,420 30,361,007
Human Resources 7,784,975 8,851,359 8,861,947 8,635,522 9,578,507 9,685,980
Management Support 11,307,610 11,854,399 11,938,245 13,600,926 13,824,115 13,148,299
Proposition 10 2,254,338 2,333,574 2,333,574 2,472,183 2,823,090 2,871,751
Office of Strategy and Innovation
— — — — 5,755,689 5,845,204
Community Action Partnership
— — — — 7,007,896 5,738,215
Total $ 59,335,161 $ 100,483,108 $ 97,662,731 $ 64,588,357 $ 116,554,358 $ 97,262,849
242 Health and Human Services AgencyAdopted Operational Plan Fiscal Years 2013-2014 and 2014-2015
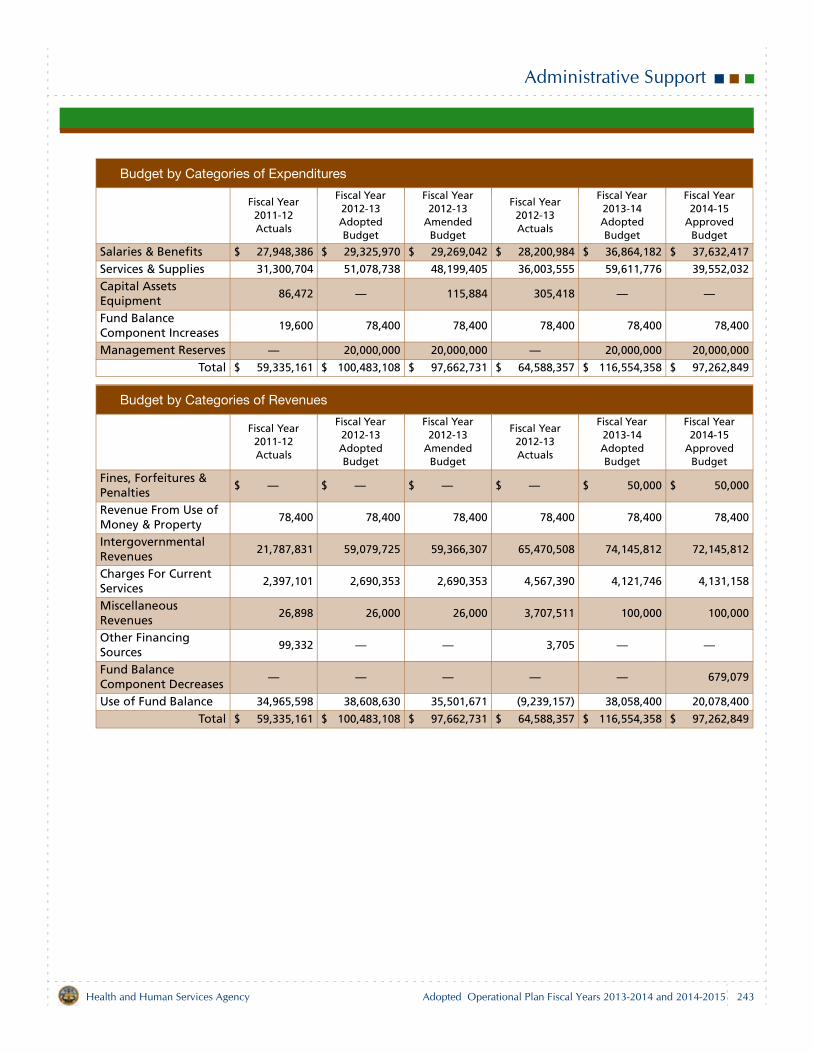
Administrative Support
Budget by Categories of Expenditures
Fiscal Year 2011-12 Actuals
Fiscal Year 2012-13 Adopted Budget
Fiscal Year 2012-13
Amended Budget
Fiscal Year 2012-13 Actuals
Fiscal Year 2013-14 Adopted Budget
Fiscal Year 2014-15
Approved Budget
Salaries & Benefits $ 27,948,386 $ 29,325,970 $ 29,269,042 $ 28,200,984 $ 36,864,182 $ 37,632,417
Services & Supplies 31,300,704 51,078,738 48,199,405 36,003,555 59,611,776 39,552,032
Capital Assets Equipment
86,472 — 115,884 305,418 — —
Fund Balance Component Increases
19,600 78,400 78,400 78,400 78,400 78,400
Management Reserves — 20,000,000 20,000,000 — 20,000,000 20,000,000
Total $ 59,335,161 $ 100,483,108 $ 97,662,731 $ 64,588,357 $ 116,554,358 $ 97,262,849
Budget by Categories of Revenues
Fiscal Year 2011-12 Actuals
Fiscal Year 2012-13 Adopted Budget
Fiscal Year 2012-13
Amended Budget
Fiscal Year 2012-13 Actuals
Fiscal Year 2013-14 Adopted Budget
Fiscal Year 2014-15
Approved Budget
Fines, Forfeitures & Penalties
$ — $ — $ — $ — $ 50,000 $ 50,000
Revenue From Use of Money & Property
78,400 78,400 78,400 78,400 78,400 78,400
Intergovernmental Revenues
21,787,831 59,079,725 59,366,307 65,470,508 74,145,812 72,145,812
Charges For Current Services
2,397,101 2,690,353 2,690,353 4,567,390 4,121,746 4,131,158
Miscellaneous Revenues
26,898 26,000 26,000 3,707,511 100,000 100,000
Other Financing Sources
99,332 — — 3,705 — —
Fund Balance Component Decreases
— — — — — 679,079
Use of Fund Balance 34,965,598 38,608,630 35,501,671 (9,239,157) 38,058,400 20,078,400
Total $ 59,335,161 $ 100,483,108 $ 97,662,731 $ 64,588,357 $ 116,554,358 $ 97,262,849
243Health and Human Services Agency Adopted Operational Plan Fiscal Years 2013-2014 and 2014-2015

County of San Diego
Land Use and Environment Group
Land Use and Environment Group & Executive Office 247
Agriculture, Weights and Measures 255
Air Pollution Control District 263
Environmental Health 271
Farm and Home Advisor 279
Parks and Recreation 285
Planning and Land Use 293
Planning and Development Services 299
Public Works 305

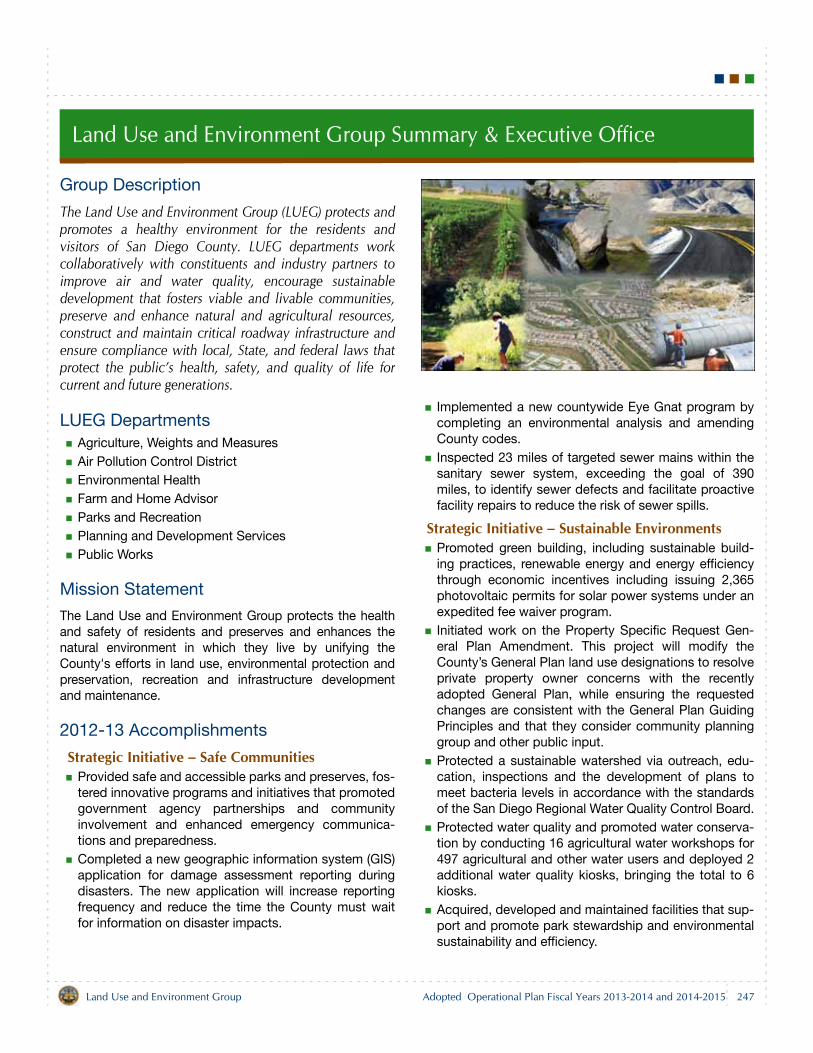
Land Use and Environment Group Summary & Executive Office
Group Description
The Land Use and Environment Group (LUEG) protects andpromotes a healthy environment for the residents andvisitors of San Diego County. LUEG departments workcollaboratively with constituents and industry partners toimprove air and water quality, encourage sustainabledevelopment that fosters viable and livable communities,preserve and enhance natural and agricultural resources,construct and maintain critical roadway infrastructure andensure compliance with local, State, and federal laws thatprotect the public’s health, safety, and quality of life forcurrent and future generations.
LUEG DepartmentsAgriculture, Weights and MeasuresAir Pollution Control DistrictEnvironmental HealthFarm and Home AdvisorParks and RecreationPlanning and Development ServicesPublic Works
Mission Statement
The Land Use and Environment Group protects the healthand safety of residents and preserves and enhances thenatural environment in which they live by unifying theCounty's efforts in land use, environmental protection andpreservation, recreation and infrastructure developmentand maintenance.
2012-13 Accomplishments
Strategic Initiative – Safe CommunitiesProvided safe and accessible parks and preserves, fos-tered innovative programs and initiatives that promotedgovernment agency partnerships and communityinvolvement and enhanced emergency communica-tions and preparedness.Completed a new geographic information system (GIS)application for damage assessment reporting duringdisasters. The new application will increase reportingfrequency and reduce the time the County must waitfor information on disaster impacts.
Implemented a new countywide Eye Gnat program bycompleting an environmental analysis and amendingCounty codes. Inspected 23 miles of targeted sewer mains within thesanitary sewer system, exceeding the goal of 390miles, to identify sewer defects and facilitate proactivefacility repairs to reduce the risk of sewer spills.
Strategic Initiative – Sustainable EnvironmentsPromoted green building, including sustainable build-ing practices, renewable energy and energy efficiencythrough economic incentives including issuing 2,365photovoltaic permits for solar power systems under anexpedited fee waiver program.Initiated work on the Property Specific Request Gen-eral Plan Amendment. This project will modify theCounty’s General Plan land use designations to resolveprivate property owner concerns with the recentlyadopted General Plan, while ensuring the requestedchanges are consistent with the General Plan GuidingPrinciples and that they consider community planninggroup and other public input.Protected a sustainable watershed via outreach, edu-cation, inspections and the development of plans tomeet bacteria levels in accordance with the standardsof the San Diego Regional Water Quality Control Board.Protected water quality and promoted water conserva-tion by conducting 16 agricultural water workshops for497 agricultural and other water users and deployed 2additional water quality kiosks, bringing the total to 6kiosks.Acquired, developed and maintained facilities that sup-port and promote park stewardship and environmentalsustainability and efficiency.
247Land Use and Environment Group Adopted Operational Plan Fiscal Years 2013-2014 and 2014-2015
Land Use and Environment Group Summary & Executive Office
Designed and initiated construction on 24 and com-pleted construction on 21 road and road-related infra-structure improvement projects that enhance the long-term sustainability of the transportation network,exceeding the goal of 7 projects.Protected residential gardens and commercial producefrom insidious pest infestations and avoided the wide-spread use of pesticides against new pests by placingand maintaining traps designed for early pest detec-tion.Created new permit requirements for all affected exist-ing permits to incorporate recently adopted Air Pollu-tion Control District (APCD) Rule 66.1 for coatingoperations thereby reducing volatile organic compoundemissions.To protect water quality, developed a database andmethodology to tabulate probable causative occur-rences leading to both total and fecal coliform watersample failures for small drinking water systems. Infor-mation was provided to system owners and operatorsas guidance for ways to reduce water quality violations,as well as posted on the Department of EnvironmentalHealth Small Drinking Water System website.
Strategic Initiative – Healthy FamiliesDeveloped and enhanced the experiences of parkpatrons and promoted healthy lifestyles by increasingrecreational opportunities and educational programs.
Performed comprehensive active living assessmentsat three parks using DPR’s new Healthy Edge ParkDesign Guidelines. Used the assessment to developa “health report card” and improvement strategy forthe facilities.Promoted healthy lifestyles for 2,325 adults andseniors through participation in 88 recreationprograms exceeding the goal of 2,000 adults and 60recreation programs.Fostered the positive development of 6,523 youththrough 180 recreation programs and services thatincrease physical, intellectual, social and/oremotional abilities exceeding the goal of 6,000 youth.Developed or enhanced five County park trails topromote health and fitness, exceeding the goal oftwo trails, by installing exercise stations or QR FitTrail stations, which allow users to access freeguided fitness instruction videos on their mobiledevices. Increased recreational opportunities for youth at parkfacilities in collaboration with six school-sponsoredsports activities.
Incorporated the County’s Live Well San DiegoBuilding Better Health initiative and other health-related messages into three environmentaleducational programs, exceeding the goal of twoprograms, and in three promotional publications.
Provided nutrition education for 670 low-income fami-lies with children, which represent 3,262 people,emphasizing healthful nutrition practices, foodresource management and food safety, exceeding thegoal of 400 families. A total of 55 teachers were trainedin nutrition curricula who then provided education to3,452 youth.Extended the restaurant inspection and grading systemto mobile food facilities, issuing grade cards to approx-imately 250 food trucks and 300 food carts that pre-pare food. Collaborated with stakeholders, changedCounty ordinances, developed a scored inspectionreport and training materials, and conducted sevenoutreach sessions to educate operators on food safetyand the new grading procedures.Repainted and re-marked crosswalks and roadway leg-ends adjacent to all 121 public school and 12 privateschool locations in the unincorporated areas of thecounty. This kept children safe from traffic and pro-vided safe routes to and from school. This activity isconducted annually to ensure markings are fresh andvisible for maximum benefit.
Required Discipline for Excellence – Continuous Improvement and Innovation
Implemented the recommendations of the Board ofSupervisors to improve the land development processfor customers. This included a shift in departmentalculture and role toward identifying project solutionsand helping customers navigate the process. Theestablishment of the department of Planning andDevelopment Services (PDS) created a new approachto serving customers and combined the land use func-tions that were formerly divided among various Countydepartments, namely Planning and Land Use, PublicWorks, and Parks and Recreation.Developed procedures and implemented a program toscan and enter emissions inventory summaries into theBusiness Case Management System (BCMS) at thefacility level that increased staff efficiency in determin-ing New Source Review requirements and facility com-pliance status.Developed and initiated the transition of the virtualenforcement response determination document intothe Business Case Management System (BCMS) within
248 Land Use and Environment GroupAdopted Operational Plan Fiscal Years 2013-2014 and 2014-2015
Land Use and Environment Group Summary & Executive Office
the Pesticide Regulation Program. This document isused to track the action taken when a violation isfound.
Required Discipline for Excellence – Information Services
Enhanced customer service by providing online accessthrough Accela Citizen Access to Site Assessment andMitigation records for the public to conduct file reviewswithout the need to make a public records request orphysically visit the Department of Environmental Healthoffices. Online access to septic records will be com-pleted in Fiscal Year 2013-14.Expanded the mobile workforce capabilities for build-ing inspectors and code enforcement staff through newsystems in Accela Citizen Access that enable real-timeaccess to land development permit systems frommobile devices.Reduced payment processing time and cost by imple-menting bar coding of registration invoices sent to cus-tomers who have point of sale systems to facilitatefaster processing of payments.Completed implementation of the BCMS. The BCMSproject overhauled all of the processes and systemsrelated to regulatory and permitting business functionswithin LUEG. All permitting functions within LUEGdepartments are now conducted in BCMS, encom-passing roughly 300 different business functionsincluding inspections, requests for service, complainttracking, cashiering, financial management, invoicing,time accounting, mobile applications functionality, andonline services for the public.BCMS implementation also included integration withthe County’s Enterprise Resource Planning (ERP) appli-cations such as Oracle Financials, Kronos, and People-Soft. Other integrations include with the County’sdocument management system, GIS, and several otherState systems.
Required Discipline for Excellence – Regional Leadership
Administered and participated in meetings of the fed-eral San Diego/Tijuana Air Quality Task Force to identifyand reduce air pollution problems in the border regionin order to better protect public health and the environ-ment.Developed standard operating procedures and guid-ance documents to provide instructions for UnifiedProgram inspectors and law enforcement investigators
on how to collect and sample illegally disposed hazard-ous waste from businesses with multiple locationsacross the State. Demonstrated regional leadership and improve publicsafety by presenting at the 2012 Wildland Urban Inter-face Conference regarding fire safe ignition-resistantconstruction, as well as lessons learned from the 2003and 2007 firestorms.
2013-15 Objectives
Strategic Initiative – Safe CommunitiesRepaint and re-mark all crosswalks and roadway leg-ends adjacent to all 121 public school and 12 privateschool locations in the unincorporated areas of thecounty.Reduce vandalism and theft by installing safety/secu-rity cameras at three park facilities.Install Wi-Fi at one park site to provide staff and cus-tomers greater access to online emergency notifica-tions and information. Protect public health and the environment by minimiz-ing the risk of sewer spills.As the Goldspotted Oak Borer (GSOB) continues todecimate oak trees, expand and enhance the existingprogram established as a foundation for GSOB educa-tion and outreach. Create online training and self-test-ing modules for public land managers, homeowners,recreationalists and other groups as needed, on thebiology, impacts and symptoms, and best manage-ment practices relating to GSOB.Work with the U.S. Environmental Protection Agency(EPA) and Baja California, Mexico as the U.S. Co-Chairof the Border 2020 Emergency Preparedness andResponse Group for the San Diego-Tijuana region to:
Coordinate and conduct binational emergencytraining with the goal of ensuring that responders inthe region use the same equipment, procedures andhave the same training.Integrate the Office of Emergency ServicesOperational Area Emergency Operations Center andthe Tijuana Protection Civil’s Emergency OperationsCenter into binational exercises.
Reduce risks to lives by ensuring buildings andimprovements are designed and constructed in accor-dance with building safety codes.
Review proposed building plans to ensure structuresare properly and safely designed.
249Land Use and Environment Group Adopted Operational Plan Fiscal Years 2013-2014 and 2014-2015
Land Use and Environment Group Summary & Executive Office
Help customers navigate the building permit andinspection process by explaining code requirementsand exploring options to achieve compliance.Conduct building inspections during construction toensure structures are built in accordance withapproved building plans.
Strategic Initiative – Sustainable EnvironmentsEnsure agricultural commodities meet internationalshipping requirements by continuing cropland trappingfor the Light Brown Apple Moth. Inspect 300 croplandtraps once every 30 days to meet export requirementsfor Canada and Mexico.Increase industry’s awareness of pesticide regulators’roles and responsibilities in protecting human health,safety and the environment by conducting 12 outreachactivities and regulatory updates during Fiscal Year2013-14.Provide staff to assist in the coordination and trainingof 1,000 volunteers through the Master Gardener and4-H programs to provide 205,000 hours of volunteerservice.Save 30 million gallons of water at 19 park facilities thathave converted to smart irrigation controllers, resultingin water conservation.Promote green building, including sustainable buildingpractices, renewable energy and energy efficiencythrough economic incentives such as reduced fees andfee waivers.Partner with East Otay Mesa property owners, the SanDiego Association of Governments (SANDAG), the Cal-ifornia Department of Transportation (CalTrans) and theCity of San Diego to plan and construct a regional san-itary sewer network to support the phased implemen-tation of the East Otay Mesa Specific Plan whilesafeguarding public health and the environment.Reduce air pollution emissions and health risk fromfreight movement using State Goods Movement Emis-sion Reduction Program (Proposition1B) funds toaward grants to equipment owners to replace older,higher emitting heavy-duty diesel equipment withnewer, cleaner models.Protect the health of the public by reducing exposureto hazardous air pollutants by testing gas fired recipro-cating internal combustion engines for compliance withthe National Emissions Standards for Hazardous AirPollutants; expanding the network of air monitors forcarbonyl compounds, including formaldehyde, to
include the areas of Barrio Logan and the Otay Mesaborder crossing; and developing the capability todeploy an emergency network of 2 fine particulate mat-ter (PM2.5) monitors within 48 hours of any wildfirethreatening a wide area of the County and provide real-time data delivery to the public.
Strategic Initiative – Healthy FamiliesProvide administrative and instructional material sup-port for 350 4-H adult and youth volunteer leaders toconduct community-based educational programs to 254-H clubs, 7 after-school sites and 8 military 4-H sites.Create safer parks, preserves and recreation centersusing volunteers to assist with park patrols, operations,and maintenance by contributing more than 96,000hours annually.Promote healthy lifestyles for 2,000 adults and seniorsthrough participation in 60 recreation programs.Ensure that all construction work by utility companiesand private developers in the County’s right-of-waythat is within 1,000 feet of a school site provides safeaccess to schools for families and children.Educate 5,000 children on awareness of and protectionfrom mosquito-borne diseases and other vector-related diseases, environmental health careers, andfood and pool safety by conducting outreach presenta-tions to primary and/or secondary school children atschools or other outreach events throughout the year.
Required Discipline for Excellence – Continuous Improvement and Innovation
Complete 85% of all (more than 130) investigativereports of pesticide illness complaints within 120 daysby implementing efficiencies identified during the Pesti-cide Regulation Program’s Business Process Re-engi-neering and using the functionality of BCMS by June30, 2014.Implement changes and monitor the Community EventPermit (CEP) process for improved customer service.Develop and implement a streamlined application pro-cess for grants under the Goods Movement EmissionReduction Program to allow easier application comple-tion and to reduce APCD processing times, resulting infaster project completion and earlier emission reduc-tions.Conduct a study on the use of a rapid molecular diag-nostic test to improve the response to sewage-con-taminated beach water.
250 Land Use and Environment GroupAdopted Operational Plan Fiscal Years 2013-2014 and 2014-2015
Land Use and Environment Group Summary & Executive Office
Complete the development of a new online paymenttool for land development projects. The new tool willaccept electronic payment for permits, fees anddeposits, reducing the need for customers to physicallyvisit an office.
Required Discipline for Excellence – Customer Satisfaction
Increase awareness of the Mobile Source IncentiveProgram by participating in eight community outreachevents to educate attendees about APCD’s mobilesource emission reduction incentive programs andgrant funding opportunities.Use State Air Quality Improvement Program grantfunding to implement an Advanced Hybrid School BusDemonstration Project in partnership with Transporta-tion Power, Inc. (TransPower), an electric propulsionsystem manufacturer located in Poway. San DiegoCounty school districts will be given the opportunity togain hands-on experience with the advanced hybridschool bus during the demonstration period.Provide excellent customer service by diagnosing100% of more than 31,000 plant and insect sampleswithin two weeks of submission.Ensure consumers get what they pay for by completing100% of annual inspections for fuel meters, taximeters, water dispensers and computing scales, and90% of all counter scales.Implement the use of an online intake form to receivepublic complaints of food borne illness. Develop a new customer service program for PDS,including identification of customer and stakeholderpriorities, customer service training and an online cus-tomer satisfaction survey to measure performance.
Required Discipline for Excellence – Regional Leadership
Host a Hazardous Analysis and Critical Control Pointsworkshop in coordination with the restaurant industry,the Food and Drug Administration and the CaliforniaDepartment of Public Health to educate local industryand regulators; invite regulators from neighboring juris-dictions to participate in the training. Work with the Industrial Environmental Association(IEA) to provide the annual “IEA-APCD Blue Sky Lead-ership Award” to three local businesses.
Required Discipline for Excellence – Information Services
Continue to refine and enhance the BCMS AccelaAutomation system that integrates land developmentpermit operations, time accounting and finances ofland development permits.Convert all 14 of the County’s intranet and internetmapping applications to the current industry-standardtechnology ArcGIS Server using Microsoft Silverlight.
Related Links
For additional information about the Land Use and Environ-ment Group, refer to the website at www.sdcounty.ca.gov/lueg/index.html.
Executive Office Budget Changes and Operational Impact: 2012-13 to 2013-14
StaffingNo change in staffing.
ExpendituresNet increase of $0.7 million.
Services and Supplies — net increase of $0.7 milliondue to rebudgets of $0.8 million for information tech-nology projects as a result of delays, offset by adecrease of $0.1 million in special departmentalexpenses due to the completion of one-time contract-ing projects.
RevenuesNet increase of $0.7 million.
Use of Fund Balance — net increase of $0.6 million. Atotal of $2.9 million is budgeted for various informationtechnology projects and consulting services. General Purpose Revenue Allocation — net increase of$0.1 million for previously negotiated salary increasesand increases in County retirement costs.
Executive Office Budget Changes and Operational Impact: 2013-14 to 2014-15
A decrease of $2.9 million in Services and Supplies is dueto the anticipated completion of one-time projects.
251Land Use and Environment Group Adopted Operational Plan Fiscal Years 2013-2014 and 2014-2015
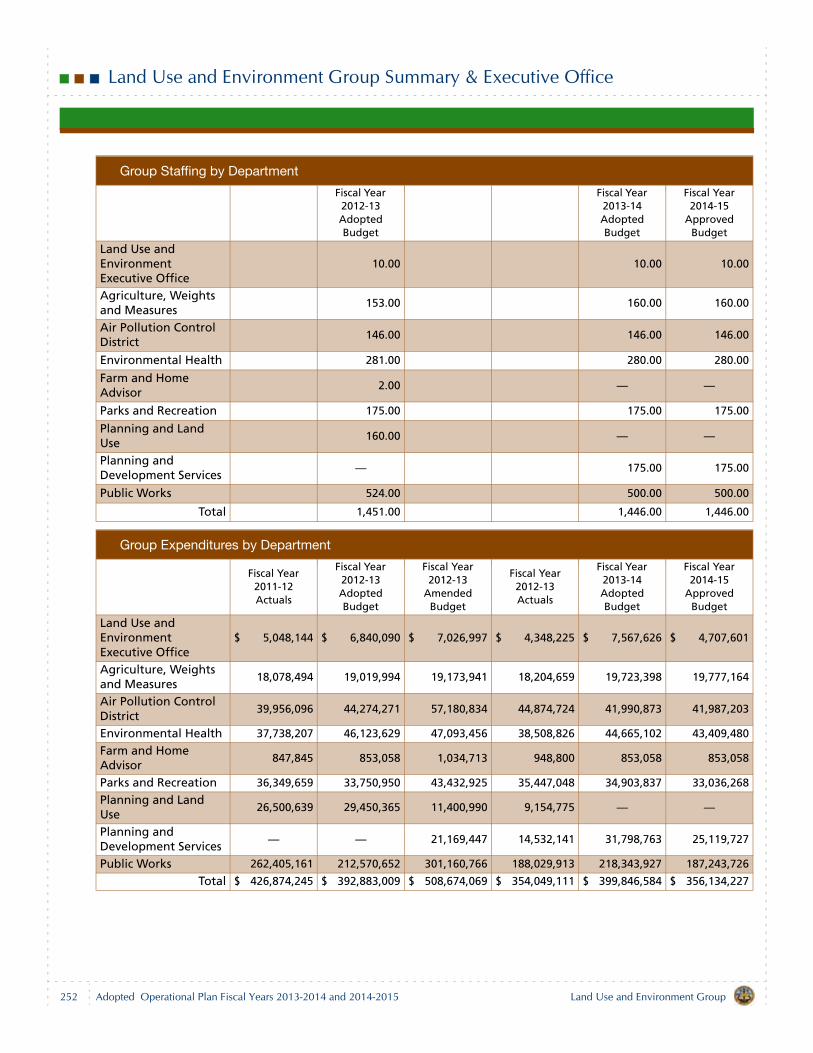
Land Use and Environment Group Summary & Executive Office
Group Staffing by Department
Fiscal Year 2012-13 Adopted Budget
Fiscal Year 2013-14 Adopted Budget
Fiscal Year 2014-15
Approved Budget
Land Use and Environment Executive Office
10.00 10.00 10.00
Agriculture, Weights and Measures
153.00 160.00 160.00
Air Pollution Control District
146.00 146.00 146.00
Environmental Health 281.00 280.00 280.00
Farm and Home Advisor
2.00 — —
Parks and Recreation 175.00 175.00 175.00
Planning and Land Use
160.00 — —
Planning and Development Services
— 175.00 175.00
Public Works 524.00 500.00 500.00
Total 1,451.00 1,446.00 1,446.00
Group Expenditures by Department
Fiscal Year 2011-12 Actuals
Fiscal Year 2012-13 Adopted Budget
Fiscal Year 2012-13
Amended Budget
Fiscal Year 2012-13 Actuals
Fiscal Year 2013-14 Adopted Budget
Fiscal Year 2014-15
Approved Budget
Land Use and Environment Executive Office
$ 5,048,144 $ 6,840,090 $ 7,026,997 $ 4,348,225 $ 7,567,626 $ 4,707,601
Agriculture, Weights and Measures
18,078,494 19,019,994 19,173,941 18,204,659 19,723,398 19,777,164
Air Pollution Control District
39,956,096 44,274,271 57,180,834 44,874,724 41,990,873 41,987,203
Environmental Health 37,738,207 46,123,629 47,093,456 38,508,826 44,665,102 43,409,480
Farm and Home Advisor
847,845 853,058 1,034,713 948,800 853,058 853,058
Parks and Recreation 36,349,659 33,750,950 43,432,925 35,447,048 34,903,837 33,036,268
Planning and Land Use
26,500,639 29,450,365 11,400,990 9,154,775 — —
Planning and Development Services
— — 21,169,447 14,532,141 31,798,763 25,119,727
Public Works 262,405,161 212,570,652 301,160,766 188,029,913 218,343,927 187,243,726
Total $ 426,874,245 $ 392,883,009 $ 508,674,069 $ 354,049,111 $ 399,846,584 $ 356,134,227
252 Land Use and Environment GroupAdopted Operational Plan Fiscal Years 2013-2014 and 2014-2015
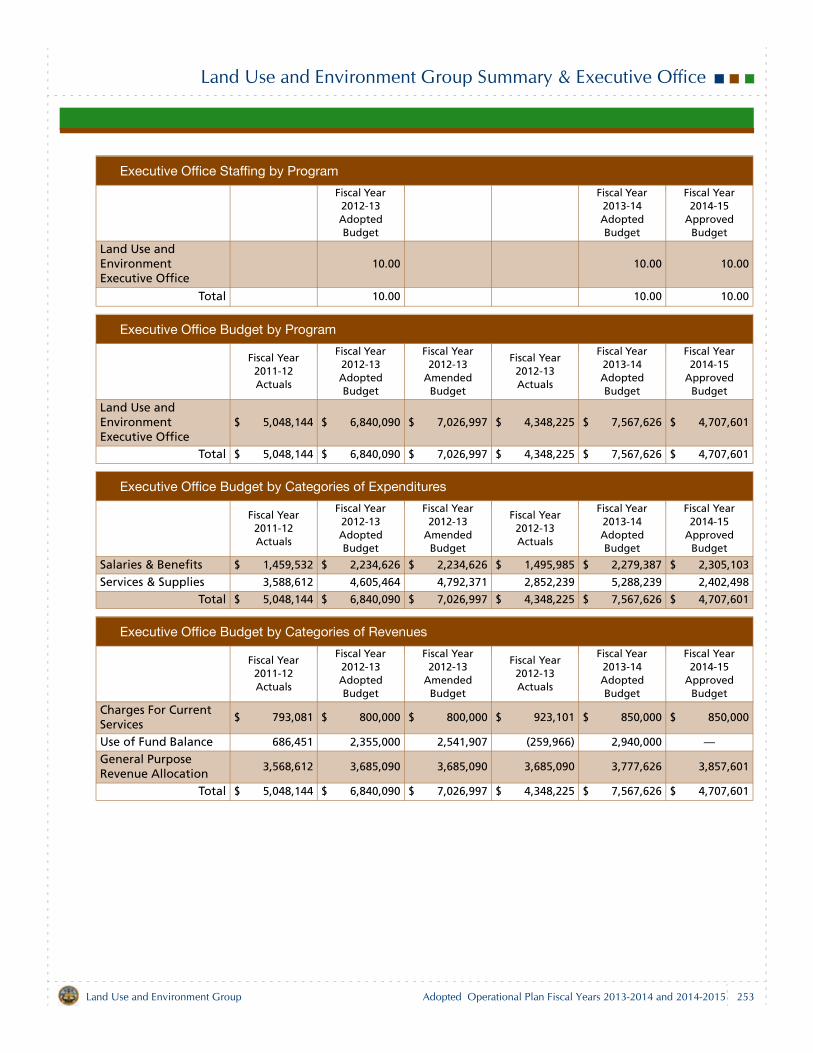
Land Use and Environment Group Summary & Executive Office
Executive Office Staffing by Program
Fiscal Year 2012-13 Adopted Budget
Fiscal Year 2013-14 Adopted Budget
Fiscal Year 2014-15
Approved Budget
Land Use and Environment Executive Office
10.00 10.00 10.00
Total 10.00 10.00 10.00
Executive Office Budget by Program
Fiscal Year 2011-12 Actuals
Fiscal Year 2012-13 Adopted Budget
Fiscal Year 2012-13
Amended Budget
Fiscal Year 2012-13 Actuals
Fiscal Year 2013-14 Adopted Budget
Fiscal Year 2014-15
Approved Budget
Land Use and Environment Executive Office
$ 5,048,144 $ 6,840,090 $ 7,026,997 $ 4,348,225 $ 7,567,626 $ 4,707,601
Total $ 5,048,144 $ 6,840,090 $ 7,026,997 $ 4,348,225 $ 7,567,626 $ 4,707,601
Executive Office Budget by Categories of Expenditures
Fiscal Year 2011-12 Actuals
Fiscal Year 2012-13 Adopted Budget
Fiscal Year 2012-13
Amended Budget
Fiscal Year 2012-13 Actuals
Fiscal Year 2013-14 Adopted Budget
Fiscal Year 2014-15
Approved Budget
Salaries & Benefits $ 1,459,532 $ 2,234,626 $ 2,234,626 $ 1,495,985 $ 2,279,387 $ 2,305,103
Services & Supplies 3,588,612 4,605,464 4,792,371 2,852,239 5,288,239 2,402,498
Total $ 5,048,144 $ 6,840,090 $ 7,026,997 $ 4,348,225 $ 7,567,626 $ 4,707,601
Executive Office Budget by Categories of Revenues
Fiscal Year 2011-12 Actuals
Fiscal Year 2012-13 Adopted Budget
Fiscal Year 2012-13
Amended Budget
Fiscal Year 2012-13 Actuals
Fiscal Year 2013-14 Adopted Budget
Fiscal Year 2014-15
Approved Budget
Charges For Current Services
$ 793,081 $ 800,000 $ 800,000 $ 923,101 $ 850,000 $ 850,000
Use of Fund Balance 686,451 2,355,000 2,541,907 (259,966) 2,940,000 —General Purpose Revenue Allocation
3,568,612 3,685,090 3,685,090 3,685,090 3,777,626 3,857,601
Total $ 5,048,144 $ 6,840,090 $ 7,026,997 $ 4,348,225 $ 7,567,626 $ 4,707,601
253Land Use and Environment Group Adopted Operational Plan Fiscal Years 2013-2014 and 2014-2015


Agriculture, Weights and Measures
Department Description
The Department of Agriculture, Weights and Measures(AWM) protects public health, the environment and theCounty’s $1.75 billion agricultural industry by educatingthe public, partnering with industry and enforcing laws andregulations.
AWM:Ensures the safe use of pesticides and investigatespesticide-related complaints and reported illnesses.Inspects eggs for defects to prevent food-borneillnesses.Prevents the establishment of pests that requirepesticide controls, sting or severely injure people,and inhibit growing fresh, nutritious fruits, vegetablesand other plants.Promotes the use of effective biocontrol measures.Regulates organic growers, certified producers andcertified farmers’ markets to allow local marketing offresh commodities.Ensures accurate net quantity of packaged goods andaccuracy of commercial weighing, measuring andscanning devices.Protects people from injury and disease caused bywildlife.
Mission Statement
Ensure the health and safety of all residents by promotingthe sustainability of agriculture and protecting the environ-ment. Protect consumers and ensure a fair marketplace byverifying products are sold by accurate weight, measureand price.
2012-13 Accomplishments
Strategic Initiative – Safe CommunitiesProtected public safety by completing weed controlactivities on 71% of 4,000 miles of County road sides(i.e., roads in the unincorporated areas of the county)which decreased fire hazards and increased visibilityfor motorists and pedestrians, exceeding the goal of50%. Ensured food quality, safety and integrity, and verifiedthat produce advertised as “organic” was registered
and certified as organic by completing 42 organic spotinspections (producer/handler/retail) and 79 organicspot inspections at 27 Certified Farmers’ Markets,exceeding the goal of 40 inspections.Increased the knowledge and safety of agriculturalworkers by providing three educational outreach pre-sentations to employees that work in pesticide-treatedfields.
Strategic Initiative – Sustainable EnvironmentsProtected residential gardens and commercial producefrom insidious pest infestations and avoided the wide-spread use of pesticides against new pests by placingand maintaining traps designed for early pest detec-tion.Increased the return on investment and leveragedfunding available for invasive weed infestations byfocusing on locations where maximum effectiveness ofweed eradication could be achieved.Ensured consumer confidence and equity in the mar-ketplace by performing 72 undercover test sales of Cal-ifornia Redemption Value (CRV) beverage containers,exceeding the goal of 60 sales.Improved efficiency by implementing changes to theSnail Master Permit Export Program, which allowsqualified nurseries confirmed to be snail-free to ship “atwill” to states with snail restrictions without additionalinspections or fees, reducing total shipping fees paidby growers for domestic export certificates by 74%(approximately $170,000), exceeding the goal of a 30%reduction in fees.Ensured agricultural commodities met internationalshipping requirements by continuing cropland trappingfor Light Brown Apple Moths.
255Land Use and Environment Group Adopted Operational Plan Fiscal Years 2013-2014 and 2014-2015
Agriculture, Weights and Measures
Required Discipline for Excellence – Continuous Improvement and Innovation
Conducted Business Process Reengineering of thePesticide Regulation Program investigation proceduresresulting in a streamlined process with improved effi-ciency and accountability.Developed and initiated the transition of the virtualenforcement response determination document intothe Business Case Management System (BCMS) withinthe Pesticide Regulation Program. This document isused to track the action taken when a violation isfound.Increased efficiency during quarantines and the abilityto locate high priority host plants by migrating theCounty’s pest detection mapping grid to the new state-wide mapping grid.Improved efficiency and field staff access to informa-tion by digitizing 50% of more than 77,000 host fruitlocations for urban pest detection trapping.
Required Discipline for Excellence – Information Services
Reduced payment processing time and cost by imple-menting bar coding of registration invoices sent to cus-tomers who have point of sale systems to facilitatefaster processing of payments.
2013-15 Objectives
Strategic Initiative – Sustainable EnvironmentsEnsure agricultural commodities meet internationalshipping requirements by continuing cropland trappingfor the Light Brown Apple Moth. Inspect 300 croplandtraps once every 30 days to meet export requirementsfor Canada and Mexico.During Fiscal Year 2013-14, protect commercial pro-duce, residential gardens and parks from pest infesta-tion by placing and maintaining more than 10,700 trapsdesigned for early pest detection, thereby mitigatingthe need for widespread use of pesticides in the envi-ronment.Ensure safe and effective pest management by sendingmonthly email communications to County IntegratedPest Control Coordinators to promote the use of Inte-grated Pest Management methods in County facilitieseach year.Increase the number of potential pest detection trap-ping sites by 10%, (5,500) by distributing multi-lingualPest Detection brochures at Certified Farmers’ Mar-
kets. Increasing the pool of trap locations improves theability to protect commercial produce, residential gar-dens and the environment from pest infestations.Increase industry’s awareness of pesticide regulators’roles and responsibilities in protecting human health,safety and the environment by conducting 12 outreachactivities and regulatory updates during Fiscal Year2013-14.Prevent the spread of the insidious pest Glassy-Winged Sharpshooter by ensuring 100% of more than2,700 plant shipments arrive at destination with no via-ble life stages of the pest.
Required Discipline for Excellence – Continuous Improvement and Innovation
Improve efficiency and accuracy of the export certifica-tion database, and merge data from two differentsources into one so that reliable data is readily avail-able to provide reports and make informed decisionsregarding resources and planning in the export pro-gram. Improve efficiency and staff access to information bydigitizing 100% of 770 Gypsy Moth and Japanese bee-tle host locations developed in the updated statewidemapping grid by June 30, 2014.Increase operational efficiency and the ability to locatehigh priority host plants by incorporating 30% of previ-ously developed trapping sites (16,440 of 54,825) intothe recently implemented statewide mapping grid sys-tem by June 30, 2014.Complete 85% of all (more than 130) investigativereports of pesticide illness complaints within 120 daysby implementing efficiencies identified during the Pesti-cide Regulation Program’s Business Process Reengi-neering and using the functionality of BCMS by June30, 2014.
Required Discipline for Excellence – Skilled, Adaptable and Diverse Workforce
Improve training for inspectors by developing a com-prehensive list of BCMS Frequently Asked Questionswith answers and posting on SharePoint by June 30,2014.By June 30, 2014, identify the departmental informa-tion that is needed by new Agricultural/StandardsInspectors within their first year of employment to facil-itate a successful move to the next level of departmen-tal excellence and to prepare for the development of adepartmental Basic Inspector Academy.
256 Land Use and Environment GroupAdopted Operational Plan Fiscal Years 2013-2014 and 2014-2015
Agriculture, Weights and Measures
Incorporate best management practices for terrestrialweed control into the annual pesticide safety trainingfor Integrated Pest Control staff to continue protectingthe natural environment from unintentional pesticidedischarges.
Required Discipline for Excellence – Customer Satisfaction
Develop a pilot program to allow Plant Health and PestPrevention customers to request and schedule inspec-tions online using Accela Citizen Access by June 30,2014.Improve communication with Spanish-speaking cus-tomers by posting one outreach presentation regardingPoint of Sale Inspections and compliance in Spanishon the AWM Webpage and translating any requiredretail consumer notice posting into Spanish by June30, 2014.
By June 30, 2014, develop an automated notice of pro-posed action for gas pump compliance in BCMS toimprove accuracy and timeliness for customers.Provide excellent customer service by diagnosing100% of more than 31,000 plant and insect sampleswithin two weeks of submission.Ensure consumers get what they pay for by completing100% of annual inspections for fuel meters, taximeters, water dispensers and computing scales, and90% of all counter scales.
Related Links
For additional information about Agriculture, Weights andMeasures, refer to the website at www.sdcounty.ca.gov/awm.
257Land Use and Environment Group Adopted Operational Plan Fiscal Years 2013-2014 and 2014-2015
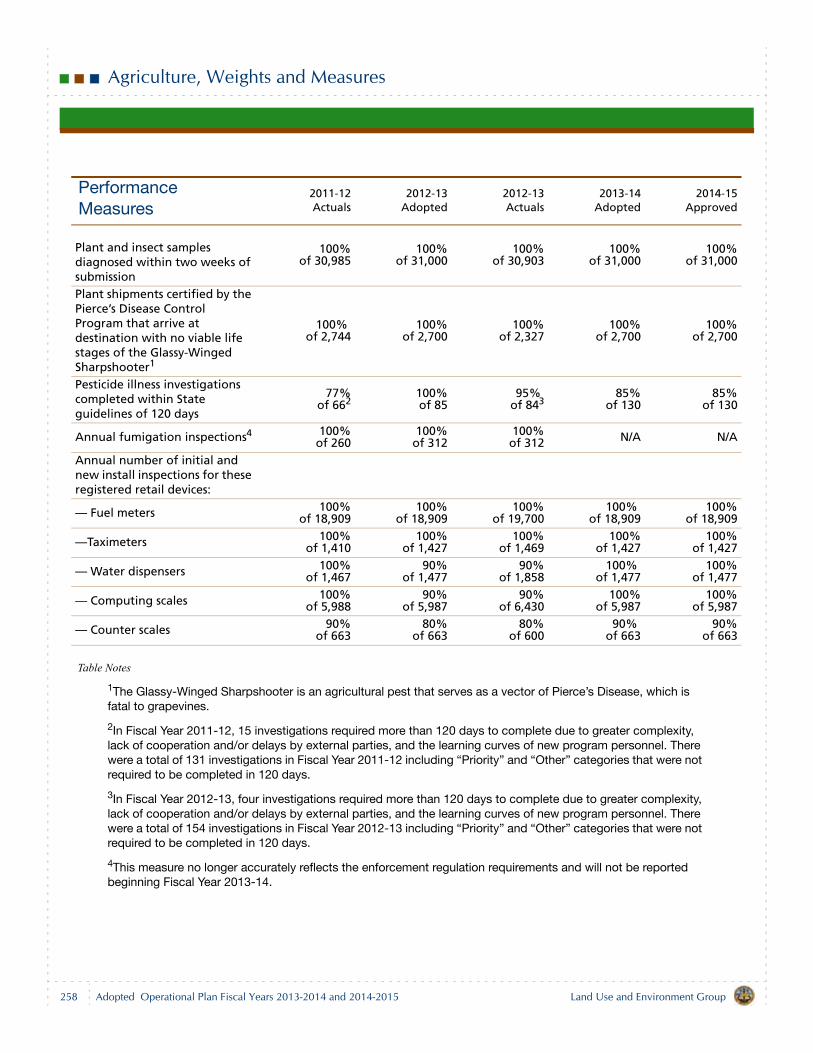
Agriculture, Weights and Measures
Table Notes
1The Glassy-Winged Sharpshooter is an agricultural pest that serves as a vector of Pierce’s Disease, which is fatal to grapevines.
2In Fiscal Year 2011-12, 15 investigations required more than 120 days to complete due to greater complexity, lack of cooperation and/or delays by external parties, and the learning curves of new program personnel. There were a total of 131 investigations in Fiscal Year 2011-12 including “Priority” and “Other” categories that were not required to be completed in 120 days.
3In Fiscal Year 2012-13, four investigations required more than 120 days to complete due to greater complexity, lack of cooperation and/or delays by external parties, and the learning curves of new program personnel. There were a total of 154 investigations in Fiscal Year 2012-13 including “Priority” and “Other” categories that were not required to be completed in 120 days.
4This measure no longer accurately reflects the enforcement regulation requirements and will not be reported beginning Fiscal Year 2013-14.
Performance Measures
2011-12Actuals
2012-13Adopted
2012-13 Actuals
2013-14Adopted
2014-15Approved
Plant and insect samples diagnosed within two weeks of submission
100%of 30,985
100%of 31,000
100%of 30,903
100%of 31,000
100%of 31,000
Plant shipments certified by the Pierce’s Disease Control Program that arrive at destination with no viable life stages of the Glassy-Winged Sharpshooter1
100% of 2,744
100%of 2,700
100%of 2,327
100%of 2,700
100%of 2,700
Pesticide illness investigations completed within State guidelines of 120 days
77%of 662
100%of 85
95% of 843
85%of 130
85%of 130
Annual fumigation inspections4 100%of 260
100%of 312
100%of 312 N/A N/A
Annual number of initial and new install inspections for these registered retail devices:
— Fuel meters 100%of 18,909
100%of 18,909
100%of 19,700
100% of 18,909
100%of 18,909
—Taximeters 100%of 1,410
100%of 1,427
100%of 1,469
100% of 1,427
100%of 1,427
— Water dispensers 100%of 1,467
90%of 1,477
90%of 1,858
100% of 1,477
100%of 1,477
— Computing scales 100%of 5,988
90%of 5,987
90%of 6,430
100% of 5,987
100%of 5,987
— Counter scales 90%of 663
80%of 663
80%of 600
90% of 663
90%of 663
258 Land Use and Environment GroupAdopted Operational Plan Fiscal Years 2013-2014 and 2014-2015
Agriculture, Weights and Measures
Budget Changes and Operational Impact: 2012-13 to 2013-14
StaffingIncrease of 7.00 staff years due to operational needs andadditional regulatory responsibilities in the following pro-grams:
Increase of 4.00 staff years related to the increase inAgricultural Water Quality (AWQ) inspections due torevisions in the Regional Municipal Separate StormSewer (MS4) Permit.Increase of 1.00 staff year related to Asian Citrus Psyl-lid (ACP) citrus grove abatement activities.Transfer of 2.00 staff years from the Farm and HomeAdvisor to Agriculture, Weights and Measures due tooperational needs.
Expenditures Net increase of $0.7 million.
Salaries and Benefits — increase of $0.9 million due tothe addition of 7.00 staff years, an increase in Countyretirement contributions and previously negotiated sal-ary increases. Capital Assets Equipment — net increase of $0.2 mil-lion for one-time funding of vehicle purchases.Services and Supplies — decrease of $0.4 million pri-marily due to the completion of one-time expendituresrelated to report scripts in BCMS.
Revenues Net increase of $0.7 million.
Licenses, Permits & Franchises — net increase of $0.3million primarily due to increased cap of State fees forMeasuring Devices and an increase in Phytosanitarycertificate issuance. Charges for Current Services — net increase of $0.4million related to the revisions in the MS4 Permit requir-ing an increase in AWQ inspections.General Purpose Revenue Allocation — increase of$0.4 million due to an increase in County retirementcontributions and previously negotiated salaryincreases as well as an increase in services and sup-plies expenditures related to AWQ inspections andACP citrus grove abatement activities.Intergovernmental Revenues — net decrease of $0.2million primarily due to the reduction of State contractrevenue in the Plant Health and Pest Prevention Pro-gram, High Risk Pest Prevention contract.Use of Fund Balance — decrease of $0.2 million. Atotal of $0.2 million is budgeted for one-time funding ofvehicle purchases.
Budget Changes and Operational Impact: 2013-14 to 2014-15
No significant change.
259Land Use and Environment Group Adopted Operational Plan Fiscal Years 2013-2014 and 2014-2015
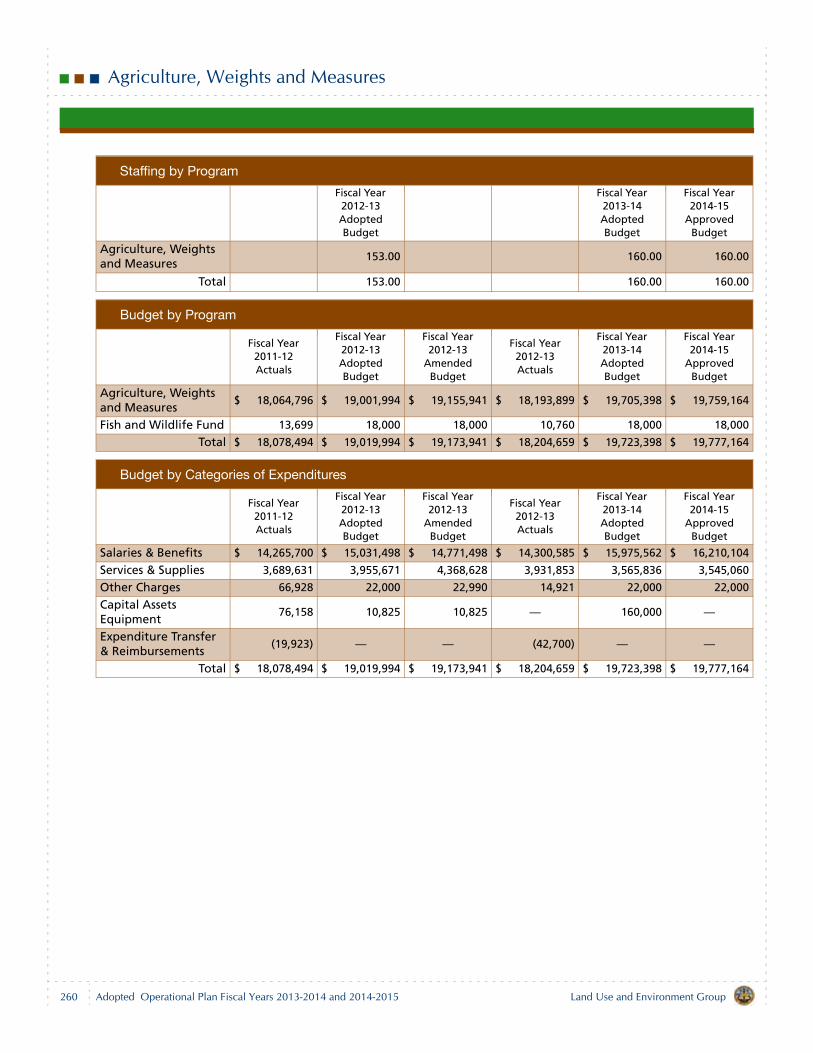
Agriculture, Weights and Measures
Staffing by Program
Fiscal Year 2012-13 Adopted Budget
Fiscal Year 2013-14 Adopted Budget
Fiscal Year 2014-15
Approved Budget
Agriculture, Weights and Measures
153.00 160.00 160.00
Total 153.00 160.00 160.00
Budget by Program
Fiscal Year 2011-12 Actuals
Fiscal Year 2012-13 Adopted Budget
Fiscal Year 2012-13
Amended Budget
Fiscal Year 2012-13 Actuals
Fiscal Year 2013-14 Adopted Budget
Fiscal Year 2014-15
Approved Budget
Agriculture, Weights and Measures
$ 18,064,796 $ 19,001,994 $ 19,155,941 $ 18,193,899 $ 19,705,398 $ 19,759,164
Fish and Wildlife Fund 13,699 18,000 18,000 10,760 18,000 18,000
Total $ 18,078,494 $ 19,019,994 $ 19,173,941 $ 18,204,659 $ 19,723,398 $ 19,777,164
Budget by Categories of Expenditures
Fiscal Year 2011-12 Actuals
Fiscal Year 2012-13 Adopted Budget
Fiscal Year 2012-13
Amended Budget
Fiscal Year 2012-13 Actuals
Fiscal Year 2013-14 Adopted Budget
Fiscal Year 2014-15
Approved Budget
Salaries & Benefits $ 14,265,700 $ 15,031,498 $ 14,771,498 $ 14,300,585 $ 15,975,562 $ 16,210,104
Services & Supplies 3,689,631 3,955,671 4,368,628 3,931,853 3,565,836 3,545,060
Other Charges 66,928 22,000 22,990 14,921 22,000 22,000
Capital Assets Equipment
76,158 10,825 10,825 — 160,000 —
Expenditure Transfer & Reimbursements
(19,923) — — (42,700) — —
Total $ 18,078,494 $ 19,019,994 $ 19,173,941 $ 18,204,659 $ 19,723,398 $ 19,777,164
260 Land Use and Environment GroupAdopted Operational Plan Fiscal Years 2013-2014 and 2014-2015

Agriculture, Weights and Measures
\
Budget by Categories of Revenues
Fiscal Year 2011-12 Actuals
Fiscal Year 2012-13 Adopted Budget
Fiscal Year 2012-13
Amended Budget
Fiscal Year 2012-13 Actuals
Fiscal Year 2013-14 Adopted Budget
Fiscal Year 2014-15
Approved Budget
Licenses Permits & Franchises
$ 3,814,301 $ 3,687,000 $ 3,687,000 $ 3,736,771 $ 3,968,500 $ 3,968,500
Fines, Forfeitures & Penalties
198,259 91,000 91,000 177,690 116,000 116,000
Revenue From Use of Money & Property
37 — — 29 — —
Intergovernmental Revenues
9,513,623 9,145,715 9,145,715 9,246,182 8,950,988 8,950,988
Charges For Current Services
445,629 399,258 399,258 516,433 824,436 829,884
Miscellaneous Revenues
27,403 47,850 47,850 18,419 103,032 104,556
Other Financing Sources
— — — 2,375 — —
Use of Fund Balance (1,118,518) 410,000 563,947 (732,410) 162,000 2,000
General Purpose Revenue Allocation
5,197,759 5,239,171 5,239,171 5,239,171 5,598,442 5,805,236
Total $ 18,078,494 $ 19,019,994 $ 19,173,941 $ 18,204,659 $ 19,723,398 $ 19,777,164
261Land Use and Environment Group Adopted Operational Plan Fiscal Years 2013-2014 and 2014-2015

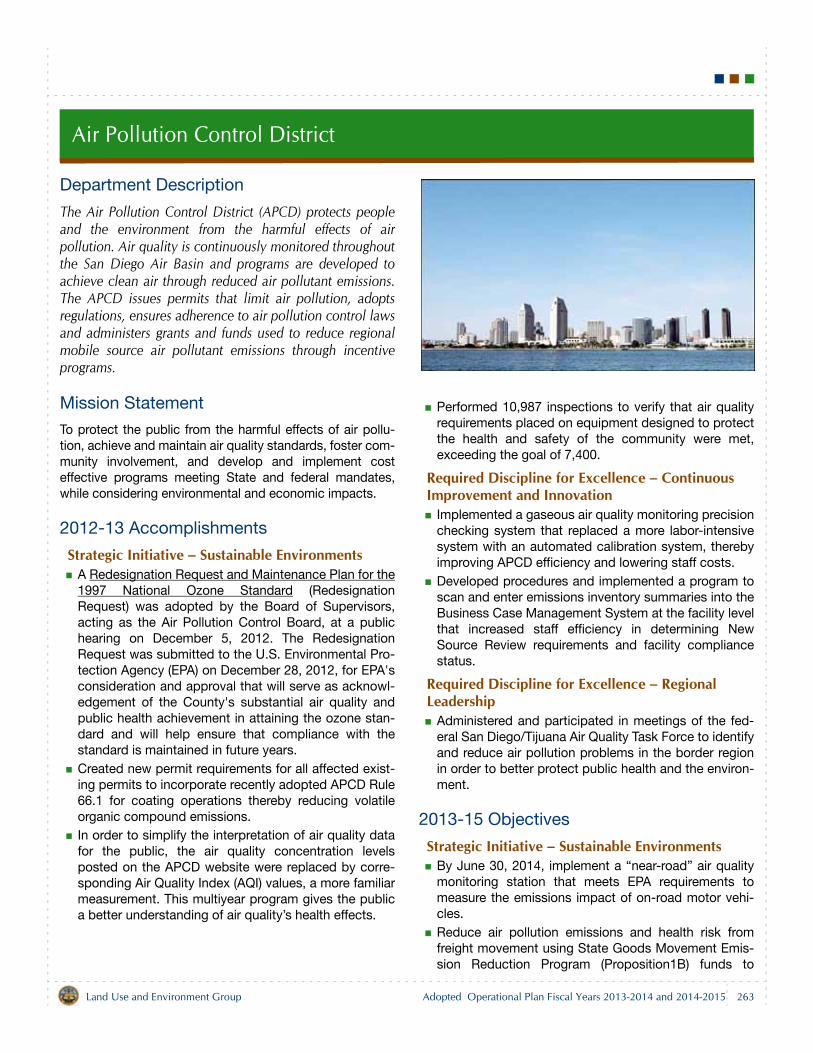
Air Pollution Control District
Department Description
The Air Pollution Control District (APCD) protects peopleand the environment from the harmful effects of airpollution. Air quality is continuously monitored throughoutthe San Diego Air Basin and programs are developed toachieve clean air through reduced air pollutant emissions.The APCD issues permits that limit air pollution, adoptsregulations, ensures adherence to air pollution control lawsand administers grants and funds used to reduce regionalmobile source air pollutant emissions through incentiveprograms.
Mission Statement
To protect the public from the harmful effects of air pollu-tion, achieve and maintain air quality standards, foster com-munity involvement, and develop and implement costeffective programs meeting State and federal mandates,while considering environmental and economic impacts.
2012-13 Accomplishments
Strategic Initiative – Sustainable EnvironmentsA Redesignation Request and Maintenance Plan for the1997 National Ozone Standard (RedesignationRequest) was adopted by the Board of Supervisors,acting as the Air Pollution Control Board, at a publichearing on December 5, 2012. The RedesignationRequest was submitted to the U.S. Environmental Pro-tection Agency (EPA) on December 28, 2012, for EPA'sconsideration and approval that will serve as acknowl-edgement of the County's substantial air quality andpublic health achievement in attaining the ozone stan-dard and will help ensure that compliance with thestandard is maintained in future years.Created new permit requirements for all affected exist-ing permits to incorporate recently adopted APCD Rule66.1 for coating operations thereby reducing volatileorganic compound emissions.In order to simplify the interpretation of air quality datafor the public, the air quality concentration levelsposted on the APCD website were replaced by corre-sponding Air Quality Index (AQI) values, a more familiarmeasurement. This multiyear program gives the publica better understanding of air quality’s health effects.
Performed 10,987 inspections to verify that air qualityrequirements placed on equipment designed to protectthe health and safety of the community were met,exceeding the goal of 7,400.
Required Discipline for Excellence – Continuous Improvement and Innovation
Implemented a gaseous air quality monitoring precisionchecking system that replaced a more labor-intensivesystem with an automated calibration system, therebyimproving APCD efficiency and lowering staff costs.Developed procedures and implemented a program toscan and enter emissions inventory summaries into theBusiness Case Management System at the facility levelthat increased staff efficiency in determining NewSource Review requirements and facility compliancestatus.
Required Discipline for Excellence – Regional Leadership
Administered and participated in meetings of the fed-eral San Diego/Tijuana Air Quality Task Force to identifyand reduce air pollution problems in the border regionin order to better protect public health and the environ-ment.
2013-15 Objectives
Strategic Initiative – Sustainable EnvironmentsBy June 30, 2014, implement a “near-road” air qualitymonitoring station that meets EPA requirements tomeasure the emissions impact of on-road motor vehi-cles.Reduce air pollution emissions and health risk fromfreight movement using State Goods Movement Emis-sion Reduction Program (Proposition1B) funds to
263Land Use and Environment Group Adopted Operational Plan Fiscal Years 2013-2014 and 2014-2015
Air Pollution Control District
award grants to equipment owners to replace older,higher emitting heavy-duty diesel equipment withnewer, cleaner models.Maintain an inspection program to protect the publicfrom the harmful effects of air pollution by annuallyconducting 7,400 inspections of equipment at regu-lated facilities for compliance with air pollution laws. Collect valid ozone concentration data on at least 90%of monitoring days in the year, thereby exceeding theEPA standard of 75% valid samples.Reduce mobile source air pollutant emissions by up to300 tons by providing incentive grants to projects thatremove high polluting vehicles and engines from ser-vice. Support the Juror Transit Pass program in cooperationwith the San Diego Association of Governments (SAN-DAG), the San Diego Metropolitan Transit System(MTS), and the courts to reduce transportation-relatedemissions resulting from jury duty.Protect the health of the public by reducing exposureto hazardous air pollutants by implementing the follow-ing actions:
Test emissions from all natural gas fired reciprocatinginternal combustion engines required to showcompliance with the National Emission Standards forHazardous Air Pollutants. Expand the network of air monitors for carbonylcompounds (toxic air pollutants) to include theEnvironmental Justice area of the Barrio Logancommunity of San Diego and the Otay Mesa bordercrossing. The chemical analysis of air samples willinclude tests for formaldehyde, a significant driver ofcancer risk in the nation.Develop the capability to deploy an emergencynetwork of two fine particulate matter (PM2.5)monitors within 48 hours of any wildfire and link theinstruments via satellite for real-time data delivery tothe public.Propose a rule for Air Pollution Control Boardconsideration to reduce air contaminant emissionsfrom house paints and other architectural coatings,reflecting the California Air Resources Board'sSuggested Control Measure for ArchitecturalCoatings and the current market availability of lower-emitting coatings. Propose a rule for Air Pollution Control Boardconsideration to reduce air contaminant emissionsfrom new, natural gas-fired residential-type waterheaters, reflecting the current market availability oflower-emitting technologies.
In coordination with affected industries, developtraining videos on how to comply with air pollutioncontrol requirements applicable to marine coatingoperations.Modify AQI calculations and reporting proceduresused for daily air quality forecasts and reports toreflect the revised National Ambient Air QualityStandard for inhalable particulate matter (PM2.5).
Required Discipline for Excellence – Customer Satisfaction
Provide excellent customer service by responding toand investigating 100% of an estimated 545 annual airpollution complaints from the public.Provide excellent customer service by promptly review-ing all Carl Moyer Program grant applications uponreceipt and notifying applicants within five businessdays of any additional information that may berequired.Use State Air Quality Improvement Program grantfunding to implement an Advanced Hybrid School BusDemonstration Project in partnership with Transporta-tion Power, Inc. (TransPower), an electric propulsionsystem manufacturer located in Poway. San DiegoCounty school districts will be given the opportunity togain hands-on experience with the advanced hybridschool bus during the demonstration period.
Required Discipline for Excellence – Regional Leadership
Participate in meetings of the San Diego RegionalClean Cities Coalition and the San Diego RegionalElectric Vehicle Infrastructure Working Group to pro-mote the use of alternative fuels and alternative fuelvehicles in the region.In order to provide the public and industry withresources to help reduce their emissions of air pollut-ants the APCD will develop a webpage linkage to edu-cational resources on the science and impacts ofclimate change and actions being taken to curb green-house gas emissions.Collaborate with the San Diego Foundation on its Cli-mate Initiative and help coordinate with government,nonprofits, businesses, and consumers to advanceregional efforts to reduce greenhouse gas emissions.The APCD will support public awareness and enhancesupport of reduction in emissions by recognizing localleaders in reducing emissions.Coordinate the VIP (Very Important Planet) receptionand the annual San Diego APCD Clean Air Awardhosted by the County of San Diego, Third District.
264 Land Use and Environment GroupAdopted Operational Plan Fiscal Years 2013-2014 and 2014-2015
Air Pollution Control District
Work with the Industrial Environmental Association(IEA) to provide the annual “IEA-APCD Blue Sky Lead-ership Award” to three local businesses.Create greater public awareness of the harmful impactsof air pollution by participating in two public outreachevents and coordinating activities with events such asthe Earth Day fair.Increase awareness of the Mobile Source IncentiveProgram by participating in eight community outreachevents to educate attendees about APCD’s mobilesource emission reduction incentive programs andgrant funding opportunities.
Required Discipline for Excellence – Accountability, Transparency and Ethical Conduct
Obtain inspection reports for 100% of the equipmentfunded through the Carl Moyer Program and GoodsMovement Emission Reduction Program to ensure thatthe new or upgraded equipment meets program spe-cific requirements to achieve emission reductions.
Required Discipline for Excellence – Continuous Improvement and Innovation
Develop and implement a streamlined application pro-cess for grants under the Goods Movement EmissionReduction Program to allow easier application comple-
tion and to reduce APCD processing times, resulting infaster project completion and earlier emission reduc-tions.Provide assistance with air pollution rules and regula-tions to the business community by creating two newcompliance assistance videos and posting them on theAPCD website.Evaluate the Federal Clean Air Act Title V permit pro-cessing procedures and implement process improve-ments in order to better meet APCD’s business needs.
Required Discipline for Excellence – Information Services
Implement an APCD file digitization pilot project anddigitize all Proposition 1B Lower-Emission School Busprogram files that are required to be sent to the Califor-nia Air Resources Board for retention for the remainderof the required 35-year bond records retention timeframe.
Related Links
For additional information about the Air Pollution ControlDistrict, refer to the website at www.sdapcd.org/index.html.
265Land Use and Environment Group Adopted Operational Plan Fiscal Years 2013-2014 and 2014-2015
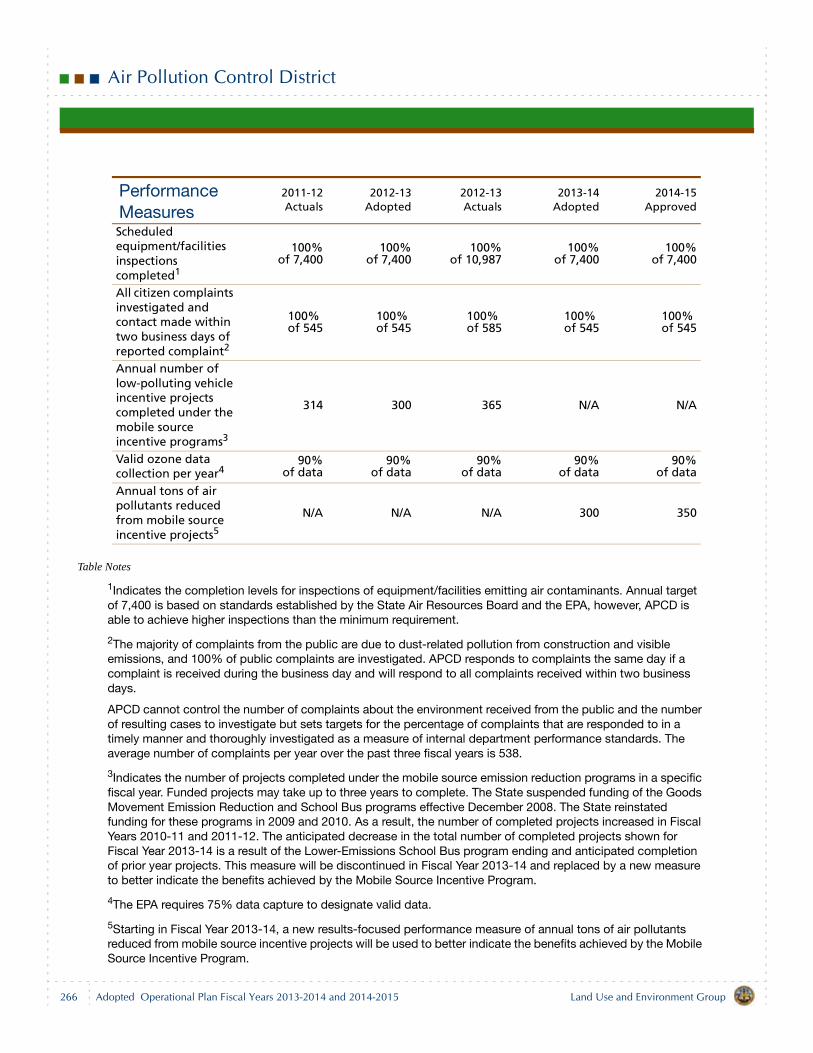
266
Air Pollution Control District
Land Use and Environment GroupAdopted Operational Plan Fiscal Years 2013-2014 and 2014-2015
Table Notes
1Indicates the completion levels for inspections of equipment/facilities emitting air contaminants. Annual target of 7,400 is based on standards established by the State Air Resources Board and the EPA, however, APCD is able to achieve higher inspections than the minimum requirement.
2The majority of complaints from the public are due to dust-related pollution from construction and visible emissions, and 100% of public complaints are investigated. APCD responds to complaints the same day if a complaint is received during the business day and will respond to all complaints received within two business days.
APCD cannot control the number of complaints about the environment received from the public and the number of resulting cases to investigate but sets targets for the percentage of complaints that are responded to in a timely manner and thoroughly investigated as a measure of internal department performance standards. The average number of complaints per year over the past three fiscal years is 538.
3Indicates the number of projects completed under the mobile source emission reduction programs in a specific fiscal year. Funded projects may take up to three years to complete. The State suspended funding of the Goods Movement Emission Reduction and School Bus programs effective December 2008. The State reinstated funding for these programs in 2009 and 2010. As a result, the number of completed projects increased in Fiscal Years 2010-11 and 2011-12. The anticipated decrease in the total number of completed projects shown for Fiscal Year 2013-14 is a result of the Lower-Emissions School Bus program ending and anticipated completion of prior year projects. This measure will be discontinued in Fiscal Year 2013-14 and replaced by a new measure to better indicate the benefits achieved by the Mobile Source Incentive Program.
4The EPA requires 75% data capture to designate valid data.
5Starting in Fiscal Year 2013-14, a new results-focused performance measure of annual tons of air pollutants reduced from mobile source incentive projects will be used to better indicate the benefits achieved by the Mobile Source Incentive Program.
Performance Measures
2011-12Actuals
2012-13Adopted
2012-13Actuals
2013-14Adopted
2014-15Approved
Scheduled equipment/facilities inspections completed1
100%of 7,400
100%of 7,400
100%of 10,987
100%of 7,400
100%of 7,400
All citizen complaints investigated and contact made within two business days of reported complaint2
100% of 545
100% of 545
100% of 585
100% of 545
100% of 545
Annual number of low-polluting vehicle incentive projects completed under the mobile source incentive programs3
314 300 365 N/A N/A
Valid ozone data collection per year4
90%of data
90%of data
90%of data
90%of data
90%of data
Annual tons of air pollutants reduced from mobile source incentive projects5
N/A N/A N/A 300 350
Air Pollution Control District
Budget Changes and Operational Impact: 2012-13 to 2013-14
StaffingNo change in staffing.
ExpendituresNet decrease of $2.3 million
Salaries and Benefits — net increase of $1.1 milliondue to increased County retirement costs, new hiresand promotions offset by vacant and under-filled posi-tions.Services and Supplies — net increase of $0.5 milliondue primarily to increased inter-departmental andmajor maintenance costs offset by decreases in infor-mation technology (IT) costs.Other Charges — decrease of $4.6 million due to thecompletion of mobile source emission incentive pro-grams.Capital Assets Equipment — increase of $0.1 milliondue to anticipated grant-related equipment purchasesfor a near-road Nitrogen Dioxide monitoring station.Operating Transfers Out — increase of $0.7 million tosupport operations.
RevenuesNet decrease of $2.3 million.
Licenses, Permits & Franchises — increase of $0.6 mil-lion to reflect a full-year’s implementation of increasedfees.
Intergovernmental Revenues — decrease of $3.1 mil-lion due to the completion of mobile source emissionsincentive programs.Other Financing Sources — net increase of $0.7 millionto support operations offset by a decrease in adminis-trative costs for incentive projects.Use of Fund Balance — decrease of $0.4 million due tothe completion of mobile source emissions incentiveprograms. Use of $1.1 million of available Fund Bal-ance includes $0.3 million contribution to reserves forfacilities, $0.3 million for emissions reduction projects,$0.3 million for replacement of outdated software fortoxic emissions tracking and $0.2 million for replace-ment of HVAC equipment.
Budget Changes and Operational Impact: 2013-14 to 2014-15
No significant changes in overall budget. Increase of $0.4million in Salaries and Benefits due to anticipated stepincreases and in County retirement costs. Decrease of $0.3million in Services and Supplies due to completion of one-time IT and maintenance projects and a decrease of $0.1million in Capital Asset Equipment associated with one-time grant-related expenditures.
267Land Use and Environment Group Adopted Operational Plan Fiscal Years 2013-2014 and 2014-2015
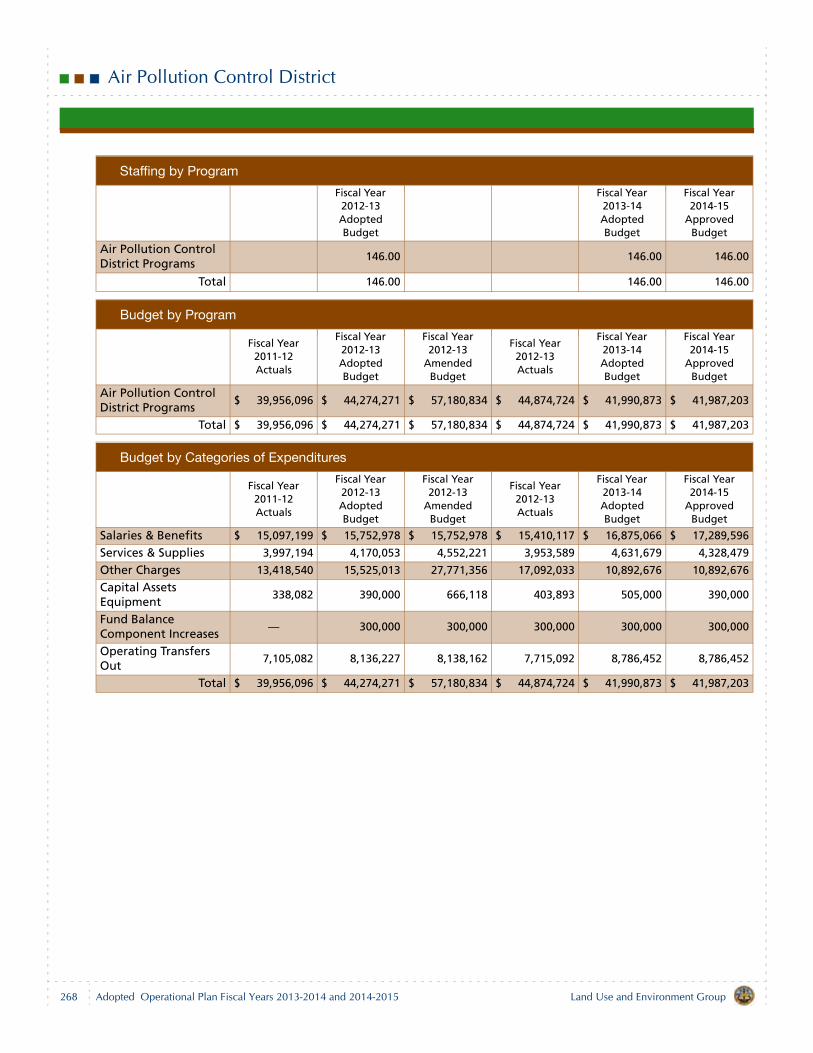
Air Pollution Control District
Staffing by Program
Fiscal Year 2012-13 Adopted Budget
Fiscal Year 2013-14 Adopted Budget
Fiscal Year 2014-15
Approved Budget
Air Pollution Control District Programs
146.00 146.00 146.00
Total 146.00 146.00 146.00
Budget by Program
Fiscal Year 2011-12 Actuals
Fiscal Year 2012-13 Adopted Budget
Fiscal Year 2012-13
Amended Budget
Fiscal Year 2012-13 Actuals
Fiscal Year 2013-14 Adopted Budget
Fiscal Year 2014-15
Approved Budget
Air Pollution Control District Programs
$ 39,956,096 $ 44,274,271 $ 57,180,834 $ 44,874,724 $ 41,990,873 $ 41,987,203
Total $ 39,956,096 $ 44,274,271 $ 57,180,834 $ 44,874,724 $ 41,990,873 $ 41,987,203
Budget by Categories of Expenditures
Fiscal Year 2011-12 Actuals
Fiscal Year 2012-13 Adopted Budget
Fiscal Year 2012-13
Amended Budget
Fiscal Year 2012-13 Actuals
Fiscal Year 2013-14 Adopted Budget
Fiscal Year 2014-15
Approved Budget
Salaries & Benefits $ 15,097,199 $ 15,752,978 $ 15,752,978 $ 15,410,117 $ 16,875,066 $ 17,289,596
Services & Supplies 3,997,194 4,170,053 4,552,221 3,953,589 4,631,679 4,328,479
Other Charges 13,418,540 15,525,013 27,771,356 17,092,033 10,892,676 10,892,676
Capital Assets Equipment
338,082 390,000 666,118 403,893 505,000 390,000
Fund Balance Component Increases
— 300,000 300,000 300,000 300,000 300,000
Operating Transfers Out
7,105,082 8,136,227 8,138,162 7,715,092 8,786,452 8,786,452
Total $ 39,956,096 $ 44,274,271 $ 57,180,834 $ 44,874,724 $ 41,990,873 $ 41,987,203
268 Land Use and Environment GroupAdopted Operational Plan Fiscal Years 2013-2014 and 2014-2015
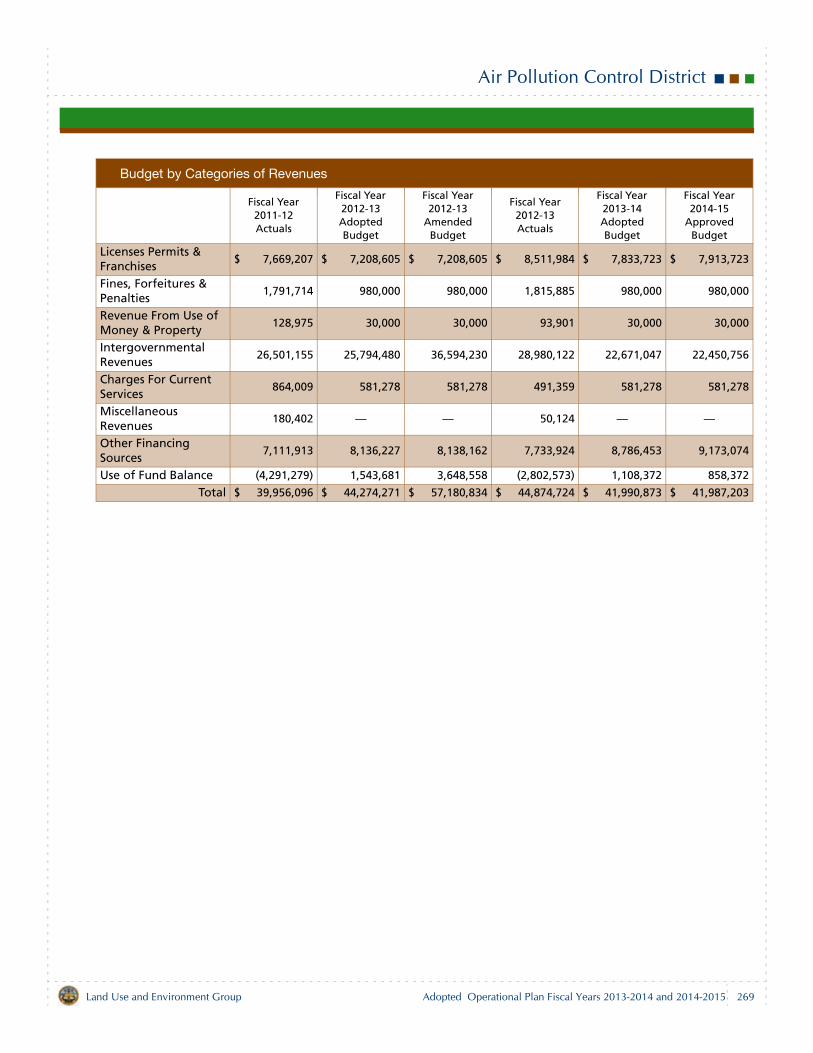
Air Pollution Control District
Budget by Categories of Revenues
Fiscal Year 2011-12 Actuals
Fiscal Year 2012-13 Adopted Budget
Fiscal Year 2012-13
Amended Budget
Fiscal Year 2012-13 Actuals
Fiscal Year 2013-14 Adopted Budget
Fiscal Year 2014-15
Approved Budget
Licenses Permits & Franchises
$ 7,669,207 $ 7,208,605 $ 7,208,605 $ 8,511,984 $ 7,833,723 $ 7,913,723
Fines, Forfeitures & Penalties
1,791,714 980,000 980,000 1,815,885 980,000 980,000
Revenue From Use of Money & Property
128,975 30,000 30,000 93,901 30,000 30,000
Intergovernmental Revenues
26,501,155 25,794,480 36,594,230 28,980,122 22,671,047 22,450,756
Charges For Current Services
864,009 581,278 581,278 491,359 581,278 581,278
Miscellaneous Revenues
180,402 — — 50,124 — —
Other Financing Sources
7,111,913 8,136,227 8,138,162 7,733,924 8,786,453 9,173,074
Use of Fund Balance (4,291,279) 1,543,681 3,648,558 (2,802,573) 1,108,372 858,372
Total $ 39,956,096 $ 44,274,271 $ 57,180,834 $ 44,874,724 $ 41,990,873 $ 41,987,203
269Land Use and Environment Group Adopted Operational Plan Fiscal Years 2013-2014 and 2014-2015

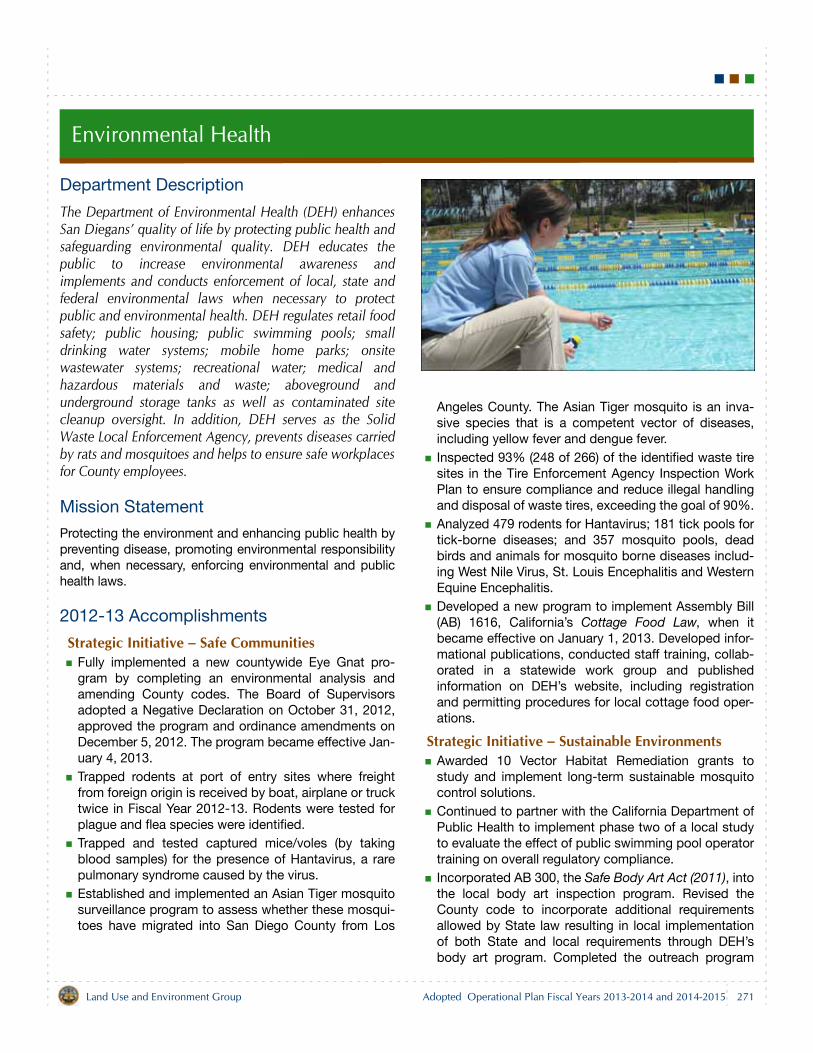
Environmental Health
Department Description
The Department of Environmental Health (DEH) enhancesSan Diegans’ quality of life by protecting public health andsafeguarding environmental quality. DEH educates thepublic to increase environmental awareness andimplements and conducts enforcement of local, state andfederal environmental laws when necessary to protectpublic and environmental health. DEH regulates retail foodsafety; public housing; public swimming pools; smalldrinking water systems; mobile home parks; onsitewastewater systems; recreational water; medical andhazardous materials and waste; aboveground andunderground storage tanks as well as contaminated sitecleanup oversight. In addition, DEH serves as the SolidWaste Local Enforcement Agency, prevents diseases carriedby rats and mosquitoes and helps to ensure safe workplacesfor County employees.
Mission Statement
Protecting the environment and enhancing public health bypreventing disease, promoting environmental responsibilityand, when necessary, enforcing environmental and publichealth laws.
2012-13 Accomplishments
Strategic Initiative – Safe CommunitiesFully implemented a new countywide Eye Gnat pro-gram by completing an environmental analysis andamending County codes. The Board of Supervisorsadopted a Negative Declaration on October 31, 2012,approved the program and ordinance amendments onDecember 5, 2012. The program became effective Jan-uary 4, 2013.Trapped rodents at port of entry sites where freightfrom foreign origin is received by boat, airplane or trucktwice in Fiscal Year 2012-13. Rodents were tested forplague and flea species were identified.Trapped and tested captured mice/voles (by takingblood samples) for the presence of Hantavirus, a rarepulmonary syndrome caused by the virus.Established and implemented an Asian Tiger mosquitosurveillance program to assess whether these mosqui-toes have migrated into San Diego County from Los
Angeles County. The Asian Tiger mosquito is an inva-sive species that is a competent vector of diseases,including yellow fever and dengue fever. Inspected 93% (248 of 266) of the identified waste tiresites in the Tire Enforcement Agency Inspection WorkPlan to ensure compliance and reduce illegal handlingand disposal of waste tires, exceeding the goal of 90%.Analyzed 479 rodents for Hantavirus; 181 tick pools fortick-borne diseases; and 357 mosquito pools, deadbirds and animals for mosquito borne diseases includ-ing West Nile Virus, St. Louis Encephalitis and WesternEquine Encephalitis.Developed a new program to implement Assembly Bill(AB) 1616, California’s Cottage Food Law, when itbecame effective on January 1, 2013. Developed infor-mational publications, conducted staff training, collab-orated in a statewide work group and publishedinformation on DEH’s website, including registrationand permitting procedures for local cottage food oper-ations.
Strategic Initiative – Sustainable EnvironmentsAwarded 10 Vector Habitat Remediation grants tostudy and implement long-term sustainable mosquitocontrol solutions.Continued to partner with the California Department ofPublic Health to implement phase two of a local studyto evaluate the effect of public swimming pool operatortraining on overall regulatory compliance. Incorporated AB 300, the Safe Body Art Act (2011), intothe local body art inspection program. Revised theCounty code to incorporate additional requirementsallowed by State law resulting in local implementationof both State and local requirements through DEH’sbody art program. Completed the outreach program
271Land Use and Environment Group Adopted Operational Plan Fiscal Years 2013-2014 and 2014-2015
Environmental Health
started in Fiscal Year 2011-12 to educate body artistsabout the requirements of the Safe Body Art Act andchanges to the local program. Continued participationin the statewide Body Art Technical Advisory Commit-tee.Conducted two training workshops for small drinkingwater system operators and provided individualizedreports on their water systems to assist with the devel-opment of their annual Consumer Confidence Reports.Reviewed and responded within 60 days to 93% (857of 919) of reports and work plans submitted to theLocal Oversight Program for remediation of under-ground storage tank fuel releases. The 100% goal ofresponse time within 60 days was not achievedbecause the number of reports submitted did not comein uniformly, with the number of submittals tripling dur-ing certain times of the year, which caused a lag inresponse times as staff worked to complete thereviews.To protect water quality, developed a database andmethodology to tabulate probable causative occur-rences leading to both total and fecal coliform watersample failures for small drinking water systems. Infor-mation was provided to system owners and operatorsas guidance for ways to reduce water quality violations,as well as posted on the DEH Small Drinking WaterSystem website.
Strategic Initiative – Healthy FamiliesResponded to 100% of 14 reports from the CountyHealth and Human Services Agency of elevated bloodlead levels in children within 24 hours to 2 weeks,depending on the blood-lead level reported.Educated more than 13,000 children on awareness andprotection from mosquito-borne diseases and othervector-related diseases; proper disposal of householdhazardous, electronic and universal wastes; hazardousmaterials, pollution prevention and risk mitigation;increased awareness of the restaurant grade card sys-tem and careers in environmental health by conducting125 outreach presentations to primary and/or second-ary school children at schools or other outreach events.Extended the restaurant inspection and grading systemto mobile food facilities, issuing grade cards to 250food trucks and 300 food carts that prepare food. Col-laborated with stakeholders, changed County ordi-nances, developed a scored inspection report andtraining materials, and conducted seven outreach ses-
sions to educate operators on food safety and the newgrading procedures.
Required Discipline for Excellence – Customer Satisfaction
Developed a customer service program that instructsstaff on good communication skills with the regulatedcommunity.Responded to complaints about mosquitoes, rats andflies by contacting 96% of 3,032 complainants withinthree days, exceeding the goal of 95%.Investigated and treated 1,004 aerial identified greenpools within 21 days of identification. These unfilteredpools have proven to be a breeding ground for mosqui-toes.
Required Discipline for Excellence – Regional Leadership
Developed standard operating procedures and guid-ance documents for Unified Program inspectors andlaw enforcement investigators on how to collect andsample illegally disposed hazardous waste from busi-nesses with multiple locations across the State. Coordinated with 18 other local jurisdictional house-hold hazardous waste programs and explored optionsfor regional cooperation, cost sharing and joint publiceducation. Participated and assisted in 10 regionalcommittee meetings to identify ways to improve ser-vice delivery and reduce program costs throughregional collaboration, including implementation of AB1343, the Paint Product Stewardship Initiative (2010).
Required Discipline for Excellence – Continuous Improvement and Innovation
Conducted a Business Process Reengineering event incoordination with all agencies involved in permitapprovals for the Community Event Permit (CEP) pro-cess. Identified process improvements, established animplementation plan and commenced implementation.Initiated a time study to determine the requirements fora dedicated CEP coordinator to implement identifiedprocess improvements.Preliminary studies in 2011 by the Vector Control Pro-gram (VCP) Diagnostic Laboratory demonstrated up to20% of rabbit ticks tested positive for the agent ofLyme disease. As a result, the VCP completed a studyto assess the risk to public health posed by rabbits andtheir ticks and concluded that these animals andinsects pose a low risk for Lyme disease.
272 Land Use and Environment GroupAdopted Operational Plan Fiscal Years 2013-2014 and 2014-2015
Environmental Health
Required Discipline for Excellence – Information Services
Enhanced customer service by providing online accessthrough Accela Citizen Access to Site Assessment andMitigation records to conduct file reviews without theneed to make a public records request or physicallyvisiting the DEH offices. Online access to septicrecords will be completed in Fiscal Year 2013-14.Digitized mobile home park and septic system recordsto provide electronic access to DEH staff during fileinspections.Prepared for the beach water quality monitoring pro-gram’s expanded use of social media tools by usingFacebook, Twitter, and a mobile application to providereal time beach water quality monitoring status to thepublic. The social media tools will be released in thesecond quarter of Fiscal Year 2013-14. Created an interactive informational kiosk to promotegreen business practices in food facilities and installedit in the DEH main permit lobby. Funding was providedby San Diego Gas and Electric (SDG&E) and the Ameri-can Recovery and Reinvestment Act. A smaller mobileunit was made available for use offsite.Created and launched a smartphone application toenable the public to report dead birds and neglectedgreen swimming pools to assist in West Nile virus pre-vention efforts.Implemented the Business Case Management System(BCMS) and use of mobile hardware technology forfield inspections.Developed an online Unified Program Facility Permitapplication process and 10% (100 of 1,000) of newpermit applicants used the online process to apply forpermits.Continued to phase in the implementation of electronicreporting requirements on facilities that are required toreport hazardous materials and hazardous wasteinventory under AB 2286, Unified Hazardous Waste andHazardous Materials (2008) for an estimated 100 facili-ties, as part of the Hazardous Materials Division transi-tion into the BCMS. Multiple workshops were heldthroughout the county to assist more than 13,000 per-mitted businesses affected by this requirement.
2013-15 Objectives
Strategic Initiative – Safe CommunitiesWork with the U.S. Environmental Protection Agency(EPA) and Baja California, Mexico as the U.S. Co-Chairof the Border 2020 Emergency Preparedness andResponse Group for the San Diego-Tijuana region to:
Coordinate and conduct binational emergencytraining with the goal of ensuring that responders inthe region use the same equipment, procedures andhave the same training.Integrate the Office of Emergency ServicesOperational Area Emergency Operations Center andthe Tijuana Protection Civil’s Emergency OperationsCenter into binational exercises.
Improve collaboration with federal, State, County andcity prosecutors, investigators and other regulatoryagencies to prosecute environmental crimes, bothlocally and Statewide, by hosting hazardous waste taskforce meetings, hosting joint training on personal pro-tective equipment and sampling, and sending twoinspectors to the Federal Law Enforcement TrainingCenter’s advanced environmental crimes multi-jurisdic-tional task force training.
Strategic Initiative – Healthy FamiliesEducate 5,000 children on awareness and protectionfrom mosquito-borne diseases and other vector-related diseases, environmental health careers, andfood and pool safety by conducting outreach presenta-tions to primary and/or secondary school children atschools or other outreach events throughout the year. Trap rodents twice per year at port of entry sites wherefreight from foreign origin is received by boat, airplaneor truck in order to conduct tests for plague and iden-tify flea species.Trap at 40 locations and test captured mice (by takingblood samples) for the presence of Hantavirus, a rarepulmonary syndrome caused by the virus.Inspect at least 50% of the 259 identified waste tiresites in the Tire Enforcement Agency Inspection WorkPlan to ensure compliance and reduce illegal handlingand disposal of waste tires.Collaborate with the Southern Chapter of the CaliforniaEnvironmental Health Association to conduct a publichousing seminar for regulated operators and regulatorsin 2014 and in 2015, resulting in a more knowledgeablehousing industry that is aware of resources available tothem so that they may make better-informed decisionsto reduce violations.
273Land Use and Environment Group Adopted Operational Plan Fiscal Years 2013-2014 and 2014-2015
Environmental Health
Required Discipline for Excellence – Customer Satisfaction
Provide quality customer service by:Reducing the average food and housing complaintresponse time from five days to three.Maintaining average plan review times for new retailfood and public swimming pool projects at levelsthat are 50% less than the State law requirement.Contacting complainants regarding mosquitoes, ratsand flies within three days.Closing mosquito control requests for service within21 days or less after initial contact.Completing review of septic system layouts within anaverage of 10 days.Completing review and approving 95% of plans andpermits for installation, repair and removal ofUnderground Storage Tanks (UST) within 10 workingdays of receiving a complete application.Reviewing and responding to 100% of LocalOversight Program (LOP) reports and work planswithin 60 days.Reviewing, processing and approving 100% ofmonitoring well permit applications within an averageof 8 working days.
Develop an online mosquito complaint form for thepublic with automatic receipt of confirmation, whichwill allow DEH to initiate a response more efficiently.Implement the use of an online intake form to receivepublic complaints of food borne illness.
Required Discipline for Excellence – Regional Leadership
Coordinate with local cities in the region to adopt localrequirements in the County Code of Regulatory Ordi-nances related to body art, public housing and publicpools to improve the uniformity of regional inspectionprograms.Co-host the annual statewide Mosquito and VectorControl Association Conference in 2014.Work with cities that currently delegate to the Countythe authority to implement the massage, pet shop andbath house inspection programs in their jurisdictions toreflect changes in State law that make those programsno longer subject to regulation by the County.
Host a Hazardous Analysis and Critical Control Pointsworkshop in coordination with the restaurant industry,the Food and Drug Administration and the CaliforniaDepartment of Public Health to educate local industryand regulators; invite regulators from neighboring juris-dictions to participate in the training.
Required Discipline for Excellence – Continuous Improvement and Innovation
Implement changes and monitor the Community EventPermit (CEP) process for improved customer service.Conduct a study on the use of a rapid molecular diag-nostic test to improve the response to sewage contam-inated beach water.Submit a request for proposal to develop Phase I of Vir-tual Unified Program inspector training and select acontractor. This training will allow for supervised andunsupervised training in a virtual environment to aug-ment instructor-led and one-on-one field inspectortraining.
Required Discipline for Excellence – Information Services
Develop the capability of accepting online applicationsand payments for at least one permit type in the Foodand Housing Division.Complete development of an automatic electronic datatransfer for compliance monitoring and enforcementinformation from the BCMS to the California ElectronicReporting System and U.S. EPA’s databases. Once thisdata transfer has been developed, create reportingtools that will allow the Hazardous Materials Division tomonitor the information.
Related Links
For additional information about the Department of Environ-mental Health, refer to the website atwww.sdcounty.ca.gov/deh and Facebook page atwww.facebook.com/pages/County-of-San-Diego-Environmental-Health/71479891529.
274 Land Use and Environment GroupAdopted Operational Plan Fiscal Years 2013-2014 and 2014-2015
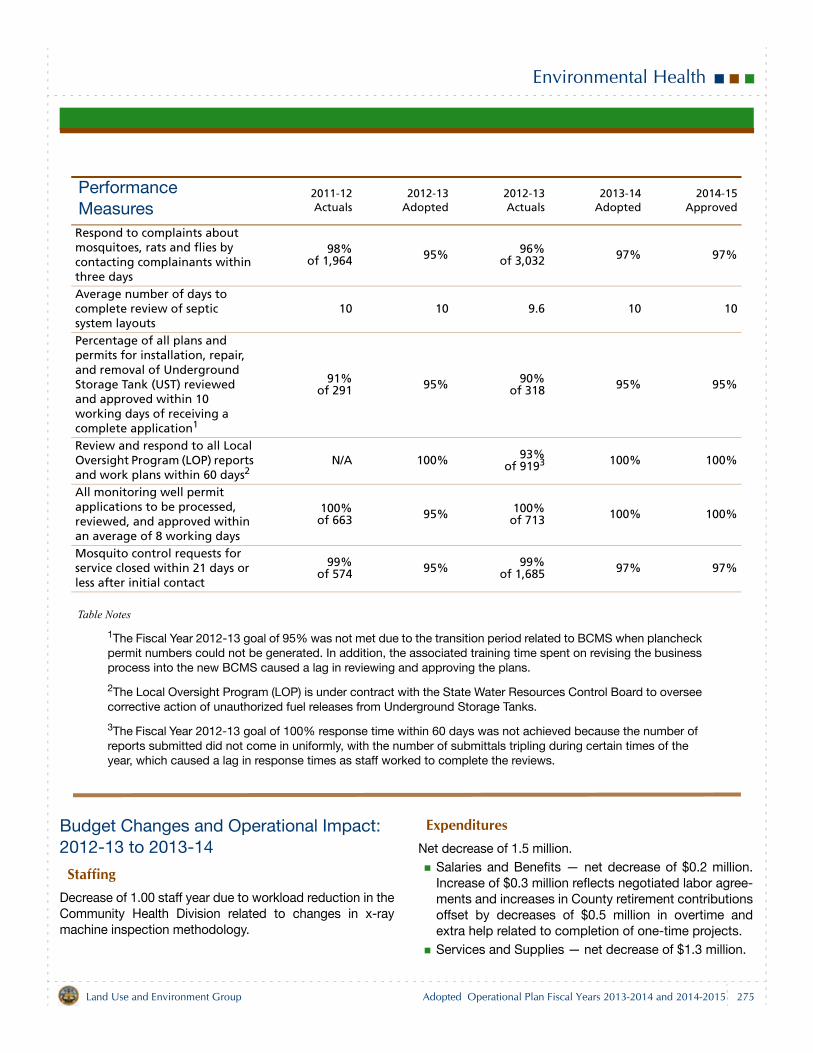
Environmental Health
Table Notes
1The Fiscal Year 2012-13 goal of 95% was not met due to the transition period related to BCMS when plancheck permit numbers could not be generated. In addition, the associated training time spent on revising the business process into the new BCMS caused a lag in reviewing and approving the plans.
2The Local Oversight Program (LOP) is under contract with the State Water Resources Control Board to oversee corrective action of unauthorized fuel releases from Underground Storage Tanks.
3The Fiscal Year 2012-13 goal of 100% response time within 60 days was not achieved because the number of reports submitted did not come in uniformly, with the number of submittals tripling during certain times of the year, which caused a lag in response times as staff worked to complete the reviews.
Budget Changes and Operational Impact: 2012-13 to 2013-14
StaffingDecrease of 1.00 staff year due to workload reduction in theCommunity Health Division related to changes in x-raymachine inspection methodology.
ExpendituresNet decrease of 1.5 million.
Salaries and Benefits — net decrease of $0.2 million.Increase of $0.3 million reflects negotiated labor agree-ments and increases in County retirement contributionsoffset by decreases of $0.5 million in overtime andextra help related to completion of one-time projects.Services and Supplies — net decrease of $1.3 million.
Performance Measures
2011-12Actuals
2012-13Adopted
2012-13Actuals
2013-14Adopted
2014-15Approved
Respond to complaints about mosquitoes, rats and flies by contacting complainants within three days
98%of 1,964 95% 96%
of 3,032 97% 97%
Average number of days to complete review of septic system layouts
10 10 9.6 10 10
Percentage of all plans and permits for installation, repair, and removal of Underground Storage Tank (UST) reviewed and approved within 10 working days of receiving a complete application1
91%of 291 95% 90%
of 318 95% 95%
Review and respond to all Local Oversight Program (LOP) reports and work plans within 60 days2
N/A 100% 93%of 9193 100% 100%
All monitoring well permit applications to be processed, reviewed, and approved within an average of 8 working days
100%of 663 95% 100%
of 713 100% 100%
Mosquito control requests for service closed within 21 days or less after initial contact
99% of 574 95% 99%
of 1,685 97% 97%
275Land Use and Environment Group Adopted Operational Plan Fiscal Years 2013-2014 and 2014-2015
Environmental Health
Decrease of $0.1 million in consultant contractservices related to completion of projects inHomeland Security Initiatives and the AmericanRecovery and Reinvestment Act.Decrease of $0.5 million due the East Otay MesaRecycling Collection Center and Landfill progressingslower than anticipated. Net decrease of $0.8 million in IT costs including areduction of $1.7 million due to implementation ofthe Business Case Management System (BCMS), anIT system which centralizes records managementand application processes offset by an increase of$0.8 million for BCMS post go-live support anddevelopment of reporting tools and an increase of$0.1 million for development of a beach water qualitymobile application.Decrease of $0.1 million is spread over variousaccounts to more accurately reflect projected costs.Increase of $0.2 million as a budgetary correction forISF Contract Services and Utilities costs
Capital Assets Equipment — No material change.
RevenuesNet decrease of $1.5 million.
Licenses, Permits & Franchises — increase of $0.2 mil-lion in Food and Housing Division and HazardousMaterials Management Division permit revenue toreflect historical trends.Intergovernmental Revenues — net decrease of $0.8million.
Decrease of $0.2 million in State funding related tofringe benefit and indirect cost limitations in theRadiological Health Program revenue agreement.Decrease of $0.2 million related to completion of anelectronic hazardous material reporting system.Decrease of $0.2 million due to completion ofHomeland Security Initiatives for emergencyresponse training and equipment, CalRecycle TireEnforcement funding to enforce waste tire storage,handling, and transportation standards, and theAmerican Recovery and Reinvestment Act forfluorescent light recycling kits and educationalmaterial.Decrease of $0.3 million is a budgetary adjustment tomove beach water quality monitoring funding toCharges for Current Services.Increase of $0.1 million in Hazardous IncidentResponse funding due to renegotiation of thecontract to ensure full cost recovery.
Charges for Current Services — net increase of $0.6million.
Increase of $0.4 million in Vector Control ProgramBenefit Assessment funds for BCMS post go-livesupport and development of reporting tools. Increases due to budgetary adjustments of $0.5million to move Land Use project processing revenuefrom Miscellaneous Revenues and $0.3 million tomove beach water quality monitoring funding fromIntergovernmental Revenues offset by a decrease of$0.6 million as a result of the East Otay MesaRecycling Collection Center and Landfill progressingslower than anticipated.
Miscellaneous Revenues — net decrease of $1.3 mil-lion.
Decrease of $0.9 million due to implementation ofBCMS and other one-time IT projects.Decrease of $0.5 million as a budgetary adjustmentto move Land Use project processing revenue toCharges for Current Services.Increase of $0.1 million for development of a beachwater quality mobile application.
Fund Balance Component Decrease — increase of$0.3 million for BCMS post go-live support and devel-opment of reporting tools.Use of Fund Balance — decrease of $0.4 million. Atotal of $0.4 million budgeted includes $0.1 million fordevelopment of BCMS reporting tools, $0.1 million forbeach water quality monitoring, $0.1 million for devel-opment of an Onsite Wastewater Treatment programand $0.1 million to offset Tribal Liaison costs, dataimaging projects and fire victim permit fee waivers.
Budget Changes and Operational Impact: 2013-14 to 2014-15
Decrease of $1.3 million. A net decrease of $0.5 million inSalaries and Benefits reflects an increase of $0.7 million fornegotiated labor agreements and increases in Countyretirement contributions offset by a decrease of $1.2 millionin salary adjustments for modified positions, on-goingvacancies, vacant positions that are not anticipated to befilled in Fiscal Year 2014-15, and adjustments due to com-pletion of the Land and Water Quality Division data imagingprojects. A decrease of $0.8 million in Services and Sup-plies is related to the completion of BCMS reporting tools,one-time IT projects and data imaging projects.
276 Land Use and Environment GroupAdopted Operational Plan Fiscal Years 2013-2014 and 2014-2015
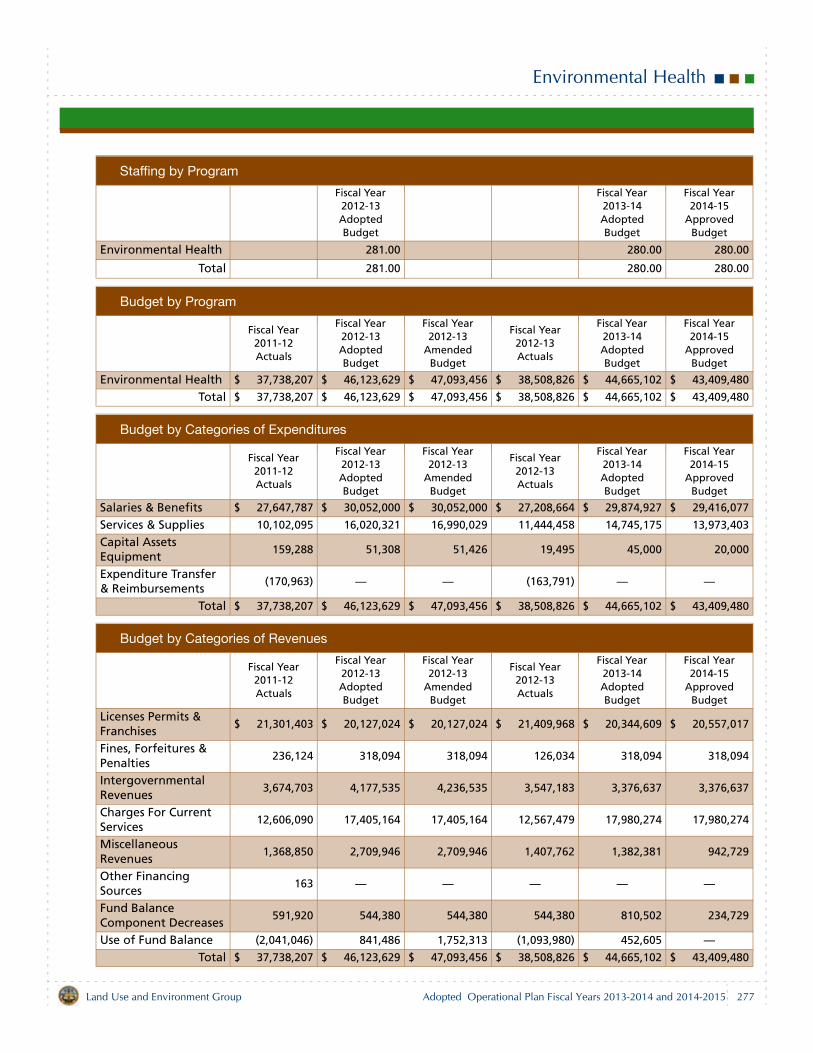
Environmental Health
Staffing by Program
Fiscal Year 2012-13 Adopted Budget
Fiscal Year 2013-14 Adopted Budget
Fiscal Year 2014-15
Approved Budget
Environmental Health 281.00 280.00 280.00
Total 281.00 280.00 280.00
Budget by Program
Fiscal Year 2011-12 Actuals
Fiscal Year 2012-13 Adopted Budget
Fiscal Year 2012-13
Amended Budget
Fiscal Year 2012-13 Actuals
Fiscal Year 2013-14 Adopted Budget
Fiscal Year 2014-15
Approved Budget
Environmental Health $ 37,738,207 $ 46,123,629 $ 47,093,456 $ 38,508,826 $ 44,665,102 $ 43,409,480
Total $ 37,738,207 $ 46,123,629 $ 47,093,456 $ 38,508,826 $ 44,665,102 $ 43,409,480
Budget by Categories of Expenditures
Fiscal Year 2011-12 Actuals
Fiscal Year 2012-13 Adopted Budget
Fiscal Year 2012-13
Amended Budget
Fiscal Year 2012-13 Actuals
Fiscal Year 2013-14 Adopted Budget
Fiscal Year 2014-15
Approved Budget
Salaries & Benefits $ 27,647,787 $ 30,052,000 $ 30,052,000 $ 27,208,664 $ 29,874,927 $ 29,416,077
Services & Supplies 10,102,095 16,020,321 16,990,029 11,444,458 14,745,175 13,973,403
Capital Assets Equipment
159,288 51,308 51,426 19,495 45,000 20,000
Expenditure Transfer & Reimbursements
(170,963) — — (163,791) — —
Total $ 37,738,207 $ 46,123,629 $ 47,093,456 $ 38,508,826 $ 44,665,102 $ 43,409,480
Budget by Categories of Revenues
Fiscal Year 2011-12 Actuals
Fiscal Year 2012-13 Adopted Budget
Fiscal Year 2012-13
Amended Budget
Fiscal Year 2012-13 Actuals
Fiscal Year 2013-14 Adopted Budget
Fiscal Year 2014-15
Approved Budget
Licenses Permits & Franchises
$ 21,301,403 $ 20,127,024 $ 20,127,024 $ 21,409,968 $ 20,344,609 $ 20,557,017
Fines, Forfeitures & Penalties
236,124 318,094 318,094 126,034 318,094 318,094
Intergovernmental Revenues
3,674,703 4,177,535 4,236,535 3,547,183 3,376,637 3,376,637
Charges For Current Services
12,606,090 17,405,164 17,405,164 12,567,479 17,980,274 17,980,274
Miscellaneous Revenues
1,368,850 2,709,946 2,709,946 1,407,762 1,382,381 942,729
Other Financing Sources
163 — — — — —
Fund Balance Component Decreases
591,920 544,380 544,380 544,380 810,502 234,729
Use of Fund Balance (2,041,046) 841,486 1,752,313 (1,093,980) 452,605 —Total $ 37,738,207 $ 46,123,629 $ 47,093,456 $ 38,508,826 $ 44,665,102 $ 43,409,480
277Land Use and Environment Group Adopted Operational Plan Fiscal Years 2013-2014 and 2014-2015

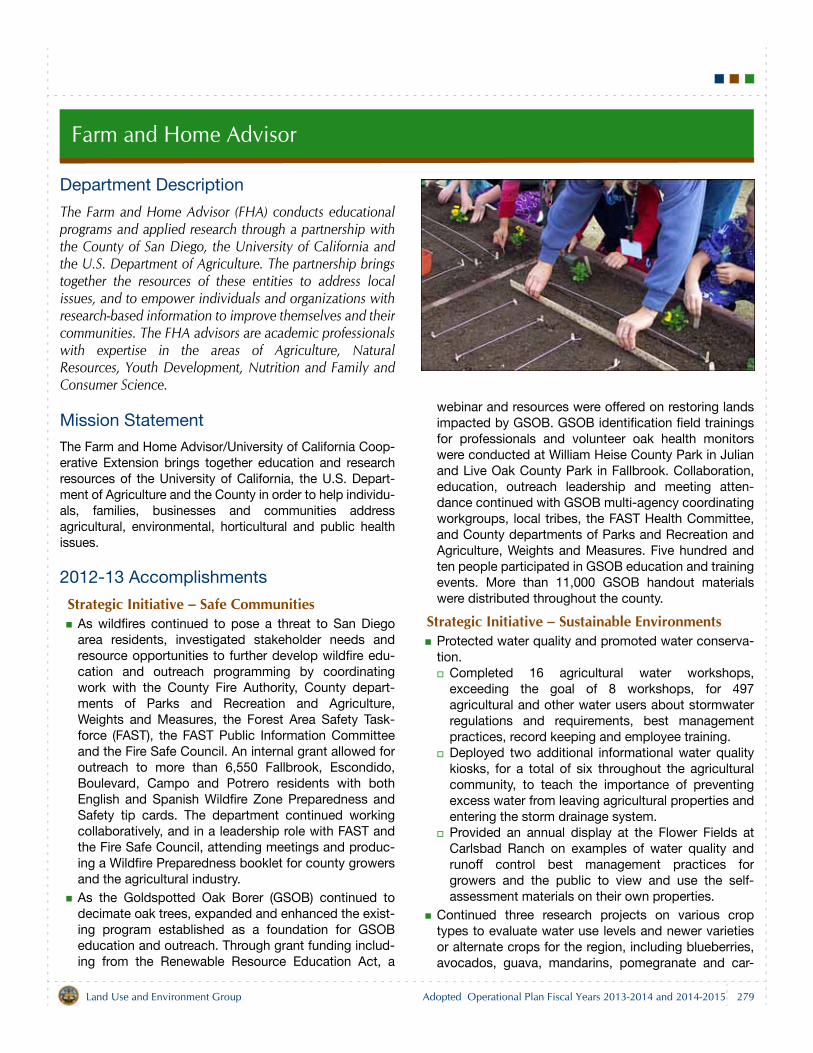
Farm and Home Advisor
Department Description
The Farm and Home Advisor (FHA) conducts educationalprograms and applied research through a partnership withthe County of San Diego, the University of California andthe U.S. Department of Agriculture. The partnership bringstogether the resources of these entities to address localissues, and to empower individuals and organizations withresearch-based information to improve themselves and theircommunities. The FHA advisors are academic professionalswith expertise in the areas of Agriculture, NaturalResources, Youth Development, Nutrition and Family andConsumer Science.
Mission Statement
The Farm and Home Advisor/University of California Coop-erative Extension brings together education and researchresources of the University of California, the U.S. Depart-ment of Agriculture and the County in order to help individu-als, families, businesses and communities addressagricultural, environmental, horticultural and public healthissues.
2012-13 Accomplishments
Strategic Initiative – Safe CommunitiesAs wildfires continued to pose a threat to San Diegoarea residents, investigated stakeholder needs andresource opportunities to further develop wildfire edu-cation and outreach programming by coordinatingwork with the County Fire Authority, County depart-ments of Parks and Recreation and Agriculture,Weights and Measures, the Forest Area Safety Task-force (FAST), the FAST Public Information Committeeand the Fire Safe Council. An internal grant allowed foroutreach to more than 6,550 Fallbrook, Escondido,Boulevard, Campo and Potrero residents with bothEnglish and Spanish Wildfire Zone Preparedness andSafety tip cards. The department continued workingcollaboratively, and in a leadership role with FAST andthe Fire Safe Council, attending meetings and produc-ing a Wildfire Preparedness booklet for county growersand the agricultural industry.As the Goldspotted Oak Borer (GSOB) continued todecimate oak trees, expanded and enhanced the exist-ing program established as a foundation for GSOBeducation and outreach. Through grant funding includ-ing from the Renewable Resource Education Act, a
webinar and resources were offered on restoring landsimpacted by GSOB. GSOB identification field trainingsfor professionals and volunteer oak health monitorswere conducted at William Heise County Park in Julianand Live Oak County Park in Fallbrook. Collaboration,education, outreach leadership and meeting atten-dance continued with GSOB multi-agency coordinatingworkgroups, local tribes, the FAST Health Committee,and County departments of Parks and Recreation andAgriculture, Weights and Measures. Five hundred andten people participated in GSOB education and trainingevents. More than 11,000 GSOB handout materialswere distributed throughout the county.
Strategic Initiative – Sustainable EnvironmentsProtected water quality and promoted water conserva-tion.
Completed 16 agricultural water workshops,exceeding the goal of 8 workshops, for 497agricultural and other water users about stormwaterregulations and requirements, best managementpractices, record keeping and employee training.Deployed two additional informational water qualitykiosks, for a total of six throughout the agriculturalcommunity, to teach the importance of preventingexcess water from leaving agricultural properties andentering the storm drainage system.Provided an annual display at the Flower Fields atCarlsbad Ranch on examples of water quality andrunoff control best management practices forgrowers and the public to view and use the self-assessment materials on their own properties.
Continued three research projects on various croptypes to evaluate water use levels and newer varietiesor alternate crops for the region, including blueberries,avocados, guava, mandarins, pomegranate and car-
279Land Use and Environment Group Adopted Operational Plan Fiscal Years 2013-2014 and 2014-2015
Farm and Home Advisor
ambola (starfruit/dragonfruit). As water prices continueto rise, these new crop types are anticipated to con-sume less water thereby bolstering economic growth.Protected water quality and prevented costly consumersaltwater boat repairs by providing outreach informa-tion to 103 staff from boating organizations and associ-ated industry groups as well as boaters on controllinginvasive species that foul the bottoms of recreationalboats.Provided outreach information to 552 San DiegoRegional Quagga Mussel Working Group members(consisting of State, regional, San Diego County WaterAuthority and City of San Diego Water Departmentstaff), associated industry groups and other interestedstakeholders on controlling invasive, freshwater mus-sels that foul freshwater delivery systems and out-compete native life.Expanded the number and size of demonstration pilotsites of habitat restoration techniques learned fromresearch in collaboration with U.S. Fish and WildlifeService, city and County departments of Parks andRecreation, Barnett Ranch Open Space Park, Univer-sity of California, Irvine and the Irvine Ranch Conser-vancy from 100 acres in Fiscal Year 2011-12 to 150acres. Constraints by various agencies, includingaccess to property, prohibited the expansion of theresearch from 150 to 200 acres as originally expected.FHA continues to work with the agencies to gain addi-tional access to expand the project.
Strategic Initiative – Healthy FamiliesImproved youth development, school readiness andnutrition in the region.
Provided administrative and instructional materialsupport for 365 4-H volunteer leaders, exceeding thegoal of 350 volunteer leaders, in order to conductcommunity-based educational programs to 24 4-Hclubs, 7 after-school sites and 8 military 4-H sites.Provided nutrition education for 670 low-incomefamilies with children, which represent 3,262 people,emphasizing healthful nutrition practices, foodresource management and food safety, exceedingthe goal of 400 families. A total of 55 teachers weretrained in nutrition curricula who then providededucation to 3,452 youth.
2013-15 Objectives
Strategic Initiative – Safe CommunitiesAs wildfires continue to pose a threat to San Diego arearesidents, continue to investigate stakeholder needsand additional resource opportunities to furtherdevelop wildfire education and outreach programming.As the GSOB continues to decimate oak trees, expandand enhance the existing program established as afoundation for GSOB education and outreach. Createonline training and self-testing modules for public landmanagers, homeowners, recreationalists and othergroups as needed, on the biology, impacts and symp-toms, and best management practices relating toGSOB.
Strategic Initiative – Sustainable EnvironmentsProtect water quality and promote water conservation.
Complete ten agricultural water workshops toeducate agricultural and other water users aboutstormwater regulations and requirements, bestmanagement practices, record keeping andemployee training.Provide printed outreach materials such asmanagement booklets, self-assessment surveys,record keeping systems and agricultural waterquality best management pocket field guides toeducate growers and other land managers.Provide an annual display at the Flower Fields atCarlsbad Ranch on examples of water quality andrunoff control best management practices forgrowers and the public to view and use the self-assessment materials on their own properties.
Continue conducting at least two research projects onvarious crop types to evaluate water use levels andnewer varieties or alternate crops for the region, includ-ing blueberries, avocados, guava, mandarins, pome-granate and carambola (starfruit/dragonfruit). As waterprices continue to rise, these new crop types are antic-ipated to consume less water thereby bolstering eco-nomic growth.Provide staff to assist in the coordination, and trainingof 1,000 volunteers through the Master Gardener and4-H programs to provide 205,000 hours of volunteerservice.Using the volunteer Master Gardener program, provideresearch-based information in the areas of home gar-dening, landscaping and pest management to countyresidents through consultations, educational exhibitsand seminar classes.
280 Land Use and Environment GroupAdopted Operational Plan Fiscal Years 2013-2014 and 2014-2015
Farm and Home Advisor
Using the Master Gardener program, provide outreachand assistance in creating and maintaining more than300 school and community gardens throughout SanDiego County. Expand the number and size of demonstration pilotsites of habitat restoration techniques learned fromresearch in collaboration with U.S. Fish and WildlifeService, city and County departments of Parks andRecreation, Barnett Ranch Open Space Park, Univer-sity of California, Irvine and the Irvine Ranch Conser-vancy from 150 acres in Fiscal Year 2012-13 to 200acres.
Strategic Initiative – Healthy FamiliesImprove youth development and nutrition in the region.
Provide administrative and instructional materialsupport for 350 4-H adult and youth volunteerleaders to conduct community-based educationalprograms to 25 4-H clubs, 7 after-school sites and 8military 4-H sites.Provide nutrition education for 500 low-incomefamilies with children, emphasizing healthful nutritionpractices, food resource management and foodsafety.
Related Links
For additional information about the Farm and Home Advi-sor Office, refer to the website at www.sdcounty.ca.gov/fha.
281Land Use and Environment Group Adopted Operational Plan Fiscal Years 2013-2014 and 2014-2015
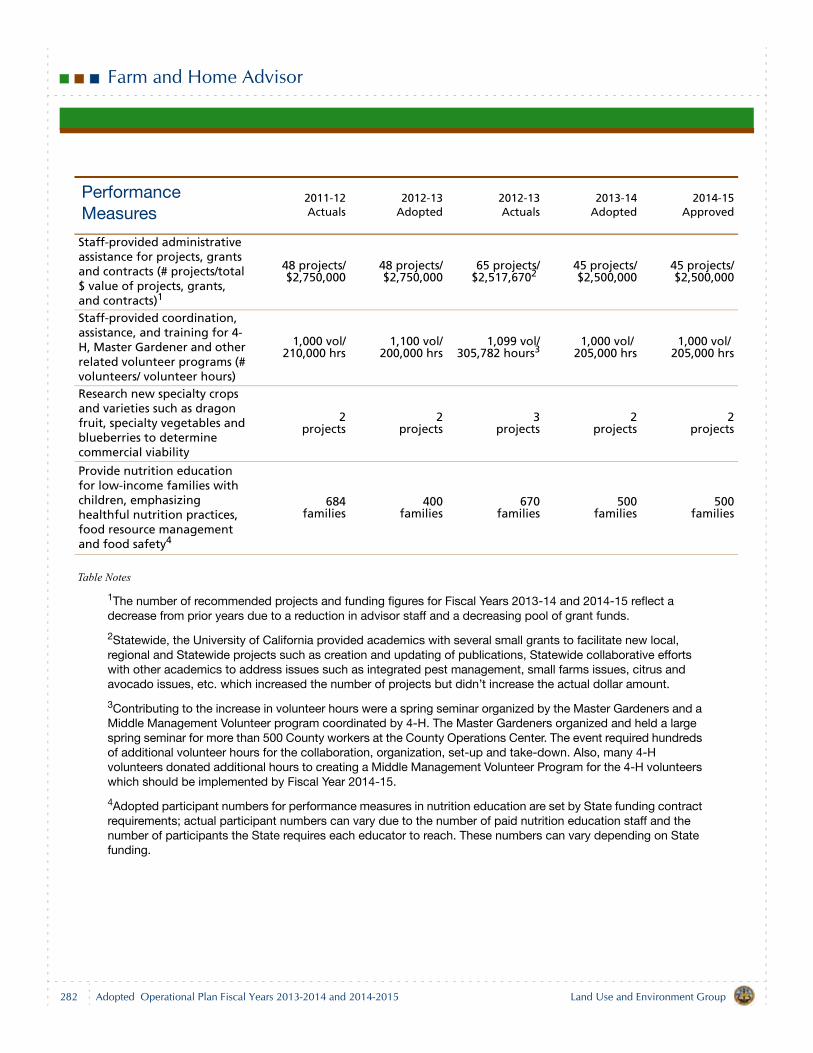
Farm and Home Advisor
Table Notes
1The number of recommended projects and funding figures for Fiscal Years 2013-14 and 2014-15 reflect a decrease from prior years due to a reduction in advisor staff and a decreasing pool of grant funds.
2Statewide, the University of California provided academics with several small grants to facilitate new local, regional and Statewide projects such as creation and updating of publications, Statewide collaborative efforts with other academics to address issues such as integrated pest management, small farms issues, citrus and avocado issues, etc. which increased the number of projects but didn’t increase the actual dollar amount.
3Contributing to the increase in volunteer hours were a spring seminar organized by the Master Gardeners and a Middle Management Volunteer program coordinated by 4-H. The Master Gardeners organized and held a large spring seminar for more than 500 County workers at the County Operations Center. The event required hundreds of additional volunteer hours for the collaboration, organization, set-up and take-down. Also, many 4-H volunteers donated additional hours to creating a Middle Management Volunteer Program for the 4-H volunteers which should be implemented by Fiscal Year 2014-15.
4Adopted participant numbers for performance measures in nutrition education are set by State funding contract requirements; actual participant numbers can vary due to the number of paid nutrition education staff and the number of participants the State requires each educator to reach. These numbers can vary depending on State funding.
Performance Measures
2011-12Actuals
2012-13Adopted
2012-13Actuals
2013-14Adopted
2014-15Approved
Staff-provided administrative assistance for projects, grants and contracts (# projects/total $ value of projects, grants, and contracts)1
48 projects/$2,750,000
48 projects/$2,750,000
65 projects/$2,517,6702
45 projects/$2,500,000
45 projects/$2,500,000
Staff-provided coordination, assistance, and training for 4-H, Master Gardener and other related volunteer programs (# volunteers/ volunteer hours)
1,000 vol/ 210,000 hrs
1,100 vol/200,000 hrs
1,099 vol/305,782 hours3
1,000 vol/ 205,000 hrs
1,000 vol/ 205,000 hrs
Research new specialty crops and varieties such as dragon fruit, specialty vegetables and blueberries to determine commercial viability
2 projects
2projects
3projects
2projects
2projects
Provide nutrition education for low-income families with children, emphasizing healthful nutrition practices, food resource management and food safety4
684 families
400families
670families
500 families
500families
282 Land Use and Environment GroupAdopted Operational Plan Fiscal Years 2013-2014 and 2014-2015
Farm and Home Advisor
Budget Changes and Operational Impact: 2012-13 to 2013-14
StaffingDecrease of 2.00 staff years. The staff years were trans-ferred from the Farm and Home Advisor to the Departmentof Agriculture, Weights and Measures during Fiscal Year2012-13 due to operational needs. Staff for the Farm andHome Advisor is provided through a partnership betweenthe County of San Diego and the University of California.
ExpendituresNo net change.
Salaries and Benefits — decrease of $0.1 million due tothe reduction of 2.00 staff years as described above.
Services and Supplies — increase of $0.1 million dueto costs associated with contracted services in SpecialDepartmental Expense.
RevenuesNo change.
Budget Changes and Operational Impact: 2013-14 to 2014-15
No significant change.
283Land Use and Environment Group Adopted Operational Plan Fiscal Years 2013-2014 and 2014-2015
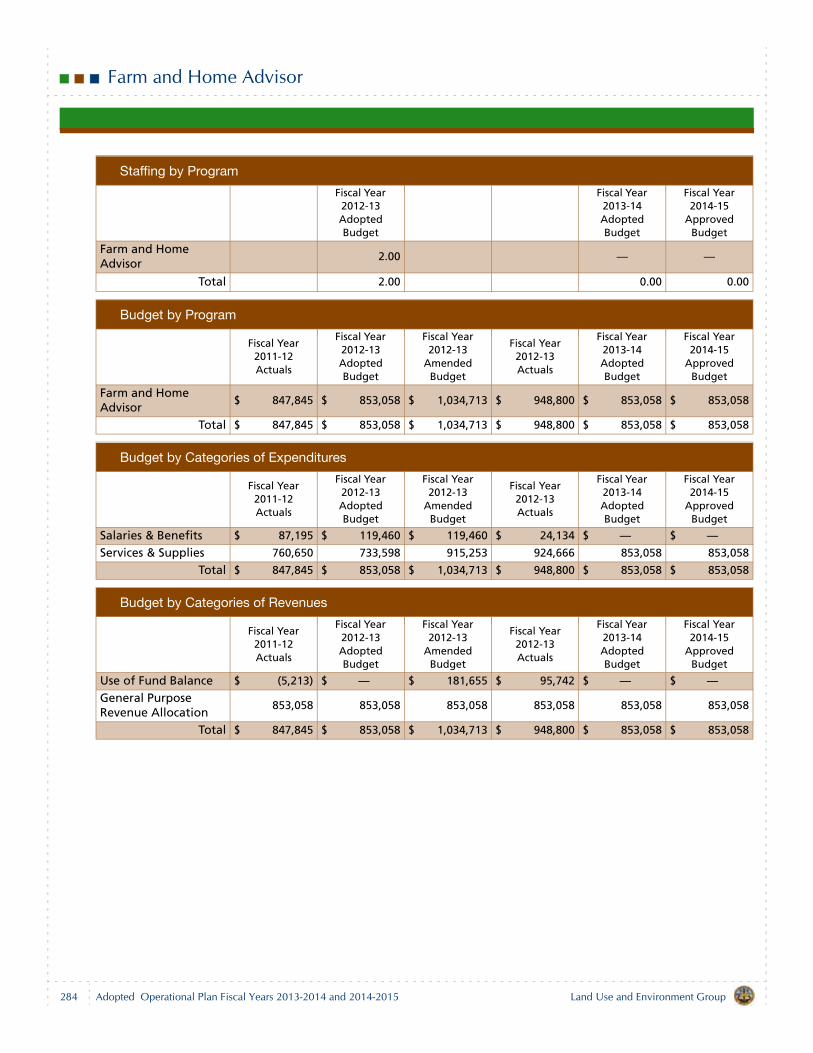
Farm and Home Advisor
Staffing by Program
Fiscal Year 2012-13 Adopted Budget
Fiscal Year 2013-14 Adopted Budget
Fiscal Year 2014-15
Approved Budget
Farm and Home Advisor
2.00 — —
Total 2.00 0.00 0.00
Budget by Program
Fiscal Year 2011-12 Actuals
Fiscal Year 2012-13 Adopted Budget
Fiscal Year 2012-13
Amended Budget
Fiscal Year 2012-13 Actuals
Fiscal Year 2013-14 Adopted Budget
Fiscal Year 2014-15
Approved Budget
Farm and Home Advisor
$ 847,845 $ 853,058 $ 1,034,713 $ 948,800 $ 853,058 $ 853,058
Total $ 847,845 $ 853,058 $ 1,034,713 $ 948,800 $ 853,058 $ 853,058
Budget by Categories of Expenditures
Fiscal Year 2011-12 Actuals
Fiscal Year 2012-13 Adopted Budget
Fiscal Year 2012-13
Amended Budget
Fiscal Year 2012-13 Actuals
Fiscal Year 2013-14 Adopted Budget
Fiscal Year 2014-15
Approved Budget
Salaries & Benefits $ 87,195 $ 119,460 $ 119,460 $ 24,134 $ — $ —Services & Supplies 760,650 733,598 915,253 924,666 853,058 853,058
Total $ 847,845 $ 853,058 $ 1,034,713 $ 948,800 $ 853,058 $ 853,058
Budget by Categories of Revenues
Fiscal Year 2011-12 Actuals
Fiscal Year 2012-13 Adopted Budget
Fiscal Year 2012-13
Amended Budget
Fiscal Year 2012-13 Actuals
Fiscal Year 2013-14 Adopted Budget
Fiscal Year 2014-15
Approved Budget
Use of Fund Balance $ (5,213) $ — $ 181,655 $ 95,742 $ — $ —General Purpose Revenue Allocation
853,058 853,058 853,058 853,058 853,058 853,058
Total $ 847,845 $ 853,058 $ 1,034,713 $ 948,800 $ 853,058 $ 853,058
284 Land Use and Environment GroupAdopted Operational Plan Fiscal Years 2013-2014 and 2014-2015
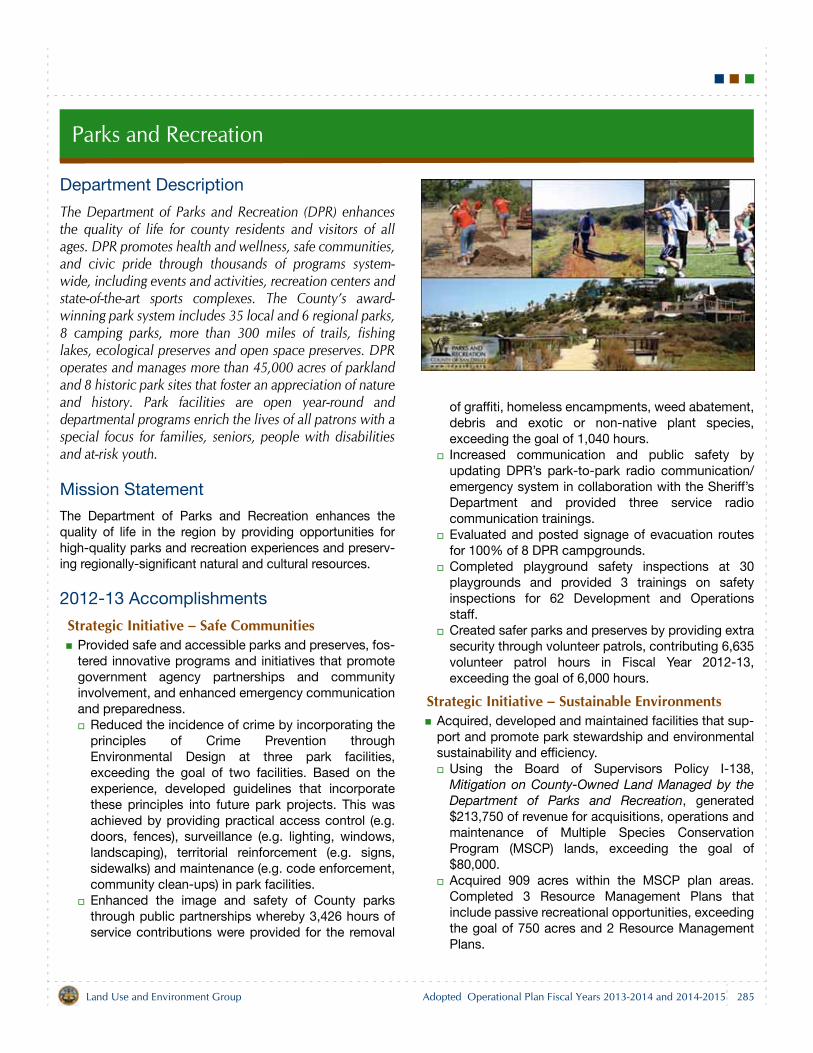
Parks and Recreation
Department Description
The Department of Parks and Recreation (DPR) enhancesthe quality of life for county residents and visitors of allages. DPR promotes health and wellness, safe communities,and civic pride through thousands of programs system-wide, including events and activities, recreation centers andstate-of-the-art sports complexes. The County’s award-winning park system includes 35 local and 6 regional parks,8 camping parks, more than 300 miles of trails, fishinglakes, ecological preserves and open space preserves. DPRoperates and manages more than 45,000 acres of parklandand 8 historic park sites that foster an appreciation of natureand history. Park facilities are open year-round anddepartmental programs enrich the lives of all patrons with aspecial focus for families, seniors, people with disabilitiesand at-risk youth.
Mission Statement
The Department of Parks and Recreation enhances thequality of life in the region by providing opportunities forhigh-quality parks and recreation experiences and preserv-ing regionally-significant natural and cultural resources.
2012-13 Accomplishments
Strategic Initiative – Safe CommunitiesProvided safe and accessible parks and preserves, fos-tered innovative programs and initiatives that promotegovernment agency partnerships and communityinvolvement, and enhanced emergency communicationand preparedness.
Reduced the incidence of crime by incorporating theprinciples of Crime Prevention throughEnvironmental Design at three park facilities,exceeding the goal of two facilities. Based on theexperience, developed guidelines that incorporatethese principles into future park projects. This wasachieved by providing practical access control (e.g.doors, fences), surveillance (e.g. lighting, windows,landscaping), territorial reinforcement (e.g. signs,sidewalks) and maintenance (e.g. code enforcement,community clean-ups) in park facilities.Enhanced the image and safety of County parksthrough public partnerships whereby 3,426 hours ofservice contributions were provided for the removal
of graffiti, homeless encampments, weed abatement,debris and exotic or non-native plant species,exceeding the goal of 1,040 hours.Increased communication and public safety byupdating DPR’s park-to-park radio communication/emergency system in collaboration with the Sheriff’sDepartment and provided three service radiocommunication trainings.Evaluated and posted signage of evacuation routesfor 100% of 8 DPR campgrounds.Completed playground safety inspections at 30playgrounds and provided 3 trainings on safetyinspections for 62 Development and Operationsstaff. Created safer parks and preserves by providing extrasecurity through volunteer patrols, contributing 6,635volunteer patrol hours in Fiscal Year 2012-13,exceeding the goal of 6,000 hours.
Strategic Initiative – Sustainable EnvironmentsAcquired, developed and maintained facilities that sup-port and promote park stewardship and environmentalsustainability and efficiency.
Using the Board of Supervisors Policy I-138,Mitigation on County-Owned Land Managed by theDepartment of Parks and Recreation, generated$213,750 of revenue for acquisitions, operations andmaintenance of Multiple Species ConservationProgram (MSCP) lands, exceeding the goal of$80,000.Acquired 909 acres within the MSCP plan areas.Completed 3 Resource Management Plans thatinclude passive recreational opportunities, exceedingthe goal of 750 acres and 2 Resource ManagementPlans.
285Land Use and Environment Group Adopted Operational Plan Fiscal Years 2013-2014 and 2014-2015
Parks and Recreation
Upgraded two park facilities with artificial turf toconserve water resources, to reduce overallmaintenance and provide state-of-the-art playingfields for year-round sports programs.Installed two photovoltaic systems (solar panels) atexisting facilities to reduce County reliance on fossilfuels and reduce annual operating costs.Increased environmental stewardship by educating5,643 youth about the importance of naturalresources, including conservation and sustainabilitystrategies through Energy Saving Adventures andOutdoor Adventure programs, exceeding the goal ofeducating 4,500 youth.Enhanced the existing Discovery Kit environmentaleducation program material and expanded theprogram to two additional sites, for a total of threesites.Replaced trees affected by the Goldspotted OakBorer at eight park locations to protect the currentCoast Live Oak tree population and replace diseasedor dying trees with pest-resistant varieties of oaktrees.Mitigated fire fuel hazards and maintained fire safezones in 40 park facilities through continuedimplementation of fuel management practices,exceeding the goal of 30 facilities.Installed eight new solar trash compactingreceptacles at parks to maintain service levels andreduce maintenance costs and staffing time for trashdisposal.Improved energy and water efficiency in ten parkfacilities by various means, including nativelandscaping retrofitting, installing new water- andenergy-efficient equipment, replacing older vehicleswith energy-efficient vehicles and reducing waterand energy usage, exceeding the goal of eightfacilities.
Strategic Initiative – Healthy FamiliesDeveloped and enhanced the experiences of parkpatrons and promoted healthy lifestyles by increasingrecreational opportunities and educational programs.
Performed comprehensive active living assessmentsat three parks using DPR’s new Healthy Edge ParkDesign Guidelines. Used the assessment to developa “health report card” and improvement strategy forthe facilities.Promoted healthy lifestyles for 2,325 adults andseniors through participation in 88 recreationprograms, exceeding the goal of 2,000 adults and 60recreation programs.
Fostered the positive development of 6,523 youththrough 180 recreation programs and services thatincrease physical, intellectual, social and/oremotional abilities, exceeding the goal of 6,000youth.Developed or enhanced five County park trails topromote health and fitness, exceeding the goal oftwo trails, by installing exercise stations or QR FitTrail stations, which allow users to access freeguided fitness instruction videos on their mobiledevices. Increased recreational opportunities for youth at parkfacilities in collaboration with six school-sponsoredsports activities.Incorporated the County’s Live Well San DiegoBuilding Better Health initiative and other health-related messages into three environmentaleducational programs, exceeding the goal of twoprograms, in three promotional publications.
2013-15 Objectives
Strategic Initiative – Safe CommunitiesProvide safe and accessible parks and preserves, fos-ter innovative programs and initiatives that promotegovernment agency partnerships and communityinvolvement, and enhance emergency communicationand preparedness.
Perform small water sampling training on potablewater requirements for park operations staff tofurther educate staff working in parks with smallwater systems on how to ensure safe drinking wateris supplied to park patrons. In collaboration with the Health and Human ServicesAgency, provide training on child abuse preventionfor all after-school full-time program coordinatorsand 50% (8 of 16) of seasonal staff to develop astrauma-informed knowledge workers.Facilitate community service projects, through courtorder and/or school participation, at park facilities fora minimum of 15,000 hours. Reduce vandalism and theft by installing safety/security cameras at three park facilities.Provide training through Agriculture, Weights andMeasures for 100 staff in park facilities on properprotocols and procedures for the use of herbicides.Install Wi-Fi at one park site to provide staff andcustomers greater access to online emergencynotifications and information.
286 Land Use and Environment GroupAdopted Operational Plan Fiscal Years 2013-2014 and 2014-2015
Parks and Recreation
Improve access at park and recreation facilities byadding Americans with Disabilities Act access tothree park facilities.
Create safer parks, preserves and recreation centers byusing volunteers to assist with park patrols, operations,and maintenance and contributing more than 96,000volunteer hours annually.
Strategic Initiative – Sustainable EnvironmentsAcquire, develop and maintain facilities that supportand promote park stewardship and environmental sus-tainability and efficiency.
Install five new solar trash compacting receptacles atparks to maintain service levels and reducemaintenance costs and staffing time for trashdisposal.Provide three new special events, such as concertsin the park or a celebration event, to further engageresidents in community life, civic, and recreationalactivities.Replace diseased, dying or dead trees at 10 parklocations to protect the current tree population andreplace with varieties of pest-resistant trees.Mitigate fire fuel hazards and maintain fire safe zonesin 40 park facilities through continuedimplementation of fuel management practices.Implement a green building GIS mapping layer thatdemonstrates DPR’s achievements in developingsustainable facilities in County parks.Incorporate cultural, historical or environmentalinterpretive components at three DPR facilities.Acquire 300 acres within the MSCP plan areas thatwill count toward the County’s commitment of 9,425acres as required by the MSCP ImplementingAgreement.Use Board Policy I-138, Mitigation on County-OwnedLand Managed by the Department of Parks andRecreation to generate $80,000 of revenue foracquisitions, operations and maintenance of MSCPlands.Save 30 million gallons of water at 19 park facilitiesthat have converted to smart irrigation controllersresulting in water conservation.
Develop a park design manual that guides the develop-ment of future park and recreation facilities.
Strategic Initiative – Healthy FamiliesDevelop and enhance the experiences of park patronsand promote healthy lifestyles by increasing recre-ational opportunities and educational programs.
Promote healthy lifestyles for 2,000 adults andseniors through participation in 60 recreationprograms.Implement the TRACK Trails interpretative programat two parks, which encourages children and familiesto participate in outdoor recreation through earningsmall rewards, such as stickers, pencils, badges andnature journals, for completing activities and hikesand recording them online. Participate in the County’s efforts in the CommunityTransformation Grant, specifically by participating inthe Health in All Policies strategy to identify acomprehensive integrated Active Transportation Planfor specific communities that would incorporate theCounty’s Trails, Bike and Pedestrian Plans.Foster positive development of 6,000 youth through180 recreation programs and services that increasephysical, intellectual, social and/or emotionalabilities.Develop or enhance two County park trails topromote health and fitness.Perform comprehensive active living assessments atthree parks using DPR’s new Healthy Edge ParkDesign Guidelines. Use the assessments to developa “health report card” and improvement strategy forfacilities.
Required Discipline for Excellence – Essential Infrastructure
Manage the execution of parks-related capital projectsidentified in the Capital Improvement Needs Assess-ment as approved by the Board of Supervisors, in atimely and cost effective manner.
San Elijo Lagoon Gateway Property Acquisition –This project is to acquire a triangle of open spacebetween Solana Beach and the Lagoon, just east ofthe Cardiff State Beach, and incorporate it into theSan Elijo Ecological Reserve. Project cost of $1.8million is budgeted in the Capital Program.San Diego Botanic Garden Expansion – This projectis for planning and development of the futureexpansion to the San Diego Botanic Garden. Projectcost of $1.0 million is budgeted in the CapitalProgram.4S Ranch Synthetic Turf South Ball Fields – Theproject consists of the conversion of 239,000 squarefeet of multi-purpose grass fields into synthetic turf,which will conserve water. Project cost of $2.5 millionis budgeted in the Capital Program.
287Land Use and Environment Group Adopted Operational Plan Fiscal Years 2013-2014 and 2014-2015
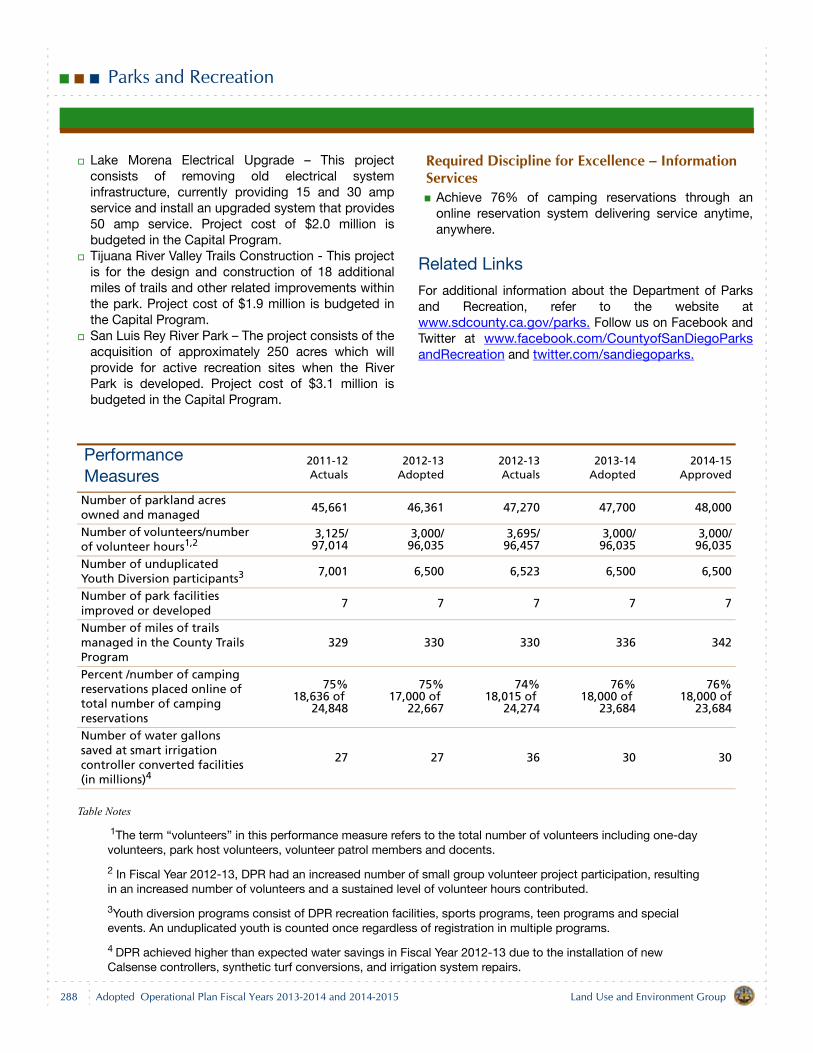
Parks and Recreation
Lake Morena Electrical Upgrade – This projectconsists of removing old electrical systeminfrastructure, currently providing 15 and 30 ampservice and install an upgraded system that provides50 amp service. Project cost of $2.0 million isbudgeted in the Capital Program.Tijuana River Valley Trails Construction - This projectis for the design and construction of 18 additionalmiles of trails and other related improvements withinthe park. Project cost of $1.9 million is budgeted inthe Capital Program.San Luis Rey River Park – The project consists of theacquisition of approximately 250 acres which willprovide for active recreation sites when the RiverPark is developed. Project cost of $3.1 million isbudgeted in the Capital Program.
Required Discipline for Excellence – Information Services
Achieve 76% of camping reservations through anonline reservation system delivering service anytime,anywhere.
Related Links
For additional information about the Department of Parksand Recreation, refer to the website atwww.sdcounty.ca.gov/parks. Follow us on Facebook andTwitter at www.facebook.com/CountyofSanDiegoParksandRecreation and twitter.com/sandiegoparks.
Table Notes
1The term “volunteers” in this performance measure refers to the total number of volunteers including one-day volunteers, park host volunteers, volunteer patrol members and docents.
2 In Fiscal Year 2012-13, DPR had an increased number of small group volunteer project participation, resulting in an increased number of volunteers and a sustained level of volunteer hours contributed.
3Youth diversion programs consist of DPR recreation facilities, sports programs, teen programs and special events. An unduplicated youth is counted once regardless of registration in multiple programs.
4 DPR achieved higher than expected water savings in Fiscal Year 2012-13 due to the installation of new Calsense controllers, synthetic turf conversions, and irrigation system repairs.
Performance Measures
2011-12Actuals
2012-13Adopted
2012-13Actuals
2013-14Adopted
2014-15Approved
Number of parkland acres owned and managed
45,661 46,361 47,270 47,700 48,000
Number of volunteers/number of volunteer hours1,2
3,125/97,014
3,000/96,035
3,695/96,457
3,000/96,035
3,000/96,035
Number of unduplicated Youth Diversion participants3 7,001 6,500 6,523 6,500 6,500
Number of park facilities improved or developed 7 7 7 7 7
Number of miles of trails managed in the County Trails Program
329 330 330 336 342
Percent /number of camping reservations placed online of total number of camping reservations
75%18,636 of
24,848
75%17,000 of
22,667
74%18,015 of
24,274
76%18,000 of
23,684
76%18,000 of
23,684
Number of water gallons saved at smart irrigation controller converted facilities (in millions)4
27 27 36 30 30
288 Land Use and Environment GroupAdopted Operational Plan Fiscal Years 2013-2014 and 2014-2015
Parks and Recreation
Budget Changes and Operational Impact: 2012-13 to 2013-14
StaffingNo change in staffing.
Expenditures Net increase of $1.2 million.
Salaries and Benefits — net increase of $0.2 milliondue to an increase in retirement costs and employeebenefits based on previously negotiated labor agree-ments.Services and Supplies — increase of $1.0 million.
Increase of $0.4 million due to increased InternalService Fund rates for facilities management, realproperty management, vehicle maintenance and fuel.Increase of $0.6 million in new major maintenanceprojects for repairs throughout County parks andfacilities.
Other Charges — increase of $0.1 million due to a bud-getary adjustment to correctly reflect the purchase ofSpecial and Transportation Equipment.Capital Assets Equipment — decrease of $0.2 milliondue to budgetary adjustment to correctly reflect thepurchase of Special and Transportation Equipment.
RevenuesNet increase of $1.2 million.
Intergovernmental Revenues — increase of $0.1 millionfor Coastal Impact Assistance Program (CIAP) grantaward.
Charges for Current Services — net increase of $0.2million.
Increase of $0.4 million in park day use and campingfees due to the implementation of cost recovery andmarketing strategies based on DPR’s Cost Recovery,Resource Allocation, and Revenue EnhancementImplementation Plan.Decrease of $0.1 million due to reduced funding forpark development from the State and Proposition 40.Decrease of $0.1 million from Plan Check and FieldInspections due to transfer of the trails conditioningprogram to the department of Planning andDevelopment Services (PDS) as part of thedepartmental reorganization.
Use of Fund Balance — increase of $0.3 million. A totalof $2.4 million is budgeted to complete major mainte-nance projects for essential repairs at park recreationfacilities. Projects are identified throughout the yearand prioritized by parks management based on theneed and impact to park patrons.General Purpose Revenue Allocation — increase of$0.6 million to offset retirement and benefit costs andoverall increase in costs associated with Internal Ser-vice Fund accounts.
Budget Changes and Operational Impact: 2013-14 to 2014-15
Net decrease of $1.9 million is primarily due to the antici-pated completion of a major maintenance projects offset byan increase in previously negotiated labor agreements andan increase in County retirement costs.
289Land Use and Environment Group Adopted Operational Plan Fiscal Years 2013-2014 and 2014-2015
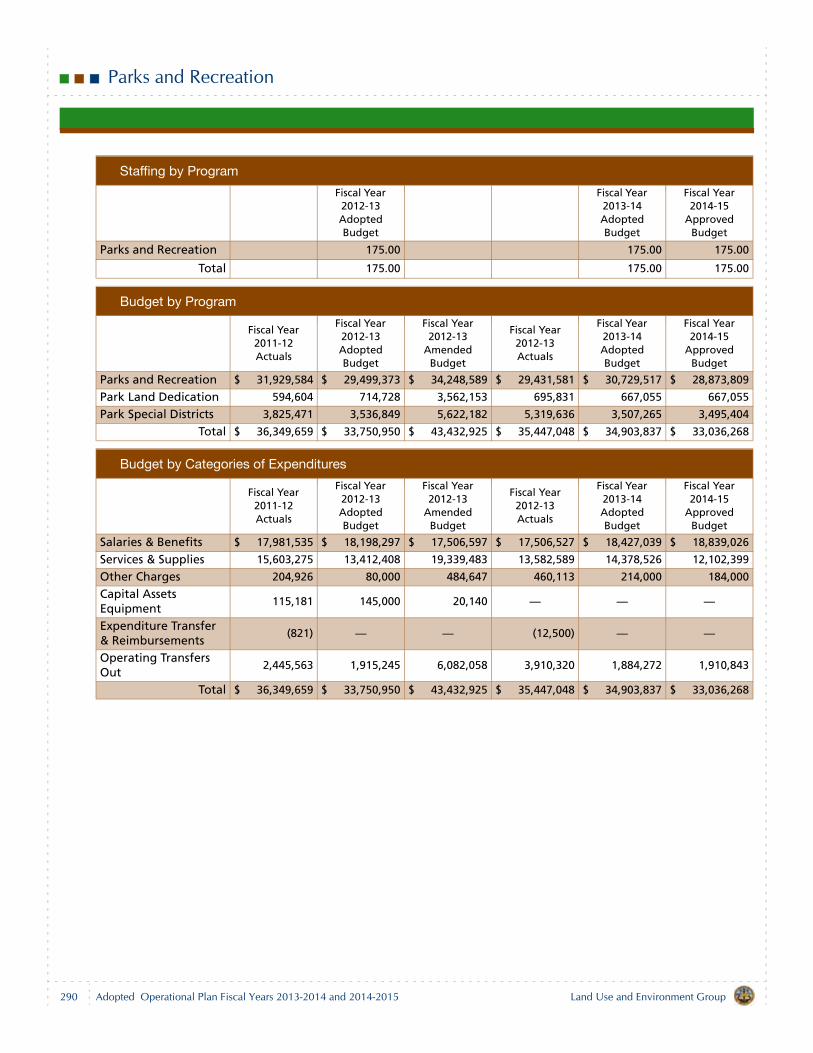
Parks and Recreation
Staffing by Program
Fiscal Year 2012-13 Adopted Budget
Fiscal Year 2013-14 Adopted Budget
Fiscal Year 2014-15
Approved Budget
Parks and Recreation 175.00 175.00 175.00
Total 175.00 175.00 175.00
Budget by Program
Fiscal Year 2011-12 Actuals
Fiscal Year 2012-13 Adopted Budget
Fiscal Year 2012-13
Amended Budget
Fiscal Year 2012-13 Actuals
Fiscal Year 2013-14 Adopted Budget
Fiscal Year 2014-15
Approved Budget
Parks and Recreation $ 31,929,584 $ 29,499,373 $ 34,248,589 $ 29,431,581 $ 30,729,517 $ 28,873,809
Park Land Dedication 594,604 714,728 3,562,153 695,831 667,055 667,055
Park Special Districts 3,825,471 3,536,849 5,622,182 5,319,636 3,507,265 3,495,404
Total $ 36,349,659 $ 33,750,950 $ 43,432,925 $ 35,447,048 $ 34,903,837 $ 33,036,268
Budget by Categories of Expenditures
Fiscal Year 2011-12 Actuals
Fiscal Year 2012-13 Adopted Budget
Fiscal Year 2012-13
Amended Budget
Fiscal Year 2012-13 Actuals
Fiscal Year 2013-14 Adopted Budget
Fiscal Year 2014-15
Approved Budget
Salaries & Benefits $ 17,981,535 $ 18,198,297 $ 17,506,597 $ 17,506,527 $ 18,427,039 $ 18,839,026
Services & Supplies 15,603,275 13,412,408 19,339,483 13,582,589 14,378,526 12,102,399
Other Charges 204,926 80,000 484,647 460,113 214,000 184,000
Capital Assets Equipment
115,181 145,000 20,140 — — —
Expenditure Transfer & Reimbursements
(821) — — (12,500) — —
Operating Transfers Out
2,445,563 1,915,245 6,082,058 3,910,320 1,884,272 1,910,843
Total $ 36,349,659 $ 33,750,950 $ 43,432,925 $ 35,447,048 $ 34,903,837 $ 33,036,268
290 Land Use and Environment GroupAdopted Operational Plan Fiscal Years 2013-2014 and 2014-2015
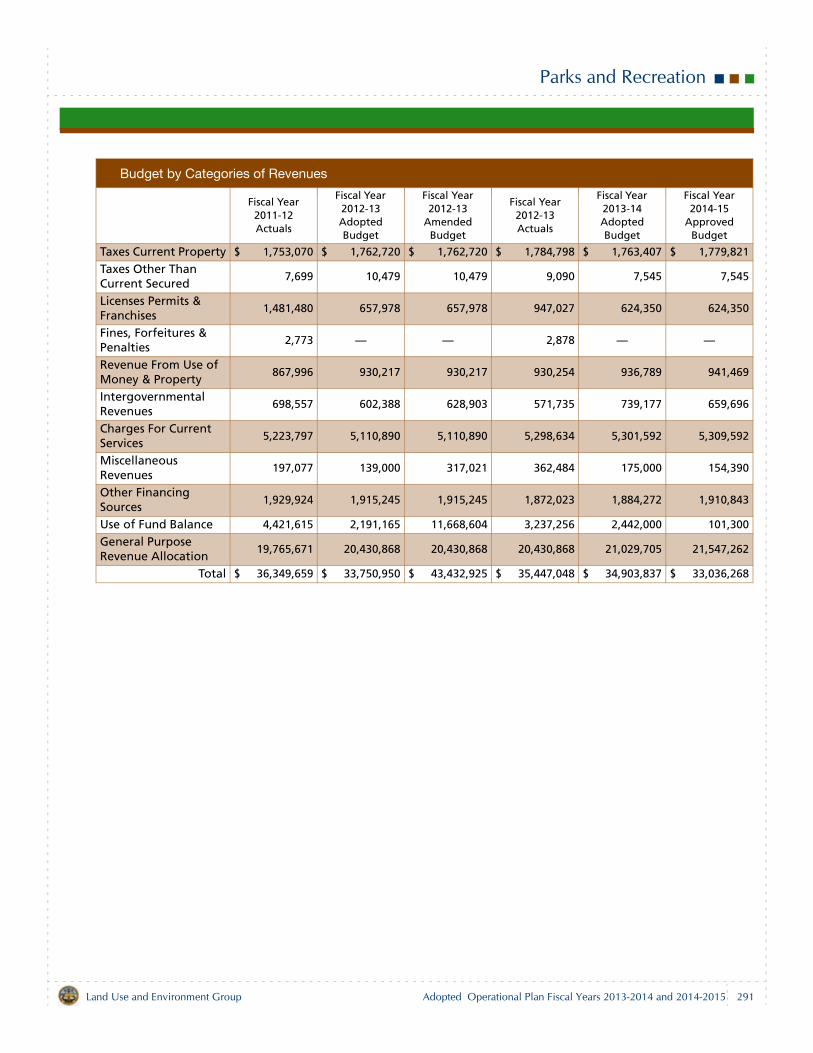
Parks and Recreation
Budget by Categories of Revenues
Fiscal Year 2011-12 Actuals
Fiscal Year 2012-13 Adopted Budget
Fiscal Year 2012-13
Amended Budget
Fiscal Year 2012-13 Actuals
Fiscal Year 2013-14 Adopted Budget
Fiscal Year 2014-15
Approved Budget
Taxes Current Property $ 1,753,070 $ 1,762,720 $ 1,762,720 $ 1,784,798 $ 1,763,407 $ 1,779,821
Taxes Other Than Current Secured
7,699 10,479 10,479 9,090 7,545 7,545
Licenses Permits & Franchises
1,481,480 657,978 657,978 947,027 624,350 624,350
Fines, Forfeitures & Penalties
2,773 — — 2,878 — —
Revenue From Use of Money & Property
867,996 930,217 930,217 930,254 936,789 941,469
Intergovernmental Revenues
698,557 602,388 628,903 571,735 739,177 659,696
Charges For Current Services
5,223,797 5,110,890 5,110,890 5,298,634 5,301,592 5,309,592
Miscellaneous Revenues
197,077 139,000 317,021 362,484 175,000 154,390
Other Financing Sources
1,929,924 1,915,245 1,915,245 1,872,023 1,884,272 1,910,843
Use of Fund Balance 4,421,615 2,191,165 11,668,604 3,237,256 2,442,000 101,300
General Purpose Revenue Allocation
19,765,671 20,430,868 20,430,868 20,430,868 21,029,705 21,547,262
Total $ 36,349,659 $ 33,750,950 $ 43,432,925 $ 35,447,048 $ 34,903,837 $ 33,036,268
291Land Use and Environment Group Adopted Operational Plan Fiscal Years 2013-2014 and 2014-2015

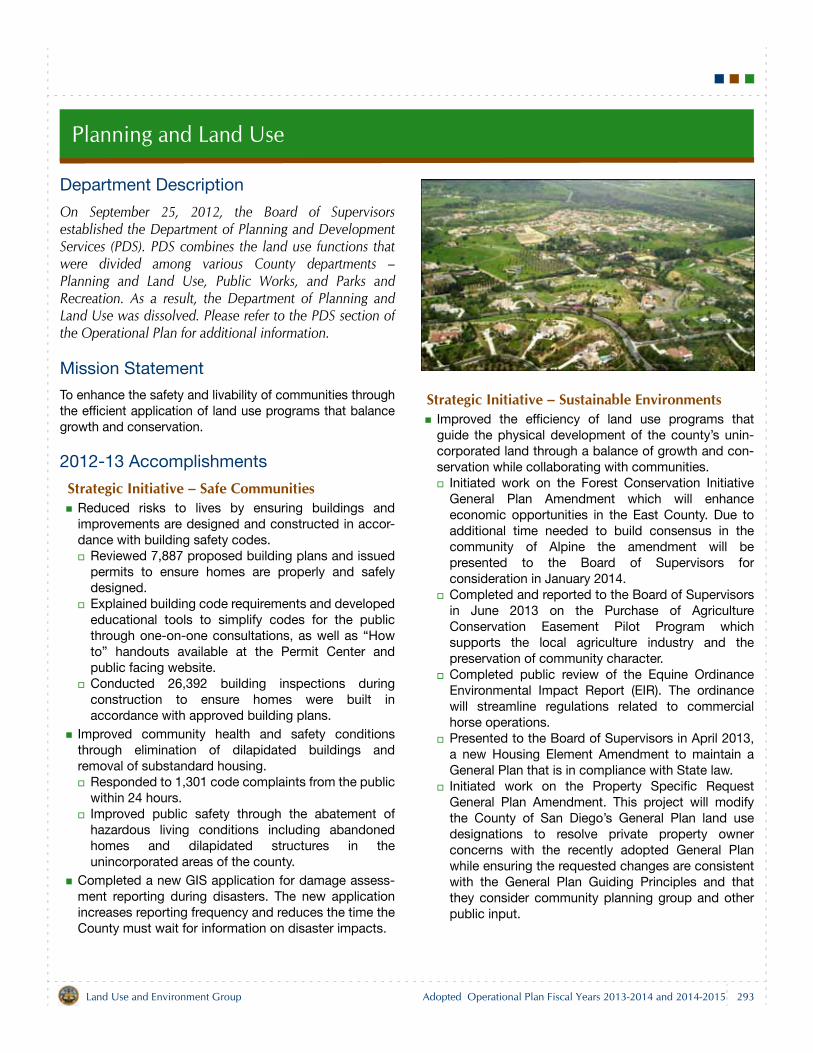
Planning and Land Use
Department Description
On September 25, 2012, the Board of Supervisorsestablished the Department of Planning and DevelopmentServices (PDS). PDS combines the land use functions thatwere divided among various County departments –Planning and Land Use, Public Works, and Parks andRecreation. As a result, the Department of Planning andLand Use was dissolved. Please refer to the PDS section ofthe Operational Plan for additional information.
Mission Statement
To enhance the safety and livability of communities throughthe efficient application of land use programs that balancegrowth and conservation.
2012-13 Accomplishments
Strategic Initiative – Safe CommunitiesReduced risks to lives by ensuring buildings andimprovements are designed and constructed in accor-dance with building safety codes.
Reviewed 7,887 proposed building plans and issuedpermits to ensure homes are properly and safelydesigned. Explained building code requirements and developededucational tools to simplify codes for the publicthrough one-on-one consultations, as well as “Howto” handouts available at the Permit Center andpublic facing website.Conducted 26,392 building inspections duringconstruction to ensure homes were built inaccordance with approved building plans.
Improved community health and safety conditionsthrough elimination of dilapidated buildings andremoval of substandard housing.
Responded to 1,301 code complaints from the publicwithin 24 hours.Improved public safety through the abatement ofhazardous living conditions including abandonedhomes and dilapidated structures in theunincorporated areas of the county.
Completed a new GIS application for damage assess-ment reporting during disasters. The new applicationincreases reporting frequency and reduces the time theCounty must wait for information on disaster impacts.
Strategic Initiative – Sustainable EnvironmentsImproved the efficiency of land use programs thatguide the physical development of the county’s unin-corporated land through a balance of growth and con-servation while collaborating with communities.
Initiated work on the Forest Conservation InitiativeGeneral Plan Amendment which will enhanceeconomic opportunities in the East County. Due toadditional time needed to build consensus in thecommunity of Alpine the amendment will bepresented to the Board of Supervisors forconsideration in January 2014.Completed and reported to the Board of Supervisorsin June 2013 on the Purchase of AgricultureConservation Easement Pilot Program whichsupports the local agriculture industry and thepreservation of community character.Completed public review of the Equine OrdinanceEnvironmental Impact Report (EIR). The ordinancewill streamline regulations related to commercialhorse operations.Presented to the Board of Supervisors in April 2013,a new Housing Element Amendment to maintain aGeneral Plan that is in compliance with State law.Initiated work on the Property Specific RequestGeneral Plan Amendment. This project will modifythe County of San Diego’s General Plan land usedesignations to resolve private property ownerconcerns with the recently adopted General Planwhile ensuring the requested changes are consistentwith the General Plan Guiding Principles and thatthey consider community planning group and otherpublic input.
293Land Use and Environment Group Adopted Operational Plan Fiscal Years 2013-2014 and 2014-2015
Planning and Land Use
Promoted green building, including sustainable build-ing practices, renewable energy and energy efficiencythrough economic incentives including issuing 2,365photovoltaic permits for solar power systems under anexpedited fee waiver program.
Required Discipline for Excellence – Continuous Improvement and Innovation
Implemented the recommendations of the Board ofSupervisors to improve the land development processfor customers. This included a shift in departmentalculture and role toward identifying project solutionsand helping customers navigate the land developmentprocess. The establishment of PDS created a newapproach to serving customers and combined the landuse functions that were formerly divided among variousCounty departments, namely Planning and Land Use,Public Works, and Parks and Recreation.Continued to identify and implement performanceimprovements to streamline the land development pro-cess to reduce processing costs and time for custom-ers as well as the County. Examples include simplifiedordinance changes for groundwater resources in Bor-rego Springs and regional parking regulations thatstreamline permit requirements. Drafted revisions to the Land Use Ordinance for theconversion of site plans from discretionary permitrequirements to ministerial permits. The Ordinance willbe presented to the Board of Supervisors by October2013 due to additional time needed for community out-reach. In Fiscal Year 2013-14, PDS staff will coordinatewith stakeholders to finalize the requirements for Boardof Supervisors consideration. Conversion from discre-tionary to ministerial simplifies the permit process andshortens the timeline for the customer.Initiated a new discretionary to ministerial permit con-version to substantially reduce processing time andcost for applicants and the County through work on theEquine Ordinance.Expanded online opportunities for building permitactivities so that customers can minimize visits toCounty facilities, thus reducing customer wait time andexpense. Examples include the new online photovol-taic permits and new online payment features.
Required Discipline for Excellence – Information Services
Expanded the mobile workforce capabilities for build-ing inspectors and code enforcement staff through newsystems in Accela Citizen Access that enable real-time
access to land development permit systems frommobile devices.Converted 12 code enforcement forms to electronicformat to improve turnaround time and reduce over-head cost. Continued improvements to the customer routing/flowmanagement system (Q-Matic) to serve customers. Afull upgrade to Q-Matic is anticipated by December2013, to make the permit process more responsive tocustomer needs and thus reduce customer wait timeand expense.Developed an online tool and smartphone applicationthat provides the public with mobile access to Countyand regional trail maps, including aerial, topographicand street views.
Required Discipline for Excellence – Customer Satisfaction
Developed and implemented staff training and a men-toring program that is centered on customer serviceand incorporates values such as project ownership andaccountability, organizational acumen, effective com-munication and a focus on outcomes. More than 100staff participated in the Customer and Stakeholder Per-spective Panel held on March 15, 2013. Thirteen staffparticipated in the County’s mentor program. In addi-tion, managers integrated customer service, mentor-ing, and discussion of the PDS values into routine teammeetings and one-on-one work with staff. Completed implementation of the Business Case Man-agement System (BCMS), which will integrate permitactivity, timekeeping and financial management forland development projects.
Required Discipline for Excellence – Regional Leadership
Created a program that allows applicants for privately-initiated development projects that are consistent withthe General Plan densities to rely on the General PlanUpdate EIR for certain environmental impact assess-ments. As a result, applicants of these projects no lon-ger need to assess, analyze and/or mitigate cumulativeproject impacts that are required under the CaliforniaEnvironmental Quality Act, saving applicants moneyand several months in the permit process.Demonstrated regional leadership and improved publicsafety by presenting at the 2012 Wildland Urban Inter-face Conference regarding fire safe ignition-resistantconstruction, as well as lessons learned from the 2003and 2007 firestorms.
294 Land Use and Environment GroupAdopted Operational Plan Fiscal Years 2013-2014 and 2014-2015
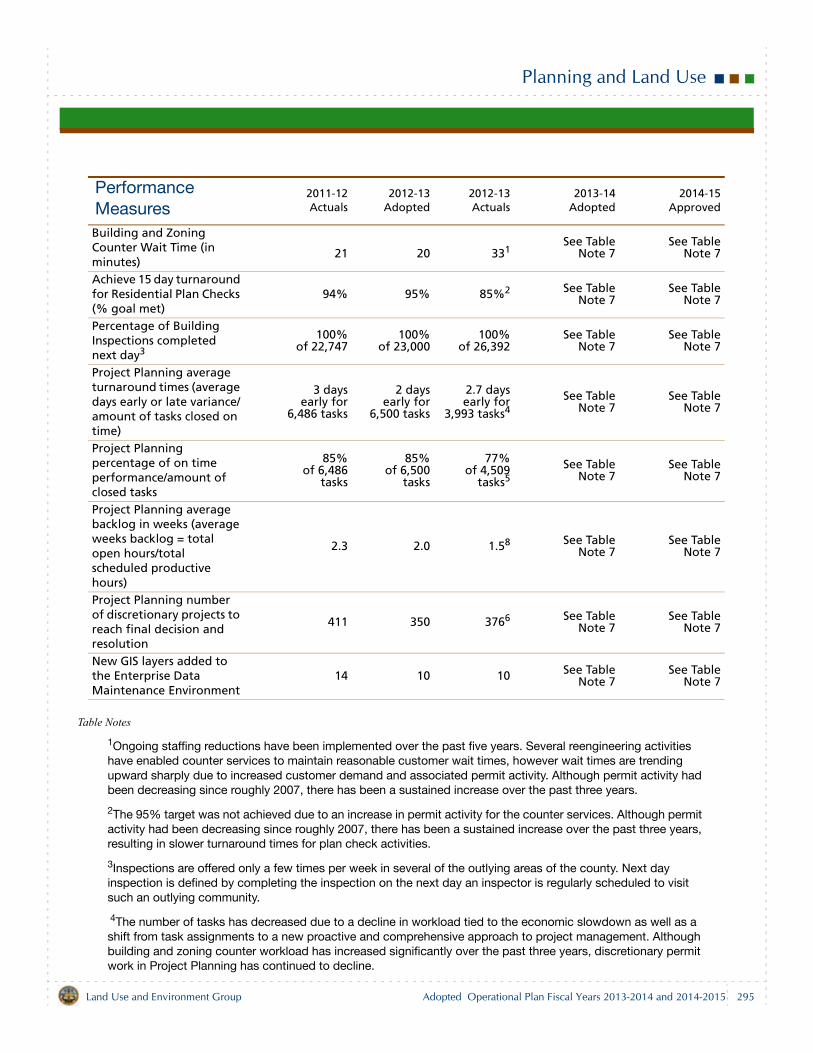
Planning and Land Use
Table Notes
1Ongoing staffing reductions have been implemented over the past five years. Several reengineering activities have enabled counter services to maintain reasonable customer wait times, however wait times are trending upward sharply due to increased customer demand and associated permit activity. Although permit activity had been decreasing since roughly 2007, there has been a sustained increase over the past three years.
2The 95% target was not achieved due to an increase in permit activity for the counter services. Although permit activity had been decreasing since roughly 2007, there has been a sustained increase over the past three years, resulting in slower turnaround times for plan check activities.
3Inspections are offered only a few times per week in several of the outlying areas of the county. Next day inspection is defined by completing the inspection on the next day an inspector is regularly scheduled to visit such an outlying community.
4The number of tasks has decreased due to a decline in workload tied to the economic slowdown as well as a shift from task assignments to a new proactive and comprehensive approach to project management. Although building and zoning counter workload has increased significantly over the past three years, discretionary permit work in Project Planning has continued to decline.
Performance Measures
2011-12Actuals
2012-13Adopted
2012-13Actuals
2013-14Adopted
2014-15Approved
Building and Zoning Counter Wait Time (in minutes)
21 20 331See Table
Note 7See Table
Note 7
Achieve 15 day turnaround for Residential Plan Checks (% goal met)
94% 95% 85%2 See TableNote 7
See TableNote 7
Percentage of Building Inspections completed next day3
100%of 22,747
100%of 23,000
100%of 26,392
See TableNote 7
See TableNote 7
Project Planning average turnaround times (average days early or late variance/amount of tasks closed on time)
3 daysearly for
6,486 tasks
2 daysearly for
6,500 tasks
2.7 daysearly for
3,993 tasks4See Table
Note 7See Table
Note 7
Project Planning percentage of on time performance/amount of closed tasks
85%of 6,486
tasks
85%of 6,500
tasks
77%of 4,509
tasks5See Table
Note 7See Table
Note 7
Project Planning average backlog in weeks (average weeks backlog = total open hours/total scheduled productive hours)
2.3 2.0 1.58 See TableNote 7
See TableNote 7
Project Planning number of discretionary projects to reach final decision and resolution
411 350 3766 See TableNote 7
See TableNote 7
New GIS layers added to the Enterprise Data Maintenance Environment
14 10 10 See TableNote 7
See TableNote 7
295Land Use and Environment Group Adopted Operational Plan Fiscal Years 2013-2014 and 2014-2015
Planning and Land Use
5As noted above, the number of tasks has decreased due to the economic slowdown as well as a reduction in the use of tasks in managing workload in the land development process. The on-time percentage reported in Fiscal Year 2012-13 is below the performance target of 85% due to a shift in department focus from task management to overall project management. Although it may take more time to complete individual tasks, the goal is a focus on overall project timeliness rather than a task focus.
6The number of discretionary permits to reach final decision has increased based on an increased number of new project applications received.
7As of Fiscal Year 2013-14, DPLU was dissolved and its functions and staff were transferred to the new PDS. Please refer to the PDS section of this document for more information.
8The backlog of discretionary permits has decreased due to improved performance and resulting in an increase in the number of projects reaching final decision.
Budget Changes and Operational Impact: 2012-13 to 2013-14
StaffingDecrease of 160.00 staff years, which includes the transferof 158.00 staff years to PDS due to the consolidation ofland development services as approved by the Board ofSupervisors on September 25, 2012 and the reduction of2.00 staff years due to decreased workload.
Expenditures Decrease of $29.5 million due to the transfer of land devel-opment services to PDS.
Revenues Decrease of $29.5 million due to the transfer of land devel-opment services to PDS.
296 Land Use and Environment GroupAdopted Operational Plan Fiscal Years 2013-2014 and 2014-2015
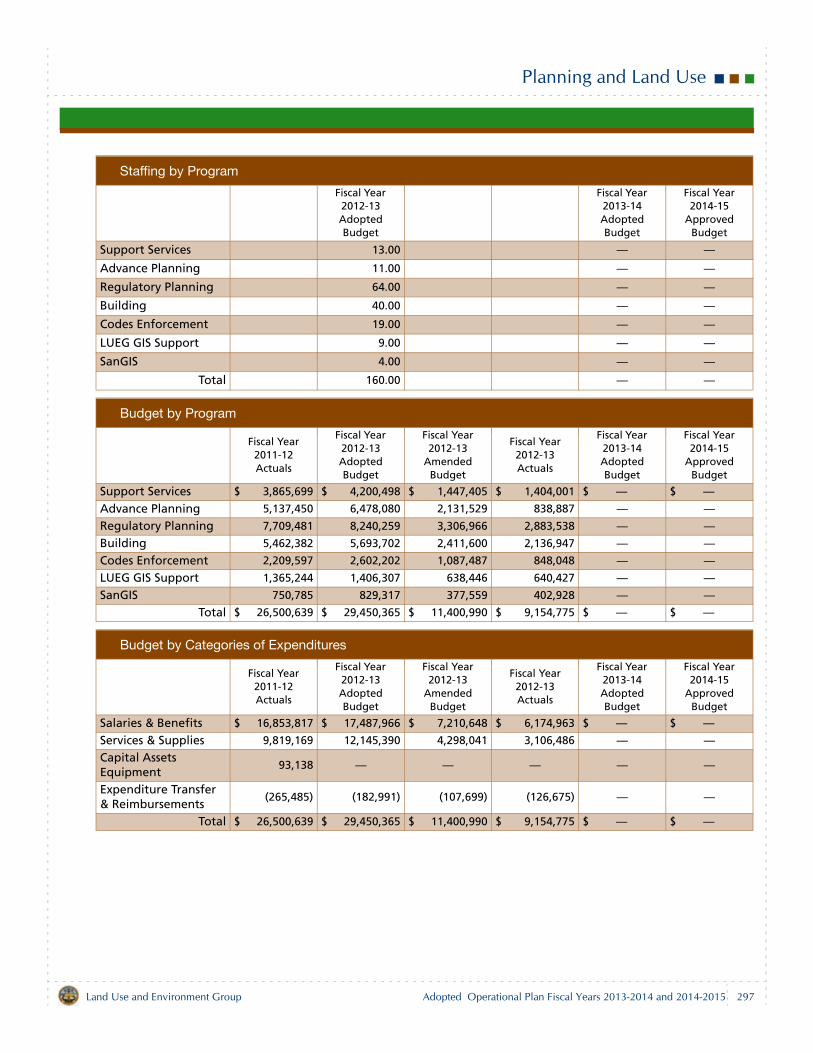
Planning and Land Use
Staffing by Program
Fiscal Year 2012-13 Adopted Budget
Fiscal Year 2013-14 Adopted Budget
Fiscal Year 2014-15
Approved Budget
Support Services 13.00 — —Advance Planning 11.00 — —
Regulatory Planning 64.00 — —
Building 40.00 — —Codes Enforcement 19.00 — —
LUEG GIS Support 9.00 — —
SanGIS 4.00 — —
Total 160.00 — —
Budget by Program
Fiscal Year 2011-12 Actuals
Fiscal Year 2012-13 Adopted Budget
Fiscal Year 2012-13
Amended Budget
Fiscal Year 2012-13 Actuals
Fiscal Year 2013-14 Adopted Budget
Fiscal Year 2014-15
Approved Budget
Support Services $ 3,865,699 $ 4,200,498 $ 1,447,405 $ 1,404,001 $ — $ —
Advance Planning 5,137,450 6,478,080 2,131,529 838,887 — —Regulatory Planning 7,709,481 8,240,259 3,306,966 2,883,538 — —Building 5,462,382 5,693,702 2,411,600 2,136,947 — —Codes Enforcement 2,209,597 2,602,202 1,087,487 848,048 — —LUEG GIS Support 1,365,244 1,406,307 638,446 640,427 — —SanGIS 750,785 829,317 377,559 402,928 — —
Total $ 26,500,639 $ 29,450,365 $ 11,400,990 $ 9,154,775 $ — $ —
Budget by Categories of Expenditures
Fiscal Year 2011-12 Actuals
Fiscal Year 2012-13 Adopted Budget
Fiscal Year 2012-13
Amended Budget
Fiscal Year 2012-13 Actuals
Fiscal Year 2013-14 Adopted Budget
Fiscal Year 2014-15
Approved Budget
Salaries & Benefits $ 16,853,817 $ 17,487,966 $ 7,210,648 $ 6,174,963 $ — $ —
Services & Supplies 9,819,169 12,145,390 4,298,041 3,106,486 — —Capital Assets Equipment
93,138 — — — — —
Expenditure Transfer & Reimbursements
(265,485) (182,991) (107,699) (126,675) — —
Total $ 26,500,639 $ 29,450,365 $ 11,400,990 $ 9,154,775 $ — $ —
297Land Use and Environment Group Adopted Operational Plan Fiscal Years 2013-2014 and 2014-2015
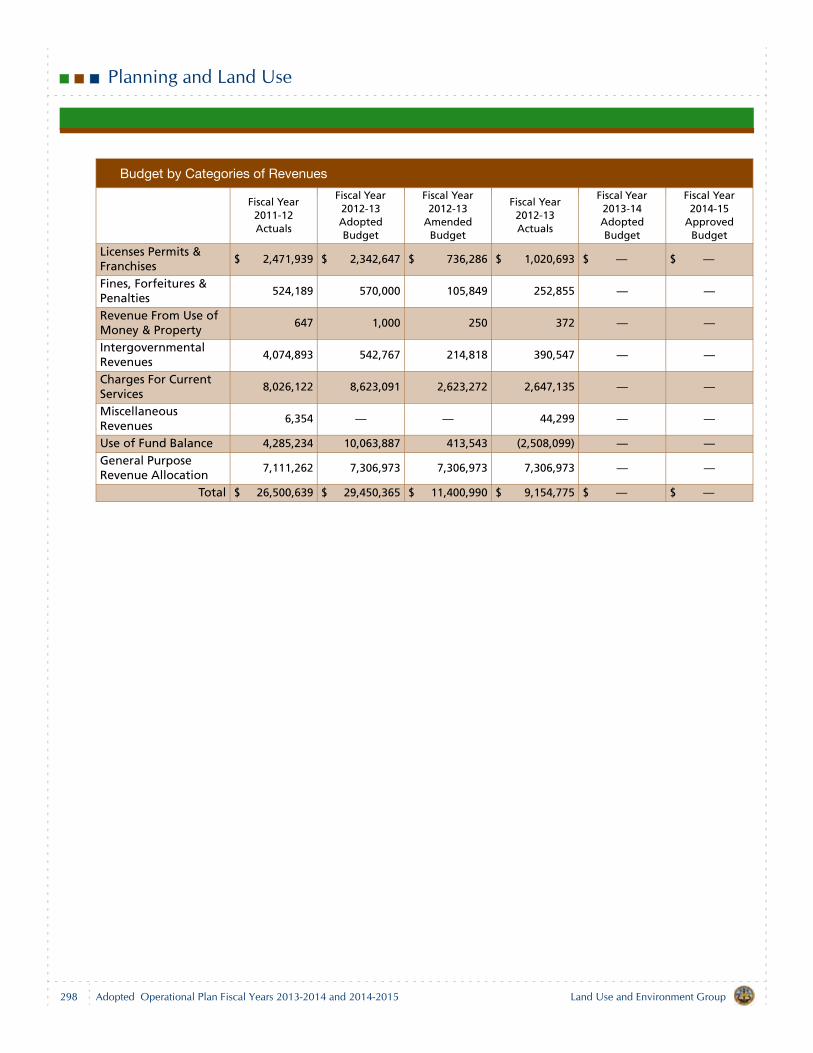
Planning and Land Use
Budget by Categories of Revenues
Fiscal Year 2011-12 Actuals
Fiscal Year 2012-13 Adopted Budget
Fiscal Year 2012-13
Amended Budget
Fiscal Year 2012-13 Actuals
Fiscal Year 2013-14 Adopted Budget
Fiscal Year 2014-15
Approved Budget
Licenses Permits & Franchises
$ 2,471,939 $ 2,342,647 $ 736,286 $ 1,020,693 $ — $ —
Fines, Forfeitures & Penalties
524,189 570,000 105,849 252,855 — —
Revenue From Use of Money & Property
647 1,000 250 372 — —
Intergovernmental Revenues
4,074,893 542,767 214,818 390,547 — —
Charges For Current Services
8,026,122 8,623,091 2,623,272 2,647,135 — —
Miscellaneous Revenues
6,354 — — 44,299 — —
Use of Fund Balance 4,285,234 10,063,887 413,543 (2,508,099) — —General Purpose Revenue Allocation
7,111,262 7,306,973 7,306,973 7,306,973 — —
Total $ 26,500,639 $ 29,450,365 $ 11,400,990 $ 9,154,775 $ — $ —
298 Land Use and Environment GroupAdopted Operational Plan Fiscal Years 2013-2014 and 2014-2015
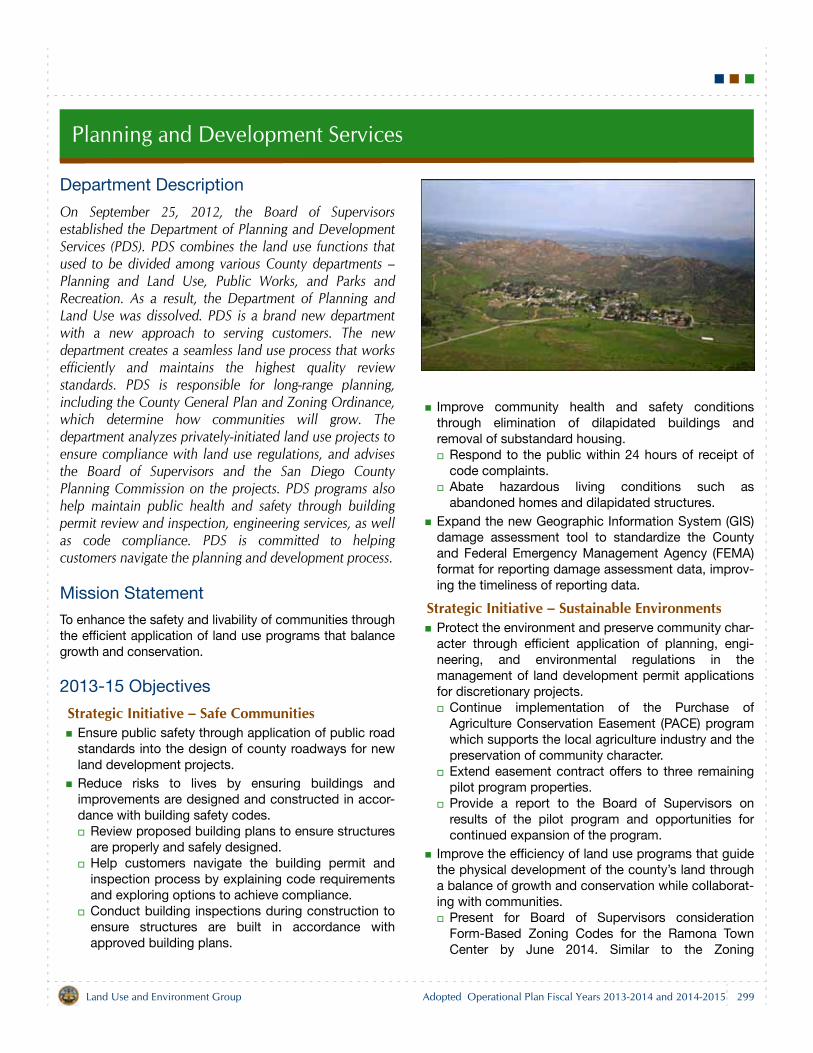
Planning and Development Services
Department Description
On September 25, 2012, the Board of Supervisorsestablished the Department of Planning and DevelopmentServices (PDS). PDS combines the land use functions thatused to be divided among various County departments –Planning and Land Use, Public Works, and Parks andRecreation. As a result, the Department of Planning andLand Use was dissolved. PDS is a brand new departmentwith a new approach to serving customers. The newdepartment creates a seamless land use process that worksefficiently and maintains the highest quality reviewstandards. PDS is responsible for long-range planning,including the County General Plan and Zoning Ordinance,which determine how communities will grow. Thedepartment analyzes privately-initiated land use projects toensure compliance with land use regulations, and advisesthe Board of Supervisors and the San Diego CountyPlanning Commission on the projects. PDS programs alsohelp maintain public health and safety through buildingpermit review and inspection, engineering services, as wellas code compliance. PDS is committed to helpingcustomers navigate the planning and development process.
Mission Statement
To enhance the safety and livability of communities throughthe efficient application of land use programs that balancegrowth and conservation.
2013-15 Objectives
Strategic Initiative – Safe CommunitiesEnsure public safety through application of public roadstandards into the design of county roadways for newland development projects.Reduce risks to lives by ensuring buildings andimprovements are designed and constructed in accor-dance with building safety codes.
Review proposed building plans to ensure structuresare properly and safely designed.Help customers navigate the building permit andinspection process by explaining code requirementsand exploring options to achieve compliance.Conduct building inspections during construction toensure structures are built in accordance withapproved building plans.
Improve community health and safety conditionsthrough elimination of dilapidated buildings andremoval of substandard housing.
Respond to the public within 24 hours of receipt ofcode complaints.Abate hazardous living conditions such asabandoned homes and dilapidated structures.
Expand the new Geographic Information System (GIS)damage assessment tool to standardize the Countyand Federal Emergency Management Agency (FEMA)format for reporting damage assessment data, improv-ing the timeliness of reporting data.
Strategic Initiative – Sustainable Environments Protect the environment and preserve community char-acter through efficient application of planning, engi-neering, and environmental regulations in themanagement of land development permit applicationsfor discretionary projects.
Continue implementation of the Purchase ofAgriculture Conservation Easement (PACE) programwhich supports the local agriculture industry and thepreservation of community character.Extend easement contract offers to three remainingpilot program properties.Provide a report to the Board of Supervisors onresults of the pilot program and opportunities forcontinued expansion of the program.
Improve the efficiency of land use programs that guidethe physical development of the county’s land througha balance of growth and conservation while collaborat-ing with communities.
Present for Board of Supervisors considerationForm-Based Zoning Codes for the Ramona TownCenter by June 2014. Similar to the Zoning
299Land Use and Environment Group Adopted Operational Plan Fiscal Years 2013-2014 and 2014-2015
Planning and Development Services
Ordinance, the Form-Based Codes will includeprovisions on allowed uses, setbacks, height andinformation on development processes. The newcodes will also provide detailed architectural andlandscaping requirements and information toapplicants on required street and trail improvements.Present for Board of Supervisors consideration theGeneral Plan/Zoning Cleanup, which will resolvemapping errors, omissions and include other minoreditorial changes.Complete public review of the North County MultipleSpecies Conservation Program text andenvironmental document by June 2015.Present for Board of Supervisors consideration theForest Conservation Initiative General PlanAmendment which will ensure a sustainableenvironment and promote economic opportunities inthe East County.
Promote green building, including sustainable buildingpractices, renewable energy and energy efficiencythrough economic incentives such as reduced fees andwaivers. Ensure effective and efficient management of discre-tionary project applications from submittal to final deci-sion.
Required Discipline for Excellence – Customer Satisfaction
Develop a new customer service program for PDS,including identification of customer and stakeholderpriorities, customer service training and an online cus-tomer satisfaction survey to measure performance.Provide quality customer service to customers bydeploying performance improvements that minimizeBuilding and Zoning Counter wait times.
Required Discipline for Excellence – Fiscal StabilityManage workload and staffing levels by balancinghousing market fluctuations with fiscal and customerservice stability.Present the annual Advance Planning Work Program tothe Board for consideration by June 2014 to prioritizethe deployment of resources for Advance Planningprojects that streamline and update County policiesand ordinances related to land development.
Required Discipline for Excellence – Skilled, Adaptable and Diverse Workforce
Develop a comprehensive workforce development pro-gram to enhance the skills of employees. The programwill focus on assessment of current capabilities, areasof future growth and development and will include atargeted training program.
Required Discipline for Excellence – Continuous Improvement and Innovation
Develop mobile applications to improve the efficiencyof operations and service to customers.
Enable building inspectors to access the BusinessCase Management System (BCMS) from the field,enhancing the efficiency of conducting fieldinspections.Enable permit research by customers, reducing theneed to visit or call a County office.
Expand the use of electronic plan check correction liststo replace paper copy correction lists for use in build-ing permits. Use of electronic correction lists improvesprocessing times and communication with customers,as well as document management practices for PDS. Complete the development of a new online paymenttool for land development projects. The new tool willaccept electronic payment for permits fees and depos-its, reducing the need for customers to physically visitan office.
Required Discipline for Excellence – Information Services
Continue to refine and enhance the BCMS that inte-grates land development permit operations, timeaccounting and finances of land development permits.Convert all 14 of the County’s intranet and internetmapping applications to the current industry-standardtechnology ArcGIS Server using Microsoft Silverlight.Develop six new GIS layers in the Enterprise DataMaintenance Environment that will result in greateraccess and transparency of land use data manage-ment in the GIS system.
Related Links
For additional information about the Department of Plan-ning and Development Services, refer to the website atwww.sdcounty.ca.gov/pds.
300 Land Use and Environment GroupAdopted Operational Plan Fiscal Years 2013-2014 and 2014-2015
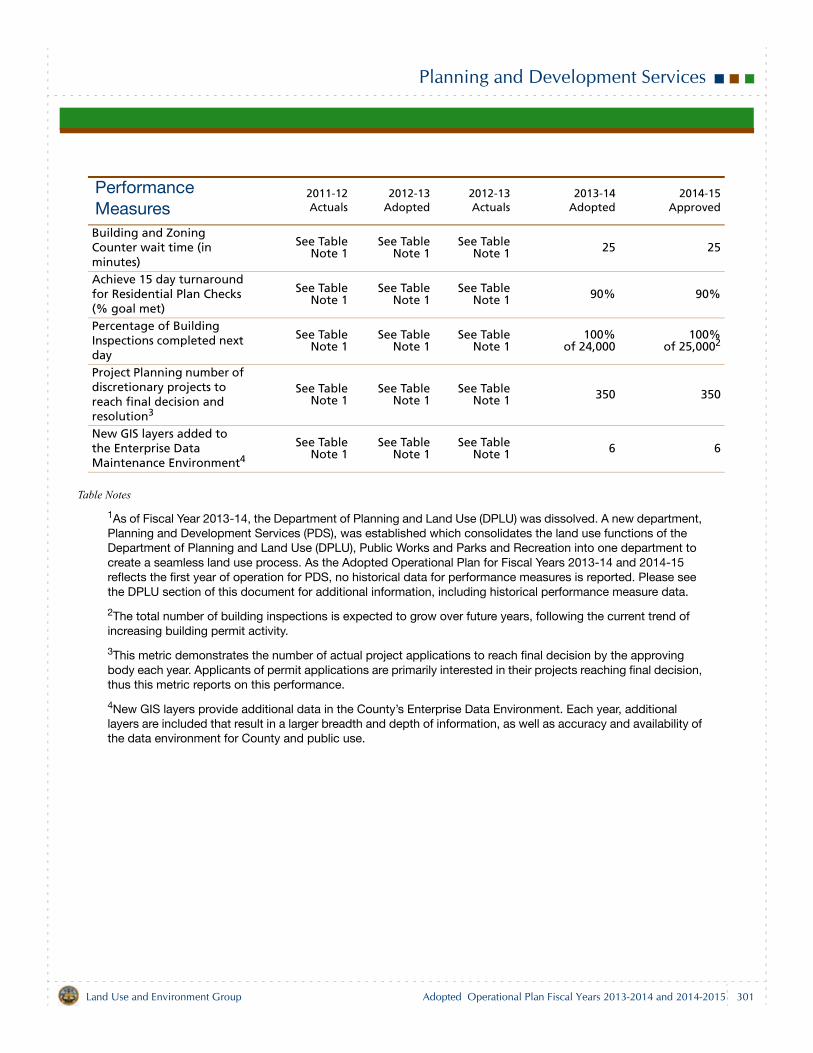
Planning and Development Services
Table Notes
1As of Fiscal Year 2013-14, the Department of Planning and Land Use (DPLU) was dissolved. A new department, Planning and Development Services (PDS), was established which consolidates the land use functions of the Department of Planning and Land Use (DPLU), Public Works and Parks and Recreation into one department to create a seamless land use process. As the Adopted Operational Plan for Fiscal Years 2013-14 and 2014-15 reflects the first year of operation for PDS, no historical data for performance measures is reported. Please see the DPLU section of this document for additional information, including historical performance measure data.
2The total number of building inspections is expected to grow over future years, following the current trend of increasing building permit activity.
3This metric demonstrates the number of actual project applications to reach final decision by the approving body each year. Applicants of permit applications are primarily interested in their projects reaching final decision, thus this metric reports on this performance.
4New GIS layers provide additional data in the County’s Enterprise Data Environment. Each year, additional layers are included that result in a larger breadth and depth of information, as well as accuracy and availability of the data environment for County and public use.
Performance Measures
2011-12Actuals
2012-13Adopted
2012-13Actuals
2013-14Adopted
2014-15Approved
Building and Zoning Counter wait time (in minutes)
See TableNote 1
See TableNote 1
See TableNote 1 25 25
Achieve 15 day turnaround for Residential Plan Checks (% goal met)
See TableNote 1
See TableNote 1
See TableNote 1 90% 90%
Percentage of Building Inspections completed next day
See TableNote 1
See TableNote 1
See TableNote 1
100%of 24,000
100%of 25,0002
Project Planning number of discretionary projects to reach final decision and resolution3
See TableNote 1
See TableNote 1
See TableNote 1 350 350
New GIS layers added to the Enterprise Data Maintenance Environment4
See TableNote 1
See TableNote 1
See TableNote 1 6 6
301Land Use and Environment Group Adopted Operational Plan Fiscal Years 2013-2014 and 2014-2015
Planning and Development Services
Budget Changes and Operational Impact: 2012-13 to 2013-14
StaffingIncrease of 175.00 staff years due to the transfer of 158.00staff years from the Department of Planning and Land Useand the transfer of 17.00 staff years from Department ofPublic Works due to the consolidation of land developmentservices to the Department of Planning and DevelopmentServices as approved by the Board of Supervisors Septem-ber 25, 2012.
Expenditures Increase of $31.8 million.
Salaries and Benefits — increase of $19.8 million dueto the transfer and consolidation associated with the175.00 staff years described above.Services and Supplies — increase of $12.2 million dueto the transfer and consolidation of land developmentservices described above.Expenditure Transfer & Reimbursements — decreaseof $0.2 million due to the transfer of land developmentservices described above.
Revenues Increase of $31.8 million.
License Permits & Franchises — increase of $2.7 mil-lion due to the transfer of permit revenue from the con-solidation of land development services describedabove.Fines, Forfeitures & Penalties — increase of $0.5 milliondue to the transfer of code enforcement citation finesfrom the consolidation of land development servicesdescribed above.Intergovernmental Revenues — increase of $0.5 milliondue to the transfer of the Joint Powers Agreement forSan Diego Geographic Information Source (SanGIS)
and Multiple Species Conservation Program (MSCP)grant revenue from the consolidation of land develop-ment services described above. Charges for Current Services — increase of $11.2 mil-lion due to the transfer of funding from the consolida-tion of land development services described above.Use of Fund Balance — A total of $9.2 million is bud-geted for use in Fiscal Year 2013-14 as follows: $2.0million of General Fund fund balance for the HomeOwner Relief and Green Building Permit Fee Waivers($1.4 million) and Purchase of Agricultural ConservationEasement (PACE) program ($0.6 million) ; $7.2 millionof Land Use and Environment Fund Balance for mobileapplications and web portal design ($0.3 million); Pub-lic GIS Server Rebuild ($0.5 million); as well as rebud-gets for one-time funding related to customer servicetraining ($0.5 million), Accela Mobile Office implemen-tation ($0.1 million), Q-Matic upgrade ($0.1 million);electronic document submittal ($0.3 million); PropertySpecific Request General Plan Amendment ($1.5 mil-lion); PACE ($1.9 million), Zoning Ordinance update($1.1 million), Green House Gas Guidelines ($0.3 mil-lion), building permit fee waivers related to Firestorm2007 ($0.5 million), and waste abatements ($0.1 mil-lion).General Purpose Revenue Allocation — increase of$7.6 million due to the consolidation of land develop-ment services described above.
Budget Changes and Operational Impact: 2013-14 to 2014-15
Decrease of $6.7 million primarily due to the anticipatedcompletion of one-time projects.
302 Land Use and Environment GroupAdopted Operational Plan Fiscal Years 2013-2014 and 2014-2015
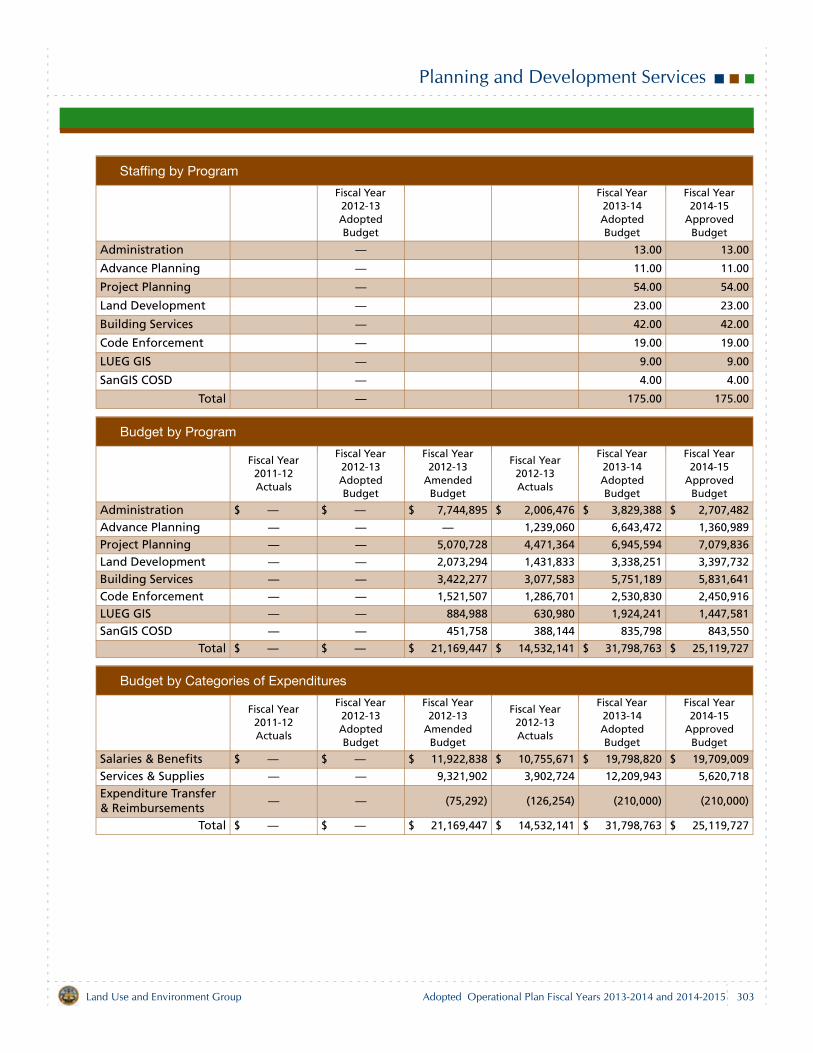
Planning and Development Services
Staffing by Program
Fiscal Year 2012-13 Adopted Budget
Fiscal Year 2013-14 Adopted Budget
Fiscal Year 2014-15
Approved Budget
Administration — 13.00 13.00
Advance Planning — 11.00 11.00
Project Planning — 54.00 54.00
Land Development — 23.00 23.00
Building Services — 42.00 42.00
Code Enforcement — 19.00 19.00
LUEG GIS — 9.00 9.00
SanGIS COSD — 4.00 4.00
Total — 175.00 175.00
Budget by Program
Fiscal Year 2011-12 Actuals
Fiscal Year 2012-13 Adopted Budget
Fiscal Year 2012-13
Amended Budget
Fiscal Year 2012-13 Actuals
Fiscal Year 2013-14 Adopted Budget
Fiscal Year 2014-15
Approved Budget
Administration $ — $ — $ 7,744,895 $ 2,006,476 $ 3,829,388 $ 2,707,482
Advance Planning — — — 1,239,060 6,643,472 1,360,989
Project Planning — — 5,070,728 4,471,364 6,945,594 7,079,836
Land Development — — 2,073,294 1,431,833 3,338,251 3,397,732
Building Services — — 3,422,277 3,077,583 5,751,189 5,831,641
Code Enforcement — — 1,521,507 1,286,701 2,530,830 2,450,916
LUEG GIS — — 884,988 630,980 1,924,241 1,447,581
SanGIS COSD — — 451,758 388,144 835,798 843,550
Total $ — $ — $ 21,169,447 $ 14,532,141 $ 31,798,763 $ 25,119,727
Budget by Categories of Expenditures
Fiscal Year 2011-12 Actuals
Fiscal Year 2012-13 Adopted Budget
Fiscal Year 2012-13
Amended Budget
Fiscal Year 2012-13 Actuals
Fiscal Year 2013-14 Adopted Budget
Fiscal Year 2014-15
Approved Budget
Salaries & Benefits $ — $ — $ 11,922,838 $ 10,755,671 $ 19,798,820 $ 19,709,009
Services & Supplies — — 9,321,902 3,902,724 12,209,943 5,620,718
Expenditure Transfer & Reimbursements
— — (75,292) (126,254) (210,000) (210,000)
Total $ — $ — $ 21,169,447 $ 14,532,141 $ 31,798,763 $ 25,119,727
303Land Use and Environment Group Adopted Operational Plan Fiscal Years 2013-2014 and 2014-2015
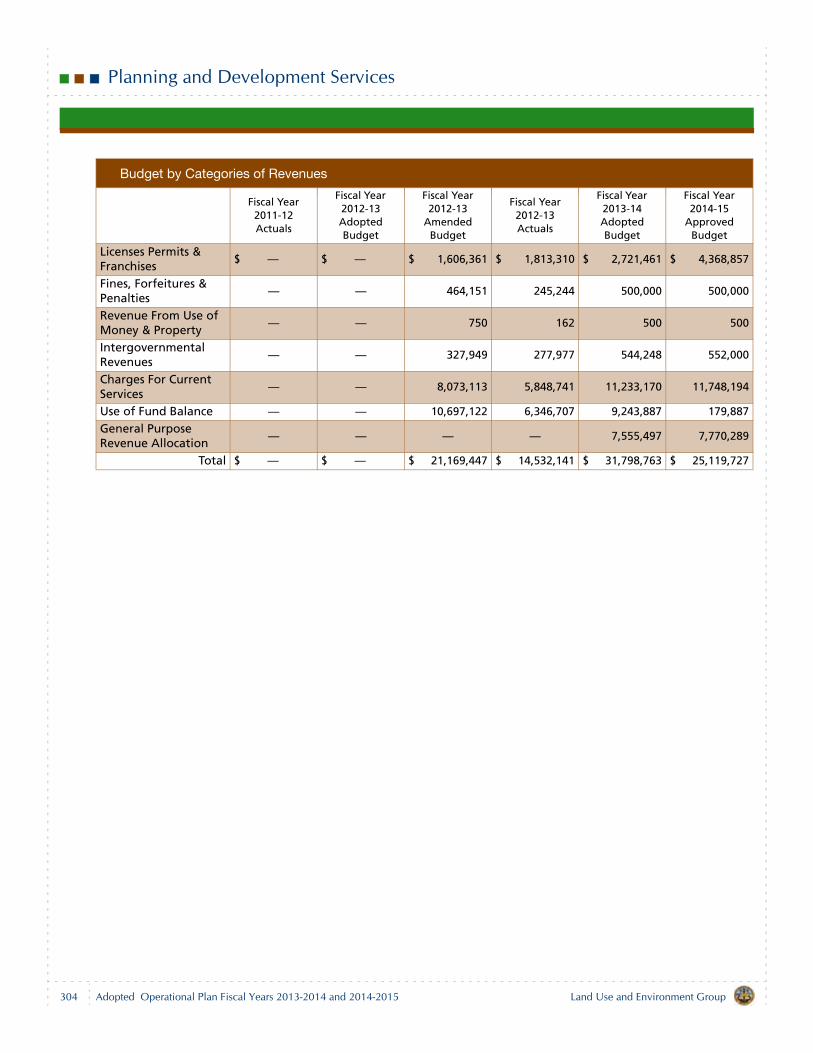
Planning and Development Services
Budget by Categories of Revenues
Fiscal Year 2011-12 Actuals
Fiscal Year 2012-13 Adopted Budget
Fiscal Year 2012-13
Amended Budget
Fiscal Year 2012-13 Actuals
Fiscal Year 2013-14 Adopted Budget
Fiscal Year 2014-15
Approved Budget
Licenses Permits & Franchises
$ — $ — $ 1,606,361 $ 1,813,310 $ 2,721,461 $ 4,368,857
Fines, Forfeitures & Penalties
— — 464,151 245,244 500,000 500,000
Revenue From Use of Money & Property
— — 750 162 500 500
Intergovernmental Revenues
— — 327,949 277,977 544,248 552,000
Charges For Current Services
— — 8,073,113 5,848,741 11,233,170 11,748,194
Use of Fund Balance — — 10,697,122 6,346,707 9,243,887 179,887
General Purpose Revenue Allocation
— — — — 7,555,497 7,770,289
Total $ — $ — $ 21,169,447 $ 14,532,141 $ 31,798,763 $ 25,119,727
304 Land Use and Environment GroupAdopted Operational Plan Fiscal Years 2013-2014 and 2014-2015
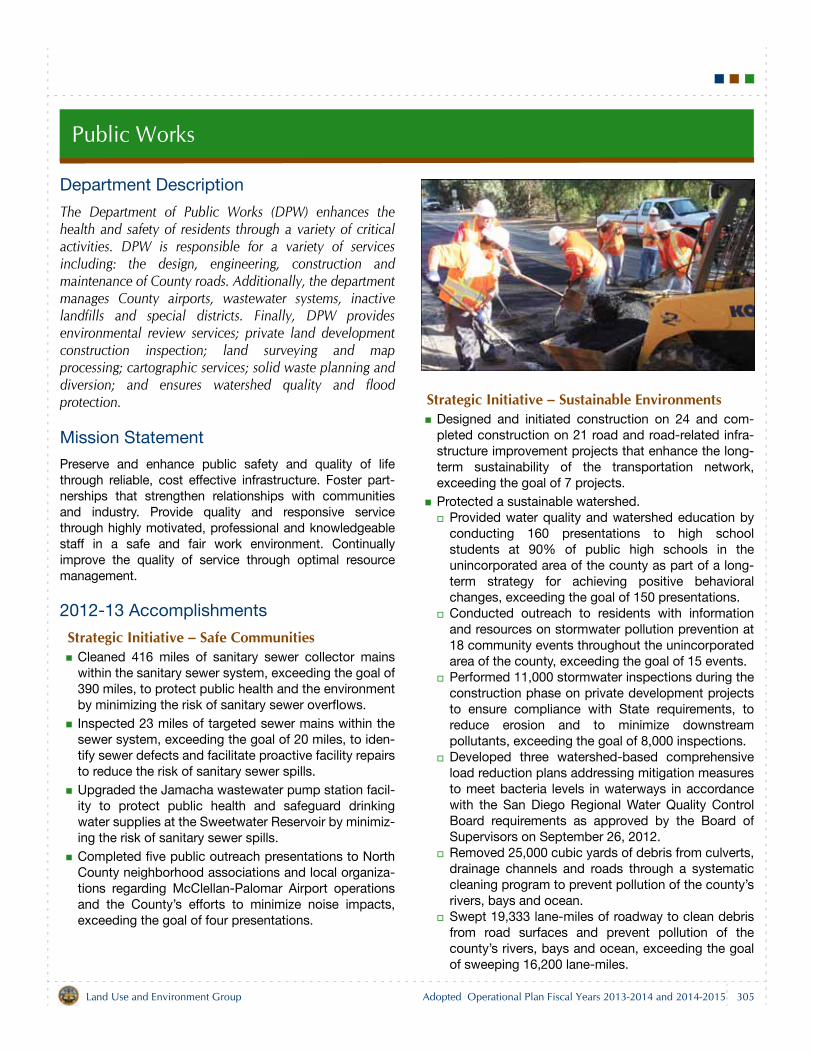
Public Works
Department Description
The Department of Public Works (DPW) enhances thehealth and safety of residents through a variety of criticalactivities. DPW is responsible for a variety of servicesincluding: the design, engineering, construction andmaintenance of County roads. Additionally, the departmentmanages County airports, wastewater systems, inactivelandfills and special districts. Finally, DPW providesenvironmental review services; private land developmentconstruction inspection; land surveying and mapprocessing; cartographic services; solid waste planning anddiversion; and ensures watershed quality and floodprotection.
Mission Statement
Preserve and enhance public safety and quality of lifethrough reliable, cost effective infrastructure. Foster part-nerships that strengthen relationships with communitiesand industry. Provide quality and responsive servicethrough highly motivated, professional and knowledgeablestaff in a safe and fair work environment. Continuallyimprove the quality of service through optimal resourcemanagement.
2012-13 Accomplishments
Strategic Initiative – Safe CommunitiesCleaned 416 miles of sanitary sewer collector mainswithin the sanitary sewer system, exceeding the goal of390 miles, to protect public health and the environmentby minimizing the risk of sanitary sewer overflows.Inspected 23 miles of targeted sewer mains within thesewer system, exceeding the goal of 20 miles, to iden-tify sewer defects and facilitate proactive facility repairsto reduce the risk of sanitary sewer spills.Upgraded the Jamacha wastewater pump station facil-ity to protect public health and safeguard drinkingwater supplies at the Sweetwater Reservoir by minimiz-ing the risk of sanitary sewer spills.Completed five public outreach presentations to NorthCounty neighborhood associations and local organiza-tions regarding McClellan-Palomar Airport operationsand the County’s efforts to minimize noise impacts,exceeding the goal of four presentations.
Strategic Initiative – Sustainable EnvironmentsDesigned and initiated construction on 24 and com-pleted construction on 21 road and road-related infra-structure improvement projects that enhance the long-term sustainability of the transportation network,exceeding the goal of 7 projects.Protected a sustainable watershed.
Provided water quality and watershed education byconducting 160 presentations to high schoolstudents at 90% of public high schools in theunincorporated area of the county as part of a long-term strategy for achieving positive behavioralchanges, exceeding the goal of 150 presentations.Conducted outreach to residents with informationand resources on stormwater pollution prevention at18 community events throughout the unincorporatedarea of the county, exceeding the goal of 15 events.Performed 11,000 stormwater inspections during theconstruction phase on private development projectsto ensure compliance with State requirements, toreduce erosion and to minimize downstreampollutants, exceeding the goal of 8,000 inspections.Developed three watershed-based comprehensiveload reduction plans addressing mitigation measuresto meet bacteria levels in waterways in accordancewith the San Diego Regional Water Quality ControlBoard requirements as approved by the Board ofSupervisors on September 26, 2012.Removed 25,000 cubic yards of debris from culverts,drainage channels and roads through a systematiccleaning program to prevent pollution of the county’srivers, bays and ocean.Swept 19,333 lane-miles of roadway to clean debrisfrom road surfaces and prevent pollution of thecounty’s rivers, bays and ocean, exceeding the goalof sweeping 16,200 lane-miles.
305Land Use and Environment Group Adopted Operational Plan Fiscal Years 2013-2014 and 2014-2015
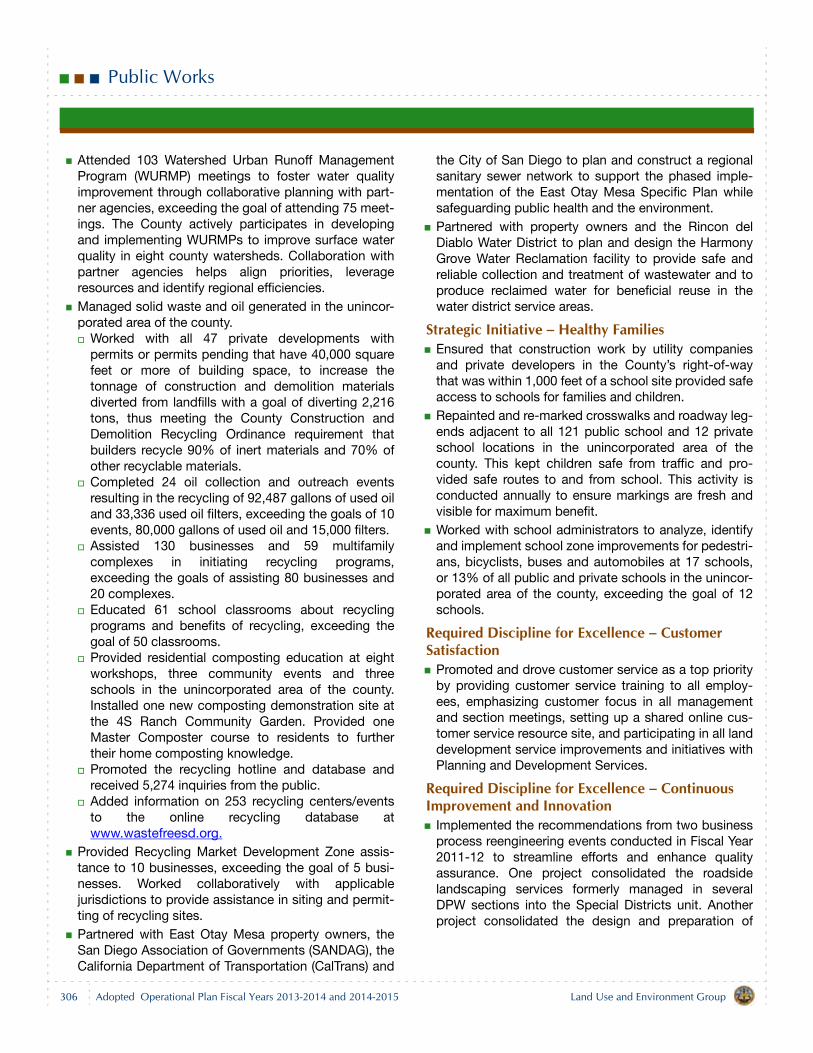
Public Works
Attended 103 Watershed Urban Runoff ManagementProgram (WURMP) meetings to foster water qualityimprovement through collaborative planning with part-ner agencies, exceeding the goal of attending 75 meet-ings. The County actively participates in developingand implementing WURMPs to improve surface waterquality in eight county watersheds. Collaboration withpartner agencies helps align priorities, leverageresources and identify regional efficiencies.Managed solid waste and oil generated in the unincor-porated area of the county.
Worked with all 47 private developments withpermits or permits pending that have 40,000 squarefeet or more of building space, to increase thetonnage of construction and demolition materialsdiverted from landfills with a goal of diverting 2,216tons, thus meeting the County Construction andDemolition Recycling Ordinance requirement thatbuilders recycle 90% of inert materials and 70% ofother recyclable materials. Completed 24 oil collection and outreach eventsresulting in the recycling of 92,487 gallons of used oiland 33,336 used oil filters, exceeding the goals of 10events, 80,000 gallons of used oil and 15,000 filters.Assisted 130 businesses and 59 multifamilycomplexes in initiating recycling programs,exceeding the goals of assisting 80 businesses and20 complexes.Educated 61 school classrooms about recyclingprograms and benefits of recycling, exceeding thegoal of 50 classrooms.Provided residential composting education at eightworkshops, three community events and threeschools in the unincorporated area of the county.Installed one new composting demonstration site atthe 4S Ranch Community Garden. Provided oneMaster Composter course to residents to furthertheir home composting knowledge. Promoted the recycling hotline and database andreceived 5,274 inquiries from the public.Added information on 253 recycling centers/eventsto the online recycling database atwww.wastefreesd.org.
Provided Recycling Market Development Zone assis-tance to 10 businesses, exceeding the goal of 5 busi-nesses. Worked collaboratively with applicablejurisdictions to provide assistance in siting and permit-ting of recycling sites.Partnered with East Otay Mesa property owners, theSan Diego Association of Governments (SANDAG), theCalifornia Department of Transportation (CalTrans) and
the City of San Diego to plan and construct a regionalsanitary sewer network to support the phased imple-mentation of the East Otay Mesa Specific Plan whilesafeguarding public health and the environment.Partnered with property owners and the Rincon delDiablo Water District to plan and design the HarmonyGrove Water Reclamation facility to provide safe andreliable collection and treatment of wastewater and toproduce reclaimed water for beneficial reuse in thewater district service areas.
Strategic Initiative – Healthy FamiliesEnsured that construction work by utility companiesand private developers in the County’s right-of-waythat was within 1,000 feet of a school site provided safeaccess to schools for families and children.Repainted and re-marked crosswalks and roadway leg-ends adjacent to all 121 public school and 12 privateschool locations in the unincorporated area of thecounty. This kept children safe from traffic and pro-vided safe routes to and from school. This activity isconducted annually to ensure markings are fresh andvisible for maximum benefit.Worked with school administrators to analyze, identifyand implement school zone improvements for pedestri-ans, bicyclists, buses and automobiles at 17 schools,or 13% of all public and private schools in the unincor-porated area of the county, exceeding the goal of 12schools.
Required Discipline for Excellence – Customer Satisfaction
Promoted and drove customer service as a top priorityby providing customer service training to all employ-ees, emphasizing customer focus in all managementand section meetings, setting up a shared online cus-tomer service resource site, and participating in all landdevelopment service improvements and initiatives withPlanning and Development Services.
Required Discipline for Excellence – Continuous Improvement and Innovation
Implemented the recommendations from two businessprocess reengineering events conducted in Fiscal Year2011-12 to streamline efforts and enhance qualityassurance. One project consolidated the roadsidelandscaping services formerly managed in severalDPW sections into the Special Districts unit. Anotherproject consolidated the design and preparation of
306 Land Use and Environment GroupAdopted Operational Plan Fiscal Years 2013-2014 and 2014-2015

Public Works
road maintenance projects, such as concrete-asphaltoverlay projects, from two separate sections intoDPW’s Capital Improvement Program.Upgraded the County’s Survey Record System (SRS)for improved stability. Program upgrades added 17new document types and uploaded more than 100,000digital format document scans into the database. Thisallows all County employees and public customers toresearch, review and retrieve vital maps, plans, anddocuments online. The upgrade also greatly enhancedthe customer’s ability to purchase all documents on theCounty’s SRS website, instead of visiting the customerservice desk in-person to purchase hard copies.
2013-15 Objectives
Strategic Initiative – Safe CommunitiesComplete four public outreach presentations to NorthCounty neighborhood associations and local organiza-tions regarding McClellan-Palomar Airport operationsand the County’s efforts to minimize noise impacts.
Strategic Initiative – Sustainable EnvironmentsDesign and initiate construction on at least 12 road androad-related infrastructure improvement projects thatenhance the long-term sustainability of the transporta-tion network.Work with contractors that are committed to the devel-opment and construction of sustainable, environmen-tally-efficient projects involving the use of recycledasphalt in County airport runway projects and the useof eco-friendly LED lighting on airport property. Protect a sustainable watershed and minimize down-stream pollutants.
Provide water quality and watershed education byconducting 150 presentations to high schoolstudents at 90% of public high schools in theunincorporated area of the county as part of a long-term strategy for achieving positive behavioralchanges.Conduct outreach to residents with information andresources on stormwater pollution prevention at 15community events throughout the unincorporatedarea of the county.Perform stormwater inspections during theconstruction phase on private development projectsto ensure compliance with State requirements andreduce erosion.Remove 25,000 cubic yards of debris from culverts,drainage channels and roads through a systematiccleaning program.
Sweep 16,200 lane-miles of roadway to clean debrisfrom road surfaces.Incorporate erosion control measures on 100% of 25new infrastructure construction sites usingstormwater Best Management Practices (BMPs) forerosion and sediment control, as required by Stateand regional stormwater permits.
Manage solid waste and oil generated in the unincor-porated area of the county.
Work with all private developments with permits orpermits pending that have 40,000 square feet ormore of building space (estimated 45), to increasethe tonnage of construction and demolition materialsdiverted from landfills, with a goal of diverting 3,000tons or 90% of inert materials and 70% of otherrecyclable materials. Goals for recycling diversionare limited by the number of projects, debrisvolumes, and how much is recycled.Complete 15 oil collection and outreach events torecycle 80,000 gallons of used oil and 20,000 usedoil filters.Assist 100 businesses and 40 multifamily complexesin initiating recycling programs.Provide education about recycling programs andbenefits of recycling to 55 school classrooms.Provide residential composting education at nineworkshops, two community events and two schoolsin the unincorporated area of the county. Install onenew composting demonstration site. Promote the County’s recycling hotline and databaseto achieve at least 5,000 inquiries from the public. Add information on 65 recycling centers/events tothe recycling database at www.wastefreesd.org.
Provide Recycling Market Development Zone assis-tance to 10 businesses. Work collaboratively withapplicable jurisdictions to provide assistance in sitingand permitting of recycling sites.Partner with East Otay Mesa property owners, SAN-DAG, CalTrans and the City of San Diego to plan andconstruct a regional sanitary sewer network to supportthe phased implementation of the East Otay MesaSpecific Plan while safeguarding public health and theenvironment.
Strategic Initiative – Healthy FamiliesProtect public health and the environment by minimiz-ing the risk of sanitary sewer spills.
Clean 390 miles of sanitary sewer collector mainswithin the sanitary sewer system.
307Land Use and Environment Group Adopted Operational Plan Fiscal Years 2013-2014 and 2014-2015
Public Works
Inspect 20 miles of targeted sewer mains within thesanitary sewer system to identify sewer defects andfacilitate proactive facility repairs.Plan and design a major upgrade of the Rancho SanDiego wastewater pump station facility.
Ensure that all construction work by utility companiesand private developers in the County’s right-of-waythat is within 1,000 feet of a school site provides safeaccess to schools for families and children.Repaint and re-mark crosswalks and roadway legendsadjacent to 121 public school and 12 private schoollocations in the unincorporated area of the county. Work with school administrators to analyze, identifyand implement school zone improvements for pedestri-ans, bicyclists, buses and automobiles at 12 schools,or 9% of all public and private schools in the unincor-porated area of the county.
Required Discipline for Excellence – Customer Satisfaction
Build stronger customer relationships through meet-ings and other communication with industry andresource agencies.
Required Discipline for Excellence – Continuous Improvement and Innovation
Develop and use a technical advisory staff group torecommend technical training, provide cross trainingand use other means to enhance the knowledge oftechnical and engineering staff.
Related Links
For additional information about the DPW, refer to the web-site at www.sdcounty.ca.gov/dpw.
308 Land Use and Environment GroupAdopted Operational Plan Fiscal Years 2013-2014 and 2014-2015
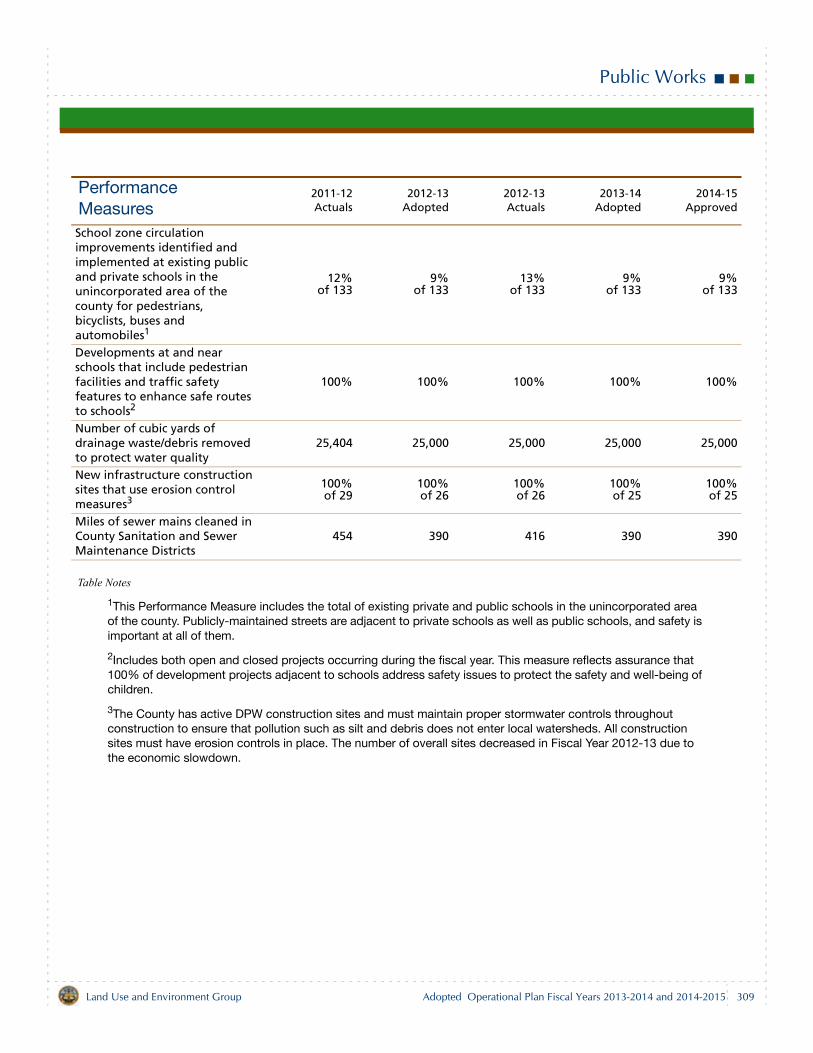
Public Works
Table Notes
1This Performance Measure includes the total of existing private and public schools in the unincorporated area of the county. Publicly-maintained streets are adjacent to private schools as well as public schools, and safety is important at all of them.
2Includes both open and closed projects occurring during the fiscal year. This measure reflects assurance that 100% of development projects adjacent to schools address safety issues to protect the safety and well-being of children.
3The County has active DPW construction sites and must maintain proper stormwater controls throughout construction to ensure that pollution such as silt and debris does not enter local watersheds. All construction sites must have erosion controls in place. The number of overall sites decreased in Fiscal Year 2012-13 due to the economic slowdown.
Performance Measures
2011-12Actuals
2012-13Adopted
2012-13Actuals
2013-14Adopted
2014-15Approved
School zone circulation improvements identified and implemented at existing public and private schools in the unincorporated area of the county for pedestrians, bicyclists, buses and automobiles1
12%of 133
9%of 133
13%of 133
9%of 133
9%of 133
Developments at and near schools that include pedestrian facilities and traffic safety features to enhance safe routes to schools2
100% 100% 100% 100% 100%
Number of cubic yards of drainage waste/debris removed to protect water quality
25,404 25,000 25,000 25,000 25,000
New infrastructure construction sites that use erosion control measures3
100%of 29
100%of 26
100%of 26
100%of 25
100%of 25
Miles of sewer mains cleaned in County Sanitation and Sewer Maintenance Districts
454 390 416 390 390
309Land Use and Environment Group Adopted Operational Plan Fiscal Years 2013-2014 and 2014-2015
Public Works
Budget Changes and Operational Impact: 2012-13 to 2013-14
StaffingNet decrease of 24.00 staff years department-wideincludes the decrease of 11.00 vacant staff years as a resultof decreased workload and the decrease of 17.00 staffyears due to a transfer of the Land Development ProjectManagement program to the Department of Planning andDevelopment Services (PDS). On September 25, 2012, theBoard established PDS to combine the land use functionsthat used to be divided among various County departmentsincluding DPW. This is offset by an increase of 4.00 staffyears (2.00 staff years in Inactive Waste Landfill programand 2.00 staff years in DPW General Fund Watershed Pro-tection Program) to meet operational needs and additionalregulatory responsibilities. Additional transfers betweenDPW funds or divisions to meet operational needs asdetailed below will result in no additional change in totalstaffing.
Road Fund net decrease of 47.00 staff years due toreduction in workload, alignment of expenditures toavailable revenue, transfer of 19.00 staff years to DPWGeneral Fund, transfer of 17.00 staff years to theDepartment of Planning and Development Services,and transfer between programs within the Road Fundand between the Road Fund and General Fund:
Land Development Program decrease of 40.00 staffyears due to:
Transfer of 17.00 staff years from the LandDevelopment Project Management program toPDS. Transfer of 19.00 staff years from the LandDevelopment Private Development ConstructionInspection program to DPW General Fund. Thistransfer aligns the functions of the Road Fundallowing the Road Fund to comply with Board ofSupervisors Policy B-29, Fees, Grants, RevenueContracts - Department Responsibility for CostRecovery.Decrease of 4.00 staff years due to decreasedworkload in cartographic and field surveyprojects.
Engineering Services Program decrease of 6.00 staffyears due to transfer of 1.00 staff year to theTransportation Services Program and the decreaseof 5.00 staff years due to reduced workload. Thetransfer of 1.00 staff year from the EngineeringServices Program to the General Fund is offset by1.00 staff year from the General Fund resulting in nonet change.
Transportation Services Program increase of 1.00staff year due to transfer from the EngineeringServices Program for increased workload resultingfrom maintenance projects.Management Services Program decrease of 2.0 staffyear due to workload reduction.
Inactive Waste Program increase of 2.00 staff years toprovide adequate supervision for crews and to performpreventive maintenance on inactive landfill sites asrequired by regulatory agencies.General Fund increase of 21.00 staff years due totransfer of 19.00 staff years from Road Fund LandDevelopment Private Development ConstructionInspection program to align staffing for private devel-oper projects in the General Fund; and the addition of2.00 staff years for Watershed Protection Program tofulfill the Total Maximum Daily Load requirements ofinspection, enforcement, coordination between agen-cies, and the planning, design, permitting and right-of-way acquisition of capital improvement projects. Trans-fer of 1.00 staff year from General Fund to Road Fund,Engineering Services Program is offset by 1.00 staffyear from the Road Fund to the General Fund resultingin no net change.
ExpendituresNet increase of $5.8 million.
Salaries and Benefits — Net decrease of $1.7 millionreflects defunding 11.00 vacant staff years partially off-set by the addition of 4.00 staff years and an increasein workers’ compensation costs, previously negotiatedsalary increases and increased County retirementcosts. Services and Supplies — Net increase of $11.4 million.
Increase of $14.0 million is related to increases invarious capital improvement projects, vehiclemaintenance and fuel costs in the EquipmentOperations Internal Service Fund (ISF), equipmentmaintenance in the San Diego County SanitationDistrict, costs from the City of San DiegoMetropolitan Wastewater Department for thetransportation of wastewater, contributions to theEquipment ISFs, Public Liability Insurance,Countywide overhead costs including depreciationfor new buildings at the County Operations Center,utilities, facility management, landscaping servicesfor maintenance of medians, and one-timeinformation services system enhancements.Decrease of $2.6 million is due primarily tocompletion of specialized stormwater studies fundedby outside agencies and County one-time General
310 Land Use and Environment GroupAdopted Operational Plan Fiscal Years 2013-2014 and 2014-2015
Public Works
Fund fund balance, completion of cleanup activitiesat the Bonsall landfill and reduced use of outsideconsultants for the Detailed Work Program.
Other Charges — Net increase of $7.5 million due pri-marily to a $9.0 million increase in one-time funding forthe Environmental Trust Fund, $0.2 million increase dueto depreciation expense in the Airports for structuresand equipment, and an increase of $0.1 million in theequipment ISFs for equipment depreciation. This is off-set by $1.6 million decrease due to completion of addi-tional right-of-way for the Bear Valley Parkway Northcapital improvement project and $0.2 million decreasein infrastructure depreciation for fully depreciated air-port projects.Capital Assets/Land Acquisition — Net increase of $1.7million.
Increase of $5.9 million in the San Diego CountySanitation District includes $4.5 million increase forthe Rancho San Diego Pump Station Improvementproject and $1.4 million increase for the IndustryRoad Interceptor Sewer Phase I Replacement, Ha-Hana Road project.Decrease of $4.2 million includes decreases forvarious capital projects completed or nearcompletion in the San Diego County SanitationDistrict and Airport Enterprise Fund.
Capital Assets Equipment — Net decrease of $0.7 mil-lion includes a decrease of $1.4 million due to comple-tion of one-time equipment purchases in Airports and adecrease in vehicle purchases in the Road Fund andLiquid Waste Equipment Acquisition ISFs offset by $0.5million increase in vehicle purchases in the AirportEquipment Acquisition ISF and $0.2 million increase inthe Road Fund for road pavement testing equipmentand purchase of a truck.Fund Balance Component Increases — Decrease of$11.5 million due to completed funding for future capi-tal projects in Lakeside, Julian and Wintergardens ser-vice areas in the San Diego County Sanitation District.Operating Transfers Out — Net decrease of $0.9 millionreflects $1.5 million decrease due to the partial com-pletion of a transfer between Road Fund and RoadFund Equipment Acquisition ISF offset by an increaseof $0.6 million due to a transfer of $0.5 million betweenthe San Diego County Sanitation District and theWastewater Enterprise Fund for one-time IT costs andthe transfer of $0.1 million between the Road Fund andRoad Fund Equipment Acquisition fund for the pur-chase of a truck.
RevenuesNet increase of $5.8 million.
Taxes Current Property — Increase of $0.05 million dueto projected taxes from property owners for the FloodControl District.Taxes Other Than Current Secured — Increase of $0.8million due to increase in Road Fund capital improve-ment projects funded by TransNet sales tax.Licenses Permits & Franchises — Decrease of $0.04million includes decreases in permits for cancelledprojects and a completed utility project offset by anincrease in passenger facility charges at County oper-ated airports.Revenue From Use of Money & Property — Netincrease of $1.0 million.
$1.2 million increase includes $0.4 million increase inequipment rental rates in the equipment ISFs, aprojected $0.7 million increase for rental propertiesowned by County airports and a $0.1 million increasefor tie down and landing fees at County airports.$0.2 million decrease due to declining interestearnings on investments and deposits in all DPWfunds and lower fuel sales at County airports.
Intergovernmental Revenues — Net increase of $7.0million.
Increase of $8.2 million is related to a $2.0 millionprojected increase in Highway Users Tax based onincreased taxes on gasoline, a $4.0 million increasedue to Federal Emergency Management AssistanceHomeland Security grants for Wing Avenue Drainageproject and a truck purchase, a $1.1 million increasein Federal Highway Planning and Construction forFederal Highway Administration projects in the RoadFund; a $0.4 million increase in State ConstructionOther due to construction of State funded SafeRoutes to School Bancroft Elementary SchoolSidewalks; a $0.6 million increase in State Aid from a$0.7 million increase for a grant funded landfillproject offset by a $0.1 million decrease due to acompleted special watershed study. Decrease of $1.2 million related to a decrease of $0.6million in Indian Gaming grant due to completion ofconstruction for Dehesa Road and Wildcat CanyonRoad Rubberized Asphalt; a $0.2 million decrease inCommunity Development Block Grant (CDBG)funded construction projects; and a $0.4 milliondecrease in Federal Department of Transportation(DOT) Airport due to completion or near completionof federally funded airport projects.
311Land Use and Environment Group Adopted Operational Plan Fiscal Years 2013-2014 and 2014-2015
Public Works
Charges for Current Services — Net decrease of $1.2million.
Decrease of $4.2 million includes a $3.3 milliondecrease due to transfer of staffing for privatedevelopment projects from DPW to PDS; a decreaseof $0.2 million due to fewer sanitation capitalimprovement projects generating shared revenuefrom other governments; a $0.2 million reduction insanitation sewer service charge rates due to fewercustomers; a $0.1 million reduction in solid wastetonnage fees due to decreased operating costs; adecrease of $0.4 million due to near completion ofprojects funded by one-time Land Use andEnvironment Group fund balance.Increase of $3.0 million includes an increase of $1.4million for the Fallbrook 1C burn site constructionproject funded by the Environmental Trust Fund; anincrease of $1.2 million for capital improvementprojects and work funded by Road Fund, AirPollution Control, Capital Outlay, Internal Service,Airport Enterprise, Liquid Waste Enterprise, InactiveWaste, Special Districts, Library, and SurveyRemonument funds; an increase of $0.1 million inTransportation Impact Fee funded capitalimprovement projects; an increase of $0.2 milliondue to increased developer deposit funded projects;and an increase of $0.1 million in custom fees atCounty airports due to an approved rate increase.
Miscellaneous Revenues — Decrease of $0.4 milliondue to reduced funding available from the StormwaterTrust Fund for the Watershed Protection Program.Other Financing Sources — Net decrease of $0.8 mil-lion includes a decrease of $1.3 million for a transferbetween the Road Fund and the Road Fund EquipmentAcquisition ISF; a $0.1 million decrease for a transferfrom the Wastewater Enterprise Fund to the LiquidWaste Equipment Acquisition ISF; offset by an increaseof $0.4 million between the San Diego County Sanita-tion District and the Wastewater Enterprise Fund forone-time IT costs; and an increase of $0.1 million in theRoad Fund for the sale of the Lemon Grove road sta-tion.Fund Balance Component Decreases — Increase of$2.6 million for Lakeside and Wintergarden service areaprojects in the San Diego County Sanitation District.Use of Fund Balance — Net decrease of $3.8 million. Atotal of $42.1 million budgeted includes:
One-time General Fund fund balance of $9.0 millionfor the Environmental Trust Fund to fund multi-year,
one-time projects at County maintained inactivelandfills and burn sites.One-time Land Use and Environment Group fundbalance of $0.2 million for process improvementactivities in the Private Development ConstructionInspection program in the DPW General Fund. Rebudget of $0.5 million of Land Use andEnvironment Group fund balance in the DPWGeneral Fund for projects that will continue intoFiscal Year 2013-14 including the County’s match forIntegrated Regional Water Management’s datamanagement system; Proctor Valley Road vacationand closure; Business Case Management system(BCMS) staff work; Accela automation hardware andsoftware for customer submittal of documents; andpre-storm preparation.One-time funding of $32.4 million for various DPWfunds including the purchase of replacement or newequipment in the DPW Internal Service EquipmentAcquisition funds; one-time capital improvementprojects in Airports Program, San Diego CountySanitation District service area, Flood ControlDistrict, and Road Fund; maintenance for pavingprojects and potential emergencies in the PermanentRoad Divisions; asset replacement in the LightingDistrict; irrigation and landscaping projects in theCounty Service Area landscaping districts; and ITprojects in the Road Fund.
General Purpose Revenue Allocation — Increase of$0.6 million for two additional staff years and ongoingstormwater permit activities in the Watershed Protec-tion Program.
Budget Changes and Operational Impact: 2013-14 to 2014-15
A net decrease of $31.1 million includes a decrease of$14.3 million in Services and Supplies due to the projectedcompletion or near completion of Road Fund capitalimprovement projects and one-time projects; a decrease of$9.0 million in Other Charges due to the deletion of fundingfrom Fiscal Year 2013-14 for multi-year one-time projects inthe Environmental Trust Fund; a decrease of $4.9 million inCapital Assets/Land Acquisition due to completion of capi-tal projects in Airports and the San Diego County SanitationDistrict; a decrease of $2.6 million in Capital Assets Equip-ment due to completed equipment purchases in the equip-ment ISFs; and a $1.3 million decrease in OperatingTransfers Out due to the completion of a transfer betweenRoad Fund and the Road Fund Equipment Acquisition ISF.
312 Land Use and Environment GroupAdopted Operational Plan Fiscal Years 2013-2014 and 2014-2015
Public Works
An offsetting increase of $1.2 million in Salaries and Bene-fits is primarily due to an increase in County retirementcosts.
313Land Use and Environment Group Adopted Operational Plan Fiscal Years 2013-2014 and 2014-2015
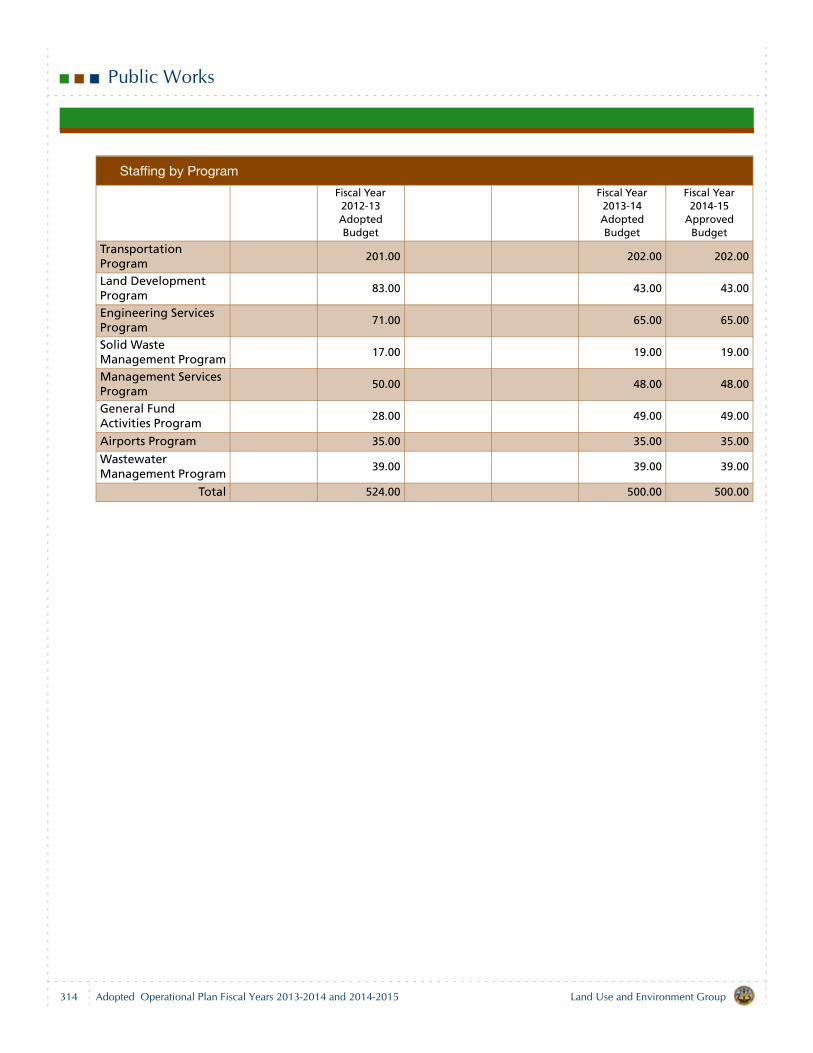
Public Works
Staffing by Program
Fiscal Year 2012-13 Adopted Budget
Fiscal Year 2013-14 Adopted Budget
Fiscal Year 2014-15
Approved Budget
Transportation Program
201.00 202.00 202.00
Land Development Program
83.00 43.00 43.00
Engineering Services Program
71.00 65.00 65.00
Solid Waste Management Program
17.00 19.00 19.00
Management Services Program
50.00 48.00 48.00
General Fund Activities Program
28.00 49.00 49.00
Airports Program 35.00 35.00 35.00
Wastewater Management Program
39.00 39.00 39.00
Total 524.00 500.00 500.00
314 Land Use and Environment GroupAdopted Operational Plan Fiscal Years 2013-2014 and 2014-2015
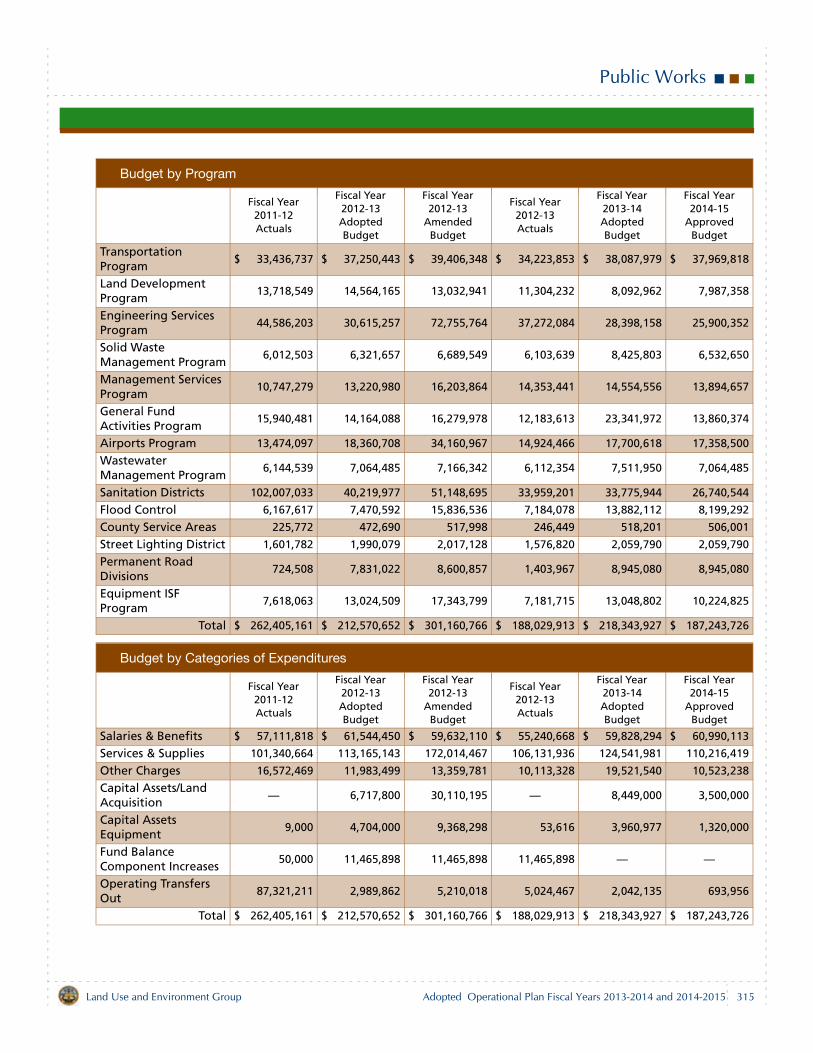
Public Works
Budget by Program
Fiscal Year 2011-12 Actuals
Fiscal Year 2012-13 Adopted Budget
Fiscal Year 2012-13
Amended Budget
Fiscal Year 2012-13 Actuals
Fiscal Year 2013-14 Adopted Budget
Fiscal Year 2014-15
Approved Budget
Transportation Program
$ 33,436,737 $ 37,250,443 $ 39,406,348 $ 34,223,853 $ 38,087,979 $ 37,969,818
Land Development Program
13,718,549 14,564,165 13,032,941 11,304,232 8,092,962 7,987,358
Engineering Services Program
44,586,203 30,615,257 72,755,764 37,272,084 28,398,158 25,900,352
Solid Waste Management Program
6,012,503 6,321,657 6,689,549 6,103,639 8,425,803 6,532,650
Management Services Program
10,747,279 13,220,980 16,203,864 14,353,441 14,554,556 13,894,657
General Fund Activities Program
15,940,481 14,164,088 16,279,978 12,183,613 23,341,972 13,860,374
Airports Program 13,474,097 18,360,708 34,160,967 14,924,466 17,700,618 17,358,500
Wastewater Management Program
6,144,539 7,064,485 7,166,342 6,112,354 7,511,950 7,064,485
Sanitation Districts 102,007,033 40,219,977 51,148,695 33,959,201 33,775,944 26,740,544
Flood Control 6,167,617 7,470,592 15,836,536 7,184,078 13,882,112 8,199,292
County Service Areas 225,772 472,690 517,998 246,449 518,201 506,001
Street Lighting District 1,601,782 1,990,079 2,017,128 1,576,820 2,059,790 2,059,790
Permanent Road Divisions
724,508 7,831,022 8,600,857 1,403,967 8,945,080 8,945,080
Equipment ISF Program
7,618,063 13,024,509 17,343,799 7,181,715 13,048,802 10,224,825
Total $ 262,405,161 $ 212,570,652 $ 301,160,766 $ 188,029,913 $ 218,343,927 $ 187,243,726
Budget by Categories of Expenditures
Fiscal Year 2011-12 Actuals
Fiscal Year 2012-13 Adopted Budget
Fiscal Year 2012-13
Amended Budget
Fiscal Year 2012-13 Actuals
Fiscal Year 2013-14 Adopted Budget
Fiscal Year 2014-15
Approved Budget
Salaries & Benefits $ 57,111,818 $ 61,544,450 $ 59,632,110 $ 55,240,668 $ 59,828,294 $ 60,990,113
Services & Supplies 101,340,664 113,165,143 172,014,467 106,131,936 124,541,981 110,216,419
Other Charges 16,572,469 11,983,499 13,359,781 10,113,328 19,521,540 10,523,238
Capital Assets/Land Acquisition
— 6,717,800 30,110,195 — 8,449,000 3,500,000
Capital Assets Equipment
9,000 4,704,000 9,368,298 53,616 3,960,977 1,320,000
Fund Balance Component Increases
50,000 11,465,898 11,465,898 11,465,898 — —
Operating Transfers Out
87,321,211 2,989,862 5,210,018 5,024,467 2,042,135 693,956
Total $ 262,405,161 $ 212,570,652 $ 301,160,766 $ 188,029,913 $ 218,343,927 $ 187,243,726
315Land Use and Environment Group Adopted Operational Plan Fiscal Years 2013-2014 and 2014-2015

Public Works
Budget by Categories of Revenues
Fiscal Year 2011-12 Actuals
Fiscal Year 2012-13 Adopted Budget
Fiscal Year 2012-13
Amended Budget
Fiscal Year 2012-13 Actuals
Fiscal Year 2013-14 Adopted Budget
Fiscal Year 2014-15
Approved Budget
Taxes Current Property $ 5,265,449 $ 5,228,448 $ 5,228,448 $ 5,341,646 $ 5,279,932 $ 5,279,932
Taxes Other Than Current Secured
13,009,315 4,294,088 6,629,769 3,142,217 5,110,699 4,871,368
Licenses Permits & Franchises
322,663 207,388 207,388 239,310 165,000 165,000
Fines, Forfeitures & Penalties
104,060 — — 62,657 — —
Revenue From Use of Money & Property
20,416,161 20,408,289 20,408,289 19,522,362 21,448,009 21,447,212
Intergovernmental Revenues
77,769,026 70,143,372 89,867,313 73,326,010 77,186,315 70,703,698
Charges For Current Services
52,356,577 55,166,506 53,502,840 52,117,061 53,952,105 53,007,715
Miscellaneous Revenues
6,044,361 2,130,098 3,940,303 1,517,987 1,696,692 1,502,598
Other Financing Sources
87,728,148 2,989,862 5,199,862 4,793,495 2,149,444 801,265
Fund Balance Component Decreases
16,261,474 — — — 2,551,989 2,000,000
Use of Fund Balance (22,861,319) 45,913,902 110,087,855 21,878,471 42,072,274 20,610,079
General Purpose Revenue Allocation
5,989,248 6,088,699 6,088,699 6,088,699 6,731,468 6,854,859
Total $ 262,405,161 $ 212,570,652 $ 301,160,766 $ 188,029,913 $ 218,343,927 $ 187,243,726
316 Land Use and Environment GroupAdopted Operational Plan Fiscal Years 2013-2014 and 2014-2015
County of San Diego
Community Services Group
Community Services Group & Executive Office 319
Animal Services 323
County Library 329
General Services 335
Housing & Community Development 343
Purchasing and Contracting 351
County Successor Agency 357
Registrar of Voters 361

Community Services Group Summary & Executive Office
Group Description
The Community Services Group Executive Office ensuresfiscal responsibility and provides management direction forsix County departments and the former San Diego CountyRedevelopment Agency and Successor Agency. The sixdepartments are:
Animal ServicesHousing and Community DevelopmentCounty LibraryRegistrar of VotersGeneral ServicesPurchasing and Contracting
Through these departments, the Community Services Groupprovides a wide variety of public services to Countyresidents and offers internal support services to Countydepartments. Public services include animal protection,sheltering and adoption; 33 branch libraries and 2 mobilelibraries with collections and programs; housing assistancesuch as rental and first-time homebuyer programs;community and economic development; and voter andelection services. Internal support services includemanaging County facilities, major maintenance projects,capital improvements, fleet management, Countywidecontracting oversight and procurement, and energy usagemanagement.
Mission Statement
To provide cost-effective and responsive services to cus-tomers – the public, client cities and County departments.These services are provided with an emphasis on customersatisfaction, quality and value.
2012-13 Accomplishments
The departments of the Community Services Group collec-tively support all Strategic Initiatives and Required Disci-plines for Excellence. Their program results are detailed insubsequent sections. Accomplishments include:
Selection of the County Library as the 2012 Library ofthe Year by the Library Journal.Opened the new Lincoln Acres Library, communityroom, and business offices for Sheriff staff and theLower Sweetwater Fire Protection District.
Increased the number of permanent vote-by-mail vot-ers by 15.6% for a total of 798,020 voters.Completed the addition of Chinese language to votingand election materials.Improved County operations through sustainabilityefforts in alternative energy systems, energy conserva-tion, recycling, and green building design.Ensured that more than 70% of the dogs and cats inCounty animal shelters were reunited with their owneror adopted into a new home.Developed new communication channels to releasetimely housing-related information to the public inemergencies as well as information about ongoinghousing and community development opportunities.Enabled electronic responses to County procurementefforts through enhancements to BuyNet, the County’se-procurement website.Conducted the activities of the County Oversight Boardto conclude the programs and activities of the formerRedevelopment Agency.
2013-15 Objectives
Community Services Group activities over the next twoyears continue the departments’ support of the County’sStrategic Initiatives, dedication to internal and external cus-tomer service, and maintaining a culture of accountabilityand transparency in the use of public resources. Objectivesinclude:
Strategic Initiative – Healthy FamiliesSupport regional efforts with a variety of programs andoutreach to reduce homelessness among families andveterans and increase self-sufficiency.
319Community Services Group Adopted Operational Plan Fiscal Years 2013-2014 and 2014-2015
Community Services Group Summary & Executive Office
Strategic Initiative – Sustainable EnvironmentsCelebrate 100 years of the County Library withbranches as centers of communities, while lookingahead to the use of technology in service delivery.
Required Discipline for Excellence – Essential Infrastructure
Plan and design facilities to serve the growing needs ofCounty residents including new capital projects forlibraries in Alpine and Imperial Beach, infrastructureimprovements at Lake Morena, and a new office for theAssessor/Recorder/County Clerk in El Cajon.Construct the new Registrar of Voters (ROV) buildingon the County Operations Center Campus, relocationof ROV operations and equipment in time to conductthe 2014 election cycle, and sale of the County Opera-tions Center Annex, the current location of the ROV.Maintain County facilities by performing preventivemaintenance on buildings and systems according toschedule.
Required Discipline for Excellence – Skilled, Adaptable and Diverse Workforce
Deliver training in procurement, contracting, andrecords management through both classroom andonline.
Related Links
For additional information about the Community ServicesGroup, refer to the website at www.sdcounty.ca.gov/community.
Executive Office Budget Changes and Operational Impact: 2012-13 to 2013-14
StaffingNo change in staffing.
ExpendituresNet increase of $0.8 million
Services and Supplies — net increase of $1.2 milliondue to one-time projects in the Department of GeneralServices: $0.9 million for water and energy-efficiency
projects in County facilities and $0.5 million for aninfrastructure condition assessment of County parksoffset by a decrease in a prior year one-time project of$0.2 million.Operating Transfers Out — net decrease of $0.5 milliondue to a decrease in prior year one-time projects of$0.7 million offset by an increase of $0.2 million for aone-time information technology project to improvebuilding information data management in the Depart-ment of General Services.Management Reserves — no net increase. Manage-ment Reserves are budgeted as a contingency forunplanned operational and other unanticipated needsin departments.
RevenuesIncrease of $0.8 million.
Use of Fund Balance — increase of $0.8 million for atotal budget of $4.9 million to fund one-time projectsand provide management reserves for operating con-tingencies: $3.3 million for management reserves, $0.9million for water and energy-efficiency projects inCounty facilities, $0.5 million for an infrastructure con-dition assessment of County parks, and $0.2 million foran information technology project to improve buildinginformation data management.General Purpose Revenue Allocation — No significantchange.
Executive Office Budget Changes and Operational Impact: 2013-14 to 2014-15
Net decrease of $1.5 million due primarily to a decrease of$1.3 million in Services and Supplies and a decrease inOperating Transfers Out of $0.2 million due to the antici-pated completion of prior year one-time projects.
320 Community Services GroupAdopted Operational Plan Fiscal Years 2013-2014 and 2014-2015
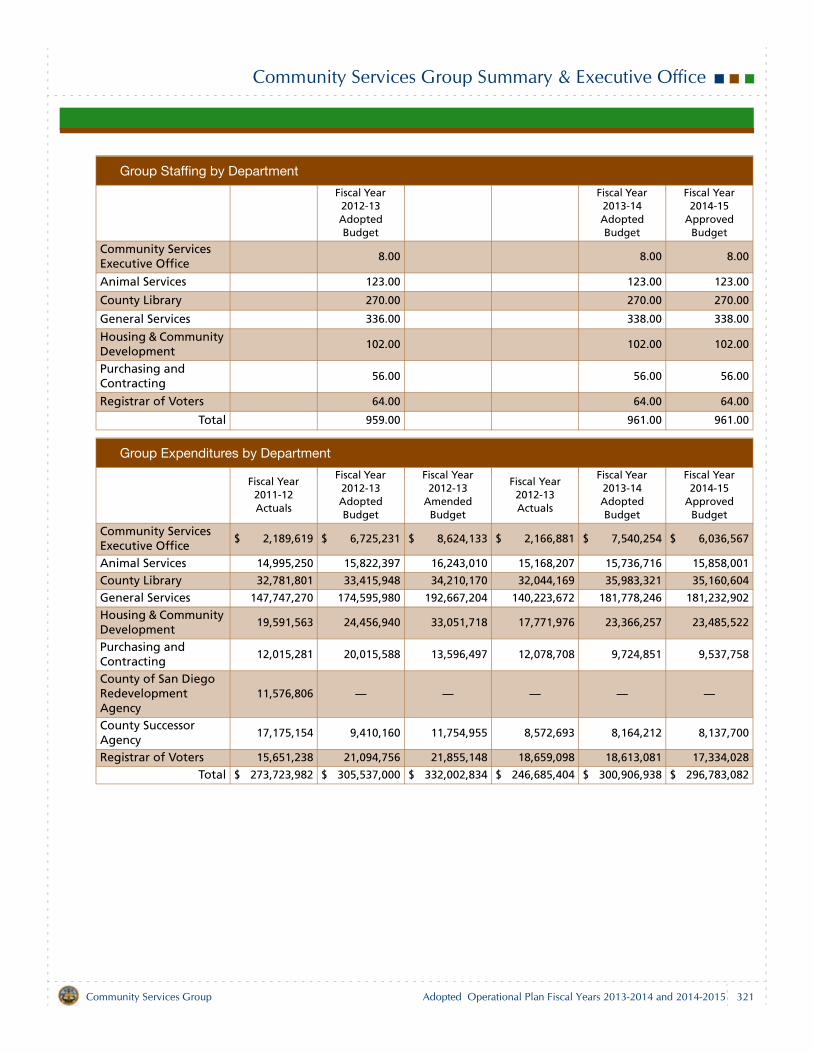
Community Services Group Summary & Executive Office
Group Staffing by Department
Fiscal Year 2012-13 Adopted Budget
Fiscal Year 2013-14 Adopted Budget
Fiscal Year 2014-15
Approved Budget
Community Services Executive Office
8.00 8.00 8.00
Animal Services 123.00 123.00 123.00
County Library 270.00 270.00 270.00
General Services 336.00 338.00 338.00
Housing & Community Development
102.00 102.00 102.00
Purchasing and Contracting
56.00 56.00 56.00
Registrar of Voters 64.00 64.00 64.00
Total 959.00 961.00 961.00
Group Expenditures by Department
Fiscal Year 2011-12 Actuals
Fiscal Year 2012-13 Adopted Budget
Fiscal Year 2012-13
Amended Budget
Fiscal Year 2012-13 Actuals
Fiscal Year 2013-14 Adopted Budget
Fiscal Year 2014-15
Approved Budget
Community Services Executive Office
$ 2,189,619 $ 6,725,231 $ 8,624,133 $ 2,166,881 $ 7,540,254 $ 6,036,567
Animal Services 14,995,250 15,822,397 16,243,010 15,168,207 15,736,716 15,858,001
County Library 32,781,801 33,415,948 34,210,170 32,044,169 35,983,321 35,160,604
General Services 147,747,270 174,595,980 192,667,204 140,223,672 181,778,246 181,232,902
Housing & Community Development
19,591,563 24,456,940 33,051,718 17,771,976 23,366,257 23,485,522
Purchasing and Contracting
12,015,281 20,015,588 13,596,497 12,078,708 9,724,851 9,537,758
County of San Diego Redevelopment Agency
11,576,806 — — — — —
County Successor Agency
17,175,154 9,410,160 11,754,955 8,572,693 8,164,212 8,137,700
Registrar of Voters 15,651,238 21,094,756 21,855,148 18,659,098 18,613,081 17,334,028
Total $ 273,723,982 $ 305,537,000 $ 332,002,834 $ 246,685,404 $ 300,906,938 $ 296,783,082
321Community Services Group Adopted Operational Plan Fiscal Years 2013-2014 and 2014-2015
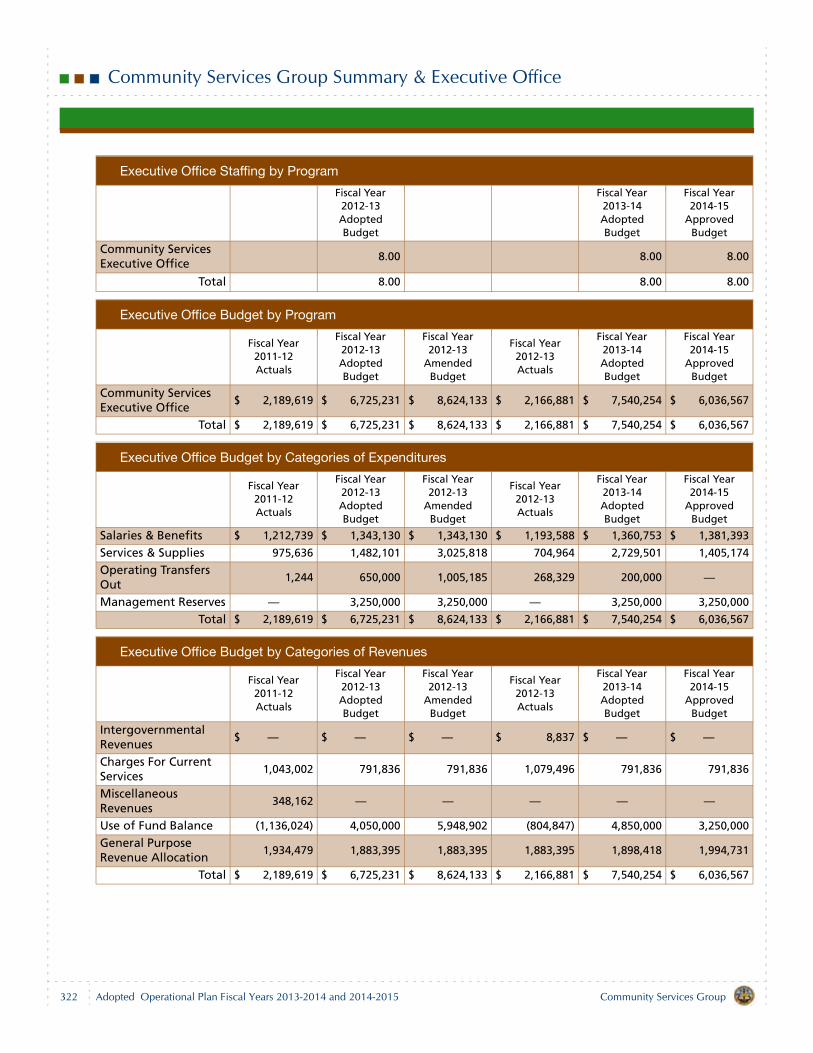
Community Services Group Summary & Executive Office
Executive Office Staffing by Program
Fiscal Year 2012-13 Adopted Budget
Fiscal Year 2013-14 Adopted Budget
Fiscal Year 2014-15
Approved Budget
Community Services Executive Office
8.00 8.00 8.00
Total 8.00 8.00 8.00
Executive Office Budget by Program
Fiscal Year 2011-12 Actuals
Fiscal Year 2012-13 Adopted Budget
Fiscal Year 2012-13
Amended Budget
Fiscal Year 2012-13 Actuals
Fiscal Year 2013-14 Adopted Budget
Fiscal Year 2014-15
Approved Budget
Community Services Executive Office
$ 2,189,619 $ 6,725,231 $ 8,624,133 $ 2,166,881 $ 7,540,254 $ 6,036,567
Total $ 2,189,619 $ 6,725,231 $ 8,624,133 $ 2,166,881 $ 7,540,254 $ 6,036,567
Executive Office Budget by Categories of Expenditures
Fiscal Year 2011-12 Actuals
Fiscal Year 2012-13 Adopted Budget
Fiscal Year 2012-13
Amended Budget
Fiscal Year 2012-13 Actuals
Fiscal Year 2013-14 Adopted Budget
Fiscal Year 2014-15
Approved Budget
Salaries & Benefits $ 1,212,739 $ 1,343,130 $ 1,343,130 $ 1,193,588 $ 1,360,753 $ 1,381,393
Services & Supplies 975,636 1,482,101 3,025,818 704,964 2,729,501 1,405,174
Operating Transfers Out
1,244 650,000 1,005,185 268,329 200,000 —
Management Reserves — 3,250,000 3,250,000 — 3,250,000 3,250,000
Total $ 2,189,619 $ 6,725,231 $ 8,624,133 $ 2,166,881 $ 7,540,254 $ 6,036,567
Executive Office Budget by Categories of Revenues
Fiscal Year 2011-12 Actuals
Fiscal Year 2012-13 Adopted Budget
Fiscal Year 2012-13
Amended Budget
Fiscal Year 2012-13 Actuals
Fiscal Year 2013-14 Adopted Budget
Fiscal Year 2014-15
Approved Budget
Intergovernmental Revenues
$ — $ — $ — $ 8,837 $ — $ —
Charges For Current Services
1,043,002 791,836 791,836 1,079,496 791,836 791,836
Miscellaneous Revenues
348,162 — — — — —
Use of Fund Balance (1,136,024) 4,050,000 5,948,902 (804,847) 4,850,000 3,250,000
General Purpose Revenue Allocation
1,934,479 1,883,395 1,883,395 1,883,395 1,898,418 1,994,731
Total $ 2,189,619 $ 6,725,231 $ 8,624,133 $ 2,166,881 $ 7,540,254 $ 6,036,567
322 Community Services GroupAdopted Operational Plan Fiscal Years 2013-2014 and 2014-2015
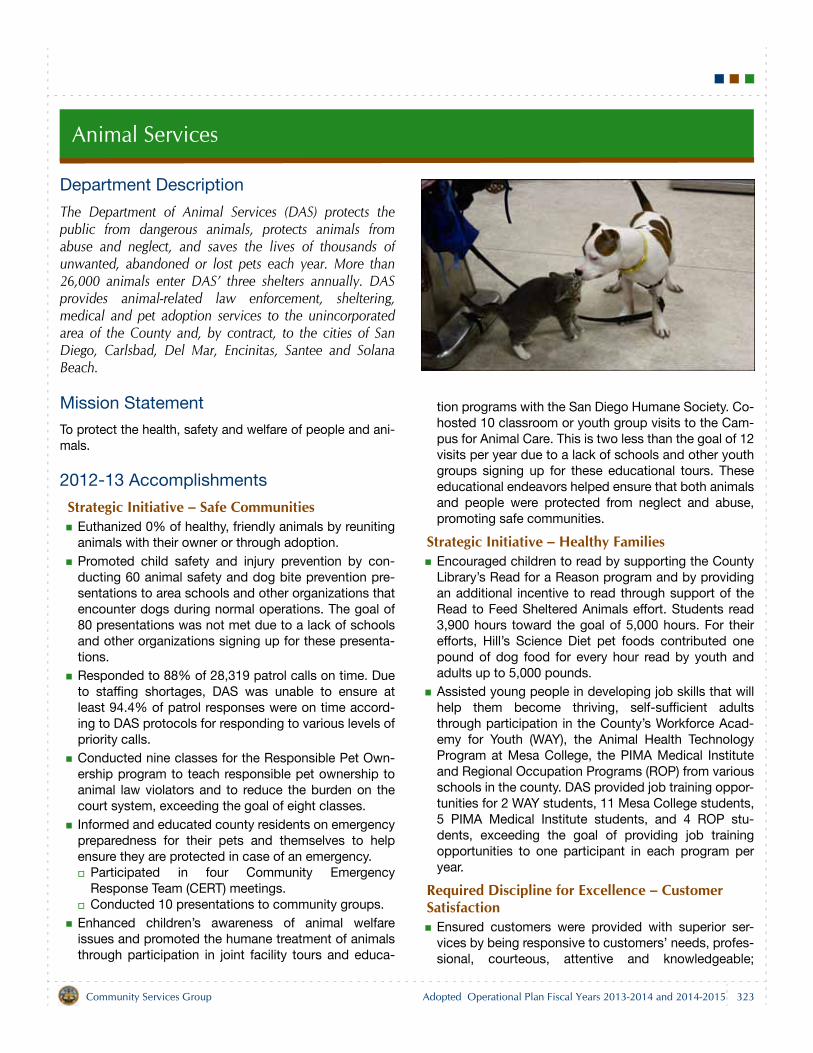
Animal Services
Department Description
The Department of Animal Services (DAS) protects thepublic from dangerous animals, protects animals fromabuse and neglect, and saves the lives of thousands ofunwanted, abandoned or lost pets each year. More than26,000 animals enter DAS’ three shelters annually. DASprovides animal-related law enforcement, sheltering,medical and pet adoption services to the unincorporatedarea of the County and, by contract, to the cities of SanDiego, Carlsbad, Del Mar, Encinitas, Santee and SolanaBeach.
Mission Statement
To protect the health, safety and welfare of people and ani-mals.
2012-13 Accomplishments
Strategic Initiative – Safe CommunitiesEuthanized 0% of healthy, friendly animals by reunitinganimals with their owner or through adoption.Promoted child safety and injury prevention by con-ducting 60 animal safety and dog bite prevention pre-sentations to area schools and other organizations thatencounter dogs during normal operations. The goal of80 presentations was not met due to a lack of schoolsand other organizations signing up for these presenta-tions.Responded to 88% of 28,319 patrol calls on time. Dueto staffing shortages, DAS was unable to ensure atleast 94.4% of patrol responses were on time accord-ing to DAS protocols for responding to various levels ofpriority calls. Conducted nine classes for the Responsible Pet Own-ership program to teach responsible pet ownership toanimal law violators and to reduce the burden on thecourt system, exceeding the goal of eight classes.Informed and educated county residents on emergencypreparedness for their pets and themselves to helpensure they are protected in case of an emergency.
Participated in four Community EmergencyResponse Team (CERT) meetings.Conducted 10 presentations to community groups.
Enhanced children’s awareness of animal welfareissues and promoted the humane treatment of animalsthrough participation in joint facility tours and educa-
tion programs with the San Diego Humane Society. Co-hosted 10 classroom or youth group visits to the Cam-pus for Animal Care. This is two less than the goal of 12visits per year due to a lack of schools and other youthgroups signing up for these educational tours. Theseeducational endeavors helped ensure that both animalsand people were protected from neglect and abuse,promoting safe communities.
Strategic Initiative – Healthy FamiliesEncouraged children to read by supporting the CountyLibrary’s Read for a Reason program and by providingan additional incentive to read through support of theRead to Feed Sheltered Animals effort. Students read3,900 hours toward the goal of 5,000 hours. For theirefforts, Hill’s Science Diet pet foods contributed onepound of dog food for every hour read by youth andadults up to 5,000 pounds.Assisted young people in developing job skills that willhelp them become thriving, self-sufficient adultsthrough participation in the County’s Workforce Acad-emy for Youth (WAY), the Animal Health TechnologyProgram at Mesa College, the PIMA Medical Instituteand Regional Occupation Programs (ROP) from variousschools in the county. DAS provided job training oppor-tunities for 2 WAY students, 11 Mesa College students,5 PIMA Medical Institute students, and 4 ROP stu-dents, exceeding the goal of providing job trainingopportunities to one participant in each program peryear.
Required Discipline for Excellence – Customer Satisfaction
Ensured customers were provided with superior ser-vices by being responsive to customers’ needs, profes-sional, courteous, attentive and knowledgeable;
323Community Services Group Adopted Operational Plan Fiscal Years 2013-2014 and 2014-2015
Animal Services
achieved a customer satisfaction rating of 4.67, belowthe target of 4.72 (on a scale of 1 to 5, with 5 being“excellent”).
Required Discipline for Excellence – Regional Leadership
Made eight presentations to community or industrygroups describing DAS services, disaster prepared-ness, animal health and welfare issues, cruelty investi-gations and/or new animal-related legislation.Submitted three articles to trade journals or communitypublications to highlight DAS services, animal healthand welfare issues, dog bite prevention and/or adop-tion opportunities.Provided 17 dog bite prevention presentations forCounty departments and local area companies to pro-mote the safety of employees who may encounterdogs in the scope of their duties (e.g., SDG&E and theU.S. Postal Service). This is less than the goal of 24dog bite presentations since some of the previousdepartments and companies did not request repeatpresentations this year.
Required Discipline for Excellence – Skilled, Adaptable and Diverse Workforce
Continued to seek qualified diverse applicants byattending four job fairs and advertising positions inperiodicals targeted to minority populations in order tofill positions as needed.
Required Discipline for Excellence – Continuous Improvement and Innovation
DAS strives to continuously improve the plight and wel-fare of the animals in its care through best practices,innovation and creative strategies. To fulfill its missionand provide maximum service and value to the com-munity, DAS focused on the following key objectives:
Ensured at least 72.4% of 21,793 sheltered dogs andcats were reunited with their owner or adopted into anew home, exceeding the goal of 71.4%.Of animals that were euthanized, 28% weretreatable. DAS provided medical care to as manytreatable animals as possible and made every effortto place these animals with rescue partners andadopters. However, due to an increased volume ofanimals with pre-existing medical conditions thatwere surrendered or abandoned by their owners,DAS did not meet the goal of ensuring no more than12.9% of treatable animals were euthanized. While DAS reduced the dependency on veterinaryclinics, it did not meet the goal of increasing thenumber of in-house sterilization surgeries by 500
over the previous year to 3,400, primarily due tosurgical staff shortages. Instead, DAS completed2,499 in-house surgeries. DAS did increase the useof mobile spay/neuter services to reduce or eliminatewait times for adopters to take possession of theirnew pet.
Developed and implemented one business processreengineering improvement that reduced costs orenhanced customer service, productivity or revenue.DAS improved its kennel inventory process by imple-menting a new system that greatly reduced the amountof time needed for daily inventory of animals, improvingefficiency and increasing productivity. A second projectwas not undertaken due to a lack of staff resources.
2013-15 Objectives
Strategic Initiative – Safe CommunitiesAchieve goal of 0% euthanasia of any healthy, friendlyanimal by reuniting animals with their owner or throughadoption.Promote child safety and injury prevention by conduct-ing a minimum of 80 animal safety and dog bite pre-vention presentations to area schools and otherorganizations that encounter dogs during normal oper-ations.Respond to 94.4% of patrol calls on time according toDAS protocols for responding to various levels of prior-ity calls.Conduct eight classes for the Responsible Pet Owner-ship program to teach responsible pet ownership toanimal law violators and to reduce the burden on thecourt system.Inform and educate county residents on emergencypreparedness for their pets and themselves to helpensure they are protected in case of an emergency.
Participate in four Community Emergency ResponseTeam (CERT) meetings per year.Conduct 10 presentations to community groups.
Enhance children’s awareness of animal welfare issuesand promote the humane treatment of animals throughparticipation in a joint facility tour and education pro-gram with the San Diego Humane Society, and by co-hosting a minimum of 12 classroom or youth group vis-its per year to the Campus for Animal Care or otherCounty animal shelters. These educational endeavorswill help ensure that both animals and people are pro-tected from neglect and abuse, promoting safe com-munities.
324 Community Services GroupAdopted Operational Plan Fiscal Years 2013-2014 and 2014-2015
Animal Services
In support of the County’s Live Well San Diego LivingSafely initiative, expand the use of social media to edu-cate the public and increase awareness of variousissues such as animal safety, neglect and disaster pre-paredness by posting quarterly educational bulletins onthe DAS Facebook page and website.
Strategic Initiative – Healthy FamiliesEncourage children to read by supporting the CountyLibrary’s Read for a Reason program and by providingan additional incentive to read through supporting ani-mals.Assist young people in developing job skills that willhelp them become thriving, self-sufficient adultsthrough providing job training for at least one partici-pant each in the County’s Workforce Academy forYouth, the Animal Health Technology Program at MesaCollege, the PIMA Medical Institute and ROP programsfrom various schools in the county.
Required Discipline for Excellence – Customer Satisfaction
Ensure customers are provided with superior servicesby being responsive to customers’ needs, professional,courteous, attentive and knowledgeable; achieve acustomer satisfaction rating of 4.72 or higher (on ascale of 1 to 5, with 5 being “excellent”).
Required Discipline for Excellence – Regional Leadership
Make eight presentations per year to community orindustry groups describing DAS services, disaster pre-paredness, animal health and welfare issues, crueltyinvestigations and/or new animal-related legislation.Submit at least three articles to trade journals or com-munity publications to highlight DAS services, animalhealth and welfare issues, dog bite prevention and/oradoption opportunities.
Provide at least 24 dog bite prevention presentationsper year for County departments and local area com-panies to promote the safety of employees who mayencounter dogs in the scope of their duties (e.g.,SDG&E and the U.S. Postal Service).
Required Discipline for Excellence – Skilled, Adaptable and Diverse Workforce
Continue to seek qualified diverse applicants byattending four job fairs and advertising positions inperiodicals targeted to minority populations in order tofill positions as needed.
Required Discipline for Excellence – Continuous Improvement and Innovation
DAS strives to continuously improve the plight and wel-fare of the animals in its care through best practices,innovation and creative strategies. To fulfill its missionand provide maximum service and value to the com-munity, DAS focuses on the following key objectives:
Ensure at least 71.4% of an estimated 26,000sheltered dogs and cats are reunited with their owneror adopted into a new home.Ensure no more than 12.9% of treatable animals areeuthanized by providing medical care whenresources allow and placing animals with rescuepartners or adopters.
Develop and implement at least two business processreengineering improvements that reduce costs orenhance customer service, productivity or revenue byJune 30, 2015.
Related Links
For additional information about the Department of AnimalServices, refer to the website at www.sddac.com and fol-low DAS on Facebook at www.facebook.com/sddac.
325Community Services Group Adopted Operational Plan Fiscal Years 2013-2014 and 2014-2015
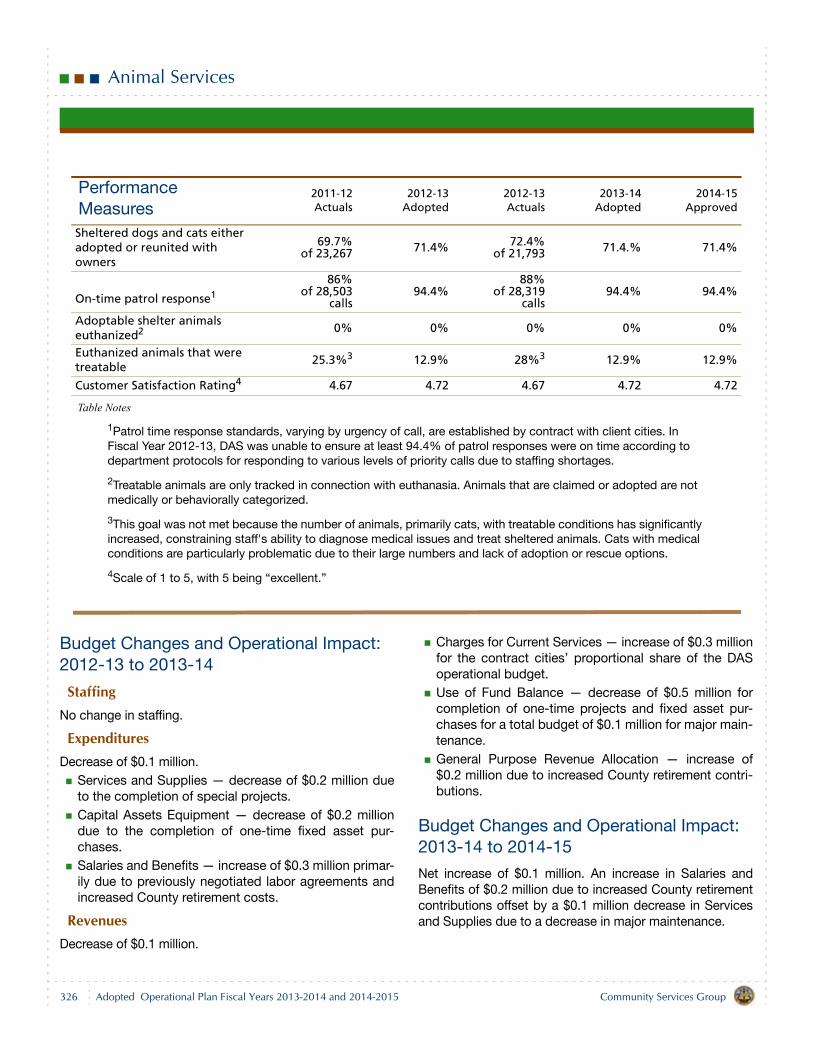
Animal Services
Table Notes
1Patrol time response standards, varying by urgency of call, are established by contract with client cities. In Fiscal Year 2012-13, DAS was unable to ensure at least 94.4% of patrol responses were on time according to department protocols for responding to various levels of priority calls due to staffing shortages.
2Treatable animals are only tracked in connection with euthanasia. Animals that are claimed or adopted are not medically or behaviorally categorized.
3This goal was not met because the number of animals, primarily cats, with treatable conditions has significantly increased, constraining staff's ability to diagnose medical issues and treat sheltered animals. Cats with medical conditions are particularly problematic due to their large numbers and lack of adoption or rescue options.
4Scale of 1 to 5, with 5 being “excellent.”
Budget Changes and Operational Impact: 2012-13 to 2013-14
StaffingNo change in staffing.
ExpendituresDecrease of $0.1 million.
Services and Supplies — decrease of $0.2 million dueto the completion of special projects. Capital Assets Equipment — decrease of $0.2 milliondue to the completion of one-time fixed asset pur-chases.Salaries and Benefits — increase of $0.3 million primar-ily due to previously negotiated labor agreements andincreased County retirement costs.
RevenuesDecrease of $0.1 million.
Charges for Current Services — increase of $0.3 millionfor the contract cities’ proportional share of the DASoperational budget.Use of Fund Balance — decrease of $0.5 million forcompletion of one-time projects and fixed asset pur-chases for a total budget of $0.1 million for major main-tenance.General Purpose Revenue Allocation — increase of$0.2 million due to increased County retirement contri-butions.
Budget Changes and Operational Impact: 2013-14 to 2014-15
Net increase of $0.1 million. An increase in Salaries andBenefits of $0.2 million due to increased County retirementcontributions offset by a $0.1 million decrease in Servicesand Supplies due to a decrease in major maintenance.
Performance Measures
2011-12Actuals
2012-13Adopted
2012-13Actuals
2013-14Adopted
2014-15Approved
Sheltered dogs and cats either adopted or reunited with owners
69.7%of 23,267 71.4% 72.4%
of 21,793 71.4.% 71.4%
On-time patrol response1
86%of 28,503
calls94.4%
88%of 28,319
calls94.4% 94.4%
Adoptable shelter animals euthanized2 0% 0% 0% 0% 0%
Euthanized animals that were treatable
25.3%3 12.9% 28%3 12.9% 12.9%
Customer Satisfaction Rating4 4.67 4.72 4.67 4.72 4.72
326 Community Services GroupAdopted Operational Plan Fiscal Years 2013-2014 and 2014-2015
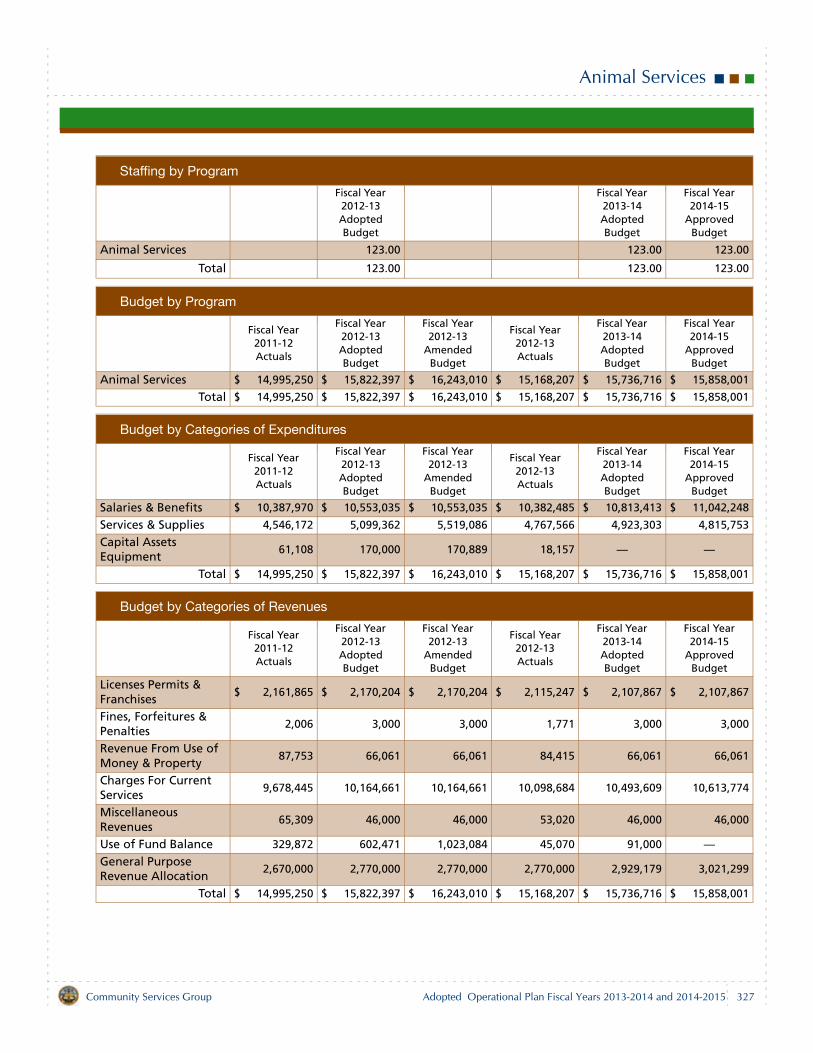
Animal Services
Staffing by Program
Fiscal Year 2012-13 Adopted Budget
Fiscal Year 2013-14 Adopted Budget
Fiscal Year 2014-15
Approved Budget
Animal Services 123.00 123.00 123.00
Total 123.00 123.00 123.00
Budget by Program
Fiscal Year 2011-12 Actuals
Fiscal Year 2012-13 Adopted Budget
Fiscal Year 2012-13
Amended Budget
Fiscal Year 2012-13 Actuals
Fiscal Year 2013-14 Adopted Budget
Fiscal Year 2014-15
Approved Budget
Animal Services $ 14,995,250 $ 15,822,397 $ 16,243,010 $ 15,168,207 $ 15,736,716 $ 15,858,001
Total $ 14,995,250 $ 15,822,397 $ 16,243,010 $ 15,168,207 $ 15,736,716 $ 15,858,001
Budget by Categories of Expenditures
Fiscal Year 2011-12 Actuals
Fiscal Year 2012-13 Adopted Budget
Fiscal Year 2012-13
Amended Budget
Fiscal Year 2012-13 Actuals
Fiscal Year 2013-14 Adopted Budget
Fiscal Year 2014-15
Approved Budget
Salaries & Benefits $ 10,387,970 $ 10,553,035 $ 10,553,035 $ 10,382,485 $ 10,813,413 $ 11,042,248
Services & Supplies 4,546,172 5,099,362 5,519,086 4,767,566 4,923,303 4,815,753
Capital Assets Equipment
61,108 170,000 170,889 18,157 — —
Total $ 14,995,250 $ 15,822,397 $ 16,243,010 $ 15,168,207 $ 15,736,716 $ 15,858,001
Budget by Categories of Revenues
Fiscal Year 2011-12 Actuals
Fiscal Year 2012-13 Adopted Budget
Fiscal Year 2012-13
Amended Budget
Fiscal Year 2012-13 Actuals
Fiscal Year 2013-14 Adopted Budget
Fiscal Year 2014-15
Approved Budget
Licenses Permits & Franchises
$ 2,161,865 $ 2,170,204 $ 2,170,204 $ 2,115,247 $ 2,107,867 $ 2,107,867
Fines, Forfeitures & Penalties
2,006 3,000 3,000 1,771 3,000 3,000
Revenue From Use of Money & Property
87,753 66,061 66,061 84,415 66,061 66,061
Charges For Current Services
9,678,445 10,164,661 10,164,661 10,098,684 10,493,609 10,613,774
Miscellaneous Revenues
65,309 46,000 46,000 53,020 46,000 46,000
Use of Fund Balance 329,872 602,471 1,023,084 45,070 91,000 —General Purpose Revenue Allocation
2,670,000 2,770,000 2,770,000 2,770,000 2,929,179 3,021,299
Total $ 14,995,250 $ 15,822,397 $ 16,243,010 $ 15,168,207 $ 15,736,716 $ 15,858,001
327Community Services Group Adopted Operational Plan Fiscal Years 2013-2014 and 2014-2015

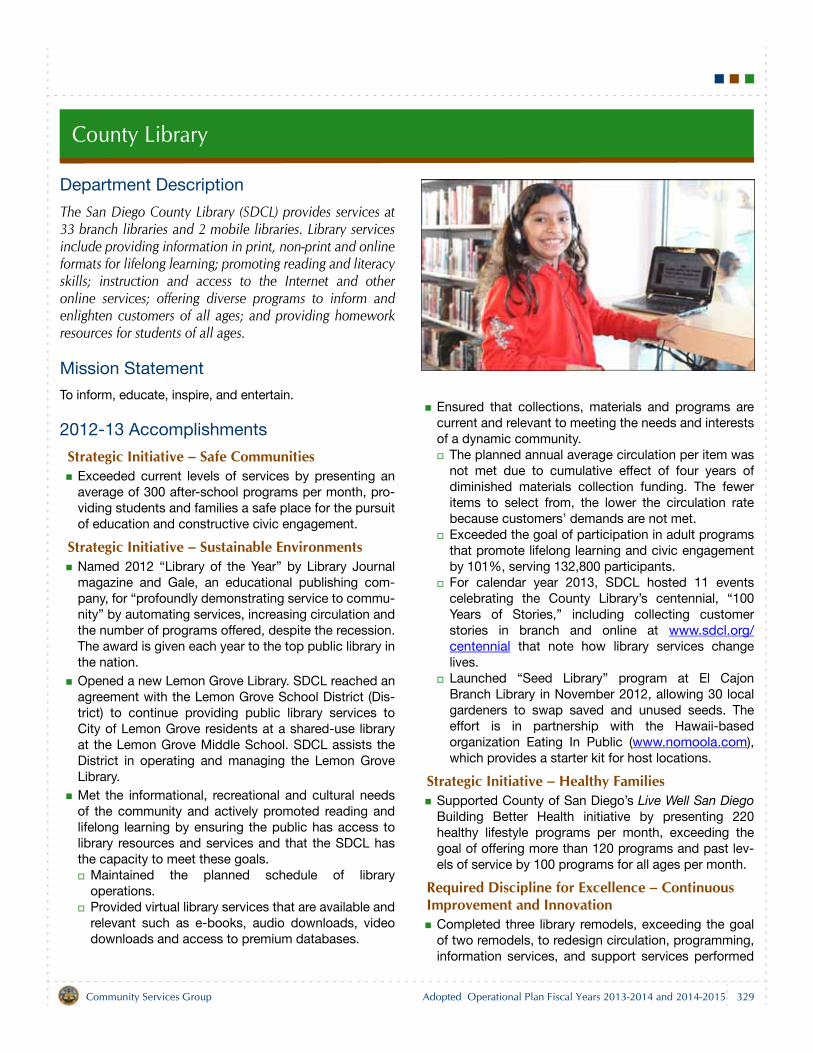
County Library
Department Description
The San Diego County Library (SDCL) provides services at33 branch libraries and 2 mobile libraries. Library servicesinclude providing information in print, non-print and onlineformats for lifelong learning; promoting reading and literacyskills; instruction and access to the Internet and otheronline services; offering diverse programs to inform andenlighten customers of all ages; and providing homeworkresources for students of all ages.
Mission Statement
To inform, educate, inspire, and entertain.
2012-13 Accomplishments
Strategic Initiative – Safe CommunitiesExceeded current levels of services by presenting anaverage of 300 after-school programs per month, pro-viding students and families a safe place for the pursuitof education and constructive civic engagement.
Strategic Initiative – Sustainable EnvironmentsNamed 2012 “Library of the Year” by Library Journalmagazine and Gale, an educational publishing com-pany, for “profoundly demonstrating service to commu-nity” by automating services, increasing circulation andthe number of programs offered, despite the recession.The award is given each year to the top public library inthe nation.Opened a new Lemon Grove Library. SDCL reached anagreement with the Lemon Grove School District (Dis-trict) to continue providing public library services toCity of Lemon Grove residents at a shared-use libraryat the Lemon Grove Middle School. SDCL assists theDistrict in operating and managing the Lemon GroveLibrary. Met the informational, recreational and cultural needsof the community and actively promoted reading andlifelong learning by ensuring the public has access tolibrary resources and services and that the SDCL hasthe capacity to meet these goals.
Maintained the planned schedule of libraryoperations.Provided virtual library services that are available andrelevant such as e-books, audio downloads, videodownloads and access to premium databases.
Ensured that collections, materials and programs arecurrent and relevant to meeting the needs and interestsof a dynamic community.
The planned annual average circulation per item wasnot met due to cumulative effect of four years ofdiminished materials collection funding. The feweritems to select from, the lower the circulation ratebecause customers’ demands are not met.Exceeded the goal of participation in adult programsthat promote lifelong learning and civic engagementby 101%, serving 132,800 participants.For calendar year 2013, SDCL hosted 11 eventscelebrating the County Library’s centennial, “100Years of Stories,” including collecting customerstories in branch and online at www.sdcl.org/centennial that note how library services changelives.Launched “Seed Library” program at El CajonBranch Library in November 2012, allowing 30 localgardeners to swap saved and unused seeds. Theeffort is in partnership with the Hawaii-basedorganization Eating In Public (www.nomoola.com),which provides a starter kit for host locations.
Strategic Initiative – Healthy FamiliesSupported County of San Diego’s Live Well San DiegoBuilding Better Health initiative by presenting 220healthy lifestyle programs per month, exceeding thegoal of offering more than 120 programs and past lev-els of service by 100 programs for all ages per month.
Required Discipline for Excellence – Continuous Improvement and Innovation
Completed three library remodels, exceeding the goalof two remodels, to redesign circulation, programming,information services, and support services performed
329Community Services Group Adopted Operational Plan Fiscal Years 2013-2014 and 2014-2015
County Library
in the branches and headquarters to increase effi-ciency, allowing SDCL to meet ongoing demands forservices with staffing that has been significantlyreduced due to resource constraints.
Required Discipline for Excellence – Customer Satisfaction
Ensured customers were provided with superior ser-vices by being responsive to the needs of the commu-nity, reflecting SDCL’s commitment to excellenceoffered by professional, courteous, attentive, andknowledgeable staff. Achieved an average customersatisfaction rating of 4.50 (on a scale of 1 to 5, with 5being “excellent”).
Required Discipline for Excellence – Information Services
Completed the radio frequency-enabled loss preven-tion security gates pilot project to deter theft of librarymaterials at the Vista and El Cajon branch libraries.Placed 48 Google Chromebooks (wireless, ultralightlaptops) into service for public use at eight branchesincluding Borrego Springs, Casa de Oro, El Cajon, LaMesa, Rancho San Diego, San Marcos, Santee andSpring Valley.
2013-15 Objectives
Strategic Initiative – Safe CommunitiesMaintain the current levels of services by offering anaverage of 200 after-school programs each month, tooffer students and families a safe place for the pursuitof education and constructive civic engagement insupport of the County’s Live Well San Diego LivingSafely initiative.Implement a pilot mentorship program for at-risk teenboys at two library branches incorporating technologyand reading, and sustain a participation rate of 20%out of 24 participants.
Strategic Initiative – Sustainable EnvironmentsMeet the informational, recreational and cultural needsof the community and actively promote reading andlifelong learning by ensuring the public has access tolibrary resources and services and that the SDCL hasthe capacity to meet these goals.
Maintain the planned schedule of library operations.Provide virtual library services that are available andrelevant such as e-books, audio downloads, videodownloads and access to premium databases.
Ensure that collections, materials and programs arecurrent and relevant to meeting the needs and interestsof a dynamic community.
Meet the planned annual average circulation peritem.Maintain participation in adult programs thatpromote lifelong learning and civic engagement byserving 100,000 participants.For calendar year 2013, host events celebrating theCounty Library’s centennial, “100 Years of Stories,”including collecting customer stories in branch andonline at www.sdcl.org/centennial that note howlibrary services change lives.
Strategic Initiative – Healthy FamiliesSupport the County of San Diego’s Live Well San DiegoBuilding Better Health initiative by offering more than140 healthy lifestyle programs for all ages every month.
Required Discipline for Excellence – Customer Satisfaction
Ensure customers are provided with superior servicesby being responsive to the needs of the community,reflecting SDCL’s commitment to excellence offered byprofessional, courteous, attentive, and knowledgeablestaff. Achieve an average customer satisfaction ratingof 4.70 or higher (on a scale of 1 to 5, with 5 being“Excellent.”)Ensure customers are provided with quality programsthat are current, relevant, and engaging. Achieve anaverage customer satisfaction rating of 4.75 or higher(on a scale of 1 to 5, with 5 being “Excellent”) forSDCL programs.
Required Discipline for Excellence – Information Services
Complete the implementation of the 24/7 Library-To-Go pilot project at the County Operations Center toprovide library services to remote areas currently with-out library services; post implementation assessmentand review at 6 months; install another 24/7 Library-To-Go kiosk in Bonsall; examine the viability and feasibilityof rolling out these devices to other potential locations.Plan and install, as needed, radio frequency-enabledloss prevention security gates to deter theft of librarymaterials.
Related Links
For additional information about the County Library, refer tothe website at www.sdcl.org.
330 Community Services GroupAdopted Operational Plan Fiscal Years 2013-2014 and 2014-2015
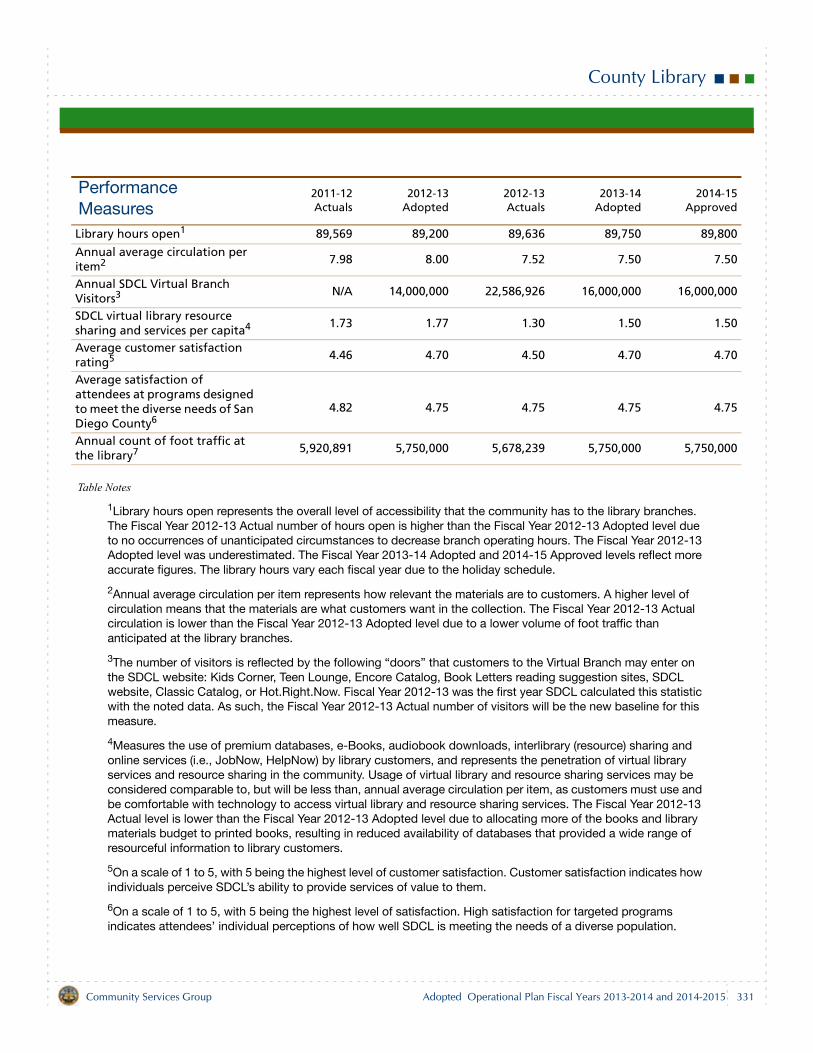
County Library
Table Notes
1Library hours open represents the overall level of accessibility that the community has to the library branches. The Fiscal Year 2012-13 Actual number of hours open is higher than the Fiscal Year 2012-13 Adopted level due to no occurrences of unanticipated circumstances to decrease branch operating hours. The Fiscal Year 2012-13 Adopted level was underestimated. The Fiscal Year 2013-14 Adopted and 2014-15 Approved levels reflect more accurate figures. The library hours vary each fiscal year due to the holiday schedule.
2Annual average circulation per item represents how relevant the materials are to customers. A higher level of circulation means that the materials are what customers want in the collection. The Fiscal Year 2012-13 Actual circulation is lower than the Fiscal Year 2012-13 Adopted level due to a lower volume of foot traffic than anticipated at the library branches.
3The number of visitors is reflected by the following “doors” that customers to the Virtual Branch may enter on the SDCL website: Kids Corner, Teen Lounge, Encore Catalog, Book Letters reading suggestion sites, SDCL website, Classic Catalog, or Hot.Right.Now. Fiscal Year 2012-13 was the first year SDCL calculated this statistic with the noted data. As such, the Fiscal Year 2012-13 Actual number of visitors will be the new baseline for this measure.
4Measures the use of premium databases, e-Books, audiobook downloads, interlibrary (resource) sharing and online services (i.e., JobNow, HelpNow) by library customers, and represents the penetration of virtual library services and resource sharing in the community. Usage of virtual library and resource sharing services may be considered comparable to, but will be less than, annual average circulation per item, as customers must use and be comfortable with technology to access virtual library and resource sharing services. The Fiscal Year 2012-13 Actual level is lower than the Fiscal Year 2012-13 Adopted level due to allocating more of the books and library materials budget to printed books, resulting in reduced availability of databases that provided a wide range of resourceful information to library customers.
5On a scale of 1 to 5, with 5 being the highest level of customer satisfaction. Customer satisfaction indicates how individuals perceive SDCL’s ability to provide services of value to them.
6On a scale of 1 to 5, with 5 being the highest level of satisfaction. High satisfaction for targeted programs indicates attendees’ individual perceptions of how well SDCL is meeting the needs of a diverse population.
Performance Measures
2011-12Actuals
2012-13Adopted
2012-13Actuals
2013-14Adopted
2014-15Approved
Library hours open1 89,569 89,200 89,636 89,750 89,800
Annual average circulation per item2 7.98 8.00 7.52 7.50 7.50
Annual SDCL Virtual Branch Visitors3 N/A 14,000,000 22,586,926 16,000,000 16,000,000
SDCL virtual library resource sharing and services per capita4 1.73 1.77 1.30 1.50 1.50
Average customer satisfaction rating5 4.46 4.70 4.50 4.70 4.70
Average satisfaction of attendees at programs designed to meet the diverse needs of San Diego County6
4.82 4.75 4.75 4.75 4.75
Annual count of foot traffic at the library7 5,920,891 5,750,000 5,678,239 5,750,000 5,750,000
331Community Services Group Adopted Operational Plan Fiscal Years 2013-2014 and 2014-2015
County Library
7The number of persons using the library is a critical measure of the success of SDCL. This measure is taken from “people counters” that are installed at the entrance of each branch library. Any increase shows the growth in use of physical library services.
Budget Changes and Operational Impact: 2012-13 to 2013-14
StaffingNo change in staffing.
ExpendituresIncrease of $2.6 million
Salaries and Benefits — increase of $0.3 million due toan increase in County retirement contributions, flexcredit, and worker’s compensation costs.Services and Supplies — increase of $2.0 million pri-marily due to an increase in books and library materials($1.0 million), allocated central support costs ($0.1 mil-lion), Department of General Services Internal ServiceFund costs ($0.1 million), and major maintenanceimprovement projects at San Marcos, Vista, RanchoSanta Fe, Borrego Springs, Fallbrook, and Valley Cen-ter library branches ($0.8 million). Capital Assets Equipment — increase of $0.3 milliondue to an automated materials project and the installa-tion of a 24/7 Library-To-Go kiosk.Management Reserves — budgeted for operating con-tingencies and pending labor negotiations.
RevenuesNet increase of $2.6 million
Taxes Current Property — increase of $0.3 million in thecurrent secured property tax projections.
Intergovernmental Revenues — increase of $0.5 millionin Redevelopment Agency Tax Increment projections.Charges For Current Services — decrease of $0.2 mil-lion in library services revenue projections.Other Financing Sources – increase of $0.9 million inGeneral Fund contributions for major maintenanceimprovement projects and a 24/7 Library-To-Go kiosk.Use of Fund Balance — increase of $0.9 million. Totalbudget of $2.9 million will be used to fund manage-ment reserves of $1.0 million, major maintenance of$0.2 million, $0.2 million to provide a match for publicdonations for library materials, $0.1 million for an auto-mated materials handler (book sorter), $1.0 million foradditional books and library materials for librarybranches, and $0.4 million for holding position vacan-cies for new libraries at Alpine and Imperial Beach.
Budget Changes and Operational Impact: 2013-14 to 2014-15
A net decrease of $0.8 million in total expenditures. Anincrease of $0.4 million in Salaries and Benefits is primarilydue to previously negotiated salary increases and anincrease in County retirement contributions is offset by adecrease of $1.2 million in Services and Supplies and Capi-tal Asset Equipment due to eliminating one-time costs of anautomated materials project, a 24/7 Library-To-Go kiosk,and major maintenance projects.
332 Community Services GroupAdopted Operational Plan Fiscal Years 2013-2014 and 2014-2015
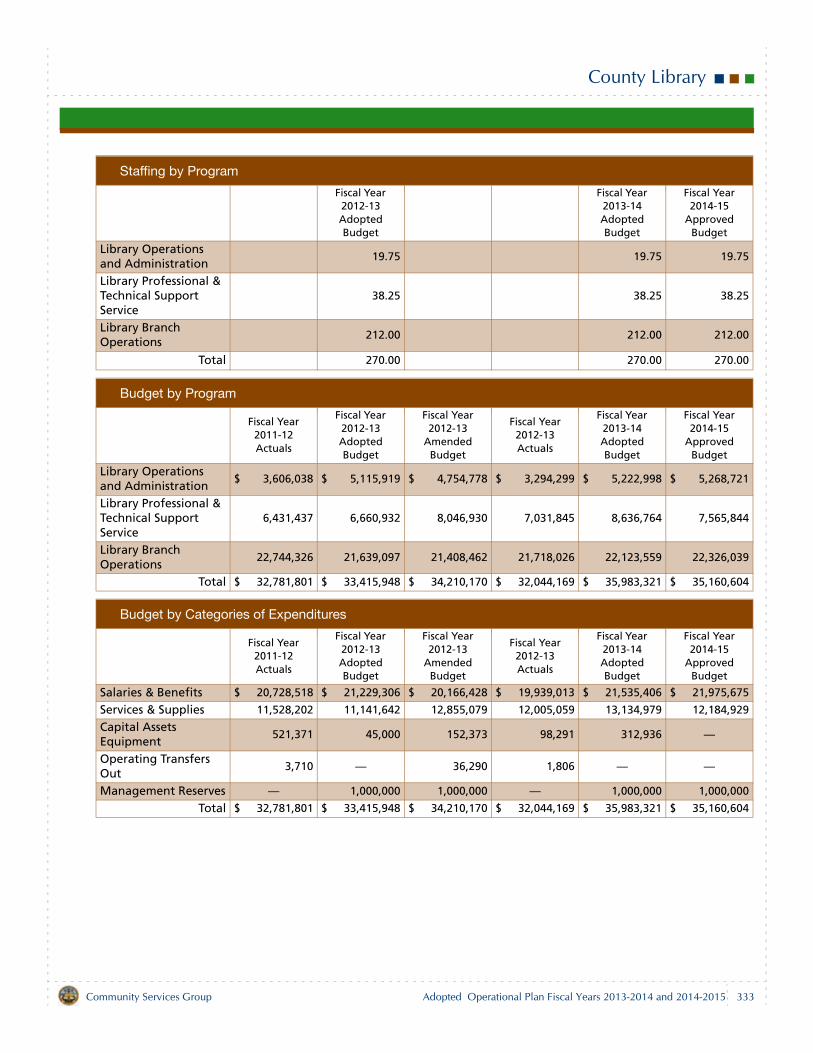
County Library
Staffing by Program
Fiscal Year 2012-13 Adopted Budget
Fiscal Year 2013-14 Adopted Budget
Fiscal Year 2014-15
Approved Budget
Library Operations and Administration
19.75 19.75 19.75
Library Professional & Technical Support Service
38.25 38.25 38.25
Library Branch Operations
212.00 212.00 212.00
Total 270.00 270.00 270.00
Budget by Program
Fiscal Year 2011-12 Actuals
Fiscal Year 2012-13 Adopted Budget
Fiscal Year 2012-13
Amended Budget
Fiscal Year 2012-13 Actuals
Fiscal Year 2013-14 Adopted Budget
Fiscal Year 2014-15
Approved Budget
Library Operations and Administration
$ 3,606,038 $ 5,115,919 $ 4,754,778 $ 3,294,299 $ 5,222,998 $ 5,268,721
Library Professional & Technical Support Service
6,431,437 6,660,932 8,046,930 7,031,845 8,636,764 7,565,844
Library Branch Operations
22,744,326 21,639,097 21,408,462 21,718,026 22,123,559 22,326,039
Total $ 32,781,801 $ 33,415,948 $ 34,210,170 $ 32,044,169 $ 35,983,321 $ 35,160,604
Budget by Categories of Expenditures
Fiscal Year 2011-12 Actuals
Fiscal Year 2012-13 Adopted Budget
Fiscal Year 2012-13
Amended Budget
Fiscal Year 2012-13 Actuals
Fiscal Year 2013-14 Adopted Budget
Fiscal Year 2014-15
Approved Budget
Salaries & Benefits $ 20,728,518 $ 21,229,306 $ 20,166,428 $ 19,939,013 $ 21,535,406 $ 21,975,675
Services & Supplies 11,528,202 11,141,642 12,855,079 12,005,059 13,134,979 12,184,929
Capital Assets Equipment
521,371 45,000 152,373 98,291 312,936 —
Operating Transfers Out
3,710 — 36,290 1,806 — —
Management Reserves — 1,000,000 1,000,000 — 1,000,000 1,000,000
Total $ 32,781,801 $ 33,415,948 $ 34,210,170 $ 32,044,169 $ 35,983,321 $ 35,160,604
333Community Services Group Adopted Operational Plan Fiscal Years 2013-2014 and 2014-2015
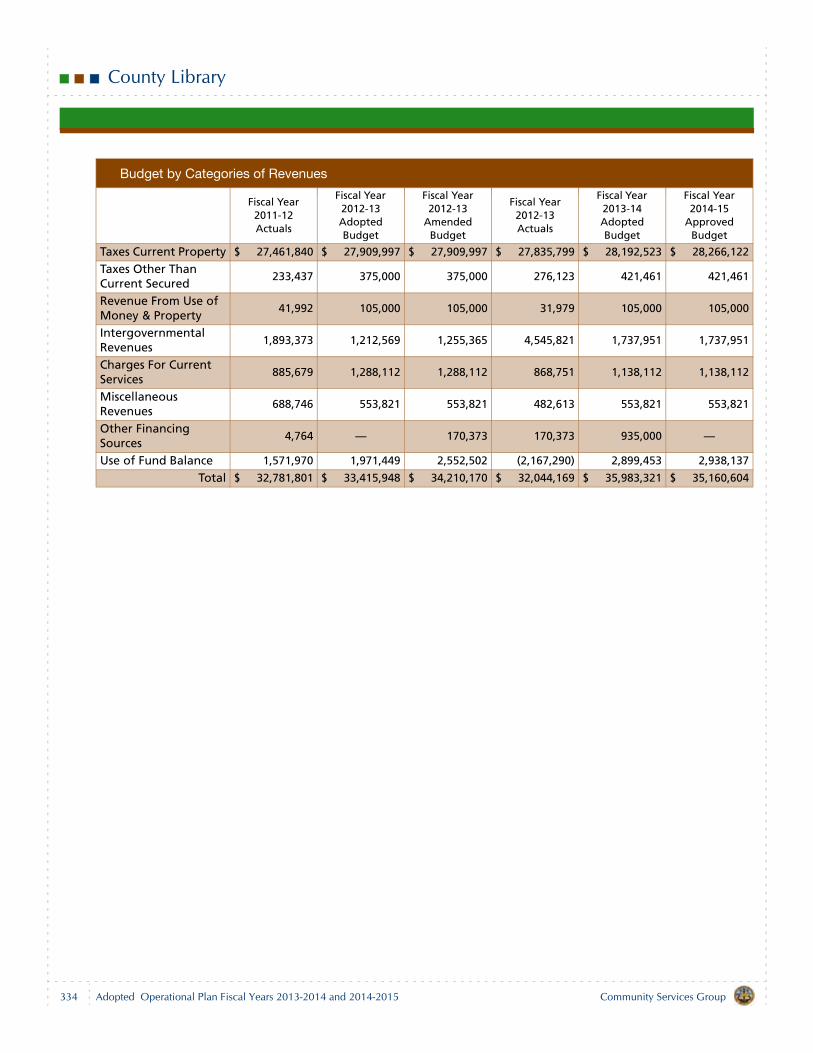
County Library
Budget by Categories of Revenues
Fiscal Year 2011-12 Actuals
Fiscal Year 2012-13 Adopted Budget
Fiscal Year 2012-13
Amended Budget
Fiscal Year 2012-13 Actuals
Fiscal Year 2013-14 Adopted Budget
Fiscal Year 2014-15
Approved Budget
Taxes Current Property $ 27,461,840 $ 27,909,997 $ 27,909,997 $ 27,835,799 $ 28,192,523 $ 28,266,122
Taxes Other Than Current Secured
233,437 375,000 375,000 276,123 421,461 421,461
Revenue From Use of Money & Property
41,992 105,000 105,000 31,979 105,000 105,000
Intergovernmental Revenues
1,893,373 1,212,569 1,255,365 4,545,821 1,737,951 1,737,951
Charges For Current Services
885,679 1,288,112 1,288,112 868,751 1,138,112 1,138,112
Miscellaneous Revenues
688,746 553,821 553,821 482,613 553,821 553,821
Other Financing Sources
4,764 — 170,373 170,373 935,000 —
Use of Fund Balance 1,571,970 1,971,449 2,552,502 (2,167,290) 2,899,453 2,938,137
Total $ 32,781,801 $ 33,415,948 $ 34,210,170 $ 32,044,169 $ 35,983,321 $ 35,160,604
334 Community Services GroupAdopted Operational Plan Fiscal Years 2013-2014 and 2014-2015
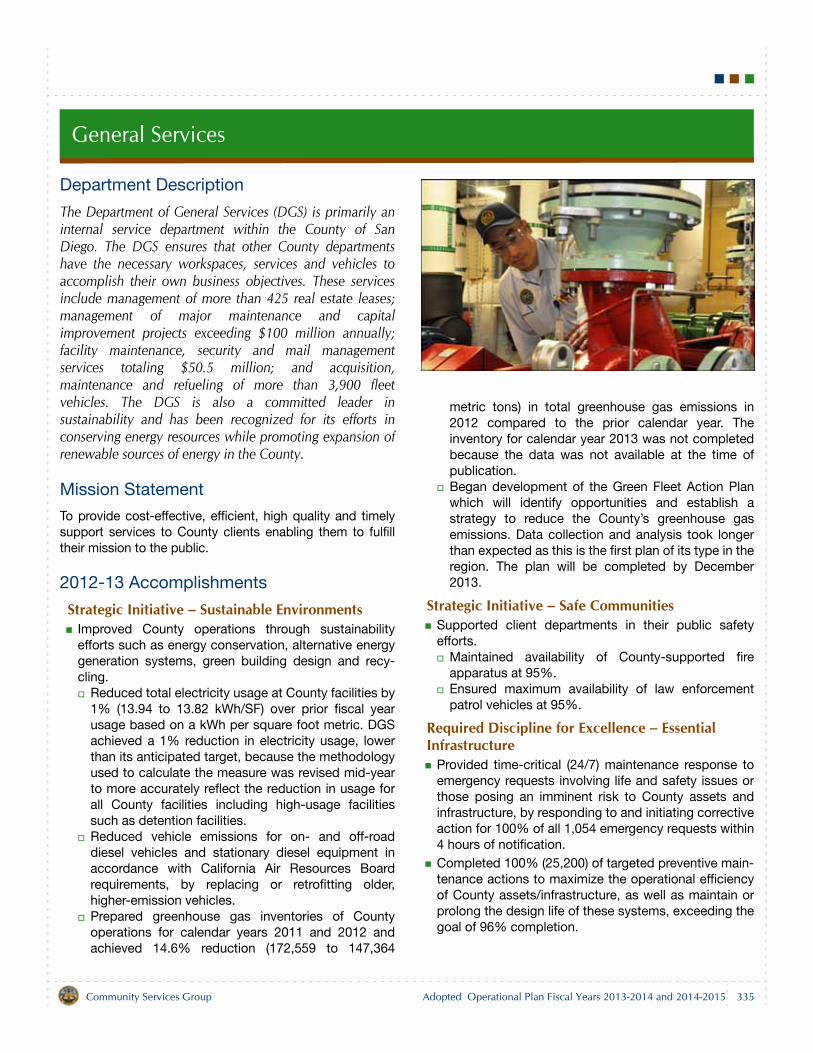
General Services
Department Description
The Department of General Services (DGS) is primarily aninternal service department within the County of SanDiego. The DGS ensures that other County departmentshave the necessary workspaces, services and vehicles toaccomplish their own business objectives. These servicesinclude management of more than 425 real estate leases;management of major maintenance and capitalimprovement projects exceeding $100 million annually;facility maintenance, security and mail managementservices totaling $50.5 million; and acquisition,maintenance and refueling of more than 3,900 fleetvehicles. The DGS is also a committed leader insustainability and has been recognized for its efforts inconserving energy resources while promoting expansion ofrenewable sources of energy in the County.
Mission Statement
To provide cost-effective, efficient, high quality and timelysupport services to County clients enabling them to fulfilltheir mission to the public.
2012-13 Accomplishments
Strategic Initiative – Sustainable EnvironmentsImproved County operations through sustainabilityefforts such as energy conservation, alternative energygeneration systems, green building design and recy-cling.
Reduced total electricity usage at County facilities by1% (13.94 to 13.82 kWh/SF) over prior fiscal yearusage based on a kWh per square foot metric. DGSachieved a 1% reduction in electricity usage, lowerthan its anticipated target, because the methodologyused to calculate the measure was revised mid-yearto more accurately reflect the reduction in usage forall County facilities including high-usage facilitiessuch as detention facilities. Reduced vehicle emissions for on- and off-roaddiesel vehicles and stationary diesel equipment inaccordance with California Air Resources Boardrequirements, by replacing or retrofitting older,higher-emission vehicles.Prepared greenhouse gas inventories of Countyoperations for calendar years 2011 and 2012 andachieved 14.6% reduction (172,559 to 147,364
metric tons) in total greenhouse gas emissions in2012 compared to the prior calendar year. Theinventory for calendar year 2013 was not completedbecause the data was not available at the time ofpublication.Began development of the Green Fleet Action Planwhich will identify opportunities and establish astrategy to reduce the County’s greenhouse gasemissions. Data collection and analysis took longerthan expected as this is the first plan of its type in theregion. The plan will be completed by December2013.
Strategic Initiative – Safe CommunitiesSupported client departments in their public safetyefforts.
Maintained availability of County-supported fireapparatus at 95%.Ensured maximum availability of law enforcementpatrol vehicles at 95%.
Required Discipline for Excellence – Essential Infrastructure
Provided time-critical (24/7) maintenance response toemergency requests involving life and safety issues orthose posing an imminent risk to County assets andinfrastructure, by responding to and initiating correctiveaction for 100% of all 1,054 emergency requests within4 hours of notification.Completed 100% (25,200) of targeted preventive main-tenance actions to maximize the operational efficiencyof County assets/infrastructure, as well as maintain orprolong the design life of these systems, exceeding thegoal of 96% completion.
335Community Services Group Adopted Operational Plan Fiscal Years 2013-2014 and 2014-2015
General Services
Received the 2012 California Counties Facilities Ser-vices Association Award of Excellence in recognition ofexceptional dedication to Facility Management Pro-gram excellence, as well as the 2013 City of San DiegoDirector’s Recycling Award.Completed 100% of 140 active real estate lease acqui-sition inspections to ensure operational efficiency forCounty departments. The reduction in leases from 143to 140 was primarily due to County departments mov-ing from leased to owned facilities with the completionof the County Operations Center. Planned and executed the County’s capital projectsand other infrastructure projects in a timely and cost-effective manner, to meet departments’ needs.
Completed construction and fully occupied thePhase 1B office buildings and Conference Center atthe County Operations Center (COC).Completed construction of the Lincoln Acres Libraryand Community Room project which provided for theexpansion of the library, community room, park playarea and offices for the Lower Sweetwater FireProtection District and Sheriff Department. Began construction of the new Rancho San DiegoSheriff’s Station with completion by fall 2013.Began construction of the new San Diego CountyWomen’s Detention and Reentry Facility and onschedule to complete occupancy of Phase 1 of theproject by summer 2014, with completion of thedetention facility construction anticipated January2016, subject to State funding.Awarded design-build contract for construction ofthe new Cedar and Kettner parking structuredevelopment with completion by spring 2015.Began construction of the County AdministrationCenter Waterfront Park with completion by spring2014.Completed relocation of 41 business tenants fromproperty adjacent to the COC in order to relocate theRegistrar of Voters (ROV) by December 2013.Began construction of the new ROV building at theCOC for completion in December 2013.Awarded a design-build contract for the new EastMesa Reentry Facility, with completion scheduled forspring 2014.Awarded a design-build contract for construction ofthe new Pine Valley Sheriff Substation replacing anundersized leased facility. On track to complete the sale of the County
Operations Center Annex property by January 2014.
Required Discipline for Excellence – Continuous Improvement and Innovation
Completed 96% (7,604 of 7,920) of vehicle and mobileequipment preventive maintenance actions to maxi-mize the operational effectiveness of County vehicles.Implemented a new service, fleet mobile maintenance,to reduce costs and increase operational efficiencywithin County departments.
Required Discipline for Excellence – Fiscal StabilityMaximized postage discounts by bar coding 97%(487,420 of 502,495) of all standard business letters,exceeding the goal of 95%.Matched the average market rental rate for Class Boffice space. However, the DGS did not meet the goalof reducing the cost of space for County operations to95% or lower than the average market rental rate dueto the consolidation of more than 300,000 square feetof space from long-term, below-average market rateleases to new COC facilities.Maintained and monitored the timely collection of rentrevenue ensuring that 97% (237 of 245) of all DGSleases were less than 30 days delinquent.
2013-15 Objectives
Strategic Initiative – Sustainable EnvironmentsImprove County operations through sustainabilityefforts such as energy conservation, alternative energygeneration systems, green building design and recy-cling.
Reduce total electricity usage at County facilitieseach year by 2% over prior fiscal year usage basedon a kWh per square foot metric.Reduce vehicle emissions by 3% of 4,371 metrictons (2011 baseline) for on- and off-road dieselvehicles and stationary diesel equipment inaccordance with California Air Resources Boardrequirements, by replacing or retrofitting olderhigher-emission vehicles.Prepare greenhouse gas inventories of Countyoperations for calendar years 2013 and 2014.Achieve a 1% reduction in total greenhouse gasemissions each year compared to the prior calendaryear.Implement Green Fleet Action Planrecommendations to reduce the County’s vehicle
336 Community Services GroupAdopted Operational Plan Fiscal Years 2013-2014 and 2014-2015
General Services
Strategic Initiative – Safe CommunitiesSupport client departments in their public safetyefforts.
Maintain availability of County-supported fireapparatus at a minimum of 95%.Ensure maximum availability of law enforcementpatrol vehicles at 95%.
Required Discipline for Excellence – Essential Infrastructure
Provide time-critical (24/7) maintenance response toemergency requests involving life and safety issues orthose posing an imminent risk to County assets andinfrastructure, by responding to and initiating correctiveaction for 100% of all emergency requests within 4hours of notification.Complete 96% of targeted preventive maintenanceactivities to maximize the operational efficiency ofCounty assets/infrastructure, as well as maintain orprolong the design life of these systems.Complete the sale of COC Annex property by January2014.Complete 100% of lease inspections on all Countyasset leases, excluding regional communication sys-tem radio sites, to ensure the maximum life of the assetis maintained.Plan and execute the County’s capital projects andother infrastructure projects in a timely and cost-effec-tive manner, to meet departments’ needs.
Complete occupancy of Phase 1 of the new SanDiego County Women’s Detention and ReentryFacility project by summer 2014, with construction ofthe facility anticipated to be completed by January2016, subject to State funding.Complete construction of the East Mesa Re-Entryand Rehabilitation Facility, and related supportfacilities in spring 2014.Complete Phase 1 of the County AdministrationCenter Waterfront Park in fall 2013 and Phase 2 inspring 2014.Complete construction of the Rancho San DiegoSheriff Station in fall 2013.Complete COC emergency generation consolidationin November 2013.Coordinate with the Administrative Office of theCourts to begin construction of the new DowntownCourthouse, and Courthouse/Hall of Justice Bridge
by winter 2014 and completion in 2016. With theSheriff and the San Diego Superior Court, developalternate approaches to transportation for inmatearraignment and non-jury hearings by 2016, toaddress the State’s decision not to build a PrisonerTransfer Tunnel.By fall 2014, prepare a proposal for review by theFacilities Planning Board for the interim andpermanent relocation of the justice system supportdepartments that are not included in the new StateCourthouse and will be displaced by demolition ofthe old courthouse or are in leased space. The planwill assist in strategically placing these departmentsaround the new State Courthouse once constructionis completed. Complete the new design-build Pine Valley SheriffStation project by spring 2014.Award a design-build contract for the new BoulevardFire Station for completion by winter 2014-15.Award a design-build contract for the replacement ofthe Assessor/Recorder/County Clerk’s El Cajonoffice for completion in 2015.Coordinate with key departments to prepare long-term facility effectiveness assessments and masterplans to be used as tools in the development of theCapital Improvement Needs Assessment and MajorMaintenance Improvement Plan. Award a design-build contract for the construction ofa new 13,500 square feet Alpine library to replace theexisting 3,018 square feet facility, for completion inmid-2015.Award a design-build contract for the construction ofa new 14,000 square feet Imperial Beach branchlibrary to replace the existing 5,100 square feetfacility, with connectivity and potential improvementsto the existing adjacent community center, forcompletion in 2015.Initiate the next three-year cycle of facility conditionassessments, including an assessment survey ofparks infrastructure, to refresh the maintenance andrenewal recommendations to the capital and majormaintenance planning programs.
Required Discipline for Excellence – Continuous Improvement and Innovation
Complete 96% of vehicle and mobile equipment pre-ventative maintenance actions to maximize the opera-tional effectiveness of County vehicles.
337Community Services Group Adopted Operational Plan Fiscal Years 2013-2014 and 2014-2015
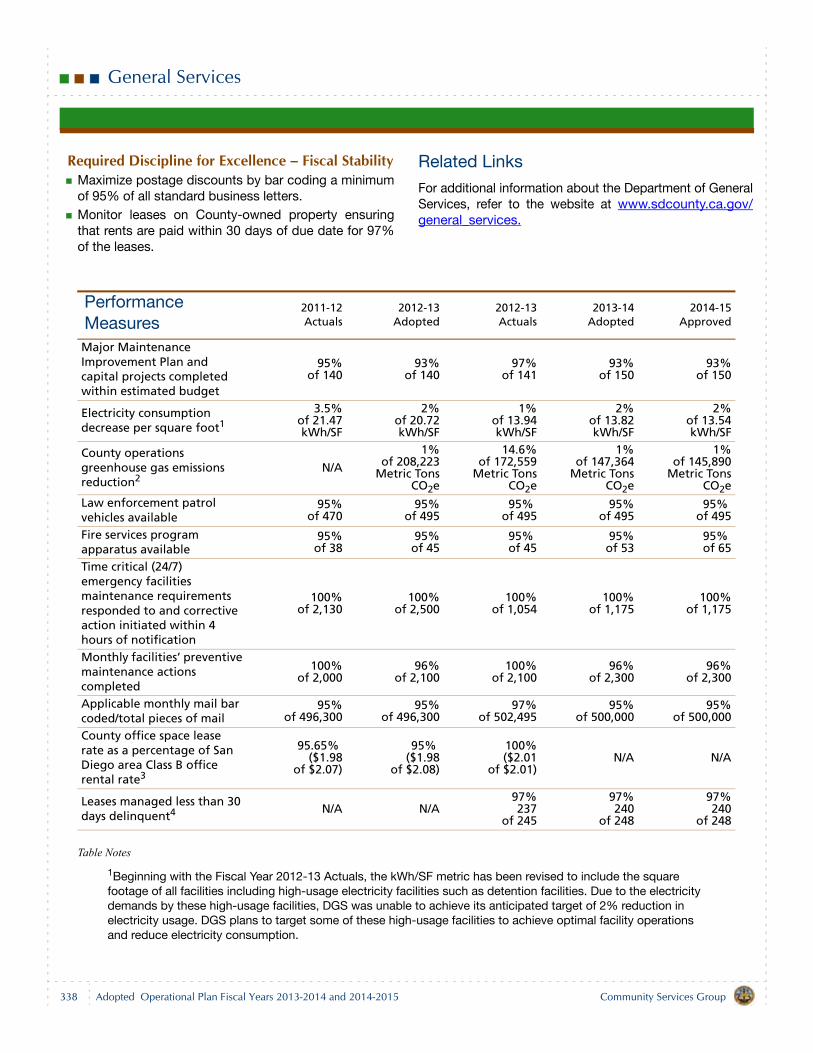
General Services
Required Discipline for Excellence – Fiscal StabilityMaximize postage discounts by bar coding a minimumof 95% of all standard business letters.Monitor leases on County-owned property ensuringthat rents are paid within 30 days of due date for 97%of the leases.
Related Links
For additional information about the Department of GeneralServices, refer to the website at www.sdcounty.ca.gov/general_services.
Table Notes
1Beginning with the Fiscal Year 2012-13 Actuals, the kWh/SF metric has been revised to include the square footage of all facilities including high-usage electricity facilities such as detention facilities. Due to the electricity demands by these high-usage facilities, DGS was unable to achieve its anticipated target of 2% reduction in electricity usage. DGS plans to target some of these high-usage facilities to achieve optimal facility operations and reduce electricity consumption.
Performance Measures
2011-12Actuals
2012-13Adopted
2012-13Actuals
2013-14Adopted
2014-15Approved
Major Maintenance Improvement Plan and capital projects completed within estimated budget
95%of 140
93%of 140
97%of 141
93%of 150
93%of 150
Electricity consumption decrease per square foot1
3.5%of 21.47kWh/SF
2%of 20.72kWh/SF
1%of 13.94kWh/SF
2%of 13.82kWh/SF
2%of 13.54kWh/SF
County operations greenhouse gas emissions reduction2
N/A
1%of 208,223
Metric TonsCO2e
14.6%of 172,559
Metric TonsCO2e
1%of 147,364
Metric TonsCO2e
1%of 145,890
Metric TonsCO2e
Law enforcement patrol vehicles available
95%of 470
95%of 495
95% of 495
95%of 495
95% of 495
Fire services program apparatus available
95%of 38
95%of 45
95% of 45
95%of 53
95% of 65
Time critical (24/7) emergency facilities maintenance requirements responded to and corrective action initiated within 4 hours of notification
100%of 2,130
100% of 2,500
100%of 1,054
100%of 1,175
100%of 1,175
Monthly facilities’ preventive maintenance actions completed
100%of 2,000
96%of 2,100
100%of 2,100
96%of 2,300
96%of 2,300
Applicable monthly mail bar coded/total pieces of mail
95%of 496,300
95%of 496,300
97%of 502,495
95%of 500,000
95%of 500,000
County office space lease rate as a percentage of San Diego area Class B office rental rate3
95.65% ($1.98
of $2.07)
95% ($1.98
of $2.08)
100%($2.01
of $2.01)N/A N/A
Leases managed less than 30 days delinquent4 N/A N/A
97%237
of 245
97%240
of 248
97%240
of 248
338 Community Services GroupAdopted Operational Plan Fiscal Years 2013-2014 and 2014-2015
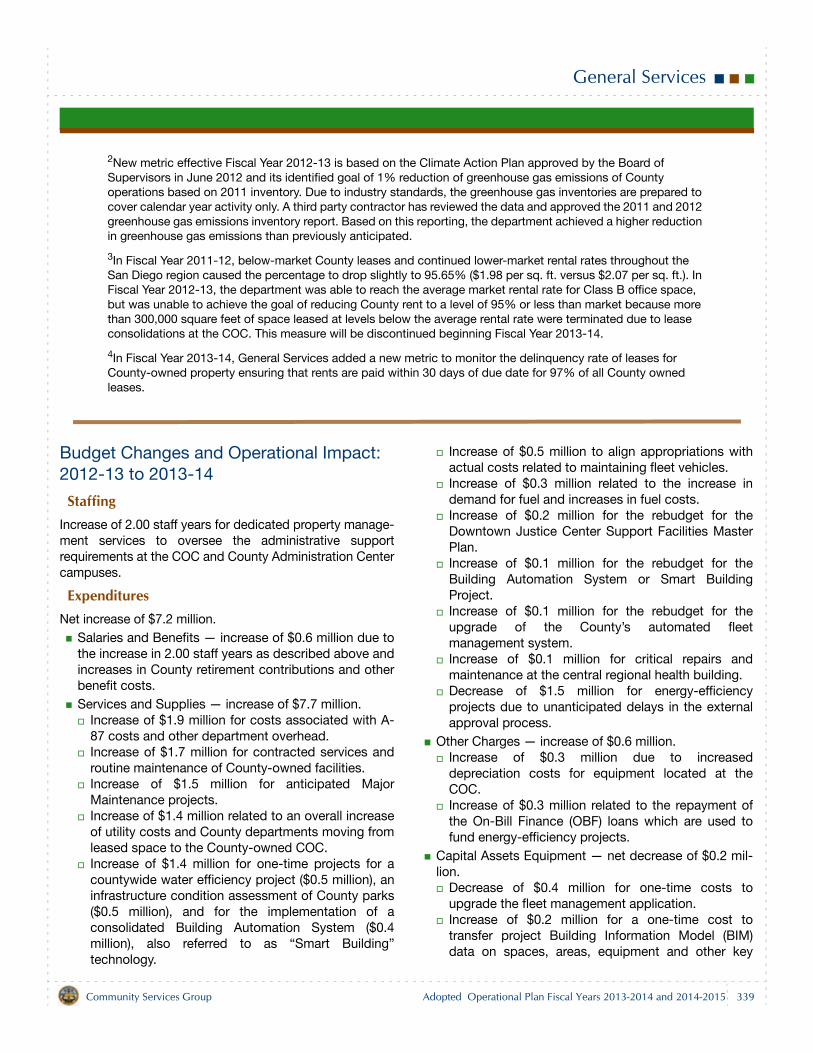
General Services
2New metric effective Fiscal Year 2012-13 is based on the Climate Action Plan approved by the Board of Supervisors in June 2012 and its identified goal of 1% reduction of greenhouse gas emissions of County operations based on 2011 inventory. Due to industry standards, the greenhouse gas inventories are prepared to cover calendar year activity only. A third party contractor has reviewed the data and approved the 2011 and 2012 greenhouse gas emissions inventory report. Based on this reporting, the department achieved a higher reduction in greenhouse gas emissions than previously anticipated.
3In Fiscal Year 2011-12, below-market County leases and continued lower-market rental rates throughout the San Diego region caused the percentage to drop slightly to 95.65% ($1.98 per sq. ft. versus $2.07 per sq. ft.). In Fiscal Year 2012-13, the department was able to reach the average market rental rate for Class B office space, but was unable to achieve the goal of reducing County rent to a level of 95% or less than market because more than 300,000 square feet of space leased at levels below the average rental rate were terminated due to lease consolidations at the COC. This measure will be discontinued beginning Fiscal Year 2013-14.
4In Fiscal Year 2013-14, General Services added a new metric to monitor the delinquency rate of leases for County-owned property ensuring that rents are paid within 30 days of due date for 97% of all County owned leases.
Budget Changes and Operational Impact: 2012-13 to 2013-14
StaffingIncrease of 2.00 staff years for dedicated property manage-ment services to oversee the administrative supportrequirements at the COC and County Administration Centercampuses.
ExpendituresNet increase of $7.2 million.
Salaries and Benefits — increase of $0.6 million due tothe increase in 2.00 staff years as described above andincreases in County retirement contributions and otherbenefit costs.Services and Supplies — increase of $7.7 million.
Increase of $1.9 million for costs associated with A-87 costs and other department overhead.Increase of $1.7 million for contracted services androutine maintenance of County-owned facilities. Increase of $1.5 million for anticipated MajorMaintenance projects.Increase of $1.4 million related to an overall increaseof utility costs and County departments moving fromleased space to the County-owned COC. Increase of $1.4 million for one-time projects for acountywide water efficiency project ($0.5 million), aninfrastructure condition assessment of County parks($0.5 million), and for the implementation of aconsolidated Building Automation System ($0.4million), also referred to as “Smart Building”technology.
Increase of $0.5 million to align appropriations withactual costs related to maintaining fleet vehicles.Increase of $0.3 million related to the increase indemand for fuel and increases in fuel costs.Increase of $0.2 million for the rebudget for theDowntown Justice Center Support Facilities MasterPlan.Increase of $0.1 million for the rebudget for theBuilding Automation System or Smart BuildingProject.Increase of $0.1 million for the rebudget for theupgrade of the County’s automated fleetmanagement system.Increase of $0.1 million for critical repairs andmaintenance at the central regional health building. Decrease of $1.5 million for energy-efficiencyprojects due to unanticipated delays in the externalapproval process.
Other Charges — increase of $0.6 million.Increase of $0.3 million due to increaseddepreciation costs for equipment located at theCOC. Increase of $0.3 million related to the repayment ofthe On-Bill Finance (OBF) loans which are used tofund energy-efficiency projects.
Capital Assets Equipment — net decrease of $0.2 mil-lion.
Decrease of $0.4 million for one-time costs toupgrade the fleet management application.Increase of $0.2 million for a one-time cost totransfer project Building Information Model (BIM)data on spaces, areas, equipment and other key
339Community Services Group Adopted Operational Plan Fiscal Years 2013-2014 and 2014-2015
General Services
data elements for maintenance, operations andwarranty into Tririga, the facilities managementapplication.
Operating Transfers Out — decrease of $1.5 million toreflect the reduction in transfers to the Major Mainte-nance Internal Services Fund for delayed energy-effi-ciency projects as described above.
RevenuesNet increase of $7.2 million.
Revenue from Use of Money & Property — decrease of$1.2 million.
Decrease of $0.7 million in rents and concessionsdue to the loss of lease revenue related to currentconstruction projects including the previously leasedChesapeake properties and the Cedar-Kettnerparking lot.Decrease of $0.4 million in interest on deposits dueto lower than anticipated interest received for theacquisition of replacement vehicles.
Charges for Current Services — increase of $10.3 mil-lion reflects services provided to client departmentsbased on operational needs ($10.0 million), for theSmart Building project ($0.1 million), and the Down-town Justice Center Support Facilities Master Plan($0.2 million). Miscellaneous Revenues — increase of $0.1 million toaccount for the trust fund reimbursement related toenergy-efficiency programs.Other Financing Sources — net decrease of $3.6 mil-lion.
Decrease of $1.5 million due to a reduction in OBFfunding for energy-efficiency projects due tounanticipated delays in the approval process.Decrease of $1.5 million in the operating transfer tothe Major Maintenance Internal Service Funddecreasing the funding to support the energy-efficiency projects as described above.
Decrease of $0.7 million for one-time funding relatedto the completion of the upgrade for the fleetmanagement application ($0.4 million) and adecrease in the operating transfer related to non-billable project management services provided toCounty departments ($0.3 million). Decrease of $0.3 million due to a technicaladjustment to record the loss on disposal of fixedassets in Fleet Management.Increase of $0.2 million for one-time funding totransfer project Building Information Model (BIM)data on spaces, areas, and equipment into Tririga asdescribed above.Increase of $0.1 million for the rebudget to upgradethe automated fleet management system.
Use of Fund Balance — increase of $1.2 million. A totalof $9.7 million is budgeted to fund the Fleet Manage-ment Internal Service Fund Countywide replacementacquisition program ($9.6 million), and a rebudget forcritical repairs and maintenance at the central regionalhealth building ($0.1 million). General Purpose Revenue Allocation — increase of$0.3 million to fund non-billable project managementservices provided to County departments.
Budget Changes and Operational Impact: 2013-14 to 2014-15
A net decrease of $0.5 million is due to an increase of $1.4million associated with anticipated additional staffing forthe new San Diego County Women’s Detention and ReentryFacility, partially offset by a decrease of $1.8 million primar-ily due to the completion of one-time projects.
340 Community Services GroupAdopted Operational Plan Fiscal Years 2013-2014 and 2014-2015
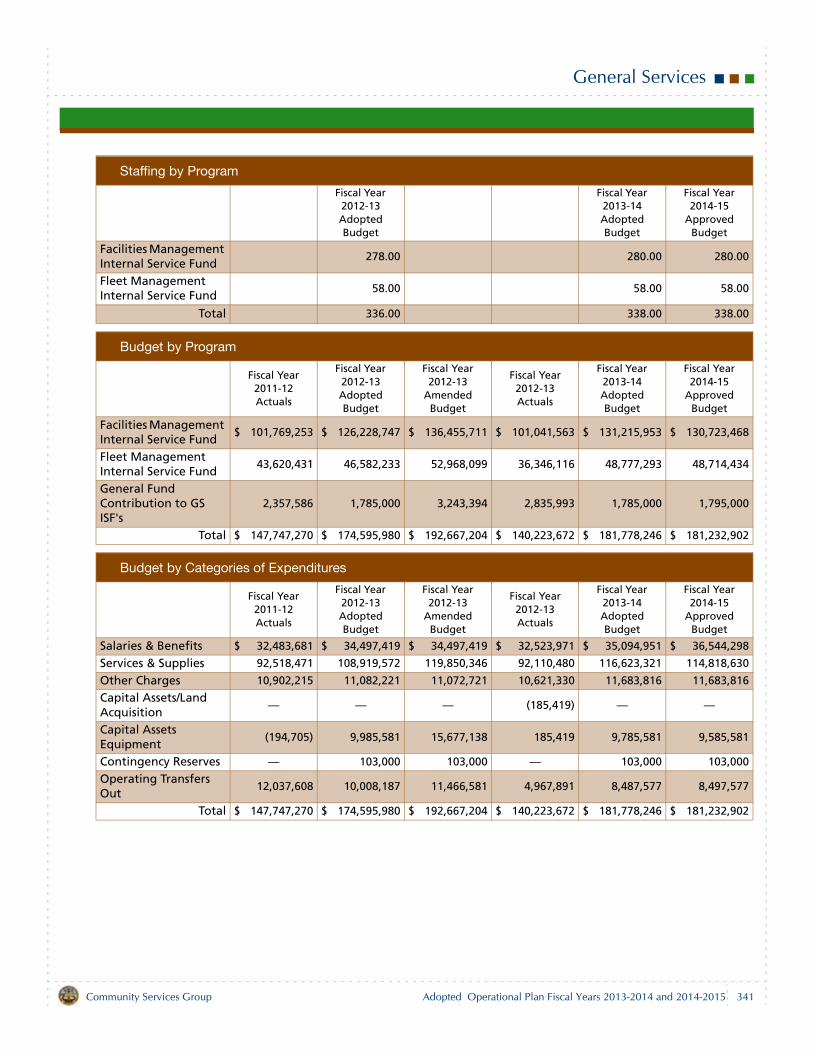
General Services
Staffing by Program
Fiscal Year 2012-13 Adopted Budget
Fiscal Year 2013-14 Adopted Budget
Fiscal Year 2014-15
Approved Budget
Facilities Management Internal Service Fund
278.00 280.00 280.00
Fleet Management Internal Service Fund
58.00 58.00 58.00
Total 336.00 338.00 338.00
Budget by Program
Fiscal Year 2011-12 Actuals
Fiscal Year 2012-13 Adopted Budget
Fiscal Year 2012-13
Amended Budget
Fiscal Year 2012-13 Actuals
Fiscal Year 2013-14 Adopted Budget
Fiscal Year 2014-15
Approved Budget
Facilities Management Internal Service Fund
$ 101,769,253 $ 126,228,747 $ 136,455,711 $ 101,041,563 $ 131,215,953 $ 130,723,468
Fleet Management Internal Service Fund
43,620,431 46,582,233 52,968,099 36,346,116 48,777,293 48,714,434
General Fund Contribution to GS ISF's
2,357,586 1,785,000 3,243,394 2,835,993 1,785,000 1,795,000
Total $ 147,747,270 $ 174,595,980 $ 192,667,204 $ 140,223,672 $ 181,778,246 $ 181,232,902
Budget by Categories of Expenditures
Fiscal Year 2011-12 Actuals
Fiscal Year 2012-13 Adopted Budget
Fiscal Year 2012-13
Amended Budget
Fiscal Year 2012-13 Actuals
Fiscal Year 2013-14 Adopted Budget
Fiscal Year 2014-15
Approved Budget
Salaries & Benefits $ 32,483,681 $ 34,497,419 $ 34,497,419 $ 32,523,971 $ 35,094,951 $ 36,544,298
Services & Supplies 92,518,471 108,919,572 119,850,346 92,110,480 116,623,321 114,818,630
Other Charges 10,902,215 11,082,221 11,072,721 10,621,330 11,683,816 11,683,816
Capital Assets/Land Acquisition
— — — (185,419) — —
Capital Assets Equipment
(194,705) 9,985,581 15,677,138 185,419 9,785,581 9,585,581
Contingency Reserves — 103,000 103,000 — 103,000 103,000
Operating Transfers Out
12,037,608 10,008,187 11,466,581 4,967,891 8,487,577 8,497,577
Total $ 147,747,270 $ 174,595,980 $ 192,667,204 $ 140,223,672 $ 181,778,246 $ 181,232,902
341Community Services Group Adopted Operational Plan Fiscal Years 2013-2014 and 2014-2015
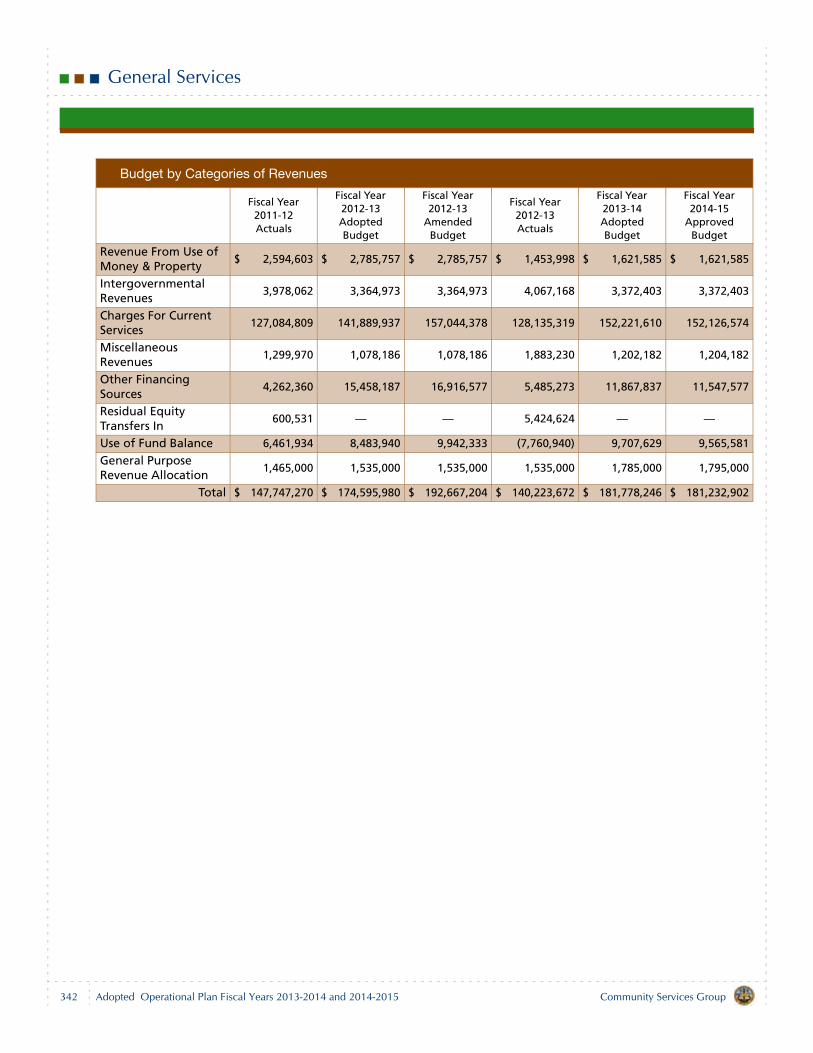
General Services
Budget by Categories of Revenues
Fiscal Year 2011-12 Actuals
Fiscal Year 2012-13 Adopted Budget
Fiscal Year 2012-13
Amended Budget
Fiscal Year 2012-13 Actuals
Fiscal Year 2013-14 Adopted Budget
Fiscal Year 2014-15
Approved Budget
Revenue From Use of Money & Property
$ 2,594,603 $ 2,785,757 $ 2,785,757 $ 1,453,998 $ 1,621,585 $ 1,621,585
Intergovernmental Revenues
3,978,062 3,364,973 3,364,973 4,067,168 3,372,403 3,372,403
Charges For Current Services
127,084,809 141,889,937 157,044,378 128,135,319 152,221,610 152,126,574
Miscellaneous Revenues
1,299,970 1,078,186 1,078,186 1,883,230 1,202,182 1,204,182
Other Financing Sources
4,262,360 15,458,187 16,916,577 5,485,273 11,867,837 11,547,577
Residual Equity Transfers In
600,531 — — 5,424,624 — —
Use of Fund Balance 6,461,934 8,483,940 9,942,333 (7,760,940) 9,707,629 9,565,581
General Purpose Revenue Allocation
1,465,000 1,535,000 1,535,000 1,535,000 1,785,000 1,795,000
Total $ 147,747,270 $ 174,595,980 $ 192,667,204 $ 140,223,672 $ 181,778,246 $ 181,232,902
342 Community Services GroupAdopted Operational Plan Fiscal Years 2013-2014 and 2014-2015
Housing and Community Development
Department Description
The Department of Housing and Community Development(HCD) provides housing assistance and communityimprovements that benefit low- and moderate-incomepersons. HCD provides services to county residents throughrental assistance, minor home improvement loans, first-timehomebuyer assistance and public improvement programs.These programs reduce blight, improve neighborhoods andalleviate substandard housing. They also increase thesupply of affordable housing by preserving housing stockand stimulating private sector production of lower-incomehousing units.
Mission Statement
Promote safe, affordable housing opportunities andimproved communities in the San Diego region.
2012-13 Accomplishments
Strategic Initiative – Healthy FamiliesProvided 20 competitive academic scholarships toheads of household and/or their children who haveestablished five-year family self-sufficiency goals inacademic or vocational self-sufficiency, or who residein public housing, exceeding the goal of 15 scholar-ships.Provided $65,000 for the County Health and HumanServices Agency’s (HHSA’s) Hotel/Motel Voucher Pro-gram to help close the gap in funding for emergencyhousing for 209 homeless families, as identified by theHealth and Human Services Agency, residing in theCounty’s Community Development Block Grant(CDBG) jurisdiction. The Regional Cold Weather ShelterVoucher Program provides emergency shelter throughthe issuance of hotel vouchers for homeless families,disabled and elderly individuals.Promoted self-sufficiency by issuing 33 housing choicevouchers to all eligible homeless families who gradu-ated from transitional housing programs and werereferred by homeless service agencies. The referralsare from the 12 homeless service agencies through theCounty’s Continuum of Care program.Supported the County’s Live Well San Diego BuildingBetter Health initiative, by funding the continuation ofthe HOME Tenant-based Rental Assistance programsthat served 75 youth aging out of the foster care sys-
tem, exceeding the goal of 65 youth, and 52 familieswith children that were participants of the County’ssubstance abuse recovery and family reunification pro-grams, exceeding the goal of 44 families.Provided rental assistance to permanently house 294homeless veterans through the Veterans Affairs Sup-portive Housing (VASH) program, exceeding the goal of200. Use of these vouchers is dependent upon referralsreceived from the U.S. Department of Veterans Affairs(VA).Supported the Live Well San Diego Building BetterHealth initiative by establishing partnerships withHHSA First Five Commission, Aging and IndependenceServices, and Public Health Services to provide newresources to Family Self-Sufficiency Program partici-pants offering needed services to those workingtoward self-sufficiency. Collaborated with the VA, the U.S. Department ofHousing and Urban Development (HUD), other housingauthorities and local nonprofit agencies to reduce thetime to house homeless veterans. This effort stream-lined referral processes, inspections and internal pro-cedures resulting in housing 103 homeless veterans in100 days.
Strategic Initiative – Sustainable EnvironmentsEnsured environmental reviews were performed on100% (80 projects) of federally funded programsincluded in the Fiscal Year 2012-13 Annual FundingPlans. In keeping with County policy of functionalthreading, environmental reviews were conducted bythe Department of Public Works. In compliance withHUD regulations, HCD ensured environmental reviewswere completed on all program projects in order toanalyze the effect a proposed project will have on the
343Community Services Group Adopted Operational Plan Fiscal Years 2013-2014 and 2014-2015
Housing and Community Development
people and the natural environment within a desig-nated project area and the effect that the material andsocial environment may have on a project.
Strategic Initiative – Safe CommunitiesSupported the Live Well San Diego Living Safely initia-tive by promoting crime-free communities and renew-ing annual Crime-Free Certifications at all four publichousing sites, in collaboration with the local policedepartment.Educated the community by conducting five commu-nity outreach meetings throughout the county regard-ing affordable housing and community revitalizationfunding opportunities available annually through fourfederal entitlement programs: CDBG, HOME Invest-ment Partnership Program, Emergency Shelter Grantand Housing Opportunities for Persons with AIDS,exceeding the goal of four community outreach meet-ings.Addressed issues impacting community living stan-dards by conducting 10 community revitalization meet-ings with policymakers and stakeholders.Promoted fair housing by completing 40 random sitetests on multifamily rental properties to ensure compli-ance with fair housing laws, exceeding the goal of 35site tests.The goal to ensure that permanent affordable housingproviders were in compliance with the Uniform FederalAccessibility Standards (UFAS) by requiring at least20% (8 out of 40 providers) complete the UFAS Acces-sibility Checklist Self-certification was not met duringFiscal Year 2012-13 due to a restructuring of availableresources based on 3 cumulative fiscal year net reduc-tions totaling 34% of CDBG, and 50% of HOME Invest-ment Partnerships program funds. The feasibility ofconducting this activity will be reevaluated for inclusionin upcoming fiscal years.Supported the Live Well San Diego Building BetterHealth initiative by funding 32 completed public com-munity projects for parks, street/sidewalk improve-ments, public services, community, youth and familycenters, American with Disabilities Act (ADA) improve-ments and affordable housing activities to promotewellness and enhance the quality of life in San DiegoCounty neighborhoods.Inspected 100% of 11,292 units that were leasedthrough the Rental Assistance Division and ensuredthat these units were decent, safe and sanitary bymeeting Housing Quality Standards required by HUD.
Required Discipline for Excellence – Customer Satisfaction
Held four Section 8 owner/landlord seminars to edu-cate owners on the requirements of the program, aswell as promote the benefits of participating as a part-ner.Ensured customers were provided with superior ser-vices by being responsive to customers’ needs, profes-sional, courteous, attentive and knowledgeable. A keyindicator of how well service was provided wasachievement of a customer service satisfaction ratingof 4.90 (on a scale of 1 to 5, with 5 being “excellent”),exceeding the goal of a 4.70 rating.
Required Discipline for Excellence – Information Services
Added two new communication channels, makingadditional information and resources available to thepublic 24/7. The following resources now providetimely housing-related information in the event of anemergency and highlight department undertakings,community development housing and opportunities forself-sufficiency and employment.
The HCD YouTube Channel (http://www.youtube.com/user/CountyofSanDiegoHCD?feature=watch) highlightsimportant housing-related videos and resources. The annual CDBG application webinar was recordedand posted to the HCD website allowing greaterpublic access to this information.
Created a web-based module to allow 24/7 self-servicewhen completing or updating rental assistance appli-cations. Full implementation is anticipated in fall 2013.
Required Discipline for Excellence – Regional Leadership
As the Lead Agent and Collaborative Applicant onbehalf of the Regional Continuum of Care Council(RCCC), submitted the annual application to HUD andwas awarded $15.1 million in homeless funding onbehalf of the Regional Continuum of Care (CoC) toaddress homelessness in the San Diego region. Since1997, more than $65 million has been awarded toCounty homeless housing programs. These funds sup-port 52 local homeless housing programs that helpindividuals, families, veterans and victims of domesticviolence. The funding addresses a wide variety ofhousing needs including transitional housing, perma-nent supportive housing and the Homeless Manage-ment Information System (HMIS).
344 Community Services GroupAdopted Operational Plan Fiscal Years 2013-2014 and 2014-2015
Housing and Community Development
Demonstrated regional leadership by providing fivepresentations on the County’s homeless programs tofive public groups, and by participating in three out-reach activities to address homelessness in the SanDiego region.
2013-15 Objectives
Strategic Initiative – Healthy FamiliesProvide $65,000 for HHSA’s Hotel/Motel Voucher Pro-gram to help close the ongoing gap in funding foremergency housing for homeless families in theCounty’s jurisdiction as identified by the Regional TaskForce on the Homeless. The Regional Cold WeatherShelter Voucher Program provides emergency shelterthrough the issuance of hotel vouchers for homelessfamilies, disabled and elderly individuals. Support the Live Well San Diego Building Better Healthinitiative, by funding the continuation of the HOME Ten-ant-based Rental Assistance programs that serve up to65 youth aging-out of the foster care system and 44families with children that are participants of theCounty’s substance abuse recovery and family reunifi-cation programs.Provide 15 competitive academic scholarships annu-ally to heads of household and/or their children whohave established five-year family self-sufficiency goalsin academic or vocational self- sufficiency or thatreside in Public Housing.Promote self-sufficiency by providing permanent hous-ing for up to 200 eligible homeless families graduatingfrom transitional housing programs provided by 11homeless service agencies through the County’s Con-tinuum of Care program. All eligible homeless familiesreferred by the 11 agencies will be assisted until thehousing funding allocation is fully expended.Assist families to secure safe, decent and affordablehousing through rental assistance subsidies by using100% of the anticipated annual funding allocation of$102.7 million or issue up to 11,195 vouchers to pro-vide a nurturing and healthy environment while improv-ing opportunities for children and adults in support ofthe Live Well San Diego Building Better Health initiative.Provide rental assistance to permanently house up to305 homeless veterans through the VASH program.Utilization of these vouchers is dependent upon HCDreceiving referrals from the VA.
Increase the number of participants receiving VASHsecurity and utility deposit assistance funded throughthe Emergency Solutions Grant (ESG) funds to 10 totalparticipants, to allow recipients and their familiesaccess to permanent housing.Use the Family Self Sufficiency and Ross Service Coor-dinator Program Coordinating Committee (PCC) to pro-vide program participants three new resources topromote self-sufficiency.
Strategic Initiative – Safe CommunitiesEnsure environmental reviews are performed on 100%(minimum of 62) of federally funded programs includedin the Fiscal Year 2013-14 Annual Funding Plans. Inkeeping with County policy of functional threading,environmental reviews will be conducted by theDepartment of Public Works. In compliance with HUDregulations, HCD will ensure environmental reviews willbe completed on all program projects in order to ana-lyze the effect a proposed project will have on the peo-ple and the natural environment within a designatedproject area and the effect the material and social envi-ronment may have on a project.Based on the recently completed Energy Roadmap,implement two energy-efficiency measures at the fiveHousing Authority-owned residential properties (e.g.,replace incandescent bulbs with compact fluorescentlamps, replace refrigerators with ENERGY STAR mod-els, install motion-sensor lighting and install low-flowkitchen faucets or faucet aerators).Educate the community by conducting a minimum offour community outreach meetings throughout thecounty regarding affordable housing and communityrevitalization funding opportunities available annuallythrough four federal entitlement programs: CommunityDevelopment Block Grant, HOME Investment Partner-ship Program, Emergency Solutions Grant and HousingOpportunities for Persons with AIDS.Address issues impacting community living standardsby conducting 10 community revitalization meetingswith policymakers and stakeholders.Promote fair housing by completing a minimum of 35random site tests on multifamily rental properties toensure compliance with fair housing laws.Provide First-Time Homebuyer assistance or HOMERepair assistance to at least 30 households.Support the Live Well San Diego Building Better Healthinitiative by funding 23 public community projects forparks, street/sidewalk improvements, public services,community, youth and family centers, health clinics,
345Community Services Group Adopted Operational Plan Fiscal Years 2013-2014 and 2014-2015
Housing and Community Development
American with Disabilities Act (ADA) improvements andaffordable housing activities to promote wellness andenhance the quality of life in San Diego County neigh-borhoods.Inspect 100% of 11,359 units that are leased throughthe Rental Assistance Division and ensure that theseunits are decent, safe and sanitary by meeting HousingQuality Standards required by HUD.
Required Discipline for Excellence – Customer Satisfaction
Hold four Section 8 owner/landlord seminars to con-tinue to educate owners on the requirements of theprogram, as well as promoting the benefits of partici-pating in the program.Ensure customers are provided with superior servicesby being responsive to customers’ needs, professional,courteous, attentive and knowledgeable. A key indica-tor of how well service is provided will be to achieve acustomer service satisfaction rating of 4.7 or better (ona scale of 1 to 5 with 5 being “excellent”).
Required Discipline for Excellence – Regional Leadership
Provide regional leadership through participation in twohousing industry organizations and/or by providing upto three presentations to relevant groups/events.Participate in the regular San Diego Housing Federa-tion Policy Committee meetings. The Federation leadsthe region’s efforts in identifying housing opportunitiesand challenges affecting the local community. HCDrepresents the County’s interests in the effort to pro-duce, improve, and preserve local housing options. TheFederation conducts its advocacy efforts in all 18 citiesin the San Diego region and the unincorporated areas
of San Diego County. The Federation also monitors andtakes positions on State and federal housing programs,regulations and legislation.
Required Discipline for Excellence – Information Services
Implement a newly created web-based module forrental assistance applications. It is anticipated that2,500 applicants will establish user accounts to updaterental assistance applications and that the self-serviceapplication will reduce processing time for waiting listdatabase updates from 7 days to 1 and enhance cus-tomer service.Provide enhanced customer service by sharing/dis-seminating information on Housing Quality Standards(HQS) inspections via the HCD website, emails, videos,social media and/or Quick Response (QR) barcodes.
Required Discipline for Excellence – Accountability, Transparency and Ethical Conduct
Two Tenant Commissioners who serve on the HousingAuthority of the County of San Diego (HACSD) Board ofCommissioners will complete ethics training.To encourage the highest level of ethical standards,engage in a public education campaign to heightenawareness of program integrity. Due to increasedawareness, it is anticipated that the number of reportsof potential program fraud will increase by 10% to 40 of400 total fraud reports.
Related Links
For additional information about the Department of Housingand Community Development, refer to the website atwww.sdcounty.ca.gov/sdhcd/index.html and follow HCDon Facebook at www.facebook.com/sdhcd.
346 Community Services GroupAdopted Operational Plan Fiscal Years 2013-2014 and 2014-2015
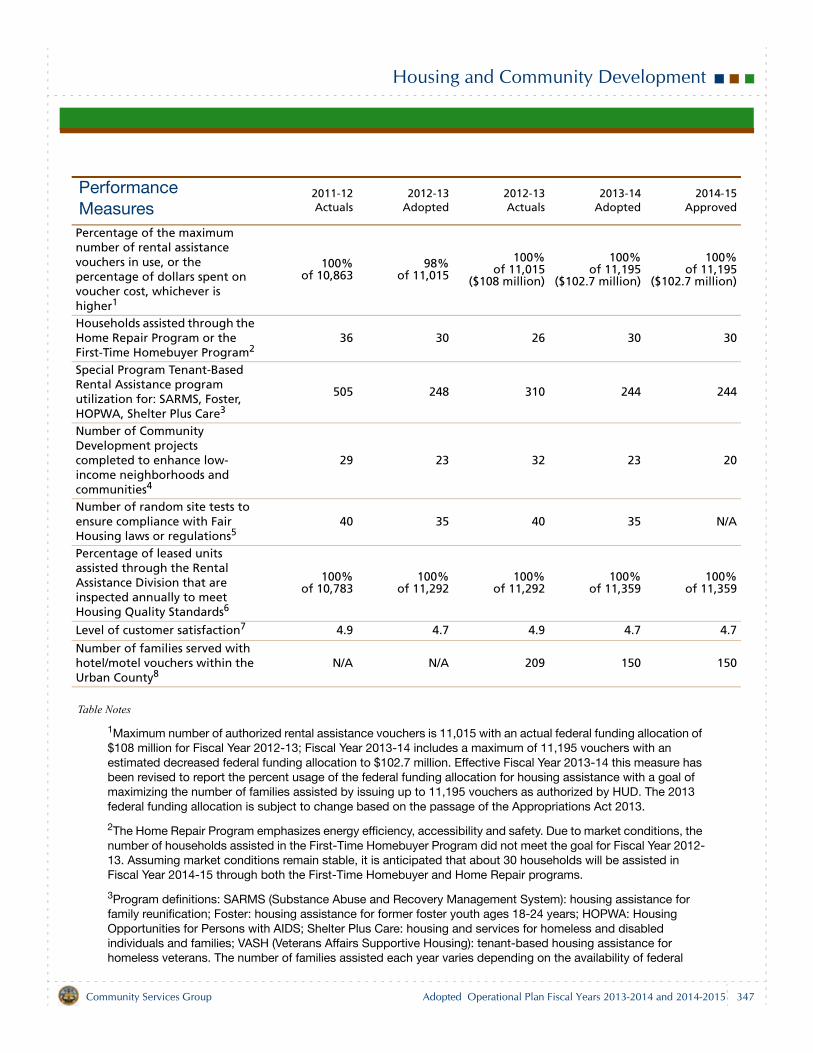
Housing and Community Development
Table Notes
1Maximum number of authorized rental assistance vouchers is 11,015 with an actual federal funding allocation of $108 million for Fiscal Year 2012-13; Fiscal Year 2013-14 includes a maximum of 11,195 vouchers with an estimated decreased federal funding allocation to $102.7 million. Effective Fiscal Year 2013-14 this measure has been revised to report the percent usage of the federal funding allocation for housing assistance with a goal of maximizing the number of families assisted by issuing up to 11,195 vouchers as authorized by HUD. The 2013 federal funding allocation is subject to change based on the passage of the Appropriations Act 2013.
2The Home Repair Program emphasizes energy efficiency, accessibility and safety. Due to market conditions, the number of households assisted in the First-Time Homebuyer Program did not meet the goal for Fiscal Year 2012-13. Assuming market conditions remain stable, it is anticipated that about 30 households will be assisted in Fiscal Year 2014-15 through both the First-Time Homebuyer and Home Repair programs.
3Program definitions: SARMS (Substance Abuse and Recovery Management System): housing assistance for family reunification; Foster: housing assistance for former foster youth ages 18-24 years; HOPWA: Housing Opportunities for Persons with AIDS; Shelter Plus Care: housing and services for homeless and disabled individuals and families; VASH (Veterans Affairs Supportive Housing): tenant-based housing assistance for homeless veterans. The number of families assisted each year varies depending on the availability of federal
Performance Measures
2011-12Actuals
2012-13Adopted
2012-13Actuals
2013-14Adopted
2014-15Approved
Percentage of the maximum number of rental assistance vouchers in use, or the percentage of dollars spent on voucher cost, whichever is higher1
100%of 10,863
98%of 11,015
100%of 11,015
($108 million)
100%of 11,195
($102.7 million)
100%of 11,195
($102.7 million)
Households assisted through the Home Repair Program or the First-Time Homebuyer Program2
36 30 26 30 30
Special Program Tenant-Based Rental Assistance program utilization for: SARMS, Foster, HOPWA, Shelter Plus Care3
505 248 310 244 244
Number of Community Development projects completed to enhance low-income neighborhoods and communities4
29 23 32 23 20
Number of random site tests to ensure compliance with Fair Housing laws or regulations5
40 35 40 35 N/A
Percentage of leased units assisted through the Rental Assistance Division that are inspected annually to meet Housing Quality Standards6
100%of 10,783
100%of 11,292
100%of 11,292
100%of 11,359
100%of 11,359
Level of customer satisfaction7 4.9 4.7 4.9 4.7 4.7
Number of families served with hotel/motel vouchers within the Urban County8
N/A N/A 209 150 150
347Community Services Group Adopted Operational Plan Fiscal Years 2013-2014 and 2014-2015

Housing and Community Development
funding allocations to these programs and the housing assistance cost per family. Effective Fiscal Year 2012-13, the VASH program is now included with the Housing Choice Voucher (HCV) program and reported as part of rental assistance vouchers.
4It is anticipated that the number of completed projects will decline beginning in Fiscal Year 2013-14 due to potential entitlement reductions and potential nonfederal funding reductions impacting partner agencies administering CDBG projects.
5Fair Housing laws are federal laws that prohibit housing discrimination on the basis of race or color, national origin, religion, sex, familial status or disability. The existing contractual agreement with HCD’s Fair Housing contract provider expires in March 2014. New fair housing goals and performance measures will be established by HCD for Fiscal Year 2014-15 and future years once procurement efforts and contract negotiations are completed.
6Housing Quality Standards are HUD’s minimum physical standards required for each assisted rental unit.
7Overall customer satisfaction rating on a scale of 1 (“unsatisfactory”) to 5 (“excellent”), where 4 is “very satisfactory.”
8New measure effective Fiscal Year 2013-14 to reflect HCD’s priorities. HCD provides funding on behalf of the Urban County to provide for winter shelter needs where facilities are unavailable. The Urban County consists of the unincorporated areas of the County of San Diego and the cities of Coronado, Del Mar, Imperial Beach, Lemon Grove, Poway and Solana Beach. The program typically runs from late November through April and provides vouchers for hotel/motel rooms for families with children, the disabled, and the elderly.
Budget Changes and Operational Impact: 2012-13 to 2013-14
StaffingNo change in staffing.
ExpendituresNet decrease of $1.1 million.
Salaries and Benefits — net decrease of $0.1 milliondue to increased County retirement contributions offsetby projected salary savings from vacant positions.Services and Supplies — net increase of $0.5 million.
Increase of $1.6 million in contracted services foraffordable housing projects based on one-timecarryover of remaining prior year Home Investmentand Partnership Grant (HOME) funding allocation. Increase of $0.2 million in contracted services foremergency housing services based on one-timecarryover of remaining prior year Emergency ShelterGrant (ESG) funding allocation.Decrease of $0.4 million in program administrationcost due to elimination of one-time project cost fordata automation, decrease in various discretionaryexpenses to offset cost increases in other servicessuch as utilities and contracted informationtechnology services.
Decrease of $0.2 million in affordable housing projectcost based on one-time carryover of prior yearremaining CDBG funding allocation reallocated toCDBG community improvement and residentialrehabilitation projects.Decrease of $0.6 in Shelter Plus Care (SPC) programcontracted services for community-based homelessassistance based on decreased federal annualfunding.Decrease of $0.1 million in Housing Opportunities forPersons with Aids (HOPWA) program contractedservices for temporary housing services due toreallocation of funds to rental housing assistance.
Other Charges — net decrease of $1.5 million.Decrease of $1.7 million in project cost due toreallocation of HOME funding annually allocated tohousing assistance and other cities projects toHOME affordable housing based on the approved2013-14 Annual Funding Plan Allocation.Decrease of $0.8 million in project cost for first-timehomebuyer assistance loans based on a lowerestimate of the amount of loans funded with theCalHome grant to be completed in Fiscal Year 2013-14. The CalHome State funding is used to augmentthe First-Time Homebuyer Program.
348 Community Services GroupAdopted Operational Plan Fiscal Years 2013-2014 and 2014-2015
Housing and Community Development
Increase of $0.1 million in community developmentand residential rehabilitation project cost due to one-time carryover of remaining prior year CDBGuncommitted funding allocation. Increase of $0.1 million in project cost for rentalassistance to rapidly provide housing assistance toeligible low-income veterans based on available ESGgrant allocation.Increase of $0.5 million in SPC project cost fortemporary housing assistance administered throughthe Housing Authority based on a grant contract byHUD. Increase of $0.3 million in project cost for rentalassistance for eligible low-income individuals basedon a one-time carryover of remaining prior yearHOPWA funding allocation.
RevenuesNet decrease of $1.1 million.
Intergovernmental Revenue — net decrease of $1.0million.
Decrease of $0.8 million in CalHome revenue basedon an estimated lower number of completed FirstTime Homebuyer Assistance loans in Fiscal Year2013-14. The CalHome State funding is used toleverage the First-Time Homebuyer Program fundingthat provides loans to eligible low-income first timehomebuyers.Decrease of $0.2 million in SPC revenue based onthe actual amount of grant funding awarded to theCounty. The SPC grant provides funding for effortsby nonprofit providers, State and local governmentsto quickly rehouse homeless individuals and familieswhile minimizing the trauma and dislocation causedto homeless individuals, families, and communitiesby homelessness.Decrease of $0.1 million in HOME revenue due to theelimination of a one-time rebudget of funds in FiscalYear 2012-13.
Decrease of $0.6 million in Aid from the HousingAuthority revenue for program administration basedon a decreased funding allocation for calendar year2013.Increase of $0.3 million in CDBG revenue based onone-time carryover of remaining prior year fundingallocation for housing administration activities. Increase of $0.3 million in ESG revenue based onone-time carryover of remaining uncommitted prioryear funding allocation.Increase of $0.1 million in HOPWA revenue based onone-time carryover of remaining prior yearuncommitted funding allocation for rental andhousing assistance services partially offset withelimination of one-time rebudget of funds from FiscalYear 2012-13.
Miscellaneous Revenue — Increase of $0.1 million inrevenue from program income based on anticipatedloan reconveyances.Use of Fund Balance — decrease of $0.2 million. Atotal budget of $0.3 million includes the rebudget of$0.1 million for a one-time communications equipmentimprovement project and $0.1 million for affordablehousing contracts monitoring and program administra-tion costs related to the Successor Housing Agencyprogram for temporary rental housing assistance to eli-gible low-income residents in the Gillespie Field andUpper San Dieguito River Improvement Project areas.
Budget Changes and Operational Impact: 2013-14 to 2014-15
Net increase of $0.1 million due to an increase of $0.2 mil-lion in Salaries and Benefits for increased County retirementcontributions offset by a decrease in Services and Suppliesof $0.1 million based on a one-time expenditure of Use ofFund Balance for communications equipment improve-ment.
349Community Services Group Adopted Operational Plan Fiscal Years 2013-2014 and 2014-2015
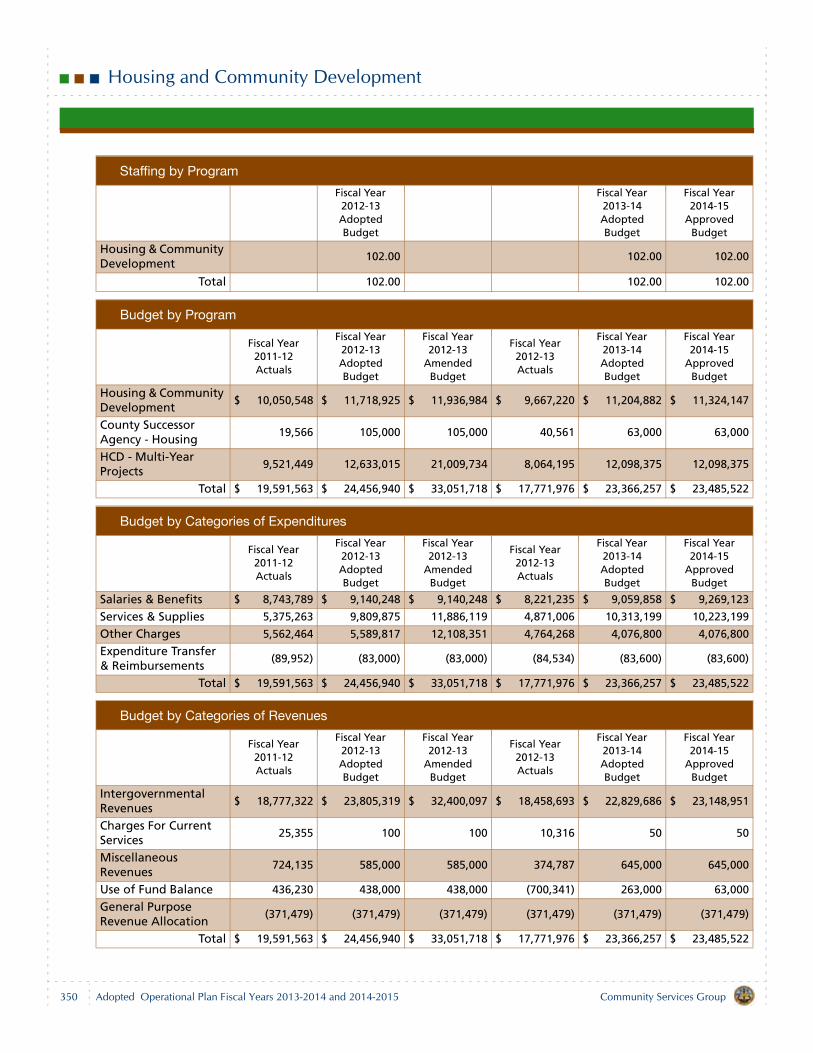
Housing and Community Development
Staffing by Program
Fiscal Year 2012-13 Adopted Budget
Fiscal Year 2013-14 Adopted Budget
Fiscal Year 2014-15
Approved Budget
Housing & Community Development
102.00 102.00 102.00
Total 102.00 102.00 102.00
Budget by Program
Fiscal Year 2011-12 Actuals
Fiscal Year 2012-13 Adopted Budget
Fiscal Year 2012-13
Amended Budget
Fiscal Year 2012-13 Actuals
Fiscal Year 2013-14 Adopted Budget
Fiscal Year 2014-15
Approved Budget
Housing & Community Development
$ 10,050,548 $ 11,718,925 $ 11,936,984 $ 9,667,220 $ 11,204,882 $ 11,324,147
County Successor Agency - Housing
19,566 105,000 105,000 40,561 63,000 63,000
HCD - Multi-Year Projects
9,521,449 12,633,015 21,009,734 8,064,195 12,098,375 12,098,375
Total $ 19,591,563 $ 24,456,940 $ 33,051,718 $ 17,771,976 $ 23,366,257 $ 23,485,522
Budget by Categories of Expenditures
Fiscal Year 2011-12 Actuals
Fiscal Year 2012-13 Adopted Budget
Fiscal Year 2012-13
Amended Budget
Fiscal Year 2012-13 Actuals
Fiscal Year 2013-14 Adopted Budget
Fiscal Year 2014-15
Approved Budget
Salaries & Benefits $ 8,743,789 $ 9,140,248 $ 9,140,248 $ 8,221,235 $ 9,059,858 $ 9,269,123
Services & Supplies 5,375,263 9,809,875 11,886,119 4,871,006 10,313,199 10,223,199
Other Charges 5,562,464 5,589,817 12,108,351 4,764,268 4,076,800 4,076,800
Expenditure Transfer & Reimbursements
(89,952) (83,000) (83,000) (84,534) (83,600) (83,600)
Total $ 19,591,563 $ 24,456,940 $ 33,051,718 $ 17,771,976 $ 23,366,257 $ 23,485,522
Budget by Categories of Revenues
Fiscal Year 2011-12 Actuals
Fiscal Year 2012-13 Adopted Budget
Fiscal Year 2012-13
Amended Budget
Fiscal Year 2012-13 Actuals
Fiscal Year 2013-14 Adopted Budget
Fiscal Year 2014-15
Approved Budget
Intergovernmental Revenues
$ 18,777,322 $ 23,805,319 $ 32,400,097 $ 18,458,693 $ 22,829,686 $ 23,148,951
Charges For Current Services
25,355 100 100 10,316 50 50
Miscellaneous Revenues
724,135 585,000 585,000 374,787 645,000 645,000
Use of Fund Balance 436,230 438,000 438,000 (700,341) 263,000 63,000
General Purpose Revenue Allocation
(371,479) (371,479) (371,479) (371,479) (371,479) (371,479)
Total $ 19,591,563 $ 24,456,940 $ 33,051,718 $ 17,771,976 $ 23,366,257 $ 23,485,522
350 Community Services GroupAdopted Operational Plan Fiscal Years 2013-2014 and 2014-2015
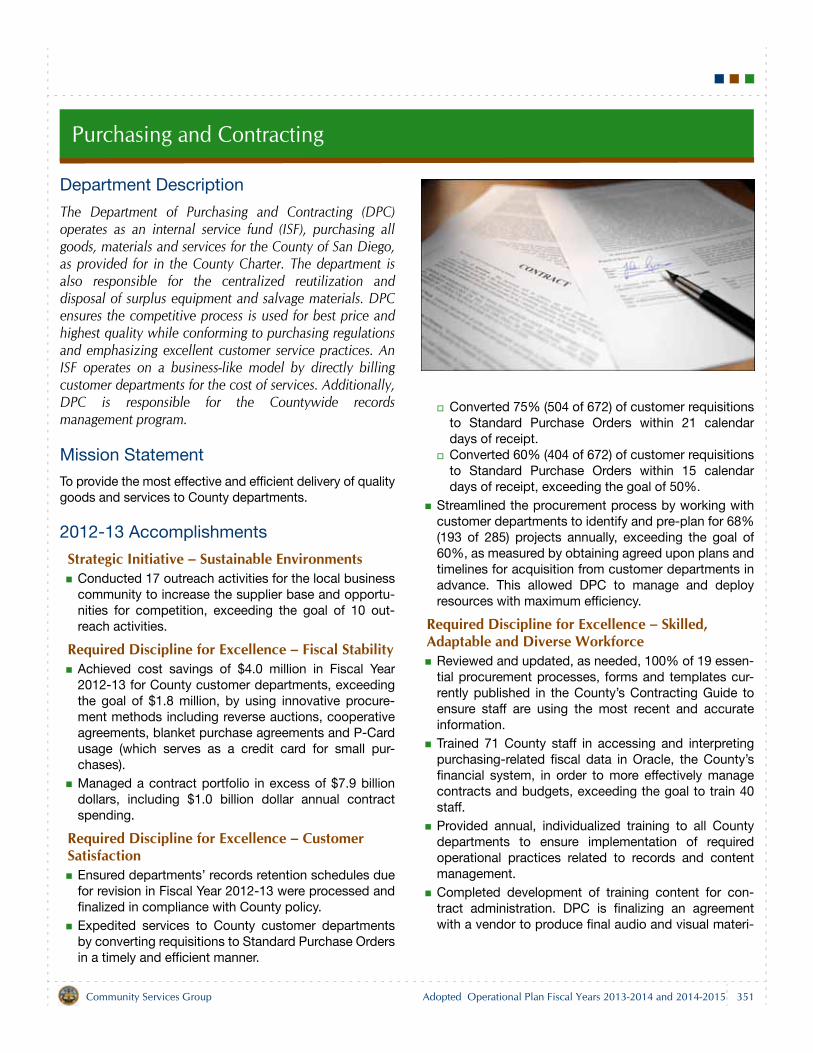
Purchasing and Contracting
Department Description
The Department of Purchasing and Contracting (DPC)operates as an internal service fund (ISF), purchasing allgoods, materials and services for the County of San Diego,as provided for in the County Charter. The department isalso responsible for the centralized reutilization anddisposal of surplus equipment and salvage materials. DPCensures the competitive process is used for best price andhighest quality while conforming to purchasing regulationsand emphasizing excellent customer service practices. AnISF operates on a business-like model by directly billingcustomer departments for the cost of services. Additionally,DPC is responsible for the Countywide recordsmanagement program.
Mission Statement
To provide the most effective and efficient delivery of qualitygoods and services to County departments.
2012-13 Accomplishments
Strategic Initiative – Sustainable EnvironmentsConducted 17 outreach activities for the local businesscommunity to increase the supplier base and opportu-nities for competition, exceeding the goal of 10 out-reach activities.
Required Discipline for Excellence – Fiscal StabilityAchieved cost savings of $4.0 million in Fiscal Year2012-13 for County customer departments, exceedingthe goal of $1.8 million, by using innovative procure-ment methods including reverse auctions, cooperativeagreements, blanket purchase agreements and P-Cardusage (which serves as a credit card for small pur-chases).Managed a contract portfolio in excess of $7.9 billiondollars, including $1.0 billion dollar annual contractspending.
Required Discipline for Excellence – Customer Satisfaction
Ensured departments’ records retention schedules duefor revision in Fiscal Year 2012-13 were processed andfinalized in compliance with County policy.Expedited services to County customer departmentsby converting requisitions to Standard Purchase Ordersin a timely and efficient manner.
Converted 75% (504 of 672) of customer requisitionsto Standard Purchase Orders within 21 calendardays of receipt.Converted 60% (404 of 672) of customer requisitionsto Standard Purchase Orders within 15 calendardays of receipt, exceeding the goal of 50%.
Streamlined the procurement process by working withcustomer departments to identify and pre-plan for 68%(193 of 285) projects annually, exceeding the goal of60%, as measured by obtaining agreed upon plans andtimelines for acquisition from customer departments inadvance. This allowed DPC to manage and deployresources with maximum efficiency.
Required Discipline for Excellence – Skilled, Adaptable and Diverse Workforce
Reviewed and updated, as needed, 100% of 19 essen-tial procurement processes, forms and templates cur-rently published in the County’s Contracting Guide toensure staff are using the most recent and accurateinformation.Trained 71 County staff in accessing and interpretingpurchasing-related fiscal data in Oracle, the County’sfinancial system, in order to more effectively managecontracts and budgets, exceeding the goal to train 40staff.Provided annual, individualized training to all Countydepartments to ensure implementation of requiredoperational practices related to records and contentmanagement.Completed development of training content for con-tract administration. DPC is finalizing an agreementwith a vendor to produce final audio and visual materi-
351Community Services Group Adopted Operational Plan Fiscal Years 2013-2014 and 2014-2015
Purchasing and Contracting
als. Additionally, DPC is re-evaluating its training strate-gies in order to deliver customized procurementtrainings to County groups and departments.
Required Discipline for Excellence – Information Services
Completed the development phase of the BuyNet elec-tronic approval project and undergoing preparations foruser acceptance testing. The receipt of electronic pro-posal documents through the County’s e-procurementwebsite will shorten solicitation timelines, reduce theneed for potential suppliers to travel to County officesor send documents and reduce the need to store androute lengthy paper documents. The delay in projectcompletion is a result of limited staff resources of theinformation technology (IT) vendor.Completed the Statement of Work for the enhancementof the Two-Step Procurement process via BuyNet. Thisproject will provide efficiency to buyers by simplifyingthe existing process and improving communicationwith proposers. This project supports DPC’s electronicreceipt of all solicitations. The delay in project comple-tion is tied to the delay in completion of the BuyNetelectronic approval project and limited staff resourcesof the IT vendor.Created and published four new Oracle classes in theCounty’s web-based Learning Management System(LMS) and classroom-based courses, giving greaterflexibility for end users to access training. LMS classesallow end users to receive training online at their con-venience and eliminate costs associated with travelingto classroom-based courses, such as transportationand travel time.
2013-15 Objectives
Strategic Initiative – Sustainable EnvironmentsConduct a minimum of 12 outreach activities in FiscalYear 2013-14 and 12 in Fiscal Year 2014-15 for thelocal business community to increase the supplier baseand opportunities for competition.
Required Discipline for Excellence – Fiscal StabilityAchieve cost savings of $3.3 million in Fiscal Year2013-14 and $3.5 million in Fiscal Year 2014-15 forCounty customer departments by using innovative pro-curement methods such as reverse auctions, coopera-tive agreements, blanket purchase agreements and P-Card usage (which serves as a credit card for smallpurchases).
Required Discipline for Excellence – Customer Satisfaction
Ensure departments’ records retention schedules duefor revision in Fiscal Years 2013-14 and 2014-15 areprocessed and finalized in compliance with Countypolicy.Expedite services to County customer departments byconverting requisitions to Standard Purchase Orders ina timely and efficient manner.
Convert at least 75% of customer requisitions toStandard Purchase Orders within 21 calendar daysof receipt.Convert 50% of customer requisitions to StandardPurchase Orders within 15 calendar days of receipt.
Required Discipline for Excellence – Skilled, Adaptable and Diverse Workforce
Provide training for at least 50 County staff in access-ing and interpreting purchasing-related fiscal data inOracle in order to more effectively manage contractsand budgets.Provide annual, individualized training to all Countydepartments to ensure implementation of requiredoperational practices related to records and contentmanagement.Deploy contract administration training electronically inFiscal Year 2013-14, making training available to allCounty staff that require it.
Required Discipline for Excellence – Information Services
Complete the technological enhancement project fortwo-step proposals and bids submitted via BuyNet.The first step is for potential suppliers to submit theirqualifications for review before proceeding to the nextstep, the submission of bids and/or proposals by thosesuppliers deemed qualified. This will shorten procure-ment timelines and clarify communication with propos-ers. This project also supports DPC’s move towardelectronic receipt of all solicitations.Create and publish four new Oracle LMS classes andclassroom-based courses giving greater flexibility forend-users to access training. Complete the requirements for a project that provides asecure, efficient and time-saving method for the publicto obtain relevant contract information from theCounty’s website. This effort will enable self-servicewhile maintaining document security and will bedeployed into production in Fiscal Year 2014-15.
352 Community Services GroupAdopted Operational Plan Fiscal Years 2013-2014 and 2014-2015
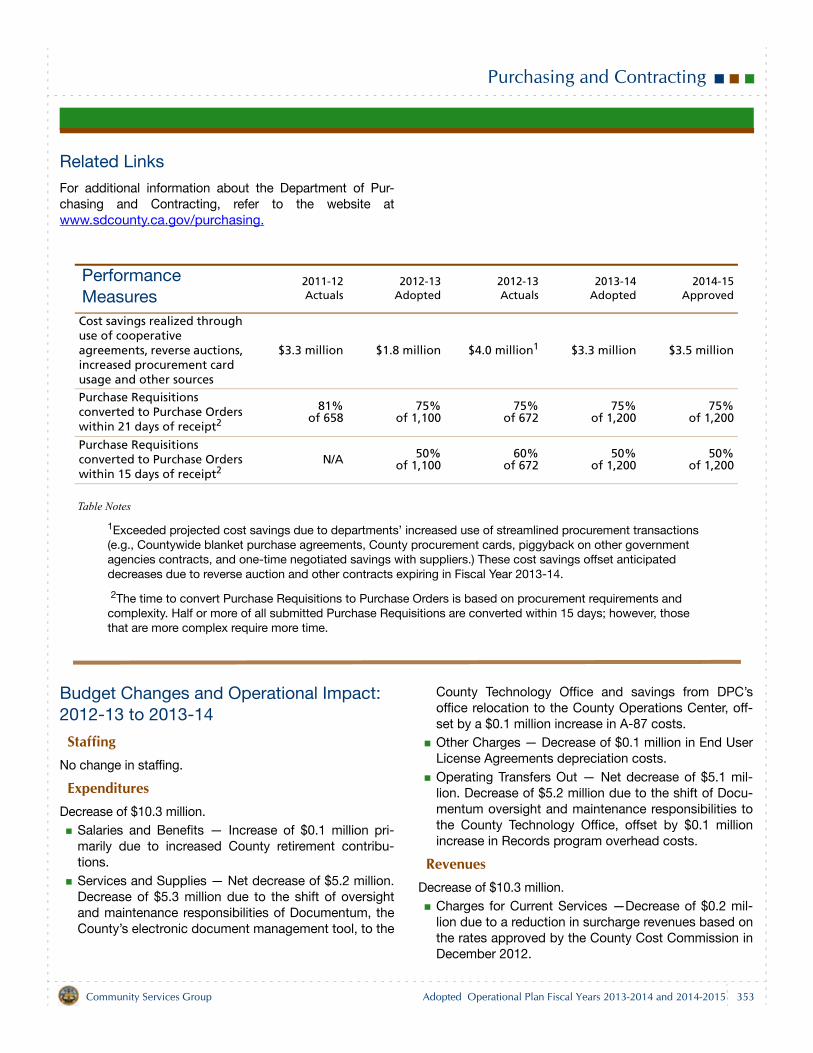
Purchasing and Contracting
Related Links
For additional information about the Department of Pur-chasing and Contracting, refer to the website atwww.sdcounty.ca.gov/purchasing.
Table Notes
1Exceeded projected cost savings due to departments’ increased use of streamlined procurement transactions (e.g., Countywide blanket purchase agreements, County procurement cards, piggyback on other government agencies contracts, and one-time negotiated savings with suppliers.) These cost savings offset anticipated decreases due to reverse auction and other contracts expiring in Fiscal Year 2013-14.
2The time to convert Purchase Requisitions to Purchase Orders is based on procurement requirements and complexity. Half or more of all submitted Purchase Requisitions are converted within 15 days; however, those that are more complex require more time.
Budget Changes and Operational Impact: 2012-13 to 2013-14
StaffingNo change in staffing.
ExpendituresDecrease of $10.3 million.
Salaries and Benefits — Increase of $0.1 million pri-marily due to increased County retirement contribu-tions. Services and Supplies — Net decrease of $5.2 million.Decrease of $5.3 million due to the shift of oversightand maintenance responsibilities of Documentum, theCounty’s electronic document management tool, to the
County Technology Office and savings from DPC’soffice relocation to the County Operations Center, off-set by a $0.1 million increase in A-87 costs. Other Charges — Decrease of $0.1 million in End UserLicense Agreements depreciation costs. Operating Transfers Out — Net decrease of $5.1 mil-lion. Decrease of $5.2 million due to the shift of Docu-mentum oversight and maintenance responsibilities tothe County Technology Office, offset by $0.1 millionincrease in Records program overhead costs.
RevenuesDecrease of $10.3 million.
Charges for Current Services —Decrease of $0.2 mil-lion due to a reduction in surcharge revenues based onthe rates approved by the County Cost Commission inDecember 2012.
Performance Measures
2011-12Actuals
2012-13Adopted
2012-13Actuals
2013-14Adopted
2014-15Approved
Cost savings realized through use of cooperative agreements, reverse auctions, increased procurement card usage and other sources
$3.3 million $1.8 million $4.0 million1 $3.3 million $3.5 million
Purchase Requisitions converted to Purchase Orders within 21 days of receipt2
81%of 658
75%of 1,100
75%of 672
75%of 1,200
75%of 1,200
Purchase Requisitions converted to Purchase Orders within 15 days of receipt2
N/A 50%of 1,100
60%of 672
50%of 1,200
50%of 1,200
353Community Services Group Adopted Operational Plan Fiscal Years 2013-2014 and 2014-2015
Purchasing and Contracting
Other Financing Sources — Net decrease of $5.1 mil-lion. Decrease of $5.2 million due to the shift of Docu-mentum oversight and maintenance responsibilities toCounty Technology Office, offset by $0.1 millionincrease in Records program overhead costs. Use of Fund Balance — Net decrease of $3.9 million isthe result of a $4.1 million decrease for Documentumversion upgrade and End User License Agreementdepreciation cost, offset by an increase of $0.2 millionto support ISF rates. General Purpose Revenue Allocation — Decrease of$1.1 million due to the shift of Documentum oversightand maintenance responsibilities to County TechnologyOffice and an adjustment for overhead costs of theRecords program.
Budget Changes and Operational Impact: 2013-14 to 2014-15
Net decrease of $0.2 million. Decrease of $0.3 million inServices and Supplies due to anticipated completion ofBuyNet improvement for two-step procurements and con-tracts web publishing in Fiscal Year 2013-14, offset by anincrease of $0.1 million in Salaries and Benefits due toincreased County retirement contributions.
354 Community Services GroupAdopted Operational Plan Fiscal Years 2013-2014 and 2014-2015
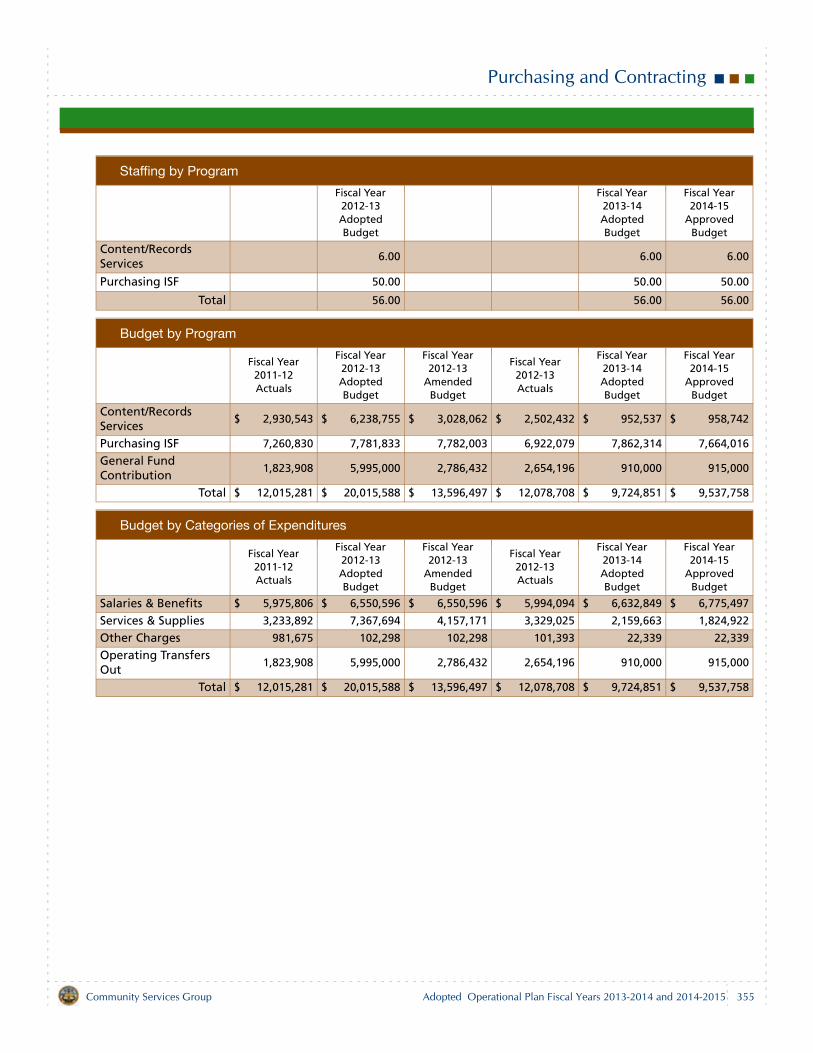
Purchasing and Contracting
Staffing by Program
Fiscal Year 2012-13 Adopted Budget
Fiscal Year 2013-14 Adopted Budget
Fiscal Year 2014-15
Approved Budget
Content/Records Services
6.00 6.00 6.00
Purchasing ISF 50.00 50.00 50.00
Total 56.00 56.00 56.00
Budget by Program
Fiscal Year 2011-12 Actuals
Fiscal Year 2012-13 Adopted Budget
Fiscal Year 2012-13
Amended Budget
Fiscal Year 2012-13 Actuals
Fiscal Year 2013-14 Adopted Budget
Fiscal Year 2014-15
Approved Budget
Content/Records Services
$ 2,930,543 $ 6,238,755 $ 3,028,062 $ 2,502,432 $ 952,537 $ 958,742
Purchasing ISF 7,260,830 7,781,833 7,782,003 6,922,079 7,862,314 7,664,016
General Fund Contribution
1,823,908 5,995,000 2,786,432 2,654,196 910,000 915,000
Total $ 12,015,281 $ 20,015,588 $ 13,596,497 $ 12,078,708 $ 9,724,851 $ 9,537,758
Budget by Categories of Expenditures
Fiscal Year 2011-12 Actuals
Fiscal Year 2012-13 Adopted Budget
Fiscal Year 2012-13
Amended Budget
Fiscal Year 2012-13 Actuals
Fiscal Year 2013-14 Adopted Budget
Fiscal Year 2014-15
Approved Budget
Salaries & Benefits $ 5,975,806 $ 6,550,596 $ 6,550,596 $ 5,994,094 $ 6,632,849 $ 6,775,497
Services & Supplies 3,233,892 7,367,694 4,157,171 3,329,025 2,159,663 1,824,922
Other Charges 981,675 102,298 102,298 101,393 22,339 22,339
Operating Transfers Out
1,823,908 5,995,000 2,786,432 2,654,196 910,000 915,000
Total $ 12,015,281 $ 20,015,588 $ 13,596,497 $ 12,078,708 $ 9,724,851 $ 9,537,758
355Community Services Group Adopted Operational Plan Fiscal Years 2013-2014 and 2014-2015
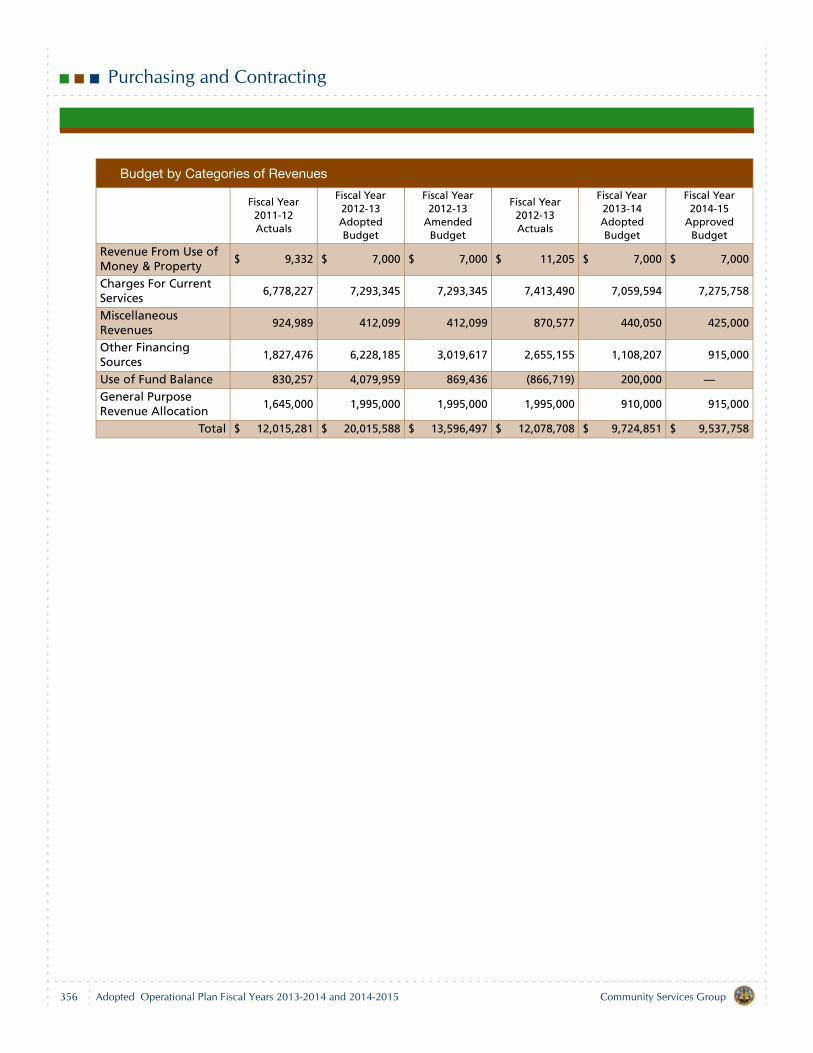
Purchasing and Contracting
Budget by Categories of Revenues
Fiscal Year 2011-12 Actuals
Fiscal Year 2012-13 Adopted Budget
Fiscal Year 2012-13
Amended Budget
Fiscal Year 2012-13 Actuals
Fiscal Year 2013-14 Adopted Budget
Fiscal Year 2014-15
Approved Budget
Revenue From Use of Money & Property
$ 9,332 $ 7,000 $ 7,000 $ 11,205 $ 7,000 $ 7,000
Charges For Current Services
6,778,227 7,293,345 7,293,345 7,413,490 7,059,594 7,275,758
Miscellaneous Revenues
924,989 412,099 412,099 870,577 440,050 425,000
Other Financing Sources
1,827,476 6,228,185 3,019,617 2,655,155 1,108,207 915,000
Use of Fund Balance 830,257 4,079,959 869,436 (866,719) 200,000 —General Purpose Revenue Allocation
1,645,000 1,995,000 1,995,000 1,995,000 910,000 915,000
Total $ 12,015,281 $ 20,015,588 $ 13,596,497 $ 12,078,708 $ 9,724,851 $ 9,537,758
356 Community Services GroupAdopted Operational Plan Fiscal Years 2013-2014 and 2014-2015
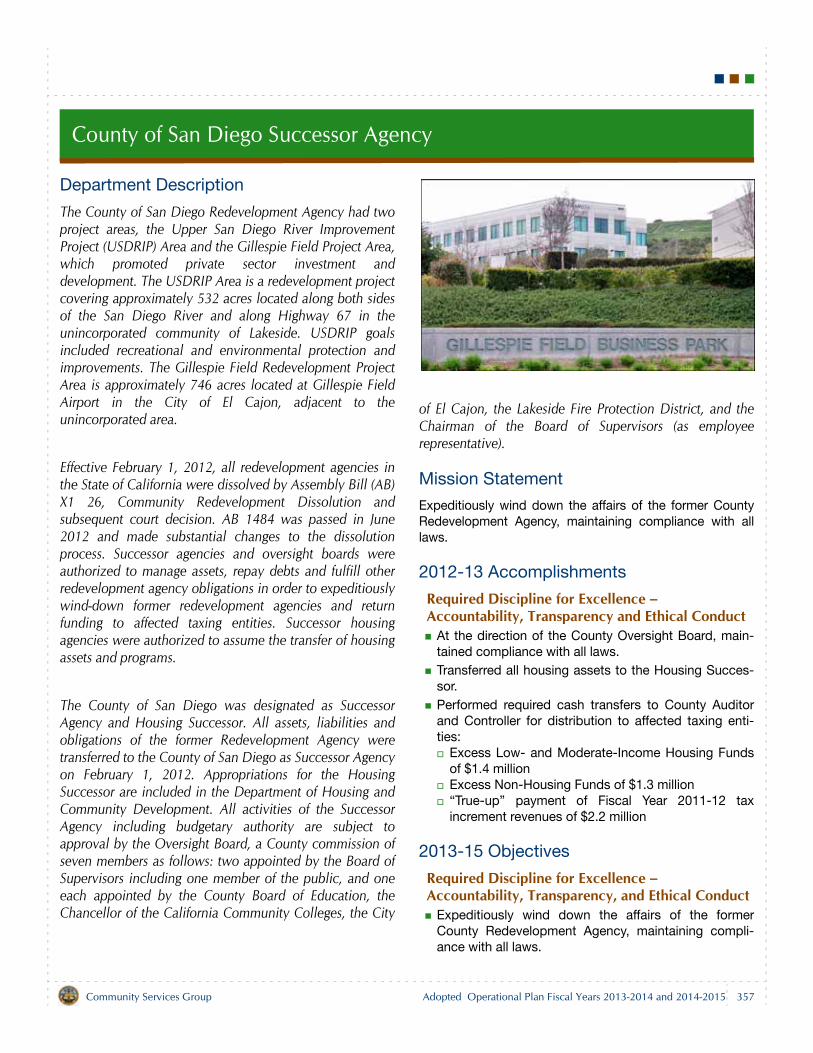
County of San Diego Successor Agency
Department Description
The County of San Diego Redevelopment Agency had twoproject areas, the Upper San Diego River ImprovementProject (USDRIP) Area and the Gillespie Field Project Area,which promoted private sector investment anddevelopment. The USDRIP Area is a redevelopment projectcovering approximately 532 acres located along both sidesof the San Diego River and along Highway 67 in theunincorporated community of Lakeside. USDRIP goalsincluded recreational and environmental protection andimprovements. The Gillespie Field Redevelopment ProjectArea is approximately 746 acres located at Gillespie FieldAirport in the City of El Cajon, adjacent to theunincorporated area.
Effective February 1, 2012, all redevelopment agencies inthe State of California were dissolved by Assembly Bill (AB)X1 26, Community Redevelopment Dissolution andsubsequent court decision. AB 1484 was passed in June2012 and made substantial changes to the dissolutionprocess. Successor agencies and oversight boards wereauthorized to manage assets, repay debts and fulfill otherredevelopment agency obligations in order to expeditiouslywind-down former redevelopment agencies and returnfunding to affected taxing entities. Successor housingagencies were authorized to assume the transfer of housingassets and programs.
The County of San Diego was designated as SuccessorAgency and Housing Successor. All assets, liabilities andobligations of the former Redevelopment Agency weretransferred to the County of San Diego as Successor Agencyon February 1, 2012. Appropriations for the HousingSuccessor are included in the Department of Housing andCommunity Development. All activities of the SuccessorAgency including budgetary authority are subject toapproval by the Oversight Board, a County commission ofseven members as follows: two appointed by the Board ofSupervisors including one member of the public, and oneeach appointed by the County Board of Education, theChancellor of the California Community Colleges, the City
of El Cajon, the Lakeside Fire Protection District, and theChairman of the Board of Supervisors (as employeerepresentative).
Mission Statement
Expeditiously wind down the affairs of the former CountyRedevelopment Agency, maintaining compliance with alllaws.
2012-13 Accomplishments
Required Discipline for Excellence – Accountability, Transparency and Ethical Conduct
At the direction of the County Oversight Board, main-tained compliance with all laws.Transferred all housing assets to the Housing Succes-sor.Performed required cash transfers to County Auditorand Controller for distribution to affected taxing enti-ties:
Excess Low- and Moderate-Income Housing Fundsof $1.4 million Excess Non-Housing Funds of $1.3 million“True-up” payment of Fiscal Year 2011-12 taxincrement revenues of $2.2 million
2013-15 Objectives
Required Discipline for Excellence – Accountability, Transparency, and Ethical Conduct
Expeditiously wind down the affairs of the formerCounty Redevelopment Agency, maintaining compli-ance with all laws.
357Community Services Group Adopted Operational Plan Fiscal Years 2013-2014 and 2014-2015
County of San Diego Successor Agency
Related Links
For information about the County Successor Agency, referto the website at www.sdcounty.ca.gov/community/county_oversight_board.html.
For additional information about Gillespie Field, refer to thewebsite located at www.sdcounty.ca.gov/dpw/airports/gillespie.html.
Budget Changes and Operational Impact: 2012-13 to 2013-14
By State law, only payments on enforceable obligations ofthe former redevelopment agency and administration costsmay be paid by the Successor Agency. These payments arepresented semi-annually to the County Oversight Board forfinal approval.
ExpendituresNet decrease of $1.2 million.
Other Charges — net decrease of $0.3 million for ascheduled loan repayment to the Airport EnterpriseFund. The loan was disallowed by the State Depart-ment of Finance.Operating Transfers Out — net decrease of $0.9 milliondue to accounting transfers among funds for the loanrepayment.
RevenuesNet decrease of $1.2 million.
Taxes Other Than Current Secured — net decrease of$0.3 million for the scheduled loan repayment to theAirport Enterprise Fund.Other Financing Sources — net decrease of $0.9 mil-lion due to accounting transfers among funds for theloan repayment.
Budget Changes and Operational Impact: 2013-14 to 2014-15
No significant change.
358 Community Services GroupAdopted Operational Plan Fiscal Years 2013-2014 and 2014-2015
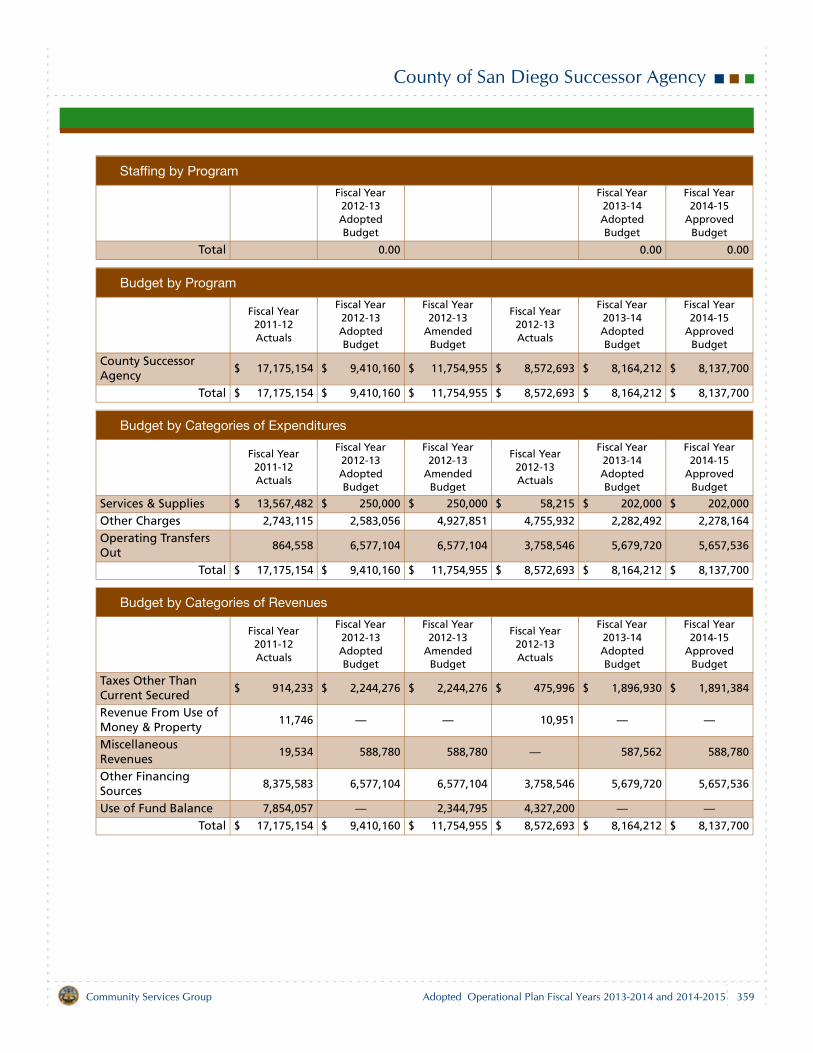
County of San Diego Successor Agency
Staffing by Program
Fiscal Year 2012-13 Adopted Budget
Fiscal Year 2013-14 Adopted Budget
Fiscal Year 2014-15
Approved Budget
Total 0.00 0.00 0.00
Budget by Program
Fiscal Year 2011-12 Actuals
Fiscal Year 2012-13 Adopted Budget
Fiscal Year 2012-13
Amended Budget
Fiscal Year 2012-13 Actuals
Fiscal Year 2013-14 Adopted Budget
Fiscal Year 2014-15
Approved Budget
County Successor Agency
$ 17,175,154 $ 9,410,160 $ 11,754,955 $ 8,572,693 $ 8,164,212 $ 8,137,700
Total $ 17,175,154 $ 9,410,160 $ 11,754,955 $ 8,572,693 $ 8,164,212 $ 8,137,700
Budget by Categories of Expenditures
Fiscal Year 2011-12 Actuals
Fiscal Year 2012-13 Adopted Budget
Fiscal Year 2012-13
Amended Budget
Fiscal Year 2012-13 Actuals
Fiscal Year 2013-14 Adopted Budget
Fiscal Year 2014-15
Approved Budget
Services & Supplies $ 13,567,482 $ 250,000 $ 250,000 $ 58,215 $ 202,000 $ 202,000
Other Charges 2,743,115 2,583,056 4,927,851 4,755,932 2,282,492 2,278,164
Operating Transfers Out
864,558 6,577,104 6,577,104 3,758,546 5,679,720 5,657,536
Total $ 17,175,154 $ 9,410,160 $ 11,754,955 $ 8,572,693 $ 8,164,212 $ 8,137,700
Budget by Categories of Revenues
Fiscal Year 2011-12 Actuals
Fiscal Year 2012-13 Adopted Budget
Fiscal Year 2012-13
Amended Budget
Fiscal Year 2012-13 Actuals
Fiscal Year 2013-14 Adopted Budget
Fiscal Year 2014-15
Approved Budget
Taxes Other Than Current Secured
$ 914,233 $ 2,244,276 $ 2,244,276 $ 475,996 $ 1,896,930 $ 1,891,384
Revenue From Use of Money & Property
11,746 — — 10,951 — —
Miscellaneous Revenues
19,534 588,780 588,780 — 587,562 588,780
Other Financing Sources
8,375,583 6,577,104 6,577,104 3,758,546 5,679,720 5,657,536
Use of Fund Balance 7,854,057 — 2,344,795 4,327,200 — —Total $ 17,175,154 $ 9,410,160 $ 11,754,955 $ 8,572,693 $ 8,164,212 $ 8,137,700
359Community Services Group Adopted Operational Plan Fiscal Years 2013-2014 and 2014-2015

Registrar of Voters
Department Description
The Registrar of Voters (ROV) is entrusted with providingthe means for all eligible citizens of San Diego County toexercise their right to actively participate in the democraticprocess. The department works to ensure widespread,ongoing opportunities to register and vote in fair andaccurate elections for all federal, State and local offices andmeasures. The ROV is also responsible for providing accessto the information needed for citizens to engage in theinitiative, referendum and recall petition processes.
Mission Statement
Conduct voter registration and voting processes with thehighest level of professional election standards, includingaccountability, security and integrity, thereby earning andmaintaining public confidence in the electoral process.
2012-13 Accomplishments
Required Discipline for Excellence – Sustainable Environments
Informed 1.6 million registered voters of countywideenvironmental programs and ways to reduce environ-mental risks using “filler” pages printed in the SampleBallot and Voter Information Pamphlets provided to allregistered voters for the November 6, 2012 PresidentialGeneral Election.Conserved resources by printing 1.6 million November6, 2012 Presidential General Election Sample Ballotand Voter Information Pamphlets on approximately 169tons of paper and by printing 700,000 Sample Ballotand Voter Information Pamphlets on approximately10.7 tons of paper for the March 12, 2013 40th StateSenate District Special, March 26, 2013 City of SanDiego District 4 Special, May 21, 2013 Consolidated80th State Assembly and City of San Diego District 4Special and June 18, 2013 City of Encinitas Specialelections containing as much as 25% post-consumerrecycled paper.Conducted the November 6, 2012 Presidential General,March 12, 2013 40th State Senate District Special,March 26, 2013 City of San Diego District 4 Special,May 21, 2013 Consolidated 80th State Assembly andCity of San Diego District 4 Special, May 21, 2013 SanDiego County Employees Retirement Association(SDCERA) 3rd Seat, and June 18, 2013 City of EncinitasSpecial elections with efficiency and integrity.
Increased the number of permanent vote-by-mail vot-ers by 15.6% (or 107,740) to a total of 798,020 for theNovember 6, 2012 Presidential General Election. Thisrepresents a 10.6% increase over the goal of a 5%increase in permanent vote-by-mail voters.By Monday after Election Day, tallied 74.3% (500,869of 673,599) of vote-by-mail ballots for the November 6,2012 Presidential General Election. The goal of an 85%tally (or 514,845 of an estimated 605,700) of vote-by-mail ballots for this election was not met due to anincrease of 15.6% (or 107,740) in permanent vote-by-mail voters after the June 5, 2012 Presidential PrimaryElection, which exceeded the original forecastedgrowth of 5%.Continued to recruit and replace non-accessible pollsites to comply with federal and State accessibilityrequirements by increasing the number of accessiblepoll sites for the November 6, 2012 Presidential Gen-eral Election by 7.4% (or 45), for a total of 657, basedon the number of sites for the June 5, 2012 PresidentialPrimary Election of 612.Engaged the community in the electoral process andensured polling sites were sufficiently staffed with qual-ified personnel for the November 6, 2012 PresidentialGeneral Election by meeting the planned recruitmentgoals for poll workers.Processed 100% (or 93,021) of valid voter registrationsreceived on or before the 15-day close of registrationby the seventh day before the November 6, 2012 Presi-dential General Election, ensuring that eligible regis-trants were printed in the official roster of voters andtherefore had the opportunity to vote using a regularballot.
361Community Services Group Adopted Operational Plan Fiscal Years 2013-2014 and 2014-2015
Registrar of Voters
Required Discipline for Excellence – Customer Satisfaction
In addition to translating all voting and election materi-als into Spanish, Filipino and Vietnamese, added thetranslation of all voting and election materials into Chi-nese and recruited Chinese bilingual poll workers forthe November 6, 2012 Presidential General, March 12,2013 40th State Senate District Special and March 26,2013 City of San Diego District 4 Special, May 21, 2013Consolidated 80th State Assembly and City of SanDiego District 4 Special, and June 18, 2013 City ofEncinitas Special elections. Also implemented a voteroutreach plan focused on the Chinese community. Achieved an overall customer satisfaction rating withcore services of 4.72 (using a scale of 1 to 5, with 5being “excellent”).Encouraged overall satisfaction and retention of volun-teers by mailing all poll worker stipends within 14 work-ing days after the November 6, 2012 PresidentialGeneral Election, exceeding the goal by one day.
Required Discipline for Excellence – Regional Leadership
As a result of redistricting activities following the 2010decennial census, 75 voter precinct boundaries wererealigned to 50 new water and irrigation district bound-aries and 25 new trustee areas in 5 school districtsbefore the November 6, 2012 Presidential GeneralElection.
Required Discipline for Excellence – Skilled, Adaptable and Diverse Workforce
Enhanced employee awareness and knowledge ofsafety and security concerns by holding quarterlySafety and Security Committee meetings to reviewaccidents and identify high-risk security concerns.100% of poll worker trainers completed online trainingassessments with scores of 90% or higher at least 26days prior to the November 6, 2012 Presidential Gen-eral Election, exceeding the goal of 95%.
Required Discipline for Excellence – Accountability, Transparency and Ethical Conduct
Processed vote-by-mail ballots for the November 6,2012 Presidential General Election according to identi-fied management controls, including pre-planningmeetings with the vendor, onsite vendor inspections,validation of election materials, hiring, training andscheduling of staff, revision of training materials andsupervisory oversight.
Required Discipline for Excellence – Continuous Improvement and Innovation
Enhanced the processing efficiency of vote-by-mailballots by maintaining an automated mail ballot pro-cessing system that screened, scanned, sorted, andopened returned mail ballot envelopes; and verifiedand reconciled ballots returned and counted in theNovember 6, 2012 Presidential General Election.
Reported 33% (or 393,106 of 1,203,265) of all ballotscast in the Mail Ballot report released just after 8:00p.m. on November 6, 2012 Presidential GeneralElection night.The per-mail-ballot labor cost of processing vote-by-mail ballots returned in the November 6, 2012Presidential General Election was 46 cents, a 5 centincrease from the June 5, 2012 Presidential PrimaryElection and above the goal of no more than 40cents. This increase was due to additional staffingrequired to process the greater than anticipatednumber of returned mail ballots and the increase incompensation for higher-skilled seasonal staff.
2013-15 Objectives
Strategic Initiative – Healthy FamiliesDistribute information in support of the County’s LiveWell San Diego Building Better Health and Living Safelystrategies using “filler” pages printed in the SampleBallot and Voter Information Pamphlets provided to allregistered voters for the June 2014 Gubernatorial Pri-mary and November 2014 Gubernatorial General elec-tions.
Strategic Initiative – Sustainable EnvironmentsContinue to distribute information on reducing environ-mental risks using “filler” pages printed in the SampleBallot and Voter Information Pamphlets provided to allregistered voters for the June 2014 Gubernatorial Pri-mary and November 2014 Gubernatorial General elec-tions.Conserve resources by printing the Sample Ballot andVoter Information Pamphlets for all elections con-ducted in Fiscal Years 2013-15 on paper containing asmuch as 25% post-consumer recycled paper.Based on the number of permanent vote-by-mail vot-ers (798,020) for the November 6, 2012 PresidentialGeneral Election, increase the number of permanentvote-by-mail voters by 3% (or 23,950), for a total of821,970, for the November 2014 Gubernatorial GeneralElection.
362 Community Services GroupAdopted Operational Plan Fiscal Years 2013-2014 and 2014-2015
Registrar of Voters
Continue to recruit and replace non-accessible pollsites to comply with federal and State accessibilityrequirements:
Increase the number of accessible poll sites for theJune 2014 Gubernatorial Primary Election by 7% (or46), for a total of 703, based on the number of sitesfor the November 6, 2012 Presidential GeneralElection of 657.Increase the number of accessible poll sites for theNovember 2014 Gubernatorial General Election by3% (or 21), for a total of 724, based on theanticipated number of sites for the June 2014Gubernatorial Primary Election of 703.
Engage the community in the electoral process andensure polling sites are sufficiently staffed with quali-fied personnel for the June 2014 Gubernatorial Primaryand the November 2014 Gubernatorial General elec-tions by meeting the planned recruitment goals for pollworkers. Process 100% of valid registrations received on orbefore the 15-day close of registration by the 7th daybefore the election to ensure eligible registrants areprinted in the official roster of voters and therefore havethe opportunity to vote using a regular ballot.
Required Discipline for Excellence – Customer Satisfaction
Ensure customer satisfaction with core services bymaintaining a 4.7 or better overall customer satisfac-tion rating (on a scale of 1 to 5, with 5 being “excel-lent”) during and after the transition to a new ROVfacility planned for December 2013.To encourage overall satisfaction and retention of vol-unteers, mail all poll worker stipends in 15 workingdays or less from Election Day for all elections in FiscalYears 2013-15, ensuring all poll workers are reim-bursed in a timely manner.
Required Discipline for Excellence – Skilled, Adaptable and Diverse Workforce
Ensure 100% of poll worker trainers complete onlinetraining assessments with scores of 90% or higher nolater than 26 days prior to the June 2014 GubernatorialPrimary and the November 2014 Gubernatorial Generalelections, ensuring knowledgeable instructors areavailable and prepared to train poll workers.
Required Discipline for Excellence –
Accountability, Transparency and Ethical ConductIncrease public access to the election process, specifi-cally the processing of the vote-by-mail ballots andtabulation of ballots.Ensure 50% (725 of 1,450) precincts are tallied by11:30 p.m. on Election Night for the June 2014 Guber-natorial Primary and November 2014 GubernatorialGeneral elections.
Required Discipline for Excellence – Continuous Improvement and Innovation
Continue to enhance the processing efficiency of vote-by-mail ballots by maintaining an automated mail ballotprocessing system to screen, scan, sort, verify signa-ture and open returned mail ballot envelopes, and byverifying and reconciling ballots returned and counted.
Report 85% of eligible mail ballots received by theROV by the Sunday before Election Day in the firstElection Night Results Bulletin released shortly after8:00 p.m. for the June 2014 Gubernatorial Primaryand November 2014 Gubernatorial Generalelections.Report 33% or more of all mail ballots cast in the firstElection Night Results Bulletin for the June 2014Gubernatorial Primary and November 2014Gubernatorial General elections.By Monday after Election Day, tally 85% of mailballots received by the ROV for the June 2014Gubernatorial Primary and November 2014Gubernatorial General elections.Achieve a per-mail-ballot labor cost for vote-by-mailballots returned in the June 2014 GubernatorialPrimary and November 2014 Gubernatorial Generalelections of no more than 40 cents.
Required Discipline for Excellence – Essential Infrastructure
Transition to a new modern and environmentallyfriendly building in December 2013. The modernizedbuilding will provide the public with easier access toobserve the administration of elections.
Related Links
For additional information about the Registrar of Voters,refer to the website at www.sdvote.com orwww.sdcounty.ca.gov/voters/Eng/Eindex.shtml.
363Community Services Group Adopted Operational Plan Fiscal Years 2013-2014 and 2014-2015
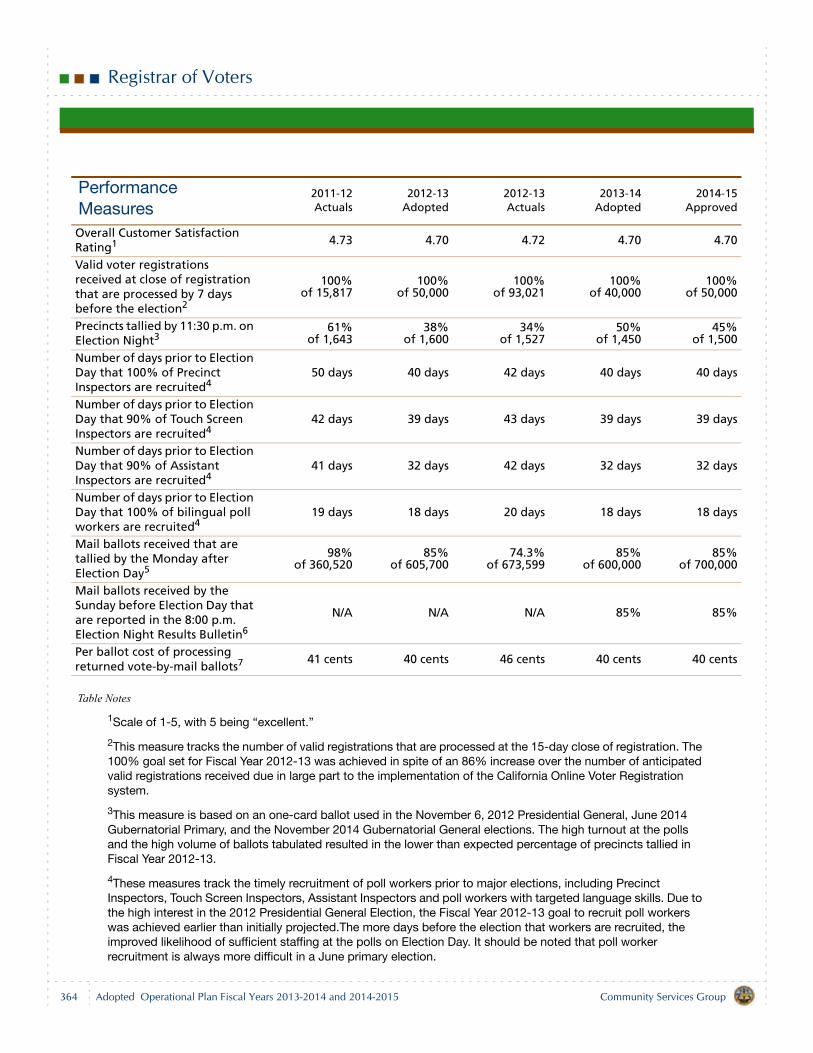
Registrar of Voters
Table Notes
1Scale of 1-5, with 5 being “excellent.”
2This measure tracks the number of valid registrations that are processed at the 15-day close of registration. The 100% goal set for Fiscal Year 2012-13 was achieved in spite of an 86% increase over the number of anticipated valid registrations received due in large part to the implementation of the California Online Voter Registration system.
3This measure is based on an one-card ballot used in the November 6, 2012 Presidential General, June 2014 Gubernatorial Primary, and the November 2014 Gubernatorial General elections. The high turnout at the polls and the high volume of ballots tabulated resulted in the lower than expected percentage of precincts tallied in Fiscal Year 2012-13.
4These measures track the timely recruitment of poll workers prior to major elections, including Precinct Inspectors, Touch Screen Inspectors, Assistant Inspectors and poll workers with targeted language skills. Due to the high interest in the 2012 Presidential General Election, the Fiscal Year 2012-13 goal to recruit poll workers was achieved earlier than initially projected.The more days before the election that workers are recruited, the improved likelihood of sufficient staffing at the polls on Election Day. It should be noted that poll worker recruitment is always more difficult in a June primary election.
Performance Measures
2011-12Actuals
2012-13Adopted
2012-13Actuals
2013-14Adopted
2014-15Approved
Overall Customer Satisfaction Rating1 4.73 4.70 4.72 4.70 4.70
Valid voter registrations received at close of registration that are processed by 7 days before the election2
100%of 15,817
100%of 50,000
100%of 93,021
100%of 40,000
100%of 50,000
Precincts tallied by 11:30 p.m. on Election Night3
61%of 1,643
38%of 1,600
34%of 1,527
50%of 1,450
45%of 1,500
Number of days prior to Election Day that 100% of Precinct Inspectors are recruited4
50 days 40 days 42 days 40 days 40 days
Number of days prior to Election Day that 90% of Touch Screen Inspectors are recruited4
42 days 39 days 43 days 39 days 39 days
Number of days prior to Election Day that 90% of Assistant Inspectors are recruited4
41 days 32 days 42 days 32 days 32 days
Number of days prior to Election Day that 100% of bilingual poll workers are recruited4
19 days 18 days 20 days 18 days 18 days
Mail ballots received that are tallied by the Monday after Election Day5
98%of 360,520
85%of 605,700
74.3%of 673,599
85%of 600,000
85%of 700,000
Mail ballots received by the Sunday before Election Day that are reported in the 8:00 p.m. Election Night Results Bulletin6
N/A N/A N/A 85% 85%
Per ballot cost of processing returned vote-by-mail ballots7 41 cents 40 cents 46 cents 40 cents 40 cents
364 Community Services GroupAdopted Operational Plan Fiscal Years 2013-2014 and 2014-2015
Registrar of Voters
5In Fiscal Year 2012-13, it was anticipated that 85% of an estimated 605,700 vote-by-mail ballots received would be processed and tallied by the Monday following Election Day for the November 6, 2012 Presidential General Election. Actual figures from this election show 74.3% of 673,599 (or 500,869) were processed and tallied by the Monday following Election Day. This shortfall was attributed to a 15.6% (or 107,740) increase in the number of permanent vote-by-mail voters since the June 5, 2012 Presidential Primary Election.
6This new Fiscal Year 2013-14 measure tracks the number of vote-by-mail ballots returned to the ROV by the Sunday before Election Day and counted by 8:00 p.m. on Election Night. The purpose of this objective is to measure the increase in the number of returned vote-by-mail ballots that are processed, verified and counted by Sunday before Election Day. This will allow staff to process, verify, and count 100% of vote-by-mail ballots that are returned to the polls on Election Day by the Monday after Election Day.
7The department anticipated further processing efficiencies and a labor cost reduction in the November 6, 2012 Presidential General Election to 40 cents; however, per-mail-ballot labor cost increased by 5 cents due to a larger than anticipated number of returned mail ballots.
Budget Changes and Operational Impact: 2012-13 to 2013-14
StaffingNo change in staffing.
ExpendituresNet decrease of $2.5 million.
Salaries and Benefits — increase of $0.1 million due toadditional temporary help for the recruitment andreplacement of non-accessible poll sites and the pre-ventative maintenance of 10,200 voting machines.Services and Supplies — net decrease of $2.6 milliondue to eliminating expenditure for new Americans withDisabilities (ADA) voting booths. The ROV and the Vot-ing Accessibility Advisory Committee (VAAC) havebeen working closely on the requirements for a newADA voting booth. The ROV has issued a Request forProposal and a Request for Bid to find a vendor whocan meet the requirements developed by the ROV andVAAC. At this time, there is not a vendor or an ADA vot-ing booth that meets those requirements.
RevenuesNet decrease of $2.5 million.
Intergovernmental Revenues — increase of $0.4 milliondue to Help America Vote Act (HAVA) 261 grant fundingfor recruiting and replacing non-accessible poll sites;and HAVA 301 grant funding for the preventative main-tenance of 10,200 voting machines, annual mainte-nance agreement, replacement of voting booths, andOptical Scan (OS) cards.
Charges for Current Services (Election Services) —decrease of $2.8 million due to the lower number ofbillable jurisdictions that participate in the 2014 Guber-natorial Primary Election as compared to the 2012Presidential General Election.Use of Fund Balance — net decrease of $1.5 million. Atotal of $2.7 million is budgeted for unemploymentinsurance premiums ($0.4 million), costs related to relo-cating to the new ROV building ($2.0 million) and costsrelated to the warehouse asset tracking system andpoll worker internet project ($0.3 million).General Purpose Revenue Allocation — increase of$1.4 million to provide ongoing funding for the Vote-by-Mail program.
Budget Changes and Operational Impact: 2013-14 to 2014-15
Net decrease of $1.3 million is the result of a decrease of$0.02 million in Salaries and Benefits due to lower tempo-rary labor costs; a decrease of $0.3 million in Services andSupplies due to one-time purchase of the warehouse assettracking system and the poll worker internet project and adecrease of one-time funding of $2.0 million in CapitalAssets/Land Acquisition for relocation of the ROV offset byan increase of $1.0 million in Fund Balance ComponentIncreases to provide funding for the 2016 Presidential Pri-mary Election which has a fewer number of participatingbillable jurisdictions compared to the 2014 GubernatorialGeneral Election.
365Community Services Group Adopted Operational Plan Fiscal Years 2013-2014 and 2014-2015
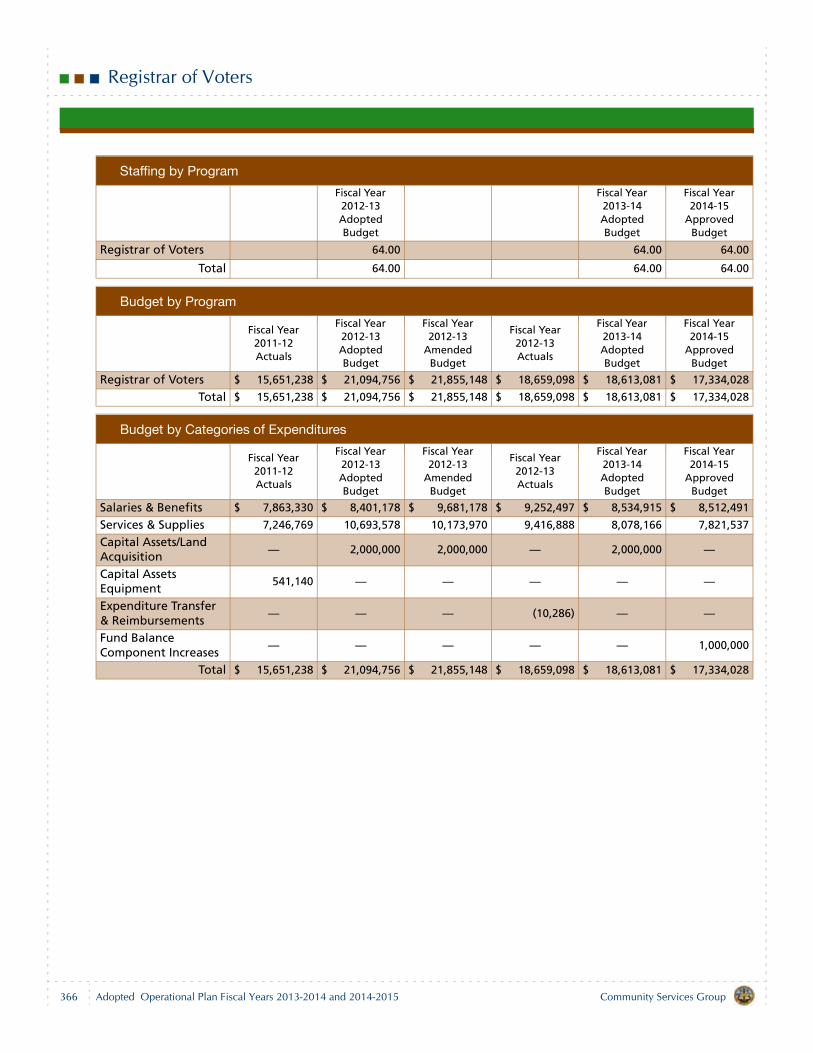
Registrar of Voters
Staffing by Program
Fiscal Year 2012-13 Adopted Budget
Fiscal Year 2013-14 Adopted Budget
Fiscal Year 2014-15
Approved Budget
Registrar of Voters 64.00 64.00 64.00
Total 64.00 64.00 64.00
Budget by Program
Fiscal Year 2011-12 Actuals
Fiscal Year 2012-13 Adopted Budget
Fiscal Year 2012-13
Amended Budget
Fiscal Year 2012-13 Actuals
Fiscal Year 2013-14 Adopted Budget
Fiscal Year 2014-15
Approved Budget
Registrar of Voters $ 15,651,238 $ 21,094,756 $ 21,855,148 $ 18,659,098 $ 18,613,081 $ 17,334,028
Total $ 15,651,238 $ 21,094,756 $ 21,855,148 $ 18,659,098 $ 18,613,081 $ 17,334,028
Budget by Categories of Expenditures
Fiscal Year 2011-12 Actuals
Fiscal Year 2012-13 Adopted Budget
Fiscal Year 2012-13
Amended Budget
Fiscal Year 2012-13 Actuals
Fiscal Year 2013-14 Adopted Budget
Fiscal Year 2014-15
Approved Budget
Salaries & Benefits $ 7,863,330 $ 8,401,178 $ 9,681,178 $ 9,252,497 $ 8,534,915 $ 8,512,491
Services & Supplies 7,246,769 10,693,578 10,173,970 9,416,888 8,078,166 7,821,537
Capital Assets/Land Acquisition
— 2,000,000 2,000,000 — 2,000,000 —
Capital Assets Equipment
541,140 — — — — —
Expenditure Transfer & Reimbursements
— — — (10,286) — —
Fund Balance Component Increases
— — — — — 1,000,000
Total $ 15,651,238 $ 21,094,756 $ 21,855,148 $ 18,659,098 $ 18,613,081 $ 17,334,028
366 Community Services GroupAdopted Operational Plan Fiscal Years 2013-2014 and 2014-2015
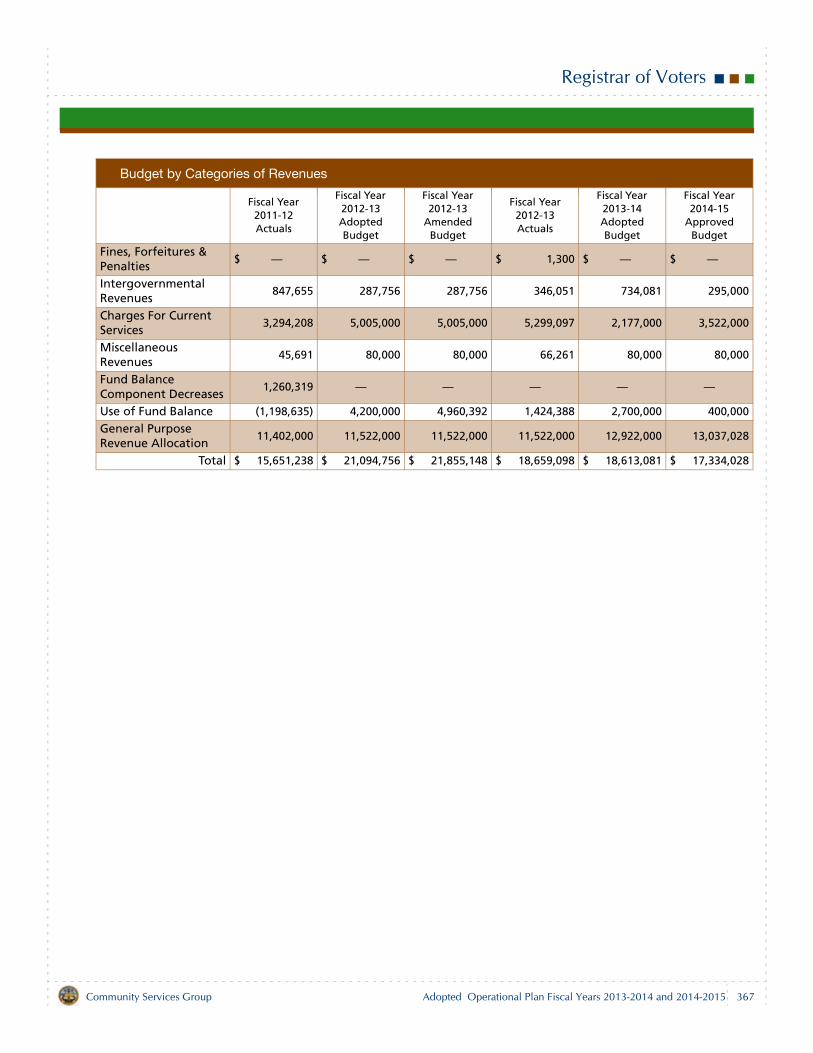
Registrar of Voters
Budget by Categories of Revenues
Fiscal Year 2011-12 Actuals
Fiscal Year 2012-13 Adopted Budget
Fiscal Year 2012-13
Amended Budget
Fiscal Year 2012-13 Actuals
Fiscal Year 2013-14 Adopted Budget
Fiscal Year 2014-15
Approved Budget
Fines, Forfeitures & Penalties
$ — $ — $ — $ 1,300 $ — $ —
Intergovernmental Revenues
847,655 287,756 287,756 346,051 734,081 295,000
Charges For Current Services
3,294,208 5,005,000 5,005,000 5,299,097 2,177,000 3,522,000
Miscellaneous Revenues
45,691 80,000 80,000 66,261 80,000 80,000
Fund Balance Component Decreases
1,260,319 — — — — —
Use of Fund Balance (1,198,635) 4,200,000 4,960,392 1,424,388 2,700,000 400,000
General Purpose Revenue Allocation
11,402,000 11,522,000 11,522,000 11,522,000 12,922,000 13,037,028
Total $ 15,651,238 $ 21,094,756 $ 21,855,148 $ 18,659,098 $ 18,613,081 $ 17,334,028
367Community Services Group Adopted Operational Plan Fiscal Years 2013-2014 and 2014-2015

County of San Diego
Finance and General Government Group
Finance and General Government Group & Executive Office 371
Board of Supervisors 379
Assessor/Recorder/County Clerk 385
Treasurer-Tax Collector 391
Chief Administrative Office 399
Auditor and Controller 411
County Technology Office 419
Civil Service Commission 425
Clerk of the Board of Supervisors 429
County Counsel 435
Grand Jury 441
Human Resources 443
County Communications Office 447

Finance and General Government Group & Executive Office
Group Description
The Finance and General Government Group providesessential support services and infrastructure to externalcustomers and the County organization that enablesachievement of the goals laid out in the County’s StrategicPlan and adherence to the General Management System(GMS). The Finance and General Government Groupmaintains and continually strengthens the financialbackbone of County operations and bears responsibility forhuman resources, technology, communications, legal,legislative and other key government functions. Services areprovided to internal and external customers based on thefollowing principles that align with the RequiredDisciplines for Excellence:
Consistent and fair administration of laws, regulationsand policies.Targeted and effective training and support to ensurethat employees are informed of laws and regulations.Genuine respect for fiduciary duties as stewards oftaxpayer resources.Maintenance of a skilled, adaptable and diverseworkforce focused on employee development andgrowth as knowledge workers prepared to serve theneeds of today and tomorrow.Use of enabling technologies to improve businessprocesses and operational excellence.Commitment to demonstrating the value of theservices provided to County departments and thepublic, through performance monitoring andmanagement.Active efforts to identify significant needs, challengesand risks through long-range strategic planning
Finance and General Government Group Departments
Assessor/Recorder/County ClerkTreasurer-Tax CollectorChief Administrative OfficeAuditor and ControllerCounty Technology OfficeCivil Service Commission
Clerk of the Board of SupervisorsCounty CounselGrand JuryHuman ResourcesCounty Communications Office
Mission Statement
To provide timely, accurate, efficient and effective financial,legislative and general government services to residents,local public agencies, County departments and individualCounty employees that are consistent with federal, Stateand local requirements.
2012-13 Accomplishments
Required Discipline for Excellence – Fiscal StabilityEngaged 23 of 25 existing bargaining units within 8 of 9existing employee organizations in the collective bar-gaining process. Continuing negotiations toward reso-lution of the bargaining process.To continue to fund the delivery of superior servicesthroughout the San Diego County region, the Treasurer-Tax Collector invested public monies held in the Trea-sury and maximized cash resources, without sacrificingthe principles of safety or liquidity, for a yield of 0.45%in Fiscal Year 2012-13.Arranged financing for the construction of a parkingfacility at the intersection of Cedar Street and KettnerBoulevard, including the sale of $27.8 million in long-term obligations. The parking facility has been plannedin conjunction with the County Administration Center(CAC) Waterfront Park.
371Finance and General Government Group Adopted Operational Plan Fiscal Years 2013-2014 and 2014-2015
Finance and General Government Group & Executive Office
Required Discipline for Excellence – Accountability, Transparency and Ethical Conduct
Submitted 100% (1,572) of federal, State and localfinancial reports and annual financial statements thatcomply with regulations and reporting standards forCounty departments, outside government agencies,investors and taxpayers by their due dates to ensureaccountability and transparency of financial transac-tions.Provided open access to County business by making47 audio recordings of Board of Supervisors meetingsavailable on the Internet in a timely manner.
Required Discipline for Excellence – Information Services
Implemented the Mobile Applications DevelopmentPlatform (MADP) to facilitate the development anddeployment of mobile applications. The full productionrelease was completed in February 2013 and is cur-rently under County Technology Office (CTO) PlatformSupport.The transition to a new web-based office practice man-agement system (Tymetrix’s T360), which manages allcase and advisory information, has calendaring capa-bilities, retains client and contract information, storessupporting legal documents, and tracks time and bill-ing information, was delayed due to a system designchange initiated by the vendor. Delaying the projectminimized the additional costs that would have beenincurred from the necessity to re-train staff on the newuser-interface design once it was implemented. Thenew system will be implemented in Fiscal Year 2013-14.
2013-15 Objectives
Strategic Initiative – Healthy FamiliesCounty Counsel will provide effective legal services tothe Health and Human Service Agency (HHSA) in mat-ters relating to children who have been dependents ofthe Juvenile Court.
Prevail in 98% or more of Juvenile Dependencypetitions filed in Superior Court.Prevail in 95% or more of Juvenile Dependencyappeals and writs filed.
Strategic Initiative – Safe CommunitiesCounty Communications Office will participate in atleast two drills each fiscal year to prepare for andrespond to major natural or man-made disastersimpacting the San Diego County region. Provide accu-
rate and timely emergency and recovery information tothe public and media, using a wide variety of traditionaland new media tools, such as the County’s new emer-gency website, social media, news releases, video andmobile technology.
Required Discipline for Excellence – Information Services
Full system implementation of the new integratedrecording and vital records system is scheduled tooccur by June 2014. This will allow the Assessor/Recorder/County Clerk to leverage necessary newtechnologies in order to maintain a high level of fiscalstability and service to citizens.Develop and implement an upgrade to the County’score Human Resources software application toimprove operational efficiency in personnel recordmanagement, by December 2014.
Required Discipline for Excellence – Fiscal StabilityMaintain the County’s strong issuer credit ratings ofAa1 (GSR) (Moody’s Investors Service), AAA (Standard& Poor’s) and AAA (Fitch Ratings) to ensure lower debtinterest costs.To continue to fund the delivery of superior servicesthroughout the San Diego County region, the Treasurer-Tax Collector will invest public monies held in the Trea-sury and maximize cash resources, without sacrificingthe principles of safety or liquidity, for an anticipatedweighted average rate of return of 0.55% in Fiscal Year2013-14 and 0.60% in Fiscal Year 2014-15.Accurately identify current and future revenue, as costand cash flow trends, in a timely manner in order tofacilitate allocation of limited resources to Countygroups and departments.
Related Links
For more information on the Finance and General Govern-ment Group, refer to the website at www.sdcounty.ca.gov/fg3.
Executive Office Budget Changes and Operational Impact: 2012-13 to 2013-14
StaffingIncrease of 14.00 staff years to reflect the transfer of exist-ing positions from the Auditor & Controller to the ExecutiveOffice to improve alignment of divisional functions withinthe organization. The increase includes 13.00 staff yearsfrom the Office of Financial Planning and 1.00 staff year
372 Finance and General Government GroupAdopted Operational Plan Fiscal Years 2013-2014 and 2014-2015
Finance and General Government Group & Executive Office
from the Auditor & Controller Administration Division. A cor-responding decrease is reflected in the Auditor & Control-ler’s staffing levels.
ExpendituresIncrease of $20.8 million.
Salaries and Benefits — increase of $2.1 million primar-ily due to the staffing transfers described above. Theincrease also includes a $0.2 million managementinternship program to be funded by the ExecutiveOffice for one year. Services and Supplies — increase of $12.7 million, pri-marily for information technology implementation proj-ects.
Increase of $8.0 million for a scheduled upgrade ofthe County’s human resource information system.Increase of $2.0 million for data servers and storagerequired for enterprise resource planning (ERP)systems.Increase of $1.5 million for County AdministrationCenter (CAC) facility maintenance and repair.Increase of $0.8 million for information technologycosts transferred from Auditor & Controller inreorganization mentioned above.Increase of $0.3 million for documentation ofspecifications and plans to complete scheduledupgrade of County’s labor timekeeping system.Increase of $0.3 million to reflect reallocation ofinformation technology contractual costs.Corresponding decreases are reflected in otherCounty departments due to reallocation.Decrease of $0.2 million in various services andsupplies accounts based on estimated usage.
Management Reserves — increase of $6.0 million forpotential costs associated with the County’s IntegratedProperty Tax System (IPTS), which is scheduled tobegin production operations in early 2014.
RevenuesNet increase of $20.8 million.
Charges for Current Services — increase of $0.4 millionrelated to external department overhead payments (A-87) charged to other governmental entities primarily forERP support.Use of Fund Balance — increase of $17.3 million for atotal of $20.5 million. Total uses of fund balanceinclude:
$8.0 million for a scheduled upgrade of the County’shuman resource information system.$6.0 million in potential costs associated with IPTS,pending scheduled production operations in early2014. $2.5 million for unanticipated IT costs and groupneeds.$2.0 million for increase in ERP data servers andstorage pending stabilization of ongoing expenditurelevels.$1.5 million for increases in CAC facility maintenanceand repair costs.$0.2 million for a one-year management internshipprogram.$0.3 million for documentation and preparation forscheduled upgrade of labor timekeeping system.
General Purpose Revenue Allocation — increase of$3.1 million, including $2.7 million for transfer of staff-ing and related functions from Auditor & Controllermentioned above, $0.2 million for increase in realloca-tion of ongoing IT contract costs mentioned above, and$0.2 million for various other increases in services &supplies throughout the department.
Executive Office Budget Changes and Operational Impact: 2013-14 to 2014-15
Net decrease of $11.5 million is mainly attributable todecreases in the planned use of fund balance for informa-tion technology projects. No change in staffing for FiscalYear 2014-15.
373Finance and General Government Group Adopted Operational Plan Fiscal Years 2013-2014 and 2014-2015
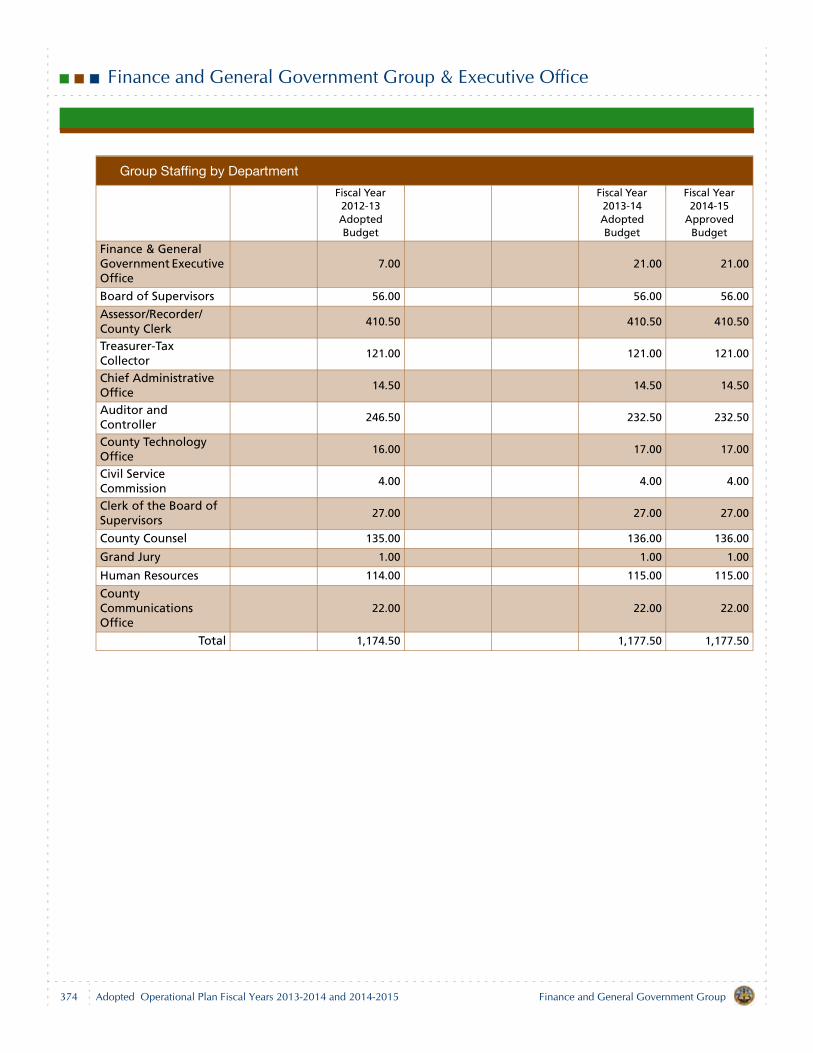
Finance and General Government Group & Executive Office
Group Staffing by Department
Fiscal Year 2012-13 Adopted Budget
Fiscal Year 2013-14 Adopted Budget
Fiscal Year 2014-15
Approved Budget
Finance & General Government Executive Office
7.00 21.00 21.00
Board of Supervisors 56.00 56.00 56.00
Assessor/Recorder/County Clerk
410.50 410.50 410.50
Treasurer-Tax Collector
121.00 121.00 121.00
Chief Administrative Office
14.50 14.50 14.50
Auditor and Controller
246.50 232.50 232.50
County Technology Office
16.00 17.00 17.00
Civil Service Commission
4.00 4.00 4.00
Clerk of the Board of Supervisors
27.00 27.00 27.00
County Counsel 135.00 136.00 136.00
Grand Jury 1.00 1.00 1.00
Human Resources 114.00 115.00 115.00
County Communications Office
22.00 22.00 22.00
Total 1,174.50 1,177.50 1,177.50
374 Finance and General Government GroupAdopted Operational Plan Fiscal Years 2013-2014 and 2014-2015
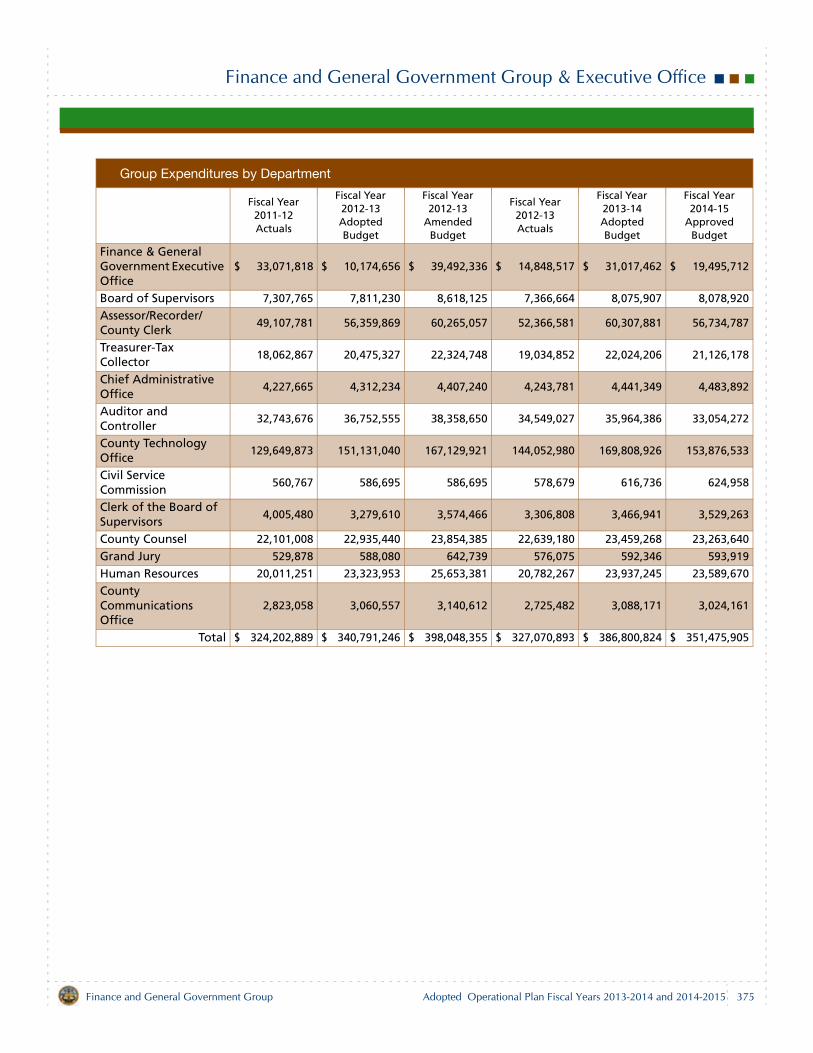
Finance and General Government Group & Executive Office
Group Expenditures by Department
Fiscal Year 2011-12 Actuals
Fiscal Year 2012-13 Adopted Budget
Fiscal Year 2012-13
Amended Budget
Fiscal Year 2012-13 Actuals
Fiscal Year 2013-14 Adopted Budget
Fiscal Year 2014-15
Approved Budget
Finance & General Government Executive Office
$ 33,071,818 $ 10,174,656 $ 39,492,336 $ 14,848,517 $ 31,017,462 $ 19,495,712
Board of Supervisors 7,307,765 7,811,230 8,618,125 7,366,664 8,075,907 8,078,920
Assessor/Recorder/County Clerk
49,107,781 56,359,869 60,265,057 52,366,581 60,307,881 56,734,787
Treasurer-Tax Collector
18,062,867 20,475,327 22,324,748 19,034,852 22,024,206 21,126,178
Chief Administrative Office
4,227,665 4,312,234 4,407,240 4,243,781 4,441,349 4,483,892
Auditor and Controller
32,743,676 36,752,555 38,358,650 34,549,027 35,964,386 33,054,272
County Technology Office
129,649,873 151,131,040 167,129,921 144,052,980 169,808,926 153,876,533
Civil Service Commission
560,767 586,695 586,695 578,679 616,736 624,958
Clerk of the Board of Supervisors
4,005,480 3,279,610 3,574,466 3,306,808 3,466,941 3,529,263
County Counsel 22,101,008 22,935,440 23,854,385 22,639,180 23,459,268 23,263,640
Grand Jury 529,878 588,080 642,739 576,075 592,346 593,919
Human Resources 20,011,251 23,323,953 25,653,381 20,782,267 23,937,245 23,589,670
County Communications Office
2,823,058 3,060,557 3,140,612 2,725,482 3,088,171 3,024,161
Total $ 324,202,889 $ 340,791,246 $ 398,048,355 $ 327,070,893 $ 386,800,824 $ 351,475,905
375Finance and General Government Group Adopted Operational Plan Fiscal Years 2013-2014 and 2014-2015
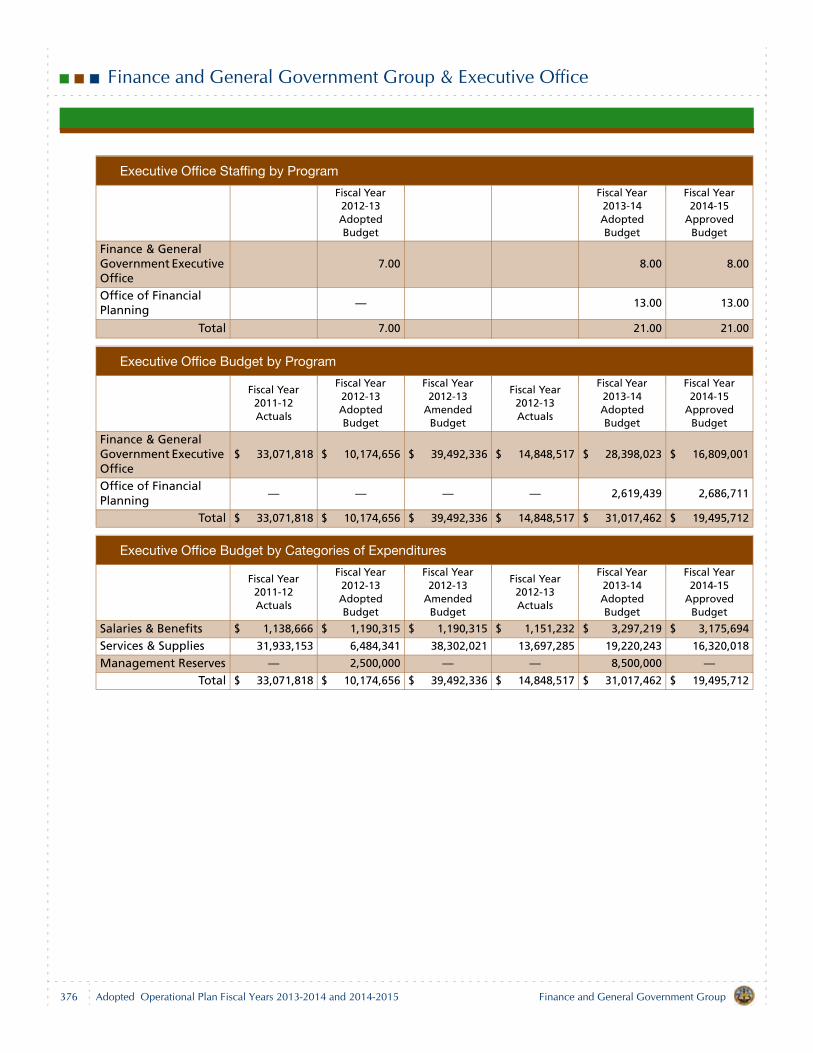
Finance and General Government Group & Executive Office
Executive Office Staffing by Program
Fiscal Year 2012-13 Adopted Budget
Fiscal Year 2013-14 Adopted Budget
Fiscal Year 2014-15
Approved Budget
Finance & General Government Executive Office
7.00 8.00 8.00
Office of Financial Planning
— 13.00 13.00
Total 7.00 21.00 21.00
Executive Office Budget by Program
Fiscal Year 2011-12 Actuals
Fiscal Year 2012-13 Adopted Budget
Fiscal Year 2012-13
Amended Budget
Fiscal Year 2012-13 Actuals
Fiscal Year 2013-14 Adopted Budget
Fiscal Year 2014-15
Approved Budget
Finance & General Government Executive Office
$ 33,071,818 $ 10,174,656 $ 39,492,336 $ 14,848,517 $ 28,398,023 $ 16,809,001
Office of Financial Planning
— — — — 2,619,439 2,686,711
Total $ 33,071,818 $ 10,174,656 $ 39,492,336 $ 14,848,517 $ 31,017,462 $ 19,495,712
Executive Office Budget by Categories of Expenditures
Fiscal Year 2011-12 Actuals
Fiscal Year 2012-13 Adopted Budget
Fiscal Year 2012-13
Amended Budget
Fiscal Year 2012-13 Actuals
Fiscal Year 2013-14 Adopted Budget
Fiscal Year 2014-15
Approved Budget
Salaries & Benefits $ 1,138,666 $ 1,190,315 $ 1,190,315 $ 1,151,232 $ 3,297,219 $ 3,175,694
Services & Supplies 31,933,153 6,484,341 38,302,021 13,697,285 19,220,243 16,320,018
Management Reserves — 2,500,000 — — 8,500,000 —Total $ 33,071,818 $ 10,174,656 $ 39,492,336 $ 14,848,517 $ 31,017,462 $ 19,495,712
376 Finance and General Government GroupAdopted Operational Plan Fiscal Years 2013-2014 and 2014-2015

Finance and General Government Group & Executive Office
Executive Office Budget by Categories of Revenues
Fiscal Year 2011-12 Actuals
Fiscal Year 2012-13 Adopted Budget
Fiscal Year 2012-13
Amended Budget
Fiscal Year 2012-13 Actuals
Fiscal Year 2013-14 Adopted Budget
Fiscal Year 2014-15
Approved Budget
Revenue From Use of Money & Property
$ 130,040 $ 20,000 $ 20,000 $ 109,454 $ 10,000 $ 10,000
Intergovernmental Revenues
14,947 19,156 19,156 17,646 29,551 29,551
Charges For Current Services
471,990 537,622 537,622 497,531 923,639 923,639
Miscellaneous Revenues
3,740 — — 5,262 — —
Use of Fund Balance 28,144,507 3,223,690 32,541,370 7,844,436 20,558,000 8,820,000
General Purpose Revenue Allocation
4,306,593 6,374,188 6,374,188 6,374,188 9,496,272 9,712,522
Total $ 33,071,818 $ 10,174,656 $ 39,492,336 $ 14,848,517 $ 31,017,462 $ 19,495,712
377Finance and General Government Group Adopted Operational Plan Fiscal Years 2013-2014 and 2014-2015

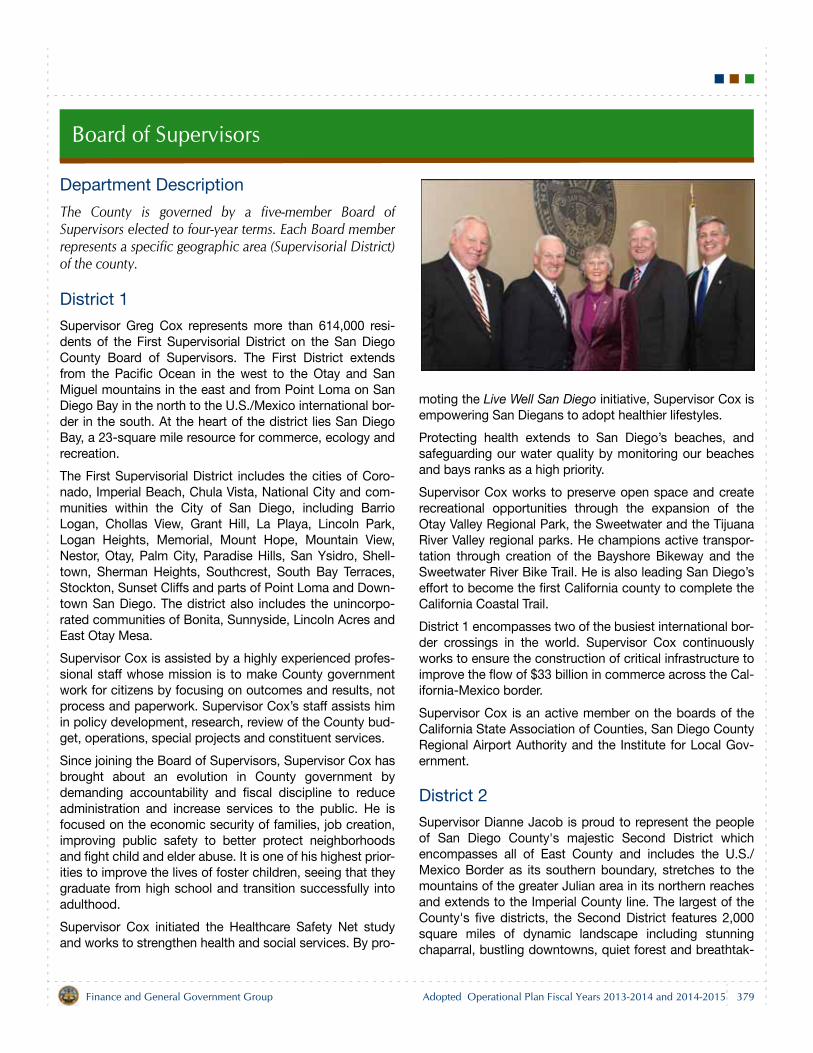
Board of Supervisors
Department Description
The County is governed by a five-member Board ofSupervisors elected to four-year terms. Each Board memberrepresents a specific geographic area (Supervisorial District)of the county.
District 1
Supervisor Greg Cox represents more than 614,000 resi-dents of the First Supervisorial District on the San DiegoCounty Board of Supervisors. The First District extendsfrom the Pacific Ocean in the west to the Otay and SanMiguel mountains in the east and from Point Loma on SanDiego Bay in the north to the U.S./Mexico international bor-der in the south. At the heart of the district lies San DiegoBay, a 23-square mile resource for commerce, ecology andrecreation.
The First Supervisorial District includes the cities of Coro-nado, Imperial Beach, Chula Vista, National City and com-munities within the City of San Diego, including BarrioLogan, Chollas View, Grant Hill, La Playa, Lincoln Park,Logan Heights, Memorial, Mount Hope, Mountain View,Nestor, Otay, Palm City, Paradise Hills, San Ysidro, Shell-town, Sherman Heights, Southcrest, South Bay Terraces,Stockton, Sunset Cliffs and parts of Point Loma and Down-town San Diego. The district also includes the unincorpo-rated communities of Bonita, Sunnyside, Lincoln Acres andEast Otay Mesa.
Supervisor Cox is assisted by a highly experienced profes-sional staff whose mission is to make County governmentwork for citizens by focusing on outcomes and results, notprocess and paperwork. Supervisor Cox’s staff assists himin policy development, research, review of the County bud-get, operations, special projects and constituent services.
Since joining the Board of Supervisors, Supervisor Cox hasbrought about an evolution in County government bydemanding accountability and fiscal discipline to reduceadministration and increase services to the public. He isfocused on the economic security of families, job creation,improving public safety to better protect neighborhoodsand fight child and elder abuse. It is one of his highest prior-ities to improve the lives of foster children, seeing that theygraduate from high school and transition successfully intoadulthood.
Supervisor Cox initiated the Healthcare Safety Net studyand works to strengthen health and social services. By pro-
moting the Live Well San Diego initiative, Supervisor Cox isempowering San Diegans to adopt healthier lifestyles.
Protecting health extends to San Diego’s beaches, andsafeguarding our water quality by monitoring our beachesand bays ranks as a high priority.
Supervisor Cox works to preserve open space and createrecreational opportunities through the expansion of theOtay Valley Regional Park, the Sweetwater and the TijuanaRiver Valley regional parks. He champions active transpor-tation through creation of the Bayshore Bikeway and theSweetwater River Bike Trail. He is also leading San Diego’seffort to become the first California county to complete theCalifornia Coastal Trail.
District 1 encompasses two of the busiest international bor-der crossings in the world. Supervisor Cox continuouslyworks to ensure the construction of critical infrastructure toimprove the flow of $33 billion in commerce across the Cal-ifornia-Mexico border.
Supervisor Cox is an active member on the boards of theCalifornia State Association of Counties, San Diego CountyRegional Airport Authority and the Institute for Local Gov-ernment.
District 2
Supervisor Dianne Jacob is proud to represent the peopleof San Diego County's majestic Second District whichencompasses all of East County and includes the U.S./Mexico Border as its southern boundary, stretches to themountains of the greater Julian area in its northern reachesand extends to the Imperial County line. The largest of theCounty's five districts, the Second District features 2,000square miles of dynamic landscape including stunningchaparral, bustling downtowns, quiet forest and breathtak-
379Finance and General Government Group Adopted Operational Plan Fiscal Years 2013-2014 and 2014-2015
Board of Supervisors
ing desert. Home to more than 630,000 residents, includingmore than 270,000 unincorporated residents, the SecondDistrict has more unincorporated area residents than theother four districts combined. For this reason, many resi-dents depend on County government for nearly all localpublic services and have more contact with their supervisorthan in more urban districts.
The public's safety, stronger fire protection, new libraries,ball fields, recreational opportunities and a fiscally soundCounty government have been the hallmarks of SupervisorJacob's leadership. She helped transform a county on thebrink of bankruptcy into a strong, lean, service-driven orga-nization that puts taxpayers first. Even before the CedarFire in 2003, Supervisor Jacob was working with rural fireagencies to improve fire protection and emergency medicalservices in rural areas where the threat of wildfire is themost severe. Since 2003, County government has investedmore than $250 million to make the region safer from wild-fire. A former teacher, Supervisor Jacob has long made kidsa top priority. Whether it's expanding health care coveragefor young children or building and improving places for kidsto play, Supervisor Jacob believes safe and healthy kidsrepresent the district's bright future.
The Second District includes the unincorporated communi-ties of Alpine, Boulevard, Campo, Casa de Oro, Crest,Cuyamaca, Dehesa, Descanso, Dulzura, Granite Hills, Gua-tay, Harbison Canyon, Jacumba, Jamul, Julian, LakeMorena, Lakeside, Mount Laguna, Mount Helix, Pine Hills,Pine Valley, Potrero, Ramona, Rancho San Diego, SanPasqual, Santa Ysabel, Shelter Valley, Spring Valley, Tecate,Vallecitos and Wynola, as well as the Indian Reservations ofBarona, Campo, Ewiiaapaayp, Inaja/Cosmit, Jamul, LaPosta, Manzanita, Mesa Grande, Santa Ysabel, Sycuan andViejas. The Second District encompasses the cities of ElCajon, La Mesa, Lemon Grove, Santee, Poway and thecommunities of Allied Gardens, College Area, Del Cerro,Grantville, Navajo, Rolando and San Carlos in the City ofSan Diego.
District 3
Supervisor Dave Roberts represents a district that stretchesfrom the coastline to the inland valleys and includesresearch centers, a military base, bedroom communitiesand major employment centers. By adhering to the county’sGeneral Management System, Supervisor Roberts pro-motes strong fiscal discipline, a clean environment, andabove all, safe and livable communities. He is an activesupporter of libraries, parks and job creation.
With nearly 630,000 residents, District 3 overlays all or por-tions of five incorporated cities, including nearly a dozendistinct communities within the city of San Diego.
District 3 takes in coastal communities from Torrey PinesState Beach through Encinitas. At the southwest boundaryof the district is Sorrento Valley and Torrey Pines Mesa, ahub of biotech, high-tech and pharmaceutical research,where companies make everything from wireless devices toalgae-based motor fuel. This portion of the district includesthe cities of Del Mar, Solana Beach and Encinitas. Thesecities receive law enforcement, library and other servicesfrom the County of San Diego.
Along the coastline, Supervisor Roberts has championedefforts to restore and enhance many miles of beaches,coastal lagoons and watersheds. He has participated in amulti-agency effort to restore the San Dieguito wetlandsand has promoted the development of a pedestrian trailalong the railroad right-of-way. He believes in helping tostimulate the economy, and in good, common sense devel-opment. The supervisor is a champion of solar power, andstrict laws protecting victims of domestic violence. Hebelieves in strong Sheriff and fire protection.
District 3 bridges the coast to the inland corridor by way ofMira Mesa, where Qualcomm, Inc. – the region’s largest pri-vate-sector employer – is headquartered. The northeastcorner of District 3 includes historic Escondido as well asSan Pasqual Valley, communities with rich agriculturalroots. Just south of Escondido and Lake Hodges is RanchoBernardo, where multinational companies such as Sonyand Northrop Grumman employ many thousands of resi-dents. Moving south, District 3 includes the bedroom com-munities of Carmel Mountain Ranch, Scripps Ranch,Tierrasanta and Sabre Springs. The District also overlaysthe eastern portion of Marine Corps Air Station Miramar.
Supervisor Roberts works with all of these communities byrecommending county funding to support a host of publicsafety, tourism, business and social service groups at workwithin the many neighborhoods.
District 4
Supervisor Ron Roberts represents the Fourth SupervisorialDistrict, considered the most ethnically diverse district inSan Diego County. Approximately 630,000 people reside inthe district, which encompasses about half the populationof the city of San Diego. Since his election to the Board ofSupervisors in 1994, Supervisor Roberts has focused hisenergy on a wide variety of issues, from improving theplight of foster youth, assisting vulnerable seniors and
380 Finance and General Government GroupAdopted Operational Plan Fiscal Years 2013-2014 and 2014-2015
Board of Supervisors
enhancing public safety through technology, to supportinggrowing the regional economy and making sure that theCounty of San Diego remains one of the best-managedcounties in America.
Because all of the Fourth Supervisorial District is locatedwithin the city of San Diego, the bulk of municipal services,like street improvements, trash collection and tree trim-ming, fall under the jurisdiction of the San Diego City Coun-cil. In general, the Board of Supervisors is responsible forissues that are more regional in nature, such as publichealth, animal control, air quality, water quality, probationand operation of the jail system.
The Fourth Supervisorial District spans 100 square miles,extending north to UC San Diego, west to the PacificOcean, east to Encanto and south to Paradise Hills. Thedistrict also includes the neighborhoods of Adams North,Alta Vista, Bay Ho, Bay Park, Birdland, Castle, CherokeePoint, Chollas Creek, City Heights (where more than 30 lan-guages are spoken), Clairemont Mesa, Colina Del Sol, Cor-ridor, Cortez Hill, Crown Point, El Cerrito, East Village,Emerald Hills, Encanto, Fairmount Park, Fairmount Village,Gaslamp Quarter, Golden Hill, Hillcrest, Jamacha Lomita,Kearny Mesa, Kensington, La Jolla, Liberty Station, LindaVista, Little Italy, Loma Portal, Marina, Middletown, Midway,Mission Beach, Mission Hills, Mission Valley, Morena, Nor-mal Heights, North Park, Oak Park, Ocean Beach, PacificBeach, Park West, Redwood Village, Serra Mesa, Skyline,South Park, Swan Canyon, Talmadge Park, UniversityHeights, Valencia Park and Webster. Points of interestwithin the district include Old Town State Historic Park, Bal-boa Park, Ocean Beach Pier, Mission Bay, the Children’sPool in La Jolla and the world-famous San Diego Zoo.
District 5
Supervisor Bill Horn has represented the Fifth District sincehis election to the Board of Supervisors in 1994. The districtcovers the northern most area of San Diego County, andstretches from the wave-swept sands of the Oceansidecoast, to the pine-topped hills of the Palomar MountainRange and beyond to the expanses of the Anza-BorregoDesert. The district, with nearly 1,800 square miles, is a vastresource of nature, industry, resorts, golf courses, fine res-taurants and agriculture. Currently, approximately 630,000people reside in the Fifth District. Efficient and friendly ser-vice is a top priority for Supervisor Horn. His staff assistswith research, development and analysis of the Countybudget, operations, and policies in addition to respondingto the needs of constituents and supporting SupervisorHorn in his contact with the public. Supervisor Horn is
proud of the district’s access to health care, public safetyresources, improved methods of protecting the public fromsexual predators, emergency preparedness and strongrelationships with faith-based organizations.
Within the Fifth District are the cities of Oceanside, Carls-bad, Vista, and San Marcos, as well as Marine Corps BaseCamp Pendleton. The district includes the unincorporatedcommunities of Agua Caliente, Bear Valley, Birch Hill, Bon-sall, Borrego Springs, Buena, De Luz, Eagles Nest, ElfinForest, Fairbanks Ranch, Fallbrook, Gopher Canyon, Har-mony Grove, Hidden Meadows, Jesmond Dene, La JollaAmago, Lake Henshaw, Lake San Marcos, Lake Wohlford,Lilac, Morettis, Oak Grove, Ocotillo Wells, Pala, PalomarMountain, Pauma Valley, Rainbow, Ranchita, Rancho SantaFe, San Felipe, San Ignacio, San Luis Rey, Sunshine Sum-mit, Twin Oaks Valley, Valley Center, Warner Springs, andWinterwarm. The district is also home to the Indian Reser-vations of La Jolla, Los Coyotes, Mesa Grande, Pala,Pauma/Yuima, Rincon, Santa Ysabel and San Pasqual.Also within the district boundaries are vast areas of NationalForest, State Park lands, the San Onofre Nuclear Generat-ing Station and the United States Naval Weapons Station atFallbrook.
Supervisor Horn is an avocado rancher and citrus grower,so agriculture remains close to his heart. Agriculture is amajor industry in the Fifth District and the San Diego region,bringing in more than $5.1 billion in annual value to the localeconomy. Summits and valleys are covered with groves ofavocado and citrus trees. Decorative flowers, grown com-mercially, paint the hills of Carlsbad each year with a rain-bow of colors. Elsewhere, cattlemen tend their herds in theoak-studded inland valley, and farmers plant and harvesttheir crops that include strawberries and tomatoes. Inspringtime, wildflowers carpet the Anza-Borrego Desert.With water availability and distribution a critical need in theregion, Supervisor Horn has been a leader in finding solu-tions to the water crisis.
Innovation, tourism and specialized manufacturing are notonly thriving but are the future in the Fifth District. Addition-ally, the biotechnology industry has firmly established itselfin the District, providing high-paying jobs to thousands ofworkers. North County is also becoming a regional power-house for higher education and healthcare, as the CaliforniaState University San Marcos campus continues to growand the $1 billion, 740,000 square foot Palomar MedicalCenter was finally opened in 2012. Over half of the County’s1,932 miles of roads are located in District 5, and over thenext forty years North County is expected to implementanother $11.5 billion in transit and highway infrastructure.Under the leadership of Supervisor Horn, plans to expand
381Finance and General Government Group Adopted Operational Plan Fiscal Years 2013-2014 and 2014-2015
Board of Supervisors
McClellan-Palomar Airport, a crucial economic driver forNorth County, are being developed. He has also createdorganizations, such as Prosperity on Purpose, to generatenew opportunities and secure economic developmentfunds for North County. Supervisor Horn is committed toprotecting property rights, creating jobs, ensuring publicsafety, balancing growth, eliminating traffic congestion andpreserving our natural resources.
Related Links
For additional information about the Board of Supervisors,refer to the website at www.sdcounty.ca.gov/general/bos.html.
382 Finance and General Government GroupAdopted Operational Plan Fiscal Years 2013-2014 and 2014-2015
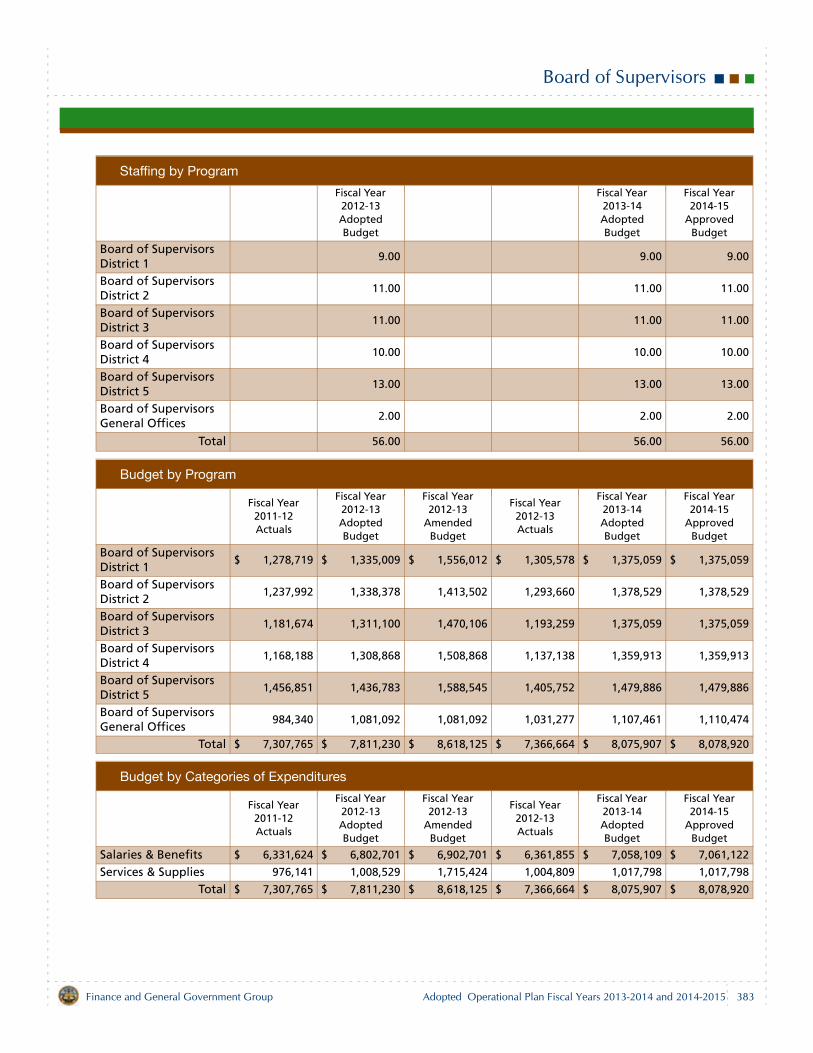
Board of Supervisors
Staffing by Program
Fiscal Year 2012-13 Adopted Budget
Fiscal Year 2013-14 Adopted Budget
Fiscal Year 2014-15
Approved Budget
Board of Supervisors District 1
9.00 9.00 9.00
Board of Supervisors District 2
11.00 11.00 11.00
Board of Supervisors District 3
11.00 11.00 11.00
Board of Supervisors District 4
10.00 10.00 10.00
Board of Supervisors District 5
13.00 13.00 13.00
Board of Supervisors General Offices
2.00 2.00 2.00
Total 56.00 56.00 56.00
Budget by Program
Fiscal Year 2011-12 Actuals
Fiscal Year 2012-13 Adopted Budget
Fiscal Year 2012-13
Amended Budget
Fiscal Year 2012-13 Actuals
Fiscal Year 2013-14 Adopted Budget
Fiscal Year 2014-15
Approved Budget
Board of Supervisors District 1
$ 1,278,719 $ 1,335,009 $ 1,556,012 $ 1,305,578 $ 1,375,059 $ 1,375,059
Board of Supervisors District 2
1,237,992 1,338,378 1,413,502 1,293,660 1,378,529 1,378,529
Board of Supervisors District 3
1,181,674 1,311,100 1,470,106 1,193,259 1,375,059 1,375,059
Board of Supervisors District 4
1,168,188 1,308,868 1,508,868 1,137,138 1,359,913 1,359,913
Board of Supervisors District 5
1,456,851 1,436,783 1,588,545 1,405,752 1,479,886 1,479,886
Board of Supervisors General Offices
984,340 1,081,092 1,081,092 1,031,277 1,107,461 1,110,474
Total $ 7,307,765 $ 7,811,230 $ 8,618,125 $ 7,366,664 $ 8,075,907 $ 8,078,920
Budget by Categories of Expenditures
Fiscal Year 2011-12 Actuals
Fiscal Year 2012-13 Adopted Budget
Fiscal Year 2012-13
Amended Budget
Fiscal Year 2012-13 Actuals
Fiscal Year 2013-14 Adopted Budget
Fiscal Year 2014-15
Approved Budget
Salaries & Benefits $ 6,331,624 $ 6,802,701 $ 6,902,701 $ 6,361,855 $ 7,058,109 $ 7,061,122
Services & Supplies 976,141 1,008,529 1,715,424 1,004,809 1,017,798 1,017,798
Total $ 7,307,765 $ 7,811,230 $ 8,618,125 $ 7,366,664 $ 8,075,907 $ 8,078,920
383Finance and General Government Group Adopted Operational Plan Fiscal Years 2013-2014 and 2014-2015
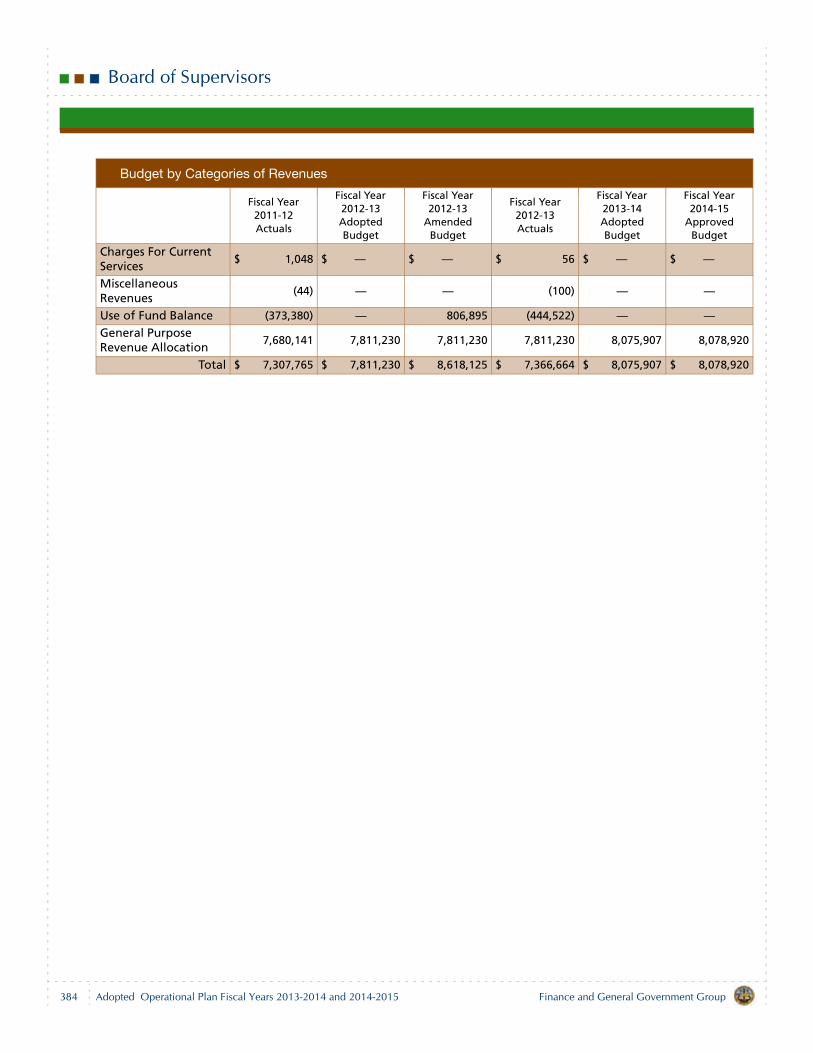
Board of Supervisors
Budget by Categories of Revenues
Fiscal Year 2011-12 Actuals
Fiscal Year 2012-13 Adopted Budget
Fiscal Year 2012-13
Amended Budget
Fiscal Year 2012-13 Actuals
Fiscal Year 2013-14 Adopted Budget
Fiscal Year 2014-15
Approved Budget
Charges For Current Services
$ 1,048 $ — $ — $ 56 $ — $ —
Miscellaneous Revenues
(44) — — (100) — —
Use of Fund Balance (373,380) — 806,895 (444,522) — —General Purpose Revenue Allocation
7,680,141 7,811,230 7,811,230 7,811,230 8,075,907 8,078,920
Total $ 7,307,765 $ 7,811,230 $ 8,618,125 $ 7,366,664 $ 8,075,907 $ 8,078,920
384 Finance and General Government GroupAdopted Operational Plan Fiscal Years 2013-2014 and 2014-2015
Assessor/Recorder/County Clerk
Department Description
The Assessor is mandated by the Constitution of the State ofCalifornia to locate, identify and establish values for allvacant land, improved real estate, business property andcertain mobile homes, boats and aircraft. In addition, theAssessor maintains records on all taxable properties withinthe boundaries of the County of San Diego, includingmaintaining maps of all real property parcels. The Recorderis mandated by the Government Code to examine, record,index and archive records submitted for recordation orfiling and to make available to the public all records in thecustody of the Recorder. The County Clerk is mandated bythe Government Code to issue and maintain a record offictitious business names, issue marriage licenses, offer civilmarriage ceremonies and provide certified copies of vitalrecords, including birth, death and marriage certificates.
Mission Statement
To provide prompt and courteous service to the public inaccomplishing the duties and responsibilities of the depart-ment; to have fair and uniform assessments of all taxableproperty in accordance with property tax laws; to providefor the orderly and expeditious recordation, archiving andretrieval of legal documents submitted and to provide forthe efficient distribution to the public.
2012-13 Accomplishments
Strategic Initiative – Sustainable EnvironmentsRecorded property ownership in a timely manner, facili-tating access to ownership information for the buying,selling and financing of property.Located, identified and appraised all property so thepublic and businesses are assured a fair and uniformassessment of their property under the auspices of allapplicable State property tax laws, rules and regula-tions.Recorded births, deaths, marriages and Fictitious Busi-ness Name statements in a timely manner to enable thepublic and businesses to establish identity in order toconduct their affairs.A Request for Proposal (RFP) was issued andresponses were received from multiple vendors toredact identity information from documents recorded
during the period 1990 through 2008 in order to complywith Government Code 27301a. Project to begin in Fis-cal Year 2013-14.
Required Discipline for Excellence - Fiscal StabilityCollected, distributed and accounted for all mandatedfees and transfer taxes so County departments, federaland State agencies, cities and special districts can ful-fill their legal responsibilities.Continued to review departmental fee structure toensure that costs for services are fully recovered.
Required Discipline for Excellence – Information Services
Continued system development, testing and trainingfor Phase I (Official Records) of the new integratedrecording and vital records system. Full system imple-mentation is scheduled to occur by June 2014, allow-ing the Assessor/Recorder/County Clerk (ARCC) toleverage necessary new technologies in order to main-tain a high level of fiscal stability and service to its citi-zens.Started required Department of Justice (DOJ) systemtesting for the electronic recording module and testingtransmission lines have been installed. Implementationof the electronic recording module will enable thedepartment to reduce document processing time andenhance customer service.Developed and implemented an internal ARCC Share-Point site, a file sharing application. Development ofthe external SharePoint site is underway and estimatedcompletion is scheduled for Fiscal Year 2013-14. Thiswill provide a consolidated venue for all departmentalservices and information for both staff and the public.
385Finance and General Government Group Adopted Operational Plan Fiscal Years 2013-2014 and 2014-2015
Assessor/Recorder/County Clerk
Required Discipline for Excellence – Customer Satisfaction
Provided the public with services that are of value tothem in a competent and professional manner andachieved a customer service rating of 93%. Initiated a customer service training program; 40% ofdepartmental staff have completed this training byJune 30, 2013. Provided the public with a variety of online forms andrelated services. This provides a more efficient andeffective level of customer service by leveraging the lat-est in online form processing and electronic signaturetechnology.Extended customer services at the Chula Vista branchoffice; began offering civil ceremonies in August 2012.Document recording services will be offered at thisbranch 3-6 months following full implementation of theelectronic recording system.
2013-15 Objectives
Strategic Initiative – Sustainable EnvironmentsRecord property ownership in a timely manner, facilitat-ing access to ownership information for the buying,selling and financing of property.Locate, identify and appraise all property so the publicand businesses are assured a fair and uniform assess-ment of their property under the auspices of all applica-ble State property tax laws, rules and regulations.Record births, deaths, marriages and Fictitious Busi-ness Name statements in a timely manner to enable thepublic and businesses to establish identity in order toconduct their affairs.Complete Birth, Death and Marriage Backfile ImagingProject to electronically preserve critical recorded doc-uments and vital records. Project to be completed inFiscal Year 2013-14.In order to comply with Government Code 27301a, acontract to redact identity information from documentsrecorded during the period 1990 through 2008 wasawarded in Fiscal Year 2012-13. Project to be com-pleted in Fiscal Year 2013-14.
Required Discipline for Excellence – Fiscal StabilityCollect, distribute and account for all mandated feesand transfer taxes to ensure County departments, fed-eral and State agencies, cities and special districts canfulfill their legal responsibilities.Continue to review departmental fee structure toensure that costs for services are fully recovered.
Required Discipline for Excellence – Information Services
Full system implementation of the new integratedrecording and vital records system is scheduled tooccur by June 2014. This will allow the ARCC to lever-age necessary new technologies in order to maintain ahigh level of fiscal stability and service to residents.Implementation of the electronic recording module thatwill allow the department to electronically acceptrecorded documents, in addition to reducing documentprocessing time and enhance customer service.Develop and implement an external ARCC SharePointsite, a file sharing application. This will provide a venuefor all departmental services and information to thepublic.
Required Discipline for Excellence – Customer Satisfaction
Provide the public with services that are of value tothem in a competent and professional manner andachieve a customer service rating of at least 93%. Maintain excellent customer service by ensuring alldepartmental staff complete the customer servicetraining program initiated by ARCC before June 30,2014.Provide the public with a variety of online forms andrelated services. This will provide a more efficient andeffective level of customer service by leveraging the lat-est in online form processing and electronic signaturetechnology.Extend customer services at the Chula Vista andKearny Mesa branch offices; document recording ser-vices to be offered in January 2014.
Related Links
For more information on the Assessor/Recorder/CountyClerk, refer to the website at http://arcc.co.san-diego.ca.us.
386 Finance and General Government GroupAdopted Operational Plan Fiscal Years 2013-2014 and 2014-2015
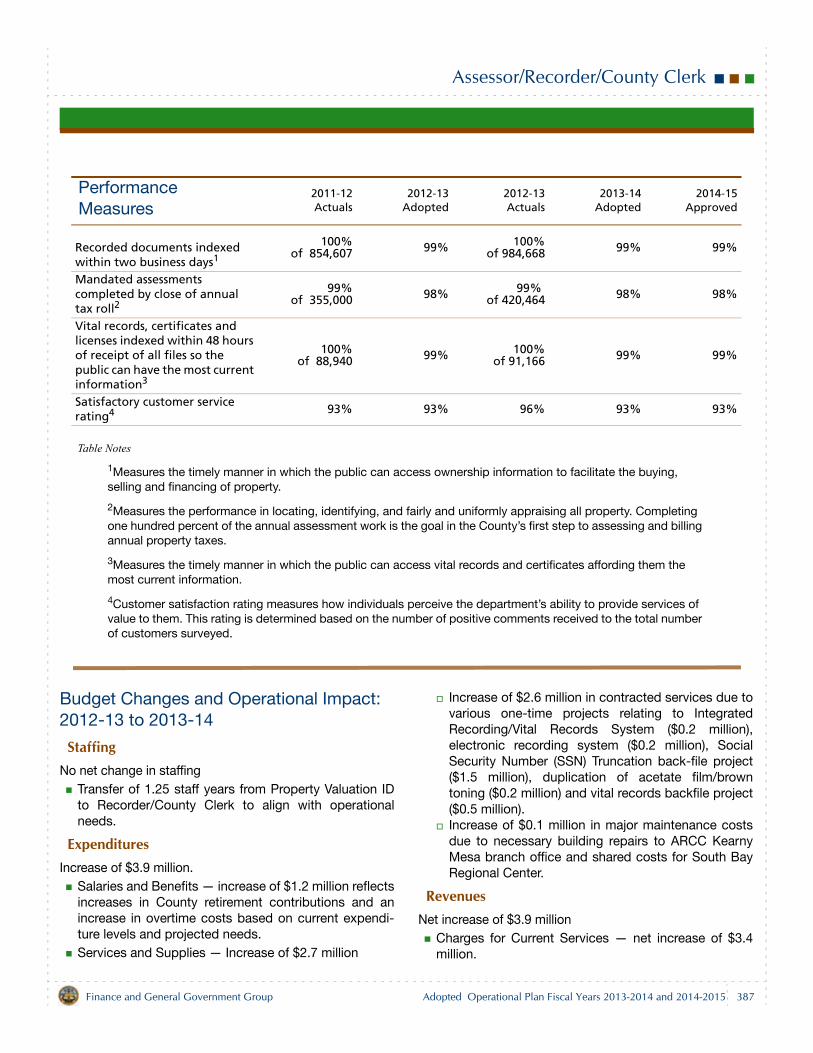
Assessor/Recorder/County Clerk
Table Notes
1Measures the timely manner in which the public can access ownership information to facilitate the buying, selling and financing of property.
2Measures the performance in locating, identifying, and fairly and uniformly appraising all property. Completing one hundred percent of the annual assessment work is the goal in the County’s first step to assessing and billing annual property taxes.
3Measures the timely manner in which the public can access vital records and certificates affording them the most current information.
4Customer satisfaction rating measures how individuals perceive the department’s ability to provide services of value to them. This rating is determined based on the number of positive comments received to the total number of customers surveyed.
Budget Changes and Operational Impact: 2012-13 to 2013-14
StaffingNo net change in staffing
Transfer of 1.25 staff years from Property Valuation IDto Recorder/County Clerk to align with operationalneeds.
ExpendituresIncrease of $3.9 million.
Salaries and Benefits — increase of $1.2 million reflectsincreases in County retirement contributions and anincrease in overtime costs based on current expendi-ture levels and projected needs.Services and Supplies — Increase of $2.7 million
Increase of $2.6 million in contracted services due tovarious one-time projects relating to IntegratedRecording/Vital Records System ($0.2 million),electronic recording system ($0.2 million), SocialSecurity Number (SSN) Truncation back-file project($1.5 million), duplication of acetate film/browntoning ($0.2 million) and vital records backfile project($0.5 million).Increase of $0.1 million in major maintenance costsdue to necessary building repairs to ARCC KearnyMesa branch office and shared costs for South BayRegional Center.
RevenuesNet increase of $3.9 million
Charges for Current Services — net increase of $3.4million.
Performance Measures
2011-12Actuals
2012-13Adopted
2012-13Actuals
2013-14Adopted
2014-15Approved
Recorded documents indexed within two business days1
100%of 854,607 99% 100%
of 984,668 99% 99%
Mandated assessments completed by close of annual tax roll2
99%of 355,000 98% 99%
of 420,464 98% 98%
Vital records, certificates and licenses indexed within 48 hours of receipt of all files so the public can have the most current information3
100%of 88,940 99% 100%
of 91,166 99% 99%
Satisfactory customer service rating4
93% 93% 96% 93% 93%
387Finance and General Government Group Adopted Operational Plan Fiscal Years 2013-2014 and 2014-2015
Assessor/Recorder/County Clerk
Increase of $0.4 million in (AB) 2890 RecoveredCosts revenue to reflect anticipated increase insupplemental assessment revenues.Increase of $0.2 million in Property Tax SystemAdministration revenue to reflect anticipated increasein collections from cities for services rendered. Increase of $1.5 million in Recording Documentrevenues due to anticipated increase in documentrecordings. Increase of $0.5 million in Certified Copy VitalStatistics revenue due to one-time project relating tobackfile imaging/scanning/indexing project. Increase of $0.2 million in Micrographics Trust Fundrevenue due to one-time initiative relating toduplication of acetate film/brown toning efforts. Increase of $0.2 million in E-recording revenue due toincrease in ongoing costs for electronic recordingsystem.Increase of $1.5 million in Social Security NumberTruncation revenue due to one-time redactionbackfile projects.Decrease of $1.1 million in Recording FeeModernization Trust Fund revenue as a result ofongoing program costs being offset by increasedrecording revenues.
Use of Fund Balance — Decrease of $0.4 million todelete prior year one-time funding relating to theupgrade of old microfilm to a more stable film mediumin the Assessor’s Office.General Purpose Revenue Allocation — Increase of$0.9 million due to increase in projected personnelcosts.
Budget Changes and Operational Impact: 2013-14 to 2014-15
Net decrease of $3.6 million is primarily the result of reduc-tions in Services and Supplies of $4.2 million due to elimi-nation of one-time initiatives from Fiscal Year 2013-14 ($0.6million in temporary contract help, $0.1 million in softwareapplication costs, $3.1 million in contracted services, $0.2million in minor equipment costs and $0.2 million in majormaintenance costs) and a reduction of Capital Asset Equip-ment costs ($0.2 million). This is partially offset by anincrease in Salaries and Benefits of $0.8 million to reflectincreases in County retirement contributions.
388 Finance and General Government GroupAdopted Operational Plan Fiscal Years 2013-2014 and 2014-2015
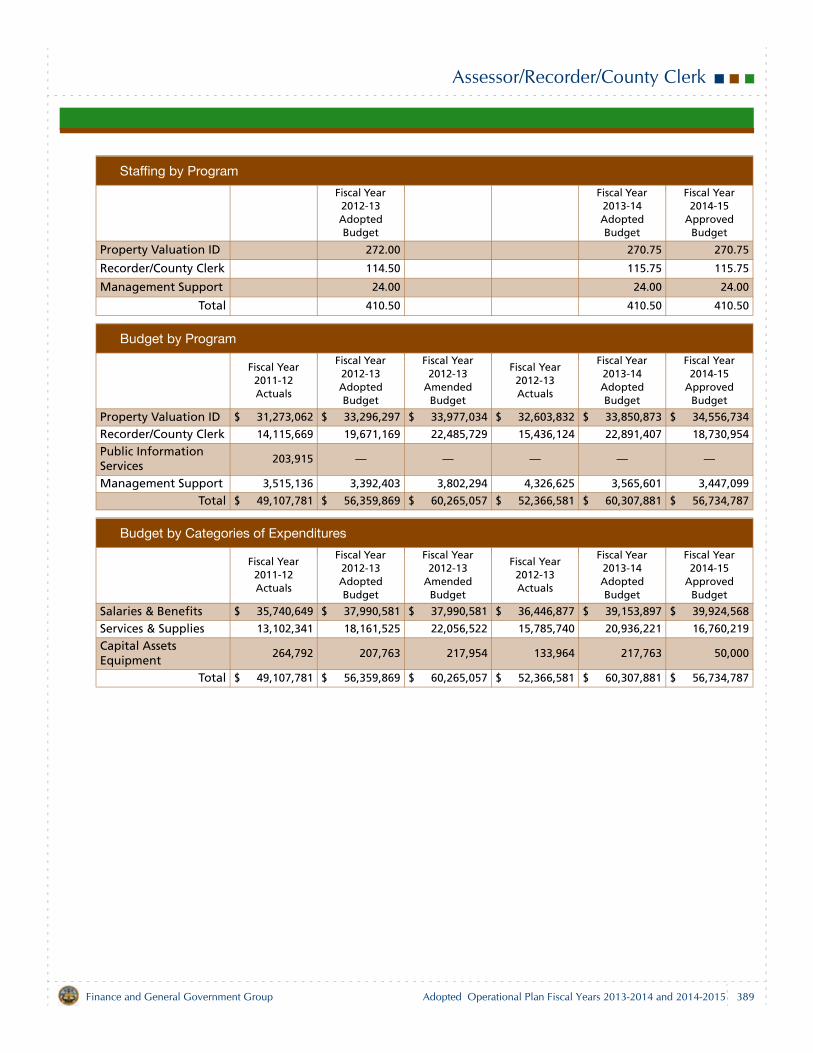
Assessor/Recorder/County Clerk
Staffing by Program
Fiscal Year 2012-13 Adopted Budget
Fiscal Year 2013-14 Adopted Budget
Fiscal Year 2014-15
Approved Budget
Property Valuation ID 272.00 270.75 270.75
Recorder/County Clerk 114.50 115.75 115.75
Management Support 24.00 24.00 24.00
Total 410.50 410.50 410.50
Budget by Program
Fiscal Year 2011-12 Actuals
Fiscal Year 2012-13 Adopted Budget
Fiscal Year 2012-13
Amended Budget
Fiscal Year 2012-13 Actuals
Fiscal Year 2013-14 Adopted Budget
Fiscal Year 2014-15
Approved Budget
Property Valuation ID $ 31,273,062 $ 33,296,297 $ 33,977,034 $ 32,603,832 $ 33,850,873 $ 34,556,734
Recorder/County Clerk 14,115,669 19,671,169 22,485,729 15,436,124 22,891,407 18,730,954
Public Information Services
203,915 — — — — —
Management Support 3,515,136 3,392,403 3,802,294 4,326,625 3,565,601 3,447,099
Total $ 49,107,781 $ 56,359,869 $ 60,265,057 $ 52,366,581 $ 60,307,881 $ 56,734,787
Budget by Categories of Expenditures
Fiscal Year 2011-12 Actuals
Fiscal Year 2012-13 Adopted Budget
Fiscal Year 2012-13
Amended Budget
Fiscal Year 2012-13 Actuals
Fiscal Year 2013-14 Adopted Budget
Fiscal Year 2014-15
Approved Budget
Salaries & Benefits $ 35,740,649 $ 37,990,581 $ 37,990,581 $ 36,446,877 $ 39,153,897 $ 39,924,568
Services & Supplies 13,102,341 18,161,525 22,056,522 15,785,740 20,936,221 16,760,219
Capital Assets Equipment
264,792 207,763 217,954 133,964 217,763 50,000
Total $ 49,107,781 $ 56,359,869 $ 60,265,057 $ 52,366,581 $ 60,307,881 $ 56,734,787
389Finance and General Government Group Adopted Operational Plan Fiscal Years 2013-2014 and 2014-2015
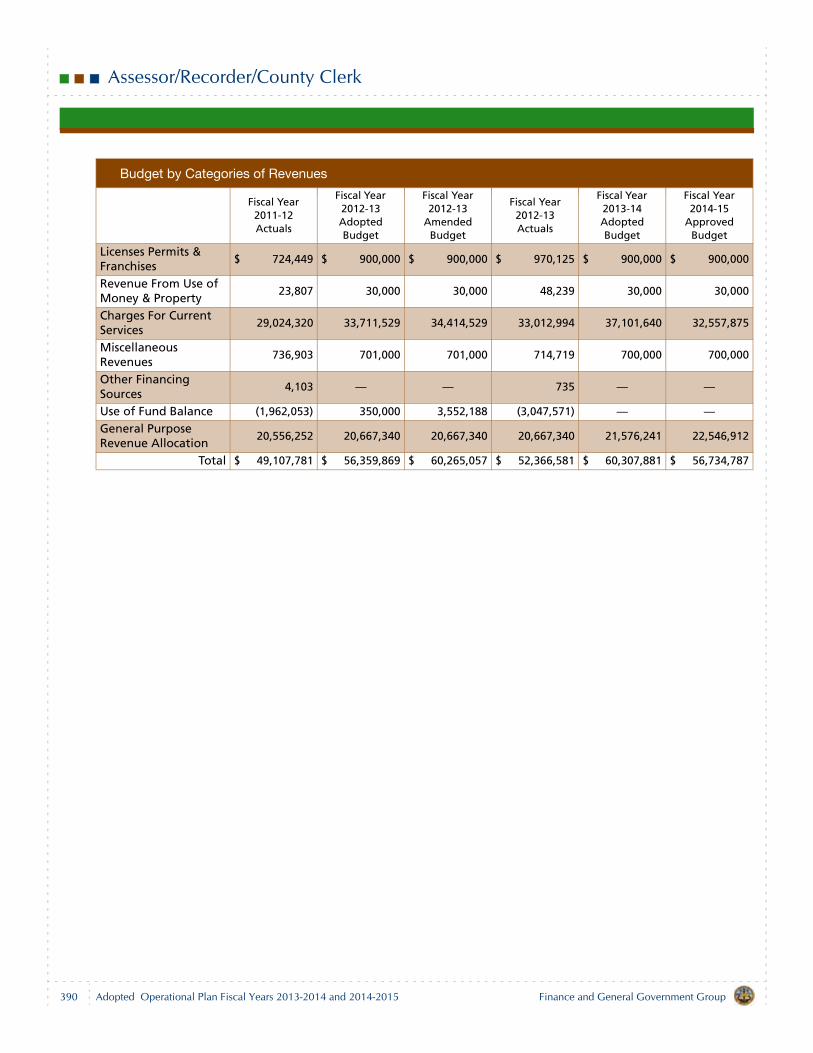
Assessor/Recorder/County Clerk
Budget by Categories of Revenues
Fiscal Year 2011-12 Actuals
Fiscal Year 2012-13 Adopted Budget
Fiscal Year 2012-13
Amended Budget
Fiscal Year 2012-13 Actuals
Fiscal Year 2013-14 Adopted Budget
Fiscal Year 2014-15
Approved Budget
Licenses Permits & Franchises
$ 724,449 $ 900,000 $ 900,000 $ 970,125 $ 900,000 $ 900,000
Revenue From Use of Money & Property
23,807 30,000 30,000 48,239 30,000 30,000
Charges For Current Services
29,024,320 33,711,529 34,414,529 33,012,994 37,101,640 32,557,875
Miscellaneous Revenues
736,903 701,000 701,000 714,719 700,000 700,000
Other Financing Sources
4,103 — — 735 — —
Use of Fund Balance (1,962,053) 350,000 3,552,188 (3,047,571) — —General Purpose Revenue Allocation
20,556,252 20,667,340 20,667,340 20,667,340 21,576,241 22,546,912
Total $ 49,107,781 $ 56,359,869 $ 60,265,057 $ 52,366,581 $ 60,307,881 $ 56,734,787
390 Finance and General Government GroupAdopted Operational Plan Fiscal Years 2013-2014 and 2014-2015
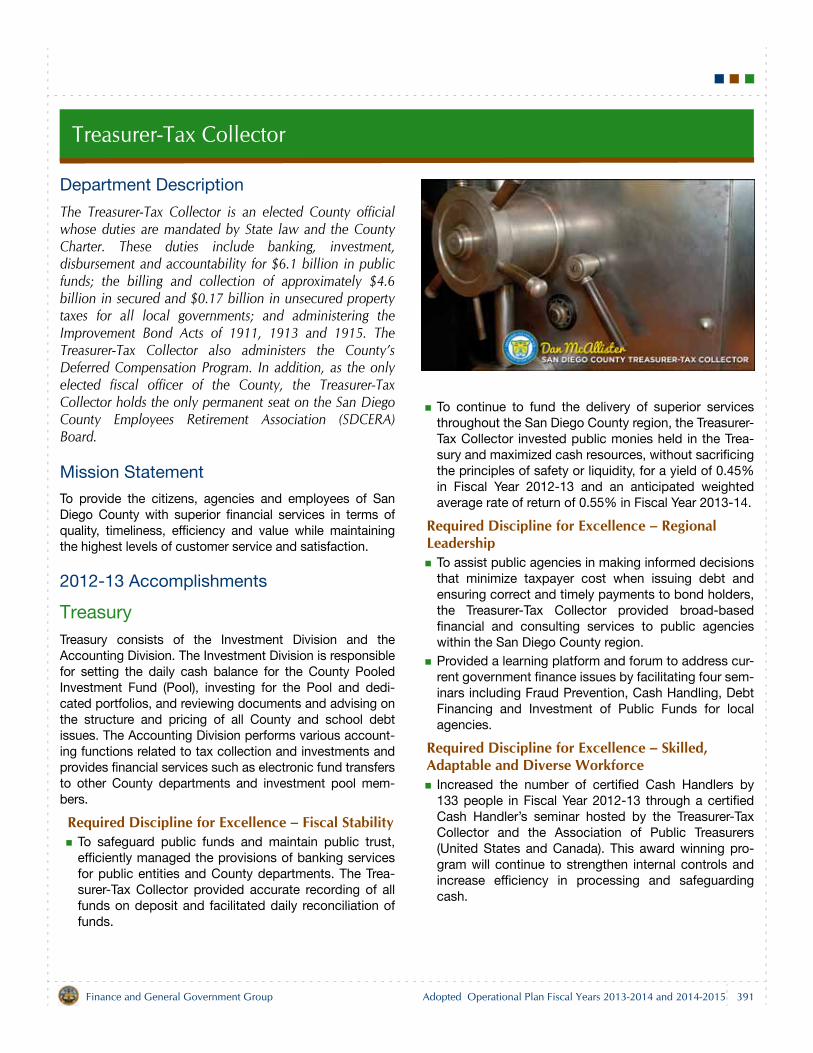
Treasurer-Tax Collector
Department Description
The Treasurer-Tax Collector is an elected County officialwhose duties are mandated by State law and the CountyCharter. These duties include banking, investment,disbursement and accountability for $6.1 billion in publicfunds; the billing and collection of approximately $4.6billion in secured and $0.17 billion in unsecured propertytaxes for all local governments; and administering theImprovement Bond Acts of 1911, 1913 and 1915. TheTreasurer-Tax Collector also administers the County’sDeferred Compensation Program. In addition, as the onlyelected fiscal officer of the County, the Treasurer-TaxCollector holds the only permanent seat on the San DiegoCounty Employees Retirement Association (SDCERA)Board.
Mission Statement
To provide the citizens, agencies and employees of SanDiego County with superior financial services in terms ofquality, timeliness, efficiency and value while maintainingthe highest levels of customer service and satisfaction.
2012-13 Accomplishments
TreasuryTreasury consists of the Investment Division and theAccounting Division. The Investment Division is responsiblefor setting the daily cash balance for the County PooledInvestment Fund (Pool), investing for the Pool and dedi-cated portfolios, and reviewing documents and advising onthe structure and pricing of all County and school debtissues. The Accounting Division performs various account-ing functions related to tax collection and investments andprovides financial services such as electronic fund transfersto other County departments and investment pool mem-bers.
Required Discipline for Excellence – Fiscal StabilityTo safeguard public funds and maintain public trust,efficiently managed the provisions of banking servicesfor public entities and County departments. The Trea-surer-Tax Collector provided accurate recording of allfunds on deposit and facilitated daily reconciliation offunds.
To continue to fund the delivery of superior servicesthroughout the San Diego County region, the Treasurer-Tax Collector invested public monies held in the Trea-sury and maximized cash resources, without sacrificingthe principles of safety or liquidity, for a yield of 0.45%in Fiscal Year 2012-13 and an anticipated weightedaverage rate of return of 0.55% in Fiscal Year 2013-14.
Required Discipline for Excellence – Regional Leadership
To assist public agencies in making informed decisionsthat minimize taxpayer cost when issuing debt andensuring correct and timely payments to bond holders,the Treasurer-Tax Collector provided broad-basedfinancial and consulting services to public agencieswithin the San Diego County region.Provided a learning platform and forum to address cur-rent government finance issues by facilitating four sem-inars including Fraud Prevention, Cash Handling, DebtFinancing and Investment of Public Funds for localagencies.
Required Discipline for Excellence – Skilled, Adaptable and Diverse Workforce
Increased the number of certified Cash Handlers by133 people in Fiscal Year 2012-13 through a certifiedCash Handler’s seminar hosted by the Treasurer-TaxCollector and the Association of Public Treasurers(United States and Canada). This award winning pro-gram will continue to strengthen internal controls andincrease efficiency in processing and safeguardingcash.
391Finance and General Government Group Adopted Operational Plan Fiscal Years 2013-2014 and 2014-2015
Treasurer-Tax Collector
Tax CollectionTax Collection is responsible for mailing, sorting and batch-ing approximately 1.4 million tax bills and statements peryear; managing property tax refund activity, research ofpayment exceptions and erroneous payments and paymentprocessing; collecting property taxes on personal property(unsecured taxes) and several other types of specialtytaxes; issuing tax clearance certificates for mobile homesand maps; payment plan activities; and the management ofall tax sale activities. Tax Collection is also responsible forproviding customer service to County residents at the mainbranch and four additional branches located throughout thecounty.
Required Discipline for Excellence – Fiscal StabilityMaintained a collection rate of 98.2% for securedtaxes, and 97.5% for unsecured taxes by preparingand mailing property tax bills/notices, and processingtax payments in a timely manner to ensure timely reve-nue collection on behalf of San Diego County’s taxpay-ers by June 30, 2013.
Required Discipline for Excellence – Information Services
Participated in the further development of the Inte-grated Property Tax System (IPTS) in conjunction withthe Assessor/Recorder/County Clerk, Auditor and Con-troller and County Technology Office.
Deferred CompensationThe Deferred Compensation Program administers allaspects of the 401(a) Incentive Retirement Deferred Com-pensation Plan and the 457 Deferred Compensation Plan.The Deferred Compensation Program is a voluntary way tosave for retirement in addition to the County’s pension sys-tem. These plans are available to full-time and part-timepermanent employees of the County of San Diego.
Required Discipline for Excellence – Skilled, Adaptable and Diverse Workforce
Broadened the Countywide base of employees whoare planning for financial security during retirement bythe following measures:
Increased enrollment in the Deferred Compensation457 Plan to 48.8% by June 30, 2013 and plan tomaintain a rate of 48.2% through June 30, 2014.Increased the average participant contribution in theDeferred Compensation 457 Plan to $132 per payperiod by June 30, 2013 and expect to maintain anamount of $91 through June 30, 2014.
Continued to educate employees on the DeferredCompensation Plan by presenting two Investment &Retirement Symposiums each fiscal year.Continued to increase employee awareness andunderstanding by conducting annual educationalworkshops and redesigning promotional materialsand presentations to increase the knowledge base ofall employees.
2013-15 Objectives
TreasuryRequired Discipline for Excellence – Fiscal Stability
To safeguard public funds and maintain public trust,Treasurer-Tax Collector will efficiently manage the pro-visions of banking services for public entities andCounty departments. The Treasurer-Tax Collector willalso provide accurate recording of all funds on depositand facilitate daily reconciliation of funds.To continue to fund the delivery of superior servicesthroughout the San Diego County region, the Treasurer-Tax Collector will invest public monies held in the Trea-sury and maximize cash resources, without sacrificingthe principles of safety or liquidity, for an anticipatedweighted average rate of return of 0.55% in Fiscal Year2013-14 and 0.60% in Fiscal Year 2014-15.
Required Discipline for Excellence – Regional Leadership
To assist public agencies in making informed decisionsthat minimize taxpayer cost when issuing debt andensuring correct and timely payments to bond holders,the Treasurer-Tax Collector will provide broad-basedfinancial and consulting services to public agencieswithin the San Diego County region.Provide a learning platform and forum to address cur-rent government finance issues by facilitating four sem-inars including Fraud Prevention, Cash Handling, DebtFinancing and Investment of Public Funds for localagencies.
Tax CollectionRequired Discipline for Excellence – Fiscal Stability
Maintain a collection rate of 98% for secured taxes and97% for unsecured taxes by preparing and mailingproperty tax bills/notices, and processing tax pay-ments in a timely manner to ensure timely revenue col-lection on behalf of San Diego County’s taxpayers, byJune 30, 2014.
392 Finance and General Government GroupAdopted Operational Plan Fiscal Years 2013-2014 and 2014-2015
Treasurer-Tax Collector
Required Discipline for Excellence – Information Services
Participate in the development of IPTS with the Asses-sor/Recorder/County Clerk, Auditor and Controller andCounty Technology Office to prepare IPTS for deploy-ment.
Deferred CompensationRequired Discipline for Excellence – Skilled, Adaptable and Diverse Workforce
Broaden the Countywide base of employees who areplanning for financial security during retirement by thefollowing measures:
Increase enrollment in the Deferred Compensation457 Plan to 48.2% through June 30, 2014 andmaintain it through June 30, 2015.
Increase the average participant contribution in theDeferred Compensation 457 Plan to $91 per payperiod by June 30, 2014 and maintain through June30, 2015.Continue to educate employees on the DeferredCompensation Plan by presenting two Investment &Retirement Symposiums each fiscal year.Continue to increase employee awareness andunderstanding by conducting educationalworkshops and redesigning promotional materialsand presentations to increase the knowledge base ofall employees by June 30, 2014.
Related Links
For additional information about the Treasurer-Tax Collec-tor, refer to the website at www.sdtreastax.com.
393Finance and General Government Group Adopted Operational Plan Fiscal Years 2013-2014 and 2014-2015
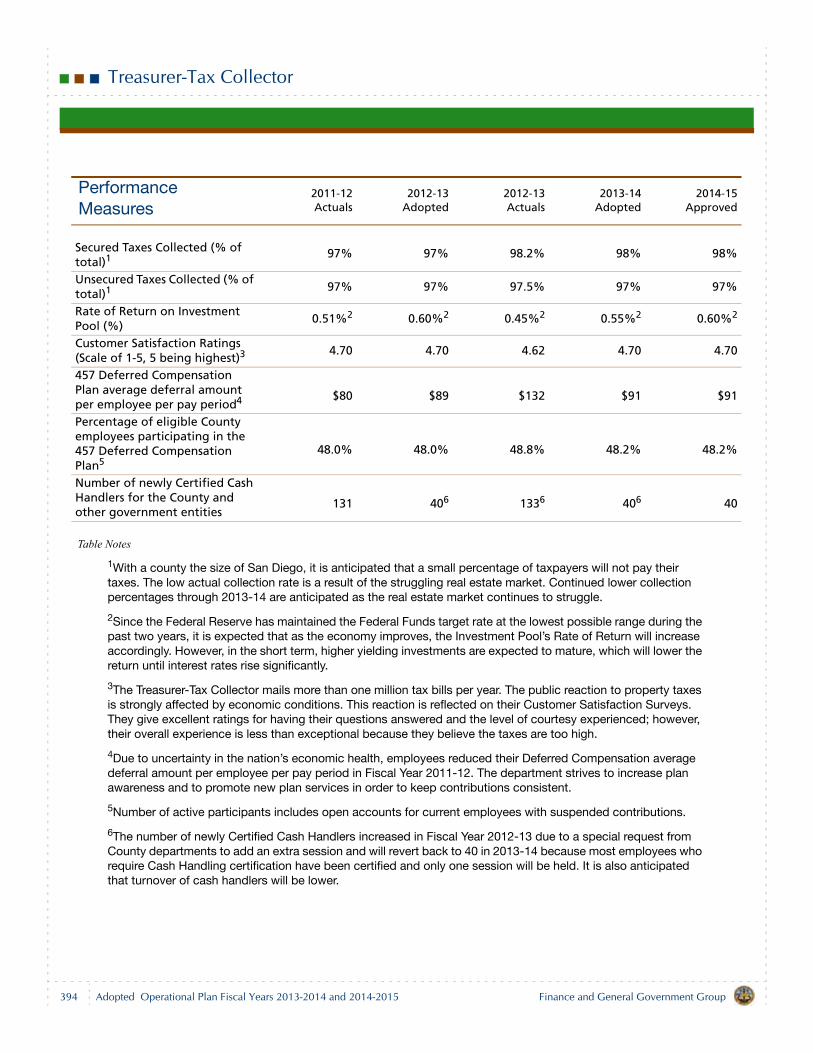
Treasurer-Tax Collector
Table Notes
1With a county the size of San Diego, it is anticipated that a small percentage of taxpayers will not pay their taxes. The low actual collection rate is a result of the struggling real estate market. Continued lower collection percentages through 2013-14 are anticipated as the real estate market continues to struggle.
2Since the Federal Reserve has maintained the Federal Funds target rate at the lowest possible range during the past two years, it is expected that as the economy improves, the Investment Pool’s Rate of Return will increase accordingly. However, in the short term, higher yielding investments are expected to mature, which will lower the return until interest rates rise significantly.
3The Treasurer-Tax Collector mails more than one million tax bills per year. The public reaction to property taxes is strongly affected by economic conditions. This reaction is reflected on their Customer Satisfaction Surveys. They give excellent ratings for having their questions answered and the level of courtesy experienced; however, their overall experience is less than exceptional because they believe the taxes are too high.
4Due to uncertainty in the nation’s economic health, employees reduced their Deferred Compensation average deferral amount per employee per pay period in Fiscal Year 2011-12. The department strives to increase plan awareness and to promote new plan services in order to keep contributions consistent.
5Number of active participants includes open accounts for current employees with suspended contributions.
6The number of newly Certified Cash Handlers increased in Fiscal Year 2012-13 due to a special request from County departments to add an extra session and will revert back to 40 in 2013-14 because most employees who require Cash Handling certification have been certified and only one session will be held. It is also anticipated that turnover of cash handlers will be lower.
Performance Measures
2011-12Actuals
2012-13Adopted
2012-13Actuals
2013-14Adopted
2014-15Approved
Secured Taxes Collected (% of total)1
97% 97% 98.2% 98% 98%
Unsecured Taxes Collected (% of total)1
97% 97% 97.5% 97% 97%
Rate of Return on Investment Pool (%)
0.51%2 0.60%2 0.45%2 0.55%2 0.60%2
Customer Satisfaction Ratings (Scale of 1-5, 5 being highest)3
4.70 4.70 4.62 4.70 4.70
457 Deferred Compensation Plan average deferral amount per employee per pay period4 $80 $89 $132 $91 $91
Percentage of eligible County employees participating in the 457 Deferred Compensation Plan5
48.0% 48.0% 48.8% 48.2% 48.2%
Number of newly Certified Cash Handlers for the County and other government entities
131 406 1336 406 40
394 Finance and General Government GroupAdopted Operational Plan Fiscal Years 2013-2014 and 2014-2015
Treasurer-Tax Collector
Budget Changes and Operational Impact: 2012-13 to 2013-14
StaffingNo net change in staffing.
Transfer of 1.00 staff year from Treasury to Administra-tion to provide increased support for information tech-nology procurement activity and ensure propriety ofsegregation of duties in administrative operations.
ExpendituresIncrease of $1.5 million
Salaries and Benefits — increase of $0.3 million dueprimarily to County retirement contributions.Services and Supplies — Net increase of $1.3 million
Increase of $1.0 million in major maintenance due toone-time expenses for asbestos abatement andnecessary office facility repairs. Increase of $0.3 million in application services forupgrade of Image RPS, the department’s paymentprocessing application.
RevenuesIncrease of $1.5 million
Charges For Current Services – Increase of $0.2 milliondue to increase of banking services pooled money off-sets related to direct service activity.Miscellaneous Revenues – Increase of $0.2 million dueto revenues from effects of economy. Use of Fund Balance — Increase of $1.0 million to fundthe one-time costs of asbestos abatement and relatedexpenditures; and to complete application upgradedescribed above.General Purpose Revenue Allocation — Increase of$0.2 million primarily to fund Salaries and Benefitsexpenses described above.
Budget Changes and Operational Impact: 2013-14 to 2014-15
Net decrease of $0.9 million to reflect the anticipated com-pletion of $1.1 million in office facility improvements andapplication upgrades in Fiscal Year 2013-14, offset by a$0.2 million increase in County retirement contributions.
395Finance and General Government Group Adopted Operational Plan Fiscal Years 2013-2014 and 2014-2015
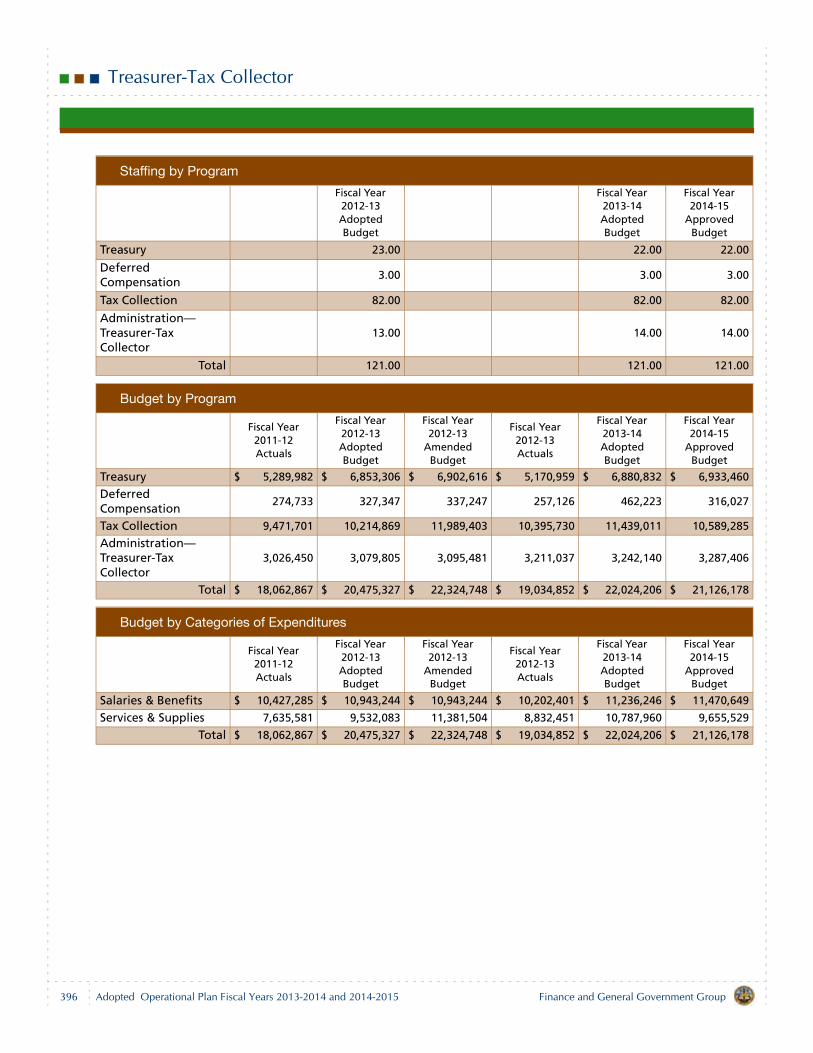
Treasurer-Tax Collector
Staffing by Program
Fiscal Year 2012-13 Adopted Budget
Fiscal Year 2013-14 Adopted Budget
Fiscal Year 2014-15
Approved Budget
Treasury 23.00 22.00 22.00
Deferred Compensation
3.00 3.00 3.00
Tax Collection 82.00 82.00 82.00
Administration—Treasurer-Tax Collector
13.00 14.00 14.00
Total 121.00 121.00 121.00
Budget by Program
Fiscal Year 2011-12 Actuals
Fiscal Year 2012-13 Adopted Budget
Fiscal Year 2012-13
Amended Budget
Fiscal Year 2012-13 Actuals
Fiscal Year 2013-14 Adopted Budget
Fiscal Year 2014-15
Approved Budget
Treasury $ 5,289,982 $ 6,853,306 $ 6,902,616 $ 5,170,959 $ 6,880,832 $ 6,933,460
Deferred Compensation
274,733 327,347 337,247 257,126 462,223 316,027
Tax Collection 9,471,701 10,214,869 11,989,403 10,395,730 11,439,011 10,589,285
Administration—Treasurer-Tax Collector
3,026,450 3,079,805 3,095,481 3,211,037 3,242,140 3,287,406
Total $ 18,062,867 $ 20,475,327 $ 22,324,748 $ 19,034,852 $ 22,024,206 $ 21,126,178
Budget by Categories of Expenditures
Fiscal Year 2011-12 Actuals
Fiscal Year 2012-13 Adopted Budget
Fiscal Year 2012-13
Amended Budget
Fiscal Year 2012-13 Actuals
Fiscal Year 2013-14 Adopted Budget
Fiscal Year 2014-15
Approved Budget
Salaries & Benefits $ 10,427,285 $ 10,943,244 $ 10,943,244 $ 10,202,401 $ 11,236,246 $ 11,470,649
Services & Supplies 7,635,581 9,532,083 11,381,504 8,832,451 10,787,960 9,655,529
Total $ 18,062,867 $ 20,475,327 $ 22,324,748 $ 19,034,852 $ 22,024,206 $ 21,126,178
396 Finance and General Government GroupAdopted Operational Plan Fiscal Years 2013-2014 and 2014-2015
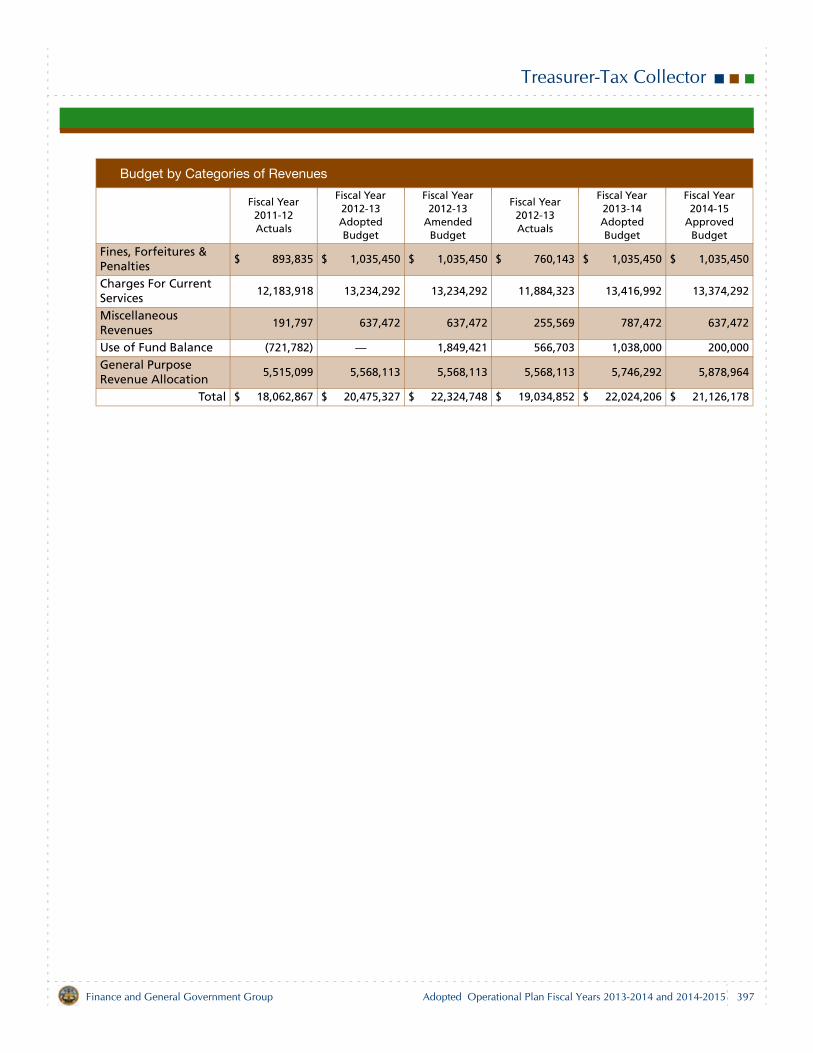
Treasurer-Tax Collector
Budget by Categories of Revenues
Fiscal Year 2011-12 Actuals
Fiscal Year 2012-13 Adopted Budget
Fiscal Year 2012-13
Amended Budget
Fiscal Year 2012-13 Actuals
Fiscal Year 2013-14 Adopted Budget
Fiscal Year 2014-15
Approved Budget
Fines, Forfeitures & Penalties
$ 893,835 $ 1,035,450 $ 1,035,450 $ 760,143 $ 1,035,450 $ 1,035,450
Charges For Current Services
12,183,918 13,234,292 13,234,292 11,884,323 13,416,992 13,374,292
Miscellaneous Revenues
191,797 637,472 637,472 255,569 787,472 637,472
Use of Fund Balance (721,782) — 1,849,421 566,703 1,038,000 200,000
General Purpose Revenue Allocation
5,515,099 5,568,113 5,568,113 5,568,113 5,746,292 5,878,964
Total $ 18,062,867 $ 20,475,327 $ 22,324,748 $ 19,034,852 $ 22,024,206 $ 21,126,178
397Finance and General Government Group Adopted Operational Plan Fiscal Years 2013-2014 and 2014-2015

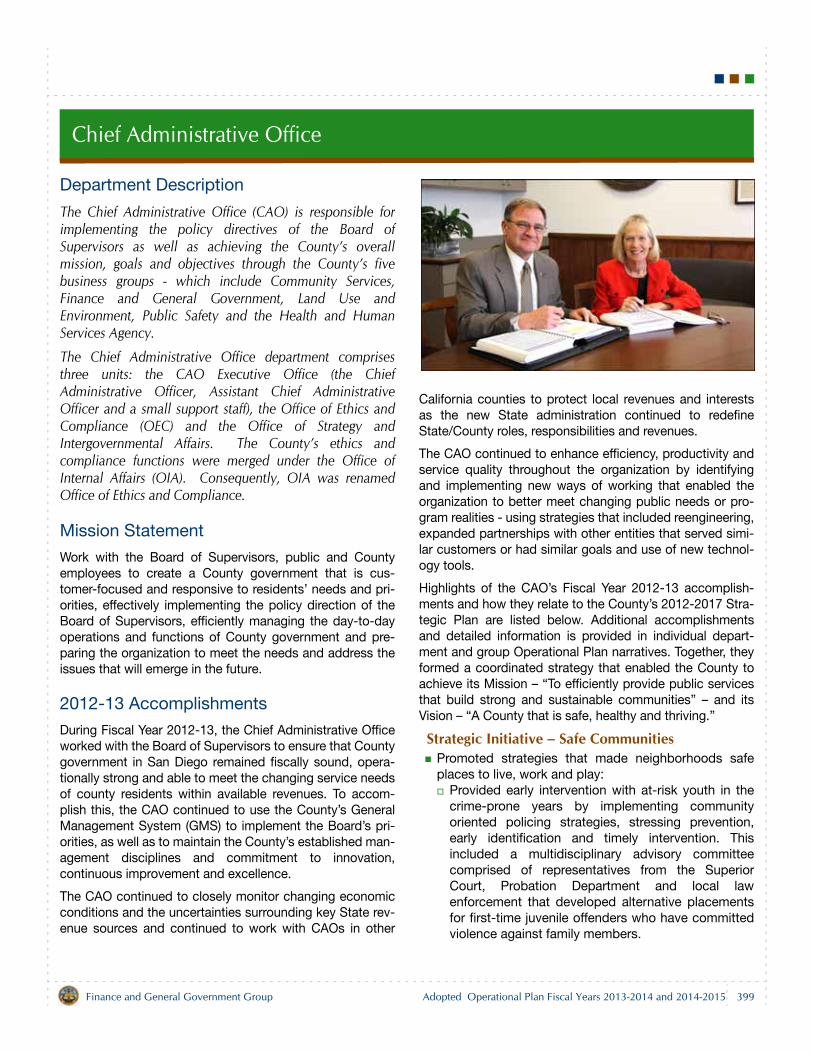
Chief Administrative Office
Department Description
The Chief Administrative Office (CAO) is responsible forimplementing the policy directives of the Board ofSupervisors as well as achieving the County’s overallmission, goals and objectives through the County’s fivebusiness groups - which include Community Services,Finance and General Government, Land Use andEnvironment, Public Safety and the Health and HumanServices Agency.
The Chief Administrative Office department comprisesthree units: the CAO Executive Office (the ChiefAdministrative Officer, Assistant Chief AdministrativeOfficer and a small support staff), the Office of Ethics andCompliance (OEC) and the Office of Strategy andIntergovernmental Affairs. The County’s ethics andcompliance functions were merged under the Office ofInternal Affairs (OIA). Consequently, OIA was renamedOffice of Ethics and Compliance.
Mission Statement
Work with the Board of Supervisors, public and Countyemployees to create a County government that is cus-tomer-focused and responsive to residents’ needs and pri-orities, effectively implementing the policy direction of theBoard of Supervisors, efficiently managing the day-to-dayoperations and functions of County government and pre-paring the organization to meet the needs and address theissues that will emerge in the future.
2012-13 Accomplishments
During Fiscal Year 2012-13, the Chief Administrative Officeworked with the Board of Supervisors to ensure that Countygovernment in San Diego remained fiscally sound, opera-tionally strong and able to meet the changing service needsof county residents within available revenues. To accom-plish this, the CAO continued to use the County’s GeneralManagement System (GMS) to implement the Board’s pri-orities, as well as to maintain the County’s established man-agement disciplines and commitment to innovation,continuous improvement and excellence.
The CAO continued to closely monitor changing economicconditions and the uncertainties surrounding key State rev-enue sources and continued to work with CAOs in other
California counties to protect local revenues and interestsas the new State administration continued to redefineState/County roles, responsibilities and revenues.
The CAO continued to enhance efficiency, productivity andservice quality throughout the organization by identifyingand implementing new ways of working that enabled theorganization to better meet changing public needs or pro-gram realities - using strategies that included reengineering,expanded partnerships with other entities that served simi-lar customers or had similar goals and use of new technol-ogy tools.
Highlights of the CAO’s Fiscal Year 2012-13 accomplish-ments and how they relate to the County’s 2012-2017 Stra-tegic Plan are listed below. Additional accomplishmentsand detailed information is provided in individual depart-ment and group Operational Plan narratives. Together, theyformed a coordinated strategy that enabled the County toachieve its Mission – “To efficiently provide public servicesthat build strong and sustainable communities” – and itsVision – “A County that is safe, healthy and thriving.”
Strategic Initiative – Safe CommunitiesPromoted strategies that made neighborhoods safeplaces to live, work and play:
Provided early intervention with at-risk youth in thecrime-prone years by implementing communityoriented policing strategies, stressing prevention,early identification and timely intervention. Thisincluded a multidisciplinary advisory committeecomprised of representatives from the SuperiorCourt, Probation Department and local lawenforcement that developed alternative placementsfor first-time juvenile offenders who have committedviolence against family members.
399Finance and General Government Group Adopted Operational Plan Fiscal Years 2013-2014 and 2014-2015
Chief Administrative Office
Educated residents through community outreachand employed prevention and safety programs,including Office of Emergency Services’ (OES) “OESfor Kids” personal preparedness sessions at fiveelementary schools and Boys and Girls Clubs andthrough communication to businesses.Provided safe and accessible parks and preserves,fostered innovative programs and initiatives thatpromoted government agency partnerships andcommunity involvement and enhanced emergencycommunications and preparedness.Repainted and re-marked crosswalks and roadwaylegends adjacent to all 121 public school and 12private school locations in the unincorporated areasof the county. This kept children safe from traffic andprovided safe routes to and from school. This activityis conducted annually to ensure markings are freshand visible for maximum benefit.
Promoted and implemented strategies that protect res-idents from crime.
Continued proactive law enforcement activities in theunincorporated area and cities that contract with theSheriff’s Department for law enforcement services,with deputies initiating more than 309,000 actionswhile on patrols.Monitored offenders subject to communitysupervision to mitigate new crime offenses, resultingin 64% of supervised adult offenders completingtheir term of supervision with no convictions for anew crime.Employed intelligence-led policing strategies tocrime problems at the local and regional level,including expanding the Tracking Known Offenderprogram to all Sheriff stations.
Provided for a strong, collaborative criminal justice sys-tem that holds offenders accountable.
Collaborated with the local courts to ensureoffenders were appropriately detained or sanctioned,including participation in Offender Reentry Court,Adult and Juvenile Drug Court, and Homeless Court.Employed appropriate punitive measures that werebalanced with rehabilitation opportunities, whereappropriate. Introduced a Residential Reentry Centerto provide work readiness training to certain in-custody offenders.Provided quality investigation and crime analysis thatled to successful identification and prosecution ofoffenders. Deployed the San Diego Regional SexOffender Management System as an investigative
tool available to the Sexual Assault FelonyEnforcement (S.A.F.E) Task Force to 100% of locallaw enforcement agencies.
Reduced recidivism by implementing treatment strate-gies that help offenders successfully reenter society.
Advanced the provision of treatment and diversionprograms while adult offenders are in jail, addressingboth health and behavioral health needs with thecreation of the Reentry Services Division within theSheriff’s Detention Services Bureau.Employed transitional services for offenders as theyexited out of detention facilities. Established aCommunity Transition Center to engage returningpost release community supervision offenders totreatment and services.Integrated evidence-based practices and principlesin collaboration with community and justice partners,including training 741 Deputy Probation Officers inresearch-supported methods of offender caseplanning and intervention strategies.
Continued to strengthen the County’s and communi-ties’ ability to prepare for, respond to and recover fromdisasters.
Collaborated with regional fire service agencies toimprove fire protection and emergency responseservices, including the introduction of additionaltraining opportunities for volunteer firefighters.Engaged residents, the private sector and localjurisdictions through community outreach events andemergency readiness planning, including training for100 regional partners on the proper use of theAlertSanDiego mass notification system.Completed a new Geographic Information System(GIS) application for damage assessment reportingduring disasters. The new application increasedreporting frequency and thus reduced the time theCounty must wait for information on disasterimpacts.
Implemented a new countywide Eye Gnat program bycompleting an environmental analysis and amendingCounty codes.
Ensured food quality safety and integrity, and verifiedthat produce advertised as “organic” was registeredand certified as organic by increasing organic spotinspections by 33% to 40 inspections.Inspected 23 miles of targeted sewer mains withinthe sanitary sewer system, exceeding the goal of 390miles, to identify sewer defects and facilitateproactive facility repairs to reduce the risk of sewerspills.
400 Finance and General Government GroupAdopted Operational Plan Fiscal Years 2013-2014 and 2014-2015
Chief Administrative Office
Strategic Initiative – Sustainable EnvironmentsPromoted green building, including sustainable build-ing practices, renewable energy and energy efficiencythrough economic incentives including issuing 2,365photovoltaic permits for solar power systems under anexpedited fee waiver program.Initiated work on the Property Specific Request Gen-eral Plan Amendment. This project will modify theCounty’s General Plan land use designations to resolveprivate property owner concerns with the recentlyadopted General Plan, while ensuring the requestedchanges are consistent with the General Plan GuidingPrinciples and that they consider community planninggroup and other public input. Improved County operations through sustainabilityefforts in alternative energy systems, energy conserva-tion, recycling, and green building design.Protected a sustainable watershed via outreach, edu-cation, inspections and developed plans to meet bac-teria levels in accordance with the San Diego RegionalWater Quality Control Board.Protected water quality and promoted water conserva-tion by conducting 16 agricultural water workshops for497 agricultural and other water users and deployed 2additional water quality kiosks, bringing the total to 6kiosks.Acquired, developed and maintained facilities that sup-port and promote park stewardship and environmentalsustainability and efficiency.Designed and initiated construction on 24 and com-pleted construction on 21 road and road-related infra-structure improvement projects that enhance the long-term sustainability of the transportation network,exceeding the goal of 7 projects.Promoted increased civic engagement by increasingthe number of permanent vote-by-mail voters by15.6% and completing the addition of Chinese lan-guage to voting and election materials. This representsa 10.6% increase over the goal of a 5% increase in per-manent vote-by-mail voters.Protected residential gardens and commercial producefrom insidious pest infestations and avoided the wide-spread use of pesticides against new pests by placingand maintaining traps designed for early pest detec-tion.Maintained the planned schedule of library operationsand current level of services, including an average of200 after-school programs each month, at the County’s33 branch libraries and 2 mobile libraries.
Strategic Initiative – Healthy FamiliesContinue implementation of Live Well San Diego strategiesto provide the right services, to the right people, at the righttime by:
Built a better service delivery system that is innovativeand outcome-driven.
Implemented year one of the CommunityTransformation Grant (CTG) supported public healthefforts to reduce chronic diseases, promote healthierlifestyles, reduce health disparities, and decreasehealth care costs.Implemented the first phase of the multi-yearCommunity Based Care Transitions Program (CCTP)to reduce readmissions to hospitals by Medicarerecipients. Public Health Nurses at Aging andIndependence Services are receiving referrals from13 participating private and public hospitalsthroughout the county. CCTP improves the quality ofcare for more than 21,000 high-risk, high-cost, fee-for-service Medicare patients as they transition fromthe acute care hospital to other care providers in thecommunity, and reduces the risk of an avoidablehospital readmission which results in improvedquality of life for the participants and reduced coststo taxpayers.Evaluated data from the two pilot programsintegrating physical and behavioral health services.Two programs established with one providingcomprehensive counseling and mental healthservices for children and adults (ICARE), and thesecond program adding psychiatric consultations tosupport primary care providers (SmartCare).Established Extended Foster Care program, anoutcome from Assembly Bill (AB) 12, the CaliforniaFostering Connections to Success Act (2010), toextend foster care to 21 years of age. More than 500youth received transitional services in the first year,assisting them to become self-sufficient adults..Ensured that more than 70% of the dogs and cats inCounty Animal Shelters were reunited with theirowner or adopted into a new home.
Supported positive choices that empowered residentsto take responsibility for their own health and well-being.
Implemented the multi-year Community NutritionEducation Program grant to provide nutritioneducation and promote access to healthy foods to3,432 at-risk, low-income individuals who receive orare potentially eligible to receive CalFresh nutritionassistance. Implemented the multi-year Community
401Finance and General Government Group Adopted Operational Plan Fiscal Years 2013-2014 and 2014-2015
Chief Administrative Office
Transformation Grant (CTG) in support of publichealth efforts to reduce chronic diseases, promotehealthier lifestyles, reduce health disparities, anddecrease health care costs for the region. Keyaccomplishments to date include procurements fortobacco-free living activities, promotion of activemodes of transportation including walking andbicycling, and services that increase access tohealthy food and beverages. Provided nutrition education for 670 low-incomefamilies with children, which represent 3,262 people,emphasizing healthful nutrition practices, foodresource management and food safety, exceedingthe goal of 400 families. A total of 55 teachers weretrained in nutrition curricula who then providededucation to 3,452 youth.Piloted a program, which received 576 referrals, forhigh-risk individuals with severe mental illness tohelp them take required medication and participatein treatment.
Pursued policy and environmental changes that madeit easier for people to engage in healthy and safebehaviors.
Developed and enhanced the experiences of parkpatrons and promoted healthy lifestyles byincreasing recreational opportunities and educationalprograms.Developed six regional Live Well San DiegoNeighborhood-based plans by using a standardizedprocess for engaging community partners andaligning efforts in advancing a public-privatepartnership.Implemented second phase of the succession planto advance Live Well San DiegoPartnered with the Escondido Union School Districton a successful proposal for the Paving the Way forSafe Routes to School State grant that will invest$375,000 over two years to improve the safety ofwalking and bicycling by school-aged children andtheir families in the neighborhoods surroundingseveral Escondido schools.Partnered with the San Diego Association ofGovernments (SANDAG) and San Diego StateUniversity on a project to install bicycle counters instreets and along bike paths throughout the countyto encourage healthy lifestyles and activities toprevent obesity.Began improvements to Family Resource Centersand ACCESS (a public benefits transaction callcenter), including increasing accuracy of payment,
and technological enhancements to improvecustomer service.
Required Disciplines for ExcellenceFiscal Stability
Engaged 23 of 25 existing bargaining units within 8 of 9existing employee organizations in the collective bar-gaining process. Continuing negotiations toward reso-lution of the bargaining process. Continued to maintain the County’s high credit ratingsby managing within the construct of County GMS fiscaldisciplines, maintaining a structurally-balanced budgetand prudent reserves and ensuring that County resi-dents’ tax dollars are spent as efficiently as possible.Arranged financing for the construction of a parkingfacility at the intersection of Cedar Street and KettnerBoulevard, including the sale of $27.8 million in long-term obligations. The parking facility has been plannedin conjunction with the County Administration Center(CAC) Waterfront Park.To continue to fund the delivery of superior servicesthroughout the San Diego County region, the Treasurer-Tax Collector invested public monies held in the Trea-sury and maximized cash resources, without sacrificingthe principles of safety or liquidity, for a yield of 0.45%in Fiscal Year 2012-13.
Skilled, Adaptable and Diverse WorkforceBegan phase 2 of the Knowledge Integration Project(KIP) to develop the foundation for informationexchange across multiple disciplines to improve theinformation available and coordinate services forshared clients.To ensure the smooth delivery of future services andcontinued organizational growth and improvement,completed the first round of the County Mentor Part-nership Program and develop succession planningtools that departments can use to enhance employees’leadership skills and support succession planningefforts.
Essential InfrastructureSignificant multi-year projects that were scheduled forFiscal Year 2012-13 or in progress include:
New CAC Waterfront Park - in progressNew parking structure at Cedar and Kettner streetsin San Diego - in progressPhase 1B of the County Operations Center (COC),allowing the relocation of County staff from the COCAnnex, CAC and leased office space - in progress
402 Finance and General Government GroupAdopted Operational Plan Fiscal Years 2013-2014 and 2014-2015
Chief Administrative Office
Development of the newly-acquired County propertyon Chesapeake Drive, adjacent to the COC, toinclude a new location for the Registrar of Voters - inprogressReplacement Women’s Detention Facility – inprogressNew Rancho San Diego Sheriff’s Station – inprogressEast Mesa Reentry Facility – in progress
Opened the new Lincoln Acres Library, communityroom and business offices for Sheriff staff and theLower Sweetwater Fire Protection District.
Accountability, Transparency and Ethical ConductSubmitted 100% (1,572) of federal, State and localfinancial reports and annual financial statements thatcomply with regulations and reporting standards forCounty departments, outside government agencies,investors and taxpayers by their due dates to ensureaccountability and transparency of financial transac-tions.Provided open access to County business by making47 Board of Supervisors meetings available on theInternet when they are held and afterward in audio andvideo archives.
Information ServicesNamed 2012 “Library of the Year” by Library Journalmagazine and Gale, an educational publishing com-pany, for “profoundly demonstrating service to com-munity” by automating services, increasing circulationand the number of programs it offers — despite therecession. The award is given each year to the top pub-lic library in the nation.Implemented the Mobile Enterprise Application Plat-form to facilitate the development and deployment ofmobile applications. Expanded the mobile workforcecapabilities for building inspectors and code enforce-ment through new systems that enable real-timeaccess to permit systems from mobile devices thatfield inspectors will use. Explored and developed eightmobile applications to improve service delivery andenhance the flow of information to the public.The transition to a new web-based office practice man-agement system (Tymetrix’s T360), which manages allcase and advisory information, has calendaring capa-bilities, retains client and contract information, storessupporting legal documents, and tracks time and bill-ing information, was delayed due to a system designchange initiated by the vendor. Delaying the projectminimized the additional costs that would have been
incurred from the necessity to re-train staff on the newuser-interface design once it was implemented. Thenew system will be implemented in Fiscal Year 2013-14.Enhanced customer service by providing online accessthrough Accela Citizen Access to Site Assessment andMitigation records for the public to conduct file reviewswithout the need to make a public records request orphysically visit the Department of Environmental Healthoffices. Online access to septic records will be com-pleted in Fiscal Year 2013-14.Reduced payment processing time and cost by imple-menting bar coding of registration invoices sent to cus-tomers who have point of sale systems to facilitatefaster processing of the payments.Initiated the phased upgrade of the region’s agingRegional Communication System (RCS), beginningwith replacing the RCS Core in Fiscal Year 2012-13,and continuing planning for replacement of subsequentmajor components to begin in Fiscal Year 2013-14.Continued the replacement of the County’s aging leg-acy Property Tax Collection system with a modern Inte-grated Property Tax System, scheduled for completionin Fiscal Year 2015-16. This project will replace the oldtechnology currently used to value properties, collecttaxes and distribute the revenue collected with a newsystem that will enable the County to be more efficient,automate many processes, and require less mainte-nance and support. The new system will also giveCounty property owners the ability to complete certainrequired forms online instead of traveling to Countyfacilities or mailing physical documents, improving cus-tomer satisfaction and reducing the need for travel andprinting.Enabled electronic responses to County procurementefforts through enhancements to BuyNet, the County’se-procurement website.
Regional LeadershipConducted the activities of the County Oversight Boardto conclude the programs and activities of the formerRedevelopment Agency.Administered and participated in meetings of the fed-eral San Diego/Tijuana Air Quality Task Force to identifyand reduce air pollution problems in the border regionin order to better protect public health and the environ-ment.Developed standard operating procedures and guid-ance documents to provide instructions for UnifiedProgram inspectors and law enforcement investigators
403Finance and General Government Group Adopted Operational Plan Fiscal Years 2013-2014 and 2014-2015
Chief Administrative Office
on how to collect and sample illegally disposed hazard-ous waste from businesses with multiple locationsacross the State.Demonstrated regional leadership and improve publicsafety by presenting at the 2012 Wildland Urban Inter-face Conference regarding fire safe ignition-resistantconstruction, as well as lessons learned from the 2003and 2007 firestorms.
Continuous Improvement and InnovationImplemented Board of Supervisors directed recom-mendations to improve the land development processfor customers. This included a shift in departmentalculture and role toward identifying project solutionsand helping customers navigate the process. Theestablishment of the department of Planning andDevelopment Services (PDS) created a new approachto serving customers and combined the land use func-tions that were formerly divided among various Countydepartments, namely Planning and Land Use, PublicWorks, and Parks and Recreation.Developed procedures and implemented a program toscan and enter emission inventory summaries into theBusiness Case Management System (BCMS) at thefacility level that increased staff efficiency in determin-ing New Source Review requirements and facility com-pliance status.Developed and initiated the transition of the virtualenforcement response determination document intothe Business Case Management System (BCMS) withinthe Pesticide Regulation Program. This document isused to track the action taken when a violation isfound.Developed new communication channels to releasetimely housing-related information in emergencies aswell as ongoing housing and community developmentopportunities.Completed consolidation and co-location of the PublicAdministrator/Public Guardian and the BehavioralHealth Conservator unit to improve service coordina-tion.
Customer SatisfactionPromoted and made customer service a top priority bydeveloping and providing customer service trainingemphasizing customer focus in all Land Use and Envi-ronment Group management and section meetings andinstructed staff on good communication skills with thepublic and regulated community.
Completed an implementation plan and draftedchanges to the County Ordinance to institute a lettergrading system similar to the one used in restaurantsfor meat markets and for mobile food facilities that pre-pare food.Began multi-year Supplemental Nutrition AssistanceProgram (SNAP) grant activities to implement a systemfor electronic documents conversion and tracking, andto help streamline reduce processing time.
2013-15 Objectives
During Fiscal Years 2013-15, the Chief Administrative Officewill work with the Board of Supervisors to ensure thatCounty government in San Diego remains fiscally sound,operationally strong and able to meet the changing serviceneeds of County residents within available revenues. Toaccomplish this, the CAO will continue to use the County’sGeneral Management System (GMS) to implement theBoard’s priorities, as well as to maintain the County’s estab-lished management disciplines and commitment to innova-tion, continuous improvement and excellence.
The CAO will continue to closely monitor changing eco-nomic conditions and the uncertainties surrounding keyState revenue sources and will continue to work with CAOsin other California counties to protect local revenues andinterests as the State continues to redefine State/Countyroles, responsibilities and revenues.
The CAO will also continue to enhance efficiency, produc-tivity and service quality throughout the organization byidentifying and implementing new ways of working thatenable the organization to better meet changing publicneeds or program realities - using strategies that includereengineering, expanded partnerships with other entitiesthat serve similar customers or have similar goals and useof new technology tools.
Highlights of the CAO’s Fiscal Year 2013-15 Objectives andhow they relate to the County’s 2013-2018 Strategic Planare listed below. Additional accomplishments and detailedinformation is provided in individual department and groupOperational Plan narratives. Together, they form a coordi-nated strategy that enables the County to achieve its Mis-sion–“To efficiently provide public services that build strongand sustainable communities”–and its Vision–“A Countythat is safe, healthy and thriving.”
Strategic Initiative – Safe Communities Residents are protected from crime or abuse:
Monitor offenders subject to community supervisionto mitigate new crimes.
404 Finance and General Government GroupAdopted Operational Plan Fiscal Years 2013-2014 and 2014-2015
Chief Administrative Office
Employ information-led policing strategies to crimeproblems at the local and regional levels.Reduce recidivism through evidence-basedpractices and services in collaboration withcommunity and justice partners.Continue proactive law enforcement activities in theunincorporated area and in cities that contract withthe Sheriff’s Department for law enforcementservices.Expand services to offenders in custody andincrease detention capacity; support the opening ofPhase I of the San Diego County Women’s Detentionand Reentry Facility and begin the operation of theEast Mesa Reentry Facility.
Neighborhoods are safe places to live, work and play:Reduce risks to lives by ensuring buildings andimprovements are designed and constructed inaccordance with building safety codes.Review proposed building plans to ensure structuresare properly and safely designed.Help customers navigate the building permit andinspection process by explaining code requirementsand exploring options to achieve compliance.Conduct building inspections during construction toensure structures are built in accordance withapproved building plans.
Communities are resilient to disasters and emergen-cies.
Coordinate with local and regional agencies’emergency services and critical first responderagencies to strengthen the regional emergencynotification system.Collaborate with regional fire service agencies toimprove fire protection and emergency responseservices.Incorporate disaster preparedness into programsand services that target vulnerable populations andencourage self-sufficiency during and after anadverse event.Work with the U.S. Environmental Protection Agency(EPA) and Baja California, Mexico as the U.S. Co-Chair of the Border 2020 Emergency Preparednessand Response Group for the San Diego-Tijuanaregion to:
Coordinate and conduct binational emergencytraining with the goal of ensuring that respondersin the region use the same equipment,procedures and have the same training.
Integrate the Office of Emergency ServicesOperational Area Emergency Operations Centerand the Tijuana Protection Civil’s EmergencyOperations Center into binational exercises.
County Communications Office will participate in atleast two drills each fiscal year to prepare for andrespond to major natural or man-made disastersimpacting the San Diego County region. Provideaccurate and timely emergency and recoveryinformation to the public and media, using a widevariety of traditional and new media tools, such asthe County’s new emergency website, social media,new releases, video and mobile technology.
Strategic Initiative – Sustainable Environments Promote green building, including sustainable buildingpractices, renewable energy and energy efficiencythrough economic incentives such as reduced fees andfee waivers. Issue 2,000 photovoltaic permits for solarpower systems under an expedited fee waiver pro-gram.Partner with East Otay Mesa property owners, the SanDiego Association of Governments (SANDAG), the Cal-ifornia Department of Transportation (CalTrans) and theCity of San Diego to plan and construct a regional san-itary sewer network to support the phased implemen-tation of the East Otay Mesa Specific Plan whilesafeguarding public health and the environment.Save 30 million gallons of water at 19 park facilities thathave converted to smart irrigation controllers, resultingin water conservation.Reduce air pollution emissions and health risk fromfreight movement using State Goods Movement Emis-sion Reduction Program (Proposition1B) funds toaward grants to equipment owners to replace older,higher emitting heavy-duty diesel equipment withnewer, cleaner models.Protect the health of the public by reducing exposureto hazardous air pollutants by implementing test emis-sions from all natural gas, expand the network of airmonitors for carbonyl compounds, and develop thecapability to deploy an emergency network of 2 fineparticulate matter (PM2.5) monitors within 48 hours ofany wildfire and link the instruments via satellite forreal-time data delivery to the public.Ensure agricultural commodities meet internationalshipping requirements by continuing cropland trappingfor the Light Brown Apple Moth. Inspect 300 croplandtraps once every 30 days to meet export requirementsfor Canada and Mexico.
405Finance and General Government Group Adopted Operational Plan Fiscal Years 2013-2014 and 2014-2015
Chief Administrative Office
Strategic Initiative – Healthy FamiliesEnsure integration and achievement of Live Well San Diegostrategies to provide the right services, to the right people,at the right time.
Build a better service delivery system that is innovative,impactful, and outcome driven.
County Counsel will provide effective legal servicesto the Health and Human Service Agency (HHSA) inmatters relating to children who have beendependents of the Juvenile Court.Prevail in 98% or more of Juvenile Dependencypetitions filed in Superior Court.Prevail in 95% or more of Juvenile Dependencyappeals and writs filed.Implement the multi-year Community TransformationGrant (CTG) to support public health efforts toreduce chronic diseases, promote healthier lifestyles,reduce health disparities, and decrease health carecosts.Promote the well-being of children and the self-sufficiency of families through the success of thechild support program.Provide Public Health Nurse home visits toparticipants in the Community Based CareTransitions Programs (CCTP) to help themproactively manage their chronic medical conditions.Strengthen Child Welfare Services by implementing/expanding trauma-informed practices to and co-locating with staff from community basedorganizations to improve outcomes such as timelyreunification and stable out-of-home placements.Celebrate 100 years of the County Library withbranches as centers of communities, while lookingahead to the use of technology in service delivery.Create safer parks, preserves and recreation centersusing volunteers to assist with park patrols,operations, and maintenance by contributing morethan 96,000 hours annually.Ensure that all construction work by utilitycompanies and private developers in the County’sright-of-way that is within 1,000 feet of a school siteprovides safe access to schools for families andchildren.
Support positive choices that empower residents totake responsibility for their own health and well-being.
Implement the multi-year Supplemental NutritionAssistance Program Education (SNAP-Ed) project topromote nutrition education and obesity preventionservices to low-income families in the regions that
are potentially eligible for the federally fundedCalFresh food assistance program. This project is acontinuation of the grant formerly known as theCommunity Nutrition Education program.Support regional efforts with a variety of programsand outreach to reduce homelessness amongfamilies and veterans and increase self-sufficiency.Promote healthy lifestyles for 2,000 adults andseniors through participation in 60 recreationprograms.Educate 5,000 children on awareness of andprotection from mosquito-borne diseases and othervector-related diseases, environmental healthcareers, and food and pool safety by conductingoutreach presentations to primary and/or secondaryschool children at schools or other outreach eventsthroughout the year.
Pursue policy and environmental changes that make iteasier for people to engage in healthy and safe behav-iors.
Implement regional community health improvementplans through the participation or leadership ofResident Leadership Academy (RLA) graduates. Thepurpose of the RLA is to build community capacityfor health improvement in local neighborhoods.Support Department of Human Resources wellnessinitiatives that promote healthy and safe behaviors inthe workplace.Implement third phase of the succession plan toadvance Live Well San Diego
Required Disciplines for ExcellenceFiscal Stability
Maintain the County’s strong issuer credit ratings of“Aa1” (GSR) (Moody’s Investors Service), “AAA” (Stan-dard & Poor’s) and “AAA” (Fitch Ratings) to ensurelower debt interest costs.To continue to fund the delivery of superior servicesthroughout the San Diego County region, the Treasurer-Tax Collector will invest public monies held in the Trea-sury and maximize cash resources, without sacrificingthe principles of safety or liquidity, for an anticipatedweighted average rate of return of 0.55% in Fiscal Year2013-14 and 0.60% in Fiscal Year 2014-15.Accurately identify current and future revenue, as costand cash flow trends, in a timely manner in order tofacilitate allocation of limited resources to Countygroups and departments.
406 Finance and General Government GroupAdopted Operational Plan Fiscal Years 2013-2014 and 2014-2015
Chief Administrative Office
Skilled, Adaptable and Diverse WorkforceTo ensure the smooth delivery of future services andcontinued organizational growth and improvement,complete the second round of the County Mentor Part-nership Program and develop succession planningtools that departments can use to enhance employees’leadership skills and support succession planningefforts.
Essential InfrastructurePlan and design facilities to serve the growing needs ofCounty residents including new capital projects forlibraries in Alpine and Imperial Beach, infrastructureimprovements at Lake Morena, a new Registrar of Vot-ers building on the County Operations Center Campusand a new office building for the Assessor/Recorder/County Clerk in El Cajon. Continue significant multi-year projects:
CAC Waterfront ParkParking structure at Cedar and Kettner streets in SanDiegoReplacement Women’s Detention FacilityNew Rancho San Diego Sheriff’s StationEast Mesa Reentry Facility
Accountability, Transparency and Ethical ConductSubmit 100% of federal, State and local financialreports and annual financial statements that complywith regulations and reporting standards for Countydepartments, outside government agencies, investorsand taxpayers by their due dates to ensure account-ability and transparency of financial transactions.
Information ServicesContinue the phased upgrade of the region’s agingRegional Communication System (RCS), planning forreplacement of subsequent major components tobegin in Fiscal Year 2013-14.Continue the replacement of the County’s aging legacyProperty Tax Collection system with a modern Inte-grated Property Tax System, scheduled for completionin Fiscal Year 2015-16. This project will replace the oldtechnology currently used to value properties, collecttaxes and distribute the revenue collected with a newsystem that will enable the County to be more efficient,automate many processes, and require less mainte-nance and support. The new system will also giveCounty property owners the ability to complete certainrequired forms online instead of traveling to Countyfacilities or mailing physical documents, improving cus-tomer satisfaction and reducing the need for travel andprinting.
Develop and implement an upgrade to the County’score Human Resources software application toimprove operational efficiency in personnel recordmanagement by December 2014.Full system implementation of the new integratedrecording and vital records system is scheduled tooccur by June 2014. This will allow the Assessor/Recorder/County Clerk to leverage necessary newtechnologies in order to maintain a high level of fiscalstability and service to its citizens.Leverage technology innovations to improve servicedelivery and operational efficiency. Continue projects tosupport improved process efficiencies and data shar-ing.Complete the implementation of the 24/7 Library-To-Go pilot project at the County Operations Center toprovide library services to remote areas currently with-out library services; post implementation assessmentand review at 6 months; examine the viability and feasi-bility for rolling out these devices to other potentiallocations.Continue to refine and enhance the Accela Automationsystem that integrates land development permit opera-tions, time accounting and finances of land develop-ment permits.Convert all 14 of the County’s intranet and internetmapping applications to the current industry-standardtechnology ArcGIS Server using Microsoft Silverlight.
Regional LeadershipHost a Hazardous Analysis and Critical Control Pointsworkshop in coordination with the restaurant industry,the Food and Drug Administration and the CaliforniaDepartment of Public Health to educate local industryand regulators; invite regulators from neighboring juris-dictions to participate in the training.Work with the Industrial Environmental Association(IEA) to provide the annual “IEA-APCD Blue Sky Lead-ership Award” to three local businesses.Pursue voluntary Public Health Accreditation status topromote accountability and continuous improvement.
Continuous Improvement and InnovationComplete 85% of all (more than 130) investigativereports of pesticide illness complaints within 120 daysby implementing efficiencies identified during the Pesti-cide Regulation Program’s Business Process Re-engi-neering and using the functionality of BCMS by June30, 2014.Implement changes and monitor the Community EventPermit (CEP) process for improved customer service.
407Finance and General Government Group Adopted Operational Plan Fiscal Years 2013-2014 and 2014-2015
Chief Administrative Office
Complete the development of a new online paymenttool for land development projects. The new tool willaccept electronic payment for permits fees and depos-its, reducing the need for customers to physically visitan office.Use State Air Quality Improvement Program grantfunding to implement an Advanced Hybrid School BusDemonstration Project in partnership with Transporta-tion Power, Inc. (TransPower), an electric propulsionsystem manufacturer located in Poway. San DiegoCounty school districts will be given the opportunity togain hands-on experience with the advanced hybridschool bus during the demonstration period.Effective Fiscal Year 2013-14, Public Administrator/Public Guardian and Behavioral Health Conservatorunit will become part of Aging and Independence Ser-vices to reflect Health and Human Services Agency’sreorganization to improve effectiveness and efficiencyin service delivery.
Customer SatisfactionEnsure consumer value by completing 100% of annualinspections for fuel meters, taxi meters, water dispens-ers and computing scales, and 90% of all counterscales.Provide excellent customer service by diagnosing100% of more than 31,000 plant and insect sampleswithin two weeks of submission.Implement the use of an online intake form to receivepublic complaints of food borne illness.Transition Healthy Families and Low Income HealthProgram participants into appropriate health programsto promote continuity of care and a medical home, pro-viding patient-centered, comprehensive, and coordi-nated care.
Related Links
For additional information about the Chief AdministrativeOffice, refer to the website at www.sdcounty.ca.gov/cao.
Budget Changes and Operational Impact: 2012-13 to 2013-14
StaffingNo net change in staffing.
Transfer of 4.00 staff years from OIA to OEC due to theCounty’s ethics and compliance functions being mergedunder OIA. As a consequence, OIA was renamed OEC.
ExpendituresIncrease of $0.1 million.
Services and Supplies – Increase of $0.1 million pri-marily as a result of an increase in the public liabilityexpense.
RevenuesIncrease of $0.1 million.
General Purpose Revenue Allocation — increase of$0.1 million primarily to offset the increased public lia-bility cost.
Budget Changes and Operational Impact: 2013-14 to 2014-15
No significant changes.
408 Finance and General Government GroupAdopted Operational Plan Fiscal Years 2013-2014 and 2014-2015
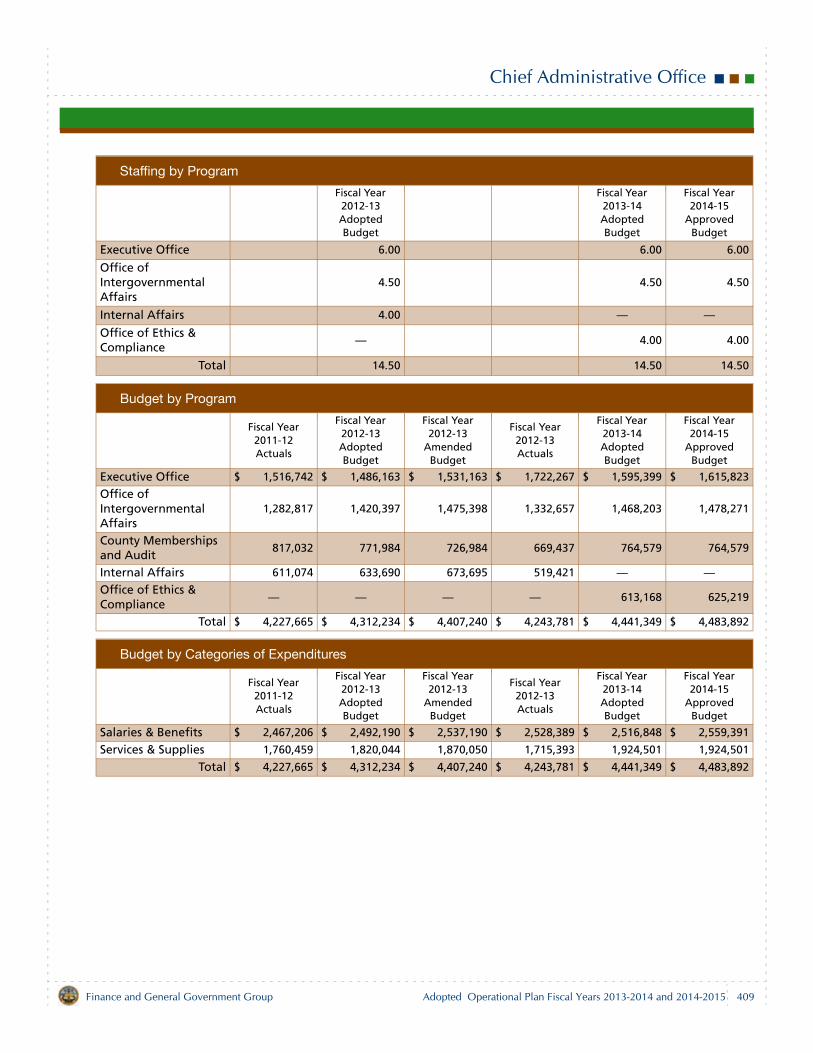
Chief Administrative Office
Staffing by Program
Fiscal Year 2012-13 Adopted Budget
Fiscal Year 2013-14 Adopted Budget
Fiscal Year 2014-15
Approved Budget
Executive Office 6.00 6.00 6.00
Office of Intergovernmental Affairs
4.50 4.50 4.50
Internal Affairs 4.00 — —Office of Ethics & Compliance
— 4.00 4.00
Total 14.50 14.50 14.50
Budget by Program
Fiscal Year 2011-12 Actuals
Fiscal Year 2012-13 Adopted Budget
Fiscal Year 2012-13
Amended Budget
Fiscal Year 2012-13 Actuals
Fiscal Year 2013-14 Adopted Budget
Fiscal Year 2014-15
Approved Budget
Executive Office $ 1,516,742 $ 1,486,163 $ 1,531,163 $ 1,722,267 $ 1,595,399 $ 1,615,823
Office of Intergovernmental Affairs
1,282,817 1,420,397 1,475,398 1,332,657 1,468,203 1,478,271
County Memberships and Audit
817,032 771,984 726,984 669,437 764,579 764,579
Internal Affairs 611,074 633,690 673,695 519,421 — —Office of Ethics & Compliance
— — — — 613,168 625,219
Total $ 4,227,665 $ 4,312,234 $ 4,407,240 $ 4,243,781 $ 4,441,349 $ 4,483,892
Budget by Categories of Expenditures
Fiscal Year 2011-12 Actuals
Fiscal Year 2012-13 Adopted Budget
Fiscal Year 2012-13
Amended Budget
Fiscal Year 2012-13 Actuals
Fiscal Year 2013-14 Adopted Budget
Fiscal Year 2014-15
Approved Budget
Salaries & Benefits $ 2,467,206 $ 2,492,190 $ 2,537,190 $ 2,528,389 $ 2,516,848 $ 2,559,391
Services & Supplies 1,760,459 1,820,044 1,870,050 1,715,393 1,924,501 1,924,501
Total $ 4,227,665 $ 4,312,234 $ 4,407,240 $ 4,243,781 $ 4,441,349 $ 4,483,892
409Finance and General Government Group Adopted Operational Plan Fiscal Years 2013-2014 and 2014-2015
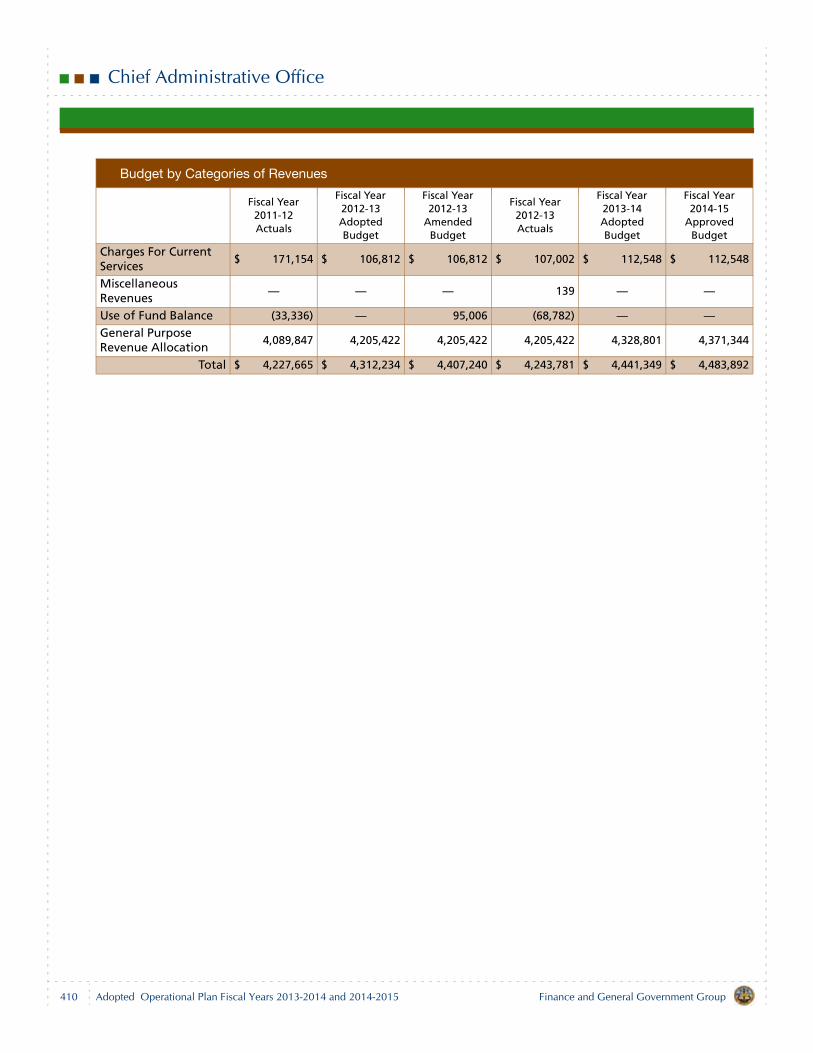
Chief Administrative Office
Budget by Categories of Revenues
Fiscal Year 2011-12 Actuals
Fiscal Year 2012-13 Adopted Budget
Fiscal Year 2012-13
Amended Budget
Fiscal Year 2012-13 Actuals
Fiscal Year 2013-14 Adopted Budget
Fiscal Year 2014-15
Approved Budget
Charges For Current Services
$ 171,154 $ 106,812 $ 106,812 $ 107,002 $ 112,548 $ 112,548
Miscellaneous Revenues
— — — 139 — —
Use of Fund Balance (33,336) — 95,006 (68,782) — —General Purpose Revenue Allocation
4,089,847 4,205,422 4,205,422 4,205,422 4,328,801 4,371,344
Total $ 4,227,665 $ 4,312,234 $ 4,407,240 $ 4,243,781 $ 4,441,349 $ 4,483,892
410 Finance and General Government GroupAdopted Operational Plan Fiscal Years 2013-2014 and 2014-2015
Auditor and Controller
Department Description
Governed by the overriding principles of fiscal integrity,customer satisfaction, and continuous improvement andinnovation, the Auditor and Controller has four primaryresponsibilities. First, in accordance with the CountyCharter and generally accepted accounting principles, thedepartment maintains accounts for the financialtransactions of all departments and of those agencies orspecial districts whose funds are kept in the CountyTreasury and provides reports necessary to manage theCounty operations. The department furnishes customerfocused financial decision making support to the Board ofSupervisors and the Chief Administrative Officer, andadvances the goals and visions of the Board utilizing theGeneral Management System and County's Strategic Plan.Additionally, the department performs independent,objective and cost effective audit services. Finally, thedepartment provides cost effective and efficientprofessional collections and accounts receivablemanagement services to maximize recovery of monies duethe County. The department is the leading financialmanagement resource of the County and its long-termobjective is to continue to broaden its role of controller intoa provider of value-added financial services. Tostrategically align financial and operational planningservices, the Office of Financial Planning was moved fromthe Auditor and Controller to the Finance and GeneralGovernment Group Executive Office.
Mission Statement
To provide superior financial services for the County of SanDiego that ensure financial integrity, promote accountabilityin government and maintain the public trust.
2012-13 Accomplishments
Required Discipline for Excellence – Accountability, Transparency and Ethical Conduct
Submitted 100% (1,572) of federal, State and localfinancial reports and annual financial statements thatcomply with regulations and reporting standards forCounty departments, outside government agencies,
investors and taxpayers by their due dates to ensureaccountability and transparency of financial transac-tions.Processed 97% of County payments within five busi-ness days after receipt of invoice by Accounts Payable(AP) to ensure timely payment of vendors and contrac-tors. The prompt payment of invoices ensures that theCounty captures any discounts that are available forearly invoice payment. The goal was not achieved dueto unanticipated vacancies. As a result, the processingof some payments was delayed, exceeding the 5 dayprocessing goal. Although the goal was not achieved,all available discounts were captured.Provided high quality audit services, including Statemandated and operational/performance audits, toensure the integrity of management control systems, toimprove performance across the enterprise, and toensure the most efficient use of resources. Of all auditrecommendations contained in internal audit reportsissued by the Office of Audits and Advisory Services(OAAS), 100% (159 of 159) were implemented on orbefore their due date. Met the arbitrage limit as established by bond counselwithin four months of the date of issuance of the Taxand Revenue Anticipation Notes (TRANs). Meeting thearbitrage limit within the specified time ensures that theCounty avoids penalties associated with excessiveTRANs borrowing.
Required Discipline for Excellence – Regional Leadership
Earned the State Controller’s Award for AchievingExcellence in Financial Reporting for the fiscal yearending June 30, 2011.
411Finance and General Government Group Adopted Operational Plan Fiscal Years 2013-2014 and 2014-2015
Auditor and Controller
Received the Government Finance Officers Association(GFOA) Certificate of Achievement for Excellence inFinancial Reporting for the County’s ComprehensiveAnnual Financial Report (CAFR) for the fiscal year end-ing June 30, 2012.Earned the GFOA – Award for Outstanding Achieve-ment in Popular Annual Financial Reporting (PAFR) forthe fiscal year ended June 30, 2012.Earned the GFOA – Distinguished Budget PresentationAward for the fiscal year beginning July 1, 2012.
Required Discipline for Excellence – Information Services
In coordination with the Assessor/Recorder/CountyClerk, Treasurer-Tax Collector and the County Technol-ogy Office continued the development and implemen-tation of the Integrated Property Tax System (IPTS),which will significantly improve property assessment,tax collection and apportionment activities in theCounty.Initiated the upgrade of the County’s budget applica-tion. The upgrade of this application, which supportsthe County’s overall budget development process, willensure continued support of this key application.Documented the requirements necessary for theupgrade of Revenue and Recovery’s Cashiering andCash Management System to create an online pay-ment portal for the collection of county debts andimprove our compliance with the State’s best practicesas prescribed in Penal Code §1463.007.Upgraded Fusion Middleware (FMW) software applica-tion to latest release. The upgrade of FMW will enablethe County to transition certain key legacy customapplications and components to the upgraded versionresulting in improved functional capabilities.Successfully implemented new internal controls soft-ware. The implementation of this new application,which supports the County’s internal audit function, willserve as a foundation to improve the County’s audit,compliance, and risk management functions.
Required Discipline for Excellence – Fiscal StabilityMaintained the County’s strong issuer credit ratings ofAa1 (GSR) (Moody’s Investors Service), AAA (Standard& Poor’s) and AAA (Fitch Ratings) to ensure lower debtinterest costs.Actual General Purpose Revenue received was 5.9%greater than the budgeted General Purpose Revenue,which exceeded the target, that the variance be nogreater than 2.5% of the actual revenue received. Theexcess revenue is attributable mainly to residual and
one-time payments in Aid from Redevelopment Suc-cessor Agencies; growth in assessed value of proper-ties; higher revenues in current secured property taxand Teeter Tax Reserve Excess accounts resulting fromlower delinquency rates; and higher than expectedrevenue from Real Property Transfer taxes. Accurately identified current and future revenue, as wellas cost and cash flow trends, in a timely manner inorder to facilitate allocation of limited resources to SanDiego County groups and departments.
Required Discipline for Excellence – Essential Infrastructure
Relocated Auditor and Controller (A&C) offices to newoffice space at the County Operations Center, whichreduced the amount being paid for leased office space.
2013-15 Objectives
Required Discipline for Excellence – Accountability, Transparency and Ethical Conduct
Submit 100% of federal, State and local financialreports and annual financial statements that complywith regulations and reporting standards for Countydepartments, outside government agencies, investorsand taxpayers by their due dates to ensure account-ability and transparency of financial transactions.Process 100% of County payments within five busi-ness days after receipt of invoice by Accounts Payableto ensure timely payment of vendors and contractors.The prompt payment of invoices ensures that theCounty captures any discounts that are available forearly invoice payment.Provide high quality audit services, including Statemandated and operational/performance audits, toensure the integrity of management control systems, toimprove performance across the enterprise, and toensure the most efficient use of resources.Meet the arbitrage limit as established by bond counselwithin four months of the date of issuance of the Taxand Revenue Anticipation Notes (TRANS). Meeting thearbitrage limit within the specified time ensures that theCounty avoids penalties associated with excessiveTRANs borrowing.
Required Discipline for Excellence – Fiscal StabilityMaintain the County’s strong issuer credit ratings of“Aa1” (GSR) (Moody’s Investors Service), “AAA” (Stan-dard & Poor’s) and “AAA” (Fitch Ratings) to ensurelower debt interest costs.
412 Finance and General Government GroupAdopted Operational Plan Fiscal Years 2013-2014 and 2014-2015
Auditor and Controller
Accurately identify current and future revenue, as wellas cost and cash flow trends, in a timely manner inorder to facilitate allocation of limited resources to SanDiego County groups and departments.Meet or exceed the prior year’s actual recovery ratepercentage (total dollars collected/total availableaccounts receivable) of 7.25%. This measure repre-sents the effectiveness of collection activities per-formed by the Office of Revenue & Recovery (ORR).
Required Discipline for Excellence – Regional Leadership
Earn the State Controller’s Award for Achieving Excel-lence in Financial Reporting for the Fiscal Year endingJune 30, 2012.Continue to apply for recognitions through GFOA –Certificate of Achievement for Excellence in FinancialReporting for the CAFR and the Award for OutstandingAchievement in Popular Annual Financial Reporting forthe PAFR.
Required Discipline for Excellence – Information Services
In coordination with the Assessor/Recorder/CountyClerk, Treasurer-Tax Collector and the County Technol-
ogy Office, continue implementation of the IPTS, whichwill significantly improve property assessment, tax col-lection and apportionment activities in the County.Complete the upgrade of the County’s budget applica-tion. The upgrade of this application, which supportsthe County’s overall budget process; will ensure con-tinued product support of this key application. Replace the County’s existing Miscellaneous Transac-tion Batch Transfer/Deposit (MTB-DT) with a newFusion Middleware based application Deposit AR Real-location Transfer (DART). This new application will pro-vide County users with improved functionality andsimplify future upgrades.Upgrade County Data Warehouse to latest applicationrelease (OBIEE 11G) which includes many new featuressuch as: updated dashboards, better user interface(UI), and improved integration with web services andother applications.
Related Links
For additional information about the Auditor and Controller,refer to the website at www.sdcounty.ca.gov/auditor.
413Finance and General Government Group Adopted Operational Plan Fiscal Years 2013-2014 and 2014-2015
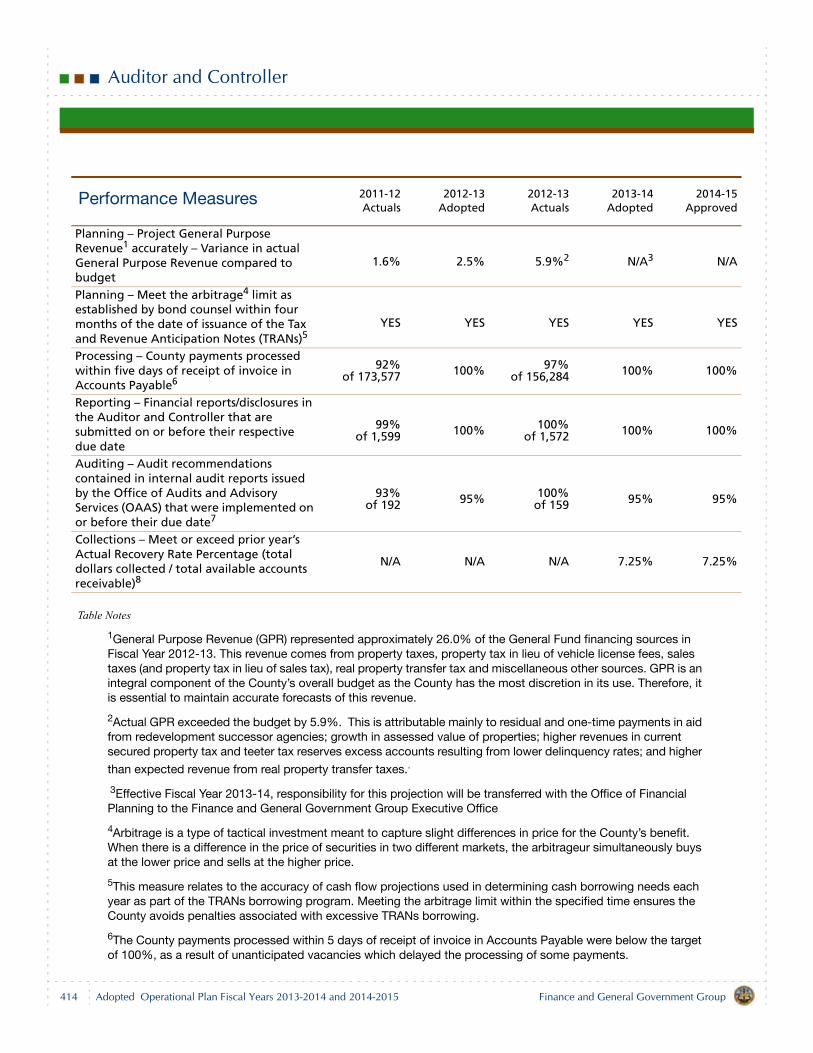
Auditor and Controller
Table Notes
1General Purpose Revenue (GPR) represented approximately 26.0% of the General Fund financing sources in Fiscal Year 2012-13. This revenue comes from property taxes, property tax in lieu of vehicle license fees, sales taxes (and property tax in lieu of sales tax), real property transfer tax and miscellaneous other sources. GPR is an integral component of the County’s overall budget as the County has the most discretion in its use. Therefore, it is essential to maintain accurate forecasts of this revenue.
2Actual GPR exceeded the budget by 5.9%. This is attributable mainly to residual and one-time payments in aid from redevelopment successor agencies; growth in assessed value of properties; higher revenues in current secured property tax and teeter tax reserves excess accounts resulting from lower delinquency rates; and higher
than expected revenue from real property transfer taxes..
3Effective Fiscal Year 2013-14, responsibility for this projection will be transferred with the Office of Financial Planning to the Finance and General Government Group Executive Office
4Arbitrage is a type of tactical investment meant to capture slight differences in price for the County’s benefit. When there is a difference in the price of securities in two different markets, the arbitrageur simultaneously buys at the lower price and sells at the higher price.
5This measure relates to the accuracy of cash flow projections used in determining cash borrowing needs each year as part of the TRANs borrowing program. Meeting the arbitrage limit within the specified time ensures the County avoids penalties associated with excessive TRANs borrowing.
6The County payments processed within 5 days of receipt of invoice in Accounts Payable were below the target of 100%, as a result of unanticipated vacancies which delayed the processing of some payments.
Performance Measures 2011-12Actuals
2012-13Adopted
2012-13Actuals
2013-14Adopted
2014-15Approved
Planning – Project General Purpose Revenue1 accurately – Variance in actual General Purpose Revenue compared to budget
1.6% 2.5% 5.9%2 N/A3 N/A
Planning – Meet the arbitrage4 limit as established by bond counsel within four
months of the date of issuance of the Tax and Revenue Anticipation Notes (TRANs)5
YES YES YES YES YES
Processing – County payments processed within five days of receipt of invoice in Accounts Payable6
92%of 173,577 100% 97%
of 156,284 100% 100%
Reporting – Financial reports/disclosures in the Auditor and Controller that are submitted on or before their respective due date
99% of 1,599 100% 100%
of 1,572 100% 100%
Auditing – Audit recommendations contained in internal audit reports issued by the Office of Audits and Advisory Services (OAAS) that were implemented on or before their due date7
93%of 192 95% 100%
of 159 95% 95%
Collections – Meet or exceed prior year’s Actual Recovery Rate Percentage (total dollars collected / total available accounts receivable)8
N/A N/A N/A 7.25% 7.25%
414 Finance and General Government GroupAdopted Operational Plan Fiscal Years 2013-2014 and 2014-2015
Auditor and Controller
7Audit recommendations seek to improve and strengthen County operations in areas of risk management, control, and governance processes. The implementation percentage quantifies the impact and quality of OAAS audit recommendations towards improving County operations in accordance with the objectives of the General Management System.
8This measure represents the effectiveness of collection activities performed by the Office of Revenue & Recovery (ORR). ORR is responsible for the management, collections, and accounting of receivables owed to the County of San Diego for a variety of programs and services, excluding child support and property taxes.
Budget Changes and Operational Impact: 2012-13 to 2013-14
StaffingDecrease of 14.00 staff years:
Decrease of 13.00 staff years as a result of the Office ofFinancial Planning being moved to the Finance andGeneral Government Group Executive Office.Decrease of 1.00 staff year to the Finance and GeneralGovernment Group to provide administrative support.Transferred 1.00 staff year from Controller Division toORR for better alignment with operational needs.
ExpendituresNet decrease of $0.8 million
Salaries and Benefits — decrease of $2.2 million is pri-marily due to the transfer of 14.00 staff years from theAuditor and Controller to the Finance and General Gov-ernment Executive Office.Services and Supplies — increase of $1.4 million pri-marily as a result of one-time costs associated withvarious IT projects including an upgrade of the annualfinancial reporting application, ERP disaster recoveryapplication and architecture, ERP middlewareenhancements, and data archiving projects.
RevenuesNet decrease of $0.8 million
Miscellaneous Revenue — increase of $0.1 million dueto anticipated revenue as a result of an electronic pay-ment solution.Use of Fund Balance — increase of $1.2 million for atotal budget of $3.4 million to fund various one-time ITprojects detailed above.General Purpose Revenue Allocation — decrease of$2.1 million, which is primarily a result of the transfer of14.00 staff years from A&C to the Finance and GeneralGovernment Executive Office.
Budget Changes and Operational Impact: 2013-14 to 2014-15
Net decrease of $2.9 million is primarily the result of reduc-tions in Services and Supplies due to the elimination ofone-time expenditures planned for Fiscal Year 2013-14.These reductions are partially offset by increases in Countyretirement contributions.
415Finance and General Government Group Adopted Operational Plan Fiscal Years 2013-2014 and 2014-2015
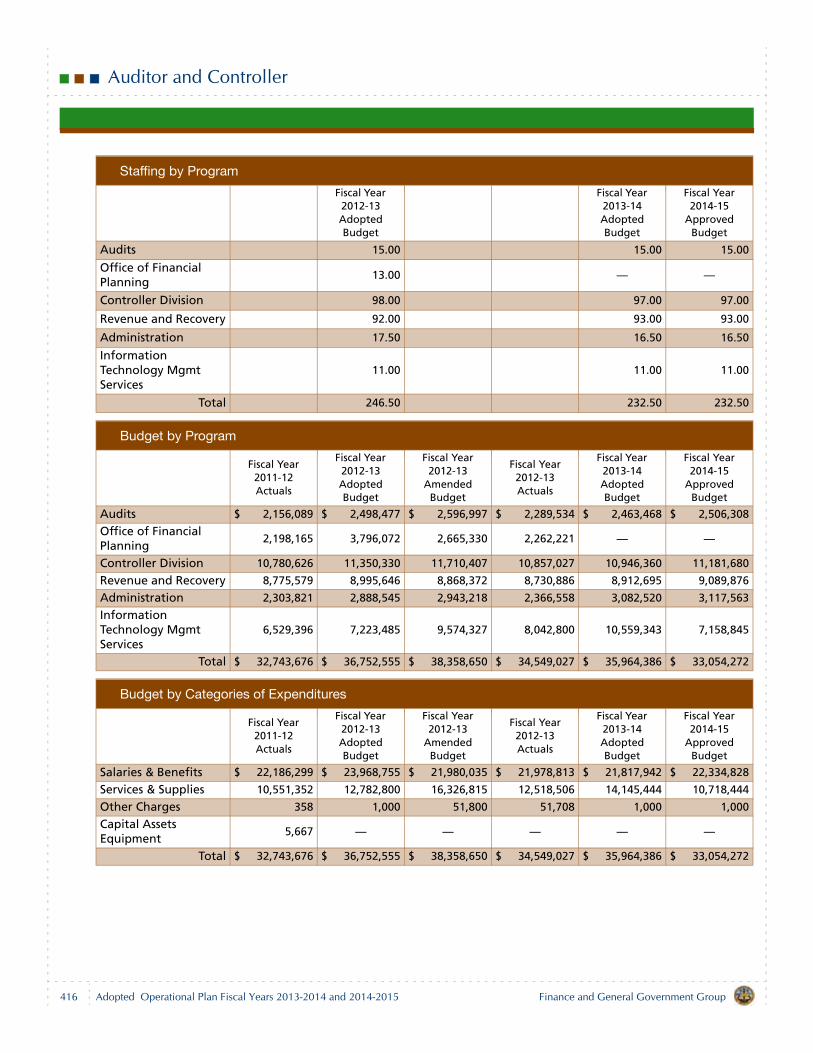
Auditor and Controller
Staffing by Program
Fiscal Year 2012-13 Adopted Budget
Fiscal Year 2013-14 Adopted Budget
Fiscal Year 2014-15
Approved Budget
Audits 15.00 15.00 15.00
Office of Financial Planning
13.00 — —
Controller Division 98.00 97.00 97.00
Revenue and Recovery 92.00 93.00 93.00
Administration 17.50 16.50 16.50
Information Technology Mgmt Services
11.00 11.00 11.00
Total 246.50 232.50 232.50
Budget by Program
Fiscal Year 2011-12 Actuals
Fiscal Year 2012-13 Adopted Budget
Fiscal Year 2012-13
Amended Budget
Fiscal Year 2012-13 Actuals
Fiscal Year 2013-14 Adopted Budget
Fiscal Year 2014-15
Approved Budget
Audits $ 2,156,089 $ 2,498,477 $ 2,596,997 $ 2,289,534 $ 2,463,468 $ 2,506,308
Office of Financial Planning
2,198,165 3,796,072 2,665,330 2,262,221 — —
Controller Division 10,780,626 11,350,330 11,710,407 10,857,027 10,946,360 11,181,680
Revenue and Recovery 8,775,579 8,995,646 8,868,372 8,730,886 8,912,695 9,089,876
Administration 2,303,821 2,888,545 2,943,218 2,366,558 3,082,520 3,117,563
Information Technology Mgmt Services
6,529,396 7,223,485 9,574,327 8,042,800 10,559,343 7,158,845
Total $ 32,743,676 $ 36,752,555 $ 38,358,650 $ 34,549,027 $ 35,964,386 $ 33,054,272
Budget by Categories of Expenditures
Fiscal Year 2011-12 Actuals
Fiscal Year 2012-13 Adopted Budget
Fiscal Year 2012-13
Amended Budget
Fiscal Year 2012-13 Actuals
Fiscal Year 2013-14 Adopted Budget
Fiscal Year 2014-15
Approved Budget
Salaries & Benefits $ 22,186,299 $ 23,968,755 $ 21,980,035 $ 21,978,813 $ 21,817,942 $ 22,334,828
Services & Supplies 10,551,352 12,782,800 16,326,815 12,518,506 14,145,444 10,718,444
Other Charges 358 1,000 51,800 51,708 1,000 1,000
Capital Assets Equipment
5,667 — — — — —
Total $ 32,743,676 $ 36,752,555 $ 38,358,650 $ 34,549,027 $ 35,964,386 $ 33,054,272
416 Finance and General Government GroupAdopted Operational Plan Fiscal Years 2013-2014 and 2014-2015

Auditor and Controller
Budget by Categories of Revenues
Fiscal Year 2011-12 Actuals
Fiscal Year 2012-13 Adopted Budget
Fiscal Year 2012-13
Amended Budget
Fiscal Year 2012-13 Actuals
Fiscal Year 2013-14 Adopted Budget
Fiscal Year 2014-15
Approved Budget
Intergovernmental Revenues
$ 91,771 $ 70,970 $ 70,970 $ 78,301 $ 75,628 $ 75,628
Charges For Current Services
7,092,616 6,722,110 6,722,110 6,900,898 6,754,163 6,754,163
Miscellaneous Revenues
62,505 157,688 157,688 365,981 290,000 290,000
Use of Fund Balance (1,300,780) 2,250,000 3,856,095 (347,940) 3,430,000 —General Purpose Revenue Allocation
26,797,563 27,551,787 27,551,787 27,551,787 25,414,595 25,934,481
Total $ 32,743,676 $ 36,752,555 $ 38,358,650 $ 34,549,027 $ 35,964,386 $ 33,054,272
417Finance and General Government Group Adopted Operational Plan Fiscal Years 2013-2014 and 2014-2015

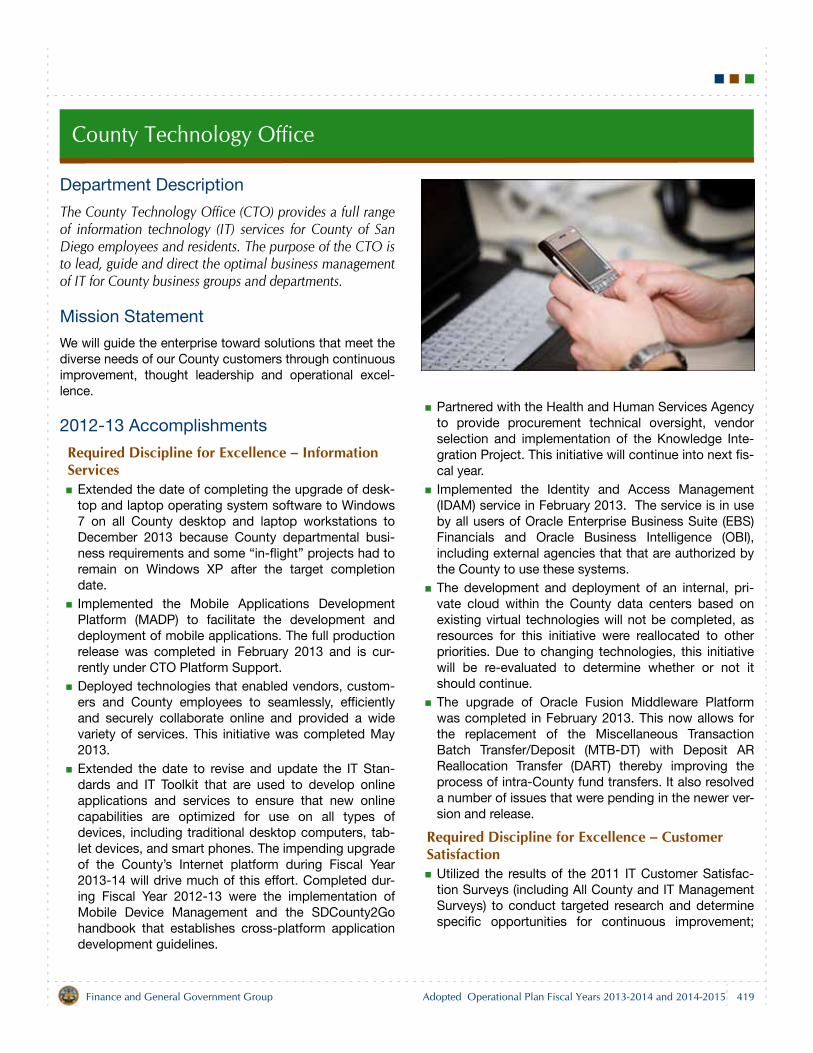
County Technology Office
Department Description
The County Technology Office (CTO) provides a full rangeof information technology (IT) services for County of SanDiego employees and residents. The purpose of the CTO isto lead, guide and direct the optimal business managementof IT for County business groups and departments.
Mission Statement
We will guide the enterprise toward solutions that meet thediverse needs of our County customers through continuousimprovement, thought leadership and operational excel-lence.
2012-13 Accomplishments
Required Discipline for Excellence – Information Services
Extended the date of completing the upgrade of desk-top and laptop operating system software to Windows7 on all County desktop and laptop workstations toDecember 2013 because County departmental busi-ness requirements and some “in-flight” projects had toremain on Windows XP after the target completiondate. Implemented the Mobile Applications DevelopmentPlatform (MADP) to facilitate the development anddeployment of mobile applications. The full productionrelease was completed in February 2013 and is cur-rently under CTO Platform Support.Deployed technologies that enabled vendors, custom-ers and County employees to seamlessly, efficientlyand securely collaborate online and provided a widevariety of services. This initiative was completed May2013. Extended the date to revise and update the IT Stan-dards and IT Toolkit that are used to develop onlineapplications and services to ensure that new onlinecapabilities are optimized for use on all types ofdevices, including traditional desktop computers, tab-let devices, and smart phones. The impending upgradeof the County’s Internet platform during Fiscal Year2013-14 will drive much of this effort. Completed dur-ing Fiscal Year 2012-13 were the implementation ofMobile Device Management and the SDCounty2Gohandbook that establishes cross-platform applicationdevelopment guidelines.
Partnered with the Health and Human Services Agencyto provide procurement technical oversight, vendorselection and implementation of the Knowledge Inte-gration Project. This initiative will continue into next fis-cal year. Implemented the Identity and Access Management(IDAM) service in February 2013. The service is in useby all users of Oracle Enterprise Business Suite (EBS)Financials and Oracle Business Intelligence (OBI),including external agencies that that are authorized bythe County to use these systems. The development and deployment of an internal, pri-vate cloud within the County data centers based onexisting virtual technologies will not be completed, asresources for this initiative were reallocated to otherpriorities. Due to changing technologies, this initiativewill be re-evaluated to determine whether or not itshould continue.The upgrade of Oracle Fusion Middleware Platformwas completed in February 2013. This now allows forthe replacement of the Miscellaneous TransactionBatch Transfer/Deposit (MTB-DT) with Deposit ARReallocation Transfer (DART) thereby improving theprocess of intra-County fund transfers. It also resolveda number of issues that were pending in the newer ver-sion and release.
Required Discipline for Excellence – Customer Satisfaction
Utilized the results of the 2011 IT Customer Satisfac-tion Surveys (including All County and IT ManagementSurveys) to conduct targeted research and determinespecific opportunities for continuous improvement;
419Finance and General Government Group Adopted Operational Plan Fiscal Years 2013-2014 and 2014-2015
County Technology Office
developed strategies for implementing improvementactivities; and advanced employee satisfaction withtechnology in key focus areas.Developed a feedback process to assess how wellinfrastructure and applications projects meet the needsof County departments. CTO conducted five pilot proj-ects to assess business value and the degree to whichbusiness objectives were met.Provided a comprehensive plan and infrastructure toallow the County to securely manage a wide variety ofmobile devices for use by County employees (BringYour Own Device/Technology concept). This will elimi-nate the need of carrying two mobile devices, one fortheir personal use and one for work and still providenecessary security. A new Mobile Device ManagementIT solution design was initiated in the last fiscal quarterand implementation is expected to be completed inFiscal Year 2013-14.
Required Discipline for Excellence – Fiscal StabilityMaintained IT costs for services at rates established inthe IT Outsourcing Agreement. New services werebenchmarked and analyzed for best value to theCounty to provide a fair and reasonable price.Established a contract to update IT cost managementsystem (Chargeback) to improve efficiencies in moni-toring and reporting IT costs to County users. The sys-tem will be available in Fiscal Year 2013-14.
Required Discipline for Excellence – Continuous Improvement and Innovation
Completed the implementation of Project and PortfolioManagement (PPM) software, an HP Enterprise Ser-vices (HPES) solution for managing all aspects of ITprojects, including status reporting, issues manage-ment, risk management and time reporting.Completed the implementation of Application LifecycleManagement (ALM) software, an HPES solution formanaging applications through development, testingand implementation.Extended the implementation of future phases of theService Manager application to modernize the toolsand services used within the County to September2013 due to reallocation of staff to other priorities. Developed a retirement roadmap strategy as part of theApplications Rationalization project and identifiedapplications that may have technology risks and/orminimal business value. The project was completed byJune 30, 2013.
Required Discipline for Excellence – Regional Leadership
Provided regional and national leadership through par-ticipation on advisory boards and speaking engage-ments.Received the national Digital Government AchievementAward for Justice Electronic Library System (JELS) inthe Government to Government category.Received the 2012 California State Association ofCounties (CSAC) Award for JELS.Presented at the 2013 annual CSAC conference – ITInnovation Summit
Required Discipline for Excellence – Skilled, Adaptable and Diverse Workforce
Provided employees and community members with ITlearning opportunities via vendor fairs and IT educationdays.
2013-15 Objectives
Required Discipline for Excellence – Information Services
Complete upgrade of the Windows 7 operating systemsoftware on all County desktop and laptop worksta-tions prior to the April 2014 Windows XP support dead-line.Create a single repository called DocVault to storeApplications work products that is accessible toCounty staff. This repository will have fundamental tax-onomy and search tools.Implement an enterprise constituent contact manage-ment and request management solution that will pro-vide the County with a cohesive system for trackingconstituent contact information and referrals. The sys-tem will be used by the five County Board of Supervi-sors offices, as well as County departments thatreceive and process requests for information from thepublic. Planned implementation of Service Manager (HPESapplication) to replace the aging MyRequest Systemhas been cancelled based on preliminary testing.
Required Discipline for Excellence – Customer Satisfaction
Utilize the results of the 2012 IT Customer SatisfactionSurveys (including All County and IT Management Sur-veys) to conduct targeted research and determine spe-
420 Finance and General Government GroupAdopted Operational Plan Fiscal Years 2013-2014 and 2014-2015
County Technology Office
cific opportunities for continuous improvement,develop strategies for implementing improvementactivities, and advance satisfaction in key focus areas.
Required Discipline for Excellence – Fiscal StabilityMaintain IT costs for services at rates established in theIT Outsourcing Agreement. New services will bebenchmarked and analyzed for best value to theCounty to provide a fair and reasonable price.Effectively manage performance of the County’s Out-sourcing Provider to ensure timeliness and value of ITservices.
Required Discipline for Excellence – Regional Leadership
Provide regional and national leadership through par-ticipation on advisory boards and speaking engage-ments.
Required Discipline for Excellence – Skilled, Adaptable and Diverse Workforce
Develop and implement Organization Change Manage-ment Plan for the Integrated Property Tax System(IPTS) project.Provide employees and community members with ITlearning opportunities via vendor fairs and IT educationdays.Provide County user training for the updated IT costmanagement system to improve efficiencies in moni-toring and reporting IT costs.
Required Discipline for Excellence – Continuous Improvement and Innovation
Redesign and re-implement the County’s public-facingwebsite on new technology that will allow for ease ofdesign and sizing for mobile viewing as well as provide
the ability for each County department to manage theirspecific content and features easily and cost-effec-tively.Re-architect the Documentum environment to enablenew features of Documentum version 6.7 and tightlyintegrate with Captiva for capture solution. The first twoapplications to utilize the platform will be CalWin Elec-tronic Records Management System (ERMS) and Xen-docs.Implement Adobe LiveCycle solution to allow formsdevelopment, data loss prevention of Adobe docu-ment, and enable additional product feature capabili-ties.Implement a new Customer Relationship Managementsystem to identify, record, and track requests for infor-mation and other communications received from thepublic. This system will ensure that County residentsreceive a timely and accurate response when makinginquiries of County government.Provide technical oversight and support for the Knowl-edge Integration Project (KIP), a Health and HumanServices Agency (HHSA) initiative that will set the foun-dation for centralized client care information. Whencompleted, this new system will integrate informationfrom several different HHSA systems to provide bothCounty and external providers with a quick and accu-rate online information resource.
Related Links
For additional information about the CTO, refer to the web-site at www.sdcounty.ca.gov/cto.
421Finance and General Government Group Adopted Operational Plan Fiscal Years 2013-2014 and 2014-2015
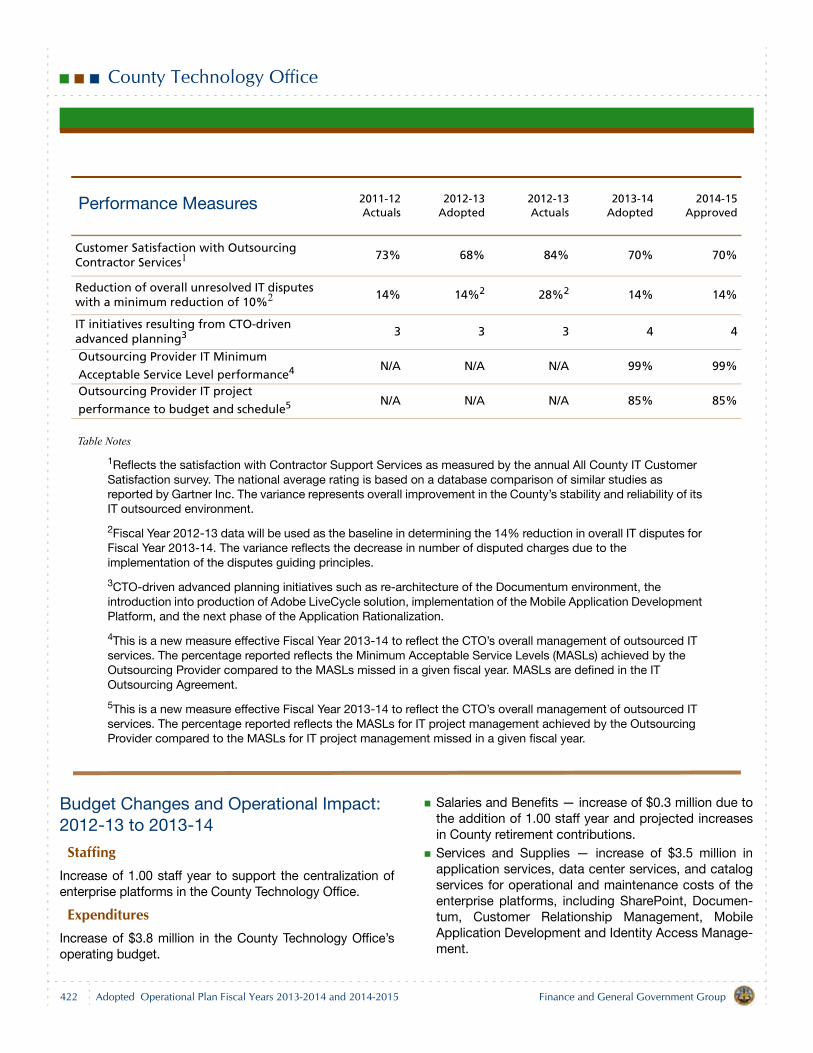
County Technology Office
Table Notes
1Reflects the satisfaction with Contractor Support Services as measured by the annual All County IT Customer Satisfaction survey. The national average rating is based on a database comparison of similar studies as reported by Gartner Inc. The variance represents overall improvement in the County’s stability and reliability of its IT outsourced environment.
2Fiscal Year 2012-13 data will be used as the baseline in determining the 14% reduction in overall IT disputes for Fiscal Year 2013-14. The variance reflects the decrease in number of disputed charges due to the implementation of the disputes guiding principles.
3CTO-driven advanced planning initiatives such as re-architecture of the Documentum environment, the introduction into production of Adobe LiveCycle solution, implementation of the Mobile Application Development Platform, and the next phase of the Application Rationalization.
4This is a new measure effective Fiscal Year 2013-14 to reflect the CTO’s overall management of outsourced IT services. The percentage reported reflects the Minimum Acceptable Service Levels (MASLs) achieved by the Outsourcing Provider compared to the MASLs missed in a given fiscal year. MASLs are defined in the IT Outsourcing Agreement.
5This is a new measure effective Fiscal Year 2013-14 to reflect the CTO’s overall management of outsourced IT services. The percentage reported reflects the MASLs for IT project management achieved by the Outsourcing Provider compared to the MASLs for IT project management missed in a given fiscal year.
Budget Changes and Operational Impact: 2012-13 to 2013-14
StaffingIncrease of 1.00 staff year to support the centralization ofenterprise platforms in the County Technology Office.
ExpendituresIncrease of $3.8 million in the County Technology Office’soperating budget.
Salaries and Benefits — increase of $0.3 million due tothe addition of 1.00 staff year and projected increasesin County retirement contributions.Services and Supplies — increase of $3.5 million inapplication services, data center services, and catalogservices for operational and maintenance costs of theenterprise platforms, including SharePoint, Documen-tum, Customer Relationship Management, MobileApplication Development and Identity Access Manage-ment.
Performance Measures 2011-12Actuals
2012-13Adopted
2012-13Actuals
2013-14Adopted
2014-15Approved
Customer Satisfaction with Outsourcing Contractor Services1 73% 68% 84% 70% 70%
Reduction of overall unresolved IT disputes with a minimum reduction of 10%2 14% 14%2 28%2 14% 14%
IT initiatives resulting from CTO-driven advanced planning3 3 3 3 4 4
Outsourcing Provider IT Minimum
Acceptable Service Level performance4 N/A N/A N/A 99% 99%
Outsourcing Provider IT project
performance to budget and schedule5 N/A N/A N/A 85% 85%
422 Finance and General Government GroupAdopted Operational Plan Fiscal Years 2013-2014 and 2014-2015
County Technology Office
Increase of $14.9 million in the Information TechnologyInternal Service Fund (ISF) based on information technol-ogy expenditures projected by all County departments,including one-time projects such as the scheduled upgradeof the County’s human resource information system, andincreases in various IT accounts for ongoing costs such asdata storage and application support.
RevenuesIncrease of $3.8 million in the County Technology Office’soperating budget.
Use of Fund Balance — increase of $0.9 million for atotal budget of $4.1 million is budgeted.
$1.6 million for enterprise platform upgrades andlicenses.$2.5 million for one-time IT initiatives, includingredesign and mobilization of County websites,implementation of constituent relationshipmanagement (CRM) software, and improvement ofdigital authorization and approval systems.
General Purpose Revenue Allocation — increase of$2.8 million to support the various operational andmaintenance costs associated with the centralizationof enterprise platforms in the CTO.
Increase of $14.9 million in the Information Technology ISF.Charges for Current Services — increase of $14.4 mil-lion is based on information technology expendituresprojected by all County departments. Each departmentis billed for IT services on a monthly basis.Other Financing Sources — increase of $0.6 million isbased on an increase in costs for ERP system licensesand related expenditures that are typically fundedthrough an operating transfer from the General Fund.
Budget Changes and Operational Impact: 2013-14 to 2014-15
Total expenditures decrease by $15.9 million primarily as aresult of a decrease of $12.8 million in the Information Tech-nology ISF due to anticipated completion of one-time ITprojects and projected decreases in IT services required byvarious County departments. A $3.2 million decrease existsin the County Technology Office’s operating budget due tothe anticipated completion of one-time IT initiativesdescribed above.
423Finance and General Government Group Adopted Operational Plan Fiscal Years 2013-2014 and 2014-2015
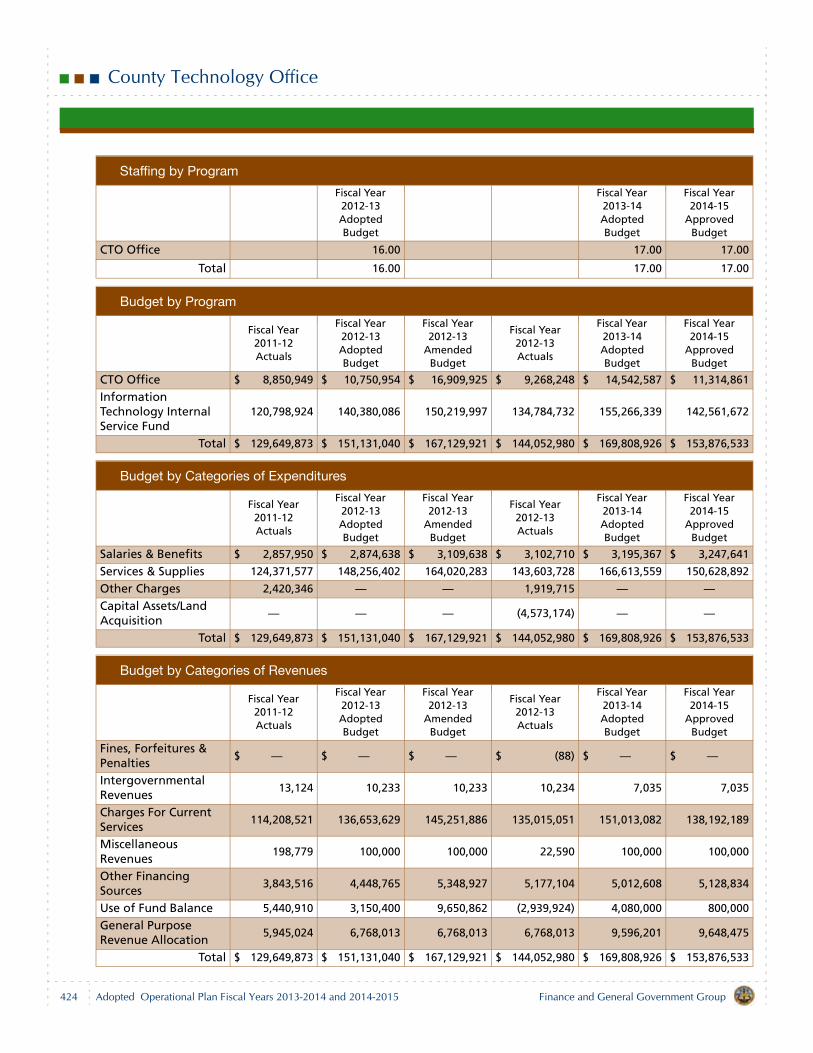
County Technology Office
Staffing by Program
Fiscal Year 2012-13 Adopted Budget
Fiscal Year 2013-14 Adopted Budget
Fiscal Year 2014-15
Approved Budget
CTO Office 16.00 17.00 17.00
Total 16.00 17.00 17.00
Budget by Program
Fiscal Year 2011-12 Actuals
Fiscal Year 2012-13 Adopted Budget
Fiscal Year 2012-13
Amended Budget
Fiscal Year 2012-13 Actuals
Fiscal Year 2013-14 Adopted Budget
Fiscal Year 2014-15
Approved Budget
CTO Office $ 8,850,949 $ 10,750,954 $ 16,909,925 $ 9,268,248 $ 14,542,587 $ 11,314,861
Information Technology Internal Service Fund
120,798,924 140,380,086 150,219,997 134,784,732 155,266,339 142,561,672
Total $ 129,649,873 $ 151,131,040 $ 167,129,921 $ 144,052,980 $ 169,808,926 $ 153,876,533
Budget by Categories of Expenditures
Fiscal Year 2011-12 Actuals
Fiscal Year 2012-13 Adopted Budget
Fiscal Year 2012-13
Amended Budget
Fiscal Year 2012-13 Actuals
Fiscal Year 2013-14 Adopted Budget
Fiscal Year 2014-15
Approved Budget
Salaries & Benefits $ 2,857,950 $ 2,874,638 $ 3,109,638 $ 3,102,710 $ 3,195,367 $ 3,247,641
Services & Supplies 124,371,577 148,256,402 164,020,283 143,603,728 166,613,559 150,628,892
Other Charges 2,420,346 — — 1,919,715 — —Capital Assets/Land Acquisition
— — — (4,573,174) — —
Total $ 129,649,873 $ 151,131,040 $ 167,129,921 $ 144,052,980 $ 169,808,926 $ 153,876,533
Budget by Categories of Revenues
Fiscal Year 2011-12 Actuals
Fiscal Year 2012-13 Adopted Budget
Fiscal Year 2012-13
Amended Budget
Fiscal Year 2012-13 Actuals
Fiscal Year 2013-14 Adopted Budget
Fiscal Year 2014-15
Approved Budget
Fines, Forfeitures & Penalties
$ — $ — $ — $ (88) $ — $ —
Intergovernmental Revenues
13,124 10,233 10,233 10,234 7,035 7,035
Charges For Current Services
114,208,521 136,653,629 145,251,886 135,015,051 151,013,082 138,192,189
Miscellaneous Revenues
198,779 100,000 100,000 22,590 100,000 100,000
Other Financing Sources
3,843,516 4,448,765 5,348,927 5,177,104 5,012,608 5,128,834
Use of Fund Balance 5,440,910 3,150,400 9,650,862 (2,939,924) 4,080,000 800,000
General Purpose Revenue Allocation
5,945,024 6,768,013 6,768,013 6,768,013 9,596,201 9,648,475
Total $ 129,649,873 $ 151,131,040 $ 167,129,921 $ 144,052,980 $ 169,808,926 $ 153,876,533
424 Finance and General Government GroupAdopted Operational Plan Fiscal Years 2013-2014 and 2014-2015
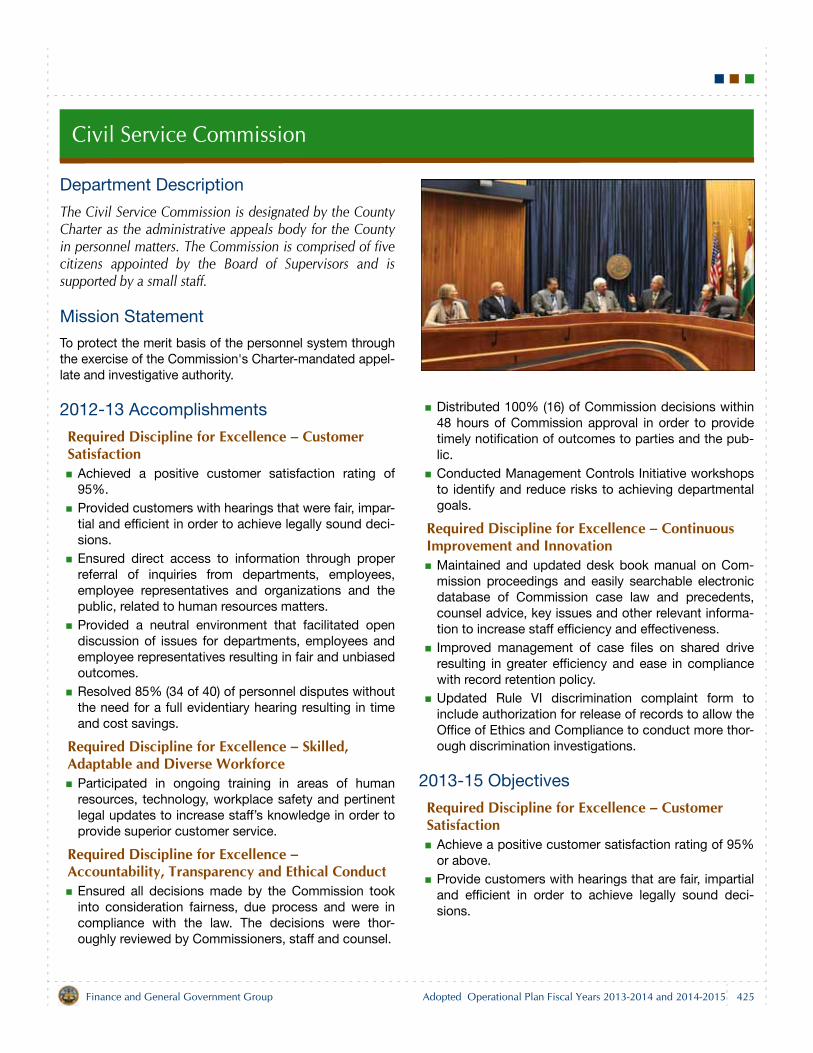
Civil Service Commission
Department Description
The Civil Service Commission is designated by the CountyCharter as the administrative appeals body for the Countyin personnel matters. The Commission is comprised of fivecitizens appointed by the Board of Supervisors and issupported by a small staff.
Mission Statement
To protect the merit basis of the personnel system throughthe exercise of the Commission's Charter-mandated appel-late and investigative authority.
2012-13 Accomplishments
Required Discipline for Excellence – Customer Satisfaction
Achieved a positive customer satisfaction rating of95%.Provided customers with hearings that were fair, impar-tial and efficient in order to achieve legally sound deci-sions.Ensured direct access to information through properreferral of inquiries from departments, employees,employee representatives and organizations and thepublic, related to human resources matters.Provided a neutral environment that facilitated opendiscussion of issues for departments, employees andemployee representatives resulting in fair and unbiasedoutcomes.Resolved 85% (34 of 40) of personnel disputes withoutthe need for a full evidentiary hearing resulting in timeand cost savings.
Required Discipline for Excellence – Skilled, Adaptable and Diverse Workforce
Participated in ongoing training in areas of humanresources, technology, workplace safety and pertinentlegal updates to increase staff’s knowledge in order toprovide superior customer service.
Required Discipline for Excellence – Accountability, Transparency and Ethical Conduct
Ensured all decisions made by the Commission tookinto consideration fairness, due process and were incompliance with the law. The decisions were thor-oughly reviewed by Commissioners, staff and counsel.
Distributed 100% (16) of Commission decisions within48 hours of Commission approval in order to providetimely notification of outcomes to parties and the pub-lic.Conducted Management Controls Initiative workshopsto identify and reduce risks to achieving departmentalgoals.
Required Discipline for Excellence – Continuous Improvement and Innovation
Maintained and updated desk book manual on Com-mission proceedings and easily searchable electronicdatabase of Commission case law and precedents,counsel advice, key issues and other relevant informa-tion to increase staff efficiency and effectiveness. Improved management of case files on shared driveresulting in greater efficiency and ease in compliancewith record retention policy.Updated Rule VI discrimination complaint form toinclude authorization for release of records to allow theOffice of Ethics and Compliance to conduct more thor-ough discrimination investigations.
2013-15 Objectives
Required Discipline for Excellence – Customer Satisfaction
Achieve a positive customer satisfaction rating of 95%or above.Provide customers with hearings that are fair, impartialand efficient in order to achieve legally sound deci-sions.
425Finance and General Government Group Adopted Operational Plan Fiscal Years 2013-2014 and 2014-2015
Civil Service Commission
Ensure direct access to information through properreferral of inquiries from departments, employees,employee representatives and organizations and thepublic, related to human resources matters.Provide a neutral environment that facilitates open dis-cussion of issues for departments, employees andemployee representatives resulting in fair and unbiasedoutcomes.Resolve 55% of personnel disputes without the needfor a full evidentiary hearing resulting in time and costsavings.
Required Discipline for Excellence – Skilled, Adaptable and Diverse Workforce
Participate in ongoing training in areas of humanresources, technology, workplace safety and pertinentlegal updates to increase staff’s knowledge in order toprovide superior customer service.
Required Discipline for Excellence – Accountability, Transparency and Ethical Conduct
Ensure all decisions made by the Commission will take
into consideration fairness, due process and are incompliance with the law. The decisions will be thor-oughly reviewed by Commissioners, staff and counsel.Distribute at least 95% of Commission decisions within48 hours of Commission approval in order to providetimely notification of outcomes to parties and the pub-lic.
Required Discipline for Excellence – Continuous Improvement and Innovation
Maintain and update desk book manual on Commis-sion proceedings and easily searchable electronicdatabase of Commission case law and precedents,counsel advice, key issues and other relevant informa-tion to increase staff efficiency and effectiveness.
Related Links
For additional information about the Civil Service Commis-sion, refer to the website at www.sdcounty.ca.gov/civilservice.
Table Notes
1Resolving personnel disputes without a full evidentiary hearing saves money and staff time for the Commission office, other County departments, employees and prospective employees.
2Increase in personnel disputes resolved without a full evidentiary hearing over prior fiscal year is primarily due to greater number of settlements/withdrawals of disciplinary appeals prior to hearing.
Performance Measures
2011-12Actuals
2012-13Adopted
2012-13Actuals
2013-14Adopted
2014-15Approved
Positive customer satisfaction rating
95% 95% 95% 95% 95%
Personnel disputes resolved without need of an evidentiary hearing1
55%of 29 55% 85%2
of 40 55% 55%
Commission decisions distributed within 48 hours of Commission approval
100%of 19 95% 100%
of 16 95% 95%
426 Finance and General Government GroupAdopted Operational Plan Fiscal Years 2013-2014 and 2014-2015
Civil Service Commission
Budget Changes and Operational Impact: 2012-13 to 2013-14
StaffingNo change in staffing.
ExpendituresMinor increase in expenditures primarily as a result of anincrease in public liability insurance premiums.
RevenuesMinor increase in General Purpose Revenue to offsetincrease in expenditures described above.
Budget Changes and Operational Impact: 2013-14 to 2014-15
No significant changes.
427Finance and General Government Group Adopted Operational Plan Fiscal Years 2013-2014 and 2014-2015
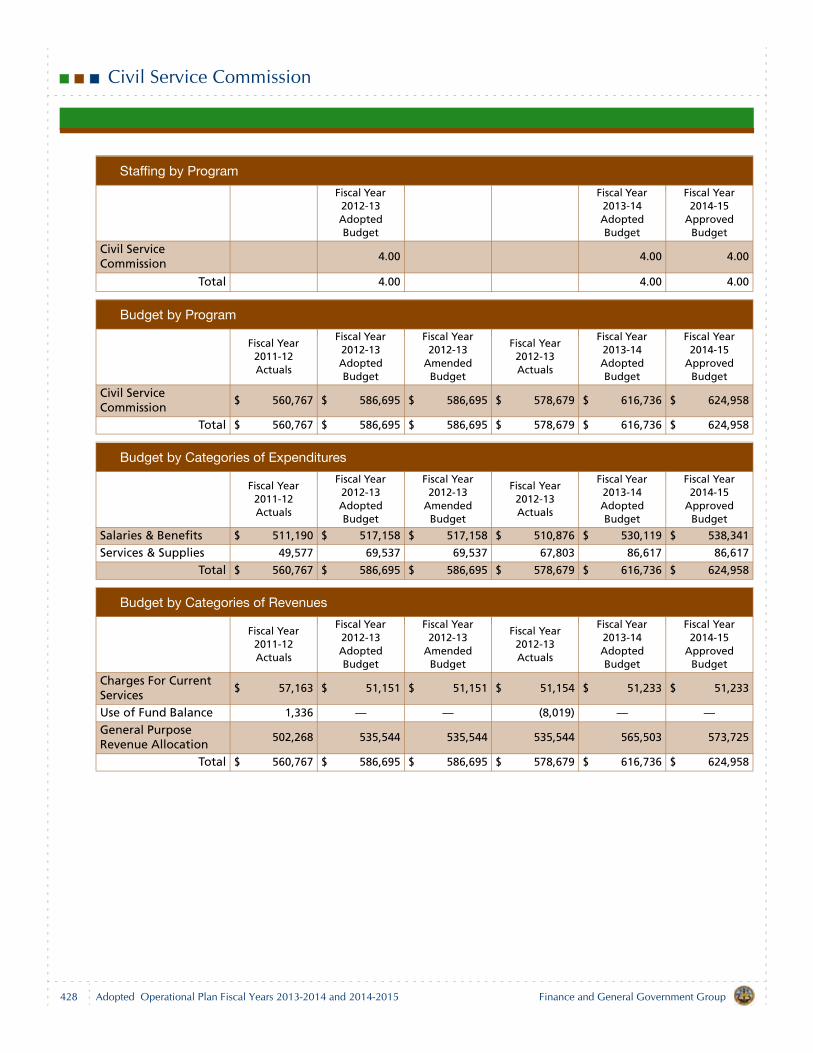
Civil Service Commission
Staffing by Program
Fiscal Year 2012-13 Adopted Budget
Fiscal Year 2013-14 Adopted Budget
Fiscal Year 2014-15
Approved Budget
Civil Service Commission
4.00 4.00 4.00
Total 4.00 4.00 4.00
Budget by Program
Fiscal Year 2011-12 Actuals
Fiscal Year 2012-13 Adopted Budget
Fiscal Year 2012-13
Amended Budget
Fiscal Year 2012-13 Actuals
Fiscal Year 2013-14 Adopted Budget
Fiscal Year 2014-15
Approved Budget
Civil Service Commission
$ 560,767 $ 586,695 $ 586,695 $ 578,679 $ 616,736 $ 624,958
Total $ 560,767 $ 586,695 $ 586,695 $ 578,679 $ 616,736 $ 624,958
Budget by Categories of Expenditures
Fiscal Year 2011-12 Actuals
Fiscal Year 2012-13 Adopted Budget
Fiscal Year 2012-13
Amended Budget
Fiscal Year 2012-13 Actuals
Fiscal Year 2013-14 Adopted Budget
Fiscal Year 2014-15
Approved Budget
Salaries & Benefits $ 511,190 $ 517,158 $ 517,158 $ 510,876 $ 530,119 $ 538,341
Services & Supplies 49,577 69,537 69,537 67,803 86,617 86,617
Total $ 560,767 $ 586,695 $ 586,695 $ 578,679 $ 616,736 $ 624,958
Budget by Categories of Revenues
Fiscal Year 2011-12 Actuals
Fiscal Year 2012-13 Adopted Budget
Fiscal Year 2012-13
Amended Budget
Fiscal Year 2012-13 Actuals
Fiscal Year 2013-14 Adopted Budget
Fiscal Year 2014-15
Approved Budget
Charges For Current Services
$ 57,163 $ 51,151 $ 51,151 $ 51,154 $ 51,233 $ 51,233
Use of Fund Balance 1,336 — — (8,019) — —General Purpose Revenue Allocation
502,268 535,544 535,544 535,544 565,503 573,725
Total $ 560,767 $ 586,695 $ 586,695 $ 578,679 $ 616,736 $ 624,958
428 Finance and General Government GroupAdopted Operational Plan Fiscal Years 2013-2014 and 2014-2015
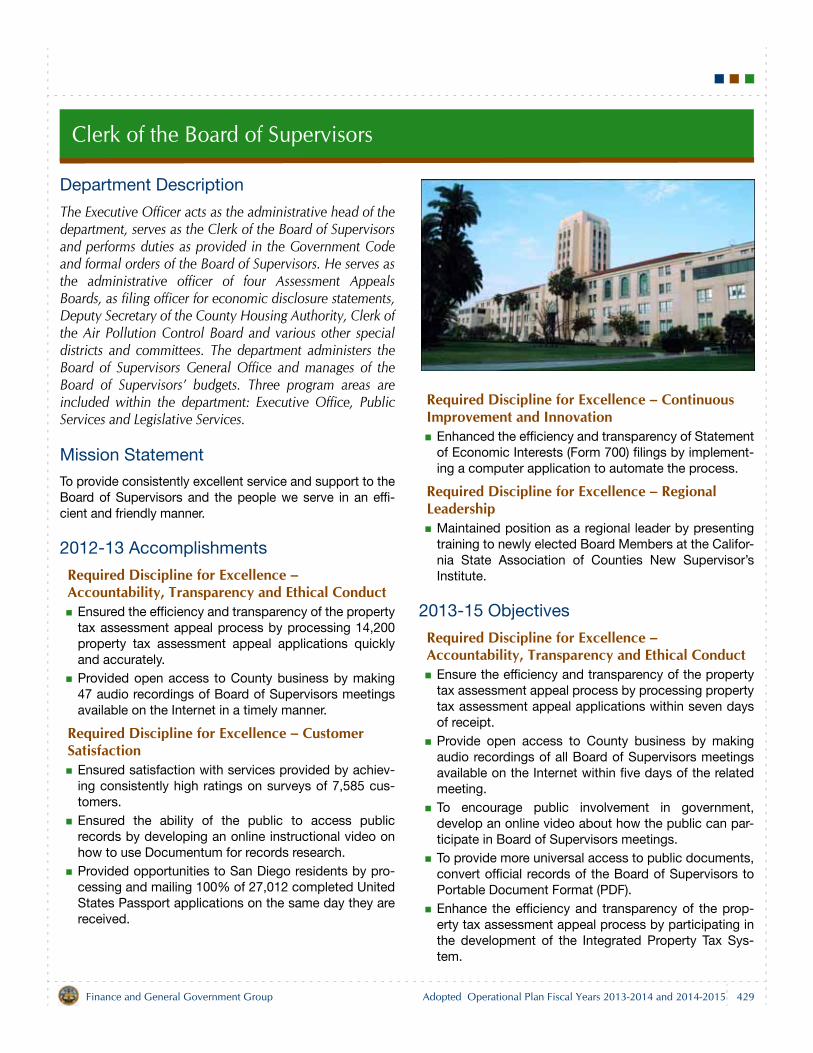
Clerk of the Board of Supervisors
Department Description
The Executive Officer acts as the administrative head of thedepartment, serves as the Clerk of the Board of Supervisorsand performs duties as provided in the Government Codeand formal orders of the Board of Supervisors. He serves asthe administrative officer of four Assessment AppealsBoards, as filing officer for economic disclosure statements,Deputy Secretary of the County Housing Authority, Clerk ofthe Air Pollution Control Board and various other specialdistricts and committees. The department administers theBoard of Supervisors General Office and manages of theBoard of Supervisors’ budgets. Three program areas areincluded within the department: Executive Office, PublicServices and Legislative Services.
Mission Statement
To provide consistently excellent service and support to theBoard of Supervisors and the people we serve in an effi-cient and friendly manner.
2012-13 Accomplishments
Required Discipline for Excellence – Accountability, Transparency and Ethical Conduct
Ensured the efficiency and transparency of the propertytax assessment appeal process by processing 14,200property tax assessment appeal applications quicklyand accurately.Provided open access to County business by making47 audio recordings of Board of Supervisors meetingsavailable on the Internet in a timely manner.
Required Discipline for Excellence – Customer Satisfaction
Ensured satisfaction with services provided by achiev-ing consistently high ratings on surveys of 7,585 cus-tomers.Ensured the ability of the public to access publicrecords by developing an online instructional video onhow to use Documentum for records research.Provided opportunities to San Diego residents by pro-cessing and mailing 100% of 27,012 completed UnitedStates Passport applications on the same day they arereceived.
Required Discipline for Excellence – Continuous Improvement and Innovation
Enhanced the efficiency and transparency of Statementof Economic Interests (Form 700) filings by implement-ing a computer application to automate the process.
Required Discipline for Excellence – Regional Leadership
Maintained position as a regional leader by presentingtraining to newly elected Board Members at the Califor-nia State Association of Counties New Supervisor’sInstitute.
2013-15 Objectives
Required Discipline for Excellence – Accountability, Transparency and Ethical Conduct
Ensure the efficiency and transparency of the propertytax assessment appeal process by processing propertytax assessment appeal applications within seven daysof receipt.Provide open access to County business by makingaudio recordings of all Board of Supervisors meetingsavailable on the Internet within five days of the relatedmeeting.To encourage public involvement in government,develop an online video about how the public can par-ticipate in Board of Supervisors meetings.To provide more universal access to public documents,convert official records of the Board of Supervisors toPortable Document Format (PDF).Enhance the efficiency and transparency of the prop-erty tax assessment appeal process by participating inthe development of the Integrated Property Tax Sys-tem.
429Finance and General Government Group Adopted Operational Plan Fiscal Years 2013-2014 and 2014-2015
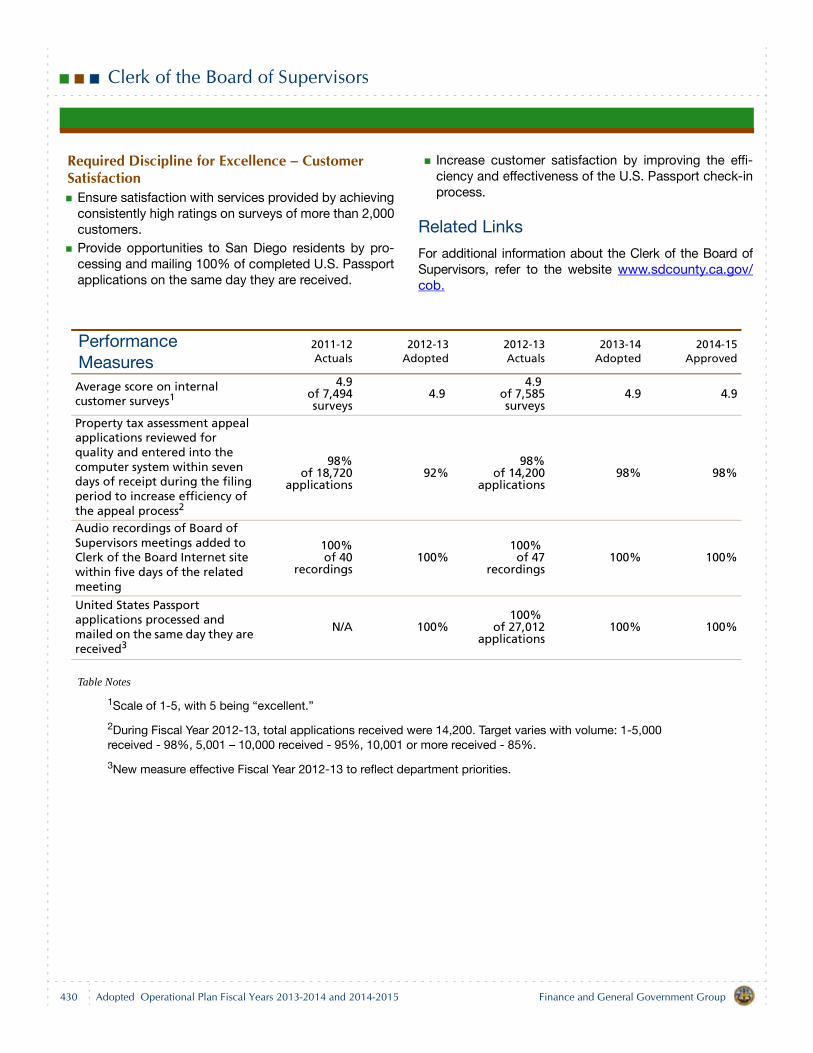
430
Clerk of the Board of Supervisors
Finance and General Government GroupAdopted Operational Plan Fiscal Years 2013-2014 and 2014-2015
Required Discipline for Excellence – Customer Satisfaction
Ensure satisfaction with services provided by achievingconsistently high ratings on surveys of more than 2,000customers.Provide opportunities to San Diego residents by pro-cessing and mailing 100% of completed U.S. Passportapplications on the same day they are received.
Increase customer satisfaction by improving the effi-ciency and effectiveness of the U.S. Passport check-inprocess.
Related Links
For additional information about the Clerk of the Board ofSupervisors, refer to the website www.sdcounty.ca.gov/cob.
Table Notes
1Scale of 1-5, with 5 being “excellent.”
2During Fiscal Year 2012-13, total applications received were 14,200. Target varies with volume: 1-5,000 received - 98%, 5,001 – 10,000 received - 95%, 10,001 or more received - 85%.
3New measure effective Fiscal Year 2012-13 to reflect department priorities.
Performance Measures
2011-12Actuals
2012-13Adopted
2012-13Actuals
2013-14Adopted
2014-15Approved
Average score on internal customer surveys1
4.9of 7,494 surveys
4.9 4.9
of 7,585surveys
4.9 4.9
Property tax assessment appeal applications reviewed for quality and entered into the computer system within seven days of receipt during the filing period to increase efficiency of the appeal process2
98%of 18,720
applications92%
98%of 14,200
applications98% 98%
Audio recordings of Board of Supervisors meetings added to Clerk of the Board Internet site within five days of the related meeting
100%of 40
recordings100%
100% of 47
recordings100% 100%
United States Passport applications processed and mailed on the same day they are received3
N/A 100%100%
of 27,012applications
100% 100%
Clerk of the Board of Supervisors
Budget Changes and Operational Impact: 2012-13 to 2013-14
StaffingNo change in staffing.
ExpendituresIncrease of $0.2 million.
Salaries and Benefits — increase of $0.1 million primar-ily due to an increase in County retirement contribu-tions.Services and Supplies — increase of $0.1 million pri-marily due to increased costs of maintaining informa-tion technology automation systems.
RevenuesIncrease of $0.2 million
Charges for Current Services — increase of $0.1 millionprimarily due to increased revenue from passportacceptance and photo service.General Purpose Revenue Allocation — increase of$0.1 million to support expenditure changes describedabove, partially offset by an increase in Charges forCurrent Services.
Budget Changes and Operational Impact: 2013-14 to 2014-15
Net increase of $0.1 million in Salaries and Benefits primar-ily due to an increase in County retirement contributions.
431Finance and General Government Group Adopted Operational Plan Fiscal Years 2013-2014 and 2014-2015
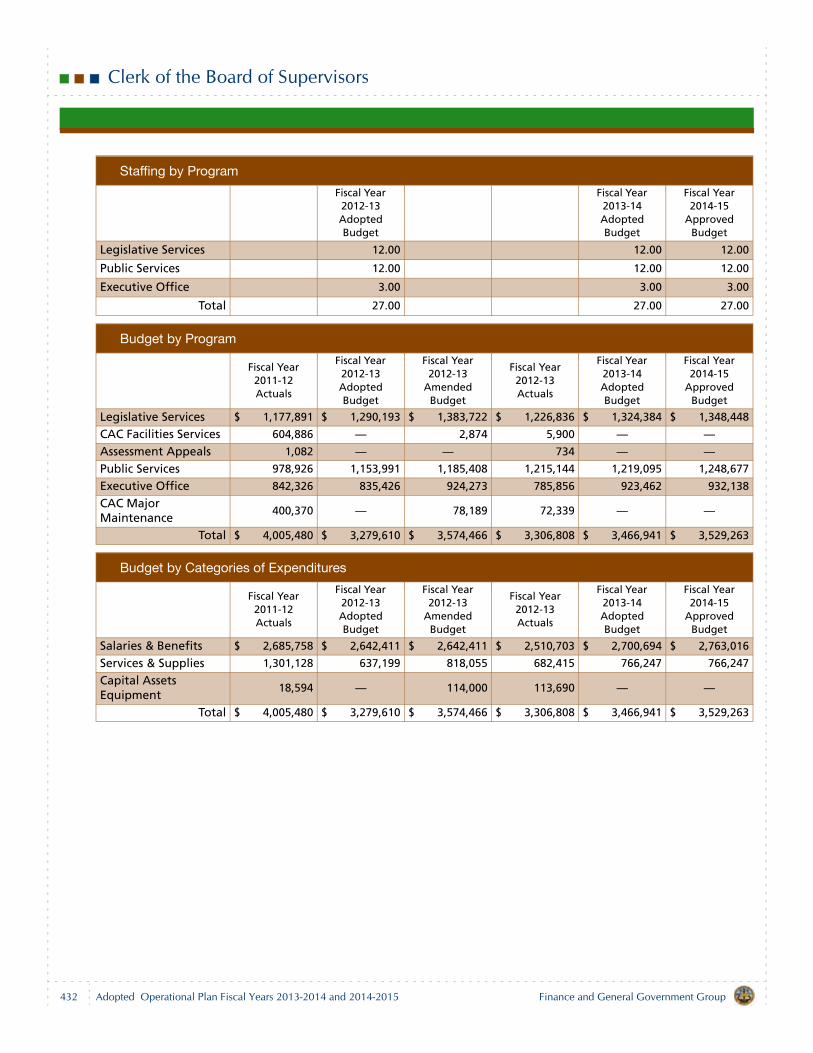
Clerk of the Board of Supervisors
Staffing by Program
Fiscal Year 2012-13 Adopted Budget
Fiscal Year 2013-14 Adopted Budget
Fiscal Year 2014-15
Approved Budget
Legislative Services 12.00 12.00 12.00
Public Services 12.00 12.00 12.00
Executive Office 3.00 3.00 3.00
Total 27.00 27.00 27.00
Budget by Program
Fiscal Year 2011-12 Actuals
Fiscal Year 2012-13 Adopted Budget
Fiscal Year 2012-13
Amended Budget
Fiscal Year 2012-13 Actuals
Fiscal Year 2013-14 Adopted Budget
Fiscal Year 2014-15
Approved Budget
Legislative Services $ 1,177,891 $ 1,290,193 $ 1,383,722 $ 1,226,836 $ 1,324,384 $ 1,348,448
CAC Facilities Services 604,886 — 2,874 5,900 — —Assessment Appeals 1,082 — — 734 — —Public Services 978,926 1,153,991 1,185,408 1,215,144 1,219,095 1,248,677
Executive Office 842,326 835,426 924,273 785,856 923,462 932,138
CAC Major Maintenance
400,370 — 78,189 72,339 — —
Total $ 4,005,480 $ 3,279,610 $ 3,574,466 $ 3,306,808 $ 3,466,941 $ 3,529,263
Budget by Categories of Expenditures
Fiscal Year 2011-12 Actuals
Fiscal Year 2012-13 Adopted Budget
Fiscal Year 2012-13
Amended Budget
Fiscal Year 2012-13 Actuals
Fiscal Year 2013-14 Adopted Budget
Fiscal Year 2014-15
Approved Budget
Salaries & Benefits $ 2,685,758 $ 2,642,411 $ 2,642,411 $ 2,510,703 $ 2,700,694 $ 2,763,016
Services & Supplies 1,301,128 637,199 818,055 682,415 766,247 766,247
Capital Assets Equipment
18,594 — 114,000 113,690 — —
Total $ 4,005,480 $ 3,279,610 $ 3,574,466 $ 3,306,808 $ 3,466,941 $ 3,529,263
432 Finance and General Government GroupAdopted Operational Plan Fiscal Years 2013-2014 and 2014-2015
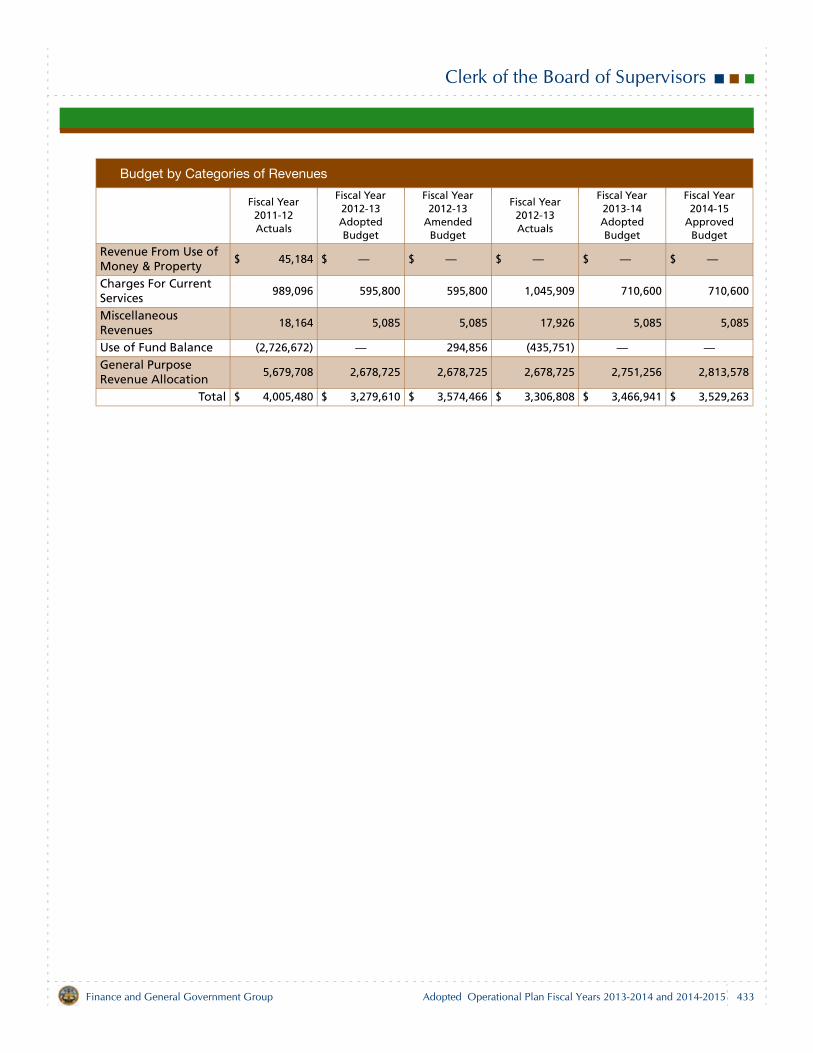
Clerk of the Board of Supervisors
Budget by Categories of Revenues
Fiscal Year 2011-12 Actuals
Fiscal Year 2012-13 Adopted Budget
Fiscal Year 2012-13
Amended Budget
Fiscal Year 2012-13 Actuals
Fiscal Year 2013-14 Adopted Budget
Fiscal Year 2014-15
Approved Budget
Revenue From Use of Money & Property
$ 45,184 $ — $ — $ — $ — $ —
Charges For Current Services
989,096 595,800 595,800 1,045,909 710,600 710,600
Miscellaneous Revenues
18,164 5,085 5,085 17,926 5,085 5,085
Use of Fund Balance (2,726,672) — 294,856 (435,751) — —General Purpose Revenue Allocation
5,679,708 2,678,725 2,678,725 2,678,725 2,751,256 2,813,578
Total $ 4,005,480 $ 3,279,610 $ 3,574,466 $ 3,306,808 $ 3,466,941 $ 3,529,263
433Finance and General Government Group Adopted Operational Plan Fiscal Years 2013-2014 and 2014-2015

County Counsel
Department Description
The San Diego County Charter provides that CountyCounsel serves as the civil legal advisor for the County andrepresents the County in all civil actions by and against theCounty, its officers, boards, commissions and employees.County Counsel serves as the attorney for the Countythrough the Board of Supervisors, County officers,employees, departments, boards and commissions. CountyCounsel maintains proactive participation in all phases ofgovernmental decision making and a very active andsuccessful litigation program. County Counsel also providesrepresentation of the County’s Health and Human ServicesAgency in juvenile dependency matters and provides legalservices on a fee basis to several special districts. CountyCounsel oversees the County’s Claims Division, whichadministers claims filed against the County by members ofthe public, as well as employee lost property claims.
Mission Statement
To deliver the highest quality legal services to our clients asefficiently and economically as possible in order to facilitatethe achievement of the goal of the County to better servethe residents of San Diego County.
2012-13 Accomplishments
Required Discipline for Excellence – Customer Satisfaction
Provided quality, accurate, effective and timely legal adviceto all County departments to enable them to fulfill their mis-sion and objectives in accordance with the law, reduce therisk of liability and use taxpayer dollars efficiently and effec-tively.
Completed 100% (30 of 30) of all advisory assignmentsfor the Board of Supervisors and Chief AdministrativeOfficer by their due dates.Completed 99% (1,460 of 1,481) of all advisory assign-ments for County departments by the agreed upon duedates.Continued County Counsel law student internship pro-gram (14 interns) to provide quality service to clients.
Required Discipline for Excellence – Fiscal StabilityAggressively represented the County in litigation, maintain-ing fiscal stability while advancing the overall interests ofthe County of San Diego and the public it serves.
Resolved 83% (85 of 103) of all lawsuits against theCounty by a court decision/dismissal, and resolved17% (18 of 103) by settlement.Prevailed in 100% (85 of 85) of court decisions in alllawsuits filed against the County.Achieved a success rate of 100% (8 of 8) in Countycode enforcement and other lawsuits where the Countyis the plaintiff by winning in court or obtaining favorablefinancial settlements.Handled 100% (103 of 103) of the defense of all law-suits filed in California against the County, unless aconflict of interest required outside counsel to handle acase, thereby reducing outside counsel costs to theCounty and taxpayers.
Strategic Initiative – Healthy FamiliesProvided effective legal services to the Health and HumanService Agency (HHSA) in matters relating to children whohave been dependents of the Juvenile Court.
Prevailed in 96% (1,317 of 1,378) of Juvenile Depen-dency petitions filed in Superior Court.Prevailed in 96% (329 of 342) of Juvenile Dependencyappeals and writs filed.
Strategic Initiative – Sustainable EnvironmentsSupported the County’s objective of promoting responsibledevelopment, economic vitality and the highest quality oflife.
435Finance and General Government Group Adopted Operational Plan Fiscal Years 2013-2014 and 2014-2015
County Counsel
Completed 100% (3 of 3) draft Environmental ImpactReport reviews within 40 days or less.
Required Discipline for Excellence – Regional Leadership
County Counsel attorneys engaged in numerous leadershiproles in the County and throughout the State, with theexpectation that they would provide positive and construc-tive influences in the professional practice of law in theregion.
Maintained significant involvement in the activities of15 regional organizations and committees.
Required Discipline for Excellence – Skilled, Adaptable and Diverse Workforce
Provided education and risk mitigation training to Countyofficers and employees to support a committed, capableand diverse workforce.
Provided 92 education programs on selected legalsubjects for County departments.Provided 60 specialized risk mitigation sessions, suchas risk roundtables, settlement committee discussionsand post-litigation debriefings to address risk issues,helping to promote risk management and decreasefuture legal liability.Provided 28 internal and/or external training sessionsfor County Counsel staff, including Mandatory Continu-ing Legal Education, to ensure staff continues to pro-vide the highest quality legal services to the County byremaining current on developments in the law.
Required Discipline for Excellence – Information Services
Optimized information technology systems to improveoperational efficiency and service to customers.
Continued to work with the County Technology Officeon the development of a centralized document reposi-tory and electronic briefcase system for JuvenileDependency-related court documents. This centralizedrepository will be shared by multiple departments(including San Diego Superior Court and HHSA’s ChildWelfare Services) and will result in an efficient elec-tronic retrieval process, eliminating the need for paperdocuments.The transition to a new web-based office practice man-agement system (Tymetrix’s T360), which manages allcase and advisory information, has calendaring capa-bilities, retains client and contract information, storessupporting legal documents, and tracks time and bill-
ing information was delayed due to a system designchange initiated by the vendor. Delaying the projectminimized the additional costs that would have beenincurred from the necessity to re-train staff on the newuser-interface design once it was implemented.Maintained the County Counsel intranet site by con-tinuing to provide legal links, up-to-date training mate-rials and other information which could support clientdepartments.Continued to expand use of available mobile technolo-gies, such as implementing web-based solutions orincreasing the use of mobile computing to increase effi-ciencies.The capability to implement a paperless electronic bill-ing technology which will streamline invoicing proce-dures and payment processes will be assessed whenwe transition to the new web-based office practicemanagement system referenced above. This technol-ogy will create a bidirectional data feed into theCounty’s Oracle Financial system, and will provide effi-ciencies in data entry and reconciliation.
2013-15 Objectives
Required Discipline for Excellence – Customer Satisfaction
Provide quality, accurate, effective and timely legal adviceto all County departments to enable them to fulfill their mis-sion and objectives in accordance with the law, reduce therisk of liability and use taxpayer dollars efficiently and effec-tively.
Complete 98% of all advisory assignments for theBoard of Supervisors and Chief Administrative Officerby their due dates.Complete 95% or more of all advisory assignments forCounty departments by the agreed upon due dates.Continue County Counsel law student internship pro-gram to provide quality service to clients.
Required Discipline for Excellence – Fiscal StabilityAggressively represent the County in litigation, maintainingfiscal stability while advancing the overall interests of theCounty of San Diego and the public it serves.
Resolve 80% or more of all lawsuits against the Countyby a court decision/dismissal, and resolve 20% or lessby settlement.Prevail in 90% or more of court decisions in all lawsuitsfiled against the County.
436 Finance and General Government GroupAdopted Operational Plan Fiscal Years 2013-2014 and 2014-2015
County Counsel
Achieve a success rate of 90% or more in County codeenforcement and other lawsuits where the County isthe plaintiff by winning in court or obtaining favorablefinancial settlements.Handle 95% or more of the defense of all lawsuits filedin California against the County, unless a conflict ofinterest requires outside counsel to handle a case,thereby reducing outside counsel costs to the Countyand taxpayers.
Strategic Initiative – Healthy FamiliesProvide effective legal services to the Health and HumanService Agency (HHSA) in matters relating to children whohave been dependents of the Juvenile Court.
Prevail in 98% or more of Juvenile Dependency peti-tions filed in Superior Court.Prevail in 95% or more of Juvenile Dependencyappeals and writs filed.
Strategic Initiative – Sustainable EnvironmentsSupport the County’s objective of promoting responsibledevelopment, economic vitality and the highest quality oflife.
Complete 100% of all draft Environmental ImpactReport reviews within 40 days or less.
Required Discipline for Excellence – Regional Leadership
County Counsel attorneys will engage in numerous leader-ship roles in the County and throughout the State, whichwill provide positive and constructive influences in the pro-fessional practice of law in the region.
Maintain significant involvement in the activities of atleast 15 regional organizations and committees.
Required Discipline for Excellence – Skilled, Adaptable and Diverse Workforce
Provide education and risk mitigation training to Countyofficers and employees to support a committed, capableand diverse workforce.
Provide 50 or more education programs on selectedlegal subjects for County departments.Provide 50 or more specialized risk mitigation sessions,such as risk roundtables, case evaluation committeediscussions and post-litigation debriefings to addressrisk issues, helping to promote risk management anddecrease future legal liability.
Provide 24 or more internal and/or external trainingsessions for County Counsel staff, including MandatoryContinuing Legal Education, to ensure staff continuesto provide the highest quality legal services to theCounty by remaining current on developments in thelaw.
Required Discipline for Excellence – Information Services
Optimize information technology systems to improve oper-ational efficiency and service to customers.
Continue toward development of a centralized docu-ment repository and electronic briefcase system forJuvenile Dependency-related court documents. Thiscentralized repository will be shared by multipledepartments (including San Diego Superior Court andHHSA’s Child Welfare Services) and will result in an effi-cient electronic retrieval process, eliminating the needfor paper documents. Complete the transition to a new Web-based officepractice management system (Tymetrix’s T360), whichmanages all case and advisory information, has calen-daring capabilities, retains client and contract informa-tion, stores supporting legal documents, and trackstime and billing information.Improve the County Counsel intranet site by continuingto provide legal links, up-to-date training materials andother information which could support client depart-ments.Continue to expand use of available mobile technolo-gies, such as implementing web-based solutions orincreasing the use of mobile computing to increase effi-ciencies.Implement a paperless electronic billing technologywhich will streamline invoicing procedures and pay-ment processes. This technology will create a bidirec-tional data feed into the County’s Oracle Financialsystem, and will provide efficiencies in data entry andreconciliation.
Related Links
For additional information about County Counsel, refer tothe website at www.sdcounty.ca.gov/CountyCounsel.
437Finance and General Government Group Adopted Operational Plan Fiscal Years 2013-2014 and 2014-2015
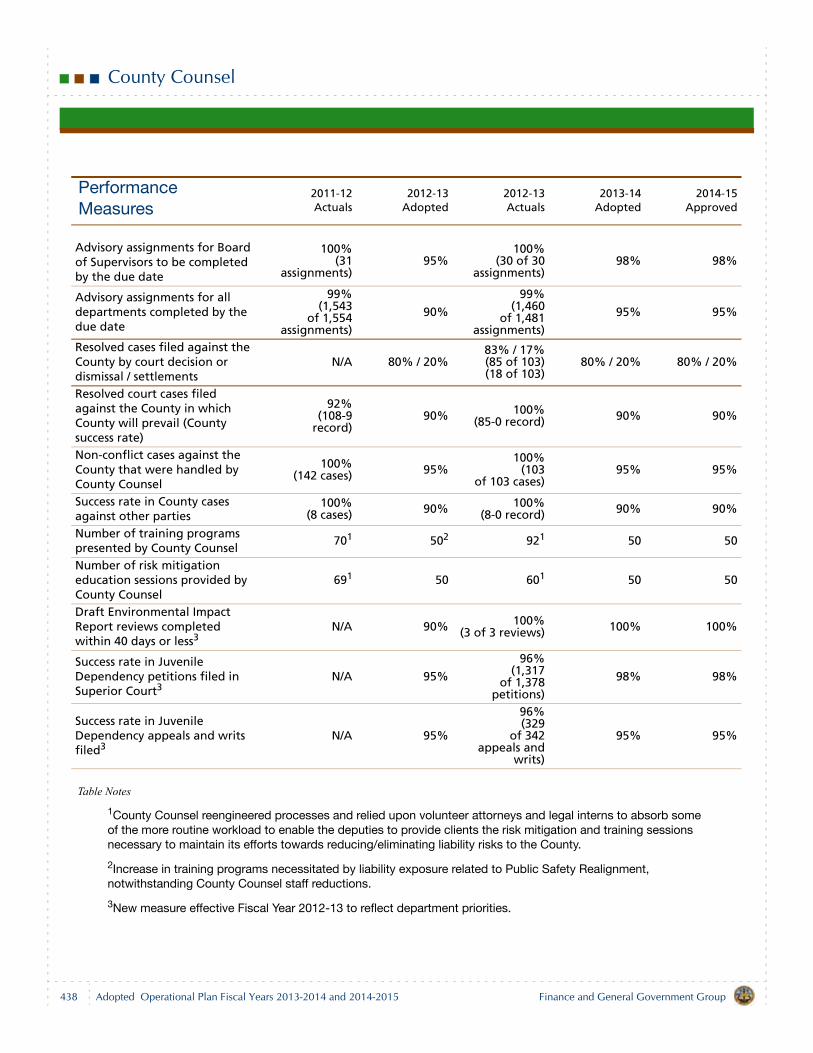
County Counsel
Table Notes
1County Counsel reengineered processes and relied upon volunteer attorneys and legal interns to absorb some of the more routine workload to enable the deputies to provide clients the risk mitigation and training sessions necessary to maintain its efforts towards reducing/eliminating liability risks to the County.
2Increase in training programs necessitated by liability exposure related to Public Safety Realignment, notwithstanding County Counsel staff reductions.
3New measure effective Fiscal Year 2012-13 to reflect department priorities.
Performance Measures
2011-12Actuals
2012-13Adopted
2012-13Actuals
2013-14Adopted
2014-15Approved
Advisory assignments for Board of Supervisors to be completed by the due date
100%(31
assignments)95%
100%(30 of 30
assignments)98% 98%
Advisory assignments for all departments completed by the due date
99%(1,543
of 1,554assignments)
90%
99%(1,460
of 1,481assignments)
95% 95%
Resolved cases filed against the County by court decision or dismissal / settlements
N/A 80% / 20%83% / 17%(85 of 103)(18 of 103)
80% / 20% 80% / 20%
Resolved court cases filed against the County in which County will prevail (County success rate)
92%(108-9
record)90% 100%
(85-0 record) 90% 90%
Non-conflict cases against the County that were handled by County Counsel
100%(142 cases) 95%
100%(103
of 103 cases)95% 95%
Success rate in County cases against other parties
100%(8 cases) 90% 100%
(8-0 record) 90% 90%
Number of training programs presented by County Counsel
701 502 921 50 50
Number of risk mitigation education sessions provided by County Counsel
691 50 601 50 50
Draft Environmental Impact Report reviews completed within 40 days or less3
N/A 90% 100%(3 of 3 reviews) 100% 100%
Success rate in Juvenile Dependency petitions filed in Superior Court3
N/A 95%
96%(1,317
of 1,378petitions)
98% 98%
Success rate in Juvenile Dependency appeals and writs filed3
N/A 95%
96%(329
of 342appeals and
writs)
95% 95%
438 Finance and General Government GroupAdopted Operational Plan Fiscal Years 2013-2014 and 2014-2015
County Counsel
Budget Changes and Operational Impact: 2012-13 to 2013-14
StaffingIncrease of 1.00 staff year due to transfer of Senior DeputyCounty Counsel staff from Health & Human ServicesAgency (HHSA) to support increased HHSA programneeds.
ExpendituresNet increase of $0.5 million.
Salaries and Benefits — increase of $1.0 million primar-ily due to significant increases in County retirementcontribution costs and the addition of 1.00 staff year.Expenditure Transfer & Reimbursements — decreaseof $0.4 million due to addition of 1.00 staff year to pro-vide exclusive legal services to HHSA and increasedoperational costs for providing exclusive legal servicesto client departments. By transferring an increasedamount of expenditures to client departments, CountyCounsel will effectively reduce its total expenditures.
RevenuesNet increase of $0.5 million.
Charges for Current Services — Increase of $0.5 milliondue to project workloads and slight adjustments in costrecovery rates. Use of Fund Balance — Decrease of $0.1 million for atotal planned use of $0.4 million. Uses of fund balanceinclude $0.2 million for Justice Electronic Library Sys-tem (JELS) document scanning and mobile technology,and $0.1 million for enhancements to the department’scase management system (T360) for improved financialtransparency.General Purpose Revenue Allocation — Increase of$0.2 million based primarily on projected increases inretirement contributions.
Budget Changes and Operational Impact: 2013-14 to 2014-15
No change in staffing.
Net decrease of $0.2 million due primarily to elimination ofone-time expenditures included in the Fiscal Year 2014-15approved budget, partially offset by projected increases inCounty retirement contributions.
439Finance and General Government Group Adopted Operational Plan Fiscal Years 2013-2014 and 2014-2015
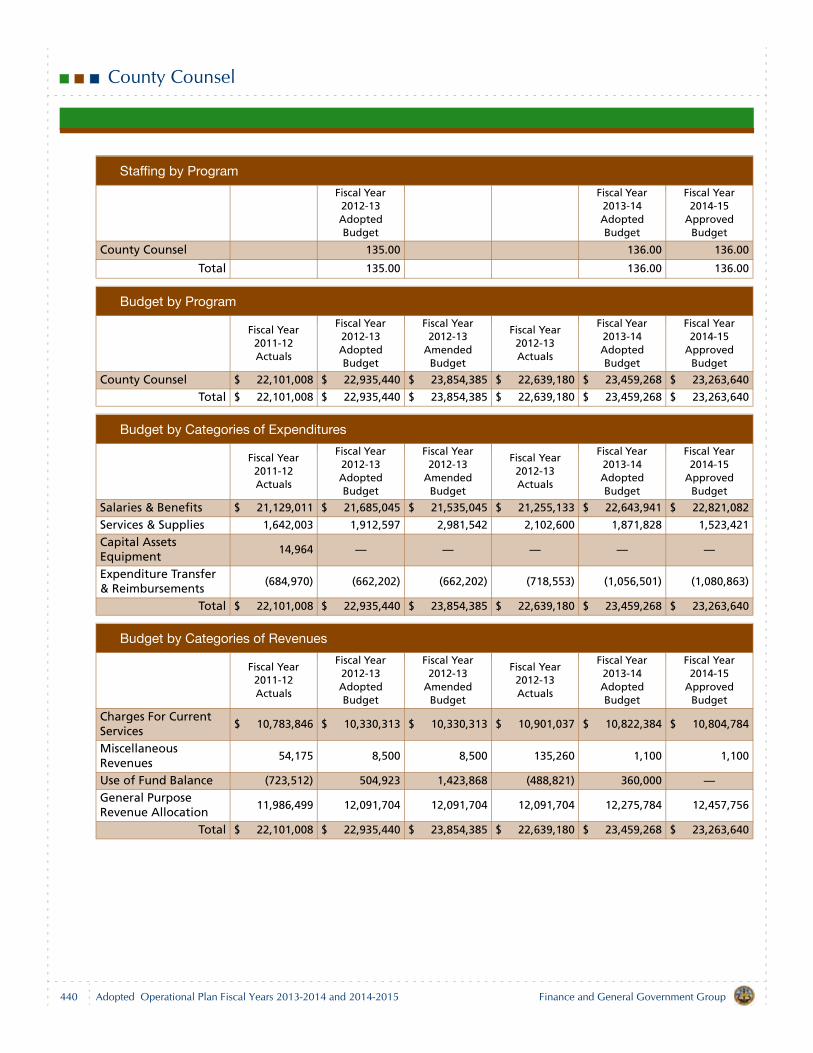
County Counsel
Staffing by Program
Fiscal Year 2012-13 Adopted Budget
Fiscal Year 2013-14 Adopted Budget
Fiscal Year 2014-15
Approved Budget
County Counsel 135.00 136.00 136.00
Total 135.00 136.00 136.00
Budget by Program
Fiscal Year 2011-12 Actuals
Fiscal Year 2012-13 Adopted Budget
Fiscal Year 2012-13
Amended Budget
Fiscal Year 2012-13 Actuals
Fiscal Year 2013-14 Adopted Budget
Fiscal Year 2014-15
Approved Budget
County Counsel $ 22,101,008 $ 22,935,440 $ 23,854,385 $ 22,639,180 $ 23,459,268 $ 23,263,640
Total $ 22,101,008 $ 22,935,440 $ 23,854,385 $ 22,639,180 $ 23,459,268 $ 23,263,640
Budget by Categories of Expenditures
Fiscal Year 2011-12 Actuals
Fiscal Year 2012-13 Adopted Budget
Fiscal Year 2012-13
Amended Budget
Fiscal Year 2012-13 Actuals
Fiscal Year 2013-14 Adopted Budget
Fiscal Year 2014-15
Approved Budget
Salaries & Benefits $ 21,129,011 $ 21,685,045 $ 21,535,045 $ 21,255,133 $ 22,643,941 $ 22,821,082
Services & Supplies 1,642,003 1,912,597 2,981,542 2,102,600 1,871,828 1,523,421
Capital Assets Equipment
14,964 — — — — —
Expenditure Transfer & Reimbursements
(684,970) (662,202) (662,202) (718,553) (1,056,501) (1,080,863)
Total $ 22,101,008 $ 22,935,440 $ 23,854,385 $ 22,639,180 $ 23,459,268 $ 23,263,640
Budget by Categories of Revenues
Fiscal Year 2011-12 Actuals
Fiscal Year 2012-13 Adopted Budget
Fiscal Year 2012-13
Amended Budget
Fiscal Year 2012-13 Actuals
Fiscal Year 2013-14 Adopted Budget
Fiscal Year 2014-15
Approved Budget
Charges For Current Services
$ 10,783,846 $ 10,330,313 $ 10,330,313 $ 10,901,037 $ 10,822,384 $ 10,804,784
Miscellaneous Revenues
54,175 8,500 8,500 135,260 1,100 1,100
Use of Fund Balance (723,512) 504,923 1,423,868 (488,821) 360,000 —General Purpose Revenue Allocation
11,986,499 12,091,704 12,091,704 12,091,704 12,275,784 12,457,756
Total $ 22,101,008 $ 22,935,440 $ 23,854,385 $ 22,639,180 $ 23,459,268 $ 23,263,640
440 Finance and General Government GroupAdopted Operational Plan Fiscal Years 2013-2014 and 2014-2015
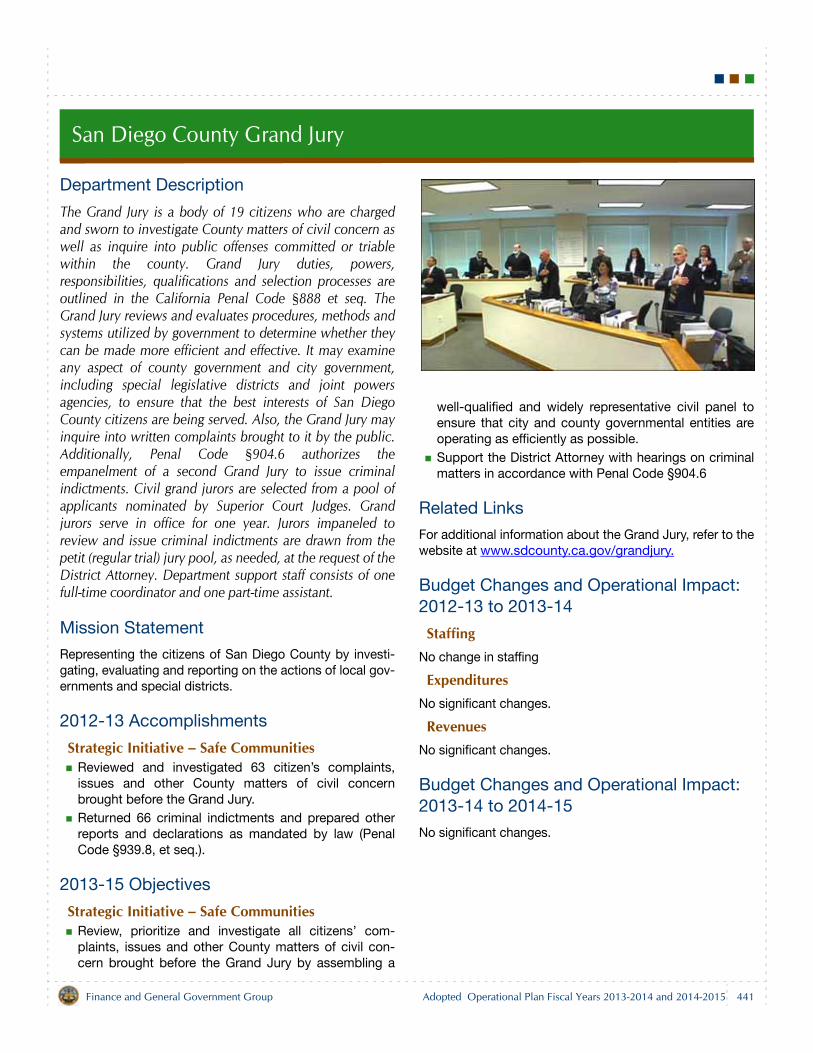
San Diego County Grand Jury
Department Description
The Grand Jury is a body of 19 citizens who are chargedand sworn to investigate County matters of civil concern aswell as inquire into public offenses committed or triablewithin the county. Grand Jury duties, powers,responsibilities, qualifications and selection processes areoutlined in the California Penal Code §888 et seq. TheGrand Jury reviews and evaluates procedures, methods andsystems utilized by government to determine whether theycan be made more efficient and effective. It may examineany aspect of county government and city government,including special legislative districts and joint powersagencies, to ensure that the best interests of San DiegoCounty citizens are being served. Also, the Grand Jury mayinquire into written complaints brought to it by the public.Additionally, Penal Code §904.6 authorizes theempanelment of a second Grand Jury to issue criminalindictments. Civil grand jurors are selected from a pool ofapplicants nominated by Superior Court Judges. Grandjurors serve in office for one year. Jurors impaneled toreview and issue criminal indictments are drawn from thepetit (regular trial) jury pool, as needed, at the request of theDistrict Attorney. Department support staff consists of onefull-time coordinator and one part-time assistant.
Mission Statement
Representing the citizens of San Diego County by investi-gating, evaluating and reporting on the actions of local gov-ernments and special districts.
2012-13 Accomplishments
Strategic Initiative – Safe CommunitiesReviewed and investigated 63 citizen’s complaints,issues and other County matters of civil concernbrought before the Grand Jury.Returned 66 criminal indictments and prepared otherreports and declarations as mandated by law (PenalCode §939.8, et seq.).
2013-15 Objectives
Strategic Initiative – Safe CommunitiesReview, prioritize and investigate all citizens’ com-plaints, issues and other County matters of civil con-cern brought before the Grand Jury by assembling a
well-qualified and widely representative civil panel toensure that city and county governmental entities areoperating as efficiently as possible.Support the District Attorney with hearings on criminalmatters in accordance with Penal Code §904.6
Related Links
For additional information about the Grand Jury, refer to thewebsite at www.sdcounty.ca.gov/grandjury.
Budget Changes and Operational Impact: 2012-13 to 2013-14
StaffingNo change in staffing
ExpendituresNo significant changes.
RevenuesNo significant changes.
Budget Changes and Operational Impact: 2013-14 to 2014-15
No significant changes.
441Finance and General Government Group Adopted Operational Plan Fiscal Years 2013-2014 and 2014-2015
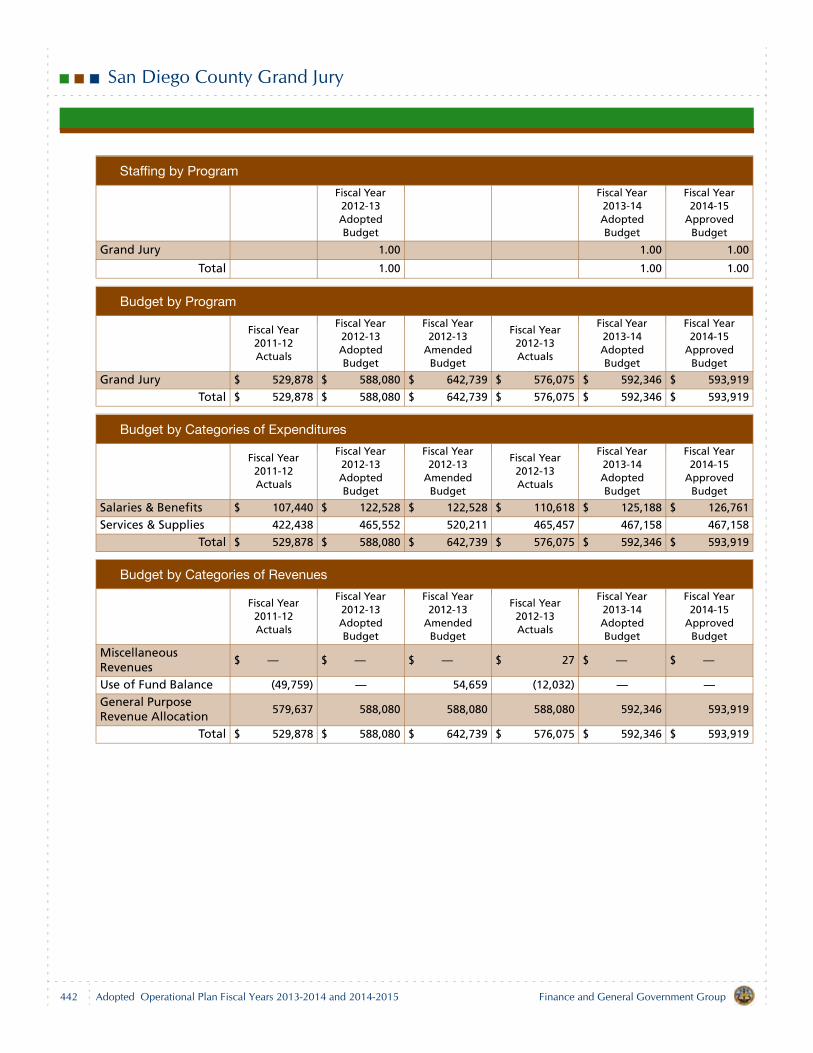
San Diego County Grand Jury
Staffing by Program
Fiscal Year 2012-13 Adopted Budget
Fiscal Year 2013-14 Adopted Budget
Fiscal Year 2014-15
Approved Budget
Grand Jury 1.00 1.00 1.00
Total 1.00 1.00 1.00
Budget by Program
Fiscal Year 2011-12 Actuals
Fiscal Year 2012-13 Adopted Budget
Fiscal Year 2012-13
Amended Budget
Fiscal Year 2012-13 Actuals
Fiscal Year 2013-14 Adopted Budget
Fiscal Year 2014-15
Approved Budget
Grand Jury $ 529,878 $ 588,080 $ 642,739 $ 576,075 $ 592,346 $ 593,919
Total $ 529,878 $ 588,080 $ 642,739 $ 576,075 $ 592,346 $ 593,919
Budget by Categories of Expenditures
Fiscal Year 2011-12 Actuals
Fiscal Year 2012-13 Adopted Budget
Fiscal Year 2012-13
Amended Budget
Fiscal Year 2012-13 Actuals
Fiscal Year 2013-14 Adopted Budget
Fiscal Year 2014-15
Approved Budget
Salaries & Benefits $ 107,440 $ 122,528 $ 122,528 $ 110,618 $ 125,188 $ 126,761
Services & Supplies 422,438 465,552 520,211 465,457 467,158 467,158
Total $ 529,878 $ 588,080 $ 642,739 $ 576,075 $ 592,346 $ 593,919
Budget by Categories of Revenues
Fiscal Year 2011-12 Actuals
Fiscal Year 2012-13 Adopted Budget
Fiscal Year 2012-13
Amended Budget
Fiscal Year 2012-13 Actuals
Fiscal Year 2013-14 Adopted Budget
Fiscal Year 2014-15
Approved Budget
Miscellaneous Revenues
$ — $ — $ — $ 27 $ — $ —
Use of Fund Balance (49,759) — 54,659 (12,032) — —General Purpose Revenue Allocation
579,637 588,080 588,080 588,080 592,346 593,919
Total $ 529,878 $ 588,080 $ 642,739 $ 576,075 $ 592,346 $ 593,919
442 Finance and General Government GroupAdopted Operational Plan Fiscal Years 2013-2014 and 2014-2015
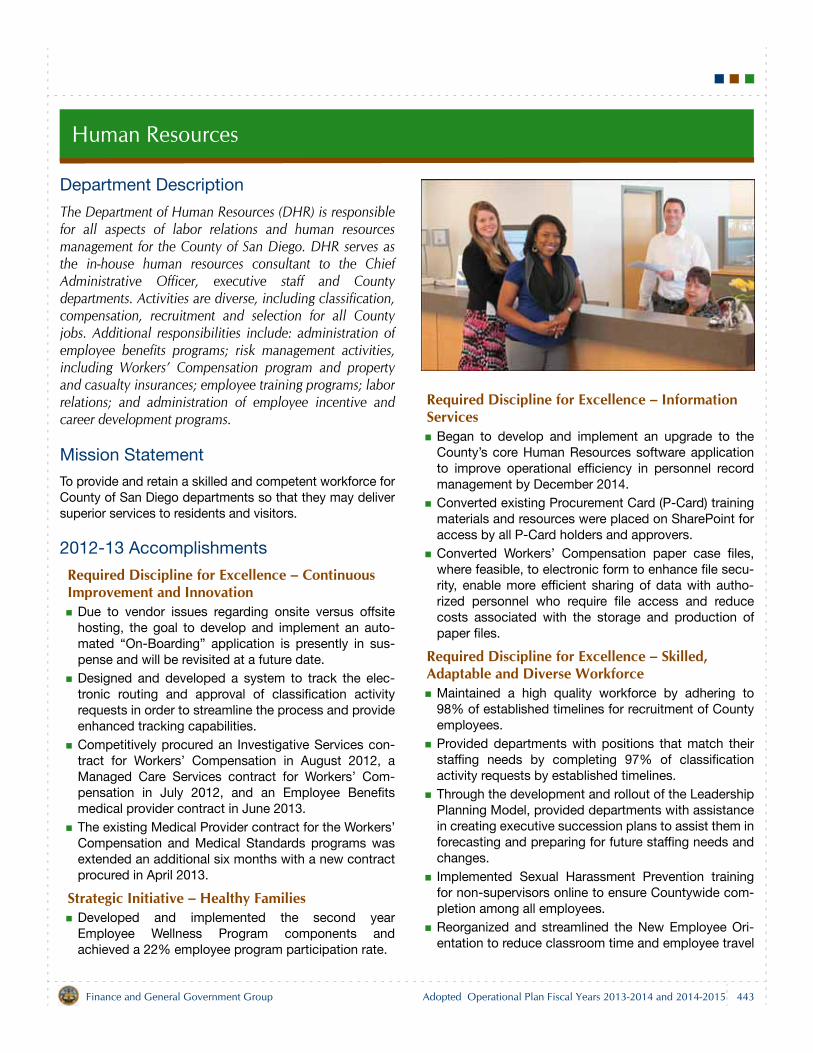
Human Resources
Department Description
The Department of Human Resources (DHR) is responsiblefor all aspects of labor relations and human resourcesmanagement for the County of San Diego. DHR serves asthe in-house human resources consultant to the ChiefAdministrative Officer, executive staff and Countydepartments. Activities are diverse, including classification,compensation, recruitment and selection for all Countyjobs. Additional responsibilities include: administration ofemployee benefits programs; risk management activities,including Workers’ Compensation program and propertyand casualty insurances; employee training programs; laborrelations; and administration of employee incentive andcareer development programs.
Mission Statement
To provide and retain a skilled and competent workforce forCounty of San Diego departments so that they may deliversuperior services to residents and visitors.
2012-13 Accomplishments
Required Discipline for Excellence – Continuous Improvement and Innovation
Due to vendor issues regarding onsite versus offsitehosting, the goal to develop and implement an auto-mated “On-Boarding” application is presently in sus-pense and will be revisited at a future date.Designed and developed a system to track the elec-tronic routing and approval of classification activityrequests in order to streamline the process and provideenhanced tracking capabilities.Competitively procured an Investigative Services con-tract for Workers’ Compensation in August 2012, aManaged Care Services contract for Workers’ Com-pensation in July 2012, and an Employee Benefitsmedical provider contract in June 2013.The existing Medical Provider contract for the Workers’Compensation and Medical Standards programs wasextended an additional six months with a new contractprocured in April 2013.
Strategic Initiative – Healthy FamiliesDeveloped and implemented the second yearEmployee Wellness Program components andachieved a 22% employee program participation rate.
Required Discipline for Excellence – Information Services
Began to develop and implement an upgrade to theCounty’s core Human Resources software applicationto improve operational efficiency in personnel recordmanagement by December 2014.Converted existing Procurement Card (P-Card) trainingmaterials and resources were placed on SharePoint foraccess by all P-Card holders and approvers.Converted Workers’ Compensation paper case files,where feasible, to electronic form to enhance file secu-rity, enable more efficient sharing of data with autho-rized personnel who require file access and reducecosts associated with the storage and production ofpaper files.
Required Discipline for Excellence – Skilled, Adaptable and Diverse Workforce
Maintained a high quality workforce by adhering to98% of established timelines for recruitment of Countyemployees.Provided departments with positions that match theirstaffing needs by completing 97% of classificationactivity requests by established timelines.Through the development and rollout of the LeadershipPlanning Model, provided departments with assistancein creating executive succession plans to assist them inforecasting and preparing for future staffing needs andchanges.Implemented Sexual Harassment Prevention trainingfor non-supervisors online to ensure Countywide com-pletion among all employees.Reorganized and streamlined the New Employee Ori-entation to reduce classroom time and employee travel
443Finance and General Government Group Adopted Operational Plan Fiscal Years 2013-2014 and 2014-2015
Human Resources
expense by eliminating an additional day of classroomtraining.Supported the training needs of the Office of Emer-gency Services on the Advanced Recovery Initiative bymaking training available to the appropriately identifiedemployees during Fiscal Year 2012-13.
Required Discipline for Excellence – Fiscal StabilityEngaged 23 of 25 existing bargaining units within 8 of 9existing employee organizations in the collective bar-gaining process. Continuing negotiations toward reso-lution of the bargaining process. Continued negotiations toward a fiscally prudent suc-cessor agreement for In-Home Support Services (IHSS)Public Authority. However, it is anticipated that theState of California will take control of IHSS sometime in2015.
2013-15 Objectives
Required Discipline for Excellence – Skilled, Adaptable and Diverse Workforce
Increase diversity outreach by including advertise-ments in diverse publications on 100% of recruitments.Conduct the Labor Relations Academy training byMarch 31, 2014.Support the training needs of the Office of EmergencyServices on the Advanced Recovery Initiative by trans-forming Local Assistance Center (LAC) Orientationclassroom training to an e-learning module in order toprovide training as soon as an employee is identified asa LAC worker by June 30, 2014.Provide Countywide formal, informal, and social learn-ing opportunities in support of the Leadership Develop-ment Model by June 30, 2015.Maintain a high quality workforce by adhering to 98%of established timelines for recruitment of Countyemployees.Provide departments with positions that match theirstaffing needs by completing 98% of classificationactivity requests by established timelines.
Strategic Initiative – Healthy FamiliesDevelop and implement the third year Employee Well-ness Program components and achieve a 15%employee program participation rate.
Required Discipline for Excellence – Fiscal StabilityNegotiate fiscally prudent successor agreement withthe 2 bargaining units within the Deputy Sheriffs’ Asso-ciation by July 2014.
Required Discipline for Excellence – Information Services
Develop and implement an upgrade to the County’score Human Resources software application toimprove operational efficiency in personnel recordmanagement by December 2014.Review and Update Labor Relations Intranet websitecontent by December 31, 2013.Convert Medical Standards paper files, where feasible,to electronic form to enhance file security, enable moreefficient sharing of data with appropriate staff requiringfile access and reduce costs associated with the stor-age and production of paper files by June 30, 2015.Enhance recruiting webpage to include various meansof social media in order to better attract the new gener-ation of candidates.Coordinate the migration of the Learning ManagementSystem (LMS) from HP to SumTotal hosting to improveoperational efficiency by June 30, 2015.
Required Discipline for Excellence – Customer Satisfaction
Procure a portable fingerprinting machine to facilitateoff-site background process and improve customerservice by June 30, 2014.
Required Discipline for Excellence – Continuous Improvement and Innovation
Conduct Countywide study on all IT classifications toevaluate the appropriate current and future use of all ITclassifications and determine if there is a need tostreamline or modify class functions.Analyze current Workers’ Compensation claims man-agement system and conduct research into alternativesystems to ensure optimal performance and best useof County resources by June 30, 2014.Competitively procure an Employee Benefits Brokerand Consultant Services Contract by January 2014.Use the autoscore feature in NeoGov on all recruit-ments with 50 or more applicants in order to automateverification of minimum qualifications and reduce theamount of time spent by staff to review individual appli-cations.
444 Finance and General Government GroupAdopted Operational Plan Fiscal Years 2013-2014 and 2014-2015
Human Resources
Related Links
For additional information about the Department of HumanResources, refer to the website at www.sdcounty.ca.gov/hr.
Table Notes
1Classification activity requests are departmental requests to either create or modify a job classification.
Budget Changes and Operational Impact: 2012-13 to 2013-14
StaffingIncrease of 1.00 staff year.
Increase of 1.00 staff year in the Employee BenefitsDivision to provide customer service and operationalactivities for two new high deductable medical plans,Health Savings Accounts and limited purpose flexiblespending accounts.
Expenditures Net increase of $0.6 million.
Services and Supplies — increase of $0.6 million dueto increases in contractual service costs associatedwith software maintenance in the Employee Develop-ment Division, broker services in the Employee Bene-fits Division and negotiation support in the LaborRelations Division.
RevenuesNet increase of $0.6 million.
Charges for Current Services — increase of $0.2 millionas a result of increase external department overheadpayments (A-87) for services rendered.
Miscellaneous Revenue — increase of $0.4 million dueto cost reimbursement of the Workers’ Compensationportion of the Employee Benefits Internal Service Fund.Use of Fund Balance — increase of $0.1 million for atotal budget of $0.5 million. One-time funding includes$0.1 million for automating employee contributions tohealth savings accounts, software and minor equip-ment purchases of $0.1 million, and $0.3 million to con-tinue funding of the Workforce Academy for Youthprogram.General Purpose Revenue Allocation — decrease of$0.1 million primarily due to cost recovery of servicesrendered as described in Charges for Current Servicesabove. Partially offset by increased ongoing needsdescribed in Salaries & Benefits above.
Budget Changes and Operational Impact: 2013-14 to 2014-15
Net decrease of $0.3 million, including $0.6 milliondecrease in Services & Supplies for anticipated completionof one-time projects in Fiscal Year 2013-14, partially offsetby projected increase in Salaries & Benefits primarily forCounty retirement contributions.
Performance Measures
2011-12Actuals
2012-13Adopted
2012-13Actuals
2013-14Adopted
2014-15Approved
Classification activity requests1 completed within prescribed time frame
97% of 184
98%of 150
97%of 316
98%of 150
98%of 150
Recruitment plan/serviceagreements/timelines met
99%of 455
98%of 400
98%of 485
98%of 400
98%of 400
445Finance and General Government Group Adopted Operational Plan Fiscal Years 2013-2014 and 2014-2015
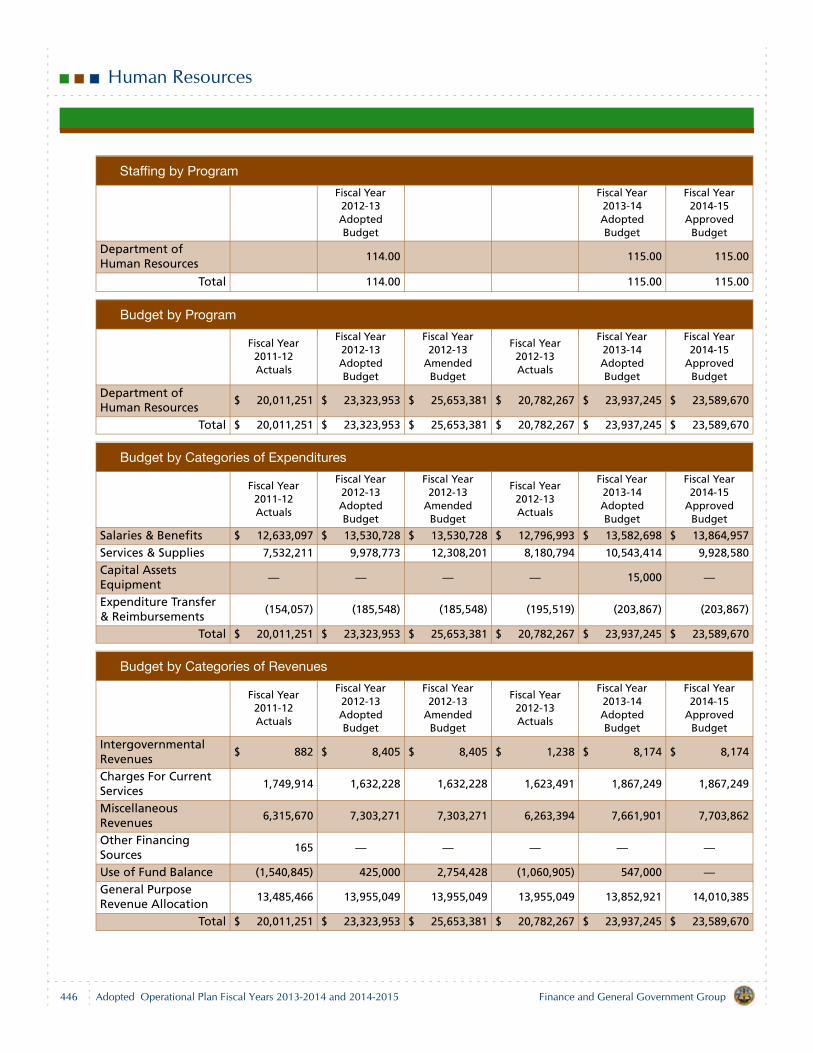
Human Resources
Staffing by Program
Fiscal Year 2012-13 Adopted Budget
Fiscal Year 2013-14 Adopted Budget
Fiscal Year 2014-15
Approved Budget
Department of Human Resources
114.00 115.00 115.00
Total 114.00 115.00 115.00
Budget by Program
Fiscal Year 2011-12 Actuals
Fiscal Year 2012-13 Adopted Budget
Fiscal Year 2012-13
Amended Budget
Fiscal Year 2012-13 Actuals
Fiscal Year 2013-14 Adopted Budget
Fiscal Year 2014-15
Approved Budget
Department of Human Resources
$ 20,011,251 $ 23,323,953 $ 25,653,381 $ 20,782,267 $ 23,937,245 $ 23,589,670
Total $ 20,011,251 $ 23,323,953 $ 25,653,381 $ 20,782,267 $ 23,937,245 $ 23,589,670
Budget by Categories of Expenditures
Fiscal Year 2011-12 Actuals
Fiscal Year 2012-13 Adopted Budget
Fiscal Year 2012-13
Amended Budget
Fiscal Year 2012-13 Actuals
Fiscal Year 2013-14 Adopted Budget
Fiscal Year 2014-15
Approved Budget
Salaries & Benefits $ 12,633,097 $ 13,530,728 $ 13,530,728 $ 12,796,993 $ 13,582,698 $ 13,864,957
Services & Supplies 7,532,211 9,978,773 12,308,201 8,180,794 10,543,414 9,928,580
Capital Assets Equipment
— — — — 15,000 —
Expenditure Transfer & Reimbursements
(154,057) (185,548) (185,548) (195,519) (203,867) (203,867)
Total $ 20,011,251 $ 23,323,953 $ 25,653,381 $ 20,782,267 $ 23,937,245 $ 23,589,670
Budget by Categories of Revenues
Fiscal Year 2011-12 Actuals
Fiscal Year 2012-13 Adopted Budget
Fiscal Year 2012-13
Amended Budget
Fiscal Year 2012-13 Actuals
Fiscal Year 2013-14 Adopted Budget
Fiscal Year 2014-15
Approved Budget
Intergovernmental Revenues
$ 882 $ 8,405 $ 8,405 $ 1,238 $ 8,174 $ 8,174
Charges For Current Services
1,749,914 1,632,228 1,632,228 1,623,491 1,867,249 1,867,249
Miscellaneous Revenues
6,315,670 7,303,271 7,303,271 6,263,394 7,661,901 7,703,862
Other Financing Sources
165 — — — — —
Use of Fund Balance (1,540,845) 425,000 2,754,428 (1,060,905) 547,000 —General Purpose Revenue Allocation
13,485,466 13,955,049 13,955,049 13,955,049 13,852,921 14,010,385
Total $ 20,011,251 $ 23,323,953 $ 25,653,381 $ 20,782,267 $ 23,937,245 $ 23,589,670
446 Finance and General Government GroupAdopted Operational Plan Fiscal Years 2013-2014 and 2014-2015
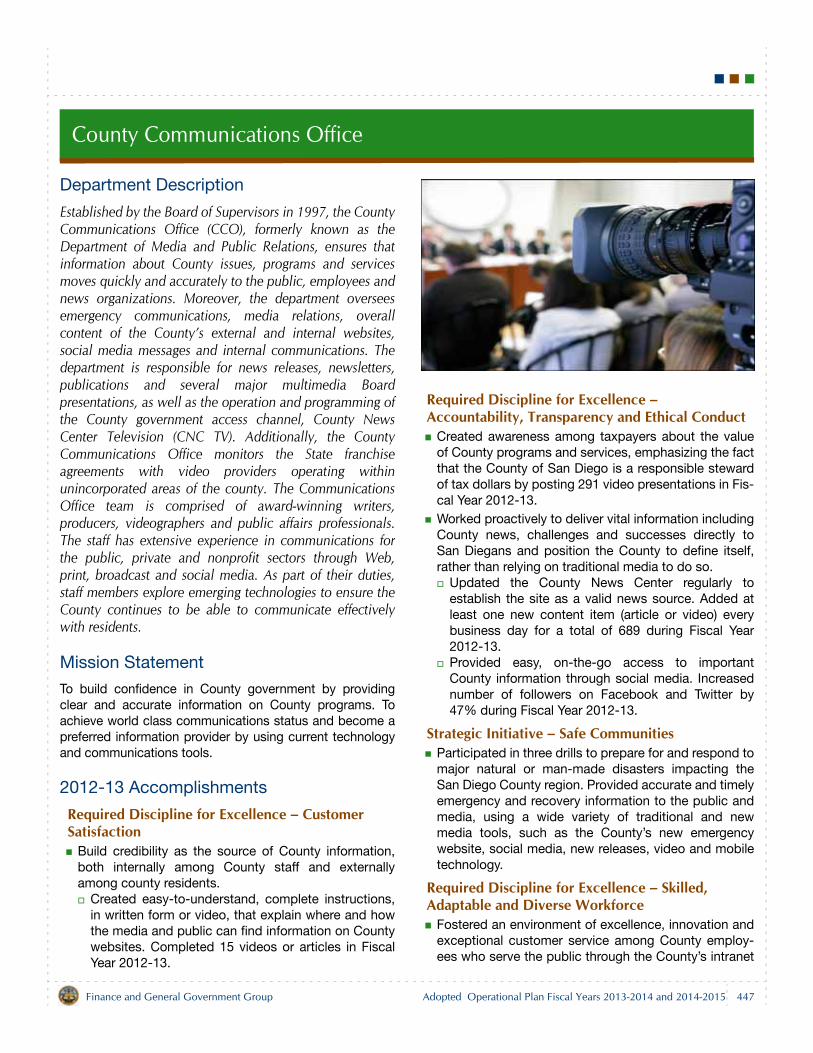
County Communications Office
Department Description
Established by the Board of Supervisors in 1997, the CountyCommunications Office (CCO), formerly known as theDepartment of Media and Public Relations, ensures thatinformation about County issues, programs and servicesmoves quickly and accurately to the public, employees andnews organizations. Moreover, the department overseesemergency communications, media relations, overallcontent of the County’s external and internal websites,social media messages and internal communications. Thedepartment is responsible for news releases, newsletters,publications and several major multimedia Boardpresentations, as well as the operation and programming ofthe County government access channel, County NewsCenter Television (CNC TV). Additionally, the CountyCommunications Office monitors the State franchiseagreements with video providers operating withinunincorporated areas of the county. The CommunicationsOffice team is comprised of award-winning writers,producers, videographers and public affairs professionals.The staff has extensive experience in communications forthe public, private and nonprofit sectors through Web,print, broadcast and social media. As part of their duties,staff members explore emerging technologies to ensure theCounty continues to be able to communicate effectivelywith residents.
Mission Statement
To build confidence in County government by providingclear and accurate information on County programs. Toachieve world class communications status and become apreferred information provider by using current technologyand communications tools.
2012-13 Accomplishments
Required Discipline for Excellence – Customer Satisfaction
Build credibility as the source of County information,both internally among County staff and externallyamong county residents.
Created easy-to-understand, complete instructions,in written form or video, that explain where and howthe media and public can find information on Countywebsites. Completed 15 videos or articles in FiscalYear 2012-13.
Required Discipline for Excellence – Accountability, Transparency and Ethical Conduct
Created awareness among taxpayers about the valueof County programs and services, emphasizing the factthat the County of San Diego is a responsible stewardof tax dollars by posting 291 video presentations in Fis-cal Year 2012-13.Worked proactively to deliver vital information includingCounty news, challenges and successes directly toSan Diegans and position the County to define itself,rather than relying on traditional media to do so.
Updated the County News Center regularly toestablish the site as a valid news source. Added atleast one new content item (article or video) everybusiness day for a total of 689 during Fiscal Year2012-13.Provided easy, on-the-go access to importantCounty information through social media. Increasednumber of followers on Facebook and Twitter by47% during Fiscal Year 2012-13.
Strategic Initiative – Safe CommunitiesParticipated in three drills to prepare for and respond tomajor natural or man-made disasters impacting theSan Diego County region. Provided accurate and timelyemergency and recovery information to the public andmedia, using a wide variety of traditional and newmedia tools, such as the County’s new emergencywebsite, social media, new releases, video and mobiletechnology.
Required Discipline for Excellence – Skilled, Adaptable and Diverse Workforce
Fostered an environment of excellence, innovation andexceptional customer service among County employ-ees who serve the public through the County’s intranet
447Finance and General Government Group Adopted Operational Plan Fiscal Years 2013-2014 and 2014-2015
County Communications Office
site, posting 275 content items (article or video) in sup-port of the Strategic Initiatives and Required Disci-plines during Fiscal Year 2012-13.
2013-15 Objectives
Required Discipline for Excellence – Accountability, Transparency and Ethical Conduct
Create awareness among taxpayers about the value ofCounty programs and services, emphasizing the factthat the County of San Diego is a responsible stewardof tax dollars by posting 200 video presentations in Fis-cal Year 2013-14 and another 205 in Fiscal Year 2014-15. Work proactively to deliver vital information includingCounty news, challenges and successes directly toSan Diego County residents and position the County todefine itself, rather than relying on traditional media todo so.
Update the County News Center regularly toestablish the site as a valid news source. Add at leastone new content item (article or video) everybusiness day for a total of 310 during Fiscal Year2013-14, and another 315 during Fiscal Year 2014-15.Provide easy, on-the-go access to important Countyinformation through social media. Increase numberof followers on Facebook and Twitter by 10% duringFiscal Year 2013-14, and an additional 10% duringFiscal Year 2014-15.
Strategic Initiative – Safe CommunitiesParticipate in at least two drills each fiscal year to pre-pare for and respond to major natural or man-madedisasters impacting the San Diego County region. Pro-vide accurate and timely emergency and recoveryinformation to the public and media, using a wide vari-ety of traditional and new media tools, such as theCounty’s new emergency website, social media, newreleases, video and mobile technology.
Required Discipline for Excellence – Skilled, Adaptable and Diverse Workforce
Foster an environment of excellence, innovation andexceptional customer service among County employ-ees who serve the public through the County’s intranetsite, posting 135 content items (article or video) in sup-port of the Strategic Initiatives and Required Disci-plines for Excellence during Fiscal Year 2013-14, andanother 140 during Fiscal Year 2014-15.
Required Discipline for Excellence – Continuous Improvement and Innovation
Work together with the County Technology Office toredesign the County’s public-facing website, empha-sizing design and content that enhances the public’sability to access information about the County’s pro-grams and services from a variety of mobile devices.
Related Links
For additional information about the County Communica-tions Office and/or CNC TV, refer to the website atwww.sdcounty.ca.gov/dmpr or www.countynewscenter.com.
448 Finance and General Government GroupAdopted Operational Plan Fiscal Years 2013-2014 and 2014-2015
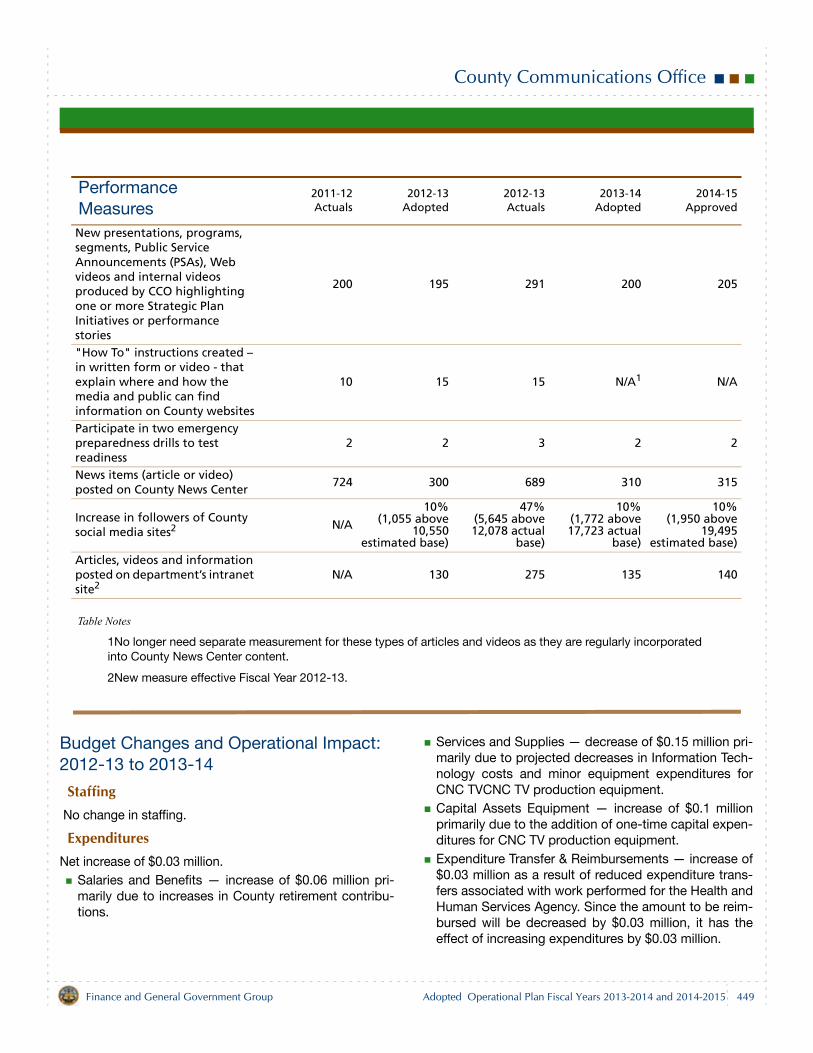
County Communications Office
Table Notes
1No longer need separate measurement for these types of articles and videos as they are regularly incorporated into County News Center content.
2New measure effective Fiscal Year 2012-13.
Budget Changes and Operational Impact: 2012-13 to 2013-14
Staffing No change in staffing.
ExpendituresNet increase of $0.03 million.
Salaries and Benefits — increase of $0.06 million pri-marily due to increases in County retirement contribu-tions.
Services and Supplies — decrease of $0.15 million pri-marily due to projected decreases in Information Tech-nology costs and minor equipment expenditures forCNC TVCNC TV production equipment.Capital Assets Equipment — increase of $0.1 millionprimarily due to the addition of one-time capital expen-ditures for CNC TV production equipment.Expenditure Transfer & Reimbursements — increase of$0.03 million as a result of reduced expenditure trans-fers associated with work performed for the Health andHuman Services Agency. Since the amount to be reim-bursed will be decreased by $0.03 million, it has theeffect of increasing expenditures by $0.03 million.
Performance Measures
2011-12Actuals
2012-13Adopted
2012-13Actuals
2013-14Adopted
2014-15Approved
New presentations, programs, segments, Public Service Announcements (PSAs), Web videos and internal videos
produced by CCO highlighting one or more Strategic Plan Initiatives or performance stories
200 195 291 200 205
"How To" instructions created – in written form or video - that explain where and how the media and public can find information on County websites
10 15 15 N/A1 N/A
Participate in two emergency preparedness drills to test readiness
2 2 3 2 2
News items (article or video) posted on County News Center
724 300 689 310 315
Increase in followers of County social media sites2 N/A
10%(1,055 above
10,550estimated base)
47%(5,645 above12,078 actual
base)
10%(1,772 above17,723 actual
base)
10%(1,950 above
19,495estimated base)
Articles, videos and information posted on department’s intranet site2
N/A 130 275 135 140
449Finance and General Government Group Adopted Operational Plan Fiscal Years 2013-2014 and 2014-2015
County Communications Office
RevenuesNet increase of $0.03 million
Licenses, Permits & Franchises — decrease of $0.03million in Public Educational Governmental (PEG)Access Fee revenue, as a result of the decreases inminor equipment expenditures for CNC TV productionequipment.General Purpose Revenue Allocation — increase of$0.06 million as result of increases in County retirementcontributions and to offset the reduced expendituretransfers noted above.
Budget Changes and Operational Impact: 2013-14 to 2014-15
Net decrease of $0.06 million attributed to a decrease of$0.1 million due to the elimination of one-time capitalexpenditures for CNC TV production equipment, which isoffset by an increase of $0.04 million in County retirementcontributions.
450 Finance and General Government GroupAdopted Operational Plan Fiscal Years 2013-2014 and 2014-2015
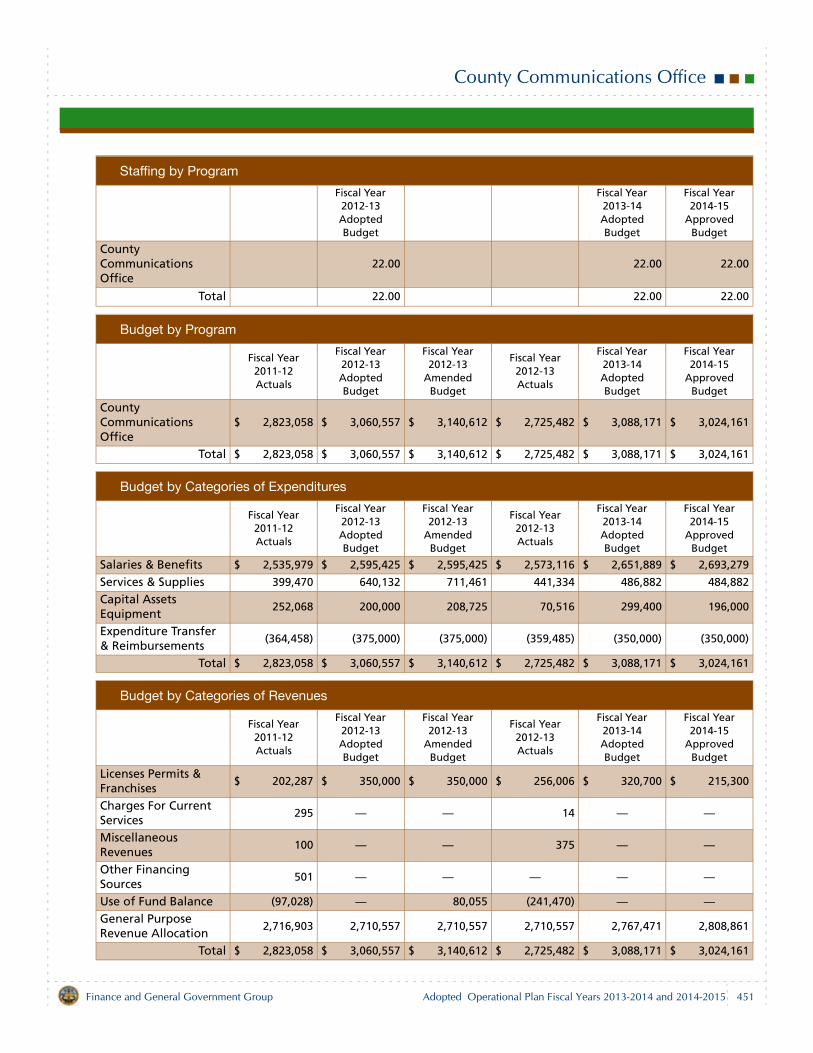
County Communications Office
Staffing by Program
Fiscal Year 2012-13 Adopted Budget
Fiscal Year 2013-14 Adopted Budget
Fiscal Year 2014-15
Approved Budget
County Communications Office
22.00 22.00 22.00
Total 22.00 22.00 22.00
Budget by Program
Fiscal Year 2011-12 Actuals
Fiscal Year 2012-13 Adopted Budget
Fiscal Year 2012-13
Amended Budget
Fiscal Year 2012-13 Actuals
Fiscal Year 2013-14 Adopted Budget
Fiscal Year 2014-15
Approved Budget
County Communications Office
$ 2,823,058 $ 3,060,557 $ 3,140,612 $ 2,725,482 $ 3,088,171 $ 3,024,161
Total $ 2,823,058 $ 3,060,557 $ 3,140,612 $ 2,725,482 $ 3,088,171 $ 3,024,161
Budget by Categories of Expenditures
Fiscal Year 2011-12 Actuals
Fiscal Year 2012-13 Adopted Budget
Fiscal Year 2012-13
Amended Budget
Fiscal Year 2012-13 Actuals
Fiscal Year 2013-14 Adopted Budget
Fiscal Year 2014-15
Approved Budget
Salaries & Benefits $ 2,535,979 $ 2,595,425 $ 2,595,425 $ 2,573,116 $ 2,651,889 $ 2,693,279
Services & Supplies 399,470 640,132 711,461 441,334 486,882 484,882
Capital Assets Equipment
252,068 200,000 208,725 70,516 299,400 196,000
Expenditure Transfer & Reimbursements
(364,458) (375,000) (375,000) (359,485) (350,000) (350,000)
Total $ 2,823,058 $ 3,060,557 $ 3,140,612 $ 2,725,482 $ 3,088,171 $ 3,024,161
Budget by Categories of Revenues
Fiscal Year 2011-12 Actuals
Fiscal Year 2012-13 Adopted Budget
Fiscal Year 2012-13
Amended Budget
Fiscal Year 2012-13 Actuals
Fiscal Year 2013-14 Adopted Budget
Fiscal Year 2014-15
Approved Budget
Licenses Permits & Franchises
$ 202,287 $ 350,000 $ 350,000 $ 256,006 $ 320,700 $ 215,300
Charges For Current Services
295 — — 14 — —
Miscellaneous Revenues
100 — — 375 — —
Other Financing Sources
501 — — — — —
Use of Fund Balance (97,028) — 80,055 (241,470) — —General Purpose Revenue Allocation
2,716,903 2,710,557 2,710,557 2,710,557 2,767,471 2,808,861
Total $ 2,823,058 $ 3,060,557 $ 3,140,612 $ 2,725,482 $ 3,088,171 $ 3,024,161
451Finance and General Government Group Adopted Operational Plan Fiscal Years 2013-2014 and 2014-2015

County of San Diego
Capital Program
Capital Program 455
Capital Appropriations 458
Operating Impact of Capital Program 462
Capital Program Summary 470
Capital Outlay Fund 473
County Health Complex Fund 489
Justice Facility Construction Fund 490
Library Projects Fund 493
Multiple Species Conservation Program Fund 495
Edgemoor Development Fund 497
Lease Payments 499
Outstanding Capital Projects by Group/Agency 503

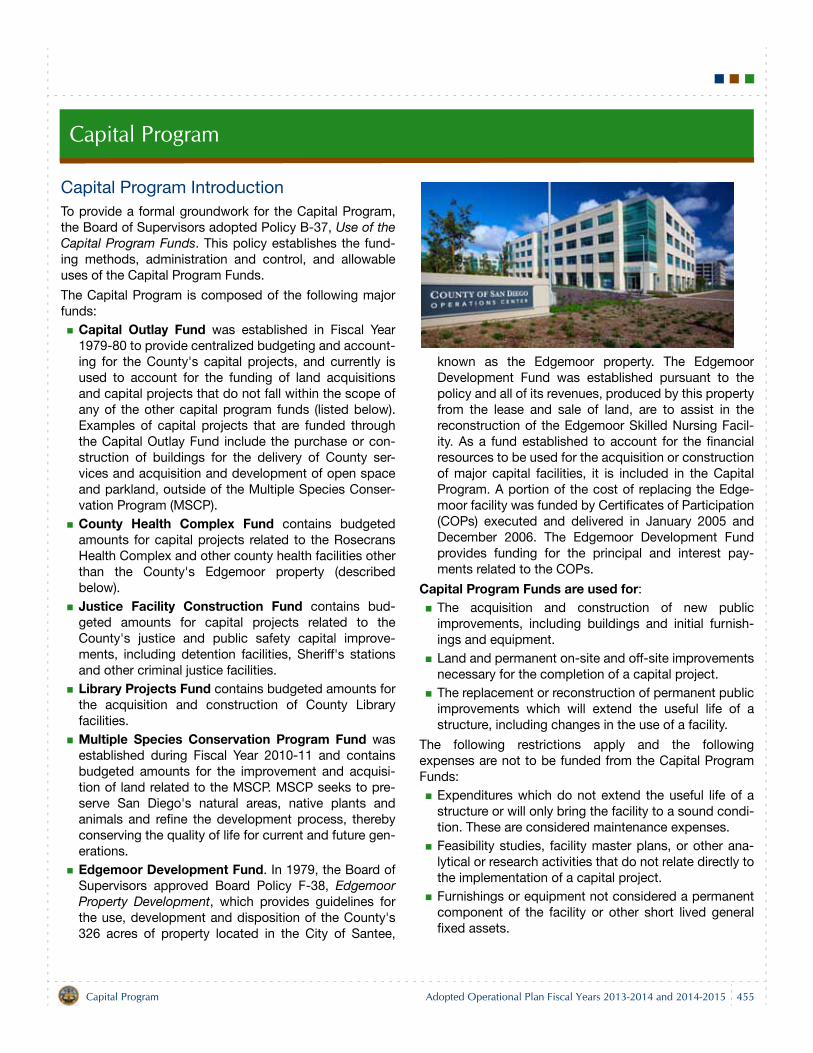
Capital Program
Capital Program Introduction To provide a formal groundwork for the Capital Program,the Board of Supervisors adopted Policy B-37, Use of theCapital Program Funds. This policy establishes the fund-ing methods, administration and control, and allowableuses of the Capital Program Funds.
The Capital Program is composed of the following majorfunds:
Capital Outlay Fund was established in Fiscal Year1979-80 to provide centralized budgeting and account-ing for the County's capital projects, and currently isused to account for the funding of land acquisitionsand capital projects that do not fall within the scope ofany of the other capital program funds (listed below).Examples of capital projects that are funded throughthe Capital Outlay Fund include the purchase or con-struction of buildings for the delivery of County ser-vices and acquisition and development of open spaceand parkland, outside of the Multiple Species Conser-vation Program (MSCP).County Health Complex Fund contains budgetedamounts for capital projects related to the RosecransHealth Complex and other county health facilities otherthan the County's Edgemoor property (describedbelow).Justice Facility Construction Fund contains bud-geted amounts for capital projects related to theCounty's justice and public safety capital improve-ments, including detention facilities, Sheriff's stationsand other criminal justice facilities.Library Projects Fund contains budgeted amounts forthe acquisition and construction of County Libraryfacilities.Multiple Species Conservation Program Fund wasestablished during Fiscal Year 2010-11 and containsbudgeted amounts for the improvement and acquisi-tion of land related to the MSCP. MSCP seeks to pre-serve San Diego's natural areas, native plants andanimals and refine the development process, therebyconserving the quality of life for current and future gen-erations.Edgemoor Development Fund. In 1979, the Board ofSupervisors approved Board Policy F-38, EdgemoorProperty Development, which provides guidelines forthe use, development and disposition of the County's326 acres of property located in the City of Santee,
known as the Edgemoor property. The EdgemoorDevelopment Fund was established pursuant to thepolicy and all of its revenues, produced by this propertyfrom the lease and sale of land, are to assist in thereconstruction of the Edgemoor Skilled Nursing Facil-ity. As a fund established to account for the financialresources to be used for the acquisition or constructionof major capital facilities, it is included in the CapitalProgram. A portion of the cost of replacing the Edge-moor facility was funded by Certificates of Participation(COPs) executed and delivered in January 2005 andDecember 2006. The Edgemoor Development Fundprovides funding for the principal and interest pay-ments related to the COPs.
Capital Program Funds are used for:The acquisition and construction of new publicimprovements, including buildings and initial furnish-ings and equipment.Land and permanent on-site and off-site improvementsnecessary for the completion of a capital project.The replacement or reconstruction of permanent publicimprovements which will extend the useful life of astructure, including changes in the use of a facility.
The following restrictions apply and the followingexpenses are not to be funded from the Capital ProgramFunds:
Expenditures which do not extend the useful life of astructure or will only bring the facility to a sound condi-tion. These are considered maintenance expenses.Feasibility studies, facility master plans, or other ana-lytical or research activities that do not relate directly tothe implementation of a capital project.Furnishings or equipment not considered a permanentcomponent of the facility or other short lived generalfixed assets.
Capital Program Adopted Operational Plan Fiscal Years 2013-2014 and 2014-2015 455
Capital Program
Roads, bridges, or other similar infrastructure projectsthat are provided for through special revenue fundssuch as the Road Fund.
The Board of Supervisors may appropriate funding fromany legal source to the Capital Program Funds for presentor future capital projects. The Board of Supervisors hasjurisdiction over the acquisition, use and disposal ofCounty-owned real property and County-leased propertyunder the authority of Government Code §23004. All pro-ceeds from the sale of fixed assets (land and structures)are allocated to the Capital Program Funds unless other-wise specifically directed by the Board of Supervisors.Administrative policies and procedures have been estab-lished to provide appropriate controls on the scope ofprojects and expenditure of funds.
The County's capital improvements planning process isoutlined in Board of Supervisors' Policy G-16, CapitalFacilities and Space Planning. The process reflects thegoals of the County's Five-Year Strategic Plan and identi-fies the Department of General Services (DGS) as stewardfor the management and planning of the County's capitalfacilities. DGS coordinates the implementation of PolicyG-16 by setting a schedule, designing a process and cre-ating evaluation criteria for establishing the CapitalImprovements Needs Assessment (CINA).
In accordance with Policy G-16, the CINA is prepared andpresented annually to the Board of Supervisors to guidethe development and funding of both immediate and long-term capital projects. The CINA includes a comprehensivelist of all current and anticipated capital projects over afive-year period. Funded projects are given first priority,followed by partially funded projects and, finally, unfundedprojects. Preparation of the CINA involves the followingprocess:
A “Call for Projects” begins in August when depart-ments submit projects, including a description, esti-mated costs and level of available funding. This is anopportunity for departments to submit high prioritycapital projects for review and evaluation. Capitalrequests are defined per County Administrative Man-ual, Item 0050-01-06 Capital, Space and MaintenanceRequests, as those projects which improve or enhancean existing facility or space within it. The definitionincludes projects that increase the value or extend theuseful life of a structure, such as construction of wallsor partitions, construction or change of public counterareas, installation of water tanks on County property,development of parkland, and construction of newtransit centers.
The Facilities Planning Board, which consists of theDeputy Chief Administrative Officer/Auditor and Con-troller, the five Group Finance Directors and the Direc-tor of DGS, reviews and prioritizes the projects. In orderto plan effectively for the County's overall capital needsand to make efficient use of resources, capital projectsare prioritized using specific criteria including but notlimited to:
Strategic Plan linkageCritical need: life, safety and emergencyState/federal mandates: legal binding commitmentsOperating budget impacts: quantifiable reducedoperating costsMaintenance budget impacts: quantifiable reducedmaintenance costsCustomer service benefitsQuality of life
The Facilities Planning Board makes a presentationand recommendations to the Group General Managerswho then either concur with or modify the recommen-dations.The CINA is presented to the Chief Administrative Offi-cer (CAO) for final review and approval before presen-tation to the Board of Supervisors, which accepts theCINA and refers to the CAO the responsibility of deter-mining project timing and the funding mechanisms tocarry out the CINA.
Once funding is identified, projects are included in thetwo-year Operational Plan capital program, usually in theyear they are to be initiated. In some instances, resourcesmay be accumulated over time and the project is startedonly after all the funding has been identified. Each organi-zational Group is responsible for identifying fundingsources for its projects. Any long-term financing obliga-tions required for implementation of the CINA must first beapproved by the Debt Advisory Committee and then bythe Board of Supervisors, as required by Board of Supervi-sors Policy B-65, Long-Term Financial Obligation Manage-ment Policy.
The Board of Supervisors or the CAO also may recom-mend mid-year adjustments to the budget as circum-stances warrant to meet emergent requirements or tobenefit from unique development or purchase opportuni-ties. A budget adjustment may be made if the projectrequest meets at least one of the following criteria:
Public or employee health/safety is threatened byexisting or imminent conditions.The County will face financial harm (property damage,loss of revenue, litigation, etc.) if prompt action is nottaken.
456 Capital ProgramAdopted Operational Plan Fiscal Years 2013-2014 and 2014-2015
Capital Program
The Board of Supervisors has approved a new programor program change which specifically includes addi-tional space and funding for space-related costs.
Any appropriations remaining in the capital project at theend of the fiscal year automatically roll over into the nextfiscal year along with any related encumbrances until theproject is completed.
The tables beginning on page 499 provide information for
the Capital Program Funds for Lease Payments1, followedby a list of the County's current outstanding Capital Proj-ects.
1Lease Payments are budgeted in the General Fund in Finance Other. In order to consolidate all Capital activity, the Lease Payments detail is displayed near the end of the Capital Program section for informational purposes.
Capital Program Adopted Operational Plan Fiscal Years 2013-2014 and 2014-2015 457
Capital Appropriations
The Fiscal Years 2013-15 Adopted Operational Planincludes $51.2 million in new appropriations over the nexttwo years for various capital projects. The following sec-tion briefly describes the anticipated cost and purpose ofeach project.
Assessor/Recorder/County Clerk (ARCC) El Cajon Branch Office
This project will replace the existing 8,920 square footCounty facility located on Magnolia Street in the City of ElCajon, housing County Assessor/Recorder/County Clerk(ARCC) staff and operations. The replacement facility isanticipated to be approximately 14,500 square feet, andwill provide office and parking space to accommodategrowth in ARCC staff. The project includes acquisition ofadditional property adjacent to the current site and thenew facility will provide a more functional and efficientfacility to ARCC, allowing for improved operations. Thereplacement ARCC El Cajon Branch Office facilities areanticipated to include 65 parking spaces and accommo-date up to 40 staff members. Construction for the projectis anticipated to begin in 2014 and to be completed in2015 and cost $7.5 million. For Fiscal Year 2013-14,appropriations include $5.0 million based on Finance andGeneral Government Group Fund Balance and $2.5 mil-lion, based on Miscellaneous Revenue from the RecorderModernization Trust Fund.
Alpine LibraryThe current Alpine Branch of the County Library is a 3,000square foot facility located on Arnold Way in the commu-nity of Alpine. This project will replace the current facilitywith a new, 13,500 square foot Leadership in Energy andEnvironmental Design (LEED) facility to be located onCounty-owned property adjacent to the Alpine CommunityCenter and Veterans Wall of Honor. Construction is antici-pated to begin in mid-2014 and end in mid-2015. The totalcost of the project, including the site acquisition and furni-ture, fixtures, and equipment is anticipated to be $10.7million. Appropriations for this project of $9.8 million,based on ongoing General Purpose Revenue, are includedin Fiscal Year 2013-14 to supplement the $0.9 funded todate.
Imperial Beach LibraryThis project will replace the current 5,000 square footImperial Beach Branch of the County Library with a largerfacility of up to 14,000 feet, which includes the remodel ofthe 2,000 square foot Imperial Beach Community Center.The project includes redevelopment of the site in general,improving the connectivity between the Library and theImperial Beach Community Center. Construction for thisproject is anticipated to begin in 2014 and be completedin 2015. The total cost of the project is $9.5 million, and todate $1.1 million has been funded. Appropriations of theremaining $8.4 million needed, based on ongoing GeneralPurpose Revenue, are included in Fiscal Year 2013-14.
San Elijo Lagoon Gateway Property AcquisitionThe San Elijo Lagoon Ecological Reserve is one of the fewremaining coastal wetlands in San Diego County, and ishome to numerous species of plants and animals. TheReserve features a self-guided nature trail along with anadditional five miles of trails, and a nature center withmuseum quality interactive exhibits within a 5,525-squarefoot facility. The San Elijo Lagoon Gateway PropertyAcquisition project will permanently acquire a portion of3.4 acres of open space within the City of Solana Beachadjacent to the Lagoon, just east of the Cardiff StateBeach, and incorporate it into the Reserve. Fiscal Year2013-14 includes funding of $1.8 million, based on Gen-eral Purpose Revenue.
4S Ranch Synthetic Turf South Ball FieldsThe 4S Ranch Sports Park is one of the County's premiersports facilities offering numerous sports amenities withina 25-acre park near the communities of Rancho Bernardoand Rancho Penasquitos. Facilities include five baseball/softball fields, five soccer fields, two tennis courts, twobasketball courts, and a roller hockey rink. The SportsPark also provides other community amenities includingplaygrounds, a gazebo, and a picnic area. The 4S RanchSynthetic Turf South Ball Fields project includes the con-version of 239,000 square feet of multi-purpose grassfields into synthetic turf, which will conserve water. Fund-ing of $2.5 million, based on General Purpose Revenue isincluded in Fiscal Year 2013-14.
458 Capital ProgramAdopted Operational Plan Fiscal Years 2013-2014 and 2014-2015
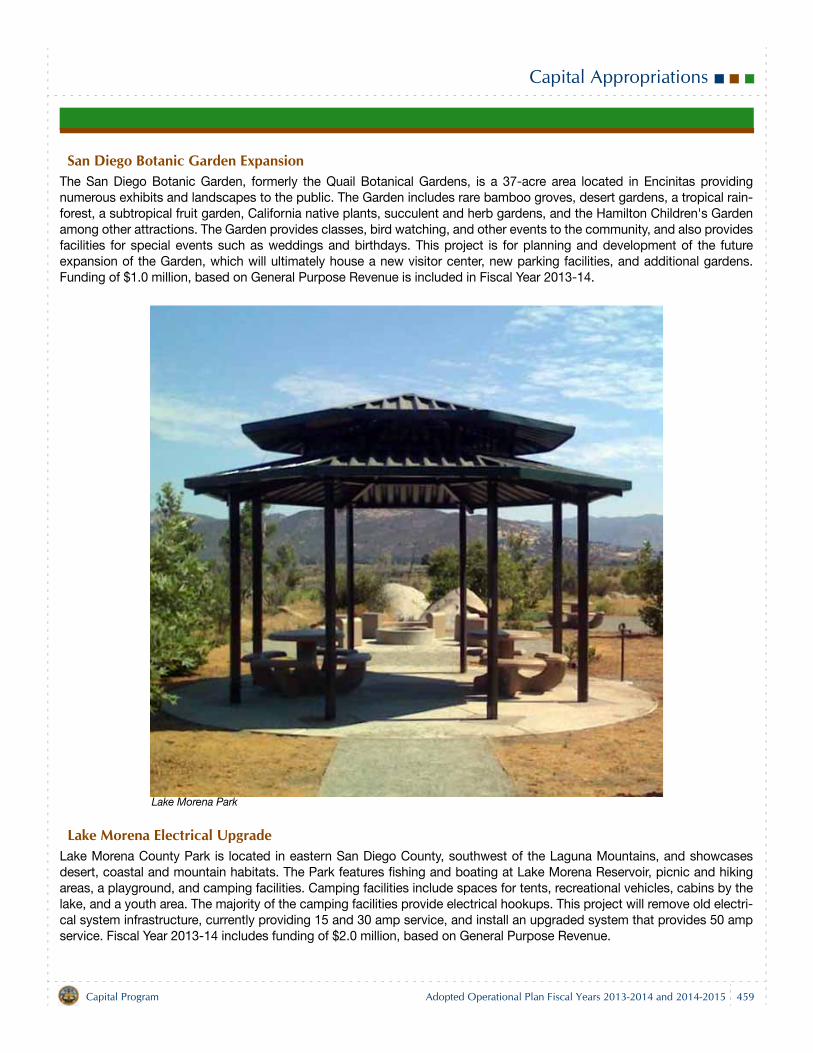
Capital Appropriations
San Diego Botanic Garden ExpansionThe San Diego Botanic Garden, formerly the Quail Botanical Gardens, is a 37-acre area located in Encinitas providingnumerous exhibits and landscapes to the public. The Garden includes rare bamboo groves, desert gardens, a tropical rain-forest, a subtropical fruit garden, California native plants, succulent and herb gardens, and the Hamilton Children's Gardenamong other attractions. The Garden provides classes, bird watching, and other events to the community, and also providesfacilities for special events such as weddings and birthdays. This project is for planning and development of the futureexpansion of the Garden, which will ultimately house a new visitor center, new parking facilities, and additional gardens.Funding of $1.0 million, based on General Purpose Revenue is included in Fiscal Year 2013-14.
Lake Morena Electrical UpgradeLake Morena County Park is located in eastern San Diego County, southwest of the Laguna Mountains, and showcasesdesert, coastal and mountain habitats. The Park features fishing and boating at Lake Morena Reservoir, picnic and hikingareas, a playground, and camping facilities. Camping facilities include spaces for tents, recreational vehicles, cabins by thelake, and a youth area. The majority of the camping facilities provide electrical hookups. This project will remove old electri-cal system infrastructure, currently providing 15 and 30 amp service, and install an upgraded system that provides 50 ampservice. Fiscal Year 2013-14 includes funding of $2.0 million, based on General Purpose Revenue.
Lake Morena Park
Capital Program Adopted Operational Plan Fiscal Years 2013-2014 and 2014-2015 459
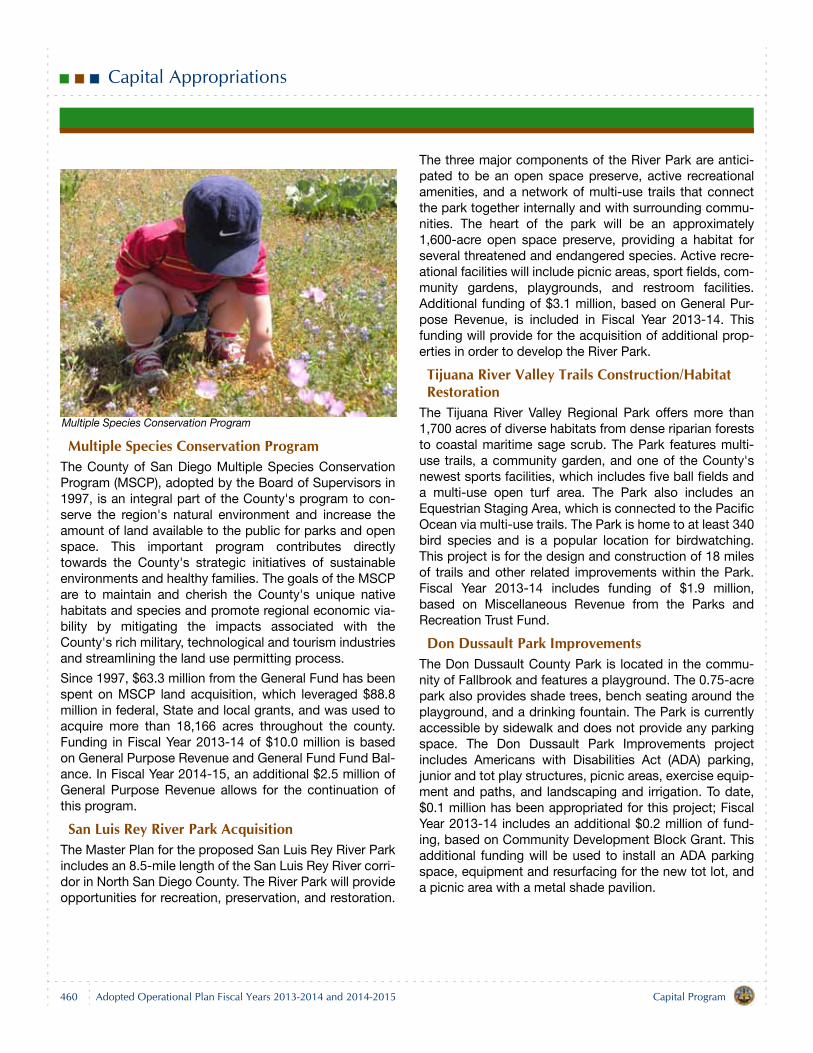
Capital Appropriations
Multiple Species Conservation ProgramThe County of San Diego Multiple Species ConservationProgram (MSCP), adopted by the Board of Supervisors in1997, is an integral part of the County's program to con-serve the region's natural environment and increase theamount of land available to the public for parks and openspace. This important program contributes directlytowards the County's strategic initiatives of sustainableenvironments and healthy families. The goals of the MSCPare to maintain and cherish the County's unique nativehabitats and species and promote regional economic via-bility by mitigating the impacts associated with theCounty's rich military, technological and tourism industriesand streamlining the land use permitting process.
Since 1997, $63.3 million from the General Fund has beenspent on MSCP land acquisition, which leveraged $88.8million in federal, State and local grants, and was used toacquire more than 18,166 acres throughout the county.Funding in Fiscal Year 2013-14 of $10.0 million is basedon General Purpose Revenue and General Fund Fund Bal-ance. In Fiscal Year 2014-15, an additional $2.5 million ofGeneral Purpose Revenue allows for the continuation ofthis program.
San Luis Rey River Park AcquisitionThe Master Plan for the proposed San Luis Rey River Parkincludes an 8.5-mile length of the San Luis Rey River corri-dor in North San Diego County. The River Park will provideopportunities for recreation, preservation, and restoration.
The three major components of the River Park are antici-pated to be an open space preserve, active recreationalamenities, and a network of multi-use trails that connectthe park together internally and with surrounding commu-nities. The heart of the park will be an approximately1,600-acre open space preserve, providing a habitat forseveral threatened and endangered species. Active recre-ational facilities will include picnic areas, sport fields, com-munity gardens, playgrounds, and restroom facilities.Additional funding of $3.1 million, based on General Pur-pose Revenue, is included in Fiscal Year 2013-14. Thisfunding will provide for the acquisition of additional prop-erties in order to develop the River Park.
Tijuana River Valley Trails Construction/Habitat Restoration
The Tijuana River Valley Regional Park offers more than1,700 acres of diverse habitats from dense riparian foreststo coastal maritime sage scrub. The Park features multi-use trails, a community garden, and one of the County'snewest sports facilities, which includes five ball fields anda multi-use open turf area. The Park also includes anEquestrian Staging Area, which is connected to the PacificOcean via multi-use trails. The Park is home to at least 340bird species and is a popular location for birdwatching.This project is for the design and construction of 18 milesof trails and other related improvements within the Park.Fiscal Year 2013-14 includes funding of $1.9 million,based on Miscellaneous Revenue from the Parks andRecreation Trust Fund.
Don Dussault Park ImprovementsThe Don Dussault County Park is located in the commu-nity of Fallbrook and features a playground. The 0.75-acrepark also provides shade trees, bench seating around theplayground, and a drinking fountain. The Park is currentlyaccessible by sidewalk and does not provide any parkingspace. The Don Dussault Park Improvements projectincludes Americans with Disabilities Act (ADA) parking,junior and tot play structures, picnic areas, exercise equip-ment and paths, and landscaping and irrigation. To date,$0.1 million has been appropriated for this project; FiscalYear 2013-14 includes an additional $0.2 million of fund-ing, based on Community Development Block Grant. Thisadditional funding will be used to install an ADA parkingspace, equipment and resurfacing for the new tot lot, anda picnic area with a metal shade pavilion.
Multiple Species Conservation Program
460 Capital ProgramAdopted Operational Plan Fiscal Years 2013-2014 and 2014-2015
Capital Appropriations
Jess Martin Multi-Use Ball Fields Irrigation and Seepage Pit
The Jess Martin County Park is a nine-acre communitypark located just south of the community of Julian alongState Highway 79. The Park features a playground, skatepark, ball fields, fitness and exercise facilities, picnictables, and a restroom, providing various recreationalopportunities to the community. The Jess Martin Multi-Use Ball Fields Irrigation and Seepage Pit project will pro-vide a new irrigation mainline and a seepage pit system forthe ball fields. Funding for this project of $0.2 million,based on Community Development Block Grant revenue,is included in Fiscal Year 2013-14.
4S Ranch Shade Structure—Boys and Girls ClubThe 4S Ranch Shade Structure—Boys and Girls Club proj-ect includes the construction of a shade structure over anexisting play area within the 4S Ranch Sports Park. Theplayground is adjacent to the Boys and Girls Club locatedon the east side of the park. Fiscal Year 2013-14 includesfunding for this project in the amount of $0.2 million,based on General Purpose Revenue.
4S Ranch Shade Structure—Sports ParkThe 4S Ranch Shade Structure—Sports Park projectincludes the construction of a shade structure over anexisting playground within the 4S Ranch Sports Park,adjacent to the north ball fields. Funding for this project of$0.1 million, based on General Purpose Revenue, isincluded in Fiscal Year 2013-14.
Capital Program Adopted Operational Plan Fiscal Years 2013-2014 and 2014-2015 461
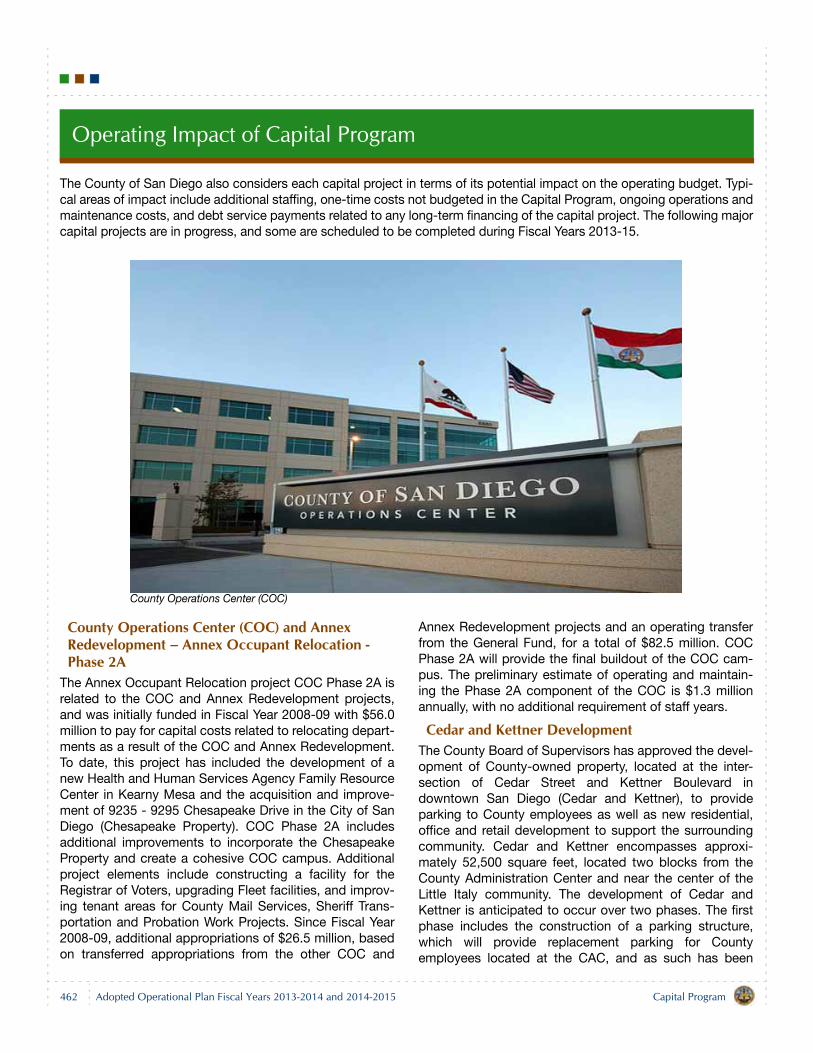
Operating Impact of Capital Program
The County of San Diego also considers each capital project in terms of its potential impact on the operating budget. Typi-cal areas of impact include additional staffing, one-time costs not budgeted in the Capital Program, ongoing operations andmaintenance costs, and debt service payments related to any long-term financing of the capital project. The following majorcapital projects are in progress, and some are scheduled to be completed during Fiscal Years 2013-15.
County Operations Center (COC) and Annex Redevelopment – Annex Occupant Relocation - Phase 2A
The Annex Occupant Relocation project COC Phase 2A isrelated to the COC and Annex Redevelopment projects,and was initially funded in Fiscal Year 2008-09 with $56.0million to pay for capital costs related to relocating depart-ments as a result of the COC and Annex Redevelopment.To date, this project has included the development of anew Health and Human Services Agency Family ResourceCenter in Kearny Mesa and the acquisition and improve-ment of 9235 - 9295 Chesapeake Drive in the City of SanDiego (Chesapeake Property). COC Phase 2A includesadditional improvements to incorporate the ChesapeakeProperty and create a cohesive COC campus. Additionalproject elements include constructing a facility for theRegistrar of Voters, upgrading Fleet facilities, and improv-ing tenant areas for County Mail Services, Sheriff Trans-portation and Probation Work Projects. Since Fiscal Year2008-09, additional appropriations of $26.5 million, basedon transferred appropriations from the other COC and
Annex Redevelopment projects and an operating transferfrom the General Fund, for a total of $82.5 million. COCPhase 2A will provide the final buildout of the COC cam-pus. The preliminary estimate of operating and maintain-ing the Phase 2A component of the COC is $1.3 millionannually, with no additional requirement of staff years.
Cedar and Kettner DevelopmentThe County Board of Supervisors has approved the devel-opment of County-owned property, located at the inter-section of Cedar Street and Kettner Boulevard indowntown San Diego (Cedar and Kettner), to provideparking to County employees as well as new residential,office and retail development to support the surroundingcommunity. Cedar and Kettner encompasses approxi-mately 52,500 square feet, located two blocks from theCounty Administration Center and near the center of theLittle Italy community. The development of Cedar andKettner is anticipated to occur over two phases. The firstphase includes the construction of a parking structure,which will provide replacement parking for Countyemployees located at the CAC, and as such has been
County Operations Center (COC)
462 Capital ProgramAdopted Operational Plan Fiscal Years 2013-2014 and 2014-2015
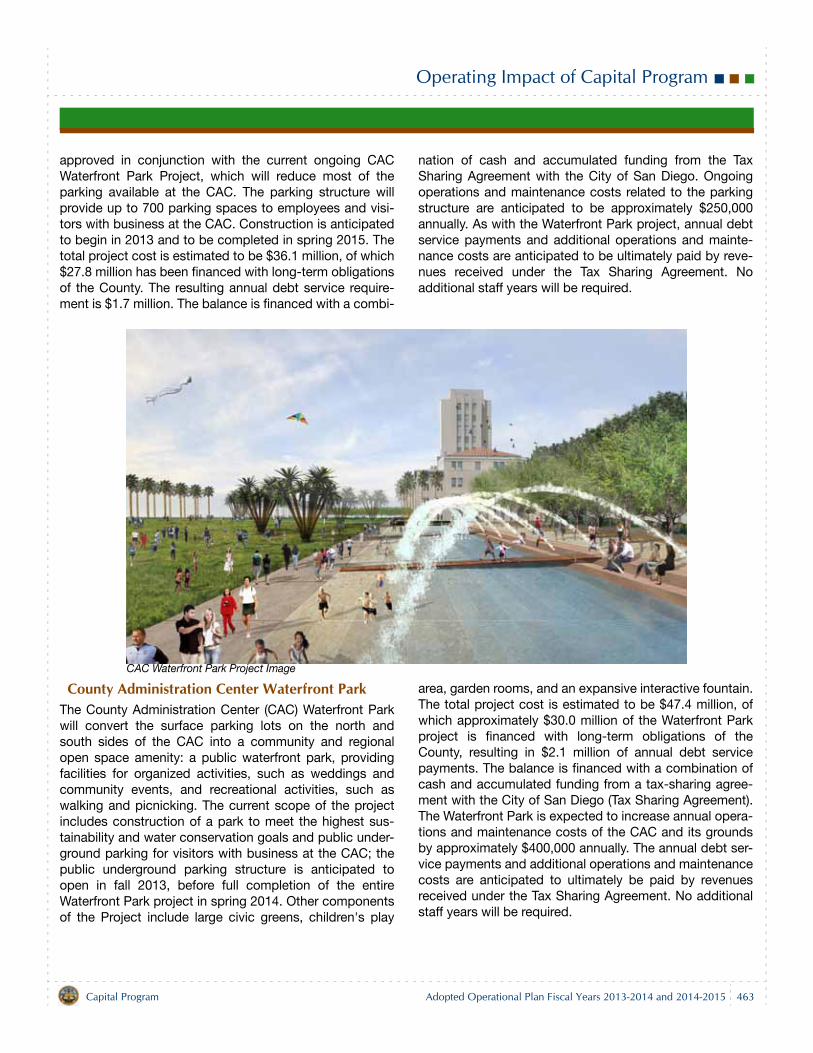
Operating Impact of Capital Program
approved in conjunction with the current ongoing CACWaterfront Park Project, which will reduce most of theparking available at the CAC. The parking structure willprovide up to 700 parking spaces to employees and visi-tors with business at the CAC. Construction is anticipatedto begin in 2013 and to be completed in spring 2015. Thetotal project cost is estimated to be $36.1 million, of which$27.8 million has been financed with long-term obligationsof the County. The resulting annual debt service require-ment is $1.7 million. The balance is financed with a combi-
nation of cash and accumulated funding from the TaxSharing Agreement with the City of San Diego. Ongoingoperations and maintenance costs related to the parkingstructure are anticipated to be approximately $250,000annually. As with the Waterfront Park project, annual debtservice payments and additional operations and mainte-nance costs are anticipated to be ultimately paid by reve-nues received under the Tax Sharing Agreement. Noadditional staff years will be required.
County Administration Center Waterfront ParkThe County Administration Center (CAC) Waterfront Parkwill convert the surface parking lots on the north andsouth sides of the CAC into a community and regionalopen space amenity: a public waterfront park, providingfacilities for organized activities, such as weddings andcommunity events, and recreational activities, such aswalking and picnicking. The current scope of the projectincludes construction of a park to meet the highest sus-tainability and water conservation goals and public under-ground parking for visitors with business at the CAC; thepublic underground parking structure is anticipated toopen in fall 2013, before full completion of the entireWaterfront Park project in spring 2014. Other componentsof the Project include large civic greens, children's play
area, garden rooms, and an expansive interactive fountain.The total project cost is estimated to be $47.4 million, ofwhich approximately $30.0 million of the Waterfront Parkproject is financed with long-term obligations of theCounty, resulting in $2.1 million of annual debt servicepayments. The balance is financed with a combination ofcash and accumulated funding from a tax-sharing agree-ment with the City of San Diego (Tax Sharing Agreement).The Waterfront Park is expected to increase annual opera-tions and maintenance costs of the CAC and its groundsby approximately $400,000 annually. The annual debt ser-vice payments and additional operations and maintenancecosts are anticipated to ultimately be paid by revenuesreceived under the Tax Sharing Agreement. No additionalstaff years will be required.
CAC Waterfront Park Project Image
Capital Program Adopted Operational Plan Fiscal Years 2013-2014 and 2014-2015 463
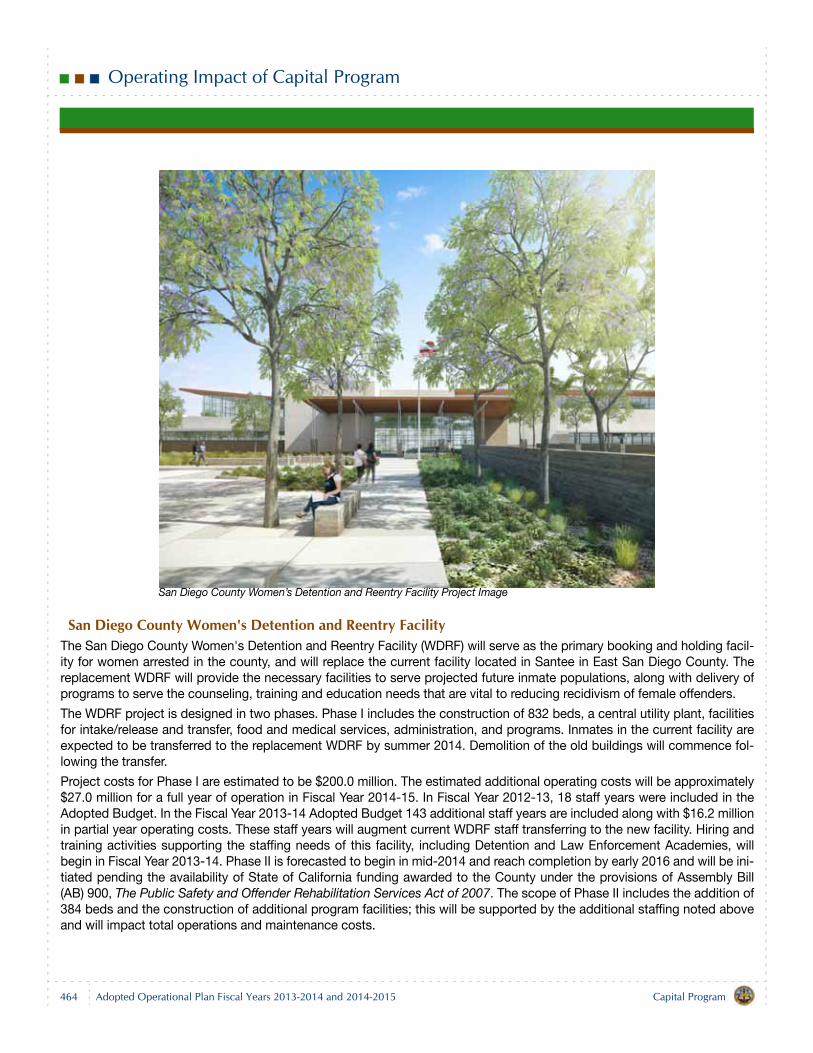
Operating Impact of Capital Program
San Diego County Women's Detention and Reentry FacilityThe San Diego County Women's Detention and Reentry Facility (WDRF) will serve as the primary booking and holding facil-ity for women arrested in the county, and will replace the current facility located in Santee in East San Diego County. Thereplacement WDRF will provide the necessary facilities to serve projected future inmate populations, along with delivery ofprograms to serve the counseling, training and education needs that are vital to reducing recidivism of female offenders.
The WDRF project is designed in two phases. Phase I includes the construction of 832 beds, a central utility plant, facilitiesfor intake/release and transfer, food and medical services, administration, and programs. Inmates in the current facility areexpected to be transferred to the replacement WDRF by summer 2014. Demolition of the old buildings will commence fol-lowing the transfer.
Project costs for Phase I are estimated to be $200.0 million. The estimated additional operating costs will be approximately$27.0 million for a full year of operation in Fiscal Year 2014-15. In Fiscal Year 2012-13, 18 staff years were included in theAdopted Budget. In the Fiscal Year 2013-14 Adopted Budget 143 additional staff years are included along with $16.2 millionin partial year operating costs. These staff years will augment current WDRF staff transferring to the new facility. Hiring andtraining activities supporting the staffing needs of this facility, including Detention and Law Enforcement Academies, willbegin in Fiscal Year 2013-14. Phase II is forecasted to begin in mid-2014 and reach completion by early 2016 and will be ini-tiated pending the availability of State of California funding awarded to the County under the provisions of Assembly Bill(AB) 900, The Public Safety and Offender Rehabilitation Services Act of 2007. The scope of Phase II includes the addition of384 beds and the construction of additional program facilities; this will be supported by the additional staffing noted aboveand will impact total operations and maintenance costs.
San Diego County Women’s Detention and Reentry Facility Project Image
464 Capital ProgramAdopted Operational Plan Fiscal Years 2013-2014 and 2014-2015
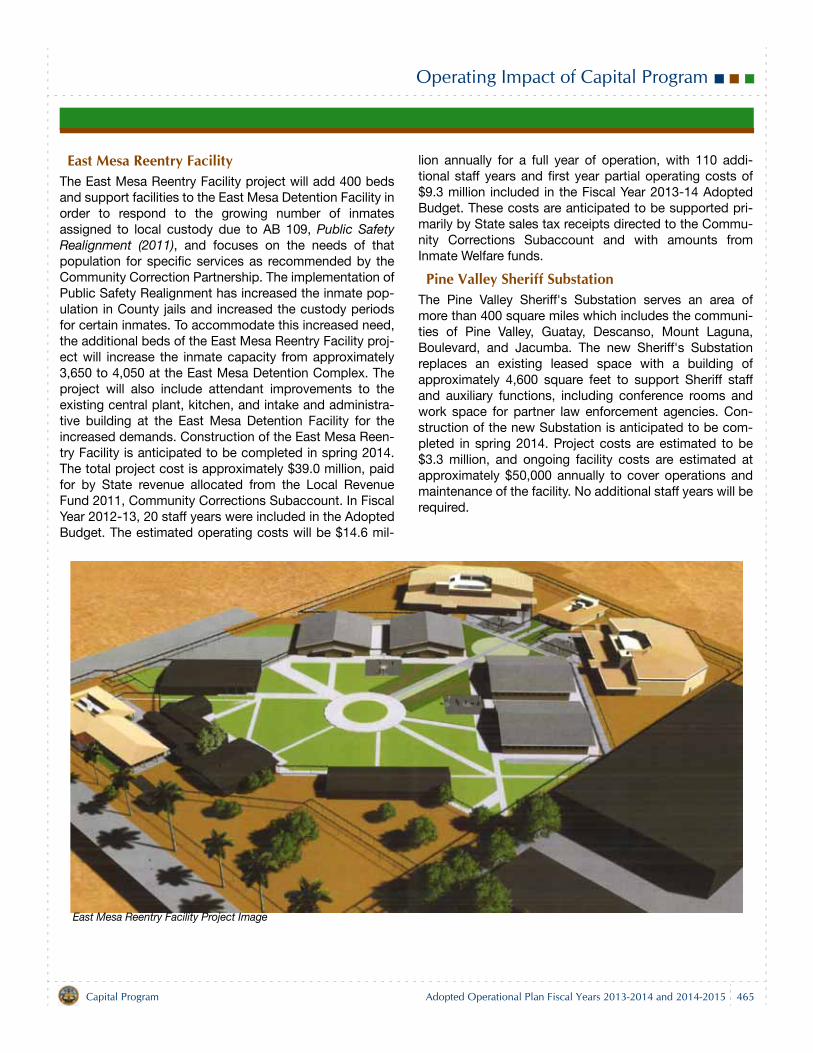
Operating Impact of Capital Program
East Mesa Reentry FacilityThe East Mesa Reentry Facility project will add 400 bedsand support facilities to the East Mesa Detention Facility inorder to respond to the growing number of inmatesassigned to local custody due to AB 109, Public SafetyRealignment (2011), and focuses on the needs of thatpopulation for specific services as recommended by theCommunity Correction Partnership. The implementation ofPublic Safety Realignment has increased the inmate pop-ulation in County jails and increased the custody periodsfor certain inmates. To accommodate this increased need,the additional beds of the East Mesa Reentry Facility proj-ect will increase the inmate capacity from approximately3,650 to 4,050 at the East Mesa Detention Complex. Theproject will also include attendant improvements to theexisting central plant, kitchen, and intake and administra-tive building at the East Mesa Detention Facility for theincreased demands. Construction of the East Mesa Reen-try Facility is anticipated to be completed in spring 2014.The total project cost is approximately $39.0 million, paidfor by State revenue allocated from the Local RevenueFund 2011, Community Corrections Subaccount. In FiscalYear 2012-13, 20 staff years were included in the AdoptedBudget. The estimated operating costs will be $14.6 mil-
lion annually for a full year of operation, with 110 addi-tional staff years and first year partial operating costs of$9.3 million included in the Fiscal Year 2013-14 AdoptedBudget. These costs are anticipated to be supported pri-marily by State sales tax receipts directed to the Commu-nity Corrections Subaccount and with amounts fromInmate Welfare funds.
Pine Valley Sheriff SubstationThe Pine Valley Sheriff's Substation serves an area ofmore than 400 square miles which includes the communi-ties of Pine Valley, Guatay, Descanso, Mount Laguna,Boulevard, and Jacumba. The new Sheriff's Substationreplaces an existing leased space with a building ofapproximately 4,600 square feet to support Sheriff staffand auxiliary functions, including conference rooms andwork space for partner law enforcement agencies. Con-struction of the new Substation is anticipated to be com-pleted in spring 2014. Project costs are estimated to be$3.3 million, and ongoing facility costs are estimated atapproximately $50,000 annually to cover operations andmaintenance of the facility. No additional staff years will berequired.
East Mesa Reentry Facility Project Image
Capital Program Adopted Operational Plan Fiscal Years 2013-2014 and 2014-2015 465
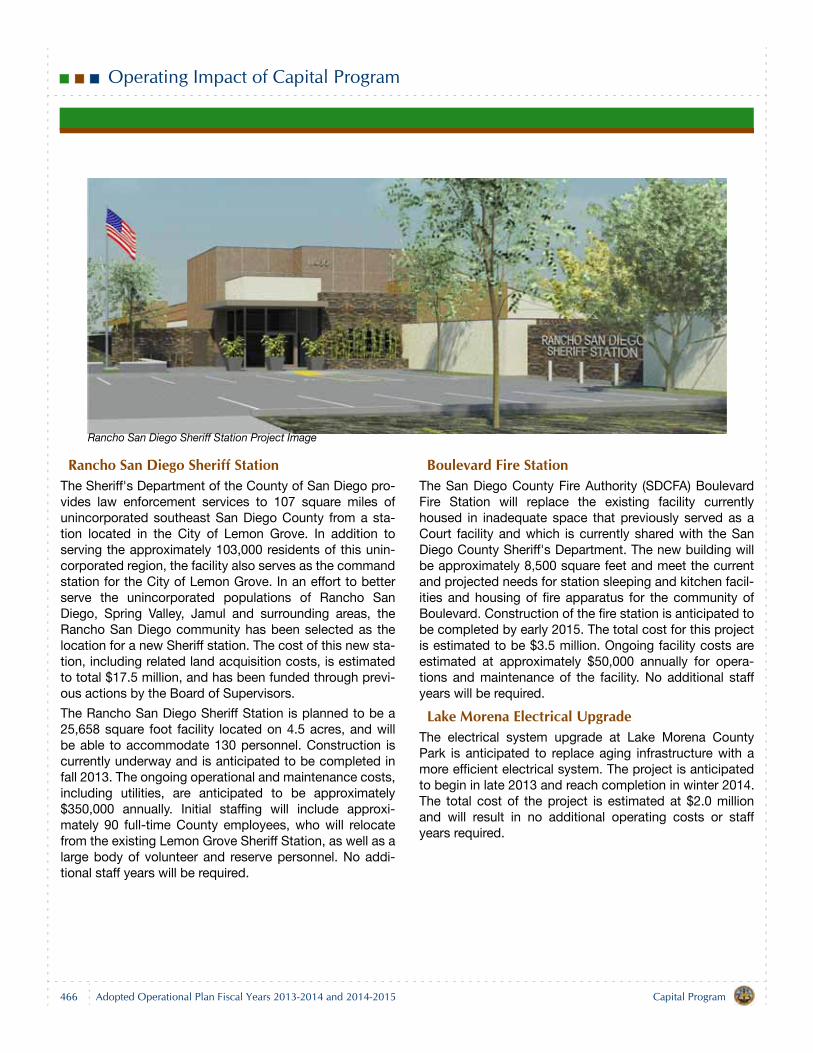
Operating Impact of Capital Program
Rancho San Diego Sheriff StationThe Sheriff's Department of the County of San Diego pro-vides law enforcement services to 107 square miles ofunincorporated southeast San Diego County from a sta-tion located in the City of Lemon Grove. In addition toserving the approximately 103,000 residents of this unin-corporated region, the facility also serves as the commandstation for the City of Lemon Grove. In an effort to betterserve the unincorporated populations of Rancho SanDiego, Spring Valley, Jamul and surrounding areas, theRancho San Diego community has been selected as thelocation for a new Sheriff station. The cost of this new sta-tion, including related land acquisition costs, is estimatedto total $17.5 million, and has been funded through previ-ous actions by the Board of Supervisors.
The Rancho San Diego Sheriff Station is planned to be a25,658 square foot facility located on 4.5 acres, and willbe able to accommodate 130 personnel. Construction iscurrently underway and is anticipated to be completed infall 2013. The ongoing operational and maintenance costs,including utilities, are anticipated to be approximately$350,000 annually. Initial staffing will include approxi-mately 90 full-time County employees, who will relocatefrom the existing Lemon Grove Sheriff Station, as well as alarge body of volunteer and reserve personnel. No addi-tional staff years will be required.
Boulevard Fire StationThe San Diego County Fire Authority (SDCFA) BoulevardFire Station will replace the existing facility currentlyhoused in inadequate space that previously served as aCourt facility and which is currently shared with the SanDiego County Sheriff's Department. The new building willbe approximately 8,500 square feet and meet the currentand projected needs for station sleeping and kitchen facil-ities and housing of fire apparatus for the community ofBoulevard. Construction of the fire station is anticipated tobe completed by early 2015. The total cost for this projectis estimated to be $3.5 million. Ongoing facility costs areestimated at approximately $50,000 annually for opera-tions and maintenance of the facility. No additional staffyears will be required.
Lake Morena Electrical UpgradeThe electrical system upgrade at Lake Morena CountyPark is anticipated to replace aging infrastructure with amore efficient electrical system. The project is anticipatedto begin in late 2013 and reach completion in winter 2014.The total cost of the project is estimated at $2.0 millionand will result in no additional operating costs or staffyears required.
Rancho San Diego Sheriff Station Project Image
466 Capital ProgramAdopted Operational Plan Fiscal Years 2013-2014 and 2014-2015
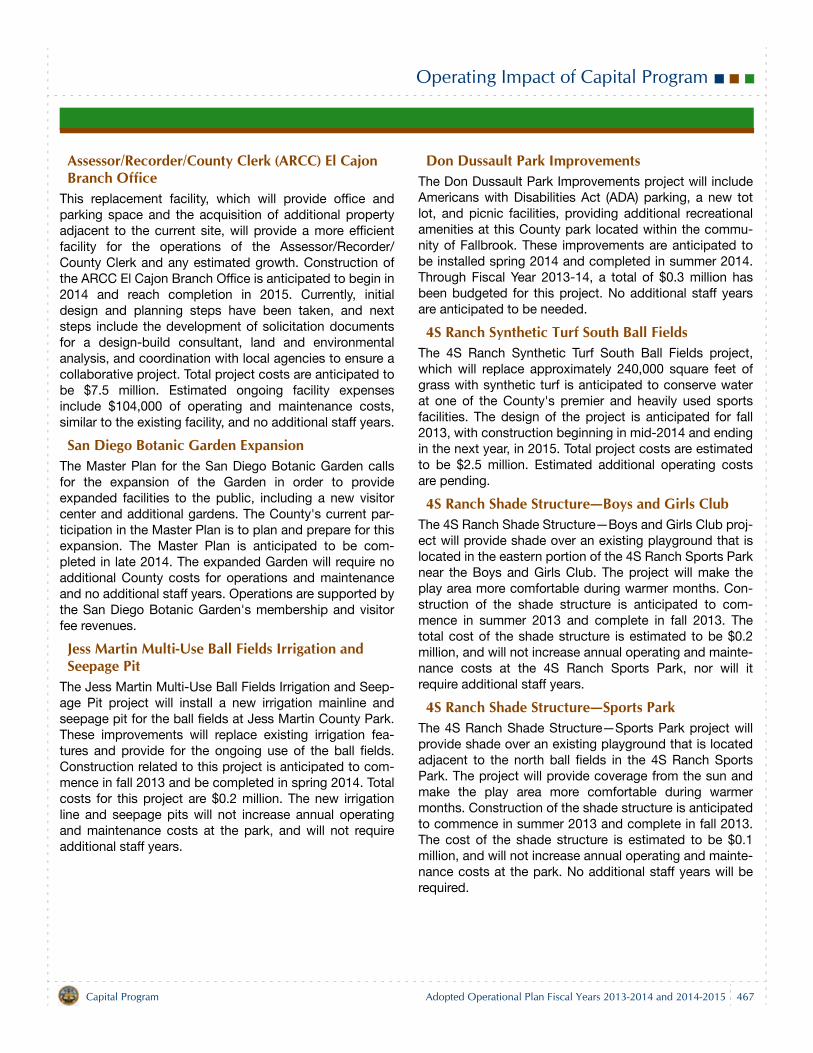
Operating Impact of Capital Program
Assessor/Recorder/County Clerk (ARCC) El Cajon Branch Office
This replacement facility, which will provide office andparking space and the acquisition of additional propertyadjacent to the current site, will provide a more efficientfacility for the operations of the Assessor/Recorder/County Clerk and any estimated growth. Construction ofthe ARCC El Cajon Branch Office is anticipated to begin in2014 and reach completion in 2015. Currently, initialdesign and planning steps have been taken, and nextsteps include the development of solicitation documentsfor a design-build consultant, land and environmentalanalysis, and coordination with local agencies to ensure acollaborative project. Total project costs are anticipated tobe $7.5 million. Estimated ongoing facility expensesinclude $104,000 of operating and maintenance costs,similar to the existing facility, and no additional staff years.
San Diego Botanic Garden ExpansionThe Master Plan for the San Diego Botanic Garden callsfor the expansion of the Garden in order to provideexpanded facilities to the public, including a new visitorcenter and additional gardens. The County's current par-ticipation in the Master Plan is to plan and prepare for thisexpansion. The Master Plan is anticipated to be com-pleted in late 2014. The expanded Garden will require noadditional County costs for operations and maintenanceand no additional staff years. Operations are supported bythe San Diego Botanic Garden's membership and visitorfee revenues.
Jess Martin Multi-Use Ball Fields Irrigation and Seepage Pit
The Jess Martin Multi-Use Ball Fields Irrigation and Seep-age Pit project will install a new irrigation mainline andseepage pit for the ball fields at Jess Martin County Park.These improvements will replace existing irrigation fea-tures and provide for the ongoing use of the ball fields.Construction related to this project is anticipated to com-mence in fall 2013 and be completed in spring 2014. Totalcosts for this project are $0.2 million. The new irrigationline and seepage pits will not increase annual operatingand maintenance costs at the park, and will not requireadditional staff years.
Don Dussault Park ImprovementsThe Don Dussault Park Improvements project will includeAmericans with Disabilities Act (ADA) parking, a new totlot, and picnic facilities, providing additional recreationalamenities at this County park located within the commu-nity of Fallbrook. These improvements are anticipated tobe installed spring 2014 and completed in summer 2014.Through Fiscal Year 2013-14, a total of $0.3 million hasbeen budgeted for this project. No additional staff yearsare anticipated to be needed.
4S Ranch Synthetic Turf South Ball FieldsThe 4S Ranch Synthetic Turf South Ball Fields project,which will replace approximately 240,000 square feet ofgrass with synthetic turf is anticipated to conserve waterat one of the County's premier and heavily used sportsfacilities. The design of the project is anticipated for fall2013, with construction beginning in mid-2014 and endingin the next year, in 2015. Total project costs are estimatedto be $2.5 million. Estimated additional operating costsare pending.
4S Ranch Shade Structure—Boys and Girls ClubThe 4S Ranch Shade Structure—Boys and Girls Club proj-ect will provide shade over an existing playground that islocated in the eastern portion of the 4S Ranch Sports Parknear the Boys and Girls Club. The project will make theplay area more comfortable during warmer months. Con-struction of the shade structure is anticipated to com-mence in summer 2013 and complete in fall 2013. Thetotal cost of the shade structure is estimated to be $0.2million, and will not increase annual operating and mainte-nance costs at the 4S Ranch Sports Park, nor will itrequire additional staff years.
4S Ranch Shade Structure—Sports ParkThe 4S Ranch Shade Structure—Sports Park project willprovide shade over an existing playground that is locatedadjacent to the north ball fields in the 4S Ranch SportsPark. The project will provide coverage from the sun andmake the play area more comfortable during warmermonths. Construction of the shade structure is anticipatedto commence in summer 2013 and complete in fall 2013.The cost of the shade structure is estimated to be $0.1million, and will not increase annual operating and mainte-nance costs at the park. No additional staff years will berequired.
Capital Program Adopted Operational Plan Fiscal Years 2013-2014 and 2014-2015 467
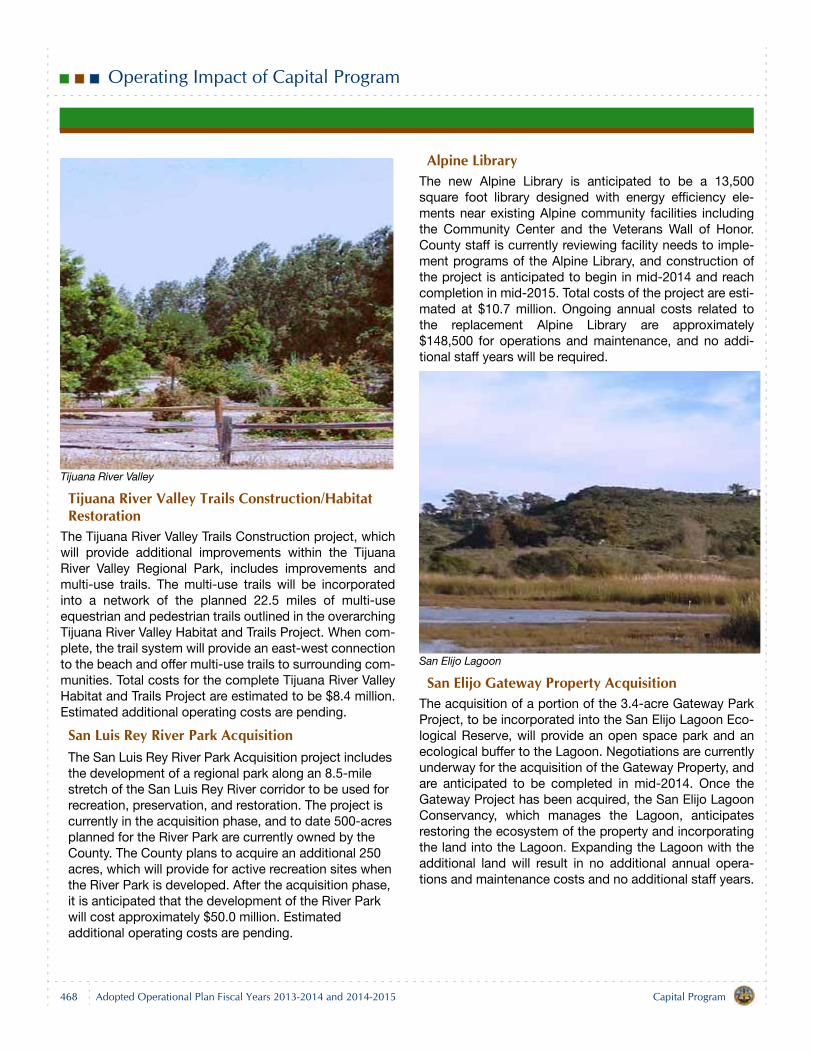
Operating Impact of Capital Program
Tijuana River Valley
Tijuana River Valley Trails Construction/Habitat Restoration
The Tijuana River Valley Trails Construction project, whichwill provide additional improvements within the TijuanaRiver Valley Regional Park, includes improvements andmulti-use trails. The multi-use trails will be incorporatedinto a network of the planned 22.5 miles of multi-useequestrian and pedestrian trails outlined in the overarchingTijuana River Valley Habitat and Trails Project. When com-plete, the trail system will provide an east-west connectionto the beach and offer multi-use trails to surrounding com-munities. Total costs for the complete Tijuana River ValleyHabitat and Trails Project are estimated to be $8.4 million.Estimated additional operating costs are pending.
San Luis Rey River Park AcquisitionThe San Luis Rey River Park Acquisition project includes the development of a regional park along an 8.5-mile stretch of the San Luis Rey River corridor to be used for recreation, preservation, and restoration. The project is currently in the acquisition phase, and to date 500-acres planned for the River Park are currently owned by the County. The County plans to acquire an additional 250 acres, which will provide for active recreation sites when the River Park is developed. After the acquisition phase, it is anticipated that the development of the River Park will cost approximately $50.0 million. Estimated additional operating costs are pending.
Alpine LibraryThe new Alpine Library is anticipated to be a 13,500square foot library designed with energy efficiency ele-ments near existing Alpine community facilities includingthe Community Center and the Veterans Wall of Honor.County staff is currently reviewing facility needs to imple-ment programs of the Alpine Library, and construction ofthe project is anticipated to begin in mid-2014 and reachcompletion in mid-2015. Total costs of the project are esti-mated at $10.7 million. Ongoing annual costs related tothe replacement Alpine Library are approximately$148,500 for operations and maintenance, and no addi-tional staff years will be required.
San Elijo Lagoon
San Elijo Gateway Property AcquisitionThe acquisition of a portion of the 3.4-acre Gateway ParkProject, to be incorporated into the San Elijo Lagoon Eco-logical Reserve, will provide an open space park and anecological buffer to the Lagoon. Negotiations are currentlyunderway for the acquisition of the Gateway Property, andare anticipated to be completed in mid-2014. Once theGateway Project has been acquired, the San Elijo LagoonConservancy, which manages the Lagoon, anticipatesrestoring the ecosystem of the property and incorporatingthe land into the Lagoon. Expanding the Lagoon with theadditional land will result in no additional annual opera-tions and maintenance costs and no additional staff years.
468 Capital ProgramAdopted Operational Plan Fiscal Years 2013-2014 and 2014-2015
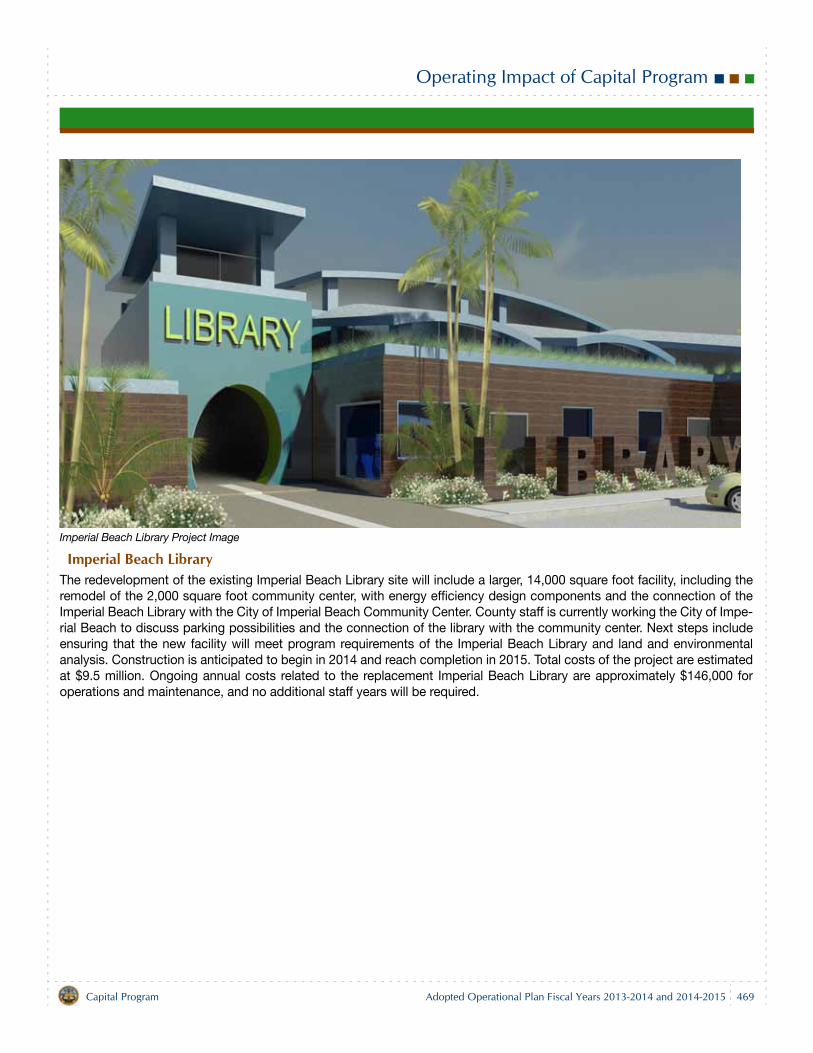
Operating Impact of Capital Program
Imperial Beach Library Project Image
Imperial Beach LibraryThe redevelopment of the existing Imperial Beach Library site will include a larger, 14,000 square foot facility, including theremodel of the 2,000 square foot community center, with energy efficiency design components and the connection of theImperial Beach Library with the City of Imperial Beach Community Center. County staff is currently working the City of Impe-rial Beach to discuss parking possibilities and the connection of the library with the community center. Next steps includeensuring that the new facility will meet program requirements of the Imperial Beach Library and land and environmentalanalysis. Construction is anticipated to begin in 2014 and reach completion in 2015. Total costs of the project are estimatedat $9.5 million. Ongoing annual costs related to the replacement Imperial Beach Library are approximately $146,000 foroperations and maintenance, and no additional staff years will be required.
Capital Program Adopted Operational Plan Fiscal Years 2013-2014 and 2014-2015 469
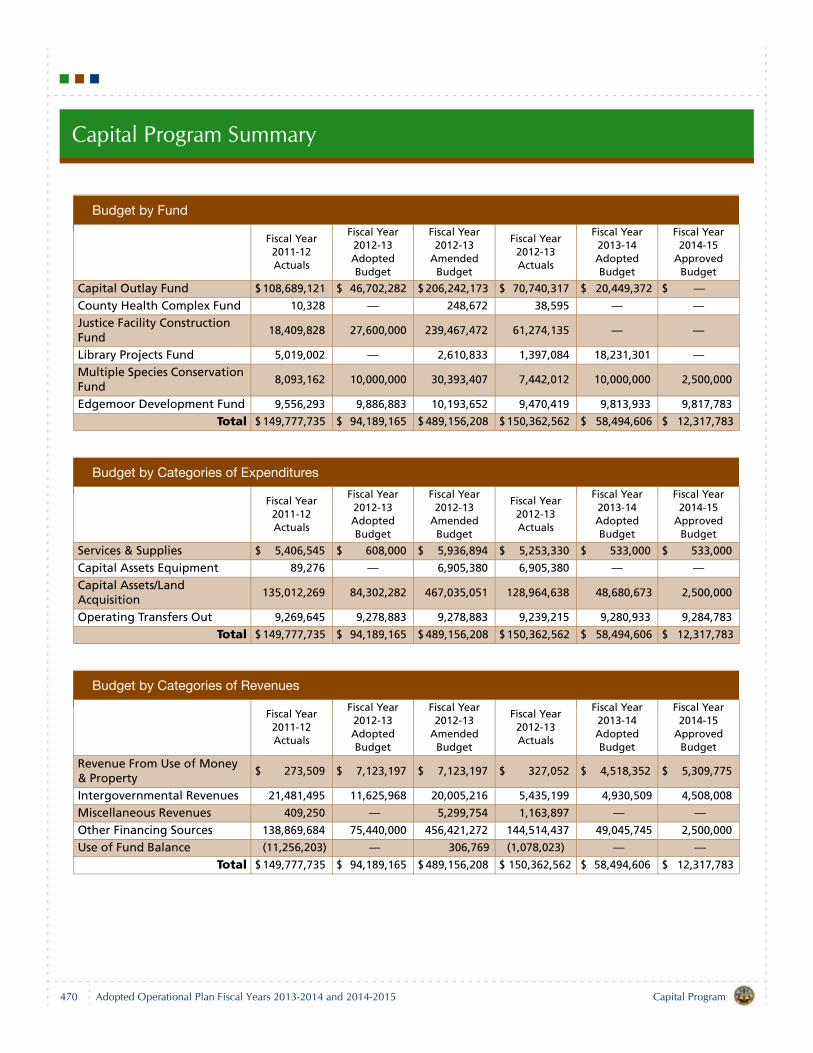
Capital Program Summary
Budget by Fund
Fiscal Year 2011-12 Actuals
Fiscal Year 2012-13 Adopted Budget
Fiscal Year 2012-13
Amended Budget
Fiscal Year 2012-13 Actuals
Fiscal Year 2013-14 Adopted Budget
Fiscal Year 2014-15
Approved Budget
Capital Outlay Fund $ 108,689,121 $ 46,702,282 $ 206,242,173 $ 70,740,317 $ 20,449,372 $ —
County Health Complex Fund 10,328 — 248,672 38,595 — —
Justice Facility Construction Fund
18,409,828 27,600,000 239,467,472 61,274,135 — —
Library Projects Fund 5,019,002 — 2,610,833 1,397,084 18,231,301 —
Multiple Species Conservation Fund
8,093,162 10,000,000 30,393,407 7,442,012 10,000,000 2,500,000
Edgemoor Development Fund 9,556,293 9,886,883 10,193,652 9,470,419 9,813,933 9,817,783
Total $ 149,777,735 $ 94,189,165 $ 489,156,208 $ 150,362,562 $ 58,494,606 $ 12,317,783
Budget by Categories of Expenditures
Fiscal Year 2011-12 Actuals
Fiscal Year 2012-13 Adopted Budget
Fiscal Year 2012-13
Amended Budget
Fiscal Year 2012-13 Actuals
Fiscal Year 2013-14 Adopted Budget
Fiscal Year 2014-15
Approved Budget
Services & Supplies $ 5,406,545 $ 608,000 $ 5,936,894 $ 5,253,330 $ 533,000 $ 533,000
Capital Assets Equipment 89,276 — 6,905,380 6,905,380 — —
Capital Assets/Land Acquisition
135,012,269 84,302,282 467,035,051 128,964,638 48,680,673 2,500,000
Operating Transfers Out 9,269,645 9,278,883 9,278,883 9,239,215 9,280,933 9,284,783
Total $ 149,777,735 $ 94,189,165 $ 489,156,208 $ 150,362,562 $ 58,494,606 $ 12,317,783
Budget by Categories of Revenues
Fiscal Year 2011-12 Actuals
Fiscal Year 2012-13 Adopted Budget
Fiscal Year 2012-13
Amended Budget
Fiscal Year 2012-13 Actuals
Fiscal Year 2013-14 Adopted Budget
Fiscal Year 2014-15
Approved Budget
Revenue From Use of Money & Property
$ 273,509 $ 7,123,197 $ 7,123,197 $ 327,052 $ 4,518,352 $ 5,309,775
Intergovernmental Revenues 21,481,495 11,625,968 20,005,216 5,435,199 4,930,509 4,508,008
Miscellaneous Revenues 409,250 — 5,299,754 1,163,897 — —
Other Financing Sources 138,869,684 75,440,000 456,421,272 144,514,437 49,045,745 2,500,000
Use of Fund Balance (11,256,203) — 306,769 (1,078,023) — —
Total $ 149,777,735 $ 94,189,165 $ 489,156,208 $ 150,362,562 $ 58,494,606 $ 12,317,783
470 Capital ProgramAdopted Operational Plan Fiscal Years 2013-2014 and 2014-2015
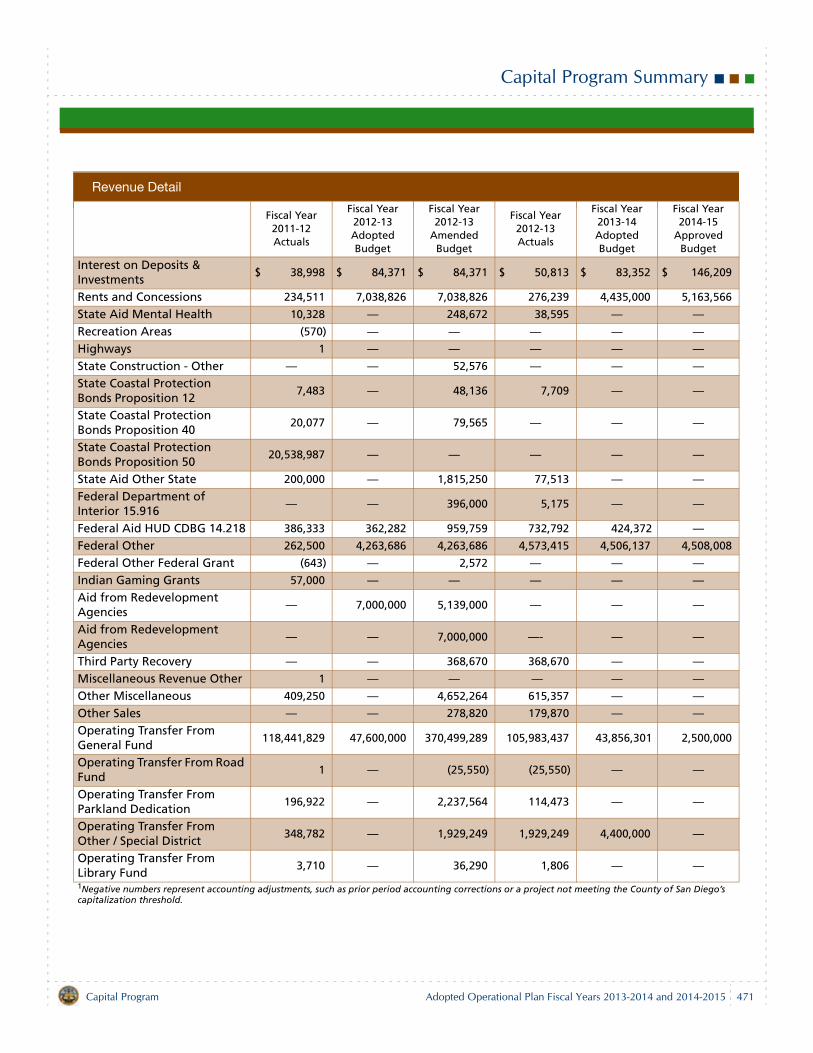
Capital Program Summary
Revenue Detail
Fiscal Year 2011-12 Actuals
Fiscal Year 2012-13 Adopted Budget
Fiscal Year 2012-13
Amended Budget
Fiscal Year 2012-13 Actuals
Fiscal Year 2013-14 Adopted Budget
Fiscal Year 2014-15
Approved Budget
Interest on Deposits & Investments
$ 38,998 $ 84,371 $ 84,371 $ 50,813 $ 83,352 $ 146,209
Rents and Concessions 234,511 7,038,826 7,038,826 276,239 4,435,000 5,163,566
State Aid Mental Health 10,328 — 248,672 38,595 — —
Recreation Areas (570) — — — — —
Highways 1 — — — — —
State Construction - Other — — 52,576 — — —
State Coastal Protection Bonds Proposition 12
7,483 — 48,136 7,709 — —
State Coastal Protection Bonds Proposition 40
20,077 — 79,565 — — —
State Coastal Protection Bonds Proposition 50
20,538,987 — — — — —
State Aid Other State 200,000 — 1,815,250 77,513 — —
Federal Department of Interior 15.916
— — 396,000 5,175 — —
Federal Aid HUD CDBG 14.218 386,333 362,282 959,759 732,792 424,372 —
Federal Other 262,500 4,263,686 4,263,686 4,573,415 4,506,137 4,508,008
Federal Other Federal Grant (643) — 2,572 — — —
Indian Gaming Grants 57,000 — — — — —
Aid from Redevelopment Agencies
— 7,000,000 5,139,000 — — —
Aid from Redevelopment Agencies
— — 7,000,000 —- — —
Third Party Recovery — — 368,670 368,670 — —
Miscellaneous Revenue Other 1 — — — — —
Other Miscellaneous 409,250 — 4,652,264 615,357 — —
Other Sales — — 278,820 179,870 — —
Operating Transfer From General Fund
118,441,829 47,600,000 370,499,289 105,983,437 43,856,301 2,500,000
Operating Transfer From Road Fund
1 — (25,550) (25,550) — —
Operating Transfer From Parkland Dedication
196,922 — 2,237,564 114,473 — —
Operating Transfer From Other / Special District
348,782 — 1,929,249 1,929,249 4,400,000 —
Operating Transfer From Library Fund
3,710 — 36,290 1,806 — —
1Negative numbers represent accounting adjustments, such as prior period accounting corrections or a project not meeting the County of San Diego’s capitalization threshold.
Capital Program Adopted Operational Plan Fiscal Years 2013-2014 and 2014-2015 471
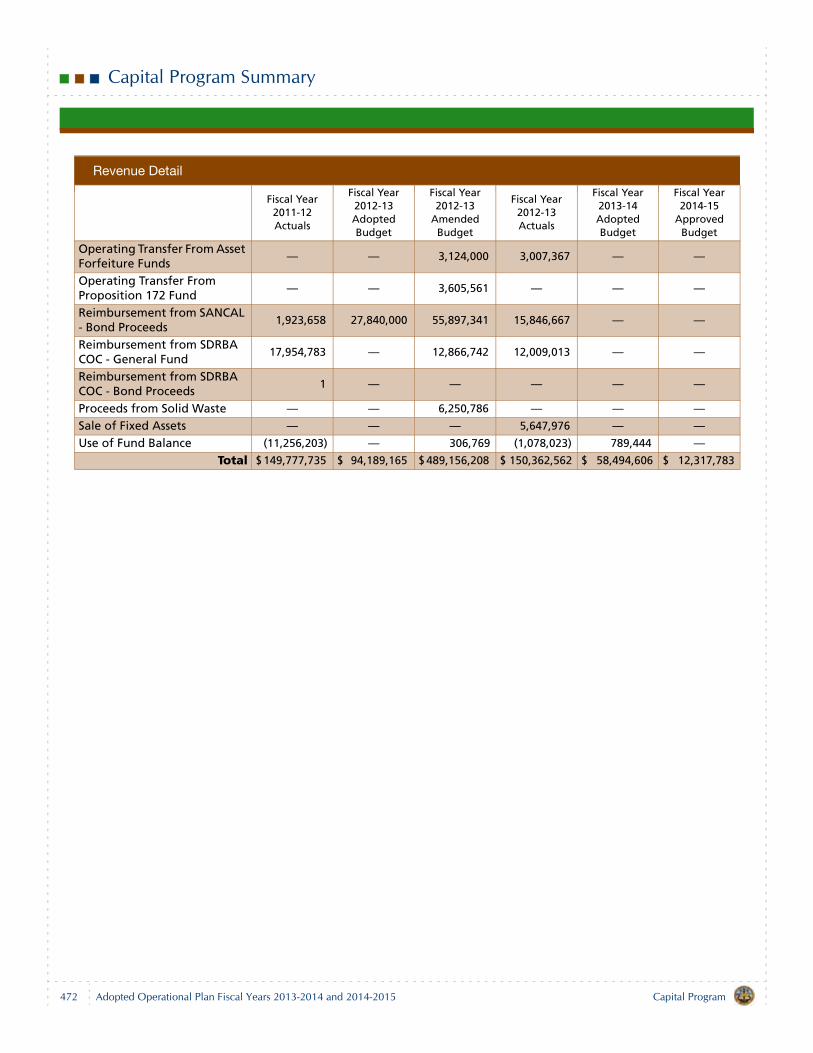
Capital Program Summary
Revenue Detail
Fiscal Year 2011-12 Actuals
Fiscal Year 2012-13 Adopted Budget
Fiscal Year 2012-13
Amended Budget
Fiscal Year 2012-13 Actuals
Fiscal Year 2013-14 Adopted Budget
Fiscal Year 2014-15
Approved Budget
Operating Transfer From Asset Forfeiture Funds
— — 3,124,000 3,007,367 — —
Operating Transfer From Proposition 172 Fund
— — 3,605,561 — — —
Reimbursement from SANCAL - Bond Proceeds
1,923,658 27,840,000 55,897,341 15,846,667 — —
Reimbursement from SDRBA COC - General Fund
17,954,783 — 12,866,742 12,009,013 — —
Reimbursement from SDRBA COC - Bond Proceeds
1 — — — — —
Proceeds from Solid Waste — — 6,250,786 — — —
Sale of Fixed Assets — — — 5,647,976 — —
Use of Fund Balance (11,256,203) — 306,769 (1,078,023) 789,444 —
Total $ 149,777,735 $ 94,189,165 $ 489,156,208 $ 150,362,562 $ 58,494,606 $ 12,317,783
472 Capital ProgramAdopted Operational Plan Fiscal Years 2013-2014 and 2014-2015
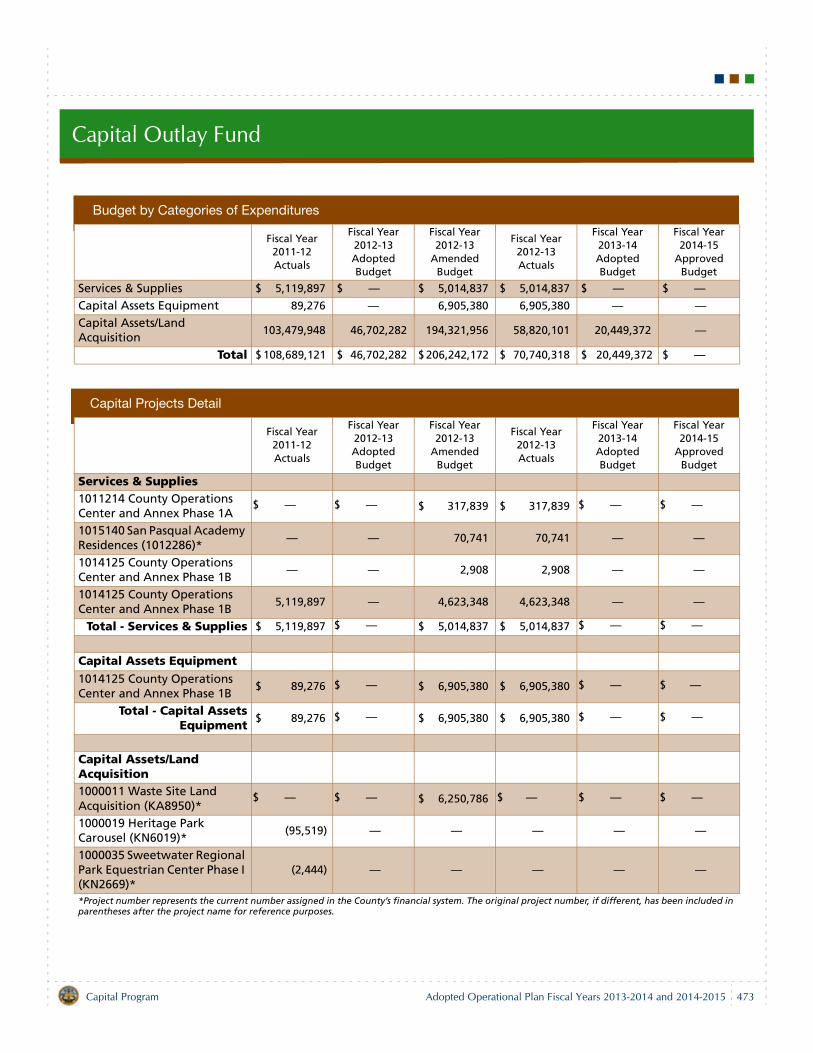
Capital Outlay Fund
Budget by Categories of Expenditures
Fiscal Year 2011-12 Actuals
Fiscal Year 2012-13 Adopted Budget
Fiscal Year 2012-13
Amended Budget
Fiscal Year 2012-13 Actuals
Fiscal Year 2013-14 Adopted Budget
Fiscal Year 2014-15
Approved Budget
Services & Supplies $ 5,119,897 $ — $ 5,014,837 $ 5,014,837 $ — $ —
Capital Assets Equipment 89,276 — 6,905,380 6,905,380 — —
Capital Assets/Land Acquisition
103,479,948 46,702,282 194,321,956 58,820,101 20,449,372 —
Total $ 108,689,121 $ 46,702,282 $ 206,242,172 $ 70,740,318 $ 20,449,372 $ —
Capital Projects Detail
Fiscal Year 2011-12 Actuals
Fiscal Year 2012-13 Adopted Budget
Fiscal Year 2012-13
Amended Budget
Fiscal Year 2012-13 Actuals
Fiscal Year 2013-14 Adopted Budget
Fiscal Year 2014-15
Approved Budget
Services & Supplies1011214 County Operations Center and Annex Phase 1A
$ — $ — $ 317,839 $ 317,839 $ — $ —
1015140 San Pasqual Academy Residences (1012286)*
— — 70,741 70,741 — —
1014125 County Operations Center and Annex Phase 1B
— — 2,908 2,908 — —
1014125 County Operations Center and Annex Phase 1B
5,119,897 — 4,623,348 4,623,348 — —
Total - Services & Supplies $ 5,119,897 $ — $ 5,014,837 $ 5,014,837 $ — $ —
Capital Assets Equipment1014125 County Operations Center and Annex Phase 1B
$ 89,276 $ — $ 6,905,380 $ 6,905,380 $ — $ —
Total - Capital AssetsEquipment
$ 89,276 $ — $ 6,905,380 $ 6,905,380 $ — $ —
Capital Assets/Land Acquisition1000011 Waste Site Land Acquisition (KA8950)*
$ — $ — $ 6,250,786 $ — $ — $ —
1000019 Heritage Park Carousel (KN6019)*
(95,519) — — — — —
1000035 Sweetwater Regional Park Equestrian Center Phase I (KN2669)*
(2,444) — — — — —
*Project number represents the current number assigned in the County’s financial system. The original project number, if different, has been included in parentheses after the project name for reference purposes.
Capital Program Adopted Operational Plan Fiscal Years 2013-2014 and 2014-2015 473
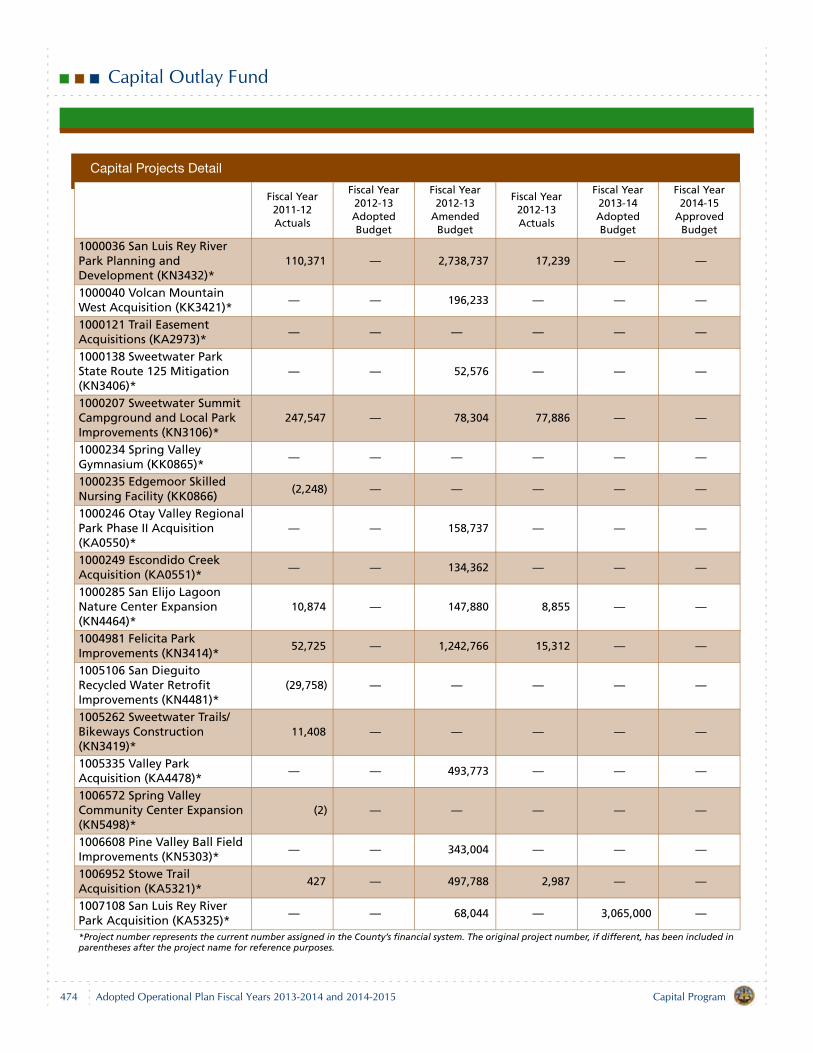
Capital Outlay Fund
1000036 San Luis Rey River Park Planning and Development (KN3432)*
110,371 — 2,738,737 17,239 — —
1000040 Volcan Mountain West Acquisition (KK3421)*
— — 196,233 — — —
1000121 Trail Easement Acquisitions (KA2973)*
— — — — — —
1000138 Sweetwater Park State Route 125 Mitigation (KN3406)*
— — 52,576 — — —
1000207 Sweetwater Summit Campground and Local Park Improvements (KN3106)*
247,547 — 78,304 77,886 — —
1000234 Spring Valley Gymnasium (KK0865)*
— — — — — —
1000235 Edgemoor Skilled Nursing Facility (KK0866)
(2,248) — — — — —
1000246 Otay Valley Regional Park Phase II Acquisition (KA0550)*
— — 158,737 — — —
1000249 Escondido Creek Acquisition (KA0551)*
— — 134,362 — — —
1000285 San Elijo Lagoon Nature Center Expansion (KN4464)*
10,874 — 147,880 8,855 — —
1004981 Felicita Park Improvements (KN3414)*
52,725 — 1,242,766 15,312 — —
1005106 San Dieguito Recycled Water Retrofit Improvements (KN4481)*
(29,758) — — — — —
1005262 Sweetwater Trails/Bikeways Construction (KN3419)*
11,408 — — — — —
1005335 Valley Park Acquisition (KA4478)*
— — 493,773 — — —
1006572 Spring Valley Community Center Expansion (KN5498)*
(2) — — — — —
1006608 Pine Valley Ball Field Improvements (KN5303)*
— — 343,004 — — —
1006952 Stowe Trail Acquisition (KA5321)*
427 — 497,788 2,987 — —
1007108 San Luis Rey River Park Acquisition (KA5325)*
— — 68,044 — 3,065,000 —
*Project number represents the current number assigned in the County’s financial system. The original project number, if different, has been included in parentheses after the project name for reference purposes.
Capital Projects Detail
Fiscal Year 2011-12 Actuals
Fiscal Year 2012-13 Adopted Budget
Fiscal Year 2012-13
Amended Budget
Fiscal Year 2012-13 Actuals
Fiscal Year 2013-14 Adopted Budget
Fiscal Year 2014-15
Approved Budget
474 Capital ProgramAdopted Operational Plan Fiscal Years 2013-2014 and 2014-2015
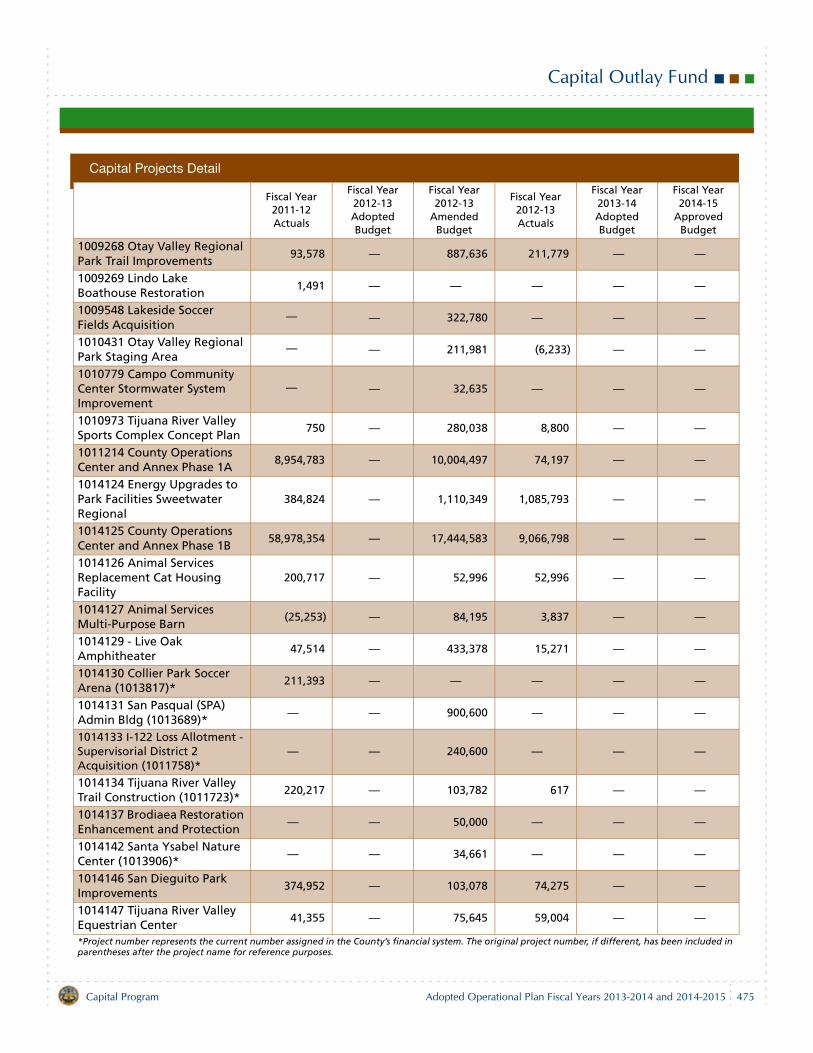
Capital Outlay Fund
1009268 Otay Valley Regional Park Trail Improvements
93,578 — 887,636 211,779 — —
1009269 Lindo Lake Boathouse Restoration
1,491 — — — — —
1009548 Lakeside Soccer Fields Acquisition
— — 322,780 — — —
1010431 Otay Valley Regional Park Staging Area
— — 211,981 (6,233) — —
1010779 Campo Community Center Stormwater System Improvement
— — 32,635 — — —
1010973 Tijuana River Valley Sports Complex Concept Plan
750 — 280,038 8,800 — —
1011214 County Operations Center and Annex Phase 1A
8,954,783 — 10,004,497 74,197 — —
1014124 Energy Upgrades to Park Facilities Sweetwater Regional
384,824 — 1,110,349 1,085,793 — —
1014125 County Operations Center and Annex Phase 1B
58,978,354 — 17,444,583 9,066,798 — —
1014126 Animal Services Replacement Cat Housing Facility
200,717 — 52,996 52,996 — —
1014127 Animal Services Multi-Purpose Barn
(25,253) — 84,195 3,837 — —
1014129 - Live Oak Amphitheater
47,514 — 433,378 15,271 — —
1014130 Collier Park Soccer Arena (1013817)*
211,393 — — — — —
1014131 San Pasqual (SPA) Admin Bldg (1013689)*
— — 900,600 — — —
1014133 I-122 Loss Allotment - Supervisorial District 2 Acquisition (1011758)*
— — 240,600 — — —
1014134 Tijuana River Valley Trail Construction (1011723)*
220,217 — 103,782 617 — —
1014137 Brodiaea Restoration Enhancement and Protection
— — 50,000 — — —
1014142 Santa Ysabel Nature Center (1013906)*
— — 34,661 — — —
1014146 San Dieguito Park Improvements
374,952 — 103,078 74,275 — —
1014147 Tijuana River Valley Equestrian Center
41,355 — 75,645 59,004 — —
*Project number represents the current number assigned in the County’s financial system. The original project number, if different, has been included in parentheses after the project name for reference purposes.
Capital Projects Detail
Fiscal Year 2011-12 Actuals
Fiscal Year 2012-13 Adopted Budget
Fiscal Year 2012-13
Amended Budget
Fiscal Year 2012-13 Actuals
Fiscal Year 2013-14 Adopted Budget
Fiscal Year 2014-15
Approved Budget
Capital Program Adopted Operational Plan Fiscal Years 2013-2014 and 2014-2015 475
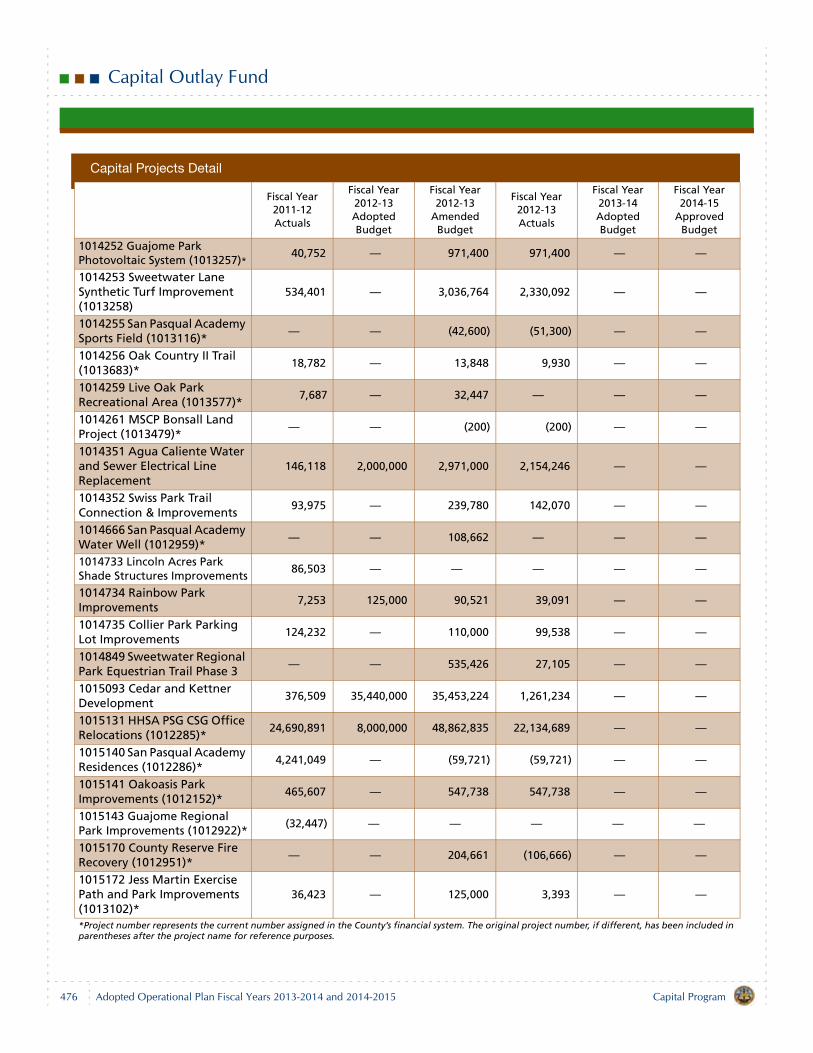
Capital Outlay Fund
1014252 Guajome Park Photovoltaic System (1013257)*
40,752 — 971,400 971,400 — —
1014253 Sweetwater Lane Synthetic Turf Improvement (1013258)
534,401 — 3,036,764 2,330,092 — —
1014255 San Pasqual Academy Sports Field (1013116)*
— — (42,600) (51,300) — —
1014256 Oak Country II Trail (1013683)*
18,782 — 13,848 9,930 — —
1014259 Live Oak Park Recreational Area (1013577)*
7,687 — 32,447 — — —
1014261 MSCP Bonsall Land Project (1013479)*
— — (200) (200) — —
1014351 Agua Caliente Water and Sewer Electrical Line Replacement
146,118 2,000,000 2,971,000 2,154,246 — —
1014352 Swiss Park Trail Connection & Improvements
93,975 — 239,780 142,070 — —
1014666 San Pasqual Academy Water Well (1012959)*
— — 108,662 — — —
1014733 Lincoln Acres Park Shade Structures Improvements
86,503 — — — — —
1014734 Rainbow Park Improvements
7,253 125,000 90,521 39,091 — —
1014735 Collier Park Parking Lot Improvements
124,232 — 110,000 99,538 — —
1014849 Sweetwater Regional Park Equestrian Trail Phase 3
— — 535,426 27,105 — —
1015093 Cedar and Kettner Development
376,509 35,440,000 35,453,224 1,261,234 — —
1015131 HHSA PSG CSG Office Relocations (1012285)*
24,690,891 8,000,000 48,862,835 22,134,689 — —
1015140 San Pasqual Academy Residences (1012286)*
4,241,049 — (59,721) (59,721) — —
1015141 Oakoasis Park Improvements (1012152)*
465,607 — 547,738 547,738 — —
1015143 Guajome Regional Park Improvements (1012922)*
(32,447) — — — — —
1015170 County Reserve Fire Recovery (1012951)*
— — 204,661 (106,666) — —
1015172 Jess Martin Exercise Path and Park Improvements (1013102)*
36,423 — 125,000 3,393 — —
*Project number represents the current number assigned in the County’s financial system. The original project number, if different, has been included in parentheses after the project name for reference purposes.
Capital Projects Detail
Fiscal Year 2011-12 Actuals
Fiscal Year 2012-13 Adopted Budget
Fiscal Year 2012-13
Amended Budget
Fiscal Year 2012-13 Actuals
Fiscal Year 2013-14 Adopted Budget
Fiscal Year 2014-15
Approved Budget
476 Capital ProgramAdopted Operational Plan Fiscal Years 2013-2014 and 2014-2015
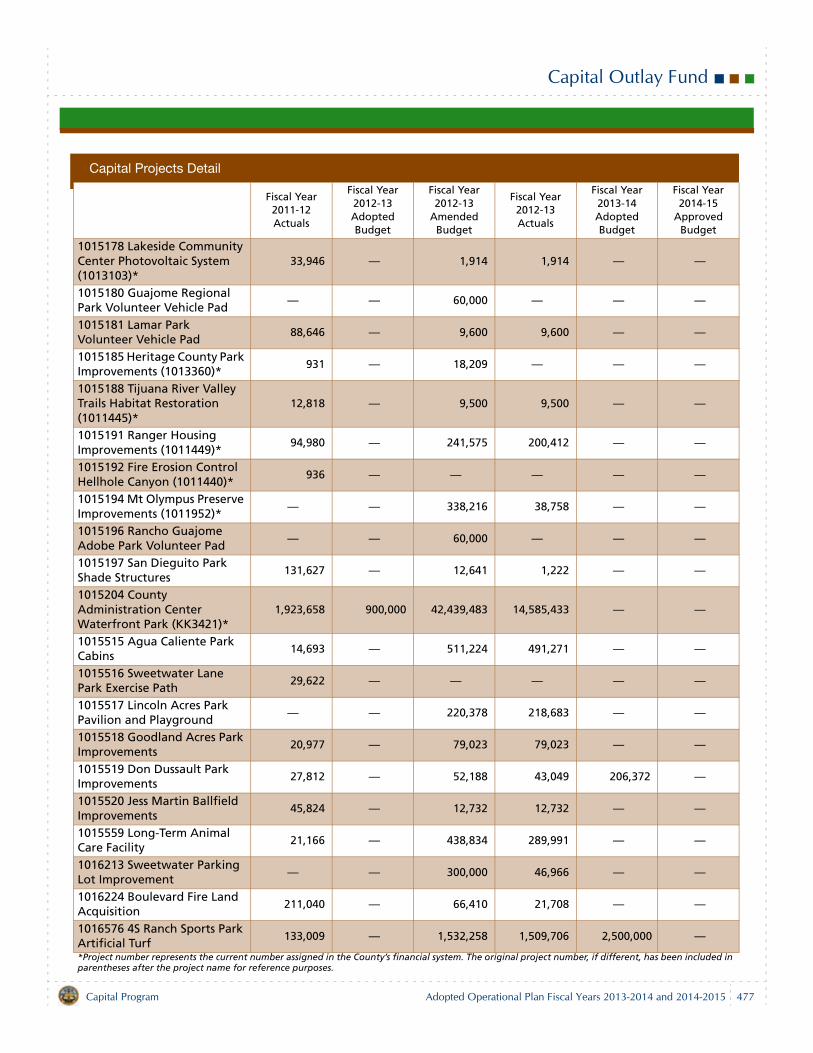
Capital Outlay Fund
1015178 Lakeside Community Center Photovoltaic System (1013103)*
33,946 — 1,914 1,914 — —
1015180 Guajome Regional Park Volunteer Vehicle Pad
— — 60,000 — — —
1015181 Lamar Park Volunteer Vehicle Pad
88,646 — 9,600 9,600 — —
1015185 Heritage County Park Improvements (1013360)*
931 — 18,209 — — —
1015188 Tijuana River Valley Trails Habitat Restoration (1011445)*
12,818 — 9,500 9,500 — —
1015191 Ranger Housing Improvements (1011449)*
94,980 — 241,575 200,412 — —
1015192 Fire Erosion Control Hellhole Canyon (1011440)*
936 — — — — —
1015194 Mt Olympus Preserve Improvements (1011952)*
— — 338,216 38,758 — —
1015196 Rancho Guajome Adobe Park Volunteer Pad
— — 60,000 — — —
1015197 San Dieguito Park Shade Structures
131,627 — 12,641 1,222 — —
1015204 County Administration Center Waterfront Park (KK3421)*
1,923,658 900,000 42,439,483 14,585,433 — —
1015515 Agua Caliente Park Cabins
14,693 — 511,224 491,271 — —
1015516 Sweetwater Lane Park Exercise Path
29,622 — — — — —
1015517 Lincoln Acres Park Pavilion and Playground
— — 220,378 218,683 — —
1015518 Goodland Acres Park Improvements
20,977 — 79,023 79,023 — —
1015519 Don Dussault Park Improvements
27,812 — 52,188 43,049 206,372 —
1015520 Jess Martin Ballfield Improvements
45,824 — 12,732 12,732 — —
1015559 Long-Term Animal Care Facility
21,166 — 438,834 289,991 — —
1016213 Sweetwater Parking Lot Improvement
— — 300,000 46,966 — —
1016224 Boulevard Fire Land Acquisition
211,040 — 66,410 21,708 — —
1016576 4S Ranch Sports Park Artificial Turf
133,009 — 1,532,258 1,509,706 2,500,000 —
*Project number represents the current number assigned in the County’s financial system. The original project number, if different, has been included in parentheses after the project name for reference purposes.
Capital Projects Detail
Fiscal Year 2011-12 Actuals
Fiscal Year 2012-13 Adopted Budget
Fiscal Year 2012-13
Amended Budget
Fiscal Year 2012-13 Actuals
Fiscal Year 2013-14 Adopted Budget
Fiscal Year 2014-15
Approved Budget
Capital Program Adopted Operational Plan Fiscal Years 2013-2014 and 2014-2015 477
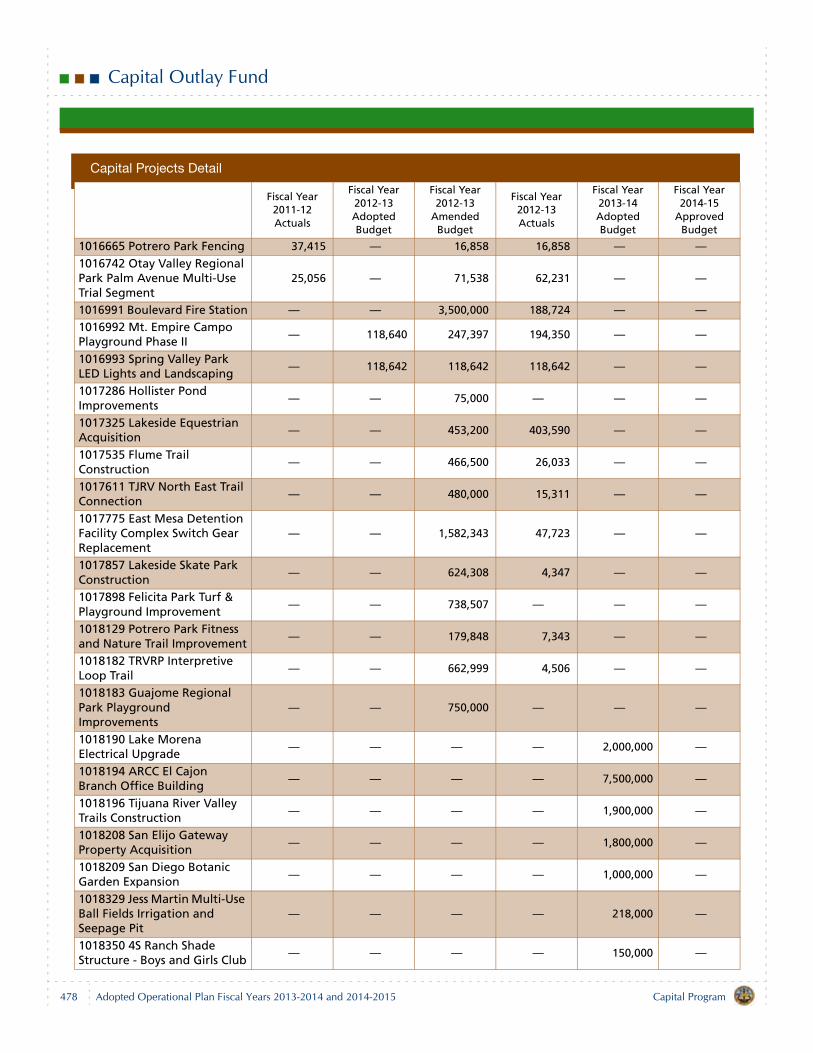
Capital Outlay Fund
1016665 Potrero Park Fencing 37,415 — 16,858 16,858 — —
1016742 Otay Valley Regional Park Palm Avenue Multi-Use Trial Segment
25,056 — 71,538 62,231 — —
1016991 Boulevard Fire Station — — 3,500,000 188,724 — —
1016992 Mt. Empire Campo Playground Phase II
— 118,640 247,397 194,350 — —
1016993 Spring Valley Park LED Lights and Landscaping
— 118,642 118,642 118,642 — —
1017286 Hollister Pond Improvements
— — 75,000 — — —
1017325 Lakeside Equestrian Acquisition
— — 453,200 403,590 — —
1017535 Flume Trail Construction
— — 466,500 26,033 — —
1017611 TJRV North East Trail Connection
— — 480,000 15,311 — —
1017775 East Mesa Detention Facility Complex Switch Gear Replacement
— — 1,582,343 47,723 — —
1017857 Lakeside Skate Park Construction
— — 624,308 4,347 — —
1017898 Felicita Park Turf & Playground Improvement
— — 738,507 — — —
1018129 Potrero Park Fitness and Nature Trail Improvement
— — 179,848 7,343 — —
1018182 TRVRP Interpretive Loop Trail
— — 662,999 4,506 — —
1018183 Guajome Regional Park Playground Improvements
— — 750,000 — — —
1018190 Lake Morena Electrical Upgrade
— — — — 2,000,000 —
1018194 ARCC El Cajon Branch Office Building
— — — — 7,500,000 —
1018196 Tijuana River Valley Trails Construction
— — — — 1,900,000 —
1018208 San Elijo Gateway Property Acquisition
— — — — 1,800,000 —
1018209 San Diego Botanic Garden Expansion
— — — — 1,000,000 —
1018329 Jess Martin Multi-Use Ball Fields Irrigation and Seepage Pit
— — — — 218,000 —
1018350 4S Ranch Shade Structure - Boys and Girls Club
— — — — 150,000 —
Capital Projects Detail
Fiscal Year 2011-12 Actuals
Fiscal Year 2012-13 Adopted Budget
Fiscal Year 2012-13
Amended Budget
Fiscal Year 2012-13 Actuals
Fiscal Year 2013-14 Adopted Budget
Fiscal Year 2014-15
Approved Budget
478 Capital ProgramAdopted Operational Plan Fiscal Years 2013-2014 and 2014-2015
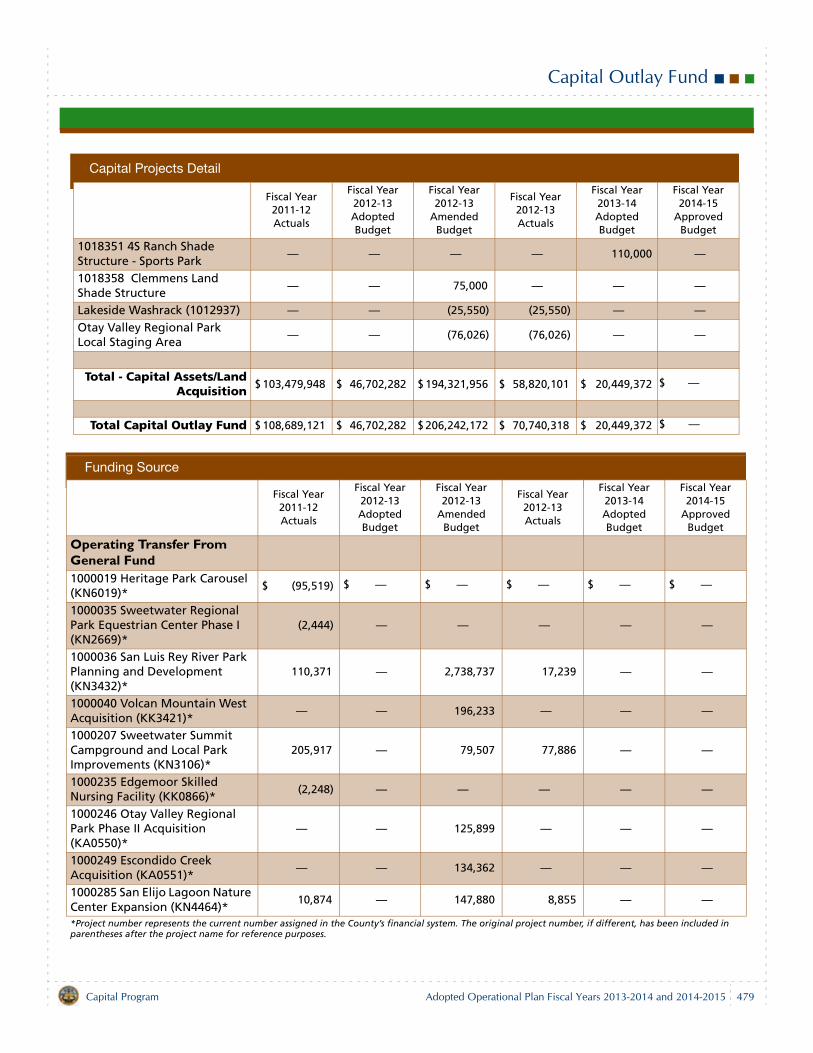
Capital Outlay Fund
1018351 4S Ranch Shade Structure - Sports Park
— — — — 110,000 —
1018358 Clemmens Land Shade Structure
— — 75,000 — — —
Lakeside Washrack (1012937) — — (25,550) (25,550) — —
Otay Valley Regional Park Local Staging Area
— — (76,026) (76,026) — —
Total - Capital Assets/LandAcquisition
$ 103,479,948 $ 46,702,282 $ 194,321,956 $ 58,820,101 $ 20,449,372 $ —
Total Capital Outlay Fund $ 108,689,121 $ 46,702,282 $ 206,242,172 $ 70,740,318 $ 20,449,372 $ —
Funding Source
Fiscal Year 2011-12 Actuals
Fiscal Year 2012-13 Adopted Budget
Fiscal Year 2012-13
Amended Budget
Fiscal Year 2012-13 Actuals
Fiscal Year 2013-14 Adopted Budget
Fiscal Year 2014-15
Approved Budget
Operating Transfer From General Fund1000019 Heritage Park Carousel (KN6019)*
$ (95,519) $ — $ — $ — $ — $ —
1000035 Sweetwater Regional Park Equestrian Center Phase I (KN2669)*
(2,444) — — — — —
1000036 San Luis Rey River Park Planning and Development (KN3432)*
110,371 — 2,738,737 17,239 — —
1000040 Volcan Mountain West Acquisition (KK3421)*
— — 196,233 — — —
1000207 Sweetwater Summit Campground and Local Park Improvements (KN3106)*
205,917 — 79,507 77,886 — —
1000235 Edgemoor Skilled Nursing Facility (KK0866)*
(2,248) — — — — —
1000246 Otay Valley Regional Park Phase II Acquisition (KA0550)*
— — 125,899 — — —
1000249 Escondido Creek Acquisition (KA0551)*
— — 134,362 — — —
1000285 San Elijo Lagoon Nature Center Expansion (KN4464)*
10,874 — 147,880 8,855 — —
*Project number represents the current number assigned in the County’s financial system. The original project number, if different, has been included in parentheses after the project name for reference purposes.
Capital Projects Detail
Fiscal Year 2011-12 Actuals
Fiscal Year 2012-13 Adopted Budget
Fiscal Year 2012-13
Amended Budget
Fiscal Year 2012-13 Actuals
Fiscal Year 2013-14 Adopted Budget
Fiscal Year 2014-15
Approved Budget
Capital Program Adopted Operational Plan Fiscal Years 2013-2014 and 2014-2015 479
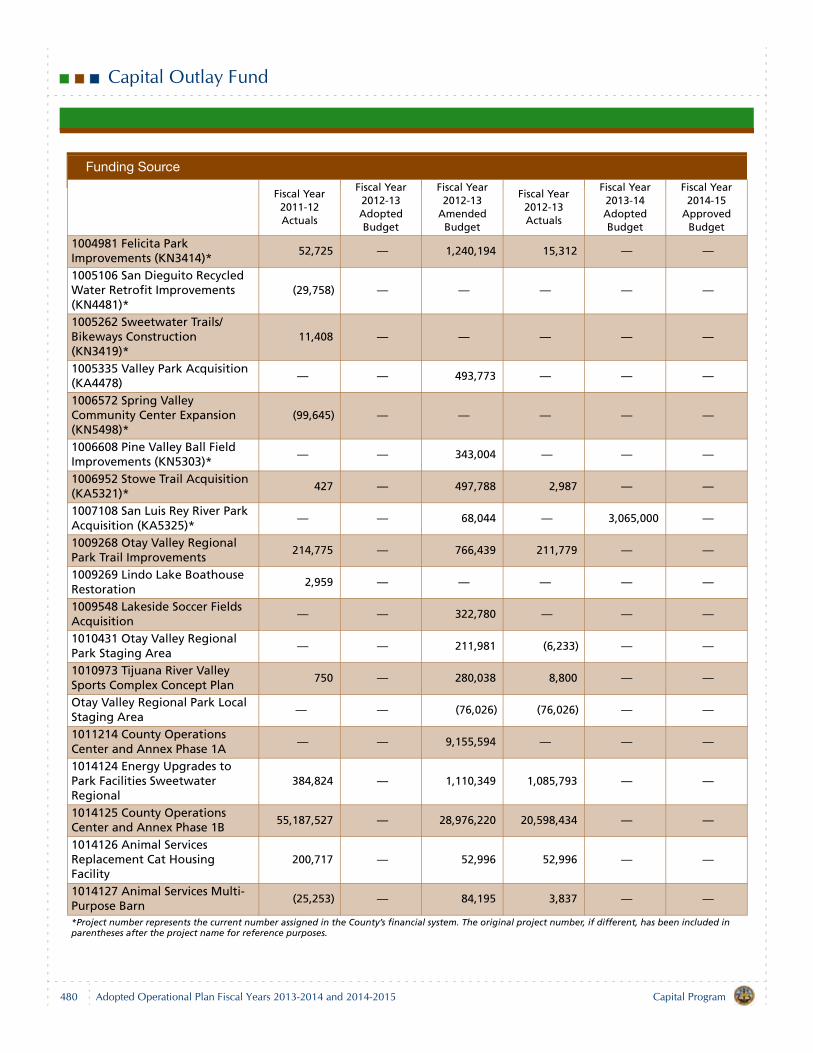
Capital Outlay Fund
1004981 Felicita Park Improvements (KN3414)*
52,725 — 1,240,194 15,312 — —
1005106 San Dieguito Recycled Water Retrofit Improvements (KN4481)*
(29,758) — — — — —
1005262 Sweetwater Trails/Bikeways Construction (KN3419)*
11,408 — — — — —
1005335 Valley Park Acquisition (KA4478)
— — 493,773 — — —
1006572 Spring Valley Community Center Expansion (KN5498)*
(99,645) — — — — —
1006608 Pine Valley Ball Field Improvements (KN5303)*
— — 343,004 — — —
1006952 Stowe Trail Acquisition (KA5321)*
427 — 497,788 2,987 — —
1007108 San Luis Rey River Park Acquisition (KA5325)*
— — 68,044 — 3,065,000 —
1009268 Otay Valley Regional Park Trail Improvements
214,775 — 766,439 211,779 — —
1009269 Lindo Lake Boathouse Restoration
2,959 — — — — —
1009548 Lakeside Soccer Fields Acquisition
— — 322,780 — — —
1010431 Otay Valley Regional Park Staging Area
— — 211,981 (6,233) — —
1010973 Tijuana River Valley Sports Complex Concept Plan
750 — 280,038 8,800 — —
Otay Valley Regional Park Local Staging Area
— — (76,026) (76,026) — —
1011214 County Operations Center and Annex Phase 1A
— — 9,155,594 — — —
1014124 Energy Upgrades to Park Facilities Sweetwater Regional
384,824 — 1,110,349 1,085,793 — —
1014125 County Operations Center and Annex Phase 1B
55,187,527 — 28,976,220 20,598,434 — —
1014126 Animal Services Replacement Cat Housing Facility
200,717 — 52,996 52,996 — —
1014127 Animal Services Multi-Purpose Barn
(25,253) — 84,195 3,837 — —
*Project number represents the current number assigned in the County’s financial system. The original project number, if different, has been included in parentheses after the project name for reference purposes.
Funding Source
Fiscal Year 2011-12 Actuals
Fiscal Year 2012-13 Adopted Budget
Fiscal Year 2012-13
Amended Budget
Fiscal Year 2012-13 Actuals
Fiscal Year 2013-14 Adopted Budget
Fiscal Year 2014-15
Approved Budget
480 Capital ProgramAdopted Operational Plan Fiscal Years 2013-2014 and 2014-2015
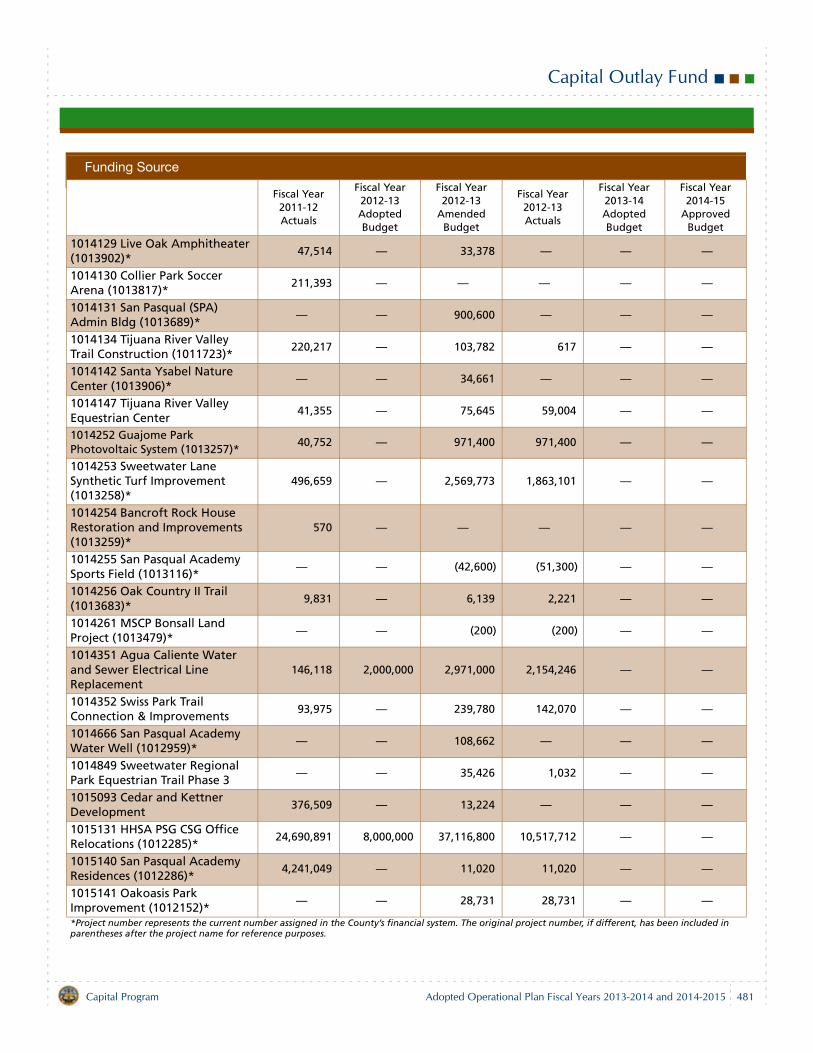
Capital Outlay Fund
1014129 Live Oak Amphitheater (1013902)*
47,514 — 33,378 — — —
1014130 Collier Park Soccer Arena (1013817)*
211,393 — — — — —
1014131 San Pasqual (SPA) Admin Bldg (1013689)*
— — 900,600 — — —
1014134 Tijuana River Valley Trail Construction (1011723)*
220,217 — 103,782 617 — —
1014142 Santa Ysabel Nature Center (1013906)*
— — 34,661 — — —
1014147 Tijuana River Valley Equestrian Center
41,355 — 75,645 59,004 — —
1014252 Guajome Park Photovoltaic System (1013257)*
40,752 — 971,400 971,400 — —
1014253 Sweetwater Lane Synthetic Turf Improvement (1013258)*
496,659 — 2,569,773 1,863,101 — —
1014254 Bancroft Rock House Restoration and Improvements (1013259)*
570 — — — — —
1014255 San Pasqual Academy Sports Field (1013116)*
— — (42,600) (51,300) — —
1014256 Oak Country II Trail (1013683)*
9,831 — 6,139 2,221 — —
1014261 MSCP Bonsall Land Project (1013479)*
— — (200) (200) — —
1014351 Agua Caliente Water and Sewer Electrical Line Replacement
146,118 2,000,000 2,971,000 2,154,246 — —
1014352 Swiss Park Trail Connection & Improvements
93,975 — 239,780 142,070 — —
1014666 San Pasqual Academy Water Well (1012959)*
— — 108,662 — — —
1014849 Sweetwater Regional Park Equestrian Trail Phase 3
— — 35,426 1,032 — —
1015093 Cedar and Kettner Development
376,509 — 13,224 — — —
1015131 HHSA PSG CSG Office Relocations (1012285)*
24,690,891 8,000,000 37,116,800 10,517,712 — —
1015140 San Pasqual Academy Residences (1012286)*
4,241,049 — 11,020 11,020 — —
1015141 Oakoasis Park Improvement (1012152)*
— — 28,731 28,731 — —
*Project number represents the current number assigned in the County’s financial system. The original project number, if different, has been included in parentheses after the project name for reference purposes.
Funding Source
Fiscal Year 2011-12 Actuals
Fiscal Year 2012-13 Adopted Budget
Fiscal Year 2012-13
Amended Budget
Fiscal Year 2012-13 Actuals
Fiscal Year 2013-14 Adopted Budget
Fiscal Year 2014-15
Approved Budget
Capital Program Adopted Operational Plan Fiscal Years 2013-2014 and 2014-2015 481
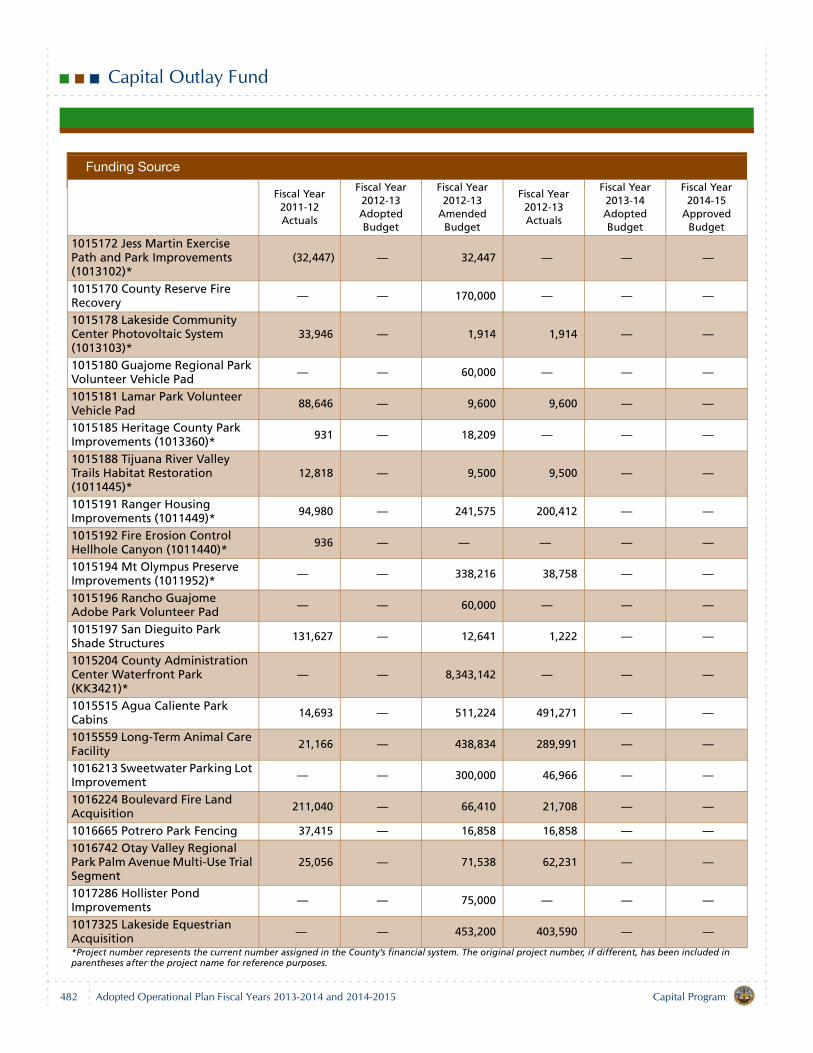
Capital Outlay Fund
1015172 Jess Martin Exercise Path and Park Improvements (1013102)*
(32,447) — 32,447 — — —
1015170 County Reserve Fire Recovery
— — 170,000 — — —
1015178 Lakeside Community Center Photovoltaic System (1013103)*
33,946 — 1,914 1,914 — —
1015180 Guajome Regional Park Volunteer Vehicle Pad
— — 60,000 — — —
1015181 Lamar Park Volunteer Vehicle Pad
88,646 — 9,600 9,600 — —
1015185 Heritage County Park Improvements (1013360)* 931 — 18,209 — — —
1015188 Tijuana River Valley Trails Habitat Restoration (1011445)*
12,818 — 9,500 9,500 — —
1015191 Ranger Housing Improvements (1011449)*
94,980 — 241,575 200,412 — —
1015192 Fire Erosion Control Hellhole Canyon (1011440)*
936 — — — — —
1015194 Mt Olympus Preserve Improvements (1011952)*
— — 338,216 38,758 — —
1015196 Rancho Guajome Adobe Park Volunteer Pad
— — 60,000 — — —
1015197 San Dieguito Park Shade Structures
131,627 — 12,641 1,222 — —
1015204 County Administration Center Waterfront Park (KK3421)*
— — 8,343,142 — — —
1015515 Agua Caliente Park Cabins
14,693 — 511,224 491,271 — —
1015559 Long-Term Animal Care Facility
21,166 — 438,834 289,991 — —
1016213 Sweetwater Parking Lot Improvement
— — 300,000 46,966 — —
1016224 Boulevard Fire Land Acquisition
211,040 — 66,410 21,708 — —
1016665 Potrero Park Fencing 37,415 — 16,858 16,858 — —
1016742 Otay Valley Regional Park Palm Avenue Multi-Use Trial Segment
25,056 — 71,538 62,231 — —
1017286 Hollister Pond Improvements
— — 75,000 — — —
1017325 Lakeside Equestrian Acquisition
— — 453,200 403,590 — —
*Project number represents the current number assigned in the County’s financial system. The original project number, if different, has been included in parentheses after the project name for reference purposes.
Funding Source
Fiscal Year 2011-12 Actuals
Fiscal Year 2012-13 Adopted Budget
Fiscal Year 2012-13
Amended Budget
Fiscal Year 2012-13 Actuals
Fiscal Year 2013-14 Adopted Budget
Fiscal Year 2014-15
Approved Budget
482 Capital ProgramAdopted Operational Plan Fiscal Years 2013-2014 and 2014-2015
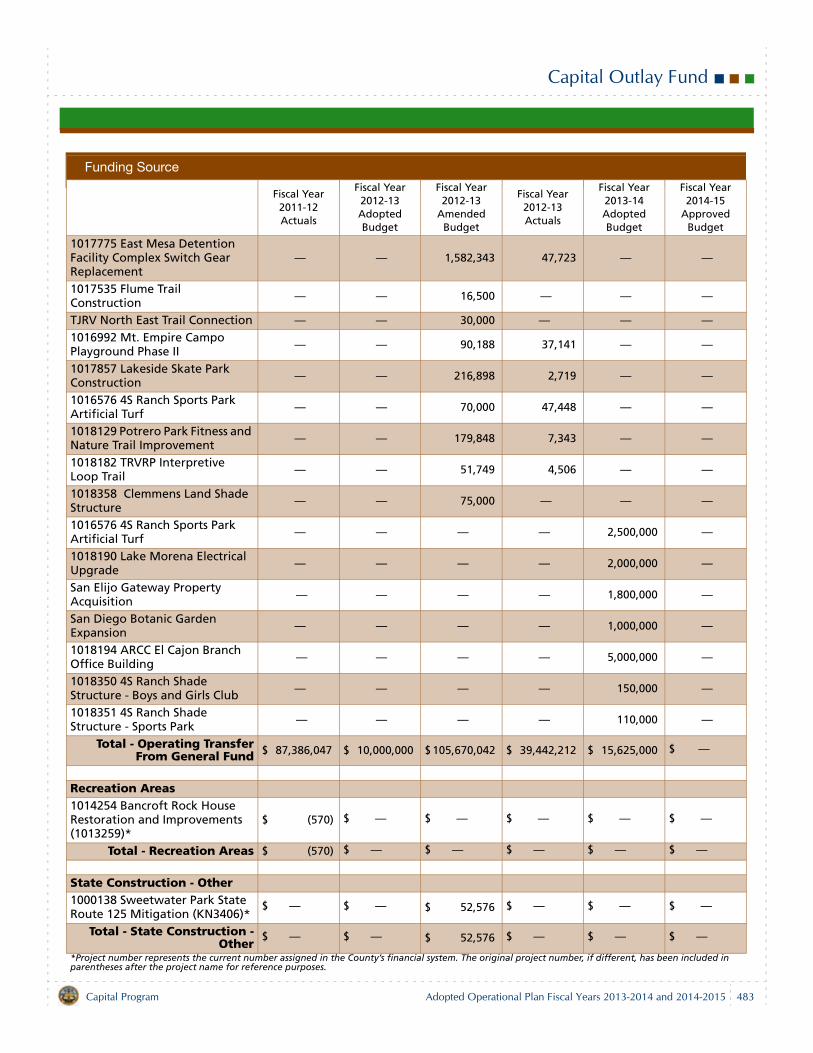
Capital Outlay Fund
1017775 East Mesa Detention Facility Complex Switch Gear Replacement
— — 1,582,343 47,723 — —
1017535 Flume Trail Construction
— — 16,500 — — —
TJRV North East Trail Connection — — 30,000 — — —
1016992 Mt. Empire Campo Playground Phase II
— — 90,188 37,141 — —
1017857 Lakeside Skate Park Construction
— — 216,898 2,719 — —
1016576 4S Ranch Sports Park Artificial Turf
— — 70,000 47,448 — —
1018129 Potrero Park Fitness and Nature Trail Improvement
— — 179,848 7,343 — —
1018182 TRVRP Interpretive Loop Trail
— — 51,749 4,506 — —
1018358 Clemmens Land Shade Structure
— — 75,000 — — —
1016576 4S Ranch Sports Park Artificial Turf
— — — — 2,500,000 —
1018190 Lake Morena Electrical Upgrade
— — — — 2,000,000 —
San Elijo Gateway Property Acquisition
— — — — 1,800,000 —
San Diego Botanic Garden Expansion
— — — — 1,000,000 —
1018194 ARCC El Cajon Branch Office Building
— — — — 5,000,000 —
1018350 4S Ranch Shade Structure - Boys and Girls Club
— — — — 150,000 —
1018351 4S Ranch Shade Structure - Sports Park
— — — — 110,000 —
Total - Operating TransferFrom General Fund $ 87,386,047 $ 10,000,000 $ 105,670,042 $ 39,442,212 $ 15,625,000 $ —
Recreation Areas1014254 Bancroft Rock House Restoration and Improvements (1013259)*
$ (570) $ — $ — $ — $ — $ —
Total - Recreation Areas $ (570) $ — $ — $ — $ — $ —
State Construction - Other1000138 Sweetwater Park State Route 125 Mitigation (KN3406)*
$ — $ — $ 52,576 $ — $ — $ —
Total - State Construction -Other
$ — $ — $ 52,576 $ — $ — $ —
*Project number represents the current number assigned in the County’s financial system. The original project number, if different, has been included in parentheses after the project name for reference purposes.
Funding Source
Fiscal Year 2011-12 Actuals
Fiscal Year 2012-13 Adopted Budget
Fiscal Year 2012-13
Amended Budget
Fiscal Year 2012-13 Actuals
Fiscal Year 2013-14 Adopted Budget
Fiscal Year 2014-15
Approved Budget
Capital Program Adopted Operational Plan Fiscal Years 2013-2014 and 2014-2015 483
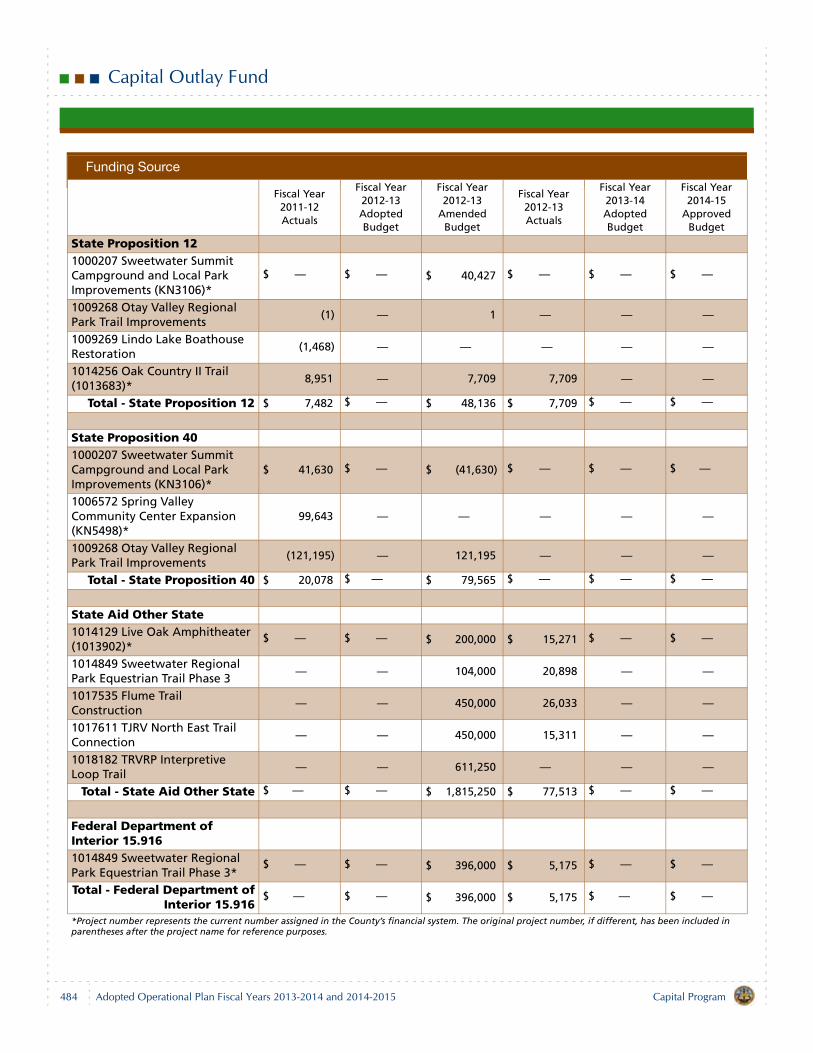
Capital Outlay Fund
State Proposition 121000207 Sweetwater Summit Campground and Local Park Improvements (KN3106)*
$ — $ — $ 40,427 $ — $ — $ —
1009268 Otay Valley Regional Park Trail Improvements
(1) — 1 — — —
1009269 Lindo Lake Boathouse Restoration
(1,468) — — — — —
1014256 Oak Country II Trail (1013683)*
8,951 — 7,709 7,709 — —
Total - State Proposition 12 $ 7,482 $ — $ 48,136 $ 7,709 $ — $ —
State Proposition 401000207 Sweetwater Summit Campground and Local Park Improvements (KN3106)*
$ 41,630 $ — $ (41,630) $ — $ — $ —
1006572 Spring Valley Community Center Expansion (KN5498)*
99,643 — — — — —
1009268 Otay Valley Regional Park Trail Improvements
(121,195) — 121,195 — — —
Total - State Proposition 40 $ 20,078 $ — $ 79,565 $ — $ — $ —
State Aid Other State1014129 Live Oak Amphitheater (1013902)*
$ — $ — $ 200,000 $ 15,271 $ — $ —
1014849 Sweetwater Regional Park Equestrian Trail Phase 3
— — 104,000 20,898 — —
1017535 Flume Trail Construction
— — 450,000 26,033 — —
1017611 TJRV North East Trail Connection
— — 450,000 15,311 — —
1018182 TRVRP Interpretive Loop Trail
— — 611,250 — — —
Total - State Aid Other State $ — $ — $ 1,815,250 $ 77,513 $ — $ —
Federal Department of Interior 15.916 1014849 Sweetwater Regional Park Equestrian Trail Phase 3*
$ — $ — $ 396,000 $ 5,175 $ — $ —
Total - Federal Department ofInterior 15.916
$ — $ — $ 396,000 $ 5,175 $ — $ —
*Project number represents the current number assigned in the County’s financial system. The original project number, if different, has been included in parentheses after the project name for reference purposes.
Funding Source
Fiscal Year 2011-12 Actuals
Fiscal Year 2012-13 Adopted Budget
Fiscal Year 2012-13
Amended Budget
Fiscal Year 2012-13 Actuals
Fiscal Year 2013-14 Adopted Budget
Fiscal Year 2014-15
Approved Budget
484 Capital ProgramAdopted Operational Plan Fiscal Years 2013-2014 and 2014-2015
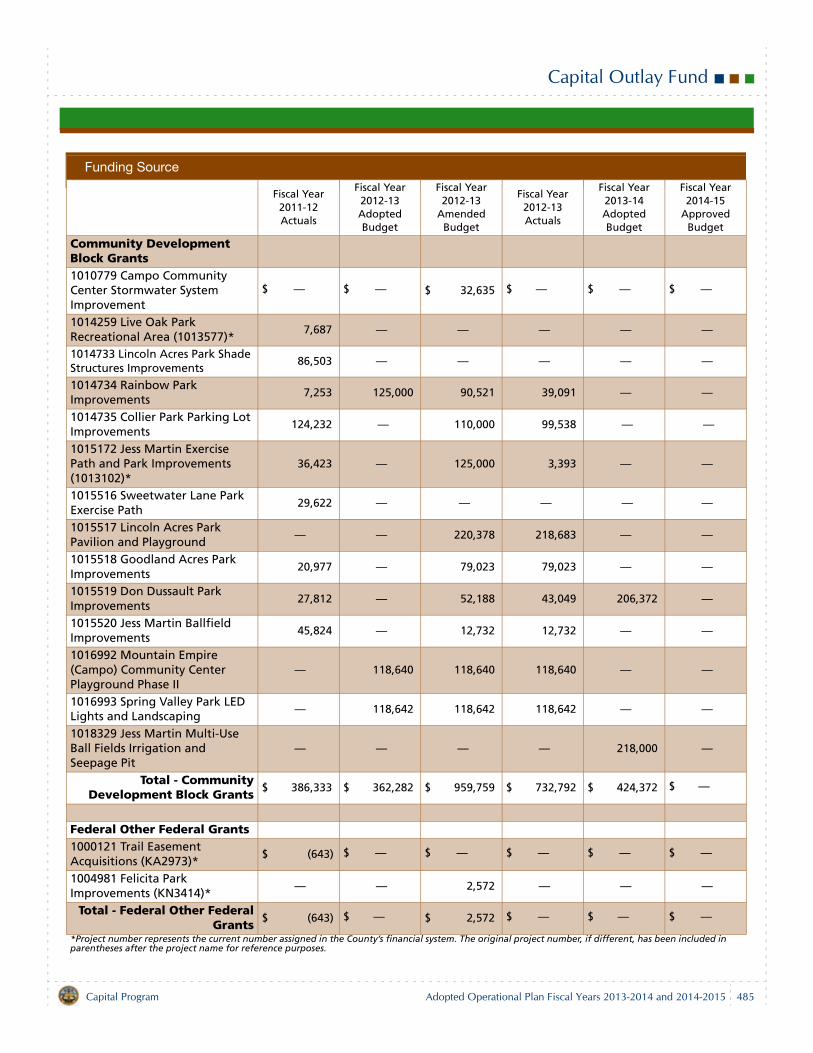
Capital Outlay Fund
Community Development Block Grants1010779 Campo Community Center Stormwater System Improvement
$ — $ — $ 32,635 $ — $ — $ —
1014259 Live Oak Park Recreational Area (1013577)*
7,687 — — — — —
1014733 Lincoln Acres Park Shade Structures Improvements
86,503 — — — — —
1014734 Rainbow Park Improvements
7,253 125,000 90,521 39,091 — —
1014735 Collier Park Parking Lot Improvements
124,232 — 110,000 99,538 — —
1015172 Jess Martin Exercise Path and Park Improvements (1013102)*
36,423 — 125,000 3,393 — —
1015516 Sweetwater Lane Park Exercise Path
29,622 — — — — —
1015517 Lincoln Acres Park Pavilion and Playground
— — 220,378 218,683 — —
1015518 Goodland Acres Park Improvements
20,977 — 79,023 79,023 — —
1015519 Don Dussault Park Improvements
27,812 — 52,188 43,049 206,372 —
1015520 Jess Martin Ballfield Improvements
45,824 — 12,732 12,732 — —
1016992 Mountain Empire (Campo) Community Center Playground Phase II
— 118,640 118,640 118,640 — —
1016993 Spring Valley Park LED Lights and Landscaping
— 118,642 118,642 118,642 — —
1018329 Jess Martin Multi-Use Ball Fields Irrigation and Seepage Pit
— — — — 218,000 —
Total - CommunityDevelopment Block Grants
$ 386,333 $ 362,282 $ 959,759 $ 732,792 $ 424,372 $ —
Federal Other Federal Grants1000121 Trail Easement Acquisitions (KA2973)*
$ (643) $ — $ — $ — $ — $ —
1004981 Felicita Park Improvements (KN3414)*
— — 2,572 — — —
Total - Federal Other FederalGrants
$ (643) $ — $ 2,572 $ — $ — $ —
*Project number represents the current number assigned in the County’s financial system. The original project number, if different, has been included in parentheses after the project name for reference purposes.
Funding Source
Fiscal Year 2011-12 Actuals
Fiscal Year 2012-13 Adopted Budget
Fiscal Year 2012-13
Amended Budget
Fiscal Year 2012-13 Actuals
Fiscal Year 2013-14 Adopted Budget
Fiscal Year 2014-15
Approved Budget
Capital Program Adopted Operational Plan Fiscal Years 2013-2014 and 2014-2015 485
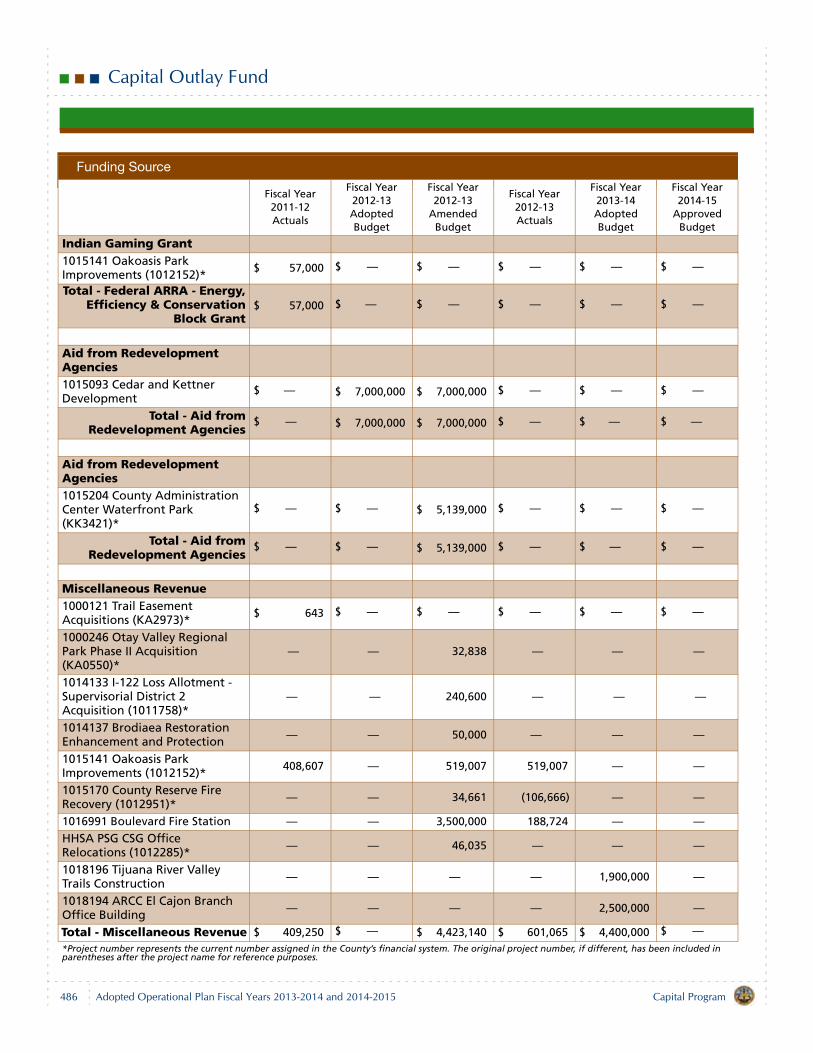
Capital Outlay Fund
Indian Gaming Grant1015141 Oakoasis Park Improvements (1012152)*
$ 57,000 $ — $ — $ — $ — $ —
Total - Federal ARRA - Energy,Efficiency & Conservation
Block Grant$ 57,000 $ — $ — $ — $ — $ —
Aid from Redevelopment Agencies1015093 Cedar and Kettner Development
$ — $ 7,000,000 $ 7,000,000 $ — $ — $ —
Total - Aid fromRedevelopment Agencies
$ — $ 7,000,000 $ 7,000,000 $ — $ — $ —
Aid from Redevelopment Agencies1015204 County Administration Center Waterfront Park (KK3421)*
$ — $ — $ 5,139,000 $ — $ — $ —
Total - Aid fromRedevelopment Agencies
$ — $ — $ 5,139,000 $ — $ — $ —
Miscellaneous Revenue1000121 Trail Easement Acquisitions (KA2973)*
$ 643 $ — $ — $ — $ — $ —
1000246 Otay Valley Regional Park Phase II Acquisition (KA0550)*
— — 32,838 — — —
1014133 I-122 Loss Allotment - Supervisorial District 2 Acquisition (1011758)*
— — 240,600 — — —
1014137 Brodiaea Restoration Enhancement and Protection
— — 50,000 — — —
1015141 Oakoasis Park Improvements (1012152)*
408,607 — 519,007 519,007 — —
1015170 County Reserve Fire Recovery (1012951)*
— — 34,661 (106,666) — —
1016991 Boulevard Fire Station — — 3,500,000 188,724 — —
HHSA PSG CSG Office Relocations (1012285)*
— — 46,035 — — —
1018196 Tijuana River Valley Trails Construction
— — — — 1,900,000 —
1018194 ARCC El Cajon Branch Office Building
— — — — 2,500,000 —
Total - Miscellaneous Revenue $ 409,250 $ — $ 4,423,140 $ 601,065 $ 4,400,000 $ —
*Project number represents the current number assigned in the County’s financial system. The original project number, if different, has been included in parentheses after the project name for reference purposes.
Funding Source
Fiscal Year 2011-12 Actuals
Fiscal Year 2012-13 Adopted Budget
Fiscal Year 2012-13
Amended Budget
Fiscal Year 2012-13 Actuals
Fiscal Year 2013-14 Adopted Budget
Fiscal Year 2014-15
Approved Budget
486 Capital ProgramAdopted Operational Plan Fiscal Years 2013-2014 and 2014-2015
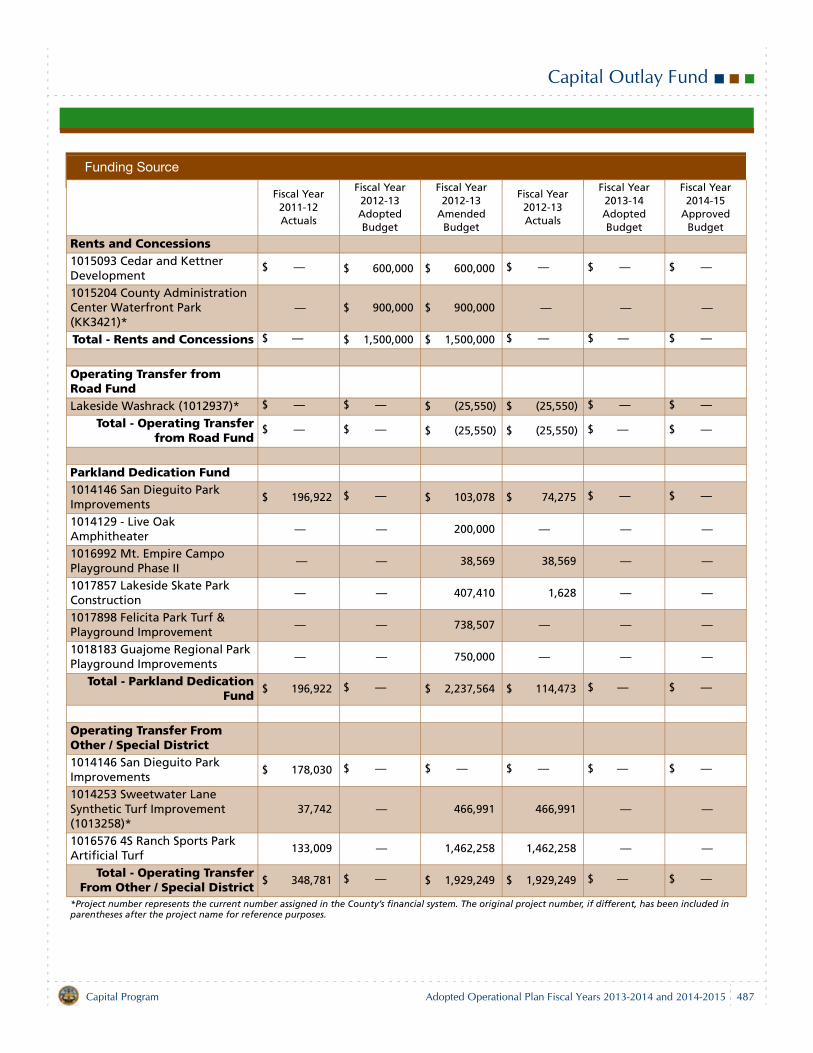
Capital Outlay Fund
Rents and Concessions1015093 Cedar and Kettner Development
$ — $ 600,000 $ 600,000 $ — $ — $ —
1015204 County Administration Center Waterfront Park (KK3421)*
— $ 900,000 $ 900,000 — — —
Total - Rents and Concessions $ — $ 1,500,000 $ 1,500,000 $ — $ — $ —
Operating Transfer from Road FundLakeside Washrack (1012937)* $ — $ — $ (25,550) $ (25,550) $ — $ —
Total - Operating Transferfrom Road Fund
$ — $ — $ (25,550) $ (25,550) $ — $ —
Parkland Dedication Fund1014146 San Dieguito Park Improvements
$ 196,922 $ — $ 103,078 $ 74,275 $ — $ —
1014129 - Live Oak Amphitheater
— — 200,000 — — —
1016992 Mt. Empire Campo Playground Phase II
— — 38,569 38,569 — —
1017857 Lakeside Skate Park Construction
— — 407,410 1,628 — —
1017898 Felicita Park Turf & Playground Improvement
— — 738,507 — — —
1018183 Guajome Regional Park Playground Improvements
— — 750,000 — — —
Total - Parkland DedicationFund
$ 196,922 $ — $ 2,237,564 $ 114,473 $ — $ —
Operating Transfer From Other / Special District1014146 San Dieguito Park Improvements
$ 178,030 $ — $ — $ — $ — $ —
1014253 Sweetwater Lane Synthetic Turf Improvement (1013258)*
37,742 — 466,991 466,991 — —
1016576 4S Ranch Sports Park Artificial Turf
133,009 — 1,462,258 1,462,258 — —
Total - Operating TransferFrom Other / Special District
$ 348,781 $ — $ 1,929,249 $ 1,929,249 $ — $ —
*Project number represents the current number assigned in the County’s financial system. The original project number, if different, has been included in parentheses after the project name for reference purposes.
Funding Source
Fiscal Year 2011-12 Actuals
Fiscal Year 2012-13 Adopted Budget
Fiscal Year 2012-13
Amended Budget
Fiscal Year 2012-13 Actuals
Fiscal Year 2013-14 Adopted Budget
Fiscal Year 2014-15
Approved Budget
Capital Program Adopted Operational Plan Fiscal Years 2013-2014 and 2014-2015 487

Capital Outlay Fund
Reimbursement from SANCAL - Bond Proceeds1015093 Cedar and Kettner Development
$ — $ 27,840,000 $ 27,840,000 $ 1,261,234 $ — $ —
1015204 County Administration Center Waterfront Park (KK3421)*
1,923,658 — 28,057,341 14,585,433 — —
Total - Reimbursement fromSANCAL - Bond Proceeds
$ 1,923,658 $ 27,840,000 $ 55,897,341 $ 15,846,667 $ — $ —
Reimbursement from SDRBA - COC - General Fund1011214 County Operations Center and Annex Phase 1A
$ 8,954,783 $ — $ — $ — $ — $ —
1014125 County Operations Center and Annex Phase 1B
9,000,000 — — — — —
1015131 HHSA PSG CSG Office Relocations (1012285)*
— — — — — —
Total - Reimbursement fromSDRBA COC - General Fund
$ 17,954,783 $ — $ — $ — $ — $ —
Reimbursement from SDRBA COC - Bond Proceeds1011214 County Operations Center and Annex Phase 1A
$ — $ — $ 1,166,742 $ 392,036 $ — $ —
1015131 HHSA PSG CSG Office Relocations (1012285)*
— — 11,700,000 11,616,977 — —
Total - Reimbursement fromSDRBA COC - Bond Proceeds
$ — $ — $ 12,866,742 $ 12,009,013 $ — $ —
Proceeds from Solid Waste1000011 Waste Site Land Acquisition (KA8950)*
$ — $ — $ 6,250,786 $ — $ — $ —
Total - Proceeds from SolidWaste
$ — $ — $ 6,250,786 $ — $ — $ —
Total Capital Outlay FundingSources
$ 108,689,121 $ 46,702,282 $ 206,242,172 $ 70,740,318 $ 20,449,372 $ —
*Project number represents the current number assigned in the County’s financial system. The original project number, if different, has been included in parentheses after the project name for reference purposes.
Funding Source
Fiscal Year 2011-12 Actuals
Fiscal Year 2012-13 Adopted Budget
Fiscal Year 2012-13
Amended Budget
Fiscal Year 2012-13 Actuals
Fiscal Year 2013-14 Adopted Budget
Fiscal Year 2014-15
Approved Budget
488 Capital ProgramAdopted Operational Plan Fiscal Years 2013-2014 and 2014-2015
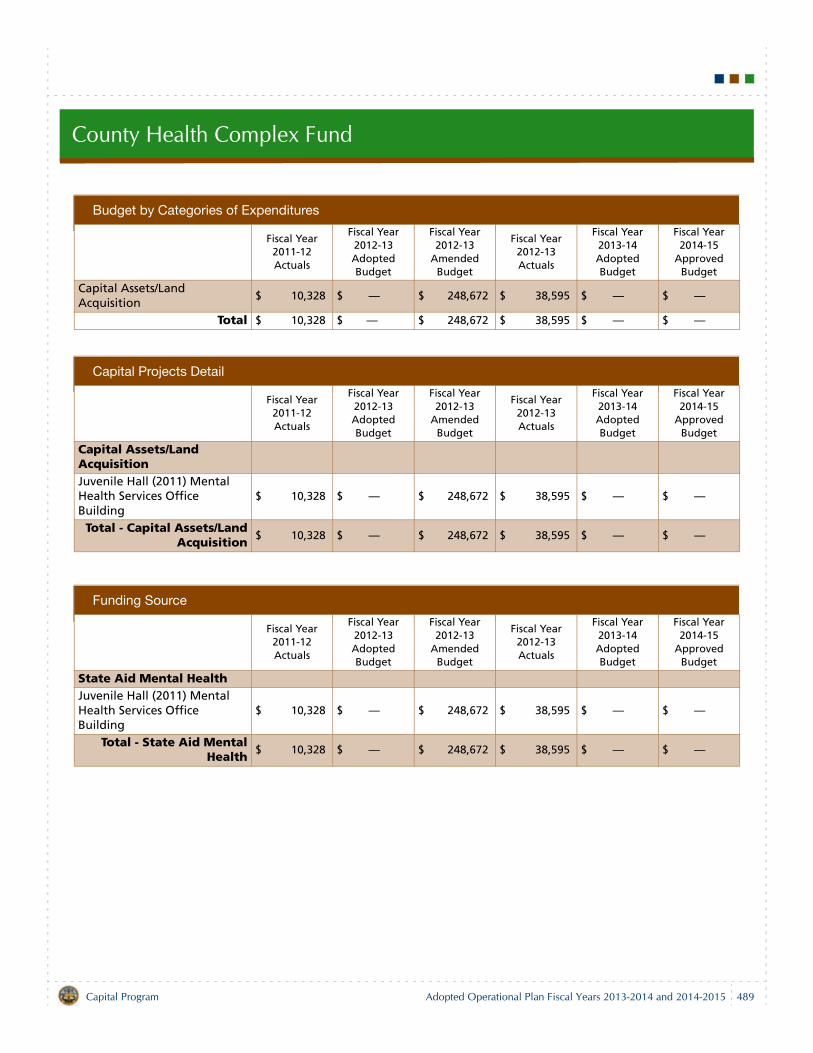
County Health Complex Fund
Budget by Categories of Expenditures
Fiscal Year 2011-12 Actuals
Fiscal Year 2012-13 Adopted Budget
Fiscal Year 2012-13
Amended Budget
Fiscal Year 2012-13 Actuals
Fiscal Year 2013-14 Adopted Budget
Fiscal Year 2014-15
Approved Budget
Capital Assets/Land Acquisition
$ 10,328 $ — $ 248,672 $ 38,595 $ — $ —
Total $ 10,328 $ — $ 248,672 $ 38,595 $ — $ —
Capital Projects Detail
Fiscal Year 2011-12 Actuals
Fiscal Year 2012-13 Adopted Budget
Fiscal Year 2012-13
Amended Budget
Fiscal Year 2012-13 Actuals
Fiscal Year 2013-14 Adopted Budget
Fiscal Year 2014-15
Approved Budget
Capital Assets/Land AcquisitionJuvenile Hall (2011) Mental Health Services Office Building
$ 10,328 $ — $ 248,672 $ 38,595 $ — $ —
Total - Capital Assets/LandAcquisition
$ 10,328 $ — $ 248,672 $ 38,595 $ — $ —
Funding Source
Fiscal Year 2011-12 Actuals
Fiscal Year 2012-13 Adopted Budget
Fiscal Year 2012-13
Amended Budget
Fiscal Year 2012-13 Actuals
Fiscal Year 2013-14 Adopted Budget
Fiscal Year 2014-15
Approved Budget
State Aid Mental HealthJuvenile Hall (2011) Mental Health Services Office Building
$ 10,328 $ — $ 248,672 $ 38,595 $ — $ —
Total - State Aid MentalHealth
$ 10,328 $ — $ 248,672 $ 38,595 $ — $ —
Capital Program Adopted Operational Plan Fiscal Years 2013-2014 and 2014-2015 489
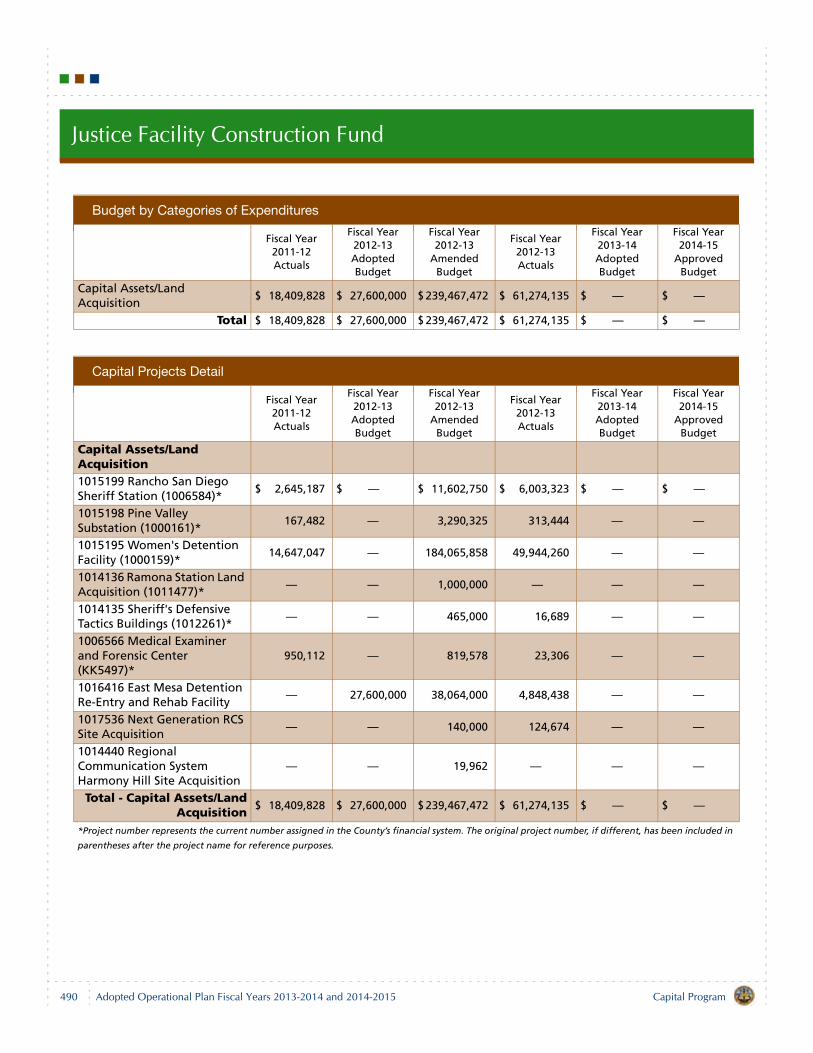
Justice Facility Construction Fund
Budget by Categories of Expenditures
Fiscal Year 2011-12 Actuals
Fiscal Year 2012-13 Adopted Budget
Fiscal Year 2012-13
Amended Budget
Fiscal Year 2012-13 Actuals
Fiscal Year 2013-14 Adopted Budget
Fiscal Year 2014-15
Approved Budget
Capital Assets/Land Acquisition
$ 18,409,828 $ 27,600,000 $ 239,467,472 $ 61,274,135 $ — $ —
Total $ 18,409,828 $ 27,600,000 $ 239,467,472 $ 61,274,135 $ — $ —
Capital Projects Detail
Fiscal Year 2011-12 Actuals
Fiscal Year 2012-13 Adopted Budget
Fiscal Year 2012-13
Amended Budget
Fiscal Year 2012-13 Actuals
Fiscal Year 2013-14 Adopted Budget
Fiscal Year 2014-15
Approved Budget
Capital Assets/Land Acquisition1015199 Rancho San Diego Sheriff Station (1006584)*
$ 2,645,187 $ — $ 11,602,750 $ 6,003,323 $ — $ —
1015198 Pine Valley Substation (1000161)*
167,482 — 3,290,325 313,444 — —
1015195 Women's Detention Facility (1000159)*
14,647,047 — 184,065,858 49,944,260 — —
1014136 Ramona Station Land Acquisition (1011477)*
— — 1,000,000 — — —
1014135 Sheriff's Defensive Tactics Buildings (1012261)*
— — 465,000 16,689 — —
1006566 Medical Examiner and Forensic Center (KK5497)*
950,112 — 819,578 23,306 — —
1016416 East Mesa Detention Re-Entry and Rehab Facility
— 27,600,000 38,064,000 4,848,438 — —
1017536 Next Generation RCS Site Acquisition
— — 140,000 124,674 — —
1014440 Regional Communication System Harmony Hill Site Acquisition
— — 19,962 — — —
Total - Capital Assets/LandAcquisition
$ 18,409,828 $ 27,600,000 $ 239,467,472 $ 61,274,135 $ — $ —
*Project number represents the current number assigned in the County’s financial system. The original project number, if different, has been included in
parentheses after the project name for reference purposes.
490 Capital ProgramAdopted Operational Plan Fiscal Years 2013-2014 and 2014-2015
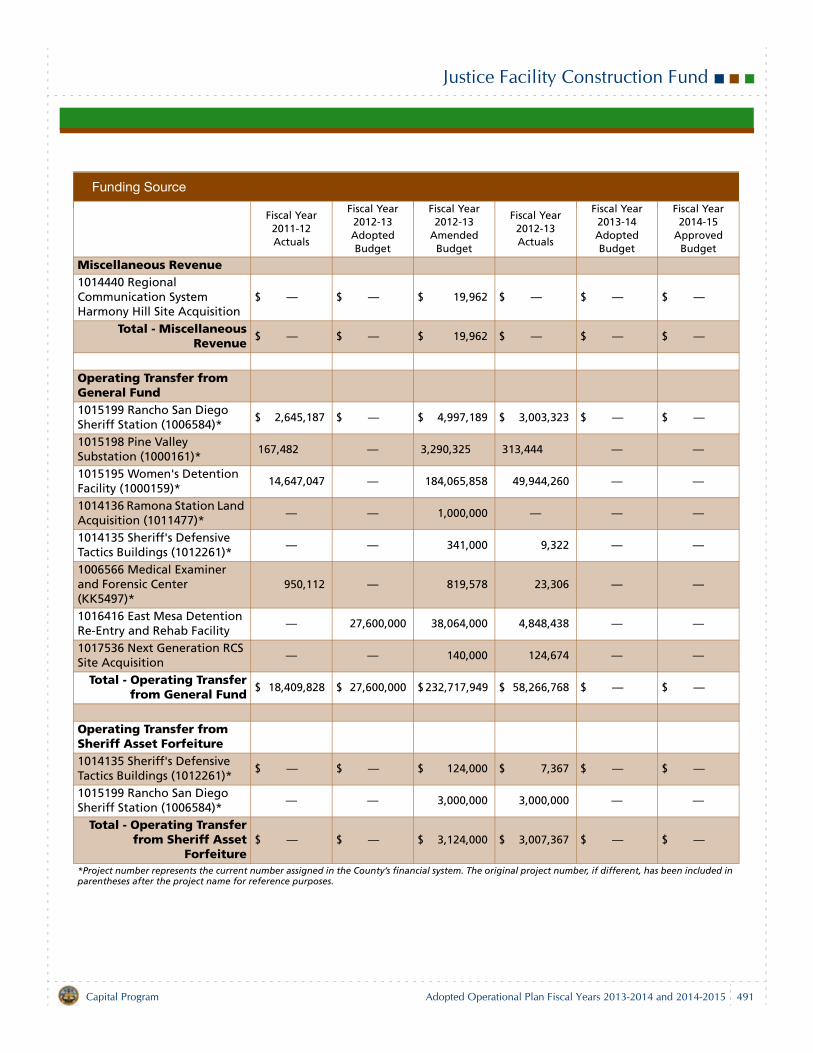
Justice Facility Construction Fund
Funding Source
Fiscal Year 2011-12 Actuals
Fiscal Year 2012-13 Adopted Budget
Fiscal Year 2012-13
Amended Budget
Fiscal Year 2012-13 Actuals
Fiscal Year 2013-14 Adopted Budget
Fiscal Year 2014-15
Approved Budget
Miscellaneous Revenue1014440 Regional Communication System Harmony Hill Site Acquisition
$ — $ — $ 19,962 $ — $ — $ —
Total - MiscellaneousRevenue
$ — $ — $ 19,962 $ — $ — $ —
Operating Transfer from General Fund1015199 Rancho San Diego Sheriff Station (1006584)*
$ 2,645,187 $ — $ 4,997,189 $ 3,003,323 $ — $ —
1015198 Pine Valley Substation (1000161)*
167,482 — 3,290,325 313,444 — —
1015195 Women's Detention Facility (1000159)*
14,647,047 — 184,065,858 49,944,260 — —
1014136 Ramona Station Land Acquisition (1011477)*
— — 1,000,000 — — —
1014135 Sheriff's Defensive Tactics Buildings (1012261)*
— — 341,000 9,322 — —
1006566 Medical Examiner and Forensic Center (KK5497)*
950,112 — 819,578 23,306 — —
1016416 East Mesa Detention Re-Entry and Rehab Facility
— 27,600,000 38,064,000 4,848,438 — —
1017536 Next Generation RCS Site Acquisition
— — 140,000 124,674 — —
Total - Operating Transferfrom General Fund
$ 18,409,828 $ 27,600,000 $ 232,717,949 $ 58,266,768 $ — $ —
Operating Transfer from Sheriff Asset Forfeiture1014135 Sheriff's Defensive Tactics Buildings (1012261)*
$ — $ — $ 124,000 $ 7,367 $ — $ —
1015199 Rancho San Diego Sheriff Station (1006584)*
— — 3,000,000 3,000,000 — —
Total - Operating Transferfrom Sheriff Asset
Forfeiture$ — $ — $ 3,124,000 $ 3,007,367 $ — $ —
*Project number represents the current number assigned in the County’s financial system. The original project number, if different, has been included in parentheses after the project name for reference purposes.
Capital Program Adopted Operational Plan Fiscal Years 2013-2014 and 2014-2015 491
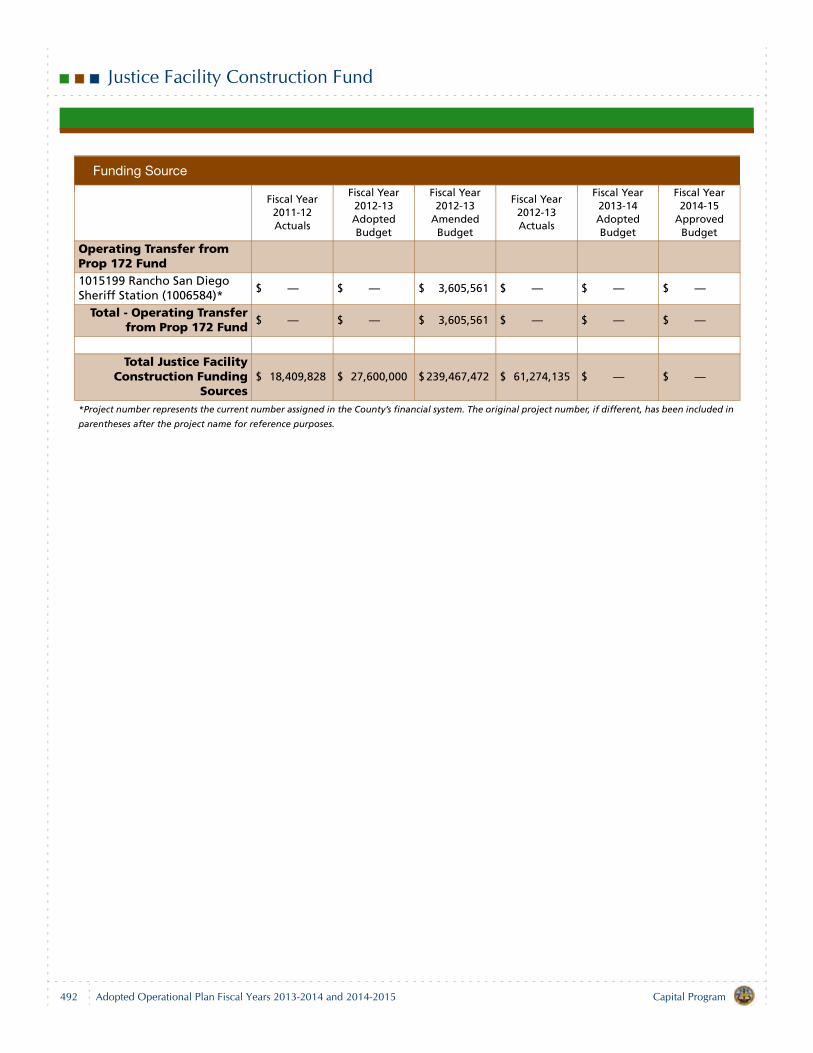
Justice Facility Construction Fund
Justice Facility Construction Fund
Operating Transfer from Prop 172 Fund1015199 Rancho San Diego Sheriff Station (1006584)*
$ — $ — $ 3,605,561 $ — $ — $ —
Total - Operating Transferfrom Prop 172 Fund
$ — $ — $ 3,605,561 $ — $ — $ —
Total Justice FacilityConstruction Funding
Sources$ 18,409,828 $ 27,600,000 $ 239,467,472 $ 61,274,135 $ — $ —
*Project number represents the current number assigned in the County’s financial system. The original project number, if different, has been included in
parentheses after the project name for reference purposes.
Funding Source
Fiscal Year 2011-12 Actuals
Fiscal Year 2012-13 Adopted Budget
Fiscal Year 2012-13
Amended Budget
Fiscal Year 2012-13 Actuals
Fiscal Year 2013-14 Adopted Budget
Fiscal Year 2014-15
Approved Budget
492 Capital ProgramAdopted Operational Plan Fiscal Years 2013-2014 and 2014-2015
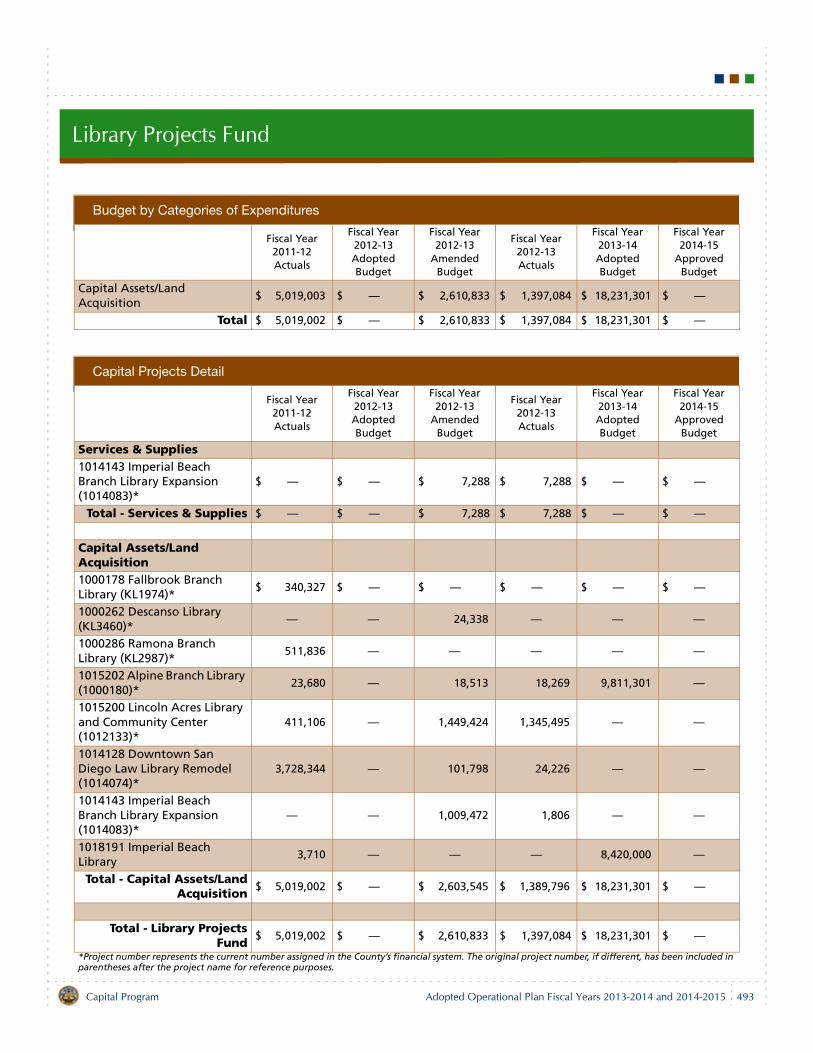
Library Projects Fund
Budget by Categories of Expenditures
Fiscal Year 2011-12 Actuals
Fiscal Year 2012-13 Adopted Budget
Fiscal Year 2012-13
Amended Budget
Fiscal Year 2012-13 Actuals
Fiscal Year 2013-14 Adopted Budget
Fiscal Year 2014-15
Approved Budget
Capital Assets/Land Acquisition
$ 5,019,003 $ — $ 2,610,833 $ 1,397,084 $ 18,231,301 $ —
Total $ 5,019,002 $ — $ 2,610,833 $ 1,397,084 $ 18,231,301 $ —
Capital Projects Detail
Fiscal Year 2011-12 Actuals
Fiscal Year 2012-13 Adopted Budget
Fiscal Year 2012-13
Amended Budget
Fiscal Year 2012-13 Actuals
Fiscal Year 2013-14 Adopted Budget
Fiscal Year 2014-15
Approved Budget
Services & Supplies1014143 Imperial Beach Branch Library Expansion (1014083)*
$ — $ — $ 7,288 $ 7,288 $ — $ —
Total - Services & Supplies $ — $ — $ 7,288 $ 7,288 $ — $ —
Capital Assets/Land Acquisition1000178 Fallbrook Branch Library (KL1974)*
$ 340,327 $ — $ — $ — $ — $ —
1000262 Descanso Library (KL3460)*
— — 24,338 — — —
1000286 Ramona Branch Library (KL2987)*
511,836 — — — — —
1015202 Alpine Branch Library (1000180)*
23,680 — 18,513 18,269 9,811,301 —
1015200 Lincoln Acres Library and Community Center (1012133)*
411,106 — 1,449,424 1,345,495 — —
1014128 Downtown San Diego Law Library Remodel (1014074)*
3,728,344 — 101,798 24,226 — —
1014143 Imperial Beach Branch Library Expansion (1014083)*
— — 1,009,472 1,806 — —
1018191 Imperial Beach Library
3,710 — — — 8,420,000 —
Total - Capital Assets/LandAcquisition
$ 5,019,002 $ — $ 2,603,545 $ 1,389,796 $ 18,231,301 $ —
Total - Library ProjectsFund
$ 5,019,002 $ — $ 2,610,833 $ 1,397,084 $ 18,231,301 $ —
*Project number represents the current number assigned in the County’s financial system. The original project number, if different, has been included in parentheses after the project name for reference purposes.
Capital Program Adopted Operational Plan Fiscal Years 2013-2014 and 2014-2015 493
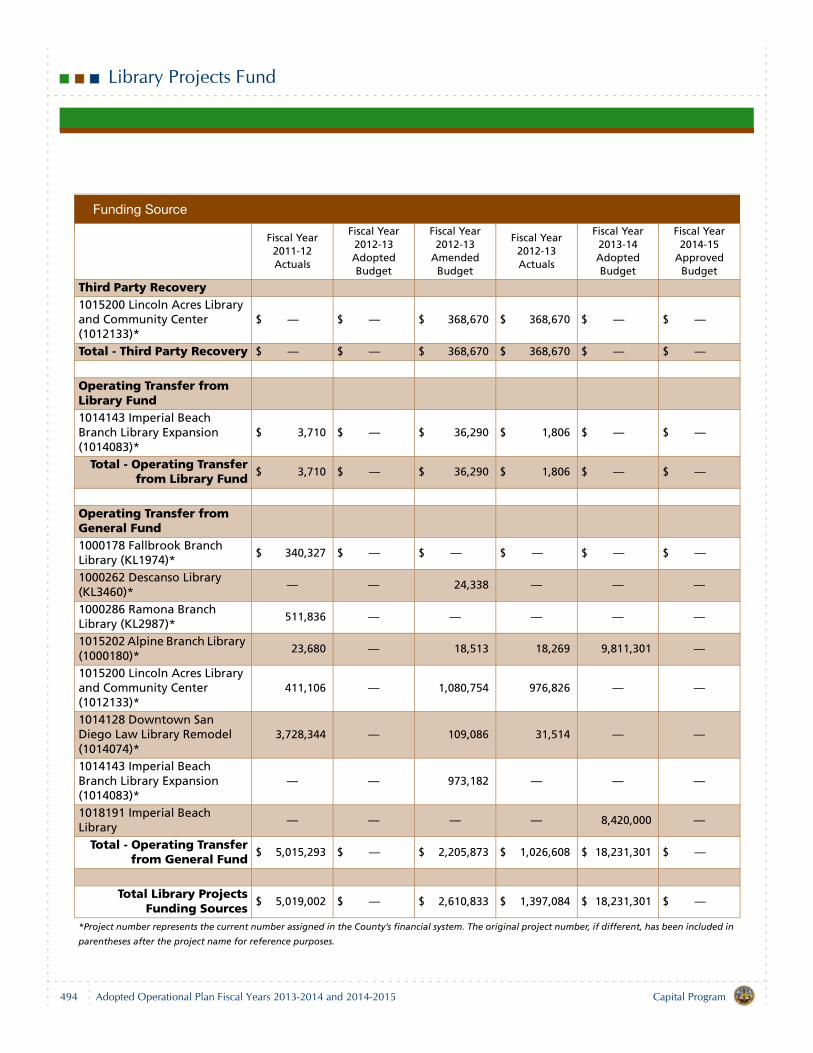
Library Projects Fund
Funding Source
Fiscal Year 2011-12 Actuals
Fiscal Year 2012-13 Adopted Budget
Fiscal Year 2012-13
Amended Budget
Fiscal Year 2012-13 Actuals
Fiscal Year 2013-14 Adopted Budget
Fiscal Year 2014-15
Approved Budget
Third Party Recovery1015200 Lincoln Acres Library and Community Center (1012133)*
$ — $ — $ 368,670 $ 368,670 $ — $ —
Total - Third Party Recovery $ — $ — $ 368,670 $ 368,670 $ — $ —
Operating Transfer from Library Fund1014143 Imperial Beach Branch Library Expansion (1014083)*
$ 3,710 $ — $ 36,290 $ 1,806 $ — $ —
Total - Operating Transferfrom Library Fund
$ 3,710 $ — $ 36,290 $ 1,806 $ — $ —
Operating Transfer from General Fund1000178 Fallbrook Branch Library (KL1974)*
$ 340,327 $ — $ — $ — $ — $ —
1000262 Descanso Library (KL3460)*
— — 24,338 — — —
1000286 Ramona Branch Library (KL2987)*
511,836 — — — — —
1015202 Alpine Branch Library (1000180)*
23,680 — 18,513 18,269 9,811,301 —
1015200 Lincoln Acres Library and Community Center (1012133)*
411,106 — 1,080,754 976,826 — —
1014128 Downtown San Diego Law Library Remodel (1014074)*
3,728,344 — 109,086 31,514 — —
1014143 Imperial Beach Branch Library Expansion (1014083)*
— — 973,182 — — —
1018191 Imperial Beach Library
— — — — 8,420,000 —
Total - Operating Transferfrom General Fund
$ 5,015,293 $ — $ 2,205,873 $ 1,026,608 $ 18,231,301 $ —
Total Library ProjectsFunding Sources
$ 5,019,002 $ — $ 2,610,833 $ 1,397,084 $ 18,231,301 $ —
*Project number represents the current number assigned in the County’s financial system. The original project number, if different, has been included in
parentheses after the project name for reference purposes.
494 Capital ProgramAdopted Operational Plan Fiscal Years 2013-2014 and 2014-2015
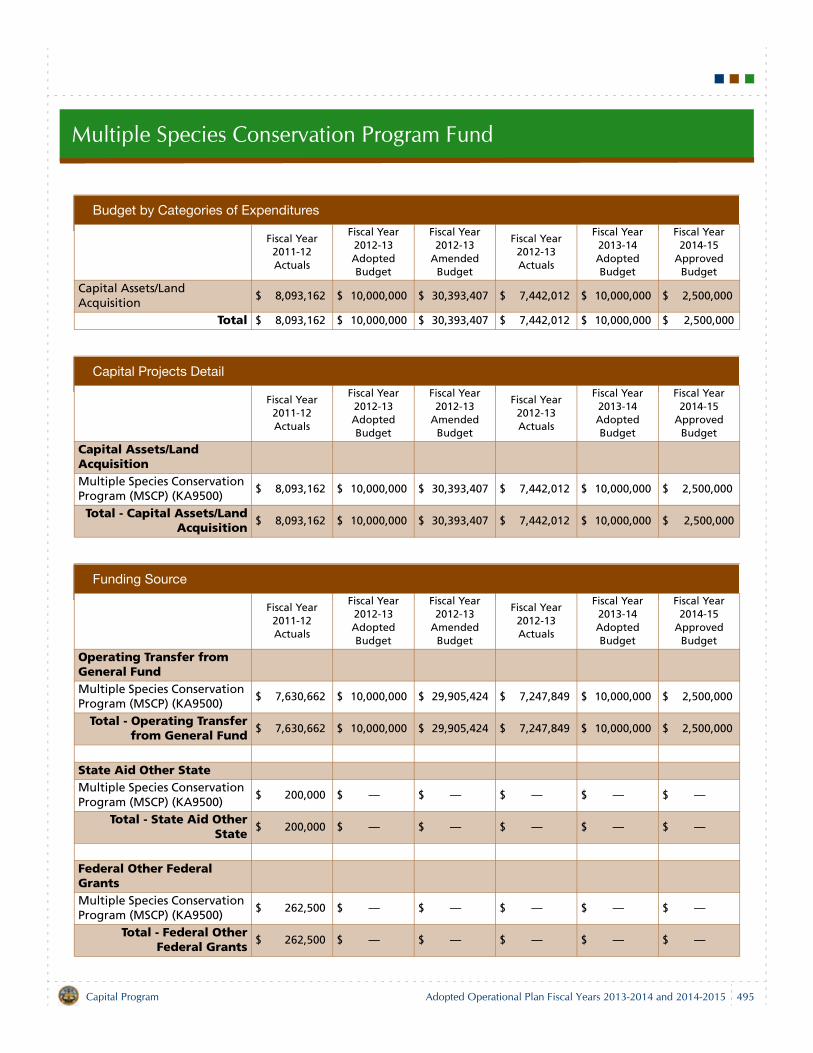
Multiple Species Conservation Program Fund
Budget by Categories of Expenditures
Fiscal Year 2011-12 Actuals
Fiscal Year 2012-13 Adopted Budget
Fiscal Year 2012-13
Amended Budget
Fiscal Year 2012-13 Actuals
Fiscal Year 2013-14 Adopted Budget
Fiscal Year 2014-15
Approved Budget
Capital Assets/Land Acquisition
$ 8,093,162 $ 10,000,000 $ 30,393,407 $ 7,442,012 $ 10,000,000 $ 2,500,000
Total $ 8,093,162 $ 10,000,000 $ 30,393,407 $ 7,442,012 $ 10,000,000 $ 2,500,000
Capital Projects Detail
Fiscal Year 2011-12 Actuals
Fiscal Year 2012-13 Adopted Budget
Fiscal Year 2012-13
Amended Budget
Fiscal Year 2012-13 Actuals
Fiscal Year 2013-14 Adopted Budget
Fiscal Year 2014-15
Approved Budget
Capital Assets/Land AcquisitionMultiple Species Conservation Program (MSCP) (KA9500)
$ 8,093,162 $ 10,000,000 $ 30,393,407 $ 7,442,012 $ 10,000,000 $ 2,500,000
Total - Capital Assets/LandAcquisition
$ 8,093,162 $ 10,000,000 $ 30,393,407 $ 7,442,012 $ 10,000,000 $ 2,500,000
Funding Source
Fiscal Year 2011-12 Actuals
Fiscal Year 2012-13 Adopted Budget
Fiscal Year 2012-13
Amended Budget
Fiscal Year 2012-13 Actuals
Fiscal Year 2013-14 Adopted Budget
Fiscal Year 2014-15
Approved Budget
Operating Transfer from General FundMultiple Species Conservation Program (MSCP) (KA9500)
$ 7,630,662 $ 10,000,000 $ 29,905,424 $ 7,247,849 $ 10,000,000 $ 2,500,000
Total - Operating Transferfrom General Fund
$ 7,630,662 $ 10,000,000 $ 29,905,424 $ 7,247,849 $ 10,000,000 $ 2,500,000
State Aid Other StateMultiple Species Conservation Program (MSCP) (KA9500)
$ 200,000 $ — $ — $ — $ — $ —
Total - State Aid OtherState
$ 200,000 $ — $ — $ — $ — $ —
Federal Other Federal GrantsMultiple Species Conservation Program (MSCP) (KA9500)
$ 262,500 $ — $ — $ — $ — $ —
Total - Federal OtherFederal Grants
$ 262,500 $ — $ — $ — $ — $ —
Capital Program Adopted Operational Plan Fiscal Years 2013-2014 and 2014-2015 495
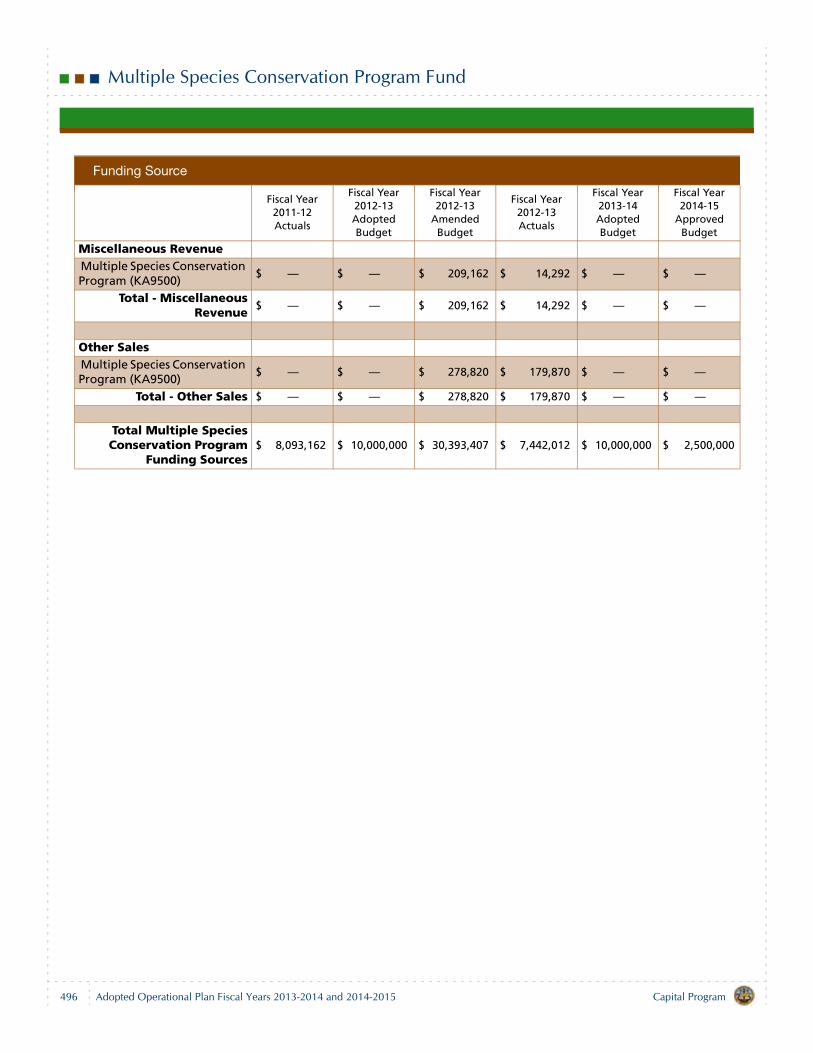
Multiple Species Conservation Program Fund
Miscellaneous Revenue Multiple Species Conservation Program (KA9500)
$ — $ — $ 209,162 $ 14,292 $ — $ —
Total - MiscellaneousRevenue
$ — $ — $ 209,162 $ 14,292 $ — $ —
Other Sales Multiple Species Conservation Program (KA9500)
$ — $ — $ 278,820 $ 179,870 $ — $ —
Total - Other Sales $ — $ — $ 278,820 $ 179,870 $ — $ —
Total Multiple SpeciesConservation Program
Funding Sources$ 8,093,162 $ 10,000,000 $ 30,393,407 $ 7,442,012 $ 10,000,000 $ 2,500,000
Funding Source
Fiscal Year 2011-12 Actuals
Fiscal Year 2012-13 Adopted Budget
Fiscal Year 2012-13
Amended Budget
Fiscal Year 2012-13 Actuals
Fiscal Year 2013-14 Adopted Budget
Fiscal Year 2014-15
Approved Budget
496 Capital ProgramAdopted Operational Plan Fiscal Years 2013-2014 and 2014-2015
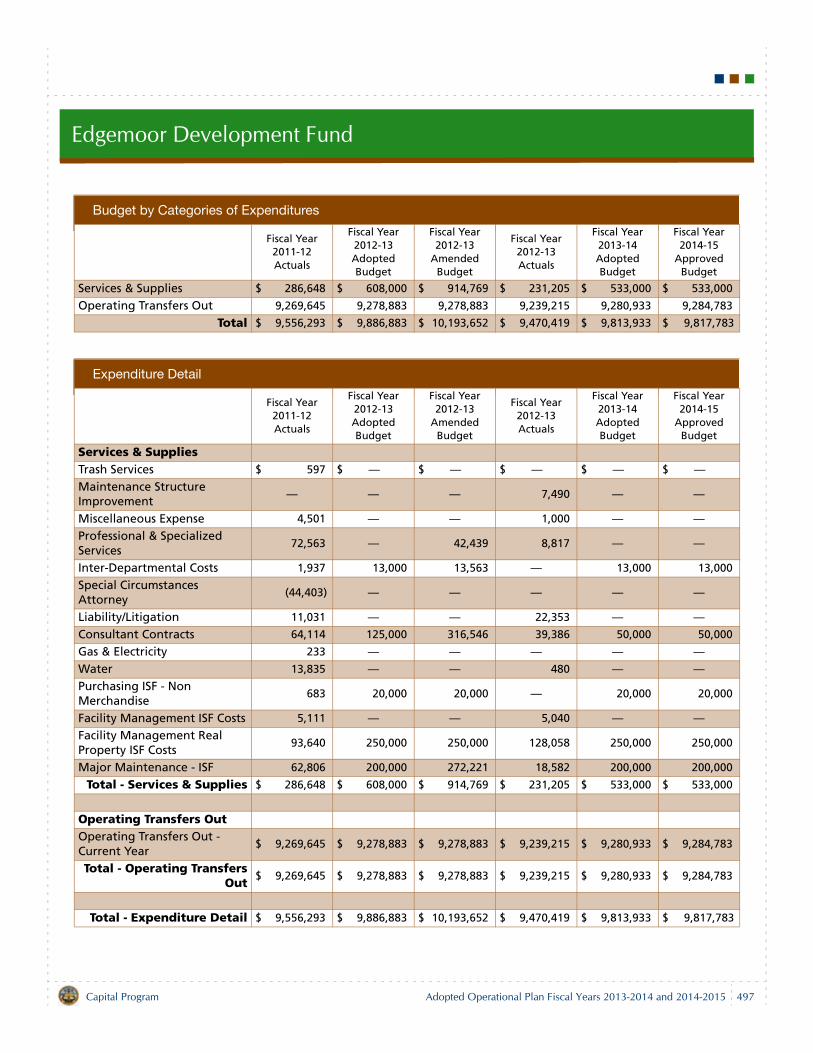
Edgemoor Development Fund
Budget by Categories of Expenditures
Fiscal Year 2011-12 Actuals
Fiscal Year 2012-13 Adopted Budget
Fiscal Year 2012-13
Amended Budget
Fiscal Year 2012-13 Actuals
Fiscal Year 2013-14 Adopted Budget
Fiscal Year 2014-15
Approved Budget
Services & Supplies $ 286,648 $ 608,000 $ 914,769 $ 231,205 $ 533,000 $ 533,000
Operating Transfers Out 9,269,645 9,278,883 9,278,883 9,239,215 9,280,933 9,284,783
Total $ 9,556,293 $ 9,886,883 $ 10,193,652 $ 9,470,419 $ 9,813,933 $ 9,817,783
Expenditure Detail
Fiscal Year 2011-12 Actuals
Fiscal Year 2012-13 Adopted Budget
Fiscal Year 2012-13
Amended Budget
Fiscal Year 2012-13 Actuals
Fiscal Year 2013-14 Adopted Budget
Fiscal Year 2014-15
Approved Budget
Services & SuppliesTrash Services $ 597 $ — $ — $ — $ — $ —
Maintenance Structure Improvement
— — — 7,490 — —
Miscellaneous Expense 4,501 — — 1,000 — —
Professional & Specialized Services
72,563 — 42,439 8,817 — —
Inter-Departmental Costs 1,937 13,000 13,563 — 13,000 13,000
Special Circumstances Attorney
(44,403) — — — — —
Liability/Litigation 11,031 — — 22,353 — —
Consultant Contracts 64,114 125,000 316,546 39,386 50,000 50,000
Gas & Electricity 233 — — — — —
Water 13,835 — — 480 — —
Purchasing ISF - Non Merchandise
683 20,000 20,000 — 20,000 20,000
Facility Management ISF Costs 5,111 — — 5,040 — —
Facility Management Real Property ISF Costs
93,640 250,000 250,000 128,058 250,000 250,000
Major Maintenance - ISF 62,806 200,000 272,221 18,582 200,000 200,000
Total - Services & Supplies $ 286,648 $ 608,000 $ 914,769 $ 231,205 $ 533,000 $ 533,000
Operating Transfers OutOperating Transfers Out - Current Year
$ 9,269,645 $ 9,278,883 $ 9,278,883 $ 9,239,215 $ 9,280,933 $ 9,284,783
Total - Operating TransfersOut
$ 9,269,645 $ 9,278,883 $ 9,278,883 $ 9,239,215 $ 9,280,933 $ 9,284,783
Total - Expenditure Detail $ 9,556,293 $ 9,886,883 $ 10,193,652 $ 9,470,419 $ 9,813,933 $ 9,817,783
Capital Program Adopted Operational Plan Fiscal Years 2013-2014 and 2014-2015 497
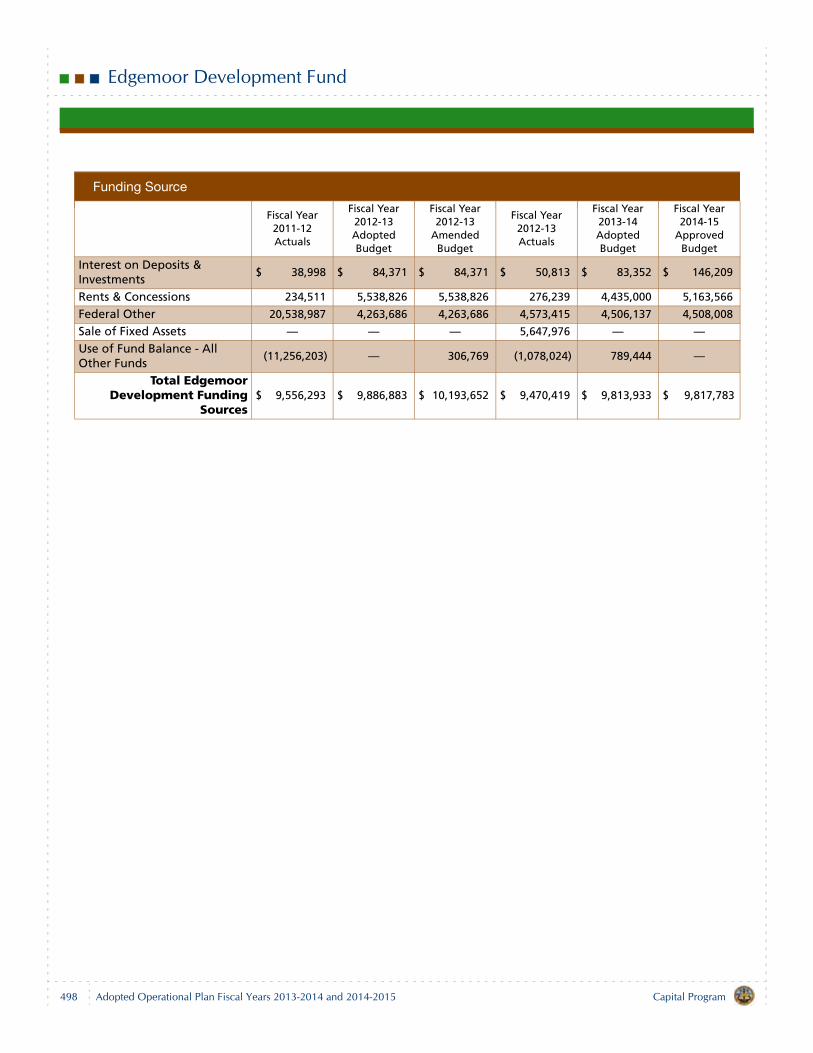
Edgemoor Development Fund
Funding Source
Fiscal Year 2011-12 Actuals
Fiscal Year 2012-13 Adopted Budget
Fiscal Year 2012-13
Amended Budget
Fiscal Year 2012-13 Actuals
Fiscal Year 2013-14 Adopted Budget
Fiscal Year 2014-15
Approved Budget
Interest on Deposits & Investments
$ 38,998 $ 84,371 $ 84,371 $ 50,813 $ 83,352 $ 146,209
Rents & Concessions 234,511 5,538,826 5,538,826 276,239 4,435,000 5,163,566
Federal Other 20,538,987 4,263,686 4,263,686 4,573,415 4,506,137 4,508,008
Sale of Fixed Assets — — — 5,647,976 — —
Use of Fund Balance - All Other Funds
(11,256,203) — 306,769 (1,078,024) 789,444 —
Total EdgemoorDevelopment Funding
Sources$ 9,556,293 $ 9,886,883 $ 10,193,652 $ 9,470,419 $ 9,813,933 $ 9,817,783
498 Capital ProgramAdopted Operational Plan Fiscal Years 2013-2014 and 2014-2015
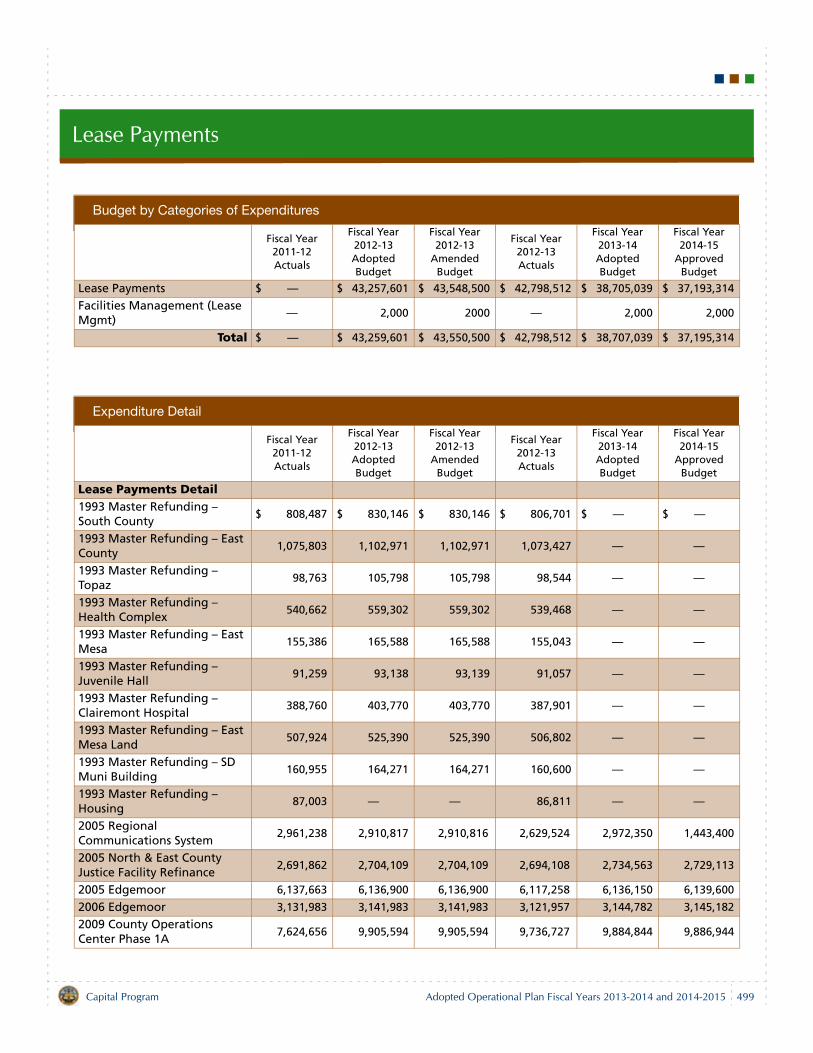
Lease Payments
Budget by Categories of Expenditures
Fiscal Year 2011-12 Actuals
Fiscal Year 2012-13 Adopted Budget
Fiscal Year 2012-13
Amended Budget
Fiscal Year 2012-13 Actuals
Fiscal Year 2013-14 Adopted Budget
Fiscal Year 2014-15
Approved Budget
Lease Payments $ — $ 43,257,601 $ 43,548,500 $ 42,798,512 $ 38,705,039 $ 37,193,314
Facilities Management (Lease Mgmt)
— 2,000 2000 — 2,000 2,000
Total $ — $ 43,259,601 $ 43,550,500 $ 42,798,512 $ 38,707,039 $ 37,195,314
Expenditure Detail
Fiscal Year 2011-12 Actuals
Fiscal Year 2012-13 Adopted Budget
Fiscal Year 2012-13
Amended Budget
Fiscal Year 2012-13 Actuals
Fiscal Year 2013-14 Adopted Budget
Fiscal Year 2014-15
Approved Budget
Lease Payments Detail1993 Master Refunding – South County
$ 808,487 $ 830,146 $ 830,146 $ 806,701 $ — $ —
1993 Master Refunding – East County
1,075,803 1,102,971 1,102,971 1,073,427 — —
1993 Master Refunding – Topaz
98,763 105,798 105,798 98,544 — —
1993 Master Refunding – Health Complex
540,662 559,302 559,302 539,468 — —
1993 Master Refunding – East Mesa
155,386 165,588 165,588 155,043 — —
1993 Master Refunding – Juvenile Hall
91,259 93,138 93,139 91,057 — —
1993 Master Refunding – Clairemont Hospital
388,760 403,770 403,770 387,901 — —
1993 Master Refunding – East Mesa Land
507,924 525,390 525,390 506,802 — —
1993 Master Refunding – SD Muni Building
160,955 164,271 164,271 160,600 — —
1993 Master Refunding – Housing
87,003 — — 86,811 — —
2005 Regional Communications System
2,961,238 2,910,817 2,910,816 2,629,524 2,972,350 1,443,400
2005 North & East County Justice Facility Refinance
2,691,862 2,704,109 2,704,109 2,694,108 2,734,563 2,729,113
2005 Edgemoor 6,137,663 6,136,900 6,136,900 6,117,258 6,136,150 6,139,600
2006 Edgemoor 3,131,983 3,141,983 3,141,983 3,121,957 3,144,782 3,145,182
2009 County Operations Center Phase 1A
7,624,656 9,905,594 9,905,594 9,736,727 9,884,844 9,886,944
Capital Program Adopted Operational Plan Fiscal Years 2013-2014 and 2014-2015 499
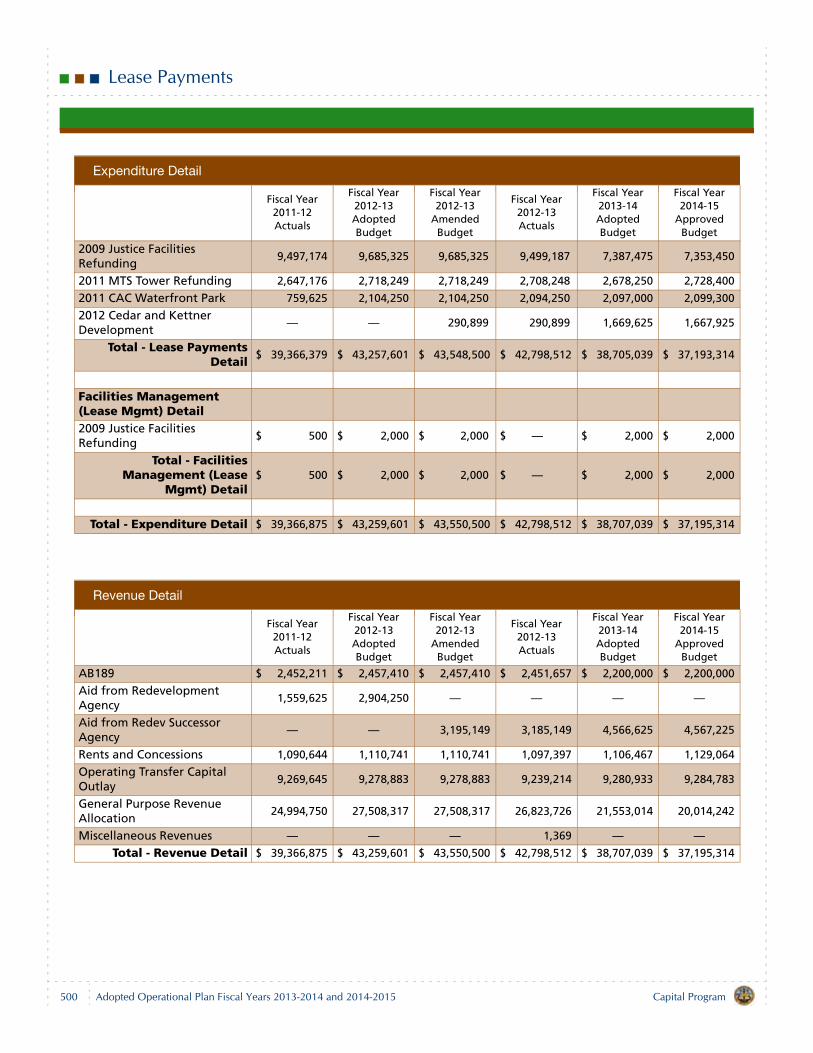
Lease Payments
2009 Justice Facilities Refunding
9,497,174 9,685,325 9,685,325 9,499,187 7,387,475 7,353,450
2011 MTS Tower Refunding 2,647,176 2,718,249 2,718,249 2,708,248 2,678,250 2,728,400
2011 CAC Waterfront Park 759,625 2,104,250 2,104,250 2,094,250 2,097,000 2,099,300
2012 Cedar and Kettner Development
— — 290,899 290,899 1,669,625 1,667,925
Total - Lease PaymentsDetail
$ 39,366,379 $ 43,257,601 $ 43,548,500 $ 42,798,512 $ 38,705,039 $ 37,193,314
Facilities Management (Lease Mgmt) Detail2009 Justice Facilities Refunding
$ 500 $ 2,000 $ 2,000 $ — $ 2,000 $ 2,000
Total - FacilitiesManagement (Lease
Mgmt) Detail$ 500 $ 2,000 $ 2,000 $ — $ 2,000 $ 2,000
Total - Expenditure Detail $ 39,366,875 $ 43,259,601 $ 43,550,500 $ 42,798,512 $ 38,707,039 $ 37,195,314
Revenue Detail
Fiscal Year 2011-12 Actuals
Fiscal Year 2012-13 Adopted Budget
Fiscal Year 2012-13
Amended Budget
Fiscal Year 2012-13 Actuals
Fiscal Year 2013-14 Adopted Budget
Fiscal Year 2014-15
Approved Budget
AB189 $ 2,452,211 $ 2,457,410 $ 2,457,410 $ 2,451,657 $ 2,200,000 $ 2,200,000
Aid from Redevelopment Agency
1,559,625 2,904,250 — — — —
Aid from Redev Successor Agency
— — 3,195,149 3,185,149 4,566,625 4,567,225
Rents and Concessions 1,090,644 1,110,741 1,110,741 1,097,397 1,106,467 1,129,064
Operating Transfer Capital Outlay
9,269,645 9,278,883 9,278,883 9,239,214 9,280,933 9,284,783
General Purpose Revenue Allocation
24,994,750 27,508,317 27,508,317 26,823,726 21,553,014 20,014,242
Miscellaneous Revenues — — — 1,369 — —
Total - Revenue Detail $ 39,366,875 $ 43,259,601 $ 43,550,500 $ 42,798,512 $ 38,707,039 $ 37,195,314
Expenditure Detail
Fiscal Year 2011-12 Actuals
Fiscal Year 2012-13 Adopted Budget
Fiscal Year 2012-13
Amended Budget
Fiscal Year 2012-13 Actuals
Fiscal Year 2013-14 Adopted Budget
Fiscal Year 2014-15
Approved Budget
500 Capital ProgramAdopted Operational Plan Fiscal Years 2013-2014 and 2014-2015
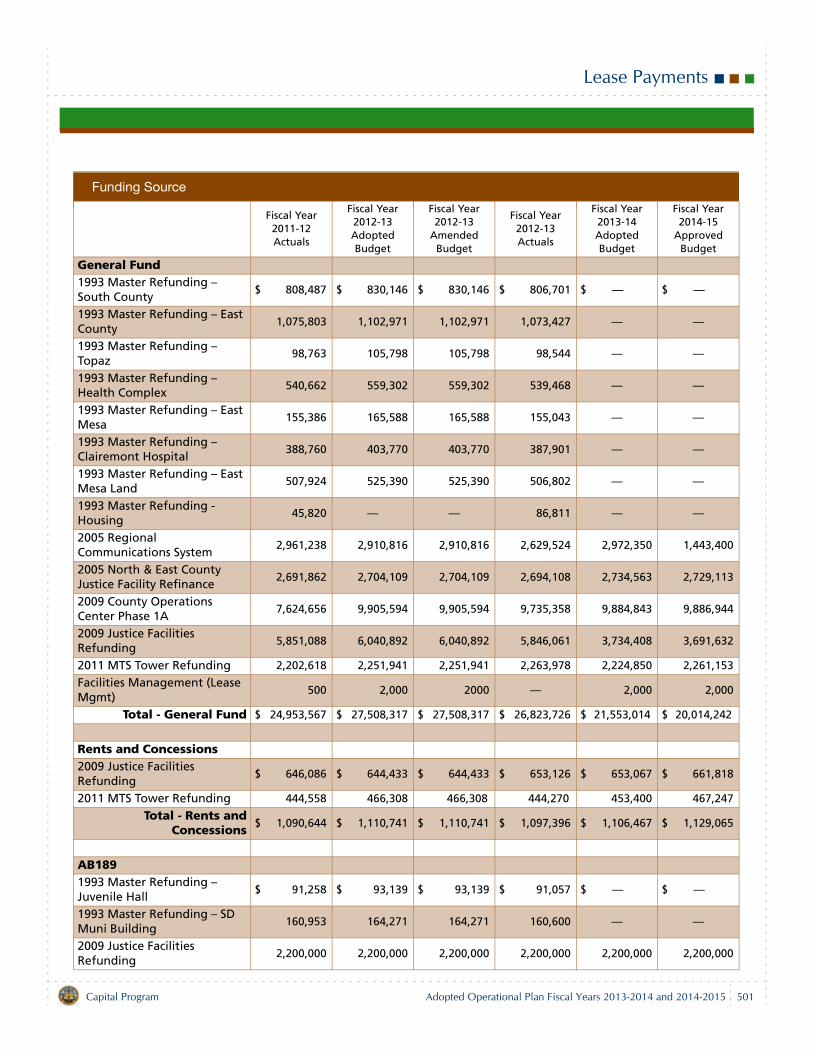
Lease Payments
Funding Source
Fiscal Year 2011-12 Actuals
Fiscal Year 2012-13 Adopted Budget
Fiscal Year 2012-13
Amended Budget
Fiscal Year 2012-13 Actuals
Fiscal Year 2013-14 Adopted Budget
Fiscal Year 2014-15
Approved Budget
General Fund1993 Master Refunding – South County
$ 808,487 $ 830,146 $ 830,146 $ 806,701 $ — $ —
1993 Master Refunding – East County
1,075,803 1,102,971 1,102,971 1,073,427 — —
1993 Master Refunding – Topaz
98,763 105,798 105,798 98,544 — —
1993 Master Refunding – Health Complex
540,662 559,302 559,302 539,468 — —
1993 Master Refunding – East Mesa
155,386 165,588 165,588 155,043 — —
1993 Master Refunding – Clairemont Hospital
388,760 403,770 403,770 387,901 — —
1993 Master Refunding – East Mesa Land
507,924 525,390 525,390 506,802 — —
1993 Master Refunding - Housing
45,820 — — 86,811 — —
2005 Regional Communications System
2,961,238 2,910,816 2,910,816 2,629,524 2,972,350 1,443,400
2005 North & East County Justice Facility Refinance
2,691,862 2,704,109 2,704,109 2,694,108 2,734,563 2,729,113
2009 County Operations Center Phase 1A
7,624,656 9,905,594 9,905,594 9,735,358 9,884,843 9,886,944
2009 Justice Facilities Refunding
5,851,088 6,040,892 6,040,892 5,846,061 3,734,408 3,691,632
2011 MTS Tower Refunding 2,202,618 2,251,941 2,251,941 2,263,978 2,224,850 2,261,153
Facilities Management (Lease Mgmt)
500 2,000 2000 — 2,000 2,000
Total - General Fund $ 24,953,567 $ 27,508,317 $ 27,508,317 $ 26,823,726 $ 21,553,014 $ 20,014,242
Rents and Concessions2009 Justice Facilities Refunding
$ 646,086 $ 644,433 $ 644,433 $ 653,126 $ 653,067 $ 661,818
2011 MTS Tower Refunding 444,558 466,308 466,308 444,270 453,400 467,247
Total - Rents andConcessions
$ 1,090,644 $ 1,110,741 $ 1,110,741 $ 1,097,396 $ 1,106,467 $ 1,129,065
AB1891993 Master Refunding – Juvenile Hall
$ 91,258 $ 93,139 $ 93,139 $ 91,057 $ — $ —
1993 Master Refunding – SD Muni Building
160,953 164,271 164,271 160,600 — —
2009 Justice Facilities Refunding
2,200,000 2,200,000 2,200,000 2,200,000 2,200,000 2,200,000
Capital Program Adopted Operational Plan Fiscal Years 2013-2014 and 2014-2015 501
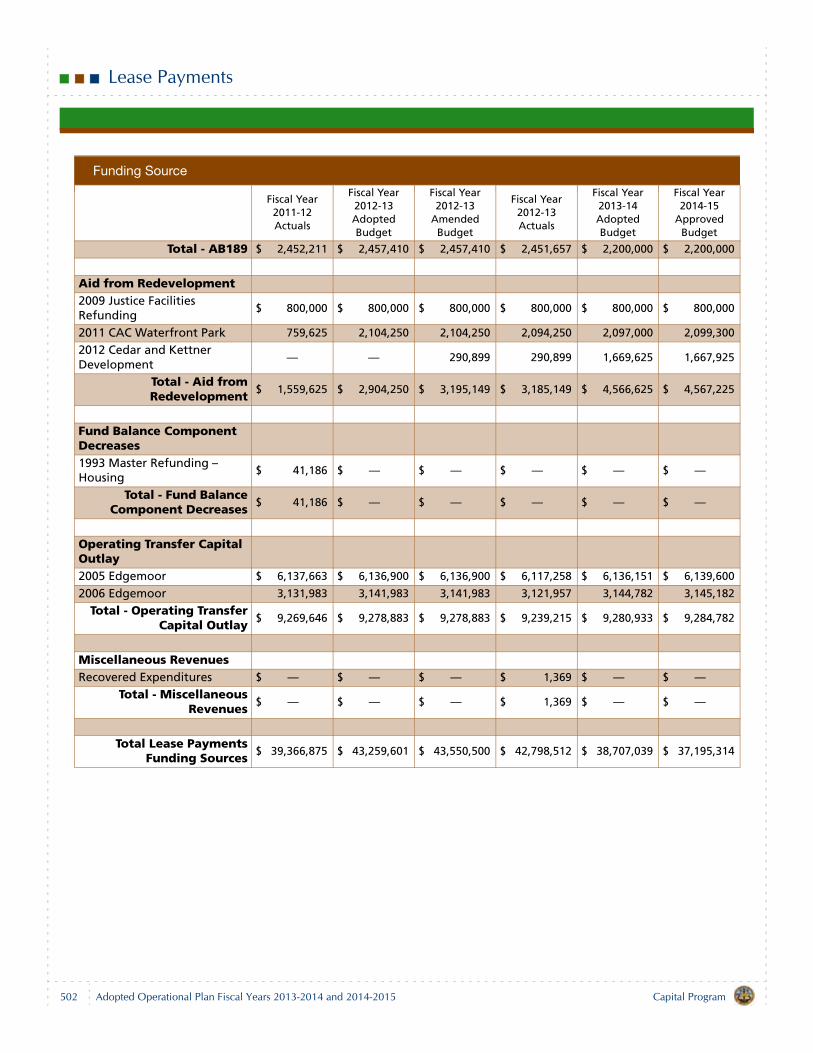
Lease Payments
Total - AB189 $ 2,452,211 $ 2,457,410 $ 2,457,410 $ 2,451,657 $ 2,200,000 $ 2,200,000
Aid from Redevelopment2009 Justice Facilities Refunding
$ 800,000 $ 800,000 $ 800,000 $ 800,000 $ 800,000 $ 800,000
2011 CAC Waterfront Park 759,625 2,104,250 2,104,250 2,094,250 2,097,000 2,099,300
2012 Cedar and Kettner Development
— — 290,899 290,899 1,669,625 1,667,925
Total - Aid fromRedevelopment
$ 1,559,625 $ 2,904,250 $ 3,195,149 $ 3,185,149 $ 4,566,625 $ 4,567,225
Fund Balance Component Decreases1993 Master Refunding – Housing
$ 41,186 $ — $ — $ — $ — $ —
Total - Fund BalanceComponent Decreases
$ 41,186 $ — $ — $ — $ — $ —
Operating Transfer Capital Outlay2005 Edgemoor $ 6,137,663 $ 6,136,900 $ 6,136,900 $ 6,117,258 $ 6,136,151 $ 6,139,600
2006 Edgemoor 3,131,983 3,141,983 3,141,983 3,121,957 3,144,782 3,145,182
Total - Operating TransferCapital Outlay
$ 9,269,646 $ 9,278,883 $ 9,278,883 $ 9,239,215 $ 9,280,933 $ 9,284,782
Miscellaneous RevenuesRecovered Expenditures $ — $ — $ — $ 1,369 $ — $ —
Total - MiscellaneousRevenues
$ — $ — $ — $ 1,369 $ — $ —
Total Lease PaymentsFunding Sources
$ 39,366,875 $ 43,259,601 $ 43,550,500 $ 42,798,512 $ 38,707,039 $ 37,195,314
Funding Source
Fiscal Year 2011-12 Actuals
Fiscal Year 2012-13 Adopted Budget
Fiscal Year 2012-13
Amended Budget
Fiscal Year 2012-13 Actuals
Fiscal Year 2013-14 Adopted Budget
Fiscal Year 2014-15
Approved Budget
502 Capital ProgramAdopted Operational Plan Fiscal Years 2013-2014 and 2014-2015
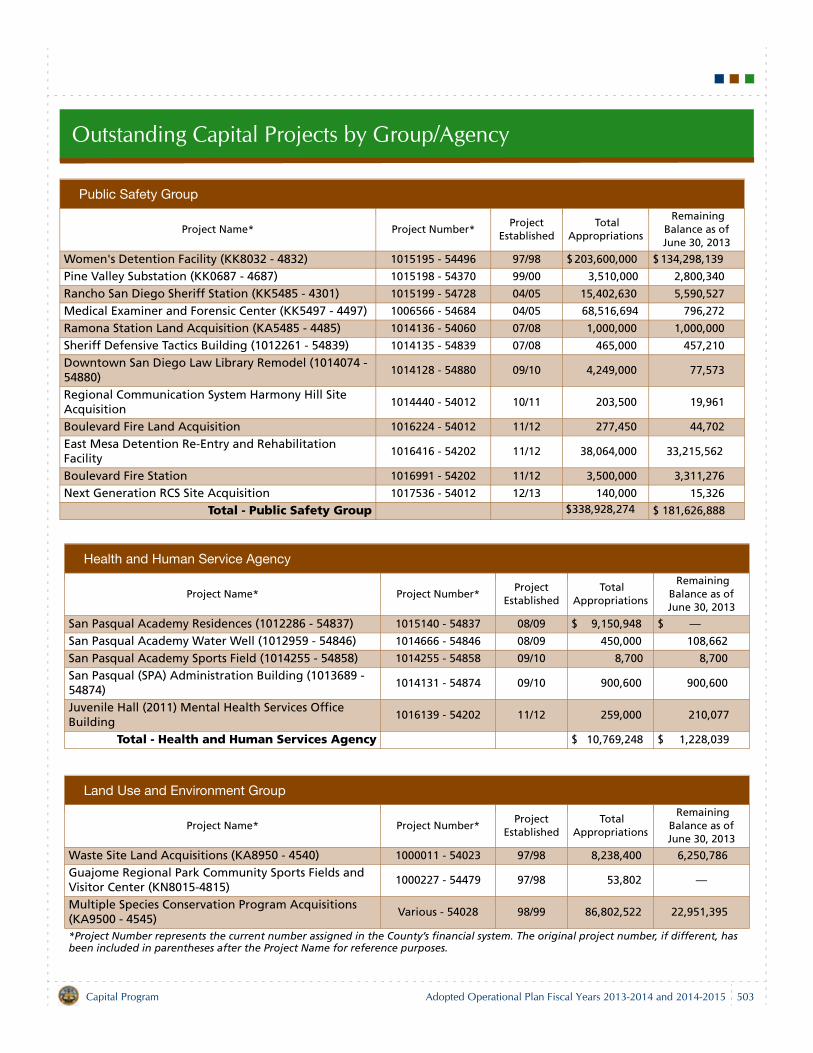
Outstanding Capital Projects by Group/Agency
Public Safety Group
Project Name* Project Number*Project
Established Total
Appropriations
Remaining Balance as of June 30, 2013
Women's Detention Facility (KK8032 - 4832) 1015195 - 54496 97/98 $ 203,600,000 $ 134,298,139
Pine Valley Substation (KK0687 - 4687) 1015198 - 54370 99/00 3,510,000 2,800,340
Rancho San Diego Sheriff Station (KK5485 - 4301) 1015199 - 54728 04/05 15,402,630 5,590,527
Medical Examiner and Forensic Center (KK5497 - 4497) 1006566 - 54684 04/05 68,516,694 796,272
Ramona Station Land Acquisition (KA5485 - 4485) 1014136 - 54060 07/08 1,000,000 1,000,000
Sheriff Defensive Tactics Building (1012261 - 54839) 1014135 - 54839 07/08 465,000 457,210
Downtown San Diego Law Library Remodel (1014074 -54880)
1014128 - 54880 09/10 4,249,000 77,573
Regional Communication System Harmony Hill Site Acquisition
1014440 - 54012 10/11 203,500 19,961
Boulevard Fire Land Acquisition 1016224 - 54012 11/12 277,450 44,702
East Mesa Detention Re-Entry and Rehabilitation Facility
1016416 - 54202 11/12 38,064,000 33,215,562
Boulevard Fire Station 1016991 - 54202 11/12 3,500,000 3,311,276
Next Generation RCS Site Acquisition 1017536 - 54012 12/13 140,000 15,326
Total - Public Safety Group $338,928,274 $ 181,626,888
Health and Human Service Agency
Project Name* Project Number*Project
Established Total
Appropriations
Remaining Balance as of June 30, 2013
San Pasqual Academy Residences (1012286 - 54837) 1015140 - 54837 08/09 $ 9,150,948 $ —
San Pasqual Academy Water Well (1012959 - 54846) 1014666 - 54846 08/09 450,000 108,662
San Pasqual Academy Sports Field (1014255 - 54858) 1014255 - 54858 09/10 8,700 8,700
San Pasqual (SPA) Administration Building (1013689 - 54874)
1014131 - 54874 09/10 900,600 900,600
Juvenile Hall (2011) Mental Health Services Office Building
1016139 - 54202 11/12 259,000 210,077
Total - Health and Human Services Agency $ 10,769,248 $ 1,228,039
Land Use and Environment Group
Project Name* Project Number*Project
Established Total
Appropriations
Remaining Balance as of June 30, 2013
Waste Site Land Acquisitions (KA8950 - 4540) 1000011 - 54023 97/98 8,238,400 6,250,786
Guajome Regional Park Community Sports Fields and Visitor Center (KN8015-4815)
1000227 - 54479 97/98 53,802 —
Multiple Species Conservation Program Acquisitions (KA9500 - 4545)
Various - 54028 98/99 86,802,522 22,951,395
*Project Number represents the current number assigned in the County’s financial system. The original project number, if different, has been included in parentheses after the Project Name for reference purposes.
Capital Program Adopted Operational Plan Fiscal Years 2013-2014 and 2014-2015 503
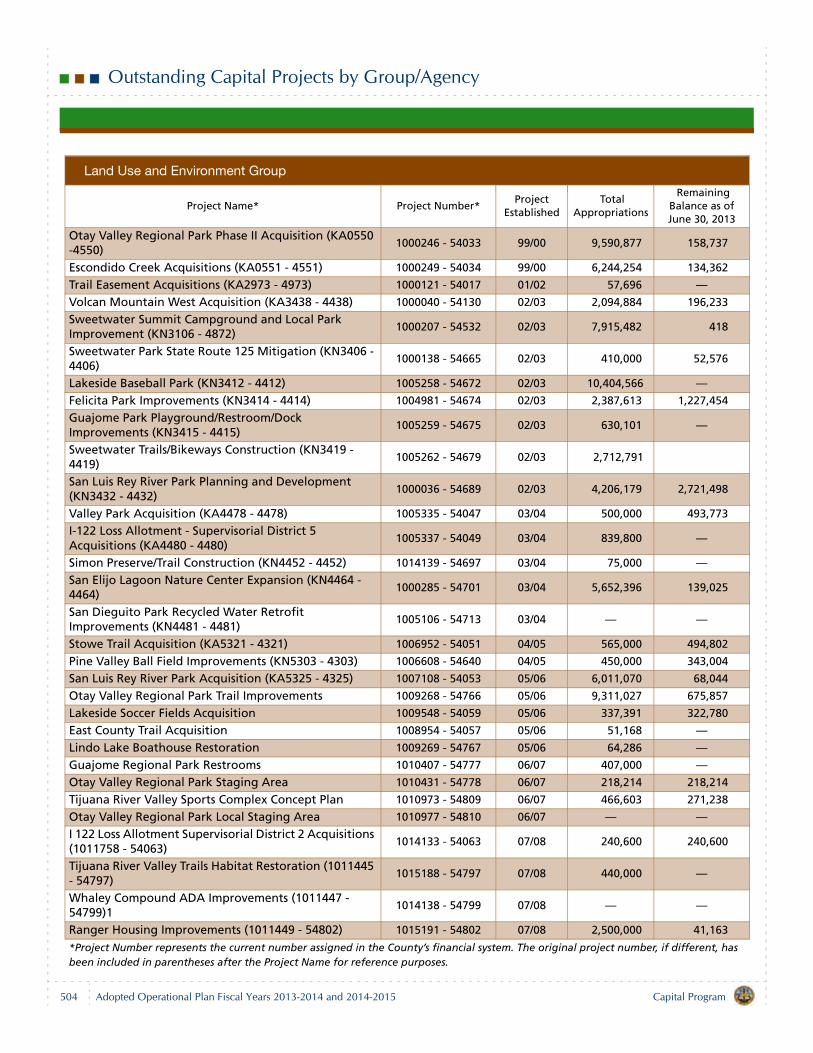
Outstanding Capital Projects by Group/Agency
Otay Valley Regional Park Phase II Acquisition (KA0550 -4550)
1000246 - 54033 99/00 9,590,877 158,737
Escondido Creek Acquisitions (KA0551 - 4551) 1000249 - 54034 99/00 6,244,254 134,362
Trail Easement Acquisitions (KA2973 - 4973) 1000121 - 54017 01/02 57,696 —
Volcan Mountain West Acquisition (KA3438 - 4438) 1000040 - 54130 02/03 2,094,884 196,233
Sweetwater Summit Campground and Local Park Improvement (KN3106 - 4872)
1000207 - 54532 02/03 7,915,482 418
Sweetwater Park State Route 125 Mitigation (KN3406 - 4406)
1000138 - 54665 02/03 410,000 52,576
Lakeside Baseball Park (KN3412 - 4412) 1005258 - 54672 02/03 10,404,566 —
Felicita Park Improvements (KN3414 - 4414) 1004981 - 54674 02/03 2,387,613 1,227,454
Guajome Park Playground/Restroom/Dock Improvements (KN3415 - 4415)
1005259 - 54675 02/03 630,101 —
Sweetwater Trails/Bikeways Construction (KN3419 - 4419)
1005262 - 54679 02/03 2,712,791
San Luis Rey River Park Planning and Development (KN3432 - 4432)
1000036 - 54689 02/03 4,206,179 2,721,498
Valley Park Acquisition (KA4478 - 4478) 1005335 - 54047 03/04 500,000 493,773
I-122 Loss Allotment - Supervisorial District 5 Acquisitions (KA4480 - 4480)
1005337 - 54049 03/04 839,800 —
Simon Preserve/Trail Construction (KN4452 - 4452) 1014139 - 54697 03/04 75,000 —
San Elijo Lagoon Nature Center Expansion (KN4464 - 4464)
1000285 - 54701 03/04 5,652,396 139,025
San Dieguito Park Recycled Water Retrofit Improvements (KN4481 - 4481)
1005106 - 54713 03/04 — —
Stowe Trail Acquisition (KA5321 - 4321) 1006952 - 54051 04/05 565,000 494,802
Pine Valley Ball Field Improvements (KN5303 - 4303) 1006608 - 54640 04/05 450,000 343,004
San Luis Rey River Park Acquisition (KA5325 - 4325) 1007108 - 54053 05/06 6,011,070 68,044
Otay Valley Regional Park Trail Improvements 1009268 - 54766 05/06 9,311,027 675,857
Lakeside Soccer Fields Acquisition 1009548 - 54059 05/06 337,391 322,780
East County Trail Acquisition 1008954 - 54057 05/06 51,168 —
Lindo Lake Boathouse Restoration 1009269 - 54767 05/06 64,286 —
Guajome Regional Park Restrooms 1010407 - 54777 06/07 407,000 —
Otay Valley Regional Park Staging Area 1010431 - 54778 06/07 218,214 218,214
Tijuana River Valley Sports Complex Concept Plan 1010973 - 54809 06/07 466,603 271,238
Otay Valley Regional Park Local Staging Area 1010977 - 54810 06/07 — —
I 122 Loss Allotment Supervisorial District 2 Acquisitions (1011758 - 54063)
1014133 - 54063 07/08 240,600 240,600
Tijuana River Valley Trails Habitat Restoration (1011445 - 54797)
1015188 - 54797 07/08 440,000 —
Whaley Compound ADA Improvements (1011447 - 54799)1
1014138 - 54799 07/08 — —
Ranger Housing Improvements (1011449 - 54802) 1015191 - 54802 07/08 2,500,000 41,163
*Project Number represents the current number assigned in the County’s financial system. The original project number, if different, has been included in parentheses after the Project Name for reference purposes.
Land Use and Environment Group
Project Name* Project Number*Project
Established Total
Appropriations
Remaining Balance as of June 30, 2013
504 Capital ProgramAdopted Operational Plan Fiscal Years 2013-2014 and 2014-2015
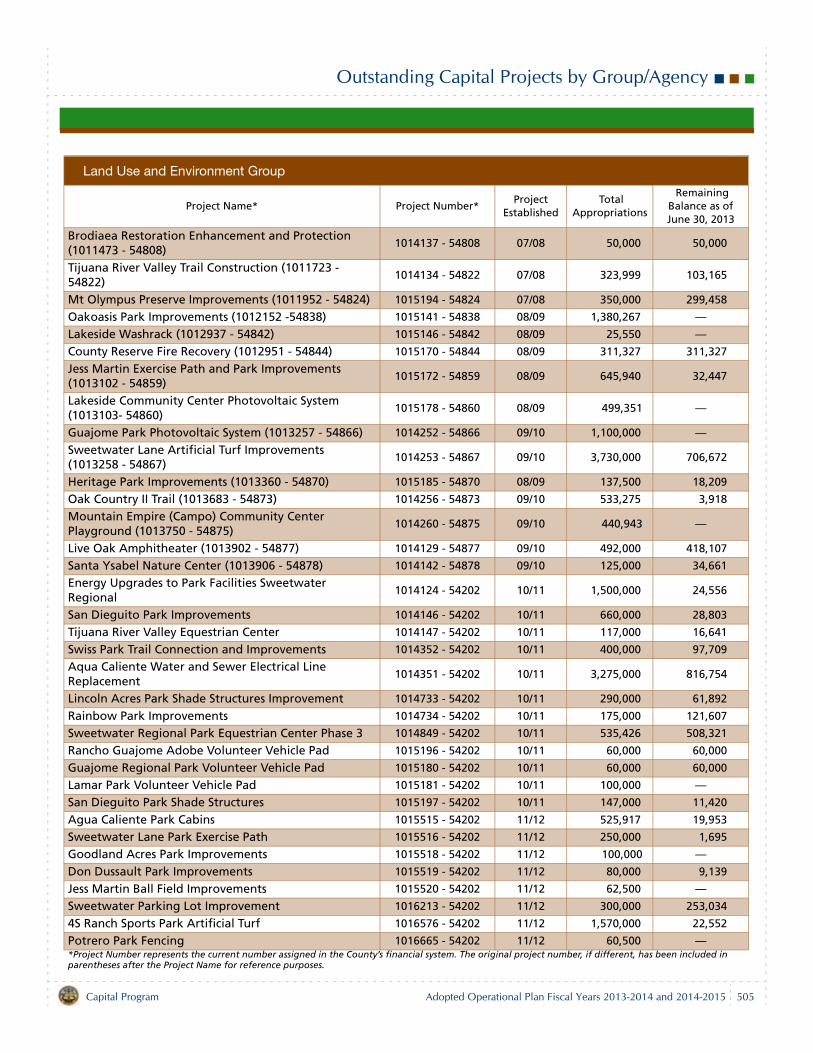
Outstanding Capital Projects by Group/Agency
Brodiaea Restoration Enhancement and Protection (1011473 - 54808)
1014137 - 54808 07/08 50,000 50,000
Tijuana River Valley Trail Construction (1011723 - 54822)
1014134 - 54822 07/08 323,999 103,165
Mt Olympus Preserve Improvements (1011952 - 54824) 1015194 - 54824 07/08 350,000 299,458
Oakoasis Park Improvements (1012152 -54838) 1015141 - 54838 08/09 1,380,267 —
Lakeside Washrack (1012937 - 54842) 1015146 - 54842 08/09 25,550 —
County Reserve Fire Recovery (1012951 - 54844) 1015170 - 54844 08/09 311,327 311,327
Jess Martin Exercise Path and Park Improvements (1013102 - 54859)
1015172 - 54859 08/09 645,940 32,447
Lakeside Community Center Photovoltaic System (1013103- 54860)
1015178 - 54860 08/09 499,351 —
Guajome Park Photovoltaic System (1013257 - 54866) 1014252 - 54866 09/10 1,100,000 —
Sweetwater Lane Artificial Turf Improvements (1013258 - 54867)
1014253 - 54867 09/10 3,730,000 706,672
Heritage Park Improvements (1013360 - 54870) 1015185 - 54870 08/09 137,500 18,209
Oak Country II Trail (1013683 - 54873) 1014256 - 54873 09/10 533,275 3,918
Mountain Empire (Campo) Community Center Playground (1013750 - 54875)
1014260 - 54875 09/10 440,943 —
Live Oak Amphitheater (1013902 - 54877) 1014129 - 54877 09/10 492,000 418,107
Santa Ysabel Nature Center (1013906 - 54878) 1014142 - 54878 09/10 125,000 34,661
Energy Upgrades to Park Facilities Sweetwater Regional
1014124 - 54202 10/11 1,500,000 24,556
San Dieguito Park Improvements 1014146 - 54202 10/11 660,000 28,803
Tijuana River Valley Equestrian Center 1014147 - 54202 10/11 117,000 16,641
Swiss Park Trail Connection and Improvements 1014352 - 54202 10/11 400,000 97,709
Aqua Caliente Water and Sewer Electrical Line Replacement
1014351 - 54202 10/11 3,275,000 816,754
Lincoln Acres Park Shade Structures Improvement 1014733 - 54202 10/11 290,000 61,892
Rainbow Park Improvements 1014734 - 54202 10/11 175,000 121,607
Sweetwater Regional Park Equestrian Center Phase 3 1014849 - 54202 10/11 535,426 508,321
Rancho Guajome Adobe Volunteer Vehicle Pad 1015196 - 54202 10/11 60,000 60,000
Guajome Regional Park Volunteer Vehicle Pad 1015180 - 54202 10/11 60,000 60,000
Lamar Park Volunteer Vehicle Pad 1015181 - 54202 10/11 100,000 —
San Dieguito Park Shade Structures 1015197 - 54202 10/11 147,000 11,420
Agua Caliente Park Cabins 1015515 - 54202 11/12 525,917 19,953
Sweetwater Lane Park Exercise Path 1015516 - 54202 11/12 250,000 1,695
Goodland Acres Park Improvements 1015518 - 54202 11/12 100,000 —
Don Dussault Park Improvements 1015519 - 54202 11/12 80,000 9,139
Jess Martin Ball Field Improvements 1015520 - 54202 11/12 62,500 —
Sweetwater Parking Lot Improvement 1016213 - 54202 11/12 300,000 253,034
4S Ranch Sports Park Artificial Turf 1016576 - 54202 11/12 1,570,000 22,552
Potrero Park Fencing 1016665 - 54202 11/12 60,500 —*Project Number represents the current number assigned in the County’s financial system. The original project number, if different, has been included in parentheses after the Project Name for reference purposes.
Land Use and Environment Group
Project Name* Project Number*Project
Established Total
Appropriations
Remaining Balance as of June 30, 2013
Capital Program Adopted Operational Plan Fiscal Years 2013-2014 and 2014-2015 505
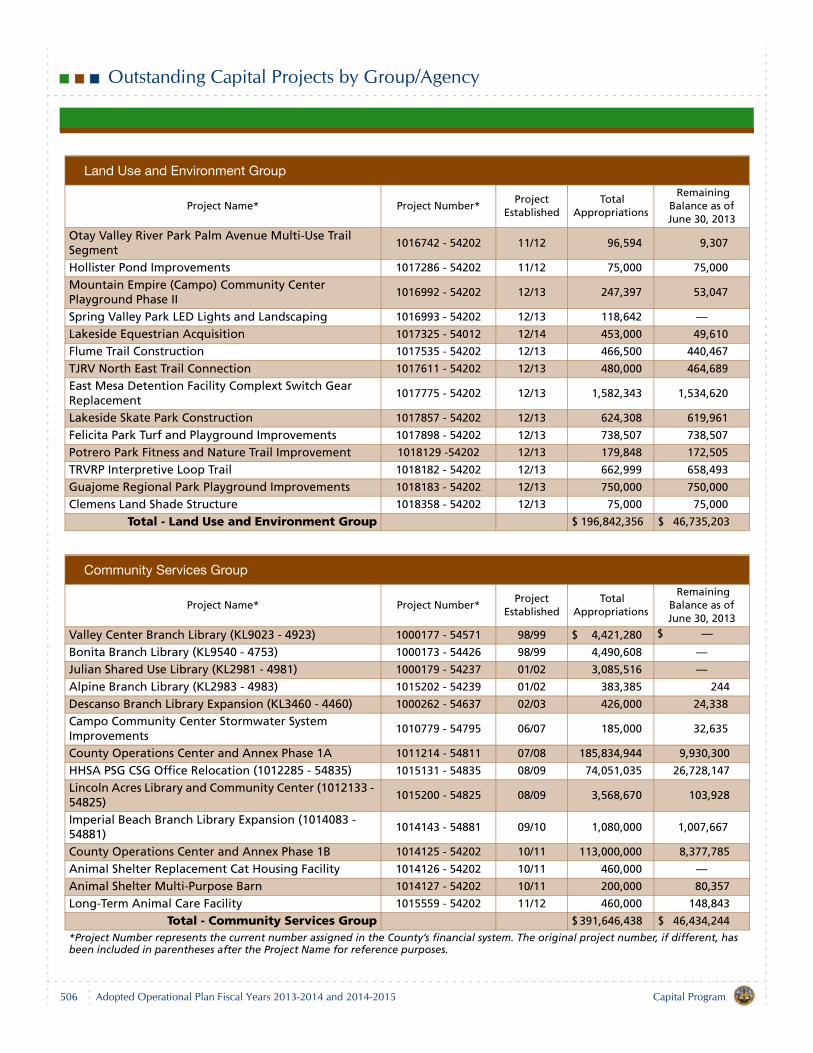
Outstanding Capital Projects by Group/Agency
Otay Valley River Park Palm Avenue Multi-Use Trail Segment
1016742 - 54202 11/12 96,594 9,307
Hollister Pond Improvements 1017286 - 54202 11/12 75,000 75,000
Mountain Empire (Campo) Community Center Playground Phase II
1016992 - 54202 12/13 247,397 53,047
Spring Valley Park LED Lights and Landscaping 1016993 - 54202 12/13 118,642 —
Lakeside Equestrian Acquisition 1017325 - 54012 12/14 453,000 49,610
Flume Trail Construction 1017535 - 54202 12/13 466,500 440,467
TJRV North East Trail Connection 1017611 - 54202 12/13 480,000 464,689
East Mesa Detention Facility Complext Switch Gear Replacement
1017775 - 54202 12/13 1,582,343 1,534,620
Lakeside Skate Park Construction 1017857 - 54202 12/13 624,308 619,961
Felicita Park Turf and Playground Improvements 1017898 - 54202 12/13 738,507 738,507
Potrero Park Fitness and Nature Trail Improvement 1018129 -54202 12/13 179,848 172,505
TRVRP Interpretive Loop Trail 1018182 - 54202 12/13 662,999 658,493
Guajome Regional Park Playground Improvements 1018183 - 54202 12/13 750,000 750,000
Clemens Land Shade Structure 1018358 - 54202 12/13 75,000 75,000
Total - Land Use and Environment Group $ 196,842,356 $ 46,735,203
Community Services Group
Project Name* Project Number*Project
Established Total
Appropriations
Remaining Balance as of June 30, 2013
Valley Center Branch Library (KL9023 - 4923) 1000177 - 54571 98/99 $ 4,421,280 $ —
Bonita Branch Library (KL9540 - 4753) 1000173 - 54426 98/99 4,490,608 —
Julian Shared Use Library (KL2981 - 4981) 1000179 - 54237 01/02 3,085,516 —
Alpine Branch Library (KL2983 - 4983) 1015202 - 54239 01/02 383,385 244
Descanso Branch Library Expansion (KL3460 - 4460) 1000262 - 54637 02/03 426,000 24,338
Campo Community Center Stormwater System Improvements
1010779 - 54795 06/07 185,000 32,635
County Operations Center and Annex Phase 1A 1011214 - 54811 07/08 185,834,944 9,930,300
HHSA PSG CSG Office Relocation (1012285 - 54835) 1015131 - 54835 08/09 74,051,035 26,728,147
Lincoln Acres Library and Community Center (1012133 - 54825)
1015200 - 54825 08/09 3,568,670 103,928
Imperial Beach Branch Library Expansion (1014083 - 54881)
1014143 - 54881 09/10 1,080,000 1,007,667
County Operations Center and Annex Phase 1B 1014125 - 54202 10/11 113,000,000 8,377,785
Animal Shelter Replacement Cat Housing Facility 1014126 - 54202 10/11 460,000 —
Animal Shelter Multi-Purpose Barn 1014127 - 54202 10/11 200,000 80,357
Long-Term Animal Care Facility 1015559 - 54202 11/12 460,000 148,843
Total - Community Services Group $ 391,646,438 $ 46,434,244*Project Number represents the current number assigned in the County’s financial system. The original project number, if different, has been included in parentheses after the Project Name for reference purposes.
Land Use and Environment Group
Project Name* Project Number*Project
Established Total
Appropriations
Remaining Balance as of June 30, 2013
506 Capital ProgramAdopted Operational Plan Fiscal Years 2013-2014 and 2014-2015
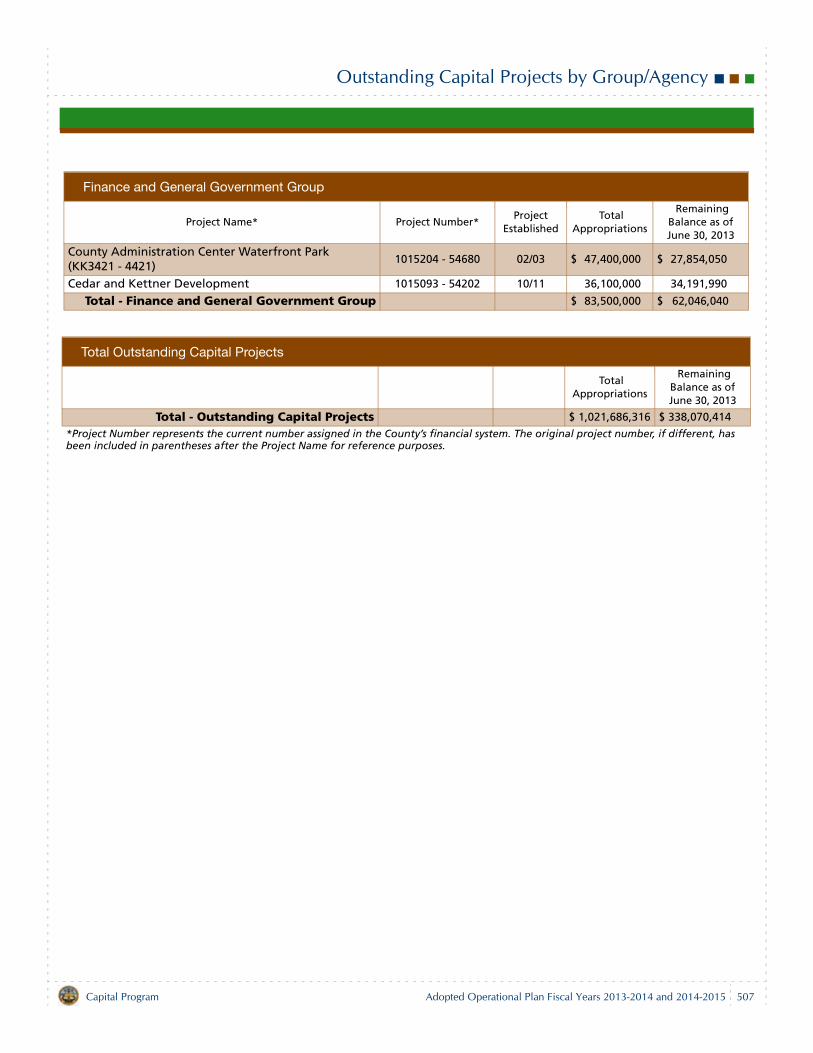
Outstanding Capital Projects by Group/Agency
Finance and General Government Group
Project Name* Project Number*Project
Established Total
Appropriations
Remaining Balance as of June 30, 2013
County Administration Center Waterfront Park (KK3421 - 4421)
1015204 - 54680 02/03 $ 47,400,000 $ 27,854,050
Cedar and Kettner Development 1015093 - 54202 10/11 36,100,000 34,191,990
Total - Finance and General Government Group $ 83,500,000 $ 62,046,040
Total Outstanding Capital Projects
Total Appropriations
Remaining Balance as of June 30, 2013
Total - Outstanding Capital Projects $ 1,021,686,316 $ 338,070,414*Project Number represents the current number assigned in the County’s financial system. The original project number, if different, has been included in parentheses after the Project Name for reference purposes.
Capital Program Adopted Operational Plan Fiscal Years 2013-2014 and 2014-2015 507

County of San Diego
Finance Other
Finance Other 511

Finance Other
Description
Finance Other includes miscellaneous funds and programs that are predominantly Countywide in nature, have no staffing associated with them or exist for proper budgetary accounting purposes. Responsibility for these funds and programs rests primarily with departments in the Finance and General Government Group.
The funding levels for these programs are explained below and shown in the table that follows.
Cash BorrowingThese appropriations fund the cost of financing theCounty's short-term cash borrowing program. During thecourse of the fiscal year, the County could experience tem-porary shortfalls in available cash due to the timing ofexpenditures and receipt of revenues. To meet these cashflow needs, the County issues Tax and Revenue Anticipa-tion Notes (TRANs). Typically, TRANs are issued at thebeginning of the fiscal year and mature at the end of thatfiscal year. The TRAN amount for Fiscal Year 2013-14 is$60.0 million. See also the section of this document onDebt Management Policies and Obligations.
Community EnhancementThe Community Enhancement program provides grantfunding for cultural activities, museums, visitor and conven-tion bureaus, economic development councils and othersimilar institutions that promote and generate tourism and/or economic development at the regional and communitylevels throughout San Diego County. Per Board of Supervi-sors Policy B-58, Funding of the Community EnhancementProgram, the amount of funding available for the Commu-nity Enhancement program approximately equals theamount of Transient Occupancy Tax (TOT) revenues esti-mated to be collected each fiscal year. Applications forgrants are submitted to the Board of Supervisors by March1 for the upcoming fiscal year, with approval of projectsgiven through the budget adoption process. The fundinglevel for Fiscal Year 2013-14 is budgeted at $2.68 million,$2.6 million of which reflects anticipated TOT revenues. Theadditional $0.08 million is a one-time appropriation basedon General Fund fund balance from over-realized TOT reve-nues in Fiscal Year 2011-12.
Neighborhood Reinvestment ProgramThe Neighborhood Reinvestment Program (formerly Com-munity Projects) is governed by Board of Supervisors PolicyB-72, Neighborhood Reinvestment Program, and providesgrant funds to County departments, public agencies, andnonprofit community organizations for one-time community,social, environmental, educational, cultural or recreationalneeds. Resources available for the program are subject tobudget priorities as established by the Board of Supervi-sors. Recommendations for grant awards are madethroughout the year by individual Board members subjectto approval by the Board of Supervisors as a whole. Thefunding source is General Fund fund balance. The fundinglevel for Fiscal Year 2013-14 is budgeted at $5.0 million.
Contributions to County Library SystemFor Fiscal Year 2013-14, a one-time appropriation of $0.9million was established in Contributions to the CountyLibrary System for various maintenance and enhancementprojects to libraries throughout the county. No appropria-tions are projected for Fiscal Year 2014-15.
Contingency Reserve - General FundA Contingency Reserve of $20.0 million is budgeted for Fis-cal Year 2013-14 and $20.0 million is approved for FiscalYear 2014-15. These appropriations comply with the targetof 2% of General Purpose Revenue (GPR) for the Contin-gency Reserve as outlined in Board Policy B-71, Fund Bal-ance and Reserves. At $20.0 million, the ContingencyReserve represents 2.0% of the Fiscal Year 2013-14 bud-geted GPR and Fiscal Year 2014-15 estimated GPR ($978.0million and $986.1 million, respectively). These appropria-tions are a source of funding for unanticipated needs,
Finance Other Adopted Operational Plan Fiscal Years 2013-2014 and 2014-2015 511
Finance Other
events or for various uncertainties that may occur duringthe fiscal year. It also provides a cushion in the event of rev-enue shortfalls.
Contributions to Capital ProgramThese appropriations represent the General Fund cost fornew or augmented capital development or land acquisitionprojects. For Fiscal Year 2013-14, $43.9 million is budgetedin the Contributions to Capital Program. Of this total, $9.8million is for a new Alpine Library, $8.4 million is for a newImperial Beach Library and to improve the connectivity withthe Imperial Beach Community Center, $10.0 million is forthe acquisition of land under the Multiple Species Conser-vation Program (MSCP), $2.0 million is for the Lake MorenaElectrical Upgrade, $5.0 million is for the Assessor,Recorder, County Clerk (ARCC) El Cajon Branch OfficeBuilding to replace the existing facility, $1.8 million is for theSan Elijo Gateway Property Acquisition, $1.0 million is forthe San Diego Botanic Garden Acquisition, $2.5 million isfor the 4S Ranch Synthetic Turf South Ball Fields, $3.1 mil-lion is for the San Luis Rey River Park Acquisition and $0.3million is for the 4S Ranch shade structure.
For Fiscal Year 2014-15, $2.5 million is recommended forMSCP land acquisition.
Lease Payments - Capital ProjectsThe appropriations for this program are for the annual leasepayments due to the San Diego County Capital Asset Leas-ing Corporation (SANCAL) and the San Diego RegionalBuilding Authority (SDRBA) on the County's outstandingCertificates of Participation (COPs) and Lease RevenueBonds, the proceeds of which were used to finance variouscapital projects. The budget of $38.7 million in Fiscal Year2013-14 is a net decrease of $4.6 million from the FiscalYear 2012-13 Adopted Operational Plan as a result ofdecreases in certain scheduled leases, partially offset bythe start of a lease payment for the Cedar & Kettner Devel-opment Project.
The Fiscal Year 2014-15 payments are estimated at $37.2million, a net decrease of $1.5 million. See the Capital Pro-gram section of this document for the detail on the leasepurchase payments.
Commitment for Unforeseen Catastrophic EventsIn Fiscal Year 2007-08, the Board of Supervisors estab-lished a Commitment for Unforeseen Catastrophic Events,previously identified as a General Reserve, of $55.5 million.
Once established, only changes to the commitment areshown in subsequent budgets. Government Code §§29085-29086 allows for the creation of this commitment andrestricts the ability to decrease this amount to only the timeof budget adoption. Subsequent to budget adoption, thecommitment may be increased, but amounts may only beused for legally declared emergencies as defined in Gov-ernment Code §29127. The amount of the County's Com-mitment for Unforeseen Catastrophic Events is governed byBoard Policy B-71, Fund Balance and Reserves, which setsa target amount that is equivalent to 5% of budgeted GPR.At $55.5 million, it equates to 5.7% of Fiscal Year 2013-14budgeted GPR of $978.0 million and, therefore, exceedsthe 5% target level. No additional contribution to the com-mitment is projected for Fiscal Year 2014-15 because thebalance is anticipated to remain in excess of the 5% target.
General Fund Minimum Fund Balance for Economic UncertaintyBoard Policy B-71, Fund Balance and Reserves, requiresthat the County maintain prudent levels of fund balance andreserves to help ensure fiscal stability and establishes tar-get levels for the Contingency Reserve, the Commitment forUnforeseen Catastrophic Events and a General Fund Mini-mum Fund Balance for Economic Uncertainty. The first twoof these three components are discussed above. For thethird component, the target requires that a minimumamount of unassigned fund balance equivalent to 10% ofthe budgeted GPR be available for economic uncertainty. InFiscal Year 2009-10, the Board of Supervisors established aGeneral Fund Minimum Fund Balance for Economic Uncer-tainty, previously identified as a Designation, at $100.0 mil-lion, slightly above the 10% level. In accordance withGovernment Accounting Standards Board Statement Num-ber 54, Fund Balance Reporting and Governmental FundType Definitions (GASB 54), the amount representing theMinimum Fund Balance for Economic Uncertainty wasreported in the County of San Diego Comprehensive AnnualFinancial Report as unassigned fund balance starting in Fis-cal Year 2010-11. For Fiscal Year 2013-14, the 10% targetlevel is $97.8 million, but the original $100.0 million amountwill remain in place. For Fiscal Year 2014-15, the 10% tar-get level is projected to be $98.6 million, under the $100.0million which will remain in place.
512 Finance OtherAdopted Operational Plan Fiscal Years 2013-2014 and 2014-2015
Finance Other
Countywide General ExpensesThe primary objective of these appropriations is to fundCountywide projects and other Countywide needs. Bud-geted at $28.0 million, the major components of theCountywide General Expenses program in Fiscal Year2013-14 are:
A Pension Stabilization Fund in anticipation of higherpayments to the County's retirement fund in futureyears.Contribution to the Information Technology (IT) InternalService Fund to support the Countywide component ofthe IT outsourcing contract.Contribution to the Employee Benefits Internal ServiceFund to support workers' compensation costs basedon the transfer settlement between the County and theState for pre-calendar year 2000 workers'compensation cases for court employees.Pension payments required by the County EmployeesRetirement Law that must be paid by the County inaccordance with Internal Revenue Code §415(m).Miscellaneous appropriations for unanticipatedprogram needs.
Countywide Shared Major MaintenanceIn Fiscal Year 2013-14, appropriations totaling $1.7 millionare budgeted for major maintenance projects at Countyfacilities that are shared by departments from multiplegroups. The funding level for Fiscal Year 2014-15 is pro-jected to be $2.0 million. Appropriations for major mainte-nance projects are otherwise budgeted by the department/group that directly benefits from the improvements.
Employee Benefits Internal Service FundIn Fiscal Year 1994-95, the County established anEmployee Benefits Internal Service Fund (ISF) to report allof its employee risk management activities. The appropria-tions for this fund support claim payments and administra-tive costs of the County's self-insured workers'compensation program and unemployment insurance pro-gram expenses.
Workers' compensation rates (premiums) are charged toindividual departments based on that department's ten-year experience (claim history) and the department's riskfactor based on its blend of occupational groups as estab-lished by the Workers' Compensation Insurance RatingBureau (WCIRB) of California. WCIRB has developed aclassification system based on potential risk of injury. Anannual actuarial assessment is prepared by an actuary to
estimate the liability and capture the costs associated withall reported and unreported claims. As of June 30, 2012, theestimated liability was $113.0 million and the cash balancewas $106.6 million. As of June 30, 2013, the estimated lia-bility increased to $132.5 million and the cash balance as ofJune 30, 2013 is $108.0 million. Appropriations for FiscalYear 2013-14 reflect a $6.3 million increase in the workers'compensation budget from the Fiscal Year 2012-13Adopted Operational Plan primarily due to increased claimspayments and an increase in the Contingency Reserve to$3.0 million. A $3.0 million Contingency Reserve is plannedfor Fiscal Year 2014-15.
The County is self-insured for unemployment benefit costsand therefore must reimburse the State for any unemploy-ment benefit payments that are attributed to a claimant'sprevious employment with the County. County departmentsprovide the funding source for these payments. Beginningin Fiscal Year 2010-11, unemployment insurance rates (pre-miums) are charged to departments based 70% on eachdepartment's five-year claims experience and 30% on bud-geted staffing levels. Budgeted appropriations for FiscalYear 2013-14 reflect a $0.3 million decrease over the FiscalYear 2012-13 Adopted Operational Plan, primarily due todecreased claims payments.
Local Agency Formation Commission AdministrationThese appropriations reflect the County's contribution tothe San Diego Local Agency Formation Commission(LAFCo) in accordance with provisions in GovernmentCode §56381. LAFCo is a State chartered regulatoryagency with countywide authority. LAFCo performs studiesand renders jurisdictional decisions affecting the boundar-ies and government structure of cities and special districts.Through Fiscal Year 2000-01, LAFCo was funded exclu-sively by the County and user fees. Beginning with FiscalYear 2001-02, funding for LAFCo is shared by the County,the 18 cities, 61 independent special districts in San DiegoCounty as well as user fees. Appropriations of $0.4 millionare budgeted for Fiscal Year 2013-14 and $0.4 million areprojected for Fiscal Year 2014-15.
Public Liability Internal Service FundIn Fiscal Year 1994-1995, the County established the PublicLiability Internal Service Fund (ISF) to report all of its publicrisk management activities. The County is self-insuredthrough the ISF for premises liability at medical facilities,medical malpractice, errors and omissions, false arrest,forgery, automobile and general liability. The cost to General
Finance Other Adopted Operational Plan Fiscal Years 2013-2014 and 2014-2015 513
Finance Other
Fund departments, other funds and special districts is dis-tributed based on a weighted risk factor: 90% allocatedbased on the last five years' loss experience and 10%based on staff hours of exposure. The County contractswith an actuary to annually assess the long-term liability ofthe fund to determine an adequate level of reserves. Theestimated liability for June 30, 2012 was $25.9 million. As ofJune 30, 2012, the fund had a cash balance of $35.5 mil-lion. The estimated liability for June 30, 2013 decreased to$24.0 million and the cash balance as of June 30, 2013 is$40.5 million. The budgeted appropriations of $18.9 millionin Fiscal Year 2013-14 are offset by $13.8 million in chargesto departments, $5.0 million of available fund balance tomitigate unanticipated expenses and $0.1 million in interestearnings of the fund.
Pension Obligation BondsThe appropriations for this debt service fund reflect thescheduled principal and interest payments and relatedadministrative expenses for the 2002, 2004, and the 2008
taxable Pension Obligation Bonds (POBs). With the finalprepayment of eligible taxable POBs, the remaining princi-pal and interest payments are structured as level debt ser-vice in the amount of $81.5 million annually. See the DebtManagement Policies and Obligations section of this docu-ment on page 96 for more information on the POBs, includ-ing the history, outstanding principal and scheduledpayments.
Debt Service Local BoardsThis represents the debt service payment for MajesticPines, which was issued in January 1973 for the construc-tion of a water distribution system in the Julian area. Thecost was offset by a special assessment on propertieslocated within the service area. The debt was paid off inJanuary 2012, therefore no further appropriations will bebudgeted for Majestic Pines.
514 Finance OtherAdopted Operational Plan Fiscal Years 2013-2014 and 2014-2015
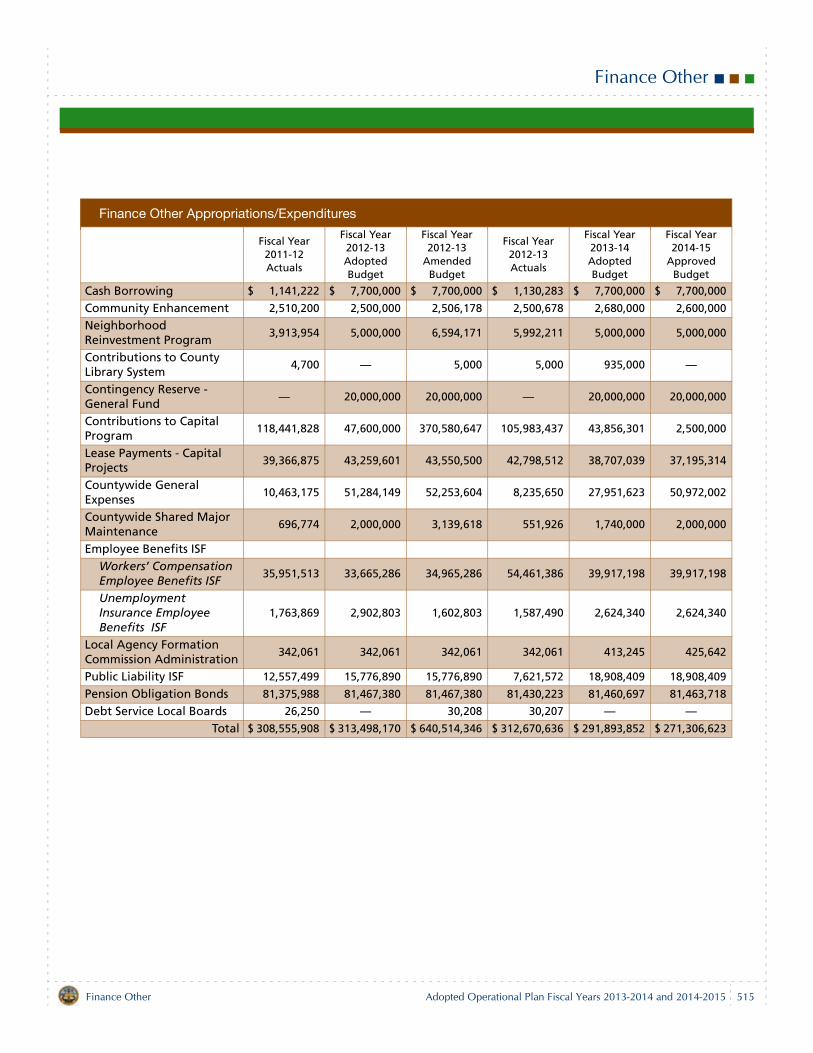
Finance Other
Finance Other Appropriations/Expenditures
Fiscal Year2011-12Actuals
Fiscal Year2012-13AdoptedBudget
Fiscal Year2012-13
AmendedBudget
Fiscal Year2012-13Actuals
Fiscal Year2013-14AdoptedBudget
Fiscal Year2014-15
ApprovedBudget
Cash Borrowing $ 1,141,222 $ 7,700,000 $ 7,700,000 $ 1,130,283 $ 7,700,000 $ 7,700,000
Community Enhancement 2,510,200 2,500,000 2,506,178 2,500,678 2,680,000 2,600,000
Neighborhood Reinvestment Program
3,913,954 5,000,000 6,594,171 5,992,211 5,000,000 5,000,000
Contributions to County Library System
4,700 — 5,000 5,000 935,000 —
Contingency Reserve - General Fund
— 20,000,000 20,000,000 — 20,000,000 20,000,000
Contributions to Capital Program
118,441,828 47,600,000 370,580,647 105,983,437 43,856,301 2,500,000
Lease Payments - Capital Projects
39,366,875 43,259,601 43,550,500 42,798,512 38,707,039 37,195,314
Countywide General Expenses
10,463,175 51,284,149 52,253,604 8,235,650 27,951,623 50,972,002
Countywide Shared Major Maintenance
696,774 2,000,000 3,139,618 551,926 1,740,000 2,000,000
Employee Benefits ISFWorkers’ Compensation Employee Benefits ISF
35,951,513 33,665,286 34,965,286 54,461,386 39,917,198 39,917,198
Unemployment Insurance Employee Benefits ISF
1,763,869 2,902,803 1,602,803 1,587,490 2,624,340 2,624,340
Local Agency Formation Commission Administration
342,061 342,061 342,061 342,061 413,245 425,642
Public Liability ISF 12,557,499 15,776,890 15,776,890 7,621,572 18,908,409 18,908,409
Pension Obligation Bonds 81,375,988 81,467,380 81,467,380 81,430,223 81,460,697 81,463,718
Debt Service Local Boards 26,250 — 30,208 30,207 — —
Total $ 308,555,908 $ 313,498,170 $ 640,514,346 $ 312,670,636 $ 291,893,852 $ 271,306,623
Finance Other Adopted Operational Plan Fiscal Years 2013-2014 and 2014-2015 515

County of San Diego
Appendices
Appendix A: All Funds - Budget Summary 519
Appendix B: Budget Summary and Changes in Fund Balance 531
Appendix C: General Fund Budget Summary 546
Appendix D: Health & Human Services—General Fund 551
Appendix E: Operational Plan Abbreviationsand Acronyms 553
Appendix F: Glossary of Operational Plan Terms 555

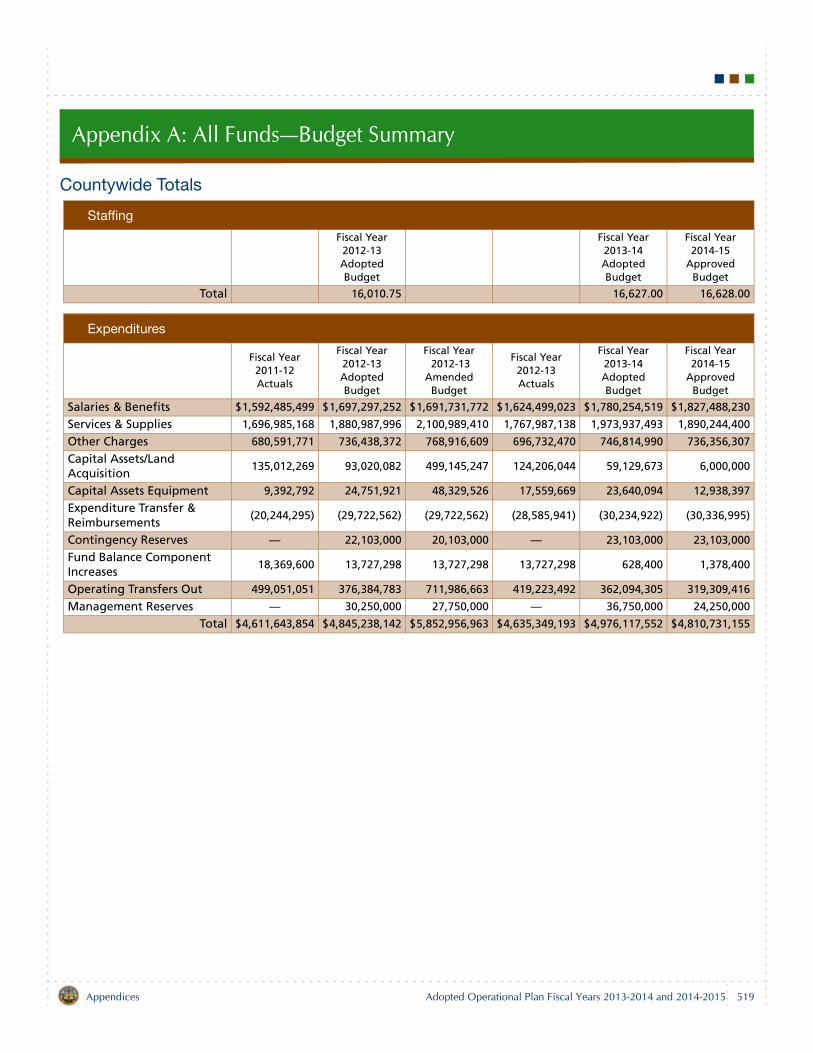
Appendix A: All Funds—Budget Summary
Countywide Totals
Staffing
Fiscal Year2012-13Adopted Budget
Fiscal Year2013-14Adopted Budget
Fiscal Year2014-15
Approved Budget
Total 16,010.75 16,627.00 16,628.00
Expenditures
Fiscal Year 2011-12Actuals
Fiscal Year2012-13Adopted Budget
Fiscal Year 2012-13
Amended Budget
Fiscal Year2012-13Actuals
Fiscal Year2013-14Adopted Budget
Fiscal Year2014-15
Approved Budget
Salaries & Benefits $1,592,485,499 $1,697,297,252 $1,691,731,772 $1,624,499,023 $1,780,254,519 $1,827,488,230
Services & Supplies 1,696,985,168 1,880,987,996 2,100,989,410 1,767,987,138 1,973,937,493 1,890,244,400
Other Charges 680,591,771 736,438,372 768,916,609 696,732,470 746,814,990 736,356,307
Capital Assets/Land Acquisition
135,012,269 93,020,082 499,145,247 124,206,044 59,129,673 6,000,000
Capital Assets Equipment 9,392,792 24,751,921 48,329,526 17,559,669 23,640,094 12,938,397
Expenditure Transfer & Reimbursements
(20,244,295) (29,722,562) (29,722,562) (28,585,941) (30,234,922) (30,336,995)
Contingency Reserves — 22,103,000 20,103,000 — 23,103,000 23,103,000
Fund Balance Component Increases
18,369,600 13,727,298 13,727,298 13,727,298 628,400 1,378,400
Operating Transfers Out 499,051,051 376,384,783 711,986,663 419,223,492 362,094,305 319,309,416
Management Reserves — 30,250,000 27,750,000 — 36,750,000 24,250,000
Total $4,611,643,854 $4,845,238,142 $5,852,956,963 $4,635,349,193 $4,976,117,552 $4,810,731,155
519Appendices Adopted Operational Plan Fiscal Years 2013-2014 and 2014-2015
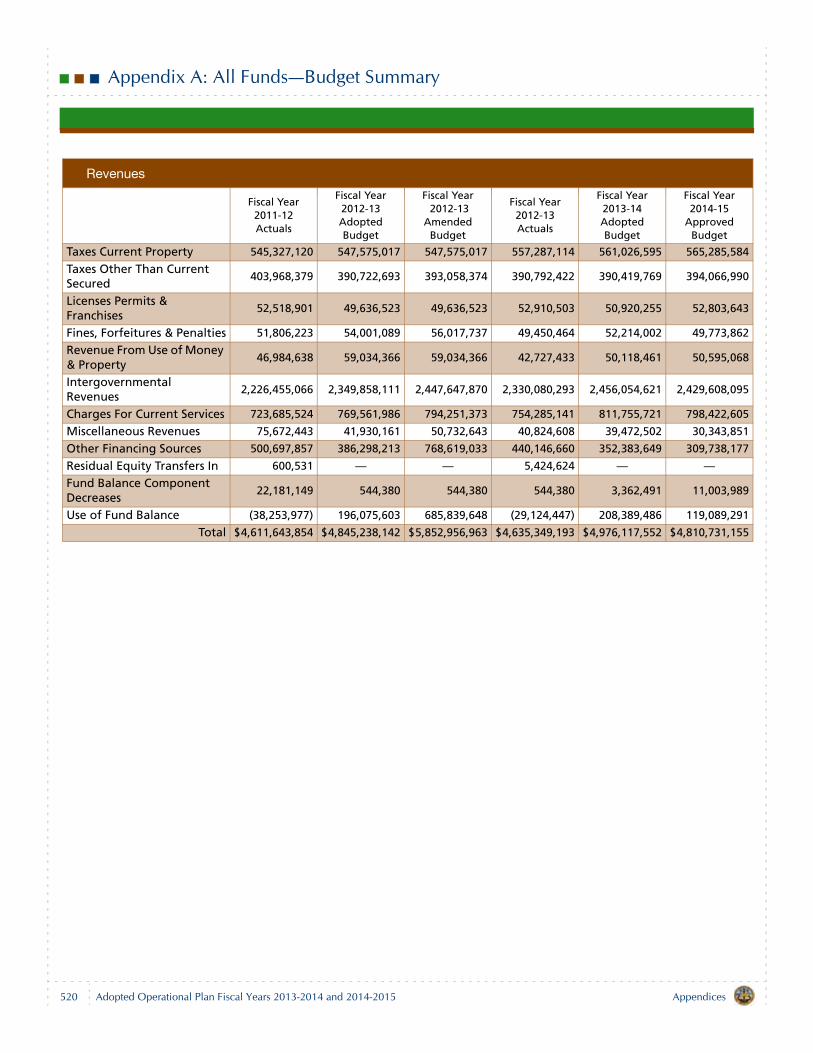
Appendix A: All Funds—Budget Summary
Revenues
Fiscal Year 2011-12Actuals
Fiscal Year2012-13Adopted Budget
Fiscal Year 2012-13
Amended Budget
Fiscal Year2012-13Actuals
Fiscal Year2013-14Adopted Budget
Fiscal Year2014-15
Approved Budget
Taxes Current Property 545,327,120 547,575,017 547,575,017 557,287,114 561,026,595 565,285,584
Taxes Other Than Current Secured
403,968,379 390,722,693 393,058,374 390,792,422 390,419,769 394,066,990
Licenses Permits & Franchises
52,518,901 49,636,523 49,636,523 52,910,503 50,920,255 52,803,643
Fines, Forfeitures & Penalties 51,806,223 54,001,089 56,017,737 49,450,464 52,214,002 49,773,862
Revenue From Use of Money & Property
46,984,638 59,034,366 59,034,366 42,727,433 50,118,461 50,595,068
Intergovernmental Revenues
2,226,455,066 2,349,858,111 2,447,647,870 2,330,080,293 2,456,054,621 2,429,608,095
Charges For Current Services 723,685,524 769,561,986 794,251,373 754,285,141 811,755,721 798,422,605
Miscellaneous Revenues 75,672,443 41,930,161 50,732,643 40,824,608 39,472,502 30,343,851
Other Financing Sources 500,697,857 386,298,213 768,619,033 440,146,660 352,383,649 309,738,177
Residual Equity Transfers In 600,531 — — 5,424,624 — —Fund Balance Component Decreases
22,181,149 544,380 544,380 544,380 3,362,491 11,003,989
Use of Fund Balance (38,253,977) 196,075,603 685,839,648 (29,124,447) 208,389,486 119,089,291
Total $4,611,643,854 $4,845,238,142 $5,852,956,963 $4,635,349,193 $4,976,117,552 $4,810,731,155
520 AppendicesAdopted Operational Plan Fiscal Years 2013-2014 and 2014-2015
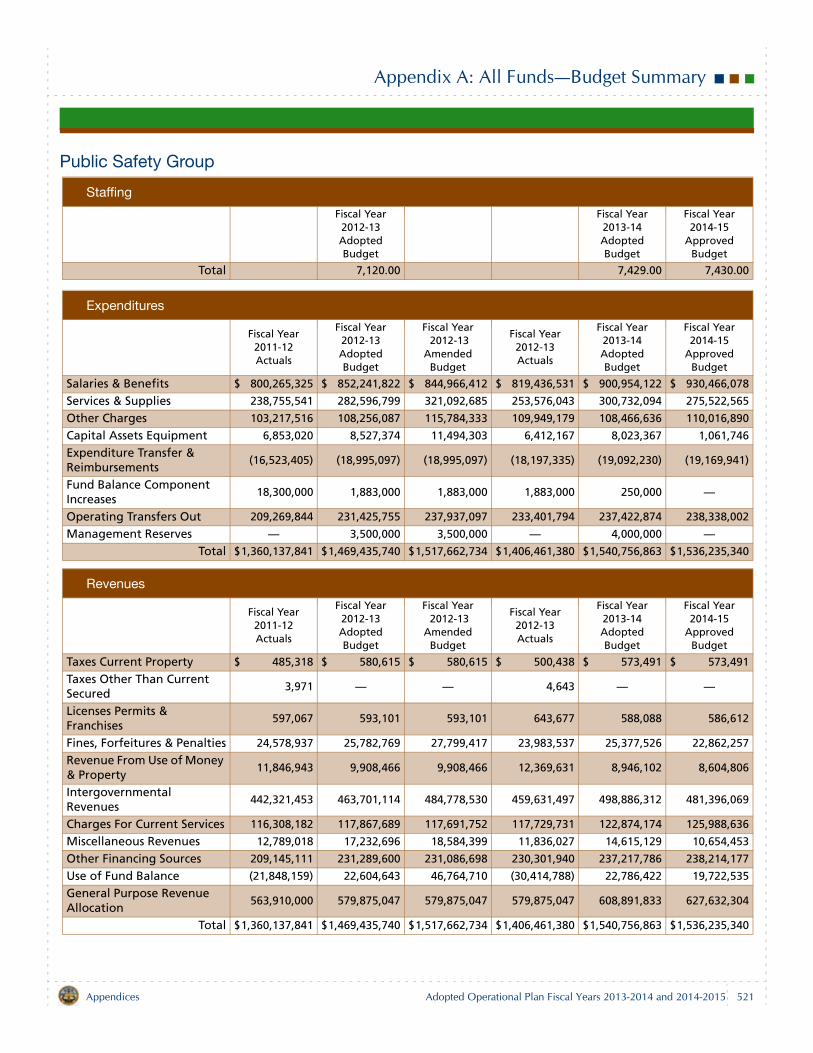
Appendix A: All Funds—Budget Summary
Public Safety Group
Staffing
Fiscal Year2012-13Adopted Budget
Fiscal Year2013-14Adopted Budget
Fiscal Year2014-15
Approved Budget
Total 7,120.00 7,429.00 7,430.00
Expenditures
Fiscal Year 2011-12Actuals
Fiscal Year2012-13Adopted Budget
Fiscal Year 2012-13
Amended Budget
Fiscal Year2012-13Actuals
Fiscal Year2013-14Adopted Budget
Fiscal Year2014-15
Approved Budget
Salaries & Benefits $ 800,265,325 $ 852,241,822 $ 844,966,412 $ 819,436,531 $ 900,954,122 $ 930,466,078
Services & Supplies 238,755,541 282,596,799 321,092,685 253,576,043 300,732,094 275,522,565
Other Charges 103,217,516 108,256,087 115,784,333 109,949,179 108,466,636 110,016,890
Capital Assets Equipment 6,853,020 8,527,374 11,494,303 6,412,167 8,023,367 1,061,746
Expenditure Transfer & Reimbursements
(16,523,405) (18,995,097) (18,995,097) (18,197,335) (19,092,230) (19,169,941)
Fund Balance Component Increases
18,300,000 1,883,000 1,883,000 1,883,000 250,000 —
Operating Transfers Out 209,269,844 231,425,755 237,937,097 233,401,794 237,422,874 238,338,002
Management Reserves — 3,500,000 3,500,000 — 4,000,000 —Total $1,360,137,841 $1,469,435,740 $1,517,662,734 $1,406,461,380 $1,540,756,863 $1,536,235,340
Revenues
Fiscal Year 2011-12Actuals
Fiscal Year2012-13Adopted Budget
Fiscal Year 2012-13
Amended Budget
Fiscal Year2012-13Actuals
Fiscal Year2013-14Adopted Budget
Fiscal Year2014-15
Approved Budget
Taxes Current Property $ 485,318 $ 580,615 $ 580,615 $ 500,438 $ 573,491 $ 573,491
Taxes Other Than Current Secured
3,971 — — 4,643 — —
Licenses Permits & Franchises
597,067 593,101 593,101 643,677 588,088 586,612
Fines, Forfeitures & Penalties 24,578,937 25,782,769 27,799,417 23,983,537 25,377,526 22,862,257
Revenue From Use of Money & Property
11,846,943 9,908,466 9,908,466 12,369,631 8,946,102 8,604,806
Intergovernmental Revenues
442,321,453 463,701,114 484,778,530 459,631,497 498,886,312 481,396,069
Charges For Current Services 116,308,182 117,867,689 117,691,752 117,729,731 122,874,174 125,988,636
Miscellaneous Revenues 12,789,018 17,232,696 18,584,399 11,836,027 14,615,129 10,654,453
Other Financing Sources 209,145,111 231,289,600 231,086,698 230,301,940 237,217,786 238,214,177
Use of Fund Balance (21,848,159) 22,604,643 46,764,710 (30,414,788) 22,786,422 19,722,535
General Purpose Revenue Allocation
563,910,000 579,875,047 579,875,047 579,875,047 608,891,833 627,632,304
Total $1,360,137,841 $1,469,435,740 $1,517,662,734 $1,406,461,380 $1,540,756,863 $1,536,235,340
521Appendices Adopted Operational Plan Fiscal Years 2013-2014 and 2014-2015
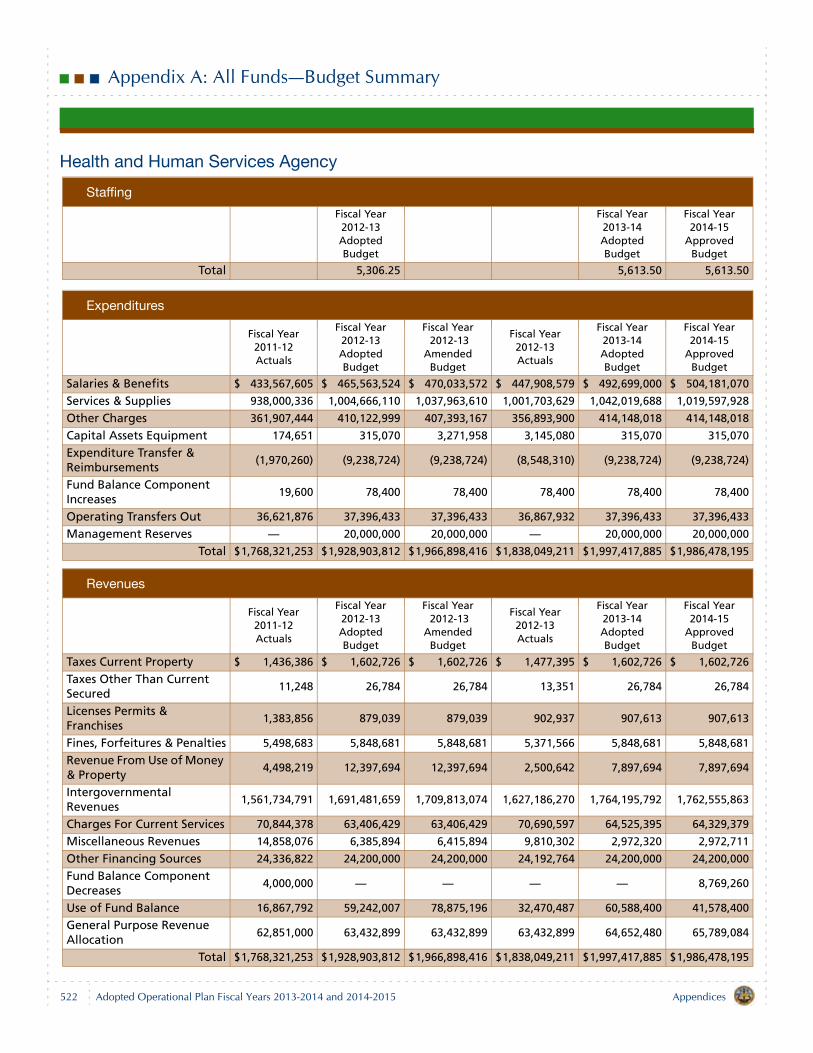
Appendix A: All Funds—Budget Summary
Health and Human Services Agency
Staffing
Fiscal Year2012-13Adopted Budget
Fiscal Year2013-14Adopted Budget
Fiscal Year2014-15
Approved Budget
Total 5,306.25 5,613.50 5,613.50
Expenditures
Fiscal Year 2011-12Actuals
Fiscal Year2012-13Adopted Budget
Fiscal Year 2012-13
Amended Budget
Fiscal Year2012-13Actuals
Fiscal Year2013-14Adopted Budget
Fiscal Year2014-15
Approved Budget
Salaries & Benefits $ 433,567,605 $ 465,563,524 $ 470,033,572 $ 447,908,579 $ 492,699,000 $ 504,181,070
Services & Supplies 938,000,336 1,004,666,110 1,037,963,610 1,001,703,629 1,042,019,688 1,019,597,928
Other Charges 361,907,444 410,122,999 407,393,167 356,893,900 414,148,018 414,148,018
Capital Assets Equipment 174,651 315,070 3,271,958 3,145,080 315,070 315,070
Expenditure Transfer & Reimbursements
(1,970,260) (9,238,724) (9,238,724) (8,548,310) (9,238,724) (9,238,724)
Fund Balance Component Increases
19,600 78,400 78,400 78,400 78,400 78,400
Operating Transfers Out 36,621,876 37,396,433 37,396,433 36,867,932 37,396,433 37,396,433
Management Reserves — 20,000,000 20,000,000 — 20,000,000 20,000,000
Total $1,768,321,253 $1,928,903,812 $1,966,898,416 $1,838,049,211 $1,997,417,885 $1,986,478,195
Revenues
Fiscal Year 2011-12Actuals
Fiscal Year2012-13Adopted Budget
Fiscal Year 2012-13
Amended Budget
Fiscal Year2012-13Actuals
Fiscal Year2013-14Adopted Budget
Fiscal Year2014-15
Approved Budget
Taxes Current Property $ 1,436,386 $ 1,602,726 $ 1,602,726 $ 1,477,395 $ 1,602,726 $ 1,602,726
Taxes Other Than Current Secured
11,248 26,784 26,784 13,351 26,784 26,784
Licenses Permits & Franchises
1,383,856 879,039 879,039 902,937 907,613 907,613
Fines, Forfeitures & Penalties 5,498,683 5,848,681 5,848,681 5,371,566 5,848,681 5,848,681
Revenue From Use of Money & Property
4,498,219 12,397,694 12,397,694 2,500,642 7,897,694 7,897,694
Intergovernmental Revenues
1,561,734,791 1,691,481,659 1,709,813,074 1,627,186,270 1,764,195,792 1,762,555,863
Charges For Current Services 70,844,378 63,406,429 63,406,429 70,690,597 64,525,395 64,329,379
Miscellaneous Revenues 14,858,076 6,385,894 6,415,894 9,810,302 2,972,320 2,972,711
Other Financing Sources 24,336,822 24,200,000 24,200,000 24,192,764 24,200,000 24,200,000
Fund Balance Component Decreases
4,000,000 — — — — 8,769,260
Use of Fund Balance 16,867,792 59,242,007 78,875,196 32,470,487 60,588,400 41,578,400
General Purpose Revenue Allocation
62,851,000 63,432,899 63,432,899 63,432,899 64,652,480 65,789,084
Total $1,768,321,253 $1,928,903,812 $1,966,898,416 $1,838,049,211 $1,997,417,885 $1,986,478,195
522 AppendicesAdopted Operational Plan Fiscal Years 2013-2014 and 2014-2015
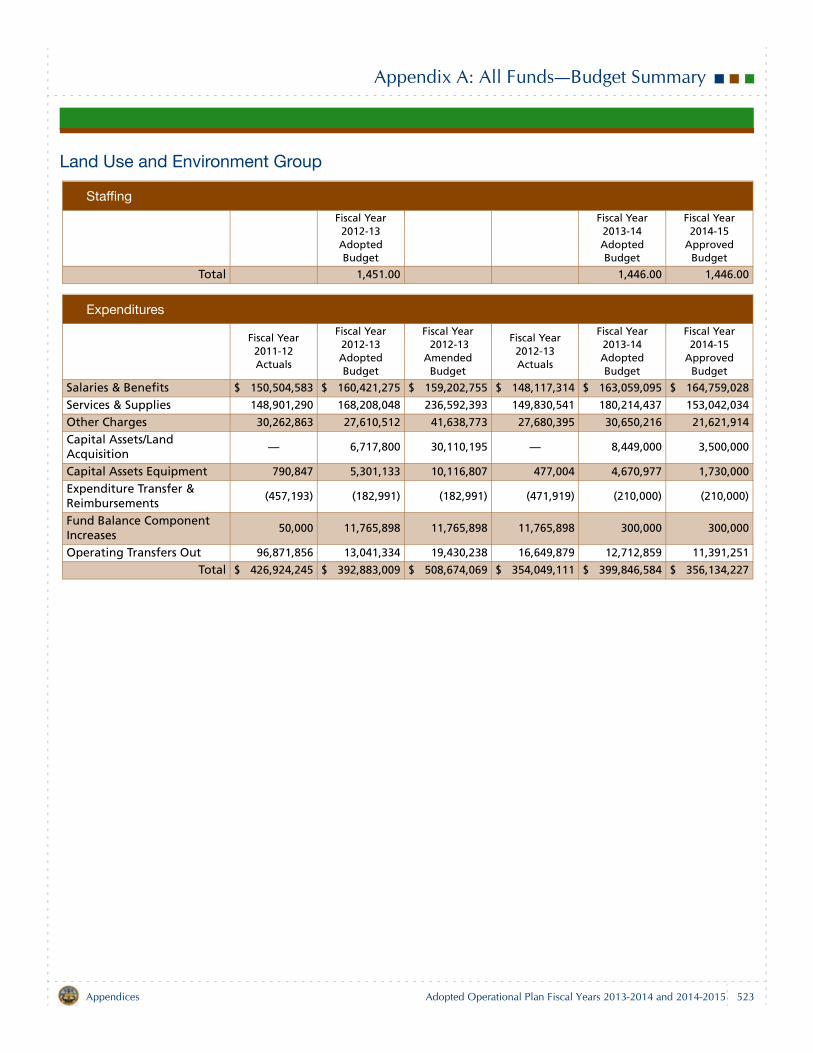
Appendix A: All Funds—Budget Summary
Land Use and Environment Group
Staffing
Fiscal Year2012-13Adopted Budget
Fiscal Year2013-14Adopted Budget
Fiscal Year2014-15
Approved Budget
Total 1,451.00 1,446.00 1,446.00
Expenditures
Fiscal Year 2011-12Actuals
Fiscal Year2012-13Adopted Budget
Fiscal Year 2012-13
Amended Budget
Fiscal Year2012-13Actuals
Fiscal Year2013-14Adopted Budget
Fiscal Year2014-15
Approved Budget
Salaries & Benefits $ 150,504,583 $ 160,421,275 $ 159,202,755 $ 148,117,314 $ 163,059,095 $ 164,759,028
Services & Supplies 148,901,290 168,208,048 236,592,393 149,830,541 180,214,437 153,042,034
Other Charges 30,262,863 27,610,512 41,638,773 27,680,395 30,650,216 21,621,914
Capital Assets/Land Acquisition
— 6,717,800 30,110,195 — 8,449,000 3,500,000
Capital Assets Equipment 790,847 5,301,133 10,116,807 477,004 4,670,977 1,730,000
Expenditure Transfer & Reimbursements
(457,193) (182,991) (182,991) (471,919) (210,000) (210,000)
Fund Balance Component Increases
50,000 11,765,898 11,765,898 11,765,898 300,000 300,000
Operating Transfers Out 96,871,856 13,041,334 19,430,238 16,649,879 12,712,859 11,391,251
Total $ 426,924,245 $ 392,883,009 $ 508,674,069 $ 354,049,111 $ 399,846,584 $ 356,134,227
523Appendices Adopted Operational Plan Fiscal Years 2013-2014 and 2014-2015

Appendix A: All Funds—Budget Summary
Revenues
Fiscal Year 2011-12Actuals
Fiscal Year2012-13Adopted Budget
Fiscal Year 2012-13
Amended Budget
Fiscal Year2012-13Actuals
Fiscal Year2013-14Adopted Budget
Fiscal Year2014-15
Approved Budget
Taxes Current Property $ 7,018,519 $ 6,991,168 $ 6,991,168 $ 7,126,444 $ 7,043,339 $ 7,059,753
Taxes Other Than Current Secured
13,017,013 4,304,567 6,640,248 3,151,307 5,118,244 4,878,913
Licenses Permits & Franchises
37,060,992 34,230,642 34,230,642 37,679,064 35,657,643 37,597,447
Fines, Forfeitures & Penalties 2,857,119 1,959,094 1,959,094 2,683,241 1,914,094 1,914,094
Revenue From Use of Money & Property
21,413,816 21,369,506 21,369,506 20,547,080 22,415,298 22,419,181
Intergovernmental Revenues
122,231,956 110,406,257 141,015,464 116,339,756 113,468,412 106,693,775
Charges For Current Services 80,315,305 88,086,187 88,495,814 80,409,942 90,722,855 90,306,937
Miscellaneous Revenues 7,824,446 5,026,894 7,015,120 3,401,073 3,357,105 2,704,273
Other Financing Sources 96,770,149 13,041,334 15,253,269 14,401,817 12,820,169 11,885,182
Fund Balance Component Decreases
16,853,394 544,380 544,380 544,380 3,362,491 2,234,729
Use of Fund Balance (20,924,074) 63,319,121 141,555,505 24,161,149 58,421,138 21,751,638
General Purpose Revenue Allocation
42,485,610 43,603,859 43,603,859 43,603,859 45,545,796 46,688,305
Total $ 426,924,245 $ 392,883,009 $ 508,674,069 $ 354,049,111 $ 399,846,584 $ 356,134,227
524 AppendicesAdopted Operational Plan Fiscal Years 2013-2014 and 2014-2015
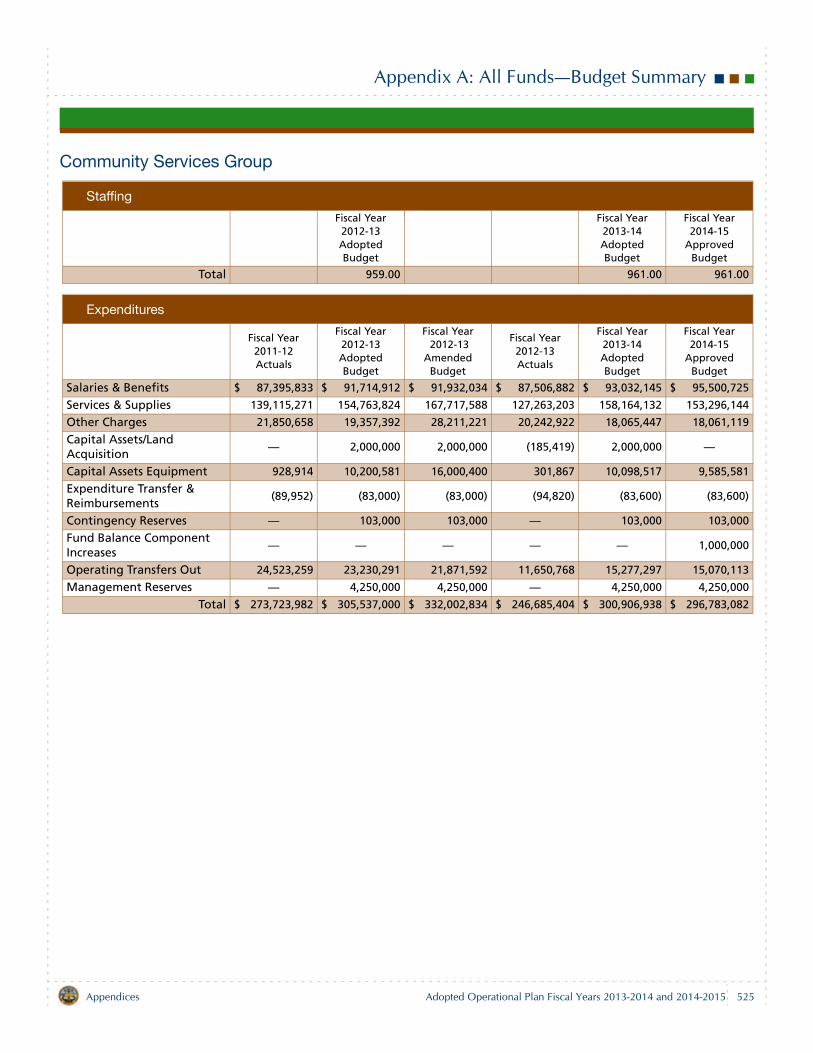
Appendix A: All Funds—Budget Summary
Community Services Group
Staffing
Fiscal Year2012-13Adopted Budget
Fiscal Year2013-14Adopted Budget
Fiscal Year2014-15
Approved Budget
Total 959.00 961.00 961.00
Expenditures
Fiscal Year 2011-12Actuals
Fiscal Year2012-13Adopted Budget
Fiscal Year 2012-13
Amended Budget
Fiscal Year2012-13Actuals
Fiscal Year2013-14Adopted Budget
Fiscal Year2014-15
Approved Budget
Salaries & Benefits $ 87,395,833 $ 91,714,912 $ 91,932,034 $ 87,506,882 $ 93,032,145 $ 95,500,725
Services & Supplies 139,115,271 154,763,824 167,717,588 127,263,203 158,164,132 153,296,144
Other Charges 21,850,658 19,357,392 28,211,221 20,242,922 18,065,447 18,061,119
Capital Assets/Land Acquisition
— 2,000,000 2,000,000 (185,419) 2,000,000 —
Capital Assets Equipment 928,914 10,200,581 16,000,400 301,867 10,098,517 9,585,581
Expenditure Transfer & Reimbursements
(89,952) (83,000) (83,000) (94,820) (83,600) (83,600)
Contingency Reserves — 103,000 103,000 — 103,000 103,000
Fund Balance Component Increases
— — — — — 1,000,000
Operating Transfers Out 24,523,259 23,230,291 21,871,592 11,650,768 15,277,297 15,070,113
Management Reserves — 4,250,000 4,250,000 — 4,250,000 4,250,000
Total $ 273,723,982 $ 305,537,000 $ 332,002,834 $ 246,685,404 $ 300,906,938 $ 296,783,082
525Appendices Adopted Operational Plan Fiscal Years 2013-2014 and 2014-2015
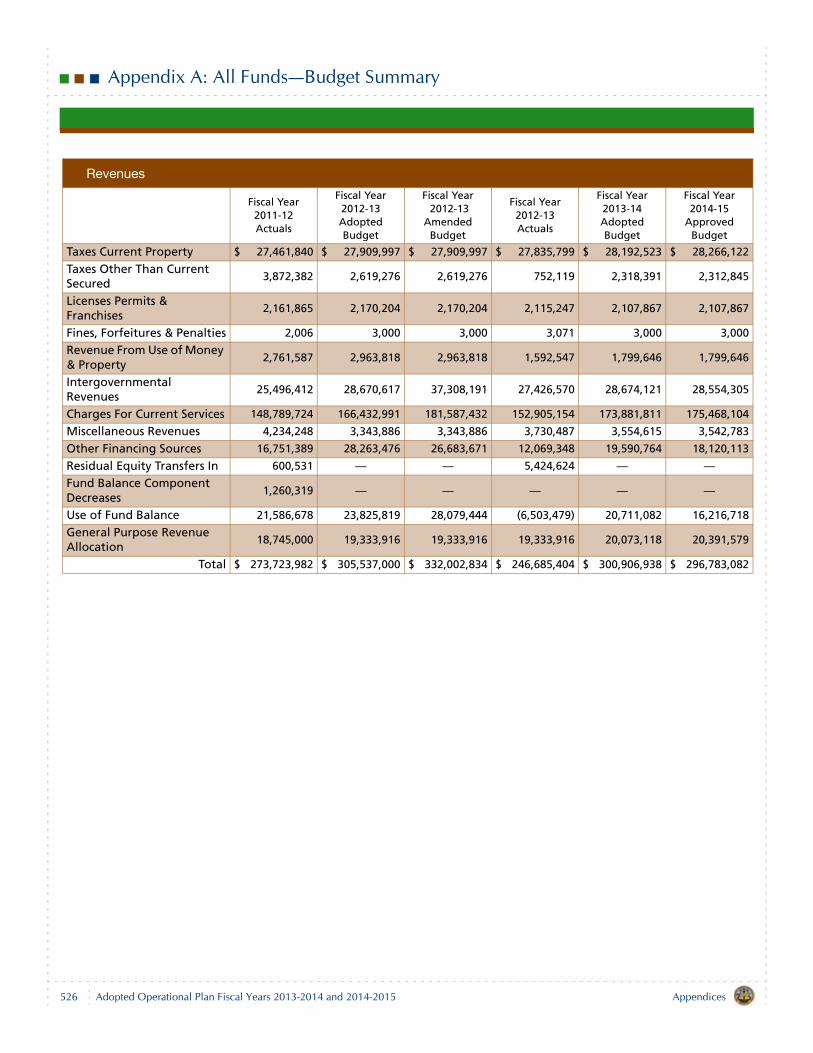
Appendix A: All Funds—Budget Summary
Revenues
Fiscal Year 2011-12Actuals
Fiscal Year2012-13Adopted Budget
Fiscal Year 2012-13
Amended Budget
Fiscal Year2012-13Actuals
Fiscal Year2013-14Adopted Budget
Fiscal Year2014-15
Approved Budget
Taxes Current Property $ 27,461,840 $ 27,909,997 $ 27,909,997 $ 27,835,799 $ 28,192,523 $ 28,266,122
Taxes Other Than Current Secured
3,872,382 2,619,276 2,619,276 752,119 2,318,391 2,312,845
Licenses Permits & Franchises
2,161,865 2,170,204 2,170,204 2,115,247 2,107,867 2,107,867
Fines, Forfeitures & Penalties 2,006 3,000 3,000 3,071 3,000 3,000
Revenue From Use of Money & Property
2,761,587 2,963,818 2,963,818 1,592,547 1,799,646 1,799,646
Intergovernmental Revenues
25,496,412 28,670,617 37,308,191 27,426,570 28,674,121 28,554,305
Charges For Current Services 148,789,724 166,432,991 181,587,432 152,905,154 173,881,811 175,468,104
Miscellaneous Revenues 4,234,248 3,343,886 3,343,886 3,730,487 3,554,615 3,542,783
Other Financing Sources 16,751,389 28,263,476 26,683,671 12,069,348 19,590,764 18,120,113
Residual Equity Transfers In 600,531 — — 5,424,624 — —Fund Balance Component Decreases
1,260,319 — — — — —
Use of Fund Balance 21,586,678 23,825,819 28,079,444 (6,503,479) 20,711,082 16,216,718
General Purpose Revenue Allocation
18,745,000 19,333,916 19,333,916 19,333,916 20,073,118 20,391,579
Total $ 273,723,982 $ 305,537,000 $ 332,002,834 $ 246,685,404 $ 300,906,938 $ 296,783,082
526 AppendicesAdopted Operational Plan Fiscal Years 2013-2014 and 2014-2015
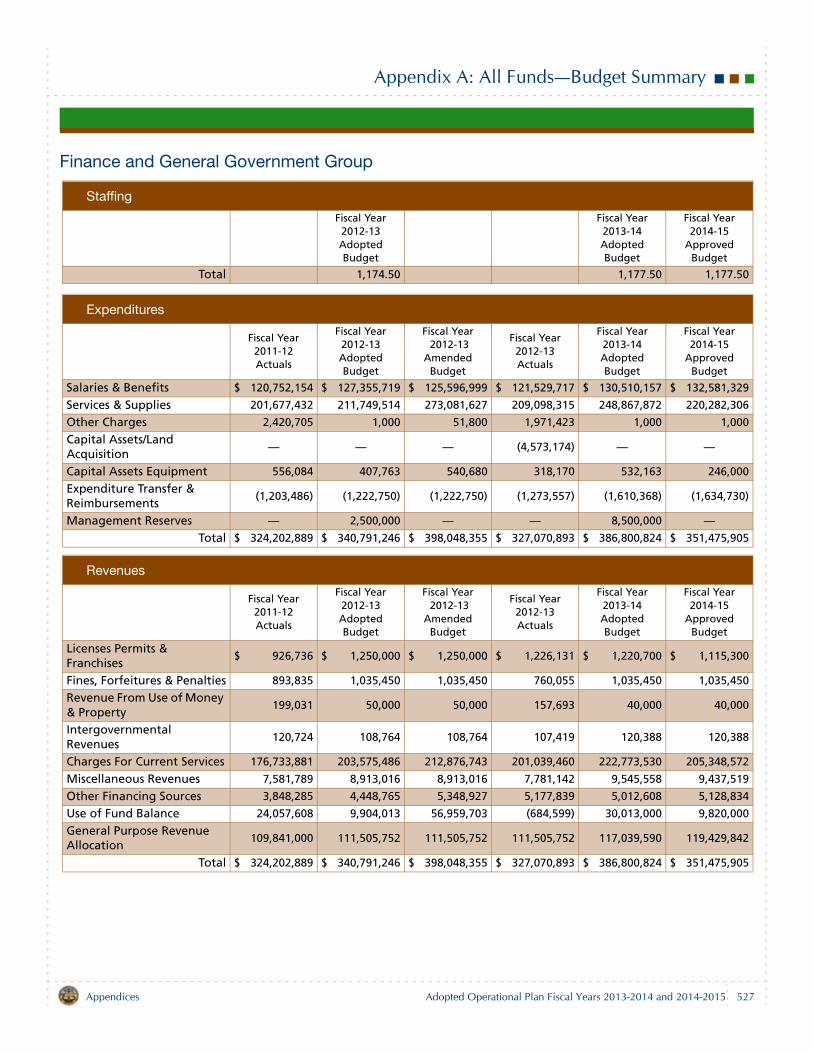
Appendix A: All Funds—Budget Summary
Finance and General Government Group
Staffing
Fiscal Year2012-13Adopted Budget
Fiscal Year2013-14Adopted Budget
Fiscal Year2014-15
Approved Budget
Total 1,174.50 1,177.50 1,177.50
Expenditures
Fiscal Year 2011-12Actuals
Fiscal Year2012-13Adopted Budget
Fiscal Year 2012-13
Amended Budget
Fiscal Year2012-13Actuals
Fiscal Year2013-14Adopted Budget
Fiscal Year2014-15
Approved Budget
Salaries & Benefits $ 120,752,154 $ 127,355,719 $ 125,596,999 $ 121,529,717 $ 130,510,157 $ 132,581,329
Services & Supplies 201,677,432 211,749,514 273,081,627 209,098,315 248,867,872 220,282,306
Other Charges 2,420,705 1,000 51,800 1,971,423 1,000 1,000
Capital Assets/Land Acquisition
— — — (4,573,174) — —
Capital Assets Equipment 556,084 407,763 540,680 318,170 532,163 246,000
Expenditure Transfer & Reimbursements
(1,203,486) (1,222,750) (1,222,750) (1,273,557) (1,610,368) (1,634,730)
Management Reserves — 2,500,000 — — 8,500,000 —Total $ 324,202,889 $ 340,791,246 $ 398,048,355 $ 327,070,893 $ 386,800,824 $ 351,475,905
Revenues
Fiscal Year 2011-12Actuals
Fiscal Year2012-13Adopted Budget
Fiscal Year 2012-13
Amended Budget
Fiscal Year2012-13Actuals
Fiscal Year2013-14Adopted Budget
Fiscal Year2014-15
Approved Budget
Licenses Permits & Franchises
$ 926,736 $ 1,250,000 $ 1,250,000 $ 1,226,131 $ 1,220,700 $ 1,115,300
Fines, Forfeitures & Penalties 893,835 1,035,450 1,035,450 760,055 1,035,450 1,035,450
Revenue From Use of Money & Property
199,031 50,000 50,000 157,693 40,000 40,000
Intergovernmental Revenues
120,724 108,764 108,764 107,419 120,388 120,388
Charges For Current Services 176,733,881 203,575,486 212,876,743 201,039,460 222,773,530 205,348,572
Miscellaneous Revenues 7,581,789 8,913,016 8,913,016 7,781,142 9,545,558 9,437,519
Other Financing Sources 3,848,285 4,448,765 5,348,927 5,177,839 5,012,608 5,128,834
Use of Fund Balance 24,057,608 9,904,013 56,959,703 (684,599) 30,013,000 9,820,000
General Purpose Revenue Allocation
109,841,000 111,505,752 111,505,752 111,505,752 117,039,590 119,429,842
Total $ 324,202,889 $ 340,791,246 $ 398,048,355 $ 327,070,893 $ 386,800,824 $ 351,475,905
527Appendices Adopted Operational Plan Fiscal Years 2013-2014 and 2014-2015
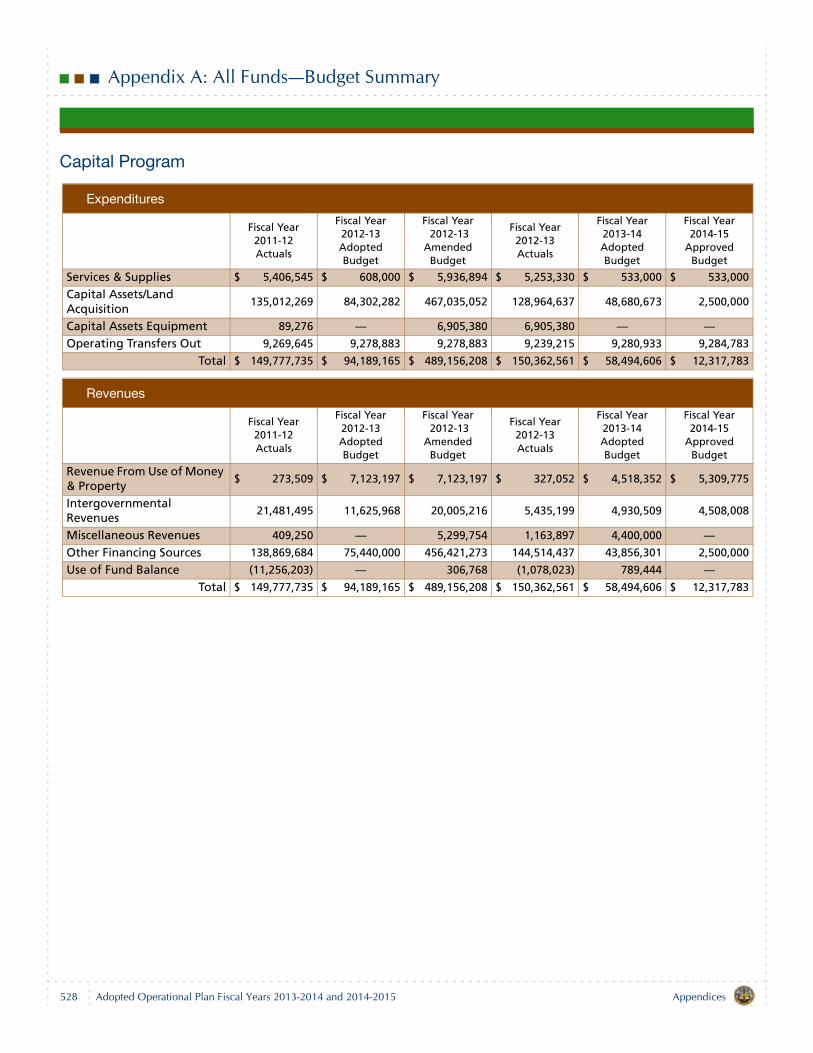
Appendix A: All Funds—Budget Summary
Capital Program
Expenditures
Fiscal Year 2011-12Actuals
Fiscal Year2012-13Adopted Budget
Fiscal Year 2012-13
Amended Budget
Fiscal Year2012-13Actuals
Fiscal Year2013-14Adopted Budget
Fiscal Year2014-15
Approved Budget
Services & Supplies $ 5,406,545 $ 608,000 $ 5,936,894 $ 5,253,330 $ 533,000 $ 533,000
Capital Assets/Land Acquisition
135,012,269 84,302,282 467,035,052 128,964,637 48,680,673 2,500,000
Capital Assets Equipment 89,276 — 6,905,380 6,905,380 — —Operating Transfers Out 9,269,645 9,278,883 9,278,883 9,239,215 9,280,933 9,284,783
Total $ 149,777,735 $ 94,189,165 $ 489,156,208 $ 150,362,561 $ 58,494,606 $ 12,317,783
Revenues
Fiscal Year 2011-12Actuals
Fiscal Year2012-13Adopted Budget
Fiscal Year 2012-13
Amended Budget
Fiscal Year2012-13Actuals
Fiscal Year2013-14Adopted Budget
Fiscal Year2014-15
Approved Budget
Revenue From Use of Money & Property
$ 273,509 $ 7,123,197 $ 7,123,197 $ 327,052 $ 4,518,352 $ 5,309,775
Intergovernmental Revenues
21,481,495 11,625,968 20,005,216 5,435,199 4,930,509 4,508,008
Miscellaneous Revenues 409,250 — 5,299,754 1,163,897 4,400,000 —Other Financing Sources 138,869,684 75,440,000 456,421,273 144,514,437 43,856,301 2,500,000
Use of Fund Balance (11,256,203) — 306,768 (1,078,023) 789,444 —Total $ 149,777,735 $ 94,189,165 $ 489,156,208 $ 150,362,561 $ 58,494,606 $ 12,317,783
528 AppendicesAdopted Operational Plan Fiscal Years 2013-2014 and 2014-2015
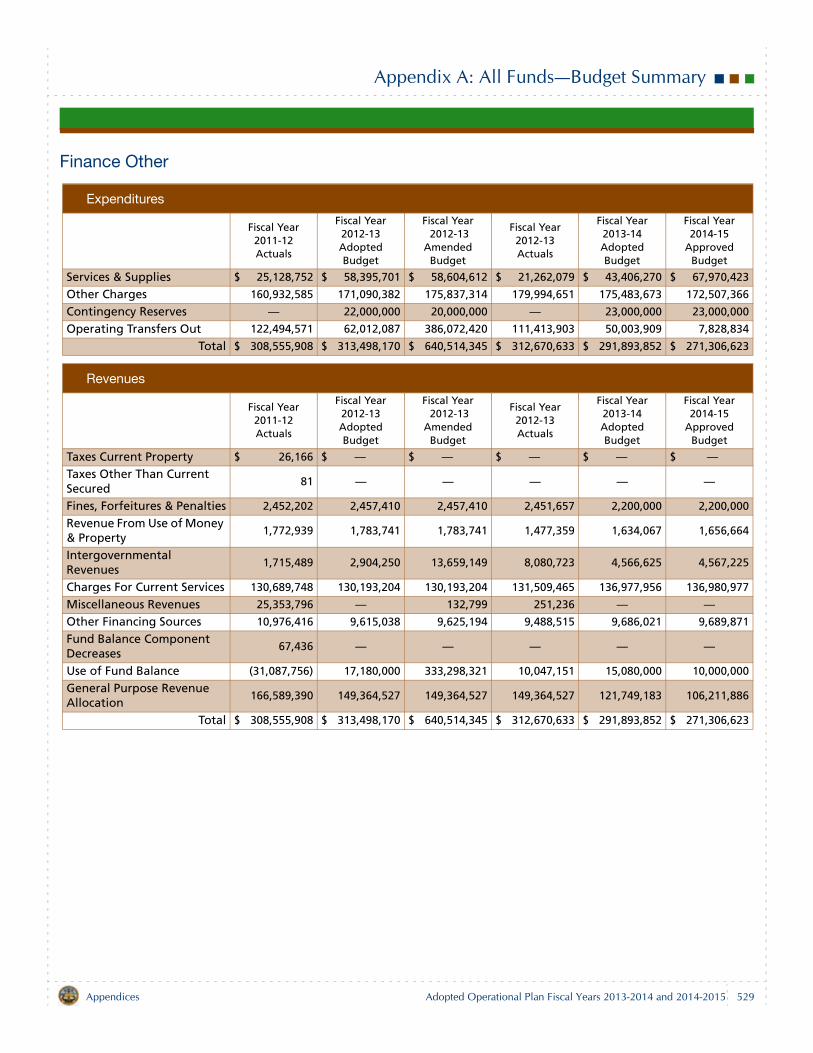
Appendix A: All Funds—Budget Summary
Finance Other
Expenditures
Fiscal Year 2011-12Actuals
Fiscal Year2012-13Adopted Budget
Fiscal Year 2012-13
Amended Budget
Fiscal Year2012-13Actuals
Fiscal Year2013-14Adopted Budget
Fiscal Year2014-15
Approved Budget
Services & Supplies $ 25,128,752 $ 58,395,701 $ 58,604,612 $ 21,262,079 $ 43,406,270 $ 67,970,423
Other Charges 160,932,585 171,090,382 175,837,314 179,994,651 175,483,673 172,507,366
Contingency Reserves — 22,000,000 20,000,000 — 23,000,000 23,000,000
Operating Transfers Out 122,494,571 62,012,087 386,072,420 111,413,903 50,003,909 7,828,834
Total $ 308,555,908 $ 313,498,170 $ 640,514,345 $ 312,670,633 $ 291,893,852 $ 271,306,623
Revenues
Fiscal Year 2011-12Actuals
Fiscal Year2012-13Adopted Budget
Fiscal Year 2012-13
Amended Budget
Fiscal Year2012-13Actuals
Fiscal Year2013-14Adopted Budget
Fiscal Year2014-15
Approved Budget
Taxes Current Property $ 26,166 $ — $ — $ — $ — $ —Taxes Other Than Current Secured
81 — — — — —
Fines, Forfeitures & Penalties 2,452,202 2,457,410 2,457,410 2,451,657 2,200,000 2,200,000
Revenue From Use of Money & Property
1,772,939 1,783,741 1,783,741 1,477,359 1,634,067 1,656,664
Intergovernmental Revenues
1,715,489 2,904,250 13,659,149 8,080,723 4,566,625 4,567,225
Charges For Current Services 130,689,748 130,193,204 130,193,204 131,509,465 136,977,956 136,980,977
Miscellaneous Revenues 25,353,796 — 132,799 251,236 — —Other Financing Sources 10,976,416 9,615,038 9,625,194 9,488,515 9,686,021 9,689,871
Fund Balance Component Decreases
67,436 — — — — —
Use of Fund Balance (31,087,756) 17,180,000 333,298,321 10,047,151 15,080,000 10,000,000
General Purpose Revenue Allocation
166,589,390 149,364,527 149,364,527 149,364,527 121,749,183 106,211,886
Total $ 308,555,908 $ 313,498,170 $ 640,514,345 $ 312,670,633 $ 291,893,852 $ 271,306,623
529Appendices Adopted Operational Plan Fiscal Years 2013-2014 and 2014-2015
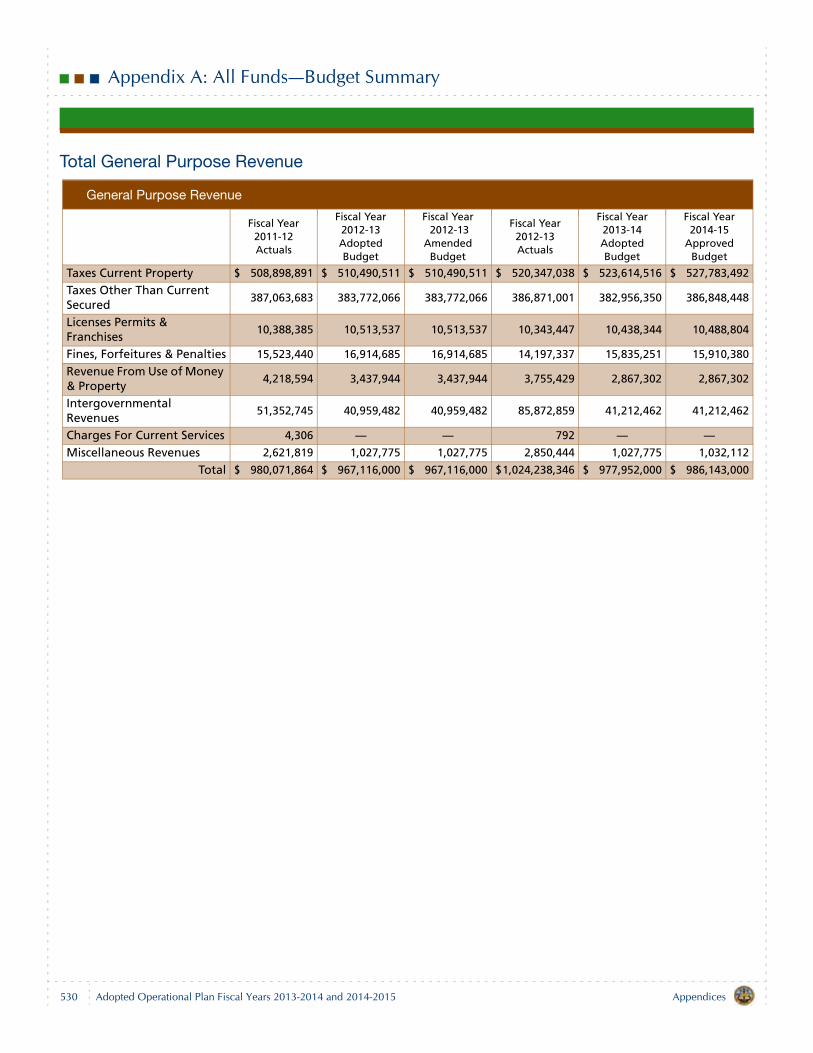
Appendix A: All Funds—Budget Summary
Total General Purpose Revenue
General Purpose Revenue
Fiscal Year 2011-12Actuals
Fiscal Year2012-13Adopted Budget
Fiscal Year 2012-13
Amended Budget
Fiscal Year2012-13Actuals
Fiscal Year2013-14Adopted Budget
Fiscal Year2014-15
Approved Budget
Taxes Current Property $ 508,898,891 $ 510,490,511 $ 510,490,511 $ 520,347,038 $ 523,614,516 $ 527,783,492
Taxes Other Than Current Secured
387,063,683 383,772,066 383,772,066 386,871,001 382,956,350 386,848,448
Licenses Permits & Franchises
10,388,385 10,513,537 10,513,537 10,343,447 10,438,344 10,488,804
Fines, Forfeitures & Penalties 15,523,440 16,914,685 16,914,685 14,197,337 15,835,251 15,910,380
Revenue From Use of Money & Property
4,218,594 3,437,944 3,437,944 3,755,429 2,867,302 2,867,302
Intergovernmental Revenues
51,352,745 40,959,482 40,959,482 85,872,859 41,212,462 41,212,462
Charges For Current Services 4,306 — — 792 — —Miscellaneous Revenues 2,621,819 1,027,775 1,027,775 2,850,444 1,027,775 1,032,112
Total $ 980,071,864 $ 967,116,000 $ 967,116,000 $1,024,238,346 $ 977,952,000 $ 986,143,000
530 AppendicesAdopted Operational Plan Fiscal Years 2013-2014 and 2014-2015
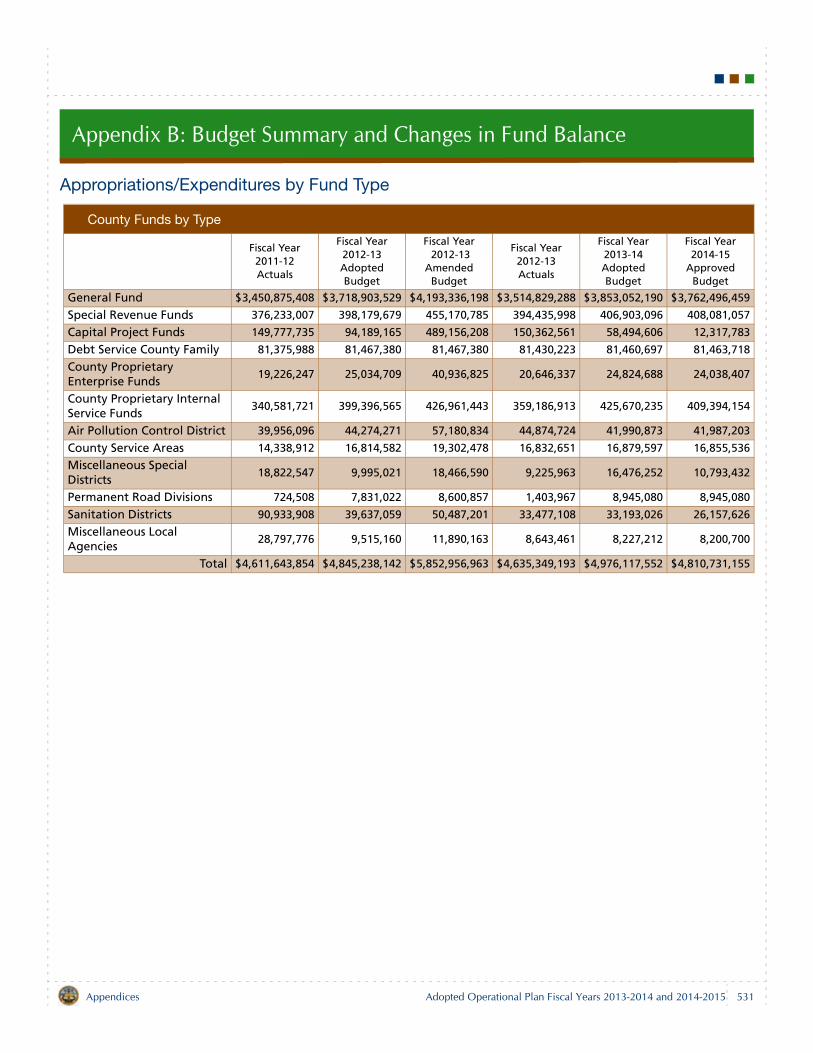
Appendix B: Budget Summary and Changes in Fund Balance
Appropriations/Expenditures by Fund Type
County Funds by Type
Fiscal Year 2011-12Actuals
Fiscal Year2012-13Adopted Budget
Fiscal Year 2012-13
Amended Budget
Fiscal Year2012-13Actuals
Fiscal Year2013-14Adopted Budget
Fiscal Year2014-15
Approved Budget
General Fund $3,450,875,408 $3,718,903,529 $4,193,336,198 $3,514,829,288 $3,853,052,190 $3,762,496,459
Special Revenue Funds 376,233,007 398,179,679 455,170,785 394,435,998 406,903,096 408,081,057
Capital Project Funds 149,777,735 94,189,165 489,156,208 150,362,561 58,494,606 12,317,783
Debt Service County Family 81,375,988 81,467,380 81,467,380 81,430,223 81,460,697 81,463,718
County Proprietary Enterprise Funds
19,226,247 25,034,709 40,936,825 20,646,337 24,824,688 24,038,407
County Proprietary Internal Service Funds
340,581,721 399,396,565 426,961,443 359,186,913 425,670,235 409,394,154
Air Pollution Control District 39,956,096 44,274,271 57,180,834 44,874,724 41,990,873 41,987,203
County Service Areas 14,338,912 16,814,582 19,302,478 16,832,651 16,879,597 16,855,536
Miscellaneous Special Districts
18,822,547 9,995,021 18,466,590 9,225,963 16,476,252 10,793,432
Permanent Road Divisions 724,508 7,831,022 8,600,857 1,403,967 8,945,080 8,945,080
Sanitation Districts 90,933,908 39,637,059 50,487,201 33,477,108 33,193,026 26,157,626
Miscellaneous Local Agencies
28,797,776 9,515,160 11,890,163 8,643,461 8,227,212 8,200,700
Total $4,611,643,854 $4,845,238,142 $5,852,956,963 $4,635,349,193 $4,976,117,552 $4,810,731,155
531Appendices Adopted Operational Plan Fiscal Years 2013-2014 and 2014-2015
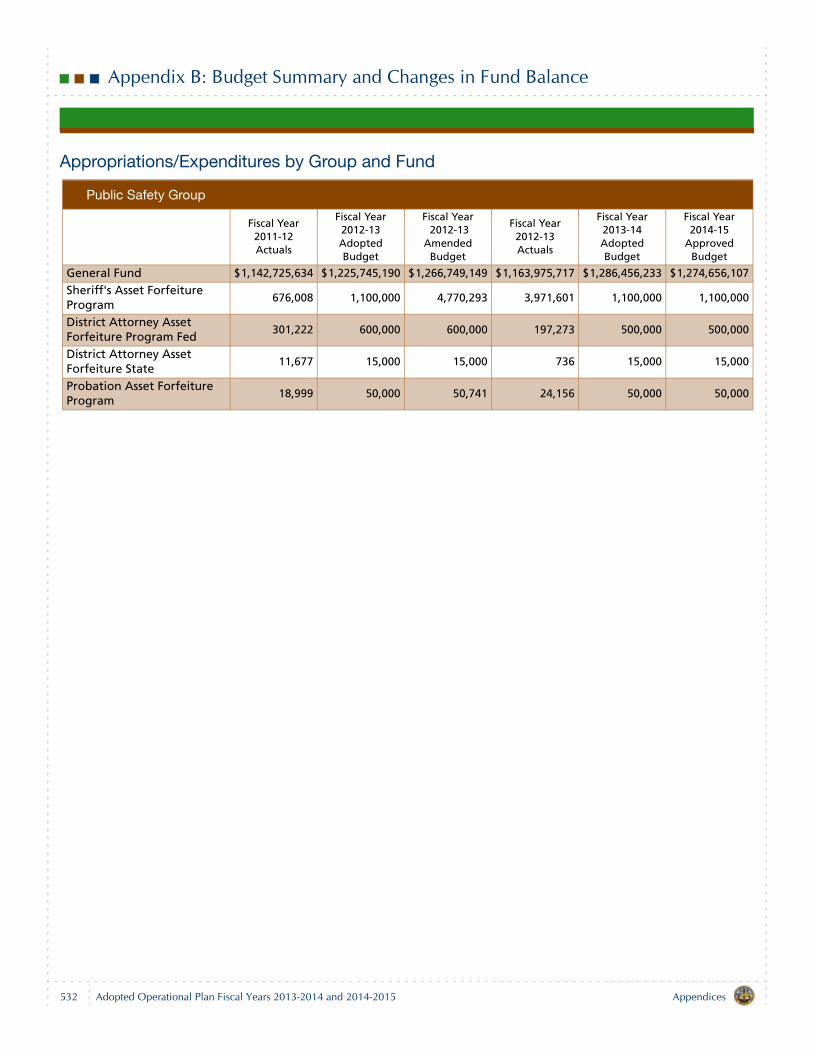
Appendix B: Budget Summary and Changes in Fund Balance
Appropriations/Expenditures by Group and Fund
Public Safety Group
Fiscal Year 2011-12Actuals
Fiscal Year2012-13Adopted Budget
Fiscal Year 2012-13
Amended Budget
Fiscal Year2012-13Actuals
Fiscal Year2013-14Adopted Budget
Fiscal Year2014-15
Approved Budget
General Fund $1,142,725,634 $1,225,745,190 $1,266,749,149 $1,163,975,717 $1,286,456,233 $1,274,656,107
Sheriff's Asset Forfeiture Program
676,008 1,100,000 4,770,293 3,971,601 1,100,000 1,100,000
District Attorney Asset Forfeiture Program Fed
301,222 600,000 600,000 197,273 500,000 500,000
District Attorney Asset Forfeiture State
11,677 15,000 15,000 736 15,000 15,000
Probation Asset Forfeiture Program
18,999 50,000 50,741 24,156 50,000 50,000
532 AppendicesAdopted Operational Plan Fiscal Years 2013-2014 and 2014-2015
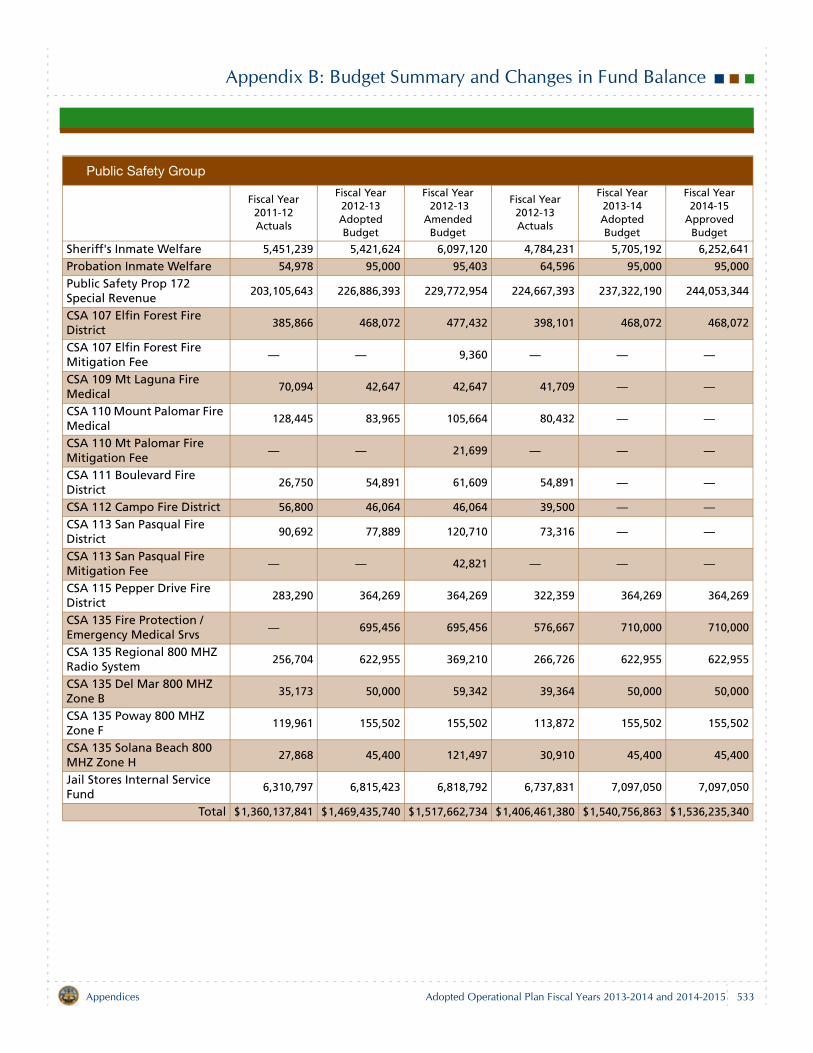
Appendix B: Budget Summary and Changes in Fund Balance
Sheriff's Inmate Welfare 5,451,239 5,421,624 6,097,120 4,784,231 5,705,192 6,252,641
Probation Inmate Welfare 54,978 95,000 95,403 64,596 95,000 95,000
Public Safety Prop 172 Special Revenue
203,105,643 226,886,393 229,772,954 224,667,393 237,322,190 244,053,344
CSA 107 Elfin Forest Fire District
385,866 468,072 477,432 398,101 468,072 468,072
CSA 107 Elfin Forest Fire Mitigation Fee
— — 9,360 — — —
CSA 109 Mt Laguna Fire Medical
70,094 42,647 42,647 41,709 — —
CSA 110 Mount Palomar Fire Medical
128,445 83,965 105,664 80,432 — —
CSA 110 Mt Palomar Fire Mitigation Fee
— — 21,699 — — —
CSA 111 Boulevard Fire District
26,750 54,891 61,609 54,891 — —
CSA 112 Campo Fire District 56,800 46,064 46,064 39,500 — —CSA 113 San Pasqual Fire District
90,692 77,889 120,710 73,316 — —
CSA 113 San Pasqual Fire Mitigation Fee
— — 42,821 — — —
CSA 115 Pepper Drive Fire District
283,290 364,269 364,269 322,359 364,269 364,269
CSA 135 Fire Protection / Emergency Medical Srvs
— 695,456 695,456 576,667 710,000 710,000
CSA 135 Regional 800 MHZ Radio System
256,704 622,955 369,210 266,726 622,955 622,955
CSA 135 Del Mar 800 MHZ Zone B
35,173 50,000 59,342 39,364 50,000 50,000
CSA 135 Poway 800 MHZ Zone F
119,961 155,502 155,502 113,872 155,502 155,502
CSA 135 Solana Beach 800 MHZ Zone H
27,868 45,400 121,497 30,910 45,400 45,400
Jail Stores Internal Service Fund
6,310,797 6,815,423 6,818,792 6,737,831 7,097,050 7,097,050
Total $1,360,137,841 $1,469,435,740 $1,517,662,734 $1,406,461,380 $1,540,756,863 $1,536,235,340
Public Safety Group
Fiscal Year 2011-12Actuals
Fiscal Year2012-13Adopted Budget
Fiscal Year 2012-13
Amended Budget
Fiscal Year2012-13Actuals
Fiscal Year2013-14Adopted Budget
Fiscal Year2014-15
Approved Budget
533Appendices Adopted Operational Plan Fiscal Years 2013-2014 and 2014-2015
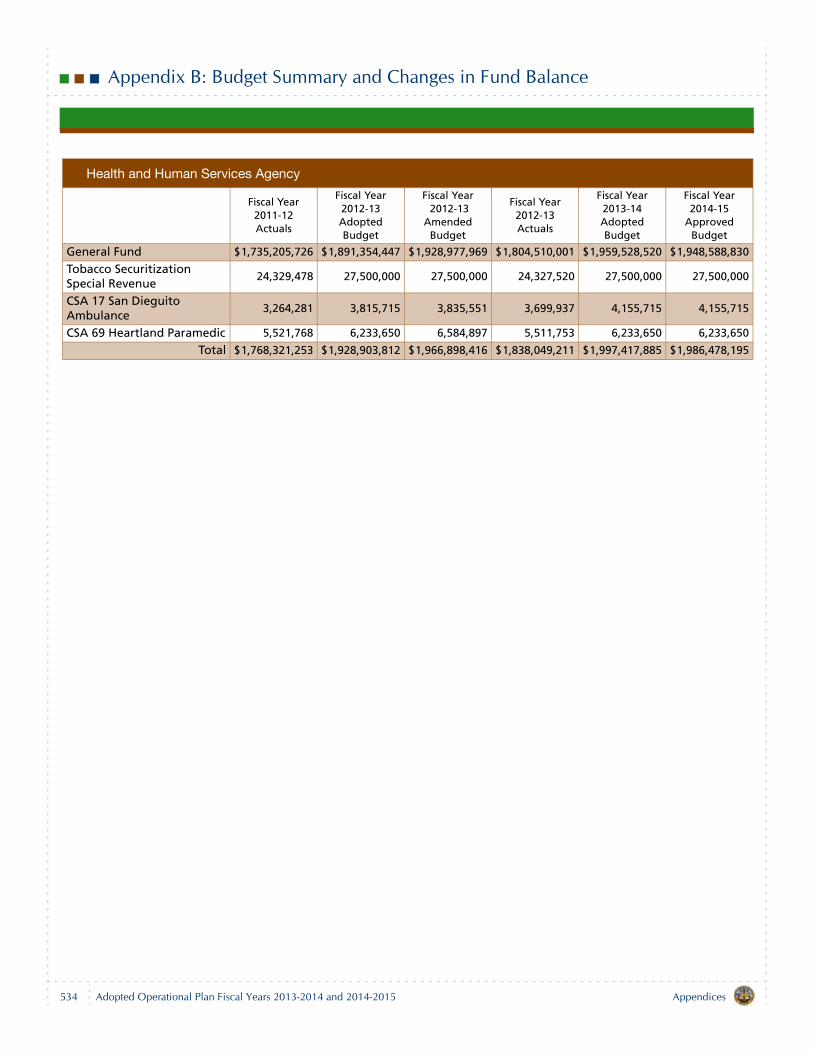
Appendix B: Budget Summary and Changes in Fund Balance
Health and Human Services Agency
Fiscal Year 2011-12Actuals
Fiscal Year2012-13Adopted Budget
Fiscal Year 2012-13
Amended Budget
Fiscal Year2012-13Actuals
Fiscal Year2013-14Adopted Budget
Fiscal Year2014-15
Approved Budget
General Fund $1,735,205,726 $1,891,354,447 $1,928,977,969 $1,804,510,001 $1,959,528,520 $1,948,588,830
Tobacco Securitization Special Revenue
24,329,478 27,500,000 27,500,000 24,327,520 27,500,000 27,500,000
CSA 17 San Dieguito Ambulance
3,264,281 3,815,715 3,835,551 3,699,937 4,155,715 4,155,715
CSA 69 Heartland Paramedic 5,521,768 6,233,650 6,584,897 5,511,753 6,233,650 6,233,650
Total $1,768,321,253 $1,928,903,812 $1,966,898,416 $1,838,049,211 $1,997,417,885 $1,986,478,195
534 AppendicesAdopted Operational Plan Fiscal Years 2013-2014 and 2014-2015
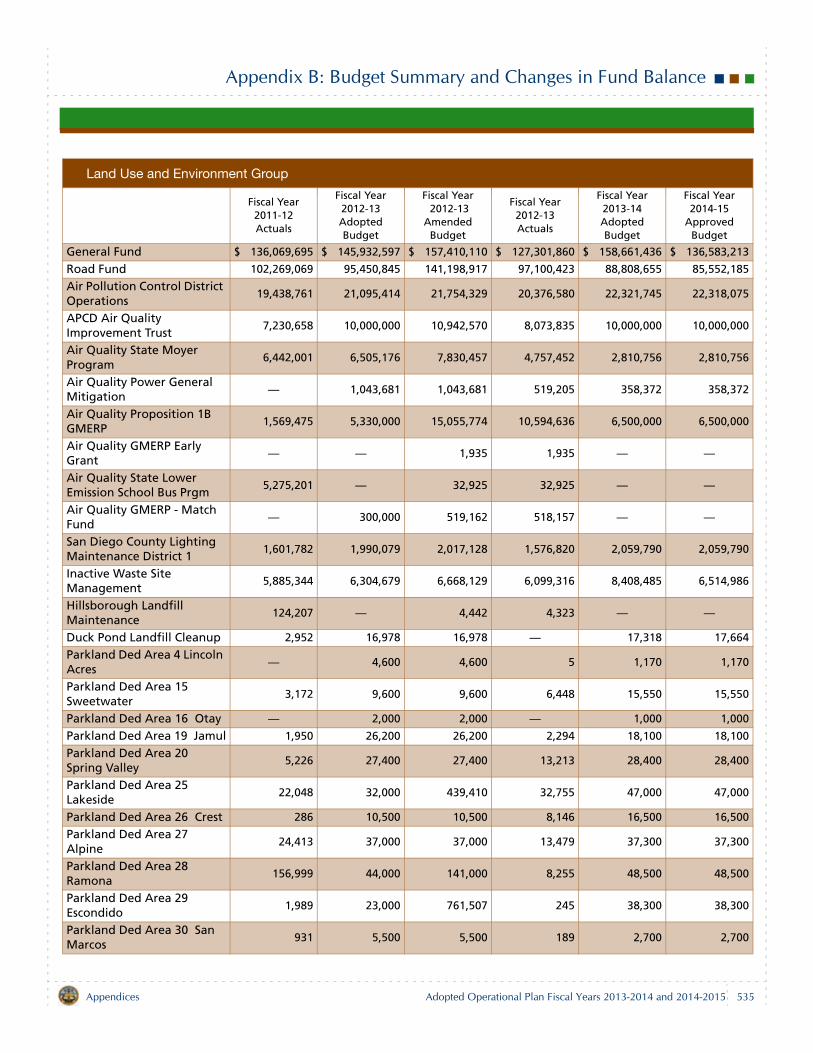
Appendix B: Budget Summary and Changes in Fund Balance
Land Use and Environment Group
Fiscal Year 2011-12Actuals
Fiscal Year2012-13Adopted Budget
Fiscal Year 2012-13
Amended Budget
Fiscal Year2012-13Actuals
Fiscal Year2013-14Adopted Budget
Fiscal Year2014-15
Approved Budget
General Fund $ 136,069,695 $ 145,932,597 $ 157,410,110 $ 127,301,860 $ 158,661,436 $ 136,583,213
Road Fund 102,269,069 95,450,845 141,198,917 97,100,423 88,808,655 85,552,185
Air Pollution Control District Operations
19,438,761 21,095,414 21,754,329 20,376,580 22,321,745 22,318,075
APCD Air Quality Improvement Trust
7,230,658 10,000,000 10,942,570 8,073,835 10,000,000 10,000,000
Air Quality State Moyer Program
6,442,001 6,505,176 7,830,457 4,757,452 2,810,756 2,810,756
Air Quality Power General Mitigation
— 1,043,681 1,043,681 519,205 358,372 358,372
Air Quality Proposition 1B GMERP
1,569,475 5,330,000 15,055,774 10,594,636 6,500,000 6,500,000
Air Quality GMERP Early Grant
— — 1,935 1,935 — —
Air Quality State Lower Emission School Bus Prgm
5,275,201 — 32,925 32,925 — —
Air Quality GMERP - Match Fund
— 300,000 519,162 518,157 — —
San Diego County Lighting Maintenance District 1
1,601,782 1,990,079 2,017,128 1,576,820 2,059,790 2,059,790
Inactive Waste Site Management
5,885,344 6,304,679 6,668,129 6,099,316 8,408,485 6,514,986
Hillsborough Landfill Maintenance
124,207 — 4,442 4,323 — —
Duck Pond Landfill Cleanup 2,952 16,978 16,978 — 17,318 17,664
Parkland Ded Area 4 Lincoln Acres
— 4,600 4,600 5 1,170 1,170
Parkland Ded Area 15 Sweetwater
3,172 9,600 9,600 6,448 15,550 15,550
Parkland Ded Area 16 Otay — 2,000 2,000 — 1,000 1,000
Parkland Ded Area 19 Jamul 1,950 26,200 26,200 2,294 18,100 18,100
Parkland Ded Area 20 Spring Valley
5,226 27,400 27,400 13,213 28,400 28,400
Parkland Ded Area 25 Lakeside
22,048 32,000 439,410 32,755 47,000 47,000
Parkland Ded Area 26 Crest 286 10,500 10,500 8,146 16,500 16,500
Parkland Ded Area 27 Alpine
24,413 37,000 37,000 13,479 37,300 37,300
Parkland Ded Area 28 Ramona
156,999 44,000 141,000 8,255 48,500 48,500
Parkland Ded Area 29 Escondido
1,989 23,000 761,507 245 38,300 38,300
Parkland Ded Area 30 San Marcos
931 5,500 5,500 189 2,700 2,700
535Appendices Adopted Operational Plan Fiscal Years 2013-2014 and 2014-2015
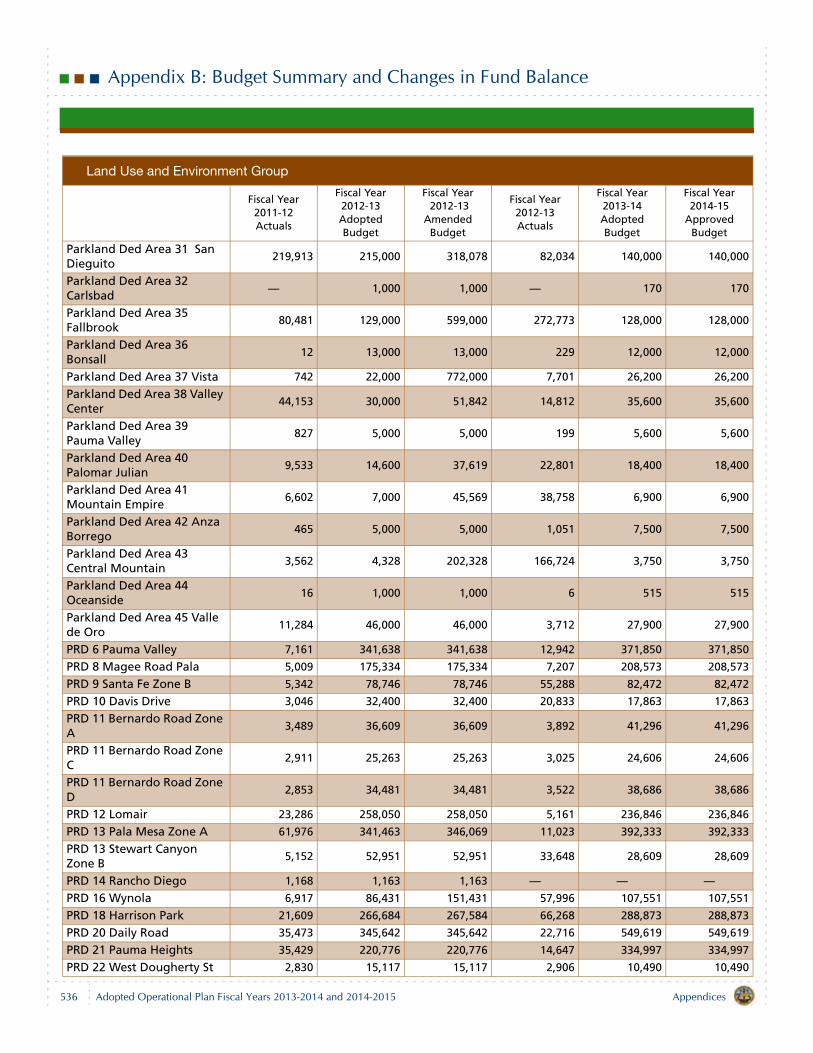
Appendix B: Budget Summary and Changes in Fund Balance
Parkland Ded Area 31 San Dieguito
219,913 215,000 318,078 82,034 140,000 140,000
Parkland Ded Area 32 Carlsbad
— 1,000 1,000 — 170 170
Parkland Ded Area 35 Fallbrook
80,481 129,000 599,000 272,773 128,000 128,000
Parkland Ded Area 36 Bonsall
12 13,000 13,000 229 12,000 12,000
Parkland Ded Area 37 Vista 742 22,000 772,000 7,701 26,200 26,200
Parkland Ded Area 38 Valley Center
44,153 30,000 51,842 14,812 35,600 35,600
Parkland Ded Area 39 Pauma Valley
827 5,000 5,000 199 5,600 5,600
Parkland Ded Area 40 Palomar Julian
9,533 14,600 37,619 22,801 18,400 18,400
Parkland Ded Area 41 Mountain Empire
6,602 7,000 45,569 38,758 6,900 6,900
Parkland Ded Area 42 Anza Borrego
465 5,000 5,000 1,051 7,500 7,500
Parkland Ded Area 43 Central Mountain
3,562 4,328 202,328 166,724 3,750 3,750
Parkland Ded Area 44 Oceanside
16 1,000 1,000 6 515 515
Parkland Ded Area 45 Valle de Oro
11,284 46,000 46,000 3,712 27,900 27,900
PRD 6 Pauma Valley 7,161 341,638 341,638 12,942 371,850 371,850
PRD 8 Magee Road Pala 5,009 175,334 175,334 7,207 208,573 208,573
PRD 9 Santa Fe Zone B 5,342 78,746 78,746 55,288 82,472 82,472
PRD 10 Davis Drive 3,046 32,400 32,400 20,833 17,863 17,863
PRD 11 Bernardo Road Zone A
3,489 36,609 36,609 3,892 41,296 41,296
PRD 11 Bernardo Road Zone C
2,911 25,263 25,263 3,025 24,606 24,606
PRD 11 Bernardo Road Zone D
2,853 34,481 34,481 3,522 38,686 38,686
PRD 12 Lomair 23,286 258,050 258,050 5,161 236,846 236,846
PRD 13 Pala Mesa Zone A 61,976 341,463 346,069 11,023 392,333 392,333
PRD 13 Stewart Canyon Zone B
5,152 52,951 52,951 33,648 28,609 28,609
PRD 14 Rancho Diego 1,168 1,163 1,163 — — —PRD 16 Wynola 6,917 86,431 151,431 57,996 107,551 107,551
PRD 18 Harrison Park 21,609 266,684 267,584 66,268 288,873 288,873
PRD 20 Daily Road 35,473 345,642 345,642 22,716 549,619 549,619
PRD 21 Pauma Heights 35,429 220,776 220,776 14,647 334,997 334,997
PRD 22 West Dougherty St 2,830 15,117 15,117 2,906 10,490 10,490
Land Use and Environment Group
Fiscal Year 2011-12Actuals
Fiscal Year2012-13Adopted Budget
Fiscal Year 2012-13
Amended Budget
Fiscal Year2012-13Actuals
Fiscal Year2013-14Adopted Budget
Fiscal Year2014-15
Approved Budget
536 AppendicesAdopted Operational Plan Fiscal Years 2013-2014 and 2014-2015
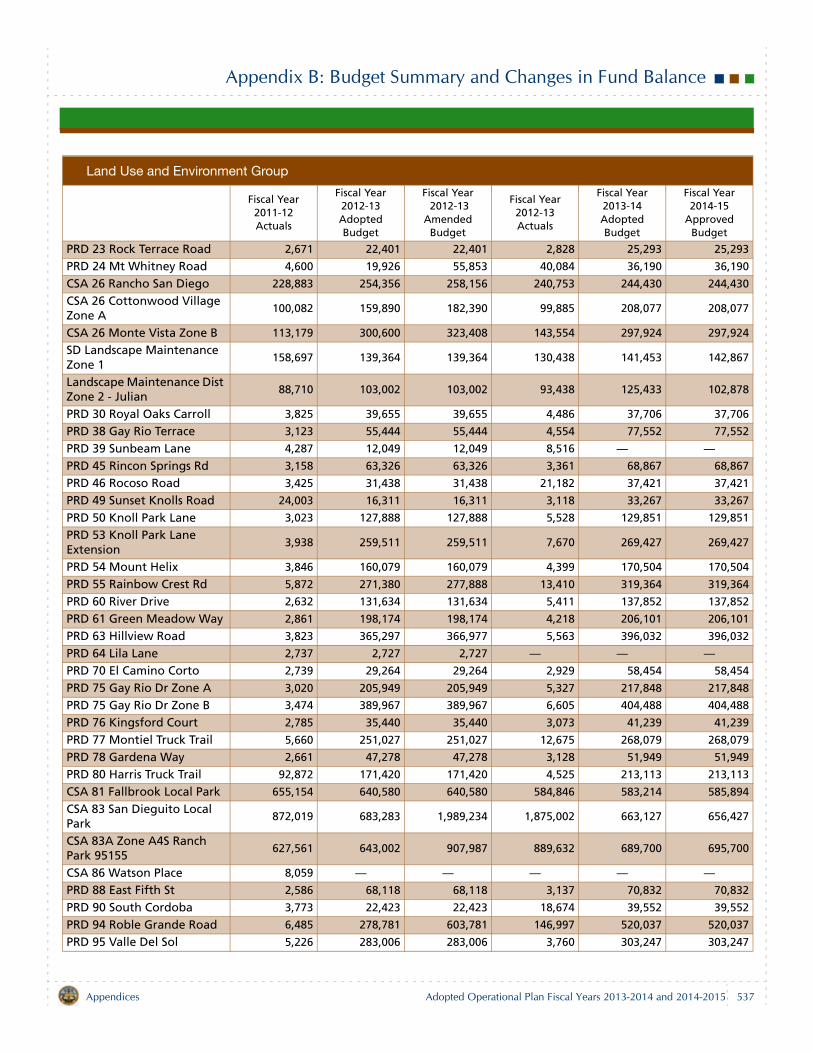
Appendix B: Budget Summary and Changes in Fund Balance
PRD 23 Rock Terrace Road 2,671 22,401 22,401 2,828 25,293 25,293
PRD 24 Mt Whitney Road 4,600 19,926 55,853 40,084 36,190 36,190
CSA 26 Rancho San Diego 228,883 254,356 258,156 240,753 244,430 244,430
CSA 26 Cottonwood Village Zone A
100,082 159,890 182,390 99,885 208,077 208,077
CSA 26 Monte Vista Zone B 113,179 300,600 323,408 143,554 297,924 297,924
SD Landscape Maintenance Zone 1
158,697 139,364 139,364 130,438 141,453 142,867
Landscape Maintenance Dist Zone 2 - Julian
88,710 103,002 103,002 93,438 125,433 102,878
PRD 30 Royal Oaks Carroll 3,825 39,655 39,655 4,486 37,706 37,706
PRD 38 Gay Rio Terrace 3,123 55,444 55,444 4,554 77,552 77,552
PRD 39 Sunbeam Lane 4,287 12,049 12,049 8,516 — —PRD 45 Rincon Springs Rd 3,158 63,326 63,326 3,361 68,867 68,867
PRD 46 Rocoso Road 3,425 31,438 31,438 21,182 37,421 37,421
PRD 49 Sunset Knolls Road 24,003 16,311 16,311 3,118 33,267 33,267
PRD 50 Knoll Park Lane 3,023 127,888 127,888 5,528 129,851 129,851
PRD 53 Knoll Park Lane Extension
3,938 259,511 259,511 7,670 269,427 269,427
PRD 54 Mount Helix 3,846 160,079 160,079 4,399 170,504 170,504
PRD 55 Rainbow Crest Rd 5,872 271,380 277,888 13,410 319,364 319,364
PRD 60 River Drive 2,632 131,634 131,634 5,411 137,852 137,852
PRD 61 Green Meadow Way 2,861 198,174 198,174 4,218 206,101 206,101
PRD 63 Hillview Road 3,823 365,297 366,977 5,563 396,032 396,032
PRD 64 Lila Lane 2,737 2,727 2,727 — — —PRD 70 El Camino Corto 2,739 29,264 29,264 2,929 58,454 58,454
PRD 75 Gay Rio Dr Zone A 3,020 205,949 205,949 5,327 217,848 217,848
PRD 75 Gay Rio Dr Zone B 3,474 389,967 389,967 6,605 404,488 404,488
PRD 76 Kingsford Court 2,785 35,440 35,440 3,073 41,239 41,239
PRD 77 Montiel Truck Trail 5,660 251,027 251,027 12,675 268,079 268,079
PRD 78 Gardena Way 2,661 47,278 47,278 3,128 51,949 51,949
PRD 80 Harris Truck Trail 92,872 171,420 171,420 4,525 213,113 213,113
CSA 81 Fallbrook Local Park 655,154 640,580 640,580 584,846 583,214 585,894
CSA 83 San Dieguito Local Park
872,019 683,283 1,989,234 1,875,002 663,127 656,427
CSA 83A Zone A4S Ranch Park 95155
627,561 643,002 907,987 889,632 689,700 695,700
CSA 86 Watson Place 8,059 — — — — —PRD 88 East Fifth St 2,586 68,118 68,118 3,137 70,832 70,832
PRD 90 South Cordoba 3,773 22,423 22,423 18,674 39,552 39,552
PRD 94 Roble Grande Road 6,485 278,781 603,781 146,997 520,037 520,037
PRD 95 Valle Del Sol 5,226 283,006 283,006 3,760 303,247 303,247
Land Use and Environment Group
Fiscal Year 2011-12Actuals
Fiscal Year2012-13Adopted Budget
Fiscal Year 2012-13
Amended Budget
Fiscal Year2012-13Actuals
Fiscal Year2013-14Adopted Budget
Fiscal Year2014-15
Approved Budget
537Appendices Adopted Operational Plan Fiscal Years 2013-2014 and 2014-2015
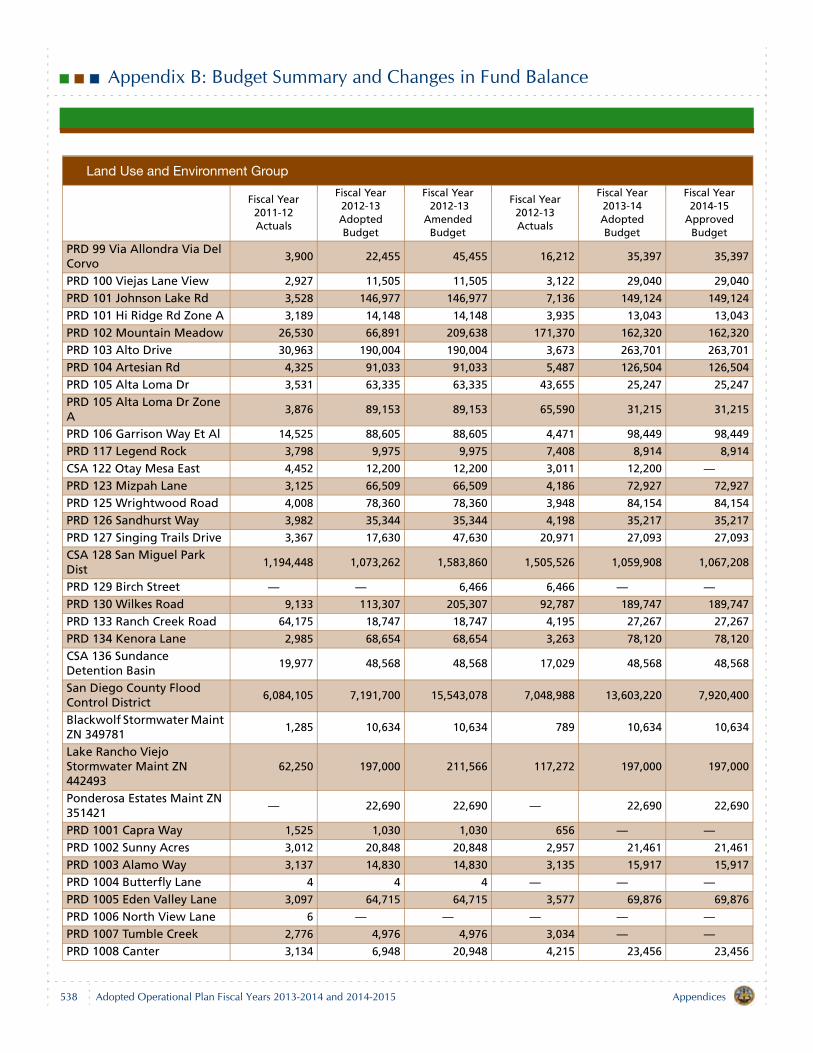
Appendix B: Budget Summary and Changes in Fund Balance
PRD 99 Via Allondra Via Del Corvo
3,900 22,455 45,455 16,212 35,397 35,397
PRD 100 Viejas Lane View 2,927 11,505 11,505 3,122 29,040 29,040
PRD 101 Johnson Lake Rd 3,528 146,977 146,977 7,136 149,124 149,124
PRD 101 Hi Ridge Rd Zone A 3,189 14,148 14,148 3,935 13,043 13,043
PRD 102 Mountain Meadow 26,530 66,891 209,638 171,370 162,320 162,320
PRD 103 Alto Drive 30,963 190,004 190,004 3,673 263,701 263,701
PRD 104 Artesian Rd 4,325 91,033 91,033 5,487 126,504 126,504
PRD 105 Alta Loma Dr 3,531 63,335 63,335 43,655 25,247 25,247
PRD 105 Alta Loma Dr Zone A
3,876 89,153 89,153 65,590 31,215 31,215
PRD 106 Garrison Way Et Al 14,525 88,605 88,605 4,471 98,449 98,449
PRD 117 Legend Rock 3,798 9,975 9,975 7,408 8,914 8,914
CSA 122 Otay Mesa East 4,452 12,200 12,200 3,011 12,200 —PRD 123 Mizpah Lane 3,125 66,509 66,509 4,186 72,927 72,927
PRD 125 Wrightwood Road 4,008 78,360 78,360 3,948 84,154 84,154
PRD 126 Sandhurst Way 3,982 35,344 35,344 4,198 35,217 35,217
PRD 127 Singing Trails Drive 3,367 17,630 47,630 20,971 27,093 27,093
CSA 128 San Miguel Park Dist
1,194,448 1,073,262 1,583,860 1,505,526 1,059,908 1,067,208
PRD 129 Birch Street — — 6,466 6,466 — —PRD 130 Wilkes Road 9,133 113,307 205,307 92,787 189,747 189,747
PRD 133 Ranch Creek Road 64,175 18,747 18,747 4,195 27,267 27,267
PRD 134 Kenora Lane 2,985 68,654 68,654 3,263 78,120 78,120
CSA 136 Sundance Detention Basin
19,977 48,568 48,568 17,029 48,568 48,568
San Diego County Flood Control District
6,084,105 7,191,700 15,543,078 7,048,988 13,603,220 7,920,400
Blackwolf Stormwater Maint ZN 349781
1,285 10,634 10,634 789 10,634 10,634
Lake Rancho Viejo Stormwater Maint ZN 442493
62,250 197,000 211,566 117,272 197,000 197,000
Ponderosa Estates Maint ZN 351421
— 22,690 22,690 — 22,690 22,690
PRD 1001 Capra Way 1,525 1,030 1,030 656 — —PRD 1002 Sunny Acres 3,012 20,848 20,848 2,957 21,461 21,461
PRD 1003 Alamo Way 3,137 14,830 14,830 3,135 15,917 15,917
PRD 1004 Butterfly Lane 4 4 4 — — —PRD 1005 Eden Valley Lane 3,097 64,715 64,715 3,577 69,876 69,876
PRD 1006 North View Lane 6 — — — — —PRD 1007 Tumble Creek 2,776 4,976 4,976 3,034 — —PRD 1008 Canter 3,134 6,948 20,948 4,215 23,456 23,456
Land Use and Environment Group
Fiscal Year 2011-12Actuals
Fiscal Year2012-13Adopted Budget
Fiscal Year 2012-13
Amended Budget
Fiscal Year2012-13Actuals
Fiscal Year2013-14Adopted Budget
Fiscal Year2014-15
Approved Budget
538 AppendicesAdopted Operational Plan Fiscal Years 2013-2014 and 2014-2015
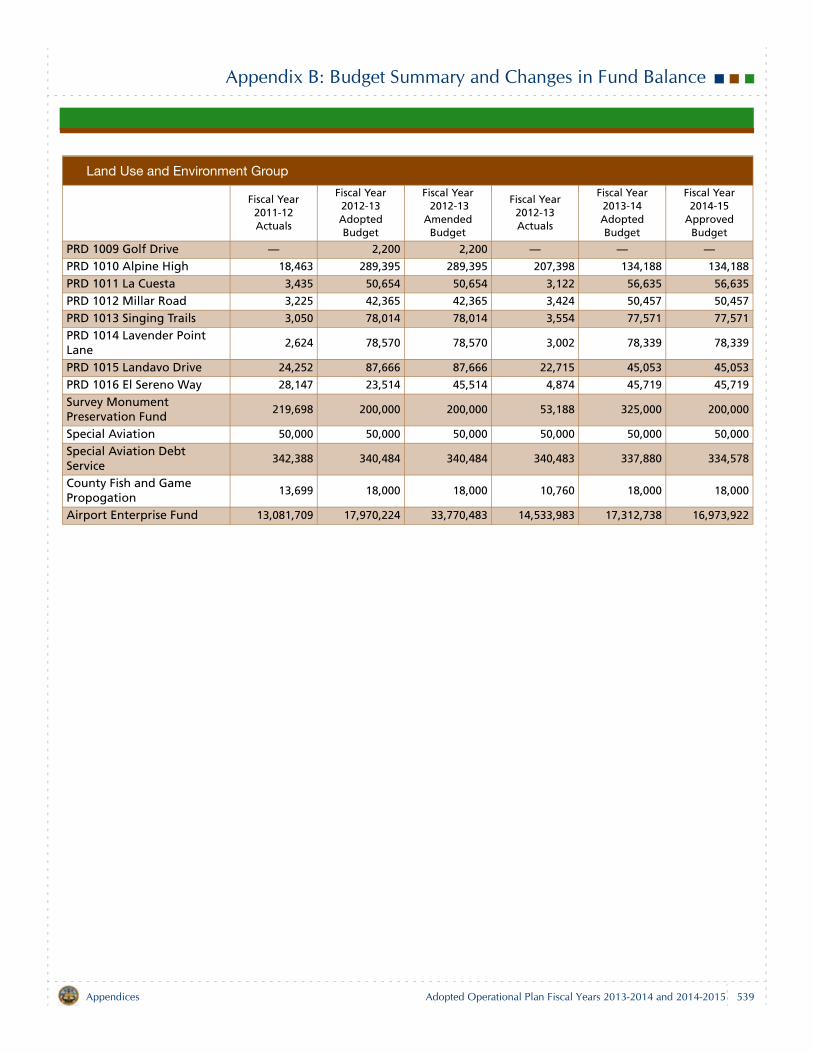
Appendix B: Budget Summary and Changes in Fund Balance
PRD 1009 Golf Drive — 2,200 2,200 — — —PRD 1010 Alpine High 18,463 289,395 289,395 207,398 134,188 134,188
PRD 1011 La Cuesta 3,435 50,654 50,654 3,122 56,635 56,635
PRD 1012 Millar Road 3,225 42,365 42,365 3,424 50,457 50,457
PRD 1013 Singing Trails 3,050 78,014 78,014 3,554 77,571 77,571
PRD 1014 Lavender Point Lane
2,624 78,570 78,570 3,002 78,339 78,339
PRD 1015 Landavo Drive 24,252 87,666 87,666 22,715 45,053 45,053
PRD 1016 El Sereno Way 28,147 23,514 45,514 4,874 45,719 45,719
Survey Monument Preservation Fund
219,698 200,000 200,000 53,188 325,000 200,000
Special Aviation 50,000 50,000 50,000 50,000 50,000 50,000
Special Aviation Debt Service
342,388 340,484 340,484 340,483 337,880 334,578
County Fish and Game Propogation
13,699 18,000 18,000 10,760 18,000 18,000
Airport Enterprise Fund 13,081,709 17,970,224 33,770,483 14,533,983 17,312,738 16,973,922
Land Use and Environment Group
Fiscal Year 2011-12Actuals
Fiscal Year2012-13Adopted Budget
Fiscal Year 2012-13
Amended Budget
Fiscal Year2012-13Actuals
Fiscal Year2013-14Adopted Budget
Fiscal Year2014-15
Approved Budget
539Appendices Adopted Operational Plan Fiscal Years 2013-2014 and 2014-2015
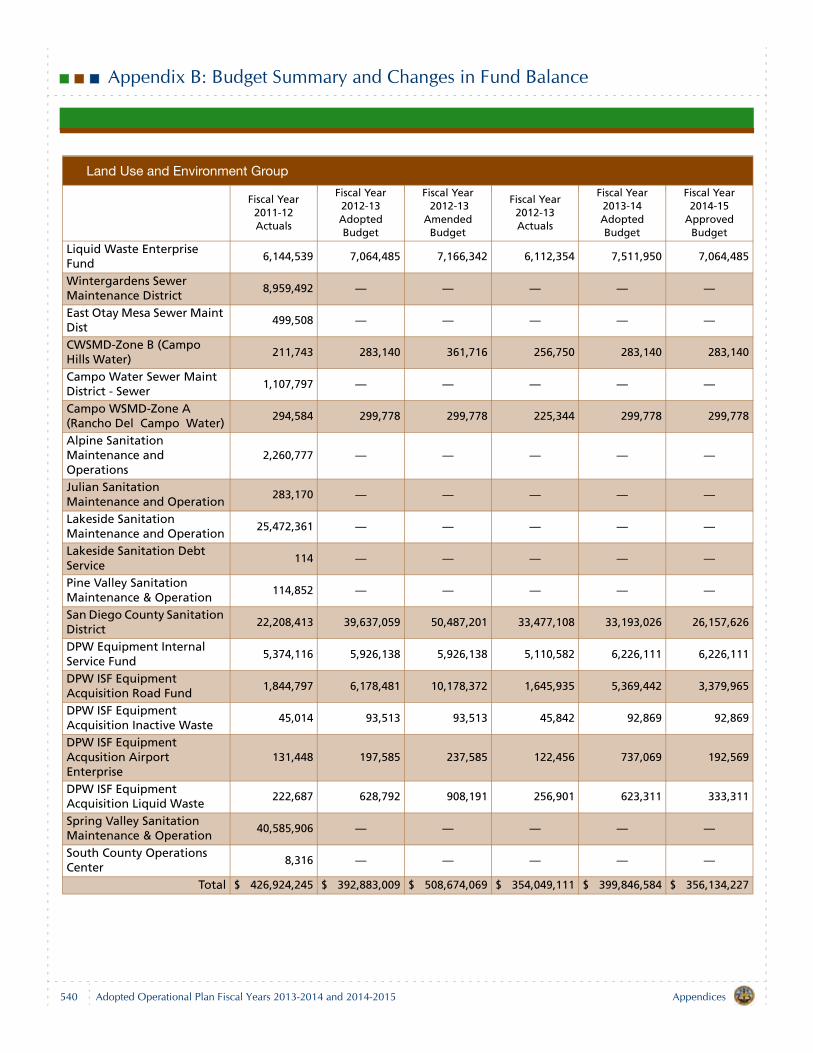
Appendix B: Budget Summary and Changes in Fund Balance
Liquid Waste Enterprise Fund
6,144,539 7,064,485 7,166,342 6,112,354 7,511,950 7,064,485
Wintergardens Sewer Maintenance District
8,959,492 — — — — —
East Otay Mesa Sewer Maint Dist
499,508 — — — — —
CWSMD-Zone B (Campo Hills Water)
211,743 283,140 361,716 256,750 283,140 283,140
Campo Water Sewer Maint District - Sewer
1,107,797 — — — — —
Campo WSMD-Zone A (Rancho Del Campo Water)
294,584 299,778 299,778 225,344 299,778 299,778
Alpine Sanitation Maintenance and Operations
2,260,777 — — — — —
Julian Sanitation Maintenance and Operation
283,170 — — — — —
Lakeside Sanitation Maintenance and Operation
25,472,361 — — — — —
Lakeside Sanitation Debt Service
114 — — — — —
Pine Valley Sanitation Maintenance & Operation
114,852 — — — — —
San Diego County Sanitation District
22,208,413 39,637,059 50,487,201 33,477,108 33,193,026 26,157,626
DPW Equipment Internal Service Fund
5,374,116 5,926,138 5,926,138 5,110,582 6,226,111 6,226,111
DPW ISF Equipment Acquisition Road Fund
1,844,797 6,178,481 10,178,372 1,645,935 5,369,442 3,379,965
DPW ISF Equipment Acquisition Inactive Waste
45,014 93,513 93,513 45,842 92,869 92,869
DPW ISF Equipment Acqusition Airport Enterprise
131,448 197,585 237,585 122,456 737,069 192,569
DPW ISF Equipment Acquisition Liquid Waste
222,687 628,792 908,191 256,901 623,311 333,311
Spring Valley Sanitation Maintenance & Operation
40,585,906 — — — — —
South County Operations Center
8,316 — — — — —
Total $ 426,924,245 $ 392,883,009 $ 508,674,069 $ 354,049,111 $ 399,846,584 $ 356,134,227
Land Use and Environment Group
Fiscal Year 2011-12Actuals
Fiscal Year2012-13Adopted Budget
Fiscal Year 2012-13
Amended Budget
Fiscal Year2012-13Actuals
Fiscal Year2013-14Adopted Budget
Fiscal Year2014-15
Approved Budget
540 AppendicesAdopted Operational Plan Fiscal Years 2013-2014 and 2014-2015
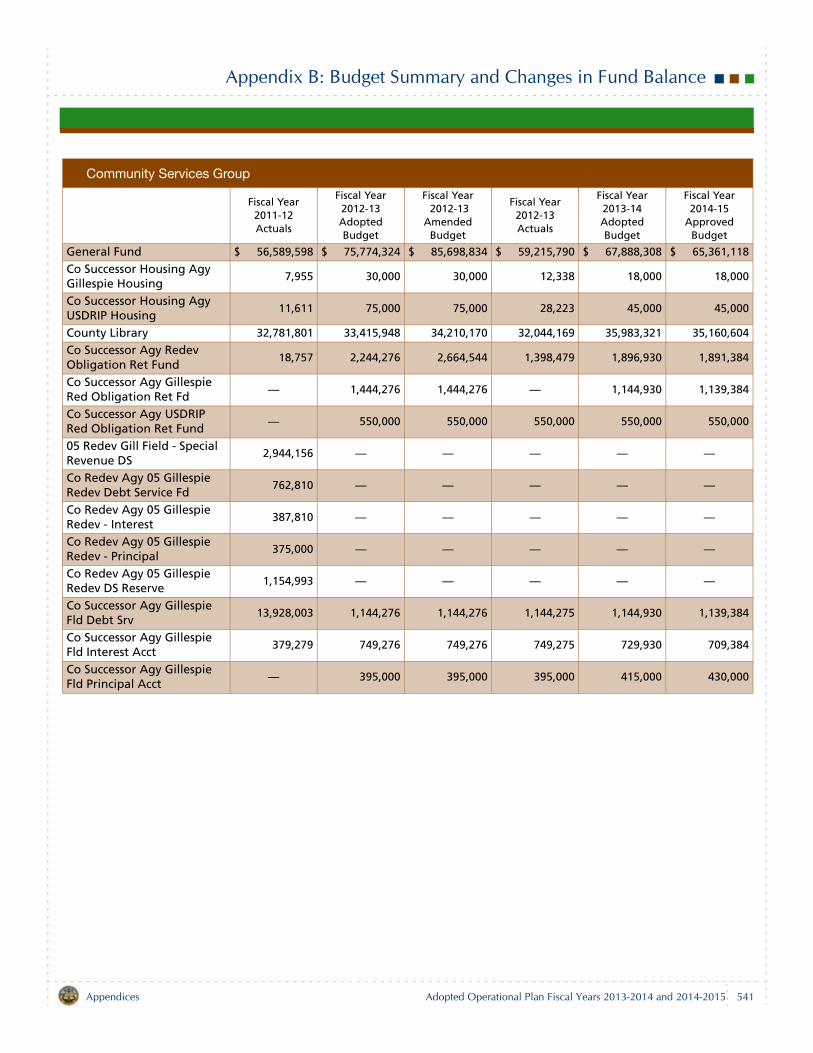
Appendix B: Budget Summary and Changes in Fund Balance
Community Services Group
Fiscal Year 2011-12Actuals
Fiscal Year2012-13Adopted Budget
Fiscal Year 2012-13
Amended Budget
Fiscal Year2012-13Actuals
Fiscal Year2013-14Adopted Budget
Fiscal Year2014-15
Approved Budget
General Fund $ 56,589,598 $ 75,774,324 $ 85,698,834 $ 59,215,790 $ 67,888,308 $ 65,361,118
Co Successor Housing Agy Gillespie Housing
7,955 30,000 30,000 12,338 18,000 18,000
Co Successor Housing Agy USDRIP Housing
11,611 75,000 75,000 28,223 45,000 45,000
County Library 32,781,801 33,415,948 34,210,170 32,044,169 35,983,321 35,160,604
Co Successor Agy Redev Obligation Ret Fund
18,757 2,244,276 2,664,544 1,398,479 1,896,930 1,891,384
Co Successor Agy Gillespie Red Obligation Ret Fd
— 1,444,276 1,444,276 — 1,144,930 1,139,384
Co Successor Agy USDRIP Red Obligation Ret Fund
— 550,000 550,000 550,000 550,000 550,000
05 Redev Gill Field - Special Revenue DS
2,944,156 — — — — —
Co Redev Agy 05 Gillespie Redev Debt Service Fd
762,810 — — — — —
Co Redev Agy 05 Gillespie Redev - Interest
387,810 — — — — —
Co Redev Agy 05 Gillespie Redev - Principal
375,000 — — — — —
Co Redev Agy 05 Gillespie Redev DS Reserve
1,154,993 — — — — —
Co Successor Agy Gillespie Fld Debt Srv
13,928,003 1,144,276 1,144,276 1,144,275 1,144,930 1,139,384
Co Successor Agy Gillespie Fld Interest Acct
379,279 749,276 749,276 749,275 729,930 709,384
Co Successor Agy Gillespie Fld Principal Acct
— 395,000 395,000 395,000 415,000 430,000
541Appendices Adopted Operational Plan Fiscal Years 2013-2014 and 2014-2015
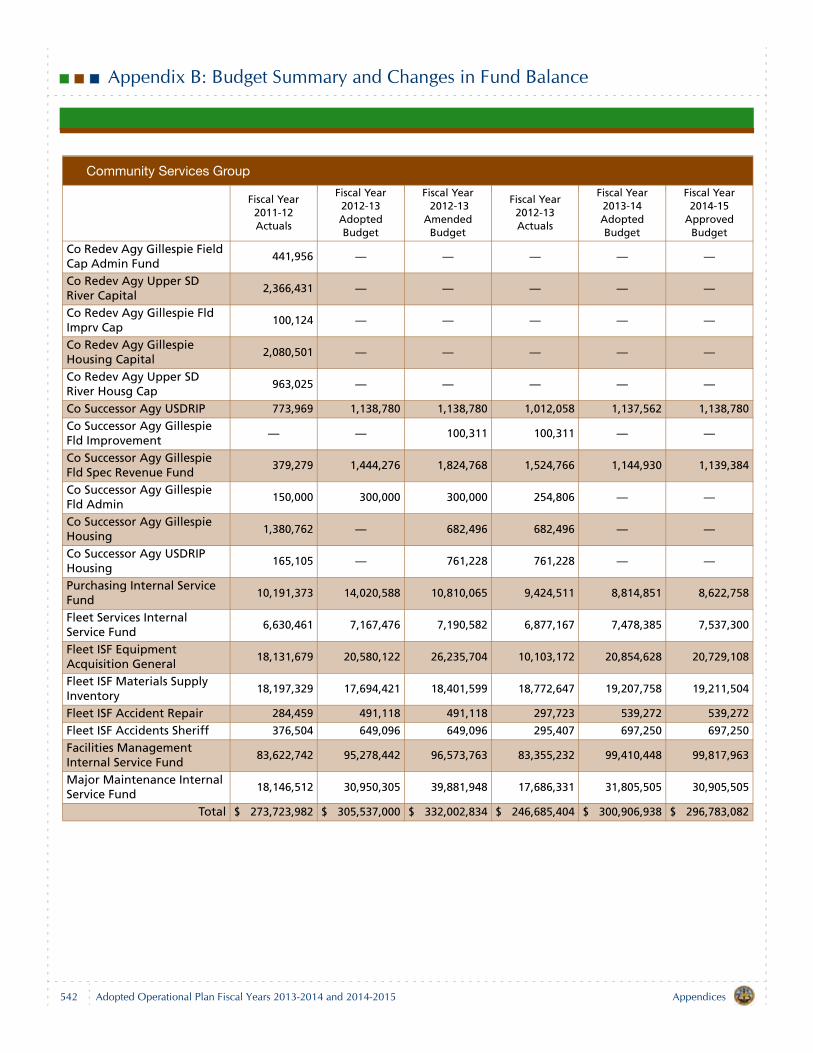
Appendix B: Budget Summary and Changes in Fund Balance
Co Redev Agy Gillespie Field Cap Admin Fund
441,956 — — — — —
Co Redev Agy Upper SD River Capital
2,366,431 — — — — —
Co Redev Agy Gillespie Fld Imprv Cap
100,124 — — — — —
Co Redev Agy Gillespie Housing Capital
2,080,501 — — — — —
Co Redev Agy Upper SD River Housg Cap
963,025 — — — — —
Co Successor Agy USDRIP 773,969 1,138,780 1,138,780 1,012,058 1,137,562 1,138,780
Co Successor Agy Gillespie Fld Improvement
— — 100,311 100,311 — —
Co Successor Agy Gillespie Fld Spec Revenue Fund
379,279 1,444,276 1,824,768 1,524,766 1,144,930 1,139,384
Co Successor Agy Gillespie Fld Admin
150,000 300,000 300,000 254,806 — —
Co Successor Agy Gillespie Housing
1,380,762 — 682,496 682,496 — —
Co Successor Agy USDRIP Housing
165,105 — 761,228 761,228 — —
Purchasing Internal Service Fund
10,191,373 14,020,588 10,810,065 9,424,511 8,814,851 8,622,758
Fleet Services Internal Service Fund
6,630,461 7,167,476 7,190,582 6,877,167 7,478,385 7,537,300
Fleet ISF Equipment Acquisition General
18,131,679 20,580,122 26,235,704 10,103,172 20,854,628 20,729,108
Fleet ISF Materials Supply Inventory
18,197,329 17,694,421 18,401,599 18,772,647 19,207,758 19,211,504
Fleet ISF Accident Repair 284,459 491,118 491,118 297,723 539,272 539,272
Fleet ISF Accidents Sheriff 376,504 649,096 649,096 295,407 697,250 697,250
Facilities Management Internal Service Fund
83,622,742 95,278,442 96,573,763 83,355,232 99,410,448 99,817,963
Major Maintenance Internal Service Fund
18,146,512 30,950,305 39,881,948 17,686,331 31,805,505 30,905,505
Total $ 273,723,982 $ 305,537,000 $ 332,002,834 $ 246,685,404 $ 300,906,938 $ 296,783,082
Community Services Group
Fiscal Year 2011-12Actuals
Fiscal Year2012-13Adopted Budget
Fiscal Year 2012-13
Amended Budget
Fiscal Year2012-13Actuals
Fiscal Year2013-14Adopted Budget
Fiscal Year2014-15
Approved Budget
542 AppendicesAdopted Operational Plan Fiscal Years 2013-2014 and 2014-2015
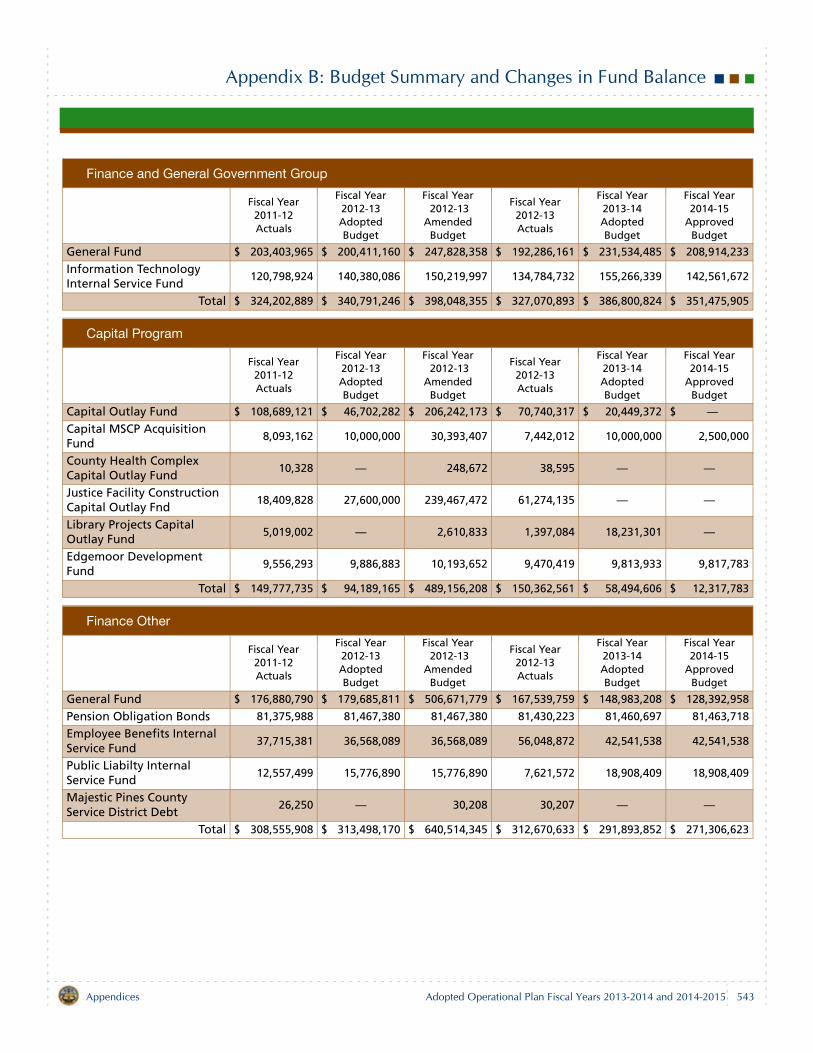
Appendix B: Budget Summary and Changes in Fund Balance
Finance and General Government Group
Fiscal Year 2011-12Actuals
Fiscal Year2012-13Adopted Budget
Fiscal Year 2012-13
Amended Budget
Fiscal Year2012-13Actuals
Fiscal Year2013-14Adopted Budget
Fiscal Year2014-15
Approved Budget
General Fund $ 203,403,965 $ 200,411,160 $ 247,828,358 $ 192,286,161 $ 231,534,485 $ 208,914,233
Information Technology Internal Service Fund
120,798,924 140,380,086 150,219,997 134,784,732 155,266,339 142,561,672
Total $ 324,202,889 $ 340,791,246 $ 398,048,355 $ 327,070,893 $ 386,800,824 $ 351,475,905
Capital Program
Fiscal Year 2011-12Actuals
Fiscal Year2012-13Adopted Budget
Fiscal Year 2012-13
Amended Budget
Fiscal Year2012-13Actuals
Fiscal Year2013-14Adopted Budget
Fiscal Year2014-15
Approved Budget
Capital Outlay Fund $ 108,689,121 $ 46,702,282 $ 206,242,173 $ 70,740,317 $ 20,449,372 $ —Capital MSCP Acquisition Fund
8,093,162 10,000,000 30,393,407 7,442,012 10,000,000 2,500,000
County Health Complex Capital Outlay Fund
10,328 — 248,672 38,595 — —
Justice Facility Construction Capital Outlay Fnd
18,409,828 27,600,000 239,467,472 61,274,135 — —
Library Projects Capital Outlay Fund
5,019,002 — 2,610,833 1,397,084 18,231,301 —
Edgemoor Development Fund
9,556,293 9,886,883 10,193,652 9,470,419 9,813,933 9,817,783
Total $ 149,777,735 $ 94,189,165 $ 489,156,208 $ 150,362,561 $ 58,494,606 $ 12,317,783
Finance Other
Fiscal Year 2011-12Actuals
Fiscal Year2012-13Adopted Budget
Fiscal Year 2012-13
Amended Budget
Fiscal Year2012-13Actuals
Fiscal Year2013-14Adopted Budget
Fiscal Year2014-15
Approved Budget
General Fund $ 176,880,790 $ 179,685,811 $ 506,671,779 $ 167,539,759 $ 148,983,208 $ 128,392,958
Pension Obligation Bonds 81,375,988 81,467,380 81,467,380 81,430,223 81,460,697 81,463,718
Employee Benefits Internal Service Fund
37,715,381 36,568,089 36,568,089 56,048,872 42,541,538 42,541,538
Public Liabilty Internal Service Fund
12,557,499 15,776,890 15,776,890 7,621,572 18,908,409 18,908,409
Majestic Pines County Service District Debt
26,250 — 30,208 30,207 — —
Total $ 308,555,908 $ 313,498,170 $ 640,514,345 $ 312,670,633 $ 291,893,852 $ 271,306,623
543Appendices Adopted Operational Plan Fiscal Years 2013-2014 and 2014-2015
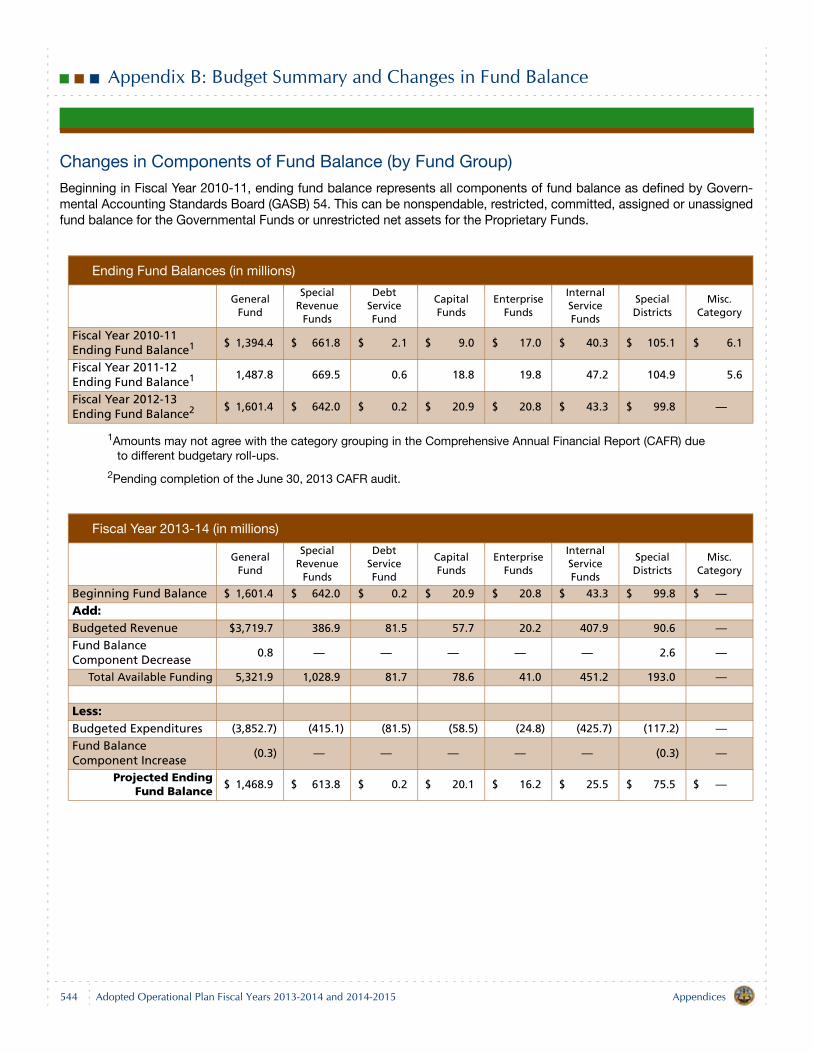
Appendix B: Budget Summary and Changes in Fund Balance
Changes in Components of Fund Balance (by Fund Group)
Beginning in Fiscal Year 2010-11, ending fund balance represents all components of fund balance as defined by Govern-mental Accounting Standards Board (GASB) 54. This can be nonspendable, restricted, committed, assigned or unassignedfund balance for the Governmental Funds or unrestricted net assets for the Proprietary Funds.
1Amounts may not agree with the category grouping in the Comprehensive Annual Financial Report (CAFR) dueto different budgetary roll-ups.
2Pending completion of the June 30, 2013 CAFR audit.
Ending Fund Balances (in millions)
GeneralFund
SpecialRevenue
Funds
DebtServiceFund
CapitalFunds
EnterpriseFunds
InternalServiceFunds
SpecialDistricts
Misc.Category
Fiscal Year 2010-11Ending Fund Balance1 $ 1,394.4 $ 661.8 $ 2.1 $ 9.0 $ 17.0 $ 40.3 $ 105.1 $ 6.1
Fiscal Year 2011-12Ending Fund Balance1 1,487.8 669.5 0.6 18.8 19.8 47.2 104.9 5.6
Fiscal Year 2012-13 Ending Fund Balance2 $ 1,601.4 $ 642.0 $ 0.2 $ 20.9 $ 20.8 $ 43.3 $ 99.8 —
Fiscal Year 2013-14 (in millions)
GeneralFund
SpecialRevenue
Funds
DebtServiceFund
CapitalFunds
EnterpriseFunds
InternalServiceFunds
SpecialDistricts
Misc.Category
Beginning Fund Balance $ 1,601.4 $ 642.0 $ 0.2 $ 20.9 $ 20.8 $ 43.3 $ 99.8 $ —
Add: Budgeted Revenue $3,719.7 386.9 81.5 57.7 20.2 407.9 90.6 —
Fund Balance Component Decrease
0.8 — — — — — 2.6 —
Total Available Funding 5,321.9 1,028.9 81.7 78.6 41.0 451.2 193.0 — Less: Budgeted Expenditures (3,852.7) (415.1) (81.5) (58.5) (24.8) (425.7) (117.2) —
Fund Balance Component Increase
(0.3) — — — — — (0.3) —
Projected EndingFund Balance
$ 1,468.9 $ 613.8 $ 0.2 $ 20.1 $ 16.2 $ 25.5 $ 75.5 $ —
544 AppendicesAdopted Operational Plan Fiscal Years 2013-2014 and 2014-2015
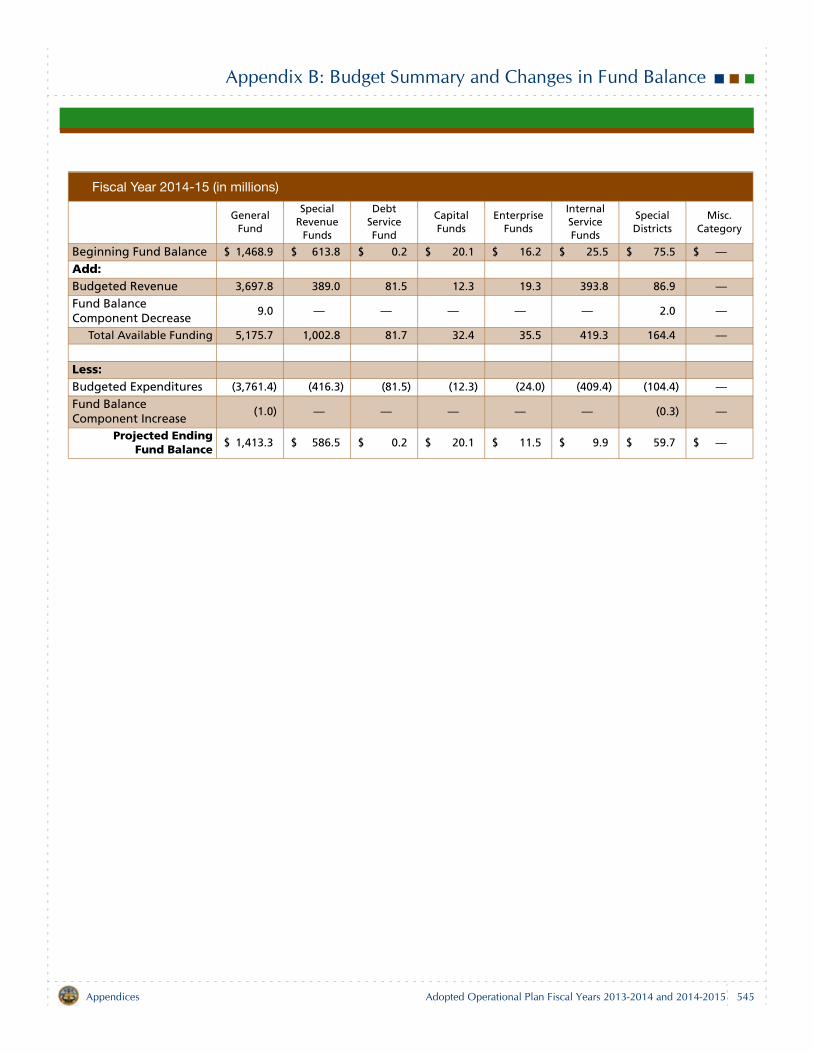
Appendix B: Budget Summary and Changes in Fund Balance
Fiscal Year 2014-15 (in millions)
GeneralFund
SpecialRevenue
Funds
DebtServiceFund
CapitalFunds
EnterpriseFunds
InternalServiceFunds
SpecialDistricts
Misc.Category
Beginning Fund Balance $ 1,468.9 $ 613.8 $ 0.2 $ 20.1 $ 16.2 $ 25.5 $ 75.5 $ —
Add: Budgeted Revenue 3,697.8 389.0 81.5 12.3 19.3 393.8 86.9 —
Fund Balance Component Decrease
9.0 — — — — — 2.0 —
Total Available Funding 5,175.7 1,002.8 81.7 32.4 35.5 419.3 164.4 — Less: Budgeted Expenditures (3,761.4) (416.3) (81.5) (12.3) (24.0) (409.4) (104.4) —
Fund Balance Component Increase
(1.0) — — — — — (0.3) —
Projected EndingFund Balance
$ 1,413.3 $ 586.5 $ 0.2 $ 20.1 $ 11.5 $ 9.9 $ 59.7 $ —
545Appendices Adopted Operational Plan Fiscal Years 2013-2014 and 2014-2015
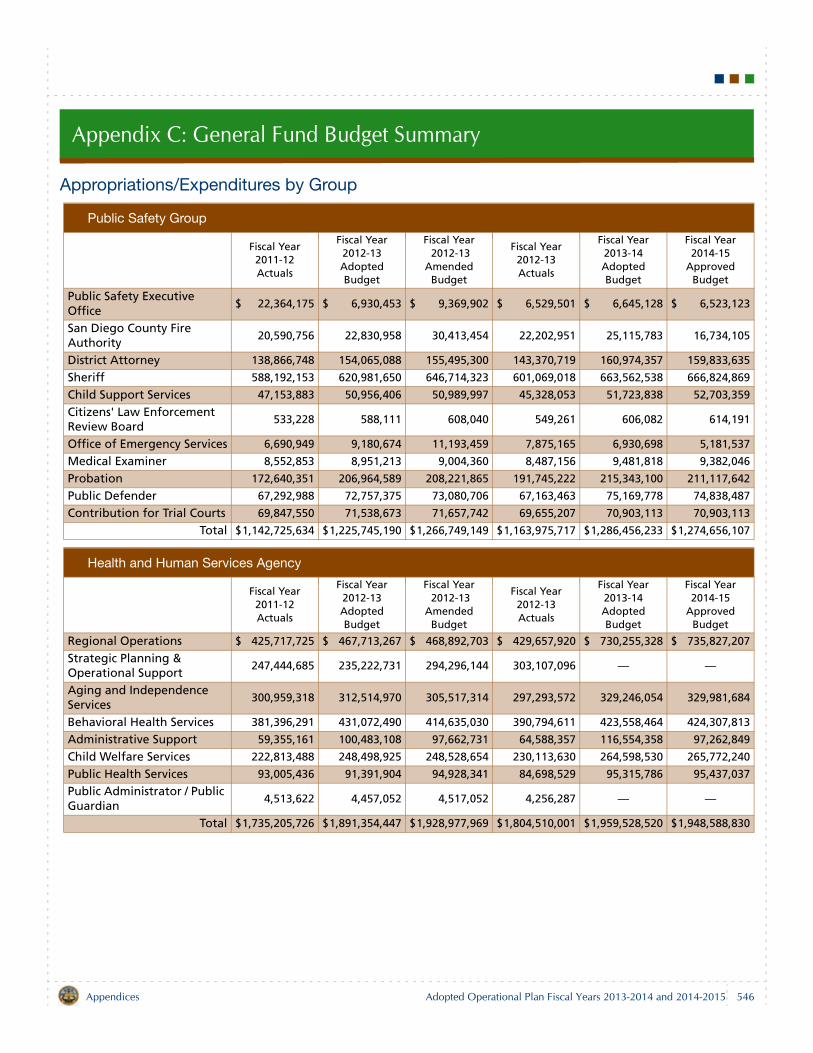
Appendix C: General Fund Budget Summary
Appropriations/Expenditures by Group
Public Safety Group
Fiscal Year 2011-12Actuals
Fiscal Year2012-13Adopted Budget
Fiscal Year 2012-13
Amended Budget
Fiscal Year2012-13Actuals
Fiscal Year2013-14Adopted Budget
Fiscal Year2014-15
Approved Budget
Public Safety Executive Office
$ 22,364,175 $ 6,930,453 $ 9,369,902 $ 6,529,501 $ 6,645,128 $ 6,523,123
San Diego County Fire Authority
20,590,756 22,830,958 30,413,454 22,202,951 25,115,783 16,734,105
District Attorney 138,866,748 154,065,088 155,495,300 143,370,719 160,974,357 159,833,635
Sheriff 588,192,153 620,981,650 646,714,323 601,069,018 663,562,538 666,824,869
Child Support Services 47,153,883 50,956,406 50,989,997 45,328,053 51,723,838 52,703,359
Citizens' Law Enforcement Review Board
533,228 588,111 608,040 549,261 606,082 614,191
Office of Emergency Services 6,690,949 9,180,674 11,193,459 7,875,165 6,930,698 5,181,537
Medical Examiner 8,552,853 8,951,213 9,004,360 8,487,156 9,481,818 9,382,046
Probation 172,640,351 206,964,589 208,221,865 191,745,222 215,343,100 211,117,642
Public Defender 67,292,988 72,757,375 73,080,706 67,163,463 75,169,778 74,838,487
Contribution for Trial Courts 69,847,550 71,538,673 71,657,742 69,655,207 70,903,113 70,903,113
Total $1,142,725,634 $1,225,745,190 $1,266,749,149 $1,163,975,717 $1,286,456,233 $1,274,656,107
Health and Human Services Agency
Fiscal Year 2011-12Actuals
Fiscal Year2012-13Adopted Budget
Fiscal Year 2012-13
Amended Budget
Fiscal Year2012-13Actuals
Fiscal Year2013-14Adopted Budget
Fiscal Year2014-15
Approved Budget
Regional Operations $ 425,717,725 $ 467,713,267 $ 468,892,703 $ 429,657,920 $ 730,255,328 $ 735,827,207
Strategic Planning & Operational Support
247,444,685 235,222,731 294,296,144 303,107,096 — —
Aging and Independence Services
300,959,318 312,514,970 305,517,314 297,293,572 329,246,054 329,981,684
Behavioral Health Services 381,396,291 431,072,490 414,635,030 390,794,611 423,558,464 424,307,813
Administrative Support 59,355,161 100,483,108 97,662,731 64,588,357 116,554,358 97,262,849
Child Welfare Services 222,813,488 248,498,925 248,528,654 230,113,630 264,598,530 265,772,240
Public Health Services 93,005,436 91,391,904 94,928,341 84,698,529 95,315,786 95,437,037
Public Administrator / Public Guardian
4,513,622 4,457,052 4,517,052 4,256,287 — —
Total $1,735,205,726 $1,891,354,447 $1,928,977,969 $1,804,510,001 $1,959,528,520 $1,948,588,830
546Appendices Adopted Operational Plan Fiscal Years 2013-2014 and 2014-2015
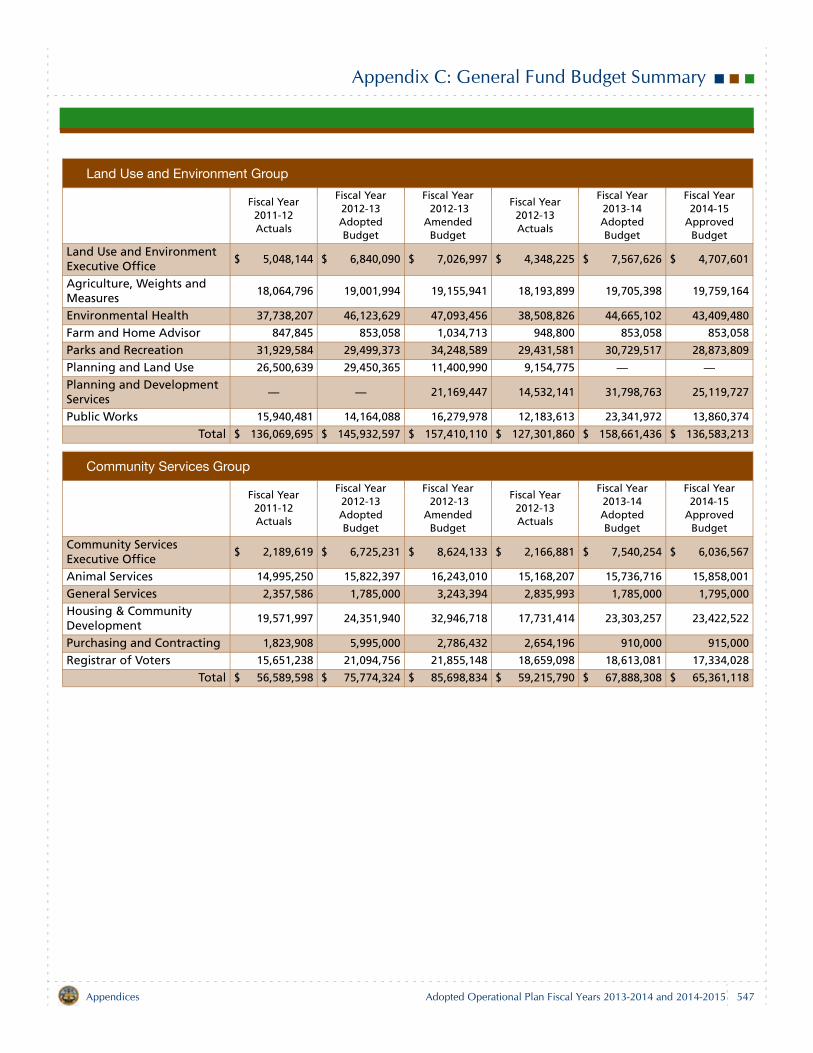
Appendix C: General Fund Budget Summary
Land Use and Environment Group
Fiscal Year 2011-12Actuals
Fiscal Year2012-13Adopted Budget
Fiscal Year 2012-13
Amended Budget
Fiscal Year2012-13Actuals
Fiscal Year2013-14Adopted Budget
Fiscal Year2014-15
Approved Budget
Land Use and Environment Executive Office
$ 5,048,144 $ 6,840,090 $ 7,026,997 $ 4,348,225 $ 7,567,626 $ 4,707,601
Agriculture, Weights and Measures
18,064,796 19,001,994 19,155,941 18,193,899 19,705,398 19,759,164
Environmental Health 37,738,207 46,123,629 47,093,456 38,508,826 44,665,102 43,409,480
Farm and Home Advisor 847,845 853,058 1,034,713 948,800 853,058 853,058
Parks and Recreation 31,929,584 29,499,373 34,248,589 29,431,581 30,729,517 28,873,809
Planning and Land Use 26,500,639 29,450,365 11,400,990 9,154,775 — —Planning and Development Services
— — 21,169,447 14,532,141 31,798,763 25,119,727
Public Works 15,940,481 14,164,088 16,279,978 12,183,613 23,341,972 13,860,374
Total $ 136,069,695 $ 145,932,597 $ 157,410,110 $ 127,301,860 $ 158,661,436 $ 136,583,213
Community Services Group
Fiscal Year 2011-12Actuals
Fiscal Year2012-13Adopted Budget
Fiscal Year 2012-13
Amended Budget
Fiscal Year2012-13Actuals
Fiscal Year2013-14Adopted Budget
Fiscal Year2014-15
Approved Budget
Community Services Executive Office
$ 2,189,619 $ 6,725,231 $ 8,624,133 $ 2,166,881 $ 7,540,254 $ 6,036,567
Animal Services 14,995,250 15,822,397 16,243,010 15,168,207 15,736,716 15,858,001
General Services 2,357,586 1,785,000 3,243,394 2,835,993 1,785,000 1,795,000
Housing & Community Development
19,571,997 24,351,940 32,946,718 17,731,414 23,303,257 23,422,522
Purchasing and Contracting 1,823,908 5,995,000 2,786,432 2,654,196 910,000 915,000
Registrar of Voters 15,651,238 21,094,756 21,855,148 18,659,098 18,613,081 17,334,028
Total $ 56,589,598 $ 75,774,324 $ 85,698,834 $ 59,215,790 $ 67,888,308 $ 65,361,118
547Appendices Adopted Operational Plan Fiscal Years 2013-2014 and 2014-2015
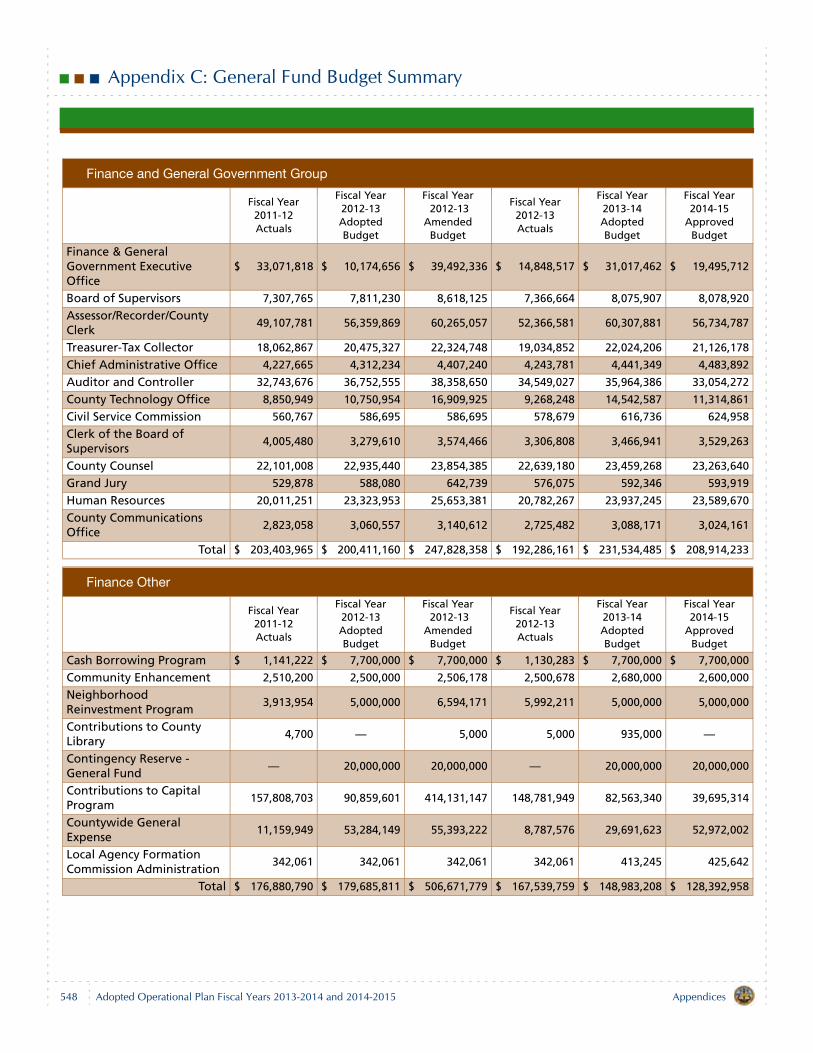
Appendix C: General Fund Budget Summary
Finance and General Government Group
Fiscal Year 2011-12Actuals
Fiscal Year2012-13Adopted Budget
Fiscal Year 2012-13
Amended Budget
Fiscal Year2012-13Actuals
Fiscal Year2013-14Adopted Budget
Fiscal Year2014-15
Approved Budget
Finance & General Government Executive Office
$ 33,071,818 $ 10,174,656 $ 39,492,336 $ 14,848,517 $ 31,017,462 $ 19,495,712
Board of Supervisors 7,307,765 7,811,230 8,618,125 7,366,664 8,075,907 8,078,920
Assessor/Recorder/County Clerk
49,107,781 56,359,869 60,265,057 52,366,581 60,307,881 56,734,787
Treasurer-Tax Collector 18,062,867 20,475,327 22,324,748 19,034,852 22,024,206 21,126,178
Chief Administrative Office 4,227,665 4,312,234 4,407,240 4,243,781 4,441,349 4,483,892
Auditor and Controller 32,743,676 36,752,555 38,358,650 34,549,027 35,964,386 33,054,272
County Technology Office 8,850,949 10,750,954 16,909,925 9,268,248 14,542,587 11,314,861
Civil Service Commission 560,767 586,695 586,695 578,679 616,736 624,958
Clerk of the Board of Supervisors
4,005,480 3,279,610 3,574,466 3,306,808 3,466,941 3,529,263
County Counsel 22,101,008 22,935,440 23,854,385 22,639,180 23,459,268 23,263,640
Grand Jury 529,878 588,080 642,739 576,075 592,346 593,919
Human Resources 20,011,251 23,323,953 25,653,381 20,782,267 23,937,245 23,589,670
County Communications Office
2,823,058 3,060,557 3,140,612 2,725,482 3,088,171 3,024,161
Total $ 203,403,965 $ 200,411,160 $ 247,828,358 $ 192,286,161 $ 231,534,485 $ 208,914,233
Finance Other
Fiscal Year 2011-12Actuals
Fiscal Year2012-13Adopted Budget
Fiscal Year 2012-13
Amended Budget
Fiscal Year2012-13Actuals
Fiscal Year2013-14Adopted Budget
Fiscal Year2014-15
Approved Budget
Cash Borrowing Program $ 1,141,222 $ 7,700,000 $ 7,700,000 $ 1,130,283 $ 7,700,000 $ 7,700,000
Community Enhancement 2,510,200 2,500,000 2,506,178 2,500,678 2,680,000 2,600,000
Neighborhood Reinvestment Program
3,913,954 5,000,000 6,594,171 5,992,211 5,000,000 5,000,000
Contributions to County Library
4,700 — 5,000 5,000 935,000 —
Contingency Reserve - General Fund
— 20,000,000 20,000,000 — 20,000,000 20,000,000
Contributions to Capital Program
157,808,703 90,859,601 414,131,147 148,781,949 82,563,340 39,695,314
Countywide General Expense
11,159,949 53,284,149 55,393,222 8,787,576 29,691,623 52,972,002
Local Agency Formation Commission Administration
342,061 342,061 342,061 342,061 413,245 425,642
Total $ 176,880,790 $ 179,685,811 $ 506,671,779 $ 167,539,759 $ 148,983,208 $ 128,392,958
548 AppendicesAdopted Operational Plan Fiscal Years 2013-2014 and 2014-2015
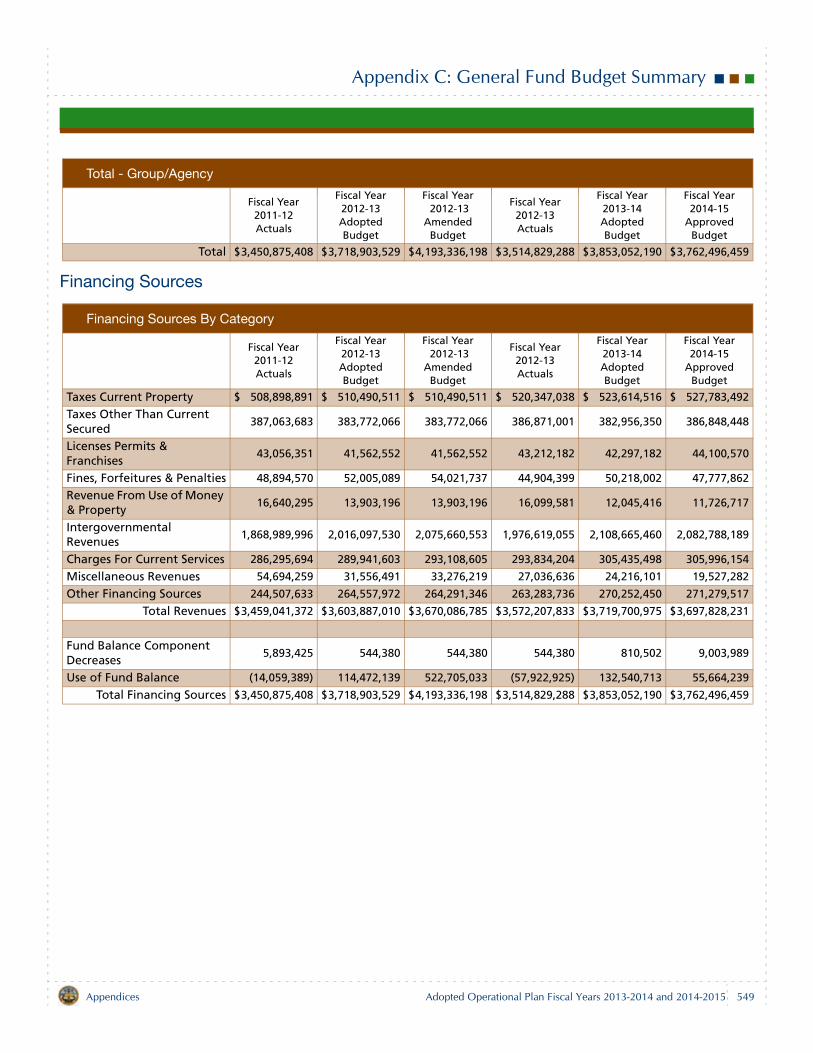
Appendix C: General Fund Budget Summary
Financing Sources
Total - Group/Agency
Fiscal Year 2011-12Actuals
Fiscal Year2012-13Adopted Budget
Fiscal Year 2012-13
Amended Budget
Fiscal Year2012-13Actuals
Fiscal Year2013-14Adopted Budget
Fiscal Year2014-15
Approved Budget
Total $3,450,875,408 $3,718,903,529 $4,193,336,198 $3,514,829,288 $3,853,052,190 $3,762,496,459
Financing Sources By Category
Fiscal Year 2011-12Actuals
Fiscal Year2012-13Adopted Budget
Fiscal Year 2012-13
Amended Budget
Fiscal Year2012-13Actuals
Fiscal Year2013-14Adopted Budget
Fiscal Year2014-15
Approved Budget
Taxes Current Property $ 508,898,891 $ 510,490,511 $ 510,490,511 $ 520,347,038 $ 523,614,516 $ 527,783,492
Taxes Other Than Current Secured
387,063,683 383,772,066 383,772,066 386,871,001 382,956,350 386,848,448
Licenses Permits & Franchises
43,056,351 41,562,552 41,562,552 43,212,182 42,297,182 44,100,570
Fines, Forfeitures & Penalties 48,894,570 52,005,089 54,021,737 44,904,399 50,218,002 47,777,862
Revenue From Use of Money & Property
16,640,295 13,903,196 13,903,196 16,099,581 12,045,416 11,726,717
Intergovernmental Revenues
1,868,989,996 2,016,097,530 2,075,660,553 1,976,619,055 2,108,665,460 2,082,788,189
Charges For Current Services 286,295,694 289,941,603 293,108,605 293,834,204 305,435,498 305,996,154
Miscellaneous Revenues 54,694,259 31,556,491 33,276,219 27,036,636 24,216,101 19,527,282
Other Financing Sources 244,507,633 264,557,972 264,291,346 263,283,736 270,252,450 271,279,517
Total Revenues $3,459,041,372 $3,603,887,010 $3,670,086,785 $3,572,207,833 $3,719,700,975 $3,697,828,231
Fund Balance Component Decreases
5,893,425 544,380 544,380 544,380 810,502 9,003,989
Use of Fund Balance (14,059,389) 114,472,139 522,705,033 (57,922,925) 132,540,713 55,664,239
Total Financing Sources $3,450,875,408 $3,718,903,529 $4,193,336,198 $3,514,829,288 $3,853,052,190 $3,762,496,459
549Appendices Adopted Operational Plan Fiscal Years 2013-2014 and 2014-2015

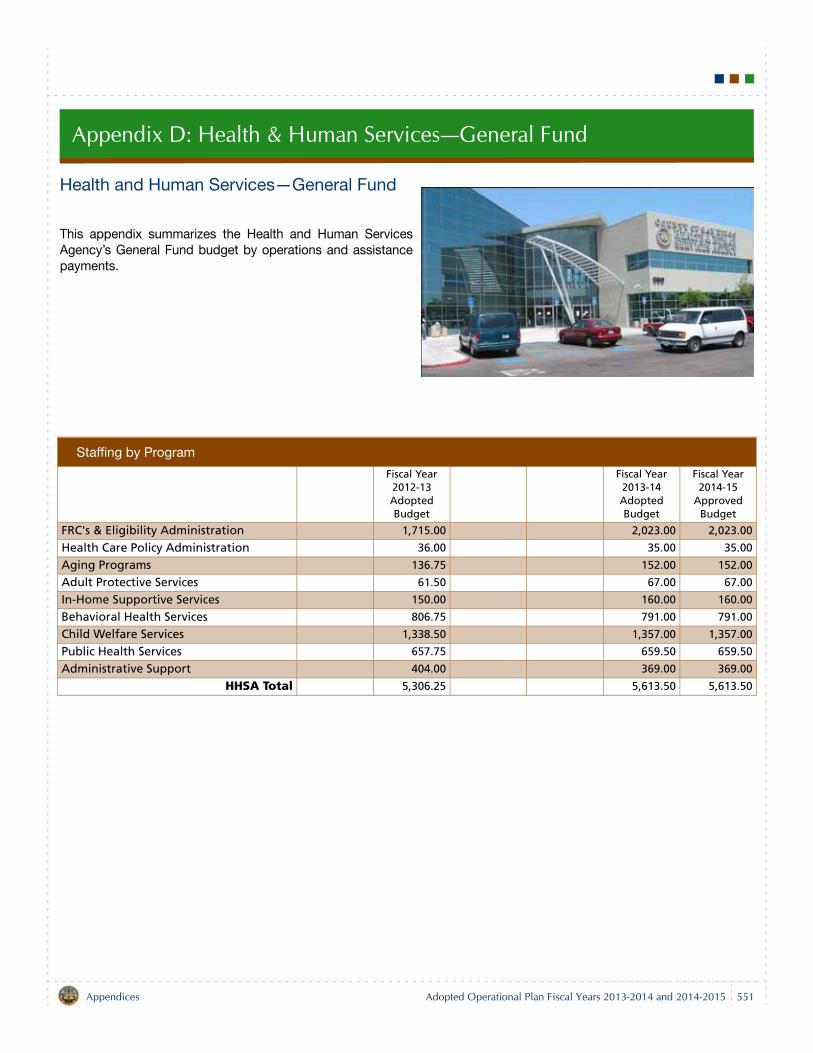
Appendix D: Health & Human Services—General Fund
Health and Human Services—General Fund
This appendix summarizes the Health and Human ServicesAgency’s General Fund budget by operations and assistancepayments.
Staffing by Program
Fiscal Year2012-13AdoptedBudget
Fiscal Year2013-14AdoptedBudget
Fiscal Year2014-15
ApprovedBudget
FRC's & Eligibility Administration 1,715.00 2,023.00 2,023.00
Health Care Policy Administration 36.00 35.00 35.00
Aging Programs 136.75 152.00 152.00
Adult Protective Services 61.50 67.00 67.00
In-Home Supportive Services 150.00 160.00 160.00
Behavioral Health Services 806.75 791.00 791.00
Child Welfare Services 1,338.50 1,357.00 1,357.00
Public Health Services 657.75 659.50 659.50
Administrative Support 404.00 369.00 369.00
HHSA Total 5,306.25 5,613.50 5,613.50
Appendices Adopted Operational Plan Fiscal Years 2013-2014 and 2014-2015 551
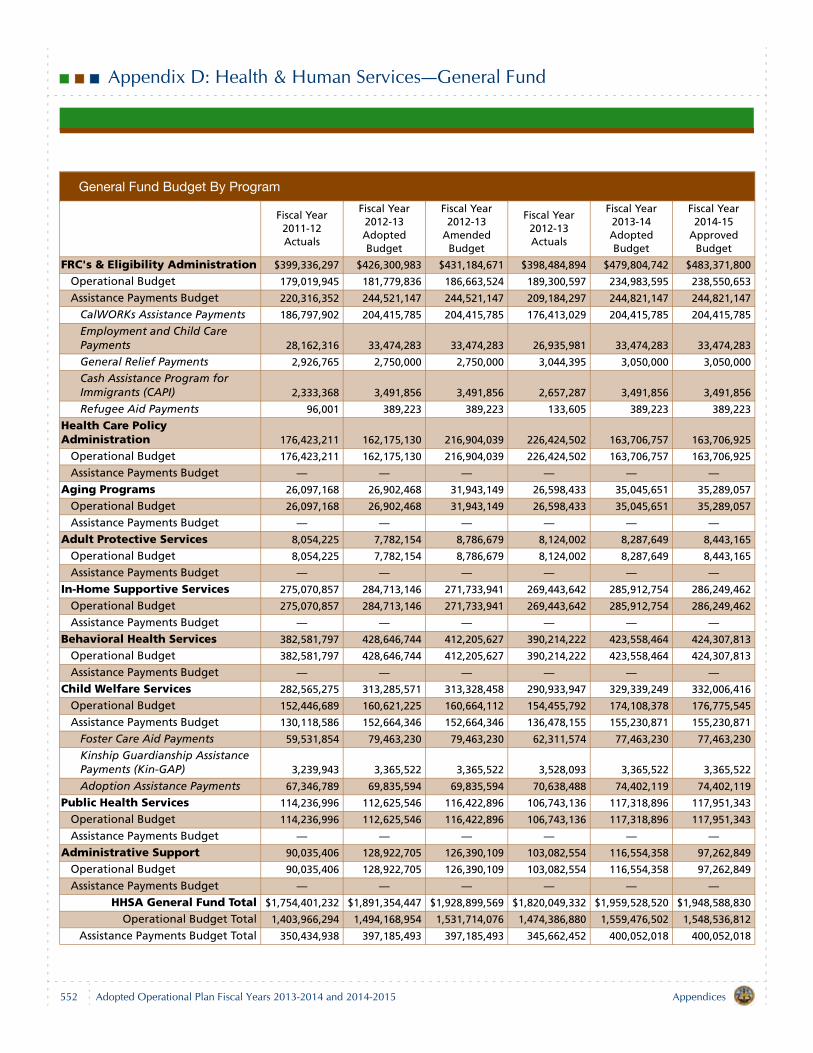
Appendix D: Health & Human Services—General Fund
General Fund Budget By Program
Fiscal Year2011-12Actuals
Fiscal Year2012-13AdoptedBudget
Fiscal Year2012-13
AmendedBudget
Fiscal Year2012-13Actuals
Fiscal Year2013-14AdoptedBudget
Fiscal Year2014-15
ApprovedBudget
FRC's & Eligibility Administration $399,336,297 $426,300,983 $431,184,671 $398,484,894 $479,804,742 $483,371,800
Operational Budget 179,019,945 181,779,836 186,663,524 189,300,597 234,983,595 238,550,653
Assistance Payments Budget 220,316,352 244,521,147 244,521,147 209,184,297 244,821,147 244,821,147
CalWORKs Assistance Payments 186,797,902 204,415,785 204,415,785 176,413,029 204,415,785 204,415,785
Employment and Child Care Payments 28,162,316 33,474,283 33,474,283 26,935,981 33,474,283 33,474,283
General Relief Payments 2,926,765 2,750,000 2,750,000 3,044,395 3,050,000 3,050,000
Cash Assistance Program for Immigrants (CAPI) 2,333,368 3,491,856 3,491,856 2,657,287 3,491,856 3,491,856
Refugee Aid Payments 96,001 389,223 389,223 133,605 389,223 389,223
Health Care Policy Administration 176,423,211 162,175,130 216,904,039 226,424,502 163,706,757 163,706,925
Operational Budget 176,423,211 162,175,130 216,904,039 226,424,502 163,706,757 163,706,925
Assistance Payments Budget — — — — — —
Aging Programs 26,097,168 26,902,468 31,943,149 26,598,433 35,045,651 35,289,057
Operational Budget 26,097,168 26,902,468 31,943,149 26,598,433 35,045,651 35,289,057
Assistance Payments Budget — — — — — —
Adult Protective Services 8,054,225 7,782,154 8,786,679 8,124,002 8,287,649 8,443,165
Operational Budget 8,054,225 7,782,154 8,786,679 8,124,002 8,287,649 8,443,165
Assistance Payments Budget — — — — — —
In-Home Supportive Services 275,070,857 284,713,146 271,733,941 269,443,642 285,912,754 286,249,462
Operational Budget 275,070,857 284,713,146 271,733,941 269,443,642 285,912,754 286,249,462
Assistance Payments Budget — — — — — —
Behavioral Health Services 382,581,797 428,646,744 412,205,627 390,214,222 423,558,464 424,307,813
Operational Budget 382,581,797 428,646,744 412,205,627 390,214,222 423,558,464 424,307,813
Assistance Payments Budget — — — — — —
Child Welfare Services 282,565,275 313,285,571 313,328,458 290,933,947 329,339,249 332,006,416
Operational Budget 152,446,689 160,621,225 160,664,112 154,455,792 174,108,378 176,775,545
Assistance Payments Budget 130,118,586 152,664,346 152,664,346 136,478,155 155,230,871 155,230,871
Foster Care Aid Payments 59,531,854 79,463,230 79,463,230 62,311,574 77,463,230 77,463,230
Kinship Guardianship Assistance Payments (Kin-GAP) 3,239,943 3,365,522 3,365,522 3,528,093 3,365,522 3,365,522
Adoption Assistance Payments 67,346,789 69,835,594 69,835,594 70,638,488 74,402,119 74,402,119
Public Health Services 114,236,996 112,625,546 116,422,896 106,743,136 117,318,896 117,951,343
Operational Budget 114,236,996 112,625,546 116,422,896 106,743,136 117,318,896 117,951,343
Assistance Payments Budget — — — — — —
Administrative Support 90,035,406 128,922,705 126,390,109 103,082,554 116,554,358 97,262,849
Operational Budget 90,035,406 128,922,705 126,390,109 103,082,554 116,554,358 97,262,849
Assistance Payments Budget — — — — — —
HHSA General Fund Total $1,754,401,232 $1,891,354,447 $1,928,899,569 $1,820,049,332 $1,959,528,520 $1,948,588,830
Operational Budget Total 1,403,966,294 1,494,168,954 1,531,714,076 1,474,386,880 1,559,476,502 1,548,536,812
Assistance Payments Budget Total 350,434,938 397,185,493 397,185,493 345,662,452 400,052,018 400,052,018
552 AppendicesAdopted Operational Plan Fiscal Years 2013-2014 and 2014-2015
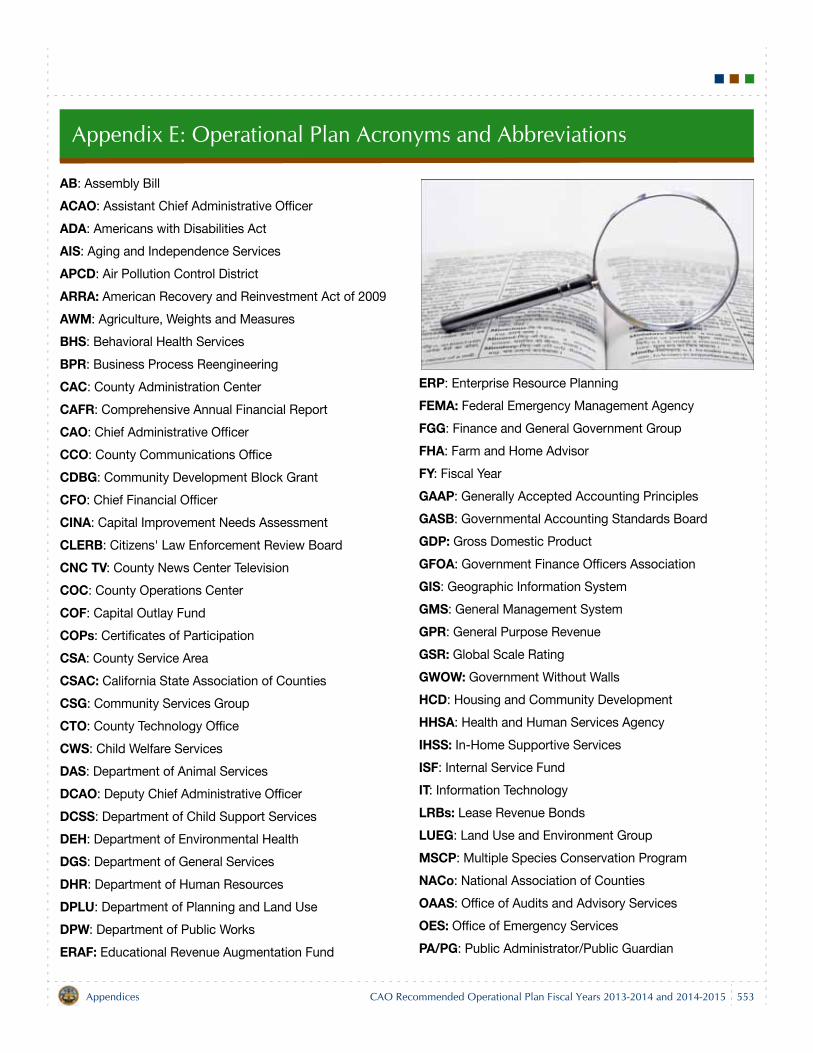
Appendix E: Operational Plan Acronyms and Abbreviations
AB: Assembly Bill
ACAO: Assistant Chief Administrative Officer
ADA: Americans with Disabilities Act
AIS: Aging and Independence Services
APCD: Air Pollution Control District
ARRA: American Recovery and Reinvestment Act of 2009
AWM: Agriculture, Weights and Measures
BHS: Behavioral Health Services
BPR: Business Process Reengineering
CAC: County Administration Center
CAFR: Comprehensive Annual Financial Report
CAO: Chief Administrative Officer
CCO: County Communications Office
CDBG: Community Development Block Grant
CFO: Chief Financial Officer
CINA: Capital Improvement Needs Assessment
CLERB: Citizens' Law Enforcement Review Board
CNC TV: County News Center Television
COC: County Operations Center
COF: Capital Outlay Fund
COPs: Certificates of Participation
CSA: County Service Area
CSAC: California State Association of Counties
CSG: Community Services Group
CTO: County Technology Office
CWS: Child Welfare Services
DAS: Department of Animal Services
DCAO: Deputy Chief Administrative Officer
DCSS: Department of Child Support Services
DEH: Department of Environmental Health
DGS: Department of General Services
DHR: Department of Human Resources
DPLU: Department of Planning and Land Use
DPW: Department of Public Works
ERAF: Educational Revenue Augmentation Fund
ERP: Enterprise Resource Planning
FEMA: Federal Emergency Management Agency
FGG: Finance and General Government Group
FHA: Farm and Home Advisor
FY: Fiscal Year
GAAP: Generally Accepted Accounting Principles
GASB: Governmental Accounting Standards Board
GDP: Gross Domestic Product
GFOA: Government Finance Officers Association
GIS: Geographic Information System
GMS: General Management System
GPR: General Purpose Revenue
GSR: Global Scale Rating
GWOW: Government Without Walls
HCD: Housing and Community Development
HHSA: Health and Human Services Agency
IHSS: In-Home Supportive Services
ISF: Internal Service Fund
IT: Information Technology
LRBs: Lease Revenue Bonds
LUEG: Land Use and Environment Group
MSCP: Multiple Species Conservation Program
NACo: National Association of Counties
OAAS: Office of Audits and Advisory Services
OES: Office of Emergency Services
PA/PG: Public Administrator/Public Guardian
Appendices CAO Recommended Operational Plan Fiscal Years 2013-2014 and 2014-2015 553
Appendix E: Operational Plan Acronyms and Abbreviations
PDS: Planning and Development Services
PHS: Public Health Services
POB: Pension Obligation Bond
PRD: Permanent Road Division
PSG: Public Safety Group
RFP: Request for Proposal
RPTT: Real Property Transfer Tax
SANCAL: San Diego County Capital Asset Leasing Corpo-ration
SANDAG: San Diego Association of Governments
SanGIS: San Diego Geographic Information Source
SB: Senate Bill
SDCERA: San Diego County Employees Retirement Asso-ciation
SDCFA: San Diego County Fire Authority
SDRBA: San Diego Regional Building Authority
SPOS: Strategic Planning and Operational Support
TABs: Tax Allocation Bonds
TOT: Transient Occupancy Tax
TRANs: Tax and Revenue Anticipation Notes
UAAL: Unfunded Actuarial Accrued Liability
USDRIP: Upper San Diego River Improvement Project
VLF: Vehicle License Fees
554 AppendicesCAO Recommended Operational Plan Fiscal Years 2013-2014 and 2014-2015
Appendix F: Glossary of Operational Plan Terms
Account: A distinct reporting category in a ledger used forbudgeting or accounting purposes. All budgetary transac-tions, whether revenue or expenditure related, are recordedin accounts. Also called Object in the County's Budgeting,Reporting and Analysis Support System (BRASS).
Accrual Basis: The basis of accounting under which reve-nues are recorded when earned and expenditures (orexpenses) are recorded as soon as they result in liabilitiesfor benefits received, notwithstanding that the receipt ofcash or the payment of cash may take place, in whole or inpart, in another accounting period.
Activity: A departmental effort that contributes to theaccomplishment of specific identified program objectives.
Actuarial Accrued Liability: The actuarial accrued liability,as assessed by an actuary, generally represents the presentvalue of fully projected benefits attributable to service creditthat has been earned (or accrued) as of the valuation date;it is computed differently under different funding methods.
Actuals: The County’s year-end actual dollars for expendi-tures and revenues for a fiscal year. Also, the year-endactual measures or results for statistical performance datafor a fiscal year.
Actuary: A person professionally trained in the technicalaspects of pensions, insurance and related fields. The actu-ary estimates how much money must be contributed to aninsurance or pension fund in order to provide current andfuture benefits.
Adopted Budget: The annual budget formally approved bythe Board of Supervisors for a specific fiscal year.
Adopted Operational Plan: The Board of Supervisors'two-year financial plan that allocates resources to specificprograms and services that support the County's long-termgoals; it includes the adopted budget for the first year and atentative budget that is approved in principle for the secondyear.
Amended Budget: A budget that reflects the adopted bud-get plus the carry forward budget from the previous yearand any mid-year changes authorized during the fiscal year.
Americans with Disabilities Act (ADA): A federal law that,among other provisions, requires modification of publicbuildings to ensure access for people with disabilities.
Appropriation: A legal authorization to make expendituresand to incur obligations for specific purposes.
Appropriation for Contingency: A budgetary provisionrepresenting that portion of the financing requirements setaside to meet unforeseen expenditure requirements or tooffset revenue shortfalls.
Arbitrage: As defined by treasury regulations, the profitearned from investing low yielding tax-exempt proceeds inhigher yielding taxable securities. In general, arbitrage prof-its earned must be paid to the United States Treasury asrebate unless a specific exception to the rebate require-ments applies.
Assessed Valuation: A valuation set upon real estate orother property by a government as a basis for levying taxes.
Asset: An item owned or a resource held that has monetaryvalue.
Assigned Fund Balance: That portion of fund balance thatreflects an intended use of resources. For nongeneralfunds, it is the amount in excess of nonspendable,restricted and committed fund balance.
Assistant Chief Administrative Officer (ACAO): TheCounty's second-highest ranking executive, the ACAOworks with the Chief Administrative Officer in a chief oper-ating officer capacity to implement the Board of Supervi-sors' policies and to manage the County's workforce andannual budget.
Balance Sheet: The financial statement disclosing theassets, liabilities and equity of an entity at a specified datein conformity with Generally Accepted Accounting Princi-ples (GAAP).
Balanced Budget or Balanced Operational Plan: A bud-get in which the planned expenditures and the means offinancing them are equal. A balanced annual budget isrequired by the State of California per Government Code§29000, et seq.
Appendices CAO Recommended Operational Plan Fiscal Years 2013-2014 and 2014-2015 555
Appendix F: Glossary of Operational Plan Terms
Board of Supervisors: The five-member, elected governingbody of the County authorized by the California State Con-stitution. Each Board member represents a specific geo-graphic area (Supervisorial District) of the county.
Bond: A written promise to pay a specified sum of money,called the face value or principal amount, at a specifieddate or dates in the future, called the maturity date(s),together with periodic interest at a specified rate. Some-times, however, all or a substantial portion of the interest isincluded in the face value of the bond. The sale of bonds isone mechanism used to obtain long-term financing.
Budget: A financial plan for a single fiscal year includesrecommended expenditures for a given period and the rec-ommended means of financing them. The annual budget iscontained within the Operational Plan.
Business Process Reengineering (BPR): The fundamentalrethinking and radical redesign of business processes toachieve dramatic improvements in critical measures of per-formance, such as cost, quality, service and speed. Onegoal of BPR is to generate budgetary savings to permit real-locations of resources to other priority needs and services.
California State Association of Counties (CSAC): Anorganization that represents county government before theCalifornia Legislature, administrative agencies and the fed-eral government.
CalWIN: CalWORKs Information Network: A fully integratedonline, real-time automated system to support eligibilityand benefits determination, client correspondence, man-agement reports, interfaces and case management for pub-lic assistance programs, such as the CalWORKs Program.
CalWORKs: California Work Opportunity and Responsibil-ity to Kids program. A welfare program that gives cash aidand services to eligible needy California families.
Capital Assets: Tangible and intangible assets acquired foruse in operations that will benefit more than a single fiscalyear. Typical examples of tangible assets are land, improve-ments to land, easements, buildings, building improve-ments, infrastructure, equipment, vehicles and machinery.
Capital Assets Equipment: Equipment that includes mov-able personal property of a relatively permanent nature(useful life of one year or longer) and of significant value,such as furniture, machines, tools, weapons and vehicles.An item costing $5,000 or more is budgeted in the appropri-ate capital asset account and capitalized. When an individ-ual item costs less than $5,000 (including weapons and
modular equipment) it is budgeted in the minor equipmentaccount.
Capital Assets/Land Acquisition: Expenditure accountsthat include expenditures for the acquisition of land andbuildings and construction of buildings and improvements.
Capital Expenditures: Expenditures incurred for theimprovement to or acquisition of land, facilities and infra-structure.
Capital Improvement Needs Assessment (CINA): Anannually updated five-year list of planned capital projects,developed by the Department of General Services in com-pliance with Board of Supervisors Policies G-16 and B-37.
Capital Outlay Fund (COF): One of the Capital Programfunds that is used exclusively to finance the acquisition,construction and completion of permanent public improve-ments including public buildings and for the costs ofacquiring land and permanent improvements. Revenues areobtained from the sale of fixed assets, from lease or rentalof County-owned facilities, and from other funds such asgrants and contributions when allocated to the COF by theBoard of Supervisors.
Capital Program Budget: A spending plan for improve-ments to or acquisition of land, facilities and infrastructure.The capital program budget balances revenues and expen-ditures, specifies the sources of revenues and lists eachproject or acquisition. Appropriations established in thecapital program budget are carried forward until the projectis completed.
Carry Forward Budget: The budget that captures encum-brances and appropriations related to the encumbrances,at the end of the fiscal year, that is carried over into the nextfiscal year.
Cash Flow: The analysis of cash receipts (revenues) torequired payments (expenditures) and reporting of net cashbalance projections. The Auditor and Controller preparescash flow reports that project the inflow, outflow and netbalance of cash on a monthly, quarterly and annual basis.
Certificates of Participation (COPs): Certificates issuedfor the financing of capital assets. A certificate is similar to abond and represents an undivided interest in the paymentsmade by the public agency pursuant to a financing lease.Even though they are not treated as indebtedness of theissuer by California state law, the federal tax law treats thelease obligation as if it were a debt.
556 AppendicesCAO Recommended Operational Plan Fiscal Years 2013-2014 and 2014-2015
Appendix F: Glossary of Operational Plan Terms
Charges for Current Services: Revenues received as aresult of fees charged for certain services provided to citi-zens and other public agencies. This group of revenueaccounts includes revenues resulting from: interfund trans-actions between governmental fund types; collection oftaxes and special assessments and accounting and bank-ing services for other governmental agencies; special dis-trict audits; election services provided to governmentalagencies under contract, including charges for consolidat-ing elections and rental of voting booths; planning andengineering services such as subdivision fees, traffic sur-veys, sale of plans and specifications and blueprints, andplan or map check fees; library services including specialmaterials usage fees, book fines and lost or damagedbooks; park and recreational facilities usage includingcamping, parking and picnic area usage; document record-ing services, certified copies of vital statistics and fees forfiling fictitious business names; animal services such asvaccination and impound fees; law enforcement servicesprovided under contract to governmental agencies; andreimbursement for hospital care and services for prisoners,juvenile court wards and juvenile hall.
Chief Administrative Officer of the County (CAO): Thehighest ranking County executive who provides policy-based program and financial decision making support tothe Board of Supervisors. The CAO oversees the operationof more than 40 departments and manages the allocation ofpersonnel, capital and budgetary resources within theCounty organization. The position is appointed by theBoard of Supervisors. The lines of authority flow from theBoard of Supervisors to the CAO and Assistant CAO(ACAO) and then to the Deputy CAO of each Group.
Committed Fund Balance: Self-imposed limitations set onfunds prior to the end of a period. Limitations imposed bythe highest level of decision making, and requires formalaction at that same level to remove.
Community Development Block Grant (CDBG): A federalgrant administered by the County for housing and develop-ment activities that: (1) benefit lower income persons; (2)prevent/eliminate slums and blight; or (3) meet urgent com-munity development needs.
Comprehensive Annual Financial Report (CAFR): Theannual audited financial statement of the County.
Contingency Reserve: Appropriations set aside to meetunforeseen economic and operational circumstances.
Cost Applied: The transfer of costs of services performedby one budget unit for the benefit of another budget unitwithin the same fund.
County Administration Center (CAC): The central Countyadministration facility located at 1600 Pacific Highway, SanDiego, California.
County News Center Television (CNC TV): The County’stelevision station, which broadcasts Board of Supervisorsmeetings and programs of community interest.
County Service Area (CSA): An assessment district com-prised of unincorporated area property owners who pay forspecial services, such as park maintenance, fire suppres-sion and paramedic services, through special assessmentson their property tax bills.
Credit Rating: A rating determined by a credit ratingagency that indicates the agency's opinion of the likelihoodthat a borrower such as the County will be able to repay itsdebt. The rating agencies include Standard & Poor's, Fitchand Moody's.
Current Assets: Assets which are available or can be madereadily available to finance current operations or to pay cur-rent liabilities. Those assets that will be used up or con-verted into cash within one year (i.e. temporary investmentsand taxes receivable that will be collected within one year).
Current Liabilities: Liabilities that are payable within oneyear. Liabilities are obligations to transfer assets (i.e. cash)or provide services to other entities in the future as a resultof past transactions or events.
Custodian Bank: In finance, a custodian bank, or simplycustodian, refers to a financial institution responsible forsafeguarding a firm's or individual's financial assets. Therole of a custodian in such a case would be the following: tohold in safekeeping assets, such as equities and bonds,arrange settlement of any purchases and sales of suchsecurities, collect information on and income from suchassets (dividends in the case of equities and interest in thecase of bonds), provide information on the underlying com-panies and their annual general meetings, manage cashtransactions, perform foreign exchange transactions whererequired and provide regular reporting on all their activitiesto their clients.
Debt Service: Annual principal and interest payments thatlocal government owes on borrowed money.
Debt Service Fund: A fund established to account for theaccumulation of resources for and the payment of principaland interest on long-term debt.
Deferred Revenue: Measurable revenue that has beenearned but not yet collected until beyond 180 days of theend of the fiscal year.
Appendices CAO Recommended Operational Plan Fiscal Years 2013-2014 and 2014-2015 557
Appendix F: Glossary of Operational Plan Terms
Department: The basic organizational unit of governmentwhich is functionally unique in its delivery of services.
Depreciation: The decrease in the service life or estimatedvalue of capital assets attributable to wear and tear, deteri-oration and the passage of time.
Deputy Chief Administrative Officer (DCAO): GeneralManagers (GM) of one of three County functional groups:Public Safety, Community Services and Land Use and Envi-ronment. The GM of the Finance and General GovernmentGroup is the Chief Financial Officer, and the GM of theHealth and Human Services Agency (HHSA) is the Director.See General Manager.
Educational Revenue Augmentation Fund (ERAF): Thefund that was set up in each county at the direction of theState Legislature in the early 1990s to enable a shift of aportion of county, city and special district property taxes toschool districts in response to State budget shortfalls.
Employee Benefits: The portion of an employee compen-sation package that is in addition to wages. Included arethe employer's share of costs for Social Security and thevarious pension, medical and life insurance plans.
Encumbrance: A commitment within the County to usefunds for a specific purpose.
Enterprise Fund: A fund established to account for opera-tions that are financed and operated in a manner similar toprivate business enterprises (e.g. water, gas and electricutilities; airports; parking garages; or transit systems). Thegoverning body intends that the costs of providing goodsand services to the general public on a continuing basis befinanced or recovered primarily through user charges.
Enterprise Resource Planning (ERP)/Enterprise Systems(ES): New applications to replace, enhance and integrateexisting Financial and Human Resources systems.
Entitlement Program: A program in which funding is allo-cated according to eligibility criteria; all persons or govern-ments that meet the criteria specified by federal or Statelaws may receive the benefit.
Estimated Revenue: The amount of revenue expected toaccrue or to be collected during a fiscal year.
Expenditure: A decrease in net financial resources. Expen-ditures include current operating expenses that require thepresent or future use of net current assets, debt service andcapital outlays, and intergovernmental grants, entitlementsand shared revenues.
Expenditure Transfers & Reimbursements: This expendi-ture account group, which is shown as a decrease in
expenditures, consists of transfers of costs for servicesprovided between budget units in the same governmentaltype fund. The cost of the service is transferred to the reve-nue earning department with an equal reduction in cost tothe department providing the service.
Fiduciary Fund: A fund containing assets held in a trusteecapacity or as an agent for others which cannot be used tosupport the County's own programs. For example, theCounty maintains fiduciary funds for the assets of theInvestment Trust Fund. This trust fund holds the invest-ments on behalf of external entities in either the Countypool or specific investments.
Financial Planning Calendar: A timetable outlining theprocess and tasks to be completed during the financialplanning and budget cycle.
Fines, Forfeitures & Penalties: A group of revenueaccounts that includes vehicle code fines, other court fines,forfeitures and penalties, and penalties and costs on delin-quent taxes.
Firestorm 2003: A devastating wildfire that occurred in SanDiego County in October 2003 that financially affectedevery department and has resulted in continued programsand services to either recover from the damage or imple-ment plans to avert another fire-related disaster.
Firestorm 2007: A devastating wildfire that occurred in SanDiego County in October 2007 that financially affected theCounty and has resulted in the implementation of new pro-grams or services to recover from the damage of the disas-ter.
Fiscal Year (FY): A 12-month period to which the annualoperating budget applies and at the end of which a govern-ment determines its financial position and the results of itsoperations. The County of San Diego's fiscal year is July 1through June 30.
Fund: A fiscal and accounting entity with a self-balancingset of accounts in which cash and other financial resources,all related liabilities and equities or balances, and changestherein, are recorded and segregated to carry on specificactivities or attain certain objectives in accordance withspecial regulations, restrictions or limitations.
Fund Balance: The difference between fund assets andfund liabilities of governmental funds. Fund Balance may beused in the budget by a Group or department for theupcoming year as a funding source for one-time projects/services.
558 AppendicesCAO Recommended Operational Plan Fiscal Years 2013-2014 and 2014-2015
Appendix F: Glossary of Operational Plan Terms
Fund Balance Components: The classifications that seg-regate fund balance by constraints on purposes for whichamounts can be spent. There are five classifications: Non-spendable Fund Balance. Restricted Fund Balance, Com-mitted Fund Balance, Assigned Fund Balance andUnassigned Fund Balance.
Fund Balance Components Increases/Decreases: Anexpenditure or revenue account group that indicates that afund balance component is to be augmented (increased) orused as a funding source (decreased). These two catego-ries are only used for adjustments to Restricted, Committedor Assigned fund balance.
GASB 54: Governmental Accounting Standards Board(GASB) Statement Number 54 which establishes a fund bal-ance classification hierarchy based on constraints that gov-ern how the funds can be used.
General Fund: The County's primary operating fund, whichis used to account for all financial resources, except thoserequired to be accounted for in another fund.
General Management System (GMS): The County's com-plete guide for planning, implementing, monitoring andrewarding all functions and processes that affect the deliv-ery of services to customers. It links planning, execution,value management, goal attainment and compensation.
General Manager (GM): An executive management classreporting directly to the Chief Administrative Officer (CAO)or Assistant CAO. Responsible for managing all financial,personnel, and operational functions for each of theCounty's five business Groups (Community Services,Finance and General Government, Land Use and Environ-ment, Health and Human Services, and Public Safety), andcoordinating the Group initiatives in accordance with theCAO's Strategic Plan and County goals.
General Obligation Bonds: Bonds backed by the full faithand credit of a governmental entity.
General Plan Update: (Previously referred to as GeneralPlan 2020). A multi-year project to revise the San DiegoCounty Comprehensive General Plan that forms the frame-work for growth in the unincorporated communities.
General Purpose Revenue: Revenue derived from sourcesnot specific to any program or service delivery that may beused for any purpose that is a legal expenditure of Countyfunds. Examples of General Purpose Revenue includeproperty taxes, sales taxes, property tax in lieu of vehiclelicense fees, court fines, real property transfer tax and mis-cellaneous other sources.
General Purpose Revenue Allocation: The amount ofGeneral Purpose Revenue that is budgeted to fund agroup's or a department's services after all other funding
sources for those services are taken into account; it is alsocommonly referred to as net county cost.
Generally Accepted Accounting Principles (GAAP): Theuniform minimum standards and guidelines for financialaccounting and reporting. They govern the form and con-tent of the financial statement of an entity.
Geographic Information System (GIS): A regional datawarehouse providing electronic geographic data and mapsto County and city departments and other users.
Governmental Accounting Standards Board (GASB): Theindependent authoritative accounting and financial report-ing standard-setting body for U.S. state and local govern-ment entities.
Government Finance Officers Association (GFOA): Anorganization comprised of government accounting andfinance professionals throughout the United States andCanada, whose goals include but are not limited to improv-ing financial management practices and encouraging excel-lence in financial reporting and budgeting by state and localgovernments.
Governmental Fund: The funds that are generally used toaccount for tax-supported activities; it accounts for themajority of funds, except for those categorized as proprie-tary or fiduciary funds.
Grant: Contributions of cash or other assets from anothergovernmental agency or other organization to be used orexpended for a specified purpose, activity or facility.
Group/Agency: Headed by a General Manager, the highestorganizational unit to which a County department/programreports. There are four Groups and one Agency. Eachdepartment/program belongs to one of the following: PublicSafety Group (PSG), Land Use and Environment Group(LUEG), Community Services Group (CSG), Finance andGeneral Government Group (FGG) or Health and HumanServices Agency (HHSA).
Information Technology: A term that encompasses allforms of technology used to create, store, exchange anduse information in its various forms including business data,conversations, still images and multimedia presentations.
Interfund Transfers: The transfer of resources betweenfunds of the same government reporting entity.
Intergovernmental Revenue: Revenue received from othergovernment entities in the form of grants, entitlements,shared revenues and payments in lieu of taxes. Examplesof State revenue include Health and Social ServicesRealignment, Proposition 172 Public Safety Sales Tax,highway user tax, in-lieu taxes, public assistance adminis-tration, health administration and Homeowner's PropertyTax Relief. Major federal revenue includes public assistance
Appendices CAO Recommended Operational Plan Fiscal Years 2013-2014 and 2014-2015 559
Appendix F: Glossary of Operational Plan Terms
programs, health administration, disaster relief, grazing feesand Payments In-lieu of Taxes for federal lands.
Internal Service Fund (ISF): A proprietary type fund usedto account for the financing of goods or services providedby one department to other departments of the County, orto other governmental units, on a cost-reimbursementbasis.
Joint Powers Agreement (JPA): A contractual agreementbetween a city, county and/or special district in which ser-vices are agreed to be performed, or the County agrees tocooperate with or lend its powers to the other entity.
Lease: A contract granting use or occupation of propertyduring a specified time for a specified payment.
Liability: As referenced in the section on MeasurementFocus and Basis of Accounting, a liability is a legal obliga-tion to transfer assets or provide services to another entityin the future as a result of past transactions or events.
Licenses, Permits & Franchises: Revenue accounts thatinclude revenue from animal licenses, business licenses,permits and franchises.
Major Fund: A fund in which one element (total assets, lia-bilities, revenues, or expenditures/expenses) is at least 10percent of the corresponding element total for all funds ofthat category or type, and at least 5 percent of the corre-sponding element for all governmental and enterprise fundscombined, as set forth in GASB Statement Number 34,Basic Financial Statements-and Management's Discussionand Analysis-for State and Local Governments. By itsnature, the General Fund of a government entity is always amajor fund.
Managed Competition: A framework in which Countydepartments compete with the private sector to determinethe most cost-effective method of delivering services.
Mandate: A requirement from the State or federal govern-ment that the County perform a task, perform a task in aparticular way, or perform a task to meet a particular stan-dard.
Management Reserves: An expenditure category uniqueto the County of San Diego. Management Reserves areintended to be used to handle unforeseen expenses thatarise during the budget year or as a means to set asidefunds for a planned future year use. The level of Manage-ment Reserves is generally dependent upon fund balancerealized by a Group/Agency or department, but may bebudgeted for General Fund departments based on ongoing
General Purpose Revenue allocation or comparable reve-nue source in the case of special funds. No expenditurescan be made from Management Reserves; instead appro-priations must first be transferred to a sub-account underone of the other expenditures categories (e.g. Salaries andBenefits, Services and Supplies, etc.).
Miscellaneous Revenues: A group of revenue accountsthat includes other sales, tobacco settlement and othermonetary donations from private agencies, persons orother sources.
Mission: The general assignment of the organization. Whatthe County is striving to do over a continuous period oftime. The County's mission is "to efficiently provide publicservices that build strong and sustainable communities."
Multiple Species Conservation Program (MSCP): Thisprogram will preserve a network of habitat and open space,protecting biodiversity and enhancing the region's quality oflife. The County is one of several entities participating in theMSCP.
National Association of Counties (NaCo): An organizationthat represents the interests of counties across the nationon Capitol Hill and throughout the federal bureaucracy.
Nonspendable Fund Balance: That portion of netresources that cannot be spent either because of its form orthat it must be maintained intact.
Objective: A statement of anticipated accomplishment,usually measurable and time bound.
Objects (Line Items): A sub-classification (or roll-upaccount) of expenditures and revenues based on type ofgoods or services (Salaries and Benefits, Services and Sup-plies, Other Charges, Capital Assets, etc.) or by type of rev-enue (Fines, Forfeitures and Penalties, Taxes CurrentProperty, Intergovernmental Revenue, etc.).
Operating Budget: A plan of current expenditures and therecommended means of financing them. The annual oper-ating budget is the primary means by which most of thefinancing, acquisition, spending and service delivery activi-ties of a government are controlled.
Operating Transfers: Operating transfers result when onefund provides a service on behalf of another fund. The pro-viding fund budgets the amount required by the other fundin the "Operating Transfer Out" expenditure account. Thereceiving fund budgets the amount in one of the "OperatingTransfer In" revenue accounts.
560 AppendicesCAO Recommended Operational Plan Fiscal Years 2013-2014 and 2014-2015
Appendix F: Glossary of Operational Plan Terms
Operational Plan Document: The County's two-yearfinancial plan. It is presented in a program budget formatthat communicates expenditure and revenue information aswell as goals, objectives and performance measures forCounty departments.
Ordinance: A regulation, an authoritative rule, a statute.
Other Charges: A group of expenditure accounts thatincludes support and care of other persons (such as assis-tance payments), bond redemptions, retirement of otherlong-term debt, interest on bonds, other long-term debtand notes and warrants, judgments and damages, rights-of-way, taxes and assessments, depreciation, bad debts,income allocation, contributions to noncounty governmen-tal agencies and inter fund expenditures.
Other Financing Sources: An increase in current financialresources that is reported separately from revenues toavoid distorting revenue trends. Examples include sale ofcapital assets, transfers in and long-term debt proceeds.
Parkland Dedication Ordinance (PLDO): The County ordi-nance that created a mechanism for funding local parksdevelopment and established the Parkland DedicationFund.
Pension Obligation Bond (POB): Bonds issued to financeall or part of the unfunded actuarial accrued liabilities of theissuer's pension plan. The proceeds are transferred to theissuer's pension system as a prepayment of all or part ofthe unfunded pension liabilities of the issuer to ensure thesoundness of the plan.
Performance Measures: Indicators of the amount of workaccomplished, the efficiency with which tasks were com-pleted and/or the effectiveness of a program, oftenexpressed as the extent to which objectives were accom-plished. Performance measures in this Operational Planfocus primarily on outcome measures (planned results).
Permanent Road Division: An assessment district com-prised of unincorporated area property owners who pay forspecial road work, such as road improvements and mainte-nance, through special assessments on their property taxbills.
Program: A set of activities directed to attaining specificpurposes or objectives.
Program Revenue: Revenue generated by programs and/or dedicated to offset a program's costs.
Proposed Budget: See Recommended Budget.
Proprietary Funds: The classification used to account for agovernment's ongoing organizations and activities that aresimilar to those often found in the private sector (i.e., enter-prise and internal service funds).
Public Hearings: Board of Supervisors meetings open tothe public that provide citizens an opportunity to expresstheir views on the merits of the County's proposals and ser-vices.
Public Liability: Claims against a public entity, its officersand employees, and/or agencies resulting in damages to athird party arising from the conduct of the entity or anemployee acting within the course and scope of theiremployment.
Real Property Transfer Tax (RPTT): A tax assessed onproperty when ownership is transferred.
Reappropriation: The inclusion of a balance from the prioryear's budget as part of the budget of the subsequent fiscalyear. Reappropriation is common for encumbrances out-standing at the end of a fiscal year that a governmentintends to honor in the subsequent year.
Rebudget: To include funds for a project or services bud-geted in the previous year but not spent within that year normeeting the criteria for an encumbrance at year-end.
Recommended Budget: The budget document developedby the CAO and formally approved by the Board of Supervi-sors to serve as the basis for public hearings and delibera-tions prior to the determination of the adopted budget. Mayalso be referred to as the Recommended Operational Plan,Proposed Budget or Proposed Operational Plan.
Request for Proposal (RFP): An official request for propos-als to be submitted to the County to perform specified ser-vices. The RFP sets forth the services being sought andrequests information from firms interested in procuring theengagement.
Required Disciplines: The key organizational disciplinesset out in the County's Strategic Plan intended to ensurethat the County maintains a high level of operational excel-lence in order to accomplish the Strategic Initiative goals.The required disciplines include: fiscal stability; customersatisfaction; regional leadership; skilled, adaptable anddiverse workforce; essential infrastructure; accountability/transparency; continuous improvement; and informationtechnology.
Restricted Fund Balance: That portion of fund balancesubject to externally enforceable limitations on useimposed by law, constitutional provision, or other regula-tion.
Appendices CAO Recommended Operational Plan Fiscal Years 2013-2014 and 2014-2015 561
Appendix F: Glossary of Operational Plan Terms
Revenue From Use of Money & Property: Revenueaccounts that include investment income, rents and con-cessions and royalties.
Salaries and Benefits: A group of expenditure accountsthat includes expenses related to compensation of Countyemployees.
SANCAL: San Diego County Capital Asset Leasing Corpo-ration. A nonprofit corporation governed by a five-memberBoard of Directors which is appointed by the County Boardof Supervisors. SANCAL's purpose is to facilitate the issu-ance of low-cost financing instruments to fund the procure-ment of County buildings and equipment.
Securitization: A type of structured financing whereby anentity that is to receive future payments sells the right tothat income stream to a third party in exchange for an up-front payment. For example, the County securitized theTobacco Settlement Payments, receiving the revenue up-front and reducing the risk of not collecting all of the pay-ments.
Services and Supplies: A group of expenditure accountsthat includes nonpersonnel operating expenses such ascontract services, office supplies, information technologyservices, minor equipment and facilities maintenance.
Special District: An area in which an independent unit oflocal government is set up to perform a specific function ora restricted number of related functions, such as streetlighting or waterworks. A special district might be com-posed of cities, townships, or counties, or any part or com-bination of these.
Special Revenue Fund: A fund used to account for theproceeds of specific revenue sources that are legallyrestricted to expenditures for specified purposes.
Staff Year: In concept, one person working full-time for oneyear; the hours per year that a full-time employee isexpected to work. A normal fiscal year equals 2,088 staffhours (occasionally 2,080 or 2,096 staff hours). Two work-ers, each working half that number of hours, together equalone staff year. County salaries and benefits costs are basedon the number of staff years required to provide a service.
Strategic: Dealing with creation of overall plans and todetermine how best to achieve the general goal of an entity.
Strategic Initiatives: As used by the County, the broadorganizationwide goals that guide the allocation ofresources and set programs. The County has three strate-
gic initiatives: Safe Communities (Promote safe communi-ties), Sustainable Environments (Support environments thatfoster viable, livable communities while bolstering eco-nomic growth), and Healthy Families (Make it easier forresidents to lead healthy lives while improving opportuni-ties for children and adults).
Successor Agency: The agency responsible for managingthe dissolution of a redevelopment agency as laid out inAssembly Bill X1 26, Community Redevelopment Dissolu-tion. In most cases, the city or county that created the rede-velopment agency has been designated as the successoragency. The County of San Diego is the Successor Agencyfor the County of San Diego Redevelopment Agency.
Tax and Revenue Anticipation Notes (TRANs): A short-term, interest bearing note used as a cash managementtool. Public agencies often receive revenues on an unevenbasis throughout a fiscal year. The borrowed funds allowthe agency to meet cash requirements during periods oflow revenue receipts and repay the funds when the reve-nues are greater.
Transient Occupancy Tax (TOT): A tax levied by theCounty on rental receipts for temporary lodging in a hotel orother similar facility doing business in the unincorporatedarea.
Trust Fund: A fund used to account for assets held by agovernment unit in a trustee capacity or as an agent forothers and which, therefore, cannot be used to support thegovernment's own programs. The County is sometimesrequired to segregate revenues it receives from certainsources into a trust fund, but these funds are accounted forin the financial statements as County assets.
Unassigned Fund Balance: Residual net resources. Totalfund balance in the general fund in excess of nonspend-able, restricted, committed and assigned fund balance.
Unfunded Actuarial Accrued Liability (UAAL): The presentvalue of benefits earned to date that are not covered byplan assets; commonly used in pension fund discussions.The excess, if any, of the actuarial accrued liability over theactuarial value of assets. See also Actuarial Accrued Liabil-ity.
Vision: The image that an individual or organization has ofitself or an end state. A picture of future desired outcomes.The County's vision is "A county that is safe, healthy andthriving."
562 AppendicesCAO Recommended Operational Plan Fiscal Years 2013-2014 and 2014-2015
Index
AAbbreviations and Acronyms, 553Administrative Support, 237Aging and Independence Services, 205Agriculture, Weights and Measures, 255Air Pollution Control District, 263Animal Services, 323Assessor / Recorder / County Clerk, 385Auditor and Controller, 411Awards and Recognition, 105
BBehavioral Health Services, 213Board of Supervisors, 3, 379Budget, 39
2012-13 Adopted Budget, 7, 39Calendar, 33County Business Group, 39Expenditure Category, 45Fund Type, 49General Fund, 64General Purpose Revenue, 75Process, 30Revenue Category/Source, 9, 58Staffing, 10, 52
CCapital Program, 455
Capital Outlay Fund, 473Justice Facility Construction Fund, 492Multiple Species Conservation Program Fund, 499
New Appropriations and Projects, 458Operating Impact, 462Outstanding Capital Projects, 503
Capital Program (continued)Summary, 470
Chief Administrative Office, 399Chief Administrative Officer’s Message, 5Child Support Services, 137
Child Welfare Services, 221Citizens' Law Enforcement Review Board, 143Civil Service Commission, 425Clerk of the Board of Supervisors, 429Community Services Group, 319County Communications Office, 447County Counsel, 435County Library, 329County Successor Agency, 357County Technology Office, 419
DDebt Management, 96Demographics, 16District Attorney, 121
EEconomic Indicators, 16, 19Environmental Health, 271
FFarm and Home Advisor, 279Finance and General Government Group, 371Finance Other, 511Funding Source, 9, 58
See also Revenue
GGeneral Management System, 27General Services, 335Glossary, 555Governmental Structure, 27Grand Jury, 441Guide to the Operational Plan Content, 34
HHealth and Human Services Agency, 181Housing & Community Development, 343Human Resources, 443
Index CAO Recommended Operational Plan Fiscal Years 2013-2014 and 2014-2015 563
Index
LLand Use and Environment Group, 247
MMedical Examiner, 153Mission and Vision, 11
OOffice of Emergency Services, 147Organizational Chart, 4
PParks and Recreation, 285Planning and Development Services, 299Planning and Land Use, 293Policies, 86, 96Probation, 157Public Administrator / Public Guardian, 233Public Defender, 165Public Health Services, 227Public Safety Group, 113Public Works, 305
Purchasing and Contracting, 351
RRegional Operations, 187Regional Operations, Health and Human Services
Agency, 551Registrar of Voters, 361Reserves and Resources, 93Revenue, 9, 58
Category/Source, 9, 58Fund Type, 49General Fund, 64General Purpose, 75
SSan Diego County Fire Authority, 173Sheriff, 127Staffing, 10, 52Strategic Planning & Operational Support, 199
TTreasurer - Tax Collector, 391
564 IndexCAO Recommended Operational Plan Fiscal Years 2013-2014 and 2014-2015