Embed Size (px)
Citation preview
Adsorption and Reaction of SO2 with a Polycrystalline UO2 Film: Promotion of S-O BondCleavage by Creation of O-Defects and Na or Ca Coadsorption
T. W. Schlereth,† M. N. Hedhili, †,‡ B. V. Yakshinskiy,† T. Gouder,§ and T. E. Madey*,†
Laboratory for Surface Modification, Department of Physics and Astronomy, Rutgers, The State UniVersity ofNew Jersey, Piscataway, New Jersey 08854, and European Commission, Joint Research Center, Institute forTransuranium Elements, Postfach 2340, D-76125 Karlsruhe, Germany
ReceiVed: May 19, 2005; In Final Form: September 5, 2005
To characterize UO2 for its possible use in desulfurization applications, the interactions of molecular sulfurdioxide (SO2) with a polycrystalline uranium dioxide film have been studied by means of X-ray photoelectronspectroscopy (XPS), temperature-programmed desorption (TPD), and low-energy ion scattering (LEIS). Thestoichiometric, oxygen-deficient, calcium-precovered and sodium-precovered UO2 surfaces have beencharacterized. The changes in oxide reactivity upon creation of oxygen vacancies and coadsorption of sodiumand calcium have been studied. After creation of a reduced UO2-x surface (x ∼ 0.44) via Ar+ sputtering, theU 4f XPS spectrum shows conspicuous differences that are good indicators of the surface stoichiometry.Molecular SOx formation (x ) 2-4) is observed after SO2 deposition onto stoichiometric UO2 and onto UO2
precovered with small amounts (<1 ML) of Na or Ca; complete dissociation of SO2 is not observed. Heatingleads to desorption of the SOx species and to transformation of SO2 to SO3 and SO3 to SO4. On oxygen-deficient UO2 and on UO2 precovered with large Na or Ca coverages (g4 ML), both the formation of SOxspecies and complete dissociation of SO2 are observed. A higher thermal stability of the sulfur componentsis observed on these surfaces. In all cases for which dissociation occurs, the XPS peak of atomic sulfurshows similar structure: three different binding states are observed. The reactivity of oxygen-deficient UO2
and sodium- and calcium-precovered UO2 (coveragesg 4 ML) is attributed to charge transfer into theantibonding LUMO of the adsorbed molecule.
1. Introduction
Metal oxides have a large number of applications, includingthe development of corrosion protection, solid-state gas sensors,and fuel cell electrodes, as well as microelectronics andheterogeneous catalysis. Recently, interest in exploring thephysical, electronic, and catalytic properties of uranium dioxide(UO2) has increased. The reason for this is the desire to findpossible applications for depleted uranium, which is currentlystored in huge stockpiles in the United States and elsewhere.1,2
Depleted uranium has a reduced concentration of the fissionableisotope U-235; it is a waste product of nuclear fuel production.Various possible utilizations, such as the use of uranium oxideas semiconductor material, catalyst, or even radiation shieldingare being explored.1,3 Uranium oxides show catalytic activityfor the destruction of volatile organic compounds (VOC) suchas butane, benzene, and chlorobenzene.4,5 Uranium dioxide hasalso been used as a catalytic support for steam reforming ofmethane.6 Motivated by the fact that thousands of metric tonsof uranium fuel are placed in water storage, the interaction ofwater with UO2(001),7 UO2(100),8 and UO2(111)9 has beenstudied. Also the influence of surface defects on the reactionsof ethanol and carboxylic acids with UO2(111) has beeninvestigated.10,11To probe the possible use of UO2 as a catalystin hydrodesulfurization reactions (HDS), the adsorption of H2S
onto UO2(001)12 and polycrystalline UO2,13 as well as theinteractions of thiophene with stoichiometric and O-deficientpolycrystalline UO2,14 has been examined.
Sulfur dioxide formed during the combustion of fossil fuelsis a major air pollutant that causes health risks, environmentalhazards, and equipment corrosion.15 In industrial applicationsSO2 is known to poison metal/oxide catalysts. To reduce thesenegative effects SO2 has to be removed from effluent gases. Atpresent, the most widely used technique is scrubbing, in whichsolid compounds such as CaCO3 (limestone) are employed toremove SO2 via a chemical reaction.15 In another method, theSO2-containing stream is passed over a high area metal oxidebed (CaO, BaO, MgO, ZnO, TiO2, etc.) and the molecules aretrapped as SOx species.16 All these techniques result in hugeamounts of solid waste that require disposal in landfills. Thus,there is a need for new technologies to reduce the amount ofwaste generated during the removal of SO2. There is a generaldesire to employ metal oxides as catalysts for the destructionof SO2 (the DeSOx process) via the Claus reaction SO2 + 2H2Sf 2H2O + 3Ssolid or via the reaction SO2 + 2CO f 2CO2 +Ssolid.16 Metal oxides, such as NiO,17 CeO2,18 MoO2,19,20
ZnO,19,21and MgO,16,22have been extensively examined for theiractivity toward the destruction of SO2. Many of these oxidesare able to oxidize SO2 forming SOx (x ) 3, 4) species, butonly on MoO2 dissociation of small amounts of SO2 is observed.Catalytic dissociation of SO2 using CeO2 and Ca-doped CeO2as catalysts in a gas stream reactor has been reported.23,24Thereare no published reports for the interaction of SO2 with UO2.The research is motivated by the possibility of using UO2 as acatalyst for the destruction of SO2.
* Corresponding author. Tel.:+1-732-445-5185. Fax:+1-732-445-4991. E-mail address: [email protected].
† Rutgers, The State University of New Jersey.‡ Permanent address: Laboratoire de Physique de la Matie`re Condense´e,
Facultedes Sciences de Tunis, 1060 Tunis, Tunisia.§ Institute for Transuranium Elements.
20895J. Phys. Chem. B2005,109,20895-20905
10.1021/jp0526344 CCC: $30.25 © 2005 American Chemical SocietyPublished on Web 10/14/2005
In this paper the interactions of sulfur dioxide with uraniumdioxide are studied by means of X-ray photoelectron spectros-copy (XPS), temperature-programmed desorption (TPD), andlow-energy ion scattering (LEIS).
2. Experimental Section
All experiments were carried out under UHV conditions in achamber with base pressure of∼5 × 10-11 Torr. The chamberis equipped with XPS, TPD, and LEIS. A detailed descriptionof the experimental apparatus has been given previously.12,13
The sample is mounted onto anx-y-z rotary manipulator,which allows cooling to∼100 K by liquid nitrogen and resistiveheating toT > 600 K. The polycrystalline∼1000 Å thick UO2
film was prepared in Karlsruhe by reactive sputtering of uraniumonto a molybdenum substrate (10× 10× 1 mm3) under oxygenatmosphere. The molybdenum plate is mounted via Ta supportwires, which allow for resistive heating of the sample. Fortemperature measurements, a chromel/alumel thermocouple isspot-welded onto the edge of the sample.
Research grade SO2 (Matheson) with a purity of 99.98% isdosed onto the sample through a capillary array gas doser, whichprovides a flux enhancement of∼50 times compared to dosingvia backfilling. The purity is analyzed with a quadrupole massspectrometer prior to use. Sodium is deposited from a SAESGetter source, whereas calcium deposition is performed usinga specially built metal evaporator.25 All XPS spectra are recordedusing Al KR excitation and grazing takeoff angle (70° withrespect to sample normal), with the analyzer operating modeFAT 22 (fixed analyzer transmission at a pass energy of 22eV). The spectra are calibrated using the binding energy of theU 4f7/2 peak of stoichiometric UO2 (∼280.1 eV). The sampleis typically cleaned by sputtering with Ar+ ions (1.5 keV, 1µA), followed by annealing to 500 K in the presence of oxygen(5 × 10⁻⁷ Torr) for 5 min to restore stoichiometry. Thecleanliness and stoichiometry of the sample are monitored byXPS and LEIS. Oxygen defects are created by Ar+ sputtering(1.5 keV) of the clean, reoxidized sample for 20 min at a samplecurrent of∼1.5 µA.
3. Results
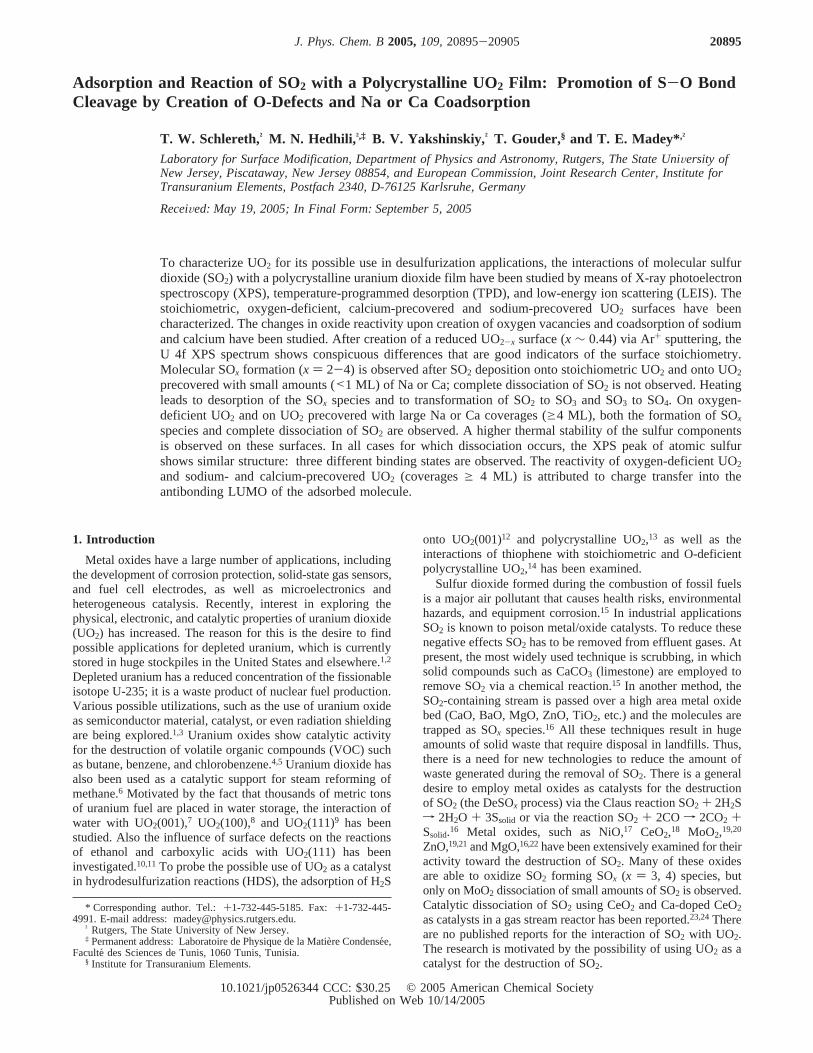
3.1. Adsorption and Desorption of SO2 on StoichiometricUO2. Figure 1 displays a series of TPD spectra for SO2 (64amu) adsorbed on stoichiometric UO2 at 100 K as a functionof increasing exposure. Reported exposures are uncorrected forthe doser enhancement factor of∼50; the heating rate is 2.5K/s. The inset shows the spectra for small exposures (e0.018L) of SO2. For a very small dose of SO2 (∼3 × 10⁻⁴ L), abroad desorption peak with peak maximum as high as 495 K isfound. The desorption peak shifts to lower temperatures withincreasing SO2 exposures.
A relatively sharp peak centered at∼133 K appears andcontinues to grow in intensity (does not saturate); such behavioris consistent with desorption from a physisorbed multilayer ofSO2. On the basis of the appearance and growth of the multilayerpeak and the saturation of the high-temperature feature, weidentify an exposure of 0.018 L with the formation of∼80%of a monolayer. The increased background above∼550 K forhigher coverages is associated with desorption from the sampleholder. Taking this background into account, we measure amaximum desorption temperature of∼550 K (i.e. no desorptionoccurs for T > 550 K). For a multilayer of SO2 similardesorption peak temperature values (∼133 K) are reported forvarious metal surfaces26-30 and Au supported on MgO(100).31
The estimated desorption energy for multilayer SO2, according
to the Redhead method,32,33 is ∼0.35 eV/molecule (∼8 kcal/mol). This is in agreement with reported values for thedesorption energy of multilayer SO2 from other substrates (8kcal/mol).31
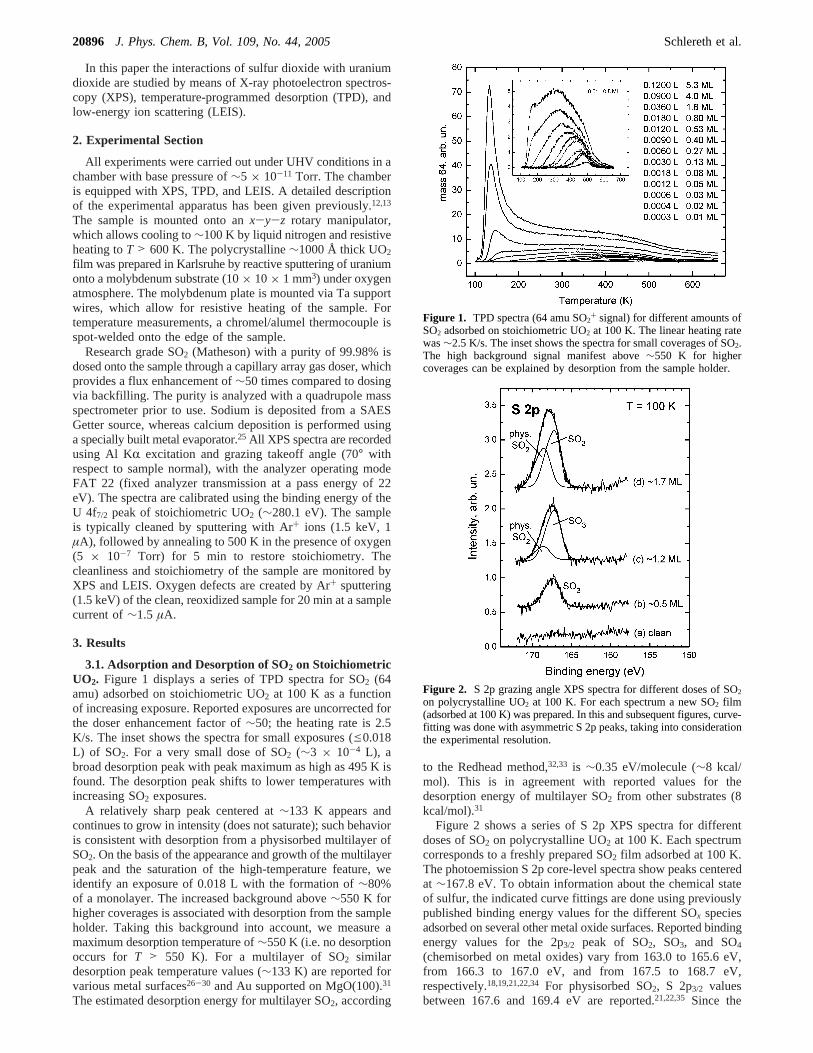
Figure 2 shows a series of S 2p XPS spectra for differentdoses of SO2 on polycrystalline UO2 at 100 K. Each spectrumcorresponds to a freshly prepared SO2 film adsorbed at 100 K.The photoemission S 2p core-level spectra show peaks centeredat ∼167.8 eV. To obtain information about the chemical stateof sulfur, the indicated curve fittings are done using previouslypublished binding energy values for the different SOx speciesadsorbed on several other metal oxide surfaces. Reported bindingenergy values for the 2p3/2 peak of SO2, SO3, and SO4
(chemisorbed on metal oxides) vary from 163.0 to 165.6 eV,from 166.3 to 167.0 eV, and from 167.5 to 168.7 eV,respectively.18,19,21,22,34For physisorbed SO2, S 2p3/2 valuesbetween 167.6 and 169.4 eV are reported.21,22,35 Since the
Figure 1. TPD spectra (64 amu SO2+ signal) for different amounts ofSO2 adsorbed on stoichiometric UO2 at 100 K. The linear heating ratewas∼2.5 K/s. The inset shows the spectra for small coverages of SO2.The high background signal manifest above∼550 K for highercoverages can be explained by desorption from the sample holder.
Figure 2. S 2p grazing angle XPS spectra for different doses of SO2
on polycrystalline UO2 at 100 K. For each spectrum a new SO2 film(adsorbed at 100 K) was prepared. In this and subsequent figures, curve-fitting was done with asymmetric S 2p peaks, taking into considerationthe experimental resolution.
20896 J. Phys. Chem. B, Vol. 109, No. 44, 2005 Schlereth et al.
binding energy ranges for chemisorbed SO4 and physisorbedSO2 overlap, the assignment of these SOx species has to be donecarefully. To consider the asymmetry of the S 2p peak(associated with the unresolved 2p spin-orbit splitting), eachfitted peak shown in the following is the sum of the two peaksS 2p1/2 and S 2p3/2 separated by 1.19 eV with an intensity ratioof 1:2 (S 2p1/2:S 2p3/2) in accordance with theory. The line shapeis a mixed Gaussian/Lorentzian function with a Lorentziancontribution of 30%. The S 2p1/2 and S 2p3/2 peaks have thesame full width half-maximum (fwhm) of∼2 eV.
Figure 2, curve a, shows a background spectrum for a cleanuranium dioxide surface. Spectrum b was recorded afteradsorption of∼0.5 ML of SO2 at 100 K. It consists of a singlepeak, whereas for higher exposures in spectra c and d a secondpeak on the higher binding energy side emerges. On the basisof its binding energy, the peak in spectrum b is assigned toSO3. The additional peak in spectra c and d grows in intensitywith increasing coverages, while the peak associated with SO3
remains almost constant. Because of its higher binding energyand the fact that its intensity grows with higher coverages, thesecond peak is assigned to physisorbed SO2. The S 2p bindingenergy values for the sulfur components of all experimentsreported herein are summarized in Table 1.
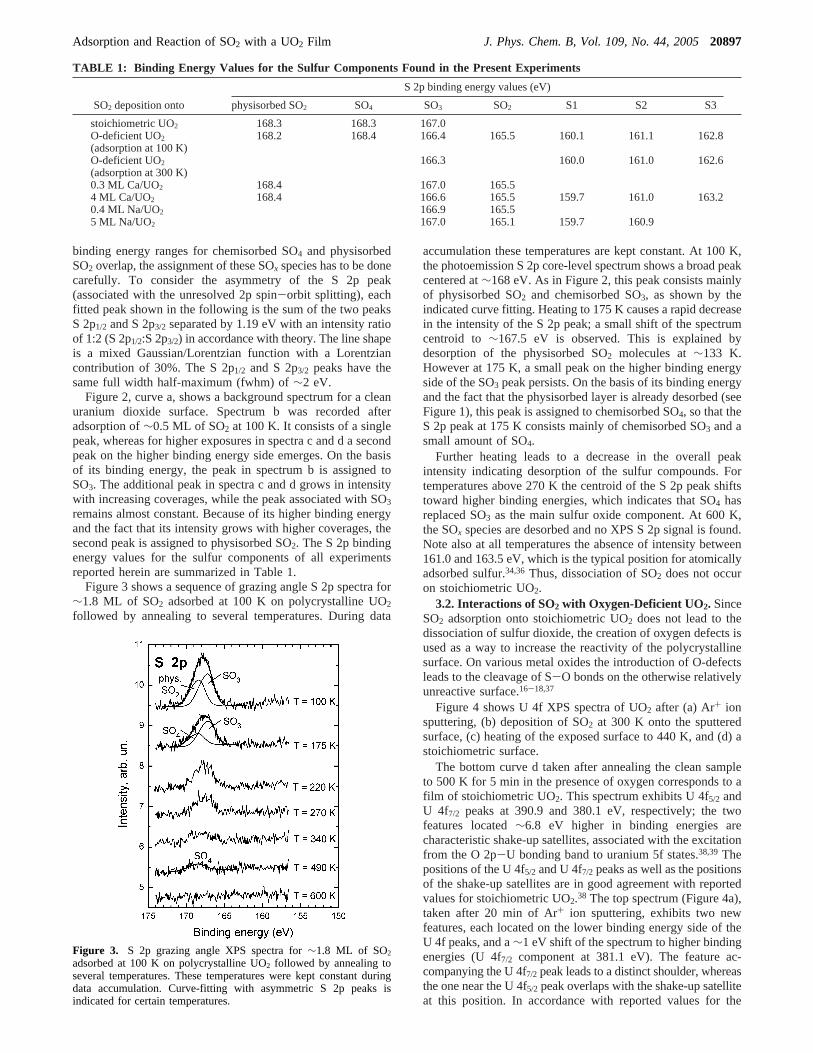
Figure 3 shows a sequence of grazing angle S 2p spectra for∼1.8 ML of SO2 adsorbed at 100 K on polycrystalline UO2
followed by annealing to several temperatures. During data
accumulation these temperatures are kept constant. At 100 K,the photoemission S 2p core-level spectrum shows a broad peakcentered at∼168 eV. As in Figure 2, this peak consists mainlyof physisorbed SO2 and chemisorbed SO3, as shown by theindicated curve fitting. Heating to 175 K causes a rapid decreasein the intensity of the S 2p peak; a small shift of the spectrumcentroid to ∼167.5 eV is observed. This is explained bydesorption of the physisorbed SO2 molecules at∼133 K.However at 175 K, a small peak on the higher binding energyside of the SO3 peak persists. On the basis of its binding energyand the fact that the physisorbed layer is already desorbed (seeFigure 1), this peak is assigned to chemisorbed SO4, so that theS 2p peak at 175 K consists mainly of chemisorbed SO3 and asmall amount of SO4.
Further heating leads to a decrease in the overall peakintensity indicating desorption of the sulfur compounds. Fortemperatures above 270 K the centroid of the S 2p peak shiftstoward higher binding energies, which indicates that SO4 hasreplaced SO3 as the main sulfur oxide component. At 600 K,the SOx species are desorbed and no XPS S 2p signal is found.Note also at all temperatures the absence of intensity between161.0 and 163.5 eV, which is the typical position for atomicallyadsorbed sulfur.34,36 Thus, dissociation of SO2 does not occuron stoichiometric UO2.
3.2. Interactions of SO2 with Oxygen-Deficient UO2. SinceSO2 adsorption onto stoichiometric UO2 does not lead to thedissociation of sulfur dioxide, the creation of oxygen defects isused as a way to increase the reactivity of the polycrystallinesurface. On various metal oxides the introduction of O-defectsleads to the cleavage of S-O bonds on the otherwise relativelyunreactive surface.16-18,37
Figure 4 shows U 4f XPS spectra of UO2 after (a) Ar+ ionsputtering, (b) deposition of SO2 at 300 K onto the sputteredsurface, (c) heating of the exposed surface to 440 K, and (d) astoichiometric surface.
The bottom curve d taken after annealing the clean sampleto 500 K for 5 min in the presence of oxygen corresponds to afilm of stoichiometric UO2. This spectrum exhibits U 4f5/2 andU 4f7/2 peaks at 390.9 and 380.1 eV, respectively; the twofeatures located∼6.8 eV higher in binding energies arecharacteristic shake-up satellites, associated with the excitationfrom the O 2p-U bonding band to uranium 5f states.38,39 Thepositions of the U 4f5/2 and U 4f7/2 peaks as well as the positionsof the shake-up satellites are in good agreement with reportedvalues for stoichiometric UO2.38 The top spectrum (Figure 4a),taken after 20 min of Ar+ ion sputtering, exhibits two newfeatures, each located on the lower binding energy side of theU 4f peaks, and a∼1 eV shift of the spectrum to higher bindingenergies (U 4f7/2 component at 381.1 eV). The feature ac-companying the U 4f7/2 peak leads to a distinct shoulder, whereasthe one near the U 4f5/2 peak overlaps with the shake-up satelliteat this position. In accordance with reported values for the
TABLE 1: Binding Energy Values for the Sulfur Components Found in the Present Experiments
S 2p binding energy values (eV)
SO2 deposition onto physisorbed SO2 SO4 SO3 SO2 S1 S2 S3
stoichiometric UO2 168.3 168.3 167.0O-deficient UO2 168.2 168.4 166.4 165.5 160.1 161.1 162.8(adsorption at 100 K)O-deficient UO2 166.3 160.0 161.0 162.6(adsorption at 300 K)0.3 ML Ca/UO2 168.4 167.0 165.54 ML Ca/UO2 168.4 166.6 165.5 159.7 161.0 163.20.4 ML Na/UO2 166.9 165.55 ML Na/UO2 167.0 165.1 159.7 160.9
Figure 3. S 2p grazing angle XPS spectra for∼1.8 ML of SO2
adsorbed at 100 K on polycrystalline UO2 followed by annealing toseveral temperatures. These temperatures were kept constant duringdata accumulation. Curve-fitting with asymmetric S 2p peaks isindicated for certain temperatures.
Adsorption and Reaction of SO2 with a UO2 Film J. Phys. Chem. B, Vol. 109, No. 44, 200520897
binding energies of U0, both features are assigned to the presenceof U0 or uranium with an oxidation state close to zero.38,40Theappearance of additional features and the peak shift aftersputtering have previously been reported by Senanayake andIdriss9 and also attributed to U0.
The sputter-induced shift in the U 4f spectrum arises fromthe different electronic properties of UO2 and UO2-x. Uraniumdioxide is a Mott-Hubbard insulator and, thus, theoretically,is not conducting.41,42However, slight deviations from stoichi-ometry have been shown to create positive charge carriers inthe case of excess oxygen and negative charge carriers in thecase of depleted oxygen.42 Thus, hyperstoichiometric uraniumdioxide is a p-type semiconductor and hypostoichiometricuranium dioxide is an n-type semiconductor; the Fermi levelshifts as a result of the transition from UO2+x to UO2-x.42-44
This displacement of the Fermi level from the top of the valenceband to the bottom of the conduction band leads to a shift inthe XPS spectra, since the Fermi level of the sample is alignedwith that of the spectrometer. A similar binding energy shift of∼1.4 eV in the O 1s spectrum (∼0.4 eV higher than that of theU 4f spectrum) is also caused by sputtering (not shown here).This can be explained by the different electronic environmentof the remaining oxygen after sputtering, which leads to anadditional shift. The resulting shift is the sum of the shift dueto the p-n transition and the true chemical shift due to oxygendeficiency.
A shift of 1 eV between the U 4f spectra of stoichiometricand oxygen-deficient UO2 was also seen by Van den Berghe etal.43 and Miserque et al.44 Winer et al.40 and Senanayake andIdriss9 report a shift of∼0.8 eV in the U 4f spectrum for thetransition from UO2 to UO2-x. In addition, Winer et al. alsoreport that the O 1s shift for UO2-x is ∼0.2 eV higher than thatof the U 4f.
During 20 min Ar+ ion sputtering the XPS peak area ratio O1s/U 4f gradually decreases by∼22%; the averaged surfacestoichiometry of the sputtered surface is estimated to be UO2-x
with x ∼ 0.44 (sensitivity factors and spin-orbit splitting areconsidered in estimatingx).
After an exposure of 120 L of SO2 onto the sputtered surfaceat 300 K (spectrum b in Figure 4), the U0 features on the higherbinding energy sides of the U 4f peaks are greatly attenuatedand the shift in the spectrum is reduced to∼0.4 eV (U 4f7/2
component at 380.5 eV). This indicates the filling of oxygenvacancies by incorporation of oxygen from SO2. However theremaining core level shift and small persistent U0 features showthat even a large exposure (120 L), exceeding the monolayersaturation dose, cannot heal all the oxygen-deficient sites. Thissuggests that not only surface defects but also subsurface defectshave been created by sputtering. After annealing the sample to440 K (curve c) the spectrum shifts back to the position forstoichiometric UO2 (U 4f7/2 component at 380.1 eV) and nosignificant difference with the spectrum for the oxygen annealedsample (stoichiometric UO2 in Figure 4d) is seen. At thistemperature the subsurface defects are believed to be healedmainly by oxygen diffusion from the bulk of the sample. Healingof O-defects in UO2 by diffusion of oxygen during annealingwas previously reported by Stultz et al.8
Figure 5a displays the XPS S 2p spectra for 4 ML of SO2
dosed at 100 K onto an oxygen-deficient (Ar+ sputtered) UO2sample, followed by annealing of the sample to differenttemperatures up to 635 K. The spectrum at 100 K exhibits abroad asymmetrical feature with a maximum at∼168 eV. Thebreadth and the shape of the feature indicate that multiple statesof sulfur oxides (SOx) are present. The spectrum can be curve-fitted with three asymmetrical S 2p peaks. The fact that thesignal is strongly attenuated after heating to 265 K leads to theconclusion that the main contribution to the 100 K peak is fromphysisorbed SO2. This is supported by the indicated curve fittingwith a large peak at binding energies characteristic for phys-isorbed SO2 and two smaller peaks at lower binding energies(binding energies are given in Table 1). These two peaks areassociated with chemisorbed SO3 and SO2 and are attenuatedby ∼30% due to the considerably thick layer of physisorbedSO2. Because the binding energy of physisorbed SO2 overlapswith that for chemisorbed SO4, we cannot exclude the possibilitythat a small fraction of SO4 also contributes to the broad signalat 100 K. Upon heating of the sample to 265 K, the SOx featureattenuates and its center shifts to lower binding energiesexhibiting a maximum at∼166.5 eV. Annealing to 265 K alsoleads to a new feature between∼159 and∼164.5 eV corre-sponding to multiple binding states of sulfur. At 300 K SO3 isthe dominant species, but also a small contribution of SO4 existson the oxygen-deficient surface. Further annealing over 465 Kresults in the attenuation of SOx and sulfide features. The shiftof the center of the SOx peak to higher binding energies indicatesthat SO4 is a persistent species, as confirmed by curve-fitting;the formation of a feature centered at∼161.2 eV is in goodagreement with reported binding energy values for atomicsulfur.34,37 Upon further heating to 635 K both signals greatlyattenuate and almost reach the background level.
The structure of the sulfur peak at lower binding energiesand its behavior between 300 and 465 K is rather complex.Curve-fitting reveals two S 2p peaks (S2 (161.1 eV) and S3(162.8 eV)) at 300 K. Upon heating of the sample to 465 K, S3vanishes, S2 grows, and the new peak S1 (160.1 eV) emerges.The multiple S peaks may be related to different adsorptionsites, as discussed in section 4.2.
Figure 5b shows the S 2p XPS spectra for sputtered UO2
exposed to a saturation dose of SO2 (120 L) at 300 K followedby annealing to different temperatures up to 540 K. Afterdeposition two peaks are observed in the spectrum: one at∼166.7 eV corresponding to adsorbed SO3 as the dominant SOx
Figure 4. U 4f grazing angle XPS spectra of UO2 after (a) Ar+ ionsputtering, (b) deposition of SO2 at 300 K onto the sputtered surface,(c) heating of the exposed surface to 440 K, and (d) a stoichiometricsurface.
20898 J. Phys. Chem. B, Vol. 109, No. 44, 2005 Schlereth et al.
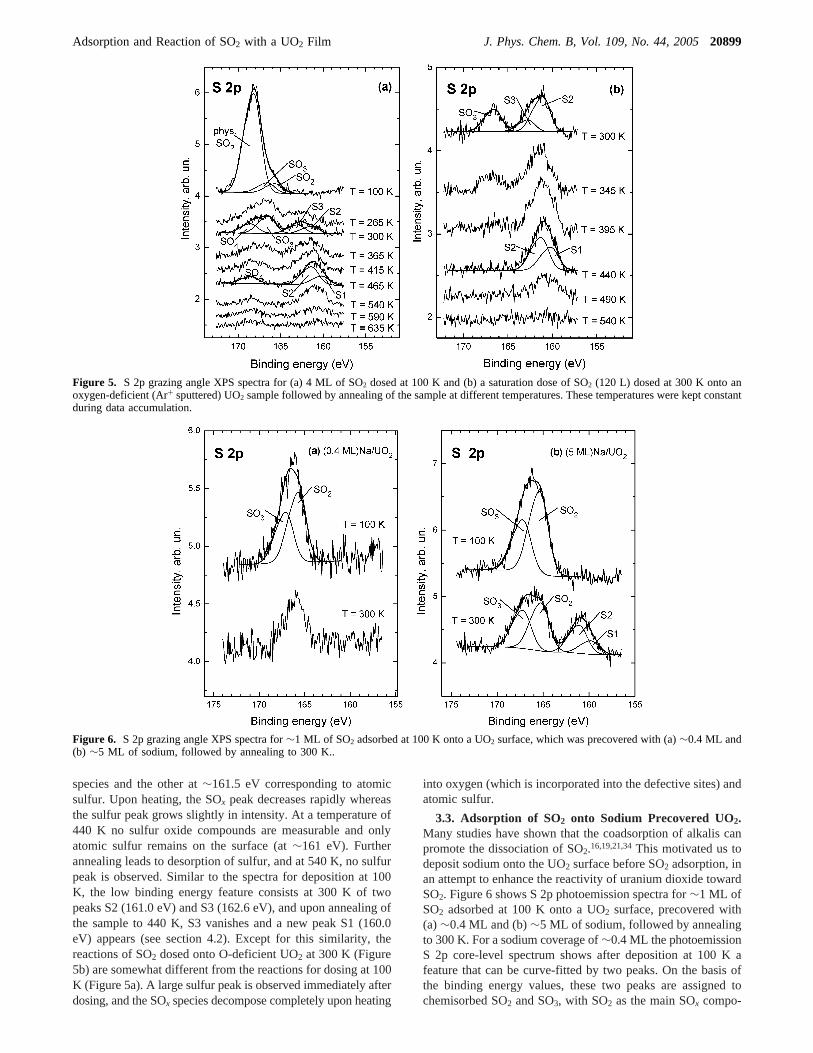
species and the other at∼161.5 eV corresponding to atomicsulfur. Upon heating, the SOx peak decreases rapidly whereasthe sulfur peak grows slightly in intensity. At a temperature of440 K no sulfur oxide compounds are measurable and onlyatomic sulfur remains on the surface (at∼161 eV). Furtherannealing leads to desorption of sulfur, and at 540 K, no sulfurpeak is observed. Similar to the spectra for deposition at 100K, the low binding energy feature consists at 300 K of twopeaks S2 (161.0 eV) and S3 (162.6 eV), and upon annealing ofthe sample to 440 K, S3 vanishes and a new peak S1 (160.0eV) appears (see section 4.2). Except for this similarity, thereactions of SO2 dosed onto O-deficient UO2 at 300 K (Figure5b) are somewhat different from the reactions for dosing at 100K (Figure 5a). A large sulfur peak is observed immediately afterdosing, and the SOx species decompose completely upon heating
into oxygen (which is incorporated into the defective sites) andatomic sulfur.
3.3. Adsorption of SO2 onto Sodium Precovered UO2.Many studies have shown that the coadsorption of alkalis canpromote the dissociation of SO2.16,19,21,34This motivated us todeposit sodium onto the UO2 surface before SO2 adsorption, inan attempt to enhance the reactivity of uranium dioxide towardSO2. Figure 6 shows S 2p photoemission spectra for∼1 ML ofSO2 adsorbed at 100 K onto a UO2 surface, precovered with(a)∼0.4 ML and (b)∼5 ML of sodium, followed by annealingto 300 K. For a sodium coverage of∼0.4 ML the photoemissionS 2p core-level spectrum shows after deposition at 100 K afeature that can be curve-fitted by two peaks. On the basis ofthe binding energy values, these two peaks are assigned tochemisorbed SO2 and SO3, with SO2 as the main SOx compo-
Figure 5. S 2p grazing angle XPS spectra for (a) 4 ML of SO2 dosed at 100 K and (b) a saturation dose of SO2 (120 L) dosed at 300 K onto anoxygen-deficient (Ar+ sputtered) UO2 sample followed by annealing of the sample at different temperatures. These temperatures were kept constantduring data accumulation.
Figure 6. S 2p grazing angle XPS spectra for∼1 ML of SO2 adsorbed at 100 K onto a UO2 surface, which was precovered with (a)∼0.4 ML and(b) ∼5 ML of sodium, followed by annealing to 300 K..
Adsorption and Reaction of SO2 with a UO2 Film J. Phys. Chem. B, Vol. 109, No. 44, 200520899
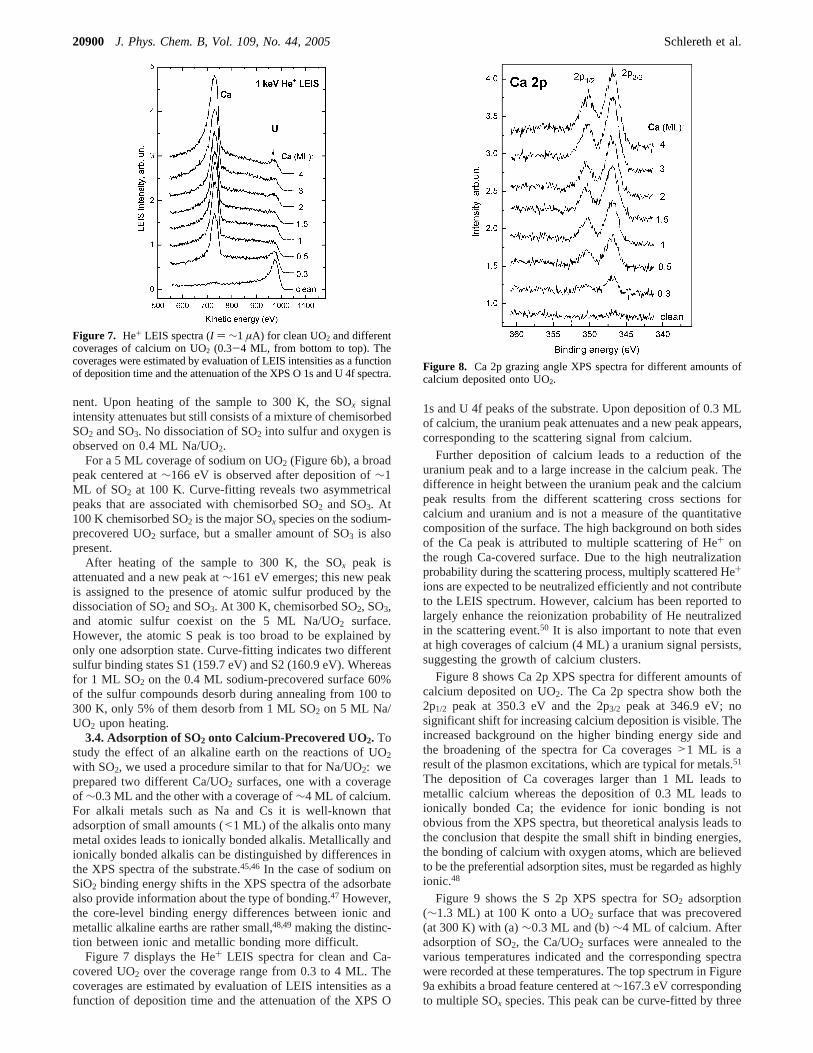
nent. Upon heating of the sample to 300 K, the SOx signalintensity attenuates but still consists of a mixture of chemisorbedSO2 and SO3. No dissociation of SO2 into sulfur and oxygen isobserved on 0.4 ML Na/UO2.
For a 5 MLcoverage of sodium on UO2 (Figure 6b), a broadpeak centered at∼166 eV is observed after deposition of∼1ML of SO2 at 100 K. Curve-fitting reveals two asymmetricalpeaks that are associated with chemisorbed SO2 and SO3. At100 K chemisorbed SO2 is the major SOx species on the sodium-precovered UO2 surface, but a smaller amount of SO3 is alsopresent.
After heating of the sample to 300 K, the SOx peak isattenuated and a new peak at∼161 eV emerges; this new peakis assigned to the presence of atomic sulfur produced by thedissociation of SO2 and SO3. At 300 K, chemisorbed SO2, SO3,and atomic sulfur coexist on the 5 ML Na/UO2 surface.However, the atomic S peak is too broad to be explained byonly one adsorption state. Curve-fitting indicates two differentsulfur binding states S1 (159.7 eV) and S2 (160.9 eV). Whereasfor 1 ML SO2 on the 0.4 ML sodium-precovered surface 60%of the sulfur compounds desorb during annealing from 100 to300 K, only 5% of them desorb from 1 ML SO2 on 5 ML Na/UO2 upon heating.
3.4. Adsorption of SO2 onto Calcium-Precovered UO2. Tostudy the effect of an alkaline earth on the reactions of UO2
with SO2, we used a procedure similar to that for Na/UO2: weprepared two different Ca/UO2 surfaces, one with a coverageof ∼0.3 ML and the other with a coverage of∼4 ML of calcium.For alkali metals such as Na and Cs it is well-known thatadsorption of small amounts (<1 ML) of the alkalis onto manymetal oxides leads to ionically bonded alkalis. Metallically andionically bonded alkalis can be distinguished by differences inthe XPS spectra of the substrate.45,46 In the case of sodium onSiO2 binding energy shifts in the XPS spectra of the adsorbatealso provide information about the type of bonding.47 However,the core-level binding energy differences between ionic andmetallic alkaline earths are rather small,48,49making the distinc-tion between ionic and metallic bonding more difficult.
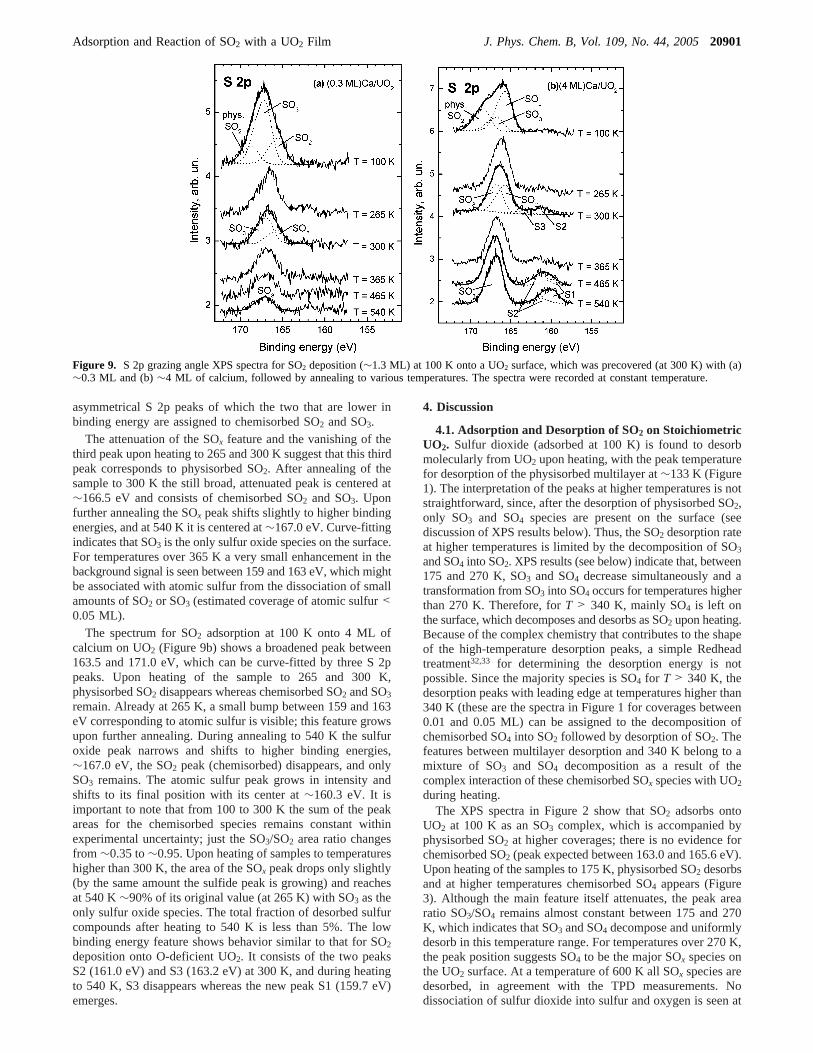
Figure 7 displays the He+ LEIS spectra for clean and Ca-covered UO2 over the coverage range from 0.3 to 4 ML. Thecoverages are estimated by evaluation of LEIS intensities as afunction of deposition time and the attenuation of the XPS O
1s and U 4f peaks of the substrate. Upon deposition of 0.3 MLof calcium, the uranium peak attenuates and a new peak appears,corresponding to the scattering signal from calcium.
Further deposition of calcium leads to a reduction of theuranium peak and to a large increase in the calcium peak. Thedifference in height between the uranium peak and the calciumpeak results from the different scattering cross sections forcalcium and uranium and is not a measure of the quantitativecomposition of the surface. The high background on both sidesof the Ca peak is attributed to multiple scattering of He+ onthe rough Ca-covered surface. Due to the high neutralizationprobability during the scattering process, multiply scattered He+
ions are expected to be neutralized efficiently and not contributeto the LEIS spectrum. However, calcium has been reported tolargely enhance the reionization probability of He neutralizedin the scattering event.50 It is also important to note that evenat high coverages of calcium (4 ML) a uranium signal persists,suggesting the growth of calcium clusters.
Figure 8 shows Ca 2p XPS spectra for different amounts ofcalcium deposited on UO2. The Ca 2p spectra show both the2p1/2 peak at 350.3 eV and the 2p3/2 peak at 346.9 eV; nosignificant shift for increasing calcium deposition is visible. Theincreased background on the higher binding energy side andthe broadening of the spectra for Ca coverages>1 ML is aresult of the plasmon excitations, which are typical for metals.51
The deposition of Ca coverages larger than 1 ML leads tometallic calcium whereas the deposition of 0.3 ML leads toionically bonded Ca; the evidence for ionic bonding is notobvious from the XPS spectra, but theoretical analysis leads tothe conclusion that despite the small shift in binding energies,the bonding of calcium with oxygen atoms, which are believedto be the preferential adsorption sites, must be regarded as highlyionic.48
Figure 9 shows the S 2p XPS spectra for SO2 adsorption(∼1.3 ML) at 100 K onto a UO2 surface that was precovered(at 300 K) with (a)∼0.3 ML and (b)∼4 ML of calcium. Afteradsorption of SO2, the Ca/UO2 surfaces were annealed to thevarious temperatures indicated and the corresponding spectrawere recorded at these temperatures. The top spectrum in Figure9a exhibits a broad feature centered at∼167.3 eV correspondingto multiple SOx species. This peak can be curve-fitted by three
Figure 7. He+ LEIS spectra (I ) ∼1 µA) for clean UO2 and differentcoverages of calcium on UO2 (0.3-4 ML, from bottom to top). Thecoverages were estimated by evaluation of LEIS intensities as a functionof deposition time and the attenuation of the XPS O 1s and U 4f spectra.
Figure 8. Ca 2p grazing angle XPS spectra for different amounts ofcalcium deposited onto UO2.
20900 J. Phys. Chem. B, Vol. 109, No. 44, 2005 Schlereth et al.
asymmetrical S 2p peaks of which the two that are lower inbinding energy are assigned to chemisorbed SO2 and SO3.
The attenuation of the SOx feature and the vanishing of thethird peak upon heating to 265 and 300 K suggest that this thirdpeak corresponds to physisorbed SO2. After annealing of thesample to 300 K the still broad, attenuated peak is centered at∼166.5 eV and consists of chemisorbed SO2 and SO3. Uponfurther annealing the SOx peak shifts slightly to higher bindingenergies, and at 540 K it is centered at∼167.0 eV. Curve-fittingindicates that SO3 is the only sulfur oxide species on the surface.For temperatures over 365 K a very small enhancement in thebackground signal is seen between 159 and 163 eV, which mightbe associated with atomic sulfur from the dissociation of smallamounts of SO2 or SO3 (estimated coverage of atomic sulfur<0.05 ML).
The spectrum for SO2 adsorption at 100 K onto 4 ML ofcalcium on UO2 (Figure 9b) shows a broadened peak between163.5 and 171.0 eV, which can be curve-fitted by three S 2ppeaks. Upon heating of the sample to 265 and 300 K,physisorbed SO2 disappears whereas chemisorbed SO2 and SO3
remain. Already at 265 K, a small bump between 159 and 163eV corresponding to atomic sulfur is visible; this feature growsupon further annealing. During annealing to 540 K the sulfuroxide peak narrows and shifts to higher binding energies,∼167.0 eV, the SO2 peak (chemisorbed) disappears, and onlySO3 remains. The atomic sulfur peak grows in intensity andshifts to its final position with its center at∼160.3 eV. It isimportant to note that from 100 to 300 K the sum of the peakareas for the chemisorbed species remains constant withinexperimental uncertainty; just the SO3/SO2 area ratio changesfrom ∼0.35 to∼0.95. Upon heating of samples to temperatureshigher than 300 K, the area of the SOx peak drops only slightly(by the same amount the sulfide peak is growing) and reachesat 540 K∼90% of its original value (at 265 K) with SO3 as theonly sulfur oxide species. The total fraction of desorbed sulfurcompounds after heating to 540 K is less than 5%. The lowbinding energy feature shows behavior similar to that for SO2
deposition onto O-deficient UO2. It consists of the two peaksS2 (161.0 eV) and S3 (163.2 eV) at 300 K, and during heatingto 540 K, S3 disappears whereas the new peak S1 (159.7 eV)emerges.
4. Discussion
4.1. Adsorption and Desorption of SO2 on StoichiometricUO2. Sulfur dioxide (adsorbed at 100 K) is found to desorbmolecularly from UO2 upon heating, with the peak temperaturefor desorption of the physisorbed multilayer at∼133 K (Figure1). The interpretation of the peaks at higher temperatures is notstraightforward, since, after the desorption of physisorbed SO2,only SO3 and SO4 species are present on the surface (seediscussion of XPS results below). Thus, the SO2 desorption rateat higher temperatures is limited by the decomposition of SO3
and SO4 into SO2. XPS results (see below) indicate that, between175 and 270 K, SO3 and SO4 decrease simultaneously and atransformation from SO3 into SO4 occurs for temperatures higherthan 270 K. Therefore, forT > 340 K, mainly SO4 is left onthe surface, which decomposes and desorbs as SO2 upon heating.Because of the complex chemistry that contributes to the shapeof the high-temperature desorption peaks, a simple Redheadtreatment32,33 for determining the desorption energy is notpossible. Since the majority species is SO4 for T > 340 K, thedesorption peaks with leading edge at temperatures higher than340 K (these are the spectra in Figure 1 for coverages between0.01 and 0.05 ML) can be assigned to the decomposition ofchemisorbed SO4 into SO2 followed by desorption of SO2. Thefeatures between multilayer desorption and 340 K belong to amixture of SO3 and SO4 decomposition as a result of thecomplex interaction of these chemisorbed SOx species with UO2during heating.
The XPS spectra in Figure 2 show that SO2 adsorbs ontoUO2 at 100 K as an SO3 complex, which is accompanied byphysisorbed SO2 at higher coverages; there is no evidence forchemisorbed SO2 (peak expected between 163.0 and 165.6 eV).Upon heating of the samples to 175 K, physisorbed SO2 desorbsand at higher temperatures chemisorbed SO4 appears (Figure3). Although the main feature itself attenuates, the peak arearatio SO3/SO4 remains almost constant between 175 and 270K, which indicates that SO3 and SO4 decompose and uniformlydesorb in this temperature range. For temperatures over 270 K,the peak position suggests SO4 to be the major SOx species onthe UO2 surface. At a temperature of 600 K all SOx species aredesorbed, in agreement with the TPD measurements. Nodissociation of sulfur dioxide into sulfur and oxygen is seen at
Figure 9. S 2p grazing angle XPS spectra for SO2 deposition (∼1.3 ML) at 100 K onto a UO2 surface, which was precovered (at 300 K) with (a)∼0.3 ML and (b)∼4 ML of calcium, followed by annealing to various temperatures. The spectra were recorded at constant temperature.
Adsorption and Reaction of SO2 with a UO2 Film J. Phys. Chem. B, Vol. 109, No. 44, 200520901
any temperature. Thus, the formation of SO3 at 100 K and ofSO4 at higher temperatures may be due to the interaction ofSO2 with the oxygen centers of the UO2 surface via the reaction:19,21
Since no chemisorption of SO2 is seen, we conclude that thecorresponding interaction of SO2 with the metal sites21,22,52isweaker than the interaction with the oxygen sites of the surface,which are the adsorption sites associated with the formation ofSO3 and SO4 species.16,22 The presence of steps and latticedefects in the polycrystalline UO2 sample enhance the formationof SO3 and SO4-like species by increasing the number of low-coordinated oxygen atoms. The presence of SO4 as the majorsulfur oxide species forT > 270 K can be explained bypreferential desorption of SO3 at higher temperatures or tem-perature-dependent transformation of SO3 into SO4 via reactionof SO3 with surface oxygen atoms. This transformation can beinduced by the increased accessibility of low-coordinated oxygenatoms due to enhanced mobility of the chemisorbed compoundor lattice deformations at elevated temperatures.22
Our results are similar to reported reactions of SO2 withseveral other metal oxides. For MgO(100),22,34 there is also noevidence for chemisorption of SO2 at low temperature; instead,SO3 is the main sulfur oxide species reported for this surface.For TiO2(100)37 and TiO2(110)52 a thermally activated two-stepreaction with SO3 as intermediate product is reported, followedby the transformation into SO4 as the stable end product. Foradsorption at higher temperatures, SO4 is also seen on ZnO,19
CeO2,18 andR-Fe2O353 as the principal stable SOx compound.
4.2. Basic Principles for the Cleavage of S-O Bonds andInteractions of SO2 with Oxygen-Deficient UO2. The dis-sociation of adsorbed SO2 occurs via weakening of the S-Obonds by charge transfer from the substrate to the antibondingLUMO of SO2. Such a charge transfer is difficult on oxidesubstrates due to the low electron density on the metal cations.However, it is possible to enable a metal oxide to cleave S-Obonds by creation of occupied metal states above the valenceband of the oxide by creating oxygen vacancies, coadsorbingalkali metals, or doping with a transition metal.16 In Figure 10energy level diagrams for the bands of stoichiometric UO2 andthe molecular orbitals (MO) of SO2 are shown.
In addition, Figure 10 shows the atomic orbital (AO) levelsof U0, Na, Ca and Ca+, and the tops of the conduction bands ofmetallic U, Na, and Ca. The highest occupied atomic orbitallevels of U0, Na, and Ca as well as the tops of the conductionbands of metallic U, Na, and Ca are closer to the LUMO ofSO2 than the top of the U 5f2 band of UO2, whereas the highestoccupied levels of ionically bonded Na and Ca are below thetop of the highest occupied UO2 band. It is important to notethat the atomic orbital levels of adsorbed atoms are broadeneddue to substrate-adsorbate level-mixing. As a result of imagecharge effects, they are shifted closer to the Fermi level thanthe ones shown in Figure 10, which are the AO levels for thefree atoms.57 Furthermore the atomic levels due to chargetransfer to the substrate are not completely filled. However, thisdonation of charge into substrate levels can also provideoccupied states above the valence band of UO2. Therefore, thepresence of neutral Na or Ca atoms or metallic Na or Ca canpromote charge transfer into the LUMO of SO2 and lead to thedissociation of SO2; ionic Na or Ca is not able to facilitatedissociation. The description of the changes in the electronicproperties of the UO2 surface induced by Ar+ ion sputtering interms of an energy level diagram is more complex. Since
sputtering of UO2 can lead to isolated defects but also to smallclusters of metallic uranium, the highest occupied level liesbetween the two limiting cases of atomic U0 and metallicuranium. This position is closer to the LUMO than the U 5f2
band of UO2, so that the creation of reduced uranium enhancesthe ability of UO2 to dissociate SO2. In the experimentsdiscussed in this section, oxygen defects were created beforeSO2 adsorption.
The changes in the U 4f XPS spectra caused by Ar+ ionsputtering (Figure 4a) have been discussed in section 3.2 andare known to be related to the surface stoichiometry. Even afterexposure to high doses of oxygen-containing molecules (120 Lof SO2), the U 4f XPS spectrum (Figure 4b) still shows featuresfor reduced UO2; this observation is interpreted as follows.Sulfur dioxide can heal only the outermost surface layer bydissociation into sulfur and oxygen. Thus, subsurface defectscreated during Ar+ ion sputtering are responsible for thepersistence of reduced UO2 features after SO2 adsorption. Thecreation of subsurface defects is possible due to preferentialsputtering of oxygen, as observed on many metal oxides.Preferential sputtering is in general more pronounced for oxidescontaining more massive metals.58 The subsurface defects canbe healed by annealing to 440 K, where oxygen atoms diffusefrom the bulk of the sample to the defect sites.8
The Ar+ ion sputtering also has a dramatic influence on thereactivity of UO2 toward SO2, as shown in Figure 5. In contrastto adsorption on stoichiometric UO2 not only SO3 and phys-isorbed SO2 but also chemisorbed SO2 is present at 100 K(Figure 5a). This indicates that the interaction of SO2 with themetallic centers is increased due to the lack of oxygen. Aninterpretation of the presence of chemisorbed SO2 is that theformation of the SO3 complex on UO2 may happen in two stepssimilar to the mechanism proposed for MgO,22 where first abonding between SO2 and the metal centers is established(inducing a weakening of the metal-oxygen bond in the
Figure 10. Energy level diagram showing UO2 bands,44,54 molecularorbital levels of SO2,19 atomic orbital levels of U0, Na, Ca, and Ca+,55,56
and the top of the conduction bands of metallic U, Na, and Ca. Theenergy values are referenced to the vacuum level. The energy rangesof the UO2 bands have been calculated from data referenced to theFermi level.44,54Because the work function of UO2 is not known exactly,the UO2 bands plotted should be viewed as an approximation. Theempty and occupied states of stoichiometric UO2 are indicated by dottedlines and solid lines, respectively.
SO2,gas+ nOsurf f SO2+n,ads n ) 1, 2
20902 J. Phys. Chem. B, Vol. 109, No. 44, 2005 Schlereth et al.
substrate), followed by SO2 bonding to the oxygen sites of theoxide. The reduced concentration of oxygen in the substratemay cause the reaction to stop at low temperatures in the firststep, resulting in chemisorbed SO2. The physisorbed SO2desorbs upon heating, followed by desorption of the chemi-sorbed SO2 below 300 K. A distinct sulfur signal appearing at265 K indicates that a fraction of the SO2 dissociates completelyon O-deficient UO2. The disappearance of the chemisorbed SO2
peak results not only from desorption but also from dissociation.Unlike stoichiometric UO2, the formation of chemisorbed SO4
on the oxygen-deficient surface may not be from the reactionof SO2 or SO3 with substrate oxygen; rather, it may be associatedwith the reaction of SO2 and SO3 with oxygen atoms producedby SO2 dissociation. Between 300 and 465 K the amount ofatomic sulfur increases whereas the amount of SOx speciesdecreases; a decrease in the SO3/SO4 peak area ratio is alsoobserved in this temperature range. This indicates that, inaddition to the simple desorption, two types of reactions mayoccur: (a) the direct dissociation of SO3 and (at highertemperatures) SO4 into sulfur and oxygen; (b) the transformationof SO3 into SO4 caused in part by the reaction of SO3 withoxygen atoms from completely dissociated SOx. The endproducts for adsorption on the reduced surface are thermallymore stable than those for adsorption on stoichiometric UO2.
For deposition at 300 K, displayed in Figure 5b, atomic sulfurand SO3 coexist on the oxide surface immediately after dosing.At 440 K the SOx species are entirely dissociated and onlyatomic sulfur is left on the oxide surface. Upon heating of thesample to 540 K the accumulated sulfur desorbs completely.The large intensity at the position for atomic sulfur and the factthat heating produces no SO4 signal indicates that the chemistryfor SO2 adsorption at 300 K onto hypostoichiometric UO2 isdifferent from that at 100 K. For SO2 deposition at 100 K onO-deficient UO2, followed by heating, two different reactionsare believed to occur, namely the dissociation of SO2 and theformation of SO4 via the reaction of SO2 and SO3 with oxygenatoms from dissociated SO2. In contrast, for deposition at 300K on O-deficient UO2 followed by heating, the dissociation ofSO2 is the preferred reaction. For deposition at 300 K nophysisorbed SO2 layer accumulates; only a small amount of SOx
is chemisorbed on the surface, and the system has enoughthermal energy to dissociate SO2 readily during the adsorptionprocess, whereas for adsorption at 100 K SO2 is mainlyphysisorbed. The smaller SOx concentration and in particularthe absence of the large physisorbed SO2 layer might be thereasons for suppression of SO4 formation after SO2 depositionat 300 K. Thus, only the dissociation reaction occurs; SO2
dissociates directly upon adsorption until all reactive centersare occupied with sulfur or oxygen. Upon heating, oxygendiffuses into the reduced subsurface region and thus producesnew active sites for the dissociation of chemisorbed SO3.
Because of its breadth, the interpretation of the atomic sulfurpeak (Figure 5) is not straightforward. During annealing a trendto lower binding energies is observed. One interpretation forthe peaks S1, S2, and S3 is that they correspond to differentadsorption sites and geometries. The polycrystalline UO2 sampleexhibits numerous defects that can provide different adsorptionsites. Since no XPS data for SO is available, we cannot excludethe possibility that the peak with the highest binding energy(S3) may be related to sulfur coordinated to only one oxygenatom. Another possible interpretation is the presence of poly-atomic sulfur molecules (Sn) as reported for adsorption of sulfuronto different metal surfaces.59,60 In these cases evidence forthe presence of S2, S4, and S8 is seen.
Sputtering of UO2 leads to uranium in a low oxidation state(U0). The metal cations in a reduced oxidation state can provideoccupied electronic states above the valence band of the metaloxide16,61 (see Figure 10) that are needed for the interactionwith the LUMO of SO2. After both experiments (deposition at100 K and at 300 K) the surface stoichiometry is restored, asconfirmed by XPS measurements. The healing of O-defectsoccurs in two steps: (1) incorporation of oxygen atoms fromdissociated SOx at temperatures lower than 440 K; (2) diffusionof oxygen atoms from the bulk of the sample to the defectivesites during annealing to temperatures higher than 440 K. Thisis supported by the fact that for temperatures higher than 465K no further dissociation but only desorption of sulfur compo-nents is observed.
The creation of oxygen defects has also been used success-fully to enhance the reactivity of several other metal oxidestoward SO2. On MgO the existence of surface and subsurfaceoxygen vacancies was seen to be important for S-O bondcleavage.16 Also on CeO2,18 NiO(100),17 and TiO2(100),34
dissociation of SO2 was seen only after the introduction ofoxygen defects.
4.3. Adsorption of SO2 onto Sodium-Precovered UO2.Coadsorption of sodium with SO2 was used in an attempt toincrease the ability of stoichiometric UO2 to dissociate SO2.We prepared two Na/UO2 surfaces, one with a sodium coverageof 0.4 ML and the other with a sodium coverage of 5 ML.Complete dissociation of SO2 is only seen for a coverage of 5ML of sodium on UO2.
Almost invariably, evidence for SK (Stranski-Krastanov) orlayer growth is seen for alkali adsorption on metal oxides.45
Sodium adsorbs in ionic form for small coverages on manymetal oxides and metallic sodium forms with increasingcoverage.45,47 Thus, for a coverage of 0.4 ML, sodium isexpected to form ionic bonds with the UO2 substrate. A coverageof 5 ML of sodium produces metallic sodium. The XPS resultsfor adsorption of SO2 onto Na/UO2 at 100 K (Figure 6) showa mixture of SO2 and SO3 for both sodium coverages (0.4 and5 ML). However, the ratio SO2/SO3 is higher (by about 15%)in the case of 5 ML sodium coverage. Upon heating of thesample to 300 K, about 60% of the sulfur species on 0.4 MLNa/UO2 desorb, whereas on 5 ML Na/UO2, 95% of the sulfurspecies remain on the substrate in form of SO2, SO3, and atomicsulfur (from complete dissociation). The absence of the SO4
peak and the appearance of chemisorbed SO2, even at a lowcoverage of sodium (0.4 ML), suggest that Na preferentiallybonds to oxygen and thus blocks the O sites for interaction withSO2, which leads to a decrease in SO3 and SO4 production andto the formation of chemisorbed SO2 (as discussed above foroxygen-deficient UO2). Oxygen as the preferred adsorption sitefor sodium was also reported for TiO2(110)62 and MgO.63 Forthe 0.4 ML Na/UO2 system, the appearance of SO3 can beexplained by reaction of SO2 with oxygen atoms of UO2 (similarto stoichiometric UO2). For a coverage of 5 ML of sodium,however, the surface is covered completely with sodium, andno interactions with surface oxygen should be possible. Thus,the presence of SO3 must be explained by another mechanismthat provides the needed oxygen. The amount of SO3 observedis too big to be caused by reaction of SO2 with oxygen of theresidual gas. Formation of SO3 without sufficient oxygenconcentration was also observed for SO2 deposition onto themetals Zn64 and Sn65 and explained by the proposed dispro-portionation reaction:
2SO2,adsf SOgas+ SO3,ads
Adsorption and Reaction of SO2 with a UO2 Film J. Phys. Chem. B, Vol. 109, No. 44, 200520903
It is, however, important to note that so far no reportsconfirming the SO gas evolution upon SO2 deposition on thesemetals are available. The disproportionation reaction may alsobe the dominating pathway for the formation of SO3 on the 5ML Na/UO2 surface. The minor change in sulfur compoundcoverage after heating to 300 K indicates the enhanced abilityof the surface to bind SOx and sulfur species; during heating,SOx decomposes into oxygen and sulfur almost without de-sorption of sulfur components. The low desorption duringheating of the 5 ML Na/UO2 surface can be explained byincreased adsorption energy due to the smaller energy separationbetween Na and SO2 LUMO level compared to the separationbetween the 5f2 band of UO2 and the SO2 LUMO level (seeFigure 10) and was also seen for Cs/ZnO19 and Na/MgO(100).34
The bonding energy is roughly proportional to 1/(ELUMO -EAS);19 the smaller the separation between the LUMO level ofSO2 ELUMO and the adsorption site levelEAS, the higher is thebonding energy. The position of the sulfide peaks S1 and S2are similar to that observed for SO2 on the oxygen-deficientUO2 surface.
The ability of high coverages of alkali metals on oxides todissociate SO2 was seen on several other systems.16,19,21,34
However, unlike Na/MgO,16,34 Cs/ZnO,19 and K or Cs/ZnO-(0001h)-O,21 sodium on UO2 does not promote S-O bondcleavage for small coverages (<1 ML) of the alkali. Alkalisinteract strongly with a narrow-band gap oxide substrate, whichleads to a charge transfer from the alkali to the oxide and toreduction of the substrate metal cations.45,66 Therefore, theinteractions of UO2 (band gap 2.1-2.7 eV42,43 ) with sodiumare very strong and cause a charge transfer from sodium to UO2.For small coverages of Na (<1 ML) this leads to ionicsodium45,47,66and thus reduces the density of occupied states(from metallic sodium) above the valence band that arenecessary to enhance the interaction of the substrate with theLUMO of SO2 (see Figure 10). On the other hand, the reductionof uranium cations due to alkali adsorption may not be strongenough to provide electronic states that can transfer chargecarriers into the LUMO of SO2, unlike what was seen for alkalideposition onto TiO2.45 The absence of metallic sodium andsufficiently reduced uranium at low alkali coverage thereforeleads to a surface that is not able to decompose SO2. Afterheating of the sample to 300 K, the sulfur species on bothsurfaces (0.4 ML Na/UO2 and 5 ML Na/UO2) may be bondedas various compounds, such as NaxSOy complexes, and for asodium coverage of 5 ML also in form of sodium sulfides andoxides. The formation of these Na compounds might alsoexplain why no transformation of SO3 into SO4 is observed uponheating in contrast to the experiments with stoichiometric andO-deficient UO2 (Figures 3 and 5).
4.4. Adsorption of SO2 onto Calcium-Precovered UO2. Wehave studied the adsorption of SO2 onto UO2 surfaces precov-ered with different amounts of calcium (0.3 and 4 ML), toexamine the influences of earth alkali metals on oxide reactivity.Sulfur dioxide dissociates only on the UO2 surface precoveredwith a large coverage (4 ML) of calcium.
For deposition of SO2 at 100 K onto 0.3 ML Ca/UO2,physisorbed SO2 as well as chemisorbed SO2 and SO3 arepresent. In contrast to the Na/UO2 system, SO3 is the majorsulfur oxide species. Since the calcium coverage of 0.3 ML iscomparable to the sodium coverage of 0.4 ML, this mightindicate that oxygen sites are not as strongly blocked by calciumas by sodium. Heating leads to desorption of physisorbed SO2
followed by chemisorbed SO2 and SO3. Since only SO3 remainson the surface at 540 K, a transformation from SO2 into SO3
by reaction of SO2 with oxygen atoms of the substrate oxidecannot be excluded. Sulfur dioxide deposition at 100 K onto 4ML Ca/UO2 leads to the same three products, but for this surfacechemisorbed SO2 represents the main SOx compound. Weconclude that at this coverage calcium greatly reduces theinteractions between the oxide surface and SO2. The smallamount of SO3 produced may result, like on the 5 ML Na/UO2
system, mainly from the disproportionation reaction rather thanfrom reaction of SO2 with surface oxygen (see section 4.3).Similar to sodium, calcium on UO2 can also increase theadsorption energy of sulfur compounds; the small amount ofdesorption (less than 5%) of sulfur species during heating ofthe 4 ML Ca/UO2 surface is analogous to Na/UO2 and isassociated with the small energy separation between Ca (metal-lic) and SO2 LUMO level, leading to a high adsorption energy.This low amount of desorption, the disappearance of chemi-sorbed SO2 upon heating, and the continuous growth of the SO3
and sulfide signals for temperatures higher than 100 K suggestthe complete dissociation of SO2 and a transformation of SO2into SO3 via reaction of SO2 with oxygen atoms from SO2dissociation. The transformation of SO3 into SO4 is suppressedby the reduced accessibility of surface oxygen and by thecompeting reaction of oxygen with calcium. The structure ofthe sulfide peak consisting of the peaks S1, S2, and S3 is similarto that observed for SO2 on oxygen-deficient UO2 (section 4.2).The sulfur species may form various compounds with Ca onboth surfaces (0.3 ML Ca/UO2 and 4 ML Ca/UO2). These mayinclude CaxSOy complexes and for a calcium coverage of 4 MLalso calcium sulfides and oxides.
Only large coverages of calcium lead to the cleavage of S-Obonds, supporting the conclusion that metallic states above thevalence band of a metal oxide are, unlike ionic states, able tointeract with the LUMO of SO2 and weaken S-O bonds thusleading to dissociation of SO2 (see Figure 10). Also the reductionof uranium by ionic calcium for small coverages of the earthalkali is not strong enough to provide these necessary states.Thus, a fractional monolayer of calcium is not a good promoterfor the dissociation of SO2 on UO2.
5. Conclusion
The interactions of SO2 with stoichiometric, oxygen-deficient,sodium-precovered and calcium-precovered UO2 have beenexamined. On stoichiometric UO2, sulfur dioxide adsorbs as SO3
via reaction with surface oxygen. Heating leads to a transforma-tion into SO4, but no dissociation is observed. Argon ionsputtering of UO2 leads to the formation of surface andsubsurface oxygen defects. The surface oxygen vacancies canbe healed by adsorption of SO2. After sputtering the U 4f XPSspectra exhibit two new features corresponding to the presenceof uranium with a low oxidation state and a shift in bindingenergies due to a p-n transition that UO2 undergoes duringsputtering. On oxygen-deficient UO2 complete dissociation ofSO2 is observed and the reaction starts at temperatures as lowas 265 K. Sulfur dioxide adsorbs onto oxygen-deficient UO2 inthe form of chemisorbed SO2 and SO3 at 100 K and transformsduring annealing into SO4 and atomic sulfur. At 300 K SO2dissociates readily during adsorption and small amounts of SO3
are seen.On both sodium- and calcium-precovered UO2, sulfur dioxide
adsorbs as chemisorbed SO2 and SO3. On the Ca/UO2 systema transformation into SO3 is observed upon heating. For bothsystems (Na/UO2 and Ca/UO2) dissociation of SO2 is only seenfor large coverages (g4 ML) of the coadsorbed metal. Theadsorption of large coverages of sodium or calcium also greatlyenhances the adsorption energy of sulfur components.
20904 J. Phys. Chem. B, Vol. 109, No. 44, 2005 Schlereth et al.
The atomic sulfur peak shows similar structure in all caseswhere dissociation occurs; three different binding states areobserved. These could correspond to different adsorption siteson the polycrystalline sample or to sulfur molecules in differentpolyatomic modifications (Sn).
Acknowledgment. This work has been supported in partby the U.S. Department of Energy (DOE), Oak Ridge Officeof Site Closure (EM-32), and the DOE Office of Basic EnergySciences.
References and Notes
(1) DOE/EIS-026; U.S. Department of Energy; Office of NuclearEnergy, Science, and Technology: 1999.
(2) Dubrin, J. W.UCRL-AR-124080; Lawrence Livermore NationalLaboratory: Livermore, CA, 1997; V. 1, Rev. 2.
(3) Depleted Uranium Hexafluoride Management Program: DepletedUranium Hexafluoride Fact Sheet; U.S. Department of Energy, Office ofEnvironmental Management: Springfield, VA, 2001.
(4) Hutchings, G. J.; Heneghan, C. S.; Hudson, I. D.; Taylor, S. H.Nature1996, 384, 341.
(5) Heneghan, C. S.; Hutchings, G. J.; O’Leary, S. R.; Taylor, S. H.;Boyd, V. J.; Hudson, I. D.Catal. Today1999, 54, 3.
(6) Gordeeva, L. G.; Aristov, Y. I.; Moroz, E. M.; Rudina, N. A.;Zaikovskii, V. I.; Tanashev, Y. Y.; Parmon, V. N.J. Nucl. Mater.1995,218, 202.
(7) Hedhili, M. N.; Yakshinskiy, B. V.; Madey, T. E.Surf. Sci.2000,445, 512.
(8) Stultz, J.; Paffett, M. T.; Joyce, S. A.J. Phys. Chem. B2004, 108,2362.
(9) Senanayake, S. D.; Idriss, H.Surf. Sci.2004, 563, 135.(10) Chong, S. V.; Idriss, H.Surf. Sci.2002, 504, 145.(11) Chong, S. V.; Barteau, M. A.; Idriss, H.Catal. Today2000, 63,
283.(12) Wu, Q.; Yakshinskiy, B. V.; Madey, T. E.Surf. Sci.2003, 523, 1.(13) Wu, Q.; Yakshinskiy, B. V.; Gouder, T.; Madey, T. E.Catal. Today
2003, 85, 291.(14) Hedhili, M. N.; Yakshinskiy, B. V.; Schlereth, T. W.; Gouder, T.;
Madey, T. E.Surf. Sci.2005, 574, 17.(15) Stern, A. C.; Boubel, R. W.; Turner, D. B.; Fox, D. L.Fundamentals
of air pollution, 2nd ed.; Academic Press: Orlando, FL, 1984.(16) Rodriguez, J. A.; Jirsak, T.; Gonzalez, L.; Evans, J.; Perez, M.;
Maiti, A. J. Chem. Phys.2001, 115, 10914.(17) Li, X.; Henrich, V. E.Phys. ReV. B 1993, 48, 23.(18) Rodriguez, J. A.; Jirsak, T.; Freitag, A.; Hanson, J. C.; Larese, J.
Z.; Chaturvedi, S.Catal. Lett.1999, 62, 113.(19) Rodriguez, J. A.; Jirsak, T.; Hrbek, J.J. Phys. Chem. B1999, 103,
1966.(20) Jirsak, T.; Rodriguez, J. A.; Hrbek, J.Surf. Sci.1999, 426, 319.(21) Rodriguez, J. A.; Jirsak, T.; Chaturvedi, S.; Kuhn, M.Surf. Sci.
1999, 442, 400.(22) Rodriguez, J. A.; Jirsak, T.; Freitag, A.; Larese, J. Z.; Maiti, A.J.
Phys. Chem. B2000, 104, 7439.(23) Triguero, L.; de Carolis, S.; Baudin, M.; Wojcik, M.; Hermansson,
K.; Nygren, M. A.; Pettersson, L. G. M.Faraday Discuss.1999, 114, 351.(24) de Carolis, S.; Pascual, J. L.; Pettersson, L. G. M.; Baudin, M.;
Wojcik, M.; Hermansson, K.; Palmqvist, A. E. C.; Muhammed, M.J. Phys.Chem. B1999, 103, 7627.
(25) Yates, J. T., Jr.Experimental InnoVations in Surface Science;Springer-Verlag: New York, 1998; p 644.
(26) Hofer, M.; Stolz, H.; Wassmuth, H.-W.Surf. Sci. 1992, 272, 342.(27) Polcik, M.; Wilde, L.; Haase, J.; Brena, B.; Cocco, D.; Comelli,
G.; Paolucci, G.Phys. ReV. B 1996, 53, 13720.(28) Ahner, J.; Effendy, A.; Vajen, K.; Wassmuth, H.-W.Vacuum1990,
41, 98.(29) Sun, Z.-J.; Gravelle, S.; Mackay, R. S.; Zhu, X.-Y.; White, J. M.
J. Chem. Phys.1993, 99, 10021.
(30) Liu, G.; Rodriguez, J. A.; Dvorak, J.; Hrbek, J.; Jirsak, T.Surf.Sci.2002, 505, 295.
(31) Rodriguez, J. A.; Perez, M.; Jirsak, T.; Evans, J.; Hrbek, J.;Gonzalez, L.Chem. Phys. Lett.2003, 378, 526.
(32) de Jong, A. M.; Niemantsverdriet, J. W.Surf. Sci.1990, 233, 355.(33) Redhead, P. A.Vacuum1962, 12, 203.(34) Rodriguez, J. A.; Perez, M.; Jirsak, T.; Gonzalez, L.; Maiti, A.Surf.
Sci. 2001, 477, L279.(35) Sun, Y.-M.; Sloan, D.; Alberas, D. J.; Kovar, M.; Sun, Z.-J.; White,
J. M. Surf. Sci.1994, 319, 34.(36) Rodriguez, J. A.; Jirsak, T.; Chaturvedi, S.J. Chem. Phys.1999,
111, 8077.(37) Raza, H.; Harte, S. P.; Muryn, C. A.; Wincott, P. L.; Thornton, G.;
Casanova, R.; Rodriguez, A.Surf. Sci.1996, 366, 519.(38) Allen, G. C.; Tucker, P. M.; Tyler, J. W.J. Phys. Chem.1982, 86,
224.(39) Allen, G. C.; Tucker, P. M.Chem. Phys. Lett.1976, 43, 254.(40) Winer, K.; Colmenares, C. A.; Smith, R. L.; Wooten, F.Surf. Sci.
1987, 183, 67.(41) Kotani, A.; Ogasawara, H.Physica B1993, 186-188, 16.(42) Winter, P. W.J. Nucl. Mater.1989, 161, 38.(43) Van den Berghe, S.; Miserque, F.; Gouder, T.; Gaudreau, B.;
Verwerft, M. J. Nucl. Mater.2001, 294, 168.(44) Miserque, F.; Gouder, T.; Wegen, D. H.; Bottomley, P. D. W.J.
Nucl. Mater.2001, 298, 280.(45) Campbell, C. T.Surf. Sci. Rep.1997, 27, 1.(46) Diebold, U.; Pan, J.-M.; Madey, T. E.Surf. Sci.1995, 331-333,
845.(47) Yakshinskiy, B. V.; Madey, T. E.; Ageev, V. N.Surf. ReV. Lett.
2000, 7, 75.(48) Pacchioni, G.; Sousa, C.; Illas, F.; Parmigiani, F.; Bagus, P. S.Phys.
ReV. B 1993, 48, 11573.(49) Bagus, P. S.; Pacchioni, G.; Sousa, C.; Minerva, T.; Parmigiani, F.
Chem. Phys. Lett.1992, 196, 641.(50) Sasaki, M.; Scanlon, P. J.; Ermolov, S.; Brongersma, H. H.Nucl.
Instrum. Methods Phys. Res., Sect. B2002, 190, 127.(51) Moulder, J. F.; Stickle, W. F.; Sobol, P. E.; Bomben, K. D.
Handbook of X-ray photoelectron spectroscopy; Perkin-Elmer Corp.: EdenPrairie, MN, 1992.
(52) Warburton, D. R.; Purdie, D.; Muryn, C. A.; Prabhakaran, K.;Wincott, P. L.; Thornton, G.Surf. Sci.1992, 269-270, 305.
(53) Kurtz, R. L.; Henrich, V. E.Phys. ReV. B 1987, 36, 3413.(54) Baer, Y.; Schoenes, J.Solid State Commun.1980, 33, 885.(55) Martin, W. C.; Musgrove, A.; Kotochigova, S.; Sansonetti, J. E.
National Institute of Standards and Technology; available at: http://physics.nist.gov/PhysRefData/IonEnergy/ionEnergy.html, 2003 (Aug 17,2004).
(56) Handbook of Chemistry and Physics; Lide, D. R., Ed.; CRC Press:Boston, MA, 1991.
(57) Zangwill, A. Physics at surfaces; Cambridge University Press:Cambridge, U.K., 1988.
(58) Hofmann, S.Rep. Prog. Phys.1998, 61, 827.(59) Vericat, C.; Vela, M. E.; Andreasen, G.; Salvarezza, R. C.; Vazquez,
L.; Martin-Gago, J. A.Langmuir2001, 17, 4919.(60) Hrbek, J.; Li, S. Y.; Rodriguez, J. A.; van Campen, D. G.; Huang,
H. H.; Xu, G.-Q.Chem. Phys. Lett.1997, 267, 65.(61) Henrich, V. E.; Cox, P. A.The surface science of metal oxides;
Cambridge University Press: Cambridge, U.K., 1994.(62) Lagarde, P.; Flank, A.-M.; Prado, R. J.; Bourgeois, S.; Jupille, J.
Surf. Sci.2004, 553, 115.(63) Snyder, J. A.; Jaffe, J. E.; Lin, Z.; Hess, A. C.; Gutowski, M.Surf.
Sci.2000, 445, 495.(64) Chaturvedi, S.; Rodriguez, J. A.; Jirsak, T.; Hrbek, J.J. Phys. Chem.
B 1998, 102, 7033.(65) Rodriguez, J. A.; Jirsak, T.; Chaturvedi, S.; Hrbek, J.J. Am. Chem.
Soc.1998, 120, 11149.(66) Madey, T. E.; Yakshinskiy, B. V.; Ageev, V. N.; Johnson, R. E.J.
Geophys. Res.1998, 103, 5873.
Adsorption and Reaction of SO2 with a UO2 Film J. Phys. Chem. B, Vol. 109, No. 44, 200520905

![Spriggite, Pb 3 [(UO 2 ) 6 O 8 (OH) 2 ] (H 2 O) 3 , a new mineral with β-U 3 O 8 –type sheets: Description and crystal structure](https://img.pdfslide.net/doc/110x75/6349faf96bb2dc8f2504eba6/spriggite-pb-3-uo-2-6-o-8-oh-2-h-2-o-3-a-new-mineral-with-v-u-3-o.jpg)


