Embed Size (px)
Citation preview

Adsorption and Wetting experiments, thermodynamics and molecular aspects
CENTRALE LAND BO UWC ATA LOG US
0000 0577 5115

Promotor: dr. J. Lyklema
hoogleraar in de fysische chemie, met bijzondere
aandacht voor de grensvlak- en kolloïdchemie
Co-promotor: dr. ir. L.K. Koopal
universitair hoofddocent bij de
vakgroep Fysische en Kolloïdchemie

/vi hiJ %z£)i, 19^2.
Adsorption and Wetting experiments, thermodynamics and molecular aspects
Lucas Jozef Maria Schlangen
Proefschrift
ter verkrijging van de graad van doctor
in de landbouw- en milieuwetenschappen
op gezag van de rector magnificus,
dr. C. M. Karssen,
in het openbaar te verdedigen
op dinsdag 27 juni 1995
des namiddags te vier uur in de Aula
van de Landbouwuniversiteit te Wageningen.
.M z Cf ! ( MQ o

CIP-DATA KONINKLIJKE BIBLIOTHEEK, DEN HAAG
Schlangen, Lucas Jozef Maria
Adsorption and wetting: experiments, thermodynamics and molecular aspects / Lucas Jozef Maria Schlangen. - [S.l. : s.n.]. - III. Thesis Landbouwuniversiteit Wageningen. - With réf. -
With summary in Dutch. ISBN 90-5485-400-6
Subject headings: contact angle / normal alkanes / self-consistent-field lattice fluid theory
Cover: Doolhof der Druppels (Droplets Labyrinth)
.^TEIT

The White Rabbit put on his spectacles. "Where shall I begin,
please your Majesty?" he asked. "Begin at the beginning," the King
said, very gravely, "and go on till you come to the end: then stop. "
(from: "Alice's Adventures in Wonderland", Lewis Carroll, 1865)

Voorwoord
Hoe korter je nadenkt over een vraag hoe eenvoudiger het antwoord vaak zal zijn. Soms
moet je echter juist lang nadenken voor een eenvoudig antwoord, terwijl een eenvoudig
antwoord weer aanleiding kan geven tot lang denken. "Hoe staan adsorptie en
bevochtiging met elkaar in verband?" was de centrale vraagstelling waaraan ik
gedurende vier jaar heb gewerkt. Getuige de omvang van het proefschrift is het
antwoord wel wetenschappelijk maar niet echt eenvoudig geworden. Voor eenvoud is
of heel weinig of heel veel kennis vereist. Het eerste station is gepasseerd, het tweede is
in zicht maar nog niet gehaald.
Het schrijven van een proefschrift vergt veel van één persoon maar is zeker geen
eenzaam avontuur, vele mensen zijn er direct of indirect bij betrokken. Een aantal van
hen wil ik hier graag met name noemen. Luuk, in (onze) discussies heeft het jou nooit
aan stelligheid ontbroken. Met de jou eigen directe en voortvarende wijze van
communiceren heb jij mij dikwijls weten te stimuleren, ook op moeilijke momenten.
Hiermee heb je zowel mij als het proefschrift veel goedgedaan. Ik kijk met veel plezier
terug naar onze samenwerking en hoop nog vaker mensen zoals jij te treffen.
Martien Cohen Stuart heeft met zijn inspirerende ideeënstroom geholpen het
onderzoek op de rails te zetten en te houden. Daarnaast bleek hij uitermate bedreven in
"la diplomatie française". Hoewel mijn promotor Hans Lyklema zich meesttijds op de
achtergrond hield was hij steeds paraat wanneer hem naar zijn mening of advies werd
gevraagd. Hans, bedankt voor het in mij gestelde vertrouwen. De theoretische
berekeningen waren niet mogelijk geweest wanneer ik niet op de schouders had kunnen
staan van Frans, Cas en Peter, mensen die in meerdere opzichten (een) prima
gezelschap zijn. Jos en Mare, jullie maakten mijn werkplek tot een thuis waar het
uitstekend werken was, ik zal jullie missen.
Dankzij en door de uitermatig plezierige sfeer op het lab en daarbuiten (zoals tijdens
feestjes, wandelweekenden en volleyactiviteiten) heb ik de mens in de collega en de
collega in de mens mogen ontdekken. In dit verband wil ik (nog) een aantal mensen niet
onvermeld laten: Martin TA, Katinka, Janet, Jeannette, Ronald en Anton bedankt!
Je tiens à exprimer mes plus profonds remerciements au Dr. Michel Robin pour
m'avoir accueilli au Laboratoire de Physico-Chimie Appliquée et d'Analyse de l'Institut
Français du Pétrole. Ma reconnaissance va également à Xhuliano, Emmanuelle, Gerard,
Albert, Yannick, Yves, Suzanne, Thierry, Didier et Corrine pour leur hospitalité et

leur amitié au travail. J'ai de très bons souvenirs des heures de repas et des petites
ballades avec vous. Emanuelle, ton remarquable sens de l'humour (je me souviens des
"trucs" comme "le Roi de la soudure" et le "GTT") et ton amitié ont fait de mon séjour à
Paris un vrai plaisir, merci.
Zonder mijn vrienden, met name Yvonne, Romke, René, Wendelmoet, Antoine,
Elles en Evert, zou ik niet de persoon zijn die ik nu ben. Dit geldt des te meer voor mijn
ouders op wie ik zo dikwijls heb mogen bouwen en met wie ik nu nog steeds graag op
vakantie mag gaan.
Lieve Anne,
te midden de betrekkelijkheid der woorden,
sta ik trots met jou, zij aan zij.
Luc

Contents
CHAPTER 1
General Introduction 1.1. Wetting 1 1.2. Adsorption and wetting 2 1.3. Lattice theory for adsorption and wetting 6 1.4. Contents and outline of this thesis 7
CHAPTER 2
Thermodynamics of Wetting and Vapour Adsorption Abstract 11 2.1. Introduction 11 2.2. Thermodynamic relations between adsorption and wetting 12
Spreading tension and wettability 19 Liquid-liquid displacement 20 Work of different types of wetting 21
2.3. Discussion 22 Wetting of silica from vapour adsorption data 23 Partial wetting adsorption isotherms 24
References 25
CHAPTER 3
Wetting and Adhesion on Charged Solids: interfacial thermodynamics and surface charge Abstract 27 3.1. Introduction 27 3.2. Surface charge and wetting and adhesion 28
The surface charge 28 Wetting and adhesion 29 Interfacial tension of charged interfaces 29
3.3. Surface charge and wettability of silica 31 The nature of the silica surface 31 Potentiometrie titrations of silica 32
3.4. Results and discussion 33 Relevance of the surface charge for oil recovery 35 The work of adhesion on charged solids 36
3.5. Conclusions 36 References 38
CHAPTER 4
Thin Hydrocarbon and Water Films on Bare and Methylated Silica: vapour adsorption, wettability, adhesion and surface forces Abstract 41 4.1. Introduction 41 4.2. Experimental 42
Adsorptives 42 Substrates 42 Gravimetry 43
4.3. Results 44 Adsorption on silica 44 Adsorption on methylated silica 44
4.4. Comparison with other measurements 46 I: Hydrocarbon and water adsorption on silica 47
Water on silica 47 Alkanes on silica 48
II : Water and hydrocarbon adsorption on alkylated silica 50 Water on alkylated silica 50 n-Alkanes on alkylated surfaces 50 Cyclohexane on alkyklated silica 50
4.5. Alkane adsorption mechanism 52 Bare silica 52 Alkylated surfaces 53
4.6. Discussion 53 Modelling alkane adsorption 53 Adsorption and wettabilty 53 Characterization of bare and methylated silica 57 Disjoining pressure isotherms of adsorbed films 59
4.7. Conclusions 63 Appendix 1 64 Appendix II 65 References 67
CHAPTER 5
A Lattice-Fluid Description of n-Alkanes: vapour-liquid properties, heat of vaporization, interfacial structure and surface tensions Abstract 69 5.1. Introduction..... 69 5.2. Self consistent field theory for chain molecules in inhomogeneous systems 71
General 71 Segment density distribution 71 Chain conformation: first order Markow statistics 73 Thermodynamic relations and the SCF-LF theory 75

5.3. Results 78 SCF-LF parameters for n-alkanes 78 Bulk properties of n-alkanes 82
Vapour pressures 82 Critical point 83 Liquid and vapour densities 83 Heat of vaporization of n-alkanes 85
Interfacial properties of n-alkanes at the liquid-vapour interface 87 Volume fraction profiles 87 LV interfacial tension 88 Temperature dependence 89 Chain length dependence 92 General remark on the interfacial tension calculations 93
5.4. Conclusions 94 References 96
CHAPTER 6
Vapour Adsorption and Wetting of Alkanes on Bare and Alkylated Surfaces: a statistical thermodynamic approach Abstract 99 6.1 Introduction 99 6.2. Self consistent field lattice fluid theory for adsorption of chain molecules.. 101
SCF theory for adsorption 101 Rotational isomeric state scheme 102 SCF-lattice fluid theory 104 SCF-LF theory and wetting 105 Parameter choice 108
6.3. Vapour adsorption isotherms 109 la: Bare rigid solids without grafted chains 110 lb: Rigid surfaces; solids completely grafted with chains 114 Ic: Volume fraction profiles of octamer films on rigid substrates 114 IIa: Soft surfaces: solids partially grafted with chains 116 lib: Volume fraction profiles of octamer films on soft surfaces 119 III: Comparison with measured alkane adsorption on bare and
methylated silica 122 6.4. Wettability of aliphatic fluids at solid substrates 123
Temperature dependence of alkane contact angles on rigid/fully alkylated surfaces 123 Alkane contact angles on soft/partially alkylated surfaces 125 Chain length dependency of the contact angle and critical surface tension 128 Comparison with experimental contact angles 130
6.5. Conclusions 130 References 133
Summary 135
Samenvatting 141
Curriculum Vitae 145

Chapter 1
General Introduction
1.1. Wetting
Wetting refers to the different situations that may arise when a liquid comes into
contact with a solid surface originally contacting a gas or another liquid. The liquid
may move out over the solid until it comes to a halt when the angle between the liquid-
fluid and solid-liquid interface reaches a certain value, the contact angle. Alternatively,
the liquid may spread maximally over the solid under displacement of the original
contacting liquid or gas.
Wetting of solid substrates by liquids is relevant for many natural and commercial
processes. Ducks grease their feathers in order to render them strongly water repellent.
If water would completely wet their feathers this would strongly reduce their
floatability. This example shows that the wetting properties of a solid can be controlled
by changing the "surface composition" of the solid: coating operations allow wettability
control. In human invented coating operations teflon (polytetrafluoroethylene) is often
used as surface coating material because of its very low affinity for other materials.
This low affinity character can easily be demonstrated by putting a water droplet in a
teflon coated frying-pan: the droplet tries to minimize its contact area with the pan and
will not spread. In special waterproof and breathing outdoor garmets expanded
polytetrafluorethylene is often applied as membrane material. The membrane iself is
water repellent whereas moisture vapour is still able to pass through the tiny pores in
the membrane.
In many industrial technologies wetting (-related) problems are encountered. In
coating industry, a decorative or protective coating should spread over the object and
give good adhesion. Furthermore, during manufacture the coating formulation should
wet, disperse and stabilize the pigments and protective agents. In semiconductor
industry, silicon wafers are often cleaned from adhering particles by immersion in
liquid prior to processing. When a particle adhering to the wafer passes through the
liquid-gas interface the liquid may sweep the particle from the solid. The larger the
resistance of the particle to be wetted by the liquid the more efficient the cleaning will
be. In flotation processes, as for instance metal extraction from ore, wettability
differences between particles, dispersed in a liquid medium, are used to separate the
different types of particles from the dispersion. Other examples of processes for which
wetting is relevant are the spreading of the liquid droplets on solids formed by spraying

CHAPTER 1
of agricultural chemicals, the penetration and spreading of ink on paper, painting,
lubrication and the displacement of oil by water in enhanced oil recovery.
The significance of wetting for many processes and products is now increasingly
recognized and this has stimulated much research in the area [1, 2]. Also from a
fundamental perspective, wetting studies are challenging as the macroscopic wetting
properties of a system are the result of intermolecular interactions acting across fluid-
solid and fluid-fluid interfaces. Over the past few decades knowledge of these
interactions has increased considerably [3-5]. This renewed scientific interest in both the
statics and dynamics of wetting [6].
This thesis concentrates both on the macroscopic conditions and on the molecular
interpretation of wetting. To this end wetting and adhesion will be studied in the
context of adsorption. Special attention will be paid to linear hydrocarbons as they often
serve as standards in wettability and adhesion studies [7, 8].
1.2. Adsorption and wetting
In general, the molecular density and organisation of a fluid in interfacial regions
differs from that of bulk fluid. At a hard impenetrable solid surface molecules are
restricted in their movement and the number of conformations (shapes and orientations)
they can have. When vapour molecules adsorb on a solid this results in a decrease in
entropy that has to be compensated for by the adsorption energy. Only when the
adsorption energy compensates this entropy loss will molecules accumulate in the
interfacial region.
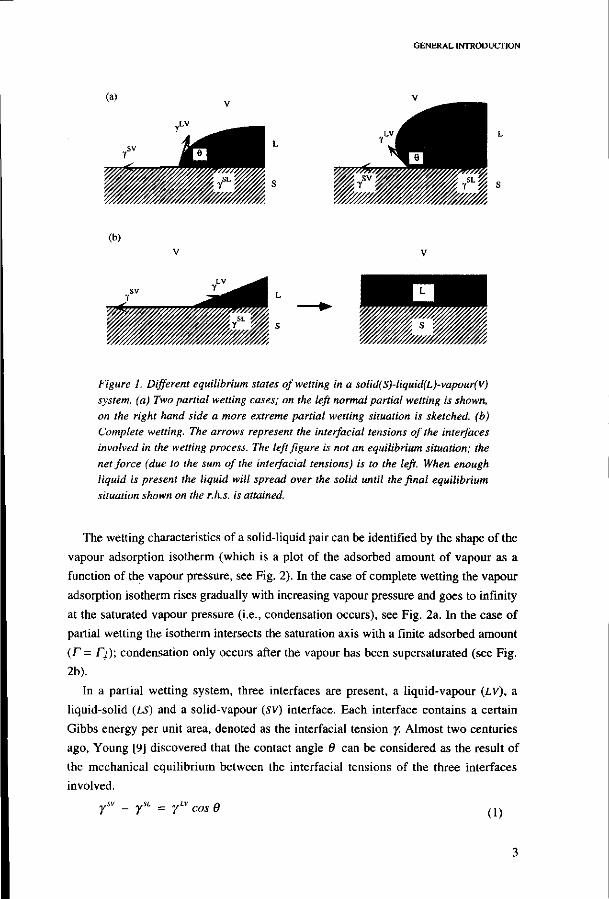
When a liquid contacts a solid surface, two different equilibrium states of wetting
can be found. These equilibrium states are denoted as "partial" and "complete" wetting.
Partial wetting refers to the situation where the liquid only partially spreads on the solid
under formation of a droplet with a finite contact angle 0, as depicted in Fig. la. In the
case of complete wetting the liquid spreads maximally over the solid substrate. If
enough liquid is present, the final equilibrium state is a macroscopic liquid layer which
covers the whole solid surface, see Fig. lb.
Adsorption and wetting are strongly related. This is particularly obvious when
considering the adsorption of vapour V of a volatile liquid L onto a solid surface 5.
Adsorbing vapour molecules form a film which thickens with increasing vapour
pressure. At saturation and in the presence of enough vapour, the adsorbed film may
grow to a macroscopically thick layer with properties of bulk liquid. In this case the
solid is completely wetted by the liquid. When the thickness of the film formed at
saturation is not macroscopic we are dealing with partial wetting.
GENERAL INTRODUCTION
(a)
(b)
Figure 1. Différent equilibrium states of wetting in a solid(S)-liquid(L)-vapour(V) system, (a) Two partial wetting cases; on the left normal partial wetting is shown, on the right hand side a more extreme partial wetting situation is sketched, (b) Complete wetting. The arrows represent the interfacial tensions of the interfaces involved in the wetting process. The left figure is not an equilibrium situation; the net force (due to the sum of the interfacial tensions) is to the left. When enough liquid is present the liquid will spread over the solid until the final equilibrium situation shown on the r.h.s. is attained.
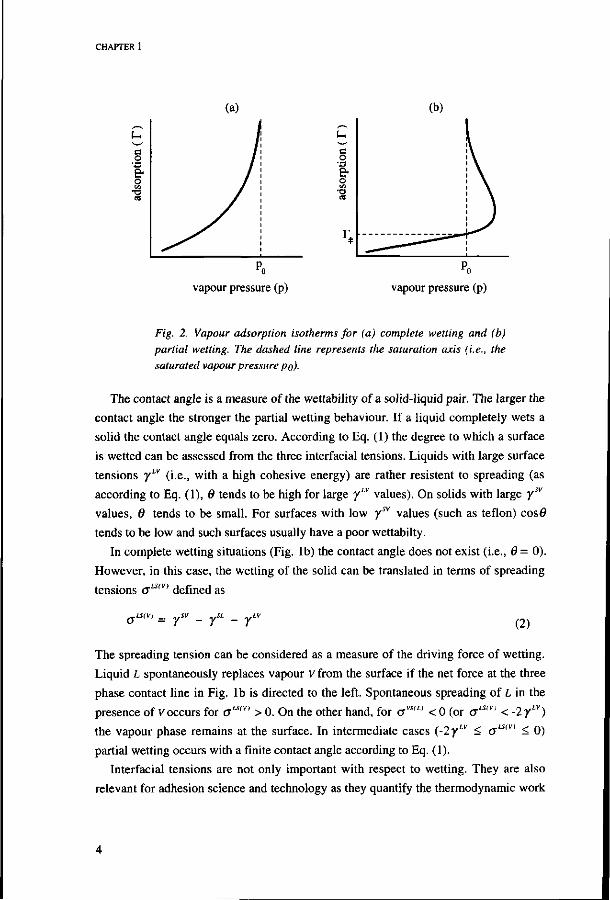
The wetting characteristics of a solid-liquid pair can be identified by the shape of the
vapour adsorption isotherm (which is a plot of the adsorbed amount of vapour as a
function of the vapour pressure, see Fig. 2). In the case of complete wetting the vapour
adsorption isotherm rises gradually with increasing vapour pressure and goes to infinity
at the saturated vapour pressure (i.e., condensation occurs), see Fig. 2a. In the case of
partial wetting the isotherm intersects the saturation axis with a finite adsorbed amount
(T = r^e); condensation only occurs after the vapour has been supersaturated (see Fig.
2b).
In a partial wetting system, three interfaces are present, a liquid-vapour (LV), a
liquid-solid (LS) and a solid-vapour (sv) interface. Each interface contains a certain
Gibbs energy per unit area, denoted as the interfacial tension y. Almost two centuries
ago, Young [9] discovered that the contact angle 0 can be considered as the result of
the mechanical equilibrium between the interfacial tensions of the three interfaces
involved.
rsv - rSL = rLV cos e ( 1 )
CHAPTER 1
e o
f o
vapour pressure (p) vapour pressure (p)
Fig. 2. Vapour adsorption isotherms for (a) complete wetting and (b) partial wetting. The dashed line represents the saturation axis (i.e., the saturated vapour pressure po).
The contact angle is a measure of the wettability of a solid-liquid pair. The larger the
contact angle the stronger the partial wetting behaviour. If a liquid completely wets a
solid the contact angle equals zero. According to Eq. (1) the degree to which a surface
is wetted can be assessed from the three interfacial tensions. Liquids with large surface
tensions yLV (i.e., with a high cohesive energy) are rather resistent to spreading (as
according to Eq. (1), 6 tends to be high for large yLV values). On solids with large ysv
values, 6 tends to be small. For surfaces with low ysv values (such as teflon) cos0
tends to be low and such surfaces usually have a poor wettabilty.
In complete wetting situations (Fig. lb) the contact angle does not exist (i.e., 0 = 0).
However, in this case, the wetting of the solid can be translated in terms of spreading
tensions au,v' defined as
(jWVI - yW _ ySI
r (2)
The spreading tension can be considered as a measure of the driving force of wetting.
Liquid L spontaneously replaces vapour V from the surface if the net force at the three
phase contact line in Fig. lb is directed to the left. Spontaneous spreading of L in the
presence of Voccurs for amv' > 0. On the other hand, for <7VSIL' < 0 (or c r " m < -2yLV)
the vapour phase remains at the surface. In intermediate cases (-2yLV < <r"m < 0)
partial wetting occurs with a finite contact angle according to Eq. (1).
Interfacial tensions are not only important with respect to wetting. They are also
relevant for adhesion science and technology as they quantify the thermodynamic work

GENERAL INTRODUCTION
of adhesion WA- For adhesion of liquid L on a solid S that is originally in contact with a
vapour V, W^(y> equals
wr> = rsv + r - rL o)
Interfacial tensions of interfaces involving a solid phase cannot be measured directly.
However, the interfacial tension difference between SV and SL interfaces is
experimentally accessible (using Eq. (1)) from measurements of cos 6 and yLV. It is also
possible to determine ysv -ySL from vapour adsorption isotherms, relating the surface
concentration r (mole/unit area) to the relative equilibrium pressure p/p0 in the gas
phase. According to Gibbs law, the surface pressure of the solid-vapour interface
nsv(r) is defined as the difference between the surface tension in vacuum of a pristine
surface 5, ys, and the interfacial tension of the same interface S containing r moles of
vapour molecules
KSV(D = ys - ysv(D = RT f r d lnp/p„ ( 4 )
where R is the gas constant and T is the absolute temperature.
Equation (4) can be extended to include a thick adsorbed layer that has properties of
bulk liquid (complete wetting). If a thick liquid layer ( r = T_) is adsorbed on S, the
interfacial pressure nsv(r_) equals
n»(rj=f - (ySL
+ yL) ( 5 a )
In the case of partial wetting meta- and unstable adsorbed states have to be passed
before a thick liquid layer is eventually formed at saturation. In Fig. lb these states
correspond to the part of the isotherm behind the saturation axis. This part of the
isotherm can not be fully measured. Therefore, nsv(T_) cannot be assessed from
experimental vapour adsorption isotherms. Only the interfacial pressure 7tsv(rt) of the
thin film formed at saturation can be determined. The value of ^(T^) is related to the
contact angle according to
x (rt) = 7 - (7 +7 cosd) (5b)
The interfacial pressure of any other vapour ( V; or v2) can be obtained in the same
way using Eq. (4). In principle, ySL' -ySk can be found by subtraction of Ksv'(r„)
from nSV2(Tm) so that liquid(L,)-liquid(i.2) displacement can be studied using
analogues of Eqs. (1) and (2). The use of Gibbs law to describe wetting is not restricted
to wetting studies on macroscopically flat surfaces but may also be applied to powdered
solids.

CHAPTER 1
In general, many solid surfaces are charged which affects the wetting properties of
the solid. The surface charge develops due to adsorption of charged species. This means
that the effect of the surface charge on the solid-liquid interfacial tension can be
established thermodynamically by means of Gibbs law. Together with Eqs. (1) and (2),
this provides a means to characterize the influence of the surface charge on the
wettability of a solid substrate.
1.3. Lattice theory for adsorption and wetting
At saturation, partially wetting liquids have a stable state with a finite adsorbed amount.
Meta- and unstable states have to be passed before condensation occurs and a stable
macroscopic liquid layer is formed at the saturated vapour pressure. The unstable region
of adsorption isotherms cannot be measured and theoretical models have to be invoked
to allow extrapolation of the part of the isotherm beyond f j (see Fig. 2b).
The quality of adsorption models is determined by the extent to which certain
physical premises (e.g. homogeneity of the surfaces, architecture of the molecules,
localized or mobile adsorption, lateral interactions) are considered. For short chain
molecules such as alkanes, the physics of adsorption will be strongly determined by the
chain nature of the molecules and the conformations they can assume in their vapour
phase or adsorbed state. In most adsorption models (e.g., Langmuir, Volmer, BET [10])
the adsorbing molecules are considered as sperical particles, this makes such models
inapt to describe adsorption of chain molecules correctly.
By means of lattice theories the properties of chain molecules in complex systems
can be investigated at relatively low computational cost. Lattice theories have been
applied quite succesfully to investigate fluid mixtures and interfaces [11], polymeric
melts, polymeric solutions and polymer adsorption [12], solid-fluid interfaces and
polymeric brushes [13], lipid bilayers [14] and surfactant behaviour [15, 16]. This wide
diversity of applications suggests that lattice theories provide a versatile theoretical
framework for the description of adsorption and wetting of fluids composed of chain
molecules.
In this thesis the properties of liquid and vapour phases composed of chain
molecules will be studied using an equilibrium lattice theory for chain molecules,
originally developed by Scheutjens and Fleer [17, 18]. In the theory, a chain molecule is
represented as a flexible chain of beads (the segments), each bead representing a
repeating unit of the molecule. The chains are placed on a lattice (see Fig. 3) so that the
configurational statistics of the molecules can be evaluated relatively easily, in our case
by combining Markov chain statistics with a random mixing (mean field)

GENERAL INTRODUCTION
f *ti • • • • • •« * • # •
trrxxsHB
Figure 3. A lattice representation of chain molecules and their liquid-vapour interface; the circles represent the segments of the chain molecules.
Liquid Vapour
approximation. Each chain experiences an average potential energy field generated by
all other molecules in the system. In the potential energy field intermolecular
interactions are accounted for by Flory-Huggins parameters. The potential energy field
both depends on and determines the volume fractions in the system. Numerical methods
are applied to find the self-consistent potential energy field and the (corresponding)
volume fraction distribution. The equilibrium volume fraction profiles, in the direction
perpendicular to the interface, of the different components are obtained by minimizing
the total free energy of the system. From the equilibrium volume fraction profiles the
adsorbed amounts can be calculated together with the mechanical- (such as pressure
and energy) and thermodynamic properties (e.g. interfacial tensions) of the system.
1.4. Contents and outline of this thesis
As stated in the introductory section, the central aim of the project is to understand and
predict wettability starting from vapour adsorption. Special attention is paid to chain
molecules (e.g. n-alkanes) at solid interfaces.
In Chapter 2 the thermodynamics of wetting and adsorption and their relations are
discussed. Spreading tensions of individual liquids are derived from vapour adsorption
isotherms using the Gibbs equation. For complete wetting this is straightforward.
However, in those cases where the liquid does not wet the solid completely, the
isotherm has an unstable branch which is experimentally inaccessible. This implies that
the spreading tension has to be obtained in an alternative way, namely by combining
the solid-liquid-vapour contact angle with the (measurable) stable part of the vapour
adsorption isotherm. The wetting characteristics of a solid with respect to a pair of
immiscible liquids L\ and L2 c a n be deduced from the difference between the spreading
tensions aL,s'v'' and aL>s,v'> of the individual liquids.
In Chapter 3 thermodynamic relations between the surface charge of a solid and its
wetting and adhesion behaviour will be derived starting from the Gibbs equation. The

CHAPTER 1
relations are used to investigate the water wettability of silica as a function of its surface
charge as measured by Potentiometrie titrations.
Chapter 4 describes the gravimetric determination of (alkane and water) vapour
adsorption isotherms on two substrates: powdered (pyrogenic) silica (Aerosil-OX50)
and the same adsorbent, after modification by (complete) methylation. The formation of
thin adsorbed layers onto both substrates is investigated for different (linear and cyclic)
alkanes. The measured isotherms are compared with data available in the literature and
transformed into surface pressure and disjoining pressure isotherms. The surface
pressure isotherms allow us to derive the work of adhesion and to obtain information on
the components of the solid surface tension. The disjoining pressure isotherms are
interpreted in terms of interaction forces acting in adsorbed (thin) films.
In Chapter 5 the self-consistent-field (SCF) theory of Scheutjens and Fleer [17, 18] is
extended to serve as a lattice fluid theory for the description of aliphatic chains. The
liquid and vapour phases of chain molecules (e.g., n-alkanes) are described as a binary
mixure of chains and free volume entities, the vacancies. The input parameters (i.e.,
chain lengths and interactions) required are derived from the experimental temperature
dependence of the n-alkane vapour pressures. With these parameters, the critical
temperatures, liquid and vapour densities, heats of vaporization, LV interfacial tensions
of n-alkanes of different chain lengths are inferred. Also the temperature dependency of
the heat of vaporization, the interfacial structure and interfacial tensions are
investigated.
In Chapter 6 the SCF theory is used to describe alkane vapour adsorption on
homogeneous solids. The influence of differences in the adsorption energies of chain
end and middle segments is investigated, together with the effect of chain flexibility.
The contact angles of chain molecular liquids on rigid and "soft" solids (i.e., with end-
attached chains) are scrutinized. On rigid solids, the contact angles are studied as a
function of the chain length of the liquid molecules so that the critical surface tension
(for wetting) of the solid can be determined. The calculations are performed at different
temperatures. Moreover, the adsorption isotherms of an octamer on a rigid solid are
calculated at different temperatures. Also, the temperature dependence of the interfacial
tension of the rigid solid-octameric fluid interface (with the pristine solid as a reference
state) is investigated and used to infer the contact angle as a function of temperature.
Furthermore, the effect of alkylation (i.e, surface grafting with terminally attached
chains) on the adsorption isotherm and contact angles of an octameric liquid on solids

GENERAL INTRODUCTION
with grafted chains is investigated as a function of the grafting density and the grafted
chain length.
The results calculated in Chapters 5 and 6 are compared with experimental data. In
general a good qualitative and in some cases even a good quantitative agreement is
found. The advantage of the SCF theory is that macroscopic and molecular aspects of
wetting are described simultaneously while taking into account both the structure and
the interactions of the substrate and the fluid molecules.

CHAPTER 1
References
[I] Berg, J. C. (Ed.), "Wettability"; Marcel Dekker Inc.: New York, 1993. [2] Schrader, M. E., Loeb, G. I. (Eds.), "Modern Approaches to Wettability Theory and
Applications"; Plenum Press: New York, 1992. [3] Hough, D. B. and White, L. R., Adv. Colloid Interface Sei., 14,1980, p. 3-41. [4] Derjaguin, B. V., Churaev, N. V. and Muller, V. M., in "Surface Forces"; Consultants
Bureau: New York, 1987. [5] Israelachvili, J. N., in "Intermolecular & Surface Forces"; Acedemic Press: London,
1992. [6] Mittal, L. K. (Ed.), "Contact Angle, Wettability and Adhesion"; VSP BV.: Utrecht, 1993. [7] Zisman, W. A., in "Contact Angle, Wettability and Adhesion" Gould, R. F. (Ed.);
American Chemical Society: Washington, D. C, 1964: p. 1-51. [8] Fowkes, F. M., in "Contact Angle Wettability and Adhesion" Gould, R. F. (Ed.);
American Chemical Society: Washington, D. C, 1964: p. 99-111. [9] Young, T., Phil. Trans. Roy. Soc. London, 95,1805, p. 65. [10] Young, D. M. and Crowell, A. D., in "Physical Adsorption of Gases"; Butterworths:
London, 1962. [II] Guggenheim, E. A., in "Mixtures"; Clarendon: Oxford, 1952. [12] Flory, P. J., in "Principles of Polymer Chemistry"; Cornell University Press: Ithaca (N.
Y.), 1953. [13] Fleer, G. J., Cohen Stuart, M. A., Scheutjens, J. M. H. M., Cosgrove, T. and Vincent, B.,
in "Polymers at Interfaces"; Chapman & Hall.: Cambridge, 1993. [14] Leermakers, F. A. M. and Scheutjens, J. M. H. M„ J. Phys. Chem., 89 (5), 1988, p. 3264-
3274. [15] Böhmer, M. R., Koopal, L. K. and Lyklema, J., J. Phys. Chem., 95 (23), 1991, p. 9569-
9578. [16] Böhmer, M. R. and Koopal, L. K., Langmuir, 8(11), 1992, p. 2660-2665. [17] Scheutjens, J. M. H. M. and Fleer, G. J., J. Phys. Chem., 83,1979, p. 1619-1635. [18] Scheutjens, J. M. H. M. and Fleer, G. J., J. Phys. Chem., 84,1980, p. 178-190.
10

Chapter 2
Thermodynamics of Wetting and Vapour Adsorption*
Abstract
Starting from the Gibbs adsorption equation the thermodynamic relations between vapour adsorption and wetting are derived. The surface pressure of a film formed by vapour adsorption on a solid surface is calculated from the vapour adsorption isotherm and related to the spreading tension and contact angle in the solid-liquid-vapour system. The surface pressure at the saturated vapour pressure determines, together with the interfacial tension of the liquid, the difference between the interfacial tension of a (clean) solid and a solid-liquid interface. The individual surface pressure values of two different immiscible liquids allow to predict the wettability in a solid-liquid-liquid system. The procedure is illustrated for a silica-water-octane system.
2.1. Introduction
Wettability is important for many practical processes such as dying, painting, coating and
lubrication. In oil recovery, the wettability of reservoir rocks by aqueous drive fluids
determines the effectiveness of displacement and the amount of oil recovered. Because of
its many applications wettability is a widely studied subject [1]. In general, two cases of
wetting can be distinguished: partial wetting and complete wetting. Partial wetting refers
to the situation where at equilibrium a drop of liquid (with a finite contact angle) is
formed on the solid. In the case of complete wetting the solid is fully covered by a
macroscopically thick liquid layer and the value of the contact angle equals zero.
Often, wettability is investigated without recourse to adsorption studies. However,
adsorption and wettability are strongly related. The formation of (wetting) layers or a
films on solid surfaces is the result of an adsorption process. Adsorption decreases the
surface tension of the solid by an amount that is denoted the solid-vapour surface
pressure n?v [2]. The value of the surface pressure can be calculated from the adsorption
isotherm. It is also possible to obtain the surface pressure from the disjoining pressure
isotherm [3].
Surface pressure values at the saturated vapour pressure are useful to study either the
spreading tension or the contact angle in a vapour-liquid-solid system. Starting from a
model for vapour adsorption isotherms, Adamson has discussed the relation between the
isotherm and the spreading tension (complete wetting) or the contact angle (partial
* This chapter has been published in Colloids and Surfaces A: Schlangen, L. J. M., Koopal, L. K., Cohen Stuart, M. A. and Lyklema, J., Colloids Surfaces A, 1994, 89, p. 157-167.
11

CHAPTER 2
wetting) in liquid-vapour-solid systems [4-6]. In combination with contact angle studies,
surface pressures can be used to investigate the composition of a film that is in
equilibrium with a droplet [7]. Some investigators have used the surface pressure to
calculate the Lifshits-van der Waals contribution to the interfacial tension of the solid yfw
[7, 8].
In the present work the thermodynamic relations derived by Adamson are extended in
order to investigate the competitive wetting of a solid in presence of two different liquids.
The surface pressures calculated from the adsorption of the vapours of both individual
liquids will be used for this goal. As the thermodynamic relations are generally valid the
approach covers wetting on both flat and powdered solids. Wetting on flat surfaces can
be studied directly as contact angles can be easily measured. However, on powders,
wettability studies are more complicated [9] and the analysis of vapour isotherms on
powders provides at least a good complementary tool to investigate wetting. To illustrate
the procedure we will briefly investigate a silica-water-octane system which can be
considered a primitive model of an oil reservoir.
2.2. Thermodynamic relations between adsorption and wetting
Adsorption occurring on a solid affects the interfacial Gibbs energy to an extent
depending on the nature of the adsorbing molecules and the adsorbed amount. The
change in interfacial tension upon adsorption (the surface pressure) can be both positive
or negative depending on the occurrence of positive or negative adsorption. For vapour
adsorption on a solid the surface pressure n SV(T) has a positive value defined as the
difference between the interfacial tension of the clean (i.e., in vacuum) solid surface S
denoted by ys and the interfacial tension ysv(T) of the same surface in contact with
adsorbing vapour V of liquid L with chemical potential ß and adsorbed amount r :
7rsv(r) = ys-Ysv(D (1)
The excess Gibbs energy Ga of a flat interface of area A at temperature T (according to
the Gibbs convention the volume of the interface equals zero) can be expressed as
Gff = l M , « r (2)
where ß{ is the chemical potential of component i and nf is the molar excess amount of i
(with respect to the Gibbs dividing plane) present at the interface. According to the first
and second law of thermodynamics, the differential of the excess Gibbs energy depends
on the interfacial excess of entropy Sa, the interfacial excess of pressure (i.e., the
interfacial tension y) and the excess adsorbed amount nf and reads
dGCT = - Sa dT - A dy + Z M, dnf (3)
12

THERMODYNAMICS OF ADSORPTION AND WETTING
Since Eqs. (2) and (3) are simultaneously valid it follows that
Ay = - % AT - Zr{ Aßt (4)
where S° is the interfacial excess entropy of the surface per unit area and i") is the excess
adsorbed amount of component i per unit surface, nf /A. Equation (4) is the Gibbs
adsorption equation (for a more detailed discussion see ref. [10]).
In the case of vapour adsorption on insoluble, non-volatile solids, the Gibbs dividing
plane is fixed so that the surface excess of solid with respect to the dividing plane equals
zero. This means that for pure vapour adsorbing on a solid at constant temperature the
Gibbs adsorption equation only contains the Td/i term of the vapour. The surface
pressure can now be obtained directly by integration of Eq. (4). At constant temperature
we have
r nsv(D= fr(fi)dfi (5)
If the vapour behaves ideally d/i = RT d In p/p0 with p/p0 is the relative vapour pressure,
so that we may write
r 7isv(T) = RT J r à In p/p0 (6)
r=o
According to Eq. (6) the surface pressure at a certain vapour pressure equals the area
under the adsorption isotherm plotted as T versus lnp/p0.
Near saturation (p/p0 = 1) adsorption isotherms for partial and complete wetting are
differently shaped. In the partial wetting case the amount adsorbed at saturation can be
finite and a stable thin film (with a thickness of one or a few monolayers) can be formed.
In the complete wetting case the adsorption goes to infinity at saturation and a
macroscopically thick liquid layer is formed on the solid. The high pressure regions of
some adsorption isotherms corresponding to the different kinds of wetting behaviour are
sketched in Fig. 1. The most simple case is shown in Fig. la, curve 1: the isotherm goes
smoothly to infinity at the saturation condition, fi*. Curve 2 is a somewhat more
complicated isotherm: there is a step in the surface concentration when going to
saturation. This step occurs at a value of the chemical potential where the areas enclosed
by the dashed isotherm and the normal at fiJump are equal. Both curves eventually result
in complete wetting and a macroscopically thick layer of liquid L. The adsorbed amount
13

CHAPTER 2
uJ»mp „ ,
Figure 1. Different types of vapour adsorption isotherms near the saturated
vapour pressure (at fl*). The curves in (a) correspond to complete wetting.
Isotherm 1 continuously increases and reaches r „ at the saturation pressure.
Isotherm 2 shows a step at \l 'umi' and approaches ƒ"„ at saturation. In the case
of complete wetting, the area S2 bounded between isotherm 2 and the pfi axis,
exceeds the area St. The curves in (b) represent partial wetting. At saturation,
the isotherm has a stable state with a finite adsorbed amount (Tt). The isotherm
continues in the supersaturation region and finally approaches r„. At
saturation, bulk liquid (TJ can be in equilibrium with a thin film (Tf) through
the curved interface of a droplet with a finite contact angle. In general partial
wetting occurs when the area S, of an isotherm exceeds the area denoted S2.
14

THERMODYNAMICS OF ADSORPTION AND WETTING
in this situation is r„, where °° is used to denote that the film is macroscopically thick
and has properties of bulk liquid. The surface pressure at saturation T^v(r„) equals
therefore
itsv(rj=ys-(ySL+rL) (7)
In the case of partial wetting (see Fig. lb, curves 1 and 2) the vapour adsorption can be
finite (denoted rt) at saturation. The stable states of the adsorbed film correspond to
those parts of the isotherm for which d/7d/x > 0. After passing supersaturation (and the
meta- and unstable regions) some vapour may condense on the solid surface. In a closed
system the adsorbed film at the saturation pressure can therefore be in equilibrium with a
liquid droplet characterized by its contact angle 0 (between 0° and 180°). This equilibrium
is given by the Young-Dupré relation
7sv(rt)= ysl+yL cosd (8)
where yL is the surface tension of the liquid (or: the liquid-vapour interfacial tension).
This equation is valid for homogeneous, smooth surfaces that are chemically inert and
insoluble in the liquids they contact. If this is not the case the equation still holds but the
parameters of Eq. (8) vary with the location on the surface and with time. By combining
Eqs. (1) and (8) we obtain for the surface pressure (7t5V( rf)) due to the thin adsorbed
film formed at saturation:
nsv(rt) = ys - (ySL + yL cosO) (9)
If the vapour pressure is further increased above the saturated vapour pressure (i.e. the
vapour is supersaturated) eventually a phase transition will occur and the vapour
condenses leading to the formation of a macroscopic liquid layer on the surface. The
surface pressure (7TSV(T„J) of this layer is given by Eq. (7). According to Eqs. (7) and
(9), the difference in surface pressure between the film and the condensed layer, that may
coexist at saturation, equals
nSV(r„) - 7tsv(rt) = y'(cosd - 1) (10)
Formally this difference can also be written as
r_ rt r_ nsv(r„) - Ksv(r:l:) = / rdfi - J rdß = ƒ raß ( i l ) .sv,
l t ) = r=o r=o
Hence in the case of partial wetting it follows
yL(cos9- 1) = J r(n)d(i (12)
15

CHAPTER 2
Provided the measured isotherm can be extended to the supersaturation region, Eq. (12)
allows the calculation of the contact angle from the difference in areas enclosed by the
saturation axis (/J*) and the isotherm. For curve 1 in Fig. lb the r.h.s of Eq. (12) equals
S2- S, . This difference is slightly negative and 0° < 6 < 90°. Curve 2 shows a more
extreme situation, the area St is large and S2 is negligible so that -2 /• < S2- Sj < - /•.
In this case cos 0becomes negative and 90° <0< 180°.
Since a range of unstable film thicknesses has to be passed when going from the film
formed at saturation to the thick condensed layer, the exact behaviour of this part of the
adsorption isotherm is hard to determine experimentally. One way to solve this problem
is to use an adsorption model which is fitted to the measured isotherm and also predicts
the adsorbed amounts after passing saturation. Adamson and co workers [5, 6] fitted an
adsorption model based on a potential theory adsorption function (a four-constant
equation) to experimentally measured isotherms and contact angles and obtained fairly
reasonable values for the parameters describing the interactions in his model. However,
by also using the measured contact angles, predicting a contact angle with the obtained
equation is of course trivial. In the discussion we will return to the problems related to the
prediction of the course of the partial wetting isotherm around the saturation pressure.
Before continuing, it is instructive to summarise the various adsorption and wetting
conditions in an energy diagram. Figure 2 shows such a diagram for the complete wetting
case. The initial situation is the bare surface, with interfacial tension ys. In the beginning
of the adsorption process, at low relative pressures, an adsorbed film will be formed on
the surface (with interfacial tension ysv(T)) and the surface pressure changes with
adsorption according to Eq. (6). As the saturated vapour pressure is approached a
macroscopically thick liquid layer is formed and the surface pressure levels off to the
value given by Eq. (7) (the interfacial tension of the solid with this thick liquid layer
equals ySL + yL). The lowest energy state, with interfacial tension ySL- is obtained upon
immersion. The corresponding diagram for the partial wetting case is shown in Fig. 3.
For low vapour pressures the situation is comparable to the one in Fig. 2. At saturation a
thin film (finite adsorbed amount) can be in equilibrium with a drop of liquid with a
curved interface. The decrease in interfacial tension due to the adsorbed film is given by
7tsv(rt). After supersaturation r„ is reached and the interfacial tension in the system
equals ySL + yL. For partial wetting this state has a higher interfacial tension level than
ysv(rt) (see Eq. (8)). The interfacial tension upon immersion, ySL, is lower than
ysv(rt) if the contact angle is smaller than 90°, whereas ySL is larger than ysv (r:f) for
0>9O°.
16

THERMODYNAMICS OF ADSORPTION AND WETTING
clean solid ( S) w. m
thin adsorbed film or submonolayer
(T)
macroscopically thick liquid layer ( r „ ) of L on S
7tsv(D= j r ( n )dn
YSV(D 1 H V«,)= J rdu
SL L Y + Y
immersion of S
in liquid L
Figure 2. Schematic representation of the values of the interfacial tensions of
the solid (S), liquid (L) and vapour (V) interfaces involved in the adsorption
and wetting process in the case of complete wetting. Vapour (of chemical
potential ß) adsorbing on the solid reduces the interfacial tension. Eventually,
at saturation (at /i*J, this results in a thick liquid layer F „ with energy state
ySL + yL. Full immersion of S in L leads to a still lower Gibbs energy state y .
17

CHAPTER 2
clean solid (S)
macroscopically thick liquid layer (r„0 of L on S
droplet in coexistance with a thin adsorbed film
w, m
Y S L + Y L
ysv(r+)
immersion of S
in liquid L
T~\ YL (cose - 1) = ƒ f ( n )du
T YL cos e
Figure 3. Schematic representation of the values of the interfacial tensions of
the solid (S), liquid (L) and vapour (V) interfaces involved in the adsorption
and wetting process in the case of partial wetting. At saturation, the adsorption
at the solid is finite (Tf) and the SV interfacial tension equals y (Ft). The
adsorbed layer formed at saturation (F^) can be in equilibrium with a drop of
contact angle 6. After passing supersaturation a macroscopic layer (T^) is
formed with energy level y +y . The difference between y (rf) and
ySL + yL is related to the contact angle. The contact angle also determines the
difference between ysv(Tt) and ySL (the energy state after immersion). The
contact angle for the scheme lies between 0 and 90°. If the contact angle lies
between 90 and 180° cos 6 will be negative and the scheme has to be modified
so that ysv(rt) < ySL < (ySL + yL).
18

THERMODYNAMICS OF ADSORPTION AND WETTING
Spreading tension and wettability
It has been shown that, in principle, the surface pressure and the contact angle in a solid-
liquid-vapour system can be obtained from the adsorption isotherm. When complete
wetting occurs the surface pressure at the saturated vapour pressure equals the spreading
tension. The spreading tension is a parameter used to characterise the wettability of a
surface. It is defined as the difference in interfacial tensions of the initial and final state of
the wetting process.
Consider a surface S originally covered by fluid 1 that is brought into contact with
fluid 2, fluids 1 and 2 are immiscible. To describe the displacement of 1 by 2 the
spreading tension <72S<" in such a system is defined by
a2SWSYS,_(Y,2+yS2) ( 1 3 )
Spreading of 2 on 5 occurs if <j2S(l> > 0. Rewriting Eq. (13) as
—2S(I) „ S2 „SI „,12 , , , -x
O = K - K -J (14)
shows that the spreading tension is related to the interfacial pressures KS' = ys - ysl
and KS2 = ys - ys2. Alternatively, we can also define the spreading tension als<2> for
the reverse situation of a surface S initially covered by fluid 2, and brought into contact
with fluid l. This quantity is related to a2S<1> by
G,S(2)+G2S(n=-2y'2 (15)
The wetting possibilities of a two fluid-solid system can be expressed in terms of the
spreading tension. The following cases may be distinguished:
a) When o2S(l) > 0 (or o's(2) < -2y'2) fluid 2 will tend to displace 1 from the
solid surface, eventually 2 will totally cover (or wet in case of a liquid) the
solid.
b) When als<2> > 0 (or a2S<" < -2yn) fluid 1 will tend to completely cover the
solid surface, under displacement of 2.
c) Partial wetting will occur in the intermediate cases, i.e. when the spreading
tension lies between ~2y12 and 0. The contact angle 6 is given by the Young-
Dupré equation (Eq. (8)).
The conditions for the different wetting situations are given schematically in Table 1.
Consider 2 to be a liquid and 1 the vapour of the liquid.
19

CHAPTER 2
Table 1. Spreading tensions and the corresponding wetting behaviour. Two spreading tensions are given, the spreading tension a of a solid S originally covered by phase I and brought into contact with phase 2 and the spreading tension O of solid S originally contacting 2 brought into contact with 1.
Wetting behaviour Spreading tension
a"<» = /' _(Y" + r") a15'2' = y"-(r" + r")
Complete wetting:
2 displaces 1 from the surface
1 displaces 2 from the surface
Partial wetting:
a2S'">0
a2S("<-2y'2
-2rl2<a2S"><0
als,2'<-2r'2
om2> > 0
-2yl2<ow' < 0
formation of a droplet of 1 cos öl = (Y" " / ' VY"
formation of a droplet of 2 cos e2 = (f ~ Y" UY"
Liquid-liquid displacement
The wetting behaviour and the occurrence of displacement on a solid contacting two
immiscible liquids can be studied analogously since the same relations are valid if phase 1
is another liquid instead of a vapour. From the interfacial tensions of the solid-liquid and
liquid-vapour interfaces involved in the wetting process, the wettability or displacement
in a liquid-liquid-solid system can be evaluated using the expression for the spreading
tension (Eq. (13)).
For pure vapour of different liquids adsorbing on a given solid, Eqs. (7) or (9) can be
used to calculate nsv for different individual vapours. Once the KSV values are known
the interfacial pressure KSL of the liquid on the solid can be found. In the case of
complete wetting, Eq. (7) applies and KSV is given by
KSL = ys - YSL = KSV(rj + yL (16)
In the case of partial wetting, Eq. (9) holds and
nSL =ys-ySL =KSV(rt) + yL cosd (17)
This means that the nSL values for different liquids can be obtained from the surface
pressures that follow from the adsorption isotherms.
20

THERMODYNAMICS OF ADSORPTION AND WETTING
For a two-liquid-solid system the spreading tension can be evaluated using the individual
nsv values for the different liquids. If each of the individual liquids 1 and 2 completely
wets the surface, the spreading tension o2S(l> of the liquid-liquid pair can be calculated
by combining Eqs. (14) and (16) to
„"<'> = y*-y<- y» + „^(rj - XSV<(rj (18)
where KSVi (T„ ) is the surface pressure at saturation for adsorption of pure fluid i on 5.
The values of y', y2 and y'2 are easily measurable interfacial tensions of the pure
liquids 1 and 2 and the 12 interface. If one of the individual liquid phases (say 2) partially
wets the surface we have for the liquid-liquid pair
o2S«> = y2 cos62 - y' - y'2 + Ksv' (Tt2) - KSV> (r„) (19)
92 being the contact angle of a drop of 2 on the solid S in equilibrium with its vapour. If
we have a situation that, individually, both liquids partially wet the surface we can
calculate the spreading tension according to
a2S(i> = y2 cos0^ _ yi cosdi _ yn + nM2(rt2) _ Ksv,(rtl) (20)
In principle, the surface pressures KSV' and 7TSVz and the contact angles 0, and 02 can be
determined from the individual vapour adsorption isotherms using Eqs. (6), (10) and
(12).
Based on Eqs. (18), (19) and (20) the wetting state of a two liquid-solid system can be
evaluated. As explained above and summarised in Table 1, three different cases can be
distinguished, depending on the value of a2S<l>: (i) 2 displaces 1 from the surface for
a2Sil> > 0 , (ii) 1 stays on the surface if a2S<l> < -2 ƒ2 or (iii) partial wetting occurs in
the intermediate case.
Work of different types of wetting
If complete wetting occurs for a liquid on a solid, different wetting processes can be
distinguished, each with its own amount of work. The work of spreading Ws, defined as
the work performed when a clean solid is brought into contact with a liquid (in
equilibrium with its vapour) which spreads on the surface, equals
Ws = YS-(YSL+YL) = xSV(rj (21)
Immersion of the solid in liquid corresponds to the work of immersional wetting W,
defined as
W, = ys - ySL = yL+ Ksv(rj (22)
21

CHAPTER 2
Y ^ -t. y
,SL ,
a a
wA ws
y Y SL x y L
w,
Figure 3. The work of adhesional wetting WA, immersional wetting W;
and spreading wetting Ws is expressed schematically as a function of the differences in interfacial tensions of the SV, LV and SL interfaces.
When a solid and a liquid interface are brought into contact we speak of adhesional
wetting. The work of adhesional wetting WA or the work of adhesion is defined
according to
wA=rs + yL-rSL-- 2yL + nsv(rj (23)
The relations between Ws, Wt and WA are shown schematically in Fig. 4, the sum of the
interfacial tensions of the system decreases in the downward direction of the figure. Eqs.
(21)-(23) show that the work performed during a wetting process can be obtained from
the interfacial tension of the liquid and iév(rj as determined from the vapour adsorption
isotherm.
2.3. Discussion
It has been shown that, in principle, quantities such as cos 0, nßL, <J2S<I> and the various
works of wetting can be obtained from the vapour adsorption isotherms of the liquids
under consideration. These quantities characterize the wetting behavour of a single liquid
on a solid. Furthermore, from the wetting behaviour of individual liquids the
displacement of a liquid from a solid by another liquid (immiscible with the first) can be
22

THERMODYNAMICS OF ADSORPTION AND WETTING
predicted. The approach followed is based on equilibrium thermodynamics, it does not
provide information on the kinetics of the wetting processes. For the interpretation of the
thermodynamically found contact angle we refer to Good [11].
Wetting of silica from vapour adsorption data
To illustrate the method described, we will anticipate the gravimetrical octane and water
vapour adsorption isotherms measured at 17°C on powdered silica Aerosil OX-50 (see
Chapter 4). The silica/octane/water system is chosen as a primitive model to investigate
the wettability in an oil reservoir (i.e., rock containing brine and crude oil). The
adsorption and surface pressure isotherms, calculated according to Eq. (6) from the area
under the adsorption isotherms, are shown in Figs. 2 and 6a of Chapter 4, respectively.
The n-octane (0) and water (W) adsorption isotherms on silica Aerosil OX-50 (Si) both
rise sharply as saturation is approached. Asumming complete wetting of both water and
n-octane, the KSV values near saturation (see Table 1 in chapter 4) and the interfacial
tensions of the pure liquids are used to calculate the KSL values for the silica-octane (SiO)
and the silica-water (SiW) interface according to Eq. (16). The KSL values for the SiO and
SiW interface are 39 and 159 mJ/m2, respectively. Since water and octane hardly mix,
both the KSL values and the interfacial tensions of the silica-pure water and silica-pure
octane interface will be hardly affected by the presence of the other liquid.
The value of the spreading tension aws,(0> in a solid/water/octane system calculated
from Eq. (18) equals 69 mJ/m2. Hence on the basis of Gibbs energy considerations it is
concluded that the silica surface will be preferentially wetted by water. The calculated
values of the various works of wetting, Ws, W, and WA, for water on silica are 86, 159
and 232 mJ/m2 respectively, those for octane on silica 17, 39 and 60 mJ/m2. Also here
we see that the water silica values are much larger than the octane-silica values indicating
the preference of the silica surface for water. The high values of the water-silica system
are due to hydrogen bond formation between water and the OH groups of the silica
surface.
In practice with oil recovery the situation is considerably less simple than in the
silica/water/octane system. In a typical oil reservoir the wettability on the pore scale will
be affected by the heterogeneity of the reservoir rock. There may be some areas where the
rock is water wet and some where the rock is oil wet. In such a reservoir negative values
of am<0' occur locally. The displacement of oil from these regions by waterflooding will
be enhanced by the addition of a surfactant that mainly reduces the interfacial tensions of
the water-oil and solid-water interface (whereas the surfactant should have minor effects
on the oil-solid interfacial tension).
23

CHAPTER 2
Another complication encountered in practice is that brine and crude oils usually
contain various electrolytes and natural surface active components (f.i., asphaltenes),
respectively. Adsorption of the surface active components and/or salts on the reservoir
minerals influences the wettability of the rock material [12]. In general this adsorption can
be taken into account in the Gibbs adsorption equation (see also Chapter 3). Moreover,
impurities present in the liquids and dissolution of the solid in the contacting liquid(s) can
in principle, all be taken into account as extra components in the Gibbs equations for the
different interfaces involved. In practice this is not an easy task, but qualitative
predictions are still possible.
Partial wetting adsorption isotherms
In the treatment we discussed it has been assumed that the total vapour adsorption
isotherm is known. In the case of complete wetting, the whole isotherm can be measured.
In the case of partial wetting, the isotherm crosses the saturated vapour pressure axis, and
knowledge of the isotherm around p/p0 = 1 (including the meta-and unstable part) is not
obvious. In practice it may sometimes be more easy to measure the contact angle directly
instead of predicting its value from the vapour adsorption isotherm. When combining this
the contact angle with nsv(rt), liquid-liquid displacement can be predicted according to
Eqs. (19) and (20). Due to supersaturation effects, it may sometimes be necessary to
estimate the surface pressure KSV(Tt) by extrapolation of the isotherm close to the
saturated vapour pressure. If the value of the contact angle is not known one can try to
model the course of the isotherm in the meta - and unstable region. One way to do this is
to use the potential theory for adsorption [4]. The meta- and unstable regions of the
adsorption isotherm can also be modelled using the concept of disjoining pressure,which
is defined as the additional pressure in a thin film in thermodynamic equilibrium. For an
adsorbed film of a volatile liquid the disjoining pressure is proportional to In p/p0 and
knowledge of the disjoining pressure as a function of film thickness implies knowledge
of the adsorption isotherm. The disjoining pressure and its various contributions due to
electrostatic, dispersive and structural interaction forces are well studied [13-15]. A third
alternative way to obtain the required information is the use of models for the work of
adhesion [16]. Once WA and KSV (rt) are known the contact angle can be calculated and
displacement can be predicted. In the models for WA always some estimation of ys is
required. Hence, this method is only suited for well studied solids.
In general, prediction of the adsorption isotherm on the basis of a sophisticated model
seems the most elegant way to asses the meta- and unstable region in the partial wetting
adsorption isotherm. Moreover, this renders wetting (and displacement) studies feasible.
24

THERMODYNAMICS OF ADSORPTION AND WETTING
References
[I] Gennes, P. G., Rev. Mod. Phys., 57 (3), 1985, p. 827-863. [2] Bangham, D. H. and Razouk, R. I., Trans. Faraday Soc, 33 , 1937, p. 1459-1472. [3] Derjaguin, B. V., Churaev, N. V. and Muller, V. M., in "Surface Forces"; Consultant
Bureau: New York, 1987: p. 79. [4] Adamson, A. W., J. Colloid Interface Sei, 27 (2), 1968, p. 180-187. [5] Adamson, A. W., J. Colloid Interface Sei, 44 (2), 1973, p. 273-281. [6] Tadros, M. E., Hu, P. and Adamson, A. W., J. Colloid Interface Sei, 49 (2), 1974, p.
184-195. [7] Janczuk, B., Chibowski, E. and Bialopiotrowicz, T., J. Colloid Interface Sci„ 102 (2),
1984, p. 533-538. [8] Fowkes, F. M., Ind. Eng. Chem., 12, 1964, p. 40. [9] Dunstan, D. and White, L. R., J. Colloid Interface Sei, 111 (1), 1986, p. 60-64. [10] Everett, D. H., Pure Appl. Chem., 53, 1981, p. 2181-2198. [II] Good, R. J., in "Surface and Colloid Science, Vol. 11", Good, R. J. and Stomberg, R.
R. (Eds.), Plenum Press: New York, 1979: p. 1-29. [12] Salathiel, R. A., J. Pet. Technoi, 25, 1973, p. 1216. [13] Derjaguin, B. V., Churaev, N. V. and Muller, V. M., in "Surface Froces"; Consultant
Bureau: New York, 1987. [14] Churaev, N. V. and Derjaguin, B. V., J. Colloid Interface Sei, 103 (2), 1985, p. 542-
553. [15] Churaev, N. V. and Zorin, Z. M., Adv. Colloid Interface Sei, 40 , 1992, p. 109-146. [16] Mittal, K. L. (Ed.), "Contact Angle, Wettability and Adhesion"; VSP: Utrecht, 1993.
25

Chapter 3
Wetting and Adhesion on Charged Solids: interfacial thermodynamics and surface charge
Abstract
Starting from the Gibbs adsorption equation a thermodynamic framework is developed which describes the surface charge (and electrolyte concentration) dependence of the water contact angle on surfaces exposing ionizable groups. According to this framework, the solid-(aqueous)liquid-vapour contact angle in the case of partial wetting is maximal at the point of zero charge of the solid. The contact angle (and the work of adhesion) decrease with increasing surface charge. In the case of complete wetting the presence of charge on a surface increases its tendency to be water wetted. The derived equations are used to study the wetting of silica, a primitive model for sandstone. The surface charge density of silica Aerosil OX-50 is determined from Potentiometrie titrations at a series of indifferent electrolyte (KCl) concentrations ranging from 0.01 M to IM. The silica surface charge becomes increasingly negative with increasing ionic strength and/or increasing pH. At the point of zero charge silica is already completely wetted by water. Charging of the surface results in a still better water wettability although this cannot be observed experimentally. At pH-9 and 1 M KCl the silica-water interfacial tension is 22 mJ/mr lower than that of the uncharged silica-water interface (pH-3).
3.1. Introduction
The adhesion and wetting behaviour of solids depends on their surface properties such
as roughness, charge and heterogeneity. In many fundamental and technological
situations, such as the wetting of oil-reservoir rocks, mineral flotation and contact angle
studies on functionalized (polymeric) surfaces, charged surfaces are dealt with. In order
to understand and predict the wettability and adhesion of charged substrates a basic
understanding of the influence of electrostatics on the interfacial tension of the solid-
liquid interface is required.
When a charged solid contacts a liquid in which ions are present, ions will
accumulate at or near the surface in order to neutralize the surface charge. The
combination of the surface charge and its countercharge in solution is called the
electrical double layer. The electrical double layer has a large influence on the
macroscopic (solid-liquid-vapour) contact angle [1,2]. On functionalized surfaces and
monolayers the water contact angle depends on the hydrophilicity of the functionalizing
group [3]. So-called contact angle titrations show that the water wettability of
functionalized surfaces improves for pH values at which (more) interfacial groups
27

CHAPTER 3
become ionized [4, 5]. On alkanethiol-monolayers bearing carboxylic groups the water
wettability at low pH values decreases with increasing pH, upon a further rise in pH the
water contact angle reaches a maximum after which it decreases with a further increase
in pH [6], This behaviour probably arises from conformational changes in the
carboxylate groups upon surface ionization.
In the present paper we will discuss wetting on charged interfaces from a general
thermodynamic point of view, based on the Gibbs adsorption equation. The approach
will be outlined for silica which is often used as a model mineral substrate because of
its optical properties. Moreover, it can be readily rendered more hydrophobic by
alkylation [7]. The silica surface charge as a function of pH and salt concentration is
determined by means of Potentiometrie titrations and correlated to the water wettability
of silica. As the approach outlined is based on thermodynamics it is universally valid
and therefore suited for application to other substrates.
3.2. Surface charge and wetting and adhesion
The surface charge
Solids in aqueous electrolyte solutions may build up a surface charge due to adsorption
of charge-determining electrolyte. When the concentration of indifferent electrolyte is
much larger than the concentration of charge determining electrolyte, the surface excess
of charge-determining ions equals the surface charge. Consider a solid for which H+
and OH~ are the charge determining ions. The charge density asnL of the solid-liquid
interface (SL) then follows from
<C(pH) = F(r*a-r%M) (i)
where F is the Faraday constant and r^a and r^L0H are the adsorption densities (per
m2 SL interface) of the hydrogen and hydroxyl ions and their counter ions, respectively.
As r^cl and r^LOH depend on the proton concentration the surface charge is pH
dependent. Amphoteric materials have a certain pH at which the surface charge equals
zero. This pH is called the point of zero charge (p.z.c). In the absence of specific
adsorption [8] and patchwise surface heterogeneity [9] the p.z.c. can be determined from
the common intersection point in curves of the surface charge vs. pH at different ionic
strengths. The common intersection point occurs because an increase in indifferent
electrolyte concentration will increase the screening of the surface charge on the left
and right side of the p.z.c. resulting in an increase of the (negative or positive) surface
charge, at the p.z.c. there is nothing to screen and electrolyte has no effect [10].
28

WETTING AND ADHESION ON CHARGED SOLIDS
Wetting and adhesion
When a macroscopic amount of liquid comes into contact with a solid a number of
situations may arise. Complete wetting réfères to the situation where the liquid spreads
maximally over the solid. When enough liquid is present the solid will eventually be
totally covered with a macroscopically thick liquid layer. The situation where at
equilibrium a liquid droplet, with a finite contact angle, is formed at the interface is
referred to as partial wetting. The wettability of an interface can be characterized by the
spreading tension. For a solid S, originally contacting vapour V, brought into contact
with liquid L the spreading tension <7"'v' is defined as
aU,V, 3 ySV _ {JLV + ySL) ( 2 )
where y is the interfacial tension of the interface denoted by the superscripts. Liquid L
completely wets the solid if <7U,V' > 0. For -2yLV < a1*'"' < 0, partial wetting occurs
[11] with a macroscopic contact angle 0 . According to the Young-Dupré relation, the
contact angle in the solid-liquid-vapour system can be related to the interfacial tensions
in the system
cos O = (Ysv-ySL) / JLV (3)
The work of adhesion W4"'v' of L on S, originally in contact with V, is related to the
interfacial tensions and the contact angle according to
WU*V> = y** + yLV _ ySL = yLV(] + ^ Q ) ( 4 )
Equations (2) - (4) show that the influence of a surface charge on wetting and adhesion
properties follows from the surface charge dependence of the interfacial tensions
involved.
Interfacial tension of charged interfaces
Adsorption of a component ; onto an interface changes the interfacial tension according
to Gibbs law. The change depends on the change in chemical potential d/i, upon
adsorption and the interfacial excess amount of (', 7"]5L, with respect to the Gibbs
dividing plane. For a rigid solid (i.e. a solid which does not dissolve or deform) in
contact with a liquid at constant pressure and temperature, the SL interfacial tension will
change upon adsorption of component(s) i from L according to
dfL = - I nSL An. (5)
29

CHAPTER 3
When liquid L is an aqueous electrolyte solution of indifferent electrolyte (KCl) and
charge determining electrolyte (HCl or KOH) Eq. (5) can be written as
dySL = - (rl?c>SL dnKa + r<r*LdtiHCl+ r<K^LdßK0H) (6)
where rfw>SL denotes the relative surface excess (with respect to water) [ 12] of species i
at the SL interface. At sufficiently high concentrations of KCl, addition of HCl or KOH
does not affect the activity of KCl, dßKCl = 0 , and dßK0H ~ dß0H , moreover,
dfiHCl ~ dßH+ = - 2.303 RTdpH . According to the water dissociation equilibrium,
we have dßOH- = - dßH+ and for constant ßKCl » ßHCl, ßtiOH Eq- (6) reduces to
dySL = 2.303 RT (P^ - r'^)dpH = 2.303 RT (<rs„L(pH)/F) dpH (7)
For normal charging behaviour, the solid-liquid interfacial tension is maximal at the
point of zero charge (<7„L = dpH = 0). The interfacial tension of a charged solid-
liquid interface ySL(pH) follows by integration of Eq. (7) from the pH at the point of
zero charge pH0 to the actual pH value of the solution in contact with the solid
pH
fL(pH) - fL(pH°) = 2.303 (RT/F) ƒ o?(pH) dpH (8) pH"
where ySL(pH°) denotes the interfacial tension of the SL interface at the p.z.c
In principle, addition of electrolyte to water affects the (saturated) vapour pressure
and therefore changes the adsorption of water vapour onto the solid. However, at
constant and sufficiently high concentrations of indifferent electrolyte, the addition of
charge determining electrolyte hardly affects the ionic strength and the vapour pressure.
Adsorption of water and electrolyte at the solid-vapour (SV) interface affects the SV
interfacial tension analogously to Eq. (5). If the adsorbed film formed at the saturated
vapour présure is very thin (i.e., below the thickness of the electrical double layer) the
adsorbed water layer has a rather low dielectric constant which prevents adsorption of
charge detemining species (r^cl = r^a = r^0H = 0). In this case, we may put dysv =
0. If thicker adsorbed films are formed at the saturated vapour présure the adsorbed
water layer will be more comparable to bulk water. In this case dysv depends on the
thickness of the adsorbed film. Normally, electrolyte adsorption at the SV interface is
lower than for the SL interface and dysv maximally equals dySL. Therefore, when
changing the pH in a droplet at fixed p, T and salt concentration, we may write for
dysv:
dysv = ƒ dySL = ƒ 2.303 RT (o^(pH)/F) dpH (9)
30

WETTING AND ADHESION ON CHARGED SOLIDS
where ƒ is a proportionality factor depending on the thickness of the SV film formed at
the saturated vapour pressure. For very thin SV films ƒ = 0, for very thick SV films/layers
ƒ approaches unity. Charge determining ions have no particular affinity for the liquid-
vapour interface and at constant (and sufficiently high) indifferent electrolyte
concentration yLV is virtually independent of the pH.
From the surface charge dependence of the interfacial tensions we are able to study the
role of the surface charge in wetting and adhesion. Combining Eqs. (2), (7), (8) and (9)
directly reveals that normally (i.e., for /< 1) the spreading tension cr"'v' in a solid-
liquid-vapour system increases with increasing surface charge density. In other words,
the water wettability of a solid increases with the solid surface charge. By combining
Eqs. (3), (7), (8) and (9) we obtain for the pH dependence of the contact angle
cos 6(pH) - cos d(pH°) = -± -—?—
f 1 »» m
= ^ V 2.303 (RT/F) f of (pH) àpH y pH1'
Normally ƒ < 1, hence, according to Eq. (10), the contact angle has a maximum at the
p.z.c. and decreases with increasing surface charge in either direction.
With the thermodynamic framework presented above, the effect of surface charge on
the work of adhesion can be characterized separately. Combining Eqs. (4), (7), (8) and
(9) yields:
pH
Wflv,(pH) - wr'ipH0) = (f-1) 2.303 (RT/F) f af (pH) àpH (11) pH"
The treatment discussed above is based on thermodynamics, hence, it is also valid
for substrates with charge determining ions other than H+ and OH-. In this case the pH
in the equations presented above has to be replaced by pX, X representing the charge
determining species of the substrate.
3.3. Surface charge and wettability of silica
The nature of the silica surface
The surface properties of silica are primarily determined by the density and
arrangements of the surface silanol (-Si-O-H) groups. These surface silanol groups can
occur isolated or hydrogen bonded to other surface silanols. Isolated silanol groups
31

CHAPTER 3
have no possibility of forming hydrogen bonds with neighbouring surface silanol
groups. Both types of silanols can be identified by their infrared absorption bands [13].
The surface concentration of both types of silanols depends on the methods used for
prepararing and cleaning the silica. Upon thermal dehydroxylation of silica the
hydrogen bonded silanols form siloxane (-Si-O-Si-) groups under evolution of water.
Dehydroxylation of the hydroxyl groups on the silica surface is reversible up to
± 400 °C [14]. When a silica is dehydroxylated well above this temperature (> 850 °C)
the siloxane groups are not rehydrated upon exposure to water vapour. However, in
alkaline solutions, surface Si atoms dissolve rather easily and rehydration of the surface
siloxane groups may occur. The surface siloxane groups are rather hydrophobic; on a
heat dehydroxylated silica water adsorption occurs mainly on the few remaining
isolated silanol groups [14]. A heat treatment reduces the number of surface hydroxyl
groups and increases the silica-water contact angle.
The silica used in this study is Aerosil OX-50, a pyrogenic (or fumed) silica,
prepared from oxidation of a gaseous SiCl4 at high temperature. In general, pyrogenic
silica particles are not porous. They have a high fraction of siloxane bonds and a few
isolated silanol groups at their surfaces that account for their hydrophilicity. The surface
charge density of a silica-water interface originates from the deprotonation of the
silanol groups present at (or under) the silica surface. At ambient pH values a silica
surface is negatively charged. The precise point of zero charge of silica is rather
difficult to obtain from the common intersection point of the surface charge vs. pH
curves at different ionic strengths. The common intersection point is not very distinct;
the point of zero charge (in the acidic region) is approached asymptotically. However,
this also means that the surface charge versus pH curves are rather insensitive to the
exact choice of the p.z.c. In the literature the pH at the iso electric point is often
assigned a value of 2-3 [15]. In the absence of specific adsorption this i.e.p. equals the
point of zero charge.
Potentiometrie titrations of silica
Surface charge-/?// curves of silica Aerosil OX-50 in aqueous KCl solutions of different
ionic strength are determined at 25 °C using an automated titration set up. A (Metrohm)
combined glass electrode is used for the titrations, which are performed in a well closed
thermostatted, double-walled vessel under a C02 free, water vapour saturated, nitrogen
atmosphere. The behaviour of the cell was checked by performing blank titrations and
comparing these to calculated blank curves. For the suspension titrations 50 ml of KCl
solution was added to about 0.6 g silica. The suspension is placed in an ultrasonic bath
for 60 minutes in order to reduce any aggregation of the silica particles. Before starting
32

WETTING AND ADHESION ON CHARGED SOLIDS
the titration the solution was brought to pH 3 and purged with (extremely pure) nitrogen
for at least 45 minutes. The silica suspension was then titrated between pH 3 and pH 9
with 0.1 M KOH and back with 0.1 M HCl. In order to determine the extent of the
proton and hydroxyl ion adsorption on the sample as a function of the pH, the
proton/hydroxyl consumption of the blank solution was subtracted from the overal
suspension consumption.
The (Potentiometrie) titration curves were measured at salt concentrations of 0.01,
0.1 and 1 M KCl respectively. Small deviations between the hydroxyl ion and the
(reverse) proton titrations are ascribed to dissolution of the silica at higher pH values
(pH > 8.5 ), by a rather rapid titration (in our case for titration runs of ± 2 hours) these
differences are minimized [16].
3.4. Results and discussion
The absolute magnitude of the surface charge density is calculated from the
Potentiometrie titration curves assuming the surface charge of silica to be negligibly
small at pH=3. In order to convert the adsorption of charge determining ions from
mole/g silica to mole/m2 the (BET(N2)) surface area of 45 m2/g was used.
The surface charges for different concentrations of KCl are given in Fig. 1. For
pH < 6 the surface charge is low, at higher pH values a larger charge is build up at the
silica surface. Increasing the salt concentration improves the screening of the
electrostatic interactions so that, at given pH, more charge can be accommodated at the
surface. The magnitude of the surface charges found for bare Aerosil OX-50 compare
very well with those found by Abendroth [17] for silica CAB-O-SIL M7 (a pyrogenic
silica). This indicates that both silicas have a similar surface chemistry. On precipitated
BDH silica, considerably higher (up to 1.9 C/m2 ) surface charges have been measured
[16]. A pyrogenic silica has a low concentration of surface silanol groups so that a
rather modest surface charge develops with increasing pH. A fully dehydroxylated
silica (treated at 900 °C) has roughly one surface silanol group per nm2 [18]. On a
precipitated (i.e., a non-heat-treated and porous) silica, previous studies have shown a
density of 8-10 hydroxyl groups per nm2 [13, 19]. A "fully" hydrated and annealed silica
surface contains approximately 5 hydroxyl groups per nm2, if larger silanol group
densities are found on a silica surface these are probably due to the presence of internal
SiOH groups which were assumed to be present at the surface [20]. When solely all
surface silanols of the heat-dehydroxylated and the fully hydrated annealed silica would
dissociate, this results in surface charges of -0.16 and -0.80 C/m2, respectively. The
surface charge of a pyrogenic silica is expected to be comparable to that of a heat
dehydroxylated silica.
33

CHAPTER 3
e u
J3 O U o
-0.3
-0.2
-0.1
0.0
-
-
• 0.01 M KCl • 0.1 M KCl o IM KCl
t l^SDOOtegSfg^ffS P0 0 ! , 1 , 1 ,
pH 10
Figure 1. The surface charge densities at 25 °C of silica Aerosil OX-50 in KCl solution as a function ofpH and ionic strength.
ü -20
x Q.
I -10
-
-
a 0.01 M KCl . 0.1 M KCl o 1 M KCl
W T i i i i !
pH 10
Figure 2. Surface pressures at 25 °C of silica Aerosil OX-50 as a function of the pH, calculated from an integration (see Eq. 8) of the surface charge curves given in Fig 1.
34

WETTING AND ADHESION ON CHARGED SOLIDS
However, rehydration might render the pyrogenic silica more comparable to a fully
hydrated annealed silica. Furthermore, titration of a pyrogenic silica until rather high
pH values (i.e., at which the silica starts to dissolve) could easily increase the number of
surface silanol groups.
By integrating the surface charge as a function of the pH the decrease in silica-water
interfacial tension upon charging the solid can be calculated according to Eq. (8). The
results are plotted in Fig. 2. According to Eqs. (8), (10) and (11), the surface charge
dependency of the contact angle and the work of adhesion, respectively, directly
follows from Fig. 2. The presence of charge (i.e., adsorption of potential determining
ions) at the silica surface increases the surface pressure and reduces the silica-water
interfacial tension. For pH > 4 the addition of salt reduces the silica-water interfacial
tension.
In general, the interfacial tension of any charged solid-water interface is decreased
upon the addition of electrolyte. Therefore, the water spreading tension on charged
solids normally increases when increasing the surface charge (i.e., by raising the pH
and/or the salt concentration), see also Eqs. (2), (7) and (9).
Relevance of the surface charge for oil recovery
In order to demonstrate the implications of the thermodynamic framework presented
above, the wettability in an oil reservoir (reservoir rock/oil/brine) will be briefly
discussed. Many rock surfaces are charged, and their surface charge depends on the
salinity, pH and specific adsorption of species from the oil or brine phase [21].
Although the exact electrolyte composition of the brine and the exact behaviour of the
(heterogeneous) reservoir rock surface charge are not known, the present approach can
be used to predict some trends. The presence of salt will increase the preference of a
charged surface to be wetted by the aqueous (brine) phase. This means that the
efficiency of an aqueous solution to displace oil from a charged surface increases when
the salt content of the aqueous phase is increased. In order to evaluate the influence of
the pH on the reservoir wettability, knowledge of the location of the p.z.c. or of the
electrokinetically measurable isoelectric point of the reservoir rock is required. Finally,
the polarizability of the liquid medium close to the surface, determines the screening
and the surface charge. Organic adsorbates usually have a lower dielectric permittivity
than water and their adsorption will, in general, suppress the surface charge (see f.i. ref.
[22]). Hence, both uncharged and charged adsorbates affect the surface charge.
Asphaltene (apolar species present in crude oils) adsorption on reservoir rocks will, in
general, decrease the surface charge and decrease the waterflooding efficiency in
tertiary oil recovery.
35

CHAPTER 3
The work of adhesion on charged solids
Many authors split up the substrate-liquid work of adhesion in two additive parts, a
Lifshits-van der Waals part, denoted by WA LW and a rest term, non Lifshits-van der
Waals, denoted by WA nLW, according to [23]
WA = WALW + WAnLW (12)
However, WA is a Gibbs energy and contains both enthalpic and entropie contributions.
In general the entropie contributions contain configurational entropy terms that are not
additive, i.e. Eq. (12) is an approximation. For a better analysis the configurational
entropy contribution has to be considered separately (by, for instance, a statistical
thermodynamic treatment).
In Eq. (12), all non Lifshits-van der Waals interactions are included in WA nLW.
Many authors (mainly) attribute WA nLW to acid-base interactions and various semi-
empirical models describing acid-base interactions have been proposed [23-25]. The
input parameters of such models are usually defined within a certain concept of acid-
base interactions whereas several concepts may be interplaying. Furthermore, in many
cases reliable experimental data are lacking so that the input parameters for the various
acid-base models are uncertain. Moreover, such acid-base models are fairly crude
approximations for complicated interactions.
It should be noted that the possible long range electrostatic and structural
contributions to the work of adhesion are both included in WA n LW. The former can be
easily described by means of Eq. (11).
3.5. Conclusions
The contact angle and the work of adhesion in a solid-liquid-vapour system are
maximal at the point of zero charge of the solid-liquid interface. The effect of the
surface charge (and changing electrolyte concentrations) on the work of adhesion and
the contact angle can be evaluated quantitatively by integrating the surface charge as a
function of the (logarithm of the) concentration of charge detemining electrolyte at
constant indifferent electrolyte concentration.
On a pyrogenic silica the surface charge increases with increasing pH and salt
concentration. At IM KCl and pH = 9 the surface charge of the pyrogenic silica equals
-0.25 C/m2. Compared to the uncharged silica (i.e., for pH = 3), this surface charge
increases the solid-liquid interfacial tension by 22 mJ/m2, whereas this surface charge
decreases the work of adhesion by maximally 22 mJ/m2.
36

WETTING AND ADHESION ON CHARGED SOLIDS
The pH dependency of water contact angles on substrates exposing ionizable groups
is usually interpreted qualitatively from the degree of ionization of the functional
groups at the surface. However, it is worthwhile to determine the (absolute) surface
charge on these substrates. Together with the thermodynamic framework presented here
this allows a quantitative explanation.
The surface charge on solids can also be studied in terms of (theoretical) adsorption
equations for charge determining ions. In combination with the thermodynamic
approach outlined this indulges one to investigate the influence of different types of
solid charging behaviour (e.g. monofunctional, zwitterionic or amphoteric surfaces [26])
on the adsorption, adhesion and and wetting properties of such solids.
37
CHAPTER 3
References
[I] Billet, D. F., Hough, D. B. and Ottewill, R. H., J. Electroanal. Chem., 14, 1976, p. 107-
120.
[2] Fokkink, L. G. and Ralston, J., Colloids Surfaces A, 36,1989, p. 69-76.
[3] Holmes-Farley, S. R., Bain, C. D. and Whitesides, G. M., Langmuir, 4 (4), 1988, p. 921-
937.
[4] Holmes-Farley, S. R., Reamey, R. H., McCarthy, T. J., Deutch, J. and Whitesides, G. M.,
Langmuir, 1 (6), 1985, p. 725-740.
[5] Whitesides, G. M., Biebuyck, H. A., Folkers, J. P. and Prime, K. L., J. Adhesion Sei.
Techn., 5(1), 1991, p. 57-69.
[6] Lee, T. R., Carey, R. I., Biebuyck, H. A. and Whitesides, G. M, Langmuir, 10 (3), 1994,
p. 741-749.
[7] Hair, M. L. and Hertl, W„ J. Phys. Chem., 73 (7), 1969, p. 2372-2378.
[8] Lyklema, J., J. Colloid Interface Sei, 99 (1), 1984, p. 109-117.
[9] Koopal, L. K. and van Riemsdijk, W. H., J. Colloid Interface Sei., 128 (1), 1989, p. 188-
200.
[10] de Keizer, A., Böhmer, M. R., Mehrian, T. and Koopal, L. K., Colloids Surfaces A, 51,
1990, p. 339-357.
[II] Schlangen, L. J. M., Koopal, L. K., Cohen Stuart, M. A. and Lyklema, J., Colloids
Surfaces A, 89, 1994, p. 157-167, most of this work is included as Chapter 2 in this
Thesis.
[12] Everett, D. H., Pure & Appl. Chem., 53,1981, p. 2181-2198.
[13] Kiselev, A. V. and Lygin, V. I., in "Infrared Spectra of Surface Compounds"; Wiley and
Sons: New York, 1975: p. 80.
[14] Young, G. J., J. Colloid (Interface) Sei., 13, 1958, p. 67-85.
[15] Parks, G. A., J. Phys. Chem., 65,1969, p. 177.
[16] Tadros, T. F. and Lyklema, J., J. Electroanal. Chem., 17,1968, p. 267.
[17] Abendroth, R. P., J. Colloid Interface Sei., 34,1970, p. 591-596.
[18] Hair, M. L., in "Silanes, Surfaces and Interfaces"; Leyden, D. E. (Ed.), Gordon and
Beach Science Publishers: New York, 1986: p. 25-43.
[19] Nishiokoka, G. M. and Schramke, J. A., J. Colloid Interface Sei., 105 (1), 1985, p. 102-
111.
[20] Her, R. K., in "The Chemistry of Silica: Solubility, Polymerization, Colloid and Surface
Properties and Biochemistry"; John Wiley & Sons Inc.: New York, 1979: p. 635-640.
[21] Anderson, W. G., J. Petr. Tech., Oct. 1986, p. 1125.
38

WETTING AND ADHESION ON CHARGED SOLIDS
[22] Szczypa, J., Kajdewicz, I. and Kosmulski, M., J. Colloid Interface Sei, 137 (1), 1990, p.
157-162.
[23] Fowkes, F. M, J. Adhesion Sei. Techn., 1 (1), 1987, p. 7-27.
[24] Mittal, K. L. and Anderson(Jr.), H. R. (Eds.), "Acid-Base Interactions: Relevance to
Adhesion Science and Technology"; VSP: Utrecht, 1991.
[25] Berg, J. C , in "Wettability", Berg, J. C. (Ed.); Marcel Dekker Ine: New York, 1993:
Chapter 2.
[26] Koopal, L. K., in "Coagulation and Flocculation: Theory and Applications"; Surfactant
Science Series ,Vol 47; Dobias, B (Ed.), Marcel Dekker Inc.: New York, 1993: chapter 4.
39

Chapter 4
Thin Hydrocarbon and Water Films on Bare and Methylated Silica: vapour adsorption, wettability, adhesion and surface forces *
Abstract
The vapour adsorption of different n-alkanes, cyclohexane, toluene and water on
bare and methylated pyrogenic silica (Aerosil OX-50) has been studied
gravimetrically. Linear adsorption isotherms of the n-alkanes and of cyclohexane
on both substrates are found until high relative vapour pressures, the same holds
for toluene on methylated silica. The linearity of the isotherms indicates relatively
weak lateral interactions between adsorbed molecules. On bare silica, the
adsorption, expressed in moles/m2, of the n-alkanes studied (C7-C9) is independent
of chain length. The adsorption strongly increases after the coverage
corresponding to a monolayer of 'alkanes oriented perpendicular to the surface has
been reached. Methylation of the silica decrease the adsorption of all adsorptives
studied. On methylated silica the octane isotherm lies below the coverage of a
monolayer parallel to the surface until just before saturation. From the adsorption
data surface pressure isotherms are constructed and the work of adhesion is
obtained. The work of adhesion reveals that the Lifshits-van der Waals part of the
silica surface tension is reduced from 44 mJ/m2 for bare (pyrogenic) silica to 30
mj/m2 for methylated silica. The adsorption data are also converted to disjoining
pressure isotherms. At small film thicknesses, the disjoining pressure can be
described by an exponential short-range interaction.
4.1. Introduction
Adsorption is often used as a tool to modify the physico-chemical properties of
interfaces. Practical applications of adsorption include steric stabilisation, flotation,
coating, lubrication, wetting and oil recovery. Such applications benefit from detailed
studies on the adsorption mechanism and the interaction forces involved. Adsorption
can be studied either from a macroscopic or from a more molecular point of view. The
former approach focuses, for example, on adhesion, wetting and thin film behaviour in
terms of the spreading tension, contact angle and surface pressures. The latter is based
on a molecular interpretation of macroscopic properties. Information on these
macroscopic properties can be obtained from, for instance, adsorption studies, surface
force measurements, colloidal stability or disjoining pressure measurements.
Adsorption of liquids that are sufficiently volatile at ambient temperature is often
investigated by studying the vapour adsorption on a solid. On flat interfaces, techniques
This Chapter has been accepted for publication in Langmuir: Schlangen, L. J. M., Koopal, L. K., Cohen Stuart, M. A., Lyklema, J., Robin, M. and Toulhoat, H., Langmuir, 1995, in press.
41
CHAPTER 4
like crystal resonant frequency change [1] and ellipsometry [2-4] are used for this goal. With these techniques it is difficult to determine the adsorption accurately in the steep isotherm part near saturation, because of difficulties with the vapour pressure control. However, this range can be studied by measuring disjoining pressures, for instance by pressing a vapour bubble against a solid-liquid interface [5].
Many vapour adsorption studies have been performed on silica and related substrates [2, 4, 6, 7]. In this study the influence of the alkane chain length and cyclicity on the formation of thin adsorbed layers onto silica is investigated. Furthermore, the adsorption behaviour on bare and methylated silica will be compared. Gravimetric vapour adsorption experiments have been carried out on a pyrogenic silica and on the same adsorbent, after modification by (complete) methylation. When rather volatile liquids are used, the difficulties encountered with the control and measurement of the low vapour pressures of the adsorptive are minimal. The measured isotherms are compared with data available in the literature and transformed into surface- and disjoining pressure isotherms. The surface pressure isotherms are related to the tangential component of the pressure tensor whereas disjoining pressure isotherms refer to its normal component. Surface pressure isotherms allow interpretation in terms of two-dimensional equations of state and can be used to obtain information on components the solid surface tension [8]. The disjoining pressure isotherms can be used to assess the interaction forces acting in (thin) films [5].
4.2. Experimental
Adsorptives
The adsorptives used in this study were n-heptane (Merck), n-octane (SDS), n-nonane (Merck), cyclohexane (Aldrich), toluene (Aldrich) and water. All the alkanes were p/a (> 98%) grade and used without further purification. The water was of ultra high quality (UHQ, resistivity 18 MQ cm at 25 °C), obtained using an Elgastat UHQ II system.
Substrates
A powdered pyrogenic non-porous silica Aerosil OX-50 (Degussa) and fully methylated Aerosil OX-50 have been used as substrates. Prior to methylation, the Aerosil OX-50 was cleaned by rinsing for two hours under reflux with a hot 50%-50% mixture of nitric acid and sulfuric acid, followed by prolonged rinsing with UHQ water until pH 7 had been reached. After this treatment the Aerosil OX-50 was dried overnight under vacuum at 150 °C. The clean Aerosil OX-50 was methylated by overnight immersion in a 15% (v/v) solution of HMDS (hexamethyldisilazane, Fluka) in refluxing toluene (for the reaction mechanism, see Refs. [9, 10]). After methylation the powder was successively rinsed with dry toluene, acetone and UHQ water. Finally, the methylated Aerosil OX-50 was dried under vacuum at 100 °C overnight. The
42

THIN PHYSISORBED ALKANE AND WATER FILMS
Cahn lOOOelektrobalance
I MKS 128
pressure gauge
liquid thermostat
cold trap
MKS 220 pressure gauge
Drytel 30 vacuumpump
adsorptive supply
Fig. 1. The gravimetric set-up for adsorption measurements.
surface areas of the Aerosil OX-50 and the methylated Aerosil OX-50, as determined by BET(N2) gas adsorption, were 45 m2/g and 36 m2/g, respectively. Before measuring an adsorption isotherm, each sample was outgassed by overnight heating in the gravimetric set-up at 150°C under a pressure lower then lO3 mbar, in order to remove any physically adsorbed molecules (especially water) [11].
Gravimetry
The adsorption isotherms of the n-alkanes, cyclohexane, toluene and water on the substrates were determined by measuring the increase in weight at equilibrium as a function of the relative vapour pressure. In Fig. 1 the general set-up of the gravimetric equipment is shown. A Cahn 1000 electrobalance (sensitivity 0.1 (lg) is connected to two pressure gauges (MKS Baraton 220, 0-5000 mbar and MKS Baraton 128, 0-100 mbar), a (liquid nitrogen) cold trap in connection with a Drytel 30 vacuum pump (oil-free, two-stage pumping system) and the adsorptive supply, a liquid reservoir (at saturated vapour pressure) at room temperature.
The weighing unit of the balance is made vibration-free by placing it on a sand-filled case. The substrate is placed in a cylindrical aluminium sample bucket (height: 60 mm, outer- and inner diameter: 13 mm and 12 mm, respectively). The bucket acts as a radiator [12], draining the heat of adsorption. The bucket is surrounded by a glass outer tube placed in a liquid thermostat at 17 °C. In order to prevent condensation, the rest of the set-up is kept at room temperature. The temperature in the sample bucket was 17 °C; this value is determined by filling the sample bucket with liquid and measuring the equilibrium pressure attained in the set-up. For the measurement of the water vapour adsorption isotherms, silanisation of the inside of the glass outer tube was necessary.
In order to avoid spurting of the sample from the bucket upon evacuation of the setup some pieces of aluminium foil were inserted in the sample bucket. The time needed for the recording of an isotherm is minimized by a stepwise introduction of adsorptive,
43
CHAPTER 4
instead of a more time-consuming (quasi-equilibrium) continuous introduction [13]. A small amount of vapour is admitted to the sample via a tap, connecting the adsorptive supply and the balance. Once equilibrium has been reached (i.e., the adsorbed mass and the vapour pressure reading had become constant) the mass and vapour pressure are recorded. Vapour admissions are repeated until close to saturation.
In the gravimetric experiment, the mass reading has a contribution due to the buoyancy force. Calibration with nitrogen (assuming ideal behaviour of the gas present in the set-up) showed that, in a typical experiment, the buoyancy correction could be safely ignored compared to the change in the adsorbed mass (see Appendix I).
4.3. Results
Although the electrobalance had a sensitivity of 0.1 u.g, the weight fluctuations registered during the measurements indicated a standard deviation of about 4 |ig for hydrocarbon adsorption and circa 40 |Xg for water adsorption. For a typical isotherm this corresponds to a maximum absolute error of about 0.02 nmole/m2 for the alkane-and 0.9 (imole/m2 for the water adsorption isotherm. The precision of the measured pressure was in the order of 0.005 mbar.
Adsorption on silica
The equilibrium adsorbed amounts (in |0.moles/m2) for the n-alkanes, cyclohexane, toluene and water on the bare silica are plotted in Fig. 2. Figure 2a shows that for the n-alkanes on silica, the adsorption increases approximately linearly with the vapour pressure until relative pressures of about 0.75. The isotherms coincide within experimental error. Figure 2b shows the adsorption of octane, cyclohexane, toluene and water on Aerosil OX-50. The adsorption isotherms of the linear alkanes and cyclohexane also coincide up to about p/po=OJ5. The hydrocarbon adsorption isotherms exhibit a continuous, monotoneous increase. The shape of the toluene and water adsorption isotherms differs from those of the alkanes; for both a weak knee-bend is found at p/po=0.1. For toluene the adsorption levels at intermediate pressures are about twice as high as for the alkanes, whereas for water about four times as much moles are adsorbed. As the vapour pressure approaches saturation, all isotherms, except that for water, show a steep increase without intersection with the saturation axis (P/P0=1)-
Adsorption on methylated silica
The adsorption isotherms for octane, toluene, cyclohexane and water on methylated Aerosil OX-50 are given in Fig. 3. In Fig. 3a the entire isotherms is plotted, Fig. 3b displays the initial parts more clearly. All adsorption isotherms in Fig. 3a increase rather sharply as saturation is approached. Comparing Figs. 2b and 3 it is evident that methylation of the Aerosil OX-50 leads (for all adsorptives studied) to a lower
44
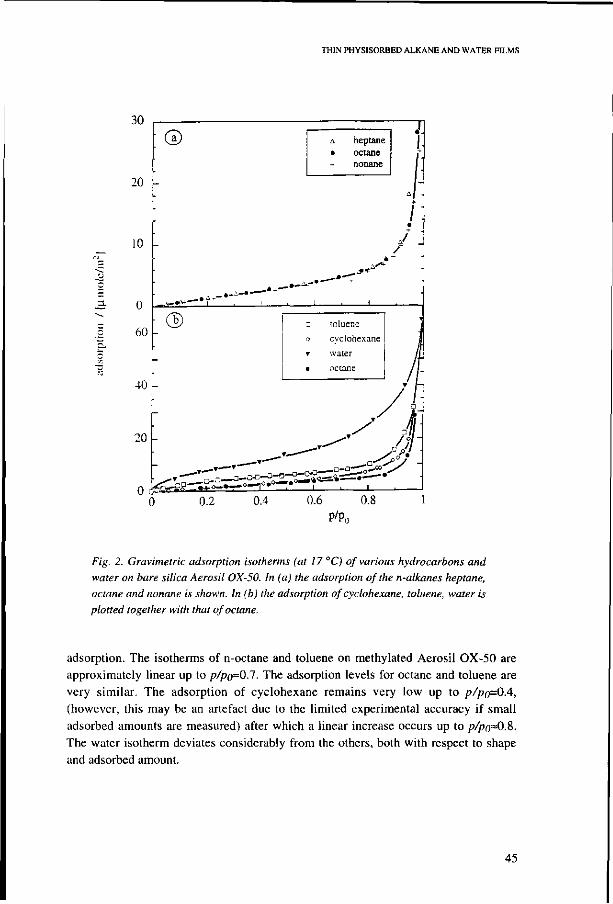
THIN PHYSISORBED ALKANE AND WATER FILMS
30
20
© a heptane • octane
nonane
0
60
40
20
r.H-«»- ' I
® toluene cyclohexane water octane
0
0.2 0.4 0.6 0.8
PyPo
Fig. 2. Gravimetric adsorption isotherms (at 17 °C) of various hydrocarbons and
water on bare silica Aerosil OX-50. In (a) the adsorption of the n-alkanes heptane,
octane and nonane is shown. In (b) the adsorption of cyclohexane, toluene, water is
plotted together with that of octane.
adsorption. The isotherms of n-octane and toluene on methylated Aerosil OX-50 are
approximately linear up to p/po~0.7. The adsorption levels for octane and toluene are
very similar. The adsorption of cyclohexane remains very low up to p/po=0.4,
(however, this may be an artefact due to the limited experimental accuracy if small
adsorbed amounts are measured) after which a linear increase occurs up to p/po~0.i.
The water isotherm deviates considerably from the others, both with respect to shape
and adsorbed amount.
45

CHAPTER 4
30
® • octane
a toluene
o cyclohexane
T water
0.6 0.8
P/Po
Fig. 3. Adsorption isotherms (at 17 °C) of octane, cyclohexane, toluene and water
on methylated silica Aerosil OX-50. In Fig. (a) the complete isotherm is plotted
whereas Fig. (b) is an enlargement of the low adsorption region.
4.4. Comparison with other measurements
In order to enable comparison of the present results with ellipsometric studies, the
average thickness h of the adsorbed layer is obtained from the adsorbed amount (I~) and
the molar volume for which the molar volume in bulk liquid was chosen. In
ellipsometry, a similar assumption is made when the refractive indices of the adsorbed
layer and of bulk liquid are equated. In Figs. 4 and 5 our film thicknesses are compared
to data from ellipsometric and gravimetric adsorption measurements available in the
literature. [4, 6, 7, 14-16] Anticipating further discussion, we point out that the overall
agreement is satisfactory, particularly in the range of low p/po- Generally, above
p/pQ=Q.%, the gravimetric isotherms on the powdered Aerosil OX-50 are sligthly higher
than the ellipsometric ones on flat substrates. These discrepancies found for powdered
46

THIN PHYSISORBED ALKANE AND WATER FILMS
Aerosil OX-50, are probably due to the occurrence of inter-particle condensation (in the section "surface pressure isotherms" we will return to this issue).
I: Hydrocarbon and water adsorption on silica
Before comparing adsorption studies on different silica substrates we briefly discuss the surface properties of the various silicas. The Hamaker constants for quartz (anhydrous crystalline silica) and (anhydrous amorphous) silica are alike [17], Furthermore, both substrates have a similar surface-silanol and -siloxane group density [18] (a normal, fully hydroxylated Si02 surface has about 4.6 surface silanol groups per nm2, i.e. a surface density of 7.6 ftmol/m2) so that adsorption on these surfaces may be comparable. The pyrogenic (anhydrous amorphous) Aerosil OX-50 is expected to have a similar surface silanol group density and distribution as a heat-dehydroxylated silica/quartz on which only isolated silanol groups remain at the surface (about one surface silanol group per nm2) [18]. Rehydration of such a heat-dehydroxylated Si02 can be quick or extremely slow depending on the duration and temperature of the heat dehydroxylation treatment. Rehydration of a heat-dehydroxylated SiC>2 (heated 10 hours at 900°C) in water under ambient circumstances took several years [18].
Water on silica
Water vapour adsorbs rather strongly onto silica due to the possibility of hydrogen bond formation between the water molecules and the surface silanol groups. It is known that the adsorption and wetting (characteristics) of water on SiC>2 are affected by the surface density of the silanol groups. Dehydroxylation results in a lower surface silanol density and hence in a lower water adsorption [14], without affecting the BET(N2) area [19]. In Fig. 4a it can be seen that the current water vapour adsorption data are in good agreement with gravimetric experiments of water adsorption at 25 °C on ground quartz reported by Whalen [ 15] and the ellipsometric results by Beaglehole and Christenson [4]. The latter authors measured the adsorption of water at 18.1 °C on a silicon wafer covered with a thin SiC>2 layer, formed by a HNO3 treatment. Beaglehole and Christenson found that their SiÜ2 layer was moderately hydrophobic and they considered their substrate to resemble a heat-dehydroxylated quartz. At saturation they measured a film of limited thickness (0.64 nm). The present water vapour adsorption isotherm shows a rather steep increase in adsorbed amount as saturation is approached and appears to intersect the saturation axis at a film thickness of about 1.25 nm. At saturation, ellipsometrically determined water film thicknesses on quartz range between 2 and 8 nm, depending on the temperature [20]. However, if extreme care is taken in cleaning the quartz surface, a continuous increase in film thickness with vapour pressure up to about 150 nm at p/pQ-l is found [3]. A meticulously cleaned quartz surface is relatively hydrophilic and completely wetted by water (contact angle = 0°). The lower film thicknesses found for less elaborately cleaned quartz are likely due to hydrophobic contaminants. These contaminants oppose the effect of the surface silanol
47
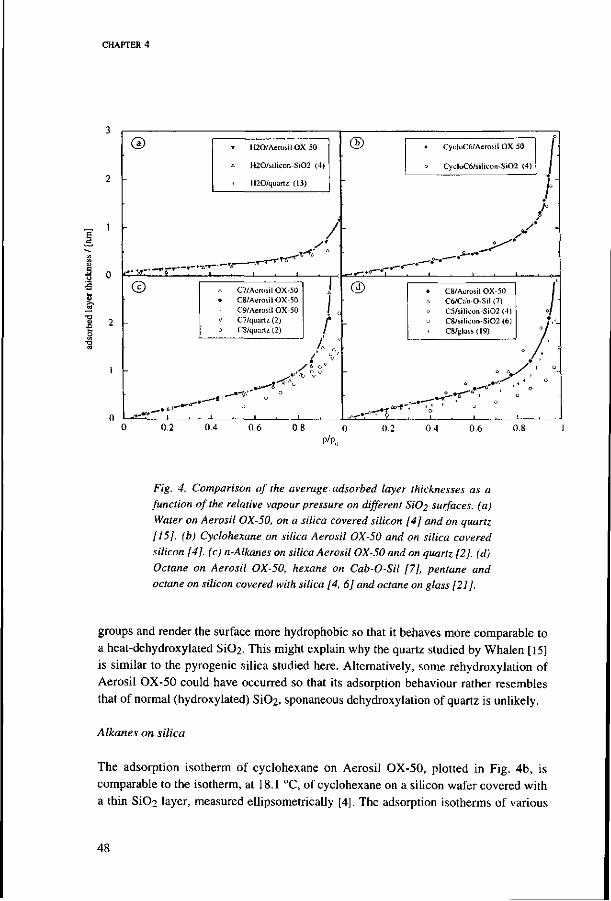
CHAPTER 4
^ 1
O
3
H20/Aerosil OX-50
H20/silicon-Si02 (4)
H20/quartz (13)
/ y
r K < ' < _ — » - • - » -
_ L _
O C7/Aera,il OX-50 C8/AerObil OX-50 C9/Aerosil OX-50 C7/quartz (2) C8/quarlz (2) r
—• û *
® CycloC6/Aerosil OX-50
CycloC6/silii:on-Si02 (4)
© C8/Aürosil OX-50 C6/Cab-0-Sil (7) C5/silkün-Si02 (4) C8/silicon-Si02 (6) C8/glass(l9)
*»./,
>r-s
• • ' • 1 ,
0.2 0.4 0.6 0.2 0.4 0.6 P/P„
Fig. 4. Comparison of the average adsorbed layer thicknesses as a function of the relative vapour pressure on different S1O2 surfaces, (a) Water on Aerosil OX-50, on a silica covered silicon [4] and on quartz [15]. (b) Cyclohexane on silica Aerosil OX-50 and on silica covered silicon [4]. (c) n-Alkanes on silica Aerosil OX-50 and on quartz [2]. (d) Octane on Aerosil OX-50, hexane on Cab-O-Sil [7], pentane and octane on silicon covered with silica [4, 6] and octane on glass [21].
groups and render the surface more hydrophobic so that it behaves more comparable to
a heat-dehydroxylated SiÛ2. This might explain why the quartz studied by Whalen [15]
is similar to the pyrogenic silica studied here. Alternatively, some rehydroxylation of
Aerosil OX-50 could have occurred so that its adsorption behaviour rather resembles
that of normal (hydroxylated) SiC>2, sponaneous dehydroxylation of quartz is unlikely.
Alkanes on silica
The adsorption isotherm of cyclohexane on Aerosil OX-50, plotted in Fig. 4b, is
comparable to the isotherm, at 18.1 °C, of cyclohexane on a silicon wafer covered with
a thin Si02 layer, measured ellipsometrically [4]. The adsorption isotherms of various
48

THIN PHYS1SORBED ALKANE AND WATER FILMS
n-alkanes on Aerosil OX-50 and on other SiC>2 substrates are plotted in Figs. 4c and d. The n-alkane adsorption isotherms on Aerosil OX-50 (Fig 4c) are very similar to that for cyclohexane (Fig. 4b). Those of the n-alkanes on Aerosil OX-50 are in fair agreement (see Fig. 4c) with ellipsometric studies by Gee et al. [2] of n-heptane on hydroxylated quartz at 21 °C. The shape of the n-octane isotherm by Gee et al. is similar to ours although we found higher adsorbed amounts. Figure 4d shows that the isotherms of the n-alkanes on Aerosil OX-50 coincide with the gravimetric one of n-hexane on heat (800°C)-dehydroxylated pyrogenic silica (Cab-O-Sil) measured, at 22 °C, by Hair and Hertl [7]. The n-octane adsorption isotherm in Fig. 4d by Levinson and coworkers [6] was measured ellipsometrically on a silicon wafer (at 17.2 °C) which has been heated in air at 850 °C so that it became covered by a silica layer of about 100 nm thick. Levinson and coworkers [6] measured a lower adsorbed amount for octane than we did on Aerosil OX-50, but the shapes of the isotherms are similar. In relation to the observed absolute differences between the ellipsometric and gravimetric studies we note that the adsorbed amounts plotted in the gravimetric isotherms depend on the specific surface areas assigned to the substrates. There is always the possibility that nitrogen, alkane and water molecules each "see" a different surface area. Figure 4d shows the adsorption of octane on glass, obtained ellipsometrically at 25 °C [21]. The differences in n-alkane adsorption between glass and pure SiÜ2 are minor. The ellipsometric adsorption at 18.1 °C of n-pentane on a Si02-covered silicon wafer [4] shown in Fig 4d, is in fair agreement with the current results.
Comparing Figs. 4c and 4d we note that, despite the differences in the degree of surface dehydroxylation of the adsorbing SiÛ2, the adsorption isotherms below p/po=O.S are rather similar. Gee et al. [2] have also confirmed this for n-pentane. However, it should be realized that the similarity of alkane adsorption on a heat-dehydroxylated and a hydroxylated SiÛ2 could be due to rehydration of the dehydroxylated SiÛ2 surface. Secondly, the presence of hydrophobic impurities or physisorbed water at the hydroxylated SiÛ2 surface might neutralize (part of) the influence of the surface silanols on hydrocarbon adsorption (it has been observed that bulk water has a significantly lower pentane adsorption compared to silica [22]). For a more detailed comparison of the present results with those from the literature a better knowledge of the way of preparing, storing, the pretreatment and outgassing conditions of the various SiÛ2 surfaces is required.
In general, it can be concluded that, for vapour pressures below p/p0=0.8, the gravimetric adsorption isotherms on powdered Aerosil OX-50 are consistent with adsorption studies on similar flat surfaces, available in the literature. In an ellipsometric experiment, the film thickness is a reflection of the optical contrast and assumptions concerning the refractive index n or dn/dF have to be made. The gravimetric isotherms are directly available experimentally, without any assumptions except the choice of the specific surface area. The consistency shows that the assumptions made to obtain ellipsometric layer thicknesses are quite reasonable. Furthermore it endorses the linearity of alkane adsorption isotherms on silica up to p/pg=Q.15.
49

CHAPTER 4
II: Water and hydrocarbon adsorption on alkylated silica
Water on alkylated silica
In Fig. 5a the water adsorption on methylated Aerosil OX-50 is compared to water
adsorption at 22°C on methylated Cab-O-Sil as measured gravimetrically by Hair and
Hertl.[7] Up to p/pg=0.%, the isotherms are in fair agreement and show a very low water
adsorption, as is expected from the low surface tension of a methylated surface.
n-Alkanes on alkylated surfaces
In Fig. 5b our octane film thicknesses on methylated Aerosil OX-50 are plotted,
together with other results. Blake et al. [16] performed a gravimetric study (at 22°C) of
octane adsorption on aluminium foil modified by exposure to pentanol. Exposure of an
alumina surface to an alcohol (R-OH) vapour results in adjacent surface -OR and -OH
groups and provides a means of hydrophobizing the alumina surface. When the five
shortest n-alcohols are used for this treatment, three surface -OR groups per ran2 can be
introduced, independent of R [23]. The alcohol treatment creates a low-energy surface
with an alkane affinity that depends on the chain length of the alcohol used for
hydrophobization [16]. Blake et al. found that the differences between decane
adsorption on a propanol- and on a pentanol-modified aluminia are large, whereas the
differences between decane adsorption on a pentanol- and on a dodecanol-modified
alumina are small. This suggests that alcohols larger than pentanol are able to screen
most of the aluminium surface. Some differences in adsorption between methylated
silica (which has only CH3 groups in the grafted layer) and the pentanol-modified
alumina could be expected due to the presence of CH2 groups at the modified alumina.
Furthermore, the solid substrate itself could also cause some differences in adsorption
behaviour. Figure 5b shows that, with respect to n-octane, an alcohol-modified alumina
surface is comparable to methylated Aerosil OX-50.
In Fig. 5b, the adsorption of hexane on methylated Cab-O-Sil, measured
gravimetrically by Hair and Hertl (at 22°C) [7], is also shown. Figure 5b shows that, on
methylated Cab-O-Sil, hexane adsorbs to a larger extent than octane on methylated
Aerosil OX-50. A similar increase in adsorbed amount has been found by Blake et al.
[16] on their pentanol-treated aluminium foil when going from n-hexane to n-dodecane.
Cyclohexane on alkylated silica
The cyclohexane film thicknesses, measured gravimetrically on methylated Aerosil
OX-50, are in good agreement with those obtained ellipsometrically on a silicon wafer
covered with a silica layer bearing grafted (by means of HMDS treatment) methyl
groups [6], see Fig. 5b. The gravimetrically determined adsorption is somewhat higher
than the ellipsometric one. Both isotherms increase in a rather linear way up to
/>/p0=0.8.
50

THIN PHYSISORBED ALKANE AND WATER FILMS
0.5
0.4
0.3
0.2
0.1
1.0
0.5
. © H20/M-Aerosil OX-50
H20/M-Cab-0-Sil (7)
_1_
© C8/M-Aerosil OX-50 C8/A1-0-C5 (14) C6/M-Cab-0-Sil (7) CycloC6/M-Aerosil OX-50 CycloC6/silicon-M-Si02 (6)
, / / • • / -
. . - Û - * '
' - 'T i i i——~ *" 0.2 0.4 0.6 0.8
P/Pn
Fig. 5. Same as Fig. 4, but for various methylated (M-) S1O2 surfaces.
(a) Water on M-Aerosil OX-50 and on M-Cab-O-Sil [7]. (b) Octane
and cyclohexane on M-Aerosil OX-50, octane on alcohol modified
aluminum foil [16], hexane on M-Cab-O-Sil [7] and cyclohexane on a
methylated silica layer on silicon [6].
51

CHAPTER 4
4.5. Alkane adsorption mechanism
Bare silica
The comparison made above indicates that the linear (Henry) region of the n-alkane adsorption isotherms on silica, which extends much further (up to p/po=0.&) than usually observed, can be considered as an established fact. Furthermore it shows that n-alkane adsorption onto silica is hardly chain length dependent. If n-alkanes were perpendicularly oriented, a monolayer would correspond to 8.3 (imole/m2, a monolayer of molecules oriented parallel to the surface to about 4.0, 3.5 and 3.0 u.mole/m2 for n-heptane, n-octane and n-nonane, respectively [24]. Figure 2a shows that the amount of linear alkanes adsorbed on bare silica is below the value for a perpendicular monolayer of alkanes up to p/po=0.9. From these observations it can be inferred that the n-alkanes have a relatively low affinity for silica and do not adsorb in a flat conformation. In order to maximize their adsorption energy, the alkanes will tend to adsorb parallel to the surface, but this tendency is opposed by the incurred conformational entropy loss. For n-alkanes of different chain length these opposing effects lead to very similar molar adsorbed amounts.
The linearity of the alkane adsorption isotherms at lower vapour pressures points towards weak lateral interactions between the adsorbed alkane molecules. This is also in line with the low adsorption and could result from the fact that adsorption is restricted to certain sites. If these sites are spaceously distributed over the surface or separated by sites that are energetically less favourable or unfavourable for alkane adsorption (e.g. due to entropie reasons), lateral interactions between the adsorbate molecules will be absent or small. On silica the free surface silanols might play the role of the strongly adsorbing sites (since free hydroxyls are strongly adsorbing sites and hydrocarbon molecules interact on a 1:1 basis with free silanols [7]), whereas the surface siloxanes could act as the less- or unfavourable sites. Furthermore, with increasing vapour pressure, the adsorbed molecules increasingly protrude in the gas phase, so that lateral interactions remain small and a linear isotherm results. The tendency of adsorbate molecules to protrude into the vapour phase increases with increasing surface coverage. Above p/po=Q.15, and above a limiting adsorbed amount of 5 (imole/m2, irrespective of the chain length of the n-alkane, the adsorption starts to increase above the linear isotherm. At p/po=0.9 the adsorption rises sharply and condensation occurs. The adsorbed amount of 8.3 (imole/m2 at this relative vapour pressure agrees well with the area of 0.19-0.25 nm2 per n-alkane molecule adsorbed perpendicularly to the surface, given by Fowkes [24]. This suggests that multilayer formation only occurs after completion of a monolayer of perpendicularly oriented molecules.
52

THIN PHYSISORBED ALKANE AND WATER FILMS
Alkylated surfaces
The comparison of several adsorption studies on alkylated surfaces shows that alkylation decreases the alkane adsorption as compared to the bare surface. For alkylated substrates the attractive forces of the bulk solid are (at least partially) screened by the grafted layer, covering the solid. Longer alkanes adsorb to a lesser extent than shorter ones. Until close to saturation the adsorption remains below the value for a parallel n-alkane monolayer. This points to a rather low alkane affinity of an alkylated substrate and suggests that, on a methylated silica, hydrocarbon molecules adsorb predominantly parallel to the surface, possibly becoming partially embedded within the grafted layer. Presumably, an increasing chain length of the adsorbing n-alkane gives a stronger decrease in conformational entropy upon adsorption, so that the adsorption is lower for longer n-alkanes.
On a methylated silica, cyclohexane has a lower adsorption (in moles/m2) than n-octane. A cyclic molecule is less flexible than a chain molecule of the same number of carbon atoms so that it has fewer possibilities to adapt its structure to the grafted layer.
4.6. Discussion
Modelling alkane adsorption
The quality of equations to describe adsorption (e.g., Langmuir, BET, Polyani [25]) is determined by the extent to which certain physical premises (e.g. homogeneity of the surfaces, architecture of the molecules, localized or mobile adsorption, lateral interactions) are considered. For alkanes, the physics of adsorption will be strongly determined by the conformations they can assume. Simple adsorption equations are inadequate to describe such adsorption. In Chapter 6 a self-consistent-field theory for adsorption of chain molecules, originally developed for polymer adsorption [26], will be used for a detailed molecular and thermodynamic interpretation of the hydrocarbon adsorption isotherms.
Adsorption and wettability
Adsorption can result in the formation of wetting layers and is very important in relation to wettability. If enough adsorptive is present, complete and partial wetting can be distinghuished. In the case of complete wetting, a macroscopic liquid layer will be formed spontaneously at the substrate. In the case of partial wetting, the liquid forms a droplet with a finite contact angle on the substrate. The critical surface tension y(. is an empirical parameter that can be used to characterize these two wetting situations [27]. Liquids with a surface tension lower than the critical value completely wet the substrate, liquids with an interfacial tension higher than the critical surface tension partially wet the substrate. The two types of wetting can also be distinguished by the shape of the adsorption isotherm. In the case of complete wetting, the vapour
53

CHAPTER 4
adsorption gradually increases with increasing vapour pressure until at saturation the
adsorption rises very steeply to infinity. Partially wetting liquids form a thin film (finite
adsorption) on the substrate at the saturation vapour pressure. [28] When enough liquid
is present, macroscopic droplets are formed. Such droplets coexist with the thin
adsorbed film.
In Fig. 2 all adsorption isotherms on Aerosil OX-50 approach the saturation axis
asymptotically. Hence, all liquids studied completely wet the silica surface, which is
not very striking (the spreading and wetting of liquid on a substrate is favoured by a
high substrate surface tension [29]). The vapour adsorption isotherms measured on the
methylated Aerosil OX-50 (see Fig. 3) also rise sharply close to saturation, suggesting
complete wetting. The critical surface tension yc of a surface covered entirely by CH3
groups (determined from the contact angles of a series of homologous alkanes [27]) lies
between 22 and 24 mJ/m2 , depending on the degree of order present in the layer. The
interfacial tension of n-octane lies below yc, hence, octane is expected to wet the
methylated silica completely. However, the liquid surface tensions of cyclohexane,
toluene and water exceed yc. According to this reasoning, a finite adsorbed amount is
expected at saturation, in contrast to the experimental results.
The sharp increase in adsorption close to saturation, found for partially wetting
liquids, may be due to an insufficiently accurate vapour pressure control. During the
vapour adsorption measurements close to saturation, supersaturation might have
occurred. Upon supersturation the meta- and unstable range of the isotherm can be
passed so that the adsorbed amount "jumps" from the stable thin film branch of the
isotherm (with a finite adsorbed amount at saturation) to the stable thick film branch of
the isotherm. Once on the stable thick-film branch of the isotherm, the adsorption rises
continuously with a further increase in vapour pressure. At saturation the adsorption
rises indefinitely although the liquid is only partially wetting. For completely wetting
liquids the occurrence of supersaturation has no effect on the shape of the isotherm. In
addition, a (relatively small) interparticle condensation effect could contribute to the
rise in adsorption close to saturation. Therefore, the data are not good enough to decide
on the wetting behaviour.
From individual vapour adsorption isotherms surface pressures can be calculated. The
surface pressure is useful to study the contact angle and spreading tension for a solid
contacting a liquid. Furthermore, in the case of two non-miscible adsorptives, the
occurrence of liquid-liquid displacement on a solid can be assessed [29]. The surface
pressure only indirectly depends on the adsorbent-adsorbate interactions. It is primarily
a property of the adsorbate.
The surface pressure is defined as the difference between the interfacial tension of
the "clean" solid (i.e., in vacuum) and the same in contact with an (adsorbing) vapour.
At constant temperature, assuming ideal behaviour of the vapour, we can write for the
surface pressure nsy as a function of adsorption F
r nsv(r)= RT J rdlnp/po (1)
54

THIN PHYSISORBED ALKANE AND WATER FILMS
• octane ü toluene o cyclohexane
water
50 75 adsorption / [jimole/m2]
Fig. 6. The surface pressures of the various liquids on bare silica (Fig. a)
and methylated silica (Fig. b) obtained from an integration of the
adsorption isotherms shown in Figs. 2 and 3.
where p/p0 is the relative vapour pressure. According to Eq. (1), the surface pressure
follows directly from the area under the vapour adsorption isotherm if F is plotted
versus In p/p0.
In the case of complete wetting, the surface pressure approaches asymptotically its
saturation value denoted by n (Tx). The symbol F„ is used to indicate that the
adsorbed layer is macroscopically thick and has the properties of bulk liquid. In the case
of partial wetting only a thin (non macroscopic) film is adsorbed at saturation. If
enough adsorptive is present this film can be in equilibrium with a droplet and
KSV(T„) must be derived from the surface pressure of this thin film KSV(Tt) and the
cosine of the contact angle [29].
55

CHAPTER 4
Table 1. Surface pressures near saturation, wetting properties of the liquid, work
of adhesion of the liquid Eq. (2), Lifshitz-van der Waals part of the solid
interfacial tension (calculated using Eq. (4)). The values in brackets refer to
partial wetting situations where the surface pressures near saturation do not
neccesarily correspond to 71 (T„)-
adsorptive yL w e t t i KsvL a t w s vapour of „ j , ^ liquid L saturation mJ/m2 mJ/m2
mJ/m2
adsorption on silica Aerosil OX-50
heptane
octane
nonane
20.4
21.8
22.8
complete
complete
complete
22
17
16
62
60
61
44 ±3
cyclohexane
toluene
water
adsorption on
octane
cyclohexane
toluene
water
25.5
28.5
72.8
methylated
21.8
25.5
28.5
72.8
complete
complete ?
Aerosil OX-50
complete
partial
partial
partial
17
39
(86)
8
(6)
(7)
(36)
68
96
(232)
51
(58)
(63)
(182)
_
_
30 —
-
-
The surface pressures were calculated according to Eq. (1). Henry's adsorption law
( K = rRT) was used to estimate the magnitude of the initial surface pressure in the
first point of the experimental isotherm, this initial value was used to start the numerical
integration from the first point of the adsorption isotherm. In Figs. 6a and 6b the results
are shown for bare and methylated Aerosil OX-50, respectively. In Table 1 the values
of the highest surface pressures, obtained close to saturation, are summarized. Due to
the possible occurrence of interparticle condensation the measured adsorption and
surface pressures may be too high close to saturation. However, in the case of complete
wetting, this hardly contributes to the surface pressure value since interparticle
condensation falls within the plateau of the surface pressure isotherm. For partially
wetting liquids, the possible occurrence of supersaturation implies that the surface
pressures close to saturation do not necessarily correspond to KSV(Tt) or nsv(T^).
The highest surface pressures of the alkanes and water on Aerosil OX-50 are in fair
agreement with those for octane and water on glass (15 and 119 mJ/m2 respectively)
determined ellipsometrically (at 25 °C) by Chibowski et al. [21].
56

THIN PHYSISORBED ALKANE AND WATER FILMS
Characterization of bare and methylated silica
The surface pressure at infinite adsorption KSV (T„) can be used to investigate the work of adhesion WA of the liquid-substrate pair under consideration according to Eq. (2) [29]
WA = Ksv(r„) + 2yL (2)
where yL is the interfacial tension of the liquid L -vapour interface. In order to characterize intermolecular interactions of a substrate, many authors split up the substrate-liquid work of adhesion in two additive parts, a Lifshits-van der Waals (LW) part, denoted by WA LW and a rest term, non Lifshits-van der Waals, denoted by WA, nLw according to [30].
WA = WALW + WAnLW (3)
It should be realized that WA is a Gibbs energy and contains both enthalpic and entropie contributions. In general the entropie contributions contain configurational entropy terms that are not additive, i.e. Eq. (3) is an approximation. For a better analysis the configurational entropy contribution has to be considered separately (as can be done in, for instance, a statistical thermodynamic treatment). Often WA LW is expressed (following the Berthelot principle) as the geometric mean of the Lifshits-van der Waals contributions to the interfacial tensions involved
WA,LW ~ 2 4YLLW rlw (4)
where y£w and ysLW are the Lifshits-van der Waals contributions to the surface tension
of liquid L and solid S respecitvely. In general, these values are determined by bringing the surfaces into contact with apolar liquids (aL) for which it is assumed that only dispersive forces are operative so that yaL=ylw and WA nLW~0. However, the Berthelot principle is correct for surface enthalpies but not for surface tensions (surface Gibbs energies) since entropie contributions do not obey this principle. Furthermore, contact with another phase may change the molecular orientation and density profiles of interfacial regions. These changes will depend on the two phases that are brought into contact. Hence yj^w and ys
LW should be considered as approximate constants only. Despite the approximations inherent to Eqs. (3) and (4), the approach has proven to
be quite useful in practice [31]. Combining Eqs. (3) and (4) allows to determine ysLW of
bare and methylated silica using the nsv (T„) values of the different apolar (non-aromatic) vapours. For bare silica Aerosil OX-50, the values are rather consistent (see Table 1) and a mean ys
LW value of 44 ± 3 mJ/m2 is found. The ylw values obtained from different experiments may depend on the
experimental conditions such as the presence of physisorbed water and impurities. The y'lw value detemined for silica Aerosil OX-50 is considerably less than the
57

CHAPTER 4
values of 78 mJ/m2 [32] and 71.8 mJ/m2 [33] reported for quartz but in good agreement with the values of 39.8 mJ/m2 and 41.1 mJ/m2 for laboratory and commercial SiÛ2 respectively, as determined by liquid penetration (through a wick) into a thin horizontal powder layer [34]. For glass, Chibowski et al. [21] found ys
LW values of 32 mJ/m2 and 25 mJ/m2, depending on the experimental method used. The values of Chibowski et al. are rather low due to the fact that an inflection point near the second monolayer in their surface pressure isotherm was taken for the calculation of ys
LW instead of the surface pressure of the macroscopically thick liquid layer formed at saturation. Taking Chibowski et al.'s value of the surface pressure near saturation of 15 mJ/m2 for silica-octane would give a ys
LW for glass of 39 mJ/m2, in good agreement with the present result.
Given the critical interfacial tension of a methylated surface, only octane is expected to completely wet such a surface and to form a macroscopic layer at saturation spontaneously. Hence, the surface pressure KSV'(T„) of octane is directly available from the adsorption isotherm and using Eqs. (2) and (4) a Lifshits-van der Waals part of the interfacial tension of 30 mJ/m2 is obtained for the methylated silica. This value is identical to that reported in the literature for a flat interface constituted of -CH3 groups only [35]. The value of ys
LW for methylated Aerosil OX-50 is considerably lower than that for bare Aerosil OX-50, but not as low as the liquid surface tension of pure alkanes.
Using the values of the surface pressure at saturation of toluene and water, given in Table 1, and setting ys
LW = 44 mJ/m2 for Aerosil OX-50, WA nLW can be calculated from Eqs. (2) to (4). The Lifshits-van der Waals component of the toluene surface tension is considered equal to yL, the surface tension of water is split up in a y^w of 21.8 mJ/m2 and a non-LW part of 51.0 mJ/m2 [36]. For silica-toluene and silica-water WA nLW values of 25 and 170 mJ/m2, respectively, are obtained. The non zero value for toluene is likely due to its aromatic nature allowing 7i-electron exchange with the substrate. Water is able to form hydrogen bonds, therefore the non-LW interactions at the silica-water interface will be stronger than at the silica-toluene interface.
A polar phase has other interactions besides Lifshits-van der Waals interactions. All these interactions are included in WA n LW but also entropie effects differing from those occurring for apolar liquids (with the same y[w as the polar liquid) are included in WA nLW. Many authors (mainly) attribute WA nLW to acid-base interactions and various semi-empirical models describing acid-base interactions have been developed [8,37,38]. Comparing these models with the present experimental data did not lead to consistent results (see Appendix II) and no firm conclusions could be drawn. The input parameters of the models are usually defined within a certain concept of acid-base interactions whereas several concepts may be interplaying. Furthermore, in many cases reliable experimental data are lacking so that the input parameters for the vatious acid-base models are uncertain. Moreover, acid-base models are fairly crude approximations of the reality for complicated systems.
58

THIN PHYSISORBED ALKANE AND WATER FILMS
Disjoining pressure isotherms of adsorbed films
In the literature, adsorbed films are often investigated in terms of the difference in chemical potential between the film and the corresponding bulk liquid. This difference is reflected in the disjoining pressure. According to its definition the disjoining pressure, 11(h), can be expressed as [5]
11(h) = - (dG(h)/dh)p T (5)
The symbol G(h) stands for the excess Gibbs energy of the film (per unit area) as a function of the film thickness h. The disjoining pressure can also be defined as the additional external pressure that is needed to keep a film of thickness h in mechanical equilibrium with its surroundings [5]
RT 11(h) = - — ln(p/p0)
Vm (6)
where Vm is the molar volume of the bulk liquid. The disjoining pressure varies with p/po and, hence, with the film thickness. The dependence of the disjoining pressure on the layer thickness is the disjoining pressure isotherm. It emphasises (in contradistinction to adsorption isotherms) the decay of the interactions with the film thickness.
Disjoining pressure isotherms on bare and methylated Aerosil OX-50 are calculated from the measured adsorption isotherms according to Eq. (6), assuming that the molecular volume in the adsorbed film equals that of bulk liquid. The resulting isotherms are plotted semilogarithmically in Fig. 7. This figure shows that, in general, the first part of the disjoining pressure isotherms on bare and methylated Aerosil OX-50 can be described by a short range exponential interaction of the form
ns = Ke~hn (7)
where K is a constant and / a characteristic decay length. The straight lines through the experimental points in Fig. 7 describe this short range exponential interaction with the parameters K and / given in Table 2. A comparison of the K values in Table 2 with the corresponding adsorption isotherms shows that the K value is a measure of the affinity of the adsorption: the larger its value the higher the affinity.
For the n-alkanes and cyclohexane on bare Aerosil OX-50, similar values of K and / apply. Compared to these values, the K value of toluene is higher whereas the decay length is comparable. For water / is considerably smaller than in the case of alkanes whereas K is much higher.
On methylated Aerosil OX-50, the K value of octane is not significantly different from that on bare Aerosil OX-50 whereas the decay length is considerably shorter. For cyclohexane the first experimental points (below 0.05 nm) are omitted since they may be due to an artefact (see results). The values of K and / for cyclohexane on methylated
59

CHAPTER 4
S 'S '3
10"
108
107 r
10" =-
103
• . Y
&iJr_
\ \ °»
A
• G
ô
•
S. 0 >s_0
n-alkanes (C7-C9) toluene cyclohexane water exponential interaction
D O
D
(S>
1 2 3 4 adsorbed layer thickness / [nm]
S
z
i-i D< 00 c 'S
•5
108
107 r
10°
103
V
&A
1
• G
0
T
•
octane
toluene
cyclohexane
water
exponential interaction
G *
1 \ . 1
®
G '
0.2 0.4 0.6 o.: adsorbed layer thickness / [nm]
Fig. 7. Semilogarithmic disjoining pressure isotherms. The symbols are the experimental results, the solid curves are the exponential short range interaction according to Eq. (7), using the parameters shown in Table 2. (a) n-alkanes, cyclohexane, toluene and water on silica Aerosil OX-50. (b) octane, toluene, cyclohexane and water on methylated Aerosil OX-50.
60
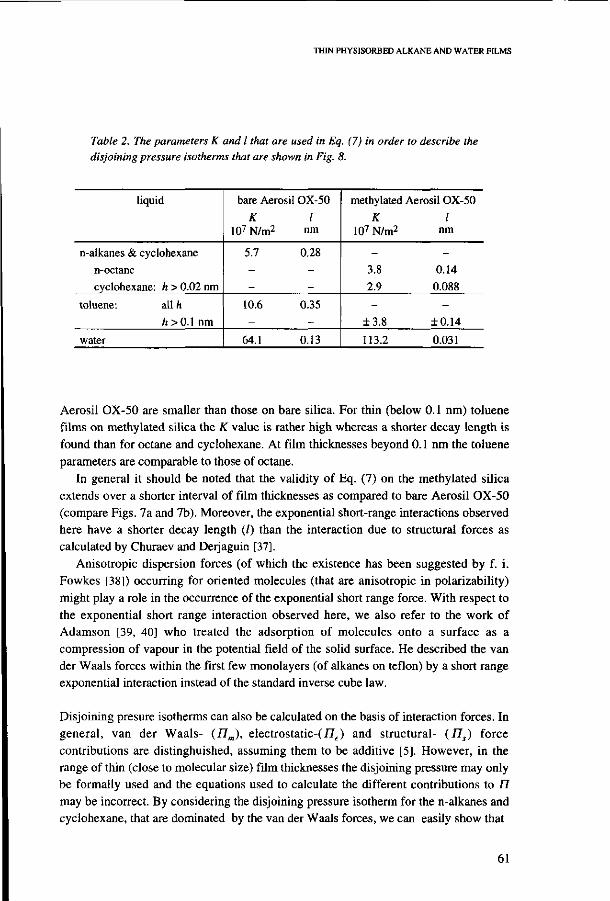
THIN PHYSISORBED ALKANE AND WATER FILMS
Table 2. The parameters K and I that are used in Eq. (7) in order to describe the disjoining pressure isotherms that are shown in Fig. 8.
liquid
n-alkanes & cyclohexane
n-octane
cyclohexane: h > 0.02 nm
toluene: all h
h>0.\ nm
water
bare Aerosil OX-50 K I
107 N/m2 nm
5.7
10.6
64.1
0.28
0.35
0.13
methylated Aerosil OX-50
K I 107 N/m2 nm
3.8
2.9
±3.8
113.2
0.14
0.088
+ 0.14
0.031
Aerosil OX-50 are smaller than those on bare silica. For thin (below 0.1 nm) toluene films on methylated silica the K value is rather high whereas a shorter decay length is found than for octane and cyclohexane. At film thicknesses beyond 0.1 nm the toluene parameters are comparable to those of octane.
In general it should be noted that the validity of Eq. (7) on the methylated silica extends over a shorter interval of film thicknesses as compared to bare Aerosil OX-50 (compare Figs. 7a and 7b). Moreover, the exponential short-range interactions observed here have a shorter decay length (/) than the interaction due to structural forces as calculated by Churaev and Derjaguin [37].
Anisotropic dispersion forces (of which the existence has been suggested by f. i. Fowkes [38]) occurring for oriented molecules (that are anisotropic in polarizability) might play a role in the occurrence of the exponential short range force. With respect to the exponential short range interaction observed here, we also refer to the work of Adamson [39, 40] who treated the adsorption of molecules onto a surface as a compression of vapour in the potential field of the solid surface. He described the van der Waals forces within the first few monolayers (of alkanes on teflon) by a short range exponential interaction instead of the standard inverse cube law.
Disjoining présure isotherms can also be calculated on the basis of interaction forces. In general, van der Waals- (V7m), electrostatic-(77(l) and structural- (TIS) force contributions are distinghuished, assuming them to be additive [5]. However, in the range of thin (close to molecular size) film thicknesses the disjoining pressure may only be formally used and the equations used to calculate the different contributions to TI may be incorrect. By considering the disjoining pressure isotherm for the n-alkanes and cyclohexane, that are dominated by the van der Waals forces, we can easily show that
61

CHAPTER 4
10"
O, M S 'S '3
107 ,
105
0.01
A O + «* o,
A
• + 0
— C8 van der Waals heptane octane nonane cyclohexane
®
0.1 1 10
adsorbed layer thickness [nm]
10* F
Ü 107
a, c 'S 'S
10'
:
o
-
0 o
• 0
0
o
0 0
octane
cyclohexane
- C8 van der Waals
• • • i i
o
\ • \ • \ °
© \ -
m
0.001 0.01 0.1 1 10 adsorbed layer thickness / [nm]
Fig. 8. Double logarithmic plot of the disjoining pressure, the symbols are the experimental results for the hydrocarbons, the curves are calculated theoretically, (a) Bare Aerosil OX-50, the line shown is calculated using Eq. (8a) with A = -1.67 I0'20 J. (b) Disjoining pressures on methylated Aerosil OX-50. The drawn curve is calculated using Eq. (8b) with A = -1.67 1Q-20 J and g = 0.27 nm.
62

THIN PHYSISORBED ALKANE AND WATER FILMS
the classical description does not match with the thin films observed here. The classical equation for the van der Waals part relates TJm to the Hamaker constant A(h) according to
"-'» - - 3 <8a> The Hamaker constant can be derived from the Lifshits theory [41, 42], for h < 12 nm, A(h) = constant. For octane on quartz the Hamaker constant equals -1.67 10~20 J (calculated theoretically [43]). This value is expected to apply also to n-heptane, n-nonane and cylohexane. On grafted surfaces the thickness (g) of the grafted layer can be taken into account according to
njh) = ~A(h) , (8b) 6n(h + gf
The value of A(h) in Eq. (8b) is assumed to be unaffected by the presence of the grafted layer (i.e., with respect to dispersive interactions, the grafted layer is considered comparable to the adsorbing liquid). The disjoining pressures for the n-alkanes and cyclohexane, calculated according to Eqs. (8a) and (8b), are plotted double logarithmically in Figs. 8a and 8b and compared to the experimental results. In a double logarithmic plot Eq. (8a) results in a straigth line, for Eq. (8b) a straigth line is obtained as soon as h » g. The solid curve in Fig. 8b is obtained from Eq. (8b) using g=0.27 to fit the experimental results around h = 0.1 nm.
The comparison made in Figs. 8a and 8b shows that the experimental results for thin films cannot be described with the classical equations for the van der Waals contribution to 77. However, for adsorbed films formed near saturation (for p/po > 0.8) this conclusion can not be drawn from the present experiment as interparticle condensation effects can not be excluded.
4.7. Conclusions
Adsorption isotherms of n-alkanes and cyclohexane (expressed in ujnole/m2) on bare SiÜ2 are linear up to p/po=0.15. Within experimental accuracy, the n-alkane isotherms (of C7-9) on bare SiC>2 are independent of chain length. The toluene and water adsorption isotherms on SiC>2 have a knee and the molar adsorbed amounts found are higher compared to the alkanes.
Methylation of SiC>2 leads to a lowering of the adsorption of all adsorptives studied. The adsorption isotherms of octane, cyclohexane and toluene on methylated silica are linear up to p/po=0.7. Methylation of silica Aerosil OX-50 decreases y[w from 44 mJ/m2 (for bare Aerosil OX-50) to 30 mJ/m2.
The linearity of the isotherms points to weak or even absent lateral interactions. The chain length-independency of n-alkane adsorption on bare silica suggests that the adsorbed molecules are protruding in the gas phase. Until close to saturation, the
63

CHAPTER 4
n-alkane adsorbed amounts on bare silica are below monolayer adsorption for perpendicularly oriented molecules, on methylated silica the adsorption lies below a monolayer of molecules oriented parallel to the surface. This suggests that on bare silica n-alkanes dominatingly adsorb end-on, perpendicular to the surface, whereas on methylated silica, parallel adsorption dominates.
Because of the chain architecture of the alkanes simple adsorption theories cannot describe their adsorption adequately. In Chapter 6 we will discuss the adsorption isotherms in more depth by comparing the experimental results with a self-consistent-field theory for the adsorption of chain molecules [26]. This theory also allows to investigate the wetting behaviour of chain molecule liquids.
For thin film thicknesses (i.e., below a few tenth of a nm) the disjoining pressure isotherms of apolar molecules on bare and methylated Aerosil OX-50 can be described in terms of a short-range exponentially decaying interaction. The ordinary macroscopic models are not very suited for the description of thin films, since the molecular organization and the discrete character of the adsorbed layer are extremely important. However, the gap between the continuum and discrete, molecular description of interactions can be bridged using, for instance, a self-consistent-field theory [26] for adsorption.
Appendix I
In a gravimetric experiment the magnitude of the buoyancy force varies with the vapour pressure p of the adsorptive and can be calculated from the difference in upthrust (Aw) between the two sides of the balance. Assuming ideality of the adsorptive gas, this difference can be calculated from the weight of the displaced fluid according to
Aw = ^p(VJTc - VJTJ (1.1)
where M is the relative molar mass of the adsorptive, R the gas constant, Vc and Vs
indicate the volume of the bucket plus counterweights and the volume of the sample bucket plus sample, respectively, their temperatures being Tc and 7\. In principle, buoyancy can be eliminated by arranging that Vc/Tc - Vs/Ts (this can be done by adjusting the volume of the counterweights). However, in practice this is not very convenient, it is more easy to admit a gas of negligible adsorption to the system and to plot the mass of the bucket as a function of the vapour pressure. From this plot Vc/Tc - Vy7"t can be determined by means of Eq. (1.1). Depending on the temperature, helium, argon or nitrogen are commonly used as calibrating gas [44]. The buoyancy correction follows from this calibration in combination with the molecular mass ratio of the adsorptive over the calibrating gas.
The effect of the buoyancy force in our gravimetric experiments has been measured using nitrogen as inert gas. Typically, the difference in upthrust was in the order of
64

THIN PHYSISORBED ALKANE AND WATER FILMS
0.4 (ig per mbar (N2) vapour pressure increase. This means that, for all adsorptives studied, the measured adsorbed mass is too low by an amount that corresponds to 0.014 |imol adsorptive for each mbar vapour pressure (increase). For a typical adsorption isotherm the substrate surface area equals roughly 2.5 m2. This means that at saturation the adsorbed amounts measured for n-octane and water will be too low by 0.07 and 0.12 (i.mole/m2, respectively. Therefore, the boyancy correction can be safely ignored compared to the change in the adsorbed mass.
Appendix II
Various theories describing acid-base interactions have been developed [45-47]. Fowkes [45] suggested to express the acid-base contribution to the work of adhesion WA AB as
WAAB = -fnABA(Hm)AB =fnAB(EAEB + CACB) (II. 1)
where nAB is the interfacial concentration of acid-base bonds (in mole/m2), A(Hm)AB is the molar enthalpy of acid-base complexation and ƒ is an enthalpy-to-free-energy correction factor [48]. The enthalpy of acid-base complexation can be expressed in the Drago constants CA, Cß, EA and Eg (C and E representing the covalent and electrostatic contribution of the acid A or base B, in (kJ/mole)l/2, to the adduct stability, respectively) [49]. Drago parameters for toluene are (to our knowledge) not available in literature. However, toluene is expected to behave, with respect to acid-base interaction capacity, similarly to benzene, for which the Drago constants are available. For silica the Drago constants are EA = 8.93 and CA = 2.32 for silica [50], for benzene EB = 0.75 and CB = 1.8 [51]. Taking ƒ (arbitrary) equal to unity, we have A(Hm)Ag= -10.9 kJ/mole. If WA AB is considered equal to the WA „ LW value for silica-toluene of 25 mJ/m2, the interfacial concentration of acid-base bonds is calculated to be about 1.4 acid-base bonds per nm2. If only one acid-base bond is formed per toluene this corresponds to an occupied surface of 0.72 nm2 per adsorbed toluene, consistent with a molecular area of about 0.48 nm2 as measured for a flatly adsorbed toluene molecule [52].
Silica in water is negatively charged, which means that in this case the silica has an acidic character and water acts as a base. In Drago's studies only the acid character of water has been assessed [53] and no literature data on the Drago constants of water as a base could be found.
In another method, developed by Bolger and Michaels [46, 48], the Gibbs energy change per mole acid-base contact A(Gm)AB and WA AB is assessed from the iso-electric-point of the substrate (pHiep) and minus the logarithm of the proton association or dissociation constants of the base or acid adhering to the surface. For silica interacting with a base we have
WA. AB = nAB (-A(GJAB) = nAB 2.303 RT (PKh - pH,ep) (II.2)
65

CHAPTER 4
Table 1.1. The electron donor and acceptor components of the interfacial tension of laboratory and commercial silica and toluene and water (taken from Ref. [34]) that are used for the calculation of the acid-base component of the work of adhesion according to Eq. {113).
silica
lab. SiÛ2
com. Si02
water
toluene
7-[mJ/m2]
43.7
62.4
25.5
2.7
7+
[mJ/m2]
2.4
0.13
25.5
0
For water acting as a base the proton association constant pK\, equals -1.7, the pHiep of
silica is roughly 3 (see also Chapter 3) so that A(Gm)AB equals -26 kJ/mole. Assuming
that the maximum value of WA nLW for silica-water found in this study (170 mJ/m2)
roughly equals WA AB would imply 3.9 acid-base contacts per nm2. This value is close
to the amount of silanols present at the surface of a fully hydroxylated and annealed
silica and would suggest that the silica Aerosil OX-50 used is (at least partially)
rehydroxylated. For silica-toluene a similar procedure can be followed (considering
toluene as an acid!) leading to A(Gm)AB = -198 kJ/mole for silica-toluene so that,
according to Eq. (II.2) with WA AB = WA n LW = 25 mJ/m2, 0.08 acid-base contacts are
formed per nm2. The overestimation of A(Gm) and underestimation of HAB are likely
due to the fact that the negative of the logarithm of the proton dissociation constant of
toluene is very large [48]. Furthermore the acidic nature of toluene in presence of silica
is questionable.
The acid-base contribution to the work of adhesion can also be expressed as [47]
WA,AB = 2^f^ + 2^f+ (II.3)
with yf and y+ a r e the electron donor component and the electron acceptor component
of the interfacial tension of L respectively. Using the parameters given in Table 1.1 the
acid-base part of the work of adhesion for water on laboratory and commercial SiC>2 are
82.4 and 83.4 mJ/m2 respecively, for toluene 5.1 and 1.2 mJ/m2 respectively. The
agreement with the experimentally found values for WA n LW is not very good.
The different outcome of the various semi-empirical acid-base descriptions shows
that the models describing acid-base interactions need further improvement.
Furthermore, by setting WA AB = WA nLW, all molecular subtilities and long range
electrostatic interactions are interpreted as acid-base interactions. This complicates
(experimental) verification of acid-base models.
66

THIN PHYSISORBED ALKANE AND WATER FILMS
References
[I] Wade, W. H. and Slutsky, L. J., J. Chem. Phys., 40 (11), 1964, p. 3394-3396.
[2] Gee, L. M., Healy, T. W. and White, L. R., J. Colloid Interface Sei, 131 (1), 1989, p. 18.
[3] Pashley, R. M. and Kitchener, J. A., J. Colloid Interface Sei., 71 (3), 1979, p. 491-500.
[4] Beaglehole, D. and Christenson, H. K., J. Phys. Chem., 96,1992, p. 3395.
[5] Derjaguin, B. V., Churaev, N. V. and Muller, V. M., in "Surface Forces"; Consultants
Bureau: New York, 1987. [6] Levinson, P., Valignat, M. P., Fraysse, N., Cazabat, A. M. and Heslot, F., Thin Solid
Films, 234 ,1993, p. 482-485.
[7] Hair, M. L. and Hertl, W„ J. Phys. Chem., 73 (12), 1969, p. 4269-4276.
[8] Fowkes, F. M., McCarthy, D. C. and Mostafa, M. A., J. Colloid Interface Sei., 78 (1),
1980, p. 200-206.
[9] Armistead, C. G. and Hockey, J. A., Trans. Faraday Soc., 67,1964, p. 2249-2556.
[10] Hertl, W. and Hair, M. L., J. Phys. Chem., 75 (14), 1971, p. 2181-2185.
[II] Nishioka, G. M. and Schramle, J. A., J. Colloid Interface Sei., 105 (1), 1985, p. 102-111.
[12] Rouquerol, J. and Davy, L., Thermochimica Acta, 24,1978, p. 391-397.
[13] Partyka, S. and Rouquerol, J., in "Progress in Vacuum Microbalance Techniques"
(Vol. 3), Eyroud, C. and Escoubes, M. (Eds.), Heyden: London, 1975: p. 83-92.
[14] Gee, M. L., Healy, T. W. and White, L. R., J. Colloid Interface Sei, 140 (2), 1990, p.
450-465.
[15] Whalen, J. W., J. Phys. Chem, 65,1961, p. 1676-1681.
[16] Blake, T. D., Cayias, J. L., Wade, W. H. and Zerdecki, J. A., J. Colloid Interface Sei, 37
(4), 1971, p. 678-685.
[17] Lyklema, J., in "Fundamentals of Interface and Colloid Science"; Academic Press Inc.:
London, 1991: Appendix 9.
[18] Her, R. K., in "The Chemistry of Silica"; John Wiley & Sons: New York, 1979: p. 634.
[19] Baker, F. S. and Sing, K. S. W., J. Colloid Interface Sei, 55 (3), 1976, p. 606-613.
[20] Derjaguin, B. V., Zorin, Z. M., Churaev, N. V. and Shisin, V. A., in "Wetting, Spreading
and Adhesion", Padday, J. F. (Ed.), Academic Press: London, 1978: p. 201-212.
[21] Chibowski, E., Holysz, L., Kip, G. A. M., van Silfhout, A. and Busscher, H. J., J. Colloid
Interface Sei, 132 (1), 1989, p. 54.
[22] Gregg, S. J. and Sing, K. S. W., in "Adsorption, Surface Area and Porosity"; Academic
Press Inc.: London, 1982: p. 71.
[23] Blake, T. D. and Wade, W. H., J. Phys. Chem., 75 (12), 1971, p. 1887-1892.
[24] Fowkes, F. M„ J. Colloid Interface Sei, 28 (3/4), 1968, p. 493-505.
[25] Adamson, A. W., in "Physical Chemistry of Surfaces"; John Wiley & Sons: New York,
1976: Chapter 14.
[26] Scheutjens, J. M. H. M. and Fleer, G. J., J. Phys. Chem., 83, 1979, p. 1619-1635.
[27] Zisman, W. A., in "Contact Angle, Wettability, and Adhesion"; Gould, R. F. (Ed.),
Advances in Chemistry Series, Vol. 43: American Chemical Society, Washington, D. C ,
1964: p. 21.
67
CHAPTER 4
[28
[29;
po; [31
[32
[33
[34;
[35;
[36;
[37;
[38;
[39;
[4o;
[41
[42;
[43
[44;
[45
[46;
[47
[48;
[49
[so;
[51
[52
[53
Churaev, N. V. and Zorin, Z. M., Adv. Coll. Int. Sei., 40,1992, p. 109-146.
Schlangen, L. J. M., Koopal, L. K., Cohen Stuart, M. A. and Lyklema, J., Colloids
Surfaces A, 89,1994, p. 157-167; most of it is included as Chapter 2 in this thesis
Fowkes, F. M., J. Adhesion Sei. Techn., 1 (1), 1987, p. 7-27.
Mittal, K. L. (Ed.), "Contact Angle, Wettability and Adhesion"; VSP B.V., Utrecht, 1993.
Fowkes, F. M., in "Chemistry and Physics of Interfaces", Gushee, D. E. (Ed.), American
Chemical Society: Washington, D. C , 1965: p. 5-14.
Wojcik, W. and Bilinski, B., Colloids Surfaces A, 30, 1988, p. 275-285.
Chibowski, E., in "Contact Angle, Wettability and Adhesion", Mittal, K. L. (Ed.), VSP:
Utrecht, 1993: p. 641-662.
Wu, S., in "Polymer Handbook", Brandrup, J. and Immergut, E. H. (Ed.), John Wiley &
Sons: New York, 1989: p. VI/411.
Fowkes, F. M., in "Contact Angle, Wettability and Adhesion", Gould, R. F. (Ed.),
American Chemical Society: Washington, D. C , 1964: p. 99-111.
Churaev, N. V. and Derjaguin, B. V., J. Colloid Interface Sei., 103 (2), 1985, p. 542-553.
Fowkes, F. M , J. Phys. Chem., 84 (5), 1980, p. 510-512.
Adamson, A. W., J. Colloid Interface Sei., 27 (2), 1968, p. 180-187.
Adamson, A. W., J. Colloid Interface Sei., 44 (2), 1973, p. 273-281.
Hough, D. B. and White, L. R., Adv. Colloid Int. Sei., 14,1980, p. 3-41.
Derjaguin, B. V., Churaev, N. V. and Rabinovich, Y. I., Adv. Colloid Int. Sei., 28 , 1988,
p. 197-244.
Churaev, N. V., Kolloidnyi Zhurnal, 36 (2), 1974, p. 323-327.
Gregg, S. J. and Sing, K. S. W., in "Adsorption, Surface Area and Porosity"; Academic
press: London and New York, 1967: p. 328.
Fowkes, F. M., in "Adhesion and Adsorption of Polymers", Lee, L.-H. (Ed.), Plenum
Publishing Corporation: New York, 1980: p. 43-52.
Bolger, J. C. and Michaels, A. S., in "Interfacial conversions", Weiss and Cheevers
(Eds.), Elsevier: New York, 1969.
van Oss, C. J., Chaudhury, M. K. and Good, R. J., Adv. Colloid Interface Science, 28,
1987, p. 35-64.
Berg, J. C , in "Wettability", Berg, J. C. (Ed.), Marcel Dekker Inc.: New York, 1993: p.
101-107,133-136.
Drago, R. S., Vogel, G. C. and Needham, T. E., J. Am. Chem. Soc, 93, 1971, p. 6014-
6026.
Backstrom, K., Lindman, B. and Engstrom, S., Langmuir, 4 , 1988, p. 872.
Fowkes, F. M., in "Acid-Base Interactions", Mittal, K. L. and Andersom, H. R. (Eds.),
VSP, The Netherlands: Utrecht, 1991: p. 104.
Mc. Clellan, A. L. and Harnsberger, H. F., J. Colloid Interface Sei., 23 (4), 1967, p. 577-
599.
Drago, R. S., Parr, L. B. and Chamberlain, C. S., J. Am. Chem. Soc, 99 (10), 1977, p.
3203-3209.
68

Chapter 5
A Lattice-Fluid Description of n-Alkanes: vapour-liquid properties, heat of vaporization, interfacial structure and surface tensions*
Abstract
A self-consistent-field (SCF) lattice theory for chain molecules in inhomogeneous systems is used to evaluate the physical and thermodynamic properties of fluids and fluid-fluid interfaces. The fluid is considered as a mixture of chain molecules and monomeric vacancies. Intermolecular interactions are described in terms of Flory-Huggins (FH) % parameters. For the homologous series of linear alkanes, these parameters are assessed from a fit to vapour pressure data. Each carbon atom of the linear alkane is considered as a segment with a volume of 0.027 nm3. The % value of a segment-vacancy contact reflects the segment-segment interaction, for which % equals zero by definition, and is taken inversely proportional to the temperature T in K according to 580/T. With these parameters n-alkane bulk properties such as vapour pressures, density and heat of vaporization can be obtained together with structural and thermodynamic properties of the liquid-vapour (LV) interface. The calculated volume fraction profiles of the LV interfacial region reveal that chain ends are the major constituents on the vapour side of the interface. For longer chains and lower temperatures the relative preference of the chain ends to protrude into the vapour phase is more pronounced. The calculated variation of the n-alkane LV interfacial tension (y) with temperature agrees quantitatively with experimental data. At temperatures close to 0 K, the theory predicts the occurence of positive dy/dT values. The trend in the LV interfacial tension of n-alkanes with increasing molecular weight is also correctly predicted by the theory.
5.1. Introduction
A profound knowledge of the structure and thermodynamic properties of interfaces (e.g.
surface and interfacial tensions) contributes to a better understanding and prediction of
cohesion-, adhesion- and wetting phenomena. In many practical applications chain
molecules are an important constituent of interfacial regions and there is a need for a
theory capable of describing the properties of such interfaces. Lattice theories,
demanding relatively low computational cost, are useful for this aim. They have been
applied quite succesfully to investigate a wide variety of systems such as fluid mixtures
This chapter has been submitted for publication in J. Phys. Chetn.
69
CHAPTER 5
and interfaces [1], polymeric melts, polymeric solutions and polymer adsorption [2],
solid-fluid interfaces and polymeric brushes [3], lipid bilayers [4] and surfactant
behaviour [5, 6]. This list of different applications indicates that lattice theories provide
a versatile theoretical framework for the description of both bulk and interfacial
properties of chain molecules.
A large part of lattice theory studies concentrates on polymer-containing solutions or
polymer melts [3]. The description of gaseous phases by lattice theories has recieved
less attention [7, 8]. Liquid-vapour interfaces are sometimes investigated while
neglecting the presence of molecules in the vapour phase [9] but such approaches are
not rigourous. A consistent description requires a theory in which both bulk-liquid and
-vapour are taken into account.
The liquid-vapour (phase) behaviour of hydrocarbons is well studied as it is of
particular importance to the petrochemical industry. Monte Carlo simulations of
n-alkanes yield phase diagrams [ 10] and heats of vaporization [II] that are in good
agreement with experimental data. Such simulations also provide a useful model for the
determination of the critical properties of long chain alkanes [10, 12]. Monte Carlo (or
molecular dynamics) simulations are also able to describe the molecular sturcture of
polymer melt-gas interfaces [13]. However, they are less suited to investigate the
interfacial thermodynamics of these systems.
In the present paper a self-consistent-field (SCF) theory, originally developed by
Scheutjens and Fleer [14, 15] and generalized by Evers et al. [16] is used as a lattice
fluid (LF) theory. This SCF-LF theory is capable to describe both the thermodynamic
and structural properties of chain molecules at liquid-vapour (LV) interfaces.
Furthermore, it also describes bulk liquid and vapour properties of chain molecules
with the same set of input parameters.
In the SCF-LF theory, chain-molecular fluids are described as a binary mixure of
chain-molecules (alkanes) and free volume entities, the vacancies. The parameters
needed follow from the temperature dependence of the vapour pressure. The critical
temperatures, fluid densities, heats of vaporization and interfacial tensions of chain
molecules will be investigated with the theory. Furthermore, the temperature
dependence of the heat of vaporization, the structure of the LV interface and its
interfacial tension will be investigated and compared to experimental data.
The SCF-LF approach can be extended to investigate fluids of complicated
molecular architecture (e.g., long, branched or cyclic hydrocarbons) and their mixtures.
In addition, adsorption can be easily studied within the SCF-LF theory. Hence, the n-
alkane description presented here is a first step on the way to investigate vapour
adsorption and wetting on solid surfaces.
70

LATTICE FLUID THEORY FOR n-ALKANES
5.2. Self consistent field theory for chain molecules in inhomogeneous systems
General
The lattice theory of Scheutjens and Fleer [14, 15] was originally developed to describe
the equilibrium adsorption of systems containing long flexible chain molecules. By
restricting the molecules on a lattice the probabilities of all conformations can be
evaluated relatively easily. Lattice theories can describe fluids as a mixture of empty
sites, the vacancies, and the fluid molecules. In the theory, each molecule consists of a
chain of segments. The individual segments experience a potential energy that depends
on their average surrounding by other segments. Using Boltzmann statistics, the
segment volume fractions can be calculated from the potential energies. However, the
segment volume fractions, in turn, determine the segment potential energies. Therefore,
numerical methods are applied to find the self-consistent potential energy field and the
corresponding equilibrium segment density profiles. The final volume fraction profiles
describe the set of conformations for every type of molecule that corresponds to the
minimum Helmholtz energy of the system.
In the SCF theory of Scheutjens and Fleer there is always one component (often
denoted solvent) that is considered to fill all lattice sites of the system that are not
already occupied by the other component(s). The SCF theory can be used as a statistical
thermodynamic lattice fluid theory in which vacancies may be included as the space
filling component. Scheutjens and Kijlstra [17] were the first to include free volume in
the SCF theory and explored the possibility of using the SCF theory as a lattice fluid
theory.
Segment density distribution
In the SCF theory it is assumed that each segment exactly fills one lattice site. The
lattice consists of M parallel lattice layers numbered z = 1...M each with lattice spacing
(i.e., the lattice layer thickness) /. Each lattice layer contains L lattice sites. The lattice
boundary conditions of the system are of key importance. At a reflecting boundary, the
distribution functions and volume fractions in the layers outside the system equal those
of the layers inside the system if the layers are equidistant with respect to the reflecting
boundary. If reflecting conditions are imposed on both lattice boundaries, fluid-fluid or
gas-liquid interfaces, can be investigated. The system then has to be large enough so
that bulk properties have been reached within the limits of the lattice boundaries.
The density (or volume fraction) of the segments is considered to be uniform within
each lattice layer but variable in the z direction. A flexible chain molecule has an
71

CHAPTER 5
integer number of segments of type(s) x and/or y. Each type of molecule present in the
system (i.e., the molecular components) is denoted by an index J', vacancies are
distinghuished by the index o. The total length of the chain molecule is detemined by
the number ( Nt) of segments it contains. The volume fraction of segment x in layer z is
indicated as <j)Jz).
The various segments interact with each other, with the vacancies (or solvent) and
with the adjoining phase (e.g. the surface, if present). The interaction of segment x with
segment y is given by the Flory-Huggins contact interaction parameter £ (expressed
in units of kT). The potential energy (with respect to that in the bulk solution) of a free
segment x in layer z, ujz), is given by [18]
ux(z) = iï(z) + kTXxxy(<<S>y(z)> - # ; (1) J
The potential energy u'(z) is independent of the segment type and accounts for the fact
that the sum of all volume fractions in layer z should equal unity (i.e., the lattice is
completely filled). The volume fraction of segment y in the bulk is denoted <py. The
summation term in Eq. (1) accounts for the contact energies of segment x with its
nearest neighbours. The number of contacts of a segment x, in layer z, with segment y
are considered to be proportional to the volume fractions of v in the same and adjacent
lattice layers (z, z-1 and z+7). The "contact-averaged" volume fraction < <py(z)> is
given by
< 4>y(z) > = X_, <py(z -1 ) + A0 (j)y(z) + Ki 4>y(z +1) (2)
where A0 is the fraction of contacts within the layer z, A_, and A+/ denote the fractions of
contacts in the layers z-1 and z+1 respectively. The values of A0, A_; and A+/ depend on
the type of lattice used. In general, the contact fractions only affect the results
quantitatively, without affecting qualitative features. In the interfacial region, however,
lattice artefacts may appear. These artefacts are minimal when A0, A_; and A+/ in Eq. (2)
are put equal to 1/3.
The conformational statistics of the chain molecules in the lattice are evaluated using
a weighted chain extension procedure that adds, one by one, segments to the chain. The
probability of each chain extension with a segment x is weighted with a (Boltzmann-
like) segment weighting factor Gx(z) defined as
Gx(z) = exp (-uJz)lkT) (3)
The product of the appropriate segment weighting factors of all the chain segments of a
molecule determines the molecular volume fraction. In this multiplication the
72

LATTICE FLUID THEORY FOR n-ALKANES
connectivity of the chain molecule has to be taken into account. For this goal the chain
statistics have to be evaluated.
Chain conformation: first order Markov statistics
A detailed and generalized derivation of the SCF theory for first-order-Markov statistics
can be found in [16], here its main principles are resumed. Consider a flexible molecule
i of chain length N, built of segments with ranking number 5 and end segments s=l and
s=N. In order to facilitate the counting of conformations of such a molecule, it is
customary to divide the chain molecule into two chain fragments with their
corresponding distribution functions.
The weighting factor of a chain molecule (fragment) / with segment s in layer z
under the condition that segment i is linked by a chain of segments to segment s'
somewhere in the system will be denoted as Gt(z, s\s') = XG,(z, S I z', s') , where the
sum is over all possible starting positions z'. Likewise, G{(z,s\l) is the weighting
factor of an s-mer of which the position of the first segment is free and its last segment
s localized in layer z, Gi(z,s\Nj) is the distribution function for an (w,-*+/)-mer with
its last segment s in layer z and its first segment Nt free. The distribution functions of
these two end fragments of a free chain are generated by "growing" the chain fragments
by means of recurrence relations. One chain is generated from segment / to s, Eq. (4a),
the other from segment Ni to 5 , Eq. (4b).
G,(z,s\l) = G,(z,s) < G,(z,s-l\l)> (4a)
Gi(z,s\Nj) = Gt(z,s) <Gi(z,s + l\Ni)> (4b)
The brackets <> denote "contact-averaged" distribution functions for the three possible
values of z, according to
<Gi(z,s-i\i)> = X^G,(z-hs-i\l) + X0Gi(z,s-l\i) +
X+,G,(z + i,s-l\i)
and likewise for < Gt(z,s + l\ Nj)>. If segment s of molecule i is of type x then
G,(z,s) = GJz).
The distribution functions of the chain fragments in Eqs. (4a) and (4b) are generated
starting from free segments, s=l and s= Ni respectively, according to
G, (z , / l / j = GiCz-s) Vz (6)
G,.fz,w(.lw;j = G,(z,s)
73
The distr ibution functions (4a) and (4b) determine the distribution function
Gj(z, s I /; Nj) of chain molecule segment s in layer z provided segment s is part of a
chain molecule with the first segment and the last (W,th) segment anywhere in the
system. The segment volume fraction ^(z, s I /; Nj) of s in z now follows from
*l(z,sU;N<) = C,Gl(z,sU;Nl) - C, G ^ ' J ^ ^ ( 7 )
Gi(z,s)
where C; is a normalisation constant. In order to prevent double counting of the linking
segment s (present in both chain end fragments), the product of both chain end point
distribution functions is divided by the free segment weighting factor of s in layer z-
The normalisation constant follows from the total amount of segments of component i
6t in the system according to
N M
e, = I X4>i(z.s\i;Nt) (8) .(=/ 7 = 1
For component i with chain length Nt, Eqs. (7) and (8) can be combined to
C = °-i = â (9)
If not 0,., but the volume fraction in the bulk <pt is kept constant the normalisation
constant follows from
C, = -^- (10) Ni
The segment density profiles in layer z follow from a summation over all possible
values of J within a chain molecule of chain lenght Nt.
<Pi(z) = l^z.sM;^) (11)
The SCF theory can also be applied to branched chains (i.e., chains with more than two
chain fragments linked to one segment s) [4].
Once the self-consistent equilibrium volume fraction profile and the correponding
potential energy field are found, the partition function can be evaluated so that the
mechanical (e.g. pressure and energy) and thermodynamic properties (e.g. enthalpies,
interfacial tensions and chemical potentials) of the system can be derived [4].
74
LATTICE FLUID THEORY FOR n-ALKANES
Thermodynamic relations and the SCF-LF theory
According to thermodynamics the differential of the Helmholtz energy F of a system
consisting of two homogeneous bulk phases separated by a flat interface reads
dF = -SdT - pdV + ydA + 2 > , dra, (12)
where S is the entropy, T the temperature, p the pressure and V the volume of the
system, y and A are the interfacial tension and the area of the interface, respectively,
/ij is the chemical potential of molecule i and «, denotes the number of molecules i
present in the system. The index / runs over all types of molecules present in the
system.
According to Eq. (12) the pressure is given by
p= -(dF/dV)TA/nl (13)
In a lattice fluid system, free volume is accounted for by means of vacancies. The
volume in a lattice fluid system is given by the sum of the volumes of all lattice sites
that are either occupied by molecule segments or monomeric vacancies according to
V = v £nkNk = ML (14a)
where v is the volume of a lattice site and the index k runs over all components {kj (i.e.,
the molecules (ij and vacancies o) present in the system. The lattice site volume is
defined by the lattice spacing and the type of lattice used. In the lattice fluid model v
and Nk are constants and we have
dV = v XNkdnk (14b)
The only way in which V of a lattice fluid system can change at constant 7", A and { nj
is by adding or withdrawing vacancies, therefore, (dV)T A /n f is equal to
(dV>, A fll j = v dn0. Hence, Eq. (13) can be rewritten as
P= - ^ F / a u ™ , . ^ = -A./V ( i 5a )
where fik = (dF/dnk) , or, alternatively,
-pdV = /J„d;i„ (15b)
75

CHAPTER 5
This means that for a lattice fluid system, Eq. (12) reduces to
dF = -SdT + YdA + (dF/dn„)TA/nkfJdn„ + Z(dF/dnk)TA/nM/dnk
= -SdT+ ydA + £fikdnk (16) k
Note that the equality £ßk dnk = £ßi d"i following from Eqs. (12), (15b) and (16)
does not neccessarily imply that fik equals fit, see also Eq. (21).
According to statistical thermodynamics, the characteristic function of the grand
canonical partition function JZ({fikj, M, L, T) equals
-kT In E({ßkj, M, L, T) = -kT In Q({nk}, M, L, Ü) + Ü - £fik nk
= JA (17)
where £2({nkJ, M, L, Ü) is the micro canonical partition function and the energy
Ü = TS + y A + Zßknk- Within the SCF theory Eq. (17) can be evaluated k according to [16]
ya/kT = yA/LkT
- -ier/Nt - Xw(z)/kT- ±ZZZx»(4>Jz) «i>B(z)> - fiti) k z * 7. A B
(18)
where a is the lattice cell area, 6ekxc - 9k - M <j)k and </>k is the bulk volume fraction
of the segment type (A or B) or component (k) denoted by the subscript.
According to Eq. (12), the chemical potential /i; is defined as the change in
Helmholtz energy upon the addition of one molecule j to a macroscopic system, without
changing T, V, A and /n,#; / of the system
> ' ' J-'T.V.A.ln^ii (19)
In the lattice fluid theory (free) volume is treated as a component, and the condition of
constant V in Eq. (19) has to be restated in terms of the composition of the system.
According to the generalized chain rule we have
(dFI^K, A. KM,,; = (^l^r. ..,*,,,,<>„ + (^I^T.A.M (^I^K. ,,/„,,, „ (20)
The subsripts i and j are used to denote the type of the molecular component whereas
the vacancies are denoted by o. In a lattice fluid system constant T, A, Vand {n^}
imply that (dnrl/dnj) = - N . Hence, equation (20) can be rewritten as
ßj = fij- Njfl„ (21)
76

LATTICE FLUID THEORY FOR n-ALKANES
Note that Equation (21) only applies to molecular components).
In a lattice fluid theory a liquid-vapour system is considered as a binary mixture of
molecules / (containing segments A only) and monomeric vacancies o. In such a binary
mixture the partial Helmholtz energy of a vacancy equals, according to FH theory (Ref.
[2] p. 511),
fi„ = kT(ln 0* + (1 - 1/N,) 0* + XM, (tf)2) (22)
Equations (22) and (15a) can be combined to find the expression for/?
p = _ ÏÏ. (in tf + (1 - m 0* + XM (tff} (23)
The interactions in the lattice fluid are accounted for by FH contact interaction
parameters Xxy The FH parameters are related to the the pair contact energies e (in J)
between the segment types denoted by the subscipts according to
Xxy = Z(2£xy - exx - eyy)/2kT (24)
where Z is the coordination number. According to Eq. (24), the FH interaction
parameter for identical segments equals zero. In a binary mixture of aliphatic chain
molecules (consisting of segments A) and vacancies (o) there is only one non-zero
interaction parameter, xA,r By definition, the contact energy for a contact in which a
vacancy is involved equals zero. Hence, XM, ls directly related to the contact energy
between two A segments as
XA„ = -ZeAA/2kT. (25a)
As identical molecule segments attract each other eAA is negative and XM> ls positive. In
the FH theory, x l& considered as purely enthalpic, i.e., its (absolute) magnitude is
independent of temperature. Hence, one may write
XM= c2/T (25b)
where C2 (expressed in K) is a constant equal to - Z EAA/'2 k.
The above expressions for the bulk parameters illustrate how the SCF-LF theory can
be used to assess fluid properties. When necessary, a further elaboration of the theory
will be presented in the results section. To be able to describe the properties of n-
alkanes, the values of the chain length, segment-vacancy interaction and lattice cell
volume have to be determined. In the results section reliable estimates for these
parameters will be obtained.
77
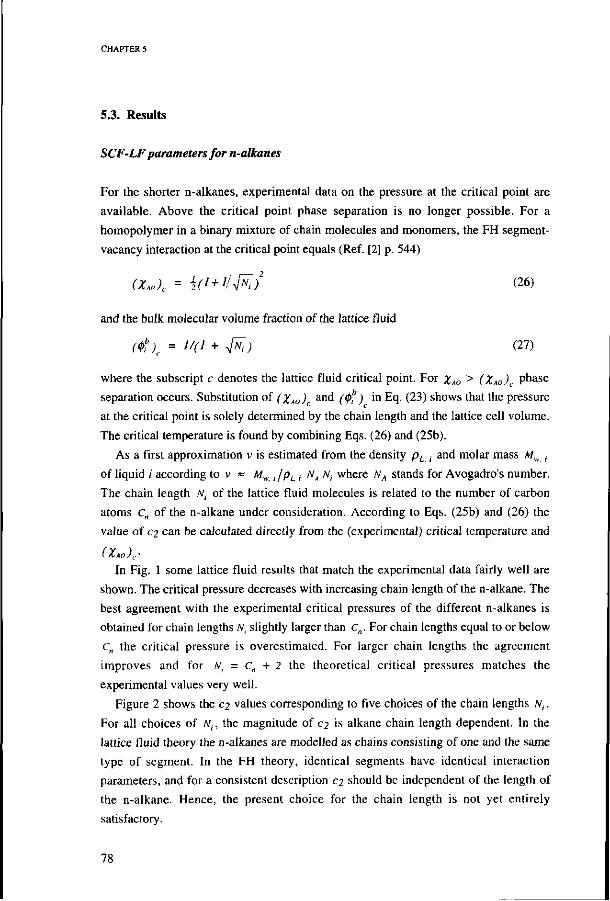
CHAPTER 5
5.3. Results
SCF-LF parameters for n-alkanes
For the shorter n-alkanes, experimental data on the pressure at the critical point are
available. Above the critical point phase separation is no longer possible. For a
homopolymer in a binary mixture of chain molecules and monomers, the FH segment-
vacancy interaction at the critical point equals (Ref. [2] p. 544)
(X„)c = l2(l + ll^)2 (26)
and the bulk molecular volume fraction of the lattice fluid
ftf )r = 1/(1 + 4^) (27)
where the subscript c denotes the lattice fluid critical point. For %A0 > (XAO) phase
separation occurs. Substitution of (XAO) . a n ^ (<!>?) in Eq. (23) shows that the pressure
at the critical point is solely determined by the chain length and the lattice cell volume.
The critical temperature is found by combining Eqs. (26) and (25b).
As a first approximation v is estimated from the density pL , and molar mass Mw ;
of liquid / according to v ~ Mw i/pu ; NA Nt where NA stands for Avogadro's number.
The chain length Ni of the lattice fluid molecules is related to the number of carbon
atoms c„ of the n-alkane under consideration. According to Eqs. (25b) and (26) the
value of C2 can be calculated directly from the (experimental) critical temperature and
( XAO ) , . •
In Fig. 1 some lattice fluid results that match the experimental data fairly well are
shown. The critical pressure decreases with increasing chain length of the n-alkane. The
best agreement with the experimental critical pressures of the different n-alkanes is
obtained for chain lengths Ni slightly larger than Cn. For chain lengths equal to or below
C„ the critical pressure is overestimated. For larger chain lengths the agreement
improves and for w,- = C„ + 2 the theoretical critical pressures matches the
experimental values very well.
Figure 2 shows the C2 values corresponding to five choices of the chain lengths Nr
For all choices of Nh the magnitude of C2 is alkane chain length dependent. In the
lattice fluid theory the n-alkanes are modelled as chains consisting of one and the same
type of segment. In the FH theory, identical segments have identical interaction
parameters, and for a consistent description C2 should be independent of the length of
the n-alkane. Hence, the present choice for the chain length is not yet entirely
satisfactory.
78

LATTICE FLUID THEORY FOR n-ALKANES
e
1 10
10°
6 10°
:= 4 io" -
2 10
30
Figure 1. The critical pressure of various n-alkanes as a function of chain length, plotted on a semi-logarithmic scale. Lattice fluid results (curves through open points) compared to experimental data (solid circles) [19].
X
800
700 -
600 -
500 -
400
300
_ - y-
>
: JS
'• \
' o^
A
4. N = C -2
\ N, = C» - '
\ / N, = C,,
W^~ N,= c„ + '
N | = Cn + 2
10 15 20 25
Figure 2. The molecule segment-vacancy contact interaction parameter C2 that matches the experimental critical temperature [19] and Eq. (26) through Eq. (25b). Different choices of Nj are made to describe the n-alkanes.
79

An alternative way to assess a general set of lattice fluid parameters describing the n-
alkanes is through the (saturated) vapour pressure as a function of temperature, see
Refs. [20, 21] for experimental data. Equations (23) and (25b) define the temperature
dependence of the lattice fluid pressure. The lattice cell volume follows from the molar
mass Mi of component i, its density pt(T) and molecular bulk volume fraction <j>f (T) at
temperature T according to
v = M' *<T> (28) N,P,(T)NA
According to Eqs. (25b) and (28) the lattice cell volume is defined by the volume
fractions 0f that, in turn, depend on %M). In order to assess XA„ o r c2 fr°m
experimental vapour pressure data, a numerical least square procedure is used. In this
procedure, the lattice cell volume used is taken to be independent of temperature and
determined by Eq. (28) and the liquid density at 293.15 K.
The outcome of the numerical procedure for each alkane depends on the chain
lengths assigned to JV,\ We substituted those values that agreed best with the critical
pressures (see Fig. 1). The use of Eq. (28) in the numerical procedure resulted in lattice
cell volumes that are n-alkane dependent. For a general lattice fluid description of the n-
alkanes, the partial molecular volume of the latttice fluid should be defined by the chain
length only. Therefore, it is preferable to set the lattice cell volume of all n-alkanes at a
constant value. A volume of 0.027 nm3 for a CH2 group is a reasonable choice. Using
this constant (n-alkane independent) v in the numerical procedure instead of Eq. (28),
hardly affects the accuracy and C2 values with which the experimental vapour pressures
are described. For various relations between N, and Cn, the resulting C2 values of the n-
alkanes up to C„=25, are shown in Fig. 3. According to Fig. 3 the C2 value (for v =
0.027 nm3) approaches a rather constant value of about 580 if Ni equals C„. The
present choice of (general) n-alkane parameters is quite satisfactory and summarized in
Table 1, in which a denotes the lattice cell area. The a value given in the Table
corresponds to an (FCC) lattice cell volume of 0.027 nm3. Also included in the Table
are the lattice cell volume and the lattice-fluid critical temperature Tc, the latter is
obtained by equating Eqs. (25b) and (26). In the next sections, the SCF-LF theory is
used to predict several bulk and interfacial properties of the n-alkanes with the
parameters shown in Table 1.
80

LATTICE FLUID THEORY FOR n-ALKANES
W 1000
800
600
400
Figure 3. The molecule segment-vacancy contact Interaction parameter C2 obtained from the numerical procedure for v = 0.027 nm^. Different choices ofNj are made to describe the n-alkanes.
Table 1. Parameter choice for the description of n-alkanes with the SCF lattice fluid theory. The critical temperature within the SCF-LF theory is also given.
A-AC)
Ni
V
a
Tc
[kT]
[nm3]
[nm2]
[K] (/
580/T
c« 0.027
0.09
1160
+ i/Wt)2

CHAPTER 5
Bulk properties of n-alkanes
Vapour pressures
For n-octane and n-hexadecane, the calculated vapour pressures (using the parameters
in Table 1 are compared to the experimental data in Fig. 4.
4 10"
3 10"
2 10"
fr 1 10"
S 1 105
5 10"
octane, Ni = 8
-
-
1 1 K * " * ^ 1 1
hexadecane, N. = 16
-
-
/
©/
'/
i i
©
i i
©
y ^
i i i i
®
i i i i
:
• :
1
1 l l
/ -
/
i
i i i
10"
- 10"
- 10"
300 400 500 600 300 temperature / [K]
400 500 600
ie h
-. 10"
103
Figure 4. Saturated vapour pressures of n-octane (a and b) and n-hexadecane (c and d). The solid curves are experimental results [20, 21 J, dashed curves are calculated. In panels (a) and (c) the pressure is plotted on a linear scale; in panels (b) and (d) a logarithmic pressure scale is used.
Figure 4 demonstrates that the lattice fluid theory is able to reproduce, at least
semiquatitatively, the temperature dependence of the n-alkane vapour pressures. For
long n-alkanes the agreement is excellent. For short n-alkanes the lattice fluid theory
underestimates the vapour pressure, especially at more elevated temperatures. For
yv,=8, the dotted curve covers a larger temperature range than the solid curve. This
implies that the calculated critical temperature is slightly overestimated. For longer
chains the agreement between the calculated and experimental pressures improves.
82

LATTICE FLUID THEORY FOR n-ALKANES
6 10°
" 4 106h
2 10° -
-
-•
—
-
-
-
® \
^ \ . experimental
**- ^* \ . **G- \ ,
""O. * s .
lattice fluid *-©. *"»
« 10
C„(°rnalkane) 20
Figure 5. The lattice fluid pressures (the open circles) at the experimental critical temperature (calculated using the perameters shown in Table 1) compared to the experimental critical pressure (the solid circles) of various n-alkanes [19].
Critical point
In Fig. 5 the lattice fluid pressure (using the parameters in Table 1) at the experimental
critical temperature of the different n-alkanes is calculated and compared to the critical
pressure. At the (experimental) critical temperature the calculated pressure aproaches
the experimental critical pressure. For chain lengths above 12 the theory is unable to
calculate the volume fractions accurately (the value of %M according to Eq. (25b)
approaches (XM)C)-
As noted in relation to Fig. 4, the critical temperature within the lattice fluid theory
does not correspond precisely to the experimental value. In Fig. 6 the two are
compared. For infinitely large chains, the critical temperature of the lattice fluid (using
C2 = 580) attains a plateau value of 1160 K. Especially for the shorter n-alkanes the
critical temperatures are overestimated by the lattice fluid theory. For larger n-alkanes
the agreement is again quite good. The extends of correspondence between theory and
experiment indicate the over-all accuracy of the choices made with respect to the lattice
theory and its parameter values.
Liquid and vapour densities
In the theory, both the liquid and vapour density as a function of temperature follow
from the volume fractions of the coexisting phases according to Eq. (28). For n-octane
volume fractions and densities are calculated functions of the temperature. The
83
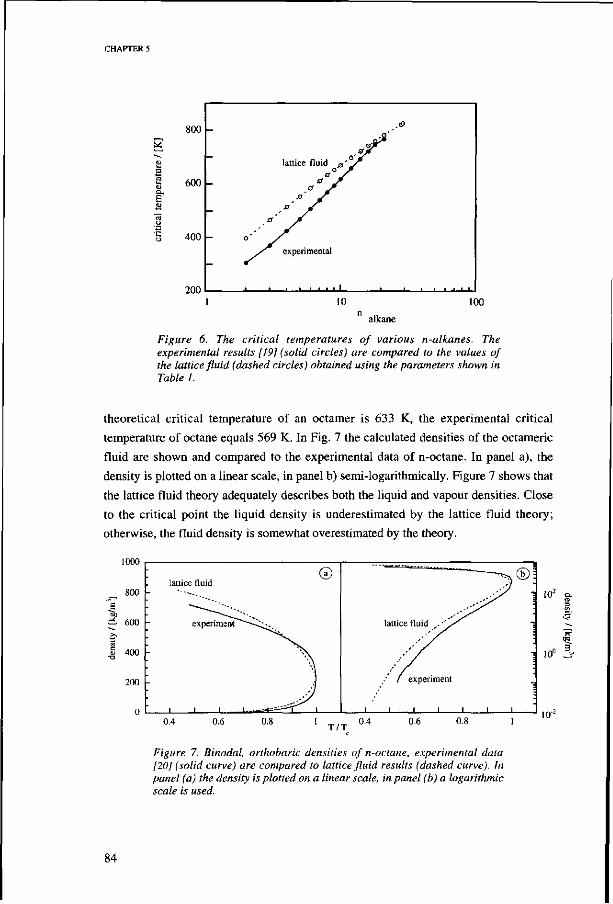
800 -
g 6001-Q. S
400 -
200
-
-
-
— o '
OUT
lattice fluid B'J 0 y
0 ß s' J»
.0 ß 0' Jf
S experimental
1
,<s>
10 100
alkane
Figure 6. The critical temperatures of various n-alkanes. The experimental results [19] (solid circles) are compared to the values of the lattice fluid (dashed circles) obtained using the parameters shown in Table 1.
theoretical critical temperature of an octamer is 633 K, the experimental critical
temperature of octane equals 569 K. In Fig. 7 the calculated densities of the octameric
fluid are shown and compared to the experimental data of n-octane. In panel a), the
density is plotted on a linear scale, in panel b) semi-logarithmically. Figure 7 shows that
the lattice fluid theory adequately describes both the liquid and vapour densities. Close
to the critical point the liquid density is underestimated by the lattice fluid theory;
otherwise, the fluid density is somewhat overestimated by the theory.
1000
800
600
S 400
200
lattice fluid ©
0.4
1 10'
experiment
T / T 0.4 0.6 0.8
10" a-
10-"
Figure 7. Binodal, orthobaric densities of n-octane, experimental data [201 (solid curve) are compared to lattice fluid results (dashed curve). In panel (a) the density is plotted on a linear scale, in panel (b) a logarithmic scale is used.
84

LATTICE FLUID THEORY FOR n-ALKANES
Heat of vaporization of n-alkanes
The heat of vaporization expresses the enthalpy difference between coexisting liquid
and vapour phases. The enthalpy is defined as H = U + pV. Within the SCF-LF theory,
the (configurational) energy U of a homogeneous binary mixture bulk phase,
consisting of N* segments x and N* segments y, equals
U" = l2Z(exx N'x + £yy N*y) + N'y £ Xxy kT (29a)
The first term in Eq. (29a) represents the (perfect) configurational energy for random
mixing, the second term is the mixing energy contribution due to interactions between
the mixing segments.
For a mixture of molecule segments and vacancies em> = eMI = 0 (vacancies
experience no interactions). Furthermore, xA<> c a n be related to eAA (Eq. 25a)) and Eq.
(29a) reduces to
U"=-XAoN,n,^kT (29b)
where nt is the number of molecules / in the system with energy Ub, The molecular
energy uf in bulk liquid or vapour of molecules ;', defined as uf = Ub /« , , therefore
equals -/V, XAO $ kT • The molecular enthalpy h\, in bulk liquid or vapour follows
from ftf = (Uh + pV)/ni. Realizing that V= nt• A/,-v /(/if, and making use of Eq. (15a),
hj can be calculated as
A," = «f - fi0 Njtf (30)
The molecular enthalpy of vaporization 4 r a /A ' s defined as the enthalpy difference
between the coexisting bulk vapour and liquid phases (denoted by the superscripts V
and L, respectively):
\uph,=hJ-K (3D
The molar heat (enthalpy) of vaporization is obtained as Ava„Hi = NA 4^,.,/Î,.
In Fig. 8, the computed molar heats of vaporization for the homologous series of n-
alkanes are compared to experimental data [19], see Fig. 8. Panel a) shows the results at
298.15 K, panel b) shows the results at the normal (1 atm) boiling points. At room
temperature, the calculated values tend to be too low. The discrepancy increases with
ZV,. The experimental and theoretical data both depend linearly on the chain length
(Fig. 8a). At the normal boiling points the enthalpy of vaporization of the n-alkanes also
increases with increasing chain length (see Fig. 8b), however, this increase is smaller
than that at room temperature. At the normal boiling points, the calculated heats of
85

CHAPTER 5
l.o i<r
5.0 10"
0.0
; T =
-. •
•
. A
= 298.15 K
experiment f ,*>'
f o'
J*ti' lattice fluid J>,0
Sa
At'
. i . . . . i . . . , i , . , , i
©
.1 1 1 . 4
T = T boiling (1 atm)
lattice fluid 0..
0»"""
^• ' ' exper iment
^ e
• • • • 1 • • • • 1 • • • • 1 • • • i 1 • • i i
®: -
. • • — ° . •
:
-•
10 20 0 n alkane
10 15 20 25 30
Figure 8. The molar enthalpy of vaporization of different n-alkanes. Experimental data [19] (solid points) are compared to lattice fluid results (open circles). In (a) the data at 298 K are plotted against the number of carbon atoms of the n-alkane, in (b) the SCF results at the normal boiling points of the n-alkanes are compared to (extrapolated) experimental data.
vaporization are in quite good agreement with the (extrapolated) experimental values
[19].
The entropy of vaporization is related to the enthalpy of vaporization. In a binary
mixture of vacancies and molecules i we have for the Gibbs energy G = pt n^ and
A>an8i = Si - St - MÏ - ßt = 0- This implies that the molar entropy of vaporization
directly follows from AvapSi - Ay^H; / T. The molar entropies of vaporization
corresponding to the enthalpies of Fig. 8 are plotted in Fig. 9. At room temperature
\ St increases with the chain length of the n-alkane. However, at the normal boiling
points \apSi is rather constant for the different chain lengths. Increasing the n-alkane
chain length raises the boiling temperature and \aplii similarly, consequently, \apSi
is hardly affected. For most fluids, molecules in the vapour phase interact minimally
and are in a state of disorder. The differences in ^ St of individual fluids may be
associated with the internal order in the liquid. Obviously, for n-alkanes, the molecular
stucture at the normal boiling point is rather independent of the alkane chain length.
Summarizing we conclude that the parameters shown in Table 1 are reasonable choices
for the description of the bulk properties of n-alkanes with the SCF-LF theory. Figures
4 to 9 show that, with these parameters, the theory is able to reproduce the trends in
bulk properties as a function of chain length and temperature and that even a reasonable
quantitative agreement between calculated and experimental data is achieved,
especially for longer n-alkanes. Therefore, the present parameter choice will be
maintained when describing the interfacial properties of different n-alkanes with the
SCF-LF theory.
86

LATTICE FLUID THEORY FOR n-ALKANES
T = 298.15 K
alkane
Figure 9. The entropy of vaporization for the homologous series of n-alkanes corresponding to Fig. 8. Calculated values (open points) are compared to experimental data (solid points) at room temperature (circles) and at the normal boiling temperature (triangles).
Interfacial properties ofn-alkanes at the liquid-vapour interface
Volume fraction profiles
With the SCF-LF theory the structure of the liquid-vapour (LV) interface can be
investigated. The segments of a chain molecule are numbered from s = 1 to s = /V,.
Segments with ranking numbers s = 1+x and s = Nrx have identical volume fraction
profiles <pj(z,s). The total volume fraction in layer z (£<t>j(z,s)) is further investigated s
by expressing the contribution of a segment with ranking number i to £<j>i(z,s) in a
relative volume fraction according to (j>j(z,s) N, / ^</>;(z, s). If a lattice layer is part of s
an isotropic phase, the relative volume fractions are unity for any segment. The density
profiles at the boundary of the coexisting liquid and vapour phases are plotted in Fig. 10
for two temperatures and for chain molecules with N; = 4 and TV, = 8. Both the
absolute (left) and the corresponding relative (right) volume fraction profiles are shown.
In each panel, the liquid phase is positioned at the left hand side, the vapour phase on
the right hand side. The shaded regions in the plots indicate the highest segment and
vacancy density gradients between two adjacent lattice layers. The volume fraction
profiles are symmetrical with respect to exchanging molecules and vacancies.
87

CHAPTER 5
With decreasing temperature the thickness of the interfacial region (with densities
differing from those in the coexisting bulk phases) decreases. At T = 0 K any interface
becomes dead sharp. The relative volume fraction profiles (panels b, d and f) reveal that
the chain end segments have a (relative) preference for the vapour side of the interface
whereas the middle segments avoid this region. In a molecular dynamics simulation
study [22] and other lattice fluid studies [9] this feature has also been observed. With
increasing temperature this behaviour becomes less pronounced (compare panels b and
d). Increasing the chain length enhances the (relative) preference of the chain ends for
the vapour phase boundary side of the interface (compare panels d and f)-
The reason for the difference in interfacial behaviour of chain end and -middle
segments is twofold. Firstly, middle segments drag two neighbouring segments to the
interfacial region whereas end segments only have one neighbouring segment. Thus,
when chain ends are exposed to the vapour boundary side of the interface, the number
of unfavourable segment-vacancy contacts is smaller. Secondly, the conformational
entropy of a chain molecule in the interfacial region is larger when a chain end is
pushed out of the interface instead of a train of segments. These two effects become
more pronounced upon decreasing the temperature and increasing the chain length.
LV interfacial tension
The interfacial tension 7 follows from the density profiles according to Eq. (18). To
investigate a liquid-vapour interface within the SCF-LF theory, the amount of
molecules in the system is chosen such that two homogeneous bulk phases coexist. The
densities of these coexisting phases follow directly from the Flory theory [2]. In the
SCF-LF calculations of the interfacial tension, lattice artefacts are elimated by adjusting
the amount of molecules until the volume fractions of the coexisting bulk phases equal
those calculated with the Flory theory [23]. The interfacial tension of the lattice fluid is
expressed per area of a lattice-site. For conversion to units of J/m2 this value has to be
multiplied with the lattice cell area (a). This area is assigned the value corresponding to
the lattice cell volume in the FCC latice used, i.e., a = v1 = 0.09 nm2.
The interfacial tensions for different temperatures and chain lengths are calculated
and compared with experimental data. Usually, experimental data are obtained under an
atmosphere of hydrocarbon vapour and dry nitrogen. In the temperature range of the
comparison (i.e., above 0°C) nitrogen is assumed an inert gas with a negligible
influence on the measured interfacial tensions.

LATTICE FLUID THEORY FOR n-ALKANES
z+10 z+15 layer number
Figure 10. Absolute (left) and correponding relative (right) volume
fraction profiles of the liquid-vapour interfacial region for various
temperatures and chain lengths. The steepest decay in the absolute
volume fraction profiles between two adjacent lattice layers is shaded.
89

Temperature dependence
According to general thermodynamics (Eq. (12)) the interfacial tension / i s related to
the Helmholtz energy as
y = (dF/dA)T v lnj} = (dU/dA)T v {Hi , - T (dS/dA)T v fn> y (32)
the second term on the right hand side accounts for the excess interfacial entropy
S° = (dS/dA)T v j and equals -(dy/dT)v . According to Eq. (32), the interfacial
tension at the absolute zero point equals (dU/dA)T , ..
Figure 11a shows the calculated temperature dependence of the interfacial tension
for (alkaoe) molecules of various lengths. Upon decreasing the temperature any fluid
will eventually freeze. As application of the SCF-LF theory may not be justified for
frozen states, the curves are only drawn for temperatures above the freezing
temperatures of the n-alkanes. The frozen states will be briefly discussed at the end of
this section. The calculated y(T) curves above the melting point (see solid curves in
Fig. 11a) show that (dy/dT)v . . < 0, both for monomers and chain molecules, hence
Sa is positive. According to the theory Sa decreases with increasing chain length.
Upon increasing the temperature (for a certain chain length) the magnitude of Sa
increases until it reaches a maximum (at the inflection point of the y(T) curve). After
the maximum Sa decreases with increasing temperature to vanish (together with the
phase boundary) at the critical temperature.
The interfacial excess entropy has two (main) contributions: the excess
conformational entropy of the chains at the interface and the excess entropy of mixing
vacancies and molecules. For monomeric fluids the conformational contribution at the
interface is absent and S° is solely determined by the mixing term. Thus, the maximum
in Sa(T) for the monomeric fluid is a reflection of the temperature dependency of the
interfacial excess mixing entropy. The y(T) curves suggest that this conclusion also
applies to chain molecular fluids.
In Fig. 1 lb the results of the lattice fluid calculations for n-alkanes in the liquid state
(i.e., for T/Tc > 0.35) are plotted against the reduced temperature T/Tc. The calculated
y(T/Tt.) curves are virtually independent of the chain length. When experimental data
on the temperature dependency of the interfacial tension for different individual n-
alkanes [24] are plotted against the reduced température T/Tc an almost linear
mastercurve results (see Fig 1 lb). The quantitative agreement between the lattice feid
results and experimental data is satisfactory, the calculated values are somewhat lower
than the experimental data.
90

LATTICE FLUID THEORY FOR n-ALKANES
30
3~ 15
• . : : : : : - : : - :
- Y \
-
-
• i
•• / N i= '
\ \ \ \ / N'=8
\ \ \ \ \ N,= '6
i \ i \ i . N. , X . ,
® -•---il|t^vNi=4 ® ' 7 \ ""^^w • experimental
N.= l 1 S ! « . V^^^(C5,C8,C!>.CIO.CI2) _
r̂ K. N = 8 ^l% N'"6 A , •
. , . , . , . |NJ 200 400 600
temperature / [K] 0.2 0.4 0.6 0.8
T/T
- 30
- 15
Figure 11. The liquid-vapour interfacial tension for liquids of varying chain length as a function of temperature (calculated using the parameters in Table 1). The drawn curves are the results calculated for temperatures above the melting temperature of the n-alkane with Cn = Nj. Below the melting point only calculated points are shown. In panel (b) the calculated interfacial tensions are plotted against the reduced temperature. Below the melting temperature the curves are dashed. The experimental interfacial tensions for several n-alkanes [24] (C5, C8, C9, CIO and C12) are also shown.
As indicated above, the SCF-LF theory may not be suited to describe highly ordered
frozen phases. In the theory molecules are considered to be randomly distributed, i.e. at
low temperatures it describes a supercooled fluid. Yet it may be interesting to discuss
the initial (low temperature) part of the y(T/Tc) plots as the calculated trends may be
useful to improve our understanding of surface freezing (occuring a few degrees above
the bulk freezing temperature) of longer (C„ > 14) n-alkanes [25, 26].
At 0 K, interfaces are dead sharp (i.e., $ = 0 and 0f = 1). In the SCF-LF theory the
interfacial tension is given by the contact fraction with the next layer X+l together with
the segment-vacancy interaction according to y = A+I c2 k/a (as xM - ci k< s e e Eq.
(25b)), independent of the chain length. Very close to the absolute zero point Sa
vanishes and (dy/óyr)vf . has to become 0, irrespective of the chain length.
Calculations of this region are hampered by numerical problems associated with the
high XA„ values. Figure 1 lb shows that for monomers y only decreases with
temperature whereas for chain molecules a maximum interfacial tension is found at
T/Fc ~ 0.12, rather independent of the chain length. The maximum in the y(T/Tc)
curves, if real, would imply the occurence of negative (dS/dA)T v , values around
T/Tc = 0.12. For n-alkanes just above their bulk freezing temperature, the occurence of
negative Sa values has also been observed experimentally [25, 26]. A negative Sa
91

CHAPTER 5
means that the entropy of the interfacial region is lower than in the bulk, i.e. the
interfacial region has a higher degree of organisation than the high density bulk phase.
A physical argument could be that at a sharp interface, the conformational entropy of
the molecules in the interface is restricted as compared to that in the (high density) bulk
phase. This restriction will be more serious for longer chains than for shorter ones.
In our calculations the maximum in the y(T/Tc) curve not only occurs for longer n-
alkanes, it is also found for very short n-alkanes for which surface freezing has not been
observed. Furthermore, the y maximum occurs at temperatures below the
experimentally established n-alkane surface freezing temperatures [25, 26]. These
discrepancies propably have to do with the weakness of the current SCF-LF theory to
describe frozen phases. However, it is worthwhile trying to improve the SCF-LF
description of frozen n-alkane surface films by f.i. application of the Self-Consistent
Anisotropic Field Scheme [27] in which the tendency of densily packed chain molecules
to line up is accounted for.
Chain length dependence
The calculated chain length dependence of n-alkane LV interfacial tension is compared
with experimental data [24] (at T - 293.15 K, under 1 bar of hydrocarbon vapour and
dry nitrogen) in Fig. 12a. Another way of comparing is to plot the SCF-LF results
directly against the experimental values, this is done in Fig. 12b. The experimental
surface tensions of the homologous series of n-alkanes scale with the molecular weight
to the power -2/3 [28]. The drawn and dotted curves in Fig. 12a are described by the
relation
v = v - k / C 2I3
In I n->°° ""ulk ' '"n (33)
The constants /„_>„, and kalk (in mJ/m2) corresponding to these curves are 37.3 and
62.5 for the experimental data and 27.9 and 25.4 for the SCF-LF results, respectively.
This implies that the scaling of the calculated LV interfacial tension with the number of
carbon atoms of the n-alkane is correcly reproduced but not the absolute value.
For the shorter n-alkanes, the generalized lattice fluid parameters (see Table 1)
overestimate the interfacial tension. This overestimation can be traced back to the fact
that the lattice cell volume determines the area of a lattice site. According to the liquid
density at 293.15 K and Eq. (28), the lattice eel volume of the shorter n-alkanes
(especially for Cn < 8) is higher than the 0.027 nm3 used in the calculations. This
means that lattice cell area is underestimated and that the calculated value of the
interfacial tension will be too high. For C„ > 8 the lattice cell volume is close to 0.027
92
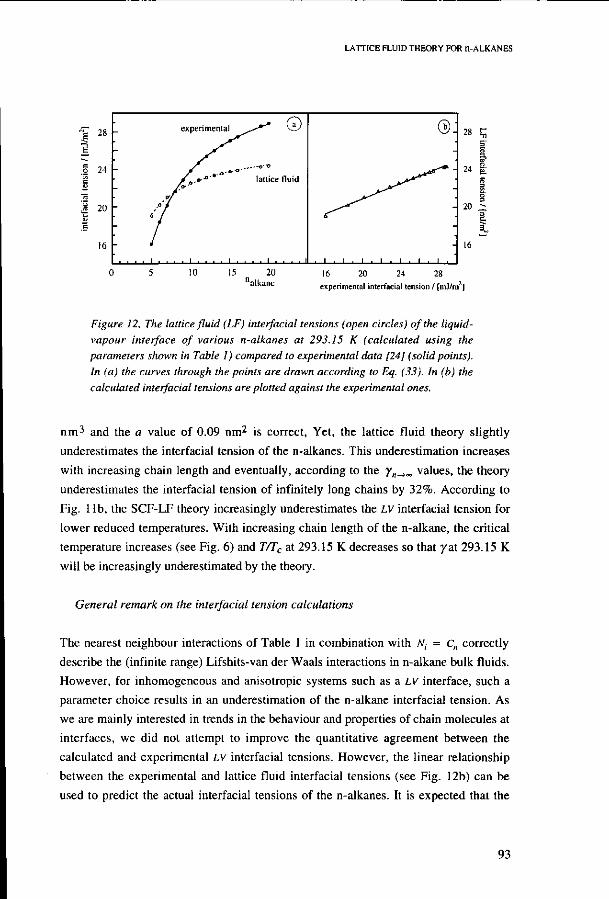
LATTICE FLUID THEORY FOR n-ALKANES
"E 28
I 24 c
J 20
e
16
experimental ©
.-o-o
lattice fluid
10
®. 28 C
24 5'
15 20 nalkane
16 20 24 28 experimental interfacial tension / [mJ/nT]
Figure 12. The lattice fluid (LF) interfacial tensions (open circles) of the liquid-vapour interface of various n-alkanes at 293.15 K (calculated using the parameters shown in Table 1) compared to experimental data [24] (solid points). In (a) the curves through the points are drawn according to Eq. (33). In (b) the calculated interfacial tensions are plotted against the experimental ones.
nm 3 and the a value of 0.09 nm2 is correct, Yet, the lattice fluid theory slightly
underestimates the interfacial tension of the n-alkanes. This underestimation increases
with increasing chain length and eventually, according to the yn^,„ values, the theory
underestimates the interfacial tension of infinitely long chains by 32%. According to
Fig. 1 lb, the SCF-LF theory increasingly underestimates the LV interfacial tension for
lower reduced temperatures. With increasing chain length of the n-alkane, the critical
temperature increases (see Fig. 6) and T/Tc at 293.15 K decreases so that y at 293.15 K
will be increasingly underestimated by the theory.
General remark on the interfacial tension calculations
The nearest neighbour interactions of Table 1 in combination with Nt = Cn correctly
describe the (infinite range) Lifshits-van der Waals interactions in n-alkane bulk fluids.
However, for inhomogeneous and anisotropic systems such as a LV interface, such a
parameter choice results in an underestimation of the n-alkane interfacial tension. As
we are mainly interested in trends in the behaviour and properties of chain molecules at
interfaces, we did not attempt to improve the quantitative agreement between the
calculated and experimental LV interfacial tensions. However, the linear relationship
between the experimental and lattice fluid interfacial tensions (see Fig. 12b) can be
used to predict the actual interfacial tensions of the n-alkanes. It is expected that the
93

CHAPTER 5
calculated and experimental interfacial tensions of chain molecules will ameliorate if
the chain flexibility is reduced by, for instance, the RIS scheme [4].
The current lattice fluid calculations are an important improvement compared to
previous efforts to model the chain length dependence of the interfacial tension of the
n-alkanes [9]. In these previous calculations the volatility of the liquid has been
neglected. Including vapour molecules in the lattice fluid theory description of the LV
interface results in rather good quantitative and qualitative agreement between
calculated and experimental n-alkane interfacial tensions.
5.4. Conclusions
The SCF-LF theory (semi)quantitatively reproduces various bulk and interfacial
properties of normal-alkanes. The description of the temperature dependence of the
vapour pressure of the homologous series of n-alkanes is optimal if the n-alkane
molecules are considered as chain molecules with a chain length equal to the number of
carbon atoms. In the SCF-LF theory the segment-segment interactions (for which the
FH parameter is zero by definition) are reflected in the non zero FH interaction
parameter for a chain segment-vacancy contact %All, Under the conditions mentioned
XM is independent of the (n-alkane) chain length and equals 580/7 (T in K) for all n-
alkanes. Using these parameters n-alkane (liquid-vapour) bulk properties such as
saturated vapour pressure, densitiy and heat of vaporization are calculated for different
temperatures. The quantitative and quantative agreement between the calculated results
and experimental data is satisfactory.
Density profiles of the LV interfacial region reveal that chain end segments,
protruding into the vapour, are the major constituent of vapour side of the interface. At
the liquid side of the interface, chain middle and end segments are equally distributed.
The theory is able to reproduce the chain length dependence and temperature
dependence of the n-alkane interfacial tensions rather accurately. For 0.4 < T/Tc < 0.8,
the calculated interfacial tension of chain molecule fluids rises linearly with decreasing
T/Tc. This has also been established experimentally. For the moment experimental data
on the interfacial tension of n-alkanes for T/Tc values below 0.4 are lacking. The
theoretical predictions can be verified experimentally by measuring the LV interfacial
tension of shorter n-alkanes, which are still liquids below T/Tc = 0.4.
If the theory is applied for temperatures below the n-alkane freezing temperatures,
positive d / /d7 values occur and a maximum in the LV interfacial tension is found at
T/Tc = 0.12, irrespective of the chain length of the molecule.
94

LATTICE FLUID THEORY FOR n-ALKANES
The lattice fluid theory description of the n-alkane interfacial properties may be
improved by considering flexibility contraints, for instance trans-gauche conformations.
Furthermore, it is rather straightforward to extend the present theory to more complex
systems such as fluid mixtures, or fluids (vapour and liquid) at solid surfaces with or
without grafted groups. As the present theory allows the computation of interfacial
tensions of these interfaces the work of adhesion and contact angles as a function of
temperature and chain length of the (wetting) liquid can be investigated. The same can
be done for grafted solids as a function of grafting-density and -chain length. Some of
these aspects will be elaborated a forthcoming publication.
95

CHAPTER 5
References
[I] Guggenheim, E. A., in "Mixtures"; Clarendon : Oxford, 1952.
[2] Flory, P. J., in "Principles of Polymer Chemistry"; Cornell University Press: Ithaca (N.
Y.), 1953.
[3] Fleer, G. J., Cohen Stuart, M. A., Scheutjens, J. M. H. M, Cosgrove, T. and Vincent, B.,
in "Polymers at Interfaces"; Chapman & Hall.: Cambridge, 1993.
[4] Leermakers, F. A. M. and Scheutjens, J. M. H. M., J. Phys. Chem., 89 (5), 1988, p. 3264-
3274.
[5] Böhmer, M. R., Koopal, L. K. and Lyklema, J., J. Phys. Chem., 95 (23), 1991, p. 9569-
9578.
[6] Böhmer, M. R. and Koopal, L. K., Langmuir, 8(11), 1992, p. 2660-2665.
[7] Sanchez, I. C. and Lacombe, R. H., J. Phys. Chem., 80 (21), 1976, p. 2353-2362.
[8] Poser, C. I. and Sanchez, I. C , J. Colloid Interface Sei., 69 (3), 1979, p. 539-548.
[9] Theodorou, D. N., Macromolecules, 22 (12), 1989, p. 4578-4589.
[10] Siepmann, J. I., Karaborni, S. and Smit, B., Nature, 365 (23 Sept.), 1993, p. 330-332.
[II] Kaminski, G., Duffy, E. M., Matsui, T. and Jorgensen, W. L., J. Phys. Chem., 98 (49),
1994, p. 13077-13082.
[12] Smit, B., Karaborni, S. and Siepmann, J. I., J. Chem. Phys., 102 (5), 1995, p. in press.
[13] Madden, W. G., J. Chem. Phys., 87 (2), 1987, p. 1405-1422.
[14] Scheutjens, J. M. H. M. and Fleer, G. J., J. Phys. Chem., 83,1979, p. 1619-1635.
[15] Scheutjens, J. M. H. M. and Fleer, G. J„ J. Phys. Chem., 84, 1980, p. 178-190.
[16] Evers, O. A., Scheutjens, J. M. H. M. and Fleer, G. J., Macromolecules, 23, 1990, p.
5221-5232.
[17] Kijlstra, J. and Scheutjens, J. M. H. M., "Vacancies in the Lattice Model", 1986, MSc
thesis Dept. Physical and Colloid Science, Wageningen Agricultural University, The
Netherlands.
[18] van Lent, B. and Scheutjens, J. M. H. M., Macromolecules, 22,1989, p. 1931-1937.
[19] Lide, D. R. (Ed.), in "CRC Handbook of Chemistry and Physics"; CRC Press Inc.: Boca
Raton, U.S.A., 1992-1993.
[20] Timmermans, J., in "Physico-Chemical Constants of Pure Organic Compounds";
American Elsevier.: New York, 1950 (Vol. I) and 1965 (Vol. II).
[21] Boublink, T., Fried, V. and Hala, E., in "The vapour Pressures of Pure Substances";
Physical Sciences Data 17; Elsevier: 1984.
[22] Weber, T. A., J. Chem. Phys., 72 (7), 1980, p. 4014-4018.
[23] Barneveld, P. A., Scheutjens, J. M. H. M. and Lyklema, J., Langmuir, 8, 1992, p. 3122-
3130.
96
LATTICE FLUID THEORY FOR n-ALKANES
[24] Jasper, J. J. and Kring, E. V., J. Phys. Chem, 59,1955, p. 1019-1021.
[25] Earnshaw, J. C. and Hughes, C. J., Phys. Rev. A., 46 (8), 1992, p. R4494-R4496.
[26] Wu, X. Z., Ocko, B. M., Sirota, E. B., Sinha, S. K. and Deutsch, M., Physica A, 200 ,
1993, p. 751-758.
[27] Meijer, L. A., Leermakers, F. A. M. and Nelson, A., Langmuir, 10 (4), 1994, p. 1199-
1206.
[28] Legrand, D. G. and Gaines, G. L., J. Colloid Interface Sei, 31 (2), 1969, p. 162-167.
97

Chapter 6
Vapour Adsorption and Wetting of Alkanes on Bare and Alkylated Solids:
a statistical thermodynamic approach
Abstract
The adsorption, structure and thermodynamics of aliphatic chain molecular fluids at rigid solids and at solids with terminally grafted aliphatic chains are investigated with a lattice-fluid theory. Vapour adsorption isotherms, including the meta- and unstable regions, are calculated for both types of substrates. The effect of adsorption energy differences between end and middle segments on the adsorption isotherm of an octamer on a rigid solid is investigated together with the influence of the chain flexibility. Furthermore, contact angles are calculated on rigid solids and on solids with terminally grafted chains. On a poorly wetted rigid solid, the contact angle decreases with increasing chain length of the wetting liquid and increasing temperature. This is mainly due to the influence of the temperature on the liquid-vapour and solid-liquid interfacial tensions. Grafting of aliphatic chains to a very poorly wetted (bare) solid decreases the contact angle of the octameric liquid. Moreover, the contact angle as a function of the grafting density passes through a minimum. The rise beyond the minimum has an entropie origin. When chains are grafted on a completely wetting solid this eventually results in a finite contact angle; higher grafting densities give higher contact angles. With increasing chain length of the grafted molecules lower contact angles are found on both solid substrates. With the theory both the thermodynamics and molecular aspects of chain molecular fluids at solid substrates are described. This reveals that contact angles on grafted solids mainly result from the absorption of middle segments (of the wetting molecules) within the grafted layer.
6.1. Introduction
Adhesion and wetting are technologically interesting phenomena and have many
practical applications including printing, painting, coating, oil recovery and polymer
melt processing. For such applications control over the adhesion and wetting properties
of materials is extremely relevant. This requires a profound understanding of the
thermodynamics and structures of the interfaces involved.
Vapour adsorption and contact angle measurements are useful tools to study the
behaviour of fluids at solid interfaces. In general the vapour adsorption gradually rises
with increasing vapour pressure. If the fluid completely wets the substrate, the vapour
adsorption isotherm rises very steeply to infinity as saturation is approached (i.e., a
99

CHAPTER 6
macroscopic liquid layer is formed). A partial wetting adsorption isotherm has two
stable states at saturation; a finite adsorbed amount (thin film) and a macroscopic liquid
layer. If enough liquid is present, these two states can coexist through the curved
interface of a droplet with a finite contact angle.
Hydrocarbons are major constituents of fuels, oils, lubricants and polymers. Because
of their (industrial) importance both the bulk and interfacial properties of hydrocarbons
are extensively studied. Their properties are also important with respect to the
behaviour of biological molecules (such as lipids) of which hydrocarbon chains are
important building units. In wetting and adhesion studies alkanes are often used as
standards [1]. Furthermore, in many scientific and technological applications the
hydrophobicity of solids is controlled by grafting aliphatic chains to the solid surface.
Usually alkanes completely wet oxide surfaces. On alkylated substrates short
n-alkanes completely wet whereas longer n-alkanes partially wet [2]. In various
independent gravimetric and ellipsometric vapour adsorption studies, isotherms with a
large linear part have been reported for alkanes adsorbing onto silica surfaces [3, 4]. Up
to close to saturation the adsorption is lower than the coverage that corresponds to a
monolayer of perpendicularly adsorbed n-alkanes. At saturation the isotherm diverges
to infinity (complete wetting). Vapour adsorption isotherms of alkanes on alkylated
surfaces show low adsorbed amounts [3, 5]. The adsorbed amounts are lower than the
adsorption corresponding to a monolayer of n-alkanes oriented parallel to the surface.
This persists until close to saturation.
Bulk fluid properties of n-alkanes have been described succesfully by means of
Monte Carlo simulations [6, 7]. Until now, the simulation of chain molecular fluids at
interfaces has recieved less attention [8, 9]. Furthermore, usually such simulations
concentrate on the molecular structure and not on the adsorbed amounts or the
interfacial thermodynamics. Modelling approaches leading to adsorption isotherm
equations for spherical molecules (such as BET, Volmer and Langmuir [10]), are
inadequate to describe n-alkane adsorption isotherms; they do not take into account the
chain nature of the molecules. However, the self-consistent-field (SCF) theory,
originally developed by Scheutjens and Fleer [11, 12], is very well suited for the
description chain molecules and their (interfacial) behaviour and provides an excellent
alternative for the classical adsorption theories.
In the previous Chapter a self-consistent-field lattice fluid (SCF-LF) theory has been
outlined and applied to describe both the stucture and the thermodynamics of n-alkane
bulk fluids and their liquid-vapour (LV) interfaces. Here, the theory will be applied to
describe n-alkane adsorption on solid surfaces. Vapour adsorption isotherms (including
the meta- and unstable regions) of chain molecules on rigid solids and on solids with
grafted chains will be calculated. For rigid solids, the influence of differences in
100

ADSORPTION AND WETTING OF ALIPHATIC FLUIDS
adsorption energy between chain end and middle segments will be investigated together
with the effect of chain flexibility. Moreover, the interfacial tensions of the solid-
vapour and solid-liquid interfaces of aliphatic fluids on hard solids and "soft" alkylated
substrates (i.e., a solid with terminally grafted aliphatic chains) are calculated and used
to obtain contact angles [13]. On a hard solid, the contact angles of aliphatic liquids are
calculated for different chain lengths and temperatures. The contact angle of an
octameric liquid on "soft" alkylated substrates is calculated as a function of the grafting
density and the grafted chain length.
The theory describes both the thermodynamics and structural aspects of chain
molecular fluids at solid substrates. It offers a united approach of wetting and
adsorption in which thermodynamics and molecular aspects are included. This allows
one to relate the wettability in a system to the structure of the interfaces involved in the
wetting process.
6.2. Self-consistent field lattice fluid theory for adsorption of chain molecules
SCF theory for adsorption
The main principles of the Self Consistent Field (SCF) theory for adsorption of chain
molecules are shortly summarized in this section; for a detailed description of the
theory we refer to Chapter 5 and Refs. [11, 12, 14, 15].
In the SCF theory a chain molecule i is considered as a series of A', segments
numbered s=l...Nj. Examples of chain molecules with TV, = 8 that can be built from
segment types x and y are xs or y-X(,-y, when we whish to to take the difference between
end and middle segments into account. The segments are placed on a lattice consisting
of layers parallel to the surface and numbered from z=l to z=M. The segments in a
lattice layer experience a potential energy field that depends on their average
surrounding by other segments and (nearest-neighbour) segment-segment interactions.
The latter are quantified by Flory-Huggins x parameters. With a mean field
approximation in every lattice layer (only inhomogeneities in the direction
prependicular to the surface are considered), the weighted probability Gt(z,s) of
finding an arbitrary free segment s of molecule / in an arbitrary layer z, is evaluated
using Boltzmann statistics. The probabilities of all possible conformations of the chain
molecules are calculated by means of Markov statistics. This allows one to obtain the
equilibrium volume fraction <px(z) for all segment types x in all lattice layers z. As the
segment volume fraction profiles both determine and depend on the potential energy
field, the equilibrium field and volume fraction profile are determined numerically.
From these self consistent volume fraction profiles the partition function can be
101

CHAPTER 6
calculated and the thermodynamic and mechanic properties of the system can be
derived.
Adsorption on solids can be studied with the SCF theory by placing an adsorbing,
impenetrable boundary (a solid wall) on one side of the system. At the other boundary
of the system, reflecting conditions are assumed [11]. The interaction of a segment (x)
in the lattice layer directly adjacent to the solid wall S, with the solid is described by the
Xxs interaction parameter. If two impenetrable walls are placed on both system
boundaries, adsorption in slits can be investigated.
The excess adsorbed amount of component i, 8fxc (expressed as the number of
segments adsorbed on top of one surface site) follows from the equilibrium density
profiles according to
M
er = i^fz) - ti) (i) Z = I
where 0* is the volume fraction of molecule i in the bulk. The (excess) number of
adsorbed molecules per surface site n"c is related to 0 " ' according to
nexc
«r = — (2) TV,.
In the SCF theory different kind (c.q. order) of Markov statistics can be used [14]. If
first order Markov statistics are applied, two consecutive bonds of a chain may overlap
each other (i.e., backfolding of segment s+1 on s-1 can occur). When dealing with
short chains, it is, in principle, possible to store the whole chain conformation so that
backfolding within a chain can be excluded. However, due to the mean field
approximation made within the SCF theory, it is impossible to prevent a segment of one
chain molecule from entering a lattice site that is already occupied by a segment
belonging to another chain molecule. Therefore it is not very utile to implement full
self-avoidance in the theory. However, within the SCF theory, a rotational isomeric
state (RIS) scheme (i.e., a third order Markov approximation) has been developed [14].
This scheme reduces the chain flexibility and distinghuishes between gauche and trans
conformations of the chain.
Rotational isomeric state scheme
The RIS scheme excludes direct backfolding of a chain and takes the semi-flexibility of
the chain configurations into account. Each sequence of three C-C bonds has two
secondary minima and one primary minimum in the configurational energy. These
minima correspond to the two gauche configurations and the trans configuration,
102

ADSORPTION AND WETTING OF ALIPHATIC FLUIDS
respectively. The energy of the trans configuration is about 1 kT lower than that of the
gauche configuration [16]. In the RIS scheme a three propagation choice lattice (a
tetrahedral lattice) is used in order to describe the probability of the trans and gauche
configurations.
A typical chain molecule segment has two bond directions with the rest of the chain,
denoted by the superscripts a, ß and y or a', ß' and y' depending on the type of site it
occupies [14]. The weighting factor of a free segment s is independent of the bond
directions a and ß and given by
Gt(z,saß) = Gi(z,s) if a * ß
( 3 )
Gif^f) = 0 if a = ß
The second equality expresses that segment 5 cannot form two bonds in the same
direction, i.e., it excludes direct backfolding within one chain. The probabilities of the
different conformations of a chain molecule are counted by splitting the chain in
fragments with their corresponding fragment weighting factors. The weighting factor of
a chain extending from segment 1, anywhere in the system, to segment s, in layer z,
with orientation aß, is denoted by Gt(z,saß \1). The subscript i denotes that the
fragment is part of chain (molecule) i. Note that that for all segments s, Gj(z, s I s)
equals the free segment weighting factor G{(z,saß). The chain (fragment) weighting
factors are generated, starting from the monomeric weighting factors for s=J or s= Nt
(Eq. (3)), by adding segments one by one according to
G,(z,saß\l) = Gi(z,saß)y^r~a"'ß"Gl(z',s-l"'a'\l)
(4) Gl(z,s
aß\Ni) = G,(z,saß)ZrX
a"-ß"-r'Gi(z',s+lßY\ N.)
The superscripts a", ß" and y" denote the bond orientation as determined by the two
bond directions of the bonds linking two segments (e.g. for a" these bond directions
are a and a') and X? ~a 'ß and Aa ~ß ~r are the probabilities of such a set of
successive bond orientations. In order to prevent overlapping of two consecutive bonds
A" ~ß ~Y = 0 when a" = ß" or ß" = y". Depending on the bond direction, z' can be
z-l, z or z+l.
In the first extension step according to Eq. (4) (i.e., when growing monomers to
dimers), the trans or gauche configurational energy of the chain does not play a role; the
second segments s = 2 and s = N-l of the chain fragments may choose from four,
equally probable, propagation directions; in this case, A" 'ß ~y equals 0.25. During the
second and further extensions, the a"-ß"-y" configuration of each three consecutive
bonds is reflected in A" ~ß "y . The configuration is trans if the bond orientations a"
103

CHAPTER 6
and y" are identical, otherwise the configuration is gauche. For a trans configuration
the value of X" ~ß ~y equals X = l/Ctg, for a gauche configuration
Xg = exp(- Ulg /kT)/C'g, where U's is the gauche configuration energy minus the
trans configuration energy and Clg is a normalisation constant. For each trans
configuration of a linear chain two gauche configurations are possible hence,
X' + 2 Xg = 1 so that C,g = l + 2 exp(-U,g/kT) must be obeyed.
The volume fractions of segment s, with orientation aß of chain molecule i can be
calculated from the two chain fragment distribution functions according to
0,- (z, saß I /; N, ; = Ct Gi (z, saß I 1; N, )
= C, A' aß Gi(z,s
aß\l)Gi(z,saß\Nt) (5)
G,(z,saß)
On a tetrahedral lattice two alternating types of sites can be distinghuished, on each
type a segment may assume 12 different orientations aß , therefore Xaß equals 1/24
[14]. The volume fraction of segment s in layer z is obtained by summation of Eq. (5)
over all possible bond orientations aß.
If studying isotropic systems (e.g., a bulk phase), application of the RIS scheme in
the SCF theory does not affect the calculated volume fractions and thermodynamic
quantities. Only when anisotropic systems (e.g. interfaces) are studied does application
of the RIS scheme affect the SCF results.
SCF-lattice fluid theory
The Self Consistent Field theory can be used as a lattice fluid (LF) theory, capable of
describing bulk fluid and liquid-vapour interfacial behaviour of chain molecules. Hereto
free volume is accounted for by introducing vacancies as one of the components in the
system. Due to the presence of these vacancies the expressions for the chemical
potential fij of molecular component j and the pressure p in the SCF-LF theory read
(see previous Chapter)
ßj = (dF/dnj )T A in t h n - Nj (dF/dn„ )T A ^, = fiJ - Nj fl„ (6a)
p= -î-(dFldn„)TAIniJ = -fijv (6b)
where F represents the Helmholtz energy of a system of temperature T, area A, rij
molecules j, with chain length Nj, and «„ (monomeric) vacancies, v is a constant that
represents the volume of one lattice cell, fik. is defined as (dFjdnk.)T where
104

ADSORPTION AND WETTING OF ALIPHATIC FLUIDS
the index k runs over all components in the system, hence it also includes the vacancies.
In order to calculate the relative vapour pressure of a lattice fluid the saturated
vapour pressure po is needed. At po two homogeneous phases (liquid and vapour) may
coexist. In the lattice fluid theory phase separation can only occur if the binodal is
reached. The binodal position can be found by equating the pressures and chemical
potentials ßj in the two coexisting phases. The relative vapour pressure of a lattice
fluid p/p0 directly follows from the the partial of the Helmholtz energy of a vacancy in
a sytem with pressure p and molecular composition «, (Eq. 6b) divided by the value of
this partial at the binodal
iL = À _ (7) Po (fi„)0
with (fi„)0 = (dFjdn0) where (nk^oj0 is the molecular composition of the
system at the binodal.
According to Eq. (6b), varying the molecular composition of a binary SCF-LF
system changes the vapour pressure of the system and allows us to calculate vapour
adsorption isotherms.
SCF-LF theory and wetting
Vapour adsorption isotherms can be used to characterize the wettability of the fluid-
solid pair considered. In the case of complete wetting the adsorbed amount (expressed
in moles/m2 and denoted by F ) at saturation approaches the value for a macroscpic
layer with properties of bulk liquid ( F —» F J . In the case of partial wetting the
isotherm intersects the saturation axis with a finite adsorbed amount (Ff), only after
supersaturating the vapour does the isotherm rise to infinity (condensation). If enough
vapour is present at saturation, both adsorbed states F^ and F„ can coexist through the
curved interface of a droplet with a finite contact angle 6. The larger the contact angle
the poorer the wetting. In the case of complete wetting, the notion of contact angle
looses its meaning (0=0).
The magnitude of the equilibrium contact angle in a liquid (L)-vapour (V)-solid (S)
system can be related to the interfacial tensions involved in the contact angle formation
according to [13]
y'y (cos O - I) = ysv - (ySL + JLV) (8)
where ysv is the interfacial tension of the solid with the thin adsorbed film ( F^) that is
formed at the saturated vapour pressure and yiL + yLV is the interfacial excess free
energy of the same solid, covered by a macroscopically thick adsorbed layer with
105

CHAPTER 6
properties of bulk liquid. The value of the contact angle in a liquid-vapour-solid system
can be assessed from an integration of the meta- and unstable region of the (semi-
logarithmically plotted) vapour adsorption isotherm. With help of Gibbs' adsorption law
we have derived [17]
r_ yLV (cos 0- 1) = RTf r(-L) d fo£ (9)
rt
where R is the gas constant.
According to general thermodynamics, the interfacial excess free energy is related to
the Helmholtz energy F of the system:
F = -pV + y A + Zß.n, (10)
where V is the volume of the system, A denotes the interfacial area and the index (' runs
over all types of molecules present in the system. Within the SCF-LF theory this
expression reduces to (see Chapter 5)
F=yA+Zfiknk (11) k
where the index k runs over all components in the system, inclusive the vacancies as
they account for the free volume contribution (-pV) to F in the system. According to
standard statistical thermodynamics, the Helmholtz energy of a system follows from the
canonical partition function Q as F = - kT In Q. In the SCF theory Q can be
evaluated from the volume fraction profiles [ 15] and y can be calculated by rewriting
Eq. (11) as
(Y- y") A = - kTlnQ- £ßknk (12) k
where y denotes the interfacial tension of the reference state. Its appearance in Eq.
(12) is due to the fact that, in the SCF theory, the term on the right hand side of Eq. (12)
gives the excess interfacial free energy per unit surface with respect to a reference state
in which the pristine interface (i.e, the interface without adsorbed and/or grafted chains)
is included. For liquid-vapour systems, the reference state is the homogeneous bulk
fluid without any interface and y = 0. For solid-fluid systems, the reference state is
defined by the homogeneous bulk fluid and the pristine solid surface with interfacial
tension yi .
106

ADSORPTION AND WETTING OF ALIPHATIC FLUIDS
In the SCF theory the surface tension y can also be evaluated directly from the
grand canonical partition function and the segment density distribution according to
[15]
(7 y*)A = LkT( -Zetxc/Nk - Zu'(z)/kT
^ 7. A' B' /
(13)
where L is the number of lattice sites per lattice layer. The potential energy u'(z)
accounts for the fact that the sum of all volume fractions in layer z should equal unity
(i.e., the lattice should be completely filled). The counters A' and B' in Eq. (13) run over
all segments (including the vacancies) in the system except for the segments of the solid
surface (S), the brackets <> denote a contact averaged volume fraction [15]. For the
derivation of Eq. (13) use is made of the following expression for the normalisation
constant
C, = tf/N, (14)
For ungrafted solids Eqs. (12) and (13) both yield correct, identical values of y.
However, for chains that are grafted to a solid, Eq. (14) does not apply as such chains
cannot leave the system. In this case Eq. (13) becomes more complicated and its correct
version has not yet been implemented. Therefore, the interfacial tensions of grafted
solids are calculated by means of Eq. (12). In Eq. (12), the contribution of the grafted
chains is included in Q whereas the index k runs over all components in the system
except for the grafted molecules (for which fi is not defined).
The theory expresses the interfacial tensions of the thin adsorbed film ( 7^) and the
macroscopic liquid layer (F„), both formed at the saturated vapour pressure, with
respect to the same reference state (ys>). The first, ysv(Tt), equals ysv - y s \ the latter,
ysv(r„) equals ys' +yLV - ys*. Once ysv(Tt), ysv(rj and yLV are calculated, the
contact angle can be predicted by rewriting Eq. (8) to
y"'(cos e - 1) = ysv(rl:) - ysv(rj (15)
For the calculation of the contact angle the reference state ys is irrelevant as it cancels
inEq. (15).
Calculating the contact angle, either by means of Eq. (15) or by means of Eq. (9),
yields the same results. However, Eq. (15) is quicker and more accurate than Eq. (9) as
the latter requires calculation and numerical integration of the adsorption isotherm.
Therefore we will use Eq. (15) for our contact angle predictions.
107

CHAPTER 6
Parameter choice
The properties of chain molecules at solid sufaces are studied using the same
parameters as those that successfully described bulk fluid poperties of hydrocarbons
(see Chapter 5). This means that n-alkanes will be described as flexible chains of n
segments (An), in which each segment A represents one carbon atom. Furthermore, the
segment (and lattice cell) volume equals 27 nm3 and the interaction between two A
segments is described by a FH segment (zl)-vacancy (o) interaction parameter %Mt equal
to 580/T (as Xxx - ° f ° r a ' l segment types X). In this description, differences between
the n-alkane CH3- and -CH2- groups (the chain end and middle segments, respectively)
are averaged over all segments of the chain molecule.
Aliphatic chains are anisotropic in their polarizability [18, 19]. In the present theory
this anisotopy can be incorporated in a primitive way by differentiating between the
interactions of the end and middle segments of an n-alkane with the other segments in the
system. In homogeneous (isotropic) bulk phases, differences between chain end and
middle segments are averaged out and making a distinction does not affect the results.
At interfaces preferential structuring may occur and it is important to make a distinction
between end and middle segments, especially at solid-fluid interfaces as the solid may
have a substantially different interaction with a CH3 segment than with a CH2 segment.
Therefore, the adsorption of aliphatic chains is investigated by modelling n-alkanes as
B-An-2-B chains with end segments of type B and middle segments of type A. The A and
B segments have different interactions with the solid substrate 5 only; several values
(~1/T) will be chosen. The segment-vacancy interaction parameters of the A and B
segments are kept the same, i.e. %Blt = %MI = 580/T and xAB = 0» so that the description
of the n-alkane bulk and LV interfacial properties as given in Chapter 5 remains the
same.
The effect of the chain flexibility on the adsorption isotherms is investigated by
comparing SCF calculations for flexible chains (first order Markov chain statistics) to
calculations for semi-flexible chains using the RIS scheme. The trans-gauche energy in
units of kT (U's /kT) in the RIS scheme is assigned a value of 290/7. The trans-gauche
energies segments A and B within a certain bond are identical.
For many applications the hydrophobicity of solid surfaces is controlled by grafting
aliphatic chains to the surface. In our calculations, the simplest model of a hydrophobic
solid is a hard wall consisting of aliphatic segments. The interactions of A and B
segments with such a solid are described by xAS= XBS- 0
a n d Xos~XOA = 580/T. We will
refer to such a solid as a rigid alkylated surface. With the theory also a more
sophisticated description of an alkylated solid is possible, e.g. by considering such a
108

ADSORPTION AND WETTING OF ALIPHATIC FLUIDS
substrate as a hard solid S with terminally grafted (or chemisorbed) chains. For this
purpose, one end of the grafted chain is restricted to the first lattice layer adjacent to the
solid surface. The adsorption energy of the restricted end segment is effectively -°°.
Except for this difference, the segments of the grafted chains are identical to those of
the free (adsorbing) chains. The grafting density a equals the number n of grafted
chains per lattice layer of L lattice sites according to
CTÇ = nK/L (16)
For the investigation of alkane adsorption and contact angles on soft alkylated surfaces
we do not discriminate between the adsorption energies of end and middle segments.
Furthermore we will, for these systems, restrict ourselves to first order Markov
statistics. Hence, for this part of the study the n-alkanes and the grafted n-alkyl chains
are exclusively described as homo-oligomers An.
6.3. Vapour adsorption isotherms
The different kinds of experimentally measured hydrocarbon adsorption isotherms are
interpreted with the SCF-LFA theory. Before starting the more detailed presentation
and discussion of the adsorption isotherms we wish to make a general remark
concerning the (small) oscillations occurring in our calculated vapour adsorption
isotherms around the condensation axis. These oscillations are lattice-layer
condensation steps, artefacts resulting from the lattice and the mean field approximation
used. Each lattice layer has a uniform density (mean field), and condenses at a specific
chemical potential. When a layer condenses, the amount of material and the chemical
potential of the bulk phase suddenly decrease. This results in the (artificial) oscillating
behaviour of the chemical potential upon each successive layer condensation. In the
lattice layers near the interface, the segment adsorption energy of the surface and the
chain length of the molecules dominate the layer-filling. Therefore, at lower adsorbed
amounts the oscillations in the adsorption isotherm are much less pronounced or absent.
Chain flexibility reduction (or a temperature decrease) results in larger density
differences between the vapour and the adsorbed phase. In this case lattice layer
condensation steps require more vapour molecules. This increases the oscillation of the
chemical potential upon a layer condensation step.
When interpreting the calculated results it should be realized that xAt is not the
standard adsorption energy. It is appropriate to consider the standard adsorption energy
of segment A as the energy change upon displacing a vacancy in layer z=l by an A
segment: x'L,„ = &_, (xAX + X,,,, ~ X„s ~ XA<J< where A., is the contact fraction
between the surface and the first adsorbate (lattice) layer, see also previous Chapter.
109
CHAPTER 6
la: Bare rigid solids without grafted chains
First we consider adsorption of a homo-oligomer (Ag) on a hard impenetrable interface.
In Fig. 1 some calculated results are presented for four values of %AS. In general, a
chain molecule adsorbing onto a solid substrate is restricted in its number of
conformations. The adsorption energy has to compensate for the entropy loss upon
adsorption. If the adsorption energy is not sufficiently negative the molecules do not
adsorb. When the chemical potential of the adsorbate (the As vapour pressure) is
increased more molecules adsorb. Low adsorption energies are unable to compensate
for the entropy loss upon adsorption (see Fig. 1 for %AS > -2), and noticable adsorption
only occurs upon supersaturating the vapour. Once the whole supersaturation part of the
isotherm has been passed, all layers do fill up and the adsorption diverges to infinity at
p/pQ = 1 (condensation). When the adsorption energy becomes more favourable,
adsorption occurs at low vapour pressures (see %AS - ~4)- ^n order to maximize their
configurational entropy the adsorbed molecules stick out from the first lattice layer to
the adjacent layers. This means that after some adsorption has occurred at fairly low
vapour pressure, the lateral interactions in the first lattice layers adjacent to the solid
surface become significant. Therefore, the adsorption proceeds rather strongly when the
vapour pressure is further increased and a step in the isotherm occurs. After this step,
the vapour boundary side of the adsorbed layer becomes less diffuse. This decreases the
lateral interactions and the adsorption rises gradually with the vapour pressure until
condensation occurs. For very favourable adsorption energies (see f.i. XAS = ~6), the
"step" occurs at much lower vapour pressures and becomes more gradual.
Semi-flexible chains loose less configuration entropy upon adsorption, therefore,
they already adsorb at lower pressures than flexible ones. For low adsorption energies
this reduces the size of the supersaturation loops. For high adsorption energies semi-
flexible chains have a smaller step in the isotherm than flexible ones. Moreover, at
higher vapour pressures they adsorb less than flexible ones. An adsorbed semi-flexible
chain can increase its number of favourable segment-surface contacts at a lower
entropie cost. Therefore, semi-flexible chains adsorb more flat to the surface than
flexible ones. Therefore, the molecular volume fractions and the lateral attraction in the
lattice layers near the solid will be lower than for flexible chains. This reduces the size
of the initial step in the isotherm and the further adsorption (compare panels a and b
with c and d in Fig. 1 for %AS < - 4 kT).
As a second case we consider the adsorption of aliphatic chains B-A(,-B while
differentiating between the adsorption energies of chain end segments B (the CH3
groups) and chain middle segments A (the C H2 groups). In Figs. 2 and 3 some
110

ADSORPTION AND WETTING OF ALIPHATIC FLUIDS
Figure 1. The surface excess amount (at T = 290 K) of a homo-oligomer (A%) as a function of its relative pressure for different %AS values as indicated in the figure, Xos = 0 and %A(I = 2. In a) and b) the results for first order Markov chain statistics are shown on a linear and logarithmic axis, respectively. Figures c) and d) are identical plots obtained by applying the RIS scheme with U H/kT = I.
calculated vapour adsorption isotherms of the octamer B-A(,-B are plotted against the
relative vapour pressure for different adsorption energies xAS and %BS.
First we discuss the isotherms of a flexible chain with a low middle segment-surface
interaction parameter, XAS = ~2 (Fig. 2a and b) using the homogeneous chain with
Xss = XAS = - 2 as standard. If XBS 'S ' e s s favourable than xAs t n ' s decreases adsorption
and increases the supersaturation loop in the isotherm. When xB$ ls decreased below
XAS, the size of the supersaturation loop decreases and the isotherm has an initial
step/loop after which the adsorption significantly increases with the vapour pressure.
Decreasing XBS implies that adsorbed chains will stick out more strongly from the
interface. The lacerai attractions are effective over more lattice layers and, especially at
higher adsorption values, end on adsorption becomes more favourable. When
Xm < X , j , after the initial step in the isotherm, higher adsorbed amounts occur for
B-Afj-B than for A$-
111

CHAPTER 6
Figure 2. The excess adsorbed amount of B-A^-B plotted against the vapour pressure for
XA„ = XBO = 2 ' XAB = °- Xos = ° and XAS = -2. >he XBS values are denoted in the figures. In panels (a) and (b) the results for first order Markov statistics are shown. Panels (c) and (d) show the results obtained upon applying the RIS scheme with U K/kT = J.
Now consider adsorption of semi-flexible chains (Fig. 2c and d). As explained
previously, the initial adsorption of semi-flexible chains is higher than that of flexible
ones (compare panels a and b with c and d in Fig. 2); this also reduces the
supersaturation loops in the isotherms. For XBS > XAS ( w e a k end segment-surface
interactions), semi-flexible chains initally adsorb more strongly to the interface than
flexible ones as their entropie penalty for flat adsorption is less than for flexible chains.
At higher vapour pressures semi-flexible and flexible chain behave rather alike. For
XBS < XAS (strong end segment-surface interaction), semi-flexible chains initially
adsorb more strongly to the interface than flexible ones. At higher surface coverages
this effect is inversed. In this case the adsorbed semi-flexible chains extend further from
the interface than flexible ones. This raises the volume fractions and lateral interactions
in the lattice layers near the solid and enhances adsorption. For %BS = -16 the chains
have a strong preference to adsorb with their end segments. Close to the saturated
vapour pressure only one end segment per chain is adsorbed and the semi-flexible
chains form a densily packed layer of end-on adsorbed molecules. The vapour boundary
side of this layer is rather sharp. Therefore, adsorption onto this layer is entropically
112

ADSORPTION AND WETTING OF ALIPHATIC FLUIDS
1.2
0.8
0.4
0.0
-
XB
1
X = - 4 A A S
flexible chain
= - 1 6
dd - 8
XBS
.j .V.V.'.-v
= -6 J,
(a)
, X = - 4 / *"BS
1 . . . .
X = - 4 A A S semi-flexible chain (RIS)
y = - 6 ' "BS
X B S = - 8 \ . ^
X B S = ~ I 6 \ ^ \^ . - ' 7
i (b) •
A X = - 4 ' J ^BS
1 K V X B S = ~ 2 '
^ x =o"
0.5 P/P„
0.5
1.2
- 0.8
- 0.4
P/P0 1.5
Figure 3. The excess adsorbed amount of the octameric molecules (B-A(,-B) plotted against the vapour pressure for XM, = XBO = 2' XAB = °- Xos = ° and XAS = " 4 'he XBS values are denoted in the figures. In panel (a) the results for first order Markov statistics are shown. Panel (b) shows results obtained using the RIS scheme with U g/kT = 1.
unfavourable and a slight supersaturation is required before molecular multilayer
condensation occurs (see Fig. 2c and d for XBS = -16). Flexible chains with XBS = - ' 6
have a higher fraction of molecules with both end segments adsorbed than semi-flexible
chains. Therefore, their alignment in the adsorbed layer is more difficult and less
perfect than for semi-flexible chains and no supersaturation loop occurs (see Fig. 2a and
b).
Next we discuss adsorption of B-A^-B with xAS = - 4 (Fig. 3). These isotherms resemble
the ones in Fig. 2. For XBS - XAS' t n e isotherms in Fig. 3 are higher than those of Fig. 2,
at low pressures more molecules adsorb in the first layer due to the lower xAS value. At
somewhat higher pressures, these higher adsorbed amounts enhance the lateral
atttractions so that the initial step in the isotherm in Fig. 3 occurs at much lower
pressures than in Fig. 2. For xBs < XAS< m e hi§h middle segment adsorption energy
makes the initial adsorption in Fig. 3 higher than of Fig. 2. Furthermore, the intial step
in the isotherm is shifted to lower vapour pressures. However, once beyond the initial
step, the isotherms with xBs < XAS °f F'S- 3 are lower than the ones in Fig. 2. In Fig. 3
the chains adsorb in a more flat configuration than in Fig. 2. This decreases the
segmental volume fractions and lateral attractions in the lattice layers further away from
the surface and results in lower adsorbed amounts. When the flexibility of the chains in
Fig. 3a is reduced this results in an flatter adsorption and in lower adsorbed amounts
(compare Figs. 3a and 3b). For the lower values of XBS a r ,d higher relative vapour
pressures, the chains tend to be end-on adsorbed, leading to relatively high adsorption
values. For xBs = -16, the end segment adsorption energy is so large that it dominates
the adsorption and the isotherms in Figs. 2 and 3 are very similar.
113

CHAPTER 6
lb: Rigid surfaces; solids completely grafted with chains
In the SCF-LFA theory, the simplest case of an alkylated solid is a flat solid covered
with a completely filled monolayer of end-grafted aliphatic chains (<7 =1). Adsorption
onto such a substrate does not alter the structure of the grafted layer and is independent
of the grafted chain length or the underlying solid. A flexible homo-octamer A$,
adsorbing on a rigid alkylated solid grafted with chains of segments A, with %OA = 2,
yields an identical adsorption isotherm as the one shown in Fig. la and b with %AS = - 2 ,
Xos = 0, XAO = 2- In both cases the displacement energy Xmc» equals -4 .
Ic: Volume fraction profiles of octamer films on rigid substrates
For the discussion and understanding of the adsorption behaviour of chain molecules at
rigid substrates it is instructive to compare the structures of the adsorbed layers framed
on the different substrates. With the SCF-LFA theory these structures can be easily
investigated by means of segment density profiles. In Fig. 4 the segment density
profiles of the adsorbed octamer films (F^) formed &tp/po=\ on two rigid solids (x*s =
0 and XAS = ~^)< investigated in the section la, are plotted semilogarithmically. Also the
octamer profile on a completely alkylated surface (tr =1) is included. Both the end and
middle segment density profiles of the adsorbate chains are plotted. The end segments
are indicated as "CH3" the middle segments as "CH2". Despite the different
nomenclature of the chain end and middle segments, no distinction is made between
their interactions; in the calculations both are represented by the same segment type A.
In the figures, the solid surface is positioned in layer 0, for <r = 1, layer z=[ is the first
lattice layer adjacent to the (fully occupied) grafted layer. The lattice layers z > 13 are
part of the homogeneous bulk vapour phase.
In an isotropic octameric bulk the CH3:CH2 density ratio equals 1:3. In Fig. 4 this 1:3
ratio corresponds to the difference (in cm) between the "CH3" and "CH2" segment
volume fractions in the vapour phase (i.e., for z > 13). When this difference is below the
bulk value, this means that the CH3:CH2 density ratio in that layer is above that in bulk
vapour, i.e., in such a layer the end segments are preferred over the middle segments.
The thickness of the adsorbed layer in Fig. 4 increases with increasing affinity of the
segments for the surface (i.e., with decreasing XASIO,)- F ° r a l ' ("g'd) substrates shown in
Fig. 4 the decay of the volume fraction in the adsorbed layer extends over about 5
114
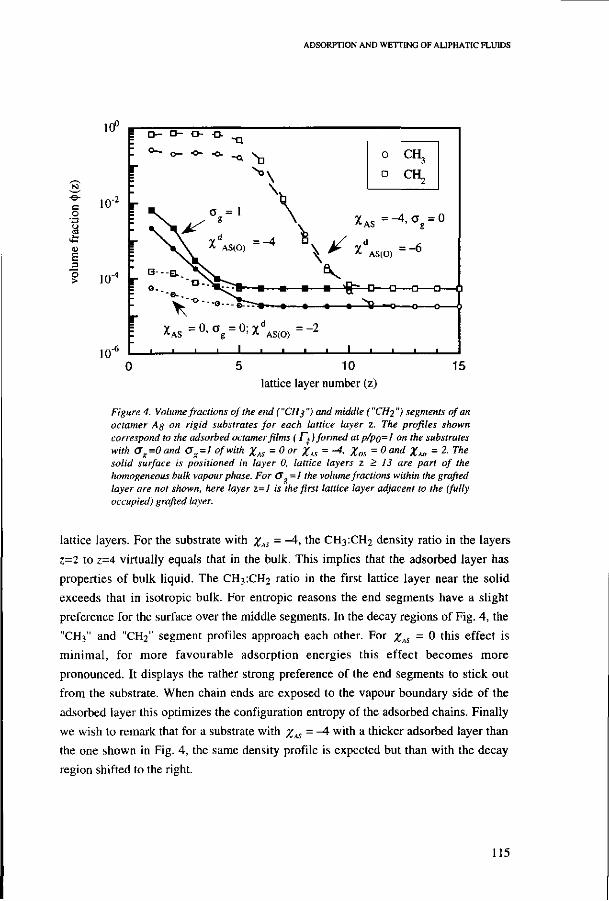
ADSORPTION AND WETTING OF ALIPHATIC FLUIDS
-e-c o
>
10° : D— Ö- -D- -D-
10-'
o CH3
n CH„
5 10 lattice layer number (z)
Figure 4. Volume fractions of the end ("CHj") and middle ("CH2") segments of an octamer A$ on rigid substrates for each lattice layer z. The profiles shown correspond to the adsorbed octamer films ( T^) formed at p/po=l on the substrates with aR=0 and 0^=1 of with XAS = 0 or %AS = -4, %os = 0 and XA„ = 2. The solid surface is positioned in layer 0, lattice layers z > 13 are part of the homogeneous bulk vapour phase. For O =1 the volume fractions within the grafted layer are not shown, here layer z=I is the first lattice layer adjacent to the (fully occupied) grafted layer.
lattice layers. For the substrate with %AS = ~~^< t n e CH3:CH2 density ratio in the layers
z=2 to z-4 virtually equals that in the bulk. This implies that the adsorbed layer has
properties of bulk liquid. The CH3:CH2 ratio in the first lattice layer near the solid
exceeds that in isotropic bulk. For entropie reasons the end segments have a slight
preference for the surface over the middle segments. In the decay regions of Fig. 4, the
"CH3" and "CH2" segment profiles approach each other. For %AS = 0 this effect is
minimal, for more favourable adsorption energies this effect becomes more
pronounced. It displays the rather strong preference of the end segments to stick out
from the substrate. When chain ends are exposed to the vapour boundary side of the
adsorbed layer this optimizes the configuration entropy of the adsorbed chains. Finally
we wish to remark that for a substrate with xAS = ~4 with a thicker adsorbed layer than
the one shown in Fig. 4, the same density profile is expected but than with the decay
region shifted to the right.
115

CHAPTER 6
IIa: Soft surfaces: solids partially grafted with chains
Molecules adsorbing on substrates that are partially grafted with chains are able to
penetrate the grafted layer and alter its structure. Therefore, we will refer to such a
substrate as a "soft surface". On a soft surface, both adsorbing and grafted chains occur
in the lattice layers adjacent to the surface. This affects the volume fractions, lateral
interactions and entropy in these layers. The adsorption of an octameric fluid Ag onto
soft surfaces with grafted chains An is investigated for different grafting densities and
grafting chain lengths n. This is done for two different interactions (xAS) between the
bare surface 5 and the A segments. In Fig. 5 %ÄS equals 0, in Fig. 6 XAS equals -A.
When a solid with %AS - 0 (Fig. 5) is grafted, the interactions of the adsorbate
segments with segments of the grafted chains are more favourable than with the (bare)
solid itself. Grafting monomers onto such a solid hardly imposes extra conformation
restrictions on the adsorbing molecules with respect to their adsorption on the bare
solid. The main effect of monomer-grafting is the increased affinity of the adsorbing
molecules for the substrate; the adsorption continuously increases with increasing
monomer grafting density (see Fig. 5a). For low grafting densities (o < 0.25) of
tetramers (Fig. 5b) and octamers (Fig. 5c) the adsorption also increases with a .
However, by further increasing the tetramer or octamer grafting density, the order in the
grafted layer increases together with the (configuration) entropy loss upon adsorption.
Adsorption of chains within the grafted layer now leads to considerable entropy losses
and hardly occurs. Therefore, the adsorption (eventually) decreases with increasing o
and a maximum occurs in the adsorbed amount as a function of a (see Fig. 5 panels b
and c). Longer grafted chains affect the configurational entropy in the lattice layers
adjacent to the surface more strongly than shorter ones. Hence, the maximum
adsorption for the first occurs at lower oK values than for the latter, compare panels (b)
and (c) in Fig. 5.
On the solid with a high adsorption energy (Fig. 6) the interactions of the adsorbate
segments with the solid itself are more favourable than those with the grafted chains. In
general, increasing the grafting density on such a solid decreases the adsorbed amounts.
An exception to this trend occurs for low grafting densities and low vapour pressures.
In this case grafted chains increase the adsorption compared to the bare solid (see Figs.
6a and b for a =0.25). For low vapour pressures and CTÄ=0.25, the adsorption energy
gain due to the formation of adsorbate segment - solid contacts is still considerable. In
addition to this adsorption energy, the adsorbate also has favourable lateral interactions
with the grafted chains so that the adsorption is increased. The segments of the grafted
chain also adsorb on the high affinity solid (%AS = -4) . This decreases the lateral
interactions in the outer part of the grafted layer. Moreover, at low grafting densities
116

ADSORPTION AND WETTING OF ALIPHATIC FLUIDS
0.4
0.2
0.4
•3 0.2 E
0.4
XAS = ° (a)
monomer-grafted
XAS = 0 (c)
octamer-grafted
Figure. 5. Octamer (A$) adsorption isotherms on alkylated substrates with 4 different grafting densities (ft 0.25, 0.5. 0.75 and 1). %A% = 0. Xos = ° an(i
XM, = 2. Different homogeneous grafted chains An are examined; (a) n = /. (b) n = 4 and (c) n = 8.
117

CHAPTER 6
y = - 4
monomer-grafted
"o
Figure 6. Octamer (Ag) adsorption isotherms on alkylated substrates with 4 different grafting densities (0, 0.25, 0.5, 0.75 and I), %AS = -4, %m = 0 and XAt, — 2. Different homogeneous grafted chains An are examined; (a) n = 1, (h)n = 4 and (c) n = 8.
118

ADSORPTION AND WETTING OF ALIPHATIC FLUIDS
(for os< 0.25) longer grafted chains screen the underlying solid more effectively than
shorter ones and the initial part of the isotherms with 0^=0.25 in Fig. 6 is lower for
substrates with longer grafted chains than for substrates with shorter grafted chains.
Hb: Volume fraction profiles of octamer films on soft surfaces
In Figs. 7 and 8 the respective volume faction profiles on the substrates of Figs. 5 and 6
with<7A,=0.25 and CTA,=0.75 are considered. The end and middle segment density
profiles of both the grafted and adsorbing chains are shown. The end and middle
segments of the adsorbate are indicated as "CH3 octane" and "CH2 octane", respectively.
The end segment of a grafted chain which is restricted to the solid is denoted as "S-CH2
grafted". The middle segments of the grafted chains are denoted by "CH2 grafted", the
free end segment of the grafted chain is denoted as "CH3 grafted". The nomenclature
used only serves to distinghuish the end and middle segments of the chains. No
distinction is made between the interactions of the CH3 and CH2 groups; both are
represented by the same segment type A.
The volume fraction profiles in Figs. 7 and 8 reveal that at the vapour side of the
adsorbed layer end segments are preferred over middle segments. With increasing
grafting density the grafted layer extends further from the solid. Moreover, the
preference of the free, unrestricted end segment of the grafted chain to be far from the
solid surface is enhanced. Increasing CT̂ , renders the grafted layer less diffuse, and its
profile more stepwise. From Monte Carlo simulations of grafted chains in a poor
solvent [20] similar conclusions are drawn. Our calculations also show that the vapour
boundary of the grafted layer becomes more diffuse when the chain length of the
grafted molecules is increased. A more diffure boundary of the grafted layer increases
the lateral interactions between the adsorbate and grafted chains in the outer part of the
grafted layer. This enhances adsorption.
Within the grafted layer close to the solid, adsorbate end segments are, for entropie
reasons, preferred over adsorbate middle segments, see panels (d) and (f) in Figs. 7 and
8. In the outer part of the grafted layer (e.g. for octamer-grafted solids in lattice layers
z=6, z=7 and z=8) the highest volume fractions of adsorbing segments are found.
Moreover, the CH3:CH2 ratio of the adsorbate in these layers is below that in bulk. This
implies that adsorption on soft alkylated surfaces is largely due to the accumulation of
adsorbate chain middle segments in the outer part of the grafted layer.
At high(er) grafting densities and long(er) grafted chains, the lattice layers close to
the solid become increasingly filled with segments of the grafted chains. This expels the
adsorbate segments from the lattice layers near the surface to the layers where the
volume fractions of the grafted segments are lower, see Figs. 7 and 8.
119

CHAPTER 6
10"
ïo-2
10"
10"
10'
io-
10" r
10'
10"
monomer grafted (a)
^AS = 0
G =0.25
tetramer grafted X. = 0 & a =0.25
(c)
0--°. 9- - - •; . »---- S-CH, grafted
[>••• CH, grafted
-•• CH i grafted
•• CH 3 octane
CH, octane
octamer grafted (e)
A A S
O =0.25
monomer grafted
Y = 0 AAS
a =0.75
(b) :
_ i _
tetramer grafted W
XAS = °
c =0.75
octamer grafted (f)
XAS = ° O =0.75
10"
10"'
10 4
10"
10"'
10'
10"
1 0 '
10"
10 0
lattice layer z
10 15
Figure 7. Volume fractions of the end ( "CHj ") and middle ( "CH2 ") segments in each lattice layer z. The profiles shown correspond to the adsorbed octamer films (T.A formed at p/pQ=/ on the substrates with G =0.25 and 0.75 for which the adsorption isotherms are shown Fig. 5. The grafted segments are denoted by open symbols and dashed curves, the adsorbate segments correspond to the closed symbols and drawn curves. The solid surface is positioned in layer 0, lattice layers z > 15 are part of the homogeneous bulk vapour phase.
120

ADSORPTION AND WETTING OF ALIPHATIC FLUIDS
10"
io-2
104
10"
•H IO"'
10"
10- L-
monomer grafted (a)
*AS = ^
6.. = 0.25
tetramer grafted JCAS = ^ & a , = 0.25
(c)
»---- S-CH, grafted
D—- CH,grafted
• --- CH grafted
• CH^ octane
CH^ octane
octamer grafted (e)
y = -4 AAS a = 0.25
monomer grafted w
* A S = ^
6^ = 0.75
- •—•—•—• •
. i i
tetramer grafted (<*)
ZAS = - 4
rj = 0.75
octamer grafted (0
"q X = - 4
1(J . = 0.75
10"
IO"
10"'
10"
1 0 '
10"'
10"
W'
Iff"
10 0 lattice layer z
10 15
Figure 8. Volume fractions of the end {"CHj") and middle ("CH2 ") segments in each lattice layer z. The profiles shown correspond to the adsorbed octamer films ( T^) formed at p /po=/ on the substrates with O =0.25 and 0.75 for which the adsorption isotherms are shown Fig. 6. The grafted segments are denoted by open symbols and dashed curves, the adsorbate segments correspond to the closed symbols and drawn curves. The solid surface is positioned in layer 0, lattice layers z > 15 are part of the homogeneous bulk vapour phase.
121
CHAPTER 6
When comparing the volume fraction profiles on the low affinity substrates (Fig. 7)
to the ones on the high affinity substrates (Fig. 8), the grafted chains on the latter have a
lower preference to stretch from the substrate. In Fig. 8 the segments are more strongly
attracted by the solid than in Fig. 7. At high grafting densities of tetramers and
octamers, the first lattice layers near the solid are almost exclusively filled by segments
of the grafted chains, see Figs. 7 and 8. The solid is now practically screened by the
grafted molecules and adsorption is mainly due to the adsorbate - grafted chain
interactions. In this case the adsorption hardly depends on the adsorption energy of the
solid, see also Figs. 5 and 6.
For very long grafted chains, the adsorption will almost entirely be determined by
the interactions between the adsorbate and the grafted chains. For substrates with very
long grafted chains, the volume fractions profiles and adsorption of the adsorbate
segments will not be affected when changing the chain length of the grafted molecules.
The density profile and the adsorption will only shift to lattice layers further away from
the solid surface. This is not yet the case in Figs. 7 and 8 for which the changes in
volume fraction profiles are still significant when grafting octamers instead of
tetramers.
Ill: Comparison with measured alkane adsorption on bare and methylated silica
The calculated isotherm of a semi-flexible B-A^-B chain with XBS - ~& a n d XAS ~ ~2
(see Fig. 2c) resembles the experimentally observed linear adsorption isotherm of
normal octane on silica (see Chapter 4). With increasing surface coverage the adsorbed
molecules line up in a direction perpendicular to the surface, due to the favourable end
segment adsorption energy. This increases the lateral interactions in the lattice layers
adjacent to the solid but also decreases the configurational entropy of the adsorbed
chains. These two opposing effects make that the vapour adsorption increases
approximately linearly with the vapour pressure. This is in good agreement with the
experimental results. Experimental studies showed that the adsorbed amount near
p/po = 0.9, was about the value corresponding to a monolayer of perpendicularly
oriented alkanes (see Chapter 4). Our calculations yield lower adsorbed amounts.
Probably, the chain flexibility is overestimated in the model so that the chains do not
stretch up to 8 lattice layers from the surface. This results in an underestimation of the
lateral attractions and of the adsorption in these layers. The quantitative agreement
could be improved when chain end segments are assigned a different, more
unfavourable, interaction with the vacancies than the chain middle segments. This will
122

ADSORPTION AND WETTING OF ALIPHATIC FLUIDS
increase the tendency of the chains to adsorb end on and also promote (further)
adsorption at the vapour boundary of the end on adsorbed layer. The flexibility of the
chains can be affected by assigning different values to the trans-gauche energies of the
chain end and middle segments. If chain end segments have higher trans-gauche
energies than middle segments they will adsorb more strongly than the middle ones,
this will improve the quantitative agreement. For a more quantitative explanation of the
measured linear isotherms these aspects require further investigation.
Experimental alkane adsorption isotherms on alkylated substrates are below the
monolayer coverage for parallel adsorbed molecules until close to saturation (see
Chapter 4). This behaviour can be reproduced by describing alkanes, adsorbing on a
rigid alkylated solid, as semi-flexible chains As with modest segment adsorption
energies ( %AS > -2) or as B-A(,-B chains with a high middle segment adsorption energy
( XAS = ""4) a r ,d a l ° w e n d segment adsorption energies (xBS S -2).
The calculations show that, in general, grafting of (alkyl) chains onto a solid with a
high affinity for the chain-like adsorbate considerably reduces the adsorption at all
grafting densities (see Fig. 6). The theoretical isotherms on such soft alkykated solids
also agree qualitatively with experminetally measured ones (see Chapter 4). For all the
cases in which qualitative agreement with experimental alkane adsorption isotherms on
alkylated solids is found, adsorption of the adsorbate middle segments is more
favourable than adsorption of the end segments of the adsorbate. Such behaviour can be
due to different segment-surface interaction parameters of the chain end and middle
segments. Moreover, this behaviour may also result from entropie effects that lead to
preferential adsorption of middle segments within the grafted layer. By simulaneously
considering both effects in our description of alkane adsorption on alkylated solids, a
better quantitative agreement between theory and experiment can be obtained.
However, this remains a task for the future.
6.4. Wettability of aliphatic fluids at solid substrates
Temperature dependence of alkane contact angles on rigid/fully alkylated surfaces
As explained in section 6.2. the SCF theory allows to calculate the wetting behaviour.
For the calculation of the contact angle two ways are open: (i) substituting the
(calculated) adsorption isotherm data in Eq. (9) or (ii) inserting the interfacial tensions
calculated from Eq. (12) in Eq. (15). In general, the wettability in a solid-liquid-vapour
system depends on the temperature. With increasing temperature, the wetting behaviour
can change from partial to complete wetting.
123

CHAPTER 6
Ë 0.2 -
0.8
0.4
0.0
0.8 -
0.4 -
0.0 100
-
-
-
-•
—
--
-* . _ *~ -
\ YLV
YSVj-y s - \ ^
Ysv(rt)-ys*
,
< -
• • • i
(b)
i
/ ( c ) :
^ \ ~ \
-
•
'. \
" .
1 . . . . 1 . . . .
- 40
o
30 S
20 o
- 10
300 500 temperature / [K]
Figure 9. (a) Semilogarthmic adsorption isotherms of an aliphatic octameric fluid (Ag) on a rigid alkylated surface (S) at different temperatures T. Interactions used are XAS = 0, Xm = 580/T and XA„ = 580/T- <b> Calculated / " f ^ J - f ' , y " ( r „ ) - JS • and yL" values for an octamer on the rigid alkylated solid specified in (a), (c) Cosines of the contact angle (solid) and contact angle (dashed) at different temperatures T calculated using Eq. (15) and the data plotted in Fig. 9h.
124

ADSORPTION AND WETTING OF ALIPHATIC FLUIDS
In Fig. 9a some calculated adsorption isotherms of an octameric fluid (Ag) on a rigid
alkylated surface are plotted for several temperatures. The interaction parameters used
are %AS= 0, Xos= 580/T, %AO= 580/T. All isotherms have very low adsorbed amounts and
intersect the saturation axis (p/po = 1) with a finite adsorption. With increasing
temperature the size of the supersaturation loop decreases. At 500 K the supersaturation
loop has practically disappeared.
With the SCF theory also ysv(rt) - y5*, ysv(T„)- ys', and yLV of an octameric
fluid at the rigid alkylated surface of Fig. 9a are calculated as a function of temperature.
The results are plotted in Fig. 9b. The calculated interfacial tensions are expressed in
units of kT per lattice site area. In our model the lattice area equals 0.09 nm2, hence in
order to transform the calculated values to units of J/m2 we have to multiply with
£770.09 1018. Figure 9b shows that yLV strongly depends on the temperature, for a
discussion of yLV and its temperature dependence we refer to Chapter 5. Figure 9b also
shows that on the rigid substrate ysv(Tt) - ys hardly depends on the temperature.
From the interfacial tensions in Fig. 9b the contact angle is calculated as a function
of temperature by means of Eq. (15). The results are shown in Fig. 9c. Figures 9a and
9c clearly show that the contact angle decreases with the area of the supersaturation
loop (from rt to r„ in the isotherm, see Eq. 9); both decrease when the temperature is
increased.
The results shown in Fig. 9 are in agreement with the Cahn prediction that for
temperatures sufficiently close to the critical point (for our octamer 622 K) complete
wetting occurs [21]. Moreover, Fig. 9 shows that the temperature dependence of the
contact angle on the rigid alkylated surface is mainly due to the temperature
dependencies of ySiY-TJ- yy' and yLV.
Alkane contact angles on soft/partially alkylated surfaces
Contact angles of an octameric liquid on two different solids with terminally grafted
chains are calculated for different grafting densities and grafting chain lengths. The two
solids differ with respect to the affinity of the bare, ungrafted surface for the aliphatic
segments and have been previously considered in Figs. 4-8. The parameter choice in
Fig 10a is identical to the one in Figs. 5 and 7, the parameters in Fig. 10b are the same
as those used in Figs. 6 and 8. In order to display the trend more clearly also a grafted
chain length of 16 is included in Fig. 10b.
On the bare solid with xAS = 0 (Fig- 10a) t n e affinity of the solid for the aliphatic
segments is low and the wettability is poor. In general, grafting aliphatic chains to the
low affinity solid increases the wettability and decreases the contact angle. When
125

CHAPTER 6
40
20
40 -
20 -
1 • tetramer-grafted
i V \
. - ' /
/
/ •oc tamer-grafted I
r : . . i
X« = - *
monomer-grafted
tetramer-grafted
octamer-grafted
o L i - i - . r L . - r - r ' i L
hexadecamer-grafted
0 0.2 0.4 0.6 0.8 1 grafting density (O )
Figure 10. Contact angles of an octameric (Ag) liquid on two different solids as a function of the grafting density. Four different grafted chains An with n=l, 4 and 8 are examined. Panel (a): low affinity solid ( %AS = 0, %os = 0 and %m = 2>- Panel (b>: n'gh aff'nit>' solid, XAS ~ -4< Xos = O a"d XAO = 2< '" order to display the trend more clearly we also included a hexadecamer-grafted surface (n=l6).
126

ADSORPTION AND WETTING OF ALIPHATIC FLUIDS
monomers are grafted to the solid, the effective affinity of the liquid molecules for the
substrate increases (see also Figs. 5 and 7 and their discussion) and the contact angle
gradually decreases with increasing a . In the present case the grafted segments are
placed on top of the surface. Adsorption of adsorbate segments onto the grafted
monomers is more favourable than adsorption on the bare solid. This largely accounts
for the contact angle decrease with increasing cA,. Moreover, monomer grafting with
CT̂ ,< 0.5 creates adsorption sites inbetween the grafted monomers with a rather
favourable adsorption energy (due to the lateral attractions). Hence, initially the contact
angle on the low affinity solid decreases rather strongly with increasing a . When the
first lattice layer becomes predominantly filled by grafted monomers, adsorbate
molecules loose more configurational entropy when they adsorb into this layer and the
contact angle decrease becomes more gradual. For a monomer-grafted substrate, the
maximal number of high energy contacts possible within the first lattice layer
(inbetween the grafted monomers) is reached at <7A,=0.5 and for ag> 0.5, the number of
high energy sites within the grafted layer diminishes. This also contributes to the more
gradual contact angle decrease when increasing o^ beyond 0.5.
When longer chains are grafted to the surface a pronounced minimum in the 6 vs.
a plot occurs. With increasing grafted chain length this minimum decreases,
moreover, the initial slope of the 9 vs. a plot becomes more negative. As a
consequence, the minimum in the 0 vs. a^ plot shifts to lower grafting densities and
lower contact angle values. The grafted chain-adsorbate contacts are more favourable
than the adsorbate-(bare) solid contacts. Therefore, the adsorption increases (and the
contact angle decreases) with the grafted chain length and/or with <y as long as this is
not opposed by entropy effects within the grafted layer. At higher grafting densities of
teramers and octamers entropy effects within the grafted layer become more important
and begin to oppose adsorption; the contact angle starts to increase with increasing
grafting density. For longer grafted chains this already occurs at lower grafting densities
than for shorter chains.
For high affinity solids (xAS = -4, Fig. 10b), increasing the grafting density
(eventually) increases the contact angle as the grafted chains decrease the adsorption
free energy. When the substrate is grafted with monomers the octameric liquid remains
completely wetting (zero contact angle) up to grafting densities of 0.67. For o^ above
0.67 the contact angle sharply increases with the grafting density. On a tetramer-grafted
surface an octameric liquid becomes partially wetting at grafting densities of 0.17.
When octamers (or even hexadecamers) are grafted on the solid, the contact angle
already increases at grafting densities close to zero. Furthermore, increasing the chain
length of the grafted molecules results in a more gradual transition from complete
(6 = 0) to partial wetting.
127
CHAPTER 6
Grafting of a solid changes the volume fractions and lateral interactions in the
adsorbed layer. Furthermore, the presence of grafted chains affects the configurational
entropy of the adsorbed layer. When increasing the grafted chain length and/or crA>, the
screening of the solid underlying the grafted layer increases. On the low affinity solid
(with #,,5=0, Fig. 10a) the grafted chains prefer to stretch from the surface for entropie
reasons. This also occurs on the high affinity solid with rather high Gg (^AS=-4, Fig.
10b). Stretching of the grafted chains increases the adsorbate-surface interactions by
means of the increased lateral attractions. Therefore, in general, longer grafted chains
result in lower contact angles than shorter ones. The minimum in the 6 vs. ag curve in
Fig. 10a occurs due to the optimum in the number of configurations of the grafted and
adsorbed chains as a function of a^. when the grafted layer gets more dense, it
becomes increasingly difficult for the adsorbate to penetrate into the grafted layer. On a
high affinity solid ( £„5 =-4, Fig. 10b) the segments of the grafted chains adsorb onto the
solid. Hence, at low grafting densities, the grafted molecules ly rather parallel to the
solid surface. Therefore, shorter grafted chains are less capable to screen the high
affinity solid than longer ones and require higher grafting densities in order to obtain a
finite contact angle. As explained previously, at rather high cr̂ , longer grafted
molecules stretch further and more easily from the solid than shorter ones. On the high
affinity solid this not only decreases the contact angle but also renders the transition
from complete to partial wetting more gradual. In general, for very high C7S and long
grafted chains (larger than tetramers), the solid is completely screened by the grafted
layer and the contact angle becomes virtually independent of the solid underlying the
grafted layer (compare f.i. the tetramer and octamer grafted substrates with a > 0.5 in
Figs. 10a and b).
Chain length dependency of the contact angle and critical surface tension
The equilibrium contact angles of (aliphatic) chain-molecular liquids on a hard
alkylated surface are calculated for different chain lengths of the wetting liquid. These
calculations are performed for several temperatures. In Fig. 11 the resulting cos 0 values
are plotted against the LV interfacial tension of the chain molecular liquid. In the figure
the lowest cos0 value at a certain temperature always corresponds to -420, the shortest
partially wetting liquid is also indicated.
A linear relation between cos0 and yLV is found for each temperature. The contact
angle decreases with decreasing the chain length of the wetting liquid. At high
temperatures only the long n-alkanes partially wet an alkylated surface, at lower
temperatures also relatively short n-alkanes partially wet the solid. Decreasing the
temperature also renders the slopes of the curves less negative. Zisman [2] defined the
128

ADSORPTION AND WETTING OF ALIPHATIC FLUIDS
YLV / [mJ/m2]
Figure. 11. Calculated contact angles of linear-chain-aliphatic liquids (An with n=3, 4, 5, 6, 7, 8, 10, 12, 14, 16, 20) on a rigid alkylated surface (S) as a function of the interfacial tension of the LV interface. The calculations are performed at various temperatures which are indicated in the figure. The interaction parameters used are XAS = 0, Xos = 580/T, % = 580/T. For each temperature the shortest partial wetting liquid is indicated in the figure, for shorter n-alkanes cos 9=1.
critical surface tension as the intercept of the horizontal line cos0 =1 with the straight
line through cos0. The intercept marks the transition from complete to partial wetting.
With increasing temperature this intercept shifts to lower yLV values, i.e., the critical
surface tension decreases. This shows that complete wetting becomes more favourable
when the temperature is increased. For the n-alkanes it is predicted that the critical
surface tension decreases by about 5 mJ/m2 for each 100 K temperature increase.
With the theory plots like Fig. 11 can be calculated for different adsorbate-surface
interactions. In Table 1 some of the contact angles of Ag on the rigid substrates already
presented in Fig. 10 are summarized. At T=290 K %iS(0) in Fig. 11 equals -A and cos 0
of As equals 0.67. According to Table 1, cos 0 of an As droplet increases with
increasing affinity (i.e., with decreasing XAS(O>) °f t n e substrate. Hence, the curves in
Fig. 11 will shift to the right when increasing the adsorbate-substrate interactions (i.e.,
when decreasing XAS,0,)-
Table I. Contact angles 9 at T = 290 K of the octameric fluid Ag on the different rigid substrates S of Fig. 10, Xos = °- XM, ~ 2-
substrate
z « = o. <rK = 0 *£,„, = - 2 CT = 1 7d = -4 w # * A.ASIOI '
XAS =-4, CT,=0 xi,o,--^
e 115
48
0
cos 9
-0.42
0.67
1
129

CHAPTER 6
Comparison with experimental contact angles
A detailed comparison of theoretical contact angle predictions with experimental
studies is hampered by the microscopic heterogeneity of the surface (resulting from a
number of complications including active sites, surface roughness or adsorbing
molecules). Nevertheless, for the wetting of n-alkanes on low afffinity (alkylated) solids
a reasonable agreement between the calculated contact angles and experimental data is
obtained; Zisman plots for a series of homologous n-alkanes on various low affinity
substrates [2] show a linear relation comparable to the one found in Fig. 11.
6.5. Conclusions
Vapour adsorption isotherms (including the meta- and unstable regions) of an octameric
fluid on various solids are calculated. When the adsorption is mainly driven by a high
end-segment (B) adsorption energy (f.i. %BS = -8 and %AS = -2), a linear isotherm results
for semi-flexible chains B-A^-B adsorbing on a rigid solid. The shape of this isotherm is
qualitatively agrees with n-alkane isotherms measured on bare silica. With the theory
also adsorption isotherms resembling the ones measured for n-alkanes on methylated
silica can be obtained. Hereto interaction parameters are needed that favour a rather
parallel adsorption of the chain-molecules with respect to the surface (f.i. xBs - ~2 and
XK = -4)-A chain flexibility reduction (by applying the RIS scheme) increases the tendency of
adsorbed chains to line up. In general, this increases the adsorbed amounts when the
interaction parameters favour end-on adsorption, whereas this reduces the adsorbed
amounts when the interaction parameters are in favour of adsorption parallel to the
substrate.
On a poorly wetted rigid (allkylated) surface, an increasing contact angle has been
calculated for increasing chain length of the wetting n-alkane An. The contact angles
and the (Zisman) critical surface tension for wetting decrease with increasing
temperature. When the temperature approaches the critical temperature of the wetting
fluid, complete wetting occurs. Furthermore, it is established that the temperature
dependence of the contact angle is largely due to the influence of the temperature on the
liquid-vapour and solid-liquid interfacial tensions.
On solids with terminally grafted chains, octamer {As) adsorption isotherms and
contact angles are calculated for different grafting densities and grafted chain lengths.
Grafting of aliphatic chains to a very poorly wetted (bare) solid surface decreases the
contact angle of the octameric liquid. On a such a solid, the contact angle as a function
130
ADSORPTION AND WETTING OF ALIPHATIC FLUIDS
of the grafting density passes through a minimum. Before the minimum the contact
angle decreases due to the increasing number of contacts between the grafted chains
and the adsorbate. The rise beyond the minimum is has an entropie origin. On a
completely wetting (bare) solid grafting of chains eventually results in a finite contact
angle and higher grafting densities give higher contact angles. In general, the contact
angle on both substrates decreases with increasing grafted chain length.
On grafted solids adsorption mainly occurs in the outer parts of the grafted layer.
The adsorption in this region is largely due to the penetration of adsorbate middle
segments within the grafted layer. This implies that vapour adsorption and wettability
of Ag on alkylated substrates are largely determined by the sharpness of the vapour-
boundary side of the grafted layer. When this boundary becomes more diffuse the
lateral interactions between the adsorbate and the grafted chains are more favourable.
This enhances the adsorption and decreases the contact angle.
The wettability of liquid-vapour-solid systems is, to a large extend, determined by the
structure of the thinnest adsorbed layer/film that can form at saturation. When the solid-
vapour interfacial structure of this layer resembles that of the bulk liquid-vapour
interface, a liquid droplet will spread over its (thin) adsorbed film. When the structure
differs considerably from that of the bulk liquid-vapour interface, the liquid will not
spread on its adsorbed layer (autophobicity) and a finite contact angle occurs.
In this Chapter it has been shown that the thermodynamic and molecular aspects of
wetting and adsorption can be described and related within the SCF-LFA theory. In
principle, the theory is also suitable for the description of fluids of, or substrates grafted
with, chains of a more complicated molecular architecture (e.g. branched or cyclic
molecules) and their interfaces. Moreover, the work of adhesion of chain molecular
liquids on various substrates can be calculated and compared to current theories of
adhesion forces and (Lifshits-van der Waals) interfacial tension contributions. With the
SCF-LFA theory also random heterogeneous surfaces [22] and rough substrates [23] can
be described so that liquid contact angles on such substrates can be calculated and
compared with the results obtained with e.g. the classical theories for heterogeneous
(Cassie [22]) and rough (Wenzel [23]) surfaces.
It is also possible to extend the present theory to a two dimensional (2D) SCF
approximation instead of the one dimension we used in this work. This allows one to
calculate a contour plot of the droplet. From this plot the contact angle can be inferred.
By comparing the contact angle obtained from this contour plot with the (ID
calculated) equilibrium contact angle, the effect of the drop size and its curvature (and
line tension) on the contact angle can, in principle, be studied.
131

CHAPTER 6
Currently a "dynamic" version of the SCF theory is being developed in the
department of Physical and Colloid Chemistry. In the future, this theory will allow
investigation of the dynamics of evaporation of chain molecular liquids. Moreover, it
will enable to study the dynamics of adsorption and wetting on solid substrates.
132

ADSORPTION AND WETTING OF ALIPHATIC FLUIDS
References
[I] Mittal, L. K. (Ed.), "Contact Angle, Wettability and Adhesion"; VSP BV.: Utrecht, 1993. [2] Zisman, W. A., in "Contact Angle, Wettability, and Adhesion"; Advances in Chemistry
Series 43; Gould, R. F. (Ed.), American Chemical Society: Washington, D. C , 1964: p. 1-52.
[3] Schlangen, L. J. M, Koopal, L. K., Cohen Stuart, M. A., Lyklema, J., Robin, M. and Toulhoat, H., Langmuir, in press , 1995; included as Chapter 4 in this thesis.
[4] Levinson, P., Valignat, M. P., Fraysse, N., Cazabat, A. M. and Heslot, F., Thin Solid Films, 234 , 1993, p. 482-485.
[5] Blake, T. D., Cayias, J. L. and Zerdecki, J. A., J. Colloid Interface Sei., 37 (4), 1971, p. 678-685.
[6] Kaminski, G., Duffy, E. M., Matsui, T. and Jorgensen, W. L., J. Phys. Chem., 98 (49), 1994, p. 13077-13082.
[7] Smit, B., Karaborni, S. and Siepmann, J. I., J. Chem. Phys., 102 (5), 1995. [8] Madden, W. G., J. Chem. Phys., 87 (2), 1987, p. 1405-1422. [9] Xia, T. K., Ouyang, J., Ribarsky, M. W. and Landman, U., Phys. Rev. Let, 69 (13), 1992,
p. 1967-1970. [10] Adamson, A. W., in "Physical Chemistry of Surfaces"; John Wiley & Sons: New York,
1976: Chapter 14 and references therein. [II] Scheutjens, J. M. H. M. and Fleer, G. J., J. Phys. Chem., 83, 1979, p. 1619-1635. [121 Scheutjens, J. M. H. M. and Fleer, G. J., J. Phys. Chem., 84, 1980, p. 178-190. [13] Young, T., Trans. Roy. Soc. London, 95, 1805, p. 65. [14] Leermakers, F. A. M. and Scheutjens, J. M. H. M., J. Phys. Chem., 89 (5), 1988, p. 3264-
3274. [15] Evers, O. A., Scheutjens, J. M. H. M. and Fleer, G. J., Macromolecules, 23, 1990, p.
5221-5232. [16] Di Marzio, E. A. and Rubin, R. J., J. Chem. Phys., 55, 1971, p. 4318. [17] Schlangen, L. J. M., Koopal, L. K., Cohen Stuart, M. A. and Lyklema, J., Colloids
Surfaces A, 89, 1994, p. 157-167; most of it is included in Chapter 2 of this thesis. [ 18] Fowkes, F. M., J. Colloid Interface Sei, 28 (3/4), 1968, p. 493-505. [19] Fowkes, F. M., J. Phys. Chem., 84 (5), 1980, p. 510-512. [20] Weinhold, J. D. and Kumar, S. K., J. Chem. Phys., 101 (5), 1994, p. 4312-4323. 121] Cahn, J. W., J. Chem. Phys., 66 (8), 1977, p. 3667-3672. [22] Cassie, A. B. D., Discussions Farad. Soc, 3,1948, p. 11. [23] Wenzel, R. N., Ind. Eng. Chem., 28, 1936, p. 988.
133
Summary
Adsorption and wetting are related phenomena. In order to improve knowledge of both
and their relations, experiments, thermodynamics and a theoretical interpretation have
been connected, starring n-alkanes.
Starting from the Gibbs adsorption equation thermodynamic relations between vapour
adsorption and wetting are derived. The surface pressure of a film, formed by vapour
adsorption on a solid surface, is calculated by integrating the vapour adsorption
isotherm. The surface pressure at the saturated vapour pressure determines, together with
the interfacial tension of the liquid, the difference between the interfacial tension of a
clean solid and a solid-liquid interface. Moreover, the surface pressure is related to the
spreading tension and contact angle in a solid-liquid-vapour system. The thermodynamic
equations derived are generally valid and the approach covers wetting on both flat and
powdered solids. From the individual surface pressure values of two immiscible liquids,
wetting and displacement in a solid-liquid-liquid system can be assessed. The procedure
is illustrated for a silica-water-octane system. Silica is one of the most abundant minerals
on earth and the oil/water wettability of silica can be considered a model for oil
displacement in reservoir rocks.
By combining the Young equation with the Gibbs adsorption equation, the contact angle
and the work of adhesion of an aqueous electrolyte solution on a charged solid is
investigated as a function of the solid surface charge density or the electrolyte
concentration. In the case of partial wetting, the solid-solution-vapour contact angle is a
maximum at the point of zero charge of the solid. The contact angle decreases and the
work of adhesion increases with increasing absolute value of the surface charge. The
derived equations are used to study the wettability of silica under changing electrolyte
conditions. The surface charge density of silica Aerosil OX-50 at a number of indifferent
KCl concentrations, ranging from 0.01 M to IM, is determined as a function of pH by
Potentiometrie titrations. The silica surface charge increases with increasing ionic
strength and increasing pH. At its point of zero charge (pH° ~ 3) silica is already
completely wetted by water. Charging of the surface results in an even better water
wettability although this can not be observed experimentally. At pH = 9 and 1 M KCl the
silica surface charge equals -0.25 C/m2. Compared to the uncharged silica, this surface
135

SUMMARY
charge decreases the silica-water interfacial tension by 22 mJ/m2. Under usual
conditions the electrolyte adsorption at the solid-vapour interface will be less than at the
solid-water interface. With respect to an uncharged silica (pH=3), the silica surface
charge of -0.25 C/m2 decreases the silica-(water)vapour interfacial tension by
maximally 22 mJ/m2 whereas it increases the work of adhesion by maximally 22 mJ/m2.
By combining the present approach with theoretical equations describing the adsorption
of charge determining ions on solids with different kinds and amounts of chargable
groups the wettabililty of such solids as a function of their charging behaviour can be
described theoretically. This remains a task for the future.
The vapour adsorption of different n-alkanes, cyclohexane, toluene and water on bare
and methylated pyrogenic silica (Aerosil OX-50) has been studied gravimetrically.
Linear adsorption isotherms of the n-alkanes and of cyclohexane on both substrates are
found until high relative vapour pressures. The same holds for toluene on methylated
silica. The linearity of the isotherms indicates relatively weak lateral interactions
between adsorbed molecules. On bare silica, the adsorption of the n-alkanes studied (C7-
C9) is, expressed in moles/m2, independent of the chain length. The adsorption strongly
increases after the coverage corresponding to a monolayer of alkanes, oriented
perpendicular to the surface, has been reached (at p/po ~ 0.8). Methylation of the silica
decreases the adsorption of all adsorptives studied. Until just before saturation the octane
adsorption on methylated silica is below that of a monolayer parallel to the surface. The
shape of these adsorption isotherms indicates that on bare silica n-alkanes predominantly
adsorb end-on, perpendicular to the surface, whereas on methylated silica, the adsorption
is rather parallel. From the adsorption data surface pressure isotherms are constructed
and the work of adhesion is obtained. The work of adhesion reveals that the Lifshits-van
der Waals part of the silica surface tension is reduced from 44 mJ/m2 for bare
(pyrogenic) silica to 30 mJ/m2 for methylated silica. The adsorption data are also
converted to disjoining pressure isotherms. At low film thicknesses, these can be
described by an exponential short-range interaction. The classical macroscopic models
are not very suited for the description of such thin films for which the molecular
organization and the discrete character of the adsorbed layer are extremely important.
However, thin adsorbed layers can be described on the basis of microscopic models for
adsorption. Also surface pressures of simple systems can be obtained from classical
adsorption equations (e.g., Langmuir, Volmer, BET, Polyani). However, for chain
molecules like n-alkanes these models are inadequate as they are unable to describe the
structure of the molecules and their adsorbed layers. This problem can be overcome by
136
ADSORPTION AND WETTING
using, for instance, a more recent self-consistent-field (SCF) theory, orginially
developed by Scheutjens and Fleer and extended by Leermakers and others.
The SCF theory is applied for the description of chain molecular fluids and their
interfaces. Hereto a fluid is considered as a mixture of chains and monomeric vacancies.
The latter account for the free volume in the system. Intermolecular interactions are
described in terms of Flory-Huggins (FH) parameters. For the homologous series of
linear alkanes, these parameters are generalized and assessed from a fit to vapour
pressure data. In the SCF lattice-fluid theory, each alkane is described as a chain of
segments with a volume of 0.027 nm3 each. The segment-segment interactions (for
which the FH parameter is zero by definition) are reflected in a non-zero FH interaction
parameter for a chain segment-vacancy contact %ko. Under the conditions mentioned
XM equals 580/r (T in K) for all n-alkanes. With these parameters n-alkane bulk
properties such as the vapour pressure, density, critical point and heat of vaporization
can be obtained together with structural and thermodynamic properties of the liquid-
vapour (LV) interface. The calculations reveal that chain ends are the major constituents
on the vapour side of the (alkane) LV interface. For longer chains and lower temperatures
the (relative) preference of the chain ends to protrude into the vapour phase is more
pronounced. The calculated variation of the n-alkane LV interfacial tension (y) with
temperature and chain length agrees quantitatively with experimental data. If the theory
is applied for temperatures below the (experimental) n-alkane freezing points, positive
dy/dT values occur and a maximum in the LV interfacial tension is found at T/Tc ~ 0.12,
irrespective of the chain length of the molecule. In experimental studies close to the n-
alkane freezing points similar observations have been made. However, a comparion of
these experimental observations with our theoretical predictions should be performed
with some reservation as the theory describes a frozen phase as an isotropic supercooled
fluid.
The lattice fluid theory description of the n-alkane interfacial properties may be
improved by considering chain-flexibility constraints, such as trans-gauche
conformations and/or by distinghuishing (the parameters of the) CH3 and CH2 segments.
It is rather straightforward to extend the present theory to more complex systems such as
fluid mixtures, or fluids (vapour and liquid) at solid surfaces. The interfacial tensions of
such interfaces can be inferred from the theory so that the work of adhesion and contact
angles on these interfaces can be investigated as a function of temperature and chain
length of the (wetting) liquid. Some of these aspects are elaborated in the last Chapter.
137

The adsorption, structure and thermodynamics of (aliphatic) chain molecular fluids at rigid
surfaces and at solids with thermally grafted (aliphatic) chains is also investigated. Vapour
adsorption isotherms, inclusive the meta- and unstable regions, of an octameric fluid on
various substrates are calculated. The octameric molecules are modelled as B-A^-B chains
where A represents a CH2 segment and B a CH3 segment. On a bare solid, the influence of
adsorption energy differences between the A and B segments of the chain molecule is
investigated together with the influence of the chain flexibility. For semi-flexible chains
with high chain end-adsorption energies the shape of the calculated isotherm qualitatively
agrees with the linear vapour adsorption isotherms measured for n-alkanes on bare silica.
With the theory adsorption isotherms resembling the ones measured for n-alkanes on
methylated silica can be obtained. This requires semi-flexible chains with interaction
parameters that favour a rather parallel adsorption of the chain-molecules with respect to
the surface. A reduction of the chain flexibility, for instance by applying the RIS scheme,
increases the tendency of the adsorbed molecules to line up. In general, this increases the
adsorbed amounts when the interaction parameters favour end-on adsorption whereas this
reduces the adsorbed amounts when the interaction parameters are in favour of parallel
adsorption. On a poorly wetted rigid solid, a decreasing contact angle was calculated for
increasing chain length of the (aliphatic) wetting liquid An. The contact angles and the
(Zisman) critical surface tension for wetting decrease with increasing temperature. When
the temperature approaches the critical temperature of the wetting fluid, complete wetting
occurs. Furthermore, it is established that the temperature dependence of the contact angle
mainly results from the influence of the temperature on the liquid-vapour and solid-liquid
interfacial tensions.
On solids with grafted chains, octamer (As) adsorption isotherms and contact angles are
calculated for different grafting densities and grafted chain lengths. Grafting aliphatic
chains on a very poorly wetted (bare) solid decreases the contact angle of the octameric
liquid. On such a solid, the contact angle as a function of the grafting density passes
through a minimum. The rise beyond the minimum has an entropie origin. Grafting of
chains on a completely wetting (bare) solid eventually results in a finite contact angle;
higher grafting densities give rise to higher contact angles. When longer chains are grafted,
lower contact angles result for both substrates. The calculations provide insight into the
wettability of a substrate by chain-molecular fluids on a molecular level. Partial wetting of
chain molecules can be explained from an autophobic effect: due to the ordering
(anisotropy) of the molecules present in the thinnest adsorbed layer that can form at
saturation, molecules of the isotropic liquid are repelled. The liquid does not spread on the
thin film and droplet formation results. The calculations reveal that the partial wetting of
138

ADSORPTION AND WETTING
chain molecular liquids on grafted solids is largely due to the enrichment of the grafted
layer by middle segments of the liquid molecules.
In this thesis the thermodynamics and molecular aspects of adsorption and wetting have
been investigated and coupled by means of vapour adsorption isotherms and a lattice fluid
theory. At present a reasonable (semi) quantitative agreement between theory and
experiments has been achieved. For the (near) future, some other investigations based on
the present theory are challenging. Firstly, a better quantitative agreement with
experimental data is feasible by optimizing the description of the aliphatic molecules, for
instance by incorporating differences between end and middle segments and their mutual
interactions, or, in our case, their interactions with a vacancy. Secondly, the theory is able
to describe random, heterogeneous surfaces and rough substrates so that contact angles of
chain molecular liquids on such substrates can be inferred and compared to theories such as
developed by Cassie and Wenzel. Moreover, the theory can be extended to a two-
dimensional SCF approximation instead of the one dimension we used in this work. This
renders calculation of the (density) contour plot of a droplet feasible. By comparing the
contact angle of this contour plot with the equilibrium contact angle, calculated in one-
dimensional SCF, the effect of the drop size, its curvature and line tension on the contact
angle can be studied. Finally, a "dynamic" version of the SCF theory is currently being
developed in the department of Physical and Colloid Chemistry. In the future, this theory
will be suited to investigate the dynamics of evaporation of chain molecular liquids as well
as the dynamics of their adsorption, spreading and contact angles on solid substrates.
139

Samenvatting
Bevochtiging heeft betrekking op het gedrag van een vloeistof aan een oppervlak.
Wanneer een oppervlak volledig wordt bevochtigd dan spreidt de vloeistof over het
oppervlak. Indien een oppervlak onvolledig of slecht wordt bevochtigd dan spreidt de
vloeistof niet over het oppervlak maar vormt een druppel. Een alledaags voorbeeld van
bevochtiging zijn de regendruppels op ruiten in huizen en auto's. Wanneer het water
goed zou spreiden over de ruit dan zou dat op een regenachtige dag het zicht van een
automobilist sterk verbeteren. Een ander voorbeeld: eenden vetten hun veren in om ze
sterk waterafstotend te maken. Hierdoor kunnen ze makkelijker blijven drijven.
De bevochtiging van een oppervlak wordt beheerst door de stoffen die op dat
oppervlak aanwezig zijn. Dit is relevant voor bijvoorbeeld de aardolie-, verf- en
coatingindustrie. Teflon (polytetrafluorethyleen) bijvoorbeeld is een veel toegepaste
oppervlaktecoating. Vergeleken met andere materialen is de hechting van allerlei
stoffen op een teflon oppervlak relatief zwak. Teflon wordt dan ook vaak aangebracht
in koekepannen om aanbakken te voorkomen. De lage affiniteit van teflon voor allerlei
andere stoffen wordt direkt zichtbaar wanneer een waterdruppel in een teflon gecoate
koekepan wordt gelegd: de druppel probeert zo weinig mogelijk contact te maken met
de pan en de vloeistof blijft als een klein bolletje op het oppervlak staan.
De affiniteit van een vast oppervlak voor andere moleculen komt tot uitdrukking in
de oppervlaktespanning. Als ruwe vuistregel geldt: des te hoger de oppervlaktespanning
van een vast oppervlak des te makkelijker de hechting (adsorptie) van moleculen aan
dat oppervlak en des te beter de bevochtiging door een vloeistof. Adsorptie aan een
oppervlak verlaagt normaal gesproken de oppervlaktespanning. Dit verklaart waarom
water wel spreidt over goed schoon gemaakte ruiten maar niet over ongewassen (vette)
ruiten. Op ongewassen ruiten maken geadsorbeerde "vettige" stoffen de oppervlakte
spanning van het glas zo laag dat waterdruppels blijven liggen.
Lineaire (n-)alkanen zijn moleculen met de chemische structuur CH3-(CH2)«-2-CH3.
Alkanen zijn belangrijke bestanddelen van fossiele brandstoffen, olie, smeermiddelen
en polymeren. In bevochtiging- en adhesieonderzoeken worden alkanen vaak gebruikt
als model ("ijk") stoffen. In dit proefschrift worden daarom met name de adsorptie en
bevochtiging van alkanen op vaste oppervlakken bestudeerd.
Adsorptie en bevochtiging staan nauw met elkaar in verband. Dit verband is het
duidelijkst wanneer de damp van een vloeistof adsorbeert op een vast oppervlak. Met
toenemende dampdruk hopen meer dampmoleculen zich op aan het oppervlak. Indien
141
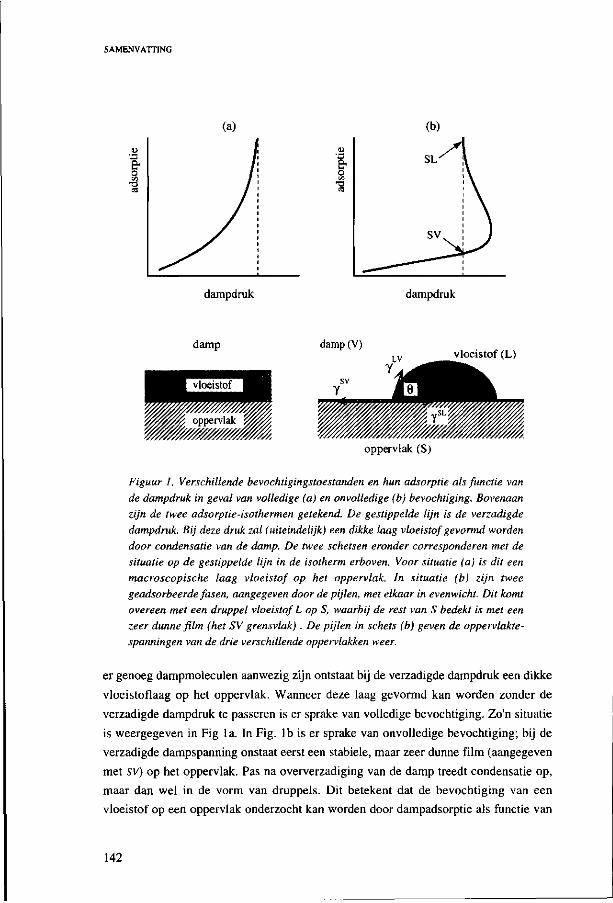
SAMENVATTING
dampdruk dampdruk
damp damp (V) vloeistof (L)
oppervlak (S)
Figuur 1. Verschillende bevochtigingstoestanden en hun adsorptie als functie van de dampdruk in geval van volledige (a) en onvolledige (b) bevochtiging. Bovenaan zijn de twee adsorptie-isothermen getekend. De gestippelde lijn is de verzadigde dampdruk. Bij deze druk zal (uiteindelijk) een dikke laag vloeistof gevormd worden door condensatie van de damp. De twee schetsen eronder corresponderen met de situatie op de gestippelde lijn in de isotherm erboven. Voor situatie (a) is dit een macroscopische laag vloeistof op het oppervlak. In situatie (b) zijn twee geadsorbeerde fasen, aangegeven door de pijlen, met elkaar in evenwicht. Dit komt overeen met een druppel vloeistof L op S, waarbij de rest van S bedekt is met een zeer dunne fdm (het SV grensvlak) . De pijlen in schets (b) geven de oppervlaktespanningen van de drie verschillende oppervlakken weer.
er genoeg dampmoleculen aanwezig zijn ontstaat bij de verzadigde dampdruk een dikke
vloeistoflaag op het oppervlak. Wanneer deze laag gevormd kan worden zonder de
verzadigde dampdruk te passeren is er sprake van volledige bevochtiging. Zo'n situatie
is weergegeven in Fig la. In Fig. lb is er sprake van onvolledige bevochtiging; bij de
verzadigde dampspanning onstaat eerst een stabiele, maar zeer dunne film (aangegeven
met SV) op het oppervlak. Pas na oververzadiging van de damp treedt condensatie op,
maar dan wel in de vorm van druppels. Dit betekent dat de bevochtiging van een
vloeistof op een oppervlak onderzocht kan worden door dampadsorptie als functie van
142

ADSORPTIE EN BEVOCHTIGING
de dampdruk te meten. Een dergelijke dampadsorptie-curve, gemeten bij constante
temperatuur, wordt een adsorptie-isotherm genoemd.
In een onvolledig bevochtigend vloeistof-damp-vast (oppervlak) systeem wordt de
hoek die de druppel maakt met het oppervlak de randhoek genoemd. De grootte van de
randhoek (6) wordt gegeven door het mechanisch evenwicht tussen de grensvlak
spanningen, zie ook de schets in Fig. Ib. De randhoek karakteriseert de bevochtiging:
hoe groter de randhoek des te slechter de bevochtiging.
Allereerst is dampadsorptie gekoppeld aan bevochtiging binnen een algemeen
thermodynamisch kader. Met deze koppeling kan ook de verdringing van een vloeistof
aan een oppervlak door een andere vloeistof beschreven worden. Het algemene kader
verklaart ook waarom de randhoek van een waterdruppel op een oplaadbaar oppervlak
maximaal is wanneer de oppervlaktelading nul is. Door het oppervlak op te laden
(positief of negatief) neemt de randhoek af, dat wil zeggen, het oppervlak wordt beter
bevochtigd door water.
De dampadsorptie van «-alkanen op silica (een van de meest voorkomende
mineralen in de aardkorst) is, met een heel precieze balans, tot op één miljoenste gram
nauwkeurig gemeten als functie van de dampdruk. De «-alkaan adsorptie voor
« = 7, 8 of 9, uitgedrukt in aantal moleculen per m2, bleek lineair toe te nemen met de
dampdruk en was onafhankelijk van de ketenlengte n. Indien voorafgaand aan de
adsorptiemetingen, methyl (-CH3) groepen verankerd worden aan het silica oppervlak
wordt een lagere «-alkaan adsorptie gevonden. De vorm van de gemeten adsorptie-
isothermen suggereert dat «-alkanen tamelijk loodrecht adsorberen op kale silica terwijl
ze veel vlakker gaan liggen op gemethyleerde silica. Alkanen bevochtigen kale silica
volledig, op gemethyleerde silica wordt onvolledige bevochting gevonden. Samen met
de gemeten isothermen geeft dit aan dat de bevochtiging van een oppervlak door
alkanen sterk afhangt van de structuur van de SV alkaanfilm.
Om een beter inzicht te krijgen in het gedrag van alkanen aan grensvlakken is gebruik
gemaakt van een statistisch-thermodynamische theorie die oorspronkelijk ontwikkeld is
door Scheutjens en Fleer en is uitgebreid door o.a. Leermakers. In deze theorie worden
ketenmoleculen (in dit geval «-alkanen) beschreven als een keten opgebouwd uit aan
elkaar gekoppelde eenheden. Deze eenheden worden segmenten genoemd. Ieder
segment stelt een C-atoom van een alkaanmolecuul voor. De ruimtelijke verdeling van
de moleculen wordt beschreven door de ketens in een rooster te plaatsen (zie Fig. 2).
Met deze theorie kan zowel de (evenwichts)structuur als de oppervlaktespanning van
een oppervlak met alkaanmoleculen uitgerekend worden.
143

f *ti «••ff •nnn« nnnnn • # # #
nnnn^
• •
vloeistof damp
Figuur 2. Octaanmoleculen en hun vloeistof-damp grensvlak binnen een roostermodel. Octaan wordt voorgesteld als een keten van 8 segmenten, ieder segment vult precies één roostercel. De zwarte balken geven aan welke segmenten samen één molecuul vormen.
SAMENVATTING
Berekeningen aan alkaan vloeistof-
damp grensvlakken laten zien dat de
uiteinden van de alkaanketens bij voor
keur uitsteken in de dampfase. Voor
langere n-alkanen en bij lagere tempe
raturen is deze voorkeur sterker. De
berekende LV grensvlakspanningen voor
diverse «-alkanen bij verschillende tem
peraturen komen goed overeen met ge
meten waarden.
De adsorptie, structuur en opper
vlaktespanningen van verschillende vaste
oppervlakken die in contact staan met
alkaandamp of alkaanvloeistof zijn met
de theorie bestudeerd. In de adsorptieberekeningen is de invloed van adsorptie-energie
verschillen tussen eind (CH3) en midden (CH2) segmenten op het adsorptiegedrag van
n-alkanen onderzocht. De aldus berekende alkaan isothermen komen goed overeen met
de gemeten curven. Daarnaast zijn n-alkaan randhoeken op verschillende onvolledig
bevochtigende oppervlakken uitgerekend. Hierbij is gekeken naar de invloed van de
temperatuur en de n-alkaanketenlengte op de randhoek. De berekende randhoeken
nemen toe wanneer de temperatuur daalt of wanneer de ketenlengte van de
bevochtigende alkaan stijgt. Verder blijkt dat chemische verankering van
koolwaterstofketens aan een volledig bevochtigend oppervlak dat oppervlak slechter
bevochtigbaar maken voor n-alkanen. Hierbij hebben korte verankerde ketens normaal
gesproken een sterker effect op de randhoek dan langere.
Met de theorie is een beter inzicht verkregen in het mechanisme van bevochtiging op
moleculair niveau. De structuur van de dunste geadsorbeerde laag die gevormd kan
worden bij de verzadigde dampdruk (het SV grensvlak, zie Fig. lb) kan sterk afwijken
van die in bulk vloeistof, bijvoorbeeld doordat de geadsorbeerde moleculen plat gaan
liggen op het oppervlak. In dit geval zal alkaanvloeistof als druppels op het oppervlak
met de geadsorbeerde alkaanmoleculen blijven liggen. De theorie beschrijft zowel de
vloeistof en damp fasen van «-alkanen als hun gedrag aan vloeibare en vaste
oppervlakken op moleculaire en macroscopische schaal. Hiermee voorziet de theorie in
een gemeenschappelijke benadering van adsorptie en bevochtiging waarbinnen
thermodynamica, moleculaire aspecten en experimenten aan elkaar gekoppeld worden.
144

Curriculum Vitae
Lucas Jozef Maria Schlangen is op 21 Juli 1968 te Enschede geboren. In 1986 heeft hij
het einddiploma Atheneum B aan het Boschveldcollege te Venray behaald en begon hij
zijn studie Moleculaire Wetenschappen aan de Landbouwuniversiteit Wageningen. In
November 1990 studeerde hij cum laude af in de Fysisch-chemische en Chemische
oriëntaties van deze studierichting. Vanaf december 1990 was hij, in het kader van het
EG project JOULE, voor vier jaar werkzaam als assistent in opleiding bij de vakgroep
Fysische en Kolloïdchemie. Ten behoeve van dit project was hij van oktober 1991 tot
oktober 1992 gedetacheerd aan het Institut Français du Pétrole te Parijs. Begin 1995
rondde hij het onderzoek af met het schrijven van dit proefschrift. Vanaf april 1995 is
hij werkzaam op het Philips Natuurkundig Laboratorium te Eindhoven.
145


