Embed Size (px)
Citation preview

Aerosol Particle Number Concentration Measurements in FiveEuropean Cities Using TSI-3022 Condensation ParticleCounter over a Three-Year Period during Health Effects of AirPollution on Susceptible Subpopulations
Pasi Aalto, Kaarle Hameri, Pentti Paatero, and Markku KulmalaDepartment of Physical Sciences, University of Helsinki, Helsinki, Finland
Tom Bellander and Niklas BerglindDepartment of Occupational and Environmental Health, Stockholm, Sweden
Laura Bouso, Gemma Castano-Vinyals, and Jordi SunyerInstitut Municipal d’Investigacio Medica, Barcelona, Spain
Giorgio Cattani and Achille MarconiInstituto Superiore di Sanita, Rome, Italy
Josef Cyrys, Stephanie von Klot, Annette Peters, and Katrin ZetzscheForschungszentrum Institut f. Epidemiologie, Neuherberg, Germany
Timo Lanki and Juha PekkanenNational Public Health Institute, Department of Environmental Health, Unit of EnvironmentalEpidemiology, Kuopio, Finland
Fredrik NybergInstitute of Environmental Medicine, Karolinska Institute, Stockholm, Sweden
Billy SjovallStockholm Air Quality and Noise Analysis, Stockholm, Sweden
Francesco ForastiereDepartment of Epidemiology, Local Health Authority Rome E, Rome, Italy
ABSTRACTIn this study, long-term aerosol particle total numberconcentration measurements in five metropolitan areas
across Europe are presented. The measurements havebeen carried out in Augsburg, Barcelona, Helsinki, Rome,and Stockholm using the same instrument, a condensa-tion particle counter (TSI model 3022). The results showthat in all of the studied cities, the winter concentrationsare higher than the summer concentrations. In Helsinkiand in Stockholm, winter concentrations are higher by afactor of two and in Augsburg almost by a factor of threecompared with summer months. The winter maximum ofthe monthly average concentrations in these cities isbetween 10,000 cm�3 and 20,000 cm�3, whereas the sum-mer min is �5000–6000 cm�3. In Rome and in Barcelona,the winters are more polluted compared with summers byas much as a factor of 4–10. The winter maximum in bothRome and Barcelona is close to 100,000 cm�3, whereas
IMPLICATIONSThis manuscript gives an overview of aerosol particle num-ber concentrations in five European cities over about atwo-year period. These data are valuable for: (1) providingbasic information about fine and ultrafine particulate pollu-tion concentrations in European cities; (2) showing the di-urnal and annual variation of the aerosol concentrations; (3)providing data for future legislation concerning the partic-ulate pollution; and (4) giving a database that can be usedin epidemiological studies related to aerosol particles andhealth effects.
TECHNICAL PAPER ISSN 1047-3289 J. Air & Waste Manage. Assoc. 55:1064–1076
Copyright 2005 Air & Waste Management Association
1064 Journal of the Air & Waste Management Association Volume 55 August 2005

the summer minimum is �10,000 cm�3. During theweekdays the maximum of the hourly average concentra-tions in all of the cities is detected during the morninghours between 7 and 10 a.m. The evening maxima werepresent in Barcelona, Rome, and Augsburg, but these werenot as pronounced as the morning ones. The daily max-ima in Helsinki and Stockholm are close or even lowerthan the daily minima in the more polluted cities. Theconcentrations between these two groups of cities aredifferent with a factor of about five during the whole day.The study pointed out the influence of the selection of themeasurement site and the configuration of the samplingline on the observed concentrations.
INTRODUCTIONIn recent years a number of studies have focused on therelationship between ambient particulate matter and ad-verse health effects. Elevated concentrations of aerosolparticles have been associated with increases in all-causemortality, mortality for respiratory and cardiovasculardiseases, hospital admissions, and exacerbation of respi-ratory symptoms in chronically ill patients.1–3 An exten-sive summary of �100 studies can be found in an articleby Pope and Dockery.4 These studies can be subdivided intwo main categories: acute and chronic exposure studies,focusing on either the short term variation or the longterm changes in particulate air pollution levels.
Standards to limit the concentrations of particle masswith particle aerodynamic diameter �10 �m are widelyestablished in many countries. In addition, progress to-ward criteria for regulating the fine fraction of particulatematter (aerodynamic diameter �2.5 �m) has been madeboth in the United States and Europe. However, both ofthese standards are based on particle mass and neglect toexplicitly address ultrafine particles (�100 nm in aerody-namic diameter) because of the small contribution ofsuch particles on total aerosol particle mass. Ultrafineparticles can easily be inhaled and deposited in the deeperregions of the respiratory tract and can, therefore, pose ahealth risk. In fact, both toxicological and epidemiologi-cal studies have indicated that a high number concentra-tion of ultrafine particles may cause serious health ef-fects.5–8
Recent literature presents several studies focusing onthe properties of ultrafine particles in urban areas. The find-ings indicate that the behavior of the particulate mass and ofthe total number concentration, which is dominated by theultrafine fraction of aerosol particles, have to be investigatedseparately. Ruuskanen et al.9 found that ultrafine particlesand the fine fraction of particulate matter differed bothin sources and temporal variability in urban air. Theypresented a principal component analysis showing that
particulate pollution can be divided in two categories, dom-inated either by aerosol particle mass or total number.
Several long-term datasets on aerosol particle numberconcentrations and size distributions have been pub-lished recently, reflecting the paucity of data on long-term particle number concentrations and difficulty in es-tablishing meaningful standards for the concentration oftotal particle number. Long-term measurements of aero-sol particle number size distributions over 4 years inLeipzig, Germany, have been presented by the Institutefor Tropospheric Research group.10 A similar data set over6 years in Helsinki, Finland, is presented by Hussein etal.11 and for a roadside site in London over �3years byCharron and Harrison.12 These studies have been per-formed with stationary monitoring equipment in a fixedsite. Bukowiecki et al.13 had a different approach andpublished seasonal data measured using a mobile labora-tory in the Zurich area. Whereas more information onlong-term ultrafine aerosol properties, thus, has accumu-lated recently, all of the studies can be viewed as individ-ual case studies in which the details of the instrumenta-tion, site characteristics, and study periods are alldifferent. There is clearly a need for systematic compari-son between different cities in different climatic condi-tions.
In addition to temporal variability on different timescales, information on the spatial variation of particlenumber concentration is also essential in studies of hu-man exposure of pollutants. Few studies have looked intothis topic in detail. Buzorius et al.14 investigated the totalaerosol particle number concentration at four differentplaces in Helsinki. They found that during working days,when traffic intensity is relatively high, correlation be-tween different concentration time series was �0.7. Thisindicates that one can use a central monitoring site topredict the temporal behavior at another site in the samecity, but the total number concentration may be signifi-cantly different. Besides correlation, this study showedrather similar values in three measurement sites in townarea, located within 3 km from each other. The concen-tration differed by a factor of two between the two ex-treme sites, whereas the other two had similar averageconcentrations. In addition, comparison measurementsperformed at the same site, but 60-m apart showed similarvalues within �10% difference.
In previous field studies, several common featurescan be identified. First of all, traffic is found to be the mostimportant source for ultrafine particles in urban areas.Traffic produces primary particles with the highest num-bers at �70–100 nm in aerodynamic diameter. In addi-tion, traffic is responsible for producing a high number ofparticles close to 10 nm in diameter. These particles areformed in the atmosphere close to the tail pipe of the
Aalto et al.
Volume 55 August 2005 Journal of the Air & Waste Management Association 1065

vehicle, and their rate of formation has been shown todepend on both the type of the vehicle and the meteoro-logical conditions.10,12
This study is part of a European Union-funded projectnamed Health Effects of Air Pollution on Susceptible Sub-populations. The aims of the project were as follows: (1) toquantify the risk of hospitalization and of death becauseof air pollution, in particular airborne ultrafine particles,in individuals with coronary heart disease, and (2) toquantify the attributable risk of environmental exposuresamong a sensitive subgroup to facilitate appropriate pub-lic health strategies for the prevention of air pollutionrelated health effects. For the part of the study that ispresented in this article, the task was specifically to pro-vide a database of cross-European data on ultrafine parti-cles for the study areas in the Health Effects of Air Pollu-tion on Susceptible Subpopulations study.
In this article, we present long-term aerosol particletotal number concentration measurements in five metro-politan areas across the Europe. The measurements havebeen carried out using identical, well-characterized, andcalibrated instrumentation. In addition, the measure-ment sites have been selected to facilitate intercompari-son between the cities. Also, the influence of the specificmonitoring environment and the sampling inlet con-struction were studied using a reference site and referenceinstrumentation during part of the study. The data can beuseful in estimating the exposure of large urban popula-tions to fine and ultrafine aerosol particles in differentclimatic conditions.
INSTRUMENTATIONIn this study particle number concentration was mea-sured with a TSI model 3022 condensation particle
counter (CPC).15 The schematics of the instrument is pre-sented in Figure 1. In this instrument aerosol is drawninto the instrument with a built-in pump. The user mayselect an inlet flow of either 0.3 L/min or 1.5 L/min. In ourexperiments we used the higher flow rate to achieve lowersampling losses. The flow rate is controlled with a pressuregauge connected to an orifice flow element. Aerosol is atfirst drawn into a saturator. The saturator walls are keptsaturated with butanol with the aid of an automaticallyfilled pool and a fibrous felt. A resistance heater keeps thesaturator temperature at 35 °C. When the aerosol exitsfrom the saturator, it is saturated with butanol vapor. Onexiting the saturator, aerosol is drawn into the condenserwhere the wall temperature is kept at 10 °C with a ther-moelectric device. When aerosol starts to cool, butanolbegins to condense on the nearest surface available, in-cluding aerosol particle surfaces. Depending on the parti-cle concentration, particles can grow up to a diameter of10 �m before they exit the condenser and are opticallydetected. The condenser exit nozzle accelerates the drop-lets through a laser beam. Part of the light scattered by thedroplet is detected with a photodetector.
The CPC 3022 has three modes of operation. Thereal-time single-particle counting mode counts the elec-trical pulses generated by photodetector individually oversome time period and calculates the concentration usingthe given aerosol flow rate. It is used for particle concen-trations �1000 cm�3. In single-particle live-time count-ing mode the counter clock is advanced just when theelectronics is ready to detect a particle. The electronics isstopped for a few microseconds each time a particle isdetected. In other words, only the time when the instru-ment is ready to detect a new particle is taken into ac-count. This so called live time is then used to calculate the
Figure 1. Schematic illustration of the condensation particle counter TSI 3022.
Aalto et al.
1066 Journal of the Air & Waste Management Association Volume 55 August 2005

final concentration. The live time counting mode is usedfor particle concentration between 1000 and 10,000cm�3. After 10,000 cm�3 photometric calibration is usedto calculate the concentration. In this mode the intensityof light scattered from multiple particles in the scatteringvolume is detected, and the concentration is calculatedusing a calibration table saved to the instrument. TheCPC is not calibrated for concentrations �107 cm�3. Thecalibration is saved to the CPC’s in steps of 0.1 V around10,000 cm�3 corresponding to a concentration step of5,000 cm�3. About 15 calibration points are used over theconcentration span typical for city areas. Fluctuations of0.005 V are common in the photodetector voltage, whichcorresponds to concentration fluctuations of �250 cm�3.It is quite characteristic of the instrumentation that whencounting mode shifts from live time to photometric cali-bration, mode a concentration step either down or up isobserved. The reasons for this step are mainly the errors inconcentrations from the live time counting mode as theconcentration gets higher and also the changes of thecalibration in the photometric mode with time. The mag-nitude of this step is usually rather small, �10%, and iswithin the overall accuracy of the instrument.
According to the standard operation procedure of theHealth Effects of Air Pollution on Susceptible Subpopula-tions study, the instrument used should be either a newone or factory calibrated before the campaign. During the3-year campaign, each instrument should be comparedagainst a “standard” instrument at least once. In prac-tice each instrument was either changed to a fresh one,factory calibrated, or calibrated by the University ofHelsinki more than once during the campaign. Eachinstrument was compared against a reference at leastonce during the campaign. Each week the instrumentwas checked. Data was copied from the logging com-puter, and the computer clock was set to the correctreference time (local wintertime), status lights werechecked, and butanol was drained and filled. A butanolbottle was kept connected to the instrument all of thetime. The pump was switched off, and photodetectorvoltage and aerosol particle concentration werechecked when the flow was off. Flow rates were mea-sured with a low-pressure drop flow calibrator. If theflow was off by �10%, flow was adjusted. The CPC waskept in a “high flow mode,” 1.5 L/min. The data wastransferred to a common database in Helsinki and savedas 1-min averages.
Instrument calibrations were made by the Universityof Helsinki for some instruments. Charged monodispersesilver aerosol particles were used for the calibration. Con-centration calibration was made against an aerosol elec-trometer and a TSI model 3025 instrument. The model3025 was used also as a standard when model 3022 cut-off
diameters were determined. The typical 50% cut-off di-ameter for model 3022 was around 7 nm.
According to the standard operating procedure, sam-pling lines should be made of stainless steel tube with ani.d. �4 mm. The length of the sampling line should be �5meters, and it should be as short as possible. Later it wasnoticed that, especially in Rome and Barcelona, adding adrier to the sampling line was essential. Water started toaccumulate inside the instrument despite the scheduledbutanol change. At first Permapure driers were tested, butsilicagel driers were found to be more reliable, althoughmore laborious. The change of the sampling lines in themiddle of the campaign caused some artifacts to the databecause of the larger diffusion losses after adding thedrier. The losses in the Permapure drier are similar to thatof 2 m of regular tubing, and losses in the silicagel driercorrespond to 5 meters of regular tubing. The losses werestudied by operating another CPC parallel to the one withthe dryer. The use of dryers leads to 10% losses of 15-nmparticles for the Permapure drier and 20% losses for thesilicagel drier.
The field comparisons against standard instrumentrecently calibrated by the University of Helsinki wereperformed at least once during the campaign in eachcity. The comparisons were made with ambient air byrunning the instruments parallel with as similar sam-pling lines as possible. In Helsinki and Barcelona thecomparison appeared to be fairly satisfactory. Hourlyaverage concentrations differed in most cases by �10%,which is the accuracy stated by manufacturer. At theother sites the comparisons were not so successful. InAugsburg the difference was sometimes �60%, inRome, �50%, and in Stockholm, 30%. During the sec-ond comparison period in Stockholm during autumn2002 the difference was �10%. In Rome a more detailedcomparison study was made with three CPC’s duringthe spring 2003. The discrepancies were found to be�20% with identical sampling lines. This discrepancymight partly be explained by the fact that two of theinstruments were calibrated in Helsinki and one by themanufacturer. Pearson correlation coefficients were,however, �0.98. When instruments were comparedwith different sampling lines and 7 m apart from eachother, the discrepancy increased. The hourly correla-tions decreased to 0.75 and concentration differencesbetween the instrument rose to 60%. The length of thesampling line has an effect on the total concentrationbecause in polluted environments the mean particlesize can be quite small, close to 10 nm in diameter. Thesmall particles are strongly affected by diffusion and aredeposited on the walls of the sampling lines. The in-struments were compared again some months later, and
Aalto et al.
Volume 55 August 2005 Journal of the Air & Waste Management Association 1067

the results were very similar. Instrument calibrationwas not changed during this time.
Particle number concentration measurements withCPC’s have many sources of possible errors. The instru-ment response is linearly proportional to the sampleflow rate. The flow rate might change or become unsta-ble when the flow-measuring element becomes contam-inated. In most cases the reason for unstable flow is thepenetration of butanol or water into the sampling lines.It is essential to keep the water out of the instrument. Insome centers the filling system of the butanol failed afew times during the measurement period causing theinstrument flooding. The photometric calibration ofthe instrument can also change in time. This mighthappen because of contamination of the optics, laserpower drop, or saturator contamination. Optics con-tamination and laser power drop directly affect theinstrument response. Optics can get contaminated be-cause of high large particle concentrations. This hap-pened once during the period because of asphalt worksclose to the measurement site in one center (Stock-holm). Water or butanol leakage to the optics mightalso contaminate it. Laser power will decrease overtime, and the instrument should be serviced and thelaser current checked by the manufacturer every thirdyear. Saturator contamination affects the maximum su-persaturation inside the saturator, which leads to in-crease in cut-off diameter of the device and smaller finaldroplet sizes. If the droplet size after the condenser fallsbelow 0.5 �m, droplets are not detected with the opticalcounter. Typical contaminants are, again, water andlarge dust particles. Data acquisition problems were alsofairly common. Computers can fail, and power breaksmay cause trouble. These problems were observed in allof the cities, but they did not produce major problemsin the dataset.
SITE DESCRIPTIONSThe study period was from May 2001 to December 2003. In
some centers, the experiments were started already earlier,
and all of the centers managed to start measurements by
May 2001. It was decided before the campaign that the
measurement sites should be urban background sites. This
means locations at some distance from direct sources and
broadly representative of citywide background concentra-
tions. The sites could be situated in elevated locations, parks,
or urban residential areas. The sites are summarized in Table
1. Three of the primary sites, in Helsinki, Stockholm, and
Barcelona, are elevated sites close to the city center. The
Augsburg site is situated inside a garden and the Rome site
by a moderately busy street close to the downtown area. The
secondary site in Rome is situated inside a park. In Stock-
holm, the secondary site is located in a street canyon.
HelsinkiHelsinki has a population of �0.5 million people. It is
bounded in the south by the Gulf of Finland. The mea-
surement site is located �3.5 km north of the city center,
100 m west of one of the main roads carrying traffic into
and out from the city. One of the city harbors and several
power plants are located 2 km south of the site. The
instrument is located on the fourth floor level �13 m
above the nearest small street and �100 m from the
closest major street. The sample was taken through a wall,
and the inlet extends 1 m outside of the wall. The sample
line is a 2.5-m long 4-mm i.d. stainless steel tube. Sam-
pling started May 1, 2001, with a plain stainless steel line,
but on August 8, 2001, the Permapure drier (MD-070–24
sec-4) was added to the line because of water accumula-
tion inside the CPC. Later, on April 22, 2003, instrument
maintenance was taken over by the RUPIOH project (re-
lationship between ultrafine and fine particulate matter
Table 1. Summary of the site descriptions.
City Site Street AddressDistance/Height (m)
CiteClass
Helsinki — Gustaf Hällströmin katu 2 100/13 ub
Stockholm Rosenlundsgatan Rosenlundsgatan 50/20 ub
— Hornsgatan Hornsgatan 3/3.5 ks
Augsburg — Stephansplatz 6 150/2 ub
Barcelona IMIM Doctor Aiguader 80 100/15 ub
— UPF Ramon Trias Fargas 25–27 300/20 ub
Rome Inst. Super. di Sanità Viale Regina Elena 299 10/2.5 rs
— Botanical garden Largo Cristina di Svezia 24 400/3 ub
Notes: Distance refers to distance of the nearest main street and height means height above the ground. Site classes
are ub � urban background; rs � roadside; and ks � kerbside. IMIM � Institut Municipal d‘Investigació Mèdica;
UPF � Universitat Pompeu Fabra.
Aalto et al.
1068 Journal of the Air & Waste Management Association Volume 55 August 2005

in indoor and outdoor air and respiratory health, Euro-pean Union-funded research project), and the drier waschanged to a 30–cm-long silicagel drier, and the tubelength was increased to 4 m.
StockholmStockholm has a population of �1 million people. The cityis limited by the Baltic Sea in the east. The instrument islocated on the roof of the Stockholm Air Quality and NoiseAnalysis measurement site on Rosenlundsgatan a few kilo-meters south from the city center. This area constitutes thesouthern edge of the Stockholm downtown area. Mainroads surround the site a few hundred meters away. Theinlet is 20 m above the street and 50 m from the closestbigger road. The inlet line is a 2-m long stainless steel tubewith an i.d. of 4 mm. On July 4, 2002, the Permapure drierwas added to the line, and it was removed on November 26,2002. No major problems with sampling occurred. Only onemonth of data was lost during the summer 2003 because ofinstrument problems. In Stockholm particles are measuredalso at a secondary street canyon site on Hornsgatan. Theinlet is 4 m from the building and 3 m from the middle ofthe nearest lane. The height above ground level is 3.5 m. Itextends 1.5 m outside the sidewalk over the vehicle lanes.The size of the inlet is 4 mm.
AugsburgAugsburg is a city in Germany with a population of �0.45million people, located some 60 km west of Munich. TheAugsburg measuring site is in the orchard of the monas-tery St. Stephan. This orchard is enclosed by a wall that is�3 m high. The measurement device is in the orchard, ata distance of 15 m from the nearest wall. The monasteryis located �1 km north of downtown Augsburg, on thehigh banks of the river Lech. The nearest street is at adistance of 50 m, being a minor street with low trafficintensity, and the nearest major street is �150 m away.The nearest stationary particle source is a thermal powerstation (powered by gas) at a distance of 300 m. Thesample inlet is a 120-cm long SS tubing 3 mm in diameterlocated 2 m above the ground. No dryer was used.
Measurements in Augsburg suffered major problemsbecause of instrument problems between July 10, 2003,and December 1, 2003. Data from another nearby mea-surement site was used to fill the gap in primary site databetween September 8, 2003, and December 1, 2003.
BarcelonaThe city of Barcelona has a population of �1.5 millionpeople. It is located on the north coast of the Mediterra-nean. The instrument is located in downtown Barcelonaby the sea, a few hundred meters west of the Port Olimpicde Barcelona. The city center is north of the site. The main
road (B10) is located just 30–40 m north of the site. The
city harbor is located some kilometers west of the site, and
the main power plant about the same distance to the east.
The site is influenced by sea breeze. The instrument loca-
tion is very similar to that of the Helsinki site. It is in the
fourth floor of the Institut Municipal d’Investigacio Med-
ica. Initially the sampling line was 2.1 m long and 4 mm
in diameter. A similar Permapure drier to that in Helsinki
was installed to the sampling line on October 24, 2001,
but it did not function as expected. Because we were not
able to find out the reason, a new 47-cm long Topas
silcagel drier replaced the Permapure drier on March 21,
2003.
Measurements in Barcelona suffered from CPC prob-
lems and computer problems several times. Between July
4 and September 29, 2001, the instrument was being
serviced because of water accumulation inside the instru-
ment. This caused some breaks in the data. Between May
6 and July 22, 2002, the CPC experienced some fluctua-
tions in the flow rate, which caused a 2-week break in
July. The instrument was changed, but problems with the
instrument continued until September 7, 2002, when the
serviced instrument was reinstalled. The next breakdown
occurred on December 24, 2002, because of flow rate
problems. The CPC was replaced January on 15, 2003, and
subsequently the new instrument behaved fairly well,
indicating that the drier worked well and prevented water
entering the instrument. However, the whole November
2003 was lost because of instrument problems.
A second instrument was installed �500 m from In-
stitut Municipal d’Investigacio Medica, on the fourth
floor of a building of the Universitat Pompeu Fabra, and
was run between February 28, 2002, and May 8, 2002. The
distance from the nearest busy street is 300 m, and the
sampling height is 20 m. The length of the sampling line
was �1 m, and there was no dryer in the sampling line.
RomeRome has a population of �2.6 million people. It is the
capital of Italy located by the river Tevere (Tiber) �20 km
from the Mediterranean Sea. It covers a densely populated
area �20 km in diameter surrounded by ringway E80. The
primary site instrument is located on the front yard of the
Italian National Institute of Health, inside an instrument
container. The inlet is located few meters from the street
Viale Regina Elena at a height of 3 m from the ground. A
traffic intensity of 25,000 cars/days was estimated, con-
stant throughout the year except for August. The city
center is located few kilometers west of the site but still
within the city area. Traffic pollution was presumed to be
roughly intermediate relative to the city, considering the
Aalto et al.
Volume 55 August 2005 Journal of the Air & Waste Management Association 1069

traffic intensity and location of the site between the cen-ter and suburban areas. The area is not subject to indus-trial emission. This site could be considered as a traffic-influenced site.
The secondary site is located in a protective containerinside a botanical park located in the area surroundingthe city center. To the east of the sampling site there is alittle hill (Gianicolo Hill) characterized by many differentplants and trees. To the south there is the famous districtof Trastevere (�400 m from the sampling point), which isa limited traffic area (only for residents). To the west andnorth there is the river of Rome (Tevere) and �2 km to thenorth, the San Peter Square. The nearest busy traffic streetis located at �400 m from the sampling inlet. We canassume the site as an urban background site.
Both sites have identical stainless steel inlet tubes,with 4-mm i.d., and the total length of the tube (from theinlet to the instrument) is 2.25 m. The tube extrudes fromthe cover of the containers for 1.2 m. The distance be-tween the inlet and the ground is 2.5 m at the primarysite, and 3 m at the secondary site. The Permapure dryers(model MD-070–24 sec-4) that were later installed did notsubstantially modify measurements from these instru-ments, because it was inserted after cutting off an appro-priate portion of the original tube.
The driers were installed to primary site June 6, 2002,and to secondary site at the end of March 2002. In spite ofthe drier, water continued to cause some trouble duringthe summer of 2002 at both sites and during the summer2003 at the primary site. The primary site CPC had to beserviced during the summer 2003 and the secondary site
CPC during the summer 2002.
RESULTSAnnual Variation
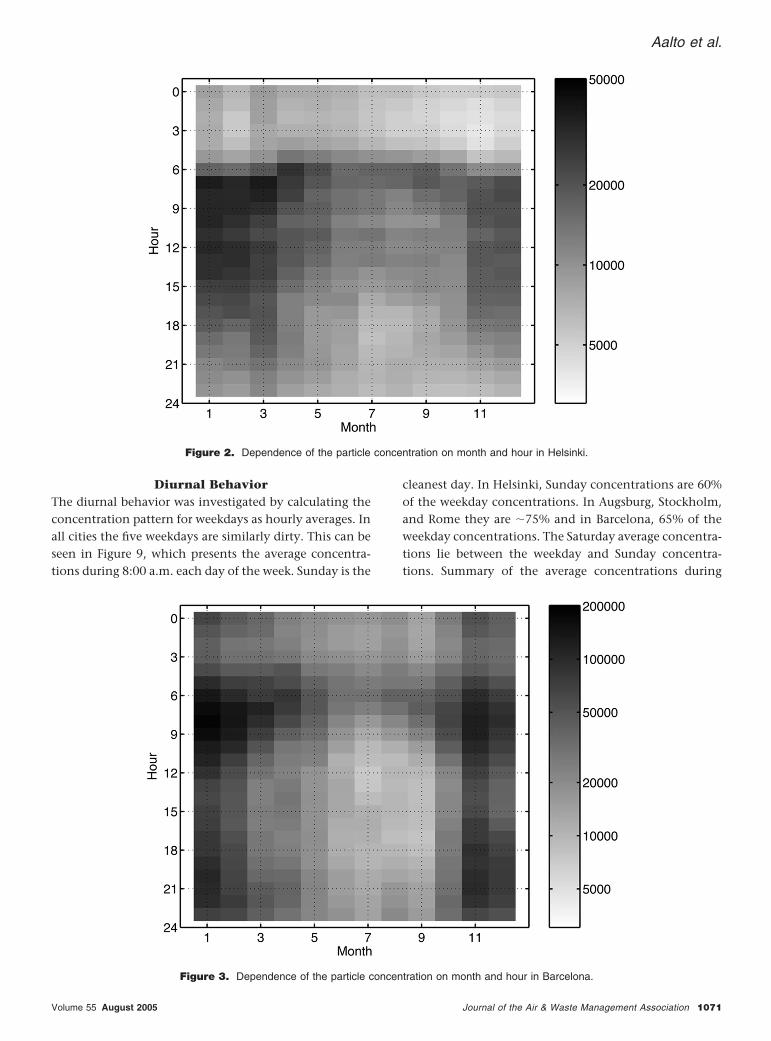
The sites can be divided to two subgroups. Helsinki, Stock-holm, and Augsburg belong to a group that could becharacterized as relatively clean urban areas. In all of thesethree cities, yearly average concentrations are �10,000cm�3. The second group consists of the cities of Rome andBarcelona and may be regarded as polluted urban areas.Yearly averages in these two cities are about five timeshigher than in the “clean” cities. Typical values are�50,000 cm�3 and monthly means reaching values are ashigh as 100,000 cm�3 (in Barcelona). The summary of theconcentration statistics at all of the cities is given at Table2. The variation of the aerosol particle number concen-tration in both clean and polluted cities (Helsinki andBarcelona) are shown in Figures 2 and 3. In both cities, theconcentration varies both annually and diurnally. Quali-tatively, the cities look relatively similar. However, theabsolute values are markedly different. In addition, amore detailed look at the temporal variation also shows
clear differences. In Helsinki, the high concentrationsappear during winter months (October to March) andbetween daytime (6:00 a.m. to 6:00 p.m.). In Barcelona,the annual behavior shows similarly higher concentra-tions during winter months. However, the diurnal patternseems to be weaker with high concentrations also duringthe nighttime. The temporal variation is discussed inmore detail below.
In all five of the cities, the winter concentrationsare higher than the summer concentrations. The an-nual variations of the concentration in all cities areplotted in Figures 4–8. The monthly mean values, aswell as 25 and 75 percentiles and minimum and max-imum values of the daily average concentrations areshown. In Helsinki and Stockholm, winter concentra-tions are higher by a factor of two and in Augsburgalmost by a factor of three compared with summermonths. The cleanest month in Stockholm and Hel-sinki is typically July and in August in Augsburg. Thedirtiest month is typically January, but there is somevariation between years, and high concentrations areobserved typically from November to March. The win-ter maximum (monthly mean) in these clean cities isbetween 10,000 cm�3 and 20,000 cm�3, whereas thesummer min is �5000–6000 cm�3. The effect of theaddition of a drier into the sampling line in Helsinkican be seen as decreasing concentration during spring2003. The decrease is notable, and the issue of dryer willbe discussed in more detail later in the article.
In Rome and Barcelona, the winters are more pol-luted compared with summers by as much as a factor of4–10. The cleanest month in these cities is usuallyAugust. The dirtiest month is also typically Januarywith high concentrations during all the months be-tween November and March. The winter maximum inboth Rome and Barcelona is close to 100,000 cm�3,whereas the summer minimum is �10,000 cm�3. Thesummer values in Rome and Barcelona are close to thewinter values in clean cities.
Table 2. Summary of the daily mean concentration statistics at the five
sites.
Augsburg Barcelona Helsinki Rome Stockholm
Mean 10,222 39,246 11,009 43,497 10,325
Std 5446 34,359 6270 23,445 4682
Min 2378 1141 1245 6601 2781
25% 6129 15,351 6359 26,297 6914
Med 8991 26,146 9474 38,479 9259
75% 13,001 50,330 13,978 54,517 12,701
Max 37,337 175,135 42,524 139,639 37,279
Note: The concentrations are given in units cm�3.
Aalto et al.
1070 Journal of the Air & Waste Management Association Volume 55 August 2005
Diurnal BehaviorThe diurnal behavior was investigated by calculating theconcentration pattern for weekdays as hourly averages. Inall cities the five weekdays are similarly dirty. This can beseen in Figure 9, which presents the average concentra-tions during 8:00 a.m. each day of the week. Sunday is the
cleanest day. In Helsinki, Sunday concentrations are 60%of the weekday concentrations. In Augsburg, Stockholm,and Rome they are �75% and in Barcelona, 65% of theweekday concentrations. The Saturday average concentra-tions lie between the weekday and Sunday concentra-tions. Summary of the average concentrations during
Figure 2. Dependence of the particle concentration on month and hour in Helsinki.
Figure 3. Dependence of the particle concentration on month and hour in Barcelona.
Aalto et al.
Volume 55 August 2005 Journal of the Air & Waste Management Association 1071

different days of the week in different cities is presented inTable 3.
During the weekdays the maximum concentrationin all of the cities is detected during the morning hoursbetween 7 a.m. and 10 a.m. in the wintertime. Theaverage diurnal behavior is shown in Figure 10. Theshift to daylight savings time can be clearly detected inMarch and October (data not shown). In Helsinki theconcentration reaches a maximum between 7:00 and8:00 a.m., and then gradually decreases until 2:00 a.m.the following night. No afternoon maximum is de-tected. In Barcelona the concentration maximum isalso detected between 7:00 and 8:00 a.m., and a clearevening maximum is detected around 9:00 p.m. Thelate maximum could be explainable by the decrease ofthe sea breeze. In Rome the maximum concentration isdetected between 8:00 and 9:00 a.m. and the evening max-imum around 7:00 or 8:00 p.m. In Augsburg the morningmaximum is detected between 8:00 and 9:00 a.m. and the
evening maximum between 9:00 and 10:00 p.m. In Stock-holm the morning maximum is achieved quite late, around9:00 a.m., and similarly to Helsinki, no clear evening max-imum is detected. Instead, a weak afternoon rush hour max-imum can be seen. It can be seen in Figure 10 that the dailymaxima in the clean cities are close or even lower than thedaily minima in the more polluted cities. The concentra-tions between these two groups of cities are different with afactor of about five during the whole day.
The diurnal pattern of the particle number concen-tration is caused mainly by the variation in traffic dur-ing the day and by the strength of air mixing. Themorning concentration maximum is caused by in-creased particle emissions from the traffic. It is notedthat the mixing of the boundary layer is also increasedduring the early morning hours because of increasingsun radiation. Later in the day the mixing height of theboundary layer increases, and the evening peak is not asstrong as the morning maximum. Also, the relative
Figure 6. Monthly statistics of daily means in Augsburg.
Figure 7. Monthly statistics of daily means in Barcelona.
Figure 4. Monthly statistics of daily means in Helsinki.
Figure 5. Monthly statistics of daily means in Stockholm.
Aalto et al.
1072 Journal of the Air & Waste Management Association Volume 55 August 2005

amounts of petrol and diesel vehicles may have diurnalpatter, which may result to the absence of the after-noon peak.16,17 In coastal sites of Barcelona, Helsinki,and Stockholm, sea breeze also causes concentrationdecrease during low wind speed days.
The average diurnal behavior during Saturdays (Fig-ure 11) and Sundays (Figure 12) is very different to that ofweekdays, indicating the role of traffic as the strongestsource influencing the aerosol particle number concentra-tion. However, the differences between the cities are atthe similar level as during the weekdays.
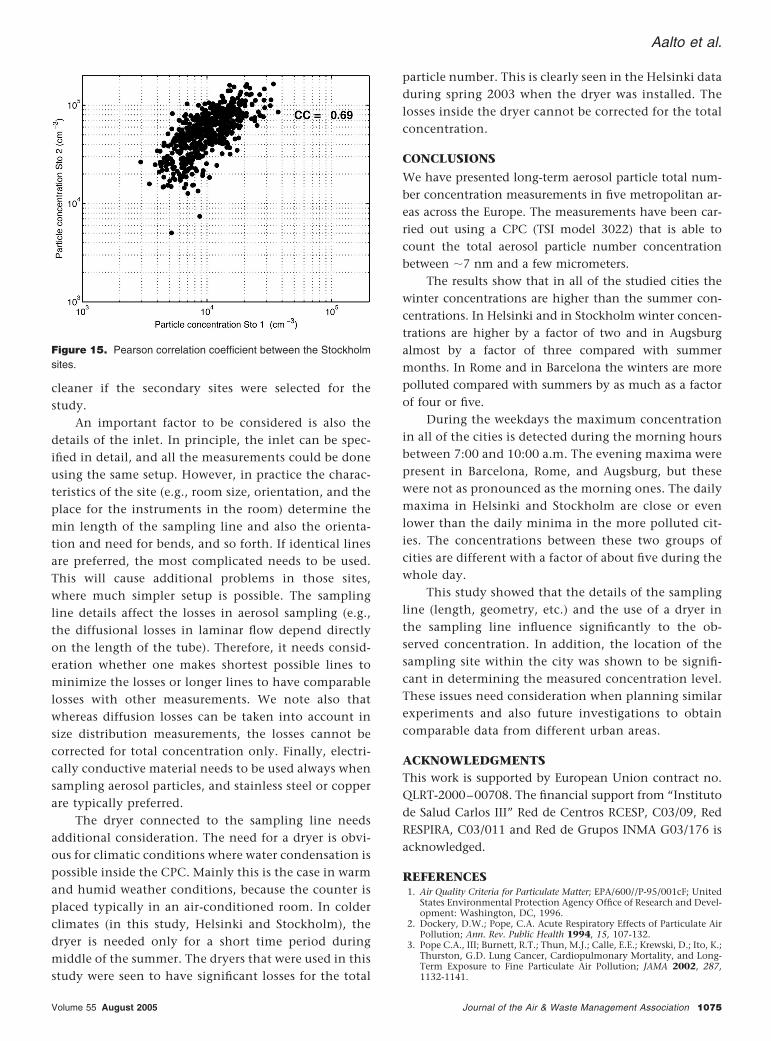
Spatial Variation of the Total ConcentrationTo study the influence of the actual location of the mea-surement site, parallel measurements were conducted inthree of the cities: Barcelona (60 days), Rome (293 days),and Stockholm (534 days). It is shown earlier by Buzoriuset al.14 that correlation between sites may be expected.
However, the absolute values of the sites are probablydifferent because of different distances from local emis-sions (streets) and micrometeorological parameters. Thecorrelations between the simultaneous measurements intwo sites are presented in Figures 13–15. The averageconcentrations at the secondary sites were in Barcelona,52,840 cm�3, in Rome, 49,967 cm�3, and in Stockholm,11,136 cm�3. The concentration ratios between the par-allel sites were rather similar in Barcelona and Rome (2.21and 2.53, correspondingly), whereas in Stockholm theratio was much larger—0.16. Note that in Stockholm thesecondary site was closer to the traffic emissions com-pared with the primary site, whereas in Barcelona and inRome the situation was the opposite.
DISCUSSIONThis study shows that clear annual and diurnal behaviorof the number concentration of aerosol particles is foundin the studied European cities. It is probable that thesame is valid for other cities, which have similar emis-sion patterns and climatic conditions. The max valuesare always found during the wintertime, whereas min is
Figure 8. Monthly statistics of daily means in Rome.
Figure 9. Average concentrations at 8 a.m. each day of the weekfor all studied cities.
Figure 10. Hourly dependence of particle concentration duringweekdays.
Table 3. Weekday dependence of particle concentration (cm�3; daily
average).
Weekday Helsinki Barcelona Rome Augsburg Stockholm
Mon 12,751 40,526 45,292 10,595 10,942
Tue 12,669 40,729 46,387 11,187 11,471
Wed 12,261 42,762 46,251 10,960 11,123
Thu 12,411 42,954 46,429 10,443 11,511
Fri 12,577 44,771 45,684 10,918 10,934
Sat 7757 34,412 39,924 9472 8226
Sun 6877 27,636 33,999 8209 8038
Aalto et al.
Volume 55 August 2005 Journal of the Air & Waste Management Association 1073

in the middle of the summer. The diurnal concentra-tion pattern is also similar in all of the studied citiesindicating the major role of the traffic as the source offine and ultrafine particles. Whereas similarities be-tween the cities are obvious, there are also differencesthat are significant and may have several explanations.
One of the main differences between the five cities isthe absolute values of the concentrations. The two south-ern cities had clearly higher concentrations during thewhole study period. The reasons for that might includemeteorological differences, as well as differences in theactual emissions. The latter include factors like size andpopulation of the city, traffic intensity, the relativeamounts of different types of vehicles, and so forth. All ofthese have probably significant differences but are notstudied within this study. However, more investigationsare needed before target values for aerosol particle num-ber concentrations can be meaningfully set.
The measurements were carried out using similar in-strumentation and at sites that were designed to be com-parable. The main idea was to obtain data that is compa-rable between the sites. However, several major issues thatneed to be considered were found during the measure-ments. First of all, the actual location of the site appears tobe important. Within this study, three of the cities hadadditional measurements for some time at a nearby site.The comparison between the two sites of the same cityindicate that the mean concentrations can be severaltimes higher at one of the two sites. This finding isbased on only three measurements and, therefore, themagnitude of this problem needs more attention. How-ever, for example, the classification of Stockholm as aclean city would be different if the other site withhigher concentration was selected as the study site.Similarly, Rome and Barcelona would appear much
Figure 11. Hourly dependence of particle concentration Saturdays.
Figure 12. Hourly dependence of particle concentration duringSundays.
Figure 13. Pearson correlation coefficient between the Barcelonasites.
Figure 14. Pearson correlation coefficient between the Rome sites.
Aalto et al.
1074 Journal of the Air & Waste Management Association Volume 55 August 2005
cleaner if the secondary sites were selected for thestudy.
An important factor to be considered is also thedetails of the inlet. In principle, the inlet can be spec-ified in detail, and all the measurements could be doneusing the same setup. However, in practice the charac-teristics of the site (e.g., room size, orientation, and theplace for the instruments in the room) determine themin length of the sampling line and also the orienta-tion and need for bends, and so forth. If identical linesare preferred, the most complicated needs to be used.This will cause additional problems in those sites,where much simpler setup is possible. The samplingline details affect the losses in aerosol sampling (e.g.,the diffusional losses in laminar flow depend directlyon the length of the tube). Therefore, it needs consid-eration whether one makes shortest possible lines tominimize the losses or longer lines to have comparablelosses with other measurements. We note also thatwhereas diffusion losses can be taken into account insize distribution measurements, the losses cannot becorrected for total concentration only. Finally, electri-cally conductive material needs to be used always whensampling aerosol particles, and stainless steel or copperare typically preferred.
The dryer connected to the sampling line needsadditional consideration. The need for a dryer is obvi-ous for climatic conditions where water condensation ispossible inside the CPC. Mainly this is the case in warmand humid weather conditions, because the counter isplaced typically in an air-conditioned room. In colderclimates (in this study, Helsinki and Stockholm), thedryer is needed only for a short time period duringmiddle of the summer. The dryers that were used in thisstudy were seen to have significant losses for the total
particle number. This is clearly seen in the Helsinki dataduring spring 2003 when the dryer was installed. Thelosses inside the dryer cannot be corrected for the totalconcentration.
CONCLUSIONS
We have presented long-term aerosol particle total num-ber concentration measurements in five metropolitan ar-eas across the Europe. The measurements have been car-ried out using a CPC (TSI model 3022) that is able tocount the total aerosol particle number concentrationbetween �7 nm and a few micrometers.
The results show that in all of the studied cities thewinter concentrations are higher than the summer con-centrations. In Helsinki and in Stockholm winter concen-trations are higher by a factor of two and in Augsburgalmost by a factor of three compared with summermonths. In Rome and in Barcelona the winters are morepolluted compared with summers by as much as a factorof four or five.
During the weekdays the maximum concentrationin all of the cities is detected during the morning hoursbetween 7:00 and 10:00 a.m. The evening maxima werepresent in Barcelona, Rome, and Augsburg, but thesewere not as pronounced as the morning ones. The dailymaxima in Helsinki and Stockholm are close or evenlower than the daily minima in the more polluted cit-ies. The concentrations between these two groups ofcities are different with a factor of about five during thewhole day.
This study showed that the details of the samplingline (length, geometry, etc.) and the use of a dryer inthe sampling line influence significantly to the ob-served concentration. In addition, the location of thesampling site within the city was shown to be signifi-cant in determining the measured concentration level.These issues need consideration when planning similarexperiments and also future investigations to obtaincomparable data from different urban areas.
ACKNOWLEDGMENTSThis work is supported by European Union contract no.QLRT-2000–00708. The financial support from “Institutode Salud Carlos III” Red de Centros RCESP, C03/09, RedRESPIRA, C03/011 and Red de Grupos INMA G03/176 isacknowledged.
REFERENCES1. Air Quality Criteria for Particulate Matter; EPA/600//P-95/001cF; United
States Environmental Protection Agency Office of Research and Devel-opment: Washington, DC, 1996.
2. Dockery, D.W.; Pope, C.A. Acute Respiratory Effects of Particulate AirPollution; Ann. Rev. Public Health 1994, 15, 107-132.
3. Pope C.A., III; Burnett, R.T.; Thun, M.J.; Calle, E.E.; Krewski, D.; Ito, K.;Thurston, G.D. Lung Cancer, Cardiopulmonary Mortality, and Long-Term Exposure to Fine Particulate Air Pollution; JAMA 2002, 287,1132-1141.
Figure 15. Pearson correlation coefficient between the Stockholmsites.
Aalto et al.
Volume 55 August 2005 Journal of the Air & Waste Management Association 1075

4. Pope C.A., III; Dockery D.W. Epidemiology of Particle Effects. In Hol-gate, S.T., Koren, H., Maynard, R., Samet, J., eds. Air Pollution andHealth. Academic Press: London, 1999, 673-705.
5. Oberdorster, G.; Gelein, R.; Ferin, J.; Weiss, B. Association of Particu-late Air Pollution and Acute Mortality: Involvement of Ultrafine Par-ticles? Inhalation Toxicol. 1995, 7, 111-124.
6. Oberdorster, G. Toxicology of Ultrafine Particles: In Vivo Studies;Philosophical Transactions of the Royal Society of London A 2000, 358,2719-2740.
7. Pekkanen, J.; Timonen, K.L.; Ruuskanen, J.; Reponen, A.; Mirme, A. Effects ofUltra-Fine and Fine Particles in Urban Air on Peak Expiratory Flow AmongChildren With Asthmatic Symptoms; Environ. Res. 1997, 74, 24-33.
8. Wichmann, H.E.; Peters, A. Epidemiological Evidence of the Effects ofUltrafine Particle Exposure; Philosophical Transactions of the Royal Soci-ety of London A 2000, 358, 2751-2769.
9. Ruuskanen, J.; Tuch, Th.; Ten Brink, H.; Peters, A.; Khlystov, A.;Mirme, A.; Kos, G.P.A., Brunekreef, B.; Wichmann, H.E.; Buzorius, G.;Vallius, M.; Kreyling, W.G.; Pekkanen, J. Concentrations of Ultrafine,Fine and PM2.5 Particles in Three European Cities; Atmos. Environ.2001, 35, 3729-3738.
10. Wehner, B.; Wiedensohler, A. Long Term Measurements of Submi-crometer Urban Aerosols: Statistical Analysis for Correlations withMeteorological Conditions and Trace Gases; Atmos. Chem. Phys. 2003,3, 867-879.
11. Hussein, T.; Puustinen, A.; Aalto, P.P.; Makela, J.M.; Hameri K. andKulmala, M. Urban Aerosol Number Size Distributions; Atmos. Chem.Phys. Discuss 2003, 3, 5139-5184.
12. Charron, A.; Harrison, R.M. Primary Particle Formation from vehicleEmissions during Exhaust Dilution in the Roadside Atmosphere; At-mos. Environ. 2003, 37, 4109-4119.
13. Bukowiecki, N.; Dommen, J.; Prevot, A.S.H., Weingartner E.; Balt-ensperger, U. Fine and Ultrafine Particles in the Zurich (Switzerland)Area Measured With a Mobile Laboratory: an Assessment of the Sea-sonal and Regional Variation Throughout a Year, Atmos; Chem. Phys.2003, 3, 1477-1494.
14. Buzorius, G.; Hameri, K.; Pekkanen, J.; Kulmala, M. Spatial Variation ofAerosol Number Concentration in Helsinki City; Atmos. Environ.1999, 33, 553-565.
15. Agarwald J.K.; Sem, G.J. Continuous Flow, Single-Particle-CountingCondensation Nucleus Counter; J. Aerosol Sci. 1980, 11, 343-357.
16. Wehner, B.; Birmili, W.; Gnauk T.; Wiedensohler, A. Particle NumberSize Distributions in a Street Canyon and Their Transformation intothe Urban-Air Background: Measurements and a Simple Model Study;Atmos. Environ. 2002, 36, 2215-2223.
17. Wåhlin, P.; Palmgren F.; Van Dingenen, R. Experimental Studies ofUltrafine Particles in Streets and Their Relationship to Traffic; Atmos.Environ. 35 Supplement No. 2001, 1, S63-S69.
About the Authors
Pasi Aalto, laboratory manager, Kaarle Hameri, professor,Pentti Paatero, laboratory manager, and Markku Kulmala,professor, are from the Department of Physical Sciences,University of Helsinki, Helsinki, Finland. Tom Bellander,associate professor, and Niklas Berglind, statistician, arefrom the Department of Occupational and EnvironmentalHealth, Stockholm, Sweden. Laura Bouso, research assis-tant, Gemma Castano-Vinyals, PhD student, and Jordi Su-nyer, senior researcher and professor, are from the InstitutMunicipal d‘Investigacio Medica, Barcelona, Spain. GiorgioCattani, research assistant, and Achille Marconi, researchdirector, are from the Instituto Superiore di Sanita, Rome,Italy. Josef Cyrys, research associate, Stephanie von Klot,research associate, Annette Peters, senior researcher, andKatrin Zetzsche, data manager, are from the Forschung-szentrum Institut f. Epidemiologie, Neuherberg, Germany.Timo Lanki, researcher, and Juha Pekkanen, professor, arefrom the National Public Health Institute, Department ofEnvironmental Health, Unit of Environmental Epidemiology,Kuopio, Finland. Fredrik Nyberg, lecturer, is from the Insti-tute of Environmental Medicine, Karolinska Institute, Stock-holm, Sweden. Billy Sjovall, technician, is from the Stock-holm Air Quality and Noise Analysis, Stockholm, Sweden.Francesco Forastiere, head of Environmental EpidemiologyUnit, is from the Department of Epidemiology, Local HealthAuthority Rome E, Rome, Italy. Address correspondenceto: Kaarle Hameri, Division of Atmospheric Sciences, De-partment of Physical Sciences, P.O. Box 64 (Gustaf Hall-stromin Katu 2), FIN-00014, University of Helsinki, Finland;phone: �358-40-5684487; fax: �358-9-19150860; e-mail:[email protected].
Aalto et al.
1076 Journal of the Air & Waste Management Association Volume 55 August 2005


