Embed Size (px)
Citation preview

Africa’s Infrastructure


Vivien Foster and Cecilia Briceño-Garmendia
Editors
A copublication of the Agence Française de Développement and the World Bank
Africa’s Infrastructure
A Time for Transformation

© 2010 The International Bank for Reconstruction and Development / The World Bank1818 H Street, NWWashington, DC 20433Telephone: 202-473-1000Internet: www.worldbank.orgE-mail: [email protected]
All rights reserved
1 2 3 4 12 11 10 09
This volume is a product of the staff of the International Bank for Reconstruction and Development / The World Bank. The fi ndings, interpretations, and conclusions expressed in this volume do not necessarily refl ect the views of the Executive Directors of The World Bank or the governments they represent.
The World Bank does not guarantee the accuracy of the data included in this work. The boundaries, colors, denominations, and other information shown on any map in this work do not imply any judgement on the part of The World Bank concerning the legal status of any territory or the endorsement or acceptance of such boundaries.
Rights and PermissionsThe material in this publication is copyrighted. Copying and/or transmitting portions or all of this work without permission may be a violation of applicable law. The International Bank for Reconstruction and Development / The World Bank encourages dissemination of its work and will normally grant permission to reproduce portions of the work promptly.
For permission to photocopy or reprint any part of this work, please send a request with complete information to the Copyright Clearance Center Inc., 222 Rosewood Drive, Danvers, MA 01923, USA; telephone: 978-750-8400; fax: 978-750-4470; Internet: www.copyright.com.
All other queries on rights and licenses, including subsidiary rights, should be addressed to the Offi ce of the Publisher, The World Bank, 1818 H Street, NW, Washington, DC 20433, USA; fax: 202-522-2422; e-mail: [email protected].
ISBN: 978-0-8213-8041-3eISBN: 978-0-8213-8083-3DOI: 10.1596/978-0-8213-8041-3
Cover and interior design: Naylor Design
Cover photo: Arne Hoel/World Bank; technician in a chlorination facility at a water treatment plant in Senegal.
Library of Congress Cataloging-in-Publication Data Africa’s infrastructure : a time for transformation. p. cm. ISBN 978-0-8213-8041-3 — ISBN 978-0-8213-8083-3 (electronic) 1. Infrastructure (Economics)—Africa. I. World Bank. II. Africa Infrastructure Country Diagnostic. HC800.Z9C324 2009 363.6096—dc22
2009025406

Africa Development Forum Series
The Africa Development Forum series was created in 2009 to focus on issues of signifi cant relevance to Sub-Saharan Africa’s social and economic development. Its aim is both to record the state of the art on a specifi c topic and to contribute to ongoing local, regional, and global policy debates. It is designed specifi cally to provide practitioners, scholars, and students with the most up-to-date research results while highlighting the promise, challenges, and opportunities that exist on the continent.
The series is sponsored by the Agence Française de Développement and the World Bank. The manuscripts chosen for publication represent the highest quality in each institution’s research and activity output and have been selected for their relevance to the development agenda. Working together with a shared sense of mission and interdisciplinary purpose, the two institutions are committed to a common search for new insights and new ways of analyzing the development realities of the Sub-Saharan Africa Region.
Advisory Committee Members
Agence Française de DéveloppementPierre Jacquet, Directeur de la Stratégie et Chef ÉconomisteRobert Peccoud, Directeur de la Recherche
World BankShantayanan Devarajan, Chief Economist, Africa RegionJorge Arbache, Senior Economist


Preface xixAcknowledgments xxiAbbreviations xxiii
Overview Africa’s Infrastructure: A Time for Transformation 1Finding 1: Infrastructure Contributed over Half of Africa’s Improved Growth Performance 2
Finding 2: Africa’s Infrastructure Lags Well behind That of Other Developing Countries 2
Finding 3: Africa’s Diffi cult Economic Geography Presents a Challenge for Infrastructure Development 3
Finding 4: Africa’s Infrastructure Services Are Twice as Expensive as Elsewhere 4
Finding 5: Power Is Africa’s Largest Infrastructure Challenge by Far 5
Finding 6: Africa’s Infrastructure Spending Needs at $93 Billion a Year Are More than Double Previous Estimates by the Commission for Africa 6
Finding 7: The Infrastructure Challenge Varies Greatly by Country Type 7
Finding 8: A Large Share of Africa’s Infrastructure Is Domestically Financed 8
Finding 9: After Potential Effi ciency Gains, Africa’s Infrastructure Funding Gap Is $31 Billion a Year, Mostly in the Power Sector 9
Finding 10: Africa’s Institutional, Regulatory, and Administrative Reform Process Is Only Halfway Along 12
Key Recommendations 14
Note 26
References 26
The Overall Story 29
Introduction The Africa Infrastructure Country Diagnostic 31Genesis of the Project 32
Scope of the Project 33
Contents
PART 1
vii
vii i Contents
Note 41
References 41
1 Meeting Africa’s Infrastructure Needs 43Infrastructure: The Key to Africa’s Faster Growth 44
Africa’s Infrastructure Defi cit 47
Africa’s Infrastructure Price Premium 49
How Much Does Africa Need to Spend on Infrastructure? 52
Overall Price Tag 58
Notes 60
References 60
2 Closing Africa’s Funding Gap 65Spending Allocated to Address Infrastructure Needs 66
How Much More Can Be Done within the Existing Resource Envelope? 67
Annual Funding Gap 75
How Much Additional Finance Can Be Raised? 75
Costs of Capital from Different Sources 82
Most Promising Ways to Increase Funds 82
What Else Can Be Done? 83
Notes 84
References 85
3 Dealing with Poverty and Inequality 87Access to Modern Infrastructure Services—Stagnant and Inequitable 88
Affordability of Modern Infrastructure Services—Subsidizing the Better Off 90
Alternatives to Modern Infrastructure Services—the Missing Middle 94
Policy Challenges for Accelerating Service Expansion 97
Notes 102
References 102
4 Building Sound Institutions 105Institutional Reforms: A Glass Half Full 106
Does Private Sector Participation Work? 110
How Can State-Owned Enterprise Performance Be Improved? 117
Do Independent Regulators Make Sense? 120
Notes 122
References 122

Contents ix
5 Facilitating Urbanization 125Viewing Cities as Engines of Growth 126
Strengthening Urban-Rural Links 126
The Costs of Providing Infrastructure—Sensitive to Density 130
Investment Needs 132
Infrastructure Financing 133
Policy Issues and Implications 137
Six Principles for Effi cient Urbanization 139
Notes 140
References 141
6 Deepening Regional Integration 143Why Regional Integration Matters 144
Opportunities for Regional Cooperation across Infrastructure Sectors 146
Meeting the Challenges of Regional Integration of Infrastructure in Africa 154
Notes 160
References 160
Sectoral Snapshots 163
7 Information and Communication Technologies: A Boost for Growth 165The African ICT Revolution 166
ICT Sector Developments 167
Institutional Reforms in the ICT Sector 168
Completing the Remaining Investment Agenda 172
Policy Challenges 174
Notes 179
References 179
8 Power: Catching Up 181Africa’s Chronic Power Problems 182
A Huge Investment Backlog 185
The Promise of Regional Power Trade 187
Improving Utility Performance through Institutional Reform 187
The Challenge of Cost Recovery 191
Policy Challenges 194
Notes 201
References 201
PART 2

x Contents
9 Transport: More Than the Sum of Its Parts 203Integrating Multimodal Transport 204
Developing Logistics Systems 205
Developing Transit Corridors for Landlocked Countries 206
Increasing Competition 207
Revisiting Attitudes toward Private Supply and Profi t 209
Meeting Social Obligations 209
Notes 210
References 210
10 Roads: Broadening the Agenda 211Road Infrastructure—Lagging Other Regions Somewhat 212
Road Infrastructure Institutions and Finance—Promising Developments 213
Road Expenditures—More Maintenance, Less Rehabilitation 215
Road Conditions—Refl ecting Quality of Sector Governance 217
Infrastructure Spending Needs—an Average of 1.5 Percent of GDP a Year 217
Transport Services—the Forgotten Problem 219
Moving Forward—Broadening the Reform Agenda 221
Notes 226
References 226
11 Railways: Looking for Traffi c 229Africa’s Rail Networks 230
The African Rail Market 233
How Much Investment Can Be Justifi ed? 236
Institutional Arrangements and Performance 238
Key Issues for Governments 243
The Way Ahead 246
Notes 246
References 246
12 Ports and Shipping: Landlords Needed 249The African Shipping Market 250
African Ports 252
Policy Issues and Implementation Challenges 255
Notes 258
References 258
13 Airports and Air Transport: The Sky’s the Limit 259The African Air Transport Market 260
Air Transport Policy in Africa 263

Contents xi
African Air Transport Infrastructure 265
Policy Challenges 267
Notes 269
References 270
14 Water Resources: A Common Interest 271Water Resources and Economic Development: Challenges for Africa 272
Addressing the Challenges 276
Investing in Africa’s Water Security 279
Note 284
References 284
15 Irrigation: Tapping Potential 287Agriculture and Poverty Reduction 288
Current State of Irrigation 289
Economic Investment Potential and Needs 290
Effect of Expanding Agricultural Water Development 293
Implementation Challenges 294
Notes 296
References 297
16 Water Supply: Hitting the Target? 299The Millennium Development Goal for Water—Elusive for Many 300
Differing Patterns of Urban and Rural Access 300
Financing the MDG 302
Using Appropriate Technologies 305
The Challenge of Cost Recovery 307
Improving Utility Performance through Institutional Reform 309
Reforms in the Rural Space 313
Policy Recommendations 316
Notes 321
References 321
17 Sanitation: Moving Up the Ladder 323The State of Sanitation in Africa 324
Challenges and Policy Options 329
Several Common Challenges Remain for All Countries 333
Notes 335
References 335
Index 337

xii Contents
Boxes I.1 The AICD Geographic Information Systems Platform for Africa 35
1.1 Introducing a Country Typology 51
2.1 Does Defi cit-Financed Public Investment in Infrastructure Pay for Itself? 77
3.1 Access to Basic Infrastructure and Time Use 95
3.2 Access, Affordability, and Alternatives—Urban Public Transportation 96
3.3 Are Connection Subsidies Well Targeted to the Poor? 98
4.1 Infrastructure’s Institutional Scorecard 106
4.2 Privatization in African Ports 114
4.3 Lessons from the DAWASA Lease Contract (Tanzania) 116
4.4 Lessons from Successful SOE Reforms in Botswana Power Corporation 118
4.5 Performance Agreement for the National Water and Sewerage Corporation (Uganda) 119
4.6 Regulation by Contract in Senegal 121
5.1 Land Issues in Tanzania 136
6.1 Not So EASSy 148
6.2 One-Stop Border Posts to Facilitate Trade 159
8.1 South Africa’s Power Supply Crisis 183
8.2 Kenya’s Success with Private Participation in Power 189
8.3 Botswana’s Success with a State-Owned Power Utility 190
8.4 CREST Spreading Good Practices 196
8.5 Rural Electrifi cation in Mali 199
9.1 9.1 Impediments to Transit Traffi c Growth in the Maputo Corridor 207
9.2 A New Attempt to Reform the Transit System in the Cameroon–Central African Republic–Chad Corridor 208
10.1 The Role of AGETIPs 215
12.1 Private Participation and Port Effi ciency: The Case of Apapa Container Terminal, Lagos, Nigeria 257
14.1 The Metolong Dam and Water Supply Program in Lesotho 277
15.1 Assumptions for Irrigation Investment Potential Study 291
15.2 An Enabling Environment for Reform: Offi ce du Niger 295
15.3 Nigeria’s Fadama Water User Association: Expanding Irrigation 296
16.1 Legalizing Household Water Resellers in Côte d’Ivoire 302
16.2 Standposts in Kigali, Rwanda 306
16.3 Cost Recovery, Equity, and Effi ciency in Water Tariffs in Africa 308
16.4 Senegal’s Successful Experience with Private Sector Participation 312
16.5 Uganda’s Successful Case of State-Owned Enterprise Reform 314
16.6 Issues Constraining Rural Water Supply in Cross River State, Nigeria 316
17.1 What Is Improved Sanitation? 324
17.2 Ethiopia’s Success with a Community-Led Program 331
17.3 Burkina Faso’s Sanitation Tax 334

Contents xiii
Figures O.1 Access to Household Services 3
O.2 Underlying Causes of Africa’s Power Supply Crisis 6
O.3 Burden of Infrastructure Spending Needs 8
O.4 Infrastructure Public Spending as a Percentage of GDP 9
O.5 Rehabilitation Backlog 10
O.6 Hidden Costs of Utility Ineffi ciencies 11
O.7 Infrastructure Funding Gap by Sector and Country Type 12
O.8 Institutional Progress across Sectors 13
O.9 Access to and Affordability of Household Services 23
I.1 Country Coverage of the Africa Infrastructure Country Diagnostic 34
I.2 Representativeness of Phase I Sampled Countries 34
1.1 Changes in Growth per Capita Caused by Changes in Growth Fundamentals 45
1.2 Changes in Growth per Capita Caused by Changes in Different Kinds of Infrastructure 45
1.3 Contribution of Infrastructure to Total Factor Productivity of Firms 46
1.4 Growth of Africa’s Infrastructure Stocks Compared with Asia 49
1.5 Africa’s Aggregate Infrastructure Spending Needs, by Country, 2006–15 59
2.1 Sources of Financing for Infrastructure Capital Investment, by Sector and Country Type 68
2.2 Split Investment Responsibilities between Governments and Public Enterprises, by Type of Country and Sector 69
2.3 Rehabilitation Backlog 73
2.4 Costs of Capital by Funding Source 83
2.5 Spreading Spending over Time 84
3.1 Coverage of Network Infrastructure Services, 1990–2005 88
3.2 Expansion of Access to Infrastructure Services Each Year, Mid-1990s to Mid-2000s 89
3.3 Projected Universal Access for Piped Water for Sub-Saharan African Countries, 2050 and Beyond 89
3.4 Coverage of Modern Infrastructure Services, by Budget Quintile 89
3.5 Share of Household Budgets Spent on Infrastructure Services, by Budget Quintile 91
3.6 Population with Service Connections Who Do Not Pay for Service 91
3.7 Affordability of Subsistence Consumption Priced at Cost-Recovery Levels 91
3.8 Extent to Which Electricity and Water Subsidies Reach the Poor, by Country 93
3.9 Amount of Subsidy Needed to Maintain Affordability of Water and Electricity Service, 2005 94
3.10 Access to Alternative Water and Sanitation Services across All Income Levels 96
3.11 Increased Industrial and Commercial Tariffs, Niger and Malawi 99
3.12 Residential Customers Using Prepayment Meters, by Utility 100
4.1 Institutional Progress across Countries, by Income Group, Aid Dependence, and Resource Richness 108
4.2 Institutional Progress across Sectors 109

xiv Contents
4.3 Institutional Progress on Reforms, Regulation, and Governance 110
4.4 Implementation of Private Participation across Sectors 111
4.5 Private Participation in Management and Investment across Sectors 111
4.6 Links between Private Sector Participation and Performance Indicators in Telecommunications 113
4.7 Links between Market Concentration and Performance Indicators in Telecommunications 113
4.8 Links between Port Concessions and Performance Indicators 114
4.9 Links between Rail Concessions and Performance Indicators 115
4.10 Links between Electricity Management Contracts and Performance Measures 115
4.11 Prevalence of Good Governance Practices among State-Owned Enterprises for Infrastructure 119
4.12 Prevalence of Performance Contracts in Electricity and Water 120
5.1 Access to Infrastructure by Location 129
5.2 Change in Urban and Rural Service Coverage, 1990–2005 130
5.3 Quality Differentials between Main and Rural Road Networks 130
5.4 Affordability of a Basic Package of Household Infrastructure 133
5.5 Spatial Split of Historic Infrastructure Investments 133
5.6 Spatial Split of Future Infrastructure Investment Needs 134
5.8 Municipal Budgets of Selected African Cities 134
5.7 Institutional Patterns of Water and Electricity Supply in Urban Areas 134
6.1 Africa’s Regional Infrastructure Challenge 147
6.2 Savings from Power Trade for Major Potential Power-Importing Countries 150
6.3 Uneven Distribution of Airport Hubs across Africa: Traffi c Flows between Top-60 Intraregional City Pairs 152
7.1 Growth of Mobile Subscribers in Africa, 1998–2006 166
7.2 Global System for Mobile Communications Coverage in Africa, 1998 to Third Quarter of 2006 166
7.3 Price of One-Minute, Peak-Rate Call to the United States, 2006 167
7.4 Price Basket for Internet Access, 2005 167
7.5 Net Change in Fixed-Line Market, 2001–05 168
7.6 Costs of Overstaffi ng for Fixed-Line Incumbents in Selected Countries 169
7.7 Value Added and Excise Taxes on Mobile Telephone Services, 2006 169
7.8 Status of Mobile Competition, 1993–2006 170
7.9 Tariff Rebalancing in African Countries with a Liberalized Telecommunication Sector, 1993–2006 170
7.10 Voice Coverage Gaps in 24 Sub-Saharan Countries 173
7.11 Broadband Coverage Gaps in 24 African Countries 173
8.1 Underlying Causes of Africa’s Power Supply Crisis 183
8.2 Economic Cost of Outages in Selected Countries 184
8.3 Economic Burden Associated with Power Utility Ineffi ciencies in Selected Countries 188

Contents xv
8.4 Ineffi ciency in Utility Performance 188
8.5 Effect of Reform Measures on Hidden Costs 189
8.6 Underpricing of Power in Selected Countries 191
8.7 Electricity Costs and Revenues by Type of Power System, 2001–05 192
8.8 Past and Future Cost-Recovery Situation 192
8.9 Affordability of Subsistence Consumption of Power at Cost-Recovery Pricing 193
8.10 External Financing Commitments for the African Power Sector, 1994–2007 201
9.1 Africa Registers Low Scores on the Logistics Performance Index, 2007 205
10.1 Progress with Road Fund Reforms 214
10.2 Average Annual Spending on Road Transport, by Country, 2001–05 216
10.3 Rehabilitation and Maintenance Spending Relative to Norms 216
10.4 Distribution of Road Network Length across Condition Classes, by Country 218
11.1 Map of African Rail Networks 230
11.2 Rail Network Size and Traffi c by Region 231
11.3 Average Railway Network Traffi c Density, 2001–05 232
11.4 Average Railway Traffi c Volumes, 2001–05 234
11.5 Private Participation in African Railways since 1990 239
11.6 Labor Productivity on African Rail Systems 241
11.7 Rail Concession Labor Productivity 242
12.1 Balance of Sub-Saharan African Container Trade, 2005 251
12.2 African Ports, by Size 252
12.3 Average Moves per Hour by Category of Port 254
13.1 Growth of Air Traffi c, 1997–2006 260
13.2 Top-60 International Routes within Sub-Saharan Africa, 2007 261
13.3 Regional Growth Zones in Seats Offered, All Travel Categories 262
13.4 Airfares by Distance on African Routes, Including North Africa, 2008 263
13.5 International Civil Aviation Organization Analysis of Safety Implementation in Africa, 2004 268
14.1 Interannual Hydroclimatic Variability in Africa, by Selected Regions and Countries 273
14.2 Africa’s International River Basins 274
14.3 Africa’s Hydropower Potential 275
14.4 Sub-Saharan Africa’s Irrigation Potential 276
14.5 Water Security and Growth 276
14.6 Water Interventions and Poverty 278
14.7 Water Reservoir Storage per Capita in Selected Countries, 2003 280
14.8 Degree of Regional Water Cooperation 283
15.1 Percentage of Cultivated Area Equipped for Irrigation, by Country 290
15.2 Investment Potential for Dam-Based and Small-Scale Irrigation 292
16.1 Increases in Access to Water by Source, 1990s to Early 2000s 303
16.2 Coverage of Water Services, by Budget Quintile 303

xvi Contents
16.3 Economic Burden of Water Underpricing, by Country 307
16.4 Affordability of Cost-Recovery Tariffs in Low-Income Countries 309
16.5 Economic Burden of Water Utility Operational Ineffi ciencies, by Country 310
16.6 Effect of Utility Ineffi ciency on Access Expansion and Water Quality 311
16.7 Hidden Costs and Institutional Frameworks 311
16.8 Overview of Reforms Affecting Urban Utilities 311
16.9 Overview of Rural Water Reforms 315
17.1 The Sanitation Ladder 325
17.2 Percentage of the Population Sharing Toilet Facilities 325
17.3 Coverage of Sanitation by Budget Quintile 326
17.4 Annual Growth in Coverage of Sanitation Types, 1990–2005 326
17.5 Moving Up to the Bottom Rung of the Sanitation Ladder: Côte d’Ivoire and Ethiopia, 1990–2005 327
17.6 Upgrading Latrines: Madagascar and Rwanda, 1990–2005 327
17.7 Mainstreaming Septic Tanks: Senegal, 1990–2005 327
17.8 Characterizing Patterns of Access to Sanitation across Urban and Rural Areas 328
Tables O.1 Africa’s Infrastructure Defi cit 3
O.2 Africa’s High-Cost Infrastructure 5
O.3 Overall Infrastructure Spending Needs for Sub-Saharan Africa 7
O.4 Infrastructure Spending on Addressing Sub-Saharan Africa’s Infrastructure Needs 9
O.5 Finding Resources: The Effi ciency Gap and the Funding Gap 12
O.6 Overview of Private Participation in Infrastructure 14
I.1 AICD Background Papers 33
I.2 AICD Working Papers 41
1.1 Links between Infrastructure and Growth in Africa: What the Research Says 44
1.2 Evidence on Links between Infrastructure and MDGs in Africa 47
1.3 International Perspective on Africa’s Infrastructure Defi cit 48
1.4 Intraregional Perspective on Africa’s Infrastructure Defi cit 50
1.5 Africa’s High-Cost Infrastructure 50
1.6 10-Year Economic and Social Targets for Investment Needs Estimates, 2006–15 52
1.7 Africa’s Power Needs, 2006–15 53
1.8 Power Spending Needs, 2006–15 54
1.9 Irrigation Spending Needs, 2006–15 55
1.10 Water and Sanitation Spending Needs, 2006–15 55
1.11 Transport Spending Needs, 2006–15 57
1.12 ICT Spending Needs beyond the Purely Market Driven: Investment Only, 2006–15 58
1.13 Overall Infrastructure Spending Needs for Africa, 2006–15 58
2.1 Spending of Most Important Players Traced to Needs (Annualized Flows) 67

Contents xvii
2.2 Annual Budgetary Flows 69
2.3 Average Budget Variation Ratios for Capital Spending 70
2.4 Existing Disbursements above Those Directed to Infrastructure Needs, Annualized Flows 71
2.5 Economic Rates of Return for Key Infrastructure 71
2.6 Potential Gains from Increased Cost Recovery 72
2.7 Potential Gains from Greater Operational Effi ciency 73
2.8 Finding Resources: The Effi ciency Gap and the Funding Gap 74
2.9 Funding Gaps, by Sector and Country Group 75
2.10 Net Change in Central Government Budgets, by Economic Use, 1995–2004 76
2.11 Annualized ODA Investment Flows 78
2.12 Historic Annualized Investment Flows from China, India, and Arab Countries 79
2.13 Annual Private Participation Investment Flows 80
2.14 Outstanding Financing Stock for Infrastructure, as of 2006 81
3.1 Understanding Coverage of Infrastructure Services: The Role of Supply and Demand Factors 90
3.2 Monthly Household Budgets 91
3.3 Capital Cost of Best, Second-Best, and Traditional Alternatives 97
3.4 Potential Targeting Performance of Connection Subsidies under Various Scenarios 101
4.1 Correlation between Institutional Scores for Infrastructure and Measures of Broader Country Governance 109
4.2 Cancellation of African Private Participation Contracts 111
4.3 Overview of Experience with Private Participation in Infrastructure 117
4.4 Links between Governance and Performance Indicators for Electricity and Water 120
4.5 Links between Regulation and Performance Indicators for Telecommunications, Electricity, and Water 121
4.6 Links between Type of Regulator and Performance Indicators for Water 121
5.1 Link between Agricultural Productivity and Distance to Urban Centers 127
5.2 Distribution of Population by Type of Settlement and Country Type 127
5.3 Economic Differentials between Rural and Urban Populations, by Country Type 128
5.4 Sectoral Contributions to GDP and GDP Growth 128
5.5 Households with Access to One or More Modern Infrastructure Services 131
5.6 Capital Cost per Capita of Infrastructure Provision, by Density 131
5.7 Overview of Local Infrastructure Financing Mechanisms 135
5.8 Population Density across Country Types 135
6.1 Costs of Reaching Full Intercontinental and Intraregional Connectivity 148
6.2 Benefi ts of Access to an Underwater Cable 149
6.3 Profi le of Top-Six Potential Power-Exporting Countries 150
6.4 Average Delivery Time for Containers from Vessel to Consignee 151
6.5 Key Transport Corridors for International Trade, Sub-Saharan Africa 151
7.1 Prices for Access to International Voice and Internet Connectivity 171

xvii i Contents
7.2 Investments Needed to Close Gaps in Voice and Broadband Coverage in Sub-Saharan Africa 172
8.1 Economic Cost of Emergency Power Generation 184
8.2 Power Sector Spending Needs 185
8.3 Financing Flows to the Power Sector 186
8.4 Composition of Power Sector Funding Gap 186
8.5 Cost and Affordability of Monthly Power Bills at Cost-Recovery Prices: Past and Future 193
10.1 Average Daily Traffi c on the Main Road Network 213
10.2 Road Sector Spending Needs 219
10.3 Financing Flows to the Road Sector 219
10.4 Overview of Key Road Freight Parameters on Main International Corridors 220
12.1 Traffi c Trends for Container Trade, Sub-Saharan Ports, by Region, 1995–2005 250
12.2 Traffi c Trends for General Cargo, 1995–2005 251
12.3 Private Transactions for All Port Sectors, 2000–07 254
12.4 Average Port Delays 255
12.5 Typical Gateway Container and General Cargo Handling Charges in World Markets 255
13.1 Air Traffi c Growth in Sub-Saharan Africa, 2001–07 261
13.2 Air Service Liberalization in African Regional Groupings 264
13.3 Runway Quality in Sub-Saharan Africa, 2007 266
14.1 Water Availability and Withdrawal 275
14.2 Capital Investment Needs in Large Multipurpose Hydropower Storage by 2015 281
15.1 Selected Irrigation Investment Indicators for Sub-Saharan Africa 289
15.2 Potential Investment Needs for Large-Scale, Dam-Based, and Complementary Small-Scale Irrigation in Sub-Saharan Africa 291
15.3 Share of Crops under Irrigation, Irrigation Investment Needs Assessment 293
15.4 Sensitivity of Irrigation Potential to Assumed Investment Cost 293
15.5 Food Price Changes for Various Indicators, 2020 and 2050 294
16.1 Evolution of Water Supply Coverage in Africa, by Source 301
16.2 Services Provided by Utilities in Their Service Areas 301
16.3 Quality of Services Provided by Utilities in Their Service Areas 302
16.4 Average Price for Water Service in 15 Largest Cities, by Type of Provider 303
16.5 Estimated Annual Financing Needed to Meet the Water MDG 303
16.6 Existing Financial Flows to Water Supply and Sanitation 304
16.7 Composition of Water Sector Funding Gap 305
16.8 Overview of Private Sector Participation’s Effect on Utility Performance 312
16.9 Relationship between Rural Reform Index and Success in Expanding Rural Service Coverage 315
17.1 Patterns of Access to Sanitation in Africa 326
17.2 Cost of Sanitation Facilities in Senegal 332

Preface
xix
This study is part of the Africa Infrastruc-ture Country Diagnostic (AICD), a project designed to expand the world’s knowledge of physical infrastructure in Africa. The AICD will provide a baseline against which future improvements in infrastructure services can be measured, making it possible to monitor the results achieved from donor support. It should also provide a more solid empirical foundation for prioritizing investments and designing policy reforms in the infrastructure sectors in Africa.
The AICD is based on an unprecedented effort to collect detailed economic and techni-cal data on the infrastructure sectors in Africa. The project has produced a series of origi-nal reports on public expenditure, spending needs, and sector performance in each of the main infrastructure sectors, including energy, information and communication technologies, irrigation, transport, and water and sanitation. This volume synthesizes the most signifi cant fi ndings of those reports.
The fi rst phase of the AICD focused on 24 countries that together account for 85 percent of the gross domestic product, population, and infrastructure aid fl ows of Sub-Saharan Africa. The countries are Benin, Burkina Faso, Cameroon, Cape Verde, Chad, Côte d’Ivoire,
the Democratic Republic of Congo, Ethiopia, Ghana, Kenya, Lesotho, Madagascar, Malawi, Mozambique, Namibia, Niger, Nigeria, Rwanda, Senegal, South Africa, Sudan, Tanzania, Uganda, and Zambia. Under a second phase of the proj-ect, coverage is expanding to include as many of the additional African countries as possible.
The AICD was commissioned by the Infrastructure Consortium for Africa (ICA) following the 2005 G8 (Group of Eight) sum-mit at Gleneagles, Scotland, which fl agged the importance of scaling up donor fi nance for infrastructure in support of Africa’s develop-ment. The World Bank is implementing the AICD under the guidance of a steering com-mittee that represents the African Union, the New Partnership for Africa’s Development (NEPAD), Africa’s regional economic com-munities, the African Development Bank (AfDB), the Development Bank of South Africa (DBSA), and major infrastructure donors. Financing for the AICD is provided by a multidonor trust fund to which the main contributors are the United Kingdom’s Depart-ment for International Development (DFID), the Public- Private Infrastructure Advisory Facility (PPIAF), Agence Française de Dével-oppement (AFD), the European Commission, and Germany’s Entwicklungsbank (KfW).

xx Preface
A group of distinguished peer reviewers from policy-making and academic circles in Africa and beyond reviewed all major outputs of the study to ensure the technical quality of the work.
The Sub-Saharan Africa Transport Pol-icy Program (SSATP) and the Water and Sanitation Program (WSP) provided technical support on data collection and analysis per-taining to their respective sectors.
This and other volumes analyzing key infra-structure topics, as well as the underlying data sources described above, will be available for download from http://www.infrastructureafrica.org. Stand-alone summaries are avail-able in English and French.
Inquiries concerning the availability of data sets should be directed to the volume editors at the World Bank in Washington, DC.
Acknowledgments
xxi
This report was undertaken by the director’s offi ce of the Department for Sustainable Devel-opment in the Africa Region of the World Bank. A number of directors oversaw the implementa-tion of the project throughout its life, including (in chronological order) Michel Wormser, John Henry Stein (acting), and Inger Andersen.
The task team leaders for the report were Vivien Foster and Cecilia Briceño-Garmendia, and the core team for the project comprised Aijaz Ahmad, Dominique Akele, Sudeshna Ghosh Banerjee, Carolina Dominguez Torres, Sophie Hans-Moevi, Elvira Morella, Nataliya Pushak, Rupa Ranganathan, Maria Shkaratan, and Karlis Smits.
The project team is grateful to a number of World Bank colleagues who acted as advisers on key cross-cutting aspects of the report. These include Antonio Estache, Jose Luis Irigoyen, and Jyoti Shukla, who provided advice on gen-eral infrastructure issues; Sarah Keener, who provided advice on social issues; Paul Martin, who provided advice on environmental issues; and Stephen Mink, who provided advice on rural and agricultural issues.
A technical advisory panel provided indepen-dent, external peer review on the quality of the background papers on which this report is based. The panel was cochaired by Shanta Devarajan (chief economist, Africa Region, World Bank) and Louis Kasekende (chief economist, African Development Bank), and comprised Adeola Adenikinju (professor, University of Ibadan, Nigeria), Emmanuelle Auriol (professor, Univer-sity of Toulouse, France), Tony Gomez-Ibanez
(professor, John F. Kennedy School of Govern-ment, Harvard University), Cheikh Kane (inde-pendent expert on infrastructure fi nance), and Xinzhu Zhang (professor, Chinese Academy of Social Sciences, Beijing).
In order to ensure broad-based par-ticipation and consultation of World Bank technical practices, a number of internal peer review groups were formed to provide guidance and feedback on earlier drafts of the document. The individual groups and their members are as follows: ICT sector—Mavis Ampah, Philippe Dongier, Clemencia Torres, and Mark Williams; irrigation sector—Barbara Miller, Stephen Mink, and Ashok Subramanian; power sector—Philippe Benoit, David Donaldson, Vijay Iyer, Luiz Maurer, Rob Mills, Lucio Monari, Kyran O’Sullivan, Prasad Tallapragada, Clemencia Torres, and Tjaarda Storm Van Leeuwen; transport sector— Pierre Pozzo di Borgo, Michel Luc Donner, Michel Iches, Marc Juhel, Cornelis Kruk, Alain Labeau, Charles Schlumberger, and Kavita Sethi; water supply and sanitation sector—Ventura Bengoechea, Jaime Biderman, Matar Fall, Sarah Keener, Peter Kolsky, Alex McPhail, Eustache Ouayoro, Christophe Pre-vost, Caroline van den Berg, and Meike van Ginneken; fi nance theme—Gerardo Corro-chano, Michael Fuchs, James Leigland, Anand Rajaram, Sudhir Shetty, Jyoti Shukla, Clem-encia Torres, Marilou Uy, and Marinus Ver-hoeven; poverty and inequality theme—Judy Baker, Douglas Barnes, Ellen Hamilton, Julian Lampietti, and Kenneth Simler; institutional

theme—James Leigland and Jyoti Shukla; urban theme—Jaime Biderman, Catherine Farvacque-Vitkovic, Matthew Glasser, Sumila Gulyani, and Uri Raich; and regional integra-tion theme—Uwe Deichmann, Jakob Kolster, and Mark Tomlinson.
An editorial team comprising Bruce Ross-Larson, Steven Kennedy, and Joseph Caponio contributed signifi cantly to improving the quality of the fi nal manuscript submitted to the World Bank Offi ce of the Publisher for publication.
xxii Acknowledgments

$ All dollar amounts are in U.S. dollars unless otherwise indicated.
ADF African Development FundAFRICATIP Association Africaine des
Agences d’Exécution des Travaux d’Intérêt Public
AGETIP agence d’exécution des travaux d’intérêt public
AICD Africa Infrastructure Country Diagnostic
AMADER Agence Malienne pour le Développement de l’Energie Domestique et l’Electrifi cation Rurale (Malian Agency for the Development of Domestic Energy and Rural Electrifi cation)
BPC Botswana Power CorporationCEAR Central East African RailwaysCREST Commercial Reorientation of
the Electricity Sector Toolkit DHS demographic and health
surveyEASSy Eastern African Submarine
Cable SystemGIS geographic information
systemsGNI gross national incomeGSM global systems mobileIBNET International Benchmarking
NetworkIBT increasing block tariff ICT information and
communication technologyIDA International Development
Association
IPP independent power producerJMP Joint Monitoring Programme KenGen Kenya Electricity Generating
Company KPLC Kenya Power and Lighting
Company MDG Millennium Development
GoalNEPAD New Partnership for Africa’s
DevelopmentNWSC National Water and Sewerage
Corporation O&M operation and maintenance ODA offi cial development assistanceOECD Organisation for
Economic Co-operation and Development
PPI private participation in infrastructure
PSP private sector participationSAT-3 South Atlantic 3/West Africa
Submarine Cable SEACOM South Africa–East Africa–
South Asia–Fiber Optic CableSODECI Société de Distribution d’Eau
de la Côte d’IvoireSOE state-owned enterpriseSSATP Sub-Saharan Africa Transport
Policy ProgramTEAMS The East Africa Marine SystemTEU 20-foot equivalent unit TIR Transports Internationaux
RoutiersVoIP Voice over Internet Protocol WiMAX Worldwide Interoperability for
Microwave AccessWSS water supply and sanitation
Abbreviations


1
Overview
Africa’s Infrastructure: A Time for Transformation
T he Africa Infrastructure Country Diag-nostic is an unprecedented attempt to collect comprehensive data on the infra-
structure sectors in Africa—covering power, transport, irrigation, water and sanitation, and information and communication technology (ICT)—and to provide an integrated analysis of the challenges they face. Based on extensive fi eldwork across Africa, the following main fi ndings have emerged:
• Infrastructure has been responsible for more than half of Africa’s recent improved growth performance and has the potential to contribute even more in the future.
• Africa’s infrastructure networks increas-ingly lag behind those of other developing countries and are characterized by miss-ing regional links and stagnant household access.
• Africa’s diffi cult economic geography pre-sents a particular challenge for the region’s infrastructure development.
• Africa’s infrastructure services are twice as expensive as elsewhere, refl ecting both
dis economies of scale in production and high profit margins caused by lack of competition.
• Power is by far Africa’s largest infrastructure challenge, with 30 countries facing regular power shortages and many paying high pre-miums for emergency power.
• The cost of addressing Africa’s infrastruc-ture needs is around $93 billion a year, about one-third of which is for maintenance—more than twice the Commission for Afri-ca’s (2005) estimate.
• The infrastructure challenge varies greatly by country type—fragile states face an impossible burden and resource-rich coun-tries lag despite their wealth.
• A large share of Africa’s infrastructure is domestically fi nanced, with the central gov-ernment budget being the main driver of infrastructure investment.
• Even if major potential effi ciency gains are captured, Africa would still face an infra-structure funding gap of $31 billion a year, mainly in power.
2 AFRICA’S INFRASTRUCTURE: A TIME FOR TRANSFORMATION
• Africa’s institutional, regulatory, and admin-istrative reforms are only halfway along, but they are already proving their effect on operational effi ciency.
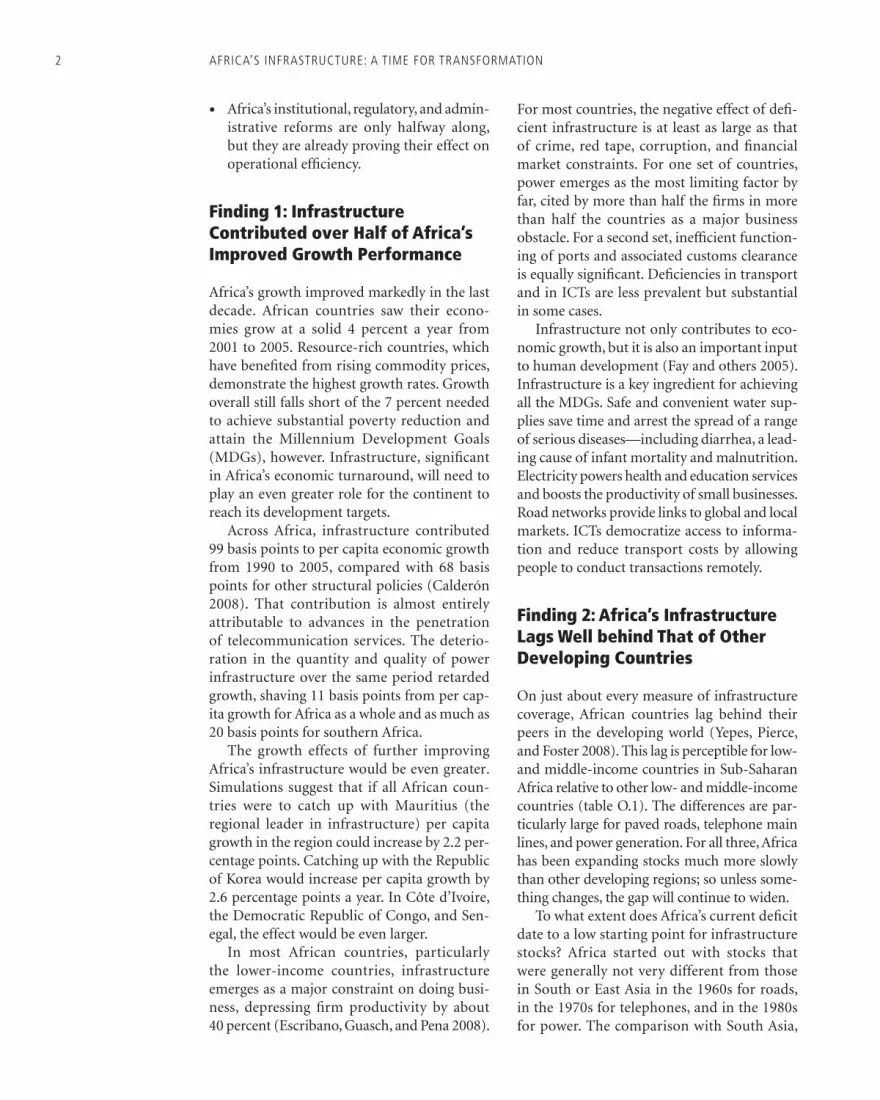
Finding 1: Infrastructure Contributed over Half of Africa’s Improved Growth Performance
Africa’s growth improved markedly in the last decade. African countries saw their econo-mies grow at a solid 4 percent a year from 2001 to 2005. Resource-rich countries, which have benefi ted from rising commodity prices, demonstrate the highest growth rates. Growth overall still falls short of the 7 percent needed to achieve substantial poverty reduction and attain the Millennium Development Goals (MDGs), however. Infrastructure, signifi cant in Africa’s economic turnaround, will need to play an even greater role for the continent to reach its development targets.
Across Africa, infrastructure contributed 99 basis points to per capita economic growth from 1990 to 2005, compared with 68 basis points for other structural policies (Calderón 2008). That contribution is almost entirely attributable to advances in the penetration of telecommunication services. The deterio-ration in the quantity and quality of power infrastructure over the same period retarded growth, shaving 11 basis points from per cap-ita growth for Africa as a whole and as much as 20 basis points for southern Africa.
The growth effects of further improving Africa’s infrastructure would be even greater. Simulations suggest that if all African coun-tries were to catch up with Mauritius (the regional leader in infrastructure) per capita growth in the region could increase by 2.2 per-centage points. Catching up with the Republic of Korea would increase per capita growth by 2.6 percentage points a year. In Côte d’Ivoire, the Democratic Republic of Congo, and Sen-egal, the effect would be even larger.
In most African countries, particularly the lower-income countries, infrastructure emerges as a major constraint on doing busi-ness, depressing fi rm productivity by about 40 percent (Escribano, Guasch, and Pena 2008).
For most countries, the negative effect of defi -cient infrastructure is at least as large as that of crime, red tape, corruption, and fi nancial market constraints. For one set of countries, power emerges as the most limiting factor by far, cited by more than half the fi rms in more than half the countries as a major business obstacle. For a second set, ineffi cient function-ing of ports and associated customs clearance is equally signifi cant. Defi ciencies in transport and in ICTs are less prevalent but substantial in some cases.
Infrastructure not only contributes to eco-nomic growth, but it is also an important input to human development (Fay and others 2005). Infrastructure is a key ingredient for achieving all the MDGs. Safe and convenient water sup-plies save time and arrest the spread of a range of serious diseases—including diarrhea, a lead-ing cause of infant mortality and malnutrition. Electricity powers health and education services and boosts the productivity of small businesses. Road networks provide links to global and local markets. ICTs democratize access to informa-tion and reduce transport costs by allowing people to conduct transactions remotely.
Finding 2: Africa’s Infrastructure Lags Well behind That of Other Developing Countries
On just about every measure of infrastructure coverage, African countries lag behind their peers in the developing world (Yepes, Pierce, and Foster 2008). This lag is perceptible for low- and middle-income countries in Sub-Saharan Africa relative to other low- and middle-income countries (table O.1). The differences are par-ticularly large for paved roads, telephone main lines, and power generation. For all three, Africa has been expanding stocks much more slowly than other developing regions; so unless some-thing changes, the gap will continue to widen.
To what extent does Africa’s current defi cit date to a low starting point for infrastructure stocks? Africa started out with stocks that were generally not very different from those in South or East Asia in the 1960s for roads, in the 1970s for telephones, and in the 1980s for power. The comparison with South Asia,

Africa’s Infrastructure: A Time for Transformation 3
which has similar per capita incomes, is par-ticularly striking. In 1970, Sub-Saharan Africa had almost three times the generating capac-ity per million people as South Asia. In 2000, South Asia had left Sub-Saharan Africa far behind—with almost twice the generation capacity per million people. Also in 1970, Sub-Saharan Africa had twice the main-line telephone density of South Asia, but by 2000, the two regions were even.
Since 1990, coverage of household services has barely improved (fi gure O.1, panel a). Africa is unlikely to meet the MDGs for water and sanitation. Moreover, on current trends,
universal access to these and other household services is more than 50 years away in most African countries (Banerjee, Wodon, and oth-ers 2008). Even where infrastructure networks are in place, a signifi cant percentage of house-holds remains unconnected, suggesting that demand-side barriers exist and that univer-sal access entails more than physical rollouts of networks. As might be expected, access to infrastructure in rural areas is only a frac-tion of that in urban areas, even where urban coverage is already low by international stan-dards (Banerjee, Wodon, and others 2008) (fi gure O.1, panel b).
Finding 3: Africa’s Difficult Economic Geography Presents aChallenge for Infrastructure Development
Relative to other continents, Africa is char-acterized by low overall population density (36 people per square kilometer), low rates of urbanization (35 percent), but relatively rapid rates of urban growth (3.6 percent a year), a relatively large number of landlocked coun-tries (15), and numerous small economies. A further complication is that the continent experiences particularly high hydrological variability, with huge swings in precipitation across areas, seasons, and time, which climate change is likely to exacerbate.
Table O.1 Africa’s Infrastructure Deficit
Normalized units
Sub-Saharan Africa
low-income countries
Other low-income countries
Paved-road density 31 134
Total road density 137 211
Main-line density 10 78
Mobile density 55 76
Internet density 2 3
Generation capacity 37 326
Electricity coverage 16 41
Improved water 60 72
Improved sanitation 34 51
Source: Yepes, Pierce, and Foster 2008.Note: Road density is measured in kilometers per 100 square kilometers of arable land; telephone density in lines per thousand population; generation capacity in megawatts per million popula-tion; electricity, water, and sanitation coverage in percentage of population.
b. Rural-urban divide
0
20
40
60
80
piped water electricity flush toilets landlinetelephones
a. Stagnant trends
0
10
20
30
40
1990–95 1996–2000 2001–05
% o
f pop
ulat
ion
% o
f pop
ulat
ion
national rural urbanpiped water electricity
flush toilets landline telephones
Figure O.1 Access to Household Services
Source: Banerjee, Wodon, and others 2008.

4 AFRICA’S INFRASTRUCTURE: A TIME FOR TRANSFORMATION
Africa’s atomized nation-states are refl ected in the region’s fragmentary infrastructure networks. Sub-Saharan Africa comprises 48 nation-states, many of which are very small. The bulk of those countries have populations of fewer than 20 million and economies smaller than $10 billion. International frontiers bear little relation either to natural features (such as river basins) or to artifi cial features (such as cities and their accessibility to trading chan-nels, such as ports). Intraregional connectiv-ity is therefore very low, whether measured in transcontinental highway links, power inter-connectors, or fi ber-optic backbones. Most continuous transport corridors are concerned with providing access to seaports, whereas the intraregional road network is characterized by major discontinuities. Few cross-border inter-connectors exist to support regional power exchange, even though many countries are too small to produce power economically on their own. Until recently, the whole of East Africa lacked access to a global submarine cable to pro-vide low-cost international communications and Internet access. The intraregional fi ber-optic network is also incomplete, but growing rapidly. Because of their geographic isolation, landlocked countries in particular suffer from the lack of regional connectivity.
Both the spatial distribution and rapid migration of Africa’s population create major challenges for reaching universal access. In rural areas, over 20 percent of the population lives in dispersed settlements where typical popula-tion densities are less than 15 people per square kilometer; hence, the costs of providing infra-structure are comparatively high. In urban areas, population growth rates averaging 3.6 percent a year are leaving infrastructure service provid-ers severely stretched. As a result, urban service coverage has actually declined over the last decade, and lower-cost alternatives are fi lling the resulting gap (Banerjee, Wodon, and others 2008; Morella, Foster, and Banerjee 2008). In addition, population densities in African cities are rela-tively low by global standards and do not benefi t from large economies of agglomeration in the provision of infrastructure services. As a result, the costs of providing a basic infrastructure package can easily be twice as much as in other developing cities (Dorosh and others 2008).
Africa’s water resources are abundant, but because of an absence of water stor-age and distribution infrastructure, they are grossly underused. Therefore, water security—eliable water supplies and acceptable risks from fl oods and other unpredictable events, including those from climate change—will require a significant expansion of water storage capacity from the current 200 cubic meters per capita (Grey and Sadoff 2006). In other parts of the world, such capacity is in the thousands of cubic meters. The cost of expanding water storage is extremely high in relation to the size of Africa’s economies, suggesting the phasing of investments, with initial focus on achieving water security for key growth poles.
Water also needs to be distributed for agri-cultural use. In a handful of countries, only 7 million hectares are equipped for irrigation. Although the irrigation-equipped area is less than 5 percent of Africa’s cultivated area, it produces 20 percent of the value of agricultural production. An additional 12 million hectares could be economically viable for irrigation as long as costs are contained (You 2008).
Finding 4: Africa’s Infrastructure Services Are Twice as Expensive as Elsewhere
Not only are Africa’s infrastructure networks defi cient in coverage, but the price of the services provided is also exceptionally high by global standards (table O.2). Whether for power, water, road freight, mobile telephones, or Internet services, the tariffs paid in Africa are several multiples of those paid in other parts of the developing world. The explana-tion for Africa’s higher prices sometimes lies in genuinely higher costs, and sometimes in high profi ts. The policy prescriptions for the two cases are, of course, radically different.
Power provides the clearest example of infrastructure with costs genuinely higher in Africa than elsewhere. Many smaller coun-tries have national power systems below the 500-megawatt threshold and therefore often rely on small diesel generation that can cost up to $0.35 per kilowatt-hour to run, about

Africa’s Infrastructure: A Time for Transformation 5
twice the costs faced by larger countries typi-cally with coal- or hydropower-based systems (Eberhard and others 2008).
High road freight tariffs in Africa have much more to do with high profi t margins than high costs (Teravaninthorn and Rabal-land 2008). The costs for Africa’s trucking operators are not much higher than costs in other parts of the world, even when informal payments are counted. Profi t margins, by con-trast, are exceptionally high, particularly in Central and West Africa, where they reach 60 to 160 percent. The underlying cause is limited competition combined with a highly regulated market based on tour de role principles, which allocate freight to transporters through a cen-tralized queuing method rather than allowing truckers to enter into bilateral contracts with customers directly.
The high costs of international telephony and Internet services refl ect a mixture of cost and profi t factors. Countries without access to a submarine cable must rely on expensive satellite technology for international connec-tivity and have charges typically twice those in countries that do enjoy such access. Even when access to a submarine cable is secured, countries with a monopoly on this interna-tional gateway still have tariffs substantially
higher than those without (Minges and oth-ers 2008).
Finding 5: Power Is Africa’s Largest Infrastructure Challenge by Far
Whether measured in generation capacity, electricity consumption, or security of sup-ply, Africa’s power infrastructure delivers only a fraction of the service found elsewhere in the developing world (Eberhard and others 2008). The 48 Sub-Saharan Africa countries (with 800 million people) generate roughly the same power as Spain (with 45 million people). Power consumption, at 124 kilowatt-hours per capita annually and falling, is only 10 per-cent of that found elsewhere in the developing world, barely enough to power one 100-watt lightbulb per person for 3 hours a day.
More than 30 African countries experience power shortages and regular interruptions to service (fi gure O.2). The underlying causes vary: failures to bring on new capacity to keep pace with the demands of economic growth, droughts that reduced hydropower in East Africa, oil price hikes that inhibited afford-ability of diesel imports for many West African countries, and confl icts that destroyed power infrastructure in fragile states. Africa’s fi rms report losing 5 percent of their sales because of frequent power outages—a fi gure that rises to 20 percent for informal fi rms unable to afford backup generation. Overall, the economic costs of power outages can easily rise to 1–2 percent of GDP.
A common response to the crisis is to ten-der short-term leases for emergency power. At least 750 megawatts of emergency generation are operating in Sub-Saharan Africa, which for some countries constitute a large pro-portion of their national installed capacity. However, emergency generation is expensive at costs of $0.20–$0.30 per kilowatt-hour, and for some countries, the price tag can be as high as 4 percent of GDP. Paying for emer-gency leases absorbs signifi cant budgetary resources, reducing the funds for longer-term solutions.
Table O.2 Africa’s High-Cost Infrastructure
Infrastructure sectorSub-Saharan
Africa
Other developing
regions
Power tariffs ($ per kilowatt-hour) 0.02–0.46 0.05–0.10
Water tariffs ($ per cubic meter) 0.86–6.56 0.03–0.60
Road freight tariffs ($ per ton-kilometer) 0.04–0.14 0.01–0.04
Mobile telephony ($ per basket per month) 2.60–21.00 9.90
International telephony ($ per 3-minute call to the United States) 0.44–12.50 2.00
Internet dial-up service ($ per month) 6.70–148.00 11.00
Sources: Authors’ estimates based on Africon 2008; Bannerjee, Skilling, and others 2008; Eberhard and others 2008; Minges and others 2008; Teravaninthorn and Raballand 2008; Wodon 2008a and 2008b.Note: Ranges reflect prices in different countries and various consumption levels. Prices for telephony and Internet service represent all developing regions, including Africa.

6 AFRICA’S INFRASTRUCTURE: A TIME FOR TRANSFORMATION
Finding 6: Africa’s Infrastructure Spending Needs at $93 Billion a Year Are More than Double Previous Estimates by the Commission for Africa
Meeting Africa’s infrastructure needs calls for a very substantial program of infrastructure investment and maintenance:
• Develop an additional 7,000 megawatts a year of new power generation capacity (about half through multipurpose water storage schemes).
• Enable regional power trade by laying 22,000 megawatts of cross-border transmis-sion lines.
• Complete the intraregional fiber-optic backbone network and continental subma-rine cable loop.
• Interconnect capitals, ports, border cross-ings, and secondary cities with a good-quality road network.
• Provide all-season road access to Africa’s high-value agricultural land.
• More than double Africa’s irrigated area.
• Meet the MDGs for water and sanitation.
• Raise household electrifi cation rates by 10 percentage points.
• Provide global systems mobile voice signal and public access broadband to 100 percent of the population.
Implementing such an ambitious program to address Africa’s infrastructure needs would cost around $93 billion a year (about 15 percent of the region’s GDP). Some two-thirds of this total relates to capital expenditure, and the remain-ing one-third to operation and maintenance
MALINIGER
BURKINAFASO
SUDANCHAD
ETHIOPIA
TANZANIA
COMOROSMAYOTTE
MOZ
AMBI
QUE
KENYA
UGANDA
ZAMBIA
MAL
AWI
BOTSWANA
ZIMBABWE
LESOTHO
SOUTHAFRICA
NAMIBIA
ANGOLA
REP.
OF C
ONGO
GABON
CAM
EROO
N
NIGERIA
BEN
IN
GHA
NA
SWAZILAND
MAD
AGAS
CAR
CENTRALAFRICAN REPUBLIC
SOMALIA
DEMOCRATICREPUBLIC OF
CONGO
BURUNDI
RWANDA
CAPE VERDE
LIBERIA
GUINEA
CÔTE
D'IV
OIR
E
TOGO
DJIBOUTI
ERITREA
GUINEA-BISSAU
SIERRA LEONE
GAMBIA
EQUATORIAL GUINEA
SAO TOME AND PRINCIPE
MAURITIUS
SEYCHELL
ES
SENEGAL
Main cause or trigger
natural causes (droughts)
oil price shock
system disrupted by conflict
high growth, low investment/structural issues
MAURITANIA
Figure O.2 Underlying Causes of Africa’s Power Supply Crisis
Source: Eberhard and others 2008.

Africa’s Infrastructure: A Time for Transformation 7
requirements (table O.3; Briceño-Garmendia, Smits, and Foster 2008).
That cost is well over twice the $39 billion of infrastructure spending estimated by the Com-mission for Africa report in 2005. That fi gure was based on a cross-country econometric study, rather than the more detailed country-level microeconomic modeling (Estache 2005). A more recent update of the cross-country model used for the Commission for Africa report came up with revised estimates in the range of $80 billion to $90 billion, much closer to those reported here (Yepes 2007).
About 40 percent of the total spending needs are associated with power, refl ecting Africa’s particularly large defi cits. About one-third of the power investment needs (some $9 billion a year) are associated with multipur-pose water storage for hydropower and water resource management. After power, water sup-ply and sanitation and then transport are the most signifi cant items.
Given recent escalations in unit costs, these estimates are a lower bound. Although the investment estimates here are based on the most accurate unit-cost data available, develop-ment agencies are reporting signifi cant cost escalations on projects under implementa-tion. For road projects, these escalations have averaged 35 percent but in some cases have been as high as 50–100 percent. Closer inspec-tion reveals that no single factor explains this escalation. Domestic infl ation, tight construc-tion industry conditions, oil price hikes, and
inadequate competition for tenders have all played their role, with the last factor by far the strongest.
The global fi nancial crisis of 2008 can be expected to reduce demand for some types of infrastructure, but it would not hugely alter the estimated spending needs. Planning and social targets rather than economic growth drive a large share of the spending needs, for example, the transport spending needs (which are largely based on connectivity objectives) and the water and sanitation spending needs (which are based on the MDGs). The spending needs with the strongest direct link to economic growth are those for the power sector. However, because of the large investment backlog in the sector, the estimated spending needs contain a strong component of refurbishment and catch-up. Thus, even halving economic growth esti-mates for the region would reduce estimated power spending needs by only 20 percent. The global recession could also be expected to affect demand for ICT services, as well as trade-related infrastructure, such as railways and ports. However, the weight of these infrastruc-tures in the total spending needs is not much more than 10 percent.
Finding 7: The Infrastructure Challenge Varies Greatly by Country Type
The infrastructure challenge differs mark-edly across African country groups (Briceño- Garmendia, Smits, and Foster 2008). Because of the widely varying circumstances, distin-guishing among middle-income countries (like Cape Verde and South Africa), resource-rich countries with economies heavily reliant on petroleum or mineral revenues (like Nige-ria and Zambia), fragile states emerging from confl ict (like Côte d’Ivoire and the Demo-cratic Republic of Congo), and the remaining low-income countries that are neither fragile nor resource rich (like Senegal and Uganda) is helpful.
By far the most daunting infrastructure challenges are those facing the fragile states (fi gure O.3). The recent confl icts affecting these countries usually resulted in the destruction
Table O.3 Overall Infrastructure Spending Needs for Sub-Saharan Africa$ billions annually
Infrastructure sector
Capital expenditure
Operation and
maintenanceTotal
spending
ICT 7.0 2.0 9.0
Irrigation 2.9 0.6 3.4
Power 26.7 14.1 40.8
Transport 8.8 9.4 18.2
WSS 14.9 7.0 21.9
Total 60.4 33.0 93.3
Source: Authors’ estimates based on Banerjee, Wodon, and others 2008; Carruthers, Krishnamani, and Murray 2008; Mayer and others 2008; Rosnes and Vennemo 2008.Note: Column totals may not add exactly because of rounding errors. ICT = information and communication technology; WSS = water supply and sanitation.

8 AFRICA’S INFRASTRUCTURE: A TIME FOR TRANSFORMATION
or dilapidation of their (already modest) national infrastructure platforms. In the Dem-ocratic Republic of Congo, about 50 percent of infrastructure assets need rehabilitation. The fragile states’ infrastructure spending needs are especially large, particularly when mea-sured against the size of their economies. Such countries would, on average, need to devote 37 percent of their GDPs to infrastructure spending to build a solid infrastructure plat-form. With their diffi cult environments, they attract relatively little external fi nancing, cap-turing only 10 percent of overseas development assistance and 6 percent of private capital fl ows allocated to infrastructure. In addition to their huge fi nancing burden, the fragile states do not use their current resource envelope well; they underspend on maintenance and have ineffi -cient service providers.
Nonfragile low-income countries need to allocate, on average, about 23 percent of their GDPs to build and sustain a basic infrastruc-ture platform, a level diffi cult to envisage in practice. Therefore, these countries will have to make diffi cult choices about the prioritization of their infrastructure investments, and most of them have a long way to go in improving the effi ciency of operating existing infrastructure.
The resource-rich countries are, in principle, much better placed to meet their infrastruc-ture spending needs, though in practice they
have not tended to do so. Resource-rich coun-tries could meet their infrastructure spending needs for a more manageable price tag of about 12 percent of GDP. Moreover, the large roy-alty payments they received during the recent commodity boom provide a ready source of fi nance. Yet resource rich-countries actually lag nonfragile low-income countries in their infrastructure stocks and spend less on infra-structure. They have been devoting their added wealth not to infrastructure development but to paying off debts. The governance challenges in a resource-rich environment may thus prevent the transformation of wealth into infrastructure.
Meeting the infrastructure needs of the middle-income countries looks to be much more manageable. These countries should be able to meet their infrastructure spending needs with 10 percent of GDP. They are also much stronger in asset maintenance and insti-tutional effi ciency. Their more urban popula-tions also facilitate network rollout.
Finding 8: A Large Share of Africa’s Infrastructure Is Domestically Financed
Existing spending on infrastructure in Africa is higher than previously thought, amounting to $45 billion a year when budget and off-budget spending (including state-owned enterprises and extrabudgetary funds) and external fi nan-ciers are taken into account. The latter include the private sector, offi cial development assis-tance, and fi nanciers that do not belong to the Organisation for Economic Co-operation and Development (OECD). As much as two-thirds of this overall spending is domestically sourced: $30 billion of annual spending is fi nanced by the African taxpayer and infra-structure user, and a further $15 billion is from external sources (table O.4).
The public sector remains the dominant source of fi nance for water, energy, and transport in all but the fragile states. Public investment is largely tax fi nanced and executed through cen-tral government budgets, whereas the operating and maintenance expenditure is largely fi nanced from user charges and executed through state-owned enterprises. Current levels of public
0
5
10
15
20
% o
f GD
P 25
30
35
40
fragil
e low
-inco
me
coun
tries
nonfr
agile
low-in
come
coun
tries
resou
rce-ric
h
coun
tries
middle-
incom
e
coun
tries
Sub-S
ahara
n Afric
a
capital operation and maintenance
Figure O.3 Burden of Infrastructure Spending Needs
Source: Briceño-Garmendia, Smits, and Foster 2008.Note: Figures refer to investment (except public sector) and include recurrent spending. Public sector covers general govern-ment and nonfinancial enterprises.

Africa’s Infrastructure: A Time for Transformation 9
fi nance are substantially higher relative to GDP in the low-income states, typically absorbing 5–6 percent of total GDP (fi gure O.4). In abso-lute terms, however, spending remains very low, no more than $20–$30 per capita a year (Briceño-Garmendia, Smits, and Foster 2008).
Looking only at investment, one fi nds that offi cial development assistance, private partici-pation in infrastructure, and non-OECD fi nan-ciers together exceed domestically financed public investment (Briceño-Garmendia, Smits, and Foster 2008). The private sector is by far the largest source, on a par with domestic public investment. Much smaller, but still signifi cant, capital fl ows are provided by offi cial develop-ment assistance and, to a lesser extent, non-OECD fi nanciers, such as China, India, and the Arab states. The focus differs markedly in each case. Offi cial development assistance makes an important contribution to water and transport, particularly in fragile states. Non-OECD fi nance is signifi cant in energy and rail, especially in resource-rich countries. Private participation in infrastructure is heavily concentrated in ICT.
Finding 9: After Potential Efficiency Gains, Africa’s Infrastructure Funding Gap Is $31 Billion a Year, Mostly in the Power Sector
Addressing a wide range of ineffi ciencies could make the existing resource envelope go much
further—to the tune of $17 billion a year. This is Africa’s major infrastructure effi ciency gap (Briceño-Garmendia, Smits, and Foster 2008).
First, some countries are allocating more resources to some areas of infrastructure than would appear to be warranted (Briceño- Garmendia, Smits, and Foster 2008). This “excess expenditure” amounts to $3.3 billion a year overall. The largest share of this excess expenditure relates to public spending on ICT infrastructure that the private sector could pro-vide, particularly in middle-income countries.
Table O.4 Infrastructure Spending on Addressing Sub-Saharan Africa’s Infrastructure Needs$ billions annually
Infrastructure sector
Operation and maintenance Capital expenditure
Public sector
Public sector ODA
Non-OECD fi nanciers
Private sector Total
Total spending
ICT 2.0 1.3 0.0 0.0 5.7 7.0 9.0
Power 7.0 2.4 0.7 1.1 0.5 4.6 11.6
Transport 7.8 4.5 1.8 1.1 1.1 8.4 16.2
WSS 3.1 1.1 1.2 0.2 2.1 4.6 7.6
Irrigation 0.6 0.3 — — — 0.3 0.9
Total 20.4 9.4 3.6 2.5 9.4 24.9 45.3
Source: Briceño-Garmendia, Smits, and Foster 2008.Note: Based on annualized averages for 2001–06. Averages weighted by country GDP. Figures are extrapolations based on the 24-country sample covered in AICD Phase 1. Totals may not add exactly because of rounding errors. ICT = information and communication technology; ODA = official development assistance; OECD = Organisation for Economic Co-operation and Development; WSS = water supply and sanitation. — Not available.
% o
f GD
P
0
1.0
2.0
3.0
4.0
5.0
6.0
7.0
fragil
e low
-inco
me
coun
tries
Sub-S
ahara
n Afric
a
nonfr
agile
low-in
come
coun
tries
resou
rce-ric
h cou
ntries
middle-
incom
e
coun
tries
capital operation and maintenance
Figure O.4 Infrastructure Public Spending as a Percentage of GDP
Source: Briceño-Garmendia, Smits, and Foster 2008.

10 AFRICA’S INFRASTRUCTURE: A TIME FOR TRANSFORMATION
Although some of this “overspending” may be justifi ed by phasing or sequencing, at least part of these resources could possibly be real-located to underfunded sectors. A need exists to monitor infrastructure expenditure more closely against identifi ed needs and priorities and considering expected economic returns.
Second, African countries are typically executing only about two-thirds of the budget allocated to public investment in infrastruc-ture (Briceño-Garmendia, Smits, and Foster 2008). Put differently, public investment could in theory increase by 30 percent without any increase in spending, simply by addressing the institutional bottlenecks that inhibit capital budget execution. Changes include better plan-ning of investment projects, earlier completion of feasibility studies, more effi cient procure-ment processes, and a move to medium-term multiyear budgeting. Increasing capital budget execution to 100 percent could capture an addi-tional $1.9 billion a year in public investment.
Third, on average, about 30 percent of the infrastructure assets of a typical African coun-try need rehabilitation (fi gure O.5). This share is even higher for rural infrastructure and for countries affected by violent confl ict. The reha-bilitation backlog refl ects a legacy of under-funding maintenance, a major waste given that the cost of rehabilitating infrastructure is several times higher than the cumulative
cost of sound preventive maintenance. For example, spending $1 on road maintenance provides a savings of $4 to the economy. So some reallocation of resources from invest-ment to maintenance may be warranted, par-ticularly in low-income countries with very low maintenance spending. For roads, an estimated $1.9 billion of capital spending on rehabilita-tion could have been avoided with sound pre-ventive maintenance.
Fourth, Africa’s power and water utilities present very high ineffi ciency in distribution losses, undercollection of revenues, and over-staffi ng (fi gure O.6). Utilities typically collect only 70–90 percent of billed revenues, and dis-tribution losses can easily be twice the technical best practice. According to household surveys, about 40 percent of those connected to utility services do not appear to be paying for them, a share that rises to 65 percent for a signifi cant minority of countries. Undercollection is also a problem for some of Africa’s road funds (Gwilliam and others 2008). State-owned tele-communication incumbents employ roughly six times the number of employees per con-nection than do privately operated enterprises in developing countries. For ICT, countries retaining state-owned incumbents are often incurring signifi cant losses from overstaffi ng that average 0.2 percent of GDP. Similarly, though to a lesser extent, overemployment in power and water utilities ranges from 20 percent to 80 percent over benchmarks in other developing areas. Overall, the revenues lost through these ineffi ciencies can easily exceed the current turnover of the utilities by several multiples. For power, these losses are also material at the national level, absorbing 0.5 percent of GDP on the Sub-Saharan Afri-can average, or $3.4 billion annually (Brice-ño-Garmendia, Smits, and Foster 2008). For water, the absolute value of the ineffi ciencies is smaller, with the average amount accounting for 0.2 percent of GDP, or $1 billion a year.
Fifth, underpricing of infrastructure services is substantial. Although African infrastructure charges are high by international standards, so are the infrastructure costs. Even relatively high tariffs can fail to cover more than the operat-ing costs. The revenues uncollected because of underpricing of power and water amount to
0
10
20
% o
f ass
ets
in n
eed
of r
ehab
ilita
tion
30
40
50
power
gene
ration
nonru
ral av
erage
main ro
ads
overa
ll ave
rage
irriga
tion
urban
wate
r
rural
water
rural
avera
ge
railw
ays
rural
roads
Figure O.5 Rehabilitation Backlog
Source: Briceño-Garmendia, Smits, and Foster 2008.
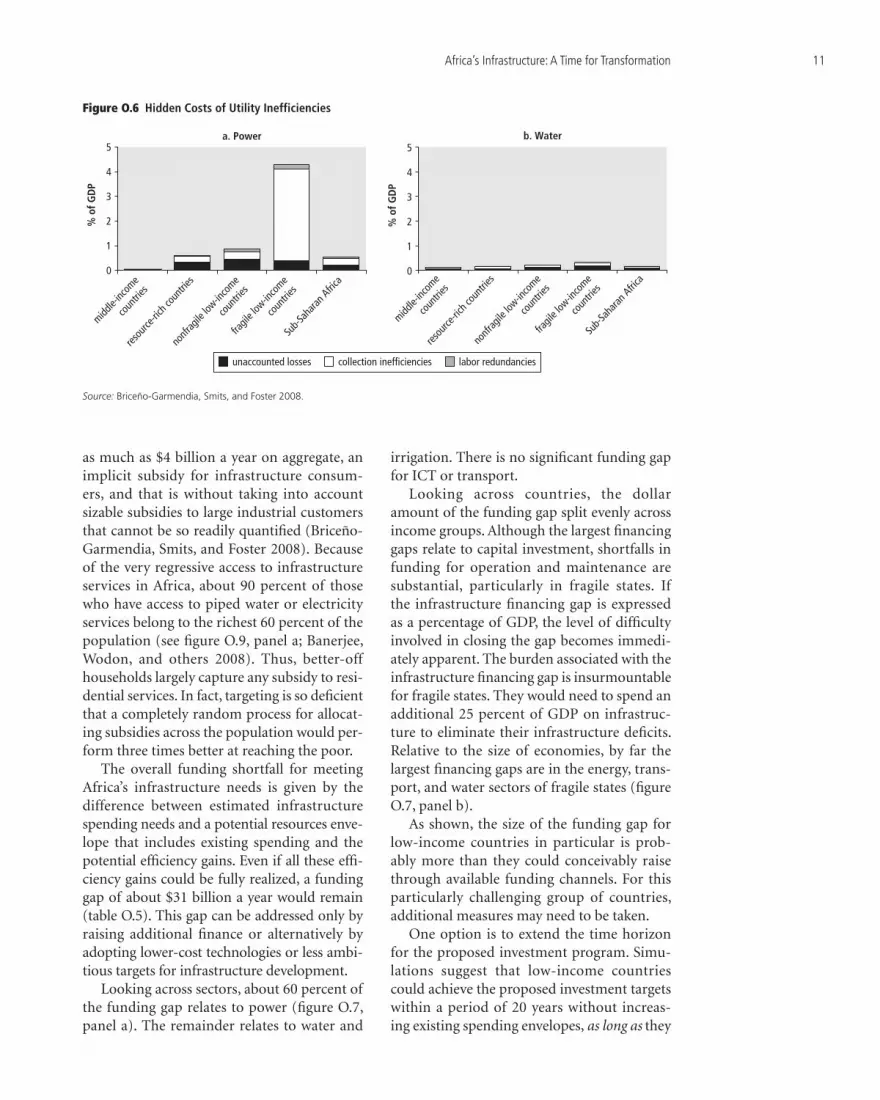
Africa’s Infrastructure: A Time for Transformation 11
as much as $4 billion a year on aggregate, an implicit subsidy for infrastructure consum-ers, and that is without taking into account sizable subsidies to large industrial customers that cannot be so readily quantifi ed (Briceño-Garmendia, Smits, and Foster 2008). Because of the very regressive access to infrastructure services in Africa, about 90 percent of those who have access to piped water or electricity services belong to the richest 60 percent of the population (see fi gure O.9, panel a; Banerjee, Wodon, and others 2008). Thus, better-off households largely capture any subsidy to resi-dential services. In fact, targeting is so defi cient that a completely random process for allocat-ing subsidies across the population would per-form three times better at reaching the poor.
The overall funding shortfall for meeting Africa’s infrastructure needs is given by the difference between estimated infrastructure spending needs and a potential resources enve-lope that includes existing spending and the potential effi ciency gains. Even if all these effi -ciency gains could be fully realized, a funding gap of about $31 billion a year would remain (table O.5). This gap can be addressed only by raising additional fi nance or alternatively by adopting lower-cost technologies or less ambi-tious targets for infrastructure development.
Looking across sectors, about 60 percent of the funding gap relates to power (fi gure O.7, panel a). The remainder relates to water and
irrigation. There is no signifi cant funding gap for ICT or transport.
Looking across countries, the dollar amount of the funding gap split evenly across income groups. Although the largest fi nancing gaps relate to capital investment, shortfalls in funding for operation and maintenance are substantial, particularly in fragile states. If the infrastructure fi nancing gap is expressed as a percentage of GDP, the level of diffi culty involved in closing the gap becomes immedi-ately apparent. The burden associated with the infrastructure fi nancing gap is insurmountable for fragile states. They would need to spend an additional 25 percent of GDP on infrastruc-ture to eliminate their infrastructure defi cits. Relative to the size of economies, by far the largest fi nancing gaps are in the energy, trans-port, and water sectors of fragile states (fi gure O.7, panel b).
As shown, the size of the funding gap for low-income countries in particular is prob-ably more than they could conceivably raise through available funding channels. For this particularly challenging group of countries, additional measures may need to be taken.
One option is to extend the time horizon for the proposed investment program. Simu-lations suggest that low-income countries could achieve the proposed investment targets within a period of 20 years without increas-ing existing spending envelopes, as long as they
0
1
2
3
4
a. Power b. Water5
0
1
2
3
% o
f GD
P
% o
f GD
P
4
5
fragil
e low
-inco
me
coun
tries
Sub-S
ahara
n Afric
a
nonfr
agile
low-in
come
coun
tries
resou
rce-ric
h cou
ntries
middle-
incom
e
coun
tries
fragil
e low
-inco
me
coun
tries
Sub-S
ahara
n Afric
a
nonfr
agile
low-in
come
coun
tries
resou
rce-ric
h cou
ntries
middle-
incom
e
coun
tries
unaccounted losses collection inefficiencies labor redundancies
Figure O.6 Hidden Costs of Utility Inefficiencies
Source: Briceño-Garmendia, Smits, and Foster 2008.

12 AFRICA’S INFRASTRUCTURE: A TIME FOR TRANSFORMATION
fully exploit effi ciency gains. One cannot say the same of fragile states, however. They would still require a substantial increase in spending to meet the investment targets in any reason-able time frame, even when ineffi ciencies are fully captured.
Another possibility is to adopt lower-cost technologies to trim investment needs. Sav-ings of approximately one-third of spending requirements in transport and in water and san-itation are achievable in this way, by adopting lower-cost road designs or lower-end solutions for water and sanitation (such as standposts and improved latrines). Countries face a stark trade-off between the level of service provided and the speed with which they can serve their entire population.
Finding 10: Africa’s Institutional, Regulatory, and Administrative Reform Process Is Only Halfway Along
During the last decade, African states have made concerted efforts toward institutional reform in infrastructure. One could probably fairly say that the institutional reform process is halfway along (Vagliasindi and Nellis 2009). They have made progress, but few countries have a modern institutional framework for these sectors. Overall, the greatest progress has been in telecommunications, whereas trans-port lags furthest behind (fi gure O.8). The focus also varies. In telecommunications, the
0
1
2
3
4
power
water s
upply
and s
anita
tion
irriga
tion
trans
port
inform
ation
and
commun
ation
techn
ology
% o
f GD
P
% o
f GD
P
0
10
5
15
20
25
30
fragil
e low
-inco
me
coun
tries
nonfr
agile
low-
incom
e cou
ntries
resou
rce-ric
h
coun
tries
middle-
incom
e
coun
tries
a. Sector b. Country type
capital operation and maintenance
Figure O.7 Infrastructure Funding Gap by Sector and Country Type
Source: Briceño-Garmendia, Smits, and Foster 2008.
Table O.5 Finding Resources: The Efficiency Gap and the Funding Gap$ billions annually
Item Electricity ICT Irrigation Transport WSSCross-sector
gain Total
Infrastructure spending needs (40.8) (9.0) (3.4) (18.2) (21.9) n.a. (93.3)
Existing spending 11.6 9.0 0.9 16.2 7.6 n.a. 45.3
Effi ciency gap 6.0 1.3 0.1 3.8 2.9 3.3 17.4
Gain from raising capital execution 0.2 0.0 0.1 1.3 0.2 n.a. 1.9
Gain from eliminating operational ineffi ciencies 3.4 1.2 — 1.9 1.0 n.a. 7.5
Gain from tariff cost recovery 2.3 — — 0.6 1.8 n.a. 4.7
Potential for reallocation n.a. n.a. n.a. n.a. n.a. 3.3 3.3
Funding gap (23.2) 1.3 (2.4) 1.9 (11.4) 3.3 (30.6)
Source: Briceño-Garmendia, Smits, and Foster 2008.Note: ICT = information and communication technology; n.a. = not applicable; — = not available; WSS = water supply and sanitation. Parentheses indicate negative values.

Africa’s Infrastructure: A Time for Transformation 13
emphasis has been on implementing sector reform, and in water on improving the gover-nance of state-owned enterprises.
Private participation has varied enormously (Vagliasindi and Nellis 2009). Since the mid-1990s, many African countries have experi-mented with various forms of private participa-tion in infrastructure, with very heterogeneous results (table O.6).
The private sector has proved willing to invest only in mobile telephones, power plants, and container terminals. The number of mobile subscribers and the share of the popu-lation receiving mobile signals increased by a factor of 10 in fi ve years, the result of compe-tition among private operators. Private inves-tors have also provided signifi cant fi nance for thermal power generation (3,000 megawatts) and for container terminals at ports, even if the volumes fall substantially short of require-ments. Toll-road concessions are confi ned to South Africa; traffi c volumes elsewhere are not enough to make such endeavors fi nancially self-sustaining.
In power, water, and railways, the pri-vate sector has delivered improvements in operational performance but no new fi nance. The numerous concessions (and related con-tractual forms) covering railways, power, and water distribution have not delivered signifi -cant investment. Because of a combination of low tariffs and low volumes, none of these
businesses delivers cash fl ows high enough to fi nance investment. However, these arrange-ments have often (though not always) been good for operational performance, even if characterized by renegotiation and premature cancellation. A growing area of experimenta-tion is the multiyear performance-based road maintenance contract with the private sector, which shows promise in safeguarding mainte-nance activities and keeping costs down.
Some progress has occurred with gov-ernance reform of state-owned enterprises, where incentive-based performance contracts and external auditing seem to be paying off. Corporate governance reforms, including the establishment of a somewhat independent board of directors, are becoming more prev-alent across sectors, even if few enterprises have full corporatization that includes limited liability, rate of return, and dividend poli-cies. Performance contracts with incentives and independent external audits have become dominant features of the reform process for governance of state-owned enterprises, for both electricity and water. When combined with managerial performance incentives, these measures seem to be having a material effect on performance. The introduction of inde-pendent audits has also increased effi ciency, for both electric and water utilities.
Evidence on the links between introduc-ing an independent regulator and improving
Figure O.8 Institutional Progress across Sectorspercentage score on institutional scorecard
0
10
20
30
40
50
60
70
80
90
100
telecommunications electricity water
b. Ports and railways a. Telecommunications, electricity, and water
0
10
20
30
40
50
60
70
80
90
100
ports railways
reforms regulation governance reforms regulation
Source: Vagliasindi and Nellis 2009.Note: See Vagliasindi 2008c for the definition of the institutional indicators.

14 AFRICA’S INFRASTRUCTURE: A TIME FOR TRANSFORMATION
performance is currently mixed (Vagliasindi and Nellis 2009). Some critics argue that regu-latory agencies have simply created additional risks because of unpredictable decisions,
resulting from excessive discretion and overly broad objectives (Eberhard 2007). Regulatory autonomy remains elusive: in some countries, turnover among commissioners has been high, and the gap between law (or rule) and practice has been wide. For water, where the vast major-ity of service providers are state-owned enter-prises, no evidence exists of any benefi t from regulation. For power and telecommunications, some effect is discernible, but it is far from unambiguous. Weak regulatory autonomy and capacity constraints undermine the credibility of independent regulators. Most African regu-latory agencies are embryonic, lacking funding and in many cases qualifi ed personnel.
Key Recommendations
Based on these fi ndings, one can make the fol-lowing 10 key recommendations:
• Addressing Africa’s infrastructure effi ciency gap is a pressing policy priority with poten-tial dividends of $17 billion a year.
• One of the most fl agrant ineffi ciencies is the failure to maintain infrastructure assets—maintenance needs to be understood as an investment in asset preservation.
• Institutional reform remains essential for tackling utilities’ operational inefficien-cies, both through private participation and through governance reforms for state-owned enterprises.
• Institutional reform should also go beyond utilities to strengthen the planning func-tions of the line ministries and address seri-ous defi ciencies in the budgetary process.
• Reforms are needed to get full value from existing infrastructure, where widespread administrative and regulatory bottlenecks prevent facilities from being fully used.
• Regional integration can contribute signifi -cantly to reducing infrastructure costs, by allowing countries to capture scale econo-mies and manage regional public goods effectively.
• Development of infrastructure networks needs to be strategically informed by the spatial distribution of economic activities and by economies of agglomeration.
Table O.6 Overview of Private Participation in Infrastructure
Infrastructure sector
Extent of private participation
Nature of experience Prospects
ICT
Mobile telephony Over 90 percent of countries have licensed multiple mobile operators
Extremely benefi cial with exponential increase in coverage and penetration
Several countries still have potential to grant additional licenses
Fixed telephony About 60 percent of countries have divested state-owned telecommunication incumbent
Controversial in some cases, but has helped improve overall sector effi ciency
Several countries still have potential to undertake divestitures
Power
Power generation 34 independent power projects provide 3,000 MW of new capacity, investing $2.5 billion
Few cancellations but frequent renegotiations; power purchase agreements have proved costly for utilities
Likely to continue, given huge unsatisfi ed demands and limited public sector capacity
Power distribution 16 concessions and 17 management or lease contracts in 24 countries
Problematic and controversial; one-quarter of contracts cancelled before completion
Movement toward hybrid models involving local private sector in similar frameworks
Transport
Airports Four airport concessions, investing less than $0.1 billion, plus some divestitures
No cancellations but some lessons learned
Limited number of additional airports viable for concessions
Ports 26 container terminal concessions, investing $1.3 billion
Processes can be controversial, but cancellations have been few and results positive
Good potential to continue
Railroads 14 railroad concessions, investing $0.4 billion
Frequent renegotia-tions, low traffi c, and costly public service obligations keep investment below expectations
Likely to continue but model needs to be adapted
Roads 10 toll-road projects, almost all in South Africa, investing $1.6 billion
No cancellations reported
Limited because only 8 percent of road network meets minimum traffi c threshold, almost all in South Africa
Water
Water 26 transactions, mainly management or lease contracts
Problematic and controversial; 40 percent of contracts cancelled before completion
Movement toward hybrid models involving local private sector in similar frameworks
Sources: Authors’ elaboration based on Bofinger 2009; Bullock 2009; Eberhard and others 2008; Gwilliam and others 2008; Minges and others 2008; Mundy and Penfold 2008; and Svendsen, Ewing, and Msangi 2008.Note: ICT = information and communication technology; MW = megawatts.

Africa’s Infrastructure: A Time for Transformation 15
• Infrastructure’s social policy needs to be rethought, placing more emphasis on recov-ering costs from those who can afford it and on recasting subsidies to accelerate access.
• Achieving universal access will call for greater attention to removing barriers that prevent the uptake of services and offer-ing practical and attractive second-best solutions.
• Closing Africa’s infrastructure fi nancing gap is critical to the region’s prosperity, and the global fi nancial crisis has only made infrastructure more relevant.
Recommendation 1: Address Africa’s Infrastructure Effi ciency Gap as a Pressing Policy Priority The fi ndings presented underscore the magni-tude of ineffi ciency with which Africa spends its current infrastructure resources. Of Africa’s overall infrastructure spending needs of about $93 billion a year, as much as $17 billion could be met simply by using existing resources more effectively.
Reaping this effi ciency dividend has to be a major policy priority for the region, and efforts to scale up infrastructure fi nance need to be made in the context of genuine com-mitments to address effi ciency. Pouring addi-tional funding into sectors characterized by high levels of ineffi ciency makes little sense. However, postponing increases in fi nance until effi ciency improves is not a valid option: the cost to economic growth and human develop-ment is simply too high. Rather, development partner efforts to secure additional resources for infrastructure fi nance must be matched by government efforts to improve their effi ciency in using such resources. Parallel progress is needed on both fronts.
Moreover, investment fi nance is needed in some cases to allow ineffi ciencies to be captured (for example, where roads must be rehabilitated before they return to a “maintainable” condition or when meters must be installed to improve revenue collection). These kinds of effi ciency-related investments deserve to be prioritized because of the high returns they typically bring.
The current global financial crisis only strengthens the motivation for addressing
infrastructure ineffi ciencies. As African coun-tries begin to feel the pinch of the global fi nan-cial crisis, and as other sources of funding begin to dry up, measures to improve the effi ciency of using existing resources become particularly attractive. Such measures provide an addi-tional internal source of fi nance at a relatively low monetary cost. Of course, in some cases, signifi cant investments may be needed before effi ciency gains can be captured (for example, reducing distribution losses in power or water). In other cases, the economic context of the crisis may simply increase the political cost of taking such measures, such as raising cost recovery or laying off excess employees.
Potential effi ciency gains take a wide variety of forms, which are developed in the recom-mendations that follow. Briefl y, they include the following areas:
• Safeguarding maintenance expenditure to avoid wasting resources on the repeated rehabilitation of existing assets, which could save $2.6 billion a year in avoidable capital expenditure for the roads sector alone
• Reforming institutions to improve the oper-ational performance of utilities and other service providers that are currently wasting $6 billion a year on ineffi ciencies such as overstaffi ng, undercollection of revenues, and distribution losses
• Addressing defi ciencies in the public expen-diture framework, where $3.3 billion a year of infrastructure resources appear to be poorly allocated across sectors and low bud-get execution prevents $1.8 billion a year of public investment funds from being spent
• Modernizing administrative and regulatory frameworks to reduce bottlenecks that pre-vent services from being provided effectively across existing infrastructure networks and impose substantial costs on infrastructure users
• Reaping the economies of scale and coor-dination benefi ts associated with regional integration, which in the case of power alone can be as high as $2 billion a year
• Securing the highest returns from new infrastructure investments by using them to secure economies of agglomeration and

16 AFRICA’S INFRASTRUCTURE: A TIME FOR TRANSFORMATION
to facilitate the development of productive activities along key economic corridors
• Rethinking infrastructure social policy to place more emphasis on cost recovery from those who can afford to pay, and redirecting the current $4 billion a year of subsidies to accelerate access among lower-income groups
• Reducing the costs of meeting key infra-structure targets by adopting lower-cost technologies that provide reasonable lev-els of service at a price that is affordable to both consumers and the government.
Recommendation 2: Make Greater Efforts to Safeguard Maintenance SpendingThe traditional neglect of maintenance expen-diture needs to be reversed by rethinking maintenance as asset preservation. One-third of Africa’s infrastructure assets need rehabilita-tion, indicating that historic neglect of main-tenance is endemic. For fragile states and for rural infrastructure, the share of assets needing rehabilitation is much higher. The shortfall in road maintenance spending is costing Africa $1.9 billion a year in avoidable capital expen-ditures. In fact, spending $1 on maintenance can provide a savings of approximately $4 to the economy.
Thus, Africa’s infrastructure fi nancing gap is not only about raising investment capital; a substantial part of it relates to maintenance. Yet maintenance offers one of the highest returns to infrastructure spending, so it may be more helpful to think of maintenance as a kind of investment in asset preservation.
The road sector shows that maintenance can be improved through suitable institutional reforms. Since the mid-1990s, the majority of African countries have established road funds as a means of channeling road user charges to network maintenance. Countries with road funds do signifi cantly better at raising adequate maintenance funds as long as the fuel levies paid into these funds are set high enough to provide material fi nancing. More-over, countries with both road funds and road agencies do signifi cantly better in safeguard-ing the quality of their road networks. The use
of multiyear performance-based contracts for roads has further contributed to the effi cacy and effi ciency of road maintenance. These fi ndings illustrate that a combination of fund-ing mechanisms, institutional capacity, and contractual incentives is needed to overcome the maintenance challenge.
Donors have traditionally eschewed fund-ing maintenance, arguing it is more sustainable for funding directly from country budgets. The argument is a good one. However, the willing-ness of donors to fund asset rehabilitation can create perverse incentives for countries to neglect maintenance, because governments face a choice between raising taxes today to fi nance maintenance or simply waiting a few years to obtain subsidized donor capital for reconstruction. In low-income, low-capacity environments where maintenance is unlikely to be forthcoming, donors may be well advised to take this choice explicitly into account in project design, rather than simply assume that maintenance will happen. One way of doing so is to choose more capital-intensive, low- maintenance technologies. Even if they rep-resent a higher investment cost in the short run, overall life-cycle costs may be lower if reconstruction can be avoided or postponed. As donors move toward sectorwide budget support, they will have a greater opportu-nity to ensure that maintenance spending is adequately supported in the budget envelope. In any case, as a general principle, the estab-lishment of a sound framework for fi nancing maintenance should be a prerequisite for the funding of major capital programs.
Recommendation 3: Tackle Ineffi ciency through Institutional ReformSince the mid-1990s, the institutional agenda has broadened and deepened (Vagliasindi and Nellis 2009). In the 1990s, the emphasis of institutional reform was on sector restructur-ing and private participation, transplanting to Africa experiences from other parts of the developing world. This approach yielded dra-matic results in telecommunications, but else-where the benefi ts were more limited and the experiences more problematic. Even so, private fi nance to African infrastructure came from
Africa’s Infrastructure: A Time for Transformation 17
nowhere to provide a fl ow of funds comparable in scale to overseas development assistance.
A more nuanced, less dogmatic perspec-tive on the private sector has emerged. This perspective values private fi nancing in mobile telephony, power generation, and ports, while recognizing its limits in roads, rail, power, and water (see table O.6). Even for infrastructure where the proven appetite for private fi nance is very limited, the potential contribution of the private sector to tackling costly manage-ment inefficiencies (undercollected utility revenues, low labor productivity, or neglected road maintenance) remains valuable. Indeed, the effi ciency gains from such performance improvements are themselves a signifi cant source of sector fi nance. Moreover, the concept of private participation has undergone signifi -cant expansion. More emphasis has fallen on the local (not international) private sector and on hybrid models that experiment with differ-ent ways of allocating responsibilities between public and private partners.
Another important way in which the insti-tutional reform agenda has broadened is the greater focus on the quality of governance for enterprises that remain state owned (Vagli-asindi and Nellis 2009). The recognition that the private sector will never be a ubiquitous service provider has come with the realiza-tion that state-owned enterprises are here to stay. Therefore, it is necessary to recommit to the diffi cult process of reforming state-owned enterprises.
Renewed efforts on state-owned enterprise reform should favor governance over technical fi xes. Fortunately, better governance of state-owned enterprises can improve performance. Past efforts at improving utility management focused too heavily on technical issues at the expense of corporate governance and account-ability. Future state-owned enterprise reforms seem justifi ed as long as they focus on deeper institutional issues. Key measures include greater decision-making autonomy for the board of directors, more objective selection criteria for senior managers, rigorous disclo-sure of confl icts of interest, and more trans-parent, merit-based recruitment processes.
Parallel efforts can strengthen fi nancial and operational monitoring of state-owned
enterprises by their supervisory agencies, whether line ministries or ministries of fi nance. Transparency and accountability of state-owned enterprises depend on solid systems of fi nancial management, procurement, and management information. Today, basic oper-ational and fi nancial data on fi rm perfor-mance are not produced, reported, or acted on. Without information or, perhaps worse, without action on what information is pro-duced, better outcomes cannot be expected. Key measures include auditing and publishing fi nancial accounts and using comprehensive cost-based accounting systems that allow the functional unbundling of costs and a clearer sense of cost centers. After this foundation is in place, contracting mechanisms can improve performance—within the public sector or with the private sector.
Public sector performance contracts need strong performance incentives. Initial attempts to improve African state-owned enterprises through performance contracts with their line ministry or other supervisory agency were minimally effective. Recent efforts in water (Uganda), however, have had a much more positive effect. The key feature of these con-tracts is to incorporate incentives for good managerial (and staff) performance and, more rarely, sanctions for failure to reach targets.
Creating effective performance incentives in the public sector can be challenging, mak-ing management contracts with the private sector a relevant option. Either expatriate or local management teams can be contracted with, each of which offers advantages. Clarity about what a contract can and cannot achieve, particularly given its short time horizons, is essential. At best, a management contract can improve performance in a handful of rela-tively manageable aspects of effi ciency, such as revenue collection and labor productivity. It cannot solve defi ciencies in the broader insti-tutional framework; ideally, these should be addressed beforehand. Nor can a management contract raise investment fi nance or deliver major effects on service quality that require substantial investments or lengthy gestations.
In principle, regulation can do much; but in practice, regulation has proved diffi cult. Regu-lators have been set up across Africa, precisely

18 AFRICA’S INFRASTRUCTURE: A TIME FOR TRANSFORMATION
to insulate utilities from political interference while closely monitoring enterprises. Improving regulatory performance is a long-term process to be pursued where private participation and competitive pressures are signifi cant. The chal-lenge of establishing new public institutions in developing countries is often underestimated. Independent regulation requires a strong polit-ical commitment and competent institutions and people. Where some or all are lacking, con-sidering complementary or transitional options that reduce discretion in regulatory decision making through more explicit rules and proce-dures or by outsourcing regulatory functions to advisory regulators and expert panels may be wise (Eberhard 2007).
Recommendation 4: Include Line Ministries and Budgetary Processes on the Institutional Reform AgendaMuch of the emphasis of recent reforms has been on restructuring the service provider or utility, bringing in private management, applying regulatory oversight, and so on. Little attention has been given to institutional strengthening of the sector line ministries. These line ministries have responsibilities, which, if not adequately discharged, can jeopardize the functioning of the sector. They take the lead in sector planning, participate in the formulation of the public budgets, and execute investments. How-ever, defi ciencies exist in all those areas. Unless they are tackled head on, the effect of reforms on service providers will remain limited.
Stronger sector planning is needed in infra-structure line ministries to ensure that the construction of critical new assets begins early enough to come on stream when needed. Too often overlooked or debilitated during the course of sector restructuring efforts, plan-ning is a critical sector function. It is essential to restore this vital planning capability in the line ministries and to develop sound techni-cal methodologies for identifying and selecting infrastructure projects. More rigorous project screening can ensure that infrastructure invest-ments are selected according to their expected returns and are appropriately sequenced and synchronized with one another and with broader development plans to maximize syn-ergies and avoid costly bottlenecks.
A clear example is power generation. Tra-ditionally, planning and procurement of new power infrastructure were the province of the state-owned utility. With power sector reforms and independent power producers, those func-tions were often moved to the ministry of energy or electricity. The transfer of skills was not always simultaneous, however, so plans were not adequately informed by the complex-ities on the ground. In many cases, planning has collapsed. New plants are rarely timely, thereby opening power gaps that prompt recourse to temporary power and discour-age investors. When procurement is (fi nally) undertaken, the authorities may not take the trouble to conduct international competitive bidding. This outcome is unfortunate because a rigorous bidding process lends credibility and transparency to procurement and results in more competitively priced power.
Because domestic public spending fi nances the bulk of Africa’s infrastructure investments, development partners need a broader view of the quality of public spending. Across the infrastructure sectors, most investments are by line ministries through the budgetary process. Shortcomings in the way the rest of the sec-tor budget is allocated and spent may offset development fi nance that focuses too narrowly on specifi c project interventions. So donor resources are best channeled programmatically as budgetary support or through sectorwide projects, and development partners need to take a broader interest in the overall quality of public spending. Thus, infrastructure interven-tions must be grounded in a broader under-standing of the public expenditure framework in each sector.
Ad hoc political priorities with little or no economic screening too often characterize the budgetary process. The annual budget cycle prevents adequate follow-through on the fund-ing of multiyear infrastructure projects. When it comes to implementation, many countries have significant problems with budgetary execution, with procurement bottlenecks pre-venting the full budget allocations from mate-rializing in actual spending.
Key aspects of the public expenditure framework need to be addressed. The budget-ing process needs to move to a medium-term

Africa’s Infrastructure: A Time for Transformation 19
framework and link sector objectives and resource allocations, underpinned by clear sector plans that go down to specifi c activities and their associated costs. The careful incor-poration of maintenance in medium-term sector-planning tools can prevent the growing need for asset rehabilitation. Project appraisal should underpin the budgetary process for public investment to ensure that all invest-ments under political consideration pass at least a minimum threshold of economic via-bility. Administrative processes that delay the release of budgeted funds must be overhauled, and procedures for procurement, disbursement, financial management, and accountability must be modernized and streamlined.
Water provides interesting examples of how bottlenecks in the budgetary process can prevent the use of available resources. In West Africa, the binding constraint is not the availability of budgetary resources in many instances but the capacity to disburse them in a timely fashion (Prevost 2009). In Tanzania, steep increases in budget allocations to the sec-tor followed water’s identifi cation as a priority in the country’s poverty reduction strategy, but disbursements increased at a much slower pace, thus impeding any immediately discern-ible effect on access (Van den Berg 2009).
Parallel improvements are also needed in the way donor fi nance is channeled. Given the rele-vance of external funds, a solid public expendi-ture management system for African countries requires that donors improve the predictability of their support and streamline and harmonize their procedures. In that sense, a focus on mul-tidonor initiatives that pool funds to provide general budgetary support for a sectorwide program of interventions is preferable.
Recommendation 5: Use Administrative and Regulatory Reforms to Get Full Value from Existing InfrastructureAfrica is failing to get the full development potential even from its existing infrastructure networks. Administrative and regulatory fail-ures create bottlenecks and prevent infrastruc-ture assets from delivering the services they are supposed to. These problems are particu-larly evident in transport, where high-impact reforms are urgently needed.
Liberalizing the trucking industry can reduce the exorbitant road freight costs in Central and West Africa. The regulation and market structures of the road freight industry, not the quality of road infrastructure, are the binding constraints on international corridors (Teravaninthorn and Raballand 2008). Road freight tariffs, which can reach $0.08–$0.13 per ton-kilometer in Central and West Africa, refl ect the high profi t margins of trucking services (60–160 percent). The tour de role regulatory framework, based on market shar-ing and centralized allocations of freight, lim-its vehicle mileage and undermines incentives to improve fl eet quality. The alternative is to combine free entry to the market and market pricing with regulatory enforcement of rules for quality and operating behavior. Already practiced in southern Africa, these reforms can reduce road freight tariffs to $0.05 per ton-kilometer. Without such reforms, further investments in upgrading road network qual-ity will simply lead to higher profi t margins for the trucking industry without lowering trans-port costs for consumers.
One-stop border posts are essential to avoid extensive delays in transit traffi c along interna-tional road corridors. Road conditions along Africa’s major international corridors are good, with trucks reaching speeds of 50–60 kilome-ters an hour, but long delays at borders slow effective velocities to little more than 10 kilo-meters an hour. A journey of 2,500 kilometers from Lusaka, Zambia, to the port of Durban in South Africa takes on average eight days—four days of travel time and four days spent at border crossings. Compare that total with land border-crossing times of no more than half an hour for industrialized countries. The cost of delays for an eight-axle interlink truck has been estimated at about $300 a day. The investments to develop one-stop border facili-ties and to modernize customs procedures are relatively modest and would pay back in barely a year. Without such reforms, further invest-ments in the road network will have little effect on overall transit times.
More reliable interconnection services can avoid even longer delays on international rail corridors. Locomotives from one country are generally not allowed to travel on another

20 AFRICA’S INFRASTRUCTURE: A TIME FOR TRANSFORMATION
country’s network, mainly because of the inability to provide breakdown assistance to foreign operators. As a result, rail freight crossing borders must wait to be picked up by a different locomotive. These delays can be extensive. A journey of 3,000 kilometers from Kolwezi on the Democratic Republic of Congo border to the port of Durban in South Africa takes 38 days—including 9 days of travel time and 29 days associated primarily with loading and interchange of freight. This delay partly refl ects the lack of reliable, well-maintained locomotives, but it also refl ects the absence of clear contractual incentives to service traffi c from a neighboring country’s network. Reduc-ing such delays would require total rethinking of contractual relationships and access rights linking the railways along the corridor. It would also likely require a regional clearing-house to ensure transparency and fairness in reciprocal track access rights.
Slow movement of containers and cargo through Africa’s ports imposes very high eco-nomic costs. Many fi rms cite bottlenecks at ports as their most pressing infrastructure constraint in countries as diverse as Burkina Faso, Cameroon, Malawi, Mauritius, and South Africa. Container dwell times in East and West Africa are 12–15 days, twice the international best practice of 7 days. Most delays are caused by long processing and administration times and poor handling in congested port areas, rather than by any real limitations in basic quay capacity. These delays can be very costly. One extra day in port costs more than $35,000 for a 2,200-TEU (20-foot equivalent unit) ves-sel in 2006 and proportionately more for larger ships. Shipping lines have responded by intro-ducing “congestion charges”: for a 20-foot container in 2006, ranging from $35 a day in Dakar, Senegal, to $420 a day in Tema, Ghana.
The solution lies in modernizing customs administration and improving effi ciency of cargo handling. The two main bottlenecks within ports are loading and unloading of cargo and customs administration—both need to be addressed simultaneously. Inadequate cranes are part of the problem, but new equip-ment alone will not deliver better performance unless staff practices are also modernized. Ports with container terminal concessions have
boosted handling rates. Modernizing customs administration requires modern information technology and associated database systems. Such soft infrastructure has traditionally been underfunded, contributing to poor port effi -ciency. Governance issues may also affl ict cus-toms administration.
Port and land distribution infrastructure need to be integrated. The lack of an inte-grated land distribution system, particularly for transit traffi c, further impedes container traffi c. Making the most progress are dry and liquid bulk exports, where many port facilities are privately owned and integrated within a comprehensive logistics system. Container-ized trade, in contrast, is often only skin-deep. Containers are packed and unpacked near the ports, and the benefi ts of fully integrated mul-timodal transport corridors associated with container adoption are not secured. As a result, little containerized traffi c moves into the land-locked hinterland, and most of those countries’ imports are transported as general cargo.
Overall, the transport regulatory and administrative framework needs to promote seamless multimodal transportation networks more consciously. Transport chains can be no stronger than their weakest links, which are usually the interchanges between different modalities—such as road to rail or rail to sea. The weaknesses are partly physical, where no physical connection exists between the modes and no infrastructure is available for transship-ment. However, they are also partly institu-tional, with responsibility for the interchanges not falling clearly to one modal agency or the other. Finally, they are partly operational, with the government collecting taxes and duties, or staff collecting bribes, slowing movements, and pushing up costs. Even at the sector policy and planning level, Africa’s transport modes are too often parceled out across separate line ministries, thereby preventing a cohesive inter-modal transport framework from emerging.
Recommendation 6: PursueRegional Integration to Reduce Infrastructure Costs Regional integration lowers costs across all aspects of infrastructure. The high cost of infra-structure services in Africa is partly attributable
Africa’s Infrastructure: A Time for Transformation 21
to fragmentary national boundaries preventing achievement of scale economies.
In ICT, power, ports, and airports, regional collaboration essentially provides scale econ-omies that reduce the cost of service. Most African countries are simply too small to develop infrastructure cost-effectively on their own. In ICTs, regional collaboration in continental fi ber-optic submarine cables can reduce Internet and international call charges by half, relative to national reliance on satel-lite communications. In power, 21 countries have national power systems below the mini-mum effi cient scale of a single plant. By shar-ing large-scale, cost-effective energy resources across countries, regional trade can reduce electricity costs by $2 billion a year. The traf-fi c fl ows to most of Africa’s national ports and airports are too low to provide the scale econ-omies needed to attract services from major international shipping companies and airlines. Regional collaboration in multicountry hubs can help overcome this problem.
In road and rail corridors and transbound-ary river basins, collaborative management of these regional public goods reduces the cost. Many of Africa’s infrastructure assets and natu-ral resources are regional public goods that cut across national frontiers and can be effectively developed and maintained only through inter-national collaboration. Road and rail corridors need to be managed collaboratively to smooth transport and trade services to Africa’s 15 land-locked countries, avoiding the extensive border delays that slow international road freight to 10 kilometers an hour. Africa’s 63 international river basins call for cooperative water resource management and coordinated investments to increase basin yields of food, power, and other economic opportunities, while strengthening environmental sustainability and mitigating the effects of droughts and fl oods.
Reaping these benefits poses numerous institutional challenges. Among them are mobilizing political will, developing effective regional institutions, setting priorities soundly, harmonizing regulatory procedures, and facili-tating project preparation and fi nance.
Notwithstanding the economic case for regional integration, the mobilization of politi-cal will faces considerable obstacles. Regional
infrastructure involves a high level of trust between countries, not least because of the implied dependence on neighbors for key resources, such as energy and water. For example, if regional power trade were pursued fully, 16 African countries would import more than half their power needs. A large share of that power would come from fragile states, such as the Democratic Republic of Congo and Guinea.
Regional institutions are needed to facili-tate agreements and implement compensa-tion mechanisms. Some countries have more to gain from regional integration than others do. As long as regional integration provides a substantial economic dividend, one should be able to design compensation mechanisms that make all participating countries better off. Benefi t sharing was pioneered through inter-national river basin treaties, such as that for Senegal, and could be applied to other regional infrastructure more broadly. Africa has an extensive architecture of regional political and technical bodies, but they have overlapping memberships, limited technical capacity, and limited enforcement powers. Nor do they cur-rently have the capacity to implement cross-border compensation mechanisms.
Moving on regional projects that deliver quick wins is important. Because of the daunt-ing investment agenda, better sequencing and priority setting for regional projects are needed. Political, economic, and spatial approaches have all been widely discussed. Regional proj-ects range from bilateral cooperation on a transmission line or border post to vast and complex interventions, sometimes with a con-tinental reach. Given the size of the challenges, starting small with projects that deliver tangible high returns and building incrementally on ini-tial successes may be advisable.
Regulatory harmonization needs to go hand in hand with physical integration. Unless regu-latory frameworks and administrative proce-dures are harmonized to allow the free fl ow of services across national boundaries, physical integration of infrastructure networks will be ineffective. Making progress on regulatory reform has a relatively low monetary cost, but it can have a very high return. A good example is the Yamoussoukro Decision: opening the skies for air transportation across Africa, it has

22 AFRICA’S INFRASTRUCTURE: A TIME FOR TRANSFORMATION
led to greater freedom in the negotiation of bilateral agreements.
Greater efforts are needed to facilitate prepa-ration of complex regional projects, which are particularly costly and time-consuming to pre-pare. That is especially true when projects are large in relation to the size of the host economy and when they essentially depend on fi nancing from downstream benefi ciaries. They also stretch the donor fi nancing systems that are more typi-cally geared toward national investments.
Recommendation 7: Take a Spatial View of Infrastructure Development PrioritiesInfrastructure networks are inherently spatial, both refl ecting and underpinning the spatial distribution of economic activity. Infrastruc-ture plays a key role in enabling cities to benefi t from economies of agglomeration. Transport networks interconnect urban centers with each other and with international trading networks, providing the basis for exchange between the urban and rural economies. Energy, water, and ICT all enhance productivity within urban and rural spaces. Therefore, infrastructure plans and priorities should be strategically informed by a clear understanding of the spatial dis-tribution of economic activity and potential. A clear example of this approach is the Spatial Development Initiative of the New Partnership for Africa’s Development (NEPAD).
The spatial lens is a useful basis for pri-oritization of infrastructure investments and provides insight into cross-sectoral links. Looking at infrastructure through a spatial lens allows identifi cation of the key bottle-necks along various trading corridors, which are typically the highest-return interventions. Cross-sectoral links also become more appar-ent through a spatial view, shedding light on the need for coordinating interventions across infrastructure sectors and between infrastruc-ture and client economic sectors. An emerg-ing literature suggests that because of synergy effects, the returns from bundling multiple infrastructure interventions in a particular spatial area (Torero and Escobal 2005) or along a given spatial corridor (Briceño-Garmendia and Foster 2009a, 2009b) are higher than those from making the same investments in a
spatially uncoordinated manner. In Africa—too often—the limited infrastructure available is thinly spread out, preventing such synergies from being captured.
The urbanization process calls for a regional development perspective on infrastructure that looks at each city and its rural hinterland as an integrated economic unit. Africa is urban-izing fast, creating change that is predictable and benefi cial for both urban and rural areas. Prosperity and density go together, as changes in productivity require agglomeration econo-mies, larger markets, and better connectiv-ity. Concentration and urbanization trigger prosperity in both urban and rural areas, and well-functioning cities facilitate the transition from subsistence agriculture by providing a large market for rural products and support-ing nonfarm activities. The debate of rural versus urban development should therefore be replaced by the understanding that rural and urban development are closely linked and mutually dependent—and that economic inte-gration of rural and urban areas is the only way to produce growth and inclusive development.
In urban areas, defi ciencies in land policies and planning have become a huge impediment to extending infrastructure services. African cities are growing fast, but with insuffi cient infrastructure and poor institutions, most new settlements are informal and not cov-ered by basic services. Urban planning should be strengthened to reduce sprawl, enhance densifi cation, prevent development in pre-carious environmental zones, and provide the appropriate balance between public and private land to safeguard key trunk networks. Property rights must be clearly defi ned so that land markets can function. Cities frequently lack the fi nancial basis to develop the infra-structure critical to their success. The local tax base, though potentially large, is typically unexploited, leaving municipalities reliant on central government transfers, which are too often inadequate or unpredictable.
Large agricultural sectors and rural econo-mies remain central to economic growth and poverty reduction in Africa. Yet the access of rural populations to infrastructure is extremely low. Rural roads and irrigation systems are together perhaps the most pressing of rural

Africa’s Infrastructure: A Time for Transformation 23
infrastructure needs. The two go hand in hand, and their development should follow the value of agricultural land and the spatial proximity to urban markets. ICT has made huge strides in expanding rural access, with one in two rural Africans now in range of a global systems mobile signal. This platform can contribute to agricultural productivity through simple text-message extension services, through bulletins on agricultural market prices and meteoro-logical conditions, and as a vehicle for fi nan-cial transactions. The possibilities are only just beginning to be explored.
Recommendation 8: Rethink Infrastructure Social PolicyAlthough Africa’s infrastructure services are rel-atively expensive, costs remain even higher than prices, and this lack of cost recovery has major detrimental effects. Underpricing infrastructure services is costing Africa $4.7 billion a year in forgone revenues. In addition, because of ineq-uitable access to infrastructure services, these subsidies are highly regressive, largely bypass-ing the poor (fi gure O.9). The underrecovery of costs impairs the fi nancial health of utilities and slows the pace of service expansion.
Concerns about affordability are usually the pretext for underpricing services but do not bear much scrutiny (fi gure O.9). A subsis-tence-level monthly utility bill priced in cost-recovery terms typically amounts to $6–$10 a month. In the middle-income countries, bills of this magnitude do not appear to present an affordability problem anywhere across the income spectrum. Nor do bills of this mag-nitude pose affordability issues for the more affl uent groups in low-income countries, the main ones to enjoy access to services. Afford-ability would become a binding constraint in low-income countries only when service cov-erage starts to exceed 50 percent. Only in the poorest of countries, and those with excep-tionally high infrastructure costs, does full cost recovery seem unachievable for today’s more affl uent consumers. Even in these cases, operating cost recovery should be a feasible objective, with subsidies limited to capital costs. Simulations suggest that raising tariffs to cost recovery would have only minimal effects on poverty rates in most cases.
The affordability of services depends not only on prices, but also on the type of payment arrangements that are made avail-able to consumers. Prepayment (pioneered in the mobile telephone sector) can help households budget their consumption and reduce revenue risks for operators. The same approach is technologically feasible for elec-tricity, and a growing number of power utili-ties are adopting it.
Subsidies are important, but subsidy design needs major rethinking, with a sharper focus on subsidizing connections, which can be more equitable and effective in expanding coverage. The affordability problems with con-nection charges are often much more serious than those with use-of-service charges. More-over, the absence of a connection may itself be a good targeting variable for identifying
0
20
40
60
80
Q1 Q2budget quintile
Q3 Q4 Q5
0
20
40
60
80
100b. Affordability curve
a. Access by quintile
% o
f hou
seho
lds
falli
ngbe
yond
the
5 p
erce
ntaf
ford
abili
ty t
hres
hold
% o
f hou
seho
lds
2 4 6 8 10 12monthly utility bill (US$)
14 16
low-income countriesmiddle-income countriesSub-Saharan Africa overall
piped water electricity
Figure O.9 Access to and Affordability of Household Services
Source: Banerjee, Wodon, and others 2008.Note: Q1 = first (or poorest) budget quintile; Q2 = second budget quintile; Q3 = third (or middle) budget quintile; Q4 = fourth budget quintile; Q5 = top (or richest) budget quintile.

24 AFRICA’S INFRASTRUCTURE: A TIME FOR TRANSFORMATION
disadvantaged households, although less so in a low-access environment where coverage may be far from universal, even among affl u-ent households.
An important test of the coherence of a subsidy policy is to see whether it would be affordable for the country under universal access. The existing underpricing of utility services that benefi t just a small minority costs many African countries as much as 1 percent of GDP. As countries move toward universal access, that subsidy burden would increase proportionately, rapidly becoming unafford-able for the national budget. Countries should thus consider how the cost of any proposed subsidy policy would escalate as coverage increases. This test of the fi scal affordability of a subsidy is an important reality check that can prevent countries from embarking on poli-cies that are simply not scalable and will keep coverage low.
Recommendation 9: Find Practical Ways to Broaden Access to Infrastructure ServicesUniversal access to infrastructure services remains distant for most African countries. The vast majority of African households today lack access to modern power, piped water, sew-erage, and even all-season roads that service their communities. The very slow progress in expanding this access since the mid-1990s sug-gests that universal access to infrastructure is more than 50 years away for most countries in Africa.
This situation calls for a different approach to expanding modern infrastructure services and for greater attention to second-best alter-natives. Business as usual will not bring about the acceleration of infrastructure access that Africa needs. Moreover, even if access can be accelerated, many people will have to continue to rely on alternatives to modern infrastruc-ture services for many years to come. There-fore, infrastructure social policies in Africa need to give greater thought to improving and expanding second-best alternatives.
In expanding modern infrastructure networks, closer attention should be paid to the demand side of the equation. The mobile telephone revolution has clearly demonstrated
that Africa can widely and rapidly adopt modern infrastructure services. Low charges for initial connection make market entry affordable. Prepayment schemes eliminate credit risk and give customers full control over their spending. Services are well tailored to customer demands. Other network services, notably power and water, have tended to view access as a matter of simply rolling out new networks, overlooking the fact that even where networks are available, the hookup rates are relatively low. They need to pay greater atten-tion to demand-side issues that prevent cus-tomers from making connections: connection charges that are much higher than household incomes, as well as tenure and urban devel-opment issues. The most cost-effective way to increase access for many utilities may be through densifi cation programs that increase hookups to existing networks by using greater community outreach to understand better the demand side of the market.
Second-best alternatives can be fi ne-tuned to provide feasible and attractive infrastructure services to those otherwise unserved. The vast majority of those without access to modern infrastructure services rely on traditional alter-natives, such as candles, wells, or unimproved latrines. Although doing the job, these tradi-tional alternatives tend to be inconvenient, inferior, or unsafe. Second-best solutions, such as street lighting, solar lanterns, standposts, and improved latrines, would provide house-holds with superior services at a cost that is somewhat higher than the traditional alterna-tives but still falls far short of modern services. Puzzlingly, these second-best solutions are not very prevalent in Africa, and even where they exist, they tend to be available primarily to the more affl uent.
A key problem seems to be the public-good nature of many of these solutions (such as standposts and street lighting), which makes it diffi cult for service providers to recover costs and greatly complicates the administration of the facilities. Effective institutional arrange-ments must be found to support implemen-tation of these alternatives. Another problem is that some of these alternatives, although cheaper, may simply not be cheap enough to be widely affordable.

Africa’s Infrastructure: A Time for Transformation 25
Recommendation 10: Close the Infrastructure Funding GapNotwithstanding the importance of all these effi ciency measures, a substantial infrastruc-ture fi nancing gap of $31 billion a year remains. Such a large shortfall looked daunting even before the onset of the global fi nancial crisis.
As of year-end 2007, many factors had converged to bring about rapid and sustained increases in all major sources of external fi nance for African infrastructure. Following the Gleneagles Summit, OECD development assistance placed greater emphasis on sup-porting African infrastructure. Offi cial devel-opment assistance fl ows almost doubled, from $4.1 billion in 2004 to $8.1 billion in 2007. The resurgence of economic growth on the conti-nent led to an upswing in private participation. Since the late 1990s, private investment fl ows to Sub-Saharan infrastructure almost tripled, going from about $3 billion in 1997 to $9.4 billion in 2006/07 (about 1.5 percent of regional GDP). In addition, non-OECD countries—notably China and India—began to take a growing interest in fi nancing infrastructure within a framework of South-South coop-eration. Their commitments rose from almost nothing in the early 2000s to fi nance about $2.6 billion of African infrastructure annually between 2001 and 2006. Although disburse-ments tend to lag commitments by several years, if the record commitments of 2007 are fully honored, the disbursements of external fi nance for African infrastructure may con-tinue to increase over the next few years.
In the absence of any offsetting measures, domestic infrastructure spending would likely fall, compromising economic recovery and deepening poverty. The existing gap of $31 billion a year could widen further as public budgets are squeezed, external capital fl ows decline, and consumer ability to pay user charges is eroded. The ability to construct new infrastructure, address regional bottle-necks, and maintain existing assets would be severely reduced. In Latin America during the 1990s, some 50 percent of the fi scal compres-sion to balance the public books came from cuts in infrastructure spending. In Indonesia following the Asian crisis, public investment in infrastructure fell from 7 percent of GDP to
2 percent. Growth in Latin America and Asia was compromised in a “lost decade.”
Many countries, ranging from China and India to Argentina and Mexico, have used infrastructure-based fi scal stimulus in times of economic crisis. If well targeted to addressing key economic bottlenecks and complemented by policy reforms, infrastructure investments can pave the way for the later resurgence of economic growth. Furthermore, some kinds of public works contracts are labor intensive, creating short-term employment to alleviate poverty. Although Africa could benefi t from such a program, the continent does not have the means to fi nance it without external sup-port. Estimates suggest that a $50 billion stim-ulus package would be needed to offset the impact of the economic crisis on Africa, and that focusing such a package on infrastructure investments would have the largest short-term effect on GDP growth, boosting projections for 2010 to 4 percent, compared with the postcrisis 1.7 percent. In the long term, Africa would see a permanent increase of 2.5 percent of GDP (ODI 2009).
Any increase in donor fi nance for African infrastructure should pay particular attention to the power sector and to the fragile states. Donors have neglected power since the 1990s. Although the private sector can contribute to funding power generation, donors will still need to scale up substantially to address the current crisis in the sector. This scale-up was already under way before the onset of the cri-sis, with donor commitments that fi rst topped $1 billion a year in 2005 reaching a peak of $2.3 billion in 2007. Fragile states stand out as receiving less than their fair share of donor fi nance for infrastructure. Given the magni-tude of the fi nancing gap that these countries face relative to the size of their economies, as well as the importance of infrastructure in regenerating their development, a case exists for channeling incremental donor resources in their direction.
Some of Africa’s larger low-income coun-tries have the potential to raise a signifi cant amount of local fi nance for infrastructure if suitable instruments can be developed. In a handful of African countries, domestic capi-tal markets are beginning to look wide and

26 AFRICA’S INFRASTRUCTURE: A TIME FOR TRANSFORMATION
deep enough to provide signifi cant volumes of infrastructure fi nance, Nigeria being the most salient example (Irving and Manroth 2009). However, most of this fi nance takes the form of relatively short-maturity commercial bank lending, often not the best suited for infra-structure projects. A need exists to further develop corporate bond markets and to create regulatory conditions for greater participation by institutional investors in funding infra-structure investments.
Note The authors of this chapter are Vivien Foster
and Cecilia Briceño-Garmendia.
ReferencesAfricon. 2008. “Unit Costs of Infrastructure Proj-
ects in Sub-Saharan Africa.” Background Paper 11, Africa Infrastructure Sector Diagnostic, World Bank, Washington, DC.
Banerjee, Sudeshna, Heather Skilling, Vivien Foster, Cecilia Briceño-Garmendia, Elvira Morella, and Tarik Chfadi. 2008. “Ebbing Water, Surging Defi -cits: Urban Water Supply in Sub-Saharan Africa.” Background Paper 12, Africa Infrastructure Sector Diagnostic, World Bank, Washington, DC.
Banerjee, Sudeshna, Quentin Wodon, Amadou Diallo, Taras Pushak, Hellal Uddin, Clarence Tsimpo, and Vivien Foster. 2008. “Access, Afford-ability, and Alternatives: Modern Infrastructure Services in Africa.” Background Paper 2, Africa Infrastructure Sector Diagnostic, World Bank, Washington, DC.
Bofi nger, Heinrich C. 2009. “Air Transport: Chal-lenges to Growth.” Background Paper 16, Africa Infrastructure Sector Diagnostic, World Bank, Washington, DC.
Briceño-Garmendia, Cecilia, and Vivien Foster. 2009a. “Democratic Republic of Congo: Pri-oritizing Infrastructure Investments—a Spatial Approach.” World Bank, Washington, DC.
———. 2009b. “Republic of Congo: Prioritiz-ing Infrastructure Investments—a Spatial Approach.” World Bank, Washington, DC.
Briceño-Garmendia, Cecilia, Karlis Smits, and Vivien Foster. 2008. “Financing Public Infra-structure in Sub-Saharan Africa: Patterns, Issues, and Options.” AICD Background Paper 15, Africa Infrastructure Sector Diagnostic, World Bank, Washington, DC.
Bullock, Richard. 2009. “Taking Stock of Railway Companies in Sub-Saharan Africa.” Background Paper 17, Africa Infrastructure Sector Diagnos-tic, World Bank, Washington, DC.
Calderón, César. 2008. “Infrastructure and Growth in Africa.” Working Paper 3, Africa Infrastructure Country Diagnostic, World Bank, Washington, DC.
Carruthers, Robin, Ranga R. Krishnamani, and Siobhan Murray. 2008. “Improving Connectiv-ity: Investing in Transport Infrastructure in Sub-Saharan Africa.” Background Paper 7, Africa Infrastructure Country Diagnostic, World Bank, Washington, DC.
Commission for Africa. 2005. Our Common Inter-est: Report of the Commission for Africa. London: Commission for Africa.
Dorosh, Paul, Hyoung-Gun Wang, Liang You, and Emily Schmidt. 2008. “Crop Production and Road Connectivity in Sub-Saharan Africa: A Spatial Analysis.” Working Paper 19, Africa Infrastructure Country Diagnostic, World Bank, Washington, DC.
Eberhard, Anton. 2007. “Matching Regulatory Design to Country Circumstances: The Poten-tial of Hybrid and Transitional Models.” Gridlines, Note 23 (May), Public-Private Infrastructure Advisory Facility, World Bank, Washington, DC.
Eberhard, Anton, Vivien Foster, Cecilia Briceño-Garmendia, Fatimata Ouedraogo, Daniel Camos, and Maria Shkaratan. 2008. “Under-powered: The State of the Power Sector in Sub-Saharan Africa.” Background Paper 6, Africa Infrastructure Sector Diagnostic, World Bank, Washington, DC.
Escribano, Alvaro, J. Luis Guasch, and Jorge Pena. 2008. “Impact of Infrastructure Constraints on Firm Productivity in Africa.” Working Paper 9, Africa Infrastructure Sector Diagnostic, World Bank, Washington, DC.
Estache, Antonio. 2005. “What Do We Know about Sub-Saharan Africa’s Infrastructure and the Impact of Its 1990 Reforms?” World Bank, Washington, DC.
Fay, Marianne, Danny Leipziger, Quentin Wodon, and Tito Yepes. 2005. “Achieving Child-Health-Related Millennium Development Goals: The Role of Infrastructure.” World Development 33 (8): 1267–84.
Grey, David, and Claudia Sadoff. 2006. “Water for Growth and Development: A Framework for Analysis.” Theme Document of the 4th World Water Forum, Mexico City, March.
Gwilliam, Ken, Vivien Foster, Rodrigo Archondo-Callao, Cecilia Briceño-Garmendia, Alberto Nogales, and Kavita Sethi. 2008. “The Burden of Maintenance: Roads in Sub-Saharan Africa.” Background Paper 14, Africa Infrastructure Sector Diagnostic, World Bank, Washington, DC.

Africa’s Infrastructure: A Time for Transformation 27
Irving, Jacqueline, and Astrid Manroth. 2009. “Local Sources of Financing for Infrastructure in Africa: A Cross-Country Analysis.” Policy Research Working Paper 4878, World Bank, Washington, DC.
Mayer, Rebecca, Ken Figueredo, Mike Jensen, Tim Kelly, Richard Green, and Alvaro Federico Barra. 2008. “Costing the Needs for Investment in ICT Infrastructure in Africa.” Background Paper 3, Africa Infrastructure Sector Diagnostic, World Bank, Washington, DC.
Minges, Michael, Cecilia Briceño-Garmendia, Mark Williams, Mavis Ampah, Daniel Camos, and Maria Shkratan. 2008. “Information and Communications Technology in Sub-Saharan Africa: A Sector Review.” Background Paper 10, Africa Infrastructure Sector Diagnostic, World Bank, Washington, DC.
Morella, Elvira, Vivien Foster, and Sudeshna Ghosh Banerjee. 2008. “Climbing the Ladder: The State of Sanitation in Sub-Saharan Africa.” Back-ground Paper 13, Africa Infrastructure Country Diagnostic, World Bank, Washington, DC.
Mundy, Michael, and Andrew Penfold. 2008. “Beyond the Bottlenecks: Ports in Sub-Saharan Africa.” Background Paper 8, Africa Infrastructure Sector Diagnostic, World Bank, Washington, DC.
ODI (Overseas Development Institute). 2009. A Development Charter for the G-20. London: ODI.
Prevost, Christophe. 2009. “Benin Rural Water Pub-lic Expenditure Review: Findings, Impacts and Lesson Learned.” Paper presented at Water Week, World Bank, Washington, DC, February 17–20.
Rosnes, Orvika, and Haakon Vennemo. 2008. “Powering Up: Costing Power Infrastructure Investment Needs in Southern and Eastern Africa.” Background Paper 5, Africa Infrastruc-ture Sector Diagnostic, World Bank, Washing-ton, DC.
Svendsen, Mark, Mandy Ewing, and Siwa Msangi. 2008. “Watermarks: Indicators of Irrigation Sector Performance in Sub-Saharan Africa.”
Background Paper 4, Africa Infrastructure Sector Diagnostic, World Bank, Washington, DC.
Teravaninthorn, Supee, and Gael Raballand. 2008. “Transport Prices and Costs in Africa: A Review of the Main International Corridors.” Working Paper 14, Africa Infrastructure Sector Diagnos-tic, World Bank, Washington, DC.
Torero, Maximo, and Javier Escobal. 2005. “Mea-suring the Impact of Asset Complementarities: The Case of Rural Peru.” Cuadernos de Economia 42 (May): 137–64.
Vagliasindi, Maria, and John Nellis. 2009. “Evalu-ating Africa’s Experience with Institutional Reform for the Infrastructure Sectors.” Working Paper 23, Africa Infrastructure Country Diag-nostic, World Bank, Washington, DC.
Van den Berg, Caroline. 2009. “Public Expenditure Review in the Water Sector: The Case of Tan-zania.” Paper presented at Water Week, World Bank, Washington, DC, February 17–20.
Wodon, Quentin, ed. 2008a. “Electricity Tariffs and the Poor: Case Studies from Sub-Saharan Africa.” Working Paper 11, Africa Infrastructure Country Diagnostic, World Bank, Washington, DC.
———. 2008b. “Water Tariffs and the Poor: Case Studies from Sub-Saharan Africa.” Working Paper 12, Africa Infrastructure Country Diag-nostic, World Bank, Washington, DC.
Yepes, Tito. 2007. “New Estimates of Infrastructure Expenditure Requirements.” World Bank, Wash-ington, DC.
Yepes, Tito, Justin Pierce, and Vivien Foster. 2008. “Making Sense of Sub-Saharan Africa’s Infrastructure Endowment: A Benchmarking Approach.” Working Paper 1, Africa Infrastruc-ture Country Diagnostic, World Bank, Washing-ton, DC.
You, Liang Zhi. 2008. “Irrigation Investment Needs in Sub-Saharan Africa.” Background Paper 9, Africa Infrastructure Country Diagnostic, World Bank, Washington, DC.


The Overall Story
Par t 1


31
The Africa Infrastructure Country Diagnostic
Introduction
I n 2005, the Commission for Africa drew public attention to the magnitude and urgency of Africa’s development challenges
and sounded a new appeal to the international community to meet them. In its landmark report, Our Common Interest, the commission underscored infrastructure as one of the con-tinent’s central challenges:
Infrastructure is a key component of the investment climate, reducing the costs of doing business and enabling people to access markets; is crucial to advances in agriculture; is a key enabler of trade and integration, impor-tant for offsetting the impact of geographical dislocation and sovereign fragmentation, and critical to enabling Africa to break into world markets; and is fundamental to human devel-opment, including the delivery of health and education services to poor people. Infrastruc-ture investments also represent an important untapped potential for the creation of pro-ductive employment. (Commission for Africa 2005: chap. 7, para. 61, citations omitted)
In the years preceding the commission’s report, external capital fl ows for African infra-structure had reached a historic low. During
the 1990s, many donors shifted their priorities to social interventions focused on poverty alle-viation, overlooking the central importance of economic growth as an engine of poverty reduc-tion. Moreover, private capital fl ows in the early 2000s were weak in the aftermath of the Asian crisis. The commission’s report stated that
despite its clear benefits, African govern-ments and their development partners sharply reduced, over the 1990s, the share of resources allocated to infrastructure—refl ecting its lower priority in policy discussions. In retrospect, this was a serious policy mistake, driven by the international community, which undermined growth prospects and generated a substantial backlog of investment—a backlog that will take strong action, over an extended period of time, to overcome. (Commission for Africa 2005: chap. 7, para. 63, citations omitted)
The report estimated Sub-Saharan Africa’s infrastructure fi nancing needs to be $39 bil-lion per year, divided almost equally between capital expenditure ($22 billion) and spending on operation and maintenance ($17 billion). On this basis, it recommended a doubling of infrastructure spending in the region, to be

32 AFRICA’S INFRASTRUCTURE: A TIME FOR TRANSFORMATION
supported by increased donor allocations of $10 billion up to 2010.
Soon after the publication of the commis-sion’s report, the Group of Eight summit at Gleneagles expressed a fi rm political commit-ment to scale up donor fi nancing for African infrastructure, which led to the formation of the Infrastructure Consortium for Africa. The consortium became a forum where major bilateral and multilateral donors could work with continental and regional institutions to spearhead economic integration and maintain the momentum behind the political commit-ment of Gleneagles.
Genesis of the Project
From its inception, the consortium recognized that the paucity of information and analysis on African infrastructure severely constrained scaling up. Even the most elementary data—on quantity and quality of infrastructure stocks, access to services, prices and costs, effi ciency parameters, historic spending, and future investment needs—were either nonexistent or limited in coverage. Most standard global databases on infrastructure covered barely a handful of African countries.
A stocktaking paper concluded that the data situation seriously impeded the region’s abil-ity to interpret and understand the state of its infrastructure. It asserted that “[w]e don’t know precisely how well Sub-Saharan Africa is meet-ing its infrastructure needs, because the quality and quantity of the data has become so poor. Improving Africa’s ability to monitor and bench-mark its performance should be a top priority for the international community and is likely to be a major challenge requiring signifi cant coor-dination across countries and donors” (Estache 2005: executive summary, 1). The consortium concluded that, without such information, evaluating the success of past interventions, prioritizing current allocations, and providing a benchmark to measure future progress would be diffi cult. Therefore, the consortium decided to unite in a joint knowledge program, the Africa Infrastructure Country Diagnostic (AICD). The goal of the AICD is to improve the knowledge base of the African infrastructure sectors.
A steering committee chaired by the Afri-can Union Commission was formed to over-see the AICD project. The committee included representatives from the African Development Bank, the New Partnership for Africa’s Devel-opment, and the regional economic com-munities (Common Market for Eastern and Southern Africa, Economic Community of Central African States, Economic Community of West African States East African Commu-nity, Economic Community of West African States, and Southern African Development Community). Agence Française de Développe-ment, the U.K.’s Department for International Development, the European Commission, Germany’s Kreditanstalt für Wiederaufbau, the Public-Private Infrastructure Advisory Facility, and the World Bank pledged resources to the project. The implementation of AICD was delegated to the Africa Vice Presidency of the World Bank. The steering committee also convened a technical advisory panel of academics from around the world to provide independent review of the studies.
Technical work on the project began in mid-2006 and proceeded in three stages. The fi rst stage, running from mid-2006 to mid-2007, was devoted to primary data collection at the country level, and it produced a suite of new databases on African infrastructure. The second stage, from mid-2007 to mid-2008, focused on data analysis. It led to the pro-duction of a number of background papers analyzing key aspects of infrastructure at the continental level (see table I.1). The third stage, from mid-2008 to mid-2009, involved consul-tation and outreach on preliminary fi ndings and focused on producing this report.
For the purposes of the diagnostic, infra-structure is defi ned to include all the main networks, those associated with information and communication technologies (ICTs), irri-gation, power, sanitation, water, and transport (including air, maritime, rail, and road). As far as possible, the diagnostic aims to cover not only physical infrastructure but also the services it provides. The emphasis is on pub-lic access infrastructure, so the study does not cover oil and gas pipelines or private port and rail infrastructure dedicated to the exclusive use of particular mineral or industrial activities.

The Africa Infrastructure Country Diagnostic 33
Neither does the diagnostic consider needs for water storage infrastructure required to protect countries from droughts and fl oods beyond those necessitated by particular downstream uses such as hydropower electricity generation, irrigation, and water supply.
The primary unit of analysis for the diag-nostic is the country. The focus is on Sub-Saharan Africa, given the genesis of the proj-ect as a response to the major infrastructure defi cits in that part of the continent. Owing to budgetary and feasibility constraints, the diagnostic was originally limited to 24 of the 48 countries in the Sub-Saharan region (fi gure I.1). This Phase I sample covers almost all of the major countries, which together account for about 85 percent of the population and GDP of the region. They were carefully selected to represent the economic, geographic, cultural, and political diversity that charac-terizes the region (fi gure I.2). Therefore, the sample of 24 countries is statistically represen-tative, providing an adequate basis for draw-ing inferences about the overall infrastructure situation of Sub-Saharan Africa.
Later, the project steering committee rec-ommended extending the coverage of the diagnostic to as many of the remaining Afri-can countries as possible. Following further fund-raising, Phase II of the project was ini-tiated in mid-2008. It incorporates 16 more countries, raising the total to 40. Although the focus remains on Sub-Saharan Africa, Phase II includes greater coverage of North African countries in a number of areas to com-plete the African picture and provide a point of comparison with the Sub-Saharan region.
Scope of the Project
The results of Phase II were not available at the time of writing, so the results presented in this volume are based on the analysis of the 24 Phase I countries. However, all fi nancial aggregates in this report have been scaled up to cover the whole of Sub-Saharan Africa. Financial estimates were scaled to refl ect the weight of the 24 sample countries in the overall GDP of the region.
The country-level analysis has three pillars, each of which is described below:
• The spending needs pillar estimates the cost of future infrastructure requirements.
• The fi scal costs pillar documents existing patterns of infrastructure spending.
• The sector performance pillar clarifi es the scope for improvement in effi ciency as well as structural and policy reforms.
Table I.1 AICD Background Papers
Number Category and title Authors
Cross-cutting topics
BP2 Access, Affordability, and Alternatives: Modern Infrastructure Services in Africa
Sudeshna Banerjee, Quentin Wodon, Amadou Diallo, Taras Pushak, Helal Uddin, Clarence Tsimpo, and Vivien Foster
BP11 Unit Costs of Infrastructure Projects in Sub-Saharan Africa
Willem van Zyl, Lynette Coetzer, and Chris Lombard
BP15 Financing Public Infrastructure in Sub-Saharan Africa: Patterns, Issues, and Options
Cecilia Briceño-Garmendia, Karlis Smits, and Vivien Foster
Spending needs studies
BP3 Costing the Needs for Spending in ICT Infrastructure in Africa
Rebecca Mayer, Ken Figueredo, Mike Jensen, Tim Kelly, Richard Green, and Alvaro Federico Barra
BP5 Powering Up: Costing Power Infrastructure Spending Needs
Orvika Rosnes and Haakon Vennemo
BP7 Improving Connectivity: Investing in Transport Infrastructure in Sub-Saharan Africa
Robin Carruthers, Ranga Rajan Krishnamani, and Siobhan Murray
BP9 Irrigation Investment Needs in Sub-Saharan Africa: A Matter of Scale
Liang Zhi You
State-of-the-sector reviews
BP1 Stuck in Traffi c: Urban Transport in Africa Ajay Kumar and Fanny Barrett
BP4 Watermarks: Indicators of Irrigation Sector Performance in Sub-Saharan Africa
Mark Svendsen, Mandy Ewing, and Siwa Msangi
BP6 Underpowered: The State of the Power Sector in Sub-Saharan Africa
Anton Eberhard, Vivien Foster, Cecilia Briceño-Garmendia, Fatimata Ouedraogo, Daniel Camos, and Maria Shkaratan
BP8 Beyond the Bottlenecks: Ports in Sub-Saharan Africa
Michael Mundy and Andrew Penfold
BP10 Information and Communications Technology in Sub-Saharan Africa: A Sector Review
Michael Minges, Cecilia Briceño-Garmendia, Mark Williams, Mavis Ampah, Daniel Camos, and Maria Shkratan
BP12 Ebbing Water, Surging Defi cits: Urban Water Supply in Sub-Saharan Africa
Sudeshna Banerjee, Heather Skilling, Vivien Foster, Cecilia Briceño-Garmendia, Elvira Morella, and Tarik Chfadi
BP13 Climbing the Ladder: The State of Sanitation in Sub-Saharan Africa
Elvira Morella, Vivien Foster, and Sudeshna Ghosh Banerjee
BP14 The Burden of Maintenance: Roads in Sub-Saharan Africa
Ken Gwilliam, Vivien Foster, Rodrigo Archondo-Callao, Cecilia Briceño-Garmendia, Alberto Nogales, and Kavita Sethi
BP16 Air Transport: Challenges to Growth Heinrich C. Bofi nger
BP17 Taking Stock of Railway Companies in Sub-Saharan Africa
Richard Bullock

34 AFRICA’S INFRASTRUCTURE: A TIME FOR TRANSFORMATION
of Africa’s spending needs, and most of them had limited country coverage. The best-known global cross-country studies estimate spending needs using econometric techniques and mac-roeconomic panel data (Estache 2005; Fay and Yepes 2003; Yepes 2007). These studies iden-tify historical relationships between GDP and physical infrastructure stocks to predict infra-structure requirements given current growth forecasts. Unit costs of infrastructure are then used to convert these predictions into fi nancial estimates. These types of studies provide inter-nationally consistent, fi rst-order approxima-tions of investment needs. They are likely to underestimate requirements, however, because they tend to focus on infrastructure quantity rather than quality; do not take into account repressed demand and social targets; and use single, global (as opposed to country-specifi c), unit-cost parameters based on effi -cient implementation.
Country-specifi c or sector-specifi c engi-neering cost studies existed for particular infrastructure packages: the West Africa Power Pool Master Plan, for example, and the African Development Bank’s study of the Trans-Africa Highway Network, in addition to various country or regional master plans. These stud-ies tend to be accurate and internalize policy-defi ned targets, but they have a number of dis-advantages. They are costly to produce, are not available for all countries and sectors, and tend to adopt a wide variety of methodologies that limit their comparability across countries.
The AICD project studied spending needs in fi ve sectors: ICT, irrigation, power, trans-port, and water and sanitation. The objective of the studies was to develop a simple but robust country-based microeconomic methodology that would be signifi cantly more accurate than the “top-down” macro studies, yet substantially more straightforward and standardized than the “bottom-up” engineering studies. The meth-odology aims to capture both market-driven investments to keep pace with the demands generated by a growing economy and politically determined investment targets to meet social needs that may not be commercially lucrative without government subsidy. As important as estimating the magnitude of investment needs, the models calculate spending requirements for
0
10
20
30
40
50
60
70
80
90
100
anglo
phon
e
franc
opho
ne
lusop
hone
low in
come
lower
middle
incom
e
uppe
r midd
le inc
ome
landlo
cked
poorl
y gov
erned
confl
ict af
fected
% o
f cou
ntri
es
Sub-Saharan Africa Africa Infrastructure Country Diagnostic
Figure I.2 Representativeness of Phase I Sampled Countries
Note: AICD = Africa Infrastructure Country Diagnostic.
CAPE VERDE MAURITANIA
FORMERSPANISH
SAHARA
ALGERIA
MOROCCO
LIBYA ARAB REP.OF EGYPT
MALI
GUINEA
SENEGAL
GHANA
BENIN
TOGO
NIGERCHAD
SUDAN
ETHIOPIA
ERITREA
DJIBOUTI
NIGERIA
BURKINAFASO
CENTRALAFRICAN REPUBLIC
CÔTED’IVOIRE
GUINEA-BISSAU
SIERRA LEONE
EQUATORIAL GUINEASÃO TOMÉ AND PRÍNCIPE
LIBERIA
THE GAMBIA
SOMALIA
TUNISIA
KENYAUGANDA
BURUNDI
TANZANIA
DEM. REP.OF
CONGO
CONGOGABON
CAMEROON
RWANDA
ANGOLA
NAMIBIA BOTSWANA
SOUTHAFRICA
ZAMBIA
ZIMBABWE
MALAWI
MOZAMBIQUE
SWAZILAND
LESOTHO
MADAGASCAR
COMOROS
MAURITIUS
SEYCHELLES
This map was produced by the Map Design Unit of The World Bank.The boundaries, colors, denominations and any other information shown onthis map do not imply, on the part of The World Bank Group, any judgmenton the legal status of any territory, or any endorsement or acceptance ofsuch boundaries.
Phase IPhase IIPhase II (partial)
Figure I.1 Country Coverage of the Africa Infrastructure Country Diagnostic
Estimating Future Spending NeedsAt the outset of the AICD project, only a small number of standardized cross-country studies focused on estimating the magnitude

The Africa Infrastructure Country Diagnostic 35
rehabilitation of existing infrastructure assets as well as maintenance needs to sustain opera-tional (existing and new) assets.
The goal was not so much to produce an estimate as to create a model that would allow exploration of spending needs under a vari-ety of different assumptions about economic growth, social objectives, unit costs, and other relevant parameters. Projections were based on World Bank GDP growth projections for the next decade and United Nations demographic forecasts.
In most cases, no clear methodological precedents existed for producing country-level estimates of spending needs based on this kind of microeconomic modeling. A technique adopted across many of these stud-ies was spatial modeling using geographic
information systems (GIS) tools. Creation of an African GIS database collated from diverse sources and permitting the overlay of geophysical, agroecological, demographic, and economic features with infrastructure networks made this approach possible (see box I.1). The input parameters needed to run the spending needs models could be derived largely from an extensive desk review of avail-able information.
Although efforts were made to develop methodologies that were consistent across sectors, the specifi cs of each sector raised par-ticular challenges that called for some adapta-tion. In all cases, spending needs include new investment, rehabilitation of existing assets, and operation and maintenance associated with new and existing assets.
BOX I . 1
Early in the AICD process, it became appar-ent that geographic information systems (GIS) would be a key input to many aspects of infra-structure analysis. A decision was therefore made to assemble all available geographic databases of relevance to the African infra-structure sectors into a single GIS platform.
The platform includes data sets from dif-ferent scales, levels of detail, reference years, and coding schemes. In all, more than 20 sep-arate thematic layers of geographic informa-tion cover each of the following topics.
• Infrastructure networks: power stations, transmission lines, dam sites, irrigated areas, roads (including type, condition, and traffi c), railways, ports, airports, submarine cables, fi ber-optic backbones, and global systems mobile (GSM) signal coverage
• Physiographic features: topography, meteo-rology, watercourses, river basin boundaries, soil type, land coverage, and agricultural usage and potential
• Socioeconomic features: cities, population densities, mines, oil fi elds, poverty indica-tors, travel time to nearest urban centers, and household access to services.
The GIS platform was assembled from a wide variety of sources. Public domain data, available from the World Bank and other organizations, such as the Food and Agriculture Organization, the International Food Policy Research Institute, the International Union for Conservation of Nature, the U.S. Geological Survey, the Center for International Earth Science Information Net-work, the U.S. National Geospatial-Intelligence Agency, and Oak Ridge National Laboratory, were a primary resource. In some cases, gov-ernment transport or other agencies provided data. Databases were also purchased from private sector sources or constructed from pri-mary country data collected as part of the AICD project. Where possible, an effort was made to update existing data sets with information on condition, status, or other characteristics, based on expert assessment and other sources.
The AICD GIS platform is publicly avail-able on the project Web site, http://www.infrastructureafrica.org, where users may con-sult preassembled infrastructure atlases for each country, regional economic community, and the continent; make use of the GIS tool to cre-ate their own customized maps; or download shape fi les for more technical GIS analysis.
The AICD Geographic Information Systems Platform for Africa

36 AFRICA’S INFRASTRUCTURE: A TIME FOR TRANSFORMATION
statals were devoting resources to infrastructure development and maintenance. The Interna-tional Monetary Fund’s Government Financial Statistics reports central government budget-ary spending for a number of broadly defi ned infrastructure sectors but does not include the expenditures of state-owned enterprises and special nonbudgetary funds dedicated to infrastructure, both of which are highly sig-nifi cant for the sector. Moreover, it does not break down expenditures according to specifi c infrastructure sectors and functional outlays, such as capital or maintenance and operat-ing expenditures. Most important, even the very limited data recorded through the Fund’s Government Financial Statistics were available for only a handful of African countries.
Using the limited information available at the time, researchers made some fi rst-order estimates of Africa’s public expenditure on infrastructure (see Estache 2005; Estache, Gonzalez, and Trujillo 2007). Notwithstand-ing numerous caveats regarding the quality and coverage of the public fi nance data, the overall picture that emerged showed alloca-tion of a declining share of public budgets to infrastructure from 1980 to 2000.
Without a detailed understanding of expen-diture patterns of key public institutions—central governments and state-owned enterprises—pinpointing the magnitude and nature of the region’s infrastructure fi nancing gap or assessing the effi ciency and effectiveness of public spending is diffi cult. To overcome these limitations, the AICD project built a new database of standardized cross-country data that seeks to give a detailed yet comprehensive picture of public infrastructure spending, both within and beyond the bounds of central gov-ernment budgets. Data collection was based on a standardized methodology and covers, as far as possible, the period 2001–06. To ensure the cross-country comparability of the data, a detailed methodology including templates guided data collection in the fi eld and back-offi ce processing and documentation (Briceño-Garmendia 2007).
The methodology is designed to be compre-hensive insofar as it covers all relevant budget-ary and nonbudgetary areas of infrastructure spending. The collection of data on spending
• For ICTs, the spatial analysis was used to estimate the costs, revenues, and hence fi nancial viability of rolling out services to remote rural communities.
• For irrigation, the fi nancial viability of irri-gating crops at different locations was pre-screened as suitable for large- or small-scale irrigation development based on proximity to large dams in one case and the road net-work in the other.
• For transport, the spatial analysis was used to measure the extent of the road network needed to meet a set of regional, national, urban, and rural connectivity standards. Linking these directly to economic objec-tives did not prove feasible.
• For power, the model is based on a least-cost optimization model that selects the most cost-effective expansion path for national or regional power sector development to meet a given projection of demand.
• For water and sanitation, the model builds upon existing work (Mehta, Fugelsnes, and Virjee 2005; Water and Sanitation Program 2006) and uses demographic growth trends to analyze the number of new connections needed to meet the Millennium Development Goals (WHO and UNICEF 2006) under a variety of different technological choices.
The results of the AICD spending needs studies are presented in chapter 1 and further detailed in the corresponding sectoral chapters in part 2. Detailed background papers also doc-ument the methodology and results for each sector in much greater detail (see table I.1).
All of the spending needs models developed for the project are available online at the proj-ect Web site. The Web-based versions allow users to apply sensitivity of spending needs to varying assumptions over a wide range of input parameters for specifi c countries. The results are displayed both numerically and spa-tially in the form of maps.
Documenting Existing Spending PatternsAt the outset of the AICD project, almost no information was available about the extent to which African governments and their para-
The Africa Infrastructure Country Diagnostic 37
was grounded in an overview of the institu-tional framework for delivering infrastructure services in each of the countries while aiming to identify all of the channels through which public resources go into infrastructure. The work began with a detailed review of the cen-tral government budget. Thereafter, fi nancial statements were collected from all the para-statals and special funds that had been identi-fi ed in the institutional review.
In countries where infrastructure service providers are highly decentralized (as in munici-pal water utilities), fi nancial statements could be collected from only the three largest provid-ers. Privatized infrastructure service provid-ers were included if a majority of their shares remained government owned or if they con-tinued to depend on the state for capital or operating subsidies. Thus, telecommunication incumbents were typically included, whereas mobile operators were not.
In some countries, local governments have begun to play an increasingly prominent role in infrastructure service provision, but com-prehensive expenditure data at the local gov-ernment level could not always be collected. In some cases, however, the central govern-ment produces consolidated local government accounts. Otherwise, an alternative source of information was the fi scal transfers from cen-tral to local governments reported in the budget and on which local governments relied, given limited alternative sources of revenue. In some cases, transfers are earmarked for infrastruc-ture spending; in others, the share allocated to infrastructure could only be estimated.
Data were collected to permit both classi-fi cation and cross-classifi cation by economic and functional categories. That is, a matrix was established so that spending on each functional category could be decomposed according to the economic nature of the expense and vice versa. Functional classifi cation followed as closely as possible the four-digit category or class level of the functional classifi cation (COFOG) pro-posed in the International Monetary Fund’s Government Financial Statistics Manual 2001 (IMF 2001), making possible identifi cation of all major infrastructure subsectors. The eco-nomic classifi cation of expenses also followed the Fund’s framework, making it possible to
distinguish to some extent between current expenditures, capital expenditures, and vari-ous subcategories.
Much of the necessary data could be lifted directly from the budget documents and fi nancial statements of the relevant parastatals, although in many cases, careful recoding of the data was necessary to align them with the proj-ect template. Local consultants undertook fi eld-work that was coordinated centrally to ensure quality control and data consistency. The focus of data collection was on executed expendi-tures, but wherever possible, the budgeted and released expenditures were also collected.
The targeted period for data collection was 2001–06, although a complete time series was not always available. All fi nancial data are pre-sented as annual averages over the period, to smooth out annual variations and maximize available data points. All data were denomi-nated in local currency and centrally normal-ized using exchange rate, GDP, and population data taken from the World Development Indi-cators database of the World Bank.
Public expenditure data were complemented by fi nancing data from secondary sources to provide a comprehensive view of fi nancial fl ows to African infrastructure and the rela-tive importance of the different players. These secondary sources included the World Bank’s Private Participation in Infrastructure data-base, which documents trends in private capital fl ows; the Development Assistance Committee database of the Organisation for Economic Co-operation and Development (OECD), cov-ering external fi nancial support from bilateral and multilateral OECD donors; and a new database on non-OECD fi nance for African infrastructure (Foster and others 2008). To make these fi nancial fl ows methodologically consistent with those for public expenditure, researchers converted commitments made by external fi nanciers into disbursements using typical disbursement profi les for infrastruc-ture projects. Every effort was made to avoid double counting between public expenditure and external fi nance.
The results of the public expenditure analy-sis provide the foundation for chapter 2 of this report, but they are reported in much greater detail in Background Paper 15 (see table I.1).

38 AFRICA’S INFRASTRUCTURE: A TIME FOR TRANSFORMATION
At this time, one can say that the level of pub-lic expenditure on infrastructure in Africa is substantially higher than previously thought—and certainly several times higher than earlier estimates. The resulting public expenditure database is now available to the public via the project Web site and can be downloaded by users for a variety of purposes. The database con-tains detailed information about expenditure patterns by institution, sector, and functional category.
The analysis of public spending patterns was complemented by work on unit costs of infrastructure projects and included a review of the costs and cost structures associated with a sample of donor-funded projects covering roads, power, and water supply. The typical outputs of these projects were standardized to permit the creation of standardized unit costs. Data were collected from the bills of quantities for the public works contracts of these projects and entered into the standardized template. The overall sample included 115 road projects, 144 water projects, and 58 power projects. The resulting database of unit costs illustrates the dispersion that can be experienced in donor-funded infrastructure projects depending on a range of factors.
Understanding Sector PerformanceAt the beginning of the project, relatively little systematic, comprehensive, and empirically grounded literature was available on the per-formance of the fi ve infrastructure sectors.
To develop a comprehensive and detailed portrait of the infrastructure sectors in Sub-Saharan Africa, the AICD developed a set of standardized performance indicators covering both the consumer and the service provider perspectives. These indicators are collected for the full range of infrastructure subsec-tors, including air transport, ICT, irrigation, ports, power, railways, roads, and water and sanitation. In each case, a common conceptual structure was adopted.
A fi rst block of qualitative indicators was gen-erated through a substantial questionnaire that documents the details of the legal, institutional, and regulatory framework, which are summa-rized in a series of specially developed indexes (see chapter 4 in this volume). Qualitative data,
provide a snapshot of the situation prevailing in 2006 at the time of data collection. A second block of quantitative indicators documents the operational, technical, and fi nancial aspects of sector performance, with particular focus on infrastructure service providers such as utilities. Wherever possible, the quantitative data cover the period 2001 to 2006, and the most recent available year is the one reported.
For each sector, manuals were developed to guide the data collection for the indicators. The manuals map the rationale and conceptual structure of the data collection, provide detailed defi nitions of the indicators, lay out question-naire formats to assist in eliciting information, and map a database structure for coding of the data. Such detailed manuals were designed to guide consultants responsible for data collection and to ensure comparability of indicators across countries and ultimately over time, should the process be repeated.
For some sectors (power, railways, roads, water and sanitation), the indicators could be collected only through detailed in-country fi eldwork. For a number of other sectors (air transport, ICT, irrigation, ports), the data could be collected remotely through the arm’s-length administration of questionnaires with telephone follow-up and the compilation of data from existing publications and sources. The data collection involved contacting several hundred infrastructure institutions around Africa, including more than 16 rail operators, 20 road entities, 30 power utilities, 30 ports, 60 airports, 80 water utilities, and 100 ICT operators, as well as the relevant line ministries in all of the countries.
The data collection focused on the compi-lation of existing information available from the target institutions through their annual reports, internal databases, and knowledge of their managers. Thus, the coverage of the databases refl ects the state of self-knowledge of the institutions. The project did not have the resources to undertake primary survey work to obtain data on missing indicators.
The resulting data were centralized, and two forms of quality control were conducted. The fi rst was a review by specialists knowledgeable about the countries in question. The second consisted of logic and consistency checks on

The Africa Infrastructure Country Diagnostic 39
the database as a whole by examining data pat-terns and outliers.
The survey of infrastructure service provid-ers was complemented by work on patterns of household access to and expenditure on infra-structure services aimed to integrate all exist-ing household surveys conducted in Africa from 1990 to 2005. These sources included 67 demographic and health surveys (DHSs) and multi-indicator cluster surveys contain-ing detailed information on household access patterns, and 30 budget surveys containing detailed information on household expendi-ture patterns. Data from all of these surveys were standardized (based on a careful com-parison of questionnaires) and integrated into a single meta-database, making consistent analysis possible of time trends within coun-tries and diverging patterns across countries. A standardized approach was used to group households socioeconomically according to asset quintiles in the case of the DHSs and expenditure quintiles in the case of the budget surveys. The meta-database covers 39 countries in Africa; time trends are available for 23 of the countries.
The main source of telecommunications data for Africa is the International Telecom-munication Union, which compiles time-series data on a number of indicators and publishes information on telecommunications regulation. In addition, a number of one-off reports had been written on the African tele-communication sector. These reports quickly become outdated and are often limited to cer-tain groups of countries. The AICD project has improved the timeliness, detail, and scope of these data sets, including compiling more recent data than are available from intergov-ernmental sources, verifying the accuracy of existing information, widening and completing coverage for all African countries, and enhanc-ing data to incorporate more detailed and spe-cifi c indicators for tariffs, regulations, market structure, and the user’s perspective, among others. The project has also structured the data into analytical categories and compiled several indexes to facilitate comprehension of the vast amount of data. In summary, the information in the AICD data set for ICT provides a struc-tured framework of comprehensive, inclusive,
and up-to-date information on the status of ICT in Africa not available from any other single source.
In transportation, the Sub-Saharan Africa Transport Policy Program (SSATP) has played an important role in developing the knowl-edge base through an abundant literature of case studies and policy reports. The SSATP has made some efforts to move toward a set of quantitative indicators for the transport sector, although these remain limited in scope. The program has played a leading role in develop-ing road sector modeling tools, most notably RONET, that enable road maintenance costs to be estimated based on a detailed physical specifi cation of the road network. In addition, there have been important contributions to the understanding of institutional reform in the road sector (Benmaamar 2006) and some work on the performance of African rail concessions. At the outset of the AICD, however, no unifi ed database existed on road type, condition, and traffi c. These data were collected on a georefer-enced, link-by-link basis that allows the infor-mation to be presented graphically in a map and that underpins detailed fi nancial analysis of the road network using the RONET model.
At the outset of the project, relatively little continent-wide analysis of the African water utilities existed (Estache and Gassner 2004b). The starting point for water utility data col-lection was the databases developed by the Water Utilities Partnership and the Interna-tional Benchmarking Network (IBNET). Both sources were sparse in their country coverage and focused primarily on utility operational performance without covering the institutional framework in any great depth. Both initia-tives informed the development of indicators under the AICD, which aimed to be consistent with them in areas of overlap. The data col-lection process was coordinated with IBNET to increase African country coverage for both projects. Generally speaking, the AICD opera-tional and fi nancial performance indicators are a subset of those collected by IBNET, but the qualitative indicators and tariff schedules collected through AICD go much further than anything done before. Five modules of qualita-tive data were collected for each country, cover-ing the institutional and regulatory framework

40 AFRICA’S INFRASTRUCTURE: A TIME FOR TRANSFORMATION
for water provision, governance arrangements for specifi c water utilities, the status of the sani-tation sector, the status of the rural water sector in each country, and the prevalence and charac-teristics of small-scale service providers in the largest city in each country. The quantitative indicators aim to capture the operational and fi nancial performance of utilities from 2001 to 2006, together with their tariff schedules. In countries where service provision is decentral-ized, comprehensive data could not be captured on all utilities, but efforts were made to cover the three largest utilities in each country.
In the case of irrigation, limited data were available at the country level. Sub-Saharan Africa has little experience with irrigated agriculture. Most performance indicators are limited to specifi c irrigation systems. The best single source of data on comparable cross-country indicators was the global databases of the Food and Agriculture Organization. They were complemented where needed by data from the World Bank and the International Food Policy Research Institute.
Power was undoubtedly the least docu-mented of Africa’s infrastructure sectors at the outset of the project (Estache and Gassner 2004a). Some basic indicators on overall energy balance and national power generation port-folios were available from the International Energy Agency and others, but coverage of African countries remained quite limited, and the available indicators did not provide any real picture of power utility performance. Although the Union of Producers, Transporters and Dis-tributors of Electric Power in Africa (the Afri-can power utilities association) has developed its own database of performance indicators, it is not available to the general public. The Africa Energy Commission is also developing a data-base of energy indicators for the continent, but it was not available in time for this project.
The results of the various sector reviews provide the foundation for the corresponding sector chapters contained in part 2 (chapters 7–17) of this report. In addition, the results of the household survey analysis are reported in chapter 3 on poverty and inequality, while the overall fi ndings of the institutional analysis are summarized in chapter 4 on institutions. The resulting databases of sector performance
indicators are now available to the public on the project Web site, http://www.infrastructureafrica.org, and through the Development Data Plat-form of the World Bank. Containing detailed information about institutional, operational, technical, and fi nancial indicators relating to each of the sectors covered, the database can be downloaded for a variety of purposes.
The work on these three pillars and cross-cutting issues resulted in the creation of 17 original background papers on which this “Flagship Report” is based (table I.1). The main fi ndings that follow in this report refer to these background papers. Readers seeking further technical details on any of these issues can fi nd these papers through the project Web site (http://www.infrastructureafrica.org). In due course, the background papers will be repackaged as four sectoral volumes on ICT, power, transport, and water and sanitation, which will be technical companions to this Flagship Report.
In addition to these three central pillars of the data collection effort, more than 20 working papers were commissioned, cover-ing a range of ad hoc topics of relevance to African infrastructure (table I.2). The top-ics include linkages between infrastructure, growth and fi scal sustainability, welfare effects of infrastructure reforms, utility tariffs and subsidies, urban infrastructure services, local private fi nance of infrastructure, impact of inadequate power supply on fi rms, and the role of small, independent suppliers of water. The working papers are also available on the project Web site.
Beyond the initial data baseline estab-lished here, the AICD project aims to estab-lish a sustainable basis for ongoing data collection on Africa’s infrastructure sectors. This Flagship Report presents and analyzes the baseline information on the African infrastructure sectors collected because of this project. The long-term value of the effort depends on the sustainability of data collec-tion efforts to ensure that key infrastructure trends on the continent can be tracked over time and progress against this benchmark can be accurately measured. Plans are under way for the Statistical Department of the African Development Bank to take over the

The Africa Infrastructure Country Diagnostic 41
long-term data collection effort based on the methodological framework developed under the AICD project. The sponsors of the AICD project remain fi rmly committed to ensuring the sustainability of the data collection effort.
Note The authors of this chapter are Vivien Foster
and Cecilia Briceño-Garmendia.
ReferencesBenmaamar, Mustapha. 2006. “Financing of Road
Maintenance in Sub-Saharan Africa: Reforms and Progress towards Second Generation Road Funds.” Discussion Paper 6, Road Management and Financing Series, Sub-Saharan Africa Transport Policy Program, World Bank, Washington, DC.
Table I.2 AICD Working Papers
Number Title Author
WP1 Making Sense of Sub-Saharan Africa’s Infrastructure Endowment: A Benchmarking Approach Tito Yepes, Justin Pierce, and Vivien Foster
WP2 Paying the Price for Unreliable Power Supplies: Own Generation of Electricity by Private Firms in Africa
Vivien Foster and Jevgenijs Steinbuks
WP3 Infrastructure and Growth in Africa César Calderón
WP4 Electricity Reforms in Mali: A Micro-Macro Analysis of the Effects on Poverty and Distribution Dorothée Boccanfuso, Antonio Estache, and Luc Savard
WP5 Electricity Reforms in Senegal: A Micro-Macro Analysis of the Effects on Poverty and Distribution Dorothée Boccanfuso, Antonio Estache, and Luc Savard
WP6 Building Sector Concerns into Macro-Economic Financial Programming: Lessons from Senegal and Uganda
Antonio Estache and Rafael Muñoz
WP7 Cost Recovery, Equity, and Effi ciency in Water Tariffs: Evidence from African Utilities Sudeshna Banerjee, Vivien Foster, Yvonne Ying, Heather Skilling, and Quentin Wodon
WP8 Potential for Local Private Finance of Infrastructure in Africa Jacqueline Irving and Astrid Manroth
WP9 Impact of Infrastructure Constraints on Firm Productivity in Africa Alvaro Escribano, J. Luis Guasch, and Jorge Pena
WP10 A Tale of Three Cities: Understanding Differences in Provision of Modern Services Sumila Gulyani, Debabrata Talukdar, and Darby Jack
WP11 Electricity Tariffs and the Poor: Case Studies from Sub-Saharan Africa Quentin Wodon
WP12 Water Tariffs and the Poor: Case Studies from Sub-Saharan Africa Quentin Wodon
WP13 Provision of Water to the Poor in Africa: Informal Water Markets and Experience with Water Standposts
Sarah Keener, Manuel Luengo, and Sudeshna Banerjee
WP14 Transport Prices and Costs in Africa: A Review of the Main International Corridors Supee Teravaninthorn and Gaël Raballand
WP15 The Impact of Infrastructure Spending in Sub-Saharan Africa: A CGE Modeling Approach Jean-François Perrault and Luc Savard
WP16 Water Reforms in Senegal: A Micro-Macro Analysis of the Effects on Poverty and Distribution Dorothée Boccanfuso, Antonio Estache, and Luc Savard
WP17 Fiscal Costs of Infrastructure Provision: A Practitioner’s Guide Cecilia Briceño-Garmendia
WP18 Crop Production and Road Connectivity in Sub-Saharan Africa: A Spatial Analysis Paul Dorosh, Hyoung-Gun Wang, Liang You, and Emily Schmidt
WP19 The Impact of the Yamassoukro Decision Charles Schlumberger
WP20 Cost Recovery, Equity, and Effi ciency in Power Tariffs: Evidence from African Utilities Cecilia Briceño-Garrmendia and Maria Shkaratan
WP21 What Can We Learn from Household Surveys about Cooking Fuel Use in Sub-Saharan Africa?
Daniel Camos
WP22 Evaluating Africa’s Experience with Institutional Reform for the Infrastructure Sectors Maria Vagliasindi and John Nellis
Briceño-Garmendia, Cecilia. 2007. “Fiscal Costs of Infrastructure Provision: A Practitioner’s Guide.” Working Paper 17, Africa Infrastructure Coun-try Diagnostic, World Bank, Washington, DC.
Commission for Africa. 2005. Our Common Inter-est: Report of the Commission for Africa. London: Commission for Africa.
Estache, Antonio. 2005. “What Do We Know about Sub-Saharan Africa’s Infrastructure and the Impact of Its 1990 Reforms?” World Bank, Washington, DC.
Estache, Antonio, and Katharina Gassner. 2004a. “The Electricity Sector of Sub-Saharan Africa: Basic Facts and Emerging Issues.” World Bank, Washington, DC.
———. 2004b. “Recent Economic Developments in the Water and Sanitation Sectors of Selected Sub-Saharan African Countries: Overview of Basic Facts and Emerging Issues.” World Bank, Washington, DC.

42 AFRICA’S INFRASTRUCTURE: A TIME FOR TRANSFORMATION
Estache, Antonio, Marianela Gonzalez, and Lourdes Trujillo. 2007. “Government Expenditures on Health, Education and Infrastructure: A Naïve Look at Levels, Out-comes and Effi ciency.” Policy Research Working Paper 4219, World Bank, Washington, DC.
Fay, Marianne, and Tito Yepes. 2003. “Investing in Infrastructure: What Is Needed from 2000 to 2010?” Policy Research Working Paper 3102, World Bank, Washington, DC. http://ssrn.com/abstract=636464.
Foster, Vivien, William Butterfi eld, Chuan Chen, and Nataliya Pushak. 2008. Building Bridges: China’s Growing Role as Infrastructure Finan-cier for Sub-Saharan Africa. Trends and Policy Options no. 5. Washington, DC: Public-Private Infrastructure Advisory Facility, World Bank.
IMF (International Monetary Fund). 2001. Gov-ernment Financial Statistics Manual 2001 (GFSM 2001). Washington, DC: IMF Statistics Department.
Mehta, Meera, Thomas Fugelsnes, and Kameel Virjee. 2005. “Financing the Millennium Devel-opment Goals for Water and Sanitation: What Will It Take?” International Journal of Water Resources Development 21 (2): 239–52.
Water and Sanitation Program. 2006. Getting Africa on Track to Meet the MDGs for Water and Sanitation: A Status Overview of Sixteen African Countries. Joint Report of African Ministers Council on Water, African Development Bank, European Union Water Initiative, and Water and Sanitation Program. Nairobi: Water and Sanita-tion Program–Africa, World Bank.
WHO and UNICEF (World Health Organization and United Nations Children’s Fund). 2006. Meeting the MDG Drinking Water and Sanitation Target: The Urban and Rural Challenge of the Decade. Geneva: WHO and UNICEF.
Yepes, Tito. 2007. “New Estimates of Infrastructure Expenditure Requirements.” World Bank, Washington, DC.

43
Meeting Africa’s Infrastructure Needs
Infrastructure is central to Africa’s develop-ment.1 Major improvements in information and communication technology (ICT), for
example, added as much as 1 percentage point to Africa’s per capita growth rate during the last decade, since the mid-1990s. However, defi ciencies in infrastructure are holding back the continent by at least 1 percentage point in per capita growth. In many countries, infra-structure limitations, particularly in power, depress productivity at least as much as red tape, corruption, and lack of fi nance—the usual suspects in many people’s minds when they think of constraints on growth.
In density of paved roads, capacity to gener-ate power, and coverage of telephone main lines, both low-income and middle-income African countries lag behind their peers elsewhere in the developing world.2 A few decades ago, in the 1960s to 1980s, Africa’s infrastructure endow-ments were similar to those in East and South Asia, but those regions have since expanded their infrastructure stocks more rapidly, surpassing Africa’s position. Meeting Africa’s infrastructure needs and developing cost-effective modes of infrastructure service delivery will entail a sub-stantial program of infrastructure investment. In addition to building new infrastructure, existing facilities must be rehabilitated and maintained.
The estimated spending needs are $93 billion a year (15 percent of the region’s GDP)—more than twice the 2005 estimate by the Commission for Africa.3 Total spending estimates divide fairly evenly among the middle-income countries, the resource-rich countries, and low-income nonfragile states (in the neighborhood of $28 billion–$30 billion a year), with low-income frag-ile states accounting for a smaller share of total needs (about $14 billion a year). The burden on their economies varies dramatically per income group, ranging from 10–12 percent of GDP for middle-income and resource-rich countries to 25 percent of GDP for low-income nonfragile states and 36 percent for fragile states. The total cost splits two to one between capital investment and operation and maintenance expenses.
Over 40 percent of the expenditure needed is in the power sector, which must install 7,000 megawatts of new generation capac-ity each year just to keep pace with demand. Slightly more than 20 percent is associated with achievement of the Millennium Development Goals (MDGs) for water supply and sanitation. A further 20 percent of the spending require-ment is associated with the transport sector to achieve a reasonable level of regional, national, rural, and urban connectivity and to maintain existing assets.
Chapter1

44 AFRICA’S INFRASTRUCTURE: A TIME FOR TRANSFORMATION
Infrastructure: The Key to Africa’s Faster Growth
African economies have grown at a solid 4 percent annual average in recent years. The fastest growth has been in resource-rich countries, which have benefi ted from rising commodity prices. In almost all cases, how-ever, that performance still falls short of the 7 percent growth needed to achieve substan-tial poverty reduction and attain the MDGs. Although infrastructure has contributed to Africa’s recent economic turnaround, it will need to do even more to reach the continent’s development targets.
Inadequate infrastructure impedes faster growth in Africa. This view, highlighted by the Commission for Africa (2005), is supported by considerable economic research (table 1.1). Based on a cross-country econometric analysis and a handful of country studies, the research confi rms a strong and signifi cant connection between infrastructure stocks and economic growth. Although the relationship undoubt-edly runs in both directions—infrastructure supporting growth and growth promoting infrastructure—modern research techniques
allow isolation of the fi rst of these effects with some precision. The estimated effect of rais-ing Africa’s infrastructure to some regional or international benchmark shows considerable consistency of 1 or 2 percentage points in per capita growth.
A key question for policy makers is how much infrastructure development contributes to growth relative to other policy parameters. One study fi nds that expanding and improving infrastructure contributed almost 1 percent-age point to per capita economic growth from 1990 to 2005, compared with only 0.8 percent-age point for macroeconomic stabilization and structural policies (Calderón 2008). Stabiliza-tion policies include measures to control price infl ation and rein in fi scal defi cits, while struc-tural policies include measures to enhance human capital, increase fi nancial depth, pro-mote trade openness, and improve governance. Central Africa is the region where infrastruc-ture improvements have made the largest contribution to recent growth, totaling 1.1 percentage points. Only in West Africa did the effect of macroeconomic policies on growth exceed that of infrastructure. Over the same period, infrastructure in East Asia contributed
Table 1.1 Links between Infrastructure and Growth in Africa: What the Research Says
Study Method Scope Sector Conclusions
Easterly and Levine 1997 Multicountry Africa Telecommunications, power
Infrastructure is strongly and signifi cantly correlated with growth.
Esfahani and Ramirez 2003 Multicountry Africa Telecommunications, power
Africa’s growth per capita would be 0.9 point higher with East Asia’s infrastructure.
Calderón and Servén 2008 Multicountry Africa Telecommunications, power, roads
Africa’s growth per capita would be 1.0 point higher with the Republic of Korea’s infrastructure.
Estache, Speciale, and Veredas 2005 Multicountry Africa Various Confi rms earlier work and underscores equal relevance for coastal and landlocked countries.
Calderón 2008 Multicountry Africa Telecommunications, power, roads
Africa’s growth per capita would be 2.3 points higher with Mauritius’s infrastructure.
Calderón and Servén 2008 Multicountry Africa Telecommunications, power, roads
Extends earlier results to show infrastructure also has a negative effect on inequality.
Fedderke and Bogetic 2006 Country study South Africa Various Finds long-term relationship between infrastructure and growth based on robust econometric techniques.
Ayogu 1999 Production function Nigeria Various Finds strong association between infrastructure and output in panel data.
Kamara 2008 Production function Various Africa Various Finds strong association between infrastructure and output in panel data.
Reinikka and Svensson 1999a Enterprise surveys Uganda Power Unreliable power is a signifi cant deterrent to private sector investment.
Escribano, Guasch, and Pena 2008 Enterprise surveys Africa Various Infrastructure has a substantial effect on total factor productivity.
Source: Authors’ elaboration.

Meeting Africa’s Infrastructure Needs 45
1.2 percentage points to per capita growth (fi gure 1.1).
The substantial contribution of infrastruc-ture to Africa’s recent growth is almost entirely attributable to greater penetration of telecom-munications (fi gure 1.2). In contrast, the defi -cient infrastructure of the power sector has retarded growth, reducing per capita growth for Africa as a whole by 0.11 percentage point and for southern Africa by as much as 0.2 per-centage point. The effect of road infrastructure is generally positive, if rather small, perhaps because of the absence of a widely available measure of road quality, which is the critical variable affecting transport costs.
More detailed microeconomic work on the relationship between infrastructure and the per-formance of fi rms (see table 1.1) supports these macroeconomic fi ndings. The data consistently show a strong relationship between infrastruc-ture stocks and the output, productivity, and investment behavior of fi rms. An exhaustive study analyzed the entire set of investment cli-mate surveys in Africa (Escribano, Guasch, and Pena 2008). The central fi nding was that in most African countries, particularly the low-income countries, infrastructure is a major constraint on doing business and depresses fi rm produc-tivity by about 40 percent. The study fi rst looked at the relative contribution of infrastructure and noninfrastructure investment variables to fi rm productivity (fi gure 1.3). For many coun-tries, such as Ethiopia, Malawi, and Senegal, the negative effect of defi cient infrastructure is at least as large as that of crime, red tape, corrup-tion, and lack of fi nancing.
For a subset of countries—among them Botswana, Ethiopia, and Mali—power is the most limiting infrastructure factor, cited as a major business obstacle by more than half the fi rms in more than half the countries (fi gure 1.3). Poorly functioning ports and slow cus-toms clearance are signifi cant constraints for Burkina Faso, Cameroon, and Mauritius. Defi -ciencies in broader transport infrastructure and ICTs are less prevalent but nonetheless substantial in Benin and Madagascar.
Infrastructure is also an important input to human development (Fay and others 2005). As such, it is a key ingredient in the MDGs (table 1.2).
Safe water’s effect on health is well docu-mented. Serious illnesses transmitted through unsafe water, such as infectious diarrhea, are a leading cause of infant mortality (Esrey and others 1991). Moreover, better water and sanita-tion service is associated with less malnutrition and stunting. Waterborne illnesses can be a sub-stantial economic burden, affecting both adult productivity and children’s overall health and education. The economic gain of meeting the MDG target for water is estimated at $3.5 billion in year 2000 prices, and the cost-benefi t ratio is about 11 to 1, suggesting that the benefi ts of safe water are far greater than the cost of pro-vision (Hutton 2000; Hutton and Haller 2004). Household members, primarily women and
–0.5
0
0.5
perc
enta
ge p
oint
s of
per
cap
ita
econ
omic
gro
wth
1.0
1.5
2.0
2.5
stabilization policies structural policies infrastructure
Western
Europ
e
East
Asian T
igers
North A
frica
West Afric
a
East
Africa
South
ern Afric
a
Centra
l Afric
aAfric
a
Figure 1.1 Changes in Growth per Capita Caused by Changes in Growth Fundamentals
Source: Calderón 2008.
2.5
2.0
1.5
1.0
0.5
–0.5
0
North A
frica
West Afric
a
East
Africa
South
ern Afric
a
Centra
l Afric
aAfric
a
perc
enta
ge p
oint
s of
per
cap
ita
econ
omic
gro
wth
telecommunications power roads
Figure 1.2 Changes in Growth per Capita Caused by Changes in Different Kinds of Infrastructure
Source: Calderón 2008.

46 AFRICA’S INFRASTRUCTURE: A TIME FOR TRANSFORMATION
children, face a substantial opportunity cost in travel time when they have to fetch water. More than 20 percent of the population in Cameroon, Ghana, Mauritania, Niger, and Tanzania must travel more than 2 kilometers to their primary water supply. Rural dwellers tend to travel far-ther than urban dwellers (Blackden and Wodon 2005; Wodon 2008).
Better provision of electricity has impor-tant benefi ts for health because vaccines and medications can be safely stored in hospitals and food can be preserved at home (Jimenez and Olson 1998). Electricity also improves literacy and primary school completion rates because students can read and study after sundown (Barnes 1988; Brodman 1982; Foley
1990; Venkataraman 1990). Similarly, better access to electricity lowers costs for businesses and increases investment, driving economic growth (Reinikka and Svenson 1999b).
Improved transportation networks enable isolated rural communities to move into com-mercial agriculture, thereby increasing their income, and to use health and education ser-vices some distance away (Barwell 1996; Calvo and others 2001; Davis, Lucas, and Rikard 1996; Ellis and Hine 1998; World Bank 1996). By reducing the time and money it takes to move goods, better transportation improves competitiveness, helping create more jobs and boost incomes (Limão and Venables 1999; World Bank 2000, 2001).
a. Overall contribution of infrastructure
0 20 40% contribution to total factor productivity
60 80 100 0 20 40% contribution to total factor productivity
60 80 100
Malawi
Benin
Senegal
Uganda
Ethiopia
Zambia
Eritrea
Mali
Cameroon
Mauritania
Burkina Faso
Niger
Tanzania
Madagascar
Kenya
South Africa
Mauritius
Swaziland
Botswana
Namibia
b. Infrastructure contribution by sector
Mauritius
Tanzania
Benin
Cameroon
Burkina Faso
Niger
Mauritania
Malawi
South Africa
Madagascar
Senegal
Kenya
Zambia
Uganda
Mali
Namibia
Swaziland
Botswana
Ethiopia
Eritrea
infrastructure others electricity customs clearance transportation
information and cummunicationtechnology
water
Figure 1.3 Contribution of Infrastructure to Total Factor Productivity of Firms
Source: Escribano, Guasch, and Pena 2008.

Meeting Africa’s Infrastructure Needs 47
The expansion of ICT networks democra-tizes access to information. It can be particu-larly critical for rural populations otherwise cut off from important technological know-how or critical information about market prices (Kenny 2002; Saunders, Warford, and Wellenius 1994). In many cases, telecommunication improve-ments also reduce transportation spending by allowing people to avoid fruitless journeys or to perform transactions remotely (Telecommuni-cation Development Bureau 1999).
Africa’s Infrastructure Deficit
By just about every measure of infrastructure coverage, African countries lag behind their peers in other parts of the developing world (see table 1.3; Yepes, Pierce, and Foster 2008).
The differences are particularly large for paved-road density, telephone main lines, and power generation. The gap exists for both low-income and middle-income groups.
Was Africa’s current infrastructure defi -cit caused by a low historic starting point? Has it always been worse-off than the rest of the world? In the 1960s (roads), 1970s (tele-phones), and 1980s (power), Africa’s stocks were quite similar to those of South or East Asia. (The one exception was paved-road den-sity, in which South Asia already enjoyed a huge advantage over both Africa and East Asia as far back as the 1960s. For household cov-erage of electricity, both South and East Asia were already far ahead of Africa in the early 1990s, and this gap has widened over time.)
Africa expanded its infrastructure stocks more slowly than other developing regions,
Table 1.2 Evidence on Links between Infrastructure and MDGs in Africa
Study MDG Sector Conclusion
Calvo 1994 Promote gender equality
Water In four African countries surveyed, women saved over 1 hour per day after they began using a new, improved water source in their villages.
Eberhard and Van Horen 1995
Eradicate poverty Electricity In Cape Town, South Africa, households with electricity spent 3–5 percent of their incomes on energy, compared with 14–16 percent for those without access.
Lanjouw, Quizon, and Sparrow 2001
Eradicate poverty Electricity In Tanzania, the presence of electricity in a village increased income from nonfarm business activities by 61%. Nonfarm income in villages with electricity was 109 times that in villages without electricity.
Kenny 2002 Eradicate poverty ICT In Zambia, a survey of 21,000 farmers found that 50 percent of farmers credited radio-backed farm forums with increasing their crop yields.
Saunders, Warford, and Wellenius 1994
Eradicate poverty ICT A survey of transportation costs of an agricultural cooperative in Uganda in 1982 demonstrated that 200 agricultural cooperatives would save an average of $500,000 per year because of telecommunica-tions as a result of avoided transportation costs.
Aker 2008 Eradicate poverty ICT In Niger, introduction of cell phones reduced price dispersion of grains, improving farmer and consumer welfare.
World Bank 2000 Eradicate poverty Transport In Ghana, after a rural roads rehabilitation project, costs for transporting goods and passengers fell by about one-third on average.
Croppenstedt and Demeke 1996
Eradicate poverty Transport In rural Ethiopia, farmers with access to an all-weather road increased their probability of using fertilizer by 10–20 percent because of cheaper transport costs.
Doumani and Listorti 2001 Achieve universal education
Water In Nigeria, Guinea worm, a parasitic infection caused by poor-quality drinking water, was responsible for 60 percent of all school absenteeism.
Jimenez and Olson 1998 Reduce child mortality Electricity Clinics in Uganda and Ghana with photovoltaic cells for power kept refrigerators running for three to four years, whereas in Mali, clinics without these facilities had refrigerator failure about 20 percent of the time.
Telecommunication Devel-opment Bureau 1999
Reduce child/maternal mortality
ICT In Mozambique, telemedicine could save hospitals up to $10,000 a year due to savings in transportation costs for inappropriate referrals.
Davis, Lucas, and Rikard 1996
Reduce child/maternal mortality
Transport In Tanzania, between one-third and one-half of villagers affected by a rural roads project reported improved access to health care.
McCarthy and Wolf 2001 Reduce child/maternal mortality
Water Across 20 African countries, access to safe water was found to be the fourth most important determi-nant of health outcomes, after access to health care, income, and fertility rate.
Sources: Authors’ elaboration based largely on Kerf 2003a, 2003b, 2003c, and 2003d.Note: ICT = information and communication technology; MDG = Millennium Development Goal.
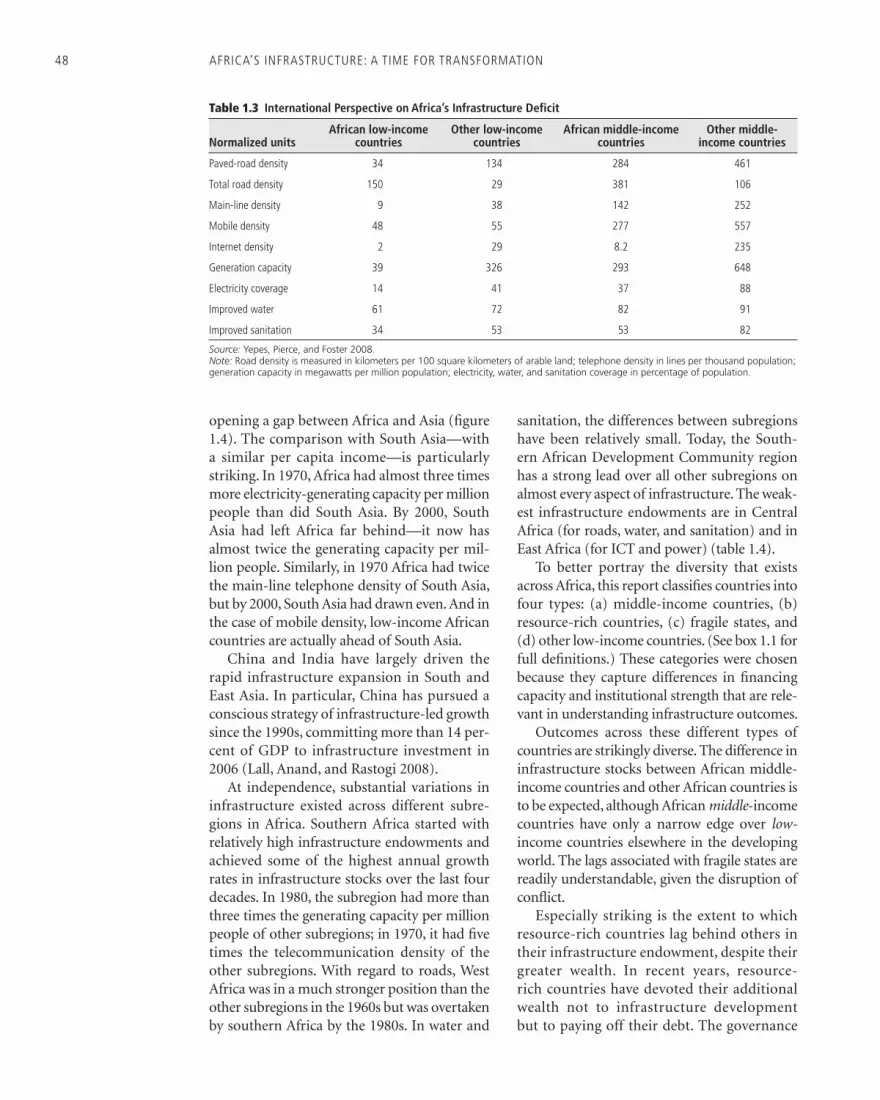
48 AFRICA’S INFRASTRUCTURE: A TIME FOR TRANSFORMATION
opening a gap between Africa and Asia (fi gure 1.4). The comparison with South Asia—with a similar per capita income—is particularly striking. In 1970, Africa had almost three times more electricity-generating capacity per million people than did South Asia. By 2000, South Asia had left Africa far behind—it now has almost twice the generating capacity per mil-lion people. Similarly, in 1970 Africa had twice the main-line telephone density of South Asia, but by 2000, South Asia had drawn even. And in the case of mobile density, low-income African countries are actually ahead of South Asia.
China and India have largely driven the rapid infrastructure expansion in South and East Asia. In particular, China has pursued a conscious strategy of infrastructure-led growth since the 1990s, committing more than 14 per-cent of GDP to infrastructure investment in 2006 (Lall, Anand, and Rastogi 2008).
At independence, substantial variations in infrastructure existed across different subre-gions in Africa. Southern Africa started with relatively high infrastructure endowments and achieved some of the highest annual growth rates in infrastructure stocks over the last four decades. In 1980, the subregion had more than three times the generating capacity per million people of other subregions; in 1970, it had fi ve times the telecommunication density of the other subregions. With regard to roads, West Africa was in a much stronger position than the other subregions in the 1960s but was overtaken by southern Africa by the 1980s. In water and
sanitation, the differences between subregions have been relatively small. Today, the South-ern African Development Community region has a strong lead over all other subregions on almost every aspect of infrastructure. The weak-est infrastructure endowments are in Central Africa (for roads, water, and sanitation) and in East Africa (for ICT and power) (table 1.4).
To better portray the diversity that exists across Africa, this report classifi es countries into four types: (a) middle-income countries, (b) resource-rich countries, (c) fragile states, and (d) other low-income countries. (See box 1.1 for full defi nitions.) These categories were chosen because they capture differences in fi nancing capacity and institutional strength that are rele-vant in understanding infrastructure outcomes.
Outcomes across these different types of countries are strikingly diverse. The difference in infrastructure stocks between African middle-income countries and other African countries is to be expected, although African middle-income countries have only a narrow edge over low-income countries elsewhere in the developing world. The lags associated with fragile states are readily understandable, given the disruption of confl ict.
Especially striking is the extent to which resource-rich countries lag behind others in their infrastructure endowment, despite their greater wealth. In recent years, resource-rich countries have devoted their additional wealth not to infrastructure development but to paying off their debt. The governance
Table 1.3 International Perspective on Africa’s Infrastructure Deficit
Normalized unitsAfrican low-income
countriesOther low-income
countriesAfrican middle-income
countriesOther middle-
income countries
Paved-road density 34 134 284 461
Total road density 150 29 381 106
Main-line density 9 38 142 252
Mobile density 48 55 277 557
Internet density 2 29 8.2 235
Generation capacity 39 326 293 648
Electricity coverage 14 41 37 88
Improved water 61 72 82 91
Improved sanitation 34 53 53 82
Source: Yepes, Pierce, and Foster 2008. Note: Road density is measured in kilometers per 100 square kilometers of arable land; telephone density in lines per thousand population; generation capacity in megawatts per million population; electricity, water, and sanitation coverage in percentage of population.

Meeting Africa’s Infrastructure Needs 49
challenges in a resource-rich environment may also prevent the transformation of that wealth into infrastructure.
Africa’s Infrastructure Price Premium
The prices paid by African consumers for infra-structure services are exceptionally high by global standards (table 1.5). The tariffs charged in Africa for power, water, road freight, mobile
telephone, or Internet services are several multi-ples of those paid in other parts of the developing world. Two explanations exist for Africa’s high prices. First, the cost of providing infrastructure services in Africa is genuinely higher than else-where because of the small scale of production, the reliance on suboptimal technologies, or the ineffi cient management of resources. Second, the high prices refl ect high profi t margins caused by the lack of competition in service provision and inadequate price regulation. Of course, the two factors can be simultaneously at play.
a. Paved-road density
b. Total road density
01960
inde
xin
dex
inde
xpe
rcen
t
1970 1980 1990 2000
5
4
3
2
1
01980
1990–95 1996–2000 2001–05
20001990
1960 1970 1980 1990 2000
5
10
15
20
25
0
1
2
3
4
5 1009080706050403020100
d. Generation capacity
e. Electricity coverage
Africa South Asia East Asia
c. Main-line density
inde
x
perc
ent
1990–95 1996–2000 2001–051970 1980 1990 2000
100
80
60
40
20
00
5
10
15
20
25f. Piped-water coverage
Figure 1.4 Growth of Africa’s Infrastructure Stocks Compared with Asia
Sources: Banerjee and others 2008; Yepes, Pierce, and Foster 2008. Note: Road density is measured in kilometers per 100 square kilometers of arable land; telephone density, in lines per 1,000 people; generation capacity, in megawatts per 1 million people.

50 AFRICA’S INFRASTRUCTURE: A TIME FOR TRANSFORMATION
Power provides the clearest example of a sector with genuinely higher costs in Africa than elsewhere. Many small countries rely on small-scale diesel generation that can cost up to $0.40 per kilowatt-hour in operating costs alone—about three times higher than coun-tries with larger power systems (over 500 megawatts), which are typically hydropower based (Eberhard and others 2008).
In contrast, high road freight tariffs in Africa are caused more by excessive profi t margins than by high costs (Teravaninthorn and Raballand 2008). The costs that Africa’s trucking operators face are not signifi cantly higher than in other parts of the world, even when informal pay-ments are taken into account. However, profi t
margins are exceptionally high, particularly in Central and West Africa where they reach lev-els of 60 to 160 percent. The underlying cause is the limited competition in the sector, com-bined with a highly regulated market based on tour de role principles, whereby freight is allocated to transporters through a central-ized queuing method rather than by allowing truckers to enter into bilateral contracts with customers directly.
The high prices for international tele-phone and Internet service in Africa refl ect a mixture of cost and profi t. In countries that have no access to a submarine cable and are forced to rely on expensive satellite technol-ogy, charges are typically twice as high as in
Table 1.5 Africa’s High-Cost Infrastructure
Sector AfricaOther developing
regions
Power tariffs ($ per kilowatt-hour) 0.02–0.46 0.05–0.1
Water tariffs ($ per cubic meter) 0.86–6.56 0.03–0.6
Road freight tariffs ($ per ton-kilometer) 0.04–0.14 0.01–0.04
Mobile telephony ($ per basket per month) 2.6–21.0 9.9
International telephony ($ per 3-minute call to United States) 0.44–12.5 2.0
Internet dial-up service ($ per month) 6.7–148.0 11
Sources: Banerjee and others 2008; Eberhard and others 2008; Minges and others 2008; Teravaninthorn and Raballand 2008.Note: Ranges reflect prices in different countries and various consumption levels. Prices for telephony and Internet represent all developing regions, including Africa.
Table 1.4 Intraregional Perspective on Africa’s Infrastructure Deficit
Normalized units ECOWAS EAC SADC Central Middle incomea Resource richaLow income, nonfragilea
Low income, fragilea
Paved-road density 38 29 92 4 284 14 14 55
Total road density 144 362 193 44 381 66 106 197
Main-line density 28 6 80 13 142 14 7 16
Mobile density 72 46 133 84 277 105 46 53
Internet density 2 2 4 1 8.2 1.6 1.2 3.1
Generation capacity 31 16 176 47 293 67 39 40
Electricity coverage 18 6 24 21 37 26 16 12
Improved water 63 71 68 53 82 57 57 66
Improved sanitation 35 42 46 28 53 32 37 31
Source: Yepes, Pierce, and Foster 2008. Note: Road density is measured in kilometers per 100 square kilometers of arable land; telephone density in lines per thousand population; generation capacity in megawatts per million population; electricity, water, and sanitation coverage in percentage of population. EAC = East African Community; ECOWAS = Economic Community of West African States; SADC = Southern African Development Community.a. Country groupings are discussed in box 1.1.

Meeting Africa’s Infrastructure Needs 51
Africa’s numerous countries face widely diverse economic situations. Understanding that structural differences in coun-tries’ economies and institutions affect their growth and fi nancing challenges as well as their economic decisions (Collier and O’Connell 2006), this report introduces a four-way country typology to organize the rest of the discussion. This typology provides a succinct way of illustrating the diver-sity of infrastructure fi nancing challenges faced by different African countries.
• Middle-income countries have GDP per capita in excess of $745 but less than $9,206. Examples include Cape Verde, Lesotho, and South Africa (World Bank 2007).
• Resource-rich countries are countries whose behaviors are strongly affected by their endowment of natural resources (Collier and O’Connell 2006; IMF 2007). Resource-rich countries typically depend on minerals, petroleum, or both. A country is classifi ed as resource rich if primary com-modity rents exceed 10 percent of GDP. (South Africa is
not classifi ed as resource intensive, using this criterion.) Examples include Cameroon, Nigeria, and Zambia.
• Fragile states are low-income countries that face particu-larly severe development challenges, such as weak gov-ernance, limited administrative capacity, violence, or the legacy of confl ict. In defi ning policies and approaches toward fragile states, different organizations have used differing criteria and terms. Countries that score less than 3.2 on the World Bank’s Country Policy and Insti-tutional Performance Assessment belong to this group. Some 14 countries of Africa are in this category. Examples include Côte de Ivoire, the Democratic Republic of Congo, and Sudan (World Bank 2005).
• Other low-income countries compose a residual category of countries with GDP per capita below $745 and that are neither resource-rich nor fragile states. Examples include Benin, Ethiopia, Senegal, and Uganda.
Source: Briceño-Garmendia, Smits, and Foster 2008.
Introducing a Country Typology
BOX 1 . 1
MAURITANIA
CAPE VERDE
GAMBIAGUINEA-BISSAU
SENEGAL
SIERRA LEONEGUINEA
LIBERIA
CÔTED'IVOIRE TOGO
GHANABENIN NIGERIA
GABON
resource-rich countries
nonfragile low-income countries
fragile low-income countries
middle-income countries
CONG
O
ANGOLA
MALI NIGER
CHADSUDAN
ETHIOPIA SOMALIA
KENYAUGANDA
RWANDABURUNDI
TANZANIA
CONGO,DEM REP
ZAMBIA
MALAWI
ZIMBABWEMOZAMBIQUE
MADAGASCAR MAURITIUS
LESOTHO
SWAZILAND
BURKINA FASO
ERITREA
EQUATORIAL GUINEA
SOUTH AFRICA
NAMIBIA BOTSWANA
CENTRAL AFRICANREPUBLICCAMEROON

52 AFRICA’S INFRASTRUCTURE: A TIME FOR TRANSFORMATION
countries that enjoy cable access. Even when access to a submarine cable is obtained, coun-tries with a monopoly on this international gateway have tariffs that are substantially higher than those without a monopoly (Min-ges and others 2008).
How Much Does Africa Need to Spend on Infrastructure?
Meeting Africa’s infrastructure needs and developing cost-effective modes of infra-structure service delivery call for a substantial program of investment, rehabilitation, and dis-ciplined maintenance combined. The physical infrastructure requirements are the grounds for a new set of estimates for spending require-ments that are the foundation of this report. In all cases, the estimated spending takes into account both growth-related and social demands for infrastructure, and it incorporates the costs of maintenance and rehabilitation as well as new investment.
The time horizon for estimating spend-ing needs is a decade. The assumption is that over a period of 10 years running up to 2015, the continent should be expected to address its infrastructure backlog, keep pace with the demands of economic growth, and attain a number of key social targets for broader infra-structure access (table 1.6).
Power Spending Needs Are by Far the LargestAfrica’s largest infrastructure needs are in the power sector. Whether measured in generat-ing capacity, electricity consumption, or secu-rity of supply, Africa’s power infrastructure delivers only a fraction of the service found elsewhere in the developing world (Eberhard and others 2008). The 48 countries of Africa (with a combined population of 800 million) generate roughly the same amount of power as Spain (with a population of 45 million). Power consumption, which is 124 kilowatt-hours per capita per year and falling, is only 10 percent of that found elsewhere in the developing world, barely enough to power one 100-watt light-bulb per person for 3 hours a day. Africa’s fi rms report that frequent power outages cause them to lose 5 percent of their sales; this fi gure rises to 20 percent for fi rms in the informal sector that are unable to afford backup generators. Chap-ter 8 in this volume contains a more detailed discussion of Africa’s power challenges.
Addressing this power shortage will require enormous investments in infrastructure over the next decade. Based on four economic mod-els, covering the Central, East, Southern, and West African Power Pools, potential generation projects in each power pool are identifi ed and ranked according to cost-effectiveness. These models make possible estimating the cost of meeting power demand under a range of
Table 1.6 10-Year Economic and Social Targets for Investment Needs Estimates, 2006–15
Sector Economic target Social target
Information and communication technology
Complete submarine cable loop around Africa and 36,000-kilometer fi ber-optic backbone network interconnecting national capitals to each other and to submarine cable loop.
Extend GSM voice signal and public access broadband to 100 percent of the rural population.
Irrigation Develop all fi nancially viable opportunities for large- and small-scale irrigation, potentially some 12 million hectares.
n.a.
Power Attain demand-supply balance in power production, developing 7,000 megawatts of new generation capacity annually within a regional framework entailing 22,000 megawatts of new cross-border interconnections.
Raise household electrifi cation rate by about 10 percentage points over current levels, entailing an additional 57 million new house-hold connections.
Transport Attain 250,000 kilometers of good-quality road networks supporting regional and national connectivity goals.
Raise the Rural Access Index from the current level of 34 percent nationally to 100 percent in highest-value agricultural areas.
Place entire urban population within 500 meters of road supporting motorized access.
Water and sanitation n.a. Meet the Millennium Development Goals for water and sanitation.
Sources: Banerjee and others 2008; Carruthers, Krishnamani and Murray 2008; Mayer and others 2008; Rosnes and Vennemo 2008; You 2008.Note: GSM = global systems mobile. n.a. = not applicable.

Meeting Africa’s Infrastructure Needs 53
alternative scenarios that consider access tar-gets, fuel prices, unit costs of investment, and feasibility of cross-border trade (Vennemo and Rosnes 2008).
Demand for power is almost directly pro-portional to economic growth. Installed capac-ity will need to grow by more than 10 percent annually—or more than 7,000 megawatts a year—just to meet Africa’s suppressed demand, keep pace with projected economic growth, and provide additional capacity to support the rollout of electrifi cation. Since 1995, expan-sion of the sector has averaged barely 1 per-cent annually, or less than 1,000 megawatts a year. Most of that power would go to meet nonresidential demands from the commercial and industrial sectors.
The most cost-effective way to expand Afri-ca’s power generation is through regional trade that allows countries to pool the most attrac-tive primary energy resources across national boundaries. Regional trade shaves around $0.01 per kilowatt-hour off the marginal cost of power generation in each of the power pools (and as much as $0.02 to $0.04 per kilowatt-hour for some countries), leading to savings of about $2 billion a year in the costs of develop-ing and operating the power system. Mobilizing the benefi ts of regional trade depends on devel-oping major untapped hydropower projects in the Democratic Republic of Congo, Ethio-pia, and Guinea, which would become major exporters in the Southern, East, and West Afri-can Power Pools, respectively (table 1.7). It also hinges on establishing some 22,000 megawatts of interconnectors that will be needed over the
next decade (to 2015), to allow power to fl ow freely from country to country. The fi nancial returns on these interconnectors can be as high as 120 percent in the Southern African Power Pool; it is typically 20–30 percent in the other pools. Regional trade can also put Africa on a path to cleaner development, because it would increase hydropower’s share of the continent’s generation portfolio from 36 percent to 48 per-cent, displacing 20,000 megawatts of thermal plant in the process and saving 70 million tons of carbon emissions each year. Finally, raising electrifi cation rates will require extending dis-tribution networks to reach almost 6 million additional households a year over the next dec-ade (to 2015).
The overall costs for the power sector in Africa are a staggering $41 billion a year—$27 billion for investment and $14 billion for operation and maintenance (table 1.8). About half the investment costs are for development of new generating capacity. Approximately 15 percent is earmarked for rehabilitation of exist-ing generation and transmission assets. About 40 percent of the costs are for the Southern Africa Power Pool alone.
Achieving Water Security Remains an Unquantifi ed ChallengeOne important infrastructure requirement not explicitly estimated in the investment costs is water storage capacity, which is required to reach water security. Africa experiences huge swings in precipitation across areas, across seasons, and over time (Grey and Sadoff 2006). Climate change will only exacerbate this
Table 1.7 Africa’s Power Needs, 2006–15
PoolNew generation capacity (MW)
New cross-border interconnectors (MW)
New household connections (millions)
CAPP 4,395 831 2.5
EAPP 17,108 3,878 20.0
SAPP 33,319 11,786 12.2
WAPP 18,003 5,625 21.5
Island states 368 n.a. 1.2
Total 73,193 22,120 57.4
Source: Adapted from Rosnes and Vennemo 2008.Note: CAPP = Central African Power Pool; EAPP = Eastern African Power Pool (including Nile basin but excluding the Arab Republic of Egypt); Island states = Cape Verde, Madagascar, and Mauritius; SAPP = Southern African Power Pool; WAPP = Western African Power Pool. n.a. = not applicable.

54 AFRICA’S INFRASTRUCTURE: A TIME FOR TRANSFORMATION
variability. As a result, water security—defi ned as reliable water supplies and acceptable risks from fl oods and other unpredictable events, including those from climate change—will require a signifi cant expansion of water stor-age capacity from the current level of 200 cubic meters per capita. The amount of storage needed to withstand both fl ood and drought risks has not yet been precisely modeled for most African countries; hence, the needed investment could not be estimated. Even a simplistic approach, however, such as estimat-ing the cost of bringing all African countries from their current storage levels of around 200 cubic meters per capita to South Africa’s level of 750 cubic meters per capita, is enough to illustrate the hundreds of billions of dollars that could be required.
Nevertheless, about half the new genera-tion capacity outlined for the power sector relates to water storage infrastructure with multipurpose benefits. These hydropower schemes would therefore also contribute, to an unknown extent, toward achieving the water security objective. The increased storage capac-ity they represent could—under appropriate multipurpose management principles—help attenuate the shocks associated with fl oods and droughts. See chapter 14 in this volume for a more detailed discussion of Africa’s water resource challenges.
Scope for Expanding Irrigated AreasOnly 7 million hectares, in a handful of coun-tries, are equipped for irrigation. Although
it constitutes less than 5 percent of Africa’s cultivated area, the irrigation-equipped area represents 20 percent of the value of agricul-tural production. Chapter 15 in this volume contains a more detailed discussion of Africa’s irrigation challenges.
The model suggests that a further 6.8 million hectares are economically viable for irrigation, based on local agroecological characteristics, market access, and infrastructure costs (You 2008). Most of this area, more than 5.4 mil-lion hectares, is ideal for small-scale irrigation schemes, assuming that they can be developed for an investment of no more than $2,000 a hectare. A further 1.4 million hectares has the potential for large-scale irrigation schemes that could be retrofi tted to dams already serv-ing hydropower purposes or incorporated into the development of new hydropower schemes foreseeable within the next decade, assuming that the distribution infrastructure needed for irrigation can be added for an investment of no more than $3,000 a hectare. Finally, 1.7 million hectares equipped for irrigation have fallen into disuse but could be recovered by rehabilitating the infrastructure. Spreading these investments over a 10-year span would require $2.7 billion annually, plus a further $0.6 billion a year to support maintenance of new and existing sys-tems (table 1.9).
Reaching for the MDGs in Water and SanitationThe MDG target for access to safe water is 75 percent of the population by 2015; for
Table 1.8 Power Spending Needs, 2006–15$ billions annually
Pool
Investment
Total operation and maintenance
Total spending needsRehabilitation New generation
New transmission and distribution Total investment
CAPP 0.1 0.9 0.3 1.3 0.2 1.4
EAPP 0.3 3.5 3.0 6.8 1.1 7.9
SAPP 2.6 4.5 2.9 10.0 8.4 18.4
WAPP 1.0 3.5 3.7 8.2 4.0 12.3
Island states 0 0.1 0.2 0.3 0.3 0.6
Total 4.0 12.5 10.1 26.6 14.0 40.6
Source: Adapted from Rosnes and Vennemo 2008.Note: CAPP = Central African Power Pool; EAPP = Eastern African Power Pool (including Nile basin but excluding the Arab Republic of Egypt); Island states = Cape Verde, Madagascar, and Mauritius; SAPP = Southern African Power Pool; WAPP = Western African Power Pool. Row totals may not add exactly because of rounding errors.

Meeting Africa’s Infrastructure Needs 55
improved sanitation, it is 63 percent. As of 2006, the last year for which offi cial data have been published, the fi gures for Africa were 58 per-cent and 31 percent, respectively. To meet the MDG goal, the number of people with access to safe water would need to increase from 411 million to 701 million by 2015—an increase of 29 million a year compared with recent prog-ress of only 11 million per year. To meet the MDG sanitation goal, the number of people with access to improved service would need to increase from 272 million in 2006 to 617 mil-lion by 2015—an increase of 35 million a year compared with recent progress of only 7 mil-lion a year. Chapters 16 and 17 in this volume offer more detailed discussions of Africa’s water supply and sanitation challenges, respectively.
The overall price tag for reaching the water and sanitation MDG access is estimated at $22 billion (roughly 3.3 percent of Africa’s GDP), with water accounting for more than two-thirds (table 1.10). Capital investment needs can be conservatively estimated at $15 billion a year (2.2 percent of the region’s GDP). These needs include both new infrastructure and rehabilitation of existing assets. Estimates are based on minimum acceptable asset standards. It is assumed that access patterns (or relative prevalence of water and sanitation modali-ties) remain broadly the same between 2006 and 2015 and that services are upgraded for only a minimum number of customers. The maintenance requirements stand at $7 bil-lion a year (1.1 percent of the region’s GDP). Operation and maintenance of network and non-network services, respectively, amount to 3 percent and 1.5 percent of the replace-ment value of installed infrastructure. Reha-bilitation costs have been estimated based on a model that takes into account the mainte-nance backlog of network infrastructure in each country.
Transport Needs Are SubstantialAfrica’s road density seems sparse compared with the vastness of the continent, but it is not unreasonable relative to the continent’s popu-lation and income. A more detailed discus-sion of Africa’s transport challenges appears in chapters 9–13 in this volume. The adequacy of Africa’s current transport network can best be assessed by examining whether it provides an adequate level of connectivity to facilitate the movement of people and goods between regions, within nations, out of rural areas, and across cities. Using a spatial model, one can assess the cost of linking economic and demographic nodes through transport infra-structures so as to achieve regional, national, urban, and rural connectivity.
Regional connectivity within the African continent requires a network that links all capital cities and cities with over 1 million inhabitants to deep-sea ports and interna-tional borders. This objective can be achieved with a two-lane network of a little over 100,000 kilometers maintained in good condition. About 70 percent of this network is already in place, but about one-quarter of it needs to be widened from one lane to two lanes, and about three-quarters of it needs to be improved to good quality. The overall cost of meeting this target amounts to $2.7 billion a year, or barely 15 percent of total spending needs for the transport sector. The bulk of this expenditure is for investment.
Table 1.10 Water and Sanitation Spending Needs, 2006–15$ billions annually
Sector Investment Maintenance Total
Water 11.0 5.5 16.5
Sanitation 3.9 1.4 5.4
Total 14.9 7.0 21.9
Source: Banerjee and others 2008.
Table 1.9 Irrigation Spending Needs, 2006–15$ billions annually
Total maintenance
Investment
RehabilitationLarge-scale
schemesSmall-scale
schemesTotal
investment Total
0.6 0.6 0.3 1.8 2.7 3.3
Source: You 2008.

56 AFRICA’S INFRASTRUCTURE: A TIME FOR TRANSFORMATION
Regional connectivity also requires a rail network, ports with adequate capacity, and airports. For railways, the main costs are for rehabilitation of the existing track. For ports, more container berths are needed to keep pace with the growth of international trade. For air transport, the model does not suggest any need for new terminals, but some expansion is pro-vided based on passenger traffi c projects. For runways, the investments primarily relate to improving the condition of existing runways. No need was found for building new runways, although in a few cases lengthening existing runways to support the use of larger aircraft was relevant.
Connectivity within a country requires extending the regional network to link capital cities to their corresponding provincial cen-ters and to other cities with more than 25,000 inhabitants by at least a one-lane paved road. The overall regional network and such national networks would encompass 250,000 kilome-ters to meet this objective. About half of this network already exists in the form of paved roads, whereas the other half would need to be upgraded to a paved network. The cost of meeting this target is $2.9 billion a year. A sub-stantial share of that amount is for upgrading existing unpaved roads to paved surfaces.
Rural connectivity is defi ned as providing accessibility to all-season roads in high-value agricultural areas. Only one-third of rural Afri-cans live close to an all-season road, compared with two-thirds of the population in other developing regions. Because of low popula-tion densities in rural Africa, raising this Rural Access Index to 100 percent for Africa would be essentially unaffordable. An alternative approach is to provide 100 percent rural con-nectivity to those areas with the highest agri-cultural land value. Limiting access attention to areas with 80 percent of the highest agri-cultural production value, the cost would be a signifi cant $2.5 billion a year, or close to 13 percent of the overall spending requirement. About half of that sum is for maintenance, whereas the remainder is devoted to improving the condition of existing rural roads, upgrad-ing road surfaces to ensure all-season accessi-bility, and to a lesser extent, adding new roads to reach isolated populations.
Urban connectivity is defi ned as ensur-ing that the entire urban population lives no farther than 500 meters from a paved road capable of supporting motorized access. Afri-can cities today have paved-road densities well below the average for well-provided cities in other developing countries, which typically have densities of 300 meters per 1,000 inhab-itants. Meeting the objective of 500 meters would require adding 17,000 kilometers to the current urban road network, and upgrading and improving 70,000 kilometers of the exist-ing network, costing $1.6 billion a year, which serves to underscore the signifi cance of urban roads within Africa’s overall transport require-ments. Most of this sum is needed to widen and pave existing urban roads.
To create a transport network that provides adequate regional, national, rural, and urban road connectivity complemented by adequate rail, port, and airport infrastructure will require signifi cant spending—$18 billion a year, half of which is related to maintenance (table 1.11). Investment requirements are driven primarily by spending needed to upgrade the category of existing assets (for example, from a gravel to a paved road), to improve the condition of exist-ing assets (from poor to good or fair condition), and to expand the capacity of existing assets (for example, from one lane to two lanes). Just over half of this spending would be directed at nonroad transport modes, particularly for their maintenance. The remainder is roughly evenly spread among national connectivity, urban connectivity, and rural connectivity.
ICT Spending Needs Look More ManageableAfrica’s progress in ICT is close to that seen else-where in the developing world. The percentage of Africa’s population living within range of a global systems mobile signal rose from 5 per-cent in 1999 to 57 percent in 2006 (Minges and others 2008). Over the same period, more than 100 million Africans became mobile telephone subscribers. Indeed, in some countries, house-hold access to mobile telephone services now exceeds that of piped water. Internet penetra-tion lags considerably, with little more than 2 million subscribers and a further 12 million estimated to be making use of public access

Meeting Africa’s Infrastructure Needs 57
facilities. The ICT revolution has been accom-plished largely through market liberalization and private sector investment, which will continue to be the main driving force behind future investments. The state will need to con-tinue investing in a few critical areas, however. Chapter 7 in this volume contains a more detailed discussion of Africa’s ICT challenges.
The private sector will undertake the major expenditures in this sector to service growth in market demand. The urban market for ICT ser-vices is well established and profi table. Demand for voice services in this market is expected to grow as penetration rates continue to rise from 20 to 46 lines per 100 inhabitants. In addition, incipient markets for broadband services are expected to expand from 0.04 to 2.54 lines per 100 inhabitants. These demands can be met entirely by private sector investment.
Spatial models are used to simulate the com-mercial viability of further expanding cover-age of voice and broadband signals into rural areas using global systems mobile and WiMAX (Worldwide Interoperability for Microwave Access) technologies (Mayer and others 2008). The models consider the cost of network rollout based on topographical factors and local avail-ability of power. They also estimate local revenue potential based on demographic densities, per capita incomes, and estimated subscriber rates.
With no market barriers, the private sector alone could profi tably extend global systems mobile signal coverage to about 95 percent of Africa’s population (Mayer and others 2008). The remaining 5 percent, living in isolated rural communities, is not commercially viable and would require a signifi cant state subsidy to connect. The percentage of the population that is not commercially viable varies substantially across countries, from less than 1 percent in Nigeria to more than 20 percent in the Demo-cratic Republic of Congo.
Broadband service, by contrast, is still in its infancy and will expand only if signifi cant investments are made in rolling out high-capacity fi ber-optic cable across the continent. Just interconnecting all Africa’s capitals would require a network of 36,000 kilometers of fi ber-optic cable. If the network were extended to cover all cities with 500,000 or more inhab-itants, more than 100,000 kilometers of cable
would be required. Private fi nance would likely be forthcoming for the highest-traffi c seg-ments. However, the more ambitious the aspi-rations for extending connectivity, the larger the component of public fi nance that would be required.
A modest level of broadband service could be provided using WiMAX technology to provide low-volume connectivity to a lim-ited number of institutions and public access telecenters in rural areas. Using this approach, and again in the absence of market barri-ers, the private sector alone could profi tably extend WiMAX coverage to about 89 percent of Africa’s population (Mayer and others 2008). The remaining 11 percent, living in isolated rural communities, are not commer-cially viable and would require a signifi cant state subsidy to support network rollout. As with voice, the percentage of the population that is not commercially viable to cover varies substantially across countries, from less than 1 percent in Nigeria to more than 70 percent in the Democratic Republic of Congo.
Finally, Africa is in the process of complet-ing a network of submarine cables that links it to the global intercontinental network. Several projects are already under way to close the loop around the eastern side of the continent. Some strengthening of the West African submarine system is also needed, plus cable links to service
Table 1.11 Transport Spending Needs, 2006–15$ billions annually
Sector/area
Investment
Total maintenance
Overall total
Improve condition
Upgrade category
Add capacity
Total investment
Regional connectivity 0.5 1.1 0.2 1.8 0.9 2.7
National connectivity 0.5 1.2 0.2 1.9 1.0 2.9
Rural connectivity 0.8 0.4 0.1 1.3 1.2 2.5
Urban connectivity 0.3 0.4 0.4 1.1 0.5 1.6
Railways, ports, and airports 0.2 0.6 1.9 2.7 5.9 8.6
Total 2.2 3.7 2.7 8.6 9.6 18.2
Source: Carruthers, Krishnamani, and Murray 2008.Note: Railways, ports, and airports include investments by South Africa’s Transnet and other demand-driven transport investment needs covered by the private sector.Column totals may not add exactly because of rounding errors.

58 AFRICA’S INFRASTRUCTURE: A TIME FOR TRANSFORMATION
outlying islands, such as the Comoros, Mada-gascar, and the Seychelles. The private sector is showing considerable appetite to take on this kind of investment.
The investment costs of this additional ICT infrastructure, beyond what would be purely driven by market demand, are relatively mod-est when compared with other infrastructure sectors. Achieving universal rural access for both voice service and limited broadband ser-vice based on WiMAX technology could be accomplished for an investment of $1.7 billion a year, the bulk of which could come from the private sector, with additional public fund-ing amounting to no more than $0.4 billion a year. Completing the submarine and intrare-gional fi ber-optic backbone would entail an annual (private sector) investment of less than $0.2 billion, although this sum would more than double if a more ambitious network con-necting all cities with over 500,000 inhabitants were envisaged (table 1.12). Factoring in the market-driven investments needed to keep pace with demand in established urban markets, the estimated ICT sector annual investment need rises to $7 billion a year, plus another $2 billion annually for operation and maintenance.
Overall Price Tag
Africa’s overall cost to build new infrastruc-ture, refurbish dilapidated assets, and operate and maintain all existing and new installa-tions is estimated at almost $93 billion a year for 2006 through 2015 (15 percent of African GDP; table 1.13 and fi gure 1.5).
Comparison with the Commission for AfricaThe $93 billion estimate is more than twice the estimate of the Commission for Africa in 2005, which was based on cross-country econo-metric studies, rather than the more detailed country-level microeconomic modeling of the Africa Infrastructure Country Diagnostic (Estache 2006). A recent update of the cross-country model used for the Commission for Africa report came up with a revised estimate of $80 billion to $90 billion (Yepes 2007).
Some 40 percent of the total is for the power sector, which requires about $41 billion each year (6 percent of African GDP; Rosnes and Vennemo 2008). A signifi cant share of the spending for power is for investment in multipurpose water storage schemes and thus makes an important contribution to water resources management. The second-largest component is the cost of meeting the MDGs for water and sanitation—about $22 billion (3 percent of regional GDP). The third-largest price tag is associated with the transport sector, which comes in at just over $18 billion (3.6 percent of GDP).
Distribution of Spending among CountriesThree groups of countries—the middle-income countries, the resource-rich countries, and the low-income nonfragile states—share roughly equally in the bulk of total spending. Each of these groups needs to spend around
Table 1.13 Overall Infrastructure Spending Needs for Africa, 2006–15$ billions annually
SectorCapital
expenditureOperation and maintenance
Total needs
ICT 7.0 2.0 9.0
Irrigation 2.7 0.6 3.3
Power 26.7 14.1 40.8
Transport 8.8 9.4 18.2
WSS 14.9 7.0 21.9
Total 60.4 33.0 93.3
Sources: Authors’ calculations based on Banerjee and others 2008; Carruthers, Krishnamani, and Murray 2008; Mayer and others 2008; Rosnes and Vennemo 2008.Note: ICT = information and communication technology; WSS = water supply and sanitation.Row totals may not add exactly because of rounding errors.
Table 1.12 ICT Spending Needs beyond the Purely Market Driven: Investment Only, 2006–15$ billions annually
Type of investment
Universal access to voice
signal
Universal access to broadband
platform
Fiber-optic backbone linking
capital citiesSubmarine
cables
Private 0.58 0.68 — —
Public 0.20 0.23 — —
Total investment 0.78 0.91 0.03 0.18
Source: Mayer and others 2008.Note: In contrast to the preceding tables, the expenditure for operation and maintenance is excluded because of the difficulty of apportioning it across the different subcategories presented.— Not available.

Meeting Africa’s Infrastructure Needs 59
$28 billion to $30 billion to meet its infrastruc-ture needs. The price tag for the fragile states is only about half as much at $13 billion. The largest spending needs for an individual coun-try by far are in South Africa, which requires $27 billion a year.
The burden of spending relative to the countries’ GDPs is very different across groups. For middle-income and resource-rich countries, the burden appears manageable,
amounting to no more than 10 percent to 13 percent of their respective GDPs. For low-income countries, however, as much as 25 percent of GDP would be needed, rising to an implausible 37 percent for the low-income fragile states. Ethiopia, Madagascar, Niger, and above all, the Democratic Republic of Congo face an impossible challenge—their infrastruc-ture needs range from 26 to over 70 percent of GDP (see fi gure 1.5, panel a).
Figure 1.5 Africa’s Aggregate Infrastructure Spending Needs, by Country, 2006–15
Sources: Authors’ calculations based on Banerjee and others 2008; Carruthers, Krishnamani, and Murray 2008; Mayer and others 2008; Rosnes and Vennemo 2008.
a. As a percentage of GDP
0 10 20 30 40 50 60 70
Cape Verde
Namibia
Cameroon
South Africa
Malawi
Nigeria
Lesotho
Rwanda
Côte d´Ivoire
Benin
Ghana
Burkina Faso
Zambia
Sudan
Uganda
Kenya
Tanzania
Chad
Mozambique
Senegal
Niger
Madagascar
Ethiopia
Congo, Dem. Rep. of
middle-income countries
resource-rich countries
nonfragile low-income countries
fragile low-income countries
Africa
% of GDP
b. In US$ billions annually
0 20 40 60 80 100
Cape Verde
Lesotho
Rwanda
Malawi
Burkina Faso
Benin
Namibia
Chad
Niger
Uganda
Zambia
Cameroon
Ghana
Madagascar
Mozambique
Senegal
Côte d´Ivoire
Tanzania
Kenya
Congo, Dem. Rep. of
Ethiopia
Sudan
Nigeria
South Africa
fragile low-income countries
nonfragile low-income countries
resource-rich countries
middle-income countries
Africa
US$ billions/year
investment (new and rehabilitation) operation and management

60 AFRICA’S INFRASTRUCTURE: A TIME FOR TRANSFORMATION
Distribution of Spending—Investment versus MaintenanceThe overall spending requirements break down two to one between investment and operation and maintenance, with the balance between them shifting across country groupings. In the middle-income countries, the spending needs are skewed toward maintenance, which absorbs more than half the total. These countries have already put in place much of the infrastruc-ture they need, and their main challenge is to preserve it in good condition. Across the three other country groupings, almost three-quarters of spending needs are associated with invest-ment and only one-quarter with operation and maintenance. These countries have a vast con-struction (and reconstruction) agenda to com-plete before they will have much to maintain.
Will the Price Tag Grow—or Shrink?These estimates of investment are based on costs prevailing in 2006, the base year for all of the African Infrastructure Country Diag-nostic fi gures. It is well known that the unit costs of infrastructure provision have escalated signifi cantly during the last few years (Africon 2008).
The most reliable evidence available comes from the road sector, where cost overruns reported on multilateral agency projects in 2007 averaged 60 percent. The higher costs are not just from infl ation in petroleum and asso-ciated input prices, but they also refl ect a lack of competition for civil works contracts and the tight position of the global construction industry, as well as lengthy delays in project implementation. Similar escalations in unit costs have been reported anecdotally in other areas of infrastructure, notably power. Pos-sibly, the recent upward pressure on the costs of infrastructure may be reversed as the cur-rent global downturn takes its toll, but that is hard to predict. Based on the situation in 2006, the preceding estimates likely represent a conservative lower boundary for the cost of developing infrastructure assets at today’s prices.
The global fi nancial crisis of 2008 can be expected to reduce demand for some types of infrastructures, but it would not hugely alter the estimated spending needs. A large share
of the spending needs are driven by targets rather than economic growth; this applies, for example, to the transport spending needs (which are largely based on connectivity objec-tives) and to the water and sanitation spend-ing needs (which are based on the MDGs). The spending needs with the strongest direct link to economic growth are those for the power sector. However, because of the large backlog in that sector, estimated spending needs con-tain a strong component of refurbishment and catch-up. Thus, even halving economic growth estimates for the region would reduce esti-mated power spending needs by only 20 per-cent. The global recession could be expected to affect demand for ICT services and trade-related infrastructure, such as railways and ports. However, the weight of those infrastruc-tures in the total spending needs is not much more than 10 percent.
Notes The authors of this chapter are Vivien Foster and
Cecilia Briceño-Garmendia, who drew on back-ground material and contributions from César Calderón, Alvaro Escribano, J. Luis Guasch, Paul Lombard, Siobhan Murray, Jorge Pena, Justin Pierce, Tito Yepes, and Willem van Zyl.
1. Although the Africa Infrastructure Country Diagnostic project is limited to the study of Sub-Saharan African countries, this book sometimes substitutes Africa for Sub-Saharan Africa. The reader should bear in mind, however, that the information refers only to Sub-Saharan Africa.
2. Road density is measured in kilometers per 100 square kilometers; telephone density in lines per thousand population; electricity generation in megawatts per million population; and electric-ity, water, and sanitation coverage in percentage of population.
3. Monetary fi gures are in U.S. dollars unless oth-erwise noted.
ReferencesAfricon. 2008. “Unit Costs of Infrastructure Proj-
ects in Sub-Saharan Africa.” Background Paper 11, Africa Infrastructure Sector Diagnostic, World Bank, Washington, DC.
Aker, Jenny. 2008. “Does Digital Divide or Provide? The Impact of Cell Phones on Grain Markets in Niger.” Center for International and Devel-opment Economics Research, University of California, Berkeley.

Meeting Africa’s Infrastructure Needs 61
Ayogu, Melvin. 1999. “Before Prebendalism: A Positive Analysis of Core Infrastructure Invest-ment in a Developing Fiscal Federalism.” African Development Review 11 (2): 169–98.
Banerjee, Sudeshna, Quentin Wodon, Amadou Diallo, Taras Pushak, Hellal Uddin, Clarence Tsimpo, and Vivien Foster. 2008. “Access, Afford-ability, and Alternatives: Modern Infrastructure Services in Africa.” Background Paper 2, Africa Infrastructure Sector Diagnostic, World Bank, Washington, DC.
Barnes, Douglas F. 1988. Electric Power for Rural Growth: How Electricity Affects Rural Life in Devel-oping Countries. Boulder, CO: Westview Press.
Barwell, Ian. 1996. “Transport and the Village: Findings from African Village-Level Travel and Transport Surveys and Related Studies.” Discussion Paper 344, World Bank, Washington, DC.
Blackden, Mark, and Quentin Wodon, eds. 2005. “Gender, Time Use and Poverty in Sub-Saharan Africa.” Working Series Paper 73, World Bank, Washington, DC.
Briceño-Garmendia, Cecilia, Karlis Smits, and Vivien Foster. 2008. “Financing Public Infra-structure in Sub-Saharan Africa: Patterns, Issues, and Options.” AICD Background Paper 15, Africa Infrastructure Sector Diagnostic, World Bank, Washington, DC.
Brodman, Janice. 1982. “Rural Electrifi cation and the Commercial Sector in Indonesia.” Discus-sion Paper D-73L, Resources for the Future, Washington, DC.
Calderón, César. 2008. “Infrastructure and Growth in Africa.” Working Paper 3, Africa Infrastruc-ture Country Diagnostic, World Bank, Washington, DC.
Calderón, César, and Luis Servén. 2008. “Infra-structure and Economic Development in Sub-Saharan Africa.” Policy Research Working Paper 4712, World Bank, Washington, DC.
Calvo, Christina Malmberg. 1994. “Case Study on the Role of Women in Rural Transport: Access of Women to Domestic Facilities.” Sub-Saharan Africa Transport Policy Program Working Paper 11, World Bank, Washington, DC.
Calvo, Christina Malmberg, Colin Gannon, Kenneth M. Gwilliam, and Zhi Liu. 2001. “Transport: Infrastructure and Services—Technical Notes.” PRSP Toolkit, World Bank, Washington, DC.
Carruthers, Robin, Ranga R. Krishnamani, and Siobhan Murray. 2008. “Improving Connectiv-ity: Investing in Transport Infrastructure in Sub-Saharan Africa.” Background Paper 7, Africa Infrastructure Country Diagnostic, World Bank, Washington, DC.
Collier, Paul, and Stephen O’Connell. 2006. “Opportunities and Choices.” Draft chapter for the synthesis volume of the Explaining African Economic Growth PRoject of Oxford University and Swarthmore College, Centre for Study of African Economies.
Commission for Africa. 2005. Our Common Inter-est: Report of the Commission for Africa. London: Commission for Africa.
Croppenstedt, Andre, and Mulat Demeke. 1996. “Determinants of Adoption and Levels of Demand for Fertiliser for Cereal Growing Farmers in Ethiopia.” Working Paper 96-3, Centre for the Study of African Economies, Oxford, U.K.
Davis, Tony, Kimberly Lucas, and Ken Rikard. 1996. Agricultural Transport Assistance Program: Impact Study. Washington, DC: United States Agency for International Development.
Doumani, Fadi M., and James A. Listorti. 2001. “Environmental Health: Bridging the Gaps.” World Bank Discussion Paper 422, World Bank, Washington, DC.
Easterly, William, and Ross Levine. 1997. “Africa’s Growth Tragedy: Policies and Ethnic Divisions.” Quarterly Journal of Economics 112 (4): 1203–50. http://ssrn.com/abstract=88828.
Eberhard, Anton, Vivien Foster, Cecilia Briceño-Garmendia, Fatimata Ouedraogo, Daniel Camos, and Maria Shkaratan. 2008. “Under-powered: The State of the Power Sector in Sub-Saharan Africa.” Background Paper 6, Africa Infrastructure Sector Diagnostic, World Bank, Washington, DC.
Eberhard, Anton, and Clive Van Horen. 1995. Poverty and Power: Energy and the South African State. London: UCT and Pluto.
Ellis, Simon, and John Hine. 1998. “The Provi-sion of Rural Transport Services: Approach Paper.” Sub-Saharan Africa Transport Policy Program Working Paper 37, World Bank, Washington, DC.
Escribano, Alvaro, J. Luis Guasch, and Jorge Pena. 2008. “Impact of Infrastructure Constraints on Firm Productivity in Africa.” Working Paper 9, Africa Infrastructure Sector Diagnostic, World Bank, Washington, DC.
Esfahani, Hadi Salehi, and Maria Teresa Ramirez. 2003. “Institutions, Infrastructure, and Economic Growth.” Journal of Develop-ment Economics 70: 443–77. http://ssrn.com/abstract=310779.
Esrey, S. A., J. B. Potash, L. Roberts, and C. Shiff. 1991. “Effects of Improved Water Supply and Sanitation on Ascariasis, Diarrhea, Dracunculia-sis, Hookworm Infection, Schistosomiasis and

62 AFRICA’S INFRASTRUCTURE: A TIME FOR TRANSFORMATION
Trachoma.” Bulletin of the World Health Organi-zation 89 (5): 609–21.
Estache, Antonio. 2006. “Africa’s Infrastructure: Challenges and Opportunities.” Paper pre-sented at “Realizing the Potential for Profi table Investment in Africa” seminar, IMF Institute and Joint Africa Institute, Tunis, February 28–March 1.
Estache, Antonio, Biagio Speciale, and David Vere-das. 2005. “How Much Does Infrastructure Mat-ter for Growth in Sub-Saharan Africa?” World Bank, Washington, DC.
Fay, Marianne, Danny Leipziger, Quentin Wodon, and Tito Yepes. 2005. “Achieving Child-Health-Related Millennium Development Goals: The Role of Infrastructure.” World Development 33 (8): 1267–84.
Fedderke, Johannes W., and Zeljko Bogetic. 2006. “Infrastructure and Growth in South Africa: Direct and Indirect Productivity Impacts of 19 Infrastructure Measures.” Policy Research Work-ing Paper 3989, World Bank, Washington, DC.
Foley, Gerald. 1990. Electricity for Rural People. London: Panos Institute.
Grey, David, and Claudia Sadoff. 2006 “Water for Growth and Development: A Framework for Analysis.” Theme Document of the 4th World Water Forum, Mexico City, March.
Hutton, Guy. 2000. Considerations in Evaluating the Cost-Effectiveness of Environmental Health Inter-ventions. Geneva: World Health Organization.
Hutton, Guy, and Laurence Haller. 2004. Evalu-ation of the Costs and Benefi ts of Water and Sanitation Improvements at the Global Level: Water, Sanitation and Health Protection of the Human Environment. Geneva: World Health Organization.
IMF (International Monetary Fund). 2007. Regional Economic Outlook: Sub-Saharan Africa. Washington, DC: IMF.
Jimenez, Antonio, and Ken Olson. 1998. Renew-able Energy for Rural Health Clinics. Golden, CO: National Renewable Energy Laboratory. http://www.nrel.gov/docs/legosti/fy98/25233.pdf.
Kamara, Samura. 2008. “Restoring Economic Growth and Stability in Fragile and Post-Confl ict Low Income States: Views from the Trench.” Paper presented at World Bank Poverty Reduction and Economic Management confer-ence, Washington, DC, April 15–16.
Kenny, Charles. 2002. “The Costs and Benefi ts of ICTs for Direct Poverty Alleviation.” Develop-ment Policy Review 20: 141–57.
Kerf, Michel. 2003a. “Linkages between Energy and Poverty Alleviation.” World Bank, Washington, DC.
———. 2003b. “Linkages between ICT and Pov-erty Alleviation.” World Bank, Washington, DC.
———. 2003c. “Linkages between Transport and Poverty Alleviation.” World Bank, Washington, DC.
———. 2003d. “Linkages between Water and Sani-tation and Poverty Alleviation.” World Bank, Washington, DC.
Lall, Rajiv, Ritu Anand, and Anupam Rastogi. 2008. “Developing Physical Infrastructure: A Com-parative Perspective on the Experience of the People’s Republic of China and India.” Asian Development Bank, Manila.
Lanjouw, Peter, Jamie Quizon, and Robert Spar-row. 2001. “Non-Agricultural Earnings in Peri-Urban Areas of Tanzania: Evidence from Household Survey Data.” Food Policy 26: 385–403.
Limão, Nuno, and Anthony Venables. 1999. “Infra-structure, Geographical Disadvantage and Transportation Costs.” Policy Research Working Paper 2257, World Bank, Washington, DC.
Mayer, Rebecca, Ken Figueredo, Mike Jensen, Tim Kelly, Richard Green, and Alvaro Federico Barra. 2008. “Costing the Needs for Investment in ICT Infrastructure in Africa.” Background Paper 3, Africa Infrastructure Sector Diagnostic, World Bank, Washington, DC.
McCarthy, F. Desmond, and Holger Wolf. 2001. “Comparative Life Expectancy in Africa.” Policy Research Working Paper 2668, World Bank, Washington, DC.
Minges, Michael, Cecila Briceño-Garmendia, Mark Williams, Mavis Ampah, Daniel Camos, and Maria Shkratan. 2008. “Information and Com-munications Technology in Sub-Saharan Africa: A Sector Review.” Background Paper 10, Africa Infrastructure Sector Diagnostic, World Bank, Washington, DC.
Reinikka, Ritva, and Jakob Svensson. 1999a. “Confronting Competition: Firms’ Investment Response and Constraints in Uganda.” In Assessing an African Success: Farms, Firms, and Government in Uganda’s Recovery, ed. Paul Col-lier and Ritva Reinikka. Washington, DC: World Bank.
——. 1999b. “How Inadequate Provision of Pub-lic Infrastructure and Services Affects Private Investment.” Policy Research Working Paper 2262, World Bank, Washington, DC.
Rosnes, Orvika, and Haakon Vennemo. 2008. “Powering Up: Costing Power Infrastructure Investment Needs in Southern and Eastern Africa.” Background Paper 5, Africa Infra-structure Sector Diagnostic, World Bank, Washington, DC.

Meeting Africa’s Infrastructure Needs 63
Saunders, Robert J., Jeremy Warford, and Bjorn Wellenius. 1994. Telecommunications and Economic Development. 2nd ed. Baltimore: Johns Hopkins University Press for the World Bank.
Telecommunication Development Bureau. 1999. Telemedicine and Developing Countries—Lessons Learned. Geneva: International Telecommunica-tion Union.
Teravaninthorn, Supee, and Gaël Raballand. 2008. “Transport Prices and Costs in Africa: A Review of the Main International Corri-dors.” Working Paper 14, Africa Infrastructure Sector Diagnostic, World Bank, Washington, DC.
Venkataraman, K. 1990. “Rural Electrifi cation in the Asian and Pacifi c Region.” In Power Systems in Asia and the Pacifi c, with Emphasis on Rural Electrifi cation, ed. Economic and Social Com-mission for Asia and the Pacifi c, 310–32. New York: United Nations.
Vennemo, Haakon, and Ornica Rosnes. 2008. “Powering-Up: Costing Power Infrastructure Investment Needs in Africa.” Background Paper 5, Africa Infrastructure Country Diagnostic, World Bank, Washington, DC.
Wodon, Quentin, ed. 2008. “Electricity Tariffs and the Poor: Case Studies from Sub-Saharan Africa.” Working Paper 11, Africa Infrastruc-ture Country Diagnostic, World Bank, Washington, DC.
World Bank. 1996. “Socio-Economic Impact of Rural Roads: Impact Evaluation Report for the Fourth Highway Project in Morocco.” OED Report 15808-MOR, World Bank, Washington, DC.
———. 2000. “Ghana: Building a Stronger Transportation System.” Precis 189, Washington, DC.
———. 2001. Cities on the Move: A World Bank Urban Transport Strategy Review. Washington, DC: World Bank.
———. 2005. Global Monitoring Report 2005. Washington, DC: World Bank.
———. 2007. DEPweb glossary. Development Education Program, World Bank. http://www.worldbank.org/depweb/english/modules/glossary.html#middle-income.
Yepes, Tito. 2007. “New Estimates of Infrastructure Expenditure Requirements.” World Bank, Washington, DC.
Yepes, Tito, Justin Pierce, and Vivien Foster. 2008. “Making Sense of Sub-Saharan Africa’s Infrastructure Endowment: A Benchmarking Approach.” Working Paper 1, Africa Infra-structure Country Diagnostic, World Bank, Washington, DC.
You, Liang Zhi. 2008. “Irrigation Investment Needs in Sub-Saharan Africa.” Background Paper 9, Africa Infrastructure Country Diagnostic, World Bank, Washington, DC.


Chapter2
65
Closing Africa’s Funding Gap
T he cost of addressing Africa’s infrastruc-ture needs is estimated at $93 billion, some 15 percent of Africa’s GDP—about
two-thirds for investment and one-third for maintenance. The burden varies greatly by country type. About half of the capital invest-ment needs are for power, refl ecting the par-ticularly large physical defi cits in that area.
Existing spending is higher than previously thought. African governments, infrastructure users, the private sector, and external sources together already contribute about $45 billion to directly address the infrastructure needs previously identifi ed. About one-third of this amount is spent by middle-income countries, whereas fragile states barely account for 5 per-cent of it (about $2 billion in total), mirroring the weakness of their economies and the enormous disparity in terms of fi nancing and institutional capabilities across Sub-Saharan African countries. About two-thirds of the existing spending is domestically sourced, from taxes or user charges, and channeled through public institutions, making the public sector—governments and nonfi nancial pub-lic enterprises together—the most important fi nancier of capital investment, funding more than half of total investment.
Substantial evidence indicates that a lot more can be done within Africa’s existing resource envelope. Ineffi ciencies of various kinds total about $17 billion a year. If appro-priately tackled, fixing these inefficiencies could expand the existing resource envelope by 40 percent.
First, countries and development institu-tions allocate $3.3 billion in infrastructure spending to areas that appear surplus to the basic infrastructure requirements (as defi ned in chapter 1 of this volume), which suggests that public and aid fl ows can be redirected toward areas of greater impact on development.
Second, because only three-fourths of the capital budgets allocated to infrastructure are actually executed, about $2 billion in public investment is being lost.
Third, underspending on infrastructure asset maintenance is another major waste of resources because the cost of rehabilitating infrastructure assets is several times higher than the cumulative cost of sound preven-tive maintenance. In the road sector alone, addressing undermaintenance can save $1.9 billion a year in rehabilitation, or spending $1 on maintenance can be a savings of about $4 to the economy.
Chapter2

66 AFRICA’S INFRASTRUCTURE: A TIME FOR TRANSFORMATION
Fourth, Africa’s power and water utilities and state-owned telecommunication incumbents waste about $6 billion a year on ineffi ciencies such as overstaffi ng, revenue undercollection, and distribution losses.
Fifth, underpricing infrastructure services accounts for $4 billion a year in lost revenues.
In all, with existing allocation patterns and even if potential effi ciency gains are fully captured, a funding gap of $31 billion a year remains: three-quarters for capital and one-quarter for maintenance. About $23 billion of this gap relates to power and a further $11 bil-lion to water supply and sanitation (WSS). For fragile states, the funding gap is an implausible 25 percent of GDP on average, almost equally divided among energy, water, and transport.
How can Africa close such a sizable funding gap, equivalent to one-third of the estimated infrastructure needs? Additional funds will be required, and in a few countries—mainly the fragile ones—the magnitude of the funding gap calls for considering taking more time to attain targets or using lower-cost technologies. Historical trends do not suggest much pros-pect of increasing allocations from the public budget: even when fi scal surpluses existed, they did not visibly favor infrastructure. External fi nance has been buoyant in recent years, and disbursements will likely continue to grow as projects committed move to the implementa-tion stage. In light of today’s fi nancial crisis, however, prospects for new commitments do not look good. Private capital fl ows, in particu-lar, can be expected to decline. Fiscal pressure is growing in donor countries, and to judge by previous crises, foreign aid is likely to slow.
By delaying investment timetables, and assuming that effi ciency gains are fully cap-tured, many countries could even attain the infrastructure targets without increasing their spending envelopes. Targeting a high level of service might not always work in the best inter-est of a country. Lower-cost technologies can permit broadening the portion of the popula-tion with access to some level of service.
Closing Africa’s funding gap inevitably requires undertaking needed reforms to reduce or eliminate the ineffi ciencies of the system. Only then can the infrastructure sectors become attractive to a broader array of investors and
the countries benefi t fully from the additional fi nance. Otherwise, what is the use of pouring water into a leaking bucket?
Spending Allocated to Address Infrastructure Needs
Africa is spending $45 billion a year to address its infrastructure needs. Existing spending on infrastructure in Africa is higher than previ-ously thought when budget and off-budget spending (including state-owned enterprises and extrabudgetary funds) and external fi nanc-ing (comprising offi cial development assistance [ODA], fi nanciers from outside the Organisation for Economic Co-operation and Development [OECD], and private participation in infra-structure [PPI]) are taken into account. This level of spending is associated with allocations directly targeted to cover the needs identifi ed in chapter 1. In practice, however, some coun-tries spend more on some infrastructure subsec-tors than the estimated benchmark requirements while incurring funding gaps in other subsec-tors. This existing spending with potential for reallocation is not counted here but is consid-ered later in this chapter.
The four-way country typology introduced in chapter 1 of this volume—comprising mid-dle-income countries, resource-rich coun-tries, fragile states, and other low-income countries—serves as a basis for summarizing the diversity of infrastructure fi nancing chal-lenges (see box 1.1). Expressed as a percentage of GDP, infrastructure spending is comparable across the different country types, at around 5–6 percent of GDP, with the exception of nonfragile low-income countries, which spend at 10 percent of their GDP. In absolute dollar terms, the middle-income countries spend the most (roughly $16 billion), refl ecting their much larger purchasing power. Fragile states, by contrast, account for a tiny amount of over-all spending (about $2 billion), refl ecting the weakness of their economies (table 2.1).
The public sector, with the lion’s share of spending, is by far the most important fi nan-cier. In the middle-income countries, domestic public sector resources (comprising tax reve-nues and user charges raised by state-owned

Closing Africa’s Funding Gap 67
enterprises) account for the bulk of spending across all infrastructure subsectors. Across the other country typologies, domestic public sec-tor resources contribute approximately half of total spending. One-third of this aggregate public sector spending (or an equivalent of 1.5 percent of GDP) can be traced exclusively to capital investments.
This level of effort by African governments to develop their infrastructure pales when com-pared with what East Asian countries have done in recent decades. China, for example, adopted a determined and clear strategy to increase infra-structure investment (publicly and privately fi nanced) as a means of achieving accelerated economic growth. Fixed capital formation in Chinese infrastructure more than doubled between 1998 and 2005. By 2006, only infra-structure investment was higher than 14 percent of GDP, perhaps the highest in the world.
Excluding middle-income countries, external fi nanciers contribute roughly one-half of Afri-ca’s total spending on infrastructure. External sources include ODA from the OECD countries, offi cial fi nance from non-OECD countries (such as China, India, and the Arab funds), and PPI. External fi nance is primarily for investment—broadly defi ned to include asset rehabilitation and reconstruction—and in most cases does not provide for O&M. Since the late 1990s, PPI has been the largest source of external fi nance, fol-lowed by ODA and non-OECD fi nance, which are broadly comparable in magnitude.
Patterns of specialization are clear across the different sources of external fi nance ( fi gure 2.1). Across sectors, PPI is strongly concen-trated on information and communication technology (ICT), which shows the highest commercial returns. ODA has tended to focus on public goods with high social returns, nota-bly roads and water. Much non-OECD fi nance has gone to energy and, to a lesser extent, to railways, both sectors with strong links to industry and mining. Across countries, PPI has tended to go to middle-income and resource-rich countries, which have the greatest ability to pay for services. Non-OECD fi nance has shown a preference for resource-rich countries, with a strong pattern linking infrastructure investment and natural resource extraction, and ODA has preferred nonfragile low-income states with limited domestic resources but ade-quate institutional capacity. The fragile states do not seem to have captured their fair share from any of the external sources.
How Much More Can Be Done within the Existing Resource Envelope?
Africa is losing about $17 billion per year to various ineffi ciencies in infrastructure opera-tions or spending. In this context, four distinct opportunities can be identifi ed for effi ciency gains. First, improving budget execution rates
Table 2.1 Spending of Most Important Players Traced to Needs (Annualized Flows)
Percentage of GDP $ billions
O&M Capital expenditure
Total
O&M Capital expenditure
TotalCountry type
Public sector
Public sector ODA
Non-OECD fi nanciers Private
Total capital expenditures
Public sector
Public sector ODA
Non-OECD fi nanciers Private
Total capital expenditures
Middle income 3.7 1.2 0.1 0.0 0.8 2.1 5.8 10.0 3.1 0.2 0.0 2.3 5.7 15.7
Resource rich 1.1 1.5 0.2 0.7 1.7 4.1 5.2 2.5 3.4 0.5 1.4 3.8 9.1 11.7
Low-income nonfragile 4.0 1.5 2.2 0.5 1.9 6.1 10.1 4.4 1.6 2.5 0.6 2.1 6.7 11.1
Low-income fragile 2.0 0.6 1.0 0.8 1.2 3.6 5.6 0.8 0.2 0.4 0.3 0.5 1.4 2.1
Africa 3.2 1.5 0.6 0.4 1.5 3.9 7.1 20.4 9.4 3.6 2.5 9.4 24.9 45.3
Sources: Africa Infrastructure Country Diagnostic (AICD); Briceño-Garmendia, Smits, and Foster 2008 for public spending; PPIAF 2008 for private flows; Foster and others 2008 for non-OECD financiers. Note: Aggregate public sector covers general government and nonfinancial enterprises. Figures are extrapolations based on the 24-country sample covered in AICD Phase 1. Totals may not add exactly because of rounding errors. O&M = operation and maintenance; ODA = official development assistance; OECD = Organisation for Economic Co-operation and Development; Private = private participation in infrastructure and household self-finance of sanitation facilities.
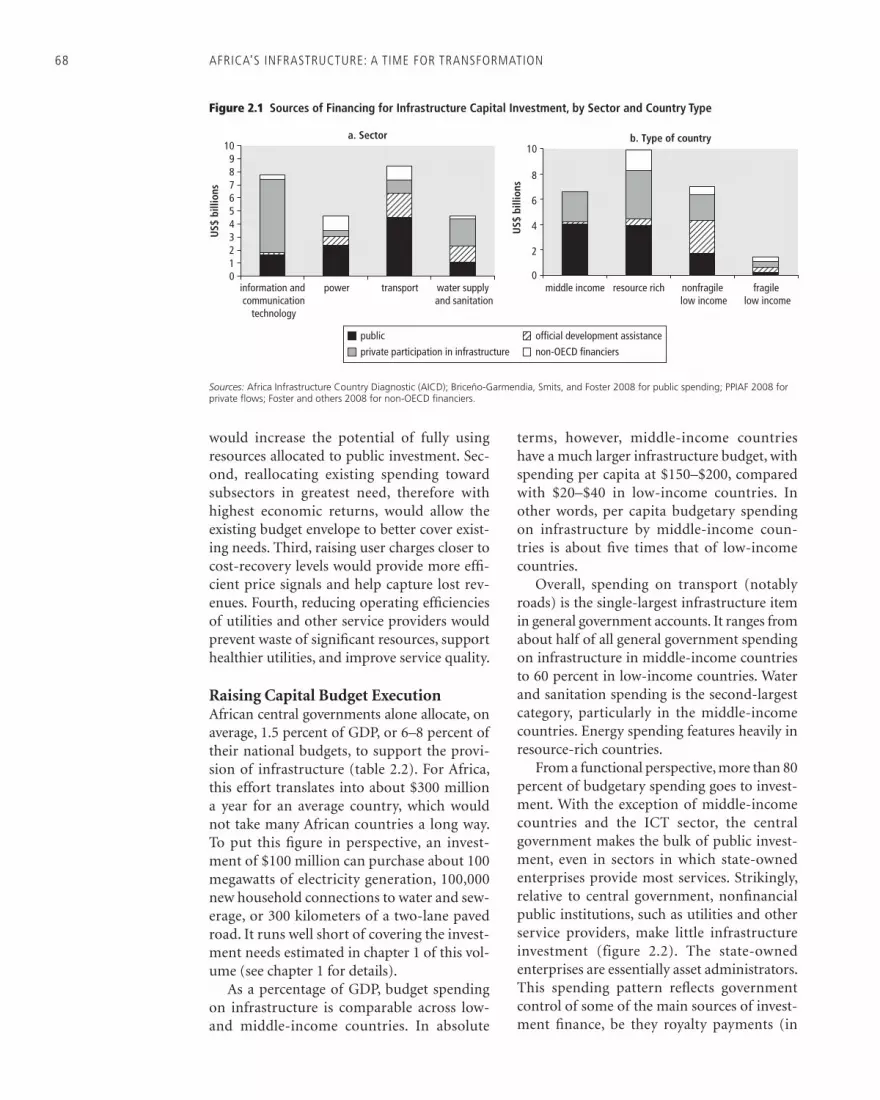
68 AFRICA’S INFRASTRUCTURE: A TIME FOR TRANSFORMATION
would increase the potential of fully using resources allocated to public investment. Sec-ond, reallocating existing spending toward subsectors in greatest need, therefore with highest economic returns, would allow the existing budget envelope to better cover exist-ing needs. Third, raising user charges closer to cost-recovery levels would provide more effi -cient price signals and help capture lost rev-enues. Fourth, reducing operating effi ciencies of utilities and other service providers would prevent waste of signifi cant resources, support healthier utilities, and improve service quality.
Raising Capital Budget Execution African central governments alone allocate, on average, 1.5 percent of GDP, or 6–8 percent of their national budgets, to support the provi-sion of infrastructure (table 2.2). For Africa, this effort translates into about $300 million a year for an average country, which would not take many African countries a long way. To put this fi gure in perspective, an invest-ment of $100 million can purchase about 100 megawatts of electricity generation, 100,000 new household connections to water and sew-erage, or 300 kilometers of a two-lane paved road. It runs well short of covering the invest-ment needs estimated in chapter 1 of this vol-ume (see chapter 1 for details).
As a percentage of GDP, budget spending on infrastructure is comparable across low- and middle-income countries. In absolute
terms, however, middle-income countries have a much larger infrastructure budget, with spending per capita at $150–$200, compared with $20–$40 in low-income countries. In other words, per capita budgetary spending on infrastructure by middle-income coun-tries is about fi ve times that of low-income countries.
Overall, spending on transport (notably roads) is the single-largest infrastructure item in general government accounts. It ranges from about half of all general government spending on infrastructure in middle-income countries to 60 percent in low-income countries. Water and sanitation spending is the second-largest category, particularly in the middle-income countries. Energy spending features heavily in resource-rich countries.
From a functional perspective, more than 80 percent of budgetary spending goes to invest-ment. With the exception of middle- income countries and the ICT sector, the central government makes the bulk of public invest-ment, even in sectors in which state-owned enterprises provide most services. Strikingly, relative to central government, nonfi nancial public institutions, such as utilities and other service providers, make little infrastructure investment (figure 2.2). The state-owned enterprises are essentially asset administrators. This spending pattern refl ects government control of some of the main sources of invest-ment fi nance, be they royalty payments (in
0123456789
10
information and communication
technology
US$
bill
ions
US$
bill
ions
power
a. Sector b. Type of country
transport water supply and sanitation
0
2
4
6
8
10
middle income resource rich nonfragile low income
fragile low income
public official development assistance
private participation in infrastructure non-OECD financiers
Figure 2.1 Sources of Financing for Infrastructure Capital Investment, by Sector and Country Type
Sources: Africa Infrastructure Country Diagnostic (AICD); Briceño-Garmendia, Smits, and Foster 2008 for public spending; PPIAF 2008 for private flows; Foster and others 2008 for non-OECD financiers.

Closing Africa’s Funding Gap 69
resource-rich countries) or external develop-ment funds (in low-income countries). It also refl ects to some extent the limited capability of state-owned enterprises to fund their capital investment through user fees.
Because central governments are such key players in infrastructure investment, ineffi cien-cies within the public expenditure management systems are particularly detrimental. By way of example, central governments face signifi cant problems in executing their infrastructure bud-gets. African countries are, on average, unable to spend as much as one-quarter of their capi-tal budgets and one-third of their recurrent budgets in the corresponding fi scal year (table 2.3). The poor timing of project appraisals and late releases of budgeted funds because of pro-curement problems often prevent the use of resources within the budget cycle. Delays affect-ing in-year fund releases are also associated with poor project preparation, leading to changes in the terms agreed upon with contractors in the original contract (deadlines, technical spec-ifi cations, budgets, costs, and so on). In other cases, cash is reallocated to nondiscretionary spending driven by political or social pres-sures. Historically, the road sector is the worst offender of unused budget allocations, some-times as much as 60 percent of the budget.
Improving the effi ciency of budget execu-tion could make a further $2 billion available for infrastructure spending each year. If the bot-tlenecks in capital execution could be resolved, countries could on average increase their capital spending by about 30 percent without any increase in current budget allocations. This
fi nding assumes, arguably a stretch, that budget estimates are realistic and aligned with resources available. Either way, the associated saving sug-gests that the resolution of these planning, bud-geting, and procurement challenges should be central to the region’s reform agenda.
Even if budgets are fully spent, concerns exist about whether funds reach their fi nal destinations. A few public expenditure track-ing surveys have attempted to trace the share of each budget dollar that results in pro-ductive front-line expenditures. Most of the existing case studies concern social sectors, rather than infrastructure, but they illustrate
Table 2.2 Annual Budgetary Flows
Percentage of GDP $ billions
Country type Electricity ICT Irrigation Transport WSS Total Electricity ICT Irrigation Transport WSS Total
Middle income 0.0 0.1 0.1 0.6 0.7 1.5 0.0 0.2 0.2 1.7 1.8 4.0
Resource rich 0.4 0.0 0.1 0.8 0.3 1.6 0.8 0.0 0.3 1.7 0.7 3.6
Low-income nonfragile 0.1 0.1 0.3 0.7 0.3 1.5 0.1 0.1 0.3 0.8 0.4 1.7
Low-income fragile — — — 0.6 0.1 0.7 — — — 0.2 0.0 0.3
Africa 0.1 0.1 0.1 0.7 0.5 1.5 0.8 0.4 0.8 4.4 3.1 9.5
Sources: Africa Infrastructure Country Diagnostic; Briceño-Garmendia, Smits, and Foster 2008.Note: Based on annualized averages for 2001–06. Averages weighted by country GDP. Figures are extrapolations based on the 24-country sample covered in AICD Phase 1. Totals may not add exactly because of rounding errors. ICT = information and communication technology; WSS = water supply and sanitation. — Not available.
Figure 2.2 Split Investment Responsibilities between Governments and Public Enterprises, by Type of Country and Sector
Sources: Africa Infrastructure Country Diagnostic; Briceño-Garmendia, Smits, and Foster 2008.Note: Based on annualized averages for 2001–06. Averages weighted by country GDP.
0
middle
incom
e
resou
rce ric
h
nonfr
agile
low in
come
fragil
e low
inco
me
middle
incom
e
resou
rce ric
h
nonfr
agile
low in
come
fragil
e low
inco
me
middle
incom
e
resou
rce ric
h
nonfr
agile
low in
come
fragil
e low
inco
me
middle
incom
e
resou
rce ric
h
nonfr
agile
low in
come
fragil
e low
inco
me
0.1
information and communication
technology
power transport water
0.20.30.40.50.60.70.80.91.0
% o
f GD
P
public enterprisesgovernment

70 AFRICA’S INFRASTRUCTURE: A TIME FOR TRANSFORMATION
leakages of public capital spending as high as 92 percent (see Pritchett 1996; Rajkumar and Swaroop 2002; Reinikka and Svensson 2002, 2003; Warlters and Auriol 2005; and references cited therein).
Reallocating Existing Spending to Subsectors in Need About $3.3 billion a year is spent above the estimated requirements to meet the identifi ed infrastructure needs (see chapter 1 in this vol-ume). This spending—funded by (or through) public budgets—includes domestically raised funds and international aid (OECD and non-OECD sources). Most of this apparent over-spending is in telecommunications in countries that have maintained state ownership of the fi xed-line incumbent. State ownership not only uses expensive public resources in activities that the already competitive telecommunication market can provide but also forgoes future tax revenues from expanded business activity. To a much lesser extent and only in middle-income countries, the other sector showing potential for reallocation is transport. The overspending in this case is driven by apparent overinvest-ment in road networks that, as will be seen later, paradoxically coexists with undermainte-nance (table 2.4).
How much of that spending in ‘‘excess’’ of infrastructure needs is infl uenced by politi-cal factors? How far are these politics-tainted decisions from economic optimization? How should these resources be reallocated? Estimates of the economic rates of return to key infrastructure interventions can provide some answers.
Across infrastructure interventions in Africa, the rates of return to road maintenance are
the highest, averaging for the continent more than a 100 percent economic rate of return and well above returns for rehabilitation and new construction (table 2.5). By favoring investment over maintenance, African govern-ments have been implicitly equating public investment with productive expenditure, even though not all investment is productive and not all current spending is wasteful.1 The maintenance of public goods under the juris-diction of general governments is essential to harness the economic returns to capital and to avoid costly rehabilitation. Highest returns to maintenance are seen in networks already well developed, particularly in middle-income coun-tries and nonfragile low-income countries.
From a sectoral perspective, economic returns to railway investments are the lowest among infrastructure interventions. Railway rehabilitation interventions are justifi ed only for a few higher traffi c systems. Investment in water supply and irrigation would bring very solid returns in health benefi ts and productiv-ity, but returns to power generation need to be compounded by coordinated investment in transmission and distribution networks.
Improving Cost Recovery from User Charges Two-thirds of African power and water utili-ties apply tariffs that comfortably cover oper-ating costs, but only one-fi fth of those utilities set tariffs high enough to recover full capital costs. Achieving recovery of only operating costs across all African power and water utili-ties would raise $2.5 billion a year (0.4 percent of the region’s GDP). Revising tariffs to make them equal to long-term marginal costs, and thereby enabling all African power and water
Table 2.3 Average Budget Variation Ratios for Capital Spending
Country type Electricity Communication Roads Transport WSS IrrigationOverall
infrastructure
Middle income — 100 75 100 66 60 78
Resource rich 60 37 71 73 43 — 65
Low-income nonfragile 75 64 72 72 72 68 76
Low-income fragile — — — — — — —
Sub-Saharan Africa 66 72 73 79 66 66 75
Sources: Africa Infrastructure Country Diagnostic; adapted from Briceño-Garmendia, Smits, and Foster 2008.Note: Budget variation ratio is defined as executed budget divided by allocated budget. Based on annualized averages for 2001–06. WSS = water supply and sanitation. — Not available.

Closing Africa’s Funding Gap 71
utilities to recover capital costs also, would increase the potential for effi ciency gains to $4.2 billion a year (0.7 percent of the region’s GDP; table 2.6). Although underpricing is equally prevalent in power and water utilities, the value of the lost GDP revenues is slightly higher for power (at 0.4 percent of GDP) than for water (at 0.3 percent).
Raising tariffs to cost-recovery levels is evi-dently easier said than done and entails a host of social and political challenges. Chapter 3 in this volume examines these issues in greater depth and provides a realistic appraisal of the feasibility of improving cost recovery for util-ity services in Africa.
In the road sector, a widespread movement exists for using fuel levies and taxes as indirect user charges (see chapter 10 in this volume). For this system to work, fuel levies need to be set high enough to cover the maintenance costs imposed by the use of the road network. Comparing existing fuel levies with the levels needed to secure road maintenance makes it possible to estimate the underpricing in roads.
Underpricing user charges for roads costs the region some $0.6 billion a year (0.1 percent of GDP).
Reducing the Operating Ineffi ciencies of Utilities African state-owned enterprises are charac-terized by low investment and high operating ineffi ciency. State-owned enterprises account for between 80 percent (energy) and 40 per-cent (water) of total public expenditures (general government and nonfi nancial enter-prises). Despite their large resource base, they invest comparatively little—on average, an equivalent of between 15 percent (energy) and 18 percent (water) of the government resource envelope. As a result, governments are typi-cally required to step in to assume most of the investment responsibilities of state-owned enterprises, which are relegated to undertak-ing daily operation and maintenance. In many cases, investment is unaffordable because of the signifi cant underpricing of services, which barely allows the recovery of operating costs.
Table 2.4 Existing Disbursements above Those Directed to Infrastructure Needs, Annualized Flows
Percentage of GDP $ billions
Country type Electricity ICT Irrigation Transport WSS Total Electricity ICT Irrigation Transport WSS Total
Middle income — 1.4 — 0.0 0.1 1.5 — 3.7 — 0.0 0.3 4.1
Resource rich — — 0.0 0.4 — 0.4 — — 0.0 0.8 — 0.8
Low-income nonfragile — 0.1 — 0.2 — 0.3 — 0.1 — 0.3 — 0.4
Low-income fragile — — — — — — — — — — — —
Africa — 0.5 — — — 0.5 — 3.3 — — — 3.3
Source: Africa Infrastructure Country Diagnostic.Note: Based on annualized averages for 2001–06. Averages weighted by country GDP. Figures are extrapolations based on the 24-country sample covered in AICD Phase 1. Totals for Africa differ from the sum of the individual groups because reallocation is allowed only within groups. ICT = information communication and technology; WSS = water supply and sanitation. — Not available.
Table 2.5 Economic Rates of Return for Key Infrastructure
Country typeRailway
rehabilitation IrrigationRoad
rehabilitationRoad
upgradesRoad
maintenance Generation Water
Middle income 18.5 19.3 45.4 19.8 143.0 13.6 26.8
Resource rich 10.8 24.2 16.2 17.4 114.5 20.2 37.0
Low-income nonfragile 6.2 17.2 17.6 12.8 125.7 14.3 7.7
Low-income fragile 2.5 — 9.2 12.0 67.6 24.7 36.9
Sub-Saharan Africa 5.1 22.2 24.2 17.0 138.8 18.9 23.3
Source: Africa Infrastructure Country Diagnostic. Note: — Not available.

72 AFRICA’S INFRASTRUCTURE: A TIME FOR TRANSFORMATION
In addition, most state-owned enterprises operate at arm’s length from the central gov-ernment, failing in practice to meet criteria for sound commercial management. When these enterprises run into fi nancial diffi cul-ties, the general government—as the main stakeholder—acts as the lender of last resort, absorbing debts and assuming by default the fi nancial, political, regulatory, and misman-agement risks. Lumpy capitalizations and debt swaps that cover the cumulative cost of opera-tional ineffi ciencies are frequent events in the African utility sector, which can potentially create a moral hazard that would perpetuate operational ineffi ciencies if proactive reforms are not undertaken.
This section considers four types of oper-ational inefficiencies and estimates their potential monetary value. First, state-owned enterprises may retain more employees than is strictly necessary to discharge their func-tions, often because of political pressure to provide jobs for members of certain interest groups. This issue affects state-owned enter-prises across the board, including those in ICT, power, and water. Second, utilities incur substantial losses on their power and water distribution networks. Both poor network maintenance, which leads to physical leakage, and poor network management, which leads to clandestine connections and various forms of theft, contribute to these losses. Third, power and water utilities face serious problems in col-lecting their bills, largely a result of the social and political impediments to disconnecting services, which lead to a nonpayment culture.
Fourth, the undermaintenance of infrastruc-ture assets is widespread but represents a false economy because the rehabilitation of assets is usually much more costly in present-value terms than the preventive maintenance to avoid such asset deterioration.
Overemployment. Overemployment reaches $1.5 billion a year (0.24 percent of GDP; table 2.7). Most overemployment was found in telecommunication utilities in countries that have retained state ownership of their fi xed-line incumbent. In Sub-Saharan Africa, such utilities achieve, on average, 94 connections per employee, compared to developing-country benchmarks of 420 connections per employee, an overemployment ratio of 600 percent. Similarly, African power and water utilities have overemployment ratios of 88 percent and 24 percent, respectively, over non-African developing-country benchmarks. These striking results for labor ineffi ciencies underscore the importance of strengthening external governance mechanisms that can impose discipline on the behavior of state-owned enterprises. Overemployment par-tially explains why in African countries with a publicly owned operator, the share of spend-ing allocated to capital spending frequently remains below 25 percent of total spending despite pressing investment needs.
Distribution Losses. Distribution losses amount to $1.8 billion a year (0.3 percent of GDP). Afri-can power utilities typically lose 23 percent of their energy in distribution losses, more than
Table 2.6 Potential Gains from Increased Cost Recovery
Percentage of GDP $ billions annually
Country type Electricity ICT Irrigation Transport WSS Total Electricity ICT Irrigation Transport WSS Total
Middle income 0.0 — — 0.0 0.4 0.4 0.0 — — 0.0 1.0 1.0
Resource rich 0.8 — — 0.1 0.1 0.9 1.7 — — 0.2 0.2 2.0
Low-income nonfragile 0.8 — — 0.2 0.3 1.1 0.8 — — 0.2 0.3 1.3
Low-income fragile 0.0 — — 0.1 0.6 0.7 0.0 — — 0.0 0.2 0.3
Africa 0.4 — — 0.1 0.3 0.7 2.3 — — 0.6 1.8 4.7
Source: Africa Infrastructure Country Diagnostic.Note: Based on annualized averages for 2001–06. Averages weighted by country GDP. Figures are extrapolations based on the 24-country sample covered in AICD Phase 1. Totals may not add exactly because of rounding errors. ICT = information and communication technology; WSS = water supply and sanitation. — Not available.

Closing Africa’s Funding Gap 73
twice the best practice of 10 percent. Similarly, African water utilities typically lose 35 percent of their water in distribution losses, nearly twice the 20 percent benchmark. The fi nan-cial value of those distribution losses is much higher for power at $1.3 billion per year than for water at $0.5 billion per year.
Undercollection of Bills. The undercollection of bills amounts to $2.9 billion a year (0.5 per-cent of GDP). African power and water utili-ties manage to collect about 90 percent of the bills owed to them by their customers, short of a best practice of 100 percent. Again, although water utilities perform worse than power utili-ties at the enterprise level, the fi nancial value of the losses is much greater for power. In many African countries, public institutions are among the worst offenders in failing to pay for utility services. The undercollection of fuel levies for road sector maintenance is also an issue, although the absolute values for this ineffi ciency are smaller than expected.
Undermaintenance. Deferring maintenance expenditures is perhaps the most perverse ineffi -ciency and the hardest to quantify. Given the pre-carious fi nancing position of the infrastructure sectors, cutting back on maintenance is often the only way to make ends meet, but spending too little on maintenance is a false economy. Rehabilitating or replacing poorly maintained assets is much more costly than keeping them up with sound preventive maintenance. Moreover, consumers end up suffering as service quality gradually declines. Indeed, not providing main-tenance and replacement investment is the most costly way of fi nancing today’s operations.
On average, 30 percent of African infra-structure assets need rehabilitation (fi gure 2.3). Although documenting the exact magnitude of undermaintenance is diffi cult, the share of today’s assets in need of rehabilitation provides a good indicator of past neglect. In general, the state of rural infrastructure is substantially worse than the rest, with 35 percent of assets in need of rehabilitation, compared with 25 per-cent elsewhere and 40 percent of roads. Wide differences exist across countries. In the best cases (Burkina Faso and South Africa), little more than 10 percent of assets need rehabilita-tion, and in the worst cases (the Democratic Republic of Congo, Nigeria, Rwanda, and Uganda), more than 40 percent do.
For roads alone, undermaintenance over time leads to additional capital spending of $1.4 billion a year (0.2 percent of GDP).
Table 2.7 Potential Gains from Greater Operational Efficiency
Operational ineffi ciencies
Percentage of GDP $ billions annually
Electricity ICT IrrigationTransport (roads) WSS Total Electricity ICT Irrigation
Transport (roads) WSS Total
Losses 0.2 — — — 0.1 0.3 1.3 — — 0.5 1.8
Undercollection 0.3 — — 0.1 0.1 0.5 1.9 — 0.5 0.5 2.9
Labor ineffi ciencies 0.0 0.2 — — — 0.2 0.3 1.3 — — 0.0 1.5
Undermaintenance — — — 0.2 — 0.2 — 1.4 — 1.4
Total 0.5 0.2 — 0.3 0.2 1.2 3.4 1.3 — 1.9 1.0 7.5
Source: Africa Infrastructure Country Diagnostic.Note: Based on annualized averages for 2001–06. Averages weighted by country GDP. Figures are extrapolations based on the 24-country sample covered in AICD Phase 1. Totals may not add exactly because of rounding errors. ICT = information and communication technology; WSS = water supply and sanitation. — Not available.
0
10
20
% o
f ass
ets
in n
eed
of r
ehab
ilita
tion
30
40
50
power
gene
ration
nonru
ral av
erage
main ro
ads
overa
ll ave
rage
irriga
tion
urban
wate
r
rural
water
rural
avera
ge
railw
ays
rural
roads
Source: Briceño-Garmendia, Smits, and Foster 2008.
Figure 2.3 Rehabilitation Backlog

74 AFRICA’S INFRASTRUCTURE: A TIME FOR TRANSFORMATION
Although undermaintenance affects all infra-structure sectors, only for roads were suffi -cient data available to quantify the cost. Every $1 that goes unspent on road maintenance leads to a $4 liability to the economy (Nogales 2009). Therefore, capital spending on roads is much higher than it would otherwise need to be—with continual reconstructing of the same assets rather than creating new ones. The vast majority of Sub-Saharan African countries do not cover road maintenance costs; more than half of the countries have shortfalls of over 40 percent of maintenance needs. However, institutions seem to have an important role to play. Countries with well-designed second-generation road funds seem to do much bet-ter in meeting their maintenance needs (see chapter 10 in this volume).
Closing the Effi ciency Gap by Promoting Reforms In sum, $17.4 billion could be captured through improvements in infrastructure man-agement and institutions. The largest potential gains of $7.5 billion a year come from address-ing operating ineffi ciencies. Some of the most pressing and most rewarding would be resolv-ing undermaintenance of roads and increas-ing the effi ciency of the power utilities. The second-largest potential gains of $3.3 billion a year come from improving the allocation of existing resources across sectors, essentially
transferring resources from areas that seem to be overfunded to areas that are clearly under-funded. The next-largest potential gain of $4.7 billion a year would come from raising user charges for infrastructure services. Again, better pricing of power produces the greatest dividends. Finally, raising budget execution ratios through improvements in the public expenditure framework could capture an addi-tional $2 billion a year.
Addressing some of the operational defi -ciencies may require substantial investments in network rehabilitation or system upgrades. Reallocating resources, raising user charges, and reducing overemployment all carry signifi cant political costs, which complicate their imple-mentation. Therefore, expecting that all these effi ciency gains could be fully captured is unre-alistic. Given the magnitude of the needs, cap-turing only half of them would much improve the fi nancing and the perspectives for new fi nancing in the African infrastructure sectors.
Even if all these effi ciency gains could be fully realized, a sizable funding gap would remain. Chapter 1 of this volume identifi ed spending requirements of $93 billion a year to address Africa’s infrastructure needs. Setting these requirements against the $45 billion of existing spending directly traced to these needs and the $17 billion of potential effi ciency gains still leaves an annual infrastructure funding gap of $31 billion (table 2.8).
Table 2.8 Finding Resources: The Efficiency Gap and the Funding Gap$ billions annually
Item Electricity ICT Irrigation Transport WSSCross-sector
gain Total
Infrastructure spending needs (40.8) (9.0) (3.4) (18.2) (21.9) n.a. (93.3)
Existing spending 11.6 9.0 0.9 16.2 7.6 n.a. 45.3
Effi ciency gap 6.0 1.3 0.1 3.8 2.9 3.3 17.4
Gain from raising capital execution 0.2 0.0 0.1 1.3 0.2 n.a. 1.9
Gain from eliminating operational ineffi ciencies 3.4 1.2 — 1.9 1.0 n.a. 7.5
Gain from tariff cost recovery 2.3 — — 0.6 1.8 n.a. 4.7
Potential for reallocation n.a. n.a. n.a. n.a. n.a. 3.3 3.3
Funding gap (23.2) 1.3 (2.4) 1.9 (11.4) 3.3 (30.6)
Source: Briceño-Garmendia, Smits, and Foster 2008.Note: ICT = information and communication technology; n.a. = not applicable; — = not available; WSS = water supply and sanitation. Parentheses indicate negative values.

Closing Africa’s Funding Gap 75
Annual Funding Gap
Existing spending and potential effi ciency gains can be netted from estimated spend-ing needs to gauge the extent of the shortfall. The result is that Africa still faces an annual funding gap of about $31 billion (5.1 percent of GDP). Over 70 percent of the infrastruc-ture funding gap is for energy, representing a shortfall of $23 billion a year. The rest of the gap is related to WSS, where about an additional $11 billion is needed annually to meet the Millennium Development Goals (MDGs), and to a lesser extent irrigation, which accounts for roughly $2 billion annu-ally of the funding gap. No funding gap was found for ICT and transport, where, on the contrary, close to $1 billion and $2 billion a year, respectively, could be available if effi -ciencies were captured within each of these sectors (table 2.9).
About 60 percent of the funding gap relates to low-income fragile and nonfragile coun-tries combined. The resource-rich countries generate one-fourth of the funding gap, and a further 18 percent of the gap is attributable to middle-income countries. As a percentage of GDP, the burden of the shortfall for resource-rich and middle-income countries is smallest at 2–4 percent of GDP. Nonfragile low-income countries face a shortfall of 9 percent of GDP, and fragile states face an insurmountable 25 percent. By far, the largest funding gaps relative to GDP are for energy and water in fragile states.
Although the infrastructure funding gap is primarily for capital investment, a shortfall also exists for O&M. About two-thirds of the infrastructure funding gap relates to shortfalls in capital investment. All together, Africa needs to increase infrastructure capital investment by 5 percent of its GDP (approximately $28 bil-lion annually); nonfragile low-income coun-tries need to invest an additional 8 percent, and fragile states an additional 18 percent. The remainder of the infrastructure funding gap relates to O&M: low-income countries cover at most two-thirds of their O&M needs.
Closing the $31 billion infrastructure fund-ing gap is partly about raising additional funds but also about possibly taking more time to attain targets or using lower-cost technolo-gies. The remainder of this chapter evaluates the potential for raising additional fi nance and very generally explores policy adjustments to reduce the price tag and the burden of the fi nancial gap.
How Much Additional Finance Can Be Raised?
Only a limited number of fi nancing sources are available, and the current global fi nancial crisis is likely to affect them all adversely. First, domestic public fi nance is the largest source of funding today, but it presents little scope for an increase, except possibly in countries enjoy-ing natural resource windfalls. Second, ODA to African infrastructure has grown substantially
Table 2.9 Funding Gaps, by Sector and Country Group
Percentage of GDP $ billions annually
Country type Electricity ICT Irrigation Transport WSS
Potential for
reallocation Total Electricity ICT Irrigation Transport WSS
Potential for
reallocation Total
Middle income 3.9 (0.3) 0.0 (0.1) 0.0 (1.5) 2.0 10.7 (0.9) 0.1 (0.3) 0.0 (4.1) 5.5
Resource rich 2.0 0.2 0.8 (0.6) 1.7 (0.4) 3.7 4.5 0.5 1.8 (1.4) 3.7 (0.8) 8.2
Low-income nonfragile 4.2 (0.2) 0.6 (0.4) 4.7 (0.3) 8.6 4.7 (0.2) 0.7 (0.5) 5.2 (0.4) 9.5
Low-income fragile 7.1 1.9 0.1 5.3 10.2 0.0 24.6 2.7 0.7 0.0 2.0 3.9 0.0 9.4
Africa 3.6 (0.2) 0.4 (0.3) 1.8 (0.5) 4.8 23.2 (1.3) 2.4 (1.9) 11.4 (3.3) 30.6
Source: Africa Infrastructure Country Diagnostic.Note: Based on annualized averages for 2001–06. Averages weighted by country GDP. Figures are extrapolations based on the 24-country sample covered in AICD Phase 1. Totals do not add because efficiency gains cannot be carried across country groups. ICT = information and communication technology; WSS = water supply and sanitation.

76 AFRICA’S INFRASTRUCTURE: A TIME FOR TRANSFORMATION
in recent years in line with political pledges, but this assistance could slow down if countercycli-cal assistance is put in place. Third, non-OECD fi nance has been rising steeply, but its future is now unclear. Fourth, private participation, also very buoyant during Africa’s recent growth upswing, will be particularly vulnerable to the downturn in global markets. Finally, local capital markets have so far contributed little to infrastructure fi nance outside South Africa, but they could eventually become more important in some of the region’s larger economies.
Little Scope for Raising More Domestic FinanceA key question is the extent to which coun-tries may be willing to allocate additional fi scal resources to infrastructure. In the run-up to the current fi nancial crisis, the fi scal situation in Sub-Saharan Africa was favorable. Rapid eco-nomic growth averaging 4 percent a year from 2001 to 2005 translated into increased domestic fi scal revenues of just over 3 percent of GDP on average. In resource-rich countries, burgeoning resource royalties added 7.7 percent of GDP to the public budget. In low-income countries, substantial debt relief increased external grants by almost 2 percent of GDP.
To what extent were the additional resources available during the recent growth surge allo-cated to infrastructure? The answer is surpris-ingly little (table 2.10). The most extreme case is that of the resource-rich countries, particu-larly Nigeria. Huge debt repayments more than fully absorbed the fi scal windfalls in these countries. As a result, budgetary spend-ing actually contracted by 3.7 percent of GDP,
with infrastructure investment bearing much of that, falling by almost 1.5 percent of GDP. In middle-income countries, budgetary spend-ing increased by almost 4.1 percent of GDP, but the effect on infrastructure spending was almost negligible, and the additional resources went primarily to current social sector spend-ing. Only in the low-income countries did the overall increases in budgetary expenditure have some effect on infrastructure spend-ing. Even there, however, the effect was fairly modest and confi ned to capital spending. The nonfragile low-income countries have allo-cated 30 percent of the budgetary increase to infrastructure investments. The fragile states, despite seeing their overall budgetary expenditures increase by about 3.9 percent of GDP, have allocated only 6 percent of the increase to infrastructure.
Compared with other developing regions, public fi nancing capabilities in Sub-Saharan Africa are characterized by weak tax revenue collection. Domestic revenue generation around 23 percent of GDP trails averages for other developing countries and is lowest for low-income countries (less than 15 percent of GDP a year). Despite the high growth rates in the last decade, domestically raised revenues grew by less than 1.2 percent of GDP. This fi nding suggests that increasing domestic revenues above what is currently raised would require undertaking challenging institutional reforms to increase the effectiveness of revenue collection and broaden the tax base. Without such reforms, domestic revenue generation will remain weak.
The borrowing capacity from domestic and external sources is also limited. Domestic
Table 2.10 Net Change in Central Government Budgets, by Economic Use, 1995–2004percentage of GDP
UseSub-Saharan
Africa Middle income Resource richLow-income nonfragile
Low-income fragile
Net expenditure budget 1.89 4.08 (3.73) 1.69 3.85
Current infrastructure spending as a share of expenditures 0.00 0.02 0.03 0.00 0.09
Capital infrastructure spending as a share of expenditures (0.14) 0.04 (1.46) 0.54 0.22
Source: Africa Infrastructure Country Diagnostic, adapted from Briceño-Garmendia, Smits, and Foster 2008.Note: Based on annualized averages for 2001–06. Averages weighted by country GDP. Totals are extrapolations based on the 24-country sample as covered in AICD Phase 1.

Closing Africa’s Funding Gap 77
borrowing is often very expensive, with inter-est rates far exceeding those on concessional external loans. Particularly for the poorest countries, the scarcity of private domestic sav-ings means that public domestic borrowing tends to precipitate sharp increases in interest rates, building up a vicious circle. For many Sub-Saharan countries, the ratios of debt ser-vice to GDP are more than 6 percent.
The global fi nancial crisis can be expected to reduce fi scal receipts because of lower revenues from taxes, royalties, and user charges. Africa is not exempt from its impact. Growth projections for the coming years have been revised down-ward from 5.1 to 3.5 percent, which will reduce tax revenues and likely depress the demand and willingness to pay for infrastructure ser-vices. Commodity prices have fallen to levels of the early 2000s. The effect on royalty revenues, however, will depend on the saving regime in each country. A number of oil producers have been saving royalty revenues in excess of $60 a barrel, so the current downturn will affect sav-ings accounts more than budgets. Overall, this adverse situation created by the global fi nan-cial crisis will put substantial pressure on public sector budgets. In addition, many African coun-tries are devaluing their currency, reducing the purchasing power of domestic resources.
Based on recent global experience, fi scal adjustment episodes tend to fall dispropor-tionately on public investment—and infra-structure in particular.2 Experience from earlier crises in East Asia and Latin America indicates that infrastructure spending is par-ticularly vulnerable to budget cutbacks dur-ing crisis periods. Based on averages for eight Latin American countries, cuts in infrastruc-ture investment amounted to about 40 percent of the observed fi scal adjustment between the early 1980s and late 1990s (Calderón and Servén 2004). This reduction was remark-able because public infrastructure investment already represented less than 25 percent of overall public investment in Latin American countries. These infrastructure investment cuts were later identifi ed as the underlying problem holding back economic growth in the whole region during the 2000s (box 2.1). Sim-ilar patterns were observed in East Asia dur-ing the fi nancial crisis of the mid-1990s. For
example, Indonesia’s total public investment in infrastructure dropped from 6–7 percent of GDP in 1995–97 to 2 percent in 2000. Given recent spending patterns, every reason exists to expect that, in Africa, changes in the over-all budget envelope will affect infrastructure investment in a similar pro-cyclical manner.
Offi cial Development Assistance—Sustaining the Scale-UpFor most of the 1990s and early 2000s, ODA to infrastructure in Sub-Saharan Africa remained steady at a meager $2 billion a year. The launch of the Commission for Africa Report in 2004 was followed by the Group of Eight Gleneagles
BOX 2 .1
Does Defi cit-Financed Public Investment in Infrastructure Pay for Itself?Underinvestment in infrastructure, health, and education during much of the 1990s has ignited a lively debate on whether some countries could tolerate a larger public defi cit if the additional resources were invested in growth-enhancing sectors. The analysis undertaken by the International Monetary Fund does not explicitly take into account the potential link between public investment and growth—only its short-term costs. Nevertheless, running a short-term defi cit now may help produce the growth that will balance the budget later.
By incorporating this long-run growth effect into the standard models used to assess fi scal sustainability, one can see whether taking a longer-term perspective would lead to a more favorable stance for defi cit-fi nanced infrastructure. The results turn out to be very country specifi c, underscoring the diffi culty of generalizing in this area.
In Uganda, investment in infrastructure leads to higher output, but also—because of its relatively low productivity—worsens the debt ratio. A better way to fi nance infrastructure may be to improve the existing capital stock by prioritizing O&M expenditure over new investments. Although increased public expenditure on health and education also leads to higher output, the effect is not as large as for infrastructure.
In Senegal, by contrast, public investment in infrastructure does not seem to be as effective in boosting growth. Both O&M spending on infrastructure and public investment in other sectors such as health and education seem to have a stronger effect on growth. However, no matter how spending is allocated, it seems to worsen the debt-to-GDP ratio, refl ecting the low productivity of public expenditure in this case.
Source: Estache and Muñoz 2008.

78 AFRICA’S INFRASTRUCTURE: A TIME FOR TRANSFORMATION
Summit in July 2005, where the Infrastructure Consortium for Africa was created to focus on scaling up donor fi nance to meet Africa’s infrastructure needs. The main bilateral and multilateral donors committed to double by 2010 the (already higher) 2004 fl ows to reach $10 billion a year, about 1.6 percent of Africa’s GDP at that time. Donors have so far lived up to their promises, and ODA fl ows to African infrastructure almost doubled from $4.1 bil-lion in 2004 to $8.1 billion in 2007. Close to three-quarters of ODA comes from multi-lateral donors (African Development Bank, European Community, and International Development Association [IDA]), while Japan and the United States drive the doubling of bilateral commitments.
A signifi cant lag occurs between ODA com-mitments and their disbursement, suggesting that disbursements should continue to increase in the coming years. The commitments just reported are significantly higher than the estimated ODA disbursements of $3.8 billion (table 2.11). This gap reflects the normal lags associated with project implementation. Because ODA is channeled through the gov-ernment budget, the execution of funds faces some of the same problems affecting domes-tically fi nanced public investment, including procurement delays and low country capacity to execute funds. Divergences between donor and country fi nancial systems, as well as unpre-dictability in the release of funds, may further retard the disbursement of donor resources. Bearing all this in mind, if all commitments up to 2007 are fully honored, ODA disburse-ments could be expected to rise signifi cantly (IMF 2009; World Economic Outlook 2008).
ODA commitments were also set to increase further before the crisis, but prospects no longer look so good. The three multilateral agencies—the African Development Bank, the European Commission, and the World Bank—secured record replenishments for their concessional funding windows for the three to four years beginning in 2008. In principle, funding allo-cations to African infrastructure totaling $5.2 billion a year could come from the multilateral agencies alone in the near future. In practice, however, the crisis may divert multilateral resources from infrastructure projects and toward emergency fi scal support. Bilateral sup-port, based on annual budget determinations, may be more sensitive to the fi scal squeeze in OECD countries, and some decline can be anticipated. Historical trends suggest that ODA has tended to be pro-cyclical rather than coun-tercyclical (IMF 2009; ODI 2009; UBS Invest-ment Research 2008; World Economic Outlook 2008; and references cited therein).
Non-OECD Financiers—Will Growth Continue?Non-OECD countries fi nanced about $2.6 bil-lion of African infrastructure annually between 2001 and 2006 (table 2.12).3 This sum is not far short of the volumes from ODA; however, the focus of the fi nance is very different. Non-OECD fi nanciers have been active primarily in oil-exporting countries (Angola, Nigeria, and Sudan). The bulk of their resources have gone to power and to transport. In the power sec-tor, primarily hydroelectric schemes received $1 billion per year, and in the transport sec-tor, railways received nearly $1 billion a year. For electricity, that amounts to 0.17 percent
Table 2.11 Annualized ODA Investment Flows
Percentage of GDP $ billions
Country type Electricity ICT Irrigation Transport WSS Total Electricity ICT Irrigation Transport WSS Total
Middle income 0.01 0.00 0.00 0.03 0.04 0.08 0.03 0.01 0.00 0.09 0.10 0.23
Resource rich 0.03 0.01 0.00 0.11 0.11 0.25 0.08 0.01 0.00 0.23 0.24 0.56
Low-income nonfragile 0.50 0.03 0.00 1.12 0.71 2.36 0.55 0.04 0.00 1.24 0.78 2.61
Low-income fragile 0.10 0.01 0.00 0.64 0.29 1.04 0.04 0.00 0.00 0.23 0.10 0.38
Africa 0.11 0.01 0.00 0.28 0.19 0.59 0.69 0.06 0.00 1.80 1.23 3.77
Source: Africa Infrastructure Country Diagnostic.Note: Based on annualized averages for 2001–06. Averages weighted by country GDP. Figures are extrapolations based on the 24-country sample covered in AICD Phase 1. Totals may not add exactly because of rounding errors. ICT = information and communication technology; WSS = water supply and sanitation.

Closing Africa’s Funding Gap 79
of African GDP, signifi cantly larger than the 0.11 percent coming from ODA.
China’s offi cial economic assistance qua-drupled between 2001 and 2005, reaching more than 35 Sub-Saharan countries. Most of the inflows have gone to resource-rich countries, in some cases making use of barter arrangements under the “Angola mode.” 4 This type of South-South cooperation builds on economic complementarities between China and Africa. China takes a strategic interest in Africa’s natural resource sector, while Africa harnesses China’s strengths in construction to develop its economic infrastructure.
India has become a significant financier of energy projects in Africa. India’s fi nancial assistance focused initially on export credits to facilitate the purchase of Indian goods. However, India has signaled a bold commitment to sup-port big infrastructure projects, predominantly in energy, with up to $1 billion in Nigeria (including a 9-million-ton per year refi nery, a 200-megawatt power plant, and a 1,000-kilometer cross-country railway) and close to $100 million a year in Sudan (for a 700-kilometer oil pipeline from Khartoum to Port Sudan and four 125-kilowatt power plants).
The Gulf States, through their various devel-opment agencies, have been funding African infrastructure for some time. Infrastructure projects of a smaller scale than those funded by the Chinese and Indian governments char-acterize their portfolio, with strong support to such countries as Mali, Mauritania, Senegal, and Sudan. Resources from the Gulf States have been distributed almost equally among water, roads, and small energy projects.
For the three major sources of external fi nance,significant complementarity exists, despite some overlap. PPI seeks the most commercially lucrative opportunities in telecommunications. Non-OECD financiers focus on productive infrastructure (primarily power generation and railroads). Traditional ODA focuses on fi nanc-ing public goods (such as roads and water sup-ply) and plays a broader role in power system development and electrifi cation.
A similar pattern of specialization emerges geographically, with different countries rely-ing to differing degrees on the various sources of fi nance. The countries most heavily reliant on PPI are Kenya and Nigeria, supplemented by ODA in Kenya and by Chinese fi nancing in Nigeria. The countries that rely predominantly on non-OECD fi nanciers are often oil produc-ers (Angola, Gabon, Guinea, Mauritania, and Sudan). Most of the remaining countries rely primarily on traditional ODA (Burundi, Mali, Niger, Rwanda, and Tanzania). Other coun-tries (the Democratic Republic of Congo and Guinea) draw on a mixture of OECD and non-OECD sources.
The implementation process for ODA and non-OECD fi nance is completely different. A key difference between Chinese fi nance and ODA is that whereas the latter is channeled through the government budget, the former tends to be executed directly by China, often with associated imports of human resources. Although this approach raises signifi cant chal-lenges, it does at least offer the possibility of circumventing some of the capital budget execution problems typically associated with public investment.
Table 2.12 Historic Annualized Investment Flows from China, India, and Arab Countries
Percentage of GDP $ billions
Country type Electricity ICT Irrigation Transport WSS Total Electricity ICT Irrigation Transport WSS Total
Middle income 0.00 0.01 0.00 0.01 0.00 0.02 0.00 0.02 0.00 0.02 0.01 0.05
Resource rich 0.33 0.06 0.00 0.34 0.04 0.76 0.74 0.13 0.00 0.75 0.08 1.69
Low-income nonfragile 0.12 0.15 0.00 0.22 0.05 0.54 0.13 0.17 0.00 0.24 0.05 0.59
Low-income fragile 0.58 0.07 0.00 0.11 0.06 0.82 0.21 0.03 0.00 0.04 0.02 0.30
Africa 0.17 0.05 0.00 0.16 0.03 0.41 1.08 0.34 0.00 1.06 0.16 2.64
Source: Africa Infrastructure Country Diagnostic, adapted from Foster and others 2008.Note: Based on annualized averages for 2001–06. Averages weighted by country GDP. Figures are extrapolations based on the 24-country sample covered in AICD Phase 1. Totals may not add exactly because of rounding errors. ICT = information and communication technology; WSS = water supply and sanitation.

80 AFRICA’S INFRASTRUCTURE: A TIME FOR TRANSFORMATION
Non-OECD finance also raises concerns about sustainability. The non-OECD fi nanciers from China, India, and the Gulf States follow sectors, countries, and circumstances aligned with their national business interests. They offer realistic fi nancing options for power and trans-port and for postconfl ict countries with natural resources. However, nongovernmental organiza-tions are voicing concerns about the associated social and environmental standards. Non-OECD financiers also provide investment finance without associated support on the operational, institutional, and policy sides, raising questions about the sustainability of the new assets.
How the current economic downturn will affect non-OECD fi nance is diffi cult to pre-dict because of the relatively recent nature of these capital infl ows. Coming from fi scal and royalty resources in their countries of origin, they will likely suffer from budgetary cutbacks. The downturn in global commodity prices may also affect the motivation for some of the Chinese infrastructure fi nance linked to natu-ral resource development.
Private Investors—over the HillSince the late 1990s, private investment fl ows to Sub-Saharan African infrastructure tripled, increasing from about $3 billion in 1997 to $9.4 billion in 2006/07. That is about 1.5 per-cent of regional GDP for all sectors, more than recent ODA fl ows (0.6 percent of GDP, or $3.7 billion a year) but still less than half of general government spending (table 2.13).
Close to two-thirds of cumulative private commitments between 1990 and 2006 were in ICT-related projects (Leigland and Butterfi eld 2006). Power was second. Socially challenging
sectors, such as WSS, attracted almost no private activity. The same is true of longer-term and higher-risk projects. Through 2004, greenfi eld and small projects accounted for 70 percent of all PPI, while concessions and divestitures of incumbent utilities accounted for less than 10 percent. Greenfi eld transac-tions, with no long-term risks and little or no investment, are much more prominent than in other regions, and they tend to be small.
Africa’s resource-rich countries have been capturing the largest volume of private partici-pation. Relative to their GDP, Africa’s middle-income countries are not doing that well, while low-income countries—even fragile states—are capturing fl ows worth well over 1 percent of GDP.
Since the mid-1990s, a shift has occurred toward projects with longer horizons. Conces-sions and existing assets increased to 20 percent of the private partnerships in infrastructure. Sectors other than ICT have increased; the most important recorded transactions are in trans-port, such as the concessions in Sudan for the Juba Port ($30 million) and Uganda’s Rift Val-ley railways ($400 million concession). More-over, larger greenfi eld power projects, beyond concessions and management contracts, are starting to emerge.
Private capital fl ows, in particular, are likely to be affected by the global fi nancial crisis. In the aftermath of the Asian fi nancial crisis, pri-vate participation in developing countries fell by about one-half over a period of fi ve years, following its peak in 1997. Existing transac-tions are also coming under stress as they encounter diffi culties refi nancing short- and medium-term debt.
Table 2.13 Annual Private Participation Investment Flows
Percentage of GDP $ billions
Country type Electricity ICT Irrigation Transport WSS Total Electricity ICT Irrigation Transport WSS Total
Middle income 0.00 0.60 — 0.16 0.00 0.76 0.01 1.63 — 0.44 0.00 2.08
Resource rich 0.13 1.13 — 0.21 0.00 1.47 0.28 2.52 — 0.47 0.01 3.28
Low-income nonfragile 0.15 1.19 — 0.12 0.00 1.46 0.16 1.32 — 0.13 0.00 1.61
Low-income fragile 0.02 0.72 — 0.04 0.00 0.78 0.01 0.26 — 0.01 0.00 0.28
Africa 0.07 0.89 — 0.16 0.00 1.12 0.46 5.72 — 1.05 0.01 7.24
Source: Adapted from PPIAF 2008.Note: Based on annualized averages for 2001–06. Averages weighted by country GDP. Figures are extrapolations based on the 24-country sample covered in AICD Phase 1. Totals may not add exactly because of rounding errors. ICT = information and communication technology; WSS = water supply and sanitation. — Not available.

Closing Africa’s Funding Gap 81
Local Sources of Finance—a Possibility in the Medium Term Local capital markets are a major source of infrastructure fi nance in South Africa, but not yet elsewhere. Local infrastructure fi nance consists primarily of commercial bank lend-ing, some corporate bond and stock exchange issues, and a nascent entry of institutional investors. Because the scale of local fi nanc-ing in South Africa and its advanced state of evolution are so far ahead of those elsewhere, attention here focuses on prospects elsewhere in the region.
Outside South Africa, the stock of outstand-ing local infrastructure fi nance amounts to $13.5 billion (table 2.14). This fi gure comprises transport, the fi rst-ranking sector of all local infrastructure fi nancing, attracting 47 percent of the total, followed by ICT at 32 percent.5
The low-income nonfragile countries were the destination for 55 percent of all local infra-structure fi nancing identifi ed in this study. The two low-income fragile countries (Côte d’Ivoire and the Democratic Republic of Congo) attracted just 3.5 percent ($474 million), nearly three-quarters of it in bank fi nancing and the remainder in equity issues by companies in Côte d’Ivoire. For the resource-rich countries, the $4.9 billion in local infrastructure fi nanc-ing was a nearly equal mix of bank and equity fi nancing. For the three middle-income coun-tries, more than half of the $544 million in
local fi nancing was in corporate bonds, all to fi nance transport.
Only 10 percent of outstanding bank loans are for fi nancing infrastructure investments. At about $5 billion, this sum is a little less than the total for Malaysia alone.
However, a recent trend indicates new issu-ers (particularly of corporate bonds) are com-ing to market in several countries, in some cases with a debut issue. More than half (52 percent) of the corporate bonds listed on the markets at year-end 2006 were by infrastructure compa-nies. The share of corporate bonds outstand-ing at year-end 2006 that had been issued to fi nance infrastructure exceeded half in 7 of the 11 countries with bond markets reporting these data. West Africa’s regional exchange, the BRVM (Bourse Régionale des Valeurs Mobilières), had the highest share of issues fi nancing infrastruc-ture (more than 90 percent). The amount of fi nancing is still small, however.
Local fi nancial markets remain underdevel-oped, shallow, and small. Long-term fi nancing with maturities commensurate with infra-structure projects is scarce.6 The capacity of local banking systems remains too small and constrained by structural impediments to fi nance infrastructure. Most countries’ banks have signifi cant asset-liability maturity mis-matches for infrastructure fi nancing. Bank deposits and other liabilities still have largely short-term tenors. More potential may exist
Table 2.14 Outstanding Financing Stock for Infrastructure, as of 2006$ millions
Outstanding fi nancing for infrastructure WSS Electricity ICT Transport Public works Total
% of total outstanding
stock
Middle income (excluding South Africa) — 82.0 — 440.7 21.3 544.0 4.0
Resource rich 1.7 1,097.6 2,303.9 1,459.1 46.8 4,909.1 36.5
Low-income nonfragile — 1,496.7 1,984.5 4,065.5 4.4 7,551.0 56.1
Low-income fragile — 63.0 53.4 346.3 — 462.7 3.4
Total 1.7 2,739.3 4,341.8 6,311.7 72.4 13,466.9
Share on total outstanding stock (%) 0.01 20.34 32.24 46.87 0.54 100.0
Source: Adapted from Irving and Manroth 2009.Note: Based on annualized averages for 2001–06. Averages weighted by country GDP. Figures are extrapolations based on the 18-country sample covered in AICD Phase 1. Totals may not add exactly because of rounding errors. Stock includes bank loans, government bonds, corporate bonds, and equity issues. Stock level reported under “Transport” may be an overestimate because many countries report this category together with elements of communications and storage. Based on data from the following 18 countries—middle income: Cape Verde, Lesotho, and Namibia; resource rich: Cameroon, Chad, and Nigeria; low income: Burkina Faso, the Democratic Republic of Congo, Ethiopia, Ghana, Madagascar, Malawi, Mozambique, Niger, Rwanda, Tanzania, Uganda, and Zambia. ICT = information and communication technology; WSS = water supply and sanitation. — Not available.

82 AFRICA’S INFRASTRUCTURE: A TIME FOR TRANSFORMATION
for syndicated lending with local bank par-ticipation—though the increase in new loans over 2000–06 occurred in a favorable external fi nancing environment.
Harnessing the signifi cant potential for local capital markets to fi nance infrastructure, particularly local bond markets, is contingent on their further development. It is also contin-gent on further reforms, including those that would deepen the local institutional inves-tor base. Well-functioning and appropriately regulated local institutional investors (pen-sion funds and insurance companies) would be natural sources of long-term fi nancing for infrastructure because their liabilities would better match the longer terms of infrastructure projects. Private pension providers have begun to emerge with a shift from defi ned-benefi t to defi ned-contribution schemes, viewed as less costly, more transparent, and easier to man-age. Moreover, local institutional investors are taking a more diversifi ed portfolio approach to asset allocation.
Regional integration of financial mar-kets could achieve greater scale and liquidity.More cross-border intraregional listings—of both corporate bonds and equity issues—and more cross-border intraregional investment (particularly by local institutional investors) could help overcome national capital markets’ impediments of small size, illiquidity, and inadequate market infrastructure. They could also facilitate the ability of companies and gov-ernments to raise fi nancing for infrastructure.7
So far, this intraregional approach to rais-ing infrastructure fi nancing remains largely untapped.8
The African banking system did not feel the effects of the global fi nancial crisis at fi rst, but the crisis is slowly but surely affecting fi nan-cial systems around the region, adding to the already enormous challenge of developing local fi nancial markets.
Costs of Capital from Different Sources
The various sources of infrastructure fi nance reviewed in the previous sections differ greatly in their associated cost of capital
(fi gure 2.4). For public funds, raising taxes is not a costless exercise. Each dollar raised and spent by a Sub-Saharan African government has a social value premium (or marginal cost of public funds) of almost 20 percent. That premium captures the incidence of that tax on the society’s welfare (caused by changes in consumption patterns and administrative costs, among other things).9 To allow ready comparisons across fi nancing sources, this study standardized the fi nancial terms as the present value of a dollar raised through each of the different sources. In doing so, it recog-nized that all loans must ultimately be repaid with tax dollars, each of which attracts the 20 percent cost premium.
Wide variation exists in lending terms. The most concessional IDA loans charge zero interest (0.75 percent service charge) with 10 years of grace. India, China, and the Gulf States, respectively, charge 4 percent, 3.6 per-cent, and 1.5 percent interest and grant four years of grace.10
The cost of non-OECD fi nance is some-where between that of public funds and ODA. The subsidy factor for Indian and Chinese funds is about 25 percent and for the Arab funds, 50 percent. ODA typically provides a subsidy factor of 60 percent, rising to 75 per-cent for IDA resources. In addition to the cost of capital, the different sources of fi nance dif-fer in the transaction costs associated with their use, which may offset or accentuate some of the differences.
Most Promising Ways to Increase Funds
Given this setting, what are the best ways of increasing the availability of funds for infra-structure development? The place to start is clearly to get the most from existing budget envelopes, which can provide up to $17.4 bil-lion a year of additional resources internally. Beyond that, a substantial funding gap still remains. Before the fi nancial crisis, the pros-pects for reducing—if not closing—this gap were reasonably good. Resource royalties were at record highs, and all sources of external fi nance were buoyant and promising further

Closing Africa’s Funding Gap 83
growth. With the onset of the global fi nancial crisis, that situation has changed signifi cantly and in ways that are not yet entirely foresee-able. The possibility exists across the board that all sources of infrastructure fi nance in Africa may fall rather than increase, further widening the funding gap. Only resource-rich countries have the possibility of using natural resource savings accounts to provide a source of fi nanc-ing for infrastructure, but only if macroeco-nomic conditions allow. One of the few things that could reverse this overall situation would be the agreement upon a major stimulus pack-age for Africa by the international community, with a focus on infrastructure as part of the effort to rekindle economic growth and safe-guard employment.
What Else Can Be Done?
Most of the low-income countries, and in particular the fragile states, face a substantial funding gap even if all the existing sources of funds—including efficiency gains—are tapped. What other options do these countries have? Realistically, they need either to defer the attainment of the infrastructure targets pro-posed here or to try to achieve them by using lower-cost technologies.
Taking More Time The investment needs presented in this book are based on the objective of addressing Africa’s infrastructure backlog within 10 years. To meet this target, middle-income, resource-rich, and low-income nonfragile states would need to increase their existing infrastructure spending by 50 to 100 percent, while low-income fragile states would need to increase their infrastructure spending by an impossible 350 percent. Extend-ing the time horizon for the achievement of these goals should make the targets more afford-able. But how long a delay would be needed to make the infrastructure targets attainable with-out increasing existing spending envelopes?
By delaying only three years, spreading the investment needs over 13 rather than 10 years, middle-income countries could achieve the proposed targets within existing spending envelopes (fi gure 2.5, panel a). However, this
conclusion assumes they have fi rst fully cap-tured effi ciency gains. Without such effi ciency gains, the targets could not be met even over 30 years without increasing spending above cur-rent levels (fi gure 2.5, panel b).
Low-income nonfragile and resource-rich countries would need to delay an additional decade to meet targets with existing spending levels. By spreading the investment needs over 20 rather than 10 years, these countries could achieve the proposed targets within existing spending envelopes (fi gure 2.5, panel a). Again, this outcome would be possible only if effi ciency gains are fully exploited. Otherwise, they would need more than 30 years to reach the target with existing resources (fi gure 2.5, panel b).
Low-income fragile states would need to delay by more than two decades to meet infra-structure targets within existing spending lev-els. By spreading the investment needs over 30 rather than 10 years, low-income fragile states could achieve the proposed targets within existing spending envelopes (fi gure 2.5, panel a). However, without effi ciency gains, these countries would take much longer than 30 years to meet the associated targets or alter-natively would still need to double their exist-ing spending to reach the target in 30 years (fi gure 2.5, panel b).
Using Lower-Cost TechnologiesMany possible alternative technological solu-tions exist for meeting a given infrastructure target, and each offers a particular combina-tion of fi nancial cost and quality of service.
0.33
0.51
0.65
0.87
0.91
1.17
1.1
0 0.20 0.40 0.60 0.80 1.00 1.20
International Development Association
official development assistance
Gulf States
China
India
public funds
private sector
cost of raising $1 of financing (US$)
Figure 2.4 Costs of Capital by Funding Source
Sources: Average marginal cost of public funds: as estimated by Warlters and Auriol 2005; cost of equity for private sector: as in Estache and Pinglo 2004 and Sirtaine and others 2005; authors’ calculations.

84 AFRICA’S INFRASTRUCTURE: A TIME FOR TRANSFORMATION
Where budgets are constrained, policy mak-ers face a choice between providing a high level of service to a few people or a lower level of service to a broader cross-section of the population. Critical trade-offs must be con-sidered; thus, one cannot jump to the conclu-sion that a high level of service is always in a country’s best interest. The extent to which cost-saving technologies are available var-ies considerably across sectors. Two of the clearest cases are water and roads, which are discussed in detail next. Unfortunately, the power sector (which has by far the largest associated investment tag) does not present many technological alternatives for reducing the cost of electricity generation.
Using alternative technologies in WSS. In the case of water and sanitation, the cost of achiev-ing the MDGs drops by 30 percent with greater reliance on lower-cost technologies. The MDGs can be achieved using either higher-end solutions, such as piped water and septic tanks, or cheaper solutions, such as standposts and improved latrines. The scenario consid-ered here is one where the MDGs are met by preserving the prevalent mix of high-end and lower-end technologies. That is, the relative share of the population enjoying access to a direct water connection, sewers, or a septic tank—all regarded as high-level services—compared to the share of people with access to lower-end solutions, such as standposts and
unimproved latrines, remains the same as it is today (see chapters 16 and 17 in this volume). Thus, as population grows, the number of peo-ple accessing high-level services will be larger in absolute terms. If instead, all additional people served use cheaper solutions, such as standposts and improved latrines in urban areas or boreholes and unimproved latrines in rural areas, the overall cost of meeting the MDGs would fall by 30 percent.
Using alternative technologies in roads. In the case of roads, the cost of reaching regional and national connectivity targets can be reduced by 30 percent by adopting lower standards for trunk roads. Road connectivity targets can be attained by using different engineering stan-dards. The scenario considered here is one in which regional and national connectivity are achieved by a good-condition asphalt road network with at least two lanes for regional and at least one lane for national connectivity. The same connectivity could be achieved at a cost reduction of 30 percent if a single-surface-treatment road in fair condition is substituted for an asphalt road in good condition.
Notes The authors of this chapter are Cecilia Briceño-
Garmendia and Nataliya Pushak, who drew on background material and contributions from William Butterfi eld, Chuan Chen, Vivien Foster, Jacqueline Irving, Astrid Manroth, Afua Sarkodie, and Karlis Smits.
–500
50100
vari
atio
n in
res
ourc
es n
eede
d(%
dev
iati
on fr
om c
urre
nt e
nvel
ope)
vari
atio
n in
res
ourc
es n
eede
d(%
dev
iati
on fr
om c
urre
nt e
nvel
ope)
150200250300350400450500
a. Resource envelope plus potential efficiency gains b. Existing resource envelope
10 11 12 13 14 15 16 17number of years needed to attain infrastructure targets number of years needed to attain infrastructure targets
18 19 20 21 22 23 24 25 26 27 28 29 30–50
050
100150200250300350400450500
10 11 12 13 14 15 16 17 18 19 20 21 22 23 24 25 26 27 28 29 30
fragile low-income countries nonfragile low-income countries
middle-income countries resource-rich countries
Figure 2.5 Spreading Spending over Time
Source: Authors’ calculations.

Closing Africa’s Funding Gap 85
1. In particular, maintenance is essential to har-ness the economic returns of capital, but good-quality data on how much of current expendi-tures go to maintenance is hard to track.
2. Servén (2005) and Hicks (1991) summarize the facts on Latin American and other developing countries. For industrialized countries, see also Roubini and others (1989); De Haan, Sturm, and Sikken (1996) document the experience of industrialized countries.
3. This section draws heavily on Foster and others (2008).
4. Essentially, the Angola mode was devised to enable African nations to pay for infrastructure with natural resources. In a single transaction, China bundles development-type assistance with commercial-type trade fi nance. A Chi-nese resource company makes repayments in exchange for the oil or mineral rights. The China Export-Import Bank acts as a broker, receiving money for the sale and paying the contractor for providing the infrastructure. This arrange-ment safeguards against currency inconvertibil-ity, political instability, and expropriation.
5. Data are as of year-end 2006, or most recent available, for the sampled countries, excluding South Africa.
6. Because South Africa’s fi nancial markets are so much more developed than any of those of the other 23 focus countries, this section excludes South Africa.
7. One new initiative is the Pan-African Infra-structure Development Fund, a 15-year regional fund for raising fi nance for commercially viable infrastructure projects in Africa, which raised $625 million in its fi rst close in 2007, including funds from Ghanaian and South African insti-tutional investors.
8. In addition, the lack of a benchmark yield curve in the vast majority of those African countries that have an organized bond market has limited cor-porate bond issuance, as has the general absence of credit ratings agencies and a lack of awareness among prospective issuers as well as investors.
9. The marginal cost of public funds measures the change in welfare associated with raising an additional unit of tax revenue (Warlters and Auriol 2005).
10. See Foster and others (2008) for further details.
ReferencesBriceño-Garmendia, Cecilia, Karlis Smits, and Vivien
Foster. 2008. “Fiscal Costs of Infrastructure in Sub-Saharan Africa.” Africa Infrastructure Country Diagnostic. Washington, DC: World Bank.
Calderón, César, and Luis Servén. 2004. “Trends in Infrastructure in Latin America, 1980–2001.” Policy Research Working Paper 3401, World Bank, Washington, DC.
De Haan, Jakob, Jan Sturm, and Bernd Sikken. 1996. “Government Capital Formation: Explain-ing the Decline.” Weltwirtschaftliches Archiv 132 (1): 55–74.
Estache, Antonio, and Rafael Muñoz. 2008. “Build-ing Sector Concerns into Macro-Economic Financial Programming: Lessons from Senegal and Uganda.” Working Paper 6, Africa Infra-structure Country Diagnostic, World Bank, Washington, DC.
Estache, Antonio, and Maria Elena Pinglo. 2004. “Are Returns to Private Infrastructure in Developing Countries Consistent with Risks since the Asian Crisis?” Policy Research Working Paper 3373. World Bank, Washington, DC.
Foster, Vivien, William Butterfi eld, Chuan Chen, and Nataliya Pushak. 2008. Building Bridges: China’s Growing Role as Infrastructure Finan-cier for Sub-Saharan Africa. Trends and Policy Options no. 5. Washington, DC: Public-Private Infrastructure Advisory Facility, World Bank.
Hicks, Norman. 1991. “Expenditure Reductions in Developing Countries Revisited.” Journal of International Development 3 (1): 29–37.
Irving, Jacqueline, and Astrid Manroth. 2009. “Local Sources of Financing for Infrastructure in Africa: A Cross-Country Analysis.” Policy Research Working Paper 4878, World Bank, Washington, DC.
IMF (International Monetary Fund). 2009. The State of Public Finances: Outlook and Medium-Term Pol-icies after the 2008 Crisis. Washington, DC: IMF.
Leigland, James, and William Butterfi eld. 2006. “Reform, Private Capital Needed to Develop Infrastructure in Africa: Problems and Pros-pects for Private Participation.” Gridlines, Note 8 (May), Public-Private Infrastructure Advisory Facility, World Bank, Washington, DC.
Nogales, Alberto. 2009. “The Cost of Postponing Roads Maintenance.” World Bank, Washington, DC.
ODI (Overseas Development Institute). 2009. A Development Charter for the G-20. London: ODI.
PPIAF (Public-Private Infrastructure Advisory Facility). 2008. Private Participation in Infrastruc-ture Project Database, http://ppi.worldbank .org/.
Pritchett, Lant. 1996. “Mind Your P’s and Q’s. The Cost of Public Investment Is Not the Value of Public Capital.” Policy Research Working Paper 1660, World Bank, Washington, DC.
Rajkumar, Andrew, and Vinaya Swaroop. 2002. “Pub-lic Spending and Outcomes: Does Governance

86 AFRICA’S INFRASTRUCTURE: A TIME FOR TRANSFORMATION
Matter?” Policy Research Working Paper 2840, World Bank, Washington, DC.
Reinikka, Ritva, and Jakob Svensson. 2002. “Explaining Leakage of Public Funds.” Discussion Paper 3227, Centre for Economic Policy Research, London, U.K.
———. 2003. “The Power of Information: Evi-dence from a Newspaper Campaign to Reduce Capture.” Policy Research Working Paper 3239, World Bank, Washington, DC.
Roubini, Nouriel, Jeffrey Sachs, Seppo Honkapohja, and Daniel Cohen. 1989. “Government Spending and Budget Defi cits in the Industrial Countries.” Economic Policy 8 (4): 99–132.
Servén, Luis. 2005. “Fiscal Discipline, Public Investment and Growth.” World Bank, Washington, DC.
Sirtaine, Sophie, Maria Elena Pinglo, J. Luis Guasch, and Viven Foster. 2005. How Profi table Are Infrastructure Concessions in Latin America? Empirical Evidence and Regulatory Implications. Trends and Policy Options no. 2. Washington, DC: Public-Private Infrastructure Advisory Facility, World Bank.
UBS Investment Research. 2008. “Global Economic Perspectives: The Global Impact of Fiscal Policy.”
Warlters, Michael, and Emmanuelle Auriol. 2005. “The Marginal Cost of Public Funds in Africa.” Policy Research Working Paper 3679, World Bank, Washington, DC.
World Economic Outlook. 2008. “Estimating the Size of the European Stimulus Packages for 2009.”

Dealing with Poverty and Inequality
87
Chapter3
C overage of modern infrastructure ser-vices has been stagnant since the mid-1990s and remains strongly skewed
toward more affl uent households. In urban areas, those who fail to hook up to nearby net-works form a signifi cant share of the unserved population, suggesting that demand-side barri-ers are also at work. In these circumstances, the key questions are whether African households can afford to pay for modern infrastructure services, and if not, whether African govern-ments can afford to subsidize them.
A subsistence power or water bill ranges between $2 and $8 a month. This cost is well within the affordable range for most house-holds in Africa’s middle-income countries and for the more affl uent segments that cur-rently enjoy access to utilities in low-income countries. However, affordability would defi -nitely become an issue for most people in the poorest low-income countries should access be broadened.
African governments already spend $4.1 billion a year (0.7 percent of GDP) on power and water subsidies that benefi t mainly a small group of affl uent customers. Expanding these levels of subsidy to the entire population would be fi scally unsustainable for most countries.
In the absence of modern infrastructure services, the next best option would be to reach households with lower-cost, second-best solutions, such as standposts, improved latrines, or street lighting. However, the preva-lence of these second-best solutions is surpris-ingly low in Africa, and those that exist tend to cater more to the higher-income groups than to the middle of the income distribu-tion. The majority of Africans resort instead to traditional alternatives, such as wells, unim-proved latrines, or kerosene lamps. Signifi cant challenges exist in increasing the coverage of second-best alternatives, particularly because their public good nature makes some of these technologies more diffi cult for service provid-ers to operate on a commercial basis.
The business-as-usual approach to expand-ing service coverage in Africa does not appear to be working. Turning this situation around will require rethinking the approach to service expansion in four ways. First, coverage expan-sion is not only about network rollout, but also about a need to address demand-side barriers such as high connection charges or legal tenure. Second, cost recovery for household services needs to be improved to ensure that utilities have the fi nancial basis to invest in service

88 AFRICA’S INFRASTRUCTURE: A TIME FOR TRANSFORMATION
expansion. Third, rethinking the design of util-ity subsidies to better target them and to accel-erate service expansion is desirable. Fourth, any approach must consider the actual level of service that households can afford to pay and that governments can afford to subsidize and put greater emphasis on second-best alterna-tives to modern infrastructure services.
Access to Modern Infrastructure Services—Stagnant and Inequitable
Coverage of modern infrastructure services in Africa is very low by global standards (Estache and Wodon 2007). Coverage of electricity is about 20 percent in Africa; 33 percent in South Asia; and more than 85 percent in East Asia, Latin America, and the Middle East. Cover-age of piped water is 12 percent in Africa, 21 percent in South Asia, and more than 35 per-cent in other developing regions. Coverage of fl ush toilets is 6 percent in Africa, 34 percent in South Asia, and more than 30 percent in other developing regions. Africa’s telecommunica-tions coverage, however, compares favorably with South Asia’s and is not so far behind that of other developing regions. Africa’s low cov-erage of infrastructure services in part refl ects its relatively low urbanization rates, because urban agglomeration greatly facilitates the extension of infrastructure networks.1
Household surveys show only modest gains in access to modern infrastructure services over the period 1990–2005 (fi gure 3.1). This stag-nant overall picture masks two divergent trends. Service coverage in rural areas has seen modest improvements, whereas that in urban areas has actually declined. For example, urban cover-age of piped water fell from 50 percent in the early 1990s to 39 percent in the early 2000s, and urban coverage of fl ush toilets from 32 percent to 27 percent. Although many new connections are being made in urban areas, declining urban coverage largely refl ects the inability of service providers to keep pace with urban population growth of 3.6 percent a year.
The pace of service expansion differs dra-matically across sectors and countries. The
percentage of the population added annually to the coverage of modern infrastructure services is a good measure of the intensity of effort in service expansion—and it differs dramatically across services (fi gure 3.2). Less than 0.5 percent of the population is added each year to the net-work of piped water and fl ush toilets, whereas about 1.5 percent is added to that of electricity and cellular telephone services. For water and sanitation, the rate of expansion of alternative services such as latrines, standposts, and bore-holes is signifi cantly faster than that of piped water and fl ush toilets. These regional averages mask outstanding performances by individual countries. For piped water, Benin, Côte d’Ivoire, and Senegal reach an additional 1.5–2.0 percent of their population each year, compared with less than 0.1 percent for Africa as a whole.
Universal access to modern infrastructure services lies at least 50 years in the future for most countries. Projecting current rates of service expansion forward and taking into account anticipated demographic growth, one can estimate the year countries will reach uni-versal access to each of the modern infrastruc-ture services. The results are sobering. Under business as usual, less than 20 percent of Sub-Saharan African countries will reach universal access for piped water by 2050, and less than 45 percent will reach universal access to elec-tricity (fi gure 3.3). In about one-third of coun-tries, universal access to piped water and fl ush toilets will not be reached in this century.
Coverage varies dramatically across house-holds with different budget levels (fi gure 3.4).
Source: Banerjee, Wodon, and others 2008.
35
30
25
% o
f hou
seho
lds
20
15
10
0
5
1990–95 1996–2000 2001–05
piped water electricity
flush toilets landline telephone
Figure 3.1 Coverage of Network Infrastructure Services, 1990–2005

Dealing with Poverty and Inequality 89
Among the poorest 60 percent of the population, coverage of almost all modern infrastructure services is well below 10 percent.Conversely, the vast majority of households with coverage belong to the more affl uent 40 percent of the population. In most countries, inequality of access has increased over time, suggesting that most new connections have gone to more affl u-ent households (Diallo and Wodon 2005). This situation is not entirely surprising, given that, even among households with greater purchas-ing power, coverage is far from universal, and well under 50 percent in most cases. Relative to the other modern infrastructure services, electricity coverage is somewhat higher across the spectrum.
Low coverage rates can refl ect both sup-ply and demand factors. On the one hand, the household may be physically distant from an infrastructure network (and thus face an absence of supply). On the other hand, the household may choose not to connect to a network even when it is nearby (and thus express a lack of demand). Understanding this difference is important because the policy implications differ radically. By exploiting the spatial distribution of household survey samples in urban areas, one can quantify the relative importance of these supply and demand factors in accounting for low ser-vice coverage. Using this approach, one can distinguish between the percentage of popula-tion that has access to the service (those living physically close to the infrastructure) and the percentage of the population that hooks up to the service when it is available.
Lack of coverage for urban electricity supply is equally about demand and supply factors. The power infrastructure for elec-tricity is physically close to 93 percent of the urban population, but only 75 percent of those with access actually hook up to the service. This means that half of the popu-lation lacking coverage live close to power infrastructure. One can often observe this phenomenon in African cities, where informal settlements fl anking major road corridors lack power service even though distribution lines run overhead.
Overall, the coverage gap for piped water is primarily attributable to supply factors
(table 3.1). The physical extent of the piped water network is more limited, reaching only 73 percent of the urban population, and hookup rates for those in proximity are only 48 percent. In general, the role of demand
2.0
1.5
1.0
0.5
0
piped
wate
r
% o
f pop
ulat
ion
flush
toile
t
impro
ved l
atrine
s
stand
posts
landli
ne te
lepho
nes
boreh
oles
electr
icity
cell p
hone
s
tradit
ional
latrin
es
Figure 3.2 Expansion of Access to Infrastructure Services Each Year, Mid-1990s to Mid-2000s
Source: Banerjee, Wodon, and others 2008.
Figure 3.3 Projected Universal Access for Piped Water for Sub-Saharan African Countries, 2050 and Beyond
100
80
% o
f cou
ntri
es
60
40
piped water flush toilets electricity landlinetelephones
20
0
by 2050 2050–2100 2100–2200 after 2200
Source: Banerjee, Wodon, and others 2008.
Figure 3.4 Coverage of Modern Infrastructure Services, by Budget Quintile
budget quintile
% o
f hou
seho
lds 80
100
60
40
20
0Q1 Q2 Q3 Q4 Q5
piped water electricity flush toilets
landlinetelephones
cell phones garbagecollected
Source: Banerjee, Wodon, and others 2008.Note: The data are the latest available as of 2006.

90 AFRICA’S INFRASTRUCTURE: A TIME FOR TRANSFORMATION
factors is higher in middle-income countries than in low-income countries, refl ecting the fact that infrastructure networks are more highly developed in the former and have a broader geographical reach.
It may appear paradoxical that households do not universally take up connections to modern infrastructure services as networks become physically available. Clear economic reasons exist, however, why this might be so. In some cases, households may have access to cheaper substitutes, such as boreholes. More substitutes are available for piped water than for electricity, which may explain the much lower hookup rates for the former. In other cases, utility connection charges are set pro-hibitively high for low-income households. For example, 60 percent of the water utilities sur-veyed for this study apply connection charges in excess of $100. Charges range from about $6 in the Upper Nile in Sudan to more than $240 in Côte d’Ivoire, Mozambique, Niger, and South Africa. The average connection charge across the region is 28 percent of gross national income (GNI) per capita. For Niger, the charge is more than 100 percent of GNI per capita. Similarly, the fi ve water utilities in Mozambique charge more than 75 percent of GNI per capita. These comparisons illustrate how high connec-tion charges present a barrier to affordability.
The tenure status of households may also signifi cantly impede hookup to modern infra-structure services. A study of slum households in Dakar and Nairobi fi nds that coverage of piped water and electricity is more than twice as high among owner-occupiers as among ten-ants (Gulyani, Talukdar, and Jack 2008). Even among owner-occupiers, lack of formal legal titles can affect hookup to services.
Affordability of Modern Infrastructure Services—Subsidizing the Better Off
African households exist on very limited household budgets. The average African house-hold of fi ve persons has a monthly budget of less than $180, ranging from about $60 in the poorest quintile to $340 in the richest quintile (table 3.2). Thus, purchasing power—even in Africa’s most affl uent households—is modest in absolute terms. Across the spectrum, house-hold budgets in middle-income countries are roughly twice those in low-income countries.
Most African households spend more than half their modest budgets on food, with little left over for other items. Spending on infrastructure services (including utilities, energy, and trans-port) averages about 7 percent of a household’s budget, though this can be 15–25 percent in some countries and represents overall a signifi -cant share of the nonfood budget. As household budgets increase, infrastructure services absorb a growing share, rising from less than 4 percent among the poorest quintile to more than 8 per-cent among the richest (fi gure 3.5). In terms of absolute expenditure, this difference is even more pronounced: whereas households in the poorest quintile spend, on average, no more than $2 per month on all infrastructure services, households in the richest quintile spend almost $40 per month.
Given such low household budgets, a key question is whether households can afford to pay for modern infrastructure services. One measure of affordability is nonpayment for infrastructure services. Nonpayment directly limits the ability of utilities and service provid-ers to expand networks and improve services by undermining their fi nancial strength. Based on
Table 3.1 Understanding Coverage of Infrastructure Services: The Role of Supply and Demand Factorspercent (population-weighted average)
Decomposition of coverage Unserved due to factors
Infrastructure Access Hookup Coverage Supply Demand
Piped water
Low-income countries 68 42 31 86 14
Middle-income countries 91 74 69 64 36
Overall 73 48 38 81 19
Electricity
Low-income countries 93 73 69 50 50
Middle-income countries 95 86 81 39 61
Overall 93 75 71 48 52
Source: Banerjee, Wodon, and others 2008.Note: Access is defined as the percentage of the population that lives physically close to infrastructure. Hookup is defined as the percentage of the population that connects to infrastructure when it is avail-able. Coverage is defined as the percentage of the population that has the infrastructure service; it is essentially the product of access and hookup.. In calculating the proportion of gap attributable to demand and supply factors, one considers the hookup rate of the top budget quintile in each geo-graphical area to be an upper bound on potential hookup, absent demand-side constraints.

Dealing with Poverty and Inequality 91
household surveys, one can compare for each quintile the percentage of households that report paying for the service with the percent-age of households that report using the service. Those that do not pay include both clandestine users and formal customers who fail to pay their bills. Overall, about 40 percent of people connected to infrastructure services do not pay for them (fi gure 3.6). Nonpayment rates range from about 20 percent in the more affl u-ent quintile to about 60 percent in the poorest quintile. A signifi cant nonpayment rate, even among the more affl uent quintiles, suggests that a culture of payment problems exists in addition to any affordability issues.
The cost of providing subsistence con-sumption of water or electricity ranges from $2 to $8 a month, depending on the extent of consumption and cost recovery (fi gure 3.7). A more formal method of gauging affordability is to measure the cost of utility bills against household budgets. The cost of a monthly subsistence consumption of piped water can
range between $2 (based on an operating cost-recovery tariff of $0.40 per cubic meter and an absolute minimum consumption of 4 cubic meters) and $8 (based on a full cost-recovery tariff of $0.80 per cubic meter and a
Table 3.2 Monthly Household Budgets2002 $
Income groupNational average
Poorest quintile
Second quintile
Third quintile
Fourth quintile
Richest quintile
Overall 177 59 97 128 169 340
Low-income countries 139 53 80 103 135 258
Middle-income countries 300 79 155 181 282 609
Source: Banerjee, Wodon, and others 2008.
budg
et s
hare
(%)
expe
ndit
ure
(US$
/mon
th)
9876543210
poorest second thirdquintile
fourth richest
40
35
30
25
20
15
10
5
0
budget share (left axis) expenditure (right axis)
Figure 3.5 Share of Household Budgets Spent on Infrastructure Services, by Budget Quintile
Source: Banerjee, Wodon, and others 2008.
0102030405060708090
100
% o
f pop
ulat
ion
electricity piped water
poorest second thirdquintile
fourth richest
Figure 3.6 Population with Service Connections Who Do Not Pay for Service
Source: Banerjee, Wodon, and others 2008.
90
80
70
60
50
40
30
20
10
0
100
2 4 6 8 10 12 14 16monthly bill (US$)
% o
f hou
seho
lds
spen
ding
mor
e th
an5%
of t
heir
mon
thly
bud
get
upper bound for subsistence consumption
lower bound for subsistence consumption
low-income countries
middle-income countries
Figure 3.7 Affordability of Subsistence Consumption Priced at Cost-Recovery Levels
Source: Banerjee, Wodon, and others 2008.

92 AFRICA’S INFRASTRUCTURE: A TIME FOR TRANSFORMATION
more typical modest household consumption of 10 cubic meters). The cost of a monthly subsistence consumption of power can range between $2 (based on a low-cost country tar-iff of $0.08 per kilowatt-hour and an absolute minimum consumption of 25 kilowatt-hours) and $8 (based on a high-cost country tar-iff of $0.16 per kilowatt-hour and a more typical modest household consumption of 50 kilowatt-hours).
An affordability threshold of 5 percent of household budgets provides a gauge for measuring which utility bills might be afford-able to African households. By looking at the distribution of household budgets, one can cal-culate the percentage of households for which such bills would absorb more than 5 percent of their budgets and thus prove unaffordable. Monthly bills of $2 are affordable to almost the entire African population. Monthly bills of $8 would remain affordable for the entire popula-tion of the middle-income African countries, indicating that cost recovery should not be a major problem for these countries.
Cost-recovery tariffs would also be afford-able for those currently enjoying access in low-income countries, but not for the remaining population. In low-income countries, monthly bills of $8 would remain perfectly affordable for the most affl uent 20–40 percent of the population, the only portion enjoying access. However, such bills would not be affordable to the poorest 60–80 percent that currently lack access even if services were extended to them. The affordability problems associated with a universal access policy would be particularly large for a handful of the poorest low-income countries—Burundi, the Democratic Repub-lic of Congo, Ethiopia, Guinea-Bissau, Malawi, Niger, Tanzania, and Uganda—where as much as 80 percent of the population could not afford a monthly bill of $8.
The immediate poverty-related effect of raising tariffs to cost-recovery levels is gener-ally quite small, although it may have second-order effects. Detailed analysis of the effect of signifi cant tariff increases of the order of 40 percent for power and water services in Senegal and power services in Mali confi rms that the immediate poverty-related effect on consumers is small, essentially because very
few poor consumers are connected to the ser-vice (Boccanfuso, Estache, and Savard 2008a, 2008b, 2008c). As the consequences of higher power or water prices work their way through the economy, however, broader second-order effects on wages and prices of goods in the economy as a whole can lead to more substan-tial effects on poverty (Boccanfuso, Estache, and Savard 2008a, 2008b, 2008c).
Notwithstanding these fi ndings, most Afri-can countries heavily subsidize tariffs for power and water services. On average, power tariffs recover only 75 percent of full costs, and water tariffs only 64 percent. The resulting implicit service subsidies amount to as much as $4.1 billion a year (0.7 percent of Africa’s GDP), divided evenly between power and water (see chapter 2 of this volume).
Because electricity and water subsidies are typically justifi ed by the need to make ser-vices affordable to low-income households, a key question is whether subsidies reach such households. Results across a wide range of African countries, for both power and water sectors, show that the share of subsidies going to the poor is less than half of the share of the poor in the overall population, indicating a very regressive distribution (fi gure 3.8). This result is hardly surprising given that connections to power and water services are already highly skewed toward more affl uent households. To put these results in perspective, one must com-pare them with the targeting achieved by other forms of social policy. Estimates for Cameroon, Gabon, and Guinea indicate that expenditures on primary education and basic health care reach the poor better than do power and water subsidies (Wodon 2008a, 2008b).
Can African governments afford to further expand today’s subsidy model to achieve uni-versal access? Little justifi cation currently exists for utility subsidies, given that they typically do not reach unconnected low-income house-holds but rather favor more affl uent, connected households that do not really need subsidies to afford the service. However, the preced-ing analysis indicates that affordability would become a major issue to the extent that Africa’s low-income countries move aggressively toward universal access. Given the very high macro-economic cost today of subsidizing even the

Dealing with Poverty and Inequality 93
minority of the population with access to power and water, a legitimate question is whether African governments can afford to scale up this subsidy-based model to the remainder of their populations.
Providing universal use-of-service sub-sidies for power and water would absorb an unaffordable 1.6 percent of GDP above exist-ing spending, about two-thirds for power and one-third for water. These values are high in relation to existing operation and maintenance expenditure, so it is diffi cult to believe that they would be fi scally affordable for govern-ments (fi gure 3.9).
One-time capital subsidies could be pro-vided at a lower cost and if spread over 20 years, might just be affordable. The cost of providing a one-time capital subsidy of $200 to cover network connection costs for all
unconnected households over 20 years would be substantially low, only 0.35 percent of GDP for power and about 0.25 percent of GDP for piped water. A key difference is that the cost of this one-time subsidy would disappear at the end of the decade, whereas the use-of-service subsidy would continue indefi nitely.
The welfare case is quite strong for one-time capital subsidies to support universal connection. Households without access to utility services eventually pay much higher prices and, as a result, limit their consumption to very low levels. Small-scale piped-network operators charge 1.5 times the formal network price, point sources charge 4.5 times the for-mal network price, and mobile distributors can charge up to 12 times the formal utility tariff (Kariuki and Schwartz 2005). A recent survey of Accra, Dar es Salaam, and Nairobi
a. Electricity
measure of distributional incidence
0
Nigeria
Gabon
Congo, Rep. of
Côte d'Ivoire
Cape Verde
Togo
São Tomé and Principe
Senegal
Cameroon
Mozambique
Ghana
Central African Republic
Guinea
Burundi
Burkina Faso
Chad
Malawi
Uganda
Rwanda
Nigeria, Kaduna
Nigeria, Fed. Cap. Ter.
Niger
Gabon
Congo, Rep. of
Congo, Dem. Rep. of
Côte d'Ivoire
Cape Verde
Togo
Senegal
Cameroon
Central African Republic
Guinea
Ghana
Burundi
Burkina Faso
Chad
Malawi, Blantyre
Malawi, Lilongwe
Uganda
Rwanda
0.2 0.4 0.6 0.8 1 1.2
measure of distributional incidence
0 0.2 0.4 0.6 0.8 1
b. Water
1.2
regr
essi
ve
prog
ress
ive
regr
essi
ve
prog
ress
ive
Figure 3.8 Extent to Which Electricity and Water Subsidies Reach the Poor, by Country
Sources: Banerjee, Wodon, and others 2008; Wodon 2008a, 2008b.Note: This figure presents a measure of distributional incidence, which captures the percentage of total subsidy value reaching the poor relative to the percentage of the poor in the population. A value greater than 1 implies that the subsidy distribution is progressive (pro-poor), because the share of benefits allocated to the poor is larger than their share in the total population. A value less than 1 implies that the distribution is regressive.

94 AFRICA’S INFRASTRUCTURE: A TIME FOR TRANSFORMATION
found that the price of utility-piped water ranges from $0.5 to $1.5 a cubic meter, whereas small water enterprises charge between $4 and $6 (McGranahan and others 2006). Similarly, for electricity, the cost of providing basic illu-mination through candles or kilowatt-hours is an order of magnitude greater than that for electricity per effective unit of lighting (Foster and Tré 2003).
Interestingly, even though nonutility water vendors charge higher unit prices, those pur-chasing water from vendors do not necessar-ily spend more than those purchasing water from the public utility—they simply adjust the quantity consumed.
Nonmonetary benefi ts of connection can also be very signifi cant. Beyond the potential monetary savings, piped water and electricity are associated with a wide range of health, edu-cation, and productivity benefi ts (see chapter 1 of this volume). Better water and sanitation service is associated with less malnutrition and stunting, and it liberates women from the time-consuming chore of collecting water, leaving more time for income-generating activities (box 3.1). Better electricity provision improves literacy and primary school completion rates, because better quality of light allows students to read and study without sunlight.
Finally, affordability concerns also exist for urban transportation services. Transportation represents one of the largest household bud-get expenditure shares among infrastructure services, absorbing 4–6 percent of the budgets of those households reporting expenditures.
% o
f GD
P
2.0
2.5
1.5
1.0
0.5
0
% o
f GD
P
2.0
2.5
1.5
1.0
0.5
0electricity
a. Ongoing use-of-service subsidy b. One-time connection subsidy
water electricity water
operating subsidy needed to maintain affordability
operation and maintenance spending (2005)
capital subsidy needed to maintain affordability
capital spending (2005)
Figure 3.9 Amount of Subsidy Needed to Maintain Affordability of Water and Electricity Service, 2005
Source: Banerjee, Wodon, and others 2008.
Box 3.2 details some of the access and afford-ability challenges arising for urban transpor-tation in Africa’s burgeoning cities.
Alternatives to Modern Infrastructure Services—the Missing Middle
Even with renewed efforts, most African coun-tries will not realize universal access to modern infrastructure services for some decades. In the meantime, most households will continue to rely on alternative ways of meeting their water and energy requirements (fi gure 3.10). For the most part, these methods comprise traditional alternatives such as wells, unim-proved latrines, and kerosene lamps. However, second-best alternatives also exist that provide a signifi cantly higher level of service than the traditional solutions but at a substantially lower cost than full-blown piped water or power connections. Examples include stand-posts for water supply, improved latrines for sanitation, and street lighting for basic neigh-borhood illumination.
Although traditional alternatives are in widespread use, second-best alternatives have not yet become popular in most countries. The water and sanitation sectors illustrate this point very clearly. In both cases, the traditional alter-natives (whether wells or unimproved latrines) provide the largest share of service across the income spectrum. However, the second-best alternatives (whether standposts or improved

Dealing with Poverty and Inequality 95
latrines) have coverage rates comparable to or even lower than the best alternatives (whether piped water or fl ush toilets) despite their sig-nifi cant cost advantages. Moreover, coverage of the second-best alternatives is just as regres-sive as that of the best alternatives. Neverthe-less, some countries have made signifi cant progress in expanding coverage of second-best alternatives—such as the Democratic Republic of Congo, Mozambique, Tanzania, and Uganda for standposts; and Burkina Faso, Cameroon, Ghana, Madagascar, and Rwanda for improved latrines. Although data are not available to make a similar comparison for lighting, it is well known that coverage of street lighting lags.
The capital costs of the second-best alter-natives are still only a fraction of those asso-ciated with the best alternatives, even if they are also signifi cantly more expensive than the traditional alternatives (table 3.3). Thus, the second-best alternatives provide an opportu-nity to make limited investment budgets go further and accelerate the expansion of service improvements.
Therefore, understanding the factors that lie behind this “missing middle” is important. Once again, both demand and supply issues
conspire to limit the extension of the second-best alternatives.
On the demand side, the costs of the second-best alternatives may still be relatively high, given limited household budgets. Water from standposts, though relatively cheap to provide, is often retailed by intermediaries charging substantial markups that outweigh the underlying advantages in construction costs. Improved latrines, though cheaper than flush toilets, are nonetheless substantially more expensive than unimproved latrines, and uneducated households may not be aware of the health benefi ts.
On the supply side, their public good nature greatly complicates the implementa-tion of second-best alternatives. The provision of standposts and street lighting is unattractive to utilities because of their limited scope for revenue collection as well as the greater poten-tial for revenue loss from increased clandestine connections once networks are provided. For improved latrines, the limited experience of the local construction sector restricts the avail-ability of such designs and may keep their costs higher than they would be in a mass market (see chapter 17 of this volume).
BOX 3 .1
It is often said that access to basic infrastructure could help increase the earnings of households both by making their work more productive and by freeing time allocated to domestic chores and allocating such time savings to pro-ductive work. Some authors have argued that households face a “time overhead” constraint—the minimum number of hours that household members must spend on basic chores vital to the well-being and survival of the family. This burden includes time spent preparing meals, washing clothes, cleaning, transporting water, and gathering fuel for cooking and heating. Access to basic infrastructure can signifi cantly reduce this time overhead, and thereby free time for productive work. Because households that lack access to basic infrastructure tend to be poor and because most of these households have members who want to work longer hours to increase their earnings, access to
infrastructure could reduce poverty through a reallocation of household members’ time.
Some emerging evidence from household surveys indicates that the time saved from access to basic infrastructure can indeed be substantial. Using data from Sierra Leone, Wodon and Ying (2009) show that women work more than men on domestic tasks and that the domestic workload of children is also high. Access to water and electricity helps reduce domestic work time by up to 10 hours a week. Using data from Guinea, Bardasi and Wodon (2009) fi nd effects on time use of a simi-lar order of infrastructure for access to water. The question remains whether household members could fi nd employment opportunities using the time saved through access to infra-structure. Even if time savings were remunerated at a fraction of the minimum wage, the economic return of these projects is often very large owing to the time savings of households.
Access to Basic Infrastructure and Time Use

96 AFRICA’S INFRASTRUCTURE: A TIME FOR TRANSFORMATION
piped water
public standpost
surface water
well water
open defecation
VIP/chemical/SANPLAT
flush toilet
traditional latrine
60
% o
f hou
seho
lds
% o
f hou
seho
lds50
40
30
20
10
0
60
50
40
30
20
10
0Q1
a. Alternative water services b. Alternative sanitation services
Q2
budget quintile budget quintileQ3 Q4 Q5 Q1 Q2 Q3 Q4 Q5
Figure 3.10 Access to Alternative Water and Sanitation Services across All Income Levels
Source: Banerjee, Wodon, and others 2008.
BOX 3 .2
Access to urban transportation services in Sub-Saharan Africa is constrained both by the limited reach of the urban paved-road network and by the limited size of the bus fl eet.
Only one-third of the roads in African cities are paved, ranging from barely 10 percent in Kinshasa (Democratic Republic of Congo) and Kigali (Rwanda) to more than 70 percent in Kampala (Uganda). Paved-road density is typically about 300 meters per 1,000 inhabitants, compared with more typical values of 1,000 meters per 1,000 inhab-itants for developing cities around the world. Overall, the road network constitutes less than 7 percent of the land area in most African cities, compared with 25–30 percent in developed-country cities. The low coverage of the paved network limits the reach of bus services. In many African cit-ies, numerous outlying neighborhoods can be reached only by two-wheeled vehicles.
The typical availability of bus services in African cities is 30–60 bus seats per 1,000 residents, although the number can be as low as 10 seats per 1,000 in Addis Ababa (Ethio-pia), Kinshasa, and Ouagadougou (Burkina Faso). In con-trast to middle-income countries that typically have 30–40 large bus seats per 1,000 residents, low-income countries in Africa have only 6 per 1,000.
The proliferation of informal minibus services has been a private response to the fi nancial demise of large, publicly run bus services in most cities. Although minibuses have been very responsive to demand, they pose a variety of social issues, including congestion, pollution, and road safety. Moreover, the lack of effective regulation of minibuses leads
to business practices, such as overcrowding, erratic schedul-ing, and price discrimination, that favor business interests over those of consumers.
Bus fares in African cities tend to be about $0.30 per one-way trip, irrespective of bus size. Evidence from bud-get surveys indicates that households spend on average $12–$16 a month on urban transportation services. This sum is enough to purchase about 20 round-trip bus tickets per month, which covers the essential travel requirements of one commuter per household, leaving nothing to cover travel needs of other household members. Expenditure levels of the poorest households would be inadequate to cover the transportation costs of even one commuter per household.
A signifi cant minority of urban households do not report any expenditure on urban transportation, suggest-ing that their transportation needs are met entirely by foot. Data on the modal split of urban journeys show, on aver-age, 37 percent of urban trips taken on buses and another 37 percent on foot. The remainder of trips is spread across a range of private modes. The percentage of trips on foot can be 50 percent or more—Nairobi, Kenya (47); Douala, Cameroon (60); and Conakry, Guinea (78).
The combination of low access and limited affordability for service conspires to seriously constrain the mobility of urban residents, preventing cities from realizing their full potential to bring together people, services, and economic opportunities.
Source: Kumar and Barrett 2008.
Access, Affordability, and Alternatives—Urban Public Transportation

Dealing with Poverty and Inequality 97
Policy Challenges for Accelerating Service Expansion
The business-as-usual approach to expand-ing service coverage in Africa does not appear to be working. The low and stagnant cover-age of household services comes with a major social and economic toll. Most African coun-tries have tackled universal access by provid-ing heavily subsidized best options, such as piped water and electricity. This approach has tended to bankrupt and debilitate sector institutions without bringing about any sig-nifi cant acceleration of coverage. The associ-ated public subsidies have also largely bypassed most needy groups. Few services and countries are expanding coverage at rates high enough to outstrip demographic growth, particularly urbanization.
Turning this situation around will require rethinking the approach to service expansion in four ways. First, coverage expansion is not just about network rollout. Demand-side barriers such as high connection charges or legal ten-ure must be addressed. Second, cost recovery for household services needs to be improved to ensure a fi nancial basis for utilities to invest in service expansion. Third, rethinking the design of utility subsidies to better target them and to accelerate service expansion is desirable. Fourth, the level of service that households can afford to pay for and governments can afford to subsidize must be considered realistically and greater emphasis placed on second-best modern solutions.
Remembering the Demand Side of the EquationOverlooking the demand side of network rollout can lead to much lower returns on
infrastructure investments. The challenge of reaching universal access is typically character-ized as a supply problem of rolling out infra-structure networks to increasingly far-fl ung populations. However, household survey evi-dence shows that a signifi cant segment of the unserved population in urban areas lives close to a network. The relatively low rate of hookup to existing infrastructure networks leads to lower fi nancial, economic, and social returns to the associated investment, because the physical asset is operating below its full carrying capac-ity. This fi nding has implications for network rollout strategy.
First, hookup—rather than access—needs to be considered the key measure of success. Interventions that aim to expand service cov-erage too often measure their outcomes by the number of people who can connect to the network provided. As a result, little attention is given to whether these connections actu-ally materialize after the project’s completion. Unless the focus of monitoring and evaluation shifts from access to hookup, those involved in service expansion will have little incentive to think about the demand side of service coverage.
Second, the most cost-effective way of increasing coverage may be to pursue densi-fi cation programs that increase hookup rates in targeted areas. Unserved populations liv-ing physically close to infrastructure networks could (in principle) be covered at a much lower capital cost than those living farther away, thereby providing the highest potential return to a limited investment budget. In that sense, they may deserve priority attention in efforts to raise coverage.
Third, expanding coverage requires com-munity engagement. Dealing with the demand-side barriers that prevent hookup requires a
Table 3.3 Capital Cost of Best, Second-Best, and Traditional Alternatives$ per capita
Alternative Water Sanitation Lighting
Traditional Well 21 Unimproved latrine 39 Kerosene lamp —
Second best Standpost 80 Improved latrine 57 Street lighting —
Best Piped water 283 Flush toilet 125 Electricity 133
Source: Chapter 5 of this volume.Note: Capital cost estimates are based on a density of 3,272 persons per square kilometer.— Not available.

98 AFRICA’S INFRASTRUCTURE: A TIME FOR TRANSFORMATION
more detailed understanding of the potential client base of the utility. What are their alterna-tives? How much can they afford to pay? What other constraints do they face? This approach in turn suggests a broader skill base than utilities may routinely retain, going beyond standard expertise in network engineering to encompass sociological, economic, and legal analysis of—and engagement with—the target populations.
Fourth, careful thought should be given to how connection costs might be recovered. As noted earlier, high connection charges—widespread across Africa—are one obvious demand-side barrier to hookup, even when use-of-service charges would be affordable. In these circumstances, one may legitimately ask whether substantial one-time up-front connection charges are the most sensible way to recover network connection costs. Alterna-tives can be considered, including repaying connection costs over several years through an installment plan; socializing connection costs by recovering them through the general tariff and, hence, sharing them across the entire cus-tomer base; or directly subsidizing them from the government budget (see box 3.3).
Fifth, expansion of utility networks needs to be closely coordinated with urban devel-opment. In many periurban neighborhoods,
expansion of utility networks is hampered by the absence of legal tenure and by high turnover rates among tenants, not to mention inadequate spacing of dwellings. Providing services to these communities will require close cooperation with urban authorities because many of these issues can be resolved only if they are addressed in a synchronized and coordinated manner.
Taking a Hard-Headed Look at AffordabilityUnderrecovery of costs has serious implica-tions for the fi nancial health of utilities and slows the pace of service expansion. Many of Africa’s water and power utilities capture only two-thirds of the revenues needed to function sustainably. This revenue shortfall is rarely cov-ered through timely and explicit fi scal transfers. Instead, maintenance and investment activities are curtailed to make ends meet, starving the utility of funds to expand service coverage and eroding the quality of service to existing cus-tomers (see chapter 8 on power and chapter 16 on water utilities in this volume).
Affordability, the usual pretext for under-pricing services, does not bear much scru-tiny. Political economy likely provides the real explanation for low tariffs, with populations currently connected to utility services tending to be those with the greatest voice. The implicit
BOX 3 .3
Within the framework of Niger’s poverty reduction strategy, some 11,200 branchement sociaux (social connections) to the water net-work were provided in 2002–04, about half of them in Niamey. To be eligible for a social con-nection, household members had to be living in a house within 20 meters of the main pipe, and the house had to be built of solid materials (a permanent construction). Some geographic targeting to the poor was achieved by making the social connections in poor and suburban quarters of the city.
To obtain a social connection, a house-hold had to pay a deposit of 17,500 francs
(CFAF) (US$39) plus CFAF 2,500 (US$6) of administrative fees. Moreover, the household had to be able to pay the bill each month in a single installment. The 11,200 connections had been originally planned over fi ve years, but they were realized in only a year and a half, and some 600 requests could not be satisfi ed.
Households that benefi ted from a social connection belonged to the poorer income quintiles of the population, suggesting that the connections were fairly well targeted.
Source: Tsimpo and Wodon 2009.
Are Connection Subsidies Well Targeted to the Poor?
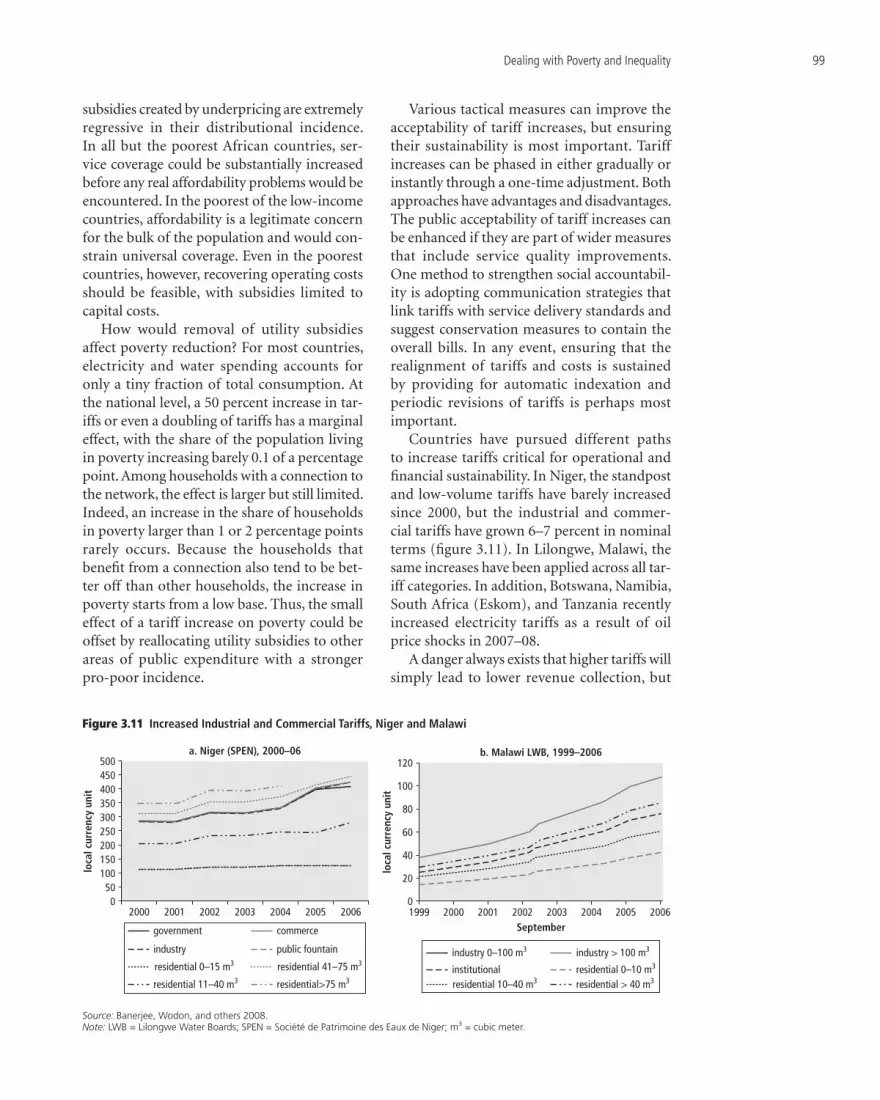
Dealing with Poverty and Inequality 99
subsidies created by underpricing are extremely regressive in their distributional incidence. In all but the poorest African countries, ser-vice coverage could be substantially increased before any real affordability problems would be encountered. In the poorest of the low-income countries, affordability is a legitimate concern for the bulk of the population and would con-strain universal coverage. Even in the poorest countries, however, recovering operating costs should be feasible, with subsidies limited to capital costs.
How would removal of utility subsidies affect poverty reduction? For most countries, electricity and water spending accounts for only a tiny fraction of total consumption. At the national level, a 50 percent increase in tar-iffs or even a doubling of tariffs has a marginal effect, with the share of the population living in poverty increasing barely 0.1 of a percentage point. Among households with a connection to the network, the effect is larger but still limited. Indeed, an increase in the share of households in poverty larger than 1 or 2 percentage points rarely occurs. Because the households that benefi t from a connection also tend to be bet-ter off than other households, the increase in poverty starts from a low base. Thus, the small effect of a tariff increase on poverty could be offset by reallocating utility subsidies to other areas of public expenditure with a stronger pro-poor incidence.
Various tactical measures can improve the acceptability of tariff increases, but ensuring their sustainability is most important. Tariff increases can be phased in either gradually or instantly through a one-time adjustment. Both approaches have advantages and disadvantages. The public acceptability of tariff increases can be enhanced if they are part of wider measures that include service quality improvements. One method to strengthen social accountabil-ity is adopting communication strategies that link tariffs with service delivery standards and suggest conservation measures to contain the overall bills. In any event, ensuring that the realignment of tariffs and costs is sustained by providing for automatic indexation and periodic revisions of tariffs is perhaps most important.
Countries have pursued different paths to increase tariffs critical for operational and fi nancial sustainability. In Niger, the standpost and low-volume tariffs have barely increased since 2000, but the industrial and commer-cial tariffs have grown 6–7 percent in nominal terms (fi gure 3.11). In Lilongwe, Malawi, the same increases have been applied across all tar-iff categories. In addition, Botswana, Namibia, South Africa (Eskom), and Tanzania recently increased electricity tariffs as a result of oil price shocks in 2007–08.
A danger always exists that higher tariffs will simply lead to lower revenue collection, but
500 120
100
80
60
40
20
01999 2000 2001 2002 2003 2004 2005 2006
450400350300250200
loca
l cur
renc
y un
it
loca
l cur
renc
y un
it
September
150100
50
2000 2001
a. Niger (SPEN), 2000–06 b. Malawi LWB, 1999–2006
2002 2003 2004 2005 20060
government commerce
industry public fountain
residential 11–40 m3 residential>75 m3
residential 0–15 m3 residential 41–75 m3industry 0–100 m3
institutionalresidential 10–40 m3
industry > 100 m3
residential 0–10 m3
residential > 40 m3
Figure 3.11 Increased Industrial and Commercial Tariffs, Niger and Malawi
Source: Banerjee, Wodon, and others 2008.Note: LWB = Lilongwe Water Boards; SPEN = Société de Patrimoine des Eaux de Niger; m3 = cubic meter.

100 AFRICA’S INFRASTRUCTURE: A TIME FOR TRANSFORMATION
prepayment meters can help. In the absence of a strong payment culture, customers who object to tariff hikes may “retaliate” by refusing to pay their bills. Thus, even before address-ing tariff adjustments, utilities must work on raising revenue collection rates toward best practice and establishing a payment culture. At least for power, one technological solu-tion is to use prepayment meters, which place customers on a debit card system similar to that for cellular telephones. For utilities, this approach eliminates credit risk and avoids nonpayment. For customers, it allows them to control their expenditure and avoid consum-ing beyond their means. South Africa was at the forefront in development of the keypad-based prepayment electricity meter. ESKOM launched the fi rst product, Cashpower, in 1990. Tshwane in South Africa reports univer-sal coverage of its consumers with prepayment meters. In Lesotho, Namibia, and Rwanda, a majority of residential customers use prepay-ment meters. In Ghana and Malawi, a clear policy exists of rapidly increasing the share of residential customers on prepayment meters (fi gure 3.12).
Targeting Subsidies to Promote Service ExpansionSubsidies also have a role to play, but their design requires major rethinking. Subsidies have a valuable and legitimate role in the proper circumstances. They may be appropriate when households genuinely cannot purchase a sub-sistence allowance of a service that brings major social and economic benefi ts to themselves and those around them, as long as governments can afford to pay those subsidies. However, the design and targeting of utility subsidies must be radically improved to fulfi ll their intended role. As noted earlier, the utility subsidies pro-vided in Africa today largely bypass the poorest.
African utilities typically subsidize con-sumption, but subsidizing connection is potentially more equitable and effective in expanding coverage. The affordability prob-lems associated with connection charges are often much more serious than those associated with use-of-service charges. Because connec-tions are also disproportionately concentrated among the more affl uent, the absence of con-nections is disproportionately concentrated among the poorest, which could potentially facilitate the targeting process.
The targeting performance of connection subsidies ultimately hinges on how new connec-tions are allocated. In African countries, where coverage is far from universal even among the higher-income groups, connection subsidies may be just as regressive as consumption sub-sidies, essentially because the unserved higher-income groups will likely be the fi rst to benefi t from coverage expansion. Simulations suggest that—if new subsidized connections mirror the distribution of existing connections—the share of connection subsidies going to the poor would be only about 36 percent of the share of the poor in the population—a highly regressive result no better than that of existing consump-tion subsidies (table 3.4).
Limiting subsidies to connections in new network rollout rather than densification of the existing network would substantially improve targeting. The share of connection subsidies going to the poor would rise to 74–95 percent of their share in the population, depending on the utility involved, but the
utili
ty
Tshwane
LEC
NORED
ESKOM
VRA
Escom
Sonabel
SBEE
TANESCO
Electrogaz
100 20
residential customers withprepayment meters (%)
30 40 50 60 70 80 90 100
Figure 3.12 Residential Customers Using Prepayment Meters, by Utility
Source: Eberhard and others 2008.Note: Electrogaz = Rwanda’s national electric utility; Escom = Electricity Supply Corporation (Malawi); ESKOM = South Africa’s national electric utility; LEC = Lesotho Electricity Company; NORED = Northern Electricity Distribution Service (Namibia); SBEE = Société Béninoise d’Énergie Électrique (Benin); Sonabel = Société Nationale d’Électricité du Burkina (Burkina Faso); TANESCO = Tanzania Electricity Supply Company Limited; Tshwane = Tshwane Local Electric Utility (South Africa); VRA = Volta River Authority (Ghana).

Dealing with Poverty and Inequality 101
outcome would remain regressive. Providing a connection subsidy equally likely to reach all unconnected households would ensure that the percentage going to the poor exceeds their share of the population by 112–118 percent—fi nally, a progressive result. Improving the distributional incidence beyond this modest level would require connection subsidies to be accompanied by other socioeconomic screens. These fi ndings illustrate that in the low-access environment in most African countries, the absence of a connection remains a relatively weak targeting variable.
Can anything be done to improve targeting of use-of-service subsidies? The poor perfor-mance of existing utility subsidies is explained by pro-rich coverage and by the widespread use of poorly designed IBTs. Common design failures in water IBTs include high fixed charges and minimum consumption levels that penalize small consumers, as well as the large size and universal applicability of the fi rst subsidized block (Banerjee, Foster, and oth-ers 2008). Common design failures in power IBTs include large subsistence thresholds that allow only consumers with exceptionally high consumption to contribute fully to cost recovery (Briceño-Garmendia and Shkaratan 2008). Achieving major improvements in the targeting of use-of-service subsidies by over-hauling the design of increasing block tariffs (IBTs) is diffi cult. Some improvements in tar-geting could be achieved by eliminating fi xed charges, reducing the size of fi rst blocks to cover only genuinely subsistence consump-tion, and changing from an IBT to a volume-differentiated tariff in which those consuming beyond a certain level forfeit the subsidized fi rst-block tariff completely. Even with these modifi cations, however, the targeting of such tariffs would improve only marginally and not become strongly pro-poor in absolute terms.
Global experience suggests that the target-ing of utility subsidies can be improved and become reasonably progressive, if some form of geographical or socioeconomic targeting vari-ables can be used beyond the level of consump-tion (Komives and others 2005). However, such targeting schemes hinge on the existence of household registers or property cadastres that
support the classifi cation of benefi ciaries, as well as a signifi cant amount of administrative capacity. Both factors are often absent in Africa, particularly in the low-income countries.
An important test of the coherence of a subsidy policy is whether the country could afford the policy if it were scaled up to univer-sal access. The underpricing of utility services that benefi t just a small minority of the popu-lation costs many African countries as much as 1 percent of GDP. As countries move toward universal access, that subsidy burden would increase proportionately, rapidly becoming unaffordable for the national budget. Thus, countries should consider how the cost of any proposed subsidy policy would escalate as cov-erage improves. This test of a subsidy’s fi scal affordability is an important consideration to help countries avoid embarking on policies that are simply not scalable.
Another potentially effective method of targeting is to limit the allocation of subsidies to lower-cost and lower-quality alternatives that encourage self-selection. For services such as water, for which different modes of service provision exist, subsidies could possibly be concentrated on second-best alternatives such as standposts while requiring full cost recov-ery from private piped-water connections. The theory is that more affl uent customers will eschew second-best services and automatically opt to pay the full cost of the best alternative, thus identifying themselves and leaving the subsidized service to less affl uent customers. In Africa, however, the use of self-selection may be less effective, because coverage of second-best alternatives such as standposts and improved latrines is just as regressive as coverage of best
Table 3.4 Potential Targeting Performance of Connection Subsidies under Various Scenarios percentage of total poor getting connection subsidies relative to percentage of poor in the population
Utility
New connections mirror pattern of
existing connections
Only households beyond reach of existing network
receive connection subsidies
All unconnected households receive
subsidy
Electricity 37 95 118
Water 35 74 112
Sources: Banerjee, Wodon, and others 2008; Wodon 2008a, 2008b.

102 AFRICA’S INFRASTRUCTURE: A TIME FOR TRANSFORMATION
alternatives such as piped water and fl ush toilets.
Giving More Consideration to Second-Best SolutionsSecond-best solutions appear to provide a happy compromise but face many implemen-tation challenges. As noted earlier, second-best approaches provide modern services that are far preferable in welfare terms to their traditional alternatives and are still much less costly than best modern infrastructure services. So why are these second-best services fairly rare in Africa—and skewed toward more affl uent households?
A key problem of many second-best solu-tions is that their public good nature compli-cates their adoption. Both public standposts and street lighting are essentially public goods. This characterization makes it diffi cult for utilities to recover the costs of these services and exposes them to theft by extending the network’s reach into lower-income areas. Thus, utilities have no real incentive to provide such loss-prone services. In addition, facilities are vulnerable to maintenance issues, because nobody is respon-sible for preventing, reporting, or addressing problems. One solution is to introduce an agent responsible for managing the facility, charging for service, and soliciting maintenance activi-ties. However, covering the agent’s salary adds signifi cantly to the cost of the second-best alter-native, and agents often exploit their control-ling position to charge excessive rates.
The African experience with standposts pro-vides pointers for improving the performance of such public facilities (Keener, Luengo, and Banerjee 2008). Where standposts are admin-istered by local agents, the management model should be grounded in the prevailing culture of the benefi ciary community. Checks and bal-ances are needed to ensure that the delegated manager behaves responsibly. The utility also must be closely involved in monitoring the sta-tus of the standposts, regularly collecting the water revenues, and providing technical assis-tance to the standpost operators. Therefore, defi ning a useful set of incentives that bolster the utility’s growing interest in participating in the standpost business is essential. In some environments, resale of water by households with private connections can be a practical
alternative to standposts, although it is often not legally recognized. In addition, yard taps that serve four or fi ve households—not several hundred—can reduce costs while avoiding some of the most serious public good problems.
Notes The authors of this chapter are Sudeshna Ghosh
Banerjee, Quentin Wodon, and Vivien Foster, who drew on background material and contribu-tions from Tarik Chfadi, Amadou Diallo, Sarah Keener, Taras Pushak, Maria Shkaratan, Clarence Tsimpo, Helal Uddin, and Yvonne Ying.
1. The cross-regional fi gures for infrastructure coverage are unweighted simple averages.
ReferencesBanerjee, Sudeshna, Vivien Foster, Yvonne Ying,
Heather Skilling, and Quentin Wodon. 2008. “Achieving Cost Recovery, Equity and Effi ciency in Water Tariffs: Evidence from African Utilities.” Working Paper 7, Africa Infrastructure Country Diagnostic, World Bank, Washington, DC.
Banerjee, Sudeshna, Quentin Wodon, Amadou Diallo, Taras Pushak, Hellal Uddin, Clarence Tsimpo, and Vivien Foster. 2008. “Access, Afford-ability, and Alternatives: Modern Infrastructure Services in Africa.” Background Paper 2, Africa Infrastructure Sector Diagnostic, World Bank, Washington, DC.
Bardasi, Elena, and Quentin Wodon. 2009. “Work-ing Long Hours and Having No Choice: Time Poverty in Guinea.” Policy Research Working Paper 4961, World Bank, Washington, DC.
Boccanfuso, Dorothée, Antonio Estache, and Luc Savard. 2008a. “Electricity Reforms in Mali: A Micro-Macro Analysis of the Effects on Pov-erty and Distribution.” Working Paper 4, Africa Infrastructure Country Diagnostic, World Bank, Washington, DC.
———. 2008b. “Electricity Reforms in Senegal: A Micro-Macro Analysis of the Effects on Pov-erty and Distribution.” Working Paper 5, Africa Infrastructure Country Diagnostic, World Bank, Washington, DC.
———. 2008c. “Water Reforms in Senegal: A Micro-Macro Analysis of the Effects on Poverty and Distribution.” Working Paper 16, Africa Infrastructure Country Diagnostic, World Bank, Washington, DC.
Briceño-Garmendia, Cecilia, and Maria Shkaratan. 2008. “Achieving Cost Recovery, Equity, and Effi ciency in Power Tariffs: Evidence from African Utilities.” Working Paper 21, Africa Infrastructure Country Diagnostic, World Bank, Washington, DC.

Dealing with Poverty and Inequality 103
Diallo, Amadou, and Quentin Wodon. 2005. “A Note on Access to Network-Based Infrastructure Services in Africa: Benefi t and Marginal Inci-dence Analysis.” World Bank, Washington, DC.
Eberhard, Anton, Vivien Foster, Cecilia Briceño-Garmendia, Fatimata Ouedraogo, Daniel Camos, and Maria Shkaratan. 2008. “Under-powered: The State of the Power Sector in Sub-Saharan Africa.” Background Paper 6, Africa Infrastructure Sector Diagnostic, World Bank, Washington, DC.
Estache, Antonio, and Quentin Wodon. 2007. Infrastructure and Poverty in Sub-Saharan Africa. Directions in Development Series. Washington, DC: World Bank.
Foster, Vivien, and Jean-Philippe Tré. 2003. “Mea-suring the Impact of Energy Interventions on the Poor—An Illustration from Guatemala.” In Infrastructure for Poor People: Public Policy for Private Provision, ed. Penelope Brook and Tim Irwin, 125–78. Washington, DC: World Bank.
Gulyani, Sumila, Debabrata Talukdar, and Darby Jack. 2008. “A Tale of Three Cities: Understand-ing Differences in Provision of Modern Services.” Working Paper 10, Africa Infrastructure Country Diagnostic, World Bank, Washington, DC.
Kariuki, Mukami, and Jordan Schwartz. 2005. “Small-Scale Private Service Providers of Water and Electricity: A Review of Incidence, Struc-ture, Pricing, and Operating Characteristics.” Policy Research Working Paper 3727, World Bank, Washington, DC.
Keener, Sarah, Manuel Luengo, and Sudeshna G. Banerjee. 2008. “Provision of Water to the Poor in Africa: Informal Water Markets and Experi-ence with Water Standposts.” Working Paper 13,
Africa Infrastructure Country Diagnostic, World Bank, Washington, DC.
Komives, Kristin, Vivien Foster, Jonathan Halpern, and Quentin Wodon. 2005. Water, Electricity, and the Poor: Who Benefi ts from Utility Subsidies? Washington, DC: World Bank.
Kumar, Ajay, and Fanny Barrett. 2008. “Stuck in Traffi c: Urban Transport in Africa.” Background Paper 1, Africa Infrastructure Country Diagnos-tic, World Bank, Washington, DC.
McGranahan, Gordon, Cyrus Njiru, Mike Albu, Mike Smith, and Diana Mitlin. 2006. How Small Water Enterprises Can Contribute to MDGs: Evi-dence from Dar es Salaam, Nairobi, Khartoum, and Accra. Leicestershire, U.K.: Water, Engineer-ing and Development Centre, Loughborough University.
Tsimpo, Clarence, and Quentin Wodon. 2009. “Who Benefi ts from Electricity Consumption versus Connection Subsidies? Evidence from Niger.” Development Dialogue on Values and Ethics, World Bank, Washington, DC.
Wodon, Quentin, ed. 2008a. “Electricity Tariffs and the Poor: Case Studies from Sub-Saharan Africa.” Working Paper 11, Africa Infrastructure Country Diagnostic, World Bank, Washington, DC.
———. 2008b. “Water Tariffs and the Poor: Case Studies from Sub-Saharan Africa.” Working Paper 12, Africa Infrastructure Country Diagnostic, World Bank, Washington, DC.
Wodon, Quentin, and Yvonne Ying. 2009. “The Determinants of Domestic Work Time in Sierra Leone.” Development Dialogue on Values and Ethics, World Bank, Washington, DC.


Building Sound Institutions
105
Chapter4
Institutional competence and capacity are important determinants of the performance of infrastructure providers in every sector.
That seems obvious, but systematic analysis has been lacking on the nature and extent of the links between stronger institutions and better outcomes: specifi cally, broader access, higher service quality, and more fi nancially effi cient service. This chapter looks at the different institutional models applied, the approaches to strengthen infrastructure-relevant institu-tions, and the effect of the various approaches on performance.
The standard infrastructure reform and pol-icy prescription package of the 1990s—market restructuring, private involvement up to and including privatization, establishing indepen-dent regulators, and enhancing competition—yielded a fair number of positive results in Africa. This conclusion deserves stress: ben-efi cial outcomes following the application of these reforms have often been unacknowledged or at least underappreciated. Nevertheless, this set of reforms has proved more diffi cult to apply in Africa than in other regions. One fi nds in Africa numerous failures to implement, or fully implement, the policy package; renegotia-tions or cancellations of contracts with private
providers; outcomes below expectations; and a high degree of offi cial and public skepticism about whether the application of the standard package is producing (or even could produce) the desired results. A large part of the explana-tion for this situation is thought to lie in the relative weakness of African practices, policies, and agencies (that is, institutions) that guide and oversee African infrastructure sectors and fi rms, public or private.
The statistical analysis for this chapter suggests that institutions make a difference. It reveals strong links between institutional reforms and enhanced governance in the coun-try, sector, and enterprise—and improvements in the quantity and quality of infrastructure services (with sectoral variation). Given the link between institutional development and performance improvements, and the high costs of inaction, strengthening sectoral institutions and country and sectoral governance is a very worthwhile investment.
Most African countries have undertaken preliminary institutional reforms, mainly the broader sectoral policy and legal measures, many of which can be accomplished by the stroke of a pen. What has lagged are regulatory and governance reforms; they have taken much

106 AFRICA’S INFRASTRUCTURE: A TIME FOR TRANSFORMATION
more time to bear fruit. For instance, effective regulation requires building organizations that challenge established vested interests. Gover-nance improvements, particularly in state-owned enterprises (SOEs), require aligning internal and external incentives, which again require broader reforms of the external envi-ronment for infrastructure service providers.
Institutional Reforms: A Glass Half Full
Africa’s institutional framework for infrastruc-ture is no more than halfway along the path to best practice. The components of the institu-tional performance indicators developed for this study capture a wide range of characteristics of the institutional environment (box 4.1). A coun-try’s aggregate score on this index suggests the extent of institutional reforms. Overall, although
almost all African countries have embarked on institutional reforms, on average they have adopted no more than 50 percent of good insti-tutional practices. The variation in performance across countries is roughly two to one, with the most advanced countries (Kenya) scoring about 70 percent and those furthest behind scoring 30 percent (Benin).
At the country level, progress in one infra-structure sector is no guarantee of progress in another. That is, institutional development in infrastructure sectors is uneven both among and within countries. Countries that perform fairly well in one aspect of infrastructure do not neces-sarily do so in another. This fi nding suggests that sector-specifi c constraints may be as important as country-specifi c constraints. It also points to the potential for greater cross-fertilization of experiences across sectors within a country.
In addition, the quality of the institutional framework differs across country groupings.
To analyze the links between institutional factors related to infrastructure and performance outcomes at the sector and enterprise levels, this study devised a standardized survey-based methodology that describes the nature of each insti-tutional reform and measures the intensity of the reform efforts. The methodology builds on, and is compatible with, other recent literature on the subject.
This methodology yields a “scorecard,” a succinct snap-shot of what has happened, sector by sector, in three key institutional dimensions: (a) broad sectoral policy reforms, (b) amount and quality of regulation, and (c) enterprise gov-ernance. First, reform is defi ned as implementing sectoral legislation, restructuring enterprises, and introducing policy oversight and private sector participation. Second, the qual-ity of regulation entails progress in establishing autono-mous, transparent, and accountable regulatory agencies and regulatory tools (such as quality standards and tariff methodology). Third, governance entails the implementa-tion of measures inside the enterprise (such as strengthening shareholder voice and supervision, board and management autonomy, and mechanisms for accounting and disclosure) and measures aimed at improving the external environ-ment in which the enterprise operates (including outsourc-ing to the private sector and introducing discipline from a
competitive labor and capital market). Note that reform and regulation are country-level indicators, whereas governance is measured at the enterprise level.
The Infrastructure Institutional Scorecard applied in this chapter derives from a detailed survey of African infrastruc-ture sectors and enterprises. The reform and regulatory scorecards cover 24 countries for all sectors (except railways and ports, which included only 21 countries and 15 coun-tries, respectively). The governance scorecards have been collected for the 24 telecommunication providers and 21 railway providers. A sample of 30 utilities in the electricity sector and a sample of 52 utilities in the water sector were examined.
The resulting list of institutional reforms represents a refi nement and extension of previous attempts to generate a global scorecard of institutional reforms for infrastructure sectors. The choice of the indicators was made in consulta-tion with infrastructure sector experts. Operationally relevant indicators were selected, each of which had to meet two conditions. First, an action was chosen if a consensus existed that it represented “best practice” and was being applied in different sectors. Second, the data needed to calculate the indicator had to be relatively easy to obtain at the sectoral and enterprise levels.
(continued)
BOX 4.1
Infrastructure’s Institutional Scorecard

Building Sound Institutions 107
Refl ecting countries’ broader characteristics, the extent of institutional reforms differs across these groups (fi gure 4.1). For example, middle-income countries are signifi cantly fur-ther ahead with power sector reform, whereas aid- dependent low-income countries are signifi -
cantly further ahead with water reform, perhaps refl ecting the strong role of donors in this sector. For telecommunications reform, the resource-rich low-income countries have higher scores.
A correlation exists between the quality of infrastructure institutions and the overall
BOX 4.1
(continued)
Jointly, the three sets of indicators (reform, regulatory, and governance) added together summarize the overall level and type of institutional reforms in any given country.
Separately, each indicator serves as a basis for measuring the (aggregate and disaggregate) effect of progress in reforms and enterprise performance.
Reform Legislation Existence of de jure reform Implementation of reform
Restructuring Unbundling/separation of business lines State-owned enterprise corporatization Existence of regulatory body
Policy Oversight Oversight of regulation monitoring outside the ministry Dispute arbitration outside the ministryTariff approval outside the ministry Investment plan outside the ministry Technical standard outside the ministry
Private Sector Involvement Private de jure/de facto Private sector management/investment/ownership Absence of distressed/renegotiation/renationalization
Regulation Autonomy Formal autonomy on hiring/fi ring Financial autonomy (partial/full) Managerial autonomy (partial/full)Multisectoral agency/commissioners
Transparency Publication of decisions via report/Internet/public hearing
Accountability Existence of appeal Independence of appeal (partial/full)
Tools Existence of tariff methodology/tariff indexationExistence of regulatory review; length of regulatory review
Internal GovernanceOwnership and Shareholder QualityConcentration of ownership Corporatization/limited liability Rate of return and dividend policy
Managerial and Board Autonomy Autonomy in hiring/fi ring/wages/production/sales Size of board Selection of board members Presence of independent directors
Accounting, Disclosure, and Performance Monitoring Publication of annual reports International fi nancial reporting standards/external audits/independent auditAudit publication Remuneration of noncommercial activity Performance contracts/with incentives Penalties for poor performance Monitoring/third-party monitoring
External Governance Labor Market Discipline Restriction on dismissing employees Wages, compared to private sector Benefi ts, compared to private sector
Capital Market Discipline No exemption from taxation Access to debt, compared to private sectorNo state guarantees Public listing
Outsourcing Billing and collection Meter reading Human resources information technology
Source: Vagliasindi 2008c.

108 AFRICA’S INFRASTRUCTURE: A TIME FOR TRANSFORMATION
quality of institutions in the country, though this correlation is much stronger for electricity than for water (table 4.1). A key question is the extent to which a country can make progress in reforming infrastructure institutions if its wider governance framework is defi cient (Levy 2007). Numerous indicators have been developed in recent years (for example, by Kaufman, Kraay, and Mastruzzi 2008), attempting to capture
the overall level of governance and control of corruption,1 as well as the quality of public administration. A polity executive constraint indicator also measures the extent of checks and balances within a government (Center for Systemic Peace 2006).
Nevertheless, some countries do well on infrastructure despite broader governance limitations, and vice versa. For Kenya and Niger, lower scores on the country governance indicators have not impeded the achieve-ment of good scores across all utilities’ insti-tutional reforms. For Zambia, low scores in budget execution and fi nancial management have not prevented the country from earn-ing reasonably good scores in infrastructure institutional reforms. By contrast, Benin and Lesotho display high country governance and polity executive constraint scores and have decent budgetary and fi nancial management standards, but neither has a high overall insti-tutional score in the utility sectors.
Institutional development in the utilities sector is well ahead of that in the transport sector (fi gure 4.2). Unsurprisingly, institutional development is furthest ahead in telecommu-nications, where technological change and competition have driven momentous change, bringing the overall average reform score to just under 50 percent. Electricity and water are not that far behind, with institutional reform scores just over 40 percent. Although institu-tional actions in power and water lag those in telecommunications for implementing reform agendas, they score somewhat higher in the quality of regulation. Also, the governance framework for the main service providers is signifi cantly better than that for fi xed-line tele-communication incumbents. By contrast, insti-tutional scores for ports and railways are only about half those for the utilities. These sectors have made signifi cant progress with reform but lag in developing the regulatory framework.
Across countries and sectors, the greatest progress has been in sector reform. Average scores exceed 60 percent for reform legislation and 50 percent for sector restructuring, policy oversight, and private sector participation (fi gure 4.3, panel a). Telecommunications, the most advanced, scores about 80 percent of the best-practice index across all areas of sector reform.
a. Income group
0102030405060708090
100
water telecommunications
b. Aid dependence
0102030405060708090
100
electricity
electricity
water telecommunications
c. Resource richness
0102030405060708090
100
electricity water telecommunications
low income middle income
aid dependent not aid dependent
not resource rich resource rich
Figure 4.1 Institutional Progress across Countries, by Income Group, Aid Dependence, and Resource Richnesspercentage score on institutional scorecard
Source: Vagliasindi and Nellis 2009. Note: See Vagliasindi 2008c for the definition of the institutional indicators.
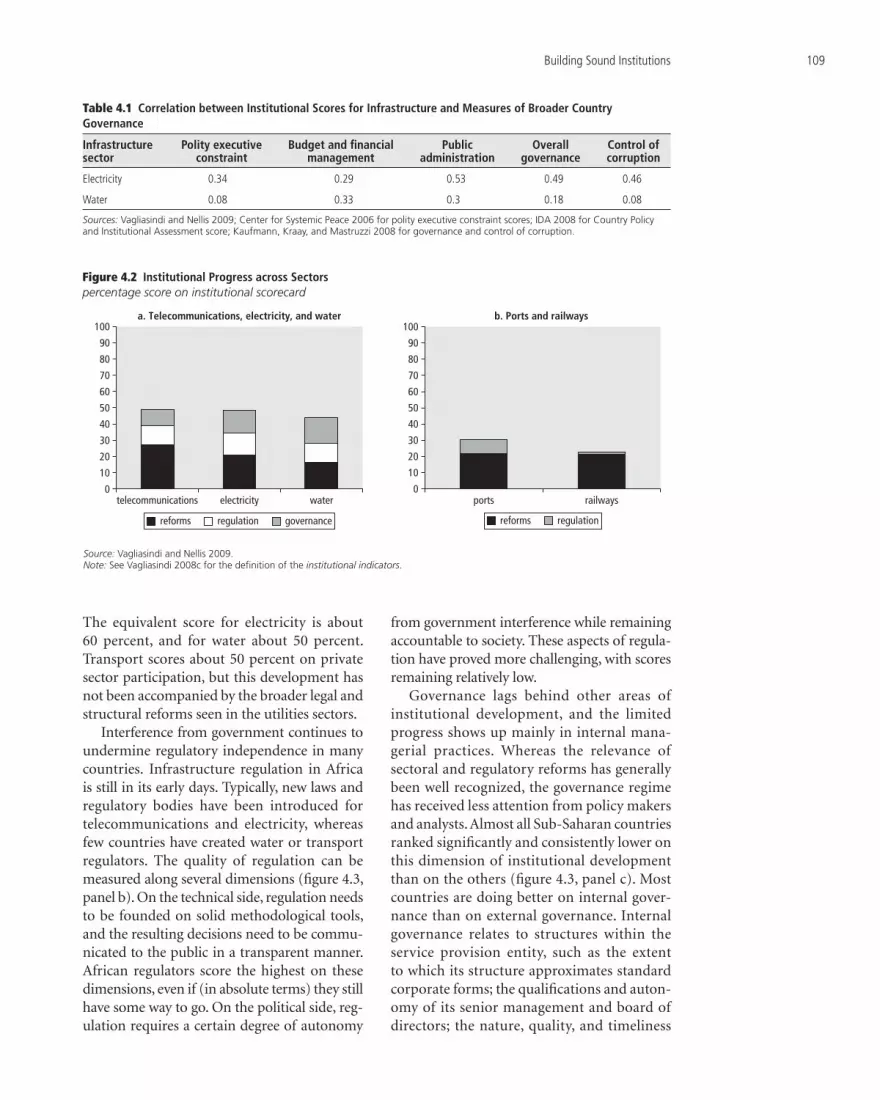
Building Sound Institutions 109
The equivalent score for electricity is about 60 percent, and for water about 50 percent. Transport scores about 50 percent on private sector participation, but this development has not been accompanied by the broader legal and structural reforms seen in the utilities sectors.
Interference from government continues to undermine regulatory independence in many countries. Infrastructure regulation in Africa is still in its early days. Typically, new laws and regulatory bodies have been introduced for telecommunications and electricity, whereas few countries have created water or transport regulators. The quality of regulation can be measured along several dimensions (fi gure 4.3, panel b). On the technical side, regulation needs to be founded on solid methodological tools, and the resulting decisions need to be commu-nicated to the public in a transparent manner. African regulators score the highest on these dimensions, even if (in absolute terms) they still have some way to go. On the political side, reg-ulation requires a certain degree of autonomy
from government interference while remaining accountable to society. These aspects of regula-tion have proved more challenging, with scores remaining relatively low.
Governance lags behind other areas of institutional development, and the limited progress shows up mainly in internal mana-gerial practices. Whereas the relevance of sectoral and regulatory reforms has generally been well recognized, the governance regime has received less attention from policy makers and analysts. Almost all Sub-Saharan countries ranked signifi cantly and consistently lower on this dimension of institutional development than on the others (fi gure 4.3, panel c). Most countries are doing better on internal gover-nance than on external governance. Internal governance relates to structures within the service provision entity, such as the extent to which its structure approximates standard corporate forms; the qualifi cations and auton-omy of its senior management and board of directors; the nature, quality, and timeliness
Table 4.1 Correlation between Institutional Scores for Infrastructure and Measures of Broader Country Governance
Infrastructure sector
Polity executive constraint
Budget and fi nancial management
Public administration
Overall governance
Control of corruption
Electricity 0.34 0.29 0.53 0.49 0.46
Water 0.08 0.33 0.3 0.18 0.08
Sources: Vagliasindi and Nellis 2009; Center for Systemic Peace 2006 for polity executive constraint scores; IDA 2008 for Country Policy and Institutional Assessment score; Kaufmann, Kraay, and Mastruzzi 2008 for governance and control of corruption.
0
10
20
30
40
50
60
70
80
90
100
telecommunications electricity water
b. Ports and railways a. Telecommunications, electricity, and water
0
10
20
30
40
50
60
70
80
90
100
ports railways
reforms regulation governance reforms regulation
Figure 4.2 Institutional Progress across Sectorspercentage score on institutional scorecard
Source: Vagliasindi and Nellis 2009. Note: See Vagliasindi 2008c for the definition of the institutional indicators.

110 AFRICA’S INFRASTRUCTURE: A TIME FOR TRANSFORMATION
of the information it submits to its overseers; and the adoption of accounting and disclosure standards. External governance, by contrast, refers to external market disciplines: being subject to private rather than public sector accounting and auditing systems, contract-ing out noncore activities to private provid-ers, and being obliged to raise debt or equity funds on private capital markets, domestic or international.
Only Kenya and South Africa have raised much from external capital markets. Kenya corporatized its power distribution utility and more recently its generation fi rm, and then issued a minority of shares in each on the Nairobi Stock Exchange. The 2006 initial public offering of 30 percent of the shares of KenGen raised $35 million, a small but sig-nifi cant start. In South Africa, share issuance was not considered feasible, but the national utility, ESKOM, was corporatized, obtained a credit rating, and then issued corporate bonds—$120 million in 2007 alone.
The data generated in the sectoral chapters and the institutional scorecard analysis shed considerable light on the effi cacy of the three central pillars of infrastructure institutional reform, namely, private sector participation (PSP), state-owned enterprise governance, and regulators.
Does Private Sector Participation Work?
The lessons learned from overall experi-ence with PSP demonstrate sectoral nuances. Whereas some sectors display a signifi cant extent of PSP that has brought about valuable outcomes (mobile telephony, power genera-tion, and ports), results are mixed in other sec-tors (roads, power and water distribution).
The extent of private participation varies signifi cantly across sectors. Despite widespread legislation in the region allowing private oper-ators entry into infrastructure, implementa-tion lags are common, particularly for water and railways (fi gure 4.4).
In Africa, most private participation in water, electricity, railways, and ports has been by methods other than full divestiture, that is,
c. Governance quality
0
10
20
30
40
50
60
70
80
90
100
owne
rship
board
auton
omy
acco
untab
ility
outso
urcing
avera
ge
labor
market
capit
al mark
et
telecommunications electricity water ports railways
b. Regulatory quality
0
10
20
30
40
50
60
70
80
90
100
auton
omy
trans
paren
cy
acco
untab
ility
tools
avera
ge
a. Sectoral reforms
0
10
20
30
40
50
60
70
80
90
100
legisla
tion
restru
cturin
g
policy
overs
ight
priva
te sec
tor
avera
ge
Figure 4.3 Institutional Progress on Reforms, Regulation, and Governancepercentage score on institutional scorecard
Source: Vagliasindi and Nellis 2009. Note: See box 4.1 for the definition of the institutional indicators.

Building Sound Institutions 111
through management contracts, leases, and concessions. Only in telecommunications has divestiture been widely applied. The amount of private participation, of all sorts, varies by sector, with the most in telecommunications and the least in water (fi gure 4.5).
As noted previously, private participation in Africa has had some problems. Twenty-
fi ve percent of contracts in water have been canceled, as have 15 percent in electricity (table 4.2). Note that these cancellations do not include contracts that have undergone renegotiation because of the complaints of one or both of the parties involved; nor do they account for cases where anticipated renewals of leases or, especially, management contracts have not occurred, leading to a resumption of state management. In all infrastructure sectors, contract negotiation, monitoring, and enforce-ment have proved more time-consuming and diffi cult than expected.
Despite these difficulties, the survey undertaken for this chapter reveals signifi cant gains from private participation in some sec-tors and for certain aspects of performance. A higher degree of private sector involvement is associated with higher labor productiv-ity (connections per employee), though the link is statistically signifi cant only in the case of electricity and ports, and higher but not statistically signifi cant cost-recovery ratios. In telecommunications, the countries with above-average private involvement display higher access in both the fi xed and the mobile segments of the market. More extensive private involvement in ports is associated with above-average technical effi ciency.
100
90
80
70
60
perc
enta
ge o
f cou
ntri
es
50
40
30
20
10
0
ports
railw
ays
water
electr
icity
teleco
m-
munica
tions
actually implementedallowed by law
Figure 4.4 Implementation of Private Participation across Sectors
Source: Vagliasindi and Nellis 2009.
Figure 4.5 Private Participation in Management and Investment across Sectors
100
90
80
70
60
perc
enta
ge o
f cou
ntri
es
50
40
30
20
10
0
ports
railw
ays
water
electr
icity
teleco
m-
munica
tions
management investment
Source: Vagliasindi and Nellis 2009.
Table 4.2 Cancellation of African Private Participation Contracts
Type of contractNumber of contracts
Percentage canceled
Water
Management contract 15 20
Lease contract 7 45
Concession contract 4 50
BTO/BOO 1 0
Divestiture 1 0
Total 28 25
Electricity
Management or lease contract 17 24
Concession contract 16 31
Independent power project 34 6
Divestiture 7 —
Total 74 15
Source: Vagliasindi and Nellis 2009.Note: BOO = build-operate-own; BTO = build-transfer-operate. — Not applicable.

112 AFRICA’S INFRASTRUCTURE: A TIME FOR TRANSFORMATION
Earlier empirical studies also fi nd some evidence of positive outcomes, albeit based on case study evidence and by no means in all instances. For example, a recent study of seven infrastructure privatizations in Africa assessed three factors: (a) effi ciency gains and losses, (b) nature and competence of the transaction, and (c) who won and who lost (and by how much) in society because of the transaction (BIDE 2006). Three of the seven (Côte d’Ivoire electricity, Senegal Airlines, and Senegal water) were assessed as “unqualifi ed success stories” in effi ciency terms, according to a variety of fi nancial and service quality measures. Three others (Mozambique water and Uganda water and telecommunications) were assessed as producing “some positive changes but less than what most expect from privatization.” Only Senegal electricity was classifi ed as having “no signifi cant effect” (BIDE 2006: 2). None of the seven was assessed as negatively affecting effi ciency.
Such studies found a close correlation between the competence in negotiating the transaction and the effi ciency gains by the new private operator. The distributional effect could be assessed fully in two cases (Côte d’Ivoire electricity and Senegal water) and partially in the other fi ve. Even with limited information, the study found a correlation between institutional capacity and wider dis-tribution of benefi ts. That is, the cases having the better institutional arrangements in con-ducting the transaction show better outcomes for a broader range of stakeholders than do the cases where the transaction process was rated lower.
Using the analysis of the sectoral chapters in this study, one can further assess the extent and effect of private participation in African infrastructure, from the most extensive and successful involvement to the least.
TelecommunicationsPrivate participation in telecommunications has taken place in the majority of Sub-Saharan countries. In 15 countries, at least partial priva-tization of the state-owned fi xed-line telecom-munication incumbent has occurred. Licensing new private mobile operators for greenfi eld networks has been even more widespread.
Privatization of fi xed-line incumbents has affected access and productivity, and qual-ity of services somewhat, though the change is not statistically signifi cant (fi gure 4.6). The growth in the number of subscribers has been low and in almost all countries negative, except Nigeria, the only country where competition has also been introduced in the fi xed-line seg-ment of the market. Productivity is also low, compared with international benchmarks (lines per employee).
Still, several private participation transac-tions in the fi xed-line segment of these mar-kets (the remaining natural monopoly) have run into problems. In the last few years, stra-tegic investors from developed countries have largely withdrawn from African telecommuni-cation privatizations. Only three such sales have occurred since 2001, and in those sales, no tra-ditional strategic partner obtained a controlling stake. Recent telecommunication divestitures have either been public offerings (South Africa and Sudan), sales to developing-country inves-tors (ZTE of China in Niger and Maroc Telecom in Burkina Faso), or sales to domestic investors (Malawi and Nigeria). In several instances, gov-ernments have repurchased shares in incum-bent operators. That happened in Ghana and is planned in Rwanda. In Tanzania in 2005, the government repurchased shares previously privatized in its fi xed-line operator, TTCL. In May 2007, the government placed TTCL under a three-year management contract with a Cana-dian fi rm, SaskTel. As of early 2009, the govern-ment was considering canceling the contract, claiming that SaskTel had failed in its commit-ment to raise nonguaranteed debt fi nancing to rehabilitate and expand the network.
Access has spread quickly since 1998 because of the rapid rise of mobile telephony, largely from the combination of private participation and increasingly intense competition. Private investment, the bulk of it greenfi eld, in cellular phone technology has allowed new providers to enter previously monopolistic markets, result-ing in greater access and declining, though still comparatively high, consumer prices. Analysts generally argue that the dramatic increases in African access to and coverage of telecom-munication services owe more to the entry of new mobile operators, thereby strengthening

Building Sound Institutions 113
competition, than to the improved information and incentives of private managers and owners. Most new mobile operators are controlled by one of fi ve multinational fi rms operating in the region: France Telecom, MTC (Kuwait), MTN (South Africa), Millicom (Luxembourg), or Vodacom (South Africa).
The salutary effects of competition are appar-ent. A strong link exists between liberalization in this sector (and others) and better outcomes in access and productivity (fi gure 4.7). Countries with lower market concentration in the mobile segment of the market, measured by the Her-fi ndahl-Hirschman Index,2 have much higher penetration rates and productivity in the same segment of the market, as well as in the fi xed-line business, though none of these links are statistically signifi cant.
PortsBy 2006, 20 port concessions were operating in Africa, with 6 more in process. Evaluations of these concessions indicate that delays, costs, and thefts were reduced and that port infrastructure started to improve. Cargo-handling rates and the use of better handling systems in African “concessioned” ports are signifi cantly higher than in state-managed ports (fi gure 4.8).
Private sector involvement has grown greatly in container terminals in the region since 2000 (now in eight countries and in pro-cess in several others). Case study evidence for Nigeria and Tanzania confi rms the results of the statistical evidence reported here (see box 4.2). Nonetheless, the level of private sector penetration in the African port sector is low, compared with other regions.
RailwaysConcessions to the private sector have been applied in 13 of the 24 countries reviewed, and the mechanism is presently under nego-tiation in 3 countries and under consideration in another 3 countries. Evaluations of several other longer-standing concessions, nonethe-less, conclude that railways under concessions perform more effi ciently than those remain-ing in state hands, although the difference is signifi cant only in locomotive availability and coach productivity (fi gure 4.9).
0 20 40 60 80 100
number of faults(per main line per year)
main telephone line(100 lines per employee)
mobile subscribers (thousandof subscribers per employee)
total telephone subscribers(per 100 people)
state-owned enterprisesprivatized
Figure 4.6 Links between Private Sector Participation and Performance Indicators in Telecommunications
Source: Vagliasindi and Nellis 2009. Note: None of these performance differentials was found to be statistically significant at 5 percent.
0 20 40 60 80 100
number of faults(per main line per year)
main telephone lines(100 lines per employee)
mobile subscribers (thousandof subscribers per employee)
total telephone subscribers(per 100 people)
low market concentration high market concentration
Figure 4.7 Links between Market Concentration and Performance Indicators in Telecommunications
Source: Vagliasindi and Nellis 2009. Note: None of these performance differentials was found to be statistically significant.
The concession process is not always smooth. For example, the Kenya-Uganda con-cessionaire, brought in with much fanfare in 2006, has had diffi culties in raising the prom-ised investment fi nancing. The contract was renegotiated in late 2008 to reduce the share-holding of the original investor and to allow the owning governments to seek new private partners.

114 AFRICA’S INFRASTRUCTURE: A TIME FOR TRANSFORMATION
Concessions have not resolved the key issue of mobilizing fi nance. The drawback of concessions is that they rarely produce the anticipated (and in many cases, contracted) investments for network rehabilitation and expansion. The reason is that service revenues are too low to support investment fi nance, partly due to low traffi c volumes and intense intermodal competition and partly due to the failure by governments to compensate conces-sionaires for running loss-making obligatory passenger services. Thus, chronic underinvest-ment and dilapidated infrastructure remain as major railway problems. The limited invest-ment capital forthcoming has been fi nanced by international financial institutions and passed through government to the private rail-way operators.
ElectricityThe most common form of private participa-tion in the electricity sector has been inde-pendent power projects (IPPs), with 34 in 11 African countries (Besant-Jones 2006). Assessments of African IPPs have drawn attention to the lack of alternatives, given the severe shortfalls in generation throughout the region and the very important fact that most IPPs do produce the amounts of electricity called for in the contracts. Without IPP pro-duction, the number and duration of service disruptions would be far higher than it has been in recent years.
Low transparency in IPP negotiations translated into high costs. Many, if not most, IPPs were negotiated hastily, in periods of cri-sis, and competitive bidding processes were often amended or skipped entirely. That haste resulted in extremely high costs that now pose a heavy fi nancial burden on the balance sheets of power purchasers: national distribu-tion utilities (and their government owners). This situation, in turn, has led to widespread suspicion that IPP negotiations were incom-petently or corruptly managed (Gratwick and Eberhard 2008).
Regulatory benchmarking can be used to enhance transparency. A proposed method-ology would facilitate a regulatory review of power purchase agreements by explicitly bench-marking them for price and risk allocation, to
BOX 4.2
Privatization in African PortsA lease in the container terminal in the port of Dar es Salaam, Tanzania, produced, within fi ve years, a doubling of throughput, a 70 percent reduction in container dwell time, greater customer sat-isfaction, record profi ts, and vastly increased government revenues (from taxes, lease fees, and payments of $14 per container cleared). The number of expatriate managers fell from 17 to 4; the number of Tanzanian senior managers doubled. More than half the original workforce was dismissed, but salaries for those remaining increased by an average 300 percent—and postlease expansion in operations created 500 new jobs, far more than the number previously laid off. Dar es Salaam became the fastest container terminal in Africa, with performance exceeding that of many European and Australian ports.
In 2004, Nigeria started a major effort to reform its clogged, ineffi -cient, and very expensive ports. The government enacted “upstream” policy and legal reforms while hiring, through concessions, expe-rienced private operators to manage, operate, and rehabilitate 26 ports. The new autonomous regional port authorities, now the “landlords” of the ports, negotiated the concession contracts. The Federal Ministry of Transport took on the role of sector policy maker. Just a few months after the concessioning of the Apapa-Lagos con-tainer terminal, delays for berthing space had dwindled, and leading shipping lines reduced their congestion surcharge from $525 to $75, saving the Nigerian economy an estimated $200 million a year. Observ-ers credit the improvements as much to the upstream reform of the institutional setting as to bringing on board private operators.
Worth noting is that Tanzania and Nigeria are the top two coun-tries in institutional reforms.
Sources: World Bank 2005 for Tanzania; Leigland and Palsson 2007 for Nigeria.
100 20 30 40 50 60 70 80 90
container gantries ashandling system
(percent)**
average moves perhour (unit: 100 moves)*
annual (weighted average)growth rate of container
trade 1995–2000
concessioned others
Figure 4.8 Links between Port Concessions and Performance Indicators
Source: Vagliasindi and Nellis 2009. Note: *Performance differential is statistically significant at the 10 percent level; **significant at the 5 percent level.

Building Sound Institutions 115
identify and ensure that the terms of the agree-ments are “fair and balanced” to all parties who will be directly and indirectly affected by these transactions (Besant-Jones, Tenenbaum, and Tallapragada 2008). The Nigerian energy regu-lator has tested the methodology.
Management contracts are the second most common form of electricity PSP, with 17 in 15 countries.3 Management contracts have produced large and signifi cant labor produc-tivity gains (fi gure 4.10), though they have not proved suffi cient, in and of themselves, to overcome the broader policy and institu-tional defi ciencies of the sector. The effects of these contracts on cost recovery, system losses, and collection rates, however, turn out to be minimal and statistically insignifi cant (fi gure 4.10). As with concessions in railways, management contracts in electricity have not been instrumental in generating invest-ment funds.
Several independent evaluations of man-agement contracts conclude that they pro-duced effi ciency gains and improved fi nancial performance (Davies 2004). The problem is that they have not been sustained. Only 3 of 17 negotiated contracts remain in operation. A few have been canceled. More commonly, however, although technicians and donors recommend renewal of contracts after their initial phase, African governments, for mainly sociopolitical reasons, choose to reestablish public management. Lessons from this experi-ence include the importance of setting targets not only for commercial performance but also for improvements in quality of supply and ser-vice, including expanded access, so that con-sumers experience tangible benefi ts. Effective contractual oversight is needed to track per-formance, to fairly assess and award incentive payments or penalties, and to reduce informa-tion asymmetry. Finally, postcontract manage-ment succession issues need to be addressed early (Ghanadan and Eberhard 2007).
WaterIn water, leases have been applied rather widely, with management contracts as the second most common form of private participation. Con-cessions have also been used in several African countries (in Chad, Gabon, and Senegal, for
example, dating from the 1990s). The two in Gabon and Senegal have been judged as suc-cesses in producing service improvements, network expansions, and fi nancial stability (BIDE 2006). The long-term leases in Côte d’Ivoire and Niger have been producing posi-tive fi nancial and operational results, despite diffi cult external conditions (Marin 2008). Only one divestiture has occurred, entailing
Figure 4.9 Links between Rail Concessions and Performance Indicators
Source: Vagliasindi and Nellis 2009.Note: *Performance differential is statistically significant at the 10 percent level; ***significant at the 1 percent level.
0 0.5 1.0 1.5 2.0 2.5 3.0
staff (million units of traffic per staff)
coaches (million passenger-kilometer per coach)*
cars (million ton-kilometer per car)
locomotive availability(% of time)***
state-owned enterprisesconcession
0 20 40 60 80 100 120 140 160 180 200
cost recovery(ratio base 100)
transmission and distribution loss (% on total production)
implicit collection rates(% on total electricity billed)
labor productivity(connections per employee)***
management contract other
Figure 4.10 Links between Electricity Management Contracts and Performance Measures
Source: Vagliasindi and Nellis 2009.Note: ***Performance differential is statistically significant at the 1 percent level.

116 AFRICA’S INFRASTRUCTURE: A TIME FOR TRANSFORMATION
the sale of 51 percent of equity, which was in the water company in Cape Verde in 1999.
Private participation in water has generated much hostility and opposition. Because water is a commodity essential for life, many feel that its distribution should be free or at a very low price. Despite considerable evidence of persis-tently poor performance by publicly owned and operated African water companies, many people believe that the service cannot and should not be turned over to private delivery. To support their position, they point to several notable pri-vate participation problem cases in water, such as Tanzania (see box 4.3) and Uganda.
A recent detailed empirical review of the main experiences with private sector partici-pation in the African water sector concluded that there had been benefi cial effects on enter-prise performance in a number of cases but that the extent of these impacts depended on the contractual forms that were used (Marin 2008). In the case of management contracts, which are short term in nature, there had been benefi ts in terms of revenue collection and ser-vice continuity but little effect on other aspects of performance. In the case of lease contracts,
which are medium term in nature, broader improvements in operational effi ciency had been observed. Access had also improved, although funding continued to come from the public sector.
What Have We Learned?Any evaluation of the African experience with private sector participation must be nuanced by the wide variation in sector experiences (table 4.3), and both successes and failures considered in tandem. Public and official attention have focused more on the failures and contentious cases, particularly in water, but also in power and transport. However, the lesson from African private participation is not that the approach should be discarded, but that it should be applied selectively and care-fully to those areas of infrastructure where it has a proven potential to contribute.
Expectations should also be kept realistic. Experience has shown that there are only a few niches where, either through raising investment fi nance or improving operational effi ciency, the private sector can contribute signifi cantly to investment fi nance—namely, ICT (particularly mobile networks), power generation, port con-tainer terminals, and a handful of high-traffi c road segments (table 4.3). While the overall volume of private fi nance for infrastructure investment is limited, it is nonetheless sub-stantial, having (at least during the mid-2000s) exceeded the volume of ODA for these sectors (recall table 2.1). But even in areas of infra-structure that have not proved attractive for private fi nance—such as most roads, railways, power and water distribution systems—private management can still make a signifi cant contri-bution to improving operational performance, and thereby help to recover the very substantial funds that are currently being lost to various kinds of ineffi ciency (recall table 2.8).
Of course, one cannot deny the problems in African private participation, or that many of them can be attributed, in all sectors, to institutional defi ciencies. Poor sectoral plan-ning, vague or absent sector policies, and long-standing weak fi nancial and operational performance in the utilities helped create the crises of demand and insecurity that led to rushed decisions. In state-owned infrastructure
BOX 4.3
Lessons from the DAWASA Lease Contract (Tanzania)The failed lease contract of DAWASA, the water authority for Dar es Salaam, Tanzania, is instructive. The contract was signed in August 2002. It was supposed to run for 10 years, but the government canceled it in May 2005, after only 21 months of operation. The government claimed the private provider had failed to meet water production and collection targets, pay the lease and other fees, meet service quality and quantity commitments, and pay the penalties assessed for noncompliance. For its part, the private provider claimed that its bid and business plan were based on inaccurate, out-of-date, or partial information provided by the government. Arbitration in April–May 2005 failed; the government ter-minated the contract, and the service returned to public management. Critics note that the private provider’s lawsuit against the government for breach of contract was rejected (in 2008) by a British court. They argue that this case shows how diffi cult it is to ensure that private provi-sion of water will fulfi ll either the anticipated fi nancial objectives or the distributional objectives.
Sources: BIDE 2006; Marin 2008.

Building Sound Institutions 117
fi rms, poor management, inadequate or non-existent record keeping (at both the fi rm and higher levels), and lax monitoring created organizational and informational chaos that reduced the interest of potential investors and severely complicated the due diligence processes of those who bid. Nontransparent contract negotiation proceedings, substan-dard procurement practices, and inadequate contract monitoring and enforcement mecha-nisms have been among the factors contribut-ing to higher prices, poorer-than-anticipated outcomes, renegotiated or canceled contracts, and governance issues. These institutional defi ciencies must be dealt with if private par-ticipation is to fulfi ll its potential.
Despite the inroads of private participation over the past two decades, Africa remains the region with the highest state ownership of its infrastructure utilities. The fi nancial crisis of
Table 4.3 Overview of Experience with Private Participation in Infrastructure
Infrastructure sector Extent of private participation Nature of experience Prospects
ICT
Mobile telephony Over 90 percent of countries have licensed multiple mobile operators
Extremely benefi cial with exponential increase in coverage and penetration
Several countries still have potential to grant additional licenses
Fixed telephony Some 60 percent of countries have undergone divestiture of SOE telecommunication incumbent
Controversial in some cases, but has helped improve overall sector effi ciency
Several countries still have potential to undertake divestitures
Power
Power generation 34 IPPs provide 3,000 MW of new capacity, investing $2.5 billion
Few cancellations but frequent renegotiations; PPAs have proved costly for utilities
Likely to continue, given huge unsatisfi ed demands and limited public sector capacity
Power distribution 16 concessions and 17 management or lease contracts in 24 countries
Problematic and controversial; one-quarter of contracts canceled before completion
Movement toward hybrid models involving local private sector in similar frameworks
Transport
Airports Four airport concessions, investing less than $0.1 billion, plus some divestitures
No cancellations but some lessons learned Limited number of additional airports viable for concessions
Ports 26 container terminal concessions, investing $1.3 billion
Processes can be controversial, but cancellations have been few and results positive
Good potential to continue
Railroads 14 railroad concessions, investing $0.4 billion Frequent renegotiations, low traffi c, and costly public service obligations keep investment below expectations
Likely to continue but model needs to be adapted
Roads 10 toll-road projects, almost all in South Africa, investing $1.6 billion
No cancellations reported Limited because only 8 percent of road network meets minimum traffi c threshold, almost all in South Africa
Water
Water 26 transactions, mainly management or lease contracts
Problematic and controversial; 40 percent of contracts canceled before completion
Movement toward hybrid models involving local private sector in similar frameworks
Source: Authors’ elaboration based on Bofinger 2009; Bullock 2009; Eberhard and others 2008; Gwilliam and others 2008; Minges and others 2008; Mundy and Penfold 2008; and Svendsen, Ewing, and Msangi 2008.Note: ICT = information and communication technology; IPP = independent power project; PPA = power purchase agreement; SOE = state-owned enterprise.
2008–09 will further deplete investor appetites for comparatively high-risk ventures in emerg-ing markets, heighten the reluctance of African offi cials to embark on innovative schemes, and add weight to the notion of the primacy of the public sector. Therefore, the existing level of state ownership is likely to persist, and may indeed increase, in the near to medium term. This likelihood requires renewed attention to a long-standing but recently neglected issue: improving the fi nancial and operational per-formance of state-owned fi rms (Nellis 2005; Gómez-Ibáñez 2007).
How Can State-Owned Enterprise Performance Be Improved?
Africa has the highest percentage of state-owned infrastructure utilities of any developing

118 AFRICA’S INFRASTRUCTURE: A TIME FOR TRANSFORMATION
region. Given the mixed record; the absence of investor appetite; and the antipathy of African offi cials, nongovernmental organizations, and many observers of development toward private participation—and the resulting increasing reluctance of the donor community to push for privatization in infrastructure—state own-ership is likely to be the norm for some time.
The track record so far in governance reforms is not encouraging and varies sub-stantially across sectors and countries. One must start with the recognition that a few African state-owned infrastructure fi rms have sustained good performance in the absence of private participation. Botswana and Uganda show that fully state-owned African utilities can deliver high-quality performance (see box 4.4 and box 4.5, respectively).
The cost of inaction implies high hidden costs. The estimated hidden cost of ineffi ciency coming from mispricing, unaccounted losses, and collection ineffi ciency is on average equal to 0.6 percent of GDP in the water sector and 1.9 percent of GDP in the power sector. The ineffi ciency of SOEs can also be measured by excessive employment. In the telecommu-nication sector, the hidden cost of excessive employment is on average equal to 0.1 percent of GDP.
Only limited success in achieving full cor-poratization, including establishing limited liabilities and introducing rate of return and dividend policies, has been recorded in Africa. The telecommunication sector alone can be reported as a success story, with electricity and water lagging, proving that even coun-tries with high scores compare poorly with other regions.
More limited corporate governance reforms have been started more evenly across all sec-tors and are becoming a dominant feature in electricity and water. These changes include the introduction of boards of directors (even if the size tends to be either too large or too small compared with international standards), selec-tion of board members according to a com-petitive process rather than direct appoint-ments by line ministries, and the introduction of independent directors (fi gure 4.11).
Performance contracts with incentives and independent external audits have become dominant features of the governance reform pro-cess for both electricity and water (fi gure 4.12). Independent audits have also been good for effi ciency in both cases.
Of governance reforms that appear to be the most important drivers of higher performance, two appear especially promising: performance contracts with incentives and independent external audits (table 4.4). Uganda has had good experience with a performance contract in its water company, providing the utility with incentives for good performance and produc-ing greater accountability (see box 4.5). The introduction of independent audits has also positively affected effi ciency for both electric-ity and water utilities.
What can such cases teach? First, recast and reapply the performance contract approach to SOE reform. Initial attempts to improve African SOEs using this device were mini-mally effective, but recent efforts have had a stronger and much more positive effect. The more recent performance contracts applied with some success in Uganda (and, reportedly, in Kenya) should be studied and modifi ed for broader application to African utilities across sectors.
Second, renew efforts to strengthen the fi nancial and operational monitoring of SOEs.
BOX 4.4
Lessons from Successful SOE Reforms in Botswana Power CorporationThe state-owned and -operated Botswana Power Corporation has long provided reliable, high-quality service. Over the years, Botswana Power has expanded its network in both urban and rural areas, covered its costs, posed no burden on the government bud-get, minimized system losses (10 percent), and earned a decent return on assets. Although the availability of cheap imported power from South Africa (now severely threatened) is part of the expla-nation for good performance, analysts give fi ve institutional factors equal weight in explaining this success: (a) a strong, stable economy, (b) cost-refl ective tariffs, (c) lack of government interference in mana-gerial decisions, (d) good internal governance, and (e) competent, well-motivated staff and management.
Source: PPA 2005.

Building Sound Institutions 119
Some of the structures implied in the Organi-sation for Economic Co-operation and Devel-opment’s Principles of Corporate Governance for SOEs (favoring a centralized ownership
function through an independent agency ver-sus a decentralized structure) have not yet been suffi ciently “tested” in practice and may not suit all developing countries. A centralized
0
20
40
60
80
100
waterelectricity
% o
f uti
litie
s
% o
f uti
litie
s
a. Ownership and shareholder quality b. Managerial and board autonomy
telecommunications waterelectricitytelecommunications0
10
20
30
40
50
60
70
80
90
100
corporatization limited liability
rate-of-return policy dividend policy
size of the board
presence of independent directors
selection of board members
Figure 4.11 Prevalence of Good Governance Practices among State-Owned Enterprises for Infrastructure
Source: Vagliasindi and Nellis 2009.Note: See box 4.1 for definitions of institutional indicators.
BOX 4.5
Between 1998 and 2004, the National Water and Sewer-age Corporation (NWSC) system operated under two man-agement contracts with private providers. By the end of the second contract, neither party had an interest in continuing. After 2004, public managers, operating under performance contracts, were responsible for the service. A review of per-formance during the entire period concluded that the targets set for the private management contracts were fulfi lled but that the public management team furnished similarly good performance. The main stages in the enterprise reform pro-cess are described below.
From February 1999 onward, the management of the NWSC in Uganda has sequentially implemented a number of reform programs. First, local offi cials, called area service providers (areas), negotiated with central authorities a set of tightly defi ned performance targets. Second, area manag-ers were given control over running the process. Third, they were held strictly accountable for specifi c results.
A number of measures including the 100-day program and the service and revenue enhancement programs resulted in better specifi cation of targets for the areas. The programs
also increased the head offi ce’s commitment to provide fi nancial and material resources to enable different areas to implement rehabilitation and investment programs.
In 2002, automatic tariff indexation was introduced. In addition, the Stretch-Out Program increased staff com-mitment by improving internal communication and setting tougher performance targets and corresponding incentives. A one-minute management system was introduced to further enhance individual staff members’ accountability for targets.
The government introduced a three-year performance contract in 2000. The NWSC’s debt service obligations were suspended in return for a commitment to operational and fi nancial improvements and an increase in coverage.
In 2003, a second performance contract continued the suspension of debt service and specifi ed that NWSC’s debt would be restructured to a sustainable level. A review com-mittee monitored implementation of the agreement. The main incentives of the agreements are bonuses for manag-ers and staff, if performance targets are achieved.
Sources: Baietti, Kingdom, and van Ginneken 2006; Vagliasindi 2008a.
Performance Agreement for the National Water and Sewerage Corporation (Uganda)

120 AFRICA’S INFRASTRUCTURE: A TIME FOR TRANSFORMATION
Figure 4.12 Prevalence of Performance Contracts in Electricity and Water
Source: Vagliasindi and Nellis 2009.
% o
f uti
litie
s
0
20
40
80
60
100
waterelectricity
performance contracts
performance contracts with incentives
penalties for poor performance
Table 4.4 Links between Governance and Performance Indicators for Electricity and Water
Technical lossesConnections
per employee Access
Reform/sector Yes No Yes No Yes No
Performance contracts
Electricity 24.2a 23.3a 176.8** 103.0 14.6a 28.1a
Water 36.2 33.6 13.6 6.2 28.1 14.6
Independent audit
Electricity 22.9 28.3 164.3** 92.7 22.0 9.6
Water 35.2 35.7 7.6 6.0 9.6a 22.0a
Source: Vagliasindi and Nellis 2009.Note: **Performance differential is statistically significant at the 5 percent level.a. The sign of the links between the variables is not as expected.
structure, where the owner is the ministry of fi nance rather than an independent agency, is more suited to the limited physical and human resource bases of most African countries. Moreover, it has been implemented relatively successfully in several developing countries. Under a decentralized or dual model—where the owner is the sectoral ministry or both a central authority (the ministry of fi nance or treasury) and the sectoral ministry—the cen-tral authority can collect and monitor infor-mation about the state-owned enterprises and
their economic performance, including the detailed structure of subsidies and intersec-toral arrears (Vagliasindi 2008b).
Do Independent Regulators Make Sense?
Countries rank rather low on regulatory independence across all sectors, confi rming that the standard model has not fi t the chal-lenges in Africa well. Independence in several infrastructure sectors has been challenged across all formal, fi nancial, and managerial dimensions. Evidence on the links between introducing an independent regulator and improving performance is weak, but a signifi -cant positive effect is discernible in telecom-munications (table 4.5).
In water, where state-owned enterprises still predominate and are likely to for some time, countries with an independent regu-lator perform no better than those without (table 4.5). This outcome may refl ect the fact that donors have tended to be the largest pro-moters of water regulatory agencies and they tend to assist on the most problematic situa-tions. In addition, many countries (particu-larly the francophone nations) have opted for regulation by contract rather than create an independent agency.
Nonetheless, hybrid regulatory schemes have not proved to be superior to traditional forms of regulation in the water sector. Africa Infrastructure Country Diagnostic data support no evidence on the superiority of regulation by contract over the traditional form of regulation by agency (see table 4.6 and box 4.6).
For railways and ports, the regulatory func-tion is generally entrusted to ministries of transport. Only Tanzania is establishing two multisector regulatory agencies, one for pub-lic services and the other for transport. Mali and Senegal had railway regulatory agen-cies that were later converted into a common railway-monitoring agency for both countries. In railways, an independent regulator is still considered necessary, not so much to prevent exploitation of the monopoly power of the private sector as to protect the concessionaire from the erratic behavior of governments,

Building Sound Institutions 121
including the nonpayment of passenger service obligations to the concessionaires.
Weak regulatory autonomy and capac-ity constraints undermine the credibility of the independent regulator (Eberhard 2007). Most Sub-Saharan regulatory agencies are embryonic, lacking funding and in many cases qualifi ed personnel. Budgets vary consider-ably, ranging from less than $300,000 to about $3 million for electricity. Staffi ng also varies widely, from one or two to a couple of dozen
employees. Although regulatory requirements differ with country size and income, that difference does not fully explain the observed variation in capacity. Contrast Sub-Saharan reg-ulatory budgets to those of the most developed countries: in 2005, the U.S. electricity regulator, the Federal Energy Regulatory Commission, had a budget of about $240 million for 1,200 employees, and the United Kingdom’s Offi ce of the Gas and Electricity Markets had a budget of $74 million for about 300 employees.
Table 4.5 Links between Regulation and Performance Indicators for Telecommunications, Electricity, and Water
Technical losses Connections per employee Access
Sector Regulation No regulation Regulation No regulation Regulation No regulation
Telecommunications 0.2 0.3 0.38*** 0.03 0.2*** 0.1
Electricity 23.3 25.3 155.3 117.3 22.3 11.9
Water 35.2 34.8 6.8a 8.3a 36.1 35.9
Source: Vagliasindi and Nellis 2009.Note: ***Performance differential is statistically significant at the 1 percent level.a. The sign of the links between the variables is not as expected.
Table 4.6 Links between Type of Regulator and Performance Indicators for Water
Technical losses (% production) Connections per employee Access (% households)
SectorRegulation by
contractRegulation by
agencyRegulation by
contractRegulation by
agencyRegulation by
contractRegulation by
agency
Water 39.4 31.5 0.19 0.05 16.9 32.1
Source: Vagliasindi and Nellis 2009.Note: None of these performance differentials was found to be statistically significant.
BOX 4.6
In the highly successful case of Senegalese water, the offi cials negotiating the contract did a world-class job of structuring a solid transac-tion and capturing almost immediate gains for consumers by using a creative compensation structure with many of the effi ciency properties of two-part utility pricing. By contrast, in the less-successful case of electricity, Senegalese negotiators of the electricity divestiture did not anticipate a predictable problem: “Price was set by a perfectly reasonable price-cap [Retail Price Index – x] formula, but it failed to include
a specifi c escalation factor for key input prices, and only included a general input price adjust-ment factor. When oil prices roughly doubled shortly after transfer, the operator wanted relief.” The government was reluctant to allow the price increases demanded by the private (minority) owner and operator, and the deal collapsed. The fi rm returned to public hands where, following a failed second attempt at divestiture, it has done rather well.
Source: BIDE 2006.
Regulation by Contract in Senegal

122 AFRICA’S INFRASTRUCTURE: A TIME FOR TRANSFORMATION
Notes The authors of this chapter are Maria Vagliasindi
and John Nellis, who drew on background mate-rial and contributions from Sudeshna Ghosh Banerjee, Cecelia Briceño-Garmendia, Vivien Fos-ter, Yan Li, Elvira Morella, and Maria Shkaratan.
1. The World Bank’s Country Policy and Institu-tional Assessment indicator reported in IDA 2008.
2. The index is calculated by squaring the market share of each fi rm competing in the market and summing the results. For example, for a market consisting of four fi rms with shares of 30, 30, 20, and 20 percent, the index is 2,600 (302 + 302 + 202 + 202 = 2,600).
3. Management contracts should not be confused with performance contracts. In a management contract, an owning government hires private personnel to operate an SOE. The contractor is paid a fee for service; normally, bonuses are awarded to the contractor if stipulated perfor-mance targets are met. A performance contract is a set of negotiations between a government and SOE managers from the public sector, spell-ing out the obligations and responsibilities of the two parties over a set period. Performance contracts can include incentives to SOE manage-ment (and staff); typically, the main issues speci-fi ed deal with the managers’ obligations to meet some targets and the government’s obligation to allow price increases, provide investment capital, settle past debts, pay bills on time, and so on.
ReferencesBaietti, Aldo, William Kingdom, and Meike
van Ginneken. 2006. “Characteristics of Well-Performing Public Water Utilities.” Water Supply and Sanitation Working Note 9, World Bank, Washington, DC.
Besant-Jones, John E. 2006. “Reforming Power Markets in Developing Countries: What Have We Learned?” Energy and Mining Sector Board Dis-cussion Paper 19, World Bank, Washington, DC.
Besant-Jones, John E., Bernard Tenenbaum, and Prasad Tallapragada. 2008. “Regulatory Review of Power Purchase Agreements: A Proposed Benchmarking Methodology.” Energy Sector Management Assistance Program Formal Report 337/08, World Bank, Washington, DC.
BIDE (Boston Institute of Development Economics). 2006. Impact of Privatization in Africa: Synthesis of Eight Cases. Washington, DC: World Bank.
Bofi nger, Heinrich C. 2009. “Air Transport: Chal-lenges to Growth.” Background Paper 16, Africa Infrastructure Sector Diagnostic, World Bank, Washington, DC.
Bullock, Richard. 2009. “Taking Stock of Railway Companies in Sub-Saharan Africa.” Background Paper 17, Africa Infrastructure Sector Diagnos-tic, World Bank, Washington, DC.
Center for Systemic Peace. 2006. Political Regime Characteristics and Transitions. Fairfax, VA: George Mason University.
Davies, Ian C. 2004. Management Contracts in the Electricity Sector: Case Studies in Malawi, Lesotho, Tanzania and Rwanda. Washington, DC: World Bank.
Eberhard, Anton. 2007. “Matching Regulatory Design to Country Circumstances: The Potential for Hybrid and Transitional Models.” Gridlines, Note 23. Public-Private Infrastructure Advisory Facility, World Bank, Washington, DC.
Eberhard, Anton, Vivien Foster, Cecilia Briceño-Garmendia, Fatimata Ouedraogo, Daniel Camos, and Maria Shkaratan. 2008. “Under-powered: The State of the Power Sector in Sub-Saharan Africa.” Background Paper 6, Africa Infrastructure Sector Diagnostic, World Bank, Washington, DC.
Ghanadan, Rebecca, and Anton Eberhard. 2007. “Electricity Utility Management Contracts in Africa: Lessons and Experience from the TANESCO-NET Group Solutions Manage-ment Contract in Tanzania.” Management Pro-gramme in Infrastructure Reform and Regulation Working Paper, Graduate School of Business, University of Cape Town, South Africa.
Gómez-Ibáñez, José A. 2007. “Alternatives to Infrastructure Privatization Revisited: Public Enterprise Reform from the 1960s to the 1980s.” Policy Research Working Paper 4391, World Bank, Washington, DC.
Gratwick, Katharine Nawaal, and Anton Eberhard. 2008. “An Analysis of Independent Power Projects in Africa: Understanding Development and Investment Outcomes.” Development Policy Review 26(3): 309–38.
Gwilliam, Ken, Vivien Foster, Rodrigo Archondo-Callao, Cecilia Briceño-Garmendia, Alberto Nogales, and Kavita Sethi. 2008. “The Burden of Maintenance: Roads in Sub-Saharan Africa.” Background Paper 14, Africa Infrastructure Sector Diagnostic, World Bank, Washington, DC.
IDA (International Development Association). 2008. IDA: The Platform for Achieving Results at the Country Level, Fifteenth Replenishment. Washington, DC: IDA.
Kaufmann, Daniel, Aart Kraay, and Massimo Mastruzzi. 2008. “Governance Matters VII: Aggregate and Individual Governance Indica-tors 1996–2007.” Policy Research Working Paper 4654, World Bank, Washington, DC.

Building Sound Institutions 123
Leigland, James, and Gylfi Palsson. 2007. “Port Reform in Nigeria.” Gridlines, Note 17. Public-Private Infrastructure Advisory Facility, World Bank, Washington, DC.
Levy, Brian. 2007. Governance Reforms, Poverty Reduction and Economic Management. Washington, DC: World Bank.
Marin, Philippe. 2008. Public-Private Partnerships for Urban Water Utilities: A Review of Experiences in Developing Countries. Washington, DC: World Bank.
Minges, Michael, Cecilia Briceño-Garmendia, Mark Williams, Mavis Ampah, Daniel Camos, and Maria Shkratan. 2008. “Information and Communications Technology in Sub-Saharan Africa: A Sector Review.” Background Paper 10, Africa Infrastructure Sector Diagnostic, World Bank, Washington, DC.
Mundy, Michael, and Andrew Penfold. 2008. “Beyond the Bottlenecks: Ports in Sub-Saharan Africa.” Background Paper 8, Africa Infrastruc-ture Sector Diagnostic, World Bank, Washington, DC.
Nellis, John. 2005. “The Evolution of Enterprise Reform in Africa: From State-Owned Enter-prises to Private Participation Infrastructure—and Back?” Research Paper 117, Fondazione Eni Enrico Mattei, Milan.
PPA (Power Planning Associates Ltd.). 2005. “Towards Growth and Poverty Reduction:
Lessons from Private Participation in Infrastruc-ture in Sub-Saharan Africa—Case Study of Bot-swana Power Corporation.” Report submitted to World Bank, Washington, DC.
Svendsen, Mark, Mandy Ewing, and Siwa Msangi. 2008. “Watermarks: Indicators of Irrigation Sector Performance in Sub-Saharan Africa.” Background Paper 4, Africa Infrastruc-ture Sector Diagnostic, World Bank, Washington, DC.
Vagliasindi, Maria. 2008a. “The Effectiveness of Boards of Directors of State Owned Enterprises in Developing Countries.” Policy Research Working Paper 4579, World Bank, Washington, DC.
———. 2008b. “Governance Arrangement for State-Owned Enterprises.” Policy Research Work-ing Paper 4542, World Bank, Washington, DC.
———. 2008c. “Institutional Infrastructure Indi-cators: An Application to Reforms, Regulation and Governance in Sub-Saharan Africa.” World Bank, Washington, DC.
Vagliasindi, Maria, and John Nellis. 2009. “Evalu-ating Africa’s Experience with Institutional Reform for the Infrastructure Sectors.” Working Paper 23, Africa Infrastructure Sector Diagnos-tic, World Bank, Washington, DC.
World Bank. 2005. “Second Port Modernization and Railway Restructuring Projects, Project Performance Assessment Report.” World Bank, Washington, DC.

125
Facilitating Urbanization
A frica is urbanizing fast, a change that is predictable and benefi cial. Economic geography indicates that prosperity and
density go together because higher productivity requires agglomeration economies, larger markets, and better connectivity. Concentra-tion and urbanization trigger prosperity in urban areas as much as in rural areas, and well-functioning cities facilitate trade and the transformation of rural production and non-farm activities. The debate over rural or urban development should thus be replaced by the understanding that rural and urban develop-ment are mutually dependent and that eco-nomic integration of rural and urban areas is the only way to produce growth and inclusive development.
Populated places in Africa need infrastruc-ture to enhance the competitiveness of their businesses and the productivity of their work-ers. Energy, roads, water, and information and communication technologies (ICTs) give Afri-can economies the capacity to develop. Long-run growth requires an efficient system of urban centers that includes small, medium, and larger cities that produce industrial goods and high-value services, along with well-functioning transportation networks (roads, rails, and ports)
to link national economies with regional and global markets.
African cities are growing fast, but because of insuffi cient infrastructure and poor institu-tions, most new settlements are informal and not covered by basic services. This situation has severe consequences for health, incomes, and market integration. A combination of institutional reform, land policy and planning, housing policies, and basic services is required for urban expansion that is more equitable and inclusive in nature.
Many necessary investments are beyond the limited fi scal and fi nancial base of African cities. Decentralization has increased the responsibili-ties of cities, but not their powers and incen-tives to raise (and retain) revenues. Cities need access to predictable streams of revenue and the fl exibility to raise additional resources, to safeguard service provision to their constituen-cies. They also need to improve their technical and managerial capacity to deal with priorities in investment and operation and maintenance, to guide the inevitable expansion, to attract private partners, and to understand their sur-rounding neighborhoods to develop synergies.
Africa’s large agricultural sector and rural economy remain central for overall economic
Chapter5

126 AFRICA’S INFRASTRUCTURE: A TIME FOR TRANSFORMATION
growth and poverty reduction. Better infra-structure is crucial for raising agricultural productivity and facilitating access to markets for agricultural products. The Asian experi-ence suggests that successful economic growth demands higher agricultural productivity, which raises incomes and the demand for nonagricultural products, lowers food prices, and frees up labor for (mainly urban) indus-trial and service employment (World Bank 2008).1
The policy challenge is to harness market forces that encourage concentration and pro-mote convergence in living standards between villages, towns, and cities. Policy makers will be more effective if they look at development strategies for broad economic areas that inte-grate towns and cities with their surrounding rural hinterland. This chapter discusses and estimates the infrastructure needs of rural and urban areas in the context of rapid urbaniza-tion and its challenges for infrastructure, insti-tutions, and targeted interventions.
Viewing Cities as Engines of Growth
The debate on growth strategies has often looked at urban and rural areas as compet-ing for primacy in the national agenda and in investment allocations, but now is the time to frame the debate differently. Cities exist because of the economic and social advan-tages of closeness. Urban centers contribute to national economic growth by increasing individual, business, and industry produc-tivity through agglomeration economies; by increasing household welfare through social mobility and human development; and by promoting positive institutional change. Cit-ies also drive rural development, serving as primary markets for rural production and generating income that fl ows back to rural areas. Links between urban and rural areas constitute a virtuous circle, where access to urban markets and services for nonfarm production stimulates agricultural produc-tivity and rural incomes, which in turn gen-erate demand and labor for more goods and
services. Addressing bottlenecks in city per-formance is an effective entry point into this “virtuous” circle (Kessides 2006).
Proximity to cities (neighborhood effect) is critical for enabling the shift from subsis-tence to commercial agriculture, for increasing rural incomes, and for making living standards converge. Areas within two hours’ travel time of cities of at least 100,000 people seem to have diversifi ed into nonagricultural activities (Dorosh and others 2008). Rural areas located between two and eight hours’ travel time from such cities account for more than 62 percent of the agricultural supply and generate a surplus sold to urban areas. In areas farther than eight hours from these cities, agriculture is largely for subsistence, and less than 15 percent of the land’s agricultural potential is realized (table 5.1).2 Similarly, farmers closer to cities tend to use more and higher-quality fertilizers and pesticides and better equipment, result-ing in clear improvements in productivity. So the growth of urban markets is a key factor in raising the income of the rural population in the hinterland.
Strengthening Urban-Rural Links
An integrated approach to development rec-ognizes and facilitates the links between urban and rural areas. Urban centers consume rural products and offer inputs for rural produc-tion; rural areas serve as markets for goods and services produced in urban areas. Migration produces social and economic links between urban and rural areas. Migrants often remain connected to their families, which they support through remittances. In addition, rural people often receive health services and education from nearby towns and cities. Institutional and fi scal links are often present as well. In most cases, fiscal redistribution takes place—typically from cities to rural areas, given the cities’ larger tax base.
Rural-urban links are constrained by inad-equate transport networks, poor electricity and water provision, and limited coverage of ICT. Weak institutions add to the constraints. For example, in Ethiopia, the city of Dessie enjoys

Facilitating Urbanization 127
a strategic location and is a main distribution center for manufacturing products to the sur-rounding regions (World Bank 2007). However, the lack of a developed agroprocessing industry limits the market opportunities for higher-value agricultural production and the benefi ts for the surrounding agricultural areas.
Urbanization in AfricaAfrica’s population remains predominantly rural. About 66 percent of the inhabitants live in rural areas, with signifi cant variation across countries (table 5.2).3 In African middle-income countries, half of the inhabitants live in rural areas, whereas in the landlocked low-income countries, they account for about 70 percent. The vast majority of Africa’s rural population (or half of the overall population) lives in the rural hinterland within six hours’ travel time of cities having at least 50,000 inhabitants, whereas about 16 percent of Africa’s population lives in isolated areas more than six hours’ travel time from the same cities.
The continent is urbanizing rapidly, how-ever, and will become predominantly urban by 2020. The share of urban population rose from 15 percent in 1960 to 35 percent in 2006 and will reach nearly 60 percent by 2020. Urban growth is presently estimated at 3.9 percent a year. Rural migration accounts for one-quarter of that growth, with the remainder attributable to urban demographic growth and adminis-trative reclassifi cation (Farvacque-Vitkovic, Glasser, and others 2008).
In several fragile states, civil war has con-tributed to urban expansion as people from the affected regions seek refuge in cities. One-third of Africa’s urban population is concentrated in the region’s 36 megacities with more than 1 million inhabitants. Much of the remain-der is spread across 232 intermediate cities of between 100,000 and 1 million inhabitants and in periurban areas. The largest cities are growing fastest, suggesting that Africa’s urban population will become more concentrated.
As is typical in the early phases of urbaniza-tion, urban household incomes in Africa are much higher than rural incomes, almost twice as high. The 2009 World Development Report notes that an economy’s transformation is seldom geographically balanced (World Bank 2009). Productivity tends to increase where people and economic activities concentrate to take advan-tage of agglomeration economies. The initial growth spurt is typically associated with a diver-gence in living standards between leading regions
Table 5.2 Distribution of Population by Type of Settlement and Country Type
Country type
GNI per capita
($ per capita) MegacitiesIntermediate
citiesSecondary
citiesPeriurban
areasRural
hinterlandsRemote
rural areas
Sub-Saharan Africa 875 13.4 10.2 0.2 10.3 49.8 16.4
Low-income countries, landlocked 245 8.3 8.3 0.2 7.5 56.5 19.2
Low-income countries, coastal 472 11.1 6.7 0.2 12.0 46.3 23.6
Middle-income countries 5,081 24.6 15.8 0.4 12.5 50.1 1.6
Source: Authors’ compilation based on geographic information systems analysis of Global Rural-Urban Mapping Project population density data.Note: GNI = gross national income. GNI per capita is in current dollars using the Atlas method. Estimates are based on a panel of 20 coun-tries. Megacities have more than 1 million people; intermediate cities have between 100,000 and 1 million people; secondary urban areas have between 100,000 and 50,000 people; periurban areas are less than one hour from the nearest city with more than 50,000 people; rural hinterlands are between one and six hours from the nearest city with more than 50,000 people; and remote areas are more than six hours from the nearest city with more than 50,000 people.
Percentage of total population
Table 5.1 Link between Agricultural Productivity and Distance to Urban Centers
Travel timePercentage of
total area
Percentage of total
population
Percentage of total crop production
Per capita production
($ per capita)
Less than 1.7 hours 10.0 41.4 23.6 57.00
1.7–7.6 hours 50.0 46.0 62.5 135.80
More than 7.6 hours 40.0 12.5 13.9 110.70
Total 100.0 100.0 100.0 n.a.
Source: Dorosh and others 2008.Note: Totals may not add exactly because of rounding errors. n.a. = Not applicable.

128 AFRICA’S INFRASTRUCTURE: A TIME FOR TRANSFORMATION
(mostly urban) and lagging regions (mostly rural), but as incomes increase, the divergence is followed by convergence.4 Essential household consumption converges soonest, access to basic public services next, and wages and income later. Convergence occurs because of the mobility of people and resources across regions and declin-ing economic distances among regions.
African countries stand at the beginning of this process. The difference between urban and rural incomes explains the lower urban poverty rates (35 percent) vis-à-vis rural pov-erty rates (52 percent) (table 5.3). In absolute terms, the African rural poor are almost three times as numerous as the urban poor. This pic-ture holds for every country regardless of its geography. Similar differences are observed in access to services.
The incomes in urban areas refl ect the higher productivity possible thanks to agglom-eration economies—the gain in efficiency from having many businesses and workers in proximity. In countries where traditional non-mechanized agriculture still dominates the rural sector, the difference between urban and rural productivity can be large. Assuming that agricultural output originates in rural areas and industry and services originate in urban areas, the African rural sector contributes less
than 20 percent of the continent’s GDP, despite accounting for more than 60 percent of the population (table 5.4; Kessides 2006). Recent work in Tanzania confi rms these values: the country’s urban areas are home to 23 percent of the population yet account for 51 percent of the GDP (Maal 2008). One could infer that the average productivity in urban areas is at least three times that of rural areas (Farvacque- Vitkovic, Glasser, and others 2008).
Infrastructure in Urban and Rural Areas For population centers to realize their full eco-nomic potential, the provision of infrastructure and public services must be effi cient. Basic ser-vices for households in both urban and rural areas can guarantee sustainable urbanization and social equity, enhance living conditions, and prevent disproportionate fl ows of under-served rural people to the city. Investment in infrastructure can improve productivity in the modern sector and connectivity with and across locations. Defi ciencies in infrastructure and services, which limit the potential for agglom-eration economies, hinder African economies and may explain the underperformance of businesses in Africa relative to other continents. One-third of African businesses report a worri-some lack of electricity, and 15 percent identify
Table 5.4 Sectoral Contributions to GDP and GDP Growthpercentage
1990–95 1996–2000 2001–05
Item Agriculture Industry Services Agriculture Industries Services Agriculture Industries Services
Contribution to GDP 17 31 52 17 30 53 19 31 50
Contribution to GDP growth 59 –28 69 14 30 56 26 37 37
Source: Authors’ compilation based on National Accounts data.
Table 5.3 Economic Differentials between Rural and Urban Populations, by Country Type
Monthly household budget Poverty rate
Country typeNational
($/month)Rural
($/month)Urban
($/month)National (percent)
Rural (percent)
Urban (percent)
Sub-Saharan Africa 144 106 195 48 35 52
Low-income countries, landlocked 86 75 139 49 32 53
Low-income countries, coastal 145 115 209 47 38 51
Middle-income countries 535 256 691 n.a. n.a. n.a.
Source: Authors’ compilation based on household surveys reported in Banerjee and others 2008.Note: n.a. = not applicable.

Facilitating Urbanization 129
transportation as a major constraint. Poor-quality roads and other transportation infra-structure endanger connectivity between rural and urban areas, between products and mar-kets, and between workers and labor markets.
The difference in the coverage of basic infrastructure services is huge across urban and rural areas. For the spectrum of household services, urban coverage rates are between 5 and 10 times those in rural areas (fi gure 5.1). The absolute differences are largest for power and smallest for ICT services. Electricity and improved water supply (such as piped connec-tion or standpost) extend to a majority of the urban population, but to less than one-fi fth of the rural. An even smaller share in rural areas uses septic tanks or improved latrines; and access to ICT services remains negligible. In almost half of the countries, energy coverage barely reaches 50 percent of the urban population and 5 percent of the rural. In addition, fewer than 40 percent of African urban households enjoy a private water connection, a septic tank, or an improved latrine, a share that falls to 5 percent in rural areas.
Growth in urban and rural coverage of network infrastructure tends to be positively correlated. Countries with faster expansion of urban coverage of water and electricity also tend to have faster expansion of rural cover-age, suggesting that an urban network eases expansion toward rural areas. It may also sug-gest that urban customers cross-subsidize rural water networks and electrifi cation.
Every year since 1990, an additional 0.9 per-cent of the urban population has gained access to improved water and 1.7 percent to improved sanitation, whereas the corresponding rural fi gures stand, respectively, at only 0.3 and 0.4. Electricity service has been expanded to an additional 3 percent of urban residents but to only an additional 0.8 percent of rural residents. Even so, rampant demographic pressure in urban areas has caused coverage rates to decline for all urban services (particularly improved water), whereas coverage of all rural services has increased (particularly power and ICT). As a result, the gap between urban and rural cover-age rates has narrowed slightly but at the cost of leaving urban dwellers and businesses with-out infrastructure for domestic and industrial purposes (fi gure 5.2). This fi nding shows that urban service providers have struggled to keep pace with accelerating urbanization.
Africa’s sparse road density often leaves rural areas isolated from urban markets. Only one-third of Africans living in rural areas are within 2 kilometers of an all-season road. The paved-road density is 134 kilometers per 1,000 square kilometers of arable land, and the unpaved, 490 kilometers. Moreover, the qual-ity of the rural network is perceptibly lower than that of the main network, with almost half in poor condition (fi gure 5.3). The lack of adequate urban transport is an obstacle for businesses and for labor mobility.
The spatial footprint of infrastructure net-works is larger than the coverage rates would suggest. In the rural hinterlands, where the bulk of Africa’s rural population lives, 40–50 percent of people live within range of an infrastructure network. Even in isolated rural areas, the share is as high as 15 percent. This information suggests that hookup rates to infrastructure networks are lower in rural areas. In some cases, that likely refl ects much lower rural purchasing power. In others, technical limitations might prevent rural inhabitants from connecting to infrastructure networks, even when close to one.
Infrastructure investment (particularly in rural areas) continues to focus on sector- specifi c interventions rather than spatially synchroniz-ing and concentrating the provision of different infrastructure services in larger “bundles.” Avail-able evidence suggests that bundling of services
2 3 714 12
20 22
42
6371
0102030405060708090
100
landline cell phone improvedsanitation
improvedwater
electricity
% o
f pop
ulat
ion
urbanrural
Figure 5.1 Access to Infrastructure by Location
Source: Banerjee and others 2008.

130 AFRICA’S INFRASTRUCTURE: A TIME FOR TRANSFORMATION
leads to higher returns among benefi ciary households than when the services are pro-vided individually. For example, in Peru joint access to two or more services generates a larger increase in rural household welfare than when services are accessed separately (Torero and Escobal 2005). This fi nding is valid for urban dwellers as well, at least for water, sanitation, electricity, and telephone services, regardless of how they are combined (Chong, Hentschel, and Saavedra 2007). Access to multiple services also generates a larger reduction of opportunity
costs because the interaction across services compounds positive effects, such as time savings or increased connectivity. With barriers to pro-ductivity reduced faster than when services are taken individually, poor households have more chances to access economic opportunities.
In the African context, not only are levels of household service coverage low, but they are also uncoordinated. As a result, the share of households with access to a bundle of multiple infrastructure services is very low, even among the better-off (table 5.5).
The Costs of Providing Infrastructure—Sensitive to Density
The cost of infrastructure network expansion is highly sensitive to population density. For the exact same infrastructure bundle, in both urban and rural spaces, the capital cost (per capita) declines with density. At the highest density, the cost of a bundle of high-quality services is $325 per capita; for medium- density cities, it is $665; for the rural hinterland $2,837; and for isolated areas $4,879 (table 5.6). These
0
20
perc
ent 60
40
80
10090
70
50
30
10
main network rural network
good fair poor
Figure 5.3 Quality Differentials between Main and Rural Road Networks
Source: Gwilliam and others 2008.
0
20
40
60
80
100a. Improved water
c. Electricity d. Landline
b. Improved sanitation
% o
f pop
ulat
ion
% o
f pop
ulat
ion
% o
f pop
ulat
ion
% o
f pop
ulat
ion
1996–20001990–95 2001–050
20
40
60
80
100
1990–95 1996–2000 2001–05
0
20
40
60
80
100
1990–95 1996–2000 2001–050
20
40
60
80
100
1990–95 1996–2000 2001–05
rural urban
Figure 5.2 Change in Urban and Rural Service Coverage, 1990–2005
Source: Banerjee and others 2008.
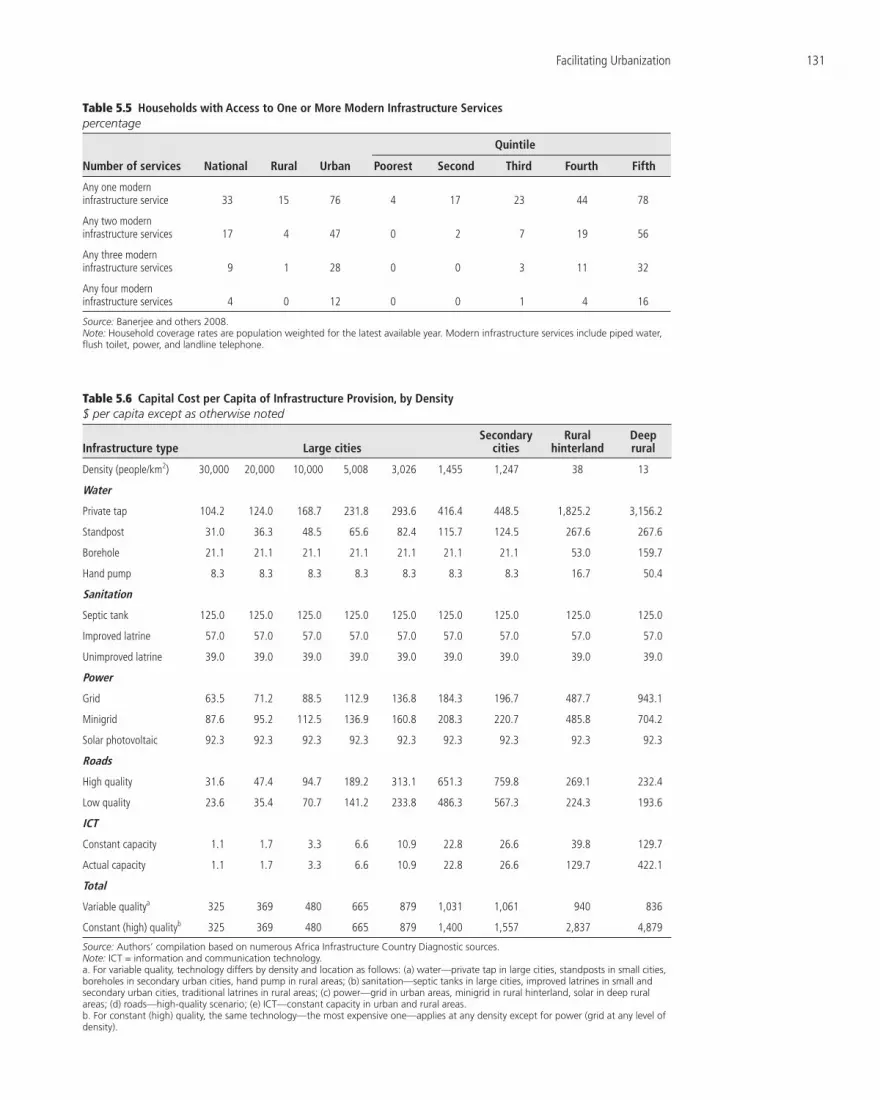
Facilitating Urbanization 131
Table 5.5 Households with Access to One or More Modern Infrastructure Servicespercentage
Quintile
Number of services National Rural Urban Poorest Second Third Fourth Fifth
Any one modern infrastructure service 33 15 76 4 17 23 44 78
Any two modern infrastructure services 17 4 47 0 2 7 19 56
Any three modern infrastructure services 9 1 28 0 0 3 11 32
Any four modern infrastructure services 4 0 12 0 0 1 4 16
Source: Banerjee and others 2008.Note: Household coverage rates are population weighted for the latest available year. Modern infrastructure services include piped water, flush toilet, power, and landline telephone.
Table 5.6 Capital Cost per Capita of Infrastructure Provision, by Density$ per capita except as otherwise noted
Infrastructure type Large citiesSecondary
citiesRural
hinterlandDeep rural
Density (people/km2) 30,000 20,000 10,000 5,008 3,026 1,455 1,247 38 13
Water
Private tap 104.2 124.0 168.7 231.8 293.6 416.4 448.5 1,825.2 3,156.2
Standpost 31.0 36.3 48.5 65.6 82.4 115.7 124.5 267.6 267.6
Borehole 21.1 21.1 21.1 21.1 21.1 21.1 21.1 53.0 159.7
Hand pump 8.3 8.3 8.3 8.3 8.3 8.3 8.3 16.7 50.4
Sanitation
Septic tank 125.0 125.0 125.0 125.0 125.0 125.0 125.0 125.0 125.0
Improved latrine 57.0 57.0 57.0 57.0 57.0 57.0 57.0 57.0 57.0
Unimproved latrine 39.0 39.0 39.0 39.0 39.0 39.0 39.0 39.0 39.0
Power
Grid 63.5 71.2 88.5 112.9 136.8 184.3 196.7 487.7 943.1
Minigrid 87.6 95.2 112.5 136.9 160.8 208.3 220.7 485.8 704.2
Solar photovoltaic 92.3 92.3 92.3 92.3 92.3 92.3 92.3 92.3 92.3
Roads
High quality 31.6 47.4 94.7 189.2 313.1 651.3 759.8 269.1 232.4
Low quality 23.6 35.4 70.7 141.2 233.8 486.3 567.3 224.3 193.6
ICT
Constant capacity 1.1 1.7 3.3 6.6 10.9 22.8 26.6 39.8 129.7
Actual capacity 1.1 1.7 3.3 6.6 10.9 22.8 26.6 129.7 422.1
Total
Variable qualitya 325 369 480 665 879 1,031 1,061 940 836
Constant (high) qualityb 325 369 480 665 879 1,400 1,557 2,837 4,879
Source: Authors’ compilation based on numerous Africa Infrastructure Country Diagnostic sources.Note: ICT = information and communication technology.a. For variable quality, technology differs by density and location as follows: (a) water—private tap in large cities, standposts in small cities, boreholes in secondary urban cities, hand pump in rural areas; (b) sanitation—septic tanks in large cities, improved latrines in small and secondary urban cities, traditional latrines in rural areas; (c) power—grid in urban areas, minigrid in rural hinterland, solar in deep rural areas; (d) roads—high-quality scenario; (e) ICT—constant capacity in urban and rural areas.b. For constant (high) quality, the same technology—the most expensive one—applies at any density except for power (grid at any level of density).

132 AFRICA’S INFRASTRUCTURE: A TIME FOR TRANSFORMATION
values illustrate the cost disadvantage of African cities (generally less dense), compared with their higher-density Asian counterparts. Africa’s urban expansion is occurring with declining densities (urban sprawl), which in itself will make per capita infrastructure costs even higher.
For Africa’s largest cities, with a popula-tion over 3 million and a median density of 5,000 people per square kilometer, water and sanitation represent the heaviest weight in the infrastructure bundle (54 percent), followed by roads (28 percent), power (17 percent), and ICTs (1 percent).
Economies of density are so important that the rollout of network infrastructure becomes prohibitive at low levels of density. In these cases, it would make sense to shift toward a package of lower-cost technological alterna-tives, such as solar panels, hand pumps, and on-site sanitation as population density falls. The cost of variable-quality technology rises more gradually—from $325 per capita in high-density cities to $665 in medium-density cities to $940 in the rural hinterland; it then drops back to $836 in isolated areas (table 5.6). The implication is that the highest per capita cost is found in secondary urban areas. Densities there are high enough to demand higher-quality solutions but still not high enough to benefi t from signifi cant economies of scale in the delivery of services.
Population density affects not only the cost of network expansion but also the avail-ability of resources to pay for it. Aggregate household spending capacity per square kilometer ranges from some $3,500 a year in deep rural areas to $2.5 million a year in cities with populations over 3 million and a density of 5,000 people per square kilometer. Therefore, in rural areas the cost of a high-quality infrastructure bundle is 10 to 20 times the annual household budgets, making it manifestly unaffordable (fi gure 5.4). This ratio falls steeply in urban areas, where the cost of the bundle is one to three times the annual household budget. For high-density cities (beyond the range observed in Africa), this ratio falls to less than two-thirds of the annual household budget.
Investment Needs
As noted in chapter 2 of this volume, Africa needs to spend some $93 billion per year to meet its infrastructure needs over the next decade to 2015. About two-thirds of this total relates to capital investment and the remaining third to operation and maintenance (Briceño-Garmendia, Smits, and Foster 2008). These investment needs can usefully be divided into three categories. The fi rst category relates to the investment needed to expand productive infra-structure that underpins the national economy as a whole: for example, generation capacity to serve industrial production;5 transmission lines; fi ber-optic backbones; and the main components of the national transport system including trunk roads, railways, airports, and seaports. The second category relates to infra-structure specifi cally needed to service the urban space, including urban roads and urban ICT, power, and water distribution networks. The third category relates to infrastructure specifi cally needed to service the rural space, including rural roads, rural household services, and irrigation.
Historically, Africa has been investing around $26 billion a year in infrastructure,6 as reported in chapter 2. Of this total, about 30 percent goes to productive infrastructure that underpins the national economy, 50 percent goes to servicing the urban space, and the remaining 20 percent to servicing the rural space (fi gure 5.5).7 The lion’s share of investment in the power sector has fi nanced the development of energy capac-ity for industrial production and transmission. Infrastructure linked to the national economy also accounts for an important share of invest-ments in transport. Across all sectors, infra-structure dedicated to servicing the urban space absorbs a greater share of investments than that dedicated to servicing the rural space. The only exception is water and sanitation, where a more even split is observed, although even that represents something of an urban bias, given that the population is predominantly rural.
Looking ahead, Africa will need to invest $60 billion per year, according to the esti-mates presented in chapter 1 of this volume. The spatial pattern of these future investments

Facilitating Urbanization 133
will look somewhat different from those of the past: 34 percent of the total will need to go to productive infrastructure that under-pins the national economy; another 32 per-cent will go to servicing the urban space, and the remaining 34 percent to service the rural space (fi gure 5.6). Thus, the share going to the national economy increases slightly, whereas the share dedicated to servicing urban spaces declines and the share dedicated to rural space increases; this pattern is observable across the individual sectors also.
Infrastructure Financing
The jurisdiction responsible for infrastructure fi nancing and provision differs hugely across sectors and countries. Although ICT and power are usually national responsibilities, respon-sibility for the water supply in urban areas is widely decentralized (fi gure 5.7). Nevertheless, in many countries, markedly the francophone countries, operation is entrusted to utilities that remain national. Where municipal utili-ties do exist, municipal governments own only a few in whole or in part. Responsibility for transport infrastructure is divided between national and local jurisdictions, with bound-aries varying from one country to another. The central government is typically responsible for the trunk road network, as well as railways, ports, and airports. Local governments are typically responsible for local roads.
Most local jurisdictions, whether urban or rural, lack the resource base to provide ade-quate infrastructure services to households and businesses. Municipal budgets are very small in relation to the cost of meeting infrastructure requirements implied by fast urban growth. Data collected from a sample of cities suggest that the average expenditure per person per year rarely exceeds $10 (fi gure 5.8). South Africa is an exception, with Cape Town at $1,163 and Durban at $1,152.
Transfers from central governments or direct fi nancing have become the most impor-tant source of funding for local infrastructure (table 5.7). Cities in most African countries depend on central transfers for more than
80 percent of their operating revenues. This dependence diminishes the incentives for local governments to raise their own revenues. Transfers are often unpredictable, hindering long-term projects and planning. They often favor small localities over larger cities with serious infrastructure bottlenecks. On the revenue side, local governments have limited
0
6
3
affordable not affordable
12
9
15
rati
o of
inve
stm
ent
cost
to
annu
alho
useh
old
budg
et b
y sq
. km
population density (no. people/sq. km)
18
30,00
0
25,00
0
20,00
0
15,00
0
10,00
09,3
404,8
763,2
722,9
942,6
171,4
541,1
88 38 13
Figure 5.4 Affordability of a Basic Package of Household Infrastructure
Source: Authors’ compilation.Note: Affordable represents those population densities in which the capital cost per hectare of a basic package of infrastructure services represents no more than one year of income for the inhabitants of that hectare. Not affordable represents those population densities in which the capital cost per hectare of a basic package of infrastructure services exceeds, by several multiples, the annual income for the inhabitants of that hectare.
0
20
40
60
80
100
perc
ent
power ICT transport water andsanitation
national ruralurban
Figure 5.5 Spatial Split of Historic Infrastructure Investments
Source: Authors’ compilation. Note: ICT = information and communication technology. National economy refers to productive infrastructure that underpins the national economy and cannot be specifically attributed to servicing inhabitants of urban or rural space (for example, the interurban trunk network, the national power interconnected system, major ports, and airports).Urban space or rural space refers to infrastructure that is primarily oriented toward servicing needs of urban or rural inhabitants, respectively (for example, urban or rural household services, urban or rural roads).

134 AFRICA’S INFRASTRUCTURE: A TIME FOR TRANSFORMATION
taxing authority, even though the potential revenue base is large. For large cities, most of the revenues collected are transferred to the national treasury.
The use of local government budgets var-ies widely across countries. In Ghana, revenues are mainly dedicated to capital expenses (78 percent), whereas in Côte d’Ivoire and Senegal, current expenditures occupy the largest account (80 percent and 90 percent, respectively). In Ghana, local taxes and local resources are almost nonexistent, whereas in Côte d’Ivoire and Senegal, they make up a signifi cant share of the revenue envelope. Own revenues col-lected by local governments are less than 1 percent of GDP in all three countries.
Spatial Planning, Land Regulations, and HousingUrban boundaries have expanded, and zones that were rural in the mid-1980s are now part of the metropolitan areas surrounding major African cities. This trend is particularly evident in the countries with faster urban growth, such as Burkina Faso, Cameroon, and Ghana (Farvacque-Vitkovic, Glasser, and others 2008). The pattern reveals strong physi-cal growth, typifi ed by moderate and patchy densifi cation within the inner-city core, as residential areas give way to commercial users and peripheral growth occurs unguided and at low density.
In many cases, spatial expansion of cities has been faster than population growth, reduc-ing density. Density in African cities ranges between 1,000 and 4,000 people per square kilometer (table 5.8). Density in rural areas is fewer than 100 people per square kilometer. Africa’s megacities are denser but still far from their Asian peers. Only a handful of African cities (such as Ifon Osun in Nigeria, Mbuji-Mayi in the Democratic Republic of Congo, or Mombasa in Kenya) attain population densities of 10,000 to 20,000 people per square kilometer, compared with densities of 20,000 to 40,000 in Bangalore, Hyderabad, and Mumbai in India; Guangzhou and Shanghai in China; and Seoul in the Republic of Korea (Bertaud 2003). The more typical densities for African megaci-ties of no more than 5,000 people per square kilometer are comparable to those of cities of
a. Water supply b. Electricity
decentralized not decentralized
61%
39%
96%
4%
Figure 5.7 Institutional Patterns of Water and Electricity Supply in Urban Areas
Sources: Banerjee and others 2008; Eberhard and others 2008.
0
20
perc
ent
40
60
80
100
power ICT transport water andsanitation
irrigation
urban productive infrastructure rural
Figure 5.6 Spatial Split of Future Infrastructure Investment Needs
Source: Authors’ compilation. Note: ICT = information and communication technology. Productive infrastructure underpins the national economy and cannot be specifically attributed to servicing inhabitants of urban or rural space (for example, the interurban trunk network, the national power interconnected system, major ports, and airports).Urban or rural refers to infrastructure that is primarily oriented toward servicing needs of urban or rural inhabitants, respectively (for example, urban or rural household services and urban or rural roads).
US$ per capita
0 5 10 15 20 25 30 35
Monrovia, Liberia
Kinshasa, Congo, Dem Rep. of
Dar es Salaam, Tanzania
Lagos, Nigeria
Porto Novo, Benin
Nairobi, Kenya
Maputo, Mozambique
Beira, Mozambique
Arusha, Tanzania
Figure 5.8 Municipal Budgets of Selected African Cities
Sources: UN-Habitat 1998; corresponding city budget documents.

Facilitating Urbanization 135
Organisation for Economic Co-operation and Development member states, such as London and New York. Built-in areas are growing faster than urban populations in 7 of 10 African cities, suggesting falling densities (Angel, Sheppard, and Civco 2005).8 As a result, the already high costs for infrastructure in urban Africa will increase with further sprawl, hin-dering the affordability of basic services and adding to the environmental and carbon footprints.
In many African countries, land institu-tions are still incipient, refl ecting the political economy and colonial legacy. In Africa, land-ownership is made diffi cult by the extreme centralization of procedures, the costs of titling, and the rapid depletion of central gov-ernments’ land reserves. In this context, spon-taneous settlements have developed. Limited land supply and high prices affect location decisions and exclude low-income house-holds from the offi cial land market. Many gov-ernments have subsidized plots, but supply is much below demand. Governments have tried to help residents excluded from land markets and have expanded infrastructure to new set-tlements, but the results have been disappoint-ing. Recent work in Burkina Faso, Ghana, and Mali reveals the coexistence of traditional and public systems of property rights, complicating registries and duplicating land rights, which are diffi cult to enforce (Farvacque-Vitkovic and others 2007, Farvacque-Vitkovic, Raghu-nath, and others 2008). The limited size of the
Table 5.8 Population Density across Country Types
Country type
GNI per capita
($ per capita)Density in megacities
Density in intermediate
cities
Density in secondary
urban areas
Density in periurban
areas
Density in rural
hinterlands
Density in remote
areas
Sub-Saharan Africa 875 3,621 1,482 1,281 89 35 13
Low-income countries, landlocked 245 2,529 1,702 1,306 132 71 14
Low-income countries, coastal 472 4,083 1,661 1,492 100 35 13
Middle-income countries 5,081 1,229 574 824 58 45 19
Source: Authors’ compilation based on geographic information systems analysis of Global Rural-Urban Mapping Project population density data and Henderson 2002 for megacities.Note: GNI = gross national income. GNI per capita is in current dollars using the Atlas method. Estimates are based on a panel of 20 countries. Density = number of people per square kilometer. Megacities have more than 1 million people; intermediate cities have between 100,000 and 1 million people; secondary urban areas have between 100,000 and 50,000 people; periurban areas are less than one hour from the nearest city with more than 50,000 people; rural hinterlands are between one and six hours from the nearest city with more than 50,000 people; and remote areas are more than six hours from the nearest city with more than 50,000 people.
Table 5.7 Overview of Local Infrastructure Financing Mechanisms
Mechanism Urban Rural
Direct central provision ICT, power, sometimes water ICT, irrigation, occasionally power and water
Central government transfers Not earmarked and usually modest Not earmarked and usually modest;
growing use of rural funds
Local taxes Signifi cant potential but requires clear property rights and greater formalization of urban economy
Much more limited potential
Municipal debt Limited number of creditworthy cases
No creditworthiness
Property sales Signifi cant potential but requires clear prior defi nition of land titles
Much more limited potential
User fees Signifi cant potential Minor potential because of lower purchasing power of households
Source: Authors’ compilation.Note: ICT = information and communication technology.
land market and the monopoly by traditional landowners lead to shortages of urban land supply and rising prices. Lack of land titles hurts business development and the estab-lishment of new fi rms. With no access to land and located in underserved and peripheral areas, the poor suffer from poor connectivity and low access to labor markets. The resis-tance of landowners and the lack of registries also hinder cities from raising revenues on urban land (box 5.1).
African cities face shortages of housing and shelter. In most countries, the real estate mar-ket and government agencies supply at most one-fourth of the annual demand for hous-ing; the remaining three-fourths turn to the

136 AFRICA’S INFRASTRUCTURE: A TIME FOR TRANSFORMATION
informal market and their own construction. In Burkina Faso and Mali, more than 45 per-cent of the population in the capital city lives in informal settlements (Farvacque-Vitkovic and others 2007). In Ghana, the market pro-duces only 20 percent of the annual demand for shelter (Farvacque-Vitkovic, Raghunath, and others 2008). In Accra, people’s increased purchasing power because of remittances has led to higher real estate prices, and zoning and legal restrictions artifi cially limit the land available for housing.
Many governments have tried to help the poor by subsidizing construction, providing tax incentives to developers, or producing public
housing, but the effect of these incentives has been minimal (Farvacque-Vitkovic, Glasser, and others 2008). Construction costs are very high, especially for landlocked countries.9 Cement, iron, and other materials are imported, making housing prices unaffordable. Most new houses are captured by medium-income households. According to estimates, of fi ve applications, only one housing unit is allocated to a needy household.10
Urban Growth and Informal SettlementsA major problem for Africa’s growing cities is the rapid spread of informal settlements. Lack of affordable serviced plots and zoning poli-cies have often excluded the poor from being integrated with urban development, leaving them in underserviced shelters (slums) both in and on the outskirts of major cities. The UN-Habitat standard defi nition of people living in slums is overcrowding, low access to water and sanitation, lack of secure ten-ure, and poor housing quality. Based on this defi nition, as much as 70 percent of Africa’s urban population resides in slums (UN-Habitat 2003), and from 1990 to 2001, the slum pop-ulation grew at 4.4 percent a year, faster than the urban population. If this trend persists, an additional 218 million Africans will be living in slums by 2020, and almost one-third of the world’s slum population will be in Africa.
Great heterogeneity exists across cities in the living and income conditions of slum residents. Not all people living in these settle-ments are income poor, although signifi cant overlap occurs, and living standards differ across countries. In many cases, informal settlements are scattered across cities, side by side with wealthier residences. In Tanzania, urban dwellers in the periurban areas do well, enjoying the freedom of informality, even without land titles or fi nished walls. Indeed, informal periurban areas are sometimes the most dynamic, precisely because overzealous regulation does not affect them. A strong “city effect” also exists. Thanks to leadership, land security, ownership, and civic participation, the inhabitants of Dakar’s slums (Senegal) have living standards far superior to Nairobi’s (Kenya) even though the latter have higher
BOX 5 .1
Land Issues in TanzaniaTanzania is at the early stage of its urbanization, and the population is growing in most urban areas. Since the 1960s, demand for urban land with services has signifi cantly and systematically exceeded what the government has supplied. Offi cial demand for plots averages 75,000, but the supply is below 6,000 a year. Most applicants lose hope and turn to informal markets to obtain land for their develop-ment needs.
Serious diffi culties also exist in accessing land for investment pur-poses. The Tanzania Investment Centre has so far registered 4,210 investment projects, 80 percent of which require access to land par-cels. However, the Tanzania Investment Centre estimates that only one-quarter of those registered can acquire land through the exist-ing formal system. Between 2004 and 2007, 440 applications for land allocation were received, but only 13 applicants received their titles, evidence that the formal land delivery system in urban areas is not working. In 1998, informal settlements in Dar es Salaam covered 48 percent of the built-up area, and recent estimates place the share as high as 70–80 percent.
The scarcity of formal plots stems from the underperformance of the public system, the lack of institutional or fi nancial resources, and the competition of the formal system with informal land develop-ment, the latter being much cheaper and easier. Institutional con-straints also exist. The 1999 Land Act concentrated most powers of land management in the central government, depriving local govern-ment authorities of the institutional structures to deal with their land-related responsibilities. Goals for the land are not explicit, and laws are not applied consistently. The division of responsibilities among actors is unclear, and there is no coordination.
Sources: Muzzini and Lindeboom 2008; Raich and Sarzin forthcoming.

Facilitating Urbanization 137
incomes and education levels (Gulyani, Taluk-dar, and Jack 2008).
The main problem of slums and informal-ity is exclusion from basic amenities. Nai-robi’s slum residents pay up to 11 times more for water sold by private vendors than those who have access to piped water (Farvacque-Vitkovic, Glasser, and others 2008). In Africa as a whole, the price of piped water is $0.50 per cubic meter, whereas water purchased from private vendors in mobile carts is $4.75 per cubic meter. Inadequate access to basic services also has implications for health and human development. Moreover, spatial mis-matches and distance constrain accessibility to education and livelihood opportunities.
Policy Issues and Implications
Infrastructure Financing Cities should be spending more and spending more wisely. Although trunk infrastructure and services with substantial spillover effects are clearly the responsibility of the central gov-ernment, cities are responsible for solid waste, sewerage, drainage, and lighting. In many cases, they are called on to help with shelter as well. The purported benefi ts of decentraliza-tion are not realized because decentralization policies have given cities more responsibili-ties (notably in social sectors) but not more resources. Without independent or predict-able sources of revenues, African cities can rarely plan or decide on the best way to allo-cate their resources.
In principle, cities have greater potential to raise local revenues. First, the larger urban economy provides a signifi cant local tax base, although its predominantly informal nature prevents the authorities from capturing taxes. Second, high-value urban properties constitute a major potential tax base, although the lack of clear property titles prevents it from being realized. Third, the higher purchasing power and tighter agglomeration of urban house-holds make recovery of a signifi cant propor-tion of infrastructure fi nancing requirements with user fees easier.
Long-term debt is always an alternative (at least in theory), but few African cities have
the creditworthiness to raise their own debt fi nance, and the few examples (South Africa and Zimbabwe) have illustrated the weakness of the system and the need for impartial credit ratings.
For larger cities, the economic base is larger, and they have greater autonomy to raise their own taxes. However, tax receipts are often sent to the central governments, and political fac-tors hinder the use of property taxes. Although African cities generate 80 percent of the coun-try’s tax revenues, they end up with less than 20 percent of the resources.11 On the other hand, larger urban areas are likely to have fewer spending responsibilities because they are often covered by national service providers (such as power and water utilities), thus reliev-ing these municipalities of some budgetary expenses they would otherwise incur.
In cities such as Dar es Salaam, Tanzania, and Nairobi, Kenya, improvement in land management institutions could open the door to increased property revenues for munici-palities, more land use and sales revenues for the government, and complementary private fi nance. For example, Cairo has held sev-eral auctions of land for conversion, adding 10 percent to the city budget. It has also swapped land permits for private infrastruc-ture in public land. For large Chinese cities, land leases are the usual method to mobilize resources, as well as in Mumbai and Bangalore in India. In 11 African countries, street address-ing (or addressage) has been established in the major municipalities, increasing municipal tax billings by about 50 percent, with 90 percent collection rates. In Burkina Faso, Mauritania, and Togo, street addressing has helped in inventorying the local tax base and implement-ing residential taxation (Farvacque-Vitkovic and others 2007; Farvacque-Vitkovic, Glasser, and others 2008; Kessides 2006). In Benin, decentralized management fostered increases in city revenue of 82 percent in Cotonou, 131 percent in Parakou, and 148 percent in Porto Novo, with better collection rates as well (Kessides 2006).
In rural areas, transfers complemented by centralized funds dominate. Many countries have tried to fund rural investment by intro-ducing centralized funding mechanisms to

138 AFRICA’S INFRASTRUCTURE: A TIME FOR TRANSFORMATION
channel earmarked central government funds and donor resources to rural infrastructure. These mechanisms include rural water funds (90 percent of countries), rural electrifi cation funds (76 percent), and rural telecommunica-tion funds (29 percent). For power, rural funds bring faster expansions in the electrifi ed rural population: an annual increase of 0.72 percent is seen in countries with such funds, compared to an annual contraction of −0.05 percent else-where. For rural water and rural ICT funds, no signifi cant differential was seen in the rate of service expansion.
Central funds can also support the mainte-nance of rural infrastructure. To deal with poor maintenance, many countries are allocating part of their national road fund revenues to the maintenance of the rural network (60 percent of countries). This decision may be a good strategy: countries that allocate at least $0.015 per liter of their fuel levies to the rural road networks have a signifi cantly higher share of their rural roads in good condition than those that allocate less, 36 percent versus 21 percent.
Land Policies and Urban and Territorial PlanningAdequate land policies and markets are the backbone of an effi cient urban transition. Land management institutions include a compre-hensive land registry, credible mechanisms for contract enforcement and confl ict resolution, fl exible zoning laws, and versatile regulation of subdivisions that help rather than hinder the conversion of land for different uses. Prop-erty rights embodied in land titles are essential for converting assets into usable wealth. The transformation of the agricultural sector from communal land rights to individual property rights is important for the rural-urban trans-formation, but it may take a long time.
Land use and building regulations become more important as urbanization advances. Governments regulate land markets to ensure separation of land between different uses and to ensure the integration of public and private uses of land, such as providing space for transport infrastructure in densely popu-lated areas. Land regulations can be overzeal-ous, however, distorting the incentives for
businesses and households to locate in the city and pushing prices up, thereby leading to a relocation of activities and residents to non-regulated places. Land acquisition delays are very long in Ethiopia and Zambia. In Mozam-bique, businesses pay on average $18,000 in processing fees for land, and in Nigeria, they must register land to use it as collateral, a pro-cess that can take up to two years and cost 15 percent of the land value (Kessides 2006).
Land institutions can improve information, strengthen property rights, record market trans-actions, and steadily move toward more open land markets. With an endowment of 63 square miles of land, the Tema Development Corpo-ration in Ghana is planning and laying out the Tema area, constructing roads and sewerage sys-tems, preparing and executing housing projects, and managing rental units. Permits for housing construction are submitted to the authority, which charges a permit fee based on the value of the property to be developed (Farvacque-Vitkovic and McAuslan 1993).
Urban planning should guide urban expan-sion and the associated infrastructure needs. Because of their top-down approach and weak implementation, urban planning and master plans have lost their meaning in many Afri-can cities. Urban dynamics are seldom cor-rectly foreseen, and in most cases, the political economy has the last word in determining the location of infrastructure or major develop-ments. To be effi cient and useful, planning should be fl exible, participatory, and indica-tive (10–15 years). Urban reference maps should lay out major roads and city services, the areas for urban expansion, and the reserves for amenities.
Planning should check sprawl, enhance densifi cation, prevent development in pre-carious environmental zones, and enhance the delivery of affordable serviced land and infra-structure. Ideally, planning should be rooted in participatory strategies and linked to local and central budgets. Without realistic projections for resource availability, urban plans often fall into discredit. Dakar (Senegal), Lagos (Nigeria), and Maputo (Mozambique) recently prepared city development strategies as frameworks to encourage participation from the community in discussing challenges and opportunities.

Facilitating Urbanization 139
Territorial planning is critical in rural areas to promote a more integrated vision of devel-opment and to enhance growth opportunities. Rural development requires the coordinated provision of infrastructure services to support agricultural production and off-farm activities, such as irrigation infrastructure, rural roads, and associated transport services, as well as storage and distribution infrastructure for agricultural products. In rural areas, the limited administra-tive capacity hinders an integrated vision. Coor-dination may be further complicated because some services, such as irrigation, may be a cen-tral government competency, whereas others (such as roads) are local. Chongqing, China’s experience with implementing a territorial development plan on a regional scale provides an example that may be of interest to Africa.
Bundling infrastructure services can sub-stantially increase the return of infrastructure investments. Bundling infrastructure not only secures larger welfare gains to households, urban and rural alike, it also maximizes the economic and social effect of infrastructure service provision in rural areas by granting better access to economic opportunities and reducing the gap between poor and nonpoor. Therefore, investment policies, especially when rural infrastructure is concerned, should more attentively seek complementarities across sec-tors. This requires that institutional coordina-tion and planning and fi nancial capacity are deployed as needed. Although bundling is an opportunity to realize larger returns on invest-ments, alone it is not enough to drive economic and social development in rural areas. A more far-reaching vision of rural development that maximizes coordination and complementa-rities across sectors beyond the infrastructure fi eld—for which, however, bundling consti-tutes an important tool—is needed. This is the scope of territorial development.
Informal Settlements Preventing the formation of slums and upgrad-ing existing ones are major concerns to policy makers; one of two possible approaches nor-mally prevails. The fi rst approach focuses on improving the living standards of slum dwell-ers in their existing locations. They are given land tenure; slums areas are equipped with
basic infrastructure services, and shelters are upgraded into better and more durable con-structions. Investment in transportation and social programs is also used to strengthen links between slum areas and the rest of the city and to facilitate social integration. The Accra District Rehabilitation Project in Ghana is an example of successful upgrading, as are several national upgrading programs in Ethio-pia, Kenya, and Uganda.
The second, more controversial, approach focuses on resettling slum dwellers, by moving them either to existing neighborhoods or to new, less crowded, and safer locations. In either case, slum dwellers are compensated for reset-tlement and disruptions to their livelihoods.
Much can be done, starting with the provi-sion of basic services and infrastructure com-bined with effective land policy. Legislation that boosts land prices and excludes the poor will need to be revised. Basic packages of services (street lighting, paving, drainage, roads) should be extended to the broadest number of people at the lowest possible cost. In Kenya, Mozambique, and Nigeria, major improvements are possible for a low of $150 per capita, compared with $1,800 or more for fi nished solutions. Urban transportation can bring the urban poor into the large labor markets. A consistent and exten-sive policy of land titling would provide clarity and predictability to the land market, develop people’s ownership, and promote private invest-ment. In many countries, however, land titling will continue to be diffi cult (more diffi cult than extending basic services) because of the political economy and weak administrative capacity.
Six Principles for Efficient Urbanization
Based on the foregoing discussion, there are six key principles for achieving effi cient urbaniza-tion. First, adopt a solid analytical framework to help defi ne priorities and sequencing. In places that are mostly rural, governments should be neutral and establish the foundations for effi -cient urbanization (World Bank 2009). Good land policies and universal provision of basic services are central. Where urbanization has accelerated, the priority should be investments

140 AFRICA’S INFRASTRUCTURE: A TIME FOR TRANSFORMATION
in connectivity to ensure that the benefi ts of rising economic density are widely shared. In highly urban places, targeted interventions may be needed to deal with slums and exclusion.
Second, recognize that the political econ-omy infl uences the urban transition. African cities are not very powerful. Unlike cities in East Asia or Latin America, African cities have little autonomy and depend on the central gov-ernment for resources, infrastructure projects, and even land development. Chinese mayors are appointed by the party, but their political careers depend on how well they develop their cities. Especially if they are elected, U.S. and European mayors may see their cities as steps to higher political positions, including the presidency. Mayors in Africa have limited free-dom of action. Many of the diffi culties Afri-can cities have in collecting property taxes are related to the political infl uence of the major landowners, who oppose such taxes.
Third, be pragmatic. While the long-term goal is to have well-defi ned property rights and land titling, in the short run, cities may need to “fi nesse” land titling and use occu-pancy as a basis for land registration and taxation. Resource-constrained governments should invest in minimum packages of water- sanitation-energy in informal underserviced quarters at the citywide level and resist the idea of transforming slums into perfect neigh-borhoods. For about $1,200 per capita, many African slum dwellers can be provided with basic services, compared with $18,000 spent in more comprehensive and sophisticated proj-ects in Latin America (Farvacque-Vitkovic, Glasser, and others 2008).
Fourth, focus on cities and areas important for the economy. The priorities should be to improve the institutional framework (espe-cially on land markets), to provide techni-cal and fi nancial resources for planning and developing infrastructure and basic services, to harness agglomeration economies, and to deal with congestion.
Fifth, improve land policies so that mar-kets are more fl exible and can respond to the increase in demand. That requires compiling inventories of government land and of for-mal and informal developers, gathering prices and costs for land plots and construction, and
broadly planning for the extension of urban settlements, taking into account transporta-tion, connectivity, and environmental factors.
Sixth, improve the fi scal soundness of cities: (a) improve transparency and predictability of transfers; (b) strengthen and simplify local taxation, changing the focus of property tax from ownership to occupancy; (c) take advan-tage of cost recovery from revenue-producing services, such as markets and bus stations—they can make up 70 percent of medium-size city revenues; and (d) use municipal contracts (between central and local governments) and adressage to help local governments manage their resources.
Notes The authors of this chapter are Elvira Morella,
Maria Emilia Freire, and Paul Dorosh, who drew on background material and contribu-tions from Alvaro Federico Barra, Catherine Farvacque-Vitkovic, Matthew Glasser, Sumila Gulyani, Darby Jack, Austin Kilroy, Barjor Mheta, Stephen Mink, Siobhan Murray, Madhu Raghunath, Uri Raich, Raj Salooja, Zmarak Shalizi, and Debabrata Talukdar.
1. Note that the early stages of this transition need not involve movements of activities or people; rural households increasingly earn incomes from rural nonagricultural activities (in agri-cultural processing, construction, commerce, and private services).
2. This correlation between agricultural produc-tion and proximity (as measured by travel time) to urban markets holds even after taking agro-ecology into account.
3. No internationally accepted standard exists for identifying urban areas, and each country tends to use its own defi nition. This situation hinders any effort to make sensible comparisons across countries. In this chapter, urban areas, from sec-ondary cities to megacities, are identifi ed using a subset of the GRUMP (Global Rural-Urban Mapping Project) urban extents layer (CIESIN 2004). The GRUMP urban extents were joined to a data set of city populations compiled by Hend-erson (2002) and of urban extents classifi ed by population size. To complete the urban-rural gradient, nonurban areas were classifi ed by dis-tance or travel time to the nearest city. The com-bination of urban extents and city populations allowed creation of a density-based typology of cities. However, given the limitations associated

Facilitating Urbanization 141
with these input data, the calculation of density is approximate at best. Even so, the density-based characterization of “urban” areas allows com-parisons across regions and refl ects the relation between density and agglomeration economies.
4. World Development Report 2009 expressed geo-graphic transformation as the development of the leading and lagging regions. Although both regions may consist of both urban and rural areas and hence agriculture and nonagriculture, in South Asia, lagging regions are predomi-nantly rural and agriculture remains the main source of livelihood.
5. As mentioned, the most important hindrance to economic production is the supply of energy. In many countries, it can account for half of the value of the fi nal output.
6. These funds include annual public investments, annualized offi cial development assistance, annu-alized emerging fi nanciers that do not belong to the Organisation for Economic Co-operation and Development, and annualized private par-ticipation in infrastructure.
7. These fi gures include energy and roads; no data are available on the share of investment on ICT and water that serves industrial production.
8. Population fi gures are derived from national censuses.
9. The price of construction is estimated at $222 per square meter, so a 75-square-meter home would cost about $17,000 (excluding land) (AGETIPE 2005). Average incomes are $850 a year, produc-ing a ratio of housing price to income of over 2,000 to 1, one of the world’s highest.
10. Efforts to develop mortgage systems for low-income households in Africa have encountered several problems: lack of credit history, lack of regular income, shallowness of the fi nancial market, lack of long-term funding, lack of land and house registries, high lending rates, and high credit risks.
11. Too often, the central government appropriates the city-generated taxes and distributes them to sectors that are not necessarily the most pro-ductive and certainly not the ones that will feed into the urban economy.
ReferencesAGETIPE (Agence d’exécution des travaux
d’intérêt public pour l’emploi). 2005. Contract documents. www.agetipe.org.
Angel, Schlomo, Stephen C. Sheppard, and Daniel L. Civco. 2005. The Dynamics of Global Urban Expansion. Washington, DC: Transport and Urban Development Department, World Bank.
Banerjee, Sudeshna, Quentin Wodon, Amadou Diallo, Taras Pushak, Hellal Uddin, Clarence Tsimpo, and Vivien Foster. 2008. “Access, Afford-ability, and Alternatives: Modern Infrastructure Services in Africa.” Background Paper 2, Africa Infrastructure Country Diagnostic, World Bank, Washington, DC.
Bertaud, Alain. 2003. “Order without Design.” http://www.alain-bertaud.com.
Briceño-Garmendia, Cecilia, Karlis Smits, and Vivien Foster. 2008. “Financing Public Infra-structure in Sub-Saharan Africa: Patterns, Issues, and Options.” Background Paper 15, Africa Infrastructure Country Diagnostic, World Bank, Washington, DC.
CIESIN (Center for International Earth Science Information Network). 2004. Global Rural-Urban Mapping Project (GRUMP): Urban Extents. Palisades, NY: CIESIN, Columbia University.
Chong, Alberto, Jesko Hentschel, and Jaime Saavedra. 2007. “Bundling of Basic Public Ser-vices and Household Welfare in Developing Countries: An Empirical Exploration for the Case of Peru.” Oxford Development Studies 35 (3): 329–46.
Dorosh, Paul, Hyoung-Gun Wang, Liang You, and Emily Schmidt. 2008. “Crop Production and Road Connectivity in Sub-Saharan Africa: A Spatial Analysis.” Working Paper 19, Africa Infrastructure Country Diagnostic, World Bank, Washington, DC.
Eberhard, Anton, Vivien Foster, Cecelia Briceño-Garmendia, Fatimata Ouedraogo, Daniel Camos, and Maria Shkaratan. 2008. “Under-powered: The State of the Power Sector in Sub-Saharan Africa.” Background Paper 6, Africa Infrastructure Country Diagnostic, World Bank, Washington, DC.
Farvacque-Vitkovic, Catherine, Alicia Casalis, Mahine Diop, and Christian Eghoff. 2007. “Development of the Cities of Mali: Challenges and Priorities.” Africa Region Working Paper 104a, World Bank, Washington, DC.
Farvacque-Vitkovic, Catherine, Matthew Glasser, Barjor Mehta, Madhu Raghunath, Austin Kilroy, Alvaro Federico Barra, and Raj Salooja. 2008. “Africa’s Urbanization for Development: Under-standing Africa’s Urban Challenges and Oppor-tunities.” World Bank, Washington, DC.
Farvacque-Vitkovic, Catherine, and Patrick McAuslan. 1993. “Politiques Foncière des Villes en Développement.” World Bank, Washington, DC.
Farvacque-Vitkovic, Catherine, Madhu Raghunath, Christian Eghoff, and Charles Boakye. 2008. “Development of the Cities of Ghana: Chal-lenges, Priorities and Pools.” Africa Region Work-ing Paper 110, World Bank, Washington, DC.

142 AFRICA’S INFRASTRUCTURE: A TIME FOR TRANSFORMATION
Gulyani, Sumila, Debabrata Talukdar, and Darby Jack. 2008. “A Tale of Three Cities: Understand-ing Differences in Provision of Modern Services.” Working Paper 10, Africa Infrastruc-ture Country Diagnostic, World Bank, Washington, DC.
Gwilliam, Ken, Vivien Foster, Rodrigo Archondo-Callao, Cecilia Briceño-Garmendia, Alberto Nogales, and Kavita Sethi. 2008. “The Bur-den of Maintenance: Roads in Sub-Saharan Africa.” Background Paper 14, Africa Infra-structure Country Diagnostic, World Bank, Washington, DC.
Henderson, J. Vernon. 2002. “World Cities Data.” http://www.econ.brown.edu/faculty/henderson/worldcities.html.
Kessides, Christine. 2006. The Urban Transition in Sub-Saharan Africa: Implications for Economic Growth and Poverty Reduction. Washington, DC: The Cities Alliance.
Maal, Simen Jansen. 2008. “Measuring the Con-tribution of Urban Centers to the National Economy of Tanzania.” Report to World Bank, Dar es Salaam, Tanzania.
Muzzini, Elisa, and Wietze Lindeboom. 2008. The Urban Transition in Tanzania: Building the
Empirical Base for Policy Dialogue. Washington, DC: World Bank.
Raich, Uri, and Zara Sarzin. Forthcoming. Financing the Urban Expansion in Tanzania. Washington, DC: World Bank.
Torero, Maximo, and Javier Escobal. 2005. “Meas-uring the Impact of Asset Complementarities: The Case of Rural Peru.” Cuadernos de Economia 42 (May): 137–64.
UN-Habitat (United Nations Human Settle-ment Programme). 1998. “Global Urban Observatory.” http://ww2.unhabitat.org/programmes/guo.
———. 2003. “Global Urban Observatory.” http://ww2.unhabitat.org/programmes/guo.
World Bank. 2007. “The Challenge of Urbaniza-tion in Ethiopia: Implications for Growth and Poverty Alleviation.” Africa Region, Water and Urban Development Unit 2, Washington, DC.
———. 2008. World Development Report 2008: Agriculture for Development. Washington, DC: World Bank.
———. 2009. World Development Report 2009: Reshaping Economic Geography. Washington, DC: World Bank.

143
Deepening Regional Integration
Chapter6
W ith many small, isolated economies, Africa’s economic geography is particularly challenging. Regional
integration is likely the only way to overcome these handicaps and participate in the global economy. Integrating physical infrastruc-ture is both a precursor to and an enabler for deeper economic integration, thereby allowing countries to gain scale economies and harness regional public goods. For successful regional integration, countries must start small; build on successes; think globally, linking Africa to more external markets; and compensate the least for-tunate, recognizing that benefi ts are not always evenly distributed.
The benefi ts of regional integration are visible across all aspects of infrastructure networks. For information and communication technol-ogy (ICT) and power, regional infrastructure provides scale economies that substantially reduce the costs of production. Thus, con-tinental fi ber-optic submarine cables could reduce Internet and international call charges by one-half. Similarly, regional power pools that allow countries to share the most cost-effective energy resources can reduce electric-ity costs by $2 billion a year. For transport and water, regional collaboration allows optimal
management and development of cross-border public goods. Road and rail corridors linking landlocked countries to the sea are an example of such a regional public good, as are regional airport and seaport hubs. The same can be said of Africa’s 63 international river basins.
Reaping these benefi ts, however, poses insti-tutional challenges:
• Building a political consensus. The politi-cal obstacles can trump the economic case. Regional infrastructure involves a high level of trust between countries, not least because of the implied dependence on neighbors for key resources such as water and energy.
• Establishing effective regional institutions. Regional institutions have to facilitate agreements and compensation. Africa has an extensive architecture of regional politi-cal and technical bodies, but these face problems because of overlapping member-ships, limited technical capacity, and lim-ited enforcement powers.
• Setting priorities for regional investments. Given the daunting investment agenda, better sequencing and priority setting of regional projects has been elusive. Political,

144 AFRICA’S INFRASTRUCTURE: A TIME FOR TRANSFORMATION
economic, and spatial approaches to prior-ity setting have all been widely discussed.
• Developing regional regulatory frameworks. Physical integration of infrastructure net-works will be effective only with harmonized regulatory frameworks and administrative procedures to allow the free fl ow of services across national borders.
• Facilitating project preparation and cross-border fi nance. The complexity of regional infrastructure projects makes them costly and time-consuming to prepare. This is particularly true when projects are large in relation to the size of the host economy and essentially depend on fi nancing from downstream benefi ciaries.
Why Regional Integration Matters
Regional approaches can address the infrastruc-ture backlog in Africa and propel economic growth, overcoming the region’s difficult geography (Limão and Venables 1999). Sub-Saharan Africa has 48 countries, most with small populations—more than 20 countries have a population of less than 5 million. Econ-omies are also very small—20 countries have a GDP of less than $5 billion. The small scale means governments have diffi culty funding the large fi xed costs associated with infrastructure development. In addition, 15 African countries are landlocked, depending on their neighbors for access to global markets.
Most infrastructure investments share char-acteristics of public goods, and all benefi t to varying degrees from scale economies. Infra-structure sharing addresses the problems of small scale and adverse location. Joint provision increases the scale of infrastructure construc-tion, operation, and maintenance. It reduces costs, pools scarce technical and managerial capacity, and creates a larger market. Econo-mies of scale are particularly important in the ICT and power sectors. Big hydropower projects that would not be economically viable for a sin-gle country make sense when neighbors share their benefi ts. Although new ICT systems—especially mobile telephones—allow provision at the local retail level, connecting Africa to
the world requires large up-front investments in undersea cables or satellite communication. For private engagement in ICT or energy, the opportunity to serve a larger regional mar-ket makes the extensive up-front investments more attractive. Airports and seaports must be organized as regional hubs to reach the scale necessary to attract airline and shipping ser-vices from beyond the continent.
Coordinated management and invest-ment allow countries to reap the best from multicountry infrastructure systems. Some regional infrastructure investments, such as many types of transport investments, pro-vide public goods, or they facilitate access to a common pool resource, as with water resource management for irrigation and other uses. Both public goods and common pool resources require strong coordination. Because the quality of a transport network depends on its weakest link, broad participation is crucial, even where benefi ts are unequally distributed. Water can be exhausted, and upstream users are in a stronger position than downstream users. Collective agreements, effective monitoring, and confl ict resolution mechanisms can ensure a fair distribution of costs and benefi ts.
The goal of all regional infrastructure efforts is to facilitate the spatial organization of economic activity as a catalyst for faster growth. Lessons from the new economic geog-raphy, for which Paul Krugman received the Nobel Prize in Economics in 2008, explain this concept. Natural resource exports will remain important, but they provide few job oppor-tunities and their benefi ts are seldom widely shared. Dutch disease, greater macroeconomic volatility, and weak governance have slowed growth in some resource-rich African coun-tries (Collier 2007). Fast employment growth and sustained welfare improvements in devel-oping countries require a move toward mod-ern, mostly export-oriented manufacturing activity. The shift in trade that allowed East Asia’s rapid growth can also benefi t Africa. In the world’s fastest-growing regions, the largest increase in trade has been within industries, for parts and components produced in one loca-tion and assembled in another. Manufacturing is more about specialized “tasks” than fi nished products (Collier and Venables 2007).

Deepening Regional Integration 145
Splitting up manufacturing processes allows much more specialization, which gives rise to scale economies and, thus, to cost advantages. The result is the concentration of specialized production in new manufactur-ing centers around the world, linked across national boundaries in regional production networks. Launching such processes in Africa will not be easy, but some general points can be made. The World Development Report 2009: Reshaping Economic Geography identifi es three principles for regional infrastructure: start small, think global, and compensate the least fortunate (World Bank 2009).
Start SmallRegional infrastructure is an ideal entry point for integration processes, because the costs and benefi ts and the rights and responsibilities can be more easily defi ned. In the past, many regional agreements have failed because they were overly ambitious, trying to achieve too much too fast. Regional infrastructure shar-ing builds institutions that promote closer economic integration, and mutual depen-dence encourages political stability. Countries will be more willing to cede some sovereignty in exchange for tangible benefi ts, such as water sharing or lower prices for power or ICT services.
Think GloballyRegional integration should not simply adapt failed import substitution policies to a regional level. Instead, it is the means to greater global integration. African markets, even with regional pooling, are too small to sustain high growth. Regional integration scales up supply by creat-ing larger production networks and benefi cial agglomeration. However, the key objective is to connect to world markets for intermediate inputs and intermediate or fi nal outputs. This approach has implications for regional infra-structure development.
For a connection to global markets, primary production centers—more likely in coastal areas—must become regional infrastructure hubs with effi cient ports and airports. These large and lumpy investments must be con-centrated where they promise the highest eco-nomic return. Little point exists in developing
several deep-water ports in neighboring coun-tries when the lack of scale deters international shipping fi rms from serving many African ports. Complementary connective infrastruc-ture (roads, transport services, and smooth border facilitation) encourages regional factor mobility and trade in intermediate inputs. With its many small countries, Africa has a large coordination problem in managing net-work infrastructure. For instance, to link the major agglomerations in Ghana and Nigeria, regional transport links also pass through Togo and Benin.
Compensate the Least FortunateThe benefits of concentration mean that growth will most likely be in a small number of existing cities that have location advantages and an existing economic base, such as coastal cities with a good investment climate. Favoring these areas in planning regional infrastructure investments, at least initially, makes economic sense. With the proper complementary poli-cies, other areas in the region will also benefi t. Labor mobility will lead to remittances from migrants who fi nd jobs in dynamic growth centers. Specialization means that even small players can fi nd a niche. For instance, car assembly may be possible only in some large African countries such as Nigeria and South Africa. However, smaller countries such as Cameroon or Zambia can specialize in com-ponents. For this approach, regional transport and communication costs must come down. For some areas, however, no amount of infra-structure investment will trigger growth. They will need coordinated incentives, preferential allocations of aid in education and health, to create portable assets in the form of human capital that can then migrate to where the employment opportunities exist.
Africa faces severe challenges in diversify-ing from raw material exports and breaking into world markets for manufactured goods. China and India have unifi ed markets with populations that are 70 percent and 50 percent larger, respectively, than all of Sub-Saharan Africa. Whereas Shanghai or Shenzen, China, draws on a catchment area for labor and prod-ucts of several hundred million people, the home market for most African growth centers

146 AFRICA’S INFRASTRUCTURE: A TIME FOR TRANSFORMATION
is limited to a few million. Enabling Africa to develop regional manufacturing clusters that can compete globally requires lowering barri-ers to both productive interaction and (at least temporarily) preferential access to world mar-kets with liberalized rules of origin. Regional integration is essential, and regional infrastruc-ture sharing must be a key priority. National infrastructure programs such as those in India or China (for example, the Golden Quadrilat-eral highway program) will involve agreement by numerous countries in Africa. However, the payoffs to greater coordination and integration of infrastructure will be large.
Opportunities for Regional Cooperation across Infrastructure Sectors
Africa’s regional infrastructure networks have major gaps that increase the costs of doing busi-ness and prevent the realization of scale econo-mies. Supply of infrastructure as a public good and management of common pool resources have been defi cient. More effi cient regional inte-gration of infrastructure is needed in all sectors: ICT, transport, power, and water (fi gure 6.1).
ICT—Slashing Costs of International Voice and Internet ConnectivityAs in other parts of the world, mobile tele-phones have greatly improved telecommuni-cations in Africa. However, the benefi ts have been limited to local and domestic communi-cations. The region’s national telecommunica-tion networks are poorly integrated with each other and the rest of the world. Optical-fi ber technology provides the least expensive and highest-capacity transmission of telephone, Internet, and other data traffi c. Submarine and land-based communication cables combine high speed and large capacity. Although initial investments are high, marginal transmission costs are very low.
Access to the global network of submarine cables is low in Africa, especially for landlocked countries that depend on neighbors for access. Both coordination and massive investments are required. The region’s main international underwater cable is the South Atlantic 3/West
Africa Submarine Cable (SAT-3), which passes along the Gulf of Guinea and down to South Africa. The entire east coast of Africa lacks access to an underwater cable. Intraregional connectivity by fi ber-optic cables is also limited. Most countries rely on satellites for interna-tional telecommunications, including Internet access, leading to prices for dial-up and broad-band Internet at least twice as high as in other regions. Transmission capacities are low, and costs are high. Countries without access to an underwater cable have only 3 bits of bandwidth per capita, whereas those with access have 24 bits. The average cost of an international fi xed-line telephone call within Sub-Saharan Africa is $1.23 a minute, almost twice the cost of a call to the United States ($0.73 a minute). Intrare-gional call traffi c is barely 113 million minutes, compared with intercontinental call traffi c of 250 million minutes.1
Several projects are already under way to complete the loop of underwater cables around Africa, with an estimated value of $1.8 billion (table 6.1). Most are commercially sponsored and privately fi nanced, such as the Eastern African Submarine Cable System proj-ect to link South Africa and the Horn of Africa (box 6.1). The cost of completing the nascent fi ber-optic network interconnecting the capital cities of Sub-Saharan Africa and the main sub-marine cables is modest at $316 million, based on a cost of about $27,000 per kilometer.
The most immediate direct benefits of enhanced connectivity are reduced prices and better service for international voice and Internet connectivity. Prices for most services in countries with underwater cable access are half those in countries without access (table 6.2). Such large price reductions could boost demand for these services and, ultimately, economic productivity. However, too often, access to underwater cables remains with the incum-bent operator, which (without adequate regu-latory controls) charges monopoly prices that prevent consumers from reaping the full cost advantage of this technology. Countries with multiple international gateways see some com-petitive pressure, which keeps service prices signifi cantly lower than in countries where an underwater cable is the only international gateway (table 6.2).

Deepening Regional Integration 147
Beyond direct benefits, enhanced con-nectivity supports closer regional economic networks and integration with international markets (Leamer and Storper 2001). Good communication is a precondition for the emergence of buyer-supplier networks for
specialized production that exploits econo-mies of scale—to move from low-technology, standardized manufacturing to internationally competitive production and to ensure access to global markets for manufactured outputs and business services.
Figure 6.1 Africa’s Regional Infrastructure Challenge
•
•
• •••
•
•
••
••
•• ••
•••
•• •
• •• ••• •••
•• •••• •
• •••
SUDAN
LIBYA
ALGERIA
MALICHAD
NIGER
EGYPT
ANGOLA
CONGO, DEM REP
ETHIOPIA
NIGERIA
NAMIBIA
ZAMBIA
SOUTHAFRICA
TANZANIA
MAURITANIA
KENYA
MOROCCO
SOMALIA
BOTSWANAZIMBABWE
GABON
GUINEA
MOZAMBIQUE
REP. OF. CONGO
MADAGASCAR
CAMEROONGHANA
TUNISIA
CÔTE D’IVOIRE
CENTRAL AFRICANREPUBLIC
SENEGAL
BENINBURKINA FASO
MALAWI
ERITREA
LIBERIA
TOGO
SIERRA LEONE
LESOTHO
BURUNDIRWANDA
DJIBOUTI
GUINEA-BISSAU
SWAZILAND
EQUATORIAL GUINEA
COMOROS
CAPE VERDE
SAO TOMEAND PRINCIPE SEYCHELLES
Broadband networkexisting or under constructionmissing
SAINT HELENA
international river basins
•
••
• •
•
•
• •••
•
•
••
•
•
•••
••
••
•
• •• •• ••
• •••
•• •••• •
• ••
•
Main road corridorsgood or fairpoor or missing
•
•
• •••
•
•
••
•
•
•••
••
••
•
• •• •• ••
• •••
•• •••• •
• ••
•
Power networkexisting
missing
a. ICT—closing the circle b. River basins—managing common resources
c. Roads—connecting the dots d. Power—trading electricity regionally
UGANDA
SUDAN
LIBYA
ALGERIA
MALI
CHAD
NIGER
EGYPT
ANGOLA
CONGO, DEM REP
ETHIOPIANIGERIA
NAMIBIA
ZAMBIA
SOUTHAFRICA
TANZANIA
MAURITANIA
KENYA
MOROCCO
SOMALIA
BOTSWANA
ZIMBABWE
GABON
GUINEA
MOZAMBIQUE
REP. OF. CONGO
MADAGASCAR
CAMEROONGHANA
TUNISIA
CÔTE D’IVOIRE
CENTRAL AFRICANREPUBLIC
SENEGAL
GAMBIA
BENIN
BURKINA FASO
MALAWI
ERITREA
LIBERIATOGO
SIERRA LEONE
LESOTHO
BURUNDIRWANDA
DJIBOUTI
GUINEA-BISSAU
SWAZILAND
EQUATORIAL GUINEA
COMOROS
MAYOTTE
REUNION
CAPE VERDE
SAO TOMEAND PRINCIPE
SEYCHELLES
UGANDA
SUDAN
LIBYAALGERIA
MALI
CHAD
NIGER
EGYPT
ANGOLA
CONGO, DEM REP
ETHIOPIA
NIGERIA
NAMIBIA
ZAMBIA
SOUTHAFRICA
TANZANIA
MAURITANIA
KENYA
MOROCCO
SOMALIA
BOTSWANA
ZIMBABWE
GABON
GUINEA
MOZAMBIQUE
REP. OF. CONGO
MADAGASCAR
CAMEROONGHANA
TUNISIA
CÔTE D’IVOIRE
CENTRAL AFRICANREPUBLIC
SENEGAL
BENINBURKINA FASO
MALAWI
ERITREA
LIBERIATOGO
SIERRA LEONE
LESOTHO
BURUNDIRWANDA
DJIBOUTIGUINEA-BISSAU
SWAZILAND
EQUATORIAL GUINEA
COMOROS
CAPE VERDE
SAO TOMEAND PRINCIPE
SEYCHELLES
UGANDA
SUDAN
LIBYAALGERIA
MALI
CHAD
NIGER
EGYPT
ANGOLA
CONGO, DEM REP
ETHIOPIA
NIGERIA
NAMIBIA
ZAMBIA
SOUTHAFRICA
TANZANIA
MAURITANIA
KENYA
MOROCCO
SOMALIA
BOTSWANA
ZIMBABWE
GABON
GUINEA
MOZAMBIQUE
REP. OF. CONGO
MADAGASCAR
CAMEROONGHANA
TUNISIA
CÔTE D’IVOIRE
CENTRAL AFRICANREPUBLIC
SENEGAL
BENIN
BURKINA FASO
MALAWI
ERITREA
LIBERIATOGO
SIERRA LEONE
LESOTHO
BURUNDIRWANDA
DJIBOUTI
GUINEA-BISSAU
SWAZILAND
EQUATORIAL GUINEA
COMOROS
CAPE VERDE
SAO TOMEAND PRINCIPE
SEYCHELLES
UGANDA
Source: Maps provided by the African Development Bank, 2008.

148 AFRICA’S INFRASTRUCTURE: A TIME FOR TRANSFORMATION
BOX 6.1
The Eastern African Submarine Cable System (EASSy) is an underground fi ber-optic cable that runs from South Africa to Sudan, allowing all countries along the route to connect to the global submarine cable system.
Developed and owned by a consortium of about 25 telecommunication operators, mostly from eastern and southern Africa, the cable is expected to cost $230 million. About one-third of the funding will come from nonconcessional debt fi nance provided by fi ve develop-ment fi nance institutions (the International Finance Cor-poration, the European Investment Bank, the African Development Bank, the French Development Agency, and the German Development Bank), with the remainder from commercial equity.
The project took about three years to develop. The fi rst stage involved discussions and negotiations with stake-holders to determine the project’s structure. The second stage focused on the technical and fi nancial details of implementation. The third stage, laying the cable, began in 2008.
Policy makers and development fi nance institutions have focused on not repeating the experience of the SAT-3 cable, which runs along the west coast. That project was also fi nanced, built, and managed by a consortium of operators, but each member of the consortium has exclusive control over access to the cable in its own country. Lack of competition
has meant that prices remain high and the benefi ts for cus-tomers limited.
Designed to ensure effective competition and regula-tion, EASSy is owned by a consortium, which also includes a special -purpose vehicle owned by a group of smaller operators from the region. Development fi nance support for EASSy is provided as loans to this special-purpose vehi-cle, which can sell capacity in any market in the region to licensed operators on an open-access, nondiscriminatory basis, thus competing with other consortium members. As traffi c volumes increase, the special-purpose vehicle is required to pass on cost reductions to customers.
Reaching consensus about these access arrangements has been diffi cult, leading to project delays. Meanwhile, Kenya moved forward with its own underwater cable, The East Africa Marine System (TEAMS), with links to the United Arab Emirates. Technically much simpler, that project enjoys signifi cant private backing. Unless the system can be integrated in a regional net-work, however, costs will be higher and benefi ts less broadly shared than with a regional effort. A third, privately funded effort, South Africa–East Africa–South Asia–Fiber Optic Cable (SEACOM), is planned to connect South Africa and several East African countries to global networks by mid-2009.
Source: Based on interviews with staff from the World Bank’s ICT Policy Department, 2008.
Not So EASSy
Power—Capturing Scale Economies to Reduce Energy Costs Although well endowed with hydropower and thermal energy resources, African countries
have developed only a small fraction of that potential. Some of the region’s most cost-effective energy resources are far from major centers of demand in countries too poor to
Table 6.1 Costs of Reaching Full Intercontinental and Intraregional Connectivity$ millions
Region
Intercontinental connectivity Intraregional connectivity
ProjectRequired
investment ProjectRequired
investment
East Africa EASSy, TEAMS 260 Connect main hubs within and between subregions and to underwater cables
132
Southern Africa InfraCo, SRII 510 7
West and Central Africa Infi nity, GLO-1, WAFS 1,010 177
Sub-Saharan Africa total 1,780 316
Source: Mayer and others 2008.Note: Intraregional data are for 24 countries. EASSy = Eastern African Submarine Cable System; GLO-1 = Globacom-1; SRII = Southern African Development Community Regional Information Infrastructure Initiative; TEAMS = The East Africa Marine System; WAFS = West African Festoon System.

Deepening Regional Integration 149
raise the billions of dollars needed to develop them. For example, 60 percent of the region’s hydropower potential is in the Democratic Republic of Congo and Ethiopia. Because 21 of 48 Sub-Saharan African countries have total generation capacity of less than 200 megawatts—efficient scale of production below minimum—they pay a heavy penalty: costs reach $0.25 per kilowatt-hour, compared with $0.13 per kilowatt-hour in the region’s larger power systems.
The desire to pool energy resources and lever-age scale economies in power sector develop-ment led to formation of regional power pools in southern and western Africa during the mid-1990s, and more recently in eastern and central Africa. However, trade has yet to take off. Cross-border power trade accounts for only 16 percent of the region’s power consumption, more than 90 percent of it within the Southern African Power Pool, and much of that between South Africa and its immediate neighbors. Without physical or regulatory impediments, about 40 percent of eastern and southern Africa’s power consumption would be traded across national borders (Rosnes and Vennemo 2008).
If pursued to its full economic potential, regional trade would shave about $0.01 per kilowatt-hour off the marginal cost of power generation in each of the power pools. The resulting overall potential savings of regional power trade would amount to about $2 billion a year in the costs of power system develop-ment and operation (equivalent to about 5 per-cent of total power system costs). The savings come largely from substituting hydropower for thermal power, even if higher immediate investments are required.
Regional trade also puts Africa on a cleaner development path in terms of carbon emissions. Regional power trade would increase the share of hydropower in the continent’s generation portfolio from 36 percent to 48 percent, dis-placing 20,000 megawatts of thermal power in the process and saving 70 million tons a year of carbon emissions (8 percent of Sub-Saharan Africa’s anticipated emissions through 2015). Applying the Clean Development Mechanism at $15 per ton of carbon would reduce the region’s carbon emissions another 4 percent. Closely integrating power grids will also help balance loads when other renewable energy resources, such as concentrated solar and geothermal energy, are deployed on a large scale.
The 10 largest potential power-importing countries could reduce their long-run marginal cost of power by $0.02–$0.07 per kilowatt-hour (fi gure 6.2). Those that stand to gain most tend to be smaller countries or those heavily reliant on thermal power, such as Angola, Burundi, Chad, Guinea-Bissau, Liberia, Niger, and Senegal. However, reaping the full benefi ts of power trade would require a political willingness to depend heavily on power imports. As many as 16 African countries would be better-off (from a purely economic standpoint) importing more than 50 percent of their power needs.
The future of power trade depends on the health of the power sector in a handful of key exporting countries endowed with exception-ally large and low-cost hydropower resources. In descending order of export potential, these include the Democratic Republic of Congo, Ethiopia, Guinea, Sudan, Camer-oon, and Mozambique (table 6.3). The fi rst three account for 74 percent of potential
Table 6.2 Benefits of Access to an Underwater Cable
Access levelShare of
countries (%)
Price for a call within
Sub-Saharan Africa ($ per
minute)
Price for a call to the
United States ($ per minute)
Price for 20 hours of dial-up Internet
access ($ per month)
Price for ADSL broad-band Internet access ($ per
month)
No access to submarine cable 67 1.34 0.86 67.95 282.97
Access to submarine cable 32 0.57 0.48 47.28 110.71
Monopoly on international gateway 16 0.70 0.72 37.36 119.88
Competitive international gateways 16 0.48 0.23 36.62 98.49
Source: Minges and others 2008.Note: ADSL = asymmetric digital subscriber line.

150 AFRICA’S INFRASTRUCTURE: A TIME FOR TRANSFORMATION
power exports, which could become big busi-ness for them. Based on a purely illustrative profi t margin of $0.01 per kilowatt-hour on power sales, the net export revenues for these top three exporters could be 2–6 percent of their respective GDP. However, the size of the
investments needed to realize these export volumes is daunting. Each of the top three would need to invest more than $700 million a year for the next decade to develop the gen-eration capacity for export, or more than 8 percent of their GDP. Thus, supporting such investments would be diffi cult without exten-sive cross-border fi nancing arrangements that allow importing benefi ciaries to make up-front capital contributions.
To make trade possible, countries would need to develop some 22,000 megawatts of interconnectors to allow the free fl ow of power across national borders, at a cost of more than $500 million a year over the next decade. The returns to the interconnectors can be as high as 120 percent for the Southern African Power Pool, and more typically 20–30 percent for the other power pools. For countries with the most to gain from power imports, investments in cross-border transmission have exception-ally high rates of return, typically paying for themselves in less than a year.
Transport Infrastructure—Facilitating Internal and External TradeTransport infrastructure is critical for linking Africa to the global economy and promoting economic integration within the continent. However, the infrastructure demands are quite different in each case.
External Trade. For external trade, the conti-nent’s economic geography makes transport connections with the world something of a public good. Major corridors to the sea con-nect the continent’s 15 landlocked countries to the major seaports, through a combination of road and rail infrastructure. The main ports include Douala (Cameroon) for central Africa; Durban (South Africa) and Maputo (Mozam-bique) for southern Africa; Dar es Salaam (Tanzania) and Mombasa (Kenya) for eastern Africa; and Abidjan (Côte d’Ivoire), Cotonou (Benin), and Dakar (Senegal) for western Africa (table 6.4). About $200 billion a year in imports and exports moves along these cor-ridors, barely 10,000 kilometers long. About 70 percent is in good or fair condition, with donors channeling more resources to improve infrastructure along the routes.
0 1 2 3 4 5 6 7 8
Guinea-Bissau
Liberia
Niger
Angola
Chad
Burundi
Senegal
Mali
Congo, Dem. Rep. of
Equatorial Guinea
Mozambique
Sierra Leone
Lesotho
Namibia
South Africa
Gabon
Kenya
US cents per kilowatt–hour
Figure 6.2 Savings from Power Trade for Major Potential Power-Importing Countries
Source: Derived from Rosnes and Vennemo 2008.
Table 6.3 Profile of Top-Six Potential Power-Exporting Countries
Country
Potential exports
(terrawatt hours per year)
$ millions per year
Percentage of GDP
$ millions per year
Percentage of GDP
Congo, Dem. Rep. of 51.9 519 6.1 749 8.8
Ethiopia 26.3 263 2.0 1,003 7.5
Guinea 17.4 174 5.2 786 23.7
Sudan 13.1 131 0.3 1,032 2.7
Cameroon 6.8 68 0.4 267 1.5
Mozambique 5.9 59 0.8 216 2.8
Source: Derived from Rosnes and Vennemo 2008.Notes: Net revenue is calculated as the estimated volume of exports multiplied by an illustrative profit margin of $0.01 per kilowatt-hour exported. Required investment represents the investment needed for the country to be able to exploit its full economic power-exporting potential.
Net revenues Required investment

Deepening Regional Integration 151
However, regulatory and administrative hurdles continue to infl ate costs and pro-long delays for freight movements along these strategic arteries (table 6.4). Despite the reasonably good physical condition of the roads, the implicit velocity of freight move-ment is no more than 10 kilometers per hour (roughly the speed of a horse and buggy). The cause is the extensive delays of 10–30 hours at border crossings and ports. Transit times between major cities are very high by inter-national standards (table 6.4). Member coun-tries have organized corridor associations to address nonphysical barriers to transit, estab-lishing one-stop integrated border posts and improving ports and custom administration.
Tariffs for road freight can be several times higher than in other parts of the developing world (table 6.5), which is attributed not to higher road transport costs in Africa, but to exceptionally high profi t margins in the truck-ing industry (Teravaninthorn and Raballand 2008). These margins in turn refl ect carteliza-tion and restrictive regulatory frameworks, such as market entry barriers; technical regulations; and the tour de role system that allocates freight business based on queuing, particularly in cen-tral and western Africa. This system favors large fl eets with mostly older trucks in poor condi-tion. Moreover, it fosters corruption, because a transport operator can increase its volume of cargo only by bribing the freight bureaus, the government entities that allocate freight among transport operators.
Upgrading the remainder of the corridors to the sea to good condition is estimated to cost about $1.5 billion, while the annual cost of maintenance is close to $1.0 billion. Simu-lations suggest that corridor rehabilitation would yield an internal rate of return of 20–60 percent in eastern Africa’s northern corridor. However, low traffi c, poor truck use, and an aging fl eet in central and western Africa would undermine the economic viability of corridor upgrades. Investments in these regions would likely become attractive only when more fun-damental regulatory and institutional reforms improve trucking productivity.
For air transport, the size of the market is simply too small to support a proliferation of national carriers with each centered on
its own airport facility and jet fl eet. Instead, regional hubs serving multiple countries are needed, with fl eets of smaller commuter jets to move passengers along spokes and into hubs. Liberalization begun under the Yamous-soukro Decision in 1999 should allow carriers serving key routes to consolidate and a better package of intraregional services to emerge. However, implementation has been lagging, especially in harmonizing competition rules and removing nonphysical barriers such as landing rights and tariffs. In eastern and southern Africa, this consolidation of carriers and hubs has already occurred, with Ethio-pian Airlines (Addis Ababa), Kenya Airways (Nairobi), and South African Airways (Johan-nesburg) emerging as the main ones. Yet, in central and western Africa, hubs are conspicu-ous by their absence (fi gure 6.3). The collapse of key regional carriers, notably Air Afrique, partly caused this gap. Particularly striking is the failure of Lagos to emerge as a hub for western Africa.
Table 6.5 Key Transport Corridors for International Trade, Sub-Saharan Africa
CorridorLength
(kilometers)
Road in good condition (percent)
Trade density ($ millions per road
kilometer)
Implicit velocitya
(kilometers per hour)
Freight tariff
($ per ton-kilometer)
Western 2,050 72 8.2 6.0 0.08
Central 3,280 49 4.2 6.1 0.13
Eastern 2,845 82 5.7 8.1 0.07
Southern 5,000 100 27.9 11.6 0.05
Source: Teravaninthorn and Raballand 2008.a. Includes time spent stationary at ports, border crossings, and other stops.
Table 6.4 Average Delivery Time for Containers from Vessel to Consignee
Gateway DestinationDistance
(kilometers)Transit time
(days)
Mombasa, Kenya Kampala, Uganda 1,100 20
Mombasa, Kenya Kigali, Rwanda 1,700 27
Dar es Salaam, Tanzania Bujumbura, Burundi 1,800 21
Abidjan, Côte d’Ivoire Ouagadougou, Burkino Faso 1,200 7
Abidjan, Côte d’Ivoire Bamako, Mali 1,200 7
Dakar, Senegal Bamako, Mali 1,200 10
Cotonou, Benin Niamey, Niger 1,000 11
Douala, Cameroon Ndjamena, Chad 1,900 38
Lagos, Nigeria Kano, Nigeria 1,100 21
Source: Arvis 2005, quoting an international logistics company.

152 AFRICA’S INFRASTRUCTURE: A TIME FOR TRANSFORMATION
For seaports, large vessels (more than 200,000 20-foot equivalent units per year that provide scale economies to seaborne trade on east-west ports) are today able to call at only a handful of Sub-Saharan Africa’s larger ports (Luanda, Angola; Abidjan, Côte d’Ivoire; Tema, Ghana; Mombasa, Kenya; Maputo, Mozam-bique; Apapa [Lagos], Nigeria; Dakar, Senegal; Durban and Cape Town, South Africa; Dar es Salaam, Tanzania; and Lomé, Togo). Several of these ports act as regional hubs, but with relatively small transshipment volumes. In theory, coordinating the choice of hub ports on Africa’s different seaboards to reach greater economies of scale is desirable, but in prac-tice, it is diffi cult because of rivalry between national ports.
For the east coast ports, the major regional hubs are already being developed in the Middle East (Djibouti, Djibouti; Jebel Ali, United Arab
Emirates; Jeddah, Saudi Arabia; and Salalah, Oman). For southern Africa, the government of South Africa has decided to develop a sizable hub port in Richards Bay, which will likely cap-ture a signifi cant portion of the seaborne trade between Asia and subequatorial Africa. On the west coast, despite the growth of Tangiers, Morocco, room may still exist for one or two regional hubs. Dakar, with its recent container-terminal concession and port expansion plans, is a strong candidate. Apapa (Lagos), though more centrally positioned, is already strug-gling with its local market and facing heavy congestion.
Intraregional Trade. Intraregional trade depends on the internal network linking Afri-can countries to each other. Except in southern Africa, the rail network does not typically pro-vide such intraregional connectivity, because of the incompatibility of gauges and the isolated parallel corridors to the sea. Even along the more frequented sea corridors, most African railways struggle to reach economic viability because of very low traffi c volumes. With traf-fi c volume on intraregional rail routes much lower than even that on corridors to the sea, feasible further intraregional integration of rail networks in the near future is diffi cult to imagine.
It follows that the road network has the greatest potential to support intraregional trade. In the 1970s, the Trans-African High-way system was conceived as a network of all-weather roads to provide direct routes between the region’s capitals; to contribute to the region’s political, economic, and social integration and cohesion; and to ensure road transport between important areas of produc-tion and consumption (AfDB and UNECA 2000). However, national governments have had difficulty supporting needed invest-ments. The offi cial Trans-African Highway system comprises nine main corridors and reaches just over 50,000 kilometers. In mid-2008, almost half of the network was in poor condition, with about 70 percent of roads paved but 25 percent with either an earth sur-face or no formed road. Most of these miss-ing links—those with the greatest potential
Figure 6.3 Uneven Distribution of Airport Hubs across Africa: Traffic Flows between Top-60 Intraregional City Pairs
Source: Bofinger 2008.Note: Thickness of lines reflects traffic volumes.

Deepening Regional Integration 153
to knit together the continent’s economies—are in central Africa (Buys, Deichmann, and Wheeler 2006).
Extending the network to connect all Sub-Saharan African cities with more than 500,000 people would add an estimated 50,000 kilo-meters of road. The costs of completing an intra-African road network of this kind are of a larger order of magnitude than those associated with the corridors to the sea. Some estimate a one-time cost of $20 billion and an ongoing maintenance cost of $1 billion a year (Buys, Deichmann, and Wheeler 2006). The associated benefi ts are more speculative. Well-established relationships between trade volumes and transport costs mean that a fully operational Trans-African Highway network could nearly triple intra-African trade, from $10 billion a year to almost $30 billion (Buys, Deichmann, and Wheeler 2006). Even if one assumes rehabilitation costs as high as $20 bil-lion, the benefi t-cost ratio over 15 years would be as high as 5 to 1. However, even these higher projected volumes of regional trade look small alongside Africa’s existing volumes of interna-tional trade, which stand close to $200 billion per year.
Water Resources—Minimizing Confl icts, Maximizing Benefi tsAfrica has more than 60 transboundary river basins, almost half shared by three or more countries with riparian rights. The region’s sur-face water resources benefi t economic devel-opment in several ways. Well-managed water resources can create low-cost hydropower, abundant irrigation, and cost-effective surface transport. However, hydrologic variability and limited storage leave economies vulnerable to fl oods and droughts.
The transboundary nature of most water-sheds in Africa implies that regional coordi-nation in water management is important (UNESCO 2003). What happens in an upstream country can benefi t or harm its downstream neighbor. Hydropower and water storage infra-structure can provide cheaper electricity and balanced water fl ows, but excessive extraction or pollution upstream can hurt agriculture and drinking water supplies downstream. Regional
coordination based on established interna-tional public law governing water sharing can ensure equitable distribution of the benefi ts of common-pool water resources. For upstream neighbors, apart from greater regional stabil-ity, the benefi ts include sharing of the large investments in hydropower or irrigation infrastructure.
Transboundary water resource management requires strong institutional commitment. Between the 1960s and 1980s, many countries created river basin arrangements such as the Senegal River Development Organization in 1972; the Gambia River Development Organi-zation in 1978; and the Niger River Commission in 1964, later transformed into the Niger Basin Authority. External support, through media-tion and fi nancial backing, encouraged initial enthusiasm. However, nearly three decades later, with few exceptions, these transboundary orga-nizations are still in the emergent stages. Some of their challenges included waning political commitment, poor cooperation, management and technical diffi culties, armed confl ict and political instability, and poorly defi ned goals or insuffi cient capacity for proposed plans. As donor support dwindled, basin organizations also lacked the fi nancial backing to carry out their programs.
Coordination costs are high, given the sensitive nature of water resources, especially for countries in arid environments. Technical assistance and capacity building can strengthen basin organizations. One coordination tool is a management system that measures the prog-ress of water resource management in river basins (see UNESCO 2006). Such a system sets benchmarks and defi nes the monitoring framework to track water discharge, quality, and development effects.
The Senegal River Development Organiza-tion is generally considered successful in trans-boundary cooperation for water management. It built the Manantali and Diama dams, which brought irrigation to some 375,000 hectares of land, enabled 800 gigawatt-hours a year of hydropower generation, and added about 800 kilometers of navigation on the Senegal River from Senegal to Kayes, Mali. Close coor-dination between riparian neighbors also

154 AFRICA’S INFRASTRUCTURE: A TIME FOR TRANSFORMATION
allows them to address early any negative effects of water management development on agriculture and fi sheries.
Meeting the Challenges ofRegional Integration of Infrastructure in Africa
The benefi ts of regional infrastructure develop-ment are clear, but reaping those benefi ts poses political, institutional, economic, and fi nancial challenges that are far from trivial. The starting point is building political consensus among neighboring states that may have diverging national agendas or even recent histories of confl ict. Thereafter, effective regional institu-tions are needed to take forward a collabora-tive cross-border infrastructure development program and to ensure an equitable distribu-tion of benefi ts. Given the vast needs and lim-ited resources, some form of priority setting is necessary to guide efforts on the regional inte-gration agenda. Even when priorities are clear, however, funding and implementing extensive project preparation studies and arranging cross-border fi nance for complex multibillion-dollar projects is far from straightforward. Furthermore, once the regional infrastructure is in place, its effi cacy will ultimately depend on harmonizing the associated regulatory and administrative procedures.
Building a Political ConsensusRegional infrastructure is only one aspect of broader regional integration. In contrast to economic or political integration, however, cooperation in infrastructure provision is eas-ier to achieve, because benefi ts are more clearly defi ned, and countries need to cede less sover-eignty. Regional infrastructure cooperation is therefore an effective initial step on the path to broader integration.
Some countries have more to gain from regional integration than others. Landlocked countries depend particularly on effective road and rail corridors to the sea, as well as on intra-continental fiber-optic backbones that link them to submarine cables. Coastal countries depend particularly on sound management of water resources upstream. Small countries
benefi t especially from regional power trade that reduces the costs of energy supply. As long as regional integration provides a substan-tial economic dividend to some of the par-ticipating countries, designing compensation mechanisms that benefi t all of them should be possible. The concept of benefi t sharing was pioneered through international river basin treaties, such as that for the Senegal River, and could be applied to regional infrastructure more broadly.
A key prerequisite for any regional initiative is building political consensus both nationally and across borders. Although methods will vary from country to country, some broad principles apply.
Get High-Level Buy-In. Africa needs more high-level advocacy and leadership to promote regional integration for infrastructure develop-ment and beyond. Regional integration issues remain only a small part of parliamentary debate in most countries. Between infrequent regional meetings of heads of state, a sense of inertia and lack of follow-up frequently exist. Governments and international institutions must provide leadership. The African Union has the mandate to coordinate the regional integration program of Africa as spelled out in the Abuja Treaty (1991), which created the African Economic Community, with regional economic communities as building blocks. The African Union identifi ed infrastructure and regional integration as major components of economic growth and poverty reduction in Africa. The main vehicle is the New Partner-ship for Africa’s Development (NEPAD), which has not always received the requisite support from political leaders to build a consensus around fi nancially and economically viable projects. The NEPAD Heads of State Imple-mentation Committee, set up to help remove political blocks to projects, has not been effec-tive and now meets less regularly than origi-nally intended. A strong commitment from regional leaders is essential to move projects forward. When the West African Gas Pipeline ran into political differences, for example, it was the shuttle diplomacy of Nigeria’s Presi-dent Olusegun Obasanjo that kept the project on track.

Deepening Regional Integration 155
Build Trust. Trust is important for regional integration—especially when some countries stand to benefi t more than others. Coun-tries that do not trust each other may fail to reach a cooperative solution. For example, implementation of the road-railway bridge project between Kinshasa and Brazzaville and extension of the Kinshasa-Ilebo rail-way are intended to accelerate trade between the Democratic Republic of Congo and the Republic of Congo. Trust between the two countries will be a key factor in the decision to proceed with this project. Starting small, with relatively well-defi ned projects, is one way to build that trust. Frequent interaction among policy makers at all levels of govern-ment builds relationships that help overcome inevitable disagreements. Supranational orga-nizations can be honest brokers for sharing gains and resolving disputes.
Invest in Credible Information. Trust is easier to build when the facts are available to all. Good evidence must be gathered and made acces-sible to decision makers to gauge the full costs and benefi ts of regional infrastructure invest-ments, many of which involve large allocations of funds and ceding of some sovereignty. The regional economic communities must commu-nicate the potential benefi ts to all stakeholders to help build consensus. Countries are unlikely to bear the full cost of public goods if the ben-efi ts are not clear. Because regional integration can create winners and losers, assessing the likely benefi ts and costs will help.
Focus on Sharing Benefi ts, Not on Sharing Resources. Regional projects often fail because of the perception of unequal access to a natu-ral or infrastructure resource. However, what matters is how the economic benefi ts from resources or infrastructure are shared. This philosophy is best illustrated in the manage-ment of transboundary water resources, where benefi ts include fl ood protection, hydropower, irrigation, fi sheries, leisure, tourism, and peace and security. One country may benefi t most from hydropower, while another requires steady access to water for irrigation. Successful benefi t sharing includes the Lesotho Highlands Water Project and the Incomati Basin water-sharing
agreement, contributing to broader political and economic cooperation and stability.
Think Regionally, Even When Developing National Policies. Regional interdependence is a fact of life in all parts of Africa. It is criti-cal for not only landlocked countries but also larger and coastal countries, which deal with regional trade, labor migration, and expand-ing markets. National policy makers should therefore consider the regional consequences of national policy making. Donors can encourage this approach. For instance, developing an assis-tance strategy for Burkina Faso without consid-ering its place in the region in relation to Côte d’Ivoire, Ghana, and Mali makes little sense.
Establishing Effective Regional Institutions No shortage exists of regional institutions in Africa, but few are effective. The institutional architecture that supports African integration comprises more than 30 executive continental bodies, regional economic communities with many overlapping memberships, sectoral tech-nical bodies, and national planning bodies. The result is a high degree of complexity, unclear functional responsibilities for strategy and project development, and uncertain fi nancing strategies. This lack of clarity has slowed prog-ress on coherent regional strategies, realistic programs for integration priorities (such as regional infrastructure and trade integration), and technical plans for specifi c projects.
Becoming more effective is easier for agen-cies with a narrow set of tasks and responsibili-ties than for those with a broader design. The African Union Commission has struggled with its mandate because of a lack of human and fi nancial resources and unclear responsibili-ties. The regional economic communities have limited capabilities and resources and, above all, weak authority to enforce decisions. A dis-connect often exists between what is written in treaties and what happens on the ground. Insti-tutions will be more effective if a greater willing-ness exists to cede some sovereignty in return for greater economic benefi ts. Greater use of qualifi ed majority rules in some areas of policy making would lead to more streamlined deci-sion making. This approach has been debated

156 AFRICA’S INFRASTRUCTURE: A TIME FOR TRANSFORMATION
for some time in many regional economic com-munities, without resolution. Adequate fi nanc-ing is also a problem because member states often fail to pay assessed contributions in full, if at all. Regional economic communities have multiple functions, with infrastructure not nec-essarily prominent (ICA 2008). As a result, they often fail to attract and retain professional staff with the experience to identify and promote complex regional infrastructure projects.
In 2006, the regional poverty reduction strategy for West Africa by the Economic Community of West African States and the West African Economic and Monetary Union was a signifi cant milestone. Other regions also have completed strategic planning exercises: for example, the Regional Indicative Strate-gic Plan (developed by the Southern African Development Community) and the East Afri-can Community Master Plan. However, links between these regional strategic plans and country programs remain limited. Improved links are critical for coordinated implementa-tion of regional programs, which is essential to leverage outcomes at the country level. For example, the Common Market for Eastern and Southern Africa, the East African Community, and the Southern African Development Com-munity have been successfully coordinating programs through a tripartite task force.
Regional special-purpose entities or sectoral technical bodies have been more effective. A power pool, for example, has a clear mandate, suffi cient autonomy to execute its responsi-bilities, a dedicated funding mechanism, and career opportunities that attract and retain high-caliber staff. It also receives substantial capacity building. The members of a power pool are national electricity utilities, which similarly have clear functions and roles within their national contexts and are less subject to immediate political pressures than less techni-cal public agencies.
The need to increase capacity and streamline decision making extends to national agencies. For complex regional infrastructure projects, several line ministries are often involved in each country. This practice complicates consensus building and assigning of clear responsibilities.A further problem is the frequent lack of follow-up on regional commitments to national
implementation by high-level government offi cials.
Five actions to improve the effectiveness of institutions can aid regional cooperation in infrastructure provision. First, the roles and responsibilities of regional bodies concerned with regional integration must be clarifi ed. Second, increased legal authority is required for regional entities to improve and acceler-ate decision-making processes. Third, the key regional bodies must boost their professional capacity. Fourth, national planning agencies must improve their ability to strengthen links between regional strategies and national devel-opment plans. Fifth, delivery mechanisms for priority programs (for example, regional infra-structure) should be strengthened to underpin confi dence in integration by delivering tangi-ble results.
Africa’s efforts to strengthen regional integration have focused on the fi fth action. However, national priorities have limited the support for regional programs overall. Poor refl ection of regional priorities in national plans has slowed priority programs, sapping government willingness to cede sovereignty to other regional initiatives and creating a vicious circle. Progress requires rebalancing efforts among the fi ve institutional challenges.
Setting Priorities for Regional InfrastructureWith a very large backlog of infrastructure investments as well as limited fi scal space and borrowing ability, countries must set effective priorities for infrastructure investment in Africa. Projects should be well justifi ed to com-pete with investments in other sectors such as health or education. The long life of infrastruc-ture means that bad decisions are locked in for decades. An unwise investment can saddle gov-ernments with an ineffective project that will also require costly maintenance. How should priorities be set? Suitable criteria include pre-dicted economic returns, spatial targeting, and scope for private participation.
Economic Returns. Projects with the highest returns may not always be new infrastruc-ture. Strategic investments that improve the performance of infrastructure systems, such

Deepening Regional Integration 157
as addressing bottlenecks at ports or border crossings or installing power interconnectors between countries with large cost differen-tials, are often the most effective. Investments in maintenance and rehabilitation of existing infrastructure, such as roads and rail links in a network, can often yield economic benefi ts faster than new transport infrastructure.
Spatial Targeting. Too often, political expedi-ency encourages spreading out investments to all parts of a country or region, when a con-centration of productive investments in high-potential areas would yield greater economic benefi ts (World Bank 2009). The spatial devel-opment initiative supported by NEPAD aims to link trunk infrastructure with countries’ natural resource endowments. The initiative was inspired by the Maputo Development Corridor, which bundled infrastructure invest-ments and used private fi nance as the catalyst to exploit natural resources along a corridor between Mozambique and South Africa.
South Africa’s leadership was key in mov-ing the initiative forward. However, whether similar leadership will emerge in other parts of the region is unclear. Indeed, most of the spatial development initiatives are brownfi eld initiatives, in which some regional infrastruc-ture already exists. This fact raises the ques-tion of why private anchor investments have not yet been seen. A concern is that corridor development will simply facilitate exports of raw materials, whereas the goal should be eco-nomic development and employment growth through manufactured exports.
Another example of a spatial approach is the development of better links between the large coastal agglomerations in the Gulf of Guinea (Abidjan, Accra, Cotonou, Lagos, and Lomé) and providing a competitive business environ-ment sustained by policy harmonization along the corridor. Such an initiative would allow all countries to benefi t from access to major ports in Abidjan and Lagos and, ultimately, reduce international transport costs for the entire subregion.
Through shared infrastructure and bet-ter trade facilitation, Africa can emulate East Asia’s economies, which took advantage of eco-nomic complementarities in bordering regions
to increase investment and facilitate business reforms. The Zambia-Malawi-Mozambique growth triangle—initiated in 2000 and cov-ering northern Zambia, northern and central Malawi, and some central-eastern parts of Mozambique—seems to have facilitated trade and generated new economic activities.2
The Economic Community of West African States recently adopted cross-border initia-tives between bordering areas with economic complementarities, such as the Sikasso-Korhogo-Bamako initiative (based on the cotton basin shared by Burkina Faso, Côte d’Ivoire, and Mali) and the Kano-Katsina-Maharadi initiative (based on agriculture and cattle in the Nigeria-Niger border region). By identifying what is needed to facilitate cross-border production networks, bordering coun-tries can make regional infrastructure invest-ments based on profi table joint projects.
Scope for Private Participation. ICT, power plants, and ports and airports have signifi cant potential for private provision and operation. The prospect of a larger regional market can attract more interest for private fi nancing or public-private partnerships. Larger private involvement can help overcome the large infra-structure fi nancing gap, but governments must then ratify and implement protocols to facili-tate investment. Public control in many coun-tries continues to stifl e private investment. For example, regarding ports, only two African countries (Ghana and Nigeria) have adopted the internationally favored landlord model, which aims to strike a balance between public (port authority) and private (port industry) interests.
Priority-setting exercises are under way or planned. A new continental task force will report on a broad set of criteria for helping development institutions set investment pri-orities in each of the main infrastructure sec-tors. The report will feed into a joint African Union–NEPAD–African Development Bank study, the Program for Infrastructure Develop-ment in Africa, which will elaborate a vision of regional integration on the continent through infrastructure. The program will need to con-sider other ongoing processes, such as the

158 AFRICA’S INFRASTRUCTURE: A TIME FOR TRANSFORMATION
Africa-EU Energy Partnership, which aims to agree on an Electricity Master Plan for Africa, and the 2009 African Union Summit, which agreed on a short-list of fl agship projects for priority support and investment. In addi-tion, many regional economic communities and other technical regional institutions have 10-year investment plans that present a large investment menu for external fi nanciers.
A requirement for any priority setting is transparency in decision making and agree-ment on selection criteria. Decision making must be well documented and motivated, using suffi ciently detailed data and a clear explanation of assumptions, all publicly acces-sible. The investments in better information at the country and regional levels will be small relative to the public and private funds at stake, but the benefi ts of better decision making will be large.
Facilitating Project Preparation and Cross-Border FinanceProject design is complex. The appraisal phase establishes social, economic, fi nancial, techni-cal, administrative, and environmental feasibil-ity (Leigland and Roberts 2007). For regional projects, coordination among national agencies with different procedures, capacity, and admin-istrative constraints adds to the complexity. Thus, the project preparation costs for regional projects tend to be higher, and the process can take longer than that for national projects.
Preparation costs are typically about 5 per-cent of total fi nancing, or approximately double the cost of preparing national projects. These outlays occur up front when the success of the project and the likelihood of a suffi cient return from the investment are still uncertain. Regional institutions and donors have tried to address these issues, setting up more than 20 project preparation facilities, many of which explicitly support regional activities (ICA 2006). How-ever, the resources do not match the regional needs. African countries need to commit more funds and more people with the proper techni-cal, legal, and fi nancial skills for infrastructure planning and project implementation. Timely execution of project preparation activities and a suffi cient pipeline of new projects also encour-age participation of the private sector. For
operators relying on private fi nancing, a fi rm planning horizon is even more critical than for the public sector (ICA 2009).
Support for regional projects by the Infra-structure Consortium for Africa grew sharply from about $430 million in 2005 to $2.8 billion in 2007 (ICA 2007).3 Although the bilateral share has increased over time, multilateral members accounted for 60 percent of total commitments in 2007 (World Bank 2008). Multilateral institu-tions have been developing specifi c mechanisms for dealing with regional projects.
The World Bank has four criteria for regional projects to qualify for concessional funding from the International Development Association (IDA): (a) at least three countries must participate, though they can enter the project at different stages; (b) countries and the relevant regional entity must demonstrate a strong commitment; (c) economic and social benefi ts must spill over country boundaries; and (d) projects must provide a platform for policy harmonization among countries and be priorities within a well-developed and broadly supported regional strategy. A recent evalua-tion of World Bank regional integration proj-ects concluded that regional programs have been effective, if still on a relatively small scale (World Bank 2007).
The African Development Bank adopted similar principles in 2008, though it requires that only two countries participate. To help with country ownership, both institutions use a one-third, two-thirds principle, whereby participants are expected to use one IDA or African Development Fund (ADF) credit from their country allocation, supplemented by two credits from regionally dedicated resources. Currently, 17.5 percent of ADF and 15 percent of IDA resources in Africa are dedicated to regional programs.
For the EU-Africa Infrastructure Trust Fund, eligible projects must have African ownership and long-term project sustainabil-ity. They must also be cross-border projects or national projects with a regional effect on two or more countries. Regional projects funded by the Development Bank of Southern Africa must either involve a minimum of two coun-tries or be located in a single country with ben-efi ts to the region.

Deepening Regional Integration 159
Some challenges remain. Although recipi-ents of funds from the ADF and the IDA can leverage their country allocations by partici-pating in regional projects, those receiving a small allocation may be reluctant to use a large percentage on one regional project for which the benefi ts are unclear. How such concessional resources are allocated and whether enough of the overall envelope is dedicated to regional projects remain issues of debate. In addition, limited fi nancing instruments exist for middle-income countries, which is an issue in North Africa (for connectivity with countries south of the Sahara) and in southern Africa (for projects that might involve Botswana or South Africa).
Regional organizations may not always qualify for grants or concessional fi nance from donor institutions because of their suprana-tional character, limiting the availability of resources for capacity building. Furthermore, some projects with signifi cant regional spill-overs may not involve three or more countries and thus not qualify for regional fi nancing, such as the Ethiopia-Sudan interconnector or any national power-generation project that may have export potential.
Developing Regional Regulatory FrameworksBuilding physical infrastructure by itself will not yield high economic returns in regional growth and employment. Improving the legal, regulatory, and administrative environment is necessary to ensure infrastructure’s effi cient use (box 6.2).
Air transport is profi table enough to allow the private sector or public-private partnerships to invest in and improve infrastructure, but the regulatory environment and government safety and security regimes are key to success. The Yamoussoukro Declaration on free access to the African skies has improved intraregional and international connectivity.
A study of 73 African ports concluded that capacity additions and institutional reform must be placed on a fast track to realize the potential. Although some countries are under-taking new master plans for national ports, not all address the need to improve weak labor skills and stifl ing bureaucracy and to provide independent regulation.
In the energy sector, African borders limit market size through political and regula-tory barriers to electricity trade and through physical barriers. Regional power infrastruc-ture requires harmonized power pricing and third-party access regulations, effective cross-border trading contracts, and reliable and creditworthy national utilities. In much of Sub-Saharan Africa, bilateral arrangements between vertically integrated utilities guide cross-border electricity exchanges, although, increasingly, regional power pools are liberal-izing the electricity markets.
Worldwide experience in developing power pools has led to a consensus on three key building blocks for success: a common legal and regulatory framework, a durable frame-work for systems planning and operation, and an equitable commercial framework for energy exchanges (USAID 2008).
The four power pools in Sub-Saharan Africa are at different stages of development, but as countries move from bilateral to multilateral power exchanges, a commercially acceptable framework is essential. In 2006, the West African
BOX 6.2
One-Stop Border Posts to Facilitate TradeTrade logistics has three components: international shipping, opera-tions at the gateway (fi nal clearance or transit clearance at customs and handling), and inland movement (often under a transit proce-dure). At the Chirundu crossing between Zambia and Zimbabwe, the average transit times for northbound trucks range from 26 to 46 hours. The border has more than 15 agencies from both gov-ernments, each enforcing different pieces of legislation. A joint task force formed by the Common Market for Eastern and Southern Africa, the Southern African Development Community, and the East African Community for harmonization of regional trade arrange-ments started operating in 2006. The one-stop border posts under this initiative illustrate what political will can achieve. The trade facili-tation measures being addressed by the task force include using a single document for customs clearance, harmonizing information technology and electronic customs management systems, harmoniz-ing axle loading and road transit charges, and instituting regional driving license and insurance schemes.
Source: Based on interviews with staff from the World Bank’s Africa Transport Department, 2008.

160 AFRICA’S INFRASTRUCTURE: A TIME FOR TRANSFORMATION
Power Pool was granted special status to rein-force its autonomy, and the 2007 ratifi cation of an overarching legal framework (ECOWAS [Economic Community of West African States] Energy Protocol) will help promote security for investors and enshrine the principle of “open access” to national transmission grids across the region. In 2008, the ECOWAS Regional Elec-tricity Regulatory Authority was established to regulate cross-border electricity exchanges between member states.
Notes The authors of this chapter are Souleymane
Coulibaly, Andrew Roberts, Vivien Foster, and Uwe Deichmann, who drew on background material and contributions from Alvaro Feder-ico Barra, Pinki Chauduri, Siobhan Murray, and Alex Rugamba.
1. Both fi gures exclude South Africa. 2. See http://www.afrol.com/News/maw008
_growth_triangle.htm. 3. Infrastructure Consortium of Africa members
are the Group of Eight countries, World Bank Group, African Development Bank, European Community, European Investment Bank, and Development Bank of Southern Africa.
ReferencesAfDB (African Development Bank) and UNECA
(United Nations Economic Commission for Africa). 2000. Review of the Implementation Status of the Trans-African Highways and the Missing Links. Volume 2. Tunis and Addis Ababa: African Development Bank and United Nations Economic Commission for Africa.
Arvis, Jean François. 2005. “Transit and the Special Case of Land-Locked Countries.” In Customs Modernization Handbook, ed. Luc De Wulf and José B. Sokol, 243–64. Washington, DC: World Bank.
Bofi nger, Heinrich C. 2009. “Air Transport Sector Review.” Background Paper 16, Africa Infra-structure Country Diagnostic, World Bank, Washington, DC.
Buys, Piet, Uwe Deichmann, and David Wheeler. 2006. “Road Network Upgrading and Overland Trade Expansion in Sub-Saharan Africa.” Policy Research Working Paper 4097, World Bank, Washington, DC.
Collier, Paul. 2007. “Poverty Reduction in Africa.” Proceedings of the National Academy of Sciences 104 (43): 16763–68.
Collier, Paul, and Anthony Venables. 2007. “Rethinking Trade Preferences: How Africa Can Diversify Its Exports.” World Economy 30 (8): 1326–45.
ICA (Infrastructure Consortium for Africa). 2006. Infrastructure Project Preparation Facilities in Africa: User Guide for Africa. Tunis: ICA. http://www.icafrica.org/en/documentation.
———. 2007. Annual Report 2007. Tunis: ICA.
———. 2008. “Mapping of Donor and Govern-ment Capacity-Building Support to African RECs and Other Regional Bodies.” Report of Economic Consulting Associates to the Infra-structure Consortium for Africa, Tunis.
———. 2009. Attracting Investors to African Public-Private Partnerships: A Project Preparation Guide. Washington, DC: World Bank. http://www.icafrica.org/fi leadmin/documents/guides/Attracting-investors-to-African-PPP.pdf.
Leamer, Edward E., and Michael Storper. 2001. “The Economic Geography of the Internet Age.” Journal of International Business Studies 32 (4): 641–65.
Leigland, James, and Andrew Roberts. 2007. “The African Project Preparation Gap: Africans Address a Critical Limiting Factor in Infrastruc-ture Investment.” Gridlines, Note 18 (March), Public-Private Infrastructure Advisory Facility, World Bank, Washington, DC.
Limão, Nuno, and Anthony Venables. 1999. “Infra-structure, Geographical Disadvantage, and Transportation Costs.” Policy Research Working Paper 2257, World Bank, Washington, DC.
Mayer, Rebecca, Ken Figueredo, Mike Jensen, Tim Kelly, Richard Green, and Alvaro Federico Barra. 2008. “Connecting the Continent: Costing the Needs for Investment in ICT Infrastructure in Africa.” Background Paper 3, Africa Infrastruc-ture Country Diagnostic, World Bank, Washington, DC.
Minges, Michael, Cecila Briceño-Garmendia, Mark Williams, Mavis Ampah, Daniel Camos, and Maria Shkaratan. 2008. “Information and Com-munications Technology in Sub-Saharan Africa: A Sector Review.” Background Paper 10, Africa Infrastructure Sector Diagnostic, World Bank, Washington, DC.
Rosnes, Orvika, and Haakon Vennemo. 2008. “Powering Up: Costing Power Infrastructure Investment Needs in Sub-Saharan Africa.” Back-ground Paper 5, Africa Infrastructure Country Diagnostic, World Bank, Washington, DC.
Teravaninthorn, Supee, and Gaël Raballand. 2008. Transport Prices and Costs in Africa: A Review of the Main International Corridors. Directions in

Deepening Regional Integration 161
Development Series. Washington, DC: World Bank.
UNESCO (United Nations Educational, Scientifi c and Cultural Organization). 2003. Confl ict Pre-vention and Cooperation in International Water Resources. Paris: UNESCO.
———. 2006. The 2nd United Nations World Water Report: Water, a Shared Responsibility. Paris: UNESCO.
USAID (U.S. Agency for International Develop-ment). 2008. “Sub-Saharan Africa’s Power Pools:
Development Framework.” White Paper, USAID, Washington, DC.
World Bank. 2007. The Development Potential of Regional Programs: An Evaluation of World Bank Support of Multicountry Operations. Washington, DC: World Bank, Independent Evaluation Group.
———. 2008. “Africa Regional Integration Assis-tance Strategy.” World Bank, Washington, DC.
———. 2009. World Development Report 2009: Reshaping Economic Geography. Washington, DC: World Bank.


Par t 2Sectoral Snapshots


Chapter7
165
Information and Communication Technologies: A Boost for Growth
I nformation and communication technolo-gies (ICTs) have been a remarkable success in Africa. Sector reform, particularly in
the mobile segment of the market, has trans-formed the availability, quality, and cost of connectivity across the continent. In less than 10 years, mobile networks have covered 91 percent of the urban population, and cover-age in rural areas is growing. However, these high overall levels of coverage hide signifi cant variation between countries, and particularly in the proportion of their populations that have access to services. Some countries have been much more successful in providing basic voice services than others, and some segments of the market, such as fi xed-line telephone service and broadband Internet, have been less successful than the mobile segment. Fixed-line penetration rates remain low and are falling in most countries, while broadband Internet is expensive and available to only a small pro-portion of the population.
Although large parts of the ICT sector have been transformed, much remains to be done. Policy makers need to take the following steps
to address the specifi c challenges facing the ICT sector in Africa:
• Complete the reform agenda by estab-lishing full competition throughout the sector.
• Revise the licensing framework to accom-modate rapid technological change and emerging competition.
• Reform the state-owned enterprises (SOEs) that hinder sector growth and development.
• Ensure low-cost international access infra-structure by preventing monopoly control over bottleneck facilities.
• Promote the development of high-bandwidth backbone infrastructure (the networks that carry communications traffi c between fi xed points in a network).
• Stimulate innovation in the use of wireless technologies by reforming the way the radio spectrum is allocated and managed.
• Promote universal access to ensure that ICT availability is as extensive as possible.
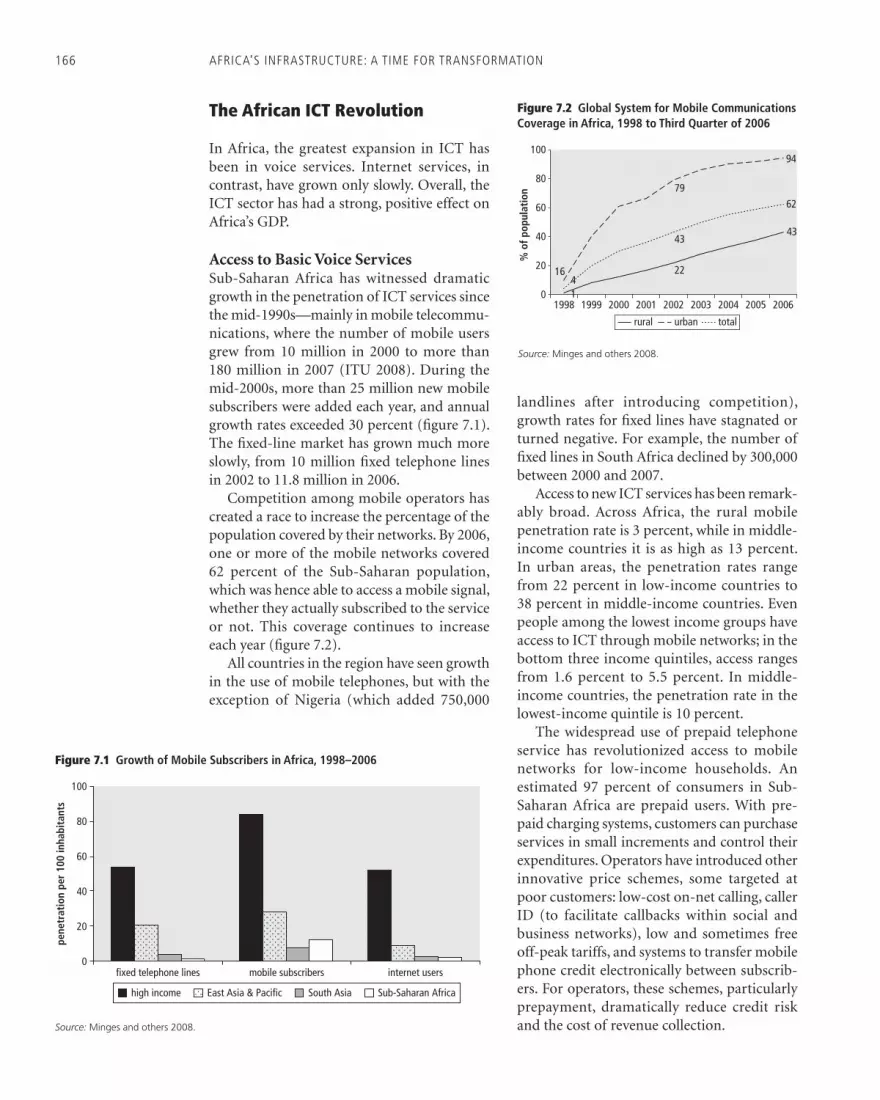
166 AFRICA’S INFRASTRUCTURE: A TIME FOR TRANSFORMATION
The African ICT Revolution
In Africa, the greatest expansion in ICT has been in voice services. Internet services, in contrast, have grown only slowly. Overall, the ICT sector has had a strong, positive effect on Africa’s GDP.
Access to Basic Voice ServicesSub-Saharan Africa has witnessed dramatic growth in the penetration of ICT services since the mid-1990s—mainly in mobile telecommu-nications, where the number of mobile users grew from 10 million in 2000 to more than 180 million in 2007 (ITU 2008). During the mid-2000s, more than 25 million new mobile subscribers were added each year, and annual growth rates exceeded 30 percent (fi gure 7.1). The fi xed-line market has grown much more slowly, from 10 million fi xed telephone lines in 2002 to 11.8 million in 2006.
Competition among mobile operators has created a race to increase the percentage of the population covered by their networks. By 2006, one or more of the mobile networks covered 62 percent of the Sub-Saharan population, which was hence able to access a mobile signal, whether they actually subscribed to the service or not. This coverage continues to increase each year (fi gure 7.2).
All countries in the region have seen growth in the use of mobile telephones, but with the exception of Nigeria (which added 750,000
landlines after introducing competition), growth rates for fi xed lines have stagnated or turned negative. For example, the number of fi xed lines in South Africa declined by 300,000 between 2000 and 2007.
Access to new ICT services has been remark-ably broad. Across Africa, the rural mobile penetration rate is 3 percent, while in middle-income countries it is as high as 13 percent. In urban areas, the penetration rates range from 22 percent in low-income countries to 38 percent in middle-income countries. Even people among the lowest income groups have access to ICT through mobile networks; in the bottom three income quintiles, access ranges from 1.6 percent to 5.5 percent. In middle-income countries, the penetration rate in the lowest-income quintile is 10 percent.
The widespread use of prepaid telephone service has revolutionized access to mobile networks for low-income households. An estimated 97 percent of consumers in Sub-Saharan Africa are prepaid users. With pre-paid charging systems, customers can purchase services in small increments and control their expenditures. Operators have introduced other innovative price schemes, some targeted at poor customers: low-cost on-net calling, caller ID (to facilitate callbacks within social and business networks), low and sometimes free off-peak tariffs, and systems to transfer mobile phone credit electronically between subscrib-ers. For operators, these schemes, particularly prepayment, dramatically reduce credit risk and the cost of revenue collection.
Figure 7.1 Growth of Mobile Subscribers in Africa, 1998–2006
Source: Minges and others 2008.
0
20
pene
trat
ion
per
100
inha
bita
nts
40
60
80
100
fixed telephone lines mobile subscribers internet users
high income East Asia & Pacific South Asia Sub-Saharan Africa
Figure 7.2 Global System for Mobile Communications Coverage in Africa, 1998 to Third Quarter of 2006
Source: Minges and others 2008.
0
20
40
60
80
100
1998 1999 2000 2001 2002 2003 2004 2005 2006
% o
f pop
ulat
ion
urban totalrural
14
16 22
43
79
43
62
94

Information and Communication Technologies: A Boost for Growth 167
This rapid growth in access to ICT in Africa has happened despite the relatively high price of services. In 2007, a representative basket of prepaid mobile services cost $12.58 a month, six times the $2 that it cost in Bangladesh, India, and Pakistan. Prices in Africa are declining but not as fast as in other world regions. In 2000, each mobile subscriber paid about $39 a month in African countries and in Bangladesh, India, and Pakistan. By 2005, that fi gure had fallen to $7 in Bangladesh, India, and Pakistan but only to $20 in Africa. If prices were to fall to the lev-els seen in South Asia, access to ICT in Africa could be signifi cantly higher.
The average price of international calls in Sub-Saharan Africa has fallen signifi cantly since 2000, but prices for calls to countries outside the region remain much lower than for calls within the region. The average peak price of a one-minute call from Africa to the United States is $0.45, compared with $1.23 for an international call within Africa. These aver-ages mask signifi cant variation among coun-tries (fi gure 7.3). Price variation is much lower for calls within Africa.
Access to the InternetUnlike the expanded access to basic voice ser-vices, rates of access to the Internet are low and growing only slowly in Africa. High prices and limited availability are key reasons, com-pounded by poor fi xed-line access networks, limited access to the broadband radio spec-trum, poor domestic backbone networks, and limited use of computers (fi gure 7.4).
ICT Sector Developments
Growth in the ICT sector in Africa has taken place primarily in mobile phones through global systems mobile (GSM) networks. The economies of scale generated by the global standardization of GSM equipment have dra-matically reduced prices of handsets and net-work equipment, and international standards allow customers to use networks in more than one country at a low cost. As a result, several pan-African operators have emerged, and they are highly innovative in their tariffs and ser-vices. For example, international roaming is a
contentious issue in many parts of the world, but multinational African operators such as Celtel, MTN, Safaricom, and Vodacom have international on-net tariffs offering savings to their customers of about 15 percent per min-ute in call charges. The major alternative global
Figure 7.3 Price of One-Minute, Peak-Rate Call to the United States, 2006
Source: Minges and others 2008.Note: Peak rate includes taxes.
0 0.5 1.0 1.5US$ per minute
2.0 2.5 3.0 3.5 4.0 4.5 5.0
South Asia
Ghana
South Africa
Cameroon
Kenya
Côte d’Ivoire
Nigeria
Senegal
Benin
Burkina Faso
Mozambique
Congo, Dem. Rep. of
Sudan
Uganda
Rwanda
Lesotho
Niger
Tanzania
Madagascar
Namibia
Malawi
Ethiopia
Zambia
Cape Verde
Chad 4.92.1
0.2
0.2
0.2
0.2
0.3
0.3
0.3
0.4
0.4
0.4
0.4
0.4
0.5
0.5
0.6
0.7
0.7
0.8
0.9
1.0
1.1
1.8
0.3
Figure 7.4 Price Basket for Internet Access, 2005
Source: Minges and others 2008.
0
10
20
30
40
50
60
70
South Asia high income East Asia & Pacific Sub-Saharan Africa
US$
per
mon
th
0
0.20.1
0.40.3
0.5
0.7
0.9
0.6
0.8
1.0
% o
f G
DP
Internet access price (% of GDP)Internet access price (US$)

168 AFRICA’S INFRASTRUCTURE: A TIME FOR TRANSFORMATION
standard for wireless voice services, Code-Division Multiple Access, is also making slow but steady progress in Africa. Operators in the region have also pioneered innovative services using the mobile telephone networks, such as mobile banking and remittance payments.
The fi xed-line market in Sub-Saharan Africa continues to be dominated by incumbents—operators that were either formerly or are currently owned by the state—and their perfor-mance remains relatively poor (fi gure 7.5). The productivity of these operators is low, and most of them have higher levels of personnel than international benchmarks, as measured by the number of lines per employee. In July 2008, the Sub-Saharan operators ranged from 20 to 346 lines per employee, whereas the fi gure was 427 in Latin America and the Caribbean region, and 700 in Organisation for Economic Co-operation and Development member countries.
The low productivity of African incumbent telecommunication companies creates hidden costs for the economy, through suboptimal allocations of resources to the sector and low consumption of telecommunication services. The cost of this excess labor can be on the order of 0.4 percent of GDP, and even higher in some cases (fi gure 7.6). For Cameroon, Ghana, and Namibia, among other countries, the level of this ineffi ciency exceeds the cost of meeting universal access targets.
Economic Impact of the ICT IndustryThe ICT sector has positively affected eco-nomic growth in Africa. Research shows that
increasing investment in ICT services results in higher long-run rates of economic growth (Roeller and Waverman 2001); according to estimates, the ICT revolution in Africa is responsible for about 1 percentage point of the improvement in Africa’s per capita eco-nomic growth rate between the mid-1990s and the mid-2000s (Calderón 2008). This positive effect will continue as investment in the sector continues and as the use of ICT raises produc-tivity in all types of businesses.
Large-scale private investment, reaching a cumulative value of about $20 billion, has driven the expansion of access to ICT. Between 1992 and 2005, the vast majority of the 82 pri-vate sector transactions in the ICT sector were for new operations in mobile communica-tions (World Bank 2009). SOE privatizations and license fees generated a further $3.3 bil-lion of revenues for the state. This investment continues today, as new deals in the region are announced regularly. The current fi nancial crisis has adversely affected investment rates, however, limiting operators’ access to fi nance.
Overall ICT employment has grown as the mobile sector directly and indirectly added jobs in African countries. Multiplier effects and new lines of business (mobile airtime agents and m-transactions) also add to employment growth and income generation. In East Africa, the mobile industry directly and indirectly pro-vides employment for close to 500,000 people (GSMA 2007).
The new ICT infrastructure and related reforms have increased government revenues through one-time fees for licenses and ongoing payments through licenses and taxes. The rev-enue generated by the ICT industry in African countries ranges from 1.7 percent to 8.2 percent of GDP, with an average of 4.0 percent. The tax and license revenues generated by the industry have also had a signifi cant positive fi scal effect (fi gure 7.7).
Institutional Reforms in the ICT Sector
Market liberalization has been the most important cause of the ICT sector’s growth in Africa. Regulatory reforms and the
Figure 7.5 Net Change in Fixed-Line Market, 2001–05
Source: Minges and others 2008.
–200
–100
0
100
200
net
chan
ge in
no.
of s
ubsc
ribe
rs (t
hous
ands
)
300
400
500
600
2001 2002 2003 2004 2005
South Africa Nigeria others

Information and Communication Technologies: A Boost for Growth 169
privatization of SOEs have complemented these market reforms.
Market ReformsThe widespread liberalization of markets in Africa and the emergence of competition, par-ticularly among mobile operators, have been the main drivers of the ICT sector’s perfor-mance (fi gure 7.8).
Countries with more competitive markets cover, on average, 64 percent of their popu-lation with mobile networks, compared with 57 percent for the less competitive markets. Among the low-income African countries, those with more competitive markets have 31 percent higher mobile penetration rates, 6 percent lower mobile prices, and 39 percent lower international call prices (as measured by the price of a call to the United States).
The benefits of market liberalization increase as competition intensifi es. In gen-eral, the annual increase in penetration rises as more fi rms enter the market. Relatively little growth occurs in market penetration in the initial change from monopoly to duopoly, but when a country issues its fourth mobile license, penetration rates increase, on aver-age, by almost 3 percentage points every year. A country’s average income also affects the performance of the telecommunication sector. In poorer countries, increased competition is felt most strongly when a market reaches four operators, whereas for middle-income coun-tries, the effect is strongest when a third opera-tor is introduced.
Some countries that have established a legal framework for a liberalized market have nonetheless failed to establish effective com-petition. Few countries have legislation with outright prohibitions on competition in tele-communications, but many have restrictions on competition arising from exclusivity clauses granted in licenses to existing operators. In 12 countries where data were available, a gap of at least two years elapsed between ending the legal restrictions on competition and granting new licenses. Twelve Sub-Saharan countries have competition in the fi xed-line and inter-national markets, but only a few of them have more than two operators in these segments. Even in the mobile segment, barely half of the
Figure 7.6 Costs of Overstaffing for Fixed-Line Incumbents in Selected Countries
Source: Minges and others 2008.
0
0.2
0.4
0.6
0.8
1.0
Kenya
Ethiop
iaCha
d
Camero
on
Namibi
a
Tanz
ania
South
Africa
Benin
Mozam
bique
Ghana
% o
f GD
P
overstaffing costs investment needs
Figure 7.7 Value Added and Excise Taxes on Mobile Telephone Services, 2006
Source: Minges and others 2008.Note: In Kenya, Tanzania, and Uganda, the excise taxes shown are applicable to mobile calls. Rwanda is planning to implement an excise tax on mobile airtime.
0 5 10 15% surcharge on mobile service
20 25 30
Lesotho
Nigeria
Sudan
Congo, Dem. Rep. of
South Africa
Cape Verde
Ethiopia
Ghana
Namibia
Rwanda
Mozambique
Malawi
Zambia
Benin
Burkina Faso
Chad
Côte d’Ivoire
Madagascar
Senegal
Cameroon
Niger
Kenya
Tanzania
Uganda
value added tax excise tax

170 AFRICA’S INFRASTRUCTURE: A TIME FOR TRANSFORMATION
countries have more than three active opera-tors despite evidence that most markets in the region can support more. Across the region, market reform is far from being complete.
Regulatory ReformChanges in the legal framework that governs the sector have matched the reforms in mar-ket structure. All African countries have laws and regulations covering telecommunications. Typically, a new law (supplemented by decrees and regulations) establishes a national regula-tory agency with general provisions for com-petition, licensing, interconnection, allocation of scarce resources (for example, numbering and spectrum), and pricing. Of the 24 coun-tries sampled, 23 have such a broad institu-tional framework and independent regulatory authorities, up from 5 in 1996.
Regulators still exert considerable control over incumbent fi xed-line operators’ tariffs. They have allowed these operators to respond to competition by rebalancing their tariffs, allowing monthly fi xed charges to increase and national and international call prices to fall. Regulators have less control over mobile oper-ators’ tariffs, which are forced down through competition (fi gure 7.9).
Some regulators have been successful in set-ting wholesale tariffs (the charges that opera-tors pay each other for handling calls when they pass from one network to another), which feed directly into the retail price that customers pay for their calls. As competition develops, par-ticularly among mobile operators, regulating these interconnection charges becomes more
important. It can be challenging for regula-tors with limited technical capacity and legal powers to impose decisions on operators, but some regulators have recently been successful. In Tanzania, the national regulatory author-ity introduced a phased reduction in mobile termination rates, based on a calculation of operators’ costs. Nigeria’s regulatory authority has established a target for mobile termination rates, and in Kenya, the regulatory authority recently established a ceiling on mobile termi-nation rates, as well as a cap on the retail price of calls between networks.
Reform of State-Owned EnterprisesAs governments have liberalized their markets and reformed the institutions for regulating them, many have also reformed the opera-tors they formerly owned. By the end of 2006, 15 African countries had sold shares in their state-owned telecommunication operator to the private sector. These transactions largely involved equity and management partner-ships with strategic investors; only Nigeria and Sudan privatized by issuing shares on local or regional stock exchanges.1 From 1993 to 2006, the total value of such privatizations was $3.5 billion, half of which was accounted for by South Africa’s Telkom.
The nature of strategic partnerships and their success have varied over time. Direct investment by developed-country investors in
Figure 7.8 Status of Mobile Competition, 1993–2006
Source: Minges and others 2008.
num
ber
of c
ount
ries
0
4
8
12
16
20
24
1993 1994 1995 1996 1997 1998 1999 2000 2001 2002 2003 2004 2005 2006
no network monopoly duopoly three or more operators
Figure 7.9 Tariff Rebalancing in African Countries with a Liberalized Telecommunication Sector, 1993–2006
Source: Minges and others 2008.Note: Price index represents prices as a percentage of their level in the base year 2000 so that only relative changes over time are highlighted.
0
50
100
150
200
250
2000 2001 2002 2003 2004 2005
pric
e in
dex
2000
= 1
00
fixed basket mobile basket
three-minute peak rate call to U.S.

Information and Communication Technologies: A Boost for Growth 171
the fi xed-line business has been complemented by sales to developing-country investors, par-ticularly from the Middle East and South Asia. The performance of these privatizations and partnerships has been mixed. In some cases, such as Uganda, the privatization of the state-owned fi xed-line incumbent was part of a successful overall reform of the sector. In oth-ers, private investors have withdrawn, resulting in the renationalization of ICT assets. Ghana and Rwanda resold the businesses after the fi rst privatization failed, indicating a sustained commitment to reform.
Despite the notable successes, the gov-ernments of many African countries retain ownership of at least one telecommunication operator, which distorts the market and creates ineffi ciencies. Thus, the region has some dis-tance to go before it has a fully privately owned and competitive telecommunication market.
Access to International ConnectivityOne of the main drivers of the high cost of Internet and of international voice calls is the price of international connectivity, deter-mined by physical access to submarine fi ber-optic cables and the level of competition in the international market. Countries with access to submarine cables have lower international call prices than those without access. Nevertheless, countries that have competitive access have signifi cantly lower prices than those retaining a gateway monopoly (table 7.1).
Access to high-capacity submarine fi ber-optic infrastructure is therefore a necessary but insuffi cient condition for low-price inter-national voice services. Countries also need to ensure that the international facilities segment of the market is competitive if customers are
to benefi t from lower prices and better quality of service.
Domestic Backbone InfrastructureBackbone network infrastructure to carry communications traffi c between fi xed points in the networks is limited, thus constraining the development of broadband Internet. Mobile operators do not require high-capacity back-bone networks to carry voice traffi c and have typically developed their own using wireless technologies. Broadband Internet backbone networks need much greater capacity, how-ever, typically using fi ber-optic cables. The limited extent of these networks is a constraint on the development of the broadband market in Africa.
Considerable variation exists across the region in how markets for domestic backbone infrastructure operate. In many countries, both implicit and explicit constraints limit development of this type of infrastructure. For example, mobile operators may be required to use the incumbent’s backbone network, or they might be allowed to build their own but not to sell backbone network services to other operators on a wholesale basis. These types of regulations limit the development of back-bone networks and hinder the development of broadband.
Countries that have fully liberalized the market for backbone networks have seen rapid growth in infrastructure competition. In Nigeria, at least four of the major operators are developing high-capacity fi ber-optic cable net-works capable of supporting high-bandwidth services, and a similar pattern is emerging in Kenya. These networks are concentrating on major urban areas and on interurban links
Table 7.1 Prices for Access to International Voice and Internet Connectivity
Access levelShare of
countries (%)
Price for a call within
Sub-Saharan Africa ($ per minute)
Price for a call to the
United States ($ per minute)
Price for 20 hours of dial-up
Internet access ($ per month)
Price for ADSL broadband
Internet access ($ per month)
No access to submarine cable 67 1.34 0.86 67.95 282.97
Access to submarine cable 32 0.57 0.48 47.28 110.71
Monopoly on international gateway 16 0.70 0.72 37.36 119.88
Competitive international gateways 16 0.48 0.23 36.62 98.49
Source: Minges and others 2008.Note: ADSL = asymmetric digital subscriber line.

172 AFRICA’S INFRASTRUCTURE: A TIME FOR TRANSFORMATION
where the majority of customers are. If high-capacity backbone networks are to extend beyond these areas, some form of public sup-port will likely be needed, preferably in part-nership with the private sector.
Completing the Remaining Investment Agenda
Voice ServicesThe cost of completing mobile network cover-age for voice in Africa is relatively modest. By adopting a spatial approach to modeling the cost of providing access to mobile phone net-works, reliable estimates have been developed of the capital and operating expenditures required for completing the rollout of GSM voice signal throughout Africa. Potential revenues are esti-mated based on population density and income distribution. Potential costs are estimated based on terrain characteristics and cell size and the resulting number of additional base stations needed to complete national GSM coverage. These raw base station numbers drive estimates of capital and operating expenditures.
Reaching all the unserved population would require investments of $0.8 billion a year over 10 years. Currently, 43.7 percent of the population lives in areas not covered by wireless voice networks. If the right competi-tive environment is established, the private sector could fi ll most of this gap, reaching 39 percent of the population—the vast majority of the unserved—with a voice signal. Only $0.3 billion per year of public investment would be needed to reach the remaining 4.7 percent of the population in the coverage gap (table 7.2).
Nevertheless, the size of the coverage gap var-ies immensely across countries (fi gure 7.10), and in a handful of cases (the Democratic Republic of Congo, Madagascar, and Zambia) can exceed 15 percent of the population.
These analytical results are robust; the size of the coverage gap increases only from 4.4 percent to 5.9 percent of the population if the amount spent on telecommunication services drops from 4 percent of GDP per capita (the baseline assumption) to 3 percent. Similarly, even if costs were three times greater than in the base case, the coverage gap would increase from 4.4 percent of the population to 12.6 percent.
Internet ServicesDespite the anticipated positive economic effect that widespread use of broadband would have on African economies, mass-market broadband Internet at speeds seen in other parts of the world is unlikely to be commer-cially viable in Africa for the near future. The broadband Internet available in most African countries is typically limited to major urban areas and to Internet cafés, businesses, and high-income residential customers. Network coverage is limited, prices are high, and speeds are lower than in other regions of the world. This limited current level of service could be expanded to national coverage using wireless network infrastructure with the same techni-cal and economic advantages as GSM voice networks (lower operating and security costs than wired networks and the potential to use prepaid billing systems). The investment to cover the entire population using limited-performance wireless broadband technology has been estimated at approximately $0.9 billion.
Table 7.2 Investments Needed to Close Gaps in Voice and Broadband Coverage in Sub-Saharan Africa
Indicator
Voice coverage Broadband coverage
Total investment
Effi cient market gap
Coverage gap
Total investment
Effi cient market gap
Coverage gap
Average annual investment ($ billions) 0.8 0.5 0.3 0.9 0.7 0.2
Percentage of population affected 43.7 39.0 4.7 100.0 89.0 11.0
Source: Mayer and others 2008.Note: Efficient market gap is the portion of total investment need that the private sector could meet under commercial terms if all regulatory barriers to entry were dismantled to allow the market to function efficiently. Coverage gap is the portion of the total investment need that the private sector could not meet even under efficient market conditions. This gap would require public subsidy because the service lacks commercial viability.

Information and Communication Technologies: A Boost for Growth 173
As long as the right competitive environment is established, the private sector would cover most of that amount, which could reach 89 percent of the population with this limited-reach broadband access. Only $0.2 billion of public investment would be needed to reach the remaining 11 percent of the population in the coverage gap (table 7.2). However, the cov-erage gap varies hugely across countries, and in a handful of cases (Chad, the Democratic
Republic of Congo, Madagascar, Mozambique, Namibia, Niger, and Zambia) can exceed 20 percent of the population (fi gure 7.11).
Backbone NetworksAlthough the existing limited level of broad-band service could be expanded at relatively low cost, the shift toward higher-speed mass-market broadband Internet access in Africa at prices that would be affordable for a signifi cant proportion
Figure 7.10 Voice Coverage Gaps in 24 Sub-Saharan Countries
Source: Mayer and others 2008.Note: Efficient market gap is the portion of the unserved market that the private sector could serve under commercial terms if all regulatory barriers to entry were dismantled to allow the market to function efficiently. Coverage gap is the portion of the unserved market that the private sector could not serve even under efficient market conditions. This gap would require public subsidy because the service lacks commercial viability.
0 20 40 60 80 100
South Africa
Nigeria
Rwanda
Uganda
Ghana
Benin
Côte d’Ivoire
Senegal
Kenya
Sudan
Malawi
Burkina Faso
Cape Verde
Cameroon
Ethiopia
Tanzania
Lesotho
Namibia
Chad
Mozambique
Niger
Zambia
Madagascar
Congo, Dem. Rep. of
% of population
existing coverage efficient market gap
coverage gap
Figure 7.11 Broadband Coverage Gaps in 24 African Countries
Source: Mayer and others 2008.Note: Efficient market gap is the portion of the unserved market that the private sector could serve under commercial terms if all regulatory barriers to entry were dismantled to allow the market to function efficiently. Coverage gap is the portion of the unserved market that the private sector could not serve even under efficient market conditions. This gap would require public subsidy because the service lacks commercial viability.
0 20 40% of population
60 80 100
Nigeria
South Africa
Rwanda
Ghana
Uganda
Benin
Côte d’Ivoire
Sudan
Kenya
Senegal
Burkina Faso
Cape Verde
Ethiopia
Cameroon
Tanzania
Lesotho
Malawi
Chad
Namibia
Niger
Zambia
Mozambique
Madagascar
Congo, Dem. Rep. of
efficient market gap coverage gap

174 AFRICA’S INFRASTRUCTURE: A TIME FOR TRANSFORMATION
of the population would involve major invest-ments in backbone infrastructure. The revenue generated from customers would be insuffi cient to make this investment commercially attractive. If governments wished to achieve this level of broadband Internet access, signifi cant levels of public subsidy would likely be required.
High-bandwidth backbone networks are a key part of the investment needed for broad-band in Africa. These networks connect towns and cities within countries and across borders. They also link to the international submarine fi ber-optic cable networks that carry commu-nications traffi c between continents.
Cross-border and interregional connectiv-ity in Africa is currently underdeveloped. One-time investment needs range from $229 million for a minimum set of links to $515 million for an extensive interregional network connecting all African capitals to one another with fi ber-optic cables. The private sector will provide much of that investment as regional operators connect their networks across borders. Private investment is also driving international sub-marine cable infrastructure in Africa. Of the fi ve major submarine fi ber-optic cables either already operating or under construction in the region, only one has direct government involve-ment; four are owned and fi nanced by private operators on commercial terms. These two types of backbone infrastructure are linked. As submarine fi ber-optic cables are developed, cross-border links to channel traffi c to landing points become more commercially viable.
Aside from routes connecting major urban centers, high-bandwidth backbone networks are unlikely to be commercially viable. Back-bone network development in these areas may require some form of public support, either through fi nancial support or through the pro-vision of easier access to existing infrastructure (for example, transport and energy networks).
Policy Challenges
The liberalization of telecommunication mar-kets since the mid-1990s has provided affordable ICT services to the public. It has also radically reshaped the roles of the public and private sectors. The traditional role of the public sector
as provider of communication infrastructure has been superseded in most countries by a new role as establisher and regulator of market structure. Few countries in the region, if any, have completed the reform agenda, however. Regulatory frameworks still contain restric-tions on investment and competition, and the poor quality of regulation in many countries creates costly ineffi ciencies. Many incumbent operators remain under state ownership, cre-ating a burden on the public sector, ineffi cien-cies in the market, and confl icts of interest for regulators. Major challenges therefore remain if widespread ICT services at affordable prices are to be available.
Completing the Reform AgendaEstablishing full and effective competition in the ICT sector can deliver rapid and sustained improvements in the availability of commu-nication services. The majority of countries have implemented some reforms, but they still have a long way to go. Completing the reform agenda is therefore the primary challenge fac-ing the ICT sector in Africa.
The most important remaining reform is to increase competition through further market liberalization. In practice, that means issuing more licenses and reforming the licensing struc-ture to allow operators more freedom to inno-vate and compete across a range of services.
As mobile networks expand into marginal areas, reducing the cost of network rollout and operation will become a more important aspect of the reform agenda. Some form of collabora-tion among competitors (for example, in the civil engineering aspects of networks, such as masts and towers) could reduce costs enough to allow companies to operate profi tably in areas where they would not otherwise be able to do so. Regrettably, this type of collaboration can also enable collusion among operators, so it must be carefully regulated.
The reform agenda will evolve as the market changes. Competition regulation is increasingly becoming part of modern sector legislation in Africa, particularly regarding the behavior of dominant operators and controlling access to essential facilities. Even where a country may not have competition legislation, ICT regu-lators are applying the tools of competition

Information and Communication Technologies: A Boost for Growth 175
analysis in telecommunication regulation. They are also adapting their regulatory approach to refl ect the evolving marketplace: for example, by relaxing controls on tariffs as competition becomes more effective at controlling them.
African countries will continue to see ben-efi ts as competition intensifi es and access to ICT increases. As prices fall, even as far as the $0.01–$0.03 per minute range currently seen in South Asia, mobile phone services will become affordable to much of the African population, bringing with it positive economic and social benefi ts. Governments will also benefi t from the expansion of telephone services. First, lower prices will fuel uptake and access to services, directly reducing the costs involved in deliver-ing universal service. Second, greater competi-tion will expose the hidden costs of the incum-bent state-owned operators, which represent a burden on government fi nances and a more general effect on the economy. The expansion of the ICT sector resulting from market liber-alization will increase the tax and license-fee revenues earned by governments, and ICT ser-vices themselves will become a more effective platform for delivering public services.
Revising the Licensing FrameworkThe traditional model of licensing is becoming obsolete. In the fi rst wave of market liberaliza-tion, licenses were linked to market segments and technologies. GSM licenses granted the right to provide mobile communications in specifi c spectrum bands using a specifi c technology, and data licenses were granted to operate in specifi c value added markets. Two factors are making this traditional approach to licensing obsolete. First, the growth of compet-itive ICT markets in Africa has demonstrated that multiple players can compete successfully, even in small markets. Managing liberaliza-tion through technology and service-specifi c licenses has therefore proved to be ineffective as a policy tool. Second, technological conver-gence allows networks to deliver multiple ICT services, thereby reducing costs and promoting service innovation. The traditional approach to licensing often prevents operators from tak-ing advantage of this convergence.
The negative effect of current licensing frameworks is especially evident in Voice over
Internet Protocol (VoIP), limited mobility, and Internet protocol television. Many licensing regimes restrict either the VoIP technology or its derived services. Direct consumer access to VoIP allows voice calls over Internet connections instead of the public switched telephone net-works. Such services offer much lower prices for long-distance and international calls; however, restrictions are common because the widespread use of VoIP could undermine the main sources of voice revenues for incumbent operators.
Licensing constraints on the mobility of specifi c wireless telecommunication operators are common in Africa. Operators with limited-mobility licenses can provide wireless telecom-munication services while allowing customers to move around within a limited area. No technological reason exists why these networks cannot offer full mobility; the restrictions are often imposed to protect existing mobile licensees. As competition in the full-mobility market increases, these restrictions will seem increasingly anachronistic.
Finally, the use of Internet networks to provide television services is increasing in Africa as the number of broadband subscrib-ers increases. This raises many challenges for regulatory systems that have traditionally dealt with communication and broadcasting media through separate institutions and through sep-arate legal and regulatory frameworks. These separations are creating obstacles to invest-ment and competition as convergence blurs the boundaries between the technologies.
The initial response of policy makers to these trends has been to move toward unifi ed licenses that remove technological distinctions and allow operators to provide a full range of services to customers. The design and imple-mentation of a unifi ed licensing system can be complex, however, magnifi ed by the need to adjust a wide range of existing rights and obli-gations, annual fees, and acquisition costs. This adjustment can be done in a transparent way through public consultation, but the migration process has to be managed carefully to avoid undue destabilization of the market.
In the medium term, licenses will have to become simpler and less restrictive to facili-tate the development of new services at lower prices. Ultimately, the challenge for African

176 AFRICA’S INFRASTRUCTURE: A TIME FOR TRANSFORMATION
countries will be to migrate from the current licensing regime to one in which controls on market entry and the services delivered by market parties would be largely abandoned. The countries of the European Union have taken this approach, moving from a system of individual licenses to a general authoriza-tion regime.
Reforming State-Owned EnterprisesReform of state-owned, fi xed-line incumbents remains a major policy challenge for govern-ments in the region. The last decade has seen the fi xed-line incumbent operators eclipsed. Compared with the mobile operators, they now play a minor role in telecommunication service in most African countries. Incum-bent operators can be a disruptive force in the economy through misallocation of public resources, use of incumbents as social buf-fers, and the regulatory uncertainty created by their presence in the market. In some cases, preferential treatment of these operators—exclusivity agreements (for example, in con-trol of international gateways and backbone capacity), banning of innovative services such as VoIP, and distortion of prices—inhibits innovation and investment and amplifi es the economic burden of SOEs on national econo-mies. This issue has emerged again as some Sub-Saharan governments fi nance the devel-opment of fi ber-optic backbone networks through their SOEs.
At a minimum, SOEs should be brought fully within the regulatory and licensing frame-work so that they are treated in the same way as private operators. This move will stimulate competition and effi ciency in resource alloca-tion. Encouraging greater private participation in SOEs to transform and grow the businesses may also be appropriate. Given the state of many incumbent operators’ networks, that may require some form of fi nancial and manage-ment incentives to attract partners and inves-tors. The challenge for governments will be to ensure that this transition is achieved without distorting the market. It can be done by allocat-ing mobile and other wireless spectrum to these operators, offering management control, and minimizing network coverage commitments.
Providing SOEs with monopoly control over specifi c segments of the market to make them more attractive to potential buyers will ulti-mately be unsuccessful, for it will distort the market and constrain its development.
Ensuring Low-Cost Access to International InfrastructureCreating the conditions for widespread broad-band access is a complex policy issue facing the ICT sector in Africa. The markets in the region are so different from those in other parts of the world that governments have no obvious models to draw on. Some lessons are beginning to emerge, however. One, in par-ticular, is the importance of access to high-capacity, low-cost bandwidth via submarine fi ber-optic cable infrastructure.
The private sector has demonstrated its capacity to develop, fi nance, and operate such cables in Africa. The challenge for govern-ments is to minimize the obstacles to this type of investment by readily issuing cable opera-tors permits and licenses. The development of infrastructure, on its own, will not guarantee better services for customers. The experience of the South Atlantic 3/West Africa Subma-rine Cable (SAT-3) cable on the west coast of Africa shows that physical access to a cable is necessary but not suffi cient for low-cost connectivity. A consortium of private opera-tors with little direct regulation controls access to the SAT-3 cable. Because these operators are protected from competition on the cable, customers have not received the full potential benefi t of the facility. The challenge for gov-ernments seeking to improve access to inter-national infrastructure is to avoid creating infrastructure bottlenecks and to encourage competition between submarine cables and landing stations. Where they cannot do this, regulators should ensure access to the facilities on equitable terms.
Landlocked countries face a special chal-lenge in ensuring that their operators have access to submarine fi ber-optic infrastruc-ture. If the private sector does not provide competitive infrastructure in the intervening countries, the government may have a role to play through public-private partnerships.

Information and Communication Technologies: A Boost for Growth 177
Promoting the Development of High-Bandwidth Backbone NetworksDomestic backbone networks will become more important as governments focus their attention on delivering affordable broadband Internet. Without these networks, countries will have diffi culty making broadband services widely available at prices that signifi cant num-bers of people are willing to pay.
Private operators are investing considerable resources in this infrastructure, and the pace is increasing as operators look at broadband as a source of future market growth. Such network development is typically limited to urban areas and interurban routes where the private sector is willing to invest in network development.
No single policy approach exists to backbone network development. Some governments pro-mote a competition-only policy, whereas oth-ers invest public resources in publicly owned networks. Regulatory frameworks often con-strain investment through restrictions on fi xed-network investment and on the services that can be sold. Wholesale markets in backbone services are thus underdeveloped, contribut-ing to the high price and limited availability of broadband Internet in the region.
Successful policy for domestic backbone network development must encourage pri-vate investment in commercially viable areas and provide public support for investment in areas that are not commercially viable. Such a policy should encourage infrastructure com-petition by removing regulatory restrictions and should reduce the cost of investment in fi ber-optic infrastructure by providing access to alternative transport and energy infra-structure. Public resources should focus on areas of the country that are not commercially viable. To the extent that public investment is needed, it should be made in partnership with the private sector to ensure that the design of the infrastructure meets the needs of market participants.
Reforming Management of the Radio SpectrumThe rapid evolution of ICT markets in Africa has increased the number of potential users of
the radio spectrum and is challenging govern-ments’ traditional systems of spectrum allo-cation and management. When one or two operators and the government dominated the mobile market, management of the radio spectrum did not present major challenges to governments. Market liberalization and technological innovation have increased the number of players wishing to use the radio spectrum, particularly for new broadband wireless Internet services. The way in which access to the radio spectrum is organized is therefore an increasingly important issue for the development of the ICT sector.
The traditional approach to organizing the spectrum’s use is to constrain development of the ICT sector. Governments have tradition-ally accomplished this by deciding how each frequency band is used and who is entitled to use it. This approach is unsuitable for markets with multiple players and spectrum uses that are continually changing. Governments are ill suited to decide the best uses for the radio spectrum and are typically unable to move fast enough in the allocation process. The effect is to constrain market development, particularly in new segments of the market, such as broad-band Internet.
The introduction of market forces will improve management of the radio spectrum. Where demand for the right to use certain areas of the radio spectrum exceeds supply, usage rights can be auctioned. Such spectrum auctions are widely used in developed coun-tries, and similar systems are used in Africa to allocate mobile network licenses (which usually include the right to use specifi ed sec-tions of the radio spectrum). Market forces can also be introduced in spectrum manage-ment after initial allocations have been made by establishing formal property rights over the spectrum and allowing owners to trade them. Establishing such primary and second-ary markets in spectrum usage would free up the spectrum and would help ensure its most effi cient use.
Further evolution in how the radio spec-trum is managed is possible by establish-ing a shared-use system for certain bands of spectrum, known as a commons approach.

178 AFRICA’S INFRASTRUCTURE: A TIME FOR TRANSFORMATION
Recent developments in wireless technology have allowed multiple users of the same radio spectrum bands to operate without undue interference. Allowing anyone to share the radio spectrum, with little or no registration and usually without a fee, reduces the cost of entry into the market and therefore encour-ages innovation in technology and service delivery.
Changing how the radio spectrum is man-aged requires political will. The establishment of a property rights scheme can arbitrarily cre-ate windfall gains and losses for current and future users. Some users of the radio spectrum may be diffi cult to incorporate into a pure market-based system. For example, requiring users in the military or emergency services to participate in spectrum markets may be par-ticularly challenging (although not impos-sible) and would certainly have budgetary implications for those agencies.
Reforming the allocation and management of the radio spectrum would change the role of government. Its primary role in spectrum management would no longer be to make technical and licensing decisions. Rather, the government’s role would be to design, oper-ate, and regulate the market in the radio spec-trum. Such a change would require changes in the legal framework governing the radio spectrum and the capacity of the regulatory institutions involved.
Promoting Universal AccessAs more people in Africa gain access to ICT services, those who remain outside the range of networks are at a disadvantage. Several gov-ernments in Africa have attempted to extend access to ICT beyond the perceived limits of the market. The quickest and most effective way of getting infrastructure to poor rural users is through competition. Malawi and Uganda have set up effectively competitive mobile mar-kets that already cover over 80 percent of the population and are continuing to expand.
For the majority of countries in Africa, only competition will result in mobile networks that cover the whole population. With a few exceptions, such as the Democratic Republic of Congo, the additional cost to make voice network coverage universal is modest. In
these countries, a service target of 100 per-cent coverage may be economically feasible. In countries where the gap left by the market is larger, a more modest target will likely be necessary.
When a universal service target is set, the major challenge is to establish a mechanism to achieve it. The majority of countries across the region currently apply a universal service levy on private operators, using the funds for specifi c ICT projects. This approach has had very limited success, particularly when con-trasted with the commercially driven network expansion into rural areas. Universal service funds often suffer from bureaucratic obstacles and political interference in expenditure, and frequently they are not spent on the sector at all. Universal service policy in Africa there-fore requires new thinking. The challenge is to meet the government’s policy objectives of universal service at minimum cost to taxpay-ers while harnessing the benefi cial effects of competition. An alternative to the traditional fund-based approach is to provide direct incentives for operators to deliver services in rural areas. For example, governments could offer operators a reduction in license-fee pay-ments in exchange for providing services in specifi ed areas, or they could establish pay-or-play schemes in which operators can choose between building networks in specifi ed areas and contributing to a universal service fund, which is then used to subsidize operators that do provide services in unprofi table areas. The major advantage of these approaches is the reduction in transfers between operators and the government, thereby lessening bureau-cratic delays or the diversion of funds.
Once a coverage target is defi ned, gov-ernments may also wish to address the issue of access for low-income groups. Call-by-call resale of services has signifi-cantly reduced the costs of accessing the network, and these systems are widespread in Africa (for example, the VillagePhone program of cell phone company MTN). Uni-versal service targets could potentially include subsidies for prepayment directed at specifi c target groups of the population. However, they would have to be carefully designed to avoid mistargeting and leakage.

Information and Communication Technologies: A Boost for Growth 179
Notes The authors of this chapter are Michael Minges,
Mark Williams, Rebecca Mayer, Cecilia Briceño-Garmendia, and Howard Williams, who drew on background material and contributions from Mavis Ampah, Alvaro Federico Barra, Daniel Camos-i-Daurella, Ken Figueredo, Richard Green, Mike Jensen, Tim Nelly, Maria Shkaratan, Maria Vagliasindi, and Bjorn Wellenius.
1. Initial public offerings of government stakes in state-owned enterprises in the telecommunica-tion sector have more recently been carried out in Kenya (2008) and Burkina Faso (2009).
ReferencesCalderón, César. 2008. “Infrastructure and Growth
in Africa.” Working Paper 3, Africa Infrastruc-ture Country Diagnostic, World Bank, Washington, DC.
GSMA (GSM Association). 2007. “Taxation and the Growth of Mobile Services in East Africa 2007.” GSMA, London.
ITU (International Telecommunication Union). 2008. African Telecommunication/ICT Indicators 2008: At a Crossroads. 8th ed. Geneva: ITU.
Mayer, Rebecca, Ken Figueredo, Mike Jensen, Tim Kelly, Richard Green, and Alvaro Federico Barra. 2008. “Costing the Needs for Investment in ICT Infrastructure in Africa.” Background Paper 3, Africa Infrastructure Country Diagnostic, World Bank, Washington, DC.
Minges, Michael, Cecilia Briceño-Garmendia, Mark Williams, Mavis Ampah, Daniel Camos, and Maria Shkaratan. 2008. “Information and Communications Technology in Sub-Saharan Africa: A Sector Review.” Background Paper 10, Africa Infrastructure Country Diagnostic, World Bank, Washington, DC.
Roeller, Lars-Hendrik, and Leonard Waverman. 2001. “Telecommunications Infrastructure and Economic Development: A Simultaneous Approach.” American Economic Review 91 (4): 909–23.
World Bank. 2009. Private Participation in Infra-structure Database. http://ppi.worldbank.org/.


Power: Catching Up
181
8Chapter
A frica’s chronic power problems have escalated in recent years into a crisis affecting 30 countries, taking a heavy
toll on economic growth and productivity. The region has inadequate generation capacity, lim-ited electrifi cation, low power consumption, unreliable services, and high costs. It also faces a power sector fi nancing gap of approximately $23 billion a year. It spends only about one-quarter of what it needs to spend on power, much of which is on operating expenditures to run the continent’s high-cost power systems, thus leaving little for the huge investments needed to provide a long-term solution.
Further development of the regional power trade would allow Africa to harness larger-scale, more cost-effective energy sources, thereby reducing energy system costs by $2 billion a year and saving 70 million tons of carbon emissions annually. Economic returns to investments in cross-border transmission are particularly high, but reaping the prom-ise of regional trade depends on a handful of major exporting countries’ raising the large volumes of fi nance needed to develop gen-eration capacity for export. It would also require political will in a large number of
importing countries that could potentially meet more than half their power demand through trade.
The operational ineffi ciencies of power utili-ties cost $3.3 billion a year, deterring investments in electrifi cation and new capacity, while under-pricing of power translates into losses of at least $2.2 billion a year. Full cost-recovery tariffs would already be affordable in countries with effi cient large-scale hydropower- or coal-based systems, but not in those relying on small-scale oil-based plants. If regional power trade comes into play, generation costs will fall, and full cost-recovery tariffs could be affordable in much of Africa.
The key policy challenges are to strengthen sector planning capabilities, too often over-looked in today’s hybrid markets. A serious recommitment to reforming state-owned enterprises (SOEs) should emphasize improve-ments in corporate governance more than purely technical fi xes. Improving cost recov-ery is essential for sustaining investments in electrifi cation and regional power generation projects. Closing the huge fi nancing gap will require improving the creditworthiness of utilities and sustaining the recent upswing in external fi nance to the sector.

182 AFRICA’S INFRASTRUCTURE: A TIME FOR TRANSFORMATION
Africa’s Chronic Power Problems
Africa’s generation capacity, stagnant since the 1980s, is woefully inadequate today. The entire installed generation capacity of the 48 Sub-Saharan countries is 68 gigawatts, no more than Spain’s, and without South Africa, the total falls to 28 gigawatts (EIA 2006). As much as one-quarter of that capacity is unavailable because of aging plants and poor maintenance.
The growth in generation capacity has been barely half that in other developing regions. In 1980, Sub-Saharan Africa was at approximately the same level as South Asia in generation capac-ity per million people, but it has since fallen far behind. Sub-Saharan African countries lag even compared with others in the same income bracket (Yepes, Pierce, and Foster 2008).
Only about one-fi fth of the Sub-Saharan population has access to electricity, compared with about one-half in South Asia and more than four-fi fths in Latin America. Since 1990, East Asia, Latin America, and the Middle East have all added at least 20 percentage points to their electrifi cation rates, but access rates in Sub-Saharan Africa are relatively stagnant, as population growth and household formation outstrip new connections.
At current trends, less than 40 percent of African countries will reach universal access to electricity by 2050 (Banerjee and others 2008). Overall, household access to electricity in urban areas is 71 percent, compared with only 12 per-cent in rural areas. Moreover, access rates in the upper half of the income distribution exceed 50 percent, whereas they are less than 20 percent in the bottom half. Given that rural areas account for about two-thirds of the population, extend-ing access presents a major challenge. Only 15 percent of the rural population lives within 10 kilometers of a substation (or within 5 kilo-meters of the medium-voltage line) and could thus be added to the electricity grid at relatively low cost. As much as 41 percent of the rural population lives in areas considered isolated or remote from the grid1 and is reachable in the medium term only by off-grid technologies such as solar photovoltaic panels, which typically cost $0.50–$0.75 per kilowatt-hour (ESMAP 2007).
The cost of producing power in Africa is exceptionally high and rising. The small
scale of most national power systems and the widespread reliance on expensive oil-based generation make the average total historic cost of producing power in Africa exception-ally high: $0.18 per kilowatt-hour with an average effective tariff of $0.14 per kilowatt-hour.2 Compare that with tariffs of $0.04 per kilowatt-hour in South Asia and $0.07 in East Asia. Rising oil prices, lower availability of hydropower, and greater reliance on emer-gency leases have put further upward pressure on costs and prices.
Power consumption is tiny and falling. Given limited power generation and low access, per capita electricity consumption in Sub-Saharan Africa (excluding South Africa) averages only 124 kilowatt-hours a year, barely 1 percent of the consumption typical in high-income countries. Even if that power were entirely allocated to household light-ing, it would hardly be enough to power one lightbulb per person for six hours a day. Sub-Saharan Africa is the only region in the world where per capita consumption is falling (World Bank 2005).
Power shortages have made service even less reliable. More than 30 African countries now experience power shortages and regular interruptions in service (fi gure 8.1). From 2001 to 2005, half of the countries in Sub-Saharan Africa achieved solid GDP growth rates in excess of 4.5 percent. Their demand for power grew at a similar pace, yet generation capacity expanded only 1.2 percent annually. South Africa shows what happens when gen-eration capacity fails to keep up with demand (box 8.1). In some countries, supply shocks exacerbated the situation. Causes of the sup-ply shocks include droughts in East Africa; oil price infl ation, which made it diffi cult for many West African countries to afford diesel imports; and confl icts that destroyed the power infrastructure in some fragile states.
Inadequate power supplies take a heavy toll on the private sector. Many African enter-prises experience frequent outages: in Sen-egal 25 days a year, in Tanzania 63 days, and in Burundi 144 days. Frequent power outages mean big losses in forgone sales and damaged equipment—6 percent of turnover on average for formal enterprises, and as much as 16 percent
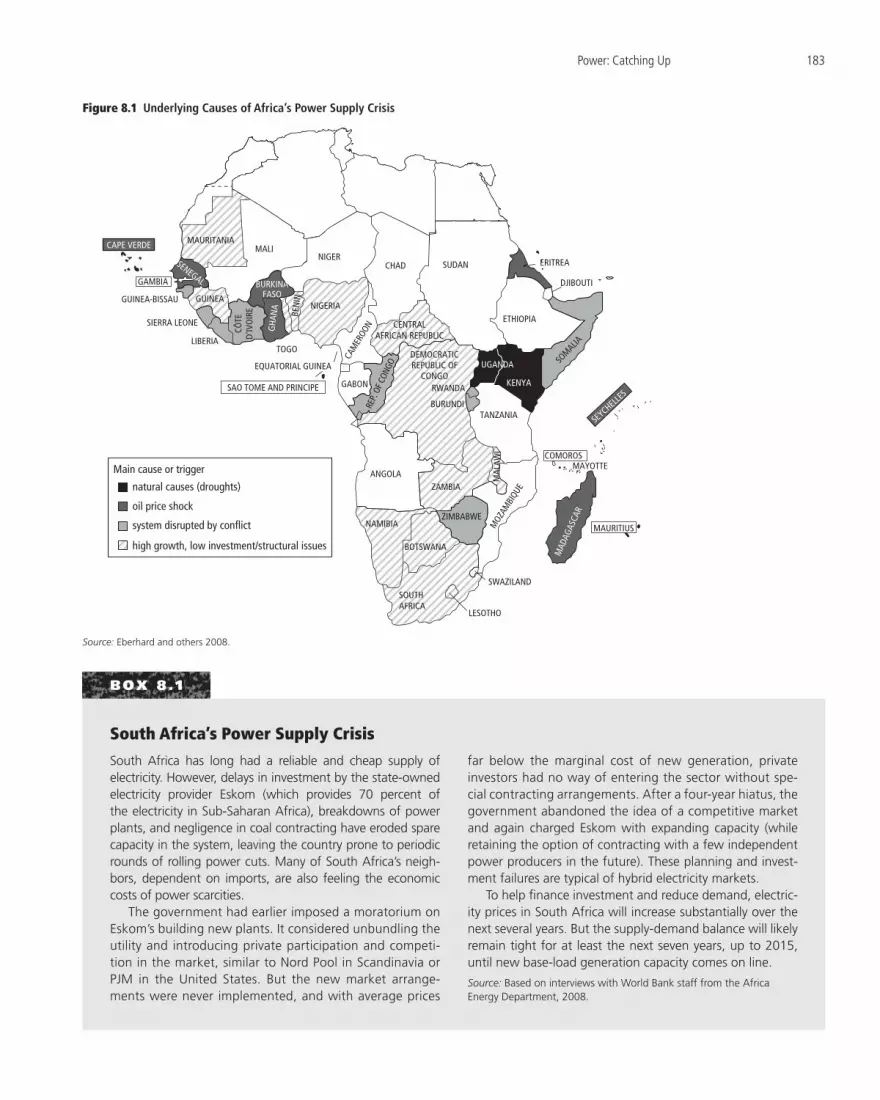
Power: Catching Up 183
MAURITANIAMALI
NIGER
BURKINAFASO
SUDANCHAD
ETHIOPIA
TANZANIA
COMOROSMAYOTTE
MOZ
AMBI
QUE
KENYA
UGANDA
ZAMBIAM
ALAW
I
BOTSWANA
ZIMBABWE
LESOTHO
SOUTHAFRICA
NAMIBIA
ANGOLA
REP.
OF C
ONGO
GABON
CAM
EROO
N
NIGERIABE
NIN
GHA
NA
SWAZILAND
MAD
AGAS
CAR
CENTRALAFRICAN REPUBLIC
SOMALIA
DEMOCRATICREPUBLIC OF
CONGO
BURUNDI
RWANDA
CAPE VERDE
LIBERIA
GUINEA
CÔTE
D'IV
OIR
E
TOGO
DJIBOUTI
ERITREA
GUINEA-BISSAU
SIERRA LEONE
GAMBIA
EQUATORIAL GUINEA
SAO TOME AND PRINCIPE
MAURITIUS
SEYCHELL
ES
SENEGAL
Main cause or trigger
natural causes (droughts)
oil price shock
system disrupted by conflict
high growth, low investment/structural issues
Figure 8.1 Underlying Causes of Africa’s Power Supply Crisis
Source: Eberhard and others 2008.
BOX 8.1
South Africa has long had a reliable and cheap supply of electricity. However, delays in investment by the state-owned electricity provider Eskom (which provides 70 percent of the electricity in Sub-Saharan Africa), breakdowns of power plants, and negligence in coal contracting have eroded spare capacity in the system, leaving the country prone to periodic rounds of rolling power cuts. Many of South Africa’s neigh-bors, dependent on imports, are also feeling the economic costs of power scarcities.
The government had earlier imposed a moratorium on Eskom’s building new plants. It considered unbundling the utility and introducing private participation and competi-tion in the market, similar to Nord Pool in Scandinavia or PJM in the United States. But the new market arrange-ments were never implemented, and with average prices
far below the marginal cost of new generation, private investors had no way of entering the sector without spe-cial contracting arrangements. After a four-year hiatus, the government abandoned the idea of a competitive market and again charged Eskom with expanding capacity (while retaining the option of contracting with a few independent power producers in the future). These planning and invest-ment failures are typical of hybrid electricity markets.
To help fi nance investment and reduce demand, electric-ity prices in South Africa will increase substantially over the next several years. But the supply-demand balance will likely remain tight for at least the next seven years, up to 2015, until new base-load generation capacity comes on line.
Source: Based on interviews with World Bank staff from the Africa Energy Department, 2008.
South Africa’s Power Supply Crisis

184 AFRICA’S INFRASTRUCTURE: A TIME FOR TRANSFORMATION
of turnover for informal enterprises unable to provide their own backstop generation (Foster and Steinbuks 2008). Therefore, many enterprises invest in backup generators. In many countries, backup generators repre-sent a signifi cant proportion of total installed power capacity: 50 percent in the Democratic Republic of Congo, Equatorial Guinea, and Mauritania, and 17 percent in West Africa as a whole. The cost of backup generation can easily run to $0.40 per kilowatt-hour or several times higher than the utility’s costs of generat-ing power (Foster and Steinbuks 2008).
The economic costs of power outages are substantial. The immediate economic cost of power shortages can be gauged by looking at the cost of running backup generators and forgoing production during power shortages. These costs typically range between 1 and 4 percent of GDP (fi gure 8.2). Over time, the lack of a reliable power supply is also a drag on eco-nomic growth. From the early 1990s to the early 2000s in Cameroon, Côte d’Ivoire, the Demo-cratic Republic of Congo, Ghana, and Senegal, inadequate power infrastructure shaved at least one-quarter of a percentage point off annual per capita GDP growth rates (Calderón 2008).
A common response to the immediate cri-sis is to tender short-term leases for emergency power. Unlike traditional power generation projects, this capacity can be put in place in a few weeks, providing a rapid response to press-ing shortages. Equipment is leased for up to two years, sometimes longer, and then reverts
to the private provider. At least an estimated 750 megawatts of emergency generation is currently operating in Sub-Saharan Africa, representing for some countries a large pro-portion of their national installed capacity. Because of the preponderance of small diesel units, the costs have typically been $0.20–$0.30 per kilowatt-hour, and for some countries, the price tag can be 4 percent of GDP (table 8.1).
0
Malawi
South Africa
Uganda
Tanzania
Kenya
Senegal
Cameroon
Madagascar
Cape Verde
Niger
Burkina Faso
Benin
1 2 3 4 5 6% of GDP
7
Source: Eberhard and others 2008, using World Bank 2007 data.Note: Economic cost is estimated as the value of lost load multiplied by the volume of load shedding. Value of lost load is derived from country-specific estimates based on enterprise survey data for sales lost due to power outages.
Figure 8.2 Economic Cost of Outages in Selected Countries
Table 8.1 Economic Cost of Emergency Power Generation
Country
Emergency generation capacity
(megawatts)
Total generation capacity
(megawatts)
Emergency generation
capacity (% of total)Cost of emergency
generation (% of GDP)
Angola 150 830 18.1 1.04
Gabon 14 414 3.4 0.45
Ghana 80 1,490 5.4 1.90
Kenya 100 1,211 8.3 1.45
Madagascar 50 140 35.7 2.79
Rwanda 15 31 48.4 1.84
Senegal 40 243 16.5 1.37
Sierra Leone 20 15 133.3 4.25
Tanzania 40 881 4.5 0.96
Uganda 100 240 41.7 3.29
Source: Eberhard and others 2008.

Power: Catching Up 185
A Huge Investment Backlog
Addressing Africa’s chronic power problems will require major investments in the refur-bishment and expansion of power infra-structure. Of the 70.5 gigawatts of installed generation capacity, some 44.3 gigawatts need to be refurbished. An additional 7,000 mega-watts of new generation capacity need to be built each year to meet suppressed demand, keep pace with projected economic growth, and provide additional capacity to support the rollout of electrifi cation. Compare that with expansion of less than 1,000 megawatts a year over the period 1990–2005. The bulk of this new power generation capacity will be needed to meet nonresidential demands. In addi-tion, raising electrifi cation rates will require extending distribution networks to reach an additional 6 million households a year from 1996 to 2005.
The total spending needs of the power sector amount to $40.6 billion a year (Rosnes and Vennemo 2008), or 6.4 percent of the region’s GDP, skewed toward capital expen-diture (table 8.2). The greatest absolute spending requirements correspond to the middle-income countries, which need to spend $14.2 billion a year, but the largest eco-nomic burden is borne by the fragile states, which would have to devote an implausible 13.5 percent of GDP to meet this goal.
Economic growth is an important driver of demand for power generation capacity. The estimates of power investment needs
presented earlier are based on growth pro-jections before the onset of the 2008 global fi nancial crisis. The International Monetary Fund reduced its GDP growth projections for Africa from 5.1 percent a year to 3.5 percent a year because of the global economic crisis. Sensitivity analysis suggests that even low-ering the original projected growth rates of 5.1 percent to half their levels would reduce estimated power sector spending needs by only about 20 percent in absolute terms, lowering required new generation capacity from just over 7,000 megawatts to just under 6,000 megawatts. The decrease in required spending would be somewhat larger in the Southern and West African Power Pools and somewhat smaller in the Central and East African Power Pools. Even so, when power spending needs are expressed as a percentage of GDP, the effect of a slower-growth sce-nario is much smaller. Because slower growth reduces GDP as well as power spending needs, the overall economic burden of power sec-tor spending needs is only very slightly lower under a low-growth scenario.
Existing spending on the power sector is $11.6 billion, or just over one-quarter of what is required. The adoption of high-cost genera-tion solutions skews existing spending toward operating expenditure, leaving only $4.6 bil-lion a year to fund the long-term investments to address the continent’s power supply crisis, more than half of which comes from domes-tic public fi nance. Existing spending repre-sents 1.8 percent of regional GDP, although
Table 8.2 Power Sector Spending Needs
$ billions annually Percentage of GDP
Country typeCapital
expenditure
Operation and
maintenanceTotal
spendingCapital
expenditure
Operation and
maintenanceTotal
spending
Sub-Saharan Africa 26.60 14.00 40.60 4.20 2.20 6.40
Middle-income countries 6.29 7.90 14.19 2.30 2.92 5.22
Low-income fragile countries 4.50 0.70 5.20 11.70 1.80 13.50
Low-income nonfragile countries 7.60 2.20 9.70 6.90 2.00 8.80
Resource-rich countries 8.40 3.35 11.77 3.79 1.50 5.29
Source: Briceño-Garmendia, Smits, and Foster 2008.Note: For a more detailed exposition of power sector spending needs, see chapter 2 in this volume. Totals may not add exactly because of rounding errors.

186 AFRICA’S INFRASTRUCTURE: A TIME FOR TRANSFORMATION
in the nonfragile low-income countries, this share increases to 2.9 percent of GDP. Of the external capital fl ows, fi nance from coun-tries not belonging to the Organisation for Economic Co-operation and Development (OECD) is the most signifi cant, accounting for $1.1 billion a year, primarily from the Export-Import Bank of China. Offi cial development assistance follows at $0.7 billion a year and then private capital fl ows of $0.5 billion a year (table 8.3).
Most of the private sector fi nance recorded relates to independent power producers
(IPPs). In recent years, 34 IPP contracts in Africa have involved investments of $2.4 billion for the construction of 3,000 megawatts of new power generation capacity. Those projects have provided much-needed generation capacity. An independent assess-ment concluded that they have also been relatively costly because of technology choices, procurement problems, and currency devalu-ations (calling for adjustments in dollar- or euro-denominated off-take agreements) (Gratwick and Eberhard 2008).
The existing resource envelope would go signifi cantly further if the sector oper-ated more effi ciently. Addressing the operat-ing ineffi ciencies of the power utilities could reduce the funding gap by $3.3 billion a year, improving cost recovery would bring an addi-tional $2.2 billion a year, and $0.3 billion a year could be recouped by improving execution of the capital budget.
Even if all these ineffi ciencies could be eliminated, a sizable power sector fi nancing gap of $23 billion a year would remain (table 8.4). Three-quarters of this fi nancing gap is a shortfall in capital expenditure, while the remaining quarter is a shortfall in operation and maintenance spending. The largest por-tion of the gap—nearly $11 billion per year—corresponds to the middle-income countries. However, the largest fi nancing burden relates to the low-income fragile states, where the fi nancing gap amounts to roughly 7 percent of their GDP.
Table 8.3 Financing Flows to the Power Sector$ billions annually
Country type
Operation and
maintenance Capital spending
Total spending
Public sector
Public sector ODA
Non-OECD fi nanciers PPI Total
Sub-Saharan Africa 7.00 2.40 0.70 1.10 0.50 4.60 11.60
Middle-income countries 2.66 0.80 0.03 0 0.01 0.80 3.50
Low-income fragile countries 0.60 0 0.04 0.20 0.01 0.30 0.80
Low-income nonfragile countries 2.00 0.40 0.60 0.10 0.20 1.30 3.20
Resource-rich countries 1.60 1.20 0.10 0.70 0.30 2.30 3.90
Source: Briceño-Garmendia, Smits, and Foster 2008.Note: Operation and maintenance includes other current expenditures. ODA = official development assistance; OECD = Organisation for Economic Co-operation and Development; PPI = private participation in infrastructure. Totals may not add exactly because of rounding errors.
Table 8.4 Composition of Power Sector Funding Gap
Country type
$ billions annually Percentage of GDP
Capital expenditure
gap
Operation and
maintenance gap Total gap
Capital expenditure
gap
Operation and
maintenance gap Total gap
Sub-Saharan Africa 17.6 5.6 23.2 2.7 0.9 3.6
Low-income fragile countries 2.6 0.1 2.8 6.9 0.2 7.1
Low-income nonfragile countries 4.5 0.1 4.7 4.1 0.1 4.2
Middle-income countries 5.5 5.2 10.7 2.0 1.9 3.9
Resource-rich countries 3.5 1.0 4.5 1.6 0.5 2.0
Sources: Briceño-Garmendia, Smits, and Foster 2008; Yepes, Pierce, and Foster 2008.Note: Totals do not add because efficiency gains cannot be carried across country groups.

Power: Catching Up 187
The Promise of Regional Power Trade
Although Sub-Saharan Africa is well endowed with both hydropower and thermal resources, only a small fraction of its power generation potential has been developed. Of the 48 Sub-Saharan countries, 21 have a generation capacity of less than 200 megawatts, well below the mini-mum effi ciency scale, which means they pay a heavy penalty: costs reach $0.25 per kilowatt-hour, twice the $0.13 per kilowatt-hour in the region’s larger power systems. One reason is that some of the region’s most cost-effective energy resources are too distant from major centers of demand in countries too poor to raise the billions of dollars needed to develop them. For example, 61 percent of the region’s hydropower potential is in just two countries: the Demo-cratic Republic of Congo and Ethiopia.
Pooling energy resources through regional power trade promises to reduce power costs. The Southern, West, East, and Central African Power Pools, created mainly to support power trade efforts, are at varying stages of maturity. If pursued to their full economic potential, regional trade could reduce the annual costs of power system operation and development by $2 billion per year (about 5 percent of total power system costs). These savings are already incorporated in the power sector spending needs previously presented. They come largely from substituting hydropower for thermal power, substantially reducing operating costs, even though it entails higher up-front investment in capital-intensive hydropower and associ-ated cross-border transmission. The returns to cross-border transmission can be as high as 120 percent for the Southern African Power Pool and more typically 20–30 percent for the other power pools. By increasing the share of hydropower, regional trade would also save 70 million tons of carbon emissions a year.
Under regional power trade, a handful of large exporting countries would serve a sub-stantial number of power importers. The Democratic Republic of Congo, Ethiopia, and Guinea would emerge as the major hydropower exporters. As many as 16 countries would be better-off (from a purely economic standpoint),
importing more than 50 percent of their power needs through regional trade. Savings range from $0.01 to $0.07 per kilowatt-hour. The largest benefi ciaries tend to be smaller nations without domestic hydropower resources. For those countries, the cost of building cross-border transmission would be paid back in less than one year, once neighboring countries have developed adequate generation capacity to support trade. (For a more detailed analysis of regional power trade potential, see chapter 6 in this volume on regional integration.)
Improving Utility Performance through Institutional Reform
The operational ineffi ciencies of power utilities cost the region $2.7 billion a year (0.8 percent of GDP on average; fi gure 8.3). They divide roughly evenly between distribution losses and revenue undercollections. Average distri-bution losses in Africa are 23.3 percent, more than twice the norm of 10 percent, affecting all countries to some degree. Average collec-tion ratios are 88.4 percent, compared with the best practice of 100 percent. Burkina Faso, Ghana, Niger, and Uganda face much greater undercollections than the rest, up to 1 percent of GDP.
Operational ineffi ciencies have been hold-ing back the pace of electrifi cation and pre-venting utilities from balancing supply and demand. They drain the public purse and undermine the performance of the utilities. One casualty of insuffi cient revenue is main-tenance. Utility managers must often choose among paying salaries, buying fuel, or pur-chasing spares. They must frequently cannibal-ize parts from other working equipment. The investment program is another major casu-alty. Utilities with below-average effi ciency electrify only 0.8 percent of the population in their service area each year, much lower than the 1.4 percent electrifi ed each year by utilities with above-average effi ciency. Utilities with low effi ciency also have greater diffi culty in keeping pace with demand. The suppressed or unmet power demand in those countries exceeds 13 percent of total demand, twice the

188 AFRICA’S INFRASTRUCTURE: A TIME FOR TRANSFORMATION
6 percent in countries with higher effi ciency (fi gure 8.4).
Institutional reform measures hold the key to improving utility performance. Countries that have advanced the institutional reform agenda for the power sector show substantially lower hidden costs than those that have not, as do countries with more developed power regulatory frameworks and better governance of their state-owned utilities (fi gure 8.5). Mea-sures that seem to have a substantial effect on reducing hidden costs are private participation in the power distribution sector and (among state-owned utilities) performance contracts that incorporate clear incentives. The case of Kenya Power and Lighting Company is par-ticularly striking (box 8.2).
Labor redundancy is another source of utility ineffi ciencies. Power utilities in Africa have overemployment of 88 percent relative to a developing country benchmark of 413 connections per employee. Overemployment by utilities results in labor overspending in the range of 0.07 percent to 0.6 percent of GDP.
The application of management contracts has been more complex than originally sup-posed. More than 20 African countries have experimented with private sector participation in power distribution, split evenly between concessions and management contracts. Man-agement contracts have attracted interest
10 2 3 4 5
% of GDP
Congo, Dem. Rep. of
Ghana
Uganda
Niger
Cape Verde
Malawi
Cameroon
Nigeria
Senegal
Tanzania
Burkina Faso
Madagascar
Rwanda
Lesotho
Ethiopia
Mozambique
Kenya
Chad
Benin
Zambia
South Africa
unaccounted losses undercollection
Figure 8.3 Economic Burden Associated with Power Utility Inefficiencies in Selected Countries
Source: Briceño-Garmendia, Smits, and Foster 2008. Note: Power utility inefficiencies include undercollection of rev-enues and unaccounted-for distribution losses.
0
2
4
6
8
10
12
14
16
low efficiencyhigh efficiency0
0.2
0.4
0.6
0.8
1.0
1.2
1.4
1.6
low efficiencyhigh efficiency
a. Effect on pace of electrification
annu
al in
crea
se in
acc
ess
to p
ower
, %
supp
ress
ed d
eman
d as
% o
f gen
erat
ion
b. Effect on magnitude of suppressed demand
Figure 8.4 Inefficiency in Utility Performance
Source: Derived from Eberhard and others 2008. Note: High efficiency refers to utilities with below-average levels of inefficiency caused by revenue undercollection and distribution losses. Low efficiency refers to utilities with above-average levels of inefficiency caused by revenue undercollection and distribution losses.

Power: Catching Up 189
0 50 100 150 200average hidden cost of inefficiencies as a percentage of utility revenue
250 300 350 400
performance contractswith incentives
management contract orconcession
high governance
high regulation
high reform
yesno
Figure 8.5 Effect of Reform Measures on Hidden Costs
Source: Eberhard and others 2008.
BOX 8.2
Kenya’s Electric Power Act of 1997 introduced independent economic regulation, essential for private sector participa-tion. It has since become government policy to put all bids for generation facilities out for competition, open to both public and private fi rms, and to give no preferential treat-ment to the national generator.
The sector was unbundled in 1998 when Kenya Electric-ity Generating Company (KenGen; generation) and Kenya Power and Lighting Company (KPLC; transmission and dis-tribution) were established. KenGen is now 30 percent pri-vately owned, and KPLC is 51 percent privately owned.
Established in 1998, the Electricity Regulatory Board (the Energy Regulatory Commission since 2007) maintains a sig-nifi cant degree of autonomy. It has issued a grid code and rules on complaints and disputes, supply rules, licenses, a safety code, and a tariff policy.
Four independent power producers supply about 12 per-cent of all power. Four more recently received licenses, and another three are expected to apply for licenses.
In the early 2000s, KPLC had substantial hidden costs in underpricing, collection losses, and distribution losses that absorbed 1.4 percent of GDP. In the run-up to a manage-ment contract, revenue collection improved from 81 per-cent in 2004 to 100 percent in 2006. Distribution losses also began to fall, though more gradually, refl ecting the greater diffi culty in resolving them. Power pricing reforms also allowed tariffs to rise in line with escalating costs, from
$0.07 in 2000 to $0.15 in 2006 and to $0.20 in 2008. As a result of those measures, the hidden costs of the power sector fell to 0.4 percent of GDP in 2006 and were elimi-nated by 2008 (see fi gure). This outcome put the sector on a fi rmer fi nancial footing and has saved the economy more than 1 percent of GDP.
Kenya’s Success with Private Participation in Power
0
25
50
75
100
% o
f rev
enue
s
% o
f GD
P
2001 2002 2003 2004 2006 20080
0.5
1.0
1.5
2.0
undercollectionsdistribution losses
underpricing total as % of GDP
KPLC’S Success in Driving Down Hidden Costs, 2001–08
Source: Interviews with World Bank staff from the Africa Energy Department, 2008.
because they are a simpler way of addressing ineffi ciencies, but their application has proved complex and contentious, and they have not always proved sustainable. Of 17 African man-agement contracts, 4 were canceled before the originally designated expiry date, and at least 5 more were not renewed after their initial term, reverting to state operation. Only 3 manage-ment contracts remain in place.
Problems with management contracts have included unrealistic expectations and limited ability to address broader sector challenges. First, many management contracts were under-taken with donor involvement. Donors saw the contracts as an initial step on the road to more extensive sector reform that would be extended

190 AFRICA’S INFRASTRUCTURE: A TIME FOR TRANSFORMATION
long enough to allow parallel policy and institutional changes to be enacted and to take root. In contrast, many African governments saw them as costly reform measures needed to secure donor fi nance and had no intention of taking the process any further. Second, although management contracts can produce fi nancial and effi ciency gains, they cannot overcome broader policy and institutional weaknesses. Moreover, the effi ciency gains do not always provide tangible improvements for customers, even though they impose substantial adjust-ment costs on management, making political support for these measures hard to build.
Most African power utilities remain state owned and operated. On average, Africa’s state-owned power utilities embody only 40 percent of good governance practices for such enterprises (Vagliasindi and Nellis 2009).
Most utilities score better on internal gover-nance criteria, such as board structure and accountability, than on external governance criteria, such as outsourcing and labor and capital market disciplines.
The acute need to improve the management of utilities and the frameworks they operate under has long been acknowledged. Over the years, substantial sums have been spent on institutional reforms: training management, improving internal accounting and external auditing, strengthening boards of directors, providing fi nancial and operational informa-tion, building reporting systems, creating and reinforcing supervisory and regulatory agen-cies, and much more. Some enduring suc-cesses have been registered (box 8.3; further discussion of institutional issues can be found in chapter 4 of this volume).
BOX 8.3
The Botswana Power Corporation (BPC) is a government-owned monopoly that produces, transmits, and distributes electrical power in Botswana. It was formed by government decree in 1970 with the objective of expand-ing and developing electrical power poten-tial in the country. From its small beginnings with one power station in Gaborone and a network that extended some 45 kilometers outside the city, the power utility’s responsi-bilities, along with the national network, have expanded enormously. The government has a regulatory role through the Energy Affairs Division of the Ministry of Minerals, Energy, and Water Affairs.
BPC increased access to power to 22 percent in 2006 and is set to reach 70 percent in 2009 and 100 percent by 2016. Through govern-ment funding, BPC is extending the electricity grid into rural areas and developing the reach of the national transmission grid. Overall, the power system operates effi ciently, with sys-tem losses of no more than 10 percent and a decent return on assets.
BPC constantly weighs its options of importing against expanding its own gen-eration facilities, taking into account both economic and strategic factors. The national system provides 132 megawatts, with the remaining 266 megawatts supplied by neigh-boring countries through the Southern African Power Pool. Since the pool’s inception in 1995, Botswana has been a major benefi ciary, and its active trading position promoted multilateral agreements among pool members, generally enhancing regional power cooperation.
Part of BPC’s strong performance is thanks to cheap imported power from South Africa (now severely threatened by the power crisis). But analysts give institutional factors equal weight: a strong, stable economy; cost-refl ective tariffs; lack of government interference in managerial decisions; good internal governance; and com-petent, well-motivated staff and management. (For a more detailed discussion of institutional reforms, see chapter 4 in this volume.)
Sources: Molefhi and Grobler 2006; PPA 2005.
Botswana’s Success with a State-Owned Power Utility

Power: Catching Up 191
The Challenge of Cost Recovery
Underpricing power costs the sector at least $2.2 billion a year in forgone revenues (0.9 per-cent of GDP on average). Underpricing power is widespread across Africa. In the worst cases (Malawi, Tanzania, and Zambia), underpricing can result in utilities’ capturing less than half of the revenues they need and creating an eco-nomic burden in excess of 2 percent of GDP (fi gure 8.6).
These figures probably understate the underpricing because of the diffi culty of cap-turing subsidies to large industrial and mining customers, which are usually contained in bilateral contracts and not refl ected in the general tariff structure. Key examples include the aluminum-smelting sector in Cameroon and Ghana and the mining sector in Zambia,
where large strategic customers have purchased power at heavily discounted rates of just a few cents per kilowatt-hour. These arrangements were initially justifi ed as locking in base-load demand to support very large power proj-ects that exceeded the country’s immedi-ate demands, but they are now questionable because competing demands have grown to absorb this capacity.
Power prices have risen substantially in recent years, but they have nonetheless failed to keep pace with escalating costs. Because of ris-ing oil prices, lower availability of hydropower, and greater reliance on emergency leases, the costs of power production in Africa rose sub-stantially in the early to mid-2000s (fi gure 8.7, panel a). In response, several countries have increased power tariffs, so that the average revenue of power utilities almost doubled over the same period (fi gure 8.7, panel b). Even so, because of historic pricing shortfalls, overall average revenues by the end of this period had barely caught up with average operating costs at the beginning of the period.
Most countries are achieving no more than operating-cost recovery. The correlation between average revenues and average oper-ating costs across Sub-Saharan countries is as high as 90 percent, indicating that operating-cost recovery is the driving principle behind power pricing in most cases. Cameroon, Cape Verde, Chad, Malawi, Niger, Rwanda, Senegal, and Tanzania (countries under the 45-degree line in fi gure 8.8, panel a) fail to meet even operating-cost recovery, and sev-eral of them face particularly high operating costs (fi gure 8.8).
The longer-term cost-recovery situation is somewhat more hopeful. Comparing existing average revenues and average operating costs misrepresents long-term cost recovery for two reasons. First, because of major ineffi ciencies in revenue collection, the average revenue col-lected per unit of electricity sold is substantially lower than the average effective tariff charged today. Second, because of the major ineffi cien-cies in generation technology and the potential for regional trade, for more than two-thirds of the countries the average incremental cost of power looking forward is lower than the aver-age historical cost of power production looking Source: Briceño-Garmendia, Smits, and Foster 2008.
0
% of GDP
1 2 3 4
Malawi
Zambia
Tanzania
Niger
Cameroon
Rwanda
Ethiopia
Senegal
Madagascar
Lesotho
Chad
Ghana
Cape Verde
Nigeria
Kenya
Mozambique
Benin
Burkina Faso
Congo, Dem. Rep. of
South Africa
Uganda
Figure 8.6 Underpricing of Power in Selected Countries

192 AFRICA’S INFRASTRUCTURE: A TIME FOR TRANSFORMATION
backward and including both historic operat-ing and capital costs.
A truer picture of long-term cost recovery comes from comparing today’s average effec-tive tariff with the average incremental cost looking forward (fi gure 8.8). At least in some countries, even the current tariff would be adequate for cost recovery, if only all revenues could be collected and the power system could move toward a more efficient production structure. In other countries, however, signifi -cant tariff adjustments would still be needed in the long term.
In most cases, the state or donors have almost entirely subsidized the historic capital costs of power development. Although the residential sector accounts for 95 percent of power utility customers in Africa, it contributes only around 50 percent of sales revenue. Thus, the pricing of power to commercial and industrial consumers is just as important for cost recovery. Neither commercial nor residential customers are close to paying full cost-recovery prices.
Subsidies to residential consumers are highly regressive. Across the bottom half of the income distribution, barely 10 percent of
0
0.05
0.10
0.15
0.20
0.25
0.30
2001 2002 2003 2004 2005
b. Average revenuea. Average operating cost
0
0.05
0.10
0.15
0.20
0.25
0.30
2001 2002 2003 2004 2005
predominantly diesel predominantly hydropoweroverall
Figure 8.7 Electricity Costs and Revenues by Type of Power System, 2001–05US$ per kilowatt-hour
Source: Eberhard and others 2008.
0
0.1
0.2
0.3
0.4
aver
age
reve
nue
average operating cost average incremental cost
aver
age
effe
ctiv
e ta
riff
0.5
0.6
0.7
0.8
0 0.1 0.2 0.3 0.4 0.5 0.6 0.7 0.8
a. Average revenues against average operating costs b. Average effective tariff against average incremental cost
0
0.1
0.2
0.3
0.4
0 0.1 0.2 0.3 0.4
Figure 8.8 Past and Future Cost-Recovery SituationUS$ per kilowatt-hour
Source: Eberhard and others 2008.

Power: Catching Up 193
households have access to electricity (Wodon 2008). Indeed, three-quarters of the house-holds with electricity come from the top two quintiles of the income distribution. Because poorer households are almost entirely excluded, they cannot benefi t from subsidies embedded in electricity prices. In many cases, targeting performance is further exacerbated by poor tariff design, with the widespread use of increasing block tariffs that provide large lifeline blocks of highly subsidized power to all consumers.
With subsistence consumption of 50 kilowatt-hours a month, the cost of a monthly utility bill priced to recover full historic costs of production would be as much as $24.30 in central Africa, which is manifestly unafford-able for the vast majority of the population (table 8.5). Elsewhere in Africa, a subsistence monthly bill priced at full historic cost would range between $7.00 and $10.70 and would be affordable to the relatively affl uent sections of the population that already enjoy access to power, but not to the poorer segments of the population that remain unconnected. Indeed, affordability of cost-recovery power bills for existing customers is today really only a prob-lem in low-income countries reliant on small-scale, oil-based generation.
Looking into the future, pricing at the lower long-run marginal cost of power would reduce the subsistence monthly bill to the $3.00–$4.00 range in central and southern Africa where abundant low-cost hydropower would become
available (table 8.5). Such modest bills would be affordable to all but the poorest 25 percent of the population. In eastern and western Africa, the subsistence monthly bill would fall in the $7.00–$9.00 range. Although this amount would likely be affordable for exist-ing customers, it would represent a problem as power access is expanded to lower-income populations. When a more effi cient power sys-tem develops, full cost-recovery tariffs would be affordable for the vast majority, except per-haps in West Africa.
If regional trade is pursued, the average costs of power production could be expected to fall toward $0.07 in central and southern Africa, $0.12 in eastern Africa, and $0.18 in western Africa. Assuming, again, subsistence consump-tion of 50 kilowatt-hours a month, a monthly utility bill under full cost-recovery pricing would be about $4 a month in central and southern Africa, $6 a month in eastern Africa, and $9 a month in western Africa. Based on an affordabil-ity threshold of 3 percent of household income, full cost-recovery tariffs would prove affordable for the vast majority of the population of low-income countries in central, eastern, and south-ern Africa (see fi gure 8.9). In West Africa, about half the population of the low-income countries would face affordability problems. A number of West African countries—notably Côte d’Ivoire,
Table 8.5 Cost and Affordability of Monthly Power Bills at Cost-Recovery Prices: Past and Future$ per month
Location Historic costLong-run
marginal cost
Central African Power Pool 24.30 3.50
East African Power Pool 9.50 7.00
Southern Africa Power Pool 7.00 3.00
West Africa Power Pool 10.70 9.00
Source: Derived from Rosnes and Vennemo 2008.Note: Dark gray shading: power bill is unaffordable to the vast majority of the population; light gray shading: power bill is affordable to existing customers only, who are typically the richest 25 percent of the income distribution; no shading: power bill is affordable to all but the poorest 25 percent of the income distribution.
0
0.2
0.4
0.6
0.8
1
1.2
2 4 6 8 10 12 14 16 18US$/month
% o
f hou
seho
lds
spen
ding
mor
eth
an 5
% o
f the
ir m
onth
ly b
udge
ts
cost-recovery bill, low bound cost-recovery bill, medium boundcost-recovery bill, high bound low-income countriesmiddle-income countries
Figure 8.9 Affordability of Subsistence Consumption of Power at Cost-Recovery Pricing
Source: Banerjee and others 2008.Note: A power bill for subsistence consumption of 50 kilowatt-hours per month is considered affordable if it absorbs no more than 5 percent of household income.

194 AFRICA’S INFRASTRUCTURE: A TIME FOR TRANSFORMATION
Ghana, Nigeria, and Senegal—already have power coverage of around 50 percent and would face affordability issues as coverage broadens. At any of these levels, power tariffs do not repre-sent a signifi cant affordability issue in the mid-dle-income countries. (For a fuller discussion of the social issues associated with utility pricing in Africa, see chapter 3 in this volume.)
Policy Challenges
The depth and extent of Africa’s power cri-sis and its associated costs demand renewed efforts to tackle the policy and institutional challenges needed to improve performance and fi nancing. The key challenges can be char-acterized as follows:
• Strengthening sector planning
• Recommitting to the reform of SOEs
• Increasing cost recovery
• Accelerating electrifi cation
• Expanding regional trade in power
• Closing the fi nancing gap.
These interdependent challenges must be dealt with simultaneously. Efforts to boost generation through regional power trade will stumble if the utilities, which will continue to be central actors, remain ineffi cient and insolvent. Expanding electricity distribution systems without addressing the shortages in generation and improving transmission capac-ity would clearly be futile. In addition, focusing exclusively on utility reform would be fruitless without a start on substantial, long-gestation investments in both generation and access to improve the quality of service and make the utilities viable. In short, these strategic priori-ties must progress together.
Strengthening Sector PlanningMost African power markets present an insti-tutional “hybrid,” with public and private actors operating in parallel. The 1990s reform prescription of unbundling and privatization, leading to wholesale and retail competition, did not prove very relevant to Africa, not least because most of the region’s power systems
are simply too small to support any meaning-ful competition. The new reality is thus one of “hybrid markets,” with the state-owned utility remaining intact and occupying a dominant market position. At the same time, because many governments and utilities lack suffi -cient investment resources, the private sector participates, typically as IPPs. Africa’s hybrid electricity markets pose new challenges in policy, regulation, planning, and procure-ment. The widespread power shortages across the continent and the increasing reliance on emergency power indicate the seriousness of those challenges.
Too often, the planning function has fallen between the cracks. Traditionally, planning and procurement of new power infrastructure were the province of the state-owned utility. With the advent of power sector reforms and the IPPs, those functions were often moved to the ministry of energy or electricity. A simultane-ous transfer of skills did not always occur, how-ever, resulting in plans that were not adequately informed by the complexities on the ground: a new hybrid market of private and public actors. In many cases, planning has collapsed. Where still present, planning tends to take the form of outdated, rigid master plans. The lack of strate-gic policy and planning for the electricity sector at the central government level is a critical weak-ness. Interventions have been piecemeal rather than integrated; many countries have focused on generation without investing in effi cient transmission and delivery of power.
This situation has led to very costly delays in commissioning new plants. In the absence of strong political leadership, good information, and the requisite planning capability, incum-bent state-owned utilities often undermine the entry of IPPs by arguing that they can supply power more cheaply or quickly than private alternatives, even if they lack the resources to do so. Poor understanding of the hybrid market deprives policy makers of clear and transpar-ent criteria for allocating new plants between the incumbent, state-owned utility and the IPPs. New plants are rarely ordered on a timely basis, thereby opening power gaps that prompt recourse to temporary power and discour-age investors. When procurement is (fi nally) undertaken, the authorities may not take the

Power: Catching Up 195
trouble to conduct international competitive bidding. This outcome is unfortunate, because a rigorous bidding process lends credibility and transparency to procurement and results in more competitively priced power.
Restoring and strengthening planning capabilities are imperative. Hybrid power markets will not disappear from the African landscape any time soon. To make the best of them, African governments and their develop-ment partners must strive to develop a robust institutional foundation for the single-buyer model, with clear criteria for power purchase (off-take) agreements and dispatches of power under those agreements. Governments must restore a strong sector planning capability at the line ministry level, establish clear policies and criteria for allocating new plant oppor-tunities between the state-owned utilities and IPPs, and commit to competitive and timely bidding processes. A well-articulated plan for the sector will allow governments to move beyond the “fi refi ghting” that has reduced their ability to anticipate exogenous shocks, such as drought or high oil prices.
Development partners need to tread care-fully in the hybrid marketplace. They can help by providing advice on transparent contract-ing frameworks and processes and by lend-ing expertise to governments and utilities as the latter seek to reach fi nancial closure with project sponsors and private investors. Lend-ing to public utilities needs to be handled care-fully; if done without adequate attention to the peculiarities of the hybrid market, it may have the unintended effect of deepening the contradictions inherent in those markets and even crowding out private investment. What is needed above all is to strengthen public insti-tutions to enable them to engage effectively with the private sector.
Recommitting to the Reform of State-Owned EnterprisesRenewed efforts on SOE reform should favor governance over technical fi xes. State-owned utilities are still prevalent across Africa, and their performance is generally poorer than in other regions. Fortunately, improving the gov-ernance of SOEs can improve performance. Past efforts at improving utility management
focused too heavily on technical issues to the exclusion of governance and accountability. Future SOE reforms seem justifi ed as long as they focus on these deeper institutional issues.
The starting point for SOE reform should be to reform corporate governance. Key mea-sures include greater decision-making auton-omy for the board of directors, more objective selection criteria for senior managers, and rig-orous disclosure of confl icts of interest, as well as more transparent and merit-based recruit-ment processes.
Parallel efforts are needed to strengthen fi nancial and operational monitoring of SOEs by their supervisory agencies, whether they are line ministries or ministries of fi nance. Trans-parency and accountability of SOEs depend on solid fi nancial management, procurement, and management information systems. Today, basic operational and fi nancial data on fi rm perfor-mance are not produced, reported, or acted on. Without information or, perhaps worse, without action based on whatever informa-tion is produced, better outcomes cannot be expected. Key measures include auditing and publishing fi nancial accounts and using com-prehensive cost-based accounting systems that allow functional unbundling of costs and a clearer sense of cost centers.
In principle, regulation can be an important part of this process, but in practice, it proves challenging to develop. Electricity regulators have been set up across Africa, precisely to insu-late utilities from political interference while closely monitoring enterprise performance. Some critics argue that regulatory agencies have simply created additional risks because of their unpredictable decisions, resulting from excessive discretion and overly broad objec-tives. Moreover, regulatory autonomy remains elusive; in some countries, turnover among commissioners has been high, while the gap between law (or rule) and practice is often wide. The challenge of establishing new public institutions in developing countries is often underestimated. Independent regula-tion requires a strong political commitment and competent institutions and people. Where some or all are lacking, it seems wise to consider complementary or transitional options that

196 AFRICA’S INFRASTRUCTURE: A TIME FOR TRANSFORMATION
reduce discretion in regulatory decision making through more explicit rules and procedures, or outsourcing the regulatory functions to advisory regulators and expert panels (Eberhard 2007).
When this foundation is in place, con-tracting mechanisms can be used to improve performance. These mechanisms could be performance contracts in the public sector or management contracts with the private sector.
Public sector performance contracts need to incorporate strong performance incen-tives. Initial attempts to improve African SOEs through performance contracts with the line ministry or other supervisory agency were minimally effective. Recent efforts in the water sector (in Uganda, for example) have had a stronger and much more positive effect. The key feature of these contracts is to incor-porate incentives for good managerial (and staff) performance and, more rarely, sanctions for failure to reach targets. This approach to more comprehensive performance contracts deserves further consideration.
Creating effective performance incentives within a public sector context can be quite challenging. Management contracts with the private sector are thus a relevant option. They can be applied with either expatriate or
local management teams, each of which offers advantages. Nonetheless, clarity about what they can and cannot achieve, particularly given their short time horizons, is important. At best, a management contract can improve per-formance on a handful of manageable aspects of effi ciency, such as revenue collection and labor productivity. It cannot solve defi cien-cies in the broader institutional framework, which ideally should be addressed earlier. Nor can a management contract raise investment fi nance or signifi cantly affect service quality if substantial investments or long gestations are required.
Utilities that have the institutional basics in place would likely benefi t from technical assistance (box 8.4). In particular, operational effi ciency programs are needed to reduce the high rates of technical, nontechnical (electric-ity theft), and collection losses. Such programs can include capacity building and technical assistance to improve management, business practices, and planning. The priorities are improved load management (to better match supply with priority customer needs), theft reduction initiatives, and increased revenue collection (through enhanced metering and better-run customer service units). Capital spending can also be reduced by using low-cost
BOX 8.4
The Commercial Reorientation of the Electric-ity Sector Toolkit (CREST) is an experiment under way in several localities served by West African electricity providers. Based on good practices from recent reforms in Indian, Euro-pean, and U.S. power corporations, CREST is a “bottom-up” approach for attacking system losses, low collection rates, and poor customer service.
To accomplish its objectives, CREST uses technical means (replacing low-tension with high-tension lines, for example, and installing
highly reliable armored and aerial bunched cables on the low-tension consumer point to reduce theft) and managerial changes (intro-ducing “spot billing” and combining data recording, data transfer, bill generation, and bill distribution). Transaction times are reduced, and cash fl ows improve. Early applications of CREST have reportedly produced positive changes in several neighborhoods in Guinea and Nigeria, two diffi cult settings.
Source: Based on interviews with World Bank staff from the Africa Energy Department, 2008.
CREST Spreading Good Practices

Power: Catching Up 197
technology standards, as in Guinea and Mali. Innovations have included adjusting technical design standards to meet the reduced require-ments of low-load systems, maximizing the use of material provided by local communities (such as locally sourced wooden poles), and recruiting employees and supervisors from the local community.
Finally, institutional change is a long-term matter, but well worth the wait. Victories on this front will be small and slow in coming. Donors may prefer the large and the quick, but they must recognize that positive changes in this fi eld lie at the heart of African power sector reform.
Increasing Cost RecoveryThe fi nancial viability of incumbent utilities is a key foundation of a healthy power sector. Financially viable utilities are more effective operationally, because they are able to fi nance timely maintenance activities. They are also more creditworthy and thus may begin to secure their own access to domestic or inter-national capital markets. Achieving this goal demands power tariffs that are high enough to cover operating costs and to contribute as much as possible to covering capital costs as well.
Cost recovery already looks feasible in coun-tries with relatively low-cost domestic power sources. In the continent’s larger countries, and in those that rely on hydropower and coal-based generation, cost-recovery tariffs already appear affordable for the majority of the popu-lation, and certainly for the affl uent minority that enjoys access to power. A case thus exists for these countries seriously to consider mov-ing closer to full cost recovery.
For countries with high-cost domestic power, cost recovery may become feasible in the medium term as regional trade devel-ops. In the continent’s smaller countries, and those reliant primarily on oil-based genera-tion, cost-recovery tariffs are largely unaf-fordable. As regional trade develops and access to more cost-effective sources of power generation open up, however, the total cost of power production will fall, making cost recovery a much more reasonable goal in the medium term. (The possible exception is
West Africa, where the costs of power will remain relatively high even with regional trade.) A case thus exists for these countries to start moving their tariffs toward longer-term cost-recovery levels, accepting that the sector will continue to register fi nancial defi -cits in the short term.
Cost recovery is particularly important for emergency power leases, to avoid divert-ing budgetary resources from long-term investments. Numerous African countries have responded to the power crisis by leasing emergency power generation. This solution is rapid and effective but simultaneously costly and temporary. Charges typically amount to $0.20–$0.30 per kilowatt-hour, without con-sidering transmission and distribution costs or associated losses. Given that the cost of backup generation for the private sector is approximately $0.40 per kilowatt-hour, and that the value of lost load may well be higher than that, the private sector should be will-ing to pay the full cost of this emergency power. Nevertheless, when emergency power is provided without any adjustment to power tariffs, the resulting fi scal drain can be very large, diverting scarce resources from the investments needed to provide a longer-term solution to the power problem. To avoid this fi scal drain, utilities must price emergency power at cost-recovery levels for nonresiden-tial customers.
Power subsidies will still be needed, but they should be well targeted and focus initially on expanding access. Existing power subsidies are captured largely by higher-income groups and do little to broaden access to electricity. Redesigning power subsidies would free scarce fi scal resources that could be redirected to subsidize the expansion of power networks to serve lower-income rural and periurban communities, or for other poverty-alleviation programs. In some of Africa’s poorest coun-tries, even low-cost power will remain unaf-fordable for a signifi cant minority of the population, so well-targeted subsidies would be needed as part of the strategy for reaching universal access. What is clearly untenable, however, is the situation where power subsi-dies that benefi t only a privileged minority of

198 AFRICA’S INFRASTRUCTURE: A TIME FOR TRANSFORMATION
the population create a signifi cant fi scal drag on the economy.
Accelerating Electrifi cationFrom a social and political perspective, expand-ing access is imperative. Yet fi nancing expan-sion to lower-income households will further strain the fi nancial viability of the power sec-tor. Tackling this dilemma will require sig-nifi cantly higher concessional fi nancing from development partners for access programs, as well as improved fi nancial and operational performance from utilities.
Given the scale of investments needed, a systematic approach to planning and fi nancing new investments is critical. The current ad hoc project-by-project approach in development partner fi nancing has led to fragmented plan-ning, volatile and uncertain fi nancial fl ows, and duplicated efforts. Engagement across the sector in multiyear programs of access rollout, supported by multiple development partners as part of a coherent national strat-egy, will channel resources in a more sustained and cost-effective way to the distribution subsector. Coordinated action by develop-ment partners will also reduce the unit costs of increasing access, by achieving economies of scale in implementation.
Completing the urban electrifi cation pro-cess requires careful attention to the social issues raised. Chapter 3 of this volume found that approximately half of the nonelectrifi ed urban population lives in proximity to the grid. Densifi cation is thus a key challenge. Demand-side barriers, including high connec-tion charges and insecure tenure, need to be addressed as part of this process. Expansion into periurban slums will need to face power theft, for which technical fi xes are available (see box 8.4).
For rural electrifi cation, emerging evidence favors more centralized approaches (Mostert 2008). Countries with dedicated rural electrifi -cation funds have higher rates of electrifi cationthan those without. Of greatest interest, how-ever, are the differences among the countries with funds. Case studies indicate that the coun-tries that have taken a centralized approach to electrifi cation, with the national utility
responsible for extending the grid, have been more successful than those that followed decentralized approaches, where a rural elec-trifi cation agency attempted to recruit multiple utilities or private companies into the electrifi -cation campaign. Therefore, expecting special-ized agencies to solve the rural electrifi cation challenge on their own may be unrealistic. They may be most productive in promoting minigrids and off-grid options as extensions of the national utility’s efforts to extend the grid, as in Mali (box 8.5).
Rural electrifi cation may need to follow urban electrifi cation. In an African context, one can legitimately ask how far rural electri-fi cation can progress when the urban electrifi -cation process is still far from complete. Across countries, a strong correlation exists between urban and rural electrifi cation rates, as well as a systematic lag between the two. Countries with seriously underdeveloped generation capacity and tiny urban customer bases are not well placed to tackle rural electrifi cation, either technically because of power shortages or fi nancially because of the lack of a basis for cross-subsidization.
Finding ways of spreading the benefi ts of electrifi cation more widely is also impor-tant. Because universal household electrifi ca-tion is still decades away in many countries, sectorwide programmatic approaches need to ensure that the benefi ts of electrifi cation touch the poorest households that may be too far from the grid or just unable to pay for a grid connection. Street lighting may be one way of doing that in urban areas. In rural areas, solar-powered electrifi cation of clinics and schools that provide essential public ser-vices to low-income communities is another way of allowing them to participate in the benefi ts of electrifi cation. Another is appro-priate technology, such as low-cost portable solar lanterns that are much more accessible and affordable to the rural public. The Light-ing Africa initiative is supporting the develop-ment of the market for such products.
Expanding Regional TradeA strategic priority is to tackle head-on the generation capacity defi cit through major

Power: Catching Up 199
regional projects. Africa’s considerable hydropower, gas, and coal resources remain underexploited. The best way to scale up gen-eration at the lowest unit cost is to develop a new generation of large power generation projects. A substantial number of these trans-formational projects should be developed in the near term to begin to make a material difference on the supply-demand balance. However, individual countries do not have the necessary investment capital, or even the electricity demand, to move forward with these large projects. A project fi nance approach predicated on regional power
off-take is needed, blending private partici-pation and donor funding.
Power pool development must proceed in parallel so that this new capacity can be trans-mitted to users. Challenges common to all the pools are rehabilitating and expanding the cross-border transmission infrastructure to increase the potential for trade and harmonizing regulations and system operating agreements. Equally important is formulating market trad-ing mechanisms so that the additional energy generated from large projects can be priced and thus allocated effi ciently and fairly (for example, through competitive pool arrangements).
BOX 8.5
Among new African rural electrifi cation agencies, AMA-DER (Agence Malienne pour le Développement de l’Énergie Domestique et l’Électrifi cation Rurale, or Malian Agency for the Development of Domestic Energy and Rural Electrifi ca-tion) has had considerable success. The starting point for AMADER is a country in which only about 3 percent of the rural population has access to electricity. Until they are con-nected, most rural households meet their lighting and small power needs with kerosene, dry cells, and car batteries, averaging monthly household expenditure of $4–$10.
Created by law in 2003, AMADER uses two major approaches to rural electrifi cation: (a) spontaneous, “bot-tom-up” electrifi cation of specifi c communities and (b) planned, “top-down” electrifi cation of large geographic areas. The bottom-up approach, which typically consists of minigrids managed by small local private operators, has been more successful. By late 2008, about 41 bottom-up projects had been fi nanced, comprising 36,277 household connections at an average cost per connection of $776. Typically, AMA-DER provides grants for about 75 percent of the connection capital costs.
Because Mali has limited renewable resources, most of the minigrid systems are diesel fi red. Customers on these isolated minigrids typically receive electricity for six to eight hours a day. In promoting these new projects, AMADER performs three main functions: it acts as a (a) provider of grants, (b) supplier of engineering and commercial techni-cal assistance, and (c) de facto regulator through its grant agreements with operators. The grant agreement can be viewed as a form of “regulation by contract” that establishes
minimum technical and commercial quality of service stan-dards and maximum allowed tariffs for both metered and unmetered customers.
To ensure that the projects are fi nancially sustainable, AMADER permits operators to charge residential and com-mercial tariffs that are higher than the comparable tariffs charged to similar customers connected to the national grid. For example, the energy charge for metered residential customers on isolated minigrids is about 50 percent higher than the comparable energy charge for grid-connected resi-dential customers served by Énergie du Mali (the national electric utility). Many of the minigrid operators also provide service to unmetered customers, who are usually billed a fl at monthly charge per lightbulb and outlet, combined with load-limiting devices to ensure that a customer does not connect lightbulbs and appliances beyond what he or she has paid for.
Financing has been a problem for both AMADER and potential operators. AMADER has been hindered by insuf-fi cient and uncertain funding for providing capital cost grants. Potential operators have had diffi culty raising equity or obtaining loans for the 20–25 percent share of capital costs not funded by AMADER. Promoting leasing arrange-ments and instituting a loan guarantee program for Malian banks that would be willing to lend to potential operators have been discussed as methods of reducing fi nancial barri-ers for operators.
Source: Interviews with World Bank staff from the Africa Energy Department, 2008.
Rural Electrifi cation in Mali

200 AFRICA’S INFRASTRUCTURE: A TIME FOR TRANSFORMATION
Although the economics of large regional generation projects are convincing, they may give rise to signifi cant political challenges. Africa could potentially save $2 billion a year in energy costs if trade were pursued to its fullest desirable extent, but the gains are much larger for some countries than for others. Small ther-mal power–dependent countries and a hand-ful of major exporters are likely to benefi t the most. About one-third of African countries would end up importing more than half of their power needs, and self-suffi ciency some-times has more political weight than access to low-cost power.
Moreover, reaping the benefi ts of regional power trade essentially depends on realiz-ing massive investments in three challenging countries. The Democratic Republic of Congo, Ethiopia, and Guinea would be the major power exporters under a regional trading sys-tem. To become major exporters, however, all three would need to invest massively in hydro-power, which could easily absorb more than 8 percent of their GDP for a decade. Even with support from cross-border fi nance, the lim-ited fi nancial capacity of these countries and the numerous governance challenges faced by the fragile states (the Democratic Republic of Congo and Guinea) make this quite a tall order.
These considerations call for an incremen-tal approach to developing regional trade. The initial emphasis needs to be on quick wins by building bilateral exchanges between neigh-bors where a particularly strong economic case exists and where the political context is supportive. This strategy will allow trading experience to build up gradually, paving the way for adding more complexity over time. Even if Africa’s fi rst-best generation options cannot always be developed or if the ultimate pattern of power production on the continent turns out to be driven more by fi nancial mus-cle than by economic expansion, the benefi ts of interconnection remain clear. Given the small scale and undiversifi ed nature of most countries’ power systems, cross-border trans-mission will always make sense as a means of boosting the effi ciency and reliability of power production.
Closing the Funding GapAfrica’s power funding gap is particularly daunting, even more so in the global fi nan-cial crisis. At $23 billion, the funding gap in Africa’s power sector is the largest of any infra-structure sector. The global fi nancial crisis will likely exacerbate the problem. As noted earlier, slower growth could reduce spending needs by as much as 20 percent, but tighter global fi nancial markets could similarly reduce avail-able funding, widening the funding gap even further.
Improving creditworthiness is an important fi rst step that could eventually assist in access-ing capital markets. The immediate subsidy savings from addressing operational effi cien-cies and cost recovery, though substantial, do not come close to closing the gap. In principle, utilities achieving operational effi ciency and cost recovery (whether state owned or pri-vately run) could aspire to raising their own capital on domestic or international markets, but that ability is still some way off. External fi nance to Africa’s power sector had been very low for some time but has picked up in recent years (fi gure 8.10).
Offi cial development assistance to public investment in power has risen substantially. In response to the power crisis, donors have increased their emphasis on the power sec-tor. Commitments averaged $1.5 billion a year for 2005–07, reaching a peak of $2.3 billion in 2007. This is an important turnaround in funding, but more will be needed if any sub-stantial inroads are to be made into Africa’s power sector challenges.
Non-OECD countries have emerged as major new power fi nanciers in Africa (Foster and others 2008). Commitments of non-OECD countries, particularly the Chinese and Indian export-import banks, came from nowhere to average about $2 billion a year in 2005–07. Most of the Chinese fi nancing has gone to 10 large hydropower projects with a combined generating capacity of over 6,000 megawatts. Once completed, these projects will increase Sub-Saharan Africa’s installed hydropower capacity by 30 percent. China is also fi nancing 2,500 megawatts of thermal power, and the Indian Bank has fi nanced

Power: Catching Up 201
signifi cant thermal generation projects in Nigeria and Sudan.
Private fi nance was also buoyant until 2007, but signifi cantly lower than offi cial fi nance. Private commitments to Africa’s power sector averaged about $1 billion a year in 2005–07, putting it in third place behind non-OECD fi nance and traditional offi cial development assistance. The bulk of private resources has gone into 3,000 megawatts of independent power projects. Although it will not be enough to close the fi nancing gap, private fi nance is very much needed. Successful private invest-ments in energy projects in Africa are still rare, however, and increased private investment will not materialize simply because of large fi nanc-ing gaps. The lessons from past failures must be addressed because private investment will fl ow only where rewards demonstrably out-weigh risks. Some early but encouraging signs indicate that scaling up generation capacity through large private sector–led projects is starting to gather momentum. A prominent example is the privately owned 250-megawatt Bujagali hydropower plant in Uganda, sup-ported by World Bank Group guarantees and funded by a private consortium. Ambitious regional projects undoubtedly present techni-cal, fi nancing, and political risks and will con-tinue to be underpinned by substantial public sector and donor contributions.
Shorter-term measures on energy effi-ciency can ease the transition. Most of the measures described here are medium term and cannot be implemented overnight. Many Sub-Saharan countries will continue to face a very tight demand-supply balance in the coming years. Therefore, shorter-term mea-sures to soften the economic and social effects of power scarcity must complement longer-term efforts at addressing the underlying structural causes of the power supply crisis. Recent experiences from countries such as Brazil show that well-designed demand-side management measures (for example, a quota system with price signals, combined with a public energy-effi ciency campaign) can go a long way toward trimming peak demand, substantially reducing power rationing at fairly low economic and social cost.
Notes The authors of this chapter are Anton Eberhard,
Vivien Foster, Cecilia Briceño-Garmendia, and Maria Shkaratan, who drew on background material and contributions from Daniel Camos-i-Daurella, Gabriel Goddard, Jaakko Hellaranta, Rob Mills, Fatimata Ouedraogo, Timo Reiss, Orvika Rosnes, Jevgenijs Steinbuks, Prasad V. S. N. Tallapragada, Maria Vagliasindi, Tjaarda Storm P. Van Leeuwen, and Haakon Vennemo.
1. Isolated areas are more than 50 kilometers from a substation and are either in the power plant buffer (within 10 kilometers for capacity below 10 megawatts, 20 kilometers for capacity below 100 megawatts, and 50 kilometers for capacity below 100 megawatts) or within 10 kilometers of a lit urban area or lit pixel. Remote areas are more than 50 kilometers from a substation and are not in the power plant buffer or within 10 kilometers of a lit urban area or lit pixel.
2. These costs are calculated at the consumption level of 100 kilowatt-hours a month.
ReferencesBanerjee, Sudeshna, Quentin Wodon, Amadou
Diallo, Taras Pushak, Hellal Uddin, Clarence Tsimpo, and Vivien Foster. 2008. “Access, Afford-ability and Alternatives: Modern Infrastructure Services in Africa.” Background Paper 2, Africa Infrastructure Country Diagnostic, World Bank, Washington, DC.
0
1,000
2,000
3,000
US$
mill
ions
4,000
5,000
6,000
1994 1995 1996 1997 1998 1999 2000 2001 2002 2003 2004 2005 2006 2007
official development assistance private participation in infrastructure
non-OECD
Figure 8.10 External Financing Commitments for the African Power Sector, 1994–2007
Source: Briceño-Garmendia, Smits, and Foster 2008.Note: OECD = Organisation for Economic Co-operation and Development.

202 AFRICA’S INFRASTRUCTURE: A TIME FOR TRANSFORMATION
Briceño-Garmendia, Cecilia. 2008. “Quasi-Fiscal Costs: A Never Ending Concern.” Internal note, Africa Infrastructure Country Diagnostic, World Bank, Washington, DC.
Briceño-Garmendia, Cecilia, Karlis Smits, and Vivien Foster. 2008. “Financing Public Infra-structure in Sub-Saharan Africa: Patterns, Issues, and Options.” Background Paper 15, Africa Infrastructure Country Diagnostic, World Bank, Washington, DC.
Calderón, César. 2008. “Infrastructure and Growth in Africa.” Working Paper 3, Africa Infrastructure Country Diagnostic, World Bank, Washington, DC.
Eberhard, Anton. 2007. “Matching Regulatory Design to Country Circumstances: The Potential of Hybrid and Transitional Models.” Gridlines, Note 23 (May). Public-Private Infrastructure Advisory Facility, World Bank, Washington, DC.
Eberhard, Anton, Vivien Foster, Cecilia Briceño-Garmendia, Fatimata Ouedraogo, Daniel Camos, and Maria Shkaratan. 2008. “Under-powered: The State of the Power Sector in Sub-Saharan Africa.” Background Paper 6, Africa Infrastructure Country Diagnostic, World Bank, Washington, DC.
EIA (Energy Information Administration). 2006. International Energy Annual. Washington, DC: U.S. Department of Energy. http://www.eia.doe.gov/emeu/international/contents.html.
ESMAP (Energy Sector Management Assistance Program). 2007. “Technical and Economic Assessment of Off-Grid, Mini-Grid and Grid Electrifi cation Technologies.” ESMAP Technical Paper 121/07, World Bank, Washington, DC.
Foster, Vivien, William Butterfi eld, Chuan Chen, and Nataliya Pushak. 2008. Building Bridges: China’s Growing Role as Infrastructure Finan-cier for Africa. Trends and Policy Options no. 5. Washington, DC: Public-Private Infrastructure Advisory Facility, World Bank.
Foster, Vivien, and Jevgenijs Steinbuks. 2008. “Paying the Price for Unreliable Power Supplies: In-House Generation of Electricity by Firms in Africa.” Policy Research Working Paper 4913, World Bank, Washington, DC.
Gratwick, Katharine Nawaal, and Anton Eberhard. 2008. “An Analysis of Independent Power Projects in Africa: Understanding Development and Investment Outcomes.” Development Policy Review 26 (3): 309–38.
Molefhi, Benjamin O. C., and L. J. Grobler. 2006. “Demand-Side Management: A Challenge and Opportunity for Botswana Electric Energy Sector.” North-West University, Potchefstroom, South Africa.
Mostert, Wolfgang. 2008. Review of Experience with Rural Electrifi cation Agencies: Lesson for Africa. Eschborn, Germany: EU Energy Initiative Part-nership Dialogue Facility.
PPA (Power Planning Associates). 2005. “Towards Growth and Poverty Reduction: Lessons from Private Participation in Infrastructure in Sub-Saharan Africa—Case Study of Botswana Power Corporation.” Summary report, World Bank, Washington, DC.
Rosnes, Orvika, and Haakon Vennemo. 2008. “Powering Up: Costing Power Infrastructure Investment Needs in Southern and Eastern Africa.” Background Paper 5, Africa Infrastruc-ture Sector Diagnostic, World Bank, Washington, DC.
Vagliasindi, Maria, and John Nellis. 2009. “Evalu-ating Africa’s Experience with Institutional Reform for the Infrastructure Sectors.” Working Paper 23, Africa Infrastructure Country Diag-nostic, World Bank, Washington, DC.
Wodon, Quentin, ed. 2008. “Electricity Tariffs and the Poor: Case Studies from Sub-Saharan Africa.” Working Paper 11, Africa Infrastructure Country Diagnostic, World Bank, Washington, DC.
World Bank. 2005. African Development Indicators. Washington, DC: World Bank.
———. 2007. Enterprise Surveys database. http://www.enterprisesurveys.org/.
Yepes, Tito, Justin Pierce, and Vivien Foster. 2008. “Making Sense of Sub-Saharan Africa’s Infrastructure Endowment: A Benchmarking Approach.” Working Paper 1, Africa Infrastruc-ture Country Diagnostic, World Bank, Washington, DC.

Transport: More Than the Sum of Its Parts
9Chapter
203
S o much variety exists among the trans-port modes and their infrastructure, in both policy and technical matters, that
the following four chapters deal with them separately. Those modes interact and intercon-nect in complex ways, however, raising com-mon issues.
Many movements of passengers and freight involve more than one mode of transport, with impediments at the point of interchange, often caused by corrupt customs administration, or restrictions on entry to the transport market. In freight, Sub-Saharan Africa suffers particularly from such blockages, which delay shipments, increase costs, and hinder the development of logistics systems so critical in sophisticated global markets. Because Africa has so many landlocked countries, this problem is multina-tional and must be confronted on a regional or a corridor basis.
One of the main sources of restrictive entry is the perceived need to protect national carri-ers or the existing carriers. Although this pro-tection has largely withered away in interna-tional shipping and inter-African air transport, it still prevails in road freight.
Increasing the scope for competition among carriers is a challenge confronting most trans-port modes. In most parts of the world, com-petition has involved extending the role of the private sector. Franchises and concessions per-mit this extension without loss of government infl uence over activities regarded as strategic. Bus transport and trucking are already pre-dominantly private. Many African railways are now concessioned, and the role of the private sector is increasing in ports and air transport. However, the regulation of these markets often remains obstructive rather than constructive, with tour de role traffi c allocation and dispatch-ing1 reducing effi ciency and increasing costs.
A common reason for restricting competi-tion is the belief that the government can ensure provision of socially desirable services only when they are supplied by a public enterprise or strongly protected private enterprises. However, this belief is largely fallacious, particularly if the protected suppliers have no incentive to be effi -cient or no segment of the market is profi table enough to support unremunerative “social” ser-vices. Publicly owned airlines, railways, shipping companies, and bus companies have all fallen

204 AFRICA’S INFRASTRUCTURE: A TIME FOR TRANSFORMATION
short. Thus, much work remains, both nationally and regionally, in developing regulatory regimes that reconcile public and private interests.
Integrating Multimodal Transport
Inland transport costs often seriously inhibit foreign trade, which passes through a seaport or airport and then one or more land modes. For example, inland transport accounts for an estimated 40 percent of the total cost from the point of origin to the port of destination for West African cocoa and coffee exports.
The transport chains are no stronger than their weakest links, usually the interchanges. The weaknesses are partly physical, with no physical connection between the modes and no infrastructure for transshipment; partly institutional, with responsibility for the inter-changes not falling clearly to one modal agency or the other; and partly operational, with the government collecting taxes and duties or staff collecting bribes, slowing movements, and pushing up costs.
The port-rail link is the fi rst major weakness. Although rail transport is advantageous for long-distance, time-insensitive commodities, it depends heavily on internationally traded traf-fi c. To hold this traffi c, it must be linked effi -ciently to good port connections, but confl icts between rail and port jurisdictions over rail seg-ments in port areas often inhibit this link. Except in South Africa, inland transport and facilities are poorly aligned with port development. The stripping and stuffi ng of containers in port areas also increases congestion in many ports. It is no accident that some of the most successful rail lines in Africa operate in national corridors where specialized rail and port facilities are ver-tically integrated (for example, Spoornet coal and ore lines and Gabonese manganese ore).
Good links between complementary rail systems are also essential. Some railway orga-nizations already contribute to this. The bina-tional railways in Côte d’Ivoire–Burkina Faso and Senegal-Mali provide good examples, as does the operation of contiguous railways by the same concessionaire (Central East African Railways in Mozambique and Malawi). How-ever, they also create local monopolies that
can increase their profi ts through predatory practices, as in Zambia’s treatment of copper exports by the Democratic Republic of Congo (see chapter 11 in this volume). In East Africa, joint concessioning of railways is part of a donor–funded corridor, where border-crossing arrangements have been reformed. Some coun-tries are now trying to develop coordinated corridor systems, as in the Ghana Gateway and Maputo corridors.
Other transport modes may also be involved. Inland waterway transport historically carried primary products from landlocked countries but is now in decline. The three major lakes in East and Central Africa—Victoria, Tanganyika, and Malawi—used to be important in transit and intraregional trade. Particularly on Lake Victo-ria, the lake services were part of the railway sys-tems linking the railheads at the inland ports of Bell (Uganda), Kisumu (Kenya), and Mwanza (Tanzania). The Kenya and Uganda lake opera-tions were concessioned together with the rail-ways in those countries, whereas in Tanzania, the lake services were separated from the railways. Only one service now operates on Lake Victo-ria, and some of the railway track leading to the ports is in poor repair, especially in Kenya.
The story is similar in West and Central Africa, where the Congo basin has a navigable network of 12,000 kilometers, covering nearly 4 million square kilometers in nine countries. In principle, this waterway could be a very valuable resource in a multimodal transport network serving the region, particularly given low associated transport costs of $0.05 per ton-kilometer versus $0.15 per ton-kilometer for road or rail freight in Central Africa, albeit at signifi cantly lower speeds. In practice, however, the river corridor suffers from an outdated and insuffi cient infrastructure, inadequate chan-nel markings and maintenance, feeble regula-tion, and numerous nonphysical barriers to movement. Thus, it is ever more marginal in transport. Recognizing this untapped poten-tial, in October 2005, the Executive Secretary of the Economic and Monetary Community of Central Africa encouraged the governments of Cameroon, the Central African Republic, the Democratic Republic of Congo, and the Repub-lic of Congo to establish the Commission Inter-nationale du Bassin Congo- Oubangui-Sangha

Transport: More Than the Sum of Its Parts 205
to improve the physical and regulatory arrange-ments for inland navigation. A consultancy study is examining the current arrangements in the four participating countries and identi-fying steps to begin an effective redevelopment of inland navigation (CICOS 2007).
Developing Logistics Systems
The transport problems of doing business in Africa are not just a matter of poor infrastructure or high transport costs. Modern logistics systems also emphasize the effi ciency of customs and other border agencies, the ease and affordability of arranging international shipments, the com-petence of the local logistics sector, the ability to track and trace shipments, and their timeliness. These various aspects of logistic performance are encapsulated in a logistic performance index (fi gure 9.1). Except for South Africa, Sub-Saharan African countries perform poorly not only on infrastructure quality, but also on all the main aspects of logistics competence.
Africa is thus viewed as logistics-unfriendly; third-party logistics systems, so important in increasing production and distribution effi -ciency in the industrial countries, are poorly
developed in Africa. Whatever the main mode of transport, the most serious impediments are administrative. For example, in road transport, regulation and market structures of the road freight industry, rather than the quality of the road infrastructure, are the binding constraints on international movements (Teravaininthorn and Raballand 2008). African governments must understand the importance of the qualitative aspects of logistic performance and act to remove administrative obstacles to that performance.
Corruption, through bribery of a range of offi cials having a combination of discretion-ary power and a quasi-monopoly position in the logistics chain, is a critical problem. For example, corruption can increase the total shipping costs, including costs of overland transport, port clearance, and ocean ship-ping, of a standard 20-foot container trav-eling between South Africa’s economic hub and eastern Africa or the Far East by up to 14 percent and the total port costs by up to 130 percent. Contrary to common belief, no robust evidence links corruption with low wage levels or lack of job rotation. Rather, it is highly correlated with the extent to which rules, regulations, and the organizational fea-tures of bureaucracies give public offi cials the
1 <= LPI <= 2.29 2.29 <= LPI <= 2.53 3.14 <= LPI <= 52.53 <= LPI <= 3.14 no data
Figure 9.1 Africa Registers Low Scores on the Logistics Performance Index, 2007
Source: World Bank 2007.Note: LPI = Logistics Performance Index; 1 is the lowest score and 5 is the highest score.

206 AFRICA’S INFRASTRUCTURE: A TIME FOR TRANSFORMATION
bargaining rights to extort bribe payments from shippers. In a comparison between the ports of Maputo (Mozambique) and Durban (South Africa), bribery of customs offi cials accounted for 80 percent of total bribery in Maputo, but only 10 percent in Durban (Sequeira and Macchi 2009). The explanation was that, in Maputo, a low level of automa-tion existed and both monitoring and sanc-tioning were weak, whereas in Durban, the opposite was the case. In contrast, bribery of port offi cials was lower in the privately con-cessioned Maputo port, where a higher level of automation, monitoring, and sanctioning exists than in the publicly operated Durban port, where automation is low and monitoring and sanctioning are weak.
Developing Transit Corridors for Landlocked Countries
The weakness of logistics systems impinges most on the landlocked countries. In southern Africa, operating costs are not excessively higher than in Europe ($0.08 per ton kilo-meter in 2008), but queues at borders and restrictions on access to the market mean that rates on international routes are higher by 10–30 percent. Being landlocked adds four days to exports and nine days to imports for land distribution of equivalent distances within a seaport country. However, this differ-ence is usually less than the sea transit time. Much more problematic is the high variability of transit time, especially for imports. The unreliability of import and export chains stems largely from inadequate transit proce-dures, overregulation, multiple controls, and poor border service (World Bank 2008). In addition, bribes and unnecessary charges can add 50 percent to the transport costs between a port and a landlocked country. Because of these impediments, landlocked countries have a much smaller involvement in world trade than the coastal countries, and they have remained predominantly dependent on exports of raw materials. Although increasing prices for raw materials over the past fi ve years have helped landlocked countries in Africa, they remain vulnerable to a change in that trend.
Most of the critical trade facilitation imped-iments stem from the procedure and services in the transit country, which often sees no advantage for its own economy in addressing the needs of transit traffi c. This view may, in fact, be mistaken if transit traffi c contributes to scale economies in the transit country’s own port and maritime or air service sectors, and particularly if the goods transported com-plement, rather than compete with, its own products. Even in those circumstances, how-ever, the vested interests of the benefi ciaries of bribes and providers of unnecessary border service may be diffi cult to overcome. Further-more, governments of transit countries with potential benefi ts may give the wrong signals (see box 9.1).
These problems with transit countries are increasingly recognized. In August 2003, attendees at an intergovernmental conference at Almaty, Kazakhstan, agreed to a Program of Action calling for joint efforts by landlocked and transit countries to revise their regulatory frameworks and improve transit-related infra-structure and procedures with the assistance of other countries and microfi nance institutions.
Some critical elements of a reform program can be identifi ed. Reform of trucking regulation is essential and is discussed further in chapter 10 of this volume. This must be supplemented by a reengineering of the transit system. In the longer term, something similar to the European Transports Internationaux Routiers (TIR), which provides a reliable system based on a single manifest (the TIR carnet) and a chain of guarantees, could speed freight through international borders, though the immediate introduction of a system is doubtful. More immediately, one-stop border posts, in which the two border countries share the informa-tion provided, could eliminate duplication and speed transit. Customs must be automated, limiting direct contact between offi cials and agents; monitoring and sanctioning must be strengthened; and port management must be privatized to reduce corruption. Inland clear-ance centers or dry ports, which deal with traf-fi c under bond, can circumvent the traditional impediments of the seaports. Development of airfreight can also overcome the constraints for some traffi c.

Transport: More Than the Sum of Its Parts 207
Some progress has been made in this direc-tion. Trucking regulation is more liberal in southern Africa than in other parts of Sub-Saharan Africa. Transit system reform is being introduced to facilitate transit traffi c through Cameroon to Chad and the Central African Republic (see box 9.2).
One-stop border post initiatives apply to the border between Kenya and Uganda at Malaba; between Zambia and Zimbabwe at Chirundu; between Zimbabwe and Mozam-bique at Forbes/Machipanda; along the Trans-Kalahari Corridor; and in West Africa on selective borders of Burkina Faso, Ghana, Mali, and Togo. Some landlocked countries already have bonded warehouses at the ports in West Africa, and rail concessionaires are developing facilities to speed transits, such as the Sitarail intermodal terminal proposal in Ouagadougou, Burkina Faso; the ZRS com-pany customs bond at the Victoria Falls border crossing between Zambia and Zimbabwe; and
the planned Madarail bonded container ter-minal near Antananarivo, Madagascar.
Much remains to be done to fi ll gaps in the implementation of the Almaty program. Gen-erally accepted corridor-monitoring indica-tors are required to check progress. Trucking markets and the associated freight-forwarding sector reforms need to be extended. Agreement between neighboring countries on transit sys-tem reforms must be encouraged by donor contributions and facilitated by the develop-ment of best practice standards.
Increasing Competition
Competition between suppliers of an individ-ual transport mode improves service quality and reduces costs, as shown in chapter 10 on road transport and chapter 13 on air transport in this volume. Competition between modes may also result in the replacement of one by
Maputo is the closest port to the industrial center of South Africa in Gauteng province (581 kilometers compared with 750 kilometers between Durban port and Johannesburg) and current congestion at Durban port gives it an apparent advantage for shippers with time-sensitive goods. If Maputo could capture 1 percent of the 700 million tons of traffi c from and to Gauteng and Mpumalanga provinces, its total throughput would be doubled. However, despite major road investment in the Maputo-Gauteng corridor and a rather successful port concession process, transit traffi c accounted for less than 40 percent of Maputo’s total traffi c in 2007, and the port operated at less than 30 percent of its capacity. With so much spare capacity at Maputo and so much con-gestion in Durban, both countries would seem to benefi t if transit traffi c were increased.
Why has this not yet happened? Road conditions are not a major obstacle, and transport prices are not abnormally high along the international corridor. However, many large South African shippers are reluctant to shift their transport routes from Durban because they perceive the business cli-mate in Mozambique to be too unpredictable to invest in redirecting their logistics routes. Mozambique has a logistics performance index below the Sub-Saharan Africa average and much below that of South Africa. Maputo port users
must face increased transport unpredictability because of the absence of direct calls by shipping lines (except Mitsui O.S.K. Lines) due to low volumes. Corruption is also greater in Maputo, averaging 15 percent of a one-way overland ship-ping rate for a standard 40-foot container, compared with only 7 percent for Durban (Sequeira and Macchi 2009).
Above all, the Mozambique government has not been acting to overcome this lack of confi dence, as exempli-fi ed by its policies on traffi c scanning. In April 2006, the government granted the concession of a scanner to Kudumba, a private sector operator. Initially, all exports had to be scanned, including bulk cargo with a fee per ton and exported cars from South Africa. Although scan-ning fees have decreased considerably since 2006 for cer-tain terminal operators (for example, from $100 per car to $15 per car), fees continue to be high compared to world practices. The absence of transparency and participation in the decision to introduce scanning technology and the determination of fees and the lack of a transparent bid-ding process in the award of the concession to Kudumba have further strengthened the perception of uncertainty in the business environment.
Source: Raballand and Macchi 2008.
Impediments to Transit Traffi c Growth in the Maputo Corridor
BOX 9.1

208 AFRICA’S INFRASTRUCTURE: A TIME FOR TRANSFORMATION
the other. For example, road improvement in Mauritania effectively eliminated domestic air transport, and all African railways have had diffi culty retaining passenger traffi c where a road alternative exists. However, various modes may be complementing each other or competing with each other at the same time. Reconciling these tensions is very diffi cult.
Where modes compete, effi cient alloca-tion of traffi c between them would normally depend on their relative prices refl ecting their relative costs; however, that can be diffi cult to interpret. Where traffi c is heavily imbalanced (as in international trade) and cost structures differ between modes, both commercial pres-sure and economic effi ciency may call for widely varying price–marginal cost ratios, and predatory pricing is diffi cult to defi ne.
Attention to the fairness of competitive conditions is important. Roads are publicly provided at costs to users that do not even cover maintenance, whereas privately provided
rail service is expected to cover its full costs, including track. The viability of privately concessioned railways can be hurt by under-charging for road maintenance and not enforc-ing axle load limits on road traffi c.
National transport strategies that put infrastructure charging for road and rail on a common basis would probably reduce budget burdens and improve road conditions. The net effect on modal split is more diffi cult to predict because of security, reliability, and other non-cost items considered in determining choices. For example, a comparison of road and rail tariffs on fi ve concessioned railways showed road tariffs exceeding rail tariffs by 44–213 per-cent. More competition between road and rail, abetted by increasing road costs, might reduce trucker profi t margins rather than increase the mode share or pricing power of rail. Given the cartels and high profi t rates in road haulage, even greater benefi ts could likely be obtained by promoting competition in road haulage.
BOX 9.2
A New Attempt to Reform the Transit System in the Cameroon–Central African Republic–Chad CorridorA major reform is being piloted as part of the Central Africa Transport and Transit Facilitation Project fi nanced by the African Development Bank, the Agence Française de Développement, the European Commission, and the Inter-national Development Association. The object is to meet the needs of two landlocked countries, the Central African Republic and Chad, that suffer some of the highest inter-national transport costs and worst logistics conditions among developing countries. Freight bureaus enforcing mandatory freight allocations and queuing manage inter-national transport between the two countries and the port of Douala, Cameroon, under bilateral conventions. The main problems with the existing transit regime include very slow release of goods from the port of Douala, requir-ing seven documents, all of which must be cleared by three separate offi ces. Multiple checkpoints and controls also exist on the roads to the landlocked countries. Both transport charges and the guarantees required from banks are signifi cantly more costly than for comparable services in other countries.
A TIR (Transport Internationaux Routiers)-based interna-tional road transit convention (TIPAC, or Transit Inter-États des Pays de l’Afrique Centrale), signed in 1991, was never fol-lowed. In 2008, despite the reluctance of the vested interests to lose the multiple rents in the existing system, and thanks mainly to strong leadership and pressure for reform from the Cameroonian government and customs, agreement was eventually reached on a substantially revised transit system. The main elements are introduction of one common transit document, removal of all checkpoints on the roads, and use of information technology based on ASYCUDA (Automated SYstem for CUstoms Data) by the United Nations Conference on Trade and Development. The last adds a bar code to the transit document and container that is read optically at the start, destination, and border to simplify transit procedures for authorized freight forwarders who have obtained a standing customs guarantee from the banking system. If implemented, the changes are expected to yield substantial benefi ts of shorter delivery times, greater predictability, and lower prices.
Source: World Bank 2008.

Transport: More Than the Sum of Its Parts 209
Revisiting Attitudes toward Private Supply and Profit
Private participation in supply, central to com-petition, can increase the effi ciency of operation and the mobilization of private capital. How-ever, to activate these benefi ts, governments must understand the commercial realities that motivate private business. Excess private profi t from a monopoly should be constrained. Yet private fi rms will not participate if governments deny them a reasonable return on investment, a necessity for a private operation and not a sin.
Consistent policies to attract private sec-tor fi nance and management should include an explicit determination of the objectives of private participation. Policy makers should recognize that private participation can bring effi ciency benefi ts not only in cases of marginal commercial viability, but also in sectors deemed highly profi table (ports) or deemed desirable albeit highly unprofi table (some railway conces-sions). That awareness calls for a wider range of forms of private participation, including nega-tive concessions and affermage arrangements.2 A specialist national agency dealing with priva-tization could help in producing such policies and forms of participation.
Government use of public sector monop-oly powers to generate excess revenues can be equally damaging, even if ostensibly to sup-port other unprofi table services. Internal cross subsidies have usually had adverse effects. For example, South Africa’s Spoornet draws cross subsidies for loss-producing freight and passenger services both from the ostensibly profi table ore and coal services and, through Transnet, from ports and pipelines.
In practice, the effect has been to denude the core services of investment. In Africa, the aver-age age of locomotives is 25 years and of freight wagons, 25–30 years, both nearly twice the international best practice. In the ore services, a capacity gap exists, and Spoornet’s safety record appears to be low and deteriorating. The port system is also being denied investment. Despite the high technical competence of the South African system, the recent National Freight Logistics Study concluded, “Restoring rail reli-ability is fundamental and is the single most
important challenge facing the freight logistics sector in South Africa” (Department of Trans-port 2005: 13). The dangers of exploiting pub-lic monopoly powers also arise in airports in several countries where the benefi ts of private managerial effi ciency are forgone by keeping such activities in the public sector.
Careful consideration must therefore be given to establishing appropriate oversight and regu-latory institutions. Creation and exploitation of monopoly powers by cartelization need to be under continual review, covering both indus-trial structure and commercial behavior. Many countries could develop a small but skilled unit to advise governments and specialized modal regulators on the principles of regulation.
One further concern about private foreign involvement in supply merits consideration. Concerns about reliance on private foreign control of services critical to national secu-rity have been widely used as an argument for maintaining national air transport and ship-ping fl eets and for limiting foreign capital in national infrastructure fi nance. In practice, uneconomically small airlines and shipping fl eets protected by cargo reservation tend to push up costs and drain national resources (to the detriment of national security). In addition, resistance to involving the global container port terminal operators denies countries the effi ciency and investment that such participa-tion could bring.
Thus, countries need mechanisms to rec-oncile private (and foreign) participation in fi nancing transport infrastructure with eco-nomic, social, and strategic objectives. This approach calls for more fundamental consid-eration of the nature and appropriateness of social and strategic objectives and for analysis of the relative effectiveness of different instru-ments in achieving those objectives. Develop-ing a range of contract designs appropriate to different objectives is part of this challenge.
Meeting Social Obligations
Most African governments, wishing to be seen as keeping down costs of public passenger transport, have maintained low bus and rail

210 AFRICA’S INFRASTRUCTURE: A TIME FOR TRANSFORMATION
passenger fares. Where fares are commercially unviable, however, they are likely to under-mine the supply of the public services. Even where the controls are enforced only on pub-licly provided modes (notably rail or conven-tional large bus services), they typically shift business to an informal sector with higher fares or lower service quality, failing to assist poorer citizens.
Governments could pay compensation for the imposed social obligations. However, only in rare cases, such as the support of the public bus company in Addis Ababa, are public service obligation payments adequate and timely. More generally, the failure to achieve this timeliness postpones, but does not avoid, the collapse of public bus service. The same appears to be happening with the provisions for subsidizing rail passengers in some rail concessions. Where subsidized rail services have economically viable road alternatives, the subsidy (if paid) drains resources from the economy. More com-prehensive and well-thought-out strategies for fare controls and subsidies, probably by pro-curing subsidized services through competitive tendering, can ensure the most effective use of transport infrastructure.
Notes The author of this chapter is Kenneth Gwilliam,
who drew on background material and con-tributions from Jean Francois Arvis, Rodrigo Archondo-Callao, Jose L. Guasch, Alberto Nogales, Gael Raballand, Sandra Sequeira, and Kavita Sethi.
1. Tour de role dispatching is a system in which service suppliers are allocated traffi c strictly in turn. It is widely applied in the public transport and trucking markets. This system limits direct
competition and usually results in low vehicle use and high unit costs.
2. A negative concession is one offered for a loss-making service, in which the competition is conducted in terms of the minimum public subsidy required by the operator to take on the loss-making service. An affermage contract is similar to a management contract, but the pri-vate operator takes responsibility for all opera-tion and maintenance functions, both technical and commercial.
ReferencesCICOS (Commission Internationale du Bassin
Congo-Oubangui-Sangha). 2007. Plan d’action strategique pour la promotion de la navigation dans le bassin Congo-Oubangui-Sangha. Hamburg: HPC Hamburg Port Consulting GmbH.
Department of Transport. 2005. “National Freight Logistics Strategy.” Department of Transport, Republic of South Africa.
Raballand, Gaël, and Patricia Macchi. 2008. The Critical Importance of Strengthened Regional Integration for Growth and Development in Mozambique. Washington, DC: World Bank.
Sequeira, Sandra, and Patricia Macchi. 2009. “The Importance of Soft Transport Infrastructure: Customs Offi cials in Maputo versus the Port Operators in Durban.” Afrique Contemporaine 230 (2).
Teravaininthorn, Supee, and Gaël Raballand. 2008. Transport Prices and Costs in Africa: A Review of the Main International Corridors. Directions in Development Series. Washington, DC: World Bank.
World Bank. 2007. Connecting to Compete: Trade Logistics in the Global Economy—the Logistics Performance Index and Its Indicators. Washington, DC: World Bank.
———. 2008. Improving Trade and Transport for Landlocked Developing Countries. Washington, DC: World Bank.

211
Chapter10
Roads: Broadening the Agenda
A frican governments have been address-ing the low density and poor condition of their road networks. Institutional
reform since the mid-1990s has progressed well, with a remarkable consensus on the content. Most countries have second-generation road funds supported by fuel levies, and many oth-ers have autonomous road agencies. Specialist maintenance management agencies have been established, and new forms of contract-based maintenance are being introduced. Although important funding gaps remain, results are dis-cernible. On average, 80 percent of the main road network is in good or fair condition, and the current value of the national road net-works is at least 70 percent of their potential. The limited time series available also suggests that a number of countries have improved road conditions over time.
Despite this progress, the reform agenda is incomplete. In many cases, fuel levies have been set too low to be effective, and road funds and agencies do not always meet all good-practice design criteria. Modern contracting and contract management methods are far from universal. Furthermore, while policy mak-ers’ attention has focused on the institutions
and fi nancial fl ows for the interurban roads, other challenges have surfaced that will require different types of solutions.
First, the reforms to the interurban road network have affected rural roads much less. Even though agriculture is viewed as an engine of growth, only one-third of rural inhabitants live within 2 kilometers of an all-season road. Doubling this percentage would be very costly, absorbing more than 1 percent of GDP a year for a decade. The rural environment presents particular insti-tutional challenges for road maintenance.
Second, surface transportation is about more than good roads. Africa continues to be handi-capped by very high road freight tariffs, driven primarily by high profi t margins rather than high costs (or defective roads). In Central and West Africa particularly, trucking industry car-tels and restrictive tour de role traffi c allocation and dispatching practices are responsible for low vehicle mileage and poor fl eet quality. The most urgent reforms are to liberalize trucking while mitigating associated social effects. With-out such measures, further improvements in road quality will only translate into higher profi t margins for the trucking industry.

212 AFRICA’S INFRASTRUCTURE: A TIME FOR TRANSFORMATION
Third, Africa’s rapidly growing cities face major mobility problems. Urban road den-sity is low by developing-country standards. Moreover, following the demise of large buses in many cities, myriad informal minibus operators largely dominate urban transport services. Services are costly, and availability is inadequate. Few countries capture suffi cient financial resources to develop and main-tain the urban road network. Overlapping national, metropolitan, and municipal juris-dictions present serious institutional chal-lenges. Furthermore, the cross-sectoral links between urban transport and land use plan-ning are unexploited.
Road Infrastructure—Lagging Other Regions Somewhat
The region’s trunk road network comprises strategic trading corridors linking deep-sea ports to economic hinterlands. These corri-dors, which carry about $200 billion of trade a year, include no more than 10,000 kilome-ters of road. The concept of an intraregional trunk network, or Trans-African Highway, remains a distant reality because of missing links and poor maintenance on key segments. Between 60,000 and 100,000 kilometers of road are required to provide such intraconti-nental connectivity.
Africa’s national road density is substantially lower than that in other developing regions: only 204 kilometers of road per 1,000 square kilometers of land area, with only one-quarter paved, compared with a world average of 944 kilometers per 1,000 square kilometers, with more than half paved. That density is less than 30 percent of the next-lowest region, South Asia. However, Sub-Saharan African road den-sity in relation to population is slightly higher than South Asia’s and only slightly lower than the Middle East’s and North Africa’s.
Relative to GDP, however, Sub-Saharan Africa has a large road network. In Madagascar, Malawi, Mozambique, and Niger, the asset value of the road network exceeds 30 percent of GDP, an indication of the consequently large economic burden of maintenance. As a result,
the road conditions lag somewhat behind those of other developing regions, but not so much for the main trunk road network as for other roads (Gwilliam and others 2008).
With accelerating urbanization, Africa needs to develop intraurban roads, but networks in 14 African cities were found to be substan-dard (Kumar and Barrett 2007). Road den-sity (paved-road density in particular) lags far behind that in other developing cities. Capacity is generally limited. The majority of roads have one lane in each direction, and where roads are wider, pedestrians and parked vehicles often take up one lane. Intersections are close together and are ill designed for turning. Ser-vice lanes are absent, pavement is deteriorating, and street lighting is minimal. Because traffi c management is limited, accidents are frequent, with pedestrians accounting for two-thirds of fatalities.
For rural roads, beyond the classifi ed ter-tiary network, which is typically the responsi-bility of local government, a vast unclassifi ed network of tracks providing service to rural areas is usually the responsibility of local com-munities. Nevertheless, African rural commu-nities have by far the lowest accessibility to an all-season road in the developing world. Evi-dence indicates that physical isolation prevents large areas of the continent from reaching their agricultural potential. With low population density, achieving good overall rural accessi-bility would imply at least doubling the length of the classifi ed network for most countries (Starkey and others 2002).
Traffi c volumes remain low and heav-ily concentrated on the main road network (table 10.1). In most countries, at least 90 percent of reported traffi c on the classifi ed network is carried on the main networks.1 Except in Nigeria and South Africa, the traffi c on the main road network in Africa averages only about 500 vehicles a day.
Rural networks typically carry less than 10 percent of the classifi ed network’s traffi c; however, in Ethiopia, Malawi, and Nigeria, they carry more than 20 percent. Except in Nigeria, the absolute volumes of traffi c on the rural network are very low, averaging about 30 vehicles a day.

Roads: Broadening the Agenda 213
Road Infrastructure Institutions and Finance—Promising Developments
The initial thrust of institutional reform has been to create an independent source of fund-ing for road maintenance, based on road user charges, segregated from the general govern-ment budget, and administered by an autono-mous board.
Funding ArrangementsDonors have played a major role in promot-ing this institutional framework. Most coun-tries already have such second-generation road funds, and most others, except Nigeria and South Africa, are establishing them. Not all funds have good-practice designs, how-ever, and their performance varies substan-tially (fi gure 10.1).
Despite widespread application of fuel lev-ies to fund road maintenance, the level of the fuel levy, hence its utility, varies enormously across countries. The range extends from sym-bolic levels of about $0.03 a liter, nowhere near high enough, to about $0.16 a liter, which cov-ers most road maintenance needs. Many coun-tries have major diffi culties in collecting the levies, whether because of evasion (Tanzania) or delayed transfers of revenues (Rwanda), and capture perhaps as little as half the planned resources. Therefore, the road funds in Benin, Côte d’Ivoire, Ethiopia, Gabon, and Zambia still depend on budget allocations for more than three-quarters of their resources rather than being funded largely from fuel levies, as is the intention of road funds.
Toll roads affect barely 0.1 percent of the region’s classifi ed road network, almost entirely in South Africa. Toll-road concessions have
captured fewer than $1.6 billion in investment commitments, small in relation to the region’s needs. Less than 10 percent of the region’s road network attracts the 15,000 vehicles a day that are the minimum traffi c fl ow needed to make concessions economically viable. Toll roads have potential only in South Africa and to a lesser extent, in Nigeria.
Implementation AgenciesA second stage of reform has created road agencies, independent from line ministries, with responsibility for contracting out pub-lic works. About two-thirds of the 24 coun-tries sampled have a road agency, and others are planning one, but only one-third of the agency boards have private representation. Nigeria, Senegal, and South Africa have a road agency but not a road fund. Autonomy varies from full responsibility for road net-work management to limited responsibility for road maintenance programs defi ned by the road department or ministry.
About half of the countries sampled con-tract out more than 80 percent of maintenance work. Some road agencies are adopting per-formance-based maintenance contracts, under which a private contractor maintains a public road to achieve and maintain specifi ed condi-tion standards for periods ranging from 3 to 10 years in return for a fi xed payment stream. The advantages of such contracts are that they can provide a strong incentive for contractors to undertake effective maintenance, and they can reduce expenditure uncertainties for the road fund. The contracts started in Canada in the late 1980s, and industrialized coun-tries have now adopted them. In developing countries, they were fi rst applied in Argen-tina in mid-1990, but they rapidly spread
Table 10.1 Average Daily Traffic on the Main Road Network
Country type Classifi ed network
Classifi ed networkPaved
networkUnpaved networkPrimary Secondary Tertiary
Low income 236 934 182 28 1,054 50
Lower middle income 341 1,186 303 39 1,474 95
Upper middle income 1,066 5,469 117 24 2,883 5
Source: Gwilliam and others 2008.

214 AFRICA’S INFRASTRUCTURE: A TIME FOR TRANSFORMATION
to neighboring countries so that more than 40,000 kilometers of Latin American roads are now being maintained under such contracts. In Africa, Ethiopia, Ghana, and Zambia have begun to use them.
Cost savings from performance-based maintenance contracts on paved roads have ranged between 10 and 40 percent in industrial-ized countries and between 10 and 20 percent for several developing countries (Stankevich, Qureshi, and Queiroz 2005). Even where such cost savings were not achieved, the benefi ts have been substantial. In Chad, the only example in francophone Africa, the cost per kilometer of routine maintenance under a performance-based maintenance contract for a set of gravel roads was signifi cantly higher ($5,000) than under a traditional maintenance contract ($1,500) but with the benefi t that the contractor was
responsible for maintaining a level of service linked to the condition of the road surface. Under a performance-based maintenance contract, the condition of the road improves steadily, whereas under the traditional approach, the road condi-tion improves for a short period following the work and then starts deteriorating quickly until new maintenance is carried out.
A parallel institutional development, par-ticularly relevant to rural roads, involves delegating project management to special-ist agencies. In many countries, these agen-cies, agences d’exécution des travaux d’intérêt public (AGETIPs; public works implementing agency), now manage private consultants and contractors on behalf of the public authority and perform all the necessary functions for contract preparation, implementation, and supervision (box 10.1).
0 20 40% of countries
60 80 100
user representation on board
direct transfer
clear legal basis
separation of functions
revenue allocation rules
road user charges
independent auditing
% of score0 20 40 60 80 100
Burkina Faso
Cape Verde
Senegal
South Africa
Benin
Côte d’Ivoire
Lesotho
Cameroon
Mozambique
Niger
Zambia
Chad
Ethiopia
Ghana
Madagascar
Malawi
Rwanda
Kenya
Namibia
Tanzania
a. Prevalence of second-generationdesign characteristics
b. Scores on overall performance index
Source: Gwilliam and others 2008, based on data collected by World Bank 2007.
Figure 10.1 Progress with Road Fund Reforms

Roads: Broadening the Agenda 215
Road Expenditures—More Maintenance, Less Rehabilitation
On average, countries spend $9,000 a kilometer for main road networks in Sub-Saharan Africa, just below 2 percent of GDP, compared with 1 percent in typical industrial countries and 2–3 percent in fast-growing emerging economies (fi gure 10.2). Although the effort is high rela-tive to the size of Africa’s economies, it remains low in absolute terms, with low-income coun-tries spending no more than $7 per capita a year. For the main road network, maintenance spending ranges from barely $200 per kilome-ter in Chad to more than $6,000 per kilometer in Zambia. Maintenance spending per kilometer of the main network tends to be about twice that of the rural network.
Paradoxically, low-income countries spend 50 percent more per kilometer overall than do middle-income countries, while countries with road agencies and high fuel levies seem to spend somewhat less than those without. The explanation is a pronounced capital bias
in road spending, with investment account-ing for two-thirds of total spending in the resource-rich and low-income countries, par-ticularly those without adequate institutional mechanisms for funding road maintenance. Middle-income countries and those with high fuel levies tend to spend more on maintenance without incurring higher road expenditure overall. This fi nding clearly shows that timely attention to maintenance reduces the expen-diture needed to sustain the road system in the long term (Harral and Faiz 1988). Aid has partly fueled this capital bias. For example, aid fi nancing covers just over 50 percent of road investment in Senegal and almost 90 percent in Rwanda.
The capital bias would be even more pro-nounced if capital budgets were fully executed. On average, countries have budgeted 50 percent more on road investment than they spend dur-ing a given budget cycle. This underspending produces a capital budget execution ratio aver-aging about 70 percent. Defi ciencies in project planning and delays in procurement processes
BOX 10.1
Delegating the function of managing the planning, procurement, and implementation of public works to a specialist private agency is well established in French public administra-tion. In many African countries, an AGETIP was attractive to international fi nancial insti-tutions as a means of obtaining more effective implementation of donor-funded works, par-ticularly in rural sectors, where administrative skills were weakest.
Following the creation of the fi rst AGETIP in connection with a donor–fi nanced sites and services project in Senegal in 1989, the greatly improved administration of public works and timely payment enable a substantial increase in the participation of small and medium-size enterprises in public works programs, often using labor-intensive techniques. Roads, par-ticularly rural roads, are an important part of
their work. There are now 19 such agencies in 17 countries, mostly in francophone West Africa. The international association AFRICATIP (Association Africaine des Agences d’Exécu-tion des Travaux d’Intérêt Public) develops and shares best practices among its members.
The agencies play three roles: (a) compe-tent technical agencies using private sector recruitment and payment procedures, (b) man-agers of special funds, and (c) directors of the planning and programming of the investments of local authorities. They also provide techni-cal manuals and contractor training. Although originally established to facilitate donor fi nanc-ing, they now handle mostly national funds and have become instruments for indigenous business development.
Source: Diou, Henry, and Demy 2007.
The Role of AGETIPs
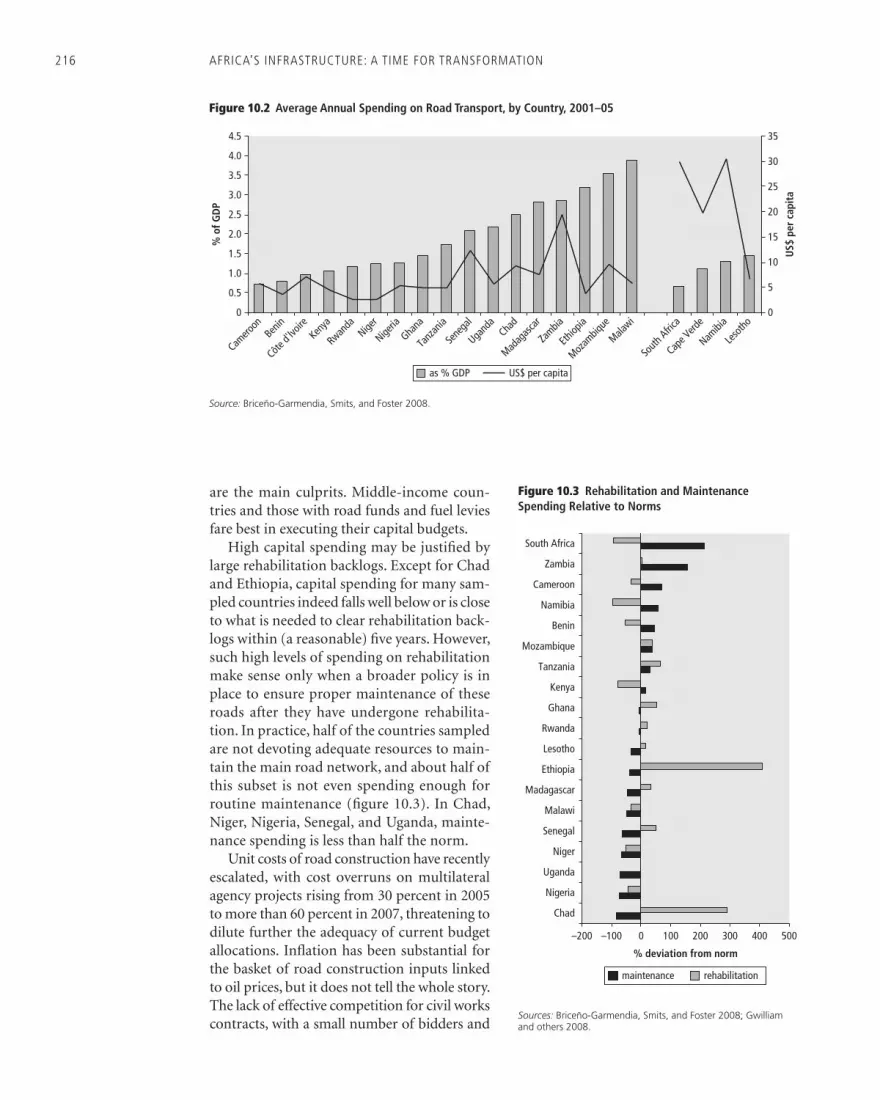
216 AFRICA’S INFRASTRUCTURE: A TIME FOR TRANSFORMATION
are the main culprits. Middle-income coun-tries and those with road funds and fuel levies fare best in executing their capital budgets.
High capital spending may be justifi ed by large rehabilitation backlogs. Except for Chad and Ethiopia, capital spending for many sam-pled countries indeed falls well below or is close to what is needed to clear rehabilitation back-logs within (a reasonable) fi ve years. However, such high levels of spending on rehabilitation make sense only when a broader policy is in place to ensure proper maintenance of these roads after they have undergone rehabilita-tion. In practice, half of the countries sampled are not devoting adequate resources to main-tain the main road network, and about half of this subset is not even spending enough for routine maintenance (fi gure 10.3). In Chad, Niger, Nigeria, Senegal, and Uganda, mainte-nance spending is less than half the norm.
Unit costs of road construction have recently escalated, with cost overruns on multilateral agency projects rising from 30 percent in 2005 to more than 60 percent in 2007, threatening to dilute further the adequacy of current budget allocations. Infl ation has been substantial for the basket of road construction inputs linked to oil prices, but it does not tell the whole story. The lack of effective competition for civil works contracts, with a small number of bidders and
0
0.5
1.0
1.5
2.0
2.5
3.0
3.5
4.0
4.5
% o
f GD
P
0
5
10
15
20
25
30
35
US$
per
cap
ita
Camero
onBen
in
Côte d'
Ivoire
Kenya
Rwanda
Niger
Nigeria
Ghana
Tanz
ania
Sene
gal
Ugand
aCha
d
Madag
ascar
Zambia
Ethiop
ia
Mozam
bique
Malawi
South
Africa
Cape V
erde
Namibi
a
Leso
tho
as % GDP US$ per capita
Source: Briceño-Garmendia, Smits, and Foster 2008.
Figure 10.2 Average Annual Spending on Road Transport, by Country, 2001–05
0–200 –100 100 200 300 400 500
Chad
Nigeria
Uganda
Niger
Senegal
Malawi
Madagascar
Ethiopia
Lesotho
Rwanda
Ghana
Kenya
Tanzania
Mozambique
Benin
Namibia
Cameroon
Zambia
South Africa
maintenance rehabilitation
% deviation from norm
Figure 10.3 Rehabilitation and Maintenance Spending Relative to Norms
Sources: Briceño-Garmendia, Smits, and Foster 2008; Gwilliam and others 2008.

Roads: Broadening the Agenda 217
wide price spreads across bids, looks to be the main culprit (Van Zyl, Coetzer, and Lombard 2008). Substantial delays in project implemen-tation also add to the costs.
These higher costs double the importance of ensuring that engineering standards are the most cost-effective possible. Network analy-sis reveals that on average, about 30 percent of main road networks are overengineered relative to observed traffi c volumes, and only 10 percent are underengineered. Particularly where rapidly expanding the extent of the passable road network is desirable, as in the Democratic Republic of Congo, adopting lower standards may be sensible, upgrading only when traffi c growth or local bottlenecks make it necessary. About 15 percent of rural networks are underengineered. Greater efforts are needed to adapt road design standards to local conditions and materials to avoid exces-sive costs in road construction, particularly for low-volume sealed roads.
Road Conditions—Reflecting Quality of Sector Governance
About half of the main network is in good con-dition, and an additional one-third is in fair condition—whereas only one-quarter of the rural network is in good condition and a further one-quarter in fair condition (fi gure 10.4).
The large variation in road quality refl ects several interacting factors. First is affordabil-ity. GDP per capita is most strongly correlated with the percentage of the main road network in good condition, suggesting that richer countries tend to spend more on maintenance. However, no such clear relationship exists for rural roads. Second are some fundamental top-ographic and climatic infl uences. Mountain-ous and wet countries generally have poorer conditions, in both main and rural networks, associated with climate rather than traffi c.
Even controlling for income and climate, however, substantial variation still exists in observed road quality across countries, vary-ing with the quality of their road sector insti-tutions and fi nancing framework. Countries with both road funds and road agencies show
substantially better road conditions than do those that lack either. Moreover, both the road fund design and the level of the fuel levy appear to signifi cantly affect the quality of the main road network, although again the effect on rural road quality is much less pronounced. The main exception, South Africa, has very good primary roads without a conventional second-generation road fund, but it does have a very effective road agency and consistent government commitment to fi nance road maintenance adequately.
Surprisingly little variation exists in the road network’s asset value as a percentage of its potential value if it all were in good condition. All countries realize at least 70 percent of this potential, suggesting that maintenance efforts are fairly well concentrated on preserving the high-value paved-road network. Moreover, the limited time series available suggests that most countries have improved the quality of their roads in recent years.
Good governance is thus critical for safe-guarding road quality through good budget fi nance and a professionally competent public sector implementation agency. Countries with road funds and high fuel levies are substan-tially more successful at raising fi nance that translates into higher road maintenance expen-ditures. Countries with road funds and quasi-independent road agencies show substantially higher quality on main road networks.
Infrastructure Spending Needs—an Average of 1.5 Percent of GDP a Year
A modest set of connectivity objectives might include the following: (a) connecting large cities and international frontiers with a good-quality, two-lane paved road; (b) connecting intermedi-ate cities and the provincial capital with a good-quality, one-lane paved road; (c) increasing to 100 percent the proportion of the rural popula-tion living within 2 kilometers of an all-season road in the agricultural areas comprising the 80 percent highest production value within each country; and (d) putting the urban population within 500 meters of a road supporting all-sea-son bus access.

218 AFRICA’S INFRASTRUCTURE: A TIME FOR TRANSFORMATION
On the basis of this package, spending needs for the road sector amount to $9.6 billion a year, skewed toward capital expen-diture (table 10.2). Because of their mature road network, the middle-income countries account for little more than 10 percent of this total. Except in middle-income coun-tries, about two-thirds of spending require-ments relate to capital expenditure, with the remainder attributable to operation and maintenance. Thus, overall, the region needs to spend 1.5 percent of GDP on roads, of which 0.6 percent of GDP is needed for road maintenance. However, the burden for low-income fragile states is very high—in excess of 7 percent of GDP.
Existing spending on the sector amounts to $6.9 billion a year, signifi cantly less than what is needed (table 10.3). Spending in the fragile states is particularly low, barely one-tenth of what is required. The public sector fi nances two-thirds of road sector spending and more than one-half of road sector investment. In the low-income countries—whether fragile or not—about half of road sector expenditure is donor fi nanced. The contribution of the private sector to road fi nance in Africa is almost negligible. Financiers from outside the Organisation for Economic Co-operation and Development are not making a major contribution to this sector.
Implementation of efficiency-oriented reforms could raise a total of $3.8 billion a year,
Source: Gwilliam and others 2008.
Figure 10.4 Distribution of Road Network Length across Condition Classes, by Country
a. Main network b. Rural network
0 25 50 75 100
Côte d'Ivoire
Uganda
Rwanda
Benin
Lesotho
Senegal
Chad
Tanzania
Madagascar
Nigeria
Cameroon
Niger
Mozambique
Zambia
Ghana
Malawi
Ethiopia
Namibia
Kenya
Burkina Faso
South Africa
% road network length
good fair poor
0 25 50 75 100
Rwanda
Uganda
Madagascar
Nigeria
Zambia
Mozambique
Senegal
Benin
Côte d'Ivoire
South Africa
Tanzania
Niger
Lesotho
Ethiopia
Cameroon
Namibia
Chad
Malawi
Kenya
Ghana
Burkina Faso
% road network length

Roads: Broadening the Agenda 219
largely eliminating the funding gap, except in fragile states. The greatest scope for effi ciency gains lies in practicing sound preventive main-tenance, which in the medium term would substantially reduce the investments needed to clear the rehabilitation backlog, saving an estimated $1.9 billion per year. Low ratios of capital budget execution are also holding back public investment in roads. Addressing this issue would capture a further $1.3 billion annu-ally. Finally, some countries face diffi culties in collecting revenues owed to their road funds; solving this problem would capture another $0.6 billion a year of resources.
Transport Services—the Forgotten Problem
Road sector interventions have traditionally focused on constructing and improving the
“hard” infrastructure. However, what ulti-mately matters from an economic perspective is the extent to which roads support effi cient, reliable, and safe transport services for various kinds of freight, as well as for urban and rural populations. Although the private sector typi-cally provides these services, the government has a critical role to play as regulator and facilitator of service provision. These “soft” transport issues deserve more attention.
Road FreightThe regulation and market structures of the road freight industry, rather than the quality of the road infrastructure, are the binding con-straints on performance in the international corridors (Teravaninthorn and Raballand 2008). Although the associated road infrastructure is generally in good condition, the administrative bottlenecks at borders and ports keep the effec-tive velocity of transit along these routes very
Table 10.3 Financing Flows to the Road Sector$ billions annually
Country type
Operation and
maintenance Capital spending
Total spending
Public sector
Public sector ODA
Non-OECD fi nanciers PPI Total
Sub-Saharan Africa 1.45 3.22 1.80 0.37 0.05 5.44 6.88
Middle income 0.41 1.21 0.09 0.02 0.05 1.37 1.77
Low income, fragile 0.06 0.19 0.23 0.03 0 0.45 0.50
Low income, nonfragile 0.61 0.58 1.24 0.14 0 1.96 2.57
Resource rich 0.31 1.29 0.23 0.17 0 1.69 2.01
Source: Briceño-Garmendia, Smits, and Foster 2008.Note: Operation and maintenance includes other current expenditures. ODA = official development assistance; OECD = Organisation for Eco-nomic Co-operation and Development; PPI = private participation in infrastructure. Totals may not add exactly because of rounding errors.
Table 10.2 Road Sector Spending Needs
$ billions annually Percentage of GDP
Country typeCapital
expenditure
Operation and
maintenanceTotal
spendingCapital
expenditure
Operation and
maintenanceTotal
spending
Sub-Saharan Africa 5.98 3.65 9.63 0.93 0.57 1.50
Middle income 0.40 0.46 0.86 0.15 0.17 0.32
Low income, fragile 1.89 0.83 2.72 4.92 2.15 7.07
Low income, nonfragile 1.84 1.23 3.07 1.67 1.11 2.78
Resource rich 1.86 1.14 3.00 0.84 0.51 1.35
Source: Carruthers, Krishnamani, and Murray 2008.Note: Totals may not add exactly because of rounding errors.

220 AFRICA’S INFRASTRUCTURE: A TIME FOR TRANSFORMATION
low (typically less than 10 kilometers an hour). Even for national traffi c, the exceptionally high road freight tariffs in parts of Africa—reaching $0.13 per tonne-kilometer in Central Africa—are attributable more to high profi t margins (60–160 percent) than to any inherent cost dis-advantage (table 10.4).
Marked performance differences occur across subregions. Performance is worst in Central and West Africa and best in southern Africa, with East Africa in between. The dif-ference can be explained by industry cartels in Central and West Africa, together with the tour de role regulatory framework. That framework is based on market sharing and centralized allocation of freight that limits vehicle mile-age and undermines incentives for improving fl eet quality. In southern Africa, by contrast, a much larger share of freight traffi c is allo-cated through competitive bilateral contracts between clients and shippers.
Rural Road TransportMost rural transport takes place near vil-lages. Trips generally involve short distances and small loads carried on paths, typically for marketing, collecting water and fi rewood, and tending crops and animals. Most trips are walking trips. Nonmotorized transport, such as a bicycle, is often unaffordable, and where mechanical transport is available to the household, it tends to be appropriated by a male household head. Changing this practice may be a demanding cultural task; in some parts of Africa, women’s use of bicycles may be considered unseemly. Nevertheless, when enough women begin to use them and the benefits to the whole household become apparent, the practice may rapidly gain social acceptance, as it has in parts of Burkina Faso.
Out-of-village travel by motorized transport, from villages to market towns and from towns to cities, is less common. Supply is typically fragmented and informal, and rural com-munities are often captive markets for local monopolists.
Urban Road TransportBuses are the common mode of public tran-sit in most cities (Kumar and Barrett 2007). Except in a handful of cases, however, mini-buses are much more prevalent than large buses. About twice as many trips are taken by minibuses and shared taxis than by large buses. The use of motorcycles for commercial transport has also grown very rapidly in recent years, mainly because of the poor state of the roads and the inability of bus companies to meet growing demand. Small-scale suburban rail networks exist in a few cities, but nowhere do they account for more than 2 percent of the market.
Supply is inadequate and tariffs are high. Most African cities have 30–60 public trans-port vehicle seats per 1,000 residents, but only 6 large bus seats per 1,000 residents (compared with 30–40 in middle-income countries). Low fl eet capacity is exacerbated by poor use of the limited vehicle fl eet, with vehicles achieving fewer than 200 kilometers a day. The quality of public transport is consequently poor, with long walking and waiting times typically dou-bling the in-vehicle time. Extreme overcrowd-ing is also common, particularly on large buses. The average cost of a one-way trip, at about $0.30, is high in relation to household budgets. Regulations that keep fares for large buses below those of minibuses and inappro-priate cost benchmarks have contributed to the demise of large buses.
Table 10.4 Overview of Key Road Freight Parameters on Main International Corridors
CorridorRoads in good condition (%)
Trade density ($ millions per
kilometer)
Implicit velocity (kilometers per hour)
Freight tariff ($ millions per
tonne-kilometer)Profi t
margins (%)
Western 72 8.2 6.0 0.08 80
Central 49 4.2 6.1 0.13 70–160
Eastern 82 5.7 8.1 0.07 70–90
Southern 100 27.9 11.6 0.05 20–60
Source: Teravaninthorn and Raballand 2008.

Roads: Broadening the Agenda 221
Minibus ownership is generally highly fragmented, with most individual entre-preneurs owning no more than one or two vehicles, generally rented out to drivers. Pow-erful unions, associations, or syndicates that organize the sector and provide a degree of self-regulation, typically based on equitable sharing of the market in the tour de role sys-tem, offset the highly fragmented ownership. This approach contributes signifi cantly to poor vehicle use and to long walking times and waiting times at terminals.
Although not confi ned to the urban trans-port situation, road safety is also a very seri-ous issue in most African countries. In the early 2000s, nearly 3,000 people were killed on Kenyan roads annually, about 68 deaths per 1,000 registered vehicles, 30 to 40 times the rate in highly motorized countries. Traffi c accidents are the third-leading cause of death after malaria and HIV/AIDS, presenting major public health problems in disability and health care costs.
Moving Forward—Broadening the Reform Agenda
The institutional reform agenda needs to be completed and broadened to encompass the demands of urban and rural connectivity. This connectivity is not just about physical infrastructure; it is also about the regulatory framework governing transport services. The recent (and likely continuing) escalation of unit road costs will strain already stretched transport budgets. Road safety also remains a concern. To deliver on these challenges will require continuing emphasis on creating effi cient agency structures to manage road programs and strengthen government capa-bilities for oversight. The agenda comprises the following:
• Completing institutional reforms
• Increasing rural accessibility
• Developing urban transport services
• Liberalizing road freight transport
• Dealing with escalating unit costs
• Improving road safety.
Completing the Institutional ReformsCountries with road funds are more successful in safeguarding road maintenance expendi-tures and spending on segments that maxi-mize network value, while those that also have road agencies see greater funding going to better road quality. Although sector reforms are widespread, closer inspection reveals that the quality and depth of those reforms are quite variable across countries.
Road funds need to be designed in line with accepted good-practice criteria. Key areas of defi ciency include (a) a lack of user represen-tation on road fund boards, (b) the absence of direct transfer mechanisms to ensure that fuel levy revenues go directly to the fund (circum-venting national budgets), (c) a strong legal foundation for road funds to safeguard their autonomy, (d) clear allocation rules for road fund revenues, and (e) a lack of systematic economic analysis guiding resource alloca-tion. Some evidence indicates that the benefi ts of road funds are larger where countries adopt the full set of good-practice design criteria.
Fuel levies need to be set at an adequate level and supported by an effective revenue col-lection mechanism. Although many countries have fuel levies, only a subset is high enough (over $0.10 a liter) to generate revenues com-mensurate with road maintenance require-ments. Even where levies are right, diffi culties in revenue collection can prevent their full cap-ture. Effective administration is thus equally important.
Effi cient road implementation agencies are a necessary complement to road funds, ensur-ing that resources are well spent; however, quasi-autonomous road agencies are not yet as widespread as road funds. Moreover, many of them fall short of good practice, particularly in autonomy and user representation on boards. A key element for their success appears to be the adoption of performance-based mainte-nance contracts, which are still less developed in Africa than in other regions.
Although agencies can overcome con-straints of public sector salaries and processes, government structures must still carry out key functions: (a) determining road standards, (b) carrying out road classifi cations, and (c) set-ting long-range planning goals. Governments

222 AFRICA’S INFRASTRUCTURE: A TIME FOR TRANSFORMATION
will continue to formulate transport policy and to regulate and oversee the new road insti-tutions. If they do not perform these functions effectively, the new institutions are bound to suffer. For example, road funds will not get the revenue increases they need, and road agen-cies will be unable to deliver realistic network improvement programs.
Increasing Rural AccessibilityProviding full road accessibility to 100 percent of Africa’s rural inhabitants would entail a vast expansion in the all-season road network, vir-tually tripling its length. For many countries, this goal is unlikely to be affordable in the medium term, highlighting the need to care-fully select and prioritize rural road invest-ments. One way of doing so is to strategically align rural road investments with agricultural development programs at the national level, to prioritize those rural roads likely to have the largest effect on agricultural productivity and market access. Recent analysis of Central Africa suggests that the most attractive rural road investments may lie in areas that are at some distance from major urban markets but still within reasonable reach, because in these cases, rural road investments may be the criti-cal intervention needed to open up market accessibility (Briceño-Garmendia and others 2009a, 2009b). By contrast, road investments in very isolated rural areas may be less attrac-tive because they would not make enough of a difference in overall travel times to provide adequate market access.
Given the vast scale of Africa’s potential rural road network, the issue of keeping down unit costs becomes particularly critical. Policy mak-ers face a stark trade-off between the standard to which rural roads are built and the length of the rural network that can be developed for any given budget envelope. This choice raises questions about what kind of rural roads farm-ers really need. In many rural communities, volumes of production may be well below the threshold needed to justify the use of a truck to collect produce, and simpler roads targeted more at ensuring accessibility for two-wheeled vehicles or animal-drawn carts may be more suitable (Raballand and others 2009). In other settings, ensuring all-season accessibility may
be achievable simply through spot improve-ments at vulnerable points (such as creeks and riverbeds) without the need to upgrade the surface of the road along its entire length.
Whatever the chosen objective for rural road development, fi nancing will likely remain a challenge. Local governments mobilize only modest revenues of their own, with market and business taxes as the main sources. Intergov-ernmental transfers are thus the main source of domestic funding for local government spending in many countries. This situation poses three main problems. First, throughout most of Sub-Saharan Africa, less than 5 percent of aggregate public revenue is generally made available to local governments managing rural networks. Second, general budgets rarely allocate adequate funds for maintaining main roads, much less rural roads. Third, capital and recur-rent allocations to local governments are usually not fungible, and the allocation for recurrent expenditures may barely cover the salaries of the rural road unit. Moreover, the budget cycle dictates such transfers, so that central-to-local transfers are unlikely to be adequate and timely for maintaining local government roads.
Adequate, steady funding for local govern-ment maintenance is more likely to be forth-coming from a dedicated road fund, as long as some formal commitment exists in the road fund law to ensure that it accepts responsi-bility and provides for local roads. Although 60 percent of road fund revenues is typically allocated to the main interurban road network, countries have, to varying degrees, channeled portions to the maintenance of rural road net-works. This approach appears to be effective. Countries that allocate at least $0.015 of their fuel duties to rural roads have 36 percent of their rural networks in good condition, com-pared with 21 percent for those that do not.
Building full capacity for all management functions in each local government and com-munity is unrealistic and ineffi cient. Individ-ual local government networks are small, and the management contract for an individual local government may be too modest to attract competent consulting fi rms. In Madagascar, the average network for a local government is 140 kilometers; in Cameroon and Nigeria, it is 180 kilometers; and in Tanzania and Zambia,

Roads: Broadening the Agenda 223
it is 280 kilometers. All fall far short of the 500–2,000 kilometers needed to justify employing an engineer in a local unit. Joint service committees of local authorities can achieve economies of scale in procurement for the authorities they represent, but they usually require substantial technical assistance from central ministries or from the regional offi ces of a main road authority. In countries with an autonomous road authority responsible for main roads, local governments can contract with the road authority to manage the roads on their behalf or to assist with planning and procurement.
Some countries centralize the technical responsibility for rural roads. Relying on a road ministry or another central ministry to man-age rural roads has the advantage of a formal channel for technical support. However, the disadvantage is that the ministry often operates completely independently of the local govern-ment structure and thus is poorly connected to local needs and developments. In principle, a central coordinating unit for local govern-ment roads should perform as well as a central government rural roads department. In prac-tice, however, coordinating units for local gov-ernment roads are not always as strong as they need to be, as is illustrated by the experience of Tanzania and Zambia in the late 1990s.
Delegation of planning, procurement, and management has already been improved in many countries through the establishment of AGETIPs, and the national institutions have benefi ted from their association in AFRICA-TIP and from donor assistance. Considerable room for improvement exists in the work of the AGETIPs, however, particularly with respect to their technical capacity, the quality of preparatory studies and contract supervi-sion, and delays in project implementation (Diou, Henry, and Demy 2007).
The options are not mutually exclusive. For example, a joint services committee can use private consultants, hired through a con-tract management agency. The best option for managing local roads depends on many local factors, including the size of the authorities, the nature of the network, and the compe-tence of the private sector or higher public authority units.
Community infrastructure, including mainly unclassifi ed roads and paths for which no level of the formal government accepts responsi-bility, faces particular problems. Community contributions in cash and kind are suitable primarily for community roads and paths, but in-kind contributions may be ineffi cient, and other sources of money are necessary. Cost sharing between local communities and other government or external agencies can help raise the volume of resources mobilized and thereby increase the proportion of the network that receives regular maintenance. Well-structured donor fi nancing through rural road projects or through social and community or rural infra-structure funds can support investment in com-munity infrastructure. Cost sharing may also be effective in maintaining community roads. Many local authorities in Africa have more roads to maintain than they can afford, so cost sharing with communities has merit.
Lack of technical know-how often impedes community management. Communities in Sub-Saharan Africa need technical advice (on road design and standards, appropriate materi-als, work planning) and managerial advice (on fi nancial accounting, contract management, procurement) to perform the responsibilities that come with ownership.
For rural transport services, the main issues are increasing service quantity and keeping services affordable. The priority in transport services in rural areas must be to maintain basic year-round vehicle access for the types of vehicles likely to be operating. The quantity of access is even more important than the quality. Better rural telecommunications can provide the means of more effectively matching vehi-cles to loads. Given the monopoly power of service providers, communities can organize to increase their bargaining power through a collective lobby. Operating subsidies are usu-ally infeasible, but providing credit for vehicle purchases, possibly through piggybacking on agricultural credit programs, is an option.
Developing Urban Transport ServicesUrban public transport requires simultane-ous and integrated attention to planning urban structures, building and maintain-ing infrastructure, and organizing transport

224 AFRICA’S INFRASTRUCTURE: A TIME FOR TRANSFORMATION
services. In practice, these three primary functions are seldom housed in the same institution, and even where they remain with the central government, several ministries are usually involved. Only a handful of African cities have agencies with metropolitan responsibilities and overarching functions, and even those agencies lack the executive powers to implement their vision and must work through other units of government.
The institutional arrangements for urban roads are frequently complex. Legislation pertaining to roads is usually separate from that governing transport services, and several national and local bodies often share juris-diction. In Conakry, Guinea, several institu-tions are responsible for segments of the road network. In Accra, Ghana, responsibility for urban transport has been devolved from cen-tral to local government—at least in principle. However, local governments have neither the resources nor the technical know-how to carry out their assigned functions, so the ministry of transportation (through the department of urban roads) is effectively responsible for road maintenance and development.
In the passenger transportation market, the self-regulation of operators associations and cartels has ossifi ed fragmentation of informal operations and wasteful institution-alized procedures. Supply is inadequate and expensive. Two main options exist to remedy this situation: small and medium-size vehi-cles and, in the largest cities, light rail.
In principle, traditional, disciplined large-vehicle services could be reintroduced, but such attempts—in Dakar (Senegal), Accra, and other cities—have failed. The association of large vehicles with traditional large public monopoly companies made them vulnerable to political intervention and to the failures in cost control that destroyed them in the fi rst place. Moreover, although subsidies may be required to sustain service levels and fare aspirations, open-ended subsidies of a public operator will almost certainly pass the benefi t of subsidies to managers and employees rather than to passengers.
For some time, the small and medium-size vehicles must be part of the structure, not least because few governments have the fi scal
resources to reestablish a large-bus sector while the private sector remains wary of investing in large vehicles. The short-term options are thus to rely on self-regulation of the sector, which has usually failed, or to devise competitive structures, either “for” or “in” the market to build private confi dence in a managed private market. Attempts can also be made to stimu-late increased vehicle size, as in South Africa. This sort of strategy has achieved limited success in some central Asian countries.
In the very largest cities, exclusive road-based track systems, such as bus rapid transit or (more costly) light rail, may have a role. Such developments are being considered in Dar es Salaam in Tanzania and Lagos in Nigeria, but they are still experimental.
Liberalizing Road Freight TransportFreight tariffs in much of Africa are unneces-sarily high because of restrictive regulation and weak competition among truckers. The most damaging aspect of trucking organi-zation is the combination of self-regulation with national protection. Both militate for the interests of the incumbent national operators at the expense of their customers. They cre-ate scope for corruption while leaving socially costly problems (vehicle overloading) relatively untouched. Both areas offer alternatives.
Self-regulation is a means of maintaining on-the-road discipline in an excessively frag-mented market. It fi lls a vacuum created by the absence of effective public regulation. By its nature, it concentrates on ensuring an equita-ble distribution of traffi c between members of the association, typically through the wasteful operating procedure of tour de role dispatching. The alternative is a combination of freedom of entry and market pricing, with independent enforcement of rules on quality and operating behavior, as in effi cient road-haulage markets in Europe and the United States.
National protection appears to secure a “fair” share of traffi c for the haulers of each of the national partners in a transit market. It operates through quotas that reduce the use of vehicles and thus increase the costs. It is often supported by enforcing regulated rates, which deny the shipper the opportunity to shop around for a better deal. The alternative is to

Roads: Broadening the Agenda 225
combine free entry to the market with rigorous enforcement of national safety and operational behavior rules in all countries. Regulatory sys-tems would combine strict quality control with liberal approaches to pricing and market entry. Moving in this direction would include developing internationally agreed strategies to improve the range of elements on the main transit corridors and to strengthen enforce-ment on overloading.
Breaking the regulatory status quo in Cen-tral and West Africa is diffi cult because of a coalition of interest groups opposing change. Truckers have strong leverage on high-level authorities because they have enough monop-oly power to block trade. Governance issues also intrude because some high-level authori-ties own or indirectly control trucks or truck-ing companies and thus benefi t from the status quo and current market-sharing schemes.
Deregulating the trucking industry in Cen-tral and West Africa is thus more of a politi-cal and social challenge than a technical one. The main concern is the potential reduction in the number of trucks to match demand in road transport. That reduction could lead to a drop in trucking employment and profi ts, because some companies (or owner-operators) would disappear and others would shrink, and these social effects would need to be mitigated. Some chance exists that the coalition of inter-est groups opposing change in the transport market in most countries in Central and West Africa might not resist reforms if compensation schemes pay, at least partly, for the social costs.
The southern African international trans-port market is a good model for the rest of the continent because it combines liberalizing entry with enforcing quality and load-control rules applicable to all operators. Operations to and from South Africa are governed by bilateral agreements that provide for sharing information on traffi c development and defi ne the types of permits that can be issued. This system restricts the carriage of bilateral trade to operators from the two countries concerned and prohibits cabotage.2 It does not establish quotas, however, and it allows rates to be deter-mined by the market to enable direct contract-ing between shippers and transporters and giving incentives to effi cient operators.
Dealing with Escalating Unit CostsThe recent escalating costs of roadwork can be attributed to rising input costs against a backdrop of growing demand for contracting, which appears to have been exploited in an environment of generally low competition for contracts. No one solution exists. Infl ation in input costs lies beyond the control of policy makers, but they can take other measures.
A key issue is to ensure effective compe-tition for contracts. Road agencies should actively market contracts to obtain a set of good bidders. If at any stage in the bidding a competitive choice set of bidders does not surface (say, at prequalifi cation), something is seriously wrong, and the agency should consider postponing the process until it has identifi ed and corrected the underlying issues. Continuing the bid without a proper choice set in the hope of achieving an acceptable bid price is an unnecessary gamble.
A better understanding of the underlying cost trends and their links to contract pric-ing is also critical. Although cost infl ation lies beyond the control of sector authorities, they can increase the accuracy of the design cost estimates, improve the allowance for cost fl uctuations, and monitor cost increases through the procurement period. To this end, agencies need to understand the cost struc-ture underlying road contracts more clearly and to track international price trends for key inputs over time.
The capacity of project-executing agencies also needs to be strengthened to support the timely implementation of contracts. Delays often result from defi ciencies in the planning and procurement of sector agencies, making this a third area for attention.
Whatever the improvements to road agency procurement processes, the unit costs of road infrastructure are likely to remain on an upward path, straining already limited sector budgets. Beyond measures to improve procure-ment, considering how to design roads to keep costs down is important. Overengineering of roads—beyond the surface type needed for the anticipated traffi c volume—is an issue in parts of Africa and represents a waste of resources that should be avoided. Careful economic analysis of road investments can avoid the

226 AFRICA’S INFRASTRUCTURE: A TIME FOR TRANSFORMATION
overengineering of networks observed in some countries. In addition, experimentation with innovative technologies that keep costs down, for example, by making greater use of locally available materials, deserves consideration.
Improving Road SafetyGovernments recognize the seriousness of the road safety problem. The February 2007 Pan-African Road Safety Conference, held in Accra, Ghana, resolved to set road safety as a national health and transport priority. Areas for fund-ing include (a) strengthening prehospital emergency services; (b) mainstreaming safety design issues in road investment programs; (c) collecting reliable road accident statistics; and (d) enacting national legislation to deal with speeding, driving unroadworthy vehicles, failing to use safety helmets, using mobile phones when driving, and driving under the infl uence of alcohol.
For institutional arrangements, the choice lies between establishing a special agency and broadly injecting safety skills and procedures (such as safety audits on projects and policies) in all relevant agencies. Involving transport, education, and health agencies is a minimum, which probably requires at least a national coordination agency, such as the National Transport Safety Committee in Ghana. To have authority, the agency needs to be directly responsible to the chief minister or the cabinet. The urban equivalent would be a special unit in the mayor’s offi ce.
For program composition, the choice lies between a sequence of consistent measures and a comprehensive “big bang” approach. Evidence from various parts of the world suggests that the greatest success is through concentrated, multidimensional programs of action. For example, Japan turned a situation from disastrous to exemplary over a fairly short period by combining more stringent rules on vehicle condition, speeding, and drunk driv-ing with very high-profi le publicity campaigns and strict enforcement by traffi c police. One of the most successful initiatives in Africa has been the comprehensive program intro-duced in the Richards Bay area of KwaZulu-Natal, based on a model already introduced in Victoria, Australia.
Above all, enforcement will have to be drastically improved. Eliminating corruption in licensing, enforcing on-road behavior, and inspecting and controlling vehicle conditions are essential. Using technology to eliminate arbitrariness in implementation, together with carefully designed market incentives, has worked well in privatizing vehicle inspections in Mexico.
Notes The authors of this chapter are Kenneth Gwil-
liam, Kavita Sethi, Alberto Nogales, and Vivien Foster, who drew on background material and contributions from Rodrigo Archondo-Callao, Fanny Barrett, Cecilia Briceño-Garmendia, Robin Carruthers, Arnaud Desmarchelier, Ranga Krishnamani, Ajay Kumar, Gael Raballand, Karlis Smits, and Supee Teravaninthorn.
1. These networks typically comprise a centrally administered primary network plus secondary networks, but in Malawi, Nigeria, South Africa, and Uganda, only the primary network is cen-trally administered and included here.
2. Cabotage is the provision of transport within a country by a foreign operator.
ReferencesBriceño-Garmendia, Cecilia, Vivien Foster,
Hyoung Wang, Alvaro Federico Barra, and Ranga Rajan Krishnamani. 2009a. “Prioritizing Infrastructure Investments in the Democratic Republic of Congo: A Spatial Approach.” Report, Sustainable Development Department, Africa Region, World Bank, Washington, DC.
———. 2009b. “Prioritizing Infrastructure Investments in the Republic of Congo: A Spa-tial Approach.” Report, Sustainable Develop-ment Department, Africa Region, World Bank, Washington, DC.
Briceño-Garmendia, Cecilia, Karlis Smits, and Vivien Foster. 2008. “Financing Public Infra-structure in Sub-Saharan Africa: Patterns, Issues, and Options.” Background Paper 15, Africa Infrastructure Country Diagnostic, World Bank, Washington, DC.
Carruthers, Robin, Ranga R. Krishnamani, and Siobhan Murray. 2008. “Improving Connec-tivity: Investing in Transport Infrastructure in Sub-Saharan Africa.” Background Paper 7, Africa Infrastructure Country Diagnostic, World Bank, Washington, DC.
Diou, Christian, Michel Henry, and Babaly Deme. 2007. La Délégation de Maîtrise d’Ouvrage en Afrique en 2007. Republic of Senegal,

Roads: Broadening the Agenda 227
Public-Private Infrastructure Advisory Facility, and AFRICATIP. http://www.africatip.net/fr/publications/downloads/2008-11-11%2006:28:29/Rapport_AGETIP_MOD_vfi nale.pdf.
Gwilliam, Ken, Vivien Foster, Rodrigo Archondo-Callao, Cecilia Briceño-Garmendia, Alberto Nogales, and Kavita Sethi. 2008. “The Burden of Maintenance: Roads in Sub-Saharan Africa.” Background Paper 14, Africa Infrastructure Country Diagnostic, World Bank, Washington, DC.
Harral, Clell, and Asif Faiz. 1988. Road Deteriora-tion in Developing Countries. Washington, DC: World Bank.
Kumar, Ajay, and Fanny Barrett. 2007. “Stuck in Traffi c: Urban Transport in Africa.” Background Paper 1, Africa Infrastructure Country Diagnos-tic, World Bank, Washington, DC.
Raballand, Gaël, Somik Lall, Arnaud Desmarchelier, and Patricia Macchi. 2009. “Economic Geography and Aid Effectiveness in Transport in Sub-Saharan Africa.” Report, Transport Department, Africa Region, World Bank, Washington, DC.
Stankevich, Natalya, Navaid Qureshi, and Cesar Queiroz. 2005. “Performance-Based Contract-ing for Preservation and Improvement of Road Assets.” Transport Note TN-27, World Bank, Washington, DC.
Starkey, Paul, John Hine, Simon Ellis, and Anna Terrell. 2002. “Improving Rural Mobility: Options for Developing Motorized and Non-Motorized Transport in Rural Areas.” Technical Paper 525, World Bank, Washington, DC.
Teravaninthorn, Supee, and Gael Raballand. 2008. “Transport Prices and Costs in Africa: A Review of the Main International Corridors.” Working Paper 14, Africa Infrastructure Country Diag-nostic, World Bank, Washington, DC.
Van Zyl, Willem, Lynette Coetzer, and Chris Lombard. 2008. “Unit Costs of Infrastructure Projects in Sub-Saharan Africa.” Background Paper 11, Africa Infrastructure Country Diag-nostic, World Bank, Washington, DC.
World Bank. 2007. “Road Maintenance Initiative Matrix.” Sub-Saharan Africa Transport Program, World Bank, Washington, DC.

229
11Chapter
Railways: Looking for Traffi c
A frican railroads have changed greatly in the past 30 years. Back in the 1980s, many railway systems carried a large
share of their country’s traffi c because road transport was poor or faced restrictive regu-lations, and rail customers were established businesses locked into rail either through physical connections or (if they were para-statals) through policies requiring them to use a fellow parastatal. Since then, most national economies and national railways have been liberalized. Coupled with the general improve-ment in road infrastructure, liberalization has led to strong intermodal competition. Today, few railways outside South Africa, other than dedicated mineral lines, are essential to the functioning of the economy.
Rail networks in Africa are disconnected, and many are in poor condition. Although an extensive system based in southern Africa reaches as far as the Democratic Republic of Congo and East Africa, most other railways are disconnected lines reaching inland from the ports, serving small markets by mod-ern railway standards. Most were built rela-tively lightly, and few, other than Spoornet in South Africa, have invested in rehabilitat-ing and renewing infrastructure and rolling
stock. Moreover, various confl icts and wars have rendered several rail sections unusable. As a result, some networks have closed and many others are in relatively poor condition, with investment backlogs stretching back over many years.
Few railways are able to generate signifi -cant funds for investment. Other than for purely mineral lines, investment has usually come from bilateral and multilateral donors. Almost all remaining passenger services fail to cover their costs, and freight service tariffs are constrained by road competition. More-over, as long as the railways are government operated, bureaucratic constraints and lack of commercial incentives will prevent them from competing successfully. Since 1993, sev-eral governments in Africa have responded by concessioning their systems, often accompa-nied by a rehabilitation program funded by international fi nancial institutions.
For the most part, concessions have improved operational performance. Although results have been mixed, many concessionaires have increased traffi c volumes and have gener-ally performed more effi ciently, and there has been little evidence of monopolistic behavior. Relations with governments have often been
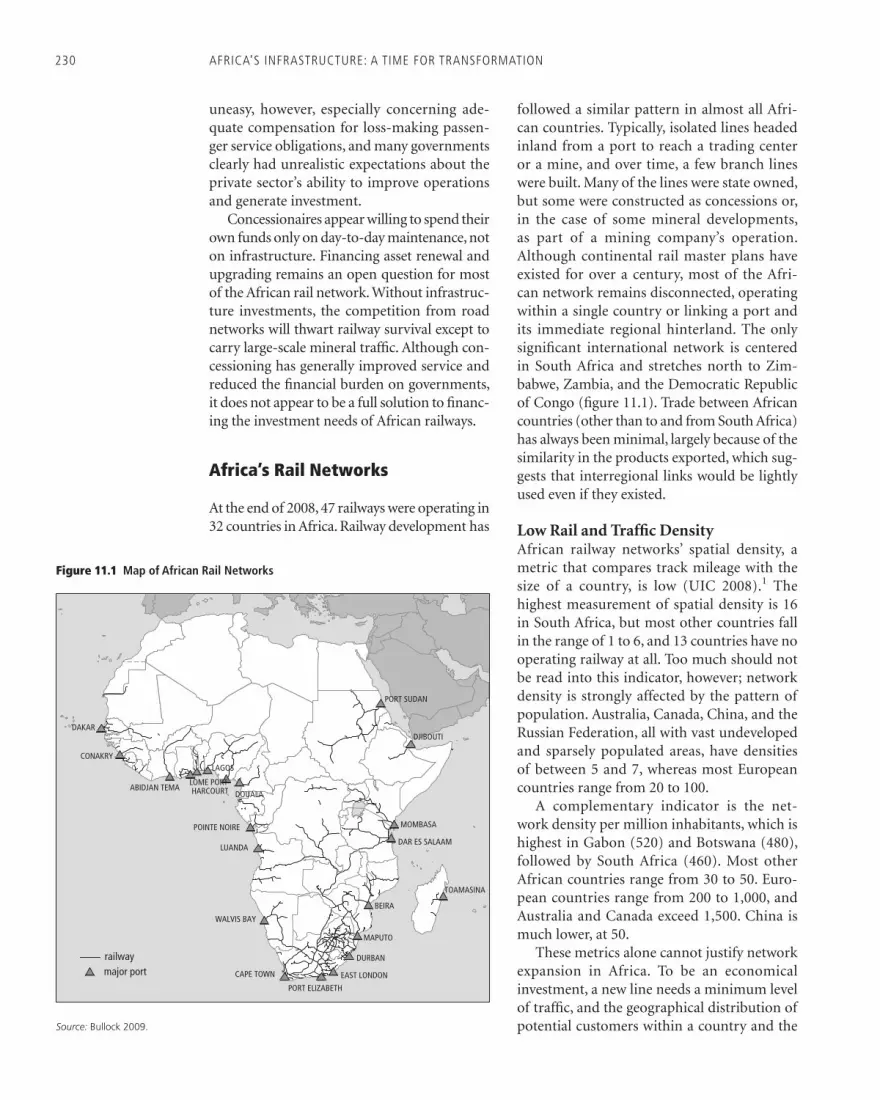
230 AFRICA’S INFRASTRUCTURE: A TIME FOR TRANSFORMATION
uneasy, however, especially concerning ade-quate compensation for loss-making passen-ger service obligations, and many governments clearly had unrealistic expectations about the private sector’s ability to improve operations and generate investment.
Concessionaires appear willing to spend their own funds only on day-to-day maintenance, not on infrastructure. Financing asset renewal and upgrading remains an open question for most of the African rail network. Without infrastruc-ture investments, the competition from road networks will thwart railway survival except to carry large-scale mineral traffi c. Although con-cessioning has generally improved service and reduced the fi nancial burden on governments, it does not appear to be a full solution to fi nanc-ing the investment needs of African railways.
Africa’s Rail Networks
At the end of 2008, 47 railways were operating in 32 countries in Africa. Railway development has
followed a similar pattern in almost all Afri-can countries. Typically, isolated lines headed inland from a port to reach a trading center or a mine, and over time, a few branch lines were built. Many of the lines were state owned, but some were constructed as concessions or, in the case of some mineral developments, as part of a mining company’s operation. Although continental rail master plans have existed for over a century, most of the Afri-can network remains disconnected, operating within a single country or linking a port and its immediate regional hinterland. The only signifi cant international network is centered in South Africa and stretches north to Zim-babwe, Zambia, and the Democratic Republic of Congo (fi gure 11.1). Trade between African countries (other than to and from South Africa) has always been minimal, largely because of the similarity in the products exported, which sug-gests that interregional links would be lightly used even if they existed.
Low Rail and Traffi c DensityAfrican railway networks’ spatial density, a metric that compares track mileage with the size of a country, is low (UIC 2008).1 The highest measurement of spatial density is 16 in South Africa, but most other countries fall in the range of 1 to 6, and 13 countries have no operating railway at all. Too much should not be read into this indicator, however; network density is strongly affected by the pattern of population. Australia, Canada, China, and the Russian Federation, all with vast undeveloped and sparsely populated areas, have densities of between 5 and 7, whereas most European countries range from 20 to 100.
A complementary indicator is the net-work density per million inhabitants, which is highest in Gabon (520) and Botswana (480), followed by South Africa (460). Most other African countries range from 30 to 50. Euro-pean countries range from 200 to 1,000, and Australia and Canada exceed 1,500. China is much lower, at 50.
These metrics alone cannot justify network expansion in Africa. To be an economical investment, a new line needs a minimum level of traffi c, and the geographical distribution of potential customers within a country and the
Figure 11.1 Map of African Rail Networks
Source: Bullock 2009.
DJIBOUTI
MOMBASA
DAR ES SALAAM
TOAMASINA
BEIRA
MAPUTO
DURBAN
EAST LONDON
PORT ELIZABETH
CAPE TOWN
WALVIS BAY
railwaymajor port
LUANDA
POINTE NOIRE
DOUALAHARCOURTLOME PORT
ABIDJAN TEMA
LAGOSCONAKRY
DAKAR
PORT SUDAN

Railways: Looking for Traffi c 231
level of usage that can be expected are more important than these national averages.
South Africa has the most important net-work (fi gure 11.2). Specialized mineral lines in western and southern Africa carry over half of the region’s freight, most of it on the Spoor-net coal and ore export lines. Southern Africa dominates general rail freight, handling over 80 percent of the freight traffi c on the non-mineral lines. Southern Africa also dominates the passenger business, with over 70 percent of passenger traffi c, largely because of its heavy commuter passenger business in cities. Some other African cities also operate commuter ser-vices, but with the exception of Dakar, Senegal, they mostly provide one or two trains at peak hours along a short line.
Traffi c density on African railways is gen-erally low.2 The highest average network traffi c density outside Spoornet is in Gabon (2.7 million traffi c units), with Cameroon and Swaziland having the only other railways over 1 million; many railways average fewer than 300,000 units (fi gure 11.3). By comparison, the average traffi c density of the Maghreb systems (Algeria, Morocco, and Tunisia) is nearly 2 mil-lion units, and the Arab Republic of Egypt, with its heavy passenger traffi c, exceeds 8 million. Most European systems average 2 million to 5 million, with densities under 1 million found only in Albania and Montenegro. With such light usage, many networks struggle to gener-ate enough funds just to maintain, much less renew, their infrastructure.
0
10
20
30
40
50
60
70
80
90
100
route-km passenger-km net ton-km
0
5
10
15
20
25
30
35
40
southern Africa Central Africa East Africa West Africa
rout
e-km
(tho
usan
ds)
perc
ent
0
2
4
6
8
10
12
14
southern Africa Central Africa East Africa West Africa
pass
enge
r-km
(bill
ions
)
0
20
40
60
80
100
120
140
southern Africa Central Africa East Africa West Africa
net
ton-
km (b
illio
ns)
a. Regional share of network and traffic c. Passenger transport
b. Route-kilometers in operation d. Freight transport
southern Africa Central Africa East Africa West Africa
general mineral general mineral
nonurban suburban
Source: Bullock 2009.Note: Southern Africa = Angola, Botswana, Madagascar, Malawi, Mozambique, Namibia, South Africa, Swaziland, Zambia, and Zimbabwe; Central Africa = Cameroon, the Democratic Republic of Congo, Gabon, and the Republic of Congo; East Africa = Djibouti, Eritrea, Ethiopia, Kenya, Sudan, Tanzania, and Uganda; West Africa = Benin, Ghana, Guinea, Mali, Mauritania, Nigeria, Senegal, and Togo.
Figure 11.2 Rail Network Size and Traffic by Region

232 AFRICA’S INFRASTRUCTURE: A TIME FOR TRANSFORMATION
low-speed, small-scale, undercapitalized net-works ill suited to modern requirements. Many structures and some of the track work are now over 100 years old. Many sections of track have deteriorated almost beyond repair. Although this situation can be tolerated on low-volume feeder lines, and indeed may be the only way some can be viably operated, it is a major handicap when competing against the modern roads being constructed in major corridors.
Most rail systems have considerable sections of track in need of repair or replacement. Some have major sections that are not in operation and will require rehabilitation before operations can resume. Even where service exists, poor track condition forces speed restrictions, resulting in lower railway competitiveness and rolling-stock productivity.
In some countries, parts of the network are not operated because of war damage, natu-ral disaster, or general neglect. Much of the Mozambican central and northern networks and railways in Angola, Côte d’Ivoire, Eritrea, Ethiopia, and the Republic of Congo either have been damaged or have had to suspend operations for as long as 20 years. The total African rail network is about 69,000 kilometers, of which some 55,000 kilometers is currently being operated (see fi gures 11.1 and 11.2). Almost all the network is single track, except for sections of the Spoornet network. Much of the South African network is electrifi ed, but the only other electrifi ed sections in Sub-Saharan Africa are in the mining region of the Demo-cratic Republic of Congo and a short section in Zimbabwe (the latter is not in use).
Signaling on many networks still relies on manual systems. On lines with low train den-sity, mechanical signals are adequate from a capacity viewpoint, but signifi cant safety problems can result from human error. Where power signaling has been installed, it often does not operate because of short circuits, lack of electrical power, and dilapidated cable networks. Telephone exchanges in many com-panies are similarly obsolete, with limited capacity and the need for spare parts that are virtually impossible to fi nd.
Most African railways use either the Cape gauge (1.067 meters or 3 feet, 6 inches) or the meter gauge. The main network in southern
Source: Bullock 2009.Note: The overall traffic units carried by a railway are the sum of the passenger-kilometers and the net tonne-kilometers of freight carried. This simple standard measure is widely used as a means of aggregat-ing freight and passenger traffic. The relative weighting of passenger and freight is conventionally taken as 1:1. BR = Botswana Railways; Camrail = Cameroon Railway Corporation; CCFB = Companhia dos Caminhos de Ferro da Beira (Mozambique); CDE = Chemin de Fer Djibouto-Ethiopien; CDN = Corre-dor de Desenvolvimento do Norte (Mozambique); CEAR = Central East African Railways Corporation (Malawi); CFCO = Chemin de Fer Congo-Océan (Republic of Congo); CFMK = Chemin de Fer Matadi-Kinshasa (Democratic Republic of Congo); CFM = Caminhos de Ferro do Mocambique; FCE = Fianarant-soa Côte Est (Madagascar); GRC = Ghana Railways Corporation; NRC = Nigeria Railways Corporation; OCBN = Organisation Commune Bénin-Niger; RSZ = Railway Systems of Zambia Ltd; RVRC-KRC = Rift Valley Rail Corporation-Kenya Railways Corporation; RVRC-URC = Rift Valley Rail Corporation-Uganda Railways Corporation; SETRAG = Société Transgabonnaise (Gabon); SNCC = Société Nationale des Chemins de Fer du Congo (Democratic Republic of Congo); SR = Swaziland Railways; SRC = Sudan Railways Corporation; TAZARA = Tanzania-Zambia Railway; TRC = Tanzania Railways Corporation.
Figure 11.3 Average Railway Network Traffic Density, 2001–05
0 500 1,000 1,500 2,000 2,500 3,000 3,500
Transnamib, Namibia
SRC, Sudan
TAZARA, Tanzania
BR, Botswana
SR, Swaziland
SNCC, Dem. Rep. of Congo
CFM, Mozambique
CFCO, Rep. of Congo
GRC, Ghana
CDE, Ethiopia
OCBN, Benin
CFMK, Dem. Rep. of Congo
NRC, Nigeria
FCE, Madagascar
SETRAG, Gabon
RVRC-KRC, Kenya
TRC, Tanzania
Camrail, Cameroon
Sitarail, Burkina Faso and Côte d’Ivoire
RSZ, Zambia
Transrail, Mali
RVRC-URC, Uganda
CCFB, Mozambique
CDN, Mozambique
CEAR, Malawi
Madarail, Madagascar
conc
essi
oned
stat
e ow
ned
traffic units per route-km (millions)
passenger freight
Dilapidated InfrastructureMost networks outside South Africa still operate with their original facilities. Limited upgrading has occurred, but the lines can still be characterized as relatively low axle-load,

Railways: Looking for Traffi c 233
and central Africa uses the Cape gauge, which is also used in some anglophone countries far-ther north. The meter gauge is used in most of francophone Africa and much of East Africa. A number of isolated standard-gauge lines are used primarily for mineral traffi c, although Nigeria is developing a new standard-gauge network to serve its capital, Abuja. Narrow-gauge lines have operated at various times, but most are now derelict. Apart from the network in East Africa and the one extending north from South Africa, few railways cross international borders. Instead, they reach rail-heads from which traffi c can be carried farther by road.
Despite the multiplicity of gauges, interop-erability is not a major problem in Africa. Two gauges exist in the same location in only three places—two in Tanzania and one in Guinea. However, mixed gauges will become a problem if some of the proposed connecting lines are constructed.
In summary, most African railways are con-fronting major infrastructure problems pri-marily associated with aging track: insuffi cient ballast, rail wear, deteriorating earthworks and formation, decrepit structures, and rail signal-ing and telecommunications with obsolete equipment and lack of spare parts. The cost of rehabilitating the networks is large compared with the existing traffi c volumes and revenues. The means by which rehabilitation can be done on a sustainable basis is the central ques-tion faced by most African railways.
The African Rail Market
Typically railways in Africa are small, carrying no more traffi c than a moderately busy branch line in other parts of the world. African rail-ways carry far more freight than passengers, with freight averaging about 80 percent of traffi c between 1995 and 2005. Almost all rail-ways carry passenger traffi c; only Swaziland and Uganda have freight-only railways. The passenger business is steadily shrinking, how-ever, and several of the railways still retaining a reasonable passenger business do so only because competing road networks are in poor condition or do not exist.
Traffi c—Low and Growing SlowlyOutside South Africa, the traffi c volumes serviced by African railways are very small; about half of the 26 railway operators sur-veyed carried traffi c of less than 500,000 traffi c units annually, while only 5 of them exceeded 1 million traffi c units annually—a volume comparable to a moderately busy branch line on other railways (fi gure 11.4). By comparison, Spoornet in South Africa carries 1 million traffi c units every three days (Thompson 2007). In some cases, the light traffi c is caused by a lack of demand; in oth-ers, it is caused by shortages of rolling stock, particularly locomotives.
Although the average haul on African net-works is relatively long with regard to their size, it is not especially so vis-à-vis road trans-port. Some railways carry mostly end-to-end traffi c; Tanzania Railways Corporation, Tazara (Tanzania-Zambia Railway Authority), and Transrail (Dakar-Bamako Railway) all haul freight an average distance of 1,000 kilometers, and some smaller railways, such as Uganda Railway or CEAR (Central East African Rail-ways), act as feeders to other systems, which carry the traffi c a few hundred kilometers farther. These systems have a good chance of competing for general freight traffi c, even as a road network improves, as long as satisfactory service levels can be achieved, but the shorter systems that require transshipment to road at railheads will generally fi nd they can compete effectively only for bulk traffi c.
Most systems operate only limited passen-ger commuter services, if any, and the aver-age distance of passenger trips is the distance between the capital of a country and major provincial centers. The only signifi cant cross-border fl ows are on the Sitarail (Côte d’Ivoire), Tazara, and Transrail networks.
Since the mid-1990s, most African coun-tries experienced steady economic growth. Average annual GDP grew 4 percent, with cor-responding increases in trade. Per capita GDP grew by about 1.5 percent a year. Countries such as Mali, Mozambique, and Tanzania that avoided political upheaval grew as much as 50 percent faster. Despite the generally favor-able economic background, only four African railways increased both their passenger and

234 AFRICA’S INFRASTRUCTURE: A TIME FOR TRANSFORMATION
have been concessioned, freight traffi c has gen-erally increased, whereas passenger traffi c has generally stagnated or declined.
The growth or decline of traffi c on many systems over the last decade often had little to do with changes in the underlying demand. War or natural disaster has had a major effect in some cases; on other railways, the volume carried refl ects the availability of rolling stock, particularly locomotives. Many railways are short of locomotives. When this situation improves with new or secondhand locomo-tives or through a locomotive rehabilitation project, traffi c will increase accordingly.
Passenger Services—in DeclineSeveral African cities have announced plans to introduce modern heavy-rail suburban com-muter networks. Such services are currently limited to South Africa and Dakar, Senegal. Experiences elsewhere in the world suggest that any new services will need substantial external fi nancial support for both capital and recurrent operating costs and should be oper-ated by new independent transport authori-ties. Almost all other passenger services face strong competition from buses and shared taxis in both price and service frequency, and few corridors remain in which rail passenger services are the only means of transport. Bus fares are typically about 30–50 percent higher than the economy rail fare, but on most routes buses are faster (sometimes twice as fast) and more frequent. Buses have the lion’s share of the market, although they suffer from the same problems as rail: unreliable departures, delays and breakdowns, and overcrowding.
The long-term prospects for nonurban rail services are generally poor (Amos and Bullock 2007). Rail services start competing with roads at speeds higher than 70 kilometers per hour. However, the cost of maintain-ing track and signaling systems that would enable these commercial speeds is signifi -cantly more than the cost of maintaining the 30- to 40-kilometer-per-hour commercial speed needed for a freight railway. In addi-tion, a very large capital investment would be required to construct new medium-speed (for example, 200 kilometers per hour) inter-urban railways. Such investment is justifi ed
200
400
600
800
1,000
1,200
1,400
1,600
1,800
2,000
conc
essi
oned
stat
e ow
ned
traffic units (millions)
Transnamib, Namibia
0
SRC, Sudan
TAZARA, Tanzania
BR, Botswana
SR, Swaziland
SNCC, Dem. Rep. of Congo
CFM, Mozambique
CFCO, Rep. of Congo
GRC, Ghana
CDE, Ethiopia
OCBN, Benin
CFMK, Dem. Rep. of Congo
NRC, Nigeria
FCE, Madagascar
SETRAG, Gabon
RVRC-KRC, Kenya
TRC, Tanzania
Camrail, Cameroon
Sitarail, Burkina Faso and Côte d’Ivoire
RSZ, Zambia
Transrail, Mali
RVRC-URC, Uganda
CCFB, Mozambique
CDN, Mozambique
CEAR, Malawi
Madarail, Madagascar
passenger-kmnet tonne-km
Source: Bullock 2009.Note: Traffic units are passenger-kilometers in the case of passenger traffic and net tonne-kilometers in the case of freight traffic. BR = Botswana Railways; Camrail = Cameroon Railway Corporation; CCFB = Companhia dos Caminhos de Ferro da Beira (Mozambique); CDE = Chemin de Fer Djibouto-Ethiopien; CDN = Corredor de Desenvolvimento do Norte (Mozambique); CEAR = Central East African Railways Corporation (Malawi); CFCO = Chemin de Fer Congo-Océan (Republic of Congo); CFMK = Chemin de Fer Matadi-Kinshasa (Democratic Republic of Congo); CFM = Caminhos de Ferro do Mocambique; FCE = Fianarantsoa Côte Est (Madagascar); GRC = Ghana Railways Corporation; NRC = Nigeria Railways Corporation; OCBN = Organisation Commune Bénin-Niger; RSZ = Railway Systems of Zambia Ltd; RVRC-KRC = Rift Valley Rail Corporation-Kenya Railways Corporation; RVRC-URC = Rift Valley Rail Corporation-Uganda Railways Corporation; SETRAG = Société Transgabonnaise (Gabon); SNCC = Société Nationale des Chemins de Fer du Congo (Democratic Republic of Congo); SR = Swaziland Railways; SRC = Sudan Railways Corporation; TAZARA = Tanzania-Zambia Railway; TRC = Tanzania Railways Corporation.
Figure 11.4 Average Railway Traffic Volumes, 2001–05
freight traffi c over the period, two of which had been concessioned. One other railway saw an increase in average passenger traffi c, and all others saw a reduction. Fifteen railways increased their freight traffi c. Where railways

Railways: Looking for Traffi c 235
only on the basis of substantial demand (sev-eral million passengers a year) and relatively high-income passengers who can afford to cover at least operational costs. Few, if any, corridors in Africa could justify such invest-ments, at least for the medium term.
Formal compensation schemes, such as pub-lic service obligations, have been introduced in a few cases to support passenger rail services, but they rarely provide timely compensation for service operations. Payment may be delayed several years or may otherwise take the form of a subsidy calculated to break even, limiting the ability of railways to increase their main-tenance and negating any attempts to improve the fi nancial performance of the freight ser-vices. As a result, most long-distance passenger services in Africa are trapped in a cycle of mini-mal investment, deteriorating services, declin-ing patronage, and fi nancial losses.
The few instances in which local trains serve villages with no road connection pose a differ-ent problem. These trains are used by traders bringing goods to and from regional centers, and although heavily loaded with passengers, they nonetheless incur major losses. Although such services can be funded through govern-ment subsidy, the long-term solution is to cre-ate feeder roads for motorized access, enabling more cost-effective means of transporting goods and greatly improving accessibility to such locations.
Freight—Needs ImprovingFreight traffi c on railways is mostly bulk and semibulk commodities, principally to and from ports. The actual commodities transported by rail refl ect the economic structure of countries served by the railway, with mining products important in several countries and timber and export crops important in West Africa. Imports are mostly manufactures, such as cement and petroleum products, and general freight. On some systems, much of the general freight is containerized (cash crops with high value are increasingly traveling this way), particularly when the trip involves crossing an intermedi-ate border before reaching the port. Unlike pas-senger services, signifi cant imbalances between traffi c in the two directions are common. Even where tonnage is approximately balanced, the
differences in the commodity mix, with many requiring specialized cars, mean freight trains are rarely fully loaded in both directions. In some cases, this natural imbalance in traffi c is accentuated for rail because road vehicles deliv-ering imports tend to backload freight at mar-ginal cost, leaving rail to transport the remaining freight without a compensating return load.
Average freight tariffs range from $0.03 to $0.05 per net tonne-kilometer, similar to tariffs on other general freight railways in compara-ble countries. Tariffs are generally constrained by competition, either from road or alternate routes (particularly in the Great Lakes region, Malawi, West Africa, and Zambia) and are also infl uenced by the traditional value-based tar-iff structures, the relative cost of carrying dif-ferent commodities (as refl ected in net tons per railcar round-trip), direction of travel, and volume. Although most rail rates are well below comparable road rates, especially for containers, rail typically carries only 20–50 percent of the traffi c in a corridor, and some of the smaller state-owned railways have an even smaller share.
Line-haul tariffs are only part of the cost equation for freight traffi c. Much is often made of the inherent lower cost of rail com-pared to road. This is true where minerals must be transported from a rail-connected mine to a rail-connected port but is not so clear for medium-distance general freight that also must be transported by road to and from railheads. Haulage between the railway and the ultimate origin and destination can be surprisingly expensive, often as much as the equivalent of 200–300 kilometers of line-haul transport, negating any advantage rail may have in pure line-haul tariffs. New sidings are sometimes constructed, but they need a certain amount of traffi c to be economical. Traffi c that needs to be collected at a central depot before being dispatched by rail is more vulnerable to road competition, and even bulk traffi c is not immune if distances are not too long. In many countries, collection and distribution chains are being streamlined, often eliminating up-country depots and distribution centers, and marketing channels have become more diver-sifi ed. The railways have often been slow to respond, steadily losing market share.

236 AFRICA’S INFRASTRUCTURE: A TIME FOR TRANSFORMATION
Level of service is a key factor in the freight business. For rail to play a signifi cant role in the general freight transport system, it must improve its service (specifi cally, overall tran-sit time, reliability, security, and service fre-quency) and ensure that it is addressing the needs of customers. Too often, what rail has offered as transport has been quite different from what the competing road hauler can offer, and road carriers can charge a signifi cant premium. In general, freight markets in Africa require reliable services (a commercial speed of 40 kilometers per hour is usually suffi cient) rather than high-speed services, with (a) rail infrastructure and rolling stock maintained for service, (b) operating discipline to ensure that schedules are maintained, and (c) commercial arrangements that ensure that customers fulfi ll their contractual responsibilities.
Most railways can win bulk mineral traffi c when it is offered, but general freight requires a reasonable level of service from rail if it is to compete with road without offering a sig-nifi cant price discount. By 2025, any remain-ing monopolies for general freight will have run their course, and the only traffi c on which African railways will have an undisputed grip will be minerals (although mining compa-nies are increasingly running even this traf-fi c directly, either as third-party operators or on their own private networks). Experience in many countries has shown that general freight transport requires operators to be fl exible, responsive, and adaptable. Fewer custom-ers are fellow parastatals under order to use a state-owned railway, and few government-owned organizations, no matter how cor-poratized they may be, have the commercial freedom to operate effectively in a fully com-petitive environment.
Rail in Africa must become a transport busi-ness in the broadest sense and must be able to adapt to new markets. The predicaments of the remaining government-owned railways, how-ever, show that rail cannot compete effectively while it is handicapped by the bureaucratic con-straints and lack of commercial incentives and accountability of a government organization. Achieving an acceptable level of service, com-bined with fl exible pricing policies and a strat-egy of providing a transport service as opposed
to merely a line-haul operation, can reduce the price discount between rail and road, increas-ing the contribution that freight can make to the maintenance and renewal of infrastructure. This improvement is one of the major benefi ts a concessionaire can offer a state-owned railway.
Moreover, because of the lack of inter-connection services and cross-border service contracts, rail freight suffers huge delays in crossing national borders. For example, a rail freight journey of 3,000 kilometers from Kolwezi on the Democratic Republic of Congo border to the port of Durban in South Africa takes 38 days to complete, an effective speed of only 4 kilometers per hour. Only 9 of these days are spent traveling, with the remainder (a staggering 29 days) taken up primarily with loading and interchanging freight, as well as some time for customs clearance. Each day of delay costs $200 per railcar. The main cause of the problems in the rail sector is the absence of reliable interconnection services when trains cross borders. Locomotives from one country are currently not allowed to travel on another country’s network, mainly because of the inability to provide breakdown assistance to foreign operators. As a result, rail freight crossing borders must wait to be picked up by a different locomotive. The delays are often extensive, partly because of the lack of reli-able, well-maintained locomotives. Delays also refl ect the lack of clear contractual incentives to service traffi c from a neighboring country’s network. Reducing such delays would there-fore require totally rethinking the contractual relationships and access rights linking the rail-ways along the corridor. It would also likely require the establishment of a regional clear-inghouse to ensure transparency and fairness in reciprocal track access rights.
How Much Investment Can Be Justified?
Providing an estimate of the investment needed by African railways is a daunting task (Carruthers, Krishnamani, and Murray 2009). In addition to building detailed inventories and assessments of infrastructure and determining how much needs to be repaired or replaced, the question of

Railways: Looking for Traffi c 237
how much investment is economically justifi ed must be asked. Lines that have been superseded by road developments and those with low traffi c levels will rarely merit reconstruction and invest-ment, and funds should instead be directed to those parts of the network with long-term value. Although a government’s desire to reinstate such links is understandable, doing so is often extremely expensive.
Investment has historically been used for new construction and rolling stock, for replacement of rolling stock, and sometimes for rehabilitation and replacement of track. Long-term maintenance neglect has caused a huge backlog investment of up to $3 billion for Africa’s railways. In practice, this one-time expenditure needed to eliminate the rehabili-tation backlog could be spread over a 10-year period at an annual rate of $300 million.
After the network is restored to good con-dition, the annual bill would fall substantially to cover only what was needed for ongoing track rehabilitation and renewal. Excluding South Africa, the Sub-Saharan network con-sists of about 44,000 kilometers of track, of which about 34,000 kilometers is operational. The infrastructure on this network will have a life of at least 40–50 years, given the gener-ally low traffi c volumes; the cost of periodic reconstruction (about $350,000 per kilome-ter) is thus equivalent to an annual cost of about $8,000 per kilometer. Few lines with an average density of fewer than 1 million net tons a year are likely to warrant this kind of major rehabilitation expenditure, because traffic would need to earn $0.08 per net tonne-kilometer to fund the reconstruction, whereas typical rail freight tariffs are no more than $0.05 per net tonne-kilometer. Lines with a density under 250,000 tons a year probably cannot support anything more than routine maintenance. Even if low-volume lines are reconstructed using cheaper, secondhand materials, this level of expenditure is unlikely to be justifi ed for more than 20,000 kilometers of the network. Overall, the ongoing annual cost of track reconstruction would thus aver-age approximately $100 million a year.
Sustaining an adequate fl eet of rolling stock will cost an additional $80 million a year. The cost of replacing rolling stock can be estimated
by using assumed average asset lives. Excluding South Africa, the Sub-Saharan network carries about 15 billion net tonne-kilometers a year, excluding the mineral lines, and about 4 billion passenger-kilometers. That level of traffi c will require, on average, replacing 500 freight cars, 20 passenger cars, and about 20 locomotives a year. As with infrastructure, much of that stock will be secondhand (from India or South Africa), but the estimated cost will still average about $80 million a year, equivalent to about $0.04 per net tonne-kilometer or passenger-kilometer. The steady-state investment in the African network north of South Africa should thus be about $200 million a year (allowing $20 million for facilities, maintenance, equip-ment, and other costs).
That amounts to a combined annual pro-gram of about $500 million for 10 years, after which investment would drop to the steady-state level of $200 million (Bullock 2009). The $500 million a year requirement refers to the period during which the rehabilitation back-log is being cleared. These calculations are only broad order-of-magnitude estimates. However, the amount needed to overcome these prob-lems is large, equal to the annual revenues of some of the railways and well beyond their capacity to self-fi nance. The only option in most cases is to seek large concessional loans or grants from third parties.
In addition to reinvestment in the cur-rent network, investment in new projects is a possibility. For years, proposals have been fl oated to create new routes for landlocked countries and to integrate the isolated net-works. The most comprehensive proposal was the 1976 master plan of the Union of African Railways for a pan-African rail network that included 26,000 kilometers of new construc-tion. Designed to create a grid to support intra-African trade development and regional economic integration, the plan was approved by the Organization of African Unity in 1979, but few, if any, of the proposed links have gone beyond the drawing board. The Union of African Railways is now concentrating on a revised plan containing a subset of 10 cor-ridors, some of which are already partially constructed, and the proposal has generated a number of regional studies and action plans.

238 AFRICA’S INFRASTRUCTURE: A TIME FOR TRANSFORMATION
Several proposals for individual segments have been made, and mining companies have pro-posed a number of dedicated mineral lines.
Few of these projects will be fi nancially or economically viable. The cost of new construc-tion of a single-track, nonelectrifi ed railway on relatively fl at terrain is at least $1.5 million per kilometer, increasing to about $5 million in more rugged country. In many cases, the pro-posed new routes would compete with existing road and rail routes, which would constrain the rates that typically could be charged to at most $0.05 per net tonne-kilometer. In the case of export mineral traffi c, the potential rate is generally constrained to about $0.02–$0.03 per net tonne-kilometer by the long-term delivered market price. Because a serviceable two-lane road can generally be constructed for approxi-mately $1 million per kilometer, the additional rail investment would be economically justifi ed only if expected traffi c was at least 2 million–4 million tons a year. If the capital costs of the infrastructure do not have to be recovered, the lines can probably be operated successfully at 0.5 million–1.0 million ton.
Institutional Arrangements and Performance
Until the 1980s, almost all African railway companies were publicly owned corporations, with varying degrees of fi nancial and manage-ment autonomy. Attempts at commercializa-tion while retaining public ownership were generally unsuccessful, and concessions were introduced in the 1990s. Under concessional arrangements, the state remains the owner of all or some of the existing assets, typically the infrastructure, and transfers the other assets (normally the rolling stock) and the responsibility to operate and maintain the rail-way to a concessionaire.
Most countries in Central, East, and West Africa have moved all or part of the way to con-cessioning, often under the pressure of multi-lateral and bilateral organizations that have until recently been the only source of large loans for asset rehabilitation and renewal. With the exception of southern Africa (Botswana, Namibia, South Africa, and Swaziland) and
countries suffering or recovering from civil disruption (Angola, the Democratic Republic of Congo, and Zimbabwe), most countries are at various stages of reform. Of the 30 African countries with publicly owned railways, 14 have opted for a concession arrangement and 1 oper-ates under a management contract (fi gure 11.5). Four others have begun the process.
Concessions—Becoming the NormThe introduction of concessions has required substantial changes in the legal and regulatory framework in many countries. In the franco-phone countries, concessions can generally be done within the existing legal system, but most anglophone countries have had to amend their railway acts. Arrangements have also been made for the economic and safety regulation of concessions, and new government bodies have been established to own the assets leased to the concessionaires.
Those railways that have not been conces-sioned remain subject to signifi cant political and governmental influence. Arrangements vary across countries, but the sectoral minis-try (normally transport) exercises political and administrative control, while the ministry of fi nance exercises fi nancial control. Board direc-tors are generally a combination of ministry offi cials and internal senior management, who are often appointed by the government. Over-sight is nominally assigned to the parliament, but in practice such control may be limited to an audit of the company accounts in its annual report (often several years in arrears). Although the governing regulatory frameworks nominally provide fi nancial and management autonomy, in practice this arrangement is considerably limited by the many opportunities for state intervention permitted under the legal and regulatory frameworks at both the institutional and jurisdictional levels. This confl ict between the control and decision functions, as well as frequent reviews by political authorities of ini-tiatives taken by the government’s authorized representatives in the corporation, discourages management initiative and effectiveness.
The fi rst railways to be concessioned were in West Africa, beginning in 1995 with the Sitarail concession linking Burkina Faso and Côte d’Ivoire and followed in the late 1990s by

Railways: Looking for Traffi c 239
Cameroon, Gabon, and Malawi. The reform momentum accelerated in the 2000s, but implementation has often been a slow process, typically taking three to fi ve years, sometimes much longer.
Most African networks leave little room for competition, and few governments have seriously considered the European model of full vertical separation. However, third-party operators run on government lines in Kenya and Senegal, and a through freight service has operated for some years from South Africa to Tanzania. Concessions do not always include the entire network, with lightly used branch lines sometimes excluded.
The initial duration of concessions varies from 15 to 30 years, and the concessionaire is free to operate its activity as a business, with freight tariffs generally determined by supply and demand, and passenger fares subject to some form of indexation. Formal regulatory structures with real teeth are rare in Africa, and many rail concessions are potentially open to market abuse, even though conces-sion agreements generally include some pro-tection, at least on paper. For example, the Zambian rail concessionaire fl agrantly price-discriminates by charging freight tariffs of $2.00 per tonne-kilometer on transit traf-fi c from the Democratic Republic of Congo to Dar es Salaam, Tanzania, while charging only $0.05 per tonne-kilometer on other freight. The reason is to divert the Democratic Republic of Congo traffi c southward toward the port of Durban in South Africa and over the Beit Bridge, which the same concessionaire operates. As a result, most of the Democratic Republic of Congo’s copper exports end up going to Durban by road.
A number of consumer protection devices exist, but they are rarely invoked. The two most common protections are (a) the power to refer rail tariffs to either the government or an inde-pendent authority and (b) the power to allow third-party operators onto the railway to com-pete with the concessionaire. Where a conces-sionaire fails to comply with the terms of the concession, whether by design or by force of circumstance, procedures exist for terminating the concession. These procedures have rarely been applied. Only one or two concessions
have been terminated (for example, Ressano Garcia in Mozambique), and two conces-sions (Transrail and Rift Valley) changed the operator.
Rail concessions in Africa have attracted a limited pool of mostly foreign private opera-tors. These operators fall into two distinct groups: (a) those seeking vertical integration of the distribution chain by acquiring domi-nant positions in specific production and transport sectors, and (b) those specializing in a single transport activity (such as railways or ports). The business cases for these rail invest-ments often appear weak, however, suggesting that the companies that seek these conces-sions focus on the fi nancial benefi ts that can be extracted from managing large investment plans (fi nanced for the most part by govern-ments) rather than concentrating on business cash fl ows.
Private companies are the majority share-holders in all concessions to date. State partici-pation is highest in Mozambique, which holds 49 percent of both CCFB (Companhia dos Caminhos de Ferro da Beira–Mozambique) and CDN (Corredor de Desenvolvimento do
railway operated by staterailway company
private sector participationprojects planned or under way
railway now under privatemanagement
part of rail network nowunder private management
SitarailCôte d’Ivoire/Burkina
Faso1995
TransrailSenegal/Mali
2003
CamrailCameroon
1999Transgabonaise
Gabon1999
TRCTanzania
2007
CDNMozambique
2005Ressano GarciaMozambique
canceled
MadarailMadagascar
2003
RVRCKenya/Uganda
2006
CCFBMozambique
2005
CANAC/WACEMTogo
1995/2002
BBRZimbabwe
1997
SizarailDem. Rep. of Congo
1995–972008
RSZZambia2003
CEARMalawi1999
Source: Bullock 2009.Note: BBR = Beitbridge Bulawayo Railway; CANAC/WACEM = CANAC Railway Services Inc./ West African Cement; CCFB = Companhia dos Caminhos de Ferro da Beira; CDN = Corredor de Desenvolvi-mento do Norte; CEAR = Central East African Railways Corporation; RSZ = Railway Systems of Zambia Ltd; RVRC = Rift Valley Rail Corporation; TRC = Tanzania Railways Corporation.
Figure 11.5 Private Participation in African Railways since 1990

240 AFRICA’S INFRASTRUCTURE: A TIME FOR TRANSFORMATION
Norte–Mozambique) and is also a signifi cant shareholder in the adjacent CEAR conces-sion. In Madagascar, the government holds 25 percent of Madarail, while governments own 10–20 percent in Abidjan-Ouagadougou Railway (Sitarail), Dakar-Bamako Railway (Transrail), and Cameroon Railway Corpo-ration (Camrail). Local private participation in concessions has generally been relatively low and is often fraught with problems during the bidding process. Employee share-holding remains under 5 percent where it exists at all.
Operational Performance—Concessioning HelpsBoth labor productivity and asset productivity (locomotive and railcar use) are low in most African networks, compared with railways elsewhere, because of the poor condition of the infrastructure and rolling stock, low traf-fi c levels, and government ownership. Under concessions, however, these indicators have improved sharply, partly because of growth in traffi c but mostly from major reductions in the workforce.
Since about 1990, almost all railway com-panies have streamlined their workforces. This measure has often been the prelude to conces-sioning, but in some cases, it has also been a general policy to improve effi ciency. Still, labor productivity on most African systems is rela-tively low by world standards, with few railways achieving over 500,000 traffi c units per staff a year, compared with an average 3.3 million traffi c units per staff a year for the South Afri-can operator Spoornet (fi gure 11.6). This low productivity not only refl ects the continuing use of labor-intensive methods with relatively little outsourcing, but it is also the consequence of a decline in traffi c without adjustments to staff levels. With low wages, the direct fi nancial impact is not always catastrophic, but having a large number of underemployed staff members corrodes morale and is a strong disincentive for those who wish to improve effi ciency. An important effect is that railways have diffi culty recruiting and retaining technically competent staff or introducing the technology required to improve service levels, for which a better-paid and more skilled workforce is essential. Asset
productivity is similarly low, with the source generally being low availability caused by a lack of spare parts.
Labor and asset productivity have improved steadily in most concessions, typically doubling because of workforce reductions either before or at the time of concessioning, the scrapping of obsolete rolling stock, and increased traffi c volumes (fi gure 11.7).
Safety is also an important aspect of opera-tional performance. Rail travel is still safer than road travel, but rail’s record in Africa is much worse than that of comparable railways elsewhere, caused by obsolete track infrastruc-ture, poorly maintained rolling stock, and lack of operational discipline. As with productivity, however, safety has generally improved follow-ing concessioning.
Financial Performance—Generally UnsustainableMost state-owned railways in Africa just about break even cashwise after receiving govern-ment support. Often, this balance occurs only because a signifi cant amount of maintenance has been deferred; when the maintenance back-log becomes too great, it is typically addressed by a loan that is treated as investment. The two companies that have been concessioned the longest (Camrail and Sitarail) make mod-est operating profi ts. The performance of RSZ (Railway Systems of Zambia) is unknown, and the cases of Kenya and Tanzania are too early to judge.
Passenger services generally do not con-tribute signifi cantly to the cost of maintaining infrastructure or to covering corporate over-head. In a few cases, they cover their marginal costs (train crew, rolling-stock maintenance, fuel or traction electricity, and passenger- handling costs). Passenger tariffs on many railways are essentially regulated, often within a framework that includes only a subset of total costs. However, many of the poorer per-forming systems in Africa would be unable to cover above-rail working expenses on a sys-temwide level even if they could set their own tariffs.
Freight services normally cover their avoid-able operating costs. Some also earn enough to cover infrastructure costs and even capital

Railways: Looking for Traffi c 241
costs for rolling stock. Earnings are a function of the tariff rate and the average carload on the revenue side, and factors such as train size, commercial speed, and rolling-stock use and availability on the cost side. In general, freight can earn enough to make operating services worthwhile, but only in some cases can it fund replacement of rolling stock, and very rarely can it earn enough to fi nance infrastructure renewal.
Where railways have been concessioned, low-interest sovereign loans to concessionaires have usually made a substantial contribution to the fi nancing of investments. Concession-aires provide a relatively low proportion of the equity. Most plan to fi nance over 80 percent of their investment with debt, and the share of the privately fi nanced investments is in many cases well below 50 percent. Conces-sions that planned a substantial contribu-tion from commercial borrowing have faced consistent criticism for their lack of invest-ment in practice. Because the value of the rolling stock transferred to the concessionaire more than compensates for the equity put into the concessions in most cases, the result is a signifi cant transfer of the fi nancial risks asso-ciated with infrastructure investment from the private sector to the public sector. The busi-ness fundamentals of many concessions are insuffi cient to support major investment on a commercial basis, and they are all too prone to signifi cant liquidity problems. Major asset maintenance and reinvestment are thus likely to be problems.
Concessions normally pay the government concession fees as well as a series of taxes (for example, value added tax, personnel social taxes, income tax), often of the same order of magnitude. Given the relative size of taxes (largely income tax) and concession fees, governments should consider the combined effect of both revenue streams when negoti-ating a concession. Regardless of the mix of fees and taxes and of any promises made dur-ing the bidding process, a concessioned rail-way’s strategy will always be constrained by the business fundamentals of the proposed railway privatization deal. A concession-aire will be able to bear only a fi nite level of charges, whether they are concession fees,
0 500 1,000 1,500 2,000 2,500
conc
essi
oned
stat
e ow
ned
traffic units/employee (thousands)
Transnamib, Namibia
SRC, Sudan
TAZARA, Tanzania
BR, Botswana
SR, Swaziland
SNCC, Dem. Rep. of Congo
CFM, Mozambique
CFCO, Rep. of Congo
GRC, Ghana
CDE, Ethiopia
OCBN, Benin
CFMK, Dem. Rep. of Congo
NRC, Nigeria
FCE, Madagascar
SETRAG, Gabon
RVRC-KRC, Kenya
TRC, Tanzania
Camrail, Cameroon
Sitarail, Burkina Faso and Côte d’Ivoire
RSZ, Zambia
Transrail, Mali
RVRC-URC, Uganda
CCFB, Mozambique
CDN, Mozambique
CEAR, Malawi
Madarail, Madagascar
Source: Bullock 2009.Note: Common averages have been used for Kenya and Uganda, which are included in a single concession, and for Nacala (Mozambique) and Malawi, which share common resources.The overall traffic units carried by a railway are the sum of the passenger-kilometers and the net tonne-kilometers of freight carried. This simple standard measure is widely used as a means of aggre-gating freight and passenger traffic. The relative weighting of passenger and freight is conventionally taken as 1:1. BR = Botswana Railways; Camrail = Cameroon Railway Corporation; CCFB = Companhia dos Caminhos de Ferro da Beira (Mozambique); CDE = Chemin de Fer Djibouto-Ethiopien; CDN = Corredor de Desenvolvimento do Norte (Mozambique); CEAR = Central East African Railways Corpo-ration (Malawi); CFCO = Chemin de Fer Congo-Océan (Republic of Congo); CFMK = Chemin de Fer Matadi-Kinshasa (Democratic Republic of Congo); CFM = Caminhos de Ferro do Mocambique; FCE = Fianarantsoa Côte Est (Madagascar); GRC = Ghana Railways Corporation; NRC = Nigeria Railways Corporation; OCBN = Organisation Commune Bénin-Niger; RSZ = Railway Systems of Zambia Ltd; RVRC-KRC = Rift Valley Rail Corporation-Kenya Railways Corporation; RVRC-URC = Rift Valley Rail Corporation-Uganda Railways Corporation; SETRAG = Société Transgabonnaise (Gabon); SNCC = Société Nationale des Chemins de Fer du Congo (Democratic Republic of Congo); SR = Swaziland Railways; SRC = Sudan Railways Corporation; TAZARA = Tanzania-Zambia Railway; TRC = Tanzania Railways Corporation.
Figure 11.6 Labor Productivity on African Rail Systems
borrowing costs, or rolling-stock acquisition costs, and concessions with high levels of both debt and concession fees will be prime candidates for renegotiation.

242 AFRICA’S INFRASTRUCTURE: A TIME FOR TRANSFORMATION
The Verdict on Concessions—Generally Benefi cial but Not the Full AnswerSince 1992, there have been 16 rail concessions in Africa. Two of the 16 have been canceled, 1 has been badly affected by war, and 1 has suffered from natural disasters and procedural delays. Six have operated for fi ve years or more but only 2 of those without a signifi cant dislo-cation of some sort.3
Except for the railways immediately adja-cent to South Africa, those that have not been concessioned have deteriorated continuously since the mid-1990s. In a number of cases, these declines will prove to be terminal. Many governments in Africa will consider conces-sions only as a last-ditch solution, but in many cases, the railways have been left to deteriorate for too long, and rectifying the situation will be a struggle.
The concessions have not been without their problems. In many cases, fi nding more than a few bidders has been diffi cult, and in several cases, bidders’ fi nancial resources have been insuffi cient to fi nance the major invest-ments required. As a result, the state has had to guarantee investments; even then, mobilizing the fi nancing has been slow. Concessionaires
have generally been unenthusiastic about run-ning passenger services, which do not generate the same revenues as freight; this situation has not been helped by delays and disputes about the payment of government compensation for unprofi table services. Further problems have arisen over the level of concession fees, the length of the concession, and arrangements for redundant staff. In some cases, these issues have led to renegotiation of the concession contract.
Despite these vicissitudes, the results to date are encouraging. Even if not all expectations have been met, most of the concessioned rail-ways have improved their traffi c levels and their productivity and are providing better service to users, albeit after a solid injection of invest-ment by donors and international fi nancial institutions. Arguably, some of this improve-ment might have occurred anyway. In addition, responsibility for the ongoing rehabilitation and maintenance of track is rapidly emerg-ing as a key issue between concessionaires and governments. A key government objective in many railway concessions is to obtain fi nance (whether private or through international fi nancial institutions) to rehabilitate track infra-structure. For most private operators, however, track rehabilitation, especially track renewal, is a major expense that drains available funds, but it is also one that can be easily deferred.
The greatest effect of concessionaires has been improved operations. Given the weak investment and regulatory climate in many African countries, investment fl ows have been limited. Under concessioning, operations have been positive, and effi ciency has clearly improved. Labor productivity has increased steadily in all the concessions in operation for over fi ve years, and similar fi gures will likely come from recent concessions. Asset produc-tivity has also generally increased. Although concessionaires in Africa typically have a more appropriate cost structure than their predeces-sors, it is rarely the ideal cost structure. Operat-ing costs on railways are a function of capital invested, as well as operating effi ciency, and many African railways have been starved of capital, substantially increasing overall operat-ing costs.
Allocative effi ciency is diffi cult to measure directly, but the evidence is generally positive.
Source: Bullock 2009.Note: The overall traffic units carried by a railway are the sum of the passenger-kilometers and the net tonne-kilometers of freight carried. This simple standard measure is widely used as a means of aggre-gating freight and passenger traffic. The relative weighting of passenger and freight is conventionally taken as 1:1. Rivi-Rivi bridge refers to the Rivi-Rivi River bridge in Balaka, Malawi. Camrail = Cameroon Railway Corporation; CEAR = Central East African Railways Corporation (Malawi); RSZ = Railway Systems of Zambia Ltd; Sitarail = railway operator for Burkina Faso and Côte d’Ivoire.
Figure 11.7 Rail Concession Labor Productivity
0
100
200
300
400
500
600
700
–5 –4 –3 –2 –1 0 1 2 3 4 5 6 7 8 9
years since concessioning
labo
r pr
oduc
tivi
ty/(t
raff
ic u
nits
[tho
usan
ds]/s
taff
)
date ofconcessioning
civil war inCôte d’Ivoire
from late-2003
Rivi-Rivi bridgecollapse
SitarailCamrail CEAR RSZ

Railways: Looking for Traffi c 243
Improved productivity, an active search for new traffi c by concessionaires, and better inter-nal business practices have all improved rail-way cost and pricing structures and lifted the level of service, thus helping attract traffi c to the mode that can carry it most effi ciently and improve intermodal competition.
Most concessionaires have fulfi lled the pas-senger service requirements in their concession agreements, even where it has been operation-ally diffi cult or where agreed public service obligation payments have not been forthcom-ing. Many of these services were inherited, and passenger service would often be more economical with a road-based system.
A recent review of four concessions found little evidence of monopolistic behavior by con-cessionaires (Pozzo di Borgo and others 2006; World Bank 2006). This review examined freight rates and whether services were being reduced so resources could be redeployed to favored users, beyond changes in services that any com-mercialized railway undertakes in response to changing traffi c patterns. Few concessions are immune from road competition, except in the few cases where roads still must be constructed or where heavy mineral movements occur. No evidence exists that personal travel has been made more expensive for the poor.
The greatest disappointment for govern-ments has been the lack of infrastructure funding from sources other than international fi nancial institutions. Concession agreements clearly put the responsibility of fi nancing track maintenance and renewal on private opera-tors. Likewise, rolling-stock fi nancing has been left to concessionaires under their contracts. However, most concessionaires initially rely on loans from international institutions, with below-market borrowing costs, lengthy loan terms, and grace periods to fi nance infrastruc-ture. (The exceptions are the Beitbridge Railway [Zimbabwe to South Africa], which relies on take-or-pay clauses that guarantee minimum revenues; the Nacala Railway in Mozambique, which is being funded at semicommercial rates; and Zambia and the Rift Valley Railways [cover-ing Kenya and Uganda], where the investment program is modest and is funded directly by the concessionaire.) Loans have been provided for rolling stock in some cases, but for many of
the low-volume operators, the sensible choice is to fi nd secondhand equipment. Much of the investment to date has been for mainte-nance and renewal backlogs, without which the railway often would not function, and can be characterized as one-time investment to get the systems running. Even that investment has been slow, more than four years in Cameroon and fi ve years on the Nacala line—a long time to wait when a business is barely breaking even.
Are concessions a long-term answer? Or are they merely quick fi xes that are living off investment by third parties and will prove unsustainable in the long term? What more must be done to ensure a sustainable sector? Many of the answers to those questions must come from governments.
Key Issues for Governments
Classic concession schemes4 in Africa are unlikely to be fi nancially attractive to bidders other than those who can secure fi nancial ben-efi ts not directly linked to the railway opera-tions.5 Consequently, unless the structure of African rail concessions changes or the mar-ket environment in which they operate alters favorably, private operators will continue to show limited interest in African railway con-cessions. Two key areas need to be addressed: the fi nancing of passenger services and major track renewals and rehabilitation, both requir-ing substantial public funding in most conces-sions. If this funding is provided, governments will also need to strengthen their regulatory capacity to ensure that the conditions are met and that the effect on the rail sector in general, and concessionaires in particular, is properly considered when policies in other sectors of the economy are developed.
Passenger ServicesIf governments want the concessionaire to operate passenger services, they should make clear compensation arrangements that can be monitored. Few passenger train services will likely cover even their above-rail costs. Their fi nancial contribution to infrastructure costs is minimal, and few services would justify investment in rolling stock, whether hauled by

244 AFRICA’S INFRASTRUCTURE: A TIME FOR TRANSFORMATION
locomotive or self-propelled. If these services are to operate for more than the initial years of a concession, governments need to develop a simple compensation scheme with timely payments. Any scheme should enable the con-cessionaire to keep all the revenue, which will encourage maximum operation, and should include a public contribution, possibly per carriage-kilometer, toward the cost of run-ning unprofitable passenger services. The scheme should be easily audited and should be reviewed periodically, perhaps every fi ve years.
If such schemes are not introduced, pas-senger services will be a constant source of confl ict between the government and the operator. Moreover, the issue will divert the focus of the concessionaire from the freight services, where improvement is far more important economically for the country.
Capacity or Willingness of Private Operators to Finance Track RenewalFew, if any, concessions are generating signifi -cant profi ts for their operators and certainly not enough to fund long-term renewals. Although most concessionaires pay fees into general gov-ernment revenue, none can afford to do so and accrue funds for future renewals at the same time. Whether a purely privately fi nanced rail concession model is sustainable in much of Africa remains doubtful. Track structures have (or should have) lives of several decades, given the traffi c volumes typically carried on an Afri-can railway. On a small system, track renewal is needed somewhere on the network only about every 20 years. It is almost always pos-sible to defer renewals for several years, albeit at the cost of deteriorating track conditions and reduced operating speeds. For any conces-sionaire who is uncertain about the future, the safest decision is to do as little track renewal as possible.
Even if they do want to renew track, private operators will often struggle to generate suffi -cient cash fl ow for it. Few concessions are strong fi nancially. If a government makes the level of the concession fee or rolling-stock purchase price the ultimate measure of a successful deal, it will limit the successful bidder’s ability to renew infrastructure. Even if an operator has suffi cient
cash, on a small network when the expenditure may not occur for 5 or 10 years, a concessionaire is unlikely to reserve funds annually and hold them in reserve that long. Furthermore, raising debt fi nancing for rail repair will generally be possible only through a general corporate loan, which is almost impossible for a small stand-alone railway.
Profi ts to the concessionaire need to be boosted, or supplementary funding sources need to be developed, or both. Today, Afri-can railway concessions offer two models for fi nancing infrastructure. In the fi rst, govern-ments fi nance initial track rehabilitation and renewal costs, generally by securing loans from international fi nancial institutions. These loans are then made to private operators and tend to cover only the initial fi ve-year investment plan in the hope that they will propel each conces-sionaire’s traffi c to a level that will then enable it to self-fi nance future track investments. This approach is commonly used for railways with a high ratio of initial track investment compared with revenues and that are thus unlikely to be able to mobilize suffi cient private fi nancing. In the second model, governments do not fi nance initial track renewal but commit to compen-sating concessionaires for their investment by the end of the concession (for example, Kenya, Uganda, and Zambia railways). In such cases, the initial amount to be invested is relatively small in relation to expected revenues, and pri-vate operators are assumed to be able to secure private fi nancing on the merits of their busi-ness case. Under both models, governments usually agree to purchase at the end of their concessions the nonamortized portion of any infrastructure investment concessionaires have fi nanced. However, the ability of many govern-ments to make such a payment is uncertain, which often affects infrastructure investment in the later stages of a concession, although a partial risk guarantee can strengthen the gov-ernment’s reimbursement commitment.
Three conditions must be met to secure privately fi nanced track investment: (a) gov-ernments ensure that the concession (and thus the proposed track investment) is fi nancially sound, (b) the nonamortized value of the assets owed to the concessionaire at the end

Railways: Looking for Traffi c 245
of the concession period remains reasonable, and (c) the concession agreement allows for a possible extension of the concession period.
Often, however, governments will still need to assist. Notwithstanding the likely improve-ments in effi ciency from concessioning, many agreements will probably fail the fi rst hurdle of fi nancial soundness. If the government still wishes to pursue a concession because of the benefi ts of rail transport, it will need to con-tribute grant funds regularly. One option is to partially fi nance infrastructure renewal inde-pendently of the concessionaire through a land transport renewal fund, which could be an extension of a road fund, created as a com-mon pool of funds by both the road and rail sectors. For example, concession payments could be paid into the fund rather than into general revenue. A rationale for this option can be developed from the external costs avoided by the carriage of passengers and freight by road rather than rail.
Effective and Effi cient Regulation of Private Rail OperatorsIn practice, many concessions ignore many or all of their reporting obligations under the concession agreements. In some cases, this situation obtains because of operator intransi-gence, in others because of a lack of expertise or initiative. Not surprisingly, both politicians and bureaucracies are often ill informed about the problems facing a concessionaire and the rem-edies being attempted. Most concessions have a long list of requirements for the concessionaire to meet, and allowing reporting to be ignored inevitably creates plenty of scope for later dis-putes. Regulatory bodies must strengthen their capacity and impose annual independent fi nan-cial and operational audits as part of concession contracts. One solution for funding the regu-latory bodies is to use the concession fees, but funding from a land transport fund, if one can be established, may be preferable.
Consistent Government Behavior toward Railway Concessionaires Aligned with Good Business PracticeUncoordinated actions from ministries within governments have negatively affected
the performance of a number of conces-sions. Examples range from administratively imposed salary levels to restrictions on access to container facilities and unfunded public service requirements. Most of these actions could be avoided by establishing a properly staffed and funded oversight body (the con-cession counterparty is generally the obvious choice for this). A government should ensure that such a body has the necessary politi-cal and technical powers to coordinate and control government actions toward pri-vate rail operators. In practice, that means the agency should meet regularly to discuss pending issues with the concessionaire. The oversight body should include, or have ready access to, a railway technical expert and a railway fi nancial expert, and someone should head it whose sole responsibility is to moni-tor the railway concession and who reports directly to the transport and fi nance minis-ters at least.
Consistent Government Approach to Infrastructure Cost RecoveryGovernments should also develop a coherent and realistic policy regarding infrastructure cost recovery. The road sector has an articulate and organized lobby. Advocates for government railways, where they exist, have generally been ineffectual and poorly prepared, although con-cessionaires are generally able to make aggres-sive representations. The lower the road costs are and the greater the degree of overloading permitted, the lower the freight rates by both road and rail will be—and less money will be available from a concessionaire to maintain and upgrade the railway infrastructure.
Road competition is strongest in south-ern Africa, which has the most liberal market structure, the largest trucks, and the best roads. In addition, the level of road user charges and the prevalence of overloading heavily affect rail. Requiring rail to fund all its long-term maintenance and upgrades, while tolerating road cost underrecovery and overloading on arterial routes, may help government budgets in the short run, but it is an almost impossible handicap for most general freight railways to overcome.
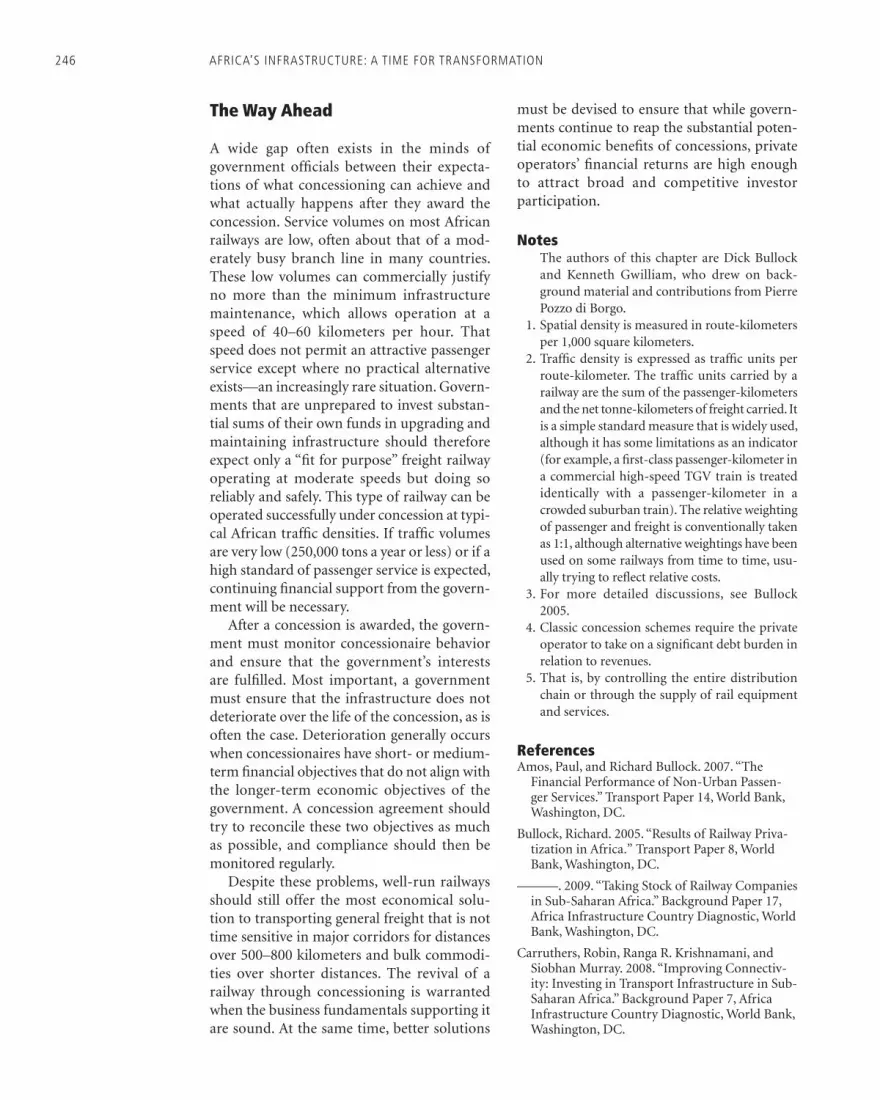
246 AFRICA’S INFRASTRUCTURE: A TIME FOR TRANSFORMATION
The Way Ahead
A wide gap often exists in the minds of government offi cials between their expecta-tions of what concessioning can achieve and what actually happens after they award the concession. Service volumes on most African railways are low, often about that of a mod-erately busy branch line in many countries. These low volumes can commercially justify no more than the minimum infrastructure maintenance, which allows operation at a speed of 40–60 kilometers per hour. That speed does not permit an attractive passenger service except where no practical alternative exists—an increasingly rare situation. Govern-ments that are unprepared to invest substan-tial sums of their own funds in upgrading and maintaining infrastructure should therefore expect only a “fi t for purpose” freight railway operating at moderate speeds but doing so reliably and safely. This type of railway can be operated successfully under concession at typi-cal African traffi c densities. If traffi c volumes are very low (250,000 tons a year or less) or if a high standard of passenger service is expected, continuing fi nancial support from the govern-ment will be necessary.
After a concession is awarded, the govern-ment must monitor concessionaire behavior and ensure that the government’s interests are fulfi lled. Most important, a government must ensure that the infrastructure does not deteriorate over the life of the concession, as is often the case. Deterioration generally occurs when concessionaires have short- or medium-term fi nancial objectives that do not align with the longer-term economic objectives of the government. A concession agreement should try to reconcile these two objectives as much as possible, and compliance should then be monitored regularly.
Despite these problems, well-run railways should still offer the most economical solu-tion to transporting general freight that is not time sensitive in major corridors for distances over 500–800 kilometers and bulk commodi-ties over shorter distances. The revival of a railway through concessioning is warranted when the business fundamentals supporting it are sound. At the same time, better solutions
must be devised to ensure that while govern-ments continue to reap the substantial poten-tial economic benefi ts of concessions, private operators’ fi nancial returns are high enough to attract broad and competitive investor participation.
Notes The authors of this chapter are Dick Bullock
and Kenneth Gwilliam, who drew on back-ground material and contributions from Pierre Pozzo di Borgo.
1. Spatial density is measured in route-kilometers per 1,000 square kilometers.
2. Traffi c density is expressed as traffi c units per route-kilometer. The traffi c units carried by a railway are the sum of the passenger-kilometers and the net tonne-kilometers of freight carried. It is a simple standard measure that is widely used, although it has some limitations as an indicator (for example, a fi rst-class passenger-kilometer in a commercial high-speed TGV train is treated identically with a passenger-kilometer in a crowded suburban train). The relative weighting of passenger and freight is conventionally taken as 1:1, although alternative weightings have been used on some railways from time to time, usu-ally trying to refl ect relative costs.
3. For more detailed discussions, see Bullock 2005.
4. Classic concession schemes require the private operator to take on a signifi cant debt burden in relation to revenues.
5. That is, by controlling the entire distribution chain or through the supply of rail equipment and services.
ReferencesAmos, Paul, and Richard Bullock. 2007. “The
Financial Performance of Non-Urban Passen-ger Services.” Transport Paper 14, World Bank, Washington, DC.
Bullock, Richard. 2005. “Results of Railway Priva-tization in Africa.” Transport Paper 8, World Bank, Washington, DC.
———. 2009. “Taking Stock of Railway Companies in Sub-Saharan Africa.” Background Paper 17, Africa Infrastructure Country Diagnostic, World Bank, Washington, DC.
Carruthers, Robin, Ranga R. Krishnamani, and Siobhan Murray. 2008. “Improving Connectiv-ity: Investing in Transport Infrastructure in Sub-Saharan Africa.” Background Paper 7, Africa Infrastructure Country Diagnostic, World Bank, Washington, DC.

Railways: Looking for Traffi c 247
Pozzo di Borgo, Pierre, Alain Labeau, Raphael Eskinazi, Julien Dehornoy, Alan Parte, and Marouane Ameziane. 2006. “Review of Selected Railway Concessions in Sub-Saharan Africa.” World Bank, Washington, DC.
Thompson, Louis. 2007. “Spoornet and Transnet Sectoral Reference Paper.” World Bank, Washington, DC.
UIC (International Union of Railways)-Statistics Centre. 2008. Railway Time-Series Data 2007. Paris: Railway Technical Publications.
World Bank. 2006. “Sub-Saharan Africa: Review of Selected Railway Concessions.” Africa Transport Sector Report 36491, World Bank, Washington, DC.


249
12Chapter
Ports and Shipping: Landlords Needed
A frican shipping has been largely dereg-ulated. However, many African coun-tries are trapped in a vicious circle of
high tariffs discouraging traffi c and further increasing costs. Poor inland links and waste-ful and costly port administration accentuate this problematic situation. The lack of an inte-grated land distribution system, particularly for transit, impedes container traffi c.
Since the mid-1990s, both general cargo and containerized cargo passing through African public ports have trebled. Southern Africa has had the fastest growth in general cargo traffi c and West Africa in container traffi c, albeit from a low base. Dry bulk traffi c (coal, grain, and some chemicals) and liquid bulk traffi c (mostly oil) have also been growing rapidly. By inter-national standards, however, these traffi c cat-egories are unbalanced, increasing the costs for African trade. Export volumes greatly exceed import volumes for dry and liquid bulks, while imports dominate exports for general cargo and container trades.
Many ports handle the traffi c, few of them large by world standards. The main transship-ment points for regional traffi c (Abidjan, Côte d’Ivoire; Dar es Salaam, Tanzania; Djibouti, Djibouti; Durban, South Africa; and Mombasa,
Kenya) are not major hubs on the main inter-national itineraries, and they appear unlikely to become so. Several ports suffer from low capacity, particularly in terminal storage, maintenance, and dredging capability. Overall, however, total use of African port capacity is estimated at 80 percent and likely to remain at this level in the near future.
Many ports are poorly equipped and inef-fi ciently operated. Container handling rates fall well below international norms. Port charges for both containers and general cargo are substantially higher than in other regions. Security standards are still extremely variable, and few ports are prepared for the dramatic changes in trade and shipping patterns now occurring.
The main requirements are organizational. Many capacity constraints could be overcome simply by making the existing ports more effi -cient. Regional port planning is required to counter the costs of fragmentation. Port pric-ing and regulatory policies need to be more commercial and to better respond to the inter-national shipping market. Comprehensive policies are required for modal integration and administrative simplifi cation, and modern port management structures are essential.

250 AFRICA’S INFRASTRUCTURE: A TIME FOR TRANSFORMATION
The landlord port system has been more successful than the service port in Africa (as elsewhere) and is best suited to introduce the private sector. Within a landlord port structure, attracting container line operators and major international terminal operators could produce effi ciency improvements. Ghana and Nigeria have moved toward the landlord port, and sev-eral francophone countries operate a hybrid model. However, development is slow, and the involvement of the effi cient private global operators is very low.
The African Shipping Market
Africa’s maritime traffi c has been growing rap-idly across all cargo types, although container traffi c is highly imbalanced and faces major challenges because of the lack of effi cient transportation links back to the hinterland. Shipping markets are small and thin, contrib-uting to relatively high costs.
Maritime Traffi c—On the Rise but Out of BalanceExcept in South Africa, container transport in Sub-Saharan Africa is still at an early stage of development; however, it is growing rapidly from a very low base, with an average annual growth rate of 7.2 percent and as high as 13.8 percent in West Africa (table 12.1). Of the 7.6 million 20-foot equivalent units (TEUs) handled by all Sub-Saharan African ports in 2005, Durban handled nearly 2 million TEUs, and the three main South African ports together handled more than 3 million TEUs. West Africa
accounts for less than 1 percent of total world container traffic and for little more than 2 percent of all African traffi c. East Africa has a heavy concentration in Mombasa (6 percent of the Sub-Saharan African total, according to the United Nations Conference on Trade and Development) while West Africa has fi ve ports handling more than 350,000 TEUs each.
The lack of an integrated land distribution system, particularly for transit traffi c, impedes container traffi c. Handling of dry and liquid bulk exports is making the most progress, with many port facilities privately owned and inte-grated in a comprehensive logistic system.
From 1995 to 2005, general cargo has grown at an average annual rate of 6.6 percent and at a rate as high as 15.7 percent in southern Africa (table 12.2), rates higher than in the rest of the world because of later containerization. General cargo has traditionally been the major type of cargo moved to landlocked countries. Little congestion occurs in the ports, but han-dling is ineffi cient, and the transfer of some of this traffi c to containers is contingent on inland distribution systems.
Dry bulk traffi c is sometimes handled at common-user general cargo facilities, but the major flows (grain from Mombasa, ferro-chrome from Maputo, and coal from Richards Bay [South Africa]) pass through privately owned and operated dry and liquid bulk termi-nals, for which the traffi c volumes are generally not well reported. In 2007, the total throughput of Richards Bay was 66 million tons, making it the world’s ninth-largest bulk exporting port. Because major global interests control these businesses, the port and shipping arrangements likely conform to the best international stan-dards. Some dry bulk traffi c is still handled on general cargo quays, suggesting the possibility for further specialization, though that depends on having a large enough basic fl ow.
Liquid bulk traffi c is predominantly oil, with 11 countries (dominated by Nigeria and Angola) supplying 12 percent of world demand and 19 percent of U.S. demand. In 2006, oil made up 85 percent of exports by value from West and Central Africa. It is a growing sector, with Asian countries (China, in particular) and the United States making signifi cant invest-ments in Africa, including placement of the
Table 12.1 Traffic Trends for Container Trade, Sub-Saharan Ports, by Region, 1995–2005
Region
Overall percentage
change
Average annual
percentage change1995 2005
East Africa–Indian Ocean 505,100 1,394,956 176 5.8
Southern Africa 1,356,000 3,091,846 128 2.5
West Africa 673,400 3,126,901 364 13.8
Total 2,534,500 7,613,703 200 7.2
Source: Mundy and Penfold 2008.Note: TEU = 20-foot equivalent unit.
TEUs
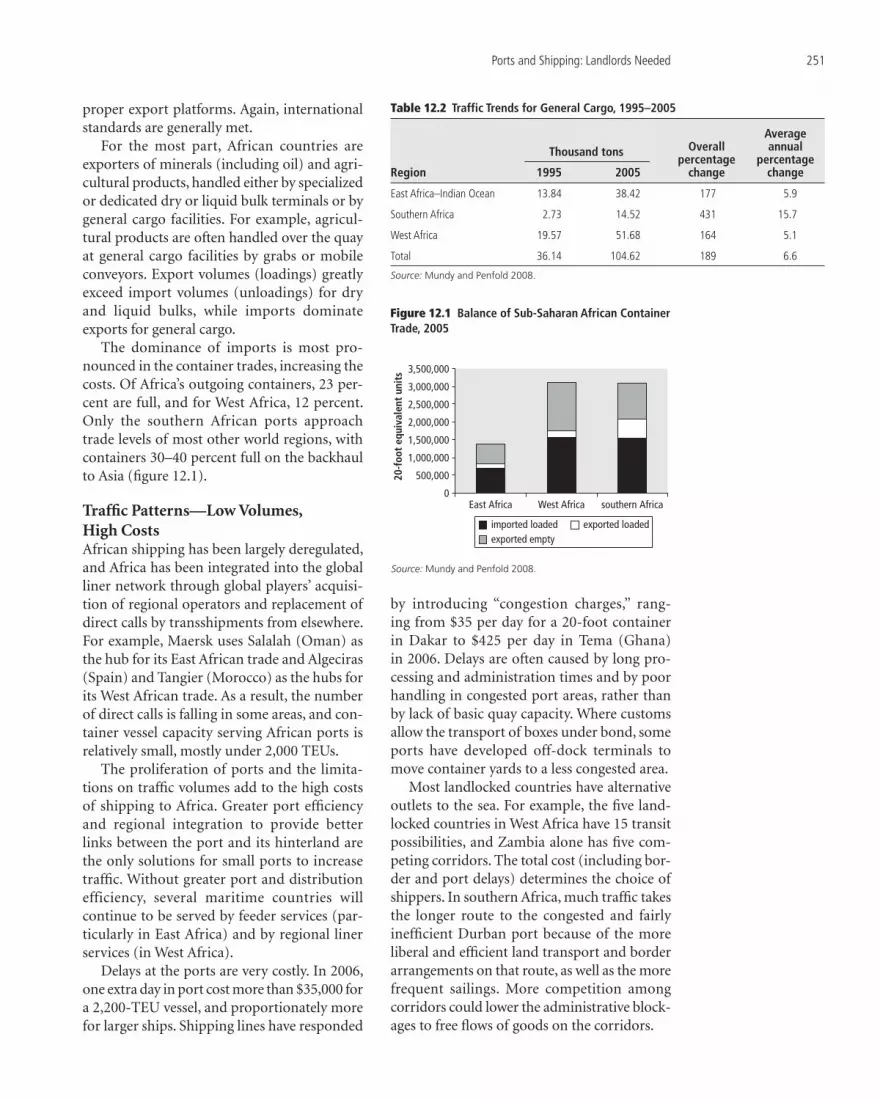
Ports and Shipping: Landlords Needed 251
proper export platforms. Again, international standards are generally met.
For the most part, African countries are exporters of minerals (including oil) and agri-cultural products, handled either by specialized or dedicated dry or liquid bulk terminals or by general cargo facilities. For example, agricul-tural products are often handled over the quay at general cargo facilities by grabs or mobile conveyors. Export volumes (loadings) greatly exceed import volumes (unloadings) for dry and liquid bulks, while imports dominate exports for general cargo.
The dominance of imports is most pro-nounced in the container trades, increasing the costs. Of Africa’s outgoing containers, 23 per-cent are full, and for West Africa, 12 percent. Only the southern African ports approach trade levels of most other world regions, with containers 30–40 percent full on the backhaul to Asia (fi gure 12.1).
Traffi c Patterns—Low Volumes, High CostsAfrican shipping has been largely deregulated, and Africa has been integrated into the global liner network through global players’ acquisi-tion of regional operators and replacement of direct calls by transshipments from elsewhere. For example, Maersk uses Salalah (Oman) as the hub for its East African trade and Algeciras (Spain) and Tangier (Morocco) as the hubs for its West African trade. As a result, the number of direct calls is falling in some areas, and con-tainer vessel capacity serving African ports is relatively small, mostly under 2,000 TEUs.
The proliferation of ports and the limita-tions on traffi c volumes add to the high costs of shipping to Africa. Greater port effi ciency and regional integration to provide better links between the port and its hinterland are the only solutions for small ports to increase traffi c. Without greater port and distribution efficiency, several maritime countries will continue to be served by feeder services (par-ticularly in East Africa) and by regional liner services (in West Africa).
Delays at the ports are very costly. In 2006, one extra day in port cost more than $35,000 for a 2,200-TEU vessel, and proportionately more for larger ships. Shipping lines have responded
by introducing “congestion charges,” rang-ing from $35 per day for a 20-foot container in Dakar to $425 per day in Tema (Ghana) in 2006. Delays are often caused by long pro-cessing and administration times and by poor handling in congested port areas, rather than by lack of basic quay capacity. Where customs allow the transport of boxes under bond, some ports have developed off-dock terminals to move container yards to a less congested area.
Most landlocked countries have alternative outlets to the sea. For example, the fi ve land-locked countries in West Africa have 15 transit possibilities, and Zambia alone has fi ve com-peting corridors. The total cost (including bor-der and port delays) determines the choice of shippers. In southern Africa, much traffi c takes the longer route to the congested and fairly ineffi cient Durban port because of the more liberal and effi cient land transport and border arrangements on that route, as well as the more frequent sailings. More competition among corridors could lower the administrative block-ages to free fl ows of goods on the corridors.
Table 12.2 Traffic Trends for General Cargo, 1995–2005
Region
Overall percentage
change
Average annual
percentage change1995 2005
East Africa–Indian Ocean 13.84 38.42 177 5.9
Southern Africa 2.73 14.52 431 15.7
West Africa 19.57 51.68 164 5.1
Total 36.14 104.62 189 6.6
Source: Mundy and Penfold 2008.
Thousand tons
0
500,00020-f
oot
equi
vale
nt u
nits
1,000,000
1,500,000
2,000,000
2,500,000
3,000,000
3,500,000
East Africa West Africa southern Africa
imported loaded exported loadedexported empty
Figure 12.1 Balance of Sub-Saharan African Container Trade, 2005
Source: Mundy and Penfold 2008.

252 AFRICA’S INFRASTRUCTURE: A TIME FOR TRANSFORMATION
African Ports
Africa has many small and medium-size ports, with a low concentration by world standards. West Africa has about 25 signifi cant ports, but none is among the 70 largest world ports. In addition, new port developments are increas-ing the proliferation (fi gure 12.2).
Port Confi guration—Need for a Better Hub-and-Feeder SystemAll three regions, eastern, western, and southern, claim to suffer from specifi c capacity problems. Mombasa and Dar es Salaam have reached their storage limits for containers in their terminals. Durban is struggling to bring in new capacity to meet container handling and storage demand. In West Africa, Luanda and Tema are short of container capacity, and Luanda, Douala (Cam-eroon), and Tema are under pressure for general cargo. Numerous factors contribute. Location in a major urban area limits the capacity of some ports (Apapa [Lagos], Nigeria). For many ports, equipment availability and maintenance
are constraints. Maintenance dredging is often inadequate (and much more costly than a few years ago) because of the reliance on ad hoc contracting rather than long-term performance contracts. In addition, many ports have poor navigational aids.
Despite these circumstances, one source considers total use of African port capacity to be 80 percent overall and likely to remain there through 2010 (Drewry Shipping Con-sultants Ltd. 2006, 2008). Making ports more effi cient could overcome many of the capacity constraints, because handling rates are below international standards. For example, the Dur-ban Container Terminal manages only about 17 moves per crane hour, short of an interna-tional norm of 25 to 30 moves.
On the East African coastline, Mombasa and Dar es Salaam are competing as regional trans-shipment points, but both face severe capac-ity constraints in the short term. Feeders serve both, mainly Salalah (Oman) and Dubai (the United Arab Emirates). For example, Europe’s main port, Rotterdam (the Netherlands), has no direct container fl ows to either port. Traffi c through Dar es Salaam has increased greatly since Hutchison Port Holdings took over the manage-ment contract for the container terminal held by International Container Terminal Services, Inc.; however, Hutchison did not undertake infrastructure investment responsibility. A com-bination of many factors resulted in terminal congestion, leading to terminal dwell times for containers of up to 30 days and increased wait-ing times for vessels. The present contract termi-nates in 2010, and negotiations are in progress to extend the contract for a much longer period with further equipment purchases planned. In Mombasa, a contract is being awarded to deepen the port, and a new container terminal to com-pete with Dar es Salaam is being discussed. In the near future, however, both ports are likely to remain relatively poor in facilities, perfor-mance, and hinterland connections. Meanwhile, Djibouti may soon provide competition for Salalah and Dubai, with DP World scheduled to bring on stream a new container terminal facility at Doraleh, targeted specifi cally at offering sig-nifi cant transshipment capacity for East Africa and the Indian Ocean. In addition, container terminal facilities in Jeddah (Saudi Arabia) are
SUDAN
MALI
CHAD
NIGER
ANGOLA
CONGO, DEM REP
ETHIOPIANIGERIA
NAMIBIA
ZAMBIA
SOUTH AFRICA
TANZANIA
MAURITANIA
KENYA
SOMALIA
BOTSWANA
CONGO
CAMEROON
ZIMBABWE
GABON
GHANA
GUINEA
UGANDA
MOZAMBIQUE
MADAGASCAR
COTE D’IVOIRECENTRAL AFRICAN REPUBLIC
SENEGAL
BENIN
BURKINA FASO
MALAWI
ERITREA
LIBERIA
TOGOSIERRA LEONE
LESOTHO
BURUNDIRWANDA
DJIBOUTIGUINEA-BISSAU
SWAZILAND
GAMBIA
EQUATORIAL GUINEA
REUNION
COMOROS
CAPE VERDE
MAYOTTE
SAO TOME AND PRINCIPE
SEYCHELLES
Cargo (million tons)< 33–10
10–50
> 50
railwaymajor road
Figure 12.2 African Ports, by Size
Source: Mundy and Penfold 2008.

Ports and Shipping: Landlords Needed 253
being extended, and in 2008, DP World signed a concession for the operation and further development of the Aden Container Terminal in Yemen. Since 2008, a consultant has been fi nalizing the National Port Strategy project for Tanzania.
In South Africa, Durban struggles to han-dle its own national traffi c and experiences recurring berth congestion crises during the peak season. Shipping lines are threatening to reintroduce a surcharge for berthing delays, as existed between 2002 and 2005. Durban also has problems of environment, security, hinter-land connections, and space. Although plans exist to bring on stream major new capacity, such as the new Pier One scheme, demand is very strong, and over the short to medium term, it may well outstrip the new capacity. The number of carriers seeking alternative locations for transshipment in the Indian Ocean islands (notably Mauritius) refl ects Durban’s problems. Although superstruc-ture and infrastructure usually are separated in South Africa, the common ownership of both within the publicly owned Transnet has clearly failed to deliver the necessary improve-ments required of a great world port ideally located to act as a transshipment center for southern Africa. Currently, South Africa is an end-of-the-line country, and unlike other major or global hubs located on one of the very large east-west routes that make econo-mies of scale possible, its problems arguably lie at least partly in the organization and the provision and management of equipment and handling space, as much as in basic quay capacity. The signifi cance of that distinction is that the solution lies in institutional reform and the mobilization of private sector capa-bilities in port service management, as well as in public sector investment.
On the West African coast, Abidjan has enjoyed some success as a container trans-shipment center, but it has suffered because of the country’s internal strife and the specifi c problems relating to ownership of operating rights for the container terminal. The need for an alternative to Abidjan is indicated by the Maersk Line’s (and its affi liate Safmarine) using the Spanish port of Algeciras and the new container terminal at Tangier (Morocco)
as its main hubs for West African container trade, relaying West African cargo moving to and from Europe and Asia. Nevertheless, the number of public-private partnerships is increasing, and competition between the pri-vate port operators in the area is fi erce. Con-sequently, some of the big global operators have become willing to look at medium-size and even small terminal projects, which they previously snubbed (Harding, Pálsson, and Raballand 2007).
Port Ownership and Management—Still Mainly a Public Service ModelPort planning and management are generally outdated, though seven sampled countries are developing new port master plans, several with a focus on institutional reform. Port regula-tion is normally undertaken by a ministry of transport, rather than by a quasi-independent agency; thus, it tends to be highly politicized. With its independent regulator, South Africa is the exception.
The dominant port management model in Africa is still the public service port: the state enterprise owns the port infrastructure and undertakes all port operations. This model is beginning to change. Some statutory incorpo-rated port agencies are being reestablished as limited liability commercial companies. Ghana and Nigeria have moved toward the landlord port, where the state owns and operates major port infrastructure but allows the private sector to provide basic services. In addition, several francophone countries have a hybrid model, called amodiation, in which the port author-ity rents on-dock storage space to privately owned, licensed stevedoring companies hired by shipping lines for cargo handling.
Since 2000, some major container terminals have been concessioned to the major interna-tional terminal operators (table 12.3). How-ever, involvement of the effi cient private global operators is still low; in 2007, the top 20 global terminal operators handled only 16 percent of throughput in Africa, compared with about 70 percent in other regions of the world. Con-cessioning has proved controversial in some cases, with the results contested in both Luanda and Dakar. No generally accepted “clean” model exists, and infl uence and corruption remain.

254 AFRICA’S INFRASTRUCTURE: A TIME FOR TRANSFORMATION
Port Performance—Room for ImprovementContainer handling falls below international standards in most ports. Even when container gantry cranes are available, the number of container moves per crane hour is usually 10 to 20, compared with 25 to 30 moves in the world ports (fi gure 12.3).1 When ships’ gear is used, the performance is even worse, with only 7 to 10 moves per hour in Dakar, East London (South Africa), Matadi (the Democratic Republic of Congo), and Walvis Bay (Namibia). The low performance is partly explained by the lower number of containers handled per call with smaller vessels. However, management is even more important. Higher handling rates are generally achieved in locations where pri-vate operators have been in residence for some time; although the hybrid Mozambique model, in which the government retains a major share, has not been so successful.
Rates for general cargo handling are also lower in Africa at 7 to 25 tons per crane hour, compared with more than 30 tons in other world ports.2 Almost all handling is through public ports.
Specialized oil and coal terminals usually do not fall under public port management. Traditionally, state-owned organizations, private interests, or a combination have developed the facilities, which fall outside the mainstream of port operations and fol-low an integrated supply-chain logic. Because of the private involvement in dry and liquid
bulk port facilities, less documentation exists about their effi ciency, but a recent study of South African ports showed the bulk ports performing well on international benchmarks (Bell and Bichou 2007).
The growing interest in Africa as a source of energy products, agricultural products, timber, and minerals might aid in creating the proper maritime export capacity. The funding for this new capacity is invariably provided as part of a turnkey project, not under a traditional port authority budget. Thus, fi nancial impediments are not envisaged.
The quality of container handling inland is indicated by the cycle times of trucks dropping off and picking up containers at the terminal and the average container dwell times in a ter-minal. The typical target for an effi cient truck cycle is 1 hour. Average cycle times are estimated
Table 12.3 Private Transactions for All Port Sectors, 2000–07
Transaction Countries Ports Number of
transactions
Number of canceled transactions
Royalty payments to government ($ millions)
Investment in facilities
($ millions)
Management or lease contract Cameroon, Kenya, Mozambique Douala, Mombasa, Maputo 4 1 0 0
Concession contract Angola, Comoros, Equatorial Guinea, Gabon, Ghana, Madagascar, Mozambique, Nigeria, Sudan, Tanzania
Luanda, Mutsamudu, Luba, Owendo, Tema, Toamasina, Beira, Maputo, Quelimane, Apapa (Lagos), Calibar, Harcourt, Lilypond, Onne, Warri, Tin Can, Juba
32 0 1,366 1,052
Greenfi eld projects Côte d’Ivoire, Equatorial Guinea, Ghana, Kenya, Mauritius
Abidjan, Luba, Tema, Mombasa, Freeport
6 0 316 236
Total 42 1 1,683 1,288
Source: Mundy and Penfold 2008.
0
4
8
12
16
20
gantr
ies
ships
’ gea
r
conc
ession
ed
unco
ncess
ioned
mov
es p
er h
our
Figure 12.3 Average Moves per Hour by Category of Port
Source: Mundy and Penfold 2008.

Ports and Shipping: Landlords Needed 255
at 5–6 hours in East Africa, 4 hours in south-ern Africa, and 10 hours or more in West Africa (table 12.4). Average container dwell times are 6 days in southern Africa, 12 days in East Africa, and 15 days or more in West Africa, more than an accepted international standard of 7 days or less. The range of dwell times in southern Africa (4–8 days) is a much tighter band than in East and West Africa, thanks largely to better organization and control of container storage at the terminal.
Like all ports in countries that are signatories to the International Convention for the Safety of Life at Sea, African ports have been required, since 2004, to comply with the International Ship and Port Facility Security Code. Although standards of security are still extremely vari-able, the estimated costs of compliance for African ports—averaging about $2 per TEU and about $.04–$.05 per ton of general cargo—have not increased overall costs signifi cantly and may have generated compensating bene-fi ts, including reduced losses through pilferage and higher customs yields (Kruk and Donner 2008). The long-term concern is a sensible bal-ance between security and costs.
Port charges for both containers and gen-eral cargo are substantially higher in African ports than in other regions (table 12.5). For container handling, the charges applied in Sub-Saharan Africa can be more than twice those typically applied for the same service in other parts of the world, with at least 50 per-cent more as the norm. Normal charges for general cargo handling per ton offl oaded from a vessel in Sub-Saharan Africa are also about 40 percent above world rates.
Policy Issues and Implementation Challenges
World trade and shipping patterns are chang-ing. Expanding containerization, in ever-larger vessels, requires port facilities to handle large vessels quickly and effi ciently. The fi nancial crisis of 2008–09 adds to the turmoil. By inter-national standards, African public port capac-ity is low, and its performance is poor, bringing higher costs and further losses in world trade shares. African governments are thus faced
with fi nding appropriate responses to changes in international trade and shipping markets.
Responses to Changes in the International Shipping MarketThe problem is not just port capacity. East Asian ports use vessels in the 8,000–11,000 TEU range, but most African ports cannot efficiently handle container vessels above 2,000 TEUs. Moreover, an upper limit exists to optimal vessel capacity because of the low total volume of freight to African ports. Serv-ing multiple African ports directly with vessels of 8,000 TEUs or more is therefore unlikely in the near future. Thus, a tendency will exist to transship through a small number of African regional hubs with container transshipment facilities to distribute traffi c along the coasts.
The direction of the trade may also be changing as some lines consider liner services from Asia by way of southern Africa to the east coast of Latin America and the Caribbean.
Table 12.4 Average Port Delays
RegionRange of truck
cycle timesRange of container
dwell times
East Africa 3.5 hours to 1 day 5 to 28 days
Southern Africa 2 to 12 hours 4 to 8 days
West Africa 6 hours to 1 + day 11 to 30 days
Source: Mundy and Penfold 2008.
Table 12.5 Typical Gateway Container and General Cargo Handling Charges in World Marketsdollars
RegionContainer handling from ship to gate
General cargo over the quay per ton
West Africa 100–320 8.00–15.00
East Africa 135–275 6.00–15.00
Southern Africa 110–243 11.00–15.00
Southeast Asia 80 8.00
Far East 144 8.00
Middle East/South Asia 96 7.00
United Kingdom 100 8.50
Northern Europe 110 7.50
Southern Europe 95 7.00
Latin America 154 9.00
Australasia 130 9.00
Source: Mundy and Penfold 2008.

256 AFRICA’S INFRASTRUCTURE: A TIME FOR TRANSFORMATION
For this trade, however, average vessel size is unlikely to increase because ships are cascaded down from longer-distance trade.
As the shipping industry has grown more capital intensive, more technically demanding, and more subject to global regulatory change, the number of active African shipping lines has severely decreased. Liberalizing the shipping market has already brought down deep-sea shipping costs; it should also facilitate the devel-opment of less-costly feeder services for con-tainer shipping. As the major traders attract the global operators, they may also develop a niche market in African feeder services, reestablishing African-owned shipping companies. For exam-ple, the establishment of Togo-based Ecoma-rine in the West African feeder market in 2003 was the fi rst indigenous development since the decline of West African national companies in the 1990s.3 Where collusion or barriers to market entry remain in the shipping market, governments will need to assess the level and distribution of benefi ts from the restraints and compare them to the widely distributed benefi ts of lower shipping costs in a deregulated market.
Strategic Port PlanningThe expected changes have implications for port planning. Africa can support only a few regional hubs and possibly one major hub (in South Africa). Competition already exists for the hub in East Africa (between Dar es Salaam and Mombasa) and will intensify as facilities are upgraded in Djibouti, and regional collab-oration—though desirable—seems unlikely. Simply investing in port capacity will not turn a port into a hub unless it has a strategic location, adequate water depth, and the facilities and performance to ensure low handling costs.
A strong corridor for transit traffi c also helps. This requires facilitating traffi c on the main trade corridors from the port to the landlocked hinterland. A common problem is the failure to address international, intermodal transport holistically. Inland movement, par-ticularly across green borders, has been slow and expensive, thereby stifl ing trade. Although logistics chains are a commercial matter, they require the facilitation of integrated port, cus-toms, and inland transport arrangements—a matter for government.
Governments will need to choose how best to develop state-of-the-art ports, with appropriate technologies and management skills. This determination will almost certainly involve the international private sector, partic-ularly in the container terminal business. Stra-tegic port planning must set the roles of the public and private sectors and identify the pro-cesses to attract and select private partners.
Countries with congested city ports or with draft limitations will need to consider whether to rehabilitate existing ports or develop new ones. Developments in the deep-sea shipping markets may also trigger the need to change location. For example, an east-west axis between Asia and Latin America would be economical only for vessels of 6,000 TEUs or larger. Any such service would necessitate a port of call in South Africa, unlikely to be satisfi ed by Durban. Cape Town is developing a new container termi-nal, but it is too far from the industrial heart of the country in Gauteng province to be a strong South African hub port. Richards Bay, which has deep water and a spacious environment, might be better. It recently launched plans for the staged development of a megaport, includ-ing a container terminal.
Port Pricing and RegulationHaving the economy benefit from lower transport costs typically requires regulating port tariffs to obtain the most effi cient sup-ply and the lowest real costs, thereby prevent-ing any monopoly, whether state owned or private, from exploiting its advantage in the market. In many countries, however, a single port is a natural monopoly, tempting gov-ernments to maintain direct ownership and operation and, thus, to use the port as a “cash cow” to support other government activities. For example, in South Africa, all major ports are owned and operated by the National Ports Authority (responsible for infrastructure) and South African Port Operations (responsible for port operations), both part of the state-owned Transnet, a wider monopoly cover-ing rail, pipelines, and ports. Transnet has presided over an extensive but opaque struc-ture of cross subsidies, allowing the whole operation to exist without government sub-sidy. Thus, South African ports suffer from

Ports and Shipping: Landlords Needed 257
underinvestment. This type of port strategy inevitably reduces the broader benefi t to the economy of having lower transport costs.
Port ManagementAfrican ports do not necessarily lack basic quay capacity (though some ports appear to be straining their limits). However, they are ineffi -cient in using the basic infrastructure. The lack of modern superstructure, particularly cranes, inhibits fast vessel turnarounds and imposes costs on customers. Continuing reliance on the public service port structure accentuates overmanning and forgoes the advantages of the modern technologies and management practices that have revolutionized world mar-kets for shipping and cargo handling (see table 12.4). The prevalence of state-owned service ports is also associated with the low concentra-tion of global operators in African ports. Hav-ing global terminal operators in this business would almost certainly improve matters: they are well acquainted with the advantages of scale
in terminal operations and with the benefi ts of an effi cient hub-and-feeder structure in the deep-sea trade.
The need is thus to mobilize private capital and management skills to improve effi ciency and develop a logistics system. In Africa, as else-where, the landlord port system has generally enjoyed greater success than the public service port and is the best way to attract the private sector. Attracting major international container lines and terminal operators can increase effi -ciency. However, mobilization of that potential still requires appropriate public sector actions in the administration of customs and the regu-lation of inland transport, as recent experience in Lagos demonstrates (see box 12.1).
Private participation by the most effi cient international port operators must be stimu-lated by a landlord port philosophy conducive to their participation and by transparent ten-dering. Such port reforms are likely to involve retrenchment and compensation. Govern-ments should develop advance strategies to
Lagos port has long been notorious for inadequate facili-ties and congestion. As part of a broader program of port reform in early 2006, the Nigerian Ports Authority awarded a concession to APM Terminals to manage, operate, and develop the Apapa container terminal, increasing capacity from 220,000 TEUs per year to 1.6 million TEUs. Within months of the award of that concession, delays for berth-ing space dwindled signifi cantly, and shipping lines reduced their congestion surcharge from $740 to $105 per TEU, saving the Nigerian economy $200 million a year. By early 2009, new gantry cranes had been acquired to triple the original capacity.
However, that was not the end of the story. Although the port’s equipment is able to handle more than 500 con-tainers per day for customs examinations, the majority of the containers are returned to stacking by the end of each day. By January 2009, the port was clogged by uncollected containers, and at the end of February, the head of the Nige-rian Ports Authority announced a temporary suspension of ship entry with immediate effect, lasting until sometime in
mid-April, to enable terminals to clear “alarming” backlogs. The controller of the Nigeria Customs Service for Apapa blamed the low clearance volume on the need to physically examine every container because of the high incidence of concealment and false declaration by importers. However, even cleared containers were not being collected. At the end of January, of the reported 9,741 containers in the port for delivery to the importers, only 851 had been cleared by cus-toms, with all charges paid and documentation completed but not picked up by agents. The Nigerian Ports Authority consequently proposed introducing demurrage charges of $4 per TEU in a bid to force owners to move their contain-ers out of the ports. In their turn, however, the containers’ agents blamed a lack of trucks, arguing that many had been booked to empty containers. Although the moratorium on entry of new vessels was lifted in early March, some back-logs and delays remained and signifi cant organizational and regulatory problems still remain.
Source: Press reports assembled by C. Bert Kruk, World Bank.
Private Participation and Port Effi ciency: The Case of Apapa Container Terminal, Lagos, Nigeria
BOX 12 . 1

258 AFRICA’S INFRASTRUCTURE: A TIME FOR TRANSFORMATION
create employment alternatives and to handle the administration and fi nance of the adjust-ment in the terms of the concession contracts.
Comprehensive Policies for Modal IntegrationGovernments must decide how best to fos-ter and fi nance integrated port and transport facilities and associated land uses. A national port plan covering modal integration and port-specifi c issues is the key. Allocating enough land for integrated development should be consid-ered in the early stages of port planning, partic-ularly for new ports. Links between rail and port concessions, while having some risk of exploita-tion in downstream markets, may provide the best incentive to good modal integration.
Governments of both coastal and land-locked countries must decide which transit corridors to support and develop. The key to exploiting the major scope for traffi c growth is coordinated system development similar to that for the Ghana Gateway and for the Maputo Corridor between the port of Maputo and South Africa, Swaziland, and Zimbabwe. Landlocked countries will likely want more than one alternative. Where the bottlenecks are at the seaports, planning and developing inland ports (dry ports) deserves consideration, par-ticularly for landlocked transit countries.
Investment for Quality—the Communications NeedsTo reduce dwell times and handling costs, coun-tries need to invest in information systems, com-munications technology, and modern customs practices. Customs procedures, in particular, act as a bottleneck to port effi ciency when they are outdated or open to corruption. As an extreme example, one port had to close for an extended period because of customs problems. Modern customs procedures and other soft infrastruc-ture have a major role in delivering effi cient port and freight transportation systems.
Striving for effi cient ports must be comple-mented by associated measures to increase transparency and reduce corruption in cus-toms administration. The African ports, like all world ports, must create port community systems not only to improve productivity and
effi ciency (and thereby reduce costs), but also to respond to the growing importance of and future obligation in supply chain security.
Notes The authors of this chapter are Mike Mundy
and Kenneth Gwilliam, who drew on back-ground material and contributions from Michel Luc Donner, Bradley Julian, Cornelis Kruk, and Andrew Penfold.
1. Some concession contracts specify required per-formance in TEUs per crane hour. Moves per hour is preferred here as an indicator because moving a 20-foot box requires the same time as moving a 40-foot box.
2. This comparison must be viewed cautiously because the productivity depends on the type of cargo handled, which is not allowed for in this crude statistic.
3. Those national companies include Sitram of Côte d’Ivoire, NNSL (Nigerian National Ship-ping Line) of Nigeria, Black Star Line of Ghana, Sotonam of Togo, and Camship of Cameroon.
ReferencesBell, Michael G. H., and Khalid Bichou. 2007.
“The Port Sector in South Africa: Towards an Integrated Policy and Institutional Reform.” World Bank, Washington, DC.
Drewry Shipping Consultants Ltd. 2006. Global Capacity Issues: Annual Review of Global Container Terminal Operators. London: Drewry Shipping Consultants Ltd.
———. 2008. Annual Review of Global Container Operators. London: Drewry Shipping Consul-tants Ltd.
Harding, Alan, Gylfi Pálsson, and Gaël Raballand. 2007. “Port and Maritime Transport Challenges in West and Central Africa.” Working Paper 84, Sub-Saharan Africa Transport Policy Program, World Bank, Washington, DC.
Kruk, C. Bert, and Michel Luc Donner. 2008. “Review of Cost of Compliance with the New International Freight Transport Security Requirements: Consolidated Report of the Investigations Carried Out in Ports in the Africa, Europe and Central Asia, and Latin America and Caribbean Regions.” Transport Paper 16, Transport Sector Board, World Bank, Washington, DC.
Mundy, Michael, and Andrew Penfold. 2008. “Beyond the Bottlenecks: Ports in Sub-Saharan Africa.” Background Paper 8, Africa Infrastruc-ture Country Diagnostic, World Bank, Washington, DC.

259
13Chapter
Airports and Air Transport: The Sky’s the Limit
A ir transport can stimulate regional eco-nomic development. In Africa, 120,000 people are employed directly in air
transport, and 20 percent of tourism jobs are associated with travelers by air. Air cargo is also important in some export trades (such as fl owers from Kenya and fi sh from Tanzania). Overall, traffi c has been growing at about 6 percent a year from 1997 to 2006. In south-ern and eastern Africa, the market growth is strongest, with three vigorous hubs and three major African carriers dominating interna-tional and domestic markets. In central and western Africa, however, the market is stag-nating, with the vacuum created by the con-fl ict in Côte d’Ivoire and the demise of several regional airlines still unfi lled.
Air transport in Sub-Saharan Africa is still expensive by international standards. Landing charges are high, partly caused by the absence of the support from concessions revenue enjoyed by many airports in the world. Because of rela-tively low volumes of traffi c on many routes in Africa, airfares are also high, despite the efforts of some governments to subsidize domestic fares from protected intercontinental routes. In many
cases, the protection of small national carriers, as an instrument for this cross subsidy, adds to the budget burden and hinders effi cient service.
Generally, infrastructure capacity is not a serious problem. The number of airports is sta-ble, and enough runways exist to handle traffi c with better scheduling and modest investment in parallel taxiways and some terminal facili-ties. Aircraft fl eets are being modernized, but air traffi c control facilities need substantial improvement. Revenues from airports and air traffi c are probably high enough to fi nance the necessary investments, but the sector does not capture them. The problem is both political and organizational.
Two other serious challenges remain. First, liberalization of the international regime within Africa must be completed, as commit-ted to in the Yamoussoukro Decision of 1999. Many international agreements within Africa have been liberalized, resulting in routes and aircraft sizes that are better adapted to the market and some large, viable indigenous carriers that are expanding. However, the domestic and intercontinental markets often remain protected, and many small, nonviable

260 AFRICA’S INFRASTRUCTURE: A TIME FOR TRANSFORMATION
state-owned operations continue, particularly in southern Africa, that are protected at the expense of potential users of air transport.
Second, air safety must be addressed. Sub-Saharan African carriers have the world’s worst accident record. Contrary to many accounts, this unenviable record is largely attributable to poor pilot capabilities and weak safety adminis-tration rather than the age of aircraft. Supervi-sory oversight of operators is particularly lax.
The African Air Transport Market
Air traffi c in Africa has been growing, but at the same time concentrating, so that fewer routes are served. Lack of competition keeps costs relatively high, and the safety record remains very worrisome. However, fleet renewal has been substantial in recent years, downsizing aircraft toward a city-jet size.
Traffi c Trends—on the RiseAll segments of the air passenger transport market in Sub-Saharan Africa have been grow-ing steadily since 1997, with a small hesitation following September 11, 2001, and a larger downturn in West and Central Africa associ-ated with the collapse of Air Afrique in 2004 (fi gure 13.1).
A notable acceleration has occurred in all main traffi c categories (measured in number of seats) since 2004, including domestic, inter-national, and intercontinental (table 13.1). Intercontinental traffi c, which relies heavily on the three major gateways of Johannesburg, Nairobi, and Addis Ababa, grew at an average of 6.2 percent a year between 2001 and 2007. Although the South African routes to Germany and the United Kingdom are still the most heavily traffi cked, the most notable feature of this growth has been the signifi cant rise in ser-vice through the Middle East from all of the main gateways.
International traffi c within Sub-Saharan Africa grew slightly faster, at an average of 6.5 percent a year between 2004 and 2007, with the same three major hubs handling 36 per-cent of such traffi c (fi gure 13.2). The national airline dominates the interregional traffi c of each hub: South African Airways (33 percent of the international traffi c at the hub), Kenya Airways (70 percent), and Ethiopian Airlines (83 percent). Both Kenya Airways and Ethio-pian Airlines have been developing new routes as the sole carrier, while most of South Afri-can Airways’ international routes have more than one carrier in competition. East Africa has the more developed network. In West and Central Africa, only Nigeria has a signifi cant number of intercontinental and international connections.
Domestic traffi c grew fastest, at more than 12 percent a year between 2004 and 2007. But that growth—as high as 67 percent in Nigeria—varied greatly and actually declined in about half of the countries in the region between 2001 and 2007. Overall, the number of domestic city-pairs served dropped by 229 in that same period. In addition, excluding Mozambique, Nigeria, and South Africa, domestic traffi c showed an aver-age annual decline of 1 percent a year and a loss of 137 routes between 2004 and 2007.
The steady growth of traffi c overall dis-guises some severe problems at the subregional level. The Banjul Accord Group of countries, including Nigeria, has shown the fastest growth, followed by the more developed, yet healthily growing regions of East and southern Africa (fi gure 13.3). Because of regional airline collapses, a swath of nations surrounding the
0
20
40
60
80
100
num
ber
of s
eats
(tho
usan
ds)
120
140
160
180
200
1997 1998 1999 2000 2001 2002 2003 2004 2005 2006
North America Southeast Asia
AfricaEurope Middle Eastall
Figure 13.1 Growth of Air Traffic, 1997–2006
Source: Bofinger 2009.
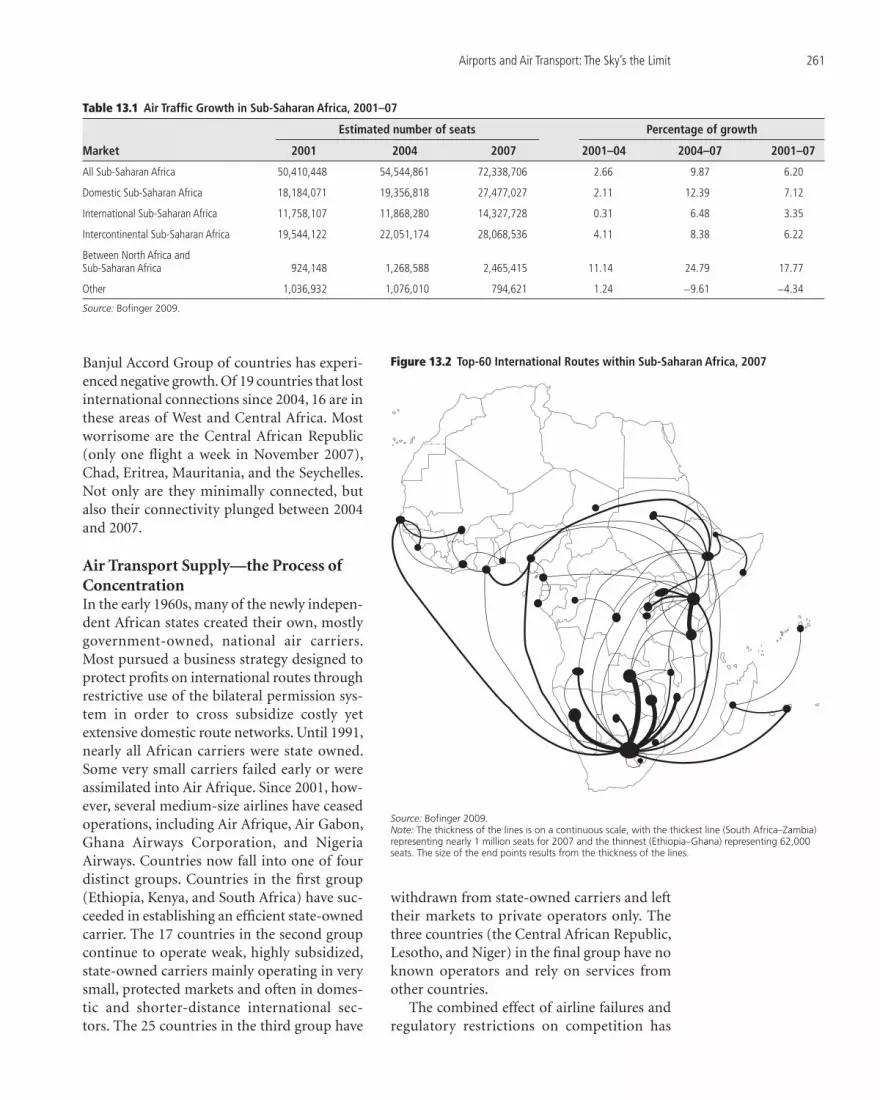
Airports and Air Transport: The Sky’s the Limit 261
Banjul Accord Group of countries has experi-enced negative growth. Of 19 countries that lost international connections since 2004, 16 are in these areas of West and Central Africa. Most worrisome are the Central African Republic (only one fl ight a week in November 2007), Chad, Eritrea, Mauritania, and the Seychelles. Not only are they minimally connected, but also their connectivity plunged between 2004 and 2007.
Air Transport Supply—the Process of ConcentrationIn the early 1960s, many of the newly indepen-dent African states created their own, mostly government-owned, national air carriers. Most pursued a business strategy designed to protect profi ts on international routes through restrictive use of the bilateral permission sys-tem in order to cross subsidize costly yet extensive domestic route networks. Until 1991, nearly all African carriers were state owned. Some very small carriers failed early or were assimilated into Air Afrique. Since 2001, how-ever, several medium-size airlines have ceased operations, including Air Afrique, Air Gabon, Ghana Airways Corporation, and Nigeria Airways. Countries now fall into one of four distinct groups. Countries in the fi rst group (Ethiopia, Kenya, and South Africa) have suc-ceeded in establishing an effi cient state-owned carrier. The 17 countries in the second group continue to operate weak, highly subsidized, state-owned carriers mainly operating in very small, protected markets and often in domes-tic and shorter-distance international sec-tors. The 25 countries in the third group have
withdrawn from state-owned carriers and left their markets to private operators only. The three countries (the Central African Republic, Lesotho, and Niger) in the fi nal group have no known operators and rely on services from other countries.
The combined effect of airline failures and regulatory restrictions on competition has
Source: Bofinger 2009.Note: The thickness of the lines is on a continuous scale, with the thickest line (South Africa–Zambia) representing nearly 1 million seats for 2007 and the thinnest (Ethiopia–Ghana) representing 62,000 seats. The size of the end points results from the thickness of the lines.
Figure 13.2 Top-60 International Routes within Sub-Saharan Africa, 2007
Table 13.1 Air Traffic Growth in Sub-Saharan Africa, 2001–07
Market
Estimated number of seats Percentage of growth
2001 2004 2007 2001–04 2004–07 2001–07
All Sub-Saharan Africa 50,410,448 54,544,861 72,338,706 2.66 9.87 6.20
Domestic Sub-Saharan Africa 18,184,071 19,356,818 27,477,027 2.11 12.39 7.12
International Sub-Saharan Africa 11,758,107 11,868,280 14,327,728 0.31 6.48 3.35
Intercontinental Sub-Saharan Africa 19,544,122 22,051,174 28,068,536 4.11 8.38 6.22
Between North Africa and Sub-Saharan Africa 924,148 1,268,588 2,465,415 11.14 24.79 17.77
Other 1,036,932 1,076,010 794,621 1.24 −9.61 −4.34
Source: Bofinger 2009.

262 AFRICA’S INFRASTRUCTURE: A TIME FOR TRANSFORMATION
been to increase concentration, both in the total market and on individual routes. By early 2008, 15 airlines accounted for 59 percent of all seat capacity offered in Africa. The top-20 intercontinental routes each average 3.45 com-peting airlines. International service within Sub-Saharan Africa is less competitive, with just 15 airlines providing more than 82 percent of capacity, and the big 3 (Ethiopian Airlines, Kenya Airways, and South African Airways) providing 57 percent.
Sixteen of the top 60 routes, and 66 of the 206 total routes, have only one carrier. Ethi-opian Airlines and, to a lesser extent, Kenya Airways have contributed to this concentra-tion by developing new routes as sole carri-ers. In most cases, domestic travel is serviced
by the national fl ag carrier and is highly con-centrated. Of the 286 routes with service in 2007, only 54 had more than one service provider—generally, the national fl ag carrier. Standing out among the larger countries for allowing competition are South Africa, where competition occurs only on the heaviest routes, and Tanzania, where more than one service provider exists on all of its 17 domestic routes.
The Equipment OperatedThe two most significant trends for Sub-Saharan African air transport have been the downsizing of aircraft toward the city-jet size (Boeing 737 or Airbus 319) and, contrary to many accounts, the renewal of the fl eet. The proportion of seat miles fl own on older Western
negative growth (–20% or so less since 2001)
good growth (20% or so more since 2001)
very high growth (almost 40% or more since 2001)
highest growth (60% or more since 2001)
data not available
Figure 13.3 Regional Growth Zones in Seats Offered, All Travel Categories
Source: Bofinger 2009.

Airports and Air Transport: The Sky’s the Limit 263
aircraft has increased to accommodate growth quickly and inexpensively only in some domes-tic markets, and even that proportion is only 4 percent of seat miles overall. A slight increase has already occurred in the use of commuter propeller aircraft on the low-volume routes in Tanzania and in West and Central Africa, and such aircraft may have an important role in the recovery of the air transport market in that subregion.
Fares—More Expensive Within Africa than OutsideAir travel within Africa is considerably more expensive per mile fl own than intercontinental travel, especially on routes of less than 2,000 nautical miles (fi gure 13.4). This cost refl ects the fact that domestic and international mar-kets are less dense and less competitive than the longer distance intercontinental markets. Moreover, aircraft landing charges are gener-ally high by international standards, partly because of the absence of nonfl ight revenues from airport concessions. In some cases, the skewed cost is limited by subsidized or fi xed pricing on domestic routes operated by a national fl ag carrier.
Flying in Africa—a Dangerous BusinessThe most notable problem of the African air transport industry is safety. In 2004, Africa experienced 22.0 percent of all accidents world-wide, despite accounting for only 4.5 percent of all sectors fl own globally. In 2006, African car-riers lost 4.31 aircraft per million departures, compared with 0.65 aircraft worldwide.
The major intercontinental carriers, most of them Asian, European, or U.S. registered, have an excellent safety record. In contrast, compa-nies operating Western-built aircraft that are still in use in most developed countries but reg-istered in a Sub-Saharan African country have had 15 fatal accidents since the mid-1990s, involving 1,080 deaths. Even worse, African carriers operating older Western- or Eastern-built aircraft have reported at least 29 accidents over same period (and suspicions exist that many others are not reported). In addition, many accidents involve fl ights conducted by the air force, which in many African countries transports civilian passengers and cargo.
Some commentators have ascribed this bad record primarily to the use of Eastern-built air-craft. Certainly, the hull loss rate per million departures of Eastern-built aircraft reached 54.35 in 2006 in Africa, 10 times the world average for such aircraft (5.61). However, a study by the Interstate Aviation Committee concluded that the fl ight safety of most Soviet-made types of aircraft is no worse and, in some cases, is better than that of their Western equiv-alents. Much more signifi cant is that mainly small, poorly regulated fringe carriers fl y these aircraft. The high accident rate in Sub-Saharan Africa is thus primarily a result of poor safety standards and lax supervision, not operation of Eastern-built or older aircraft.
Air Transport Policy in Africa
Much of the world has moved from a strictly regulated air transport industry to a more lib-eralized one. In the United States, deregulation resulted in the failure of weaker carriers, emer-gence of new low-cost carriers, rearrangement of routes, and evolution of the hub-and-spoke system. Fares fell on average, and load factors generally increased through differentiated pricing. In Europe, too, the rise of low-cost car-riers was a highly visible effect of deregulation.
0
0.50
1.00
1.50
2.00
2.50
3.00
0 1,000 2,000 3,000 4,000 5,000 6,000 7,000 8,000
distance (miles)
US$
/mile
international intercontinental domestic
between Sub-Saharan Africa and North Africa
Figure 13.4 Airfares by Distance on African Routes, Including North Africa, 2008
Source: Bofinger 2009.
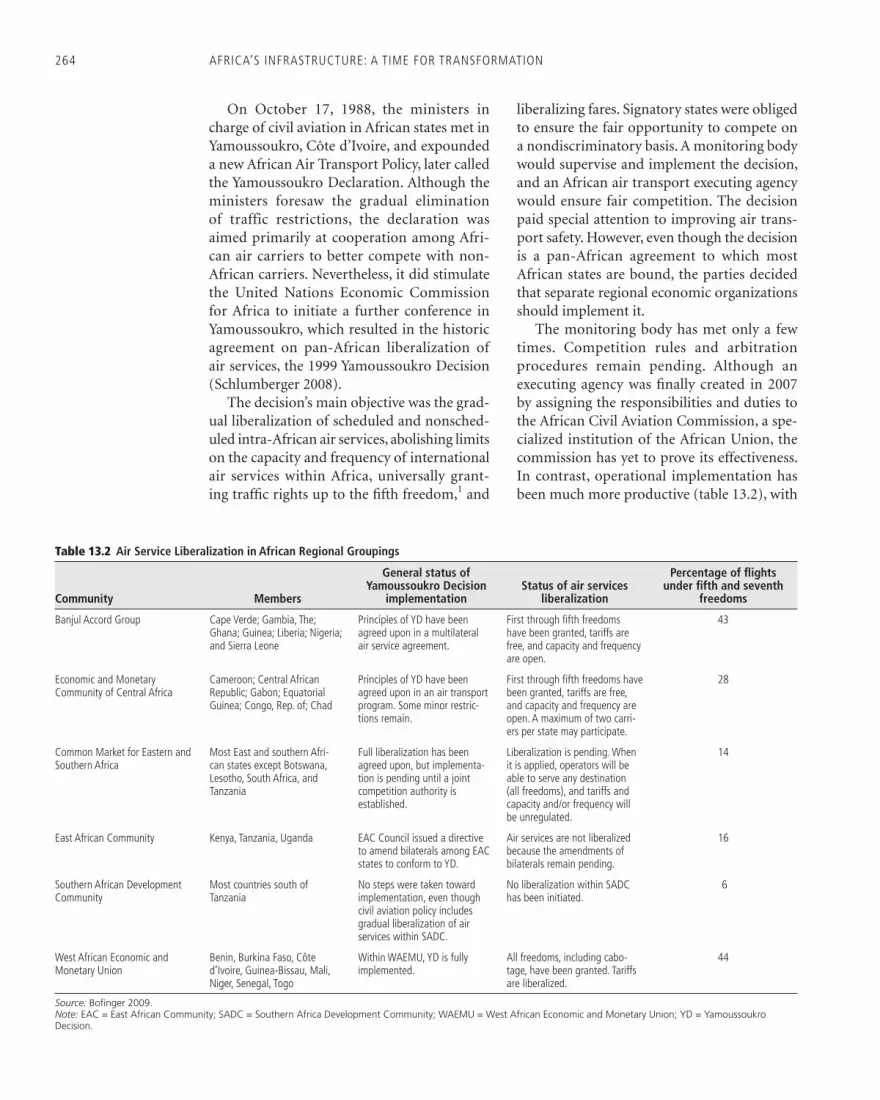
264 AFRICA’S INFRASTRUCTURE: A TIME FOR TRANSFORMATION
On October 17, 1988, the ministers in charge of civil aviation in African states met in Yamoussoukro, Côte d’Ivoire, and expounded a new African Air Transport Policy, later called the Yamoussoukro Declaration. Although theministers foresaw the gradual elimination of traffic restrictions, the declaration was aimed primarily at cooperation among Afri-can air carriers to better compete with non-African carriers. Nevertheless, it did stimulate the United Nations Economic Commission for Africa to initiate a further conference in Yamoussoukro, which resulted in the historic agreement on pan-African liberalization of air services, the 1999 Yamoussoukro Decision (Schlumberger 2008).
The decision’s main objective was the grad-ual liberalization of scheduled and nonsched-uled intra-African air services, abolishing limits on the capacity and frequency of international air services within Africa, universally grant-ing traffi c rights up to the fi fth freedom,1 and
liberalizing fares. Signatory states were obliged to ensure the fair opportunity to compete on a nondiscriminatory basis. A monitoring body would supervise and implement the decision, and an African air transport executing agency would ensure fair competition. The decision paid special attention to improving air trans-port safety. However, even though the decision is a pan-African agreement to which most African states are bound, the parties decided that separate regional economic organizations should implement it.
The monitoring body has met only a few times. Competition rules and arbitration procedures remain pending. Although an executing agency was fi nally created in 2007 by assigning the responsibilities and duties to the African Civil Aviation Commission, a spe-cialized institution of the African Union, the commission has yet to prove its effectiveness. In contrast, operational implementation has been much more productive (table 13.2), with
Table 13.2 Air Service Liberalization in African Regional Groupings
Community Members
General status of Yamoussoukro Decision
implementationStatus of air services
liberalization
Percentage of fl ights under fi fth and seventh
freedoms
Banjul Accord Group Cape Verde; Gambia, The; Ghana; Guinea; Liberia; Nigeria; and Sierra Leone
Principles of YD have been agreed upon in a multilateral air service agreement.
First through fi fth freedoms have been granted, tariffs are free, and capacity and frequency are open.
43
Economic and Monetary Community of Central Africa
Cameroon; Central African Republic; Gabon; Equatorial Guinea; Congo, Rep. of; Chad
Principles of YD have been agreed upon in an air transport program. Some minor restric-tions remain.
First through fi fth freedoms have been granted, tariffs are free, and capacity and frequency are open. A maximum of two carri-ers per state may participate.
28
Common Market for Eastern and Southern Africa
Most East and southern Afri-can states except Botswana, Lesotho, South Africa, and Tanzania
Full liberalization has been agreed upon, but implementa-tion is pending until a joint competition authority is established.
Liberalization is pending. When it is applied, operators will be able to serve any destination (all freedoms), and tariffs and capacity and/or frequency will be unregulated.
14
East African Community Kenya, Tanzania, Uganda EAC Council issued a directive to amend bilaterals among EAC states to conform to YD.
Air services are not liberalized because the amendments of bilaterals remain pending.
16
Southern African Development Community
Most countries south of Tanzania
No steps were taken toward implementation, even though civil aviation policy includes gradual liberalization of air services within SADC.
No liberalization within SADC has been initiated.
6
West African Economic and Monetary Union
Benin, Burkina Faso, Côte d’Ivoire, Guinea-Bissau, Mali, Niger, Senegal, Togo
Within WAEMU, YD is fully implemented.
All freedoms, including cabo-tage, have been granted. Tariffs are liberalized.
44
Source: Bofinger 2009.Note: EAC = East African Community; SADC = Southern Africa Development Community; WAEMU = West African Economic and Monetary Union; YD = Yamoussoukro Decision.

Airports and Air Transport: The Sky’s the Limit 265
greater freedom to negotiate bilateral agree-ments in all of the subregions.
In West Africa, the Economic Community of West African States was unable to take any signifi cant steps toward liberalizing air services, but the smaller West African Economic and Monetary Union went even beyond the Yamoussoukro principles with a regime that includes cabotage rights. The Banjul Accord Group, also in West Africa, agreed to a multi-lateral air service agreement, fully compatible with the Yamoussoukro Decision. In Central Africa, the Economic and Monetary Commu-nity of Central Africa has implemented all the necessary legislative and regulatory elements to comply with the provisions of the Yamoussoukro Decision. In East and southern Africa, the Com-mon Market for Eastern and Southern Africa achieved the most progress, but full application of the decision principles remains suspended. The East African Community has chosen the effective strategy of directing the bilaterals to conform to the decision, but signing of the agreement remains pending. The Southern African Development Community has pro-gressed the least. Apparently, the dominant posi-tion of South Africa remains the main obstacle toward implementing the decision. Overall, about two-thirds of air transport service within Africa is now liberalized.
African Air Transport Infrastructure
The existing air transport infrastructure can fairly well accommodate Africa’s current air traffi c and foreseeable growth; only a hand-ful of cases warrant investments in taxiways or terminal upgrades. Instead, the main invest-ment need lies in air traffi c control and surveil-lance equipment, which with few exceptions is largely inadequate.
Airports—a Declining Number in Service, but Adequate Runway CapacityAt least 2,900 airports exist in Africa, of which an estimated 261 in Sub-Saharan Africa received scheduled services in 2007. These airports fall into three groups. First, three major international airports (Addis Ababa,
Johannesburg, and Nairobi) act as gateways to the continent for intercontinental traffi c and as hubs for its distribution. They currently handle 36 percent of all international traffi c in Africa. Lagos could perform a similar func-tion for West and Central Africa but is lag-ging. Second, about 40 medium-size airports are connected to the hubs and primarily serve international and domestic traffi c. Third, more than 200 small and often nonviable airports act as the distribution points for frequently declining domestic air traffi c. Except for those in the Banjul Accord countries (Cape Verde, the Gambia, Ghana, Guinea, Liberia, Nigeria, and Sierra Leone), the number of airports with scheduled service dropped by 20–40 percent between 2001 and 2007.
Nearly all airports that had scheduled advertised service in November 2007 have at least one paved major runway. Only a dozen or so airstrips are unpaved, most of them in countries either in or just out of military con-fl ict. An exception is Tanzania, which has fi ve airports with scheduled service and with alter-natively surfaced runways, though projects for resurfacing are in progress.
Airports in Africa do not often have “pure” runway capacity constraints. With a five-minute separation between fl ights, a single-runway airport could accommodate 144 fl ights in 12 hours, or more than 1,000 fl ights a week. With an average load of 120 passengers, more than 17,000 passengers a day could be handled. Even with a 20-minute separation, passenger numbers would not exceed 4,300 a day. Very few airports in Africa handle more passengers than this. Capacity constraints may appear, however, on taxiways, aprons, and jetways.
In many African airports, aircraft must taxi to the turning bay, turn around, and taxi back toward the access to the apron, usually in the center of the runway. This procedure is accept-able in most airports where enough time elapses between departing and arriving aircraft to do so. Only a relatively few high-volume air-ports require parallel taxiways with multiple turn-off ramps from the runway. Despite this generally adequate fl ight capacity, policy makers in several countries are urging the construction of entirely new international airports for which no economic justifi cation exists.

266 AFRICA’S INFRASTRUCTURE: A TIME FOR TRANSFORMATION
The airside infrastructure in such major hubs as Johannesburg and Nairobi meets high inter-national standards in runway length, instru-ment landing systems, and so on. For airports with lower traffi c volumes, however, signifi cant differences in the quality of the infrastructure are apparent. Fewer than 50 percent of airport runways are in excellent or very good condi-tion, compared with 96 percent in North Africa. Although traffi c to airports without paved run-ways is low, the number of airports with poor runways is relatively high in some countries (table 13.3). Fortunately, 87 percent of the seats landed are on excellent or very good runways, and only about 4 percent of the traffi c is to air-ports with marginal or poor ratings.
Instrument landing systems can be found at nearly all airports with an estimated capacity of 1 million seats or more, but their presence drops off rapidly below this traffi c volume. In many smaller, older airports, nondirectional beacon systems—now very outdated—still pre-vail. However, this circumstance does not nec-essarily imply that new investment is needed in ground-based navigation infrastructure; today’s satellite technology can easily replace many of the ground-based systems at a much lower cost. Nevertheless, in practice, few plans have been made to replace obsolete technologies.
Airport Terminals—Few Capacity ConstraintsSome evidence exists of inadequate capacity of passenger terminals, though data are not readily available. Many Sub-Saharan African terminals report traffi c volumes at or above their declared capacity, and in some cases,
capacity issues are already being addressed. For example, Nairobi’s passenger terminal is going through an extensive upgrade to allow more than 9 million passengers a year. In other cases, the declared capacity needs to be exam-ined. For example, Malawi’s airport in Lilongwe, though clearly in need of some upgrades, does not appear on the ground to be as defi cient as the fi gures suggest. Rescheduling to prevent the simultaneous arrival of too many fl ights can be of great help.
Airport Management—Limited Privatization Airports usually have some quasi-independent operating agency, whether government owned or not. Even the company that owns South Afri-ca’s nine most important airports, includingJohannesburg, is only partially privatized, with majority ownership still held by the state. Cameroon, Côte d’Ivoire, and Madagascar have concessioned their major airport groups, although in Madagascar, the government has a majority shareholding in the concessionaire. Kenya has concessioned the development of the cargo terminal at Nairobi’s international airport. South Africa has divested some smaller airports completely. Even without full airport concessions, the range of airport service pro-viders is wide. In Tanzania’s Dar es Salaam International Airport, passenger services are performed by Swissport, and at Nairobi’s Jomo Kenyatta International Airport, a broad range of competition exists for landside services. Navigation and air traffi c control still typically fall directly under governmental agencies, with some services subcontracted.
Table 13.3 Runway Quality in Sub-Saharan Africa, 2007
Rating Airports (number)Percentage of total
airports Seats (millions)Percentage of total
seats
Excellent 31 18 67.75 68
Very good 50 29 18.49 19
Fair 46 27 8.51 9
Marginal 10 6 2.29 2
Poor 36 21 2.42 2
Total 173 100 99.50 100
Source: Bofinger 2009.

Airports and Air Transport: The Sky’s the Limit 267
Air Traffi c Control—the Critical Infrastructure Defi ciency Air traffi c control infrastructure in Africa is wanting, with the exception of airports in South Africa and Kenya.2 Addis Ababa uses no civilian radar, forcing extra distance and time separations between aircraft. In Malawi, as equipment has aged and become too expen-sive to maintain, surveillance has fallen into disrepair. Even when the equipment exists, radar procedures (and radar separations) are not always implemented. In Kenya, only the airport in Nairobi has full-time radar vector-ing, while that in Mombasa switches to radar only if weather so demands. In Tanzania, Dar es Salaam’s airport has a good radar installa-tion, with a secondary radar range in excess of 200 miles, but has no radar vectoring because of a lack of radar-certifi ed controllers.
Closely related to traffi c surveillance is the capability for aircraft communication to and from the ground. In certain areas of Africa, an airliner could fl y for more than an hour and be unable to make contact with the ground. The lack of adequate surveillance also raises concerns about search and rescue operations.3 Weather installations are also sparse, often relying on physical observation using manual techniques now commonly automated in the West. Moreover, broadband infrastructure is not available in most airports.
Policy Challenges
Countries in Africa face fi ve main challenges in developing their airports and air transport:
• Deciding what to do with national fl ag carriers
• Improving air safety
• Liberalizing air transport markets
• Financing infrastructure
• Developing and maintaining skills.
A Strategy for National Flag CarriersMost national fl ag carriers in Sub-Saharan Africa have been small by international stan-dards, with a very weak base of demand. They usually experienced political pressures
to maintain unremunerative services without direct subsidies, often performing politically determined services for no return at all. Even with protection of the home market, they lacked the potential to be commercially viable. Consequently, many of them have failed, as did the multinational Air Afrique.
Despite the failures, Africa still has many small, nationally owned fl ag carriers that were established decades ago. They survived ini-tially through protection of both the domestic market and the national share of international markets. Even when losses mounted, gov-ernments often argued that the national fl ag carrier should be retained in a restructured form, because subsidized domestic routes would be dropped without a national carrier, causing regional isolation, and revenues from foreigners traveling within the country would be lost. However, restructuring has often simply meant strengthening protection and investing in new aircraft, without improving the basic economics of the operation.
Africa has some successful nationally owned fl ag carriers, usually the dominant carrier in an intercontinental hub. However, they are rare. In most cases, instead of protecting a fl ag carrier, countries should pursue a better alternative of opening the market to allow a successful oper-ator to provide service. This approach could include a successful fl ag carrier from another country. In principle, the merger of several regional airlines should create some strength, but the experience of Air Afrique shows the dangers of political intervention and noncom-mercial operation. A possible compromise is to paint one of the successful operator’s air-craft in the fl ag carrier’s colors and hire a crew for passenger services in the country.
Improvement of Air SafetyAccording to the African Airlines Association, the age of the fl eet is the greatest concern: nearly one-third of the total fl eet of 750 aircraft is more than 20 years old, with a prevalence of ex-Soviet types in certain countries. That view is not widely accepted. Although most acci-dents in 2006 involved old, Soviet-built turbo-prop aircraft, more recent, devastating crashes have involved mainly Western-built aircraft. Worldwide averages suggest that, vintage for

268 AFRICA’S INFRASTRUCTURE: A TIME FOR TRANSFORMATION
vintage, Russian-built aircraft are as safe as Western-built aircraft if properly maintained and operated. The problem is that many small carriers acquire one or more old aircraft on the nontransparent aircraft supply market and operate them without supervision by the civil aviation authorities. Their pilots work long hours and regularly operate aircraft in a dan-gerous environment, resulting in crashes. Even for U.S.-built aircraft, U.S. National Transpor-tation Board inquiries highlighted several cases of pilot error, in which poor pilot training and assessment contributed to an accident.
In general, the International Air Trans-port Association identifi es poor regulatory oversight as the top threat to safety in Africa, followed by inadequate safety management systems. Similarly, the International Civil Avia-tion Organization’s Universal Safety Oversight Program shows that safety implementation in Africa is very defi cient. For example, West and Central Africa, and East and southern Africa perform below the world average in all the critical elements of safety implementation—in most cases, by a factor of two (fi gure 13.5). These defi ciencies are highly correlated with accident rates, suggesting that institutional failings explain much of Africa’s poor accident
record. The U.S. Federal Aviation Adminis-tration and the European Union also rate air safety in many African countries as poor.
Because of the interaction between national systems, air safety is a regional problem that needs to be addressed regionally. ASECNA (Agence pour la Sécurité de la Navigation Aéri-enne en Afrique et à Madagascar), founded in 1959, has 15 member states aiming to pool air navigation services and other infrastructure. In addition to navigation infrastructure, the orga-nization manages eight airports. Further steps are under way. In East Africa, a centralized East African civil aviation authority has just been formed with support from the U.S. Depart-ment of Transportation’s Safe Skies for Africa program. Though not yet fully implemented, the organization, now headquartered at the East African Community in Arusha, Tanzania, would supplement the existing civil aviation authorities in the member countries by pro-viding resources in a central pool available to community countries. Also, two projects for the Cooperative Development of Operational Safety and Continuing Airworthiness Program are being planned for the Southern African Development Community and the Economic and Monetary Community of Central Africa. Thus, regional pooling of resources is address-ing Africa’s shortcomings in oversight.
Liberalization of Air Transport MarketsFormal implementation of the Yamoussoukro Decision remains very slow, particularly in southern Africa. Many national airline offi -cials have advised their governments that the airlines are not ready for a free market and still need protection. Many are concerned that an open skies policy for intercontinental trans-port, particularly to Europe, would drive Afri-can carriers from the intercontinental market, with adverse secondary effects for international and domestic services in Africa.
This attitude almost certainly hinders regional development. Ample evidence already exists of the benefi ts for southern Africa from wider liberalization. For example, liberalizing the domestic market in South Africa in 1990 fueled passenger growth of 80 percent between 1994 and 2004, and eventually led to the establishment of domestic low-cost carriers.
0
10
20
30
40
50
60
70
primary
aviat
ion
legisla
tion
speci
fic op
eratin
g
regula
tions
CAA struc
ture &
safet
y
overs
ight fu
nctio
ns
techn
ical
guida
nce m
ateria
lqu
alifie
d
techn
ical p
erson
nel
licens
ing &
certif
icatio
n
oblig
ation
s
conti
nued
surve
illanc
e
oblig
ation
s
resolu
tion o
f
safety
issue
s
critical element
% o
f non
impl
emen
tati
on
East and southern Africaglobal West and Central Africa
Figure 13.5 International Civil Aviation Organization Analysis of Safety Implementation in Africa, 2004
Source: ICAO 2004.Note: CAA = Civil Aviation Authority.

Airports and Air Transport: The Sky’s the Limit 269
Similarly, liberalizing the Nairobi-Johannesburg route in 2000 increased fl ights from 4 a day to 14 and increased passenger volumes by 69 per-cent. Competition is important here. On the Johannesburg-Lusaka route (for which South African Airways had been the only carrier for over 10 years), designating the South African low-cost carrier, Kulula, as the Zambian carrier reduced fares by 33–38 percent and increased passengers by 38 percent.
Recent modeling suggests that full liberal-ization in the Southern African Development Community would reduce airfares by 18–40 percent with a low-cost carrier entering the market and would increase traffi c volume by 20 percent (Genesis Analytics and others 2006). Another half a million foreign tourists would arrive by air each year, spending more than $500 million. The multiplier effect would increase the Southern African Development Community’s GDP by about $1.5 billion, or 0.5 percent growth. Another study on liber-alizing routes on 20 city-pairs to and from Addis Ababa came to a similar conclusion (Abate 2007).
Financing of InfrastructureTwo agencies are typically concerned with air transport infrastructure. Air traffi c control is usually the function of a national civil aviation authority, whereas airport infrastructure (both airside and landside) is usually the responsi-bility of a separate airports agency. Both have fi nancing problems.
Civil aviation authorities survive on fees. Where the land mass is large and the geographic location important, signifi cant air navigation charges (exceeding many of the other service charges relied on by authorities) can be gained from overfl ights. However, reallocating those charges can be politically contentious. A truly independent regulatory body could improve services, but in many cases, the revenues end up in the national treasury.
The same situation applies to airports. In a study by the International Civil Aviation Organization using 2005 data (ICAO 2008), the main access airports in Africa were con-sidered inherently profi table. However, the nonpayment of tariffs by weak fl ag carriers in small countries undermines airport fi nance, as
does the allocation of many airport revenues (such as those for overfl ight) to the state trea-sury, with only a small part left to the sector. The sensible investment strategy would seem to be investment in existing infrastructure, not new airports, and use of newer, cheaper tech-nologies for air traffi c surveillance and naviga-tion systems.
Development and Maintenance of SkillsThe International Air Transport Association has identifi ed the lack of effective fl ight crew training and profi ciency as a major source of safety problems. Even where training is ade-quate, highly trained fl ight crews in the poorer countries can usually command higher salaries when working for a larger foreign airline. A similar drain of skills affects regulatory staff. Safety inspectors trained with donor funding abandon oversight almost immediately to earn much more working for an airline.
Many issues are interconnected. Poor coun-tries trying to maintain a domestic fl ag carrier do not pay enough to train and maintain good fl ight crews. Because funds are usually insuffi -cient to provide competitive salaries for safety inspectors, oversight standards also fall. Main-taining staff is thus linked to the policies for fl ag carriers, market liberalization, and sector fi nance. Only a coherent and fi scally affordable set of policies in these challenging areas can produce a more sustainable air transport sec-tor in Sub-Saharan Africa.
Notes The authors of this chapter are Heinrich
Bofi nger and Kenneth Gwilliam, who drew on background material and contributions from Michel Iches, Pierre Pozzo di Borgo, and Charles Schlumberger.
1. The eight “freedoms of the air” are the focus of international regulation of air transport. The fi rst and second freedoms are technical free-doms to overfl y a foreign country or to land for refueling. The third and fourth freedoms are commercial freedoms to carry passengers from a carrier’s home country to another or vice versa. The fi fth to seventh freedoms con-cern the rights to carry passengers between two foreign countries, either as an extension of a fl ight from the home country (fi fth), through
270 AFRICA’S INFRASTRUCTURE: A TIME FOR TRANSFORMATION
a stop in the home country (sixth), or without ongoing service to the home base (seventh). The eighth freedom, pure cabotage, is the right to carry traffi c between two points in a foreign country.
2. The lack of radar installations should be discussed as the lack of surveillance infrastructure, because radar is now an obsolete technology. Newer, much more accurate, and much less costly technologies are now being installed, as in the United States. Similarly, navigation aids are being supplanted by technologies based on global positioning systems in modern aircraft.
3. In a recent accident in Cameroon involving a new Boeing 737, the aircraft could not immedi-ately be located because the last known position was the departure end of the runway.
ReferencesAbate, Megersa A. 2007. “The Economic Effects
of Progressive Air Transport Liberalization in Africa.” School of Graduate Studies, Addis Ababa University, Ethiopia.
Bofi nger, Heinrich C. 2009. “Air Transport: Chal-lenges to Growth.” Background Paper 16, Africa Infrastructure Country Diagnostic, World Bank, Washington, DC.
Genesis Analytics, Andrew Myburgh, Fathima Sheik, Fatima Fiandeiro, and James Hodge. 2006. Clear Skies over Southern Africa. Wood-mead, South Africa: ComMark Trust.
ICAO (International Civil Aviation Organization). 2004. “An Update of the ICAO Universal Safety Oversight Audit Programme.” Presentation to the ICAO TCB Seminar, Singapore, January 12–14, pp. 9 and 11. http://www.icao.int/icao/en/tcb/TCB-Singapore-2004/Attachements/Presentations/Acrobat/ICAO%20USOAP%20&%20Follow-up%20Programme.pdf.
———. 2008. “Financial Situation of Airports and Air Navigation Service Providers 2005.” ICAO, Montreal, Canada.
Schlumberger, Charles E. 2008. “Air Transport Policy Research: The Implementation of the Yamoussoukro Decision.” Working Paper 20, Africa Infrastructure Country Diagnostic, World Bank, Washington, DC.

271
14Chapter
Water Resources: A Common Interest
W ater management is critical for meeting Africa’s development chal-lenges. Though water is vital for
agriculture, only 5 percent of Africa’s cultivated land is irrigated. Hydropower is also largely undeveloped in Africa; less than 10 percent of its potential has been tapped. Water for people and animals is vital for health and livelihoods, yet only 58 percent of Africans have access to safe drinking water.
African economies depend on a reliable and adequate supply of water, but high rain-fall and hydrological variability result in fre-quent droughts and fl oods that stifl e economic growth. Moreover, water resources shared by countries pose complex political and manage-ment challenges.
Achieving water security to support growth and to build climate resilience is at the heart of water resource management in Africa. Water security refl ects a country’s ability to function productively in the face of water vulnerability. It is a precondition for sustaining and increas-ing investment returns and achieving dynamic economic growth. A minimum capacity of infrastructure and institutions, backed by robust water information systems, is needed to ensure basic national water security.
Building water infrastructure will fuel growth, reduce weather-induced risk, and alleviate water-related confl icts. Both large and small infrastructure projects need to be part of a balanced water investment program that provides reliable water supplies for human health and economic activities and that pro-tects natural water and environmental assets. Development of large multipurpose storage facilities (often combined with hydropower generation) is necessary for mitigating the economic effects of hydroclimatic variabil-ity, for ensuring reliable water supply, and for using available water. Small-scale approaches to water management improve the ability of the rural poor to cope with water shocks by increasing agricultural productivity and pro-viding cost-effective water supply and drought mitigation. Sound water management institu-tions are necessary to ensure sustained returns on infrastructure investments and to optimize the use of the water by multiple users and across administrative and political borders.
The estimated annual capital cost of water resource infrastructure is approximately $10 billion, of which almost 80 percent is for development of large multipurpose hydro-power storage, and about 10 percent each is

272 AFRICA’S INFRASTRUCTURE: A TIME FOR TRANSFORMATION
for development of large storage capacity for urban water supply and investment in devel-oping small-scale infrastructure projects. As a complement to these physical investments, Africa will need an additional $1.0 billion a year to develop hydrological networks, meet gaps in water information, and develop water management institutions.
Water Resources and Economic Development: Challenges for Africa
Africa faces diffi cult water legacies in the form of high hydrological variability and a mul-tiplicity of transboundary river basins. Both challenges can be impediments to the conti-nent’s economic growth.
Africa’s Water LegaciesAfrica faces a complex challenge in water resource management because of two legacies. The fi rst is its natural legacy of high hydro-climatic variability. The amount of water in Africa is comparable to that in other regions of the world; the continent has 9 percent of the world’s water resources and 11 percent of its population. However, Africa’s water endow-ment conceals the fact that rainfall across much of the continent is variable and unpredictable, both between and within years. Interannual rainfall variability in Africa, especially in east-ern and southern Africa, is high. These regions experience year-to-year variations exceeding 30 percent around the mean, a rate much greater than the temperate climates in Europe and North America (fi gure 14.1). High seasonal variability compounds these effects, causing droughts and fl oods. Runoff in Africa is extraor-dinarily low, only half that in Asia, Australia, Europe, and North America, despite having the same average precipitation. Low runoff coupled with high rainfall variability explains the unpre-dictable, and relatively low, seasonal and annual fl ows in many African rivers.
Climate change is expected to increase this variability. The Intergovernmental Panel on Climate Change forecasts that Africa will experience a signifi cant rise in temperature
of about 3–4 degrees Celsius by the end of the 21st century, compared with the period from 1980 to 1990 (IPCC 2007). The semiarid margins of the Sahara and the central part of southern Africa will be most affected, whereas equatorial latitudes and coastal areas will be least affected. The Intergovernmental Panel on Climate Change projects that the mean annual precipitation and runoff will decrease for northern and southern Africa and increase for eastern Africa by midcentury. Precipitation intensity will also likely increase for the entire continent; the benefi t of increased rainfall in the wetter areas may be negated by the rainfall being concentrated in more extreme weather events and thus less usable. In the drier areas, the spread between high and low runoff will likely increase, substantially complicating the challenge of water resource management.
The second challenge is Africa’s political and geographic legacy in which several countries share the same river basins. Africa has more than 60 transboundary rivers, with many coun-tries sharing the same basin. International river basins cover more than 60 percent of the con-tinent, and virtually all the region’s rivers cross several borders: the Nile crosses 10, the Niger 9, the Senegal 4, and the Zambezi 8 (fi gure 14.2).
Shared water resources present a manage-ment challenge and require investment in transboundary water management capacity and institutions, even if they also offer oppor-tunities for joint action and cooperation. Cross-border rivers have further implications for regional security and development, partic-ularly as Africa tries to develop and manage its water resources for economic development.
These legacies, compounded by underde-velopment of water infrastructure, present signifi cant social, economic, and political risks. The region’s weak capacity to buffer the effects of hydrological variability creates uncertainty and risk for economic activity. The expectation of variability and unpredictability in rainfall and runoff can encourage risk-averse behav-ior at all levels of the economy. It discourages investment in land, advanced technologies, or agriculture. An unreliable water supply is also a signifi cant disincentive for investments in industry and services. Growing demands for water generate competition over water use,

Water Resources: A Common Interest 273
posing social risks to poorer communities. Weak international relations and institutions for managing the international river basins may cause regional tensions and possible con-fl icts among riparian countries.
Effects on Economic DevelopmentHydrological variability causes signifi cant eco-nomic loss and constrains growth (Grey and Sadoff 2006b). Africa lacks the capacity to buf-fer the shocks of frequent droughts and fl oods. The abundance or shortage of rainfall affects national agricultural outputs. In Kenya, losses from fl ooding caused by El Niño in 1997–98 and drought caused by La Niña in 1998–2000 ranged from 10 to 16 percent of GDP during
those years (World Bank 2004). Mozambique’s GDP growth is reduced by over 1 percentage point annually because of water shocks (World Bank 2007). In Zambia, a study of how hydro-logic variability affects the economy found that rainfall variability will cost the country $4.3 billion in lost GDP over 10 years, and it lowers the country’s agricultural growth by 1 percent-age point each year (World Bank 2008).
Underdevelopment of water resources leads to underuse of economic potential. Water resources in Sub-Saharan Africa compare well in absolute terms with other countries in the world. The region has 9 percent of the world’s water resources and about 6,000 cubic meters of annual renewable water resources per capita
150
mea
n m
onth
ly v
aria
bilit
y (m
m)
mea
n m
onth
ly v
aria
bilit
y (m
m)
mea
n m
onth
ly v
aria
bilit
y (m
m)
130
110
90
70
50
30
10
1 2 3 4 5 6 7 8 9 10 11 12
1 2 3 4 5 6 7 8 9 10 11 12
1 2 3 4 5 6 7 8 9 10 11 12
350
300
250
200
150
100
50
0
–10
200180160140120100806040200
80
60
40
20
0
–20
annu
al r
ainf
all a
nom
aly
(%)
–40
–60
–8019001880 1920 1940
a. The Sahel
b. East Africa
c. Southeast Africa
a. Sudan
b. Uganda
c. Malawi
1960 1980 2000
80
60
40
20
0
–20
annu
al r
ainf
all a
nom
aly
(%)
–40
–60
–8019001880 1920 1940
1940
1960 1980 2000
80
60
40
20
0
–20
annu
al r
ainf
all a
nom
aly
(%)
–40
–60
–8019001880 1920 1960 1980 2000
meanmean + standard deviation
mean – standard deviation
Figure 14.1 Interannual Hydroclimatic Variability in Africa, by Selected Regions and Countries
Source: Hulme and others 2001.

274 AFRICA’S INFRASTRUCTURE: A TIME FOR TRANSFORMATION
compared with Asia’s 4,000 cubic meters and the Middle East and North Africa’s 1,500 cubic meters. However, Africa has the lowest water withdrawal per capita in the world (about 170 cubic meters) because of hydrologic variability, underdeveloped water infrastruc-ture, and current water resource manage-ment. Asia and Europe use about three times the water per person; the water-scarce Middle East withdraws more than four times as much and North America more than eight times as much (table 14.1).
The low level of water mobilization leads to underdevelopment of Africa’s economic potential: less than 5 percent of cultivated land is irrigated, and less than 10 percent of hydro-power potential is developed (fi gure 14.3). Irri-gated land contributes only about 10 percent of the agricultural production in Africa, with only about 8.5 percent of cultivated land irrigated (fi gure 14.4). Less than 58 percent of Africa’s population has access to drinking water, and 31 percent to sanitation services (WHO/UNICEF 2006).
Weak institutional capacity in river basin planning and management creates potential confl icts and lost benefi ts. Confl icts are emerg-ing over water allocation and use in different parts of the region. Competing claims over water have been asserted over many of the lakes (for example, Lake Victoria and Lake Tana) and river basins for economic and environ-mental uses. The growing demand for water from the major sectors of African economies, especially agriculture, imposes a serious con-straint on the medium- and long-term growth in water availability in some river basins. The expected growth in hydropower production will likely require an increase in peak capac-ity that will add to the competition. However, the water management institutions needed to address these confl icts in many African coun-tries are weak and fragmented. Agencies with authority over a particular economic sector often make uncoordinated decisions about water allocation and use, which lead to inef-fi ciency and degradation of the resource. The absence of water rights regimes and incentives for effi cient water allocation and conservation contributes to the problem.
Cooperative management of water resourcesin international river basins is necessary to increase the basins’ yield of food, power, and economic opportunities while strengthening environmental sustainability and mitigat-ing the effects of droughts and fl oods. The cost of noncooperation is high, including the economic cost of negative environmental impacts, suboptimal water resource develop-ment, political tensions over shared resources, and the forgone benefits of joint water resource development (Sadoff, Whittington, and Grey 2003).
Lack of water infrastructure and inadequate water management mostly affect the poor. Africa’s poverty is closely linked to its depen-dence on rain-fed subsistence farming. About 28 percent of Africa’s working population is engaged in agricultural production, ranging from 4 percent in South Africa to 47 percent in Rwanda (You 2008). Because subsistence agriculture is the dominant livelihood, rain-fall, droughts, and fl oods, combined with the weak marketing network and diffi cult physical access to many areas, affect food security across
SUDAN
MALI
CHAD
NIGER
ANGOLA
CONGO, DEM REP
ETHIOPIANIGERIA
NAMIBIA
ZAMBIA
SOUTH AFRICA
TANZANIA
MAURITANIA
KENYA
SOMALIA
BOTSWANA
CONGO
CAMEROON
ZIMBABWE
GABON
GHANA
GUINEA
UGANDA
MOZAMBIQUE
MADAGASCAR
CÔTE D’IVOIRECENTRAL AFRICAN REPUBLIC
SENEGAL
BENIN
BURKINA FASO
MALAWI
ERITREA
LIBERIA
TOGOSIERRA LEONE
LESOTHO
BURUNDIRWANDA
DJIBOUTIGUINEA-BISSAU
SWAZILAND
GAMBIA
EQUATORIAL GUINEA
REUNION
COMOROS
CAPE VERDE
MAYOTTE
SAO TOME AND PRINCIPE
SEYCHELLES
SAINT HELENA
international river basins
Figure 14.2 Africa’s International River Basins
Source: Oregon State University 2005. Reprinted with permission.

Water Resources: A Common Interest 275
the region. These factors, along with limited irrigation and underdevelopment of water infrastructure, increase the rural economy’s vulnerability to water shocks. Annually, some 220 million Africans are exposed to drought, and more than 1.5 million were affected by fl oods in 2007.
Degradation of water catchments under-mines investments already made in water resources. Loss of vegetation, erosion, and sedimentation are major threats to surface-water resources, because they cause lower base fl ows and higher fl ood peaks. Poor manage-ment of Africa’s water catchments has led to excessive soil erosion, increased costs of water treatment, rapid siltation of reservoirs, decline in economic life, and disruption of water sup-plies. In Malawi, any new dam is expected to fi ll with sediment within a few years of com-missioning. The most important dams in the country are the hydropower facilities on the Shire River, which are badly affected by sedi-mentation. In Kenya, the rate of sediment out-fl ow from the Athi-Galana-Sabaki River into the Indian Ocean increased from about 50,000 tons a year in the 1950s to 8.4 million tons a year by 1992 (World Bank 2004). In countries with degraded water catchments, develop-ment of water storage infrastructure needs to be accompanied by improved protection of watersheds to sustain the investment.
Reliable hydrological and water quality data are needed for effective water resource management and informed decision making. Hydrographic networks are outdated or in need of rehabilitation in many countries.
Regular monitoring of the hydrological sys-tem (such as meteorological stations, rain gauges, and river fl ows) is steadily declin-ing, and most African countries have not updated their assessments. Africa also lags behind the rest of the world in the number of meteorological stations where data can be systematically collected for dissemination to users. According to the World Meteorological
Table 14.1 Water Availability and Withdrawal cubic meters per person
RegionPer capita actual renewal
water resources Per capita annual total
water withdrawals
Asia (excluding the Middle East) 4,079.0 631
Central America and the Caribbean 6,924.4 603
Europe 10,655.1 581
Middle East and North Africa 1,505.0 807
North America 19,992.5 1,663
South America 47,044.0 474
Oceania 54,636.8 900
Sub-Saharan Africa 6,322.5 173
Source: FAO 2003.
SUDAN
MALI
CHAD
NIGER
ANGOLA
CONGO, DEM REP
ETHIOPIANIGERIA
NAMIBIA
ZAMBIA
SOUTH AFRICA
TANZANIA
MAURITANIA
KENYA
SOMALIA
BOTSWANA
REPUBLIC OF CONGO
CAMEROON
ZIMBABWE
GABON
GHANA
UGANDA
MOZAMBIQUE
MADAGASCAR
GUINEA
CÔTE D’IVOIRE
CENTRAL AFRICAN REPUBLIC
SENEGAL
BENIN
BURKINA FASO
MALAWI
ERITREA
LIBERIA
TOGOSIERRA LEONE
LESOTHO
BURUNDI
RWANDA
DJIBOUTIGUINEA-BISSAU
SWAZILAND
GAMBIA
EQUATORIAL GUINEA
REUNION
COMOROS
CAPE VERDE
MAYOTTE
SAO TOME AND PRINCIPE
SEYCHELLES
Figure 14.3 Africa’s Hydropower Potential
Source: International Energy Agency 2006 (EI-Gazzar and others 2007, p.7).

276 AFRICA’S INFRASTRUCTURE: A TIME FOR TRANSFORMATION
Organization, Africa has only 1,150 observation stations—one-eighth the recommended num-ber (UNFCCC 2006).
Addressing the Challenges
Achieving water security is a prerequisite for attracting investment and promoting eco-nomic growth in Africa.
Water Security, Investments, and GrowthMinimum water infrastructure and institu-tional capacity are required to ensure basic national water security (Grey and Sadoff 2006b). Water security is the ability of a coun-try to function productively despite its inherent water vulnerability. A country’s water security depends on both its inherent water supply-and-demand patterns and its capacity to confront
water vulnerability. It is a precondition for sus-taining and increasing investment returns and achieving dynamic economic growth.
The more vulnerable an economy is to water variability, the greater is the required investment to achieve water security. If a country cannot provide water security, it will not be resilient to water shocks, and it will not have reliable water supplies (fi gure 14.5, sce-nario 1; Subramanian, Yu, and Dankova 2008). When an acceptable level of water security is achieved along with basic climate resilience and risk mitigation, vulnerability is no longer a severe constraint on growth. Beyond this point, further investment in water infrastruc-ture contributes to economic growth (fi gure 14.5, scenario 2). Climate change will likely impose additional costs for achieving and sus-taining water security through its effect on the spatial and temporal pattern of water demand and availability, as well as by increasing hydro-logical variability in certain areas.
Water security is a dynamic state. Its defi -nition varies in different parts of the world, reflecting geographic, social, and political factors and the stage of economic develop-ment. In Africa, hydrologic variability and extremes are at the heart of water vulnerability because they weaken growth and retard devel-opment. African countries must achieve water security to keep the risks of droughts, fl oods, and unreliable water supplies at a socially and economically acceptable level. Several studies have pointed to the strong correlation between rainfall variability and national GDP in coun-tries as diverse as Ethiopia, Kenya, Lesotho, Mozambique, and Zambia (World Bank 2004, 2006, 2007, 2008, 2009). Emerging evidence
ATLANTICOCEAN INDIAN
OCEAN
MediterraneanSea
Red
Sea
30° 20° 10°
30°
0° 10° 20° 30° 40° 50° 60°
30°
20°
10°
0°
10°
20°
30°
60°50°40°30°20°10°0°20°30° 10°
20°
10°
0°
20°
30°
10°
FORMER SPANISHSAHARA
Canary Is.(Sp)
Mayotte(Fr)
Cabinda(ANGOLA)
TOG
OBE
NIN
MOROCCO
ALGERIA
TUNISIA
LIBYA ARABREP. OFEGYPT
MALI
THE GAMBIA
CAPEVERDE
GUINEA-BISSAU GUINEA
GH
AN
A
SIERRA LEONE
LIBERIA
CÔTED’IVOIRE
SUDAN
ERITREA
ETHIOPIA
DJIBOUTI
SOMALIA
UGANDA
CENTRALAFRICAN REPUBLIC
CAMEROONEQUATORIAL GUINEA
GABONCONGO
DEMOCRATICREPUBLIC
OF CONGORWANDA
BURUNDI
TANZANIA
MOZAMBIQUE
MALAWI
ZIMBABWE
BOTSWANA
ANGOLA
NAMIBIA
SOUTHAFRICA
LESOTHOSWAZILAND
MADAGASCAR
SEYCHELLES
COMOROS
MAURITIUS
SÃO TOMÉ AND PRÍNCIPE
SENEGAL
NIGERIA
BURKINAFASO
MAURITANIA
NIGER
CHAD
KENYA
ZAMBIA
1,500 KILOMETERS1,0005000
1,000 MILES5000
76%–100%
51%–75%
26%–50%
10%–25%
–10%
INTERNATIONAL BOUNDARIES
Water-Managed Areasas Percentage of Irrigation
Potentials
This map was produced by the Map Design Unit of The World Bank. The boundaries, colors, denominations and any other informationshown on this map do not imply, on the part of The World BankGroup, any judgment on the legal status of any territory, or anyendorsement or acceptance of such boundaries.
Source: Aquastat 2005
Figure 14.4 Sub-Saharan Africa’s Irrigation Potential
Source: ECA 2006.
years
GDP
Scenario 2: waterenhances growth... ... basic water securityis achieved
Scenario 1: water-vulnerable economy...
...with climate change
Figure 14.5 Water Security and Growth
Source: Authors’ elaboration.

Water Resources: A Common Interest 277
also indicates a correlation between availability of water storage and road infrastructure and infl ows of foreign direct investment (Brown and others 2008).
Achieving Water Security: Priority Areas for ActionBalanced investments in water resource infra-structure and institutions are needed to increase productive uses of water, to mitigate the effect of recurrent floods and droughts, and to achieve basic water security as a platform for Africa’s economic growth. Priority should be given to investments that (a) focus on growth, (b) reduce rural poverty, (c) build climate resilience and adaptation, and (d) foster coop-eration in international river basins.
Focusing on GrowthGovernments should link their water interven-tions with their development objectives and poverty-reduction targets. To achieve higher economic returns and promote national growth, focusing infrastructure investments around main growth centers and along pri-mary development corridors where produc-tion, industrial development, and trade are concentrated makes sense. The availability of reliable water supplies in growth cen-ters protects investments against the risks of hydrologic variability and improves the performance of the manufacturing and ser-vice sectors. It attracts new investments and enables industries to adopt water-saving tech-nologies when the economic incentives are in place. For municipal utilities, a mix of hydro-logical risk mitigation measures and rising industrial and domestic water demands in the growth areas allows them to take advantage of economies of scale in production and dis-tribution, to extend coverage, and to improve the systems’ operation and maintenance. An example of a growth-oriented policy is the Metolong Dam and Water Supply Program in Lesotho (box 14.1)
Reducing Rural PovertyWater is an important asset for the rural poor in Africa. However, high rainfall variability and insecure access to water for consumption and
agriculture are major constraints to poverty reduction in rural Africa.
A recent Food and Agriculture Organiza-tion report (Faurès and Santini 2008) describes potential reductions in rural poverty through water resource interventions in Africa, specifi -cally in southern and eastern Africa and along the east-west central belt (fi gure 14.6). These areas have high levels of rural poverty, broad opportunities for agricultural growth, and suffi cient water in absolute physical terms.
The Metolong Dam and Water Supply Program in LesothoDevelopment of Lesotho’s water sector is part of the government’s effort to diversify the economy and improve the provision of essential services.
The greater Maseru area is the center of the country’s garment industry. It includes more than 50 fi rms employing approximately 50,000 people. This industry has resulted in an almost fourfold increase in exports since 2000, and it contributed $567 million in foreign exchange earnings in 2006 (38 percent of GDP). Water and wastewater services are essential to the continued economic contribu-tion of these companies. They currently account for half of all water consumed in Maseru, and the lack of water and wastewater infra-structure presents a major constraint to continued economic growth. The industrial growth has also stimulated an increase in urban migra-tion. Maseru, the capital of Lesotho, experienced population growth of 5.5 percent a year between 1996 and 2006, expanding to more than 350,000 people. Currently, the only source of raw water for treatment and supply to Maseru comes from a single intake on the Mohokare (Caledon) River, which is unreliable, inadequate, and of inferior quality.
To address the need for long-term, secure water supplies to the lowlands, the government commissioned a feasibility study of the Lesotho Lowlands Water Supply Scheme in 2004 with support from the European Development Fund. That study, as well as a separate study fi nanced by the Arab Bank for Development in Africa in 2003, identifi ed the construction and implementation of the Metolong Dam and Water Supply Program as the least-cost long-term solution for bulk water supply to Maseru and the surrounding lowlands. With the ability to provide 75,000 cubic meters of treated water a day, the dam, in conjunction with existing supplies, will ensure a secure supply of 115,000 cubic meters of water per day, enabling Maseru to meet domestic and industrial requirements for at least the next 40 years. The construction of the Metolong Dam is scheduled to begin in 2012.
Source: World Bank 2009.
BOX 14.1

278 AFRICA’S INFRASTRUCTURE: A TIME FOR TRANSFORMATION
Figure 14.6 Water Interventions and Poverty
Morocco
Mauritania
Liberia
Côte d´Ivoire
Togo
Nigeria
Sierra Leone
Guinea
GambiaGuinea-Bissau
FormerSpanishSahara
Mali
Algeria
Niger Chad
Tunisia
LibyaA.R. of Egypt
Sudan
Eritrea
Djibouti
Somalia
EthiopiaCentral African Republic
CameroonEquatorial Guinea
Congo
GabonDR Congo
Tanzania
Kenya
Uganda
Angola
Namibia Botswana
Zimbabwe
South Africa
0 250 510 1,000 1,500 2,045Kilometers
Lesotho
Swaziland
Mozambique
Madagascar
Zambia
legend
potential for poverty reduction
high
moderate
low
country boundaries
waterbodies
rivers
Burkina Faso
Senegal
RwandaBurundi
W E
S
N
Source: Faurès and Santini 2008.

Water Resources: A Common Interest 279
However, at the same time, water is a limiting factor for these rural livelihoods because of signifi cant seasonal and interannual variabil-ity and lack of water control. Such zones offer the greatest opportunities for expanding food production through irrigation, rain-fed agri-culture, rainfall harvesting, and conservation of soil moisture.
Community-based management and devel-opment of local watersheds and groundwater resources in the poorest areas are crucial for sustaining local livelihoods against the effects of climate variability. These measures include constructing small hydraulic structures, intro-ducing local-scale hydropower units, harvesting water, developing smallholder irrigation, and installing fl ood protection measures.
Building Climate ResilienceManaging rainfall variability is a critical task for African countries. Expanding water storage capacity (as well as improving management of the existing hydraulic structures) would mitigate the effects of water shocks and build climate resilience. Along with large storage and hydraulic structures, small multiobjective water development is an important opportu-nity for new investment. These investments should take into account the potential effects of climate change. Appropriately designed irri-gation investments would increase agricultural productivity and signifi cantly mitigate the dan-ger of rainfall variability. Investments to reduce climate vulnerability should also include hydrometeorological services and monitoring, catchment protection and management, and risk assessment and mitigation.
Fostering Transboundary CooperationOptimizing economic productivity and envi-ronmental sustainability means managing riv-ers as hydrological units at the basin level. The great hydrologic challenges that countries face at the national level of water resource manage-ment (such as rainfall and runoff variability, degrading water quality, and fl ood protection) create opportunities to gain signifi cant bene-fi ts from cooperation over shared river basins. Cooperative management of water resources increases a basin’s yields of food, power, and other economic goods while strengthening
environmental sustainability and mitigating the effects of droughts and fl oods. Countries around the Senegal and Niger Rivers have started to reap the benefi ts of a cooperative and joint approach to managing their shared waters (Andersen and others 2005; Yu 2008). Countries surrounding Lake Victoria are gain-ing environmental benefi ts from their joint efforts to eliminate encroaching water hya-cinth and other weeds. The systemwide yield of water in the Nile could likely be increased by several percentage points a year if cooperation led to water storage upstream and coordinated reservoir operation in the arid plains down-stream (Sadoff, Whittington, and Grey 2003). The countries will also likely benefi t from joint investments in water infrastructure, thereby reducing infrastructure costs and maximizing returns. Unilateral and uncoordinated deci-sions on water resources by riparian countries, in contrast, may lead to increased political tensions and confl icts, reducing development opportunities in the basins.
Investing in Africa’s Water Security
Because most African countries have low stocks of hydraulic infrastructure, emphasiz-ing investments in infrastructure is appropri-ate for them. However, institution building and reform, improvements in water manage-ment and operations, and strengthening of water information systems must complement growth in infrastructure. Development of institutions is a lengthy and costly process, and adequately sequenced and balanced, it should be advanced in parallel with infrastructure investments, paying particular attention to the development of river basin organizations.
Investing in Storage Infrastructure: Both Large and SmallDevelopment of water infrastructure is a pre-requisite for water security in Africa and for meeting the targets of the eight Millennium Development Goals. Artifi cial water storage of adequate capacity is needed to ensure reliable water supply during droughts and to retain excessive water during periods of fl ooding.

280 AFRICA’S INFRASTRUCTURE: A TIME FOR TRANSFORMATION
Despite Africa’s vulnerability to frequent droughts and fl oods, storage capacity remains underdeveloped. Average per capita storage capacity in Africa is about 200 cubic meters a year, much less than that of countries in other regions (fi gure 14.7).
Irrigation and hydropower have been the main drivers for dam construction in Africa, but a storage facility designed for a single purpose has limited capacity to serve other economic and social needs, and its invest-ments often have higher opportunity costs. For example, the Cahora Bassa Dam on the Zambezi River was constructed for the sole purpose of generating hydropower. The dev-astating 2000 fl oods in Mozambique showed that the dam could play an important fl ood mitigation role, but its operational rules do not permit use of its storage capacity to mitigate water shocks. To convert this dam into a multi-purpose reservoir would be too costly. Despite the need for power, other considerations, such as fl ood control, salinity repulsion, irrigation development, and environmental require-ments, call for multipurpose storage develop-ment. Multipurpose water projects generally result in optimal water development, maxi-mize economic returns on investments, and need to be implemented in the basinwide con-text. Two important principles for developing large water infrastructure are equitable shar-ing of the benefi ts with the people affected and mitigation of possible negative environmental effects. Thus, stakeholder participation is nec-essary at all stages of decision making, project design, and implementation.
The direct and indirect long-term eco-nomic benefi ts of investing in large storage capacity are many, but they require consider-able initial capital investments. The aggregate spending needs for African infrastructure were reported in chapter 1 of this volume, but because water resource investments are typi-cally buried within investment programs for other sectors, such as irrigation, power, and water supply, the specifi c water resource com-ponents are explicitly highlighted here.
Table 14.2 details the component of power sector investment needs explicitly attribut-able to water storage in large dams. If regional power trade could be effectively harnessed, some 50,000 megawatts of new hydropower capacity would need to be built from 2006 to 2015, but without expanding regional trade, only 33,000 megawatts of hydropower capac-ity could be developed. The trade scenario would translate into an annual average invest-ment requirement of $7.8 billion in large-scale water storage to support generation of electricity over the 2006–15 period (Rosnes and Vennemo 2008, 2009).
Not only would expanded regional trade lead to the development of more water storage, but it would also improve the cost-effectiveness of water storage. The unit capital cost of hydropower investments would fall from $5.9 million to $5.4 million per megawatt (table 14.2) because cross-border collabora-tion allows larger and more effi cient storage sites to be developed.
The key challenge is how to fi nance the multibillion-dollar large-scale water storage projects needed to make this savings a real-ity. Often the countries with the best storage sites are those with the least fi nancial capacity to develop them. Regional collaboration offers the possibility of cost-sharing arrangements among countries for large water infrastructure, allowing downstream benefi ciary countries with greater solvency to provide up-front capi-tal contributions. For example, a cooperative effort by Burundi, Rwanda, and Tanzania to design and build the Rusumo Falls hydroelec-tric project on the Kagera River could bring 60 megawatts of renewable power to an area where only 2 percent of households have access to electricity.
0
1,00038
6871,104 1,277
2,486
3,386
4,717
5,961
2,000
3,000
4,000
5,000
6,000
cubi
c m
eter
s
7,000
Ethiop
ia
South
Africa
Mexico
Thail
and
China
Brazil
Austra
lia
North A
merica
Figure 14.7 Water Reservoir Storage per Capita in Selected Countries, 2003
Source: Grey and Sadoff 2006a.

Water Resources: A Common Interest 281
Governments have traditionally shouldered the responsibility for fi nancing large hydrau-lic structures, including most multipurpose dams. Private sector participation in such investments is possible, however, for mul-tipurpose projects with revenue-creating components (such as hydropower produc-tion, commercial irrigation, and urban water supply functions) combined with nonrevenue and public-good functions (such as fl ood control, fi sh breeding, recreation, small-scale irrigation, and so forth). Promoting public-private partnerships to fi nance multipurpose water resource projects is a key challenge of decision makers.
A continuum of options from large to small infrastructure projects needs to be part of a balanced investment approach. Small water storage facilities can increase climate resilience and improve food security. Small-scale approaches to water management help the rural poor by providing cost-effective solutions to water supply and drought miti-gation. They improve the ability of the rural poor to address food insecurity by increas-ing agricultural productivity. Small storage options include (a) off-stream reservoirs, (b) on-farm ponds and networks of multipurpose small reservoirs, (c) groundwater storage, and (d) water storage through a root zone with a variety of water-harvesting techniques and conservation of soil moisture. Structures to harvest rain require little space and are not labor intensive, but they must be designed in accordance with intended usage and local circumstances to ensure cost-effectiveness.
Studies in Botswana and Zimbabwe show that 80–85 percent of all measurable rain can be collected from outside catchment areas and stored (Dixit and Patil 1996).
The estimated cost for small reservoir facili-ties is based on an assessment of small-scale irrigation development potential from 2006 to 2015 (You 2008). This analysis used a spa-tial allocation model on a 10-kilometer global grid, considering economic profi tability, crop pattern, prices, crop water productivity, water balance and availability, and distance to mar-ket for each pixel. A macroscale hydrology model used climatic data to calculate runoff for each pixel. The total small-scale irrigation area was estimated at about 10 million hect-ares, and the total water storage requirement was estimated at about 35 billion cubic meters for the countries sampled. The total cost for small irrigation storage facilities was based on the irrigation development area, required stor-age volume, and their average costs.
A certain amount of storage is also needed to keep pace with growing demands for the urban water supply. The associated invest-ment can be estimated based on demographic growth, Millennium Development Goal tar-gets, trends in water consumption, as well as unaccounted for water and the availability of supply from various sources. The storage need is put at 5.4 billion cubic meters.
Total capital investment needs for the devel-opment of water resource infrastructure for 2006–15 are estimated at approximately $10 bil-lion a year, included within estimates for power ($7.8 billion), water supply ($1.3 billion), and
Table 14.2 Capital Investment Needs in Large Multipurpose Hydropower Storage by 2015
Region
Large storage-based hydropower production (megawatts)
Capital costs per unit ($ millions per megawatts)
Total capital costs ($ billions per year)
Regional power trade expansion
No power trade expansion
Regional power trade expansion
No power trade expansion
Regional power trade expansion
No power trade expansion
Southern Africa 16,764 10,797 0.96 1.21 1.95 1.59
Eastern Africa 10,675 4,170 1.81 1.96 2.35 0.99
Western Africa 17,260 14,845 1.32 1.37 2.77 2.48
Central Africa 4,847 3,567 1.28 1.37 0.75 0.59
Total 49,546 33,379 5.37 5.91 7.82 5.65
Source: Authors’ calculations based on Rosnes and Vennemo 2008.Note: These investment cost estimates are based on actual planned large storage-based (multipurpose) hydropower projects presented for each region in Rosnes and Vennemo 2008 and 2009. Totals do not add exactly because of averaging.

282 AFRICA’S INFRASTRUCTURE: A TIME FOR TRANSFORMATION
irrigation ($0.8 billion) presented in chapter 1 of this volume.
Investing in Institutions and Information: Managing Water Resources across Sectors and JurisdictionsSound water management institutions in Africa will ensure sustained returns on infrastructure investments and optimize the allocation and use of water by multiple eco-nomic sectors and across administrative and political borders.
Despite low water use for productive pur-poses in Africa, confl icts are emerging over water in areas of concentrated economic activity. These confl icts often intensify during periods of water shortages. The drop in Lake Victoria’s level because of increased withdraw-als and the drought of 2003–06 affected other users of water around the lake. In Ethiopia’s Lake Tana, reduced inflows and increased water abstractions in 2003–04 highlighted the need for coordinated water planning and man-agement. The need for improved water alloca-tion regimes for multisectoral use can be seen in the confl icting water demands in the Inner Niger Delta in Mali and in the emerging com-peting claims of irrigation expansion plans, hydropower production, and environmental water demands in the Kafue basin in Zambia. Establishing priorities for water investments and clear policy rules to govern optimal water allocation across economic sectors will be key to enabling or constraining their relative growth. All of this should result from sound medium-term river basin planning.
Full realization of Africa’s water potential and the optimal allocation of water among various sectors require the right institutional arrangements at the national level, includ-ing (a) capable water management organiza-tions, (b) provisions for public participation in water management decisions, (c) water rights regimes, and (d) tailored incentive sys-tems. Many African countries are beginning to develop national institutions for water man-agement. Tanzania, for example, has identifi ed nine river basins for which it will develop sus-tainable development plans. This institutional
arrangement envisages stakeholder forums to address multiple uses and optimize benefi ts across sectors and administrative jurisdictions. South Africa has enacted far-reaching water legislation, and Botswana is restructuring its water-related institutions. African countries have relatively rich experience in managing water supply and sanitation through utilities. This is not the case with water resource man-agement, where for the majority of African countries, robust and sustainable institutions have yet to be developed.
Africa has a longer history of developing regional institutions to manage transboundary waters. The fi rst regional river basin organiza-tions were established in the mid-20th century (the Niger River Commission in 1964, later transformed into the Niger Basin Authority in 1980; the Senegal River Basin Organization in 1972; and the Gambia River Development Organization in 1978). Burundi, Rwanda, and Tanzania established the Kagera Basin Orga-nization in 1977. The Lake Chad Basin Devel-opment Fund was set up in 1973 to support the Lake Chad Basin Commission’s activities. More recently, the riparian countries of the Nile formed the Nile Basin Initiative in 1999 as a prelude to a more permanent institution. In 2005, the countries around Lake Victoria established the Lake Victoria Basin Commis-sion under the auspices of the East African Community.
Despite these early starts, with only a few exceptions, these transboundary river basin organizations are still in their emerging stages and remain relatively weak (UN-Water/Africa 2006). They suffer from waning political com-mitment, poor cooperation, management and technical diffi culties, armed confl ict and political instability in member states, lack of defi ned goals or weak incentives for regional cooperation, and insuffi cient capacity to carry out their plans. As donor support dwindled, basin organizations had insuffi cient fi nancial backing to carry out their programs. Today, the organizations are at various stages of develop-ment (fi gure 14.8).
In a few cases, however, river basin organiza-tions have been backed by strong government ownership and commitment and have enjoyed

Water Resources: A Common Interest 283
support from multiple donors, enabling them to successfully complete several years of insti-tutional development, confidence-building measures, and cooperative investment pro-gramming. The Niger Basin Authority, for example, undertook an institutional assessment to prepare for reorienting its efforts in early 2000. Subsequently, it introduced an organi-zational structure approved by the Niger Basin Council of Ministers, competitively recruited a team of professionals, and strengthened its fi duciary systems. The authority has also agreed on a water charter that spells out the rules of engagement for the riparian countries, includ-ing procedures for sharing information and formulating investment programs. The nine countries on the Niger have agreed to a 20-year sustainable development action plan and a related investment program.
The experience of these organizations indi-cates that the process of river basin development requires political leadership, government com-mitment, confi dence building among countries, and realization of concrete benefi ts. Substantial investments are needed for assessments, project preparation, and feasibility studies. Invest-ments in facilitating greater regional coopera-tion within the river basin organizations will also be critical. These investments can support a regional forum for dialogue, confl ict resolu-tion, and cooperation around a shared resource (Sadoff and Grey 2005).
Relevant, adequate, and reliable informa-tion enhances institutional capacity for deci-sion making. An effective water information system requires action on both the demand and supply sides. Planners and decision makers must be aware of the importance of information in decision making. Information managers must be able to develop the appro-priate mix of formal and informal knowledge and communication systems to support deci-sion makers. Thus, a water information system should include the following components:
• Hydrological information: Collection system (including instrumentation, quality con-trol, coding) for data capture for surface water, groundwater, and water quality parameters, and environmental information,
such as sediments and fi sheries. The pro-cess should include computers to analyze and store information. It will also include support services for periodic calibration of instruments.
• Spatial data: Satellite imageries, aerial sur-veys, ground surveys, bathymetry, and other data sets from geographic informa-tion systems.
• Information management: Hydrologi-cal design aids (such as maps of prob-able maximum precipitation and regional fl ood frequency studies) for use by project designers.
• Knowledge management: A model and deci-sion support system to interface with the water information system.
• Dissemination: Protocols to supply end users.
Recent experience with water resource projects indicates that investments in infor-mation and institutions will require close to 10 percent of the investment in water infrastructure. Given the estimated annual $10 billion investment for water infrastruc-ture, close to $1 billion a year of additional resources will be needed to advance the insti-tutional and information agendas.
Toward regional cooperation on shared waters
Nile Basin Initiative
• 9 countries + 1 observer• established 1999• no formal treaty framework• confidence building and investment programs in place
• 9 countries• established 1963, revitalized 2001• formal treaty framework and formal river basin organization• sustainable development plan in place
• 4 countries• established 1972• formal treaty framework and formal river basin organization• sustainable development plan in place
Niger Basin Authority Senegal River Basin Authority
Nationaldemand,nationalmarketfocus
Consultativeplanning,
exploratoryregionaldialogue
Cooperativeplanning,regional
demand andmarket
considerations
Cooperativeplanning and
management,regional
optimization
Jointownershipof assets,
jointmanagement
Figure 14.8 Degree of Regional Water Cooperation
Source: Adapted from Grey and Sadoff 2006a.

284 AFRICA’S INFRASTRUCTURE: A TIME FOR TRANSFORMATION
Note The authors of this chapter are Rimma Dankova,
Satoru Ueda, Ashok Subramanian, Winston Yu, and Jyothsna Mody, who drew on background material and contributions from Vahid Alavian.
ReferencesAndersen, Inger, Ousmane Dione, Martha
Jarosewich-Holder, and Jean-Claude Olivry. 2005. The Niger River Basin: A Vision for Sustain-able Management. Katherin George Golitzen, ed. Washington, DC: World Bank.
Brown, Casey, Daniela Domeisen, Robyn Meeks, Kenneth Hunu, and Winston Yu. 2008. “Exploring the Effect of Hydro-Climatic Variability on Eco-nomic Growth in Sub-Saharan Africa: A Water Security Index.” Technical Report 08-04, Water and Growth Report 2, International Research Institute for Climate and Society, New York.
Dixit, Medha J., and Subhash M. Patil. 1996. “Rain Water Harvesting.” Discussion paper presented at the 22nd Water, Engineering and Develop-ment Centre International Conference, New Delhi, India, September 9–13.
ECA (Economic Commission for Africa). 2006. “Water in Africa: Management Options to Enhance Survival and Growth.” Addis Ababa, Ethiopia: ECA.
EI-Gazzar, Mohamed, Yassin Ibrahim, Mohamed Bedrous, and Aziz Maher. 2007. “Hydro and Nuclear Power for African Less-Carbon Development.” Paper presented at the World Energy Congress, Rome.
FAO (Food and Agriculture Organization). 2003. FAO statistical database. http://www.fao.org/corp/statistics/en/.
Faurès, Jean-Marc, and Guido Santini, eds. 2008. Water and the Rural Poor: Interventions for Improving Livelihoods in Sub-Saharan Africa. Rome: Food and Agriculture Organization of the United Nations and International Fund for Agricultural Development.
Grey, David, and Claudia Sadoff. 2006a. “The Global Water Challenge: Poverty Growth and International Relations.” Paper presented at Global Issues Seminar Series, World Bank, Washington, DC, January 25.
———. 2006b. “Water for Growth and Develop-ment: A Framework for Analysis.” Theme docu-ment of the 4th World Water Forum, Mexico City, March.
Hulme, Mike, Ruth Doherty, Todd Ngara, Mark New, and David Lister. 2001. “African Climate Change: 1900–2100.” Climate Research 17: 145–68.
IPCC (Intergovernmental Panel on Climate Change). 2007. Climate Change 2007: Synthesis Report. Geneva: IPCC.
Oregon State University. 2005. Transboundary Freshwater Dispute database. http://www.transboundarywaters.orst.edu/database/.
Rosnes, Orvika, and Haakon Vennemo. 2008. “Powering Up: Costing Power Infrastructure Investment Needs in Sub-Saharan Africa.” Background Paper 5, Africa Infrastructure Sec-tor Diagnostic, World Bank, Washington, DC.
Sadoff, Claudia W., and David Grey. 2005. “Coop-eration in International Rivers: A Continuum of Securing and Sharing Benefi ts.” Water Interna-tional 30 (4): 1–8.
Sadoff, Claudia W., Dale Whittington, and David Grey. 2003. Africa’s International Rivers: An Eco-nomic Perspective. Washington, DC: World Bank.
Subramanian, Ashok, Winston Yu, and Rimma Dankova. 2008. “Sharing Water, Sharing Bene-fi ts, Sharing Costs.” Paper presented at the Expo Zaragoza 2008 Water Tribune, Zaragoza, Spain, June 16–September 10.
UNFCCC (United Nations Framework Conven-tion on Climate Change). 2006. “Background Paper on Impacts, Vulnerability and Adapta-tion to Climate Change in Africa for the African Workshop on Adaptation Implementation of Decision 1/CP.10 of the United Nations Climate Change Convention, Accra, Ghana, September 21–23, 2006.” http://unfccc.int/fi les/adaptation/adverse_effects_and_response_measures_art_48/application/pdf/200609_background_afri-can_wkshp.pdf.
UN-Water/Africa. 2006. African Water Development Report, 2006. Addis Ababa, Ethiopia: UN-Water/Africa.
WHO/UNICEF (World Health Organization/United Nations Children’s Fund). 2006. MDG Assessment Report. Geneva and New York: WHO/UNICEF Joint Monitoring Programme for Water Supply and Sanitation.
World Bank. 2004. “Towards a Water-Secure Kenya: Kenya Water Resources Sector Memoran-dum.” World Bank, Washington, DC.
———. 2006. “Ethiopia Country Water Resources Assistance Strategy.” Agriculture and Rural Development Department, World Bank, Washington, DC.
———.2007. “Mozambique Country Water Resources Assistance Strategy.” Africa Region Water Resources Unit, World Bank, Washington, DC.
———. 2008. “Zambia Country Water Resources Assistance Strategy.” Draft, Africa Region

Water Resources: A Common Interest 285
Water Resources Unit, World Bank, Washington, DC.
———. 2009. “Lesotho Water Sector Improvement Program (Second Phase): Metolong Dam and Water Supply Project.” Report 46272-LS, World Bank, Washington, DC.
You, Liang Zhi. 2008. “Irrigation Investment Needs in Sub-Saharan Africa.” Background Paper 9,
Africa Infrastructure Country Diagnostic, World Bank, Washington, DC.
Yu, Winston. 2008. “Benefi t Sharing in Interna-tional Rivers: Findings from the Senegal River Basin, the Columbia River Basin, and the Lesotho Highlands Water Project.” Working Paper 1, Africa Region Water Resources Unit, World Bank, Washington, DC.


Chapter
287
Irrigation: Tapping Potential
Chapter15
A large segment of Sub-Saharan Africa’s population lives in rural areas and depends heavily on agriculture. Agricul-
tural growth is clearly key to poverty reduction and to achieving the Millennium Development Goal of halving poverty by 2015. Agricultural performance has signifi cantly improved since 2000; nevertheless, agricultural productiv-ity remains the lowest in the world. Climate change and the global food price crisis provide additional challenges. A comprehensive effort is required to increase investment in agricul-tural intensifi cation. Water for agriculture is a critical ingredient of such programs.
Africa’s agricultural water remains com-paratively underdeveloped, despite economi-cally viable potential to expand irrigated areas. Today, only 3.5 percent of Africa’s agricultural land is equipped for irrigation, some 7 million hectares concentrated in a handful of countries. However, further expansion of the irrigated area would be profi table. At least 1.4 million hectares could be developed using existing or planned dams associated with hydropower development, at a total additional one-time investment of $2.6 billion in distribution of agricultural water. In addition, at least 5.4 mil-lion hectares would be viable for small-scale
irrigation, involving an additional one-time investment of $17.8 billion. In general, economic returns on small-scale schemes (on average 26 percent) are substantially higher than those on large-scale schemes (on average 17 percent).
These results, however, are critically depen-dent on keeping investment costs down to best-practice levels of $3,000 per hectare for the water distribution component of large-scale irrigation and $2,000 per hectare for small-scale irrigation, rather than the signifi -cantly higher levels often observed at the proj-ect level in the recent past. Another key fi nding is that irrigation is in most cases viable only for cash crops or high-value food crops (such as horticulture) that raise revenues in excess of $2,000 per hectare; relatively few hectares are viable for irrigation of staple food crops.
What would be the effect on development of an aggressive expansion of Africa’s irrigated agricultural area? If Africa does not increase its slow growth in irrigated area, the food supply on the continent will gradually diminish because of climate change, leading to a huge surge in cereal imports and a signifi cant increase in child malnutrition. In contrast, if Africa’s irrigated area could be tripled by 2050, the food supply would increase markedly, with a huge decline in

288 AFRICA’S INFRASTRUCTURE: A TIME FOR TRANSFORMATION
cereal imports. There would be 2 million fewer malnourished children than under the lower irrigation scenario, or about the same level that would be expected in the absence of climate change. Thus, aggressive agricultural water development could reverse the adverse effects of moderate global warming on food security.
Aggressive scaling up of investments in agricultural water raises issues associated with the performance and sustainability of irri-gated agriculture. Considerations of economic viability, farm-level profi tability, and sustain-ability should guide future investment deci-sions. In particular, investments in agricultural water should be considered as part of a com-prehensive package, including (a) empowered farmer organizations; (b) sustainable, effi -cient, and accountable agricultural support services; and (c) accessible, profi table markets. Furthermore, efforts to expand irrigation should be made in the context of national agricultural water development strategies that emphasize the importance of a more condu-cive institutional environment and that form the foundation for sectoral programs that combine investment in infrastructure with investment in institutional reforms.
Agriculture and Poverty Reduction
Agricultural growth is a key to reducing poverty. More than half of Sub-Saharan Africa’s popula-tion lives in rural areas, and agriculture accounts for a signifi cant percentage of GDP. Of Africa’s poor, 85 percent live in rural areas and depend largely on agriculture for their livelihoods. GDP growth originating in agriculture is about four times more effective in raising incomes of extremely poor people than GDP growth origi-nating outside the sector—and the potential multipliers from agricultural water investment are even higher (World Bank 2008).
Agricultural performance in the region has improved signifi cantly since 2000. Growth in agricultural GDP in Sub-Saharan Africa has accelerated from 2.3 percent a year in the 1980s to 3.8 percent a year from 2000 to 2005. Aver-age incomes in Sub-Saharan Africa have been rising in tandem with those in other regions since the mid-1990s.
Despite these encouraging developments, agricultural productivity is the lowest in the world, with per capita output only 56 percent of the world average. Output has not kept pace with population increases, and growth has occurred largely through expansion of har-vested area (rather than through more intensive use of existing cropland): more than 80 percent of output growth since 1980 has come from expansion of cropped area, compared with less than 20 percent for all other regions.
Climate change and the global food price crisis, developments likely to hit Africa dis-proportionately, further challenge agricultural performance. Water sources will become more variable. Droughts and fl oods will stress agri-cultural systems. The seas will inundate some coastal food-producing areas, and food pro-duction will fall in some places in the interior. Nevertheless, substantial uncertainty remains about where the effects will be greatest.
A comprehensive effort is required to advance agricultural productivity. Invest-ments in more reliable access to agricultural water1 are critical in support of that objective (World Bank 2008). More reliable access to agricultural water increases the opportunity to use productivity-enhancing inputs and thus supports intensifi cation and diversifi ca-tion, as well as the scope for agricultural wage employment. In addition, it reduces local food prices, improving real net incomes. It can also reduce poverty indirectly through increased rural nonfarm and urban employment. More-over, investments in irrigation improve access to markets. A more reliable, year-round supply of products, a higher and more uniform qual-ity of products, and the option to manipulate harvest dates to capture higher seasonal prices put a high premium on irrigation.
African leaders have identifi ed agricultural water development as a key area for investment. The Comprehensive Africa Agricultural Devel-opment Program prepared under the New Partnership for Africa’s Development in 2002 adopted land and water management as the fi rst of its four pillars for priority investment. It proposed extending the area under sustainable land management and reliable water control systems to 20 million hectares (more than twice the area currently under water management in

Irrigation: Tapping Potential 289
Sub-Saharan Africa) by 2015 (NEPAD 2003). In response to this call for action, the Partnership for Agricultural Water in Africa was recently launched to scale up investments in agricultural water and to harmonize donor programs.
Current State of Irrigation
Irrigation carries significant potential to increase agricultural productivity. Across Sub-Saharan Africa, irrigated agriculture accounts for about 25 percent of the value of agricultural output (table 15.1). This share is produced on just 3.5 percent of the cultivated land, confi rm-ing the potential of irrigation to improve live-lihoods in Sub-Saharan Africa and suggesting that more investment in irrigation would yield substantial benefi ts.
However, Sub-Saharan Africa’s agricultural water remains underdeveloped. Of a cultivated area of 197 million hectares, only 7 million hect-ares is equipped for irrigation, with a further 2 million hectares under some other form of water management. Overall, this area amounts to only 23 percent of the 39 million hectares that is believed to be physically suitable (though not necessarily economically viable) for irrigation. The share of cultivated area equipped for
irrigation in Sub-Saharan Africa varies consid-erably by country but is generally very low, with only a few countries reaching the 20 percent mark (fi gure 15.1). In absolute terms, more than 60 percent of the total area is concentrated in just three countries—Madagascar, South Africa, and Sudan—each with over a million hectares of irrigated area.
Donor investments in agricultural water have declined sharply. From 1994 to 1996, the total value of projects funded by all donors for irrigation and drainage was less than 10 percent of the levels 20 years earlier—just $127 million from all sources (World Bank 2007). Signifi cant scope exists for scaling up investments. Average agricultural water withdrawals are 1.3 percent of renewable water resources; groundwater use is less than 20 percent of renewable supplies, indicating signifi cant scope for further surface water and groundwater development. Expan-sion of irrigated area has been slow in Sub-Saharan Africa. Over the last 40 years, only 4 million hectares of new irrigation has been developed, by far the smallest expansion of any region. Over the same period, China added 25 million hectares, and India 32 million. Annual growth in irrigation development in the region was 2.3 percent from 1973 to 2000 and slowed further from 2000 to 2003, but it has
Table 15.1 Selected Irrigation Investment Indicators for Sub-Saharan Africapercentage
Region
Cultivated area equipped for
irrigation
Irrigation potential realized
Agricultural water withdrawals as percentage of
total renewable water resources
Dam capacity as percentage of total available surface water
Groundwater pumped as
percentage of total renewable
groundwater
Average annual expansion of
irrigated area, 1973–2000
Value of irri-gated output as percentage of total value of agricultural
output
Sudano-Sahelian 6.9 50 21.8 9.7 38.1 2.7 58.3
Eastern 2.6 11 4.9 5.5 3.1 2.4 5.0
Gulf of Guinea 1.5 7 1.2 47.1 0 2.2 6.3
Central 0.7 1 0.1 1.7 0 0.5 7.3
Southern 4.2 36 6.2 99.0 17.8 3.2 6.6
Indian Ocean Islands 30.4 71 4.2 0.1 8.7 3.5 0
Sub-Saharan Africa average 3.5 18 1.3 11.2 17.5 2.3 24.5
Asia average 33.6 67 15.8 12.0 — 2.6 —
Source: Svendsen, Ewing, and Msangi 2009.Note: The regions shown are those adopted in Frenken (2005). The grouping of countries within these regions is based on geographical and climatic homogeneity, which directly influences irrigation. Sudano-Sahelian: Burkina Faso, Cape Verde, Chad, Niger, Senegal, Sudan; Eastern: Ethiopia, Kenya, Rwanda, Tanzania, Uganda; Gulf of Guinea: Benin, Côte d’Ivoire, Ghana, Nigeria; Central: Cameroon, the Democratic Republic of Congo; Southern: Lesotho, Malawi, Mozambique, Namibia, South Africa, Zambia; Indian Ocean Islands: Madagascar. — Not available.

290 AFRICA’S INFRASTRUCTURE: A TIME FOR TRANSFORMATION
picked up in the last several years, particularly for the Central African Republic, Kenya, Mau-ritius, Nigeria, Senegal, and Zambia. An appro-priate institutional framework is required to manage water for growth. Sub-Saharan Africa’s framework of irrigation-related institutions is undeveloped. These institutions are important for managing and sharing water over agroeco-logically and hydrologically diverse areas and over transboundary basins. The establishment and sound functioning of water management bodies will provide the institutional framework and will specify the location of investment planning and implementation responsibilities for irrigation infrastructure projects.
Economic Investment Potential and Needs
Some 39 million hectares of agricultural land in Africa is deemed physically suitable for irri-gation; however, physical suitability does not necessarily entail economic viability (box 15.1). Economic potential for irrigation is highly sen-sitive to initial investment costs and requires market access, complementary inputs, extension of credit, and a supportive enabling environ-ment. Both large-scale irrigation schemes (dis-tributing water collected in major dams) and small-scale irrigation schemes (collecting water locally at the farm level) are relevant for Africa.
Profi table dam-based, large-scale irrigation appears feasible on 1.35 million hectares (table 15.2), if the attention is confi ned only to those projects that pass a threshold of 12 percent for internal rate of return. The associated one-time, on-farm investment is $2.6 billion, which would nonetheless need to be spread out over at least a decade. The countries with the greatest potential for dam-associated large-scale investments are Ethiopia, Nigeria, Sudan, and Zimbabwe, all with more than 100,000 hectares of potential. These estimates are based on the assumption that dam construction would be deemed profi table purely from a hydropower perspective and that the only costs that would need to be covered by related irrigation schemes would relate to water distri-bution infrastructure.
The small-scale irrigation potential is much greater because large, existing rain-fed areas
0 5 10 15 20 25 30 35
Central African Republic
Comoros
Congo, Dem. Rep. of
Uganda
Liberia
Togo
Benin
Botswana
Cameroon
Congo, Rep. of
Ghana
Burkina Faso
Gambia, The
Rwanda
Chad
Lesotho
Gabon
Namibia
Nigeria
Côte d’Ivoire
Burundi
Niger
Kenya
Angola
Malawi
Ethiopia
Mozambique
Zambia
Eritrea
Tanzania
Guinea-Bissau
Seychelles
Sierra Leone
Senegal
Mali
Guinea
Zimbabwe
Cape Verde
Mauritania
South Africa
Sudan
Somalia
São Tomé and Principe
Mauritius
Swaziland
Madagascar
percent
Figure 15.1 Percentage of Cultivated Area Equipped for Irrigation, by Country
Source: Svendsen, Ewing, and Msangi 2009.Note: Djibouti, with 100 percent of its cultivated area equipped for irrigation, is not shown here for easier visibility of other coun-tries. The percentage of area equipped for irrigation that is actu-ally irrigated spans a wide range in Sub-Saharan Africa. Overall, the average use rate is 71 percent in the region, compared with a similar but slightly lower 67 percent in Asia.

Irrigation: Tapping Potential 291
Table 15.2 Potential Investment Needs for Large-Scale, Dam-Based, and Complementary Small-Scale Irrigation in Sub-Saharan Africa
Region
Large-scale irrigation Small-scale irrigation
Increase in irrigated area
(million hectares)Investment cost
($ millions) Average IRR (%)
Increase in irrigated area
(million hectares)Investment cost
($ millions) Average IRR (%)
Sudano-Sahelian 0.26 508 14 1.26 4,391 33
Eastern 0.25 482 18 1.08 3,873 28
Gulf of Guinea 0.61 1,188 18 2.61 8,233 22
Central 0.00 4 12 0.30 881 29
Southern 0.23 458 16 0.19 413 13
Indian Ocean Islands 0.00 0 — 0.00 0 —
Total 1.35 2,640 17 5.44 17,790 26
Source: You 2009.Note: See table 15.1 for definitions of regional groupings. The average value for IRR was weighted by the increase in irrigated area. Benin, Chad, and Madagascar have no profitable large-scale irrigation. IRR = internal rate of return. — Not available. a. Unlike cost estimates presented elsewhere in this report, these are one-time investment costs rather than annualized figures.
could be profi tably converted to small-scale irrigation. Costs would be only slightly lower because for small-scale irrigation, on-farm water storage would need to be built in addi-tion to water distribution infrastructure. Only land within three hours’ travel time to a signifi cant town is deemed suitable for the
development of small-scale irrigation, restrict-ing it to about 30 percent of the cultivated land. Again, restricting attention to those projects that pass a threshold of 12 percent for internal rate of return, profi table small-scale irrigation could take place on 5.44 million hectares at a one-time cost of $17.8 billion that
For this study, a spatial analysis was conducted that combined hydrogeographic and economic parameters to estimate investment potential. Two categories of irrigation development were assessed: (a) dam-based, large-scale irrigation associated with hydropower reservoirs (both existing and planned) identifi ed by a com-panion study for hydropower; and (b) small-scale irrigation based on small reservoirs, farm ponds, treadle pumps, and water-harvesting structures collecting local runoff. The main data sets were (a) spatially explicit current crop distribution, (b) spatially explicit crop-specifi c biophysical potential, and (c) potential runoff and effective rainfall from a hydrological model for small-scale irrigation. Crop prices, based on commodity-specifi c world prices for 2004–06, were adjusted for country differences in price policy and market transaction costs.
Small-scale irrigation assumed a fi ve-year cycle of investment, a medium investment cost of $2,000 per hectare for on-farm investment,
and $80 per hectare for operation and main-tenance. Three hours’ travel time to the near-est market was set as the cutoff value for market access, excluding all pixels that fell beyond this range. Runoff use effi ciency for small systems was set at 30 percent; that is, only 30 percent of the captured runoff can be used for small-scale irrigation.
Large-scale irrigation assumed a medium investment cost of $3,000 per hectare for on-farm development, $0.25 per cubic meter for water delivery and conveyance, a proxy for canal operations and maintenance, and $10 per hectare for on-farm operations and mainte-nance. A 50-year investment horizon was used. Dam costs were not included because they are assumed to be fully justifi ed and fully covered by the hydropower schemes associated with the relevant dams. Overall irrigation effi ciency for large systems was assumed to be 40 percent.
Source: You 2009.
Assumptions for Irrigation Investment Potential Study
BOX 15 . 1

292 AFRICA’S INFRASTRUCTURE: A TIME FOR TRANSFORMATION
would nonetheless need to be spread out over at least a decade (see table 15.2 and fi gure 15.2). In all regions except southern Africa, small-scale irrigation has a higher internal rate of return than does large-scale irrigation. By far the great-est potential is found in Nigeria, which accounts for more than 2.5 million (or almost half) of the suitable hectares. Countries such as Cameroon, Chad, Ethiopia, Mali, Niger, South Africa, Sudan, Tanzania, Togo, and Uganda each have at least 100,000 hectares of potential.
Full development of economic irrigation potential doubles the share of cultivated land under irrigation, raising the share of cultivated land under irrigation from 3.5 percent to 7.0 per-cent. Annualized investment costs over 10 years would constitute 1.8 percent of 2000 GDP and account for 88 percent of agricultural spending. For many countries, that would imply a substan-tial increase in agricultural spending. However,
under the Comprehensive Africa Agricultural Development Program of the New Partnership for Africa’s Development, African countries have already committed themselves to raising alloca-tions of national budgetary resources to agricul-tural and rural development up to 10 percent of the total by 2015. This planned increase in spending could go some way toward meeting the costs of an expanded irrigation program.
Most of the hectares found to be viable for irrigation would be dedicated to higher-value crops (table 15.3). In most cases, irrigation is found to be viable only when high-revenue-yielding crops are cultivated, be they traditional cash crops (such as coffee) or higher-value food crops (such as horticulture). More than half of the viable hectares identifi ed are associated with crops that can yield in excess of $2,000 per hectare annually. Relatively few hectares are found where irrigation investments can be justifi ed simply to grow staple food crops.
The investment cost estimates used here reflect best-practice experience, but actual costs may often be higher. Studies suggest that well-designed and well-implemented irrigation projects in Africa can lead to costs of no more than $2,000 per hectare for small-scale irrigation schemes and $3,000 per hectare (the distribution component) for large-scale irrigation schemes. Therefore, they are the central parameters used in this modeling exercise. Nevertheless, in practice, irrigation projects in Africa may incur invest-ment costs well in excess of $4,000 per hectare (Inocencio and others 2005). Therefore, consid-ering the sensitivity of these results to possible changes in unit investment costs is important.
Estimates for both large- and (particu-larly) small-scale irrigation potential are highly sensitive to assumptions about invest-ment costs (table 15.4). Results are sensi-tive to the assumptions about investment costs per hectare and other parameters (see box 15.1). For large-scale irrigation, the number of viable hectares would decline to 54 percent of the base case if investment costs rose from $3,000 to $6,000 per hectare. This situation might be the case, for example, if irrigation were required to contribute to water storage costs and not simply to water distribution infrastructure. For small-scale irrigation, the story is much more dramatic.
Profitable area in large scale
Profitable area in small scale
Figure 15.2 Investment Potential for Dam-Based and Small-Scale Irrigation
Source: You 2009. Note: Dark gray areas indicate positive internal rate of return for dam-based irrigation. Light gray areas indicate profitable areas for small-scale irrigation. Countries left blank were not covered in the sample.

Irrigation: Tapping Potential 293
Raising the investment cost from the baseline case of $2,000 per hectare to $5,000 per hect-are would all but eliminate the economic case for small-scale irrigation. This fi nding under-scores the fact that the economic viability of much of Africa’s potentially irrigable land depends critically on containing investment costs to best-practice levels.
Effect of Expanding Agricultural Water Development
What would be the development effect of an aggressive expansion of Africa’s irrigated agri-cultural area? It has already been established that an economic case exists for developing an additional 6.8 million hectares of irrigation with respectable returns of at least 12 percent. This conclusion comes with two important caveats. First, investment costs would need to be contained to the $2,000–$3,000 per hectare range. Second, to ensure viability, most irri-gation development would need to focus on higher-value crops. Assuming such conditions were met, what would be the broader develop-ment effect? An illustrative modeling exercise is used to see how the higher agricultural yields resulting from irrigation scale-up would affect
the food economy looking ahead to 2020 and beyond.
A high but feasible 3.6 percent annual increase in investments in irrigation would triple the irrigated harvested area to 22 mil-lion hectares in 2050. The irrigated yield would grow by 10 percent in parallel with a gradual 10 percent increase in rain-fed crop productiv-ity (by increasing effective rainfall by 5 percent by 2020 and 10 percent by 2050). The effects of these investments are discernible in three areas: food prices, food imports, and nutri-tional outcomes.
Greater availability of food would help con-tain major projected increases in food prices (table 15.5). Food prices in Africa are projected to increase from the 2000 baseline level of $117 per ton of cereals to $205 by 2050. The greater food production brought about by irrigation scale-up would help limit this infl ationary pressure, keeping the price of a ton of cereals down to $177 by 2050.
Irrigation scale-up would also reduce Africa’s reliance on food imports (table 15.5). As of 2000, Africa was importing more than 23,000 tons of cereals annually. Africa’s food trade defi cit is projected to grow dramatically to more than 98,000 tons in 2050, refl ecting a substantial rise in food demand from growing and increasingly urban populations combined
Table 15.3 Share of Crops under Irrigation, Irrigation Investment Needs Assessment
Crops Average revenue ($/hectare/year) Percentage total viable hectares
Sugarcane, barley, soybeans, other pulses < 100 16
Bananas, beans, potatoes, sorghum, sugar beets, ground nuts, cassava, maize, cotton lint 100–500 14
Coffee, rice, sweet potatoes, millet 500–1,000 16
Horticulture and other high-value crops > 2,000 54
Source: Derived from You 2009.
Table 15.4 Sensitivity of Irrigation Potential to Assumed Investment Cost
Large-scale irrigation Small-scale irrigation
Initial investment cost/hectare (US$)
Hectares (percentage baseline)
Initial investment cost/hectare (US$)
Hectares (percentage baseline)
1,000 112 600 226
3,000 100 2,000 100
6,000 54 5,000 5
Source: You 2009.Note: The base case is in boldface and considers all projects that have a positive net present value including those whose internal rate of return may be below the 12 percent threshold.

294 AFRICA’S INFRASTRUCTURE: A TIME FOR TRANSFORMATION
with relatively slow expansion of output. By expanding homegrown food production, irri-gation investments could reduce food imports to only 11,000 tons by 2050.
Some discernible (though far from dra-matic) effects on malnutrition would occur (table 15.5). Because of the adverse market trends noted, child malnutrition is projected to increase slightly in the coming decades, from 32.7 million cases in 2000 to 33.8 mil-lion in 2050. The greater availability of food associated with irrigation investments would help relieve this problem, keeping the number of cases down to 31.6 million in 2050, albeit a rather modest reduction.
Overall, irrigation investments help offset some of the adverse effects anticipated from climate change (table 15.5). Climate change is an important factor driving the projected deterioration of the food supply situation in Africa. Irrigation investments can be viewed as an adaptation measure insofar as they help off-set the negative supply-side effects of climate change. Thus, irrigation offsets the effect of climate change on child malnutrition, and it more than offsets the effect on the food trade balance. Food prices would remain somewhat higher than they would have been without cli-mate change, but still considerably lower than without irrigation.
Implementation Challenges
Considerably increasing investments in irriga-tion raises issues about the performance and sustainability of these investments. A recent multidonor irrigation performance diagnostic identifi ed challenges that need to be addressed to improve the performance of irrigation investments. This section summarizes the fi ndings and recommendations of that report (World Bank 2007).
Adopt a Strategic VisionNational agricultural water development strate-gies need to be promoted. They should recognize (a) the potential contribution of agricultural water to poverty reduction and growth; (b) the imperatives of farm-level profi tability and eco-nomic viability; and (c) the need for policies, legal frameworks, and organizations that foster profi table, sustainable water-managed farming by smallholders. The strategies would analyze trade-offs and capture synergies of the various investment options. Key areas to be covered by such strategies include (a) increasing the pro-ductivity and profi tability of existing irrigation schemes; (b) expanding or developing new irrigation (including systems based on water harvesting); (c) testing and disseminating rain-water harvesting technologies; (d) developing
Table 15.5 Food Price Changes for Various Indicators, 2020 and 2050
Year
Average world price for cereals
($/metric ton)
Net cereal imports
(thousand tons)
Number of malnourished
children (thousands)
Caloric availability
(kilocalories/person/day)
Rain-fed area, cereals
(thousand hectares)
Irrigated area, cereals
(thousand hectares)
Rain-fed production,
cereals (thousand
metric tons)
Irrigated production,
cereals (thousand
metric tons)
Projection of current investment levels with climate change
2000 117 23,638 32,669 2,277 74,303 3,783 75,283 6,829
2020 187 4,370 44,041 2,241 87,109 4,847 132,184 12,851
2050 205 75,417 33,756 2,761 92,908 6,294 203,680 26,011
Projection of current investment levels without climate change
2000 117 23,638 32,669 2,277 74,303 3,783 75,283 6,829
2020 179 6,398 43,646 2,263 86,908 4,858 132,125 12,891
2050 159 98,963 31,894 2,886 92,441 6,441 204,427 26,454
Increased investments with climate change
2000 117 23,638 32,669 2,277 74,303 3,783 75,283 6,829
2020 182 −7,331 42,507 2,235 85,793 7,666 138,904 18,625
2050 177 11,134 31,640 2,852 89,560 21,722 220,820 86,003
Source: Estimates provided by International Food Policy Research Institute, Washington, D.C., 2009.

Irrigation: Tapping Potential 295
sustainable supply chains for agricultural water equipment; and (e) investing in research on agricultural water management.
Agricultural water strategies need to be incorporated into wider sectoral strategies for agriculture, rural development, and water. Water strategies should be based on integrated water resource management principles that promote an economically effi cient allocation of water to the agricultural sector, ensure that water allo-cation and management take into account the needs of the poor, and provide for effective par-ticipation by smallholders in basin planning. Agricultural water needs to be more clearly refl ected in Poverty Reduction Strategy Papers or similar national development strategies.
Invest in Institutional ReformsThe new agricultural water strategies should form the basis for sectoral programs that combine investment in infrastructure with investment in institutional reforms. A start-ing point for reforms is to improve coordi-nation among the government organizations responsible for infrastructure development (a ministry of water) and those responsible for irrigated farming (a ministry of agriculture) and to build capacity and incentives for pub-lic agencies to adopt a new agricultural water development paradigm (box 15.2). It is also desirable to develop the instruments needed for private sector involvement through public-private partnerships.
Responsibility for development should be decentralized as much as possible, based on the principle of subsidiarity. In almost all cases, reforms will focus on empower-ing potential users of agricultural water to cope with their new roles and responsibilities and to deal effectively with service providers, including irrigation agencies (which should become accountable to their clients), credit organizations, and input supply and output markets. This measure should be accompanied by investment in capacity building for farmer organizations. More generally, the role of farmers in cost sharing and in operation and maintenance should be transparent.
Monitoring and evaluation should be an essential management tool for farmers, imple-menting agencies, and fi nancing partners. As
a minimum requirement, monitoring and evaluation systems should measure inputs; costs; and changes in production, incomes, employment, health, and the environment.
Undertake Viable and Sustainable Projects Future designs and investment decisions should be based solely on economic viability, farm-level profi tability, and sustainability. Nonviable investments for “social” or “strategic” purposes should be avoided. Subsidies (if any) should be limited to (a) items having a medium- to long-term economic life (headworks and main canals on larger schemes), the cost of which is beyond the fi nancial capacity of most farmers, rather than for lower-cost investments with a short economic life (treadle pumps or on-farm
An Enabling Environment for Reform: Offi ce du NigerInitiated by the French in 1932, the Offi ce du Niger is one of the oldest and largest irrigation schemes in Sub-Saharan Africa. Located in Mali, the scheme was originally developed to supply the French textile industry with cotton and to increase food security for the Sahel region. Despite a disappointing performance in the fi rst sev-eral decades, including limited area development, poor infrastructure maintenance, and low yields, the project was rehabilitated in the early 1980s with assistance from the European Union; the World Bank; and the governments of France, Germany, the Netherlands, and the United States. Comprehensive reforms and rehabilitation tripled average paddy yields to 5 tons per hectare, increased the area under cultivation to about 80,000 hectares, boosted settler population by over 220 percent, and increased paddy production per capita from 0.9 ton to 1.6 tons, reducing poverty and increasing food security.
The project’s success is attributed to technical, institutional, and economic factors. Technical factors include water management through physical rehabilitation of irrigation and drainage networks, a comprehensive package of improved technologies, and appropri-ate agricultural mechanization. Institutional and economic factors include liberalized paddy marketing and processing, land-tenure secu-rity, infrastructure improvements, institutional reforms, and stronger partnerships with farmers. Also important were donor coordination, government commitment, and the right macroeconomic and policy environment.
Source: Based on interviews with World Bank staff from the Africa Water Resources Department, 2008.
BOX 15 .2

296 AFRICA’S INFRASTRUCTURE: A TIME FOR TRANSFORMATION
development for improved infi eld rainwater management); and (b) technology development and promotion. Subsidies for support services and operation and maintenance should pre-ferably be avoided or otherwise carefully tar-geted and provided only in the short term to kick-start commercial production.
Reducing per hectare development costs is critical for success. The cost of public irrigation development in Sub-Saharan Africa has been excessively high. Many irrigation schemes failed to capture signifi cantly higher yield levels and cropping intensities and failed to transition to production of higher-value crops. Under these circumstances, high development costs rapidly erode returns on investment. Costs have come down in recent years because of competition among contractors; the emergence of new con-tractors, particularly from low-income countries; and the introduction of affordable irrigation technologies. Keeping down development costs is important, because projects with low returns have per hectare development costs four times those of projects with good returns. Design-ing for maximum profi tability is thus critical and involves both cost-effective design and an effective strategy to increase output. A new gen-eration of well-designed and well-implemented irrigation projects has proved only marginally more costly than those of other regions.
Provide Agricultural Water as Part of a Comprehensive PackageInvestments in agricultural water are part of a comprehensive package to increase outputs, including empowered farmer organizations; sustainable, effi cient, and accountable agricul-tural support services; and accessible, profi table markets. Therefore, investments in agricultural water not only should focus on infrastructure delivery but also should address agricultural intensifi cation in a holistic way (box 15.3). Indeed, without complementary efforts to improve agricultural productivity through other channels, irrigation is unlikely to deliver the sizable increases in yield necessary to justify the original investment.
Investments need to be pro-poor. Project preparation studies should provide an under-standing of how investments in agricultural water can assist benefi ciaries to improve their
livelihoods. This understanding will make the investment more pro-poor by selecting tech-nology options that are low risk and afford-able to the poor, and by seeking to maximize farm-level profi tability and agricultural wage employment, as well as other indirect employ-ment opportunities. In addition, institutional design should ensure that the role of women in production systems and their management is taken into account and built on.
Notes The authors of this chapter are Mark Rosegrant,
Claudia Ringler, and IJsbrand de Jong, who drew on background material and contributions from Salah Darghouth, Mandy Ewing, Stephen Mink, Siwa Msangi, Siobhan Murray, Mark Svendsen, and Liang Zhi You.
Nigeria’s Fadama Water User Association: Expanding Irrigation Community-driven development can expand irrigation in Sub-Saharan Africa, particularly among homogeneous groups with high social equality. The Fadama II agricultural development project in Nige-ria supported water user associations. It increased access to productive assets and infrastructure, including agricultural inputs, irrigation infrastructure, and postharvesting equipment. Community groups were organized into user groups based on their agricultural sector (live-stock, crops, forestry, and the like) and were paid 10 percent of the asset costs. As a result, the value of productive assets for water and irrigation, which included water pumps, boreholes, and tube wells, increased nearly 3,000 percent. In addi-tion, the irrigation investment raised crop productivity in dry regions, increas-ing incomes in the dry savannahs nearly 80 percent.
Source: Based on interviews with World Bank staff from the Africa Water Resources Depart-ment, 2008.
BOX 15 .3

Irrigation: Tapping Potential 297
1. Agricultural water and irrigation are used interchangeably, and both refer to the supply of additional water to augment rainwater (if any) for crops and livestock. In this report, agricul-tural water and irrigation include drainage, where appropriate.
ReferencesFrenken, Karen, ed. 2005. Irrigation in Africa in
Figures: AQUASTAT Survey—2005. FAO Water Report 29. Rome: Food and Agriculture Organization of the United Nations.
Inocencio, Arlene, Masao Kikuchi, Manabu Tonosaki, Atsushi Maruyama, and Hilmy Sally. 2005. “Costs of Irrigation Projects: A Compari-son of Sub-Saharan Africa and Other Developing Regions and Finding Options to Reduce Costs.” Report of component study for Collaborative Programme, International Water Management Institute, Pretoria, South Africa.
NEPAD (New Partnership for Africa’s Develop-ment). 2003. Comprehensive Africa Agricul-tural Development Programme. http://www.nepad-caadp.net/.
Svendsen, Mark, Mandy Ewing, and Siwa Msangi. 2008. “Watermarks: Indicators of Irrigation Sector Performance in Sub-Saharan Africa.” Background Paper 4, Africa Infrastructure Country Diagnos-tic, World Bank, Washington, DC.
World Bank. 2007. Investment in Agricultural Water for Poverty Reduction and Economic Growth in Sub-Saharan Africa: Synthesis Report. Washing-ton, DC: World Bank.
———. 2008. World Development Report 2008: Agriculture for Development. Washington, DC: World Bank.
You, Liang Zhi. 2008. “Irrigation Investment Needs in Sub-Saharan Africa.” Background Paper 9, Africa Infrastructure Country Diagnostic, World Bank, Washington, DC.


Chapter
299
S ub-Saharan Africa as a whole is unlikely to meet the Millennium Development Goal (MDG) for water supply. Coverage in
urban areas has been declining as utilities have struggled to keep pace with population growth. In rural areas, more than 40 percent of the population continues to rely on surface water. Overall, wells and boreholes are the fastest-growing sources of supply.
The price tag for reaching the MDG for access to an improved water source is estimated at $16.5 billion a year (roughly 2.6 percent of Africa’s GDP). For many countries, these costs look prohibitive. By emphasizing lower-cost technologies, such as standposts and bore-holes, those countries could reduce the cost of meeting the MDG. However, standpost use is affected by institutional challenges that remain to be addressed.
Spending on the water sector today is $3.6 billion, one-fourth of what is required. However, some $2.7 billion available to the sector is currently being wasted due to ineffi ciency.
An important example of ineffi ciency is underpricing of services. Average water tar-iffs are about $0.67 per cubic meter, below the cost-recovery threshold of just over $1.00 per cubic meter. By underpricing water, the sector
forgoes at least $1.8 billion a year in revenues. Typically, capital costs have been subsidized, but the subsidies are highly regressive. Full capital cost recovery should be affordable for half of the population, including the bulk of those that enjoy piped water access today, but would not be affordable to the remainder.
Furthermore, the operational ineffi ciencies of water utilities cost the region $0.9 billion a year and impede service expansion. Insti-tutional reforms of legal and regulatory frameworks hold the key to improving per-formance. Private participation, particularly lease contracts, has significantly affected utility performance, but state-owned utilities will remain the central actors, and greater efforts are needed to improve their gover-nance frameworks.
Even if all these ineffi ciencies could be eliminated, the overall fi nancing gap for the water sector would still be $7.8 billion a year (1.2 percent of GDP).
Looking ahead, the institutional reform agenda remains as relevant as before, even if the focus has shifted toward a more plu-ralistic view of public and private sector roles. The reform agenda also needs to move beyond utilities to encompass line ministries
Chapter16
Water Supply: Hitting the Target?

300 AFRICA’S INFRASTRUCTURE: A TIME FOR TRANSFORMATION
and the whole public expenditure framework that underpins, and too often hinders, sec-tor investment programs. Room also exists for more cost recovery, so that scarce subsidy resources are redirected to promote access among the poorest. For the majority that does not enjoy access to a piped-water con-nection, greater thought needs to be given to how standposts can become a more effective part of urban water supplies. The burgeoning use of wells and boreholes for supply in urban areas demands urgent attention from policy makers both to improve their understanding and to develop suitable regulatory tools. In rural areas, the big challenge, in addition to continuing to expand access, is the high break-down rate from lack of maintenance, which threatens the sustainability of what has already been achieved.
The Millennium Development Goal for Water—Elusive for Many
Whereas the rest of the world is on track to achieve the MDG for water supply,1 Sub-Saharan Africa reports that only 58 percent of its population enjoys access to safe drinking water vis-à-vis a target rate of 75 percent to be reached by 2015 (WHO/UNICEF 2006).2 Progress has been modest, with access increas-ing by only 9 percentage points between 1990 and 2006, or less than 1 percentage point a year. To meet the target, growth should stand at over 2 percentage points a year. As a result, Sub-Saharan Africa lags all other regions, including South Asia, whose performance was broadly comparable to that of Sub-Saharan Africa in the past but which has moved at a much faster pace in recent years.
Some countries are closer to meeting the MDG targets than others. According to the most recent WHO/UNICEF Joint Monitoring Programme data for 2006, fi ve African coun-tries have already met the MDG target: Burkina Faso, Ghana, Malawi, Namibia, and South Africa. Moreover, an additional 12 countries had reasonable prospects of meeting the tar-get by 2015 if they continued to make steady progress: Cameroon, the Central African Republic, the Comoros, Côte d’Ivoire, Eritrea,
Guinea, Mali, Mauritania, Senegal, Sudan, Uganda, and Zimbabwe. At the other end of the spectrum, some of Africa’s most populous countries, such as the Democratic Republic of Congo and Nigeria, are a long way from meet-ing the target. The proximity of 2015 and the daunting challenges highlight the importance of understanding the performance of the water sector in the region, its achievements and shortcomings, and the factors most critical in expanding coverage.
Service options for water supply can be organized on a hierarchical ladder accord-ing to the delivery method and quality of the associated service. At the top of the ladder is piped water, which is both potable and conve-nient. Standposts offer the same potability, but through a less convenient channel and with some risk of the water becoming contaminated during collection. Next come wells and bore-holes, which, depending on their location, can be more or less convenient than standposts. The water delivered can be of good qual-ity, though that depends on the local aquifer and protection from contamination. Surface water is at the bottom of the ladder, because its quality is in most cases questionable, and it is seldom convenient. Although the objec-tive may be to provide universal piped-water access to the population, it may not be feasible or affordable in the short run. An important fi rst step is to move people away from surface water to one of the lower rungs of the water supply ladder.
Differing Patterns of Urban and Rural Access
In rural areas, reliance on surface water remains prevalent. The share of the population relying on surface water fell quite steeply in the 1990s, from 50 percent to just over 40 percent, where it has remained through 2005 (table 16.1). Boreholes are the main source of improved water, accounting for a further 40 percent of the population. Access to piped water and standposts is very low, barely increasing over the last 15 years. Indeed, in many countries, less than 1 percent of the rural population receives piped water. Strikingly, in countries

Water Supply: Hitting the Target? 301
with higher levels of urbanization, access to piped water and standposts in rural areas is substantially higher.
In urban areas, rapid population growth has caused piped-water coverage to fall mark-edly over the last 15 years. However, at close to 40 percent, it is still the single-largest source of water supply. Standpost coverage has similarly declined, whereas that of boreholes has risen, so that each of these types of service reaches about 24 percent of the urban population. The lower coverage of standposts compared with piped water is particularly striking, given their relatively low cost and the pressure to expand services rapidly. Reliance on surface water, at 7 percent of the urban population, has hardly changed.
Utilities are the central actors respon-sible for water supply in urban areas. Over-all, about two-thirds of the urban populace depends on utility water. In the middle-income countries, utilities are essentially the only players, reaching about 99 percent of the urban population, the vast majority through private piped-water connections. In low-income countries, only 49 percent of urban residents benefi t from utility water, fewer than half through private piped connections (table 16.2). For the rest, informal sharing of connections through resale between neigh-bors (15 percent of the urban population) is almost as prevalent as formal sharing through standposts (19 percent of the urban popula-tion). In Maputo, Mozambique, one-third of unconnected households purchase water from their neighbors, and in Maseru, Lesotho, household resellers provide water to 31 per-cent of the population, including almost half
of the unconnected households. Household resale, while prevalent, is often illegal, although Côte d’Ivoire illustrates the potential benefi ts of legalization (box 16.1).
Utilities report providing around 20 hours of service daily, and just over 80 percent of their samples pass chlorine tests (table 16.3). They typically produce just over 200 liters per capita served, though the amount for middle-income countries is about twice that for low-income countries. If the utilities’ total water produc-tion could be evenly distributed to the entire population residing in the utility service area, it would amount to 74 liters per capita a day, just about adequate to meet basic human needs.
Urban households that do not benefit from utility water rely on several alternatives. The rapid expansion of boreholes in urban areas has already been noted. Water vendors, another alternative, may retail water from utilities, boreholes, or surface sources, either
Table 16.1 Evolution of Water Supply Coverage in Africa, by Sourcepercentage of population
Period
Piped supply StandpostsWell and
boreholesa Surface water
Urban Rural Urban Rural Urban Rural Urban Rural
1990–95 50 4 29 9 20 41 6 50
1995–2000 43 4 25 9 21 41 5 41
2001–05 39 4 24 11 24 43 7 42
Source: Banerjee, Wodon, and others 2008.Note: The figures are based on household surveys.a. The WHO/UNICEF Joint Monitoring Programme (2006) considers protected wells and boreholes to be improved water sources. However, disaggregating the data into protected and unprotected wells and boreholes from the household surveys used in the Africa Infrastructure Country Diagnostic study is not possible.
Table 16.2 Services Provided by Utilities in Their Service Areaspercentage
Country type
Population already enjoying access to utility water
Population gaining access to utility water each year
Piped water Standposts
Resale of neighbor’s
water TotalPiped water Standposts Total
Low income 30 19 15 68 1.9 1.0 2.9
Middle income 89 10 0 99 4.5 −0.2 4.5
Averagea 44 14 6 86 2.5 0.9 3.2
Source: Banerjee, Skilling, and others 2008.Note: The figures are based on utility data for utility service areas. The coverage is higher than that obtained from household surveys because utility service areas do not cover the entirety of urban areas and because for some countries, data were available only for utilities in larger cities.aAverage is population weighted.

302 AFRICA’S INFRASTRUCTURE: A TIME FOR TRANSFORMATION
from trucks and carts, or sometimes through their own private distribution networks. Water vendors account for only 3 percent of the African urban market, rising to 7 percent for West Africa. In some countries, how-ever, their contribution to the urban water supply is much larger: Nigeria (10 percent), Chad (16 percent), Niger (21 percent), and Mauritania (32 percent). In 15 large cities in Africa, the cost of vendor water, particularly when transported directly to the household, can be 2 to 11 times more expensive than hav-ing a household connection (table 16.4). This strong willingness to pay for vendor water is a potential revenue source that the utilities are typically unable to capture.
The dynamics of service expansion reveal a similar overall pattern in both urban and rural areas: the absolute number of people depend-ing on surface water continues to grow, a grim statistic in its own right (fi gure 16.1). Across the board, wells and boreholes are expanding
coverage much more rapidly than all the utility-based alternatives together. Within the purview of the utility, access to standposts seems to be growing faster than access to piped water. But the combined growth rates of the various improved forms of water sup-ply in urban areas (less than 1 percent a year) still fall short of population growth (more than 4 percent a year).
Access to improved water sources is highly inequitable across the income distribution (fi gure 16.2). Piped water and standposts are heavily concentrated among the more affl uent segments of the population, typically in urban areas. The poorest 40 percent of the population, by contrast, depends on surface water and on wells and boreholes in almost equal measure. Piped supply covers only 10 percent of African households in the bottom 60 percent of the population. For the middle-income countries, access to piped water and standposts among the poorest quintiles is substantially higher than in the low-income countries.
Financing the MDG
The overall price tag for reaching the MDG target for access to water is estimated at $16.5 billion (roughly 2.6 percent of Africa’s GDP), which is somewhat higher than previously thought (Mehta, Fugelsnes, and Virjee 2005). Capital investment needs based on minimum acceptable asset standards and accounting for
Table 16.3 Quality of Services Provided by Utilities in Their Service Areas
Country type
Availability of utility water Quality of water supply
Liters per capita availablefor residents in
service area
Liters per capita available
for utility customers
Hours/day of continuous
service
Percentage of samples
passing chlorine test
Low income 74 149 19 83
Middle income 272 277 24 99
Averagea 167 224 21 83
Source: Banerjee, Skilling, and others 2008.aAverage is population weighted.
BOX 16 .1
Côte d’Ivoire legalized household resellers in informal settle-ments to help the poor receive safe water. This legislation enables the Société de Distribution d’Eau de la Côte d’Ivoire (SODECI) to indirectly infl uence the price and quality of the water in these areas. The utility has issued about 1,000 licenses to water resellers, who can invest in last-mile net-work extensions to cater to demand in poor neighborhoods. SODECI reduces the risk of nonpayment by requiring a sizable deposit (about $300) and invoicing resellers monthly.
Nevertheless, the scheme faces implementation chal-lenges. Household resellers pay SODECI twice: their reseller payments and a price markup for network extensions in these areas. Furthermore, no special tariff applies to house-hold resellers; they pay the high consumer tariff. Therefore, the motivation to become a household reseller is limited, and most households pay the regular domestic consumer price.
Source: Collignon and Vézina 2000.
Legalizing Household Water Resellers in Côte d’Ivoire

Water Supply: Hitting the Target? 303
both new infrastructure and rehabilitation of existing assets can be conservatively esti-mated at $11.0 billion a year (1.7 percent of the region’s GDP). The maintenance require-ments are $5.5 billion a year (0.9 percent of the region’s GDP) (table 16.5).
The cost of achieving the water MDG is very high for nonfragile low-income coun-tries (5.7 percent of GDP), and particularly high for fragile states (8.8 percent of GDP).
Although donors have been fi nancing the associated capital costs, low-income coun-tries face a maintenance bill of approximately 2 percent of GDP, perhaps even more of a challenge given weaknesses in sector institu-tions and budgeting processes. The challenge to resource-rich countries, though not insig-nifi cant, appears much more manageable. Middle-income countries should comfortably meet their fi nancing needs.
Existing spending on water and sanitation is $7.6 billion, or less than half of what is required. (Because of the diffi culty of accurately separat-ing water and sanitation, spending for both
a. Urban b. Rural
0
0.5
1.0
1.5
annu
aliz
ed in
crea
se in
acce
ss (%
of p
opul
atio
n)
annu
aliz
ed in
crea
se in
acce
ss (%
of p
opul
atio
n)
2.0
piped supply standposts wells andboreholes
surface water
piped supply standposts wells andboreholes
surface water–0.5
0
0.5
1.0
1.5
2.0
Figure 16.1 Increases in Access to Water by Source, 1990s to Early 2000s
Source: Banerjee, Skilling, and others 2008.
0
10
20
30
40
50
60
poorest second thirdquintile
fourth richest
% o
f hou
seho
lds
piped water public standpost
well watersurface water
Figure 16.2 Coverage of Water Services, by Budget Quintile
Source: Banerjee, Skilling, and others 2008.Note: In terms of household spending, poorest quintile = poorest 20 percent of the population; second quintile = second-poorest 20 percent of the population; third quintile = middle 20 percent of the population; fourth quintile = second-richest 20 percent of the population; richest quintile = richest 20 percent of the population.
Table 16.4 Average Price for Water Service in 15 Largest Cities, by Type of Provider
House connection
Small piped network
Stand post
Household reseller
Water tanker
Water vendor
Average price ($/cubic meter) 0.49 1.04 1.93 1.63 4.67 4.00
Markup over house connection (%) 100 214 336 402 1,103 811
Source: Keener, Luengo, and Banerjee 2008.
Table 16.5 Estimated Annual Financing Needed to Meet the Water MDG
Country type
$ billions annually % of GDP
O&M Capital Total O&M Capital Total
Sub-Saharan Africa 5.53 11.01 16.54 0.86 1.72 2.58
Low-income fragile 0.98 2.41 3.39 2.55 6.27 8.81
Low-income nonfragile 1.91 4.36 6.27 1.73 3.95 5.68
Middle income 1.19 1.19 2.38 0.44 0.44 0.88
Resource rich 1.47 3.12 4.59 0.66 1.40 2.06
Source: Briceño-Garmendia, Smits, and Foster 2008.Note: O&M = operation and maintenance. Row totals may not add exactly because of rounding errors.

304 AFRICA’S INFRASTRUCTURE: A TIME FOR TRANSFORMATION
services is presented together here. The more detailed discussion of sanitation can be found in chapter 17 of this volume.) African countries are already devoting signifi cant resources to meeting the water and sanitation MDG targets. Domestically funded spending accounted for over half of total spending. For capital invest-ment, donors have had a predominant role, par-ticularly in low-income countries, where they fi nance most of the investment (table 16.6). Financiers outside the Organisation for Eco-nomic Co-operation and Development have also played a role in the low-income coun-tries, whereas private fi nance has been neg-ligible. However, household self-fi nance of on-site sanitation facilities—such as latrines—is estimated to be substantial.
Public investment in water and sanitation is almost exclusively the domain of the central government. Within the public sector, general governments3 carry out most capital spend-ing, whereas public enterprises tend to execute most spending for operation and mainte-nance. Therefore, the institutional effective-ness of the line ministries is just as important as the institutional effectiveness of the utilities in ensuring that resources are well used. Thus, better public expenditure management, good selection of projects, and clear strategic guid-ance for investment should all be considered integral aspects of the sector reform agenda.
The existing resource envelope for Africa’s water supply sector would go considerably further if various serious inefficiencies—amounting to $2.7 billion a year—could be
addressed. Improving cost recovery of water utilities could reduce the gap by $1.8 billion a year, addressing operating ineffi ciencies would bring an additional $0.9 billion a year, and raising capital budget execution could recoup some $0.2 billion a year. A larger part of these gains is for the low-income countries, whose utilities should focus equally on improving cost recovery and on reducing operating inef-fi ciencies. For middle-income countries, much of the gain would come from reducing operat-ing ineffi ciencies.
Even if all of these effi ciencies could be addressed, the water sector would still face a sizable fi nancing gap of $9.3 billion a year (1.5 percent of GDP; table 16.7). The gap for capital requirements is more than twice that for operation and maintenance, suggesting that the MDG challenge is mainly about expanding access to improved water sources and rehabili-tating existing assets in poor condition.
Although the costs of investment appear high, the health dividends of meeting the MDG target are substantial. Every dollar invested in water supply generates economic benefi ts of at least $1.50 (Hutton and Haller 2004). Access to improved water brings a variety of benefi ts, particularly improved health and reduced time spent collecting water. Serious illnesses trans-mitted through unsafe water, such as infectious diarrhea, are a leading cause of infant mortal-ity. Waterborne illnesses can be a substantial economic burden, causing adult deaths and workdays lost and affecting children’s health and education.
Table 16.6 Existing Financial Flows to Water Supply and Sanitation$ billions annually
Country type
O&M Capital expenditure
TotalPublic sector
Public sector ODA
Non-OECD fi nanciers PPI
Household self-fi nance Total
Sub-Saharan Africa 3.06 1.06 1.23 0.16 0.01 2.13 4.58 7.64
Low-income fragile 0.13 0.03 0.11 0.02 0.00 0.16 0.32 0.45
Low-income nonfragile 0.30 0.25 0.78 0.05 0.00 0.45 1.54 1.83
Middle income 2.17 0.15 0.10 0.01 0.00 0.21 0.47 2.64
Resource rich 0.15 0.72 0.24 0.08 0.01 0.52 1.57 1.72
Source: Briceño-Garmendia, Smits, and Foster 2008.Note: ODA = official development assistance; OECD = Organisation for Economic Co-operation and Development; O&M = operation and maintenance; PPI = private participation in infrastructure.

Water Supply: Hitting the Target? 305
Household members, primarily women and children, face a substantial opportunity cost in time to fetch water. More than 20 percent of the population in Cameroon, Ghana, Maurita-nia, Niger, and Tanzania must travel more than 2 kilometers to the primary water supply. Rural dwellers tend to travel farther than urban dwell-ers. Therefore, the time savings from accessing water from a nearby source are enormous even when valued at a discounted wage rate.
Using Appropriate Technologies
For many countries, the costs of meeting the water MDG look prohibitive. Although the cost of meeting the MDG amounts to 2.3 percent of GDP on average, for a handful of countries (including Benin, the Democratic Republic of Congo, Kenya, and Madagascar), the cost would be in excess of 7 percent of GDP, well beyond what could be feasibly attained. So these countries must choose between achieving the MDG at a lower rung of the water supply ladder with lower-cost technologies and sub-stantially postponing their achievement of the goal. Concentrating all coverage expansion in lower-cost technologies, such as standposts and boreholes, would lower the cost of meeting the MDG to 1.6 percent of GDP on average. For Benin, Kenya, and Madagascar, the cost could be reduced to less than 4 percent of GDP, which would be more affordable. The Democratic Republic of Congo would be the only country still experiencing an overall cost above 7 per-cent of GDP.
This strategy, however, runs contrary to cur-rent practice, which sees piped water serving
the majority of those gaining access to improved water in utility service areas each year. A survey of 51 water utilities shows that about 2 percent of the population in utility service areas gains access to a formal utility water service each year—1.5 percent to piped water and 0.5 percent to standposts. Given the higher unit cost of piped water, utilities are not maximizing the effect on coverage from their limited investment budgets. Indeed, utilities could double the value for money of their investment programs (dollars per capita gain-ing access to improved water) if they weighted their investment programs toward standposts rather than private connections.
Standposts provide safe water in urban areas at about one-third the per capita cost of a private tap. Therefore, it is striking that the coverage of public standposts in urban Africa lags so far behind that of private taps and that their distributional incidence is skewed toward the better-off households.
Several institutional challenges prevent standposts from being more widely adopted (Keener, Luengo, and Banerjee 2008). Stand-posts describe a range of public water supply arrangements, from an unattended public access tap to a kiosk with a human operator. Despite their low investment cost, standposts are in practice often beset by poor main-tenance and high retail prices. The service provided by the standpost may be very low because the utility’s claims about the number served by a single standpost are highly vari-able and often unrealistic, ranging from just a few customers to 5,000, with an average of about 700. Offi cial utility data indicate that about three-quarters of standposts are in good
Table 16.7 Composition of Water Sector Funding Gap
Country type
$ billions annually Percentage of GDP
O&M Capital Total O&M Capital Total
Sub-Saharan Africa 2.74 6.60 9.34 0.43 1.03 1.45
Low-income fragile 0.75 2.00 2.76 1.96 5.22 7.17
Low-income nonfragile 1.43 2.92 4.35 1.30 2.64 3.94
Middle income 0.00 0.00 0.00 0.00 0.00 0.00
Resource rich 1.06 1.74 2.80 0.48 0.78 1.26
Source: Briceño-Garmendia, Smits, and Foster 2008.Note: O&M = operation and maintenance.

306 AFRICA’S INFRASTRUCTURE: A TIME FOR TRANSFORMATION
working order, but more detailed surveys sug-gest that fewer than half may be functioning normally at any one time.
The utility manages about half the stand-posts, but a growing number are being delegated to private or community manage-ment. Although this arrangement helps ensure sustainability, price markups to the final consumer can be large, and local elites can capture the service. Many utilities originally offered standpost services free of charge and later moved toward charging preferential rates for standpost water, typically half the price charged for a private connection. When del-egated management is introduced, however, markups are added to cover the salaries of the standpost operators, often with signifi cant profi t markups. As a result, standpost prices rise to 3 times the utility rate, and as much as
20 times in some extreme cases (for example, in Kinshasa in the Democratic Republic of Congo). Community engagement can increase the accountability of kiosk operators, but it can also lead to corruption and mismanage-ment in countries that lack social cohesion or oversight by supporting institutions.
Even so, a handful of countries are making headway with the expansion of standposts. Each year in Rwanda, an additional 3 percent of the population resident in the service area of the national utility Electrogaz gains access to standposts (box 16.2). Similarly, Lusaka Water and Sewerage Company in Zambia adds 3 per-cent of its resident population to this category every year. Another intermediate approach sometimes adopted is to install yard taps, shared by four or fi ve households. They are lower in cost than private taps, and they avoid
BOX 16 .2
Standposts in Kigali, RwandaThe water production capacity of Electrogaz, the main utility in Kigali, is inadequate to meet network demand. The lack of bulk supply causes rolling shortages throughout the city, often forcing residents with private connec-tions to seek water from public sources, such as standposts.
The fi nancial sustainability of standposts in Kigali can be estimated from the tariff paid by standpost operators ($0.42 per cubic meter), the total cost of Electrogaz’s production ($0.36 per cubic meter), the rate of unaccounted-for water in distribution and selling (35 percent and 5 percent, respectively), and the volume and price of water sold at the standposts. Three hypothetical operators selling 100 jerricans each per day at $0.02, $0.03, and $0.05 per jerrican would earn estimated monthly net incomes of about $314, $949, and $1,584, respectively (the 2007 GDP per capita was $341), making this an attractive business prop-osition for them. However, from the utility’s perspective, the combination of a low tariff and the 35 percent rate of unaccounted-for water in distribution creates a loss-producing scenario: each cubic meter supplied to a stand-
post costs $0.55 per cubic meter to supply when distribution losses are fully accounted for but brings in only $0.42 in revenue.
Kigali has roughly 240 standposts, of which an estimated 193 (80 percent) were operating in December 2008. Utility offi -cials estimate that about 60,000 people use standposts, though this fi gure includes con-sumers who use them only when their pri-mary source is unavailable. According to the total water volume recorded by public stand-post meters, the standposts could supply only 48,500 people with 20 liters per capita a day. This fi gure would be more indicative of the upper bound of the population that primarily depends on standposts (about 6 percent of the city’s population).
The utility’s limited production capacity has affected both the level of peak demand at standposts and the cost of production. Obser-vations and interviews with consumers indicate that prices have often been higher in areas when and where water service has been cut and have been lower after periods of precipita-tion that increase the availability of other supply options, such as rainwater and natural springs.
Source: Keener and others forthcoming.

Water Supply: Hitting the Target? 307
a set of complex fi nancial arrangements with the central government that prevents optimal resource allocation, fi nancial sustainability, and economically effi cient use of water resources (Briceño-Garmendia, Smits, and Foster 2008). As a result, the utility management postpones basic investment and rehabilitation decisions to “make it through the day” fi nancially. Thus, although these policies appear to be socially benign, by debilitating the fi nancial position of the utility, they ultimately lead to delayed investment and hence hold back service expan-sion to reach the unserved population.
Average water tariffs in Sub-Saharan Africa are about $0.67 per cubic meter, two-thirds of a cost-recovery threshold of just over $1.00 per cubic meter. Tariffs are already relatively high by international (even developing-country) standards (box 16.3). In 2004, average water tariffs were about $1.00 per cubic meter in members of the Organisation for Economic Co-operation and Development, around $0.35 in middle-income countries, and as low as $0.10 in South Asia (GWI 2005). Tariffs of about $0.40 per cubic meter are considered more than adequate to cover operating costs in most developing-country contexts. In low-income African countries, however, operating costs are as high as $0.60 per cubic meter on average, refl ecting inadequate selection of tech-nologies, low population density, country risk premiums, and the high cost of inputs. Current tariffs cover operating costs on average but do not contribute much toward capital costs.
In most cases, the state or donors have subsidized capital costs almost entirely. Subsi-dies to residential consumers are highly regres-sive (Banerjee, Wodon, and others 2008). Across the bottom half of the income distribution, barely 10 percent of households have access to piped water. Indeed, more than 80 percent of households with piped water come from the top two quintiles of the income distribution. Because poorer households are almost entirely excluded, they cannot benefi t from subsidies embedded in prices for piped water. In many cases, targeting performance is further exacer-bated by poor tariff design, with widespread use of minimum charges and rising block tar-iffs that provide large lifeline blocks of highly subsidized water to all consumers.
0 0.2 0.4 0.6 0.8 1.0
Cape Verde
Uganda
Tanzania
Burkina Faso
Nigeria
Sudan
Rwanda
Benin
Kenya
Ethiopia
Namibia
Mozambique
Zambia
Congo, Dem. Rep. of
South Africa
Niger
Lesotho
Ghana
Malawi
Madagascar
Côte d’Ivoire
Senegal
% of GDP
Figure 16.3 Economic Burden of Water Underpricing, by Country
Source: Briceño-Garmendia, Smits, and Foster 2008.Note: The economic burden of underpricing is defined as the difference between the average effective tariff and the full cost-recovery tariff multiplied by the total volume billed. It is the total revenue shortfall attributable to underpricing.
some of the issues associated with standposts, which serve hundreds of customers.
The Challenge of Cost Recovery
By underpricing water, the sector forgoes at least $1.8 billion a year in revenues (0.3 percent of GDP). Underpricing of water—a common problem throughout the world—is also wide-spread across Africa. In the worst cases, such as Côte d’Ivoire, Madagascar, and Senegal, underpricing can result in utilities’ capturing less than 40 percent of the revenues they need and can lead to an economic burden of around 0.7–0.9 percent of GDP (fi gure 16.3). The asso-ciated utility defi cit is often concealed within

308 AFRICA’S INFRASTRUCTURE: A TIME FOR TRANSFORMATION
BOX 16 .3
During a 2006–07 survey of 23 African countries, tariff structures for 45 water utilities were collected and ana-lyzed. These tariff structures were assessed using criteria of cost recovery, effi ciency, and equity. Many countries in Africa have adopted a two-part tariff structure that incor-porates both a fi xed charge and a water-use charge. The block structure can add to the complexity of tariffs; the number of blocks ranges between two and seven with an average of three. Only four utilities practice a one-block or linear tariff.
Cost Recovery
The experience of recovering operating costs in Africa is positive, with many utilities setting tariffs at levels high enough to recoup operation and maintenance costs. The performance of African utilities in this respect is superior to that found elsewhere in the world. In Africa, the tariff struc-tures are designed in a way that is more conducive to meet-ing operation and maintenance costs at the high or low ends of consumption. Capital cost recovery is largely elusive for residential consumers; only four utilities in Cape Verde, Namibia, and South Africa charge more than $1.
Effi ciency
The relatively high levels of metering and tariffs in Africa suggest that consumers receive a price signal to economize on water use. A signifi cant number of utilities apply fi xed charges with minimum consumption attached, however, and in these cases, low-volume consumers may not receive any kind of price signal over their consumption range. How-ever, the necessity of water demand management is less
important in Africa than elsewhere: most consumers already survive on little more than subsistence quantities of water.
Equity
More generally, African water tariff structures do not perform all that well in equity terms. A number of factors contribute to this inequity. First, the subsidy to the low block under the cur-rent increasing block tariff structure does not all go to small consumers (usually the poor); instead, a substantial amount of the subsidy leaks to large consumers. Second, because of the fi xed and minimum consumption charges and the large size of the low blocks, small consumers often end up pay-ing higher effective prices per unit than large consumers. In almost three-fourths of the cases, consumers with water intake at the survival level pay as much as or more than aver-age consumers pay. Despite the prevalence of rising block tariffs, the smallest consumers do not always pay the lowest price in Africa. Third, the connection cost is high for many utilities compared with gross national income per capita, indi-cating signifi cant affordability problems for expanding net-works into unserved areas. Fourth, the retail standpost price is signifi cantly higher than the utility-imposed price because of rent-seeking behavior on the part of operators.
African utilities operate in an environment of high-cost service provision and high-cost recovery. What emerges is a tariff structure that is relatively effi cient and that recovers at least the operation and maintenance cost. However, several utilities have enforced high connection costs and inequita-ble tariff structures that limit the ability of poor households to secure access to service or to be able to afford the service even when they have access.
Source: Banerjee, Foster, and others 2008.
Cost Recovery, Equity, and Effi ciency in Water Tariffs in Africa
a. Tariff structure b. Effective prices at different levels of household consumption
household consumption (cubic meters)
7
13
19
1 13
102468
101214161820
minimum
cons
umpti
on +
IBT
fixed
charg
e + IB
T
increa
sing b
lock t
ariff
fixed
charg
e + lin
ear
fixed
charg
elin
ear
U shap
ed
num
ber
of u
tilit
ies
29%16% 9%
20% 49%
25%
24%
27%
45%
27%9%
20%
0102030405060708090
100
4 10 40
% o
f ut
iliti
es
< $0.20 > $0.20 and < $0.40
> $0.40 and < $0.80 > $0.80
Note: IBT = increasing block tariff.

Water Supply: Hitting the Target? 309
Full capital cost recovery is generally affordable in the middle-income countries but in the low-income countries would be affordable to only 40 percent of the popula-tion. Assuming household subsistence con-sumption of 10 cubic meters per month (or about 65 liters per capita a day), a monthly utility bill under full cost-recovery pricing of $1 would be around $10. Based on an afford-ability threshold of 5 percent of household income, full cost-recovery tariffs would prove affordable for 40 percent of the population in low-income countries (fi gure 16.4). With about 10 percent of the national population already enjoying a direct water connection, an additional 30 percent of the population could be added to service and be able to afford it. The majority of the remaining 60 percent of the population would be able to afford bills of around $6 a month that would result either from operating cost recovery or from full cost recovery at a more modest consumption of about 6 cubic meters per month (or 40 liters per capita a day).
Improving Utility Performance through Institutional Reform
The operational ineffi ciencies of water util-ities, including revenue undercollection, dis-tribution losses, and labor ineffi ciencies, cost the region $0.9 billion a year (or as much as 0.15 percent of GDP). Operating ineffi cien-cies are rampant among Africa’s water utili-ties, divided roughly evenly between revenue undercollection and distribution losses. Aver-age collection ratios are relatively high in Africa at 90 percent but still short of the best practice of 100 percent. Average distribution losses in Africa are 35 percent, far above the common norm of 20 percent, with all countries affected to some degree. The overall magnitude of these ineffi ciencies can be quantifi ed by compar-ing the revenues available to the utility with the revenues available to an ideal utility that is able to charge cost-recovery tariffs, collect all its revenues, and keep distribution losses to the technical minimum (Ebinger 2006; Saavalainen and ten Berge 2006). In the worst cases, such as the Democratic Republic of
Congo, Ghana, and Zambia, operating inef-fi ciencies can create an economic burden of 0.7–1.0 percent of GDP (fi gure 16.5).
Another source of ineffi ciency is overem-ployment. State-owned enterprises can be social buffers to (very ineffi ciently) transfer rents or resources to the population. African utilities have an average of fi ve employees per 1,000 connections, more than twice the two employees per 1,000 connections frequently used as the international benchmark for devel-oping countries (Tynan and Kingdom 2002).
Operating ineffi ciencies have been imped-ing expansion. Ineffi ciencies not only drain the public purse but they also seriously undermine the performance of utilities.
One casualty of insufficient revenue is maintenance. The rate of bursts per kilome-ter of water main provides some indication of the condition of the underlying infrastructure, and hence the extent to which it is adequately operated and maintained. Among African util-ities, a huge variation occurs between low- and middle-income countries, with bursts ranging from fi ve per kilometer in the latter to just over one per kilometer in the former. Utility managers must often choose among paying salaries, buying fuel, or purchasing spares. Frequently, they must cannibalize parts from
Figure 16.4 Affordability of Cost-Recovery Tariffs in Low-Income Countries
0
10
20
30
40
50
60
% o
f hou
seho
lds
falli
ng b
eyon
d th
e 5%
affo
rdab
ility
thr
esho
ld
70
80
90
100
2 3 4 6 8monthly utility bill (US$)
10 12 14 16
percentage of low-income country population unable to afford to pay
cost of recovery bill, low bound
cost of recovery bill, medium bound
cost of recovery bill, upper bound
Source: Adapted from Banerjee, Wodon, and others 2008.Note: Tariffs are described as affordable if a monthly bill based on subsistence consumption absorbs no more than 5 percent of the household’s budget.
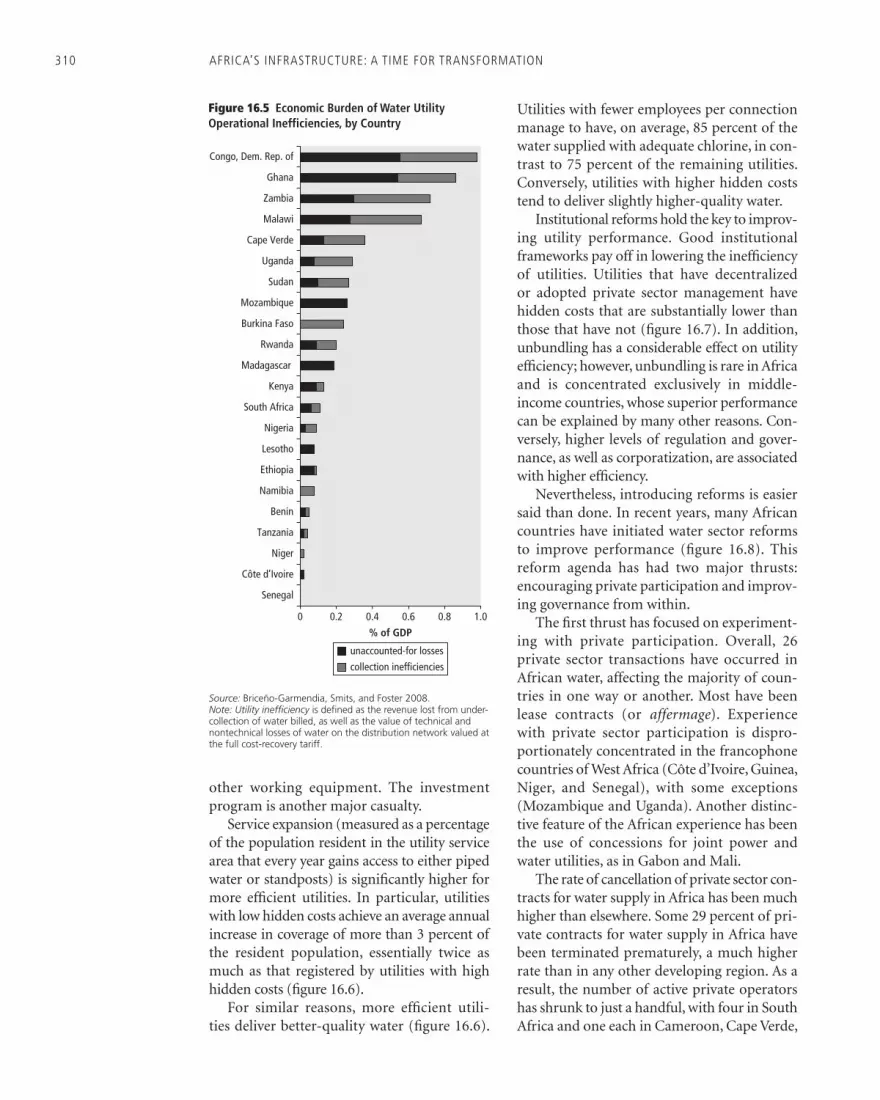
310 AFRICA’S INFRASTRUCTURE: A TIME FOR TRANSFORMATION
other working equipment. The investment program is another major casualty.
Service expansion (measured as a percentage of the population resident in the utility service area that every year gains access to either piped water or standposts) is signifi cantly higher for more effi cient utilities. In particular, utilities with low hidden costs achieve an average annual increase in coverage of more than 3 percent of the resident population, essentially twice as much as that registered by utilities with high hidden costs (fi gure 16.6).
For similar reasons, more effi cient utili-ties deliver better-quality water (fi gure 16.6).
Utilities with fewer employees per connection manage to have, on average, 85 percent of the water supplied with adequate chlorine, in con-trast to 75 percent of the remaining utilities. Conversely, utilities with higher hidden costs tend to deliver slightly higher-quality water.
Institutional reforms hold the key to improv-ing utility performance. Good institutional frameworks pay off in lowering the ineffi ciency of utilities. Utilities that have decentralized or adopted private sector management have hidden costs that are substantially lower than those that have not (fi gure 16.7). In addition, unbundling has a considerable effect on utility effi ciency; however, unbundling is rare in Africa and is concentrated exclusively in middle-income countries, whose superior performance can be explained by many other reasons. Con-versely, higher levels of regulation and gover-nance, as well as corporatization, are associated with higher effi ciency.
Nevertheless, introducing reforms is easier said than done. In recent years, many African countries have initiated water sector reforms to improve performance (fi gure 16.8). This reform agenda has had two major thrusts: encouraging private participation and improv-ing governance from within.
The fi rst thrust has focused on experiment-ing with private participation. Overall, 26 private sector transactions have occurred in African water, affecting the majority of coun-tries in one way or another. Most have been lease contracts (or affermage). Experience with private sector participation is dispro-portionately concentrated in the francophone countries of West Africa (Côte d’Ivoire, Guinea, Niger, and Senegal), with some exceptions (Mozambique and Uganda). Another distinc-tive feature of the African experience has been the use of concessions for joint power and water utilities, as in Gabon and Mali.
The rate of cancellation of private sector con-tracts for water supply in Africa has been much higher than elsewhere. Some 29 percent of pri-vate contracts for water supply in Africa have been terminated prematurely, a much higher rate than in any other developing region. As a result, the number of active private operators has shrunk to just a handful, with four in South Africa and one each in Cameroon, Cape Verde,
0 0.2 0.4 0.6 0.8 1.0
Senegal
Côte d’Ivoire
Niger
Tanzania
Benin
Namibia
Ethiopia
Lesotho
Nigeria
South Africa
Kenya
Madagascar
Rwanda
Burkina Faso
Mozambique
Sudan
Uganda
Cape Verde
Malawi
Zambia
Ghana
Congo, Dem. Rep. of
% of GDP
unaccounted-for losses
collection inefficiencies
Figure 16.5 Economic Burden of Water Utility Operational Inefficiencies, by Country
Source: Briceño-Garmendia, Smits, and Foster 2008.Note: Utility inefficiency is defined as the revenue lost from under-collection of water billed, as well as the value of technical and nontechnical losses of water on the distribution network valued at the full cost-recovery tariff.

Water Supply: Hitting the Target? 311
Côte d’Ivoire, Gabon, Ghana, Mozambique, Niger, and Senegal.
At their best, private sector contracts have accelerated access while boosting effi ciency. Private sector participation has had favorable results in improving utility performance (table 16.8), with Senegal being particularly notewor-thy (box 16.4). Management contracts, being relatively short-term instruments, have had a material effect on improving revenue collection
and service continuity, but they have had little effect on more intractable issues, such as unac-counted-for water and access. Lease contracts have had a substantial effect on improving access and have generally improved operational effi ciency. With the exception of Côte d’Ivoire, however, the associated investments have been publicly fi nanced. The lease contracts in Guinea and Maputo, Mozambique, have been affected by problems of coordination between the private contractor and the government that have held back their progress in some key areas, such as unaccounted-for water. Overall, private sector contracts accounted for (though did not necessarily fi nance) almost 20 percent of the increase of household connections in the region, twice the amount that would be expected given
0
1.0
2.0
3.0
4.0
employees per connection
a. Access expansion
hidden costs
aver
age
annu
aliz
ed in
crea
sein
acc
ess
to im
prov
ed w
ater
(% o
f pop
ulat
ion)
b. Water quality
65
70
75
80
85
90
employees per connection hidden costs
% o
f sam
ple
pass
ing
chlo
rine
tes
t
above average below average
Figure 16.6 Effect of Utility Inefficiency on Access Expansion and Water Quality
Source: Banerjee, Skilling, and others 2008.Note: Hidden cost is a measure of utility inefficiency that sums the revenues lost from underpricing, distribution losses, and undercollection of billed revenues. Employees per connection is a second measure of utility inefficiency that focuses on the extent of overstaffing.
0
50
100
150
200
decen
traliza
tion
priva
te sec
tor m
anag
emen
t
unbu
ndlin
g
high g
overn
ance
high r
egula
tion
SOE c
orpora
tizati
on
hidd
en c
osts
(% o
f rev
enue
)
yes no
Figure 16.7 Hidden Costs and Institutional Frameworks
Source: Banerjee, Skilling, and others 2008.Note: Hidden cost is a measure of utility inefficiency that sums the revenues lost from underpricing, distribution losses, and undercollection of billed revenues. High governance means the utility scores above average on the Africa Infrastructure Country Diagnostic indicator of the quality of state-owned enterprise governance (see box 4.1 in chapter 4 of this volume). High regulation means the country scores above average on the Africa Infrastructure Country Diagnostic indicator of the quality of regulation (see box 4.1 in chapter 4 of this volume). SOE = state-owned enterprise.
0
20
40
60
80
100
SOE c
orpora
tizati
on
regula
tory a
genc
y
PSP e
xperi
ence
perfo
rman
ce co
ntrac
ts
decen
traliza
tion
high S
OE gov
ernan
ce
unbu
ndlin
g
% o
f cou
ntri
esFigure 16.8 Overview of Reforms Affecting Urban Utilities
Source: Banerjee, Skilling, and others 2008.Note: PSP = private sector participation; SOE = state-owned enterprise.

312 AFRICA’S INFRASTRUCTURE: A TIME FOR TRANSFORMATION
BOX 16 .4
Senegal’s experience with private sector participation in water supply is characterized by two remarkable results: (a) an impressive expansion of access and (b) a large increase in operational effi ciency that mainly originated from a reduc-tion of nonrevenue water.
The fi rst result was mainly attributable to a massive subsi-dized connection program sponsored by donors and in part to the cash-fl ow surplus generated by the private operators. In particular, the social connection program implemented with donor support provided some 129,000 connections (75 percent of all new connections installed), benefi ting poor households living in targeted neighborhoods. A portion of the new connections ended up losing service because of nonpayment, however, despite tariffs that had been declin-ing in real terms up to 2006 and a social tariff targeted at poor households that covered the fi rst monthly block of 6 cubic meters of subsistence consumption.
The second result owed much to contractual innovations geared toward increasing the private operator’s incentives to perform effi ciently. In particular, the contract included targets for nonrevenue water reduction and bill collection, backed by fi nancial penalties for noncompliance. These tar-gets were then applied to a notional sales volume based on
the amount of water actually produced, which was used to determine the operator’s remuneration in lieu of the actual water sold. Whenever the operator fell short of the non-revenue water and bill collection targets, the notional sales volume would be lower than the actual sales, penalizing the operator.
Another innovation in Senegal’s public-private partner-ship was the responsibility of the private operator to fi nance part of the network’s rehabilitation using cash fl ow. This approach provided the operator with more fl exibility to identify and reduce water losses, lessening its dependence on the public asset-holding company.
The effect of these innovations on effi ciency has been remarkable, making Senegal’s affermage a prominent exam-ple of private participation in Africa. Today, Senegal can report a level of nonrevenue water comparable to the best water utilities in western Europe, but these results also con-fi rm that operational effi ciency is perhaps the area in which private operators can make the most positive and consis-tent effect, since the parallel progress in service expansion required substantial public sector support.
Source: Adapted from Marin 2009.
Senegal’s Successful Experience with Private Sector Participation
Table 16.8 Overview of Private Sector Participation’s Effect on Utility Performance
Country or cityPrivate sector participation
Unit change in performance before and after private participation
Household connections Improved water
Service continuity
Unaccounted-for water
Collection ratio
Labor productivity
Gabon Concession contract +20 — — −8 — —
Mali +15 +29 — −14 — —
Côte d’Ivoire Lease contract or affermage +19 +22 — — — +2.6
Guinea — +27 — 0 — —
Maputo (Mozambique) — +2 +10 −1 +24 —
Niger +9 +3 — −5 — +3.2
Senegal +18 +17 — −15 — +2.8
Johannesburg (South Africa)
Management contract — — — 0 +10 —
Kampala (Uganda) — — +6 −2 +12 —
Zambia — — +5 −28 +19 —
Source: Adapted from Marin 2009.Note: Household connections and improved water are measured as additional percentage points of households with access; service continuity is measured as additional hours per day of service; unaccounted-for water is measured as reduced percentage points of losses; collection ratio is measured as additional percentage points of collection; labor productivity is measured as additional thousands of connections served per employee. — Not available.

Water Supply: Hitting the Target? 313
their market share of only 9 percent. Half of those gains were made in Côte d’Ivoire alone (Marin 2009).
Anglophone and francophone countries have taken two distinct approaches to sector regulation. About half of the countries (mainly anglophone) have established distinct regula-tory agencies for the water sector, although a signifi cant number of them have not adopted private sector participation. Conversely, a num-ber of francophone countries with private par-ticipation have adopted regulatory frameworks contractually, without establishing an indepen-dent regulatory agency. No evidence appears to support the superiority of either of these two approaches to regulation. Neither does any evi-dence indicate that the creation of a regulatory entity has led to discernible improvements in utility performance. Even where explicit regu-latory frameworks have been established, they typically meet only about half of the corre-sponding good-practice criteria.
The second thrust of the reform agenda has focused on improving the governance of the sector from within. This approach was based on the recognition that the standard infra-structure reform prescriptions were not always as relevant or as easily applied to the water sec-tor as to other areas of infrastructure, and that service provision would remain dominated by public enterprises in the near future. The focus of these reforms has been on moving toward corporatization of state-owned enterprises and on decentralizing responsibilities to lower levelsof government. In addition, some measures have been taken to improve the governance of state-owned enterprises, aimed at adopting commercial principles and modern manage-ment methods. About 80 percent of Africa’s larger water utilities have now been corpora-tized, thereby laying the foundation for a more commercial form of management. Close to half of the countries sampled have decentral-ized their water utilities since the mid-1990s to bring responsibility closer to local communities; however, all the francophone countries studied retain centralized organization of the sector.
Africa’s state-owned water utilities typically fulfi ll only about half of the good-practice cri-teria for enterprise governance. Since the mid-1990s, some serious efforts have been made
to improve internal processes and corporate governance mechanisms, more so than in other infrastructure sectors. In particular, a growing number of utilities are using performance con-tracts, for instance, in Lesotho, Uganda, and Zambia, although not all of them incorporate the penalties, performance-based remunera-tion, and third-party monitoring that make these mechanisms truly effective. Uganda’s use of performance contracts to underpin sub-stantial improvements in sector performance is particularly noteworthy (box 16.5).
Reforms in the Rural Space
Africa remains a predominantly rural conti-nent. About 400 million rural inhabitants have no form of utility-provided water. Rural cover-age of piped-water supply and standposts has barely risen in the past 15 years, and most of the gains have come from rural inhabitants mov-ing up the water supply ladder from surface water to wells and boreholes. Until improved water sources serve more of the rural popula-tion, MDG goals will continue to be elusive.
In rural areas, the central challenge is to reduce reliance on surface water through a sus-tainable network of water access points, which are most typically boreholes. About half of the sampled countries are reducing the share of the rural population reliant on surface water and in the best cases (Lesotho, Mozambique, and Uganda) are managing to shift 2–3 per-cent of the rural population away from this option each year. In the other half of the coun-tries sampled, however, the share of the rural population reliant on surface water is actually increasing. In Chad, Kenya, and Rwanda, an additional 1 percent of the rural population is forced to rely on surface water, whereas in Burkina Faso that number rises to 3 percent, and it is nearly 10 percent in the Democratic Republic of Congo.
Even in countries that are successful in expanding rural access to improved water sources, sustainability is still a concern. A recur-ring problem in rural water systems is the lack of technical or fi nancial capacity to maintain assets. Decentralization and the breakdown of community management arrangements have

314 AFRICA’S INFRASTRUCTURE: A TIME FOR TRANSFORMATION
BOX 16 .5
The National Water and Sewerage Corporation (NWSC) is an autonomous public corporation wholly owned by the government of Uganda. The NWSC is responsible for provid-ing water and sanitation services in 23 towns to 2.2 million people, 75 percent of the population in Uganda’s large urban centers.
Before 1998, large ineffi ciencies posed the urgent need to revamp operations. They included poor service quality, very low staff productivity, and high operating expenses, with a collection rate of only 60 percent and a monthly cash defi cit of $300,000.
Turnaround strategies culminated in establishing area performance contracts between the NWSC head offi ce and a number of area managers. The head offi ce performs contract oversight, capital investment, and regulation of tariffs, rates, and charges; the area managers, acting as operators, are therefore responsible for management, operation and main-tenance services, revenue collection, and rehabilitation and extension of networks. The objective was to enhance each area’s performance by empowering managers and making them accountable for results. A comprehensive system of more focused and customer-oriented targets was designed. Typical performance indicators included working ratio, cash operating margin, nonrevenue water, collection effi ciency, and connection ratio. Performance evaluation looked at both processes and outputs and was conducted through regular as well as unannounced inspections. Incentives were both monetary, including penalties for below-target performances, and nonmonetary, including trophies to the best-performing areas and departments and publication of monthly, quarterly, and yearly best, as well as worst, performance.
In fi scal year 2003/04, the area performance contracts were changed to internally delegated area management con-tracts, aimed at giving more autonomy to operating teams and based on clearer roles, better incentive plans, and a larger risk apportioned to operating teams. The contract framework was later consolidated by using competitive bidding as a basis for awarding contracts to the operating units.
A review of 10 years of NWSC operations shows that gains in operational and fi nancial effi ciency and service expansion have been substantial and impressive relative to the performance of NWSC’s peers in Africa.
NWSC Efficiency Gains
Performance indicator 1998 2008
Service coverage (percent) 48.0 72.0
Total connections 50,826 202,559
New connections per year 3,317 25,000
Metered connections 37,217 201,839
Staff per 1,000 connections 36 7
Collection effi ciency (percent) 60.0 92.0
Nonrevenue water (percent) 60.0 32.5
Proportion of metered accounts (percent) 65.0 99.6
Annual turnover (U Sh billions) 21 84
Profi t (after depreciation) (U Sh billions) −2.0 +3.8
Note: U Sh = Uganda shillings.
Key success factors are identifi ed in the empowerment of staff; the devolution of power from central to regional operations; the increased customer focus; and the adop-tion of private sector–like management practices, including performance-based pay, “customer pays for a good service” principle, and so forth. Also, the emphasis on planning, systematic oversight and monitoring, information sharing through benchmarking, and the continuous challenging of management teams with new and clear performance tar-gets has created a strong system of checks and balances and powerfully triggered involvement, engagement, and sense of pride on the side of staff, beyond what simple fi nancial incentives might obtain.
Sources: Adapted from Muhairwe 2009; NWSC 2006.
Uganda’s Successful Case of State-Owned Enterprise Reform
put greater strain on local governments to manage services. This situation leads to rapid deterioration of rural water points to where they no longer provide the intended service, and populations are forced to return to relying on surface water. On average, one in three rural water points needs rehabilitation, and for a sig-nifi cant number of countries, the share rises to
at least one in two (the Democratic Republic of Congo, Madagascar, Malawi, Nigeria, and Tanzania). Nevertheless, in the best-case sce-narios, the share needing rehabilitation can be as low as 10–20 percent (Benin and Uganda).
Inadequate maintenance of rural water systems refl ects both institutional weaknesses and inappropriate technology choice. Besides

Water Supply: Hitting the Target? 315
weak institutional capacity, undermainte-nance is worsened by inadequate attention to technology choice, low pump density, restrictive maintenance systems, and lack of a supply chain to adequately maintain com-plex machinery (Harvey and Reed 2006; Oyo 2006). In a number of countries, problems have been caused by divorcing the supply of hand pumps from the supply of associated spare parts. Suggested solutions include gov-ernments’ taking a leading role in initial sup-ply chain management and coordinating with donors until the private sector is capable of taking over (Oyo 2006). The unavailability of private supply chains is a result of limited population density and income levels of Afri-can economies. Several initiatives, including market demand assessments (Mozambique in 2003), coordination among links in the chain, and development of supply chain products, are under way in Africa.
Several countries have made progress with institutional reforms of rural water. Under-standing what factors drive these differences in performance across countries is important, particularly whether the institutional reforms implemented have made a difference. The reform agenda for rural water comprises fi ve key components: (a) adopting an explicit rural water policy to guide interventions in the sec-tor; (b) developing a map of rural water points so that their functionality can be monitored; (c) adopting cost-recovery policies to improve the fi nancial sustainability of systems; (d) establishing a dedicated central budget fund-ing source for rural water; and (e) creating a water agency to spearhead the implementation of rural water projects.
However, progress on key rural reform mea-sures has been uneven. The extent of progress on each of these reform steps is used to create a Rural Reform Index for water. Burkina Faso, Côte d’Ivoire, and Uganda score 100 percent on this index, whereas Niger scores only 20 percent. The most widely adopted reform mea-sures are rural water policies and rural water funds, which can be found in almost all the sampled countries. The least widely adopted are rural water agencies and mapping of rural water points, which are found in fewer than half of the countries sampled (fi gure 16.9).
A strong link exists between institutional reforms and progress toward the MDG in rural areas. The most successful countries in reducing the rural population’s reliance on surface water are all—without exception— among the most aggressive reformers in Africa (table 16.9). Benin, Côte d’Ivoire, Mozambique, Namibia, Nigeria, Senegal, and Uganda are outstanding performers in reducing the share of the population consum-ing surface water and rank highest in rural reform. Conversely, the Democratic Republic of Congo, Kenya, Malawi, Niger, and Zambia increasingly rely on surface water and score very low on the Rural Reform Index. Burkina Faso and Tanzania are two countries that perform poorly on access expansion, which is
0
20
40
60
80
100
rural
water p
olicy
rural
water fu
nd
cost
recov
ery po
licy
rural
water a
genc
y
map of
rural
point
s
% o
f cou
ntri
es
Figure 16.9 Overview of Rural Water Reforms
Source: Banerjee, Skilling, and others 2008.
Table 16.9 Relationship between Rural Reform Index and Success in Expanding Rural Service Coverage
Success in getting people off surface water
Reform scoreDecreasing reliance
on surface waterIncreasing reliance on surface water
Aggressive reformers scoring more than 80% on Rural Reform Index
BeninCôte d’IvoireMozambiqueNamibiaNigeriaSenegalUganda
Burkina FasoTanzania
Moderate reformers scoring 40–80% on Rural Reform Index
EthiopiaLesotho
ChadRwanda
Slow reformers scoring less than 40% on Rural Reform Index
Congo, Dem. Rep. of KenyaMalawiNigerZambia
Source: Banerjee, Skilling, and others 2008.

316 AFRICA’S INFRASTRUCTURE: A TIME FOR TRANSFORMATION
surprising given their strong track record on institutional reforms. For moderate reform-ers, the results can go either way (box 16.6).
The degree of reform also affects whether rural water points are maintained adequately. The percentage of rural water points needing rehabilitation tends to be lower for countries with more advanced rural reform processes.4 Thus, Benin and Uganda score high on sector reform as well as on maintaining rural water points. The converse is true for the Democratic Republic of Congo and Malawi.
Policy Recommendations
On the basis of this diagnostic, the water sec-tor evidences a number of key areas for policy attention. The institutional reform agenda remains as relevant as before, even if the
focus of the agenda has shifted toward a more pluralistic view of public and private sector roles. The reform agenda also needs to move beyond utilities to encompass line ministries and the entire public expenditure framework that underpins, and too often hinders, sector investment programs. Room for improvement exists in cost recovery so that scarce subsidy resources are redirected to promote access among the poorest. For the majority that do not enjoy access to piped water, greater thought needs to be given to how standposts can become more effective for urban water supply and how to get the best out of small-scale independent providers. The burgeoning use of wells and boreholes for supply in urban areas demands urgent attention from policy makers, both to improve their understanding of this phenomenon and to develop suitable regulatory tools.
BOX 16 .6
Cross River State, one of Nigeria’s 36 states, is located in the rain forest belt of Nigeria. About 75 percent of its popula-tion, 3.25 million people, lives in rural areas and is engaged in subsistence farming. More than 70 percent lives on less than $1 a day.
Water supply in Cross River State is in crisis. Coverage stands at only 25 percent in urban areas and 31 percent in semi-urban and rural areas. Rural water is supplied mainly through boreholes with hand pumps and wells, 65 percent of which are not functioning. Moreover, no water treat-ment is provided. To meet the MDG for water, an additional 10,098 boreholes with hand pumps and 2,525 motorized boreholes will need to be built across the state by 2015, a daunting task given its current fi nancial, institutional, and technical capacity.
Cross River State has recently been the subject of an assessment of rural water supply based on public expenditure reviews covering the period from 2002 to 2007. The review shows that lack of adequate budgetary funding and low disbursement effi ciency are major constraints. Rural water captures only 0.5 percent of the state’s capital budget, and execution ratios average less than 20 percent. Weak insti-tutions and fragmented responsibilities translate into feeble leadership and rural water falling behind in the political agenda. The sector is the responsibility of the State Rural
Water Supply and Sanitation Agency, which remains a section of the Rural Development Agency. Unlike in other states, no dedicated ministry champions reforms and allocations. More important, although a rural water policy exists nationally, state policies do not necessarily refl ect national policy, and effective cooperation is not pursued between national and state governments. Responsibilities are decentralized locally, but the State Rural Water Supply and Sanitation Agency continues to be characterized by a weak and poorly funded mandate and loose connections to the national water sector.
Maintenance and rehabilitation of rural water schemes are jeopardized by the lack of skilled labor and the substan-tial underdevelopment of a local private sector. Technical capacity for routine maintenance remains low; spare parts for boreholes are diffi cult to fi nd and are very expensive where available.
Finally, no effective strategy to promote community par-ticipation has been put in place, resulting in local community involvement in rural water provision that remains shallow at best. Absent any sense of ownership, rural communities do not take responsibility for preserving and repairing facili-ties. Neither would they have the capacity to do so without adequate training.
Source: Iliyas, Eneh, and Oside 2009.
Issues Constraining Rural Water Supply in Cross River State, Nigeria

Water Supply: Hitting the Target? 317
Continue to Pursue Institutional ReformsInstitutional reforms are the key to improving water sector performance. Countries pursuing institutional reforms create more effi cient and effective sector institutions and promote more rapid expansion of higher-quality services. The potential dividend is large because address-ing utility ineffi ciencies alone could make a substantial contribution to closing the sector funding gap in many countries.
Although the majority of African countries have embarked on the sector reform agenda, few have completed it. The glass is still half full, but the experience of those countries that are furthest ahead provides some guidance for the region.
In rural areas, a few critical interventions can make a difference. Establishing a clear sector policy, creating a strong central capability for sector fi nancing and project implementation, moving to greater cost recovery, and develop-ing a system to monitor the condition of rural water points are all measures that, when imple-mented as a package, can boost performance.
In urban areas, the story is more complex. The traditional reform agenda of the 1990s has not fully proved its relevance to the sector. Per-haps surprisingly, no clear evidence indicates that regulation has made a positive contribution to sector performance across the board. Private sector participation, although controversial in implementation, has in many cases proved a useful tool for improving operational perfor-mance and effi ciency (Marin 2009). Expecta-tions that the private sector would fi nance new infrastructure for water utilities have not been met, with negligible private capital fl ows that are dwarfed by public and donor fi nance. However, the private sector has contributed to expanding access, though typically with public funding (Marin 2009).
The new reform agenda for water retains a role for private participation. Lease contracts may be the form of private participation best suited to African water utilities. By transferring more responsibility to the private sector than in a management contract, they have provided greater scope for operational improvements. In contrast to concessions, recognition is explicit that investment will need to be publicly funded,
even if the private sector can sometimes help execute it. A key lesson from Africa’s experience with lease contracts is the diffi culty of achiev-ing seamless coordination on investment plans between the contractor and the public holding company. In addition, incorporating clear con-tractual incentives for effi ciency improvements (for example, by basing the contractor’s rev-enues on ideal rather than actual performance parameters) is important (Marin 2009).
The new agenda places greater emphasis on broader reforms within governing state-owned enterprises. Given the limited scope of private participation, state-owned utilities remain cen-ter stage. Without addressing the typical defi -ciencies that affl ict such enterprises—including numerous and confl icting objectives, political interference, and lack of transparency—the sector will have diffi culty exiting low-level equilibrium. Three key areas for attention are (a) internal process improvements, (b) increasedmanagerial autonomy, and (c) more stringent performance monitoring. Incorporating mea-sures to streamline corporate processes, such as procurement, fi nancial management, and per-formance management, is essential for strength-ening the application of commercial principles and accountability mechanisms. Measures to broaden the board of directors, to increase the use of external audit and independent audit of accounts, and to incorporate independent members from beyond the public sector would help depoliticize decision making and consoli-date the arm’s-length relationship. Adopting performance-based monitoring arrangements that mimic private sector contracts is also of interest, but only to the extent that they create credible incentives by incorporating meaning-ful rewards and penalties at the personal and corporate levels and are subject to third-party monitoring.
Improve Effi cacy of Public ExpenditureThe bulk of investment in the water sector is by line ministries through the budgetary process, often with external support. The existing pat-terns of spending clearly show that although utilities are instrumental in delivering services, the general government (using either domes-tic or external capital) continues to make most of the investment decisions. Therefore,

318 AFRICA’S INFRASTRUCTURE: A TIME FOR TRANSFORMATION
a solid public investment appraisal system and strong public spending management are pre-requisites for improving both urban and rural water supply.
Major bottlenecks hold back the disburse-ment of public investment funds. Capital bud-get execution ratios for public investment in water are relatively low, 75 percent on average. In many instances, the capacity to disburse budgetary resources in a timely fashion is the binding constraint, rather than their availability (Prevost 2009). In Tanzania, steep increases in budget allocations to the sector followed its identifi cation as a priority in the country’s poverty reduction strategy; however, disburse-ments increased at a much slower pace, so there was no immediately discernible effect on access (Van den Berg 2009).
Key aspects of the public expenditure framework must be addressed. The budgeting process needs to move toward a medium-term framework and make stronger links between sector objectives (such as MDG targets) and resource allocations. Clear sector plans that detail specifi c activities and their associated costs should underpin the budget process. The careful incorporation of maintenance needs into medium-term sector planning tools is crit-ical to prevent asset rehabilitation. Administra-tive processes that delay the release of budgeted funds also need to be overhauled. At the same time, procedures for procurement, disburse-ment, fi nancial management, and accountabil-ity should be modernized and streamlined.
Donor resources are best channeled pro-grammatically as budgetary support or through sectorwide projects. Given the sector’s strong dependence on external funds, a solid public expenditure management system for African countries also requires that donors improve the predictability of their support and make prog-ress on streamlining and harmonizing admin-istrative procedures. In that sense, a focus on multidonor initiatives that pool funds to pro-vide general budgetary support for a sector-wide program of interventions is preferable.
Technical assistance to the sector has tra-ditionally been understood as improving the management practices of utilities. However, technical assistance to support line ministries in improving the framework for identifying,
appraising, prioritizing, planning, and pro-curing investment projects has an equally important role. Donors can support countries in developing good project identifi cation and appraisal tools that systematically consider the technological alternatives for expanding access and that examine the importance of spending on maintenance and rehabilitation against new investment.
Experiment with Different Institutional Models for the UnconnectedThe modest role played by standposts in urban water supply is striking. In most countries, gov-ernment and utility attention continues to focus on expansion of piped-water connections. This battle is being lost, however, because of a com-bination of rapid urbanization and fi nancially debilitated utilities. Standposts are very limited in the African urban water scene, are expand-ing relatively slowly, and remain concentrated among the more affl uent segments of the population. Simple simulations suggest that if utilities were to shift their existing investment budgets from piped connections to standposts, the rate of service expansion could potentially double. However, as long as urban households are inconvenienced by higher payments and longer water collection times, standposts are not necessarily going to be a superior solution even if they are a cheaper alternative to private piped connections. In low-income countries, resale of water by neighbors through informal standpost arrangements is almost as prevalent as formal standposts.
The key to this paradox could lie in the problematic institutional arrangements associ-ated with standposts in African cities. Utilities charge little or nothing for standpost water, and standpost revenues constitute a negligible portion of the revenue base. Therefore, utili-ties have little fi nancial incentive to expand the service. Standpost operators, where they exist, often charge large markups that make the service prohibitively expensive and that may generate signifi cant revenues never captured by the utility. The quality of service provided by standposts can be very low because of the high rates of malfunction and the very large (sometimes implausibly large) numbers of people expected to rely on each one.

Water Supply: Hitting the Target? 319
Solving this conundrum demands seri-ous attention. The way forward is not yet clear, but it calls for intensive experimenta-tion with alternative network designs and institutional setups. Standposts cover a wide range of communal arrangements or del-egated management models, some of which may be more promising than others. One option would be to increase the density of standposts to increase competition, with an immediate effect on convenience and price of water supply. Yard taps, which provide com-munal access to a smaller group of four or fi ve contiguous households, lower costs but only partially address the problem of maintenance and management. Whatever the approach, an important component of the solution will be to ensure a fairer distribution of revenues between utilities and standpost operators or other secondary water retailers. The experi-ences of the handful of low-income countries that have achieved more than 20 percent urban coverage of standposts—notably Côte d’Ivoire, Rwanda, and Senegal—deserve some study.
The popularity of the household resale option could also be exploited by making it an explicit part of the utility’s rollout strategy. Household resale of water through yard taps appears to be a widely used option in many African cities. Survey evidence highlights a variety of reasons why residents may fi nd this approach preferable to official standposts. Neighbors can offer more convenient operating hours and better water pressure; because they are nearby, less time is required to collect water. In addition, they offer more fl exible payment mechanisms than either public standposts or a private connection (Keener, Luengo, and Banerjee 2008). Therefore, increasing recogni-tion should be given to this water supply modal-ity, removing any legal barriers and potentially considering the creation of such household-based water retail enterprises as an integral component of utilities’ expansion plans.
Ultimately, investing in utility production and distribution of water is the best policy for keeping down the costs of alternatives. Within cities, water markets are strongly connected in the fi nal price offered to the consumer. The more disrupted the formal piped system, the higher the price will be in the informal sector
compared with the formal one. Increasing water production capacity and improving the effi cacy of the distribution network can signifi cantly affect the welfare of the uncon-nected as well as the connected, because it drives down the premium on alternative sources of water supply (Keener, Luengo, and Banerjee 2008).
Increase Cost Recovery with Careful Social PoliciesUnderpricing water is contributing to the fi nancial weakness of utilities, slowing access expansion, and holding back the quality of service. Given that utility customers are drawn from the upper end of the income distribution, the result is a highly regressive incidence of subsidies to the sector. A large (and generally poor) segment of the urban population is pay-ing multiples of these prices to access utility water indirectly, and in many cases more than the utility cost-recovery price.
Countries need to make progress toward further cost recovery while considering the economic circumstances of their populations. The key principle is to verify the affordability of water tariffs with reference to household budgets, rather than simply to assume that they will be unaffordable. Although the pur-chasing power of African households is quite limited, the analysis confi rms that operating cost recovery is a perfectly feasible objective for just about all African countries. Tariffs that recover full capital costs also look to be afford-able for the richest 40 percent of the popula-tion in low-income countries, where today’s piped water coverage is concentrated. Thus, little economic justifi cation exists for today’s subsidies. Countries would be better served by recovering full costs from their existing customer base and using the resulting cash fl ow to accelerate access expansion in poor neighborhoods. In the longer term, however, as access to piped water increases, low-income countries will need social tariffs that provide water priced at operating cost recovery levels for a minimum level of consumption to the substantial share of their population that can-not afford full capital cost-recovery tariffs.
Government entities need to become bet-ter customers. Government entities can easily

320 AFRICA’S INFRASTRUCTURE: A TIME FOR TRANSFORMATION
account for 20–30 percent of total billings. They can be the worst offenders in paying bills as well, with a signifi cant lag in payment time. Often, a large chunk of arrears is paid back to the utility books with little indication of future payment schedules. This uneven payment cul-ture has signifi cant implications not only for the investment planning of utilities, but also for developing a broader payment culture across society as a whole.
The design of tariff structures for water util-ities deserves serious rethinking. Most African utilities are applying increasing block tariffs, in the expectation that they will make water tariffs more equitable. However, these expectations are not always being met (Banerjee, Wodon, and others 2008). About half of the utilities using increasing block tariffs incorporate fi xed charges or minimum consumption thresholds that actually infl ate the costs of water for poor households with modest levels of consump-tion, which becomes counterproductive. A sig-nifi cant share of utilities with increasing block tariffs also has very high subsistence blocks (in excess of 10 cubic meters), and as a result they end up providing subsidized water to the vast majority of consumers, rather than to a targeted group of low-volume users.
Connection charges should be kept as low as possible, and subsidies could be reoriented toward connection. The majority of African water utilities levy piped-water connection charges in excess of $100, an insurmountable barrier for low-income households. Utilities intent on universalizing access should explore ways to radically reduce connection charges to levels that are more in line with household affordability. A number of alternative ways exist to recover connection charges, including pay-ment plans that spread them out over time or sharing of connection costs across the whole customer base through the general tariff. Con-nection costs may also be more suited to public subsidy than water usage tariffs. They have the advantage of being one-time payments linked to a concrete and monitorable action that addresses a real affordability constraint. Simulations sug-gest that connection subsidies can potentially be much more pro-poor than general subsidies to the water tariff, particularly if some simple targeting mechanisms are used (Wodon 2007).
Improve Understanding of Groundwater’s Role in the Urban SupplyAlthough wells and boreholes have long been a dominant source of improved water in rural areas, they have also become the fastest-growing source of improved water supply in African cities. Groundwater, from water wells (boreholes and hand-dug wells), now sup-plies one-fourth of urban dwellers and is the fastest-growing source of improved water supply in African cities by far. This is true in more than just those cities where groundwater has long been a major source of utility supply (such as Lusaka in Zambia and Abidjan in Côte d’Ivoire). With utility coverage rates falling in urban Africa, groundwater has essentially stepped into the breach, and the rapid growth of boreholes shows the appetite for lower-cost solutions. Investments in boreholes provide the opportunity to reach a larger proportion of the population with relatively modest resources. One in four urban Africans relies on wells and boreholes for improved supply; that ratio rises to one in two urban Africans in the low-income countries. In Burkina Faso, Malawi, Mali, Mozambique, Uganda, and Zimbabwe, the share rises as high as three in four. In Malawi, Nigeria, and Rwanda reliance on urban wells and boreholes is increasing particularly rapidly, with more than 3 percent of the population gaining access to this water source each year.
Not enough is known about the physical, institutional, and fi nancial characteristics of groundwater use. Household surveys provide a good picture of overall reliance but leave many questions unanswered. The relative preva-lence of simple, shallow hand-dug wells versus professionally drilled boreholes is unknown and so then is the extent to which ground-water supplies are adequately protected from direct wellhead contamination. The institu-tional arrangements associated with ground-water supplies are also unclear, particularly the extent to which they constitute stopgap services provided by municipalities versus private or communal self-supply initiatives. Depending on the conditions and arrangements, the capi-tal costs of such wells could be anywhere from $5,000 to $25,000 (or $10 to $20 per capita) (Foster 2008).

Water Supply: Hitting the Target? 321
In addition to growing groundwater reli-ance, African cities are characterized by heavy use of low-grade in situ sanitation, mainly in the form of unimproved latrines (see chapter 17 of this volume). Deployment of latrine sanitation at excessive population densities or with lack of proper latrine operation can lead to increased groundwater contamination that can affect the entire urban aquifer providing the groundwater supplies (Xu and Usher 2006).
Furthermore, extensive unregulated use of groundwater by private actors may prevent the most rational and effi cient exploitation of the resource for public water supply. In particular, it prevents cities from reaching economies of scale in groundwater exploitation and from following the principle of conjunctive surface water and groundwater use that allows ground-water to play its natural role as a backup supply in times of drought (Foster 2008).
Developing an improved understand-ing of the benefi ts and risks of groundwater use in fast-growing African cities and towns and of how those benefi ts and risks vary with the hydrogeological setting is urgent (Foster, Tuinhof, and Garduño 2008). This objective should begin with a city-level appraisal of (a) the quantity and quality of available urban groundwater resources; (b) the drivers, dynam-ics, and patterns of usage; and (c) an assess-ment of the vulnerability of urban aquifers to pollution from the land surface. Creating a groundwater-monitoring framework and pro-mulgating appropriate construction and oper-ation protocols for wells and in situ sanitation facilities (mainly latrines) would help safeguard groundwater quality, but guidelines for safe use of groundwater sources should accompany this framework. Appropriate governance arrange-ments also need to be established, recognizing the broad reach of groundwater resources, and should involve water utilities, public health authorities, and municipal agencies, including a suitable channel for public consultation.
Notes The authors of this chapter are Sudeshna Ghosh
Banerjee, Elvira Morella, Cecilia Briceño-Garmendia, and Vivien Foster, who drew on background material and contributions from Tarik Chfadi, Piers Cross, Alexander Danilenko,
Sarah Keener, Manuel Luengo, Dennis Mwanza, Eustache Ouayoro, Heather Skilling, Caroline van den Berg, Quentin Wodon, Guillermo Yepes, and Yvonne Ying, and received extensive support from the Water and Sanitation Pro-gram network in Africa.
1. The MDG for water supply commits countries by 2015 to halving the percentage of their pop-ulations without access to an improved water source relative to the baseline situation in 1990. For the purposes of the MDG, “improved water” includes access to piped water or standposts, as well as some types of wells and boreholes that are adequately protected.
2. The Joint Monitoring Programme of the World Health Organization and the United Nations Children’s Fund systematically tracks access to improved water supply and sanitation, but the data constraints are immense. Systematic infor-mation and data about suppliers’ characteristics and institutional environments are poor when they exist. Often, even the well-performing ser-vice providers are unrecognized outside their immediate environments, and lessons learned are not widely shared. Under the auspices of the Africa Infrastructure Country Diagnostic, a limited effort has been made to use a spe-cially designed questionnaire on institutional environment, governance structure, and tech-nical and fi nancial performance to collect data covering 51 utilities in 23 countries. This novel database covering the period from 1995 to 2005 is paired with household survey data of various years from 1990 to 2005.
3. General government includes central and local governments and special funds when off the budget.
4. Rural water indexes are negatively—if admit-tedly weakly—correlated.
ReferencesBanerjee, Sudeshna G., Vivien Foster, Yvonne Ying,
Heather Skilling, and Quentin Wodon. 2008. “Cost Recovery, Equity, and Effi ciency in Water Tariffs: Evidence from African Utilities.” Working Paper 7, Africa Infrastructure Country Diagnos-tic, World Bank, Washington, DC.
Banerjee, Sudeshna G., Heather Skilling, Vivien Foster, Cecilia Briceño-Garmendia, Elvira Morella, and Tarik Chfadi. 2008. “Ebbing Water, Surging Defi cits: Urban Water Supply in Sub-Saharan Africa.” Background Paper 12, Africa Infrastructure Country Diagnostic, World Bank, Washington, DC.
Banerjee, Sudeshna G., Quentin Wodon, Amadou Diallo, Taras Pushak, Helal Uddin, Clarence

322 AFRICA’S INFRASTRUCTURE: A TIME FOR TRANSFORMATION
Tsimpo, and Vivien Foster. 2008. “Access, Afford-ability, and Alternatives: Modern Infrastructure Services in Africa.” Background Paper 2, Africa Infrastructure Country Diagnostic, World Bank, Washington, DC.
Briceño-Garmendia, Cecilia, Karlis Smits, and Vivien Foster. 2008. “Financing Public Infra-structure in Sub-Saharan Africa: Patterns, Issues, and Options.” Background Paper 15, Africa Infrastructure Country Diagnostic, World Bank, Washington, DC.
Cardone, Rachel, and Catarina Fonseca. 2003. “Financing and Cost Recovery.” Thematic Over-view Paper 7, IRC International Water and Sani-tation Centre, Delft, the Netherlands.
Collignon, Bernard, and Marc Vézina. 2000. Inde-pendent Water and Sanitation Providers in Afri-can Cities: Full Report of a Ten-Country Study. Washington, DC: UNDP–World Bank Water and Sanitation Program.
Ebinger, Jane. 2006. “Measuring Financial Performance in Infrastructure: An Application to Europe and Central Asia.” Policy Research Working Paper 3992, World Bank, Washington, DC.
Foster, Stephen S. D. 2008. “Urban Water Supply Security in Sub-Saharan Africa: Making Best Use of Groundwater.” Paper presented at the Africa Groundwater and Climate Conference, Kampala, Uganda, June 24–28.
Foster, Stephen S. D., Albert Tuinhof, and Hector Garduño. 2008. “Groundwater in Sub-Saharan Africa: A Strategic Overview of Development Issues.” In Applied Groundwater Studies in Africa: IAH Selected Papers in Hydrogeology, vol. 13, ed. Segun Adelana and Alan MacDonald, 9–21. London: Taylor & Francis.
GWI (Global Water Intelligence). 2005. “The GWI 2005 Water Tariff Survey.” Global Water Intel-ligence 6 (9).
Harvey, Peter A., and Robert A. Reed. 2007. “Community-Managed Water Supplies in Africa: Sustainable or Dispensable?” Commu-nity Development Journal 42 (3): 365–78.
Hutton, Guy, and Laurence Haller. 2004. Evaluation of the Costs and Benefi ts of Water and Sanitation Improvements at the Global Level: Water, Sanita-tion and Health Protection of the Human Environ-ment. Geneva: World Health Organization.
Iliyas, Mohammed, Dozie Eneh, and Igiri Oside. 2009. “Public Expenditure Review in the Rural Water and Sanitation Sector for Cross River State—Nigeria.” World Bank, Washington, DC.
Keener, Sarah, Sudeshna G. Banerjee, Nils Junge, and Geoff Revell. Forthcoming. “Informal Water
Service Providers and Public Stand Posts in Africa.” World Bank, Washington, DC.
Keener, Sarah, Manuel Luengo, and Sudeshna Banerjee. 2008. “Provision of Water to the Poor in Africa: Informal Water Markets and Experi-ence with Water Standposts.” Working Paper 13, Africa Infrastructure Country Diagnostic, World Bank, Washington, DC.
Marin, Philippe. 2009. Public-Private Partnerships for Urban Water Utilities: A Review of Experi-ences in Developing Countries. Washington, DC: Public-Private Infrastructure Advisory Facility and World Bank.
Mehta, Meera, Thomas Fugelsnes, and Kameel Virjee. 2005. “Financing the Millennium Devel-opment Goals for Water Supply and Sanitation: What Will It Take?” International Journal of Water Resources Development 21 (2): 239–52.
Muhairwe, William T. 2009. “Fostering Improved Performance through Internal Contractualisa-tion.” Paper presented at World Bank Water Week, Washington, DC, February 17–20.
NWSC (National Water and Sewerage Corpo-ration). 2006. “Corporate Plan 2006–2009.” NWSC, Kampala, Uganda.
Oyo, Anthony. 2006. “Spare Parts Supplies for Handpumps in Africa: Success Factors for Sus-tainability.” Field Note 15, Water and Sanitation Program, Africa Region, Nairobi.
Prevost, Christophe. 2009. “Benin Rural Water Pub-lic Expenditure Review: Findings, Impacts and Lesson Learned.” Paper presented at World Bank Water Week, Washington, DC, February 17–20.
Saavalainen, Tapio, and Joy ten Berge. 2006. “Quasi-Fiscal Defi cit and Energy Conditionality in Selected CIS Countries.” Working Paper 06/43, International Monetary Fund, Washington, DC.
Tynan, Nicola, and Bill Kingdom. 2002. “A Water Scorecard: Setting Performance Targets for Water Utilities.” Viewpoint Note 242, World Bank, Washington, DC.
Van den Berg, Caroline. 2009. “Public Expen-diture Review in the Water Sector: The Case of Tanzania.” Paper presented at Water Week, World Bank, Washington, DC, February 17–20.
WHO/UNICEF (World Health Organization/United Nations Children’s Fund). 2006. MDG Assessment Report. Geneva and New York: WHO/UNICEF Joint Monitoring Programme for Water Supply and Sanitation.
Wodon, Quentin. 2007. “Water Tariffs, Alternative Service Providers and the Poor: Case Studies from Africa.” World Bank, Washington, DC.
Xu, Yongxin, and Brent Usher, eds. 2006. Ground-water Pollution in Africa. London: Taylor & Francis/Balkerma.

Chapter17
323
Sanitation: Moving Up the Ladder
T arget 7 of the Millennium Development Goals (MDGs) for sanitation access calls for halving by 2015 the percentage of the
population in 1990 without improved sanita-tion. At the present pace, Africa will unlikely meet the target either at the regional or (with few exceptions) at the country level. The Joint Monitoring Programme (JMP) of the World Health Organization and the United Nations Children’s Fund is charged with assessing the state of sanitation and progress toward the MDG target. The JMP’s latest data show only modest improvement, from 26 percent of the population with access in 1990 to 31 percent in 2006 (United Nations 2008; box 17.1), and many countries face diffi culty in making prog-ress (Water and Sanitation Program 2006).
Today, about 30 percent of the population practices open defecation (40 percent in rural areas) and about half of the population, urban and rural, rich and poor alike, relies on unim-proved latrines, a heterogeneous collection of facilities with poorly understood health effects. Flush toilets, mostly connected to septic tanks rather than sewers, remain a luxury, as do improved latrines, which have made headway in only a handful of countries. The prevalence of open defecation has fi nally started to fall,
but coverage of unimproved latrines is grow-ing much faster than coverage of any of the improved alternatives.
Although a bleak picture overall, some countries have expanded or upgraded sanita-tion, each year moving as much as 3 percent of their population up the “ladder” to better forms of sanitation. Ethiopia has done so with unimproved latrines; Burkina Faso, Madagas-car, and Rwanda with improved latrines; and Senegal with septic tanks.
To meet the MDG target for sanitation, coun-tries need to spend an estimated 0.9 percent of GDP a year, of which 0.7 percent is for invest-ment and 0.2 percent for operation and main-tenance. A few countries already invest in new sanitation facilities up to the recommended level, but many do not. Households pay for most of the investment bill, but whether they are spending enough on operation and main-tenance is doubtful. Based on limited evidence, governments contribute only a small fraction of investments. The health benefi ts attaching to these investments are considerable, includ-ing signifi cant reductions in the incidence of diarrhea, intestinal worms, and trachoma.
The challenges and policy options differ substantially across and within countries.

324 AFRICA’S INFRASTRUCTURE: A TIME FOR TRANSFORMATION
Individual countries or urban and rural regions thereof may face three patterns of access to sanitation; each requires appropriate policy responses.
Where open defecation remains prevalent, people must be encouraged to use latrines, if available. Key factors in changing behavior are a community’s commitment to cultural change and peer pressure. Relatively modest government expenditure to promote hygiene education can raise awareness.
Where unimproved latrines are prevalent, they should be upgraded to improved models. However, upgrading faces constraints on both the demand and supply sides. The signifi cant cost of improved facilities suggests a demand problem and the need for capital subsidy. Lack of domestic construction capacity suggests a
supply problem and the need for training and local market development. Both responses are relevant, but by starting from the supply side, policy makers can minimize the need for a sub-sidy and promote cost-reducing innovations.
Where septic tanks predominate, the chal-lenge is providing access to improved sanita-tion to a larger, lower-income population. As population densities increase and water con-sumption rises, Africa’s burgeoning cities will eventually need to develop more extensive sewerage networks. Thus, reducing the cost of networks through technological innova-tion is critical.
The State of Sanitation in Africa
Rungs on a LadderOne can think of the different types of sanita-tion as rungs on a ladder, with each rung hav-ing a higher investment cost and greater health benefi ts than the one below (fi gure 17.1). The bottom of the ladder is open defecation, a practice harmful to public health. The fi rst rung is unimproved latrines, which comprise various kinds of pits that vary greatly in their effi cacy but provide at best only basic sani-tary protection.1 The next rung is improved latrines, including a variety of engineered facil-ities such as SanPlat and Ventilated Improved Pit (VIP) latrines, and basic pits with slabs.2 When appropriately used, these provide ade-quate sanitary protection at reasonable cost. The fi nal rung of the ladder is the fl ush toilet, which may be connected to either a septic tank or (where it exists) the sewerage network. From a health perspective, the most critical move-ment is from no service (open defecation) or unimproved service (unimproved latrine) to an improved or sanitary service. Once the basic level of sanitary protection is reached, returns in health benefi ts diminish with each higher rung on the sanitation ladder.
Unimproved latrines are the most preva-lent sanitation option in Africa, but under-standing the health benefi ts they can deliver is diffi cult. Classifying unimproved latrines is complicated by the variety of installations under
What Is Improved Sanitation? The improved sanitation category in the data from the Joint Monitoring Pro-gramme of the World Health Organiza-tion and the United Nations Children’s Fund includes both fl ush toilets and improved latrines. It also includes half of the traditional latrines, an adjustment that is made because this modality can-not be disaggregated exactly between improved and unimproved sanitation.
The household analysis presented here, based on Demographic and Health Surveys and Multiple Indicator Cluster Surveys, does not adopt this kind of adjustment. Instead, the analysis disag-gregates the different types of improved and unimproved sanitation to allow a richer discussion of sanitation options and issues. Notwithstanding these methodological differences, fi ndings are broadly consistent with those reported by the JMP.
Source: Banerjee and others 2008.
BOX 17 . 1

Sanitation: Moving Up the Ladder 325
this basic label. Sometimes, an unimproved latrine can, with some modifi cation, provide enough sanitary protection to be regarded as improved. The extent to which latrines deliver the intended health benefi ts depends on how they are used. Even basic latrines can provide protection if they are covered and emptied in a timely fashion, and if hands are washed after use. Conversely, improved latrines will not pro-vide sanitary protection if people do not use them properly or do not use them at all, for example, if their installation is not accompa-nied by suffi cient efforts in hygiene promotion and social marketing.
Waterborne sewerage systems are rare in Africa. Only half of the large cities operate a sewerage network at all. Only in Namibia, South Africa, and the exceptional case of Senegal do some of the utilities covering the largest cities provide universal sewerage cover-age. More typical (as in Côte d’Ivoire, Kenya, Lesotho, Madagascar, Malawi, and Uganda) are sewer networks that reach barely 10 per-cent of the population within the service area of an urban utility. Little more than half of the households with piped water also have fl ush toilets, which are often connected to septic tanks rather than to sewers.
Typical urban sanitation includes the sharing of facilities by multiple families (fi gure 17.2). More than 40 percent of all urban households share their toilet facilities with other households; in Benin, Burkina Faso, Ghana, Guinea, Madagascar, and the Republic of Congo, the fi gure is more than 50 percent. Sharing sanitation facilities implies that not only must household members wait
to access the facilities but also they may have to pay signifi cant surcharges to facility own-ers. More important, maintenance of shared facilities is often poor, which poses health risks and may discourage use.
Differing Patterns of Access More than one-third of the population—mostly in rural areas—must still defecate in the open (table 17.1). Unimproved pit latrines are by far the most prevalent facilities in both urban and rural areas. Improved sanitation reaches less than 20 percent of the national population, less than 10 percent in rural areas. Coverage of improved latrines is no greater than that of septic tanks, despite the signifi -cant cost difference between them. Only 10 percent of the national population has the advantage of a septic tank; coverage in rural areas is practically negligible. In urban areas, septic tanks are much more common than improved latrines.
Access to sanitation varies dramatically across income groups (fi gure 17.3). Unim-proved latrines are by far the most egalitarian form of sanitation, accounting for about 50 percent of households across income ranges. Open defecation is widely practiced in the low-est income quintile and not practiced at all in the highest. Conversely, improved latrines and septic tanks, virtually nonexistent among the poorest quintiles, are used by the richest 20–40 percent of the population. Access to improved latrines parallels that of septic tanks, suggesting
Figure 17.1 The Sanitation Ladder
Source: Morella, Foster, and Banerjee 2008.
opendefecation
fixed-point defecation
health benefits
cost
unimprovedlatrine
improvedlatrine
flush toilet
notacceptable
Figure 17.2 Percentage of the Population Sharing Toilet Facilities
Source: Banerjee and others 2008.
05
101520253035404550
0–20 20–40 40–60 60–80
% of population sharing facilities
% o
f cou
ntri
es

326 AFRICA’S INFRASTRUCTURE: A TIME FOR TRANSFORMATION
that despite their lower cost, improved latrines remain something of a luxury, with little suc-cess in penetrating the middle of the income distribution. More important, the minimal presence of improved sanitation across poorer
groups highlights a crucial issue: the most vul-nerable populations are failing to benefi t from efforts to improve sanitation.
Not only are unimproved latrines the most prevalent facilities in Africa, but also their use is the fastest growing. In recent years, they have been used by an additional 2.8 percent of the population each year in urban areas and an additional 1.8 percent in rural areas, which is more than twice the rate of expan-sion of septic tanks and improved latrines combined (fi gure 17.4). Growth in the use of unimproved latrines is concentrated among the poorer quintiles, whereas growth in the use of improved latrines and septic tanks is concentrated among the richer quintiles. Because the MDG target focuses on the two most improved sanitation options, the expanding use of unimproved latrines does not always fully register in policy discussions. Meanwhile, the prevalence of open defecation in Africa has fi nally begun to decline, albeit at a very modest pace.
Notwithstanding the overall dismal pic-ture of sanitation in Africa, a number of countries have made major strides in recent years, moving more than 3 percent of their populations up the sanitation ladder annu-ally. Côte d’Ivoire and Ethiopia have achieved these results with unimproved latrines (fi gure 17.5), Madagascar and Rwanda with improved latrines (fi gure 17.6), and Senegal with septic tanks (fi gure 17.7). Ethiopia is making the most rapid progress in reduc-ing open defecation, each year moving more
Figure 17.3 Coverage of Sanitation by Budget Quintile
Source: Morella, Foster, and Banerjee 2008.Note: In terms of household spending, poorest quintile = poorest 20 percent of the population; second quintile = second-poorest 20 percent of the population; third quintile = middle 20 percent of the population; fourth quintile = second-richest 20 percent of the population; richest quintile = richest 20 percent of the population.
0
20
40
60
80
100
poorest second third fourth richestquintile
% o
f hou
seho
lds
septic tank improved latrine
unimproved latrine open defecation
Figure 17.4 Annual Growth in Coverage of Sanitation Types, 1990–2005
Source: Morella, Foster, and Banerjee 2008.
a. Urban areas
–1.0
0
1.0
2.0
3.0
septictank
improvedlatrine
unimprovedlatrine
opendefecation
septictank
improvedlatrine
unimprovedlatrine
opendefecation
annu
al c
hang
e in
cov
erag
e(%
of p
opul
atio
n)
annu
al c
hang
e in
cov
erag
e(%
of p
opul
atio
n)
b. Rural areas
–1.0
0
1.0
2.0
3.0
Table 17.1 Patterns of Access to Sanitation in Africa percentage of population
AreaOpen
defecationTraditional
latrineImproved
latrineSeptic tank
Urban 8 51 14 25
Rural 41 51 5 2
National 34 52 9 10
Source: Morella, Foster, and Banerjee 2008.

Sanitation: Moving Up the Ladder 327
Figure 17.5 Moving Up to the Bottom Rung of the Sanitation Ladder: Côte d’Ivoire and Ethiopia, 1990–2005
Source: Morella, Foster, and Banerjee 2008.
a. Côte d’Ivoire
–6.0
–4.0
–2.0
0
2.0
4.0
6.0
8.0
septictank
improvedlatrine
unimprovedlatrine
opendefecation
septictank
improvedlatrine
unimprovedlatrine
opendefecation
annu
al c
hang
e in
cov
erag
e(%
of p
opul
atio
n)
annu
al c
hang
e in
cov
erag
e(%
of p
opul
atio
n)
b. Ethiopia
–6.0
–4.0
–2.0
0
2.0
4.0
6.0
8.0
Figure 17.6 Upgrading Latrines: Madagascar and Rwanda, 1990–2005
Source: Morella, Foster, and Banerjee 2008.
septictank
improvedlatrine
unimprovedlatrine
opendefecation
septictank
improvedlatrine
unimprovedlatrine
opendefecation
annu
al c
hang
e in
cov
erag
e(%
of p
opul
atio
n)
a. Madagascar
–6.0
–4.0
–2.0
0
2.0
4.0
6.0
8.0
annu
al c
hang
e in
cov
erag
e(%
of p
opul
atio
n)
–6.0
–4.0
–2.0
0
2.0
4.0
6.0
8.0b. Rwanda
than 2 percent of its population away from the practice.
These overall trends conceal contrast-ing patterns across groups of countries and
across urban and rural areas within countries that can help structure policy alternatives (fi gure 17.8). Urban areas tend to follow one of three possible patterns. The most common is where unimproved latrines are the domi-nant mode of sanitation; the second is where improved latrines prevail, but unimproved latrines still constitute a large share; the third is where half of the population uses septic tanks and half uses unimproved latrines, but where coverage of improved latrines is nearly nonexistent. Rural areas similarly tend to fol-low one of three possible patterns. As in urban areas, the most common is where unimproved latrines dominate; the second is where open defecation is most prevalent; and the third is where coverage of improved latrines is increas-ing, though most people rely on unimproved latrines or open defecation.
Figure 17.7 Mainstreaming Septic Tanks: Senegal, 1990–2005
Source: Morella, Foster, and Banerjee 2008.
septictank
improvedlatrine
unimprovedlatrine
opendefecation
annu
al c
hang
e in
cov
erag
e(%
of p
opul
atio
n)
–6.0
–4.0
–2.0
0
2.0
4.0
6.0
8.0

328 AFRICA’S INFRASTRUCTURE: A TIME FOR TRANSFORMATION
example) are in the hands of different public and private players, which prevents one agency from championing the sector and contributes to sanitation’s falling between the cracks. The recent trend toward government decentraliza-tion has complicated the capture of adequate public resources for sanitation and allocated responsibilities to entities that lack technical capacity. Fifteen countries have adopted formal
Figure 17.8 Characterizing Patterns of Access to Sanitation across Urban and Rural Areas
Source: Morella, Foster, and Banerjee 2008.a. Data include the Central African Republic, Chad, Comoros, the Democratic Republic of Congo, Ethiopia, Guinea, Lesotho, Malawi, Mali, Mauritania, Mozambique, Nigeria, the Republic of Congo, Sudan, Tanzania, and Uganda.b. Data include Benin, Burkina Faso, Cameroon, Ghana, Madagascar, Niger, and Rwanda.c. Data include Côte d’Ivoire, Gabon, Kenya, Namibia, Senegal, South Africa, Zambia, and Zimbabwe.d. Data include Benin, Burkina Faso, Chad, Côte d’Ivoire, Ethiopia, Mauritania, Mozambique, Namibia, Niger, and Sudan.e. Data include Cameroon, Comoros, the Democratic Republic of Congo, Gabon, Ghana, Guinea, Kenya, Malawi, Mali, Nigeria, the Republic of Congo, South Africa, Tanzania, Uganda, and Zambia.f. Data include the Central African Republic, Lesotho, Madagascar, Rwanda, Senegal, and Zimbabwe.
a. Urban: prevalence of unimproved latrinesa
septictank
improvedlatrine
unimprovedlatrine
opendefecation
septictank
improvedlatrine
unimprovedlatrine
opendefecation
septictank
improvedlatrine
unimprovedlatrine
opendefecation
septictank
improvedlatrine
unimprovedlatrine
opendefecation
septictank
improvedlatrine
unimprovedlatrine
opendefecation
septictank
improvedlatrine
unimprovedlatrine
opendefecation
b. Urban: prevalence of improved latrinesb
c. Urban: bimodal patternc
d. Rural: prevalence of open defecationd
e. Rural: prevalence of unimproved latrinese
f. Rural: prevalence of improved latrinesf
Dispersed Institutional Effort As shown by an institutional survey of sector institutions in 24 countries, complexity, a mul-tiplicity of actors, and lack of accountability for sector leadership are the three salient features of the institutional framework governing the san-itation sector. Unlike water, many parts of the supply chain for sanitation (hygiene promotion, latrine construction, and latrine emptying, for

Sanitation: Moving Up the Ladder 329
national sanitation policies, and most countries have an accepted defi nition of sanitation and a hygiene promotion program. But only seven countries have policies that include cost recov-ery, and only eight have a sanitation fund or a dedicated budget line (in some cases, funded exclusively by donors, as in Chad and Ethiopia, or by a combination of the government, sector levies, and donors). Côte d’Ivoire has the only fund fi nanced entirely by sector levies.
Households Foot the BillBuilding on earlier work (Mehta, Fugelsnes, and Virjee 2005), one can estimate the overall price tag for reaching the sanitation MDG at $6 billion a year, or roughly 0.9 percent of Africa’s GDP (Morella, Foster, and Banerjee 2008). Capital investment needs based on minimum acceptable asset standards and accounting for both new infrastructure and rehabilitation of existing assets can be con-servatively estimated at $4.5 billion a year (0.7 percent of the region’s GDP). The main-tenance requirements are $1.5 billion a year (0.2 percent of the region’s GDP).
No reliable data exist on sanitation expenditures because individual households undertake so much of the expense. However, recent investment can be estimated from household surveys, using the number of house-holds acquiring access in successive years and a standard unit cost. Because this method treats all new or improved facilities as newly built, it may overestimate the cost of increasing access mainly by upgrading unimproved latrines. This approach suggests that, on average, Afri-can countries are investing about 0.5 percent of GDP in new sanitation facilities, quite close to the recommended investment level. Half of the countries appear to invest less than 0.7 percent of GDP, which is the level needed to meet the sanitation access MDG. Some countries, par-ticularly Madagascar and Rwanda, appear to have made rapid progress, investing as much as 1.0 percent of GDP. At the other end of the spectrum, Kenya, Lesotho, Namibia, and Zambia spend less than 0.2 percent of GDP.
How much of the estimated total spend-ing on sanitation comes from the public purse is hard to pin down. The few countries with
available evidence report negligible public investment on sanitation of 0.02 percent of GDP, on average, although serious measure-ment problems mean a large portion of public investment in sanitation is likely not separately coded from water supply (Briceño-Garmendia, Smits, and Foster 2008). Nevertheless, house-holds appear to be footing the bulk of the investment bill. In countries with very low current spending, whether households alone will be able to increase investment up to the level needed is uncertain. In addition, noth-ing is known about their spending on opera-tion and maintenance, which is estimated to require an additional 0.2 percent of GDP in the future. Public spending on operation and maintenance appears to have already reached this level, but evidence is limited, and spending refers mostly to sewer networks. Operation and maintenance of on-site sanitation remain a household responsibility, and facilities are notoriously poorly maintained.
Although the costs of meeting the MDG sanitation target are high, so is the associ-ated health dividend (Hutton and others 2007). Sanitation reduces the risk of intestinal worms, diarrhea, and trachoma, and it is very important—more than access to safe water—in fi ghting hookworm infection (Esrey and others 1991). Access to adequate sanitation reduces diarrhea incidence by an estimated 36 percent. Trachoma incidence was reduced by 75 percent in Gambian villages solely by controlling fl ies that breed when excreta are not safely disposed of (Emerson and others 2000). One study estimates that reaching the MDG for both water and sanitation in Africa would prevent 172 million diarrhea cases a year, saving $1.8 billion in treatment costs (Hutton 2000).3
Challenges and Policy Options
One of the strongest fi ndings emerging from this review is how much the sanitation chal-lenge differs across countries and between urban and rural areas within the same country. Decisions about where to focus policy efforts along the sanitation ladder should be informed by access patterns. Recommendations will

330 AFRICA’S INFRASTRUCTURE: A TIME FOR TRANSFORMATION
therefore distinguish the different groups identifi ed in fi gure 17.8. Judicious and low-cost public interventions can leverage house-hold spending for construction of latrines.
The ultimate objective should be to pro-vide universal access by expanding service and reducing open defecation as much as possible. Policy makers are often tempted to focus on rungs of the sanitation ladder well above the realities of their societies: for example, chan-neling limited public resources into sewer net-works that serve only a few thousand people while overlooking the urgent need to lift mil-lions more people away from open defecation. Policy attention needs to focus on moving people up from the lowest rungs of the ladder. More expensive options should be left to house-holds with the resources to take them up.
African countries may face high preva-lence of open defecation, especially in rural areas; dominance of unimproved latrines; or signifi cant development of septic tanks that reach a small share of the population, mainly wealthier urban residents. The policy options for each issue are presented as separate cases below, and countries may need to use different combinations of these approaches. The fi rst priority is to stimulate demand for sanitation and behavior change where open defecation prevails. The second is to ensure an adequate supply of improved sanitation options in settings dominated by unimproved latrines, before evaluating the need for policy interven-tions on the demand side of the market. The third is to expand access to improved sanitation across larger shares of the population, which in high-density settlements requires making sew-erage more affordable.
Stimulate Demand for Sanitation and Behavior Change Where Open Defecation PrevailsUnlike other infrastructure services, demand for sanitation cannot be assumed. Populations accustomed to open defecation may require a substantial change in cultural values and behavior to use a fi xed-point facility. Without such change, people may not use latrines at all or they may use them in a way that undermines the potential health benefi ts. A study in south-ern India showed that large public investment
in latrines without accompanying hygiene edu-cation led to only 37 percent of men using the facilities despite 100 percent coverage (World Bank 2002). Hygiene education is critical regardless of the type of sanitation challenge a country faces; safe disposal of feces and hand washing with soap protect health in all sani-tation settings. Promoting hygiene can start a virtuous cycle that builds demand for better sanitation, raising awareness of the benefi ts of sanitation and establishing codes of conduct and new life standards.
Incorrect use of latrines can dramatically reduce or even reverse their health benefi ts. A facility is sanitary and safe not only because of the technology and material used but also because of good practices and behaviors, such as keeping the facility contained and clean. An improved latrine that is not cor-rectly used and emptied still poses high risks of environmental contamination and disease. Thus, rolling out a physical investment pro-gram without accompanying promotion of hygiene makes little sense. Moreover, effec-tive hygiene promotion alone may stimulate self-fi nanced household investment in bet-ter facilities. Too often, these “soft” aspects of sanitation are overlooked, and priority is given to the “hard” aspects, such as installing and upgrading infrastructure.
Changing behavior requires sustained communication and public education at the community level. Understanding the moti-vations that interest people in hygiene and sanitation is important. Health is one consid-eration, but not necessarily the foremost in people’s minds: convenience, dignity, and social status may be more important. Adapting hygiene and sanitation promotion programs to cultural and institutional norms and intensely market-ing them to stimulate communitywide involve-ment are critical. Peer pressure—to improve one’s status—can also help. When a commu-nity recognizes preferred behaviors, pressure to conform arises, and social structures and lead-ers begin to contribute. A successful example is the Southern Nations Regional Health Bureau’s sanitation advocacy campaign launched in 2003 in southern Ethiopia. It increased latrine coverage from 13 percent of the population to 78 percent in just two years (box 17.2). Once

Sanitation: Moving Up the Ladder 331
a culturally appropriate formula is found, dra-matic change can be achieved with modest public spending focused on promoting sanita-tion rather than on fi nancing hardware.
Ensure Adequate Supply before Addressing Demand in Settings Dominated by Unimproved Latrines Where unimproved latrines prevail, the cen-tral problem is how to upgrade them to more hygienic facilities so that the full health benefi ts of fi xed-point defecation can be achieved. Coun-tries where unimproved latrines are widely used have already overcome the behavioral challenge
of moving people away from open defecation. The problem is rather about improving facili-ties. The debate centers on whether the main impediment to upgrading latrines comes from the supply side or the demand side.
Using standardized unit costs from Senegal’s sanitation sector, one can estimate the percent-age of a household’s monthly budget that would be absorbed by the up-front investment in dif-ferent types of sanitation facilities (table 17.2). Although unimproved latrines are affordable across all income levels, improved latrines cost much more than a month’s household income in Senegal—even for households
Ethiopia’s Success with a Community-Led Program
BOX 17 .2
The southern region of Ethiopia—home to diverse cultures and scores of ethnic groups—has a population of 15 million, much larger than many African countries. Population density varies, peaking at 1,100 people per square kilometer in the Wanago district.
In early 2003, access to on-site sanitation was lower than 13 percent, below the national average of 15 percent (see fi gure). Traditional latrines were most prevalent but scarcely used, poorly maintained, smelly, and dangerous to children and animals. Meanwhile, population expansion, growing household densities, and deforestation were combining to reduce private options for open defecation.
The Southern Nations Regional Health Bureau, charged by the national Ministry of Health with promoting sanitation and hygiene, applied a community-led total sanitation approach,
including zero subsidies but allowing the community to devise its own innovative and affordable models.
With a modest but dedicated sum of money, a mass com-munication campaign was launched using the slogan “Sani-tation is everyone’s problem and everyone’s responsibility.” It promoted sustainable and affordable sanitation by creating awareness and encouraging self-fi nancing across all income quintiles. Close collaboration with all stakeholders helped to build consensus and capacity to facilitate community involve-ment in hygiene promotion and supervision of construction.
At the household level, women were identifi ed as the main drivers of latrine construction. At public consensus-building meetings, they complained about how open def-ecation directly affects their lives, highlighting the health risks of contact with feces in the banana plantations and in the fi elds where they collect fodder for cattle. They also complained about the bad smell and the embarrassment of seeing people defecate openly. Featured stories cited shame as an important factor in consensus building and a strong motivator for latrine construction. Volunteer com-munity health promoters went house to house across vil-lages with health extension workers and members of the subdistrict health committee to persuade households to build latrines, and then they supervised construction.
Alongside other gains in public health, pit latrine own-ership rose from less than 13 percent in September 2003 to more than 50 percent in August 2004. By August 2005, it had reached 78 percent, and a year later was on track toward reaching 88 percent.
Source: Reproduced from Water and Sanitation Program 2008.
Latrine Construction, 2002/03–2005/06
Source: Southern Nations Regional Health Bureau.
12.8%
51.7%
78.8%88.8%
0
20
40
60
80
100
2002/03 2003/04 2004/05 2005/06
annual increase in latrines with 2005/06 projection
% in
crea
se
Ethiopia’s Success with a Community-Led Program

332 AFRICA’S INFRASTRUCTURE: A TIME FOR TRANSFORMATION
in the highest income group. These fi ndings are consistent with the patterns of access to sanitation observed across the socioeconomic spectrum in Africa. The fact that half of Afri-can households have invested in unimproved latrines in the absence of any subsidy suggests that these modest investment costs are afford-able across the income spectrum. The fact that improved latrines are found only among the wealthiest households indicates that affordabil-ity may well be an issue in this case. In addition, in urban areas, poor dwellers in slum settings often do not own their land or house and so have fewer incentives to invest in improving their living conditions.
The appropriate policy response to these demand-side constraints likely entails a public subsidy for the additional capital costs associated with a standard package of improved facilities. However, a subsidy may have drawbacks, including distorting demand and markets. Subsidies can reduce the demand of households with the ability to pay. More-over, suggesting a standard package may make poor households feel entitled to such a facility, regardless of whether it is the most appropriate for their circumstances and geographic loca-tion. Widespread adoption of a standard could also discourage innovations that may lower costs. Therefore, in the African context, many other policy measures likely need to be taken before subsidies become relevant.
From the supply side, poor knowledge in the construction sector about required designs, a lack of skilled construction workers, and a shortage of materials can explain the low prev-alence of improved latrines. Access patterns already provide some clues that supply-side issues are a real constraint in Africa. First, the
prevalence of improved latrines is low, even in middle-income countries, except in a handful of cases. Second, 40–50 percent of the popula-tion use unimproved latrines, even among the highest-income groups who may be able to pay for more advanced facilities.
A weak private sector dominated by small entrepreneurs at the local level compounds the supply problem. Latrine construction demands skills not widely available, and small enterprises often do not have the resources to develop new skills or adopt new technologies.
Supply bottlenecks should be tackled fi rst. Otherwise, subsidy resources may be wasted on households that could have fi nanced the facilities on their own. Allowing the local mar-ket to develop also provides space for inno-vation that can lower the cost of improved latrines. Technological innovation is needed to secure greater health benefi ts with cheaper variants that are tailored to a locality. This innovation should be grounded in a better understanding of the most prevalent designs for unimproved latrines in any given local-ity and should explore how relatively minor changes in these designs could help achieve health benefi ts.
Policies need to address supply-side limita-tions. Government support is best channeled toward (a) conducting research and devel-oping products, (b) marketing latrines, and (c) opening supply channels for key inputs. Training small service providers and provid-ing access to credit can also help. The National Sanitation Program in Lesotho, established 20 years ago, is dedicated to sanitation pro-motion and private sector training. House-holds directly employ private latrine builders trained under the program. The program has
Table 17.2 Cost of Sanitation Facilities in Senegalpercentage of monthly household budget
Facility National Rural UrbanPoorest quintile
Second quintile
Third quintile
Fourth quintile
Richest quintile
Septic tank 289 427 209 641 491 396 292 167
Improved latrine 194 286 140 430 330 266 196 112
Unimproved latrine 22 32 16 48 37 30 22 13
Monthly household budget (2002 $) 227 154 315 102 134 166 225 394
Source: Morella, Foster, and Banerjee 2008.

Sanitation: Moving Up the Ladder 333
increased national sanitation coverage from 20 percent of the population to 53 percent.
Make Sewerage More Affordable in High-Density Settlements In much of Africa, on-site sanitation is the most cost-effective and only practical way to secure the health benefi ts of hygienic disposal of excreta. Nevertheless, on-site sanitation has its limits. As the urban population grows, water consumption also increases, creating the challenge of safely returning large vol-umes of wastewater. In addition, given the growing urban population densities, limited land constrains the use of latrines (par-ticularly the simpler types), which require rotation of sites. At high population densi-ties, sewerage systems are both more suitable and more cost-effective.
Whereas the annual population growth in Africa averages 2.5 percent, the urban popula-tion is growing at 3.9 percent. By 2020, nearly 60 percent of Africa’s population will be in urban areas, and within 20 years, the popula-tion of most African cities will have doubled. Eventually, Africa’s burgeoning cities will need to develop more extensive sewerage networks. The statistics on affordability in table 17.2 are particularly worrisome. If households are struggling to afford improved latrines, they are much less likely to be able to afford water-borne sewerage, and the public subsidies to support such sewerage networks are equally unaffordable. Reducing the cost of sewer net-works through technological innovation is therefore critical.
One lower-cost alternative that was devel-oped in Latin America but that could be explored in Africa is condominial sewerage. These networks are designed to keep costs down by having the public collection network just touch each housing block (or condo-minium) instead of surrounding it, with the pipes serving each household then laid within the block itself at the residents’ initiative. Decentralized microsystems of treatment and disposal can also replace the conventional cen-tralized treatment system. Construction costs are reduced by using small-diameter pipes, buried at relatively shallow depth, with work partially carried out by residents. Experiences
in Latin America reveal savings of up to 65 percent (Melo 2005). Pilot condominial systems are being implemented in several African countries, most notably in the periur-ban areas of Dakar, Senegal. By 2009, the Dakar system is expected to furnish 60,000 house-holds (270,000 people) with on-site sanita-tion and to support 160 condominial schemes serving 130,000.
Several Common Challenges Remain for All Countries
Irrespective of a country’s position on the sanitation ladder, several common challenges cut across all sanitation settings: (a) secur-ing fi scal space for sanitation, (b) coordinat-ing the numerous players in the sector, and (c) developing a more refi ned approach to measuring progress.
Securing Additional ResourcesThe unglamorous nature of sanitation puts it at a disadvantage in the competition for fi scal resources. Government decentraliza-tion and poor accounting for sector expen-ditures impede understanding of the exact amount of public funds allocated. Fewer than half of the countries surveyed reported any spending on sanitation, and those that did averaged no more than 0.23 percent of GDP, including both investment and operation and maintenance (Briceño-Garmendia, Smits, and Foster 2008).
At the 2008 African Conference on Sani-tation and Hygiene in Durban, South Africa, governments committed themselves to raising public expenditure on sanitation to 0.5 percent of GDP by 2010. This commitment would require spending close to the levels needed to reach the MDG target, but reaching the target will still be diffi cult because of the need to make up for lagging past performance. Better accounting of public expenditure on sanita-tion will also be needed to monitor progress toward the target.
Although governments are called on to provide more resources, innovative fi nancing approaches that help providers and operators

334 AFRICA’S INFRASTRUCTURE: A TIME FOR TRANSFORMATION
are also needed. Cost recovery has proved to be a limited incentive because the only tariffs in sanitation are those on sewerage, and they apply only to the minority of the popula-tion served by that network. Moreover, most African utilities responsible for providing wastewater services also supply water, and the lack of accounting separation between these services makes it likely that water pays for sanitation. Burkina Faso has taken an innova-tive approach by levying a sanitation tax on the water bill, which is then used to subsidize access to improved sanitation facilities in Ouagadougou (box 17.3).
Needed—a Champion for the Sanitation Sector Given that on-site sanitation, rather than water-borne sewerage, will likely continue to domi-nate sanitation in Africa, households rather than governments will remain center stage. Even so, the government’s role in promoting demand and addressing supply bottlenecks remains. Too often, dispersion and duplication
of sanitation functions, even within the public sector, prevent one entity from leading, and sanitation issues fall between the cracks.
A key policy issue is therefore to identify and empower a clear sanitation champion within the public sector. In Senegal, the decision to take sanitation seriously was expressed through the creation of a dedicated sanitation utility. Senegal was also the fi rst country to establish a government body at the national level—the Ministry for Prevention, Public Hygiene and Sanitation (recently reorganized as the Ministry of Urban Affairs, Housing, Urban Water, Public Hygiene and Sanitation)—to coordinate sector activity. Although creat-ing a ministry in the central government may not always be necessary, Senegal provides an important lesson in singling out one entity with a clear mandate to lead.
Measuring ProgressAlthough the JMP has made strides in moni-toring progress toward the MDG target for sanitation, no commensurate effort has been made to create detailed and frequent country-level monitoring and evaluation sys-tems critical to guiding policy interventions. Most countries have no system, and in the countries that are developing a system, pro-viding a clear picture of the sector is not yet possible. Moreover, monitoring and evalu-ation systems rarely measure the effect of improved sanitation on health.
At the country level, better monitoring and evaluation systems could be built by ensuring more coordination at the ministerial level, for instance, between the ministry in charge of sani-tation and the ministry in charge of health. In addition, a larger role should be played at the local level, especially by the decentralized techni-cal departments, in collecting data and monitor-ing progress. This would require more capacity and resources from the central government.
A limitation of the JMP’s framework is the inability to discriminate among the levels of sanitary protection provided by different variations within the large class of unim-proved latrines, which will continue to domi-nate African sanitation. Unimproved latrines include a heterogeneous collection of instal-lations, only some of which can be regarded
BOX 17 .3
The on-site sanitation problems in Ouagadougou are specifi cally addressed in the Sanitation Strategic Plan being implemented by the national public utility in charge of water supply and sanitation.
A sanitation marketing approach has enhanced construction ser-vices offered to households by small providers and stimulated house-hold demand for improved sanitation facilities. Some 700 masons and social workers have been trained since the beginning of the program.
Burkina Faso’s national utility offers to provide part of the mate-rial free to households—equivalent to about a 30 percent subsidy—with the households fi nancing the rest. The utility fi nances the subsidy through a small sanitation tax on the water bill.
This example shows that on-site sanitation corresponds to a strong demand from urban dwellers, with more than 60,000 pieces of sanitation equipment subsidized so far—latrines as well as gray water–removal systems. It also demonstrates the importance of a local fi nancing mechanism. Donors have contributed to the mecha-nism, but only modestly. Most of the funds come from the tax on the water bill.
Source: Reproduced from Water and Sanitation Program 2008.
Burkina Faso’s Sanitation Tax

Sanitation: Moving Up the Ladder 335
as improved sanitation. Unfortunately, the JMP’s household survey instruments that track progress toward the MDG target cannot discriminate among the qualities of installa-tions within the unimproved latrine category. As a result, the data on progress in sanitation in Africa are blurriest precisely where most of the progress is taking place. The precision of household survey instruments should be improved in this respect.
Tracking the intermediate goal of increas-ing the share of households making use of some kind of sanitation facility, even if it is an unimproved latrine, may also be relevant, given that this is where Africa has been making the greatest progress.
Notes The authors of this chapter are Elvira Morella,
Sudeshna Ghosh Banerjee, and Vivien Foster, who drew on background material and contributions from Piers Cross, Pete Kolsky, Marianne Leblanc, Eustache Ouayoro, and Ede Perez.
1. Unimproved latrines refer to various kinds of pits for excreta disposal. Well known in Africa, Asia, and Latin America, they normally consist of a simple pit covered with logs, not usually roofed, and sometimes with no walls.
2. Improved latrines—comprising SanPlat, VIP latrines, and basic pits with slabs—ensure more hygienic separation of excreta from the immedi-ate living environment. Improved versions have walls and a roof and may include a ventilation pipe or a cover plate for the squat hole. The col-lection chamber may vary from an unlined pit to a composting chamber. The superstructure may be a crude shelter or an attractive brick or thatch construction with or without a vent pipe and with or without a seat. SanPlat latrines are slightly elevated for ease of use in the dark. They can be located close to the house and have a fi tted lid to prevent odors and keep away fl ies. VIP latrines consist of the normal pit but are fi tted with a screened vent pipe.
3. Hutton (2000) uses health care unit costs from the World Health Organization to estimate the cost of treating diarrhea, to which he adds other expenses (such as transport) incurred by the patient. A number of assumptions are made regarding treatment (such as number of visits or length of hospitalization). As a result, the mean cost per case of diarrhea for the patient is $10–$23, and the additional costs per visit
are estimated at $0.50 or less. As for economic losses from lost time at work and school and from death, Hutton relies on the concept of minimum wage rates for his estimates, adjusted to refl ect the varying productivity of the dif-ferent countries (for each country, the value of the minimum wage rate must be no larger than the local gross national product per capita and no smaller than the manufacture added value). Both health and economic benefits are presented, assuming that all interventions were implemented within 2000. To account for population growth, the projected population fi gures for 2015 are used.
ReferencesBanerjee, Sudeshna G., Quentin Wodon, Amadou
Diallo, Taras Pushak, Helal Uddin, Clarence Tsimpo, and Vivien Foster. 2008. “Access, Afford-ability and Alternatives: Modern Infrastructure Services in Sub-Saharan Africa.” Background Paper 2, Africa Infrastructure Country Diagnos-tic, World Bank, Washington, DC.
Briceño-Garmendia, Cecilia, Karlis Smits, and Vivien Foster. 2008. “Financing Public Infra-structure in Sub-Saharan Africa: Patterns, Issues, and Options.” Background Paper 15, Africa Infrastructure Country Diagnostic, World Bank, Washington, DC.
Emerson, Paul M., Sandy Cairncross, Robin L. Bailey, and David C. Mabey. 2000. “Review of the Evidence Base for the ‘F’ and ‘E’ Components of the SAFE Strategy for Trachoma Control.” Tropical Medicine and International Health 5 (8): 515–27.
Esrey, Steven A., James B. Potash, Leslie Roberts, and Clive Shiff. 1991. “Effects of Improved Water Supply and Sanitation on Ascariasis, Diarrhea, Dracunculiasis, Hookworm Infection, Schistosomiasis and Trachoma.” Bulletin of the World Health Organization 69 (5): 609–21.
Hutton, Guy. 2000. Considerations in Evaluat-ing the Cost-Effectiveness of Environmental Health Interventions. Geneva: World Health Organization.
Hutton, Guy, U-Primo E. Rodriguez, Lydia Napitupulu, Pham Ngoc Thang, and Phyrum Kov. 2007. Economic Impacts of Sanitation in Southeast Asia: A Four-Country Study Conducted in Cambodia, Indonesia, the Philippines and Vietnam under the Economics of Sanitation Initiative (ESI). Jakarta, Indonesia: World Bank, Water and Sanitation Program.
Mehta, Meera, Thomas Fugelsnes, and Kameel Virjee. 2005. “Financing the Millennium Development Goals for Water Supply and

336 AFRICA’S INFRASTRUCTURE: A TIME FOR TRANSFORMATION
Sanitation: What Will It Take?” Water Resources Development 21 (2): 239–52.
Melo, Jose Carlos. 2005. The Experience of Condo-minial Water and Sewerage Systems in Brazil: Case Studies from Brasilia, Salvador and Parauapebas. Lima, Peru: Water and Sanitation Program—Latin America, World Bank.
Morella, Elvira, Vivien Foster, and Sudeshna G. Banerjee. 2008. “Climbing the Ladder: The State of Sanitation in Sub-Saharan Africa.” Back-ground Paper 13, Africa Infrastructure Country Diagnostic, World Bank, Washington, DC.
United Nations. 2008. The Millennium Development Goals Report 2008. New York: United Nations.
Water and Sanitation Program. 2006. Getting Africa on Track to Meet the MDGs on Water and Sanitation: A Status Overview of Sixteen African
Countries. Joint Report of the African Ministers’ Council on Water, African Development Bank, the European Union Water Initiative, the United Nations Development Programme, the Water and Sanitation Program–Africa, and the World Bank. Nairobi, Kenya: Water and Sanitation Program–Africa.
———. 2008. “Can Africa Afford to Miss the Sanitation MDG Target? A Review of the Sanitation and Hygiene Status in 32 Coun-tries.” Joint Initiative of the African Ministers’ Council on Water, African Development Bank, World Bank, and Water and Sanitation Program, Washington, DC.
World Bank. 2002. “Urban Environmental Strategic Sanitation Planning: Lessons from Bharatpur, Rajasthan, India.” Field Note 23771. Water and Sanitation Program–South Asia, New Delhi.

Index
Abuja Treaty (1991), 154access
to basic infrastructure services, 95bto electricity, 52, 88, 88f, 89, 198, 199binequality of, 88–90recommendation for, 24to sanitation, 88, 88–89f, 323, 329to water resources, 129, 129–130f, 300–302, 301–302t,
313–316, 315f, 315t, 316bAccra District Rehabilitation Project (Ghana), 139ADF (African Development Fund), 158, 159affermage arrangements, 209, 210n2, 310, 312baffordability
of modern infrastructure services, 90–94service expansion challenges, 98–100
Africa Energy Commission, 40Africa–EU Energy Partnership, 158Africa Infrastructure Country Diagnostic (AICD), 31–42
background papers, 33t, 40genesis of project, 32–33GIS platform for, 35bscope of project, 33–41
country coverage of, 33, 34fexisting spending patterns, 36–38future spending needs estimates, 34–36sector performance, 38–41
working papers, 40, 41tAfrican Air Transport Policy, 264African Civil Aviation Commission, 264African Conference on Sanitation and Hygiene (2008), 333African Development Bank, 32, 34, 40–41, 78, 148b, 158African Development Fund (ADF), 158, 159African Economic Community, 154African Union, 154, 158, 264African Union Commission, 32, 155AFRICATIP (Association Africaine des Agences d’Exécution des
Travaux d’Intérèt Public), 215b, 223
Agence Française de Développement, 32Agence Malienne pour le Développement de l’Énergie
Domestique et l’Électrifi cation Rurale (AMADER), 199b
Agence pour la Sécurité de la Navigation Aérienne en Afrique et à Madagascar (ASECNA), 268
Agences d’Exécution des Travaux d’Intérèt Public (AGETIPs), 214, 215b, 223
agricultureeconomic development and, 125–126, 287, 288–289exports, 251food price changes and, 293–294, 294tirrigation. See irrigationurbanization impact on, 126, 127t, 140n2
AICD. See Africa Infrastructure Country DiagnosticAir Afrique, 151, 260, 261, 267Air Gabon, 261airports and air transport, 259–270
air traffi c control infrastructure, 267, 269, 270n2existing infrastructure, 262–263, 265–267fi nancing, 133, 269fl ight crew training, 269market, 260–263, 261–262f, 268–269national fl ag carriers, 267policy, 263–265, 264tpricing, 263, 263fprivate sector participation, 117t, 266reforms, 267–269regional connectivity and, 56, 144, 151, 152frunway capacity and quality, 265–266, 266tsafety issues, 263, 267–268, 268fsupply, 261–262, 265–266terminal capacity, 266traffi c trends, 260–261, 260f, 261t
AMADER (Agence Malienne pour le Développement de l’Énergie Domestique et l’Électrifi cation Rurale), 199b
Boxes, fi gures, notes, and tables are indicated with b, f, n, or t following the page number.
337

338 Index
amodiation model, 253Angola
non-OECD fi nancing, 78, 79power trade, 149, 150frailways, 232, 238
Apapa Container Terminal, Lagos, Nigeria, 257bAPM Terminals, 257bArab Bank for Development in Africa, 277bASECNA (Agence pour la Sécurité de la Navigation Aérienne en
Afrique et à Madagascar), 268Association Africaine des Agences d’Exécution des Travaux
d’Intérèt Public (AFRICATIP), 215b, 223Automated System for Customs Data (ASYCUDA), 208b
Backbone networks, 171–172development of high-bandwidth, 177investment needs, 173–174
backup generators, 5, 184, 184t, 197Banjul Accord Group, 260–261, 264tbank fi nancing, 81–82Bardasi, Elena, 95bbasic infrastructure services, 95bbenchmarking, 114–115Benin
governance, 108infrastructure as constraint on economic growth, 45road funding, 213sanitation, 325transport infrastructure, 150, 151turban infrastructure fi nancing, 137water MDG and, 305water supply, 88, 315, 316
bond markets, 81–82, 85n8, 110, 200boreholes, 299, 300–301, 301t, 303f, 303tBotswana
infrastructure as constraint on economic growth, 45railways, 230, 238state-owned enterprises, 118, 118butility tariffs, 99water resource management, 281, 282
Botswana Power Corporation, 118bBourse Régionale de Valeurs Mobilières (BRVM), 81bribery, 205–206. See also corruptionbroadband service, 57, 171–173, 171–172t, 173fbudget surveys, 39building regulations, 138Burkina Faso
drinking water access, 300informal settlements, 136infrastructure as constraint on economic growth, 45power sector ineffi ciencies, 187private sector participation, 112property rights, 135railways, 204, 238rural road transport, 220
sanitation, 95, 323, 325, 334btelecommunications industry privatization, 179n1transit corridor development, 207undermaintenance, 73urban growth, 134urban infrastructure fi nancing, 137urban public transportation, 96bwater supply, 313, 315, 320
Burundiaffordability issues, 92electricity outages, 182ODA, 79power trade, 149, 150fwater resource management, 280, 282
bus services, 96b, 220–221
Cameroonaffordability issues, 92airports and air transport, 266drinking water access, 300infrastructure as constraint on economic growth, 45multimodal transport network, 204–205power outages, 184power sector underpricing, 191power trade, 149, 150frailways, 231, 239, 243road network, 222sanitation, 95telecommunications sector ineffi ciency, 168transit corridor development, 207, 208btransport infrastructure, 150, 151turban growth, 134urban public transportation, 96bwater resources as human development constraint, 46, 305water utilities, 310
capacity. See institutional competence and capacityCape Verde
power sector underpricing, 191water tariffs, 308bwater utilities, 310
capital budget execution, 68–70capital markets
costs of capital, 82, 83flocal, 81–82, 81tpower sector funding gap, 200
carbon emissions, 149catchments, 275CDMA (Code-Division Multiple Access), 168cell phones. See mobile phone coverageCenter for International Earth Science Information Network, 35bCentral Africa. See also specifi c countries
airports and air transport, 263, 268, 268fair transport hubs, 151, 260economic growth, 44freight services profi t margins, 50

Index 339
freight tariffs, 220ICT investment, 147, 148b, 148tinfrastructure, 48multimodal transport network, 204–205roads, 211rural road accessibility, 222
Central African Power Pool, 52, 53–54t, 185, 187Central African Republic
airports and air transport, 261drinking water access, 300irrigation, 290, 290fmultimodal transport network, 204–205transit corridor development, 207, 208b
Central Africa Transport and Transit Facilitation Project, 208b
Central East African Railways, 204Chad
airports and air transport, 261broadband access, 173power sector underpricing, 191power trade, 149, 150fprivate sector participation, 115road maintenance, 214, 215, 216sanitation, 329transit corridor development, 207, 208bwater supply, 313
childreninfant mortality, 45piped water and, 94water resources and, 45–46, 304–305
Chinafi nancing from, 79, 79t, 80, 82, 83f, 85n3infrastructure expansion, 48irrigation, 289land use planning, 139manufacturing, 145national infrastructure programs, 146power sector investment by, 200public sector expenditures, 67urban infrastructure fi nancing, 137urban population density, 134
China Export-Import Bank, 85n3civil aviation authorities, 268, 269Clean Development Mechanism, 149climate change
agriculture and, 287, 288food security and, 293–294, 294twater resource management and, 53–54, 272, 279
coastal countriespopulation density, 134–135, 135turbanization, 127, 127turban vs. rural income level differentials, 128, 128t
Code-Division Multiple Access (CDMA), 168Commercial Reorientation of the Electricity Sector Toolkit
(CREST), 196b
Commission for Africa, 7, 31, 43, 44, 58, 77Commission Internationale du Bassin Congo–Oubangui–
Sangha, 204–205Common Market for Eastern and Southern Africa, 32, 156,
159b, 264–265, 264tcommons approach to radio spectrum use, 177community-driven development
irrigation, 296, 296bsanitation improvement, 330, 331bservice expansion, 97–98water resource management, 279
Comorosdrinking water access, 300ICT investments, 58
competitionmobile phone market, 113, 169, 170, 170fports and shipping, 256railways, 239
Comprehensive Africa Agricultural Development Program, 288, 292
concessionsairports and air transport, 266port sytems, 253, 254trailways, 238–240, 242–243, 242f, 245water utilities, 310
condominial sewerage, 333Congo. See Democratic Republic of Congo; Republic of Congoconnection charges, 90, 98–99, 98b, 308bconnection subsidies, 98bconstruction costs, 136, 141n9, 216, 225Cooperative Development of Operational Safety and Continuing
Airworthiness Program, 268corporatization of state-owned water utilities, 313corridor associations, 151corruption, 108, 151, 205–206, 207bcost recovery
improvement of, 70–71, 72tpower sector, 191–192f, 191–194, 197–198railways, 245sanitation, 334for subsistence consumption, 91–92, 91ftariffs and, 99–100, 99fwater supply, 307–309, 307f, 308b, 319–320
Côte d’Ivoireairports and air transport, 266electricity access, 193infrastructure as constraint on economic growth, 2irrigation, 290local capital markets and, 81municipal budgets, 134piped water access, 88power outages, 184private sector participation, 112, 115railways, 204, 232, 233, 238road funding, 213

340 Index
sanitation, 325, 326, 327f, 329transport infrastructure, 150, 151tutility connection charges, 90water supply, 300, 301, 302b, 307, 315, 319, 320water utilities, 310, 311, 313
Country Policy and Institutional Performance Assessment, 51country typology of AICD, 48, 51b, 66CREST (Commercial Reorientation of the Electricity Sector
Toolkit), 196b
DAWASA lease contract, 116, 116bdebt service expenditures, 76–77defi cit-fi nanced public investment, 77bDemocratic Republic of Congo
affordability issues, 92backup generators, 184broadband access, 173drinking water access, 300external fi nancing, 79hydropower projects, 53, 149, 187infrastructure as constraint on economic growth, 2local capital markets and, 81mobile phone coverage, 172, 178multimodal transport network, 204–205paved road density, 96bports and shipping, 254power outages, 184power trade, 149, 150f, 187, 200railways, 204, 230, 232, 238, 239regional integration, 155road standards, 217spending estimates, 59standposts, 95undermaintenance, 73urban public transportation, 96butility ineffi ciencies, 309water MDG and, 305water supply, 313, 314, 315, 316
demographic and health surveys (DHSs), 39, 324bdemographic trends
basic infrastructure access and, 88spending needs estimates and, 36urbanization and, 127–128
densityinfrastructure costs and, 130–132paved road, 96brailway traffi c, 230–231sewerage affordability and, 333telecommunications networks, 60n2transportation networks and, 56, 60n2, 129urban growth and, 4, 134, 135t, 141n3urban infrastructure needs and, 132, 133f
Department for International Development (UK), 32Development Assistance Committee, 37
diseasesanitation access and, 329water resources and, 45–46, 304–305
distribution lossespower sector, 187utilities, 11, 11f, 66, 72–73, 73twater resources, 309
domestic fi nance sources, 76–77DP World, 252–253drinking water. See water resources
East Africa. See also specifi c countriesairports and air transport, 268, 268fhydroclimatic variability, 272, 273fICT investment, 4, 147, 148b, 148tICT sector impact on, 168infrastructure, 48maritime traffi c growth, 250–251t, 251fport system, 252, 255railways, 204water resource management, 277
The East Africa Marine System (TEAMS, Kenya), 148b, 148tEast African Community
AICD and, 32airports and air transport, 264tLake Victoria Basin Commission, 282Master Plan, 156regional integration, 156, 159b
East African Power Pool, 52, 53, 53–54t, 185, 187East Asia
basic infrastructure access, 88capital budgets for infrastructure, 77economic growth and infrastructure, 44–45electricity access, 182infrastructure, 47–48, 49fpublic sector expenditures, 67
Eastern Africa Submarine Cable System (EASSy), 146, 148b, 148tEconomic and Monetary Community of Central Africa
AICD and, 32airports and air transport, 264–265, 264tmultimodal transport network, 204
Economic Community of West African States (ECOWAS), 32, 156, 157
Regional Electricity Regulatory Authority, 160economic development
agriculture and, 125–126, 288–289ICT sector impact, 43, 45f, 52t, 168infrastructure linked to, 2, 44–47, 44t, 45–46firrigation, 52tpower sector and, 45f, 52–53, 52t, 141n5, 183–186, 184f, 184tregional integration and, 156–157transportation sector, 52turban areas as engine for, 126water resources and, 52t, 272–276, 276f, 277, 277b

Index 341
educationelectricity access impact on, 46on hygiene, 330transport network impact on, 46water resources and, 304–305
effi ciency gap. See operating ineffi cienciesEgypt and urban infrastructure fi nancing, 137electricity. See also power sector
access to, 52, 88, 88f, 89, 198, 199bhuman development constrained by access to, 46institutional competence and capacity
private sector, 114–115Electricity Master Plan for Africa, 158Electricity Regulatory Board (Kenya), 189bElectric Power Act of 1997 (Kenya), 189bemergency power generation, 5, 184, 184t, 197energy industry. See power sectorEnergy Regulatory Commission (Kenya), 189bengineering cost studies, 34, 217equity of water tariffs, 308bEritrea
airports and air transport, 261drinking water access, 300railways, 232
ESKOM, 100, 110, 183–184bEthiopia
affordability issues, 92airports and air transport, 261hydropower projects, 53, 149, 187informal settlements, 139infrastructure as constraint on economic growth, 45land use policies, 138power trade, 149, 150f, 187, 200railways, 232road funding, 213road maintenance, 214, 216sanitation, 323, 326, 327f, 329–330, 330bspending estimates, 59traffi c volumes, 212urban development, 126–127urban public transportation, 96bwater resource management, 276, 282
Ethiopian Airlines, 151, 260, 262EU–Africa Infrastructure Trust Fund, 158European Commission, 32, 78European Development Fund, 277bEuropean Investment Bank, 148bEuropean Union
on air safety in Africa, 268energy partnership, 158freight transit regulation, 206ICT licensing framework, 176irrigation investment by, 295bwater resource management, 274, 275t
Export-Import Bank of China, 186external fi nancing
funding gap, 66, 67infrastructure investment, 8–9power sector, 186, 186t, 200–201, 201froad network spending, 218
external governance, 110
Fadama Water User Association (Nigeria), 296bfarming. See agricultureFederal Aviation Administration (U.S.), 268Federal Energy Regulatory Commission (U.S.), 121fi ber-optic networks, 146, 148b, 171–172fi nance sources
airports and air transport, 269for funding gap, 75–82railways investment needs, 244–245regional integration projects, 158–159urban infrastructure, 133–138water supply, 302–305
fi nancial marketsas external governance, 110infrastructure fi nancing, 81–82, 81tpower sector fi nancing, 200
fi scal costs, defi ned, 33fl ight crew training, 269fl ood mitigation, 280fl ush toilets
access to, 88, 88–89fcost of, 94, 96f, 97tsanitation ladder, 321–327, 324b
Food and Agriculture Organization, 35b, 40, 277food security, 274–275, 281, 287–288, 293–294, 294tfragile low-income states
access issues, 89–90in AICD typology, 48, 51bcapital budget for infrastructure, 69t, 76, 76teconomic growth constrained by infrastructure, 45economic return on infrastructure investment, 70, 71texternal fi nancing and, 67fi nancing needed to meet water MDG, 302–305, 303tfunding gap, 8, 66–67, 67t, 75, 75tinfrastructure, 2–3, 45, 48institutional competence and capacity, 107local capital markets and, 81, 81tmobile phone coverage, 166non-OECD fi nancing, 68f, 79tODA to, 68f, 78tpower sector spending needs, 185, 185t, 186tPPI investment, 68f, 80, 80tpublic sector expenditures, 67, 68–69f, 70–71troad network spending, 218, 219tspending allocation, 43, 59, 65urbanization, 127, 127t

342 Index
utility water supply, 301–302, 302twater resources funding gap, 302–305, 305t, 309, 309f
France and irrigation investment, 295bFrance Telecom, 113freedoms of the air, 269n1freight services
air transport, 259railways, 231f, 235–236regional integration, 150–151, 151troads, 219–220, 220t, 224–225shipping, 249, 250tariffs, 5, 50, 235
French Development Agency, 148bfuel levies, 73, 221funding gap, 65–86
annual, 75capital budget execution, improvement of, 68–70cost recovery improvement, 70–71, 72tcosts of capital, 82, 83fdeferral of infrastructure targets, 83, 84feffi ciency reforms, 9–12, 11f, 73t, 74, 74tfi nance sources, 75–82
defi cit-fi nanced public investment, 77bdomestic, 76–77, 76tlocal capital markets, 81–82, 81tnon-OECD, 78–80, 79toffi cial development assistance, 77–78, 78tprivate investment, 80
lower-cost technologies and, 83–84power sector, 200–201recommendation for, 22–23, 25–26spending allocation, 66–67, 67t, 70user charges, 70–71utilities, operating ineffi ciencies of, 71–74, 73f, 73t
Gabonaffordability issues, 92non-OECD fi nancing, 79power trade, 150fprivate sector participation, 115railways, 230, 231, 239road funding, 213water utilities, 310, 311
Gambia River Development Organization, 153, 282Gas and Electricity Markets, Offi ce of (U.K.), 121geographic information systems (GIS), 35, 35bGerman Development Bank, 148bGermany and irrigation investment, 295bGhana
drinking water access, 300electricity access, 194housing shortage, 136informal settlements, 139land use policies, 138municipal budgets, 134
port system, 250, 253power outages, 184power sector ineffi ciencies, 187private sector participation, 112, 157property rights, 135road maintenance, 214road network, 224sanitation, 95, 325telecommunications sector
ineffi ciency, 168privatization, 171
urban growth, 134utility ineffi ciencies, 309utility payment collection, 100water resources as human development constraint, 46, 305water utilities, 311
Ghana Airways Corporation, 261Ghana Gateway corridor, 204, 258GIS (geographic information systems), 35, 35bGlobal Rural-Urban Mapping Project (GRUMP)
urban extents, 140n3global systems mobile (GSM) networks, 167–168, 172, 175governance. See also institutional competence and capacity
Infrastructure Institutional Scorecard, 106–107binstitutional competence and capacity, 109–110, 109t, 110fpower sector, 188, 190, 195
ineffi ciencies and, 188–189, 189frailways, 243–245road conditions and, 217road freight transport, 225state-owned enterprises and, 118, 119f, 120twater utilities, 313
Government Financial Statistics (IMF), 36gray water removal systems, 334bgreenfi eld transactions
port systems, 253, 254tprivate investors, 80telecommunications, 112
groundwater, 281, 320–321Group of Eight, 32GRUMP (Global Rural-Urban Mapping Project)
urban extents, 140n3Guinea
access to basic infrastructure, 95baffordability issues, 92backup generators, 184drinking water access, 300external fi nancing, 79hydropower projects, 53non-OECD fi nancing, 79power sector governance, 196b, 197power trade, 149, 150f, 187, 200railways, 233road network, 224sanitation, 325

Index 343
urban public transportation, 96bwater utilities, 310, 311
Guinea-Bissauaffordability issues, 92power trade, 149, 150f
Gulf States, fi nancing from, 79, 79t, 80, 82, 83f
healthelectricity access and, 46informal settlements and, 137sanitation and, 329, 335n3transport network impact on, 46water resources and, 45–46, 94, 304–305
Herfi ndahl-Hirschman Index, 113, 122n2housing and urban planning, 134–136hub-and-feeder port system, 252–253human development
informal settlements and, 137infrastructure as constraint on, 45–47, 52trecommendation for, 23–24sanitation access and, 329water resources and, 274–275, 304–305
Hutchison Port Holdings, 252Hutton, Guy, 335n3hybrid power markets, 194–195hydroclimatic variability, 272, 273f
risk mitigation, 277, 279hydropower
cost, 53economies of scale and, 144local-scale units, 279non-OECD fi nancing, 78regional integration, 149, 153, 187water resource management, 275, 275f, 280, 281t
hygiene education, 330
IBNET (International Benchmarking Network), 39IBTs (increasing block tariffs), 101, 308bICTs. See information and communications technologiesIDA. See International Development AssociationIMF. See International Monetary Fundimproved latrines, 94–95, 96f, 97t, 324–327, 324b, 328fIncomati Basin water-sharing agreement, 155income levels, urban vs. rural, 128, 128t, 140n1increasing block tariffs (IBTs), 101, 308bindependent power producers (IPPs), 114–115, 186, 194independent regulators, 120–121, 121b, 121tIndia
fi nancing from, 79, 79t, 80, 82, 83finfrastructure expansion, 48irrigation, 289manufacturing, 145mobile phone costs, 167national infrastructure programs, 146power sector investment by, 200
urban infrastructure fi nancing, 137urban population density, 134
Indonesia, capital budgets for infrastructure, 77infant mortality, 45informal enterprises, 184informal settlements
electrical access and, 89urban areas, 136–137, 139
information and communications technologies (ICTs), 165–179. See also specifi c subsectors
backbone networks, 171–172, 173–174, 177cost recovery, 5developments, 167–168economic impact of, 43, 168economies of scale and, 144fi nancing, 10, 133human development and, 47infrastructure as constraint on economic growth, 45institutional competence and capacity, 108, 109f, 110finternational connectivity, 171, 176Internet access, 167, 171–172t, 172–173, 173finvestment needs, 172–174licensing framework, 175–176local capital markets and, 81market reforms, 169–170, 169–170fnon-OECD fi nancing, 68fODA for, 68foperating ineffi ciencies, 72, 74t, 168, 169fpolicy challenges, 174–178ports and shipping needs, 258PPI investment, 67, 68fprivate sector participation, 57–58, 80, 111–113, 111f, 113f,
116, 117t, 146, 148b, 168public expenditures on infrastructure, 68f, 69f, 70–71tradio spectrum management reforms, 177–178reform agenda, 168–172, 174–175regional integration, 143, 146–148, 147f, 148b, 148tregulatory reforms, 170sector performance data collection, 39spending needs, 6–7, 36, 56–58, 58tstate-owned enterprise reforms, 170–171, 176universal access, 178urban vs. rural access, 129, 129f, 130fvoice services, 166–167, 166f, 171–172t, 172, 173f
infrastructure, 43–63. See also specifi c typescurrent defi cit, 2–3, 3t, 47–49, 48t, 49f, 50tdefi ned, 32as key to growth, 44–47, 44t, 45–46fprice premium of, 4–5, 5t, 49–52, 50tregional integration, 156–158spending needs, 7, 7t, 22–23, 52–58, 52t, 58t, 59f
Commission for Africa estimate, 58country distribution, 58–59ICT, 56–58, 58tinvestment vs. maintenance, 60

344 Index
irrigated areas expansion, 54, 55tpower sector, 52–53, 53–54ttransport network, 55–56, 57twater and sanitation, 54–55, 55twater security, 53–54
urban areas, 128–130costs of, 130–132fi nancing, 133–138
Infrastructure Consortium for Africa, 32, 78, 158, 160n3Infrastructure Institutional Scorecard, 106–107b, 108–109f, 109tinland waterways, 204institutional competence and capacity, 105–123. See also specifi c
infrastructure sectorsindependent regulators, 120–121, 121b, 121tprivate sector participation, 110–117, 111f, 111t, 116b, 117trecommendation for, 16–19reform efforts, 12–14, 13f, 106–110regional integration, 143, 155–156road infrastructure, 214fscorecard, 106–107b, 108–110f, 109tstate-owned enterprises, 117–120, 118b, 119b, 190bwater and sanitation, 274
Intergovernmental Panel on Climate Change, 272International Air Transport Association, 268, 269International Benchmarking Network (IBNET), 39International Civil Aviation Organization, 268, 269International Container Terminal Services, 252International Convention for the Safety of Life at Sea, 255International Development Association (IDA), 78, 82, 83f,
158, 159International Energy Agency, 40International Finance Corporation, 148bInternational Food Policy Research Institute, 35b, 40international ICT connectivity, 171, 176International Monetary Fund (IMF), 36, 37, 77b, 185international phone service, 167, 167f, 171tInternational Ship and Port Facility Security Code, 255international shipping market, 255–256International Telecommunication Union, 39International Union for Conservation of Nature, 35bInternet access
ICT sector and, 165, 167finvestment needs, 57, 172–173, 172tprice premium on, 50–52pricing for access, 167, 167f, 171, 171tregional cooperation opportunities, 146–148
Interstate Aviation Committee, 263intraregional trade, 152–153investment climate surveys, 45investment spending
irrigation needs, 290–293, 291b, 291t, 292f, 293tmaintenance vs., 8, 8f, 60power sector backlog, 185–186railways, 236–238water security needs, 279–283
IPPs. See independent power producersirrigation, 287–297
challenges, 294–296community-driven development, 296, 296bcurrent state of, 289–290, 289t, 290feconomic impact of, 288–289impact of, 293–294institutional reforms, 295, 295binvestment needs, 36, 54, 55t, 290–293, 291b, 291t,
292f, 293toperating ineffi ciencies, 74tproject analysis, 295–296public expenditures on infrastructure, 70–71tsector performance data collection, 40strategic planning, 294–295underdevelopment of, 274, 276f, 289–290water resource management and, 280
Japan, ODA from, 78Joint Monitoring Programme (WHO/UNICEF), 300, 321n2,
323, 324b, 334–335
Kager Basin Organization, 282Kano–Katsina–Maharadi initiative, 157Kenya
airports and air transport, 261, 266, 267external governance and, 110fi ber-optic cable network, 171–172governance, 108hydrologic variability, 273informal settlements, 136–137, 139irrigation, 290, 290fmultimodal transport network, 204power sector, 189bpower trade, 150fPPI investments, 79private sector participation, 113, 189brailways, 244sanitation, 325, 329state-owned enterprises, 118submarine cable project, 148btelecommunications, 170, 179n1transport infrastructure, 150, 151turban infrastructure, 96b, 137water MDG and, 305water resource management, 275, 276water supply, 313, 315
Kenya Airways, 151, 260, 262Kenya Electricity Generating Company, 189bKenya Power and Lighting Company, 188, 189bkerosene lamps, 94, 97tKorea. See Republic of KoreaKreditanstalt für Wiederaufbau (Germany), 32Krugman, Paul, 144KwaZuluNatal program, 226

Index 345
labor ineffi cienciespower sector, 188railways, 240, 241f, 242, 242ftelecommunications, 168, 169futilities, 11, 11f, 72, 73twater utilities, 309, 312t
ladder of sanitation, 324–325, 325fLake Chad Basin Development Fund, 282Lake Victoria, 279, 282Lake Victoria Basin Commission, 282land leases, 137landline telephones, 88, 88–89f, 146, 165, 166–167, 168flandlocked countries
construction costs, 136ICT access, 176outlets to shipping, 251population density, 134–135, 135tregional integration, 143, 144, 150transit corridor development for, 206–207urbanization, 127, 127turban vs. rural income level differentials, 128, 128t
landlord port system, 250, 253, 254t, 257land ownership and regulations, 134–136, 136b,
138–139, 140large-scale irrigation, 290–292, 291b, 291t, 293tLatin America
basic infrastructure access, 88capital budgets for infrastructure, 77, 85n2condominial sewerage, 333electricity access, 182telecommunications sector performance, 168
lease contracts, 115–116, 116b, 310, 311, 317Lesotho
airports and air transport, 261drinking water access, 301governance, 108power trade, 150fsanitation, 325, 329, 332utility payment collection, 100water resource management, 276, 277bwater supply, 313water utilities, 313
Lesotho Highlands Water Project, 155Lesotho Lowlands Water Supply Scheme, 277bLiberia and power trade, 149, 150flicensing framework for ICT sector, 112, 175–176Lighting Africa initiative, 198literacy and electricity access, 46local capital markets, 81–82, 81t
as external governance, 110power sector funding gap, 200
logistics systems, 207bfor transport network, 205–206, 205f
lower-cost technologies as funding gap solution, 83–84
low-income states. See fragile low-income states; nonfragile low-income states
Lusaka Water and Sewerage Company, 306
Madagascarairports and air transport, 266broadband access, 173ICT investments, 58infrastructure as constraint on economic growth, 45irrigation, 289, 292mobile phone coverage, 172railways, 240road network, 212, 222sanitation, 95, 323, 325, 326, 327f, 329spending estimates, 59water MDG and, 305water supply, 314water supply pricing, 307
maintenancebacklog, 10, 10feconomic impact of, 73, 85n1investment vs., 8, 8f, 60recommendation for, 16road infrastructure, 56, 70, 213–214, 215–217, 216fsanitation, 329utilities, operating ineffi ciencies, 73–74, 73fwater supply, 314–315, 316bwater utilities, 309
Malawiaffordability issues, 92airports and air transport, 266drinking water access, 300hydroclimatic variability, 272, 273finfrastructure as constraint on economic growth, 45mobile phone coverage, 178power sector underpricing, 191railways, 204, 235, 239road network, 212sanitation, 325traffi c volumes, 212utility payment collection, 100utility tariffs, 99, 99fwater resources, 275water supply, 314, 315, 316, 320
Maliaffordability issues, 92drinking water access, 300independent regulators, 120informal settlements, 136infrastructure as constraint on economic growth, 45irrigation, 295bnon-OECD fi nancing, 79ODA, 79power sector governance, 197power trade, 150f

346 Index
property rights, 135railways, 204rural electrifi cation, 199bwater resource management, 282water supply, 320water utilities, 310
Malian Agency for the Development of Domestic Energy and Rural Electrifi cation, 199b
malnutrition, 45, 94, 294, 294tmanagement contracts
institutional competence and capacity, 112–116, 119b, 122n3port systems, 253, 254tpower sector, 188–190, 189f, 196water utilities, 311
manufacturing sector and regional integration, 144–145Maputo Development Corridor, 157, 204, 207b, 258maritime traffi c trends, 250–251Mauritania
airports and air transport, 261backup generators, 184drinking water access, 300multimodal transport network, 208non-OECD fi nancing, 79urban infrastructure fi nancing, 137water resources as human development constraint, 46, 305
Mauritiusinfrastructure as constraint on economic growth, 2, 45irrigation, 290, 290fports and shipping, 253
MDGs. See Millennium Development Goalsmeteorological services, 275–276, 279Metolong Dam and Water Supply Program, 277, 277bmiddle-income countries
access issues, 89–90in AICD typology, 51bcapital budget for infrastructure, 76t, 216economic return on infrastructure investment, 70, 71tfi nancing needed to meet water MDG, 302–305, 303tfunding gap, 8, 66–67, 67t, 75, 75tinfrastructure, 2–3, 48institutional competence and capacity, 107, 108flocal capital markets and, 81, 81tmobile phone coverage, 166non-OECD fi nancing, 68f, 79tODA to, 68f, 78tpopulation density, 134–135, 135tpower sector spending needs, 185, 185t, 186tPPI investment, 67, 68f, 80, 80tpublic sector expenditures, 66–68, 68–69f, 69t, 70–71t, 76road network spending, 218, 219tspending allocation, 43, 58–59, 65urbanization, 127, 127turban vs. rural income level differentials, 128, 128tutility water supply, 301–302, 302twater resources cost recovery, 309
water resources funding gap, 302–305, 305tmigration to urban areas, 126, 127Millennium Development Goals (MDGs)
funding gap and, 75infrastructure linked to, 45, 47tpoverty reduction, 287sanitation, 323, 329, 334–335water resource management, 43, 54–55, 58, 84, 279, 281water supply, 299, 300, 302–305, 303t, 321n1
Minerals, Energy, and Water Affairs Ministry (Botswana), 190bminerals exports, 251, 254minibus services, 96b, 220–221mobile phone coverage, 56–57, 166–167, 166f
access to, 88, 89feconomic impact of, 168, 169fmarket competition, 170, 170fprivate sector participation, 113
modern infrastructure servicesaffordability of, 90–94alternatives to, 94–95inequitable access to, 88–90
Morocco ports and shipping, 253mortgage lending, 141n10motorcycles, 220Mozambique
broadband access, 173drinking water access, 301hydrologic variability, 273informal settlements, 139land use policies, 138ports and shipping, 254power trade, 149, 150fprivate sector participation, 112railways, 204, 232, 239, 244road network, 212standposts, 95transit traffi c growth, 207btransport infrastructure, 150urban planning, 138utility connection charges, 90water resource management, 276, 280water supply, 313, 315, 320water utilities, 310, 311
multi-indicator cluster surveys, 39multimodal transport, 204–205Multiple Indicator Cluster Surveys, 324bmunicipal budgets, 133–137, 134f
Nairobi Stock Exchange, 110Namibia
broadband access, 173drinking water access, 300irrigation, 292ports and shipping, 254power trade, 150f

Index 347
railways, 238sanitation, 325, 329telecommunications sector ineffi ciency, 168utility payment collection, 100utility tariffs, 99water supply, 315water tariffs, 308b
national fl ag carriers, 267National Freight Logistics Study (South Africa Department of
Transport), 209National Geospatial-Intelligence Agency (U.S.), 35bNational Ports Authority (South Africa), 256National Sanitation Program (Lesotho), 332National Transportation Safety Board (NTSB, U.S.), 268National Transport Safety Commission (Ghana), 226National Water and Sewerage Commission (NWSC,
Uganda), 119bnegative concessions, 209, 210n2neighborhood effect of urban areas, 126Netherlands and irrigation investment, 295bNew Partnership for Africa’s Development (NEPAD), 32, 154,
288, 292Niger
affordability issues, 92airports and air transport, 261broadband access, 173connection subsidies, 90, 98bgovernance, 108irrigation, 290, 292ODA, 79power sector
ineffi ciencies, 187trade, 149, 150funderpricing, 191
private sector participation, 112, 115road network, 212, 216spending estimates, 59utility tariffs, 90, 99, 99fwater resources as human development constraint, 46, 305water supply, 315water utilities, 310, 311
Niger Basin Authority, 153, 282, 283, 283fNigeria
airports and air transport, 260capital budget for infrastructure, 76drinking water access, 300electricity access, 194fi ber-optic cable network, 171–172informal settlements, 139irrigation, 290, 290f, 292, 296bland use policies, 138non-OECD fi nancing, 78, 79ports and shipping, 250, 253, 257bpower sector governance, 196bPPI investments, 79
private sector participation, 113, 114b, 115, 157, 257brailways, 233road network, 213, 216, 222telecommunications industry privatization, 170traffi c volumes, 212transport infrastructure, 151tundermaintenance, 73urban planning, 138water supply, 314, 315, 316b, 320
Nigeria Airways, 261Nigerian Ports Authority, 257bNiger River basin, 272, 279Niger River Commission, 153, 282Nile Basin Initiative, 282, 283fNile River basin, 272, 279nonfragile low-income states
access issues, 89–90in AICD typology, 48, 51bcapital budget for infrastructure, 69t, 76, 76teconomic return on infrastructure investment, 70, 71tfi nancing needed to meet water MDG, 302–305, 303tfunding gap, 8, 66–67, 67t, 75, 75tinfrastructure, 2–3, 45, 48institutional competence and capacity, 107local capital markets and, 81tmobile phone coverage, 166non-OECD fi nancing, 68f, 79tODA to, 67, 68f, 78tpower sector spending needs, 185, 185t, 186, 186tPPI investment, 68f, 80, 80tpublic sector expenditures, 67, 68f, 69f, 70–71troad network spending needs, 219tspending estimates, 43, 58–59urbanization, 127, 127tutility water supply, 301–302, 302twater resources cost recovery, 309, 309fwater resources funding gap, 302–305, 305t
non-OECD fi nance sourcescost of capital, 82, 83ffunding gap, 66, 67, 76, 78–80, 79tinfrastructure investment, 8–9, 9tpower sector, 186, 200, 201fwater resources, 304
North America’s water resource management, 274, 275t
Oak Ridge National Laboratory, 35bObasanjo, Olusegun, 154OECD countries
telecommunications sector performance, 168water tariffs, 307
off-grid power technologies, 182Offi ce du Niger, 295boffi cial development assistance (ODA)
cost of capital, 82, 83ffunding gap, 66, 67, 75–78, 78t

348 Index
infrastructure investment, 8–9, 9tpower sector, 200, 201froad network spending, 218, 219twater resources, 304, 304t
open defecation, 323–325, 328f, 330operating ineffi ciencies
power sector, 181, 186, 187, 188frailways, 240recommendation for, 15–16state-owned enterprises, 118utilities, 9–13, 11–12f, 12t, 71–74, 73twater utilities, 309–313, 310–311f, 312t
optical-fi ber technology, 146, 148b, 171–172Organisation for Economic Co-operation and Development
(OECD). See also offi cial development assistance (ODA)
AICD spending estimates and, 37Principles of Corporate Governance for SOEs, 119
Organization of African Unity, 237Our Common Interest (Commission for Africa), 31overemployment
power sector, 188telecommunications, 168, 169futilities, 11, 11f, 66, 72, 73twater utilities, 309, 312t
Pakistan and mobile phone costs, 167Pan-African Infrastructure Development Fund, 85n7Pan-African Road Safety Conference (2007), 226Partnership for Agricultural Water in Africa, 289passenger services, 229, 231f
railways, 234–235, 243–244paved road density, 96bperformance contracts, 118, 119b, 120f, 122n3
power sector, 196road maintenance, 214water utilities, 313, 314b
Peru and joint household utility access, 130Pier One scheme, 253piped water
access to, 88–89, 88–89f, 96fcosts of, 95, 97thuman development benefi ts of, 94urban vs. rural access to, 300–301, 301t, 303f, 303t
policy challengesairports and air transport, 263–265, 264t, 267–269power sector, 194–201water supply, 319–320
political consensus for regional integration, 154–155polity executive constraint scores, 108ports and shipping, 249–258
confi guration of, 252–253, 252ffi nancing, 133ICT needs, 258independent regulators and, 120
infrastructure as constraint on economic growth, 45institutional competence and capacity, 108, 109f, 110finternational shipping market and, 255–256maritime traffi c trends, 250–251, 250–251t, 251fmarket, 250–251modal integration policies, 258in multimodal transport network, 204ownership and management, 253performance, 254–255, 254f, 255tpolicy issues, 255–258pricing, 256–257private sector participation, 111–113, 111f, 114b, 114f, 116,
117t, 157, 257–258, 257bregional connectivity and, 56, 144, 150, 152regulatory framework, 256–257strategic planning, 256
poverty reduction, 87–103agriculture and, 125–126, 287, 288–289, 296, 296bbasic infrastructure access, 95beconomic growth and, 44modern infrastructure services
affordability of, 90–94, 91talternatives to, 94–95inequitable access to, 88–89f, 88–90
recommendation for, 23–24regional integration and, 156service expansion challenges, 97–102
affordability analysis, 98–100demand side, 90t, 97–98second-best solutions for, 87, 94–95, 96f, 96t, 102subsidies, 98b, 100–102
urban vs. rural income level differentials, 128, 128twater resources and, 274, 277, 278f
Poverty Reduction Strategy Papers, 295power sector, 181–202
capacity issues, 5, 6f, 182, 183–184b, 183fcost recovery, 50, 191–193f, 191–194, 193t, 197–198economic impact of, 45, 45f, 52–53, 53–54t, 141n5economies of scale and, 144electricity grid access, 198, 199bfi nancing, 133funding gap, 66, 75, 75t, 186, 186t, 200–201independent regulators and, 121tinfrastructure as constraint on economic growth, 45institutional competence and capacity, 107, 108, 109,
109f, 110finstitutional reforms, 187–190investment backlog, 185–186non-OECD fi nancing for, 67, 68f, 78ODA for, 68foperating ineffi ciencies, 10–12, 11–12f, 12t, 66, 72, 73, 181,
186, 188fperformance data collection, 40planning, 194–195policy challenges, 194–201

Index 349
PPI investment, 68f, 80pricing, 4–5, 5t, 191–194, 191–192fprivate sector participation, 111–112, 111f, 115f, 116,
117t, 189bpublic expenditures on infrastructure, 68–69f, 70–71tregional integration, 143, 147f, 148–150, 150f, 187, 198–200spending needs, 36, 43, 52–53, 58, 185–186, 185tstate-owned enterprise reforms, 120f, 120t, 195–197subsidies, 92–93, 93–94ftariffs, 92–93urban vs. rural access, 129, 129f, 130fwater resource management and, 280
PPI. See private participation in infrastructureprepaid telephone service, 166prepayment meters, 100, 100fPrevention, Public Hygiene and Sanitation Ministry
(Senegal), 334pricing
airports and air transport, 263, 263finfrastructure cost premium, 4–5, 5t, 49–52, 50tports and shipping, 256–257power sector, 4–5, 5t, 191–192f, 191–194water resources, 299, 307–309, 307f
primary school completion and electricity access, 46Principles of Corporate Governance for SOEs (OECD), 119principles of effi cient urbanization, 139–140private participation in infrastructure (PPI), 66–67, 76, 79–80,
80t, 304, 304tPrivate Participation in Infrastructure database, 37private sector participation (PSP). See also specifi c infrastructure
sectorselectricity access, economic impact of, 182institutional competence and capacity, 12–14, 14t, 110–117,
111f, 111t, 113–115f, 116bpower sector, 189brailways, 239–240, 239fregional integration, 157–158water utilities, 310–313, 311f, 312b, 312t
privatization, 171, 179n1Program for Infrastructure Development in Africa, 157property rights, 134–136, 136b, 138–139, 140PSP. See private sector participationpublic expenditures on infrastructure, 8–9, 9f, 9t
documentation of, 37–38funding gap, 66–67, 67–69f, 69–71troad network spending, 218, 219tsanitation, 329water resources, 304, 304t
Public-Private Infrastructure Advisory Facility, 32public-private partnerships. See also private participation
in infrastructure (PPI); private sector participation (PSP)
agricultural water management, 295hydropower projects, 281ports and shipping, 253
water utilities, 312bpublic service port model, 253
radio spectrum management reforms, 177–178railways, 229–247
concessions, 238–240, 242–243, 242f, 245condition of, 232–233cost recovery, 245density of, 230–231fi nancial performance, 240–242fi nancing, 133freight services, 235–236government role, 243–245independent regulators, 120institutional competence and capacity, 109f, 110f, 238–243
private sector, 113–114intraregional trade and, 152investment needs and justifi cation, 236–238market for, 233–236in multimodal transport network, 204networks, 230–233, 230–231fnon-OECD fi nancing for, 67operational performance, 240passenger services, 234–235, 243–244private sector participation, 111–112, 111f, 115f, 117t,
239–240, 239f, 244–245regional connectivity and, 56regulatory framework, 245traffi c
density, 230–231, 231–232f, 246n2trends, 233–234, 234f
rainfall. See hydroclimatic variabilityrainwater harvesting, 294reform. See specifi c infrastructure sectorsRegional Indicative Strategic Plan (Southern African
Development Community), 156regional integration, 143–161
ICT sector, 146–148, 147f, 148b, 148t, 174importance of, 144–146infrastructure priorities, 156–158
economic returns, 156–157private participation, 157–158spatial targeting, 157
institutional capacity, 155–156opportunities for, 146–154political consensus for, 154–155power sector, 53, 148–150, 150f, 187, 198–200project preparation and fi nance, 158–159recommendation for, 20–22regulatory frameworks for, 159–160transport and trade networks, 56, 150–153, 151t, 152f, 159bwater resources, 153–154, 279, 282–283, 283f
regulatory frameworkbenchmarking and, 114–115ICT sector reforms, 170

350 Index
on Infrastructure Institutional Scorecard, 106–107binstitutional competence and capacity, 109, 110fmarket reforms and, 169, 170fports and shipping, 256–257power sector ineffi ciencies and, 188–189, 189f, 195property rights, 134–136, 136b, 138–139, 140radio spectrum, 178railways, 245recommendation for, 19–20regional integration, 144, 159–160road freight transport, 224–225water utilities, 313
Republic of Congomultimodal transport network, 204–205railways, 232regional integration, 155sanitation, 325
Republic of Koreainfrastructure as constraint on economic growth, 2urban population density, 134
reservoir water storage, 53–54, 58, 277, 279–282, 280fresource-rich countries
in AICD typology, 48, 51bcapital budget for infrastructure, 68–69, 69t, 76, 76teconomic growth, 44economic return on infrastructure investment, 70, 71tfi nancing needed to meet water MDG, 302–305, 303tfunding gap, 8, 66–67, 67t, 75, 75t, 83infrastructure, 48institutional competence and capacity, 107, 108flocal capital markets and, 81tnon-OECD fi nancing, 67, 68f, 78–79, 79t, 85n3ODA to, 68f, 78tpower sector spending needs, 185, 185t, 186tPPI investment, 67, 68f, 80, 80tpublic sector expenditures, 67, 68f, 69f, 70–71troad network spending needs, 219tspending estimates, 43, 58–59water resources funding gap, 302–305, 305t
risk managementhydroclimatic variability, 277
river basinstransboundary nature of, 153–154, 272–273, 274f, 279
roads, 211–227alternative technologies for, 84condition of, 217, 218fcosts of, 225–226economic impact of, 45, 45ffreight services and, 219–220, 220t, 224–225funding arrangements for, 213infrastructure, 212institutional capacity and, 213–215, 214f, 215b, 221–222intraregional trade and, 152maintenance, 56, 70, 74, 215–217, 216fODA and, 67, 218, 219t
private sector participation, 116, 117tpublic expenditures on infrastructure, 70–71t, 218–219, 219treform agenda, 221–226regional integration, 147frural transport and, 220, 222–223safety improvements, 221, 226sector performance data collection, 39spending allocation, 215–217, 216fspending needs, 36, 217–219, 219ttransport services and, 219–221urban transport and, 220–221, 223–224
RONET (road sector modeling tool), 39runway capacity and quality, 265–266, 266trural areas
electrifi cation, 198, 199bfi nancing, 138ICT sector impact on, 47infrastructure, 2–3, 3f, 128–130land use planning, 139mobile phone coverage, 166, 166froads, 211, 212, 220, 222–223sanitation, 325–326, 326f, 326t, 327, 328ftransportation networks and, 46, 56urban links to, 126–130water resource management, 46, 277, 316bwater resources as human development constraint, 305water supply access, 300–302, 313–316, 315f, 315t
Rural Development Agency (Nigeria), 316bRural Reform Index for water, 315Rwanda
agricultural employment, 274ODA, 79paved road density, 96bpower sector underpricing, 191private sector participation, 112road funding, 213road maintenance, 215sanitation, 95, 323, 326, 327f, 329telecommunications sector privatization, 171undermaintenance, 73utility payment collection, 100water resource management, 280, 282, 306, 306bwater supply, 313, 319, 320
Safe Skies for Africa program, 268safety
airports and air transport, 263, 267–268, 268fports and shipping, 255railways, 240road improvements, 221, 226
sanitation, 323–336access to, 88, 88–89f, 323, 329capital budget for, 68challenges, 329–333cost recovery, 329, 333, 334, 334b

Index 351
defi ning improvement, 324bdemand stimulation for, 330–331, 331bevaluation of, 324–329fi nancing, 75, 75t, 333–334human development constrained by, 45–46institutional competence and capacity, 328–329ladder, 324–325, 325fMDG for, 54–55, 323, 329, 334–335non-OECD fi nancing, 67, 68fODA for, 67, 68foperating ineffi ciencies, 74tpatterns of access, 325–327, 326f, 326t, 328fPPI investment, 67, 68fprogress measurement, 334–335public expenditures on infrastructure, 67, 68f, 70–71t, 329sewerage affordability, 333sharing of facilities, 325, 325fspending needs, 36, 55t, 58supply adequacy, 331–333urban vs. rural access, 129, 129f, 130f
SanPlat latrines, 324, 335n2scale economies, 143, 144, 148–150SEACOM (South Africa–East Africa–South Asia–Fiber Optic
Cable), 148bseaports. See ports and shippingsector performance. See also specifi c sectors
AICD project scope, 38–41defi ned, 33
Senegalaffordability issues, 92defi cit-fi nanced public investment, 77bdrinking water access, 300electricity access, 194electricity outages, 182independent regulators, 120, 121binformal settlements, 136infrastructure as constraint on economic growth, 2, 45irrigation, 290, 290fmunicipal budgets, 134non-OECD fi nancing, 79power sector, 149, 150f, 184, 191private sector participation, 112, 115railways, 204, 234road network, 213, 215, 216sanitation, 323, 325, 326, 327f, 331–333, 332ttransport infrastructure, 150, 151turban planning, 138water supply, 88, 307, 312b, 315, 319water utilities, 310, 311
Senegal River basin, 272, 279Senegal River Basin Organization, 282, 283fSenegal River Development Organization, 153septic tanks, 323–325service expansion challenges, 97–102
affordability analysis, 98–100
demand side, 97–98second-best solutions for, 102subsidies, 98b, 100–102
sewerage system, 325Seychelles
airports and air transport, 261ICT investments, 58
shipping. See ports and shippingSierra Leone
access to basic infrastructure, 95bpower trade, 150f
Sikasso–Korhogo–Bamako initiative, 157slums. See informal settlementssmall-scale irrigation, 290–292, 291b, 291t, 293tSociété de Distribution d’Eau de la Côte d’Ivoire
(SODECI), 302bSODECI (Société de Distribution d’Eau de la Côte
d’Ivoire), 302bSOEs. See state-owned enterprisessolar power, 182, 198South Africa
agricultural employment, 274airports and air transport, 260, 261, 266, 268–269drinking water access, 300governance, 110irrigation, 289, 292maritime traffi c growth, 250, 250–251t, 251fmultimodal transport network, 209municipal budgets, 133ports and shipping, 253, 254, 256power supply issues, 183–184bpower trade, 150fprivate sector participation, 112railways, 230, 231, 233, 234, 238, 244regional integration, 157road network, 213, 217sanitation, 325spending estimates, 59transport infrastructure, 150, 152undermaintenance, 73utility charges, 90, 99, 100water resource management, 282water tariffs, 308bwater utilities, 310
South Africa–East Africa–South Asia–Fiber Optic Cable (SEACOM), 148b
South African Airways, 151, 260, 262, 269South African Port Operations, 256South Asia
basic infrastructure access, 88drinking water access, 300electricity access, 182infrastructure, 2–3, 47–48, 49fwater tariffs, 307
South Atlantic 3/West Africa Submarine Cable (SAT-3), 146, 176
352 Index
Southern Africaairports and air transport, 268, 268fwater resource management, 277
Southern African Development CommunityAICD and, 32airports and air transport, 264–265, 264t, 269infrastructure, 48regional integration, 156, 159b
Southern African Power Pool, 52, 53–54t, 150, 185, 187, 190bSouthern Nations Regional Health Bureau, 330, 331bspatial modeling
regional integration, 157spending needs estimates and, 35, 35burban areas, 134–136
spending needsAICD estimates, 34–36Commission for Africa estimate, 58country distribution, 58–59defi ned, 33ICT, 56–58infrastructure, 52–58investment vs. maintenance, 60irrigated areas expansion, 54power sector, 52–53roads, 217–219transport network, 55–56urban areas, 132–133water and sanitation, 54–55water security, 53–54
Spoornet (South Africa), 209, 233standposts
as second-best solution, 94–95, 96f, 97t, 102as water supply, 299, 300–301, 301t, 303f, 303t, 305–306, 306b,
318–319state-owned enterprises (SOEs)
airports and air transport, 260, 267capital budget for infrastructure, 68–69corporatization of, 313ICT sector reforms, 170–171, 176institutional competence and capacity, 117–120, 119f
lessons from, 118b, 119bIPPs and, 194management contracts, 112–116, 119b, 122n3operating ineffi ciencies, 66, 71–74, 309port ownership and management, 253power sector, 190, 190b
reforms, 195–197spending needs estimates and, 36water supply, 314b
State Rural Water Supply and Sanitation Agency (Nigeria), 316b
storage infrastructure for water security, 53–54, 58, 277, 279–282, 280f
strategic planningirrigation, 294–295ports and shipping, 256
street lighting, 94–95, 97tsubmarine communication cables, 146, 148b, 149t, 174Sub-Saharan Africa. See also specifi c countries
agricultural growth, 288AICD focus on, 33, 34fairports and air traffi c, 261–262, 262fdrinking water access, 300economic growth, 76economic return on infrastructure investment, 70, 71telectricity access, 182geography as infrastructure challenge, 3–4ICT investment, 147, 148b, 148tinfrastructure fi nancing needs, 31–32irrigation, 40, 289–290, 289t, 296logistics system needs, 205–206population density, 134–135, 135twater resource management, 272–275, 275t
Sub-Saharan Africa Transport Policy Program (SSATP), 39subsidies
power sector, 192–193, 197service expansion, 98b, 100–102utility connections, 87, 98–99, 98b, 100–101, 101tof water and power tariffs, 92–93, 93–94f
Sudandrinking water access, 300hydroclimatic variability, 272, 273firrigation, 289, 290non-OECD fi nancing, 78, 79power trade, 149, 150fPPI investment, 80private sector participation, 112telecommunications industry privatization, 170utility connection charges, 90
surface water, 300, 301, 313urban vs. rural access to, 301t, 303f, 303t
Swaziland, railways in, 231, 233, 238
Tanzaniaaffordability issues, 92airports and air transport, 262–263, 266, 267budget allocation increases, 318electricity outages, 182independent regulators, 120informal settlements, 136irrigation, 290ODA, 79power sector underpricing, 191private sector participation, 113, 114b, 116, 116bproperty rights, 136brailways, 233, 239road network, 213, 222–223standposts, 95telecommunications regulation, 170transport infrastructure, 150, 151turban infrastructure, 128, 137utility tariffs, 99

Index 353
water resource management, 46, 280, 282, 305water supply, 314, 315
Tanzania Investment Centre, 136bTanzania Railways Corporation, 233tariffs
cost recovery and, 70–71, 99–100, 99fincreasing block tariffs, 101, 308bpower sector, 191price premium of, 49–52rail freight, 235road freight, 5, 50, 151subsidies of, 92–93, 93–94ftelecommunications, 170, 170fwater, 299, 307–309, 308b, 319–320
TEAMS (The East Africa Marine System, Kenya), 148b, 148ttelecommunications. See also information and communications
technologiesaccess to, 88–89fcost recovery, 5economic impact of, 45, 45f, 47independent regulators and, 120, 121tinstitutional competence and capacity, 107, 108, 109f, 110flandline. See landline telephonesoperating ineffi ciencies, 66, 72price premium on, 50–52private sector participation, 111–113, 111f, 113fregional cooperation opportunities, 146–148, 148bsector performance data collection, 39state-owned enterprises, 118
Tema Development Corporation, 138thermal power, 149, 200time allocation and basic infrastructure access, 95bTIPAC (Transit Inter-États des Pays de l’Afrique Centrale), 208bTIR (Transports Internationaux Routiers, EU), 206, 208bTogo, urban infrastructure fi nancing in, 137toll roads, 213tour de role dispatching, 203, 210n1, 220, 224trade
by landlocked countries, 206power sector, 53, 187, 198–200regional integration and, 149, 150–153, 150f, 151t, 159btransportation network and, 153, 204–205
traffi c volumesair transport, 260–261, 260f, 261tmaritime, 250–251, 250–251t, 251frailways, 233–234, 234froads, 212
Trans-Africa Highway Network, 34, 152–153, 212transboundary river basins, 153–154, 272–273, 274f, 279transit corridor development, 206–207, 207b, 208bTransit Inter-États des Pays de l’Afrique Centrale (TIPAC), 208bTransnet, 256transparency
private sector participation, 114–115, 117state-owned enterprises, 195
Transportation Department (U.S.), 268
transportation sector, 203–210alternative technologies for, 84capital budget for, 68competition, 207–208fi nancing, 133human development constrained by, 46infrastructure as constraint on economic growth, 45institutional competence and capacity, 108, 109local capital markets and, 81logistics systems for, 205–206, 205f, 207bmultimodal transport, 204–205non-OECD fi nancing, 68fODA for, 68foperating ineffi ciencies, 74tPPI investment, 68fprivate sector participation, 116, 117t, 209public expenditures on infrastructure, 68f, 69f, 70–71tregional integration, 145, 147froads. See roadssector performance data collection, 39social obligations and, 209–210spending needs, 36, 55–56, 57ttransit corridor development, 206–207, 207b, 208burban vs. rural network quality, 129, 130f
Transports Internationaux Routiers (TIR, EU), 206, 208btrucking regulation, 206–207, 224–225
Ugandaaffordability issues, 92defi cit-fi nanced public investment, 77bdrinking water access, 300hydroclimatic variability, 272, 273fhydropower project, 201informal settlements, 139mobile phone coverage, 178multimodal transport network, 204paved road density, 96bpower sector ineffi ciencies, 187PPI investment, 80private sector participation, 112, 113railways, 233, 244road maintenance, 216sanitation, 325standposts, 95state-owned enterprises, 118, 119b, 314btelecommunications industry privatization, 171undermaintenance, 73water supply, 313, 315, 316, 320
state-owned enterprise reforms, 314bwater utilities, 310, 313
underwater communication cables, 146, 149t, 174unimproved latrines, 94, 96f, 97t, 321–327, 328fUnion of African Railways, 237Union of Producers, Transporters and Distributors of
Electric Power in Africa, 40United Arab Emirates, submarine cable project, 148b

354 Index
United Kingdom and development assistance, 32United Nations Children’s Fund (UNICEF), 300, 321n2,
323, 324bUnited States and development assistance, 78, 295bUniversal Safety Oversight Program (International Civil Aviation
Organization), 268Urban Affairs, Housing, Urban Water, Public Hygiene and
Sanitation Ministry (Senegal), 334urban areas, 125–142
agricultural productivity near, 126–127, 127t, 140n2capital budgets, 133–137, 134felectrifi cation, 198as growth engine, 126growth of, 127–128, 127t, 136–137housing planning, 134–136informal settlements, 136–137, 139infrastructure, 2–3, 3f, 128–130, 129–130f, 131t
costs of, 130–132, 131t, 133–134ffi nancing, 133–138, 135t
investment needs, 132–133land regulations, 134–136, 136b, 138–139mobile phone coverage, 166, 166fprinciples of effi cient urbanization, 139–140public transportation, 94, 96broads, 220–221, 223–224rural links to, 126–130, 140n1sanitation, 325–326, 326f, 326t, 327, 328fspatial planning, 134–136territorial planning and, 138–139transportation networks and, 56water supply access, 300–302, 311f, 320–321
user charges, 68, 70–71, 72tU.S. Geological Survey, 35butilities. See also specifi c sectors
connection subsidies, 90, 98–99, 98b, 100–101, 101t, 308binstitutional competence and capacity, 108nonpayment issues, 91, 91foperating ineffi ciencies, 10–12, 11–12f, 11f, 12t, 66, 71–74,
73t, 310–313, 311f, 312tdistribution losses, 72–73overemployment, 72undercollection of bills, 73undermaintenance, 73–74, 73f
prepayment meters, 100, 100fwater supply and, 301, 301t, 302–303t, 306b, 318–319
Ventilated Improved Pit (VIP) latrines, 324, 335n2Voice over Internet Protocol (VoIP), 175voice services, 166–167, 172, 172t
water resources, 271–285, 299–322. See also irrigationalternative technologies for, 84, 96f, 97tcapital budget for, 68climate resilience, 279cost recovery, 307–309, 307f, 308b, 319–320
economic development and, 272–276, 277fi nancing, 133, 302–305, 303tfunding gap, 66, 75, 75t, 302–305, 305tgroundwater, 320–321human development constrained by, 45–46, 274–275independent regulators and, 120, 121tinstitutional competence and capacity, 108–109, 109–110f,
115–116, 116b, 282–283management of, 4, 272–275, 274–275f, 275tMDG for, 299, 300, 302–305, 303t, 321n1non-OECD fi nancing, 68f, 304ODA for, 67, 68f, 304, 304toperating ineffi ciencies, 10–12, 11–12f, 12t, 66, 72, 73, 74t,
310–311f, 310–313, 312tpoverty reduction and, 274, 277, 278fPPI investment, 68f, 304, 304tprivate sector participation, 111–112, 111f, 115–116, 116b,
117t, 310–313, 311f, 312bpublic sector expenditures, 68f, 69f, 70–71t, 304, 304treforms, 309–313, 311f, 315t, 317regional integration of resources, 153–154, 279,
282–283, 283fresellers, 301, 302brural access, 129, 129–130f, 300–302, 301–302t, 313–316,
315f, 315t, 316bsector performance data collection, 39–40security. See water securityspending needs, 36, 54–55, 55t, 58, 280–281, 281tstandposts for, 305–306, 306bstate-owned enterprises, 119b, 120f, 120t, 314bsubsidies, 92–93, 93–94ftariffs, 92–93, 299, 307–309, 308b, 319–320technologies for, 305–307, 318–319transboundary river basins, 153–154, 272–273, 274f, 279urban access, 129, 129–130f, 300–302, 301–303t, 320–321
water securitychallenges, 276–277economic development and, 276f, 277, 277binvestment needs, 279–283spending needs, 53–54storage infrastructure, 279–282
Water Utilities Partnership, 39weather forecasting, 275–276, 279wells, 94, 96f, 97t, 300
urban vs. rural access to, 300–301, 301t, 303f, 303t, 320West Africa. See also specifi c countries
airports and air transport, 263, 268, 268fair transport hubs, 151, 260backup generators, 184capital markets, 81economic growth, 44electricity access, 193freight services profi t margins, 50, 220ICT investment, 147, 148b, 148tinfrastructure, 48
Index 355
maritime traffi c growth, 250, 250–251t, 251fmultimodal transport network, 204port system, 252, 255railway concessions, 238–239regional integration, 156roads, 211water utilities, 310
West African Economic and Monetary Union, 156, 264–265, 264tWest African Gas Pipeline, 154West African Power Pool, 52, 53, 53–54t, 159–160, 185, 187
Master Plan, 34WHO/UNICEF Joint Monitoring Programme, 300WiMAX technology, 57, 58wireless technologies, 178Wodon, Quentin, 95bwomen and water resources, 45–46, 94, 304–305World Bank
AICD and, 32, 37, 40AICD GIS data from, 35bCountry Policy and Institutional Performance Assessment, 51irrigation investment by, 295bODA from, 78regional project criteria, 158
World Development Report 2009 (World Bank), 127, 141n4, 145World Health Organization (WHO), 300, 321n2, 323,
324b, 335n3World Meteorological Organization, 275–276
Yamoussoukro Decision (1999), 151, 159, 259, 264, 268yard taps, 319
Yemen ports and shipping, 253Ying, Yvonne, 95b
Zambezi River basin, 272, 280Zambia
border crossing delays, 159bbroadband access, 173governance, 108hydrologic variability, 273irrigation, 290, 290fland use policies, 138mobile phone coverage, 172power sector underpricing, 191railways, 204, 230, 235, 239, 244road network, 213, 214, 215, 222–223sanitation, 329shipping, 251transit corridor development, 207utility ineffi ciencies, 309water resource management, 276, 282, 306water supply, 315, 320water utilities, 313
Zambia–Malawi–Mozambique growth triangle, 157Zimbabwe
border crossing delays, 159bdrinking water access, 300railways, 230, 232, 238, 244transit corridor development, 207water resource management, 281water supply, 320


The World Bank is committed to preserving endangered forests and natural resources. The Offi ce of the Publisher has chosen to print Africa’s Infrastructure: A Time for Trans-formation on recycled paper with 30 percent postconsumer fi ber in accordance with the recommended standards for paper usage set by the Green Press Initiative, a nonprofi t program supporting publishers in using fi ber that is not sourced from endangered forests. For more information, visit www.greenpress initiative.org.
Saved:• 31 trees• 10 million Btu of
total energy• 2,957 lb. of net
greenhouse gases• 14,242 gal. of waste
water• 865 lb. of solid waste
ECO-AUDIT
Environmental Benefits Statement


