Embed Size (px)
Citation preview
Afro-Egyptian Journal of Infectious and Endemic Diseases
والمتوطنة المعدية لالمراض المصرية االفريقية المجلةISSN (Online): 2090-7184
ISSN ( Print ): 2090-7613
An Official Publication of Endemic and Tropical Medicine Department, Faculty of Medicine,
Zagazig University, Zagazig 44519, Egypt
Editor-in-Chief: Mohamad El-Khashab
E mail:[email protected]
Co-Editors-in-Chief: Mohamad Emam
E mail:[email protected]
Nahla Elgammal
E mail:[email protected]
Maysaa Saed
E mail:[email protected]
Executive Editor: Tarik Zaher
E mail:[email protected]
Assistant Editors: Sahar Elnimr
E mail:[email protected]
Mohamad Emara
E mail:[email protected]
Editorial Board: Zagazig University, Egypt : Amira Suliman,Endemic and Tropical Medicine
Walid Abdel-Dayem,Endemic and Tropical Medicine
Ahmad Sakr,Endemic and Tropical Medicine
Hala Ismail,Endemic and Tropical Medicine
Samia Etewa,Parasitology
Mohiddin Abdel-Fattah,Parasitology
Ayman Marii,Microbiology
Mahmoud Wahid,Pathology
Khaled Talaat,Internal Medicine
Amany Ibrahim,Internal Medicine
Ahmad Refaat,Medical Statistics
Tarek Hamed Attia, Pediatrics
Shreen Elaraby,Physiology
Heba Pasha,Biochemistry and Molecular Biology
Cairo University,Egypt: Ahmad El-Garem,Endemic and Tropical Medicine
Shukry Hunter,Endemic and Tropical Medicine
Ayman Yousry, Endemic and Tropical Medicine
Ain Shams University,Egypt: Amr Fateen,Internal Medicine
Reda El-Wakil,Endemic and Tropical Medicine
Mansoura University, Egypt: Gamal Sheha,Internal Medicine
Magdy Hamed,Internal Medicine
Tanta University,Egypt: Mohamad Sharaf,Endemic and Tropical Medicine
Nadia Elwan, Endemic and Tropical Medicine
Assiut University, Egypt: Ahmad Nasr,Endemic and Tropical Medicine
Othman Abdel-Hamid Othman, Endemic and Tropical Medicine
Benha University, Egypt: Samir Qabil,Endemic and Tropical Medicine
Magdy Atta,Endemic and Tropical Medicine
Military Medical Academy,Egypt: Mamdouh Elbahnasawy,Endemic and Tropical Medicine
Sudan: Amin A. Elzaki, Radiology
Mustafa Z. Mahmoud, Radiology
Nigeria: Adeolu O. Akinboro, Dermatology
Greece: Angela Revelas, Pathology
Saudi Arabia: Mohamed Nasr Eldin Bekhit, Endemic and Tropical Medicine
Kuwait: Mohamad Saria,Endemic and Tropical Medicine
Mohamad Alboray,Internal Medicine
Yemen: Abd Elhafez Alsady,Intrernal Medicine
Mostafa Mahmoud,Cardiology
Morocco: Zineb Tlamcani, parasitology
Secretary: Mohamad Magdy,Endemic and Tropical Medicine
Soha Elhawary,Endemic and Tropical Medicine
E-Archiving: Emad Abdel-Hamid
Talaat Fathy
Published by: Communication and Information Technology Center (CITC), Zagazig University, Zagazig, Egypt Atef Eraky
E mail:[email protected]
Wafaa Metwally
E mail:[email protected]
Mahmoud Abd-Elhamid
E mail:[email protected]
Scope of the Journal The Afro-Egyptian Journal of Infectious and Endemic Diseases (AJIED) is a peer-reviewed journal that publishes clinical,
parasitological, microbiological, physiological, biochemical, immunological and pathological studies in the field of infectious,
endemic and tropical diseases. The scope of the journal includes also articles of endemic gastroenterology and hepatology. The
journal is published quarterly by Endemic and Tropical Medicine Department, Faculty of Medicine, Zagazig University,
Zagazig, 44519, Egypt and hosted by Communication and Information Technology Center(CITC),Zagazig University, Zagazig,
Egypt .
Submission Process The Journal accepts online submissions only. Manuscripts can be submitted at http://mis.zu.edu.eg/ajied/home.aspx. Once the
manuscript has been uploaded, our system automatically generates an electronic pdf, which is then used for reviewing. All
correspondence, including notification of the Editor's decision and requests for revisions, will be managed through this system.
Authors can follow the progress of their paper using this system to final decision. For any problems please contact the Editorial
Office [email protected]. (you can send your submissions directly through this E-mail).
Due to editorial policy to accept high quality articles, the journal accept only 50% of received articles.
Authorship All authors should have made substantial contributions to all of the following:
(1) the conception and design of the study, or acquisition of data, or analysis and interpretation of data
(2) drafting the article or revising it critically for important intellectual content
(3) final approval of the version to be submitted.
Article types The following types of manuscripts are routinely accepted:
1- Original Articles: This should include an abstract, keywords, introduction, patients/material and methods, results, discussion
and references. They should be no longer than 5000 words (word count excludes tables, figures, legends and references).
2- Reviews: An abstract and keywords are required. The text should be divided into sections by suitable headings. Tables and
figures may be used as appropriate for the text. They should be no longer than 6000 words.
3- Opinions, Commentaries and Letters to the editor: These take the same form as a review.
4- Short Communications: These should be no more than 2,500 words, with up to 15 references and a maximum of 3 figures or
tables.
5- Case Reports: Case reports should present only cases of exceptional interest including presentation, diagnosis and
management of disease. They should contain short summaries, an introduction, the case report, discussion, a reference list,
tables and figure legends.
6- Images in Infectious and Endemic Diseases: These consist of interesting cases with high quality images with a short text and
no more than 10 references.
Preparation of the manuscript Please ensure that the followings are included in your submission: -One author designated as the corresponding author: His E-
mail address, full postal address Telephone and fax numbers -Keywords -Cover letter addressed to the Editor, introducing the
manuscript and confirming that it is not being submitted concurrently elsewhere -All figure captions -All tables (including title,
description, footnotes) -All necessary files have been uploaded -Manuscript has been spell checked -All text pages have been
numbered -References are in the correct format for this journal -All references mentioned in the Reference list are cited in the
text and vice versa -Permission has been obtained for use of copyrighted material from other sources (including the Web) -
Color figures are clearly marked as being intended for color reproduction or to be reproduced in black-and-white.- Manuscripts
:Please type all pages with double spacing and wide margins on one side of the paper. Title page, abstract, tables, legends to
figures and reference list should each be provided on separate pages of the manuscript. Use font such as Times New Roman or
Arial. The text should be in single-column format. Number the pages. Keep the layout of the text as simple as possible. Most
formatting codes will be removed and replaced on processing the article. In particular, do not use the options to justify text or
to hyphenate words. However, do use bold face, italics, subscripts, superscripts etc. Do not embed 'graphically designed'
equations or tables, but prepare these using the facility in Word or as a separate file in Excel. When preparing tables, if you are
using a table grid, use only one grid for each individual table and not a grid for each row. Do not prepare tables in PowerPoint.
To avoid unnecessary errors you are strongly advised to use the spellchecker. The title page should include: the title, the
name(s) and affiliation(s) of the author(s), an address for correspondence, and telephone/fax numbers for editorial queries. All
articles should include an Abstract of no more than 300 words and 3-6 key words for abstracting and indexing purposes. Please
write your text in good English. Use decimal points (not commas); use a space for thousands (10 000 and above).
Provide the following data in your submission (in the order given).
1- Title page (separate page): Title should be concise and informative. Avoid abbreviations and formulae where possible.
Author names and affiliations. Where the family name may be ambiguous (e.g., a double name), please indicate this clearly.
Present the authors' affiliation addresses (where the actual work was done) below the names. Indicate all affiliations with an
Arabic number immediately after the author's name and in front of the appropriate address. Corresponding author: This should
be indicated after authors affiliations. Clearly indicate who is willing to handle correspondence at all stages of refereeing and
publication, also post-publication. . Ensure that telephone and fax numbers (with country and area code) are provided in
addition to the e-mail address and the complete postal address.
2- Abstract: (separate paper). A concise and informative abstract is required (maximum length 300 words). The abstract should
state briefly the purpose of the research, the principal results and major conclusions. Do not cite references in the abstract.
Non-standard or uncommon abbreviations should be avoided in the abstract, but if essential they must be defined at their first
mention in the abstract itself. The abstract should be divided into: Background and study aims, patients/material and methods,
results and conclusion. Keywords Immediately after the abstract, provide a maximum of 6 keywords.
3- Abbreviations: Define abbreviations that are not standard in this field at their first occurrence in the article (even if mentioned
in the abstract). Ensure consistency of abbreviations throughout the article
4- Introduction: State the objectives of the work and provide an adequate background, avoiding a detailed literature survey or a
summary of the results. The aim of the work should be described at the end of introduction section.
5- Patients/Materials and methods: Provide sufficient detail to allow the work to be reproduced. Methods already published
should be indicated by a reference. Only relevant modifications should be described. Include in figure legends and table texts,
technical details of methods used, while describing the methods themselves in the main text.
6- Results: This should explore the significance of the results of the work, not repeat them. A combined Results and Discussion
section is often appropriate in a Short Communication but not in an Original Article. Ensure that the chapter results stands by
itself and explain all results of your work. Note that all tables and figures should be presented in separate papers.
7- Discussion: Discuss your results and avoid extensive citations and discussion of published literature.
8- Acknowledgement: Collate acknowledgements in a separate section at the end of the article and do not, therefore, include
them on the title page, as a footnote to the title or otherwise. When the work included in a paper has been supported by a grant
from any source, this must be indicated. A connection of any author with companies producing any substances or apparatus
used in the work should be declared in this section. All contributors who do not meet the criteria for authorship as defined
above should be listed in an acknowledgements section. Examples of those who might be acknowledged include a person who
provided purely technical help, writing assistance, or a department chair who provided only general support. Authors should
disclose whether they had any writing assistance and identify the entity that paid for this assistance.
9- References: References should be numbered consecutively (with parentheses) as they appear in the text e.g. [5]. Type the
reference list with double spacing on a separate sheet. This includes family name and first name initial, up to 6 authors are
required and more authors are marked with et al. Examples: 1- Abdel-Wahab M, Esmat G, El-Boraey Y, Ramzy I, Medhat E,
Strickland G. The epidemiology of schistosomiasis in Egypt: methods, training, and quality control of clinical and ultrasound
examinations . Am J Trop Med Hyg 2000 ; 62 (suppl) :17-20. 2- Wright W. Geographical distribution of schistosomes and their
intermediate hosts. Ansari N, ed. Epidemiology and control of schistosomiasis (bilharziasis). Baltimor ;University Park
Press 1973 ;42-48.. Do not include references to personal communications, unpublished data or manuscripts either 'in
preparation' or 'submitted for publication'. If essential, such material may be incorporated into the appropriate place in the text.
Recheck references in the text against reference list after your manuscript has been revised. All references listed in the text
should be included in the reference list and all references in the reference list should be included in the text.
10- Illustrations: Photographs should be presented as high quality jpg. Illustrations will not be redrawn by the Publisher: line
figures should be suitable for direct reproduction. They should be prepared with black on white background, or be black-and-
white images; ; they should be completely and consistently lettered, the size of the lettering being appropriate to that of the
illustration, taking into account the necessary reduction in size. Colour figures will be included
11- Tables: Number tables consecutively in accordance with their appearance in the text. Place footnotes to tables below the
table body and indicate them with superscript lowercase letters. Avoid vertical rules. Be sparing in the use of tables and ensure
that the data presented in tables do not duplicate results described elsewhere in the article.
Editorial Review All manuscripts are subjected to peer review. If changes are requested, revisions received later than 2 months after this request
will be treated as new submissions. When changes are made, the corresponding author should go into resubmission under title
of submission of revised manuscript, and a word document should be uploaded that indicates changes and modifications done.
Off prints The corresponding author, at no cost, will be provided with a PDF file of the article via e-mail. Authors can download the PDF
from the journal web page and in the same way the journal cover image can be downloaded.
Policy and Ethics Declarations Upon submission you will be required to declare funding, conflict of interest and to indicate whether ethical approval was
sought. This information must also be inserted into your manuscript under the acknowledgements section. If you have no
declaration to make please insert the following statements into your manuscript: Funding: None, Competing interests: None
declared, Ethical approval: Not required . Work on human beings that is submitted to AJIED should comply with the principles
laid down in the Declaration of Helsinki; Recommendations guiding physicians in biomedical research involving human
subjects. Adopted by the 18th World Medical Assembly, Helsinki, Finland, June 1964, amended by the 29th World Medical
Assembly, Tokyo, Japan, October 1975, the 35th World Medical Assembly, Venice, Italy, October 1983, and the 41st World
Medical Assembly, Hong Kong, September 1989. The manuscript should contain a statement that the work has been approved
by the appropriate ethical committees related to the institution(s) in which it was performed and that subjects gave informed
consent to the work. Studies involving experiments with animals must state that their care was in accordance with institution
guidelines.
Publication Ethics and Malpractice Statement The articles published in the Afro-Egyptian Journal of Infectious and Endemic Diseases (AJIED) are freely available to read,
download, and distribute, immediately upon publication, given that the original source and authors are cited (Creative
Commons Attribution 3.0 (CC-BY).
Publication decisions
The Editor-in-Chief of the journal is responsible for deciding which of the articles submitted to the journal should be published. The editor may be guided by the editorial policies of the journal and constrained by such legal requirements as shall then be in force regarding libel, copyright infringement, and plagiarism. The editor may confer with the members of the Editorial Board or reviewers in making this decision. The Editor-in-Chief and the reviewers evaluate manuscripts for their intellectual content without regard to race, gender, sexual orientation, religious belief, ethnic origin, citizenship, or political philosophy of the authors.
Confidentiality The Editor-in-Chief, the members of the Editorial Board, and any editorial staff must not disclose any information about a
submitted manuscript to anyone other than the authors of the manuscript, reviewers, potential reviewers, other editorial
advisers, and the publisher, as appropriate.
Originality The papers accepted for submission and publication in "The Afro-Egyptian Journal of Infectious and Endemic Diseases
(AJIED)" are supposed to be original and not previously published elsewhere except for abstracts presented in local and
international conferences. The journal editorial board has the right to withdraw the articles if found published in full
elsewhere or an issue of plagiarism was raised and the authors will not be allowed to submit any other papers to the journal
in the future.
Plagiarism All manuscripts submitted to the Afro-Egyptian Journal of Infectious and Endemic Diseases (AJIED) are subjected to
plagiarism check.
Copyright All authors must sign a copyright statement indicating that their article is solely submitted for consideration of publication in
the Afro-Egyptian Journal of Infectious and Endemic Diseases (AJIED). Please note that your article will not be sent for
external peer review without a signed copyright statement.
Competing interests All authors must disclose any financial and personal relationships with other people or organizations that could inappropriately
influence (bias) their work. Examples of potential conflicts of interest include employment, consultancies, stock ownership,
honoraria, paid expert testimony, patent applications/registrations, and grants or other funding. Role of the funding source all
sources of funding should be declared. Authors should declare the role of study sponsors, if any, in the study design, in the
collection, analysis and interpretation of data; in the writing of the manuscript; and in the decision to submit the manuscript for
publication. If the study sponsors had no such involvement, the authors should so state. hould so state.
Publication charges No publication charges are needed.
Indexing 1- Egyptian National Scientific Technical Information Network (ENSTINET): http://derp.sti.sci.eg/details.aspx?Id=Afro-
Egyptian%20Journal%20of%20Infectious%20and%20Endemic%20Diseases%20%28Online%29
2- Google Scholar
3- InnoSpace - SJIF Scientific Journal Impact Factor (IF 2012: 2.665): http://www.sjifactor.inno-space.org/passport.
php?id=2123
4- Index Copernicus (ICV for 2016: 76.5): http://journals.indexcopernicus.com/masterlist.php?q=Afro-Egyptian +Journal+
of+Infectious+and+Endemic+Diseases
5- Global Impact Factor (Impact Factor for year 2015 is =0.544) http://globalimpactfactor.com/afro-egyptian-journal-of-
infectious-and-endemic-disease/
6- Universal Impact Factor (Impact Factor for year 2013 is = 1.0599): http://www.uifactor.org/Search.aspx?q=2090-7184
7- CiteFactor: http://www.citefactor.org/search/keywords/journals/Afro-Egyptian+Journal+of+Infectious+and+Endemic+ Diseases
8- Pubicon Science Index: http://www.pubicon.org/APUIIR.aspx?cmd=Afro-Egyptian%20Journal%20of%20Infectious%
20and%20Endemic%20Diseases
9- Directory of Research Journals Indexing
10- Polish Ministry of Science and Higher Education (2/10 in 2013 and 2014 journal official report):http://
impactfactor.pl/czasopisma/832-afro_egyptian-journal-of-infectious-and-endemic-diseases
11- US National Library of Medicine (NLM) Catalog [NLM ID: 101570965]:http://www.ncbi.nlm.nih.gov/ nlmcatalog/
101614559
12- African Index Medicus (WHO): http://indexmedicus.afro.who.int/Journals/indexj.html
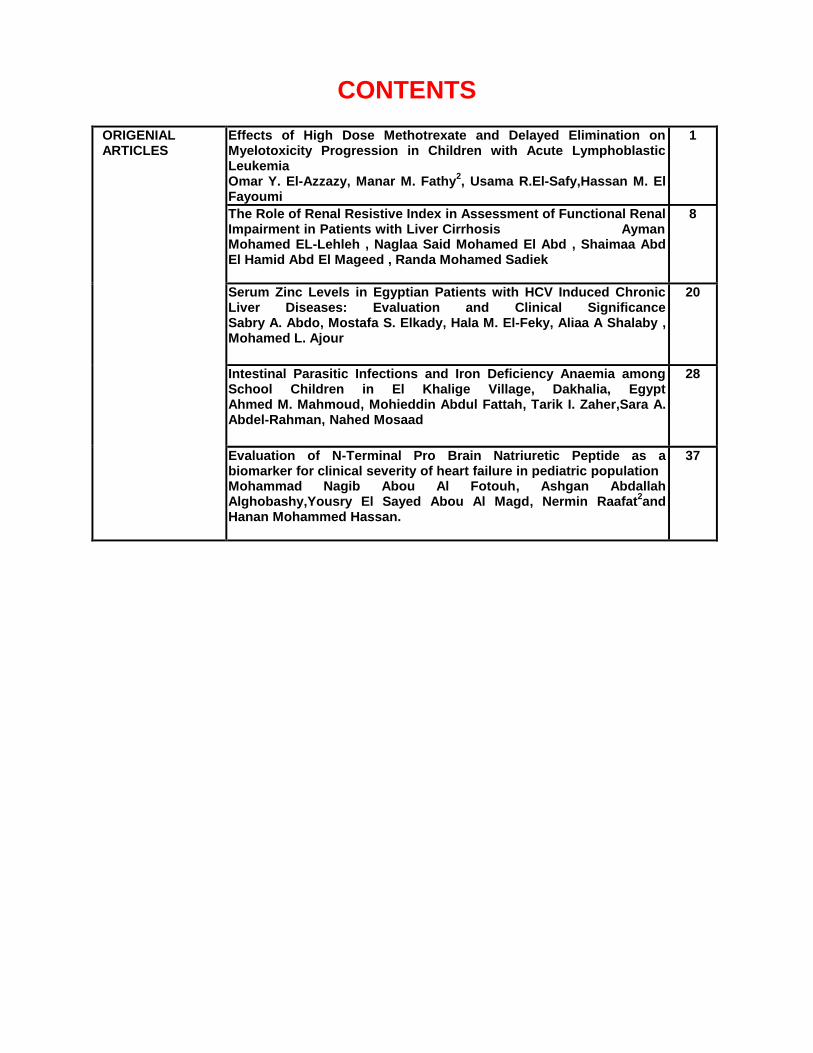
CONTENTS
ORIGENIAL ARTICLES
Effects of High Dose Methotrexate and Delayed Elimination on Myelotoxicity Progression in Children with Acute Lymphoblastic Leukemia Omar Y. El-Azzazy, Manar M. Fathy
2, Usama R.El-Safy,Hassan M. El
Fayoumi
1
The Role of Renal Resistive Index in Assessment of Functional Renal Impairment in Patients with Liver Cirrhosis Ayman Mohamed EL-Lehleh , Naglaa Said Mohamed El Abd , Shaimaa Abd El Hamid Abd El Mageed , Randa Mohamed Sadiek
8
Serum Zinc Levels in Egyptian Patients with HCV Induced Chronic Liver Diseases: Evaluation and Clinical Significance Sabry A. Abdo, Mostafa S. Elkady, Hala M. El-Feky, Aliaa A Shalaby , Mohamed L. Ajour
20
Intestinal Parasitic Infections and Iron Deficiency Anaemia among School Children in El Khalige Village, Dakhalia, Egypt Ahmed M. Mahmoud, Mohieddin Abdul Fattah, Tarik I. Zaher,Sara A. Abdel-Rahman, Nahed Mosaad
28
Evaluation of N-Terminal Pro Brain Natriuretic Peptide as a biomarker for clinical severity of heart failure in pediatric population Mohammad Nagib Abou Al Fotouh, Ashgan Abdallah Alghobashy,Yousry El Sayed Abou Al Magd, Nermin Raafat
2and
Hanan Mohammed Hassan.
37
Original article
El-Azzazy et al., Afro-Egypt J Infect Endem Dis 2017; 7(1): 1-7
http://mis.zu.edu.eg/ajied/home.aspx
1
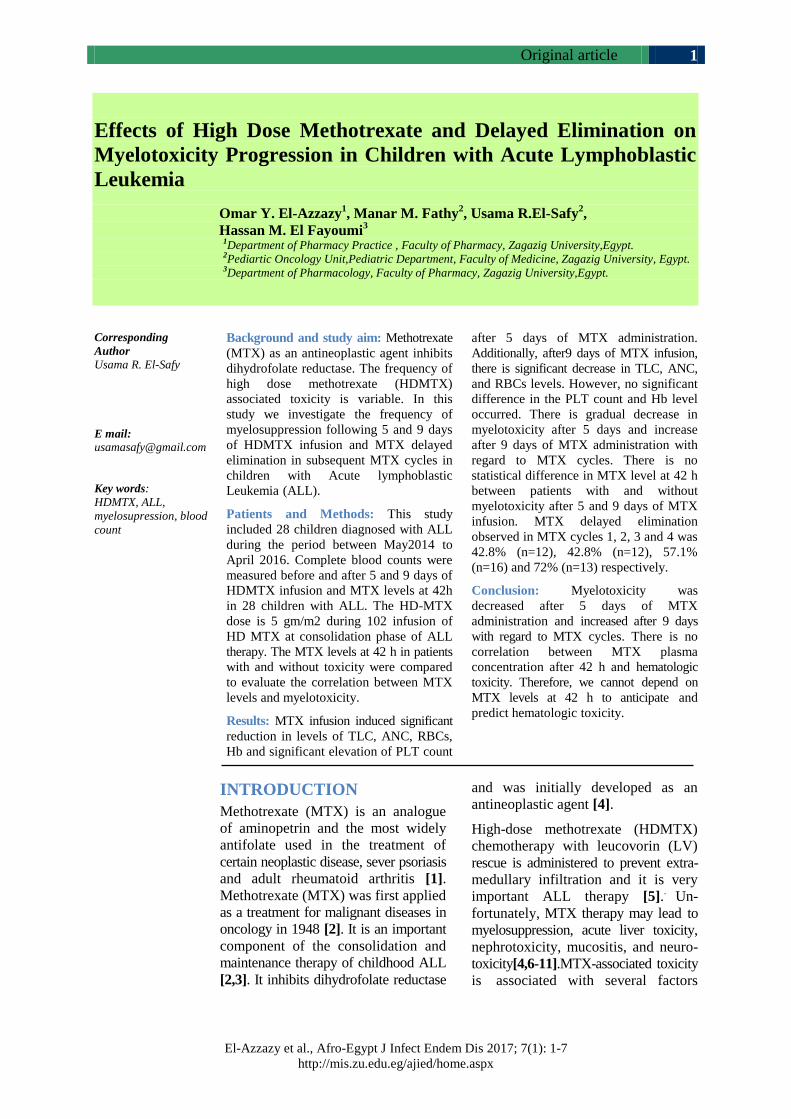
Effects of High Dose Methotrexate and Delayed Elimination on
Myelotoxicity Progression in Children with Acute Lymphoblastic
Leukemia
Omar Y. El-Azzazy1, Manar M. Fathy
2, Usama R.El-Safy
2,
Hassan M. El Fayoumi3
1Department of Pharmacy Practice , Faculty of Pharmacy, Zagazig University,Egypt. 2Pediartic Oncology Unit,Pediatric Department, Faculty of Medicine, Zagazig University, Egypt.
3Department of Pharmacology, Faculty of Pharmacy, Zagazig University,Egypt.
Corresponding
Author
Usama R. El-Safy
E mail: [email protected]
Key words:
HDMTX, ALL,
myelosupression, blood
count
Background and study aim: Methotrexate
(MTX) as an antineoplastic agent inhibits
dihydrofolate reductase. The frequency of
high dose methotrexate (HDMTX)
associated toxicity is variable. In this
study we investigate the frequency of
myelosuppression following 5 and 9 days
of HDMTX infusion and MTX delayed
elimination in subsequent MTX cycles in
children with Acute lymphoblastic
Leukemia (ALL).
Patients and Methods: This study
included 28 children diagnosed with ALL
during the period between May2014 to
April 2016. Complete blood counts were
measured before and after 5 and 9 days of
HDMTX infusion and MTX levels at 42h
in 28 children with ALL. The HD-MTX
dose is 5 gm/m2 during 102 infusion of
HD MTX at consolidation phase of ALL
therapy. The MTX levels at 42 h in patients
with and without toxicity were compared
to evaluate the correlation between MTX
levels and myelotoxicity.
Results: MTX infusion induced significant
reduction in levels of TLC, ANC, RBCs,
Hb and significant elevation of PLT count
after 5 days of MTX administration.
Additionally, after9 days of MTX infusion,
there is significant decrease in TLC, ANC,
and RBCs levels. However, no significant
difference in the PLT count and Hb level
occurred. There is gradual decrease in
myelotoxicity after 5 days and increase
after 9 days of MTX administration with
regard to MTX cycles. There is no
statistical difference in MTX level at 42 h
between patients with and without
myelotoxicity after 5 and 9 days of MTX
infusion. MTX delayed elimination
observed in MTX cycles 1, 2, 3 and 4 was
42.8% (n=12), 42.8% (n=12), 57.1%
(n=16) and 72% (n=13) respectively.
Conclusion: Myelotoxicity was
decreased after 5 days of MTX
administration and increased after 9 days
with regard to MTX cycles. There is no
correlation between MTX plasma
concentration after 42 h and hematologic
toxicity. Therefore, we cannot depend on
MTX levels at 42 h to anticipate and
predict hematologic toxicity.
INTRODUCTION
Methotrexate (MTX) is an analogue
of aminopetrin and the most widely
antifolate used in the treatment of
certain neoplastic disease, sever psoriasis
and adult rheumatoid arthritis [1].
Methotrexate (MTX) was first applied
as a treatment for malignant diseases in
oncology in 1948 [2]. It is an important
component of the consolidation and
maintenance therapy of childhood ALL
[2,3]. It inhibits dihydrofolate reductase
and was initially developed as an
antineoplastic agent [4].
High-dose methotrexate (HDMTX)
chemotherapy with leucovorin (LV)
rescue is administered to prevent extra-
medullary infiltration and it is very
important ALL therapy [5]..
Un-
fortunately, MTX therapy may lead to
myelosuppression, acute liver toxicity,
nephrotoxicity, mucositis, and neuro-
toxicity[4,6-11].MTX-associated toxicity
is associated with several factors
Original article
El-Azzazy et al., Afro-Egypt J Infect Endem Dis 2017; 7(1):1-7
http://mis.zu.edu.eg/ajied/home.aspx
2
including dose, the duration of administration,
patient risk factors, and genetic factors [12,13].
There are no sufficient data involving the use of
HDMTX pharmacokinetic and toxicity information
to anticipate hematologic toxicity in children with
ALL.
Delayed MTX elimination was defined by either
MTX concentration >1 μmol/L at 48 h or >0.1
μmol/L at 72h [14,15]. .Kidney and/or liver
dysfunction, bone marrow suppression, oral
mucosal lesions, secondary infection, and delays
in the following course of chemotherapy may be
a consequence of MTX delayed elimination [6,
16].. Therefore, adjustments of MTX and leucovorin
dose, hydration and alkalization were made to
minimize the risk of elimination delay/MTX
toxicity [16]. Previous reports referred to the
effect of some drugs as proton-pump inhibitors,
non-steroidal anti-inflammatory drugs,
trimethoprim, sulfamethoxazole, penicillins,
ciprofloxacin, anticonvulsants such as
phenobarbital on delaying MTX elimination [17-
19]..
In this study, we proposed to determine first: the
hematologic toxicity and MTX delayed elimination
frequency and second: evaluate the relationship
between hematologic toxicity and MTX level at
42 hour in children taking 5 gm/m2 MTX infusion
during the consolidation phase of ALL therapy.
PATIENTS AND METHODS
Patient Selection :
This study was approved by the Committee of
Medical Ethics of Zagazig University (IRB
number: 2184). ALL subjects include 28 patients,
16 female (57.1%) and 12 male (42.9%) were
recruited from Pediatric Hematology and Oncology
Unit Zagazig University during the period between
May 2014 and April 2016.
Inclusion criteria :
a- Both sex included
b- Age 2-18 years
c- ALL patients on high dose methotrexate.
d- In consolidation phase
Exclusion criteria :
a- Renal failure
b- Liver failure
Protocol of Study :
According to TOTAL XV protocol, all patients
in this study received four HD-MTX doses (5
g/m2) at 2-week intervals on days 1,15,29 and 43
of consolidation therapy and 6-mercaptopurine
(50 mg/m2/day) on days 1 to 56 of consolidation
therapy. These chemotherapeutics were
administered when ANC is ≥300/μL, and platelet
count is ≥50x109/L. HDMTX will be held if total
bilirubin 2 mg/dl and direct bilirubin 1.4 mg/dl.
However, 6- mercaptopurine may be held in the
presence of ANC 300/ μL, platelet count 50000/
μL or grade 3 or 4 mucositis. Dosage of 6-
mercaptopurine subsequent courses may be
reduced to 25 mg/m2/day in patients who have
prolonged neutropenia after HDMTX and 6-
mercaptopurine treatment. At least two hours
before HDMTX, prehydration IV fluid (D5W+
40 mEq NaHco3/L) will be administered at the
rate of 200 ml/m2/hr provided that urinary pH is
≥6.5. Leucovorin [15mg/m2 IV or PO for
standard/high-risk] will be started at 42 hrs after
the start of MTX and repeat every 6 hrs. The
dosage of leucovorin will be increased in patients
with high plasma MTX concentrations (1.0 µM
at 42 hrs) and continued until the MTX
concentration is less than 0.10 µM.
Complete Blood Counts and MTX Level
Assessments
In the course of 102 infusions of HD-MTX, the
MTX plasma level was measured at 42 h after
HD MTX infusion. Hemoglobin (Hb), absolute
neutrophil count (ANC), platelet (PLT) count,
red blood count (RBCs) and TLC (total leukocytes
count) were determined before MTX administration
and on the 5th and 9
th day following MTX
infusion using Automated Hematology Analyzer.
MTX concentration at 42 h was measured by
high performance liquid chromatography (HPLC)
assay.
Evaluation of Myelotoxicity
Hematological toxicity or myelotoxicity signs
were determined by absolute neutrophil count and
hemoglobin according to Common Terminology
Criteria for Adverse Events (CTCAE) [20]
(Table 1).
Statistical Analysis :
Statistical analyses of data were done by Prism 6,
Graph pad, CA, USA. Results were expressed as
mean ± standard deviation. Statistical differences
were sought using Student’s t-test or one way
analysis of variance (ANOVA) followed by
Fisher’s least significant difference (LSD) and or
post hoc test (if more than two sets of data were
being compared). Differences were considered
significant at a P<0.05.
RESULTS
Original article
El-Azzazy et al., Afro-Egypt J Infect Endem Dis 2017; 7(1): 1-7
http://mis.zu.edu.eg/ajied/home.aspx
3
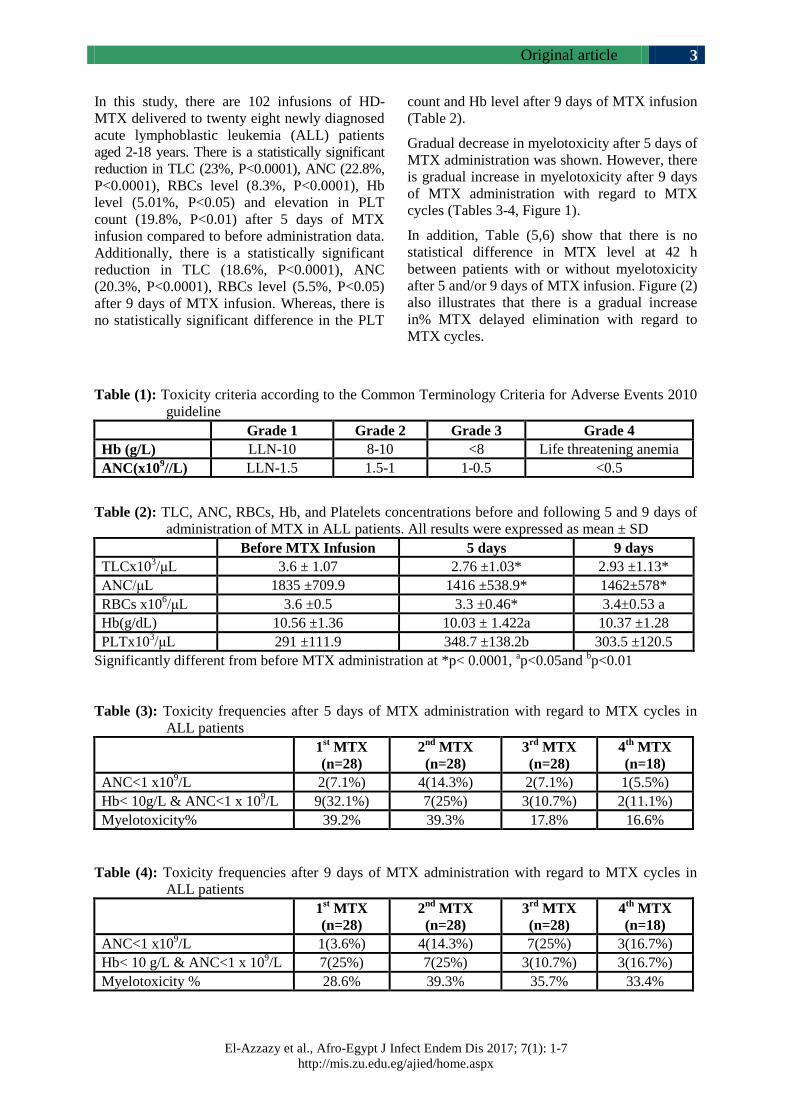
In this study, there are 102 infusions of HD-
MTX delivered to twenty eight newly diagnosed
acute lymphoblastic leukemia (ALL) patients
aged 2-18 years. There is a statistically significant
reduction in TLC (23%, P<0.0001), ANC (22.8%,
P<0.0001), RBCs level (8.3%, P<0.0001), Hb
level (5.01%, P<0.05) and elevation in PLT
count (19.8%, P<0.01) after 5 days of MTX
infusion compared to before administration data.
Additionally, there is a statistically significant
reduction in TLC (18.6%, P<0.0001), ANC
(20.3%, P<0.0001), RBCs level (5.5%, P<0.05)
after 9 days of MTX infusion. Whereas, there is
no statistically significant difference in the PLT
count and Hb level after 9 days of MTX infusion
(Table 2).
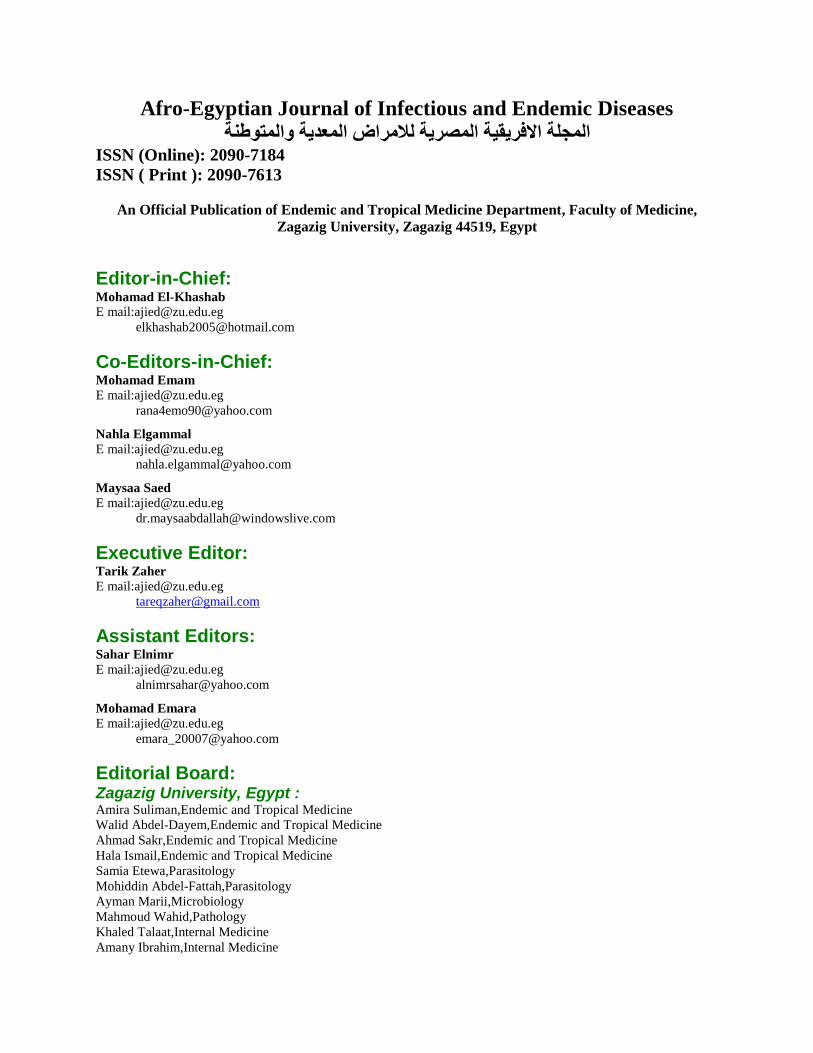
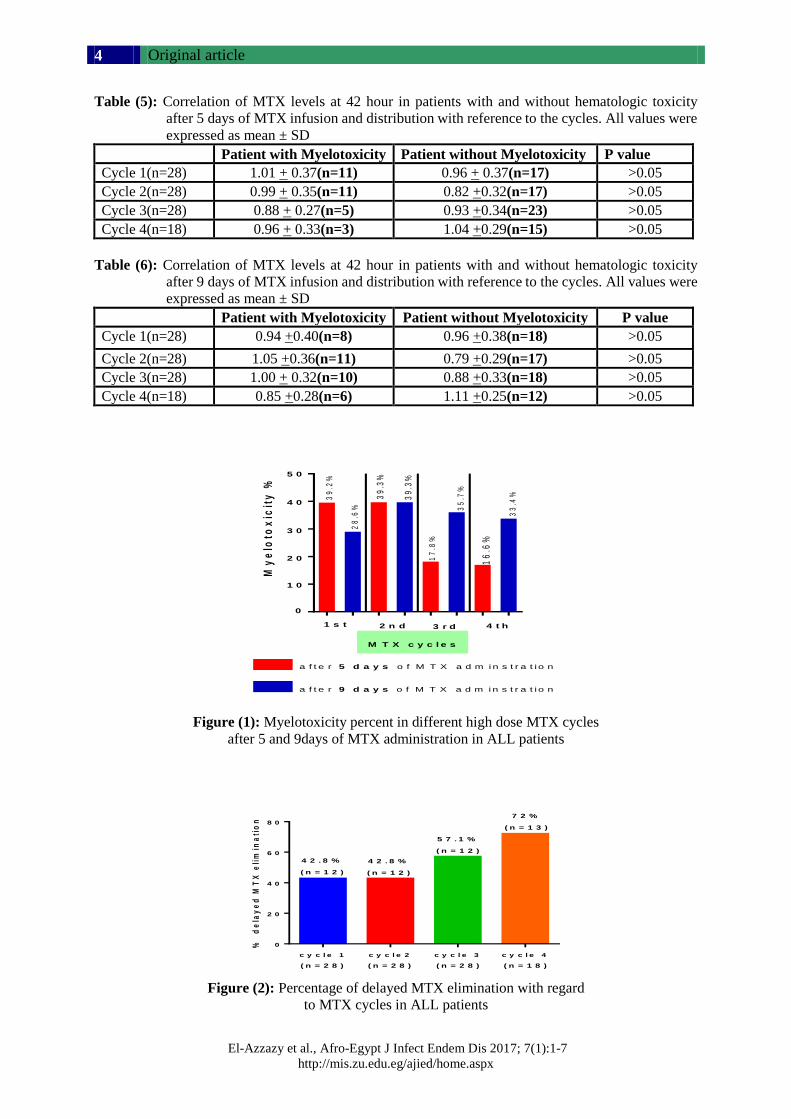
Gradual decrease in myelotoxicity after 5 days of
MTX administration was shown. However, there
is gradual increase in myelotoxicity after 9 days
of MTX administration with regard to MTX
cycles (Tables 3-4, Figure 1).
In addition, Table (5,6) show that there is no
statistical difference in MTX level at 42 h
between patients with or without myelotoxicity
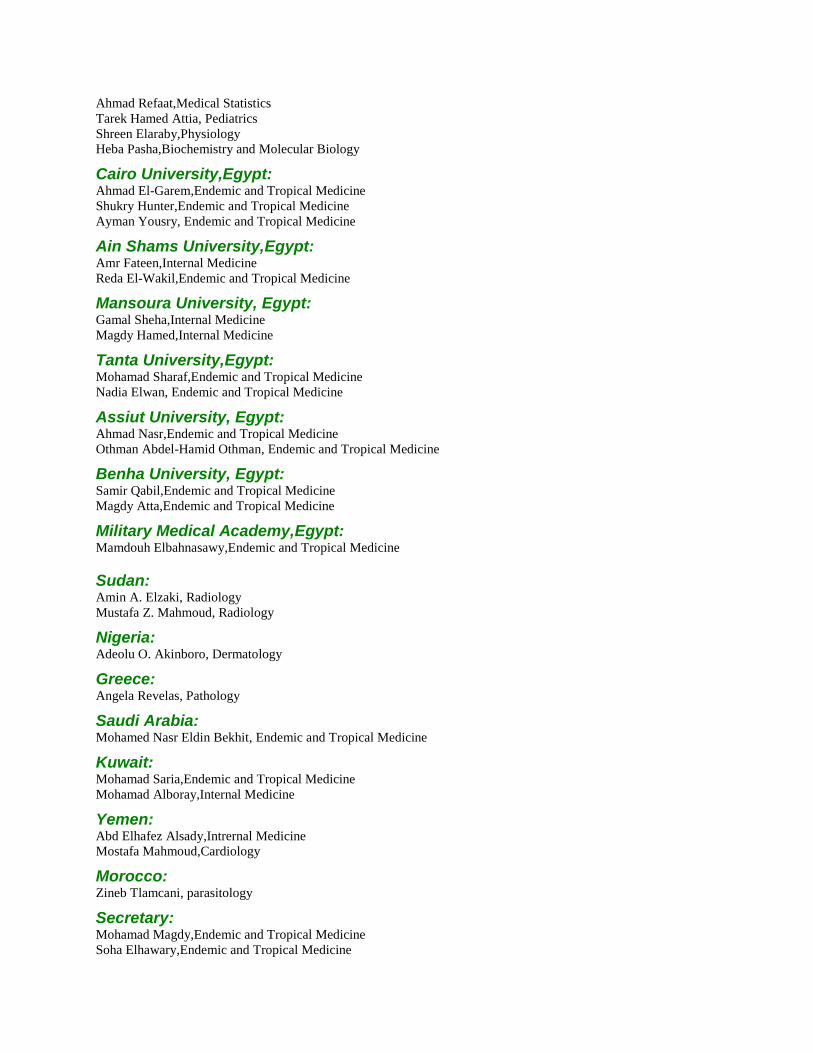
after 5 and/or 9 days of MTX infusion. Figure (2)
also illustrates that there is a gradual increase
in% MTX delayed elimination with regard to
MTX cycles.
Table (1): Toxicity criteria according to the Common Terminology Criteria for Adverse Events 2010
guideline
Grade 1 Grade 2 Grade 3 Grade 4
Hb (g/L) LLN-10 8-10 <8 Life threatening anemia
ANC(x109//L) LLN-1.5 1.5-1 1-0.5 <0.5
Table (2): TLC, ANC, RBCs, Hb, and Platelets concentrations before and following 5 and 9 days of
administration of MTX in ALL patients. All results were expressed as mean ± SD
Before MTX Infusion 5 days 9 days
TLCx103/μL 3.6 ± 1.07 2.76 ±1.03* 2.93 ±1.13*
ANC/μL 1835 ±709.9 1416 ±538.9* 1462±578*
RBCs x106/μL 3.6 ±0.5 3.3 ±0.46* 3.4±0.53 a
Hb(g/dL) 10.56 ±1.36 10.03 ± 1.422a 10.37 ±1.28
PLTx103/μL 291 ±111.9 348.7 ±138.2b 303.5 ±120.5
Significantly different from before MTX administration at *p< 0.0001, ap<0.05and
bp<0.01
Table (3): Toxicity frequencies after 5 days of MTX administration with regard to MTX cycles in
ALL patients
1
st MTX
(n=28)
2nd
MTX
(n=28)
3rd
MTX
(n=28)
4th
MTX
(n=18)
ANC<1 x10⁹/L 2(7.1%) 4(14.3%) 2(7.1%) 1(5.5%)
Hb< 10g/L & ANC<1 x 10⁹/L 9(32.1%) 7(25%) 3(10.7%) 2(11.1%)
Myelotoxicity% 39.2% 39.3% 17.8% 16.6%
Table (4): Toxicity frequencies after 9 days of MTX administration with regard to MTX cycles in
ALL patients
1st MTX
(n=28)
2nd
MTX
(n=28)
3rd
MTX
(n=28)
4th
MTX
(n=18)
ANC<1 x10⁹/L 1(3.6%) 4(14.3%) 7(25%) 3(16.7%)
Hb< 10 g/L & ANC<1 x 10⁹/L 7(25%) 7(25%) 3(10.7%) 3(16.7%)
Myelotoxicity % 28.6% 39.3% 35.7% 33.4%
Original article
El-Azzazy et al., Afro-Egypt J Infect Endem Dis 2017; 7(1):1-7
http://mis.zu.edu.eg/ajied/home.aspx
4
Table (5): Correlation of MTX levels at 42 hour in patients with and without hematologic toxicity
after 5 days of MTX infusion and distribution with reference to the cycles. All values were
expressed as mean ± SD
Patient with Myelotoxicity Patient without Myelotoxicity P value
Cycle 1(n=28) 1.01 + 0.37(n=11) 0.96 + 0.37(n=17) >0.05
Cycle 2(n=28) 0.99 + 0.35(n=11) 0.82 +0.32(n=17) >0.05
Cycle 3(n=28) 0.88 + 0.27(n=5) 0.93 +0.34(n=23) >0.05
Cycle 4(n=18) 0.96 + 0.33(n=3) 1.04 +0.29(n=15) >0.05
Table (6): Correlation of MTX levels at 42 hour in patients with and without hematologic toxicity
after 9 days of MTX infusion and distribution with reference to the cycles. All values were
expressed as mean ± SD
Patient with Myelotoxicity Patient without Myelotoxicity P value
Cycle 1(n=28) 0.94 +0.40(n=8) 0.96 +0.38(n=18) >0.05
Cycle 2(n=28) 1.05 +0.36(n=11) 0.79 +0.29(n=17) >0.05
Cycle 3(n=28) 1.00 + 0.32(n=10) 0.88 +0.33(n=18) >0.05
Cycle 4(n=18) 0.85 +0.28(n=6) 1.11 +0.25(n=12) >0.05
MT
X d
os
e 1
( 5 d
ay
)
MT
X d
os
e 1
( 9 d
ay
)
MT
X d
os
e 2
( 5 d
ay
)
MT
X d
os
e 2
( 9 d
ay
)
MT
X d
os
e 3
( 5 d
ay
)
MT
X d
os
e 3
( 9d
ay
)
MT
X d
os
e4
( 5d
ay
)
MT
X d
os
e4
( 9d
ay
)
0
1 0
2 0
3 0
4 0
5 05 0
4 0
3 0
2 0
1 0
0
My
elo
tox
icit
y %
39
.2%
28
.6%
39
.3%
17
.8%
35
.7%
16
.6%
33
.4%39
.3%
1 s t 2 n d 3 r d 4 t h
a f t e r 5 d a y s o f M T X a d m i n s t r a t i o n
a f t e r 9 d a y s o f M T X a d m i n s t r a t i o n
M T X c y c l e s
Figure (1): Myelotoxicity percent in different high dose MTX cycles
after 5 and 9days of MTX administration in ALL patients
%
de
lay
ed
MT
X e
lim
ina
tio
n
c y c l e 1 c y c l e 2 c y c l e 3 c y c l e 4
0
2 0
4 0
6 0
8 0
4 2 . 8 %
( n = 1 2 )
4 2 . 8 %
( n = 1 2 )
5 7 . 1 %
( n = 1 2 )
7 2 %
( n = 1 3 )
( n = 2 8 ) ( n = 2 8 ) ( n = 2 8 ) ( n = 1 8 )
Figure (2): Percentage of delayed MTX elimination with regard
to MTX cycles in ALL patients
Original article
El-Azzazy et al., Afro-Egypt J Infect Endem Dis 2017; 7(1): 1-7
http://mis.zu.edu.eg/ajied/home.aspx
5
DISCUSSION
Consolidation phase is considered avaluable and
important step in the treatment of children with
ALL. The use of high dose methotrexate, sometimes
in combination with 6-mercaptopurine (6-MP)
has significantly contributed to cure children (70-
80%). In this study administration of MTX
infusion for 5 days induced significant reduction
in TLC, ANC, RBCs, Hb levels and PLT count
after 5 days of MTX infusion. Similar data was
observed during 9 days administration except the
effect on PLT count and Hb level. These results
are in agreement with previous studies [21]. This
effect on blood counts especially RBCs and TLC
is attributed to higher concentration of MTXPG
in patients whose blast count decreased within 24
h . Blast cells are the origin of platelets, red
blood cells, neutrophils and other types of white
blood cells in the myeloid cell line [22].
Therefore, decrease in blast concentration of
MTXPGLC (MTX polyglutamate long chain)
may be strongly related to the rate of inhibition
of de novo purine synthesis in ALL blasts [23]..
The significant reduction of Hb after 5 days and
the non statistical significant difference of Hb
after 9 days may be justified by the results of de
Rotte et al. [24]. Methotrexate can affect HbA1c
where, methotrexate use and higher concentrations
of erythrocyte MTX Glu (erythrocyte
methotrexate polyglutamate) are associated with
decreased levels of HbA1c. Therefore,
concentrations of erythrocyte MTX Glu may be
still high after 5 days of MTX infusion. However,
after 9 days, concentrations of erythrocyte MTX
Glu may be decreased.
Lexicomp [25] has been reported that not all
patients should suffer low blood counts in RBCs,
WBCs and platelets but this low blood counts is
only common in more than 30% of patients
supporting the present finding where there is no
statistically significant difference in the PLT
count and Hb level after 9 days of MTX infusion.
The current study illustrated gradual decrease in
hematologic toxicity and myelotoxicity after 5
days of MTX infusion with repeated MTX
administrations. These results are consistent with
others [26]. Attenuation of hematologic toxicity and
myelotoxicity with repeated MTX administrations
may be related to HDMTX may be held if total
bilirubin 2mg/dl and direct bilirubin 1.4mg/dl [27].
So the myelotoxicity will be decreased.
Additionally, dosage of 6- mercaptopurine may
be reduced to 25 mg/m2/day in patients who have
prolonged neutropenia after HDMTX and 6-
mercaptopurine treatment [27]
and this may be a
good reason for the gradual decrease of
myelotoxicity [21], especially while the degree
of myelosuppression and duration of treatment
interruptions following HD-MTX is related to
the dose of concurrently administered oral 6MP
[21,28-30] and can be avoided by reductions of
the dose of 6MP in the weeks before and after
HD-MTX [31]..
On the other hand, there is gradual increase in
hematologic toxicity and myelotoxicity after 9
days of MTX infusion with repeated MTX
administrations. These results were compatible
with other previous reports [6,32]. Rask et
al[6]have been demonstrated that increase in
myelosuppression in subsequent cycles of MTX
may be related to the accumulation of cytotoxic
metabolites of MTX and 6MP. In addition, other
studies [21,29] referred to using high dose MTX
with increased doses of 6MP may also increase
hematologic toxicity.
Interestingly, this study revealed that there is no
correlation between MTX plasma concentration
after 42 hour and hematologic toxicity. These
results were supported by Özdemir et al. [32].
They documented that the MTX levels at 42 h in
patients with myelotoxicity were not different
from patients without toxicity. Additionally, Csordas
et al. [33] did not find any correlation between
myelotoxicity and the levels of serum MTX.
However, other studies reported that there is a
relationship between elevated serum MTX levels
and hematologic toxicity [6].
This study explore that there is a gradual increase
in MTX delayed elimination with regard to MTX
cycles. This may be consistent with the results of
Bauters et al. [34]. They reported that high MTX
levels (72 h) were frequently observed upon
intake of cola beverages. Higher MTX levels
were more common after intake of cola during
the first and/or second day after the start of HD-
MTX infusion. Santucci et al. [35] explained that
Cola beverages have a low pH due to their
phosphoric acid content and that may explain its
effect on MTX elimination.
CONCLUSION
There is gradual decrease in myelotoxicity after
5 days of MTX administration with regard to
MTX cycles. However, there is gradual increase
in myelotoxicity after 9 days of MTX
administration with regard to MTX cycles. There
Original article
El-Azzazy et al., Afro-Egypt J Infect Endem Dis 2017; 7(1):1-7
http://mis.zu.edu.eg/ajied/home.aspx
6
is no correlation between MTX plasma
concentration after 42h and hematologic toxicity.
Therefore, we cannot depend on MTX levels at
42 h to anticipate and predict hematologic
toxicity. Moreover, there is a gradual increase in
MTX delayed elimination with regard to MTX
cycles.
Funding: None.
Conflicts of interest: None.
Ethical Approval: The study was approved by
the Committee of Medical Ethics of Zagazig
University (IRB number: 2184) and a written
informed consent was taken from each
participant that follows the principals in the
declaration of Helsinki.
REFERENCES 1. Chu E, Takechi T, Jones K, Voeller D, Copur S,
Maley G et al. Thymidylate synthase binds to c-
myc RNA in human colon cancer cells and in
vitro. Mol Cell Biol, 1995; 15(1): 179-85.
2. Miller D. A tribute to Sidney Farber–the father of
modern chemotherapy. British Journal of
Haematology 2006; 134(1): 20-26.
3. Pui C, Robison L, and Look T. Acute lymphoblastic
leukaemia. The Lancet 2008; 371(9617): 1030-
1043.
4. Khan Z,Tripathi R, Mishra B. Methotrexate: a
detailed review on drug delivery and clinical
aspects. Expert Opinion on Drug Delivery; 2012;
9(2): 151-169.
5. Pui C. Recent research advances in childhood
acute lymphoblastic leukemia. Journal of the
Formosan Medical Association 2010; 109(11):
777-787.
6. Rask C, Albertioni F, Bentzen S, Schroeder H,
Peterson C . Clinical and pharmacokinetic risk
factors for high-dose methotrexate-induced
toxicity in children with acute lymphoblastic
leukemia: a logistic regression analysis. Acta
Oncologica 1998; 37(3): 277-284.
7. Fisgin T, Yarali N, Kara A, Bozkurt C, Birgen D,
Erten U et al. Hemostatic side effects of high-
dose methotrexate in childhood acute lymphoblastic
leukemia. Pediatric Hematology and Oncology;
2004; 21(1): 77-83.
8. Van Outryve S, Schrijvers D, Van Den B,
Wilmes P, Bogers J, Van M et al. Methotrexate-
associated liver toxicity in a patient with breast
cancer: case report and literature review. Neth J
Med; 2002; 60(5): 216-222.
9. Inaba H, Khan R, Laningham F, Crews K, Pui C,
Daw N. Clinical and radiological characteristics
of methotrexate-induced acute encephalopathy in
pediatric patients with cancer. Annals of
Oncology; 2007; 466.
10. Kaur I, Dogra S, De D, Kanwar A. Systemic
methotrexate treatment in childhood psoriasis:
further experience in 24 children from India.
Pediatric Dermatology; 2008; 25(2): 184-188.
11. Widemann B and Adamson P. Understanding and
managing methotrexate nephrotoxicity. The
Oncologist; 2006; 11(6): 694-703.
12. Neuman M, Cameron R, Haber J, Katz G,
Malkiewicz L, Shear N et al. Inducers of cytochrome
P450 2E1 enhance methotrexate-induced hepato-
cytotoxicity. Clinical Biochemistry; 1999; 32(7):
519-536.
13. Shimasaki N, Mori T, Samejima H, Sato R,
Shimada H, Yahagi N et al. Effects of methylene
tetrahydrofolatere ductase and reduced folate
carrier 1 polymorphisms on high-dose
methotrexate-induced toxicities in children with
acute lymphoblastic leukemia or lymphoma.
Journal of Pediatric Hematology/Oncology 2006;
28(2): 64-68.
14. Stoller R, Hande K, Jacobs S, Rosenberg S,
Chabner B. Use of plasma pharmacokinetics to
predict and prevent methotrexate toxicity. New
England Journal of Medicine, 1977; 297(12):
630-634.
15. Evans W, Schentag J, Jusko W. Applied pharma-
cokinetics: principles of therapeutic drug monitoring
1992: Applied Therapeutics, Incorporated.
16. Xu W, Tang Y, Song H, Shi S, Yang S.
Retrospective study on elimination delay of
methotrexate in high-dose therapy of childhood
acute lymphoblastic leukemia in China. Journal
of Pediatric Hematology/Oncology; 2007;
29(10): 688-693.
17. Levêque D, Santucci, R, Gourieux, B, Herbrecht,
R. Pharmacokinetic drug–drug interactions with
methotrexate in oncology. Expert Review of
Clinical Pharmacology; 2011; 4(6): 743-750.
18. Bezabeh S, Mackey A, Kluetz P, Jappar D,
Korvick J. Accumulating evidence for a drug–
drug interaction between methotrexate and proton
pump inhibitors. The Oncologist; 2012; 17(4):
550-554.
19. Bauters T, Lammens T, Belin P, Benoit Y,
Robays H, De Moerloose B. Interaction between
methotrexate and omeprazole in an adolescent
with leukemia: a case report. Pharmacy World &
Science; 2008; 30(4): 316-318.
20. Health US Department, Human Services. Common
Terminology Criteria for Adverse Events
(CTCAE) 2016; Version 4.0.
Original article
El-Azzazy et al., Afro-Egypt J Infect Endem Dis 2017; 7(1): 1-7
http://mis.zu.edu.eg/ajied/home.aspx
7
21. Levinsen, M., et al. Myelotoxicity after high-dose
methotrexate in childhood acute leukemia is
influenced by 6-mercaptopurine dosing but not by
intermediate thiopurinemethyltransferase activity.
Cancer Chemotherapy and Pharmacology; 2015;
75(1): 59-66.
22. Ezzone S. Hematopoietic stem cell transplantation:
A Manual for Nursing Practice 2004; p. 1 online
resource (344 pages).
23. Masson E, Relling M, Synold T, Liu Q, Schuetz
J, Sandlund J et al. Accumulation of methotrexate
polyglutamates in lymphoblasts is a determinant
of antileukemic effects in vivo. A rationale for
high-dose methotrexate. J Clin Invest; 1996;
97(1): 73-80.
24. de Rotte M, de Jong P, den Boer E, Pluijm S,
Özcan B, WeelA et al. Effect of Methotrexate
Use and Erythrocyte Methotrexate Polyglutamate
on Glycosylated Hemoglobin in Rheumatoid
Arthritis. Arthritis & Rheumatology; 2014; 66(8):
2026-2036.
25. Lexicomp Online® Methotrexate. Lexi-Drugs®
2015.
26. Ridolfi L, Barisone E, Vivalda M, Vivenza C,
Brach D, Leone L et al. Toxicity of high dose
methotrexate repeated infusions in children
treated for acute lymphoblastic leukemia and
osteosarcoma. Minerva Pediatrica; 1996; 48(5):
193-200.
27. Pui C, Relling M, Sandlund J, Downing J,
Campana D, Evans W et al. Rationale and design
of Total Therapy Study XV for newly diagnosed
childhood acute lymphoblastic leukemia. Ann
Hematol; 2004; 83 (Suppl 1): S124-126.
28. Schmiegelow K, Bretton-Meyer U. 6-
mercaptopurine dosage and pharmacokinetics
influence the degree of bone marrow toxicity
following high-dose methotrexate in children
with acute lymphoblastic leukemia. Leukemia;
2001; 15(1).
29. van KootenNiekerk P, Schmiegelow K, Schroeder
H. Influence of methylene tetrahydrofolatere
ductase polymorphisms and coadministration of
antimetabolites on toxicity after high dose
methotrexate. European Journal of Haematology;
2008; 81(5): 391-398.
30. Baxmann A, Ahmed M, Marques N, Menon V,
Pereira A, Kirsztajn G et al. Influence of muscle
mass and physical activity on serum and urinary
creatinine and serum cystatin C. Clin J Am Soc
Nephrol; 2008; 3(2): 348-354.
31. Nygaard U, Schmiegelow K. Dose reduction of
coadministered 6-mercaptopurine decreases
myelotoxicity following high-dose methotrexate
in childhood leukemia. Leukemia; 2003; 17(7):
1344-1348.
32. Özdemir Z, Turhan A, Kar Y, Bör Ö. The
frequency of hepatotoxicity and myelotoxicity in
leukemic children with different high doses of
methotrexate. International Journal of Pediatrics
and Adolescent Medicine; 2016.
33. Csordas K, Hegyi M, Eipel O, Muller J, Erdelyi
D, Kovacs G. Comparison of pharmacokinetics
and toxicity after high-dose methotrexate
treatments in children with acute lymphoblastic
leukemia. Anti-Cancer Drugs; 2013; 24(2): 189-
197.
34. Bauters T, Lammens T, Belin P, Benoit Y,
Robays H, De Moerloose B. Delayed elimination
of methotrexate by cola beverages in a pediatric
acute lymphoblastic leukemia population. Leukemia
& Lymphoma; 2013; 54(5): 1094-1096.
35. SantucciR, Levêque D, Herbrecht R. Cola beverage
and delayed elimination of methotrexate. British
Journal of Clinical Pharmacology; 2010; 70(5):
762-764.
Original article
El-Lehleh et al., Afro-Egypt J Infect Endem Dis 2017; 7(1):8-19
http://mis.zu.edu.eg/ajied/home.aspx
8
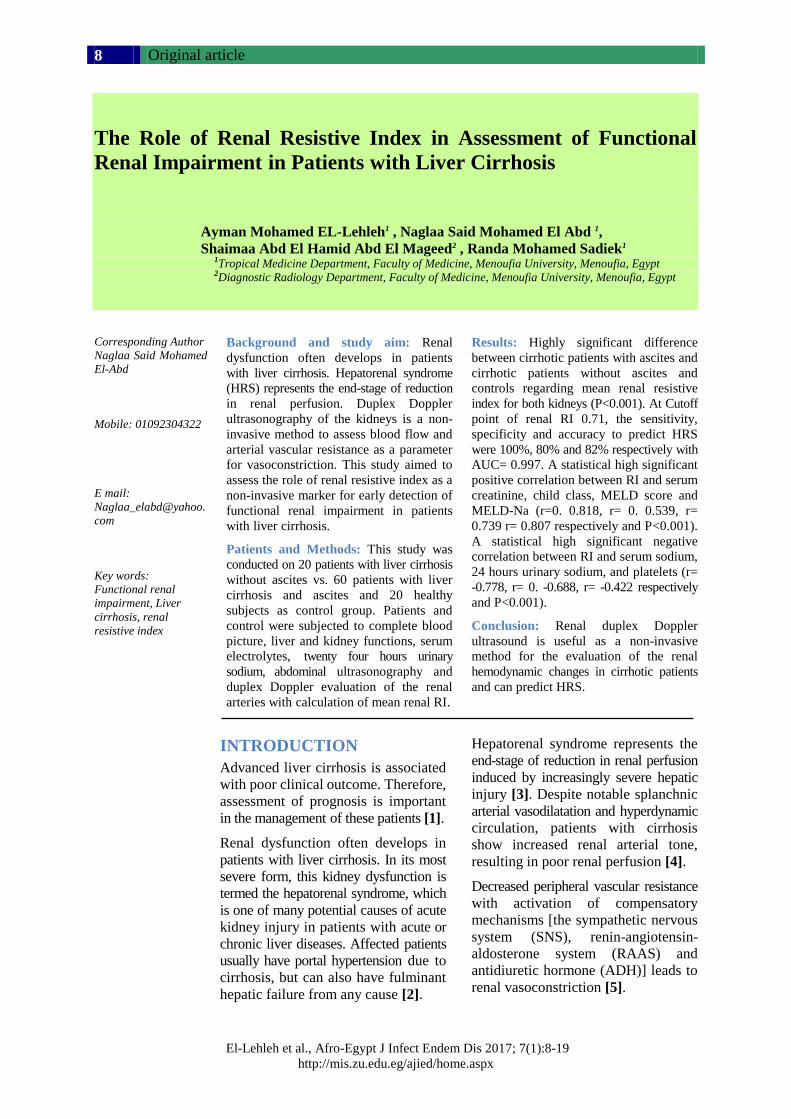
The Role of Renal Resistive Index in Assessment of Functional
Renal Impairment in Patients with Liver Cirrhosis
Ayman Mohamed EL-Lehleh1 , Naglaa Said Mohamed El Abd 1,
Shaimaa Abd El Hamid Abd El Mageed2 , Randa Mohamed Sadiek1 1Tropical Medicine Department, Faculty of Medicine, Menoufia University, Menoufia, Egypt
2Diagnostic Radiology Department, Faculty of Medicine, Menoufia University, Menoufia, Egypt
Corresponding Author
Naglaa Said Mohamed
El-Abd
Mobile: 01092304322
E mail:
Naglaa_elabd@yahoo.
com
Key words:
Functional renal
impairment, Liver
cirrhosis, renal
resistive index
Background and study aim: Renal
dysfunction often develops in patients
with liver cirrhosis. Hepatorenal syndrome
(HRS) represents the end-stage of reduction
in renal perfusion. Duplex Doppler
ultrasonography of the kidneys is a non-
invasive method to assess blood flow and
arterial vascular resistance as a parameter
for vasoconstriction. This study aimed to
assess the role of renal resistive index as a
non-invasive marker for early detection of
functional renal impairment in patients
with liver cirrhosis.
Patients and Methods: This study was
conducted on 20 patients with liver cirrhosis
without ascites vs. 60 patients with liver
cirrhosis and ascites and 20 healthy
subjects as control group. Patients and
control were subjected to complete blood
picture, liver and kidney functions, serum
electrolytes, twenty four hours urinary
sodium, abdominal ultrasonography and
duplex Doppler evaluation of the renal
arteries with calculation of mean renal RI.
Results: Highly significant difference
between cirrhotic patients with ascites and
cirrhotic patients without ascites and
controls regarding mean renal resistive
index for both kidneys (P<0.001). At Cutoff
point of renal RI 0.71, the sensitivity,
specificity and accuracy to predict HRS
were 100%, 80% and 82% respectively with
AUC= 0.997. A statistical high significant
positive correlation between RI and serum
creatinine, child class, MELD score and
MELD-Na (r=0. 0.818, r= 0. 0.539, r=
0.739 r= 0.807 respectively and P<0.001).
A statistical high significant negative
correlation between RI and serum sodium,
24 hours urinary sodium, and platelets (r=
-0.778, r= 0. -0.688, r= -0.422 respectively
and P<0.001).
Conclusion: Renal duplex Doppler
ultrasound is useful as a non-invasive
method for the evaluation of the renal
hemodynamic changes in cirrhotic patients
and can predict HRS.
INTRODUCTION
Advanced liver cirrhosis is associated
with poor clinical outcome. Therefore,
assessment of prognosis is important
in the management of these patients [1].
Renal dysfunction often develops in
patients with liver cirrhosis. In its most
severe form, this kidney dysfunction is
termed the hepatorenal syndrome, which
is one of many potential causes of acute
kidney injury in patients with acute or
chronic liver diseases. Affected patients
usually have portal hypertension due to
cirrhosis, but can also have fulminant
hepatic failure from any cause [2].
Hepatorenal syndrome represents the
end-stage of reduction in renal perfusion
induced by increasingly severe hepatic
injury [3]. Despite notable splanchnic
arterial vasodilatation and hyperdynamic
circulation, patients with cirrhosis
show increased renal arterial tone,
resulting in poor renal perfusion [4].
Decreased peripheral vascular resistance
with activation of compensatory
mechanisms [the sympathetic nervous
system (SNS), renin-angiotensin-
aldosterone system (RAAS) and
antidiuretic hormone (ADH)] leads to
renal vasoconstriction [5].
Original article
El-Lehleh et al., Afro-Egypt J Infect Endem Dis 2017; 7(1): 8-19
http://mis.zu.edu.eg/ajied/home.aspx
9
In liver cirrhosis, serum creatinine is inaccurate
in diagnosis of renal dysfunction as it overestimates
renal function due to decreased creatinine production
by the liver, protein calorie malnutrition and muscle
wasting, therefore, better methods to diagnose
this early stage of renal disease are needed [6].
Duplex Doppler ultrasonography of the kidneys
is an easy and non-invasive method to assess blood
flow and arterial vascular resistance as a parameter
for vasoconstriction [7]. The arterial resistive index
(RI) is the most widely used parameter to estimate
the arteriolar vascular resistance. It is regularly
used for screening of transplant rejection or to
diagnose renal artery stenosis [8].
A positive correlation has been described between
intrarenal RI and plasma renin activity as well as,
plasma aldosteron concentration. The activation of
the renin-angiotensin-aldosterone system plays
an important role in the pathogenesis of hepatorenal
syndrome [9]. The aim of the present work was
to assess the role of renal resistive index as a
non-invasive marker for early detection of functional
renal impairment in patients with liver cirrhosis.
PATIENTS AND METHODS
This study was conducted on 80 patients with
liver cirrhosis (proved by clinical examination,
laboratory and radiological studies) and 20 healthy
subjects without evidence of any liver or kidney
disease as controls. Patients and controls were
selected from the outpatient and/or inpatient
Department of Tropical Medicine, Menoufia
University hospital in the period between
November 2015 to May 2016. Patients with renal
impairment due to any cause other than hepatorenal
syndrome, diabetes mellitus, hypertension, acute
gastrointestinal bleeding and malignant diseases
were excluded. Patients were 53 (66.25%) males
and 27 (33.75%) females. Their ages ranged from
19 to 80 years with a mean age of 47.54 ± 15.52
as well as, 20 healthy persons of matched age and
sex as a control group. This study was approved
by the Committee for Ethics of Faculty of Medicine,
Menoufia University, Egypt and written informed
consent was obtained from each subject before
blood was collected.
Patients and controls were classified into the
following groups:
Group I: 20 patients with liver cirrhosis without
ascites.
Group II: 60 patients with liver cirrhosis and
ascites.
Group III: 20 healthy subjects as controls.
All patients and controls were subjected to the
following:
Proper and detailed history taking.
Complete clinical examinations (general and
local abdominal examinations).
Laboratory investigations: Complete blood
picture, random blood sugar, liver function
tests includes [serum bilirubin, serum
albumin, Alanin transaminase (ALT),
Aspartate transaminase (AST), prothrombin
time & concentration and INR], renal function
tests [blood urea and serum creatinine], serum
electrolytes [serum sodium concentration and
serum potassium concentration], urine
analysis, twenty four hours urinary sodium
and serological tests for viral markers [HBsAg
by and HCVAb by ELISA].
Child-Pugh classification was calculated for
all studied patients to assess the severity of
liver disease, depending on patients’ clinical
and laboratory data (ascites, hepatic
encephalopathy, serum albumin, serum
bilirubin and international normalized ratio
INR [10]. MELD score and MELD-Na also
were calculated for all studied patients
according to the following formulae: MELD =
9.57 loge [Creatinine (mg/dL)] + 3.78 loge
[Bilirubin (mg/dL)] +11.2 loge [International
Normalized Ratio] + 6.43 [11]. MELD-Na =
MELD - Na - [0.025 X MELD X (140 – Na)]
+ 140 [12].
Radiological evaluation; Abdominal ultra-
sonography was done to evaluate liver, spleen,
portal vein, the amount of ascites and both
kidneys. According to the amount of ascites
and the criteria for hepatorenal syndrome which
include; liver cirrhosis with ascites, serum
creatinine >1.5 mg/dL, no improvement of serum
creatinine (a decrease in serum <1.5 mg/dL)
after 2 days off diuretics and volume expansion
with albumin (1g/kg body weight up to a
maximum of 100 g/d), absence of shock, no
current or recent treatment with nephrotoxic
drugs, absence of signs of parenchymal renal
disease, as suggested by proteinuria (>500 mg/d)
or haematuria (>50 red blood cells per high-
power field) and/or abnormal renal ultrasound
[13], group II (cirrhotic patients with ascites)
was subdivided into:
G IIa: 27 patients with mild to moderate ascites.
G II b: 22 patients with massive ascites.
G IIc: 11 patients with hepatorenal syndrome.
Original article
El-Lehleh et al., Afro-Egypt J Infect Endem Dis 2017; 7(1):8-19
http://mis.zu.edu.eg/ajied/home.aspx
10
The renal Doppler US technique; patient fast for
8 hours prior to the Doppler ultrasonographic
examination of the native kidney. The transducer
was positioned so as to visualize the lateral or
posterolateral aspect of the kidney. In this
position, Doppler examination could performed
with the lowest appropriate angle (0-60),
establishing an appropriate approach toward
vascular structures in the periphery of the
hilum and permitting visualization of the kidney
without obstruction by gases present in the
segments of the intestine and causing artifact.
The patient was placed in the decubitus or
semi-decubitus position with the kidney to be
examined on top, thus permitting visualization
of the kidney and including an image of the
abdominal aorta. The lateral tip of the transducer
was angled slightly toward the caudal aspect,
permitting appropriate imaging of the course
of the main artery or vein [14].
Doppler analysis; patients and controls underwent
abdominal ultrasonography using US equipment
with color Doppler capability using convex
linear (2.8-5 MHz) transducer (General electric
LOGIQ P6 device). The renal resistive index
was automatically calculated by the US
equipment. Intra-renal resistance was measured
on inter-lobar arteries three times in different
regions of each kidney (upper, middle and lower
poles) and then the mean value was calculated.
Subsequently, a mean RI was calculated for
each subject (mean of both kidneys) [15].
Statistical Analysis
Data was statistically analyzed using SPSS
(statistical package for social science) (IBM,
New York, USA) program version 22 for
windows and for all the analysis a p value < 0.05
was considered statistically significant.
RESULTS
Demographics of the studied groups There was no statistical significant difference
between studied groups as regards age and sex
distribution (p value >0.05). Cirrhotic patients
without ascites (group I) were 14 males (70%) &
6 females (30%) with their mean age 45.5±15.4.
Cirrhotic patients with ascites (group II) were 39
males (65%) & 21 females (35%) with their
mean age 51.6±15.5. Control group (group III)
were 12 males (60%) and 8 females (40%) with
their mean age 50.4±16.3.
There was a statistical significant difference
between the cirrhotic patients without ascites and
cirrhotic patients with ascites regarding history
of hematemsis and/or melena, liver and splenic
size (p value <0.05) as well as, there was a
statistical high significant difference between the
same groups regarding jaundice, lower limb
edema and history of hepatic encephalopathy (p
value <0.001).
There was a statistical high significant difference
between the studied groups regarding hemoglobin
concentration and platelets count (p value <0.001) as
well as there was a statistical significant difference
between the studied groups regarding WBCs
count (p value <0.05). There was a statistical high
significant decrease in the mean values of
hemoglobin concentration (10.10 gm/dl), WBCs
(3.96 x10³ /cm3) and platelet count (70.8 x10³
/cm3) in cirrhotic patients with ascites in
comparison with cirrhotic patients without ascites
(12.34 gm/dl, 6.04 x10³/cm3 and 159.2 x10³
/cm3 respectively) and control group (13.0 gm/dl,
6.47 x10³/cm
3 and 225.9 x10
3/cm
3 respectively).
There was a statistical high significant difference
between the studied groups regarding total bilirubin,
serum albumin, prothrombin concentration, AST
and ALT (p value <0.001). There was a statistical
high significant increase in the mean values of
serum bilirubin (4.25 mg/dl) as well as, a statistical
high significant decrease in serum albumin (2.44
gm/dl) and prothrombin concentration (48.27%)
in cirrhotic patients with ascites in comparison
with cirrhotic patients without ascites (1.04
mg/dl, 3.98 gm/dl and85.5% respectively) and
control group (0.69 mg/dl, 4.13 gm/dl and 98.8%
respectively)
There was a statistical high significant difference
between cirrhotic patients without ascites and
cirrhotic patients with ascites regarding Child
classification (p value <0.001). Most patients in
GI were Child A (18 patients, 90%) on the other
hand, the majority of patients in GII were Child
C (49 patients, 81.7%).
Regarding abdominal ultrasound findings among
studied groups, there was a statistical high
significant difference between the studied groups
regarding size of liver and spleen, portal vein
dilatation and the amount of ascites (p value
<0.001). There was no statistical significant
difference between the cirrhotic patients without
ascites and cirrhotic patients with ascites regarding
the etiology of liver cirrhosis (p value = 0.69).
Chronic HCV was the commonest etiology of
cirrhosis in both groups.
Original article
El-Lehleh et al., Afro-Egypt J Infect Endem Dis 2017; 7(1): 8-19
http://mis.zu.edu.eg/ajied/home.aspx
11
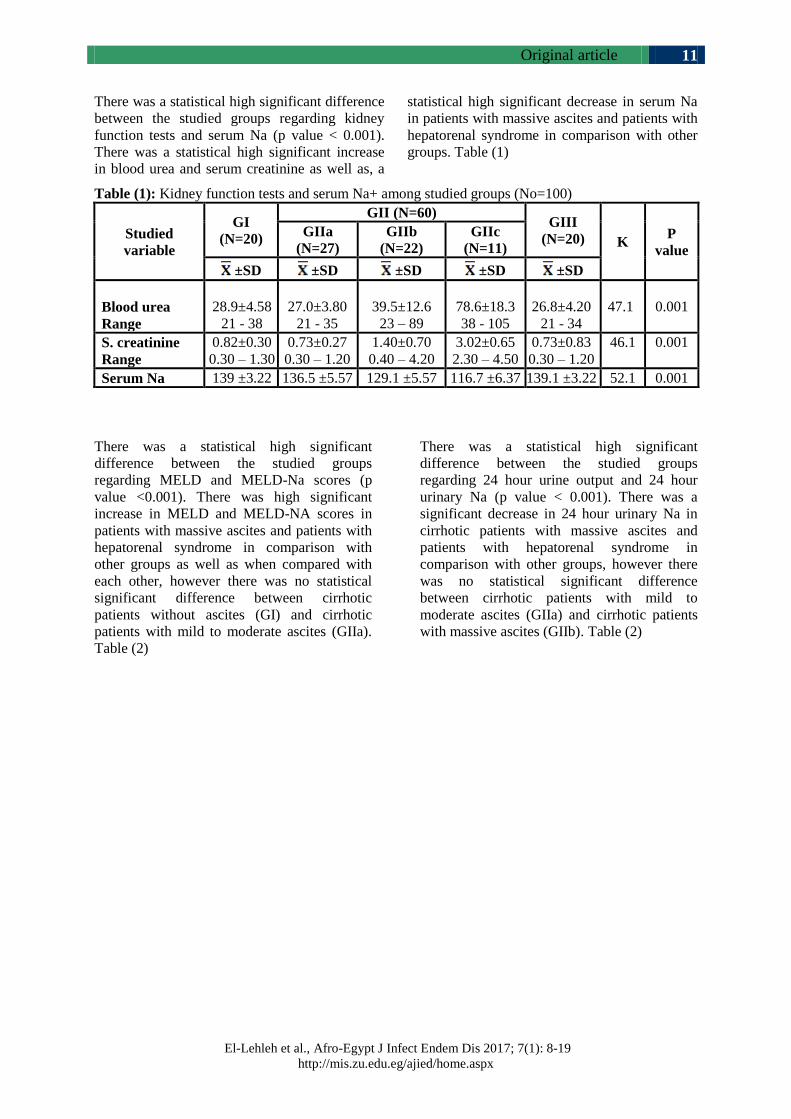
There was a statistical high significant difference
between the studied groups regarding kidney
function tests and serum Na (p value < 0.001).
There was a statistical high significant increase
in blood urea and serum creatinine as well as, a
statistical high significant decrease in serum Na
in patients with massive ascites and patients with
hepatorenal syndrome in comparison with other
groups. Table (1)
Table (1): Kidney function tests and serum Na+ among studied groups (No=100)
Studied
variable
GI
(N=20)
GII (N=60) GIII
(N=20) K P
value
GIIa
(N=27)
GIIb
(N=22)
GIIc
(N=11)
±SD ±SD ±SD ±SD ±SD
Blood urea
Range
28.9±4.58
21 - 38
27.0±3.80
21 - 35
39.5±12.6
23 – 89
78.6±18.3
38 - 105
26.8±4.20
21 - 34
47.1
0.001
S. creatinine
Range
0.82±0.30
0.30 – 1.30
0.73±0.27
0.30 – 1.20
1.40±0.70
0.40 – 4.20
3.02±0.65
2.30 – 4.50
0.73±0.83
0.30 – 1.20
46.1 0.001
Serum Na 139 ±3.22 136.5 ±5.57 129.1 ±5.57 116.7 ±6.37 139.1 ±3.22 52.1 0.001
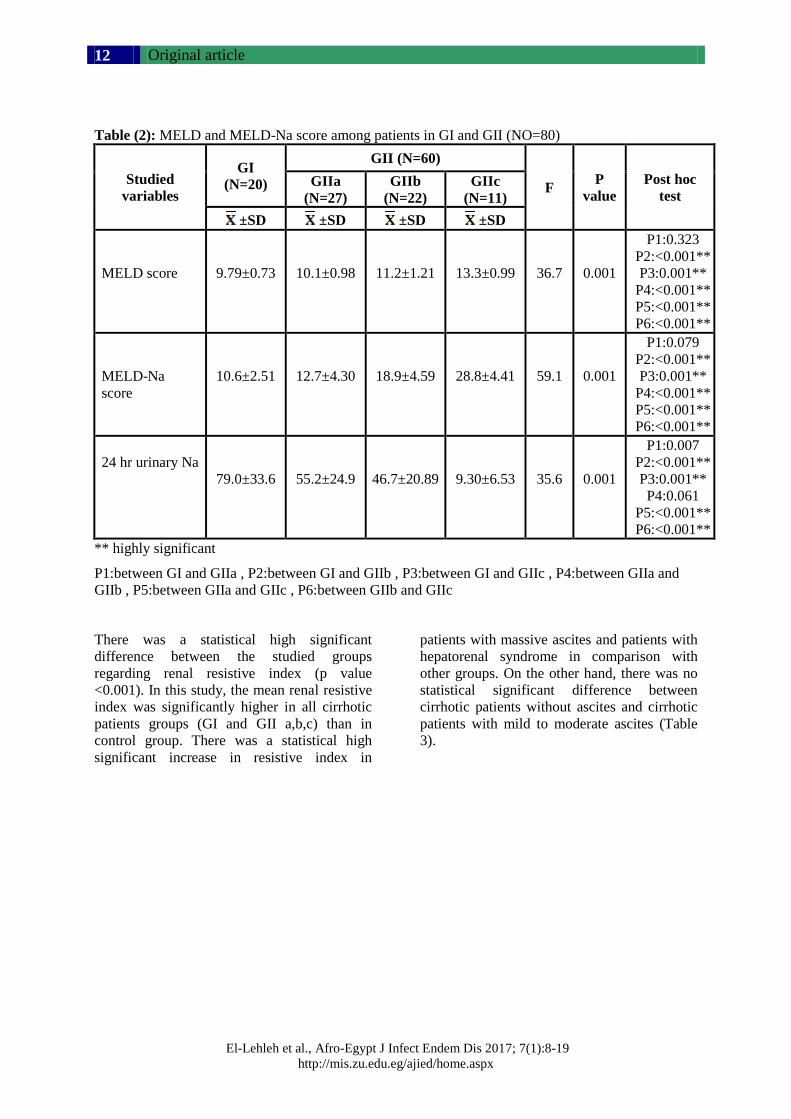
There was a statistical high significant
difference between the studied groups
regarding MELD and MELD-Na scores (p
value <0.001). There was high significant
increase in MELD and MELD-NA scores in
patients with massive ascites and patients with
hepatorenal syndrome in comparison with
other groups as well as when compared with
each other, however there was no statistical
significant difference between cirrhotic
patients without ascites (GI) and cirrhotic
patients with mild to moderate ascites (GIIa).
Table (2)
There was a statistical high significant
difference between the studied groups
regarding 24 hour urine output and 24 hour
urinary Na (p value < 0.001). There was a
significant decrease in 24 hour urinary Na in
cirrhotic patients with massive ascites and
patients with hepatorenal syndrome in
comparison with other groups, however there
was no statistical significant difference
between cirrhotic patients with mild to
moderate ascites (GIIa) and cirrhotic patients
with massive ascites (GIIb). Table (2)
Original article
El-Lehleh et al., Afro-Egypt J Infect Endem Dis 2017; 7(1):8-19
http://mis.zu.edu.eg/ajied/home.aspx
12
Table (2): MELD and MELD-Na score among patients in GI and GII (NO=80)
Studied
variables
GI
(N=20)
GII (N=60)
F P
value
Post hoc
test GIIa
(N=27)
GIIb
(N=22)
GIIc
(N=11)
±SD ±SD ±SD ±SD
MELD score
9.79±0.73
10.1±0.98
11.2±1.21
13.3±0.99
36.7
0.001
P1:0.323
P2:<0.001**
P3:0.001**
P4:<0.001**
P5:<0.001**
P6:<0.001**
MELD-Na
score
10.6±2.51
12.7±4.30
18.9±4.59
28.8±4.41
59.1
0.001
P1:0.079
P2:<0.001**
P3:0.001**
P4:<0.001**
P5:<0.001**
P6:<0.001**
24 hr urinary Na
79.0±33.6
55.2±24.9
46.7±20.89
9.30±6.53
35.6
0.001
P1:0.007
P2:<0.001**
P3:0.001**
P4:0.061
P5:<0.001**
P6:<0.001**
** highly significant
P1:between GI and GIIa , P2:between GI and GIIb , P3:between GI and GIIc , P4:between GIIa and
GIIb , P5:between GIIa and GIIc , P6:between GIIb and GIIc
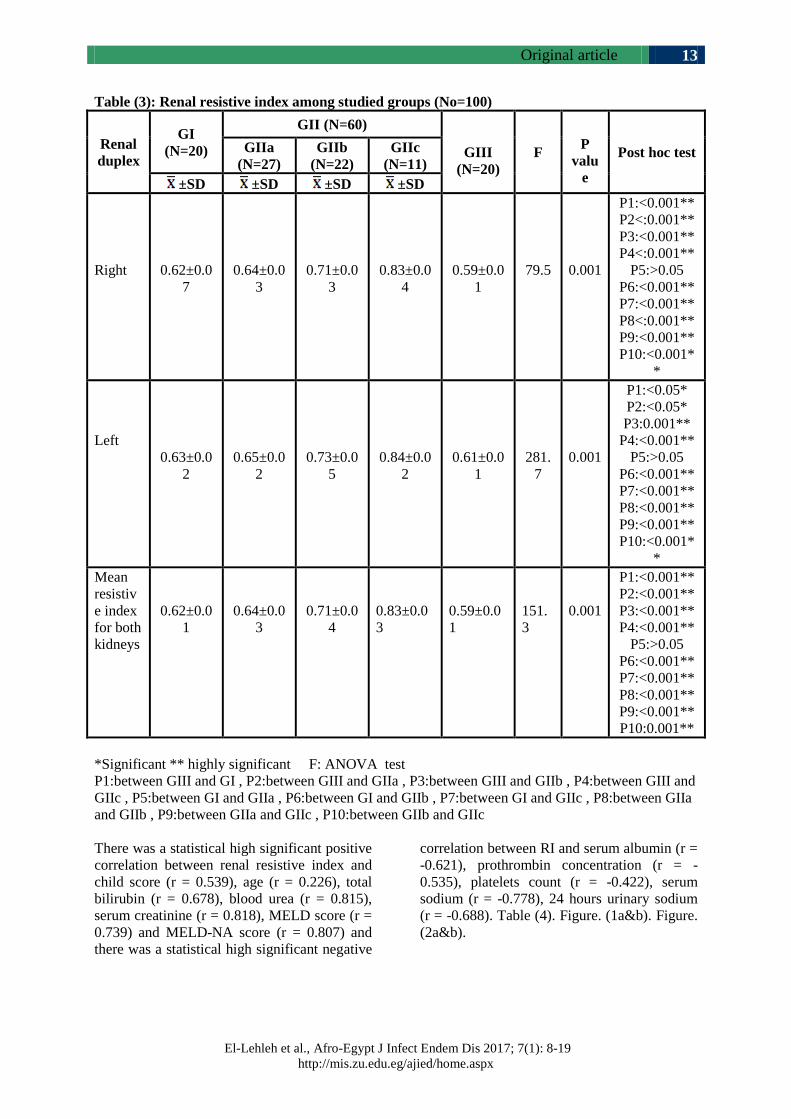
There was a statistical high significant
difference between the studied groups
regarding renal resistive index (p value
<0.001). In this study, the mean renal resistive
index was significantly higher in all cirrhotic
patients groups (GI and GII a,b,c) than in
control group. There was a statistical high
significant increase in resistive index in
patients with massive ascites and patients with
hepatorenal syndrome in comparison with
other groups. On the other hand, there was no
statistical significant difference between
cirrhotic patients without ascites and cirrhotic
patients with mild to moderate ascites (Table
3).
Original article
El-Lehleh et al., Afro-Egypt J Infect Endem Dis 2017; 7(1): 8-19
http://mis.zu.edu.eg/ajied/home.aspx
13
Table (3): Renal resistive index among studied groups (No=100)
Renal
duplex
GI
(N=20)
GII (N=60)
GIII
(N=20)
F
P
valu
e
Post hoc test GIIa
(N=27)
GIIb
(N=22)
GIIc
(N=11)
±SD ±SD ±SD ±SD
Right
0.62±0.0
7
0.64±0.0
3
0.71±0.0
3
0.83±0.0
4
0.59±0.0
1
79.5
0.001
P1:<0.001**
P2<:0.001**
P3:<0.001**
P4<:0.001**
P5:>0.05
P6:<0.001**
P7:<0.001**
P8<:0.001**
P9:<0.001**
P10:<0.001*
*
Left
0.63±0.0
2
0.65±0.0
2
0.73±0.0
5
0.84±0.0
2
0.61±0.0
1
281.
7
0.001
P1:<0.05*
P2:<0.05*
P3:0.001**
P4:<0.001**
P5:>0.05
P6:<0.001**
P7:<0.001**
P8:<0.001**
P9:<0.001**
P10:<0.001*
*
Mean
resistiv
e index
for both
kidneys
0.62±0.0
1
0.64±0.0
3
0.71±0.0
4
0.83±0.0
3
0.59±0.0
1
151.
3
0.001
P1:<0.001**
P2:<0.001**
P3:<0.001**
P4:<0.001**
P5:>0.05
P6:<0.001**
P7:<0.001**
P8:<0.001**
P9:<0.001**
P10:0.001**
*Significant ** highly significant F: ANOVA test
P1:between GIII and GI , P2:between GIII and GIIa , P3:between GIII and GIIb , P4:between GIII and
GIIc , P5:between GI and GIIa , P6:between GI and GIIb , P7:between GI and GIIc , P8:between GIIa
and GIIb , P9:between GIIa and GIIc , P10:between GIIb and GIIc
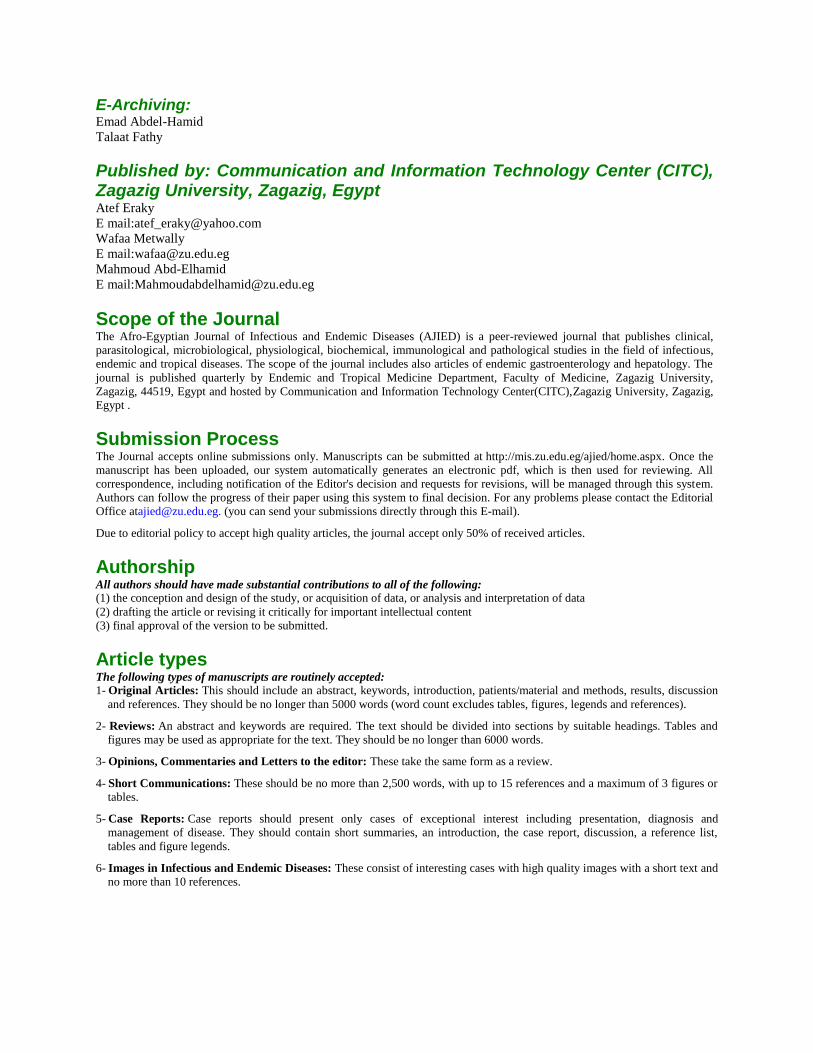
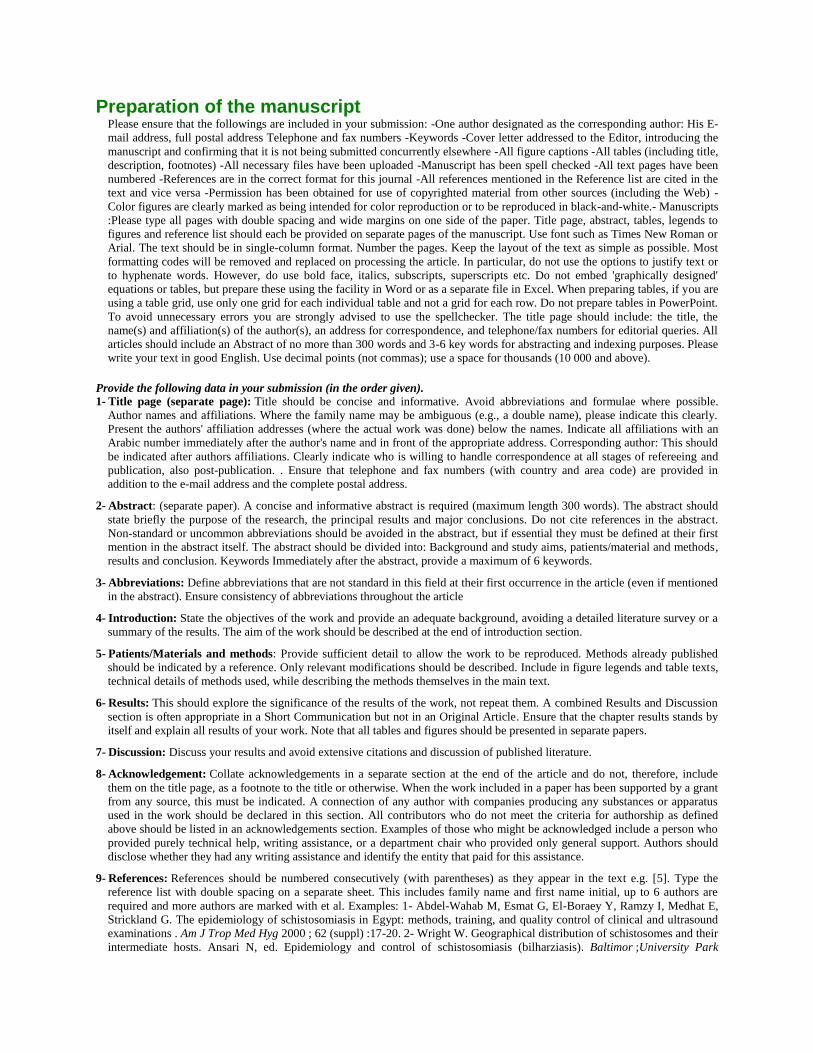
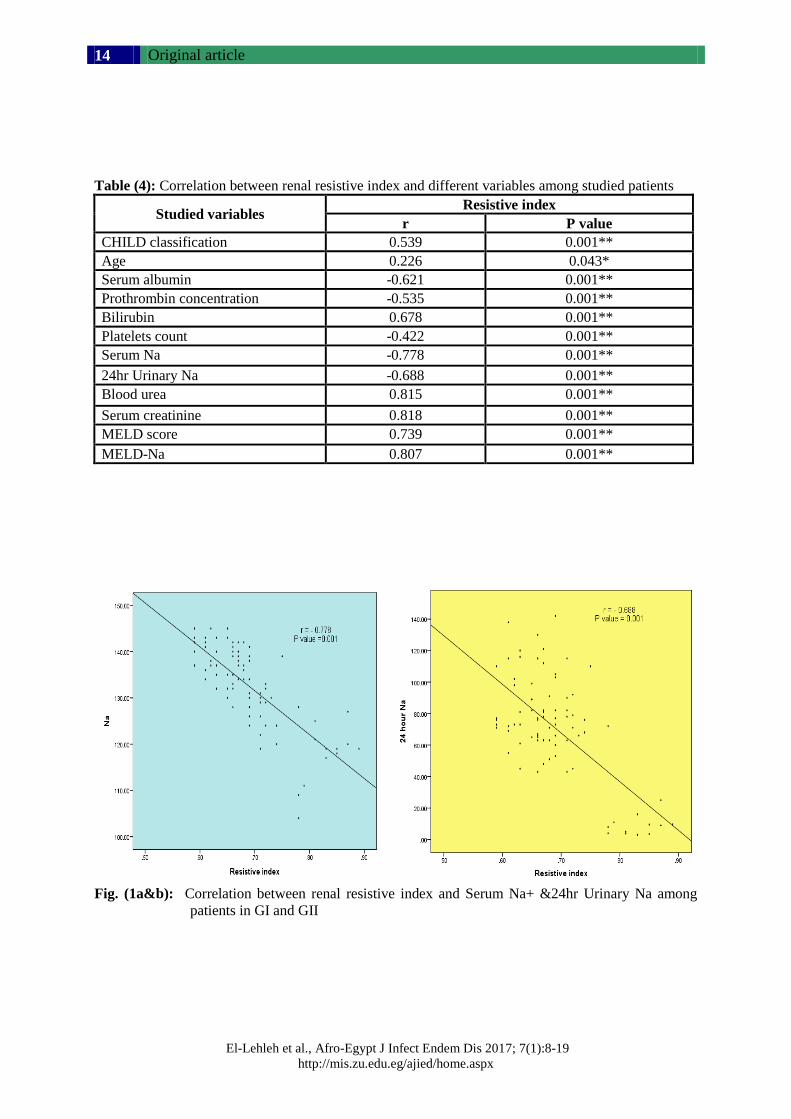
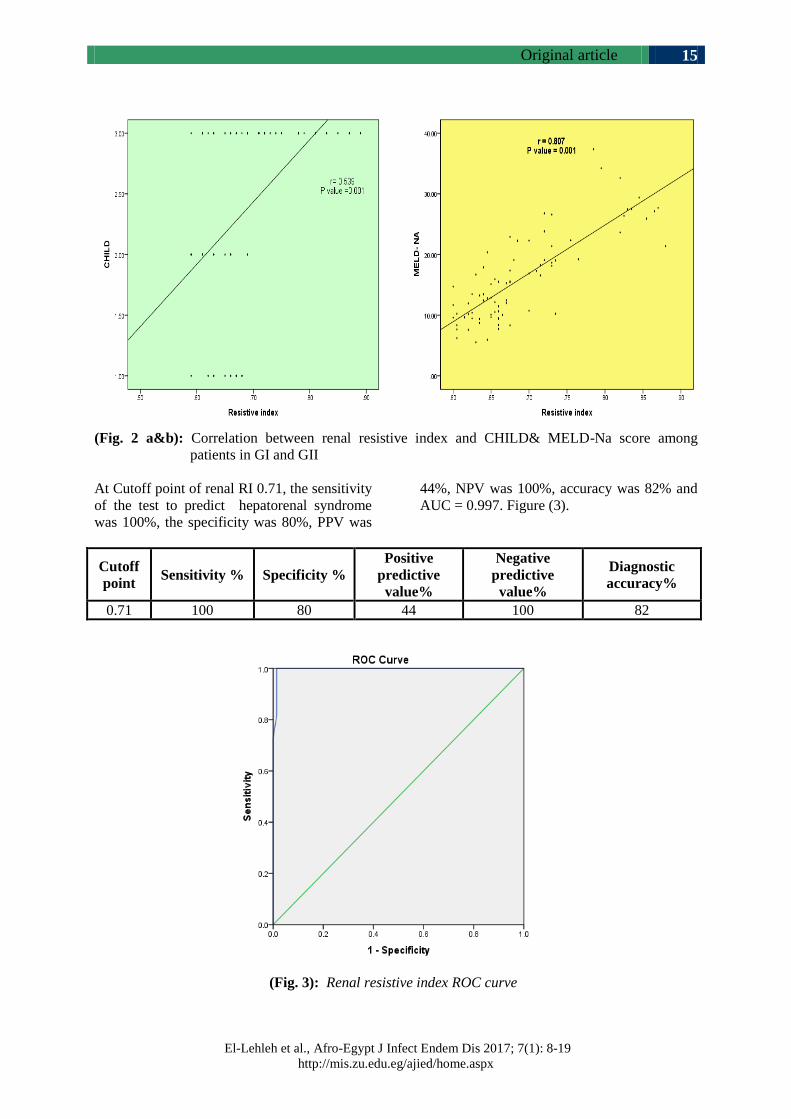
There was a statistical high significant positive
correlation between renal resistive index and
child score (r = 0.539), age (r = 0.226), total
bilirubin (r = 0.678), blood urea (r = 0.815),
serum creatinine (r = 0.818), MELD score (r =
0.739) and MELD-NA score (r = 0.807) and
there was a statistical high significant negative
correlation between RI and serum albumin (r =
-0.621), prothrombin concentration (r = -
0.535), platelets count (r = -0.422), serum
sodium (r = -0.778), 24 hours urinary sodium
(r = -0.688). Table (4). Figure. (1a&b). Figure.
(2a&b).
Original article
El-Lehleh et al., Afro-Egypt J Infect Endem Dis 2017; 7(1):8-19
http://mis.zu.edu.eg/ajied/home.aspx
14
Table (4): Correlation between renal resistive index and different variables among studied patients
Studied variables Resistive index
r P value
CHILD classification 0.539 0.001**
Age 0.226 0.043*
Serum albumin -0.621 0.001**
Prothrombin concentration -0.535 0.001**
Bilirubin 0.678 0.001**
Platelets count -0.422 0.001**
Serum Na -0.778 0.001**
24hr Urinary Na -0.688 0.001**
Blood urea 0.815 0.001**
Serum creatinine 0.818 0.001**
MELD score 0.739 0.001**
MELD-Na 0.807 0.001**
Fig. (1a&b): Correlation between renal resistive index and Serum Na+ &24hr Urinary Na among
patients in GI and GII
Original article
El-Lehleh et al., Afro-Egypt J Infect Endem Dis 2017; 7(1): 8-19
http://mis.zu.edu.eg/ajied/home.aspx
15
(Fig. 2 a&b): Correlation between renal resistive index and CHILD& MELD-Na score among
patients in GI and GII
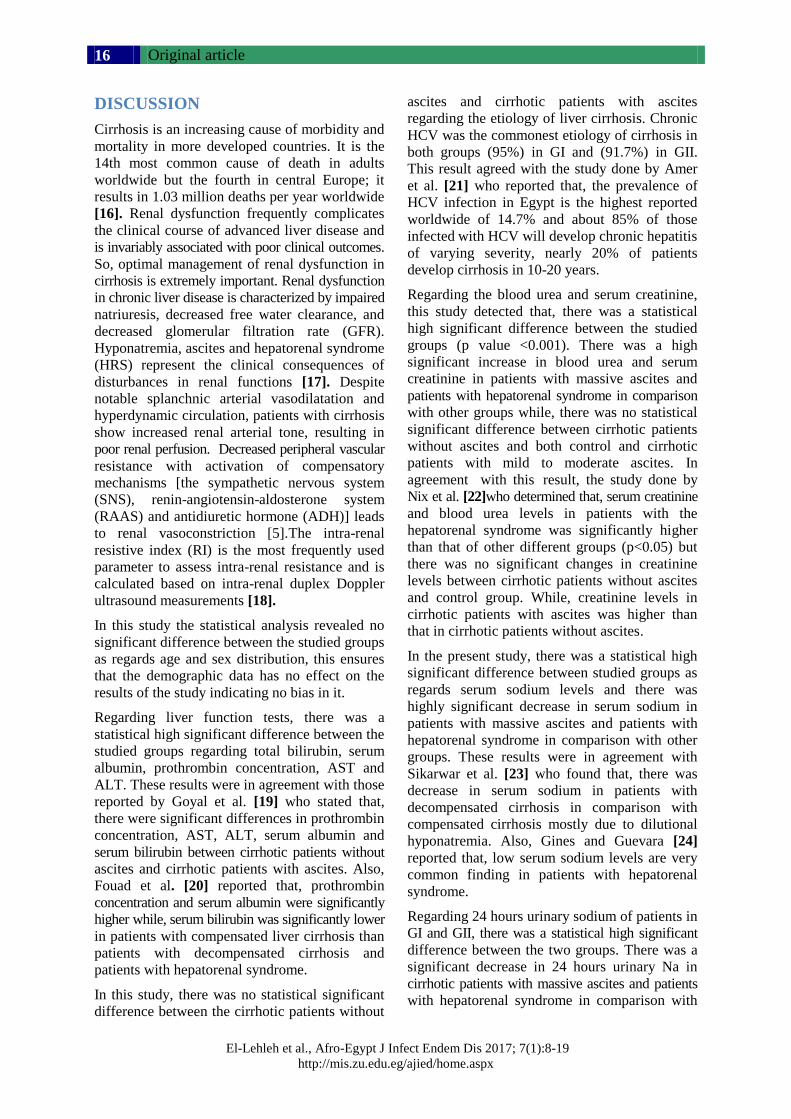
At Cutoff point of renal RI 0.71, the sensitivity
of the test to predict hepatorenal syndrome
was 100%, the specificity was 80%, PPV was
44%, NPV was 100%, accuracy was 82% and
AUC = 0.997. Figure (3).
Diagnostic
accuracy%
Negative
predictive
value%
Positive
predictive
value%
Specificity % Sensitivity % Cutoff
point
82 100 44 80 100 0.71
(Fig. 3): Renal resistive index ROC curve
Original article
El-Lehleh et al., Afro-Egypt J Infect Endem Dis 2017; 7(1):8-19
http://mis.zu.edu.eg/ajied/home.aspx
16
DISCUSSION
Cirrhosis is an increasing cause of morbidity and
mortality in more developed countries. It is the
14th most common cause of death in adults
worldwide but the fourth in central Europe; it
results in 1.03 million deaths per year worldwide
[16]. Renal dysfunction frequently complicates
the clinical course of advanced liver disease and
is invariably associated with poor clinical outcomes.
So, optimal management of renal dysfunction in
cirrhosis is extremely important. Renal dysfunction
in chronic liver disease is characterized by impaired
natriuresis, decreased free water clearance, and
decreased glomerular filtration rate (GFR).
Hyponatremia, ascites and hepatorenal syndrome
(HRS) represent the clinical consequences of
disturbances in renal functions [17]. Despite
notable splanchnic arterial vasodilatation and
hyperdynamic circulation, patients with cirrhosis
show increased renal arterial tone, resulting in
poor renal perfusion. Decreased peripheral vascular
resistance with activation of compensatory
mechanisms [the sympathetic nervous system
(SNS), renin-angiotensin-aldosterone system
(RAAS) and antidiuretic hormone (ADH)] leads
to renal vasoconstriction [5].The intra-renal
resistive index (RI) is the most frequently used
parameter to assess intra-renal resistance and is
calculated based on intra-renal duplex Doppler
ultrasound measurements [18].
In this study the statistical analysis revealed no
significant difference between the studied groups
as regards age and sex distribution, this ensures
that the demographic data has no effect on the
results of the study indicating no bias in it.
Regarding liver function tests, there was a
statistical high significant difference between the
studied groups regarding total bilirubin, serum
albumin, prothrombin concentration, AST and
ALT. These results were in agreement with those
reported by Goyal et al. [19] who stated that,
there were significant differences in prothrombin
concentration, AST, ALT, serum albumin and
serum bilirubin between cirrhotic patients without
ascites and cirrhotic patients with ascites. Also,
Fouad et al. [20] reported that, prothrombin
concentration and serum albumin were significantly
higher while, serum bilirubin was significantly lower
in patients with compensated liver cirrhosis than
patients with decompensated cirrhosis and
patients with hepatorenal syndrome.
In this study, there was no statistical significant
difference between the cirrhotic patients without
ascites and cirrhotic patients with ascites
regarding the etiology of liver cirrhosis. Chronic
HCV was the commonest etiology of cirrhosis in
both groups (95%) in GI and (91.7%) in GII.
This result agreed with the study done by Amer
et al. [21] who reported that, the prevalence of
HCV infection in Egypt is the highest reported
worldwide of 14.7% and about 85% of those
infected with HCV will develop chronic hepatitis
of varying severity, nearly 20% of patients
develop cirrhosis in 10-20 years.
Regarding the blood urea and serum creatinine,
this study detected that, there was a statistical
high significant difference between the studied
groups (p value <0.001). There was a high
significant increase in blood urea and serum
creatinine in patients with massive ascites and
patients with hepatorenal syndrome in comparison
with other groups while, there was no statistical
significant difference between cirrhotic patients
without ascites and both control and cirrhotic
patients with mild to moderate ascites. In
agreement with this result, the study done by
Nix et al. [22]who determined that, serum creatinine
and blood urea levels in patients with the
hepatorenal syndrome was significantly higher
than that of other different groups (p<0.05) but
there was no significant changes in creatinine
levels between cirrhotic patients without ascites
and control group. While, creatinine levels in
cirrhotic patients with ascites was higher than
that in cirrhotic patients without ascites.
In the present study, there was a statistical high
significant difference between studied groups as
regards serum sodium levels and there was
highly significant decrease in serum sodium in
patients with massive ascites and patients with
hepatorenal syndrome in comparison with other
groups. These results were in agreement with
Sikarwar et al. [23] who found that, there was
decrease in serum sodium in patients with
decompensated cirrhosis in comparison with
compensated cirrhosis mostly due to dilutional
hyponatremia. Also, Gines and Guevara [24]
reported that, low serum sodium levels are very
common finding in patients with hepatorenal
syndrome.
Regarding 24 hours urinary sodium of patients in
GI and GII, there was a statistical high significant
difference between the two groups. There was a
significant decrease in 24 hours urinary Na in
cirrhotic patients with massive ascites and patients
with hepatorenal syndrome in comparison with
Original article
El-Lehleh et al., Afro-Egypt J Infect Endem Dis 2017; 7(1): 8-19
http://mis.zu.edu.eg/ajied/home.aspx
17
other groups. Also, there was a statistical significant
difference between cirrhotic patients without
ascites and cirrhotic patients with mild to
moderate ascites. This was in agreement with
Kenawi et al. [25] who reported that, the urine
sodium excretion in patients with chronic liver
disease decreases with progression of disease and
also with Fouad et al. [20] who reported that,
urinary sodium excretion decrease in patients
with hepatorenal syndrome. Sikarwar et al. [23]
detected that, the mean urinary sodium
concentration was significantly higher in cirrhotic
patients without ascites than in cirrhotic patients
with ascites and it was also higher in cirrhotic
patients with ascites than in patients with
hepatorenal syndrome.
In this study, the mean renal resistive index was
significantly higher in all cirrhotic patients groups
(GI and GIIa,b,c) than in control group. This
result was in agreement with Cazzaniga et al.
[26], Ustundag et al. [27] and Fouad et al. [20]
who showed that, intra-renal RI was significantly
higher in patients with cirrhosis than in healthy
subjects. Also Masahiko et al. [28] demonstrated
that, resistive index was significantly higher in
cirrhotic patients compared to controls and
compared to patients with chronic hepatitis.
Abuelo [29] reported that, the increase in renal
vascular RI in cirrhotic patients with ascites can
be explained by a physiological homeostatic
response to vascular under filling occurring in
ascitic patients. When the vascular under filling
is moderate, the renal vasoactive substances are
effectively counterbalanced by increased renal
synthesis of prostaglandins so that, renal blood
flow and GFR remain normal. In contrast, when
the vascular under filling is severe, intense
stimulation of endogenous vasoconstrictor systems
occurs, producing renal vasoconstriction and
impairment of renal blood flow and GFR. Colle
et al. [30] reported that, intra-renal blood flow is
preserved in cirrhotic patients by intra-renal
mechanisms until the ascites becomes refractory.
When this regulation fails renal ischemia causes
tubular necrosis, azotemia and oliguric renal failure.
In the current study, there was a statistical high
significant increase in mean renal resistive index
of both kidneys in patients with massive ascites
and patients with hepatorenal syndrome in
comparison with other groups. On the other hand,
there was no statistical significant difference
between cirrhotic patients without ascites and
cirrhotic patients with mild to moderate ascites.
These results were in agreement with Maroto et
al. [31] who demonstrated that, RI was
significantly higher in decompensated cirrhotic
patients with ascites than in compensated
cirrhotic patients and that the RI of compensated
cirrhotic patients is higher than in the controls.
They reported that, these results were highly
sensitive and specific for the diagnosis of HRS.
Also, in another study, Bardi et al. [31] reported
that, patients with HRS had significantly higher
values of RI than those without HRS. The
relative risk of developing HRS in patients with
an RI = 0.70 was high. RI is a useful indicator in
patients with cirrhosis and ascites for the
diagnosis and prognosis of HRS.
In this study, there was a statistical high significant
difference between the cirrhotic patients without
ascites and cirrhotic patients with ascites
regarding Child classification. Most patients in
GI were child A, on the other hand, the majority
of patients in GII were Child C. There was a
statistical high significant positive correlation
between renal resistive index and child
classification. This result was in agreement with
the study done by Yan and Zhang [33] and
Moustafa et al. [34] who detected that, there was
positive correlation between RI and Child-Pugh
classification. Moreover, Child C patients had
the highest RI followed by Child B patients and
lastly Child A patients.
In this study, there was a statistical high significant
positive correlation between renal resistive index
and age and total bilirubin and there was a
statistical high significant negative correlation
between renal resistive index and serum albumin,
prothrombin concentration and platelets count.
This result agreed with Abdel-Bary et al. [35]
who detected that, RI had a significant positive
correlation with age and total bilirubin (r =0.593,
P<0.001) and there was a significant negative
correlation between renal RI and prothromin
concentration and serum albumin (r =_0.407,
P<0.001) (35).This result disagreed with Moustafa
et al. [34] who reported that, there was no
significant correlation between renal RI and serum
albumin.
Regarding the correlation between renal resistive
index and serum sodium there was a statistical
high significant negative correlation between
them (p value <0.001). In agreement with this
result Abdel-Bary et al. [35] who reported that,
there was negative correlation between RI and
serum sodium (r= -0.341, P value <0.001).
Original article
El-Lehleh et al., Afro-Egypt J Infect Endem Dis 2017; 7(1):8-19
http://mis.zu.edu.eg/ajied/home.aspx
18
This study showed a highly significant positive
correlation between renal resistive index and
blood urea & serum creatinine. This result agreed
with Sikarwar et al. [23] who reported that, there
was positive correlation between the values of RI
and blood Urea and serum creatinine. It was
observed that, increased renal RI value in
cirrhotic patients was associated with corresponding
increase in blood urea level and serum creatinine.
This is in contrast to Pompili et al. [36] who
reported that, there was no significant correlation
between renal RI and serum creatinine.
In this study, there was a statistical high
significant positive correlation between renal
resistive index and MELD (r= 0.739, p value <
0.001) and MELD-Na scores (r= 0.807, p value
<0.001). Theses results agreed with Abdel-Bary
et al. [35] who detected that, there was a
significant positive correlation between RI and
MELD (r= 0.859, P<0.001) and MELD Na (r=
0.769, P<0.001) (35). Patients with high MELD
score had higher RI. These results also were in
agreement with those of Umbro et al. [37] and
Moustafa et al. [34]
In this study, Resistive index ROC curve analysis
showed that, RI had AUROC = 0.997 and if the
Cutoff point of renal RI was 0.71, the sensitivity
of the test was 100%, the specificity was 80%,
PPV was 44%, NPV was 100% and accuracy
was 82%. The results of this study were close to
that reported by Abdel-Bary et al. [35] who
stated that, RI ROC curve analysis showed that
RI had AUROC = 0.903 (95% CI: 0.835–0.949
and P<0.001). At a cutoff value of RI >0.73,
renal resistive index had sensitivity of 100% and
specificity of 66.36% (35).
CONCLUSION From the present study, we conclude that, renal
duplex Doppler ultrasound is useful as a non-
invasive method for the evaluation of the renal
hemodynamic changes in cirrhotic patients with
good correlation to the severity of liver disease.
The RI may help identify a subgroup of high-risk
patients with a poor prognosis that require
special therapeutic care.
Funding: None.
Conflicts of interest: None.
Ethical approval:Approved.
REFERENCES 1. Bell H, Jahnsen J, Kittang E Raknerud N and
Sandvik L et al. Long-term prognosis of patients
with alcoholic liver cirrhosis: A 15-years follow-
up study of 100 Norwegian patients admitted to one
unit. Scand J Gastroenterol 2004; 9: 858- 863.
2. Gines P and Schrier RW: Renal failure in cirrhosis.
N Engl J Med 2009; 361:1279.
3. Wadei HM, Mai ML, Ahsan N and Gonwa TAet al.
Hepatorenal syndrome: Pathophysiology and
management. Clin J Am Soc Nephrol 2006; 1: 1066.
4. Ross S, Thometz D, Serafini F, Bloomston M,
Morton C, Zervos E et al. Renal haemodynamics
and function following partial portal decompression.
HPB (Oxford) 2009; 11(3):229–34.
5. Lata J: Hepatorenal syndrome. World J Gastro-
enterology 2012; 18(36): 4978–84..
6- Sherman DS, Fish DN and Teitebaum I: Assessing
renal function in cirrhotic patients: problems and
pitfalls. Am J Kidney Dis 2003; 41: 269-78.
7. Berzigotti A, Casadei A, Magalotti D, Castaldini N,
Losinno F, Rossi C et al. Renovascular impedance
correlates with portal pressure in patients with
liver cirrhosis. Radiology 2006; 240: 581- 586.
8. Rademacher J, Mengel M, Ellis S, Stuht S, Hiss M,
Schwarz A et al. The renal arterial resistance
Index and renal allograft survival. New Engl J
Med 2003; 349: 115- 124.
9. Kastelan S, Ljublcic N, Kastelan Z and Uravic M.
The role of duplex Doppler ultrasonography in
the diagnosis of renal dysfunction and hepatorenal
syndrome in patients with liver cirrhosis.
Hepatogastroenterology 2004; 51: 1408-1412.
10. Catherine PC, Eric MG and Sanjiv C: Cirrhosis
and portal hypertension; In: Lawrence SF, Jules
LD and Emmet BK editors. Handbook of liver
disease, 3rd
edition 2012; Saunders, an imprint of
Elsevier Inc. pp:138-143.
11. Kamath PS, Wiesner RH, Malinchoc M, Kremers
W, Therneau TM, Kosberg CL et al. A model to
predict survival in patients with end-stage liver
disease. Hepatology 2001; 33(2):464–70.
12. Kim WR, Biggins SW, Kremers WK, Wiesner
RH, Kamath PS, Benson JT et al. Hyponatremia and
mortality among patients on the liver-transplant
waiting list. N Engl J Med 2008; 359(10):1018–26.
13. Salerno F, Gerbes A, Gine`s P, Wong F and
Arroyo V. Diagnosis, prevention and treatment of
hepatorenal syndrome in cirrhosis. Gut 2007;
56:1310-1318.
14. Tublin ME, Bude RO and Platt JF: Resistive
Index in Renal Doppler Sonography: Where Do
We Stand? AJR 2003; 180:885-892.
15. Platt J, Ellis J and Rubin J: Examination of Native
Kidneys with Duplex Doppler Ultrasound. Semin
Ultrasound CT MR 1991; 12:308-318.
Original article
El-Lehleh et al., Afro-Egypt J Infect Endem Dis 2017; 7(1): 8-19
http://mis.zu.edu.eg/ajied/home.aspx
19
16. Lozano R, Naghavi M, Foreman K and Memish Z.
Global and regional mortality from 235 causes of
death for 20 age groups in 1990 and 2010: a
systematic analysis for the Global Burden of Disease
Study 2010. Lancet 2012; 380: 2095–128.
17. Angeli P, Wong F, Watson H and Gin`es.
Hyponatremia in cirrhosis: Results of a patient
population survey. Hepatology 2006; 44:1535-
1542.
18. Zeller T, Bonvini RF and Sixt S: Color-coded duplex
ultrasound for diagnosis of renal artery stenosis
and as follow-up examination after revascularization.
Catheter Cardiovasc Interv 2008; 71: 995–9.
19. Goyal S, Dixit VK, Jain AK, Shukla RC, Ghosh
and Kumar V. Intrarenal resistance index (RI) as
a predictor of early renal impairment in patients
with liver cirrhosis. Tropical Gastroenterology
2013; 34(4):235–23.
20. Fouad YM, Mokarrab H, Elgebaly AF, El Amin
H, Abdel Raheem E, Sharawy MA et al. Renal
duplex Doppler ultrasound in patients with HCV
related liver cirrhosis. Trop Gastroenterol 2009;
30(4):213–8.
21. Amer FA, Gohar M and Yousef M: Epidemiology
of Hepatitis C Virus Infection in Egypt.
International Journal of Tropical disease &
Health 2015; 7(3):119-131.
22. Nix DE, Erstad BL, Nakazato PZ and Krueger TS.
Estimation of creatinine clearance in end-stage
liver disease. Ann Pharmacother 2006; 40:900–8.
23. Sikarwar J, Muchhoria S, Singh R, Bhujade H and
Ahirwar V. Study of Resistive Index in various
stages of Liver Cirrhosis and its significance in
Calculating the Risk for Hepatorenal Syndrome.
Journal of Evolution of Medical and Dental
Sciences 2014; 3(5): 1195-1205.
24. Gines P and Guevara M: Hyponatremia in Cirrhosis:
Pathogenesis, Clinical Significance, and
Management. Hepatology 2008; 48 (3):1002-1010.
25. Kenawi AM, Hamid AA and Sahar AA: Renal
resistive index and sodium concentration as a
predictor of renal dysfunction in patients with
advanced liver cirrhosis. MD thesis 2004, Cairo
University.
26. Cazzaniga M, Salerno F, Visentin S, Cirello I,
Donarini C and Cugno M. Increased flow mediated
vasodilation in cirrhotic patients with ascites:
relationship with renal resistive index. Liver Int
2008; 28(10):1396–401.
27- Ustundag Y, Hekimog˘ lu K, Ilikhan S et al.
Serum glucagon and cystatin C levels with renal
Doppler sonography findings in nonazotemic
liver cirrhosis cases. Hepatogastroenterology
2011; 58:926–31.
28. Masahiko K, Murawaki Y and Kawasaki H:
Renovascular resistance assessed by color
Doppler ultrasonography in patients with chronic
liver diseases. Western Pacific Helicobacter
Congress No 3, Pasar, Bali, Indonesie 2000;
15(12):1424–1429.
29. Abuelo GJ: Diagnosing vascular causes of renal
failure. Ann Intern Med 1995; 123:601–14.
30. Colle I, Moreau R, Pessione F, Rassiat E, Heller
J, Chagneau C et al. Relationship between
haemodynamic alternations and the development
of ascites or refractory ascites in patients with
cirrhosis. Eur J Gastroentrol Hepatol 2001; 13:
251–6.
31. Maroto A, Ginès A, Saló J, Clària J, Ginès P,
Anibarro L et al. Diagnosis of functional renal
failure of cirrhosis with Doppler sonography:
prognostic value of resistive index. Hepatology
1994; 20:839–44.
32. Bardi A, Sapunar J and Oksenberg D. Intrarenal
arterial Doppler ultrasonography in cirrhotic patients
with ascites, with and without hepatorenal
syndrome. Rev Med Chil 2002; 130:173-80.
33. Yan Y and Zhang BL: Clinical study of renal blood
flow and endothelin in cirrhotic patients. Zhonghua
Gan Zang Bing Za Zhi 2004; 12(5):278–80.
34. Moustafa M, Eid A, Hassan M and Ahmed AA.
Evaluating the effect of midodrine on renal
resistance index in patients with liver cirrhosis
and ascites. Al Azhar Assiut Medical Journal
2016; 14:19–23.
35. Abdel-Bary SA, Safwat E, Hussein HA, Husseinb
AM and Botrosb SM. Value of renal resistive
index in hepatitis C virus related liver cirrhosis
and its response to midodrine. The Egypt J Radiol
Nucl Med 2014; 45:1079–1087.
36. Pompili M, Rapaccini GL, De Luca F, Agnes S,
Avolio AW, Covino M et al. Doppler ultrasono-
graphic evaluation of the early changes in renal
resistive index in cirrhotic patients undergoing
liver transplantation. J Ultrasound Med 1999;
18(7):497–502.
37. Umbro I, Tinti F, Fiacco F, Zavattoa A, Pisellib P,
Di Natalea V et al. Resistive index and MELDNa:
nephrologic monitoring in cirrhotic patients
awaiting liver transplantation. Transplant Proc
2013; 45:2676–2679.
Original article
Abdo et al., Afro-Egypt J Infect Endem Dis 2017; 7(1):20-27
http://mis.zu.edu.eg/ajied/home.aspx
20
Serum Zinc Levels in Egyptian Patients with HCV Induced
Chronic Liver Diseases: Evaluation and Clinical Significance
Sabry A. Abdo1, Mostafa S. Elkady
1, Hala M. El-Feky
1, Aliaa A Shalaby
2
Mohamed L. Ajour1
1Hepatology, Gastroenterology and Infectious Diseases Department Faculty of Medicine,
Benha University, Benha, Egypt
2Clinical and Chemical Pathology Department, National Research Centre,Cairo,Egypt
Corresponding Author
Hala Mohammad El
Feky
Mobile:
+201006432009
E mail: halaelfeky-
Key words: Zinc;
Hepatitis C; Chronic
liver diseases
Background and study aim: HCV
infection is a major health problem
worldwide. In Egypt the estimated
prevalence is about 22%. As Zinc (Zn) is
the second most prevalent trace element
in the body, we aimed to evaluate serum
Zn levels in patients with HCV induced
chronic liver diseases, study the relationship
between these levels and clinical profiles,
histopathological criteria and HCC
characters of the studied cases. Patients
and Methods: Sixty nine patients aged
from (18 to 67) years were included in
addition to 23 age- and sex-matched
healthy subjects serving as a control, all
were stratified into, G 1: 23 patients
biopsy proven CH. G 2: 23 cirrhosis
patients. G 3 :23 HCC patients proved by
abdominal ultrasonography, triphasic
spiral C.T Scan and AFP. Group 4 : 23
healthy persons as controls. All
underwent routine investigations and
serum Zn levels were analyzed on atomic
absorption spectrophotometer, meanwhile
cirrhotic subjects were assessed for severity
of disease by Child-Pugh classification.
Results: Serum zinc was significantly
lower in chronic hepatitis than control on
one hand and HCC group on the other
hand (p<0.001) and they were significantly
decreased in Child class C patients than
Child class A (p= 0.023). Significant
positive correlation was found between
serum Zn and age in cirrhotic group
moreover, there was no significant
correlation between serum Zn and any of
laboratory parameters in the studied
groups and fibrosis stages of chronic
hepatitis group. Negative correlation was
detected between serum Zn and tumor
multiplicity and BCLC in HCC group.
Conclusion:We can conclude that serum
zinc decreased significantly in chronic
HCV patients and these levels decreased
by increasing severity of liver disease
according to Child classification. It is
recommended to evaluate the role of zinc
supplementation in treating clinical
manifestation of liver cirrhosis and liver
cell failure due to HCV.
INTRODUCTION
Hepatitis C virus (HCV) is a major
cause of acute and chronic liver disease.
HCV infection frequently leads to
chronic hepatitis aggravated by hepatic
fibrosis and steatosis subsequently
leads to increase the risk of hepatic
cirrhosis and hepatocellular carcinoma
that are responsible for high morbidity
and mortality rate [1]. In Egypt, HCV
infection is a major health problem.
According to World Health Organization
(WHO), the estimated prevalence is
about 22% [2], because of the very
high prevalence rate of HCV in the
general Egyptian population, it accounts
for most chronic liver diseases and
HCC cases in Egypt [3].
Trace metals are integral part of
metalloenzymes and participate in
biological functions, such as oxygen
transport, free radical scavenging,
structural organization of macro-
molecules, and hormonal activity [3].
Zinc (Zn) is the second most prevalent
trace element in the body. It is
integrally involved in the normal life
cycle and it has many important
regulatory, catalytic, and defensive
functions [4]. Acute and chronic viral
Original article
Abdo et al., Afro-Egypt J Infect Endem Dis 2017; 7(1):20-27
http://mis.zu.edu.eg/ajied/home.aspx
21
hepatitis are associated with reduced serum zinc
levels, without any difference among groups
classified according to the etiology or the clinical
course of liver disease and the linkage between
zinc homeostasis and viral infection could be
identified with the assumption that viruses produce
severe oxidative stress in the hepatocytes, leading
to apoptosis or hepatocytic necrosis and causing
a decrease in protein synthesis [6]. The low serum
zinc level is common in patients with liver cirrhosis
(due to decreased intake, decreased absorption,
decreased bioavailability, and increased losses
(because of malabsorption) [5], HCC and in HCC
tumor tissue [7]. The decrease in intracellular zinc
levels in HCC could be explained by a down
regulation of ZIP14 gene expression and the near
absence of the protein within hepatoma cells in
core biopsy samples. ZIP14 localizes to the cell
membrane of normal hepatocytes and is a
functional transmembrane transporter involved in
the uptake of zinc into the cell [8]. In this study,
we evaluated serum zinc levels in patients with
HCV induced chronic hepatitis, Liver cirrhosis,
and HCC and studied the relationship between
these levels and clinical profiles, histopathological
criteria and HCC characters of the studied cases.
SUBJECTS AND METHODS
This cross-sectional study was conducted on 69
adult patients with HCV-related chronic liver
diseases who were referred to Hepatology,
Gastroenterology and Infectious diseases
department, Benha University Hospital during the
period from August 2013 to April 2014. Twenty
three healthy, age and sex matched subjects were
selected as controls. An informed medical
consents was taken for their participation in the
study. The protocol of the study was approved by
the human ethical committee of Benha University
Hospital. Patients with diseases affecting serum
zinc levels such as renal impairment and chronic
heart failure, alcohol abuse, diabetes mellitus,
previous antiviral treatment, concurrent infections
or malignancy other than HCC, chronic HBV
infection or concomitant chronic HBV and HCV
infections, zinc therapy or using hormonal drugs
was excluded in addition to patients subjected to
surgery or chemotherapy.
The Studied subjects were stratified into : Group
1 (chronic hepatitis group) that included 23 patients
who were diagnosed by liver biopsy. Group2
(cirrhotic group) that included 23 patients in whom
cirrhosis was diagnosed by clinical, laboratory
data and ultrasonographic examination. Group 3
(HCC group) that included 23 patients with HCV
related HCC who were diagnosed by abdominal
ultrasonography, triphasic C.T and AFP. Group 4
(control group) that included 23 healthy persons
as a control group with no clinical, laboratory or
ultrasonographic evidence of illness.
All subjects underwent CBC, liver profile (ALT,
AST, and bilirubin using Beckman Synchron
CX7 Delta Clinical System, prothrombin time,
and INR using stago analyzer), Serum creatinine,
Viral markers including : HCV-Ab by Enzyme
linked immunosorbent assay (ELISA) (IU/ml) in
addition to HBsAg by ELISA (IU/ml), and AFP.
Abdominal ultrasonography, abdominal triphasic
spiral C.T Scan was done for HCC group. The
severity of liver cirrhosis was assessed by Child–
Pugh score and Barcelona Clinic Liver Cancer
(BCLC) staging system was done for HCC
group.
Sample preparation: Blood samples were collected
under aseptic conditions, then samples protected
in evacuated tubes without adding any anticoagulant
agent. The samples were left standing for one hour;
sera were separated at 3000 rpm centrifugation
for 10 min and preserved at - 20°C till further
analysis.
Method of serum Zn assay:
The sera were diluted 1: 5 with double deionised
water. Zn levels were detected by atomic
absorption spectrophotometer instrument )Variant
Australia) using internal standard )Merck
Germany), then the results were multiplied by 5.
Normal range of serum Zn is (0.8 – 1.5 µg/ml).
Statistical analysis:
Sample size calculation:
Sample size was 92 subjects (69 cases and 23
controls). The α level was 0.05 as it represents
the type I error probability for a two sided test.
The sample size was calculated at 95% confidence
level (CL) and power of the study 80%. Z value
was 1.96 at 95% CL.
The collected data were tabulated and analyzed
using SPSS version 16 software (Spss Inc,
Chicago, ILL Company). Statistical analysis was
done according to Knapp and Miller [9].
Categorical data were presented as number and
percentages while quantitative data were expressed
as mean and standard deviation, median range.
Chi square test (X2), Fisher's, ANOVA (F test),
student "t", Man Whitney U test, Krauskal Wallis
Original article
Abdo et al., Afro-Egypt J Infect Endem Dis 2017; 7(1):20-27
http://mis.zu.edu.eg/ajied/home.aspx
22
test and Spearman’s correlation coefficient (rho)
were used as tests of significance.
RESULTS
Patients of HCC group were significantly older
than those of chronic hepatitis and cirrhotic groups
(P<0.001). There was no statistically significant
difference between the studied groups regarding
gender. Serum zinc levels were significantly
lower in chronic hepatitis group than control
group and HCC group (P<0.001). Patients with
Child class (C) had lower serum Zn levels than
those with Child class (A) with significant
difference between them (P= 0.023). Out of 23
HCC patients, 1 patient (4.3%) had stage 0 of
BCLC, 12 patients (52.3%) had stage A, 5
patients (21.7%) had stage B, 1 patient (4.3%)
had stage C, 4 patients (17.4%) had stage D.
Significant positive correlation was found
between serum Zn levels and age in cirrhotic
group but there was no significant correlation
between serum Zn levels and any of laboratory
parameters of the studied groups on one hand
and fibrosis stages of chronic hepatitis group on
the other hand. Negative non significant correlation
was detected between serum Zn levels and tumor
multiplicity and BCLC in HCC group.
Table (1): Demographic criteria of the studied groups
Group
Total Chronic
hepatitis group
(N=23)
Cirrhotic
group
(N=23)
HCC
group
(N=23)
Control
group
(N=23)
Gender
Male No (%)
Female No (%)
16(69.6%)
7(30.4%)
15(65.2%)
8(34.8%)
20(87.0%)
3(13.0%)
12(52.3%)
11(47.7%)
63(68.5%)
29(31.5%)
Total 23(100.0%) 23(100.0%) 23(100.0%) 23(100.0%) 92(100.0%)
P value 0.004
X2=6.59 P=0.09
Group Age (years) ANOVA
(F test) P
Mean ± SD
Chronic hepatitis group †38.65 9.79
15.95 <0.001* Cirrhotic group ‡
◊49.0 8.22
HCC group ‡†◊56.4 5.25
Control group 46.43 10.92
Original article
Abdo et al., Afro-Egypt J Infect Endem Dis 2017; 7(1):20-27
http://mis.zu.edu.eg/ajied/home.aspx
23
Table (2): Laboratory criteria of the studied groups
Variable
Chronic hepatitis
group
(N=23)
Cirrhotic group
(N=23)
HCC group
(N=23)
Control group
(N=23) P
F
test
Kraus
kal
Wallis
test AN
OV
A
Mean ± SD Mean ± SD Mean ± SD Mean ± SD
Haemoglobin
(g/dl) 13.87 1.316 ‡12.72 1.303 ‡12.03 1.319 13.00 1.421
<0.001* 7.48
WBCs (x103) 6.31 2.041 5.93 1.295 5.28 1.640 7.58 2.031 0.26 6.84
PLT (x103) 204.7 48.076 †‡113.7 51.038 †‡124.2 58.141 246.5 63.880 <0.001* 30.5
ALT (U/L) †62.20 60.278 50.91 46.497 51.86 24.074 31.60 12.276 0.01* 11.5
AST (U/L) 58.30 56.840 48.43 35.279 †66.08 39.485 34.52 12.474 0.001* 15.8
Total bilirubin
(mg/dl) 0.62 0.380 †1.04 0.651 †‡1.94 0.870 0.52 0.244
<0.001* 42.1
Serum albumin
(gm/dl) †4.43 0.43 †3.83 0.47 †‡∆3.00 0.53 4.03 0.38
<0.001* F test=
39.5
α-feto protein
(ng/ml) ◊4.52 3.14201 ◊44.44 61.63213 1422.86 2124.48964 ◊7.30 3.84282
<0.001* 52.2
Serum
creatinine
(mg/dl
0.937 0.202 1.013 0.225 1.009 0.258 1.011 0.250
0.64 0.56
PC (%) 89.8 8.61 †‡76.8 10.36 †‡∆65.2 13.45 92.1 5.47 <0.001* 36.6
INR 1.11 0.113 †‡1.26 0.204 †‡∆1.49 0.306 1.07 0.059 0.001* 5.78
PT (second) 12.75 1.423 †13.22 1.388 †‡∆14.71 2.00 11.84 0.427 <0.001* 16.2
Table (3): Mean and standard deviation of serum zinc levels among the studied groups
Group Serum Zn (µg/ml) Krauskal Wallis
test P
Mean ± SD
Chronic hepatitis group †◊0.56 0.246 25.25 <0.001*
Cirrhotic group 0.87 0.236
HCC group 0.97 0.482
Control group 1.15 0.40
Table (4): Number and percent of studied cases within each group according to serum Zn levels
Group Low Zn levels cases Normal Zn levels cases High Zn levels case
Chronic hepatitis group 19 (82.7%) 3 (13%) 1 (4.3%)
Cirrhotic group 15 (65.2%) 4 (17.4%) 4 (17.4%)
HCC group 7 (30.4%) 7 (30.4%) 9 (39.2%)
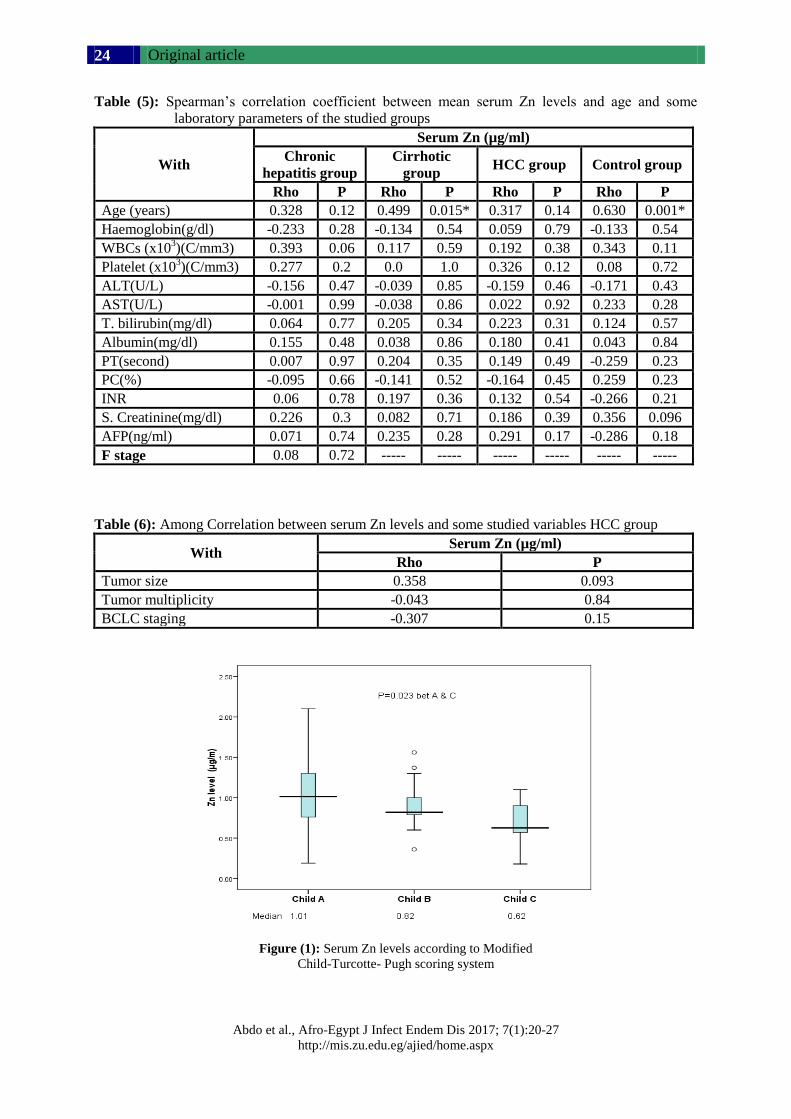
Original article
Abdo et al., Afro-Egypt J Infect Endem Dis 2017; 7(1):20-27
http://mis.zu.edu.eg/ajied/home.aspx
24
Table (5): Spearman’s correlation coefficient between mean serum Zn levels and age and some
laboratory parameters of the studied groups
With
Serum Zn (µg/ml)
Chronic
hepatitis group
Cirrhotic
group HCC group Control group
Rho P Rho P Rho P Rho P
Age (years) 0.328 0.12 0.499 0.015* 0.317 0.14 0.630 0.001*
Haemoglobin(g/dl) -0.233 0.28 -0.134 0.54 0.059 0.79 -0.133 0.54
WBCs (x103)(C/mm3) 0.393 0.06 0.117 0.59 0.192 0.38 0.343 0.11
Platelet (x103)(C/mm3) 0.277 0.2 0.0 1.0 0.326 0.12 0.08 0.72
ALT(U/L) -0.156 0.47 -0.039 0.85 -0.159 0.46 -0.171 0.43
AST(U/L) -0.001 0.99 -0.038 0.86 0.022 0.92 0.233 0.28
T. bilirubin(mg/dl) 0.064 0.77 0.205 0.34 0.223 0.31 0.124 0.57
Albumin(mg/dl) 0.155 0.48 0.038 0.86 0.180 0.41 0.043 0.84
PT(second) 0.007 0.97 0.204 0.35 0.149 0.49 -0.259 0.23
PC(%) -0.095 0.66 -0.141 0.52 -0.164 0.45 0.259 0.23
INR 0.06 0.78 0.197 0.36 0.132 0.54 -0.266 0.21
S. Creatinine(mg/dl) 0.226 0.3 0.082 0.71 0.186 0.39 0.356 0.096
AFP(ng/ml) 0.071 0.74 0.235 0.28 0.291 0.17 -0.286 0.18
F stage 0.08 0.72 ----- ----- ----- ----- ----- -----
Table (6): Among Correlation between serum Zn levels and some studied variables HCC group
With Serum Zn (µg/ml)
Rho P
Tumor size 0.358 0.093
Tumor multiplicity -0.043 0.84
BCLC staging -0.307 0.15
Figure (1): Serum Zn levels according to Modified
Child-Turcotte- Pugh scoring system
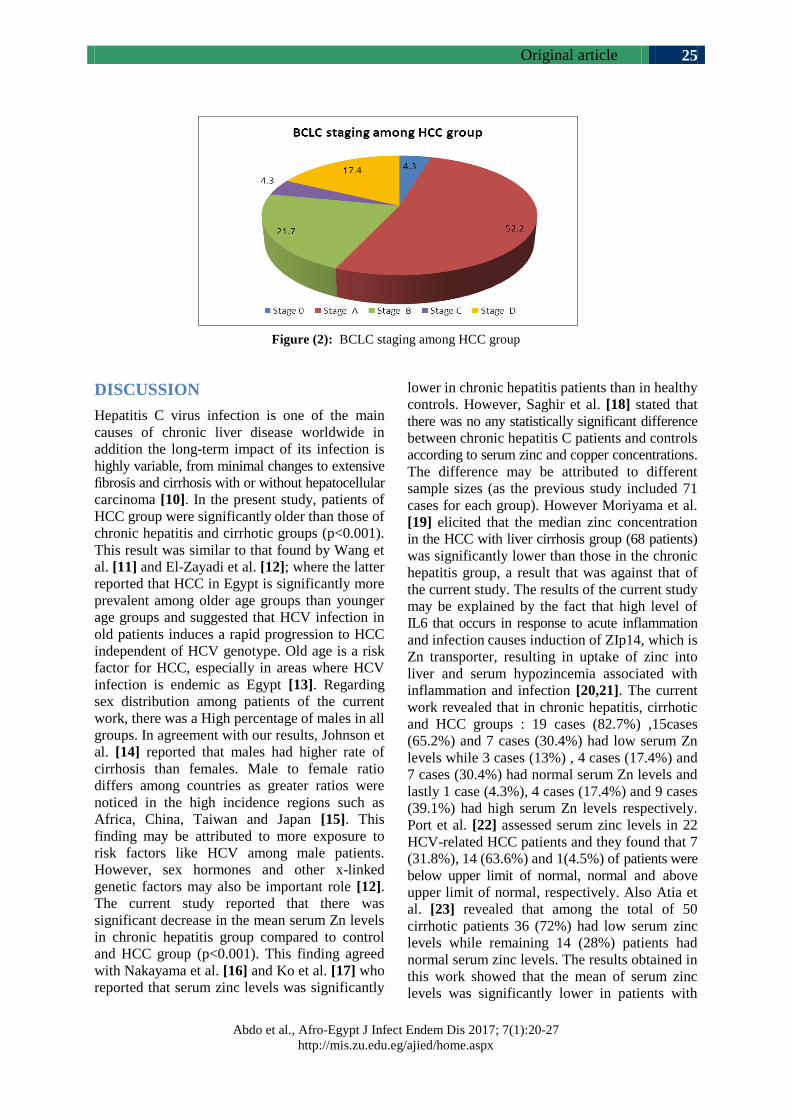
Original article
Abdo et al., Afro-Egypt J Infect Endem Dis 2017; 7(1):20-27
http://mis.zu.edu.eg/ajied/home.aspx
25
Figure (2): BCLC staging among HCC group
DISCUSSION
Hepatitis C virus infection is one of the main
causes of chronic liver disease worldwide in
addition the long-term impact of its infection is
highly variable, from minimal changes to extensive
fibrosis and cirrhosis with or without hepatocellular
carcinoma [10]. In the present study, patients of
HCC group were significantly older than those of
chronic hepatitis and cirrhotic groups (p<0.001).
This result was similar to that found by Wang et
al. [11] and El-Zayadi et al. [12]; where the latter
reported that HCC in Egypt is significantly more
prevalent among older age groups than younger
age groups and suggested that HCV infection in
old patients induces a rapid progression to HCC
independent of HCV genotype. Old age is a risk
factor for HCC, especially in areas where HCV
infection is endemic as Egypt [13]. Regarding
sex distribution among patients of the current
work, there was a High percentage of males in all
groups. In agreement with our results, Johnson et
al. [14] reported that males had higher rate of
cirrhosis than females. Male to female ratio
differs among countries as greater ratios were
noticed in the high incidence regions such as
Africa, China, Taiwan and Japan [15]. This
finding may be attributed to more exposure to
risk factors like HCV among male patients.
However, sex hormones and other x-linked
genetic factors may also be important role [12].
The current study reported that there was
significant decrease in the mean serum Zn levels
in chronic hepatitis group compared to control
and HCC group (p<0.001). This finding agreed
with Nakayama et al. [16] and Ko et al. [17] who
reported that serum zinc levels was significantly
lower in chronic hepatitis patients than in healthy
controls. However, Saghir et al. [18] stated that
there was no any statistically significant difference
between chronic hepatitis C patients and controls
according to serum zinc and copper concentrations.
The difference may be attributed to different
sample sizes (as the previous study included 71
cases for each group). However Moriyama et al.
[19] elicited that the median zinc concentration
in the HCC with liver cirrhosis group (68 patients)
was significantly lower than those in the chronic
hepatitis group, a result that was against that of
the current study. The results of the current study
may be explained by the fact that high level of
IL6 that occurs in response to acute inflammation
and infection causes induction of ZIp14, which is
Zn transporter, resulting in uptake of zinc into
liver and serum hypozincemia associated with
inflammation and infection [20,21]. The current
work revealed that in chronic hepatitis, cirrhotic
and HCC groups : 19 cases (82.7%) ,15cases
(65.2%) and 7 cases (30.4%) had low serum Zn
levels while 3 cases (13%) , 4 cases (17.4%) and
7 cases (30.4%) had normal serum Zn levels and
lastly 1 case (4.3%), 4 cases (17.4%) and 9 cases
(39.1%) had high serum Zn levels respectively.
Port et al. [22] assessed serum zinc levels in 22
HCV-related HCC patients and they found that 7
(31.8%), 14 (63.6%) and 1(4.5%) of patients were
below upper limit of normal, normal and above
upper limit of normal, respectively. Also Atia et
al. [23] revealed that among the total of 50
cirrhotic patients 36 (72%) had low serum zinc
levels while remaining 14 (28%) patients had
normal serum zinc levels. The results obtained in
this work showed that the mean of serum zinc
levels was significantly lower in patients with
Original article
Abdo et al., Afro-Egypt J Infect Endem Dis 2017; 7(1):20-27
http://mis.zu.edu.eg/ajied/home.aspx
26
Child class C than those with Child class A (P=
0.023), a result that came in agreement with
Moriyama et al. [19] and Vijaylaxmi et al. [24]
who found that the median zinc concentration in
the Child-Pugh C group was significantly lower
than those in the Child A (P<0.0001) and Child
B (P=0.0033) classes and that serum zinc levels
were significantly decreased with advancement
of liver disease as compared to early stage of
liver cirrhosis with significant negative
correlation with
Child-Pugh Score. Significant positive correlation
between serum Zn levels and age in cirrhotic
group was observed in the current work,
meanwhile there was no Significant correlation
between serum Zn levels and any of the other
laboratory parameters of the studied groups and
fibrosis stages of chronic hepatitis group. These
results came on line with El Bassuoni et al. [7]
and Anber et al. [25] who found no significant
correlations when serum Zn levels were
correlated with ALT, AST, total bilirubin, INR,
α-feto protein, serum albumin, haemoglobin %
and WBCs count. On the other hand Moriyama
et al. [19] reported highly significant positive
correlation between serum Zn levels and
haemoglobin %, platelets count, WBCs count
and serum albumin in chronic hepatitis and liver
cirrhosis groups and a highly significant negative
correlation between serum Zn levels and α-feto
protein, total bilirubin and AST level. Also the
present study showed that there was no
significant correlation between serum Zn levels
and BCLC staging (P=0.15), tumor size (P=
0.093) and multiplicity (P= 0.84) of HCC group.
The same results were reported by Moriyama et
al. [19] who stated that the size and numbers of
cancerous nodules were not correlated with the
serum concentration of zinc or with BCLC
staging system.
Funding: None.
Conflicts of interest: None.
Ethical approval:Approved.
REFERENCES 1. Umemura T, Ichijo T, Yoshizawa K, Tanaka E,
Kiyosawa K. Epidemiology of hepatocellular
carcinoma in Japan. J. Gastroenterol; 2009, 44
(suppl. 19), 102-107.
2. Ford N, Kirby C, Singh K, Mills EJ, Cooke G,
Kamarulzaman A, et al. Chronic hepatitis C
treatment outcomes in low- and middle-income
countries: a systematic review and meta-analysis.
Bull World Health Organ; 2012. 90(7): 540-550.
3. Saghir M, Shaheen N, Shah MH. Comparative
Evaluation of Trace Metals in the Blood of
Hepatitis C Patients and Healthy Donors. Biol
Trace Elem Res.; 2011, 143: 751–763.
4. Mohammad MK, Zhou Z, Cave M, Barve A,
McClain CJ. Zinc and liver disease. Nutr. Clin.
Pract.; 2012, (27): 8-20.
5. Maret W. Cellular zinc and redox states converge
in the metallothionein/thionein pair. J Nutr 2003;
133(5 Suppl. 1):1460S–62S.
6. Kalkan A, Bulut V, Avci S, Celik I, Bingol NK.
Trace elements in viral hepatitis. J. Trace Elem.
Med. Biol.; 2002, 16 (4): 227-230.
7. El Bassuoni MA, Talaat RM, Mahfouz, RG.
Serum Level of Some Trace Elements as
Prognostic Factors in Egyptian Patients with
HCV-related Liver Disease. Egyptian Journal of
Medical Microbiology, 2009, Vol. 18, No. 2.
8. Franklin RB, Costello LC. Zinc as an anti-tumor
agent in prostate cancer and in other cancers.
Arch Biochem Biophys.; 2007, 463: 211-217.
9. Knapp, RG, Miller MC. Clinical Epidemiology
and Biostatistics. National Medical Series (NMS)
from Williams and Wilkins, 1992.
10. Mutimer D, Aghemo A, Diepolder H, Negro F,
Robaeys G, Ryder S, et al. EASL Clinical
Practice Guidelines: Management of hepatitis C
virus infection. Journal of Hepatology; 2014,
Vol. 60:392–420.
11. Wang-Sheng KO, Chih-Hung GU, Ozen H.
Blood micronutrient, oxidative stress, and viral
load in patients with chronic hepatitis C. World J
Gastroenterol. 2005; 30:4697–702.
12. El-Zayadi A, Badran H, Barakat E.
Hepatocellular carcinoma in Egypt: a single
center study over decade. World J Gastroenterol.
2005; 11(33):5193–8.
13. Omata M, Lesmana LA, Tateishi R, Chen PJ, Lin
SM, Yoshida H, et al. Asian Pacific Association
for the Study of the Liver consensus
recommendations on hepatocellular carcinoma.
Hepatol Int. 2010; 4:439–74.
14. Johnson PE, Hunt CD, Milne DB. Zinc excretion
and balance in men fed diets low in Zinc. Am J
Clin Nutr. 2003; 57:557–65.
15. El-Serag H. Epidemiology of viral hepatitis and
hepatocellular carcinoma. Gastroenterology.
2012; 142(6):1264–73.
16. Nakayama A, Fukuda H, Ebara M, Hamasaki H,
Nakajima K, Sakurai H. A new diagnostic
method for chronic hepatitis, liver cirrhosis, and
hepatocellular carcinoma based on serum
Original article
Abdo et al., Afro-Egypt J Infect Endem Dis 2017; 7(1):20-27
http://mis.zu.edu.eg/ajied/home.aspx
27
metallothionein, copper, and zinc levels. Biol
Pharm Bull.; 2002, 25(4): 426-431.
17. Ko W, Guo C, Hsu G, Chiou YL, Yeh MS, Yaun
SR. The effect of zinc supplementation on the
treatment of chronic hepatitis C patients with
interferon and ribavirin. Clin Biochem.; 2005,
38(7):614-20.
18. Saghir, M, Shaheen N, Shah, MH. Comparative
Evaluation of Trace Metals in the Blood of
Hepatitis C Patients and Healthy Donors. Biol
Trace Elem Res. 2011; 143: 751–763.
19. Moriyama M, Matsumura H, Fukushima A,
Ohkido K, Arakawa Y, Nirei K et al. Clinical
Significance of Evaluation of Serum Zinc
Concentrations in C-Viral Chronic Liver Disease.
Dig Dis Sci.; 2006, 51: 1967–1977.
20. Taylor KM, Morgan HE, Johnson A, Nicholson
RI. Structure– function analysis of a novel
member of the LIV-1 subfamily of zinc
transporters, ZIP14, FEBS Lett.; 2005, 579: 427–
432.
21. Lichten LA, Cousins RJ. Mammalian zinc
transporters: nutritional and physiologic
regulation. Annu Rev Nutr.; 2009, 29:153-76.
22. Port GZ, Oliveira K, Soldera J, Tovo CV.
Biochemical nutritional profile of liver cirrhosis
patients with hepatocellular carcinoma. Arq.
Gastroenterol. 2014, Vol. 51 no.1.
23. Atia F, sultana N, Ahmed S, Ferdous S, sultana R,
Atiquzzaman M. A Study of Serum Zinc level in
Cirrhosis of Liver. Bangladesh J Med Biochem
2012; 5(2): 44-47.
24. Nangliya V, Sharma A, Yadav D, Sunder S,
Nijhawan S, Mishra S. Study of Trace Elements
in Liver Cirrhosis Patients and Their Role in
Prognosis of Disease. Biological Trace Element
Research. 2015; 165(1): 35-40.
25. Anber NH, EL-Ghannam MZ, El-Kheshen GA,
Bialy MI. Evaluation of serum zinc level in
Egyptian patients with hepatitis C-associated
cirrhosis. J Pharm Biomed Sci; 2016, 06(02):81–
85.
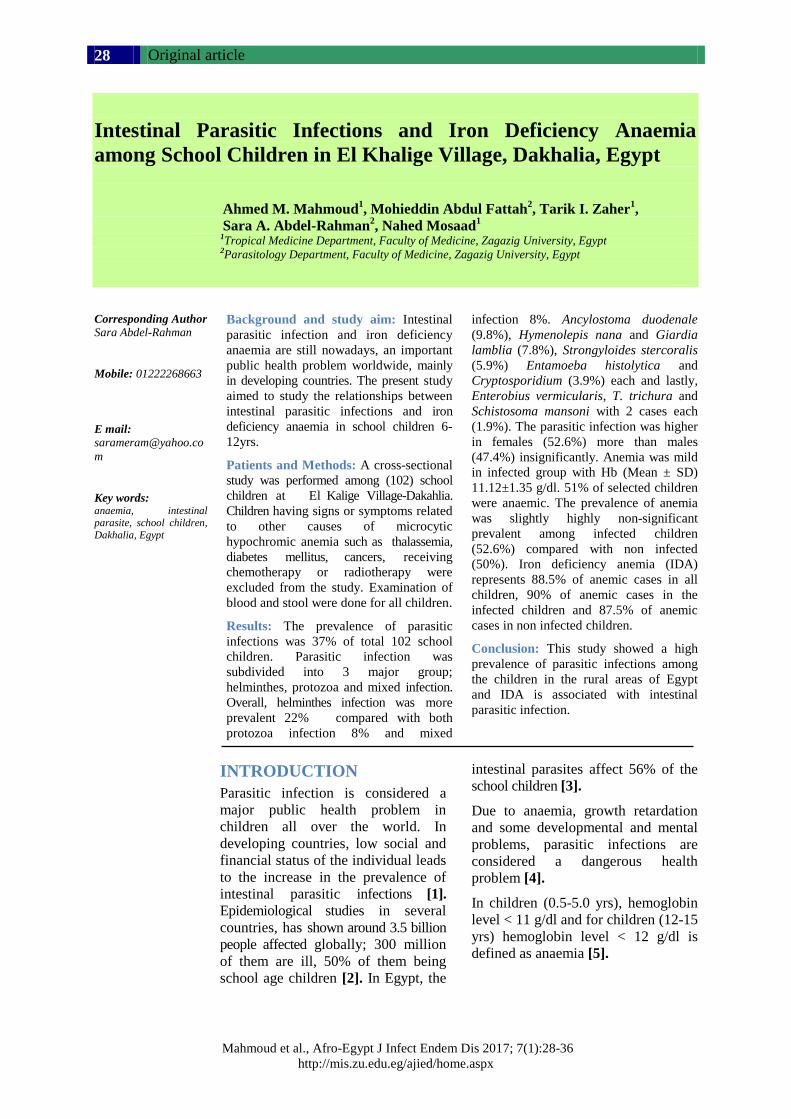
Original article
Mahmoud et al., Afro-Egypt J Infect Endem Dis 2017; 7(1):28-36
http://mis.zu.edu.eg/ajied/home.aspx
28
Intestinal Parasitic Infections and Iron Deficiency Anaemia
among School Children in El Khalige Village, Dakhalia, Egypt
Ahmed M. Mahmoud1, Mohieddin Abdul Fattah
2, Tarik I. Zaher
1,
Sara A. Abdel-Rahman2, Nahed Mosaad
1
1Tropical Medicine Department, Faculty of Medicine, Zagazig University, Egypt
2Parasitology Department, Faculty of Medicine, Zagazig University, Egypt
Corresponding Author
Sara Abdel-Rahman
Mobile: 01222268663
E mail: [email protected]
m
Key words: anaemia, intestinal parasite, school children,
Dakhalia, Egypt
Background and study aim: Intestinal
parasitic infection and iron deficiency
anaemia are still nowadays, an important
public health problem worldwide, mainly
in developing countries. The present study
aimed to study the relationships between
intestinal parasitic infections and iron
deficiency anaemia in school children 6-
12yrs.
Patients and Methods: A cross-sectional
study was performed among (102) school
children at e EleKalige Village-Dakahlia.
Children having signs or symptoms related
to other causes of microcytic
hypochromic anemia such as thalassemia,
diabetes mellitus, cancers, receiving
chemotherapy or radiotherapy were
excluded from the study. Examination of
blood and stool were done for all children.
Results: The prevalence of parasitic
infections was 37% of total 102 school
children. Parasitic infection was
subdivided into 3 major group;
helminthes, protozoa and mixed infection.
Overall, helminthes infection was more
prevalent 22% compared with both
protozoa infection 8% and mixed
infection 8%. Ancylostoma duodenale
(9.8%), Hymenolepis nana and Giardia
lamblia (7.8%), Strongyloides stercoralis
(5.9%) Entamoeba histolytica and
Cryptosporidium (3.9%) each and lastly,
Enterobius vermicularis, T. trichura and
Schistosoma mansoni with 2 cases each
(1.9%). The parasitic infection was higher
in females (52.6%) more than males
(47.4%) insignificantly. Anemia was mild
in infected group with Hb (Mean ± SD)
11.12±1.35 g/dl. 51% of selected children
were anaemic. The prevalence of anemia
was slightly highly non-significant
prevalent among infected children
(52.6%) compared with non infected
(50%). Iron deficiency anemia (IDA)
represents 88.5% of anemic cases in all
children, 90% of anemic cases in the
infected children and 87.5% of anemic
cases in non infected children.
Conclusion: This study showed a high
prevalence of parasitic infections among
the children in the rural areas of Egypt
and IDA is associated with intestinal
parasitic infection.
INTRODUCTION
Parasitic infection is considered a
major public health problem in
children all over the world. In
developing countries, low social and
financial status of the individual leads
to the increase in the prevalence of
intestinal parasitic infections [1].
Epidemiological studies in several
countries, has shown around 3.5 billion
people affected globally; 300 million
of them are ill, 50% of them being
school age children [2]. In Egypt, the
intestinal parasites affect 56% of the
school children [3].
Due to anaemia, growth retardation
and some developmental and mental
problems, parasitic infections are
considered a dangerous health
problem [4].
In children (0.5-5.0 yrs), hemoglobin
level < 11 g/dl and for children (12-15
yrs) hemoglobin level < 12 g/dl is
defined as anaemia [5].
Original article
Mahmoud et al., Afro-Egypt J Infect Endem Dis 2017; 7(1):28-36
http://mis.zu.edu.eg/ajied/home.aspx
29
Anemia is a nutritional disorder worldwide
especially in children. In various less developed
countries in both Asia and Africa, 40% of children
are anemic. In the early periods of life of
children, the Deaths reached 726,000 caused by
iron deficiency, with the highest percentage in
Africa and Southeast Asia [6].
Disturbance in the behavior of the children can
be occurred due to chronic anemia, due to its
hazard effect upon neurological development in
infants and also reduced scholastic performance
in children of school age. Rest-less legs syndrome
is common in those with iron deficiency anemia,
with several symptoms include swelling of the
arms or legs, heartburn, vague bruises, vomiting,
sweating, pallor and blood in stool [7].
The main treatment of anemia is by treatment of
the underlying disease which in most cases leads
to cure or at least improvement of anemia. So,
World Health Organization depends upon regular
edeworming of school age children in its control
strategy. Regular treatment reduces the intensity
of infection and gives a protection to those
already infected [8]. Therefore, this study was
undertaken to investigate the prevalence of
intestinal parasitic infections in school going
children in El Khalige village despite the various
precautional measures and also, the relationship
between intestinal parasitic infections and iron
deficiency anemias. The results will be taken by
the school authority to help them to adopt
deworming measures.
PATIENTS AND METHODS
Study type:
This study was a cross sectional prevalence
study. The study was conducted from January to
December 2016. The practical work was done at
the Department of Tropical Medicine and the
Medical eParasitology Department of the Faculty
of Medicine, eZagazig University, Zagazig,
Egypt.
Study area
The current study was performed at El Kalige
Village lies 10 kilometers away from EL Mansoura
city, the village supplied with a clean water
supply and central sanitary sewage systems.
Sample Size:
The calculated sample size of the study was102
children, using the following formula [9].
Where
Z = 1.96 for 95% confidence level.
p = expected prevalence of satisfaction (0.50).
d = precision (Margin of error) = 0.05
Inclusion criteria:
All children aged 6-12years attending EL-Khalige
primary school were included in this study.
Exclusion criteria:
Children suspected to have signs or symptoms
related to other causes of emicrocytic hypochromic
anemia such as thalassemia, or chronic debilitating
diseases as malignancy, chronic renal diseases,
diabetes mellitus, immune diseases were avoided .
A full history through a special sheet was
obtained by the investigator after interviewing the
mothers of the selected children and receiving a
questionnaire. The parents of the children
completed consent forms, but because many of
them refused to give information about their
income, we could not interpret the
socioeconomic standards and could not estimate
the amount of taken iron in diet.
All selected children were subjected to the
following, Full history taking including: Age,
Gender, Residence, education attainment, socio-
economic status (father or mother occupation,
household income), medical and drug history,
complaint (diarrhea, abdominal pain, anorexia,
nausea, vomiting and anal itching) pallor, jaundice,
clubbing, organomegally and ascities.
Collection of stool samples:
The stool was examined macroscopically for the
presence of blood and mucus or adult worm of
helminths.
The stool was examined microscopically also for
ova and cysts of intestinal parasites by direct wet
ᶱsmear which was done within twelve hours of
the collection of the sample. Direct examination
was performed by wet mount technique using
saline, iodine and lacto phenol. In case of
negative samples, concentration technique by
formalin acetone sedimentation method was
done [10]. Baermann’s technique was used for
demonstration of eStrongyloides larva [11]. In
addition modified acid fast staining was ᶱdone
for demonstrating coccidian parasites like
Cryptosporidium, Isospora.
Blood Collection and Determination of Iron
Status:
Test performance for Hemoglobin concentrations
was done using the Cyanmethemglobin method
to form the stable hemoglobin derivative
Z2 + P* (1-P)
n = d
2
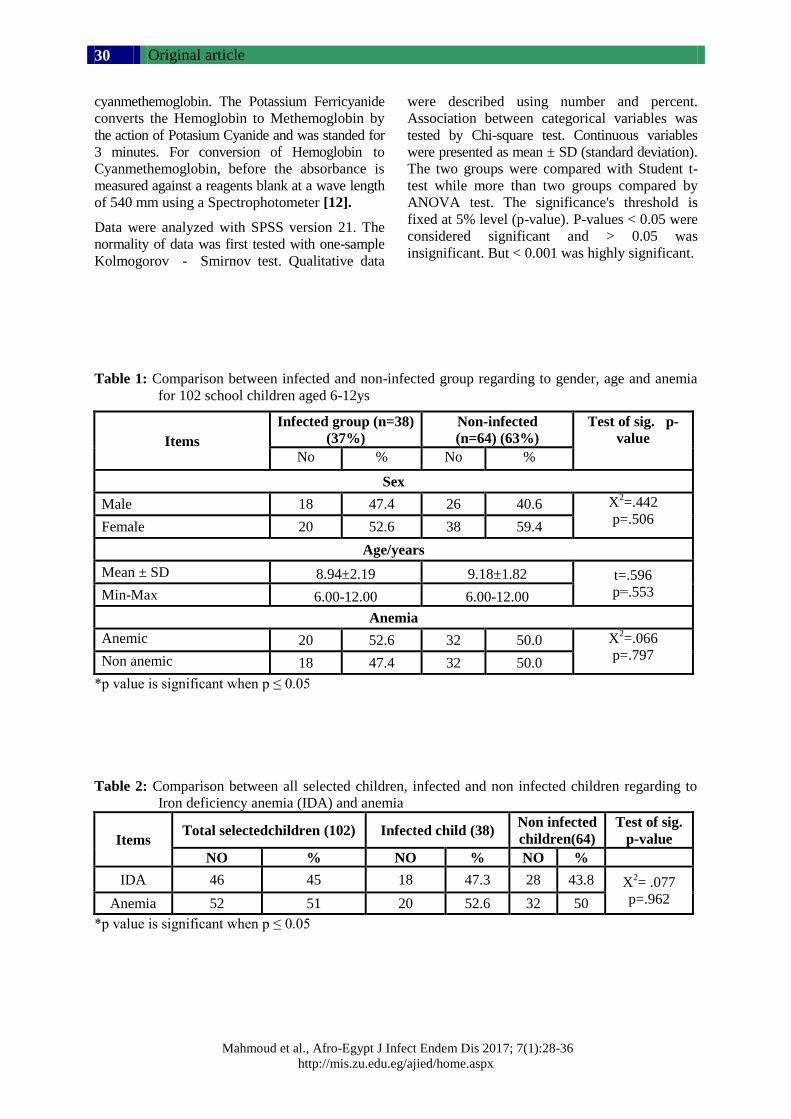
Original article
Mahmoud et al., Afro-Egypt J Infect Endem Dis 2017; 7(1):28-36
http://mis.zu.edu.eg/ajied/home.aspx
30
cyanmethemoglobin. The Potassium Ferricyanide
converts the Hemoglobin to Methemoglobin by
the action of Potasium Cyanide and was standed for
3 minutes. For conversion of Hemoglobin to
Cyanmethemoglobin, before the absorbance is
measured against a reagents blank at a wave length
of 540 mm using a Spectrophotometer [12].
Data were analyzed with SPSS version 21. The
normality of data was first tested with one-sample
Kolmogorove - eSmirnov test. Qualitative data
were described using number and percent.
Association between categorical variables was
tested by Chi-square test. Continuous variables
were presented as mean ± SD (standard deviation).
The two groups were compared with Student t-
test while more than two groups compared by
ANOVA test. The significance's threshold is
fixed at 5% level (p-value). P-values < 0.05 were
considered significant and > 0.05 was
insignificant. But < 0.001 was highly significant.
Table 1: Comparison between infected and non-infected group regarding to gender, age and anemia
for 102 school children aged 6-12ys
Items
Infected group (n=38)
(37%)
Non-infected
(n=64) (63%)
Test of sig. p-
value
No % No %
Sex
Male 18 47.4 26 40.6 X2=.442
p=.506 Female 20 52.6 38 59.4
Age/years
Mean ± SD 8.94±2.19 9.18±1.82 t=.596
p=.553 Min-Max 6.00-12.00 6.00-12.00
Anemia
Anemic 20 52.6 32 50.0 X2=.066
p=.797 Non anemic 18 47.4 32 50.0
*p value is significant when p ≤ 0.05
Table 2: Comparison between all selected children, infected and non infected children regarding to
Iron deficiency anemia (IDA) and anemia
Items Total selectedchildren (102) Infected child (38)
Non infected
children(64)
Test of sig.
p-value
NO % NO % NO %
IDA 46 45 18 47.3 28 43.8 X2= .077
p=.962 Anemia 52 51 20 52.6 32 50
*p value is significant when p ≤ 0.05
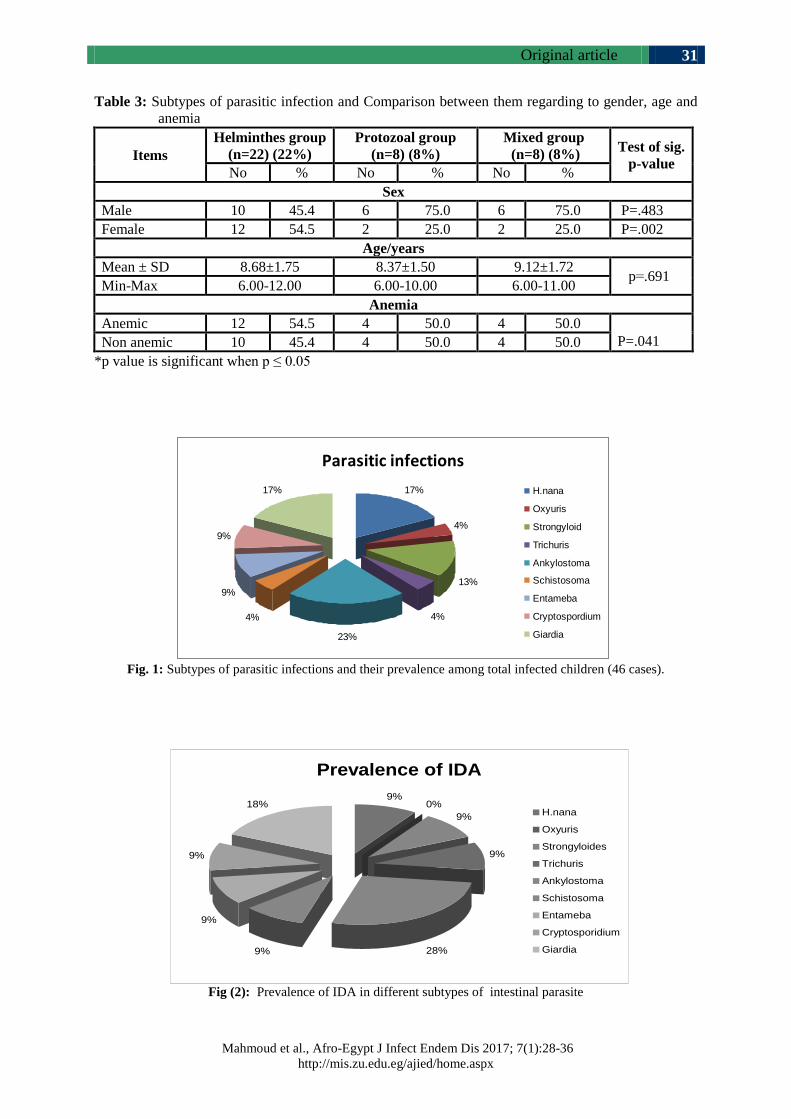
Original article
Mahmoud et al., Afro-Egypt J Infect Endem Dis 2017; 7(1):28-36
http://mis.zu.edu.eg/ajied/home.aspx
31
Table 3: Subtypes of parasitic infection and Comparison between them regarding to gender, age and
anemia
Items
Helminthes group
(n=22) (22%)
Protozoal group
(n=8) (8%)
Mixed group
(n=8) (8%) Test of sig.
p-value No % No % No %
Sex
Male 10 45.4 6 75.0 6 75.0 P=.483
Female 12 54.5 2 25.0 2 25.0 P=.002
Age/years
Mean ± SD 8.68±1.75 8.37±1.50 9.12±1.72 p=.691
Min-Max 6.00-12.00 6.00-10.00 6.00-11.00
Anemia
Anemic 12 54.5 4 50.0 4 50.0
P=.041 Non anemic 10 45.4 4 50.0 4 50.0
*p value is significant when p ≤ 0.05
Fig. 1: Subtypes of parasitic infections and their prevalence among total infected children (46 cases).
Fig (2): Prevalence of IDA in different subtypes of intestinal parasite
Parasitic infections
17%
4%
13%
4%
23%
4%
9%
9%
17% H.nana
Oxyuris
Strongyloid
Trichuris
Ankylostoma
Schistosoma
Entameba
Cryptospordium
Giardia
Prevalence of IDA
9%0%
9%
9%
28%9%
9%
9%
18%H.nana
Oxyuris
Strongyloides
Trichuris
Ankylostoma
Schistosoma
Entameba
Cryptosporidium
Giardia
Original article
Mahmoud et al., Afro-Egypt J Infect Endem Dis 2017; 7(1):28-36
http://mis.zu.edu.eg/ajied/home.aspx
32
DISCUSSION
In developing countries, intestinal parasitic
infections are one of the most prevalent
infections and also, have highly spread among
school aged children [13].
Intestinal parasitic infestations are considered as
a serious public health problem as it causes iron
deficiency anaemia, growth retardation in
children, and other physical and mental health
problems [14].
Bad effect of ᶱintestinal parasitic infestations on
child iron status was observed by eHesham et al.
[15] who linked intestinal parasitic infestations
with significant reduced mean haemoglobin
levels in children.
Prevention of iron deficiency anemia can improve
performance in school, avoid behavioral alterations,
and assure better growth. Longitudinal studies
reported that children who are anemic in
einfancy continue to have poor cognition, long-
lasting adverse effects on hearing and visual
function, poor school achievement and more
behavioral problems [16].
This cross-sectional survey was carried eout at El
Kalige village, Dakahlia governorate to demonstrate
the relationship between intestinal parasitic
infections and iron deficiency anemia in a sample
of children in this rural area in Dakahlia. Data
showed an interaction between parasitic
infections, haemoglobin level suggesting that
parasites affect serum iron level of surveyed
children.
This study was performed on 102 children (44
males, 58 females) aged 6- 12 years. The results
reported that the prevalence of parasitic
infections at this rural area was 37% (47.4% for
males, 52.6% for females) (Table 1). This was in
accordance with Sah et al. [17] who recorded
that the prevalence of intestinal parasitic
infection was e31.5% in a study performed on 147
school children attending the primary school in
Nebal. The prevalence of parasitic infection was
reported by Amare et al. [18] was lower than our
results (22.7%) in their study on school children
in Gondar, Ethiopia.
The study performed by Hegazy et al. [19] on
500 preschool children aged 2-6years in
Damanhur city, revealed that overall prevalence of
parasitic infections was 51.8%. Also Worku et al.
[20] reported parasitic prevalence 55.6%, both
results were greater than our study (37%)
(Table1) .
The explanation for this result is due to improved
sanitation which is the only definitive
intervention to eliminate parasitic infection [21].
Sanitation in this village includes sewage
systems since 1995 which helps the prevention
of contamination of soil and water and prevent
transmission of parasitic diseases. It is also due
to periodic anti helminthic therapy. Anti
helmintic treatment reduced morbidity by
decreasing the worm burden. Regular
chemotherapy in high-risk groups can reduce the
levels of infection and also, result in immediate
improvement in the growth and the health of the
children [22]. Anti-helminthic therapy is given
regularly at the start of each school year by
Primary Health Care Unit in this village. Health
education also participates in the reduction of the
prevalence of parasitic infections. Achievement
of reduction of infection and reinfection can be
done by encouraging healthy behaviors [23].
Our results reported higher parasitic infection in
females (52.6%) more than males (47.4%) but
with insignificant difference (Table 1), this was
in agreement with eRayan et al. [8] who found a
higher parasitic infection in females (59%) more
than in males (41%) in a study up on 195 rural
school children. On contrast, Pradhan et al. [13]
showed different result as the higher parasitic
infection was in males (28.2%) compared with
females (20.2%). This is explained by the
presence of other environmental or behavioral
factors other than the gender in parasitosis.
Generally, the high risk of infection in male is
due to the increased mobility of the male, while
in female is due to more soil contact during
growing vegetables and eating raw vegetable
during preparing food [17].
This study reported that, the prevalence of
anemia in all selected children was 51% (table
2).This was in accordance with Al-Mekhlafi et
al. [24] who reported that the prevalence of
anemia was 48.5% in a study was done on 241
school children (7-12) years in Pos Betau,
Malaysia. Our result was higher than the result of
a survey conducted by Ngui et al. [25] who
reported overall prevalence of anemia 26.2% and
Oliveira et al. [26] also found lower results than
our result (21.6%). On contrast, Nabakwe et al.
[27] found that anaemia was extremely high
(92%) in Kenya, which could be attributed to the
Original article
Mahmoud et al., Afro-Egypt J Infect Endem Dis 2017; 7(1):28-36
http://mis.zu.edu.eg/ajied/home.aspx
33
increase in the incidence of malaria in the area of
the study.
Our study reported a high prevalence of anemia in
infected children(52.6%) compared with non-
infected (50%)( table 1,2).This was in agreement
with a study conducted by eHesham et al. [15] to
assess the relationship between intestinal
parasites and nutritional status in Thailand
among 343 children, who showed that, the
incidence of anemia was high among the infected
children (59%) than non-infected children (42%).
Hegazy et al. [19] also reported that prevalence
of anemia was higher in infected children
(48.6%) compared with non-infected (28.8%). It
affects 20% to 50% of the world's population and
it spreads among young children [28].
This study recorded that overall, 51% of children
were anemic (Hb<11.5 g/dl). The prevalence of
IDA was 45%, which accounted for 88.5% of the
anemic cases (Table 2). Globally, these results
were in agreement with the data showed by
WHO that, in developing countries, the
prevalence of IDA is up to 48% of school-age
children [29]. This was in accordance with Aini
et al. [30] who reported that overall, 41.5% of
children were anemic and 36.5% had IDA, which
accounted for 88% of anemia in these children.
On the other hand, lower result was conducted
by Ngui et al. [31] on a total 550 school children
aged 7 - 12 years, 26.2% were anemic and 16.9%
with IDA .
Our study reported that IDA was slightly highly
non-significant among infected children with
47.3% compared with both non infected (43.8%)
and all selected children (45%) (p=0.962) (Table
2). This is explained by the fact that blood loss
(mostly occult bleeding), reduced appetite, impaired
digestion, and malabsorption may be the reasons
of poor iron status and iron deficiency anemia
that are frequently observed in children suffering
from intestinal parasitic infestations [32].
In our study parasitic infection is sub classified
into 3 major group, helminthes, protozoa and
mixed infection. Helminthic group (22), Protazoa
group (8) and 8 cases mixed protozoa and
helminthes. Overall helminthes infection were
more prevalent 22% (22/102) compared with
both protozoa infection 8% (8/102) and mixed
infection 8% (8/102) (Table 3). This coincided
with Oliveira et al. [26] who reported that the
prevalence of infection by helminths was higher
than that of protozoa (24.1%, 13.4%) in the
studied children. While mixed coinfection by
both helminthes and protozoa occurred in 6.7%.
Different result was conducted by Pradhan et al.
[13] showing that the protozoal infection was
higher than of the helminthes and mixed
infection (17.5%, 4.6%, 1.5%, respectively). Sah
et al. [17] also found that, the infection by
helminthes (13%) and of protozoa (18.5%) from
the total population of the study.
Anemia was highly non-significantly prevalent
in helminthes infection (54.5%) compared with
both protozoan and mixed infection (50% each)
(table3). This coincide with Jardim-Botelho et al.
[33] who reported increase prevalence of anaemia
associated with helminth infection compared
with both protazoal and mixed infection. Also
Alemu et al. [34] showed that helminth parasites
was the obvious cause of high anemia prevalence
compared to individuals with protozoa and
mixed infections (P<0.0001).
Among the helminthes, the highest incidence
was Ancylostoma duodenale (33.3%), followed
by Hymenolepis nana (26.6%) (Fig. 1). This
coincides with eJardim-Botelho et al. [33] who
reported also a high incidence of Ancylostoma
duodenale (69.8%) with the majority of
individuals harbouring helminthes infections.
This is in contrast with Gyawali et al. [35] and
Khanal et al. [36] on studies conducted on school
children of Nepal. These studies have found
Ascaris lumbricoides and Trichuris trichiura as
the commonest intestinal helminthes in school
children of Nepal.
Among the intestinal protozoa, Giardia lamblia
was the first one, followed by eEntamoeba
histolytica and cryptosporidium (fig 1). This was
in accordance with Pradhan et al. [13] who found
that Giardia lamblia was the most common
(58.6%) among protazoal infection. On contrast,
eRayan et al. [8] reported different result as
Entamoeba histolytica had the highest
prevalence (25.3%), then Giardia lamblia
(17.9%).
In our study, Ancylostoma duodenale was the
most common parasites associated with IDA in
anemic infected children 28% (6/22),followed by
Giardia lamblia 18% (4/22) then Hymenolepis
nana, Strongyloides stercoralis, Trichuris
trichiura, Schistosoma mansoni, cryptosporidium
9% (2/22) each (fig 2). This coincides with Aini
et al. [30] who showed that the depletion of iron
stores was mainly caused by Ancylostoma
duodenale infection. It was reported that anaemia
was more common among intestinal parasitic
Original article
Mahmoud et al., Afro-Egypt J Infect Endem Dis 2017; 7(1):28-36
http://mis.zu.edu.eg/ajied/home.aspx
34
infected especially, giardiasis. This study was
performed to show the association between
haemoglobin, serum iron, serum ferritin
concentrations in eOrang Asli children living in
endemic areas of intestinal parasitic infections in
Malaysia.
Jonker et al. [37] also found that A. duodenale
was (32.1%) from the severe cases of anemia and
(23.5%) from the non-severely ones. The
explanation for this result may be that the
severity of disease is associated with increase of
the intensity of the hookworm infection. Due to
the blood loss from the bowel mucosa of the
infected host caused by the attachment and
feeding of the adult hookworms upon it leading
to iron deficiency and anemia. Blood loss caused
by A duodenale is 2 to 10 times more than by
N.americanus.
All studies which were performed upon the
prevalence of hookworm infection, observed that
hookworm infection was a strong predictor of
IDA and anaemia in school children. In addition,
anaemia became worst in heavy hookworm
infection. Furthermore, it has been reported that
children from high prevalence of Ancylostoma
duodenale areas had significantly worse IDA
than children from low prevalence areas [38].
Many results reported that Giardia infection was
associated with lower iron levels. The prevalence
of IDA reached 74.4 % among pre-school
children infected with giardiasis and coming
from a rural area of Egypt [39]. Giardia lamblia
infection had an adverse effect on the growth and
the hemoglobin level of the children as a result
of damage to the intestinal mucosa and
malabsorption [40].
CONCLUSION
The results showed that, the prevalence of
parasitic infections is still high among the rural
children of Egypt. Iron deficiency anemia is
highly prevalent in school-children especially, in
children who have parasitic infestations. This
study emphasizes the importance of health
education, good sanitation and personal hygiene,
good cooking of food, safe water supply. And
also, Screening for intestinal parasitic infections
and appropriate treatment even they were
asymptomatic, could be an important part of the
program for anemia control in less developed
countries.
Funding: None.
Conflicts of interest: None.
Ethical approval:Approved.
REFERENCES 1. Amare B, Ali J, Moges B, Yismaw G, Belyhun
Y, Gebretsadik S, et al. Nutritional status, intestinal
parasite infection and allergy among school
children in northwest Ethiopia. BMC Pediatr;
2013, 13(7): 13-27.
2. World Health Organization/WHO. The world
health report 2002: reducing risks, promoting
healthy life. Geneva, 2002.
3. Yones DA, Galal LA, Abdallah AM, Zaghlol KS.
Effect of enteric parasitic infection on serum trace
elements and nutritional status in upper Egyptian
children. Trop Parasitol; 2015, 5(1): 29-35.
4. Le HT, Brouwer ID, Verhoef H, Nguyen KC,
Kok FJ. Anemia and intestinal parasite infection
in school children in rural Vietnam. Asia Pac J
Clin Nutr; 2007, 16(4): 716-23.
5. World Health Organization. World wide preva-
lence of anaemia 1993-2005. World Health
Organization, Geneva, 2008.
6. Iqbal MM, Malik BA. Parenteral iron therapy in
malnourished children. Pakistan Armed Forces
Med J; 2006, 56(6): 271-275.
7. Rasmuussen SA, Fernhoff PM, Scanlon KS.
Vitamin B12 deficiency in children and
adolescents. Journal of Pediatrics, 2001, 138, 10-
17.
8. Rayan P, Verghese S, McDonnell PA. Geographical
location and age affect the incidence of parasitic
infestations in school children. Indian J Pathol
Microbiol; 2010, 53:498-502.
9. Daniel AD. Sample size calculation in medical
studies. Gastroenterol Hepatol Bed Bench; 1999,
6(1): 14–17.
10. Monica C. District laboratory practice in tropical
countries Part 2. Cambridge Low Price Editions,
Cambridge University Press, 2000, 207-212 and
253-266.
11. Garcia LS, Bruckner DA. Diagnostic medical
parasitology Washington. American Society for
Microbiology, DC, 1993.
12. Dacis, J., Lewis, D. Practical hematology. 8th
Edition, Churchill Livingstone, London, 2006,
27-30.
13. Pradhan P, Bhandary S, Shakya PR, Acharya T,
Shrestha S. Prevalence of intestinal parasitic
infections among public school children in a rural village of Kathmandu Valley. Nepal Med Coll J;
2013, 16(1): 50-53.
Original article
Mahmoud et al., Afro-Egypt J Infect Endem Dis 2017; 7(1):28-36
http://mis.zu.edu.eg/ajied/home.aspx
35
14. Kim BJ, Ock MS, Chung DI, Yong TS, Lee KJ.
The intestinal parasite infection status of
inhabitants in the Roxas city, the Philippines.
Korean J Parasitol; 2003, 41(3):113–115.
15. Hesham MS, Edariah AB, Norhayati M.
Intestinal Parasitic Infections and Micronutrient
Deficiency: A Review. Med J Malaysia; 2004,
59(2):284-293.
16. Lozoff B, Jimenez E, Hagen J, Mollen E, Wolf
AW. Poorer behavioral and developmental
outcome more than 10 years after treatment for
iron deficiency in infancy. Pediatrics; 2000,
105(4): 10-15.
17. Sah RB, Bhattarai S, Yadav S, Baral R, Jha N,
Pokharel PK. A study of prevalence of intestinal
parasites and associated risk factors among the
school children of Itahari, Eastern Region of
Nepal. Trop Parasitol; 2013, 3(2):140-144.
18. Amare B, Ali J, Moges B, Yismaw G, Belyhun
Y, Gebretsadik S, et al. Nutritional status,
intestinal parasite infection and allergy among
school children in northwest Ethiopia. BMC
Pediatr; 2013, 13(7): 13-27.
19. Hegazy AM, Younis NT, Aminou HA, Badr AM.
Prevalence of intestinal parasites and its impact
on nutritional status among preschool children
living in Damanhur City, El-Behera Governorate,
Egypt. J Egypt Soc Parasitol; 2014, 44(2):517-
24.
20. Worku N, Erko B, Torben W, Belay M, Kasssu
A, Fetene T, et al. Malnutrition and intestinal
parasitic infections in school children of Gondar,
North West Ethiopia. Ethiop Med J; 2009,
47(1):9-16.
21. Asaolu S O, Ofoezie I E. The Role of Health
Education and Sanitation in the Control of Helminth
Infections. Acta Tropica; 2003, 86(2):283-294.
22. Albonico M, Smith PG, Ercole E, Hall A. Rate of
Reinfection with Intestinal Nematodes after
Treatment of Children with Mebendazole or
Albendazole in a Highly Endemic Area.
Transactions of the Royal Society of Tropical
Medicine and Hygiene; 2005, 89(5): 538–541.
23. Hotez PJ, Brooker S, Bethony JM, Bottazzi ME,
Loukas A, Xiao S. Hookworm infection. New
England Journal of Medicine; 2004, 351(8):799–
807.
24. Al-Mekhlafi MH, Surin J, Atiya AS, Ariffin WA,
Mahdy AK, Abdullah HC. Anaemia and iron
deficiency anaemia among aboriginal schoolchildren
in rural Peninsular Malaysia: an update on a
continuing problem.Trans R Soc Trop Med Hyg;
2008, 102(10):1046-1052.
25. Ngui R, Ravindran S, Ong DB, Chow TK, Low
KP, Nureena ZS, et al. Intestinal parasitic
infections and the level of immunosuppression in
HIV seropositive individuals with diarrhoea in
Kilimanjaro, Tanzania: A cross-sectional study.
PLoS Negl Trop Dis; 2013, 18(3):122-139.
26. Oliveira D, Ferreira FS, Atouguia J, Fortes F,
Guerra A, Centeno-Lima S. Infection by
Intestinal Parasites, Stunting and Anemia in
School-Aged Children from Southern Angola.
PLoS One; 2015, 10(9): e0137327.
27. Nabakwe EC, Lichtenbelt WV, Ngare DK,
Wierik M, Westerterp KR, Owino OC. Vitamin a
deficiency and anaemia in young children living
in a malaria endemic district of western Kenya.
East Afr Med J; 2005, 82(6):300-306.
28. Sungthong R, Mo-suwan L, Chongsuvivatwong
V. Effects of hemoglobin and serum ferritin on
cognitive function in school children. Asia
Pacific. Clin Nutr; 2002, 7(4): 245-255.
29. WHO. Iron deficiency anaemia: assessment,
prevention, and control. World Health Organization,
Geneva, 2001.
30. Aini P N, Al-Mekhlafi H M, Azlin M, Shaik A,
Sa'iah A, Fatmah MS, Iet al. Serum iron status in
Orang Asli children living in endemic areas of
soil-transmitted helminths. Asia Pac J Clin Nutr;
2007, 16(4):724-730.
31. Ngui R, Lim YA, Chong Kin L, Sek Chuen C,
Jaffar S. Association between anaemia, iron
deficiency anaemia, neglected parasitic infections
and socioeconomic factors in rural children of
West Malaysia. PLoS Negl Trop Dis; 2012,
6(3):23-33.
32. Binay KS, Lubna AB. Association of anemia
with parasitic infestation in Nepalese women:
results from a hospital-based study done in
eastern Nepal. Journal of Ayub Medical College;
2005, 17(3): 5-9.
33. Jardim-Botelho A, Brooker S, Geiger SM, Fleming
F, Souza Lopes AC, Diemert DJ, et al. Age
patterns in undernutrition and helminth infection
in a rural area of Brazil: associations with
ascariasis and hookworm. Trop Med Int Health;
2008, 13(4):458-67.
34. Alemu A, Shiferaw Y, Ambachew A, Hamid H.
Malaria helminth co-infections and their contribution
for aneamia in febrile patients attending Azzezo
health center, Gondar, Northwest Ethiopia: a
cross sectional study. Asian Pac J Trop Med;
2012, 5(10):803-809.
35. Gyawali N, Amatya R, Nepal HP. Intestinal
parasitosis in school going children of Dharan
municipality, Nepal. Trop Gastroentero; 2009,
30(7): 145-147.
36. Khanal L, Choudhury D, Rai SK. Prevalence of
intestinal worm infestations among school
children in Kathmandu, Nepal. Nepal Med Coll J;
2011, 13(2): 272-274.
37. Jonker FA, Calis JC, Phiri K, Brienen EA, Khoffi
H, Brabin BJ, et al. Real-time PCR demonstrates
Ancylostoma duodenale is a key factor in the
etiology of severe anemia and iron deficiency in
Malawian pre-school children. PLoS Negl Trop
Dis; 2012, 6(3)12-22.
Original article
Mahmoud et al., Afro-Egypt J Infect Endem Dis 2017; 7(1):28-36
http://mis.zu.edu.eg/ajied/home.aspx
36
38. Guyatt HL, Brooker S, Kihamia CM, Hall A,
Bundy DA. Evaluation of efficacy of school-
based anthelminthic treatments against anaemia
in children in the United Republic of Tanzania.
Bulletin of the World Health Organization ;
2001, 79(8); 695-703.
39. Hussein EM, Zaki WM, Ahmed SA, Almatary
AM, Nemr NI, Hussein AM. Predominance of
Giardia lamblia assemblage A among iron
deficiency anaemic pre-school Egyptian children.
Parasitol Res; 2016, 115(4):1537-1545.
40. Botero-Garcés JH, García-Montoya GM,
Grisales-Patiño D, Aguirre-Acevedo DC,
Alvarez-Uribe MC. Giardia intestinalis and
nutritional status in children participating in the
complementary nutrition program, Antioquia,
Colombia,May to October 2006. Rev Inst Med
Trop Sao Paulo; 2009, 51(8): 155–162.
Original article
Abou Al Fotouh et al., Afro-Egypt J Infect Endem Dis 2017; 7(1): 37-46
http://mis.zu.edu.eg/ajied/home.aspx
37
Evaluation of N-Terminal Pro Brain Natriuretic Peptide as a
biomarker for clinical severity of heart failure in pediatric
population
Mohammad Nagib Abou Al Fotouh1, Ashgan Abdallah Alghobashy
1,
Yousry El Sayed Abou Al Magd2, Nermin Raafat
2
and Hanan Mohammed Hassan1.
1Pediatric Department, Faculty of Medicine, Zagazig University, Egypt
2Medical Biochemistry Department, Faculty of Medicine, Zagazig University, Egypt
Corresponding Author
Hanan Mohammed
Hassan
Mobile:
+201224575613
E mail:
hananmohammed30@
yahoo.com
Key words: Heart
failure, N-terminal pro-
BNP, biomarker, severity, pediatric
Background and study aim: Brain
Natriuretic Peptide (BNP) and N-Terminal
pro-Brain Natriuretic Peptide (NT-pro
BNP) are frequently used in the diagnosis
of congestive heart failure (CHF), especially
for distinguishing between patients with
dyspnea of cardiac and pulmonary origin.
The present work aimed at evaluating N-
Terminal pro-Brain Natriuretic Peptide
(NT-proBNP) as a biomarker for diagnosis
of congestive heart failure (CHF) in
pediatrics and as well as its severity and
hence, helping early diagnosis of CHF in
absence of rapid echocardiographic
examination.
Subjects and Methods: The patients
group (group I) consisted of 45 children
(24 males and 21 females) aging between
45 days and 12 years. All having the
inclusion criterion of CHF. They were
subclassified into: group I-1 including 15
patients having dilated cardiomyopathy
(DCM), group I-2 including 15 patients
having congenital heart disease (CHD)
and group I-3 including 15 patients that
have developed CHF due to non-cardiac
causes. The control group was formed of
15 healthy children (group II) matched in
age and gender with the patients groups.
All children were subjected to full history
taking, physical examination, classification
of clinical severity of CHF cases according
to Modified Ross Score, imaging and
laboratory investigations including serum
level of NT-proBNP.
Results: The study revealed that serum
NT-proBNP showed a highly statistically
significant increase in CHF cases three
groups (I-1, I-2 and I-3) in comparison to
the control group (group II) (P<0.001).
NT-proBNP level showed highly
statistically significant positive correlation
with CHF class of clinical severity
(P<0.001). Regarding echocardiographic
parameters NT-proBNP showed a highly
significant positive correlation with left
ventricular end diastolic dimensions
(LVEDD) and left ventricular end systolic
dimensions (LVESD), and a highly
significant negative correlation with left
ventricular (LV) ejection fraction (EF),
fractional shortening (FS) and mitral
valve E/A ratio. At cutoff level of 1500
pg/ml, the sensitivity of NT-proBNP as a
diagnostic biomarker in children with
CHF was 98% and the specificity was
100%.
Conclusion: NT-proBNP is significantly
statistically correlated with clinical severity
of CHF and echocardiographic parameters
of CHF cases of different causes .We
highly recommend a long-term study on
the value of the level of NT-proBNP as a
prognostic risk parameter.
INTRODUCTION
CHF is a clinical syndrome where the
heart is unable to provide the output
required to meet the metabolic
demands of the body; however, the
causes and mechanisms of CHF are
significantly different between adults
and children [1]. There is no single
diagnostic test for CHF because it is
largely a clinical diagnosis based on a
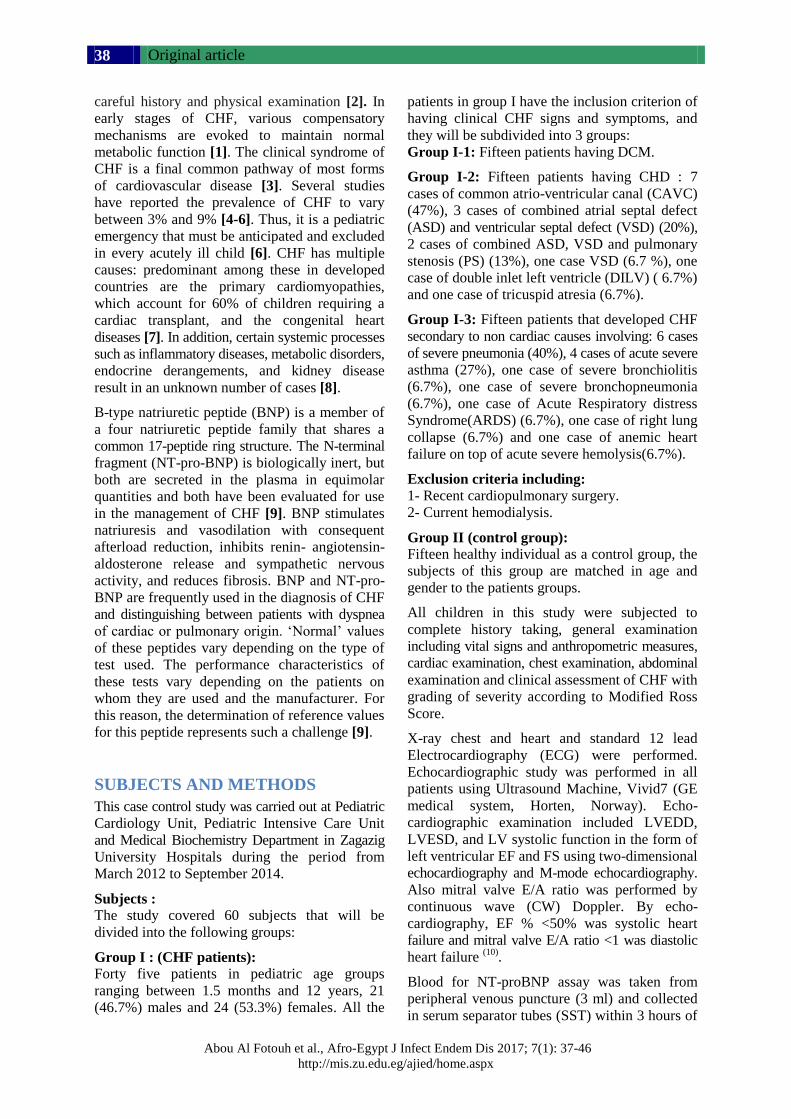
Original article
Abou Al Fotouh et al., Afro-Egypt J Infect Endem Dis 2017; 7(1): 37-46
http://mis.zu.edu.eg/ajied/home.aspx
38
careful history and physical examination [2]. In
early stages of CHF, various compensatory
mechanisms are evoked to maintain normal
metabolic function [1]. The clinical syndrome of
CHF is a final common pathway of most forms
of cardiovascular disease [3]. Several studies
have reported the prevalence of CHF to vary
between 3% and 9% [4-6]. Thus, it is a pediatric
emergency that must be anticipated and excluded
in every acutely ill child [6]. CHF has multiple
causes: predominant among these in developed
countries are the primary cardiomyopathies,
which account for 60% of children requiring a
cardiac transplant, and the congenital heart
diseases [7]. In addition, certain systemic processes
such as inflammatory diseases, metabolic disorders,
endocrine derangements, and kidney disease
result in an unknown number of cases [8].
B-type natriuretic peptide (BNP) is a member of
a four natriuretic peptide family that shares a
common 17-peptide ring structure. The N-terminal
fragment (NT-pro-BNP) is biologically inert, but
both are secreted in the plasma in equimolar
quantities and both have been evaluated for use
in the management of CHF [9]. BNP stimulates
natriuresis and vasodilation with consequent
afterload reduction, inhibits renin- angiotensin-
aldosterone release and sympathetic nervous
activity, and reduces fibrosis. BNP and NT-pro-
BNP are frequently used in the diagnosis of CHF
and distinguishing between patients with dyspnea
of cardiac or pulmonary origin. ‘Normal’ values
of these peptides vary depending on the type of
test used. The performance characteristics of
these tests vary depending on the patients on
whom they are used and the manufacturer. For
this reason, the determination of reference values
for this peptide represents such a challenge [9].
SUBJECTS AND METHODS
This case control study was carried out at Pediatric
Cardiology Unit, Pediatric Intensive Care Unit
and Medical Biochemistry Department in Zagazig
University Hospitals during the period from
March 2012 to September 2014.
Subjects :
The study covered 60 subjects that will be
divided into the following groups:
Group I : (CHF patients):
Forty five patients in pediatric age groups
ranging between 1.5 months and 12 years, 21
(46.7%) males and 24 (53.3%) females. All the
patients in group I have the inclusion criterion of
having clinical CHF signs and symptoms, and
they will be subdivided into 3 groups:
Group I-1: Fifteen patients having DCM.
Group I-2: Fifteen patients having CHD : 7
cases of common atrio-ventricular canal (CAVC)
(47%), 3 cases of combined atrial septal defect
(ASD) and ventricular septal defect (VSD) (20%),
2 cases of combined ASD, VSD and pulmonary
stenosis (PS) (13%), one case VSD (6.7 %), one
case of double inlet left ventricle (DILV) ( 6.7%)
and one case of tricuspid atresia (6.7%).
Group I-3: Fifteen patients that developed CHF
secondary to non cardiac causes involving: 6 cases
of severe pneumonia (40%), 4 cases of acute severe
asthma (27%), one case of severe bronchiolitis
(6.7%), one case of severe bronchopneumonia
(6.7%), one case of Acute Respiratory distress
Syndrome(ARDS) (6.7%), one case of right lung
collapse (6.7%) and one case of anemic heart
failure on top of acute severe hemolysis(6.7%).
Exclusion criteria including:
1- Recent cardiopulmonary surgery.
2- Current hemodialysis.
Group II (control group):
Fifteen healthy individual as a control group, the
subjects of this group are matched in age and
gender to the patients groups.
All children in this study were subjected to
complete history taking, general examination
including vital signs and anthropometric measures,
cardiac examination, chest examination, abdominal
examination and clinical assessment of CHF with
grading of severity according to Modified Ross
Score.
X-ray chest and heart and standard 12 lead
Electrocardiography (ECG) were performed.
Echocardiographic study was performed in all
patients using Ultrasound Machine, Vivid7 (GE
medical system, Horten, Norway). Echo-
cardiographic examination included LVEDD,
LVESD, and LV systolic function in the form of
left ventricular EF and FS using two-dimensional
echocardiography and M-mode echocardiography.
Also mitral valve E/A ratio was performed by
continuous wave (CW) Doppler. By echo-
cardiography, EF % <50% was systolic heart
failure and mitral valve E/A ratio <1 was diastolic
heart failure (10)
.
Blood for NT-proBNP assay was taken from
peripheral venous puncture (3 ml) and collected
in serum separator tubes (SST) within 3 hours of
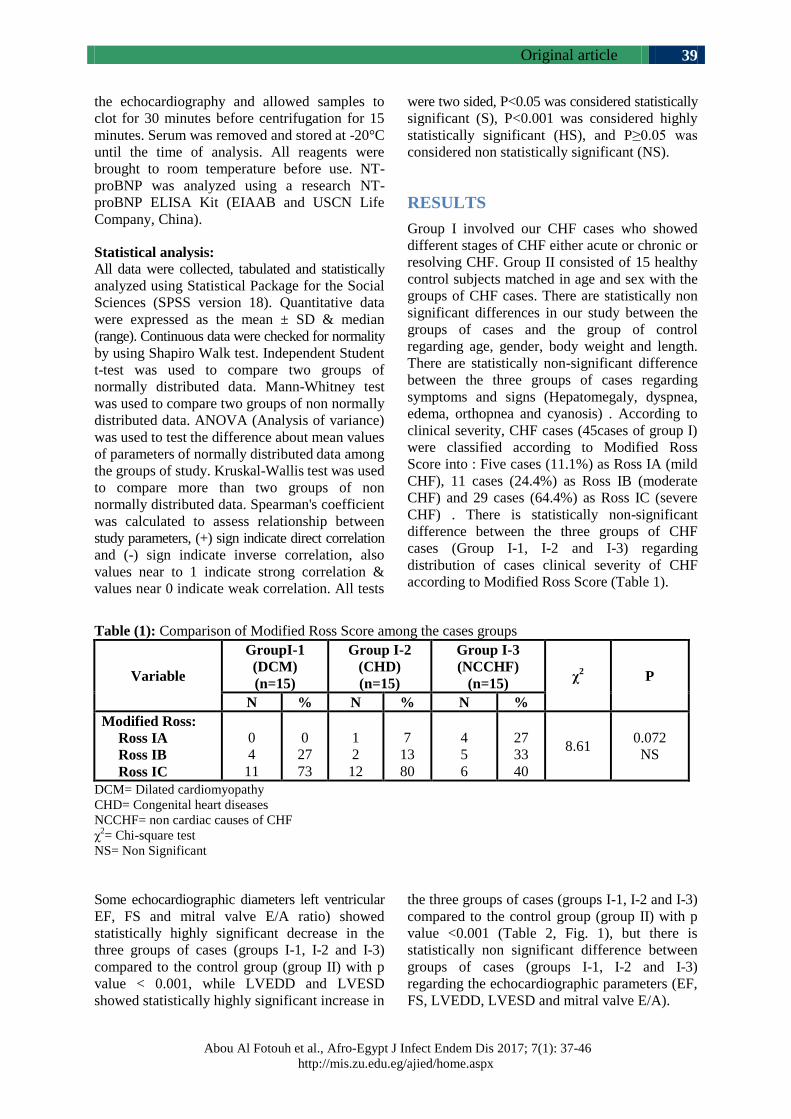
Original article
Abou Al Fotouh et al., Afro-Egypt J Infect Endem Dis 2017; 7(1): 37-46
http://mis.zu.edu.eg/ajied/home.aspx
39
the echocardiography and allowed samples to
clot for 30 minutes before centrifugation for 15
minutes. Serum was removed and stored at -20°C
until the time of analysis. All reagents were
brought to room temperature before use. NT-
proBNP was analyzed using a research NT-
proBNP ELISA Kit (EIAAB and USCN Life
Company, China).
Statistical analysis:
All data were collected, tabulated and statistically
analyzed using Statistical Package for the Social
Sciences (SPSS version 18). Quantitative data
were expressed as the mean ± SD & median
(range). Continuous data were checked for normality
by using Shapiro Walk test. Independent Student
t-test was used to compare two groups of
normally distributed data. Mann-Whitney test
was used to compare two groups of non normally
distributed data. ANOVA (Analysis of variance)
was used to test the difference about mean values
of parameters of normally distributed data among
the groups of study. Kruskal-Wallis test was used
to compare more than two groups of non
normally distributed data. Spearman's coefficient
was calculated to assess relationship between
study parameters, (+) sign indicate direct correlation
and (-) sign indicate inverse correlation, also
values near to 1 indicate strong correlation &
values near 0 indicate weak correlation. All tests
were two sided, P<0.05 was considered statistically
significant (S), P<0.001 was considered highly
statistically significant (HS), and P≥0.05 was
considered non statistically significant (NS).
RESULTS
Group I involved our CHF cases who showed
different stages of CHF either acute or chronic or
resolving CHF. Group II consisted of 15 healthy
control subjects matched in age and sex with the
groups of CHF cases. There are statistically non
significant differences in our study between the
groups of cases and the group of control
regarding age, gender, body weight and length.
There are statistically non-significant difference
between the three groups of cases regarding
symptoms and signs (Hepatomegaly, dyspnea,
edema, orthopnea and cyanosis) . According to
clinical severity, CHF cases (45cases of group I)
were classified according to Modified Ross
Score into : Five cases (11.1%) as Ross IA (mild
CHF), 11 cases (24.4%) as Ross IB (moderate
CHF) and 29 cases (64.4%) as Ross IC (severe
CHF) . There is statistically non-significant
difference between the three groups of CHF
cases (Group I-1, I-2 and I-3) regarding
distribution of cases clinical severity of CHF
according to Modified Ross Score (Table 1).
Table (1): Comparison of Modified Ross Score among the cases groups
Variable
GroupI-1
(DCM)
(n=15)
Group I-2
(CHD)
(n=15)
Group I-3
(NCCHF)
(n=15) χ
2 P
N % N % N %
Modified Ross:
Ross IA
Ross IB
Ross IC
0
4
11
0
27
73
1
2
12
7
13
80
4
5
6
27
33
40
8.61 0.072
NS
DCM= Dilated cardiomyopathy
CHD= Congenital heart diseases
NCCHF= non cardiac causes of CHF
χ2= Chi-square test
NS= Non Significant
Some echocardiographic diameters left ventricular
EF, FS and mitral valve E/A ratio) showed
statistically highly significant decrease in the
three groups of cases (groups I-1, I-2 and I-3)
compared to the control group (group II) with p
value < 0.001, while LVEDD and LVESD
showed statistically highly significant increase in
the three groups of cases (groups I-1, I-2 and I-3)
compared to the control group (group II) with p
value <0.001 (Table 2, Fig. 1), but there is
statistically non significant difference between
groups of cases (groups I-1, I-2 and I-3)
regarding the echocardiographic parameters (EF,
FS, LVEDD, LVESD and mitral valve E/A).
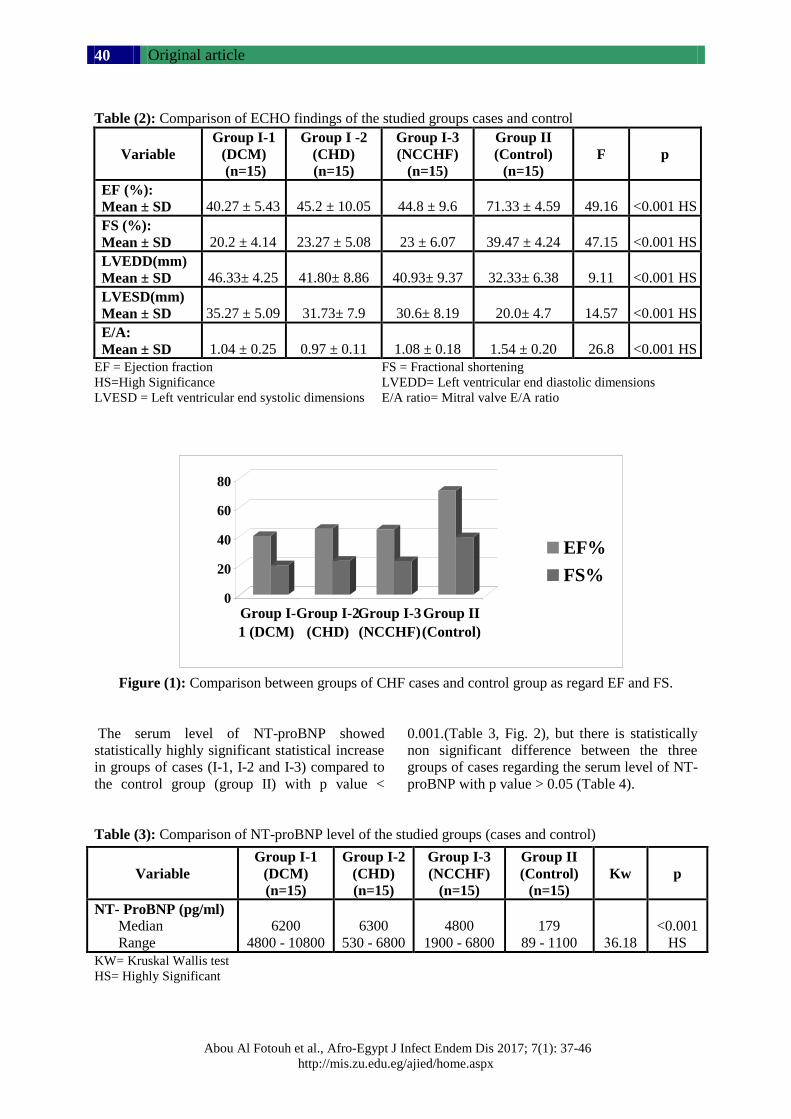
Original article
Abou Al Fotouh et al., Afro-Egypt J Infect Endem Dis 2017; 7(1): 37-46
http://mis.zu.edu.eg/ajied/home.aspx
40
Table (2): Comparison of ECHO findings of the studied groups cases and control
Variable
Group I-1
(DCM)
(n=15)
Group I -2
(CHD)
(n=15)
Group I-3
(NCCHF)
(n=15)
Group II
(Control)
(n=15)
F
p
EF (%):
Mean ± SD
40.27 ± 5.43
45.2 ± 10.05
44.8 ± 9.6
71.33 ± 4.59
49.16
<0.001 HS
FS (%):
Mean ± SD
20.2 ± 4.14
23.27 ± 5.08
23 ± 6.07
39.47 ± 4.24
47.15
<0.001 HS
LVEDD(mm)
Mean ± SD
46.33± 4.25
41.80± 8.86
40.93± 9.37
32.33± 6.38
9.11
<0.001 HS
LVESD(mm)
Mean ± SD
35.27 ± 5.09
31.73± 7.9
30.6± 8.19
20.0± 4.7
14.57
<0.001 HS
E/A:
Mean ± SD
1.04 ± 0.25
0.97 ± 0.11
1.08 ± 0.18
1.54 ± 0.20
26.8
<0.001 HS
EF = Ejection fraction FS = Fractional shortening
HS=High Significance LVEDD= Left ventricular end diastolic dimensions
LVESD = Left ventricular end systolic dimensions E/A ratio= Mitral valve E/A ratio
Figure (1): Comparison between groups of CHF cases and control group as regard EF and FS.
The serum level of NT-proBNP showed
statistically highly significant statistical increase
in groups of cases (I-1, I-2 and I-3) compared to
the control group (group II) with p value <
0.001.(Table 3, Fig. 2), but there is statistically
non significant difference between the three
groups of cases regarding the serum level of NT-
proBNP with p value > 0.05 (Table 4).
Table (3): Comparison of NT-proBNP level of the studied groups (cases and control)
KW= Kruskal Wallis test
HS= Highly Significant
Variable
Group I-1
(DCM)
(n=15)
Group I-2
(CHD)
(n=15)
Group I-3
(NCCHF)
(n=15)
Group II
(Control)
(n=15)
Kw p
NT- ProBNP (pg/ml)
Median
Range
6200
4800 - 10800
6300
530 - 6800
4800
1900 - 6800
179
89 - 1100
36.18
<0.001
HS
0
20
40
60
80
Group I-
1 (DCM)
Group I-2
(CHD)
Group I-3
(NCCHF)
Group II
(Control)
EF%
FS%
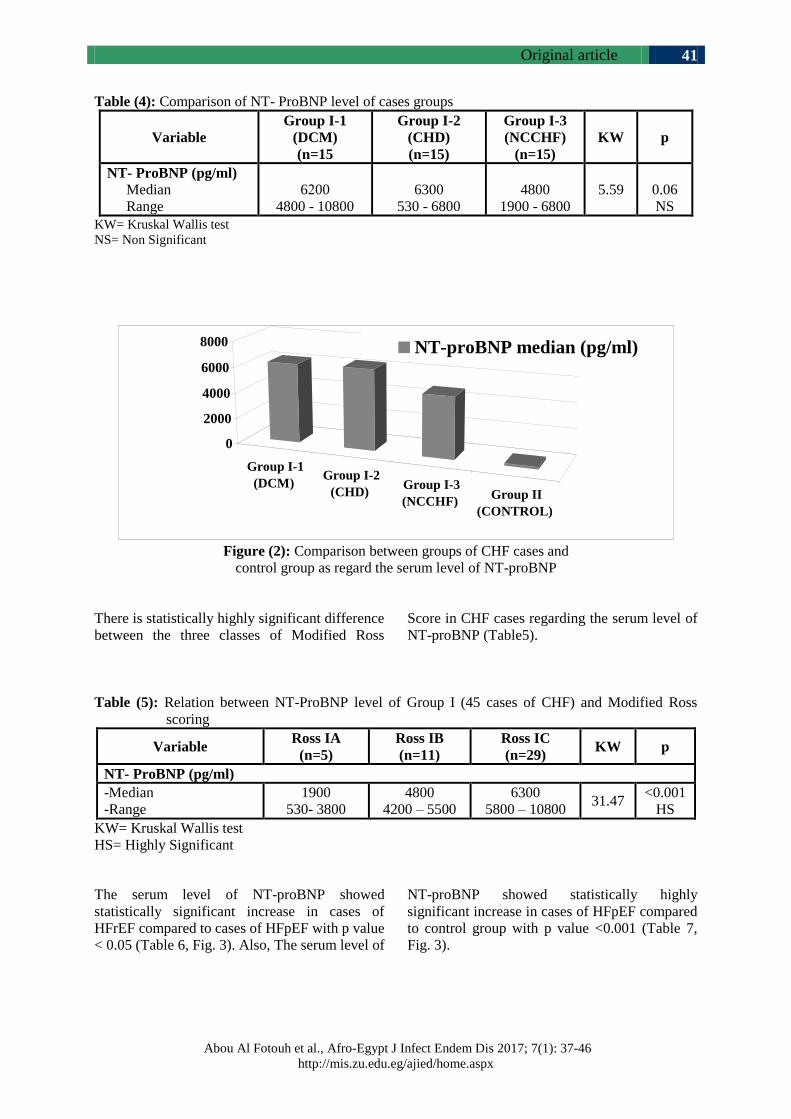
Original article
Abou Al Fotouh et al., Afro-Egypt J Infect Endem Dis 2017; 7(1): 37-46
http://mis.zu.edu.eg/ajied/home.aspx
41
Table (4): Comparison of NT- ProBNP level of cases groups
Variable
Group I-1
(DCM)
(n=15
Group I-2
(CHD)
(n=15)
Group I-3
(NCCHF)
(n=15)
KW p
NT- ProBNP (pg/ml)
Median
Range
6200
4800 - 10800
6300
530 - 6800
4800
1900 - 6800
5.59
0.06
NS
KW= Kruskal Wallis test
NS= Non Significant
Figure (2): Comparison between groups of CHF cases and
control group as regard the serum level of NT-proBNP
There is statistically highly significant difference
between the three classes of Modified Ross
Score in CHF cases regarding the serum level of
NT-proBNP (Table5).
Table (5): Relation between NT-ProBNP level of Group I (45 cases of CHF) and Modified Ross
scoring
Variable Ross IA
(n=5)
Ross IB
(n=11)
Ross IC
(n=29) KW p
NT- ProBNP (pg/ml)
-Median
-Range
1900
530- 3800
4800
4200 – 5500
6300
5800 – 10800 31.47
<0.001
HS
KW= Kruskal Wallis test
HS= Highly Significant
The serum level of NT-proBNP showed
statistically significant increase in cases of
HFrEF compared to cases of HFpEF with p value
< 0.05 (Table 6, Fig. 3). Also, The serum level of
NT-proBNP showed statistically highly
significant increase in cases of HFpEF compared
to control group with p value <0.001 (Table 7,
Fig. 3).
Group I-1
(DCM) Group I-2
(CHD) Group I-3
(NCCHF) Group II
(CONTROL)
0
2000
4000
6000
8000 NT-proBNP median (pg/ml)
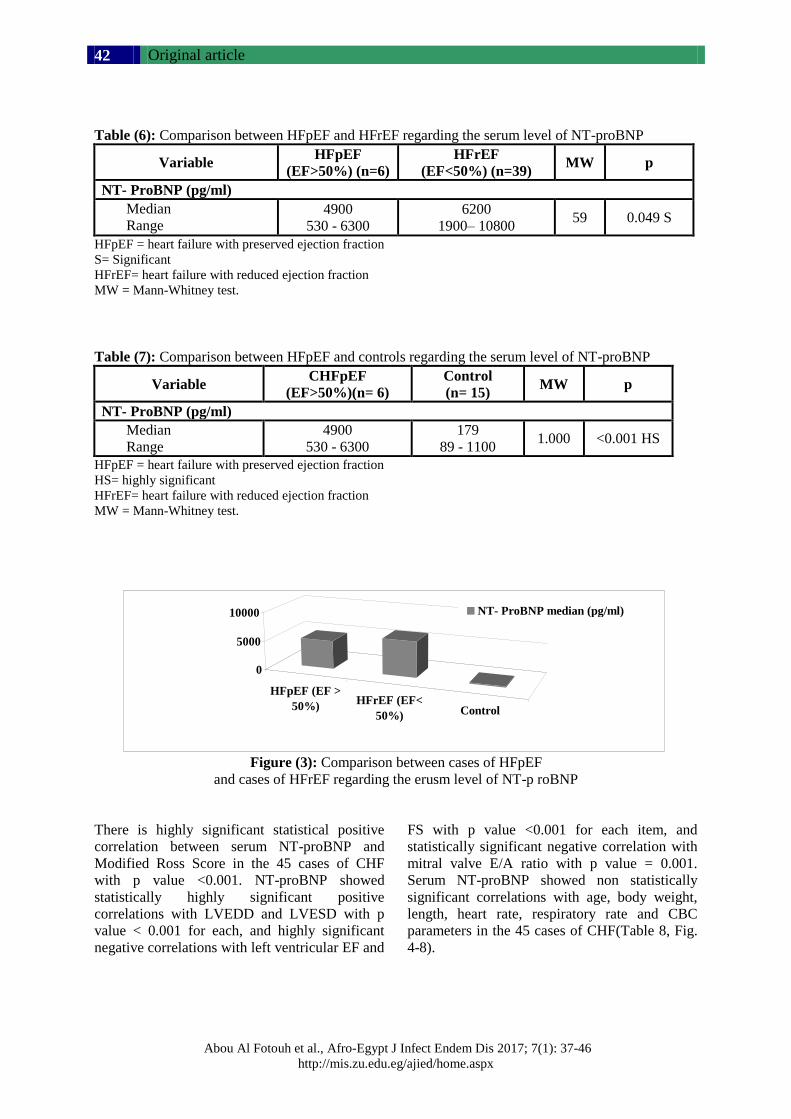
Original article
Abou Al Fotouh et al., Afro-Egypt J Infect Endem Dis 2017; 7(1): 37-46
http://mis.zu.edu.eg/ajied/home.aspx
42
Table (6): Comparison between HFpEF and HFrEF regarding the serum level of NT-proBNP
Variable HFpEF
(EF>50%) (n=6)
HFrEF
(EF<50%) (n=39) MW p
NT- ProBNP (pg/ml)
Median
Range
4900
530 - 6300
6200
1900– 10800 59 0.049 S
HFpEF = heart failure with preserved ejection fraction
S= Significant
HFrEF= heart failure with reduced ejection fraction
MW = Mann-Whitney test.
Table (7): Comparison between HFpEF and controls regarding the serum level of NT-proBNP
Variable CHFpEF
(EF>50%)(n= 6)
Control
(n= 15) MW p
NT- ProBNP (pg/ml)
Median
Range
4900
530 - 6300
179
89 - 1100 1.000 <0.001 HS
HFpEF = heart failure with preserved ejection fraction
HS= highly significant
HFrEF= heart failure with reduced ejection fraction
MW = Mann-Whitney test.
Figure (3): Comparison between cases of HFpEF
and cases of HFrEF regarding the erusm level of NT-p roBNP
There is highly significant statistical positive
correlation between serum NT-proBNP and
Modified Ross Score in the 45 cases of CHF
with p value <0.001. NT-proBNP showed
statistically highly significant positive
correlations with LVEDD and LVESD with p
value < 0.001 for each, and highly significant
negative correlations with left ventricular EF and
FS with p value <0.001 for each item, and
statistically significant negative correlation with
mitral valve E/A ratio with p value = 0.001.
Serum NT-proBNP showed non statistically
significant correlations with age, body weight,
length, heart rate, respiratory rate and CBC
parameters in the 45 cases of CHF(Table 8, Fig.
4-8).
HFpEF (EF >
50%)HFrEF (EF<
50%) Control
0
5000
10000 NT- ProBNP median (pg/ml)
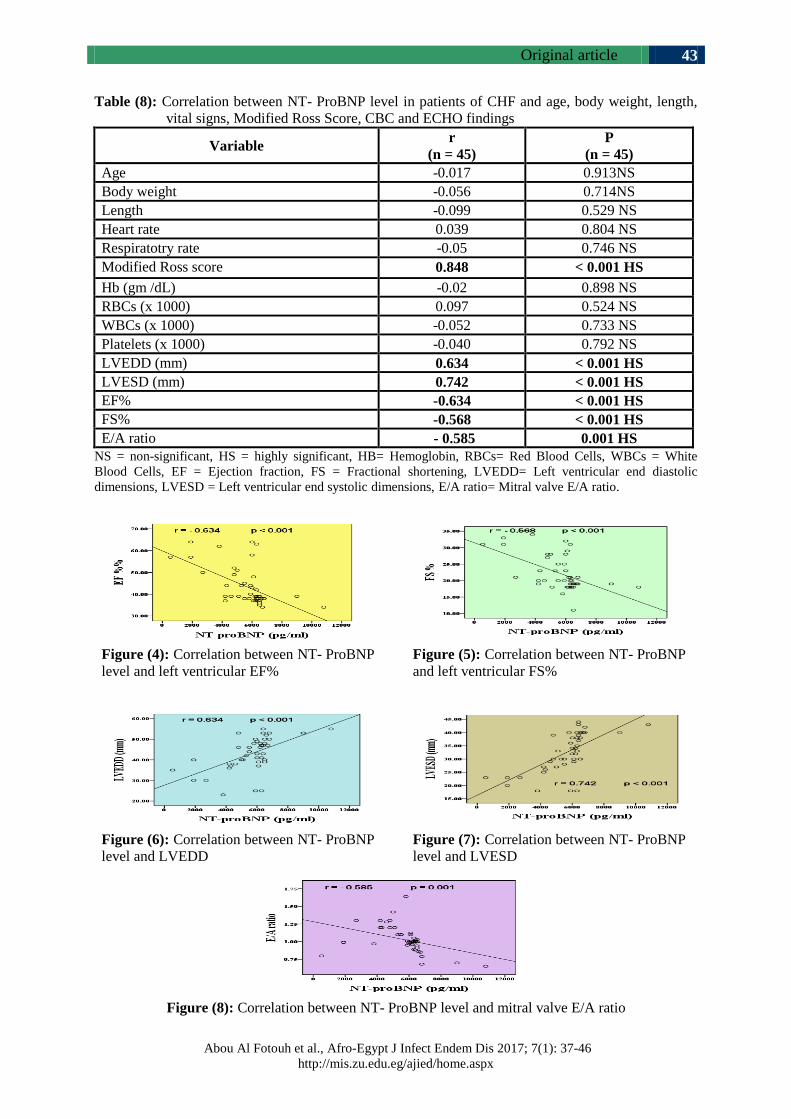
Original article
Abou Al Fotouh et al., Afro-Egypt J Infect Endem Dis 2017; 7(1): 37-46
http://mis.zu.edu.eg/ajied/home.aspx
43
Table (8): Correlation between NT- ProBNP level in patients of CHF and age, body weight, length,
vital signs, Modified Ross Score, CBC and ECHO findings
Variable r
(n = 45)
P
(n = 45)
Age -0.017 0.913NS
Body weight -0.056 0.714NS
Length -0.099 0.529 NS
Heart rate 0.039 0.804 NS
Respiratotry rate -0.05 0.746 NS
Modified Ross score 0.848 < 0.001 HS
Hb (gm /dL) -0.02 0.898 NS
RBCs (x 1000) 0.097 0.524 NS
WBCs (x 1000) -0.052 0.733 NS
Platelets (x 1000) -0.040 0.792 NS
LVEDD (mm) 0.634 < 0.001 HS
LVESD (mm) 0.742 < 0.001 HS
EF% -0.634 < 0.001 HS
FS% -0.568 < 0.001 HS
E/A ratio - 0.585 0.001 HS
NS = non-significant, HS = highly significant, HB= Hemoglobin, RBCs= Red Blood Cells, WBCs = White
Blood Cells, EF = Ejection fraction, FS = Fractional shortening, LVEDD= Left ventricular end diastolic
dimensions, LVESD = Left ventricular end systolic dimensions, E/A ratio= Mitral valve E/A ratio.
Figure (4): Correlation between NT- ProBNP
level and left ventricular EF%
Figure (5): Correlation between NT- ProBNP
and left ventricular FS%
Figure (6): Correlation between NT- ProBNP
level and LVEDD
Figure (7): Correlation between NT- ProBNP
level and LVESD
Figure (8): Correlation between NT- ProBNP level and mitral valve E/A ratio
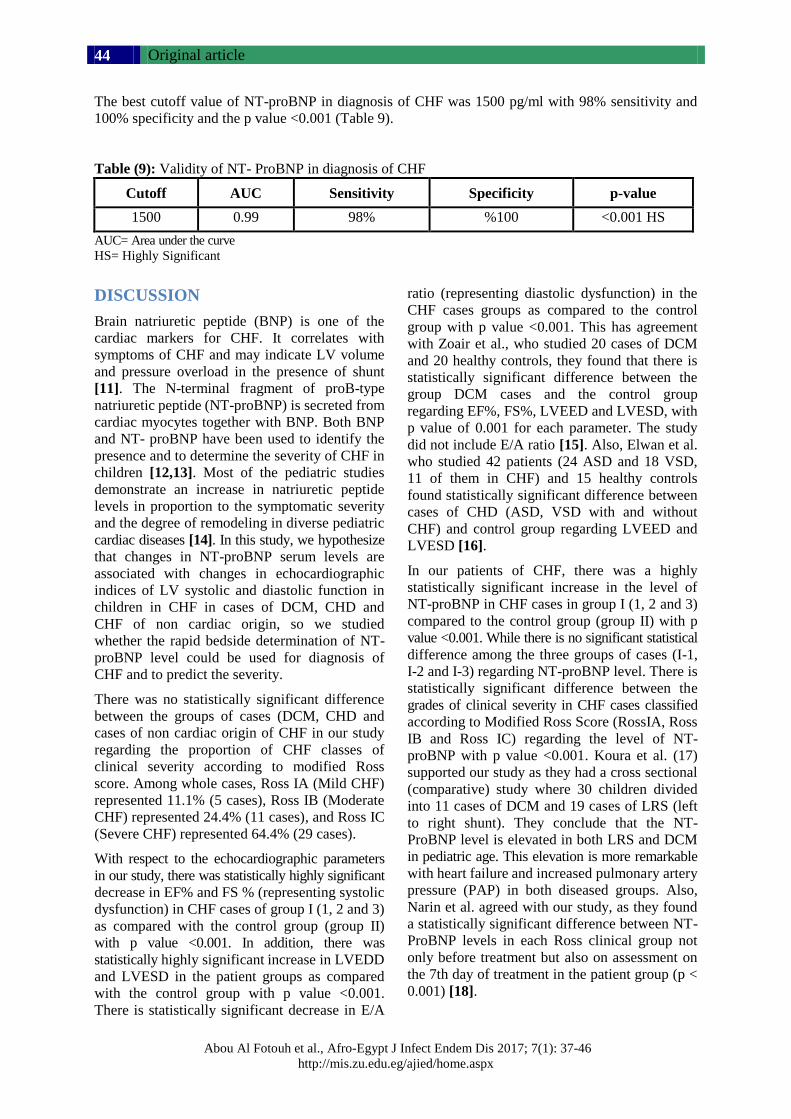
Original article
Abou Al Fotouh et al., Afro-Egypt J Infect Endem Dis 2017; 7(1): 37-46
http://mis.zu.edu.eg/ajied/home.aspx
44
The best cutoff value of NT-proBNP in diagnosis of CHF was 1500 pg/ml with 98% sensitivity and
100% specificity and the p value <0.001 (Table 9).
Table (9): Validity of NT- ProBNP in diagnosis of CHF
Cutoff AUC Sensitivity Specificity p-value
1500 0.99 98% %100 <0.001 HS
AUC= Area under the curve
HS= Highly Significant
DISCUSSION
Brain natriuretic peptide (BNP) is one of the
cardiac markers for CHF. It correlates with
symptoms of CHF and may indicate LV volume
and pressure overload in the presence of shunt
[11]. The N-terminal fragment of proB-type
natriuretic peptide (NT-proBNP) is secreted from
cardiac myocytes together with BNP. Both BNP
and NT- proBNP have been used to identify the
presence and to determine the severity of CHF in
children [12,13]. Most of the pediatric studies
demonstrate an increase in natriuretic peptide
levels in proportion to the symptomatic severity
and the degree of remodeling in diverse pediatric
cardiac diseases [14]. In this study, we hypothesize
that changes in NT-proBNP serum levels are
associated with changes in echocardiographic
indices of LV systolic and diastolic function in
children in CHF in cases of DCM, CHD and
CHF of non cardiac origin, so we studied
whether the rapid bedside determination of NT-
proBNP level could be used for diagnosis of
CHF and to predict the severity.
There was no statistically significant difference
between the groups of cases (DCM, CHD and
cases of non cardiac origin of CHF in our study
regarding the proportion of CHF classes of
clinical severity according to modified Ross
score. Among whole cases, Ross IA (Mild CHF)
represented 11.1% (5 cases), Ross IB (Moderate
CHF) represented 24.4% (11 cases), and Ross IC
(Severe CHF) represented 64.4% (29 cases).
With respect to the echocardiographic parameters
in our study, there was statistically highly significant
decrease in EF% and FS % (representing systolic
dysfunction) in CHF cases of group I (1, 2 and 3)
as compared with the control group (group II)
with p value <0.001. In addition, there was
statistically highly significant increase in LVEDD
and LVESD in the patient groups as compared
with the control group with p value <0.001.
There is statistically significant decrease in E/A
ratio (representing diastolic dysfunction) in the
CHF cases groups as compared to the control
group with p value <0.001. This has agreement
with Zoair et al., who studied 20 cases of DCM
and 20 healthy controls, they found that there is
statistically significant difference between the
group DCM cases and the control group
regarding EF%, FS%, LVEED and LVESD, with
p value of 0.001 for each parameter. The study
did not include E/A ratio [15]. Also, Elwan et al.
who studied 42 patients (24 ASD and 18 VSD,
11 of them in CHF) and 15 healthy controls
found statistically significant difference between
cases of CHD (ASD, VSD with and without
CHF) and control group regarding LVEED and
LVESD [16].
In our patients of CHF, there was a highly
statistically significant increase in the level of
NT-proBNP in CHF cases in group I (1, 2 and 3)
compared to the control group (group II) with p
value <0.001. While there is no significant statistical
difference among the three groups of cases (I-1,
I-2 and I-3) regarding NT-proBNP level. There is
statistically significant difference between the
grades of clinical severity in CHF cases classified
according to Modified Ross Score (RossIA, Ross
IB and Ross IC) regarding the level of NT-
proBNP with p value <0.001. Koura et al. (17)
supported our study as they had a cross sectional
(comparative) study where 30 children divided
into 11 cases of DCM and 19 cases of LRS (left
to right shunt). They conclude that the NT-
ProBNP level is elevated in both LRS and DCM
in pediatric age. This elevation is more remarkable
with heart failure and increased pulmonary artery
pressure (PAP) in both diseased groups. Also,
Narin et al. agreed with our study, as they found
a statistically significant difference between NT-
ProBNP levels in each Ross clinical group not
only before treatment but also on assessment on
the 7th day of treatment in the patient group (p <
0.001) [18].
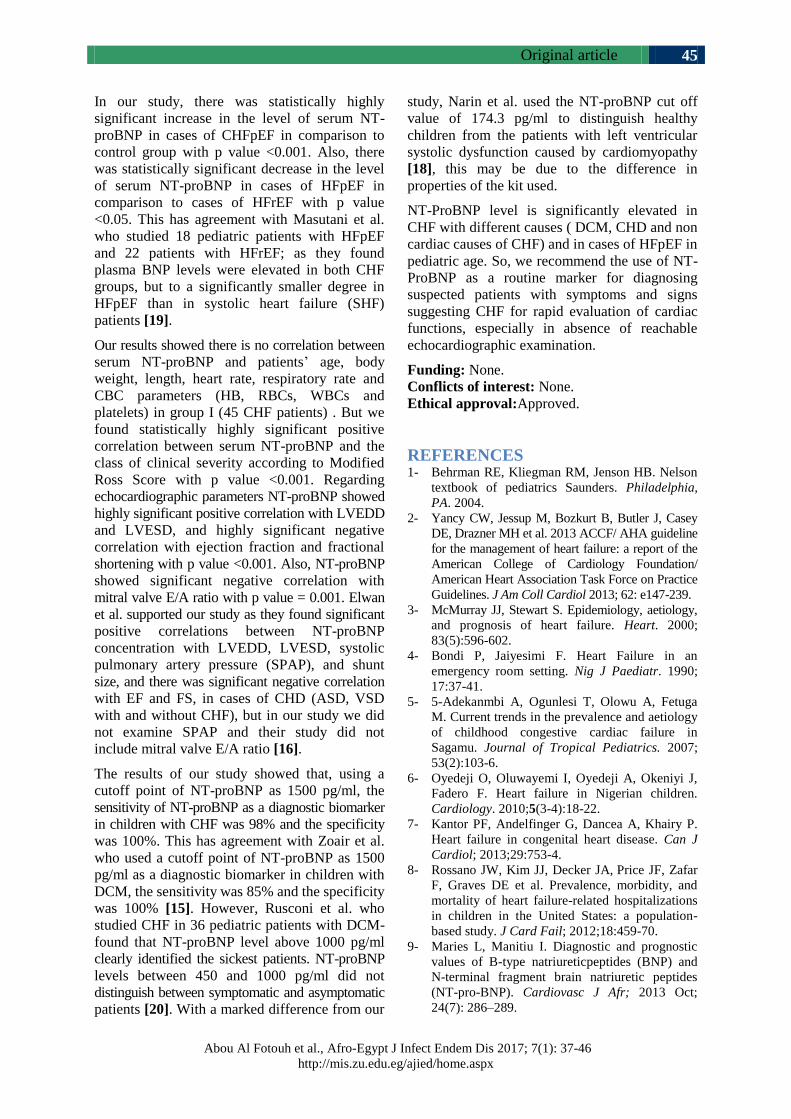
Original article
Abou Al Fotouh et al., Afro-Egypt J Infect Endem Dis 2017; 7(1): 37-46
http://mis.zu.edu.eg/ajied/home.aspx
45
In our study, there was statistically highly
significant increase in the level of serum NT-
proBNP in cases of CHFpEF in comparison to
control group with p value <0.001. Also, there
was statistically significant decrease in the level
of serum NT-proBNP in cases of HFpEF in
comparison to cases of HFrEF with p value
<0.05. This has agreement with Masutani et al.
who studied 18 pediatric patients with HFpEF
and 22 patients with HFrEF; as they found
plasma BNP levels were elevated in both CHF
groups, but to a significantly smaller degree in
HFpEF than in systolic heart failure (SHF)
patients [19].
Our results showed there is no correlation between
serum NT-proBNP and patients’ age, body
weight, length, heart rate, respiratory rate and
CBC parameters (HB, RBCs, WBCs and
platelets) in group I (45 CHF patients) . But we
found statistically highly significant positive
correlation between serum NT-proBNP and the
class of clinical severity according to Modified
Ross Score with p value <0.001. Regarding
echocardiographic parameters NT-proBNP showed
highly significant positive correlation with LVEDD
and LVESD, and highly significant negative
correlation with ejection fraction and fractional
shortening with p value <0.001. Also, NT-proBNP
showed significant negative correlation with
mitral valve E/A ratio with p value = 0.001. Elwan
et al. supported our study as they found significant
positive correlations between NT-proBNP
concentration with LVEDD, LVESD, systolic
pulmonary artery pressure (SPAP), and shunt
size, and there was significant negative correlation
with EF and FS, in cases of CHD (ASD, VSD
with and without CHF), but in our study we did
not examine SPAP and their study did not
include mitral valve E/A ratio [16].
The results of our study showed that, using a
cutoff point of NT-proBNP as 1500 pg/ml, the
sensitivity of NT-proBNP as a diagnostic biomarker
in children with CHF was 98% and the specificity
was 100%. This has agreement with Zoair et al.
who used a cutoff point of NT-proBNP as 1500
pg/ml as a diagnostic biomarker in children with
DCM, the sensitivity was 85% and the specificity
was 100% [15]. However, Rusconi et al. who
studied CHF in 36 pediatric patients with DCM-
found that NT-proBNP level above 1000 pg/ml
clearly identified the sickest patients. NT-proBNP
levels between 450 and 1000 pg/ml did not
distinguish between symptomatic and asymptomatic
patients [20]. With a marked difference from our
study, Narin et al. used the NT-proBNP cut off
value of 174.3 pg/ml to distinguish healthy
children from the patients with left ventricular
systolic dysfunction caused by cardiomyopathy
[18], this may be due to the difference in
properties of the kit used.
NT-ProBNP level is significantly elevated in
CHF with different causes ( DCM, CHD and non
cardiac causes of CHF) and in cases of HFpEF in
pediatric age. So, we recommend the use of NT-
ProBNP as a routine marker for diagnosing
suspected patients with symptoms and signs
suggesting CHF for rapid evaluation of cardiac
functions, especially in absence of reachable
echocardiographic examination.
Funding: None.
Conflicts of interest: None.
Ethical approval:Approved.
REFERENCES 1- Behrman RE, Kliegman RM, Jenson HB. Nelson
textbook of pediatrics Saunders. Philadelphia,
PA. 2004.
2- Yancy CW, Jessup M, Bozkurt B, Butler J, Casey
DE, Drazner MH et al. 2013 ACCF/ AHA guideline
for the management of heart failure: a report of the
American College of Cardiology Foundation/
American Heart Association Task Force on Practice
Guidelines. J Am Coll Cardiol 2013; 62: e147-239.
3- McMurray JJ, Stewart S. Epidemiology, aetiology,
and prognosis of heart failure. Heart. 2000;
83(5):596-602.
4- Bondi P, Jaiyesimi F. Heart Failure in an
emergency room setting. Nig J Paediatr. 1990;
17:37-41.
5- 5-Adekanmbi A, Ogunlesi T, Olowu A, Fetuga
M. Current trends in the prevalence and aetiology
of childhood congestive cardiac failure in
Sagamu. Journal of Tropical Pediatrics. 2007;
53(2):103-6.
6- Oyedeji O, Oluwayemi I, Oyedeji A, Okeniyi J,
Fadero F. Heart failure in Nigerian children.
Cardiology. 2010;5(3-4):18-22.
7- Kantor PF, Andelfinger G, Dancea A, Khairy P.
Heart failure in congenital heart disease. Can J
Cardiol; 2013;29:753-4.
8- Rossano JW, Kim JJ, Decker JA, Price JF, Zafar
F, Graves DE et al. Prevalence, morbidity, and
mortality of heart failure-related hospitalizations
in children in the United States: a population-
based study. J Card Fail; 2012;18:459-70.
9- Maries L, Manitiu I. Diagnostic and prognostic
values of B-type natriureticpeptides (BNP) and
N-terminal fragment brain natriuretic peptides
(NT-pro-BNP). Cardiovasc J Afr; 2013 Oct;
24(7): 286–289.
Original article
Abou Al Fotouh et al., Afro-Egypt J Infect Endem Dis 2017; 7(1): 37-46
http://mis.zu.edu.eg/ajied/home.aspx
46
10- Lin CW, Tang W, Wen F, Chen JJ, Zeng XL,
Chen ZG. Diagnostic Accuracy of NT-ProBNP
for Heart Failure with Sepsis in Patients Younger
than 18 Years. Harold S. Bernstein, Editor. PLoS
One {Internet}. 2016 Jan 26 {cited 2016 May
15}; 11(1): e0147930. Available from: http://
journals.plos.org/plosone/article?id= 10.1371/
journal.pone.0147930.
11- Nir A, Nasser N. Clinical value of NT-ProBNP
and BNP in pediatric cardiology. J Card Fail;
2005; 11:76–80.
12- 12-- Mangat J, Carter C, Riley G, Foo Y, Burch
M. The clinical utility of brain natriuretic peptide
in paediatric left ventricular failure. Eur J Heart
Fail; 2009; 11:48–52.
13- 13-Geiger R, Hammerer-Lercher A, Url C,
Schweigmann U, Puschendorf B, Sommer R et
al. NT-proBNP concentrations indicate cardiac
disease in pediatric patients. Int J Cardiol; 2007;
123:63–65.
14- 14-Abassi Z, Karram T, Ellaham S, Winaver
J, Hoffman A. Implications of the natriuretic
peptide system in the pathogenesis of heart
failure: diagnostic and therapeutic importance.
Pharmacol Ther; 2004; 102:223–241.
15- 15-Zoair AM, Mawlana WH, El-Bendary AS,
Nada EA. Serum levels of amino terminal of
probrain natriuretic peptide (NT-ProBNP) as a
diagnostic and prognostic biomarker in children
with dilated cardiomyopathy. Tanta Medical
Journal 2014, 42(2):53–57.
16- Elwan SA, Belal TH, Abd El-Aty RE And Salem
MA. Diagnostic Value of N-Terminal Pro-Brain
Natriuretic Peptide Level in Pediatric Patients
with Atrial or Ventricular Septal Defect. Med. J.
Cairo Univ. 2015; 83(2): 279-283.
www.medicaljournalofcairouniversity.net.
17- Koura HM, Abdalla NM, Ibrahim MH, Abo
Hashish MM1, Zaki SM. NT-proBNP in Children
With Left to Right Shunt and Dilated
Cardiomyopathy. Iran J Pediatr. In Press In
Press):e4485. doi: 10.5812/ijp.4485. http://ijp.
tums.pub/en/latest.html.
18- Narin N, Hekimoglu B, Baykan A, Uzum K. The
role of N-terminal proBNP in the clinic scoring
of heart failure due to dilated cardiomyopathy in
children. Clin Lab; 2014;60(4):563-70.
19- 19-Masutani S, Saiki H, Kurishima C, Ishido
H, Tamura M, Senzaki H. Heart Failure With
Preserved Ejection Fraction in Children –
Hormonal Imbalance Between Aldosterone and
Brain Natriuretic Peptide. Circulation Journal;
2013; 77 (9): 2375 – 2382.
20- Rusconi PG, Ludwig DA, Ratnasamy C, Mas R,
Harmon WG, Colan SD et al. Serial Measurements
of Serum NT-proBNP as Markers of Left Ventricular
Systolic Function and Remodeling in Children
with Heart Failure. Am Heart J; 2010 October ;
160(4): 776–783. doi:10.1016/j.ahj.2010.07.012.


