Embed Size (px)
Citation preview
1
Agulhas leakage into the Atlantic estimated with subsurface floats and
surface drifters
Philip L. Richardson
Woods Hole Oceanographic Institution
Physical Oceanography Department, MS #21
360 Woods Hole Road
Woods Hole, MA 02543 USA
And
Woods Hole Research Center
Woods Hole, MA 02543
Telephone: 508 289 2546
E-mail: [email protected]
December 2, 2006
Manuscript
2
Abstract
Surface drifters and subsurface floats drifting at depths near 800 m were used to study the
pathways of warm salty Indian Ocean water leaking into the South Atlantic that is a
component of the upper limb of the Atlantic meridional overturning circulation. Four
drifters and 5 floats drifted from the Agulhas Current directly into the Benguela Current.
Others looped for various amounts of time in Agulhas rings and cyclones, which
translated westward into the Atlantic contributing a large part of Indian Ocean leakage.
Agulhas rings translated into the Benguela Current where they slowly decayed. Some
large blob-like Agulhas rings with irregular shapes were found in the southeastern Cape
Basin. Drifter trajectories suggest these rings become more circular with time eventually
evolving into the circular rings observed west of the Walvis Ridge. Agulhas cyclones,
which form on the north side of the Agulhas south of Africa, translated southwestward
(to 6°E) and contributed water to the southern Cape Basin. A new discovery is a
westward extension from the mean Agulhas retroflection measured by westward drifting
floats near 41ºS out to at least 5ºW with some floats as far west as 25ºW. The Agulhas
extension appears to split the South Atlantic Current into two branches and to transport
Agulhas water westward where it is mixed and blended with eastward-flowing water
from the western Atlantic. The blended mixture flows northeastward in the northern
branch of the South Atlantic Current and into the Benguela Current. Agulhas leakage
transport was estimated from drifters and floats to be at least 15 Sv in the upper 1,000 m,
which is equivalent to the transport of the upper layer meridional overturning circulation.
It is suggested that the major component of the upper layer overturning circulation in the
Atlantic is Agulhas leakage.
3
1. Introduction
Interocean exchange of heat and salt around South Africa is thought to be key in maintaining the
global overturning circulation of the ocean (Gordon et al., 1992; Lutjeharms, 1996; de Ruijter et
al., 1999; Sloyan and Rintoul, 2001). Indian Ocean leakage into the South Atlantic takes place
near the Agulhas Current retroflection where large Agulhas rings (~ 400 km overall diameter)
pinch off and translate into the Atlantic. Agulhas rings and other Agulhas eddies and current
filaments merge with South Atlantic Current water in the Benguela Current, forming the source
of the ~ 15 x 106 m3/s warm upper layer water that flows northward through the Atlantic in
compensation for the colder southward flowing North Atlantic Deep Water. Indian Ocean leakage
water tends to be warmer and saltier than South Atlantic water of Drake Passage origin and
therefore contributes to larger northward heat and salt fluxes (Gordon et al., 1992; Sloyan and
Rintoul, 2001; Schmid et al., 2000). Variations of the leakage inferred from sea floor sediment
cores and climate variations over the last 550,000 years suggest an enhanced leakage during
present and past interglacials and a much reduced leakage during glacial intervals (Peeters et al.,
2004). Agulhas leakage appears to play a crucial role in glacial terminations, the timing of
interhemispheric climate change and the resulting resumption of the Atlantic meridional
overturning circulation (MOC) (Peeters et al., 2004).
In order to correctly model the leakage and understand its effect on the overturning circulation
and climate variations, the amounts and pathways of the present leakage need to be accurately
measured and described. Mechanisms responsible for the leakage need to be understood and
simulated realistically. However, the complexity of currents around southern Africa and the
intense eddies in the vicinity of the Agulhas retroflection make it very difficult to measure the
mean circulation patterns and interocean fluxes. At present we do not know accurately how much
Agulhas leakage there is, what its variability is, and what percentage of leakage feeds into the
upper limb of the MOC.
The purpose of this study is to use surface drifter and subsurface float trajectories to determine
the amounts and pathways of the Indian Ocean leakage of surface and intermediate water (~ 800
m) and to investigate the physical mechanisms responsible for it. Leakage was investigated by
studying individual trajectories that entered the Benguela Current from the Agulhas, including
4
those in Agulhas rings and Agulhas cyclones, as well as overall patterns of trajectories. Physical
characteristics of rings and cyclones were investigated in order to estimate their contribution to
leakage. Finally, drifter and float velocities were used to map the mean flow field at high
resolution (1° x 1°) in an attempt to reveal leakage pathways.
Acoustic float data in the region of interest have been previously discussed by Boebel et al.
(2003), Lutjeharms et al. (2003), Richardson and Garzoli (2003), and Schmid et al. (2003). This
present work builds on those studies by combining all available acoustic float trajectories, non-
acoustic float displacements, and surface drifter trajectories to further examine surface and
subsurface velocity characteristics of the flow field of the southeastern Atlantic where Indian
Ocean leakage begins its northward path toward the equator. The intermediate-level mean flow
field in the area of southern Africa has been mapped at fairly coarse (~ 3°) resolution using
acoustic floats (Boebel et al., 2003), non-acoustic floats (Davis, 2005), and a combination of
acoustic and non-acoustic floats (Núnez-Riboni et al., 2005), but these maps tend to blur smaller
scale features (< 3°). The present study uses a higher resolution map (~ 1°) in order to try and
resolve the smaller features of the circulation in the vicinity of the Agulhas retroflection.
2. Scientific Background
The upper limb of the Atlantic MOC originates in the southeastern Atlantic where South Atlantic
Current (SAC) water merges with Indian Ocean leakage in the Benguela Current (Reid, 1989;
Peterson and Stramma, 1991; Stramma and England, 1999; de Ruijter et al., 1999). The two main
sources of the upper layer MOC are Agulhas leakage and Drake Passage water that flows
northward via the Falklands (Malvinas) Current and SAC. The Benguela Current flows northward
as the eastern part of the subtropical gyre of the South Atlantic and then westward over the mid-
Atlantic Ridge as the Benguela extension, which includes both the MOC and the return flow of
the subtropical gyre. Upon reaching the western boundary the Benguela extension divides with
(roughly) half flowing southward in the Brazil Current closing the gyre in the west and half
flowing northward as the North Brazil Undercurrent and then North Brazil Current.
Accurate knowledge of the circulation patterns in the southeastern Atlantic and of the amounts of
water from different sources in the Benguela Current has remained lacking because of the
complexities of the ocean circulation and the sparse amount of suitable direct measurements.
Complexities include the partially interconnected South Atlantic and Indian Ocean gyres and the
5
formation of numerous energetic Agulhas rings and cyclones in the southeastern Atlantic. Good
reviews of what is known have been published by de Ruijter et al. (1999) and Gordon (2001).
Estimates of Agulhas leakage using geostrophic sections range from around 3-15 Sv (1 Sv = 106
m3/s), and estimates of leakage due to Agulhas rings range from around 3-9 Sv based on the
formation of 6 rings per year each with a transport of 0.5 to 1.5 Sv (de Ruijter et al., 1999;
Gordon, 2001). Estimates of the amount of intermediate water entering the Benguela Current
from the Agulhas range from near zero (Rintoul, 1991) to around 50% (Gordon et al., 1992).
Low salinity Antarctic Intermediate Water (AAIW) is one of the most prominent features of the
Atlantic and can be clearly traced from the South Atlantic across the equator and into the Gulf
Stream system. AAIW enters the subtropical gyre of the South Atlantic near its southwestern
corner in the Brazil-Falklands confluence zone and also along the southern edge of the SAC
(McCartney, 1977; Tsuchiya et al., 1994; Boebel et al., 1999a). Some SAC water enters the
Benguela Current and some merges with the Agulhas Return Current and continues eastward past
Africa. Part of this eastward flow loops into the subtropical gyre of the Indian Ocean and part
loops into the Pacific Ocean and subsequently enters the Indian Ocean through the Indonesian
Seas. Because the subtropical gyres of the Atlantic, Indian and Pacific are partially connected it
is problematic to use water properties to clearly identify sources of the Benguela Current and to
trace source waters downstream especially into the complicated eddy-rich Cape Basin.
Gordon et al. (1992) suggest that approximately 65% of the Benguela Current thermocline and as
much as 50% of the intermediate water is derived from the Indian Ocean. In their scheme, the
main supply of upper layer water flowing north across the equator is drawn from AAIW. Lower
thermocline and intermediate leakage water passes to lower latitudes of the South Atlantic where
significant amounts of intermediate water is transferred into the thermocline. Of 15 Sv of Agulhas
leakage (above 1500 m) 9 Sv continues northward in the MOC. Sloyan and Rintoul (2001)
concluded that the Atlantic MOC is closed by cold fresh intermediate water that is modified to
warm, salty varieties by air sea fluxes and interior mixing in the Atlantic and southwestern Indian
Ocean. They suggest that the lower thermocline and intermediate water (T < 10°C) in the
Benguela Current comes from the SAC and Agulhas Current in equal amounts and that of 14 Sv
flowing northward in the MOC, 10 Sv is derived from Agulhas leakage. Unresolved issues are the
relative amounts at different depths of Indian Ocean water and Drake Passage water that flow
northward in the MOC as opposed to being recycled around the western side of the Atlantic
subtropical gyre and back into the SAC. A study using floats found that around a third of the
6
intermediate water in the Benguela extension flows northward in the MOC along the western
boundary and two-thirds flows southward in the Brazil Current (Boebel et al., 1999b; see also
Schmid et al., 2000). This suggests that around 2/3 of the upper 500 m of water in the Benguela
extension continues northward in the MOC.
Agulhas Current leakage is dominated by extremely energetic eddies. Ship and satellite data have
revealed the presence of numerous large (300-500 km diameter) rings of the Agulhas Current
embedded in the Benguela Current. The rings form as the western part of the Agulhas
retroflection pinches off from the main current (Lutjeharms and Van Ballegooyen, 1988).
Approximately 5-6 rings form per year, and they have been tracked long distances across the
Atlantic using satellite altimetry (Gordon and Haxby, 1990; Byrne et al., 1996; Goni et al., 1997;
Schouten et al., 2000). Many rings have been measured at sea as described by Dumcombe Rae
(1991), Lutjeharms (1996), Arhan et al. (1999), de Ruijter et al. (1999), Garzoli et al. (1999), and
McDonagh et al. (1999). Agulhas rings are among the most energetic eddies in the world (Olson
and Evans, 1986).
In order to directly measure the transport of the Benguela Current and its water mass constituents
including leakage, the BEST program instrumented a section across the Benguela at 30°S from
the Walvis Ridge (3°E) to the coast of Africa. The mean northward transport of the Benguela
was found to be 13 Sv in the upper 1,000 m with 50% chiefly South Atlantic water, 25% Agulhas
water, and 25% a blend of Agulhas and tropical Atlantic waters (Garzoli and Gordon, 1996). The
results suggest that the Benguela Current has a stationary part located between the African Coast
and 8°E and a transient component located between 8°E and the Walvis Ridge at 3°E composed
mostly of Agulhas rings (Garzoli et al., 1997; Goni et al., 1997; Duncombe Rae et al., 1996). The
results of BEST indicated a relatively small Benguela transport and a small Agulhas leakage
transport ~ 4 Sv, which featured prominently in a review of the MOC by Schmitz (1995). Other
reports of Benguela Current transport range from around 15 Sv to 25 Sv (Stramma and Peterson,
1989; Gordon et al., 1992; Sloyan and Rintoul, 2001). Differences of the observed Benguela
transport and leakage are due to real fluctuations of the currents, Agulhas rings which are
sometimes observed and sometimes not, different assumptions about a level of no motion, and
different locations and end points of sections. In order to measure the whole Benguela transport
including leakage, sections must include the whole ring corridor and all of the intermediate water
contribution, which is offset to the west of the mean near surface Benguela Current. Some of this
was missed by the BEST line.
7
During 1997-1999, the KAPEX program seeded acoustic RAFOS floats in the intermediate water
(around 750 m) to measure the circulation in the vicinity of southern Africa including the
Agulhas Current, the SAC component entering the Benguela, and the Benguela Current (Boebel
et al., 1998). Overall objectives were to directly measure with floats the interocean exchange of
water from the Agulhas into the South Atlantic and the advection of AAIW and its various
mixing constituents in the South Atlantic. An important result was the observation of numerous
cyclonic eddies in the Agulhas and in the southeastern Cape Basin (Lutjeharms et al., 2003;
Boebel et al., 2003). Some of them translated southwestward into the South Atlantic and appeared
to trigger the pinching off of Agulhas rings (Lutjeharms et al., 2003). The combined float
trajectories reveal that the Cape Basin off Cape Town is virtually filled with Agulhas rings and
cyclonic eddies, which interact intensely with each other, change shape, bifurcate, and merge
(Fig. 1) (Boebel et al., 2003). These energetic eddies dominate the velocity field in the source
region of the Benguela Current; they stir the various source waters and advect some of the
blended product (trapped in the rings) westward over the Walvis Ridge. The earlier concept of a
sluggish Benguela Current populated by a few isolated rings is no longer tenable except perhaps
downstream, near and west of the Walvis Ridge. Agulhas leakage in the intermediate level (650-
1250 m) was estimated from a map of float velocities to be roughly 9 Sv (Boebel et al., 2003).
The float data were also used to calculate the mean velocity of the Benguela extension
downstream of the Cape Basin and were combined with geostrophic velocity profiles to calculate
the transport of the Benguela extension over the mid-Atlantic Ridge (17-35°S). The transport of
the extension was around 30 Sv (including rings), with 15 Sv in the 0-500 m layer and 15 Sv in
the 500-1000 m layer (Richardson and Garzoli, 2003).
Recently, two global ocean general circulation models were used with Lagrangian tracking of
water parcels in the upper limb of the MOC to provide a new perspective on sources and
pathways. Speich et al. (2001), using ORCA, found that 13.9 Sv of Agulhas leakage is joined by
2.3 Sv of Drake Passage water flowing through the Atlantic to comprise 16.2 Sv in the upper
layer of the MOC (at 20°N). The 13.9 Sv leakage includes 5.3 Sv from the Pacific that passes
through the Indonesian Seas, 4.2 Sv of Drake Passage water that enters into the Indian Ocean, 3.1
Sv from the Pacific south of Australia and 1.3 Sv derived from the North Atlantic. Donners and
Drijfhout (2004), using OCCAM, traced 16.2 Sv of MOC water back from the Atlantic equator
and identified 15.2 Sv as being Agulhas leakage plus 1.0 Sv of Drake Passage water passing
through the Atlantic. Of the total 17 Sv of leakage in the upper 1,000 m, 15 Sv continue
8
northward in the MOC, and 2 Sv are recycled around the gyre. Approximately 2/3 of the leakage
is located in the upper 500 m and 1/3 between 500-1,000 m. These two studies indicate that
almost all of the Agulhas leakage in the upper 1,000 m continues north in the MOC and that this
leakage is joined by relatively small amounts of Drake Passage water entering through the
Atlantic (1-2 Sv). This is in contrast to Gordon et al. (1992) who found 9 Sv of the 15 Sv leakage
to continue northward in the MOC and Sloyan and Rintoul (2001) who found 10 Sv of 14 Sv
leakage to continue northward.
3. Data and Methods
3.1 Drifters
All available drifting buoy data for the relevant region were acquired from the Global Drifting
Buoy Data Assembly Center at the NOAA Atlantic Oceanographic and Meteorological
Laboratory in Miami Florida. The drifters are similar to the WOCE-TOGA Lagrangian drifter
described by Sybrandy and Niiler (1991). Drogues were attached below the surface float and
centered at a depth of 15 m. Overall, 321 surface drifter trajectories were obtained for the region
of interest and consist of 4 values per day of position and velocity (Fig. 2). The data set comprise
238 drifter years of data from the years 1994-2004.
Near surface geostrophic velocity was estimated by removing the wind-correlated part of the
drifter velocity, which contains contributions of Ekman velocity, Stokes drift, and errors such as
drogue slip. NCEP reanalysis winds at a height of 10 m above sea level, which had been
interpolated to drifter positions, were provided by P. Niiler and N. Maximemko (personal
communication). The east and north drifter velocity components were regressed (multiple linear)
against the east and north wind velocity components in two areas of nearly constant mean drifter
velocity, one in the Benguela area (25-30°S, 2-15°W) and the other in the SAC area (35-40°S,
5°W-10°E). The regression coefficients relating current and wind speed were similar in the two
areas, so the data (130,000 observations) were grouped to obtain representative overall
coefficients (after subtracting the mean drifter velocity at zero wind velocity in each area). The
wind-driven part of drifter velocity (and standard error) was estimated as being 0.968% (±
0.029%) of the wind speed at 37.2° (± 1.7°) to the left of the wind direction. Drifter velocities
were corrected using this relationship.
9
3.2 Floats
All available subsurface float data at intermediate water depths (Fig. 3) were acquired from the
WOCE Subsurface Float Data Assembly Center (http://wfdac.whoi.edu). Two different types of
floats were available—acoustic and non-acoustic (see Gould, 2005; Núnez-Riboni et al., 2005).
The first type, RAFOS (Ranging And Fixing Of Sound) floats, were launched as part of KAPEX
(Boebel et al., 1998; Richardson et al., 2003) and were tracked acoustically, which provided
position and velocity at daily intervals (Rossby et al., 1986). A subset of the KAPEX floats
launched in the Agulhas Current were constructed to be isopycnal so they could follow the
vertical as well as horizontal motions of water parcels (Lutjeharms et al., 2003). The rest of the
KAPEX floats launched in the SAC (Boebel et al., 2003) and Benguela Currrent (Richardson and
Garzoli, 2003) were quasi-isobaric and tend to drift at nearly constant depths. In these regions
vertical motions are smaller than in the Agulhas, so it is less important that the floats are
isopycnal. However, it should be cautioned that these floats are only quasi-Lagrangian in the
presence of vertical water motions.
KAPEX deployments were made in the SAC during March-April 1997 and in the Benguela
Current during September 1997. In both areas floats were launched over a wide geographic area
and were centered at a depth near 800 m. Two main float deployments were made in the Agulhas
Current (Lutjeharms et al., 2003). The first was along a line extending off Port Elizabeth near
26°E 35°S on 3 December 1997. The second was along two lines separated by 100 km off
Durban near 31°E 31°S on 13 and 15 June 1998. The Agulhas floats were ballasted for one of
two density surfaces, 26.8 and 27.2, and typically equilibrated at depths of 300-1100 m. Most of
the floats were launched on the inshore part of the Agulhas or near its center; this becomes
important in interpreting the resulting trajectories because most of these floats were caught in
cyclonic eddies. The KAPEX floats were tracked from March 1997 to September 1999 and
provided 104 float years of data Fig. 3).
The second type of floats are non-acoustic ALACE (Autonomous Lagrangian Circulation
Explorer) floats (Davis et al., 1992; Davis, 2005). These are quasi-isobaric and periodically rise to
the surface to be positioned by satellite and then return to their original depth to continue drifting.
Typical submerged drift times are 10 and 25 days. Because of periodic breaks in the subsurface
drift of these floats, a series of subsurface displacements is not a trajectory of a water parcel.
Subsurface displacements and velocities of ALACE floats were interpolated to daily values in
10
order to combine them with the daily RAFOS data. Around 86 float years of ALACE-type float
displacements were acquired for the region of interest, most measured during the years 1996 to
2000.
3.3 Eddy characteristics
Looping drifter and float trjectories were studied to identify discrete eddies and to estimate their
characteristics. The number of loops was estimated visually from the trajectories and used to
estimate the period of rotation (T) by dividing the days tracked by the number of loops. The
characteristic swirl speed (Vs) was estimated as being equal to the root mean square velocity
about the mean velocity (U in the east direction and V in the north direction) averaged over each
looper series. The mean diameter (D) was estimated from the mean looping period (T) and mean
swirl speed (Vs) with the relation D = VsT/π. Maximum swirl speed, maximum diameter, and
minimum period of rotation averaged over a loop were also estimated for each looper trajectory
and velocity time series. Since the period of rotation and swirl speed vary with radius, these
characteristics estimated from a trajectory are representative of the radius sampled rather than for
a whole eddy. This should be kept in mind when comparing characteristics of different eddies.
Rossby number (Ro) was estimated for some eddies by Ro = ζ / f, where ζ = 2ω is the relative
vorticity of an eddy (assuming solid body rotation), ω is the angular velocity of the eddy
measured by a drifter or float, and f is the Coriolis parameter, f = 2Ωsinθ. If a drifter or float was
located outside the (approximately) solid body rotation core region of an eddy, then the calculated
Rossby number could under estimate the solid body rotation rate. The Rossby number of an eddy
can be expressed in terms of its period of rotation (T in days) as Ro = 1 / (Tsinθ), where T was
estimated from the looping drifters and floats.
3.4 Velocity maps
In order to map velocity fields, surface drifter velocities and float velocities in the depth range of
intermediate water, 500-1100 m, were grouped into 1º x 1º geographical bins for the two levels,
and average velocity, variance about the mean velocity, standard error and eddy kinetic energy
were calculated. The average depth of the floats used in mapping was 810 m, and the standard
deviation about the mean was 120 m. Mean velocity was calculated as the sum of all u velocity
components in the x direction in a bin divided by the number of observations, similarly for v
11
velocity in the y direction. Eddy kinetic energy (EKE) was calculated by averaging the u and v
velocity variances about the mean velocities in each bin. The number of degrees of freedom N/τ
was estimated by summing the number of days of daily drifter or float velocity observations
within a bin (N). N was divided by the integral time scale (τ ~ 2 days for drifters, τ ~ 4 days for
floats) of the Lagrangian autocorrelation function, which was estimated using 41 representative
50-day series of drifter velocities and 28 representative 50-day series of RAFOS float velocities
from the Cape Basin region. In practice, N/τ was estimated by summing the number of two-day
intervals for which each drifter was within a bin and the number of four-day intervals for which
each float was within a bin. The number of degrees of freedom was used to eliminate vectors in
bins containing sparse data (N/τ < 6) and to estimate standard errors. Standard error of the mean
velocity was estimated using (2Sτ/N)½, where S is the variance of velocity about the mean
velocity. To create maps, the 1º x 1º velocity and EKE values which were calculated using bins
bounded by even degrees were lightly smoothed and gaps were filled by interpolating values to
even degrees using “triangulate” in the Generic Mapping Tools, GMT (Wessel and Smith, 1998).
4. Direct observations of Agulhas leakage
Drifter and float trajectories were inspected for evidence of direct leakage from the Agulhas
Current into the Benguela Current and also for eastward return flow of Agulhas water south of the
Agulhas. Some of the trajectories were extremely convoluted in the vicinity of the retroflection
and some instruments died before going very far northwest or east. It was not always easy to
subdivide trajectories into northwestward and eastward ones. In practice, it was decided to
consider all drifters and floats that drifted westward across 20°E that had either been launched
upstream in the Agulhas or that had been clearly drifting in the Agulhas for a reasonable distance
before reaching 20°E. This longitude, 20°E, lies near Cape Agulhas and the southern tip of the
Agulhas Bank south of Africa and therefore represents the boundary between the Indian and
Atlantic Oceans. Acceptable trajectories were required to be clearly heading northwestward well
in the Benguela Current or eastward well south of the Agulhas.
Using the above definition there were 36 acceptable drifters and floats in the Agulhas of which 9
entered the Benguela Current and 27 returned eastward south of the Agulhas (Fig. 4). This
suggests that around 25% of the Agulhas leaks into the Atlantic. Four of the 12 acceptable drifters
(33%) entered the Benguela. Two of eleven acceptable isopycnal RAFOS floats launched in the
Agulhas (18%) drifted into the Benguela, one near depths of 200-300 m, the other near 600 m.
Three of the 13 acceptable ALACE-type floats (23%) at intermediated depths (near 800 m)
12
drifted into the Benguela. One additional ALACE float clearly in the Agulhas drifted far west of
the retroflection near 41°S, out to 5°W before turning back eastward again in the northern branch
of the SAC. This float died before it reached the Benguela Current, but several other floats in the
same region entered the Benguela, so this float might have done so too. This raises the possibility
of a different and more indirect westward route for Agulhas water to enter the Benguela. Some
potential biases of the different kinds of measurements are discussed in Appendix A and some
details concerning RAFOS leakage floats in Appendix B.
The directly measured transport of the Agulhas in the upper 1,000 m (near 32°S) from two
sections is 63 Sv and 70 Sv (Beal and Bryden, 1999; Donohue and Firing, 2000). Combining the
mean transport of these (66.5 Sv) with the 25% of floats and drifters that entered the Benguela
from the Agulhas suggests a leakage transport of 15.3 Sv. A better estimate of leakage transport
is obtained by dividing the Agulhas into a near surface layer and a deeper layer and using the
appropriate transport for each layer calculated from the velocity section shown by Beal and
Bryden (1999). If we assume that the leakage of drifters is representative of the wind-forced
Ekman layer in the upper 50 m of the Agulhas (5.3 Sv) and the combined leakage by RAFOS and
ALACE floats (5 out of 24 floats) is representative of the 50-1,000 m layer of the Agulhas (61.2
Sv), then the estimated leakage transport is 14.5 Sv. As a measure of transport uncertainty, it is
estimated that if one more float had entered the Benguela Current (from the Agulhas extension,
for example) then the 14.5 Sv value would have increased by 1.9 Sv. Another estimate is that if
the drifter data were representative of the upper 100 m, instead of 50 m, then the estimated
leakage would increase by around 1.5 Sv. Thus, there is a fairly large uncertainty associated with
these direct measurements of leakage.
The estimates of leakage using drifters and floats agree closely with recent results of a high
resolution numerical modeling study of the region around southern Africa. Doglioli et al. (2006)
used a Lagrangian particle-following technique to estimate that about 43,000 out of 176,000
simulated particles (24%) released near 32°S in the Agulhas made the connection to the Atlantic
Ocean giving a direct measure of leakage transport amounting to 14.5 Sv.
Trajectories of drifters and floats that leaked into the Benguela Current were reviewed in order to
search for trends. Two of the 4 Agulhas leakage drifters looped in anticyclones, which are
interpreted to be Agulhas rings and which were translating generally northwestward. One of
these drifters started looping just after crossing 20°E in what appeared to be a newly formed ring.
13
The drifter stopped looping as the ring encountered the Schmitt-Ott Seamount (minimum depth of
304 m), similar to what happened to a ring observed by Olson and Evans (1986). The two other
drifters drifted rather uneventfully northwestward up the coast. This same trend is seen in another
8 drifter trajectories that crossed 20°E near the Agulhas and entered the Benguela Current; some
were in rings, some others drifted uneventfully northwestward. Both RAFOS floats that leaked
into the Benguela made some anticyclonic loops on their way northwestward in rings. Nothing
obvious was seen in the ALACE trajectories, but their low temporal resolution prevents much
inference about rapidly rotating eddies. In summary, the trajectories in the Benguela suggest that
around half of the drifters and floats were entrained into rings for part of their drift in the
Benguela, but these episodes did not appear to dominate the trajectories.
5. Inflow to Benguela Current from the South Atlantic Current
Most drifters in the vicinity of the SAC south of around 41°S continued eastward south of the
Agulhas. Most drifters in the SAC north of around 41°S drifted northeastward into the Benguela
Current and then started to turn westward between 30-35°S. These partially merged with those
leaking in from the Agulhas, although the leakage drifters tended to drift northwestward closer to
the African coast (between 12-17°E near 30°S) than most of those entering directly from the
SAC. A broad swath of drifters going north crossed 30°S east of 10°W giving the impression of a
wide eastern boundary current. Drifters tended to not go north of 20°S where they drifted due
westward, some entering the Brazil Current and heading southwestward on the western side of
the subtropical gyre. The implication from drifters is that no surface water flows northward to the
equator. In reality, near surface water is subducted and has been traced northward to the equator
below the surface layer. For example, Zhang et al. (2003; see also Snowden and Molinari, 2003)
used drifters and hydrography to trace subducted water through the South Atlantic and into the
northward flowing North Brazil Undercurrent (Schott et al. 2005).
Numerous ALACE trajectories drifted eastward in the SAC between latitudes of 35-50°S (see
Fig. 3). Near 15°W, just east of the mid-Atlantic Ridge, the ALACE trajectories appear to divide
into two branches, one north of around 40°S and the other south of around 43°S, leaving an area
with very few trajectories centered near 41°S (between 5-15°W). This is just west of where the
Agulhas extension was observed with westward drifting floats as described below. Six ALACES
in the SAC (35-45°S) turned northward and entered the Benguela, 4 just west of Cape Town, and
two others near 10°W and 3°E (at 35°S). Two of these were entrained into Agulhas rings for
14
long drifts (6 and 13 months). The 6 ALACES tended to merge in the Benguela with those
entering from the Agulhas. Most of the ALACES in the southern branch of the SAC (south of
43°S) continued eastward south of the Agulhas.
6. Agulhas rings and cyclones
Each drifter and float trajectory was visually examined for loops and cusps, which reveal the
characteristic motion of a particle in an eddy—a swirl velocity around an eddy center plus its
translation. Time series of velocity, temperature and pressure were checked to help estimate
when a float entered and exited an eddy. An eddy was defined as two or more consecutive loops
in the same direction (looper) within a trajectory. This definition attempts to identify discrete
eddies (coherent vortices) with their approximately symmetrical rotational circulation and the
volume of trapped fluid that translates with the eddy, and to discriminate them from other types
of fluctuating ocean motions. Clockwise loopers were in cold core cyclones and counterclockwise
loopers were in warm core anticyclones.
A summary of cyclonic and antiyclonic loopers measured by surface drifters is shown in Fig. 5,
and loopers measured by floats in Fig. 6. A summary of the trajectories of anticyclones and
cyclones drawn manually through drifter and float trajectories is shown in Figs. 7 and 8. Overall,
there were 99 loopers, 47 cyclonic and 52 anticyclonic (Table 1). Sixty-eight eddies were tracked
including 33 cyclones and 35 anticyclones (Table 2). The majority of anticyclones are interpreted
to be Agulhas rings. Many cyclones in the southeastern Cape Basin are interpreted to be Agulhas
cyclones. The longest tracked eddies were two rings observed with floats for 18 months and 19
months, both over distances of 2,000 km. The most loops in an eddy were 32 in a 30°S cyclone
that was tracked with a drifter for 14 months and over a distance of almost 2,000 km. These are
records for the longest time and distance of a looping drifter. The smallest period of rotation in
the Cape Basin was 3 days for some small ~ 20 km loops in an Agulhas cyclone (Ro = 0.5).
Ring circulation is not well resolved with the low temporal resolution ALACE displacements, so
the three ALACE trajectories in rings appear jagged in Fig. 6. However, two RAFOS floats
looped in two of the rings tracked by ALACE floats, confirming they were in rings. Fig. 6
includes two ALACE trajectories, one because it is longer than the corresponding RAFOS
trajectory in the ring, and the other because it was the only one in the ring. No ALACE trajectory
15
looks like it contains cyclonic loops, probably because the somewhat faster rotation rate of
cyclones could not be resolved.
During KAPEX, 6 drifters and 8 RAFOS floats were launched on purpose in three rings that were
surveyed by ship near 30°S at 31.1°S 9.0°E, 31.2°S 3.8°W, and 29.8°S 6.1°W (Garzoli et al.,
1999; Richardson and Garzoli, 2003). Thus, trajectories of 3 rings in Fig. 7 were of these seeded
rings. Five other RAFOS floats were launched in a newly formed ring located near 37°S 16°E
(Schmid et al., 2003). None of these were classified as a looper, although when taken together
the float trajectories indicated that the ring translated northwestward. Aside from these specific
deployments in rings, the eddy trajectories were obtained by drifters or floats entrained into
eddies, plus a few launched in eddies by chance. When several drifters (or floats) were in an
eddy, the longest trajectory is shown in Figs. 5 and 6 except where two (or more) trajectories
overlap to provide a longer eddy trajectory.
6.1 Anticyclones (Agulhas rings)
Drifters and floats give a rather similar picture of anticyclones, which are interpreted to be
Agulhas rings. Virtually all rings translated (generally) northwestward, some passing over the
relatively shallow Walvis Ridge. Some drifters and floats stopped looping near the ridge, and
others changed looping characteristics indicating a disruption of the normal ring circulation by
the ridge. The pattern of ring trajectories observed here matches rings tracked altimetrically by
Byrne et al. (1995), Goni et al. (1997), Schouten et al. (2000) and Boebel et al. (2003).
Two anticyclone trajectories differ from this picture (Fig. 8). One trajectory in the southwest was
outside the ring corridor and went northeastward which suggests it was not a ring. Another
trajectory was located in the Agulhas and went southwestward. This could have been an
anticyclone translating southwestward embedded in the Agulhas, or alternatively could have been
associated with the retroflection, which was advancing southwestward after an Agulhas cyclone
cut southward across the Agulhas near 22°E causing a ring to pinch off from the previous
retroflection (see Lutjeharms et al., 2003).
The mean velocity of the rings using the 5 longest loopers (all > one year long) was 4.4 cm/s
(range = 3.2-5.9 cm/s) toward 287°. A comparison of drifter and float data where they overlap in
the same rings at roughly the same diameter and time suggests that the surface swirl velocity of
16
rings and their rotation rate is around 2-3 times larger than the intermediate depth (~ 800 m) swirl
velocity and rotation rate. Thus rings are clearly surface intensified.
The most energetic rings are located in the southeastern Cape Basin. Average drifter swirl speeds
of 5 rings there generally fall within 40-60 cm/s with a high of 86 cm/s for the ring closest to
Cape Town. Average drifter swirl speeds in rings decrease with distance from the Agulhas
retroflection, from the large values given above down to around 40 cm/sec at a distance of 1,000
km and to around 25 cm/s at 2,500 km. The estimated e-folding distance for the decay of swirl
speed is around 1300 km, well within the Cape Basin. At an average ring velocity of 4.4 cm/s
rings would have traveled 1300 km in around 340 days. This is consistent with the decay of
dynamic height anomalies in rings determined from altimetry (Byrne et al., 1995; Schouten et al.,
2000) and to the decrease of eddy kinetic energy along the ring paths. Typical average ring
diameters are around 200 km and maximum diameters are 250 km for most of the rings with little
or no trend with distance. Note that the overall diameter of rings (outer limits) is larger than the
largest loops (Olson and Evans, 1986; Arhan et al., 1999; Garzoli et al., 1999). The average
period of rotation of rings increases from around 10 days in the southeast (Ro = - 0.16) to 20-40
days in the northwest (Ro = - 0.07).
Only one ring was measured with a float (at 560 m) in the southeastern Cape Basin. Its average
swirl speed was 34 cm/sec, which suggests that the surface swirl velocity of rings there is
intensified by a factor of around 1.6 times. Older rings measured by floats have typical average
swirl speeds around 10 cm/s and typical maximum diameters are 200-250 km.
Virtually all the KAPEX RAFOS floats that crossed over the Walvis Ridge did so associated with
five rings and one cyclone. A possible explanation is that the ridge is less of a barrier to water
swirling in rings than outside of them (Richardson and Garzoli, 2003). Rings have a persistent
northwestward translation over the ridge and their rapid ~ 15 cm/s swirl velocity at 750 m
partially traps water (Flierl, 1981) and advects it over the ridge. Another explanation is that ring
translation, which is faster than the mean background flow, could have advected the floats over
the ridge before they reached it in the slower mean background flow field. However, 5 ALACE
floats crossed over the Walvis Ridge, only one of them in a ring. Although it is possible that
these ALACE floats were influenced by their periodic surfacings, which could have helped
advect the floats westward, the surface displacements are small and do not look as if they had a
significant role in advecting the floats over the ridge. This is consistent with the low surface
17
velocities observed there by drifters. Therefore, in contrast to RAFOS floats, the ALACE floats
suggest that the Walvis Ridge is not a barrier to the background (non-ring) flow.
6.2 Irregular Anticyclones
In addition to the nearly-circular loopers in Agulhas rings west of the Walvis Ridge (Figs. 5 and
6), there are some anticyclonic drifter loops that are much more irregular in shape. For simplicity
these less circular anticyclones will be called blobs. Blobs are inferred to have been shed from
the retroflection and are therefore Agulhas rings, although their shape is not very circular or ring-
like. An inspection of drifter trajectories indicates a wide variety of loop shapes extending from
the almost perfectly circular loops in some rings west of the Walvis Ridge to more highly
irregular loops in blobs, which tend to be located in the southeastern Cape Basin. A few
anticyclonic blobs were located near the western edge of the mean Agulhas retroflection and
could have been newly formed rings. Because of the irregular loops, trajectories in blobs were
not included as loopers, except for a few of the more regular-shaped blobs. Anticyclonic blobs
coincide with the locations of anticyclonic loopers in the southeastern Cape Basin (Fig. 5).
Drifter loops in blobs tend to be larger than loopers in rings, reaching 500 km in overall size.
Blobs tend to have equivalently swift surface velocities ~ 50 cm/sec.
Blobs are interpreted to be large newly formed Agulhas rings located in the southeastern Cape
Basin that are evolving in time and changing shape. The changes could be because blob-like
rings are unstable or because they are located in a highly dynamic region and are interacting
energetically with other rings, Agulhas cyclones and current filaments. In 5 cases drifter
trajectories in blobs became more circular with time and eventually were classified as loopers.
This suggests that blobs typically become more circular with time or alternatively that a smaller
more circular part separates from the original blob (or possibly both). This latter inference is
consistent with the results of Schouten et al. (2000) who found numerous rings to bifurcate in the
Cape Basin. Since blobs can be significantly larger than most rings tracked with loopers, a much
larger leakage per ring can be accomplished by blobs. For example, the formation of one 400 km
blob is approximately equal in volume transport to 2.6 rings 250 km in diameter. This suggests
that some large blob-like rings could bifurcate with each of the two split-off rings being at least
250 km in diameter.
18
Float trajectories are not as informative about blobs as drifter trajectories. This is probably
because float swirl velocities in rings are slower than drifter velocities and floats could not keep
up with the rapidly evolving shape and structure of blobs. Floats do not appear to be easily
trapped in blobs and are not able complete many loops in them. Details of a well-measured blob-
like ring are discussed in Appendix C.
6.3 Ring Leakage transport
Evidence from drifters, floats, altimetry, and shipboard measurements clearly shows that rings are
derived from the Agulhas and are an important contribution to Agulhas leakage. All the KAPEX
rings tracked by drifters and floats were also tracked by altimetry (Schouten et al., 2005; see also
Garzoli et al., 1999; Schmid et al., 2003), which provided some longer ring trajectories including
back in time to ring formation. The two techniques give similar ring trajectories. Drifters and
floats provide the additional important information that rings transport large amounts of
(partially) trapped water.
In order to estimate ring leakage transport, the volume transport of a typical ring based on drifter
and float data was combined with an estimate of ring formation rate based on altimetry. If each
ring has a maximum diameter of trapped water of 250 km, as observed with looping drifters and
floats in the northwestern Cape Basin, then the estimated annual average volume transport
associated with a ring formation is 1.6 Sv1 in the upper 1,000 m. Perhaps a better model of ring
structure is a truncated inverted cone, 250 km in diameter at the surface and 200 km in diameter
at 1,000 m. This shape models the smaller swirl velocity and smaller trapped area at 1,000 m. The
formation of one such ring per year amounts to 1.3 Sv. Using altimetry from 1993-1998, which
overlaps many of our tracked rings, Schouten et al. (2000) found that 5.0 rings/year form from the
retroflection and that some of these split, generating a total of 8.25 rings/year in the northwestern
Cape Basin. Multiplying the individual ring transports given above by 8.25 rings/year gives a
total annual ring volume transport of 10.4 to12.8 Sv. Clearly these values depend on the
formation rate of rings, which varies somewhat from year to year, and depends on their diameters,
which vary from ring to ring. Some of the blob-like rings in the southeast appear to be
significantly larger than 250 km, but some of the rings that bifurcated in the northern Cape Basin
1 A rule of thumb for eddy volume transport is that the formation of one eddy per year, one hundred kilometers in radius, and one kilometer deep is equal to one Sverdrup (Sv).
19
could be smaller than 250 km. Therefore values of transport represent averages over several
years.
The estimated ring leakage transport (10-13 Sv) is interpreted to be a large part (but not all) of the
total leakage, which includes additional transport due to the Agulhas extension ~ 2.6 Sv
(discussed below) and possibly additional surface flow and filaments. The 13-15 Sv sum of the
two components, rings and Agulhas extension, is consistent with the 14-15 Sv estimated from
individual leakage drifters and floats that directly entered the Benguela Current. These two
estimates of leakage transport (13-15 Sv and 14-15 Sv) are interpreted to include overlapping but
slightly different parts of the total leakage. Therefore, to the extent that they do not represent the
same parts of leakage, the real total leakage could be somewhat larger than either one of these
alone. This suggests that leakage transport is at least 15 Sv.
A complication concerning ring transport is that drifters and floats in the southeastern Cape Basin
usually did not remain trapped in the rings and cyclones very long, but instead made multiple
contacts with different rings and cyclones, sometimes only passing around the periphery of an
(inferred) eddy (Boebel et al., 2003; Richardson and Garzoli, 2003). The numerous entrainments
and detrainments of drifters and floats by eddies suggest that water does not remain trapped in
eddies very long in the southeastern Cape Basin, but instead is exchanged with water from other
eddies and from outside of eddies in a vigorous mixing regime called the Cape Cauldron by
Boebel et al. (2003). Indian Ocean water transported into the South Atlantic by Agulhas rings,
cyclones, and filaments appears to be vigorously stirred and mixed by the eddy field with SAC
water and tropical Atlantic water (see McDonagh et al. 1999). In such a turbulent regime Agulhas
rings do not carry leakage water very far into the Atlantic before it becomes somewhat diluted.
Therefore, transport of Indian Ocean leakage transport, estimated above for rings, is not carried
by them unaltered through a background of western South Atlantic water. Instead the background
water is a mixture of water from the Indian Ocean, Brazil Current, tropical Atlantic, and Drake
Passage. Rings plus the turbulent background flow field transport the resulting mixture
northwestward.
6.4 Cyclones.
The pattern of cyclone trajectories is very different from anticyclones. Most cyclones are located
in the southeastern Cape Basin where they translated southwestward. Another smaller collection
20
of cyclones, tracked by surface drifters near 30°S, translated mainly westward. Drifter and float
trajectories in the southeastern cyclones have some similarities. Specifically, many cyclones start
near the Agulhas just west of the Agulhas Bank; these are interpreted to be Agulhas cyclones,
which form on the northern side of the Agulhas south of Africa as either shear edge eddies or
Natal Pulses and contain Indian Ocean water (Lutjeharms et al., 2003). Some cyclones in the
southern Cape Basin might also have formed near the Agulhas retroflection and near rings that
became unstable and separated into pieces. Presumably, these also would contain some Indian
Ocean water. Because the thermocline is raised in the center of cyclones, they carry less warm
and salty water than anticyclones, which have a depressed thermocline in their centers.
RAFOS floats tracked 3 Agulhas cyclones as they translated westward past 20°E. They
translated southwestward along the northern side of the Agulhas, adjacent to the African shelf,
and entered the Cape Basin southwest of Cape Town. Fourteen floats looping in the three
cyclones reached 20°E, 10 of these floats in one cyclone. The general pattern observed by floats
was first rapid ~ 2 day loops (Ro = 0.9) with small diameter ~ 20 km near the shelf. As the floats
drifted westward, the loops usually increased in diameter and in period of rotation. Just west of
the Agulhas bank the cyclonic vorticity seems to collect in an intense cyclone, which has been
called a lee eddy (Lutjeharms et al, 2003; Penven et al. 2001). One lee eddy cyclone bifurcated
into two cyclones, which translated southwestward. Peak swirl speeds in the lee eddy cyclone
reached 50-60 cm/s, and the maximum diameter was around 200 km. The minimum period of
rotation of one cyclone was around 3 days (Ro = 0.5).
These 3 Agulhas cyclones plus several other nearby cyclones tracked by floats translated
southwestward in the Cape Basin at a mean velocity of 4.1 cm/s. However, two of these cyclones
stalled near the Schmitt-Ott Seamount and another stalled west of the Agulhas which decreased
the mean velocity somewhat. Seven drifters looping in cyclones in the same region have a mean
translation velocity of 9.6 cm/s. It is not clear why surface cyclones appeared to translate faster
since the cyclones are vertically coherent (see Boebel et al., 2003 and Lutjeharms et al., 2003);
perhaps the velocity could be biased by the shorter drifter trajectories and larger drifter swirl
velocities in the cyclones. The cyclones appear to decay somewhat from typical mean float swirl
speeds of 30-40 cm/s off Cape Town to 20-25 cm/s for those farthest southwest, a distance of
around 1200 km; similarly, the minimum period of rotation increased from around 3 days off
Cape Town (Ro = 0.5) to 12 days (Ro = 0.1) in the southwest.
21
Surface drifters looping in what are interpreted to be Agulhas cyclones measured average swirl
speeds of 40-60 cm/sec suggesting that the swirl speeds of cyclones and rings in the southeastern
Cape Basin are roughly equivalent. One energetic cyclone near 37°S 13°E had a drifter and two
floats looping in it at the same time and at approximately the same ~ 200 km diameter. The
surface swirl speed of this cyclone was around 2 times the float swirl speeds.
The trajectories of several cyclones stop near the Schmitt-Ott and Richardson Seamounts along
the Agulhas ridge (Fig. 8). Drifters and floats stopped looping as the cyclones collided with these
bathymetric features, indicating that the cyclonic circulation was disrupted. Some of the cyclones
might have continued farther southwestward as weaker remnants after the drifters and floats were
expelled. A few cyclones tracked by floats translated farther southwestward (to 5°E) than those
tracked by drifters. A possible explanation of this is that when the near surface flow in the
cyclones encounters the relatively swift surface currents of the SAC plus Ekman drift the trapped
volume in the cyclones is reduced, which tends to expel the drifters (Flierl, 1981). The expulsion
of drifters would be enhanced as the swirl velocity of cyclones decayed in the southwest.
Not all of the cyclones in the southeastern Cape Basin were formed as Agulhas cyclones. This
can be inferred from the cyclones that started farther north and translated southwestward. These
cyclones tended to be less energetic that those farther south. Four of the northern cyclones
tracked by floats started near Vema Seamount which has a minimum depth of 12 m near 31.7°S
8.3°E and which was identified by Schouten et al. (2000) as being where Agulhas rings tend to
bifurcate. It is possible that cyclones form as part of ring bifurcation. Two of these cyclones
tracked by floats translated northeastward and merged near 30°S, followed by a predominantly
westward translation up to the Walvis Ridge where the last float stopped looping.
Some of the cyclones observed with floats and altimetry seem to have originated near the eastern
boundary, and most of them translated southwestward (Boebel et al., 2003; Morrow et al., 2004).
It seems possible that they form as the flow along the eastern boundary becomes unstable and
generates cyclones. Boebel et al. (2003) suggested that the cyclones could be related to
interaction of Agulhas rings with the shelf, or to local upwelling along the shelf (Shannon and
Nelson, 1996), or to an intermediate eastern boundary current along the shelf (Shannon and
Hunter, 1988). Movies of sea level anomaly (MODAS) indicate energetic fluctuations starting
near the retroflection and propagating up the west coast, with some fluctuations moving offshore
(Boebel et al. 2003), implying that the Agulhas is the source of energy.
22
Eight drifters looping in 6 different cyclones near 30°S translated westward. Four drifters in 2
cyclones roughly 300 km apart, began looping at almost the same time (August 1998) and were
tracked simultaneously for 4 months. One of the two cyclones was tracked for a total of 14
months and almost 2,000 km as it crossed over the Walvis Ridge without any obvious disruption.
All six cyclones were observed during the period May 1996-June 2003. They seem to start in the
east near 13°E and end in the west near 17°W, a distance of 2,900 km. (One cyclone is located
west of those shown in Fig. 5.) Their average westward translation velocity is 3.4 cm/s. The 30°S
cyclones are energetic with average swirl speeds around 25 cm/sec, minimum periods of rotation
of 4 days (Ro = 0.5), and typical maximum diameters around 140 km.
A possible origin of the 30°S surface cyclones is the bifurcation process of rings in the vicinity of
Vema Seamount as was suggested for the cyclones tracked by floats near there. Agulhas rings
have been observed by altimetry to interact with topography and break into smaller eddies
(Schouten et al., 2000). Roughly half of the rings observed to split did so near Vema Seamount. It
is possible that these rings generated attached cyclones as some models predict (see Matano and
Beier, 2003) and that the cyclone and anticyclone (ring) could self-advect westward as a dipole.
Two of the 30°S cyclones had a nearby anticyclone (~ 200 km separation) observed with a
looping drifter for part of their westward translation, one on the north side, the other on the south
side. One of these cyclones translated westward as an accompanying ring (on the northeast side)
translated northwestward. This could be a hint of a more general process since Schouten et al.
(2000) show several nearly westward ring trajectories in this area. However, if the cyclone-
anticyclone dipoles are common, we should have observed more drifter anticyclonic loopers
translating westward near the 30°S cyclone path. Assuming their origin is due to rings, then these
cyclones might play a role in leakage by transporting Agulhas water that had been carried north in
rings westward over the Walvis Ridge.
6.5 Discussion of eddy translation
The Cape Basin is not the only place where anticyclones translate equatorward and cyclones
poleward. Morrow et al. (2004) find this pattern in the southeastern Indian Ocean where eddies
form in the vicinity of the Leeuwin Current and in the northeastern Pacific where at least
anticyclones translate equatorward. An example from the eastern North Atlantic are anticyclonic
Mediterranean water eddies (meddies) that translate equatorward with some nearby cyclones
23
translating poleward (Richardson et al., 2000). In the western Indian Ocean, de Ruijter et al.
(2005) found that anticyclones and cyclones form off the southern tip of Madagascar and tend to
disperse westward as observed in the Cape Basin. They appear to enter the Agulhas and translate
downstream possibly triggering the shedding of Agulhas rings and cyclones. The different
meridional translation direction of the eddies is primarily due to the β effect (Cushman-Roisin,
1994; Morrow et al., 2004). Eddies can also be advected by the background flow field as in the
case of Agulhas rings, and eddies can interact with and be advected by other nearby eddies.
7. Agulhas extension An important new feature discovered here is a westward extension near 41°S from the Agulhas
retroflection. Numerous floats drifted westward for various amounts of time in this current
including six floats for long times (Fig. 9, Table 3). The six long-drifting floats indicate a
westward flow near 41ºS extending from the main retroflection out to at least 5ºW, a distance of
around 2,000 km. Three RAFOS floats shown in Fig. 9 looped clockwise in three Agulhas
cyclones as they translated southwestward as far as 6ºE indicating a connection via discrete
eddies between the Agulhas and its extension west of 6ºE. Part of the band of cyclones in Fig. 9
coincides with mean westward velocity vectors (shown later) suggesting that the cyclones
contribute significantly to the mean velocity of this part of the extension.
ALACE float A507 drifted the whole way from the retroflection out to 5ºW during 3¼ years from
December 1995 to March 1999 (Fig. 9). It followed the mean Agulhas retroflection out to around
16ºE, then continued westward and merged with the band of cyclones near 10ºE. This float
indicates a direct connection between the retroflection and the Agulhas extension (west of the
cyclones). The other five floats in Fig. 9 drifted westward along portions of the overall westward
route at various times during this same period, suggesting the extension is a long-term (> 3 years)
component of the circulation of this region. The average westward velocity of these 6 floats is 4-5
cm/s (Table 3). At this rate water from the Agulhas could reach 5ºW in around a year and a half.
Two other floats (not shown) drifted westward west of the area shown in Fig. 9 during October
1996 to November 1997. Although there is a gap between these two trajectories and those that
end near 7ºW (Fig. 9), the gap appears to be primarily a gap of float data in the Agulhas extension
(see Fig. 3). The extension itself might at times continue another 1500 km westward across the
mid-Atlantic Ridge to around 25ºW.
24
The convoluted float trajectories (Figs. 3 and 9) in the vicinity of the extension suggest that the
westward flowing water is mixed and blended with SAC water flowing eastward. A mean
northward velocity of around 0.7 ± 0.2 cm/s is found in the Agulhas extension region (0-10ºE, 39-
44ºS). This implies that, in the mean, water in the extension passes northward into the northern
branch of the SAC (centered near 38ºS) that feeds into the Benguela Current. The three floats in
the extension west of 5ºE (Fig. 9) drifted northwestward, indicating that the western limb of the
extension feeds into the northern branch of the SAC (although one float eventually turned
southward and drifted eastward south of the retroflection). In addition, several other RAFOS and
ALACE floats tended to drift northward across the mean location of the extension as part of time-
dependent motions there which are around 7 times larger than the mean westward velocity in the
extension (0-10ºE).
Volume transport of the Agulhas extension was estimated from float velocities and cyclone
properties. In the east the contribution from Agulhas cyclones was estimated to be around 2.5 Sv
based on the formation of around 6 cyclones/year observed with altimetry (Boebel et al., 2003),
each one 130 km in diameter as estimated from looping floats (Table 3) and altimetry, and a
thickness of 1,000 m. Not all of this transport goes very far west since several floats in the
cyclones stopped looping near the Schmitt-Ott Seamount and eventually went eastward south of
the Agulhas. However, some cyclone transport went into the background flow field, and there is
some westward transport outside of cyclones as indicated by float A507 (Fig. 9).
Between 5ºW-5ºE floats in the extension (Fig. 9) meander and loop over a latitude extent of a few
degrees. The mean eastward velocities in Fig. 10 indicate the width of the average extension (0-
10ºE) is around two degrees in latitude (~ 220 km) and that the average westward velocity (and
standard error) over this width using all available data is 1.2 ± 0.4 cm/s. The transport estimated
using this velocity, a width of 220 km and a vertical thickness of 1,000 m is 2.6 ± 0.9 Sv. A
transport of ~ 2.6 Sv is a smaller but still significant amount of Indian Ocean leakage relative to
the estimates given above using leakage drifters and floats (14-15 Sv) and by combining yearly
formation rates of rings and their overall (trapped) diameters (10-13 Sv).
Since the average westward velocity could have included some meandering eastward-drifting
floats located in the swifter (~ 5-7 cm/s) SAC located north and south of the extension, the
estimated average velocity of the extension is probably a lower bound. The 4-5 cm/s average
25
westward velocity of the 6 floats listed in Table 3 is significantly larger than the average
westward velocities in Fig. 10. A simple model indicates how the apparent average velocity and
transport could be reduced by meanders. Consider a 4 cm/s westward jet, 2º in latitude wide,
embedded in a 6 cm/s eastward current. The jet’s transport averaged over a vertical thickness of
1,000 m would be 8.8 Sv. If the jet meanders linearly north and south 1º in latitude on either side
of its mean location, then the mean westward velocity in the 2º band coinciding with the mean jet
location would be reduced to 1.5 cm/s, a reduction of 62%. The mean westward transport in this
2º band would be similarly reduced to 3.3 Sv.
The Agulhas extension does not appear in velocity maps generated in a recent study of the
circulation of the South Atlantic that grouped the same float data into 3º latitude bins (Núnez-
Riboni et al., 2005). A minimum in the SAC is observed at the latitude of the extension but not
westward flow. This is because the 3º bins are larger than the 2º width of the extension, and
averages of velocity include relatively swift eastward flows located north and south of the
extension, which overwhelm the slower westward velocities of the extension.
Five hydrographic sections cross the latitude of the Agulhas extension and show westward
velocity near 41ºS: SAVE4 near 13ºW (Gordon et al., 1992), WOCE A14 near 9ºW (Mercier et
al., 2003), WOCE A11 near 5ºW (Saunders and King, 1995), AJAX near 1ºE (Whitworth and
Nowlin, 1987), and WOCE A12 near 10ºE (http://whpo.ucsd.edu). Geostrophic velocity derived
from these hydrographic sections indicates westward flow extending from intermediate water
depths up to the surface near 41ºS and amounting to typically 5 Sv over the upper 1000 m. These
sections represent synoptic measurements of the currents and are spread out in longitude and
time. They tend to confirm the pattern of float velocities and indicate that the mean transport
estimated from floats is conservative. Clearly, a directly measured vertical profile of mean
velocity is required for an improved estimate of total transport.
Surface drifters do not drift very far westward in the vicinity of the extension near 41ºS. The
mean drifter velocity is eastward, a minimum of 5 cm/s at 42ºS centered between maxima of 13
cm/s in the northern SAC and 20 cm/s in the southern SAC (Fig. 11). The minimum drifter
velocity matches perfectly the latitude of the maximum westward current measured by floats. The
lack of a mean westward surface current is probably a result of Ekman current, Stokes drift, and
drogue slip in the direction of the eastward mean wind velocity. When the wind-correlated part of
drifter velocity is removed, a westward velocity of 1.3 ± 1.9 cm/s is found located at 42ºS (Fig.
26
11). Although this velocity is smaller than the standard error, considering the errors involved in
the correction, it seems possible that the geostrophic flow immediately below the wind-forced
layer could be weakly westward like that measured by floats. A possible explanation for the lack
of significant westward geostrophic velocity in the extension (Fig. 11) is that (as was suggested
for the deeper extension) a meandering westward near-surface jet is obscured in the mean by the
inclusion of some swifter eastward velocities from the nearby SAC.
The trajectories of floats in the extension (Fig. 9) coincide with some major seamounts, which
suggests a possible connection. Two floats drifted westward near the Discovery Seamounts,
located near 1ºE 42ºS, which rise up to a depth of 426 m below the sea surface. The same two
floats continued northwestward and passed near the RSA Seamount, located near 6ºW 40ºS, with
a minimum depth of 260 m. Just west of this seamount are Gough Island and McNish Seamount
with a minimum depth of 150 m. It is possible that the seamounts and island partially block the
eastward flow in the SAC or cause it to bifurcate into two jets enabling the Agulhas extension to
flow westward there.
A possible forcing mechanism (Rhines, 1977; Boudra and de Ruijter, 1986; Nakano and Hasumi,
2005) for the extension are the energetic current fluctuations in the vicinity of the Agulhas
retroflection--the southwestward translations of Agulhas cyclones, the periodic advancing and
retreating of the retroflection, and ring formations (Fig. 1). Another possibility, suggested by
Mike Spall (personal communication), is that two meandering eastward jets separated by a gap
(the extension) could generate westward recirculations in the gap between jets. Modeling studies
reported by deRuijter et al. (1999) and Boudra and de Ruijter (1986) suggest that, although a
major part of the Agulhas retroflects, there is a leakage component which first flows westward,
eventually bending northward to connect to the South Atlantic subtropical gyre (as was observed
with floats). This results in the branching of the SAC. The northern branch would be part of the
South Atlantic subtropical gyre, and the southern branch could be the southern edge of the
supergyre, which connects the subtropical gyres of the South Atlantic and South Indian Oceans.
8. Maps of mean velocity 8.1 Surface drifter velocity
27
Surface drifter velocities were used to generate a high-resolution 1º x 1º map of mean drifter
surface velocity (Fig. 12). Clearly apparent is the mean Agulhas Current which flows
southwestward to around 18°W 40°S where it retroflects southward and eastward. The maximum
mean speed in the Agulhas south of Africa is around 100 cm/sec. Some westward (red) velocity
vectors peel off from the Agulhas near Cape Town and enter the Benguela Current, which is
defined to be the northwestward flow along the west coast of Africa. This Agulhas leakage is
joined by flow from the northern part of the broad eastward flowing SAC (34-39ºS). The
Benguela Current consists of a band of relatively swift velocities, reaching 20-25 cm/s, which
extends around 700 km off the southwestern coast of Africa (near 32°S). The band continues
northward to around 20°S where velocities are westward at around 15-20 cm/s in the Benguela
extension. A world-wide map of streamlines based on drifter velocities (Maximenko and Niiler,
2005) shows how the surface currents in our area of interest fit into the over all pattern of surface
circulation.
Between 25-34°S west of 0°W the mean surface velocity is low and generally westward. Several
Agulhas rings and a few cyclones translated through this region (Fig. 7), so some of the structure
seen in the westward velocities is caused by rings and cyclones. This is especially noticeable in
the geostrophic velocity profile between 23-31°S (Fig. 11). The boundary between the weak
westward velocities of the Benguela region and the eastward velocities in the SAC lies near 30°S
in the west and 35°S in the east; thus the boundary slopes southward toward the east. The
eastward flow of near surface water between 30-35°S in the west lies over westward flow of
intermediate water at 800 m. The band of eastward drifter velocities in the SAC south of around
40°S appears to continue eastward south of the Agulhas.
The drifter velocity map shows that virtually all the mean near surface Benguela Current was
observed during the BEST experiment, which instrumented a line along 30°S, between the
Walvis Ridge (3°E) and the African coast. The observed transport of the Benguela Current during
BEST was well measured to be 13 Sv in the upper 1000 m (Garzoli et al, 1996). This value is
slightly less than half the transport of the Benguela extension estimated during KAPEX ~ 30 Sv
(Richardson and Garzoli, 2003). The difference is due to rings and intermediate water which pass
northwestward around the offshore end of the BEST line (3°E 30°S) as shown in the float
velocity map. This missed flow led to the low leakage transport ~ 4 Sv based on BEST
measurements.
28
A map of geostrophic velocity was generated but is not shown. This is because the pattern of
geostrophic velocities is very similar to that of the drifter velocities (Fig. 12), with the exception
that geostrophic velocities are much smaller than those in Fig. 12 in the vicinity of the SAC,
Benguela Current, and Benguela extension (see Fig. 11). The large scale mean winds are in the
same general direction as the geostrophic flow—eastward over the SAC, northwestward over the
Benguela Current, and westward over the Benguela extension in the mid-Atlantic (near 20°N).
The local winds in these regions drives a near surface current with a significant component (~ 5-7
cm/s) in the direction of the geostrophic velocity. A major exception to this is the Agulhas and its
extension where the mean wind velocity is counter to surface currents. The pattern of geostrophic
velocities agrees, in general, with the surface flow field indicated by the mean dynamic
topography derived using drifters, altimetry and winds (Niiler et al., 2003; Maximenko and
Niiler, 2005).
8.2 Float velocity
29
All available subsurface float velocities in the vicinity of the intermediate water near a depth of
800 m (500 m to 1100 m) were used to generate a high-resolution 1º x 1º map of mean velocity
vectors (Fig. 13). The Agulhas Current flows southwestward along the coast of Africa reaching
18ºE 40ºS where most of the water retroflects southward and returns eastward as the Agulhas
Return Current. Fastest mean velocities are around 35 cm/s south of Africa. In this region the 12
fastest daily float speeds surpassed 100 cm/s with two reaching 130 cm/s. Part of the mean
retroflection extends farther west to around 14ºE, possibly as rings pinched off from the main
current. A band of (fairly noisy) red arrows near 39-42ºS extends from the mean retroflection
westward to around 5ºW indicating the Agulhas extension that was more visible in Figs. 9 and 10.
Some mean flow from the Agulhas enters the Benguela Current as Agulhas rings although the
velocity vectors are noisy near the retroflection due to intense Agulhas cyclones and rings. A
band of fairly noisy red arrows extends from the Agulhas near 39ºS 18ºE northwestward into the
Benguela. A few blue arrows near the southwestern point of Africa near Cape Town indicate an
apparent flow into the Agulhas. These vectors match the northeastern side of several Agulhas
cyclones tracked with floats near there. When averaged, float velocities in the southeastward
swirl velocity region of the cyclones give the false impression of mean inflow to the Agulhas
there. Farther southwest, the components of swirl velocity normal to the cyclone translation
direction tend to cancel as the cyclones pass through the region.
Because of the large velocity variance in the vicinity of the retroflection, velocity vectors tend to
have a large uncertainty, which makes them problematic for estimating leakage. Grouping data
into larger bins tends to reduce the uncertainty somewhat but does not resolve narrow current
features (see Núnez-Riboni et al., 2005). Boebel et al. (2003) mapped the KAPEX float velocities
at a 3° x 3° grid and estimated a leakage transport of order 9 Sv for the intermediate water layer
(600 m thick) and a minor inflow from the Atlantic. An upward extrapolation of this transport per
unit depth gives a value of 15 Sv for the upper 1,000 m, which agrees with leakage transport
estimated using other methods as described above.
The SAC flows eastward south of about 35ºS in two branches, a northern one centered near 38ºS
(between 5ºW-5ºE) and a southern one centered near 44ºS (Fig. 13). The northern branch feeds
into the Benguela Current east of around 0ºW merging with Agulhas leakage. The two branches
of the SAC are also seen in the maps of surface drifter velocity (Fig. 12) and coincide with
30
maxima of sea surface temperature gradients as measured by satellite (Burls and Reason, 2006).
Specifically, the northern branch of the SAC coincides with the subtropical frontal region, which
contains the northern (~35°S) and southern (~ 38°S) subtropical fronts, and the southern branch
of the SAC coincides with the sub-Antarctic front (Burls and Reason, 2006). The Agulhas
extension lies in the region of very low surface temperature gradients between these frontal
regions.
Two bands of relatively swift northwestward velocities ~ 5-7 cm/s are embedded in the broad
Benguela Current and cross over the Walvis Ridge. These bands appear to be generated by
Agulhas rings, whose translation velocity is somewhat faster than mean background velocities.
In addition, the northwestward swirl velocity located on the northeastern side of the rings adds to
the ring translation velocity and tends to cause faster mean velocities, especially where several
rings translate near each other (Fig. 7). The main Benguela Current at 800 m lies around 600 km
offshore of the African coast and is separated from the coast by mainly weak southeastward
velocities along the boundary as measured by three floats at latitudes of 21-36°S. Therefore,
much of the high velocity region of the surface Benguela, measured with drifters, is located over
a band of slow southeastward 800 m velocity. This band is considered to be part of the southward
flow of tropical Atlantic water as mentioned by Richardson and Garzoli (2003; see Gordon et al.,
1995). In addition, maximum velocities in the surface Benguela extension are near 20°S located
over generally eastward velocity at 800 m. At 20°W the maximum flow at 800 m in the Benguela
extension is between 23-34°S well south of the near-surface Benguela extension (Fig. 12).
Therefore, Agulhas leakage of intermediate water at 800 m passes underneath the near surface
Benguela Current.
8.3 Surface drifter eddy kinetic energy
A map of drifter EKE reveals highest values, colored red, in the vicinity of the Agulhas and
retroflection (Fig. 14). Ten bins had values greater than 3,000 cm2/s2 there; the maximum was
3,650 cm2/s2 near 39°S 19°E. The EKE of the Agulhas retroflection area is considerably higher
than elsewhere in the Atlantic as measured with drifters. For example, the highest value in the
Gulf Stream is 2,790 cm2/s2 (1° x 1° bin) with only two values above 2,500 cm2/s2 (Fratantoni,
2001). The Loop Current in the Gulf of Mexico has a peak value near 2,000 cm2/s2, and the
highest value in the tropical Atlantic is near 1,300 cm2/s2 (Fratantoni, 2001). World maps of EKE
based on drifter data (N. Maximenko and P. Niiler, personal communication) and altimetry
31
(Ducet et al., 2001) show that the retroflection region has the highest values of any western
boundary current. These distributions of EKE agree in general with that shown in Fig. 14.
Highest EKE values in the retroflection (red) are surrounded by relatively high values colored
yellow (500-1000 cm2/s2) including a swath extending northwest from the Agulhas through the
southern Cape Basin (Fig. 14). This swath coincides with numerous drifters looping in eddies
there (Fig. 5). The high values of EKE and low mean velocity there are indications of large eddy
induced stirring. West of the yellow swath is a green area of EKE ~ 250 cm2/s2 extending from
25-45°S coinciding with many ring trajectories and indicating the effect of ring swirl velocities at
very long distances from the formation region. North of 25°S, where the Benguela extension
flows westward near 20°S, are very low values (blue) around 100 cm2/s2. The distribution of EKE
is similar to one shown by Boebel et al. (2003) who used satellite altimetry to calculate
geostrophic velocities for the same region.
8.4 Float eddy kinetic energy
The large scale pattern of EKE in the float map (Fig. 15) is similar to the drifter map, although
the values of float EKE are much lower than the drifter EKE values. This is partly due to reduced
energy of currents and eddies measured by floats in the intermediate water and partly due to
including ALACE-type floats, which do not fully resolve mesoscale motions and cut off higher
frequency components. Another map (not shown) was generated using just high-resolution
RAFOS float data, but it covers a much smaller area because they are concentrated near the
retroflection and Cape Basin. Where they overlap, the map is similar to Fig. 15 but has somewhat
higher values as mentioned below.
Maximum EKE from floats in the Agulhas retroflection region (Fig. 15) is around 500 cm2/s2 and
from just RAFOS floats around 800 cm2/sec2. This is approximately 25% of the maximum EKE
from drifters (~ 3000 cm2/s2) and is in agreement with vertical profiles of EKE based on moored
current meter measurements in the retroflection region (Schmitz, 1996). Yellow regions of
relatively high values ~ 100-200 cm2/s2 extend both southwestward toward 45°S 5°E, where some
yellow bins match two cyclones, and northwestward through the southern Cape Basin to 33°S
6°E where some yellow bins match another two cyclones. Two green bands ~ 50 cm2/s2 continue
northwestward coinciding with locations of some rings tracked there (Fig. 7) and also coinciding
with some fast average mean velocities shown in Fig. 13. These two green bands fade to blue ~
32
25 cm2/s2 near the Walvis Ridge, the northwestern boundary of the Cape Basin. (The Walvis
Ridge cuts diagonally across the figures, from upper right to lower left, see Figs. 5-8.) In these
regions the RAFOS EKE values are around 10 to 30% larger than those in Fig. 15. A third region
of green values is located near 45°S 0-10°W coinciding with fast speeds in the SAC. In the north
and west are low EKE values ~ 5-10 cm2/s2 colored blue.
Boebel et al. (2003) also mapped EKE of the KAPEX region using RAFOS float data and found
some similar values although his 2° x 2° bin averages did not resolve very well the maximum in
the retroflection region. Davis (2005) used ALACE float velocities near 900 m depth to map eddy
diffusivity (~ 3° bins) in the Indian and Pacific oceans including the southeastern corner of the
Atlantic. He found the largest diffusivity to be in the Agulhas retroflection region.
In summary, the patterns of EKE from drifters and floats are similar although the RAFOS float
values are reduced by around a factor of 4 or so near the Agulhas retroflection. One difference
between the maps is that floats tracked some Agulhas cyclones farther southwestward (to 5°E)
than did drifters, causing some local peaks of EKE there. The major swath of high EKE values
extending northwestward through the Cape Basin in both maps appears to be caused by energetic
Agulhas rings and cyclones observed by looping drifters and floats. Some rings continued long
distances northwestward causing bands of high values of float EKE (green) there. EKE decreases
considerably near the Walvis Ridge. Agulhas leakage passes through the energetic Cape Basin
where high EKE and energetic eddies make the leakage difficult to measure and the mean
velocity difficult to map at high resolution with the present limited data.
9. Summary and conclusions
The Agulhas Current sheds large anticyclonic rings and somewhat smaller cyclones, which drift
westward into the South Atlantic contributing a major part of the total Indian Ocean leakage.
Anticyclonic rings translate northwestward directly into the Benguela Current. Because of the
energetic region in which they form, rings are often not very ring-like in the southeastern Cape
Basin, and drifters and floats often do not remain trapped in these rings for very long. Most
cyclones translate southwestward counter to the South Atlantic Current (SAC), so they do not
translate as far as rings. The Cape Basin is an eddy crossroads with cyclones and anticyclones
translating through it in different directions. This region is unique in that it is the only place on
earth where cyclones and anticyclones shed from a major western boundary current enter the
33
eastern part of an ocean basin and translate long distances westward. The Agulhas retroflection
region is also unique in having the largest eddy kinetic energy and largest eddy diffusivity of all
the western boundary currents.
Individual surface drifter and subsurface float trajectories were studied for evidence of Agulhas
leakage. Four drifters and 5 floats that had been clearly drifting in the Agulhas Current drifted
northwestward in the Benguela Current indicating a leakage of around 14-15 Sv. Because of the
relatively small numbers of these leakage drifters and floats and possible problems of the
measurements this transport could have a substantial error associated with it.
Looping trajectories (loopers) were used to identify cyclonic and anticyclonic eddies. Virtually
all anticyclones were interpreted to be Agulhas rings. They follow a northwestward path from the
retroflection region at a mean velocity around 4.4 cm/s based on 5 rings, each tracked for over a
year. Rings were found to be most energetic in the southeastern Cape Basin near the retroflection
with maximum near surface swirl speeds of 60-135 cm/s. Surface swirl speed in rings decreased
within the Cape Basin with an estimated e-folding distance of around 1300 km. A comparison of
drifter and float swirl speeds at the same approximate diameter and time in three rings indicates
that surface swirl speeds are around 2-3 times faster than the speeds at 800 m. Typical overall
diameter of rings was 250 km. The transport of a typical ring was combined with the annual
formation rate of 8.25 rings/year as observed with altimetry (Schouten et al., 2000) to estimate a
ring leakage transport of 10-13 Sv.
Several anticyclonic blob-like eddies were observed in drifter trajectories in the southeastern
Cape Basin coinciding with rings. These anticyclonic blobs are interpreted to be Agulhas rings,
but they are much less circular than most rings west of the Walvis Ridge. Because of the
irregular and changing shape of the drifter “loops” they were not classified as loopers. These
blob-like rings tended to be somewhat larger than the more-circular rings, reaching an overall size
around 500 km. Drifter loops in five blob-like rings became more circular in time and eventually
were classified as loopers.
Most cyclones were located in the southeastern Cape Basin. Many of them are interpreted to be
Agulhas cyclones, which form along the cyclonic shear region where the Agulhas flows along the
southern boundary of Africa. Just west of the Agulhas Bank some energetic cyclones were
observed with maximum surface swirl speeds of 50-60 cm/s in a cyclonic lee eddy, indicating
34
they are as energetic as rings. The maximum overall diameters of the cyclones were around 200
km, and their surface swirl speeds were around 2 times faster than that at the intermediate water
level. The minimum period of rotation (~ 20 km diameter) in the Cape Basin was around 3 days
(Ro = 0.5). Agulhas cyclones translated southwestward through the southern Cape Basin at
speeds of 5 to 10 cm/s, some reaching 5°E, a distance of 1,200 km.
Another group of cyclones was observed by 8 looping drifters near 30°S. They translated
westward along 30°S from 13°E to17°W, a distance of 2,900 km, although no cyclone made the
whole trip. These cyclones are quite energetic with maximum surface swirl speeds of 40 cm/s
and overall diameters of 140 km. It is conjectured that they form from rings that bifurcate in the
northern Cape Basin near Vema Seamount and translate westward as cyclone-anticyclone dipoles.
Several floats drifted westward near 41°S at around 4-5 cm/s in a newly discovered westward
flowing current, the Agulhas extension, that was traced from the Agulhas retroflection out to
around 5°W and perhaps as far as 25ºW. Agulhas cyclones are inferred to contribute water to the
extension. Water in the extension is blended with western Atlantic water, turns northeastward into
the northern branch of the SAC, and enters the Benguela Current. Transport of the Agulhas
extension was estimated to be at least 2.6 Sv in the upper 1,000 m. This amount should be added
to ring transport to estimate the total leakage of 13-15 Sv.
A map of mean velocity generated using surface drifter data indicates that the SAC water and
Agulhas leakage water merge off Cape Town and flow northward as an eastern boundary current
along the coast of Africa, turning westward near 20°S. A map of mean velocity derived from float
data shows that the intermediate-depth (~ 800 m) Benguela Current diverges westward from the
near surface Benguela and passes over the mid-Atlantic Ridge between 22-35°S, well south of the
maximum westward surface velocity near 20°S. Therefore intermediate-level Agulhas leakage
passes underneath the near surface Benguela Current.
The total Agulhas leakage is at least 15 Sv based on float and drifter data. This is approximately
equal to the 15 Sv of leakage found by Gordon et al. (1992) and the 15-16 Sv leakage found in
two recent global ocean modeling studies (Speich et al., 2001; Donners and Drijfhout, 2004).
These modeling studies also found that virtually all the upper layer MOC is comprised of leakage
water. The implication is that most of the observed leakage enters the MOC joined by 1-2 Sv of
Drake Passage water passing through the Atlantic. Part of the leakage is probably temporarily
35
recycled in the subtropical gyre before continuing northward. It is possible that some leakage
recirculates southward in the gyre and is exchanged with Drake Passage water in the SAC
(Gordon et al., 1992). According to the simulations of Donners and Drijfhout (2004) this would
be a small amount (~ 2 Sv above 1,000 m), but Gordon et al. (1992) suggest it could amount to 6
Sv of the 15 Sv leakage.
Most of the Agulhas leakage is interpreted to pass northwestward in the South Equatorial Current
and along the coast of Brazil in the swiftly flowing North Brazil Undercurrent and then North
Brazil Current. At 11°S and 5°S the undercurrent has maximum speeds of 70-90 cm/s centered at
depths of 200-300 m, it extends from the near surface to around 1,000 m in depth and offshore
around 100 km, and it has a transport of 26 Sv (Schott et al., 2005). This transport is partially
balanced by southward Ekman transport and offshore recirculations, leaving around 15 Sv to
continue northward in the MOC, most of which is located in the upper 500 m.
Acknowledgements
Contribution number 11388 from the Woods Hole Oceanographic Institution. Funds for this
research were provided by National Science Foundation grants OCE-0236654 to the Woods Hole
Oceanographic Institution and OCE-0236527 to the Woods Hole Research Center. Chris
Wooding calculated statistical quantities and generated the figures. Amy Bower, Will de Ruijter,
Andrea Doglioli, Chris Duncombe Rae and two anonymous reviewers provided constructive
suggestions on an earlier version of the paper.
Appendix A. Drifter and float measurement problems related to leakage
Each of the float measurement techniques has certain problems, which should be considered
when interpreting results. Surface drifters were drogued at 15 m in the wind-forced Ekman layer.
The prevailing eastward mean wind velocity in the vicinity of the retroflection generates a
northward velocity component in the Ekman layer which would tend to advect drifters and
surface water northward out of the Agulhas and into the southern Cape Basin. Although the
surface drifter trajectories are probably representative of the leakage in the Ekman layer, they
could overestimate the leakage occurring below the Ekman layer. ALACE floats, which
periodically rise to the surface, would also be influenced by northward flow in the Ekman layer
while they drifted at the surface, although much less so than surface drifters because of the short
36
times at the surface. Series of ALACE surface and subsurface displacements in the form of
trajectories were used to infer leakage of intermediate water despite these trajectories being
biased by periodic surface drifts. Therefore, estimates of leakage using ALACE float trajectories
might also somewhat overestimate true leakage of intermediate water. Finally, RAFOS floats
were launched predominantly in the northern half of the Agulhas, which seems to have caused a
large number of them to be entrained into a few cyclones located there. This somewhat limited
the number of independent realizations of the flow field. In addition, the resulting float
trajectories appear to be strongly influenced by the behavior of the cyclones, which tended to
translate southwestward and not northwestward into the Benguela. This is discussed further in
Appendix B.
Appendix B. RAFOS float details concerning leakage
A detailed inspection of the RAFOS trajectories gives some clues about processes occurring near
the retroflection. Of the first deployment of RAFOS floats in the Agulhas (December 3, 1997), 12
floats crossed 20°E in the Agulhas. Ten of these were entrained into and looped in an Agulhas
cyclone on the northern side of the Agulhas. One of the two floats that did not loop was a
leakage float. Only 6 floats of the second deployment in the Agulhas (June 13 and 15) reached
20°E in the Agulhas. Four were in two cyclones, one was in an anticyclone, and one, the second
leakage float, did not loop. Therefore two of the 3 floats that did not loop near 20°W were
leakage floats that entered the Benguela. Both of these appear to leave the Agulhas by drifting
northward around the western side of cyclones that were translating westward as measured by
looping floats. Both of these cyclones appear to have caused the pinching off of a ring to their
north (Lutjeharms et al., 2003). One of two leakage floats looped in one of these rings off Cape
Town just after leaving the Agulhas (Fig. 6). The other skirted around the periphery of a ring and
continued north. The implication is that an Agulhas float is more likely to leave the Agulhas and
enter the Benguela (becoming a leakage float) if the float was not looping in an Agulhas cyclone
near 20°E, and that cyclones strongly influence the behavior of floats by advecting them across
the mean boundary of the Agulhas. Two of the three Agulhas cyclones tracked by Agulhas floats
near 20°E appear to have encountered the Schmitt-Ott Seamount and been deflected southward
toward the retroflection. The third cyclone skirted northward around the seamount. Several floats
stopped looping during the cyclones’ encounters with this seamount and eventually went
eastward south of the Agulhas.
37
Appendix C: Detailed example of a blob-like Agulhas ring
An example of a well-measured blob-like ring was described by Schmid et al., (2003), Garzoli et
al., (1999), and Richardson and Garzoli, (2003). This ring was observed by ship near 38°S 15°E
in March 1997 and several RAFOS floats were launched in it (Schmid et al., 2003). None of these
floats was classified as a looper although the collection of float trajectories and altimetry were
used to follow the ring northwestward to June 1997. Starting in June and continuing through
August 1997 a surface drifter made some irregular anticyclonic loops in the ring, including a
large one ~ 450 km. The trajectory was so irregular that without altimetry we would not have
known the drifter was in a ring. Superimposed on the ~ 450 km irregular loop were small ~ 30 km
anticyclonic loops with fast rotation T ~ 6 days (Ro = - 0.3) indicating a smaller anticyclone was
being advected by the larger scale (irregular) ring circulation. The rapid small scale looping
seemed to become the core of the ring, which became more circular in September 1997.
In September as the drifter’s loops became more circular the trajectory was classified as a looper.
Also in September the ring was remeasured by ship, and 3 floats and 3 additional drifters were
launched in it (Garzoli et al., 1999; Richardson and Garzoli, 2003). Some floats and drifters
made numerous circular loops and are shown in Figs. 5 and 6. One float continued to loop for 18
months and only stopped because its mission ended. The main point is that this well-documented
ring started out as an anticyclonic blob without identifiable loopers. At an age of 10 months it
had evolved into a nearly circular ring which was subsequently tracked with looping floats and
drifters for a long time (18 months).
References
Arhan, A., Mercier, H., Lutjeharms, J.R.E., 1999. The disparate evolution of three Agulhas rings
in the South Atlantic Ocean. Journal of Geophysical Research 104 (C9), 20,987-21,005.
Beal, L.M., Bryden, H.L., 1999. The velocity and vorticity structure of the Agulhas Current at 32
S. Journal of Geophysical Research 104, 5151-5176.
38
Boebel, O., Davis, R.E., Ollitrault, M., Peterson, R.G., Richardson, P.L., Schmid, C., Zenk, W.,
1999b. The intermediate depth circulation of the western South Atlantic. Geophysical Research
Letters 26 (21), 3329-3332.
Boebel, O., Duncombe Rae, C., Garzoli, S., Lutjeharms, J., Richardson, P., Rossby, T., Schmid,
C., Zenk, W., 1998. Float experiment studies interocean exchanges at the tip of Africa. Eos,
Transactions American Geophysical Union 79, 1,7-8.
Boebel, O., Lutjeharms, J.R.E., Schmid, C., Zenk, W., Rossby, T., Barron, C., 2003. The Cape
Cauldron: a regime of turbulent inter-ocean exchange. Deep-Sea Research II, 50(1), 57-86.
Boebel, O., Schmid, C., Podesta, G., Zenk, W., 1999a. Intermediate Water in the Brazil-Malvinas
Confluence Zone: a Lagrangian View. Journal of Geophysical Research 104(C9), 21,063-21,082.
Boudra, D.B., de Ruijter, W.P.M., 1986. The wind-driven circulation of the South Atlantic-Indian
Ocean-II. Experiments using a multi-layer numerical model. Deep-Sea Research 33, 447-482.
Burls, N.J., Reason, C.J.C., 2006. Sea surface temperature fronts in the midlatitude South Atlantic
revealed by using microwave satellite data. Journal of Geophysical Research 111, C08001,
doi:10.1029/2005JC003133, 2006.
Byrne, D.A., Gordon, A.L., Haxby, W.F., 1995. Agulhas eddies: a synoptic view using Geosat
ERM data. Journal of Physical Oceanography, 25, 902-917.
Cushman-Roisin, B., Chassignet, E.P., Tang, B., 1990. Westward motion of mesoscale eddies.
Journal of Physical Oceanography 20, 97-113.
Davis, R., Webb, D.C., Regier, L.A., Dufour, J., 1992. The Autonomous Lagrangian Circulation
Explorer. Journal of Atmospheric and Oceanic Technology 9, 264-285.
Davis, R.E., 2005. Intermediate depth circulation of the Indian and South Pacific Oceans
measured by autonomous floats. Journal of Physical Oceanography 35(5), 683-707.
39
de Ruijter, W.P.M., Biastoch, A., Drijfhout, S.S., Lutjeharms, J.R.E., Matano, R.P., Pichevin, T.,
van Leeuwen, P.J., Weijer, W., 1999. Indian-Atlantic interocean exchange: Dynamics,
estimation and impact. Journal of Geophysical Research 104 (C9), 20,885-20,910.
De Ruijter, W.P.M., Ridderinkhof, H., Schouten, M.W., 2005. Variability of the southwest Indian
Ocean. Philosophical Transactions of the Royal Society A 363, 63-76,
doi:10.1098/rsta.2004.1478.
Dogioli, A.M.,Veneziani, M., Blanke, B., Speich, S., Griffa, A., 2006. A Lagrangian analysis of
the Indian-Atlantic interocean exchange in a regional model. Geophysical Research Letters 33,
L14611, doi:10.1029/2006GL026498.
Donners, J., Drijfhout, S., 2004. The Lagrangian view of South Atlantic interocean exchange in a
global ocean model compared with inverse model results. Journal of Physical Oceanography 34,
1019-1035.
Donohue, K.A., Firing, E., 2000. Comparison of three velocity sections of the Agulhas Current
and Agulhas Undercurrent. Journal of Geophysical Research 105, 28,585-28,593.
Ducet, N., Le Traon, P.Y., Reverdin, G., 2000. Global high-resolution mapping of ocean
circulation from TOPEX/Poseidon and ERS-1 and -2. Journal of Geophysical Research 105,
19,477-19,498.
Duncombe Rae, C.M., 1991. Agulhas retroflection rings in the South Atlantic Ocean: An
overview. South African Journal of Marine Science 11, 327-344.
Duncombe Rae, C.M., Garzoli, S.L., Gordon, A.L., 1996. The eddy field of the southeast Atlantic
Ocean: A statistical census from the Benguela Sources and Transports Project. Journal of
Geophysical Research 101(C5), 11,949-11,964.
Flierl, G.R., 1981. Particle motions in large-amplitude wave fields. Geophysical and
Astrophysical Fluid Dynamics 18, 39-74.
40
Garzoli, S.L., Goñi, G.J., Mariano, A.J., Olson, D.B., 1997. Monitoring the upper southeastern
Atlantic transports using altimeter data. Journal of Marine Research 55, 453-481.
Garzoli, S.L., Gordon, A.L., 1996. Origins and variability of the Benguela Current. Journal of
Geophysical Research 101, 897-906.
Garzoli, S.L., Richardson, P.L., Duncombe Rae, C.M., Fratantoni, D.M., Goñi, G.J., Roubicek,
A.J., 1999. Three Agulhas Rings observed during the Benguela Current Experiment. Journal of
Geophysical Research 104 (C9), 20,971-20,986.
Goñi, G.J., Garzoli, S.L., Roubicek, A.J., Olson, D.B., Brown, O.B., 1997. Agulhas ring
dynamics from TOPEX/POSEIDON satellite altimeter data. Journal of Marine Research 55, 861-
883.
Gordon, A.L., 1985. Indian-Atlantic transfer of thermocline water at the Agulhas retroflection.
Science 227, 1030-1033.
Gordon, A.L., 2001. Interocean exchange. In: Siedler, G., Church, J., Gould, J. (Eds.), Ocean
Circulation and Climate. Academic Press. London, pp. 303-314.
Gordon, A.L., 2003. The brawniest retroflection. Nature 421, 904-905.
Gordon, A.L., Bosley, K.T., Aikman, III, F., 1995. Tropical Atlantic water within the Benguela
Upwelling System at 27°S. Deep-Sea Research I 42(1), 1-12.
Gordon, A.L., Haxby, W.F., 1990. Agulhas eddies invade the South Atlantic--evidence from
GEOSAT altimeter and shipboard conductivity-temperature-depth survey. Journal Geophysical
Research 95 (C3), 3117-3125.
Gordon, A.L., Weiss, R.F., Smethie, W.M.Jr., Warner, M.J., 1992. Thermocline and intermediate
water communication between the South Atlantic and Indian Oceans. Journal of Geophysical
Research 97 (C5), 7223-7240.
41
Lutjeharms, J.R.E., 1996. The exchange of water between the South Indian and the South
Atlantic. In: Wefer, G., Berger, W.H., Siedler, G., Webb, D. (Eds.), The South Atlantic: Present
and Past Circulation. Springer. Berlin, pp. 125-162.
Lutjeharms, J.R.E., Boebel, O., Rossby, H.T., 2003. Agulhas cyclones. Deep-Sea Research II,
50(1), 13-34.
Matano, R.P., Beier, E.J., 2003. A kinematic analysis of the Indian/Atlantic interocean exchange.
Deep-Sea Research II, 50(1), 229-249.
Maximenko, N.A., Niiler, P.P., 2005. Hybrid decade-mean global sea level with mesoscale
resolution. In: Saxena, N. (Ed.), Recent Advances in Marine Science and Technology. PACON
International, Honolulu, pp. 55-59.
McCartney, M.S., 1977. Subantarctic mode water. In: Angel, M.V. (Ed.), A Voyage of
Discovery: George Deacon 70th Anniversary Volume, Supplement to Deep-Sea Research.
Pergamon Press, Oxford, pp. 103-119.
McDonagh, E.L., Heywood, K.J., Meredith, M.P., 1999. On the structure, paths, and fluxes
associated with Agulhas rings. Journal of Geophysical Research 104(C9), 21,007-21,020.
Mercier, H., Arhan, M., Lutjeharms, J.R.E., 2003. Upper-layer circulation in the eastern
Equatorial and South Atlantic Ocean in January-March 1995. Deep-Sea Research I 50, 863-887.
Morrow, R., Birol, F., 2004. Divergent pathways of cyclonic and anti-cyclonic ocean eddies.
Geophysical Research Letters 31, L24311, doi:10.1029/2004GL0209974.
Nakano, H, Hasumi, H., 2005. A Series of Zonal Jets Embedded in the Broad Zonal Flows in the
Pacific Obtained in Eddy-Permitting Ocean General Circulation Models. Journal of Physical
Oceanography 35(4), 474-488. doi: 10.1175/JPO2698.1
Niiler, P.P., Maximenko, N.A., McWilliams, J.C., 2003. Dynamically balanced absolute sea level
of the global ocean derived from near-surface velocity observations. Geophysical Research
Letters 30(22), 2164, doi:10.1029/2003GL018628.
42
Núnez-Riboni, I., Boebel, O., Ollitrault, M., You, Y., Richardson, P.L., Davis, R, 2005.
Lagrangian circulation of Antarctic Intermediate Water in the subtropical South Atlantic. Deep-
Sea Research II 52(3-4), 545-564.
Olson, D.B., Evans, R.H., 1986. Rings of the Agulhas Current. Deep-Sea Research 33, 27-42.
Peeters, F.J.C., Acheson, R., Brummer, G.A., de Ruijter, W.P.M., Schneider, R.R., Ganssen,
G.M., Ufkes, E., Kroon, D., 2004. Vigorous exchange between the Indian and Atlantic oceans at
the end of the past five glacial periods. Nature 430, 661- 665.
Penven, P., Lutjeharms, J.R.E., Marchesiello, P., Roy, C., Weeks, S.J., 2001. Generation of
cyclonic eddies by the Agulhas Current in the lee of the Agulhas Bank. Geographical Research
Letters 27, 1055-1058.
Peterson, R.G., Stramma, L., 1991. Upper-level circulation in the South Atlantic Ocean. Progress
in Oceanography 26, 1-73.
Reid, J.L., 1989. On the total geostrophic circulation of the South Atlantic Ocean: Flow patterns,
tracers, and transports. Progress in Oceanography 23, 149-244.
Rhines, P.B., 1977. The dynamics of unsteady currents. In: Goldberg, E.D., McCave, I.N.,
O’Brien, J.J., Steel, J.H., (Eds.), The Sea, vol 6. John Wiley. N. Y., pp. 189-318.
Richardson, P.L., Bower, A.S., Zenk, W., 2000. A census of Meddies tracked by floats. Progress
in Oceanography 45, 209-250.
Richardson, P.L., Garzoli, S.L., 2003. Characteristics of intermediate water flow in the Benguela
Current as measured with RAFOS floats. Deep-Sea Research II 50(1), 87-118.
Richardson, P.L., Lutjeharms, J.R.E., Boebel, O., 2003. Introduction to the “Inter-ocean exchange
around southern Africa”. Deep-Sea Research II 50(1), 1-12.
43
Rintoul, S.R., 1991. South Atlantic interbasin exchange. Journal of Geophysical Research 96,
2675-2692.
Rossby, H.T., Dorson, D., Fontaine, J., 1986. The RAFOS system. Journal of Atmospheric and
Oceanic Technology 3, 672-679.
Saunders, P.M., King, B.A., 1995. Oceanic fluxes on the WOCE A11 section. Journal of
Physical Oceanography 25, 1942-1958.
Schmid, C., Boebel, O., Zenk, W., Lutjeharms, J.R.E., Garzoli, S.L., Richardson, P.L., Barron C.,
2003. Early evolution of an Agulhas Ring. Deep-Sea Research II, 50(1), 141-166.
Schmid, C., Siedler, G., Zenk, W., 2000. Dynamics of intermediate water circulation in the
subtropical South Atlantic. Journal of Physical Oceanography 30(12), 3191-3211.
Schmitz, Jr., W.J., 1995. On the interbasin-scale thermohaline circulation. Reviews of
Geophysics 33(2), 151-173.
Schmitz, Jr., W.J., 1996. On the eddy field in the Agulhas Retroflection, with some global
considerations. Journal of Geophysical Research 101, 16,259-16,271.
Schott, F.A., Dengler, M., Zantopp, R., Stramma, L., Fischer, J., Brandt, P., 2005. The Shallow
and Deep Western Boundary Circulation on the South Atlantic at 5-11°S. Journal of Physical
Oceanography 35(11), 2031-2053.
Schouten, M.W., de Ruijter, W.P.M., van Leeuwen, P.J., Lutjeharms, J.R.E., 2000. Translation,
decay, and splitting of Agulhas rings in the southeastern Atlantic Ocean. Journal of Geophysical
Research 105 (C9), 21,913-21,925.
Shannon, L., Hunter, D., 1988. Notes on Antarctic Intermediate Water around southern Africa.
Aouth African Journal of Marine Science 6, 107-117.
44
Shannon, G., Nelson, G., 1996. The Benguela: large scale features and processes and system
variability. In: Wefer, G., Berger, W.H., Siedler, G., Webb, D.J., (Eds.), The South Atlantic:
Present and Past Circulation. Springer, Berlin Heidelberg, pp. 163-210.
Sloyan, B.M., Rintoul, S.R., 2001. Circulation, renewal, and modification of Antarctic Mode and
Intermediate Water. Journal of Physical Oceanography 31, 1005-1030.
Snowden, D.P., Molinari, R.L., 2003. Subtropical cells in the Atlantic Ocean: An observational
summary. In: Goni, G., Malanotte-Rizzoli, P., (Eds.), Interhemispheric Water Exchange in the
Atlantic Ocean. Elsevier Oceanographic Series, Elsevier, pp. 287-312.
Speich, S., Blanke, B., Madec, G., 2001. Warm and cold water routes of an O.G.C.M.
thermohaline conveyor belt. Geophysical Research Letters 28(2), 311-314.
Stramma, L., Peterson, R.G. 1989. Geostrophic transport in the Benguela Current region. Journal
of Physical Oceanography 19, 1440-1448.
Stramma, L., England, M., 1999. On the water masses and mean circulation of the South Atlantic
Ocean. Journal of Geophysical Research 104, 20,863-20,884.
Sybrandy, A.L., Niiler, P.P., 1991. WOCE/TOGA Lagrangian Drifter construction manual, SIO
Ref. 91/6, WOCE Rep. 63. Scripps Institution of Oceanography, La Jolla, CA (58 pp).
Tsuchiya, M., Talley, L.D., McCartney, M.S., 1994. Watermass distributions in the western
Atlantic; a section from South Georgia Island (54°S) northward across the equator. Journal of
Marine Research 52, 55-81.
Whitworth, III, T., Nowlin, W.D., 1987. Water Masses and Currents of the Southern Ocean at the
Greenwich Meridian. Journal of Geophysical Research 92(C6), 6462-6476.
Wessel,P., Smith, W.H.F., 1998. New, improved version of the Generic Mapping Tool Released.
EOS Transactions of the American Geophysical Union 79, 579.
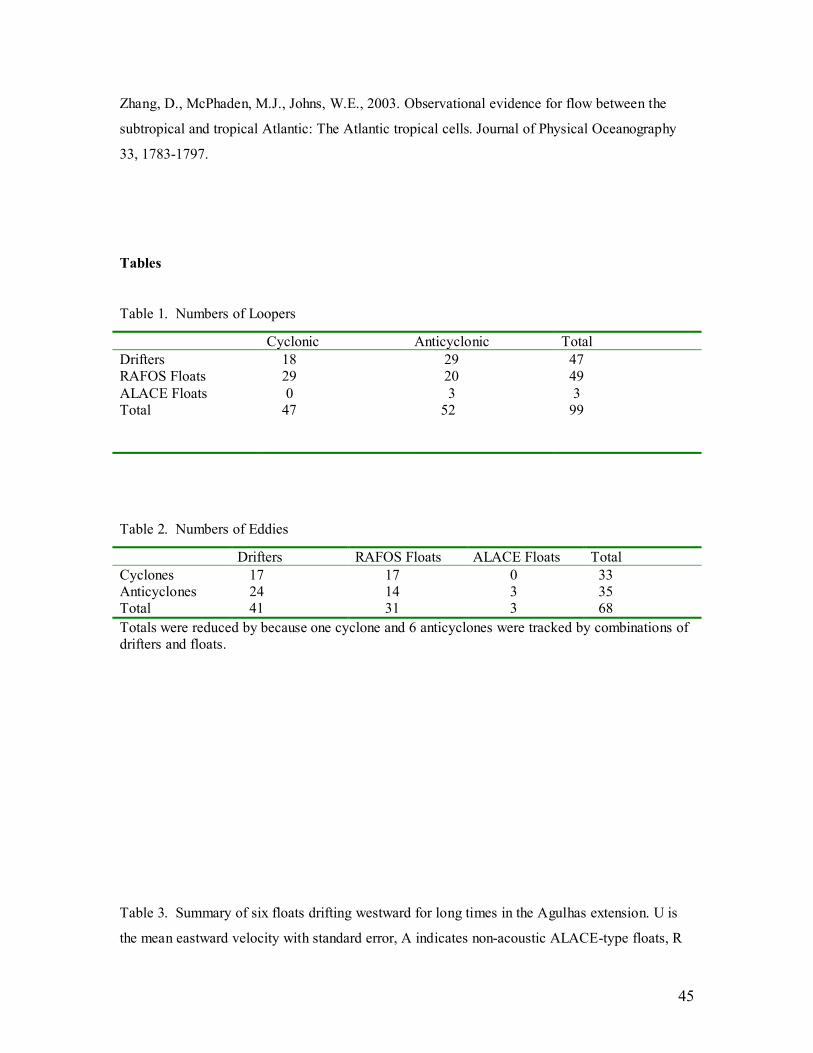
45
Zhang, D., McPhaden, M.J., Johns, W.E., 2003. Observational evidence for flow between the
subtropical and tropical Atlantic: The Atlantic tropical cells. Journal of Physical Oceanography
33, 1783-1797.
Tables
Table 1. Numbers of Loopers
Cyclonic Anticyclonic Total Drifters 18 29 47 RAFOS Floats 29 20 49 ALACE Floats 0 3 3 Total 47 52 99
Table 2. Numbers of Eddies
Drifters RAFOS Floats ALACE Floats Total Cyclones 17 17 0 33 Anticyclones 24 14 3 35 Total 41 31 3 68 Totals were reduced by because one cyclone and 6 anticyclones were tracked by combinations of drifters and floats.
Table 3. Summary of six floats drifting westward for long times in the Agulhas extension. U is
the mean eastward velocity with standard error, A indicates non-acoustic ALACE-type floats, R
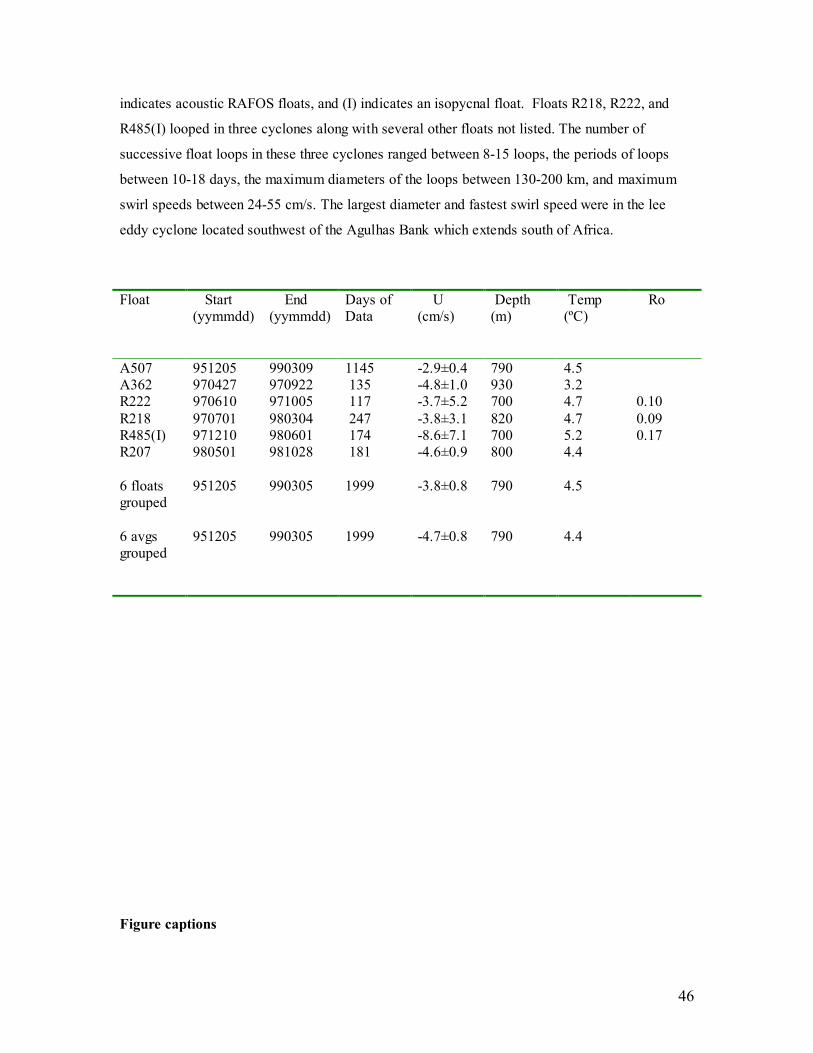
46
indicates acoustic RAFOS floats, and (I) indicates an isopycnal float. Floats R218, R222, and
R485(I) looped in three cyclones along with several other floats not listed. The number of
successive float loops in these three cyclones ranged between 8-15 loops, the periods of loops
between 10-18 days, the maximum diameters of the loops between 130-200 km, and maximum
swirl speeds between 24-55 cm/s. The largest diameter and fastest swirl speed were in the lee
eddy cyclone located southwest of the Agulhas Bank which extends south of Africa.
Float Start
(yymmdd) End (yymmdd)
Days of Data
U (cm/s)
Depth (m)
Temp (ºC)
Ro
A507 951205 990309 1145 -2.9±0.4 790 4.5 A362 970427 970922 135 -4.8±1.0 930 3.2 R222 970610 971005 117 -3.7±5.2 700 4.7 0.10 R218 970701 980304 247 -3.8±3.1 820 4.7 0.09 R485(I) 971210 980601 174 -8.6±7.1 700 5.2 0.17 R207 980501 981028 181 -4.6±0.9 800 4.4 6 floats grouped
951205 990305 1999 -3.8±0.8 790 4.5
6 avgs grouped
951205 990305 1999 -4.7±0.8 790 4.4
Figure captions
47
Figure 1. Schematic map of the circulation of intermediate water based on float trajectories and
other data. The Cape Basin is populated by numerous Agulhas rings (rotating counter clockwise)
which pinch off from the Agulhas retroflection and numerous cyclonic eddies (rotating
clockwise) many of which form along the northern boundary of the Agulhas south of Africa. The
rings tend to translate northwestward and cyclones southwestward. Several floats drifted
westward near 41ºS indicating an extension of the Agulhas, which splits the South Atlantic
Current into a northern and southern branch. This schematic view of discrete eddies is a
simplification of the Cape Basin which is very complicated. This figure is an update of one
shown by Richardson et al. (2003).
Figure 2. Summary of 321 surface drifter trajectories measured during 1994-2004 in the vicinity
of southern Africa. Velocities (one per day) were color-coded to indicate speed. High speeds >
50 cm/s are located in the vicinity of the Agulhas retroflection south if Africa. An inspection of 6-
hourly drifter velocities in the vicinity of the Agulhas found 15 which exceeded 200 cm/s, the
fastest reaching 233 cm/s. The Agulhas retroflection is the most energetic region on the planet
(Ducet et al. 2001).
Figure 3. Summary of float trajectories at intermediate water depths centered near a depth of 800
m and within the depth range 500-1100 m. Red trajectories indicate isopycnal RAFOS floats
launched in the Agulhas Current (Lutjeharms et al., 2003), green indicate quasi-isobaric RAFOS
floats launched in the vicinity of the eastern South Atlantic Current (Boebel et al., 2003), blue
indicate quasi-isobaric RAFOS floats launched in the vicinity of the Benguela Current and its
extension (Richardson and Garzoli, 2003), and black vectors are subsurface displacements of
ALACE floats (Davis, 2005). Red floats account for 11 float years, blue ones for 46 float years,
green ones for 47 float years, and black ones for 86 float years. Most of the float trajectories were
measured during the years 1996 to 2000, the RAFOS trajectories during March 1997 to
September 1999. Arrowheads are spaced at 15 days along RAFOS trajectories and at the ends of
subsurface ALACE displacements. Shaded regions indicate depths shallower than 1000 m
(darkest shading), 2000 m, 3000 m, and 4000 m (lightest shading).
Figure 4. Displacement vectors of 4 surface drifters (red), 2 RAFOS floats (blue) and 3 ALACE-
type floats (green) that drifted westward across 20ºE in the Agulhas Current and northwestward
in the Benguela Current. Displacements vectors go from 20ºE to the northwestern most point of
48
each trajectory or to where they crossed 10°W or 20°N. Displacements are shown because they
are much less complicated than trajectories and clearly indicate general drift. They provide direct
evidence of the leakage of the near surface and intermediate Agulhas water into the Atlantic.
Figure 5. Trajectories of surface drifters looping in discrete eddies. Blue trajectories indicate
clockwise rotating cyclones and red trajectories indicate counter clockwise rotating anticyclones.
Red trajectories are interpreted to have been in (mainly) warm core Agulhas rings, and the most
southern group of blue trajectories in (mainly) Agulhas cyclones. Some additional, shorter,
trajectories in the same eddies were omitted to reduce clutter as were a few short nearly-
stationary loopers. A few trajectories extended west of the left edge of the figure (10°W).
Figure 6. Trajectories of subsurface floats looping in discrete eddies. Blue indicates cyclones
and red anticyclones (as in Fig. 5). Two series of subsurface displacement vectors of ALACE-
type floats that looped (jagged loops) in two Agulhas rings are shown despite the poor resolution
of the eddy loops. Looping RAFOS floats in two of the three rings measured with ALACE floats
confirm they were in rings. A few trajectories extended west of the left edge of the figure
(10°W).
Figure 7. Trajectories of anticyclones drawn manually through looping drifter and float
trajectories. These are interpreted to be Agulhas rings except, possibly, a blue one translating
northeastward near 0ºW 44ºS which looks anomalous compared to the usual northwestward paths
and a blue one translating southwestward embedded in the Agulhas Current.
Figure 8. Trajectories of cyclones drawn manually through looping drifter and float trajectories.
Many in the southeastern group of trajectories are interpreted to be Agulhas cyclones, which form
along the northern edge of the Agulhas. The general trend is clearly southwestward translation
except for several cyclones located near 30ºS, tracked mainly by drifters, which translate nearly
westward, including one cyclone measured by a float.
Figure 9. Trajectories of four RAFOS floats (solid lines) and subsurface displacements of two
ALACE-type floats (arrows), which drifted westward near 41ºS and illustrate the Agulhas
extension (see Table 3). Westward drifting portions of longer trajectories were selected to
emphasize the extension. Only ALACE float A507 drifted all the way from the main Agulhas
Current to 7ºW. This is roughly 2,000 km past the mean location of the Agulhas retroflection.
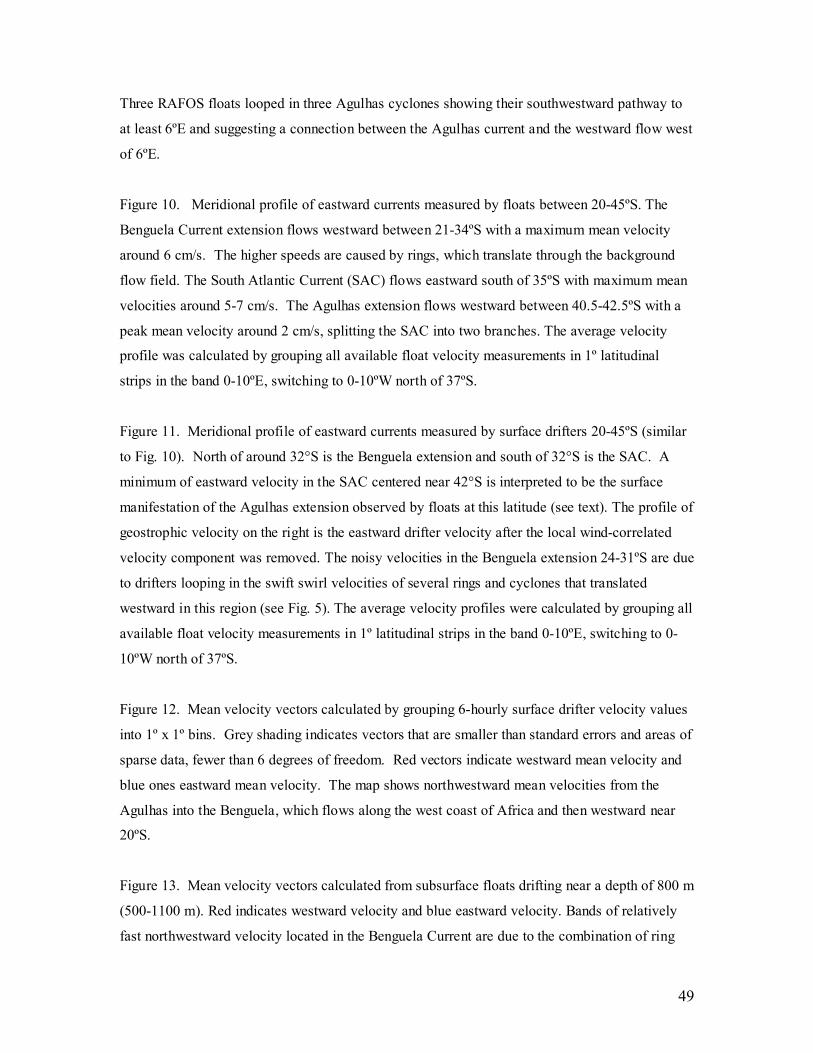
49
Three RAFOS floats looped in three Agulhas cyclones showing their southwestward pathway to
at least 6ºE and suggesting a connection between the Agulhas current and the westward flow west
of 6ºE.
Figure 10. Meridional profile of eastward currents measured by floats between 20-45ºS. The
Benguela Current extension flows westward between 21-34ºS with a maximum mean velocity
around 6 cm/s. The higher speeds are caused by rings, which translate through the background
flow field. The South Atlantic Current (SAC) flows eastward south of 35ºS with maximum mean
velocities around 5-7 cm/s. The Agulhas extension flows westward between 40.5-42.5ºS with a
peak mean velocity around 2 cm/s, splitting the SAC into two branches. The average velocity
profile was calculated by grouping all available float velocity measurements in 1º latitudinal
strips in the band 0-10ºE, switching to 0-10ºW north of 37ºS.
Figure 11. Meridional profile of eastward currents measured by surface drifters 20-45ºS (similar
to Fig. 10). North of around 32°S is the Benguela extension and south of 32°S is the SAC. A
minimum of eastward velocity in the SAC centered near 42°S is interpreted to be the surface
manifestation of the Agulhas extension observed by floats at this latitude (see text). The profile of
geostrophic velocity on the right is the eastward drifter velocity after the local wind-correlated
velocity component was removed. The noisy velocities in the Benguela extension 24-31ºS are due
to drifters looping in the swift swirl velocities of several rings and cyclones that translated
westward in this region (see Fig. 5). The average velocity profiles were calculated by grouping all
available float velocity measurements in 1º latitudinal strips in the band 0-10ºE, switching to 0-
10ºW north of 37ºS.
Figure 12. Mean velocity vectors calculated by grouping 6-hourly surface drifter velocity values
into 1º x 1º bins. Grey shading indicates vectors that are smaller than standard errors and areas of
sparse data, fewer than 6 degrees of freedom. Red vectors indicate westward mean velocity and
blue ones eastward mean velocity. The map shows northwestward mean velocities from the
Agulhas into the Benguela, which flows along the west coast of Africa and then westward near
20ºS.
Figure 13. Mean velocity vectors calculated from subsurface floats drifting near a depth of 800 m
(500-1100 m). Red indicates westward velocity and blue eastward velocity. Bands of relatively
fast northwestward velocity located in the Benguela Current are due to the combination of ring
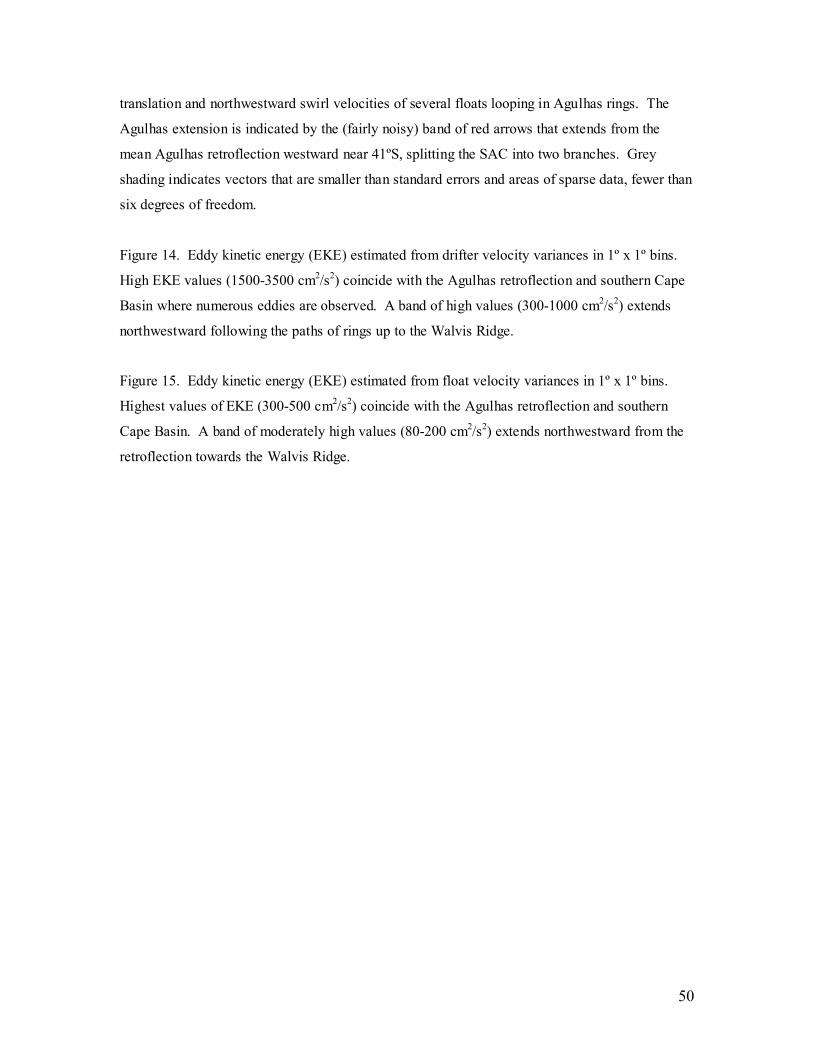
50
translation and northwestward swirl velocities of several floats looping in Agulhas rings. The
Agulhas extension is indicated by the (fairly noisy) band of red arrows that extends from the
mean Agulhas retroflection westward near 41ºS, splitting the SAC into two branches. Grey
shading indicates vectors that are smaller than standard errors and areas of sparse data, fewer than
six degrees of freedom.
Figure 14. Eddy kinetic energy (EKE) estimated from drifter velocity variances in 1º x 1º bins.
High EKE values (1500-3500 cm2/s2) coincide with the Agulhas retroflection and southern Cape
Basin where numerous eddies are observed. A band of high values (300-1000 cm2/s2) extends
northwestward following the paths of rings up to the Walvis Ridge.
Figure 15. Eddy kinetic energy (EKE) estimated from float velocity variances in 1º x 1º bins.
Highest values of EKE (300-500 cm2/s2) coincide with the Agulhas retroflection and southern
Cape Basin. A band of moderately high values (80-200 cm2/s2) extends northwestward from the
retroflection towards the Walvis Ridge.
Figure 1bClick here to download high resolution image
Figure 2Click here to download high resolution image
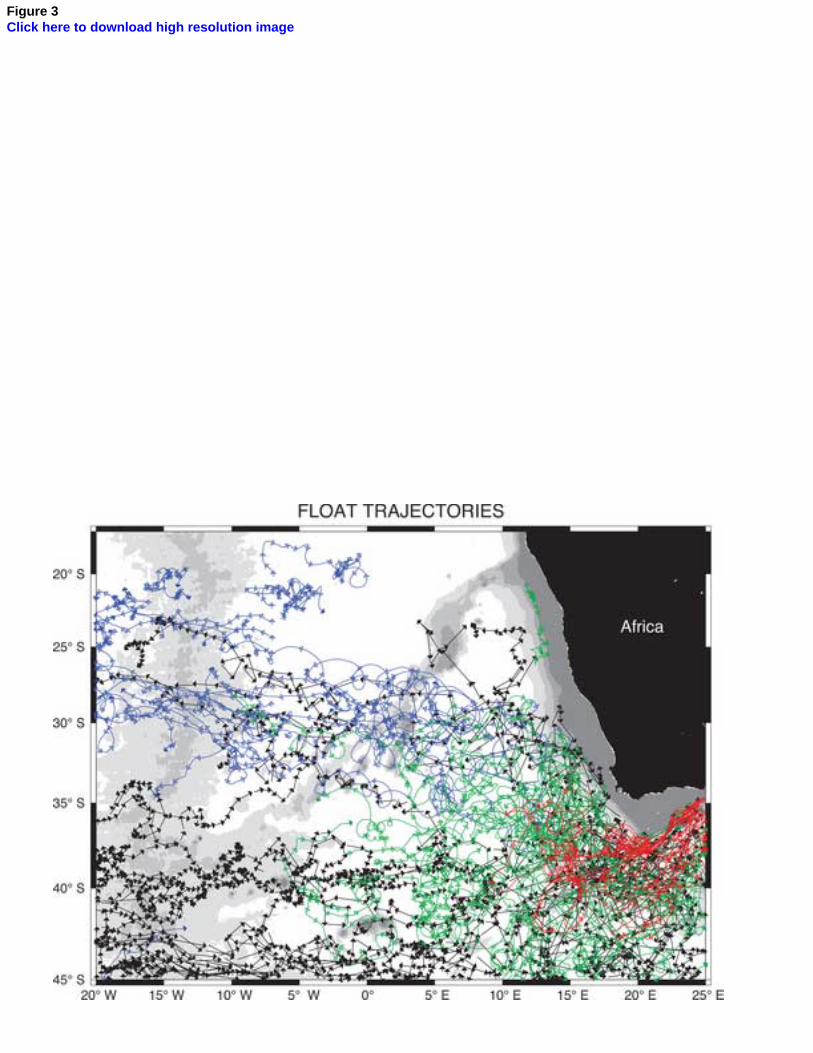
Figure 3Click here to download high resolution image
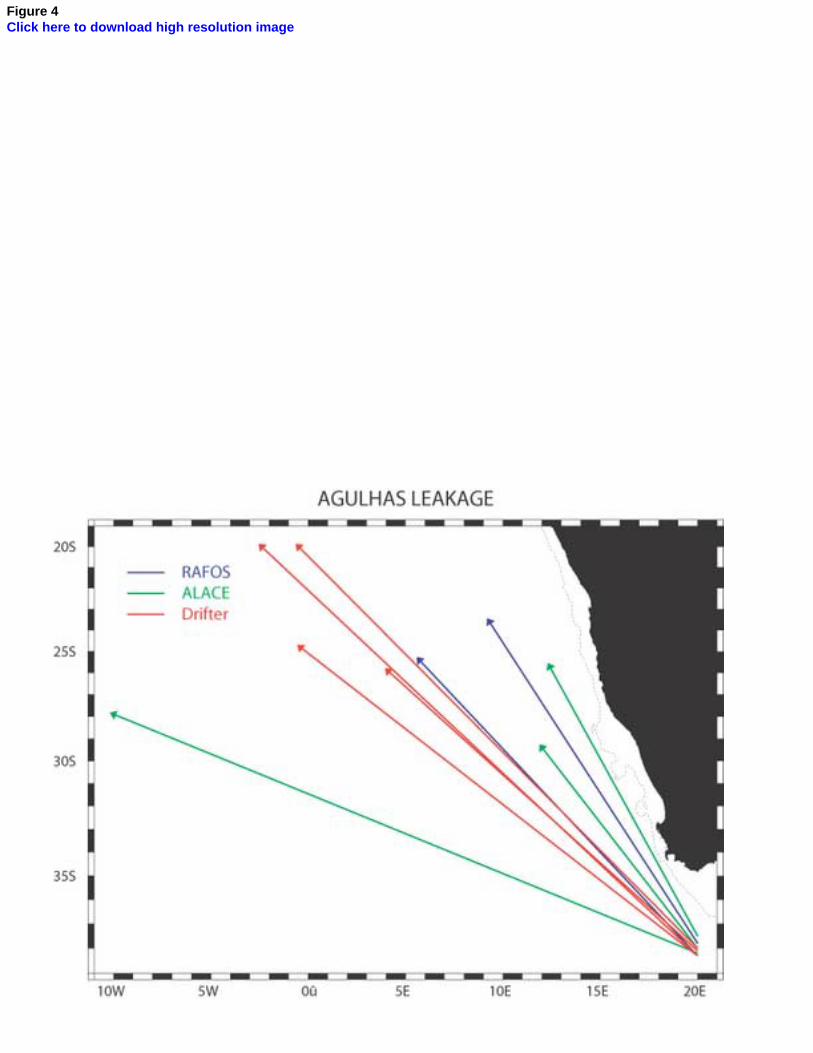
Figure 4Click here to download high resolution image
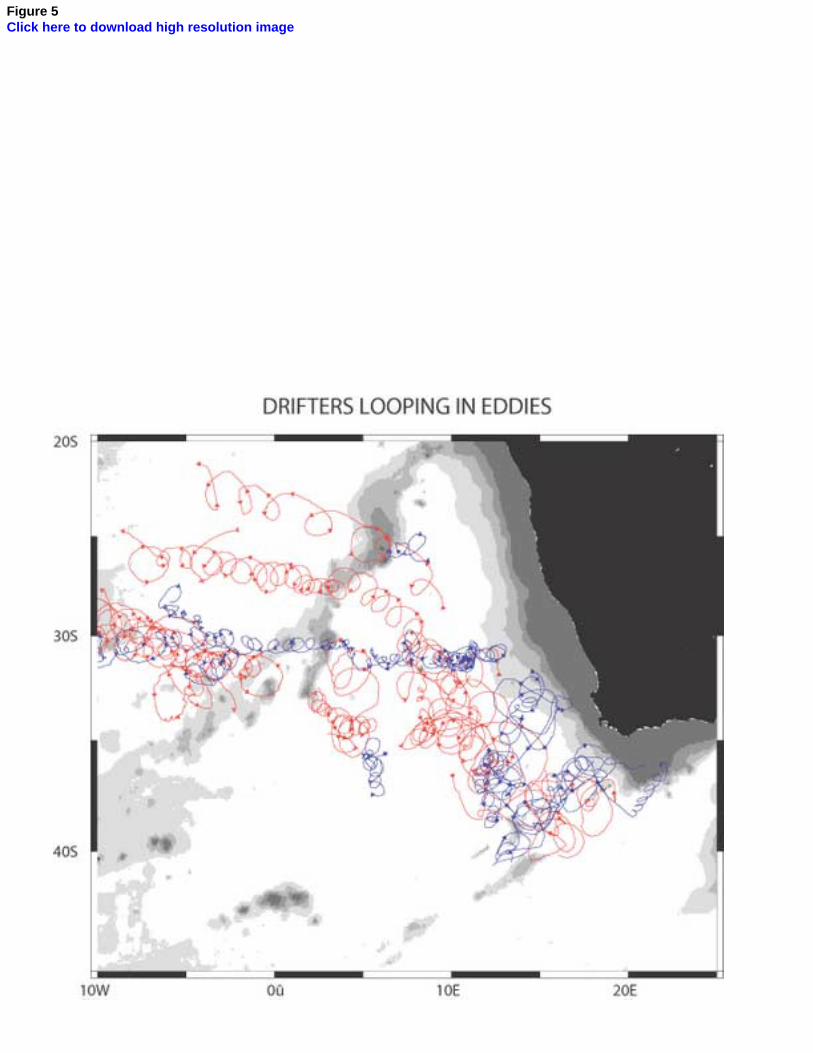
Figure 5Click here to download high resolution image
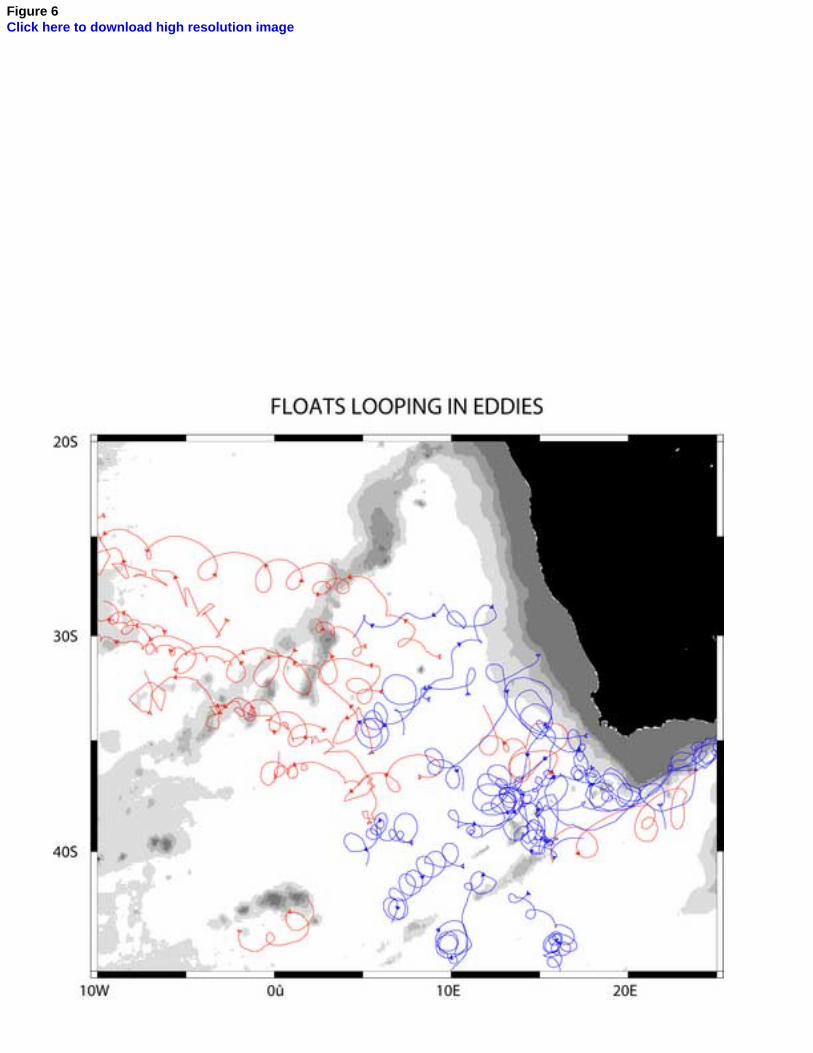
Figure 6Click here to download high resolution image
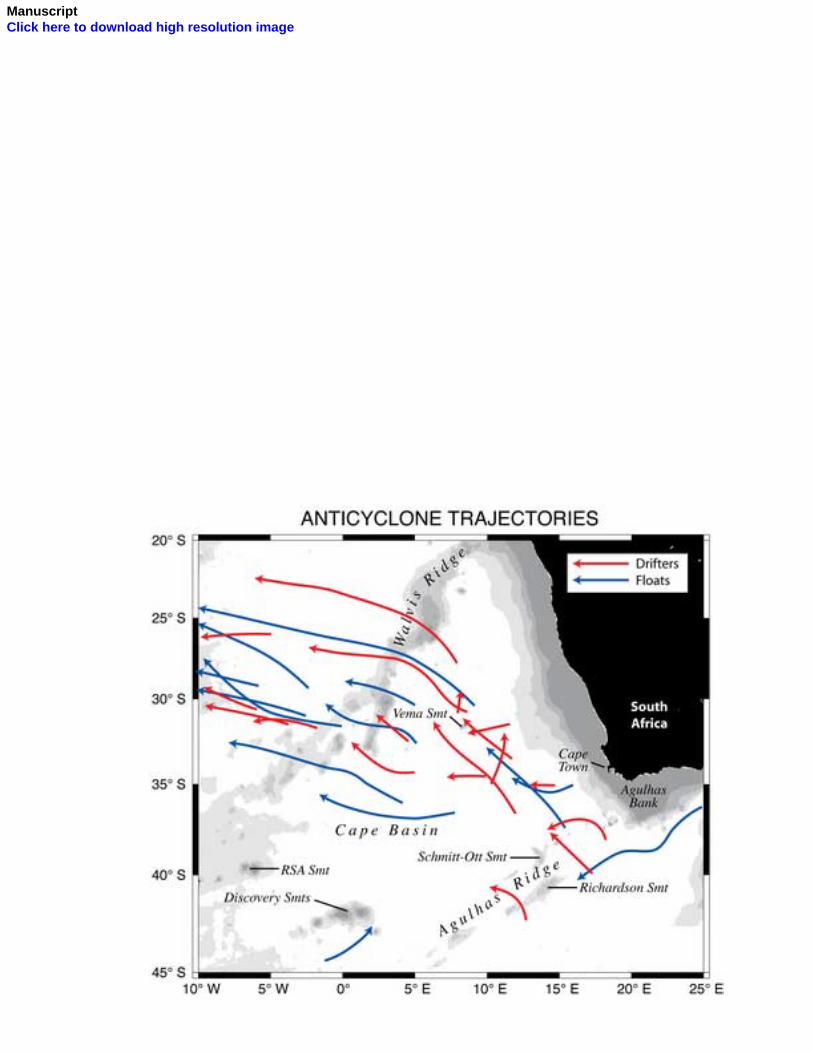
ManuscriptClick here to download high resolution image
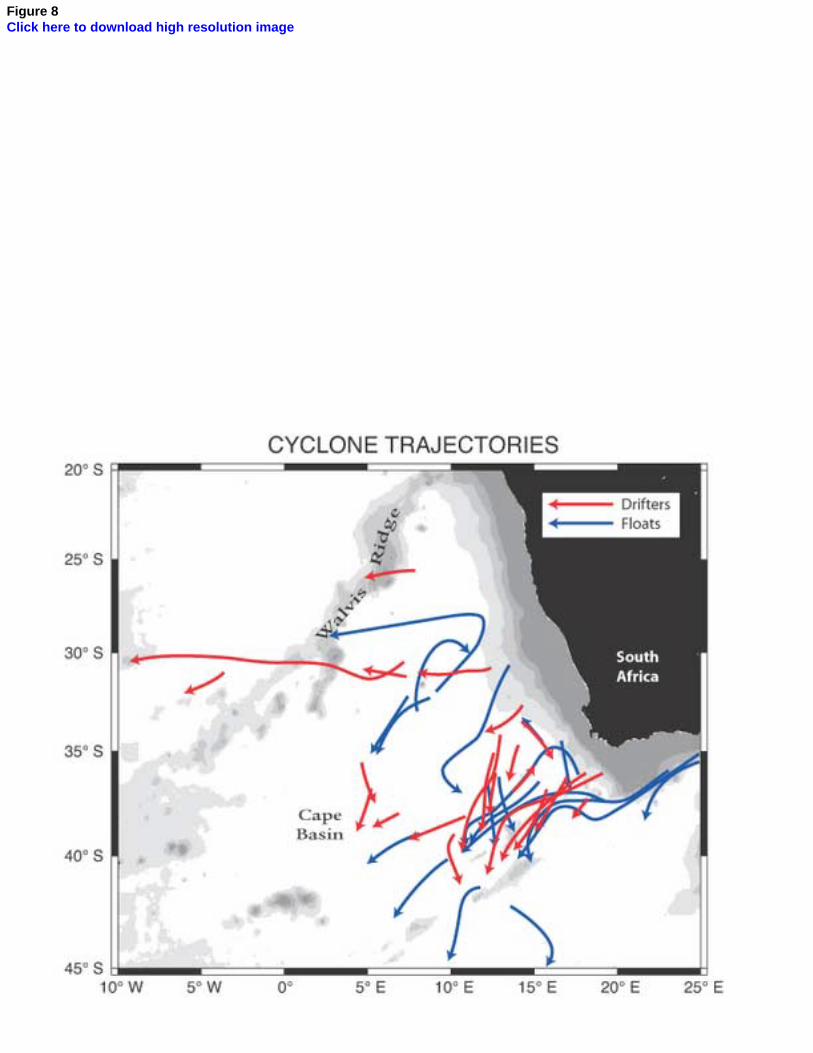
Figure 8Click here to download high resolution image
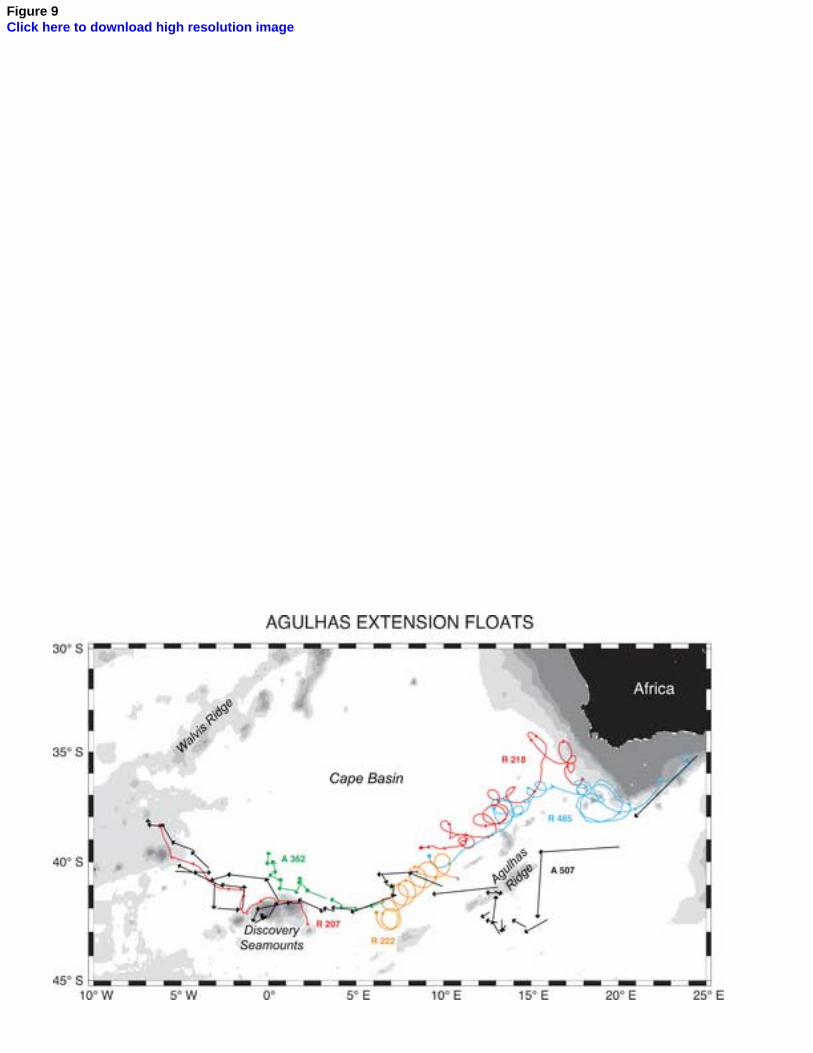
Figure 9Click here to download high resolution image
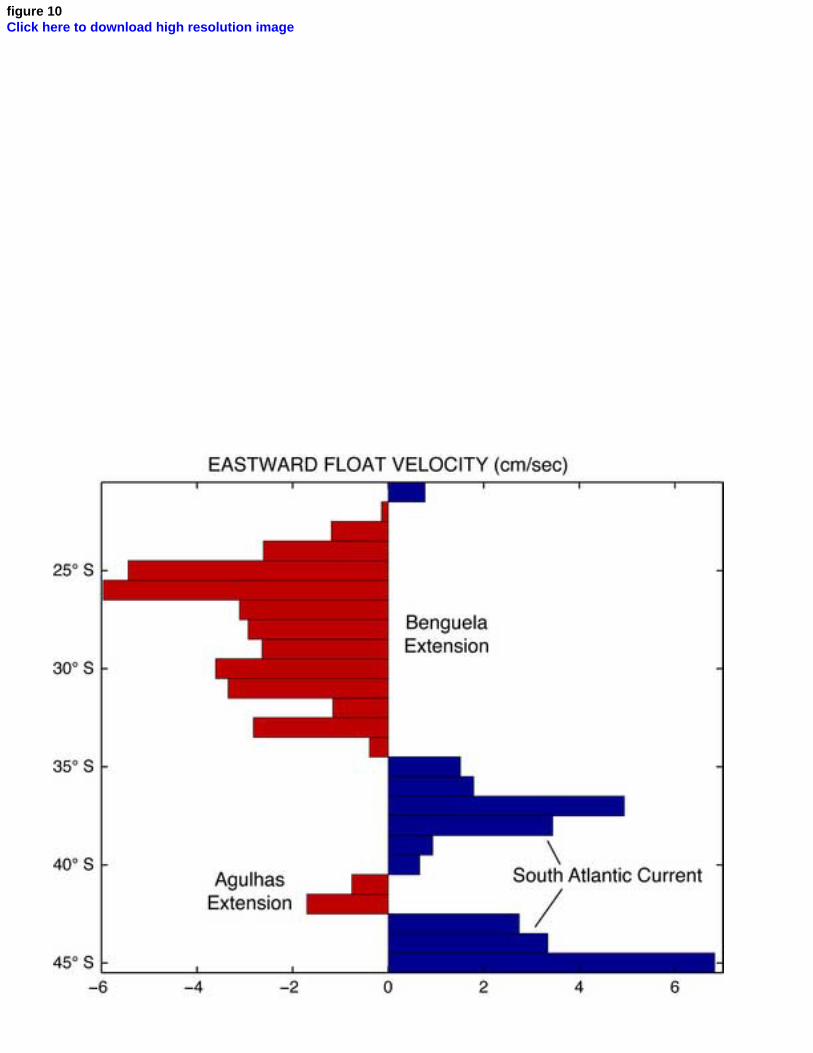
figure 10Click here to download high resolution image
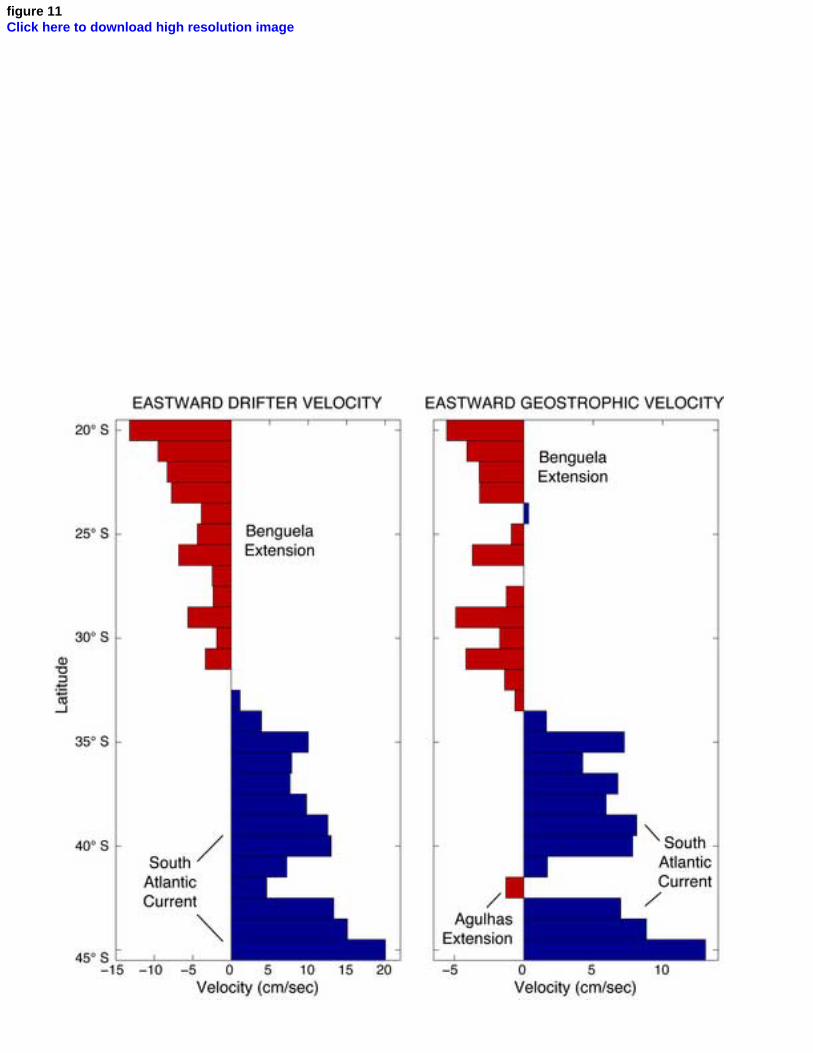
figure 11Click here to download high resolution image
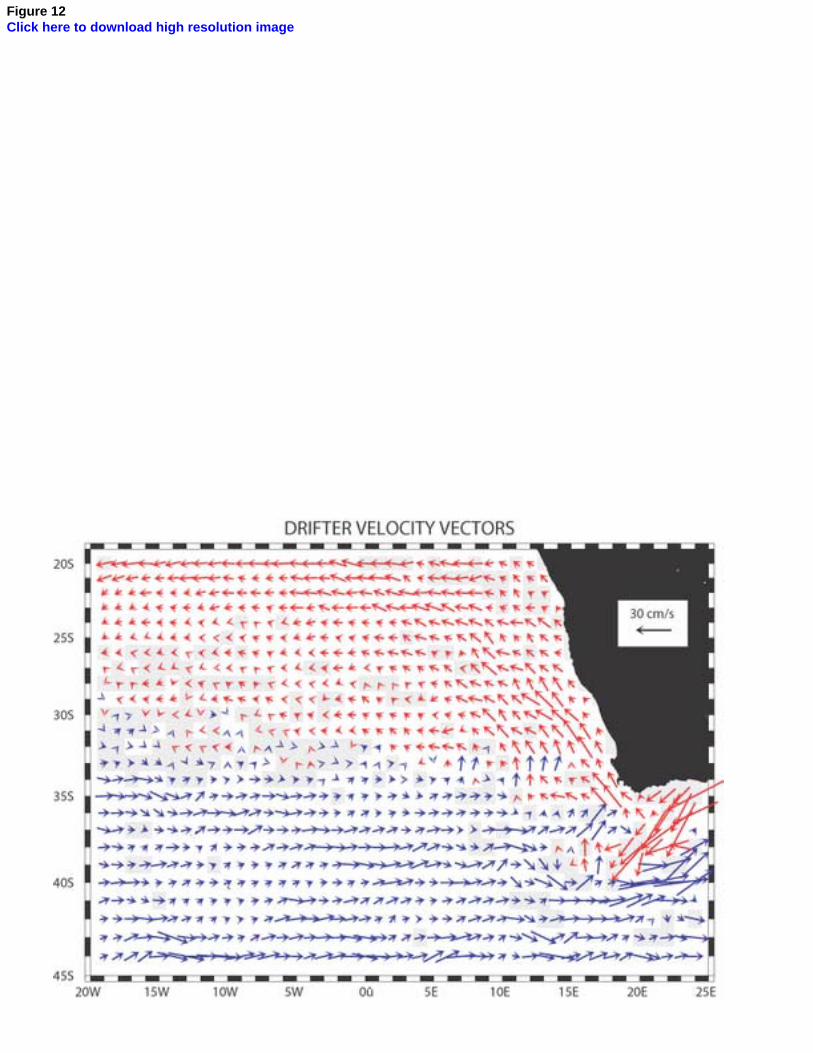
Figure 12Click here to download high resolution image
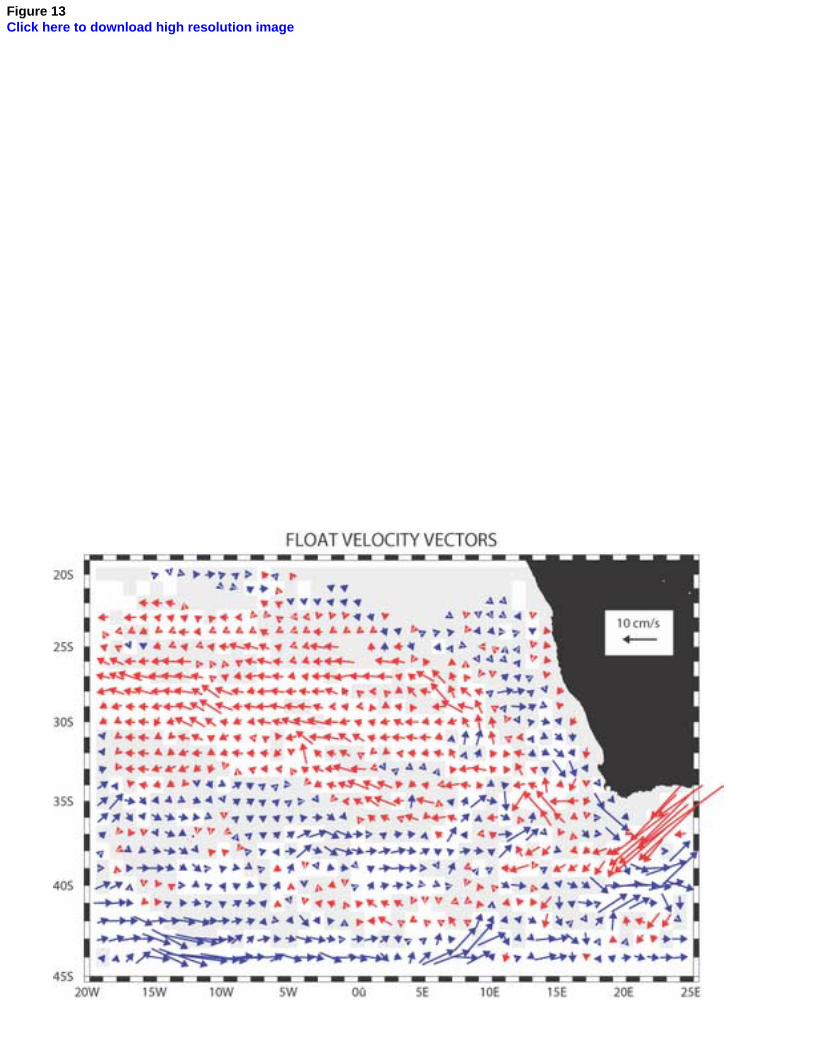
Figure 13Click here to download high resolution image
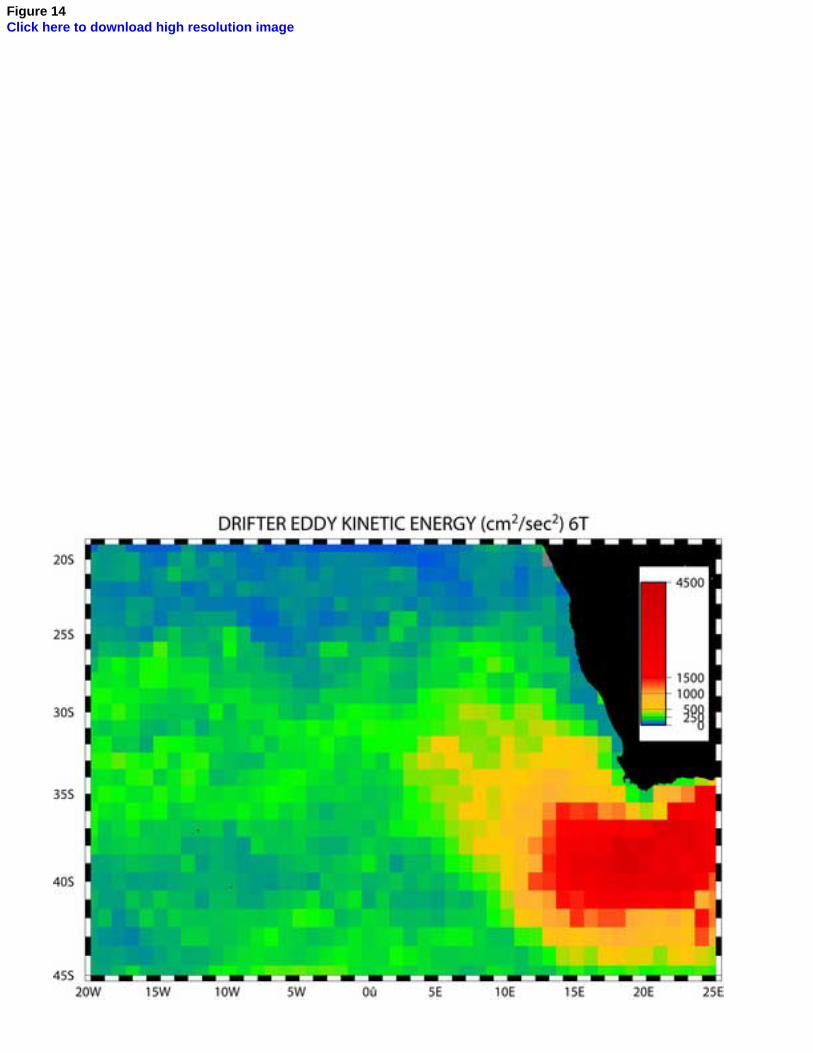
Figure 14Click here to download high resolution image
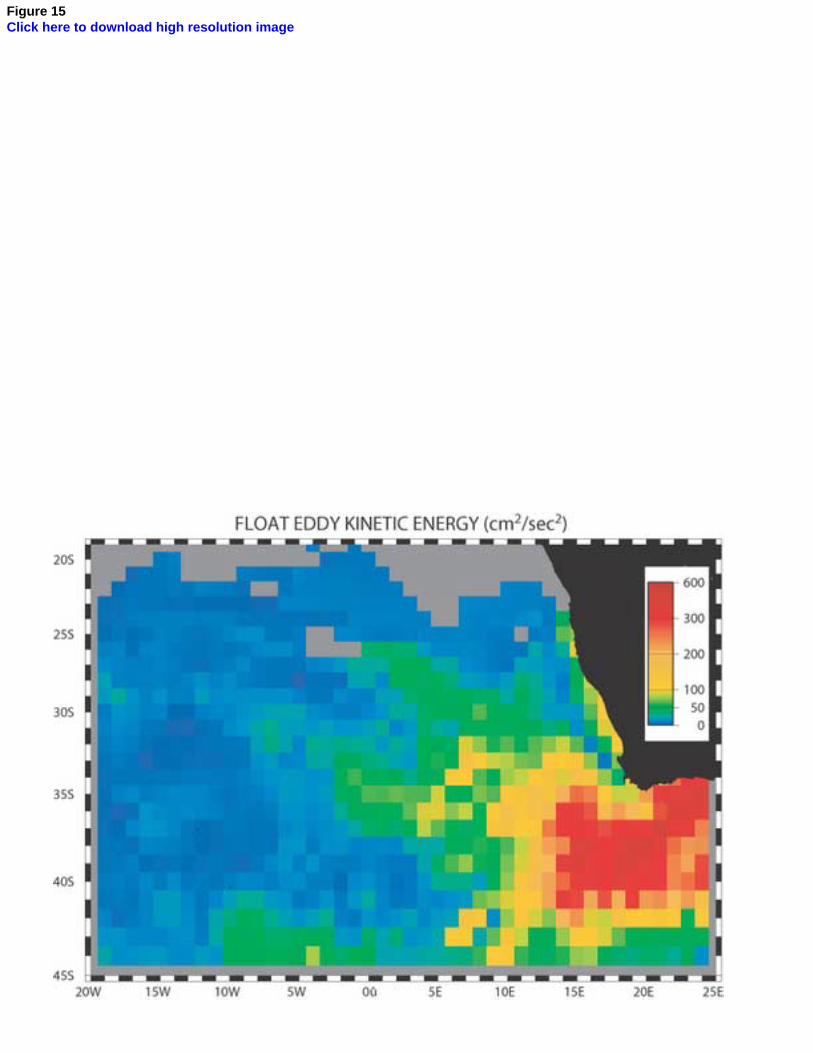
Figure 15Click here to download high resolution image


