Embed Size (px)
Citation preview

Aid and Sectoral Labour Productivity by Pablo Selaya and Rainer Thiele
No. 1468 | November 2008
Kiel Institute for the World Economy, Düsternbrooker Weg 120, 24105 Kiel, Germany
Kiel Working Paper No. 1468 | November 2008
Aid and Sectoral Labour Productivity*
Pablo Selaya and Rainer Thiele
Abstract: The paper examines empirically the proposition that aid to poor countries is detrimental for external competitiveness, giving rise to Dutch disease type effects. At the aggregate level, aid is found to have a positive effect on growth of labour productivity. A sectoral decomposition shows that the effect is significant and positive both in the tradables and the nontradables sectors. The paper thus finds no empirical support for the hypothesis that aid reduces external competitiveness in developing countries. Possible reasons are the existence of large idle labour capacity and high levels of dollarization in financial liabilities at the firm level.
Keywords: Foreign aid, sectoral labour productivity, Dutch disease
JEL classification: F35, O47
Pablo Selaya Department of Economics University of Copenhagen 1455 Copenhagen K, Denmark Telephone: +45 3532 3091 E-mail: [email protected]
Rainer Thiele Kiel Institute for the World Economy 24100 Kiel, Germany Telephone: +49 431 8814-215 E-mail: [email protected]
* An earlier version greatly benefited from comments and suggestions from Carl-Johann Dalgaard, Priscilla Mothoora, Thomas Rønde, and Finn Tarp. We are indebted to David Roodman, who generously provided access to his database. We thank PEGNet for funding Pablo Selaya's stay in Kiel during which the paper was finished. All remaining errors are ours. ____________________________________ The responsibility for the contents of the working papers rests with the author, not the Institute. Since working papers are of a preliminary nature, it may be useful to contact the author of a particular working paper about results or caveats before referring to, or quoting, a paper. Any comments on working papers should be sent directly to the author. Coverphoto: uni_com on photocase.com
I. Introduction
The empirical literature on the macroeconomic effects of aid has produced contrasting
results. While some authors claim that the effects of aid on growth and development have
been historically very close to zero (Rajan and Subramanian, 2008), or even negative
(Easterly, 2007), others (like Clemens, Radelet and Bhavnani, 2004; Roodman, 2007a;
Hansen and Tarp, 2000) conclude that on average aid has had a positive effect on growth.
Given the actual size of aid transfers, these mixed findings are to some extent disappointing,
but conceivably also not surprising “[…] given the heterogeneity of aid motives, the
limitations of the tools of analysis, and the complex causality chain linking external aid to
final outcomes.” (Bourguignon and Sundberg, 2007, p. 316). One way in which most of the
recent empirical studies reflect the fact that the causality chain linking aid to outcomes is
complex, is the common conclusion that the effects of aid are highly dependent on
idiosyncratic characteristics of the recipient countries. This is also the starting point in this
paper, where we reformulate the fundamental question on aid's effectiveness in a way that
helps to identify specific mechanisms at work, and the individual country characteristics that
matter.
Some papers already go along this line by trying to identify factors directly undermining aid's
capacity to increase growth. The arguments advanced in these papers basically belong to one
of two different strands. The first is concentrated on the negative incentives and effects that
aid may have on the institutional quality of the recipient countries (see for example Rajan and
Subramanian, 2007, and Bräutigam and Knack, 2004). The basic idea is that foreign aid may
reduce the pressure to embark on necessary institutional reforms in the recipient countries.
Some of the reasons are that aid appears as a windfall of resources alleviating structural
deficits for irresponsible fiscal authorities, or that aid tends to spur corruption and
competition for the rents it might create among special-interest groups. 1
The second strand is related to possible detrimental macroeconomic effects of aid (see for
example Adam and Bevan, 2006; Gupta, Powell and Yang, 2006; de Renzio, 2007). The
main argument in these studies is that the capacity to "absorb" the aid influx in an effective
1
1See Svensson (2000) and Djankov, Montalvo and Reynal‐Querol (2006), for example.
manner can be severely restricted. The combination of a lack of absorption capacity and a
relatively large size of aid receipts can translate into inflationary pressures and a tendency of
the domestic currency to appreciate. This hurts exportable sectors directly, and may affect
aggregate output growth and employment if the effects are sustained over a certain period.
The prospect of effects like these may rise even further as donors have promised a substantial
scaling-up of financial aid to the poorest countries.
This paper belongs to this second strand. The main question is to which extent foreign aid to
poor countries has effectively limited the growth of exportable sectors. In particular, the
paper presents an empirical assessment of the effects of aid on growth rates of average labour
productivity at the aggregate level, and a disaggregation of this effect between the impact on
the tradable (exportable) sector and the nontradable sector. A comprehensive empirical
analysis of this issue at the cross-country level is absent in the existing literature on foreign
aid. The currently available estimates of the impact of aid on sectoral competitiveness and
labour productivity rely on highly stylized simulations (Adam and Bevan, 2006), have been
purely concentrated on the manufacturing sector (Rajan and Subramanian, 2005), or the
agricultural sector (Feeny and Ouattara, 2007).
Our contribution is twofold. First, we provide estimates of the effects of aid on growth of
average labour productivity in sectors producing most of the tradable (exportable) goods and
in those producing most of the nontradable goods. The main results show significant positive
effects of aid on labour productivity growth in both sectors. They are robust to different
econometric specifications, conditioning factors, and the endogenous nature of the
relationship between donors’ aid disbursements and recipients’ economic growth.
In general, our results contrast with those of similar previous studies. Thus, in a second step,
we explore mechanisms that provide a plausible explanation for the main findings. More
precisely, the paper shows that a large inflow of aid might be beneficial for growth of average
labour productivity when the recipient country has high levels of dollarization of financial
liabilities. The basic reason is that firms indebted mostly in foreign currency benefit from an
overvalued domestic currency, because that reduces their financial costs and burdens. This
type of positive balance-sheet effects might be substantial in highly dollarized economies
and, therefore, might allow firms, and the economy, to grow faster.
2
The remainder of the paper is organized as follows. Section II reviews the link between aid
and external competitiveness and explains how we analyze it. Section III discusses
methodological issues. Section IV presents the empirical results, and Section V concludes.
II. Aid, real appreciation and external competitiveness
To explain what undermines the effect of aid on growth, Rajan and Subramanian (2005)
postulate that a plausible reason is that the benefits of aid are reduced by negative side-
effects. They present evidence indicating that one of these stems from the possibility that the
aid inflows cause overvaluation of the real exchange rate (RER) in the recipient country, and
a consequent loss of competitiveness in the exporting sectors, reflected by "systematic
adverse effects on growth, wages, and employment in labour intensive and export sectors"
(Rajan and Subramanian, 2005, p. 22).
The overall idea resembles closely the mechanics of the Dutch disease problem after an
influx of any type of foreign resources. The Dutch disease model2 predicts that in an
economy producing two types of goods (traded and the nontraded), a large inflow of foreign
resources tends to push up the nominal exchange rate and make the value of the domestic
currency stronger. Additionally, the windfall of foreign resources tends to expand the demand
for nontraded goods, raising the price of nontraded goods if they have a relatively limited
supply, which in turn tends to put upward pressure on the domestic rate of inflation. If both
effects (the nominal appreciation and the increase in domestic inflation) appear combined, the
real price of nontraded goods increases relative to the price of traded goods, which is
equivalent to say that the real exchange rate (RER) gets overvalued. This is detrimental for
growth in the traded sector if wages and other production costs do not adjust downwards in
that sector. If the slowdown in the traded sector is long-lasting, it may also retard growth in
the whole economy, especially if the production of tradable goods exhibits substantial side
effects for the economy such as the adoption of new technology and the opening of new
markets.
Among the papers that have analyzed the case of Dutch disease and RER overvaluation after
an influx of foreign aid, some show that the Dutch disease effects of aid are small (for
example Prati, Sahay and Tressel, 2003), while others suggest that they are potentially larger
(for example Elbadawi et al., 2007). However, there is a certain consensus among these 2 Described in Elbadawi et al (2007) and Nkusu (2004), for example.
3
studies on two specific points. The first is that a windfall of foreign aid does cause RER
overvaluation. The reason is that the negative effects of aid on the RER are difficult to avoid
completely, given that recipient countries tend to be limited in their ability to contain the
RER overvaluation (e.g., with contractionary monetary policies), or to expand domestic
supply (e.g., due to problems of absorptive capacity). Killick and Foster (2007) argue that the
doubling of aid to Africa by 2010, for example, will be difficult to manage for the recipient
countries in ways that "do not disadvantage producers of tradeable goods, and the private
sector generally".
The second point of consensus is that this aid-induced RER overvaluation tends to be present
mainly during the short run. This happens because, after the aid inflow has been received, the
economy has the possibility of effectively expanding the domestic supply over the medium
and longer run. An expansion in domestic supply can happen, for example, when aid is used
to build infrastructure such as new rural roads that tends to benefit relatively more the
nontradables sector. This helps to contain the tendency of the domestic price level to increase,
and the tendency of the RER to get overvalued over the long run.
Against this background, this paper presents a comprehensive econometric assessment of the
effects of aid on growth rates of average labour productivity at the aggregate level, and a
sectoral disaggregation of this effect, distinguishing the effect of aid on the tradable from the
nontradable sectors. Our basic hypothesis is that, if aid causes real appreciation and a
reduction in external competitiveness, i.e. Dutch disease type of problems, an inflow of aid
should have a negative effect on growth of sectors producing most of the tradable goods, and
a positive effect on sectors producing most of the nontradable goods.
Contrary to previous papers in the literature, our results show no evidence of Dutch disease
type effects. Hence, we explore some mechanisms that might account for this finding. The
exploration is based on the theoretical work from Nkusu (2004), who argues that developing
countries may exhibit some particular characteristics that reduce the probability of having
RER overvaluation and Dutch disease type of problems after an influx of aid, or
characteristics that even allow them to benefit when the RER gets overvalued. One of these
characteristics is the existence of idle capacity. When a developing country with idle
capacities receives foreign aid resources, the associated expansion in aggregate demand can
4
be met relatively fast by an expansion of aggregate supply. This reduces the upward pressures
on the level of inflation and, thus, also reduces the pressure for RER overvaluation.
A second characteristic reducing risks related to Dutch disease is that production in
developing countries is typically highly dependent on imported inputs. This implies that, with
input costs largely denominated in foreign currency, a RER overvaluation unambiguously
lowers total costs of production. We explore this idea by testing the hypothesis that high
levels of dollarization of financial liabilities may offset the negative effects of real
appreciation induced by aid, supporting positive, rather than negative, effects of aid on
growth.
Our empirical analysis proceeds in four steps. First we seek to identify the marginal effect of
aid on growth in aggregate average labour productivity, defined as the average growth rate of
output (GDP or Total Value Added) per worker, and denoted by . This is made along the
lines of the empirical aid-growth literature. That is, we specify a regression of growth in
output per worker on the size of aid effectively disbursed, , the direct effects of macro
policies' quality, p , geographical country-specific determinants, d , conditional effects of a ,
and on (captured by a vector
pitg
a
p d pitg Γ containing interaction terms between a , and with
the level of aid disbursed),
p d3 and other determinants of aggregate average labour productivity
growth, : Z
.),,,,( Zafg pit Γ= dp (1)
The second step in the empirical analysis involves a sectoral decomposition of the aggregate
effect. We estimate the same type of model, but using measures of growth of productivity in
the tradable (exportable) and the nontradable sectors, : pkitg ,
,),,,,(, kp
kit Zafg Γ= dp (2)
where {tradables, nontradables} and is a vector of other exogenous determinants of
sectoral average labour productivity growth.
∈k kZ
3 The interaction terms reflect the second‐order effects considered in the aid‐growth literature. In terms of the model in Dalgaard et al (2004), these effects correspond to Burnside and Dollar’s (2000) claim that aid works
with reasonable policies ( ); Hansen and Tarp’s (2000) suggestion that aid exhibits diminishing
returns ( ); and Dalgaard, Hansen and Tarp’s (2004) finding of higher aid effectiveness with
better geographic/climatic conditions ( ).
0/2 >∂∂∂ pag0/ 22 <∂∂ ag
0/2 >∂∂∂ dag
5
These first two steps are aimed to give an answer to the question of whether foreign aid
causes a relative loss of external competitiveness (Dutch disease) or not. The following steps
are aimed to explore possible reasons. In particular, we analyse if financial conditions and the
composition of debt are a relevant part of the explanation. The next steps require then (a)
extending the aggregate models in (1) and (2) to control for the characteristics of debt in the
aid-recipient countries, and (b) decomposing again this effect into its sectoral components.
Accordingly, we estimate
),,,,,( fi
pit ZZafg Γ= dp (3)
and
,),,,,,(,f
ikp
kit ZZafg Γ= dp (4)
where is a vector including financial characteristics in country , in particular
characteristics of debt in the country, and variables controlling for the RER evolution.
fiZ i
III. Method and data
1. Econometric specification The basic econometric specification for the model in (1) is
( )( ) ( )( ) ,pitZitadapaaiitititdpaiitit
pit Zaaag εβτββββββ τ +++×+=
′′′ ′ βdp dp (5)
where is a measure of growth in output per worker (or growth in average labour
productivity) in country i during period t ; , is the size of effective aid in terms of
GDP;
pitg
ita4 is the Burnside and Dollar (2000) index of good macro policies; is a
measure of structural characteristics (Dalgaard et al., 2004), proxied by the share of tropical
area in the country from Gallup, Sachs and Mellinger (1999);
itp id
τ is a vector of time-
dummies (to control for common shocks); is a zero-mean error component; and is a
vector containing other exogenous determinants of output per worker growth, specifically: (a)
the degree of financial depth, measured as the (lagged) ratio of M2 to GDP, (b) the Knack
and Keefer (1995) index of institutional quality, constructed from five ICRG variables and
trying to reflect security of private property and enforceability of contracts, (c) the level of
pitε itZ
4Effective aid is defined as the grant equivalent of official disbursements constructed by Chang, Fernandez‐Arias and Serven (1998), calculated as the sum of official grants and the grant element in concessional loans.
6
output per worker at the beginning of every period t , (d) the degree of ethno-linguistic
fractionalization in the country (Easterly and Levine, 1997), (e) the number of conflicts in
which the government is involved (UCDP/PRIO, 2006), and (f) an interaction term between
these last two.
In a similar way, the econometric specification for the sectoral decomposition proposed in
equation (2), is
( )( ) ( )( ) ,,,k
k
pitZkitadapλaaiitititdpaiitit
pkit Zaaag ελτλλλλλ τ +++×+=
′′′ ′ λdp dp (6)
where is a measure of output per worker in sector , pkitg , k ∈k {tradables, nontradables}, and
the new estimated coefficients are theλ 's.
To estimate the models in (3) and (4), which are extensions of the previous two regressions
meant to identify as directly as possible the presence of RER overvaluation and Dutch
disease, it is necessary to extend the vector with variables reflecting the evolution of the
RER and the characteristics of debt in the recipient country (in particular those related to the
level of dollarization of financial liabilities). The variables considered for this extension are
(a) the rate of RER devaluation (and the square of it), which helps to control for the effects
that the RER has directly on growth,
itZ
5 (b) the amount of external debt measured as a
proportion of GDP, and (c) the currency composition of the external debt.
The central econometric concern for the estimation of all these regressions is the endogenous
character of aid: aid disbursements are obviously determined to some extent by the recipient
country's growth process itself (Berthélemy, 2006, and Nunnenkamp and Thiele, 2006). All
the recent empirical literature on foreign aid effectiveness has turned to the use of
instrumental variables (IV) to address the problem of endogeneity. We follow this line and
perform two-stage least squares (2SLS) estimations, using the set of instruments in Dalgaard
and Hansen (2001) and Dalgaard, Hansen and Tarp (2004).6 Given that our 2SLS estimates
ran into statistical problems (as we will discuss in detail below), we also applied the GMM-
5The square of the RER devaluation is included to model formally the idea that there exists an "equilibrium RER", or a RER level that keeps the balance between keeping exports competitive and keeping the level of inflation controlled. See for example Elbadawi et al. (2007, footnote 1, p. 1). 6 These are Aid/GDP, lagged; (Aid/GDP) squared, lagged; (Policy x Aid/GDP), lagged; Policy x (log Initial GDP per capita); Policy x (log Initial GDP per capita) squared; Policy x (log Population); and a dummy for countries in the Central Francophone Africa zone. This instrumentation strategy is described and motivated in detail in Dalgaard et al (2004), but in general it is aimed to reflect donors’ overall preference to send aid to the smallest and poorest countries, those with better macro policies and to account for some strategic interests of donors in specific groups of countries (former colonies, important trade partners, or political allies, for example).
7
DIF estimator suggested by Arellano and Bond (1991) and the GMM-SYS estimator
proposed by Arellano and Bover (1995) and Blundell and Bond (1998).
2. Data on sectoral labour productivity Our estimations require measures of average labour productivity in the tradable (exportable)
and the nontradable sectors. We build these measures with data from the World Bank's World
Development Indicators on labour force participation, sectoral employment and sectoral real
Value Added (defined as the net output of a sector --measured in constant USD-- after adding
up all outputs and subtracting intermediate inputs).
The proxies we constructed for labour productivity in the tradable (exportable) sector are (a)
the non-services GDP per worker and (b) the sum of Agricultural and Industrial Value Added
per worker. The proxy constructed for the nontradables sector is based on Value Added per
worker in the Services sector.
This distinction between tradables and nontradables sectors is made under the assumptions
that the overall production in the economy comes from activity in agriculture, industry and
the services sectors, and that production of nontradables is concentrated in the services sector,
while production of tradables takes place primarily in the agricultural and industrial sectors.
This assumption is supported by the survey in Tica and Družić (2006, Table 1), who review a
large number of empirical papers analyzing the effects of productivity gaps on terms of trade,
and report that none of those studies treats the services sector as producing tradables (the 58
papers reviewed by them treat production of tradables as taking place in the agricultural
sector, or the industrial sector, or both). The argument gathers a lot of strength when it is
placed in the context of developing countries, where trade in agricultural and manufacturing
goods (containing for example exports of raw agricultural commodities, agroindustrial
products, minerals, etc.) tends to be much higher than trade in services.
The WDI provides a measure of real Value Added per worker in the Agricultural sector, but
not in the other sectors. We therefore constructed proxies for Value Added per worker in the
Industrial and Services sectors. An important point is that an accurate labour productivity
measure requires an estimate of the number of workers actually employed in the different
sectors, rather than estimates of the number of workers in the labour force or the potential
number of workers in each sector. Accordingly, we construct series for the effective sectoral
allocation of labour based on sectoral employment data from the WDI. The series for sectoral
employment were built based on interpolations of the employment data in the Agricultural,
8
Industrial and Services sectors, and completed to fill gaps towards the end of the sample
period under the assumption that the sectoral distribution of employment kept stable over
time.7 For all the estimations in the remainder of the paper then, the proxies used for levels of
sectoral labour productivity levels are measures of real Value Added in the Agricultural, the
Industrial and the Services sectors, divided by the estimated number of employed workers in
each corresponding sector.
The sample covers a group of 69 developing economies over 40 years, the period between
1962 and 2001. All the variables were averaged over periods of 4 years, to capture the
evolution of trends rather than the incidence of cycles, and to make the results comparable to
those in previous empirical studies. Our sample does not go beyond 2001 because many of
the variables used in the regressions could not be updated further than that for many countries
in the sample.
Summary statistics of our variables are displayed in Annex Table A1, and the description of
the countries and periods considered is given in Annex Table A2.
IV. Results
1. Impact of aid in the aggregate
The estimated effects of aid on growth of aggregate average labour productivity, that is the
results of regression (5), are displayed in Table 1. Column 1 contains the 2SLS estimates.
The coefficients of interest (the coefficients on the aid variable and the 3 aid-interaction
terms) show that aid has a positive and direct impact on growth of aggregate labour
productivity, and that these benefits can be increased in countries with good policies, whereas
they are lowered in countries where the amount of tropical area is large (Dalgaard et al.,
2004). This last finding can be interpreted as indicating that aid effectiveness is limited in
countries where location and climate are disadvantageous or, in particular, in countries with
large a amount of tropics, where the burden of diseases is larger (as suggested by Gallup et
al., 1999, for example) or where growth in agricultural productivity is restricted (see Masters
and Wiebe, 2000, for example).
7As a control, we constructed a series for the sectoral composition of the labour force assuming that for any given country, a larger fraction of the labour force was concentrated in sectors where the production of Value Added was higher. This change of measure yields qualitatively equivalent results to those reported in the following tables.
9
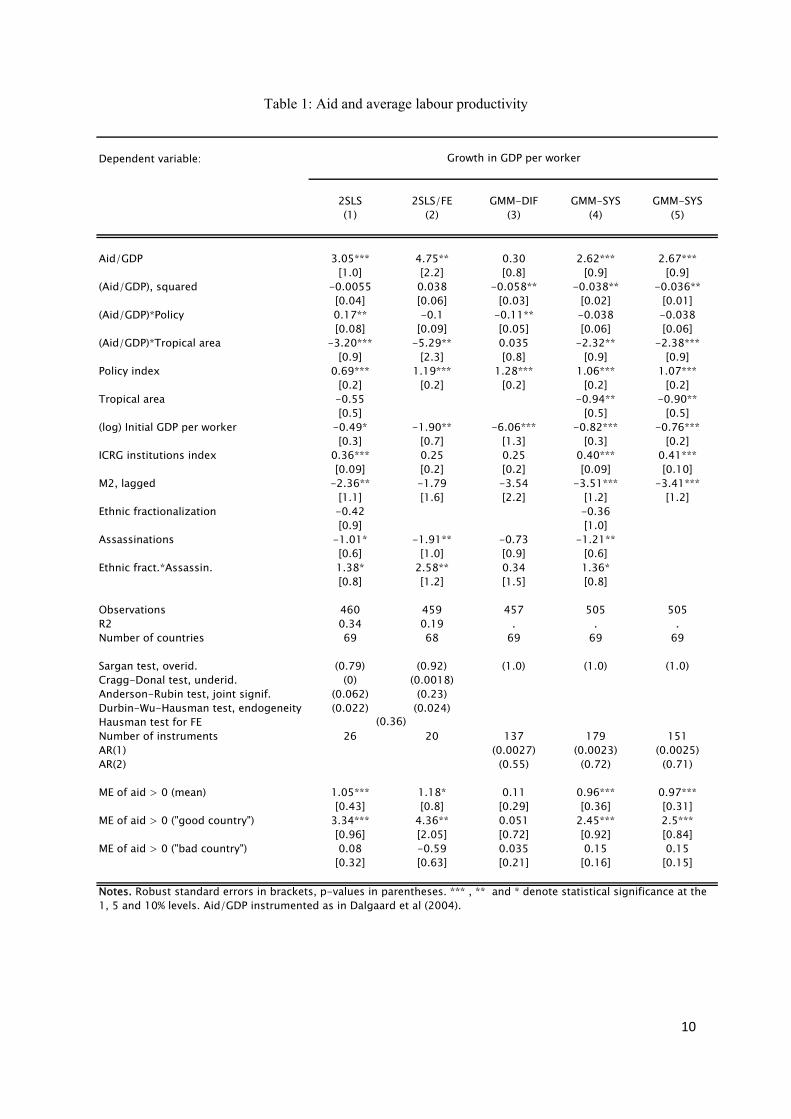
Table 1: Aid and average labour productivity
Dependent variable:
2SLS 2SLS/FE GMM-DIF GMM-SYS GMM-SYS(1) (2) (3) (4) (5)
Aid/GDP 3.05*** 4.75** 0.30 2.62*** 2.67***[1.0] [2.2] [0.8] [0.9] [0.9]
(Aid/GDP), squared -0.0055 0.038 -0.058** -0.038** -0.036**[0.04] [0.06] [0.03] [0.02] [0.01]
(Aid/GDP)*Policy 0.17** -0.1 -0.11** -0.038 -0.038[0.08] [0.09] [0.05] [0.06] [0.06]
(Aid/GDP)*Tropical area -3.20*** -5.29** 0.035 -2.32** -2.38***[0.9] [2.3] [0.8] [0.9] [0.9]
Policy index 0.69*** 1.19*** 1.28*** 1.06*** 1.07***[0.2] [0.2] [0.2] [0.2] [0.2]
Tropical area -0.55 -0.94** -0.90**[0.5] [0.5] [0.5]
(log) Initial GDP per worker -0.49* -1.90** -6.06*** -0.82*** -0.76***[0.3] [0.7] [1.3] [0.3] [0.2]
ICRG institutions index 0.36*** 0.25 0.25 0.40*** 0.41***[0.09] [0.2] [0.2] [0.09] [0.10]
M2, lagged -2.36** -1.79 -3.54 -3.51*** -3.41***[1.1] [1.6] [2.2] [1.2] [1.2]
Ethnic fractionalization -0.42 -0.36[0.9] [1.0]
Assassinations -1.01* -1.91** -0.73 -1.21**[0.6] [1.0] [0.9] [0.6]
Ethnic fract.*Assassin. 1.38* 2.58** 0.34 1.36*[0.8] [1.2] [1.5] [0.8]
Observations 460 459 457 505 505R2 0.34 0.19 . . .Number of countries 69 68 69 69 69
Sargan test, overid. (0.79) (0.92) (1.0) (1.0) (1.0)Cragg-Donal test, underid. (0) (0.0018)Anderson-Rubin test, joint signif. (0.062) (0.23)Durbin-Wu-Hausman test, endogeneity (0.022) (0.024)Hausman test for FENumber of instruments 26 20 137 179 151AR(1) (0.0027) (0.0023) (0.0025)AR(2) (0.55) (0.72) (0.71)
ME of aid > 0 (mean) 1.05*** 1.18* 0.11 0.96*** 0.97***[0.43] [0.8] [0.29] [0.36] [0.31]
ME of aid > 0 ("good country") 3.34*** 4.36** 0.051 2.45*** 2.5***[0.96] [2.05] [0.72] [0.92] [0.84]
ME of aid > 0 ("bad country") 0.08 -0.59 0.035 0.15 0.15[0.32] [0.63] [0.21] [0.16] [0.15]
Growth in GDP per worker
Notes. Robust standard errors in brackets, p-values in parentheses. *** , ** and * denote statistical significance at the 1, 5 and 10% levels. Aid/GDP instrumented as in Dalgaard et al (2004).
(0.36)
10
The rest of the coefficients in Column 1 have the expected signs: "good" policies are "good"
for growth by themselves, initial conditions matter (the coefficient on the initial level of
output per worker is significant), sound institutions (measured by the ICRG index) have a
positive effect on growth, and a high number of conflicts does not contribute to higher rates
of growth, just as do not either more ethnical division in the country. The only puzzling effect
in column 1 is the negative and significant effect of financial depth (measured by the lagged
ratio of money and deposits, M2, to GDP). This can be due to an omitted variable bias, since
a high M2/GDP ratio might be correlated with high levels of other sources of foreign capital -
-for example foreign bonds, or external debt--, which act as substitutes of aid to some extent.
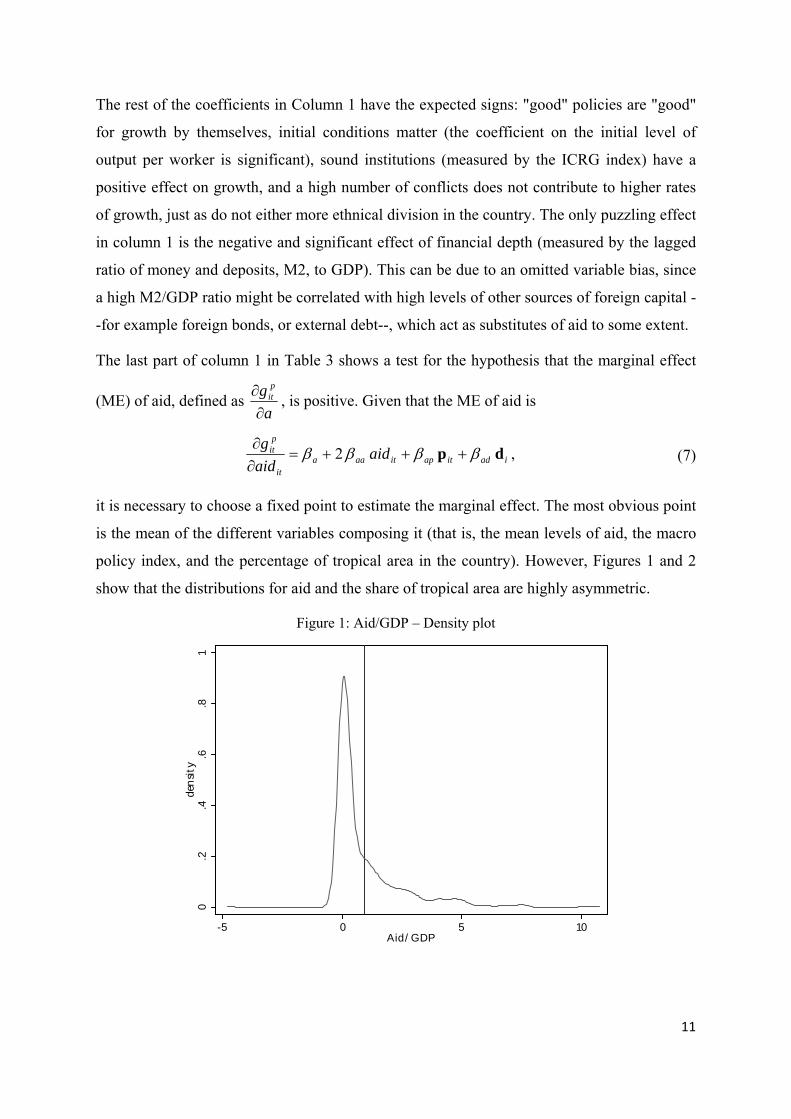
The last part of column 1 in Table 3 shows a test for the hypothesis that the marginal effect
(ME) of aid, defined as a
g pit
∂∂ , is positive. Given that the ME of aid is
iaditapitaaait
pit aid
aidg dp ββββ +++=
∂∂ 2 , (7)
it is necessary to choose a fixed point to estimate the marginal effect. The most obvious point
is the mean of the different variables composing it (that is, the mean levels of aid, the macro
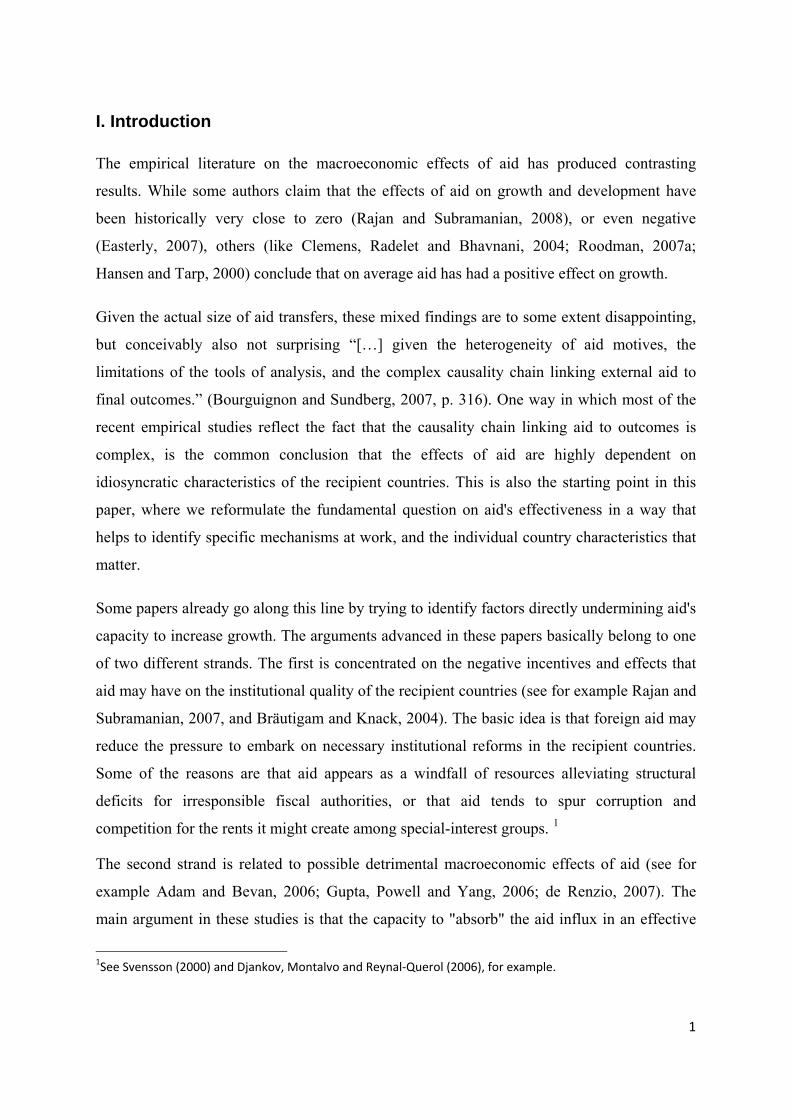
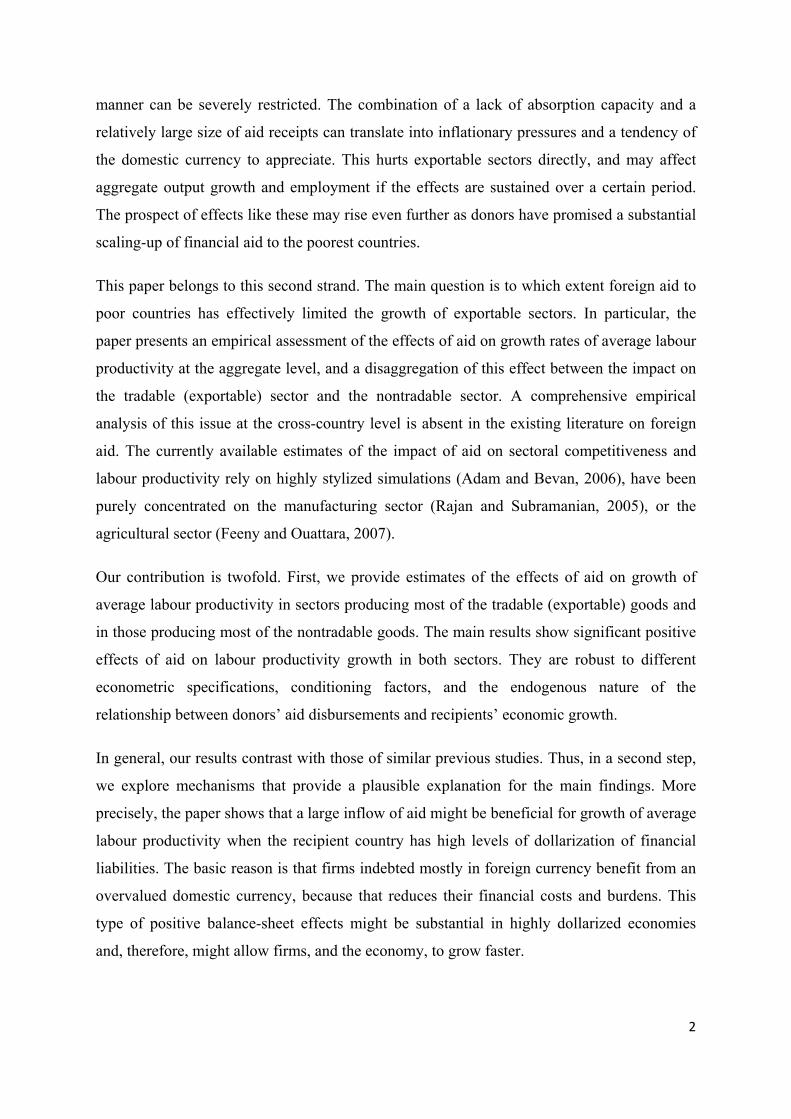
policy index, and the percentage of tropical area in the country). However, Figures 1 and 2
show that the distributions for aid and the share of tropical area are highly asymmetric.
Figure 1: Aid/GDP – Density plot
0.2
.4.6
.81
dens
ity
-5 0 5 10Aid/ GDP
11
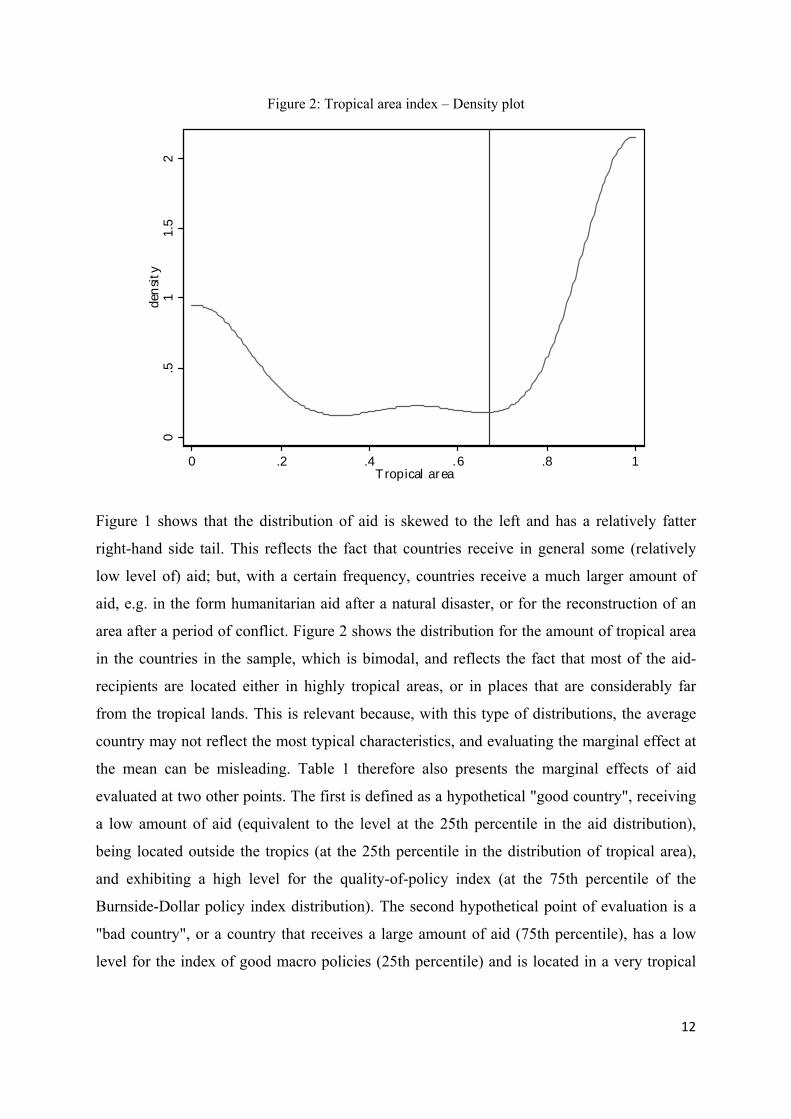
Figure 2: Tropical area index – Density plot
0.5
11.
52
dens
ity
0 .2 .4 .6 .8 1Tropical area
Figure 1 shows that the distribution of aid is skewed to the left and has a relatively fatter
right-hand side tail. This reflects the fact that countries receive in general some (relatively
low level of) aid; but, with a certain frequency, countries receive a much larger amount of
aid, e.g. in the form humanitarian aid after a natural disaster, or for the reconstruction of an
area after a period of conflict. Figure 2 shows the distribution for the amount of tropical area
in the countries in the sample, which is bimodal, and reflects the fact that most of the aid-
recipients are located either in highly tropical areas, or in places that are considerably far
from the tropical lands. This is relevant because, with this type of distributions, the average
country may not reflect the most typical characteristics, and evaluating the marginal effect at
the mean can be misleading. Table 1 therefore also presents the marginal effects of aid
evaluated at two other points. The first is defined as a hypothetical "good country", receiving
a low amount of aid (equivalent to the level at the 25th percentile in the aid distribution),
being located outside the tropics (at the 25th percentile in the distribution of tropical area),
and exhibiting a high level for the quality-of-policy index (at the 75th percentile of the
Burnside-Dollar policy index distribution). The second hypothetical point of evaluation is a
"bad country", or a country that receives a large amount of aid (75th percentile), has a low
level for the index of good macro policies (25th percentile) and is located in a very tropical
12
area (75th percentile). These two definitions are arbitrary, but they can be understood as an
approximation of the upper and lower bounds for the "typical" marginal effect of aid.
It turns out that aid has a net positive and highly significant effect in the average country. The
effect is equally significant, but 3 times larger for a "good country", and statistically not
different from zero for a "bad country".
As for the validity of the 2SLS regressions, the tests on the quality of instrumentation show
overall good results: (1) a high p-value for the Sargan test of overidentification does not
allow to reject the hypothesis that the set of instruments employed are valid, (2) a low p-value
for the Cragg-Donald test of underidentification implies that the instruments are not weak, (3)
the low p-value for the Anderson-Rubin test for joint significance of the endogenous
regressors cannot reject the hypothesis that the instruments are jointly significant, and (4) the
low p-value for the Durbin-Wu-Hausman test of endogeneity of the instruments allows to
reject the hypothesis that the endogenous regressors can be treated as exogenous, indicating
that the use of IV in this specification is appropriate.
However, even though the specification is comprehensive with respect to the main
determinants of growth, it is possible that there are important unobserved individual country
characteristics that are being omitted in the regression. To control for this, Column 2 in Table
1 presents the same regression as in Column 1, but estimates the model including individual
country fixed effects. The results are relatively similar to the ones in Column 1 regarding the
significance of the coefficients of interest, the tests on the quality of instrumentation, and the
significance of the marginal effect of aid evaluated at different points. From the statistic for
the (Hausman) test of fixed-effects, it is not possible to reject the hypothesis that the country
fixed effects are significant and, thus, correctly included in Column 2.
This poses a serious problem for these first two regressions. The reason is that if both the
unobserved country characteristics and the lagged level of the dependent variable are
significant and belong into the regression, then the 2SLS regression in Column 1 is
misspecified (because it lacks the fixed-effects terms), and the 2SLS/FE regression in
Column 2 gives inconsistent estimates (because differencing the data and estimating the
regression with the lagged level of the dependent variable on the right-hand side introduces
correlation between one of the regressors and the error term, by construction).
13
An appropriate estimator for a panel data model where (a) unobserved individual fixed
effects are relevant and (b) a lagged level of the dependent variable needs to be included as a
regressor, is the GMM-DIF estimator. This method estimates the regression in first
differences, and instruments the lagged differences in the right-hand side with lagged levels
of the variables. The number of lags to be included can be chosen arbitrarily, but following
Roodman (2007b), we restrict them to be only the ones starting from the second.
Column 3 in Table 1 presents the regression with the GMM-DIF estimator. The results are
quite different from the ones before. In particular, aid now has no significant effect on
growth. Column 3 reports however a high coefficient for the lagged level of the dependent
variable, which reflects a high level of autocorrelation. As shown by Arellano and Bover
(1995), lagged levels are weak instruments of current differences when the series are highly
persistent. The autocorrelation tests displayed in column 3 show high AR(1) for the error
term in the model in differences (which is expected to happen), but high AR(2) as well,
supporting the conjecture that the dependent variable is highly persistent. In this case, first-
differences cannot be strongly instrumented by lagged levels.
The alternative is to use the GMM-SYS estimator, which complements the model in
differences with equations in levels and instruments based on lagged differences. The GMM-
SYS estimates suggest that aid has a positive effect on growth, that the effect is not
dependent on the quality of macro policies but on the type of structural country
characteristics, and that the overall effect operates with diminishing returns. The estimates of
the marginal effects of aid are similar to those in column 1. A higher p-value for the absence
of AR(2) shows an improvement in the quality of estimation and instrumentation compared
to the GMM-DIF estimation in column 3.
Finally, Column 5 in Table 1 drops the variables associated with country conflict and
division; this helps to reduce problems of multicollinearity and the total number of
instruments, does not change the significance of the rest of the variables in the model, and
allows a more precise estimation of the marginal effects. We therefore regard it as the
preferred econometric specification.
14
2. Sectoral disaggregation of the impact of aid
Table 2 presents the sectoral decomposition of the aggregate effect of aid on growth. To
provide a benchmark, column 1 shows again the aggregate effects of aid on growth
(corresponding to Column 5 in Table 1, the preferred specification for the aggregate model).
Columns 2 and 3 contain estimates for the sectors likely to be producing most of the
exportable goods (the tradables sector). The proxy for output in the tradables sector
considered in Column 2 is output in the non-Services sector, and the one considered in
Column 3 is the aggregation of Value Added in the Agricultural and the Industrial sectors.
The most important difference between these two regressions is that column 3 shows a
significant coefficient for the aid-squared term, while column 2 does not. But the rest of the
coefficients of interest are similar in size and significance in the two specifications. Despite
the difference in the coefficient on the aid-squared term, the overall conclusion from the
marginal effects remains the same: aid is shown to have a positive marginal effect in the
tradables sector in the average country, a three times higher effect in countries with more
favourable conditions, and no significant effect in countries with less favourable conditions.
Column 4 shows the estimates of the effects of aid in the Services sector, which is taken as a
proxy for the sector producing most of the nontradable goods in a developing economy. This
column reveals a more independent impact from aid compared to Columns 2 and 3 in the
sense that the interaction term with tropical area is no longer significant. Evaluated at the
mean, the size of the marginal effects turns out to be roughly equal in services and non-
services sectors. For “good” countries, the size of the marginal effect is even lower than in
columns 2 and 3, while for “bad” countries it becomes significantly positive.
Overall, these findings do not point to systematic differences in the impact of aid on tradable
and nontradable production. This is the main result of the paper. It can be interpreted as
providing empirical evidence against the hypothesis that aid is detrimental for external
competitiveness and growth in average labour productivity, or that aid causes Dutch disease.
If aid was a cause of Dutch disease, two "symptoms" after an inflow of aid would have to be
a decline in the growth of the exportable (or tradables) sector, and a relative increase in the
growth rate of the nontradables sector. The estimates of the marginal effects of aid in
Columns 1-4 of Table 2 suggest the opposite: evaluated at the mean and at the "good"
country levels (where estimates are statistically significant), aid does not seem to cause a
15
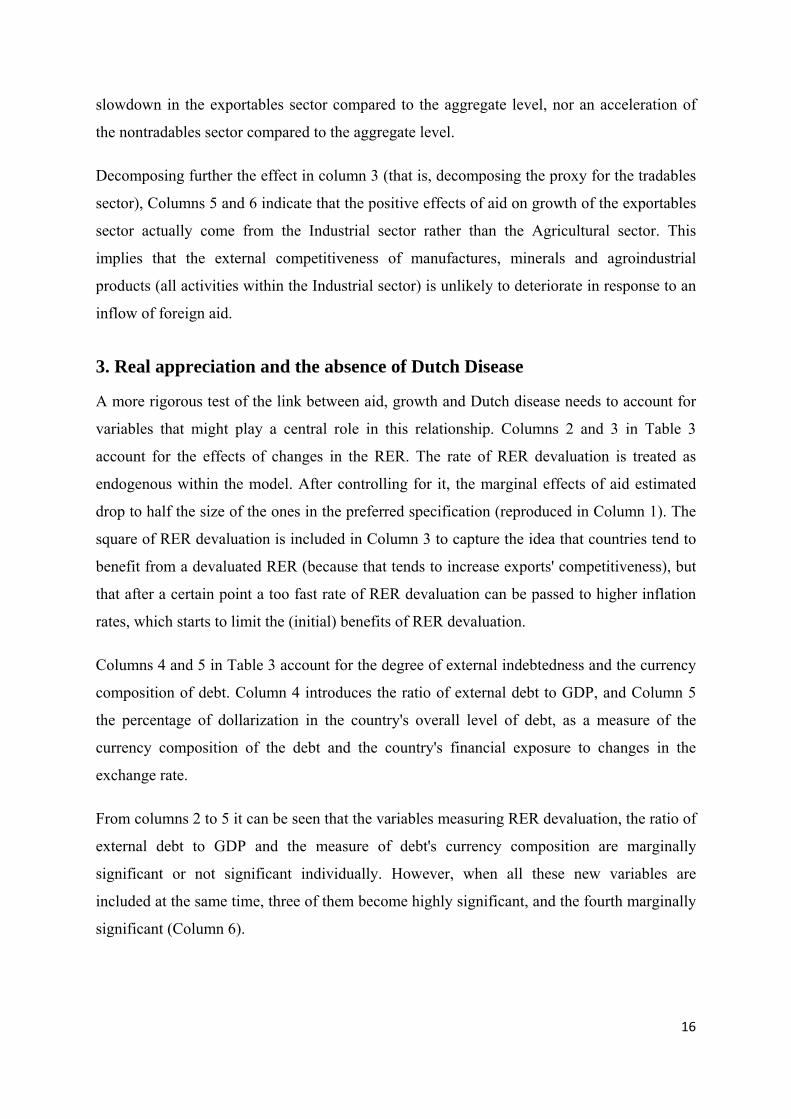
slowdown in the exportables sector compared to the aggregate level, nor an acceleration of
the nontradables sector compared to the aggregate level.
Decomposing further the effect in column 3 (that is, decomposing the proxy for the tradables
sector), Columns 5 and 6 indicate that the positive effects of aid on growth of the exportables
sector actually come from the Industrial sector rather than the Agricultural sector. This
implies that the external competitiveness of manufactures, minerals and agroindustrial
products (all activities within the Industrial sector) is unlikely to deteriorate in response to an
inflow of foreign aid.
3. Real appreciation and the absence of Dutch Disease
A more rigorous test of the link between aid, growth and Dutch disease needs to account for
variables that might play a central role in this relationship. Columns 2 and 3 in Table 3
account for the effects of changes in the RER. The rate of RER devaluation is treated as
endogenous within the model. After controlling for it, the marginal effects of aid estimated
drop to half the size of the ones in the preferred specification (reproduced in Column 1). The
square of RER devaluation is included in Column 3 to capture the idea that countries tend to
benefit from a devaluated RER (because that tends to increase exports' competitiveness), but
that after a certain point a too fast rate of RER devaluation can be passed to higher inflation
rates, which starts to limit the (initial) benefits of RER devaluation.
Columns 4 and 5 in Table 3 account for the degree of external indebtedness and the currency
composition of debt. Column 4 introduces the ratio of external debt to GDP, and Column 5
the percentage of dollarization in the country's overall level of debt, as a measure of the
currency composition of the debt and the country's financial exposure to changes in the
exchange rate.
From columns 2 to 5 it can be seen that the variables measuring RER devaluation, the ratio of
external debt to GDP and the measure of debt's currency composition are marginally
significant or not significant individually. However, when all these new variables are
included at the same time, three of them become highly significant, and the fourth marginally
significant (Column 6).
16
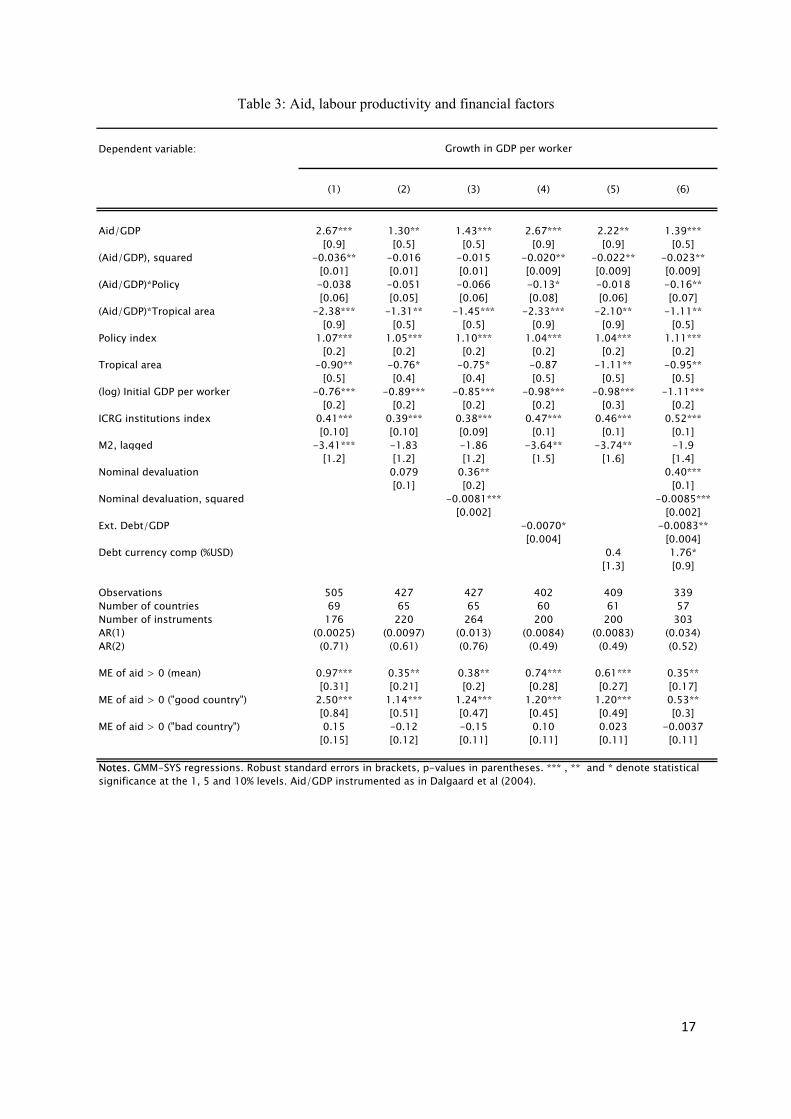
Table 3: Aid, labour productivity and financial factors
Dependent variable:
(1) (2) (3) (4) (5) (6)
Aid/GDP 2.67*** 1.30** 1.43*** 2.67*** 2.22** 1.39***[0.9] [0.5] [0.5] [0.9] [0.9] [0.5]
(Aid/GDP), squared -0.036** -0.016 -0.015 -0.020** -0.022** -0.023**[0.01] [0.01] [0.01] [0.009] [0.009] [0.009]
(Aid/GDP)*Policy -0.038 -0.051 -0.066 -0.13* -0.018 -0.16**[0.06] [0.05] [0.06] [0.08] [0.06] [0.07]
(Aid/GDP)*Tropical area -2.38*** -1.31** -1.45*** -2.33*** -2.10** -1.11**[0.9] [0.5] [0.5] [0.9] [0.9] [0.5]
Policy index 1.07*** 1.05*** 1.10*** 1.04*** 1.04*** 1.11***[0.2] [0.2] [0.2] [0.2] [0.2] [0.2]
Tropical area -0.90** -0.76* -0.75* -0.87 -1.11** -0.95**[0.5] [0.4] [0.4] [0.5] [0.5] [0.5]
(log) Initial GDP per worker -0.76*** -0.89*** -0.85*** -0.98*** -0.98*** -1.11***[0.2] [0.2] [0.2] [0.2] [0.3] [0.2]
ICRG institutions index 0.41*** 0.39*** 0.38*** 0.47*** 0.46*** 0.52***[0.10] [0.10] [0.09] [0.1] [0.1] [0.1]
M2, lagged -3.41*** -1.83 -1.86 -3.64** -3.74** -1.9[1.2] [1.2] [1.2] [1.5] [1.6] [1.4]
Nominal devaluation 0.079 0.36** 0.40***[0.1] [0.2] [0.1]
Nominal devaluation, squared -0.0081*** -0.0085***[0.002] [0.002]
Ext. Debt/GDP -0.0070* -0.0083**[0.004] [0.004]
Debt currency comp (%USD) 0.4 1.76*[1.3] [0.9]
Observations 505 427 427 402 409 339Number of countries 69 65 65 60 61 57Number of instruments 176 220 264 200 200 303AR(1) (0.0025) (0.0097) (0.013) (0.0084) (0.0083) (0.034)AR(2) (0.71) (0.61) (0.76) (0.49) (0.49) (0.52)
ME of aid > 0 (mean) 0.97*** 0.35** 0.38** 0.74*** 0.61*** 0.35**[0.31] [0.21] [0.2] [0.28] [0.27] [0.17]
ME of aid > 0 ("good country") 2.50*** 1.14*** 1.24*** 1.20*** 1.20*** 0.53**[0.84] [0.51] [0.47] [0.45] [0.49] [0.3]
ME of aid > 0 ("bad country") 0.15 -0.12 -0.15 0.10 0.023 -0.0037[0.15] [0.12] [0.11] [0.11] [0.11] [0.11]
Growth in GDP per worker
Notes. GMM-SYS regressions. Robust standard errors in brackets, p-values in parentheses. *** , ** and * denote statistical significance at the 1, 5 and 10% levels. Aid/GDP instrumented as in Dalgaard et al (2004).
17
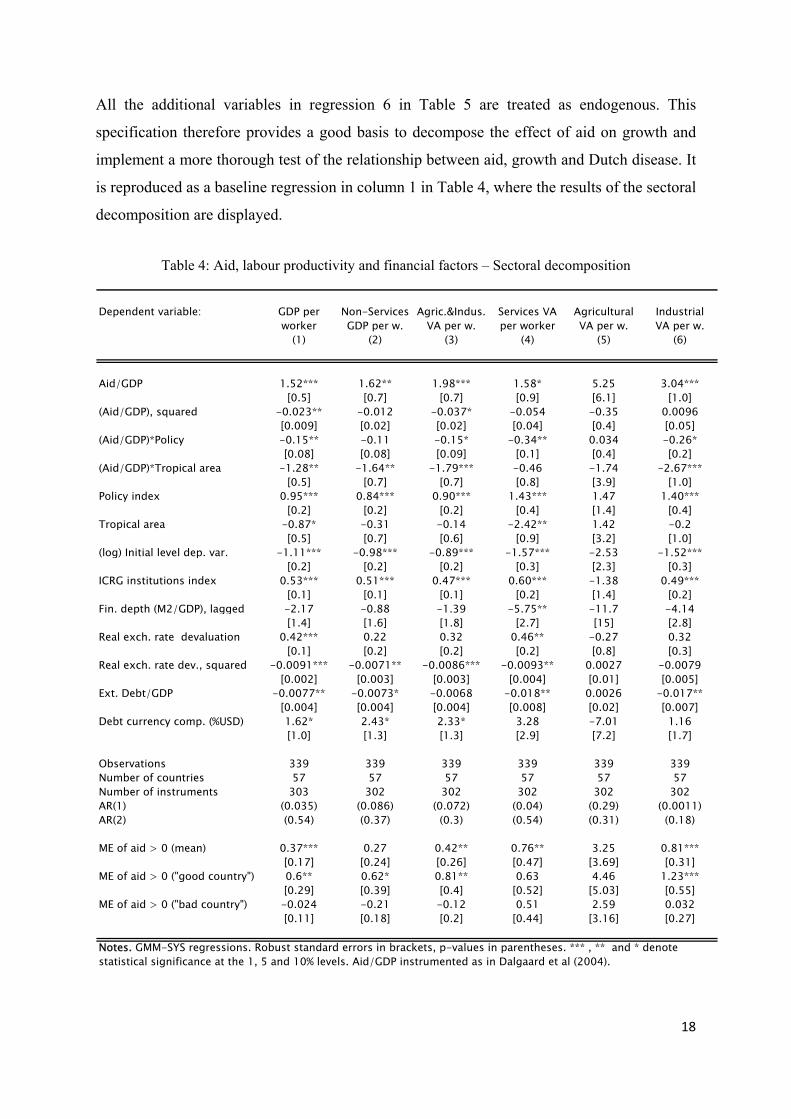
All the additional variables in regression 6 in Table 5 are treated as endogenous. This
specification therefore provides a good basis to decompose the effect of aid on growth and
implement a more thorough test of the relationship between aid, growth and Dutch disease. It
is reproduced as a baseline regression in column 1 in Table 4, where the results of the sectoral
decomposition are displayed.
Table 4: Aid, labour productivity and financial factors – Sectoral decomposition
Dependent variable: GDP per Non-Services Agric.&Indus. Services VA Agricultural Industrialworker GDP per w. VA per w. per worker VA per w. VA per w.
(1) (2) (3) (4) (5) (6)
Aid/GDP 1.52*** 1.62** 1.98*** 1.58* 5.25 3.04***[0.5] [0.7] [0.7] [0.9] [6.1] [1.0]
(Aid/GDP), squared -0.023** -0.012 -0.037* -0.054 -0.35 0.0096[0.009] [0.02] [0.02] [0.04] [0.4] [0.05]
(Aid/GDP)*Policy -0.15** -0.11 -0.15* -0.34** 0.034 -0.26*[0.08] [0.08] [0.09] [0.1] [0.4] [0.2]
(Aid/GDP)*Tropical area -1.28** -1.64** -1.79*** -0.46 -1.74 -2.67***[0.5] [0.7] [0.7] [0.8] [3.9] [1.0]
Policy index 0.95*** 0.84*** 0.90*** 1.43*** 1.47 1.40***[0.2] [0.2] [0.2] [0.4] [1.4] [0.4]
Tropical area -0.87* -0.31 -0.14 -2.42** 1.42 -0.2[0.5] [0.7] [0.6] [0.9] [3.2] [1.0]
(log) Initial level dep. var. -1.11*** -0.98*** -0.89*** -1.57*** -2.53 -1.52***[0.2] [0.2] [0.2] [0.3] [2.3] [0.3]
ICRG institutions index 0.53*** 0.51*** 0.47*** 0.60*** -1.38 0.49***[0.1] [0.1] [0.1] [0.2] [1.4] [0.2]
Fin. depth (M2/GDP), lagged -2.17 -0.88 -1.39 -5.75** -11.7 -4.14[1.4] [1.6] [1.8] [2.7] [15] [2.8]
Real exch. rate devaluation 0.42*** 0.22 0.32 0.46** -0.27 0.32[0.1] [0.2] [0.2] [0.2] [0.8] [0.3]
Real exch. rate dev., squared -0.0091*** -0.0071** -0.0086*** -0.0093** 0.0027 -0.0079[0.002] [0.003] [0.003] [0.004] [0.01] [0.005]
Ext. Debt/GDP -0.0077** -0.0073* -0.0068 -0.018** 0.0026 -0.017**[0.004] [0.004] [0.004] [0.008] [0.02] [0.007]
Debt currency comp. (%USD) 1.62* 2.43* 2.33* 3.28 -7.01 1.16[1.0] [1.3] [1.3] [2.9] [7.2] [1.7]
Observations 339 339 339 339 339 339Number of countries 57 57 57 57 57 57Number of instruments 303 302 302 302 302 302AR(1) (0.035) (0.086) (0.072) (0.04) (0.29) (0.0011)AR(2) (0.54) (0.37) (0.3) (0.54) (0.31) (0.18)
ME of aid > 0 (mean) 0.37*** 0.27 0.42** 0.76** 3.25 0.81***[0.17] [0.24] [0.26] [0.47] [3.69] [0.31]
ME of aid > 0 ("good country") 0.6** 0.62* 0.81** 0.63 4.46 1.23***[0.29] [0.39] [0.4] [0.52] [5.03] [0.55]
ME of aid > 0 ("bad country") -0.024 -0.21 -0.12 0.51 2.59 0.032[0.11] [0.18] [0.2] [0.44] [3.16] [0.27]
Notes. GMM-SYS regressions. Robust standard errors in brackets, p-values in parentheses. *** , ** and * denote statistical significance at the 1, 5 and 10% levels. Aid/GDP instrumented as in Dalgaard et al (2004).
18
Table 4, similar to Table 2, provides no support for the case that aid causes Dutch disease: in
Columns 3 and 6, for example, growth in sectors producing most of the exportables is shown
to be positively affected by aid, and with a marginal effect larger than in the overall economy.
Again it is the Industrial sector where the impact appears to be strongest These findings
strengthen our evidence on the absence of Dutch disease type of problems caused by aid,
because they turn out to be robust to the inclusion of the effects of changes in the RER and
other relevant financial variables.
A second interesting finding from Table 4 is the statistical significance of variables that
reflect the exposure of the aid-recipient economies to changes in the RER, because it can be
seen as suggestive evidence in support of positive balance-sheet effects in aid-recipient
economies. The currency composition of foreign debt is significant only in sectors that are
producing most of the exportable goods, suggesting that the positive balance-sheet effects are
more likely to benefit firms producing these (exportable) goods. When this is combined with
results from other studies showing that aid causes real appreciation, the results in Table 4
suggest that one reason for aid not creating Dutch disease type of problems might be that
firms in those economies benefit from (possibly aid-induced) appreciations of the RER, and
this might probably be partially due to having an important share of their debt denominated in
foreign currency.
This evidence also opens space for discussion and revision of the finding that RER
overvaluation has contractionary effects (as suggested for example by Shi, 2006), and tends
to support the importance of balance-sheet effects mentioned in the literature on the
contractionary effects of devaluations (see Frankel, 2005, for a recent survey on the topic).
V. Summary and Conclusion
This paper presents an empirical assessment of the hypothesis that aid is detrimental for
external competitiveness and growth in average labour productivity in the recipient countries.
This evidence is based on a sectoral decomposition of the effects of aid on aggregate growth,
and on an extension of the typical aid-growth econometric specification to control for the
effects of (a) changes in the RER and (b) financial characteristics of the debt in the different
sectors. The findings are robust to different specifications, conditioning factors, and the
endogenous nature of aid disbursements.
19
Our main results point to the absence of Dutch Disease effects: aid is found to have a positive
marginal effect on growth of output per worker, at the aggregate level, and in both the
tradable and the nontradable sectors. One possible explanation is the existence of idle
capacity in the recipient countries, which can help to promptly meet the increase in aggregate
demand caused by aid inflows. Another explanation, explored in the paper, is that Dutch
disease type of problems need not materialize in an aid-recipient economy because firms in
the tradable sector might benefit from an aid-induced RER appreciation. This would be the
case if their debt is denominated mostly in foreign currency. We find evidence supporting the
idea that the sectors producing most of the exportable goods indeed tend to benefit from a
real appreciation by having an important part of the debt denominated in foreign currency.
Taken together, the finding that aid may cause RER appreciation but not Dutch disease type
of problems, and the finding that the marginal effects of aid in countries with "bad" policies
and "weak" structural characteristics are close to zero but not negative, suggest that the
effectiveness of aid depends much more on the ability of donors to reduce the negative
incentives associated with the use of foreign aid in the recipient countries than on the ability
to control the macroeconomic type of problems supposedly undermining the effects of
foreign aid on growth.
In practice, our findings suggest that the success of the planned scaling-up of aid to the
poorest countries does not depend so much on whether the resources are spent or absorbed by
local governments (in the sense of Killick and Foster, 2007), nor on the limitations that
donors and agencies put on them to guarantee the right use of the aid resources, but rather on
whether it is possible to find a way to maintain incentives in the recipient countries and to
overcome structural bottlenecks such as low agricultural productivity in tropical areas.
20
References Adam, C. S. and D. L. Bevan (2006), "Aid and the Supply Side: Public Investment, Export
Performance, and Dutch Disease in Low-Income Countries", World Bank Economic
Review 20(2): 261-290.
Arellano, M. and S. Bond (1991), "Some Tests of Specification for Panel Data: Monte Carlo
Evidence and an Application to Employment Equations", Review of Economic Studies
58: 277-297.
Arellano, M. and O. Bover (1995). Another Look at the Instrumental Variables Estimation of
Error-Components Models. Journal of Econometrics 68: 29-51.
Berthélemy, J-C. (2006). Bilateral Donors' Interest vs. Recipients' Development Motives in
Aid Allocation: Do All Donors Behave the Same? Review of Development Economics
10(2): 179-194.
Blundell, R. and S. Bond (1998). Initial Conditions and Moments Restrictions in Dynamic
Panel Data Models. Journal of Econometrics 87: 115-143.
Bräutigam, D. and S. Knack (2004). Foreign Aid, Institutions, and Governance in Sub-
Saharan Africa. Economic Development and Cultural Change 52: 255-285.
Bourguignon, F. and M. Sundberg (2007). Aid Effectiveness – Opening the Black Box.
American Economic Review 97(2): 316-321.
Burnside, C. and D. Dollar (2000). Aid, policies and growth. American Economic Review 90:
847-868.
Chang, C., E. Fernández-Arias and L. Servén (1998). Measuring aid flows: A new approach..
World Bank Working Paper 2050.
Clemens, M., S. Radelet and R. Bhavnani (2004). Counting chickens when they hatch: The
short term effect of aid on growth. CGDEV Working Paper Number 44.
Dalgaard, C-J. and H. Hansen (2001). On aid, growth and good policies. Journal of
Development Studies 37(6): 17-41.
Dalgaard, C-J., H. Hansen and F. Tarp (2004). On the empirics of foreign aid and growth",
The Economic Journal 114: 191-216.
de Renzio, P. (2007). Paved with Good Intentions? The role of aid in reaching the
Millennium Development Goals. African Affairs 106(422): 133-140.
Djankov, S., J.G. Montalvo, and M. Reynal-Querol (2006). The curse of aid. Universitat
Pompeu Fabra Working Paper 870.
21
Elbadawi, I.A., L. Kaltani and K. Schmidt-Hebbel (2007). Post-conflict aid, real exchange
rate adjustment, and catch-up growth. World Bank Policy Research Working Paper
4187.
Easterly, W. (2007). Was Development Assistance a Mistake? American Economic Review
97(2): 328-332.
Easterly, W. and R. Levine (1997). Africa's growth tragedy: Policies and ethnic divisions.
Quarterly Journal of Economics 112(4): 1203-1250.
Feeny, S. and B. Ouattara (2007). What type of growth does foreign aid support? Applied
Economics Letters 14.
Foster, M. and T. Killick (2007). What Would Doubling Aid do for Macroeconomic
Management in Africa? Development Policy Review 25: 167-192.
Frankel, J.A. (2005). Mundell-Fleming Lecture: Contractionary currency crashes in
developing countries. IMF Staff Papers 52(2): 149-152.
Gallup, J.L., J.D. Sachs and A.D. Mellinger (1999). Geography and Economic Development.
International Regional Science Review 22(2): 179-232.
Gupta, S., R. Powell and Y. Yang (2006). Macroeconomic challenges of scaling up aid to
Africa. IMF publications.
Hansen, H. and F. Tarp (2001). Aid and Growth Regressions. Journal of Development
Economics 64(2): 547-570.
Hansen, H. and F. Tarp (2000). Aid Effectiveness Disputed. Journal of International
Development 12: 375-398.
Knack, S. and P. Keefer (1995). Institutions and economic performance: Cross-country tests
using alternative institutional measures. Economics & Politics 7: 207-227.
Killick, T. and M. Foster (2007). The Macroeconomics of Doubling Aid to Africa and the
Centrality of the Supply Side. Development Policy Review 25(2): 167-192.
Masters, W. and K. Wiebe (2000). Climate and agricultural productivity. Center for
International Development WP, Harvard University.
Nkusu, M. (2004). Aid and the Dutch Disease in Low--Income Countries: Informed
Diagnoses for Prudent Prognoses. IMF working papers, WP/04/49.
Nunnenkamp, P. and R. Thiele (2006). Targeting Aid to the Needy and Deserving: Nothing
But Promises? World Economy 29: 1177-1201.
Prati, A. and T. Tressel (2006). Aid Volatility and Dutch Disease: Is There a Role for
Macroeconomic Policies? IMF Working Paper.
22
Prati, A., R. Sahay and T. Tressel (2003). Is There a Case for Sterilizing Foreign Aid
Inflows? IMF, mimeo.
Rajan, R.G. and A. Subramanian (2008). Aid and growth: What does the cross-country
evidence really show? Review of Economics and Statistics 90(4): 643-665.
Rajan, R.G. and A. Subramanian (2007) Does Aid Affect Governance? American Economic
Review 97(2): 322-327.
Rajan, R.G. and A. Subramanian (2005). What undermines aid's impact on growth? IMF
working papers, WP/05/126.
Roodman, D. (2007a). The Anarchy of Numbers: Aid, Development, and Cross-country
Empirics. World Bank Economic Review 21: 255-277.
Roodman, D. (2007b). A short note on the problem of too many instruments. CGDEV
Working Paper 125.
Shi, J. (2006). Are Currency Appreciations Contractionary in China? NBER Working Paper
No. 12551.
Svensson, J. (2000). Foreign aid and rent-seeking. Journal of International Economics 51:
437-461.
Tica, T. and I. Družić (2006). The Harrod-Balassa-Samuelson Effect: A Survey of Empirical
Evidence. Working Paper 06-07, University of Zagreb.
UCDP/PRIO (2006). UCDP/PRIO Armed Conflicts Dataset, Centre for the Study of Civil
War at International Peace Research Institute, Oslo (PRIO) & Uppsala Conflict Data
Program (UCDP) at Department of Peace and Conflict Research, Uppsala University,
http:\\www.prio.no
23
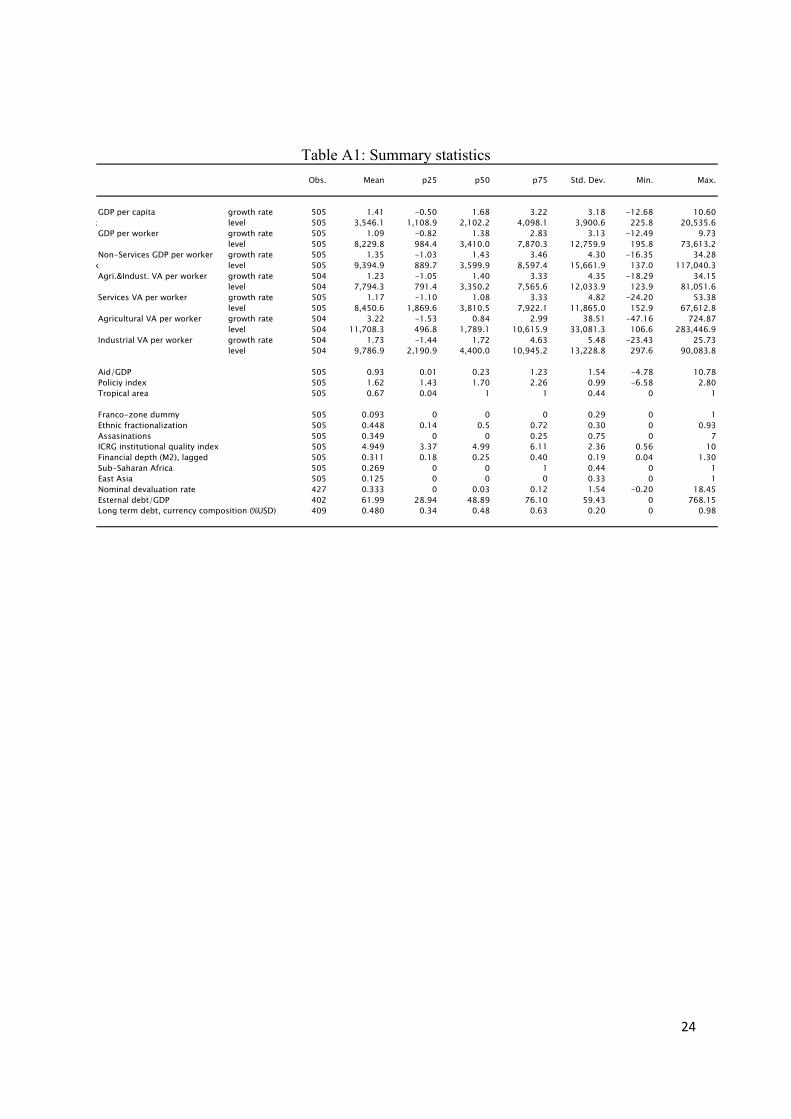
Table A1: Summary statistics Obs. Mean p25 p50 p75 Std. Dev. Min. Max.
GDP per capita growth rate 505 1.41 -0.50 1.68 3.22 3.18 -12.68 10.60k level 505 3,546.1 1,108.9 2,102.2 4,098.1 3,900.6 225.8 20,535.6
GDP per worker growth rate 505 1.09 -0.82 1.38 2.83 3.13 -12.49 9.73level 505 8,229.8 984.4 3,410.0 7,870.3 12,759.9 195.8 73,613.2
Non-Services GDP per worker growth rate 505 1.35 -1.03 1.43 3.46 4.30 -16.35 34.28k level 505 9,394.9 889.7 3,599.9 8,597.4 15,661.9 137.0 117,040.3Agri.&Indust. VA per worker growth rate 504 1.23 -1.05 1.40 3.33 4.35 -18.29 34.15
level 504 7,794.3 791.4 3,350.2 7,565.6 12,033.9 123.9 81,051.6Services VA per worker growth rate 505 1.17 -1.10 1.08 3.33 4.82 -24.20 53.38
level 505 8,450.6 1,869.6 3,810.5 7,922.1 11,865.0 152.9 67,612.8Agricultural VA per worker growth rate 504 3.22 -1.53 0.84 2.99 38.51 -47.16 724.87
level 504 11,708.3 496.8 1,789.1 10,615.9 33,081.3 106.6 283,446.9Industrial VA per worker growth rate 504 1.73 -1.44 1.72 4.63 5.48 -23.43 25.73
level 504 9,786.9 2,190.9 4,400.0 10,945.2 13,228.8 297.6 90,083.8
Aid/GDP 505 0.93 0.01 0.23 1.23 1.54 -4.78 10.78Policiy index 505 1.62 1.43 1.70 2.26 0.99 -6.58 2.80Tropical area 505 0.67 0.04 1 1 0.44 0 1
Franco-zone dummy 505 0.093 0 0 0 0.29 0 1Ethnic fractionalization 505 0.448 0.14 0.5 0.72 0.30 0 0.93Assasinations 505 0.349 0 0 0.25 0.75 0 7ICRG institutional quality index 505 4.949 3.37 4.99 6.11 2.36 0.56 10Financial depth (M2), lagged 505 0.311 0.18 0.25 0.40 0.19 0.04 1.30Sub-Saharan Africa 505 0.269 0 0 1 0.44 0 1East Asia 505 0.125 0 0 0 0.33 0 1Nominal devaluation rate 427 0.333 0 0.03 0.12 1.54 -0.20 18.45Esternal debt/GDP 402 61.99 28.94 48.89 76.10 59.43 0 768.15Long term debt, currency composition (%USD) 409 0.480 0.34 0.48 0.63 0.20 0 0.98
24
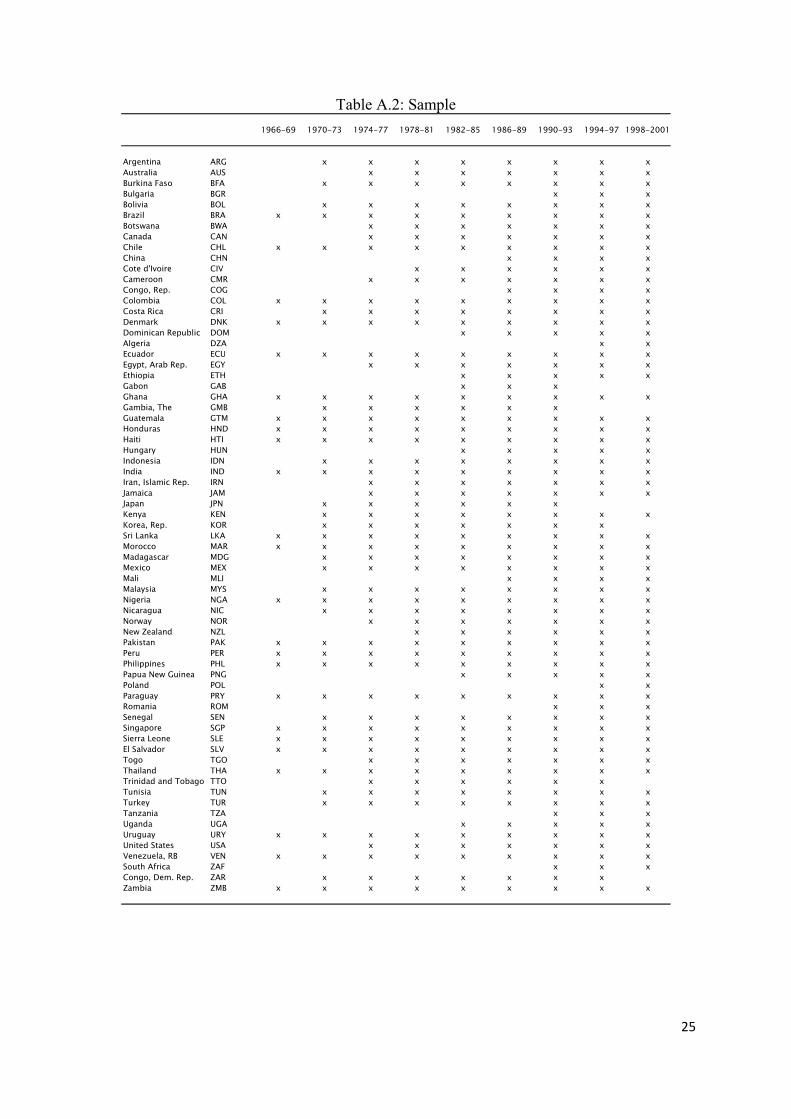
Table A.2: Sample 1966-69 1970-73 1974-77 1978-81 1982-85 1986-89 1990-93 1994-97 1998-2001
Argentina ARG x x x x x x x xAustralia AUS x x x x x x xBurkina Faso BFA x x x x x x x xBulgaria BGR x x xBolivia BOL x x x x x x x xBrazil BRA x x x x x x x x xBotswana BWA x x x x x x xCanada CAN x x x x x x xChile CHL x x x x x x x x xChina CHN x x x xCote d'Ivoire CIV x x x x x xCameroon CMR x x x x x x xCongo, Rep. COG x x x xColombia COL x x x x x x x x xCosta Rica CRI x x x x x x x xDenmark DNK x x x x x x x x xDominican Republic DOM x x x x xAlgeria DZA x xEcuador ECU x x x x x x x x xEgypt, Arab Rep. EGY x x x x x x xEthiopia ETH x x x x xGabon GAB x x xGhana GHA x x x x x x x x xGambia, The GMB x x x x x xGuatemala GTM x x x x x x x x xHonduras HND x x x x x x x x xHaiti HTI x x x x x x x x xHungary HUN x x x x xIndonesia IDN x x x x x x x xIndia IND x x x x x x x x xIran, Islamic Rep. IRN x x x x x x xJamaica JAM x x x x x x xJapan JPN x x x x x xKenya KEN x x x x x x x xKorea, Rep. KOR x x x x x x xSri Lanka LKA x x x x x x x x xMorocco MAR x x x x x x x x xMadagascar MDG x x x x x x x xMexico MEX x x x x x x x xMali MLI x x x xMalaysia MYS x x x x x x x xNigeria NGA x x x x x x x x xNicaragua NIC x x x x x x x xNorway NOR x x x x x x xNew Zealand NZL x x x x x xPakistan PAK x x x x x x x x xPeru PER x x x x x x x x xPhilippines PHL x x x x x x x x xPapua New Guinea PNG x x x x xPoland POL x xParaguay PRY x x x x x x x x xRomania ROM x x xSenegal SEN x x x x x x x xSingapore SGP x x x x x x x x xSierra Leone SLE x x x x x x x x xEl Salvador SLV x x x x x x x x xTogo TGO x x x x x x xThailand THA x x x x x x x x xTrinidad and Tobago TTO x x x x x xTunisia TUN x x x x x x x xTurkey TUR x x x x x x x xTanzania TZA x x xUganda UGA x x x x xUruguay URY x x x x x x x x xUnited States USA x x x x x x xVenezuela, RB VEN x x x x x x x x xSouth Africa ZAF x x xCongo, Dem. Rep. ZAR x x x x x x xZambia ZMB x x x x x x x x x
25


