Embed Size (px)
Citation preview

River-induced particle distribution in the northwestern Black Sea
(September 2002 and 2004)
A. P. Karageorgis,1 V. H. Kourafalou,2 C. Anagnostou,1 K. P. Tsiaras,1 D. E. Raitsos,1
V. Papadopoulos,1 and A. Papadopoulos1
Received 23 April 2009; revised 12 August 2009; accepted 14 September 2009; published 2 December 2009.
[1] Observations from two comprehensive oceanographic surveys on the northwesternBlack Sea are analyzed to reveal the hydrological characteristics of the shelf area aroundthe Danube delta in relation to particulate matter dynamics. These processes have broaderimplications on flows through the adjacent complex strait system. The surveys cover botha period of high (September 2002) and low (September 2004) discharge of the DanubeRiver. The resulting low-salinity waters generally occupied the upper 10–15 m within the20–30 m thick warm layer that was separated by deeper cooler waters through a sharpthermocline. The buoyant plume was influenced by the discharge conditions and theprevailing wind patterns. The plume structure was identified using in situ bottle data,continuous beam transmission and fluorescence profiles, and satellite remotely senseddata. Particulate matter concentration values correlated with low-salinity riverine watersand their maxima were recorded in the immediate vicinity of the Danube branches,decreasing rapidly toward the open sea. The preferred particle transport pathway in 2002was along a narrow strip near the coast, with a south-southwest direction, favored by thestrong northeasterlies which predominated prior to the cruise. Low-salinity waters andriverine particles in 2004 were characterized by mostly offshore removal, attributed tocalmer northwesterlies prior to the survey. Changes in ambient stratification due towind-driven vertical displacements of the seasonal thermocline appeared to also influencethe plume dynamics. The downwelling (upwelling) conditions that prevailed in 2002(2004) were revealed in both the in situ vertical profile temperature measurements and thesatellite-derived sea surface temperature patterns.
Citation: Karageorgis, A. P., V. H. Kourafalou, C. Anagnostou, K. P. Tsiaras, D. E. Raitsos, V. Papadopoulos, and A. Papadopoulos
(2009), River-induced particle distribution in the northwestern Black Sea (September 2002 and 2004), J. Geophys. Res., 114, C12003,
doi:10.1029/2009JC005460.
1. Introduction
[2] The northwestern Black Sea receives freshwater frommajor European rivers, namely, the Danube, Dnieper, andDniester, and the smaller southern Bug (Figure 1). TheDanube River is about 2900 km long, and its catchmentcovers 800,000 km2. It is the second largest river basin inEurope, after the Volga. Its annually averaged dischargecorresponds to approximately 6500 m3 s�1 with peaksgenerally reaching �10,000 m3 s�1. The Danube contrib-utes �60% of the freshwater discharge to the Black Sea.The Dnieper River has a total length of 2285 km, and itsbasin covers 504,000 km2, while the Dniester River has alength of 1380 km and its basin covers 72,100 km2. Thesetransboundary rivers supply substantial amounts of partic-
ulate matter into the Black Sea, although extensive dam-ming over the past decades has resulted in a dramaticdecrease. For example, Panin and Jipa [2002] have esti-mated that the Danube River average annual suspendedsediment discharge dropped by 50–70% from values reach-ing 2140 kg s�1 (67.5 � 106 t yr�1) prior to the constructionof the Iron Gate dams I (in 1972) and II (in 1984).[3] Several field study programs have yielded data sets in
the Black Sea interior and shelf areas. Both biochemical andquasi-synoptic hydrographic [Oguz et al., 1992, 1993, 1994;Ozsoy and Unluata, 1998] field data over the entire BlackSea were acquired within the ‘‘Cooperative Marine ScienceProgram’’ (CoMSBlack) project [Unluata et al., 1994]through a series of cruises in the early 1990s that focusedon open sea processes. In the framework of the multidisci-plinary European Union (EU) projects European River-Ocean System (EROS)–2000 and EROS-21, two largeexpeditions in summer 1995 and spring 1997 covered thenorthwestern Black Sea shelf, especially the ‘‘Danube-influenced’’ area, as well as some central basin open seaareas [Lancelot et al., 2002; Stanev et al., 2002]. Several
JOURNAL OF GEOPHYSICAL RESEARCH, VOL. 114, C12003, doi:10.1029/2009JC005460, 2009ClickHere
for
FullArticle
1Hellenic Centre for Marine Research, Anavyssos, Greece.2Division of Meteorology and Physical Oceanography, Rosenstiel
School of Marine and Atmospheric Science, University of Miami, Miami,Florida, USA.
Copyright 2009 by the American Geophysical Union.0148-0227/09/2009JC005460$09.00
C12003 1 of 16

field investigations were carried out focusing on the inor-ganic nutrient transformations in relation to phytoplanktondynamics [Ragueneau et al., 2002]; the microbial degrada-tion of organic matter [Becquevort et al., 2002] and itscharacterization [Saliot et al., 2002]; the abundance of thegelatinous carnivores, Mnemiopsis and Aurelia [Weisse etal., 2002]; and trace metals levels in the Danube river plume[Guieu and Martin, 2002]. However, the above data sets didnot yield detailed data on properties and dispersal of river-discharged waters and particulate load near the Danubedelta and within the immediate vicinity of the buoyantplume. Consequently, despite studies of particulate matterdynamics in the Danube-influenced area in terms of partic-ulate inputs of nutrients (mainly phosphorous) and pollu-tants (along with their biogeochemical implications) whichadsorb strongly on particles [Guieu et al., 1998; Tankere etal., 2001; Guieu and Martin, 2002; Lancelot et al., 2002],there is a lack of information regarding the marginaldispersal patterns of river-borne materials and their relationto hydrological features. Some studies on the physical
characteristics of the Danube River plume and resultingcirculation have been carried out by Kourafalou and Stanev[2001], Beckers et al. [2002], Yankovsky et al. [2004], andKourafalou et al. [2005].[4] Within the framework of the EU-funded project
‘‘Nutrient Management in the Danube Basin and its Impacton the Black Sea’’ (DANUBS), two oceanographic cruiseswere carried out in the NW sector of the Black Sea. Themain objectives of the surveys and the data analysis presentedherein were to further elucidate the dynamics of the DanubeRiver plume, by combining optical (transmissometerreadings) and bottle data (particulate matter concentration)to study the origin and fate of particulate matter in the area,as well as its horizontal and vertical distribution patterns inrelation to hydrological features. Particulate matter dynam-ics and optical properties of seawater have been studied inthe northeastern and eastern Black Sea [Nyffeler et al., 2001;Mankovskii and Solovev, 2003; Mankovskii et al., 2003]but not in the NW sector of the Black Sea. Hence, this workpresents new data for the region where the major rivers flow
Figure 1. The drainage basin of the Black Sea. Subbasins and the watershed are illustrated in dashedred lines. A red rectangle shows the study area. National borders are illustrated in dash-dotted black lines.The red triangles mark discharge areas for (from south to north) the Danube River, the Dniester River,and the neighboring southern Bug and Dnieper Rivers. The red circles mark the Bosphorus Strait betweenthe Black Sea and the Marmara Sea (MS) and the Dardanelles Strait between the Marmara Sea and theAegean Sea (AS).
C12003 KARAGEORGIS ET AL.: RIVER-INDUCED PARTICLE DISTRIBUTION
2 of 16
C12003

and constitute the largest source of terrigenous particulatesin the Black Sea.
2. Regional Setting of the Northwestern Black Sea
2.1. Morphology
[5] The NW continental shelf of the Black Sea extendsfrom the coastline to the shelf edge, at depths of 130–200 mand its maximum width is 220 km. It occupies most of thewestern Black Sea (taken here as the west of the narrowestbasin width of about 250 km, between the Crimea peninsulaand the Turkish coast). The bottom relief is smooth, result-ing from the continuous sediment input of the major riversflowing into this sector of the Black Sea. The shelftopography is complicated by the presence of the Danubedelta, the coastline bending north of the delta, coastlineirregularities due to sharp capes, and the narrowing of theshelf width immediately south of the Danube River.
2.2. Sources of Particulate Matter
[6] The major sources of freshwater and particulatematter input in the northwestern Black Sea are the Danube,Dnieper, southern Bug, and Dniester rivers (Figure 1). TheDanube River mouth is a large deltaic area with manybranches, the main ones being (from the north to the south)the Chilia, Sulina, and Gheorghe (Figure 2); many second-ary branches are still in operation or have dried out.[7] Long-term suspended sediment discharges of the
Danube River exhibited a dramatic decrease after the
1970s because of the construction of the Iron Gates dams.Mikhailov and Mikhailova [2008] have estimated that theDanube River sediment load was 52.4 � 106 t yr�1 beforeflow regulation and 36.3 � 106 t yr�1 after flow regulation,which corresponds to a decrease of �31%. Their number ismuch smaller than the 50–70% decrease estimated byPanin and Jipa [2002], but in both cases a significantreduction in sediment discharge is supported.
2.3. Hydrological Characteristics
[8] The Black Sea can be viewed as a component of theMediterranean Sea system, with particular dynamical char-acteristics that are dictated by the delicate connection withthe Mediterranean basin. The link is established through thenarrow Strait of Bosphorus (�1 km), which imposes astrong hydraulic control on the inflow of salty easternMediterranean water [Stanev et al., 2001] and outflow offresher Black Sea water [Gregg and Oszoy, 1999] throughthe adjacent Sea of Marmara that connects the Aegean andBlack seas (Figure 1). The vast area of the Black Sea(423,000 km2) and the restricted water exchange atBosphorus result in unique hydrodynamic and biogeochem-ical conditions in this basin.[9] The Black Sea circulation features a complicated
spatial structure and is characterized by strong seasonal,synoptic, and interannual variabilities. The upper 500 mlayer is dominated by the Main Rim Current (MRC) jet,which runs along the continental slope with mean velocitiesup to 0.5–0.7 m s�1. On the seaward side of the meandering
Figure 2. Study area map and bathymetry. Stations occupied during September 2002 are in blue circles,stations occupied during September 2004 are in red circles. The Danube River main branches are(1) Chilia, (2) Sulina, and (3) Gheorghe.
C12003 KARAGEORGIS ET AL.: RIVER-INDUCED PARTICLE DISTRIBUTION
3 of 16
C12003

MRC, one finds subbasin quasi-stationary cyclonic gyres,whereas at the periphery of the MRC (shoreward), anticy-clonic eddies of mesoscale size occur [Tuzhilkin, 2008]. Themost pronounced characteristic in the Black Sea hydrody-namical structure is the remarkable stability in stratification.A thin upper layer with low salinity (generally not exceeding�18.5) is superimposed on the cold intermediate layer,while most of the water column below is occupied by adeep water mass. The stable stratification is largely due toriver runoff, which provides a continuous source of fresh-water, diluting the upper basin layers and overcoming thesupply of salt through Bosphorus. One of the direct con-sequences of restricted mixing between the brackish surfacelayers and the deeper waters is the prevailing anoxicconditions, which make the Black Sea the world’s largestanoxic basin. The majority of freshwater discharge takesplace on the northwestern shelf, through strong flow rates(mainly from the Danube runoff). The low-salinity watersand associated sediments, nutrients and pollutants have asignificant impact in the hydrodynamic and biogeochemicalprocesses of the northwestern Black Sea, while governingthe shelf to open sea exchanges in the region [e.g., Lancelotet al., 2002].[10] The circulation on the northwestern Black Sea shelf
is governed by buoyancy-driven flows due to river input(dominated by Danube runoff), subject to wind-drivenadvection in the upper layers and topographic controls[Kourafalou et al., 2005]. The seasonal variability in theriver discharge and wind-forcing has a pronounced effect onthe distribution of low-salinity waters and chlorophyllabundance on this relatively broad shelf, as discussed byTsiaras et al. [2008]. They employed Sea-viewing WideField-of-view Sensor (SeaWiFS) data and a coupled bio-physical model to show two prevailing patterns on thetransport of nutrient-rich, low-salinity waters imported
through the Danube delta: an along-shelf distribution favor-ing coastal advection toward south (prevailing in winter)and an offshore tendency favoring northeastward distribu-tion with the potential for reaching the basin interior(prevailing in summer). Yankovsky et al. [2004] discussedthe influence of the basin-wide MRC on the southwardadvection of Danube waters. In addition, topographic fea-tures can influence the buoyancy-driven coastal current,such as the convergence of isobaths around capes, whichintensifies processes associated with water and sedimentdispersal around coastal headlands [Bastos et al., 2002,2003]. Eddy features on the northwestern Black Sea shelfhave been found to retain riverine waters near the coast, thusenhancing eutrophication effects [Gregoire et al., 1998].
2.4. Wind Regime During September 2002 and 2004
[11] The northerly, northeasterly, and easterly winds pre-dominate in the northwestern Black Sea in the wintertimeand generally throughout the entire year [Kosarev et al.,2008]. However, southerly wind events are also evident insynoptic time scales, as shown in the time series around thecruise periods in Figure 3. Prior and during the September2002 cruise (6–10 September), the winds were blowingfrom the northeast and then from the northwest, with speeds5–10 m s�1. The generally stronger northeasterly winds(which are downwelling favorable for the study area) weresustained for several days prior to the cruise, with a slightshift toward the southeast during the cruise period.The situation was quite different during the 2004 cruise(2–6 September), where several shifts in wind directiontook place both before and during the cruise. In particular,periods of strong, upwelling favorable winds (southerlyand westerly) alternated with periods of northerly windsduring a 10 day period before the survey, while a 2 day
Figure 3. Time series of wind vector variability at a point near the Danube delta during the time of thesurveys (6–10 September 2002 and 2–6 September 2004, marked by vertical lines). The wind fieldaround the delta was generally spatially homogeneous.
C12003 KARAGEORGIS ET AL.: RIVER-INDUCED PARTICLE DISTRIBUTION
4 of 16
C12003

period of light winds was followed by strong northerliesduring the survey.
2.5. Danube River Discharge
[12] The Danube River runoff constitutes �60% of thebulk freshwater inputs of the Black Sea (208 km3 yr�1),while the Dnieper and Dniester contribute 43.4 km3 yr�1
(12%) and 9.1 km3 yr�1 (2.4%), respectively [Mikhailovand Mikhailova, 2008].[13] Constantinescu and Menting [2000] and Van Gils et
al. [2005] provided data and model-based estimates of theDanube River discharge and inorganic suspended matter(ISM) concentration. As seen in a multiyear average ofwater discharge records (1994–2004; Figure 4), the high-flow period of the Danube River generally lasts from Marchto June (largely due to snowmelt), the low-flow period lastsfrom July to October, and secondary maxima occur in theautumn-winter period because of rainfall induced floodsfrom November to February. Also shown in Figure 4, theISM loads followed the water discharge patterns for 2002and 2004.[14] During the sampling period of 2002, the Danube
discharge was �8000 m3 s�1, which was actually close tothe highest for that year and anomalously high for earlySeptember (Figure 4a). The Danube floods which influenced
central Europe in mid-August 2002 (reaching�9000 m3 s�1)had a rapid decrease and by the end of September thedischarge was �4000 m3 s�1. Similar patterns were ob-served in the ISM load. During the 2002 cruise, the ISM loadvaried from 150 to 210 kg s�1 (Figure 4b). During the 2004cruise, the river discharge was much lower (�4000 m3 s�1),which was near the minimum discharges observed in 2004(Figure 4a) and in close agreement with the long-termaverage. The ISM load during the latter campaign was�12.5 kg s�1, i.e., an order of magnitude less than thesampling period of 2002 (Figure 4b). This signifies thatduring the two campaigns sampling was made under dif-ferent flow and ISM load conditions of the Danube River.
3. Methodology
[15] The stations (Figure 2) were chosen to map thetransport of Danube waters and sediment particles aroundthe delta, capturing both coastal and offshore distributions.The station depths were generally shallower than 100 m,except for 2 offshore stations that reached 211 m depth. Thehorizontal mapping was accompanied by detailed verticalprofiles, employing conductivity-temperature-depth (CTD),transmissometer and fluorimeter instruments, as well asbottle samples.
Figure 4. (a) Danube River discharge (m3 s�1) during 2002, 2004, and a multiyear average; (b) DanubeRiver ISM load (kg s�1) during 2002 and 2004. Survey periods are marked by black rectangles.
C12003 KARAGEORGIS ET AL.: RIVER-INDUCED PARTICLE DISTRIBUTION
5 of 16
C12003
[16] During the field work, routine cleaning of the trans-missometer lenses occurred before each cast, and an aircalibration was performed at the beginning of each cruise.The beam attenuation coefficient (c, m�1) was archived atthe same time, computed according to the equation:
c ¼ � 1
L� ln LT=100ð Þ; ð1Þ
where L is the transmissometer’s path length (m), and LT islight transmission in percent units.[17] The CTD system was also equipped with a Chelsea
AquaTracka III fluorimeter and an oxygen sensor. An
altimeter provided accurately the distance of the rosetteand CTD system from the bottom, thus allowing continuoussampling down to 1–2m above bottom (mab). Subsequently,all stations (metadata) obtained during the cruise and allmeasured parameters were transferred into Ocean DataView (ODV) software for archiving and further processing(R. Schlitzer, 2008, available at http://odv.awi.de). Variablegridding was the interpolation algorithm applied for alldistribution plots.
3.1. September 2002 Cruise
3.1.1. CTD and Transmissometry[18] During the cruise, 35 stations (Figure 2) were occu-
pied between 6 and 10 September 2002 on board the R/VAegaeo. Standard CTD measurements were obtained with aSea-Bird Electronics 11plus CTD deck unit, sampling at24 Hz. Light transmission measurements have beenobtained using two models of transmissometers both emit-ting at the red part of the spectrum: (1) a 10 cm path lengthby SeaTech (670 nm) and (2) a 25 cm by Chelsea (660 nm).SeaTech instruments have been used widely for the explo-ration of optical turbidity variations in nepheloid layers[e.g., Spinrad et al., 1983; Gardner et al., 1985; McCaveet al., 2001] and, moreover, to relate light attenuation andparticulate matter concentration [Baker and Lavelle, 1984;Gardner et al., 1985; Bishop, 1986; Moody et al., 1987;Karageorgis and Anagnostou, 2001, 2003].3.1.2. Particulate Matter Concentration[19] Seawater from various depths (high, low optical
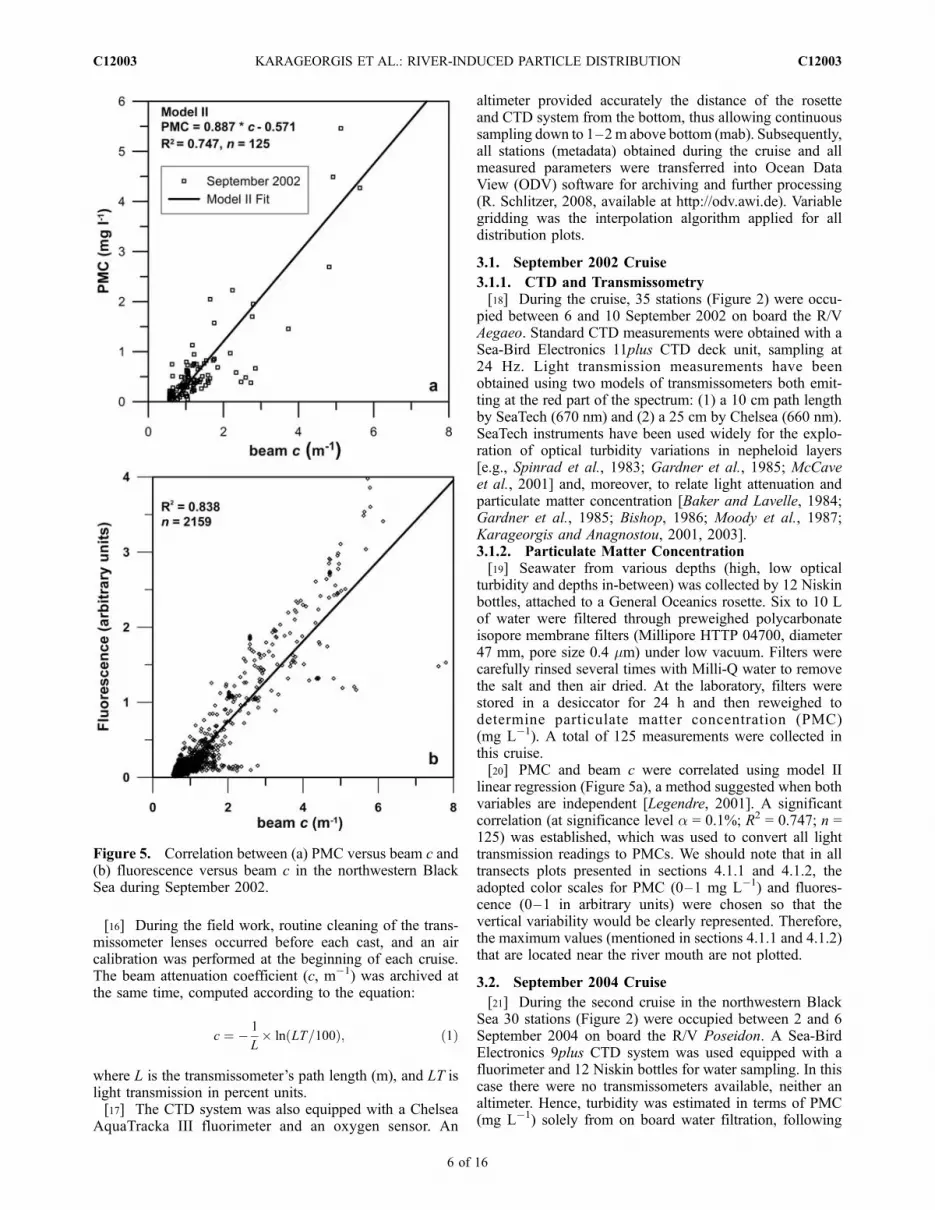
turbidity and depths in-between) was collected by 12 Niskinbottles, attached to a General Oceanics rosette. Six to 10 Lof water were filtered through preweighed polycarbonateisopore membrane filters (Millipore HTTP 04700, diameter47 mm, pore size 0.4 mm) under low vacuum. Filters werecarefully rinsed several times with Milli-Q water to removethe salt and then air dried. At the laboratory, filters werestored in a desiccator for 24 h and then reweighed todetermine particulate matter concentration (PMC)(mg L�1). A total of 125 measurements were collected inthis cruise.[20] PMC and beam c were correlated using model II
linear regression (Figure 5a), a method suggested when bothvariables are independent [Legendre, 2001]. A significantcorrelation (at significance level a = 0.1%; R2 = 0.747; n =125) was established, which was used to convert all lighttransmission readings to PMCs. We should note that in alltransects plots presented in sections 4.1.1 and 4.1.2, theadopted color scales for PMC (0–1 mg L�1) and fluores-cence (0–1 in arbitrary units) were chosen so that thevertical variability would be clearly represented. Therefore,the maximum values (mentioned in sections 4.1.1 and 4.1.2)that are located near the river mouth are not plotted.
3.2. September 2004 Cruise
[21] During the second cruise in the northwestern BlackSea 30 stations (Figure 2) were occupied between 2 and 6September 2004 on board the R/V Poseidon. A Sea-BirdElectronics 9plus CTD system was used equipped with afluorimeter and 12 Niskin bottles for water sampling. In thiscase there were no transmissometers available, neither analtimeter. Hence, turbidity was estimated in terms of PMC(mg L�1) solely from on board water filtration, following
Figure 5. Correlation between (a) PMC versus beam c and(b) fluorescence versus beam c in the northwestern BlackSea during September 2002.
C12003 KARAGEORGIS ET AL.: RIVER-INDUCED PARTICLE DISTRIBUTION
6 of 16
C12003

the procedure described above. Because of the absence ofan altimeter, the casts stopped �5 mab, to avoid touchingthe seabed.
3.3. Satellite Imagery
[22] Ocean color satellite data are a good indicator ofplume variability due to their pigment content. SeaWiFScurrent reprocessed version data were acquired from theNASA OceanColor Web site (available at http://oceancolor.gsfc.nasa.gov/). The data were level 3, 8 day standardproducts (9 km � 9 km resolution) of the near-surfacechlorophyll (Chl a) concentration (mg m�3), estimatedusing the Ocean Chlorophyll 4 version 4 (OC4v4) algorithm[O’Reilly et al., 1998]. Two 8 day data composites wereobtained for the periods 6–13 September 2002 and28 August to 4 September 2004.[23] In optically complex case II waters, Chl a may not
readily be distinguished from particulate matter and/oryellow substances (dissolved organic matter), so globalchlorophyll algorithms (such as OC4v4) may be less reli-able [International Ocean-Colour Coordinating Group,2000]. Thus, it has to be mentioned that the Chl a algorithmused in the analysis may be highly influenced (overestimat-
ing Chl a) by the factors aforementioned, especially in thecoastal waters of the Black Sea. However, even if the actualvalues may differ from reality, what is really tested here is ifin situ fluorescence data and satellite-derived Chl a followthe same spatial distribution patterns. Relevant studies in theBlack Sea using satellite remote sensing include assessmentof water constituents by Barale et al. [2002] and ofphytoplankton dynamics as by Tsiaras et al. [2008] andMcQuatters-Gollop et al. [2008].[24] The Moderate Resolution Imaging Spectroradiometer
(MODIS) data of the near surface sea surface temperature(SST) (�C) were ordered from the NASA OceanColorwebsite in Hierarchical Data Format. The analysis involvedthe processing of the global level 3, 8 day composite products(9 km by 9 km resolution) for the western Black Sea.
4. Results and Discussion
4.1. Distribution of Particulate Matter in theNorthwestern Black Sea
[25] Spatial distribution patterns of particulate matter arediscussed hereafter in terms of PMC variations at selecteddepth layers, namely at 3 m (surface nepheloid layer (SNL))
Figure 6. Near-surface distributions of (a) temperature, (b) salinity, (c) PMC, and near-bottomdistribution of (d) PMC in the northwestern Black Sea during September 2002.
C12003 KARAGEORGIS ET AL.: RIVER-INDUCED PARTICLE DISTRIBUTION
7 of 16
C12003

and a few meters above bottom (benthic nepheloid layer(BNL)), as well as along transects. Temporal distribution isdifferentiated between September 2002 and September2004 sampling periods. Temperature, salinity, and fluores-cence variations are also presented and compared againstthe PMC distribution patterns.4.1.1. September 2002[26] The observed patterns of near surface (top, �3 m)
temperature, salinity, and PMC, along with the near-bottomdistribution of PMC, are presented in Figure 6. The tem-perature distribution is characterized by warm waters(22.07–23.23�C). Relatively lower temperatures appear infront of the three branches of the Danube River, but in therest of the area temperature differences are minor, with theexception of the northeastern sector that is occupied byrelatively colder waters. By contrast, the salinity variation(Figure 6b) is high (9.08–17.85). Low salinities prevail at anarrow band in front of the Danube River, which becomesbroader at the coastal area south-southwest of the delta. Theoffshore salinities are substantially increased. From thesalinity distribution, it can be inferred that riverine watersmove toward the south-southwest.[27] The PMC distribution at the SNL varies between
0.31 and 5.35 mg L�1 (mean 0.58 mg L�1; Figure 6c). Thehighest PMC value appears at the station near the southernbranch of the Danube (Gheorghe) and the next high PMCarea lies at the south-southwest of the Danube. PMCsdecrease rapidly as we move offshore (<0.5 mg L�1). TheBNL is lesser than the SNL in terms of PMCs (range 0.02–1.31 and mean 0.29 mg L�1) and the highest values appearbetween the Sulina and Gheorghe branches (Figure 6d).BNLs are generally attributed to resuspension of fine-grained surface sediment by wave-induced bottom currents[e.g., Gardner, 1989a, 1989b]. Intense resuspension nearriver mouths is related to the composition of prodeltaicsurface sediments, being recently deposited, unconsolidatedand probably deficient in organic matter that could bind thesediment and inhibit resuspension.
[28] In situ fluorescence values at the SNL vary between0.08 and 3.60 (mean 0.835) and exhibit high values in frontof the Sulina and Gheorghe branches, with an increasingtrend toward the south-southwest (Figure 7). Fluorescencevalues decrease rapidly in the offshore direction. Similarpatterns can be seen from the SeaWiFS Chl a composite,which confirm the in situ observations (Figure 7). High Chla concentrations appear in front of the southern Bug andDnieper river mouths (where in situ measurements wereabsent), but they are confined in a local plume that appearsdistinctly separated from the Danube plume.[29] A strong and significant correlation (at significance
level a = 0.1%; R2 = 0.838, n = 2159) between fluorescenceand beam c (Figure 5b) suggests that a high proportion ofthe suspended particles in the study area were probablybiogenic, i.e., phytoplankton. This is also supported bysimilarities in the distribution patterns of PMC (Figure 6c),survey-measured fluorescence and satellite-derived Chl a(Figure 7). Taking into consideration that September 2002was a period of high freshwater and ISM discharge(Figures 4a and 4b), we may infer that the signal of alloptical sensors (transmissometer, fluorimeter, and SeaWiFS)is highly influenced by the Danube River outflow. Inaddition, accompanying high nutrient inputs favor phyto-plankton abundance.[30] The vertical distribution of temperature, salinity,
PMC, and fluorescence are illustrated in the Sulina transect(Figure 8). The presence of an impressive thermocline and aplume area characterized by near-surface minimum valuesfor salinity and maximum values for PMC and fluorescenceare the predominant features. The upper 20–30 m areoccupied by warm water with temperature >20�C, while afew meters deeper, temperature sharply drops below 12�C(Figure 8a). The warm surface waters are slightly downw-elled near the coast, with the 20�C and 12�C isothermsintersecting the bottom at about 30 and 40 m, respectively.The other parameters (Figures 8b, 8c, and 8d) exhibit theirmain variability within a plume area extending about 40 kmoff the Sulina branch, penetrating down to 10–15 m only
Figure 7. Comparison of (a) survey measured fluorescence to (b) SeaWiFS Chl a (mg m�3), both averagedover the cruise period in the northwestern Black Sea during September 2002 (weekly composite of theSeaWiFS data closest to the survey period used).
C12003 KARAGEORGIS ET AL.: RIVER-INDUCED PARTICLE DISTRIBUTION
8 of 16
C12003

near the coast. The temperature-induced stratification ismaintained offshore, while the other parameters appearvertically homogeneous beyond the 40 km wide plume area(which does not exceed the 20 m isobath). In the case offluorescence, a subsurface narrow band of slightly increasedconcentrations (relative to the ambient minimum values)appears at 25–30 m depths following the thermoclinestructure.[31] Similar distributions of the above parameters were
observed at the Gheorghe transect (not shown). The plumebecame restricted to a narrower coastal band, within the40 m isobath, which in this transect was found only about20 km offshore. The plume also slightly deepened withlowest salinity and highest PMC waters found down to 8 mdepth, as opposed to 5 m depth in the Sulina transect. Thetemperature distribution remained similar to the Sulinatransect, but the downwelling zone somewhat intensified,as indicated by a slight increase in isotherm tilt (the 12�Cisotherm intercepted the bottom at 45 m). An area of coolerwaters (less than 8�C) was observed in the deeper part of thetransect, associated with the proximity to the shelf breakand, thus, interior basin water influence. Further south, theplume experienced a considerable widening, as shown inthe transects of Figure 9, across stations perpendicular to thecoast south of the delta. The abundance of low-salinitywaters, high PMC and fluorescence is much greater than
what was observed east of the delta. The plume influencedarea extends to about 40 km offshore (similar to Sulina) butwith a downward penetration to 15 m depth all the wayacross the transect. The tilt of the isobaths in the tempera-ture transect is greatly diminished, while near-surface tem-peratures are warmer, reaching 23.23�C. Transects at andsouth of 44.5�N (not shown) maintained the plume signal atthe upper part of the water column.4.1.2. September 2004[32] During this sampling period some CTD casts failed
to record from the upper 2–3 m of the water column andsome casts started from the 5 m depth. For this reason thedistribution of temperature, salinity, and fluorescence at theSNL (Figure 10) is represented from the first available record(top). The surface distribution of temperature (Figure 10a)shows relatively warm waters all over the sampling area(maximum 23.72�C). The lowest value (22.18�C) wasrecorded near the Gheorghe branch and toward the south-west. However, it is apparent that the upper part of the watercolumn was generally occupied by warm waters. Thesalinity distribution at the surface shows a different scheme,with low salinities occupying the northern sector of thestudy area (15.75–16.52), lowest values near the Sulina andGheorghe branches and to the southwest (minimum 11.91),and, finally, higher values in the southern sector of the studyarea (Figure 10b). From these observations it is evident that
Figure 8. (a) Temperature, (b) salinity, (c) PMC, and (d) fluorescence along (e) the Sulina transect inthe northwestern Black Sea during September 2002.
C12003 KARAGEORGIS ET AL.: RIVER-INDUCED PARTICLE DISTRIBUTION
9 of 16
C12003

riverine waters, characterized by low temperature and lowsalinity exhibited a prevailing pathway toward the south-southwest very close to the coastline. However, someindication of offshore spreading is also present, possiblyrelated to the brief wind relaxation period (Figure 3).[33] The particulate matter concentration was obtained by
bottle data during this cruise and the SNL corresponds to adepth of 3 m. The PMCs at the SNL range from 0.12 to2.86 mg L�1 (mean 0.49 mg L�1). The area of higher PMCsis observed in front of the Sulina branch and southwest of theGheorghe branch, always very close to the coast (Figure 10c).Moving offshore, PMCs decrease to minimum values.The BNL concentrations (Figure 10d) range from 0.02 to0.93 mg L�1 (mean 0.25 mg L�1). The highest BNL valueis recorded southwest of the Gheorghe branch, always veryclose to the coast, where the highest SNL is also observed(Figure 10c). Relatively high BNLs are observed in thenorth and northeastern sector of the study area. Compared tothe previous sampling period, the mean BNL values arevery similar (0.29 and 0.25 mg L�1 for 2002 and 2004,respectively.[34] Fluorescence values (minimum 0.329, maximum
3.196, mean 0.886) are similar to the ones observed duringthe 2002 cruise, and their distribution at the SNL (Figure 11a)indicates that the main high concentration area is developedin front of the Sulina branch and decreases offshore toward
the east. In situ observations are in agreement with thesatellite-derived Chl a (Figure 11b), which also providesmore detailed information showing relatively higher coastalChl a values both to the north and to the south of theDanube delta. In addition, a high Chl a concentration areaappears in front of the southern Bug and Dnieper rivermouths.[35] The vertical distribution of temperature along the
Gheorghe transect (Figure 12a) shows a very intense ther-mocline developed within the upper 20 m, where thetemperature is >20�C (reaching as high as 23.85�C) andthe waters below 30 m, where it decreases rapidly below12�C reaching �7�C near the bottom. Similarly to Septem-ber 2002, PMC and fluorescence exhibit their highest valuesnear the coast and decrease gradually offshore. By contrast,salinity exhibits lowest values in the coastal stations, and itincreases offshore throughout the water column.[36] The distributions are similar at the Sulina transect
(not shown) and at the Chilia transect (Figure 13). The maindifference is that the plume signal is diminished toward thenorth, although the vertical stratification is present in bothtemperature and salinity transects (Figures 13a and 13b),with a clear tendency for low-salinity waters to extendoffshore. Still, the coastal stations had higher salinity andlower PMC than the stations further south (Figure 13c),encouraging the hypothesis that the predominant transport
Figure 9. (a) Temperature, (b) salinity, (c) PMC, and (d) fluorescence along (e) a transect south of theDanube delta in the northwestern Black Sea, during September 2002.
C12003 KARAGEORGIS ET AL.: RIVER-INDUCED PARTICLE DISTRIBUTION
10 of 16
C12003

of plume waters was southward. Fluorescence at the Chiliatransect shows consistent maxima in the midwater column(Figure 13d), where the strong thermocline is developed. Asimilar pattern was observed in the 2002 cruise, along theSulina transect (Figure 8d), but during 2004 this feature wasmuch more intense. It is possible that a subsurface deepwater nutrient pool is responsible for the observed high Chla values along the pycnocline extending from coastal tooffshore waters. The subsurface Chl a maximum is a knownfeature of the Black Sea openwaters [Vedernikov andDemidov,1997; Tsiaras et al., 2008], but it cannot be verified throughthe current data set.
4.2. River Plume Dynamics
[37] We found that the distribution of the river-borneparticles was influenced by the seasonal thermocline andthe salinity of the coastal waters, which was controlled bythe transport of riverine waters. The magnitude of theDanube River runoff and the scale of the delta categorizeit as a ‘‘large-scale’’ discharge, where the effect of theEarth’s rotation is relevant [Garvine, 1987]. In the absence
of forcing mechanisms other than the buoyant dischargeitself, the plume will develop an anticyclonic bulge near thedischarge area and a coastal current in the direction ofKelvin wave propagation (southward for the Danube).Wind-forcing acts to enhance (oppose) this coastal currentif it is downwelling (upwelling) favorable, i.e., southward(northward) for the west Black Sea coast. This has beendiscussed by Kourafalou and Stanev [2001] and Kourafalouet al. [2005] for the Danube River plume and has beenobserved for many large river discharges [e.g., Masse andMurthy, 1992; Munchow and Garvine, 1993; Hickey et al.,1998; Soares et al., 2007].[38] The detailed mapping of the coastal and shelf area
around the Danube delta allows snapshots of the riverplume development during the same month of two differentyears. The major factors showing similar environmentalcharacteristics during the two surveys were (1) winds withpersistently southward components, (2) common seasonalconditions in heat fluxes, and (3) the same topographicboundaries. Differences in the forcing functions which
Figure 10. Near-surface distributions of (a) temperature, (b) salinity, (c) PMC, and near-bottomdistribution of (d) PMC in the northwestern Black Sea during September 2004.
C12003 KARAGEORGIS ET AL.: RIVER-INDUCED PARTICLE DISTRIBUTION
11 of 16
C12003

played a significant role in the variability of the observedpatterns were (1) the wind regime prior to the surveys(preconditioning for the ambient circulation) and (2) thewater and ISM discharge of the Danube.
[39] The extremely high discharge in August 2002(Figure 4a) had the ability to create a southward coastalcurrent that was still partially maintained during the earlySeptember survey, aided by the southward component of the
Figure 11. Comparison of (a) survey measured fluorescence to (b) SeaWiFS Chl a (mg m�3), bothaveraged over the cruise period in the northwestern Black Sea during September 2004 (weekly compositeof the SeaWiFS data closest to the survey period used).
Figure 12. (a) Temperature, (b) salinity, (c) PMC, and (d) fluorescence along (e) the Gheorghe transectin the northwestern Black Sea during September 2004.
C12003 KARAGEORGIS ET AL.: RIVER-INDUCED PARTICLE DISTRIBUTION
12 of 16
C12003

wind stress (Figure 3). Although the winds during thesurvey had an eastward component, they were relativelyweak in comparison to the conditions before the survey,which had a stronger record of southwestward winds thatcoincided with the extreme discharge. We presume thatthese conditions created a substantially strong southwardcoastal current that was both buoyancy and wind driven.The survey mapped remnants of this current, and thesouthward transport of the Danube waters was still preva-lent, with little offshore transport, as shown by the near-surface salinity and PMC distributions in Figure 6 and theirvertical profiles in Figures 8c and 9c. The anticyclonicbulge was thus suppressed. The deepening and wideningof the coastal current region progressively from north(Figure 8) to south (Figure 9) is indicative of the preva-lence of the downwelling favorable winds and the lack ofoffshore removal of the Danube waters. The downwardtilting of the isotherms toward the coast (Figures 8a and 9a)is also indicative of the coastal current conditions, and theinfluence of mixing in the plume structure. These distribu-tions also suggest that the cooler offshore deep waters areeffectively blocked from reaching the Danube influencedcoastal areas.[40] The low discharge in late August to early September
2004 (typical conditions as seen in the multiyear average;Figure 4a) and the light southward (northerly) winds
(Figure 3) did not favor the preconditions for a strongsouthward current before the September 2004 survey. Theisotherms remained horizontal (Figures 12a and 13a) and asharp thermocline characterized an upper warm layer thatwas shallower as compared to the 2002 conditions. Belowthe thermocline, cooler deeper waters were allowed to reachthe shallow shelf areas. A tendency for upwelling is deducedfrom the surface horizontal temperature gradients around thesouthern area of the Danube delta in Figure 10a. High valuesof fluorescence along the pycnocline (Figure 13d) are alsoindicative of shoreward advection of nutrient rich deeperwaters. The horizontal distribution of water and particleproperties (Figure 10) exhibited a broad offshore spreadingof riverine waters, indicative of the formation of theanticyclonic plume bulge but also a tendency for southwardtransport. The width of the bulge (taken as the 16.5 isoha-line) was largest in the Chilia transect north of the delta(Figure 13b), getting smaller toward south (Figure 12b),while the lowest-salinity waters were found immediatelysouth of the delta (Figure 10b). We detect that these patternsare associated with the variability in the wind field beforeand during the survey period (Figure 3), which includedepisodes of upwelling favorable winds and a wind relaxa-tion period (both favoring bulge development) plus a shortepisode of strong southward winds (favoring southwardtransport).
Figure 13. (a) Temperature, (b) salinity, (c) PMC, and (d) fluorescence along (e) the Chilia transect inthe northwestern Black Sea during September 2004.
C12003 KARAGEORGIS ET AL.: RIVER-INDUCED PARTICLE DISTRIBUTION
13 of 16
C12003

[41] The differences in plume development during thetwo survey periods are also illustrated in Figures 7 and 11,with the aid of horizontal distributions of in situ fluores-cence and remotely sensed Chl a. The strong coastal currentin 2002 is highlighted further, exhibiting a meanderingpattern that is typical in strong, buoyancy-driven coastalflows and a diminished bulge, typical of downwellingfavorable wind impact on the river plume [Kourafalou etal., 1996a]. On the contrary, a weak coastal current and astronger offshore bulge are revealed from both data sets in2004, allowing even Chl a distribution around the delta withtendency for offshore, cross-marginal removal. The 2004distribution was also influenced by an upwelling event priorto the cruise period. As seen in the SST from satellite(MODIS) weekly composites for the two weeks before thecruise (Figure 14), a strong change in the width of the coolcoastal band along the western Black Sea took place in lateAugust/early September, as a response to the wind shiftfrom southward to eastward (Figure 3). This was presum-ably a contributing factor to the offshore advection of plumewaters observed during the 2004 survey.[42] On the basis of in situ measurements for the 2004
survey and satellite measurements for both survey periods,the core of the Danube river plume was distinctly separated
from the plumes of the other major rivers on the northwest-ern Black Sea shelf. A common plume appeared in theSeaWiFS data for the southern Bug and Dnieper rivers andits southwest domain was sampled in the extended studyarea cruise of 2004. The data suggest lack of a persistentcoastal band of riverine waters along the entire northwesternBlack Sea shelf, which would result from the blending ofneighboring river plumes, as it has been reported for othercontinental shelves. Such an example is the southwestUnited States continental shelf, where the alongshoreriverine low-salinity band [Blanton and Atkinson, 1983;Kourafalou et al., 1996b] has been partially attributed totidal mixing (which is absent in the Black Sea). Moreover,the sharp bending of the coastline between the Danube(discharging at the west coast) and the rivers along the northcoast may have implications on the evolution of the plumesand associated coastal currents, which are an effectivemechanism for the alongshore transport of riverine watersand particulates. For instance, the northerly winds thatprevailed in the 2002 survey advected north river watersoffshore (Figure 7b), rather than contributing to a southwardcurrent along the west coast, as is expected to be induced bythe Danube (and suggested by the observed high plumesignal south of the delta). Additional studies are needed togain more insight into these processes, as the southwardextent of the buoyancy-driven current along the westernBlack Sea alters the properties of the inflow to the adjacentSea of Marmara through the Bosphorus strait (Figure 1)with implications on the outflow of buoyant waters of Blacksea origin to the Aegean Sea through the Dardanelles strait[Besiktepe, 2003; Besiktepe et al., 1993]. This outflowinfluences not only the circulation in the Aegean Sea [Olsonet al., 2007; Kourafalou and Tsiaras, 2007] but alsochanges in water properties of the eastern MediterraneanSea [Zervakis et al., 2000].
5. Conclusions
[43] A comprehensive data set has been presented over abroad coastal and shelf area near the Danube delta. Thesurveys were repeated in 2002 and 2004 for the same latesummer to early fall period, yielding measurements oftemperature, salinity, particulate matter concentration, andfluorescence, during both high-discharge (2002) and low-discharge (2004) conditions. The results indicate that themain factors influencing the development and evolution ofthe Danube River plume and the transport pathways of thelow-salinity waters and associated river-borne particles arethe river loads, atmospheric conditions, and topography.The difference in observed patterns during similar seasonsin two different years allowed the discussion of interannualvariability, while conditions before the surveys and episodicevents were found to play an important role in the observedpatterns.[44] Particulate matter dynamics in the northwestern
Black Sea during the two sampling periods vary substan-tially according to the river inputs, and especially thosefrom the Danube River. The freshwater discharges andassociated materials are mainly supplied through theGheorghe branch of the Danube River, and secondly throughthe Sulina branch, resulting in a low-temperature, low-salinity, and turbid band along the delta periphery. Particulate
Figure 14. Satellite (MODIS) sea surface temperatureprior to the September 2002 survey: weekly composites for(top) 20–27 August 2004 and (bottom) 28 August 2004 to 4September 2004. Coldest coastal waters (indicative ofupwelling) are found along the northern (western) coast inthe top (bottom) plots, responding to a shift in the averagewind from northerly to northwesterly, respectively.
C12003 KARAGEORGIS ET AL.: RIVER-INDUCED PARTICLE DISTRIBUTION
14 of 16
C12003

matter concentrations appear relatively elevated near theDanube River mouths and toward the southwest, whereas afew kilometers offshore, PMCs are very low throughout thewater column. The maximum PMC measured during 2002was 5.35 mg L�1, whereas during 2004 the highest value was2.86 mg L�1. The PMC spatial distribution field matchedvery closely the fluorescence distribution, the latter beingsupported by similar near-surface Chl a distribution patternsrevealed by SeaWiFS satellite imagery composites.[45] During the sampling periods, river plume waters
occupied the upper 10–15 m of the water column promot-ing strong stratification. The temperature field also depictedoverall stratified conditions, with the upper 20–25 mgenerally occupied by warm waters over a sharp thermo-cline, while cooler waters were found near the coastpresumably because of the lower temperature of riverwaters. Downwelling (upwelling) favorable wind patternsduring 2002 (2004) allowed (inhibited) the thermocline tointersect the shallow nearshore topography and contributedto the narrow (wide) band of cooler nearshore waters, asdepicted by both in situ measurements and satellite-derivedSST.[46] The study findings suggest that the cross-marginal
removal of waters and particles associated with the DanubeRiver discharge are largely influenced by the buoyancy-driven plume circulation and wind-driven shelf flows,especially after and during sustained wind conditions. Thepredominant pathways were (1) a south-southwestern trackclose to the coastline (promoted in 2002 by both enhancedbuoyancy and the prevailing wind-driven southward cur-rent and in 2004 by a brief southward wind event) and(2) offshore spreading during the lower discharge 2004survey which was characterized by variable wind eventsfollowing a relatively calm period of winds with an east-ward component. Changes in ambient stratification due towind-driven vertical displacements of the seasonal thermo-cline appeared to also influence the plume dynamics. Asubsurface maximum in fluorescence was traced over acontinuous distribution along the thermocline from the highnear-shore values to the deepest of the survey stations inboth cruises and suggested a deep subsurface source. Thelimited domain data set gave insights to processes drivingthe alongshore transport of riverine waters and particulates,which have implications on the outflow of waters of BlackSea origin in the adjacent complex system of straits andseas.
[47] Acknowledgments. The study was funded by the EuropeanCommission, DG Research Fifth Framework Programme: Energy, environ-ment and sustainable development. Contract EVK1-CT-2000-00051:Nutrient Management in the Danube Basin and its Impact on the BlackSea (DANUBS). V. Kourafalou participated in data interpretation throughpartial funding by the Office of Naval Research (N000140810980). We aregrateful to the officers and crew of the R/V Aegaeo (Hellenic Center ofMarine Research) and R/V Poseidon (University of Kiel) for their assis-tance during field work. Thanks goes to the GIS team P. Drakopoulou andH. Kyriakidou for the preparation of the Black Sea catchment area map. Weare grateful to A. Constantinescu for providing discharge rates andinorganic suspended load of the Danube River.
ReferencesBaker, E. T., and J. W. Lavelle (1984), The effects of particle size on thelight attenuation coefficient of natural suspensions, J. Geophys. Res., 89,8197–8203, doi:10.1029/JC089iC05p08197.
Barale, V., P. Cipollini, A. Davidov, and F. Melina (2002), Water constitu-ents in the north-western Black Sea from optical remote sensing and insitu data, Estuarine Coastal Shelf Sci., 54, 309 –320, doi:10.1006/ecss.2000.0649.
Bastos, A., N. Kenyon, and M. Collins (2002), Sedimentary processes,bedforms and facies, associated with a coastal headland: Portland Bill,southern UK, Mar. Geol., 187, 235 – 258, doi:10.1016/S0025-3227(02)00380-8.
Bastos, A., M. Collins, and N. Kenyon (2003), Water and sediment move-ment around a coastal headland: Portland Bill, southern UK, Ocean Dyn.,53(3), 309–321, doi:10.1007/s10236-003-0031-1.
Beckers, J. M., M. Gregoire, J. C. J. Nihoul, E. Stanev, J. Staneva, andC. Lancelot (2002), Modelling the Danube-influenced north-western con-tinental shelf of the Black Sea. I. Hydrodynamical processes simulated by3-D and box models, Estuarine Coastal Shelf Sci., 54, 453 – 472,doi:10.1006/ecss.2000.0658.
Becquevort, S., T. Bouvier, C. Lancelot, G. Cauwet, G. Delait, V. N. Egorov,and W. N. Popovichev (2002), The seasonal modulation of organic matterutilization by bacteria in the Danube–Black Sea mixing zone, EstuarineCoastal Shelf Sci., 54, 337–354, doi:10.1006/ecss.2000.0651.
Besiktepe, S. T. (2003), Density currents in the two-layer flow: An exampleof Dardanelles outflow, Oceanol. Acta, 26, 243 –253, doi:10.1016/S0399-1784(03)00015-X.
Besiktepe, S., E. Ozsoy, and U. Unluata (1993), Filling of the Sea ofMarmara by the Dardanelles lower layer inflow, Deep Sea Res., Part I,40, 1815–1838, doi:10.1016/0967-0637(93)90034-Z.
Bishop, J. K. B. (1986), The correction and suspended particulate mattercalibration of SeaTech transmissometer data, Deep Sea Res., Part A, 33,121–134, doi:10.1016/0198-0149(86)90111-1.
Blanton, J. O., and L. P. Atkinson (1983), Transport and fate of riverdischarge on the continental shelf of the southeastern United States,J. Geophys. Res., 88, 4730–4738, doi:10.1029/JC088iC08p04730.
Constantinescu, A., and G. A. M. Menting (2000), Ecological Gradients inthe Danube Delta Lakes: Present State and Man-Induced Changes, Rep.2000–015, chap. 3, pp. 33–50, DanubeDelta Natl. Inst., Tulcea, Romania.
Gardner, W. D. (1989a), Baltimore Canyon as a modern conduit of sedi-ment to the deep sea, Deep Sea Res., Part A, 36, 323–358, doi:10.1016/0198-0149(89)90041-1.
Gardner, W. D. (1989b), Periodic resuspension in Baltimore Canyon byfocusing of internal waves, J. Geophys. Res., 94, 18,185 –18,194,doi:10.1029/JC094iC12p18185.
Gardner, W. D., P. E. Biscaye, J. R. V. Zaneveld, and M. J. Richardson(1985), Calibration and comparison of the LDGO nephelometer and theOSU transmissometer on the Nova Scotian Rise, Mar. Geol., 66, 323–344, doi:10.1016/0025-3227(85)90037-4.
Garvine, R. W. (1987), Estuary plumes and fronts in shelf waters: A layermodel, J. Phys. Oceanogr., 17(11), 1877–1896, doi:10.1175/1520-0485(1987)017<1877:EPAFIS>2.0.CO;2.
Gregg, M. C., and E. Ozsoy (1999), Mixing on the Black Sea Shelf north ofthe Bosphorus, Geophys. Res. Lett., 26, 1869– 1872, doi:10.1029/1999GL900431.
Gregoire, M., J. M. Beckers, J. C. J. Nihoul, and E. Stanev (1998),Reconnaissance of the main Black Sea’s ecohydrodynamics by meansof a 3D interdisciplinary model, J. Mar. Syst., 16, 85–105, doi:10.1016/S0924-7963(97)00101-2.
Guieu, C., and J.-M. Martin (2002), Level and fate of metals in the Danubedelta plume, Estuarine Coastal Shelf Sci., 54, 501–512, doi:10.1006/ecss.2000.0660.
Guieu, C., J.-M. Martin, S. P. C. Tankere, F. Mousty, P. Trincherini,M. Bazot, and M. H. Dai (1998), On trace metal geochemistry in theDanube River and western Black Sea, Estuarine Coastal Shelf Sci., 47,471–485, doi:10.1006/ecss.1998.0377.
Hickey, B. M., L. J. Pietrafesa, D. A. Jay, and W. C. Boicurt (1998), TheColumbia River Plume Study: Subtidal variability in the velocity and sali-nity fields, J. Geophys. Res., 103, 10,339–10,368, doi:10.1029/97JC03290.
International Ocean-Colour Coordinating Group (2000), Remote sensing ofocean colour in coastal, and other optically complex, waters, in Reportsof the International Ocean-Colour Coordinating Group, edited byS. Sathyendranath, Rep. 3, 140 pp., Dartmouth, N. S., Canada.
Karageorgis, A. P., and C. L. Anagnostou (2001), Particulate matter spatial-temporal distribution and associated surface sediment properties: Ther-maikos Gulf and Sporades Basin, NWAegean Sea, Cont. Shelf Res., 21,2141–2153, doi:10.1016/S0278-4343(01)00048-6.
Karageorgis, A. P., and C. Anagnostou (2003), Seasonal variation in thedistribution of suspended particulate matter in the NW Aegean Sea,J. Geophys. Res., 108(C8), 3274, doi:10.1029/2002JC001672.
Kosarev, A. N., V. S. Arkhipkin, and G. V. Surkova (2008), Hydrometeor-ological conditions, in The Black Sea Environment: The Handbook ofEnvironmental Chemistry, vol. 5, part Q, edited by A. G. Kostianoy andA. N. Kosarev, pp. 135–158, doi:10.1007/698_5_090, Springer, Berlin.
C12003 KARAGEORGIS ET AL.: RIVER-INDUCED PARTICLE DISTRIBUTION
15 of 16
C12003

Kourafalou, V. H., and E. V. Stanev (2001), Modeling the impact of atmo-spheric and terrestrial inputs on the western Black Sea coastal dynamics,Ann. Geophys., 19, 245–256.
Kourafalou, V. H., and K. Tsiaras (2007), A nested circulation model for thenorth Aegean Sea, Ocean Sci., 3, 1–16.
Kourafalou, V. H., L.-Y. Oey, J. D. Wang, and T. N. Lee (1996a), The fateof river discharge on the continental shelf: 1. Modeling the river plumeand the inner-shelf coastal current, J. Geophys. Res., 101, 3415–3434,doi:10.1029/95JC03024.
Kourafalou, V. H., L.-Y. Oey, T. N. Lee, and J. D. Wang (1996b), The fateof river discharge on the continental shelf: 2. Transport of low-salinitywaters under realistic wind and tidal forcing, J. Geophys. Res., 101,3435–3455, doi:10.1029/95JC03025.
Kourafalou, V. H., K. Tsiaras, and J. V. Staneva (2005), Numerical studieson the dynamics of the northwestern Black Sea shelf, Mediter. Mar. Sci.,5(1), 133–142.
Lancelot, C., J.-M. Martin, N. Panin, and Y. Zaitsev (2002), The north-western Black Sea: A pilot site to understand the complex interactionbetween human activities and the coastal environment, Estuarine CoastalShelf Sci., 54, 279–283, doi:10.1006/ecss.2000.0647.
Legendre, P. (2001), Model II regression user’s guide, 23 pp., Dep. de Sci.Biol., Univ. de Montreal, Montreal, Que., Canada. (Available at http://www.bio.umontreal.ca/legendre/index.html.)
Mankovskii, V. I., and M. V. Solovev (2003), Relationship between thebeam attenuation coefficient and the concentration of suspended matter inBlack-Sea waters, Phys. Oceanogr., 13(2), 123 – 128, doi:10.1023/A:1023752514790.
Mankovskii, V. I., A. V. Mishonov, and M. V. Solovev (2003), Hydroopticalcharacteristics of subsatellite test ranges in the Mediterranean andBlack Seas according to the data of investigations performed by theR/V Gorizont in 1998, Phys. Oceanogr., 13(1), 14–26, doi:10.1023/A:1022496720625.
Masse, A. K., and C. R. Murthy (1992), Analysis of the Niagara Riverplume dynamics, J. Geophys. Res., 97, 2403 – 2420, doi:10.1029/91JC02726.
McCave, I. N., I. R. Hall, A. N. Antia, L. Chou, F. Dehairs, R. S. Lampitt,L. Thomsen, T. C. E. Van Weering, and R. Wollast (2001), Distribution,composition, and flux of particulate material over the European margin at47�–50�N, Deep Sea Res., Part II, 48, 3107–3139, doi:10.1016/S0967-0645(01)00034-0.
McQuatters-Gollop, A., L. D. Mee, D. E. Raitsos, and G. I. Shapiro (2008),Non-linearities, regime shifts and recovery: The recent influence of cli-mate on Black Sea chlorophyll, J. Mar. Syst., 74, 649–658, doi:10.1016/j.jmarsys.2008.06.002.
Mikhailov, V. N., and M. V. Mikhailova (2008), River mouths, in The BlackSea Environment: The Handbook of Environmental Chemistry, vol. 5,part Q, edited by A. G. Kostianoy and A. N. Kosarev, pp. 91–133,doi:10.1007/698_5_061, Springer, Berlin.
Moody, J. A., B. Butman, and M. H. Bothner (1987), Near-bottom sus-pended matter concentration on the continental shelf during storms:Estimates based on in situ observations of light transmission and a par-ticle size dependent transmissometer calibration, Cont. Shelf Res., 7,609–628, doi:10.1016/0278-4343(87)90026-4.
Munchow, A., and R. W. Garvine (1993), Dynamical properties of a buoy-ancy-driven coastal current, J. Geophys. Res., 98, 20,063 –20,077,doi:10.1029/93JC02112.
Nyffeler, F., C. H-.H. Godet, E. Kontar, R. Kos’yan, V. G. Krivosheya, andI. I. Volkov (2001), Optical properties of the water column along thecontinental margin of the northeastern Black Sea, J. Mar. Syst., 31,35–44, doi:10.1016/S0924-7963(01)00045-8.
O’Reilly, J. E., S. Maritorena, B. G. Mitchell, D. A. Siegel, K. L. Carder,S. A. Garver, M. Kahru, and C. McClain (1998), Ocean color chlorophyllalgorithms for SeaWiFS, J. Geophys. Res., 103, 24,937 – 24,953,doi:10.1029/98JC02160.
Oguz, T., P. La-Violette, and U. Unluata (1992), Upper layer circulation ofthe southern Black Sea: Its variability as inferred from hydrographic andsatellite observations, J. Geophys. Res., 97, 12,569–12,584, doi:10.1029/92JC00812.
Oguz, T., V. S. Latun, M. A. Latif, V. V. Vladimirov, H. I. Sur, A. A. Markov,E. Ozsoy, B. B. Kotovshchikov, V. V. Eremeev, and U. Unluata (1993),Circulation in the surface and intermediate layers of the Black Sea, DeepSea Res., Part I, 40, 1597–1612, doi:10.1016/0967-0637(93)90018-X.
Oguz, T., et al. (1994), Mesoscale circulation and thermohaline structureof the Black Sea during HydroBlack 91, Deep Sea Res., Part I, 41,603–628, doi:10.1016/0967-0637(94)90045-0.
Olson, D. B., V. H. Kourafalou, W. H. Johns, G. Samuels, and M. Veneziani(2007), Aegean surface circulation from a satellite-tracked drifter array,J. Phys. Oceanogr., 37(7), 1898–1917, doi:10.1175/JPO3028.1.
Ozsoy, E., and U. Unluata (1998), The Black Sea, in The Sea, vol. 11,edited by A. Robinson and K. Brink, pp. 889–914, John Wiley, NewYork.
Panin, N., and D. Jipa (2002), Danube River sediment input and its inter-action with the northwestern Black Sea, Estuarine Coastal Shelf Sci., 54,551–562, doi:10.1006/ecss.2000.0664.
Ragueneau, O., et al. (2002), Biochemical transformations of inorganicnutrients in mixing zones between the Danube and the northwesternBlack Sea, Estuarine Coastal Shelf Sci., 54, 321–336, doi:10.1006/ecss.2000.0650.
Saliot, A., et al. (2002), Winter and spring characterization of particulateand dissolved organic matter in the Danube–Black Sea mixing zone,Estuarine Coastal Shelf Sci., 54, 355–367, doi:10.1006/ecss.2000.0652.
Soares, I. D., V. Kourafalou, and T. N. Lee (2007), Circulation on thewestern South Atlantic continental shelf: 2. Spring and autumn realisticsimulations, J. Geophys. Res., 112, C04003, doi:10.1029/2006JC003620.
Spinrad, R. W., J. R. V. Zaneveld, and J. C. Kitchen (1983), A study of theoptical characteristics of the suspended particles in the benthic nepheloidlayer of the Scotian Rise, J. Geophys. Res., 88, 7641–7645, doi:10.1029/JC088iC12p07641.
Stanev, E. V., J. A. Simeonov, and E. L. Peneva (2001), Ventilation of theBlack Sea pycnocline by the Mediterranean plume, J. Mar. Syst., 31, 77–97, doi:10.1016/S0924-7963(01)00048-3.
Stanev, E. V., J. M. Beckers, C. Lancelot, J. V. Staneva, P. Y. LeTraon, E. L.Peneva, and M. Gregoire (2002), Coastal-open sea exchange in the BlackSea: Observations and modelling, Estuarine Coastal Shelf Sci., 54, 601–620, doi:10.1006/ecss.2000.0668.
Tankere, S. P. C., F. L. L. Muller, J. D. Burton, P. J. Statham, C. Guieu, andJ.-M. Martin (2001), Trace metal distributions in shelf waters of the north-western Black Sea, Cont. Shelf Res., 21, 1501–1532, doi:10.1016/S0278-4343(01)00013-9.
Tsiaras, K., V. H. Kourafalou, A. Davidov, and J. Staneva (2008), A three-dimensional coupled model of the western Black Sea plankton dynamics:Seasonal variability and comparison to SeaWiFS data, J. Geophys. Res.,113, C07007, doi:10.1029/2006JC003959.
Tuzhilkin, V. S. (2008), General circulation, in The Black Sea Environment:The Handbook of Environmental Chemistry, vol. 5, part Q, edited byA. G. Kostianoy and A. N. Kosarev, pp. 159–194, doi:10.1007/698_5_090, Springer, Berlin.
Unluata, U., D. Obri, Z. Belberov, Z. Bologa, V. Eremeev, andM.Vinogradov(1994), Joint marine science program of studies in the Black Sea(CoMSBlack), Oceanology, Engl. Trans., 34, 432–435.
Van Gils, J., H. Behrendt, A. Constantinescu, K. Isermann, and M. Zessner(2005), Future development of nutrient emissions and river loads in theDanube basin, in River Basin Management, edited by J. Lawson, pp. 219–230, Taylor and Francis, Leiden, Netherlands.
Vedernikov, V. I., and A. B. Demidov (1997), Vertical distribution of pri-mary production and chlorophyll during different seasons in deep regionsof the Black Sea, Oceanology, Engl. Transl., 37, 376–384.
Weisse, T., M.-T. Gomoiu, U. Scheffel, and F. Brodrecht (2002), Biomassand size composition of the comb jelly Mnemiopsis sp. in the northwes-tern Black Sea during spring 1997 and summer 1995, Estuarine CoastalShelf Sci., 54, 423–437, doi:10.1006/ecss.2000.0656.
Yankovsky, A. E., E. M. Lemeshko, and Y. P. Ilyin (2004), The influence ofshelfbreak forcing on the alongshelf penetration of the Danube buoyantwater, Black Sea, Cont. Shelf Res., 24, 1083 – 1098, doi:10.1016/j.csr.2004.03.007.
Zervakis, V., D. Georgopoulos, and P. G. Drakopoulos (2000), The role ofthe North Aegean in triggering the recent eastern Mediterranean climatechanges, J. Geophys. Res., 105, 26,103 – 26,116, doi:10.1029/2000JC900131.
�����������������������C. Anagnostou, A. P. Karageorgis, A. Papadopoulos, V. Papadopoulos,
D. E. Raitsos, and K. P. Tsiaras, Hellenic Centre for Marine Research,46.7 km Athens-Sounio Ave., Mavro Lithari, GR-19013 Anavyssos,Greece. ([email protected]; [email protected]; [email protected]; [email protected]; [email protected]; [email protected])V. H. Kourafalou (corresponding author), Division of Meteorology and
Physical Oceanography, Rosenstiel School of Marine and AtmosphericScience, University of Miami, 4600 Rickenbacker Cswy., Miami, FL 33149,USA. (vkourafalou@ rsmas.miami.edu)
C12003 KARAGEORGIS ET AL.: RIVER-INDUCED PARTICLE DISTRIBUTION
16 of 16
C12003