Embed Size (px)
Citation preview

www.elsevier.com/locate/jmr
Journal of Magnetic Resonance 181 (2006) 21–28
Alanine check points in HNN and HN(C)N spectra
Amarnath Chatterjee, Ashutosh Kumar, Ramakrishna V. Hosur *
Department of Chemical Sciences, Tata Institute of Fundamental Research, Homi Bhabha Road, Mumbai 400 005, India
Received 23 January 2006; revised 8 March 2006Available online 30 March 2006
Abstract
Rapid resonance assignment is a key requirement in structural genomics research by NMR. In this context we present here two newpulse sequences, namely, HNN-A and HN(C)N-A that have been developed by simple modification of the previously described pulsesequences, HNN and HN(C)N [S.C. Panchal, N.S. Bhavesh, R.V. Hosur, Improved 3D triple resonance experiments, HNN andHN(C)N, for HN and 15N sequential correlations in (13C, 15N) labeled proteins: application to unfolded proteins, J. Biomol. NMR,20 (2001) 135–147]. These increase the number of start/check points in HNN and/or HN(C)N spectra and hence help in pacing up res-onance assignment in proteins.� 2006 Elsevier Inc. All rights reserved.
Keywords: HNN-A; HN(C)N-A; Check points; Triplets of residues; Band selective pulse
1. Introduction
We recently described two three-dimensional triple-reso-nance experiments, HNN and HN(C)N, for rapid resonanceassignment of HN and 15N nuclei along the backbone in (15N,13C) doubly labeled proteins [1]. These were derived by somemodification of HN(CA)NNH [2] and HN(COCA)NH [3–5]described previously. The salient features of the experimentsare: (a) the three frequency axes are HN (F3), 15N (F1), and15N (F2), (b) the experiments show correlations betweenamide and 15N of three consecutive residues, i, i � 1, andi + 1 along the polypeptide chain, (c) the various peaks inthe (F1,F3) and (F2,F3) planes of the 3D spectrum displaydifferent patterns of positive and negative signs dependingupon whether or not any of the residues at i or i � 1 positionis a glycine, and (d) prolines are characteristically identifiableby the absence of one correlation peak. Glycines and pro-lines thus generate many check points and start points forsequential walk along the polypeptide chain. Using theseideas new protocols were developed for rapid sequentialwalk along the sequence [6,7]. Thus because of the manycheck points one can generally assign the backbone HN
1090-7807/$ - see front matter � 2006 Elsevier Inc. All rights reserved.
doi:10.1016/j.jmr.2006.03.009
* Corresponding author. Fax: +91 22 2280 4610.E-mail address: [email protected] (R.V. Hosur).
and 15N resonances without having to obtain the residue spe-cific side chain assignments explicitly. As a result, during thelast two years these sequences have been successfully appliedto many proteins in the MW range 10–20 kDa [6–15]. Thesehave included both folded proteins as well as unfolded pro-teins, though it was originally thought that the pulsesequences would be too insensitive for folded proteins.
Continuing such efforts for rapid resonance assign-ments, we have developed here a new set of pulse sequenc-es, HNN-A and HN(C)N-A which helps generate newcheck points to aid sequential walks. These lead to fixedpoints based on the position of alanines along thesequence. Moreover as the glycine and proline check/startpoints remain unaltered the number of triplet patterns dra-matically increases. These features thus strengthen the pro-tocols based on HNN and HN(C)N [6,7], for resonanceassignment and the backbone amide and 15N assignmentscan be obtained much faster. These become extremelyinvaluable, when the polypeptide chain has far removedglycines along the sequence, which could pose some diffi-culties in the HNN based application alone.
We have experimentally tested these sequences with afew proteins, and we show here the data on DLC8, a com-ponent of the motor protein, dynein. We demonstrate theapplication of these to both folded and unfolded DLC8.

22 A. Chatterjee et al. / Journal of Magnetic Resonance 181 (2006) 21–28
2. Materials and methods
2.1. Protein preparation
For preparation of the monomeric DLC8 protein, theplasmids containing the insert for the protein DLC8 weretransformed into BL21-DE3 strain of Escherichia coli, thecells were grown at 37 �C in M9 minimal medium to A600
of �0.6, and then induced for production of DLC8 using0.4 mM IPTG. Uniformly 15N and 15N/13C labeled proteinsamples were prepared by growing bacteria in M9 minimalmedia supplemented with 1 g/l�1 15NH4Cl and 4 g/l�1
[13C6]glucose as the sole source of nitrogen and carbon,respectively, as required, in the solution. The cells were har-vested by centrifugation at 4500 rpm for 20 min usingBeckman Sorvall (GSA rotor) centrifuge. The cell pelletwas resuspended in extraction buffer (20 mM Tris–HCl,pH 8.0 containing 200 mM NaCl, and 10 mM imidazole)containing 2.5 lg/ml leupeptin, 1 lg/ml pepstatin,0.1 mM phenylmethylsulfonyl fluoride (PMSF), 1% TritonX-100, and 100 lg/ml lysozyme. After sonication (fiveshots of 15 s, constant duty cycle 60 Hz power, five times)and centrifugation (35,000 rpm, 4 �C, 45 min), the crudeextract was purified by affinity chromatography on aNi2+ column by eluting with 250 mM imidazole. Imidazolewas removed by dialysis against extraction buffer withoutimidazole in a 3 kDa membrane. The (His)6 tag wasremoved by treatment with thrombin protease for 12 h atroom temperature. The purity of the protein sample wasconfirmed by SDS–PAGE. The NMR sample was pre-pared by concentrating the protein to �1 mM, in acetatebuffer (20 mM, pH 3.0) containing 250 mM NaCl and1 mM dithiothreitol (DTT). For experiments with unfoldedDLC8, the sample was concentrated to �1 mM andexchanged with acetate buffer (20 mM, pH 3.0) containing250 mM NaCl, 1 mM DTT, and 6 M guanidine hydrochlo-ride, by ultra-filtration.
2.2. NMR spectroscopy
All NMR experiments were performed at 27 �C on aVarian Inova 600 MHz NMR spectrometer equipped withpulse shaping and pulse field gradient capabilities. Forthe HNN-A spectrum the delays TN, and TC, were bothset to 28 ms. Fourty complex points were used alongt1 (15N) and t2 (15N) dimensions and 1024 complex pointsalong t3 (HN). Sixteen scans were used for each FID. TheHN(C)N-A spectrum was recorded with the same TN andTC parameters, same number of t1, t2, t3 points, and theTCC delay was set to 9 ms.
3. Results and Discussions
3.1. HNN-A and HN(C)N-A pulse sequences
The new pulse sequences (Figs. 1B and D) are a result ofan extremely simple modification of the previously
described pulse sequences [1] HNN and HN(C)N (Figs.1A and C). As indicated in the figure, one of the pulses isreplaced by a band selective pulse. However, this simplemodification results in substantial spectral changes. Toappreciate these changes, a brief description of the HNNand HN(C)N sequences is presented below.
The HNN and HN(C)N experiments employ the follow-ing magnetization transfer pathways.
HNN : HNi !Niðt1Þ!
2T NCa
i�1;i!2s
Ni�1;i;iþ1ðt2Þ!Hi�1;i;iþ1ðt3Þ
HNðCÞN : HNi !Niðt1Þ!
2T NCOi�1 !
2T CCCa
i�1!2s
Ni�1;iðt2Þ!Hi�1;iðt3Þð1Þ
2TN, 2s, and 2TCC are the time periods during which mag-netization transfers take place; 2s should be chosen be-tween 22–30 ms to get best transfers and obtain thecharacteristic peak patterns in the spectra. The choicewould be a reasonable compromise between transfer effi-ciency and transverse relaxation losses.
In a chain of four residues, i � 2 to i + 1, the intensitiesof the diagonal (Id
i ) and cross (Ici�1, Ic
iþ1) peaks in the(F2,F3) planes of the HNN spectrum are given by:
Idi ¼ �ðE2
1E3E9Kdi1 þ E2
2E5E10Kdi2Þ; ð2Þ
Ici�1 ¼ E1E4E7E9Kc
i�1;
Iciþ1 ¼ E2E6E8E10Kc
iþ1;ð3Þ
where,
E1 ¼ cos piT N sin qi�1T N ;
E2 ¼ sin piT N cos qi�1T N ;
E3 ¼ cos pi�1s cos qi�1s;
E4 ¼ sin pi�1s sin qi�1s;
E5 ¼ cos pis cos qis;
E6 ¼ sin pis sin qis;
E7 ¼ sin pi�1T N cos qi�2T N ;
E8 ¼ cos piþ1T N sin qiT N ;
E9 ¼ cos ni�1s;
E10 ¼ cos nis
ð4Þ
and
pi ¼ 2p1JðCai �NiÞ; qi ¼ 2p2JðCa
i �Niþ1Þ;ni ¼ 2p1JðCa
i � Cbi Þ;
ð5Þ
Kdi1 ¼ expð�4T N RN
2i � 2sRa2;i�1Þ;
Kdi2 ¼ expð�4T N RN
2i � 2sRa2iÞ;
Kci�1 ¼ expð�2T N ðRN
2i þ RN2;i�1Þ � 2sRa
2;i�1Þ;Kc
iþ1 ¼ expð�2T N ðRN2i þ RN
2;iþ1Þ � 2sRa2iÞ:
ð6Þ
1J’s and 2J’s represent, respectively, the one bond and twobond N–Ca coupling constants, R2’s are the various trans-verse relaxation rates. The expressions in Eq. (1) reduce tothe same as given in Panchal et al. [1] except for the relax-ation factors, under the assumptions: pi = pi�1, qi = qi�1,and ni = ni�1.

Fig. 1. Pulse sequence for the (A) HNN, (B) HNN-A, (C) HN(C)N, and (D) HN(C)N-A experiment. In all the cases, narrow (hollow) and wide (filledblack) rectangular bars indicate non-selective 90� and 180� pulses, respectively. Unless indicated otherwise, the pulses are applied with phase x. The 1H and15N carrier frequencies are set at 4.71 ppm (water) and 119.0 ppm, respectively. The 13C carrier frequency is set at 56.0 ppm. The selective 1H 90� pulseused for water flip-back during the first INEPT transfer is applied for a duration of 1.4 ms with one-lobe sinc profile. Proton decoupling using theWaltz-16decoupling sequence with a field strength of 7.5 kHz is applied during most of the t1 and t2 evolution periods, and 15N decoupling using the Garp-1sequence with 0.5 kHz is applied during acquisition. The strength of the 13Ca pulses is adjusted so that they cause minimal excitation of carbonyl carbons.The band selective pulse in HNN-A (B) and HN(C)N-A (D) are indicated by bell shaped (hollow) pulses. The 180� 13CO shaped pulse had a one-lobe sincprofile with minimal excitation of 13Ca. The delays are k = 2.7 ms, j = 5.4 ms and d = 0.35 ms. sCN must be optimized and is around 12–16 ms. The valuesof the individual periods containing t1 are: A = t1/2, B = TN, and C = TN � t1/2. The values of the individual periods containing t2 are: D = TN � t2/2,E = TN, and F = t2/2. Phase cycling for the experiment is u1 = 2(x), 2(�x); u2 = x, �x, �x, x; u3 = u2; u4 = x; u5 = 4(x), 4(�x) and receiver = 2(x),2(�x). Frequency discrimination in t1 is achieved using States-TPPI phase cycling of u1 along with the receiver phase; frequency discrimination in t2 isachieved using the PEP sensitivity-enhanced gradient method. The N- and P-type signals are collected separately by inverting the sign of the G6 gradientpulse (G7 in case of HN(C)N). Signals recorded are manipulated post acquisition to generate pure absorption data. The gradient duration and levels are asfollows: G1 = 0.5 ms, 8 G/cm; G2 = 0.5 ms, 5.6 G/cm; G3 = 0.5 ms, 8 G/cm; G4 = 1 ms, 11 G/cm; G5 = 1.0 ms, 8 G/cm; G6 = 2.5 ms, 26 G/cm;G7 = 0.5 ms, 2 G/cm; G8 = 0.25 ms, 25.8 G/cm. In (C) and (D) we have composite pulses, indicated by three continuous 90� pulses, [25] that can beused to evolve 13Ca and 13CO under one-bond 13Ca–13CO coupling. The delay TCC can be set to 4.5 ms. The values of the individual periods containing t1
and t2 periods are the same as in (A). Phase cycling for the experiment is u1 = 2(�x), 2(x); u2 = x, �x, �x, x; u3 = u2; u4 = x; u5 = 4(x), 4(�x); andreceiver = 2(x), 2(�x). The gradient duration and levels are as follows: G1 = 0.5 ms, 8 G/cm; G2 = 0.5 ms, 5.6 G/cm; G3 = 0.5 ms, 8 G/cm; G4 = 1 ms,11 G/cm; G5 = 0.5 ms, 7 G/cm; G6 = 1.0 ms, 9 G/cm; G7 = 1.0 ms, 8 G/cm; G8 = 2.5 ms, 26 G/cm; G9 = 0.5 ms, 2 G/cm; G10 = 0.25 ms, 25.8 G/cm.
A. Chatterjee et al. / Journal of Magnetic Resonance 181 (2006) 21–28 23
Among the various evolutions and the transfers occur-ring through the pulse sequence, the evolution during theperiod 2s is the most crucial from the sensitivity point ofview, as, it is during this period alone that the magnetiza-tion resides on the Ca carbon which has the fastest trans-verse relaxation rate, and its minimization is crucial forhighest sensitivity in the spectrum. In Fig. 2 we show thepeak intensities under the above assumptions of equalityof p’s and q’s, as a function of s, for a set of p and q rep-resenting the b sheet structures; the average coupling con-stants for the a and b types of structures are slightlydifferent [16]: for a helices, p and q are in the ranges 8–10
and 4–6 Hz, respectively, and for b structures these valuesare in the ranges 10–13 and 6–9 Hz, respectively.
Ca evolution during 2s has another important conse-quence. A careful examination of the Eqs. (1)–(3) revealsthat for the optimum choices of the transfer periods, thefunctions E1–E8 are all positive while, E9, E10 are negative.This means depending upon presence or absence of E9, E10
(which originate from evolution under Ca–Cb couplingduring 2s period) the cross peaks can have negative or posi-tive signs, respectively. This is precisely the basis of gener-ation of different patterns of peaks due to glycines whichdo not have a Cb carbon. These generate the check points

Fig. 2. Plots of the HNN coherence transfer efficiencies. The transfer functions for the diagonal peak, Id (Eq. (2)) and the cross peak Ic (Eq. (3)) aredescribed in the text. Here, (A) is for the transfer efficiencies calculated with relaxation terms while (B) is for calculations without the relaxation terms. Thetransfer efficiency is plotted as a function of s. The plots were calculated by using, J CaCb , J CaCO, JNCO values of 35, 55, and 15 Hz, respectively. The 1JCaN,2J CaN values have been chosen to be 10.5 and 8.5 Hz, respectively. The value of TN used in the transfer functions for HNN was 14.0 ms and TCC was set to4.5 ms. Thick and dotted lines represent diagonal and sequential peaks, respectively.
24 A. Chatterjee et al. / Journal of Magnetic Resonance 181 (2006) 21–28
for sequential walks in the HNN spectrum. What thisimplies is that if a particular evolution under Ca–Cb cou-pling during 2s period is prevented either by selective un-la-beling of Cb carbon or by specific decoupling of Cb, thenadditional check points can be created in the 3D spectrum;the easy option here is to decouple the Cb and this is thebasis of the present modification. These become particular-ly necessary if the protein sequence does not contain gly-cines for long stretches.
Among the various amino acid residues, the Cb chemicalshifts of alanines are very distinct. The alanine Cb’s reso-nate most up-field (18–22 ppm) compared to all other res-idues (27–43 ppm). This is particularly more valid inunfolded proteins, where the chemical shift dispersionsare rather small. Thus it is possible to apply band selective180� pulses in the middle of the Ca evolution (2s period inFigs. 1B and D) in the pulse sequences such that all Cb
except those of alanines are inverted. Consequently, allthe alanines will not have Ca–Cb coupling evolution andwill behave like glycines; these lead to what one may callas ‘alanine check points.’ We hasten to add that thesecan be readily distinguished from the true glycine checkpoints because of the distinctly different 15N chemical shiftsof alanines and glycines. This modified pulse sequence maybe termed as HNN-A.
The expressions for the diagonal and the sequentialpeaks in HN(C)N at the same level of detail as in Eqs.(2)–(6) have already been described earlier [17] and we donot wish to repeat them here. The modification of HN(C)Nto generate HN(C)N-A presented in Fig. 1D follow thesame considerations as described for HNN-A.
Different kinds of band selective inversion pulses havebeen described in the literature [18–21]. For the alaninecheck points, an inversion band width of roughly 50 ppm(25–75 ppm) is required. Among the various possibilities,sech/tanh inversion pulses have the flattest inversion pro-files over 90% of the band width [22]. However, these pulses
are also reasonably long ranging from 1–5 ms. Square puls-es with attenuated power can also be used. These pulses areshort, simplest to calculate, but their excitation profiles arenot uniformly flat. Nevertheless, we have used these pulsesfor the present demonstration, with a larger bandwidthspecification so that the desired spectral region is properlyinverted.
3.2. Peak patterns for proline, glycine, and alanine neighbors
As described earlier by Bhavesh et al. [6], in the presentcase also triplets of residues may be considered. In theHNN spectrum every F1–F3 and F2–F3 plane contains thediagonal peak (F1 = F2 = Ni) and two sequential peaks toi � 1 and i + 1 residues. On the other hand, in the HN(C)Nspectrum, the F2–F3 plane contains the diagonal(F1 = F2 = Ni) peak and one sequential peak to i � 1 resi-due, whereas the F1–F3 plane contains the diagonal peakand one sequential peak to i + 1 residue. Thus althoughthe HN(C)N sequence generates only i and i � 1 correla-tions, the F1–F3 and F2–F3 planes taken together help iden-tifying a triplet of consecutive residues.
We have already mentioned that the evolutions of themagnetization components are slightly different for glycineand non-glycine residues, because of the absence of the Cb
carbon in the former. This results in different combinationsof positive and negative signs for the various self and crosspeaks in the different planes of the 3D spectra. Further theabsence of an amide proton for a proline results in theabsence of the corresponding peak. Moreover in the pres-ent case since the alanines also behave as glycines the listof peak patterns is expanded. In addition, 15N chemicalshifts also display certain residue type dependence [23].Glycines are distinctly upfield while alanines are downfieldcompared to others. Interestingly, the average values of theshifts for the different residue types are similar in both fold-ed and unfolded proteins, though the spreads are more in

A. Chatterjee et al. / Journal of Magnetic Resonance 181 (2006) 21–28 25
the folded proteins. Thus, there will be different patterns ofpeaks for different triplets of residues containing glycines,alanines, and prolines. The expected peak patterns for eachof the above cases in the F1–F3 planes of the HNN andHN(C)N spectra, at the F2 chemical shift of the central res-idue are schematically shown in Fig. 3. In each of theplanes, the peaks occur aligned at the amide (F3) chemicalshift of the central residue. The choice of the relative 15Nchemical shifts of Z, Z 0, and X residues is quite arbitrary.In reality, the positions of the positive and negative peakscan get altered as per the relative chemical shifts. Theimportant things to consider are: (i) the sign of the self orthe diagonal (F1 = F2) peak and (ii) the signs of the sequen-tial peaks relative to that of the diagonal peak.
Thus, here we have seven categories of triplets of resi-dues that may be distinguished: (I) ZXZ 0, (II) PXZ, ZXP,PXP, (III) PXA, PAX, PAA, AXP, AAP, XAP, PAP,(IV) XAZ, AXZ, ZXA, AAZ, ZAA, AXA, AAA, (V)GAP, PAG, PGA, AGP, (VI) GAX, AXG, XGA, XAG,GXA, AGX, and (VII) GGA, GAG, AGG, AAG, AGA,GAA, where X, Z, and Z 0 can be any residue other thanproline, glycine, and alanine. Category I is a general one,not containing glycines, alanines, and prolines, and hasbeen included to be able to distinguish the special patterns
Fig. 3. Schematic patterns in the F1–F3 planes at the F2 chemical shift of the cenA (A) and HN(C)N-A (B) spectra for various special triplet sequences of categoproline. Squares are the diagonal peaks and circles are the sequential peaks. FiIn all cases the peaks are aligned at the F3 (HN) chemical shift of the central
from the general pattern, category II has prolines but noglycines, category III has combinations of alanines andprolines, category IV has alanines but no prolines and/orglycines, category V has combinations of glycines, alanines,and prolines, category VI has combination of glycines andalanines but no prolines, and category VII has combinationof two glycines with one alanine and vice versa. Besidesthese the HNN-A and HN(C)N-A will also contain the ear-lier described [6] peak patterns due to combinations of gly-cines and prolines. The following salient features of thepatterns would be helpful in proper analysis of the spectra.
In the HNN-A experiment which generates correlationsfrom i to both i � 1 and i + 1 residues, the sign of the selfpeak for glycine and alanine is always opposite to that ofany other residue; the actual signs will depend upon howthe spectra are phased. The diagonal of glycine and ala-nines is chosen to have a negative sign. To emphasize thissign distinction, the diagonal peaks are shown with a differ-ent symbol (square) in the figure. This enables unambigu-ous discrimination between triplets having G or A, andtriplets having X as the central residues. For example, thepatterns for PAX, and PXA in HNN-A seem similar, butin the former the diagonal peak is negative and the sequen-tial is positive, whereas the reverse is true in the latter case.
tral residue in the triplets mentioned on the top of each panel, in the HNN-ries I–VII (see text). X, Z, Z 0 is any residue other than glycine, alanine, andlled and open symbols represent positive and negative signals, respectively.residue.
26 A. Chatterjee et al. / Journal of Magnetic Resonance 181 (2006) 21–28
The sign of the sequential peak at i � 1 position will bepositive or negative depending upon whether that residueis glycine; alanine or otherwise. Similarly the sign of thesequential peak to i + 1 residue will be positive or negativedepending on whether the ith residue is glycine; alanine orotherwise.
In the HN(C)N-A experiment which generates i to i � 1correlation the signs of the self and sequential peaks arealways opposite. The actual signs are dictated by whetherthe i � 1 residue is a glycine or an alanine or otherwise,and of course by the phasing of the spectra. Again the diag-
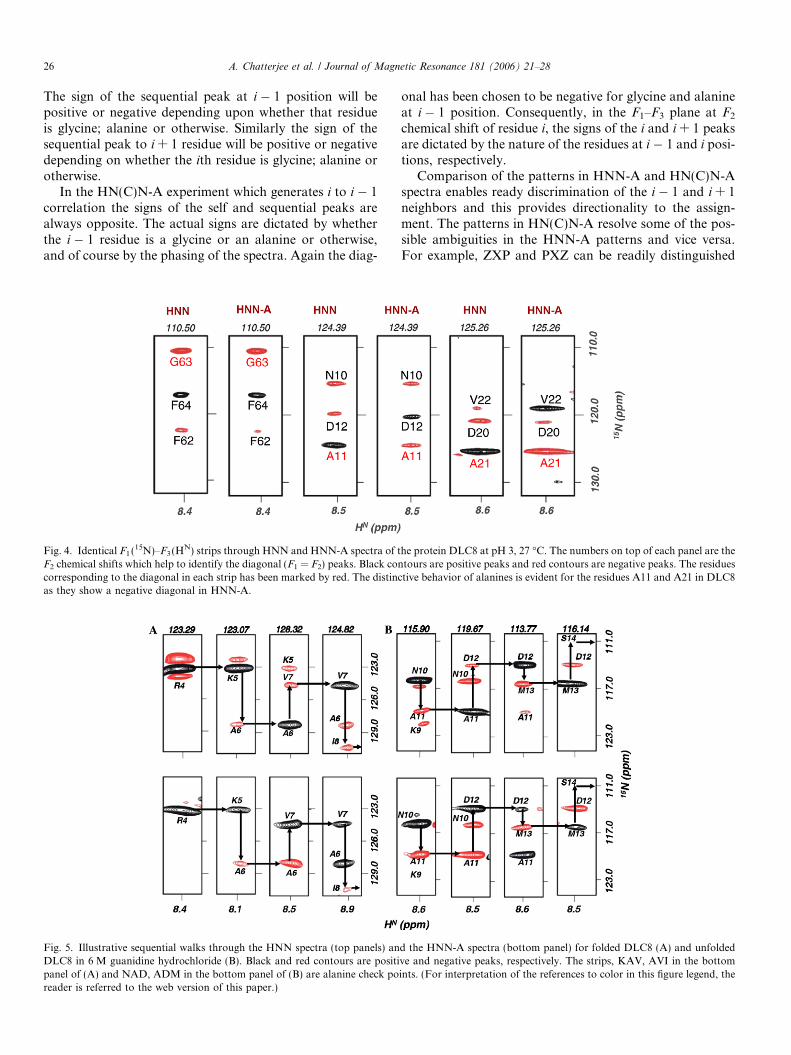
Fig. 4. Identical F1 (15N)–F3 (HN) strips through HNN and HNN-A spectra of tF2 chemical shifts which help to identify the diagonal (F1 = F2) peaks. Black concorresponding to the diagonal in each strip has been marked by red. The distinas they show a negative diagonal in HNN-A.
Fig. 5. Illustrative sequential walks through the HNN spectra (top panels) anDLC8 in 6 M guanidine hydrochloride (B). Black and red contours are positipanel of (A) and NAD, ADM in the bottom panel of (B) are alanine check poreader is referred to the web version of this paper.)
onal has been chosen to be negative for glycine and alanineat i � 1 position. Consequently, in the F1–F3 plane at F2
chemical shift of residue i, the signs of the i and i + 1 peaksare dictated by the nature of the residues at i � 1 and i posi-tions, respectively.
Comparison of the patterns in HNN-A and HN(C)N-Aspectra enables ready discrimination of the i � 1 and i + 1neighbors and this provides directionality to the assign-ment. The patterns in HN(C)N-A resolve some of the pos-sible ambiguities in the HNN-A patterns and vice versa.For example, ZXP and PXZ can be readily distinguished
he protein DLC8 at pH 3, 27 �C. The numbers on top of each panel are thetours are positive peaks and red contours are negative peaks. The residues
ctive behavior of alanines is evident for the residues A11 and A21 in DLC8
d the HNN-A spectra (bottom panel) for folded DLC8 (A) and unfoldedve and negative peaks, respectively. The strips, KAV, AVI in the bottomints. (For interpretation of the references to color in this figure legend, the

A. Chatterjee et al. / Journal of Magnetic Resonance 181 (2006) 21–28 27
from the HN(C)N-A spectrum, where as they look similarin the HNN-A spectrum. Similarly, PAA and AAP pat-terns are similar in HNN-A, but are distinctly different inHN(C)N-A. PAP and XAP would look similar inHN(C)N-A, but they can be readily distinguished fromthe HNN-A spectrum, and so on.
Thus glycines, alanines, and prolines can be used asstarting points or check points during sequential walksalong the polypeptide chain. Whenever, complete assign-ments are hampered for some reasons, by any of the meth-ods, the fixed points will serve at least as partial monitorsand enable local characterization of the protein.
The above ideas have been experimentally tested with afew proteins, and we show here the data on DLC8, a com-ponent of the motor protein, dynein [24].
Sequential walk through alanine check points: DLC8protein has 89 residues and there are four glycines. Howev-er, it has a long stretch of 51 residues which does not haveany glycines. It is here the new alanine check points becomeextremely useful. Fig. 4 shows identical (F1–F3) stripsthrough HNN and HNN-A spectra for the monomericprotein DLC8. The changes in the patterns due to alaninescan be clearly seen. Fig. 5 shows identical sequential walksthrough HNN (top panel) and HNN-A (bottom panel)spectra for both folded (A) and unfolded (B) DLC8. Thespecific patterns due to alanine are clearly evident. A sum-mary of all the observed sequential connectivities in theHNN-A spectrum for the folded DLC8 protein is shown
Fig. 6. A summary of all the observed sequential connectivities in the HNN-AThe glycines are marked by red, alanines by blue and prolines by green. (Forreferred to the web version of this paper.)
G63 G63
A11 A1
S64 S64 D12 D1
Fig. 7. Identical F1–F3 strips through HN(C)N and HN(C)N-A spectra of thechemical shifts which help to identify the diagonal (F1 = F2) peaks. Black concorresponding to the diagonal in each strip has been indicated by red. The distishow negative diagonal (i) a positive cross (i + 1) peak in HN(C)N-A.
in Fig. 6. The glycine, proline and alanines positions alongthe sequence have been highlighted in the figure. Finally,Fig. 7, shows regions from the HN(C)N-A spectrum toillustrate the alanine check points, in that spectrum.
4. Conclusions
We have described here new pulse sequences which havesignificant advantages for rapid assignment in the contextof structural genomics and protein folding studies. Wehave demonstrated the successful application of thesenew pulse sequences HNN-A and HN(C)N-A for the pro-tein DLC8. These sequences increase the number of start/check points when compared to HNN and/or HN(C)Nand hence help in pacing up the resonance assignments inproteins. However, as discussed in the original descriptionof the HNN and HN(C)N techniques [6,1], one of the con-cerns is the low sensitivity of the experiments. While this isnot a serious problem in unfolded proteins and smallerproteins, it may become a matter of concern for larger fold-ed proteins which have fast relaxation rates. Deuterationmay help overcome this problem by reducing the relaxationlosses through the pulse sequences. Even so, the resultswith non-deuterated proteins presented here indicate thatthe experiments are still practical and reasonable sensitivi-ties are evident. In the present case, the experiments havebeen performed on a VARIAN 600 MHz Inova NMRspectrometer with a S/N ratio of �540, where as in the
spectrum for the folded protein shown by underlining along the sequence.interpretation of the references to color in this figure legend, the reader is
1 A21 A21
2 V22 V22
protein DLC8 at pH3, 27 �C. The numbers on top of each panel are the F2
tours are positive peaks and red contours are negative peaks. The residuenctive behavior of alanines is evident for the residues A11 and A21 as they

28 A. Chatterjee et al. / Journal of Magnetic Resonance 181 (2006) 21–28
modern NMR spectrometers ratios of 1300 are easily avail-able and with the availability of ‘cryoprobes,’ S/N ratios ofas much as 6000 have been realized on 600 MHz spectrom-eters. At higher magnetic field strengths of up to 900 MHz(in proton frequency units), as are currently available, thesensitivities are even higher. Thus, sensitivity of theHNN-A and HN(C)N-A techniques is not as much of anissue and experiments can be successfully carried out onlarge proteins even without deuteration.
References
[1] S.C. Panchal, N.S. Bhavesh, R.V. Hosur, Improved 3D tripleresonance experiments, HNN and HN(C)N, for HN and 15Nsequential correlations in (13C, 15N) labeled proteins: application tounfolded proteins, J. Biomol. NMR 20 (2001) 135–147.
[2] R. Weisemann, H. Ruterjans, W. Bermel, 3D triple-resonance NMRtechniques for the sequential assignment of NH and 15N resonances in15N- and 13C-labelled proteins, J. Biomol. NMR 3 (1993) 113–120.
[3] S. Grzesiek, J. Anglister, H. Ren, A. Bax, Carbon-13 line narrowingby deuterium decoupling in deuterium/carbon-13/nitrogen-15enriched proteins. Application to triple resonance 4D J connectivityof sequential amides, J. Am. Chem. Soc. 115 (1993) 4369–4370.
[4] H. Matsuo, E. Kupce, H. Li, G. Wagner, Use of selective C alphapulses for improvement of HN(CA)CO-D and HN(COCA)NH-Dexperiments, J. Magn. Reson. B 111 (1996) 194–198.
[5] C. Bracken, A.G. Palmer III, J. Cavanagh, (H)N(COCA)NH andHN(COCA)NH experiments for 1H–15N backbone assignments in13C/15N-labeled proteins, J. Biomol. NMR 9 (1997) 94–100.
[6] N.S. Bhavesh, S.C. Panchal, R.V. Hosur, An efficient high-throughputresonance assignment procedure for structural genomics and proteinfolding research by NMR, Biochemistry 40 (2001) 14727–14735.
[7] A. Chatterjee, N.S. Bhavesh, S.C. Panchal, R.V. Hosur, A novelprotocol based on HN(C)N for rapid resonance assignment in (15N,13C) labeled proteins: implications to structural genomics, Biochem.Biophys. Res. Commun. 293 (2002) 427–432.
[8] M. Bozzi, M. Bianchi, F. Sciandra, M. Paci, B. Giardina, A.Brancaccio, D.O. Cicero, Structural characterization by NMR of thenatively unfolded extracellular domain of beta-dystroglycan: towardthe identification of the binding epitope for alpha-dystroglycan,Biochemistry 42 (2003) 13717–13724.
[9] A. Chatterjee, P. Mridula, R.K. Mishra, R. Mittal, R.V. Hosur,Folding regulates autoprocessing of HIV-1 protease precursor, J.Biol. Chem. 280 (2005) 11369–11378.
[10] J. Juneja, N.S. Bhavesh, J.B. Udgaonkar, R.V. Hosur, NMRidentification and characterization of the flexible regions in the160 kDa molten globule-like aggregate of barstar at low pH,Biochemistry 41 (2002) 9885–9899.
[11] C.J. Macdonald, K. Tozawa, E.S. Collins, C.N. Penfold, R. James, C.Kleanthous, N.J. Clayden, G.R. Moore, Characterisation of a mobile
protein-binding epitope in the translocation domain of colicin E9, J.Biomol. NMR 30 (2004) 81–96.
[12] S.C. Panchal, D.A. Kaiser, E. Torres, T.D. Pollard, M.K. Rosen,A conserved amphipathic helix in WASP/Scar proteins is essentialfor activation of Arp2/3 complex, Nat. Struct. Biol. 10 (2003)591–598.
[13] P. Teriete, S. Banerji, M. Noble, C.D. Blundell, A.J. Wright, A.R.Pickford, E. Lowe, D.J. Mahoney, M.I. Tammi, J.D. Kahmann, I.D.Campbell, A.J. Day, D.G. Jackson, Structure of the regulatoryhyaluronan binding domain in the inflammatory leukocyte homingreceptor CD44, Mol. Cell 13 (2004) 483–496.
[14] K. Tozawa, C.J. Macdonald, C.N. Penfold, R. James, C. Kleanthous,N.J. Clayden, G.R. Moore, Clusters in an intrinsically disorderedprotein create a protein-binding site: the TolB-binding region ofcolicin E9, Biochemistry 44 (2005) 11496–11507.
[15] X. Zhang, Y. Xu, J. Zhang, J. Wu, Y. Shi, Structural and dynamiccharacterization of the acid-unfolded state of hUBF HMG box 1provides clues for the early events in protein folding, Biochemistry 44(2005) 8117–8125.
[16] J. Wirmer, H. Schwalbe, Angular dependence of 1JNiCai
and 2J NiCai�1
coupling constants measured in J-modulated HSQCs, J. Biomol.NMR 23 (2002) 47–55.
[17] N.S. Bhavesh, A. Chatterjee, S.C. Panchal, R.V. Hosur, Applicationof HN(C)N to rapid estimation of 1JNCa coupling constants corre-lated to w torsion angles in proteins: implication to structuralgenomics, Biochem. Biophys. Res. Commun. 311 (2003) 678–684.
[18] J. Star-Lack, S.J. Nelson, J. Kurhanewicz, L.R. Huang, D.B.Vigneron, Improved water and lipid suppression for 3D PRESSCSI using RF band selective inversion with gradient dephasing(BASING), Magn. Reson. Med. 38 (1997) 311–321.
[19] D. Rosenfeld, S.L. Panfil, Y. Zur, Design of adiabatic pulses for fat-suppression using analytic solutions of the Bloch equation, Magn.Reson. Med. 37 (1997) 793–801.
[20] R. Crouch, R.D. Boyer, R. Johnson, K. Krishnamurthy, Broadbandand band-selective IMPRESS-gHMBC: compensation of refocusinginefficiency with synchronized inversion sweep, Magn. Reson. Chem.42 (2004) 301–307.
[21] S.A. Bradley, H. Hu, K. Krishnamurthy, C.E. Hadden, A band-selective composite gradient: application to DQF-COSY, J. Magn.Reson. 174 (2005) 110–115.
[22] M.S. Silver, R.I. Joseph, D.I. Hoult, Selective spin inversion innuclear magnetic resonance and coherent optics through an exactsolution of the Bloch–Riccati equation, Phys. Rev. A 31 (1985) 2753–2755.
[23] W. Peti, L.J. Smith, C. Redfield, H. Schwalbe, Chemical shifts indenatured proteins: resonance assignments for denatured ubiquitinand comparisons with other denatured proteins, J. Biomol. NMR 19(2001) 153–165.
[24] E.L. Holzbaur, R.B. Vallee, DYNEINS: molecular structure andcellular function, Annu. Rev. Cell Biol. 10 (1994) 339–372.
[25] A.J. Shaka, Composite pulses for ultra broadband inversion, Chem.Phys. Lett. 120 (1985) 201–205.