Embed Size (px)
Citation preview
RESEARCH Open Access
Albumin infusion rate and plasma volumeexpansion: a randomized clinical trial inpostoperative patients after major surgerySvajunas Statkevicius1, Johan Bonnevier1, Jane Fisher2, Björn P. Bark1, Erik Larsson3, Carl M. Öberg4, Päivi Kannisto5,Bobby Tingstedt6 and Peter Bentzer7,8*
Abstract
Background: Optimal infusion rate of colloids in patients with suspected hypovolemia is unknown, and the primaryobjective of the present study was to test if plasma volume expansion by 5% albumin is greater if fluid is administeredslowly rather than rapidly.
Methods: Patients with signs of hypoperfusion after major abdominal surgery were randomized to intravenous infusionof 5% albumin at a dose of 10 ml/kg (ideal body weight) either rapidly (30min) or slowly (180min). Plasma volume wasmeasured using radiolabeled albumin at baseline, at 30 min, and at 180min after the start of infusion. Primary outcomewas change in plasma volume from the start of infusion to 180min after the start of infusion. Secondary outcomesincluded the change in the area under the plasma volume curve and transcapillary escape rate (TER) for albumin from180 to 240min after the start of albumin infusion.
Results: A total of 33 and 31 patients were included in the analysis in the slow and rapid groups, respectively. Thechange in plasma volume from the start of infusion to 180min did not differ between the slow and rapid infusion groups(7.4 ± 2.6 vs. 6.5 ± 4.1ml/kg; absolute difference, 0.9ml/kg [95%CI, − 0.8 to 2.6], P = 0.301). Change in the area under theplasma volume curve was smaller in the slow than in the rapid infusion group and was 866 ± 341 and 1226 ± 419min ml/kg, respectively, P < 0.001. TER for albumin did not differ and was 5.3 ± 3.1%/h and 5.4 ± 3%/h in the slow and inthe rapid infusion groups, respectively, P = 0.931.
Conclusions: This study does not support our hypothesis that a slow infusion of colloid results in a greater plasmavolume expansion than a rapid infusion. Instead, our result of a smaller change in the area under the plasma volumecurve indicates that a slow infusion results in a less efficient plasma volume expansion, but further studies are requiredto confirm this finding. A rapid infusion has no effect on vascular leak as measured after completion of the infusion.
Trial registration: EudraCT2013-004446-42 registered December 23, 2014.
Keywords: Plasma volume expanders, Fluid therapy, Serum albumin
BackgroundMajor surgery initiates a systemic inflammatory responsesyndrome which disrupts the normal regulation of trans-capillary fluid exchange and may induce tissue edemaand hypovolemia [1]. Fluid replacement is therefore a
cornerstone in the perioperative treatment of thesepatients as well as in patients suffering from increasedvascular leakage of other etiologies. Although fluid ther-apy is life-saving, it is also associated with side effectssuch as further edema formation and compartment syn-dromes which may adversely affect the outcome [2–8].From a clinical perspective, it is therefore important
that fluid administered to counteract hypovolemia isretained intravascularly as much as possible. Colloids aremacromolecules for which the vessel wall has a low per-meability, and less volume is required for an equal
© The Author(s). 2019 Open Access This article is distributed under the terms of the Creative Commons Attribution 4.0International License (http://creativecommons.org/licenses/by/4.0/), which permits unrestricted use, distribution, andreproduction in any medium, provided you give appropriate credit to the original author(s) and the source, provide a link tothe Creative Commons license, and indicate if changes were made. The Creative Commons Public Domain Dedication waiver(http://creativecommons.org/publicdomain/zero/1.0/) applies to the data made available in this article, unless otherwise stated.
* Correspondence: [email protected] of Anesthesia and Intensive Care, Helsingborg Hospital,Helsingborg and Lund University, 251 87 Helsingborg, Sweden8Department of Clinical Sciences, Anesthesiology, Lund University, Lund,SwedenFull list of author information is available at the end of the article
Statkevicius et al. Critical Care (2019) 23:191 https://doi.org/10.1186/s13054-019-2477-7
plasma volume expansion compared to crystalloids [9–11]. However, extravasation of colloids is not only afunction of the vessel wall permeability but is alsodependent on the volume of fluid that is filtered acrossthe capillary wall, which in turn depends on the transca-pillary hydrostatic pressure [12]. This indicates thatinfusion rate may influence extravasation of colloids byeffects on hydrostatic pressure, but the importance ofsuch an effect on plasma volume expansion by a colloidis unclear. The hypothesis is supported by studies inrodent models of sepsis showing that plasma volumeexpansion in experimental sepsis is greater after a slowinfusion compared to a rapid infusion of the samevolume of colloid [13, 14]. In contrast, no effect of ahigh infusion rate on extravasation of albumin could bedemonstrated in porcine endotoxemia [15].Recent surveys show that infusion rate of resuscitation
fluids is highly variable [16], and no study has addressedthe importance of infusion rates for plasma volume expan-sion in a clinical setting. While rapid correction of sus-pected hypovolemia makes intuitive sense, the recentFEAST trial in septic children showed a surprising increasein mortality following resuscitation using fluid bolusescompared to less aggressive fluid resuscitation [17]. More-over, rapid plasma volume expansion has been suggested toinduce shedding of the endothelial glycocalyx through therelease of atrial natriuretic peptide [18]. Taken together, theabove suggest that rapid infusion of resuscitation fluids mayhave adverse effects and highlight the need for furtherknowledge in this aspect of fluid resuscitation.Based on these considerations, the primary objective
of this study was to test the hypothesis that plasma vol-ume expansion by a given volume of colloid is greater iffluid is administered slowly rather than rapidly. For thispurpose, postoperative patients with suspected hypovol-emia were randomized to receive 5% albumin at a doseof 10 ml/kg in 30min or in 180 min. Primary outcomewas change in plasma volume from baseline to 180 minafter the start of the albumin infusion. Secondary end-points included the change in the area under the plasmavolume curve from the start of infusion to 180 min afterthe start of the infusion, transcapillary escape rate ofalbumin, and postoperative morbidity. To assess the ef-fects of the intervention on the endothelial glycocalyx,we also measured the plasma concentration of glycoca-lyx components and hormones involved in fluid balance.
MethodsWe conducted a single-center, prospective randomizedphysiological trial of albumin administration at two differ-ent infusion rates to patients with suspected hypovolemiafollowing major abdominal surgery. The study was ap-proved by the regional ethical vetting board (# 2014/15)and was conducted at Skåne University Hospital, Lund,
Sweden. Written informed consent was obtained from allsubjects. The protocol was amended two times. The firstamendment extended the inclusion criteria to include post-operative patients after major gynecological cancer surgery(open ovarian and endometrial debulking surgery) topromote recruitment. The second amendment changed theinterim analysis plan by adding the Haybittle-Peto bound-ary for the testing of efficacy. In addition, vasopressor andinotropic therapy were omitted as exclusion criteria. Thefirst amendment was performed after 1 patient had beenincluded, and the second was performed after 24 patientshad been included. The trial was registered in the EuropeanClinical Trials Database (EudraCT 2013-004446-42) andon ClinicalTrials.gov (NCT02728921). The trial was autho-rized by the Swedish Medical Products Agency to proceedon 9 February 2014. The experimental protocol has beenpublished [19].
Inclusion criteriaPatients scheduled for non-emergent Whipple operation ormajor gynecological cancer surgery ≥ 40 years of age wereapproached by a member of the research team. The pa-tients were informed about the possibility to participate inthe study after admission to the postoperative care unit,should they fulfill the postoperative inclusion criteria. Writ-ten informed consent was collected from interested pa-tients. Patients who had given a written consent prior tothe operation were screened by a member of the researchteam the first 5 h after admission to the post-anesthesiacare unit. The inclusion criteria were (1) written consentand (2) indication for fluid therapy as judged by the phys-ician caring for the patient and at least one of the followingcriteria: (a) positive “leg raising test” (pulse pressure in-crease > 9%) [20, 21], (b) central venous oxygen saturation< 70%, (c) arterial lactate > 2.0mmol/l, (d) urine output <0.5ml/kg the hour prior to inclusion, (e) respiratory vari-ation of the inferior vena cava of more than 15% as mea-sured by ultrasound [22, 23], and (f) systolic blood pressure< 100mmHg or mean arterial blood pressure < 55mmHg.
Exclusion criteriaPatients fulfilling any of the following criteria wereexcluded: (1) hypersensitivity to the active drug or thetracer; (2) signs of postoperative bleeding; (3) history ofheart failure; (4) the physician caring for the patientconsidered that there were strong reasons to administeranother fluid or the same fluid, but in another way or ina different volume than stated in the protocol; (5) preg-nancy; and (6) clinical judgment by the investigator orthe treating physician that the patient should not partici-pate in the study for reasons other than described above.Predefined permanent withdrawal criteria included thechange of surgical procedure or the occurrence ofserious adverse events.
Statkevicius et al. Critical Care (2019) 23:191 Page 2 of 10
Intra- and postoperative care of the patientsIncluded patients received routine pre- and intraoperativecare. Anesthesia was induced intravenously using propofoland maintained using either sevoflurane or desflurane.Patients received an epidural catheter for intra- and post-operative analgesia unless contraindicated. Postoperativeepidural analgesia was provided using bupivacaine (2.5mg/ml) and morphine (0.05mg/ml) at a rate of 4–6ml/h. Crys-talloids and colloids were used as resuscitation fluids intra-operatively at the discretion of the attending anesthetist. Ahemoglobin level of 80–90 g/l was the transfusion trigger.Analgesics were given as needed during the interventionphase of the study, and the rate of vasoactive agents wasadjusted to maintain mean arterial pressure > 65mmHg.No fluids other than maintenance (2.5% or 5% glucose withelectrolytes at a rate of 1ml/kg/h) and study fluids weregiven during the intervention period. The trial was auditedby external monitors and auditing included source dataverification.
InterventionEligible patients were randomized at a ratio of 1:1 usingsealed envelopes to receive 5% albumin at a dose of 10ml/kg of predicted body weight [24] in either 30 min or180 min. Sealed envelopes were prepared by an inde-pendent party (Clinical Research Unit, Skåne UniversityHospital, Lund). Randomization was performed using acomputerized random number generator, and the re-search team was blinded to block size.
OutcomesThe primary outcome was change in plasma volume fromthe start to 180min after the start of albumin infusion.Secondary outcomes were change in the area under theplasma volume curve from the start to 180min after thestart of infusion of albumin, transcapillary escape rate(TER) for albumin, changes in hemodynamic parameters,diuresis, plasma concentration of hormones involved influid homeostasis, and plasma concentration of glycocalyxcomponents and incidence of postoperative complicationsup to 30 days postoperatively (see Additional file 1: TableS1 for the definitions of complications).
MeasurementsPlasma volume was measured by calculating the distribu-tion volume of 125I-human serum albumin (SERALB-125®,CIS Bio International, Gif-Sur-Yvette, France) administeredintravenously before the start of the albumin infusion, at30min, and at 180min after the start of the infusion. Themethod is considered to be the gold standard for the meas-urement of plasma volume [25] and is described in moredetail in the supplement. The change in the area under theplasma volume curve was calculated using the trapezoidrule. Transcapillary escape rate for albumin is a measure of
leakage of albumin from microvessels into the interstitiumand was measured by measuring plasma concentration of125I-human serum albumin at 10, 30, 45, and 60min afterthe last injection of the tracer (Additional file 1: Figure S1).The decrease in plasma concentration of 125I-humanserum albumin was fitted to be a mono exponential func-tion and is expressed as the percentage of the decrease inplasma concentration of 125I-human serum albumin perhour [26–28]. Potential sources of error in measurement oftranscapillary escape rate for albumin and plasma volumehave been evaluated previously and have been found to besmall [19, 26, 29]. Transcapillary escape rate was measuredbetween 180 and 240min after the start of the infusion toensure that both groups had received the same dose of al-bumin when the measurement was performed.Plasma concentrations of glypican-4 (Cloud-Clone Corp),
hyaluronan (Echelon Biosciences), Syndecan-1 (Diaclone),renin (IDS), copeptin (Brahms GmbH), albumin (Roche),and Mid Regional-pro Atrial Natriuretic Peptide (MR-proANP) (Brahms GmbH) were determined by immuno-logic assays according to the manufacturer’s instructionsbefore and at 180min after the start of the albumin infu-sion. On a post hoc basis, we analyzed albumin before andat 180min after the start of the albumin infusion using animmunological assay (Roche). Blood gas analysis and deter-mination of hematocrit and plasma lactate were performedusing a blood gas analyzer (Radiometer 850, Radiometer).Hematocrit was measured every 30min from baseline to180min after the start of infusion. The participants receivedroutine postoperative care after the study protocol wascompleted. Measurement of plasma volumes, transcapillaryescape rate, and plasma concentrations of glycocalyx com-ponents and hormones were made blinded to treatment.Baseline hemodynamic data and blood gases were collectedprior to treatment allocation whereas these parameterswere recorded by an investigator aware of the treatmentallocation at the later time points. For an overview of themeasurements, see Additional file 1: Figure S1.
Data collection and managementComorbidities, medications, routine laboratory analysis re-sults, American Society of Anesthesiology (ASA) classifica-tion, and Revised Cardiac Risk Index were collected fromthe hospital electronic chart system or calculated. Peri-operative data were collected from the anesthesia chart.Hemodynamic data were recorded immediately prior to thestart and at 180min after the start of albumin infusion.Diuresis was recorded 4 h before and 6 h after the start ofinfusion.
Statistical analysisIn experimental studies, a 6-ml/kg greater plasmavolume expansion was found after slow administrationof 5% albumin at a dose of 12 ml/kg compared with a
Statkevicius et al. Critical Care (2019) 23:191 Page 3 of 10
bolus dose of the same volume [13, 14]. Based on thesedata, the present study was powered to detect a differ-ence in plasma volume expansion between the groups of4 ml/kg. Assuming a standard deviation of the change inplasma volume of 5 ml/kg [30], about 30 patients in eachgroup were required to obtain a power of 80% using anunpaired t test. To adjust for the possibility that patientsdid not complete the protocol, we aimed to include 35patients in each arm.An interim analysis for the assessment of efficacy was
performed after 36 patients had completed the protocol.The Haybittle-Peto boundary was used to test for efficacymeaning that if a difference with regard to the primaryendpoint with a P ≤ 0.001 was detected, the study could bestopped.Statistical analyses were performed per protocol by an in-
dependent statistician blinded to the treatment allocation,and the main results were interpreted as specified in theprotocol [19]. Hypothesis testing was made usingtwo-tailed testing, and a P value below 0.05 was consideredsignificant. Assessment of normality was performed usinghistograms and the Shapiro-Wilk test and followed by theunpaired t test or the Mann-Whitney test as appropriate.Fisher’s exact test was used for categorical variables.Analysis of covariance (ANCOVA) and Pearson correlationanalysis were used for the sensitivity analysis. Influence ofbaseline blood volume and type of surgery on treatmenteffect were assessed in pre-specified sensitivity analyses.Data are presented as median and interquartile range or asmean ± SD. SAS 9.4 Institute Inc., Cary, NC, USA, wasused for the analysis.
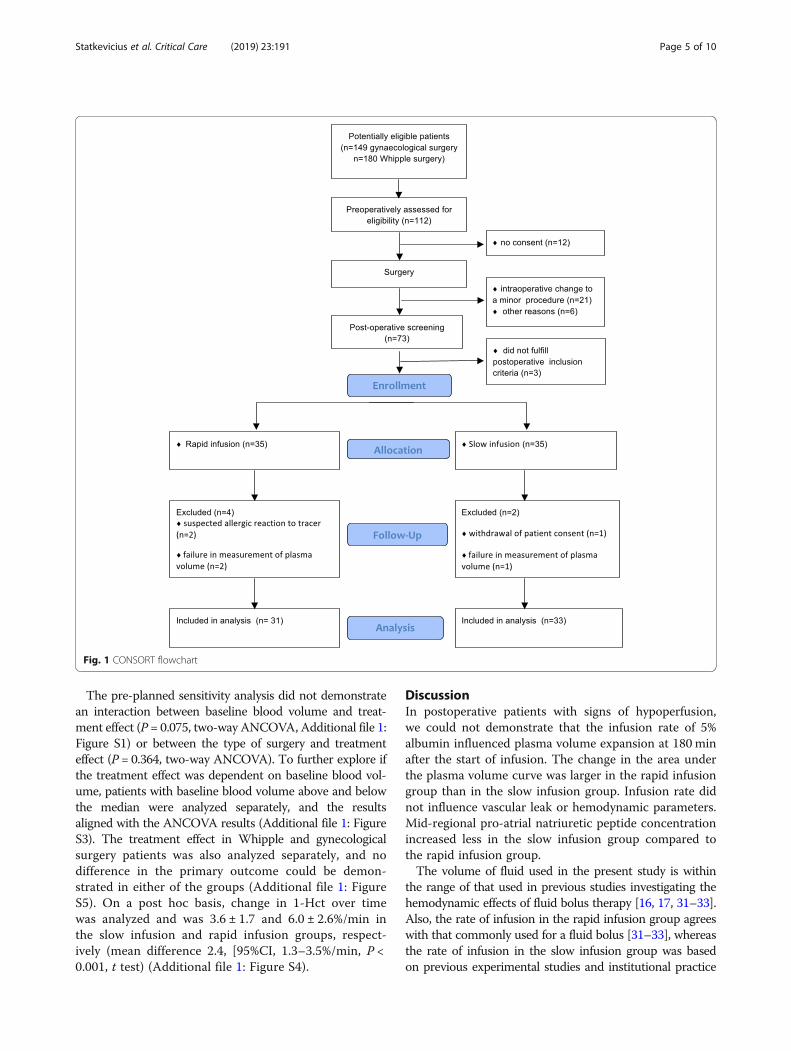
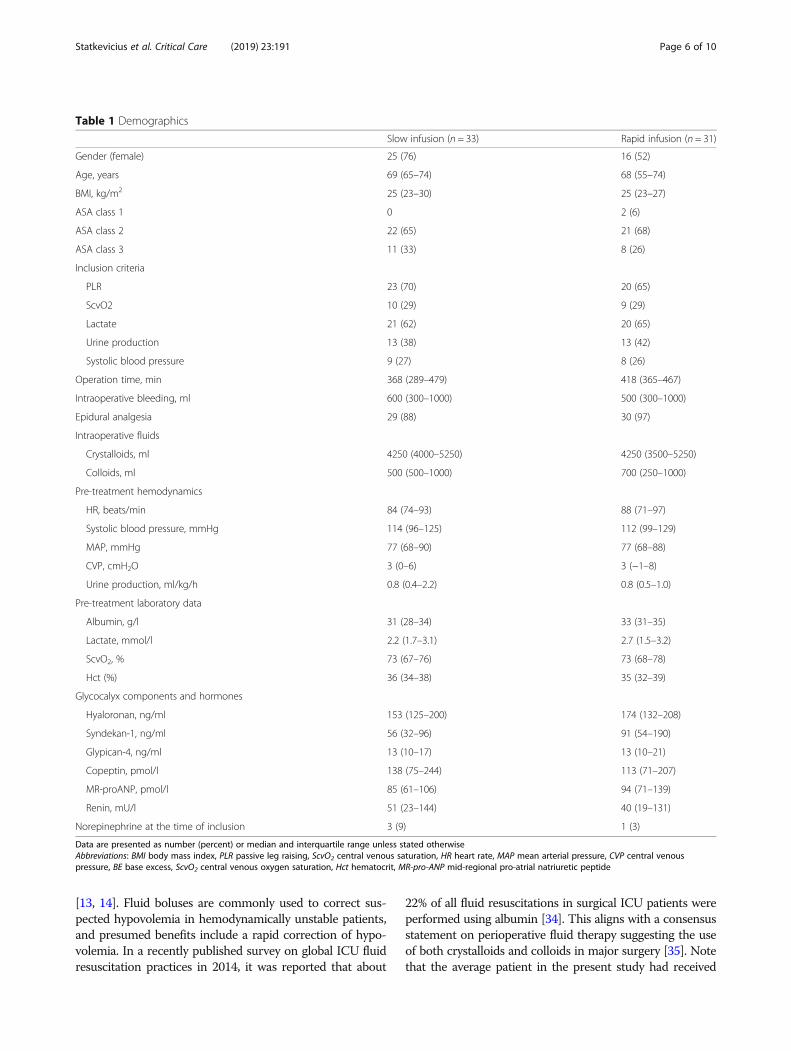
ResultsPatientsA total of 70 patients were enrolled between the 18 June2014 and the 22 November 2016, and 35 patients wereassigned to each treatment. Prior to the second amend-ment, 1 patient that had given consent was not includeddue to an ongoing vasopressor therapy. For a CONSORTflowchart of patients, see Fig. 1. Two patients experienceda suspected allergic reaction following the administrationof 125I-human serum albumin and were not included inthe study. One patient withdrew consent during theintervention. Plasma volume measurement was unsuccess-ful due to technical problems in 3 patients. A total of 33patients receiving slow infusion and 31 patients receivingrapid infusion were included in the analysis. Pre-treatmentcharacteristics are presented in Table 1. The two mostcommon criteria for fluid administration were a positivepassive leg raising test and an elevated arterial lactate. Allpatients with a positive passive leg raising test also had atleast 1 additional objective criteria suggesting hypovolemia.A total of 4 patients received treatment with norepineph-rine at inclusion, and in all cases, the dose was below
0.1 μg/kg/min. Baseline plasma volume was 46.9 ± 9.2ml/kg and 47.7 ± 6.3ml/kg in the slow and rapid groups, re-spectively (Fig. 2). This corresponded to a calculated bloodvolume of 73.1 ± 15.0ml/kg and 72.9 ± 10.3ml/kg in theslow and rapid groups, respectively.
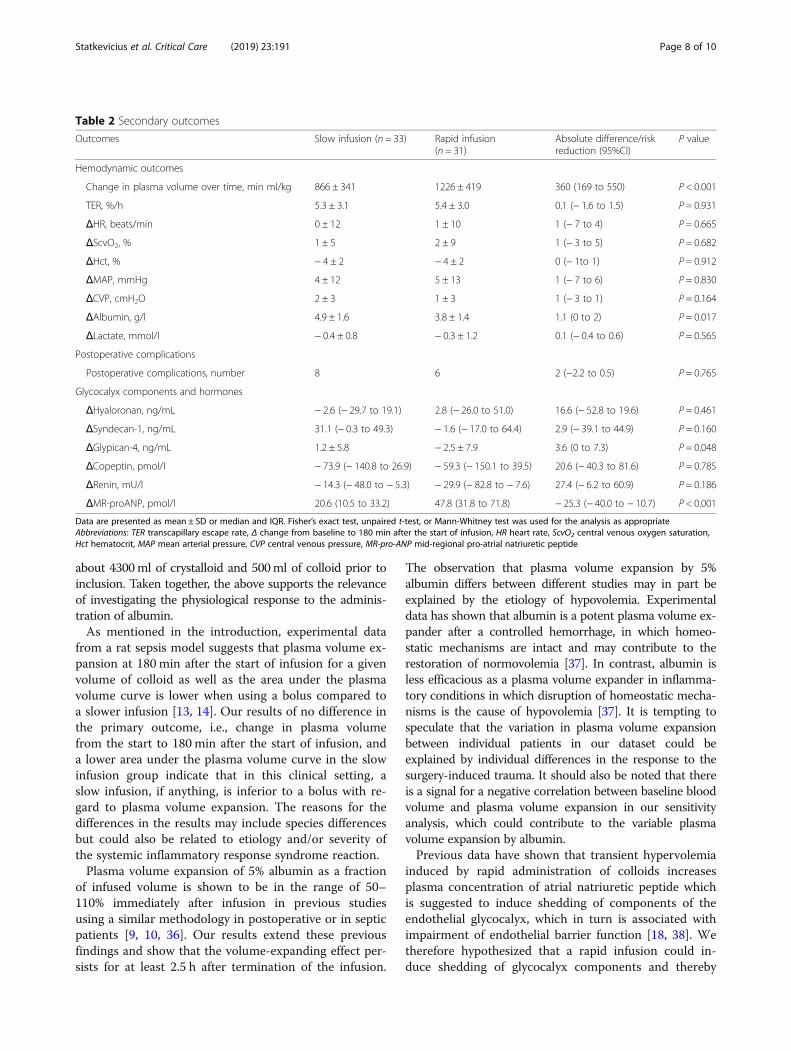
OutcomesThe increase in plasma volume from the start to 180min after the start of infusion did not differ between thetwo infusion rates and was 7.4 ± 2.6 ml/kg and 6.5 ± 4.1ml/kg in the slow and rapid infusion groups, respectively(mean difference, 0.9 [95%CI, − 0.8 to 2.63.2], P = 0.301,t test, Fig. 3). Change in the area under the plasma vol-ume curve over time was smaller in the slow infusiongroup than in the rapid infusion group and was 866 ±341 min ml/kg and 1226 ± 419 min ml/kg in the slowand rapid groups, respectively (mean difference, 360min ml/kg [95%CI, 169 to 550], P < 0.001, t test) (Table 2). The number of patients with postoperative complica-tions in the slow and rapid infusion groups was 8 and 6,respectively, and did not differ between the groups (P =0.774) (Table 2 and Additional file 1: Table S2). No treat-ment effect on transcapillary escape rate for albumin,lactate, hematocrit, or any of the hemodynamic parame-ters could be detected (Table 2). Overall diuresis fromthe start of infusion of albumin to 360 min after the startof infusion did not differ between the treatment groupsand was 1.0 ± 0.4 and 1.1 ± 0.6 ml/kg/h (mean difference,− 0.1 ml/kg/h [95%CI, − 0.1 to 0.4, P = 0.325, t test). In apost hoc analysis, hourly diuresis during this time periodwas analyzed using a mixed linear regression model anddiuresis as measured at 60 to 180 min from the start ofthe infusion was higher in the rapid infusion group thanin the slow infusion group (Additional file 1: Figure S7).A significant interaction between the time period treat-ment effect was detected suggesting a lower diuresis inthe slow group during the earlier hours and higher diur-esis at the later periods relative to the rapid infusiongroup (P = 0.002 for interaction between time periodand the treatment group, Additional file 1: Figure S7).Plasma albumin concentration increased more in theslow than in the rapid group (Table 2).Plasma concentration of the stable precursor fragment
of atrial natriuretic peptide, mid-regional pro-atrialnatriuretic peptide, increased more from the start to180 min after the start of infusion in the rapid infusiongroup than in the slow infusion group whereas reninand copeptin, the latter reflecting vasopressin release,did not differ between the groups (Table 2). Glypican-4, acomponent of the endothelial glycocalyx, increased morein the slow infusion group than in the rapid infusiongroup whereas no difference in the change in hyaluronanand syndecan-1 could be detected (Table 2).
Statkevicius et al. Critical Care (2019) 23:191 Page 4 of 10
The pre-planned sensitivity analysis did not demonstratean interaction between baseline blood volume and treat-ment effect (P = 0.075, two-way ANCOVA, Additional file 1:Figure S1) or between the type of surgery and treatmenteffect (P = 0.364, two-way ANCOVA). To further explore ifthe treatment effect was dependent on baseline blood vol-ume, patients with baseline blood volume above and belowthe median were analyzed separately, and the resultsaligned with the ANCOVA results (Additional file 1: FigureS3). The treatment effect in Whipple and gynecologicalsurgery patients was also analyzed separately, and nodifference in the primary outcome could be demon-strated in either of the groups (Additional file 1: FigureS5). On a post hoc basis, change in 1-Hct over timewas analyzed and was 3.6 ± 1.7 and 6.0 ± 2.6%/min inthe slow infusion and rapid infusion groups, respect-ively (mean difference 2.4, [95%CI, 1.3–3.5%/min, P <0.001, t test) (Additional file 1: Figure S4).
DiscussionIn postoperative patients with signs of hypoperfusion,we could not demonstrate that the infusion rate of 5%albumin influenced plasma volume expansion at 180 minafter the start of infusion. The change in the area underthe plasma volume curve was larger in the rapid infusiongroup than in the slow infusion group. Infusion rate didnot influence vascular leak or hemodynamic parameters.Mid-regional pro-atrial natriuretic peptide concentrationincreased less in the slow infusion group compared tothe rapid infusion group.The volume of fluid used in the present study is within
the range of that used in previous studies investigating thehemodynamic effects of fluid bolus therapy [16, 17, 31–33].Also, the rate of infusion in the rapid infusion group agreeswith that commonly used for a fluid bolus [31–33], whereasthe rate of infusion in the slow infusion group was basedon previous experimental studies and institutional practice
Fig. 1 CONSORT flowchart
Statkevicius et al. Critical Care (2019) 23:191 Page 5 of 10
[13, 14]. Fluid boluses are commonly used to correct sus-pected hypovolemia in hemodynamically unstable patients,and presumed benefits include a rapid correction of hypo-volemia. In a recently published survey on global ICU fluidresuscitation practices in 2014, it was reported that about
22% of all fluid resuscitations in surgical ICU patients wereperformed using albumin [34]. This aligns with a consensusstatement on perioperative fluid therapy suggesting the useof both crystalloids and colloids in major surgery [35]. Notethat the average patient in the present study had received
Table 1 Demographics
Slow infusion (n = 33) Rapid infusion (n = 31)
Gender (female) 25 (76) 16 (52)
Age, years 69 (65–74) 68 (55–74)
BMI, kg/m2 25 (23–30) 25 (23–27)
ASA class 1 0 2 (6)
ASA class 2 22 (65) 21 (68)
ASA class 3 11 (33) 8 (26)
Inclusion criteria
PLR 23 (70) 20 (65)
ScvO2 10 (29) 9 (29)
Lactate 21 (62) 20 (65)
Urine production 13 (38) 13 (42)
Systolic blood pressure 9 (27) 8 (26)
Operation time, min 368 (289–479) 418 (365–467)
Intraoperative bleeding, ml 600 (300–1000) 500 (300–1000)
Epidural analgesia 29 (88) 30 (97)
Intraoperative fluids
Crystalloids, ml 4250 (4000–5250) 4250 (3500–5250)
Colloids, ml 500 (500–1000) 700 (250–1000)
Pre-treatment hemodynamics
HR, beats/min 84 (74–93) 88 (71–97)
Systolic blood pressure, mmHg 114 (96–125) 112 (99–129)
MAP, mmHg 77 (68–90) 77 (68–88)
CVP, cmH2O 3 (0–6) 3 (−1–8)
Urine production, ml/kg/h 0.8 (0.4–2.2) 0.8 (0.5–1.0)
Pre-treatment laboratory data
Albumin, g/l 31 (28–34) 33 (31–35)
Lactate, mmol/l 2.2 (1.7–3.1) 2.7 (1.5–3.2)
ScvO2, % 73 (67–76) 73 (68–78)
Hct (%) 36 (34–38) 35 (32–39)
Glycocalyx components and hormones
Hyaloronan, ng/ml 153 (125–200) 174 (132–208)
Syndekan-1, ng/ml 56 (32–96) 91 (54–190)
Glypican-4, ng/ml 13 (10–17) 13 (10–21)
Copeptin, pmol/l 138 (75–244) 113 (71–207)
MR-proANP, pmol/l 85 (61–106) 94 (71–139)
Renin, mU/l 51 (23–144) 40 (19–131)
Norepinephrine at the time of inclusion 3 (9) 1 (3)
Data are presented as number (percent) or median and interquartile range unless stated otherwiseAbbreviations: BMI body mass index, PLR passive leg raising, ScvO2 central venous saturation, HR heart rate, MAP mean arterial pressure, CVP central venouspressure, BE base excess, ScvO2 central venous oxygen saturation, Hct hematocrit, MR-pro-ANP mid-regional pro-atrial natriuretic peptide
Statkevicius et al. Critical Care (2019) 23:191 Page 6 of 10
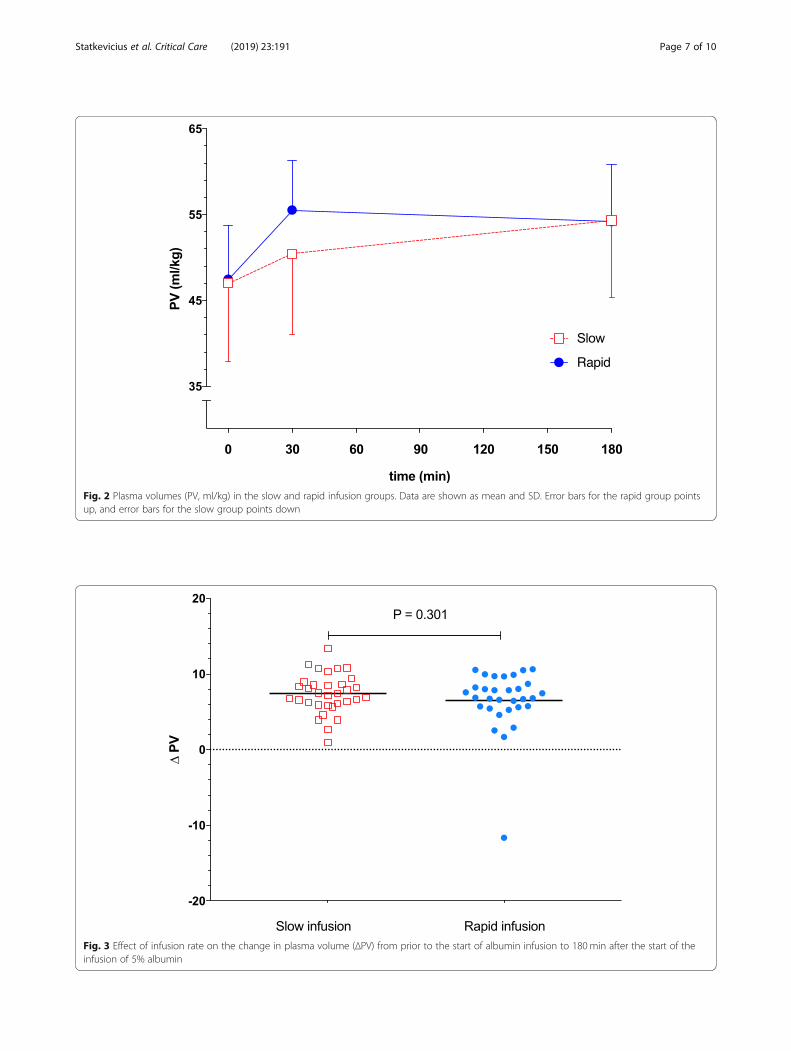
Fig. 2 Plasma volumes (PV, ml/kg) in the slow and rapid infusion groups. Data are shown as mean and SD. Error bars for the rapid group pointsup, and error bars for the slow group points down
Fig. 3 Effect of infusion rate on the change in plasma volume (ΔPV) from prior to the start of albumin infusion to 180min after the start of theinfusion of 5% albumin
Statkevicius et al. Critical Care (2019) 23:191 Page 7 of 10
about 4300ml of crystalloid and 500ml of colloid prior toinclusion. Taken together, the above supports the relevanceof investigating the physiological response to the adminis-tration of albumin.As mentioned in the introduction, experimental data
from a rat sepsis model suggests that plasma volume ex-pansion at 180 min after the start of infusion for a givenvolume of colloid as well as the area under the plasmavolume curve is lower when using a bolus compared toa slower infusion [13, 14]. Our results of no difference inthe primary outcome, i.e., change in plasma volumefrom the start to 180 min after the start of infusion, anda lower area under the plasma volume curve in the slowinfusion group indicate that in this clinical setting, aslow infusion, if anything, is inferior to a bolus with re-gard to plasma volume expansion. The reasons for thedifferences in the results may include species differencesbut could also be related to etiology and/or severity ofthe systemic inflammatory response syndrome reaction.Plasma volume expansion of 5% albumin as a fraction
of infused volume is shown to be in the range of 50–110% immediately after infusion in previous studiesusing a similar methodology in postoperative or in septicpatients [9, 10, 36]. Our results extend these previousfindings and show that the volume-expanding effect per-sists for at least 2.5 h after termination of the infusion.
The observation that plasma volume expansion by 5%albumin differs between different studies may in part beexplained by the etiology of hypovolemia. Experimentaldata has shown that albumin is a potent plasma volume ex-pander after a controlled hemorrhage, in which homeo-static mechanisms are intact and may contribute to therestoration of normovolemia [37]. In contrast, albumin isless efficacious as a plasma volume expander in inflamma-tory conditions in which disruption of homeostatic mecha-nisms is the cause of hypovolemia [37]. It is tempting tospeculate that the variation in plasma volume expansionbetween individual patients in our dataset could beexplained by individual differences in the response to thesurgery-induced trauma. It should also be noted that thereis a signal for a negative correlation between baseline bloodvolume and plasma volume expansion in our sensitivityanalysis, which could contribute to the variable plasmavolume expansion by albumin.Previous data have shown that transient hypervolemia
induced by rapid administration of colloids increasesplasma concentration of atrial natriuretic peptide whichis suggested to induce shedding of components of theendothelial glycocalyx, which in turn is associated withimpairment of endothelial barrier function [18, 38]. Wetherefore hypothesized that a rapid infusion could in-duce shedding of glycocalyx components and thereby
Table 2 Secondary outcomes
Outcomes Slow infusion (n = 33) Rapid infusion(n = 31)
Absolute difference/riskreduction (95%CI)
P value
Hemodynamic outcomes
Change in plasma volume over time, min ml/kg 866 ± 341 1226 ± 419 360 (169 to 550) P < 0.001
TER, %/h 5.3 ± 3.1 5.4 ± 3.0 0.1 (− 1.6 to 1.5) P = 0.931
ΔHR, beats/min 0 ± 12 1 ± 10 1 (− 7 to 4) P = 0.665
ΔScvO2, % 1 ± 5 2 ± 9 1 (− 3 to 5) P = 0.682
ΔHct, % − 4 ± 2 − 4 ± 2 0 (− 1to 1) P = 0.912
ΔMAP, mmHg 4 ± 12 5 ± 13 1 (− 7 to 6) P = 0.830
ΔCVP, cmH2O 2 ± 3 1 ± 3 1 (− 3 to 1) P = 0.164
ΔAlbumin, g/l 4.9 ± 1.6 3.8 ± 1.4 1.1 (0 to 2) P = 0.017
ΔLactate, mmol/l − 0.4 ± 0.8 − 0.3 ± 1.2 0.1 (− 0.4 to 0.6) P = 0.565
Postoperative complications
Postoperative complications, number 8 6 2 (−2.2 to 0.5) P = 0.765
Glycocalyx components and hormones
ΔHyaloronan, ng/mL − 2.6 (− 29.7 to 19.1) 2.8 (− 26.0 to 51.0) 16.6 (− 52.8 to 19.6) P = 0.461
ΔSyndecan-1, ng/mL 31.1 (− 0.3 to 49.3) − 1.6 (− 17.0 to 64.4) 2.9 (− 39.1 to 44.9) P = 0.160
ΔGlypican-4, ng/mL 1.2 ± 5.8 − 2.5 ± 7.9 3.6 (0 to 7.3) P = 0.048
ΔCopeptin, pmol/l − 73.9 (− 140.8 to 26.9) − 59.3 (− 150.1 to 39.5) 20.6 (− 40.3 to 81.6) P = 0.785
ΔRenin, mU/l − 14.3 (− 48.0 to − 5.3) − 29.9 (− 82.8 to − 7.6) 27.4 (− 6.2 to 60.9) P = 0.186
ΔMR-proANP, pmol/l 20.6 (10.5 to 33.2) 47.8 (31.8 to 71.8) − 25.3 (− 40.0 to − 10.7) P < 0.001
Data are presented as mean ± SD or median and IQR. Fisher’s exact test, unpaired t-test, or Mann-Whitney test was used for the analysis as appropriateAbbreviations: TER transcapillary escape rate, Δ change from baseline to 180 min after the start of infusion, HR heart rate, ScvO2 central venous oxygen saturation,Hct hematocrit, MAP mean arterial pressure, CVP central venous pressure, MR-pro-ANP mid-regional pro-atrial natriuretic peptide
Statkevicius et al. Critical Care (2019) 23:191 Page 8 of 10
increase endothelial permeability. However, our resultsthat transcapillary escape rate for albumin was in thenormal range and did not differ between the groups, andthat there was no increase in plasma concentration ofcirculating glycocalyx components after rapid infusion,indicate that such an effect is small or non-existent [27,28]. The difference in the results between our and previ-ous clinical studies with regard to the effects of rapidplasma volume expansion on glycocalyx shedding couldbe explained by the fact that we aimed to include hypo-volemic patients which probably made hypervolemia lesslikely [18]. Moreover, it is possible that the timing of themeasurement of the transcapillary escape rate of albu-min may have influenced our results. Interestingly, ourpost hoc analysis of plasma albumin revealed a larger in-crease in the slow group at 180min after the start of theinfusion. This result suggests the possibility that extrava-sation of albumin was lower in the slow infusion groupduring this time period. If so, this could be explained bythe less convective transport of albumin secondary to alower average intravascular volume from baseline to 180min in the slow group (lower area under the plasma vol-ume curve). However, the plasma concentration of albu-min reflects a balance between synthesis, metabolism,extravasation, and lymphatic return of albumin andtherefore is a less reliable marker of vascular leak thanradiolabeled albumin.The tissue trauma induced by major surgery is suggested
to initiate a stress response and a systemic inflammatoryresponse syndrome with endothelial dysfunction anddisruption of microvascular function as a consequence [39,40]. The low incidence of vasopressor use in our cohort(Table 1) despite epidural analgesia and the finding thattranscapillary escape rate of albumin was in the normalrange [26, 27] suggest a preserved endothelial barrier func-tion and a relatively mild systemic inflammatory response.Thus, the generalizability to patients with a more severedisturbance of vascular homeostasis and increased endo-thelial permeability, such as post-cardiac surgery or in sep-tic shock, is uncertain [27]. Similarly, the results cannot begeneralized to other resuscitation fluids such as crystalloidsand hyperoncotic albumin solutions or to patients withoutsigns of hypovolemia.To minimize the radiation dose, the change in the area
under the plasma volume curve was estimated by onlythree plasma volume measurement, and it could be arguedthat more frequent measurements of plasma volume couldhave influenced our results. However, the similar resultwhen evaluating changes in plasma volume by analyzingchanges in hematocrit every 30 min suggests that a greaterresolution in our measurement would not have influencedour conclusions and supports the robustness of our data.The strengths of the study include the low risk of bias
due to the randomized design, publication of the study
protocol, the blinded measurement of the majority ofthe outcomes, and the blinded analysis of the outcomes.Moreover, the use of the gold standard for the measure-ment of plasma volume [25] and auditing support thereliability and scientific integrity of the data.
ConclusionsThis study does not support our hypothesis that a slow in-fusion of colloid results in a greater plasma volume expan-sion than a rapid infusion. Instead, our result of a smallerchange in the area under the plasma volume curve indi-cates that a slow infusion results in a less efficient plasmavolume expansion, but further studies are required to con-firm this finding. A rapid infusion has no effect on vascu-lar leak as measured after completion of the infusion.
Additional file
Additional file 1: Supplementary figures and tables. (DOCX 370 kb)
AbbreviationsANCOVA: Analysis of covariance; ANOVA: Analysis of variance; ASA: AmericanSociety of Anesthesiology; CI: Confidence interval; IQR: Interquartile range;MAP: Mean arterial pressure; PV: Plasma volume; SD: Standard deviation;TER: Transcapillary escape rate
AcknowledgementsThe research team is thankful to colleagues Thomas Olsson, LennartBergqvist, and Cecilia Hindorf at the Department of Clinical Radio Physicsand to Maria Jönsson at the Department of Laboratory Medicine for thevaluable assistance in various aspects of the study.
FundingThis trial was funded by Region Skåne, Sweden, and Swedish governmentfunding [ALF # 18401], the Anna and Edwin Berger Foundation, Sweden, andThe Gyllenstierna Krapperup’s Foundation, Sweden.
Availability of data and materialsThe datasets used and/or analyzed during the current study are availablefrom the corresponding author on reasonable request.
Authors’ contributionsSS contributed to the study design, study coordination and conduct, andmanuscript preparation. JB, JF, and EL contributed to the study conduct andmanuscript preparation. BB contributed to the study design and manuscriptpreparation. CMÖ contributed to the manuscript preparation. PK contributedto the study design and conduct and manuscript preparation. BTcontributed to the study design, study conduct, and manuscript preparation.PB is the principal investigator and sponsor and was involved in the studydesign, study coordination and conduct, and manuscript preparation. Allauthors approved the final manuscript.
Ethics approval and consent to participateThe study was approved by the regional ethical vetting board (# 2014/15),Lund, Sweden.
Consent for publicationAll study participants consented to the publication of the results.
Competing interestsThe authors declare that they have no competing interests.
Statkevicius et al. Critical Care (2019) 23:191 Page 9 of 10
Publisher’s NoteSpringer Nature remains neutral with regard to jurisdictional claims inpublished maps and institutional affiliations.
Author details1Department of Anesthesia & Intensive Care, Skåne University Hospital, Lund,Sweden. 2Department of Infectious Diseases, Skåne University Hospital, Lund,Sweden. 3Department of Radiation Physics, Skåne University Hospital, Lund,Sweden. 4Department of Nephrology, Skåne University Hospital, Lund,Sweden. 5Department of Gynecology and Obstetrics, Skåne UniversityHospital, Lund, Sweden. 6Department of Surgery, Skåne University Hospital,Lund, Sweden. 7Department of Anesthesia and Intensive Care, HelsingborgHospital, Helsingborg and Lund University, 251 87 Helsingborg, Sweden.8Department of Clinical Sciences, Anesthesiology, Lund University, Lund,Sweden.
Received: 6 February 2019 Accepted: 14 May 2019
References1. Gustot T. Multiple organ failure in sepsis: prognosis and role of systemic
inflammatory response. Curr Opin Crit Care. 2011;17:153–9.2. Holodinsky JK, Roberts DJ, Ball CG, Blaser AR, Starkopf J, Zygun DA, et al.
Risk factors for intra-abdominal hypertension and abdominal compartmentsyndrome among adult intensive care unit patients: a systematic reviewand meta-analysis. Crit Care. 2013;17:R249.
3. Wiedemann HP, Wheeler AP, Bernard GR, Thompson BT, Hayden D,deBoisblanc B, et al. Comparison of two fluid-management strategies inacute lung injury. N Engl J Med. 2006;354:2564–75.
4. Brandstrup B, Tønnesen H, Beier-Holgersen R, Hjortsø E, Ørding H, Lindorff-Larsen K, et al. Effects of intravenous fluid restriction on postoperativecomplications: comparison of two perioperative fluid regimens: arandomized assessor-blinded multicenter trial. Ann Surg. 2003;238:641–8.
5. Rahbari NN, Zimmermann JB, Schmidt T, Koch M, Weigand MA, Weitz J.Meta-analysis of standard, restrictive and supplemental fluid administrationin colorectal surgery. Br J Surg. 2009;96:331–41.
6. Boyd JH, Forbes J, Nakada TA, Walley KR, Russell JA. Fluid resuscitation inseptic shock: a positive fluid balance and elevated central venous pressureare associated with increased mortality. Crit Care Med. 2011;39:259–65.
7. Payen D, de Pont AC, Sakr Y, Spies C, Reinhart K, Vincent JL. A positive fluidbalance is associated with a worse outcome in patients with acute renalfailure. Crit Care. 2008;12:R74.
8. Marik PE, Linde-Zwirble WT, Bittner EA, Sahatjian J, Hansell D. Fluidadministration in severe sepsis and septic shock, patterns and outcomes: ananalysis of a large national database. Intensive Care Med. 2017;43:625–32.
9. Ernest D, Belzberg AS, Dodek PM. Distribution of normal saline and 5%albumin infusions in septic patients. Crit Care Med. 1999;27:46–50.
10. Ernest D, Belzberg AS, Dodek PM. Distribution of normal saline and 5%albumin infusions in cardiac surgical patients. Crit Care Med. 2001;29:2299–302.
11. Jacob M, Chappell D, Hofmann-Kiefer K, Helfen T, Schuelke A, Jacob B,Burges A, Conzen P, Rehm M. The intravascular volume effect of Ringer’slactate is below 20%: a prospective study in humans. Crit Care. 2012;16:R86.
12. Rippe B, Haraldsson B. Transport of macromolecules across microvascularwalls: the two-pore theory. Physiol Rev. 1994;74:163–219.
13. Bark BP, Persson J, Grande PO. Importance of the infusion rate for theplasma expanding effect of 5% albumin, 6% HES 130/0.4, 4% gelatin, and 0.9% NaCl in the septic rat. Crit Care Med. 2013;41:857–66.
14. Bark BP, Grande PO. Infusion rate and plasma volume expansion of dextranand albumin in the septic guinea pig. Acta Anaesthesiol Scand. 2014;58:44–51.
15. von Seth M, Lipcsey M, Engström P, Larsson A, Hillered L, Maripuu E, et al. Rapidbolus administration does not increase the extravasation rate of albumin: arandomized controlled trial in the endotoxemic pig. Shock. 2017;47:514–9.
16. Cecconi M, Hofer C, Teboul JL, Pettila V, Wilkman E, Molnar Z, et al. Fluidchallenges in intensive care: the FENICE study: a global inception cohortstudy. Intensive Care Med. 2015;41:1529–37.
17. Maitland K, Kiguli S, Opoka RO, Engoru C, Olupot-Olupot P, Akech SO, et al.Mortality after fluid bolus in African children with severe infection. N Engl JMed. 2011;364:2483–95.
18. Chappell D, Bruegger D, Potzel J, Jacob M, Brettner F, Vogeser M, et al.Hypervolemia increases release of atrial natriuretic peptide and shedding ofthe endothelial glycocalyx. Crit Care. 2014;18:538.
19. Statkevicius S, Bonnevier J, Bark BP, Larsson E, Öberg CM, Kannisto P, et al.The importance of albumin infusion rate for plasma volume expansionfollowing major abdominal surgery - AIR: study protocol for a randomisedcontrolled trial. Trials. 2016;17:578.
20. Preau S, Saulnier F, Dewavrin F, Durocher A, Chagnon JL. Passive leg raisingis predictive of fluid responsiveness in spontaneously breathing patientswith severe sepsis or acute pancreatitis. Crit Care Med. 2010;38:819–25.
21. Bentzer P, Griesdale DE, Boyd J, MacLean K, Sirounis D, Ayas NT. Will thishemodynamically unstable patient respond to a bolus of intravenous fluids?JAMA. 2016;16:1298–309.
22. Barbier C, Loubières Y, Schmit C, Hayon J, Ricôme JL, Jardin F, et al. Respiratorychanges in inferior vena cava diameter are helpful in predicting fluidresponsiveness in ventilated septic patients. Intensive Care Med. 2004;30:1740–6.
23. Feissel M, Michard F, Faller JP, Teboul JL. The respiratory variation in inferiorvena cava diameter as a guide to fluid therapy. Intensive Care Med. 2004;30:1834–7.
24. Acute Respiratory Distress Syndrome Network, Brower RG, Matthay MA,Morris A, Schoenfeld D, Thompson BT, et al. Ventilation with lower tidalvolumes as compared with traditional tidal volumes for acute lung injuryand the acute respiratory distress syndrome. N Engl J Med. 2000;342:1301–8.
25. Margarson MP, Soni NC. Plasma volume measurement in septic patientsusing an albumin dilution technique: comparison with the standard radio-labelled albumin method. Intensive Care Med. 2005;31:289–95.
26. Pritchard WH, Moir TW, MacIntyre WJ. Measurement of the earlydisappearance of iodinated (I131) serum albumin from circulating blood bya continuous recording method. Circ Res. 1955;3:19–23.
27. Norberg Å, Rooyackers O, Segersvärd R, Wernerman J. Albumin kinetics inpatients undergoing major abdominal surgery. PLoS One. 2015;10:e0136371.
28. Fleck A, Raines G, Hawker F, Trotter J, Wallace PI, Ledingham IM, et al.Increased vascular permeability: a major cause of hypoalbuminaemia indisease and injury. Lancet. 1985;1:781–4.
29. Dubniks M, Persson J, Grände PO. Effect of blood pressure on plasmavolume loss in the rat under increased permeability. Intensive Care Med.2007;33:2192–8.
30. Bonfils PK, Damgaard M, Stokholm KH, Nielsen SL. 99mTc-albumin canreplace 125I-albumin to determine plasma volume repeatedly. Scand J ClinLab Invest. 2012;72:447–51.
31. Glassford NJ, Eastwood GM, Bellomo R. Physiological changes after fluidbolus therapy in sepsis: a systematic review of contemporary data. Crit Care.2014;18:696.
32. Vieillard-Baron A, Chergui K, Rabiller A, Peyrouset O, Page B, Beauchet A, etal. Superior vena caval collapsibility as a gauge of volume status inventilated septic patients. Intensive Care Med. 2004;30:1734–9.
33. Vincent JL, Weil MH. Fluid challenge revisited. Crit Care Med. 2006;34:1333–7.34. Hammond NE, Taylor C, Finfer S, Machado FR, An Y, Billot L, et al. Patterns
of intravenous fluid resuscitation use in adult intensive care patientsbetween 2007 and 2014: An international cross-sectional study. PLoS One.2017;12:e0176292.
35. Navarro LH, Bloomstone JA, Auler JO Jr, Cannesson M, Rocca GD, Gan TJ, etal. Perioperative fluid therapy: a statement from the international FluidOptimization Group. Perioper Med (Lond). 2015;4:3.
36. Lamke LO, Liljedahl SO. Plasma volume expansion after infusion of 5%, 20%and 25% albumin solutions in patients. Resuscitation. 1976;5:85–92.
37. Bansch P, Statkevicius S, Bentzer P. Plasma volume expansion with 5%albumin compared to Ringer’s acetate during normal and increasedmicrovascular permeability in the rat. Anesthesiology. 2014;121:817–24.
38. Huxley VH, Tucker VL, Verburg KM, Freeman RH. Increased capillary hydraulicconductivity induced by atrial natriuretic peptide. Circ Res. 1987;60:304–7.
39. Zhang Q, Raoof M, Chen Y, Sumi Y, Sursal T, Junger W, et al. Circulatingmitochondrial DAMPs cause inflammatory responses to injury. Nature. 2010;464:104–7.
40. O’Dwyer MJ, Owen HC, Torrance HD. The perioperative immune response.Curr Opin Crit Care. 2015;21:336–42.
Statkevicius et al. Critical Care (2019) 23:191 Page 10 of 10


