Embed Size (px)
Citation preview
Alcohol, Gender andDrinking Problems
Perspectives from Low and Middle Income Countries
Edited byIsidore S. Obot & Robin Room
Department of Mental Health and Substance Abuse, Geneva
WHO Library Cataloguing-in-Publication Data
Alcohol, gender and drinking problems: perspectives from low and middle incomecountries.
1. Alcohol drinking - adverse effects 2. Alcoholic intoxication - epidemiology 3.Sex factors 4. Socioeconomic factors 5. Multicenter studies 6. Developingcountries I. World Health Organization II. GENACIS.
ISBN 92 4 156302 8 (NLM classification: WM 274)
© World Health Organization 2005
All rights reserved. Publications of the World Health Organization can be obtainedfrom WHO Press, World Health Organization, 20 Avenue Appia, 1211 Geneva 27,Switzerland (tel: +41 22 791 2476; fax: +41 22 791 4857; email:[email protected]). Requests for permission to reproduce or translate WHOpublications - whether for sale or for noncommercial distribution - should beaddressed to WHO Press, at the above address (fax: +41 22 791 4806; email:[email protected]).
The designations employed and the presentation of the material in this publicationdo not imply the expression of any opinion whatsoever on the part of the WorldHealth Organization concerning the legal status of any country, territory, city orarea or of its authorities, or concerning the delimitation of its frontiers orboundaries. Dotted lines on maps represent approximate border lines for whichthere may not yet be full agreement.
The mention of specific companies or of certain manufacturers' products does notimply that they are endorsed or recommended by the World Health Organizationin preference to others of a similar nature that are not mentioned. Errors andomissions excepted, the names of proprietary products are distinguished by initialcapital letters.
All reasonable precautions have been taken by the World Health Organization toverify the information contained in this publication. However, the publishedmaterial is being distributed without warranty of any kind, either express orimplied. The responsibility for the interpretation and use of the material lies withthe reader. In no event shall the World Health Organization be liable for damagesarising from its use.
Typesetting: e-BookServices.com, IndiaCover design: Tushita Graphic Vision Sàrl, Geneva, SwitzerlandPrinted in China
CONTENTS
Foreword . . . . . . . . . . . . . . . . . . . . . . . . . . . . . . . . . . . . . . . . . . . . . . . . . . . . . .v
Preface . . . . . . . . . . . . . . . . . . . . . . . . . . . . . . . . . . . . . . . . . . . . . . . . . . . . . . .vii
Acknowledgements . . . . . . . . . . . . . . . . . . . . . . . . . . . . . . . . . . . . . . . . . . . . .ix
Chapter 1: Why study gender, alcohol and culture? . . . . . . . . . . . .1Richard W. Wilsnack, Sharon C. Wilsnack & Isidore S. Obot
Chapter 2: Social consequences of alcohol consumptionin Argentina . . . . . . . . . . . . . . . . . . . . . . . . . . . . . . . . . . . . . .25Myriam I. Munné
Chapter 3: Differences in drinking patterns betweenmen and women in Brazil . . . . . . . . . . . . . . . . . . . . . .49Florence Kerr-Corrêa, Andrea M. Hegedus,Alessandra F. Sanches, Luzia A.Trinca, Ligia R. S.Kerr-Pontes, Adriana M. Tucci & Tricia M. F. Floripes
Chapter 4: Alcohol, gender and partner aggression: a studyin the Greater Metropolitan Area of Costa Rica . . .69Julio Bejarano-Orozco
Chapter 5: Women and alcohol in India . . . . . . . . . . . . . . . . . . . . . .89Vivek Benegal, Madhabika Nayak, Pratima Murthy,Prabha Chandra & G. Gururaj
Chapter 6: Alcohol consumption in Mexican women:implications in a syncretic culture . . . . . . . . . . . . . . .125Martha Romero Mendoza, Maria Elena Medina-Mora,Jorge Villatoro & Ana Durand
Chapter 7: The contexts of alcohol consumption by men andwomen in Nigeria . . . . . . . . . . . . . . . . . . . . . . . . . . . . . . . .143Akanidomo J. Ibanga, Adebola V. Adetula,Zubairu Dagona, Haruna Karick & Ochiyna Ojiji
Chapter 8: Gender and alcohol in Sri Lanka . . . . . . . . . . . . . . . . .167Siri Hettige & Dharmadasa Paranagama
Chapter 9: Gender and the major consequences of alcoholconsumption in Uganda . . . . . . . . . . . . . . . . . . . . . . . . . .189Nazarius Mbona Tumwesigye & Rogers Kasirye
Chapter 10: Problems from women's and men's drinkingin eight developing countries . . . . . . . . . . . . . . . . . . . .209Robin Room & Klara Hradilova Selin
Authors . . . . . . . . . . . . . . . . . . . . . . . . . . . . . . . . . . . . . . . . . . . . . . . . . . . . .221

FOREWORD
In the year 2000 the Department of Health of the Government ofValencia, Spain, received a proposal from the Department of MentalHealth and Substance Dependence (now Substance Abuse) of the WorldHealth Organization for technical cooperation and financial support forseveral projects on alcohol programmes and policy. The projects suggestedin the proposal included data gathering, management of alcohol problemsthrough dissemination of brief intervention, the development of globalalcohol policy initiatives, and support for technology transfer in the field ofsubstance abuse in general.
The reason behind this request for cooperation was a recognition of thegrowing role of alcohol in global public health, especially in developingcountries, and the need for more funding to continue some of the WorldHealth Organization's outstanding work on alcohol. For example, thoughWHO projects on screening and brief intervention (SBI) in primary heathcare settings had been recognized as an effective strategy in reducingharmful and hazardous alcohol consumption in several developedcountries, the strategy had not been tested in developing countries. Theproposal also recognized the need for dependable and comparable data ongender and alcohol issues, including differences between men and womenin patterns of drinking and related problems.
Data from a variety of sources, especially WHO's Global AlcoholDatabase (GAD) and the annual world health reports, support thecontention that alcohol indeed has become a major risk factor for diseaseand disability in many countries across the world. That this risk isincreasing in, for example, the low-mortality developing countries of Asiaand South America where alcohol is often the highest contributor todisease burden.
Considering its interest in global public health, the ValencianGovernment was pleased to approve the signing of a cooperativeagreement with WHO in 2001 and the agreement has been renewed everyyear since then. The agreement focused on work in the following areas:gender and alcohol, alcohol policy, and knowledge transfer throughtraining. One of the first activities in the agreement was a meeting ofexperts to discuss the implications of alcohol marketing to young people'sdrinking which took place in Valencia in March 2002. The product of thatmeeting is expected to serve as a major resource in our understanding ofthe role of alcohol marketing and promotion in youth drinking behaviours.
Support provided through the agreement has also been used by WHOto fund projects on brief intervention for alcohol problems in Brazil andSouth Africa. It has also led to this book which is the product of the genderand alcohol project in seven countries on four continents (namely,
Argentina, Costa Rica, India, Kazakhstan, Nigeria, Sri Lanka and Uganda).
I am indeed pleased to contribute the foreword to this book whichpublishes contributions on gender and alcohol from six of the countriesfunded through the Valencia-WHO cooperative agreement and two othercountries. The book will go a long way in enhancing our appreciation ofgender issues in alcohol research and in the management of alcohol-related problems not only in primary care but in other settings, e.g.,prenatal clinics and the workplace. I am sure that the book will contributeto the development of alcohol policy and the provision of service to menand women with alcohol-related problems not only in the countries in thereports but all around the world. The Government of Valencia, through theDepartment of Health, is happy to be associated with WHO's commitmentto reducing alcohol problems globally and will continue to support itsefforts in achieving this goal.
Dr Bartolomé Pérez Gálvez
Director General, Drug DependenceDepartment of HealthAutonomous Government of ValenciaSpain
vi
PREFACE
This book presents data and addresses significant issues on gender andalcohol in eight low and middle income countries where such data are oftennot available. The book is a product of the multinational collaborativeproject on "Gender, Alcohol and Culture: an International Study"(GENACIS). GENACIS was funded by the European Commission, the U.S.National Institute on Alcoholism and Alcohol Abuse (NIAAA), the SwissOffice of Education and Science, the German Federal Ministry of PublicHealth, the World Health Organization, government agencies and othersources in individual countries.
The study was conceived by the International Research Group onGender and Alcohol (IRGGA), a group of researchers affiliated with theKettil Bruun Society for Social and Epidemiological Research on Alcohol(KBS). Beginning with a few countries in 1999, GENACIS grew to includeprojects in more than thirty countries and 50 researchers, all united by acommon interest in seeking greater understanding of gender and alcoholissues.
GENACIS uses a centralized data analysis and standardized measuresto assess the differences between men and women within and acrosscultures in the following areas:
• patterns and contexts of drinking; • prevalence of alcohol problems; • the experience of drinking-related violence in close relationships; • how social inequalities and social roles influence drinking and
heavy alcohol consumption;• the relationship of societal-level factors (e.g., gender equality,
drinking culture norms) to drinking and alcohol-related problems.
The study grew out of earlier projects in Europe and the U.S. and seeksto clarify further the factors associated with men's and women's drinkingand alcohol-related problems.
GENACIS is truly an international project; participating countries aredrawn from all parts of the world, especially from countries where harmfuluse of alcohol poses a threat to public health and social welfare. Fundingprovided to WHO by the Government of Valencia, Spain, made it possiblefor countries in low and middle income countries to participate in theproject. These countries are Argentina, Costa Rica, India, Kazakhstan,Nigeria, Sri Lanka and Uganda. There are also ongoing WHO-fundedprojects in three countries in the region of the Americas.
The papers published in this book report data from six of thesecountries and from two other countries (Brazil and Mexico) participatingin GENACIS. Each paper addresses a particular issue of relevance to thecountry and provides a general overview of drinking and alcohol problems.
All papers evolved through a series of revisions after consultations withand reviews by a team of experts associated with the project. These expertsand lead authors participated in group discussions held in Berlin, Krakow,and Helsinki during GENACIS steering committee meetings or the annualconference of the Kettil Bruun Society.
GENACIS is one of several projects on alcohol by the Department ofMental Health and Substance Abuse that are designed to enhance ourunderstanding of alcohol problems and provide the basis for effectiveinterventions. This product from the GENACIS project will serve as avaluable resource to researchers, service providers, policy-makers,students and all those engaged in work on alcohol and public health, andcontribute to shaping a global response to the harmful consequences ofalcohol.
Dr Benedetto SaracenoDirectorDepartment of Mental Health and Substance Abuse
viii
ACKNOWLEDGEMENTS
The preparation and publication of this book would not have beenpossible without the generous financial contribution of the AutonomousGovernment of Valencia, Spain, to the World Health Organization forprojects on Alcohol and Public Health. This support started in 2001 with agrant for work in three related areas — gender and alcohol, screening andbrief intervention for alcohol problems, and alcohol policy. The grant madeit possible for WHO to sponsor the participation of researchers from lowand middle income countries in the multinational project on Gender,Alcohol and Culture: an International Study (GENACIS).
Special thanks are due to Dr Bartolomé Pérez Gálvez, Director Generalfor Drug Dependence, Department of Health, Autonomous Government ofValencia, for his exceptional commitment to the GENACIS project and hisoverall interest in working with WHO to reduce alcohol related problemsin developing countries. Several staff of the Department of Health inValencia, especially Dr José Martinez-Raga, also contributed in variousways to the success of the projects funded by their office.
The participation of contributors in project meetings (in Berlin,Krakow and Helsinki) was made possible by grants from the U.S. NationalInstitute on Alcohol Abuse and Alcoholism/National Institutes of Health(R01AA04610 and R21AA12941), and the European Union's FifthFramework Research Programme (contract QLG4-CT-2001-01496).Grateful thanks are due to the principal investigators in these grants(Sharon Wilsnack and Kim Bloomfield, respectively), and to ArlindaKristjanson, Stephanie Kramer, and Friedericke Froehner for facilitatingthe participation of contributors in these meetings in various ways.
Richard Wilsnack and Sharon Wilsnack reviewed the papers in thisvolume and provided guidance to contributors during the preparation ofthe manuscripts, and Gerhard Gmel provided advice on data managementand statistical analysis. Their contributions greatly enhanced the quality ofthe papers published in this volume.
The WHO-GENACIS project was initiated by Maristela Monteiro andcontinued under the coordination of Vladimir Poznyak. Both of themprovided the support and encouragement needed at different stages of theproject, including the publication of this book.
Tess Narciso and Mylene Schreiber provided invaluable secretarialsupport for all activities related to the WHO/GENACIS project. IsidoreObot had overall responsibility for the implementation of the project in theseven WHO funded countries and represented WHO in the steeringcommittee of the multinational research initiative.

INTRODUCTION
Alcoholic beverages have been a part of social life for millennia, yetsocieties have always found it difficult to understand or restrain theiruse. A central theme of this book is that to better understand alcohol
consumption and its consequences, we need to better understand socialand cultural influences on the differences between men and women. Thattheme deserves careful and detailed attention for several reasons.
First, compared with women throughout the world, men are morelikely to drink, consume more alcohol, and cause more problems by doingso. This gender gap is one of the few universal gender differences in humansocial behavior. It is evident in all areas of the world (Almeida-Filho et al.,2004; Degenhardt et al., 1997; McKee et al., 2000; Perdrix et al., 1999;Rijken, Velema, & Dijkstra, 1998; Sieri et al., 2002), in drinking versusabstinence (Mohan, Chopra, & Sethi, 2002; Peltzer, 2002), in heavydrinking and intoxication (Gmel, Rehm, & Kuntsche, 2003; Higuchi et al.,1994; Siegfried et al., 2001), and in alcohol use disorders (Jhingan et al.,2003; Kebede & Alem, 1999; Yamamoto et al., 1993). The gender gap hasvaried but persisted for a long time, at least in European history (Martin,2001; Plant, 1997; Sandmaier, 1980; Warner, 1997) and in the traditions ofmany pre-industrial societies elsewhere (Child, Barry, & Bacon, 1965; Sealeet al., 2002; Suggs, 2001; Willis, 2001).
Research has suggested several possible reasons why universal genderdifferences in drinking behavior might arise. For example, if women havelower rates of gastric metabolism of alcohol than men (Baraona et al.,2001; Frezza et al., 1990; Thomasson, 1995) or smaller volumes of bodywater in which alcohol is distributed (Mirand & Welte, 1994; York & Welte,1994), women may need to consume less alcohol than men to derive thesame effects. Or, women may be more likely than men to experienceunpleasant acute effects from alcohol (such as hangover symptoms)(Slutske et al., 1995, 2003), or may not enjoy risky and poorly controlledbehavioral effects of alcohol as much as men (Hill & Chow, 2002;Rosenblitt et al., 2001; Spigner, Hawkins, & Lorens, 1993), characteristicswhich might inhibit women’s drinking. However, despite the universalityof gender differences in drinking behavior, the size of gender differences
CHAPTER 1WHY STUDY GENDER, ALCOHOL AND CULTURE?
RICHARD W.WILSNACK, SHARON C.WILSNACK & ISIDORE S. OBOT
has varied greatly in different societies, historical eras, and drinkingpatterns; and neither the universality nor the variability of those genderdifferences has yet been adequately explained (Graham et al., 1998;Watten, 1997; R. Wilsnack et al., 2000).
A second important reason to study how gender and alcohol interact isthat some of the gender differences in drinking, and much of the variationin such gender differences, are cultural. Societies have long used alcoholconsumption and its effects as important ways to differentiate, symbolize,and regulate gender roles (Joffe, 1998; Warner, 1997). Differences innormative drinking patterns help reveal to what extent societiesdifferentiate gender roles, for example, by making drinking behavior ademonstration of masculinity (Campbell, 2000; Driessen, 1992;MacDonald, 1994; Roberts, 2004; Suggs, 1996) or by forbidding women todrink as a symbol of subservience or to prevent sexual autonomy (Martin,2001; Nicolaides, 1996; Willis, 1999). Better understanding of how men’sand women’s drinking patterns differ is thus an important key toanswering broader questions of how and why societies try to get womenand men to behave differently (Gefou-Madianou, 1992; MacDonald, 1994;Murdock, 2001; Wilsnack & Wilsnack, 1997).
In recent decades there has been increased concern about drinkingbehavior as an aspect of gender roles, because in some societies genderdifferences in drinking behavior have grown smaller. A commonhypothesis about such convergence in drinking patterns is that increasedopportunities for women to perform traditionally male roles (particularlyin the workforce) have also enabled and encouraged women to increasetheir drinking, with more adverse consequences (Bergmark, 2004;Bloomfield et al., 2001). Consistent with this hypothesis, whereconvergence has occurred, it has usually been most evident amongadolescents or young adults (Grant et al., 2004; McPherson, Casswell, &Pledger, 2004; Mercer & Khavari, 1990; Plant et al., 1999). However,convergence has not always occurred where it might be expected(Bloomfield et al., 2001; Neve et al., 1996; Serdula et al., 2004; Williams,1998); it may occur for some aspects of drinking behavior but not others(Grant et al., 2004; Malyutina et al., 2004); it may sometimes occurbecause men are drinking less instead of women drinking more (Bergmark,2004; O’Brien et al., 2001; Osler et al., 2001); and it is not always relatedto women’s nontraditional roles (Malyutina et al., 2004; Neve et al, 1996).If social influences on women’s and men’s drinking are likely to behistorically and culturally complex, better cross-cultural research ongender and drinking over longer periods of time may be essential to avoidoversimplified conclusions about effects of changes in women’s and men’sroles.
A third important reason to study how gender affects alcohol use isthat false assumptions about male or female drinking may adversely affecthow societies identify and try to control alcohol-related problems. If heavy
ALCOHOL, GENDER AND DRINKING PROBLEMS
2
drinking is associated with displays of masculinity or male camaraderie,this may encourage male drinkers to deny or minimize problems resultingfrom their drinking, or to regard drunken behavior as normal orpermissible (Capraro, 2000; Nayak, 2003; Nghe, Mahalik, & Lowe, 2003),even when it leads to violence (Graham & Wells, 2003; Hunt & Laidler,2001; Tomsen, 1997). On the other hand, assumptions that women do notdrink heavily may lead to women’s drinking problems beingunderestimated or overlooked (for example, by physicians; Brienza &Stein, 2002; Denny et al., 2003; Malet et al. 2003; Svikis & Reid-Quinones,2003). However, when women’s alcohol abuse or dependence becomesconspicuous, it has often provoked social outrage and the use ofpunishment or coercion to try to stop such behavior (Blume, 1997;McLaughlin, 1991; Sandmaier, 1980), most recently by taking custody ofchildren (Dolgin, 1991; Nishimoto & Roberts, 2001) or by forcing alcohol-abusing women to be hospitalized or incarcerated if pregnant (Abel &Kruger, 2002; DeVille & Kopelman, 1998). Better understanding of genderstereotypes about both men’s and women’s drinking is essential to reducethe negative effects such stereotypes may have on treatment andprevention of alcohol-related problems.
THEORETICAL ISSUES: WHICH GENDER DIFFERENCES?Efforts to understand and explain gender differences in drinking
behavior must deal with several theoretical questions. The first question is,which gender differences are important to explain? Nearly all studies thatmeasure lifetime abstinence from alcohol find that such abstinence ismuch more common among women than among men (e.g.,Assanangkornchai, Pinkaew, & Apakupakul, 2003; Beals et al., 2003;Caraveo- Anduaga et al., 1999; Meyer et al., 2000; Vahtera et al., 2002;Wilsnack et al., 2000; Zhang et al., 2004). Table 1 shows the totalconsumption of alcohol (in litres of absolute alcohol), averageconsumption per drinker, and the proportions of male and female currentdrinkers in fourteen World Health Organization subregional groupings(current drinkers are those who had an alcoholic drink in the last 12months). The subregions are defined on the basis of child and adultmortality rates where, for example, A represents countries with very lowchild and very low adult mortality and E means that countries in that grouphave high rates of child mortality and very high adult mortality (Ezzati,2002). It is clear from the table that in all regions more males than femalesconsume alcohol, but in some regions the differences are not as marked asin others (WHO, 2004a).
Gender ratios (male/female) for drinking in the past 12 months orfor being a former drinker are generally larger than gender ratios forlifetime abstinence, and in most surveys the gender ratios (male/female)increase progressively from lifetime abstainers to former drinkers to
WHY STUDY GENDER, ALCOHOL AND CULTURE?
3
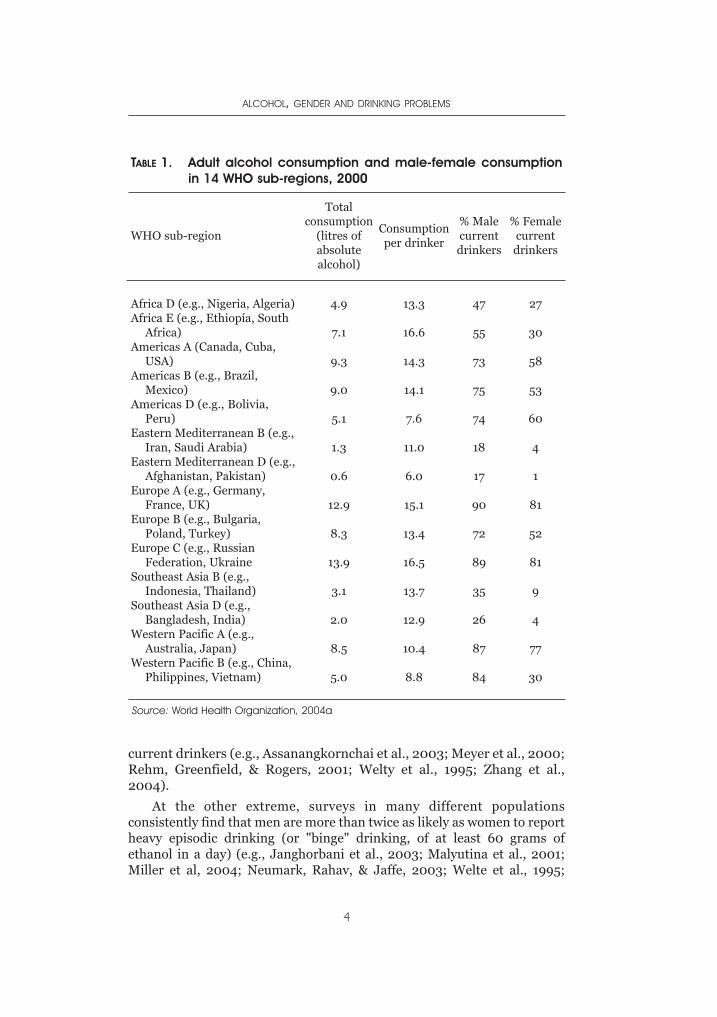
current drinkers (e.g., Assanangkornchai et al., 2003; Meyer et al., 2000;Rehm, Greenfield, & Rogers, 2001; Welty et al., 1995; Zhang et al.,2004).
At the other extreme, surveys in many different populationsconsistently find that men are more than twice as likely as women to reportheavy episodic drinking (or "binge" drinking, of at least 60 grams ofethanol in a day) (e.g., Janghorbani et al., 2003; Malyutina et al., 2001;Miller et al, 2004; Neumark, Rahav, & Jaffe, 2003; Welte et al., 1995;
ALCOHOL, GENDER AND DRINKING PROBLEMS
4
TABLE 1. Adult alcohol consumption and male-female consumptionin 14 WHO sub-regions, 2000
WHO sub-region
Totalconsumption
(litres ofabsolutealcohol)
Consumptionper drinker
% Malecurrentdrinkers
% Femalecurrentdrinkers
Africa D (e.g., Nigeria, Algeria)Africa E (e.g., Ethiopía, South
Africa)Americas A (Canada, Cuba,
USA)Americas B (e.g., Brazil,
Mexico)Americas D (e.g., Bolivia,
Peru)Eastern Mediterranean B (e.g.,
Iran, Saudi Arabia)Eastern Mediterranean D (e.g.,
Afghanistan, Pakistan)Europe A (e.g., Germany,
France, UK)Europe B (e.g., Bulgaria,
Poland, Turkey)Europe C (e.g., Russian
Federation, UkraineSoutheast Asia B (e.g.,
Indonesia, Thailand)Southeast Asia D (e.g.,
Bangladesh, India)Western Pacific A (e.g.,
Australia, Japan)Western Pacific B (e.g., China,
Philippines, Vietnam)
4.9
7.1
9.3
9.0
5.1
1.3
0.6
12.9
8.3
13.9
3.1
2.0
8.5
5.0
13.3
16.6
14.3
14.1
7.6
11.0
6.0
15.1
13.4
16.5
13.7
12.9
10.4
8.8
47
55
73
75
74
18
17
90
72
89
35
26
87
84
27
30
58
53
60
4
1
81
52
81
9
4
77
30
Source: World Health Organization, 2004a
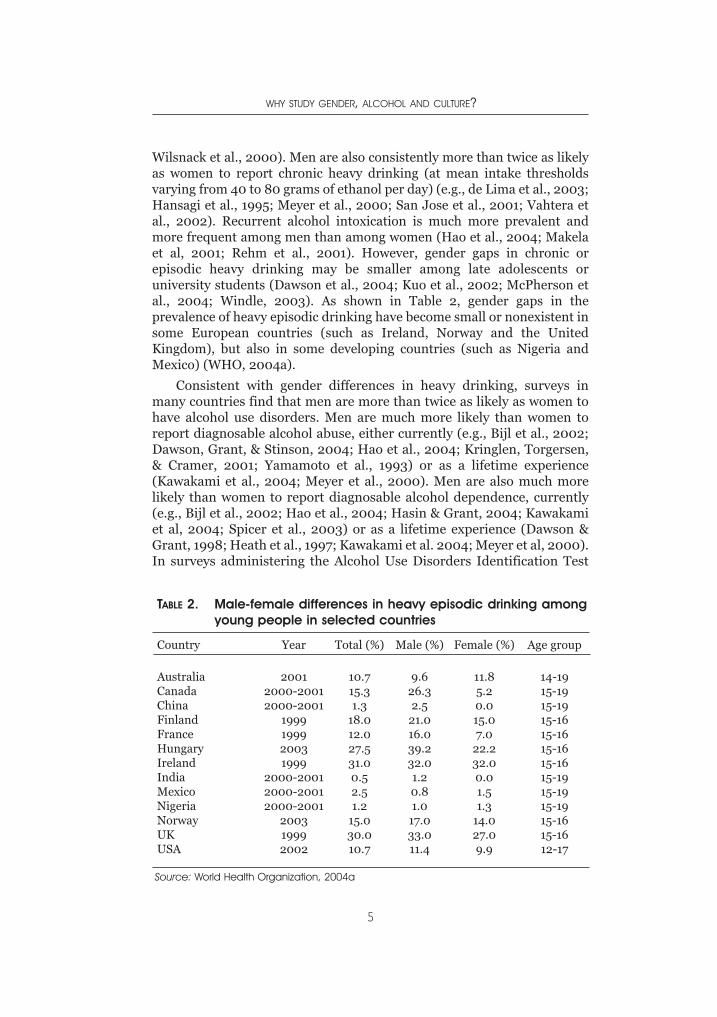
Wilsnack et al., 2000). Men are also consistently more than twice as likelyas women to report chronic heavy drinking (at mean intake thresholdsvarying from 40 to 80 grams of ethanol per day) (e.g., de Lima et al., 2003;Hansagi et al., 1995; Meyer et al., 2000; San Jose et al., 2001; Vahtera etal., 2002). Recurrent alcohol intoxication is much more prevalent andmore frequent among men than among women (Hao et al., 2004; Makelaet al, 2001; Rehm et al., 2001). However, gender gaps in chronic orepisodic heavy drinking may be smaller among late adolescents oruniversity students (Dawson et al., 2004; Kuo et al., 2002; McPherson etal., 2004; Windle, 2003). As shown in Table 2, gender gaps in theprevalence of heavy episodic drinking have become small or nonexistent insome European countries (such as Ireland, Norway and the UnitedKingdom), but also in some developing countries (such as Nigeria andMexico) (WHO, 2004a).
Consistent with gender differences in heavy drinking, surveys inmany countries find that men are more than twice as likely as women tohave alcohol use disorders. Men are much more likely than women toreport diagnosable alcohol abuse, either currently (e.g., Bijl et al., 2002;Dawson, Grant, & Stinson, 2004; Hao et al., 2004; Kringlen, Torgersen,& Cramer, 2001; Yamamoto et al., 1993) or as a lifetime experience(Kawakami et al., 2004; Meyer et al., 2000). Men are also much morelikely than women to report diagnosable alcohol dependence, currently(e.g., Bijl et al., 2002; Hao et al., 2004; Hasin & Grant, 2004; Kawakamiet al, 2004; Spicer et al., 2003) or as a lifetime experience (Dawson &Grant, 1998; Heath et al., 1997; Kawakami et al. 2004; Meyer et al, 2000).In surveys administering the Alcohol Use Disorders Identification Test
WHY STUDY GENDER, ALCOHOL AND CULTURE?
5
Source: World Health Organization, 2004a
TABLE 2. Male-female differences in heavy episodic drinking amongyoung people in selected countries
Country Year Total (%) Male (%) Female (%) Age group
AustraliaCanadaChinaFinlandFranceHungaryIrelandIndiaMexicoNigeriaNorwayUKUSA
20012000-20012000-2001
1999199920031999
2000-20012000-20012000-2001
200319992002
10.715.31.3
18.012.027.531.00.52.51.2
15.030.010.7
9.626.32.5
21.016.039.232.01.20.81.0
17.033.011.4
11.85.20.015.07.0
22.232.00.01.51.3
14.027.09.9
14-1915-1915-1915-1615-1615-1615-1615-1915-1915-1915-1615-1612-17
(AUDIT), men are consistently more than twice as likely as women toreceive scores of 8 or more, a conventional threshold for identifyingprobable alcohol use disorders (Assanangkornchai et al., 2003; Bergman& Kallmen, 2002; Mendoza-Sassi & Beria, 2003; Morales-Garcia et al.,2002; Singleton et al., 2003). In addition, there is consistent evidencethat deaths and poisoning attributable to alcohol are much more likely tooccur among men than among women (Ramstedt, 2002; Rivara et al.,2004; Yoon et al., 2003).
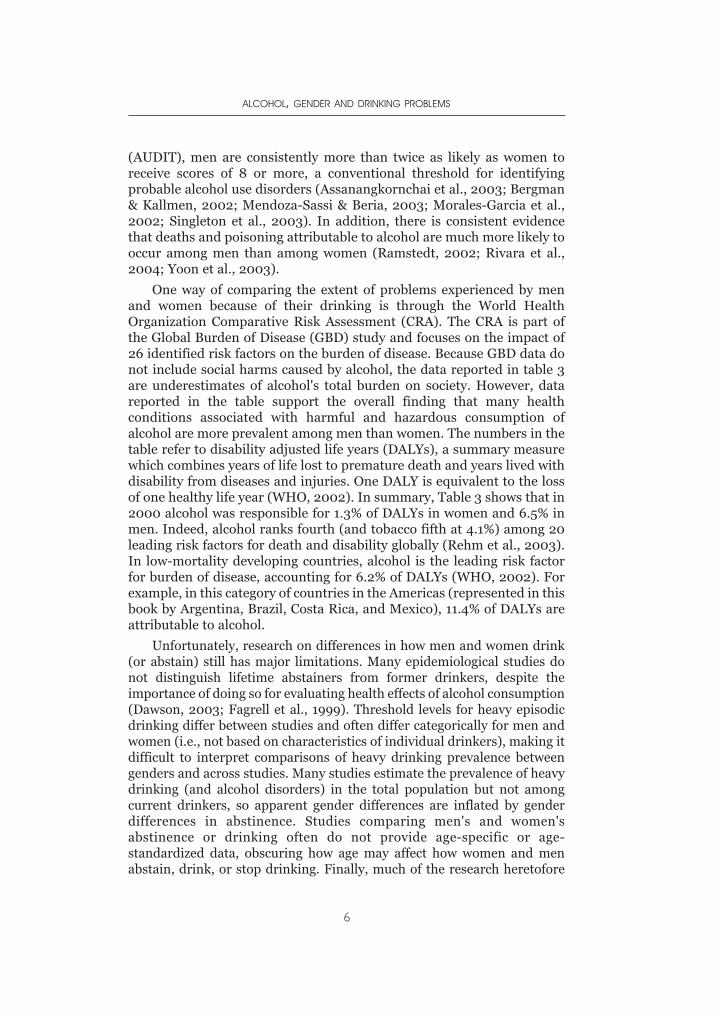
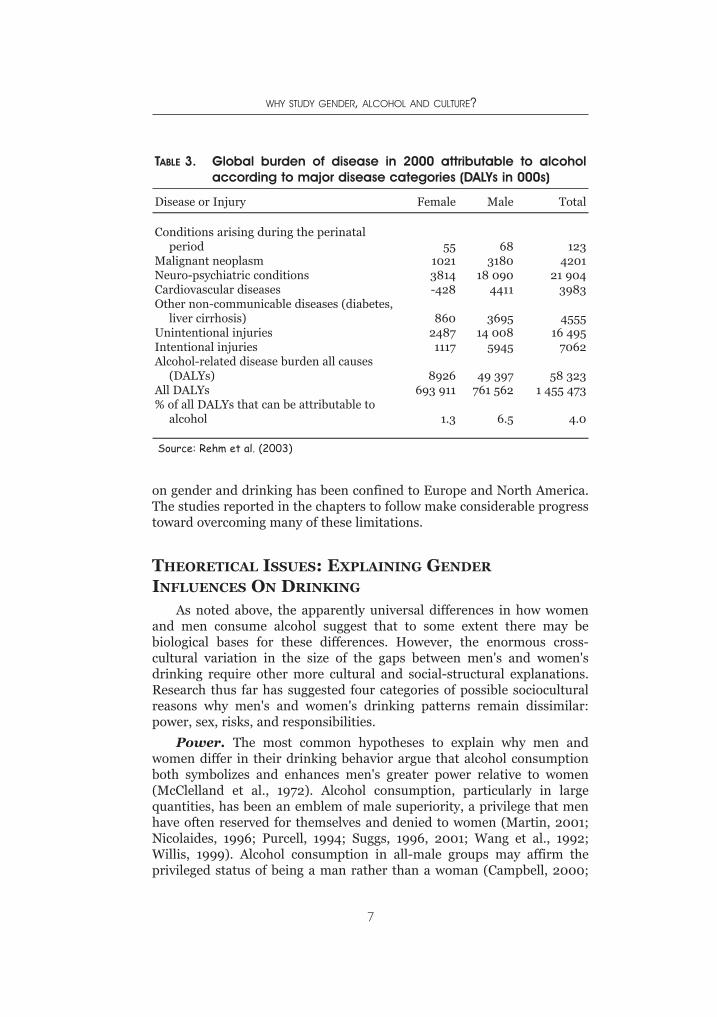
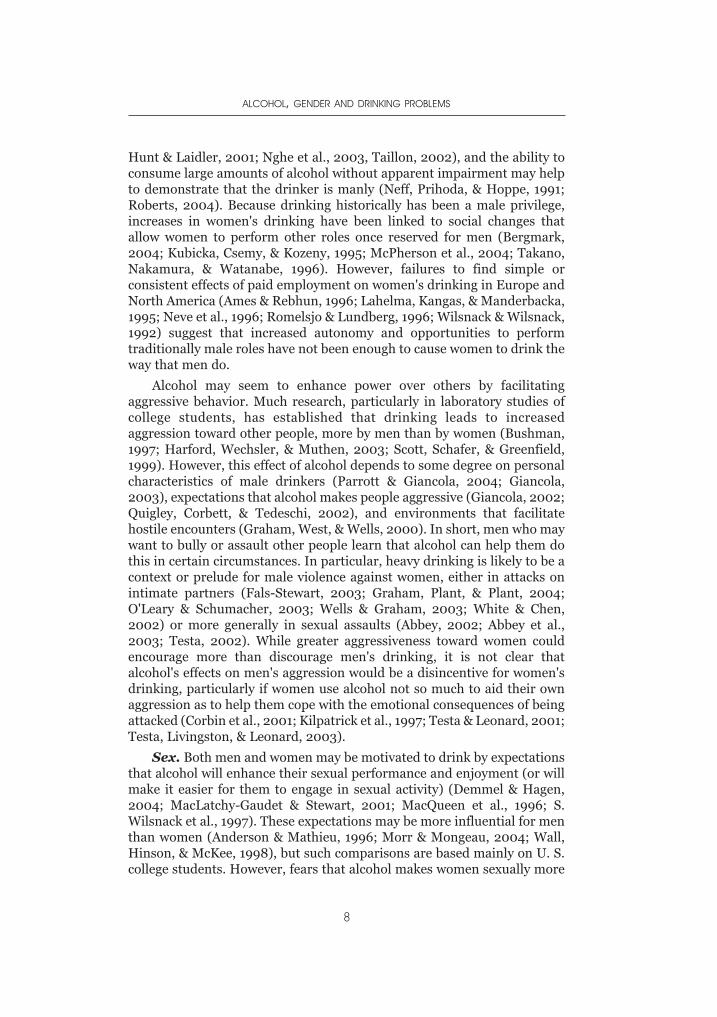
One way of comparing the extent of problems experienced by menand women because of their drinking is through the World HealthOrganization Comparative Risk Assessment (CRA). The CRA is part ofthe Global Burden of Disease (GBD) study and focuses on the impact of26 identified risk factors on the burden of disease. Because GBD data donot include social harms caused by alcohol, the data reported in table 3are underestimates of alcohol's total burden on society. However, datareported in the table support the overall finding that many healthconditions associated with harmful and hazardous consumption ofalcohol are more prevalent among men than women. The numbers in thetable refer to disability adjusted life years (DALYs), a summary measurewhich combines years of life lost to premature death and years lived withdisability from diseases and injuries. One DALY is equivalent to the lossof one healthy life year (WHO, 2002). In summary, Table 3 shows that in2000 alcohol was responsible for 1.3% of DALYs in women and 6.5% inmen. Indeed, alcohol ranks fourth (and tobacco fifth at 4.1%) among 20leading risk factors for death and disability globally (Rehm et al., 2003).In low-mortality developing countries, alcohol is the leading risk factorfor burden of disease, accounting for 6.2% of DALYs (WHO, 2002). Forexample, in this category of countries in the Americas (represented in thisbook by Argentina, Brazil, Costa Rica, and Mexico), 11.4% of DALYs areattributable to alcohol.
Unfortunately, research on differences in how men and women drink(or abstain) still has major limitations. Many epidemiological studies donot distinguish lifetime abstainers from former drinkers, despite theimportance of doing so for evaluating health effects of alcohol consumption(Dawson, 2003; Fagrell et al., 1999). Threshold levels for heavy episodicdrinking differ between studies and often differ categorically for men andwomen (i.e., not based on characteristics of individual drinkers), making itdifficult to interpret comparisons of heavy drinking prevalence betweengenders and across studies. Many studies estimate the prevalence of heavydrinking (and alcohol disorders) in the total population but not amongcurrent drinkers, so apparent gender differences are inflated by genderdifferences in abstinence. Studies comparing men's and women'sabstinence or drinking often do not provide age-specific or age-standardized data, obscuring how age may affect how women and menabstain, drink, or stop drinking. Finally, much of the research heretofore
ALCOHOL, GENDER AND DRINKING PROBLEMS
6
Source: Rehm et al. (2003)
on gender and drinking has been confined to Europe and North America.The studies reported in the chapters to follow make considerable progresstoward overcoming many of these limitations.
THEORETICAL ISSUES: EXPLAINING GENDER
INFLUENCES ON DRINKING
As noted above, the apparently universal differences in how womenand men consume alcohol suggest that to some extent there may bebiological bases for these differences. However, the enormous cross-cultural variation in the size of the gaps between men's and women'sdrinking require other more cultural and social-structural explanations.Research thus far has suggested four categories of possible socioculturalreasons why men's and women's drinking patterns remain dissimilar:power, sex, risks, and responsibilities.
Power. The most common hypotheses to explain why men andwomen differ in their drinking behavior argue that alcohol consumptionboth symbolizes and enhances men's greater power relative to women(McClelland et al., 1972). Alcohol consumption, particularly in largequantities, has been an emblem of male superiority, a privilege that menhave often reserved for themselves and denied to women (Martin, 2001;Nicolaides, 1996; Purcell, 1994; Suggs, 1996, 2001; Wang et al., 1992;Willis, 1999). Alcohol consumption in all-male groups may affirm theprivileged status of being a man rather than a woman (Campbell, 2000;
WHY STUDY GENDER, ALCOHOL AND CULTURE?
7
TABLE 3. Global burden of disease in 2000 attributable to alcoholaccording to major disease categories (DALYs in 000s)
Disease or Injury Female Male Total
Conditions arising during the perinatalperiod
Malignant neoplasmNeuro-psychiatric conditionsCardiovascular diseasesOther non-communicable diseases (diabetes,
liver cirrhosis)Unintentional injuriesIntentional injuriesAlcohol-related disease burden all causes
(DALYs)All DALYs% of all DALYs that can be attributable to
alcohol
5510213814-428
86024871117
8926693 911
1.3
683180
18 0904411
369514 008
5945
49 397761 562
6.5
1234201
21 9043983
455516 495
7062
58 3231 455 473
4.0
Hunt & Laidler, 2001; Nghe et al., 2003, Taillon, 2002), and the ability toconsume large amounts of alcohol without apparent impairment may helpto demonstrate that the drinker is manly (Neff, Prihoda, & Hoppe, 1991;Roberts, 2004). Because drinking historically has been a male privilege,increases in women's drinking have been linked to social changes thatallow women to perform other roles once reserved for men (Bergmark,2004; Kubicka, Csemy, & Kozeny, 1995; McPherson et al., 2004; Takano,Nakamura, & Watanabe, 1996). However, failures to find simple orconsistent effects of paid employment on women's drinking in Europe andNorth America (Ames & Rebhun, 1996; Lahelma, Kangas, & Manderbacka,1995; Neve et al., 1996; Romelsjo & Lundberg, 1996; Wilsnack & Wilsnack,1992) suggest that increased autonomy and opportunities to performtraditionally male roles have not been enough to cause women to drink theway that men do.
Alcohol may seem to enhance power over others by facilitatingaggressive behavior. Much research, particularly in laboratory studies ofcollege students, has established that drinking leads to increasedaggression toward other people, more by men than by women (Bushman,1997; Harford, Wechsler, & Muthen, 2003; Scott, Schafer, & Greenfield,1999). However, this effect of alcohol depends to some degree on personalcharacteristics of male drinkers (Parrott & Giancola, 2004; Giancola,2003), expectations that alcohol makes people aggressive (Giancola, 2002;Quigley, Corbett, & Tedeschi, 2002), and environments that facilitatehostile encounters (Graham, West, & Wells, 2000). In short, men who maywant to bully or assault other people learn that alcohol can help them dothis in certain circumstances. In particular, heavy drinking is likely to be acontext or prelude for male violence against women, either in attacks onintimate partners (Fals-Stewart, 2003; Graham, Plant, & Plant, 2004;O'Leary & Schumacher, 2003; Wells & Graham, 2003; White & Chen,2002) or more generally in sexual assaults (Abbey, 2002; Abbey et al.,2003; Testa, 2002). While greater aggressiveness toward women couldencourage more than discourage men's drinking, it is not clear thatalcohol's effects on men's aggression would be a disincentive for women'sdrinking, particularly if women use alcohol not so much to aid their ownaggression as to help them cope with the emotional consequences of beingattacked (Corbin et al., 2001; Kilpatrick et al., 1997; Testa & Leonard, 2001;Testa, Livingston, & Leonard, 2003).
Sex. Both men and women may be motivated to drink by expectationsthat alcohol will enhance their sexual performance and enjoyment (or willmake it easier for them to engage in sexual activity) (Demmel & Hagen,2004; MacLatchy-Gaudet & Stewart, 2001; MacQueen et al., 1996; S.Wilsnack et al., 1997). These expectations may be more influential for menthan women (Anderson & Mathieu, 1996; Morr & Mongeau, 2004; Wall,Hinson, & McKee, 1998), but such comparisons are based mainly on U. S.college students. However, fears that alcohol makes women sexually more
ALCOHOL, GENDER AND DRINKING PROBLEMS
8
active and indiscriminate, or makes women more open to sexual advances,have contributed to policies aimed to prevent or minimize women'sdrinking (McLaughlin, 1991; Nicolaides, 1996; Sandmaier, 1980; West,1997), and have reinforced social disapproval of women's drinking (Leigh,1995; Roberts, 2004). Hypothetically, women have been sociallyinfluenced to drink less than men partly as a way to restrain women'ssexual behavior. However, to the extent that women are aware that theirdrinking may increase their risks of or vulnerability to male sexualaggression (Abbey, 2002; Abbey et al., 2004; Testa, Vanzile-Tamsen, &Livingston, 2004), this might also be an incentive for some women to limittheir own drinking relative to men.
Risks. A third theoretical approach would argue that men drink morethan women do because men are generally more willing or motivated totake risks than women are (Byrnes, Miller, & Schafer, 1999; LaGrange &Silverman, 1999; Weber, Blais, & Betz, 2002). Gender differences in risk-taking may result from many possible causes: that men find risk-takingmore inherently rewarding (exciting) than women do, that risk-taking isan important part of demonstrating masculinity (but not femininity), orthat women perceive and/or avoid risks more than men do (Campbell,Muncer, & Bibel, 2001; Eckel & Grossman, 2002; Fetchenhauer & Rohde,2002; Hartog, Ferrer-Carabonell, & Jonker, 2002; Zaleskiewicz, 2001) .Alcohol consumption (especially in large quantities) may not only be aform of risk-taking, but may chemically make it easier for men to takeother risks (that women would be less likely to take, such as in aggressivebehavior). Evidence suggests that gender differences in risk-perception orrisk-taking propensity affect drinking behavior (Engwall, Hunter, &Steinberg, 2004; Spigner, Hawkins, & Loren, 1993; Zuckerman &Kuhlman, 2000), but that the risk-taking effects may be greatest in lateadolescence and early adulthood, before men assume marital and parentalroles (Byrnes et al., 1999; Hill & Chow, 2002), and/or among men whosemasculinity is threatened in other areas of life (Courtenay, 2000). If menand women are likely to differ more at higher levels of risk-taking(Hirschberger et al., 2002), this would be consistent with the greatergender differences in the heaviest and most hazardous drinking patterns,as noted above.
Responsibilities. A fourth theoretical theme in research on genderand drinking is that men's and women's drinking are differently affectedby social responsibilities. On the one hand, men may be more likely todrink heavily because drinking either helps them ignore responsibilities(particularly domestic roles) or demonstrates their immunity to roleobligations (Armeli et al., 2000; Hammill, 2001; Magazine, 2004). Onthe other hand, greater role responsibilities, particularly at home, maycause women (more than men) to limit their drinking (Ahlstrom,Bloomfield, & Knibbe, 2001; Neve et al., 1996; Schulenberg et al., 2000;Shore, 1997; Thundal, Granbom, & Allebeck, 1999), perhaps because
WHY STUDY GENDER, ALCOHOL AND CULTURE?
9
drinking might impair their role performance, or because women withmore role responsibilities are subject to greater social surveillance(Wilsnack & Cheloha, 1987). However, inhibiting effects of multiple roleresponsibilities on women's drinking have not been consistent acrosscultures or across drinking patterns (Gmel et al., 2000; Hajema &Knibbe, 1998), and may be overridden by effects of conflicts and otherdistress women experience from their combined family and work roles(Frone, 1999; Grzywacz & Marks, 2000; Koopman et al., 2003; Parker &Harford, 1992). The most that can be argued at this point is that in somesocial contexts, domestic role obligations affect men's and women'sdrinking differently, in ways that tend to maintain and magnify gendergaps in drinking behavior.
Summary. These four theoretical reasons for gender differences indrinking behavior may occur together, so it is possible that combinationsof these reasons will be sufficient to maintain gender differences indrinking in any given culture and historical era. Note also that the fourpossible ways to explain gender differences may be relevant to individuals,to groups of individuals (such as in all-male drinking), and to largersocieties and cultures. One possible inference is that male drinkingbehavior is most likely to be extreme or problematic, and genderdifferences in drinking behavior are likely to be greatest, where individuals,groups, or societies give the greatest value and importance to maledominance, sexual assertiveness, risk-taking, and avoidance of (domestic)responsibilities. The chief limitation of such a male-centered perspective isthat it may not be helpful for explaining why some women drink inhazardous or harmful ways. It is possible that some of women's drinkingpatterns and problems may result from the same factors that encouragemen's drinking (Lundahl et al., 1997; Wall, McKee, & Hinson, 2000;Williams & Ricciardelli, 1996) , but a growing body of research suggeststhat we will have to find other explanations for women's drinking that aremore important for women than for men, e.g., in terms of alcohol's effectsor expected benefits either to facilitate interpersonal relationships or tocope with the pains of lacking or losing such relationships (Covington &Surrey, 1997; Laitinen, Ek, & Sovio, 2002; Makela & Mustonen, 2000;McKee et al., 1998; Skaff, Finney, & Moos, 1999; Thundal et al., 1999).Among its many contributions, the research in the subsequent chaptersmay help to clarify what kinds of social and cultural influences mayencourage women's drinking more than men's, and thus may reduce thesize of the gender gap.
STUDYING GENDER, ALCOHOL AND
CULTURE IN EIGHT COUNTRIES
The chapters that follow are reports based on data from the projecton Gender, Alcohol and Culture: an International Study (GENACIS)
ALCOHOL, GENDER AND DRINKING PROBLEMS
10
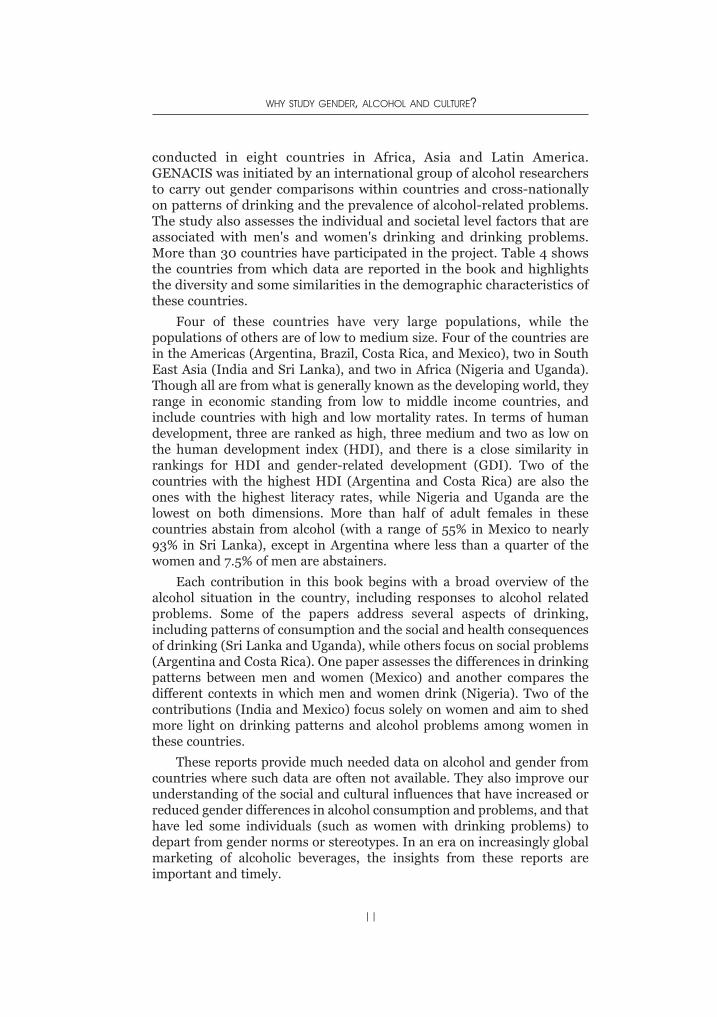
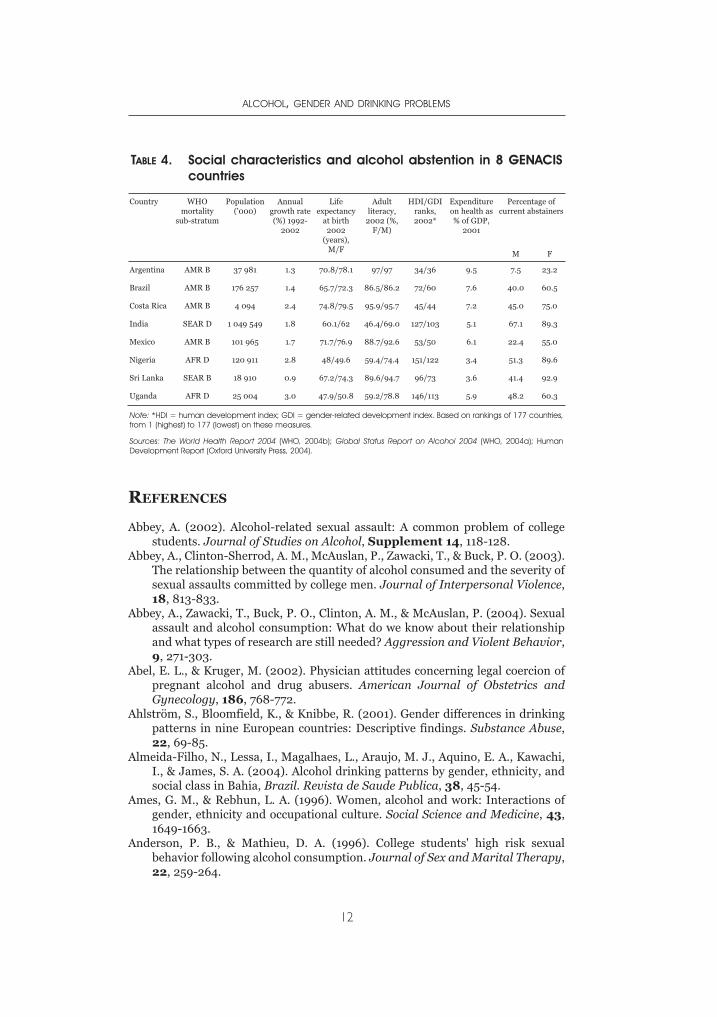
conducted in eight countries in Africa, Asia and Latin America.GENACIS was initiated by an international group of alcohol researchersto carry out gender comparisons within countries and cross-nationallyon patterns of drinking and the prevalence of alcohol-related problems.The study also assesses the individual and societal level factors that areassociated with men's and women's drinking and drinking problems.More than 30 countries have participated in the project. Table 4 showsthe countries from which data are reported in the book and highlightsthe diversity and some similarities in the demographic characteristics ofthese countries.
Four of these countries have very large populations, while thepopulations of others are of low to medium size. Four of the countries arein the Americas (Argentina, Brazil, Costa Rica, and Mexico), two in SouthEast Asia (India and Sri Lanka), and two in Africa (Nigeria and Uganda).Though all are from what is generally known as the developing world, theyrange in economic standing from low to middle income countries, andinclude countries with high and low mortality rates. In terms of humandevelopment, three are ranked as high, three medium and two as low onthe human development index (HDI), and there is a close similarity inrankings for HDI and gender-related development (GDI). Two of thecountries with the highest HDI (Argentina and Costa Rica) are also theones with the highest literacy rates, while Nigeria and Uganda are thelowest on both dimensions. More than half of adult females in thesecountries abstain from alcohol (with a range of 55% in Mexico to nearly93% in Sri Lanka), except in Argentina where less than a quarter of thewomen and 7.5% of men are abstainers.
Each contribution in this book begins with a broad overview of thealcohol situation in the country, including responses to alcohol relatedproblems. Some of the papers address several aspects of drinking,including patterns of consumption and the social and health consequencesof drinking (Sri Lanka and Uganda), while others focus on social problems(Argentina and Costa Rica). One paper assesses the differences in drinkingpatterns between men and women (Mexico) and another compares thedifferent contexts in which men and women drink (Nigeria). Two of thecontributions (India and Mexico) focus solely on women and aim to shedmore light on drinking patterns and alcohol problems among women inthese countries.
These reports provide much needed data on alcohol and gender fromcountries where such data are often not available. They also improve ourunderstanding of the social and cultural influences that have increased orreduced gender differences in alcohol consumption and problems, and thathave led some individuals (such as women with drinking problems) todepart from gender norms or stereotypes. In an era on increasingly globalmarketing of alcoholic beverages, the insights from these reports areimportant and timely.
WHY STUDY GENDER, ALCOHOL AND CULTURE?
11
REFERENCES
Abbey, A. (2002). Alcohol-related sexual assault: A common problem of collegestudents. Journal of Studies on Alcohol, Supplement 14, 118-128.
Abbey, A., Clinton-Sherrod, A. M., McAuslan, P., Zawacki, T., & Buck, P. O. (2003).The relationship between the quantity of alcohol consumed and the severity ofsexual assaults committed by college men. Journal of Interpersonal Violence,18, 813-833.
Abbey, A., Zawacki, T., Buck, P. O., Clinton, A. M., & McAuslan, P. (2004). Sexualassault and alcohol consumption: What do we know about their relationshipand what types of research are still needed? Aggression and Violent Behavior,9, 271-303.
Abel, E. L., & Kruger, M. (2002). Physician attitudes concerning legal coercion ofpregnant alcohol and drug abusers. American Journal of Obstetrics andGynecology, 186, 768-772.
Ahlström, S., Bloomfield, K., & Knibbe, R. (2001). Gender differences in drinkingpatterns in nine European countries: Descriptive findings. Substance Abuse,22, 69-85.
Almeida-Filho, N., Lessa, I., Magalhaes, L., Araujo, M. J., Aquino, E. A., Kawachi,I., & James, S. A. (2004). Alcohol drinking patterns by gender, ethnicity, andsocial class in Bahia, Brazil. Revista de Saude Publica, 38, 45-54.
Ames, G. M., & Rebhun, L. A. (1996). Women, alcohol and work: Interactions ofgender, ethnicity and occupational culture. Social Science and Medicine, 43,1649-1663.
Anderson, P. B., & Mathieu, D. A. (1996). College students' high risk sexualbehavior following alcohol consumption. Journal of Sex and Marital Therapy,22, 259-264.
ALCOHOL, GENDER AND DRINKING PROBLEMS
12
TABLE 4. Social characteristics and alcohol abstention in 8 GENACIScountries
Country WHOmortality
sub-stratum
Population('000)
Annualgrowth rate(%) 1992-
2002
Lifeexpectancy
at birth2002
(years),M/F
Adultliteracy,
2002 (%,F/M)
HDI/GDIranks,2002*
Expenditureon health as% of GDP,
2001
Percentage ofcurrent abstainers
M F
Argentina AMR B 37 981 1.3 70.8/78.1 97/97 34/36 9.5 7.5 23.2
Brazil AMR B 176 257 1.4 65.7/72.3 86.5/86.2 72/60 7.6 40.0 60.5
Costa Rica AMR B 4 094 2.4 74.8/79.5 95.9/95.7 45/44 7.2 45.0 75.0
India SEAR D 1 049 549 1.8 60.1/62 46.4/69.0 127/103 5.1 67.1 89.3
Mexico AMR B 101 965 1.7 71.7/76.9 88.7/92.6 53/50 6.1 22.4 55.0
Nigeria AFR D 120 911 2.8 48/49.6 59.4/74.4 151/122 3.4 51.3 89.6
Sri Lanka SEAR B 18 910 0.9 67.2/74.3 89.6/94.7 96/73 3.6 41.4 92.9
Uganda AFR D 25 004 3.0 47.9/50.8 59.2/78.8 146/113 5.9 48.2 60.3
Note: *HDI = human development index; GDI = gender-related development index. Based on rankings of 177 countries,from 1 (highest) to 177 (lowest) on these measures.
Sources: The World Health Report 2004 (WHO, 2004b); Global Status Report on Alcohol 2004 (WHO, 2004a); HumanDevelopment Report (Oxford University Press, 2004).
Armeli, S., Carney, M. A., Tennen, H., Affleck, G., & O'Neil, T. P. (2000). Stress andalcohol use: A daily process examination of the stressor vulnerability model.Journal of Personality and Social Psychology, 78, 979-994.
Assanangkornchai, S., Pinkaew, P., & Apakupakul, N. (2003). Prevalence ofhazardous-harmful drinking in a southern Thai community. Drug and AlcoholReview, 22, 287-293.
Baraona, E., Abittan, C. S., Dohmen, K., Moretti, M., Pozzato, G., Chayes, Z. W.,Schaefer, C., & Lieber, C. S. (2001). Gender differences in pharmacokinetics ofalcohol. Alcoholism: Clinical and Experimental Research, 25, 502-507.
Beals, J., Spicer, P., Mitchell, C. M., Novins, D. K., Manson, S. M., et al. (2003).Racial disparities in alcohol use: Comparison of two American Indianreservation populations with national data. American Journal of PublicHealth, 93, 1683-1688.
Bergman, H., & Kallmén, H. (2002). Alcohol use among Swedes and apsychometric evaluation of the Alcohol Use Disorders Identification Test.Alcohol and Alcoholism, 37, 245-251.
Bergmark, K. H. (2004). Gender roles, family, and drinking: Women at thecrossroad of drinking cultures. Journal of Family History, 29, 293-307.
Bijl, R. V., de Graaf, R., Ravelli, A., Smit, F., & Vollebergh, W. A. M. (2002). Genderand age specific first incidence of DSM III R psychiatric disorders in thegeneral population: Results from the Netherlands Mental Health Survey andIncidence Study (NEMESIS). Social Psychiatry and PsychiatricEpidemiology, 37, 372-379.
Bloomfield, K., Gmel, G., Neve, R., & Mustonen, H. (2001). Investigating genderconvergence in alcohol consumption in Finland, Germany, TheNetherlands, and Switzerland: A repeated survey analysis. SubstanceAbuse, 22, 39-53.
Blume, S. B. (1997). Women and alcohol: Issues in social policy. In R. W. Wilsnack& S. C. Wilsnack (Eds.), Gender and Alcohol: Individual and SocialPerspectives (pp. 462-489). New Brunswick, NJ: Rutgers Center of AlcoholStudies.
Brienza, R. S., & Stein, M. D. (2002). Alcohol use disorders in primary care: Dogender-specific differences exist? Journal of General Internal Medicine, 17,387-397.
Bushman, B. J. (1997). Effects of alcohol on human aggression: Validity ofproposed explanations. In M. Galanter (Ed.), Recent Developments inAlcoholism, Vol. 13: Alcohol and Violence (pp. 227-243). New York: Plenum.
Byrnes, J. P., Miller, D. C., & Schafer, W. D. (1999). Gender differences in risktaking: A meta-analysis. Psychological Bulletin, 125, 367-383
Campbell, A., Muncer, S., & Bibel, D. (2001). Women and crime: An evolutionaryapproach. Aggression and Violent Behavior, 6, 481-497.
Campbell, H. (2000). The glass phallus: Pub(lic) masculinity and drinking in ruralNew Zealand. Rural Sociology, 65, 562-581.
Capraro, R. L. (2000). Why college men drink: Alcohol, adventure, and the paradoxof masculinity. Journal of American College Health, 48, 307-315.
Caraveo-Anduaga, J. J., Colmenares-Bermudez, E., & Saldivar-Hernandez, G. J.(1999). [Gender differences in alcohol consumption in Mexico City.] SaludPublica de Mexico, 41, 177-188.
Child, I. L., Barry, H., & Bacon, M. K. (1965). A cross-cultural study of drinking: III.Sex differences. Quarterly Journal of Studies on Alcohol, Supplement 3, 49-61.
WHY STUDY GENDER, ALCOHOL AND CULTURE?
13
Corbin, W.R., Bernat, J.A., Calhoun, K.S., McNair, L.D., & Seals, K.L. (2001). Therole of alcohol expectancies and alcohol consumption among sexuallyvictimized and nonvictimized college women. Journal of InterpersonalViolence, 16, 297-311.
Courtenay, W. H. (2000). Constructions of masculinity and their influence onmen's well-being: A theory of gender and health. Social Science and Medicine,50, 1385-1401.
Covington, S. S., & Surrey, J. L. (1997). The relational model of women'spsychological development: Implications for substance abuse. In R. W.Wilsnack & S. C. Wilsnack (Eds.), Gender and Alcohol: Individual and SocialPerspectives (pp. 335-351). New Brunswick, NJ: Rutgers Center of AlcoholStudies.
Dawson, D. A. (2003). Methodological issues in measuring alcohol use. AlcoholResearch & Health, 27, 18-29.
Dawson, D. A., & Grant, B. F. (1998). Family history of alcoholism and gender:Their combined effects on DSM-IV alcohol dependence and major depression.Journal of Studies on Alcohol, 59, 97-106.
Dawson, D. A., Grant, B. F., Stinson, F. S., & Chou, P. S. (2004). Another look atheavy episodic drinking and alcohol use disorders among college andnoncollege youth. Journal of Studies on Alcohol, 65, 477-488.
Degenhardt, L., Hall, W., Teesson, M,; & Lynskey, M. (1997). Alcohol Use Disordersin Australia: Findings from the National Survey of Mental Health and WellBeing. NDARC Technical Report No. 97. National Drug and Alcohol ResearchCentre, New South Wales, Australia.
de Lima, M. S., Dunn, J., Novo, I. P., Tomasi, E., & Reisser, A. A. P. (2003). Genderdifferences in the use of alcohol and psychotropics in a Brazilian population.Substance Use and Misuse, 38, 51-65.
Demmel, R., & Hagen, J. (2004). The structure of positive alcohol expectancies inalcohol dependent inpatients. Addiction Research and Theory, 12, 125-140.
Denny, C. H., Serdula, M. K., Holtzman, D., Nelson, D. E. (2003). Physician adviceabout smoking and drinking: Are U. S. adults being informed? AmericanJournal of Preventive Medicine, 24, 71-74.
DeVille, K. A., & Kopelman, L. M. (1998). Moral and social issues regardingpregnant women who use and abuse drugs. Obstetrics and Gynecology Clinicsof North America, 25, 237-254.
Dolgin, J. L. (1991). The law's response to parental alcohol and "crack" abuse.Brooklyn Law Review, 56, 1213-1268.
Driessen, H. (1992). Drinking on masculinity: Alcohol and gender in Andalusia. InD. Gefou-Madianou (Ed.), Alcohol, Gender and Culture (pp. 71-79). London:Routledge.
Eckel, C. C., & Grossman, P. J. (2002). Sex differences and statistical stereotypingin attitudes toward financial risk. Evolution and Human Behavior, 23, 281-295.
Engwall, D., Hunter, R., & Steinberg, M. (2004). Gambling and other risk behaviorson university campuses. Journal of American College Health, 52, 245-255.
Ezzati, M., Lopez, A., Rodgers, A., Hoorn, S.V., & Murray, C.J.L. Selected major riskfactors and global and regional burden of disease. The Lancet, 360, 1347-1360.
Fagrell, B., De Faire, U., Bondy, S., Criqui, M., Gaziano, M., Gronbaek, M., Jackson,R., Klatsky, A., Salonen, J., & Shaper, A. G. (1999). The effects of light tomoderate drinking on cardiovascular diseases. Journal of Internal Medicine,246, 331-340.
ALCOHOL, GENDER AND DRINKING PROBLEMS
14
Fals-Stewart, W. (2003). The occurrence of partner physical aggression on days ofalcohol consumption: A longitudinal diary study. Journal of Consulting andClinical Psychology, 71, 41-52.
Fetchenhauer, D., & Rohde, P. A. (2002). Evolutionary personality psychology andvictimology: Sex differences in risk attitudes and short term orientation andtheir relation to sex differences in victimizations. Evolution and HumanBehavior, 23, 233-244.
Frezza, M., Di Padova, C., Pozzato, G., Terpin, M., Baraona, E., & Lieber, C. S.(1990). High blood alcohol levels in women: The role of decreased gastricalcohol dehydrogenase activity and first-pass metabolism. New EnglandJournal of Medicine, 322, 95-99.
Frone, M. R. (1999). Work stress and alcohol use. Alcohol Research & Health, 23,284-291.
Gefou-Madianou, D. (Ed.) (1992). Alcohol, Gender and Culture. New York:Routledge.
Giancola, P. R. (2002). Alcohol related aggression during the college years:Theories, risk factors and policy implications. Journal of Studies on Alcohol,Supplement 14, 129-139.
Giancola, P. R. (2003). The moderating effects of dispositional empathy on alcoholrelated aggression in men and women. Journal of Abnormal Psychology, 112,275-281.
Gmel, G., Bloomfield, K., Ahlström, S., Choquet, M., & Lecomte, T. (2000).Women's roles and women's drinking: A comparative study in four Europeancountries. Substance Abuse, 21, 249-264.
Gmel, G., Rehm, J., & Kuntsche, E. (2003). Binge-trinken in Europa: Epidemiologieund folgen. Zeitschrift zur Wissenschaft und Praxis, 49, 105-116.
Graham, K., Plant, M., & Plant, M. (2004). Alcohol, gender and partner aggression:A general population study of British adults. Addiction Research and Theory,12, 373-384.
Graham, K., & Wells, S. (2003). "Somebody's gonna get their head kicked intonight!": Aggression among young males in bars --- a question of values?British Journal of Criminology, 43, 546-566.
Graham, K., West, P., & Wells, S. (2000). Evaluating theories of alcohol-relatedaggression using observations of young adults in bars. Addiction, 95, 847-863.
Graham, K., Wilsnack, R. W., Dawson, D., & Vogeltanz, N. D. (1998). Shouldalcohol consumption measures be adjusted for gender differences? Addiction,93, 1137-1147.
Grant, B. F., Dawson, D. A., Stinson, F. S., Chou, S. P., Dufour, M. C., & Pickering,R. P. (2004). The 12-month prevalence and trends in DSM-IV alcohol abuseand dependence: United States,1991-1992 and 2001-2002. Drug and AlcoholDependence, 74, 223-234.
Grzywacz, J. G., & Marks, N. F. (2000). Family, work, work family spillover, andproblem drinking during midlife. Journal of Marriage and the Family, 62,336-348.
Hajema, K.-J., & Knibbe, R. A. (1998). Changes in social roles as predictors ofchanges in drinking behaviour. Addiction, 93, 1717-1727.
Hammill, J. (2001). The culture of masculinity in an Australian indigenouscommunity. Development, 44, 21-24.
Hansagi, H., Romelsjö, A., de Verdier, M. G., Andréasson, S., & Leifman, A. (1995).Alcohol consumption and stroke mortality: 20-year follow-up of 15,077 menand women. Stroke, 26, 1768-1773.
WHY STUDY GENDER, ALCOHOL AND CULTURE?
15
Hao, W., Su, Z. H., Lui, B. L., Zhang, K., Yang, H. Q., Chen, S. Z., Biao, M. Z., &Cui, C. (2004). Drinking and drinking patterns and health status in thegeneral population of five areas of China. Alcohol and Alcoholism, 39, 43-52.
Harford, T. C., Wechsler, H., & Muthén, B. O. (2003). Alcohol-related aggressionand drinking at off-campus parties and bars: A national study of currentdrinkers in college. Journal of Studies on Alcohol, 64, 704-711.
Hartog, J., Ferrer-Carbonell, A., & Jonker, N. (2002). Linking measured riskaversion to individual characteristics. Kyklos, 55, 3-26.
Hasin, D. S., & Grant, B. F. (2004). The co-occurrence of DSM-IV alcohol abuse inDSM-IV alcohol dependence: Results of the National Epidemiologic Survey onAlcohol and Related Conditions on heterogeneity that differ by populationsubgroup. Archives of General Psychiatry, 61, 891-896.
Heath, A. C., Bucholz, K. K., Madden, P. A. F., Dinwiddie, S. H., Slutske, W. S.,Bierut, L. J., Statham, D. J., Dunne, M. P., Whitfield, J. B., & Martin, N. G.(1997). Genetic and environmental contributions to alcohol dependence risk ina national twin sample: Consistency of findings in men and women.Psychological Medicine, 27, 1381-1396.
Higuchi, S., Parrish, K. M., Dufour, M. C., Towle, L. H., & Harford, T. C. (1994).Relationship between age and drinking patterns and drinking problems amongJapanese, Japanese-Americans, and Caucasians. Alcoholism: Clinical andExperimental Research, 18, 305-310.
Hill, E. M., & Chow, K. (2002). Life-history theory and risky drinking. Addiction,97, 401-413.
Hirschberger, G., Florian, V., Mikulinver, M., Goldenberg, J. L., & Pyszczynski, T.(2002). Gender differences in the willingness to engage in risky behavior: Aterror management perspective. Death Studies, 26, 117-141.
Hunt, G. P., & Laidler, K. J. (2001). Alcohol and violence in the lives of gangmembers. Alcohol Research & Health, 25, 66-71.
Janghorbani, M., Ho, S. Y., Lam, T. H., & Janus, E. D. (2003). Prevalence andcorrelates of alcohol use: A population-based study in Hong Kong. Addiction,98, 215-224.
Jhingan, H. P., Shyangwa, P., Sharma, A., Prasad, K. M. R., & Khandelwal, S. K.(2003). Prevalence of alcohol dependence in a town in Nepal as assessed by theCAGE questionnaire. Addiction, 98, 339-343.
Joffe, A. H. (1998). Alcohol and social complexity in ancient western Asia. CurrentAnthropology, 39, 297-322.
Kawakami, N., Shimizu, H., Haratani, T., Iwata, N., & Kitamura, T. (2004).Lifetime and 6 month prevalence of DSM III R psychiatric disorders in anurban community in Japan. Psychiatry Research, 121, 293-301.
Kebede, D., & Alem, A. (1999). The epidemiology of alcohol dependence andproblem drinking in Addis Ababa, Ethiopia. Acta Psychiatrica Scandinavica,100 (Supplement 397), 30-34.
Kilpatrick, D. G., Acierno, R., Resnick, H. S., Saunders, B. E., & Best, C. L. (1997).A two-year longitudinal analysis of the relationships between violent assaultand substance use in women. Journal of Consulting and Clinical Psychology,65, 834-847.
Koopman, C., Wanat, S. F., Whitsell, S., Westrup, D., & Matano, R. A. (2003).Relationships of alcohol use, stress, avoidance coping, and other factors withmental health in a highly educated workforce. American Journal of HealthPromotion, 17, 259-268.
ALCOHOL, GENDER AND DRINKING PROBLEMS
16
Kringlen, E., Torgersen, S., & Cramer, V. (2001). A Norwegian psychiatricepidemiological study. American Journal of Psychiatry, 158, 1091-1098.
Kubicka, L., Csemy, L., & Kozeny, J. (1995). Prague women's drinking before andafter the "velvet revolution" of 1989: A longitudinal study. Addiction, 90, 1471-1478.
Kuo, M., Adlaf, E. M., Lee, H., Gliksman, L., Demers, A., & Wechsler, H. (2002).More Canadian students drink but American students drink more: Comparingcollege alcohol use in two countries. Addiction, 97, 1583-1592.
LaGrange, T. C., & Silverman, R. A. (1999). Low self-control and opportunity:Testing the general theory of crime as an explanation for gender differences indelinquency. Criminology, 37, 41-72.
Lahelma, E., Kangas, R., & Manderbacka, K. (1995). Drinking and unemployment:Contrasting patterns among men and women. Drug and Alcohol Dependence,37, 71-82.
Laitinen, J., Ek, E., & Sovio, U. (2002). Stress-related eating and drinking behaviorand body mass index and predictors of this behavior. Preventive Medicine, 34,29-39.
Leigh, B. C. (1995). A thing so fallen and so vile: Images of drinking and sexualityin women. Contemporary Drug Problems, 22, 415-434.
Lundahl, L. H., Davis, T. M., Adesso, V. J., & Lukas, S. E. (1997). Alcoholexpectancies: Effects of gender, age, and family history of alcoholism.Addictive Behaviors, 22, 115-125.
MacLatchy-Gaudet, H. A., & Stewart, S. H. (2001). The context specific positivealcohol outcome expectancies of university women. Addictive Behaviors, 26,31-49.
MacDonald, S. (1994). Whisky, women, and the Scottish drink problem: A viewfrom the Highlands. In M. McDonald (Ed.), Gender, Drink and Drugs (pp.125-143). Providence, RI: Berg.
MacQueen, K. M., Nopkesorn, T., Sweat, M. D., Sawaengdee, Y., Mastro, T. D., &Weniger, B. G. (1996). Alcohol consumption, brothel attendance, and condomuse: Normative expectations among Thai military conscripts. MedicalAnthropology Quarterly, 10, 402-423.
Magazine, R. (2004). Both husbands and banda (gang) members: Conceptualizingmarital conflict and instability among young rural migrants in Mexico City.Men and Masculinities, 7, 144-165.
Mäkelä, K., & Mustonen, H. (2000). Relationships of drinking behavior, gender,and age with reported negative and positive experiences related to drinking.Addiction, 95, 727-736.
Mäkelä, P., Fonager, K., Hibbell, B., Nordlund, S., Sabroe, S., & Simpura, J. (2001).Episodic heavy drinking in four Nordic countries: A comparative survey.Addiction, 96, 1575-1588.
Malet, L., Llorca, P.-M., Boussiron, D., Schwan, R., Facy, F., & Reynaud, M. (2003).General practitioners and alcohol use disorders: Quantity without quality.Alcoholism: Clinical and Experimental Research, 27, 61-66.
Malyutina, S., Bobak, M., Kurilovitch, S., Nikitin, Y., & Marmot, M. (2004). Trendsin alcohol intake by education and marital status in an urban population inRussia between the mid 1980s and the mid 1990s. Alcohol and Alcoholism, 39,64-69.
Malyutina, S., Bobak, M., Kurilovitch, S., Ryizova, E., Nikitin, Y., & Marmot, M.(2001). Alcohol consumption and binge drinking in Novosibirsk, Russia, 1985-1995. Addiction, 96, 987-995.
WHY STUDY GENDER, ALCOHOL AND CULTURE?
17
Martin, A. L. (2001). Alcohol, Sex, and Gender in Late Medieval and Early ModernEurope. New York: Palgrave.
McClelland, D. C., Davis, W. N., Kalin, R., & Wanner, E. (1972). The Drinking Man:Alcohol and Human Motivation. New York: Free Press.
McKee, M., Pomerleau, J., Robertson, A., Pudule, I., Grinberga, D., Kadziauskiene,K., Abaravicius, A., & Vaask, S. (2000). Alcohol consumption in the BalticRepublics. Journal of Epidemiology and Community Health, 54, 361-366.
McKee, S. A., Hinson, R. E., Wall, A.-M., & Spriel, P. (1998). Alcohol outcomeexpectancies and coping styles as predictors of alcohol use in young adults.Addictive Behaviors, 23, 17-22.
McLaughlin, P. M. (1991). Inebriate reformatories in Scotland: An institutionalhistory. In S. Barrows & R. Room (Eds.), Drinking: Behavior and Belief inModern History (pp. 287-314). Berkeley: University of California Press.
McPherson, M., Casswell, S., & Pledger, M. (2004). Gender convergence in alcoholconsumption and related problems: Issues and outcomes from comparisons ofNew Zealand survey data. Addiction, 99, 738-748.
Mendoza-Sassi, R. A., & Beria, J. U. (2003). Prevalence of alcohol-use disordersand associated factors: A population-based study using AUDIT in southernBrazil. Addiction, 98, 799-804.
Mercer, P. W., & Khavari, K. A. (1990). Are women drinking more like men? Anempirical examination of the convergence hypothesis. Alcoholism: Clinicaland Experimental Research, 14, 461-466.
Meyer, C., Rumpf, H. J., Hapke, U., Dilling, H., & John, U. (2000). Prevalence ofalcohol consumption, abuse and dependence in a country with high per capitaconsumption: Findings from the German TACOS study. Social Psychiatry andPsychiatric Epidemiology, 35, 539-547.
Miller, J. W., Gfroerer, J. C., Brewer, R. D., Naimi, T. S., Mokdad, A., & Giles, W. H.(2004). Prevalence of adult binge drinking: A comparison of two nationalsurveys. American Journal of Preventive Medicine, 27, 197 204.
Mirand, A. L., & Welte, J. W. (1994). Total body water adjustment of mean alcoholintakes. Journal of Substance Abuse, 6, 419-425.
Mohan, D., Chopra, A., & Sethi, H. (2002). Incidence estimates of substance usedisorders in a cohort from Delhi, India. Indian Journal of Medical Research,115, 128-135.
Morales-Garcia, J. I. D. L. C., Fernandez- Garate, I. H., Tudon-Garces, H., la Pena,J. E. D., Zarate-Aguilar, A., & Madrazo-Navarro, M. (2002). [The prevalence ofhazardous and harmful use of alcohol among the insured population ofInstituto Mexicano del Seguro Social.] Salud Publica de Mexico, 44, 113-121.
Morr, M. C., & Mongeau, P. A. (2004). First date expectations The impact of sex ofinitiator, alcohol consumption, and relationship type. CommunicationResearch, 31, 3-35.
Murdock, C. G. (2001). Domesticating Drink: Women, Men, and Alcohol inAmerica, 1870 1940. Baltimore, MD: Johns Hopkins University Press.
Nayak, A. (2003). Last of the "Real Geordies"? White masculinities and thesubcultural response to deindustrialisation. Environment and Planning D:Society and Space, 21, 7-25.
Neff, J. A., Prihoda, T. J., & Hoppe, S. K. (1991). "Machismo," self-esteem,education, and high maximum drinking among Anglo, black, and Mexican-American male drinkers. Journal of Studies on Alcohol, 52, 458-463.
Neumark, Y. D., Rahav, G., & Jaffe, D. H. (2003). Socio economic status and bingedrinking in Israel. Drug and Alcohol Dependence, 69, 15-21.
ALCOHOL, GENDER AND DRINKING PROBLEMS
18
Neve, R. J. M., Drop, M. J., Lemmens, P. H., & Swinkels, H. (1996). Genderdifferences in drinking behaviour in the Netherlands: Convergence orstability? Addiction, 91, 357-373.
Nghe, L. T., Mahalik, J. R., & Lowe, S. M. (2003). Influences on Vietnamese men:Examining traditional gender roles, the refugee experience, acculturation, andracism in the United States. Journal of Multicultural Counseling andDevelopment, 31, 245-261.
Nicolaides, B. M. (1996). The state's "sharp line between the sexes": Women,alcohol and the law in the United States, 1850-1980. Addiction, 91, 1211-1229.
Nishimoto, R. H., & Roberts, A. C. (2001). Coercion and drug treatment forpostpartum women. American Journal of Drug and Alcohol Abuse, 27, 161-181.
O'Brien, S., Sinclair, H., Soni, S., O'Dowd, T., & Thomas, D. (2001). Trends inalcohol consumption in undergraduate third level students: 1992-1999. IrishJournal of Medical Science, 170, 224-227.
O'Leary, K. D., & Schumacher, J. A. (2003). The association between alcohol useand intimate partner violence: Linear effect, threshold effect, or both?Addictive Behaviors, 28, 1575-1585.
Osler, M., Jorgensen, T., Davidsen, M., Gronbaek, M., Bronnum-Hansen, H.,Madsen, M., Gerdes, U., & Schroll, M. (2001). Socioeconomic status and trendsin alcohol drinking in the Danish MONICA population, 1982-1992.Scandinavian Journal of Public Health, 29, 40-43.
Parker, D. A., & Harford, T. C. (1992). Gender-role attitudes, job competition andalcohol consumption among women and men. Alcoholism: Clinical andExperimental Research, 16, 159-165.
Parrott, D. J., & Giancola, P. R. (2004). A further examination of the relationbetween trait anger and alcohol-related aggression: The role of anger control.Alcoholism: Clinical and Experimental Research, 28, 855-864.
Peltzer, K. (2002). Health behaviour among black and white South Africans.Journal of the Royal Society for the Promotion of Health, 122, 187-193.
Perdrix, J., Bovet, P., Larue, D., Yersin, B., Burnand, B., & Paccaud, F. (1999).Patterns of alcohol consumption in the Seychelles Islands (Indian Ocean).Alcohol and Alcoholism, 34, 773-785.
Plant, M. (1997). Alcohol throughout the ages. In M. Plant, Women and Alcohol:Contemporary and Historical Perspectives (pp. 32-67). London: FreeAssociation Books.
Plant, M., Thornton, C., & Plant. M. (1999, June). The UK case for convergence.Paper presented at the 25th Annual Symposium of the Kettil Bruun Society forSocial and Epidemiological Research on Alcohol, Montreal, Canada.
Purcell, N. (1994). Women and wine in ancient Rome. In M. McDonald (Ed.),Gender, Drink and Drugs (pp. 191-208). Providence, RI: Berg.
Quigley, B. M., Corbett, A. B., & Tedeschi, J. T. (2002). Desired image of power,alcohol expectancies, and alcohol related aggression. Psychology of AddictiveBehaviors, 16, 318-324.
Ramstedt, M. (2002). Alcohol-related mortality in 15 European countries in thepostwar period. European Journal of Population, 18, 307-323.
Rehm, J., Greenfield, T. K., & Rogers, J. D. (2001). Average volume of alcoholconsumption, patterns of drinking, and all-cause mortality: Results from theUS National Alcohol Survey. American Journal of Epidemiology, 153, 64-71.
Rehm, J., Room, R., Monteiro, M., Gmel, G., Graham, K., Rehn, N., Sempos, C.T.,& Jernigan, D. (2003). Alcohol as a risk factor for global burden of disease.European Addiction Research, 9, 157-164.
WHY STUDY GENDER, ALCOHOL AND CULTURE?
19
Rijken, T., Velema, J. P., & Dijkstra, R. (1998). Alcohol consumption in the ruralpopulation of Misungwi subdistrict in Mwanza Region, Tanzania. Journal ofStudies on Alcohol, 59, 146-151.
Rivara, F. P., Garrison, M. M., Ebel, B., McCarty, C. A., & Christakis, D. A. (2004).Mortality attributable to harmful drinking in the United States, 2000. Journalof Studies on Alcohol, 65, 530-536.
Roberts, B. (2004). Drinking like a man: The paradox of excessive drinking for17th-century Dutch youths. Journal of Family History, 29, 237-252.
Romelsjo, A., & Lundberg, M. (1996). The changes in the social class distribution ofmoderate and high alcohol consumption and of alcohol related disabilities overtime in Stockholm County and in Sweden. Addiction, 91, 1307-1323.
Rosenblitt, J. C., Soler, H., Johnson, S. E., & Quadagno, D. M. (2001). Sensation-seeking and hormones in men and women: Exploring the link. Hormones andBehavior, 40, 396-402.
Sandmaier, M. (1980). Bacchantic maidens and temperance daughters. In M.Sandmaier, The Invisible Alcoholics: Women and Alcohol Abuse in America(pp. 24-57). New York: McGraw-Hill.
San Jose, B., Lagiou, P., Chloptsios, Y., & Trichopoulou, A. (2001).Sociodemographic correlates of abstinence and excessive drinking in the Greekpopulation. Substance Use and Misuse, 36, 463-475.
Schulenberg, J., O'Malley, P. M., Bachman, J. G., & Johnston, L. D. (2000). "Spreadyour wings and fly": The course of well-being and substance use during thetransition to young adulthood. In L. J. Crockett & R. K. Silbereisen (Eds.),Negotiating Adolescence in Times of Social Change (pp. 224-255). New York:Cambridge University Press.
Scott, K. D., Schafer, J., & Greenfield, T. K. (1999). The role of alcohol in physicalassault perpetration and victimization. Journal of Studies on Alcohol, 60, 528-536.
Seale, J. P., Seale, J. D., Alvarado, M., Vogel, R. L., & Terry, N. E. (2002).Prevalence of problem drinking in a Venezuelan Native American population.Alcohol and Alcoholism, 37, 198-204.
Serdula, M. K., Brewer, R. D., Gillespie, C., Denny, C. H., & Mokdad, A. (2004).Trends in alcohol use and binge drinking, 1985-1999: Results of a multi-statesurvey. American Journal of Preventive Medicine, 26, 294-298.
Shore, E. R. (1997). The relationship of gender balance at work, familyresponsibilities and workplace characteristics to drinking among male andfemale attorneys. Journal of Studies on Alcohol, 58, 297-302.
Siegfried, N., Parry, C. D. H., Morojele, N. K., & Wason D. (2001). Profile ofdrinking behaviour and comparison of self-report with the CAGEquestionnaire and carbohydrate-deficient transferrin in a rural Lesothocommunity. Alcohol and Alcoholism, 36, 243-248.
Sieri, S., Agudo, A., Kesse, E., Klipstein-Grobusch, K., San-Jose, B., Welch, A. A., Krogh,V., et al . (2002). Patterns of alcohol consumption in 10 European countriesparticipating in the European Prospective Investigation into Cancer and Nutrition(EPIC) project. Public Health Nutrition, 5 (6B) (Special Issue), 1287-1296.
Singleton, N., Bumpstead, R., O'Brien, M., Lee, A., & Meltzer, H. (2003).Psychiatric morbidity among adults living in private households. InternationalReview of Psychiatry, 15, 65-73.
Skaff, M. M., Finney, J. W., & Moos, R. H. (1999). Gender differences in problemdrinking and depression: Different "vulnerabilities"? American Journal ofCommunity Psychology, 27, 25-54.
ALCOHOL, GENDER AND DRINKING PROBLEMS
20
Slutske, W. S., Heath, A. C., Madden, P. A. F., Bucholz, K. K., Dinwiddie, S. H.,Dunne, M. P., Statham, D. S., Whitfield, J. B., & Martin, N. G. (1995). Is alcoholflushing a protective factor for alcoholism in Caucasians? Alcoholism: Clinicaland Experimental Research, 19, 582-592.
Slutske, W. S., Piasecki, T. M., & Hunt-Carter, E. E. (2003). Development andinitial validation of the Hangover Symptoms Scale: Prevalence and correlatesof hangover symptoms in college students. Alcoholism: Clinical andExperimental Research, 27, 1442-1450.
Spicer, P., Beals, J., Croy, C. D., Mitchell, C. M., Novins, D. K., Moore, L., &Manson, S. M. (2003). The prevalence of DSM III R alcohol dependence in twoAmerican Indian populations. Alcoholism: Clinical and ExperimentalResearch, 27, 1785-1797.
Spigner, C., Hawkins, W., & Loren, W. (1993). Gender differences in perception ofrisk associated with alcohol and drug use among college students. Women andHealth, 20, 87-97.
Suggs, D. N. (1996). Mosadi Tshwene: The construction of gender and theconsumption of alcohol in Botswana. American Ethnologist, 23, 597-610.
Suggs, D. N. (2001). "These young chaps think they are just men, too":Redistributing masculinity in Kgatleng bars. Social Science and Medicine, 53,241-250.
Svikis, D. S., & Reid-Quinones, K. (2003). Screening and prevention of alcohol anddrug use disorders in women. Obstetrics and Gynecology Clinics of NorthAmerica, 30, 447-468.
Taillon, P. M. (2002). "What we want is good, sober men": Masculinity,respectability, and temperance in the railroad brotherhoods, c. 1870 1910.Journal of Social History, 36, 319-338, 532.
Takano, T., Nakamura, K., & Watanabe, M. (1996). Increased female drinking inaccordance with post industrial urbanization in Japan. Alcohol andAlcoholism, 31, 41-49.
Testa, M. (2002). The impact of men's alcohol consumption on perpetration ofsexual aggression. Clinical Psychology Review, 22, 1239-1263.
Testa, M., & Leonard, K. E. (2001). The impact of marital aggression on women'spsychological and marital functioning in a newlywed sample. Journal ofFamily Violence, 16, 115-130.
Testa, M., Livingston, J. A., & Leonard, K. E. (2003). Women's substance use andexperiences of intimate partner violence: A longitudinal investigation among acommunity sample. Addictive Behaviors, 28, 1649 1664.
Testa, M., Vanzile-Tamsen, C., & Livingston, J. A. (2004). The role of victim andperpetrator intoxication on sexual assault outcomes. Journal of Studies onAlcohol, 65, 320-329.
Thomasson, H. R. (1995). Gender differences in alcohol metabolism: Physiologicalresponses to ethanol. In M. Galanter (Ed.), Recent Developments inAlcoholism, Vol. 12: Alcoholism and Women (pp. 163-179). New York:Plenum.
Thundal, K.-L., Granbom, S., & Allebeck, P. (1999). Women's alcohol dependenceand abuse: The relation to social network and leisure time. ScandinavianJournal of Public Health, 27, 30-37.
Tomsen, S. (1997). A top night: Social protest, masculinity, and the culture ofdrinking violence. British Journal of Criminology, 37, 90-103.
United Nations Development Programme (2004). World Development Report.New York: Oxford University Press.
WHY STUDY GENDER, ALCOHOL AND CULTURE?
21
Vahtera, J., Poikolainen, K., Kivimaki, M., Ala Mursula, L., & Pentti, J. (2002).Alcohol intake and sickness absence: A curvilinear relation. American Journalof Epidemiology, 156, 969 976.
Wall, A. M., Hinson, R. E., & McKee, S. A. (1998). Alcohol outcome expectancies,attitudes toward drinking and the theory of planned behavior. Journal ofStudies on Alcohol, 59, 409-419.
Wall, A. M., McKee, S. A., & Hinson, R. E. (2000). Assessing variation in alcoholoutcome expectancies across environmental context: An examination of thesituational specificity hypothesis. Psychology of Addictive Behaviors, 14, 367-375.
Wang, C.-H., Liu, W.T., Zhang, M. Y., Yu, E.S.H., Xia, Z. Y., Fernandez, M., Lung,C. T., Xu, C. L., & Qu, G. Y. (1992). Alcohol use, abuse, and dependency inShanghai. In J. E. Helzer and G.J. Canino (Eds.), Alcoholism in NorthAmerica, Europe, and Asia (pp. 264 286). New York: Oxford University Press.
Warner, J. (1997). The sanctuary of sobriety: The emergence of temperance as afeminine virtue in Tudor and Stuart England. Addiction, 92, 97-111.
Watten, R. G. (1997). Gender and consumption of alcohol: The impact of bodycomposition, sensation seeking, and coping styles. British Journal of HealthPsychology, 2 (Part 1), 15-25.
Weber, E. U., Blais, A.-R., & Betz, N. E. (2002). A domain specific risk attitudescale: Measuring risk perceptions and risk behaviors. Journal of BehavioralDecision Making, 15, 263-290.
Wells, S., & Graham, K. (2003). Aggression involving alcohol: Relationship todrinking patterns and social context. Addiction, 98, 33-42.
Welty, T. K., Lee, E. T., Yeh, J., Cowan, L. D., Go, O., Fabsitz, R. R., Le, N.-A., Oopik,A. J., Robbins, D. C., & Howard, B. V. (1995). Cardiovascular disease riskfactors among American Indians. American Journal of Epidemiology, 142,269-287.
West, M. O. (1997). Liquor and libido: ''Joint drinking'' and the politics of sexualcontrol in colonial Zimbabwe, 1920s 1950s. Journal of Social History, 30,645-667.
White, H. R., & Chen, P.-H. (2002). Problem drinking and intimate partnerviolence. Journal of Studies on Alcohol, 63, 205-214.
Williams, P. (1998). Progress of the National Drug Strategy: Key NationalIndicators: Evaluation of the National Drug Strategy, StatisticalSupplement. Canberra, Australia: Commonwealth of Australia.
Williams, R. J., & Ricciardelli, L. A. (1996). Expectancies relate to symptoms ofalcohol dependence in young adults. Addiction, 91, 1031-1039.
Willis, J. (1999). Enkurma sikitoi: Commoditization, drink, and power among theMaasai. International Journal of African Historical Studies, 32, 339 357.
Willis, J. (2001). "Beer used to belong to older men": Drink and authority amongthe Nyakyusa of Tanzania. Africa, 71, 373-390.
Wilsnack, R. W., & Cheloha, R. (1987). Women's roles and problem drinking acrossthe lifespan. Social Problems, 34, 231-248.
Wilsnack, R. W., Vogeltanz, N. D., Wilsnack, S. C., Harris, T. R., et al. (2000).Gender differences in alcohol consumption and adverse drinkingconsequences: Cross-cultural patterns. Addiction, 95, 251-265.
Wilsnack, R. W., & Wilsnack, S. C. (Eds.) (1997). Gender and Alcohol: Individualand Social Perspectives. New Brunswick, NJ: Rutgers Center of Alcohol Studies.
Wilsnack, R. W., & Wilsnack, S. C. (1992). Women, work, and alcohol: Failures ofsimple theories. Alcoholism: Clinical and Experimental Research, 16, 172-179.
ALCOHOL, GENDER AND DRINKING PROBLEMS
22
Wilsnack, S. C., Plaud, J. J., Wilsnack, R. W., & Klassen, A. D. (1997). Sexuality,gender, and alcohol use. In R. W. Wilsnack & S. C. Wilsnack (Eds.), Genderand Alcohol: Individual and Social Perspectives (pp. 250-288). NewBrunswick, NJ: Rutgers Center of Alcohol Studies.
Windle, M. (2003). Alcohol use among adolescents and young adults. AlcoholResearch & Health, 27, 79-85.
World Health Organization (2004a). Global status report on alcohol. Geneva:WHO.
World Health Organization (2002). The world health report 2002. Geneva: WHO.World Health Organization (2004b). The world health report 2004. Geneva:
WHO.Yamamoto, J., Silva, J. A., Sasao, T., Wang, C., & Nguyen, L. (1993). Alcoholism in
Peru. American Journal of Psychiatry, 150, 1059-1062.Yoon, Y.-H., Stinson, F. S., Yi, H-Y., & Dufour, M. C. (2003). Accidental alcohol
poisoning mortality in the United States, 1996-1998. Alcohol Research &Health, 27, 110-118.
York, J., & Welte, J. W. (1994). Gender comparisons of alcohol consumption inalcoholic and nonalcoholic populations. Journal of Studies on Alcohol, 55,743-750.
Zaleskiewicz, T. (2001). Beyond risk seeking and risk aversion: Personality and thedual nature of economic risk taking. European Journal of Personality, 15,S105-S122.
Zhang, J., Wang, J., Lu, Y., Qiu, X., & Fang, Y. (2004). Alcohol abuse in ametropolitan city in China: A study of the prevalence and risk factors.Addiction, 99, 1103-1110.
Zuckerman, M., & Kuhlman, D. M. (2000). Personality and risk-taking: Commonbiosocial factors. Journal of Personality, 68, 999-1029.
WHY STUDY GENDER, ALCOHOL AND CULTURE?
23

INTRODUCTION
The Republic of Argentina is located in the southern part of SouthAmerica. Its length is 3,800 km and the population is 38 million.Almost half of the population live in the Capital and Province of
Buenos Aires. Ninety six percent of the population is white and principallydescendants of Italian and Spanish immigrants. The literacy rate is 96.2%and the life expectancy is 70.4 years for men and 76.6 years for women.
Argentina has been facing an acute economic crisis in the last tenyears. Rates of poverty and unemployment have increased dramatically.After the devaluation of the currency in December 2001, the political andsocial climate started to worsen. The feeling of social vulnerability was veryhigh and the financial situation was critical. In addition, crime rates roseand the population was very concerned about security.
Alcohol related problems have been a subject of increasing awarenessin Argentina in recent years. Although little research has been done, therehas been public concern about alcohol related harm lately. Local norms arebeing redefined in order to restrict the availability of alcohol. In 2002,Argentina participated in the collaborative international project “Gender,Alcohol, and Culture: An International Study (GENACIS). The possibilityof doing a survey in the general population was challenging. Despite theadverse circumstances, the survey was carried out successfully.
The aim of the present article is to analyse the social consequences ofdrinking. Age, gender and drinking patterns will be analysed in relation toalcohol problems. These findings will be explored taking into account thecurrent economic crisis. Social consequences were chosen because theGENACIS survey provided the first comprehensive national dataconcerning different aspects of social harm related to alcohol. Firstly, anoverview of alcohol consumption and alcohol problems is given, followedby the major findings of GENACIS.
ALCOHOL CONSUMPTION IN ARGENTINA
The main alcoholic beverages in Argentina are wine, beer and spirits,with the usual strengths of 5% for beer, between 12 and 13% for wine and
CHAPTER 2SOCIAL CONSEQUENCES OF
ALCOHOL CONSUMPTION IN ARGENTINA
MYRIAM I. MUNNÉ
40% for spirits. Considering the population of 15-55 year-olds, in 1980 percapita consumption in whole litres of ethanol for spirits was 1.62, for wine16.27 and for beer 0.77; and in 1994, per capita consumption for spirits was0.63, for wine 10.72 and 2.10 for beer (Verruno, 1995).
In 1999 per capita consumption in whole litres for spirits was 0.42,6.92 for wine and 2.26 for beer (WHOSIS, 2004). An examination of thesituation at the beginning of 1980 shows Argentina to be among countrieswith the highest per capita production of wine, in the middle bracketregarding spirits and with a very low production of beer. The mostimportant change has to do with a reorientation of consumption todifferent types of alcoholic beverages. While consumption of spirits andwine have decreased, consumption of beer has increased considerably inthe same period. In the last two decades, wine consumption in Argentinadropped by more than half (Tendencias Económicas, 2002).
Historically, the wine industry was a family business, but in the last fewyears the cyclical crisis affecting the sector and the foreign capital inflow –estimated at more than US$300 million — accelerated the process ofchange, with foreign partners and/or owners moving into the industry.Over the last few years, producers had more chances to step up foreignsales. Local and foreign producers made important investments aimed atreconverting their vineyards to improve the quality and size of theirplantations.
The beer consumed in Argentina comes from four large companies. Atpresent, the installed capacity exceeds 26 million hectolitres/year, almosttwice as much as 10 years ago. Over the last 6 years, the sector’sinvestments have exceeded US$750 million, with the introduction of state-of-the-art technology, expansion and construction of new plants, thusincreasing production and quality. The sector’s leading companies havemade substantial publicity investments to step up consumption, mainlysupporting sports events and sports professionals in different fields. Insome cases, they invested more than $15 million/year in campaigns,mainly targeted at young consumers, who became the fastest grown beerdrinking segment of Argentinian society.
The local liquor industry is made up of 16 establishments devoted tothe production of high alcohol content drinks. The sector underwent aprofound restructuring in the last two decades, due to the income crunchand sizeable fiscal burden on sales of this type of beverage. Over the lastfew years, as a result of excise tax reduction for liquors in general andyouth-oriented campaigns, the so-called white drinks (vodka, gin, tequila,among others) enjoyed an upswing.
ALCOHOL-RELATED PROBLEMS
Although alcohol use is a significant threat to world health(WHO,1999), there is a lack of reliable data in the country on alcohol-
ALCOHOL, GENDER AND DRINKING PROBLEMS
26
related harm in the population. According to available data, there were277,148 deaths in the country in 2000. Among these, 733 (663 male, 110female) were caused by mental and behavioural problems due to the use ofalcohol (Ministry of Health, 2000). The population most affected was from45 to 54 years of age. There were 710 (623 male, 87 female) deaths causedby alcoholic liver disease. According to the same source, cirrhosis and otherchronic diseases were the fifth leading cause of death among people from50 to 64 years of age.
Although rates of traffic accidents are very high, especially in the cityof Buenos Aires, there are no reliable data available on the role of alcoholin these accidents. The same is true for homicide and suicide.
OVERVIEW OF RESEARCH FINDINGS
The first national study of use of psychoactive substances was carriedout in 1999 (Míguez,1999). This study was a big advance because itprovided a more complete picture of the situation at a national level. Thestudy questionnaire was an adaptation of the 1997 WHO CIDI version 2.1questionnaire. A representative sample of the country’s population agedbetween 16-64 years old consisted of 2699 people, 48.3% male and 51.7 %female. Another representative sample of 356 cases was taken for thepopulation of 12-15 year olds.
The prevalence of alcohol consumption in the last 30 days was 66.2%(78.8% male and 54.4% female). The average age at which people began todrink was 17 years old (16 for males and 18 for women). The averageconsumption of drinks by people who had reported to have drunk at leastonce a week within the last year was 4.2 (5.1 male, 2.5 female). Thealcoholic beverage most consumed was beer, followed by wine and spirits.Alcohol abuse was considered as intake higher than 70g of absolute alcoholdaily. Alcohol abuse by people reported to have drunk at least once a weekwithin the last year was 13.2% (18.1% male and 4.7% female). The rate wasmuch higher among males, and the age group with the highest rate was 16-24 year-olds. In addition, males were the ones who reported moreproblems, and especially males from the 16-24 year age group.
Nearly ten percent (9.9%; 13.4% male and 3.6% female) of the samplereported to have drunk in situations in which to do so was physicallydangerous, such as driving, handling machinery, or similar situations(among those who reported having drunk at least once a week within thelast year). In the population of 16-64 years old, alcohol abuse in the last 30days was 6.61%, with young people in a situation of social vulnerability(low socio-economic level and education) being the ones who abused more.It must be emphasized that the rate of abuse was 7 times higher in menthan in women. Alcohol dependence in people who reported having drunkin the last year was 4.3% and the patterns were similar to those for alcoholabuse (mainly males and young people in a socially vulnerable situation).
SOCIAL CONSEQUENCES OF ALCOHOL CONSUMPTION IN ARGENTINA
27
The second national study was carried out in 2004. Data is still beingprocessed but one of the major findings is that among adolescents from 12-15 years old, lifetime prevalence of the use of alcohol was 40% amongfemales and 38% among males. (SEDRONAR, 2004). Various partialstudies demonstrated that alcohol abuse has increased among youngpeople. A study carried out in the province of Buenos Aires showed thatprevalence of alcohol abuse in the last 30 days was 29% (45% male and 12%female) among young people aged 16-29 years old (SADA, 2004).
In a study in four hospitals in the province of Buenos Aires(Míguez,1994), 7% of the consultations in the Hospital Emergency Facilitywere related to alcohol and other drugs; of these, 70.4 % were associatedwith alcoholic beverages (75% males and 54.2% females), followed bycocaine 7.4% (8.3% in males and 4.2% females), andpsychopharmacological products 3.7% (1.2% males and 12.4% females).The questionnaire included a question regarding the consumption ofalcohol in the previous six hours for all the people who attended theHospital Emergency Facility. The answers were converted to absolutealcohol and 40cc was defined as a risky intake. The prevalence of thosehaving taken in excess of this figure was 5.4%.
Another study was carried out during 1994 in hospitals across thewhole country with both in-patients and patients who had been releasedwithin 30 days prior to the study (Sedronar,1994). The main cause ofhospitalization in the sample studied (260 people) was associated with theconsumption of alcohol and other drugs (42.3%), most often directly orindirectly related to the consumption of alcohol. The age groups which hadthe highest consumption were from 35-44 years old and 45-54 years old(25% each).
SOCIAL PERCEPTION OF ALCOHOL PROBLEMS AMONG
THE GENERAL POPULATION
A study of the perception of families from Buenos Aires about drugs(Necchi, 1990) revealed that illegal drugs were condemned much morethan the legal, socially accepted drugs. The occasional use of illegalsubstances such as cocaine or marijuana was considered much moredangerous than the use of alcoholic beverages. It seemed that what wasregarded as more dangerous was the social transgression and not so muchthe toxicity of the substance.
A survey carried out in a sample of 7200 people above 14 years oldfrom the whole country (APNA,1994) examined the social perception ofalcohol and drug problems. Many aspects of alcohol and drug relatedproblems were explored. A majority (82.3%) of those interviewedconsidered that alcohol and drug related problems have worsened in thelast few years. The majority of them thought that the problems associated
ALCOHOL, GENDER AND DRINKING PROBLEMS
28
with alcohol and drug consumption were due to problems within thefamily. Regarding the official approach, 72.4% thought that there was alack of state policies.
This perception of the problem is consistent with a survey carried outamong professionals dealing with alcohol and drug problems(Munné,1996). The majority of the interviewees mentioned “healthpolicies” as the most important health issue in Argentina. This would implythat health is not limited to disease but rather it refers to the pursuit ofgeneral well-being, and therefore that an appropriate policy is needed.Some of the interviewees stated that public policies do not exist, otherspointed out the lack of organization and programmes. The lack of humanand material resources was also mentioned, as well as low credibility in therole the state plays in alcohol and drug-related problems. The role ofeducation and the mass media has also been criticized and the majoritybelieved that the two are limited to informing in a partial way and at timesto disinforming. However, they recognized the greater role education andmass-media could play if only they were better oriented towards theintegral promotion of health. Alcohol and tobacco advertising was seen tobe another element contributing to the increase of consumption, and themajority of the interviewees felt that tighter regulations in this regard werenecessary.
LEGISLATION IN ARGENTINA
Since 1997, the country has had the “National Law of the fight againstalcoholism” (nº24.788), which after years of debate, was introduced on 31March 1997. This law states that a) it is forbidden countrywide to sell anykind of alcoholic beverage to people under the age of 18; b) it is in thenational interest to fight against the excessive use of alcohol; c) it isforbidden to consume alcoholic beverages in the streets, stadiums or otherplaces where sporting, education or cultural activities are being held; d)commercial alcoholic beverages produced in the country must have thealcoholic strength printed on the label of the container and also must say“Drink with moderation” and “Forbidden to be sold to minors under 18.”
There are also restrictions placed on the advertising of alcoholicbeverages, in that: a) it should not be aimed at minors under 18, b)minors under 18 should not be portrayed drinking, c) the consumptionof alcohol should not suggest the improvement of physical orintellectual performance and d) alcohol should not be connected withsexual stimulation or violence in any form. This law also created theNational Program for Prevention and Fight Against the ExcessiveConsumption of Alcohol. The Federal Council of Education and Cultureis in charge of the educational aspects of the programme. Issues relatedto the excessive consumption of alcohol must be incorporated into alllevels of education.
SOCIAL CONSEQUENCES OF ALCOHOL CONSUMPTION IN ARGENTINA
29
Public and Private institutions must have primary prevention andearly detection programmes related to the pathology of the excessiveconsumption of alcohol. Social security services must deal withpsychological, pharmacological and medical treatments related to thedisease of the excessive consumption of alcohol. They must offerassistance and rehabilitation to alcoholic patients and must haveprevention programmes. This law also prohibits driving any type ofmotor vehicle with a blood alcohol level greater than 500mg per litre ofblood. In the case of a motorbike, it is prohibited to drive with a bloodalcohol level greater than 200 mg per litre of blood. Public transport andcommercial cargo drivers are prohibited from having any traces ofalcohol in their blood stream.
Although there has not been any study on the impact of the law, thereis strong evidence that the enforcement of the law is very poor. In terms ofalcohol availability to minors, a study demonstrated that they can easilyaccess alcoholic drinks in discos and other outlets (Munné, 2001a). Manycardboard boxes (one packaging in which wine is delivered) don’t have anylabel printed indicating the alcoholic strength nor the prohibition to sell itto minors.
Social control regarding the state of being drunk in public haschanged in the last year. Argentina had until last year police edictsregarding drunkenness. Policemen had the authority to detain a drunkenperson in the streets. If that individual showed signs of chronic alcoholdependence, the police doctor could order his confinement in apsychiatric clinic. Since March 1999, the edicts were annulled and the cityof Buenos Aires now has a “Code of mutual coexistence”. This coderegulates minor infractions. Being drunk is not an infraction in itself anymore, but if a person who has committed an infraction is intoxicated withalcohol or other substances the competent authority must bring theperson immediately to an assistance centre.
Argentinian legislation does not contemplate the use of alcohol aseither aggravating or attenuating responsibility for crimes. The recurrentstandard is that of “imputability”, which is determined by psychiatricexamination of the subject. The current tendency (except in the cases ofalcohol dependent people) resultant from psychiatric examinationsindicates that the influence of alcohol while having committed a crime doesnot bear any weight to the subject´s imputability.
ALCOHOL POLICIES
In Argentina, although several national agencies are dealing with theprevention and treatment of alcohol problems, very little funds are givencompared to what is assigned for illicit drugs. In addition, the prevalentpolicy has been assigning funds for treatment (especially for illicit drugs)and resources allocated for research have been practically nonexistent.
ALCOHOL, GENDER AND DRINKING PROBLEMS
30
Prevention campaigns have been fragmented. Controls especially fordrinking-driving have been implemented temporarily, especially insummer time when there is a big influx of cars on the Argentinian roads. Inrelation to treatment, very few hospitals have treatment units for alcoholproblems. AA groups are established and are spread through the wholecountry. They gather usually in churches.
Regulations on taxes have changed with different governments. Ashappens in other developing countries such as Mexico (Riley and Marshall,1999), there are opposite interests not only between the health authoritiesand the alcohol industry, but also among different sectors of government.There is a lack of an adequate national policy. A comprehensive nationalprogramme should articulate actions that could be put in practice indifferent areas such as health, education, social services, etc.
GENDER ROLES IN THE ARGENTINIAN SOCIETY
Although relationships between men and women have changed in thepast decades, in Argentina as in other developing countries (Room et al,2002) traditional male attitudes or “machismo” still exist. Traditionally,the man was the one who had to provide all or almost all of the totalhousehold income.
Partly due to the economic crisis, this situation has started to change,consequently gender roles are being redefined. Drinking was traditionallya male issue with women controlling men’s drinking. This situation todayis that , especially among the young generation, the gender gap in drinkingis decreasing.
THE GENACIS STUDY
Gender, Alcohol and Culture: An International Study (GENACIS) is acollaborative multinational study designed by the International ResearchGroup on Gender and Alcohol (IRGGA). The research instrument consistsof a questionnaire divided into the following sections: demographics, workexperiences, social networks, drinking variables, familial and otherdrinking contexts, drinking consequences, intimate relations and sexuality,violence/victimization and health and lifestyle.
The aims of GENACIS are among others:
• to compare drinking patterns between men and women• to compare the prevalence of alcohol-related problems between
men and women• to assess the level of heavy drinking among men and women
In Argentina the original questionnaire was used with few changes.Drinking in the street was added in the section on contexts of drinking
SOCIAL CONSEQUENCES OF ALCOHOL CONSUMPTION IN ARGENTINA
31
and in the question on “how much drinking is o.k” in different situations.Some questions were included in order to find out the opinions of thegeneral population in relation to alcohol and the economic crisis (Munné,2003). There were the following statements and people had to answer ifthey strongly agree, somewhat agree, somewhat disagree or stronglydisagree:
In the crisis situation:
(a) the people I know drink more as a way of escaping from theirproblems;
(b) it is important to cut down on drinking and other expenses that arenot necessary;
(c) the people I know have stopped going to bars and restaurants andnow they drink at home or at a friend’s home;
(d) the people I know buy cheaper alcoholic drinks and/or of lessquality.
METHOD
SAMPLE
The sample was selected from the city of Buenos Aires and theProvince of Buenos Aires, a region that constitutes around 50% of thepopulation of the whole country. The sample size was 1000 with a responserate of 73.65 %. The population sampled was urban males and femalesaged between 18 and 65 years old. Sampling involved several stages:sampling of areas and buildings, sampling of households when there weremore than one household in the same building and sampling of anindividual in the household.
PROCEDURE
Data collection was through face to face interviews. The questionnairewas piloted with a sample of 30. Only a few changes were made to the finalversion of the questionnaire before starting the fieldwork. Previousexperience in surveys was one of the main considerations in the selectionof interviewers. The interviewers were psychologists, anthropologists,sociologists and social workers, and a few were university students. Most ofthem were women. Apart from the training, the interviewers were given a“Manual for interviewers,” a sheet with different community resources onalcohol and drugs, agencies dealing with domestic violence, a letter ofpresentation and their identification card. The Manual included theobjectives of the study, issues concerning techniques for interviews(including privacy, confidentiality, reliability), how to take control of theinterview, and how to behave with the sensitive parts of the questionnaire.Fieldwork started on September 25 and was completed by the end ofNovember 2002.
ALCOHOL, GENDER AND DRINKING PROBLEMS
32
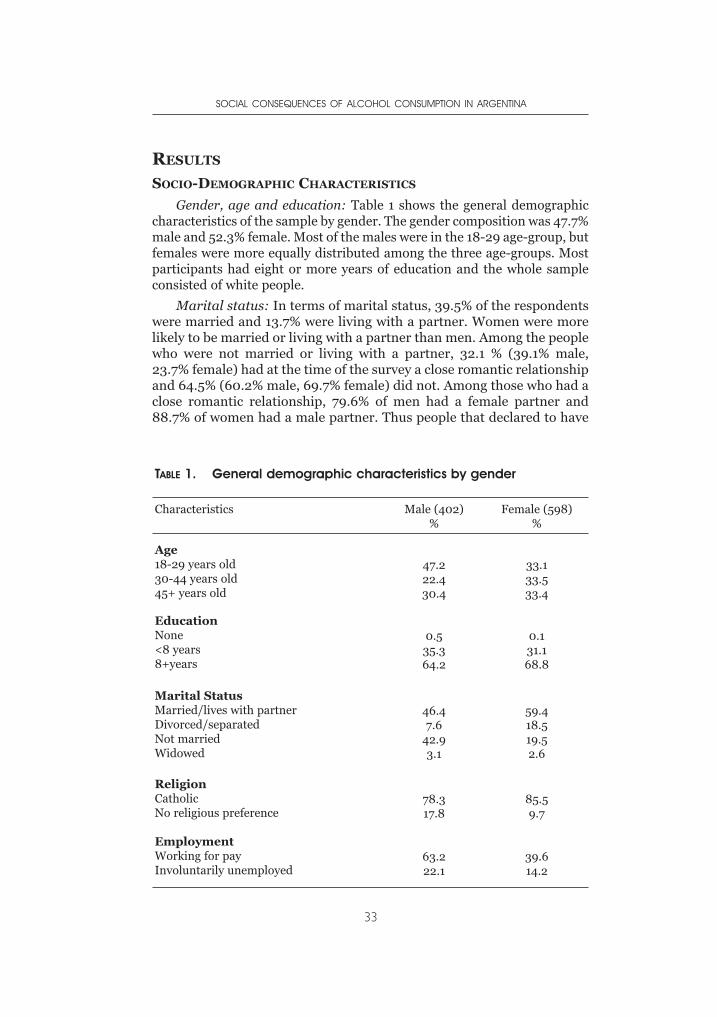
RESULTS
SOCIO-DEMOGRAPHIC CHARACTERISTICS
Gender, age and education: Table 1 shows the general demographiccharacteristics of the sample by gender. The gender composition was 47.7%male and 52.3% female. Most of the males were in the 18-29 age-group, butfemales were more equally distributed among the three age-groups. Mostparticipants had eight or more years of education and the whole sampleconsisted of white people.
Marital status: In terms of marital status, 39.5% of the respondentswere married and 13.7% were living with a partner. Women were morelikely to be married or living with a partner than men. Among the peoplewho were not married or living with a partner, 32.1 % (39.1% male,23.7% female) had at the time of the survey a close romantic relationshipand 64.5% (60.2% male, 69.7% female) did not. Among those who had aclose romantic relationship, 79.6% of men had a female partner and88.7% of women had a male partner. Thus people that declared to have
SOCIAL CONSEQUENCES OF ALCOHOL CONSUMPTION IN ARGENTINA
33
TABLE 1. General demographic characteristics by gender
Characteristics Male (402)%
Female (598)%
Age18-29 years old30-44 years old45+ years old
47.222.430.4
33.133.533.4
EducationNone<8 years8+years
0.535.364.2
0.131.168.8
Marital StatusMarried/lives with partnerDivorced/separatedNot marriedWidowed
46.47.6
42.93.1
59.418.519.52.6
ReligionCatholicNo religious preference
78.317.8
85.59.7
EmploymentWorking for payInvoluntarily unemployed
63.222.1
39.614.2
homosexual partners were very rare (1.9% for men and 0.8% forwomen).
Religion: More than eighty (82.1%; 78.3% male, 85.5% female) wereCatholic and 3.9% (3.2% male, 4.5% female) from other religions; 13.5%(17.8% male, 9.7% female) did not have any religious preference.
Occupation and income: Eighteen percent of the sample wereinvoluntarily unemployed (22.1% male, 1.2% female). Due to the acuteeconomic crisis in Argentina at the time of the study, there was each monthan increasing level of unemployment and/or under unemployment. Theaverage amount of time that people had been unemployed was 18 months.Almost half of the sample considered their work situation at leastsomewhat stressful. For 32.9% of the sample, household income was verylow and 21.1% low. This variable was constructed according to data fromINDEC (National Institute of Statistics).
Social networks: The majority of the interviewees (59%) had informalor supportive contacts with relatives, friends and others daily or almostdaily and 14.8% several times a week in the 30 days prior to the survey.Only 2.9% did not have any contact at all with relatives, friends, etc.
Women reported that they felt lonely “very often” more than twice asoften as men. An analysis of the data by region showed that people in thecity of Buenos Aires felt much more lonely very often (20.7%) thanpeople of Greater Buenos Aires (9.2%), and the rest of the province(6.1%).
Relatives and friends of the interviewees often lived in the sameneighbourhood (50.2%) or at least in the same city (30%). The rest lived inthe same region or country and only 2.1% lived in another country.
Only 20.6 % (16.3% male, 23.8% female) were members of anassociation or church. The figures were lower among 18 to 29 year-olds(15.7%) and people living in the city of Buenos Aires (13.8%).
DRINKING PATTERNS
Alcohol use is widespread; 84.5% of the sample were current drinkers.Table 2 shows drinking history by age and gender. Rates of abstentionwere: former drinker, 12.6% and lifetime abstainer, 2.9%. Women, andparticularly women over 30, were the most likely to be former drinkers(30% among those 30-44, 20% among those aged 45+).
In terms of frequency of drinking, 50% of the sample drank at leastonce a month, and 36% at least once a week. Altogether, 30% hadconsumed five or more drinks at least once in the last year, and 26%reported that their usual amount per occasion was three or more drinks.Men were more likely than women to engage in each of these behaviours.Thus 56% of the men but 26% of the women drank weekly or more often,65% of the men but 13% of the women had drunk 5+ drinks in the last year,
ALCOHOL, GENDER AND DRINKING PROBLEMS
34
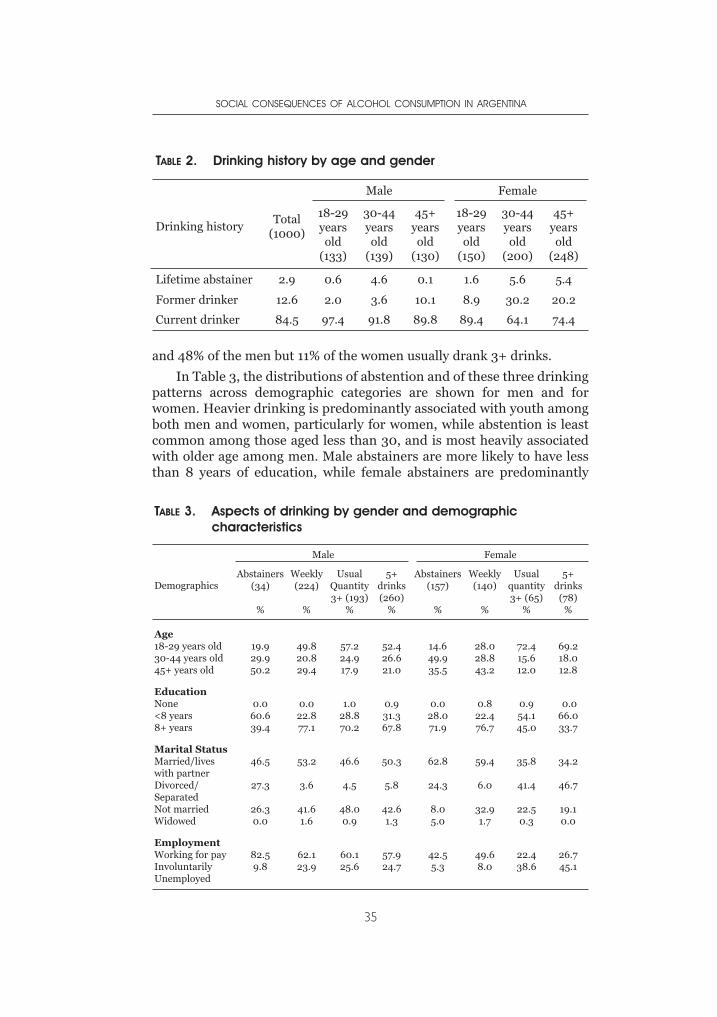
and 48% of the men but 11% of the women usually drank 3+ drinks.
In Table 3, the distributions of abstention and of these three drinkingpatterns across demographic categories are shown for men and forwomen. Heavier drinking is predominantly associated with youth amongboth men and women, particularly for women, while abstention is leastcommon among those aged less than 30, and is most heavily associatedwith older age among men. Male abstainers are more likely to have lessthan 8 years of education, while female abstainers are predominantly
SOCIAL CONSEQUENCES OF ALCOHOL CONSUMPTION IN ARGENTINA
35
TABLE 2. Drinking history by age and gender
Drinking historyTotal
(1000)
Male Female
18-29yearsold
(133)
30-44yearsold
(139)
45+yearsold
(130)
18-29yearsold
(150)
30-44yearsold
(200)
45+yearsold
(248)
Lifetime abstainer 2.9 0.6 4.6 0.1 1.6 5.6 5.4
Former drinker 12.6 2.0 3.6 10.1 8.9 30.2 20.2
Current drinker 84.5 97.4 91.8 89.8 89.4 64.1 74.4
TABLE 3. Aspects of drinking by gender and demographiccharacteristics
Demographics
Male Female
Abstainers(34)
%
Weekly(224)
%
UsualQuantity3+ (193)
%
5+drinks(260)
%
Abstainers(157)
%
Weekly(140)
%
Usualquantity3+ (65)
%
5+drinks
(78)%
Age18-29 years old30-44 years old45+ years old
19.929.950.2
49.820.829.4
57.224.917.9
52.426.621.0
14.649.935.5
28.028.843.2
72.415.612.0
69.218.012.8
EducationNone<8 years8+ years
0.060.639.4
0.022.877.1
1.028.870.2
0.931.367.8
0.028.071.9
0.822.476.7
0.954.145.0
0.066.033.7
Marital StatusMarried/liveswith partnerDivorced/SeparatedNot marriedWidowed
46.5
27.3
26.30.0
53.2
3.6
41.61.6
46.6
4.5
48.00.9
50.3
5.8
42.61.3
62.8
24.3
8.05.0
59.4
6.0
32.91.7
35.8
41.4
22.50.3
34.2
46.7
19.10.0
EmploymentWorking for payInvoluntarilyUnemployed
82.59.8
62.123.9
60.125.6
57.924.7
42.55.3
49.68.0
22.438.6
26.745.1
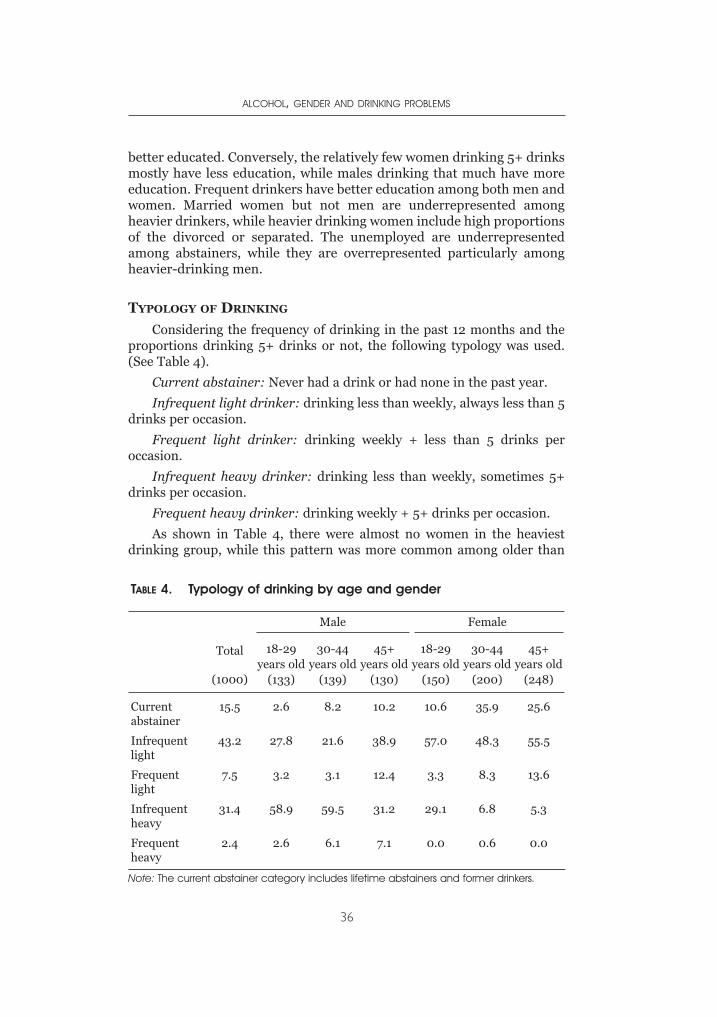
better educated. Conversely, the relatively few women drinking 5+ drinksmostly have less education, while males drinking that much have moreeducation. Frequent drinkers have better education among both men andwomen. Married women but not men are underrepresented amongheavier drinkers, while heavier drinking women include high proportionsof the divorced or separated. The unemployed are underrepresentedamong abstainers, while they are overrepresented particularly amongheavier-drinking men.
TYPOLOGY OF DRINKING
Considering the frequency of drinking in the past 12 months and theproportions drinking 5+ drinks or not, the following typology was used.(See Table 4).
Current abstainer: Never had a drink or had none in the past year.
Infrequent light drinker: drinking less than weekly, always less than 5drinks per occasion.
Frequent light drinker: drinking weekly + less than 5 drinks peroccasion.
Infrequent heavy drinker: drinking less than weekly, sometimes 5+drinks per occasion.
Frequent heavy drinker: drinking weekly + 5+ drinks per occasion.
As shown in Table 4, there were almost no women in the heaviestdrinking group, while this pattern was more common among older than
ALCOHOL, GENDER AND DRINKING PROBLEMS
36
TABLE 4. Typology of drinking by age and gender
Total
(1000)
Male Female
18-29years old
(133)
30-44years old
(139)
45+years old
(130)
18-29years old
(150)
30-44years old
(200)
45+years old
(248)
Currentabstainer
15.5 2.6 8.2 10.2 10.6 35.9 25.6
Infrequentlight
43.2 27.8 21.6 38.9 57.0 48.3 55.5
Frequentlight
7.5 3.2 3.1 12.4 3.3 8.3 13.6
Infrequentheavy
31.4 58.9 59.5 31.2 29.1 6.8 5.3
Frequentheavy
2.4 2.6 6.1 7.1 0.0 0.6 0.0
Note: The current abstainer category includes lifetime abstainers and former drinkers.
younger men. Over half of men under age 45 qualified as infrequentheavier drinkers, while among women there were substantial numbers inthis category only among those under age 30. A majority of women wereinfrequent lighter drinkers, with abstention also common among thoseaged 30 or more. Among men aged 45 or older, about half also were eitherabstainers or infrequent lighter drinkers.
DRINKING CONTEXTS
The contexts in which drinking occurs are very important to analysebecause they give useful information from a cultural and public healthperspectives. While in some cultures people only drink on weekends andin bars (without a meal), in the Argentinian culture alcohol is integratedinto daily life: 38% of men and 19.1% of women drank alcohol at a mealat least weekly. This pattern shows some differences by age groups:people from 18-29 years old drank less often at a meal than the older agegroups.
For both men and women most of the drinking was done in therespondent’s own home, followed by a friend’s home. Drinking in bars anddiscos was frequent for the younger age-groups. For men, drinking in thestreets was more frequent than drinking in restaurants: 3.9 % drank in thestreet at least weekly and mainly in the younger age-groups. It was moretolerated for males to get drunk in the street than in other situations.Public drinking, especially binge drinking increases the possibility ofseveral drinking consequences such as interpersonal violence, accidents,etc. As drinking is a social act, the company in which people drink needsour attention, especially concerning gender roles.
Women drank more frequently with their spouses or a family memberthan with other people. Men drank as often with their spouse as withfriends, followed by the company of a family member.
One of the greatest differences between both sexes was drinking withfriends. Men tend to gather with their friends and drinking is part of thiscontext much more frequently than for women. While 27.5% of men drankat least weekly with friends,7.3% of women did.
Again, for the Argentinian society drinking with friends in the streetand eventually getting drunk was a much more common situation thandrinking with friends after work before going home. The latter, a commonsituation in Western Europe, Canada and USA is a custom that started notlong ago in the city of Buenos Aires and is practised by people in the middleand high classes. Bars featuring happy hours are widespread in downtownBuenos Aires, especially Irish pubs.
Drinking alone was much higher in men: 12.7% drank alone at leastweekly while only 1.7 % of women did so. If we consider drinking withfriends and alone, a considerable proportion of men’s drinking is donewithout the potential control of a woman.
SOCIAL CONSEQUENCES OF ALCOHOL CONSUMPTION IN ARGENTINA
37
DRINKING CONSEQUENCES
There has been much research on the consequences drinking may havefor people. These consequences are also mediated by cultural factors, genderroles and the beliefs and myths people may have about the effects of alcohol.
As in other studies (e.g., Wilsnack, R. et al., 2000), men reported morepositive consequences of drinking as well as more negative consequences:25.9% of men and 4.8% of women found it easier to be open with otherpeople when they drank. Regarding sexuality, men felt less inhibited aboutsex while drinking as well as being more likely to feel sexually attractivethan women. Almost nine percent (8.6%) of men considered it usually truethat they became more aggressive towards people after drinking, whileonly 0.2% of women felt this way.
Partner aggression was also explored in the study. Among the peoplewho experienced physical aggression from the partner, 12% of males and7.2% of females had been drinking before the incident. The relationshipbetween alcohol consumption and violence (especially domestic violence)is considered to be strong by the Argentinian culture and many timesviolence is justified by the consumption of alcohol (Munné,1999).
In relation to general health problems, only 9.7% of the populationreported one or more health problems in the last year (34.5% for men inthe 18-29 age brackets). Men reported having better physical health thanwomen. This situation was repeated concerning mental and emotionalhealth: women tended to report poorer mental and emotional health thanmen did. This may suggest that women are under more stressful situationsor that they are more aware of their problem. As in many other countries,in Argentina the percentage of women seeking help in psychology clinics ismuch higher than men. Although 7.3% of the sample reported a harmfuleffect of drinking on their physical health, only 0.2% reported having anillness connected with drinking.
Questions from the CAGE questionnaire, which screens for alcoholdependence, were also explored. Altogether, 7.6% in the generalpopulation and 21.3% in the younger age group of males answeredpositively to two or more items in this questionnaire.
Respondents were also asked questions from the AUDITquestionnaire, and were scored on the seven last items (concerned withdependence symptoms or alcohol-related problems) as an indicator ofharmful use of alcohol. In total, 11.6 % of the sample responded positivelyto 2 or more of these items.
Looking in depth at the AUDIT questions, the highest rate of positiveresponse was for “not being able to stop drinking once started”, which was11.8 % in the general population. It was particularly high in the younger agegroup, with almost no differences between male and females (24.1% male,20.9% female). No other consequence of drinking was reported at such arate by men and women.
ALCOHOL, GENDER AND DRINKING PROBLEMS
38
Another question in the AUDIT, “having been unable to rememberwhat happened the night before” merits attention from the perspective ofsocial consequences. The rate was 10.2% in the overall sample and 30.2 %in the younger group of men.
Suggestions by relatives, friends or doctor to cut down drinking werealso surveyed. The figure was 9.6% for the general population and againmuch higher for young men (25.5%). Six percent of the sample tried to cutdown their drinking but were unable to do so; the figure for young men was15.7%. 7.3% of men and 0% of women considered seeking help for ownalcohol related problems. Among those who considered seeking help, 93%received it in the past 12 months, which means that once men consideredseeking help they found it, probably in the health care system or asinformal help from relatives and others.
The survey explored “how much a person in different situations shouldfeel free to drink”. Men thought that getting drunk was sometimes all rightmuch more often than women do. In fact, drunkenness was almost nottolerated at all by women. But maybe the most interesting aspect is that forwomen a man out at a bar with friends was the situation in which theythought most frequently that getting drunk is sometimes all right (2.3%),while for a woman out at a bar with friends the percentage was 0.3%.Although women’s drinking has traditionally been condemned byArgentinian society (Munné, 2001 b), men were more tolerant of women’sdrunkenness with friends (5.1%).
The gap between what people consider acceptable to drink in differentsituations and what they actually do is a big one. One possible line offurther analysis would be what drunkenness means in the Argentiniansociety and how many drinks would be considered the limit for a person tobe considered drunk.
SOCIAL CONSEQUENCES OF ALCOHOL CONSUMPTION
A number of social consequences of alcohol consumption were alsoexplored. The problems were grouped as follows: relationship problems,work problems, pressures to cut down, other social harms (see Tables 5and 6). The tables show the proportions responding concerning each itemthat it had occurred in the last year.
As shown in Table 5, rates of relationship problems wereconsiderable, especially for men in the age group 18-29 years old. Nearlya quarter (22.8%) of this group had problems with their marriage or theirintimate relationships; 23.2% had problems with other family members.On the other hand, very few women reported having relationshipsproblems. “People annoyed you by criticizing your drinking” was the mostreported relationship problem: 26.7 % of men in the age group from 18-29 years old reported having this problem. Another importantrelationship problem was “spouse threatened to leave you because of your
SOCIAL CONSEQUENCES OF ALCOHOL CONSUMPTION IN ARGENTINA
39
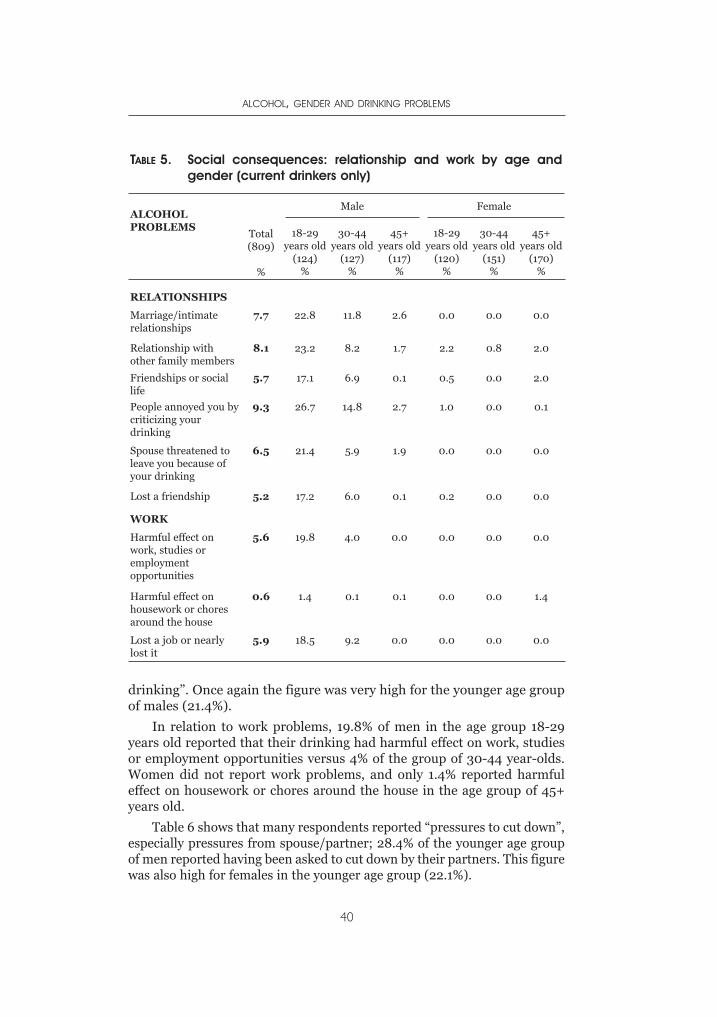
drinking”. Once again the figure was very high for the younger age groupof males (21.4%).
In relation to work problems, 19.8% of men in the age group 18-29years old reported that their drinking had harmful effect on work, studiesor employment opportunities versus 4% of the group of 30-44 year-olds.Women did not report work problems, and only 1.4% reported harmfuleffect on housework or chores around the house in the age group of 45+years old.
Table 6 shows that many respondents reported “pressures to cut down”,especially pressures from spouse/partner; 28.4% of the younger age groupof men reported having been asked to cut down by their partners. This figurewas also high for females in the younger age group (22.1%).
ALCOHOL, GENDER AND DRINKING PROBLEMS
40
TABLE 5. Social consequences: relationship and work by age andgender (current drinkers only)
ALCOHOLPROBLEMS
Total (809)
%
Male Female
18-29years old
(124)%
30-44years old
(127)%
45+years old
(117)%
18-29years old
(120)%
30-44years old
(151)%
45+years old
(170)%
RELATIONSHIPS
Marriage/intimaterelationships
7.7 22.8 11.8 2.6 0.0 0.0 0.0
Relationship withother family members
8.1 23.2 8.2 1.7 2.2 0.8 2.0
Friendships or sociallife
5.7 17.1 6.9 0.1 0.5 0.0 2.0
People annoyed you bycriticizing yourdrinking
9.3 26.7 14.8 2.7 1.0 0.0 0.1
Spouse threatened toleave you because ofyour drinking
6.5 21.4 5.9 1.9 0.0 0.0 0.0
Lost a friendship 5.2 17.2 6.0 0.1 0.2 0.0 0.0
WORK
Harmful effect onwork, studies oremploymentopportunities
5.6 19.8 4.0 0.0 0.0 0.0 0.0
Harmful effect onhousework or choresaround the house
0.6 1.4 0.1 0.1 0.0 0.0 1.4
Lost a job or nearlylost it
5.9 18.5 9.2 0.0 0.0 0.0 0.0
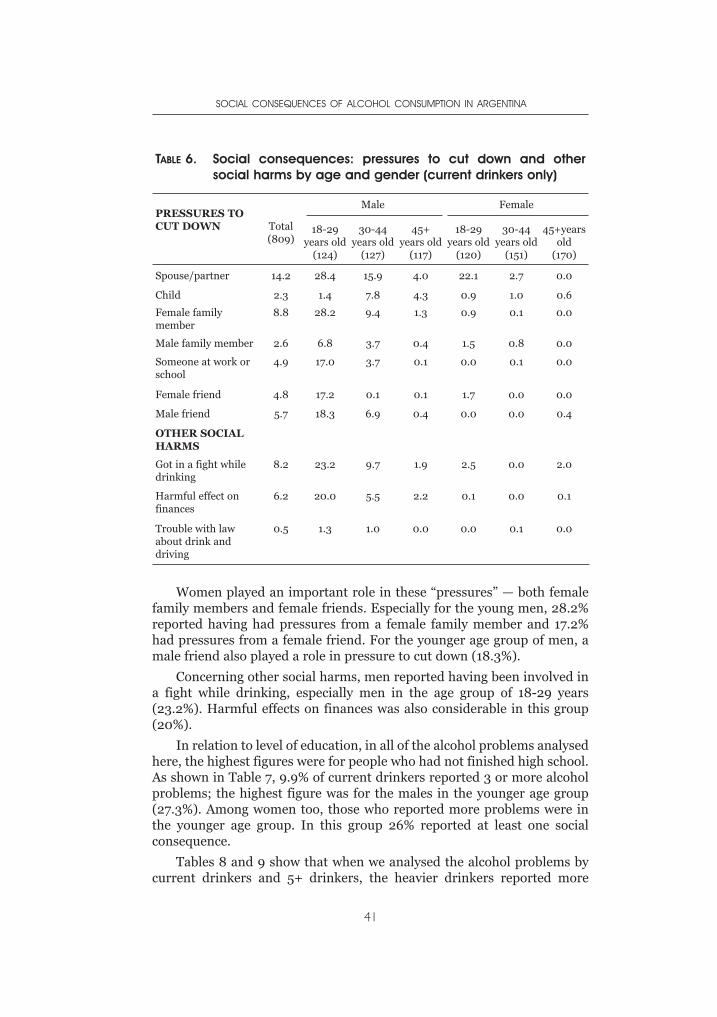
Women played an important role in these “pressures” — both femalefamily members and female friends. Especially for the young men, 28.2%reported having had pressures from a female family member and 17.2%had pressures from a female friend. For the younger age group of men, amale friend also played a role in pressure to cut down (18.3%).
Concerning other social harms, men reported having been involved ina fight while drinking, especially men in the age group of 18-29 years(23.2%). Harmful effects on finances was also considerable in this group(20%).
In relation to level of education, in all of the alcohol problems analysedhere, the highest figures were for people who had not finished high school.As shown in Table 7, 9.9% of current drinkers reported 3 or more alcoholproblems; the highest figure was for the males in the younger age group(27.3%). Among women too, those who reported more problems were inthe younger age group. In this group 26% reported at least one socialconsequence.
Tables 8 and 9 show that when we analysed the alcohol problems bycurrent drinkers and 5+ drinkers, the heavier drinkers reported more
SOCIAL CONSEQUENCES OF ALCOHOL CONSUMPTION IN ARGENTINA
41
TABLE 6. Social consequences: pressures to cut down and othersocial harms by age and gender (current drinkers only)
PRESSURES TOCUT DOWN Total
(809)
Male Female
18-29years old
(124)
30-44years old
(127)
45+years old
(117)
18-29years old
(120)
30-44years old
(151)
45+yearsold
(170)
Spouse/partner 14.2 28.4 15.9 4.0 22.1 2.7 0.0
Child 2.3 1.4 7.8 4.3 0.9 1.0 0.6
Female familymember
8.8 28.2 9.4 1.3 0.9 0.1 0.0
Male family member 2.6 6.8 3.7 0.4 1.5 0.8 0.0
Someone at work orschool
4.9 17.0 3.7 0.1 0.0 0.1 0.0
Female friend 4.8 17.2 0.1 0.1 1.7 0.0 0.0
Male friend 5.7 18.3 6.9 0.4 0.0 0.0 0.4
OTHER SOCIALHARMS
Got in a fight whiledrinking
8.2 23.2 9.7 1.9 2.5 0.0 2.0
Harmful effect onfinances
6.2 20.0 5.5 2.2 0.1 0.0 0.1
Trouble with lawabout drink anddriving
0.5 1.3 1.0 0.0 0.0 0.1 0.0
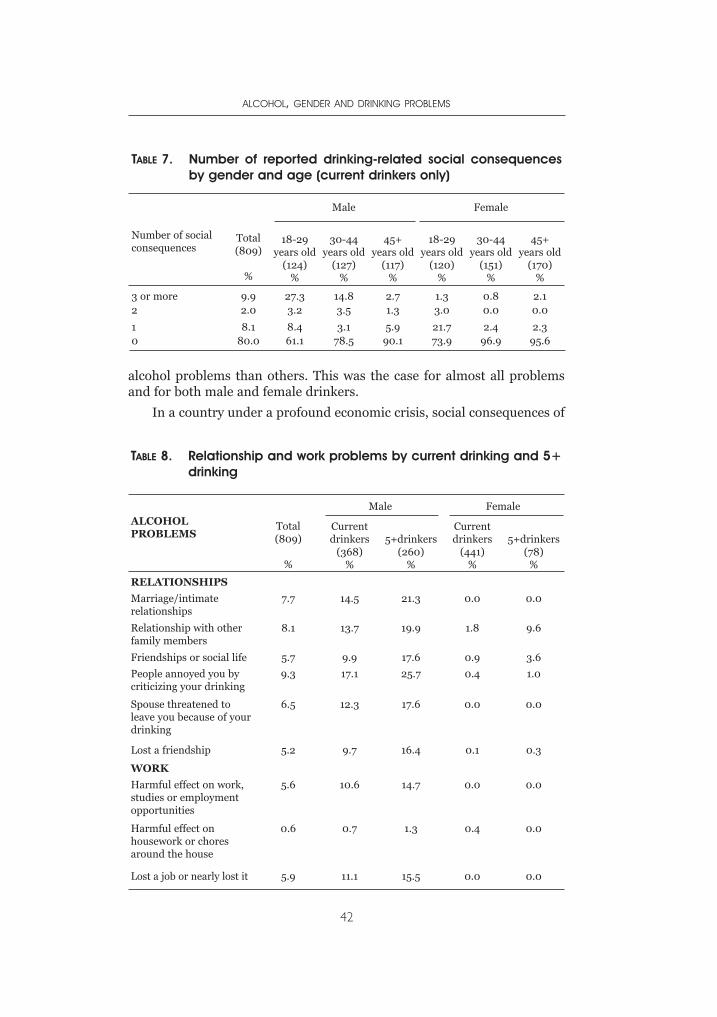
alcohol problems than others. This was the case for almost all problemsand for both male and female drinkers.
In a country under a profound economic crisis, social consequences of
ALCOHOL, GENDER AND DRINKING PROBLEMS
42
TABLE 7. Number of reported drinking-related social consequencesby gender and age (current drinkers only)
Number of socialconsequences
Total (809)
%
Male Female
18-29years old
(124)%
30-44years old
(127)%
45+years old
(117)%
18-29years old
(120)%
30-44years old
(151)%
45+years old
(170)%
3 or more 9.9 27.3 14.8 2.7 1.3 0.8 2.12 2.0 3.2 3.5 1.3 3.0 0.0 0.0
1 8.1 8.4 3.1 5.9 21.7 2.4 2.30 80.0 61.1 78.5 90.1 73.9 96.9 95.6
TABLE 8. Relationship and work problems by current drinking and 5+drinking
ALCOHOLPROBLEMS
Total (809)
%
Male Female
Currentdrinkers
(368)%
5+drinkers(260)
%
Currentdrinkers
(441)%
5+drinkers(78)
%
RELATIONSHIPS
Marriage/intimaterelationships
7.7 14.5 21.3 0.0 0.0
Relationship with otherfamily members
8.1 13.7 19.9 1.8 9.6
Friendships or social life 5.7 9.9 17.6 0.9 3.6
People annoyed you bycriticizing your drinking
9.3 17.1 25.7 0.4 1.0
Spouse threatened toleave you because of yourdrinking
6.5 12.3 17.6 0.0 0.0
Lost a friendship 5.2 9.7 16.4 0.1 0.3
WORK
Harmful effect on work,studies or employmentopportunities
5.6 10.6 14.7 0.0 0.0
Harmful effect onhousework or choresaround the house
0.6 0.7 1.3 0.4 0.0
Lost a job or nearly lost it 5.9 11.1 15.5 0.0 0.0
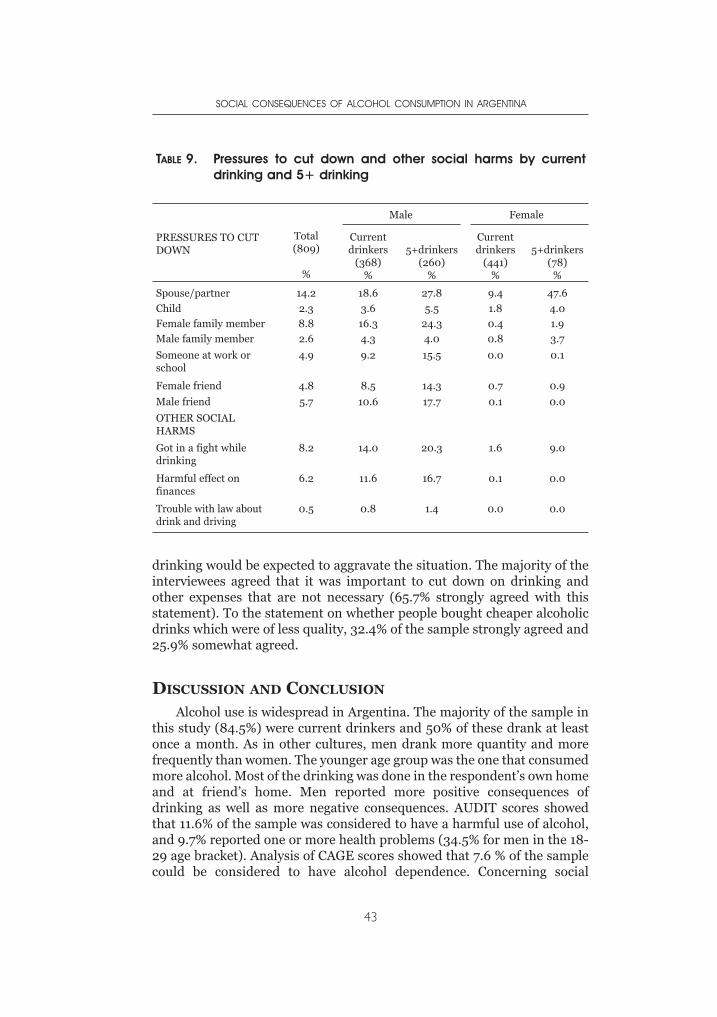
drinking would be expected to aggravate the situation. The majority of theinterviewees agreed that it was important to cut down on drinking andother expenses that are not necessary (65.7% strongly agreed with thisstatement). To the statement on whether people bought cheaper alcoholicdrinks which were of less quality, 32.4% of the sample strongly agreed and25.9% somewhat agreed.
DISCUSSION AND CONCLUSION
Alcohol use is widespread in Argentina. The majority of the sample inthis study (84.5%) were current drinkers and 50% of these drank at leastonce a month. As in other cultures, men drank more quantity and morefrequently than women. The younger age group was the one that consumedmore alcohol. Most of the drinking was done in the respondent’s own homeand at friend’s home. Men reported more positive consequences ofdrinking as well as more negative consequences. AUDIT scores showedthat 11.6% of the sample was considered to have a harmful use of alcohol,and 9.7% reported one or more health problems (34.5% for men in the 18-29 age bracket). Analysis of CAGE scores showed that 7.6 % of the samplecould be considered to have alcohol dependence. Concerning social
SOCIAL CONSEQUENCES OF ALCOHOL CONSUMPTION IN ARGENTINA
43
TABLE 9. Pressures to cut down and other social harms by currentdrinking and 5+ drinking
PRESSURES TO CUTDOWN
Total(809)
%
Male Female
Currentdrinkers
(368)%
5+drinkers(260)
%
Currentdrinkers
(441)%
5+drinkers(78)
%
Spouse/partner 14.2 18.6 27.8 9.4 47.6
Child 2.3 3.6 5.5 1.8 4.0
Female family member 8.8 16.3 24.3 0.4 1.9
Male family member 2.6 4.3 4.0 0.8 3.7
Someone at work orschool
4.9 9.2 15.5 0.0 0.1
Female friend 4.8 8.5 14.3 0.7 0.9
Male friend 5.7 10.6 17.7 0.1 0.0
OTHER SOCIALHARMS
Got in a fight whiledrinking
8.2 14.0 20.3 1.6 9.0
Harmful effect onfinances
6.2 11.6 16.7 0.1 0.0
Trouble with law aboutdrink and driving
0.5 0.8 1.4 0.0 0.0
consequences of drinking, 9.9% of current drinkers reported 3 or moresocial consequences of drinking (27.3% for men aged 18-29 years).
Harmful effects of drinking on the respondent’s relationships wereconsiderable, especially in relation to marriage and intimate relationshipsand relationships with family members. The figures were significantamong men in the younger age group. An important aspect regardingrelationship problems was the issue “people annoyed you by criticizingyour drinking”. This figure was the highest of relationship problems.
Responses to this issue need further analysis for a betterunderstanding of the Argentinian meaning of being annoyed by thecriticisms of others towards their drinking. There are at least twopossibilities: a high social control (at least from women) and the feeling ofdoing something bad which is connected to another question (on having afeeling of guilt or remorse after drinking) which was also high: 9.6% in thegeneral population and higher among younger men (25.2%).
This is also related to another aspect of social consequences, thepressure to cut down, which occurred often from spouse/partner, butalso from family members, especially females. The threat of the partnerleaving because of drinking was also one of the major relationshipproblems among men. Nevertheless, it could be argued that althoughrelatively high informal social controls exist, there is little effect ondrinking, since receiving more pressure is positively associated withheavier drinking.
Problems in relation with work were nearly exclusively a male issue;5.9% lost a job or nearly lost it because of their drinking. This figure wasconsiderably higher for men in the younger age group (18.5%). This is aparticularly harmful social consequence of drinking considering theeconomic situation in the country at the time of the study, where a personwho lost a job was unlikely to find another one. As earlier studies haveshown (e.g., Mustonen,2000) young people were more likely to reportproblems of all sorts related to alcohol use.
From a public health perspective, the findings of this study indicatethat alcohol related problems are considerable in Argentina. More in-depthanalyses are needed, especially those looking at patterns of drinking inrelationship with problems of alcohol use. Qualitative analysis mightcontribute significantly to our understanding of drinking patterns,especially for a cross-cultural comparison.
Social harms are mediated by cultures (Partanen, 1991). Thus there isa need to explore further meanings of alcohol use and abuse in theArgentinian society. It is important to analyse alcohol problems within theculture and the historical moment that these problems occur. Lately, one ofthe most important changes in alcohol epidemiology has been a newrecognition that patterns of drinking, as well as level of drinking areimportant in the links between alcohol and health (Room, 1996; 2001).
ALCOHOL, GENDER AND DRINKING PROBLEMS
44
Patterns of drinking are changing and this can be seen as underlying someof the cultural differences in social definitions of alcohol problems.
Although this survey has taught us that sensitive questions such as onsexuality and violence have been answered by respondents, there is a needto explore better ways of getting the information we are trying to obtain.The responses of informants are mediated by social expectations, and thusspecial adaptations to local uses and norms are required when usinginternationally developed measures (WHO,2000). Underestimation by therespondent is more likely to occur where the behaviour in question ispotentially discreditable, just as there may be overestimation where thebehaviour is positively regarded (Room et al., 2002).
In conclusion, research remains the essential tool to achieve a betterunderstanding of alcohol use and misuse and the basis to build up anadequate and successful health policy. To minimize the harm fromdrinking, an integrated policy is needed to articulate actions that could beput in practice in different areas such as health, education, and socialservices (Edwards, 1997).
ACKNOWLEDGEMENTS
The author is truly grateful to Robin Room for his suggestions andIsidore Obot for his assistance throughout the project leading to this paper.Special thanks are due to the project team in Argentina that made thesurvey possible.
REFERENCES
APNA (1994). Asociación de Profesionales para la nueva Argentina (Association ofprofessionals for Argentina) Encuesta nacional de drogadicción (Nationalsurvey of drugs) Buenos Aires: APNA.
Edwards, G , et al. (1997) Alcohol y Salud Publica, Spanish version of AlcoholPolicy and the Public Good. Barcelona: J.R. Prous.
Miguez, H. (1994). El abuso de alcohol y drogas en la consulta hospitalaria de laprovincia de Buenos Aires (Abuse of alcohol and drugs in hospitalconsultations in the province of Buenos Aires) Revista de Salud, Prevención ySociedad, Año 6, 6, 13-22.
Miguez. H. (1999). Estudio Nacional sobre sustancias adictivas de la RepúblicaArgentina. (National Study of Adictive Substances in Argentina). BuenosAires: SEDRONAR, Secretaría de Programación para la Prevención de laDrogadicción y Lucha contra el Narcotráfico (National Secretary for thePrevention of Drug-addiction and Fight against Drug trafficking).
Ministry of Health (2000). Estadísticas Vitales. Información Básica (BasicStatistical Information) Nº44. Buenos Aires: Ministry of Health.
Munné M (1996). A court and a hospital. Two agencies of social control. A psycho-sociological analysis of the social representations on alcohol and drugs inArgentina, Paper presented at the 22nd Annual Alcohol EpidemiologySymposium of the Kettil Bruun Society, Edinburgh, Scotland, June 3-7.
SOCIAL CONSEQUENCES OF ALCOHOL CONSUMPTION IN ARGENTINA
45
Munné, M. (1999). Alcohol and domestic violence: exploring the links and myths.Paper presented at the 25th Annual Alcohol Epidemiology Symposium of theKettil Bruun Society for Social and Epidemiological Research on Alcohol.Montreal, Canada. May 31-June 4.
Munné, M. (2001a). Young people from at risk groups and alcohol in Argentina:an exploratory study Paper presented at. International conference YouthCultures and Subcultures: functions and patterns of drinking and drug use.Skarpö, Sweden, April 23-26.
Munné, M (2001b). Drinking in tango lyrics: an approach to myths and meanings ofdrinking in Argentinian culture. Contemporary Drug Problems, 28, 415-439.
Munné, M (2003). Alcohol and the economic crisis in Argentina: Recent findings.Paper presented at 29th Annual Alcohol Epidemiology Symposium of the KettilBruun Society for Social and Epidemiological Research on Alcohol, Krakow,Poland, June.
Mustonen, H, et al. (2000) Relationships of drinking behaviour, gender, and agewith reported alcohol-related problems in Namibia. Paper presented at 26th
Annual Alcohol Epidemiology Symposium of the Kettil Bruun Society forSocial and Epidemiological Research on Alcohol, Oslo, Norway, June5-9.
Necci, S. (1990). Que saben las familias porteñas sobre las drogas (WhatArgentinian families know about drugs). Revista de Prevención, Salud ySociedad, 3, 25-35.
Partanen, J. (1991). Sociability and intoxication: alcohol and drinking in Kenya,Africa, and the Modern World. Helsinki: Finnish Foundation For AlcoholStudies (Vol. 39).
Riley, L. & Marshall, M. (eds.) (1999). Alcohol and Public Health in 8 DevelopingCountries. Geneva: World Health Organisation.
Room, R, (1996), Alcohol consumption and social harm: Conceptual issues andhistorical perspectives. Contemporary Drug Problems, 23, 373-388.
Room. R. (2001). New findings in alcohol epidemiology In: Nina Rehm with RobinRoom and Griffith Edwards. Alcohol in the European Region Consumption,Harm and Policies. Copenhagen: WHO Regional Office for Europe (pp. 35-42).
Room, R. et al. (2002.) Alcohol in Developing Societies: A Public Health Approach.Helsinki: Finnish Foundation For Alcohol Studies (in collaboration with WorldHealth Organisation).
SADA (2004). Estudio de drogas en el conurbano bonaerense. (Study of drugs inthe province of Buenos Aires). La Plata: SADA (Secretaría de atención de lasadicciones de la Provincia de Buenos Aires). (Secretary for the assistance ofaddictions in the province of Buenos Aires).
SEDRONAR (1994). (Secretaría de Programación para la Prevención de laDrogadicción y Lucha contra el Narcotráfico) Investigación intrahospitalariasobre consumo de drogas. (intrahospital survey of the consumption of drugs)Buenos Aires: SEDRONAR.
SEDRONAR (2004). Informe preliminar. Segundo estudio nacional sobre elconsumo de sustancias psicoactivas Argentina 2004. (Preliminary Report.Second national study of the use of psychoactive substances. Argentina 2004)Buenos Aires: SEDRONAR.
Tendencias Económicas (2002). La economía argentina (The Argentinianeconomy). Buenos Aires: Tendencias Económicas.
Verruno, C. et al. (1995). Análisis del consumo del alcohol a partir de los datos deproducción (Analysis of the consumption of alcohol departing from theproduction data) Buenos Aires: PROESA.
ALCOHOL, GENDER AND DRINKING PROBLEMS
46

Wilsnack. R. et al (2000). Gender differences in alcohol consumption and adversedrinking consequences: cross-cultural patterns. Addiction 95 (2), 251-265.
World Health Organisation (1999). Global Status Report on Alcohol. Geneva:World Health Organization.
World Health Organization (2000). International Guide for Monitoring AlcoholConsumption and Related Harm. Geneva: World Health Organization.
WHOSIS (2004) (WHO statistical information system) Global Alcohol Database.http//www.who.int/alcohol/alcohol_apc_data.
SOCIAL CONSEQUENCES OF ALCOHOL CONSUMPTION IN ARGENTINA
47

INTRODUCTION
Early studies on drinking and drinking patterns focused primarily onmen; however literature has expanded to include studies on women.More recently with the growth of international collaboration, there is
an increasing body of literature that examines the differences in drinkingbetween men and women in different cultures and contexts.
The study of alcohol use and gender across cultures is important forseveral reasons. According to Wilsnack and Wilsnack (1997), genderdifferences in alcohol consumption are based on the ways each culture seesmale and female roles. Consequently, gender differences in drinking varyaccording to cultural differences in social roles. Also, differences in alcoholuse reflect the broader behavioural aspects of gender roles. A betterunderstanding of why men and women have different drinking patternscan give insight into the fundamental characteristics of gender roles, andhow these roles may change or resist change. Finally, understandinggender differences in alcohol use may prevent costly biases in how societiesattempt to control or reduce alcohol related problems. Women’s alcoholproblems have often been neglected, being either viewed as not needing ordeserving help, or resulting in punishment rather than treatment. On theother hand, men frequently regard their own drinking as “normal” until itimpairs their behaviour and social relations.
One recent review of 16 general population surveys from 10 countries(Wilsnack et al., 2000) found that while there was little difference betweenwomen and men in the probability of current drinking versus abstaining,men always exceeded women in drinking frequency and quantity and inrates of heavy drinking episodes and adverse drinking consequences.Consistently, women were more likely than men to be lifetime abstainers.The authors concluded that gender differences in drinking might bebiologically influenced. However, substantial variations between countriesin the magnitude of these differences could suggest that socioculturalfactors have a strong influence. Many countries have studied women’salcohol use and gender specificities; these include the Netherlands (Neve et
CHAPTER 3DIFFERENCES IN DRINKING PATTERNS
BETWEEN MEN AND WOMEN IN BRAZIL
FLORENCE KERR-CORRÊA, ANDREA M. HEGEDUS, LUZIA A.TRINCA,ADRIANA M.TUCCI, LIGIA R. S. KERR-PONTES,
ALESSANDRA F. SANCHES & TRICIA M.F. FLORIPES
al., 1996), Mexico (Medina-Mora, 1994), Czech Republic (Kubicka et al.,1995), the Nordic countries (Haavio-Mannila, 1989), and Nigeria (Ikuesan,1994). Literature has shown that the consequences of patterns of use canimpact drinkers as much or more than drinking levels and symptomseverity (Marlatt et al., 1998). In the Federal Republic of Brazil, Almeida-Filho et al. (2004) analysed hazardous alcohol use by gender in a Northeastcity of Brazil. They defined hazardous drinking as daily or weekly bingedrinking plus episodes of drunkenness or frequent drunkenness (at leastonce a week). They found that 56% of respondents admitted to drinking.The overall 12-month prevalence of high-risk drinking was 7%, and was sixtimes more prevalent in males than females (about 13% compared to2.4%). A positive association to high-risk drinking was also found witheducation and social class, but not with ethnicity. Being male and of highersocio-economic status were associated with increased odds of high-riskdrinking.
Hypotheses regarding gender differences in alcohol use stem primarilyfrom the biological and socio-cultural aspects (Graham et al., 1998;Wilsnack et al., 2000). Biologically, the same amount of alcohol consumedby a man and a woman of the same weight will produce a higher bloodalcohol concentration in the woman. There are several reasons for this,including women’s lower body water content (Jones and Jones, 1976),differences in alcohol dehydrogenase (Frezza et al., 1990), metabolism(NIAAA, 2000), and hormone levels (Gavaler et al., 1993). Interacting withthese biological factors are socio-cultural influences in drinking behaviourthat have recently received considerable attention in literature. Areas ofinterest, other than cross-cultural genders differences in alcohol usepatterns, include abstinence, intoxication, and related sexual behaviours(Wilsnack et al., 2000).
The repressive “war on drugs” policies exported by the United Stateswere adapted by Brazil in the 1980’s to primarily combat marijuana andcocaine use. Twenty years later, the number of users still continues to grow,illustrating the inadequacy of relying upon repressive measures. Alcohol-related problems are greater than drug-related problems in Brazil, buthealth policies have been negligent when addressing them. In addition,there are substantial regional differences in economic status, access tohealthcare, education, and cultural backgrounds within the country. All ofthese factors are reflected in the patterns and use of alcohol and in drugconsumption. However, only a few studies in Brazil delineate thesedifferences. This dearth of information opens the way to imported policiesbeing adopted that are often inadequate in addressing Brazilian reality.
Alcohol use and its related problems are greater than those associatedwith illicit drugs. A Brazilian study of students (aged 12-18) in 1987 showedthat about 75% had already used alcohol, 22% had smoked tobacco, but thenumber who had used marijuana and cocaine were considerably lower: 2.8%and 0.5% respectively (Galduróz et al., 1987). At the same time, alcohol was
ALCOHOL, GENDER AND DRINKING PROBLEMS
50
involved in 95% of hospital admissions in alcohol/drug units, whilemarijuana only accounted for 1.4% and cocaine 0.8% (Noto & Carlini, 1995).
Prevalence of alcohol abuse in Brazil varies across studies. Moreira etal. (1996) in Porto Alegre (southern Brazil) found that 9.3% of their samplewas alcohol dependent, 15.5% were heavy drinkers, 12.3% drank daily, and12.3% were abstainers. Another study in Salvador (northeastern Brazil)showed that 37% of drivers involved in traffic accidents were under theinfluence of alcohol (Nery-Filho et al., 1995). Carlini et al. (1989) foundalcohol use among students to be 9.2% and Galduróz et al. (1997) found15.0%. A survey of households in São Paulo State reported alcoholdependency as 10.9% in men and 2.5% in women (Galduróz et al., 2003).Another household survey that studied the 107 largest cities in Brazil(Carlini et al., 2002) found 17.1% of men and 5.7% of women to be alcoholdependent. These results show an increasing trend in alcohol abuseincidence between the end of 80’s and more recently.
In Brazil, as in many other developing countries, there is a tendency tothink about alcohol-related problems primarily in the extreme case ofalcohol dependency. But studies have shown that there are larger and justas serious alcohol-related problems across the spectrum of drinkingbehaviours (Cahalan & Room, 1974). Important strategies thatgovernments in various countries have been using to control alcohol-related problems are the regulation of alcohol pricing and taxation. Studiesshow that increasing alcohol taxation and cost results in decreased alcoholuse and its related problems (Babor et al., 2003). Although regulation iseasy to establish by law and can be supervised at low cost, the taxes andprice of alcohol in Brazil are very low. The very low price of alcoholproducts in Brazil has contributed to the increase in alcohol consumption,primarily among young people (Carlini-Cotrim et al., 1989, 1990, 2002;Galduróz et al., 1994, 2003). The most popular alcoholic beverage in Brazilis “cachaça” or “pinga,” a distilled beverage made from sugarcane. It is verycheap (less than one dollar per liter) and has a very high alcohol content(around 40%). While beer (mostly 4.5 to 5% in ethanol content) has thehighest national consumption by sheer volume, “cachaça” is highest interms of ethanol content and it accounts for 80% of all distilled beverageconsumption in Brazil (Moreira et al., 1996).
In Brazil, there is an extremely tolerant attitude toward alcoholconsumption. Federal law that regulates alcohol advertising in Brazilallows beverages with alcohol content lower than 13% to be considered asfood. Therefore, beer can be advertised in prime time television slots andtargeted at teenagers. Also, beer is not seen as an alcoholic beverage, in factthe general public accept it almost as a soft drink.
There are other important issues regarding alcohol consumption andits related problems in Brazil. Access to alcohol is relatively easy. The lawthat imposes a minimum age for purchasing alcohol (18 years) is notenforced. There are no laws that control operating hours of bars, regulate
DIFFERENCES IN DRINKING PATTERNS BETWEEN MEN AND WOMEN IN BRAZIL
51
licenses to sell alcohol, or limit places where alcohol can be bought. Themaximum blood alcohol concentration allowed for drivers is 0.06%,however in practice, there are not enough devices or police to enforce it.
Some countries use public health policies to restrict access to alcohol;these have had considerable impact in relation to road accidents (Babor etal., 2003). São Paulo State limited the supply of alcohol in the drivingenvironment by banning sales in commercial facilities on or near statehighways (DETRAN – SP, 2004). Despite almost no enforcement, therewas a significant reduction in crashes causing injuries. This illustrates thatsuch policies, while relatively simple and not consistently applied, can havean impact on drinking and driving behaviour.
There are few studies that document alcohol-related medical problemsin Brazil. Mott et al. (1989) found that 93.6% of chronic pancreatitispatients in São Paulo city exhibited heavy alcohol use. Alcoholism was themain cause of chronic pancreatitis (Dani et al., 1990) and cirrhosis of theliver (Strauss et al., 1988). Lolio (1990) found a significant associationbetween high arterial hypertension and heavy alcohol use in the urbanpopulation of Araraquara (a city of São Paulo state). In another study,Nappo (1996) reported that alcohol was the most common substance usedin drug-related non-natural deaths in São Paulo city. In a household surveyin São Paulo State, Noto et al. (2004) evaluated the cases of householdinterpersonal violence and the consumption of alcohol and other drugs.They found that when violence was reported, 52% of perpetrators wereintoxicated by alcohol.
In summary, Brazil has no specific restrictions on the off-premise saleof alcoholic beverages, no licensing system for alcohol beverageproduction, no control of retail sales and licensing, no health warninglabels, no enforcement of advertising restrictions, and sponsorshiprestrictions are minimal (WHO, 2004).
This report is a further analysis of Brazilian data from the GENACISproject (Kerr-Corrêa et al., 2003), a multinational project that aims tocompare patterns of alcohol use/abuse between the genders in differentcontexts in several countries (Bloomfield et al., 2005; Wilsnack &Wilsnack, 2002). This chapter discusses the results of administering theGENACIS questionnaire in a Brazilian regional sample in terms of genderdifferences in drinking patterns, ranging from abstinence to problem andheavy drinking.
METHODS
SETTING
Located in central São Paulo State in Southeast Brazil, Botucatu has108,306 inhabitants. It is predominantly urban (96.2%), and has an annualgrowth rate of 1.64% (IBGE, 2004). About 98.8% of households are
ALCOHOL, GENDER AND DRINKING PROBLEMS
52
connected to the public water supply and sewage system; this isapproximately three times the national rate and double the generalSoutheast Brazilian rate — the richest area of the country (IBGE, 2004).The municipality has 4,000 enterprises and the economy is commerce andservice industry based; no single activity prevails.
SAMPLING
The GENACIS questionnaire was included as a component in amorbidity and service use survey conducted by UNESP (UniversidadeEstadual Paulista) Public Health Department. A stratified sample,representative of socio-economic and educational levels, was drawn fromBotucatu, a São Paulo State town, and included those over 17 years old.Each stratum was composed by sector census (IBGE, 2004) andrespondents were selected using cluster-sampling schemes. The samplingunit was family households, including apartments and single dwellings;student housing and commercial buildings were not included. Interviewswere conducted in as private a setting as possible. More than one personper household could be interviewed. The final sample included 740individuals who underwent face-to-face interviews in 2001 and 2002.Overall, approximately 5.8% refused to participate and some preferrednot to respond to a few questions, primarily in the violence/intimacysection.
PROCEDURE
Female interviewers, experienced in population surveys, were givenadvanced training regarding the GENACIS questionnaire by the firstauthor, and administered all measures used in this study. This advancedtraining included information specific to alcohol and drinking behaviour(e.g., antecedents and consequences, problem behaviour, and bingedrinking), and violence, sexual, and intimacy questions. Interviewers weresupervised monthly throughout the year to resolve any questions thatarose, control for interview bias and drift, and address issues regarding thesensitivity of some of the questions in this culture. Only femaleinterviewers were hired because, traditionally, females have easier accessto other people’s houses in Brazil, especially when intimate questions areasked.
MEASURES
GENACIS QUESTIONNAIRE ON GENDER, ALCOHOL AND CULTURE
The Genacis questionnaire was developed by an international group ofinvestigators who were interested in the comparison of drinking patternsbetween the genders in different contexts and cultures. It has been used in
DIFFERENCES IN DRINKING PATTERNS BETWEEN MEN AND WOMEN IN BRAZIL
53
a multinational study that includes a Brazilian component. The versionused in this study consisted of a core questionnaire of 59 items, withsections on: demographics; work experiences; social networks; drinkingvariables — including quantity/frequency; context; family history ofalcohol use; expectancies when using; and several consequences of alcoholuse – and on intimate relationships and sexuality, violence andvictimization, and health and lifestyle, including illicit and prescriptiondrug use.
The questionnaire was translated into a Brazilian Portuguese version.The translation process included several steps: a) Forward translation byseveral psychiatrists, who were bilingual; b) Back translation by a nativeEnglish professional translator who has been living in Brazil for severalyears; and c) Twenty pilot interviews conducted to identify and correctwording problems.
SELF REPORT QUESTIONNAIRE (SRQ)
This measure is a 20 item, self-assessment of mental health (Hardinget al., 1980) that has been validated in Brazil by Mari and Willians (1986).A score above 7 is considered to indicate high risk of having a mentaldisorder.
ALCOHOL CONSUMPTION VARIABLES
All alcohol consumption (e.g., beer, wine, liquor, etc.) wasstandardized to one drink of 12g of ethanol, which is the size of the averagedrink in Brazil.
Respondents were considered to be abstinent when they reportednot drinking at all in the past year. Light infrequent drinking (LD)was defined as drinking at least one, but less than three drinks peroccasion, once or less than once a month in the last 12 months. Lightfrequent drinking (LF) was defined as reporting at least one, but lessthan 3, drinks per occasion weekly or more in the last year. Moderateinfrequent drinking (MI) was defined as drinking at least three, butless than four drinks per occasion, once or less than once a month in thelast 12 months. Moderate frequent drinking (MF) was defined asdrinking at least three, but less than four drinks per occasion weekly ormore in the last year. Heavy infrequent drinking (HI) was defined asdrinking at least 5 drinks per occasion once or less than once a month inthe last 12 months. Heavy frequent drinking (HD) was defined asdrinking at least 5 drinks per occasion, weekly or more in the last year,but not qualifying for the problem drinking category. Problemdrinking (PD) was defined by: 1) as drinking at least 5 drinks peroccasion weekly or more in the last year and at least one of the following;2) one negative consequence (e.g., legal, clinical, psychiatric, familial,
ALCOHOL, GENDER AND DRINKING PROBLEMS
54
work) at any time in the last 12 months; 3) any dependence criterion. Alldrinking categories were mutually exclusive.
STATISTICAL ANALYSES
Association between alcohol use and each of the several socio-demographic variables was investigated by the chi-square test or theFisher’s exact test. Logistic regression analysis was employed to explore thestrength of the possible explanatory variables to predict drinking in twomodels, one for predicting drinking versus non-drinking (abstainers) andthe other for predicting heavy drinking versus non-heavy drinking. Hereheavy drinking was a category composed by heavy (infrequent or frequent)and problem drinking. For this last model abstainers were excluded fromthe analysis. In each case a backward variable selection procedure wasperformed to select the most important predictors (a significance level of0.15 was used to delete a variable from the model). For the first logisticanalysis (drinking vs. non-drinking) the variables considered in the modelwere: total family income, age, marital status, religion, education level(compared to post secondary education), paid work (compared to not paidwork), tobacco use, positive family alcohol use history, friend’s drinkingproblems, level of partner’s drinking, marriage satisfaction, selfassessment of physical and emotional health, and SRQ total score. For thesecond logistic analysis (heavy vs. non-heavy use) all these variables,including effect of drinking on talking to the partner about feelings orproblems and finding it easier to open up with other people under theinfluence of alcohol. These analyses were performed separately for malesand females and were conducted using SAS (SAS, 1996).
ETHICAL CONSIDERATIONS
The Ethical Committee on Research of Botucatu Medical School,UNESP, approved this project on 4 April 2001.
RESULTS
SOCIOECONOMIC DATA
Table 1 shows the main socio-economic characteristics of the sample.Of the 740 interviewees 372 (50.3%) were male (age 17 to 93, mean 50 ±21.09) and 368 (49.7%) were female (age 17 to 97, mean 50.9 ± 16.5). Mostwere married or living in a common law marriage (73.4%). About 32.2% ofthe respondents had at least eight years of education (14.4% of which hada college education), and 3.7% were illiterate. Regarding ethnicity, themajority of the interviewees were Caucasian (84.6%), followed by Mulatto(10.7%), Black (3.5%), and Asian (0.5%). About 70.8% were Catholic, 15%Evangelical/Protestant, 5.4% Kardecist or other religious faiths, and 6.2%
DIFFERENCES IN DRINKING PATTERNS BETWEEN MEN AND WOMEN IN BRAZIL
55
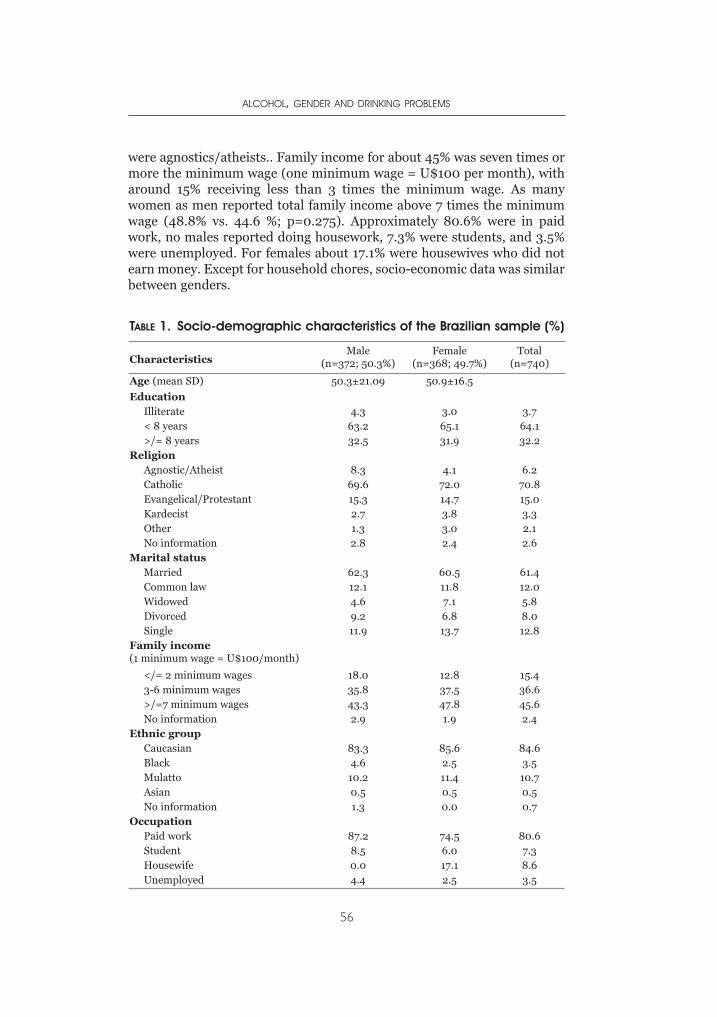
were agnostics/atheists.. Family income for about 45% was seven times ormore the minimum wage (one minimum wage = U$100 per month), witharound 15% receiving less than 3 times the minimum wage. As manywomen as men reported total family income above 7 times the minimumwage (48.8% vs. 44.6 %; p=0.275). Approximately 80.6% were in paidwork, no males reported doing housework, 7.3% were students, and 3.5%were unemployed. For females about 17.1% were housewives who did notearn money. Except for household chores, socio-economic data was similarbetween genders.
ALCOHOL, GENDER AND DRINKING PROBLEMS
56
TABLE 1. Socio-demographic characteristics of the Brazilian sample (%)
CharacteristicsMale
(n=372; 50.3%)Female
(n=368; 49.7%)Total
(n=740)
Age (mean SD) 50.3±21.09 50.9±16.5
EducationIlliterate 4.3 3.0 3.7< 8 years 63.2 65.1 64.1>/= 8 years 32.5 31.9 32.2
ReligionAgnostic/Atheist 8.3 4.1 6.2Catholic 69.6 72.0 70.8Evangelical/Protestant 15.3 14.7 15.0Kardecist 2.7 3.8 3.3Other 1.3 3.0 2.1No information 2.8 2.4 2.6
Marital statusMarried 62.3 60.5 61.4Common law 12.1 11.8 12.0Widowed 4.6 7.1 5.8Divorced 9.2 6.8 8.0Single 11.9 13.7 12.8
Family income(1 minimum wage = U$100/month)
</= 2 minimum wages 18.0 12.8 15.43-6 minimum wages 35.8 37.5 36.6>/=7 minimum wages 43.3 47.8 45.6No information 2.9 1.9 2.4
Ethnic groupCaucasian 83.3 85.6 84.6Black 4.6 2.5 3.5Mulatto 10.2 11.4 10.7Asian 0.5 0.5 0.5No information 1.3 0.0 0.7
OccupationPaid work 87.2 74.5 80.6Student 8.5 6.0 7.3Housewife 0.0 17.1 8.6Unemployed 4.4 2.5 3.5
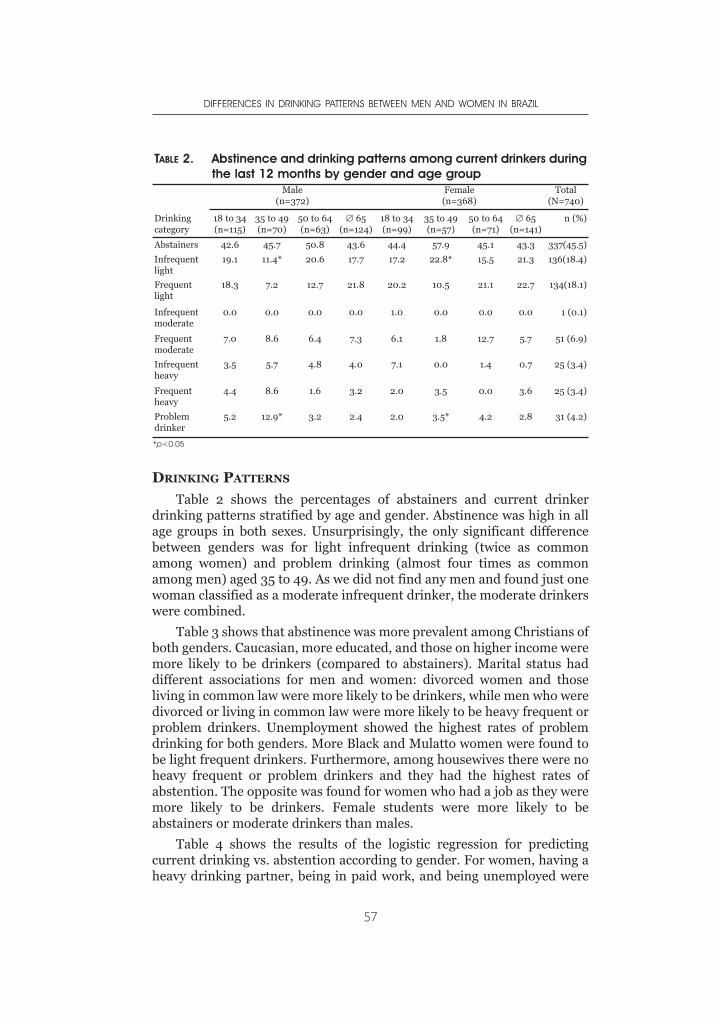
DRINKING PATTERNS
Table 2 shows the percentages of abstainers and current drinkerdrinking patterns stratified by age and gender. Abstinence was high in allage groups in both sexes. Unsurprisingly, the only significant differencebetween genders was for light infrequent drinking (twice as commonamong women) and problem drinking (almost four times as commonamong men) aged 35 to 49. As we did not find any men and found just onewoman classified as a moderate infrequent drinker, the moderate drinkerswere combined.
Table 3 shows that abstinence was more prevalent among Christians ofboth genders. Caucasian, more educated, and those on higher income weremore likely to be drinkers (compared to abstainers). Marital status haddifferent associations for men and women: divorced women and thoseliving in common law were more likely to be drinkers, while men who weredivorced or living in common law were more likely to be heavy frequent orproblem drinkers. Unemployment showed the highest rates of problemdrinking for both genders. More Black and Mulatto women were found tobe light frequent drinkers. Furthermore, among housewives there were noheavy frequent or problem drinkers and they had the highest rates ofabstention. The opposite was found for women who had a job as they weremore likely to be drinkers. Female students were more likely to beabstainers or moderate drinkers than males.
Table 4 shows the results of the logistic regression for predictingcurrent drinking vs. abstention according to gender. For women, having aheavy drinking partner, being in paid work, and being unemployed were
DIFFERENCES IN DRINKING PATTERNS BETWEEN MEN AND WOMEN IN BRAZIL
57
TABLE 2. Abstinence and drinking patterns among current drinkers duringthe last 12 months by gender and age group
Male(n=372)
Female(n=368)
Total(N=740)
Drinkingcategory
18 to 34(n=115)
35 to 49(n=70)
50 to 64(n=63)
∅ 65(n=124)
18 to 34(n=99)
35 to 49(n=57)
50 to 64(n=71)
∅ 65(n=141)
n (%)
Abstainers 42.6 45.7 50.8 43.6 44.4 57.9 45.1 43.3 337(45.5)
Infrequentlight
19.1 11.4* 20.6 17.7 17.2 22.8* 15.5 21.3 136(18.4)
Frequentlight
18.3 7.2 12.7 21.8 20.2 10.5 21.1 22.7 134(18.1)
Infrequentmoderate
0.0 0.0 0.0 0.0 1.0 0.0 0.0 0.0 1 (0.1)
Frequentmoderate
7.0 8.6 6.4 7.3 6.1 1.8 12.7 5.7 51 (6.9)
Infrequentheavy
3.5 5.7 4.8 4.0 7.1 0.0 1.4 0.7 25 (3.4)
Frequentheavy
4.4 8.6 1.6 3.2 2.0 3.5 0.0 3.6 25 (3.4)
Problemdrinker
5.2 12.9* 3.2 2.4 2.0 3.5* 4.2 2.8 31 (4.2)
*p<0.05
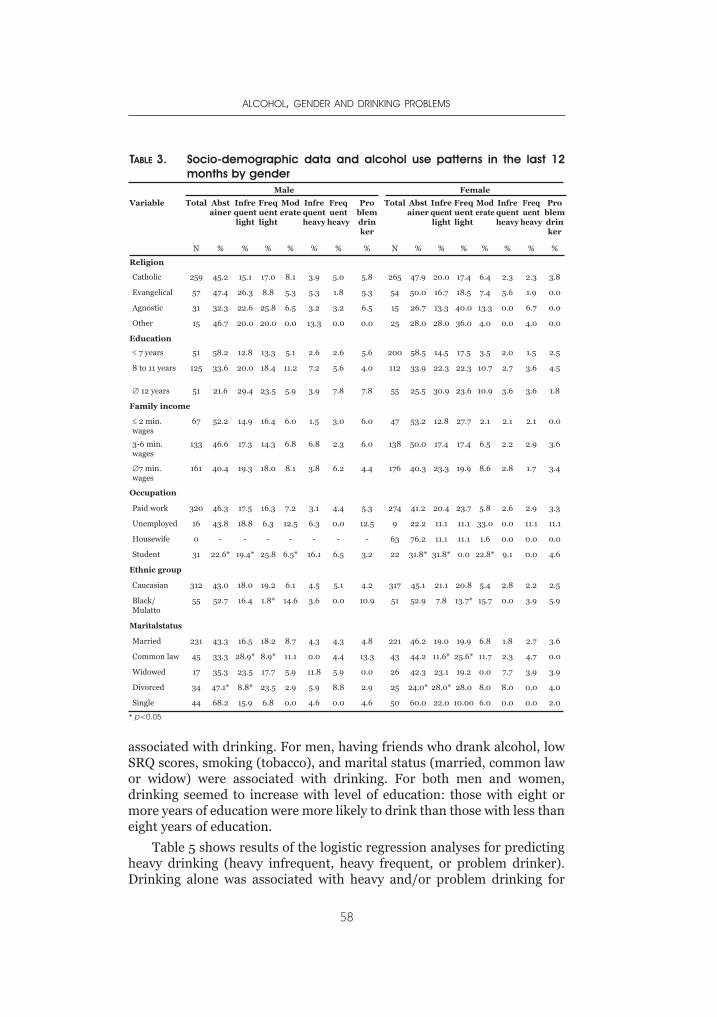
associated with drinking. For men, having friends who drank alcohol, lowSRQ scores, smoking (tobacco), and marital status (married, common lawor widow) were associated with drinking. For both men and women,drinking seemed to increase with level of education: those with eight ormore years of education were more likely to drink than those with less thaneight years of education.
Table 5 shows results of the logistic regression analyses for predictingheavy drinking (heavy infrequent, heavy frequent, or problem drinker).Drinking alone was associated with heavy and/or problem drinking for
ALCOHOL, GENDER AND DRINKING PROBLEMS
58
TABLE 3. Socio-demographic data and alcohol use patterns in the last 12months by gender
Male Female
Variable Total Abstainer
Infrequentlight
Frequentlight
Moderate
Infrequentheavy
Frequent
heavy
Problemdrinker
Total Abstainer
Infrequentlight
Frequentlight
Moderate
Infrequentheavy
Frequent
heavy
Problemdrinker
N % % % % % % % N % % % % % % %
Religion
Catholic 259 45.2 15.1 17.0 8.1 3.9 5.0 5.8 265 47.9 20.0 17.4 6.4 2.3 2.3 3.8
Evangelical 57 47.4 26.3 8.8 5.3 5.3 1.8 5.3 54 50.0 16.7 18.5 7.4 5.6 1.9 0.0
Agnostic 31 32.3 22.6 25.8 6.5 3.2 3.2 6.5 15 26.7 13.3 40.0 13.3 0.0 6.7 0.0
Other 15 46.7 20.0 20.0 0.0 13.3 0.0 0.0 25 28.0 28.0 36.0 4.0 0.0 4.0 0.0
Education
≤ 7 years 51 58.2 12.8 13.3 5.1 2.6 2.6 5.6 200 58.5 14.5 17.5 3.5 2.0 1.5 2.5
8 to 11 years 125 33.6 20.0 18.4 11.2 7.2 5.6 4.0 112 33.9 22.3 22.3 10.7 2.7 3.6 4.5
∅ 12 years 51 21.6 29.4 23.5 5.9 3.9 7.8 7.8 55 25.5 30.9 23.6 10.9 3.6 3.6 1.8
Family income
≤ 2 min.wages
67 52.2 14.9 16.4 6.0 1.5 3.0 6.0 47 53.2 12.8 27.7 2.1 2.1 2.1 0.0
3-6 min.wages
133 46.6 17.3 14.3 6.8 6.8 2.3 6.0 138 50.0 17.4 17.4 6.5 2.2 2.9 3.6
∅7 min.wages
161 40.4 19.3 18.0 8.1 3.8 6.2 4.4 176 40.3 23.3 19.9 8.6 2.8 1.7 3.4
Occupation
Paid work 320 46.3 17.5 16.3 7.2 3.1 4.4 5.3 274 41.2 20.4 23.7 5.8 2.6 2.9 3.3
Unemployed 16 43.8 18.8 6.3 12.5 6.3 0.0 12.5 9 22.2 11.1 11.1 33.0 0.0 11.1 11.1
Housewife 0 - - - - - - - 63 76.2 11.1 11.1 1.6 0.0 0.0 0.0
Student 31 22.6* 19.4* 25.8 6.5* 16.1 6.5 3.2 22 31.8* 31.8* 0.0 22.8* 9.1 0.0 4.6
Ethnic group
Caucasian 312 43.0 18.0 19.2 6.1 4.5 5.1 4.2 317 45.1 21.1 20.8 5.4 2.8 2.2 2.5
Black/Mulatto
55 52.7 16.4 1.8* 14.6 3.6 0.0 10.9 51 52.9 7.8 13.7* 15.7 0.0 3.9 5.9
Maritalstatus
Married 231 43.3 16.5 18.2 8.7 4.3 4.3 4.8 221 46.2 19.0 19.9 6.8 1.8 2.7 3.6
Common law 45 33.3 28.9* 8.9* 11.1 0.0 4.4 13.3 43 44.2 11.6* 25.6* 11.7 2.3 4.7 0.0
Widowed 17 35.3 23.5 17.7 5.9 11.8 5.9 0.0 26 42.3 23.1 19.2 0.0 7.7 3.9 3.9
Divorced 34 47.1* 8.8* 23.5 2.9 5.9 8.8 2.9 25 24.0* 28.0* 28.0 8.0 8.0 0.0 4.0
Single 44 68.2 15.9 6.8 0.0 4.6 0.0 4.6 50 60.0 22.0 10.00 6.0 0.0 0.0 2.0
* p<0.05
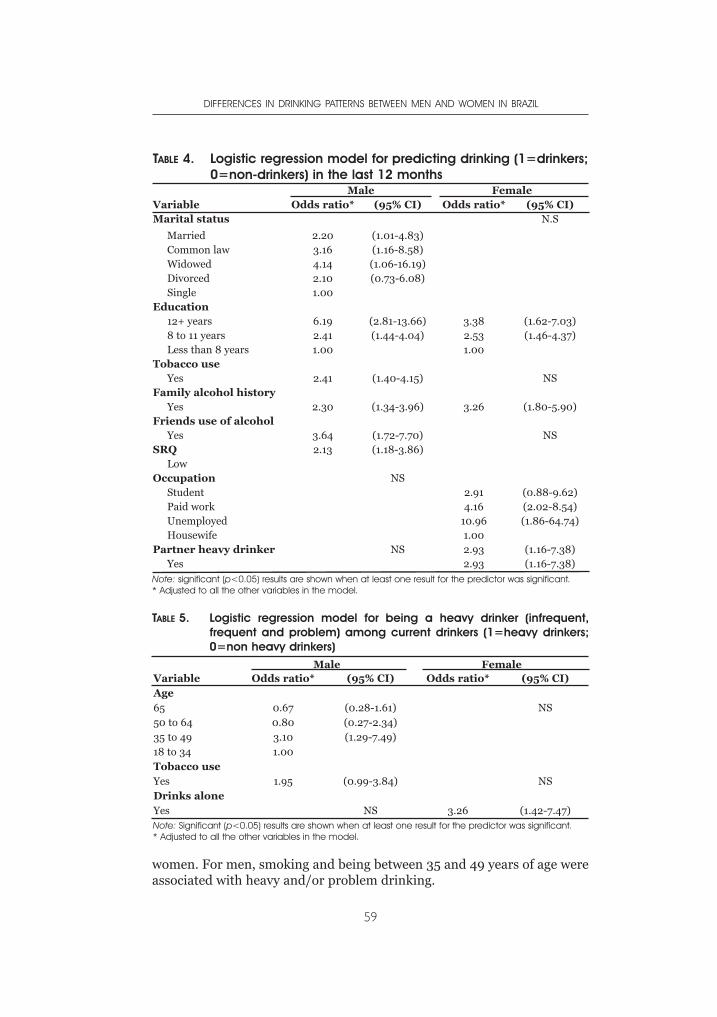
women. For men, smoking and being between 35 and 49 years of age wereassociated with heavy and/or problem drinking.
DIFFERENCES IN DRINKING PATTERNS BETWEEN MEN AND WOMEN IN BRAZIL
59
TABLE 4. Logistic regression model for predicting drinking (1=drinkers;0=non-drinkers) in the last 12 months
Male FemaleVariable Odds ratio* (95% CI) Odds ratio* (95% CI)Marital status N.S
Married 2.20 (1.01-4.83)Common law 3.16 (1.16-8.58)Widowed 4.14 (1.06-16.19)Divorced 2.10 (0.73-6.08)Single 1.00
Education12+ years 6.19 (2.81-13.66) 3.38 (1.62-7.03)8 to 11 years 2.41 (1.44-4.04) 2.53 (1.46-4.37)Less than 8 years 1.00 1.00
Tobacco useYes 2.41 (1.40-4.15) NS
Family alcohol historyYes 2.30 (1.34-3.96) 3.26 (1.80-5.90)
Friends use of alcoholYes 3.64 (1.72-7.70) NS
SRQ 2.13 (1.18-3.86)Low
Occupation NSStudent 2.91 (0.88-9.62)Paid work 4.16 (2.02-8.54)Unemployed 10.96 (1.86-64.74)Housewife 1.00
Partner heavy drinker NS 2.93 (1.16-7.38)Yes 2.93 (1.16-7.38)
Note: significant (p<0.05) results are shown when at least one result for the predictor was significant.* Adjusted to all the other variables in the model.
TABLE 5. Logistic regression model for being a heavy drinker (infrequent,frequent and problem) among current drinkers (1=heavy drinkers;0=non heavy drinkers)
Male FemaleVariable Odds ratio* (95% CI) Odds ratio* (95% CI)Age65 0.67 (0.28-1.61) NS50 to 64 0.80 (0.27-2.34)35 to 49 3.10 (1.29-7.49)18 to 34 1.00Tobacco useYes 1.95 (0.99-3.84) NSDrinks aloneYes NS 3.26 (1.42-7.47)Note: Significant (p<0.05) results are shown when at least one result for the predictor was significant.* Adjusted to all the other variables in the model.
DISCUSSION
This study used a Brazilian version of a questionnaire that had alreadybeen developed as a standardized, culturally sensitive measure of drinkingand its consequences. Results from this stratified, urban, representativesample of 740 subjects from a town of 108,306 inhabitants showed thatabstinence was common: about 45% of men and 46% of women during thelast 12 months. At the low drinking levels, women and men had verysimilar drinking patterns. The women demonstrated changes in theirsocio-cultural roles in that they were frequently working outside the home,had good incomes, and more access to alcohol. As their roles became moresimilar to men’s, so did their drinking patterns. Caucasians, the moreeducated, and people with higher incomes, were less likely to be abstainers.As expected for a Latin American country, religious affiliation (Catholicsand Evangelical/Protestants) seemed an important reason for abstinencein this region.
For women, the only risk factor for heavy drinking was drinking alone.For men, smoking and being between 35 and 49 were associated withheavy drinking.
While biological differences between women and men are importantfactors in the determination of alcohol use, socio-cultural factors also seemto play an important role. This study found that several important socio-cultural variables had an impact on gender differences in drinking,including demographic characteristics (e.g., employment, education,marital status, etc.), and social roles. These differences were also examinedin terms of different drinking patterns.
Overall, this regional sample differed somewhat from those described inother studies. Only 4.7% of the Brazilian population has 12 or more years offormal education and about 20.0% are illiterate compared to Botucatu,which presents 14.3% and 3.6%, respectively (www.datasus.gov.br). Evencompared to the Southeast region, where Botucatu is located, this town faresbetter (9.1% and 8.4%, respectively). Carmo et al. (2003) have discussed thisepidemiological transition in developing countries such as Brazil. Comparedto developed countries where decreases in infectious and parasitic diseasesand increases in chronic-degenerative diseases, accidents, and violence-related health events are due to improvements in social and economicconditions, in Brazil, these trends are present in the context of extremecomplexity and social inequality. Brazil presents a paradoxical situation,
where economic indicators (15th world economy in 2004) are incompatiblewith social indicators. As a whole, all Brazilian regions are improving, but atdrastically different levels, rates, and velocity. Botucatu is an example of thisphenomenon: it is a relatively small university town that has all its indicators(water supply, sewage, health system, educational achievement,employment, and salaries, including good jobs for women, among others)well above regional and national levels.
ALCOHOL, GENDER AND DRINKING PROBLEMS
60
Because the sample was drawn from this town, with its long history ofgood medical services, the respondents were older, Caucasian, married orliving in common law, and most women worked outside the home andearned good salaries. This may be seen as a major limitation to this study.Therefore, the results are not generalizable in that it was a stable, middle-class sample with women who functioned outside the more traditionalroles found in other areas of Brazil. However, it was conducted over oneyear, stratified by neighbourhood, and representative of the socio-economical-educational level of this community. It should be seen as astudy at one end of the socio-economic continuum in a country undergoingmajor social and economical transitions, which shows that when socio-cultural factors and social roles change, drinking differences between thegenders tend to diminish.
This study tried to examine differences in drinking levels betweenwomen and men. The same amount of alcohol consumed by a woman anda man of the same weight will produce a higher blood alcoholconcentration in women (Jones & Jones, 1976). Despite this discrepancy inphysiological alcohol effects, many surveys use the same definitions ofdrinking levels for women and men. Use of gender-specific drinkingmeasures that take into consideration female-male differences in bodyweight and body water content substantially reduces gender differences inreported alcohol consumption (Graham et al, 1998; York & Welte, 1994;Wilsnack et al, 1997). Because of the small number of people in the heavyand/or problem drinker’s categories, we could not conduct separateanalyses for different levels of drinking. However, we could find risk factorsfor drinking in both genders.
In this sample, abstinence levels were high, about 45% for both womenand men. In general, levels of drinking, quantity, and frequency weresimilar between genders, and were predominantly light in pattern.Interestingly, in the older age group, we also found no differences betweenmen and women. Nevertheless, when examining drinking at higher levelsand different age groups, gender differences were more evident. Therewere more men than women problem drinkers in the 35-49 age group. Thiscorresponds with our clinical experience in the same region, where thereare substantially more men in treatment in this age range than women(Simão et al 2002).
Binge drinking, defined as 5 or more drinks per occasion (Wechsler etal., 1994) is a pattern of alcohol use associated with increased physicaland emotional harm, including violence, accidents, unplannedpregnancy, unprotected sex, STD, and HIV. It is frequently found amongmen in most countries (Wilsnack et al., 2000). We consistently foundmore heavy drinking men than women, but this was not statisticallysignificant. The sampling procedure may in part explain the lowerprevalence of heavy drinking in single people, as it excluded mostuniversity students living in town.
DIFFERENCES IN DRINKING PATTERNS BETWEEN MEN AND WOMEN IN BRAZIL
61
The main predictors of a woman being a drinker (instead of anabstainer) were indicators of access to alcohol: these were highereducation, having a partner who is a heavy drinker, and working outsidethe home for pay and/or considering herself as unemployed (or basically aworker, not a housewife). It is important to say that they were mostly light,not even moderate, drinkers. We only had 29 women who were in theheavy or problem drinker categories. It is a pattern frequently found in theliterature on drinking when you have access, either through money or apartner who is a heavy drinker, and probably have alcoholic beveragesavailable (and company) at home to drink. Using similar methodology asthis study, it has been shown that women in several countries with higherstatus jobs and better education were more likely to drink (Gmel et al.,2000). Both clinical studies and general population surveys have foundstrong similarities between women’s and their partner’s drinking levels(Corbett et al., 1991; Demers et al., 1999; Hammer & Vaglum, 1989; Jacob& Bremer, 1986; Roberts & Leonard, 1997). Other studies have found thatmen have a stronger influence on their women’s drinking pattern than viceversa (Wilsnack & Wilsnack, 1990).
The significant effect of a family history of alcoholism on thedevelopment of alcohol abuse has also been reported in several studies(Chassin et al., 1993; 1999, Sher et al., 1991). In this study, risk factors inboth genders for drinking were higher education and a family history of analcohol problem. Some studies have found the same traits among abstainers:lower incomes, lower level of education and older ages (ICAP, 2000).
None of these factors was important for heavy and/or problemdrinkers, which only were associated with an indicator of alcoholdependence, i.e, drinking alone, as expected for women. For men, smokingand being aged 35 to 49 yeas were associated with heavy drinking.
In general, women in this sample could be seen as less conservativeand less traditional than regional or national populations if they worked forpay, outside their homes or consider themselves as unemployed asopposed to housewives. As a result, the drinking pattern of working womenwas more equivalent to men, as were their social roles. Surprisingly wefound not even one heavy or problem drinker among housewives, probablydue to the small sample size.
Similar changes in drinking and sexual behaviour found recently inliterature are also related to new social roles for women. Women in thisstudy had higher rates of employment and income compared to otherneighbourhoods in this area, with less abstinence, easier access to alcoholand higher rates of drinking (Kerr-Corrêa et al., 2003), Women’s drinkinghas often been socially more restricted than men’s out of the fear thatdrinking may more adversely affect women’s social behaviour andresponsibilities (Blume, 1997). Other authors have found that women’sintoxication reduces social control of their sexuality, making them eithermore sexually uninhibited or more sexually vulnerable (Gomberg, 1982;
ALCOHOL, GENDER AND DRINKING PROBLEMS
62
Stewart, 1992; Purcell, 1994). Traditionally, women’s drinking has beendiscouraged or concealed because it was incompatible with domestic roles,and might interfere with social control over family relationships and publicbehaviour (Ikuesan, 1994; Purcell, 1994; Warner, 1997).
If gender differences in alcohol use have a socio-cultural basis, such aswomen’s roles becoming similar to men’s, women and men’s drinkingbehaviours would be expected to converge. Some evidence of this has beenreported in the past (Hammer & Vaglum, 1989; Mercer & Khavari, 1990;Saelan et al., 1992). Nevertheless, other researchers have found persistentgender differences, both in general adult populations (Bell et al., 1984;Midanik & Clark, 1994; Neve et al., 1996), university students, and youngadult samples (Temple, 1987; Perkins, 1992; Johnston et al., 1994). This isa critical area of study that requires further investigation.
For men, low SRQ scores, friend’s alcohol abuse, marital status(married, common law or widowed), level of education, and tobacco usewere associated with drinking. The association between smoking andalcohol consumption has been well established in clinical and non-clinicalpopulations (Henningfield et al., 1990; Istvan & Matazarro, 1984).Smokers are more likely to drink alcohol and drink higher quantity thannonsmokers (Zacny, 1990).
Another study in Brazil (Almeida-Filho et al., 2004) found thatmarriage or living with a partner was a protective factor for drinking inboth genders. However, in this study we found the opposite result in men:being single was a protective factor, contrary to our expectations. This maybe explained by the higher mean age of the sample and exclusion of mostuniversity students, as not living with their families (but in fraternities,shared houses and dormitories) they were not considered as living inhouseholds for sampling purposes.
In this survey, drinking alone was the only risk factor independentlyassociated with heavy drinking in women. Other studies have found thatwomen are more likely to drink alone than men without meaningnecessarily dependence (Robbins & Martin, 1993). Nevertheless, in thiswork, the association seems indicative of harmful use of alcohol.
In summary, men generally had a higher level of alcohol use thanwomen, but both men and women showed very similar patterns in lightalcohol use, especially when considering women who were working outsidetheir homes for pay or defined themselves as unemployed. This mayindicate that they are already changing their socio-cultural roles. As theirsocial roles become more similar to men’s, so do their drinking patterns.This finding did not hold for individuals aged 35-49 years, which may bedue to the family responsibilities of women, and the more frequent bingeand/or problem drinking in men. More studies, especially with larger andmore representative samples, are needed to capture in detail genderdifferences in alcohol use patterns in this population.
DIFFERENCES IN DRINKING PATTERNS BETWEEN MEN AND WOMEN IN BRAZIL
63
ACKNOWLEDGEMENT
Support for this study was provided by FAPESP Grant (00/03150-6;01/12807-9).
REFERENCES
Almeida-Filho, N., Lessa, I., Magalhães, L., Araújo, M. J., Aquino, E., Kawachi, I.,James, S. A. (2004). Social determinants and patterns of alcohol consumptionin Bahia, Brazil. Revista de Saúde Pública, 38, 1-13.
Babor, T. F., Caetano, R., Casswell, S., Edwards, G, Giesbrecht, N. et al . (2003).Alcohol: no ordinary commodity. Oxford: Oxford University Press, 301p.
Bell, R., Havlicek, P.L., Roncek, D. W. (1984). Sex differences in the use of alcoholand tranquilizers: testing a role convergence hypothesis. American Journal ofDrug and Alcohol Abuse, 10, 551-561.
Bloomfield, K., Allamani, A., Beck, F., Bergmark, K.H., Csemy, L. et al (2005).Gender, culture and alcohol problems: a multi-national study. Project finalreport. Berlin, Germany: Institute for medical informatics, biometrics andepidemiology, Charité Universitätsmedizin Berlin.
Blume, S.B. (1997). Women and alcohol: issues in social policy. In: R.W. Wilsnack,S.C., Wilsnack, (eds.), Gender and alcohol: individual and socialperspectives. New Brunswick, NJ: Rutgers Center of Alcohol Studies: 462-489.
Cahalan, R., Room, R. (1974). Problem drinking among American men. NewBrunswuick, NJ: Rutgers Centre of Alcohol Studies.
Carlini-Cotrim, B., Carlini, E., Silva-Filho, A. R., Barbosa, M. T. S. (1989). O uso dedrogas psicotrópicas por estudantes de primeiro e segundo graus da redeestadual, em dez capitais brasileiras, 1987. (The use of psychotropic drugs byfirst and second degree students at the state network, in ten Brazilian capital,1987.) In: Consumo de drogas psicotrópicas no Brasil, em 1987. Centro deDocumentação, Ministério da Saúde, Brasilia, DF, Série C: Estudos e Projetos5, 9-84.
Carlini, E.A., Carlini-Cotrim, B., Silva-Filho, A.R. , Barbosa, M. T. S. (1990). IILevantamento nacional sobre o uso de psicotrópicos em estudantes deprimeiro e segundo graus,1989. (II National psychotropic use survey in firstand second degree students, 1989.) Centro Brasileiro de Informações sobreDrogas Psicotrópicas, Departamento de Psicobiologia, Escola Paulista deMedicina, São Paulo, SP, Brazil.
Carlini, E. A., Galduróz, J. C., Noto, A. R., Nappo, S. A. (2002). I Levantamentodomiciliar sobre o uso de drogas psicotrópicas no Brasil: estudo envolvendoas 107 maiores cidades do país, 2001. (I National psychotropic drug usesurvey in Brazil: study in the 107 biggest cities in the country, 2001.) SãoPaulo: CEBRID – Centro Brasileiro de Informações Sobre DrogasPsicotrópicas: UNIFESP, Universidade Federal de São Paulo.
Carmo, E. H., Barreto, M. L., Silva, J. B. (2003). Mudanças nos padrões demorbimortalidade da população brasileira: os desafios para o novo século.(Change in morbimortality patterns in the Brazilian population: challenges tothe new century). Epidemiologia e Serviços de Saúde, 12, 63-75.
Chassin L., Pillow, D.R., Curran P.J., Molina B.S., Barrera M. (1993). Relation ofparental alcoholism to early adolescent substance use: a test of three mediatingmechanisms. Journal Abnormal of Psychology, 102, 3–19.
ALCOHOL, GENDER AND DRINKING PROBLEMS
64
Chassin L., Pitts S.C., DeLucia C. (1999). The relation of adolescent substance useto young adult autonomy, positive activity involvement, and perceivedcompetence. Development of Psychopathology, 11, 915-932.
Corbett, K., Mora, J., Ames, G. (1991). Drinking patterns and drinking-relatedproblems of Mexican–American husbands and wives. Journal of Studies onAlcohol, 52, 215–223.
Dani, R., Mott, C. B., Guarita, D. R., Nogueira, C. E. (1990). Epidemiology and etiologyof chronic pancreatitis in Brazil: a tale of two cities. Pancreas, 5, 474-478.
Demers, A., Bisson, J., Palluy, J. (1999). Wives convergence with their husbands’alcohol use: Social conditions as mediators. Journal of Studies on Alcohol, 60,368–377.
DETRAN–SP Departamento Estadual de Trânsito (2004) Álcool e trânsito. (StateDepartment of Traffic). Internet:http://www.detran.sp.gov.br/campanhas/alcool_transito/in_alcool_transito.html
Frezza, M., Di Padova, C., Pozzato, G., Terpin, M., Baraona, E., Lieber, C. S. (1990).High blood alcohol levels in women: the role of decreased alcoholdehydrogenase activity in first pass metabolism. New England Journal ofMedicine, 322, 95-99.
Galduróz, J. C. F., D’Almeida, V., Carvalho, V., Carlini, E. A. (1994). IIILevantamento sobre o uso de drogas entre estudantes de 1º e 2º graus em 10capitais brasileiras, 1993. (III Psychotropic use survey among 1º and 2ºdegrees students in 10 Brazilian capitals, 1993). Centro Brasileiro deInformações sobre Drogas Psicotrópicas, Departamento de Psicobiologia,Escola Paulista de Medicina, Universidade Federal de São Paulo, São Paulo,SP, Brazil.
Galduróz, J. C. F., Noto, A. R., Carlini, E. A. (1997). IV Levantamento sobre o usode drogas entre estudantes de 1o e 2o graus em 10 capitais brasileiras 1997.(IV Psychotropic use survey among 1º and 2º degrees students in 10 Braziliancapitals 1997.) São Paulo; Universidade Federal de São Paulo. CentroBrasileiro de Informações sobre drogas psicotrópicas – CEBRID.
Galduróz, J. C. F., Noto, A. R., Nappo, S. A., Carlini, E. L. A. (2003). First householdsurvey on drug abuse in São Paulo, Brazil, 1999: principal findings. São PauloMedical Journal, 121, 231-237.
Gavaler, J. S., Deal, S. R., Van Thiel, D. H., Arria, A. M., Allan, M. J. (1993). Alcoholand estrogen levels in postmenopausal women: The spectrum of effect.Alcoholism: Clinical and Experimental Research, 17, 786–790.
Gmel, G., Bloomfield, K., Alhström, S., Choquet, M., Lecomte, T. (2000). Women’sroles and women’s drinking: a comparative study in four European countries.Substance Abuse, 21, 249-264.
Gomberg, E. S. L. (1982). Historical and political perspectives on women and druguse. Journal of Social Issues, 38, 9-23.
Graham, K., Wilsnack, R., Dawson, D., Vogeltanz, N. (1998). Should alcoholmeasure be adjusted for gender differences? Addiction, 93, 1717-1727.
Haavio-Mannila, E. (ed., 1989). Women, alcohol, and drugs in the Nordiccountries. Helsinki: Nordic Concil for Alcohol and Drug Research.
Hammer, T., Vaglum, P. (1989). The increase in alcohol consumption amongwomen: a phenomenon related to accessibility or stress? A general populationstudy. British Journal of Addiction, 84, 764-775.
Harding, T. W., Arango, M. V., Baltazar, J., Climent, C. E., Ibrahim, H. H. A.,Ignacio, L. L., Murthy, R. S., Wig, N. N. (1980). Mental Disorders in primary
DIFFERENCES IN DRINKING PATTERNS BETWEEN MEN AND WOMEN IN BRAZIL
65
health care: a study of their frequency and diagnosis in four developmentcountries. Psychological Medicine, 10, 231-241.
Henningfield, J.E., Clayton, R., Pollin, W. (1990). Involvement of tobacco inalcoholism and illicit drug use. British Journal of Addiction, 85, 279-91.
IBGE (Instituto Brasileiro de Geografia e Estatística www.ibge.gov.br), 2004.Ikuesan, B. A. (1994). Drinking problems and the position of women in Nigeria.
Addiction, 89, 941-944.Istvan, J., Matarazzo, J.D. (1984). Tobacco, alcohol, and caffeine use: a review of
their interrelationships. Psychological Bulletin, 95, 301-326.International Center for Alcohol Policies (June 2000). Who are the abstainers?
ICAP Reports 8.Jacob, T., Bremer, D. A. (1986). Assortative mating among men and women
alcoholics. Journal of Studies on Alcohol, 47, 219–222.Johnston, L. D., O’Malley, P. M., Bachman, J. G. (1994). National survey results on
drug use from the monitoring the future study. Vol. II. College students andyoung adults, NIH Publication 94-3810 (Rockville, MD, National Institute onDrug Abuse).
Jones, B. M., Jones, M. K. (1976). Women and alcohol: Intoxication, metabolism andthe menstrual cycle. In: Greenblatt M and Schuckit MA, eds. Alcoholism Problemsin Women and Children. New York, NY: Grune , Stratton (pp. 103–136).
Kerr-Corrêa, F., Sanches, A. F., Trinca, L. A. , Lima, M. C. P. (2003). Gender,culture and problems associated with alcohol: preliminary analysis of theBrazilian part of a multinational study. Annals of the 29th KBS AnnualMeeting, Krakow, Poland.
Kubicka, L.; Csemy, L.; Kozeny, J. (1995). Prague women’s drinking before and afterthe ‘velvet revolution’ of 1989: a longitudinal study. Addiction, 90, 1471-1478.
Lolio, C. A. (1990). The epidemiology of arterial hypertension. Revista de SaúdePública, 24, 425-432.
Mari, J., Willians, P. A. (1986). A validity study of a psychiatric screeningquestionnaire (SRQ-20) in primary care in the city of São Paulo. BritishJournal of Psychiatry, 148, 23-26.
Marlatt, G. A., Baer, J. S., Kivlahan, D. R., Dimeff, L. A., Larimer, M. E., Quigley, L.A., Somers, J. M., Williams, E. (1998). Screening and brief intervention forhigh-risk college student drinkers: results from a 2-years follow-upassessment. Journal of Consulting and Clinical Psychology, 66, 604-615.
Medina-Mora, E. (1994). Drinking and the oppression of women: the Mexicanexperience. Addiction, 89, 958-960.
Mercer, P. W., Khavari, K. A. (1990). Are women drinking more like men? Anempirical examination of the convergence hypothesis. Alcoholism: Clinicaland Experimental Research, 14, 461-466.
Midanik, L. T., Clark, W. B. (1994). The demographic distribution of U.S. drinkingpatterns in 1990: description and trends from 1984. American Journal ofPublic Health, 84, 1218-1222.
Moreira, L. B., Fuchs, F. D., Moraes, R. S., Bredemeier, M., Cardozo, S., Fuchs, S.C., Victora, C. G. (1996). Alcoholic beverage consumption and associatedfactors in Porto Alegre, a southern Brazilian city: a population-based survey.Journal of Studies on Alcohol, 57, 253-259.
Mott, C. B., Guarita, D. R., Coelho, M. E., Monteiro da Cunha, J. E., Machado, M.C., Bettarello A. (1989). Etiology of chronic pancreatitis in Sao Paulo: a studyof 407 cases. Revista do Hospital das Clinicas da Faculdade de Medicina deSão Paulo, 44, 214-220.
ALCOHOL, GENDER AND DRINKING PROBLEMS
66
National Institute on Alcohol Abuse and Alcoholism (2000). Alcohol and women:
an overview. 10th Special report to the US congress and alcohol and health.US Department of Health and Human Services: 253-257.
Nery-Filho, A., Miranda, M., Miranda, M. G. (1995). Estudo da alcoolemia numaamostra de população urbana de Salvador. (Alcoholemy study in an urbansample from Salvador.) Paper presented at the International Meeting onDrug Use and Abuse, Salvador, Bahia, Brasil.
Neve, R., Drop, M., Lemmens, P., Swinkels, H. (1996). Gender differences indrinking behaviour in the Netherlands: convergence or stability? Addiction,91, 357-373.
Nappo, S. A., Galduróz, J. C. F. (1996). Psychotropic drug-related deaths in SãoPaulo city, Brazil. In: Annals of the X World Congress of Psychiatry, Madrid,Spain, X World Congress of Psychiatry.
Noto, A. R., Carlini, E. A. (1995). Internações hospitalares provocadas por drogas:análise de sete anos consecutivos (1987-1993). (Hospital admissions caused bydrugs: analysis of seven consecutive years (1987-1993)). Revista da AssociaçãoBrasileira de Psiquiatria-Asociacion Psiquiatrica de la America Latina, 17,107-114.
Noto, A. R., Fonseca, A. M., Silva, E. A., Gálduroz, J. C. F. (2004). Violênciadomiciliar associada ao consumo de bebidas alcoólicas e de outras drogas: umlevantamento no Estado de São Paulo. (Home violence associated to alcoholicbeverage and others drugs consumption: a survey in São Paulo State). JornalBrasileiro de Dependência Química, 5, 9-17.
Perkins, H. W. (1992). Gender patterns in consequences of collegiate alcohol abuse:a 10-year study of trends in an undergraduate population. Journal of Studieson Alcohol, 53, 458-462.
Purcell, N. (1994). Women and wine in ancient Rome. In: M. MacDonald (eds.).Gender, drink and drugs: 191-208. Providence, RI.
Roberts, L. J., Leonard, K. E. (1997). Gender differences and similarities in thealcohol and marriage relationship. In: R. W. Wilsnack, S. C. Wilsnack (eds.),Gender and alcohol: individual and social perspectives: 289–311. Piscataway,NJ7 Rutgers Center of Alcohol Studies.
Robbins, C. A., Martin, S. S. (1993). Gender, styles of deviance, and drinkingproblems. Journal of Health and Social Behavior, 34, 302–321.
Saelan, H., Moler, L., Koster, A. (1992). Alcohol consumption in a Danish cohortduring 11 years, Scandinavian Journal of Social Medicine, 20, 87-93.
SAS (1996). Software release 6.12. SAS Institute Inc. Carey, NC, USA.Snare, A. (1989). Women and control. In: E. Haavio-Mannila E (ed). Women,
Alcohol, and Drugs in the Nordic Countries: 133-152. Helsinki: Nordic Councilfor Alcohol and Drug Research.
Sher K.J., Walitzer K.S., Wood P.K., Brent E.E. (1991). Characteristics of childrenof alcoholics: putative risk factors, substance use and abuse, andpsychopathology. Journal of Abnormal Psychology, 100, 427-448.
Simão, M.O., Kerr-Corrêa, F., Dalben, I., Smaira, S.I. (2002). Alcoholic and men: acomparative study of social and familial and outcome. Revista Brasileira dePsiquiatria, 24, 121-129.
Stewart, M. (1992). “I can´t drink beer, I’ve just drunk water”: alcohol, bodilysubstance and commensality among Hungarian rom. In: D. Gefou-Madianou(ed.), Alcohol, Gender, and Culture: 137-156. New York, N.Y.: Routledge.
Strauss, E., Lacet, C. M., Maffei, J. R. A., Silva, E. C., Fukushima, J., Gayotto, L.,Carlos, C. (1988). Etiologia e apresentaçäo da cirrose hepática em Säo Paulo:
DIFFERENCES IN DRINKING PATTERNS BETWEEN MEN AND WOMEN IN BRAZIL
67
análise de 200 casos (Etiology and clinical aspects of liver cirrhosis in SäoPaulo, Brazil: analysis of 200 cases). Gastroenterologia EndoscópicaDigestiva, 7, 119-23.
Temple, M. (1987). Alcohol use among male and female college students: has therebeen a convergence? Youth and Society, 19, 44-72.
Warner, J. (1997). The sanctuary of sobriety: the emergence of temperance as afeminine virtue in Tudor and Stuart England. Addiction, 92, 97-111.
Wechsler, H., Davenport, A., Dowdal, G., Moeykens, B. , Castillo, S. (1994). Healthand behavioral consequences of binge drinking in college: A national survey ofstudents at 140 campuses. JAMA, 272, 1672-1677.
Wilsnack, S. C., Plaud, J. J., Wilsnack, R. W., Klassen, A. D. (1997). Sexuality,gender and alcohol use. In: R.W. Wilsnack, S.C. Wilsnack (eds). Gender andalcohol: individual and social perspectives. New Brunnswick, NJ: RutgersCenter of Alcohol Studies. Alcohol, culture, and social control monographseries 3.
Wilsnack, R. W., Wilsnack, S. C. (1997). Gender and alcohol: Individual and socialperspectives. New Brunswick, NJ: Rutgers Center of Alcohol Studies.
Wilsnack, R. W., Vogeltanz, N. D., Wilsnack, S. C., Harris, T. R. (2000). Genderdifferences in alcohol consumption and adverse drinking consequences: Cross-cultural patterns. Addiction, 95, 251-265.
Wilsnack, S. C., Wilsnack, R. W. (1990). Women and substance abuse: researchdirections for the 1990s. Psychology of Addictive Behaviors, 4, 46–49.
Wilsnack, R. W., Wilsnack, S. C. (2002). International gender and alcohol research:recent findings. Alcohol Research & Health, 26, 245-250.
York, J. L., Welte, J. W. (1994). Gender comparisons of alcohol consumption inalcoholic and non-alcoholic populations. Journal of Studies on Alcohol, 55,743-750.
World Health Organization (2004). Global status report: alcohol policy. Geneva.WHO.
Zacny, J.P. (1990). Behavioral aspects of alcohol-tobacco interactions. RecentDevelopments in Alcoholism, 8, 205-219.
ALCOHOL, GENDER AND DRINKING PROBLEMS
68
INTRODUCTION
BACKGROUND
The Republic of Costa Rica is located in Central America, withNicaragua on the north and Panama on the south, and coasts on theeast and west. Its land area of 51 thousand square kilometers is
comparable with the size of Switzerland. According to data from the 2000national census (Instituto Nacional de Estadística y Censos, 2001) thereare 4 million inhabitants, including nearly 14% inmigrants, especially fromNicaragua. Migrant flow occurs in response to several factors: naturaldisasters, political conflict and structural economic imbalances.
A Human Development Index (HDI) of 0.821 places the country in anadvantageous position according to the United Nations DevelopmentProgramme. Literacy rate is 96% and life expectancy for women is 80.29years, and 76 years for men. The general mortality rate in 2002 was 3.71per one thousand and the infant mortality rate is 11.15 children per onethousand live births. Among primary causes of death are circulatorydiseases, tumors and reproductive system diseases. The prevalence of HIVinfection in women aged 15-24 is 0.3%
The mortality rate with regard to alcohol-related problems in 2002(liver disease, cirrhosis, alcoholic hepatitis, etc.) is 11.59 per one thousanddeaths. The male rate is 17.23, the female rate is 3.93. From all caraccidents in year 2002, one out of four involved the driver’s or pedestrian’sintoxication.
Alcohol consumption and alcohol-related problems have been a long-standing public health problem in Costa Rica. Alcohol-related matters haveundergone change according to different historical, social and economiccircumstances. One of the most important is the transformation in familyfunctioning and in men’s and women’s social roles. On the other hand,most of the research on alcohol carried out in Costa Rica in the past 20years has been done without a gender perspective, although it showed
CHAPTER 4ALCOHOL, GENDER AND
PARTNER AGGRESSION: A STUDY IN THE
GREATER METROPOLITAN AREA OF COSTA RICA
JULIO BEJARANO-OROZCO
differences between men and women. Several studies (Bejarano & Sáenz,2000; Bejarano, 2000; Jiménez & Bejarano, 1991), as well as a few otherreferences in the Latin American context (Alcaráz et al., 1999; Rumbos,2002) suggest that in the last 15 years or so, men have been drinkingbetween 3 and 4 times the amount of alcohol consumed by women. Neitherprecise statistics nor reliable estimates of the male/female alcoholconsumption ratio have been available until recent years. Since the earlyseventies research on alcohol and alcoholism (Miguez, 1985) hasrecognized that Costa Rican’s alcohol consumption can be understood inlarge part as a way to facilitate social interaction.
The historical idea of the Costa Rican nation as peasants isolated inmountains has influenced individuals’ perception of themselves, inaddition to a social definition of males with a machista component thatinvolves the repression of spontaneity and the repression of affectiveexpression. In fact, youngsters received strong social pressure to keep thecultural model of behavior intact (Escobar, 1974). In this model, themeaning of alcohol is linked with social integration and drinking is definedas a way to facilitate social solidarity. Alcohol is seen a culturally legitimateway to relieve the anxiety produced by social interaction, and that is whythe cultural modeling of young people includes alcohol for every socialactivity in which they get involved.
Since the seventies, different reports based on production and salesdata have shown a low percapita consumption of alcohol (5 litres ofabsolute alcohol per year) when compared with developed countries.Nevertheless, drinking occasions, usually happening once or twice a week,are characterized by substantial amounts of alcohol intake.
Data available in Costa Rica since 1990 clearly show that men consumemore frequently than women in all age groups (Sáenz, 1999; Jiménez &Bejarano, 1991). Men who are 20-49 years of age consume more frequentlythan younger and older men. According to the 1995 national survey onalcohol and drug abuse (Bejarano & San Lee, 1997), the prevalence of heavydrinking (5 or more drinks consumed per occasion) is higher in men(33.7%) than among women, whose prevalence is rather low (6%).Although there is strong evidence that male and female drinking behaviourare different, women’s patterns of consumption have changed in the last 25years (Bejarano, San Lee & Carvajal, 1999). From initial patterns ofmoderate consumption, women’s heavy drinking levels have increased in asignificant way.
Recent research from the beginning of the new century (Bejarano &Ugalde, 2003) has shown that more educated women show a higherprevalence of heavy drinking (by 10%), and research on 7th to 9th gradestudents suggests an earlier age of onset. In fact, the age of onset of alcoholuse for both young men and women is as low as eleven years, which is lowerthan the age of onset found in other Latin American and even Europeancountries (Jernigan, 2001). One main aspect with regard to the age of
ALCOHOL, GENDER AND DRINKING PROBLEMS
70
onset and some drinking patterns, like drunkenness, type of drinkingcontext, etc., is the absence of gender-related significant differences. Thisis a matter of growing concern at the national level, and particularly true inthe school-based context as compared to the general population.
The role of education, which shows special relations with drinking indifferent countries, the role of religion, the availability of alcohol, includingits price, the role of having work and some mood-related reasons are keyaspects to be surveyed in future investigations.
Costa Rica is part of the GENACIS study, a multinational study ofgender, alcohol and culture, and the present work explores the relationshipamong individual-level and societal variables and alcohol consumptionand alcohol problems in both men and women. The main variables arefamilial and other social settings for alcohol consumption, intimaterelations and sexuality, social networks, aggression and childhood abuse,health and lifestyle, work experience, social role, gender inequality, andaspects of the drinking culture
The objectives of the Genacis study include the following:
• Comparisons of the drinking patterns between men and women.• Comparisons of the prevalence of alcohol-related problems
between men and women.• Comparisons of correlates of women’s and men’s heavy alcohol
consumption and alcohol-related problems.• Societal-level analyses of the associations between women’s and
men’s drinking behaviour and types of drinking cultures andgender inequality
• Development of improved culture- and gender-sensitive measuresof alcohol consumption and alcohol-related problems
This work also explores the relationship of violence/victimization andalcohol consumption in the Greater Metropolitan Area of Costa Rica, anissue which is a key topic for the Genacis project. Domestic violence inCosta Rica has a growing importance, especially violence among intimatepartners, and it is recognized as a public health problem and a citizenshipsecurity issue. As pointed out by Graham, Wells and Jelley (2002),research has found higher rates of domestic violence among intimatepartners who drink heavily. The connections between alcohol consumptionand violence suggest that the effects of alcohol could play a causal role inaggression or increase the incidence and severity of male violence againsttheir partners. However, there is a considerable debate about the nature ofthe relationship between alcohol consumption and violence, and whether itis truly causal. Some authors believe that alcohol works as a factorincreasing the likelihood of aggressive behaviour or violence by reducinginhibitions, affecting judgment and impairing the ability of the drinker tointerpret cues. Other authors argue that the connection between alcoholintake and violence is culturally dependent, and happens only in places
ALCOHOL, GENDER AND PARTNER AGGRESSION:A STUDY IN THE GREATER METROPOLITAN AREA OF COSTA RICA
71
.
.
.
where social expectancies are that drinking evokes or excuses certainbehaviours (World Health Organization, 2002).
In Costa Rica partner violence accounts for a growing number ofdeaths of women by murder and a significant number of physical andpsychological injuries. In the year 2000, the National Institute on Women(Barahona, 2002) counted four thousand cases; 36% of these were newones, and 26% requested protection measures (e.g. requiring the partner tostay away from home).
This study explores some relevant aspects regarding alcoholconsumption by males and females from the Costa Rican GreaterMetropolitan Area sample, and makes a first approach to the problem ofdomestic violence and its relation with drinking behaviour.
METHOD
SAMPLING DESIGN
The master sample framework was obtained from the NationalInstitute on Statistics and Census (Instituto Nacional de Estadística yCensos, INEC), and some variables were used as controlling variables, forestablishing differences within groups. These were gender, age, occupationand economic condition. The sample was drawn from the GreaterMetropolintan Area, a geographical area which contains almost one half ofthe national population and households.
The design of the study was a household survey restricted to the GreaterMetropolitan Area population. It was a multistage cluster sample designincluding males and females aged 18 and older, living permanently ortemporarily in houses. The primary sampling unit was the segment(geographical area with an arbitrary delimitation: i.e. streets, houses, rivers,including approximately 70 households), which was selected by proportionalsize probability, based on the number of existing households in it. Thesecond sampling stage is the household, which was selected systematicallyfrom an initial random start. For each segment the interviewer had adetailed map to select the starting dwelling and the direction to follow. Thefinal sample stage was the subject in each household. The subjects wereselected randomly using a route sheet (i.e., a fieldwork interview selectionblueprint — a document containing information about household residentsfor making a systematic selection of individuals).
Sample size was 1274 respondents (630 men and 644 women). Eighty-two percent of the sample was from the urban zone and 18% from ruralareas. In the urban area 51.6% were men and 48.4% women, while in therural area 39.7% were men and 60.3% women. Each face-to-face interviewwas made by one of eight experienced and trained advanced psychologystudents, administering the standardized 30-45 minute Genacis interview.Respondents were informed that they could refuse to answer any of the
ALCOHOL, GENDER AND DRINKING PROBLEMS
72
items of the questionnaire that they did not want to answer. Fieldworkerswere also prepared to deal with any special situations regardingrespondent feelings evoked by some sensitive questions (sexuality,victimization, alcohol consumption, etc.).
The sample design did not include homeless people, patients inhospitals or those without established residence. The post-hoc weightingvariables were sex, age, working status and province.
MEASURES
The GENACIS questionnaire assessed demographic characteristics(e.g. gender, date of birth, family income, nationality and ethnicity, maritalstatus, educational level), social network (informal and supportive contactswith family and non-family members), drinking patterns (drinkingfrequency, beverage preference, amounts of alcohol per drinking session,time spent drinking, age at onset, drinking contexts), drinkingconsequences, intimate relations and sexuality, violence and victimization,health and lifestyle. The response rate in this study was 96%.
Most of the quantity and frequency of drinking questions were askedfor the past 12 months. Frequency responses were analyzed in terms ofthree main categories: more often than weekly, 1 to 3 times monthly andless than monthly. Current drinker is a respondent who reportedconsumption of any alcoholic beverage in the last 12 months. A heavydrinker is defined as a respondent who drinks five or more drinks peroccasion. Lifetime abstainers are those who have never used alcohol, andcurrent abstainers are those who had nothing to drink (including lifetimeabstainers) in the twelve months preceding the interview.
Alcohol-related problems were assessed with two screeningquestionnaires, CAGE and AUDIT. Regarding the Audit, the hazardousalcohol use (questions 1 to 3) cut-off point was 6. The dependence(questions 4 to 6) cut-off was 4 and the harmful use (questions 7 to 10) cut-off was 7 points. The cut-off point for the whole Audit was 8+ points, whichis the score that produces the highest sensitivity (Babor et al., 1992). Therewas also a set of questions related to drinking consequences at theindividual, family and social level.
A typology of drinkers was created based on drinking amounts and thefrequency of drinking:
- Infrequent light drinker: drinks less than five drinks, less than weekly- Frequent light drinker: drinks less than five drinks, more than weekly- Infrequent heavy drinker: drinks five or more drinks, less than weekly- Frequent heavy drinker: drinks five or more drinks, more than weekly
For analysis purposes some other typologies were created: currentabstainers vs. current drinkers; non-heavy drinkers vs. heavy drinkers;lifetime abstainers, former drinkers and current drinkers.
ALCOHOL, GENDER AND PARTNER AGGRESSION:A STUDY IN THE GREATER METROPOLITAN AREA OF COSTA RICA
73
.
;;;
STATISTICAL ANALYSIS
A non-parametric test (chi-square with Yate’s continuity correction)was used to test for differences between categorical variables. Multinomiallogistic regression model was carried out to test the likelihood of changesin the dependent variable due to selected independent variables.
RESULTS
DEMOGRAPHIC CHARACTERISTICS
As shown in Table 1, the ratio of males to females in the sample was0.98:1. Both men and women were distributed evenly, but men were morelikely to be single, work in the services sector and live in an urban area.Males were also more likely than females to report a middle family incomeand to provide more than half of the family income.
The distribution of age groups was similar among males and females,and it also resembled the distribution at the national level. As showed byother studies (Proyecto Estado de la Nación, 2002), women’s educationallevel was slightly higher than men’s, and they also had a lower rate ofunemployment and retirement status than men.
Both men and women were Catholics (not in Table) in similarproportion (almost 70%), but there was a significantly higher percentage ofwomen having a Protestant preference (23.3% vs. 17% in males).
THE CONTEXT WHERE SPOUSES/PARTNERS LIVE
Fifty six percent of men and women were married or lived with apartner. The partners for 14% of males and 3% of females were individualsof the same sex. The average number of people living in households wherethe respondent was living with a partner was 4.5. About 16% of singlepeople had ever lived with a partner. Altogether, 65% of men and 80% ofwomen have had children (average per respondent: 2 children).
Twenty percent of men who were married or living together and 26%of women in the same condition reported an “extremely unhappy”,“unhappy” or “fairly unhappy” relationship. One third of them reportedthat talking about feelings or problems with the partner was “verydifficult”, “difficult” or “fairly difficult”. Fifteen percent of men reportedquarreling with a partner at least several times a month, while 24% ofwomen did the same. Just 1% of males reported the spouse/partner wasdrinking (at least occasionally) while quarreling compared with 12% offemales reporting the spouse/partner drinking occasionally or morefrequently in this circumstance. One out of four men and one out of threewomen have felt lonely from time to time (13% of men, 18% of women) oroften and very often (13% of males, 15% of females) during the last 12months.
ALCOHOL, GENDER AND DRINKING PROBLEMS
74
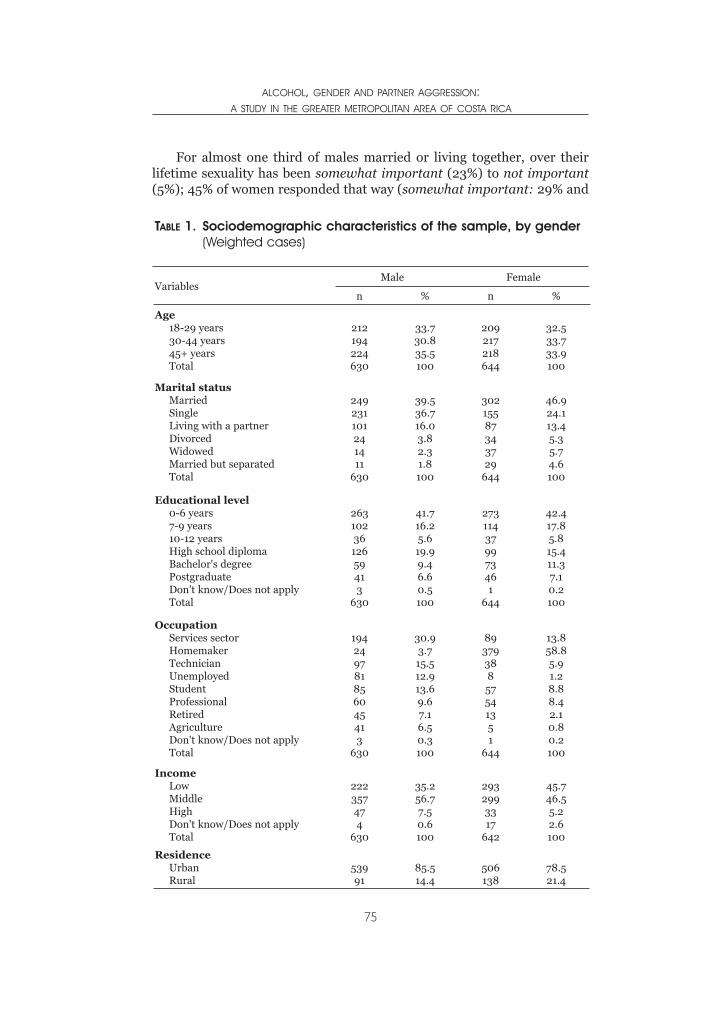
For almost one third of males married or living together, over theirlifetime sexuality has been somewhat important (23%) to not important(5%); 45% of women responded that way (somewhat important: 29% and
ALCOHOL, GENDER AND PARTNER AGGRESSION:A STUDY IN THE GREATER METROPOLITAN AREA OF COSTA RICA
75
TABLE 1. Sociodemographic characteristics of the sample, by gender(Weighted cases)
VariablesMale Female
n % n %
Age18-29 years30-44 years45+ yearsTotal
212194224630
33.730.835.5100
209217218644
32.533.733.9100
Marital statusMarriedSingleLiving with a partnerDivorcedWidowedMarried but separatedTotal
249231101241411
630
39.536.716.03.82.31.8100
30215587343729
644
46.924.113.45.35.74.6100
Educational level0-6 years7-9 years10-12 yearsHigh school diplomaBachelor's degreePostgraduateDon't know/Does not applyTotal
2631023612659413
630
41.716.25.619.99.46.60.5100
273114379973461
644
42.417.85.815.411.37.10.2100
OccupationServices sectorHomemakerTechnicianUnemployedStudentProfessionalRetiredAgricultureDon't know/Does not applyTotal
194249781856045413
630
30.93.715.512.913.69.67.16.50.3100
8937938857541351
644
13.858.85.91.28.88.42.10.80.2100
IncomeLowMiddleHighDon't know/Does not applyTotal
222357474
630
35.256.77.50.6100
2932993317
642
45.746.55.22.6100
ResidenceUrbanRural
53991
85.514.4
506138
78.521.4
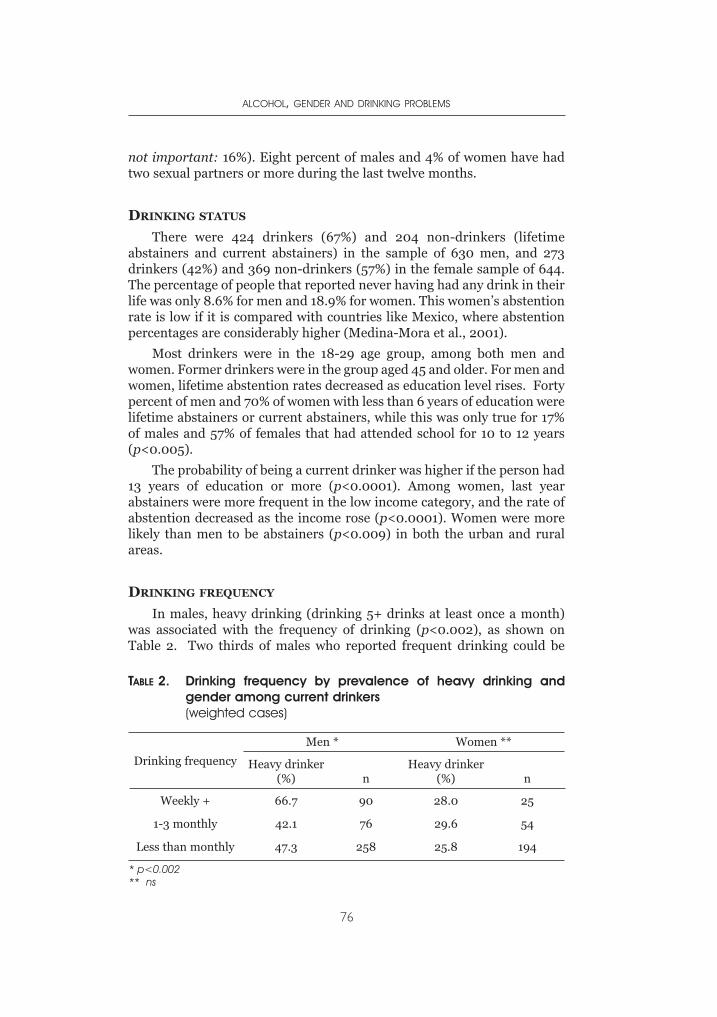
not important: 16%). Eight percent of males and 4% of women have hadtwo sexual partners or more during the last twelve months.
DRINKING STATUS
There were 424 drinkers (67%) and 204 non-drinkers (lifetimeabstainers and current abstainers) in the sample of 630 men, and 273drinkers (42%) and 369 non-drinkers (57%) in the female sample of 644.The percentage of people that reported never having had any drink in theirlife was only 8.6% for men and 18.9% for women. This women’s abstentionrate is low if it is compared with countries like Mexico, where abstentionpercentages are considerably higher (Medina-Mora et al., 2001).
Most drinkers were in the 18-29 age group, among both men andwomen. Former drinkers were in the group aged 45 and older. For men andwomen, lifetime abstention rates decreased as education level rises. Fortypercent of men and 70% of women with less than 6 years of education werelifetime abstainers or current abstainers, while this was only true for 17%of males and 57% of females that had attended school for 10 to 12 years(p<0.005).
The probability of being a current drinker was higher if the person had13 years of education or more (p<0.0001). Among women, last yearabstainers were more frequent in the low income category, and the rate ofabstention decreased as the income rose (p<0.0001). Women were morelikely than men to be abstainers (p<0.009) in both the urban and ruralareas.
DRINKING FREQUENCY
In males, heavy drinking (drinking 5+ drinks at least once a month)was associated with the frequency of drinking (p<0.002), as shown onTable 2. Two thirds of males who reported frequent drinking could be
ALCOHOL, GENDER AND DRINKING PROBLEMS
76
TABLE 2. Drinking frequency by prevalence of heavy drinking and gender among current drinkers(weighted cases)
Drinking frequency
Men * Women **
Heavy drinker(%) n
Heavy drinker(%) n
Weekly + 66.7 90 28.0 25
1-3 monthly 42.1 76 29.6 54
Less than monthly 47.3 258 25.8 194
* p<0.002** ns
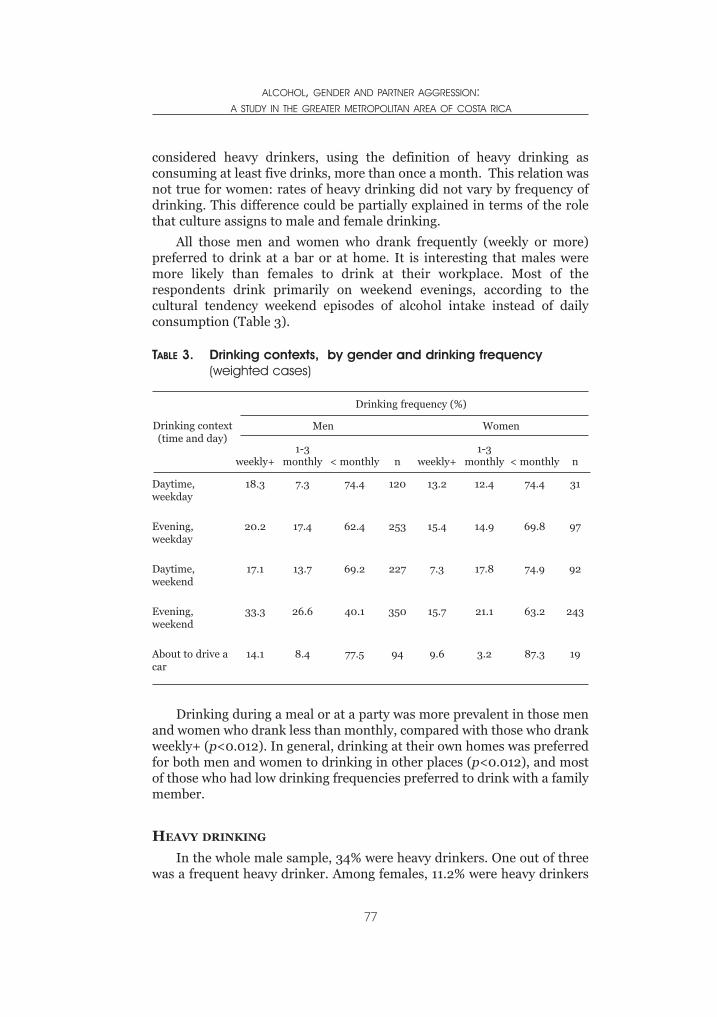
considered heavy drinkers, using the definition of heavy drinking asconsuming at least five drinks, more than once a month. This relation wasnot true for women: rates of heavy drinking did not vary by frequency ofdrinking. This difference could be partially explained in terms of the rolethat culture assigns to male and female drinking.
All those men and women who drank frequently (weekly or more)preferred to drink at a bar or at home. It is interesting that males weremore likely than females to drink at their workplace. Most of therespondents drink primarily on weekend evenings, according to thecultural tendency weekend episodes of alcohol intake instead of dailyconsumption (Table 3).
Drinking during a meal or at a party was more prevalent in those menand women who drank less than monthly, compared with those who drankweekly+ (p<0.012). In general, drinking at their own homes was preferredfor both men and women to drinking in other places (p<0.012), and mostof those who had low drinking frequencies preferred to drink with a familymember.
HEAVY DRINKING
In the whole male sample, 34% were heavy drinkers. One out of threewas a frequent heavy drinker. Among females, 11.2% were heavy drinkers
ALCOHOL, GENDER AND PARTNER AGGRESSION:A STUDY IN THE GREATER METROPOLITAN AREA OF COSTA RICA
77
TABLE 3. Drinking contexts, by gender and drinking frequency(weighted cases)
Drinking context(time and day)
Drinking frequency (%)
Men Women
weekly+1-3
monthly < monthly n weekly+1-3
monthly < monthly n
Daytime,weekday
18.3 7.3 74.4 120 13.2 12.4 74.4 31
Evening,weekday
20.2 17.4 62.4 253 15.4 14.9 69.8 97
Daytime,weekend
17.1 13.7 69.2 227 7.3 17.8 74.9 92
Evening,weekend
33.3 26.6 40.1 350 15.7 21.1 63.2 243
About to drive acar
14.1 8.4 77.5 94 9.6 3.2 87.3 19
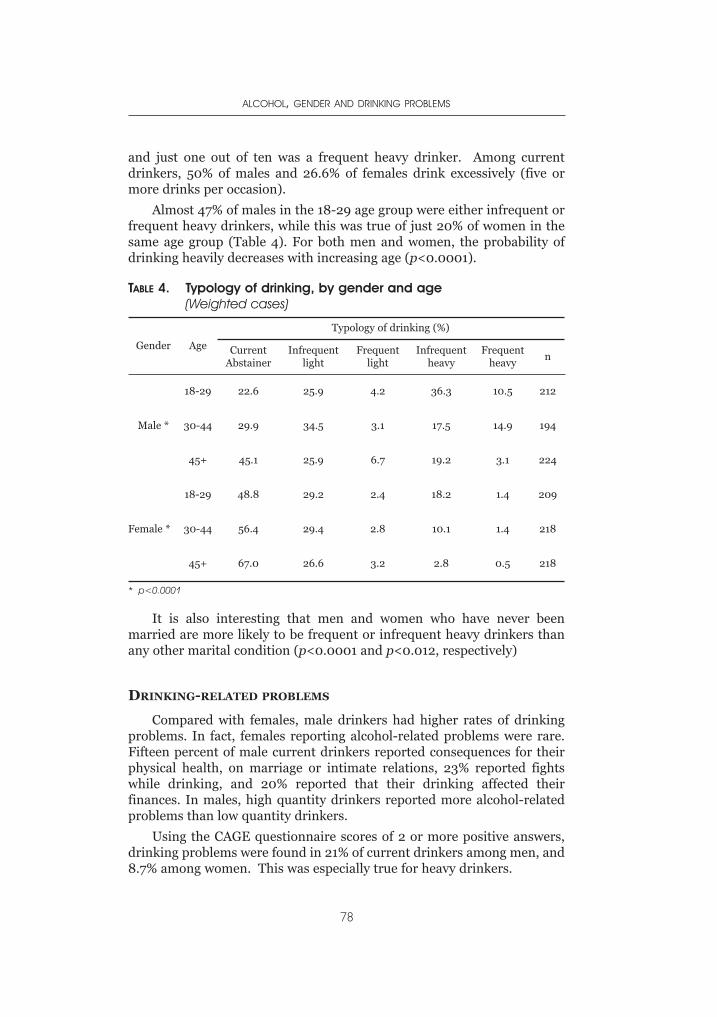
and just one out of ten was a frequent heavy drinker. Among currentdrinkers, 50% of males and 26.6% of females drink excessively (five ormore drinks per occasion).
Almost 47% of males in the 18-29 age group were either infrequent orfrequent heavy drinkers, while this was true of just 20% of women in thesame age group (Table 4). For both men and women, the probability ofdrinking heavily decreases with increasing age (p<0.0001).
It is also interesting that men and women who have never beenmarried are more likely to be frequent or infrequent heavy drinkers thanany other marital condition (p<0.0001 and p<0.012, respectively)
DRINKING-RELATED PROBLEMS
Compared with females, male drinkers had higher rates of drinkingproblems. In fact, females reporting alcohol-related problems were rare.Fifteen percent of male current drinkers reported consequences for theirphysical health, on marriage or intimate relations, 23% reported fightswhile drinking, and 20% reported that their drinking affected theirfinances. In males, high quantity drinkers reported more alcohol-relatedproblems than low quantity drinkers.
Using the CAGE questionnaire scores of 2 or more positive answers,drinking problems were found in 21% of current drinkers among men, and8.7% among women. This was especially true for heavy drinkers.
ALCOHOL, GENDER AND DRINKING PROBLEMS
78
TABLE 4. Typology of drinking, by gender and age(Weighted cases)
Gender Age
Typology of drinking (%)
CurrentAbstainer
Infrequentlight
Frequentlight
Infrequentheavy
Frequentheavy
n
Male *
18-29 22.6 25.9 4.2 36.3 10.5 212
30-44 29.9 34.5 3.1 17.5 14.9 194
45+ 45.1 25.9 6.7 19.2 3.1 224
Female *
18-29 48.8 29.2 2.4 18.2 1.4 209
30-44 56.4 29.4 2.8 10.1 1.4 218
45+ 67.0 26.6 3.2 2.8 0.5 218
* p<0.0001
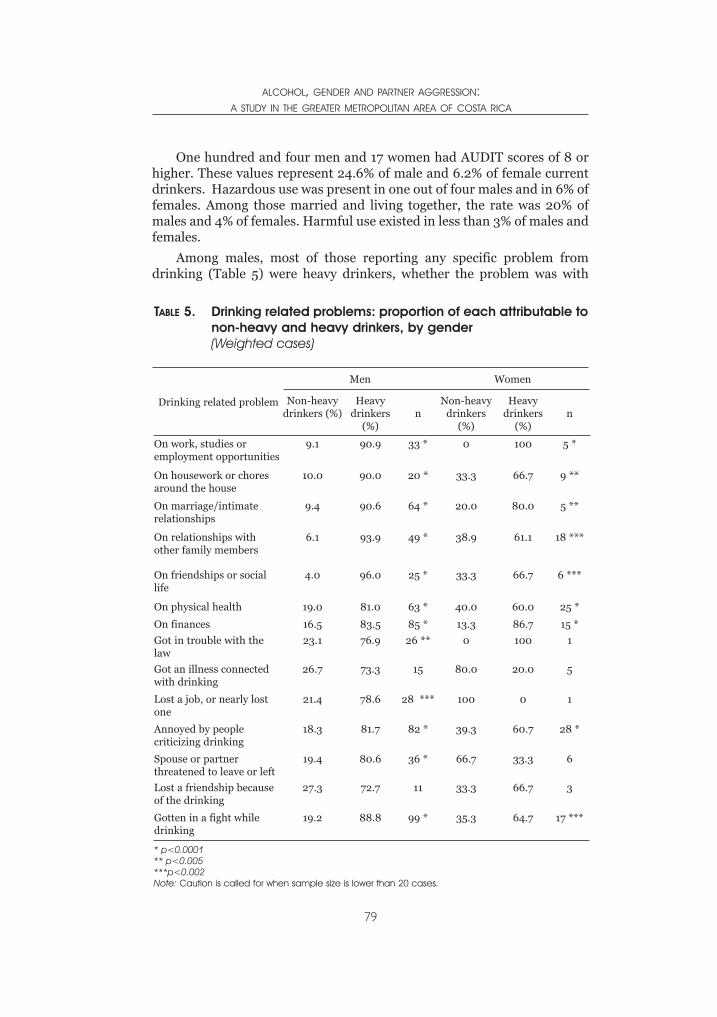
One hundred and four men and 17 women had AUDIT scores of 8 orhigher. These values represent 24.6% of male and 6.2% of female currentdrinkers. Hazardous use was present in one out of four males and in 6% offemales. Among those married and living together, the rate was 20% ofmales and 4% of females. Harmful use existed in less than 3% of males andfemales.
Among males, most of those reporting any specific problem fromdrinking (Table 5) were heavy drinkers, whether the problem was with
ALCOHOL, GENDER AND PARTNER AGGRESSION:A STUDY IN THE GREATER METROPOLITAN AREA OF COSTA RICA
79
TABLE 5. Drinking related problems: proportion of each attributable tonon-heavy and heavy drinkers, by gender(Weighted cases)
Drinking related problem
Men Women
Non-heavydrinkers (%)
Heavydrinkers
(%)n
Non-heavydrinkers
(%)
Heavydrinkers
(%)n
On work, studies oremployment opportunities
9.1 90.9 33 * 0 100 5 *
On housework or choresaround the house
10.0 90.0 20 * 33.3 66.7 9 **
On marriage/intimaterelationships
9.4 90.6 64 * 20.0 80.0 5 **
On relationships withother family members
6.1 93.9 49 * 38.9 61.1 18 ***
On friendships or sociallife
4.0 96.0 25 * 33.3 66.7 6 ***
On physical health 19.0 81.0 63 * 40.0 60.0 25 *
On finances 16.5 83.5 85 * 13.3 86.7 15 *
Got in trouble with thelaw
23.1 76.9 26 ** 0 100 1
Got an illness connectedwith drinking
26.7 73.3 15 80.0 20.0 5
Lost a job, or nearly lostone
21.4 78.6 28 *** 100 0 1
Annoyed by peoplecriticizing drinking
18.3 81.7 82 * 39.3 60.7 28 *
Spouse or partnerthreatened to leave or left
19.4 80.6 36 * 66.7 33.3 6
Lost a friendship becauseof the drinking
27.3 72.7 11 33.3 66.7 3
Gotten in a fight whiledrinking
19.2 88.8 99 * 35.3 64.7 17 ***
* p<0.0001** p<0.005***p<0.002Note: Caution is called for when sample size is lower than 20 cases.
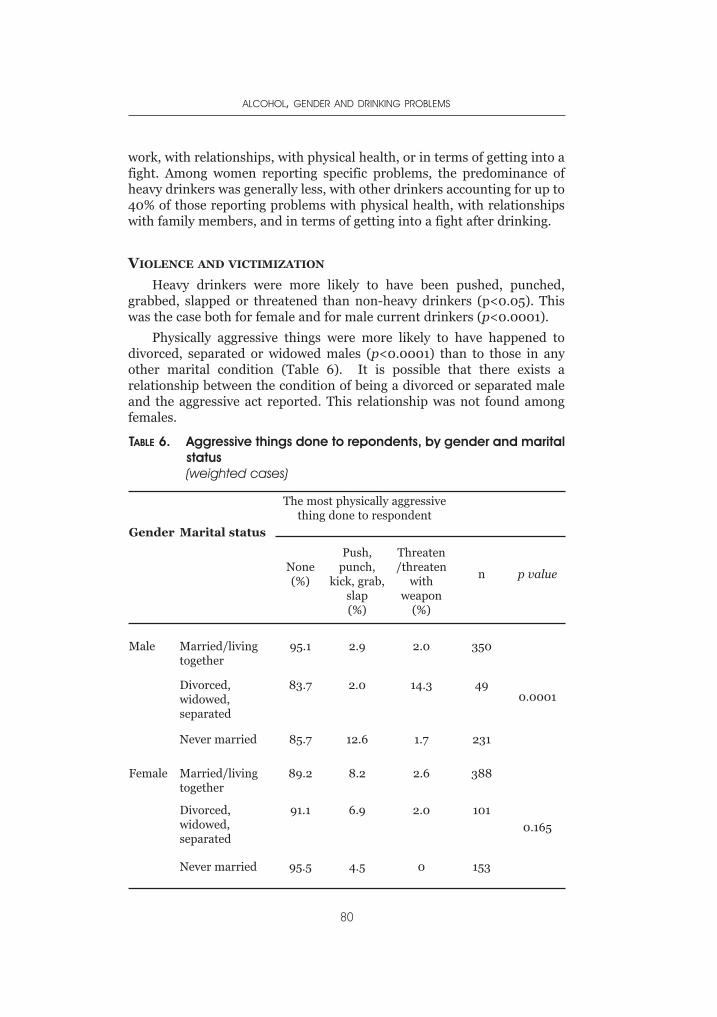
work, with relationships, with physical health, or in terms of getting into afight. Among women reporting specific problems, the predominance ofheavy drinkers was generally less, with other drinkers accounting for up to40% of those reporting problems with physical health, with relationshipswith family members, and in terms of getting into a fight after drinking.
VIOLENCE AND VICTIMIZATION
Heavy drinkers were more likely to have been pushed, punched,grabbed, slapped or threatened than non-heavy drinkers (p<0.05). Thiswas the case both for female and for male current drinkers (p<0.0001).
Physically aggressive things were more likely to have happened todivorced, separated or widowed males (p<0.0001) than to those in anyother marital condition (Table 6). It is possible that there exists arelationship between the condition of being a divorced or separated maleand the aggressive act reported. This relationship was not found amongfemales.
ALCOHOL, GENDER AND DRINKING PROBLEMS
80
TABLE 6. Aggressive things done to repondents, by gender and maritalstatus(weighted cases)
Gender Marital status
The most physically aggressivething done to respondent
None (%)
Push,punch,
kick, grab,slap(%)
Threaten/threaten
withweapon
(%)
n p value
Male Married/livingtogether
95.1 2.9 2.0 350
0.0001Divorced,widowed,separated
83.7 2.0 14.3 49
Never married 85.7 12.6 1.7 231
Female Married/livingtogether
89.2 8.2 2.6 388
0.165
Divorced,widowed,separated
91.1 6.9 2.0 101
Never married 95.5 4.5 0 153
Among males and females married or living together, those scoring 8+in the AUDIT were more likely to be victims of physical aggression thanthose whose scores were lower (p<0.003). Also males scoring 8+ weremore likely than those with lower scores to do physically aggressive thingsto their intimate partners (p<0.0001).
It is interesting that rates of partner aggression (both the mostphysically aggressive thing done to the respondent and the most physicallyaggressive things done to others by the respondent during the last 2 years)were similar in men and women in the whole sample. In fact 9% of malesand 9.2% of females reported physically aggressive things done to them, aswell as 5% reporting physically aggressive things done by them. The firstfinding has also been shown by various studies (Archer, 2000). But it doesnot necessarily mean that the levels of male and female aggression involvedwere the same. Graham et al. (2002) have pointed out that although ratesof partner aggression are similar for both genders, the dynamics and therole of alcohol are gender-specific. Among people married or livingtogether, there are more females than males reporting that they have beensubjects of aggression (p<0.0001). In women, living with someone now orin the past increases the probability of suffering physically aggressive acts.This finding is supported by studies which have shown that a woman wholives with a heavy drinker has a greater risk of physical violence from herpartner (World Health Organization, 2002).
It is clear then that aggressive actions are more likely between malesand females if they are heavy drinkers (p<0.0001). Aggressive actions werealso more present in low income males (p<0.0001) than in those withmiddle or high income. The probability of occurrence of these physicallyaggressive actions was higher if respondents were current drinkers(p<0.009 in men, p<0.005 in women), if they started to drink at age 13years or less (p<0,002), and if their current age was 30-34 years (p<0.012).
Considering the most physically aggressive thing in the last two yearsdone to males, 17% of the respondents had been drinking before the event,while 15.3% of the perpetrators had been drinking (p<0.050). Seventy fivepercent of males and females indicated that it was the spouse/partner whohad perpetrated the aggressive actions, and for more than a half of malerespondents the action happened once. Two thirds of males reported thatthe intensity of this act was low. Just one third of women said the same.Interestingly, evidence from elsewhere (World Health Organization, 2002)indicates that men who have been drinking prior to a violent act inflictmore serious violence at the time of the aggressive event.
Regarding the most physically aggressive act committed by therespondent (Table 7), one third of males reported alcohol consumptionbefore the event, while just 7.5% of females were drinking (p<0.020). Theintensity of the action was low, according to 83% of males and 68.5% offemales. The spouse/partner was the victim, according to 84.4% of malesand 69.2% of females. Concerning the emotional impact of violence,
ALCOHOL, GENDER AND PARTNER AGGRESSION:A STUDY IN THE GREATER METROPOLITAN AREA OF COSTA RICA
81
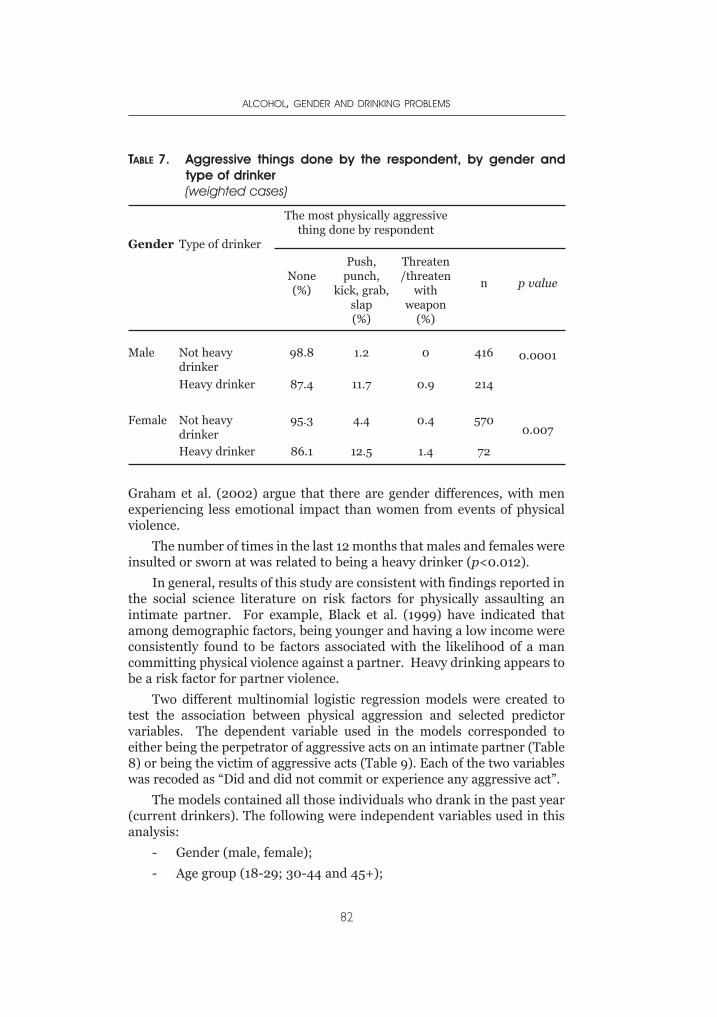
Graham et al. (2002) argue that there are gender differences, with menexperiencing less emotional impact than women from events of physicalviolence.
The number of times in the last 12 months that males and females wereinsulted or sworn at was related to being a heavy drinker (p<0.012).
In general, results of this study are consistent with findings reported inthe social science literature on risk factors for physically assaulting anintimate partner. For example, Black et al. (1999) have indicated thatamong demographic factors, being younger and having a low income wereconsistently found to be factors associated with the likelihood of a mancommitting physical violence against a partner. Heavy drinking appears tobe a risk factor for partner violence.
Two different multinomial logistic regression models were created totest the association between physical aggression and selected predictorvariables. The dependent variable used in the models corresponded toeither being the perpetrator of aggressive acts on an intimate partner (Table8) or being the victim of aggressive acts (Table 9). Each of the two variableswas recoded as “Did and did not commit or experience any aggressive act”.
The models contained all those individuals who drank in the past year(current drinkers). The following were independent variables used in thisanalysis:
- Gender (male, female);
- Age group (18-29; 30-44 and 45+);
ALCOHOL, GENDER AND DRINKING PROBLEMS
82
TABLE 7. Aggressive things done by the respondent, by gender andtype of drinker(weighted cases)
Gender Type of drinker
The most physically aggressivething done by respondent
None(%)
Push,punch,
kick, grab,slap(%)
Threaten/threaten
withweapon
(%)
n p value
Male Not heavydrinker
98.8 1.2 0 416 0.0001
Heavy drinker 87.4 11.7 0.9 214
Female Not heavydrinker
95.3 4.4 0.4 5700.007
Heavy drinker 86.1 12.5 1.4 72
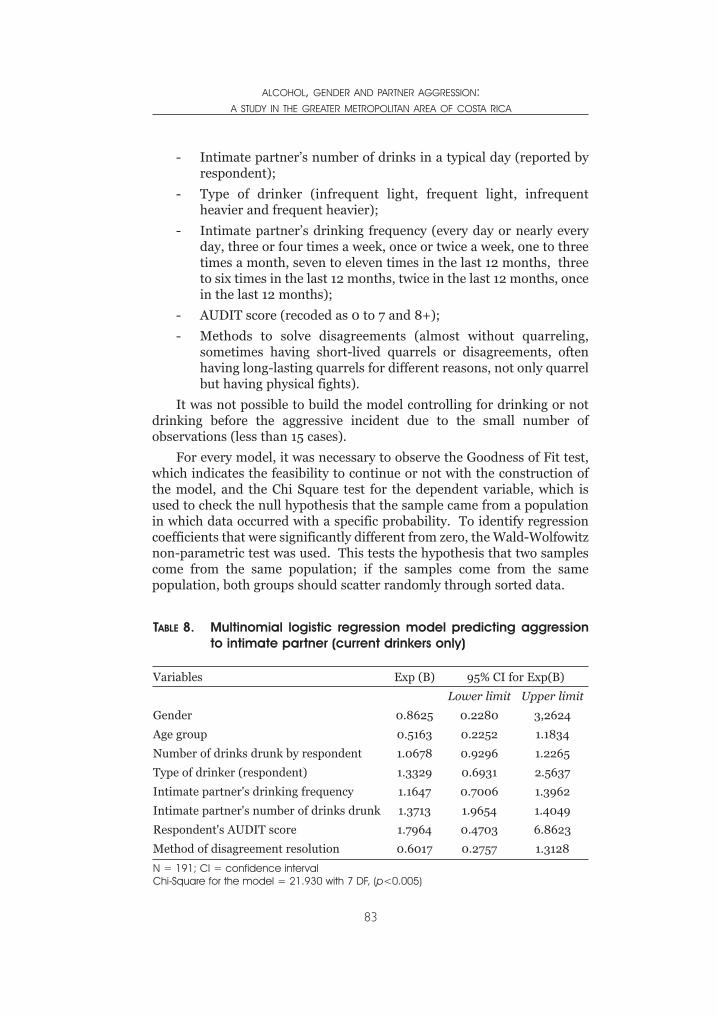
- Intimate partner’s number of drinks in a typical day (reported byrespondent);
- Type of drinker (infrequent light, frequent light, infrequentheavier and frequent heavier);
- Intimate partner’s drinking frequency (every day or nearly everyday, three or four times a week, once or twice a week, one to threetimes a month, seven to eleven times in the last 12 months, threeto six times in the last 12 months, twice in the last 12 months, oncein the last 12 months);
- AUDIT score (recoded as 0 to 7 and 8+);
- Methods to solve disagreements (almost without quarreling,sometimes having short-lived quarrels or disagreements, oftenhaving long-lasting quarrels for different reasons, not only quarrelbut having physical fights).
It was not possible to build the model controlling for drinking or notdrinking before the aggressive incident due to the small number ofobservations (less than 15 cases).
For every model, it was necessary to observe the Goodness of Fit test,which indicates the feasibility to continue or not with the construction ofthe model, and the Chi Square test for the dependent variable, which isused to check the null hypothesis that the sample came from a populationin which data occurred with a specific probability. To identify regressioncoefficients that were significantly different from zero, the Wald-Wolfowitznon-parametric test was used. This tests the hypothesis that two samplescome from the same population; if the samples come from the samepopulation, both groups should scatter randomly through sorted data.
ALCOHOL, GENDER AND PARTNER AGGRESSION:A STUDY IN THE GREATER METROPOLITAN AREA OF COSTA RICA
83
TABLE 8. Multinomial logistic regression model predicting aggressionto intimate partner (current drinkers only)
Variables Exp (B) 95% CI for Exp(B)
Lower limit Upper limit
Gender 0.8625 0.2280 3,2624
Age group 0.5163 0.2252 1.1834
Number of drinks drunk by respondent 1.0678 0.9296 1.2265
Type of drinker (respondent) 1.3329 0.6931 2.5637
Intimate partner's drinking frequency 1.1647 0.7006 1.3962
Intimate partner's number of drinks drunk 1.3713 1.9654 1.4049
Respondent's AUDIT score 1.7964 0.4703 6.8623
Method of disagreement resolution 0.6017 0.2757 1.3128
N = 191; CI = confidence intervalChi-Square for the model = 21.930 with 7 DF, (p<0.005)
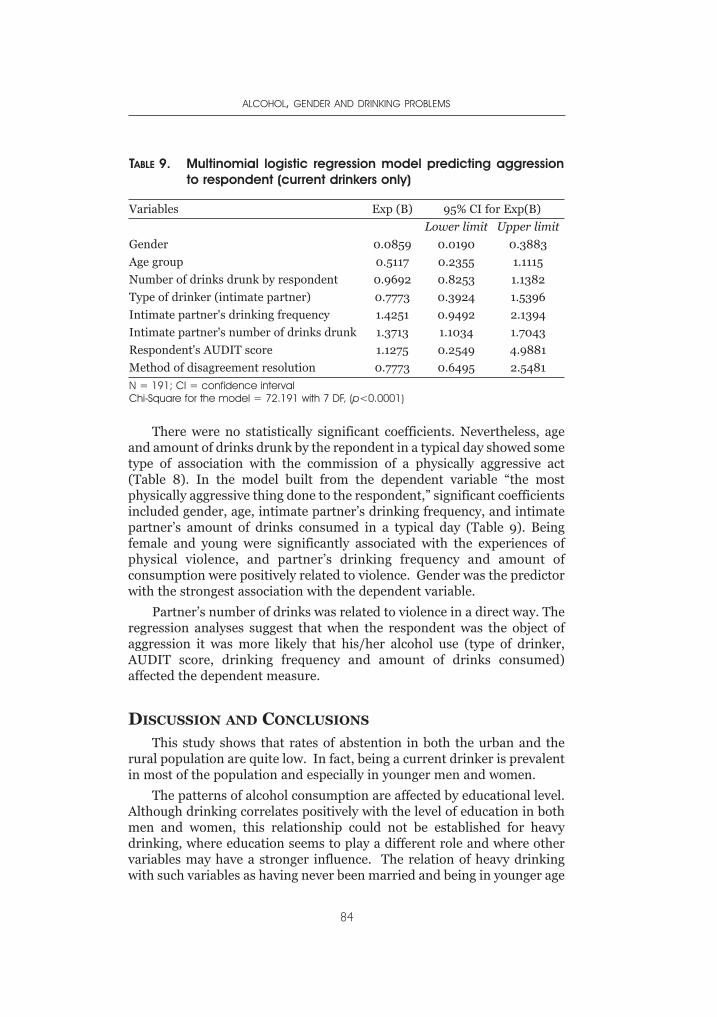
There were no statistically significant coefficients. Nevertheless, ageand amount of drinks drunk by the repondent in a typical day showed sometype of association with the commission of a physically aggressive act(Table 8). In the model built from the dependent variable “the mostphysically aggressive thing done to the respondent,” significant coefficientsincluded gender, age, intimate partner’s drinking frequency, and intimatepartner’s amount of drinks consumed in a typical day (Table 9). Beingfemale and young were significantly associated with the experiences ofphysical violence, and partner’s drinking frequency and amount ofconsumption were positively related to violence. Gender was the predictorwith the strongest association with the dependent variable.
Partner’s number of drinks was related to violence in a direct way. Theregression analyses suggest that when the respondent was the object ofaggression it was more likely that his/her alcohol use (type of drinker,AUDIT score, drinking frequency and amount of drinks consumed)affected the dependent measure.
DISCUSSION AND CONCLUSIONS
This study shows that rates of abstention in both the urban and therural population are quite low. In fact, being a current drinker is prevalentin most of the population and especially in younger men and women.
The patterns of alcohol consumption are affected by educational level.Although drinking correlates positively with the level of education in bothmen and women, this relationship could not be established for heavydrinking, where education seems to play a different role and where othervariables may have a stronger influence. The relation of heavy drinkingwith such variables as having never been married and being in younger age
ALCOHOL, GENDER AND DRINKING PROBLEMS
84
TABLE 9. Multinomial logistic regression model predicting aggressionto respondent (current drinkers only)
Variables Exp (B) 95% CI for Exp(B)
Lower limit Upper limit
Gender 0.0859 0.0190 0.3883
Age group 0.5117 0.2355 1.1115
Number of drinks drunk by respondent 0.9692 0.8253 1.1382
Type of drinker (intimate partner) 0.7773 0.3924 1.5396
Intimate partner's drinking frequency 1.4251 0.9492 2.1394
Intimate partner's number of drinks drunk 1.3713 1.1034 1.7043
Respondent's AUDIT score 1.1275 0.2549 4.9881
Method of disagreement resolution 0.7773 0.6495 2.5481
N = 191; CI = confidence intervalChi-Square for the model = 72.191 with 7 DF, (p<0.0001)
groups suggests that these segments deserve close surveillance in terms ofprevention. Certainly, females drink less frequently and their rates ofheavy drinking are lower than men, but this study also shows that levels ofdrinking and heavy drinking are rising if the situation is compared withsurvey data from the 1980s and the 1990s, at least in the GreaterMetropolitan Area.
Results from this study suggest that heavy drinking is linked with asignificant risk of alcohol-related problems, a fact which indicates thatattention should be paid more to the hazardous use of alcohol than toabstaining versus drinking. Hazardous use of alcohol implies a high risk ofdamage to health, even if this risk has not yet resulted in significantphysical or mental ill effects. This reinforces the idea of addressing acuteintoxication as a goal of problem prevention. Ours is a culture whichpromotes heavy drinking among specific groups of the population and doesnot limit drinking, as occurs in cultures with traditions of temperatedrinking. Policymakers should attend to the problem of drinking largeamounts of alcohol at one sitting, linked to specific risks, which calls forpromotion of drinking moderation and public education on the risksinvolved in drinking large quantities of alcohol in short periods of time.
A rapid increase in alcohol intake would raise the probability offurther increases in alcohol-related problems in coming years. This isespecially true if patterns of consumption of teenagers still within theeducational system, which at this point are considered critical, are takeninto account.
This study also reveals that alcohol is a risk marker for partnerviolence. In fact, the data show that alcohol abuse and even just alcoholintake are related to violence. Although men and women reported similarrates of aggression by partners, women reported greater fear and severityof aggression. For preventive purposes, it would be important to considerthe link between alcohol consumption, a low income situation and youngerage status as factors which increase the risk of violence in men.
In Costa Rica, where women’s status is clearly in transition (in terms oftheir educational level, the fact of working out of home and being thefamily head, new legislation protecting them against domestic and workviolence and promoting equalities, the gender perspective within theeducational system, etc.), it could be hypothesized that the risk of violencefrom intimate partners is higher. However, this relationship and thepossibility that high status women have a lower risk of violence should bestudied carefully.
Public concern with alcohol-related problems is not new in Costa Rica.Different and isolated efforts have been carried out since the beginning ofthe previous century, but it was not until the early 1990s that resourcesand activities were integrated within a nationwide plan. This still needs tobe converted into a national policy that integrates not only the need for
ALCOHOL, GENDER AND PARTNER AGGRESSION:A STUDY IN THE GREATER METROPOLITAN AREA OF COSTA RICA
85
treatment of chronic cases but health promotion and specific and non-specific prevention in the educational system, as well as measurestargeting alcohol availability, taxation policies, advertising regulations,legal enforcement of underage drinking and intoxication in public places.All these issues should be considered under the thesis that drinkingpatterns are better predictors of negative and positive consequences thansolely the idea of per capita consumption. And that is why it is alsonecessary to consider at the national level the practice of harm reductioninstead of promoting abstinence per se. A harm reduction approach wouldpromote those drinking patterns that maximize individual health andquality of life and improve the measures leading to reductions of the riskand severity of adverse consequences arising from alcohol consumption.However, it is important to determine which drinking patterns areharmful and which ones are not and how information on this can bedisseminated widely.
National concern about domestic violence is more recent and the linkbetween alcohol and violence is emerging as a matter of public discussion.In terms of violence and victimization issues, it is important to point outthat how a community responds to partner violence may affect the overalllevels of abuse in the community. Finally, it is important to suggest thatgovernments should invest much more in research on violence by intimatepartners.
ACKNOWLEDGEMENTS
This work was possible because of the participation of many people.First, the statistician Oscar Acuña helped in performing the statisticalanalysis, especially the multinomial logistic regression models. AndreaCuenca was the fieldwork leader and coordinated the work of MaribelCalderon, Ivon Gutierrez, Carolina Gutierrez, Sebastián Alfaro, KarlaLeiva, Manuel Coto, Andrea Brenes and Giselle Amador. Leda Vargasassisted in administrative support from the Fundación Vida y Sociedad.
REFERENCES
Alcaráz, F. et al. (1999). El consumo de drogas en Bolivia (Drug use in Bolivia). LaPaz, Bolivia: CELIN.
Archer, J. (2000). Sex differences in aggression between heterosexual partners: ameta-analytic review. Psychological Bulletin, 126, 651-680.
Barahona, V. (2002). La violencia doméstica y su relación con el consumo desustancias psicoactivas en la mujer: un estudio realizado en la Delegación de laMujer de San José (Domestic violence and its relationship with women’s druguse: a study made at the Woman’s Delegation of San José). (Tesis SEP). SanJosé, C.R.: UCR.
Babor, T et al. (1992 ) AUDIT: the Alcohol Use Disorders Identification Test:Guidelines for use in Primary Health Care. Geneva: WHO/PSA/92.4.
ALCOHOL, GENDER AND DRINKING PROBLEMS
86
Black, DA, et al. (1999) Partner, child abuse risk factor literature review: NationalNetwork of Family Resiliency. National Network for Health (online) Availableat: http://www.nnh.org/risk
Bejarano, J., Ugalde, F. (2003). Consumo de drogas en Costa Rica. Resultados dela Encuesta Nacional del 2000-2001 (Drug use in Costa Rica. Outcomes fromthe National Household Survey, 2000/2001). San José, Costa Rica: I.A.F.A
Bejarano, J., Sáenz, M. (2000). Consumo de drogas y muerte violenta en CostaRica (Drug use and violent death in Costa Rica). Adicciones, 12(3), 435-441.
Bejarano, J. (2000). Alcohol Epidemiology in Costa Rica. In: Demers, A., Room,R. & Bougault, C.. Eds. Surveys of Drinking Patterns and Problems in SevenDeveloping Countries. Geneva: World Health Organization, pp. 33-44.
Bejarano, J., San Lee, L. (1997). Alcohol y alcoholismo en la sociedad Costarricense(Alcohol and alcoholism in Costarican society). Revista de Ciencias Sociales,77, 9-20.
Bejarano, J., San Lee, L. & Carvajal, H. (1999). El consumo de drogas en la mujercostarricense (Drug use among Costa Rican women). Revista de CienciasSociales, 22(2), 41-48.
Escobar, F. (1974). San Ramón. Un estudio antropológico (San Ramón. Ananthropologic study). Centro de Estudios sobre Alcoholismo, San José, C.R.
Graham, K., Wells, S. & Jelley, J. (2002). The social context of physical aggressionamong adults. The Journal of Interpersonal Violence, 17(1), 64-83.Graham, K. et al. (2002). Alcohol, gender and partner aggression: a general
population study of adults, Ontario, Canada: Centre for Addiction and MentalHealth. (in press).
Instituto Nacional de Estadística y Censos (2001). IX Censo Nacional de Poblacióny V de Vivienda del 2000: Resultados Generales (IX National census onPopulation and V household census, 2000: General results ), San José, C.R.:INEC
Jernigan, D. (2001). Global Status Report: Alcohol and young people. Geneva:World Health Organization.
Jiménez, F., & Bejarano, J. (1991). Estudio nacional sobre consumo de alcohol ydrogas ilícitas (National household survey on alcohol and illicit drugconsumption), San José, C.R.: IAFA.
Medina-Mora, M. et al. (2001). Patterns of alcohol consumption and relatedproblems in Mexico: results from two general population surveys. In: Demers,A., Room, R. And Bourgault, Ch. eds. Surveys of drinking patterns andproblems in seven developing countries. Geneva: World Health Organization,(pp. 14-31).
Miguez, H. (1985). Epidemiología de la farmacodependencia juvenil(Epidemiology of youthful drug dependence). Boletín del InstitutoInteramericano del Niño, 223:23-30.
Proyecto Estado de la Nación (2003). Estado de la nación en desarrollo humanosostenible (Project on Nation’s Human Development), 1ª. Edición, Litografía eimprenta Lil, S.A.
Rumbos (2002). Juventud y consumo de sustancias psicoactivas (Youth andpsycoactive drug use), Bogotá, COL: Arte Laser Pub. Ltda.
Sáenz, M. (1999). La prohibición de la publicidad de las bebidas alcohólicas: unaprioridad en el sector salud (The ban of alcohol advertising: a priority of healthsector). Revista de Trabajo Social, 55, 1154-1162.
World Health Organization (2002). World report on violence and health. Geneva:World Health Organization.
ALCOHOL, GENDER AND PARTNER AGGRESSION:A STUDY IN THE GREATER METROPOLITAN AREA OF COSTA RICA
87

XI: 13. Drinking (spirituous liquor), associating with wicked people, separation from the husband,rambling abroad, sleeping (at unseasonable hours), and dwelling in other men’s houses, are the sixcauses of the ruin of women.
XI: 80. A wife who drinks spirituous liquor, is of bad conduct, rebellious, diseased, mischievous, orwasteful, may at any time be superseded (by another wife).
- The Laws of Manu c. 200 A.D.
INTRODUCTION
Research on drinking patterns among women generally shows thatwomen drink less than men (Wilsnack, 1996), across the developing(Assanangkornchai et al., 2003, Wei et al., 1999) and the developed
world (Kraus et al., 2000). In fact, in all countries and historical periodsstudied, men have consumed more alcohol and reported more alcohol-related problems than women (Fillmore et al., 1997). Reports from Indiaon women’s drinking are sparse. Whatever data exists suggests that thereare extreme gender differences in the prevalence of alcohol use.
There is general agreement that alcohol use is low in the population asa whole. The National Household Survey of Drug and Alcohol Abuse 2000-01 (Ray et al., 2004), conducted on a nationally representative sample ofmales, estimated that 26% of male adults had ever used alcohol, while theprevalence of current users was 21.4%. Previous studies of male drinkersshowed wide variations in estimates of prevalence between differentregions of the country (16.7 percent in Madras city in southern India to49.6 percent in a Punjab village in northwest India). The prevalence ofalcohol use among women (wherever data is available) has consistentlybeen estimated at less than 5 percent (Mahal, 2000; Mohan et al.,1999;Isaac, 1998; Sundaram et al., 1984).
There is also a widespread notion that alcohol use is confined to tribalwomen, women of lower socio-economic status, commercial sex workersand to a limited upper crust of the rich, and not favored by women from themiddle or upper socioeconomic classes (Ray and Sharma, 1994; Kumar &Parthasarathy, 1994). The dominant stereotype strongly associates alcoholuse with the primitive and/or poor, the immoral and the privileged(Rahman,2002; Musgrave & Stern, 1988, Thimmaiah, 1979). Alcohol use,
CHAPTER 5WOMEN AND ALCOHOL USE IN INDIA
VIVEK BENEGAL, MADHABIKA NAYAK, PRATIMA MURTHY, PRABHA CHANDRA & G. GURURAJ
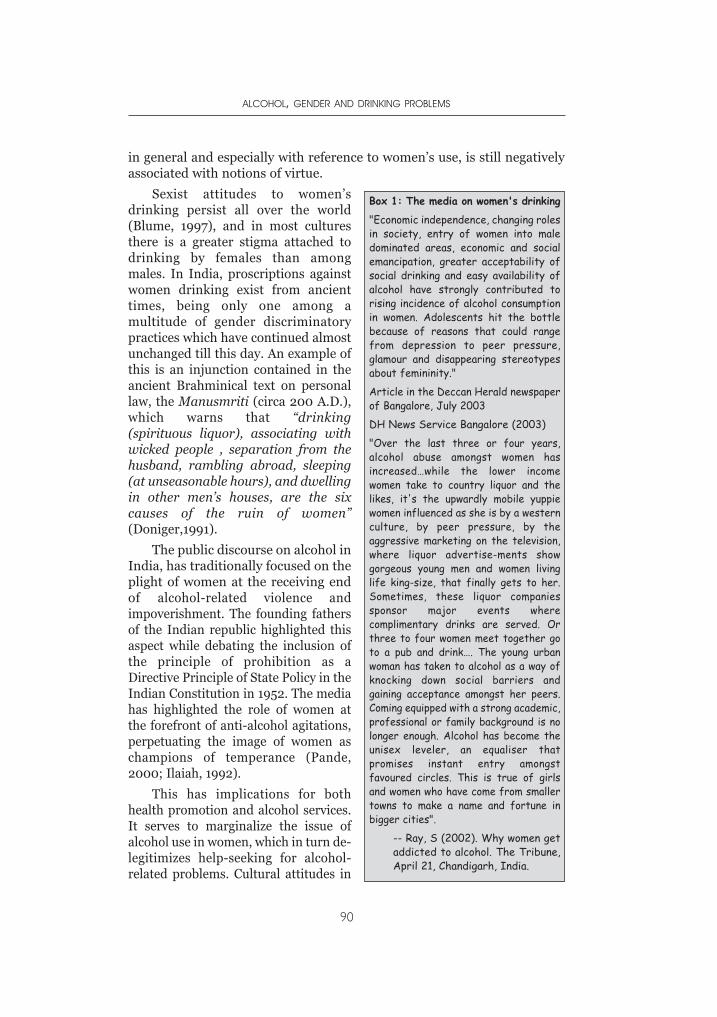
in general and especially with reference to women’s use, is still negativelyassociated with notions of virtue.
Sexist attitudes to women’sdrinking persist all over the world(Blume, 1997), and in most culturesthere is a greater stigma attached todrinking by females than amongmales. In India, proscriptions againstwomen drinking exist from ancienttimes, being only one among amultitude of gender discriminatorypractices which have continued almostunchanged till this day. An example ofthis is an injunction contained in theancient Brahminical text on personallaw, the Manusmriti (circa 200 A.D.),which warns that “drinking(spirituous liquor), associating withwicked people , separation from thehusband, rambling abroad, sleeping(at unseasonable hours), and dwellingin other men’s houses, are the sixcauses of the ruin of women”(Doniger,1991).
The public discourse on alcohol inIndia, has traditionally focused on theplight of women at the receiving endof alcohol-related violence andimpoverishment. The founding fathersof the Indian republic highlighted thisaspect while debating the inclusion ofthe principle of prohibition as aDirective Principle of State Policy in theIndian Constitution in 1952. The mediahas highlighted the role of women atthe forefront of anti-alcohol agitations,perpetuating the image of women aschampions of temperance (Pande,2000; Ilaiah, 1992).
This has implications for bothhealth promotion and alcohol services.It serves to marginalize the issue ofalcohol use in women, which in turn de-legitimizes help-seeking for alcohol-related problems. Cultural attitudes in
ALCOHOL, GENDER AND DRINKING PROBLEMS
90
Box 1: The media on women's drinking
"Economic independence, changing rolesin society, entry of women into maledominated areas, economic and socialemancipation, greater acceptability ofsocial drinking and easy availability ofalcohol have strongly contributed torising incidence of alcohol consumptionin women. Adolescents hit the bottlebecause of reasons that could rangefrom depression to peer pressure,glamour and disappearing stereotypesabout femininity." Article in the Deccan Herald newspaperof Bangalore, July 2003DH News Service Bangalore (2003)"Over the last three or four years,alcohol abuse amongst women hasincreased…while the lower incomewomen take to country liquor and thelikes, it's the upwardly mobile yuppiewomen influenced as she is by a westernculture, by peer pressure, by theaggressive marketing on the television,where liquor advertise-ments showgorgeous young men and women livinglife king-size, that finally gets to her.Sometimes, these liquor companiessponsor major events wherecomplimentary drinks are served. Orthree to four women meet together goto a pub and drink…. The young urbanwoman has taken to alcohol as a way ofknocking down social barriers andgaining acceptance amongst her peers.Coming equipped with a strong academic,professional or family background is nolonger enough. Alcohol has become theunisex leveler, an equaliser thatpromises instant entry amongstfavoured circles. This is true of girlsand women who have come from smallertowns to make a name and fortune inbigger cities".
-- Ray, S (2002). Why women getaddicted to alcohol. The Tribune,April 21, Chandigarh, India.
India (being intensely guilt-provoking and discriminatory about the use ofalcohol by females, though not by males) may prevent them fromspontaneously reporting such details. Help-seeking is delayed until physicalor psychological crises precipitate medical consultations (Murthy et al., 1995).However, there are indications that this picture may be changing. The popularmedia is full of accounts of increasing consumption among young women,especially in the urban setting [see Box 1].
A study of drinking habits conducted in Bangalore city (Kumar, 1997)reported that a fifth of young people who frequented pubs on weekendswere girls aged between 13-19 years. Interviews with women drinkersidentified boredom and lack of work at home as factors for drinking amongthe high-income group; the low-income group identified fatigue andspousal violence as triggers for drinking.
One of the highest rated television programmes in India is a nightlyprogramme called Night Out which airs every night, after the prime-timenews. This programme covers in great detail young men and women in thelarger cities of the country partying at various clubs, restaurants anddiscotheques. Prominently featured are the regular brand launches ofalcoholic beverages.
For anyone who would dismiss this as a limited urban upper classphenomenon, the reality is that India no longer lives exclusively in villages.305 million Indians live in nearly 3700 towns and cities spread across thelength and breadth of the country. This comprises 38% of its population, insharp contrast to only 60 million (15%) who lived in urban areas in 1947when the country became independent. At the same time, the labor forceparticipation rate – an indication of the number of people offeringthemselves to be employed - came down between 1999 to 2002, for ruralmales (from 876 per 1000 to 858 per 1000), rural females (470 per 1000to 423 per 1000) and urban males (796 per 1000 to 791 per 1000).However for urban females it rose in that period from 193 to 205 per 1000.
In the international literature, changes in women’s education,employment, social status and economic independence have beenimplicated in the convergence of male and female drinking patterns. Neveet al. (1996) held that as women gradually acquire equal rights in work andsocial situations, this might also be reflected in a propensity to drink inequal amounts and in the same manner as men. While this may not explainchanges in drinking patterns of non-working females, it does reflect ageneral change in societal attitudes to women’s drinking.
The little information that exists about patterns of alcohol use in Indiaindicate that women who do drink at all have patterns of equally heavyalcohol use as men. A study from southern India of a representative sampleof 7445 adult men and 6919 adult women (Benegal et al., 2003) found thatthe average consumption on typical drinking occasions, in both men andwomen, was five standard drinks (12 gm. of ethanol per drink).
WOMEN AND ALCOHOL USE IN INDIA
91
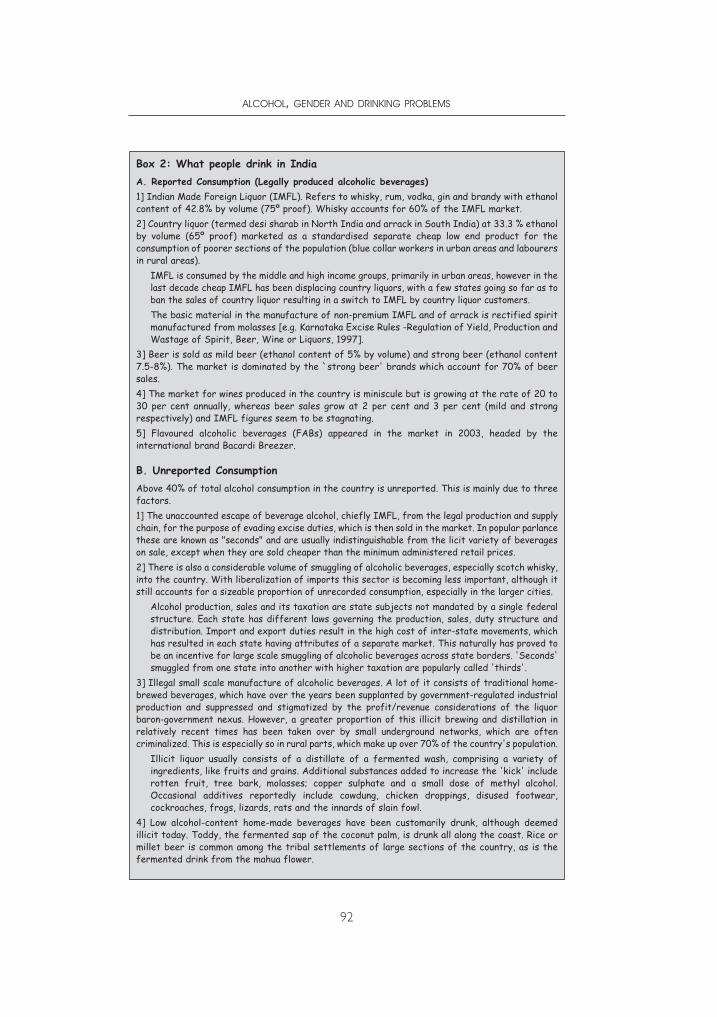
ALCOHOL, GENDER AND DRINKING PROBLEMS
92
Box 2: What people drink in IndiaA. Reported Consumption (Legally produced alcoholic beverages) 1] Indian Made Foreign Liquor (IMFL). Refers to whisky, rum, vodka, gin and brandy with ethanolcontent of 42.8% by volume (75º proof). Whisky accounts for 60% of the IMFL market.2] Country liquor (termed desi sharab in North India and arrack in South India) at 33.3 % ethanolby volume (65º proof) marketed as a standardised separate cheap low end product for theconsumption of poorer sections of the population (blue collar workers in urban areas and labourersin rural areas).
IMFL is consumed by the middle and high income groups, primarily in urban areas, however in thelast decade cheap IMFL has been displacing country liquors, with a few states going so far as toban the sales of country liquor resulting in a switch to IMFL by country liquor customers.The basic material in the manufacture of non-premium IMFL and of arrack is rectified spiritmanufactured from molasses [e.g. Karnataka Excise Rules -Regulation of Yield, Production andWastage of Spirit, Beer, Wine or Liquors, 1997].
3] Beer is sold as mild beer (ethanol content of 5% by volume) and strong beer (ethanol content7.5-8%). The market is dominated by the `strong beer' brands which account for 70% of beersales.4] The market for wines produced in the country is miniscule but is growing at the rate of 20 to30 per cent annually, whereas beer sales grow at 2 per cent and 3 per cent (mild and strongrespectively) and IMFL figures seem to be stagnating.5] Flavoured alcoholic beverages (FABs) appeared in the market in 2003, headed by theinternational brand Bacardi Breezer.
B. Unreported ConsumptionAbove 40% of total alcohol consumption in the country is unreported. This is mainly due to threefactors.1] The unaccounted escape of beverage alcohol, chiefly IMFL, from the legal production and supplychain, for the purpose of evading excise duties, which is then sold in the market. In popular parlancethese are known as "seconds" and are usually indistinguishable from the licit variety of beverageson sale, except when they are sold cheaper than the minimum administered retail prices.2] There is also a considerable volume of smuggling of alcoholic beverages, especially scotch whisky,into the country. With liberalization of imports this sector is becoming less important, although itstill accounts for a sizeable proportion of unrecorded consumption, especially in the larger cities.
Alcohol production, sales and its taxation are state subjects not mandated by a single federalstructure. Each state has different laws governing the production, sales, duty structure anddistribution. Import and export duties result in the high cost of inter-state movements, whichhas resulted in each state having attributes of a separate market. This naturally has proved tobe an incentive for large scale smuggling of alcoholic beverages across state borders. 'Seconds'smuggled from one state into another with higher taxation are popularly called 'thirds'.
3] Illegal small scale manufacture of alcoholic beverages. A lot of it consists of traditional home-brewed beverages, which have over the years been supplanted by government-regulated industrialproduction and suppressed and stigmatized by the profit/revenue considerations of the liquorbaron-government nexus. However, a greater proportion of this illicit brewing and distillation inrelatively recent times has been taken over by small underground networks, which are oftencriminalized. This is especially so in rural parts, which make up over 70% of the country's population.
Illicit liquor usually consists of a distillate of a fermented wash, comprising a variety ofingredients, like fruits and grains. Additional substances added to increase the 'kick' includerotten fruit, tree bark, molasses; copper sulphate and a small dose of methyl alcohol.Occasional additives reportedly include cowdung, chicken droppings, disused footwear,cockroaches, frogs, lizards, rats and the innards of slain fowl.
4] Low alcohol-content home-made beverages have been customarily drunk, although deemedillicit today. Toddy, the fermented sap of the coconut palm, is drunk all along the coast. Rice ormillet beer is common among the tribal settlements of large sections of the country, as is thefermented drink from the mahua flower.
Licit spirits (Indian made foreign liquors, government licensed countryliquor) along with illicitly distilled spirits constituted more than 95% of thebeverages drunk by both men and women. Beer accounted for less than 5%of consumption (Box 2). Per capita consumption at 2 litres/adult /year(calculated from 2003 sales and population figures), after adjustment forundocumented consumption (45-50% of total consumption), is likely to bearound 4 litres, but is still low compared to that in ‘wet’ nations. However,patterns of consumption are better indices of the likelihood of harm in thepopulation. Repeated observations from various places in the country havedocumented that more than 50% of all drinkers satisfy criteria forhazardous drinking. In the study quoted previously (Benegal et al., 2003),80% of male consumers and 65% of female consumers drank at hazardouslevels (AUDIT scores of eight and above). This challenges the receivedwisdom that women are less likely than men to drink heavily or withadverse consequences (Plant et al., 2000; Hibell et al., 2001; Grant, 1998;Wilsnack and Wilsnack, 1997; Plant, 1997; Pittman and White, 1991).
The signature pattern is one of heavy drinking, typically more than 5standard drinks on typical occasions. There is surprisingly little differencebetween amounts drunk by men and women.
A large proportion of drinkers of both genders drink daily or almostdaily. Of course, the frequency is significantly higher in men. Under-socialized, solitary drinking of mainly spirits, drinking to intoxication andexpectancies of drink-related disinhibition and violence add to thehazardous patterns (Gaunekar et al., 2004; Gupta et al., 2003; Benegal etal., 2003; Saxena, 1999).
Needless to say, this translates into significant alcohol-relatedmorbidity. Alcohol-related problems account for over a fifth of hospitaladmissions (Sri et al., 1997, Benegal et al., 2001) but are underrecognized byprimary care physicians. Alcohol misuse has been implicated in over 20% oftraumatic brain injuries (Gururaj, 2002), and 60% of all injuries reporting toemergency rooms (Benegal et al., 2002). It has a disproportionately highassociation with deliberate self-harm (Gururaj & Isaac, 2001), high-risksexual behavior, HIV infection (Chandra et al., 2003), tuberculosis(Rajeshwari et al., 2002), esophageal cancer (Chitra et al., 2004), liverdisease and duodenal ulcer (Sarin et al., 199 ; Jain et al., 1999).
Alcohol misuse wreaks a high social cost (Bhatt, 1998; Rao et al.,2001). A study from southern India documented that monetizable directand indirect costs attributable to alcohol, counting only persons withalcohol dependence, were more than 3 times the profits from alcoholtaxation (Benegal et al., 2000). Yet, there is inadequate recognition thatalcohol misuse is a major public health problem in India.
Women experience different alcohol problems than men and physicalproblems are experienced earlier in female drinking careers than males(Hommer et al., 2001; Holman et al., 1996; Van Thiel and Gavaler, 1988).
WOMEN AND ALCOHOL USE IN INDIA
93
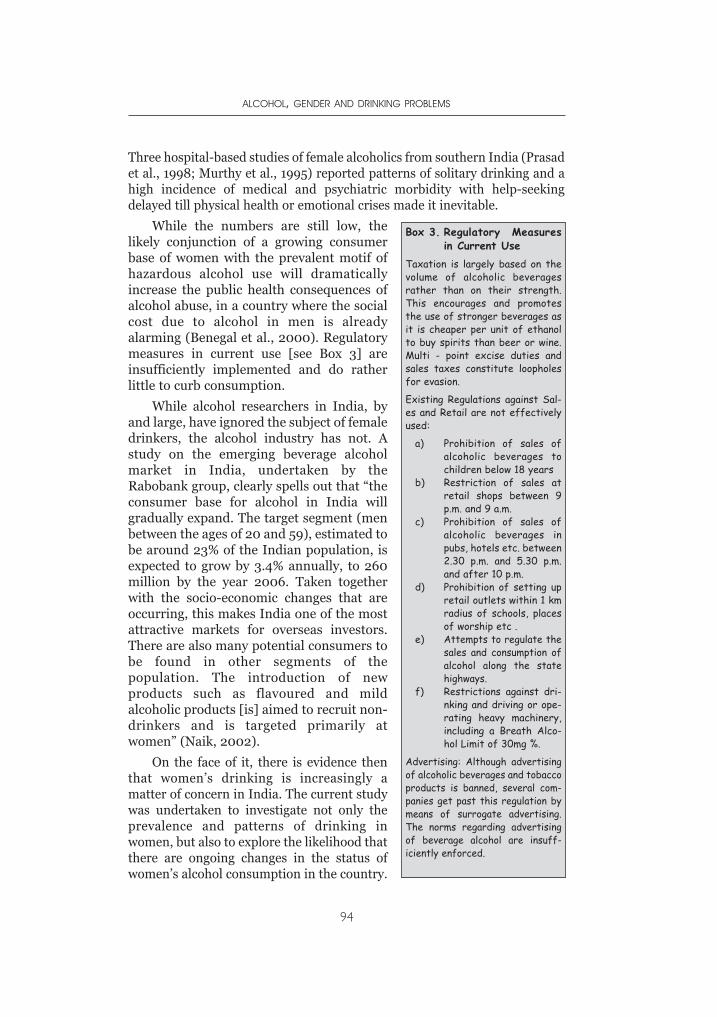
Three hospital-based studies of female alcoholics from southern India (Prasadet al., 1998; Murthy et al., 1995) reported patterns of solitary drinking and ahigh incidence of medical and psychiatric morbidity with help-seekingdelayed till physical health or emotional crises made it inevitable.
While the numbers are still low, thelikely conjunction of a growing consumerbase of women with the prevalent motif ofhazardous alcohol use will dramaticallyincrease the public health consequences ofalcohol abuse, in a country where the socialcost due to alcohol in men is alreadyalarming (Benegal et al., 2000). Regulatorymeasures in current use [see Box 3] areinsufficiently implemented and do ratherlittle to curb consumption.
While alcohol researchers in India, byand large, have ignored the subject of femaledrinkers, the alcohol industry has not. Astudy on the emerging beverage alcoholmarket in India, undertaken by theRabobank group, clearly spells out that “theconsumer base for alcohol in India willgradually expand. The target segment (menbetween the ages of 20 and 59), estimated tobe around 23% of the Indian population, isexpected to grow by 3.4% annually, to 260million by the year 2006. Taken togetherwith the socio-economic changes that areoccurring, this makes India one of the mostattractive markets for overseas investors.There are also many potential consumers tobe found in other segments of thepopulation. The introduction of newproducts such as flavoured and mildalcoholic products [is] aimed to recruit non-drinkers and is targeted primarily atwomen” (Naik, 2002).
On the face of it, there is evidence thenthat women’s drinking is increasingly amatter of concern in India. The current studywas undertaken to investigate not only theprevalence and patterns of drinking inwomen, but also to explore the likelihood thatthere are ongoing changes in the status ofwomen’s alcohol consumption in the country.
ALCOHOL, GENDER AND DRINKING PROBLEMS
94
Box 3. Regulatory Measuresin Current Use
Taxation is largely based on thevolume of alcoholic beveragesrather than on their strength.This encourages and promotesthe use of stronger beverages asit is cheaper per unit of ethanolto buy spirits than beer or wine.Multi - point excise duties andsales taxes constitute loopholesfor evasion.
Existing Regulations against Sal-es and Retail are not effectivelyused:
a) Prohibition of sales ofalcoholic beverages tochildren below 18 years
b) Restriction of sales atretail shops between 9p.m. and 9 a.m.
c) Prohibition of sales ofalcoholic beverages inpubs, hotels etc. between2.30 p.m. and 5.30 p.m.and after 10 p.m.
d) Prohibition of setting upretail outlets within 1 kmradius of schools, placesof worship etc .
e) Attempts to regulate thesales and consumption ofalcohol along the statehighways.
f) Restrictions against dri-nking and driving or ope-rating heavy machinery,including a Breath Alco-hol Limit of 30mg %.
Advertising: Although advertisingof alcoholic beverages and tobaccoproducts is banned, several com-panies get past this regulation bymeans of surrogate advertising.The norms regarding advertisingof beverage alcohol are insuff-iciently enforced.
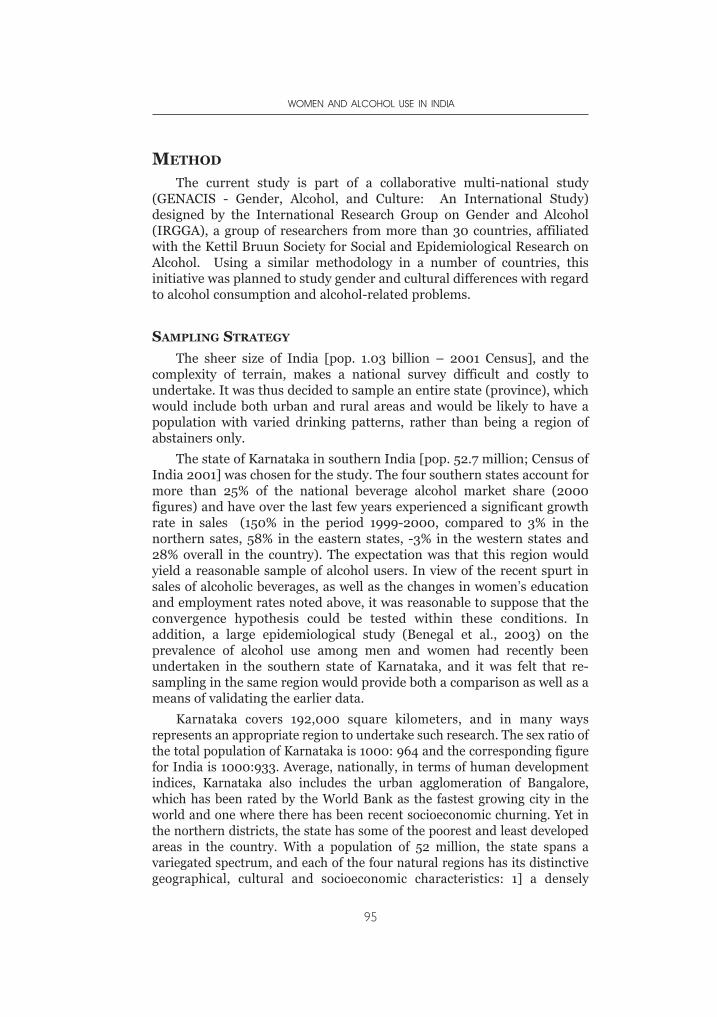
METHOD
The current study is part of a collaborative multi-national study(GENACIS - Gender, Alcohol, and Culture: An International Study)designed by the International Research Group on Gender and Alcohol(IRGGA), a group of researchers from more than 30 countries, affiliatedwith the Kettil Bruun Society for Social and Epidemiological Research onAlcohol. Using a similar methodology in a number of countries, thisinitiative was planned to study gender and cultural differences with regardto alcohol consumption and alcohol-related problems.
SAMPLING STRATEGY
The sheer size of India [pop. 1.03 billion – 2001 Census], and thecomplexity of terrain, makes a national survey difficult and costly toundertake. It was thus decided to sample an entire state (province), whichwould include both urban and rural areas and would be likely to have apopulation with varied drinking patterns, rather than being a region ofabstainers only.
The state of Karnataka in southern India [pop. 52.7 million; Census ofIndia 2001] was chosen for the study. The four southern states account formore than 25% of the national beverage alcohol market share (2000figures) and have over the last few years experienced a significant growthrate in sales (150% in the period 1999-2000, compared to 3% in thenorthern sates, 58% in the eastern states, -3% in the western states and28% overall in the country). The expectation was that this region wouldyield a reasonable sample of alcohol users. In view of the recent spurt insales of alcoholic beverages, as well as the changes in women’s educationand employment rates noted above, it was reasonable to suppose that theconvergence hypothesis could be tested within these conditions. Inaddition, a large epidemiological study (Benegal et al., 2003) on theprevalence of alcohol use among men and women had recently beenundertaken in the southern state of Karnataka, and it was felt that re-sampling in the same region would provide both a comparison as well as ameans of validating the earlier data.
Karnataka covers 192,000 square kilometers, and in many waysrepresents an appropriate region to undertake such research. The sex ratio ofthe total population of Karnataka is 1000: 964 and the corresponding figurefor India is 1000:933. Average, nationally, in terms of human developmentindices, Karnataka also includes the urban agglomeration of Bangalore,which has been rated by the World Bank as the fastest growing city in theworld and one where there has been recent socioeconomic churning. Yet inthe northern districts, the state has some of the poorest and least developedareas in the country. With a population of 52 million, the state spans avariegated spectrum, and each of the four natural regions has its distinctivegeographical, cultural and socioeconomic characteristics: 1] a densely
WOMEN AND ALCOHOL USE IN INDIA
95
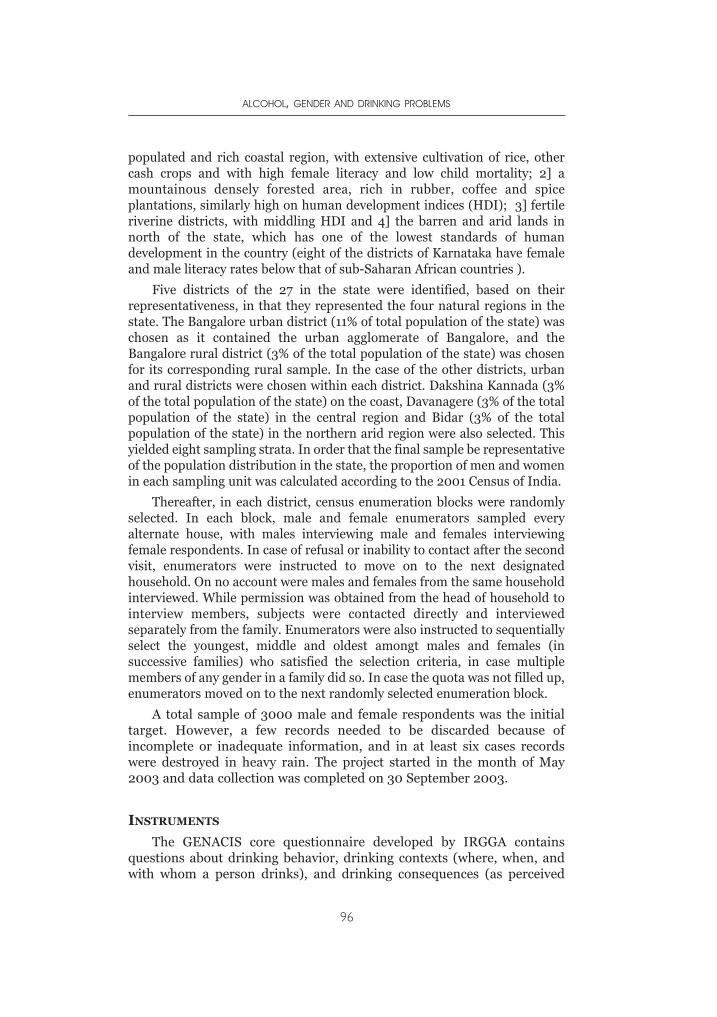
populated and rich coastal region, with extensive cultivation of rice, othercash crops and with high female literacy and low child mortality; 2] amountainous densely forested area, rich in rubber, coffee and spiceplantations, similarly high on human development indices (HDI); 3] fertileriverine districts, with middling HDI and 4] the barren and arid lands innorth of the state, which has one of the lowest standards of humandevelopment in the country (eight of the districts of Karnataka have femaleand male literacy rates below that of sub-Saharan African countries ).
Five districts of the 27 in the state were identified, based on theirrepresentativeness, in that they represented the four natural regions in thestate. The Bangalore urban district (11% of total population of the state) waschosen as it contained the urban agglomerate of Bangalore, and theBangalore rural district (3% of the total population of the state) was chosenfor its corresponding rural sample. In the case of the other districts, urbanand rural districts were chosen within each district. Dakshina Kannada (3%of the total population of the state) on the coast, Davanagere (3% of the totalpopulation of the state) in the central region and Bidar (3% of the totalpopulation of the state) in the northern arid region were also selected. Thisyielded eight sampling strata. In order that the final sample be representativeof the population distribution in the state, the proportion of men and womenin each sampling unit was calculated according to the 2001 Census of India.
Thereafter, in each district, census enumeration blocks were randomlyselected. In each block, male and female enumerators sampled everyalternate house, with males interviewing male and females interviewingfemale respondents. In case of refusal or inability to contact after the secondvisit, enumerators were instructed to move on to the next designatedhousehold. On no account were males and females from the same householdinterviewed. While permission was obtained from the head of household tointerview members, subjects were contacted directly and interviewedseparately from the family. Enumerators were also instructed to sequentiallyselect the youngest, middle and oldest amongt males and females (insuccessive families) who satisfied the selection criteria, in case multiplemembers of any gender in a family did so. In case the quota was not filled up,enumerators moved on to the next randomly selected enumeration block.
A total sample of 3000 male and female respondents was the initialtarget. However, a few records needed to be discarded because ofincomplete or inadequate information, and in at least six cases recordswere destroyed in heavy rain. The project started in the month of May2003 and data collection was completed on 30 September 2003.
INSTRUMENTS
The GENACIS core questionnaire developed by IRGGA containsquestions about drinking behavior, drinking contexts (where, when, andwith whom a person drinks), and drinking consequences (as perceived
ALCOHOL, GENDER AND DRINKING PROBLEMS
96
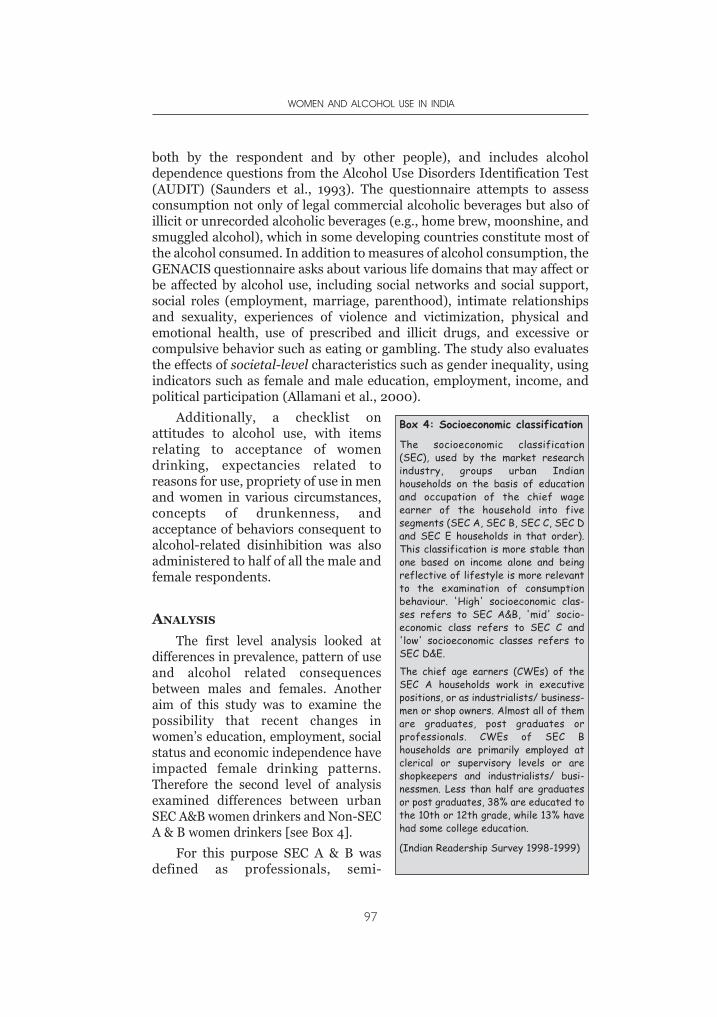
both by the respondent and by other people), and includes alcoholdependence questions from the Alcohol Use Disorders Identification Test(AUDIT) (Saunders et al., 1993). The questionnaire attempts to assessconsumption not only of legal commercial alcoholic beverages but also ofillicit or unrecorded alcoholic beverages (e.g., home brew, moonshine, andsmuggled alcohol), which in some developing countries constitute most ofthe alcohol consumed. In addition to measures of alcohol consumption, theGENACIS questionnaire asks about various life domains that may affect orbe affected by alcohol use, including social networks and social support,social roles (employment, marriage, parenthood), intimate relationshipsand sexuality, experiences of violence and victimization, physical andemotional health, use of prescribed and illicit drugs, and excessive orcompulsive behavior such as eating or gambling. The study also evaluatesthe effects of societal-level characteristics such as gender inequality, usingindicators such as female and male education, employment, income, andpolitical participation (Allamani et al., 2000).
Additionally, a checklist onattitudes to alcohol use, with itemsrelating to acceptance of womendrinking, expectancies related toreasons for use, propriety of use in menand women in various circumstances,concepts of drunkenness, andacceptance of behaviors consequent toalcohol-related disinhibition was alsoadministered to half of all the male andfemale respondents.
ANALYSIS
The first level analysis looked atdifferences in prevalence, pattern of useand alcohol related consequencesbetween males and females. Anotheraim of this study was to examine thepossibility that recent changes inwomen’s education, employment, socialstatus and economic independence haveimpacted female drinking patterns.Therefore the second level of analysisexamined differences between urbanSEC A&B women drinkers and Non-SECA & B women drinkers [see Box 4].
For this purpose SEC A & B wasdefined as professionals, semi-
WOMEN AND ALCOHOL USE IN INDIA
97
Box 4: Socioeconomic classification
The socioeconomic classification(SEC), used by the market researchindustry, groups urban Indianhouseholds on the basis of educationand occupation of the chief wageearner of the household into fivesegments (SEC A, SEC B, SEC C, SEC Dand SEC E households in that order).This classification is more stable thanone based on income alone and beingreflective of lifestyle is more relevantto the examination of consumptionbehaviour. 'High' socioeconomic clas-ses refers to SEC A&B, 'mid' socio-economic class refers to SEC C and'low' socioeconomic classes refers toSEC D&E.
The chief age earners (CWEs) of theSEC A households work in executivepositions, or as industrialists/ business-men or shop owners. Almost all of themare graduates, post graduates orprofessionals. CWEs of SEC Bhouseholds are primarily employed atclerical or supervisory levels or areshopkeepers and industrialists/ busi-nessmen. Less than half are graduatesor post graduates, 38% are educated tothe 10th or 12th grade, while 13% havehad some college education.
(Indian Readership Survey 1998-1999)
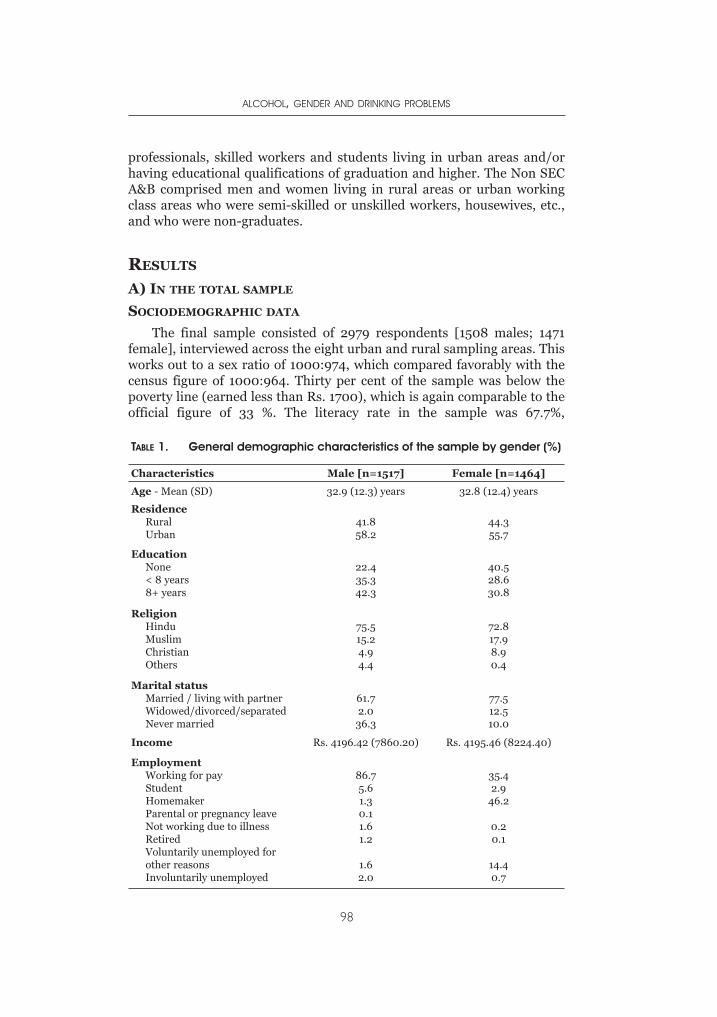
professionals, skilled workers and students living in urban areas and/orhaving educational qualifications of graduation and higher. The Non SECA&B comprised men and women living in rural areas or urban workingclass areas who were semi-skilled or unskilled workers, housewives, etc.,and who were non-graduates.
RESULTS
A) IN THE TOTAL SAMPLE
SOCIODEMOGRAPHIC DATA
The final sample consisted of 2979 respondents [1508 males; 1471female], interviewed across the eight urban and rural sampling areas. Thisworks out to a sex ratio of 1000:974, which compared favorably with thecensus figure of 1000:964. Thirty per cent of the sample was below thepoverty line (earned less than Rs. 1700), which is again comparable to theofficial figure of 33 %. The literacy rate in the sample was 67.7%,
ALCOHOL, GENDER AND DRINKING PROBLEMS
98
TABLE 1. General demographic characteristics of the sample by gender (%)
Characteristics Male [n=1517] Female [n=1464]
Age - Mean (SD) 32.9 (12.3) years 32.8 (12.4) years
ResidenceRuralUrban
41.858.2
44.355.7
EducationNone< 8 years8+ years
22.435.342.3
40.528.630.8
ReligionHinduMuslimChristianOthers
75.515.24.94.4
72.817.98.90.4
Marital statusMarried / living with partnerWidowed/divorced/separatedNever married
61.72.0
36.3
77.512.510.0
Income Rs. 4196.42 (7860.20) Rs. 4195.46 (8224.40)
EmploymentWorking for payStudentHomemakerParental or pregnancy leaveNot working due to illnessRetiredVoluntarily unemployed forother reasonsInvoluntarily unemployed
86.75.61.30.11.61.2
1.62.0
35.42.9
46.2
0.20.1
14.40.7
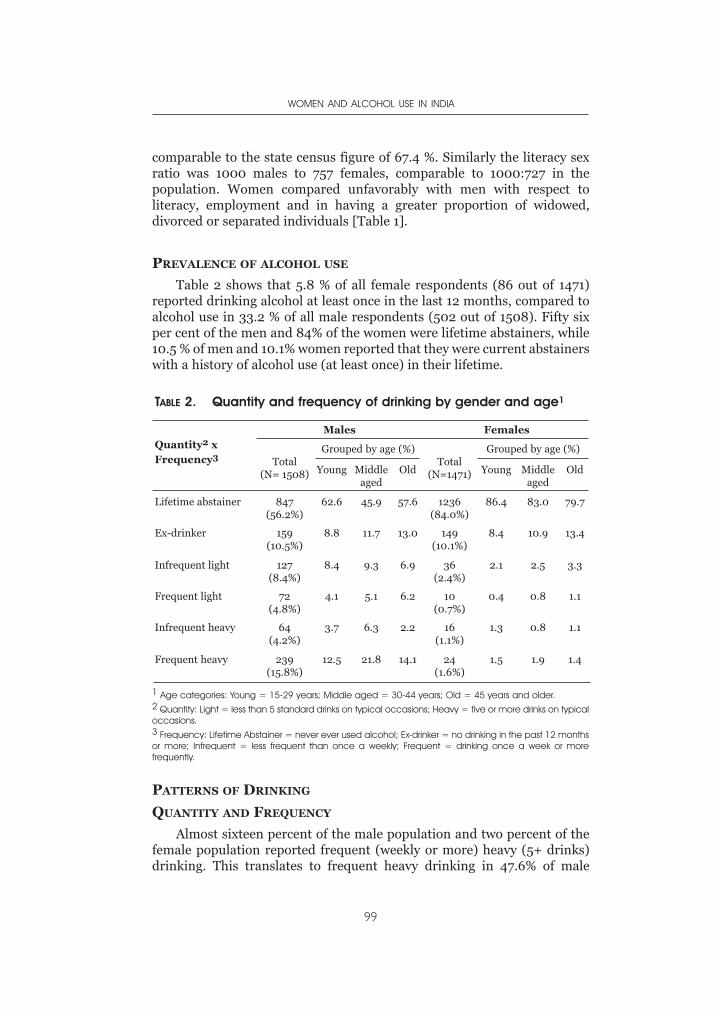
comparable to the state census figure of 67.4 %. Similarly the literacy sexratio was 1000 males to 757 females, comparable to 1000:727 in thepopulation. Women compared unfavorably with men with respect toliteracy, employment and in having a greater proportion of widowed,divorced or separated individuals [Table 1].
PREVALENCE OF ALCOHOL USE
Table 2 shows that 5.8 % of all female respondents (86 out of 1471)reported drinking alcohol at least once in the last 12 months, compared toalcohol use in 33.2 % of all male respondents (502 out of 1508). Fifty sixper cent of the men and 84% of the women were lifetime abstainers, while10.5 % of men and 10.1% women reported that they were current abstainerswith a history of alcohol use (at least once) in their lifetime.
PATTERNS OF DRINKING
QUANTITY AND FREQUENCY
Almost sixteen percent of the male population and two percent of thefemale population reported frequent (weekly or more) heavy (5+ drinks)drinking. This translates to frequent heavy drinking in 47.6% of male
WOMEN AND ALCOHOL USE IN INDIA
99
TABLE 2. Quantity and frequency of drinking by gender and age1
Quantity2 xFrequency3
Males Females
Total(N= 1508)
Grouped by age (%)Total
(N=1471)
Grouped by age (%)
Young Middleaged
Old Young Middleaged
Old
Lifetime abstainer 847(56.2%)
62.6 45.9 57.6 1236(84.0%)
86.4 83.0 79.7
Ex-drinker 159(10.5%)
8.8 11.7 13.0 149(10.1%)
8.4 10.9 13.4
Infrequent light 127(8.4%)
8.4 9.3 6.9 36(2.4%)
2.1 2.5 3.3
Frequent light 72(4.8%)
4.1 5.1 6.2 10(0.7%)
0.4 0.8 1.1
Infrequent heavy 64(4.2%)
3.7 6.3 2.2 16(1.1%)
1.3 0.8 1.1
Frequent heavy 239(15.8%)
12.5 21.8 14.1 24(1.6%)
1.5 1.9 1.4
1 Age categories: Young = 15-29 years; Middle aged = 30-44 years; Old = 45 years and older.2 Quantity: Light = less than 5 standard drinks on typical occasions; Heavy = five or more drinks on typicaloccasions.3 Frequency: Lifetime Abstainer = never ever used alcohol; Ex-drinker = no drinking in the past 12 monthsor more; Infrequent = less frequent than once a weekly; Frequent = drinking once a week or morefrequently.
drinkers and 27.9% of female drinkers. Infrequent but heavy drinking wasreported by 4.2% of the male population and 1.3% percent of the femalepopulation. Effectively then, 46.5% of women drinkers and 60.4% of maledrinkers reported heavy drinking on typical drinking occasions [Table 2].The heavy drinking was prominent in the middle-aged rather than in theyounger population among men, but in women this was equally distributedacross all age groups.
Female users drank 4.5 (2.4) drinks per typical drinking occasioncompared to 5.8 (3.5) drinks consumed by male drinkers. However, themodal value was 6 drinks for both females and males. When the heavydrinkers (people drinking more than six drinks per typical drinkingoccasion) were removed, there was no significant difference between maleand female drinkers (mean of 4 drinks per typical occasion).
Also, after removing the urban center of Bangalore, there was nosignificant difference between men and women in the quantity ofalcoholic beverage drunk per typical drinking occasion [F:M = 5.2 (1.8)drinks : 5.9 (2.7) drinks; t = 7.3, df 74, p= 0.77]. Women dranksignificantly less often than men [Female: 101 (139.3) days per year,Median = mode = 36 days per year; Male: 154.1 (154.6) days per year,Median = 52 days, mode = 365 days; t = 3, df 581, p = 0.003]. More men
(62.1%) than women (39.1%) drank once a week or more often [χ2 = 16.2,df 1, p < 0.0005].
The total number of drinks (product of number of drinks and numberof drinking occasions for each beverage drunk by the individual) wascalculated, with the highest frequency in each response category taken asthe number of times per year (e.g., 7 to 11 times a year was taken as 11 timesper year). Women users drank significantly less [746 (1151) drinks per year;mode 2190 drinks and median 180 drinks; range 2– 4686 drinks per year)than men [1409 (2412) drinks per year; mode 2190 drinks and median 312drinks; range 1–2295 drinks per year].
Current abstention from alcohol was commoner among rural men thanurban men, while it was marginally higher among rural women thanamong urban women. Current abstainers were roughly equally prevalentamong rural and urban women, however rural women had a lowerprevalence of lifetime abstainers. A larger proportion of rural than of urbanwomen drinkers reported drinking weekly or more often, as well asdrinking 5+ drinks per occasion. In contrast, a larger proportion of urbanthan of rural male drinkers reported drinking 5+ drinks per occasion,though the proportion of males drinking weekly or more was roughly equalbetween rural and urban respondents [Table 3].
A common finding in males and females was that both frequentdrinking and heavy drinking was more likely in the less educated (eight orless years of formal education), among those who had incomes below the75th percentile and in those who were married or co-habiting [Table 3].
ALCOHOL, GENDER AND DRINKING PROBLEMS
100
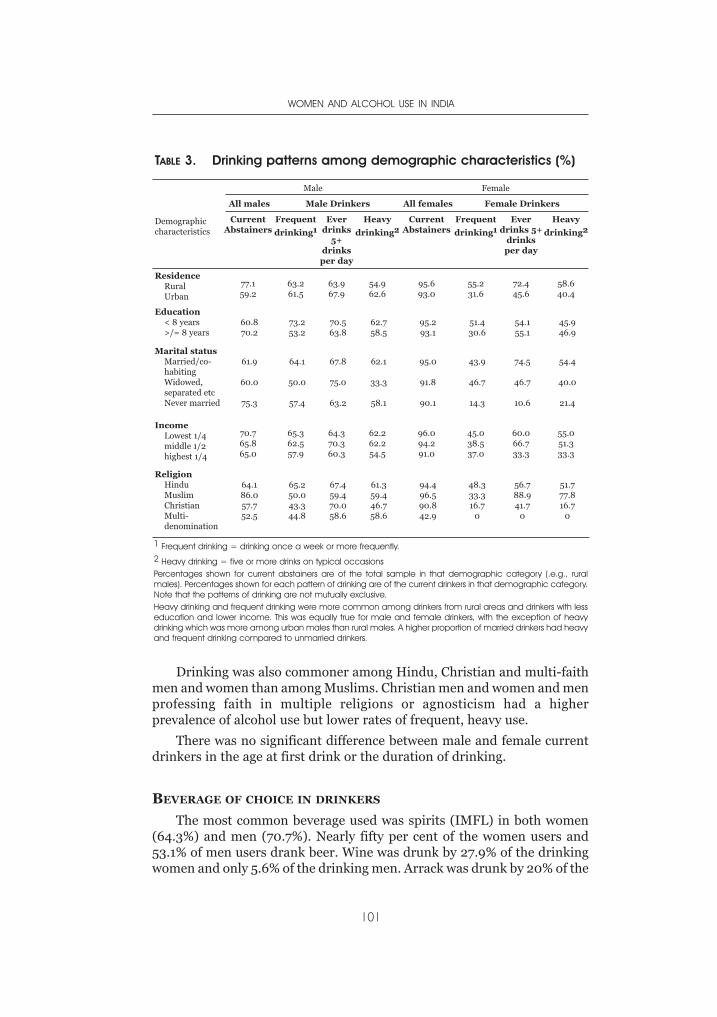
Drinking was also commoner among Hindu, Christian and multi-faithmen and women than among Muslims. Christian men and women and menprofessing faith in multiple religions or agnosticism had a higherprevalence of alcohol use but lower rates of frequent, heavy use.
There was no significant difference between male and female currentdrinkers in the age at first drink or the duration of drinking.
BEVERAGE OF CHOICE IN DRINKERS
The most common beverage used was spirits (IMFL) in both women(64.3%) and men (70.7%). Nearly fifty per cent of the women users and53.1% of men users drank beer. Wine was drunk by 27.9% of the drinkingwomen and only 5.6% of the drinking men. Arrack was drunk by 20% of the
WOMEN AND ALCOHOL USE IN INDIA
101
TABLE 3. Drinking patterns among demographic characteristics (%)
Demographiccharacteristics
Male Female
All males Male Drinkers All females Female Drinkers
CurrentAbstainers
Frequent
drinking1Ever
drinks5+
drinksper day
Heavy
drinking2Current
AbstainersFrequent
drinking1Ever
drinks 5+drinksper day
Heavy
drinking2
ResidenceRuralUrban
77.159.2
63.261.5
63.967.9
54.962.6
95.693.0
55.231.6
72.445.6
58.640.4
Education< 8 years>/= 8 years
60.870.2
73.253.2
70.563.8
62.758.5
95.293.1
51.430.6
54.155.1
45.946.9
Marital statusMarried/co-habitingWidowed,separated etcNever married
61.9
60.0
75.3
64.1
50.0
57.4
67.8
75.0
63.2
62.1
33.3
58.1
95.0
91.8
90.1
43.9
46.7
14.3
74.5
46.7
10.6
54.4
40.0
21.4
IncomeLowest 1/4middle 1/2highest 1/4
70.765.865.0
65.362.557.9
64.370.360.3
62.262.254.5
96.094.291.0
45.038.537.0
60.066.733.3
55.051.333.3
ReligionHinduMuslimChristianMulti-denomination
64.186.057.752.5
65.250.043.344.8
67.459.470.058.6
61.359.446.758.6
94.496.590.842.9
48.333.316.7
0
56.788.941.7
0
51.777.816.7
0
1 Frequent drinking = drinking once a week or more frequently.2 Heavy drinking = five or more drinks on typical occasionsPercentages shown for current abstainers are of the total sample in that demographic category (.e.g., ruralmales). Percentages shown for each pattern of drinking are of the current drinkers in that demographic category.Note that the patterns of drinking are not mutually exclusive.Heavy drinking and frequent drinking were more common among drinkers from rural areas and drinkers with lesseducation and lower income. This was equally true for male and female drinkers, with the exception of heavydrinking which was more among urban males than rural males. A higher proportion of married drinkers had heavyand frequent drinking compared to unmarried drinkers.
drinking women and 28.1% of the drinking men. Seven per cent of thedrinking women and 7.7% of the drinking men used illicit alcoholicbeverages.
Women who drank wine also tended to be more abstemious and drinkless (number of drinks per typical drinking occasion) than women whodrank spirits, country liquor or illicit liquor [3 (1.7) drinks vs. 5 (2.4)drinks; t = -3.6, df 85, p = 0.001].
Beer-drinking women, on the other hand, drank as much as the womenwho drank other beverages, unlike beer drinking men who drank less thanmen drinking other beverages [5.2 (3.6) drinks vs. 6.4 (3.3) drinks; t = -3.6,df 494, p < 0.005]. Arrack drinkers, both men [7.9 (4.3) drinks vs. 5 (2.7)drinks; t = 9, df 494, p < 0.0005] and women [5.8 (2.6) drinks vs. 4.2 (2.3)drinks; t = 0.7, df 22.6, p = 0.03], drank significantly more on typicaloccasions than those who preferred other beverages.
More than 40% of women restricted themselves to one beverage type,compared to 27% of men. Twenty five per cent of male drinkers drank threeor more beverage types across drinking occasions, while 18% of womendrinkers did so.
DRINKING CIRCUMSTANCES (see Figure 1)
The most common reported time of drinking (92% of drinking menand 93% of drinking women) was the weekend after 5 p.m.; next mostcommon were weekday evenings after 5 p.m. (81% of men and 76% ofwomen). A larger proportion of drinking men than women drank onweekday evenings [t=2.6, df 106, p=.012]. Of the people who drank daily,an equal proportion of male (20%) and female drinkers (19%) reporteddrinking everyday or almost everyday in the evening. Thirty two per cent ofmen and 15% women reported drinking on weekends before 5 p.m. and25% of men and 13% women reported drinking on weekdays before 5 p.m.(10% and 8% of men and women users reported drinking on weekdaysbefore 5 p.m. daily or almost daily).
Ninety two per cent of drinking men and 93% of drinking womenreported that they had never drunk within an hour of driving a vehicle, butthis observation needs to be tempered by the fact that a large (unspecified)proportion of the sampled population did not possess or drive vehicles.Women and men spent roughly equal time drinking on a typical day [49.2(44.8) minutes vs. 41.9 (35.9) minutes; modal value 30 minutes in bothgroups]. However urban affluent women appeared to spend a longer time oneach drink [25 (19) minutes vs. 12.2 (13.8) minutes; t =3.1, df 84, p = 0.003].
Women were more likely to drink with meals [t =5.3, df 105,p<0.0005], at friends’ homes [t=5, df104, p<0.0005], at home [t =4.5,df106, p<0.0005], and at parties [t =3.5, df 11.8, p = 0.005]. The men onthe other hand were more likely to be drinking at pubs and bars [t =2,
ALCOHOL, GENDER AND DRINKING PROBLEMS
102
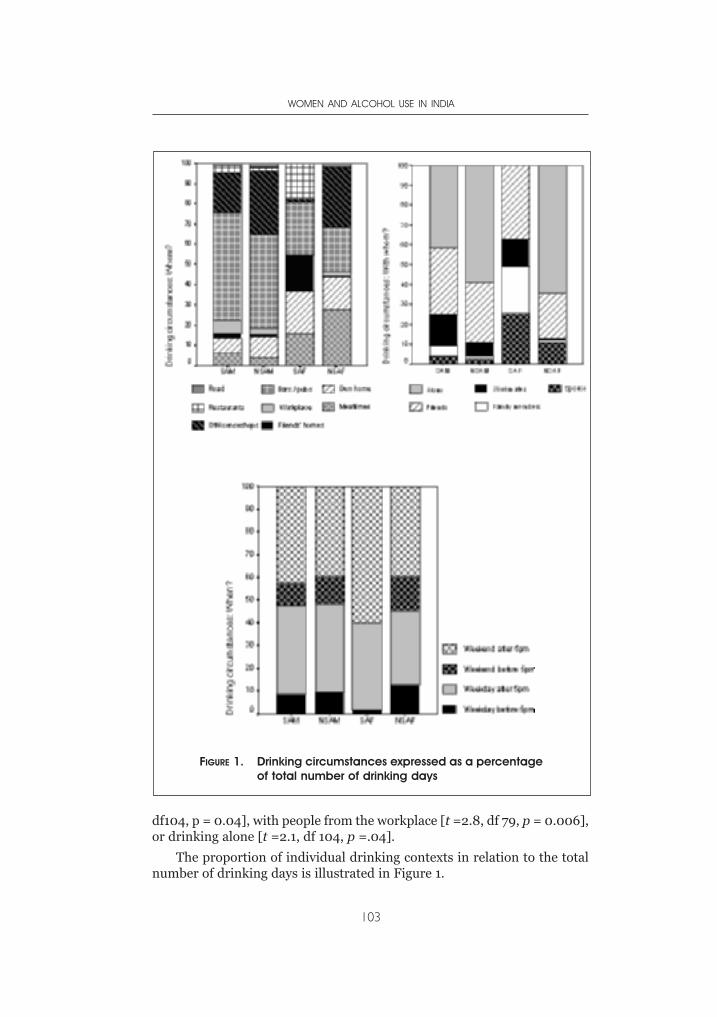
df104, p = 0.04], with people from the workplace [t =2.8, df 79, p = 0.006],or drinking alone [t =2.1, df 104, p =.04].
The proportion of individual drinking contexts in relation to the totalnumber of drinking days is illustrated in Figure 1.
WOMEN AND ALCOHOL USE IN INDIA
103
FIGURE 1. Drinking circumstances expressed as a percentageof total number of drinking days
HAZARDOUS USE
AUDIT scores were significantly higher among male users than femaleusers [10.4(7.7) vs. 6.8 (5.6); t = 4.1, df 581, p < 0.0005). Male drinkers hadconsistently higher scores on the individual AUDIT items than femaledrinkers. Twenty eight per cent of female users and 52% of male users hadpatterns of use amounting to hazardous drinking [AUDIT > 8] (t =4.1, df551, p < 0.0005).
CONSEQUENCES OF ALCOHOL USE
Among women and men who reported 2 or more problems in the pastyear (in the areas of work, household chores, physical health, familyinteraction, finances and legal problems), the women drinkers differedfrom the men in that they had consumed significantly fewer drinks in thepast year [1425.4 (1355) drinks and 3143 (3540) drinks respectively; t =3.5, df 33.3, p< 0.001].
Similarly, women reporting that their physical health had been poor tofair in the past year drank less frequently than men with the same healthstatus [75(129) days in the past year vs. 218 (158) days in the past year; t =2.3, df 96, p = 0.02 ]. They also had a lower mean consumption [776 (1726)drinks per year and 2297 (3103) drinks per year; t = 2.1, df 9.5, p = 0.06],as well as a shorter drinking career [12 (10) years and 17 (13) years; t = 1,df 7.2, p = 0.3], although these differences did not reach statisticalsignificance. More male drinkers (19%) than female drinkers (7%) hadfaced criticism of their drinking in the past year. Similarly, more maledrinkers (10%) than females (1%) admitted that their spouse threatened toleave or left because of their drinking, within the past year.
ALCOHOL AND VIOLENCE
Forty per cent of all males in the total sample and 22% of all womenrespondents reported solving disagreements by physical fights or longlasting quarrels more than several times a week.
Fifty per cent of the male drinkers and 40% of the female drinkers saidthat they became more aggressive towards other people after drinking.Twenty seven per cent of female drinkers and only 9% of male drinkersreported that their spouse/partner had been drinking more often than not,most of the time or all the time that they had quarreled in the past year.Sixteen per cent of male drinkers and 3% of the female drinkers reportedgetting into fights after drinking in the past year. Expectedly enough, moremale users (45.7%) reported quarreling more than several times a monththan male abstainers (35.6%). But among women, there appeared to be aninverse relationship between drinking status and frequent quarreling(2.9% of female users, compared to 5.9% of female abstainers).
Women with alcohol-using spouses (40%) were significantly more
ALCOHOL, GENDER AND DRINKING PROBLEMS
104
likely to have faced violence than women (11%) with abstaining spouses[Pearson Chi-Square = 144.13, df 1, p < 0.0001]. Female respondents werealso more likely to have been physically aggressive towards alcohol-usingspouses (4.5%) than towards abstaining spouses (0.9%) [Pearson Chi-Square=20.38, df1, p<0.0005]. However male respondents did not revealany greater likelihood of physical aggression towards alcohol-usingspouses, compared to males with abstaining spouses [Pearson Chi-Square=0.13, df1, p = 0.72].
Alcohol-using males were significantly more likely (three times more so)to have been physically aggressive towards their spouses, compared to maleabstainers [Pearson Chi-Square = 26.15, df 1, p < 0.0001]. Female userswere no more likely than female abstainers to have been physicallyaggressive towards their spouses [Pearson Chi-Square = 0.21, df 1, p = 0.65].
EFFECTS OF DRINKING ON INTIMACY AND SEXUALITY
Seventy one per cent of the male users and 58% of female users reportedthat they found it easier to be open with other people after drinking. Sixty-five per cent of men and 54% of women found it easier to talk to their presentpartner about their feelings or problems after drinking.
Forty per cent of men and 19% of women felt less inhibited about sexafter drinking and 40% of the men and 21% of the women felt that sexualactivity was more pleasurable for them after drinking. Likewise about 40%of men and 21% of women felt more sexually attractive after drinking.
Women users reported having their first consensual intercourse at asignificantly older age than abstaining women [20(5) years vs. 18.6 (4); t =2.8, df 1248, p<0.005], but there was no significant difference in thenumber of sexual partners between these two groups. Male users, on theother hand, reported having more sexual partners [0.85 (0.78) vs. 0.65(.68); t = 5, df 1512, p<0.0005], but did not differ from abstainers in age atfirst sexual intercourse. The male heavy users accounted for this effect, asthey had significantly more sexual partners than light users and abstainers[0.92(0.85) vs. 0.66(0.67); t = 5.9, df 203, p < 0.0005].
ALCOHOL AND OTHER SUBSTANCES
More alcohol-using women used tobacco (36%) than non-usingwomen. Similarly, male alcohol users were more likely to use tobacco (51%)than non users (34%). The prevalence of prescription drug abuse was threetimes higher in women users (2.4%) than non-users (0.7%). On the otherhand, use of these substances was relatively higher among male non-users(9.5%) than users (7.9%).Although the general prevalence was very low,use of cannabis was higher among both alcohol-using women and men(1.2% and 1.4%) than in the general population of women and men (0.1%and 0.2%). The prevalence of gambling was similarly three times higher
WOMEN AND ALCOHOL USE IN INDIA
105
among women users (1.2 %) than non-users (0.3%). Gambling was alsohigher among male users (5.8 %) than non-users (1.9%).
Age at onset of alcohol use : There was no significant difference inage at onset of use between male and female users [20.7 (5.3) years and20.3 (5.9) years respectively]. Younger alcohol users, both male [PearsonCorrelation = 0.37, p < 0.0005] and female [Pearson Correlation = 0.34, p< 0.0005] were significantly more likely to have an earlier age at onset ofuse. Males over 35 years had a mean age at onset of use of 22.5 (6.2) years,compared to 19.5 (4.2) years in users currently below 35 years [t = 6.4, df492, p < 0.005]. Women users over 35 years had a mean age at onset of useof 22 (6.7) years, compared to 19.1 (5.4) years in users currently below 35years [t = 2.2, df 79, p < 0.03].
COURSE : LIFE CYCLE AND USE
Among women, there was a significantly negative correlation betweenage and quantity drunk per typical occasion (Pearson Correlation = - 0.27,p = 0.016) and with frequency of six or more drinks drunk per typicaloccasion (Pearson Correlation = - 0.26, p = 0.026). This was not observedin male drinkers.
INFLUENCES ON DRINKING
Thirty-five per cent of female users had alcohol-using spouses,compared to 3% of male drinkers. Ten per cent of female users reported thatall or most drinking occasions in the past year had been with their spouseor partner, compared to only 1.6% of male users, yet only 4% of marriedfemale users reported having felt influenced to drink by their spouse.
Twelve per cent of all women respondents and 7.7% of all malerespondents reported childhood sexual abuse by close family members and3.9% and 3.5% respectively, by others. The occurrence of childhood sexualabuse [CSA] was disproportionately higher among women users [20.5% vs.11.3%; x2=5.7, p = 0.017) than female abstainers. But the history of CSA didnot appear to influence heavy use or bingeing in men or women.
Forcible sex after the age of 16 years was present in 10.4% of all womenrespondents and 1.6% of all males. Ninety-five percent of women and 54%of the men so abused had suffered at the hands of a close relative, spouseor partner. However, none of the women users reported such incidents inthe past year.
ATTITUDES TOWARDS DRINKING
An equal proportion of abstaining and alcohol-using women (54%)agreed strongly that it was more acceptable for men to drink than women.However that left more than 45% of women in both groups who disagreed
ALCOHOL, GENDER AND DRINKING PROBLEMS
106
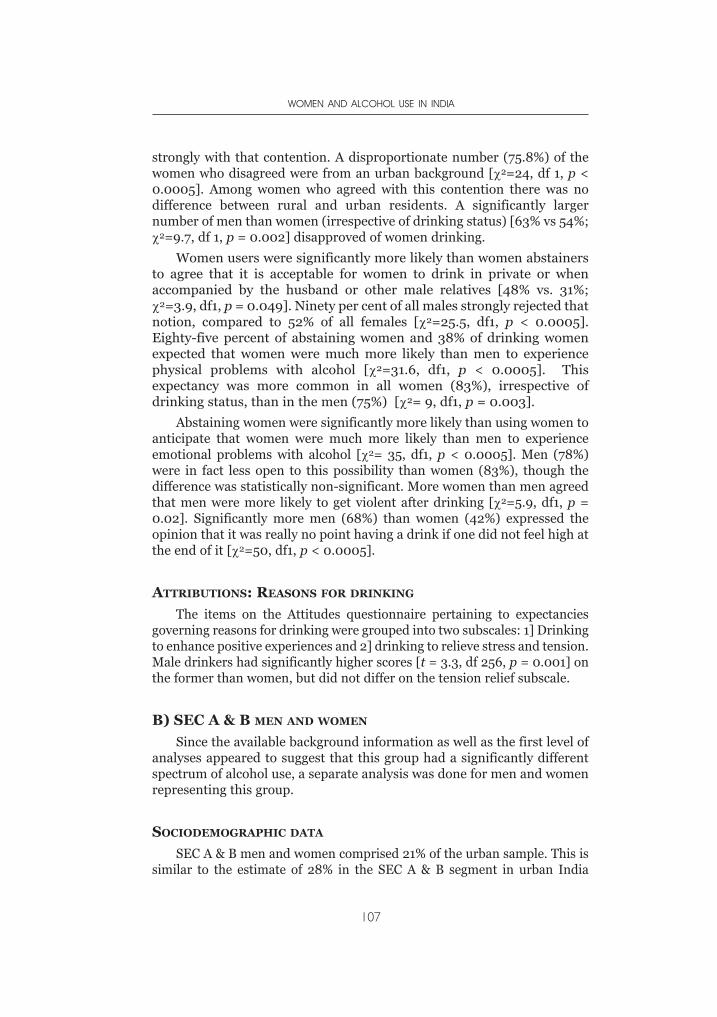
strongly with that contention. A disproportionate number (75.8%) of thewomen who disagreed were from an urban background [χ2=24, df 1, p <0.0005]. Among women who agreed with this contention there was nodifference between rural and urban residents. A significantly largernumber of men than women (irrespective of drinking status) [63% vs 54%;χ2=9.7, df 1, p = 0.002] disapproved of women drinking.
Women users were significantly more likely than women abstainersto agree that it is acceptable for women to drink in private or whenaccompanied by the husband or other male relatives [48% vs. 31%;χ2=3.9, df1, p = 0.049]. Ninety per cent of all males strongly rejected thatnotion, compared to 52% of all females [χ2=25.5, df1, p < 0.0005].Eighty-five percent of abstaining women and 38% of drinking womenexpected that women were much more likely than men to experiencephysical problems with alcohol [χ2=31.6, df1, p < 0.0005]. Thisexpectancy was more common in all women (83%), irrespective ofdrinking status, than in the men (75%) [χ2= 9, df1, p = 0.003].
Abstaining women were significantly more likely than using women toanticipate that women were much more likely than men to experienceemotional problems with alcohol [χ2= 35, df1, p < 0.0005]. Men (78%)were in fact less open to this possibility than women (83%), though thedifference was statistically non-significant. More women than men agreedthat men were more likely to get violent after drinking [χ2=5.9, df1, p =0.02]. Significantly more men (68%) than women (42%) expressed theopinion that it was really no point having a drink if one did not feel high atthe end of it [χ2=50, df1, p < 0.0005].
ATTRIBUTIONS: REASONS FOR DRINKING
The items on the Attitudes questionnaire pertaining to expectanciesgoverning reasons for drinking were grouped into two subscales: 1] Drinkingto enhance positive experiences and 2] drinking to relieve stress and tension.Male drinkers had significantly higher scores [t = 3.3, df 256, p = 0.001] onthe former than women, but did not differ on the tension relief subscale.
B) SEC A & B MEN AND WOMEN
Since the available background information as well as the first level ofanalyses appeared to suggest that this group had a significantly differentspectrum of alcohol use, a separate analysis was done for men and womenrepresenting this group.
SOCIODEMOGRAPHIC DATA
SEC A & B men and women comprised 21% of the urban sample. This issimilar to the estimate of 28% in the SEC A & B segment in urban India
WOMEN AND ALCOHOL USE IN INDIA
107
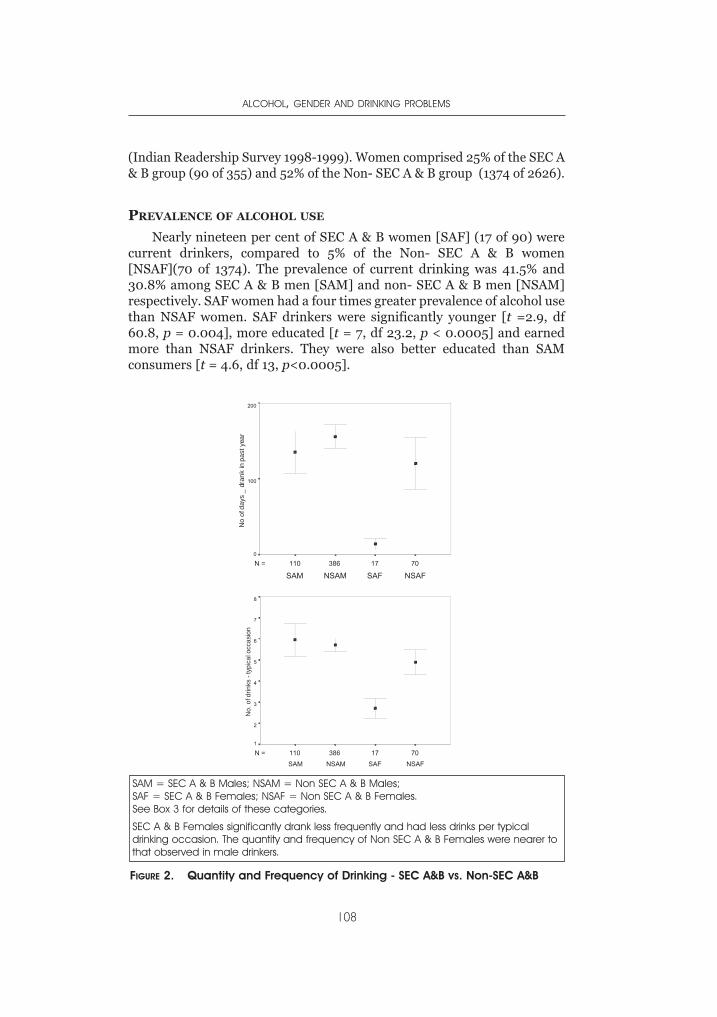
(Indian Readership Survey 1998-1999). Women comprised 25% of the SEC A& B group (90 of 355) and 52% of the Non- SEC A & B group (1374 of 2626).
PREVALENCE OF ALCOHOL USE
Nearly nineteen per cent of SEC A & B women [SAF] (17 of 90) werecurrent drinkers, compared to 5% of the Non- SEC A & B women[NSAF](70 of 1374). The prevalence of current drinking was 41.5% and30.8% among SEC A & B men [SAM] and non- SEC A & B men [NSAM]respectively. SAF women had a four times greater prevalence of alcohol usethan NSAF women. SAF drinkers were significantly younger [t =2.9, df60.8, p = 0.004], more educated [t = 7, df 23.2, p < 0.0005] and earnedmore than NSAF drinkers. They were also better educated than SAMconsumers [t = 4.6, df 13, p<0.0005].
ALCOHOL, GENDER AND DRINKING PROBLEMS
108
7017386110N =
NSAFSAFNSAMSAM
200
100
0
7017386110N =NSAFSAFNSAMSAM
8
7
6
5
4
3
2
1
FIGURE 2. Quantity and Frequency of Drinking - SEC A&B vs. Non-SEC A&B
SAM = SEC A & B Males; NSAM = Non SEC A & B Males; SAF = SEC A & B Females; NSAF = Non SEC A & B Females.See Box 3 for details of these categories.
SEC A & B Females significantly drank less frequently and had less drinks per typicaldrinking occasion. The quantity and frequency of Non SEC A & B Females were nearer tothat observed in male drinkers.
No.
of d
rinks
- ty
pica
l occ
asio
nN
o of
day
s _
dran
k in
pas
t yea
r
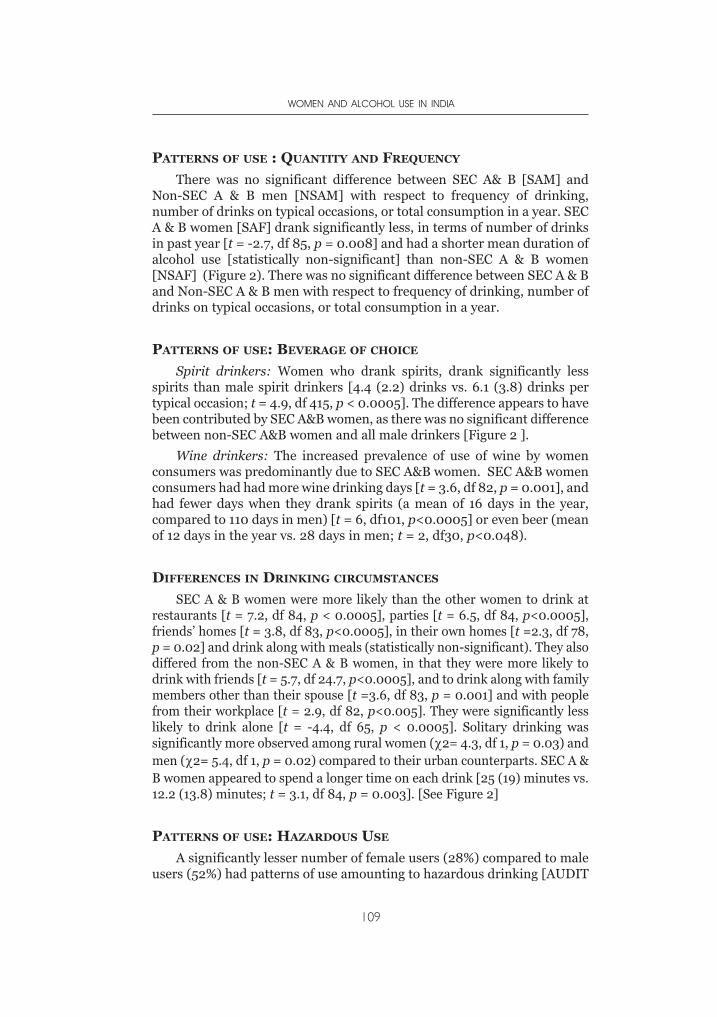
PATTERNS OF USE : QUANTITY AND FREQUENCY
There was no significant difference between SEC A& B [SAM] andNon-SEC A & B men [NSAM] with respect to frequency of drinking,number of drinks on typical occasions, or total consumption in a year. SECA & B women [SAF] drank significantly less, in terms of number of drinksin past year [t = -2.7, df 85, p = 0.008] and had a shorter mean duration ofalcohol use [statistically non-significant] than non-SEC A & B women[NSAF] (Figure 2). There was no significant difference between SEC A & Band Non-SEC A & B men with respect to frequency of drinking, number ofdrinks on typical occasions, or total consumption in a year.
PATTERNS OF USE: BEVERAGE OF CHOICE
Spirit drinkers: Women who drank spirits, drank significantly lessspirits than male spirit drinkers [4.4 (2.2) drinks vs. 6.1 (3.8) drinks pertypical occasion; t = 4.9, df 415, p < 0.0005]. The difference appears to havebeen contributed by SEC A&B women, as there was no significant differencebetween non-SEC A&B women and all male drinkers [Figure 2 ].
Wine drinkers: The increased prevalence of use of wine by womenconsumers was predominantly due to SEC A&B women. SEC A&B womenconsumers had had more wine drinking days [t = 3.6, df 82, p = 0.001], andhad fewer days when they drank spirits (a mean of 16 days in the year,compared to 110 days in men) [t = 6, df101, p<0.0005] or even beer (meanof 12 days in the year vs. 28 days in men; t = 2, df30, p<0.048).
DIFFERENCES IN DRINKING CIRCUMSTANCES
SEC A & B women were more likely than the other women to drink atrestaurants [t = 7.2, df 84, p < 0.0005], parties [t = 6.5, df 84, p<0.0005],friends’ homes [t = 3.8, df 83, p<0.0005], in their own homes [t =2.3, df 78,p = 0.02] and drink along with meals (statistically non-significant). They alsodiffered from the non-SEC A & B women, in that they were more likely todrink with friends [t = 5.7, df 24.7, p<0.0005], and to drink along with familymembers other than their spouse [t =3.6, df 83, p = 0.001] and with peoplefrom their workplace [t = 2.9, df 82, p<0.005]. They were significantly lesslikely to drink alone [t = -4.4, df 65, p < 0.0005]. Solitary drinking wassignificantly more observed among rural women (χ2= 4.3, df 1, p = 0.03) andmen (χ2= 5.4, df 1, p = 0.02) compared to their urban counterparts. SEC A &B women appeared to spend a longer time on each drink [25 (19) minutes vs.12.2 (13.8) minutes; t = 3.1, df 84, p = 0.003]. [See Figure 2]
PATTERNS OF USE: HAZARDOUS USE
A significantly lesser number of female users (28%) compared to maleusers (52%) had patterns of use amounting to hazardous drinking [AUDIT
WOMEN AND ALCOHOL USE IN INDIA
109
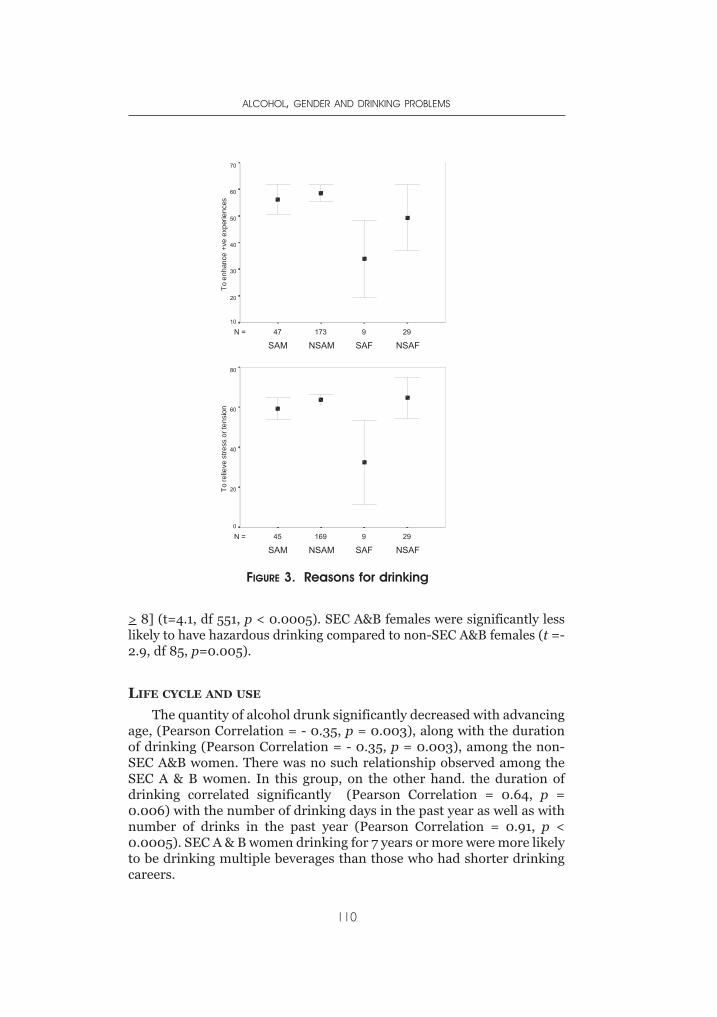
> 8] (t=4.1, df 551, p < 0.0005). SEC A&B females were significantly lesslikely to have hazardous drinking compared to non-SEC A&B females (t =-2.9, df 85, p=0.005).
LIFE CYCLE AND USE
The quantity of alcohol drunk significantly decreased with advancingage, (Pearson Correlation = - 0.35, p = 0.003), along with the durationof drinking (Pearson Correlation = - 0.35, p = 0.003), among the non-SEC A&B women. There was no such relationship observed among theSEC A & B women. In this group, on the other hand. the duration ofdrinking correlated significantly (Pearson Correlation = 0.64, p =0.006) with the number of drinking days in the past year as well as withnumber of drinks in the past year (Pearson Correlation = 0.91, p <0.0005). SEC A & B women drinking for 7 years or more were more likelyto be drinking multiple beverages than those who had shorter drinkingcareers.
ALCOHOL, GENDER AND DRINKING PROBLEMS
110
29917347N =
NSAFSAFNSAMSAM
70
60
50
40
30
20
10
29916945N =
NSAFSAFNSAMSAM
80
60
40
20
0
FIGURE 3. Reasons for drinking
To e
nhan
ce +
ve e
xper
ienc
esTo
relie
ve s
tress
or t
ensi
on
ATTRIBUTIONS: REASONS FOR DRINKING
Among women drinkers, the non-SEC A&B women had significantlyhigher scores than the SEC A&B women on drinking for tension relief, butnot for enhancement of positive expectancies.
DISCUSSION
PREVALENCE
It comes as no surprise that alcohol use in women in the state ofKarnataka in southern India is much lower than the prevalence in men.This is not dissimilar to previous observations from India (Benegal et al.,2003; Saxena, 1999; Isaac, 1998), which have reported a significantly lowerprevalence of alcohol use among women compared to men. This is alsosimilar to observations throughout the world, across different culturalcontexts of drinking.
Why do women drink less than the men? The obvious answer is that itis socio-culturally less acceptable; the prevailing sentiment, and one thatappears to be traditionally held since ancient times, is that it is moreacceptable for men to drink than for women. This is inextricably linked tothe woman’s position in society and is buttressed by strong associationswith morality. There is expectedly a strong male gender bias againstwomen drinking (even among men who themselves use alcohol). Ruralwomen and the urban poor [the Non-SEC A&B], continued to support thestatus quo, even the drinkers among them. Women from urban areas withprofessional, semiprofessional or skilled jobs and students were morepermissive and tolerant of women’s drinking, regardless of drinking status.This group predictably had a higher prevalence of drinking.
Also, women, much more than men, believed that alcohol was morelikely to cause physical and emotional problems in women than men. Alarger proportion of abstaining than of drinking women endorsed thisbelief. Such a health belief model (Kauffman, Silver & Poulin, 1997) is likelyto shape drinking choices in women. It has been observed earlier that suchnegative expectancies about health consequences are likely to prevent ortemper use (Green et al., 2003). The 6% prevalence of drinking in adultwomen (vs. 33% of men) is relatively higher than that recorded in aprevious study from this region, which indicated a prevalence of less than2% (Benegal et al., 2003). At one level this is related to the sampling designin this study, which gave greater weight to the population in the urbancenter of Bangalore, which has the maximum population density in theregion. The previous study had used a stratified sampling design with anequal proportion of respondents from all the five districts involved,without regard to the actual population density. This underestimated thedrinkers in the urban SEC A&B group. In the current assessment, theurban working class women and the rural women drinkers [Non-SEC A&B]
WOMEN AND ALCOHOL USE IN INDIA
111
constituted 2% of all adult women, with the urban affluent women drinkersgroup adding a further 4%. The relatively higher prevalence is also due tothe fact that the sampling scheme in this study involved approaching maleand female respondents directly. Previous studies usually involvedapproaching respondents nominated by the head of the household asdrinkers or non-drinkers. Given the prevailing social attitudes to alcoholuse, this obviously led to lower estimates of female users.
The prevalence of alcohol use, then, is almost twice as high amongurban women from middle and upper socioeconomic backgrounds. Again,this is a departure from earlier findings; studies done ten to twenty yearsback generally reported that rural and tribal women, or women from alower socioeconomic urban milieu, had a relatively higher prevalence ofuse. SEC A&B women had shorter drinking careers than women from ruraland lower socioeconomic backgrounds, indicating that there were a largenumber of recent users in this group. 50% of the former had drinkingcareers of less than 10 years, compared to only 20% of the latter. This couldpossibly be a snapshot of an ongoing change in drinking habits amongurban women of middle and upper socioeconomic status.
PATTERNS OF DRINKING
Taking the trends for the entire state, women drank significantly lessthan men on typical drinking occasions (although the modal value ofdrinks per typical occasion was six drinks in both men and women).However, if the women in the urban center of Bangalore are omitted fromthe analysis, there is no difference between men and women with respectto amounts drunk on a typical drinking occasion. This is similar toobservations recorded earlier in this region, which highlighted the fact thatwomen drank as much as men when they did drink (Benegal et al., 2003).In fact, at a mean of five standard drinks consumed on typical drinkingoccasions, both women and men qualified for a pattern of bingeingwhenever they drank at all. This can be considered the traditional patternof drinking among Indian women.
The consumption was significantly lower and different among womenfrom upper and middle socioeconomic groups, especially in the largerurban centres and the increasingly globalized city of Bangalore. Women,however, drank less frequently than men. In the men, daily drinking wasthe predominant pattern (around 60%); but while daily drinking in womenusers was significantly less, it was still the pattern reported by 40% of thewomen users.
This translates into a lower annual consumption in women.Nevertheless, keeping in mind the trend for bingeing on every occasion,this still is a very explosive pattern of drinking, albeit relatively lessfrequent than the men’s. It is well appreciated (Heath, 2000; Stockwell etal, 1996) that binge drinking and drinking to intoxication are associated
ALCOHOL, GENDER AND DRINKING PROBLEMS
112
with more adverse consequences, particularly acute consequences. Bothwomen and men appeared to be consuming large quantities of alcohol in avery short time. Drinking five to six drinks in about half an hour can leadto very high Blood Alcohol levels, which in turn is likely to predispose togreater morbidity. The SEC A&B woman, however, appeared to prefersipping her drink rather than gulping it down, in a departure from theoverall trend.
It is not surprising, then, that almost a third of women users and a halfof male users had patterns of alcohol use amounting to hazardousdrinking. In keeping with the general trend, the SEC A&B women were lesslikely to display patterns of hazardous drinking. Previous studies, from allover India, have similarly observed that one out of two people who drinkalcohol do so at hazardous levels. Benegal (2003) documented that around50% of women users and around 70% of male users had hazardous use.Compared to other Asian cultures, like Thailand (27% in males and 1% infemales; Assangkornchai et al., 2003), this is abnormally high.
As such, it seems evident that there is a bi-modal distribution of femalealcohol use. One pattern is seen predominantly in urban, relativelyaffluent, more educated women who are students or higher paid workingwomen (professionals, semi-professionals and skilled workers). A secondpattern is seen amongst rural or urban working class women, who weremainly housewives or working in low income unskilled jobs. It appearslikely, that here, different patterns of alcohol use are supplantingtraditional patterns. In the hinterland, the traditional patterns continue.
Women users suffered equivalent physical health consequences tomales at lower quantities and frequencies. There is also a suggestion fromthis data that physical consequences occurred after a shorter duration ofdrinking than in the men, and that women are prone to more rapidprogression of alcohol-related health problems. This is entirely consistentwith the telescoping of alcohol-related physical consequences which hasoften been observed in women alcoholics (Redgrave, 2003; Greenfield,2002). Alcohol use, as in males, constituted for females yet another nodein a matrix of risk. Women alcohol users were also likely to have otherhigh-risk lifestyle issues. Tobacco use (smoking and smokeless) wassignificantly more common among alcohol users than abstainers, withmore than a third of all drinking women using tobacco. Expectedly,tobacco use was higher in males compared to women.
Prescription drug abuse was also three times higher among womenusers than women abstainers. In contrast, the prevalence of such abusewas higher in abstinent males compared to users. It has been observed alsoin other cultures that women tend to use more medically prescribedpsychotropics than men (Grant et al., 2004; Canetto, 1999); however, inthe present sample males as a whole used more psychotropics. Onewonders if male abstainers are “substituting” prescription drugs for alcoholin an environment where alcohol use is generally stigmatized.
WOMEN AND ALCOHOL USE IN INDIA
113
Use of other substances was low, with cannabis use at about 1% in bothmales and females using alcohol. The prevalence among non-drinkers wasrare. It has been repeatedly observed that in southern India, incontradistinction to the north and north-eastern parts of the country,substance use other than alcohol is very low (Rapid Assessment Survey ofDrug Abuse in India, 2002).
Gambling was higher among female users than female abstainers, buton the whole far lower than among male users.
COHORT EFFECTS
Although there appeared to be no difference between men and womenwith respect to the age at which they started drinking, there was asignificant lowering of age at onset of alcohol use among men and womenin later birth cohorts. This is again consistent with data from a previousstudy from the same region that found very strong cohort effects, with anaccelerated onset of regular use of alcohol in younger birth cohorts(Benegal et al., 2003).
EFFECTS OF AGE
A major gender related difference was the trend towards lower alcoholuse (number of drinks on typical drinking occasions) with increasing age innon SEC A&B women. Men, conversely, tended to drink more withincreasing age. SEC A&B women appeared to be at greater risk ofincreasing consumption with increasing duration of drinking. This raisesthe likelihood that they too will in time have similarly explosive patterns ofdrinking as their non-SEC A&B counterparts, even though their currentconsumption is low. While the newly introduced low alcohol ready-to-drink beverages do not figure in this analysis, there is the very realpossibility that the SEC A&B women who start off with ready-to-drinkbeverages (pre-mixed drinks) or wine will shift to stronger alcoholicbeverages. There is some evidence that this process is already happening.SEC A & B women who have been drinking for 7 years or more are drinkingmultiple beverages, as well as drinking more frequently and largerquantities than those with shorter drinking careers.
PREFERRED BEVERAGES
It has been consistently recorded by previous observers that spirits arethe preferred alcoholic beverage in India (Benegal, 2003; Saxena, 1999;Isaac, 1998) and this is borne out in the present study. Spirits [IndianMade Foreign Liquors] were the most common beverage among both menand women in both urban and rural areas. Beer was next common beveragein both men and women, regardless of urban or rural milieu. This is adeparture from previous studies which have consistently shown a low
ALCOHOL, GENDER AND DRINKING PROBLEMS
114
consumption of beer in India. However, this parallels the growing trends inbeer sales (especially strong beer) over the past few years. Arrack (countryliquor) was the next most commonly used beverage, but concentratedentirely in the Non-SEC A&B segment. Arrack appears to be less commonamong women, though. Illicit (moonshine) liquor was common in ruralareas and among urban working class women. In fact it was more popularamong women than men. We have previously documented that in urbanworking class areas and in rural areas, where illicit liquor outlets aboundand are merged with the surroundings, it is easier for women in thesecircumstances to acquire their drink without attracting unwelcomeattention (Benegal, 2003).
Whether they drank illicit liquor, arrack, or beer, women and mendrank similar amounts. A notable exception were women from the SECA&B segment who, when drinking spirits, drank significantly smalleramounts than the men. A significantly higher proportion of womenadmitted drinking wine than the men, and this was mostly among the SECA&B segment. Wine- drinking women tended to be more abstemious.
More women than men restricted themselves to one beverage type.Men on the other hand were more catholic in their beverage choice andtended to drink multiple beverages.
DRINKING CIRCUMSTANCES
Weekend drinking (after 5 p.m.) was the most frequent event for bothmen and women. An equal proportion of men and women users reporteddrinking every evening or almost every evening. This accounted for a fifthof both male and female users. But regular heavy drinking, probablyqualifying for alcohol dependence, was also common. Almost a tenth ofmale and female users, respectively, drank on weekdays before 5 p.m. dailyor almost daily. Women and men spent roughly equal time (around half anhour) drinking on typical occasions.
More than a third of all female users had alcohol-using spouses and atenth of the women users drank almost exclusively along with theirspouses. This observation is a validation of earlier findings, where it wasnoted that most alcohol-using women were strongly influenced bysignificant males in the family (spouses, fathers, brothers) in initiation andpatterns of drinking.
The impact of male alcohol use on women and children has been amajor focus of attention in the public discourse on alcohol in India. In factthis aspect found repeated mention in the debates of the ConstituentAssembly in 1950 when the founding fathers of the modern Indian republicdebated and endorsed prohibition as a Directive Principle of state policy,repeatedly underlining the effects of alcohol on violence towards womenand children and on poverty. It has also been at the root of several women’santi-alcohol movements, which have culminated in well publicized but
WOMEN AND ALCOHOL USE IN INDIA
115
short-lived attempts at prohibition in a few states in the country. Womenwith alcohol-using spouses, in this study, were much more likely to havefaced acts of physical violence than women with abstaining spouses. Theconverse did not hold true, as women alcohol users were no more likelythan abstaining women to be violent towards their spouses.
In the general population, there was a strong expectancy linkingalcohol use and the propensity to violence in men, rather than in women.This was more common among women. Intoxication as a desired outcomeof drinking was a stronger expectancy among men than in women. Thiswas in line with the other male belief, that men tend to get drunk morethan women. In combination, this set of expectancies is likely to be apowerful template that legitimizes male drunkenness and violence afterdrinking.
A glance at the city page of any newspaper in India will underscore thispoint. On any day there are invariably one or more gory reports of murderand mayhem perpetrated by drunken men. Sometimes there are reports oflong-suffering wives or parents striking back. There is evidence of this, too,from the present study’s findings. Alcohol-using males were at greater riskof violence from their spouses, compared to abstaining men. Surprisingly,despite the proscriptive attitudes towards alcohol use in women, womenusers appeared to be at no greater risk for suffering spousal violence thanabstaining women. If at all, they appeared to be at lesser risk. This findingmust be treated with caution.
WOMEN DRINKERS
To sum up, there appear to be two widely divergent patterns ofdrinking among women. There is what appears to be a traditional pattern,as reported earlier. This is confined to less educated women from ruralsettings and poorer sections of urban society. Their drinking is marked bybingeing and drinking to intoxication, with a high proportion drinking fivedrinks or more per drinking occasion. This pattern is marked bypredominant use of cheaper, high alcohol-containing beverages: spirits,illicit liquor and country liquor. Drinking is mostly conducted in under-socialized drinking contexts. This group is more likely to drink at home,usually alone. They are also more likely to drink at off-license retail outlets,and licensed retail outlets like arrack shops. Though they drink lessfrequently, their pattern is nearer the male pattern of drinking observed inthe sample. It also appears to be more likely to serve the function of tensionrelief rather than the enhancement of positive experiences. Drinking toenhance positive experiences appears to be less of a motivation for womenas a whole compared to males. It is reasonable to posit that relief ofnegative emotional states rather than the pursuit of pleasure appears to bethe dominant motif driving women’s drinking, especially among womenfrom lower socioeconomic groups. It is clearly ego-dystonic, and leaves a
ALCOHOL, GENDER AND DRINKING PROBLEMS
116
lot of guilt and shame in its wake. They also report more alcohol-relatedproblems in the sphere of household chores, relations with family andchildren, physical health, family finances and friendships.
Then there is the other pattern, seen in affluent, educated urbanwomen who are presumably more emancipated. This group iscomparatively younger, more educated, earn more, drink less on typicaldrinking occasions, less frequently and have a shorter duration of drinking.They are more likely to be unmarried and without children. Their drinkingis under relatively more socialized circumstances: at restaurants, parties,with spouses, family members, workmates and friends. It is morenormalized in that they are more likely to drink at home and with meals.Although spirit drinking is still most common, use of lower alcoholicbeverages like wine and beer is relatively higher. Women’s drinking isperceived to be more socially acceptable in this group (although it does notreally have significantly more male endorsement). Women in this groupare motivated equally by expectancies of tension relief and theenhancement of positive experiences. These women obviously have a muchhigher spending capacity. They also have less physical, emotional andinterpersonal problems as a result of their drinking. This group ischaracterized by people in their early drinking careers, and there aresuggestions that the newer entrants are starting to drink at progressivelyyounger ages. This is so different from the traditional pattern of women’sdrinking that some observers have suggested that a novel, convivial(westernized) pattern is supplanting older drinking norms.
In marketing terms they represent two different markets. The ruraland poorer urban consumers, who drink mostly non-premium spirits andcountry liquor, constitute a market which is comparatively stagnant. Theyoung, affluent female urban drinker conversely represents an emergingmarket, which is rapidly growing. And this is clearly recognized by localalcohol manufacturers and trans-national alcoholic beverage corporations.According to one influential industry projection which predicts a realisticmarket growth of 12-14% of beverage alcohol sales in India for the next tenyears, increasing drinking among women is expected to fuel over a quarterof that movement.
The president of one of India’s largest beverage alcohol manufacturingcompanies, in a television interview, confirmed that “the entire Indianmarket is changing…[with] a huge explosion of disposable income amongthe young. Moreover, social drinking has increased. The Indian market isready for ready to drink [RTD] alcohol beverages with exotic fruitflavors…which will be a stepping stone for SEC A [urban higher income]youngsters and women to enter the alcoholic beverages segment.Especially women, who are used to fruit juices and would readily makethe transition to one with low alcohol content (“Speak” programme onSAB TV). Ready- to-drink or mixed beverages (RTD), introduced into theIndian market in 2001, have in a short span of time found a substantial
WOMEN AND ALCOHOL USE IN INDIA
117
market amongt urban youth and women. The wine market, again targetedat women, is growing at 25% per year (from 0.6 million bottles sold in 1997to 2 million bottles in 2002).
LIMITATIONS OF THE STUDY
It must be admitted that some of the observations made in this paperare based on very small sample sizes. The generalizations on women’sdrinking are after all based on just 87 women. The women in the SEC A&Bsegment number only seventeen.
But it is undeniable that the prevalence of women’s drinking in India isvery low. The sample we have gathered is fairly representative of thegeneral population in the state with regard to sex ratio, literacy rates,income, and the proportion of the SEC A&B segment. Moreover, thesefigures seem to duplicate earlier findings from the same population, withthe exception of the prevalence of drinking in women. And there appearsto be a logical explanation for that discrepancy. Also, the data is regionaland can never be taken as being representative of the entire country.However, one must also acknowledge that this is the first suchepidemiological data on women’s drinking from India. The findingsunderscore the necessity for planning further studies in this areathroughout the country as they have grave public health implications.
It is interesting to contrast two different socio-political trends thatappear to have influenced the way alcohol is viewed and used in India. First,there is the phenomenon termed sanskritisation, where as a result of socialand economic mobility, people of lower socioeconomic class adopt the moresof the higher castes and classes (Srinivas1997). It has been speculated that,with increasing education and urbanization and the resultant social andeconomic mobility which saw the growth of the urban middle classes inIndia in the last 150 years or less, there have been rapid changes in diet (infavour of the upper caste Brahminical norms of vegetarianism andabstinence from alcohol) as lower castes/classes adopted the cultural moresof the higher castes/classes in order to better adapt to their changedpositions in the social hierarchy. Historically, this has served to pushtemperance as the stated position on alcohol in the upper and growingmiddle classes. Alcohol use, in this view, was seen as an atavistic trait of theprimitive (tribals and the socially backward) or an aberration/affectation ofthe upper classes. Among males, even in recent times, although the use ofalcohol use has dramatically increased, consumption has been moreprevalent among the lower socioeconomic groups than among the middleand upper socioeconomic group [Benegal, 2003].
The results that we observe among women appear to run counter tothis trend. Emancipation as a result of education, economic independenceand urbanization, along with the effects of globalization that affect womenin urban India, appear to increase the chance of initiating alcohol
ALCOHOL, GENDER AND DRINKING PROBLEMS
118
consumption and rapidly increasing the consumer base. As noted earlier,the alcohol industry is well seized of this notion. In most developedeconomies, at least in Europe, the phenomenon of convergence is as muchdue to a reduction in male drinking as an increase in female consumption.The real danger in India is that burgeoning consumption in both males andfemales, encouraged by increasingly permissive social attitudes to alcoholuse, pushed by targeted hard-sell by the liquor industry and shaped by theexplosive drinking norms, is likely to increase manifold the alarmingly highsocial cost of alcohol abuse (Benegal et al., 2000) in the country.
ACKNOWLEDGEMENTS
We acknowledge the contributions of Lakshmi Shankaran (Field co-ordinator of the India site) and the field investigators in the GENACIS-India project, Dr. Mala Ramachandran (Bangalore City Corporation), Mrs.Geetha Krishnan; Mr. H. Shashidhar (Director, Census Operations,Karnataka).
REFERENCES
Allamani, A., Voller, F., Kubicka, L., & Bloomfield, K.(2000). Drinking cultures andthe position of women in nine European countries. Subst Abuse, 21(4), 231-247.
Assanangkornchai, S., Pinkaew, P., & Apakupakul, P. (2003). Prevalence ofhazardous-harmful drinking in a southern Thai community. Drug & AlcoholReview, 22, 287-293.
Benegal, V., Gururaj, G., & Murthy, P. (2003). Report on a WHO collaborativeproject on unrecorded consumption of alcohol in Karnataka, India[monograph on the Internet]. Available athttp://www.nimhans.kar.nic.in/Deaddiction/lit/UNDOC_Review.pdf
Benegal, V., Gururaj, G., & Murthy, P. (2002). Project report on a WHO multi centrecollaborative project on Establishing and Monitoring Alcohol’s Involvement inCasualties: 2000-2001 [monograph on the Internet]. Available athttp://www.nimhans.kar.nic.in/Deaddiction/lit/Alcohol%20and%20%20Injuries_WHO%20Collab.pdf
Benegal, V., Shantala, A., Murthy, P., & Janakiramaiah, N. (2001). Report onDevelopment of a Model District Programme for Prevention of Drug and AlcoholProblems: WHO–NIMHANS Project. [monograph on the Internet]. Available athttp://www.nimhans.kar.nic.in/Deaddiction/lit/Mandya_distt_WHO.pdf
Benegal, V., Velayudhan, A., & Jain, S. (2000). Social Costs of Alcoholism: AKarnataka Perspective. NIMHANS Journal, 18 (1&2), 6-7
Bhatt, R. V. (1998). Domestic violence and substance abuse. International Journalof Gynaecology and Obstetrics 63 Suppl 1, 25-31.
Blume, S. B. (1997). Women and alcohol: Issues in social policy. In Wilsnack, R.W., &Wilsnack, S.C., (eds.), Gender and alcohol: individual and social perspectives.New Brunswick, NJ: Rutgers Center of Alcohol Studies (pp. 462–489).
Census of India (2001). Karnataka: provisional population totals – rural urbandistribution of population, Paper 2 of 2001. Director of Census Operations,Bangalore, 2001.
WOMEN AND ALCOHOL USE IN INDIA
119
Chandra, P. S., Krishna, V. A., Benegal, V., & Ramakrishna, J. (2003). High-risksexual behaviour and sensation seeking among heavy alcohol users. IndianJournal of Medical Research, 117, 88-92.
Chitra, S., Ashok, L., Anand, L., Srinivasan, V., & Jayanthi, V. (2004). Risk factorsfor esophageal cancer in Coimbatore, Southern India: a hospital-based case-control study. Indian Journal of Gastroenterology, 23, 117-118
DH News Service Bangalore (2003) Women addicted to alcohol seek help later thanmen. Deccan Herald, Bangalore edition, Thursday, July 31, 2003.
Fillmore, K., Golding, J., Leino, E., Motoyoshi, M., Shoemaker, C., Terry, H., Ager,C., & Ferrer, H. (1997). Patterns and trends in women’s and men’s drinking. InWilsnack, R., & Wilsnack, S. (eds.). Gender and alcohol: individual and socialperspectives. New Brunswick, NJ: Rutgers Center of Alcohol Studies (pp. 21-48).
Doniger, W. (1992). The Laws of Manu. New Delhi: Penguin Classics.Gaunekar, G., Patel, V., Jacob, K. S., Vankar, G., Mohan, D., Rane, A., Prasad, S.,
Johari, N., & Chopra, A. (2004). Drinking patterns of hazardous drinkers: amulticentre study in India. In Haworth, A., & Simpson, R. (eds.), Moonshinemarkets: issues in unrecorded alcohol beverage production andconsumption. New York: Brunner-Routledge (pp.125-144).
Gomberg, E. (1996). Women’s drinking practices and problems from a lifespanperspective. In Howard, J., Martin, S., Mail, P., Hilton, M., & Taylor, E. (eds.),Women and alcohol: issues for prevention research. National Institute onAlcohol Abuse and Alcoholism (NIAAA) Research Monograph No. 32. NIHPublication No. 96-3817. Bethesda, MD: NIAAA (pp. 185-214).
Grant, M., & Litvak, J. (eds., 1998). Drinking patterns and their consequences.Philadephia: Brunner and Mazel.
Green, C. A., Polen, M. R., & Perrin, N. A. (2003). Structural models of gender,alcohol consumption and health. Substance Use and Misuse, 38, 97-125.
Greenfield, S. F. (2002). Women and alcohol use disorders. Harvard RevPsychiatry, 10, 76-85
Gupta, P. C., Saxena, S., Pednekar, M. S., Maulik, P. K. (2003). Alcoholconsumption among middle-aged and elderly men: a community study fromwestern India. Alcohol and Alcoholism, 38, 327-331.
Gururaj, G.(2002). Epidemiology of traumatic brain injuries: Indian scenario.Neurology Research, 24, 24-8.
Gururaj, G., Isaac, M. (2001). Epidemiology of suicides in Bangalore City.NIMHANS Publication No. 43, Bangalore, p.34.
Heath, D. B. (2000). Drinking occasions: comparative perspectives on alcoholand culture. Philadelphia, Pennsylvania: Brunner/Mazel.
Hibell, B., Andersson, B., Ahlström, S., Balakireva, O., Bjarnason, T., Kokkevi, A.,Morgan M. & Narusk, A. (2001). The 1999 ESPAD Report: Alcohol and otherDrug Use among students in 30 Countries, Stockholm: Swedish Council forInformation on Alcohol and other Drugs.
Holman, C. D., English, D. R., Bower, C., Kurinczuk, J. J. (1996). NHMRCrecommendations on abstinence from alcohol in pregnancy. National Healthand Medical Research Council. Medical Journal of Australia, 164(11), 699.
Hommer, D., Momenan, R., Kaiser, E., & Rawlings, R. (2001) Evidence for agender-related effect of alcoholism on brain volumes. Am J Psychiatry,158(2), 198-204.
Ilaiah, K. (1992). Andhra Pradesh’s anti-liquor movement. Economic and PoliticalWeekly, 26(45), 2406-2408.
ALCOHOL, GENDER AND DRINKING PROBLEMS
120
Isaac, M. (1998). Contemporary trends: India. In Grant, M. (ed.), Alcohol andemerging markets: patterns, problems and responses. Baltimore: Taylor andFrancis (pp. 145-176).
Jain, A., Buddhiraja, S., Khurana, B., Singhal, R., Nair, D., Arora, P., Gangwal, P.,Mishra, S. K., Uppal, B., Gondal, R., & Kar, P. (1999). Risk factors for duodenalulcer in north India. Tropical Gastroenterology 20, 36-9.
Kauffman, S. E., Silver, P., & Poulin, J. (1997). Gender differences towards alcohol,tobacco and other drugs. Social Work, 42, 231-241.
Kaufman, K. G., & Asdigian, N. (1997).Gender differences in alcohol-relatedspousal aggression. Wilsnack R and Wilsnack S (Eds.). Gender and alcohol:individual and social perspectives. New Brunswick, NJ: Rutgers Center ofAlcohol Studies (pp. 312-334).
Kraus, L., Bloomfield, K., Augustin, R., & Reese, A. (2000). Prevalence ofalcohol use and the association between onset of use and alcohol relatedproblems in a general population sample in Germany. Addiction,95(9),1389-1401.
Kumar, V. S. (1997). Behavioural malignancy: alcoholism, a bleak future? InAzariah, J., Azariah, H., & Macer, D. R.J. (eds.), Bioethics in India:proceedings of the international bioethics workshop in Madras:Biomanagement of Biogeoresources, 16-19 Jan. 1997, University of Madras.Eubios Ethics Institute. http://www.biol.tsukuba.ac.jp/~macer/index.html
Mahal, A. (2000). What works in alcohol policy? Evidence from rural India.Economic and Political Weekly, 12, 3959-68.
Midanik, L., & Clark, W. (1994). The demographic distribution of US drinkingpatterns in 1990: description and trends from 1984. American Journal ofPublic Health, 84, 1218-1222.
Miller, B. (1996). Women’s alcohol use and their violent victimization. In Howard,J., Martin, S., Mail, P., Hilton, M., & Taylor, E. (eds.), Women and alcohol:issues for prevention research. National Institute on Alcohol Abuse andAlcoholism (NIAAA) Research Monograph No. 32. NIH Publication No. 96-3817. Bethesda, MD: NIAAA, pp. 239-260.
Murthy, N.V., Benegal, V., & Murthy, P. (1995). Alcohol dependent females : aclinical profile, [monograph on the Internet]. Available athttp://www.nimhans.kar.nic.in/deaddiction/lit/Female%20Alcoholics.pdf.
Musgrave, S., & Stern, N. (1988). Alcohol demand and taxation under monopolyand oligopoly in South India in the 1970s. Journal of Development Economics,15, 15-16.
Naik, S. (2002). Indian spirits market: regulatory shackles easing. Mumbai: RaboIndia Finance Pvt. Ltd. April 2002, pp. 1-3. Available at:www.rabobank.com/Images/rabobank_publication_indian_spirits_market_2002_tcm25-151.pdf.
Neve, R. J. M., Lemmens, P. H., & Drop, M. J. (1996). Gender differences in alcoholuse and alcohol problems: mediation by social roles and gender-role attitudes.Substance Use Misuse, 32, 1439-1459.
Pande, R. (2000). From anti-arrack to total prohibition: the women’s movementin Andhra Pradesh, India. Gender, Technology and Development, 4(1),131-44.
Pittman, D.J. and White, H.R. (eds., 1991). Society, culture and drinking revisited.New Brunswick, New Jersey: Rutgers Center of Alcohol Studies.
Plant, M.L. (1997). Women and Alcohol: Contemporary and HistoricalPerspectives, London: Free Association Books.
WOMEN AND ALCOHOL USE IN INDIA
121
Plant, M.L., Miller, P., Thornton, C., Plant, M.A., & Bloomfield, K. (2000) Lifestage, alcohol consumption patterns, alcohol-related consequences andgender, Substance Abuse, 21, 265-281.
Prasad, S., Murthy, P., Varma, V., Mallika, R., & Gopinath, P.S. (1998). Alcoholdependence in women : a preliminary profile. NIMHANS Journal, 16(1), 87-91
Rahman, L. (2002). Alcohol Prohibition and Addictive Consumption in India[monograph on the Internet]. Available athttp://www.nottingham.ac.uk/economics/leverhulme/conferences/postgrad_conf_2003/Rahman_paper.pdf
Rajeswari, R., Chandrasekaran, V., Suhadev, M., Sivasubramaniam, S., Sudha, G.,& Renu, G. (2002) Factors associated with patient and health system delays inthe diagnosis of tuberculosis in South India. International Journal ofTuberculosis and Lung Disorders 6, 789-795.
Rao, K. N., Begum, S., Venkataramana, V., & Gangadharappa, N. (2001).Nutritional neglect and physical abuse in children of alcoholics. IndianJournal of Pediatrics 68, 843-845.
Ray, S. (2002). Why women get addicted to alcohol. The Tribune, Sunday, April 21,2002, Chandigarh, India.http://www.tribuneindia.com/2002/20020421/herworld.htm
Ray, R., Mondal, A. B., Gupta, K., Chatterjee, A., & Bajaj, P. (2004) The Extent,Pattern and Trends of Drug Abuse in India: National Survey. New Delhi:United Nations Office on Drugs and Crimes & Ministry of Social Justice andEmpowerment, Government of India.
Ray, R., & Sharma, H. K. (1994). Drug addiction: an Indian perspective. In V.P.Bashyam (Ed.) Souvenir of ANCIPS 1994 (pp. 106-109) Madras: IndianPsychiatric Society.
Redgrave, G. W., Swartz, K. L. & Romanoski, A. J. (2003). Alcohol misuse bywomen. International Review of Psychiatry; 15, 256-268.
Saunders, J.B., Aasland, O.G., Babor, T.F., de la Fuente, J.R., & Grant, M. (1993)Development of the Alcohol Use Disorders Identification Test (AUDIT): WHOcollaborative project on early detection of persons with harmful alcoholconsumption. II. Addiction, 88, 791-804.
Sarin, S. K., Bhatt, A., Malhotra, V., Sachdev, G., Jiloha, R. C., & Munjal, G. C.(1988). Pattern of alcohol-related liver disease in dependent alcoholics: theIndian dimension. British Journal of Addiction 83, 279-84.
Saxena, S. (1999) Country Profile on Alcohol in India. In : Riley L & Marshall M.(eds) Alcohol and Public Health in 8 Developing Countries. Geneva: WorldHealth Organisation . (pp.37-60).
Srinivas, M. N. (1997). Social change in modern India. New Delhi: OrientLongman (p6).
Sri, E. V., Raguram, R., & Srivastava, M.(1997). Alcohol problems in a generalhospital—a prevalence study. Journal of the Indian Medical Association,95, 505-6.
Stockwell, T. (1996). Interventions cannot ignore intentions. Addiction, 91(9),1283-1284.
Sundaram, K.R., Mohan, D., Advani, G. B., Sharma, H. K., & Bajaj, J. S.(1984)Alcohol abuse in a rural community in India. Part I:EpidemiologicalStudy. Drug and Alcohol Dependence 14, 27–36.
Suresh Kumar, M., & Ray, R. (eds., 2002). Rapid assessment survey of drug abusein India . New Delhi: UNDCP-ROSA and Ministry of Social Justice andEmpowerment.
ALCOHOL, GENDER AND DRINKING PROBLEMS
122
Thimmaiah G (1979) Socio-economic impact of drinking, State lottery and horse-racing in Karnataka. New Delhi: Sterling. (pp. 43 & 120).
Wei, H., Derson, Y., Xiao, S., Li, L., & Zhang, Y. (1999) Alcohol consumption andalcohol-related problems: Chinese experience from six area samples, 1994.Addiction, 94(10), 1467-76.
Wilsnack, R.W., & Wilsnack, S.C. (Eds.) Gender and Alcohol: Individual and SocialPerspectives, New Brunswick, New Jersey: Rutgers Center of Alcohol Studies.
Wilsnack, S. (1996). Patterns and trends in women’s drinking: Recent findingsand some implications for prevention. In Howard, J., Martin, S., Mail, P.,Hilton, M., & Taylor, E. (eds.), Women and alcohol: issues for preventionresearch. National Institute on Alcohol Abuse and Alcoholism (NIAAA)Research Monograph No. 32. NIH Publication No. 96-3817. Bethesda, MD:NIAAA, pp. 19-63.
WOMEN AND ALCOHOL USE IN INDIA
123

INTRODUCTION
Like many other Latin-American countries, Mexico has experiencedimportant social and cultural changes in recent years. At thebeginning of the twentieth century the Mexican population consisted
of thirteen million inhabitants. During the first three decades thepopulation increased by only three millions, which meant that in 1939 thetotal number of inhabitants reached sixteen million. During the postrevolution period the increase was mainly due to a decrease in mortality.Between 1900 and 1930 the growth rate was 0.7 percent, which in thefollowing two decades reached two percent. In this way, by the middle ofthe century the Mexican population grew to twenty five millions.
By the year 2000 there were 97 million inhabitants in the country, 48percent male and 51 percent female (INEGI, 2001). The way the populationis distributed in the territory is closely linked with socioeconomic, political,historical, environmental and cultural factors. Of these the most importantare the economic growth, the use and availability of resources,infrastructure and services, which determine the conditions of life of thepopulation and their level of wellness. Without a doubt the most importantphenomenon that Mexico experienced in the twentieth century wasgrowing urbanization. The human settlement pattern in the country ischaracterized by a strong concentration of population in a few urbancenters and a deep dispersion in small and numerous localities of thecountry. On the one hand there are cities like the Federal District, theentity with the most population in the country, with more than 5,600inhabitants per square kilometre; and on the other hand one quarter of thepopulation lives in more than ninety percent of the country, being mostlyrural in character and often characterized by poverty and migration. Thissituation has contributed to changes in the lives of women in Mexico.
THE SITUATION OF WOMEN
It is agreed that no single group of women is a good representation ofall women in a particular country. Contemporary women have a diversity
CHAPTER 6ALCOHOL CONSUMPTION AMONG MEXICAN
WOMEN: IMPLICATIONS IN A SYNCRETIC CULTURE
MARTHA ROMERO MENDOZA, MARIA ELENA MEDINA-MORA,JORGE VILLATORO & ANA DURAND
of histories, lifestyles and experiences that frame their heterogeneousworlds in relation to language, ecology, available social services,experiences with motherhood or the lack of the latter and the valueassigned to this experience in society, violence and of course, health(Lagarde, 1996).
The women’s movement for the recognition of their equality with menand the liberation of their sexuality has grown in all the country, withdifferent features and goals but with a deep sense of personal commitment.This movement has transformed the perception women have of their socialsituation. It affects their every day life, their love relationships, theirpartners, their relations with others at work, their friends, the way childrenare raised, and the place of each woman in the social sphere and thecultural production. This change has redefined their roles in love and sex,conditioned their performance with masculine and feminine values in thesocial sphere and in the life of institutions (Galende, 2001).
Modern Mexican women are syncretic and hybrid. Each one of themreflects the contradictions of two different projects for women’s existence.Modernity brings them into contact with universal material and symbolicresources resulting from globalization (Canclini, 1995) while at the sametime, each of them has to contend with traditionally established practices.The result of these contradictions is experienced through profound andinterminable changes in the nature of their own lives.
According to Canclini (1995), the process of globalization has causedfive basic socio-cultural modifications: 1) local and national organizationshave lost ground to transnational institutions; 2) the reformulation of theurban environment and the patterns of everyday coexistence (fromneighborhoods to condominiums, the workplace, study and activitiesinvolving consumption and recreation) are carried out far away fromhome, limiting the time available to inhabit one’s own place; 3) the re-elaboration of identity due to the predominance of goods and messagesthat come from the global economy and culture; 4) the redefinition of thesense of belonging and identity that is not so much organized through localand national loyalties and more organized through participation intransnational communities (music, fashion, ways of forming couples); and5) the transition from being a citizen as a representative of public opinionto being a citizen as a consumer interested in enjoying the benefits of acertain way of life.
The tension between these two projects derived from tradition andmodernity is simultaneously reflected in two phenomena related to alcoholuse: the high rate of female abstainers is paralleled by high rates of hiddenconsumption, which constitutes a major barrier to treatment.
According to Mexican culture, women are expected to abstain fromconsuming alcoholic beverages. However, as a result of globalization morewomen, particularly younger ones with higher educational attainment, are
ALCOHOL, GENDER AND DRINKING PROBLEMS
126

drinking and consequently, some of them are experiencing problems dueto this practice. Drinking may be linked to a legitimate right to pleasure(Vance, 1984), yet when women suffer from problems of alcohol abuse ordependence, they do not seek help. When they eventually resort to healthservices, they have experienced more material and health related lossesthan men, experienced more rejection from society, their partners haveabandoned most of them, and they have experienced more psychologicalproblems.
Women from cultures with a tradition of alcohol use drink andsometimes harm themselves as a result of their drinking. However, theimportance of illness is not only related to use. Even women who do notdrink are responsible, in their role of mothers, sisters or wives, forpreventing alcohol abuse in their significant others. In other words, it isthought that they “can” or “must” control alcohol abuse in their partner,sons or brothers.
In Mexico the consumption of alcohol and other drugs occurs in acontext that reflects the way women have been socialized, as well as theirstatus in society. This context affects the way women drink, the type ofdrinks they choose and how and why they have problems due to theirdrinking habits. It also affects the resources available for treatment, thebarriers they find to asking for help and the effectiveness of the help, if infact they ever receive it (ARF, 1996).
Very little Mexican research has focused on alcohol use in women(Casco 1993; Medina-Mora, 1993; Romero, 1995; Romero et al, 1997;Romero, 1998). Consequently knowledge in this area has been applied towomen on the lack of the consideration of or partial admission that theyare different. According to Barret (1990) and Romero (1998), the idea ofdifference has at least three specific uses: 1) one that effectively recordswomen’s situations and experiences; 2) the understanding that its meaninghas a positional rather than an absolute nature; and 3) sexual difference.
The aim of this chapter is to present an analysis of the epidemiologicaldata from the National Addiction Survey (NAS) and student surveys,emergency services data related to alcohol use in women, and to reveal thesocio-cultural aspects involved in women’s alcohol use from a genderperspective.
METHOD
This study uses various methods and possibilities of analysis thatprovide knowledge on the issue. It combines the results of traditionalquantitative methods, such as surveys, with the analysis of a group of indepth interviews and ethnographic observations to obtain an overview ofalcohol use in women and at the same time to understand the socialconstruction and significance of these practices.
ALCOHOL CONSUMPTION AMONG MEXICAN WOMEN: IMPLICATIONS IN A SYNCRETIC CULTURE
127
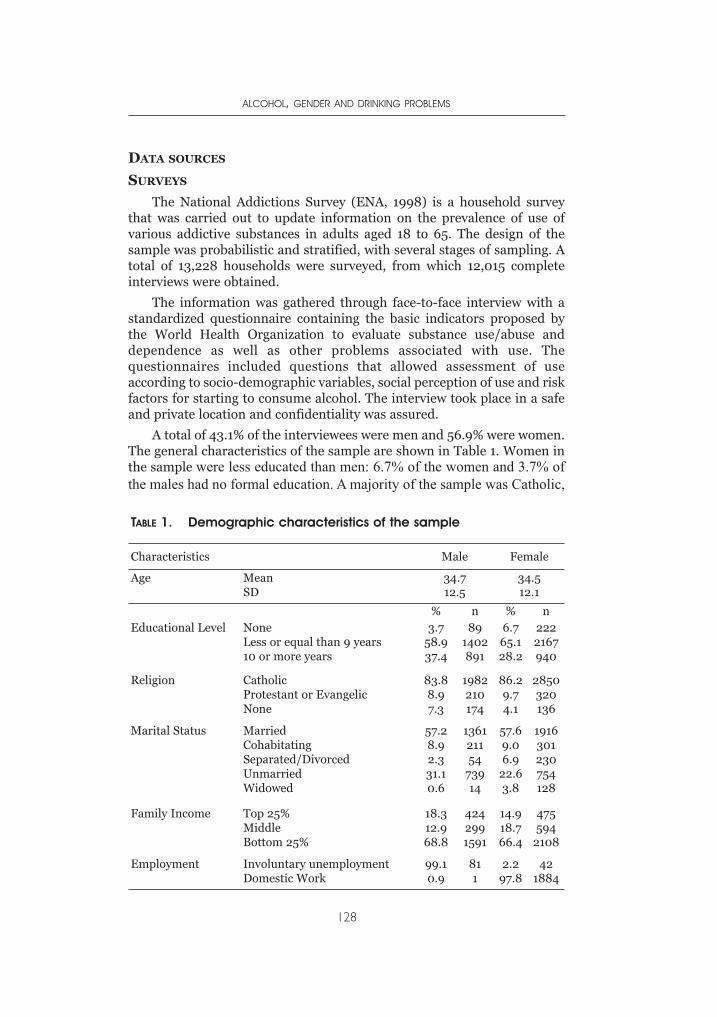
DATA SOURCES
SURVEYS
The National Addictions Survey (ENA, 1998) is a household surveythat was carried out to update information on the prevalence of use ofvarious addictive substances in adults aged 18 to 65. The design of thesample was probabilistic and stratified, with several stages of sampling. Atotal of 13,228 households were surveyed, from which 12,015 completeinterviews were obtained.
The information was gathered through face-to-face interview with astandardized questionnaire containing the basic indicators proposed bythe World Health Organization to evaluate substance use/abuse anddependence as well as other problems associated with use. Thequestionnaires included questions that allowed assessment of useaccording to socio-demographic variables, social perception of use and riskfactors for starting to consume alcohol. The interview took place in a safeand private location and confidentiality was assured.
A total of 43.1% of the interviewees were men and 56.9% were women.The general characteristics of the sample are shown in Table 1. Women inthe sample were less educated than men: 6.7% of the women and 3.7% ofthe males had no formal education. A majority of the sample was Catholic,
ALCOHOL, GENDER AND DRINKING PROBLEMS
128
TABLE 1. Demographic characteristics of the sample
Characteristics Male Female
Age MeanSD
34.712.5
34.512.1
% n % nEducational Level None
Less or equal than 9 years10 or more years
3.758.937.4
891402891
6.765.128.2
2222167940
Religion CatholicProtestant or EvangelicNone
83.88.97.3
1982210174
86.29.74.1
2850320136
Marital Status MarriedCohabitatingSeparated/DivorcedUnmarriedWidowed
57.28.92.331.10.6
136121154
73914
57.69.06.9
22.63.8
1916301230754128
Family Income Top 25%MiddleBottom 25%
18.312.968.8
4242991591
14.918.766.4
475594
2108
Employment Involuntary unemploymentDomestic Work
99.10.9
811
2.297.8
421884
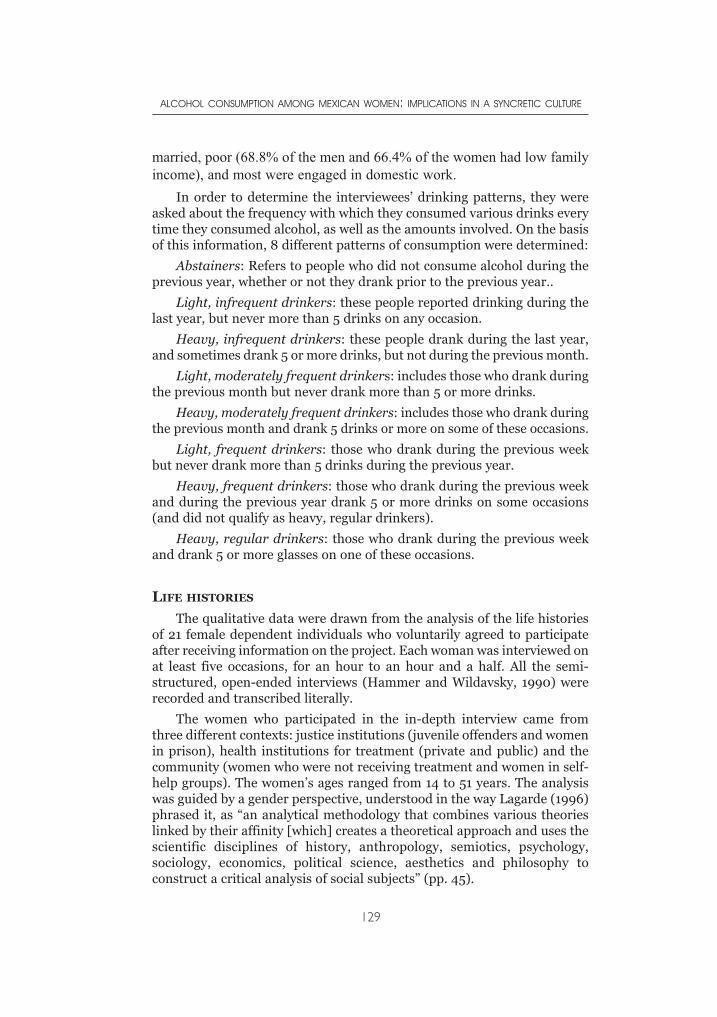
married, poor (68.8% of the men and 66.4% of the women had low familyincome), and most were engaged in domestic work.
In order to determine the interviewees’ drinking patterns, they wereasked about the frequency with which they consumed various drinks everytime they consumed alcohol, as well as the amounts involved. On the basisof this information, 8 different patterns of consumption were determined:
Abstainers: Refers to people who did not consume alcohol during theprevious year, whether or not they drank prior to the previous year..
Light, infrequent drinkers: these people reported drinking during thelast year, but never more than 5 drinks on any occasion.
Heavy, infrequent drinkers: these people drank during the last year,and sometimes drank 5 or more drinks, but not during the previous month.
Light, moderately frequent drinkers: includes those who drank duringthe previous month but never drank more than 5 or more drinks.
Heavy, moderately frequent drinkers: includes those who drank duringthe previous month and drank 5 drinks or more on some of these occasions.
Light, frequent drinkers: those who drank during the previous weekbut never drank more than 5 drinks during the previous year.
Heavy, frequent drinkers: those who drank during the previous weekand during the previous year drank 5 or more drinks on some occasions(and did not qualify as heavy, regular drinkers).
Heavy, regular drinkers: those who drank during the previous weekand drank 5 or more glasses on one of these occasions.
LIFE HISTORIES
The qualitative data were drawn from the analysis of the life historiesof 21 female dependent individuals who voluntarily agreed to participateafter receiving information on the project. Each woman was interviewed onat least five occasions, for an hour to an hour and a half. All the semi-structured, open-ended interviews (Hammer and Wildavsky, 1990) wererecorded and transcribed literally.
The women who participated in the in-depth interview came fromthree different contexts: justice institutions (juvenile offenders and womenin prison), health institutions for treatment (private and public) and thecommunity (women who were not receiving treatment and women in self-help groups). The women’s ages ranged from 14 to 51 years. The analysiswas guided by a gender perspective, understood in the way Lagarde (1996)phrased it, as “an analytical methodology that combines various theorieslinked by their affinity [which] creates a theoretical approach and uses thescientific disciplines of history, anthropology, semiotics, psychology,sociology, economics, political science, aesthetics and philosophy toconstruct a critical analysis of social subjects” (pp. 45).
ALCOHOL CONSUMPTION AMONG MEXICAN WOMEN: IMPLICATIONS IN A SYNCRETIC CULTURE
129
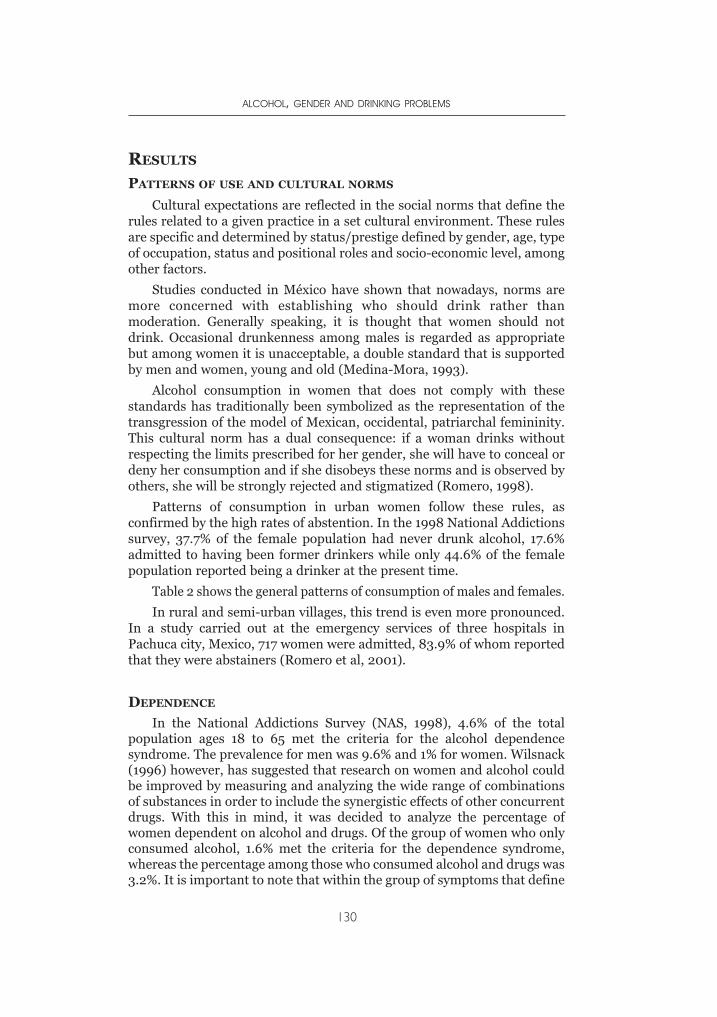
RESULTS
PATTERNS OF USE AND CULTURAL NORMS
Cultural expectations are reflected in the social norms that define therules related to a given practice in a set cultural environment. These rulesare specific and determined by status/prestige defined by gender, age, typeof occupation, status and positional roles and socio-economic level, amongother factors.
Studies conducted in México have shown that nowadays, norms aremore concerned with establishing who should drink rather thanmoderation. Generally speaking, it is thought that women should notdrink. Occasional drunkenness among males is regarded as appropriatebut among women it is unacceptable, a double standard that is supportedby men and women, young and old (Medina-Mora, 1993).
Alcohol consumption in women that does not comply with thesestandards has traditionally been symbolized as the representation of thetransgression of the model of Mexican, occidental, patriarchal femininity.This cultural norm has a dual consequence: if a woman drinks withoutrespecting the limits prescribed for her gender, she will have to conceal ordeny her consumption and if she disobeys these norms and is observed byothers, she will be strongly rejected and stigmatized (Romero, 1998).
Patterns of consumption in urban women follow these rules, asconfirmed by the high rates of abstention. In the 1998 National Addictionssurvey, 37.7% of the female population had never drunk alcohol, 17.6%admitted to having been former drinkers while only 44.6% of the femalepopulation reported being a drinker at the present time.
Table 2 shows the general patterns of consumption of males and females.
In rural and semi-urban villages, this trend is even more pronounced.In a study carried out at the emergency services of three hospitals inPachuca city, Mexico, 717 women were admitted, 83.9% of whom reportedthat they were abstainers (Romero et al, 2001).
DEPENDENCE
In the National Addictions Survey (NAS, 1998), 4.6% of the totalpopulation ages 18 to 65 met the criteria for the alcohol dependencesyndrome. The prevalence for men was 9.6% and 1% for women. Wilsnack(1996) however, has suggested that research on women and alcohol couldbe improved by measuring and analyzing the wide range of combinationsof substances in order to include the synergistic effects of other concurrentdrugs. With this in mind, it was decided to analyze the percentage ofwomen dependent on alcohol and drugs. Of the group of women who onlyconsumed alcohol, 1.6% met the criteria for the dependence syndrome,whereas the percentage among those who consumed alcohol and drugs was3.2%. It is important to note that within the group of symptoms that define
ALCOHOL, GENDER AND DRINKING PROBLEMS
130
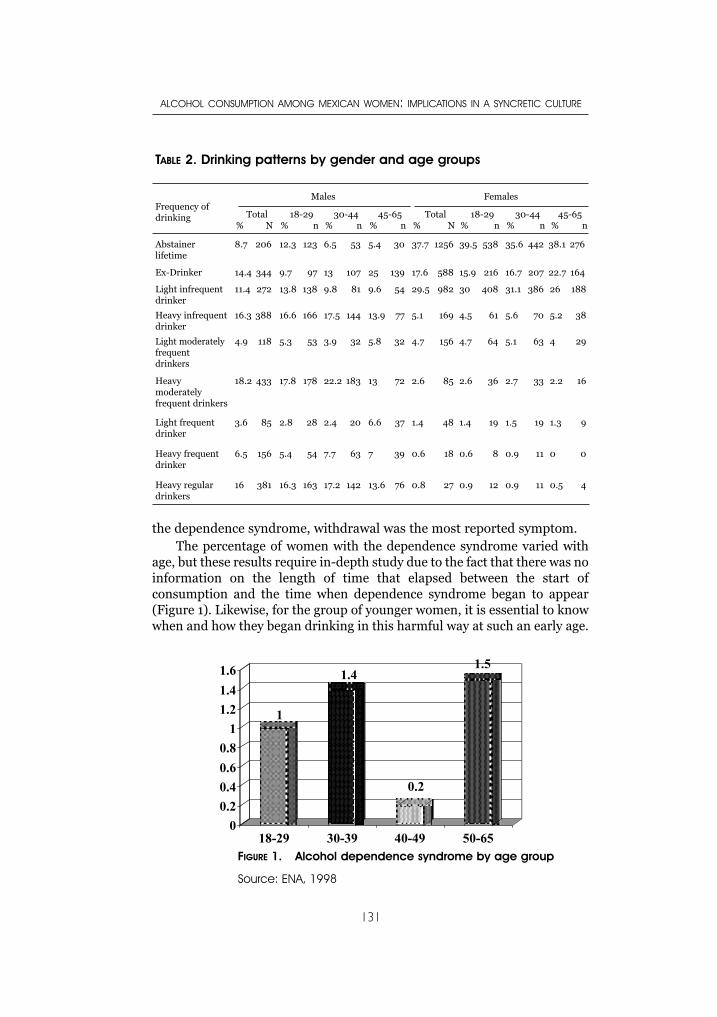
the dependence syndrome, withdrawal was the most reported symptom.The percentage of women with the dependence syndrome varied with
age, but these results require in-depth study due to the fact that there was noinformation on the length of time that elapsed between the start ofconsumption and the time when dependence syndrome began to appear(Figure 1). Likewise, for the group of younger women, it is essential to knowwhen and how they began drinking in this harmful way at such an early age.
ALCOHOL CONSUMPTION AMONG MEXICAN WOMEN: IMPLICATIONS IN A SYNCRETIC CULTURE
131
TABLE 2. Drinking patterns by gender and age groups
Frequency ofdrinking
Males Females
Total% N
18-29% n
30-44% n
45-65% n
Total% N
18-29% n
30-44% n
45-65% n
Abstainer lifetime
8.7 206 12.3 123 6.5 53 5.4 30 37.7 1256 39.5 538 35.6 442 38.1 276
Ex-Drinker 14.4 344 9.7 97 13 107 25 139 17.6 588 15.9 216 16.7 207 22.7 164
Light infrequentdrinker
11.4 272 13.8 138 9.8 81 9.6 54 29.5 982 30 408 31.1 386 26 188
Heavy infrequentdrinker
16.3 388 16.6 166 17.5 144 13.9 77 5.1 169 4.5 61 5.6 70 5.2 38
Light moderatelyfrequent drinkers
4.9 118 5.3 53 3.9 32 5.8 32 4.7 156 4.7 64 5.1 63 4 29
Heavy moderatelyfrequent drinkers
18.2 433 17.8 178 22.2 183 13 72 2.6 85 2.6 36 2.7 33 2.2 16
Light frequentdrinker
3.6 85 2.8 28 2.4 20 6.6 37 1.4 48 1.4 19 1.5 19 1.3 9
Heavy frequentdrinker
6.5 156 5.4 54 7.7 63 7 39 0.6 18 0.6 8 0.9 11 0 0
Heavy regulardrinkers
16 381 16.3 163 17.2 142 13.6 76 0.8 27 0.9 12 0.9 11 0.5 4
Source: ENA, 1998
1
1.4
0.2
1.5
0
0.2
0.4
0.6
0.8
1
1.2
1.4
1.6
18-29 30-39 40-49 50-65FIGURE 1. Alcohol dependence syndrome by age group
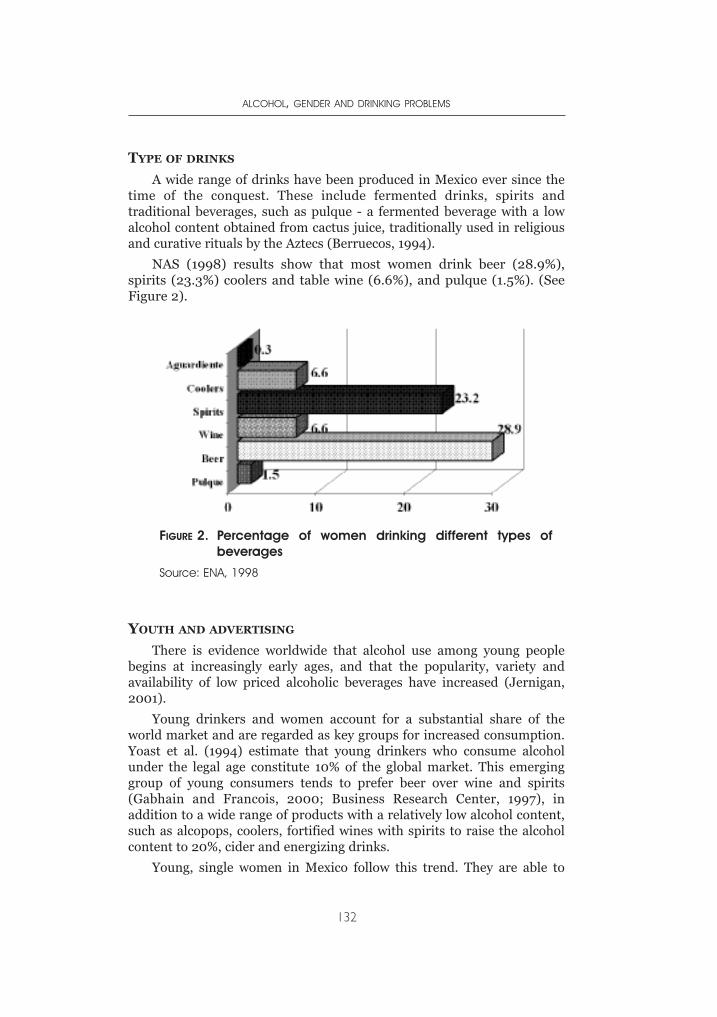
TYPE OF DRINKS
A wide range of drinks have been produced in Mexico ever since thetime of the conquest. These include fermented drinks, spirits andtraditional beverages, such as pulque - a fermented beverage with a lowalcohol content obtained from cactus juice, traditionally used in religiousand curative rituals by the Aztecs (Berruecos, 1994).
NAS (1998) results show that most women drink beer (28.9%),spirits (23.3%) coolers and table wine (6.6%), and pulque (1.5%). (SeeFigure 2).
YOUTH AND ADVERTISING
There is evidence worldwide that alcohol use among young peoplebegins at increasingly early ages, and that the popularity, variety andavailability of low priced alcoholic beverages have increased (Jernigan,2001).
Young drinkers and women account for a substantial share of theworld market and are regarded as key groups for increased consumption.Yoast et al. (1994) estimate that young drinkers who consume alcoholunder the legal age constitute 10% of the global market. This emerginggroup of young consumers tends to prefer beer over wine and spirits(Gabhain and Francois, 2000; Business Research Center, 1997), inaddition to a wide range of products with a relatively low alcohol content,such as alcopops, coolers, fortified wines with spirits to raise the alcoholcontent to 20%, cider and energizing drinks.
Young, single women in Mexico follow this trend. They are able to
ALCOHOL, GENDER AND DRINKING PROBLEMS
132
Source: ENA, 1998
FIGURE 2. Percentage of women drinking different types ofbeverages
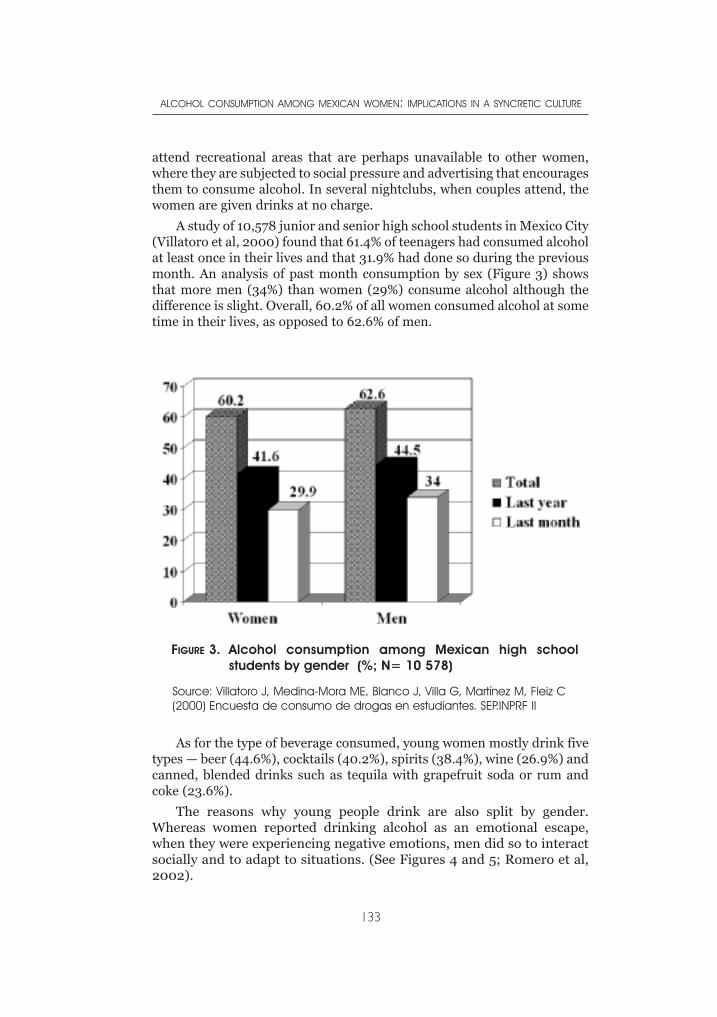
attend recreational areas that are perhaps unavailable to other women,where they are subjected to social pressure and advertising that encouragesthem to consume alcohol. In several nightclubs, when couples attend, thewomen are given drinks at no charge.
A study of 10,578 junior and senior high school students in Mexico City(Villatoro et al, 2000) found that 61.4% of teenagers had consumed alcoholat least once in their lives and that 31.9% had done so during the previousmonth. An analysis of past month consumption by sex (Figure 3) showsthat more men (34%) than women (29%) consume alcohol although thedifference is slight. Overall, 60.2% of all women consumed alcohol at sometime in their lives, as opposed to 62.6% of men.
As for the type of beverage consumed, young women mostly drink fivetypes — beer (44.6%), cocktails (40.2%), spirits (38.4%), wine (26.9%) andcanned, blended drinks such as tequila with grapefruit soda or rum andcoke (23.6%).
The reasons why young people drink are also split by gender.Whereas women reported drinking alcohol as an emotional escape,when they were experiencing negative emotions, men did so to interactsocially and to adapt to situations. (See Figures 4 and 5; Romero et al,2002).
ALCOHOL CONSUMPTION AMONG MEXICAN WOMEN: IMPLICATIONS IN A SYNCRETIC CULTURE
133
FIGURE 3. Alcohol consumption among Mexican high schoolstudents by gender (%; N= 10 578)
Source: Villatoro J, Medina-Mora ME, Blanco J, Villa G, Martínez M, Fleiz C(2000) Encuesta de consumo de drogas en estudiantes. SEP.INPRF II
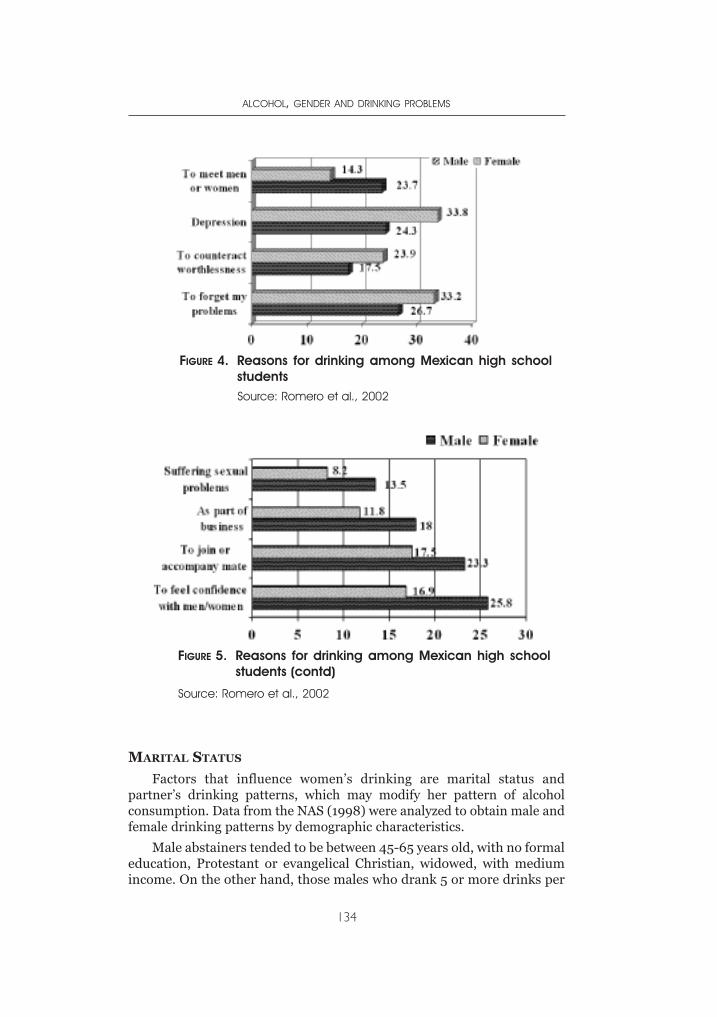
MARITAL STATUS
Factors that influence women’s drinking are marital status andpartner’s drinking patterns, which may modify her pattern of alcoholconsumption. Data from the NAS (1998) were analyzed to obtain male andfemale drinking patterns by demographic characteristics.
Male abstainers tended to be between 45-65 years old, with no formaleducation, Protestant or evangelical Christian, widowed, with mediumincome. On the other hand, those males who drank 5 or more drinks per
ALCOHOL, GENDER AND DRINKING PROBLEMS
134
Source: Romero et al., 2002
Source: Romero et al., 2002
FIGURE 4. Reasons for drinking among Mexican high schoolstudents
FIGURE 5. Reasons for drinking among Mexican high schoolstudents (contd)
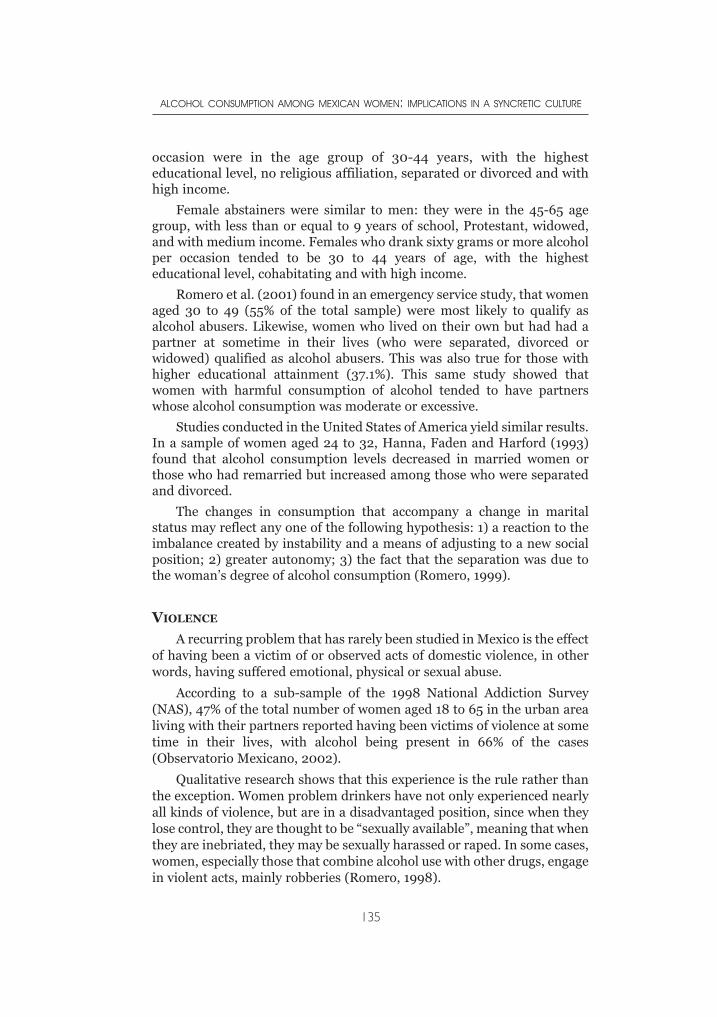
occasion were in the age group of 30-44 years, with the highesteducational level, no religious affiliation, separated or divorced and withhigh income.
Female abstainers were similar to men: they were in the 45-65 agegroup, with less than or equal to 9 years of school, Protestant, widowed,and with medium income. Females who drank sixty grams or more alcoholper occasion tended to be 30 to 44 years of age, with the highesteducational level, cohabitating and with high income.
Romero et al. (2001) found in an emergency service study, that womenaged 30 to 49 (55% of the total sample) were most likely to qualify asalcohol abusers. Likewise, women who lived on their own but had had apartner at sometime in their lives (who were separated, divorced orwidowed) qualified as alcohol abusers. This was also true for those withhigher educational attainment (37.1%). This same study showed thatwomen with harmful consumption of alcohol tended to have partnerswhose alcohol consumption was moderate or excessive.
Studies conducted in the United States of America yield similar results.In a sample of women aged 24 to 32, Hanna, Faden and Harford (1993)found that alcohol consumption levels decreased in married women orthose who had remarried but increased among those who were separatedand divorced.
The changes in consumption that accompany a change in maritalstatus may reflect any one of the following hypothesis: 1) a reaction to theimbalance created by instability and a means of adjusting to a new socialposition; 2) greater autonomy; 3) the fact that the separation was due tothe woman’s degree of alcohol consumption (Romero, 1999).
VIOLENCE
A recurring problem that has rarely been studied in Mexico is the effectof having been a victim of or observed acts of domestic violence, in otherwords, having suffered emotional, physical or sexual abuse.
According to a sub-sample of the 1998 National Addiction Survey(NAS), 47% of the total number of women aged 18 to 65 in the urban arealiving with their partners reported having been victims of violence at sometime in their lives, with alcohol being present in 66% of the cases(Observatorio Mexicano, 2002).
Qualitative research shows that this experience is the rule rather thanthe exception. Women problem drinkers have not only experienced nearlyall kinds of violence, but are in a disadvantaged position, since when theylose control, they are thought to be “sexually available”, meaning that whenthey are inebriated, they may be sexually harassed or raped. In some cases,women, especially those that combine alcohol use with other drugs, engagein violent acts, mainly robberies (Romero, 1998).
ALCOHOL CONSUMPTION AMONG MEXICAN WOMEN: IMPLICATIONS IN A SYNCRETIC CULTURE
135
The main consequences of the link between family violence andexcessive alcohol consumption are obviously more serious for women.They often fail to report these incidents out of shame, mainly because ofthe cultural connotation which regards this behavior as normal, coupledwith the uncertainty of how far to put up with this open secret whichwomen suffer in silence. According to Natera (2000) the police and healthworkers prefer not to “interfere in people’s lives”. One should not forget thefact that from a gender perspective, “what is personal is political”, meaningthat violence is both a public health issue and a political problem.
MOTHERHOOD
Expectant women who use alcohol represent many ethical and legalproblems, including their reproduction rights, their responsibility for theirchild’s health and the way in which they behave while childrearing.Qualitative research reports that usually the family of origin, legally orillegally, separates the women from their children because of their alcoholconsumption. However, one of the main issues in their narratives is theirwish to fulfill their role of mothers and their inability to do so, an importantsource of depression and hopelessness.
“I drank all the time while pregnant …when he was born I feltterribly bad…I felt for him rejection…anger…I know that is kindof hard but I wished he died…afterwards he presented seizuresand some abnormalities. He was in the emergency service.…After that experience I felt so guilty… I was not married… mymother told me “once a woman is touched by a man it isimpossible that you have a partner”… After that I had a suicideattempt… I was in the hospital for two weeks. Up to now if Idrink, my brother gets violent with my child…he is two yearsnow… My brother kicks him or put him outside the house in thecold to get me to stop drinking.”
“I became pregnant…and all the time I remembered mymother’s words: “If God sends you a child, you have to receivehim/her with love like I received you” and at the same time Ithought “I will not lose my life by being attached to a baby…allmy youth lost…what happens if the baby is born with problems?,without a hand or something?…I decided to have an abortion.”
Epidemiological data form the 1989 NAS found that 16% of womendrank alcohol during their pregnancy; 8% drank it according to their usualpattern of consumption and 5.7% reduced their alcohol intake; 7.4% ofwomen feeding their last child reported having drunk alcoholic beverageswhile nursing, especially beer.
Borges et al. (1997) made an in-depth analysis of the NAS womenwho were pregnant at some time in their lives to study three adverse
ALCOHOL, GENDER AND DRINKING PROBLEMS
136
outcomes during their last pregnancy: spontaneous abortion, stillbirthand congenital abnormalities and their relation to alcohol consumption.Results showed that alcohol consumption during pregnancy wasassociated with the prevalence of congenital abnormalities, with an oddsratio of 3.4.
MIGRANT WOMEN AND THE INDIGENOUS RURAL POPULATION
In recent decades, the Mexican countryside has been affected bynational and global political, economic and social problems that haveundermined the structure of traditional peasant production processes aswell as the form of social organization. These have influenced their valuesas well as their individual and collective projects, resulting in increases inalcohol consumption (Berruecos, 2002).
According to Marion (1974), the reconversion of agriculturalproduction has led to greater levels of poverty and an increase in rural-urban migration, which in turn has created rural impoverishment andurban overpopulation. Boltvinik (1995) confirms these data by stating thatpoverty in Mexico is significantly greater in the countryside than in urbanareas, 85% as opposed to 61.7%, according to the National PopulationCouncil, with women constituting the most impoverished sector of thepopulation. According to the National Migration Survey (1997) the profileof migrants has been modified by the growing incorporation of rural andurban women into migratory flows.
Oehmichen (20002) states that women who leave their places of originfor the cities do so when they accompany their migrating parents andspouses. Some studies, however, have shown that women’s migration ismore heavily conditioned than men’s by their stage in the life cycle, theirposition in the household, the presence of children and a partner, and thehousehold structure.
The following are some of the reasons why women leave theircommunities:
1) The rupture or lack of a bond with a male, either throughabandonment or widowhood, in which case the woman assumesresponsibility for feeding and looking after the children, if her in-laws and the family of origin lack, the means to support her andher children.
2) For poor indigenous and peasant women, it is one of the fewavailable resources for survival and to a certain extentguaranteeing the survival of their children.
3) Polygyny, understood as a simultaneous marital union between aman and two or more women. This practice often forces secondwives to emigrate because they lack the marital status and rightsenjoyed by first wives.
ALCOHOL CONSUMPTION AMONG MEXICAN WOMEN: IMPLICATIONS IN A SYNCRETIC CULTURE
137
4) In association with alcohol consumption, the most important factorfor this study. In this case, although a man does not abandon hiswife and children, he stops providing for them. Alcoholdependence reduces the financial resources for supporting thefamily, and also often involves intrafamilial violence, which inturn forces women to migrate.
5) Finally, because of the lack of an acceptable social position for anyof several reasons — single motherhood, because the womanalready has children or is over the socially acceptable age formarriage, or because the rural community does not provideemployment opportunities for her, or a proper marital status.
Patterns of alcohol use in the indigenous cultures display significantvariations, providing examples of the complete integration of alcohol useinto every aspect of life, as in the case of the Chamula in Chiapas (Polakoff,2001), or of strict use limited to certain occasions, as among theTarahumara of Chihuahua.
Among the Chamula, consumption of the traditional beverage calledposh is a common cause of early death among male drinkers. However,alcohol consumption among women also has serious consequences, as thefollowing paragraph from Polakoff (2001) so poignantly illustrates:
It took me years to get to the truth. In the past, she had often toldme about babies dying as a direct result of the state of inebriationof their mothers, but I would never have imagined the personalevent she was referring to. On 9 April 1998, when we weredrawing up her family tree, she suddenly told me that a littlebrother of hers had died on the day he entered the Catholic faith,at the age of about six months, when his mother got drunk duringthe celebration and dropped him onto the stove. The Chamulaauthorities put the parents in prison for a few days and I didn’tquite know how they got out. She never drinks nowadays, but herfriend told me that she didn’t stop drinking immediately after thetragedy. She also told me that six out of the original eightchildren born had died (only she and one of her sisters survived),rather than the three she had originally told me. ´Why didn’t youtell me the real number?´ ´Perhaps because I was embarrassedto,´ and we went on writing down the new generations ofChamula (pp. 24-25).
The growth of Protestant religious groups, particularly among ruraland indigenous communities, has also had an impact on alcoholconsumption patterns and influenced the structure of communities.Indigenous people who have become abstainers after accepting their newreligion have had more conflicts with their groups of origin, which haveoften expelled them from their lands (Díaz-Betancourt, 2004). Theseconflicts may have numerous origins that warrant in-depth study. For
ALCOHOL, GENDER AND DRINKING PROBLEMS
138
instance, some authors note that these communities reduce the influenceof local political bosses in the commercialization of alcohol, therebyaffecting their economic interests (Medina-Mora, 1997).
MORTALITY
Mexican women die because of the way they drink. The mortality rateof women aged 15 or over from cirrhosis of the liver caused by drinking hasnot changed much over the past decade. In 1985, 10.33 out of every100,000 inhabitants died from this cause, a figure that had risen to 11.20by 1996 (Medina-Mora, Natera & Borges, 2002)..
In the capital city, the total percentage of deaths related to alcoholconsumption in women increased. Data coming from databases recordingthe forensic causes of death report that in 1999, 10% of female suicideswere alcohol-related, a figure that had risen to 25% by 1995. In 1990, 3% ofwomen killed another person when they were inebriated, a figure that hadrisen to 28.4% by 1995. In 1990, 5.8% of women died in accidents whilethey were inebriated, and by 1995, this figure had increased to 17.5%(Gutiérrez, 1996).
DISCUSSION
Every woman is involved in the syncretism encapsulated in her person,experiencing the synthesis on the basis of different combinations of depth,complexity and conflict. The syncretic synthesis of identities undergoing astage of transformation constitutes and organizes the subjectivity of thesewomen who are virtually living double lives. Globalization gives them theopportunity to have access to more public space for leisure but sometimesforces them to migrate because of the economic impact in theircommunities.
The findings presented in this work should guide reflections ondecision making related to public policy regarding prevention, treatmentand research specific to women. In the prevention side, interventionstrategies should be specifically designed for women, and treatment shouldfocus attention on the medical and psychosocial needs of dependentwomen. Finally, more effort should be made to overcome treatmentbarriers and prejudices against women with alcohol-related problems.
REFERENCES
Addiction Research Foundation (1996). The hidden majority. A guidebook onalcohol and other drug issues for counselors who work with women.Toronto: Addiction Research Foundation.
Barret, M. (1990). El concepto de diferencia.[The concept of difference] Debatefeminista. September, 311-325.
ALCOHOL CONSUMPTION AMONG MEXICAN WOMEN: IMPLICATIONS IN A SYNCRETIC CULTURE
139
Berruecos, L. (1994). Bebidas y Licores de Hoy [Today’s beverages and liquors]. In:Bebidas Nacionales. Guía México Desconocido [Nacional Beverages.Unknown Mexico Guide] .No.18, Editorial Jilguero, S.A. de C.V. Mexico City:Noviembre.
Berruecos, L. (2003). La transformación de los patrones de consumo de alcohol,como resultado de la globalización, en una zona indígena de México.[Thetransformation of alcohol consumption patterns as a result of globalization, inan indigeneous zone of Mexico]. Perspectivas Políticas, 16, 1-34.
Boltvinik, J. (1995). La pobreza en México.[Poverty in Mexico] Salud Pública deMéxico, 1(37), 298-309.
Bordieu, P., & Waquant, L. (1995). Respuestas. Por una antropología reflexiva.[Responses. For a reflexive anthropology] Mexico City: Grijalbo.
Borges, G., Tapia-Conyer, R., López-Cervantes, M., Medina-Mora, M. E., Pelcastre,B., & Franco, F. (1997). Alcohol consumption and pregnancy in the Mexicannational addiction survey. Caderno Saude Publica, 13 (2), 205-211.
Canclini, N. (1995). Consumidores y ciudadanos. Conflictos multiculturales de laglobalización. [Consumers and citizens. Multicultural conflicts in theglobalization] Mexico City: Grijalbo.
Casco, M., Natera, G. (1993). El alcoholismo en la mujer: la explicación que ellasmismas dan. [Alcoholism in women: the explanation they give] Salud Mental,16(1), 24-29.
Díaz-Betancourt, J. (2004). Huicholes católicos expulsan de su comunidad aevangélicos. [Catholic huicholes expelled from their community to evangelics]Agenda, Martes 10 de Febrero, La Jornada, México.
ENA (1998). Encuesta Nacional de Adicciones.[National Survey on Addictions] Ed.Subsecretaría de Prevención y Control de Enfermedades. Dirección General deEpidemiología. Instituto Mexicano de Psiquiatría. Consejo Nacional contra lasAdicciones. Mexico City: Secretaría de Salud.
Galende, E (2001). Sexo y Amor. Anhelos e incertidumbres de la intimidad actual.[Sex and love. Uncertainties and wishes of the actual intimacy]. Buenos Aires:Paidós.
Gutiérrez, R. (1996). Bases de datos sobre estadísticas de alcohol.[Databases onalcohol statistics] Mexico City, Mexico: Centro de Información sobre alcohol.Instituto Mexicano de Psiquiatría,.
Hammer, D., Wildavsky, A. (1990). La entrevista semi-estructurada de finalabierto. Aproximación a una guía operativa. [The open-ended semi-structuredinterview] Historia y Fuente Oral, 4, 23-61.
Hanna, E., Faden, V,, Harford, T. H, (1993). Marriage: does it protect young womenfrom alcoholism? Journal of Substance Abuse, 5 (1),1-14.
INEGI (2001). Indicadores sociodemográficos de México [Sociodemographicnumbers of México] México City, Mexico: Ed. Instituto Nacional deEstadística, Geografía e Informática.
Jeringan, D. (2001). Alcohol and young people. Global Status Report. Mental Healthand Substances Dependence Department. Geneva: World Health Organization.
Lagarde, M. (2001). Identidad Femenina.[Feminine Identity] CIDHAL, Lecturas yNoticias. http:/www.laneta.apc.org/cidhal/lectura/identidad/texto3.htm.
Lagarde, M. (1996). Género y feminismo. Desarrollo humano y democracia.[Gender and feminism. Human development and democracy] Madrid: Ed.Horas y horas. Cuadernos inacabados. Número 25.
Marion, M. (1995). El derecho de pensar diferente.[The right of thinking different]Psiquiatría. Época 2, 11(2), 52-55.
ALCOHOL, GENDER AND DRINKING PROBLEMS
140
Medina-Mora, M. E. (1993). Diferencias por género en las prácticas de consumo dealcohol. [Gender differences in alcohol consumption practices] Tesis para laobtención de grado de doctora en Psicología Social. Mexico City, Mexico:Facultad de Psicología. UNAM.
Medina-Mora, M, E. (1997). Alcohol policies in developing countries. Mexicanreport. Paper presented for the alcohol policies in developing countriesmeeting. Mexico, City, April.
Medina-Mora, M. E., Natera, G., Borges, G. (2002). Alcoholismo y abuso debebidas alcohólicas.[Alcoholism and abuse of alcoholic beverages] En:Observatorio Mexicano en tabaco, alcohol y otras drogas. México City,Mexico: Ed. Consejo Nacional contra las Adicciones..
Natera, G., López, J. L., Tiburcio, M., Martín-Barba, R. M., & León Pérez, J. (2000).Violencia y alcohol, una relación peligrosa.[Violence and alcohol, a dangerousrelationship] En: Viveros M. Niñez, Adolescencia y Género, una propuestadesde la educación y la salud por la no violencia.[Adolescence and gender, apropoasal from the education and health for no violence]. México City, Mexico:Fundación Mexicana para la Salud.
Observatorio Mexicano en tabaco, alcohol y otras drogas (2002). Violencia familiary consumo de alcohol.[Domestic violence and alcohol consumption] Revisiónbibliográfica. Mexico City, Mexico: Ed. Consejo Nacional contra las Adicciones.
Oehmichen, C. (2000). Las mujeres indígenas migrantes en la comunidadextraterritorial. [The migrant indigenous women in the extraterritorialcommunity]. In: Barrera D, Oehmichen C: Migración y relaciones de géneroen México. [Migration and gender relations in Mexico] Mexico City, Mexico:Ed. GIMTRAP e Instituto de Investigaciones Antropológicas, UNAM..
Polakoff, K. (2001). Del trago a la tragedia: el consumo de alcohol en San JuanChamula, Chiapas. [From swig to tragedy: alcohol consumption in San JuanChamula, Chiapas]. Tesis para obtener el grado de maestra en antropología.Instituto de Investigaciones Antropológicas. Mexico City, Mexico: Facultad deFilosofía y Letras, UNAM.
Romero, M. (1995). Sobre la necesidad de conceptuar el género en el estudio de lasadicciones. [On the need of conceptualizing gender in addictions studies]Psicología y Salud. Instituto de Investigaciones Psicológicas de la UniversidadVeracruzana. 5 Enero-Junio, 135-146.
Romero, M. (1998). Estudio de las adicciones a sustancias psicoactivas en mujeresy su relación con otros problemas de salud mental. [Study on women’saddiction and its relationship with other mental health problems].Tesis dedoctorado en antropología. Instituto de Investigaciones Antropológicas.Facultad de Filosofía y Letras. UNAM.
Romero, M. (1999). Diversidad femenina y consumo de alcohol.[Feminine diversityand alcohol consumption] In: La mujer en la cultura del consumo de bebidascon alcohol: riesgos y beneficios”. Cuadernos FISAC, 1 (3), 47-61.
Romero, M., Gómez, C., Ramiro, M., & Díaz, A. (1997). Necesidades de atención ala salud mental de la mujer adicta.[Mental Health attention needs of addictedwomen] Salud Mental, 20(2), 38-47.
Romero, M., Mondragón, L., Cherpitel, S., Medina-Mora, M. E., & Borges, G. (2001).Characteristics of Mexican women admitted to emergency care units. Alcoholconsumption and related problems. Salud Pública de México 43(6), 537-543.
Romero, M., Villatoro, J., Fleis, C., Medina-Mora, M. E. (2002). Gender differencesin reasons for drinking: results of a Mexican Student Survey. Paper presentedat the Kettil Brunn Society Symposium, Paris.
ALCOHOL CONSUMPTION AMONG MEXICAN WOMEN: IMPLICATIONS IN A SYNCRETIC CULTURE
141
United Nations, UNDCP, WHO (1994) Subcommittee on Drug Control. Womenand Drug Abuse. A positional paper. Geneva: WHO.
Vance, C. (1984). Pleasure and danger: towards a politics of sexuality. In Vance, C.,Pleasure and danger: exploring female sexuality. London: Routledge &Kegan.
Villatoro, J., Medina-Mora, M. E., Rojano, C., Fleiz, C., Villa, G., Jasso, A., Alcàntar,M., Bermúdez, P., Castro, P., Blanco, J. (2001). Consumo de drogas, alcohol ytabaco en estudiantes del Distrito Federal: Medición otoño 2000. [Drugs,alcohol and tobacco consumption in students from the Federal District:Autumn report 2000] Reporte Global del Distrito Federal, INP-SEP, México.
Yoast, R., Larkin, L., Sherman, J. (2001). Partner or foe? The alcohol industry,youth alcohol problems and alcohol policy strategies. Policy briefing paper.Alcohol issues. Chicago: American Medical Association.
Wilsnack, S. (1996). Patterns and trends in women’s drinking: recent findings andsome implications for prevention. In J. Howard, M. Marin, M. Hilton (eds.),Women and Alcohol: issues for prevention research (pp. 19-63). Rockville,MD: US National Institute on Alcoholism and Alcohol Abuse (NIAAA)Research Monograph 32.
ALCOHOL, GENDER AND DRINKING PROBLEMS
142
INTRODUCTION
Nigeria is easily one of the most diverse and complex polities on theAfrican continent. It is distinguished from most other developingcountries by its population of approximately 135 million people,
with high concentration of youths below the age of 20 years. Nigeria gainedpolitical independence from Britain in 1960. However, in its nearly 50years of independence Nigeria has often been under military rule.
The long period of military rule had, to a certain degree, a negativeimpact on the development of the country. Although Nigeria returned tocivil rule in May 1999, the new government’s promise of macro-economicpolicy reform, poverty alleviation, improved service delivery, universalbasic education, accountability of government and reduced corruption, isyet to be realized. The economy is relatively stagnant, growing in 2002 ata rate of just 3.3%, less than half what is required to reduce poverty, andonly slightly higher than the annual population growth rate of 2.8%. Percapital income is just $300 per year; 70% of Nigerians live in poverty onless than $1 per day, and at least 15% of Nigerian children die beforereaching their fifth birthday. The country has low adult literacy rate of 58% for men, and 41 % for women. The population growth rate is high, andthe population is expected to reach 270 million in less than 25 years. Theoverall development environment in Nigeria is captured in the UnitedNations Development Programme Human Development Index whichranks Nigeria 151st out of 177 countries (UNDP, 2002).
During the economic boom of the 1970s, the country recorded rapideconomic development and experienced one of the fastest urbanizationrates in the world. However, poor leadership style and mismanagement ofthe oil boom of the 1970s resulted in a serious economic downturn in the1980s. The estimates of the urban growth rate in 1970 -1980 ranged from16 to 27%. In 1995 it was estimated to be 40%. Rural-urban migrationincreased with the development of urban centres; adolescents andparticularly young adult males, migrated in their thousands from the ruralareas to urban centres in search of jobs. This movement, largely compelledby economic forces, may add to distress and the anomie that can enhance
CHAPTER 7THE CONTEXTS OF
ALCOHOL CONSUMPTION IN NIGERIA
AKANIDOMO J. IBANGA, ADEBOLA V. ADETULA, ZUBAIRU DAGONA,HARUNA KARICK & OCHIYNA OJIJI
the attractions of drinking and drunkenness, and may remove some of thecultural constraints on alcohol consumption and subsequent behavioursuch as violence. Thus urbanization and employment-induced mobility,and in recent times, mobility induced by the sporadic ethnic and religiouscrises within the country, puts the stability of the Nigerian family in somejeopardy, a factor that has been associated with drug use (Ndom &Adelekan, 1996). Other consequences of the rural-urban drift include adecrease in agricultural productivity, and a decline in the influence of theextended family and community, as well as increased salience of the peergroup. This pattern seems similar to those of many industrializedcountries where deficiencies in social support have made young peoplemore vulnerable to the urban environment (Ferguson, 1993). Rapidurbanization and social dislocation have been linked with increasedconsumption of alcohol in Nigeria (Ebie & Pela, 1981; Lambo, 1965),especially in the 1960s and 1970s when the abuse of alcohol became quiteprominent in the country.
HISTORY OF ALCOHOL CONSUMPTION IN NIGERIA
Alcohol consumption has a long history in Nigeria, and its use iscommon in all the cultural groups in the country. It is one of the mostavailable psychoactive substances in the country, and it is consumed eitherin the form of traditional beverages (e.g., burukutu, pito, emu funfun,palm-wine, ogogoro), or as western lager beer, wine or spirituous liquors(e.g., brandy, whisky and gin). In many parts of the country, the productionand consumption of alcoholic beverages was organized around traditionalrituals, festivals and other social activities which included arrangementsaround marriages, childbearing and child-naming, weekly market days,and settling of quarrels between families and communities. Presenting oroffering alcoholic beverage was also an expression of hospitality to visitingguests.
The works of Netting (1964) and Odejide & Olatuwura (1977) haveshown that in some cultures, the use of alcohol, especially by social groupsduring festivals and ceremonies, is usually associated with rituals tohighlight the hierarchies within a particular social group or community.This may take the form of passing the traditional wine cup around in agathering in a particular order that gives primacy to age and title (Umana,1967). While the age groups of men and women were often not explicitlyseparated during these occasions, elders and men were expected to drinkmore than either young men or women (Oshodin, 1995).
In traditional Nigerian society, daily consumption of alcoholicbeverages was not the norm, as drinking revolved around festivals, ritualsand important ceremonies. Additionally, these occasions allowed for theexercise of control over who is served or not served, and the quantity whichthey are served. In this way people were somewhat protected from drinking
ALCOHOL, GENDER AND DRINKING PROBLEMS
144
excessively. This is evident in some expressions of culturally constructednorms that decry excessive drinking. It was however possible that outsidethese circumscribed settings, alcohol was produced and used privately.When consumed in this way it could be in excess of culturally permittedlimits and could result in intoxication (Obot, 1993a). It was not so muchthat excessive drinking was not tolerated, but becoming intoxicated bydrinking was looked down on and incurred sanctions. On the other hand,being able to drink large quantities without noticeable evidence ofintoxication was considered admirable (Gureje et al., 1996).
The point being made here is that in traditional Nigerian societies thewidespread consumption of large quantities of alcohol was relativelyuncommon. It can be said that abuse of alcohol became prominent in the1960s and 1970s, with the increased and widespread use of westernalcoholic beverages. In earlier centuries western alcoholic beverages wereintroduced into Nigeria by explorers, who initially brought them as gifts forAfrican chiefs. Later on, especially during the transatlantic slave trade,these alcoholic beverages were part of the articles of trade used in exchangefor slaves and other exports from the West African coast. This was thefoundation for the eventual introduction of alcohol as a commercialproduct in modern international trade between Nigeria and Europe.During the colonial era these beverages (introduced initially by theexplorers) usually had higher alcohol content than the local beverages, andwere soon considered socially harmful commodities by the colonialauthorities.
TYPES OF TRADITIONAL ALCOHOLIC BEVERAGES
Alcoholic beverages featured prominently in many traditional Nigeriancultural groups. Traditional alcoholic beverages were processed from localraw materials by methods handed down from previous generations. In theNorth central parts of Nigeria, the common alcoholic beverages areburukutu and pito produced from grains (maize, millet , or guinea corn).The production of burukutu and pito is labour intensive and it is mostlycarried out by women. Another local alcoholic beverage peculiar to thesouthern parts of the country is palmwine. Palmwine is tapped from theraffia and oil palm trees and it remains a popular drink. A distillate ofpalmwine—a spirit with high alcohol content—known locally as akpetesh,kinkana, fire water or ogogoro is also available and consumed all over thecountry.
The historical significance of ogogoro lies in the fact that it was bannedby the British administrators as part of attempts to control the WestAfrican liquor trade. Because it was considered an illicit gin, its productionwent underground, but was never really halted. In response to the desiresof the people the independent national government in 1970 lifted the banon its production and sale.
THE CONTEXTS OF ALCOHOL CONSUMPTION IN NIGERIA
145
THE ALCOHOL INDUSTRY
The production and distribution of alcohol is handled by people in bothformal and informal sectors of the Nigerian economy. The informal sectoris largely unregulated, with little or no government control. This is moreevident in regards to domestically produced alcoholic beverages. For themost part, alcoholic beverages are easily available in many makeshift,street-corner kiosks in both rural and urban centres. The government,thus, does not have accurate records of quantities produced, or the retailoutlets for these beverages. Cultural and religious restrictions, in someinstances, may confine the production, distribution, sale and theconsumption to certain areas of the cities.
The formally organized liquor industry in Nigeria has developed into asector dominated by two main companies: Nigerian Breweries Plc andGuinness Nigeria Plc. They are reportedly the two largest capitalizedcompanies on the Nigerian Stock Exchange (Uzor, 1999). As noted byObot, Ibanga and Karick (2002) in a review of the history of beerproduction in Nigeria, Nigerian Breweries Plc., though established in 1945,produced the first bottle of beer on the 14th July 1949. It was also withinthis period that a company was formed to import Guinness Extra Stout intothe country from Ireland. The increasing demand for the product led to theestablishment of a Guinness brewery in 1962. This was the third Guinnessbrewery worldwide and the first ever to be established outside of Irelandand the United Kingdom. Today, there are three Guinness breweries in thecountry. Guinness stout is sold in both 30cl and 60cl bottles. Lager beer,on the other hand, is produced and sold in 60cl bottles, approximatelytwice the size of a typical beer container in western countries. TheStandard Organization of Nigeria specifies a minimum of 3% ethanolcontent for lager and 6% for stout. A typical beer contains about 4%.
The success of these two alcohol enterprises led to establishment ofmore breweries. In 1979 there were 9 breweries, this grew to 34 by 1982,among them producing more than 40 brands of beer. Of the 34 breweries,27 (80%) were situated in the southern parts of the country and only 7(20%) were in the north. Along with these breweries were four distilleriesand nine wineries (Federal Office of Statistics, 1985). The location of theseindustries may in part be a reflection of the demand pattern and thedifferential attitudes towards the use of alcohol between the northern andthe southern parts of Nigeria. On the other hand, it may be as a result ofpolarization in the country brought about by the differential application ofthe enactment of the Liquor Amendment Ordinance No. 26 of 1919, assuggested by Gureje (1999). The enactment of this ordinance put the wholenorthern part of Nigeria under a different set of rules in regards to alcoholuse than the southern parts. It is important to note that northern Nigeriais predominantly Muslim while the south is predominantly Christian.
The economic downturn in the 1980s came with the devaluation of thecurrency and the scarcity of foreign exchange for imported inputs. The
ALCOHOL, GENDER AND DRINKING PROBLEMS
146
Nigerian government compelled the industry to substitute local rawmaterials for the imported ones. The resulting investment in plant andmachinery necessary to convert production lines to handle local rawmaterials, and the dwindling purchasing power of the general populaceexperiencing economic recession, combined to kill some of the breweries.Most hit were the regional brands that were owned by state governments;about 3 out of every 4 of these plants disappeared from the scene by 1996.The two dominant players in the alcohol industry, however, consolidatedtheir position. The volume of beer produced in the country did show anincrease between 1984 and 1994. The domestic production of beer rosefrom 7,354.7 million hectolitres in 1984 to 23,970.1 million hectolitres in1994 (Federal Office of Statistics, 1995; Akerele, 1993). This volume is stillwell below the installed capacity.
As we have noted earlier, the brewing industry in Nigeria is a veryprofitable one. The reports of the Federal Office of Statistics show thateven though aggregate index of industrial production in the country fell in1993 by 3.1%, with manufacturing declining by 4.1%, the brewing industryactually grew by about 8.5% in the same period. This growth had a spill-over effect particularly in the communities where these companies weresituated. Switching to the use of local raw materials as a result of theearlier ban on foreign raw materials led to a boost in local agriculture. Thebeer companies created jobs which allowed for employment of largenumbers of people both directly and indirectly. For many in localitieswhere the industries are sited, the beer trade became the primary economicactivity. It contributed specifically towards raising the economic profile ofwomen who constitute the greater proportion of retailers.
The existing breweries seem to have recovered from this switch and aretoday making profits in comparison to other industries that aredownsizing. The Nigeria Brewery Plc, for instance, had a turnover thatjumped from 17.7 billion naira in 2000 to 29.7 billion in 2001 (about USD$220 million at exchange rates in 2005). Profit before tax was up from 6.5billion naira to 10 billion in the years under consideration. Its share priceof 25.50 naira in December 2000 rose to 57.00 naira by the first half of2002.
ALCOHOL MARKETING AND PROMOTION IN NIGERIA
Marketing and promotion of alcoholic beverages has largely beenunrestrained in Nigeria. The emergence of democracy and theliberalization program of the government have both attracted a flow ofcapital into different sectors of the economy, as well as opening theNigerian market to all types of imported alcoholic beverages. The removalof excise duty in 1998 helped the sector to cut prices, increase turnover andenhance profit. Alcohol brewers have also become more aggressive in theiradvertising, making use of the radio, television, billboards and print media.The common theme in these advertisements is that drinking is a fun,
THE CONTEXTS OF ALCOHOL CONSUMPTION IN NIGERIA
147
modern and enlightening activity; it brings friends together; it is for thesuccessful and comes with prestige. Usually the scenes depict young andupwardly mobile men pictured alongside women having fun. The impactof this form of advertisement is seen in the image of drinking as asubstitute for other forms of recreation (Gureje et al., 1996). Adverts havealso tried to capture the distinct nature and/or “good quality” of theparticular alcoholic beverages (Obot & Ibanga, 2003; Obot, Ibanga &Karick, 2002).
In the recent past, the brewing industry has adopted marketing andpromotion strategies that target particular sections of the Nigerianpopulace. Some of the strategies adopted include sponsoring of essaycompetitions at all levels, fashion shows, sports events, musical segments,end of year carnivals, radio call-in shows, lottery type free drinks, anddiscounted drinks, in-bar promotion, and “fun fare” where alcoholicbeverages are offered free. In this way the alcohol industry aims to wormits way into the lives of people in the society.
DRINKING PATTERNS
Initial research on alcohol and drug use was initiated as a result ofcasual observations that a significant number of young people were beingadmitted into psychiatric hospitals because of abuse of drugs, particularlycannabis and alcohol (Asuni, 1964; Lambo, 1965). Clinical studiesconducted in psychiatric facilities in Nigeria found drug-related admissionaccounted for up to 11% of all admissions. In all these studies (Ahmed,1986; Obot & Olaniyi, 1991; Ikwuagu et al., 1993; 1989; Ohaeri & Odejide,1993) cannabis contributed most to drug-related problems, followed byalcohol. Only in one study (Ahmed, 1986) was alcohol more commonlyabused than other drugs, as determined by admission records in thepsychiatric hospital over a five-year period.
Surveys among students in secondary schools and tertiary institutionshave been conducted over the years. Despite the limitations inepidemiological studies conducted in the country (Obot, 1993b; Ibanga,1997; Obot et al., 2001) there is evidence on the extent of drug use amongstudents. Anumoye (1980), in a survey of 17 secondary schools, reportedthat 20% had taken alcohol at least once. In the ICAA (1988) surveys insouthern Nigeria the proportion of students who had ever used alcoholranged from 24.4% to 49.2%. Higher rates ranging from 56% - 79% havebeen found (Oshodin, 1981; Nevadomsky, 1982; Idowu, 1987; Odejide etal., 1987; Obot, 1999).
Apart from these independent studies, the National Drug LawEnforcement Agency (NDLEA) has conducted several surveys of drug andalcohol use among secondary school students in different parts of thecountry (NDLEA, 1992, 1993, 2000). Results of the studies showed a cleardifference in the use of alcohol in the north and south of the country. The
ALCOHOL, GENDER AND DRINKING PROBLEMS
148
rates of drinking reported among the youths in the northern city (Kano)were much lower than the rates reported by students in the southern cityof Lagos. This difference could be attributed to religion, the north beingpredominantly Muslim while most southerners are Christians. Equallyhigh rates have been recorded for out-of-school youths (Obot, 2001).
In tertiary institutions the rates of drinking are slightly higher.Oladimeji and Fabiyi (1993) reported past year use of alcohol as 66.4% and84%, respectively, in 1984 and 1988. Oshodin (1982) found that 87% of themales and 79% of the females had drunk alcohol in their lifetime; 78% ofthem had started drinking before entry into colleges, and 71% hadincreased their drinking.
A few general population surveys have been conducted in Nigeria.Three surveys conducted in different parts of the country fit into thiscategory. The first is the ICAA study of drug abuse in the southern parts ofthe country. Second was the study of drinking behaviour conducted amongcivil servants to determine the pattern of psychotropic drug use (a studyamong civil servants is not a general population survey). In a sample of5,320 literate civil servants they found that beer was consumed by 45.7% ofthe respondents, wine by 43.2 %, and spirits by 32.8%. Lastly, Obot (1993)conducted a general population survey in the North Central region of thecountry. Data on drinking and alcohol use was collected from 1,052 headsof households; 52.5% of the sample described themselves as alcoholdrinkers. A high proportion of them (39.2%) drank some form of alcoholat least once a day, and many of them showed a pattern of heavyconsumption of alcoholic beverages.
ALCOHOL-RELATED PROBLEMS
In traditional Nigerian culture male social drinking is approved butattracts social sanctions. Women’s drinking was determined, however, bythe quantity they were allowed by men to take on certain occasions. Sincethese controls are no longer in force, more uncontrolled drinking occurs inboth sexes, which might result in an increasing prevalence of alcohol-related problems. The absence of detailed records in most hospitals makesaccurate estimates of alcohol-related morbidity difficult. Only a fewhospitals keep records that would allow for the determination of suchdisorders as liver cirrhoses or pancreatitis, thus allowing a fulldetermination of the contribution of alcohol to health problems.
Surveys in primary care facilities show that a significant number of thoseattending these clinics for diverse medical problems, especially males, wouldhave evidence of ICD-9 or DSM-IIIR diagnosis of alcohol abuse ordependence (Ifabumuyi, 1982; Guruje et al., 1992, 1995). Findings from theICAA (1988) study point to the fact that a disproportionate part of totaladmissions in tertiary hospital beds is linked to alcohol misuse. At the levelof social functioning, problem drinkers have been shown to experience more
THE CONTEXTS OF ALCOHOL CONSUMPTION IN NIGERIA
149
problems than non-heavy drinkers. They experience more accidents,violence, disruption of family, work, and social relationships (Ibanga, 1998,2002; Obembe, 1988; Obot 1993, 2001; Obot & Obot, 1995).
CURRENT RESPONSE
The rising drug problem in the country in the 1980s and 1990s placedNigeria in a negative light internationally. In response to this, thegovernment established the National Drug Law Enforcement Agency(NDLEA), an agency that focuses largely on the control of supply andreduction of demand for illicit substances. The Government has madestrides in the direction of interdiction and enforcement of law regardingproduction and trafficking. The consideration of issues of abuse of licitdrugs, however, has not received such attention or public outcry. Forinstance, though laws exist with respect to production, distribution andconsumption of alcoholic beverages, the government has not enforced suchlaws and the public is to a large extent ignorant of their existence. The non-enforcement of these laws could be in part due to the immense benefit thatthe government derives in the form of tax from the alcohol industry. It mayalso be out of the recognition that alcohol is an integral part of the daily andceremonial life of many Nigerians. Compared with many other countries,the Nigerian government is not strict in implementing policies thatregulate alcohol production, distribution and consumption.
As this review points out, much still remains to be known about alcoholconsumption in Nigeria. There has been no general population study thattakes an in-depth look at the situational context in which alcoholconsumption occurs. The present study was designed to address this issueby taking into account possible factors that may be associated withconsumption in the different situations. This study assessed the extent ofalcohol consumption in the general population of Nigerian and provides aninsight into gender differences in the types of alcoholic beveragesconsumed and the frequency of drinking of alcoholic beverages in differentcontexts.
METHOD
SAMPLE
The sample was drawn from two out of the six political zones in thecountry: one in the north and the other in the south. Three states and theFederal Capital Territory were selected in the north (Benue, Nasarawa,Plateu), and two states in the south (Akwa Ibom, Rivers). Each state had 60enumeration areas that had been mapped out and listed. Of the 60enumeration areas (EA) in each state, 40 were chosen randomly. Wherethe household unit contained more than one housing unit, the housing unitused was selected using a table of random numbers. Ultimately ten
ALCOHOL, GENDER AND DRINKING PROBLEMS
150
household units were selected from each of the 40 EAs for inclusion in thesurvey. In these household units one adult member of the household wasdesignated as the respondent from a table of random numbers. Theselected adult was between the ages of 18 and 65 years. Excluded from thesample were people who were institutionalized, hospitalized, in school, orhad no official residence as at the time of the survey.
Thus there were 400 respondents in each of the five states sampled.Since the Federal Capital Territory has a smaller population than the states,a total of 20 out of 30 enumeration areas were sampled. In this case 15housing units were selected from each enumeration area, thus giving a totalof 300 respondents. Consequently the total number of respondentsexpected in the sample was 2,300. Representativeness was achievedthrough the selection of respondents based on other variables like sex andage. Because of the need to sample relatively equal number of males andfemales, each interviewer alternated from house-to-house between themales and females in the choice of the adult member to interview. Samplingthus involved a number of stages. The first stage was the selection of theenumeration areas. The second stage involved sampling the householdsthat were listed. The third stage involved sampling of housing units wherethere was more than one housing unit in a household (address). The finalstage involved selecting the individuals within the housing unit. Datacollection took place between October and November 2002.
PROCEDURE
Male and female interviewers were recruited from the Federal Office ofStatistics, and trained for the purpose of this study. The interviewers weretrained in two separate locations for the separate regions of the country. Thistraining was done by members of the research planning team and consultants.
Actual data collection from some of the areas posed a challenge. Dueto the terrain in some states, interviewers had to travel by diverse means(bicycle or boat) to access some of the chosen enumeration areas. In someareas of Plateau State, for instance, there were outbreaks of communalviolence at the time of the survey which made access to those communitiessomewhat difficult. In these areas interviewers had to wait for days beforedata collection could proceed. Most of the refusals that would have comefrom community heads in these situations were averted as the interviewerswere known for their data collecting roles for the Federal Office of Statisticsin the past.
MEASURES
The questionnaire used in this study was a slightly modified version ofthe questionnaire designed by International Research Group on Genderand Alcohol (IRGGA). It was a highly structured questionnaire with
THE CONTEXTS OF ALCOHOL CONSUMPTION IN NIGERIA
151
defined response codes. It consisted of more 300 questions divided into 9different sections: demographics, work experience, social networks,drinking variables, familial and other drinking context, drinkingconsequences, intimate relations and sexuality, violence/victimization,health and life style. Patterns of alcohol consumption were based onrespondents’ self-report of the frequency during the past 12 months thatthey drank any kind of alcoholic beverage as well as the quantity of alcoholthey took on a typical day that they drank.
DRINKING FREQUENCY
Frequency of taking specific alcoholic beverages was also assessed withthe number of drinks that the individual consumes on a typical day. Theresponse categories for the questions on frequency were:
Every day or nearly every day, Three or four times a week,Once or twice a week, One to three times a month, Seven toeleven times in the last 12 months, Three to six times in the last12 months, Twice in the last 12 months, Once in the last 12months, or Never in the last 12 months.
For the analysis these options were recoded into five categories as follows.
Daily or nearly daily, Weekly, Monthly, Less than monthly,Never in the last 12 months.
The quantity of drinks they consumed was obtained by asking therespondents to report the number of drinks they had on a typical day theywere drinking. This was assessed for alcoholic beverages in general as wellas for each type alcoholic beverages.
Abstainers were required to answer questions about their experiencewith alcohol. Those who had never drunk any beverage containing alcohol intheir lives were lifetime abstainers; those who had not had a drink within thepast 12 months were current abstainers. These were asked to provide reasonsfor not drinking by responding “yes” or “no” to 16 possible reasons including,lack of interest , cost, taking medication, religion and disliking the taste.
CONTEXT OF DRINKING
Questions were asked of all drinkers to examine the frequency ofdrinking in different contexts within the last 12 months. Respondents wererequired to state how much drinking occurred in the following contexts:
During mealtime, At a party or celebration, In own home, Atfriend’s home, At workplace, In a bar, In a restaurant
The response categories were:
Every day or nearly every day, Three or four times a week, Onceor twice a week, One to three times a month, Seven to eleven timesin the last 12 months, Three to six times in the last 12 months, Onceor twice in the last 12 months, Never in the last 12 months.
ALCOHOL, GENDER AND DRINKING PROBLEMS
152
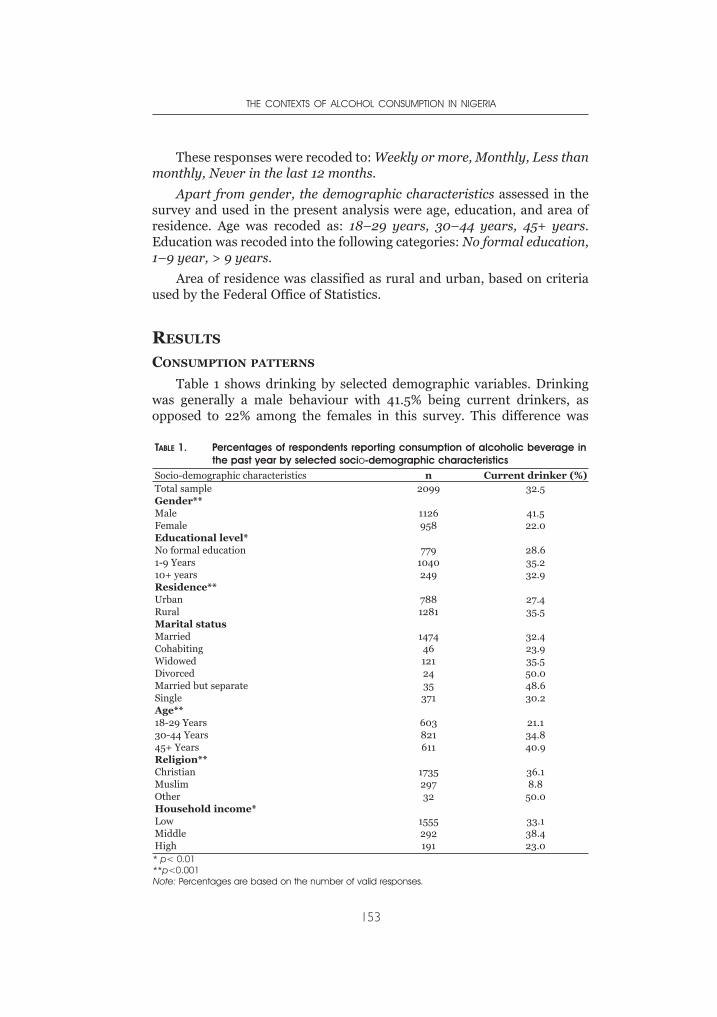
These responses were recoded to: Weekly or more, Monthly, Less thanmonthly, Never in the last 12 months.
Apart from gender, the demographic characteristics assessed in thesurvey and used in the present analysis were age, education, and area ofresidence. Age was recoded as: 18–29 years, 30–44 years, 45+ years.Education was recoded into the following categories: No formal education,1–9 year, > 9 years.
Area of residence was classified as rural and urban, based on criteriaused by the Federal Office of Statistics.
RESULTS
CONSUMPTION PATTERNS
Table 1 shows drinking by selected demographic variables. Drinkingwas generally a male behaviour with 41.5% being current drinkers, asopposed to 22% among the females in this survey. This difference was
THE CONTEXTS OF ALCOHOL CONSUMPTION IN NIGERIA
153
TABLE 1. Percentages of respondents reporting consumption of alcoholic beverage inthe past year by selected socio-demographic characteristics
Socio-demographic characteristics n Current drinker (%)Total sample 2099 32.5Gender**Male 1126 41.5Female 958 22.0Educational level*No formal education 779 28.61-9 Years 1040 35.210+ years 249 32.9Residence**Urban 788 27.4Rural 1281 35.5Marital statusMarried 1474 32.4Cohabiting 46 23.9Widowed 121 35.5Divorced 24 50.0Married but separate 35 48.6Single 371 30.2Age**18-29 Years 603 21.130-44 Years 821 34.845+ Years 611 40.9Religion**Christian 1735 36.1Muslim 297 8.8Other 32 50.0Household income*Low 1555 33.1Middle 292 38.4High 191 23.0* p< 0.01**p<0.001Note: Percentages are based on the number of valid responses.
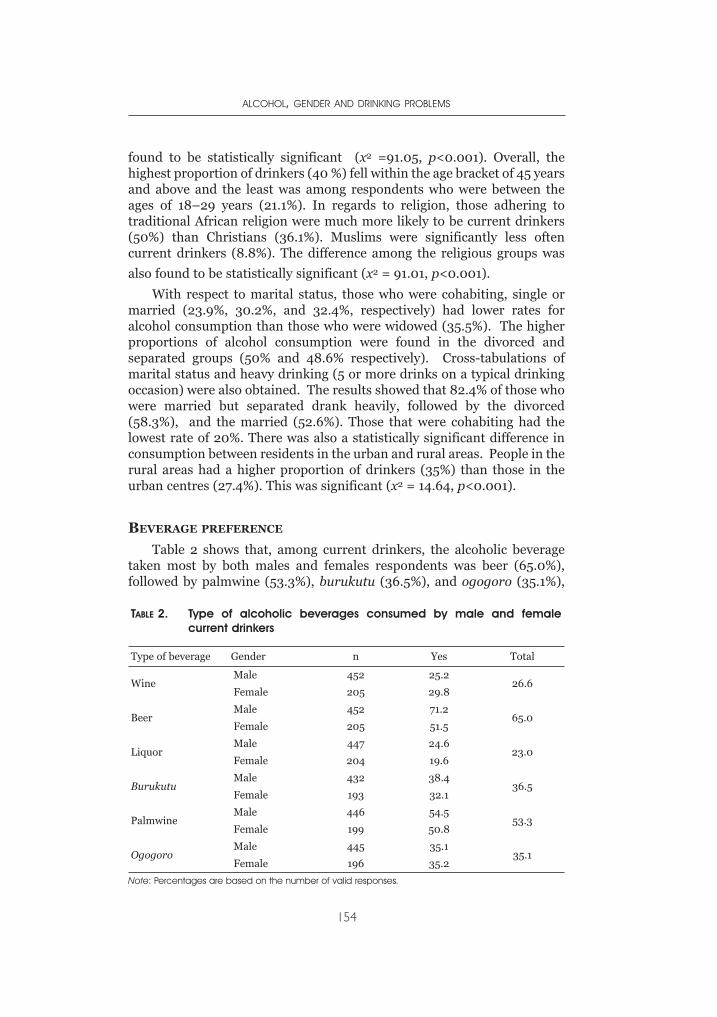
found to be statistically significant (x2 =91.05, p<0.001). Overall, thehighest proportion of drinkers (40 %) fell within the age bracket of 45 yearsand above and the least was among respondents who were between theages of 18–29 years (21.1%). In regards to religion, those adhering totraditional African religion were much more likely to be current drinkers(50%) than Christians (36.1%). Muslims were significantly less oftencurrent drinkers (8.8%). The difference among the religious groups was
also found to be statistically significant (x2 = 91.01, p<0.001).
With respect to marital status, those who were cohabiting, single ormarried (23.9%, 30.2%, and 32.4%, respectively) had lower rates foralcohol consumption than those who were widowed (35.5%). The higherproportions of alcohol consumption were found in the divorced andseparated groups (50% and 48.6% respectively). Cross-tabulations ofmarital status and heavy drinking (5 or more drinks on a typical drinkingoccasion) were also obtained. The results showed that 82.4% of those whowere married but separated drank heavily, followed by the divorced(58.3%), and the married (52.6%). Those that were cohabiting had thelowest rate of 20%. There was also a statistically significant difference inconsumption between residents in the urban and rural areas. People in therural areas had a higher proportion of drinkers (35%) than those in theurban centres (27.4%). This was significant (x2 = 14.64, p<0.001).
BEVERAGE PREFERENCE
Table 2 shows that, among current drinkers, the alcoholic beveragetaken most by both males and females respondents was beer (65.0%),followed by palmwine (53.3%), burukutu (36.5%), and ogogoro (35.1%),
ALCOHOL, GENDER AND DRINKING PROBLEMS
154
TABLE 2. Type of alcoholic beverages consumed by male and femalecurrent drinkers
Type of beverage Gender n Yes Total
WineMale 452 25.2
26.6Female 205 29.8
BeerMale 452 71.2
65.0Female 205 51.5
LiquorMale 447 24.6
23.0Female 204 19.6
BurukutuMale 432 38.4
36.5Female 193 32.1
PalmwineMale 446 54.5
53.3Female 199 50.8
OgogoroMale 445 35.1
35.1Female 196 35.2
Note: Percentages are based on the number of valid responses.
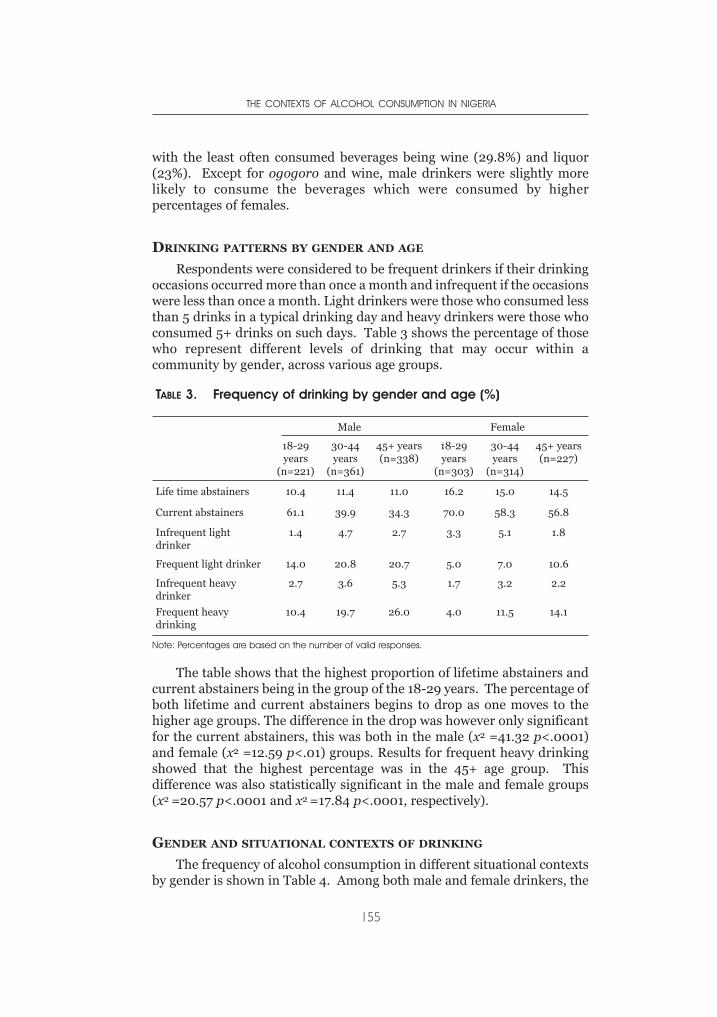
with the least often consumed beverages being wine (29.8%) and liquor(23%). Except for ogogoro and wine, male drinkers were slightly morelikely to consume the beverages which were consumed by higherpercentages of females.
DRINKING PATTERNS BY GENDER AND AGE
Respondents were considered to be frequent drinkers if their drinkingoccasions occurred more than once a month and infrequent if the occasionswere less than once a month. Light drinkers were those who consumed lessthan 5 drinks in a typical drinking day and heavy drinkers were those whoconsumed 5+ drinks on such days. Table 3 shows the percentage of thosewho represent different levels of drinking that may occur within acommunity by gender, across various age groups.
The table shows that the highest proportion of lifetime abstainers andcurrent abstainers being in the group of the 18-29 years. The percentage ofboth lifetime and current abstainers begins to drop as one moves to thehigher age groups. The difference in the drop was however only significantfor the current abstainers, this was both in the male (x2 =41.32 p<.0001)and female (x2 =12.59 p<.01) groups. Results for frequent heavy drinkingshowed that the highest percentage was in the 45+ age group. Thisdifference was also statistically significant in the male and female groups(x2 =20.57 p<.0001 and x2 =17.84 p<.0001, respectively).
GENDER AND SITUATIONAL CONTEXTS OF DRINKING
The frequency of alcohol consumption in different situational contextsby gender is shown in Table 4. Among both male and female drinkers, the
THE CONTEXTS OF ALCOHOL CONSUMPTION IN NIGERIA
155
TABLE 3. Frequency of drinking by gender and age (%)
Male Female
18-29years
(n=221)
30-44years
(n=361)
45+ years(n=338)
18-29years
(n=303)
30-44years
(n=314)
45+ years(n=227)
Life time abstainers 10.4 11.4 11.0 16.2 15.0 14.5
Current abstainers 61.1 39.9 34.3 70.0 58.3 56.8
Infrequent lightdrinker
1.4 4.7 2.7 3.3 5.1 1.8
Frequent light drinker 14.0 20.8 20.7 5.0 7.0 10.6
Infrequent heavydrinker
2.7 3.6 5.3 1.7 3.2 2.2
Frequent heavydrinking
10.4 19.7 26.0 4.0 11.5 14.1
Note: Percentages are based on the number of valid responses.
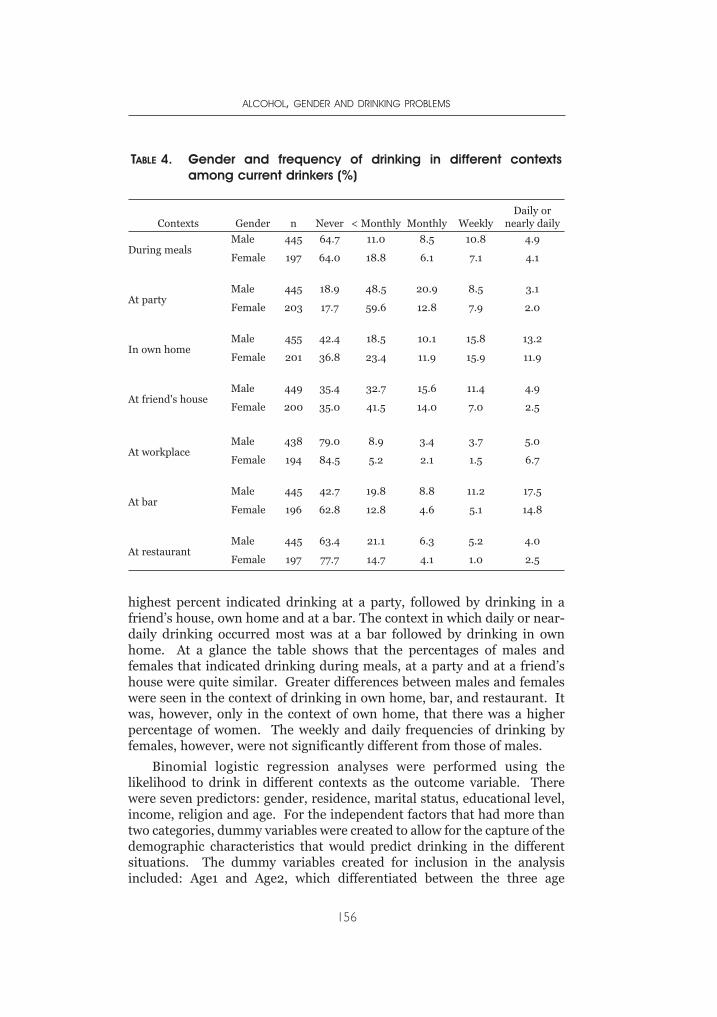
highest percent indicated drinking at a party, followed by drinking in afriend’s house, own home and at a bar. The context in which daily or near-daily drinking occurred most was at a bar followed by drinking in ownhome. At a glance the table shows that the percentages of males andfemales that indicated drinking during meals, at a party and at a friend’shouse were quite similar. Greater differences between males and femaleswere seen in the context of drinking in own home, bar, and restaurant. Itwas, however, only in the context of own home, that there was a higherpercentage of women. The weekly and daily frequencies of drinking byfemales, however, were not significantly different from those of males.
Binomial logistic regression analyses were performed using thelikelihood to drink in different contexts as the outcome variable. Therewere seven predictors: gender, residence, marital status, educational level,income, religion and age. For the independent factors that had more thantwo categories, dummy variables were created to allow for the capture of thedemographic characteristics that would predict drinking in the differentsituations. The dummy variables created for inclusion in the analysisincluded: Age1 and Age2, which differentiated between the three age
ALCOHOL, GENDER AND DRINKING PROBLEMS
156
TABLE 4. Gender and frequency of drinking in different contextsamong current drinkers (%)
Contexts Gender n Never < Monthly Monthly WeeklyDaily or
nearly daily
During mealsMale 445 64.7 11.0 8.5 10.8 4.9
Female 197 64.0 18.8 6.1 7.1 4.1
At partyMale 445 18.9 48.5 20.9 8.5 3.1
Female 203 17.7 59.6 12.8 7.9 2.0
In own homeMale 455 42.4 18.5 10.1 15.8 13.2
Female 201 36.8 23.4 11.9 15.9 11.9
At friend's houseMale 449 35.4 32.7 15.6 11.4 4.9
Female 200 35.0 41.5 14.0 7.0 2.5
At workplaceMale 438 79.0 8.9 3.4 3.7 5.0
Female 194 84.5 5.2 2.1 1.5 6.7
At barMale 445 42.7 19.8 8.8 11.2 17.5
Female 196 62.8 12.8 4.6 5.1 14.8
At restaurantMale 445 63.4 21.1 6.3 5.2 4.0
Female 197 77.7 14.7 4.1 1.0 2.5
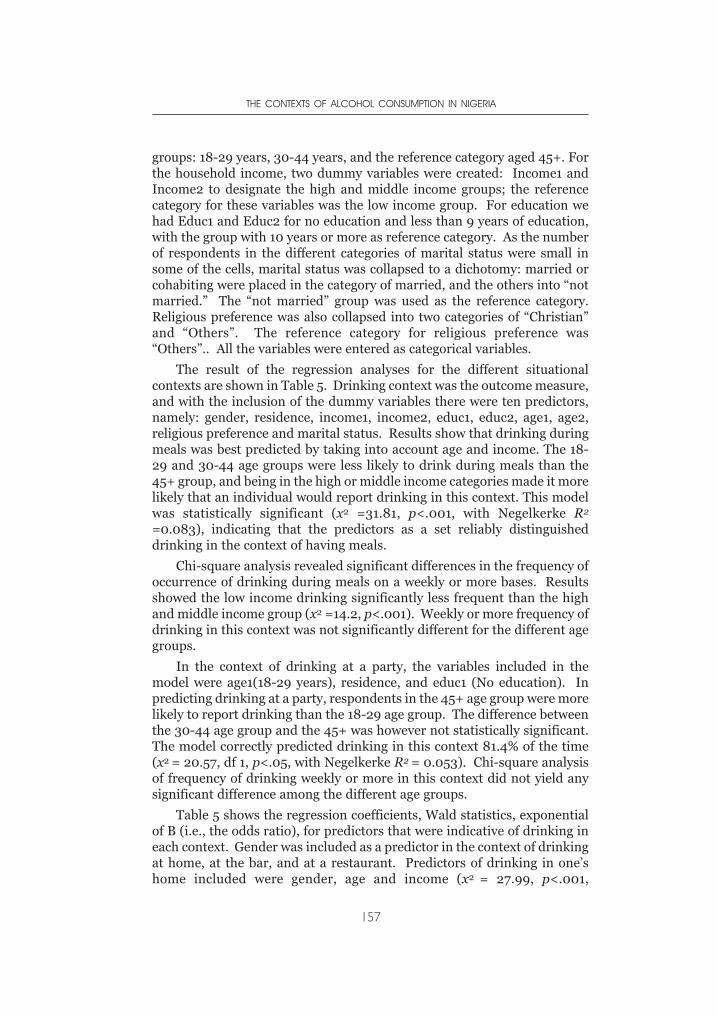
groups: 18-29 years, 30-44 years, and the reference category aged 45+. Forthe household income, two dummy variables were created: Income1 andIncome2 to designate the high and middle income groups; the referencecategory for these variables was the low income group. For education wehad Educ1 and Educ2 for no education and less than 9 years of education,with the group with 10 years or more as reference category. As the numberof respondents in the different categories of marital status were small insome of the cells, marital status was collapsed to a dichotomy: married orcohabiting were placed in the category of married, and the others into “notmarried.” The “not married” group was used as the reference category.Religious preference was also collapsed into two categories of “Christian”and “Others”. The reference category for religious preference was“Others”.. All the variables were entered as categorical variables.
The result of the regression analyses for the different situationalcontexts are shown in Table 5. Drinking context was the outcome measure,and with the inclusion of the dummy variables there were ten predictors,namely: gender, residence, income1, income2, educ1, educ2, age1, age2,religious preference and marital status. Results show that drinking duringmeals was best predicted by taking into account age and income. The 18-29 and 30-44 age groups were less likely to drink during meals than the45+ group, and being in the high or middle income categories made it morelikely that an individual would report drinking in this context. This modelwas statistically significant (x2 =31.81, p<.001, with Negelkerke R2
=0.083), indicating that the predictors as a set reliably distinguisheddrinking in the context of having meals.
Chi-square analysis revealed significant differences in the frequency ofoccurrence of drinking during meals on a weekly or more bases. Resultsshowed the low income drinking significantly less frequent than the highand middle income group (x2 =14.2, p<.001). Weekly or more frequency ofdrinking in this context was not significantly different for the different agegroups.
In the context of drinking at a party, the variables included in themodel were age1(18-29 years), residence, and educ1 (No education). Inpredicting drinking at a party, respondents in the 45+ age group were morelikely to report drinking than the 18-29 age group. The difference betweenthe 30-44 age group and the 45+ was however not statistically significant.The model correctly predicted drinking in this context 81.4% of the time(x2 = 20.57, df 1, p<.05, with Negelkerke R2 = 0.053). Chi-square analysisof frequency of drinking weekly or more in this context did not yield anysignificant difference among the different age groups.
Table 5 shows the regression coefficients, Wald statistics, exponentialof B (i.e., the odds ratio), for predictors that were indicative of drinking ineach context. Gender was included as a predictor in the context of drinkingat home, at the bar, and at a restaurant. Predictors of drinking in one’shome included were gender, age and income (x2 = 27.99, p<.001,
THE CONTEXTS OF ALCOHOL CONSUMPTION IN NIGERIA
157
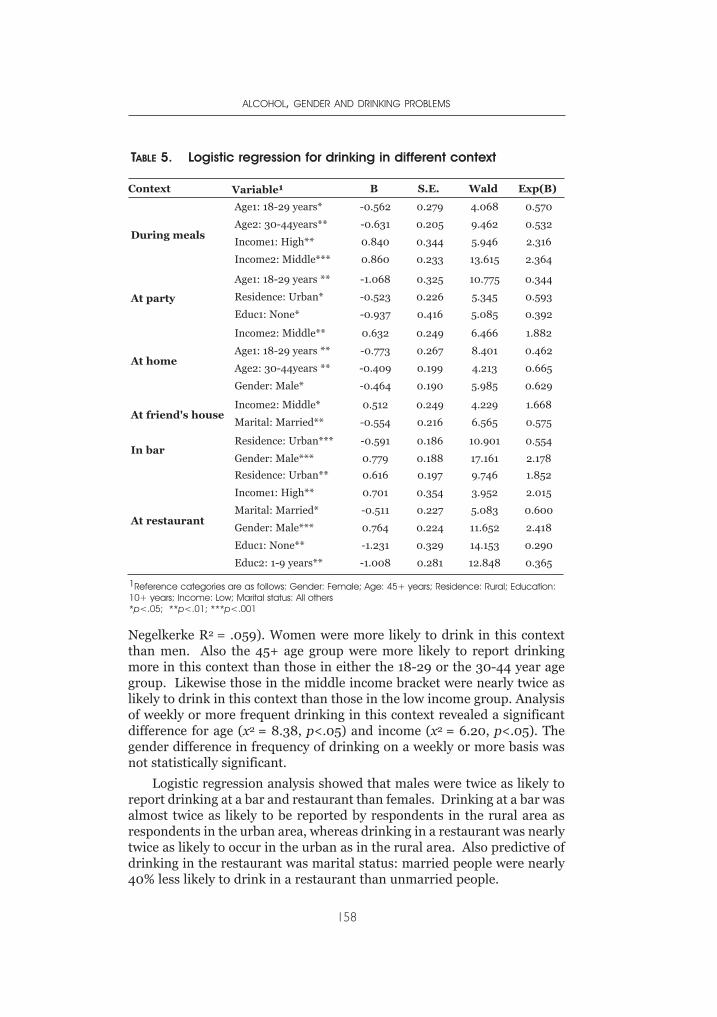
Negelkerke R2 = .059). Women were more likely to drink in this contextthan men. Also the 45+ age group were more likely to report drinkingmore in this context than those in either the 18-29 or the 30-44 year agegroup. Likewise those in the middle income bracket were nearly twice aslikely to drink in this context than those in the low income group. Analysisof weekly or more frequent drinking in this context revealed a significantdifference for age (x2 = 8.38, p<.05) and income (x2 = 6.20, p<.05). Thegender difference in frequency of drinking on a weekly or more basis wasnot statistically significant.
Logistic regression analysis showed that males were twice as likely toreport drinking at a bar and restaurant than females. Drinking at a bar wasalmost twice as likely to be reported by respondents in the rural area asrespondents in the urban area, whereas drinking in a restaurant was nearlytwice as likely to occur in the urban as in the rural area. Also predictive ofdrinking in the restaurant was marital status: married people were nearly40% less likely to drink in a restaurant than unmarried people.
ALCOHOL, GENDER AND DRINKING PROBLEMS
158
TABLE 5. Logistic regression for drinking in different context
Context Variable1 B S.E. Wald Exp(B)
During meals
Age1: 18-29 years*
Age2: 30-44years**
Income1: High**
Income2: Middle***
-0.562
-0.631
0.840
0.860
0.279
0.205
0.344
0.233
4.068
9.462
5.946
13.615
0.570
0.532
2.316
2.364
At party
Age1: 18-29 years **
Residence: Urban*
Educ1: None*
-1.068
-0.523
-0.937
0.325
0.226
0.416
10.775
5.345
5.085
0.344
0.593
0.392
At home
Income2: Middle**
Age1: 18-29 years **
Age2: 30-44years **
Gender: Male*
0.632
-0.773
-0.409
-0.464
0.249
0.267
0.199
0.190
6.466
8.401
4.213
5.985
1.882
0.462
0.665
0.629
At friend's houseIncome2: Middle*
Marital: Married**
0.512
-0.554
0.249
0.216
4.229
6.565
1.668
0.575
In barResidence: Urban***
Gender: Male***
-0.591
0.779
0.186
0.188
10.901
17.161
0.554
2.178
At restaurant
Residence: Urban**
Income1: High**
Marital: Married*
Gender: Male***
Educ1: None**
Educ2: 1-9 years**
0.616
0.701
-0.511
0.764
-1.231
-1.008
0.197
0.354
0.227
0.224
0.329
0.281
9.746
3.952
5.083
11.652
14.153
12.848
1.852
2.015
0.600
2.418
0.290
0.365
1Reference categories are as follows: Gender: Female; Age: 45+ years; Residence: Rural; Education:10+ years; Income: Low; Marital status: All others*p<.05; **p<.01; ***p<.001
DISCUSSION
The basic thrust of this work was to describe alcohol consumptionpatterns in general and its occurrence in different situational contextsmore specifically. Of interest was how the situational context is related tocertain demographic characteristics of the drinker. Here we have adopteda descriptive population perspective of drinking location. Differences inthe patterns and intensity of alcohol consumption in Nigeria aredetermined by such factors as gender, age, income, marital status and areaof residence, as selected demographic variables in the survey have shown.Although parties, friend’s house and bars were venues that experienced thehighest percentage of people indicating that they drink, variations betweenthe contexts depends to a large extent on the demographic characteristicsof individuals that patronize these venues.
The results of the study found a significant gender difference in thenumber of current drinkers, with males having a higher proportion. Theseresults suggest that drinking is primarily a male behaviour. But moreimportantly, women’s consumption patterns are different from men’s. Thegender dimension of alcohol consumption in Nigeria cannot be divorcedfrom the socio-cultural setting in Nigeria where drinking by women isgenerally not approved. It is within this framework that the gender issuesin alcohol consumption in Nigeria can be understood. For example,whereas the negative and often destructive effects of alcohol abusegenerally are increasingly a topical concern in Nigeria, the view thatalcohol abuse has different consequences for different gender and socialcategories is still not very clear to many, including policy makers andscholars. Nevertheless, in view of their roles in production anddistribution of alcohol beverages, especially the traditional alcoholbeverages, women are not as distanced from alcohol use as may beinterpreted from the results of the survey. The pattern presented in Table3 does point to the fact that women exhibit a similar pattern of drinkingacross the different age groups. This table shows the percentages ofwomen heavy drinking doubling as one moves from the 18-29 to the 30-44year age group, and further increasing with the 45+ age group. This tablefurther points out that when drinking does occur, the tendency is for it tobe frequent, (irrespective of the individual’s gender). Additionally nearlyhalf of the people that do drink are likely to engage in frequent heavydrinking.
Binomial regression analyses revealed gender as a predictive factor inthe context of drinking at home, bar and restaurant. As one would haveexpected, women tended to drink more at home than the men. This maybe more as a result of the fact that women, by reason of their role ascaretakers of the home and children, tend to spend more time at home;thus the drinking, if it occurs, would be in this context. However, thefrequency of females drinking weekly or more in this context did not differsignificantly from that of males.
THE CONTEXTS OF ALCOHOL CONSUMPTION IN NIGERIA
159
The bar is still considered a male venue and women who go there aloneare few and largely outnumbered by males. More often than not thewomen who drink at the bar do so in the company of men. This, then, mayexplain the higher ratio of males to females who drink in this context. Itshould, however, be pointed out that the women that do drink in thesevenues do not differ significantly in frequency of drinking from their malecounterparts. By implication, more men drink at the bar, but the fewwomen that do visit the bars to drink visit these locations just as frequentlyas their male counterparts.
Likewise, drinking in a restaurant is to a considerable degree areflection of the individuals that visit these places. In the Nigerian contextrestaurants are seen, more or less, as a place visited by males who are notcurrently in a resident marital relationship. Not being in such arelationship, they would tend to eat out more and this often would be in arestaurant, in the process also requesting alcoholic drinks. It is worthnoting here that gender was not seen as predictive of alcohol consumptionduring meals. It is only predictive in the context of restaurants, probablybecause women who drink during meals probably do so more often in theconfines of their own home, either together with their partners or alone.Though more and more women are getting into career jobs, many stillprefer to eat food they cooked and therefore are less likely to visitrestaurants to eat out as often as their male counterparts. When they doeat out it would often be during office hours. As drinking during work isnot considered appropriate and again that the social sanctions for so doingare more grievous for females this may act as further deterrent to theirdrinking, at this time or context. Notable also is that in terms of beveragepreference, wine is the preferred by women more. Wine is not served inmany restaurants, and when it is, often it is not served/ordered in glasses.This poses certain inconveniences if one was to then order wine with meals,particularly with a meal taken during office lunch break. Ordering a bottleof wine to go with one’s meal would necessitate having to either finish thebottle there, which may not have been the intention, or having to take itback to the office or leave the remainder at the restaurant. Carrying it tothe office would carry the risk of being socially branded, whereas leaving itbehind would be considered an economic waste.
Christianity and Islam are the two most dominant religions, and thereare many that claim to be deeply committed to them. These religions havegreatly influenced different aspects of the people’s lives, as evident in theoccurrence of religiously oriented conflicts and crises. They have alsoinfluenced people’s drinking behaviour. Both are intolerant ofconsumption of alcohol, but Islam more so than Christianity. This is notthe same for the individuals who practice other forms of religion whererituals involved often include use of alcoholic beverages as an offering,used in appeasing the gods. On the other hand, most members of Christiandenominations and Islam would not want to be publicly identified with the
ALCOHOL, GENDER AND DRINKING PROBLEMS
160
use of alcohol. The Christian denominations in Nigeria include manywhich favour abstinence. In parts of Nigeria the dominance of Muslims hasmeant that alcohol is formally forbidden. The institution of Sharia law incertain states in the country, particularly in the ones bordering the MiddleBelt region, has resulted in punitive measures being put in place to controlthe production, sale and consumption of alcoholic beverages. Byimplication, the laws make one more conscious of one’s consumption, andin that case a drinker either consciously cuts down on his drinking or doesnot accurately report the consumption. The rates of alcohol consumptionthus recorded from the Middle Belt or North Central zone may actuallyhave been affected by this. It is possible that the rates obtained in this zonein general, and among Muslims more specifically, are underestimated.
The influences of social support such as familial and communityrelationships also affects alcohol consumption. The survey shows thatthose who were cohabiting, single or married have lower rates for alcoholconsumption than those who were widowed. The highest proportions ofalcohol consumption were found in the divorced and separated. Crosstabulations carried out showed that more than 80 percent of the separatedrespondents consumed 5 or more drinks on a typical drinking day. It raisesthe question of the role that drinking may have played in the separation ordivorce. Since the study is cross-sectional, however, it cannot bedetermined whether it is the drinking that led to the separation anddivorce, or the separation and divorce that led to the drinking. The smallnumber of respondents in each of these categories also imposes additionallimitations on the inferences that can be drawn in this regard.
The survey shows that the percentage of individuals that drinkincreases with age. It would appear that as individuals move away fromparental control they move closer to and interact more frequently with peergroups, which is a risk factor for increased alcohol consumption. Or itcould be that they are now more independent socially and financially, andtherefore can afford to do so. It may also be a continuation of thetraditional patterns of drinking, whereby drinking was seen as somethingthat elders or people high in the social hierarchy of the society had accessto and control over. The respondent’s age was predictive of drinking in thecontexts of drinking at home, at a party and during meals. In each of thesesituations the older age group had greater odds of drinking. Doing soweekly or more often was found significant only in the context of drinkingin one’s home.
Results from this study call for revisiting the thesis of heavier drinkingoccurring in the urban centers, possibly as a result of the decline in theinfluence of the extended family and community and the increase salienceof peer groups. This effect of urbanization found in earlier studies mayrefer to drinking among youth, where peer influence seems greatest, andmonitoring by parents and other people is a bit relaxed. Different factorsmay however be at play in the older population, causing the drinking
THE CONTEXTS OF ALCOHOL CONSUMPTION IN NIGERIA
161
patterns observed in this work. It is possible that economic change hasloosened and reorganized the social networks surrounding drinking in thevillage so that the independence and anonymity experienced in the urbanareas is desired and pursued by those in the rural area. With less personaleconomic activities occurring in the rural area, the tendency is for peopleto have more time to initiate activities and engage in programmes that mayinvolve social gatherings. These gatherings may be in groups that servealcohol, particularly as it is regarded as a social lubricant necessary toenhance the social environment in each of the groups. It is possible thatthe drinking in the rural area is as a result of greater opportunity for peopleto meet more often in a relaxed atmosphere, than is possible in the urbanareas. It may be that the traditional communities that sanctioned drinkingin certain situations and circumstances have not changed in the concept ofdrinking in those circumstances, but rather the frequency in which thosecircumstances occur has increased.
More members of the middle income group in Nigeria indicateddrinking more than those in the low income group. Income was seen aspredictive of frequency of drinking during meals, in one’s own home, at afriend’s house, and at a restaurant. During meals, drinking was morelikely in the middle and the high income groups than the lower incomegroup. When considering frequency of drinking in this context howeverthe lower income bracket did so at a significantly less “weekly or more”frequency. A similar pattern was observed for drinking in the context ofone’s home. Thus, the higher income was predictive of drinking in thiscontext.
The majority of male and female current drinkers in Nigeria drankbrands of lager beer. This is possibly because of their widespreadavailability. This may be largely connected to the production anddistribution chains; various brands of lager beer are available all overNigeria, including the rural locations. Comparatively only very few peoplecould afford the luxury of table wine, which in Nigeria is a ‘status symbol’.Female drinkers were more likely than males to drink table wine, which isconsidered less intoxicating. That the figure for females was not highermay reflect lack of access to resources to purchase table wine.
CONCLUSION
This study set out to look at alcohol consumption patterns in Nigeria,with a specific focus on how situational contexts of alcohol consumptionrelate to certain demographic variables. The cross-sectional nature of thestudy imposes certain limitations on the inferences of causality that can bedrawn. It may be argued that predictions of context of drinking fromdemographic groups (e.g., by gender, religion or age) may relate more toseeking locations that promote greater alcohol intake. Or it could be thatdemographic group membership affects the frequency with which one will
ALCOHOL, GENDER AND DRINKING PROBLEMS
162
desire to visit or avoid visiting locations where drinking occurs. The socialatmosphere at these various drinking places also deserves some attention,as it may also contribute to the person’s consumption: certainenvironments may actually be more permissive of impulsive behavioursthan others, thus affecting the drinking pattern in that context. To clarifythe issues of causality, a longitudinal design would be needed. Despite thislimitation, however, the cross-sectional design showed that frequency ofconsumption varies with the drinking context, implying that people are tosome degree affected by their drinking environment.
Thus contextualizing the individual’s usual consumption in variouslocations may provide valuable information for evolving better strategiesfor targeted preventive actions.
Cultural norms and beliefs with regards to drinking in certain locationsaffect alcohol consumption patterns. It is important that future workexamine the effect of cultural variables and the diversity of alcoholconsumption patterns and contexts. For a country like Nigeria, with itsdiverse cultures, research of this nature is crucial in developing effectiveprevention strategies.
This study focused on the contexts of alcohol consumption and did notassess other dimensions that may influence drinking. For instance, it didnot assess the composition of the drinking group or the drinkingcompanions, and the subtle pressures exerted by such groups. Thesefactors have been seen in other studies (Greenfield & Room, 1997; Demerset al., 2003) to relate to the individual’s drinking level. More in-depthresearch will be required to provide a better explanation of drinking amongadults in Nigeria.
ACKNOWLEDGEMENTS
The authors would like to thank Isidore S. Obot, Robin Room, RichardWilsnack and other members of the North Dakota team, and the wholeGENACIS membership that saw to the completion of this project. Theircomments, suggestions and support were of immense help. We are greatlyindebted to the Federal Office of Statistics, Nigeria for releasing theirenumerators to assist in data collection.
REFERENCES
Ahmed, M.H. (1986). Drug abuse as seen in the University Department ofPsychiatry, Kaduna, Nigeria in 1980–1984. Acta Psychiatric Scandinavica,14(1), 98–101.
Ahmed, M.H.(1989). Drug abuse, women and society, some socio-demographiccharacteristics of female cases in the University department of Psychiatry,Kaduna, Nigeria in 1980-1986. West African Journal of Medicine 8(4),241–245.
THE CONTEXTS OF ALCOHOL CONSUMPTION IN NIGERIA
163
Akerele, A.O. (1993). Supply of alcohol: a major determinant of alcoholconsumption and abuse. In I.S. Obot (ed.), Epidemiology and Control ofSubstance Abuse in Nigeria (pp. 45–51). Jos: Centre for Research andInformation on Substance Abuse.
Anumoye, A. (1980). Drug use among young people in Lagos. Bulletin onNarcotics, 32(4), 49–45.
Bennet, L.A., Campillo, C., Chandrashekar, C.R. Gureje, O. & Franz P. (1998).Alcoholic beverage consumption in India, Mexico and Nigeria: a cross-culturalcomparison. Alcohol, Health and Research World, 22(4), 243–252.
Demers, A., Kairouz, S., Abdul, E.M., Gliksman, L., Newton-Taylor, B. & Marchand,A. (2002). Multi-level analysis of situational drinking among Canadianundergraduates. Social Science and Medicine, 55(3), 417–426.
Ebie, J.C. & Pela, O.A. (1981). Some socio-cultural aspects of the problem of drugabuse in Nigeria. Drug and Alcohol Dependence, 8, 302–306.
Enekwechi, E.E. (1996). Gender differences in motivation for alcohol use amongNigerian university students. Journal of Alcohol and Drug Education, 41(2)1-10.
Federal Office of Statistics (1985). Industrial Profile 1985. Lagos: FOS.Federal Office of Statistics (1999). Annual abstract of Statistics. Lagos: FOS.Gire, J.T. & Dimah, A. (2001). Cultural transformation and the changing pattern of
alcohol consumption among the Tiv of Central Nigeria. African Journal ofDrug and Alcohol Studies 1(2), 125–137.
Greenfield, T.K., & Room, R. (1997). Situational norms drinking and drunkennesstrends in the US adult population 1978-1990. Addiction, 92, 1, 33-47.
Gureje, O. et al. (1996). Comparison of alcohol and other drugs: experience fromthe WHO collaborative cross cultural applicability research (CAR) study.Addiction, 91, 1529-1538.
Gureje, O. (1999). Country profile on alcohol in Nigeria. In L. Riley and M. Marshall(ed.), Alcohol and Public Health in 8 Developing Countries. (pp. 95–114).Geneva: World Health Organization.
Ibanga, A.K.J. (1997). Epidemiologic trends in drug consumption in Nigeria.Proceedings of the National Workshop on Drug Demand Reduction Policy inNigerian (pp 61-68). Kuru, Nigeria: National Institute of Policy and StrategicStudies.
Ibanga A.K.J. (1998). Youth, drugs and secret cults. Journal of the African Councilon Narcotics, 9, 10-12.
Ibanga, A.K.J. (2002) Alcohol use: a comparative look at experiences of heavy,moderate and light drinkers. A paper presented at the sixth Bi-annualconference of the Centre For Research and Information Substance Abuse heldin Abuja, Nigeria.
Idowu, A.I. (1987). Prevalence of smoking and drug use among students in Illorinmetropolis: implications for counseling. Illorin Journal of Education, 3,85–92.
Ifabumuyi, O. (1982). Alcoholism: a missed diagnosis. In O. A. Eronosho and N.W.Bell (eds.) Mental Health in Africa (pp 115–121). Ibadan: Ibadan UniversityPress
Ikwuagu, P.U., Niftier, J.C. & Isichie, H.V. (1993). Pattern of substances abusein the psychiatric unit of Jos University Teaching Hospital: a perspective.In: I.S. Obot (ed.), Epidemiology and Control of Substance Abuse inNigeria (pp. 88–94). Jos: Centre for Research and Information onSubstance Abuse.
ALCOHOL, GENDER AND DRINKING PROBLEMS
164
Ikwuesan, B.H. (1994). Drinking problems and the position of women in Nigeria.Addiction, 89, 941-944.
International Council on Alcohol and Addictions. (1988). Report of a ResearchProject on Substance Abuse of Some Urban and Rural Areas of Nigeria.Lausanne: ICAA.
Isichie, H.U., Ikwuagu, P.U., & Eguta, J.O. (1993). Pattern of Alcoholism in Jos,Nigeria and Gastrop-Rausel, West Germany; a comparative study. InI.S.Obot (ed.), Epidemiology and Control of Substance Abuse in Nigeria(pp. 123–127). Jos: Centre for Research and Information on SubstanceAbuse.
Makanjuola. J.D. (1984) The management of alcohol-related problems in generalpractice in Nigeria. In WHO Management of Alcohol-Related Problems inGeneral Practice. Geneva: WHO.
Maula, J., Lindblad, M., & Tigerstedt, C., eds. (1990). Alcohol in DevelopingCountries. Helsinki: Nordic Council for Alcohol and Drug Research. (NADPublication No. 18).
Ndon, R.J., & Adelekan, M.L. (1996) Psychosocial correlates of substance useamong undergraduates in Ilorin University, Nigeria. East African MedicalJournal, 73(8), 541-547
Nevadomsky, J. (1982). Self-reported drug use among secondary school students intwo rapidly developing Nigerian towns. Bulletin on Narcotics, 34, 12–32.
Netting, R.N. (1964). Beer as a locus of value among the West African Kofyar.American Anthropologist, 66, 826–838.
Lambo, T.A. (1965). Medical and social problems of drug addiction in West Africa.The West African Medical Journal, 14, 236–254.
Obembe, A. (1988). Alcoholism: a ten year hospital survey. Nigerian MedicalPractitioner, 16, 181–182.
Obot, I.S. (1993a). Drinking behaviour and attitudes in Nigeria: a generalpopulation survey CDS. Monograph series no. 1/93. Jos: University of Jos
Obot, I.S. (1993b). Epidemiology of tobacco and alcohol use in Nigeria. In I.S. Obot(ed.), Epidemiology and Control of Substance Abuse in Nigeria (pp 67–87).Jos: Centre for Research and Information on Substance Abuse.
Obot, I.S., Ibanga, A.J. & Karick, H. (2002). Images of power and success: alcoholpromotion and marketing in Nigeria. Paper presented at Kettil Bruun SocietyConfercne, Paris 3 – 7th June.
Obot, I.S., Ibanga, A.J., Ojiji, O.O. & Wai, P. (2001). Drug and alcohol consumptionby out of school Nigerian adolescents. African Journal of Drug and AlcoholStudies, 1(2), 98 – 109
Obot, I.S. & Olaniyi, A. A. (1991). Drug-related psychotic disorders in four Nigerianhospitals (1984 – 1988). Nigerian Journal of Psychology, 8(1), 13-16.
Odejide, A.O. & Olatawura, M. O. (1997). Alcohol use in Nigerian rural community.African Journal of Psychiatry, 1, 69–74.
Odejide, A.O. (1978). Alcoholism a major health hazard in Nigeria. NigerianMedical Journal, 8, 230-233.
Ohaeri, J.V. & Odejide, A. O. (1993). Admission for drug and alcohol-relatedproblems in Nigeria psychiatric health care facilities in one year. Drug andAlcohol Dependence, 31, 101–109
Olademeji, B.Y. & Fabiyi, A.K. (1993). Trends in alcohol consumption amongNigerian undergraduates. In I.S. Obots (ed) Epidemiology and Control ofSubstance Abuse in Nigeria (pp. 88–94). Jos: Centre for Research andInformation on Substance Abuse.
THE CONTEXTS OF ALCOHOL CONSUMPTION IN NIGERIA
165
Oshodin, O.G.(1981). Alcohol abuse: a case study of secondary school students in arural area of Benin District, Nigeria. Drug & Alcohol Dependence, 8, 207–213.
Oshodin, O.G. (1995). Nigeria. In D.B. Heath (ed.), International Handbook onAlcohol and Culture (pp. 213-223). Westport CT: Greenwood Press
Umunna, I. (1967). The drinking culture of a Nigerian community: Onitsha.Quarterly Journal of Studies on Alcohol, 28, 529-537.
Uzor, M. (1999). Nigerian Breweries tops exchange capitalization. FinancialStandard, 17 December, p. 39.
ALCOHOL, GENDER AND DRINKING PROBLEMS
166
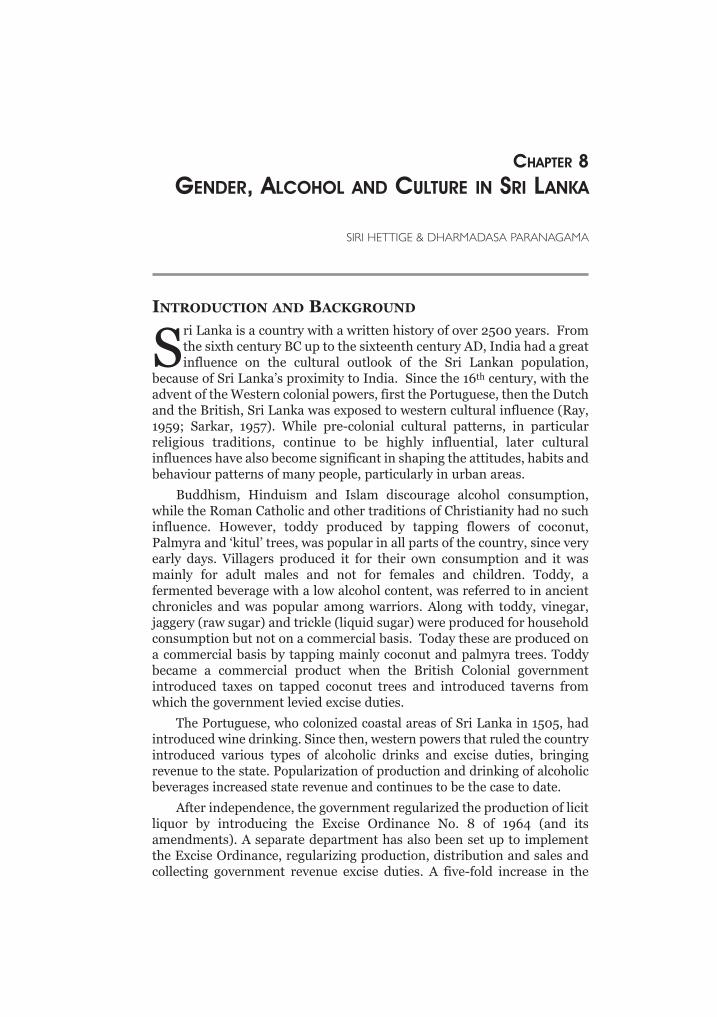
INTRODUCTION AND BACKGROUND
Sri Lanka is a country with a written history of over 2500 years. Fromthe sixth century BC up to the sixteenth century AD, India had a greatinfluence on the cultural outlook of the Sri Lankan population,
because of Sri Lanka’s proximity to India. Since the 16th century, with theadvent of the Western colonial powers, first the Portuguese, then the Dutchand the British, Sri Lanka was exposed to western cultural influence (Ray,1959; Sarkar, 1957). While pre-colonial cultural patterns, in particularreligious traditions, continue to be highly influential, later culturalinfluences have also become significant in shaping the attitudes, habits andbehaviour patterns of many people, particularly in urban areas.
Buddhism, Hinduism and Islam discourage alcohol consumption,while the Roman Catholic and other traditions of Christianity had no suchinfluence. However, toddy produced by tapping flowers of coconut,Palmyra and ‘kitul’ trees, was popular in all parts of the country, since veryearly days. Villagers produced it for their own consumption and it wasmainly for adult males and not for females and children. Toddy, afermented beverage with a low alcohol content, was referred to in ancientchronicles and was popular among warriors. Along with toddy, vinegar,jaggery (raw sugar) and trickle (liquid sugar) were produced for householdconsumption but not on a commercial basis. Today these are produced ona commercial basis by tapping mainly coconut and palmyra trees. Toddybecame a commercial product when the British Colonial governmentintroduced taxes on tapped coconut trees and introduced taverns fromwhich the government levied excise duties.
The Portuguese, who colonized coastal areas of Sri Lanka in 1505, hadintroduced wine drinking. Since then, western powers that ruled the countryintroduced various types of alcoholic drinks and excise duties, bringingrevenue to the state. Popularization of production and drinking of alcoholicbeverages increased state revenue and continues to be the case to date.
After independence, the government regularized the production of licitliquor by introducing the Excise Ordinance No. 8 of 1964 (and itsamendments). A separate department has also been set up to implementthe Excise Ordinance, regularizing production, distribution and sales andcollecting government revenue excise duties. A five-fold increase in the
CHAPTER 8GENDER, ALCOHOL AND CULTURE IN SRI LANKA
SIRI HETTIGE & DHARMADASA PARANAGAMA
government revenue from all excise duties (liquor, tobacco etc.) has beenrecorded for the ten-year period of 1992-2002, while there was around athree-fold increase in revenue from liquor. Revenue from excise tax hasincreased from 10.4 billion rupees to 52.3 billion rupees from 1992 to2002. Similarly revenue from liquor taxes has increased from 3.4 rupees to10.3 billion rupees during the same period. Excise duties contribute morethan 3% to the GDP annually. In other words, excise revenue accounts formore than 1/5th of the total tax revenue of the government. The increase inrevenue over the last 10 years was due to increases in consumption andprice hikes. The total production of alcoholic beverages in the countryduring this period had almost doubled (Central Bank, 2002).
There has thus been a rapid increase in alcohol production andconsumption over the last ten years. Beer production has increased overfivefold between 1992 and 2002, whereas hard liquor production hasincreased from 53.4 million liters to 59.6 million liters. Per capitaconsumption of beer has increased from 0.7 liters to 3.4 liters in the sameperiod. Consumption of hard liquor has also increased steadily during theperiod. Figures do not include illicit alcohol, which is estimated to bearound 50% of total alcohol availability in the country.
Availability of alcoholic drinks for the population is not limited to locallicit production. Imports and smuggling of foreign liquor and illicit localbrews also come to the market in significant quantities. The police andexcise officers arrest people almost every day who are smuggling foreignliquor and distilling and transporting illicit brews in large quantities. Yet itis a thriving and lucrative business, at times supported by corrupt lawenforcement officers and local politicians. In the suburbs around Colombo,illicit liquor is produced in large quantities and transported to other urbanareas, while in the rural areas it is produced in small quantities, mainly forpoor village drinkers.
A policy of popularizing lower-strength liquor like beer wasimplemented in 1994 by reducing the price of beer to divert hard liquordrinkers to beer. however, it could not achieve the desired objective, asdrinkers who are used to hard liquor could not be persuaded to drink beer.If a drinker could not afford licit hard liquor, he would turn to local illicitbrews, like ‘kasippu’, in which alcohol content is very high compared toarrack, the popular licit distilled beverage.
In 2002, Sri Lankan drinkers consumed 56.7 million liters of maltliquor, 56.6 million liters of arrack and 7 million liters of toddy in additionto around 3 million liters of other foreign liquor. However, the quantity ofsmuggled and illicit liquor in circulation in urban, rural and estate areasmight be equal to the quantity of arrack consumed in a given year. Thus theper capita alcohol consumption compiled using licit alcoholic productiondoes not give the true picture in the country, as the per capita consumptionmay be doubled if illicit liquor is also taken into account.
ALCOHOL, GENDER AND DRINKING PROBLEMS
168
Apart from local production, both licit and illicit, the supply of liquorfor local consumption has been increased by smuggling and imports ofliquor. In 2002, around 15.8 million liters of liquor to the value of SLRs.1,785 million (US $17 million) was imported. This included one millionliters of beer, in addition to spirits.
POLICY ON PRODUCTION, SALE, TRANSPORT AND ADVERTISING
The government of Sri Lanka made an attempt in the 1990s tointroduce a comprehensive national policy on alcohol for Sri Lanka. Thisdid not, however, result in the formulation and adoption of a nationalpolicy, apparently due to the pressure emanating from the liquor industry.So the only legal provision available for controlling liquor production,transport and sales is the Excise Ordinance No. 8 of 1964, the aim of whichis to collect taxes on alcohol and tobacco. Earlier, liquor production was amonopoly of the government. However, in the mid-1990s the private sectorwas also allowed to establish production units, for which licenses have tobe obtained from the government. Licensed breweries are given certainguidelines and periodical test checks are being carried out by the ExciseOfficers.
A license has to be obtained from the Department of Excise to establishsales points and premises of consumption.
(a) for consumption on the premises, such premises should be situatedbeyond a half mile/500 meter radius from educational institutionsand places of religious worship,
(b) for retail off-sales, the premises should be beyond 100 yards/100meters from educational institutions and place of religiousworship
The issue of licenses is further controlled by taking into account theneed for such outlets and the population ratio in that particular area.However, issuing of licenses for retail outlets has been politicized, andbribery and corruption are highly associated with this industry.
Though formally the Commissioner General of Excise can determinethe number of licenses to be issued in an area, taking into consideration thefollowing criteria, political interference has curtailed his power, and thedecisions are not always made in keeping with the criteria.
• the population and requirements of the area;
• applicant’s bank balance, payment of income and turnover taxes,eligibility and ownership of premises;
• reports of the Officer-in-Charge of the Police Station, theDivisional Secretary, and the Officer-in-Charge of the ExciseStation of the area that the applicant is the proper person to holdthe license, there is no objection from the public for the issue of
GENDER, ALCOHOL AND CULTURE IN SRI LANKA
169
.
license and there will be no threat to the maintenance of law andorder; and
• the location, size, furnishing, toilets, kitchen, food etc. of thepremises relating to hotels and restaurants.
There were over 1880 licensed outlets in the form of restaurants,hotels, rest houses, wine shops, clubs, canteens, taverns etc. by 1995.However, the number of unlicensed outlets increased tremendously allover the country, especially in congested urban areas, in the guise ofChinese restaurants and sports clubs, in addition to thousands of placeswhere illicit liquor is sold, after the liberalization of it in the mid-1990s.There is no reliable data on these various outlets.
Alcoholic beverages widely consumed in Sri Lanka can be categorized as
a) Low alcohol beverages such as beer and toddy, wine with analcohol content of less than 10%,
b) Strong liquor or spirits such as arrack, gin, brandy etc. with analcohol content of 35-40%, and
c) Illicit liquor, commonly known as ‘kassippu’ with a very highalcohol content — around 50%.
Arrack and beer are produced in equal quantities (about 57 millionliters per year), whereas other types are produced in much smallerquantities. Production of toddy, which is a fermented traditional brew,amounted to about 7 million liters in 2002.
As mentioned, earlier production and the distribution of alcohol areregulated by the Department of Excise under the Excise Ordinance No. 8 of1964. According to the Ordinance:
a) All liquor manufactories should be licensed under the ExciseOrdinance
b) Transport of liquor should be done under a licence obtained fromthe Excise Commissioner.
c) Transport of liquor up to 7500 liters is allowed without a license.
d) A licence for the production of liquor is given only afterconsidering the Government Analyst’s Report of the samples.
e) No drinking of alcohol is allowed within the premises of themanufactory.
f) Sale of alcoholic products to children is completely prohibited.
As regards labeling of products, the label used by producers must beapproved by the Excise Department and it should carry: (a) the name of themanufactory, (b) the brand, (c) the strength and (d) the price of the product.
The Ordinance also sets limits for alcohol content as follows: foreignliquor (spirits): 37.0% to 45.6 % alcohol; arrack: 33.5% to 36.8% alcohol;beer and toddy: 5.0% to 7.5% alcohol.
ALCOHOL, GENDER AND DRINKING PROBLEMS
170
.
There are no restrictions on advertising of liquor in print media andother modes of advertising like billboards, except in the case of electronicmedia, such as television. Even on television it is not legally banned, but TVand radio stations do not usually carry alcohol advertisements.
Driving under the influence of liquor can be prosecuted under the MotorTraffic Ordinance and under the Offences Committed Under the Influence ofLiquor Act No. 41 of 1979. The Traffic Police carry out frequent checks ondrunk drivers, as liquor is thought to be a major cause of grave road accidents,which are on the rise. We will return to this issue later in the chapter.
DRINKING CUSTOMS AMONG DIFFERENT POPULATION GROUPS
In Sri Lanka drinking is also associated with gender and culture. As aresult, drinking habits, frequency and amount of drinking vary amongdifferent ethno-religious communities and socio-economic classes in thecountry. Frequent heavy drinking could be found among Tamil estateworkers, whose educational attainments as well as entertainment facilitiesare quite low. Gender differences with regard to drinking are not as markedamong them, and usually cheap illicit local brews are popular among them.Frequent drinking could also be found among Roman Catholic and otherChristian populations found to the north of Colombo City. This communityis more westernized and largely English-educated and most of them areengaged in government service and business activities. Many females inthis community are also exposed to drinking, compared to other parts ofthe country, as serving liquor in households is a custom among them.Illicit liquor is also popular in these areas.
Drinking is not as heavy and frequent in other parts of the country,where the population is mainly Buddhist. Female drinking is negligible.However, heavy drinking and alcoholism is associated with low education,hard manual work and poverty in these areas. Some urban females drinkbeer or wine at social events, which upper class females frequently attend.
Drinking among teenagers is not very common, as parental care is highand culturally children are not used to taking drinks in the presence ofparents or respected elders, even at a party. The law prohibits selling drinksto teenagers, those below 18 years of age. On the other hand, drinking isspreading among youth, particularly in urban areas. Though drinking iscommon among office workers, no one is allowed to take drinks during officehours and no one i supposed to come to the office after drinking. Many officeworkers have drinks with co-workers at bars and restaurants after work.
ALCOHOL RELATED PROBLEMS
Alcohol is one of the main causes of chronic liver disease and cirrhosisof the liver, but data on morbidity and mortality that can be directly relatedto alcohol consumption are not readily available. Some of the data could be
GENDER, ALCOHOL AND CULTURE IN SRI LANKA
171
collected from the Department of the Registrar General, the Department ofPolice, the Department of Health (Health Statistics Unit) and theDepartment of Prisons. The major problem a researcher faces in thisregard is the delays in publishing annual administrative reports of relevantdepartments, from which we have to collect data. Unpublished dataavailable in public institutions cannot be readily accessed.
As the available data show, the rate (per 100,000 population) ofmorbidity and mortality caused by liver cirrhosis and other chronic liverdiseases associated with alcohol is on the rise. The rate of cases of diseasesof the liver per 100,000 population has increased from 38.5 to 125.2 anddeaths from liver diseases from 3.8 to 15.2 during the period of 1975 to2002. The rate of this disease is high in heavy drinking areas such as theUp Country plantation sector and in the Catholic and Christian areas ofNorth of Colombo (Gampaha and Puttalam Districts) (see also Hettige,1988 and Dept. of Health Services, 2002). It is noteworthy that thereported cases of alcoholic psychosis have also increased in recent years.For instance, the rate of alcoholic psychosis per 100,000 population hasincreased from 36.2 in 1990 to nearly 58 in 1995. This is an increase over60% over a five year period. Nearly one out four mental disorders in SriLanka is due to alcohol (Dept. of Health Services, 2002).
Data on deaths caused by injury and poisoning that can be directly relatedto alcohol are not readily available. The number of homicides, includingdeaths from injury purposefully inflicted, and deaths caused by accidentalpoisoning are high. Deaths caused by alcohol poisoning are included in theaccidental poisoning. While homicides increased from 1085 in 1985 to 1351 in1995, alcoholic poisoning increased from 539 to 652 over the same period.These include cases of alcohol poisoning from contaminants which is acommon occurrence among consumers of illegally produced alcohol.
And finally to look at motorcar accidents. Available data shows thattraffic accidents have increased steadily in recent years. For instance, therate of traffic accidents per 100,000 population has increased from 202 in1990 to 211 in 1993. It is significant that the rate of driving under theinfluence of alcohol has increased form 8.9 in 1990 to 20.7 in 1993, a morethan 100 % increase.
GENACIS SURVEY
The objectives of the GENACIS study in Sri Lanka have been:
i) To compare the patterns of drinking between men and women,
ii) To examine the prevalence of drinking problems among men andwomen,
iii) To assess the level of drinking among men and women,
iv) To carry out cross-national comparisons of drinking problems andheavy drinking occasions
ALCOHOL, GENDER AND DRINKING PROBLEMS
172
,
v) To contribute to the development of alcohol epidemiologyinvolving comparisons between men and women in differentcultural contexts, and
vi) To gauge public opinion on certain policy related issues.
METHOD
The main instrument of data collection was the expanded corequestionnaire developed by the international GENACIS research team. Thequestionnaire was suitably modified, taking into consideration specificlocal conditions. Having been adapted to suit the local conditions, thequestionnaire was translated into Sinhala and Tamil, the two nativelanguages. The local language versions were translated back into English inorder to ensure that there are no serious distortions made in thetranslation process. A few questions on alcohol policy issues were added tothe expanded core questionnaire used.
SAMPLE
Seventeen out of 25 districts in the island were selected and stratifiedinto four socio-economic zones, which are also identified as agro-ecological zones. The population of the districts in these zones was againstratified into three sectors, namely urban, rural and estate, and eachsector by ethnicity, namely Sinhala, Tamil and Moor. The districts thatwere not considered in the sample selection process are from the Northand East of the country, where the security situation was not favourablefor conducting the survey. The population in Zone 1 is predominantlyurban, whereas Zones 2 and 3 are predominantly rural. The estatepopulation mainly falls into Zone 4. The latest Census of Population datahave been used in the selection of the sample. The most recent census wasconducted in 2001.
A representative sample of 1200 respondents was used in thissurvey. A stratified multistage sampling technique with probabilityproportion to the size of population (PPS) and cluster samplingtechniques have been employed in selecting the 1200 respondents. Theprimary sampling unit was the household. The respondent from thehousehold was selected randomly from among all the members of thefamily aged 15 and above.
PROCEDURE
First, at least one district was selected to represent each zone.Secondly, two Divisional Secretariat Divisions (DSD) were selected fromeach selected district with PPS. Thirdly, two Grama Niladhari Divisions(GND) (village headman division) were selected at random (SRS) from
GENDER, ALCOHOL AND CULTURE IN SRI LANKA
173
each selected DSD. The required number of households was selectedemploying a systematic sampling technique. Finally, respondents whowere aged 15 years and above were selected at random using the list ofhousehold members prepared by the enumerator/interviewer.
RESULTS
In this section we provide the main results of the survey. The areascovered in the analysis were:
a) Demographic characteristics of the respondents,
b) Drinking and abstinence,
c) Frequency and quantity of drinking,
d) Characteristics of drinkers
e) Reasons for abstinence,
f) Religion, ethnicity and drinking,
g) Age at first drink,
h) Social context of drinking and
i) Opinions on policy issues.
DEMOGRAPHIC CHARACTERISTICS OF THE SAMPLE POPULATION
Demographic characteristics of the sample population by gender aregiven in Table 1. Out of the enumerated respondents, there were 698(50.6%) males and 593 (49.4%) females, with a sex ratio of 1.02 males foreach female, indicating that there was no significant gender bias in thesample. The Census of Population conducted in 2001 (a partial census)indicates a sex ratio of 0.98.
With regard to the age structure, nearly one out of four respondentswere in the younger age group of 15-29 years, and three out of five were inthe age group of 30-59 years. The older respondents aged 60 and aboveconsisted of around 14%, with more old male persons among respondents.Mean ages of males and females were 42.6 years and 40 years, respectively.Both the ethnic and the religious composition of the GENACIS sample andthe Census of Population 2001 are similar, pointing to a high degree ofaccuracy and representativeness of the sample.
In Sri Lanka there is a high correlation between ethnicity and religionof the population. Almost all the Moors are Muslim or Islamic by religion.The Catholic community consists of converts from the Sinhalese andTamil ethnic groups, who are mostly Buddhists and Hindus, respectively.Sinhala Buddhists form the majority of the population, while the size ofthe Tamil-Hindu population and Muslim-Malay Islamic population isalmost equal.
ALCOHOL, GENDER AND DRINKING PROBLEMS
174
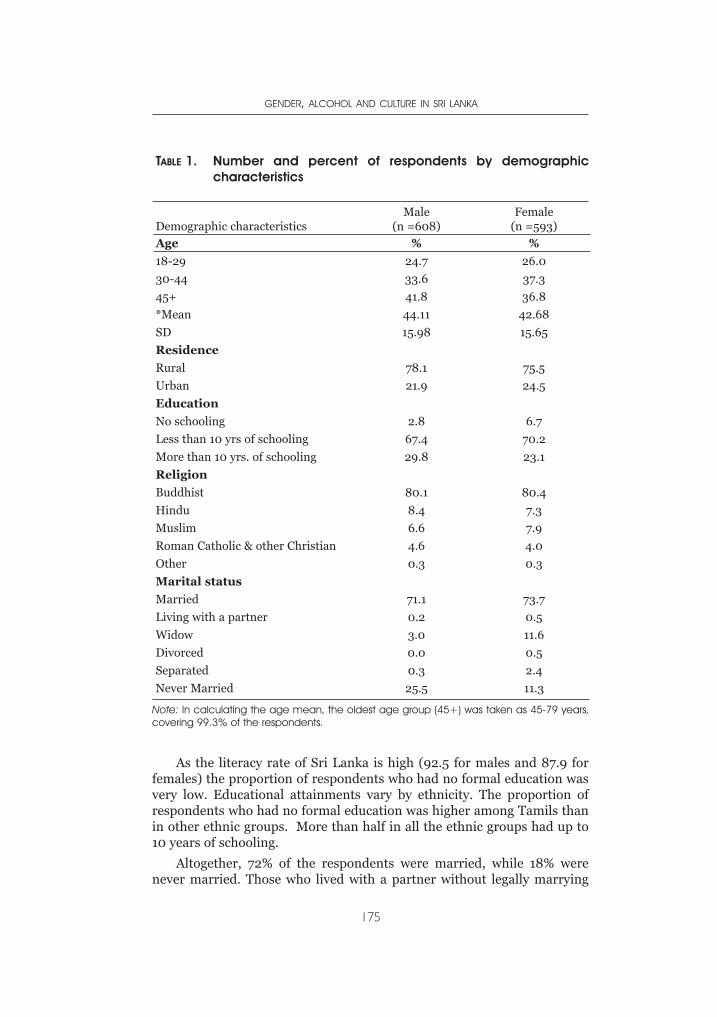
As the literacy rate of Sri Lanka is high (92.5 for males and 87.9 forfemales) the proportion of respondents who had no formal education wasvery low. Educational attainments vary by ethnicity. The proportion ofrespondents who had no formal education was higher among Tamils thanin other ethnic groups. More than half in all the ethnic groups had up to10 years of schooling.
Altogether, 72% of the respondents were married, while 18% werenever married. Those who lived with a partner without legally marrying
GENDER, ALCOHOL AND CULTURE IN SRI LANKA
175
TABLE 1. Number and percent of respondents by demographiccharacteristics
Demographic characteristicsMale
(n =608)Female
(n =593)
Age % %
18-29 24.7 26.0
30-44 33.6 37.3
45+ 41.8 36.8
*Mean 44.11 42.68
SD 15.98 15.65
Residence
Rural 78.1 75.5
Urban 21.9 24.5
Education
No schooling 2.8 6.7
Less than 10 yrs of schooling 67.4 70.2
More than 10 yrs. of schooling 29.8 23.1
Religion
Buddhist 80.1 80.4
Hindu 8.4 7.3
Muslim 6.6 7.9
Roman Catholic & other Christian 4.6 4.0
Other 0.3 0.3
Marital status
Married 71.1 73.7
Living with a partner 0.2 0.5
Widow 3.0 11.6
Divorced 0.0 0.5
Separated 0.3 2.4
Never Married 25.5 11.3
Note: In calculating the age mean, the oldest age group (45+) was taken as 45-79 years,covering 99.3% of the respondents.
were very few (0.3%). Divorced and separated respondents, 0.2% and 1.3%respectively, were also few, though the proportion of widowed respondents(7.2%) seemed to be high. In Sri Lanka living with a partner withoutgetting legally married or marrying several times are not culturally muchaccepted. At the same time, unlike in the West, in Sri Lanka, overtromantic relations among married couples are not given explicitexpression due to cultural norms prevailing among the majority of thepeople, particularly in rural areas.
A majority of the households consisted of husband and wife and theirchildren. Very often unmarried adult children live with their parents, andparents of the married couple also live in the same household, as it is asocial obligation and a responsibility of the children to support theirparents. Most adults in Sri Lanka do not enjoy old age pensions, as isusually the case in developed countries. Unemployed youth do not receiveany unemployment benefit from the state, forcing them to depend onfamilies for their sustenance. A little less than half of the households(48%) in the sample had an income less than Rs. 5,000 per month(approximately 50 US dollars) and are assumed to be poor. A similarproportion belong to the lower and upper middle class. At the same timeit may be said that nearly one out of four households were below thepoverty line, as their monthly income was below 3,000 rupees. Only 2.5%of the households belong to the upper class with a monthly income ofabove Rs. 25,000.
Two out of five (40%) respondents were engaged in household work.Respondents engaged in occupations with a higher income(Administrative, professional and large business) consist of around 2%,and around 11 % were engaged in middle level occupations (small business,technicians, clerical and teaching). Around 30% were in low income-generating occupations, such as labourers, farmers, salesmen etc. Thesocio-economic and demographic profile of the sample population givenabove points to the fact the sample selected for the survey represents thegeneral population in the country, except the people living in the North andEast. It can thus be assumed that the picture emerging from the presentsurvey corresponds to the conditions prevailing in the country.
DRINKING AND ABSTINENCE
Table 2 gives the drinking status of the respondents. It is clear that30% of the adults (aged above 15 years) are current users of alcoholicbeverages at the time of the survey, indicating that a majority (70%) arecurrent abstainers. The current abstainers include both those who had evertaken a drink, but are currently abstaining, and those who had never takenany alcoholic beverage in their lifetime. It is clear that nearly half of theadults in Sri Lanka had taken any alcoholic beverage, and of these morethan one-third had given up drinking at the time of the survey.
ALCOHOL, GENDER AND DRINKING PROBLEMS
176
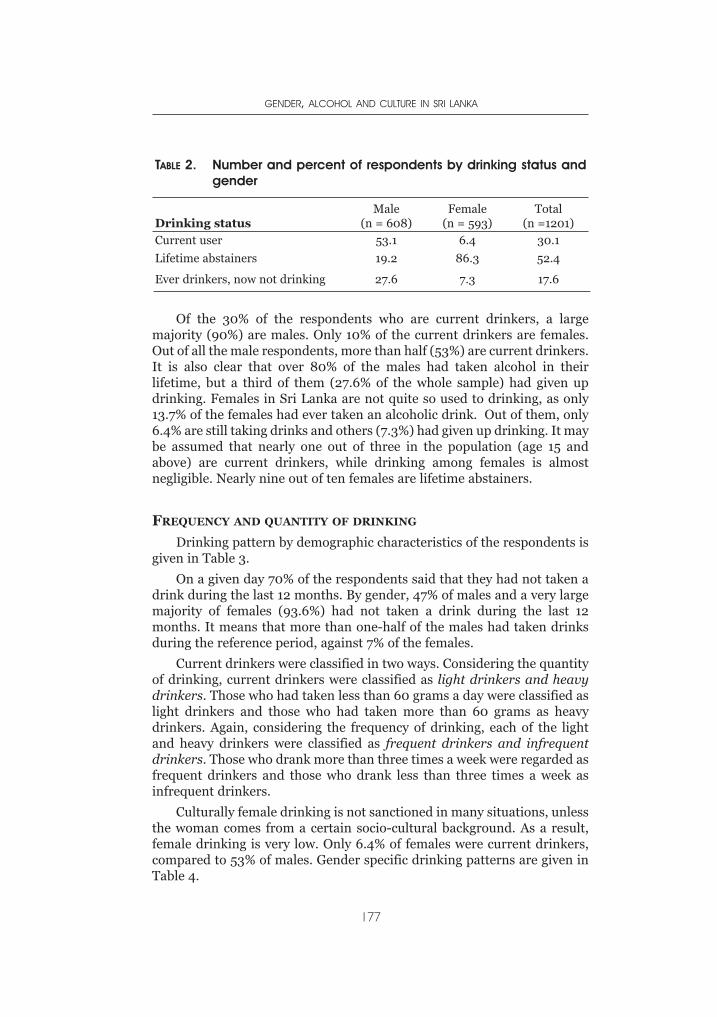
Of the 30% of the respondents who are current drinkers, a largemajority (90%) are males. Only 10% of the current drinkers are females.Out of all the male respondents, more than half (53%) are current drinkers.It is also clear that over 80% of the males had taken alcohol in theirlifetime, but a third of them (27.6% of the whole sample) had given updrinking. Females in Sri Lanka are not quite so used to drinking, as only13.7% of the females had ever taken an alcoholic drink. Out of them, only6.4% are still taking drinks and others (7.3%) had given up drinking. It maybe assumed that nearly one out of three in the population (age 15 andabove) are current drinkers, while drinking among females is almostnegligible. Nearly nine out of ten females are lifetime abstainers.
FREQUENCY AND QUANTITY OF DRINKING
Drinking pattern by demographic characteristics of the respondents isgiven in Table 3.
On a given day 70% of the respondents said that they had not taken adrink during the last 12 months. By gender, 47% of males and a very largemajority of females (93.6%) had not taken a drink during the last 12months. It means that more than one-half of the males had taken drinksduring the reference period, against 7% of the females.
Current drinkers were classified in two ways. Considering the quantityof drinking, current drinkers were classified as light drinkers and heavydrinkers. Those who had taken less than 60 grams a day were classified aslight drinkers and those who had taken more than 60 grams as heavydrinkers. Again, considering the frequency of drinking, each of the lightand heavy drinkers were classified as frequent drinkers and infrequentdrinkers. Those who drank more than three times a week were regarded asfrequent drinkers and those who drank less than three times a week asinfrequent drinkers.
Culturally female drinking is not sanctioned in many situations, unlessthe woman comes from a certain socio-cultural background. As a result,female drinking is very low. Only 6.4% of females were current drinkers,compared to 53% of males. Gender specific drinking patterns are given inTable 4.
GENDER, ALCOHOL AND CULTURE IN SRI LANKA
177
TABLE 2. Number and percent of respondents by drinking status andgender
Drinking statusMale
(n = 608)Female
(n = 593)Total
(n =1201)
Current user 53.1 6.4 30.1
Lifetime abstainers 19.2 86.3 52.4
Ever drinkers, now not drinking 27.6 7.3 17.6
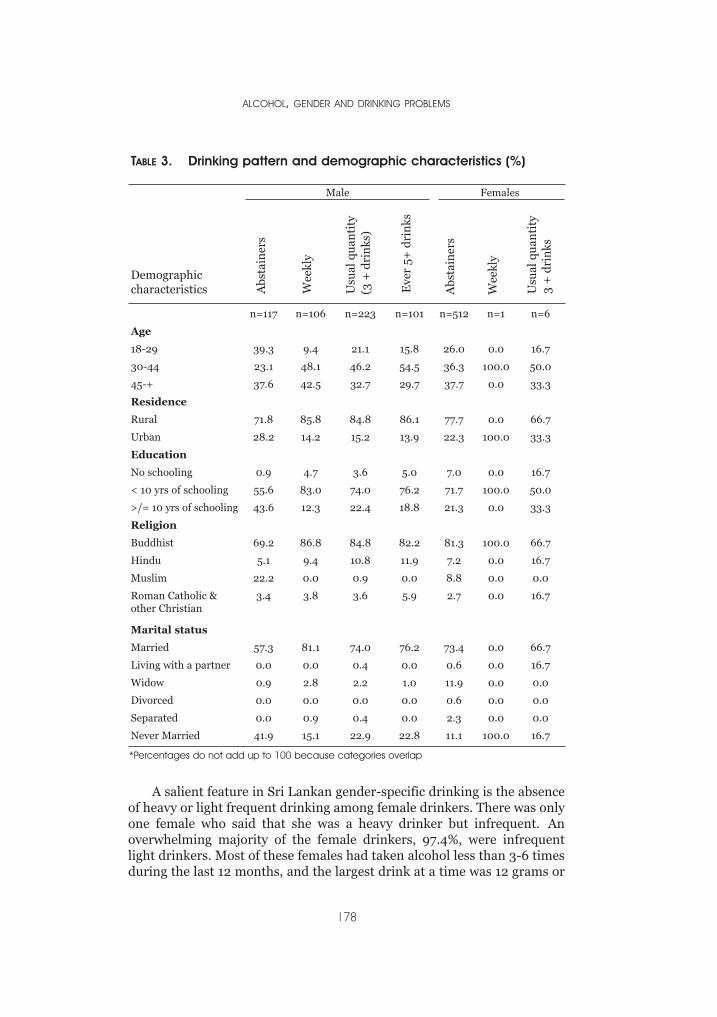
TABLE 3. Drinking pattern and demographic characteristics (%)
Male Females
Demographiccharacteristics
n=117 n=106 n=223 n=101 n=512 n=1 n=6
Age
18-29 39.3 9.4 21.1 15.8 26.0 0.0 16.7
30-44 23.1 48.1 46.2 54.5 36.3 100.0 50.0
45-+ 37.6 42.5 32.7 29.7 37.7 0.0 33.3
Residence
Rural 71.8 85.8 84.8 86.1 77.7 0.0 66.7
Urban 28.2 14.2 15.2 13.9 22.3 100.0 33.3
Education
No schooling 0.9 4.7 3.6 5.0 7.0 0.0 16.7
< 10 yrs of schooling 55.6 83.0 74.0 76.2 71.7 100.0 50.0
>/= 10 yrs of schooling 43.6 12.3 22.4 18.8 21.3 0.0 33.3
Religion
Buddhist 69.2 86.8 84.8 82.2 81.3 100.0 66.7
Hindu 5.1 9.4 10.8 11.9 7.2 0.0 16.7
Muslim 22.2 0.0 0.9 0.0 8.8 0.0 0.0
Roman Catholic &other Christian
3.4 3.8 3.6 5.9 2.7 0.0 16.7
Marital status
Married 57.3 81.1 74.0 76.2 73.4 0.0 66.7
Living with a partner 0.0 0.0 0.4 0.0 0.6 0.0 16.7
Widow 0.9 2.8 2.2 1.0 11.9 0.0 0.0
Divorced 0.0 0.0 0.0 0.0 0.6 0.0 0.0
Separated 0.0 0.9 0.4 0.0 2.3 0.0 0.0
Never Married 41.9 15.1 22.9 22.8 11.1 100.0 16.7
A salient feature in Sri Lankan gender-specific drinking is the absenceof heavy or light frequent drinking among female drinkers. There was onlyone female who said that she was a heavy drinker but infrequent. Anoverwhelming majority of the female drinkers, 97.4%, were infrequentlight drinkers. Most of these females had taken alcohol less than 3-6 timesduring the last 12 months, and the largest drink at a time was 12 grams or
ALCOHOL, GENDER AND DRINKING PROBLEMS
178
Abs
tain
ers
Wee
kly
Wee
kly
Usu
alqu
anti
ty
Usu
alqu
anti
ty
(3+
dri
nks
)
3+
dri
nks
Eve
r5+
dri
nks
Abs
tain
ers
*Percentages do not add up to 100 because categories overlap
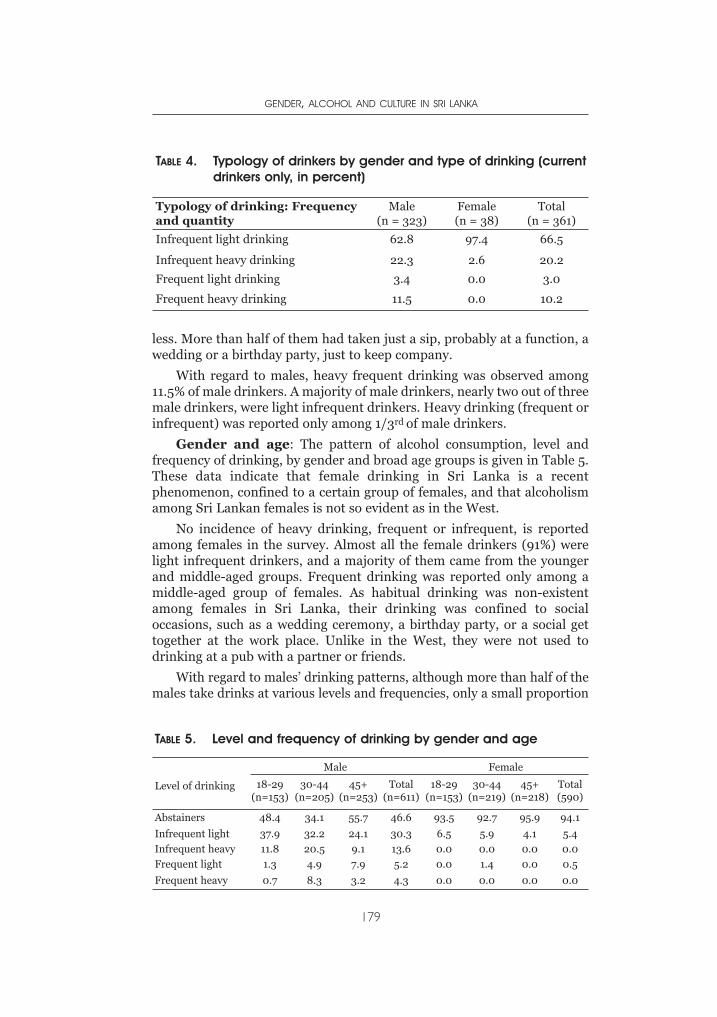
less. More than half of them had taken just a sip, probably at a function, awedding or a birthday party, just to keep company.
With regard to males, heavy frequent drinking was observed among11.5% of male drinkers. A majority of male drinkers, nearly two out of threemale drinkers, were light infrequent drinkers. Heavy drinking (frequent orinfrequent) was reported only among 1/3rd of male drinkers.
Gender and age: The pattern of alcohol consumption, level andfrequency of drinking, by gender and broad age groups is given in Table 5.These data indicate that female drinking in Sri Lanka is a recentphenomenon, confined to a certain group of females, and that alcoholismamong Sri Lankan females is not so evident as in the West.
No incidence of heavy drinking, frequent or infrequent, is reportedamong females in the survey. Almost all the female drinkers (91%) werelight infrequent drinkers, and a majority of them came from the youngerand middle-aged groups. Frequent drinking was reported only among amiddle-aged group of females. As habitual drinking was non-existentamong females in Sri Lanka, their drinking was confined to socialoccasions, such as a wedding ceremony, a birthday party, or a social gettogether at the work place. Unlike in the West, they were not used todrinking at a pub with a partner or friends.
With regard to males’ drinking patterns, although more than half of themales take drinks at various levels and frequencies, only a small proportion
GENDER, ALCOHOL AND CULTURE IN SRI LANKA
179
TABLE 4. Typology of drinkers by gender and type of drinking (currentdrinkers only, in percent)
Typology of drinking: Frequencyand quantity
Male(n = 323)
Female(n = 38)
Total(n = 361)
Infrequent light drinking 62.8 97.4 66.5
Infrequent heavy drinking 22.3 2.6 20.2
Frequent light drinking 3.4 0.0 3.0
Frequent heavy drinking 11.5 0.0 10.2
TABLE 5. Level and frequency of drinking by gender and age
Level of drinking
Male Female
18-29(n=153)
30-44(n=205)
45+(n=253)
Total(n=611)
18-29(n=153)
30-44(n=219)
45+(n=218)
Total(590)
Abstainers 48.4 34.1 55.7 46.6 93.5 92.7 95.9 94.1
Infrequent light 37.9 32.2 24.1 30.3 6.5 5.9 4.1 5.4
Infrequent heavy 11.8 20.5 9.1 13.6 0.0 0.0 0.0 0.0
Frequent light 1.3 4.9 7.9 5.2 0.0 1.4 0.0 0.5
Frequent heavy 0.7 8.3 3.2 4.3 0.0 0.0 0.0 0.0
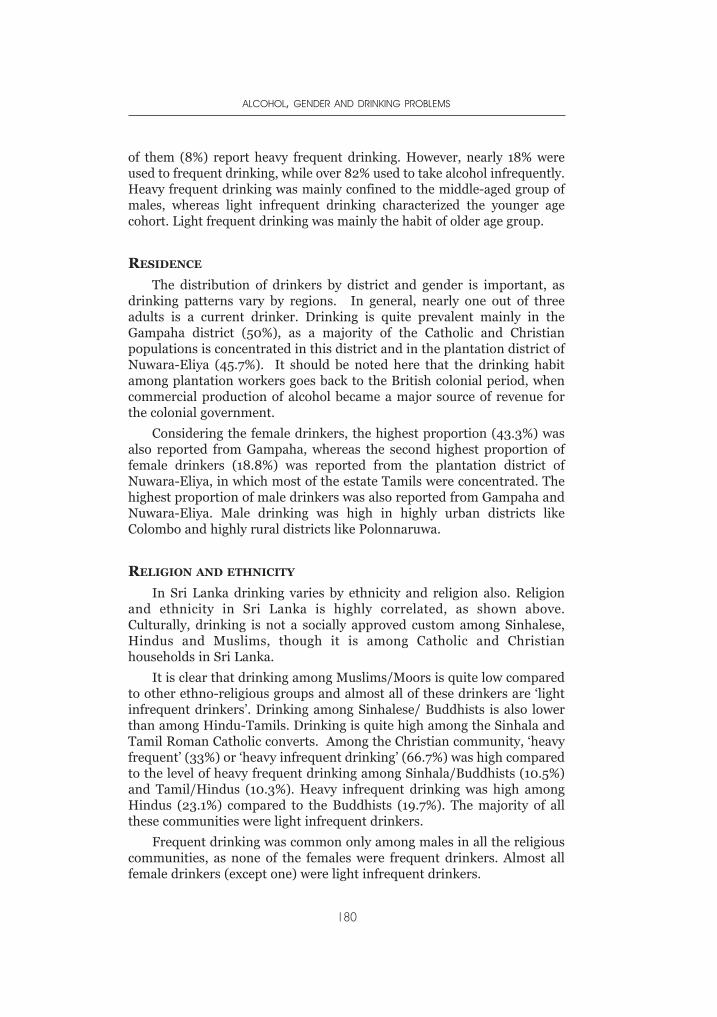
of them (8%) report heavy frequent drinking. However, nearly 18% wereused to frequent drinking, while over 82% used to take alcohol infrequently.Heavy frequent drinking was mainly confined to the middle-aged group ofmales, whereas light infrequent drinking characterized the younger agecohort. Light frequent drinking was mainly the habit of older age group.
RESIDENCE
The distribution of drinkers by district and gender is important, asdrinking patterns vary by regions. In general, nearly one out of threeadults is a current drinker. Drinking is quite prevalent mainly in theGampaha district (50%), as a majority of the Catholic and Christianpopulations is concentrated in this district and in the plantation district ofNuwara-Eliya (45.7%). It should be noted here that the drinking habitamong plantation workers goes back to the British colonial period, whencommercial production of alcohol became a major source of revenue forthe colonial government.
Considering the female drinkers, the highest proportion (43.3%) wasalso reported from Gampaha, whereas the second highest proportion offemale drinkers (18.8%) was reported from the plantation district ofNuwara-Eliya, in which most of the estate Tamils were concentrated. Thehighest proportion of male drinkers was also reported from Gampaha andNuwara-Eliya. Male drinking was high in highly urban districts likeColombo and highly rural districts like Polonnaruwa.
RELIGION AND ETHNICITY
In Sri Lanka drinking varies by ethnicity and religion also. Religionand ethnicity in Sri Lanka is highly correlated, as shown above.Culturally, drinking is not a socially approved custom among Sinhalese,Hindus and Muslims, though it is among Catholic and Christianhouseholds in Sri Lanka.
It is clear that drinking among Muslims/Moors is quite low comparedto other ethno-religious groups and almost all of these drinkers are ‘lightinfrequent drinkers’. Drinking among Sinhalese/ Buddhists is also lowerthan among Hindu-Tamils. Drinking is quite high among the Sinhala andTamil Roman Catholic converts. Among the Christian community, ‘heavyfrequent’ (33%) or ‘heavy infrequent drinking’ (66.7%) was high comparedto the level of heavy frequent drinking among Sinhala/Buddhists (10.5%)and Tamil/Hindus (10.3%). Heavy infrequent drinking was high amongHindus (23.1%) compared to the Buddhists (19.7%). The majority of allthese communities were light infrequent drinkers.
Frequent drinking was common only among males in all the religiouscommunities, as none of the females were frequent drinkers. Almost allfemale drinkers (except one) were light infrequent drinkers.
ALCOHOL, GENDER AND DRINKING PROBLEMS
180
By occupation heavy-frequent drinking among males was mainlyfound among farmers (39%), unskilled labourers (28%) and skilledlabourers (19%). It means that many more poor manual workers tend tobe alcoholics than those in other occupations. Drinking among females(light-infrequent) was mainly confined to household workers (67%),clerical (office) workers (15%) and labourers (12%). More of the night timeand shift workers were exposed to drinking than others.
At the same time, drinking among males as well as females was positivelyassociated with income. More than 60% of the males whose householdincome was higher than Rs. 25,000 took alcohol, while it gradually droppedto below 44% at the lowest income level. Drinking among females droppedfrom 27% in the high-income group to 2.3% in the low-income group. Inother words, drinking is more common among upper class women.
It is clear that manual workers and middle level office workers, as wellas those in the higher income groups, are more exposed to drinking thanothers. According to these data, drinking is not much associated withunemployment, as the unemployed probably could not afford it. In SriLanka, the unemployed do not have access to unemployment insurance asin the case in most of the developed countries.
Some think that drinking is associated with loneliness. However, it isnot so strong in the case of Sri Lankan drinkers. Nearly 70% of theinfrequent drinkers never or seldom felt lonely, though it dropped to 57%with regard to heavy frequent drinkers. It may be assumed that heavydrinking was somewhat associated with loneliness, though it is not sostrong, in the case of Sri Lanka.
Low alcohol drinks like beer are popular among female drinkers, whilea few, probably at higher income levels, had taken wine and whisky atparties. However, a few females had taken hard liquor like arrack and illicitliquor, probably at lower levels of society. Arrack was the most popularliquor, beer being the second preference, among males. In villages, wherelicit liquor was not easily available, illicit liquor with high alcohol contentwas also popular among males.
AGE AT FIRST DRINK
Age at first drink often influences the drinker to be a heavy drinker ornot. There was only one female who had her first drink at the age of 1 year.Though a majority of the female drinkers (69%) had their first drink duringtheir prime age of 20-34 years, a considerable proportion of females (18%)had their first drink at the age of 15-19 years, that is, during their school days.
Contrary to the female drinking pattern, a majority of the males (63%)got used to drinking during their teenage and prime youth, 10-24 years. Itwas revealed that heavy frequent drinkers had started to drink when theywere teenagers.
GENDER, ALCOHOL AND CULTURE IN SRI LANKA
181
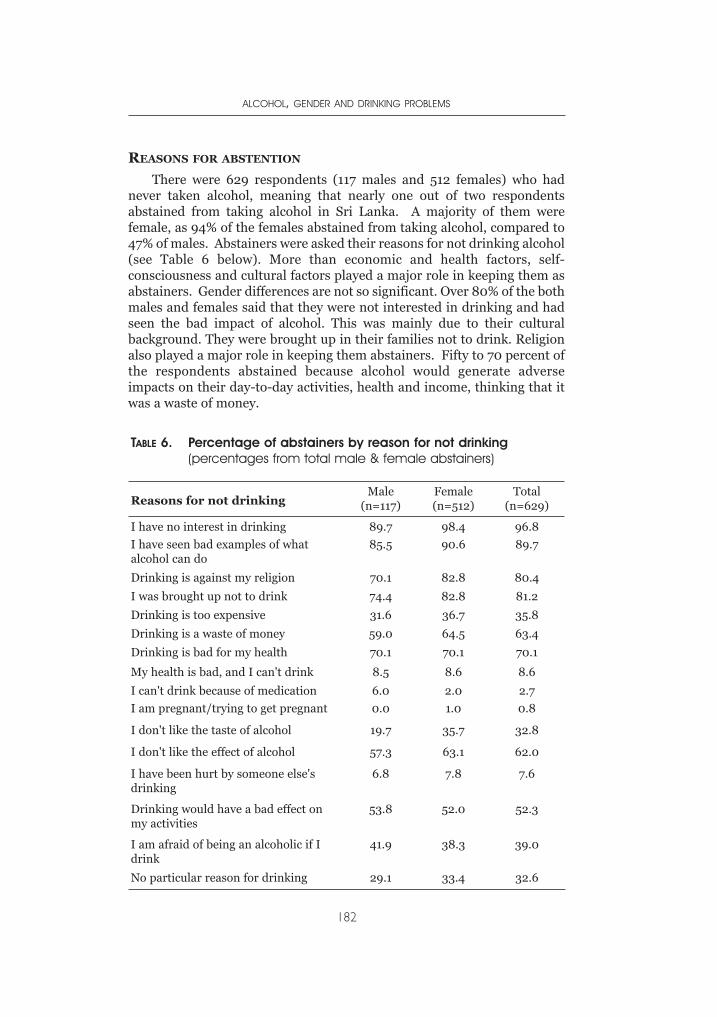
REASONS FOR ABSTENTION
There were 629 respondents (117 males and 512 females) who hadnever taken alcohol, meaning that nearly one out of two respondentsabstained from taking alcohol in Sri Lanka. A majority of them werefemale, as 94% of the females abstained from taking alcohol, compared to47% of males. Abstainers were asked their reasons for not drinking alcohol(see Table 6 below). More than economic and health factors, self-consciousness and cultural factors played a major role in keeping them asabstainers. Gender differences are not so significant. Over 80% of the bothmales and females said that they were not interested in drinking and hadseen the bad impact of alcohol. This was mainly due to their culturalbackground. They were brought up in their families not to drink. Religionalso played a major role in keeping them abstainers. Fifty to 70 percent ofthe respondents abstained because alcohol would generate adverseimpacts on their day-to-day activities, health and income, thinking that itwas a waste of money.
ALCOHOL, GENDER AND DRINKING PROBLEMS
182
TABLE 6. Percentage of abstainers by reason for not drinking(percentages from total male & female abstainers)
Reasons for not drinkingMale
(n=117)Female(n=512)
Total(n=629)
I have no interest in drinking 89.7 98.4 96.8
I have seen bad examples of whatalcohol can do
85.5 90.6 89.7
Drinking is against my religion 70.1 82.8 80.4
I was brought up not to drink 74.4 82.8 81.2
Drinking is too expensive 31.6 36.7 35.8
Drinking is a waste of money 59.0 64.5 63.4
Drinking is bad for my health 70.1 70.1 70.1
My health is bad, and I can't drink 8.5 8.6 8.6
I can't drink because of medication 6.0 2.0 2.7
I am pregnant/trying to get pregnant 0.0 1.0 0.8
I don't like the taste of alcohol 19.7 35.7 32.8
I don't like the effect of alcohol 57.3 63.1 62.0
I have been hurt by someone else'sdrinking
6.8 7.8 7.6
Drinking would have a bad effect onmy activities
53.8 52.0 52.3
I am afraid of being an alcoholic if Idrink
41.9 38.3 39.0
No particular reason for drinking 29.1 33.4 32.6
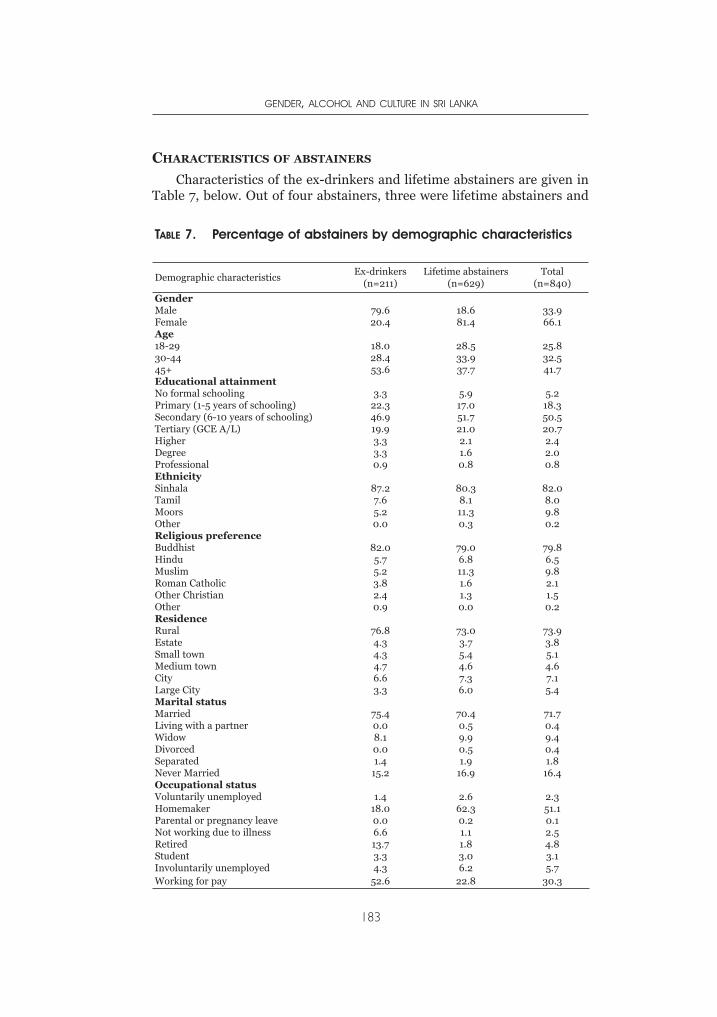
CHARACTERISTICS OF ABSTAINERS
Characteristics of the ex-drinkers and lifetime abstainers are given inTable 7, below. Out of four abstainers, three were lifetime abstainers and
GENDER, ALCOHOL AND CULTURE IN SRI LANKA
183
TABLE 7. Percentage of abstainers by demographic characteristics
Demographic characteristicsEx-drinkers
(n=211)Lifetime abstainers
(n=629)Total
(n=840)
GenderMale 79.6 18.6 33.9Female 20.4 81.4 66.1Age18-29 18.0 28.5 25.830-44 28.4 33.9 32.545+ 53.6 37.7 41.7Educational attainmentNo formal schooling 3.3 5.9 5.2Primary (1-5 years of schooling) 22.3 17.0 18.3Secondary (6-10 years of schooling) 46.9 51.7 50.5Tertiary (GCE A/L) 19.9 21.0 20.7Higher 3.3 2.1 2.4Degree 3.3 1.6 2.0Professional 0.9 0.8 0.8EthnicitySinhala 87.2 80.3 82.0Tamil 7.6 8.1 8.0Moors 5.2 11.3 9.8Other 0.0 0.3 0.2Religious preferenceBuddhist 82.0 79.0 79.8Hindu 5.7 6.8 6.5Muslim 5.2 11.3 9.8Roman Catholic 3.8 1.6 2.1Other Christian 2.4 1.3 1.5Other 0.9 0.0 0.2ResidenceRural 76.8 73.0 73.9Estate 4.3 3.7 3.8Small town 4.3 5.4 5.1Medium town 4.7 4.6 4.6City 6.6 7.3 7.1Large City 3.3 6.0 5.4Marital statusMarried 75.4 70.4 71.7Living with a partner 0.0 0.5 0.4Widow 8.1 9.9 9.4Divorced 0.0 0.5 0.4Separated 1.4 1.9 1.8Never Married 15.2 16.9 16.4Occupational statusVoluntarily unemployed 1.4 2.6 2.3Homemaker 18.0 62.3 51.1Parental or pregnancy leave 0.0 0.2 0.1Not working due to illness 6.6 1.1 2.5Retired 13.7 1.8 4.8Student 3.3 3.0 3.1Involuntarily unemployed 4.3 6.2 5.7Working for pay 52.6 22.8 30.3
one was an ex-drinker. A majority of females were abstainers and a largeproportion of these abstainers, four out of five, were lifetime abstainers,while out of male abstainers, a majority, four out of five, were ex-drinkers.Though lifetime abstinence is not age-specific, a large proportion — morethan half — of the ex-drinkers were above age 45 years. In Sri Lankaparents think that they must refrain from drinking as their children growup. As the parents advanced in age and experience more familyresponsibility they tended to give up drinking. On the other hand, only alittle less than half of the lifetime abstainers as well as ex-drinkers had asecondary educational achievement, which indicates that a majority of theabstainers were not highly educated, as expected.
Ethnicity and religious affiliations show that majority of the abstainerswere Sinhalese and Buddhists, and most of them were living in the ruralsector. Over 70% of the abstainers were married. With regard tooccupational status, out of lifetime abstainers, over 62% of werehomemakers and another 23% were working for pay. On the other hand,as a majority of ex-drinkers were males, more than half of them wereworking for pay and around 14% were retired, dropping the proportion ofhomemakers to a lower level.
SOCIAL CONTEXT OF DRINKING
Respondents in the present study were asked about the freedom fordrinking at a given occasion and cultural recognition of drinking in certaincontexts. Culturally, taking alcohol in public is not much appreciated.Female drinking even at a party is not recognized as a custom. However,with the ongoing westernization drinking at a party is becoming a commonoccurrence, as long as it is not a habit. In Sri Lanka parties are not socommon. Most of the parties that a common man has to attend once ortwice a month are wedding ceremonies, where liquor is served very often.A wife who is against her husband’s drinking very often tolerates thehusband enjoying a couple of drinks at a party. However, males as well asfemales did not approve of getting drunk. Almost all specified ‘no drinking’for a parent spending time with small children, for a wife having dinner outwith husband, for a women out at a bar with friends, for a couple of co-workers out for lunch, with friends after work before going home and whengoing to drive a vehicle. Drinking was somewhat tolerated for a man, notfor a woman, out at a bar with friends, for a husband having dinner outwith his wife and with friends at home.
RESPONDENT’S OPINION ON POLICY ISSUES
Respondents in the present study were asked about their opinion onalcohol advertising and the alcohol industry as a source of governmentincome. An overwhelming majority, nine out of ten respondents, was of theopinion that alcohol advertising should not be allowed at all. They were of
ALCOHOL, GENDER AND DRINKING PROBLEMS
184
the opinion (over 95%) that the government should take policy decisionson reducing alcohol production, sale and drinking. Only one out of fiveapproved of the government promoting alcohol as a source of revenue tothe state. A strong majority (93%) of the females, who were concernedabout the well being of the family, and 76% of the males pointed out thatdrinking affects peace in the family. More than half of the respondents,58%, said that it would affect the family income and also create healthproblems. More males than females were of the opinion that alcoholincreases violence and rate of crimes in the country.
CONCLUSION
Commercial production of alcohol in Sri Lanka goes back to thecolonial period, commencing in the early 16th century. However, afterindependence in 1948, the alcohol economy was controlled by the state,which controlled production and sale through a state monopoly. Thissituation changed in the early 1990’s when the state monopoly wasprivatized. Since then production and sale became highly commercialized,leading to increased production and consumption.
In 1995, beer was promoted by reducing the price and making itavailable at almost all restaurants, supermarkets, sport meets and clubs,with the intention of reducing the use of hard liquor. However, thisobjective could not be achieved, as hard liquor consumers did not turn tobeer. Instead, more and more new customers were added with theliberalization policy. In Sri Lanka, recent trends indicate that alcoholconsumption has a positive association with the rate of crimes, violence,road accidents, alcohol related morbidity and intra-family violence,including child abuse.
At the same time alcohol consumption and abstinence in Sri Lankaare highly related to cultural background, the type of work engaged in,and the gender and social status of an individual. More frequent drinkingwas reported among the Christian community than among Hindus,Buddhists and Muslims. Although drinking among Muslims wasreported to be low, it seems to be under-reported, as they were not readyto concede in public that they take alcohol. Drinking was high amongTamils in the estates and among Sinhalese in urban and highly ruraldistricts. In all the sectors, except among estate Tamil and Christiancommunities, drinking among females was almost negligible, due tocultural reasons.
On the other hand, Sri Lanka is undergoing rapid change in allspheres of life, largely owing to the open economic policy introduced in1977. Most of the females, who were confined to household work,cottage industries and village farms prior to 1970s, are now eager tomigrate to urban areas and adapt to factory life or migrate to the MiddleEast as domestic servants, relinquishing family life. Consequently,
GENDER, ALCOHOL AND CULTURE IN SRI LANKA
185
cultural barriers are breaking down. This process is accelerated by theelectronic media that have penetrated even the remote parts of thecountry.
In the sample there was no gender bias, as both males and femaleswere equally represented. The mean ages of the males and females were42.6 and 40 years, respectively. The literacy rate of the plantation workers,mainly Tamil, was generally low compared that of others. Maritaldisruptions in the sample were quite low as in the general population,though widowhood was somewhat high. A majority of the respondentswere engaged in household work and low income generating occupations.In general the sample represents a cross section of the total population ofthe country.
Culturally, drinking in Sri Lanka is mainly confined to males and as aresult drinking among females in the sample is almost negligible. Whilemore than half of the males were current drinkers, only 6% of the femaleswere reported as current drinkers. None of the females were heavydrinkers or frequent drinkers. Nearly one out of three males in the countryis a current drinker. More than half of the respondents were lifetimeabstainers, with wide variation by gender. One out of five males, comparedto four out of five females, was an abstainer. Heavy frequent drinking wasnot widespread in Sri Lanka, as around one out of ten males was found inthis category. The majority were light infrequent drinkers.
Drinking in Sri Lanka is gender, ethno-religious and sector specific.Frequent drinking could be found in the plantation and urban sectors,whereas drinking among Moors/Muslims was very low. At the same timedrinking was mainly confined to adults, as liquor sale to children is strictlyprohibited. Illicit liquor was popular in the low income groups. Themajority of the drinkers had their first drink at the age of 20-34 years, andit was found that those who got used to drinking at very early age of lifecontinued to be heavy drinkers. The abstainers had given many reasons fornot drinking. With regard to opinion on policy issues a very largeproportion of the respondents were against promoting liquor throughvarious types of advertising. Most respondents did not favour the stateusing alcohol as a major source of revenue.
In conclusion, it is important to note that this study had its share oflimitations. For instance, though 1200 households were selected, thesample size was not large enough to fully cover pockets of the populationwhich are exposed to much greater drinking than in the generalpopulation. Also, questionnaire surveys like this one cannot collect in-depth data, as the interviewer has limited time to probe into complexissues. It was revealed that some respondents who had been drinking at thetime of the interview denied that they take alcohol, due to culturalconstraints. (Drinking is not accepted in certain socio-cultural contexts).Some respondents were reluctant to answer a few of the culturally sensitivequestions regarding personal life.
ALCOHOL, GENDER AND DRINKING PROBLEMS
186
ACKNOWLEDGMENTS
We acknowledge the support and advice received from numerousindividuals and organizations in conducting the research on which thepresent chapter is based. The constant encouragement and support wereceived from Isidore Obot went a long way in facilitating our work. We areextremely grateful to Robin Room for his insightful comments andvaluable suggestions on an earlier version of the present chapter. We alsonote our appreciation of the guidance we received from Sharon Wilsnack,Richard Wilsnack and Arlinda Kristjanson of the University of NorthDakota GENACIS research team . Our thanks also go to our researchassistants, who did a wonderful job in collecting the necessary householddata from different parts of the country.
REFERENCES
ADIC (1994). Survey on impact of alcohol use on family well being: a study ofurban shanty dwellers, Colombo District. Colombo, Sri Lanka: Alcohol andDrug Information Center.
ADIC (1995a). Survey of substance use among a selected sample of household inan estate community. Colombo, Sri Lanka: Alcohol and Drug InformationCenter.
ADIC (1995b). Community Survey on Substance Abuse in Seven Districts, SriLanka. Colombo: Alcohol and Drug Information Center.
ADIC (1995c). Substance use among school children in six districts. Colombo, SriLanka: Alcohol and Drug Information Center.
ADIC (1996). Opinion of youth regarding alcohol and tobacco advertising.Colombo, Sri Lanka: Alcohol and Drug Information Center.
Central Bank of Ceylon (2002). Annual Report. Colombo: Central Bank of SriLanka.
Dept. of Excise (1989, 1990, 1991, 1992, 1993, 1994, 1995). Annual Reports.Colombo, Sri Lanka: Department of Excise.
Grant, Marcus (1989). Foreword. In T. Kortteinen (ed.), State monopolies andalcohol prevention. Helsinki: The Social Research Institute of Alcohol Studies,Report 181.
Gunasekara, Olcott and M.R.C. Perera (1997). Survey on assessing the impact ofdrug use on programmes for alleviating poverty. Colombo: Sober.
Gunasekara, Olcott (1997). Alcohol and tobacco in Sri Lanka. Colombo: Sober.Hettige, S. T. (1988). Alcohol related problems in Sri Lanka. In A. Erickson (ed),
Alcohol and Drugs. Colombo: Alcohol and Drug Information Center in SriLanka (pp. 76-107).
Hettige, S. T. (1989). State monopolies and alcohol prevention - Sri Lanka. In T.Kortteinen (ed.), State monopolies and alcohol prevention. Helsinki: SocialResearch Institute of Alcohol Studies (pp. 559-579).
Hettige, S. T. (1990). Social research on alcohol in Sri Lanka: background issuesand prospects. In J. Maula. et al. (eds.), Alcohol in developing countries (NADPublication No. 18). Helsinki: Nordic Council for Drug Research (pp. 194-206).
Ministry of Health (1995, 2002). Annual Health Bulletin. Colombo: Department ofHealth Services.
GENDER, ALCOHOL AND CULTURE IN SRI LANKA
187
National Dangerous Drug Control Board (1993). Hand Book of Drug AbuseInformation. Colombo: National Dangerous Drug Control Board
Police Department (various years). Administration Reports. Colombo: PoliceDepartment.
Prisons Department (1995). Prison Statistics. Colombo: Prisons Department.Ray, H.C. (ed., 1959). History of Ceylon. Colombo: University Press, University of
Sri Lanka.Registrar General’s Office (various years). Vital Statistics Reports and unpublished
data. Colombo: Department of Registrar GeneralSarkar, N.K. (1957). The demography of Ceylon. Colombo: University of Ceylon,
Government Press.Sri Lanka Customs (various years up to 1996). Annual Reports. Colombo:
Department of Customs.
ALCOHOL, GENDER AND DRINKING PROBLEMS
188
INTRODUCTION
INTRODUCTION
The republic of Uganda has a population of 23.8 million according tothe 2002 census. It borders on Kenya to the east, Sudan to the north,Democratic Republic of Congo to the west, Tanzania to the south,
and Rwanda to the extreme south west. Women constitute 51% of thepopulation. The majority (85%) of the population is rural. As of 1991, halfof the population was less than 17.2 years of age (Statistics Dept & MOFEP,1995). The economy of the country is agricultural, with over 90% of thepopulation dependent on subsistence farming and light agro-basedindustries.
Alcohol use, though not properly documented, is a widely acceptedsocial activity. It is estimated that 5-10 % of the population is dependenton alcohol, and regular users experience alcohol related problems like illhealth, marital disturbance and loss of employment (Jacobs, Aeron-Thomas, & Astropn, 2000). Use and abuse of alcohol is further facilitatedby the fact that alcohol is quite often regarded as a social drink. It is usedat cultural functions such as death, birth, marriage and circumcisionceremonies. Alcoholic beverages are therefore widely consumed by allpeople male and female, young and old with the exception of certaingroups of people who are prohibited to drink due to religious and culturalreasons. Moslems and some reformed (born again) Christians are notallowed to drink alcohol, while women and children are culturally notallowed to drink in public.
Uganda lacks a clear alcohol policy. The commercial sale oftraditionally produced spirits is regulated by the Liquor Licensing act of1964 that forbids the sale and consumption of crude Waragi (local spirit).Such a law is outdated, weak and — worse still — not enforced. There is nolaw to regulate alcohol producers to prevent unfair advertising practices.Most advertising revenue in both print and electronic media and supportto sports comes from the breweries. Consumption of factory beer is mainlyurban, and brand switching at the individual level is limited by factors that
CHAPTER 9GENDER AND THE MAJOR CONSEQUENCES
OF ALCOHOL CONSUMPTION IN UGANDA
NAZARIUS MBONA TUMWESIGYE & ROGERS KASIRYE
include price, alcohol content, companion preferences, kind ofentertainment, income level and advertising. The price of manufacturedbeer ranges from the equivalent of half a dollar for a large bottle upwards.There is low perception of risk of alcohol consumption (Willis, 2002). As aresult of weak or non-existent policies on alcohol production, sale,marketing and consumption, the availability of alcohol, together withvarious social cultural and environmental factors, has created a situation ofincreased harmful and hazardous consumption of alcohol. Alcohol isknown to be the most common substance of addiction used in thepopulation. It is estimated that alcohol causes suffering to at least 70% ofthe population either directly or indirectly (Kigozi & Kasirye, 1997)
PRODUCTION OF ALCOHOL
The country is richly supplied with alcoholic beverages. There aremany types of factory and locally brewed beer. Between 11 and 13 millioncrates of beer on average are produced in factories annually, contributingalmost 10% of state revenue. There are also large amounts of informallyproduced alcoholic beverages which are unrecorded. It is these alcoholicbeverages that are consumed by the majority of the population. Brewingand distilling of alcohol is also an accepted economic activity in the generalpopulation. In a study carried out in districts of Kabarole, Tororo and Gulu,it was found that drinking is central to the economy and social life of thefamily and community (Topouzis, 1994)
Many households in the country are involved in informal alcoholproduction at home, from which they get a substantial cash income. Themoney raised is used to pay school fees and for day-to-day home expenses.Although both men and women are engaged in production of differentalcoholic drinks, the types made from grains are almost always made bywomen (Willis, 2002). There have not been major changes in the roles ofmen and women in making alcohol beverages over the years. However,there has been a change in drinking patterns, with more women drinkingalcohol (Mulimbura, 1977). Consumption by women is affected byexposure through their involvement in the sale of alcohol. In somesituations women use children to sell the home-brewed alcohol, and as aresult these children begin drinking as early as 8 years (Mulimbura, 1977).Women’s participation in alcohol production is due to poverty and lack ofalternative income-generating activities.
CONSUMPTION
The Uganda Demographic and Health Survey (UDHS) found that onein four women and almost one in two men consumed alcohol at least oncein the previous 30 days (UBOS & ORC Macro, 2001). Among those whodrank, one in four women and one in two men got drunk at least once inthat period. The increasing involvement of children in local alcohol
ALCOHOL, GENDER AND DRINKING PROBLEMS
190
production and sale is likely to raise their level of alcohol consumption. Ingeneral, children are still restricted in the amount of alcohol they can takeand when to take it but this is difficult to monitor.
Research findings have attributed high alcohol consumption topolitical instability, poverty, unemployment and culture. Uganda’sprotracted war and political turmoil made people demoralized, loseinterest in the future and resort to excessive drinking (Topouzis, 1994).Based on the findings, the current level of alcohol consumption should behigh in the northern part of the country, where there is insecurity causedby a running rebellion and more poverty compared to the rest of thecountry.
Some researchers have suggested that poverty and related hardshipmight cause or increase the level of alcohol consumption while otherssuggest that the reverse is true. According to the 1999 Uganda participatorypoverty assessment project (UPPAP), excessive drinking was among 5major causes of poverty in the country (Lwanga-Ntale & Kimberly, 2003).In a study carried out in 1997, it was found that low economic productivityin the Kabale district was partly attributable to consumption of home-brewed alcohol (Puhalla, 2003).
Culture is also implicated in the high level of alcohol consumption inUganda. In some cultural groups, when a child is given a name, it is alsogiven alcohol to mark the occasion (Topouzis, 1994). Other occasions likecircumcision, funeral rites and weddings cannot be complete withoutdrinking alcohol. Inclusion of alcohol in the customs signifies theimportance of alcohol in people’s lives. Most times alcohol is takenfrequently and in excessive quantities because people see it as part of theirlife. Other people see it as a duty one has to fulfil. Men who don’t drink areoften not respected; drinking is identified with virility. This makes alcoholan integral part of the whole village culture and a catalyst in socialinteraction, but also a distraction depending on time spent, cost andconsequences of its consumption.
CONSEQUENCES
Research has shown that a history of alcohol consumption is associatedwith an increased chance of being infected with HIV. A study carried out inUganda found that people who drank alcohol were twice as likely to be HIV-positive as abstainers (Mbulaiteye, Ruberantwari, Nakiyingi et al., 2000).
In families, alcohol dependence has been found to be a major problemthat leads to broken homes (Mushanga, 1974). Alcohol consumptionseparates people, disrupts family unity and destroys marriage (NCC &GOU, 1994). Alcohol-dependent persons are more frequently divorced orseparated than others, and their wives or husbands and children haverelatively high rates of physical, emotional and psychosomatic illnesses(Mushanga, 1974).
GENDER AND THE MAJOR CONSEQUENCES OF ALCOHOL CONSUMPTION IN UGANDA
191
Disability and deaths caused by alcohol-related traffic accidents arestill unquantified in Uganda, and yet the country is rated fourth in thenumber of traffic accident deaths per 10,000 motor vehicles in Africa(Jacobs, Aeron-Thomas, & Astropn, 2000). The traffic law against drinkdriving was not adequately enforced by the police due to lack of equipmentto test alcohol content in blood or breath. Alcohol has been shown to be alikely contributing factor in accidents in previous research (Kobusingye,Guwatudde, & Lett, 2001).
There is a high level of domestic violence in rural areas, and it has beenlinked to alcohol consumption and perceived risk of HIV. In a study byresearchers from the Johns Hopkins Bloomberg School of Public Health,approximately one in three women living in rural Uganda reported beingphysically threatened or assaulted by their current partner. The findingsfrom the study suggest possible links between the risk of domestic violenceand alcohol consumption and women’s perceived risk of contracting HIVfrom their partners (Koenig, Lutalo, Feng et al., 2003).
There is still a lot that is unknown about the levels of alcoholconsumption and its associated problems and benefits in Uganda. Thelittle research that has been done on alcohol consumption lacks nationalrepresentativeness, is not detailed enough to cover all major issues onalcohol, and shows inconsistent results. In addition, the methods used areincapable of allowing precise estimates. For example the prevalence ofalcohol dependence of 5-10% (Jacobs et al. 2000) and the proportionsuffering (at least 70%) directly or indirectly as a result of alcoholconsumption (Kigozi & Kasirye, 1997) are not estimated precisely enough,and the differences between estimates are large.
THE GENACIS PROJECT IN UGANDA
In 2003, Uganda was one of the countries that participated in themultinational project on Gender, Alcohol and Culture: an InternationalStudy (GENACIS). The study aimed at obtaining information on genderdifferences in consumption and drinking patterns, alcohol problems,experience of domestic violence, and at making comparisons betweencountries in relation to society-level variables. The objectives of this paperare to describe the patterns of alcohol consumption, establish factorsassociated with alcohol consumption, and determine the relationshipbetween alcohol consumption and negative consequences measured.
METHOD
STUDY SETTING
The GENACIS study was designed as a cross-sectional quantitativestudy. It was carried out in the districts of Kabale, Wakiso, Tororo and Lirato represent the western, central, eastern and northern regions of Uganda,
ALCOHOL, GENDER AND DRINKING PROBLEMS
192
respectively. The respondents were men and women aged 18 years andabove who were residents of the villages and towns they were found in atsurvey time.
Within each region, the selected district represented districts mostlikely to have alcohol-related problems. In the north, Lira has internallydisplaced persons, while in the west, Kabale is among the districts leadingin alcohol-related crime. Illegal production and consumption of crude localspirits are at a high level in Kabale district. Most people in Lira, especiallyin the northern part of the district, moved towards the town due toinsecurity caused by a rebellion against the government. In the centralregion, Wakiso is among the most urbanised, with high consumption offactory-brewed beer, while in the east, Tororo, being at the busiest borderpoint, has had alcohol-related problems and drug abuse for many years.
RESEARCH INSTRUMENT
Few changes were made to a standard 30-page questionnaire from theWorld Health Organisation to reflect local context. The instrument wastranslated into local languages before being used for data collection.Education and urbanization levels were changed to suit the localclassifications. Names, terms and sizes for different brands of home andfactory-made alcohol were included, together with their alcohol content.All questions relating to forms of sexual orientation other thanheterosexual were deleted because of fear of negative reactions they wouldcause. A question on sexual partners in the previous 12 months waschanged to include sexual partners in the previous two years. Fivequestions on condom use were added in the intimate relations andsexuality section, primarily meant for those aged 18-24 years.
SAMPLING
The sex and age distribution of the total sample was nearly the same asin the national census. The Primary Sampling Units (PSUs) were sub-counties in the study districts and counties (all counties were visited).Secondary Sampling Units (SSUs) were parishes and Tertiary SamplingUnits (TSUs) were villages. Lists of counties, sub-counties and parisheswere obtained from the Uganda National Bureau of Statistics, while namesof villages were obtained from local leaders at the parish level. The under-coverage included people living in inaccessible places such as on steep hillsand in marshy lands, those in insecure areas and people who could notremember or be helped to remember their age. The government securitypersonnel advised the study team on which villages were safe and unsafe.
Within each selected district, a mix of sampling techniques was used.For a start, there was stratification by county, and then 50% of the sub-counties and 25% of the parishes were selected by simple random sampling
GENDER AND THE MAJOR CONSEQUENCES OF ALCOHOL CONSUMPTION IN UGANDA
193
technique. Within each parish, one village was randomly selected. In eachvillage, a random sample of 11 households was selected using systematicsampling. According to the technique, the data collectors moved to thecentre of the village and spun a pen to obtain a direction by random. Everyother household (one in two) in the selected direction was visited until thetotal was 11. In the event that the end of the village was reached beforegetting 11 households, the pen was spun again and a new direction taken.If two or more household members were more than 17 years old, a table ofrandom numbers or folded numbered pieces of paper was used to selectone by chance. The sample consisted of 1,479 respondents, with a responserate of 83.6%.
PROCEDURE
Prior to data collection, research assistants were selected through aninterview and rigorously trained on both theory and practical aspects ofdata collection. One of the issues covered was ensuring confidentiality andcreating a good environment in which the respondents would provideaccurate data. In situations where respondents were in the company ofother people, the advice was to seek permission to move with therespondent a few metres away from other people.
At the start of data collection, the research assistants were given a listof all types of drinks and the corresponding volumes that contained 12grams of ethanol, used as a standard measure of a drink. The volumes weredetermined after a government chemist had measured the alcohol contentof each beverage. Samples of the local drinks that were measured foralcoholic content were obtained from a Kampala city suburb. Nearly allalcoholic beverages made in rural homes are also made in urban centres tocater for low income earners who cannot afford factory made drinks. Thesurvey was carried out using face-to-face interviews.
ANALYSIS
All data were entered in EPINFO 2000 and exported to STATA V.8E.The dependent variables of interest were frequency of drinking, quantitydrunk and negative experiences thought to be associated with alcoholconsumption. The experiences were quarrelling, having more than onesexual partner in the previous 2 years, physical aggression and smoking.For further analysis, frequency of alcohol consumption and quantity ofalcohol were coded as binary outcome variables: having drunk alcohol atleast three times a week, and taking 12 or more drinks in a single day in theprevious 12 months. The explanatory variables were sex, age group,education level, income level, tribe, region, rural/urban residence, maritalstatus, number of households in the family, feeling lonely, membership ina society, occupation, religion and the persons with whom the respondentwas living.
ALCOHOL, GENDER AND DRINKING PROBLEMS
194
In the first stage of analysis, the sample was described by distributionof key background characteristics. Cross-tabulation of demographiccharacteristics with quantity drunk and frequency of alcohol consumptionwas made to describe the level and patterns of alcohol consumption. Theformat of the cross-tabulations and the selection of variables weredetermined by the GENACIS research collaboration to allow comparabilityacross countries.
The second stage of analysis involved determining the significance ofthe unadjusted effect of each independent variable on the outcomevariables. The variables, which had a p-value of less than 0.2 in a loglikelihood ratio test, were used to build a final multivariate model. Using abackward stepwise estimation method a final model was made withelimination criteria of 0.2. The models were tested for goodness of fit usingthe predictive power (proportion of rightly predicted), Lemeshow test, andspecificity and sensitivity tests.
RESULTS
BACKGROUND CHARACTERISTICS
The distribution of respondents by district was 29% for Kabale, 21% forLira, 25% for Tororo and 26% for Wakiso. Table 1 shows that the samplewas composed of 49% men and 51% women. The male-female ratio waslowest in Kabale (1:1.5) and highest in Lira (1:0.5). Nearly half (47%) of therespondents were in the age group 18-29. The majority of respondentswere from ethnic groups of Bakiga (27%), Baganda (20%), Langi (19%) andAdhola (19%).
Most respondents (86.8%) had received some kind of formaleducation, with 33.4% and 38.9% having attained primary and secondaryeducation, respectively. A large proportion of respondents belonged tothree major religions in the country. Nearly a half (48.1%) of theparticipants were Catholic, 33.3% were Protestant and 9.5% were Moslem.A half (50.5%) of the respondents lived in rural areas, 28.3% lived insuburbs and the rest in towns. Uganda is 85% rural, and the differencebetween this and the present sample results from a large number of peopledisplaced into towns in northern Uganda due to insecurity. Another reasonis the inclusion of the Wakiso district, which is among the most urbaniseddistricts in the country.
More than half of the respondents (59.1%) were married. Majoroccupations were peasant farming (25.6%) and unskilled labour (26.3%).The majority were occupied as unskilled workers (26.3%) and smallholderfarmers (25.6%). A fifth of the respondents earned the equivalent of lessthan US$ 225, while 40.8% earned between US$ 225 and US$ 900 a year.More than a half lived with their spouses (54%) or with their partners’under age children.
GENDER AND THE MAJOR CONSEQUENCES OF ALCOHOL CONSUMPTION IN UGANDA
195
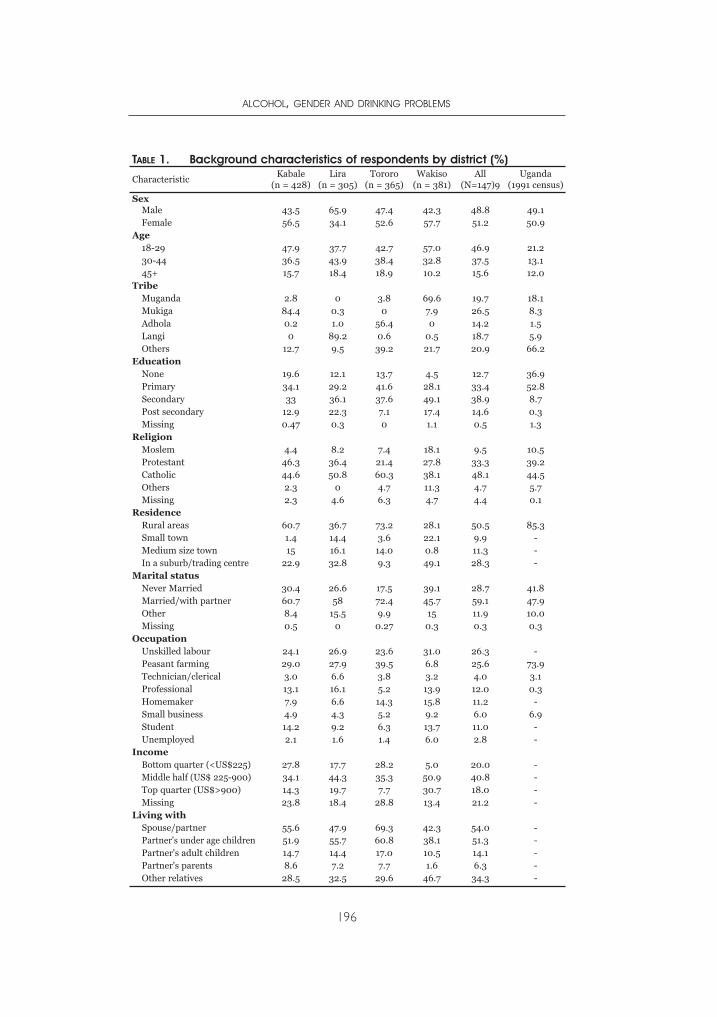
ALCOHOL, GENDER AND DRINKING PROBLEMS
196
TABLE 1. Background characteristics of respondents by district (%)
CharacteristicKabale
(n = 428)Lira
(n = 305)Tororo
(n = 365)Wakiso
(n = 381)All
(N=147)9Uganda
(1991 census)
SexMale 43.5 65.9 47.4 42.3 48.8 49.1Female 56.5 34.1 52.6 57.7 51.2 50.9
Age18-29 47.9 37.7 42.7 57.0 46.9 21.230-44 36.5 43.9 38.4 32.8 37.5 13.145+ 15.7 18.4 18.9 10.2 15.6 12.0
TribeMuganda 2.8 0 3.8 69.6 19.7 18.1Mukiga 84.4 0.3 0 7.9 26.5 8.3Adhola 0.2 1.0 56.4 0 14.2 1.5Langi 0 89.2 0.6 0.5 18.7 5.9Others 12.7 9.5 39.2 21.7 20.9 66.2
EducationNone 19.6 12.1 13.7 4.5 12.7 36.9Primary 34.1 29.2 41.6 28.1 33.4 52.8Secondary 33 36.1 37.6 49.1 38.9 8.7Post secondary 12.9 22.3 7.1 17.4 14.6 0.3Missing 0.47 0.3 0 1.1 0.5 1.3
ReligionMoslem 4.4 8.2 7.4 18.1 9.5 10.5Protestant 46.3 36.4 21.4 27.8 33.3 39.2Catholic 44.6 50.8 60.3 38.1 48.1 44.5Others 2.3 0 4.7 11.3 4.7 5.7Missing 2.3 4.6 6.3 4.7 4.4 0.1
ResidenceRural areas 60.7 36.7 73.2 28.1 50.5 85.3Small town 1.4 14.4 3.6 22.1 9.9 -Medium size town 15 16.1 14.0 0.8 11.3 -In a suburb/trading centre 22.9 32.8 9.3 49.1 28.3 -
Marital statusNever Married 30.4 26.6 17.5 39.1 28.7 41.8Married/with partner 60.7 58 72.4 45.7 59.1 47.9Other 8.4 15.5 9.9 15 11.9 10.0Missing 0.5 0 0.27 0.3 0.3 0.3
OccupationUnskilled labour 24.1 26.9 23.6 31.0 26.3 -Peasant farming 29.0 27.9 39.5 6.8 25.6 73.9Technician/clerical 3.0 6.6 3.8 3.2 4.0 3.1Professional 13.1 16.1 5.2 13.9 12.0 0.3Homemaker 7.9 6.6 14.3 15.8 11.2 -Small business 4.9 4.3 5.2 9.2 6.0 6.9Student 14.2 9.2 6.3 13.7 11.0 -Unemployed 2.1 1.6 1.4 6.0 2.8 -
IncomeBottom quarter (<US$225) 27.8 17.7 28.2 5.0 20.0 -Middle half (US$ 225-900) 34.1 44.3 35.3 50.9 40.8 -Top quarter (US$>900) 14.3 19.7 7.7 30.7 18.0 -Missing 23.8 18.4 28.8 13.4 21.2 -
Living withSpouse/partner 55.6 47.9 69.3 42.3 54.0 -Partner's under age children 51.9 55.7 60.8 38.1 51.3 -Partner's adult children 14.7 14.4 17.0 10.5 14.1 -Partner's parents 8.6 7.2 7.7 1.6 6.3 -Other relatives 28.5 32.5 29.6 46.7 34.3 -
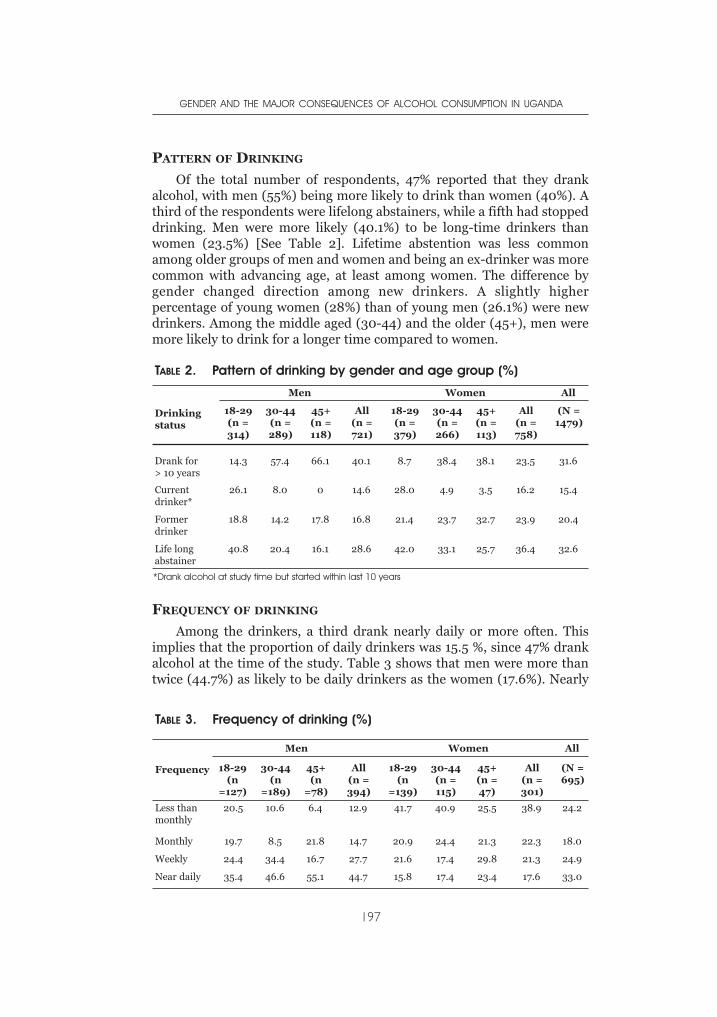
PATTERN OF DRINKING
Of the total number of respondents, 47% reported that they drankalcohol, with men (55%) being more likely to drink than women (40%). Athird of the respondents were lifelong abstainers, while a fifth had stoppeddrinking. Men were more likely (40.1%) to be long-time drinkers thanwomen (23.5%) [See Table 2]. Lifetime abstention was less commonamong older groups of men and women and being an ex-drinker was morecommon with advancing age, at least among women. The difference bygender changed direction among new drinkers. A slightly higherpercentage of young women (28%) than of young men (26.1%) were newdrinkers. Among the middle aged (30-44) and the older (45+), men weremore likely to drink for a longer time compared to women.
FREQUENCY OF DRINKING
Among the drinkers, a third drank nearly daily or more often. Thisimplies that the proportion of daily drinkers was 15.5 %, since 47% drankalcohol at the time of the study. Table 3 shows that men were more thantwice (44.7%) as likely to be daily drinkers as the women (17.6%). Nearly
GENDER AND THE MAJOR CONSEQUENCES OF ALCOHOL CONSUMPTION IN UGANDA
197
TABLE 2. Pattern of drinking by gender and age group (%)
Drinkingstatus
Men Women All
18-29(n =314)
30-44(n =289)
45+(n =118)
All(n =721)
18-29(n =379)
30-44(n =266)
45+(n =113)
All (n =758)
(N =1479)
Drank for > 10 years
14.3 57.4 66.1 40.1 8.7 38.4 38.1 23.5 31.6
Currentdrinker*
26.1 8.0 0 14.6 28.0 4.9 3.5 16.2 15.4
Formerdrinker
18.8 14.2 17.8 16.8 21.4 23.7 32.7 23.9 20.4
Life longabstainer
40.8 20.4 16.1 28.6 42.0 33.1 25.7 36.4 32.6
*Drank alcohol at study time but started within last 10 years
TABLE 3. Frequency of drinking (%)
Frequency
Men Women All
18-29(n
=127)
30-44(n
=189)
45+(n
=78)
All (n =394)
18-29(n
=139)
30-44(n =115)
45+(n =47)
All (n =301)
(N =695)
Less thanmonthly
20.5 10.6 6.4 12.9 41.7 40.9 25.5 38.9 24.2
Monthly 19.7 8.5 21.8 14.7 20.9 24.4 21.3 22.3 18.0
Weekly 24.4 34.4 16.7 27.7 21.6 17.4 29.8 21.3 24.9
Near daily 35.4 46.6 55.1 44.7 15.8 17.4 23.4 17.6 33.0
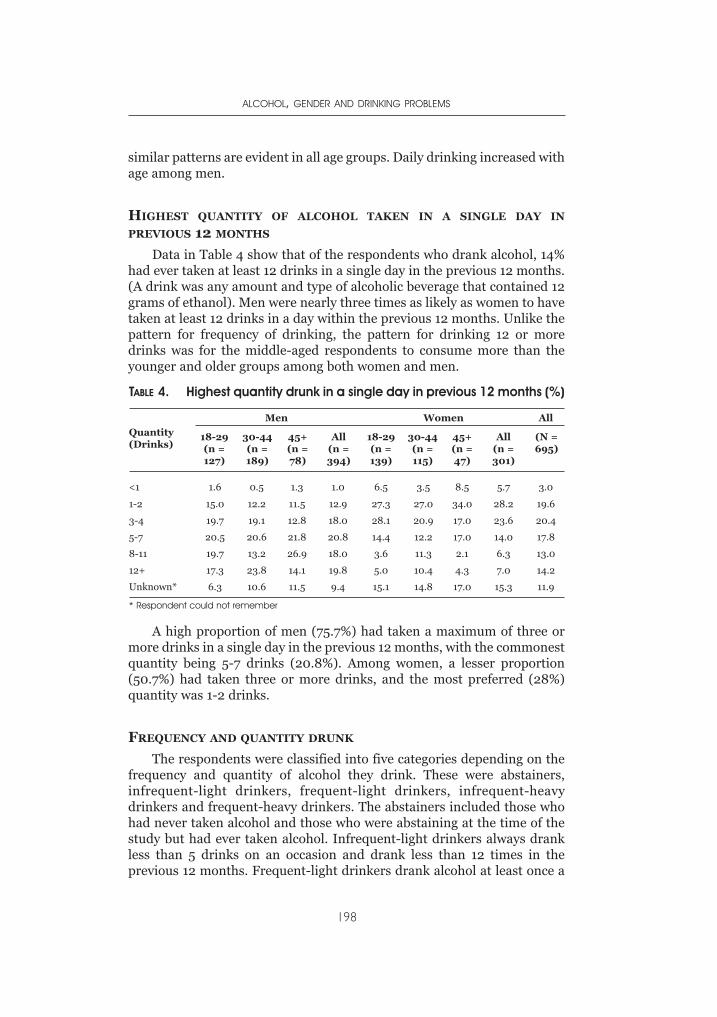
similar patterns are evident in all age groups. Daily drinking increased withage among men.
HIGHEST QUANTITY OF ALCOHOL TAKEN IN A SINGLE DAY IN
PREVIOUS 12 MONTHS
Data in Table 4 show that of the respondents who drank alcohol, 14%had ever taken at least 12 drinks in a single day in the previous 12 months.(A drink was any amount and type of alcoholic beverage that contained 12grams of ethanol). Men were nearly three times as likely as women to havetaken at least 12 drinks in a day within the previous 12 months. Unlike thepattern for frequency of drinking, the pattern for drinking 12 or moredrinks was for the middle-aged respondents to consume more than theyounger and older groups among both women and men.
A high proportion of men (75.7%) had taken a maximum of three ormore drinks in a single day in the previous 12 months, with the commonestquantity being 5-7 drinks (20.8%). Among women, a lesser proportion(50.7%) had taken three or more drinks, and the most preferred (28%)quantity was 1-2 drinks.
FREQUENCY AND QUANTITY DRUNK
The respondents were classified into five categories depending on thefrequency and quantity of alcohol they drink. These were abstainers,infrequent-light drinkers, frequent-light drinkers, infrequent-heavydrinkers and frequent-heavy drinkers. The abstainers included those whohad never taken alcohol and those who were abstaining at the time of thestudy but had ever taken alcohol. Infrequent-light drinkers always drankless than 5 drinks on an occasion and drank less than 12 times in theprevious 12 months. Frequent-light drinkers drank alcohol at least once a
ALCOHOL, GENDER AND DRINKING PROBLEMS
198
TABLE 4. Highest quantity drunk in a single day in previous 12 months (%)
Quantity(Drinks)
Men Women All
18-29(n =127)
30-44(n =189)
45+(n =78)
All (n =394)
18-29(n =139)
30-44(n =115)
45+(n =47)
All (n =301)
(N =695)
<1 1.6 0.5 1.3 1.0 6.5 3.5 8.5 5.7 3.0
1-2 15.0 12.2 11.5 12.9 27.3 27.0 34.0 28.2 19.6
3-4 19.7 19.1 12.8 18.0 28.1 20.9 17.0 23.6 20.4
5-7 20.5 20.6 21.8 20.8 14.4 12.2 17.0 14.0 17.8
8-11 19.7 13.2 26.9 18.0 3.6 11.3 2.1 6.3 13.0
12+ 17.3 23.8 14.1 19.8 5.0 10.4 4.3 7.0 14.2
Unknown* 6.3 10.6 11.5 9.4 15.1 14.8 17.0 15.3 11.9
* Respondent could not remember
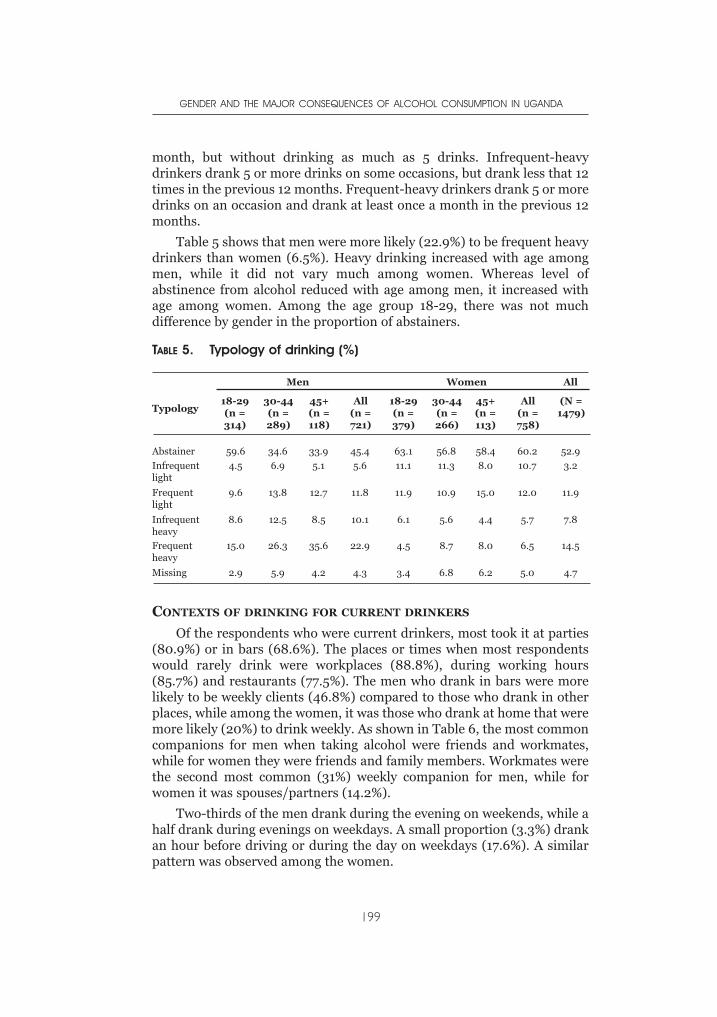
month, but without drinking as much as 5 drinks. Infrequent-heavydrinkers drank 5 or more drinks on some occasions, but drank less that 12times in the previous 12 months. Frequent-heavy drinkers drank 5 or moredrinks on an occasion and drank at least once a month in the previous 12months.
Table 5 shows that men were more likely (22.9%) to be frequent heavydrinkers than women (6.5%). Heavy drinking increased with age amongmen, while it did not vary much among women. Whereas level ofabstinence from alcohol reduced with age among men, it increased withage among women. Among the age group 18-29, there was not muchdifference by gender in the proportion of abstainers.
CONTEXTS OF DRINKING FOR CURRENT DRINKERS
Of the respondents who were current drinkers, most took it at parties(80.9%) or in bars (68.6%). The places or times when most respondentswould rarely drink were workplaces (88.8%), during working hours(85.7%) and restaurants (77.5%). The men who drank in bars were morelikely to be weekly clients (46.8%) compared to those who drank in otherplaces, while among the women, it was those who drank at home that weremore likely (20%) to drink weekly. As shown in Table 6, the most commoncompanions for men when taking alcohol were friends and workmates,while for women they were friends and family members. Workmates werethe second most common (31%) weekly companion for men, while forwomen it was spouses/partners (14.2%).
Two-thirds of the men drank during the evening on weekends, while ahalf drank during evenings on weekdays. A small proportion (3.3%) drankan hour before driving or during the day on weekdays (17.6%). A similarpattern was observed among the women.
GENDER AND THE MAJOR CONSEQUENCES OF ALCOHOL CONSUMPTION IN UGANDA
199
TABLE 5. Typology of drinking (%)
Typology
Men Women All
18-29(n =314)
30-44(n =289)
45+(n =118)
All (n =721)
18-29(n =379)
30-44(n =266)
45+(n =113)
All (n =758)
(N =1479)
Abstainer 59.6 34.6 33.9 45.4 63.1 56.8 58.4 60.2 52.9
Infrequentlight
4.5 6.9 5.1 5.6 11.1 11.3 8.0 10.7 3.2
Frequentlight
9.6 13.8 12.7 11.8 11.9 10.9 15.0 12.0 11.9
Infrequentheavy
8.6 12.5 8.5 10.1 6.1 5.6 4.4 5.7 7.8
Frequentheavy
15.0 26.3 35.6 22.9 4.5 8.7 8.0 6.5 14.5
Missing 2.9 5.9 4.2 4.3 3.4 6.8 6.2 5.0 4.7
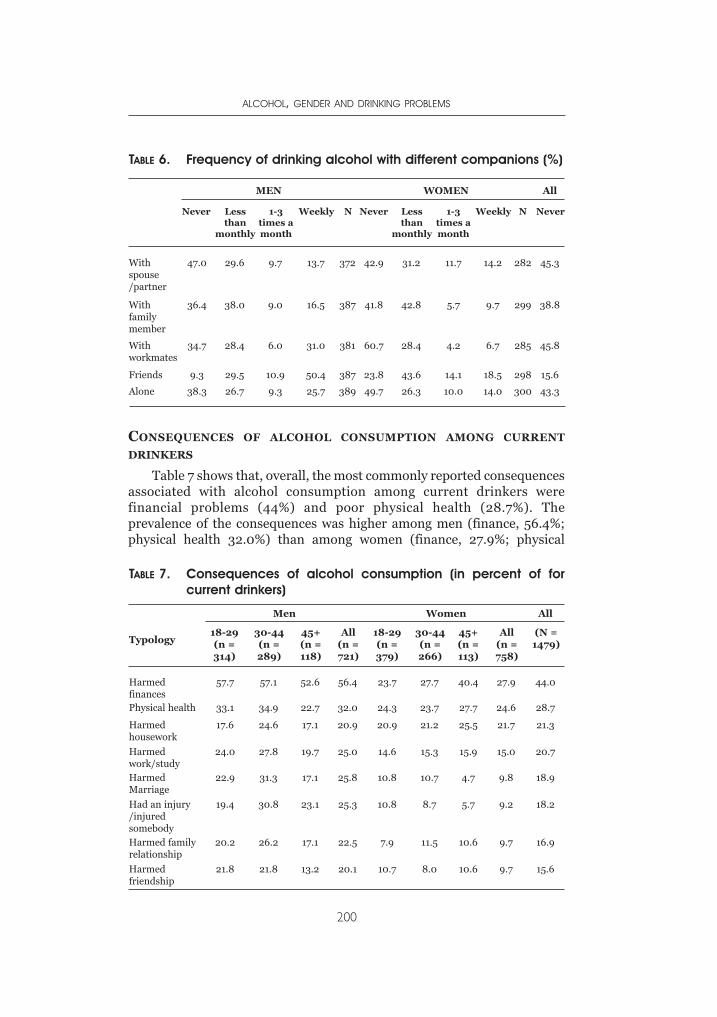
CONSEQUENCES OF ALCOHOL CONSUMPTION AMONG CURRENT
DRINKERS
Table 7 shows that, overall, the most commonly reported consequencesassociated with alcohol consumption among current drinkers werefinancial problems (44%) and poor physical health (28.7%). Theprevalence of the consequences was higher among men (finance, 56.4%;physical health 32.0%) than among women (finance, 27.9%; physical
ALCOHOL, GENDER AND DRINKING PROBLEMS
200
TABLE 6. Frequency of drinking alcohol with different companions (%)
MEN WOMEN All
Never Lessthan
monthly
1-3times amonth
Weekly N Never Lessthan
monthly
1-3times amonth
Weekly N Never
Withspouse/partner
47.0 29.6 9.7 13.7 372 42.9 31.2 11.7 14.2 282 45.3
Withfamilymember
36.4 38.0 9.0 16.5 387 41.8 42.8 5.7 9.7 299 38.8
Withworkmates
34.7 28.4 6.0 31.0 381 60.7 28.4 4.2 6.7 285 45.8
Friends 9.3 29.5 10.9 50.4 387 23.8 43.6 14.1 18.5 298 15.6
Alone 38.3 26.7 9.3 25.7 389 49.7 26.3 10.0 14.0 300 43.3
TABLE 7. Consequences of alcohol consumption (in percent of forcurrent drinkers)
Typology
Men Women All
18-29(n =314)
30-44(n =289)
45+(n =118)
All (n =721)
18-29(n =379)
30-44(n =266)
45+(n =113)
All (n =758)
(N =1479)
Harmedfinances
57.7 57.1 52.6 56.4 23.7 27.7 40.4 27.9 44.0
Physical health 33.1 34.9 22.7 32.0 24.3 23.7 27.7 24.6 28.7
Harmedhousework
17.6 24.6 17.1 20.9 20.9 21.2 25.5 21.7 21.3
Harmedwork/study
24.0 27.8 19.7 25.0 14.6 15.3 15.9 15.0 20.7
HarmedMarriage
22.9 31.3 17.1 25.8 10.8 10.7 4.7 9.8 18.9
Had an injury/injuredsomebody
19.4 30.8 23.1 25.3 10.8 8.7 5.7 9.2 18.2
Harmed familyrelationship
20.2 26.2 17.1 22.5 7.9 11.5 10.6 9.7 16.9
Harmedfriendship
21.8 21.8 13.2 20.1 10.7 8.0 10.6 9.7 15.6
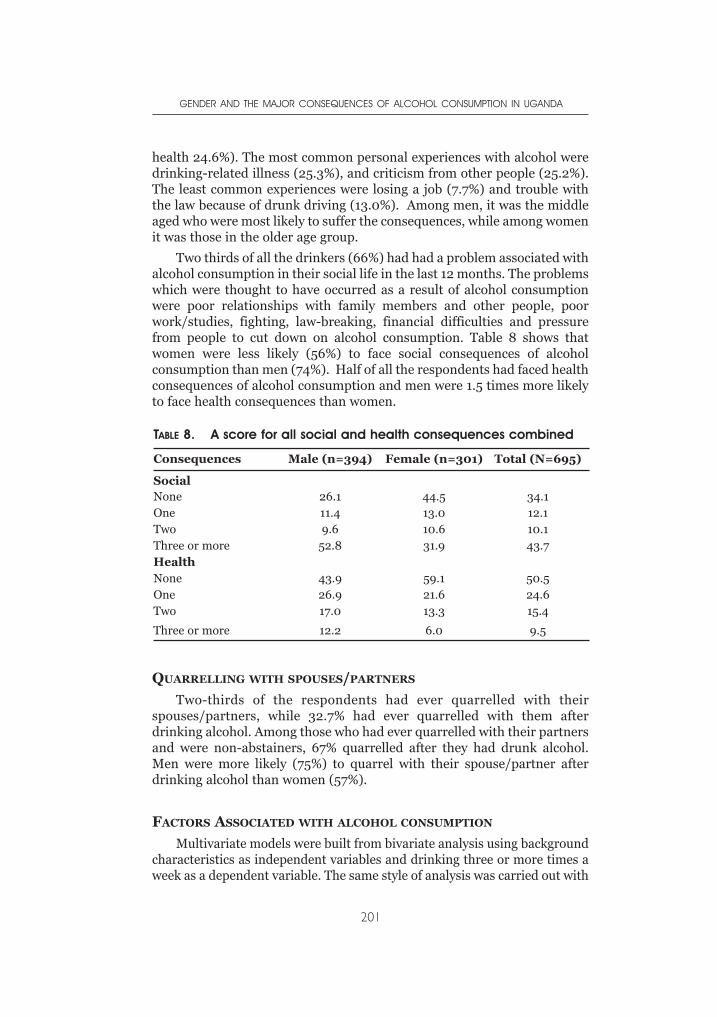
health 24.6%). The most common personal experiences with alcohol weredrinking-related illness (25.3%), and criticism from other people (25.2%).The least common experiences were losing a job (7.7%) and trouble withthe law because of drunk driving (13.0%). Among men, it was the middleaged who were most likely to suffer the consequences, while among womenit was those in the older age group.
Two thirds of all the drinkers (66%) had had a problem associated withalcohol consumption in their social life in the last 12 months. The problemswhich were thought to have occurred as a result of alcohol consumptionwere poor relationships with family members and other people, poorwork/studies, fighting, law-breaking, financial difficulties and pressurefrom people to cut down on alcohol consumption. Table 8 shows thatwomen were less likely (56%) to face social consequences of alcoholconsumption than men (74%). Half of all the respondents had faced healthconsequences of alcohol consumption and men were 1.5 times more likelyto face health consequences than women.
QUARRELLING WITH SPOUSES/PARTNERS
Two-thirds of the respondents had ever quarrelled with theirspouses/partners, while 32.7% had ever quarrelled with them afterdrinking alcohol. Among those who had ever quarrelled with their partnersand were non-abstainers, 67% quarrelled after they had drunk alcohol.Men were more likely (75%) to quarrel with their spouse/partner afterdrinking alcohol than women (57%).
FACTORS ASSOCIATED WITH ALCOHOL CONSUMPTION
Multivariate models were built from bivariate analysis using backgroundcharacteristics as independent variables and drinking three or more times aweek as a dependent variable. The same style of analysis was carried out with
GENDER AND THE MAJOR CONSEQUENCES OF ALCOHOL CONSUMPTION IN UGANDA
201
TABLE 8. A score for all social and health consequences combined
Consequences Male (n=394) Female (n=301) Total (N=695)
SocialNone 26.1 44.5 34.1One 11.4 13.0 12.1Two 9.6 10.6 10.1Three or more 52.8 31.9 43.7HealthNone 43.9 59.1 50.5One 26.9 21.6 24.6Two 17.0 13.3 15.4
Three or more 12.2 6.0 9.5
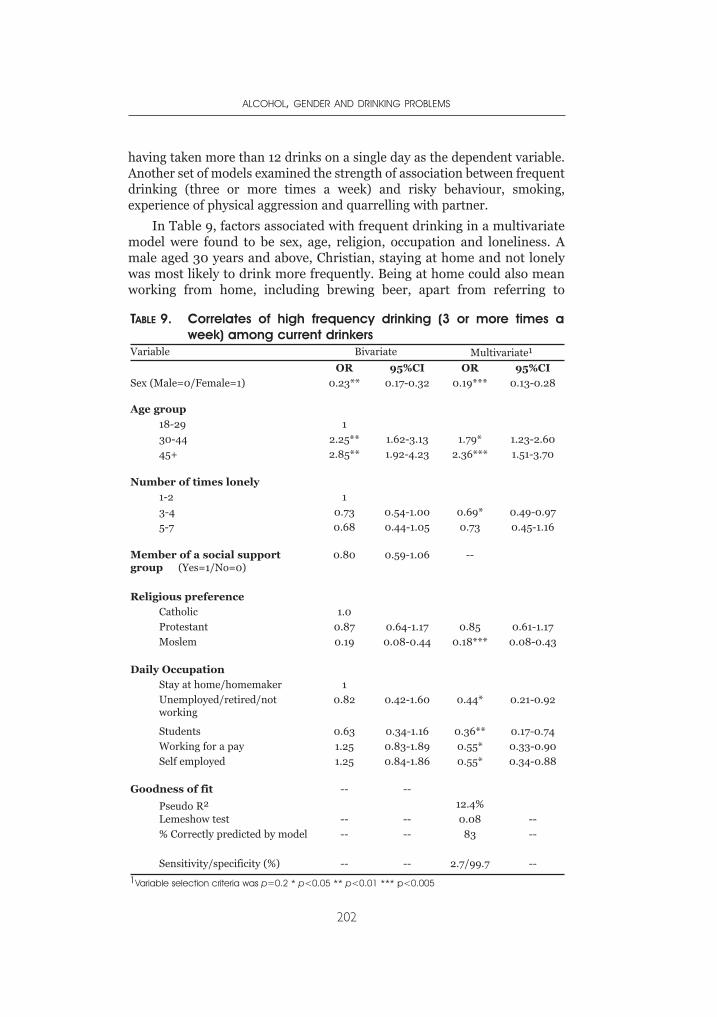
having taken more than 12 drinks on a single day as the dependent variable.Another set of models examined the strength of association between frequentdrinking (three or more times a week) and risky behaviour, smoking,experience of physical aggression and quarrelling with partner.
In Table 9, factors associated with frequent drinking in a multivariatemodel were found to be sex, age, religion, occupation and loneliness. Amale aged 30 years and above, Christian, staying at home and not lonelywas most likely to drink more frequently. Being at home could also meanworking from home, including brewing beer, apart from referring to
ALCOHOL, GENDER AND DRINKING PROBLEMS
202
TABLE 9. Correlates of high frequency drinking (3 or more times aweek) among current drinkers
Variable Bivariate Multivariate1
OR 95%CI OR 95%CI
Sex (Male=0/Female=1) 0.23** 0.17-0.32 0.19*** 0.13-0.28
Age group
18-29 1
30-44 2.25** 1.62-3.13 1.79* 1.23-2.60
45+ 2.85** 1.92-4.23 2.36*** 1.51-3.70
Number of times lonely
1-2 1
3-4 0.73 0.54-1.00 0.69* 0.49-0.97
5-7 0.68 0.44-1.05 0.73 0.45-1.16
Member of a social supportgroup (Yes=1/No=0)
0.80 0.59-1.06 --
Religious preference
Catholic 1.0
Protestant 0.87 0.64-1.17 0.85 0.61-1.17
Moslem 0.19 0.08-0.44 0.18*** 0.08-0.43
Daily Occupation
Stay at home/homemaker 1
Unemployed/retired/notworking
0.82 0.42-1.60 0.44* 0.21-0.92
Students 0.63 0.34-1.16 0.36** 0.17-0.74
Working for a pay 1.25 0.83-1.89 0.55* 0.33-0.90
Self employed 1.25 0.84-1.86 0.55* 0.34-0.88
Goodness of fit -- --
Pseudo R2 12.4%
Lemeshow test -- -- 0.08 --
% Correctly predicted by model -- -- 83 --
Sensitivity/specificity (%) -- -- 2.7/99.7 --
1Variable selection criteria was p=0.2 * p<0.05 ** p<0.01 *** p<0.005
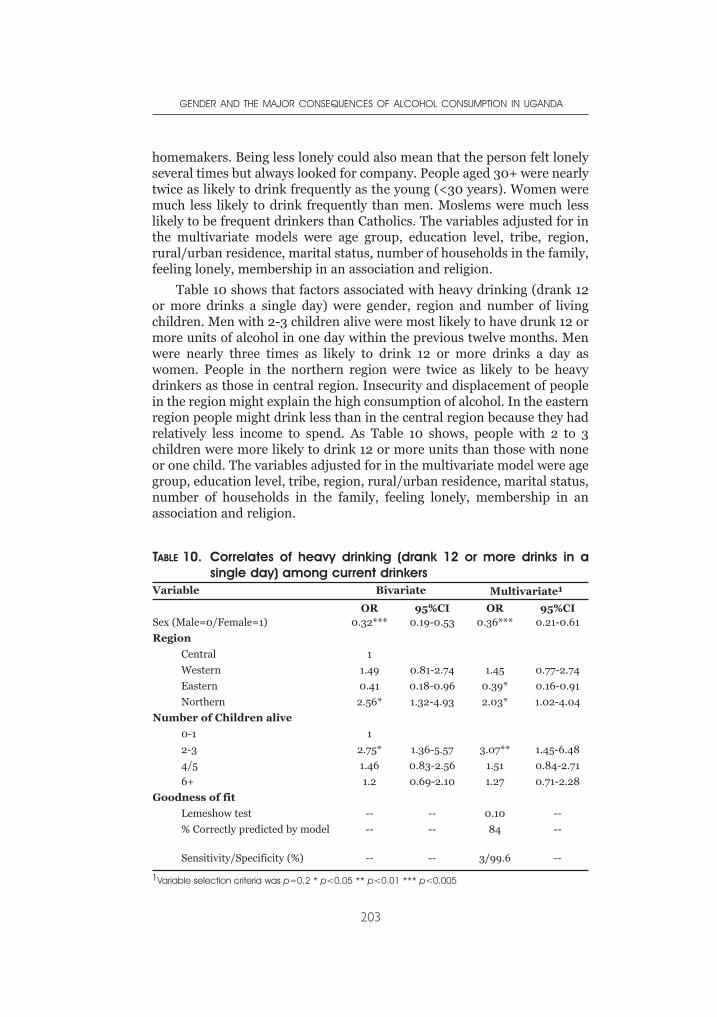
homemakers. Being less lonely could also mean that the person felt lonelyseveral times but always looked for company. People aged 30+ were nearlytwice as likely to drink frequently as the young (<30 years). Women weremuch less likely to drink frequently than men. Moslems were much lesslikely to be frequent drinkers than Catholics. The variables adjusted for inthe multivariate models were age group, education level, tribe, region,rural/urban residence, marital status, number of households in the family,feeling lonely, membership in an association and religion.
Table 10 shows that factors associated with heavy drinking (drank 12or more drinks a single day) were gender, region and number of livingchildren. Men with 2-3 children alive were most likely to have drunk 12 ormore units of alcohol in one day within the previous twelve months. Menwere nearly three times as likely to drink 12 or more drinks a day aswomen. People in the northern region were twice as likely to be heavydrinkers as those in central region. Insecurity and displacement of peoplein the region might explain the high consumption of alcohol. In the easternregion people might drink less than in the central region because they hadrelatively less income to spend. As Table 10 shows, people with 2 to 3children were more likely to drink 12 or more units than those with noneor one child. The variables adjusted for in the multivariate model were agegroup, education level, tribe, region, rural/urban residence, marital status,number of households in the family, feeling lonely, membership in anassociation and religion.
GENDER AND THE MAJOR CONSEQUENCES OF ALCOHOL CONSUMPTION IN UGANDA
203
TABLE 10. Correlates of heavy drinking (drank 12 or more drinks in asingle day) among current drinkers
Variable Bivariate Multivariate1
OR 95%CI OR 95%CISex (Male=0/Female=1) 0.32*** 0.19-0.53 0.36*** 0.21-0.61
Region
Central 1
Western 1.49 0.81-2.74 1.45 0.77-2.74
Eastern 0.41 0.18-0.96 0.39* 0.16-0.91
Northern 2.56* 1.32-4.93 2.03* 1.02-4.04
Number of Children alive
0-1 1
2-3 2.75* 1.36-5.57 3.07** 1.45-6.48
4/5 1.46 0.83-2.56 1.51 0.84-2.71
6+ 1.2 0.69-2.10 1.27 0.71-2.28
Goodness of fit
Lemeshow test -- -- 0.10 --
% Correctly predicted by model -- -- 84 --
Sensitivity/Specificity (%) -- -- 3/99.6 --
1Variable selection criteria was p=0.2 * p<0.05 ** p<0.01 *** p<0.005
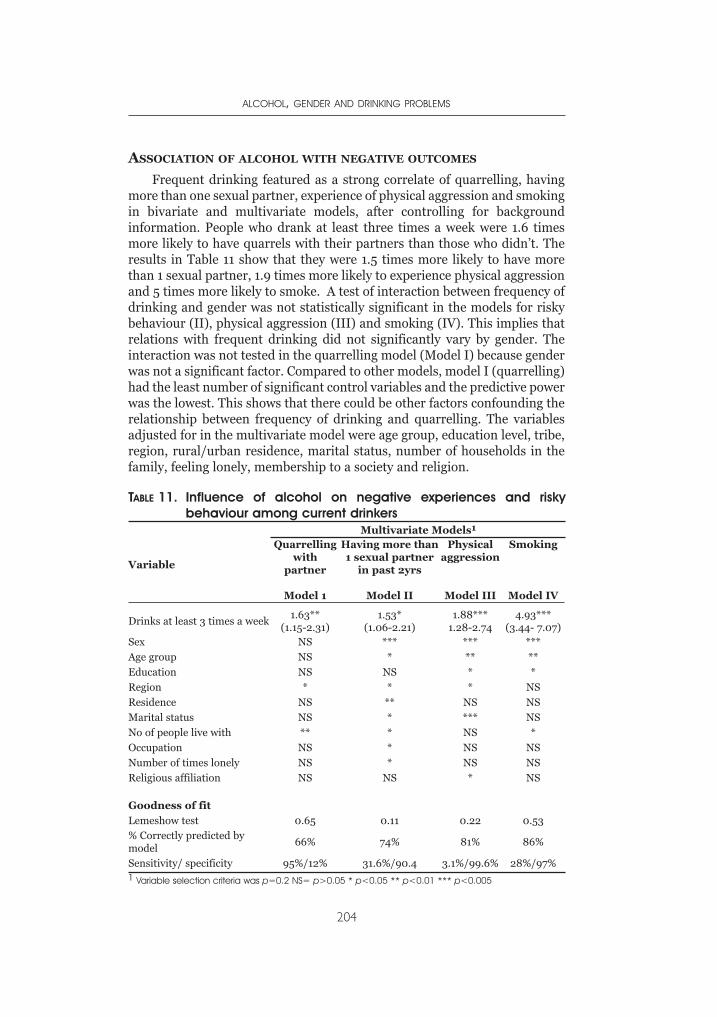
ASSOCIATION OF ALCOHOL WITH NEGATIVE OUTCOMES
Frequent drinking featured as a strong correlate of quarrelling, havingmore than one sexual partner, experience of physical aggression and smokingin bivariate and multivariate models, after controlling for backgroundinformation. People who drank at least three times a week were 1.6 timesmore likely to have quarrels with their partners than those who didn’t. Theresults in Table 11 show that they were 1.5 times more likely to have morethan 1 sexual partner, 1.9 times more likely to experience physical aggressionand 5 times more likely to smoke. A test of interaction between frequency ofdrinking and gender was not statistically significant in the models for riskybehaviour (II), physical aggression (III) and smoking (IV). This implies thatrelations with frequent drinking did not significantly vary by gender. Theinteraction was not tested in the quarrelling model (Model I) because genderwas not a significant factor. Compared to other models, model I (quarrelling)had the least number of significant control variables and the predictive powerwas the lowest. This shows that there could be other factors confounding therelationship between frequency of drinking and quarrelling. The variablesadjusted for in the multivariate model were age group, education level, tribe,region, rural/urban residence, marital status, number of households in thefamily, feeling lonely, membership to a society and religion.
ALCOHOL, GENDER AND DRINKING PROBLEMS
204
TABLE 11. Influence of alcohol on negative experiences and riskybehaviour among current drinkers
Variable
Multivariate Models1
Quarrellingwith
partner
Model 1
Having more than1 sexual partner
in past 2yrs
Model II
Physicalaggression
Model III
Smoking
Model IV
Drinks at least 3 times a week1.63**
(1.15-2.31)1.53*
(1.06-2.21)1.88***
1.28-2.744.93***
(3.44- 7.07)Sex NS *** *** ***
Age group NS * ** **
Education NS NS * *
Region * * * NS
Residence NS ** NS NS
Marital status NS * *** NS
No of people live with ** * NS *
Occupation NS * NS NS
Number of times lonely NS * NS NS
Religious affiliation NS NS * NS
Goodness of fit
Lemeshow test 0.65 0.11 0.22 0.53% Correctly predicted bymodel
66% 74% 81% 86%
Sensitivity/ specificity 95%/12% 31.6%/90.4 3.1%/99.6% 28%/97%1 Variable selection criteria was p=0.2 NS= p>0.05 * p<0.05 ** p<0.01 *** p<0.005
DISCUSSION
The results above show that nearly half of the respondents drankalcohol. Men were more likely (40%) to be long time drinkers thanwomen (24%). A third of the respondents drank alcohol nearly daily.Forty five percent of males and a third of the females drank daily. Ofthose who drank, 14 % had ever taken at least 12 drinks a day. Alcoholwas mostly taken at parties (81%) or in bars (69%). People rarely drankalcohol at work places, during working hours and in restaurants.Common consequences associated with alcohol were financial problemsand poor physical health. Two-thirds of the current drinkers had aproblem associated with alcohol in their social life. The factorsassociated with frequent alcohol consumption were being male, of olderage (30+ years) and Christian; staying at home and being social. Thefactors associated with heavy drinking were being male, hailing from thenorthern and eastern regions and having 2-3 children. Frequentdrinking of alcohol was independently associated with quarrelling withpartner, having more than one sexual partner, physical aggression andsmoking.
It is not surprising that nearly half (47%) of the respondents drankalcohol, given its strong cultural, social and economic links (Willis, 2002).Men, as expected, were more long time drinkers and at the same time morefrequent and heavy drinkers compared to women. What is new in thepatterns of drinking is that among young people, women were more likelyto be current drinkers than men. This is a sign that women might bechanging the traditional pattern of alcohol consumption; this is supportedby earlier findings (Mulimbura, 1977).
Gender differences in drinking patterns in this study are notsurprising. Results from similar GENACIS surveys show that men persistin drinking (and drinking heavily) longer in life than women (Hao,Zhonhua, Binglun et al., 2004; Kemm, 2003; Breslow & Smothers, 2004),and changes in traditional drinking patterns are most likely among theyoungest and newest drinkers (Mateos, Paramo, Carrera et al., 2002;Suggs, 2001; Suggs, 1996; Plant, Miller, Thornton et al., 2000; Mateos,Paramo, Carrera et al., 2002)
The older generation seems to drink more heavily compared to otherage groups. Probably this reflects a mix of reasons. Factors such as stress(Chittick 1958), inability to cope with the prevailing situation (Howard1963), and socio-economic problems (Topouzis, 1994) may all apply in thiscircumstance. Stress may be due to several reasons including poor healthamong the older age group, poor care and loss of loved ones, especiallychildren who leave behind orphans. Uganda has an estimated 2 millionorphans, mainly due to AIDS. Economic hardships prevailing in thecountry, low prices for produce and a high unemployment level could alsobe associated with drinking by older people.
GENDER AND THE MAJOR CONSEQUENCES OF ALCOHOL CONSUMPTION IN UGANDA
205
The results further show that although the older age group drank morefrequently and in higher amounts, the middle age group was more likely todrink the largest amount at a single time. Cultural factors contribute to thehigh frequency of drinking. The role of culture is clear in findings ofTopouzis (1994) and Barton & Wamai (1994). If drinking alcohol is anintegral part of the village culture, a catalyst in social interaction and a dutyone has to fulfil, then it is not surprising that some people drink everyday.
The findings show that there is a high rate of abstention in young mencompared with middle aged and older men. This could be attributed to newmovements within the Protestant and Catholic churches that discouragealcohol consumption and mainly target the youth. Another factor is lack ofmoney to spend on alcohol. Many of the young men are either in school ordo not have proper employment from which they can get money to spendon alcohol.
A party was the most common drinking environment. This might bedue to the cultural influence which encourages the hosting of parties. It isan obligation to give a party at some time and to attend parties. Bars werethe second most common environment for drinking, but not for women.This could mainly be due to cultural reasons (Willis, 2002). Traditionallymen drank to interact with other men and discuss social and culturalmatters in their villages (Topouzis, 1994). This is consistent with what isreported by several psychologists: that men do most of their drinking awayfrom home while the women drink with their spouses and family members(Miller & Cervantes, 1998). Women sought other women to discuss issuesthat concerned them. It was a rare occurrence to find men drinking withtheir partners. Another explanation could be that drinking alcohol is not anactivity that people always have to plan for, so that one invites familymembers. One is likely to drink with workmates because a decision todrink is made while with them during working hours. The most commondrinking time is evening and weekend in Uganda. This is evident in bothurban and rural areas.
Harm to one’s finances, poor health and loss of relationships were buta few of the common consequences of alcohol. This is in agreement withother authors (Puhalla, 2003, Koenig et al., 2003, Opunyo,1998, andMushanga, 1974). The prevalences of social (66%) and healthconsequences (50%) among current drinkers were high, the most commonconsequences of alcohol consumption being psychological harm andmarriage problems. The proportion of people who quarrel after drinkingwas high, probably due to loss of self-restraint after drinking alcohol. Inaddition, the high prevalence of quarrelling is not surprising since thefrequency of alcohol consumption is high especially among men (45%daily). In most cases of quarrelling, women tended to be the victims(Holmila, 1995).
The study showed that, apart from quarrelling, frequent drinking isassociated with having more than one sexual partner, smoking and partner
ALCOHOL, GENDER AND DRINKING PROBLEMS
206
and physical aggression. This is in agreement with findings by Koenig andothers (Koenig, Lutalo, Feng et al., 2003) that alcohol consumptionreduces self-control over emotions and sexual behaviour. Several otherstudies have found similar links.
LIMITATIONS AND RECOMMENDATIONS
The study had its share of limitations. For example, the sample was notfully representative of the regions and districts covered. People who couldnot know their age or lived in inaccessible areas were excluded, and thismight have caused a bias. Also some questions required recall of events overa long time. An example is drinking 12 or more drinks in a single occasionover the previous 12 months. Many people may not easily recall such event.
Seasonality may have had an effect on the amount drunk andfrequency of drinking. During the rainy season people could be drinkingmore because they stayed indoors for longer periods of time. They couldalso drink less because they did not move a lot to work for money. Thisresearch was not able to investigate the seasonality effect.
The alcoholic contents of the home brewed beer varies from area toarea. This study measured the content of the home brew in Kampala. Theinclusion of key questions on alcohol consumption, its problems andconsequences in major national surveys such as Uganda Demographic andHealth Survey (UDHS) and National Household Survey (NHS) couldincrease knowledge on alcohol consumption levels, patterns and associatedfactors and problems. In addition, more studies would allow monitoring ofthe levels and patterns of alcohol consumption and associated problems.
There is enough evidence to evoke action against uncontrolled alcoholconsumption in Uganda. The proportion of people experiencing negativehealth and social consequences of alcohol consumption is too high to ignore.The results of this analysis of the Uganda GENACIS data stress the need forincreased support for people who are displaced in Lira district. This is asocial wellbeing as well as a public health challenge for all involved inproviding services to women, children and youth in the country as a whole.
REFERENCES
Breslow, R. A., & Smothers, B. (2004). Drinking patterns of older Americans:National Health Interview surveys, 1997-2001. Journal of Studies on Alcohol,65, 232-240.
Hao, W., Zhonhua, S., Binglun, L., Zhang, K., Yang, H., Chen, S. et al. (2004).Drinking and drinking patterns and health systems in the general populationof five areas of China. Alcohol and Alcoholism, 39, 43-52.
Holmila, M. (1995). Alcohol and harm in the family. Paper presented on at theEuropean Conference on Health Society and Alcohol Paris, 12-14December.Copenhagen: WHO Regional Office for Europe (Euro/ICP/ALDT94 03 /CN 01/29)
GENDER AND THE MAJOR CONSEQUENCES OF ALCOHOL CONSUMPTION IN UGANDA
207
Jacobs, G., Aeron-Thomas, A., & Astropn, A. (2000). Estimating global roadfatalities (Rep. No. 445). Crowthorne, UK: Transport Research Laboratory.
Kemm, J. (2003). An analysis by birth cohort of alcohol consumption by adults inGreat Britain 1978-1998. Alcohol and Alcoholism, 2, 147.
Kigozi, F., & Kasirye, R. (1997). Alcohol, drug abuse and HIV AIDS in UgandaKampala, Uganda: Uganda AIDS Commission.
Kobusingye, O., Guwatudde, D., & Lett, R. (2001). Injury patterns in rural andurban Uganda. Injury Prevention, 7, 46-50.
Koenig, A. M., Lutalo, T., Feng, Z., Nalugoda, F., Wabwire-Mangen, F., Kiwanuka, N.et al. (2003). Domestic violence in rural Uganda: evidence from a community-based study. Bulletin of the World Health Organization, 81, 53-60.
Lwanga-Ntale, C., & Kimberly, M (2003, July). Face of chronic poverty in Ugandaas seen by the poor themselves. Conference paper on Chronic andDevelopment Policy, University of Manchester, 7 to 9 April 2003.Development Research and Training (DRT), Kampala, Uganda
Mateos, R., Paramo, M., Carrera, I., & Rodriguez-Lopez, A. (2002). Alcoholconsumption in a Southern European region (Galicia, Spain). Substance Useand Misuse, 37, 1957-1976.
Mbulaiteye, S. M., Ruberantwari, A., Nakiyingi, J., Carpenter, L., Kamali, A., &Whitworth, J. (2000). Alcohol and HIV a study among sexually active adults inrural southwest Uganda. International Journal of Epidemiology, 29, 911-915.
Miller, R. W., & Cervantes, A. E. (1998). Gender and patterns of alcohol problems:Pretreatment responses of women and men to the comprehensive drinkerprofile. Journal of Clinical Psychology, 53, 263-277.
Mulimbura (1977). Alcohol consumption in Uganda. Bachelor of Arts MakerereUniversity, Uganda.
Mushanga, T. M. (1974). Criminal homicide in Uganda. Nairobi: East AfricanLiterature Bureau.
NCC & GOU (1994). Equity and vulnerability: a situation of women, adolescentsand children in Uganda. Kampala: Government of Uganda, Uganda NationalCouncil of Science and Technology.
Plant, M. L., Miller, P., Thornton, C., Plant, M. A., & Bloomfield, K. (2000). Lifestage, alcohol consumption patterns, alcohol-related consequences andgender. Substance Abuse, 21, 265-281.
Puhalla, J. M. (2003). Soil fertility management by women farmers in Kabaledistrict, Uganda, Tallahassee: Department of Geography, University of Florida.
Statistics Dept & MOFEP (1995). The 1991 Population and Housing Census:Analytical report, Demographic characteristics Entebbe: StatisticsDepartment.
Suggs, D. N. (1996). Mosadi Tshwene: the construction of gender and theconsumption of alcohol in Botswana. American Ethnologist, 23, 597-610.
Suggs, D. N. (2001). ‘These young chaps think they are just men, too’:redistributing masculinity in Kgatleng bars. Social Science and Medicine, 53,241-250.
Topouzis, D. (1994). The socio-economic impact of HIV/AIDS on rural familieswith an emphasis on youth in Uganda. (Rep. No. TCP/UGA/2256). Kampala,Uganda: Food and Agriculture Organisation of the United Nations (FAO).
UBOS & ORC Macro (2001). Uganda Demographic and Health Survey 2000-2001. Calverton, Maryland, USA: Uganda Bureau of Statistics and ORC Macro.
Willis, J. (2002). Potent Brews: A Social History of Alcohol in East Africa, 1850-1999. Oxford: James Curry Publishers.
ALCOHOL, GENDER AND DRINKING PROBLEMS
208
The previous chapters in this monograph have examined specificaspects of drinking patterns, contexts and problems, as revealed bysurveys linked with the GENACIS project, in each of eight developing
societies. The present chapter is a first effort to analyze the data from thedifferent surveys in a common frame. Our focus is on the respondents’reports of problems related to their own drinking.
On the one hand, there are obvious limits to this perspective. Thedrinker’s view of problems may not coincide with the views of othersaround the drinker, including those who experience adverse effects fromthe drinking. Reports from surveys of household populations are alsomore likely to pick up less serious problems from drinking, missing reallyserious problems, since the latter are too infrequent to be accuratelymeasured with the usual-sized population survey, and are often morefrequent in the part of the population living outside regular households.
But, on the other hand, the perspective gives us a picture of an importantpart of the full spectrum of alcohol problems which is not measured in theusual health or social statistics. The estimates of alcohol’s role in the GlobalBurden of Disease made as part of a Comparative Risk Analysis (Rehm et al.,2004) – discussed in the introductory chapter of this monograph – focusonly on problems measured in death or morbidity statistics: illnesses or
CHAPTER 10PROBLEMS FROM WOMEN'S AND MEN'S
DRINKING IN EIGHT DEVELOPING COUNTRIES
ROBIN ROOM & KLARA HRADILOVA SELIN
Box 1.Drinking problem items analyzed in this chapterDuring the last 12 months, …1. has your drinking had a harmful effect on your marriage or intimate
relationships?2. has your drinking had a harmful effect on your relationships with other family
members, including your children?3. has your drinking had a harmful effect on your friendships or social life?4. have you gotten in a fight while drinking?5. have you had trouble with the law about your drinking and driving?6. has your drinking had a harmful effect on your work, studies or employment
opportunities?7. has your drinking had a harmful effect on your housework or chores around the
house?8. has your drinking had a harmful effect on your finances?9. has your drinking had a harmful effect on your physical health?10. have you had a feeling of guilt or remorse after drinking?
casualties. Missing from such analyses is the whole range of social problemsfrom drinking, including problems in the family, in work life or similar roles,and in civil life and public order. There have been previous efforts to analyzesurvey data on these issues in developing countries (e.g., Demers et al.,2001). But the GENACIS studies differ in an important way from suchefforts. Particularly for most of the developing countries included inGENACIS, a common questionnaire was used in each country, allowing acomparative analysis across different societies. The items included in thepresent analysis (Box 1) provide a wide coverage across different elements ofsocial problems with drinking, along with one item on health problems.Included in them are two items concerning family roles, an item onfriendship roles, two items about civil comportment, two items on job orhome productive activities, an item on finances, and an item on physicalhealth. Besides these nine items concerning tangible consequences ofdrinking, we have included for comparison with them an item about therespondent’s feelings of guilt or remorse after drinking, as a first step incomparing the extent of internalization of negative feelings aboutproblematic drinking in different cultural circumstances.
The approach taken in this chapter is to examine respondents’ reportsof problems from their own drinking in the samples from eight countriesrepresented in this monograph. Fewer results are reported for Mexico,since the study there was done before the inception of the GENACISproject, and only 2 of the 10 items considered here were included in theMexican questionnaire. The reader is referred to the previous chapters fordetails on the fieldwork in each country. We would note here only that thesamples, while of defined general adult populations, generally represent ageographical area which is less than the whole country. The Braziliansample, in particular, represents a limited area that is more middle-classthan the country as a whole. While for convenience we use the name of thecountry for each sample, it should be kept in mind that the samples are notrepresentative of the whole country.
Both because of this and because of the vagaries of meaning as itemsare translated into different languages, we pay limited attention here to theabsolute levels of positive responses to the different items. More reliable,we feel, are the comparisons, in particular by gender and age, within eachsample: those answering a question in a particular language and cultureare more likely to be interpreting it in the same way. Given this approachto the analysis, we have used unweighted data in the analysis (althoughweighting the data where appropriate would not substantially change theresults). The analysis is limited to those aged 18-65 in each sample.
THE NATIONAL CONTEXTS: DRINKING LEVELS AND PATTERNS AND
POLICY RESPONSES
Before considering the results of the survey data, it is worth
ALCOHOL, GENDER AND DRINKING PROBLEMS
210
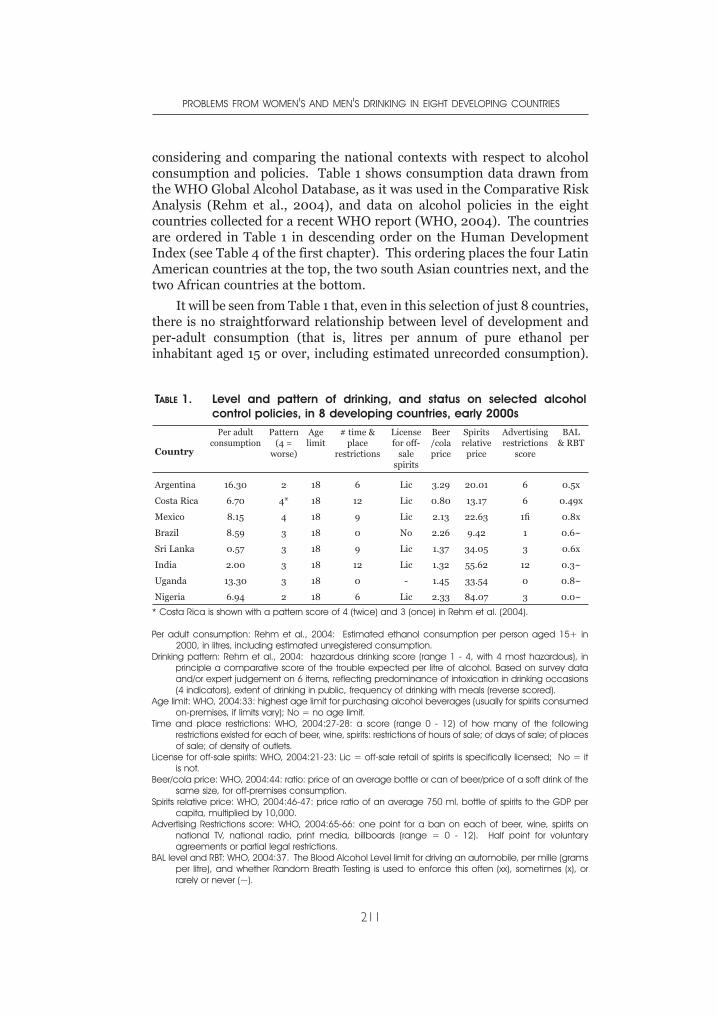
considering and comparing the national contexts with respect to alcoholconsumption and policies. Table 1 shows consumption data drawn fromthe WHO Global Alcohol Database, as it was used in the Comparative RiskAnalysis (Rehm et al., 2004), and data on alcohol policies in the eightcountries collected for a recent WHO report (WHO, 2004). The countriesare ordered in Table 1 in descending order on the Human DevelopmentIndex (see Table 4 of the first chapter). This ordering places the four LatinAmerican countries at the top, the two south Asian countries next, and thetwo African countries at the bottom.
It will be seen from Table 1 that, even in this selection of just 8 countries,there is no straightforward relationship between level of development andper-adult consumption (that is, litres per annum of pure ethanol perinhabitant aged 15 or over, including estimated unrecorded consumption).
PROBLEMS FROM WOMEN'S AND MEN'S DRINKING IN EIGHT DEVELOPING COUNTRIES
211
TABLE 1. Level and pattern of drinking, and status on selected alcoholcontrol policies, in 8 developing countries, early 2000s
Country
Per adultconsumption
Pattern(4 =
worse)
Agelimit
# time &place
restrictions
Licensefor off-
salespirits
Beer/colaprice
Spiritsrelative
price
Advertisingrestrictions
score
BAL & RBT
Argentina 16.30 2 18 6 Lic 3.29 20.01 6 0.5x
Costa Rica 6.70 4* 18 12 Lic 0.80 13.17 6 0.49x
Mexico 8.15 4 18 9 Lic 2.13 22.63 1fi 0.8x
Brazil 8.59 3 18 0 No 2.26 9.42 1 0.6~
Sri Lanka 0.57 3 18 9 Lic 1.37 34.05 3 0.6x
India 2.00 3 18 12 Lic 1.32 55.62 12 0.3~
Uganda 13.30 3 18 0 - 1.45 33.54 0 0.8~
Nigeria 6.94 2 18 6 Lic 2.33 84.07 3 0.0~
* Costa Rica is shown with a pattern score of 4 (twice) and 3 (once) in Rehm et al. (2004).
Per adult consumption: Rehm et al., 2004: Estimated ethanol consumption per person aged 15+ in2000, in litres, including estimated unregistered consumption.
Drinking pattern: Rehm et al., 2004: hazardous drinking score (range 1 - 4, with 4 most hazardous), inprinciple a comparative score of the trouble expected per litre of alcohol. Based on survey dataand/or expert judgement on 6 items, reflecting predominance of intoxication in drinking occasions(4 indicators), extent of drinking in public, frequency of drinking with meals (reverse scored).
Age limit: WHO, 2004:33: highest age limit for purchasing alcohol beverages (usually for spirits consumedon-premises, if limits vary); No = no age limit.
Time and place restrictions: WHO, 2004:27-28: a score (range 0 - 12) of how many of the followingrestrictions existed for each of beer, wine, spirits: restrictions of hours of sale; of days of sale; of placesof sale; of density of outlets.
License for off-sale spirits: WHO, 2004:21-23: Lic = off-sale retail of spirits is specifically licensed; No = itis not.
Beer/cola price: WHO, 2004:44: ratio: price of an average bottle or can of beer/price of a soft drink of thesame size, for off-premises consumption.
Spirits relative price: WHO, 2004:46-47: price ratio of an average 750 ml. bottle of spirits to the GDP percapita, multiplied by 10,000.
Advertising Restrictions score: WHO, 2004:65-66: one point for a ban on each of beer, wine, spirits onnational TV, national radio, print media, billboards (range = 0 - 12). Half point for voluntaryagreements or partial legal restrictions.
BAL level and RBT: WHO, 2004:37. The Blood Alcohol Level limit for driving an automobile, per mille (gramsper litre), and whether Random Breath Testing is used to enforce this often (xx), sometimes (x), orrarely or never (~).
Argentina, near the top of the list, and Uganda, near the bottom, have thehighest estimated consumption levels, putting Uganda as well as Argentinaup at the level of southern European wine cultures and some European beer-drinking countries. On the other hand, estimated consumption in India, andparticularly in Sri Lanka, is very low by global standards.
The second column of Table 1 shows each country’s score on ahazardous drinking pattern score developed in the WHO Comparative RiskAnalysis (Rehm et al., 2004). This score, which ranges from 1 (for the leasthazardous pattern) to 4 (for the most hazardous), in principle measures therelative increase in adverse consequences to be expected from each extralitre of alcohol consumed. It is thus a separate dimension from level ofconsumption, and is designed to express cultural differences in drinkingpatterns which would affect the rates of casualties and other consequencesfrom a given level of drinking. The score was derived from expertjudgements and (where available) survey data on six dimensions ofdrinking patterns connected to increased hazard: high quantity peroccasion, proportions of drinking to intoxication and rates of drinking inpublic places, the occurrence of fiesta drinking, and low proportions ofdaily drinking and drinking with meals (Rehm et al., 2001). The averagelevel of the eight countries on the hazardous drinking score is about 3,which is about what would be expected for a sample of developingcountries. Mexico and Costa Rica (the latter in some versions of the score)have been assigned higher scores than the average, and Argentina andNigeria lower scores.
The remaining columns of Table 1 show the status of each country inthe early 2000s on a range of indicators of alcohol policy. Uniformly, the8 countries are reported to have a minimum drinking age of 18 for allalcoholic beverages, in the middle of the range of such agesinternationally. There is considerable variation between the countries inthe extent of reported time and place restrictions on sale of alcohol, withBrazil and Uganda having the fewest such restrictions and Costa Rica andIndia the most. Brazil is reported to have no specific licensing for alcoholsales, and the data for Uganda is lacking; the other 6 countries have someform of alcohol licensing, and Costa Rica also has a spirits productionmonopoly.
The “Beer/cola price” column is the ratio of the reported prices of anaverage bottle or can of beer and of a soft drink of the same size. A highratio may reflect high beer taxes, or relatively high production costs orprofits of breweries. The ratio is not related in any obvious way to thestandard of living. Thus the highest ratio (Argentina) and the lowest(Costa Rica) are for the two highest-ranking countries in terms of theHDI. Costa Rica is apparently among the minority of countries where abeer is cheaper than a soft drink. The next column, the “spirits relativeprice”, compares the price of a bottle of spirits with the Gross DomesticProduct per capita. This index is affected by the standard of living, more
ALCOHOL, GENDER AND DRINKING PROBLEMS
212
indeed than by the level of spirits taxes, so that poorer countries tend toshow a higher relative price. However, this does reflect the reality that abottle of spirits is a greater luxury for the poor than for the affluent.Brazil and Costa Rica stand out on this index as having relatively lowspirits prices.
The density of restrictions on alcohol advertising varies across thecomplete range in the sample of 8 countries. As for restrictions on sale,Uganda and Brazil are at the bottom on this indicator, joined by Mexico, withIndia clearly at the top. There is also a considerable range on the legal blood-alcohol limit for driving, with Nigeria and India showing the most stringentrestrictions, and Uganda and Mexico the least. None of the countries reportsstrong enforcement of the limit, with random breath-testing done often.Brazil, India, Uganda and Nigeria report the least level of enforcement.
CURRENT DRINKING BY GENDER AND AGE
A precondition to the occurrence of problems related to one’s owndrinking is that one drinks at all. It is clear that abstention is much morecommon in much of the developing world than, say, in Europe – and thatglobally the proportion of abstainers is the most important determinant ofdifferences in per-adult consumption. Variations between different globalsubregions in the amount of drinking per drinker (that is, with abstainersremoved from the base) are an order of magnitude less than variations ona per-adult basis (Room et al., 2002; Babor et al., 2003).
Previous work has shown that both gender and age-norms on drinkingat all differ greatly in different countries (e.g., Roizen, 1988; Room et al.,2002: 85, 97-98). Table 2 shows that, at the level of the behaviour ofdrinking at all, there are substantial differences in the eight countries in thepresent analysis. Drinking remains an uncommon behaviour amongwomen in India and Sri Lanka, at whatever age. A bare majority of SriLankan men have had an alcoholic drink sometime in the last year, withlittle differentiation by age. Only a minority of Indian men have had a drinkwith those in the 30-49 age group more likely to be drinkers than youngeror older men. At the other end of the spectrum, Argentina conforms to thewestern European pattern of near-universal drinking, though even here thedrinking rate falls off with age among women. In all the other countries inthe study, drinking is a minority behaviour among women aged 50 andover. But in Uganda and Brazil women in this age group are neverthelessmore likely to drink than younger women. Both Uganda and Nigeria showa pattern, found elsewhere in Africa too (Roizen, 1988), of a lower rate ofdrinking among adults under age 30 than among older adults.
In terms of the further analyses in this paper, one caution from thesefindings is that the base numbers of drinkers are low among Indian andparticularly Sri Lankan women, so that the results shown should be treatedwith considerable caution.
PROBLEMS FROM WOMEN'S AND MEN'S DRINKING IN EIGHT DEVELOPING COUNTRIES
213
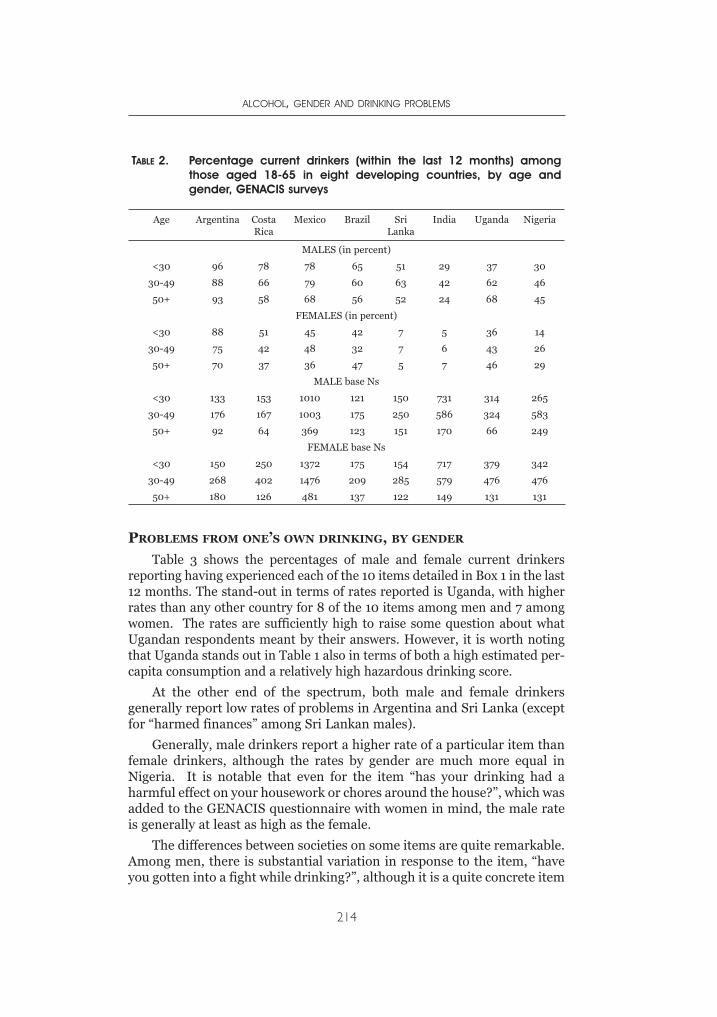
PROBLEMS FROM ONE’S OWN DRINKING, BY GENDER
Table 3 shows the percentages of male and female current drinkersreporting having experienced each of the 10 items detailed in Box 1 in the last12 months. The stand-out in terms of rates reported is Uganda, with higherrates than any other country for 8 of the 10 items among men and 7 amongwomen. The rates are sufficiently high to raise some question about whatUgandan respondents meant by their answers. However, it is worth notingthat Uganda stands out in Table 1 also in terms of both a high estimated per-capita consumption and a relatively high hazardous drinking score.
At the other end of the spectrum, both male and female drinkersgenerally report low rates of problems in Argentina and Sri Lanka (exceptfor “harmed finances” among Sri Lankan males).
Generally, male drinkers report a higher rate of a particular item thanfemale drinkers, although the rates by gender are much more equal inNigeria. It is notable that even for the item “has your drinking had aharmful effect on your housework or chores around the house?”, which wasadded to the GENACIS questionnaire with women in mind, the male rateis generally at least as high as the female.
The differences between societies on some items are quite remarkable.Among men, there is substantial variation in response to the item, “haveyou gotten into a fight while drinking?”, although it is a quite concrete item
ALCOHOL, GENDER AND DRINKING PROBLEMS
214
TABLE 2. Percentage current drinkers (within the last 12 months) amongthose aged 18-65 in eight developing countries, by age andgender, GENACIS surveys
Age Argentina CostaRica
Mexico Brazil SriLanka
India Uganda Nigeria
MALES (in percent)
<30 96 78 78 65 51 29 37 30
30-49 88 66 79 60 63 42 62 46
50+ 93 58 68 56 52 24 68 45
FEMALES (in percent)
<30 88 51 45 42 7 5 36 14
30-49 75 42 48 32 7 6 43 26
50+ 70 37 36 47 5 7 46 29
MALE base Ns
<30 133 153 1010 121 150 731 314 265
30-49 176 167 1003 175 250 586 324 583
50+ 92 64 369 123 151 170 66 249
FEMALE base Ns
<30 150 250 1372 175 154 717 379 342
30-49 268 402 1476 209 285 579 476 476
50+ 180 126 481 137 122 149 131 131
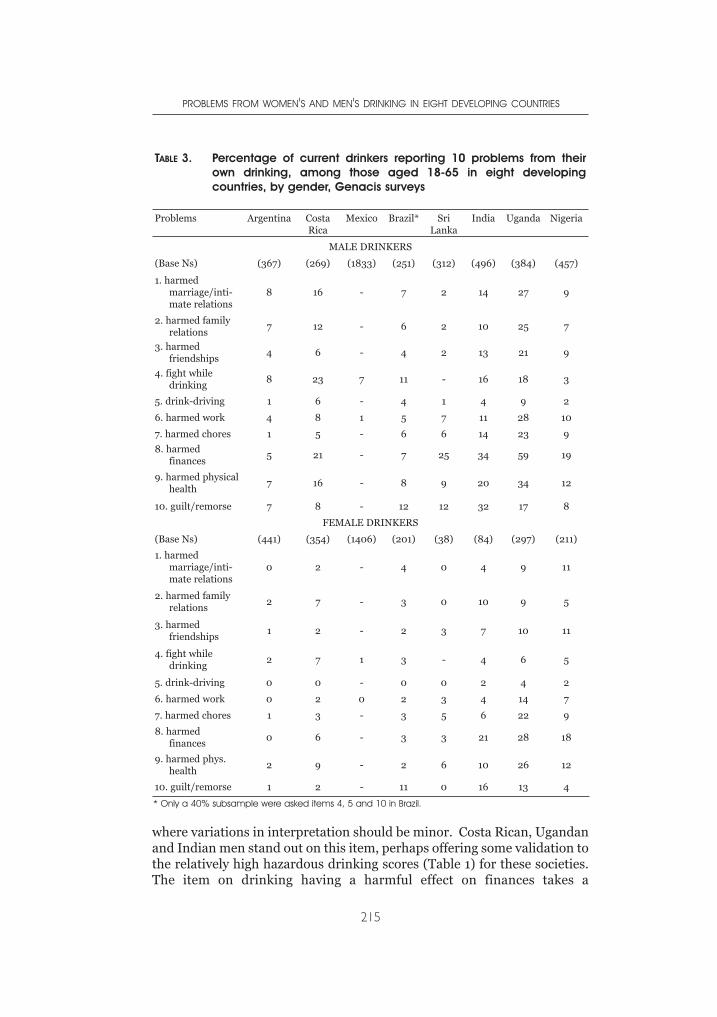
where variations in interpretation should be minor. Costa Rican, Ugandanand Indian men stand out on this item, perhaps offering some validation tothe relatively high hazardous drinking scores (Table 1) for these societies.The item on drinking having a harmful effect on finances takes a
PROBLEMS FROM WOMEN'S AND MEN'S DRINKING IN EIGHT DEVELOPING COUNTRIES
215
TABLE 3. Percentage of current drinkers reporting 10 problems from theirown drinking, among those aged 18-65 in eight developingcountries, by gender, Genacis surveys
Problems Argentina CostaRica
Mexico Brazil* SriLanka
India Uganda Nigeria
MALE DRINKERS
(Base Ns) (367) (269) (1833) (251) (312) (496) (384) (457)
1. harmedmarriage/inti-mate relations
8 16 - 7 2 14 27 9
2. harmed familyrelations
7 12 - 6 2 10 25 7
3. harmedfriendships
4 6 - 4 2 13 21 9
4. fight whiledrinking
8 23 7 11 - 16 18 3
5. drink-driving 1 6 - 4 1 4 9 2
6. harmed work 4 8 1 5 7 11 28 10
7. harmed chores 1 5 - 6 6 14 23 9
8. harmedfinances
5 21 - 7 25 34 59 19
9. harmed physicalhealth
7 16 - 8 9 20 34 12
10. guilt/remorse 7 8 - 12 12 32 17 8
FEMALE DRINKERS
(Base Ns) (441) (354) (1406) (201) (38) (84) (297) (211)
1. harmedmarriage/inti-mate relations
0 2 - 4 0 4 9 11
2. harmed familyrelations
2 7 - 3 0 10 9 5
3. harmedfriendships
1 2 - 2 3 7 10 11
4. fight whiledrinking
2 7 1 3 - 4 6 5
5. drink-driving 0 0 - 0 0 2 4 2
6. harmed work 0 2 0 2 3 4 14 7
7. harmed chores 1 3 - 3 5 6 22 9
8. harmedfinances
0 6 - 3 3 21 28 18
9. harmed phys.health
2 9 - 2 6 10 26 12
10. guilt/remorse 1 2 - 11 0 16 13 4
* Only a 40% subsample were asked items 4, 5 and 10 in Brazil.
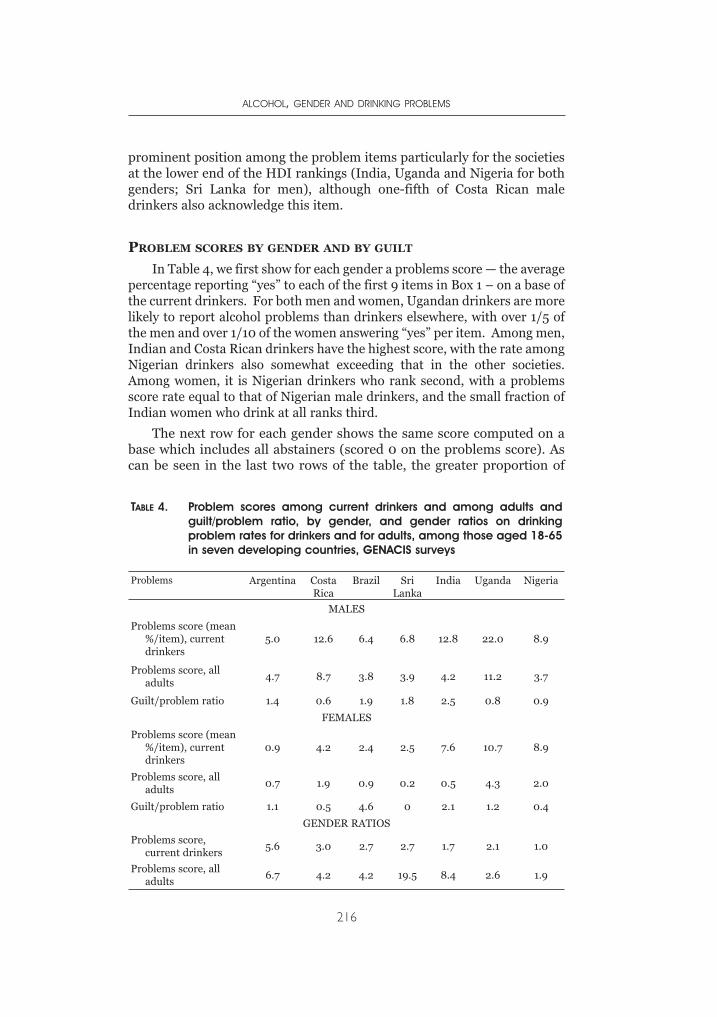
prominent position among the problem items particularly for the societiesat the lower end of the HDI rankings (India, Uganda and Nigeria for bothgenders; Sri Lanka for men), although one-fifth of Costa Rican maledrinkers also acknowledge this item.
PROBLEM SCORES BY GENDER AND BY GUILT
In Table 4, we first show for each gender a problems score — the averagepercentage reporting “yes” to each of the first 9 items in Box 1 – on a base ofthe current drinkers. For both men and women, Ugandan drinkers are morelikely to report alcohol problems than drinkers elsewhere, with over 1/5 ofthe men and over 1/10 of the women answering “yes” per item. Among men,Indian and Costa Rican drinkers have the highest score, with the rate amongNigerian drinkers also somewhat exceeding that in the other societies.Among women, it is Nigerian drinkers who rank second, with a problemsscore rate equal to that of Nigerian male drinkers, and the small fraction ofIndian women who drink at all ranks third.
The next row for each gender shows the same score computed on abase which includes all abstainers (scored 0 on the problems score). Ascan be seen in the last two rows of the table, the greater proportion of
ALCOHOL, GENDER AND DRINKING PROBLEMS
216
TABLE 4. Problem scores among current drinkers and among adults andguilt/problem ratio, by gender, and gender ratios on drinkingproblem rates for drinkers and for adults, among those aged 18-65in seven developing countries, GENACIS surveys
Problems Argentina CostaRica
Brazil SriLanka
India Uganda Nigeria
MALES
Problems score (mean%/item), currentdrinkers
5.0 12.6 6.4 6.8 12.8 22.0 8.9
Problems score, alladults
4.7 8.7 3.8 3.9 4.2 11.2 3.7
Guilt/problem ratio 1.4 0.6 1.9 1.8 2.5 0.8 0.9
FEMALES
Problems score (mean%/item), currentdrinkers
0.9 4.2 2.4 2.5 7.6 10.7 8.9
Problems score, alladults
0.7 1.9 0.9 0.2 0.5 4.3 2.0
Guilt/problem ratio 1.1 0.5 4.6 0 2.1 1.2 0.4
GENDER RATIOS
Problems score,current drinkers
5.6 3.0 2.7 2.7 1.7 2.1 1.0
Problems score, alladults
6.7 4.2 4.2 19.5 8.4 2.6 1.9
abstainers among women means that the gender ratio becomes highereverywhere when scores are computed on a base including the abstainers.Even on a base of all adults, the Ugandan sample stands out in bothgenders with a higher rate of reported problems than elsewhere, withCosta Rican males also showing a relatively high rate. On a populationbasis, only in Uganda does the alcohol problem score for females reachabove 2%.
As noted above, we included the item on feelings of guilt or remorseafter drinking in the present analysis with the idea of examining the extentto which disapproval of problematic drinking is internalized in thedifferent populations and subgroups. Table 3 shows that guilt or remorseafter drinking was particularly common among Indian drinkers of bothgenders, and also fairly common among Ugandan and Brazilian male andfemale drinkers and among Sri Lankan male drinkers. A guilt/problemscore ratio was computed and is shown in the third row for each gender inTable 4. On this basis, Indian and Brazilian problematic drinkers of bothgenders stand out as having relatively high guilt/problem ratios, with SriLankan males also relatively high. In Nigeria and Costa Rica, on the otherhand, the guilt/problem ratio was relatively low in both genders, and inUganda for males. The results of this analysis do not suggest thatUgandans might be specially sensitive to the existence of alcohol problems,which might have resulted in a lower threshold for reporting problems.
PROBLEM SCORES AND THE GUILT/PROBLEM RATIO BY GENDER AND
AGE
In Table 5 we extend the analysis of the problem score to the questionof variations by age. Argentinian males show the pattern which iscommonly found in studies in the U.S. (Hilton, 1991) and some otherdeveloped countries (though not all): the highest rate of alcohol-relatedproblems in young adulthood, a substantial drop-off after that, and afurther drop-off in older age. Costa Rican females also show this pattern,but elsewhere in the table the patterns are diverse. Among Ugandan maledrinkers, the highest rate is found in the middle age group, while amongUgandan females and Indians and Nigerians of both genders the oldest agegroup reports the highest rate. The findings are a strong caution that,considered in a global frame, patterns by age and gender differconsiderably.
Table 5 also shows results by gender and age for the guilt/problemratio described in the previous section. The base numbers are often small,making any ratio rather unstable; the Brazilian, Sri Lankan and Indianfemale figure should be treated with special caution. Looking at the othersamples, there is some evidence that the guilt/problem ratio declines withage among Argentinian and Nigerian male drinkers, but this does not seemto be a general tendency.
PROBLEMS FROM WOMEN'S AND MEN'S DRINKING IN EIGHT DEVELOPING COUNTRIES
217
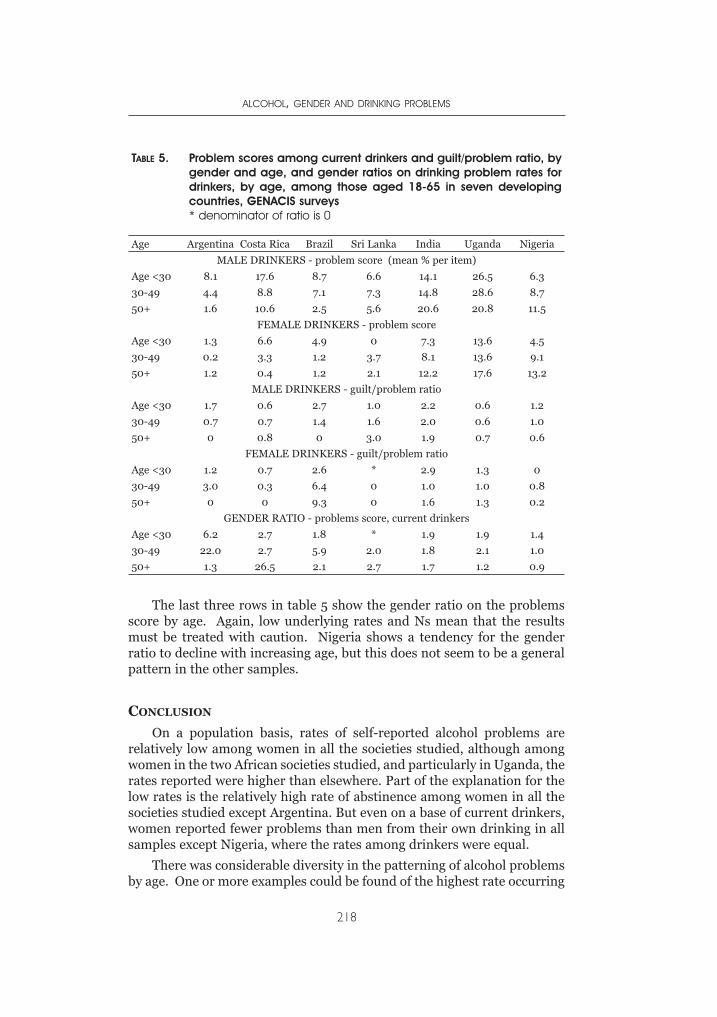
The last three rows in table 5 show the gender ratio on the problemsscore by age. Again, low underlying rates and Ns mean that the resultsmust be treated with caution. Nigeria shows a tendency for the genderratio to decline with increasing age, but this does not seem to be a generalpattern in the other samples.
CONCLUSION
On a population basis, rates of self-reported alcohol problems arerelatively low among women in all the societies studied, although amongwomen in the two African societies studied, and particularly in Uganda, therates reported were higher than elsewhere. Part of the explanation for thelow rates is the relatively high rate of abstinence among women in all thesocieties studied except Argentina. But even on a base of current drinkers,women reported fewer problems than men from their own drinking in allsamples except Nigeria, where the rates among drinkers were equal.
There was considerable diversity in the patterning of alcohol problemsby age. One or more examples could be found of the highest rate occurring
ALCOHOL, GENDER AND DRINKING PROBLEMS
218
TABLE 5. Problem scores among current drinkers and guilt/problem ratio, bygender and age, and gender ratios on drinking problem rates fordrinkers, by age, among those aged 18-65 in seven developingcountries, GENACIS surveys* denominator of ratio is 0
Age Argentina Costa Rica Brazil Sri Lanka India Uganda Nigeria
MALE DRINKERS - problem score (mean % per item)
Age <30 8.1 17.6 8.7 6.6 14.1 26.5 6.3
30-49 4.4 8.8 7.1 7.3 14.8 28.6 8.7
50+ 1.6 10.6 2.5 5.6 20.6 20.8 11.5
FEMALE DRINKERS - problem score
Age <30 1.3 6.6 4.9 0 7.3 13.6 4.5
30-49 0.2 3.3 1.2 3.7 8.1 13.6 9.1
50+ 1.2 0.4 1.2 2.1 12.2 17.6 13.2
MALE DRINKERS - guilt/problem ratio
Age <30 1.7 0.6 2.7 1.0 2.2 0.6 1.2
30-49 0.7 0.7 1.4 1.6 2.0 0.6 1.0
50+ 0 0.8 0 3.0 1.9 0.7 0.6
FEMALE DRINKERS - guilt/problem ratio
Age <30 1.2 0.7 2.6 * 2.9 1.3 0
30-49 3.0 0.3 6.4 0 1.0 1.0 0.8
50+ 0 0 9.3 0 1.6 1.3 0.2
GENDER RATIO - problems score, current drinkers
Age <30 6.2 2.7 1.8 * 1.9 1.9 1.4
30-49 22.0 2.7 5.9 2.0 1.8 2.1 1.0
50+ 1.3 26.5 2.1 2.7 1.7 1.2 0.9
in each of the three age groups studied. Thus the pattern found in U.S. andsome other studies, of a fall in alcohol problem rates in the late 20s andanother in or after the 50s, should not be assumed to hold elsewhere.Among African and Indian drinkers, indeed, there was evidence of anincrease in problem rates with increasing age.
Ugandan drinkers, both men and women, showed especially high ratesof alcohol problems, a finding which in general fits the data from othersources showing a high rate of per-capita alcohol consumption andrelatively hazardous drinking patterns. On a total-population basis, theproblem rates of Costa Rican men also stood out, and Nigerian womenstood out in comparison to other women.
The general conclusion to be drawn from alcohol’s relatively highranking as a risk factor for death and disability (Ezzati et al., 2002; Roomet al., 2005) is that a major effort to strengthen alcohol policies is neededon a global basis. The need is particularly strong, it would seem, in someof the countries included in the present analysis.
REFERENCES
Babor, T., Caetano, R., Casswell, S., Edwards, G., Giesbrecht, N., Graham, K.,Grube, J., Gruenewald, P., Hill, L., Holder, H., Homel, R., Österberg, E., Rehm,J., Room, R., & Rossow, I. (2003). Alcohol: No Ordinary Commodity –Research and Public Policy. Oxford, etc.: Oxford University Press.
Demers, A., Room, R., & Bourgault, C. (eds., 2001). Surveys of Drinking Patternsand Problems in Seven Developing Countries. Geneva: World HealthOrganization, Department of Mental Health and Substance Dependence,WHO/MSD/MSB/01.2.
Ezzati, M., Lopez, A.D., Rodgers, A., Vander Hoorn, S., Murray, C.J.L., & theComparative Risk Assessment Collaborating Group (2002) Selected majorrisk factors and global and regional burden of disease. The Lancet 360,1347-1360.
Hilton, M.E. (1991) The demographic distribution of drinking problems in 1984. In:W.B. Clark & M.E. Hilton, eds. Alcohol in America: Drinking Practices andProblems (pp. 87-101). Albany: State University of New York Press.
Rehm, J., Monteiro, M., Room, R., Gmel, G., Jernigan, D., Frick, U., & Graham, K.(2001). Steps towards constructing a global comparative risk analysis foralcohol consumption: determining indicators and empirical weights forpatterns of drinking, deciding about theoretical minimum, and dealing withdifferent consequences. European Addiction Research 7, 138-147.
Rehm, J., Room, R., Monteiro, M., Gmel, G., Graham, K., Rehn, N., Sempos, C.T.,Frick, U., & Jernigan, D. (2004). Alcohol. In: M. Ezzati, A.D. Lopez, A.Rodgers, & C.J.L. Murray, eds., Comparative Quantification of Health Risks:Global and Regional Burden of Disease Attributable to Selected Major RiskFactors. Volume 1 (pp. 959-1108). Geneva: World Health Organization.
Roizen, R. (1988). Cultural control of drinking by universal moderation ordifferential access. Presented at the annual meeting of the Society for Cross-Cultural Studies, El Paso, Texas, August.http://www.roizen.com/ron/elpaso.htm
PROBLEMS FROM WOMEN'S AND MEN'S DRINKING IN EIGHT DEVELOPING COUNTRIES
219
Room, R., Jernigan, D., Carlini-Marlatt, B., Gureje, O., Mäkelä, K., Marshall, M.,Medina-Mora, M.E., Monteiro, M., Parry, C., Partanen, J., Riley, L., & Saxena,S. (2002). Alcohol and Developing Societies: A Public Health Approach.Helsinki: Finnish Foundation for Alcohol Studies & Geneva: World HealthOrganization.
Room, R. (2005). Alcohol policy: issues and challenges for the W.H.O. EuropeanRegion. Presented at a WHO-Euro meeting on Alcohol Policy in the WHOEuropean Region, Stora Brännbo, Sigtuna, Sweden, 13-15 April.
Room, R., Babor, T., & Rehm, J. (2005). Alcohol and public health: a review. TheLancet 365:519-530.
WHO (2004). Global Status Report: Alcohol Policy. Geneva: World HealthOrganization, Department of Mental Health and Substance Abuse.
ALCOHOL, GENDER AND DRINKING PROBLEMS
220

VICTOR ADETULA
Dr Adetula is Associate Professor of political science at the University ofJos, Nigeria, with a wide range of experience in development work. He hasconducted research and published articles, book chapters and monographson broad issues of development in Nigeria, Africa and Europe.
JULIO BEJARANO
A researcher at Fundación Vida y Sociedad and the Instituto sobreAlcoholismo y Farmacodependencia, Costa Rica, Bejarano is also a professorof Psychology at Universidad Estatal a Distancia and at the IberoamericanMaster’s Degree Program on Drug Dependence. He has authored severalbooks and papers on alcohol and other drug epidemiology.
VIVEK BENEGAL
Dr Benegal is Associate Professor of psychiatry at the Deaddiction Centre atthe National Institute of Mental Health and Neuro-Sciences (NIMHANS),Bangalore, India, a regional centre for substance abuse studies for southernIndia. His areas of research interest are the epidemiology of alcohol usedisorders in India, genetics and neurobiology of alcoholism and the socialand political history of alcohol in the Indian sub-continent. His recent workhas focused on the prevalence of undocumented alcohol consumption, theassociation between alcohol and injuries in India and the study of high riskmarkers of susceptibility to alcoholism.
PRABHA S.CHANDRA
Dr Chandra is Additional Professor of Psychiatry at NIMHANS, anexecutive member of the Women’s Section of the World PsychiatricAssociation, and a member of the Advisory group on Behavioral Researchin HIV/AIDS of the Indian Council of Medical Research and the NationalAIDS Control Organization ( Governemnt of India). Her main areas ofinterest are: women’s mental health, psychosocial aspects of HIV/AIDS,HIV related risk among different populations including substance users.
ZUBAIRU KWAMBO DAGONA
Dagona is a Senior Lecturer and clinical psychologist with the Departmentof General and Applied Psychology, University of Jos, Nigeria. His areas ofresearch interest include child clinical psychology, psychology of substanceuse and abuse, and traffic psychology.
AUTHORS
ANA DURAND
A research assistant for Dr. Romero mainly in the study on addictionproblems in female prisoners, Durand obtained her bachelor’s degree inpsychology at the National Autonomous University of Mexico. She also hasa diploma in Eating Disorders and Addictions and currently studying forher master’s degree in psychotherapy. Her research interests are related tosexual abuse and substance abuse in women.
TRICIA M. F . FLORIPES
A Social worker in the Department of Neurology and Psychiatry ofBotucatu Medical School, University of São Paulo State (UniversidadeEstadual Paulista, Floripes has a FAPESP fellowship and her main interestis in treatment and prevention of alcohol abuse.
G. GURURAJ
Dr Gururaj is Professor and Head of the Department of Epidemiology (aWHO Collaborating Centre for injury prevention and safety promotion) atthe National Institute of Mental Health and Neuro-Sciences, Bangalore,India. His primary interests are injury epidemiology, prevention andcontrol, and psychiatric epidemiology. He is actively involved intranslation of research to policies and programmes at local and nationallevels. He is a member of several technical committees and has severalpublications to his credit.
ANDREA M. HEGEDUS
Research Assistant Professor in the Department of Psychiatry at theUniversity of Michigan, An Arbor, USA, Dr Hegedus’ interests includealcohol and associated consequences with a special interest in gender issues.
SIRI HETTIGE
Senior Professor of Sociology at the University of Colombo, Dr Hettige’sresearch and writing on alcohol issues spread over the last two decades. Hehas publicly advocated the need for a comprehensive national policy onalcohol in Sri Lanka, a goal yet to be achieved. He has B.A. and B.Phil.degrees in sociology from the University of Colombo and a Ph.D. degree inSocial Anthropology from Monash University, Australia.
AKANIDOMO K. J. IBANGA
Ibanga is Senior Lecturer in the Department of Psychology University ofJos, Jos, Nigeria, and deputy director, Centre for Research and
ALCOHOL, GENDER AND DRINKING PROBLEMS
222
Information on Substance Abuse (CRISA), Jos. He has been activelyengaged in research and writing on alcohol and other drugs with severalpublications and book chapters in this area.
HARUNA KARICK
Karick is a Lecturer in clinical psychology with the Department of Generaland Applied Psychology of the University of Jos, Jos, Nigeria. His researchinterests include substance abuse and stress management.
FLORENCE KERR-CORRÊA
Dr Kerr-Corrêa is a Professor of Psychiatry at the Department of Neurologyand Psychiatry of Botucatu Medical School, University of São Paulo State(Universidade Estadual Paulista), UNESP Brazil. She is responsible for theUNESP Treatment and Prevention Program on Alcohol and Drug Abuseand has a special interest in gender issues concerning alcohol/drug abuseand affective disorders.
LIGIA R. S. KERR-PONTES
Associate Professor of Epidemiology in the Department of Epidemiology atthe Department of Community Health of the Federal University of Ceará,her primary areas of work are in HIV and leprosy. She is a consultant onSTD and AIDS Programme of the Brazilian Ministry of Health and of theD. Libânia National Reference Centre of Leprosy.
NAZARIUS TUMWESIGYE MBONA
A Lecturer in the Department of Biostatistics and Epidemiology at theInstitute of Public Health, Makerere University, Kampala, Uganda, Mbonais currently on study leave pursuing a doctoral degree at the University ofSouthampton, UK. He has a Mater of Arts degree in demography fromMakerere University and a Master of Science degree in medical statisticsfrom the London School of Hygiene and Tropical Medicine (LSHTM). Hisresearch interests include dynamics of condom use and sexual abstinence,general sexual and reproductive health, and how alcohol use might belinked to sexual activity and condom use.
MA. ELENA MEDINA-MORA
Professor in the Faculty of Medicine and Faculty of Psychology at theNational Autonomous University of Mexico and director ofEpidemiological and Psychosocial Research at the National Institute ofPsychiatry, Medina-Mora is a pioneer in epidemiological studies on
AUTHORS
223
addictions in Mexico and has been in charge of the National AddictionsSurvey that has provided fundamental information for health policies inMexico in relation to addiction problems. She has served in many advisorycommittees of the World Health Organization.
MYRIAM MUNNE
Psychologist with postgraduate training in alcohol and drugs research atthe University of Buenos Aires, Argentina, Munne has worked as aresearcher in NGOs, Ministry of Justice, and the National Council of Youthand Family of Argentina and collaborated in prevention programmes onsubstance abuse at the University of Buenos Aires. She was PrincipalInvestigator of the GENACIS study in Argentina, and study leader forArgentina in the Multicentric Study on Gender, Alcohol and Harm ofAlcohol and Drug Abuse at the Pan American Health Organization(PAHO).
PRATIMA MURTHY
Murthy is Additional Professor of psychiatry at the National Institute ofMental Health and Neuro Sciences, Bangalore, India, where shecompleted her psychiatric training. She has been a consultant to theInternational Labour Organization and the United Nations Office onDrugs and Crime. She has authored monographs on women andsubstance use in India and community based drug rehabilitation andworkplace prevention.
MADHABIKA B. NAYAK
Dr Nayak is Associate Scientist at the Alcohol Research Group, PublicHealth Institute in Berkeley, California. Her research, clinical, andteaching interests pertain to health issues, including interpersonalviolence and cultural factors that affect both drinking and health. Herrecent work has focused on problematic and risky drinking andrelationships among alcohol use, interpersonal violence, and health.
ISIDORE S. OBOT
Currently a Scientist in the Department of Mental Health and SubstanceAbuse at the World Health Organization, Geneva, Switzerland, Dr Obot’scareer in the addictions field and as a teacher of psychology in Nigeria andthe USA spans over twenty years. He is founding Editor-in-chief of theAfrican Journal of Drug and Alcohol Studies and Assistant Editor ofAddiction. His research interests are in substance use epidemiology andprevention.
ALCOHOL, GENDER AND DRINKING PROBLEMS
224
OCHINYA OJIJI
Dr Ojiji is a social psychologist and assistant director at the Centre forPeace and Conflict Resolution in Abuja, Nigeria. He was formerly a lecturerin the Department of Psychology at the University of Jos, and theUniversity of Uyo, Nigeria.
DHARMADASA PARANAGAMA
A statistician and a demographer in training, he functioned as the researchofficer for the GENACIS study in Sri Lanka is. Paranagama has a B. A.degree in anthropology from the University of Vidyodaya, Sri Lanka, aDiploma in Population Studies from University of Colombo and a Masterof Arts degree in demography from the Australian National University.
ROGERS KASIRYE
Director of the Uganda Youth Development Link (UYDEL), anorganization that runs prevention and counseling programmes for youngpeople in Uganda, Kasirye was the first winner of the Vienna Civil SocietyAward of the United nations Office on Drugs and Crime in 1999. He hasbeen an investigator in alcohol related studies in Uganda.
MARTHA ROMERO
Dr Romero obtained her clinical psychology degree at the UniversidadIberoamericana, Mexico City and a Master’s degree in clinical psychologyat the National Autonomous University of Mexico. She has been workingsince 1985 at the National Institute of Psychiatry as a researcher. Her mainresearch interests have been in qualitative research and the study ofaddictions in women.
ROBIN ROOM
Robin Room is Professor and Director of the Centre for Social Research onAlcohol and Drugs at Stockholm University, Stockholm, Sweden. Hisresearch focus has been on epidemiological, social and cultural studies ofalcohol, but he has also done work in other areas of drug and gamblingproblems. He is a coauthor of Alcohol in Developing Societies: A PublicHealth Approach (2002) and a coeditor of Surveys of Drinking Patternsand Problems in Seven Developing Countries (2001).
ALESSANDRA F. SANCHES
Social worker in the Department of Neurology and Psychiatry of Universityof Sao Paulo (Unesp) at Botucatu Medical School, she completed a Fapesp
AUTHORS
225
(Fundação do Amparo à Pesquisa do Estado de São Paulo) fellowship. Herprimary interest is in treatment and prevention of alcohol abuse.
KLARA HRADILOVA SELIN
Klara H. Selin is a PhD student in sociology at the Centre for SocialResearch on Alcohol and Drugs at Stockholm University, Stockholm,Sweden. Her main research area is epidemiological studies on drinkingbehaviour, with a special interest in family matters, informal socialcontrol and harm from drinking to a third party.
LUZIA A. TRINCA
Trinca is Associate Professor of Statistics in the Department ofBiostatistics, Biosciences Institute, UNESP, Sao Paulo, Brazil. She hasconsiderable experience working in addiction research.
ADRIANA M. TUCCI
Psychologist with a Master’s degree in Mental Health and doctoral studentin the Department of Psychobiology, São Paulo Federal University(UNIFESP) where she is working on child abuse and its co-occurrence withalcohol and drug abuse.
JORGE VILLATORO
Social researcher at the Direction of Epidemiological and Social Researchat the National Institute of Psychiatry. He has been in charge of developingthe Student Survey on Addictions that provides information for MexicoCity and also at the national level. He teaches statistics at the Master’s andDoctorate degree programmes on public and mental health areas.
RICHARD W. WILSNACK
Dr Wilsnack is Professor in the Department of Clinical Neuroscience,University of North Dakota School of Medicine and Health Sciences andeditor (with Sharon Wilsnack) of the book Gender and Alcohol: Individualand Social Perspectives (Rutgers Center of Alcohol Studies, 1997). He hasserved as a consultant on alcohol research for the National Institute onAlcohol Abuse and Alcoholism and for the Robert Wood JohnsonFoundation, and as chair of the Drinking and Drugs Division of the Societyfor the Study of Social Problems. His current research interests are in (1)how biology and culture combine to create gender differences in alcoholuse, (2) how men and women drink as couples, and (3) how women’sdrinking patterns change across their lifespans.
ALCOHOL, GENDER AND DRINKING PROBLEMS
226
SHARON CARLSON WILSNACK
Chester Fritz Distinguished Professor in the Department of ClinicalNeuroscience, University of North Dakota School of Medicine and HealthSciences, she is co-editor with Linda Beckman of the volume AlcoholProblems in Women: Antecedents, Consequences, and Intervention (NewYork: Guilford Press, 1984) and with Richard Wilsnack of Gender andAlcohol: Individual and Social Perspectives (Rutgers Center of AlcoholStudies, 1997). Sharon Wilsnack is a Fellow of the American PsychologicalAssociation and has served in numerous boards and advisory groups,including as a member of the National Advisory Committee, White HouseOffice of National Drug Control Policy.
AUTHORS
227