Embed Size (px)
Citation preview

Research
Alcohol-related mortality following self-harm:a multicentre cohort study
Helen Bergen1, Keith Hawton1, Roger Webb2, Jayne Cooper2, Sarah Steeg2, Matthew Haigh2,3,
Jennifer Ness4, Keith Waters4 and Navneet Kapur2
1Department of Psychiatry, Centre for Suicide Research, Warneford Hospital, University of Oxford, Headington, Oxford
OX3 7JX, UK2Centre for Suicide Prevention in the Centre for Mental Health and Risk, University of Manchester, Jean McFarlane Building,
Oxford Road, Manchester M13 9PL, UK3Department of Psychology, Northumbria University, Newcastle upon Tyne NE1 8ST, UK4Derbyshire Healthcare NHS Foundation Trust, Mental Health Liaison Team, Royal Derby Hospital, Derby DE22 3NE, UK
Corresponding author: Keith Hawton. Email: [email protected]
Abstract
Objectives: To assess alcohol-related premature death in
people who self-harm compared to the general population,
including variation by socioeconomic deprivation.
Design: A retrospective longitudinal cohort analysis from
the Multicentre Study of self-harm in England, 1 January
2000 to 31 December 2010, with cause-specific mortality
follow-up through to 31 December 2012.
Setting: Six emergency departments in Oxford,
Manchester and Derby.
Participants: All individuals aged 15 years or more who
presented with self-harm (n¼ 39,014) to general hospital
emergency departments, together with follow-up mortality
information from the Data Linkage Service of the Health
and Social Care Information Centre.
Main outcome measures: Standardised mortality ratios
(observed/expected number of deaths: SMRs) and mean
number of years of life lost (YLL) were estimated for alco-
hol-related mortality. Patients’ characteristics and clinical
management following self-harm were also examined.
Results: After 7.5 years’ (median) follow-up, 2695 individuals
(6.9%) had died, significantly more males (9.5%) than females
(5.0%), including 307 (11.4%) from alcohol-related causes.
Alcohol-related death was more frequent than expected in
both males (SMR 8.5, 95% CI 7.3 to 9.8) and females (11.6, 9.8
to 13.7), equating to 33.7 YLL (95% CI 32.4 to 35.0) in males
and 38.1 YLL (36.6 to 39.6) in females. It was not associated
with area-level socioeconomic deprivation. Alcohol-related
death was associated with unemployed/sick/disabled status,
alcohol use during self-harm, referral to drug/alcohol services
and lack of psychosocial assessment following self-harm.
Conclusions: Hospital-presenting self-harm patients should
receive assessment following self-ham according to national
guidance to enable early identification and treatment of
alcohol problems.
Keywordsself-harm, alcohol, alcohol misuse, socio-economic depriva-
tion, mortality follow-up
Introduction
Alcohol misuse is the third leading contributor to theglobal burden of disease.1 Elevated morbidity andmortality from excessive alcohol consumption is amajor public health problem in the UK,2 and else-where.1 In England, it is a particular focus of newgovernment initiatives3 and public health strategiesto reduce avoidable deaths.4 Alcohol-related deathsin the UK doubled between 1991 and 2004,5 thenstabilised during 2002 to 2011, though with persistentgeographical differences6 and variation by socioeco-nomic deprivation.5
Self-harm (SH; intentional self-injury and self-poi-soning with or without suicidal intent) is also a majorpublic health problem,7 accounting for approxi-mately 220,000 emergency department (ED) presen-tations in England annually.8 Alcohol problemsoccur frequently,9 with half of all SH presentationsto EDs involving alcohol,10,11 and a quarter ofpatients diagnosed with harmful alcohol use.12
Alcohol misuse increases suicide risk in the SHpopulation,13 and contributes to premature mortalityfrom physical causes.14 The exact extent of excessmortality from specific alcohol-related disease5 hasnot previously been examined in the SH population.Knowledge of patients’ characteristics and aspects ofclinical management following SH may inform clin-ical practice.
We have investigated alcohol-related mortality inrelation to:
(i) risks in the SH population relative to the generalpopulation using standardised mortality ratios(SMRs) and years of life lost (YLL);
(ii) variation in SMRs by area-level socioeconomicdeprivation; and
! 2014 The Author(s)
Creative Commons CC-BY-NC: This article is distributed under the terms of the Creative Commons Attribution-NonCommercial 3.0 License (http://www.
creativecommons.org/licenses/by-nc/3.0/) which permits non-commercial use, reproduction and distribution of the work without further permission provided
the original work is attributed as specified on the SAGE and Open Access page (http://www.uk.sagepub.com/aboutus/openaccess.htm).
Journal of the Royal Society of Medicine Open;
5(8) 1–11
DOI: 10.1177/2054270414533326

(iii) patient characteristics and clinical managementfollowing SH.
Method
Setting and sample
The study was undertaken in three centres in theMulticentre Study of SH in England. The studypopulation,15 risks of suicide and accidental deathfollowing SH16 and methods used for SH and sui-cide17 have been described previously. Data were col-lected on all individuals who presented with non-fatalSH to general hospital EDs in Oxford (one),Manchester (three) and Derby (two) during the 11-year period, 1 January 2000 to 31 December 2010.Non-fatal SH was defined as intentional self-poison-ing or self-injury, irrespective of motivation or degreeof suicidal intent.18 Following SH, most patientsreceived a psychosocial assessment by specialist psy-chiatric clinicians (and some by ED staff).Demographic, clinical and hospital managementdata on each episode (including referral for aftercare)were collected by clinicians using standardised formsor electronic data entry. Patients not receiving anassessment were identified through scrutiny of EDand medical records, from which more limited datawere extracted by research clerks, or in one centre byclinicians (including sociodemographic informationand methods of SH). Alcohol involvement in SH(ingestion at the time of, or within 6 h prior to SH)was determined during specialist psychosocial or EDassessment, or from medical records.
Indicator of socioeconomic status
SMRs were calculated by quartile of socioeconomicdeprivation. Individuals’ residential postcodes attheir first episode of SH were linked to the Index ofMultiple Deprivation in England (IMD) 2007,19 inwhich higher scores indicate greater deprivation. Ofthe 354 local authority areas in England, Manchesterwas ranked fourth most deprived, Derby 69th andOxford 155th. Average IMD scores for Englandranged from 4.1 to 47.0, with quartiles: <11.8(25%), 17.3 (50%), 24.5 (75%) and >24.5.Multicentre sample IMD score quartiles were:<14.3 (25%), 29.7 (50%), 49.5 (75%) and >49.5.
Mortality
Mortality information was supplied by the DataLinkage Service of the National Health Service(NHS).20 Data used for tracing included name, sex,date of birth, NHS number and postcode of last
address. Individuals were followed up from 1January 2000 to 31 December 2012. Observationtime for individuals ended when they died or emi-grated from the UK.
We obtained alcohol-related death5 rates inEngland from the Office for National Statistics.2
Alcohol-related deaths included ICD-10 classifica-tions: mental and behavioural disorder due to alcohol(F10), degeneration of the nervous system due toalcohol (G31.2), alcoholic polyneuropathy (G62.2),alcoholic cardiomyopathy (I42.6), alcoholic gastritis(K29.2), alcohol liver disease (K70), chronic hepatitisnot elsewhere classified (K73), fibrosis and cirrhosisof the liver (K74) (excluding biliary cirrhosis [K74.3-K74.5]), alcohol-induced pancreatitis (K86.0), acci-dental and intentional poisoning by alcohol (X45,X65), and alcohol poisoning of undetermined intent(Y15). We report age SMR for alcohol-related death,by sex.
Statistical analyses
Standardised mortality ratios. Individuals traced for anylength of time were included. SMRs with exact 95%Poisson confidence intervals (CIs) were calculated forindividuals aged� 15 years from observed (O)/expected (E) number of deaths (based on generalpopulation rates for England), by age groups (15–34,35–54, 55–74, 75þ) and sex, for years 2000 to 2012.
Years of life lost. YLL were calculated from interim lifetables 1999–2001 to 2009–2011 for England.21 Lifeexpectancy was extracted for each individual at theage of death in the appropriate year, which corres-ponds to YLL. Mean values of YLL (total YLLdivided by number of deaths) with 95% CIs arereported, and findings by sex and year are presentedgraphically.
Logistic regression models. A binary logistic regressionwas undertaken with dependent variable alcohol-related death (yes/no) and independent variablesbased on information collected at each individual’sfirst episode of SH. Univariate models were deter-mined initially, then multivariate models as follows:step (i) inclusion of patient characteristic and clinicalmanagement variables (age, sex, employment status,method of SH, alcohol involvement, admission, spe-cialist assessment) that were significant in univariateanalyses (p< 0.2); step (ii) forward conditional step-wise (p< 0.05) entry of clinical aftercare variablesthat were significant in univariate analyses (p< 0.2)(referral to GP, current contact or new referral topsychiatric outpatient care, current contact or newreferral to drug/alcohol services).
2 Journal of the Royal Society of Medicine Open 5(8)

The ‘not known’ category for alcohol involvementwas included (as well as yes/no) because it has clinicalsignificance – many of these patients were notassessed, often because they were intoxicated withalcohol.22 Information on general hospital admissionfollowing SH presentation was not reliably collectedin Centre B during 2000–2004. Data on referrals todrug/alcohol services were not available in Centre A,these referrals being included in other categories ofaftercare. Thus two sensitivity analyses were carriedout excluding data for these centres. We adjusted themultivariate model for centre differences. Analyseswere conducted using SPSS v19.
Results
Sample
During 2000 to 2010, 41,286 individuals presentedwith SH and were followed up to the end of 2012.Individuals (940, 2.3%) not traced were excluded; 141individuals were censored due to emigration duringfollow-up. Of the 40,346 traced individuals, 1285(3.2%) aged under 15 years and 47 (0.1%) withunknown age were excluded from analyses. Thusthe study sample was 39,014 individuals aged� 15years (including 15 with unknown gender).Characteristics of the individuals at their first episodeof SH grouped according to alcohol involvement atthe time or within 6 h of SH are given in Table 1.
Overall, the sample was predominantly female(16,508/39,014, 57.7%), aged between 15 and 34years (24,169/39,014, 61.9%) and of White ethnicity(25,676/39,014, 89.9%). Most individuals at their firstepisode of SH in the study period used self-poisoningalone (31,557/39,014, 80.9%), 6088 used self-injuryalone (15.6%) and 1369 (3.5%) used both methods(Table 1). The most common method of self-injurywas cutting (5827/7457, 78.1%).
The majority of individuals (22,230/39,014, 57.0%)received a specialist psychosocial assessment followingSH. The remaining 43.0% (16,784/39,014) received anED assessment or advice from liaison psychiatry ser-vices or had no assessment following SH. Alcohol wasinvolved in 43.0% of first episodes (16,775/39,014),was not involved in 33.2% (12,941/39,014) and in23.8% (9298/30,914) alcohol involvement wasunknown. Of the 16,784 individuals who did notreceive a specialist psychosocial assessment, 31.7%had alcohol involved, 22.0% had no alcohol involve-ment and in 46.3%alcohol involvementwas unknown.
Deaths
After a median follow-up of 7.5 years, 6.9% (2695/39,014) of individuals had died. Deaths were more
frequent in males (1565/16,508, 9.5%) than females(1130/22,491, 5.0%; �2¼ 293.9, df¼ 1, p< 0.001).Alcohol-related deaths, 307/2695 (11.4%) occurredin a similar proportion of males (170/1565, 10.9%)and females (137/1130, 12.1%; �2¼ 1.03, df¼ 1,p¼ 0.309). Alcohol-related deaths were similar inthe three centres (Manchester 173/19,237, 0.9% vs.Oxford 57/9043, 0.6% vs. Derby 77/10,734, 0.7%;�2¼ 6.6, df¼ 2, p¼ 0.037).
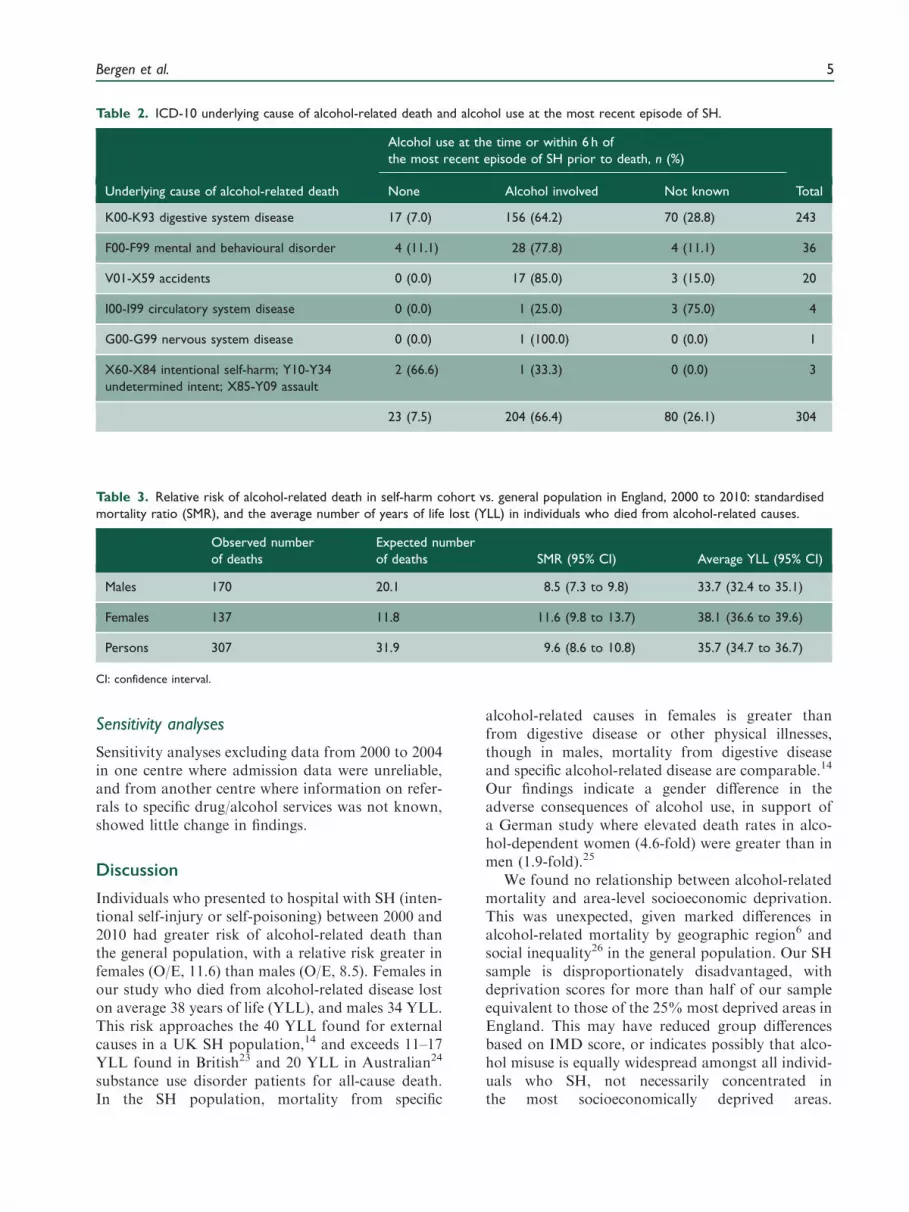
Of the 307 alcohol-related deaths, 243 (79.2%)were from digestive disease (ICD-10 K00-K93), 36(11.7%) from mental and behavioural disorder(ICD-10 F00-F99), 20 (6.5%) from accidents (V01-X59), four (1.3%) from circulatory disease (ICD-10I00-I99) and the remaining three (0.9%) from suicide(X60-X84), of undetermined intent (Y10-Y34) orassault (X85-Y09). Details of the underlying causeof alcohol-related cause of death and alcohol use atthe most recent episode of SH are given in Table 2.Two-thirds of those who died had alcohol involve-ment at their most recent episode of SH, 7.5% hadnot used alcohol and in 26.1% this information wasnot known (Table 2).
Of all 2695 deaths, 354 (13.1%) were from digest-ive disease (ICD-10 K00-K93), and of these, 243(68.6%) were also alcohol-related, and 111 (31.4%)were unrelated to alcohol.
Risk of alcohol-related death compared to the general
population. Compared to the expected numbers ofalcohol-related deaths based on general populationrates, observed deaths were eight times greater inmales, 11 times greater in females and nine timesgreater for the sexes combined (Table 3).
The mean YLL lost for males was 33.7 years (95%CI 32.4 to 35.0), for females was 38.1 (95% CI 36.6 to39.6) and for the sexes combined was 35.7 (95% CI35.0 to 36.7) (Table 3). Figure 1 shows YLL for malesand females who died, by year.
Risk of alcohol-related death compared to the general popu-
lation, by area-level socioeconomic deprivation at the first
episode of SH. IMD scores were unknown for 6.4%of individuals (2505/39,014); however, the proportionwith unknown data was similar in those who diedfrom alcohol-related causes (12/307, 3.9%) and inother individuals (2493/38,707, 6.4%, �2¼ 3.25,df¼ 1, p¼ 0.071).
Further examination showed that 58% of the SHsample had IMD scores greater than 24.5, which wasthe cut-off for the 25% most deprived local authorityareas in England.
Alcohol-related mortality showed no relationshipwith deprivation in males (Figure 2(a)) or females(Figure 2(b)).
Bergen et al. 3

Clinical management and aftercare following SH. Weexamined associations between alcohol-relateddeaths (yes/no) and the characteristics and clinicalmanagement of patients following SH in person-based analyses (Table 4).
Univariate models (Table 4) show strong associ-ations of alcohol-related death with unemploymentand sick/disability status (vs. employed), alcoholinvolvement during SH, and unknown alcoholinvolvement (vs. none), and general hospital
admission status unknown (vs. not admitted); and aweak association with self-poisoning (vs. self-injury).
The multivariate model (Table 4) shows that aftercontrolling for age, sex, method of SH and centredifferences, alcohol-related death was strongly asso-ciated with unemployment and sick/disability status,alcohol involvement at SH or unknown alcoholinvolvement, referral to drug/alcohol services andwith lack of psychosocial assessment following SH(36% less likely).
Table 1. Characteristics of individuals at the first episode of self-harm (SH) in the study period, 2000 to 2010.
Alcohol use at the time or within 6 h of the first
episode of SH in the study period, n (%)
None Alcohol involved Not known Total
Gender*
Male 4614 (28.0) 7727 (46.8) 4167 (25.2) 16,508
Female 8320 (37.0) 9045 (40.2) 5126 (22.8) 22,491
Age group
15–34 years 8584 (35.5) 9530 (39.4) 6055 (25.1) 24,169
35–54 years 3244 (26.6) 6311 (51.8) 2636 (21.6) 12,191
55–74 years 783 (37.6) 834 (40.0) 468 (22.4) 2085
75þ years 330 (58.0) 100 (17.6) 139 (24.4) 569
Ethnic group*
White 9460 (36.8) 12,774 (49.8) 3442 (13.4) 25,676
Black 425 (52.5) 256 (31.6) 129 (15.9) 810
South Asian 861 (67.3) 174 (13.6) 245 (19.1) 1280
Other 370 (44.5) 210 (25.3) 251 (30.2) 831
Employment status*
Employed 3703 (35.8) 5828 (56.3) 819 (7.9) 10,350
Unemployed 3136 (36.8) 4308 (50.6) 1069 (12.6) 8513
Sick/disabled 1113 (43.7) 1308 (51.3) 128 (5.0) 2549
Household duties/student/retired 3803 (50.0) 2490 (32.8) 1307 (17.2) 7600
Method of SH
Self-poisoning only 10,783 (34.2) 14,097 (44.7) 6677 (21.2) 31,557
Self-injury only 1660 (27.3) 2022 (33.2) 2406 (39.5) 6088
Both self-poisoning and self-injury 498 (36.4) 656 (47.9) 215 (15.7) 1369
*There were some missing values for gender (n¼ 15), employment status (25.6%) and ethnic group (26.7%)
4 Journal of the Royal Society of Medicine Open 5(8)
Sensitivity analyses
Sensitivity analyses excluding data from 2000 to 2004in one centre where admission data were unreliable,and from another centre where information on refer-rals to specific drug/alcohol services was not known,showed little change in findings.
Discussion
Individuals who presented to hospital with SH (inten-tional self-injury or self-poisoning) between 2000 and2010 had greater risk of alcohol-related death thanthe general population, with a relative risk greater infemales (O/E, 11.6) than males (O/E, 8.5). Females inour study who died from alcohol-related disease loston average 38 years of life (YLL), and males 34 YLL.This risk approaches the 40 YLL found for externalcauses in a UK SH population,14 and exceeds 11–17YLL found in British23 and 20 YLL in Australian24
substance use disorder patients for all-cause death.In the SH population, mortality from specific
alcohol-related causes in females is greater thanfrom digestive disease or other physical illnesses,though in males, mortality from digestive diseaseand specific alcohol-related disease are comparable.14
Our findings indicate a gender difference in theadverse consequences of alcohol use, in support ofa German study where elevated death rates in alco-hol-dependent women (4.6-fold) were greater than inmen (1.9-fold).25
We found no relationship between alcohol-relatedmortality and area-level socioeconomic deprivation.This was unexpected, given marked differences inalcohol-related mortality by geographic region6 andsocial inequality26 in the general population. Our SHsample is disproportionately disadvantaged, withdeprivation scores for more than half of our sampleequivalent to those of the 25% most deprived areas inEngland. This may have reduced group differencesbased on IMD score, or indicates possibly that alco-hol misuse is equally widespread amongst all individ-uals who SH, not necessarily concentrated inthe most socioeconomically deprived areas.
Table 2. ICD-10 underlying cause of alcohol-related death and alcohol use at the most recent episode of SH.
Alcohol use at the time or within 6 h of
the most recent episode of SH prior to death, n (%)
Underlying cause of alcohol-related death None Alcohol involved Not known Total
K00-K93 digestive system disease 17 (7.0) 156 (64.2) 70 (28.8) 243
F00-F99 mental and behavioural disorder 4 (11.1) 28 (77.8) 4 (11.1) 36
V01-X59 accidents 0 (0.0) 17 (85.0) 3 (15.0) 20
I00-I99 circulatory system disease 0 (0.0) 1 (25.0) 3 (75.0) 4
G00-G99 nervous system disease 0 (0.0) 1 (100.0) 0 (0.0) 1
X60-X84 intentional self-harm; Y10-Y34
undetermined intent; X85-Y09 assault
2 (66.6) 1 (33.3) 0 (0.0) 3
23 (7.5) 204 (66.4) 80 (26.1) 304
Table 3. Relative risk of alcohol-related death in self-harm cohort vs. general population in England, 2000 to 2010: standardised
mortality ratio (SMR), and the average number of years of life lost (YLL) in individuals who died from alcohol-related causes.
Observed number
of deaths
Expected number
of deaths SMR (95% CI) Average YLL (95% CI)
Males 170 20.1 8.5 (7.3 to 9.8) 33.7 (32.4 to 35.1)
Females 137 11.8 11.6 (9.8 to 13.7) 38.1 (36.6 to 39.6)
Persons 307 31.9 9.6 (8.6 to 10.8) 35.7 (34.7 to 36.7)
CI: confidence interval.
Bergen et al. 5

Further, unemployed and sick/disabled individualshad greater alcohol-related mortality than employedindividuals, thus social inequality and exclusion arealso probably involved.
Our finding that many individuals dying of alco-hol-related disease were offered referral to drug/alcohol services indicates that the seriousness oftheir alcohol use was identified at assessment follow-ing SH. Participation in specialised alcohol depend-ence treatment compared to detoxification only or no
treatment, however, did not extend survival time inalcohol-dependent individuals in Germany, suggest-ing that co-occurring health risk behaviour and treat-ment too late after disease progression may havemasked treatment effects.25 Thus early interventionis vital.
Following SH presentation, an opportunity existsto assess physical health and risk behaviour, as wellas mental health needs and risks. UK studies haveshown that tackling alcohol misuse was key to
Figure 1. Life expectancy of (a) male patients (there were no deaths in year 2000) and (b) female patients who self-harmed and
died of alcohol-related disease compared with an age-matched sample of the general population in England.
6 Journal of the Royal Society of Medicine Open 5(8)

recovery from SH behaviour in some individuals,27
and brief interventions in inpatient and ED settingsmay help reduce alcohol use,28 especially where injuryis attributed to alcohol use.29
We also identified individuals at increased risk ofalcohol-related mortality who did not receive special-ist assessment following SH, on whom informationwas lacking. SH patients taking early discharge30
and those not assessed22 are more likely to have con-sumed alcohol prior to SH or have been intoxicatedon presentation. Temporary admission and delayedassessment to allow recovery have been suggested toalleviate this problem.31
Strengths and weaknesses
Our sample includes all ED presentations for SH overan 11-year period. The large size and high proportion(97.7%) of individuals traced during a two to 13-yearfollow-up add weight to our findings.
The definition of alcohol-related death5 includesdiseases most directly due to alcohol consumption,excluding those with only some causal relationship,such as oesophageal and liver cancer andulcers. Therefore our findings may underestimatethe true extent of alcohol-related mortality in thispopulation.
Our data on alcohol involvement at the time of orprior to SH were based upon clinicians’ assessment ofindividuals’ self-reported alcohol use rather than useof an itemised scale. Some data required for
Figure 2. Age-standardised mortality ratios (SMRs) for
alcohol-related death by socioeconomic deprivation (Index
of Multiple Deprivation, 2007) category in (a) male patients
and (b) female patients (bars indicate 95% CIs; IMD 2007
quartiles: scores less than 14.3 (25%), 29.7 (50%), 49.5
(75%), and scores of 49.5 or more; higher scores indicate
greater deprivation).
Table 4. Characteristics of individuals and clinical management at the first episode of self-harm and subsequent alcohol-related
death*.
Binary logistic regression analyses
Total N¼ 39,014,
n/N (%)
Univariate, odds
ratio (95% CI) p
Multivariate,y odds
ratio (95% CI) p
Patient characteristics
Sexz
Male 170/16,508 (1.0) 1.0 (reference) 1.0 (reference)
Female 137/22,491 (0.6) 0.59 (0.47–0.74) <0.001 0.80 (0.64–1.01) 0.143
Age in years 307/39,014 (0.8) 1.04 (1.03–1.05) <0.001 1.05 (1.04–1.06) <0.001
Employment status
Employed 48/10,350 (0.5) 1.0 (reference) 1.0 (reference)
Unemployed 97/8513 (1.1) 2.5 (1.7–3.5) <0.001 2.1 (1.5–3.0) <0.001
(continued)
Bergen et al. 7

Table 4. Continued.
Binary logistic regression analyses
Total N¼ 39,014,
n/N (%)
Univariate, odds
ratio (95% CI) p
Multivariate,y odds
ratio (95% CI) p
Sick or disabled 45/2549 (1.8) 3.9 (2.6–5.8) <0.001 2.6 (1.7–4.0) <0.001
Household/retired/student/other 23/7600 (0.3) 0.65 (0.40–1.07) 0.092 0.67 (0.39–1.12) 0.127
Not known 94/10,002 (0.9) 2.0 (1.4–2.9) <0.001 1.6 (1.1–2.5) 0.024
Method of SH at first episode
SP only 262/31,557 (0.8) 1.0 (reference) 1.0 (reference)
SI only 36/6088 (0.6) 0.71 (0.5–1.01) 0.05 0.80(0.56–1.16) 0.238
SI and SP 9/1369 (0.7) 0.79 (0.41–1.54) 0.489 0.99 (0.50–1.93) 0.965
Alcohol involved in SH
None 23/12,941 (0.2) 1.0 (reference) 1.0 (reference)
Alcohol involved 212/16,775 (1.3) 7.2 (4.7–11.1) <0.001 5.9 (3.8–9.1) <0.001
Not known 72/9298 (0.8) 4.4 (2.7–7.0) <0.001 3.5 (2.1–5.9) <0.001
Clinical management
Admission to general hospital
None 66/11,601 (0.6) 1.0 (reference) 1.0 (reference)
Admission 112/17,469 (0.6) 1.1 (0.8–1.5) 0.440 1.0 (0.7–1.1.5) 0.926
Not known/not collected 129/9944 (1.3) 2.3 (1.7–3.1) <0.001 2.4 (1.6–3.6) <0.001
Specialist psychosocial assessment
None 144/1678 (0.9) 1.0 (reference) 1.0 (reference)
Specialist assessment 163/22,230 (0.7) 0.85 (0.68–1.07) 0.168 0.64 (0.47–0.88) 0.005
Referral for aftercare
Alcohol or drug service aftercare
None 256/37,269 (0.7) 1.0 (reference) 1.0 (reference)
Current or new referral 35/1124 (3.1) 4.6 (3.2–6.6) <0.001 3.2 (2.1–4.7) <0.001
Told to see 16/621 (2.6) 3.8 (2.3–6.4) <0.001 2.5 (1.5–4.4) 0.001
Psychiatric outpatient aftercare
None 242/29,412 (0.8) 1.0 (reference) –
Current or new referral 65/9602 (0.7) 0.82 (0.62–1.08) 0.161
Psychiatric inpatient aftercare
None 293/37,021 (0.8) 1.0 (reference) –
Current or new referral 14/1993 (0.7) 0.89 (0.52–1.52) 0.662
(continued)
8 Journal of the Royal Society of Medicine Open 5(8)

secondary analyses on clinical management followingSH were missing, but in sensitivity analyses excludingthese data, the main findings were essentiallyunchanged.
Clinical implications
The UK government’s strategy3 encourages use ofeffective interventions to tackle alcohol misuse suchas brief interventions, specialised treatment for alco-hol dependence and alcohol liaison nurses sitedwithin the ED. Thus, all SH patients should receiveassessment in line with guidance (e.g. NationalInstitute for Clinical Excellence32), to enable earlyidentification of alcohol problems and appropriateintervention. Our findings fully endorse thoserecommendations.
Declarations
Competing interests: None declared
Funding: The authors acknowledge financial support from the
Department of Health, including the Policy Research Programme.
Ethical approval: The monitoring systems in Oxford and Derby
have approval from local Health/Psychiatric Research Ethics
Committees to collect data on SH for local and multicentre pro-
jects. Self-harm monitoring in Manchester is part of a clinical audit
system and has been ratified by the local Research Ethics
Committee. All three monitoring systems are fully compliant
with the Data Protection Act of 1998. All centres have approval
under Section 251 of the National Health Service Act 2006 to col-
lect patient identifiable information without patient consent, and
to release patient details to the Data Linkage Service for the retrie-
val of mortality information. All patients had access to an infor-
mation leaflet about the study.
Guarantor: KH
Table 4. Continued.
Binary logistic regression analyses
Total N¼ 39,014,
n/N (%)
Univariate, odds
ratio (95% CI) p
Multivariate,y odds
ratio (95% CI) p
Self-discharge after SH episode
None 279/36,161 (0.8) 1.0 (reference) –
Took self-discharge 28/2853 (1.0) 1.30 (0.86–1.90) 0.223
GP referral aftercare
None 134/19,135 (0.7) 1.0 (reference) –
Referral by letter or phone contact 164/18,362 (0.9) 1.30 (1.02–1.61) 0.036
Told to see 9/1517 (0.6) 0.85 (0.43–1.67) 0.629
Other aftercare agency
None 258/32,598 (0.8) 1.0 (reference) –
Formal contact 25/3388 (0.7) 0.93 (0.62–1.41) 0.737
Told to see 24/3028 (0.8) 1.00 (0.66–1.52) 0.995
Adjustment for centre differences
Centre A 57/9043 (0.6) 1.0 (reference) 1.0 (reference)
Centre B 173/19,237 (0.9) 1.43 (1.06–1.93) 0.019 0.58 (0.38–0.87) 0.010
Centre C 77/10,734 (0.7) 1.14 (0.81–1.61) 0.480 0.85 (0.58–1.25) 0.416
SH: self-harm; SP: self-poisoning; SI: self-injury; CI: confidence interval
*Logistic regression for outcome of alcohol-related death (yes, no).yMultivariate analysis. Step 1: direct entry of patient characteristic and clinical management variables significant in univariate models at p< 0.2; Step 2:
forward conditional entry (p< 0.05) of referral for aftercare variables that were significant at p< 0.2 in univariate models. Final model �2¼ 405.2,
df¼ 17, p< 0.001; Nagelkerke R square¼ 0.118.zFor 15 individuals sex was not known.
Bergen et al. 9

Contributorship: KH proposed the study. HB, RW and KH
designed the analysis, HB, KH, RW, JC, SS, MH, JN and NK
interpreted the data, HB undertook the analysis and wrote the first
draft. All authors contributed to the final draft.
Acknowledgements: The authors thank members of the general
hospital psychiatric services and other clinical services, hospital
administrative staff and members of the research teams in all
three centres for assistance with data collection. The authors
declare no financial relationships with commercial interests. KH
is a National Institute for Health Research Senior Investigator.
The Department of Health had no role in study design, the collec-
tion, analysis and interpretation of data, the writing of the report
and the decision to submit the paper for publication. The views
and opinions expressed herein do not necessarily reflect those of
the Department of Health.
Provenance: Not commissioned; editorial review with anon-
ymised peer reviewers’ comments from a previous submission to
another journal.
References
1. Lim SS, Vos T, Flaxman AD, et al. A comparative
risk assessment of burden of disease and injury attribut-able to 67 risk factors and risk factor clusters in 21regions, 1990–2010: a systematic analysis for the
Global Burden of Disease Study 2010. Lancet 2013;380: 2224–2260.
2. Office for National Statistics. Alcohol-Related Deaths in
the United Kingdom, 2010. 2012. See http://www.ons.gov.uk/ons/publications/re-reference-tables.html?edition¼tcm%3A77-249220 (last checked 15 May 2013).
3. Drugs and Alcohol Unit. The Goverment’s AlcoholStrategy. 2012. See https://www.gov.uk/government/uploads/system/uploads/attachment_data/file/98121/
alcohol-strategy.pdf (last checked 16 May 2013).4. Public Health Policy and Strategy Unit/NHS
Commissioning Unit. Living Well for Longer: a Call to
Action to Reduce Avoidable Premature Mortality. 2013.See https://www.gov.uk/government/uploads/system/uploads/attachment_data/file/181103/Living_well_for_
longer.pdf. (last checked 15 May 2013).5. Breakwell C, Baker A, Griffiths C, Jackson G, Fegan G
and Marshall D. Trends and geographical variations in
alcohol-related deaths in the United Kingdom, 1991–2004. Health Stat Q 2007; 33: 6–24.
6. Office for National Statistics. Alcohol-Related Deaths in
the United Kingdom, 2011. Statistical Bulletin. 2013. Seehttp://www.ons.gov.uk/ons/rel/subnational-health4/alcohol-related-deaths-in-the-united-kingdom/2011/alcohol-
related-deaths-in-the-uk–2011.html (last checked 21 May2013).
7. Schmidtke A, Bille Brahe U, De Leo D, et al. Attemptedsuicide in Europe: rates, trends and sociodemographiccharacteristics of suicide attempters during the period
1989–1992. Results of the WHO/EURO multicentrestudy on parasuicide. Acta Psychiatr Scand 1996; 93:327–338.
8. Hawton K, Bergen H, Casey D, et al. Self-harm inEngland: a tale of three cities. Multicentre study ofself-harm. Soc Psychiatry Psychiatr Epidemiol 2007; 42:
513–521.
9. Haw C, Hawton K, Casey D, Bale E and Shepherd A.Alcohol dependence, excessive drinking and deliberateself-harm: trends and patterns in Oxford, 1989–2002.
Soc Psychiatry Psychiatr Epidemiol 2005; 40: 964–971.10. Touquet R, Csipke E, Holloway P, et al. Resuscitation
room blood alcohol concentrations: one-year cohortstudy. Emerg Med J 2008; 25: 752–756.
11. Horrocks J, Price S, House A and Owens D. Self-injuryattendances in the accident and emergency department:clinical database study. Br J Psychiatry 2003; 183:
34–39.12. Haw C, Houston K, Townsend E and Hawton K.
Deliberate self-harm patients with alcohol disorders:
characteristics, treatment, and outcome. Crisis 2001;22: 93–101.
13. Pirkola ST, Suominen K and Isomets ET. Suicide in
alcohol-dependent individuals: epidemiology and man-agement. CNS Drugs 2004; 18: 423–436.
14. Bergen H, Hawton K, Waters K, et al. Premature deathafter self-harm: a multicentre cohort study. Lancet
2012; 380: 1568–1574.15. Bergen H, Hawton K, Waters K, Cooper J and Kapur
N. Epidemiology and trends in non-fatal self-harm in
three centres in England, 2000 to 2007. Br J Psychiatry2010; 197: 493–498.
16. Bergen H, Hawton K, Kapur N, et al. Shared charac-
teristics of suicides and other unnatural deaths follow-ing non-fatal self-harm? A multicentre study of riskfactors. Psychol Med 2011; 42: 727–741.
17. Bergen H, Hawton K, Waters K, et al. How do meth-
ods of non-fatal self-harm relate to eventual suicide?J Affect Disord 2011; 136: 526–533.
18. Hawton K, Harriss L, Hall S, Simkin S, Bale E and
Bond A. Deliberate self-harm in Oxford, 1990–2000: atime of change in patient characteristics. Psychol Med
2003; 33: 987–996.
19. Office for National Statistics. Index of MultipleDeprivation (IMD), 2007. See http://data.gov.uk/dataset/index_of_multiple_deprivation_imd_2007 (last
checked 12 December 2012).20. Health and Social Care Information Centre. Data
Linkage Service, 2013. See http://www.hscic.gov.uk/datalinkage (last checked 21 May 2013).
21. Office for National Statistics. England, Interim LifeTables, 1980–82 to 2009–11. 2013 (04/06/2013). Seehttp://www.ons.gov.uk/ons/publications/re-reference-
tables.html?edition¼tcm%3A77-274529 (last checked 4June 2013).
22. Hickey L, Hawton K, Fagg J and Weitzel H.
Deliberate self-harm patients who leave the accidentand emergency department without a psychiatricassessment. A neglected population at risk of suicide.J Psychosom Res 2001; 50: 87–93.
23. Hayes RD, Chang CK, Fernandes A, et al.Associations between substance use disorder sub-groups, life expectancy and all-cause mortality in a
large British specialist mental healthcare service. DrugAlcohol Depend 2011; 118: 56–61.
24. Lawrence D, Hancock K and Kisely S. The gap in life
expectancy from preventable physical illness in
10 Journal of the Royal Society of Medicine Open 5(8)

psychiatric patients in Western Australia: retrospectiveanalysis of population based registers. BMJ 2013; 346:f2539.
25. John U, Rumpf HJ, Bischof G, Hapke U, Hanke M andMeyer C. Excess mortality of alcohol-dependent individ-uals after 14 years and mortality predictors based ontreatment participation and severity of alcohol depend-
ence. Alcohol: Clin Exp Res 2013; 37: 156–163.26. Siegler V,Al-HamaA, JohnsonB,Wells C and SheronN.
Social inequalities in alcohol-relatedmortality by national
statistics socio-economic classification, England andWales, 2001–03. Health Stat Q 2011; 50: 4–39.
27. Sinclair J and Green J. Understanding resolution of
deliberate self harm: qualitative interview study ofpatients’ experiences. BMJ 2005; 330: 1112–1115.
28. Mdege ND, Fayter D, Watson JM, Stirk L, Sowden A
and Godfrey C. Interventions for reducing alcohol con-sumption among general hospital inpatient heavy alco-hol users: a systematic review. Drug Alcohol Depend2013; 131: 1–22.
29. Walton MA, Goldstein AL, Chermack ST, et al. Briefalcohol intervention in the emergency department:Moderators of effectiveness. J Stud Alcohol Drugs
2008; 69: 550–560.30. Barr W, Leitner M and Thomas J. Self-harm patients
who take early discharge from the accident and emer-gency department: how do they differ from those who
stay? Accid Emerg Nurs 2004; 12: 108–113.31. Royal College of Psychiatrists. Better Services for
People Who Self-Harm. Quality Standards for
Healthcare Professionals, 2006. See http://www.rcpsych.ac.uk/pdf/self-harm%20quality%20standards.pdf (lastchecked 24 June 2013).
32. National Collaborating Centre for Mental Health.Self-Harm: the Short-Term Physical and PsychologicalManagement and Secondary Prevention of Self-Harm in
Primary and Secondary care (full guideline). ClinicalGuideline 16. London: National Institute for ClinicalExcellence, 2004.
Bergen et al. 11