Embed Size (px)
Citation preview
ISBN 978-82-326-2802-5 (printed ver.)ISBN 978-82-326-2803-2 (electronic ver.)
ISSN 1503-8181
Doctoral theses at NTNU, 2017:366
Kasper Kiil
Aligning Supply and Demand inGrocery Retailing
Doc
tora
l the
sis
Doctoral theses at N
TNU
, 2017:366K
asper Kiil
NTN
UN
orw
egia
n U
nive
rsity
of S
cien
ce a
nd T
echn
olog
yTh
esis
for
the
Deg
ree
ofP
hilo
soph
iae
Doc
tor
Facu
lty
of E
ngin
eeri
ngD
epar
tmen
t of M
echa
nica
l and
Indu
stri
alEn
gine
erin
g
Aligning Supply and Demand
in Grocery Retailing
Kasper Kiil
This doctoral thesis is subject to a cotutelle/double degree between Norwegian University of
Science and Technology, Norway and Aalborg University, Denmark
Norwegian University of Science and Technology Aalborg University Faculty of Engineering Faculty of Engineering and Science
Dept. of Mechanical and Industrial Engineering Dept. of Materials and Production Production Management Group Center for Logistics
Submitted: October, 2017
Supervisors: Prof. Heidi C. Dreyer
Norwegian University of Science and Technology
Prof. Hans-Henrik Hvolby
Aalborg University
Co-supervisor: Prof. Jan Ola Strandhagen
Norwegian University of Science and Technology
PhD committee: Prof. Anders Thorstenson
Aarhus University, Denmark
Prof. Paul Turner
University of Tasmania, Australia
Researcher Anita Romsdal
Norwegian University of Science and Technology, Norway
Prof. Jørn Vatn
Norwegian University of Science and Technology, Norway
ISBN: 978-82-326-2802-5 (Printed)
ISBN: 978-82-326-2803-2 (Electronic)
ISSN: 1503-8181
© Kasper Kiil
Printed in Norway, 2017
i
Acknowledgements
I hope it goes without saying that this thesis is the result of inspiration, discussions, and
encouragement from countless people. I would like to take this opportunity to express my
gratitude to those who have supported and strengthened this work.
Firstly, I had the great pleasure of having not only one but two main supervisors: Heidi C. Dreyer
and Hans-Henrik Hvolby. Heidi, thank you for guiding me through the academic arena, reviewing
ideas and papers, as well as including me in your network of both international researchers and
practitioners. Hans-Henrik, I cannot thank you enough for the countless hours you have spent on
improving and refining my work as well as your patience and kindness towards me. Thank you.
For my co-supervisor, thank you Jan Ola Strandhagen for continuously raising the quality and
unambiguity of my work through your thoughtful questions and ideas. To all three of you, I am
thankful for the willingness and support you have provided through the whole journey, as well as
the possibility and freedom I had for pursuing research topics and methods of my personal
interest.
Furthermore, I am very grateful for the support and encouragement I have received from Iskra
Dukovska-Popovska and Kenn Steger-Jensen during my many visits at Aalborg University. You
managed to both challenge and help me with individual papers as well as structuring my research
into one entity. Similarly, I would like to thank Jacques Trienekens for welcoming me at
Wageningen University and ensuring a fruitful research stay. Also, I appreciate the great amount
of support from Peter Falster (DTU) and Chris Martin (UniSA) for your keen-eyes on details by
reading, commenting, and editing papers and this thesis.
I feel indebted to express my gratitude to the Norwegian grocery retailer and their network of
suppliers and stores which have been part of this research. Through you, I have gained practical
insights and understandings. It has been the driving force for many of my research papers, and it
has provided me with a foundation for further expertise in the grocery retailing sector.
A special ‘thank you’ goes to Peter Larsen. You convinced me that I was capable of conducting
a PhD, and you have kept me motivated by sharing your experiences and reflections of the PhD
process. I am very thankful this and for the friendship that has evolved.
I have received immense support from my family. I would like to thank my parents, Marian Kiil
and Kurt Kiil, for their continuous curiosity for my work and well-being. Also, I would like to
thank my brother and his wife, Klaus Kiil and Monica Kiil, and my two nephews, Valde Kiil and
Villi Kiil. You have unquestionably eased many evenings and nights and filled me with smile
and laughter.
Finally, Lene Vestergaard, you have called me crazy many times for spending so many hours on
this. However, you have always, wholeheartedly, supported me with your endless joy and
compassion. I cannot express how grateful I am for you and your undivided support. I love you.
Trondheim, October 2017
Kasper Kiil

ii
iii
Summary
The aim of aligning supply and demand in grocery retailing is to achieve availability of products
while keeping waste, transportation, handling cost, and inventory levels at a minimum.
Availability is defined as having a product in its desired form, flavor, size, and saleable condition
in the expected location (from the consumers perspective) in stock when the consumer reaches
for the product (Aastrup and Kotzab, 2010; ECR, 2003). Ensuring high availability is necessary
to stay competitive in grocery retailing (ECR, 2003). If the products are not available consumers
may switch brand or store, leave without purchasing anything, or purchase a different style or
size. This affects grocery retailers’ reputation, revenue, and ultimately profit. Grocery retailers
should not achieve this availability simply by overflowing stores with products because unsold
products will end up being wasted when they expire. Today, we are wasting enough food along
the supply chain to feed another billion people (Kummu et al., 2012). The size of the problem is
remarkable, and even small improvements can have a significant impact, and grocery retailers
should aim to align their supply and demand (Beddington, 2011).
This PhD thesis examines how grocery retailers can align supply and demand through improved
decision making in their planning processes. Two underlying hypotheses are the ability of
“additional information to resolve uncertainty and improve the match between supply and
demand” (Ketzenberg et al., 2007, p. 1236) and that “improved supply chain wide transparency
of demand information (…) can reduce supply chain wide food waste" (Mena et al., 2014, p. 152).
By combining these two, it is expected that additional information has the ability improve the
alignment of supply and demand, which will be manifested by improved availability and reduced
food waste.
The theoretical foundation of this thesis is positioned within Operations Management and centers
upon information sharing, automatic replenishment, and sales and operations planning. On a
general level information sharing is often discussed as one of the major means to enhance supply
chain coordination (Arshinder et al., 2008) and thereby supply chain performance (Baihaqi and
Sohal, 2013; Barratt and Oke, 2007; Myrelid, 2015; Sezen, 2008). The information utilization
concept (Jonsson and Myrelid, 2016; Myrelid, 2015) emphasizes that shared information should
be incorporated at the receiver’s processes before it can create additional value for the receiving
company and the whole supply chain. However, the information utilization concept is in its
infancy and how to characterize shared information and link it to planning processes remains an
open question.
One common way of utilizing shared information in grocery retailing and create efficiency gains
is through an automatic replenishment system. It originates from the efficient consumer response
concept introduced in the early 1990’s in grocery retailing (Salmon, 1993). An automatic
replenishment system generates orders (proposals) based on shared point-of-sales and waste
information, and it became an increasingly popular method to improve product availability.
However, the usefulness of information sharing and automatic replenishment systems for
reducing food waste as well as its applicability for replenishing products with a short shelf life is
not adequately covered by the current academic literature. Consequently, as the main topic for
this thesis it is examined:
iv
1. How does information sharing contribute to align supply and demand in grocery retailing?
a. How is information sharing characterized in grocery retailing?
b. What is the impact of information sharing in grocery retailing?
Efficient consumer response also included strategies, such as efficient promotions and efficient
product introductions for managing stimulated demand. Today managing stimulated demand
remains one of the main challenges in grocery retailing (Martec, 2017; Moussaoui et al., 2016).
Grocery retailers rely on these type of activities to drive sales and increase consumer visits to the
stores. Nevertheless, its massive impact on logistics necessitates proper coordination to align
supply and demand and it is often necessary to start planning several months in advance to prepare
the whole supply chain.
In sales and operations planning, the underlying idea is to plan across the organization (and whole
supply chain) for activities which take months of preparation, e.g., extra recruitment, building up
seasonal inventory, or allocate products between facilities (Jacobs et al., 2011; Thomé et al.,
2012). Thus, applying sales and operations planning for managing stimulated demand in grocery
retailing appears tempting, but has not received any attention in the academic literature.
Therefore, as a subordinate topic this thesis examines:
2. How do grocery retailers effectively align supply and stimulated demand?
For research question 1 two literature studies were conducted to identify the characteristics of
shared information and used to develop the information utilization concept. Afterwards, a
questionnaire was distributed to suppliers, customers, transportation provider, and the grocery
retailer in a Norwegian food supply chain to understand their use of information sharing. The
output from the questionnaire was used to demonstrate the usefulness and applicability of the
identified information sharing characteristics and the information utilization concept in grocery
retailing.
Additionally, the thesis contains three studies which examine the potential improvement of
information sharing and has played a central role in the whole PhD period. A multiple case study
with access to 54 products across 21 stores was undertaken to examine the impact on food waste
and freshness of products in the stores by comparing the automatic replenishment to manual
replenishment. Furthermore, a discrete event simulation model was built to evaluate the impact
of information sharing for automatic replenishment and inventory allocations for products with a
short shelf life. The model simulates the inventory system of one product in a divergent supply
chain with one warehouse supplying 232 stores in different sizes, profiles, and delivery
frequencies. The model includes both known replenishment and inventory allocation policies
from literature, as well as newly proposed policies that were developed as part of this PhD project.
For research question 2 it was examined how grocery retailers planned stimulated demand
activities, as well as if and how sales and operations planning could be applied for this purpose.
A single case study with one of Norway’s largest grocery retailers was used to form an initial
understanding of these activities. This was later extended to a multiple case study including a
second grocery retailer from Norway, one from Britain, and a grocery wholesaler from Finland.
v
The main contributions of this thesis, regarding information sharing, can be summarized as:
• Identification and synthesis of information facets to characterize shared information which
combined with a proposed mapping tool to information sharing adds to the advancement
of the information utilization concept in grocery retailing
• An empirical evaluation of automatic replenishment which indicated an average of 17.8%
reduction in food waste across 54 products and 5.2% improvement in the weighted average
remaining shelf life (freshness) of the products in the stores. The findings also suggest the
improvement is dependent on the shelf life of the product.
• A modified age-based replenishment and two inventory allocation policies for perishables.
Based on simulation runs for one year the findings indicated that:
o Increased information sharing for replenishment of perishables with a shelf life
between 4 to 11 days can on average improve availability with 10.3% and reduce
waste with 10.7% while slightly decreasing the inventory level with 0.3%.
o Utilizing shared information with the proposed guidelines for inventory allocation
of perishable products with a shelf life between 4 and 11 days, showed a 3.3%
improvement in availability and 3.8% reduction in waste. However, these results are
possible to achieve with the information already embedded in a traditional automatic
replenishment system, which means no additional investment in data collection is
needed.
o Information sharing should be differentiated based on (at least) the shelf life of the
product and the delivery frequency to the stores to reap the highest benefits of
information sharing.
The secondary contributions, regarding demand stimulating activities, can be summarized as:
• A proposed adapted sales and operations planning process for managing stimulating
demand activities, which considers the characteristics of grocery retailing
• Six propositions for how grocery retailers could improve cross-functional planning by use
of IT, dedicated organizational resources, and by using a more formal evaluation of
previous activities as input for the following planning cycles
For practitioners in grocery retailing, the findings and contributions of this thesis have a number
of implications which can be summarized to the following advises:
• The use of information sharing is a continuous and iterative process. This thesis has
provided a list of facets and a mapping tool to structure the information flow in the supply
chain. Applying this scheme provides a visualization of what information that is utilized,
what that potentially could be utilized, as well as suggestions for how to link information
to planning processes.
• Differentiating information sharing and the subsequent planning processes based on
product characteristics is beneficial. For replenishment and inventory allocation decisions,
this thesis suggests that sharing and utilizing point-of-sales and waste data can improve the
alignment of supply and demand. More detailed information about remaining shelf life
becomes increasingly important and beneficial for products with a shelf life between 6 and
11 days and may enable automatic replenishment of these products.
vi
• The additional sales volumes created by demand stimulating activities is an important part
of the overall revenue, but it also greatly influences the underlying logistics required to
handle these volumes. This should be reflected in a corresponding importance in the
planning decisions across functions. This thesis provides a number of propositions for how
to create such an importance and how to structure a tactical planning process to support
this in grocery retailing.
Overall, this PhD thesis has contributed to how grocery retailers can align supply and demand.
Especially by means of automatic replenishment and inventory allocations, but also by
demonstrating how sales and operations planning could be useful in grocery retailing. The thesis
aspires to support future discussions and development of grocery retailing by highlighting some
of the possibilities for aligning supply and demand.
vii
Sammendrag
Formålet med å balansere forholdet mellom forsyning og etterspørsel i dagligvarehandelen er å
oppnå tilgjengelighet av produkter, samtidig som man holder matsvinn, transport- og
håndteringskostnader og lagernivåer på et minimum. Tilgjengelighet forstås her som å ha et
produkt tilgjengelig for forbruker på riktig sted, tid, i ønskede form, smak, størrelse og kvalitet
(Aastrup og Kotzab, 2010; ECR, 2003). Å sikre høy tilgjengelighet er nødvendig for å kunne
opprettholde konkurransestyrke i dagligvarehandelen (ECR, 2003). Hvis produktene ikke er
tilgjengelig, vil en kunne risikere at forbrukerne velger å kjøpe et substituttprodukt, forlater
butikken uten å ha kjøpt noe eller å bytte butikk. Dette påvirker butikkens omdømme, omsetning
og dermed fortjeneste. Høy tilgjengelighet i dagligvarebutikker bør ikke oppnås gjennom for høye
varebeholdninger, da usolgte produkter vil ende opp som matsvinn om de ikke selges før
utløpsdatoen. Summen av all mat som i dag kastes i dagligvarehandelen vil kunne ha mettet
ytterligere én milliard mennesker (Kummu et al., 2012). Størrelsen på dette problemet er
signifikant, og kun små justeringer og forbedringer kan føre til store positive effekter. Derfor er
det viktig at dagligvarehandelen greier å balansere forholdet mellom forsyning og etterspørsel
(Beddington, 2011).
Denne doktorgradsavhandlingen undersøker hvordan dagligvarehandelen bedre kan balansere
forholdet mellom forsyning og etterspørsel gjennom mer presise beslutninger i
planleggingsprosessene. To underliggende antakelser er at "informasjonsdeling kan redusere
usikkerhet og forbedre forholdet mellom forsyning og etterspørsel" [fritt oversatt] (Ketzenberg et
al., 2007, s. 1236) og at "forbedret innsyn i etterspørselsinformasjon i forsyningskjeden (…) kan
redusere matsvinnet i forsyningskjeden" [fritt oversatt] (Mena et al., 2014, s. 152). Ved å
kombinere disse to antakelsene er forventningen at informasjonsdeling bidrar til å forbedre
tilpasningen mellom forsyning og etterspørsel, som igjen vil føre til forbedret tilgjengelighet og
redusert matsvinn.
Avhandlingens teoretiske fundamentet er innen Operations Management og er sentrert rundt
informasjonsdeling, automatisk vareforsyning av varer, og sales and operations planning.
Informasjonsdeling er ofte fremhevet som et av de viktigste midlene for å koordinere
forsyningskjeden (Arshinder et al., 2008) og dermed et middel for å forbedre forsyningskjedens
prestasjoner (Baihaqi and Sohal, 2013; Barratt and Oke, 2007; Myrelid, 2015; Sezen, 2008).
Forskning på informasjonsdeling (Jonsson og Myrelid, 2016; Myrelid, 2015) har påvist at
informasjon må kunne utnyttes i mottakerens prosesser før den kan skape verdi for de involverte
parter i forsyningskjeden. Kunnskapen om deling av informasjon i verdikjeden er under utvikling,
og hvordan informasjonen som skal deles kan karakteriseres og kobles til planleggingsprosesser
er et sentralt spørsmål.
I dagligvarehandelen brukes ofte informasjonsdeling i automatiske vareforsynings systemer, som
stammer fra Efficient Consumer Response lansert i starten av 1990-årene (Salmon, 1993).
Automatisk vareforsyning fungerer ved at ordrer (forslag) genereres basert på salgs- og
svinninformasjon fra butikk. Det er en mye anvendt metode i handelen for å forbedre
tilgjengeligheten og automatisere bestillingsprosessene. Samtidig er ikke nytten av
informasjonsdeling i automatisk vareforsyning, som middel for å redusere matsvinn og mot
anvendelse på produkter med kort holdbarhet, tilstrekkelig undersøkt i eksisterende akademisk
litteratur. Denne avhandlingen har derfor følgende hovedfokus:
viii
1. Hvordan bidrar informasjonsdeling til å tilpasse forholdet mellom forsyning og
etterspørsel i dagligvarehandelen?
a. Hva karakteriserer informasjonsdeling i dagligvarehandelen?
b. Hvilken innvirkning har informasjonsdeling på dagligvarehandelen?
Ut over automatisk vareforsyning inkluderer Efficient Consumer Response strategier som styrer
kampanjer og introduksjon av nye produkter, som primært brukes for å stimulere til økt salg i
butikk. Salgsfremmende tiltak i form av kampanjer og nye produktlanseringer er en av de største
utfordringene logistikkmessig i dagligvarehandelen (Martec, 2017; Moussaoui et al., 2016).
Markedsaktiviteter som kampanjer skaper store variasjonene i omsetningen som igjen fører til
press på logistikk systemet og usikkerhet i planleggingen. Derfor er det også vanlig å starte
planleggingen av forsyningskjeden flere måneder i forveien av eksempelvis en kampanje for å
sikre at produktene er tilgjengelig i kampanjeperioden.
I sales and operations planning er ideen at man planlegger på tvers av funksjonene i bedriften
(og i noen tilfeller hele forsyningskjeden) for aktiviteter som krever lang forberedelse, f.eks.
ekstra bemanning, lageroppbygging eller allokering av produkter mellom fabrikker og lagre
(Jacobs et al., 2011; Thomé et al., 2012). Anvendelsen av sales and operations planning til å styre
salgsfremmende aktiviteter i dagligvarehandelen virker derfor relevant, men har ikke tidligere
blitt undersøkt i akademisk litteratur. Som et underordnet emne undersøker derfor denne
avhandlingen:
2. Hvordan balanseres forholdet mellom forsyning og etterspørsel effektivt i
dagligvarehandelen for stimulerende salgsaktiviteter?
For å besvare det første forskningsspørsmålet ble det utført to litteraturstudier for å identifisere
karakteristikkene ved informasjonsdeling, og for å videreutvikle konseptet rundt
informasjonsdeling. Deretter ble det benyttet et spørreskjema som ble sendt til leverandører,
kunder, transportleverandør og en dagligvareaktør i en norsk dagligvarekjede for å innhente
opplysninger om deres bruk av informasjonsdeling. Resultatet fra spørreundersøkelsen ble brukt
til å vise anvendelsen av de identifiserte informasjonsdelingskarakteristikkene og deling av
informasjon i dagligvarehandelen.
Avhandlingen inneholder i tillegg tre studier som undersøker de potensielle forbedringene ved å
dele informasjon. Det ble gjennomført et multiple case study med 54 produkter i 21 butikker.
Hensikten var å undersøke effekten av informasjonsdeling på matsvinn og produktenes
ferskhetsgrad gjennom å sammenligne produkter bestilt med og uten (manuell bestilling)
automatisk vareforsyning. Videre ble det utviklet en simuleringsmodell for å analysere effekten
av informasjonsdeling ved automatisk vareforsyning og produktallokering for produkter med kort
holdbarhet. Modellen simulerer butikker med forskjellige størrelser, profiler og
leveringsfrekvenser. Modellen inneholder både kjente vareforsynings- og allokeringsprinsipper
fra litteraturen og nye prinsipper som har blitt utviklet gjennom dette doktorgradsarbeidet.
For å besvare forskningsspørsmål 2 ble det undersøkt hvordan dagligvarekjeder planlegger
stimulerende salgsaktivitet, i tillegg til hvordan sales and operations planning kan anvendes til
dette formålet. En casestudie med en av Norges største dagligvarekjeder ble brukt for innledende
kartlegging av problemstillingen, og senere utvidet til ytterligere casestudier i dagligvarekjeder i
Norge, Storbritannia og en dagligvaregrossist i Finland, til sammen fire case.
ix
Relatert til forskningsspørsmål 1 om informasjonsdeling, er de teoretiske bidragene fra
doktorgradsarbeidet som følger:
• Identifisering og syntese av informasjonsaspektene ved delt informasjon, som kombinert
med et utviklet kartleggingsverktøy for informasjonsdeling, bidrar til å spesifisere
innholdet i informasjonen som deles i dagligvarekjeden.
• En empirisk vurdering av automatisk vareforsyning i forhold til manual vareforsyning.
Analysen viste en reduksjon i matsvinn i gjennomsnitt på 17,8% for 54 produkter, og 5,2%
forbedring i den vektede gjennomsnittlige gjenværende holdbarheten (ferskheten) for
produktene i butikk. Resultatene indikerer også at den potensielle forbedringen er avhengig
av produktets levetid.
• Et aldersbasert vareforsyningsprinsipp og to produktallokeringsprinsipper for produkter
med kort holdbarhet. Basert på simulering av disse prinsippene viste resultatene følgende:
o Økt bruk av informasjonsdeling i automatisk vareforsyning av produkter med
holdbarhet mellom 4 og 11 dager kan i gjennomsnitt forbedre tilgjengeligheten av
produkter med 10,3%, og redusere svinnet med 10,7%, mens det gjennomsnittlige
lagernivået reduseres med 0,3%.
o Bruk av informasjonsdeling for allokering av produkter med en holdbarhet på
mellom 4 og 11 dager viste en forbedring på 3,3% av tilgjengeligheten, og 3,8%
reduksjon i svinn. Disse resultatene er imidlertid også mulig å oppnå med
informasjon som er innebygd i et tradisjonelt automatisk vareforsyningssystem, som
betyr at det ikke er behov for ytterligere investeringer i datainnsamling.
o Informasjonsdeling bør differensieres med hensyn til (minst) produktets levetid og
leveringsfrekvensen til butikkene, for å oppnå store forbedringer.
De teoretiske bidragene relatert til forskningsspørsmål 2, om stimulerende salgsaktiviteter, kan
oppsummeres slik:
• En foreslått sales and operations planning prosess tilpasset en situasjon med
salgsfremmende tiltak, tilpasset egenskapene i dagligvarehandelen.
• Seks forslag til hvordan dagligvarekjedene kan forbedre planleggingen gjennom
integrasjon mellom funksjoner, bruk av IT, dedikerte organisatoriske ressurser og ved å
evaluere effekten av foregående salgsfremmende tiltak og bruke dette i fremtidige
planleggingssykluser.
For praktikere i dagligvarehandelen har resultatene fra denne avhandlingen en rekke
anvendelsesområder som kan oppsummeres i følgende anbefalinger:
• Bruken av informasjonsdeling er en kontinuerlig og iterativ prosess i dagligvarekjeden.
Denne avhandlingen inneholder en oversikt over ulike aspekt, og et kartleggingsverktøy
for å strukturere informasjonsdeling i forsyningskjeden. Det kan tydeliggjøre hvilken
informasjon som blir brukt, hva som potensialt kan benyttes, og et forslag til hvordan dette
knyttes til planleggingsprosesser.
• Det er fordelaktig med differensiert informasjonsdeling og differensiering av de
påfølgende planleggingsprosessene basert på produktegenskaper. For automatisk
vareforsyning og produktallokering indikerer denne avhandlingen at deling og utnyttelse
av salgs- og svinninformasjon kan forbedre forholdet mellom forsyning og etterspørsel.
Deling av informasjon vedrørende gjenværende holdbarhet har størst effekt for
produkter med en levetid på mellom 6 og 11 dager, og kan muliggjøre automatisk
vareforsyning av disse produktene.
x
• Salgsfremmende tiltak er en viktig mekanisme i dagligvarehandelen, men tiltakene skaper
også et høyt press på logistikk- og planleggingsfunksjonen. Effektene av salgstiltak bør
gjenspeiles gjennom større fokus på å planlegge disse aktivitetene for å sikre koordinering
på tvers av funksjoner. Denne avhandlingene inneholder en rekke forslag til hvordan man
skaper et slikt fokus, og hvordan man strukturerer en taktisk planleggingsprosess som
støtter salgsfremmende tiltak i dagligvarehandelen.
Denne doktorgradsavhandlingen har bidratt til å øke kunnskapen om hvordan dagligvarehandelen
kan balansere forholdet mellom forsyning og etterspørsel. Konkret er effekten av automatisk
vareforsyning og produktallokeringer undersøkt, men det er også demonstrert hvordan sales and
operations planning kan være nyttig i dagligvarehandelen. Avhandlingen tilstreber å utvikle
kunnskapsgrunnlaget og bidra til å forbedre dagligvarehandelen gjennom forslag til hvordan
forsyning og etterspørsel kan balanseres.
xi
Resumé
Formålet med at tilpasse forholdet mellem forsyning og efterspørgsel i dagligvarehandelen er at
opnå tilgængelighed af produkter samtidig med at spild, transport, håndteringsomkostninger og
lagerbeholdninger holdes på et minimum. Tilgængelighed defineres som at have et produkt i den
ønskede form, smag, størrelse og kvalitet på det forventede sted (fra forbrugernes perspektiv) på
hylden, når forbrugeren søger produktet (Aastrup og Kotzab, 2010; ECR, 2003). Sikring af høj
tilgængelighed er nødvendig for at forblive konkurrencedygtig i dagligvarehandlen (ECR, 2003).
Hvis produkterne ikke findes, kan forbrugerne skifte mærke eller butik, forlade butikken uden at
købe noget, eller købe et substituerende produkt. Dette påvirker butikkens omdømme, omsætning
og til sidst overskud. Dagligvareforhandlere kan ikke opnå denne høje tilgængelighed ved blot at
overfylde deres hylder med produkter, da usolgte produkter vil ende som spild, hvis de ikke
sælges i tide. I dag spildes der mad nok langs forsyningskæden til at kunne mætte en milliard
mennesker (Kummu et al., 2012). Størrelsen af problemet er bemærkelsesværdigt og selv små
forbedringer kan have en betydelig indflydelse, og dagligvareforhandlere bør derfor tilstræbe at
tilpasse forholdet mellem deres forsyning og efterspørgsel (Beddington, 2011).
Denne PhD-afhandling undersøger, hvordan dagligvareforhandlere kan tilpasse forholdet mellem
forsyning og efterspørgsel gennem forbedret beslutningstagning i deres planlægningsprocesser.
To underliggende hypoteser er at ”informationsdeling kan reducere usikkerheder og forbedre
match mellem forsyning og efterspørgsel [frit oversat]” (Ketzenberg et al., 2007, s. 1236) og at
”forbedret gennemsigtighed af efterspørgselsinformation i forsyningskæden (…) kan reducere
spildet igennem kæden [frit oversat]” (Mena et al., 2014, s. 152). Ved at kombinere disse to
hypoteser forventes det, at informationsdeling har evnen til at forbedre tilpasningen mellem
forsyning og efterspørgsel, som vil blive synliggjort ved en forbedret tilgængelighed og et
reduceret spild.
Det teoretiske fundament i afhandlingen er positioneret i Operations Management og centrerer
sig omkring informationsdeling, automatisk genopfyldning og sales and operations planning.
Informationsdeling er ofte fremhævet som værende et at de mest markante midler for at
koordinere forsyningskæden (Arshinder et al., 2008) og herigennem styrke præstationsevnen
(Baihaqi and Sohal, 2013; Barratt and Oke, 2007; Myrelid, 2015; Sezen, 2008).
Informationsudnyttelses-konceptet (Jonsson og Myrelid, 2016; Myrelid, 2015) understreger, at
delt information skal indarbejdes i modtagerens processer, før informationen kan skabe værdi for
modtageren og resten af forsyningskæden. Informationsudnyttelseskonceptet er dog stadig under
udvikling, og hvordan delt information karakteriseres og forbindes til planlægningsprocesser er
fortsat et åbent spørgsmål.
Informationsdeling anvendes ofte i dagligvarehandlen gennem automatisk genopfyldning, som
stammer fra Efficient Consumer Response, der blev introduceret i starten af 90-erne (Salmon,
1993). Automatisk genopfyldning fungerer ved at generere ordrer (forslag) baseret på information
om salgs og spild fra butikker, og har været en populær metode til at forbedre tilgængeligheden.
Anvendelsen af informationsdeling og automatisk genopfyldning til reduktion af madspild samt
anvendelighed for af dette produkter for med en kort holdbarhed er imidlertid ikke tilstrækkeligt
dækket i den nuværende akademiske litteratur. Som hovedemne har denne afhandling derfor
følgende forskningsspørgsmål:
xii
1. Hvordan bidrager informationsdeling til at tilpasse forholdet mellem salg og leverancer
i dagligvarehandel?
a. Hvordan kan informationsdeling karakteriseres for dagligvarehandel?
b. Hvad er effekten af informationsdeling for dagligvarehandel?
Efficient Consumer Response omfatter også initiativer for at styre tilbudsvarer og produkt
introduktioner, som primært bruges til at stimulere salg i butikkerne. Stimulerede salg er i dag
dog stadig en af de sværeste opgaver at styre for dagligvarekæderne (Martec, 2017; Moussaoui
et al., 2016). På grund af de ofte meget store salgsmængder har stimulerende salgsaktiviteter en
stor påvirkning på den bagvedliggende logistik og planlægning. Det er derfor også typisk at starte
planlægningen af hele forsyningskæden flere måneder i forvejen for at sikre tilgængelighed af
produkterne.
I sales and operations planning er tankesættet at man planlægger på tværs af organisationens
funktioner (og i nogle tilfælde hele forsyningskæden) for aktiviteter som kræver lang
forberedelse, eks. ekstra bemanding, lageropbygning eller allokering af produkter mellem
fabrikker og lagre (Jacobs et al., 2011; Thomé et al., 2012). Brugen af sales and operations
planning Planning til at styre salgsstimulerende aktiviteter i dagligvarekæder virker derfor
fristende, men har aldrig været undersøgt i den akademiske litteratur. Som et sekundært emne
undersøger denne afhandling derfor:
2. Hvordan tilpasses forholdet mellem forsyning og efterspørgsel effektivt i
dagligvarehandel for stimulerede salgsaktiviteter?
For at besvare forskningsspørgsmål 1 blev der udført to litteraturstudier for at identificere
karakteristerne ved informationsdeling samt for at videreudvikle informationsudnyttelses-
konceptet. Herefter blev et spørgeskema sendt til leverandører, kunder, transportudbydere og
dagligvareforhandleren i en norsk fødevarekæde for at forstå deres brug af informationsdeling.
Resultatet fra spørgeskemaet blev brugt til at demonstrere anvendeligheden og af de
identificerede karakteristikker af informationsdeling samt informationsudnyttelseskonceptet i
dagligvarehandel.
Derudover indeholder afhandlingen tre studier, der undersøger den potentielle forbedring ved
brugen af informationsdeling. Der blev gennemført et multiple case study med adgang til 54
produkter på tværs af 21 butikker for at undersøge effekten på madspild og friskhed af produkter
i butikkerne ved at sammenligne automatisk genopfyldning med manuel genopfyldning.
Derforuden blev der opbygget en simuleringsmodel til at vurdere effekten af informationsdeling
for automatisk genopfyldning og produkt allokering for produkter med kort holdbarhed.
Modellen simulerer aftræksmønsteret for ét produkt i en divergerende forsyningskæde med ét
lager, der leverer til 232 butikker i forskellige størrelser, profiler og leveringsfrekvenser.
Modellen indeholder både kendte genopfyldnings- og allokerings principper fra litteraturen samt
nye principper, som er blevet udviklet som led i dette PhD arbejde.
For forskningsspørgsmål 2 blev det undersøgt hvordan dagligvareforhandlere planlagde
stimulerede salgsaktiviteter, samt hvordan sales and operations planning kunne anvendes til dette
formål. Et casestudie med en af Norges største dagligvareforhandlere blev brugt til at danne en
første forståelse, og blev senere udvidet til et multiple case study som inkluderede en anden
dagligvareforhandler fra Norge, én fra Storbritannien og én grossist fra Finland.
xiii
De teoretiske bidrag fra forskningsspørgsmål 1, med hensyn til informationsdeling, kan
sammenfattes til:
• Identifikation og syntese af informationsfacetter til karakterisering af delt information, som
kombineret med et foreslået kortlægningsværktøj til informationsdeling bidrager til
udviklingen af informationsudnyttelseskonceptet i dagligvarehandel.
• En empirisk evaluering af automatisk genopfyldning i forhold til manual genopfyldning.
Resultaterne viste et gennemsnit på 17,8% reduktion i madspild på tværs af 54 produkter og
5,2% forbedring i den vægtede gennemsnitlige tilbageværende holdbarhed (friskhed) af
produkterne i butikkerne. Resultaterne indikerede også, at den potentielle forbedring er
afhængig af produktets levetid.
• Et genopfyldningsprincip baseret på produkterne friskhed og to produkt
allokeringsprincipper for produkter med kort holdbarhed. Baseret på simulering af disse
viste resultaterne at:
o Brug af øget informationsdeling til automatisk genopfyldning af produkter med en
holdbarhed på mellem 4 og 11 dage kan i gennemsnit forbedre tilgængeligheden
med 10,3% og reducere spildet med 10,7%, mens det gennemsnitlige lagerniveau
sænkes med 0,3%.
o Brug af informationsdeling for allokering af produkter med en holdbarhed på
mellem 4 og 11 dage viste en 3,3% forbedring af tilgængeligheden og 3,8%
reduktion i spild. Disse resultater er imidlertid mulige at opnå med information, der
allerede er indlejret i et traditionelt automatisk genopfyldningssystem, hvilket
betyder, at der ikke er behov for yderligere investeringer i dataindsamling.
o Informationsdeling bør differentieres ud fra (som minimum) produktets levetid og
leveringsfrekvensen til butikkerne for at opnå de største forbedringer ved
informationsdeling.
De teoretiske bidrag fra forskningsspørgsmål 2, med hensyn til stimulerende salgsaktiviteter, kan
sammenfattes til:
• En foreslået sales and operations planning proces tilpasset styring af stimulerende
salgsaktiviteter og som tager højde for egenskaberne i dagligvarehandelen.
• Seks forslag til hvordan dagligvareforhandlere kan forbedre deres tværfunktionelle
planlægning ved hjælp af IT, dedikerede organisatoriske ressourcer og ved at evaluere
effekten af foregående stimulerede salgsaktiviteter og bruge dette i fremtidige
planlægningscyklusser
For praktikere i dagligvarehandel har resultaterne og bidragene fra denne afhandling en række
anvendelsesområder og kan opsummeres til følgende anbefalinger:
• Brugen af informationsdeling er en kontinuerlig og iterativ proces. Denne afhandling
inkluderer en liste over facetter og et kortlægningsværktøj til at strukturere informations-
deling i forsyningskæden. Dette kan give en visualisering af, hvilke informationer der på
nuværende tidspunkt anvendes, hvad der potentielt kunne anvendes, samt forslag til
hvordan man forbinder delt information til planlægningsprocesser.
• Differentieret informationsdeling og differencering af de efterfølgende planlægnings-
processer baseret på produktegenskaber er fordelagtigt. For automatisk genopfyldning og
produkt allokering indikerer denne afhandling at deling og udnyttelse af salgs og spild
information kan forbedre balancen mellem forsyning og efterspørgsel. Deling af
information omkring tilbageværende holdbarhed har størst effekt for produkter med en
levetid på mellem 6 og 11 dage, og kan muliggøre automatisk genopfyldning af disse
produkter.
xiv
• Stimulerende salgsaktiviteter udgør en vigtig andel af den samlede omsætning, men skaber
også et stort pres på den underliggende logistik og planlægning. Denne vigtighed bør derfor
også afspejles med et større fokus på at planlægge disse aktiviteter for at sikre koordinering
på tværs af funktionerne i virksomheden. Denne afhandling indeholder en række forslag
til, hvordan man skaber et sådan fokus og hvordan man strukturerer en taktisk
planlægningsproces som understøtter stimulerende salgsaktiviteter i dagligvarehandel.
Samlet bidrager denne PhD afhandling til en række anvisninger til hvordan dagligvareforhandlere
kan tilpasse forholdet mellem forsyning og efterspørgsel. Konkret er effekten af automatisk
genopfyldning og produkt allokeringer undersøgt, men det er også demonstreret, hvordan sales
and operations planning kan være nyttig i dagligvarehandel. Afhandlingen stræber efter at
understøtte fremtidige diskussioner og den videre udvikling af dagligvarehandel ved at fremhæve
nogle af mulighederne for at tilpasse forholdet mellem forsyning og efterspørgsel.
xv
Abbreviations
CPFR Collaborative Planning Forecasting and Replenishment
CRP Continuous Replenishment Program
CV Coefficient of Variation (standard deviation compared to the mean)
ECR Efficient Consumer Response
EDI Electronic Data Interchange
EWA Not an abbreviation, but the name of an inventory policy
EWASS Modified version of the EWA policy
FIFO First In First Out (stock depletion)
LIFO Last In Last Out (stock depletion)
OIR Old Inventory Ratio (an inventory policy)
POS Point of Sales
QA Quantity Allocated
RDSCP Retail Demand and Supply Chain Planning
RQ Research Question
RSL Remaining Shelf Life
S&OP Sales and Operations Planning
SCOR Supply Chain Operations Reference
SKU Stock Keeping Unit
SS Safety Stock
VMI Vendor Managed Inventory

xvi
xvii
List of Appended Papers
Paper #1
Kiil, K., Dreyer, H.C., Hvolby H.H. (2015) Linking Information Exchange to Planning and
Control: An Overview. Advances in Production Management Systems: Innovative Production
Management Towards Sustainable Growth. 5-9 September 2015, Tokyo, Japan.
Paper #2
Kiil, K., Hvolby H.H., Trienekens, J., Behdani, B., Strandhagen, J.O. (Forthcoming) From
Information sharing to Information Utilization in Food Supply Chains. International Journal of
Information Systems and Supply Chain Management. Accepted. Will be printed August 2018.
Paper #3
Kiil, K., Dreyer, H.C., Hvolby H.H., Chabada, L. (2018) Sustainable Food Supply Chains: The
Impact of Automatic Replenishment in Grocery Stores. Production Planning and Control.
Volume 29, issue 2, pp. 106-116
Paper #4
Kiil, K., Hvolby H.H., Fraser, K., Dreyer, H.C., Strandhagen, J.O. (In review) Automatic
replenishment of perishables in grocery retailing: The value of utilizing remaining shelf life
information. British Food Journal. Submitted for first review October 2017.
Paper #5
Kiil, K., Hvolby H.H., Dreyer, H.C., Strandhagen, J.O.. (2017) Inventory Allocation of
Perishables: Guidelines. Advances in Production Management Systems: The Path to Intelligent,
Collaborative and Sustainable Manufacturing. 3-7 September 2017, Hamburg, Germany.
Paper #6
Dreyer, H.C., Dukovska-Popovska, I., Kiil, K., Kaipia, R., (2016) Retail Tactical Planning: An
Aligned Process? Advances in Production Management Systems: Production Management
Initiatives for a Sustainable World. 3-7 September 2016, Iguassu Falls, Brazil.
Paper #7
Dreyer, H.C., Kiil, K., Dukovska-Popovska, I., Kaipia, R. (In review) Enhancing tactical
planning in grocery retailing with S&OP. International Journal of Physical Distribution and
Logistics Management. Submitted for 3rd review October 2017.

xviii
xix
Table of Contents
1. Introduction .................................................................................................................... 1 1.1. The Importance of Grocery Retailing ............................................................................ 1 1.2. Characteristics of Grocery Retailing .............................................................................. 1 1.3. Challenges in Grocery Retailing and Motivation for this Study .................................... 2 1.4. Research Objective ....................................................................................................... 5 1.5. Scope............................................................................................................................. 5 1.6. Thesis Outline ............................................................................................................... 6
2. Theoretical Background .................................................................................................. 7 2.1. Planning Frameworks in Grocery Retailing ................................................................... 7 2.2. Planning with Information Sharing ............................................................................. 11 2.3. Planning Demand-Stimulating Activities ..................................................................... 20 2.5. Evaluating Performance in Grocery Retailing ............................................................. 25 2.7. Research Framework .................................................................................................. 26
3. Research Design ............................................................................................................ 27 3.1. Research Methods ...................................................................................................... 28 3.2. Research Quality ......................................................................................................... 33
4. Aligning Supply and Demand with Information Sharing ................................................ 37 4.1. Characterizing Information Sharing and Linking it to Information Utilization ............ 37 4.2. Impact of Utilizing Shared Information for Replenishment ........................................ 40 4.3. Impact of Utilizing Shared Information for Replenishment of Perishables ................ 43 4.4. Impact of Utilizing Shared Information for Inventory Allocation of Perishables ........ 52 4.5. Discussion ................................................................................................................... 58
5. Aligning Supply and Stimulated Demand ...................................................................... 67 5.1. Enhancing Tactical Planning in Grocery Retailing ....................................................... 67 5.2. Discussion ................................................................................................................... 72
6. Conclusion .................................................................................................................... 75 6.1. Revisiting the Research Questions .............................................................................. 75 6.2. Limitations and Future Research ................................................................................ 77
References ............................................................................................................................ 79
Appendix A: Questionnaire for Paper #2 .............................................................................. 91
Appendix B: Interview Guide for Paper #3 and #4 ............................................................... 95
Appendix C: Interview Guide for Paper #6 and #7 ................................................................ 97
Appendix D: Sensitivity Analysis of Replenishment Policies................................................ 101
Appendix E: Sensitivity Analysis of Inventory Allocation Policies ........................................ 105
Papers: #1 to #7

xx
1
1. Introduction
The aim of aligning supply and demand is to achieve availability of products while keeping waste,
transportation, handling cost, and inventory levels at a minimum. This chapter outlines the
motivation for studying this topic by firstly clarifying the importance of grocery retailing in
today’s food supply chains and, secondly, presenting the challenges it faces. Afterwards, the
research objective and corresponding research questions are specified together with a delimitation
of the scope.
1.1. The Importance of Grocery Retailing Convenient and sustainable conveying of food from producers to consumers has changed
considerably during the last decades, and more changes are still to come. The formation of large
retailers owning one or several stores concepts, warehouses, distribution centers, and private
labels has gained tremendous market share, and today the main part of all food products are sold
through grocery retailers. Retailers may even offer a wide range of store concepts to compete for
both the discount and premium sector and thereby increasing the total volume through its
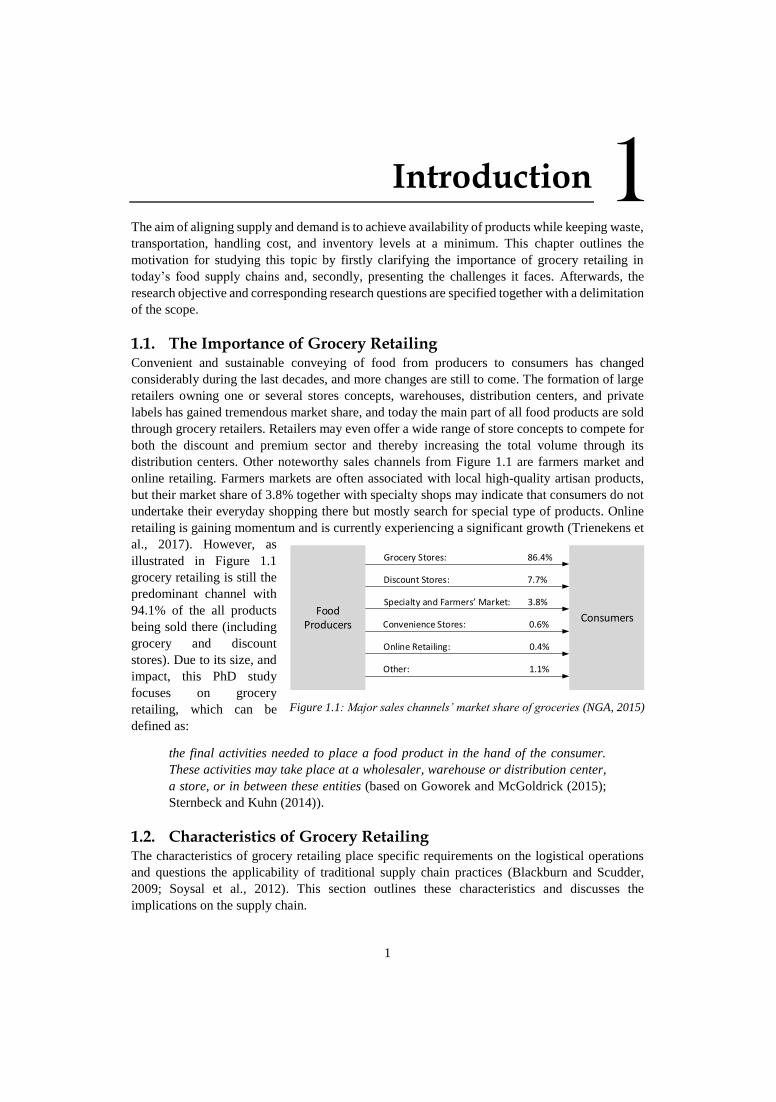
distribution centers. Other noteworthy sales channels from Figure 1.1 are farmers market and
online retailing. Farmers markets are often associated with local high-quality artisan products,
but their market share of 3.8% together with specialty shops may indicate that consumers do not
undertake their everyday shopping there but mostly search for special type of products. Online
retailing is gaining momentum and is currently experiencing a significant growth (Trienekens et
al., 2017). However, as
illustrated in Figure 1.1
grocery retailing is still the
predominant channel with
94.1% of the all products
being sold there (including
grocery and discount
stores). Due to its size, and
impact, this PhD study
focuses on grocery
retailing, which can be
defined as:
the final activities needed to place a food product in the hand of the consumer.
These activities may take place at a wholesaler, warehouse or distribution center,
a store, or in between these entities (based on Goworek and McGoldrick (2015);
Sternbeck and Kuhn (2014)).
1.2. Characteristics of Grocery Retailing The characteristics of grocery retailing place specific requirements on the logistical operations
and questions the applicability of traditional supply chain practices (Blackburn and Scudder,
2009; Soysal et al., 2012). This section outlines these characteristics and discusses the
implications on the supply chain.
Consumers
Grocery Stores: 86.4%
Discount Stores: 7.7%
Specialty and Farmers’ Market: 3.8%
Convenience Stores: 0.6%
Online Retailing: 0.4%
Other: 1.1%
Food Producers
Figure 1.1: Major sales channels’ market share of groceries (NGA, 2015)
1
2
One of the driving sources which separate and complicates grocery retailing (and food supply
chains) compared to other industries is the perishability of the products (Fredriksson and
Liljestrand, 2015; Romsdal, 2014; Van der Vorst et al., 2009). In other words, the quality and
safety, of the products change with certain rates depending on the product – which in turn has
propelled several initiatives to extend and manage this quality (Trienekens et al., 2012; Van der
Vorst et al., 2009). E.g., strawberries at room temperature may last for some days if they are
chilled down it may last up to a week, and if they are frozen more than a year. To accomplish
this, it places a direct requirement to control the temperature through the whole supply chain.
Thus, special logistical requirements are needed in grocery retailing compared to other industries
(Fredriksson and Liljestrand, 2015; Van der Vorst et al., 2005).
Even though perishability is controlled and the shelf life is extended to a week by chilling,
requirements to a high delivery frequency is still necessary to avoid undersupply and because the
use of buffer inventories is limited for products with a short shelf life (Ahumada and Villalobos,
2009). On the other hand, in case of oversupply to the stores, the use of mark-downs strategy is
often used to stimulate demand and avoid food waste (Hübner et al., 2013).
The coordination of products is further complicated due to the existence of both supply and
demand uncertainty (Romsdal, 2014; Singh, 2014; Taylor and Fearne, 2009). Production of
agricultural products such as fruit, vegetables, and meat is subject to long throughput times and
the exact day, volume, and quality might only be observable at the very end. Additionally, these
products might be subjected to seasonality, and the quality or availability of those products are
not consistent throughout the year (Romsdal, 2014). Regarding uncertainty in demand; sales in
stores have been reported to fluctuate ± 11% around the mean, while it fluctuates up to 115% at
the producer (Taylor and Fearne, 2009). This clearly demonstrates the existence of demand
amplification and a possibility to improve the inter-organizational coordination of supply and
demand.
Traceability requirements have been mandatory for companies operating in food supply chains
for several years (Trienekens and van Der Vorst, 2006). Traceability can be understood as “the
ability to determine the on-going location of products and to trace products back to their origin
and used production method” (Trienekens et al., 2014, p. 499). The main purpose and legal
argument for implementing a traceability system is to ensure public food safety and the ability to
take prompt actions if required (Thakur et al., 2011; Trienekens and van Der Vorst, 2006).
1.3. Challenges in Grocery Retailing and Motivation for this Study With more than 40 years of “out-of-stock” research in retailing on-shelf-availability remains a
struggle and a major importance of today’s retailers (Aastrup and Kotzab, 2010; Dani, 2015;
Fernie and Sparks, 2009; Moussaoui et al., 2016). This is not only true in the academic literature,
but industry surveys continuously echoed this result year after year (Martec, 2015, 2016, 2017).
Availability refers to having a product in its desired form, flavor, size, and saleable condition in
the expected location (from the consumers perspective) in stock when the consumer reaches for
the product (Aastrup and Kotzab, 2010; ECR, 2003). Of course, availability itself is not the
problem but merely a symptom which manifests the underlying challenges in grocery retailing
(Moussaoui et al., 2016). Increasing availability is “straightforward” if other cost aspects are
ignored.
3
The underlying challenges relate to the balance of availability on one side and other cost aspects,
such as e.g. transportation, inventory holding cost, products being wasted, and handling costs, on
the other side. Subsequently, there is a challenge and a need to align supply and demand
sustainably in grocery retailing (Beddington, 2011; Mena et al., 2014; Wognum et al., 2011). The
availability of products in stores is estimated to range from 93.8% to 96.8% indicating a deficit
of supply (Aastrup and Kotzab, 2009), while estimates of food waste along the supply chain
ranges from 25% to 35% indicating a surplus of supply (Kummu et al., 2012; Parfitt et al., 2010).
Recent changes and trends in consumer behavior have intensified the retailer’s need to align
supply and demand (Fernie and Sparks, 2009). Firstly, retailers are currently experiencing a
decreasing footfall (number of customers and time spent in the store) (Dani, 2015; Tugby, 2016),
and a 1.2% year-to-year decrease is expected to happen (Richardson, 2016). The footfall might
be caused by increasing online shopping (Samuel, 2017). Secondly, a clear tendency is that
consumers demand more fresh and short shelf life products – which currently account for 25% of
the total grocery sales and 35% of the growth (Nielsen, 2016b). An increased demand for healthy
ready-to-eat products, such as fresh salads, soups, sandwiches, and meal-kits has already started
and is expected to continue (Dani, 2015; Nielsen, 2016b). Hence, consumers also increasing
expects products to be fresh with a long remaining shelf life (Fernie and Sparks, 2009; Hübner et
al., 2013).
To maintain footfall, grocery retailers are using both traditional initiatives, such as promotions,
and experimenting with serval new initiatives (known as retailtainment) to attract consumers to
the stores (Dani, 2015; Vend, 2016). These stimulating activities highly affect demand and
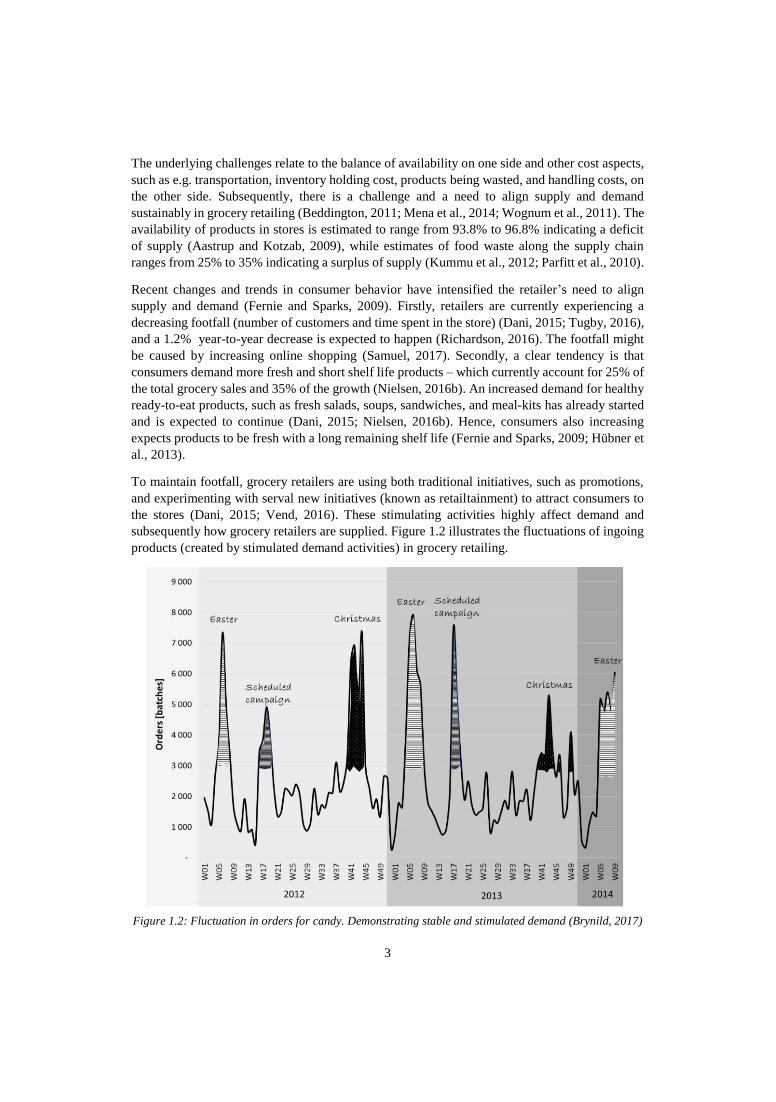
subsequently how grocery retailers are supplied. Figure 1.2 illustrates the fluctuations of ingoing
products (created by stimulated demand activities) in grocery retailing.
Figure 1.2: Fluctuation in orders for candy. Demonstrating stable and stimulated demand (Brynild, 2017)
4
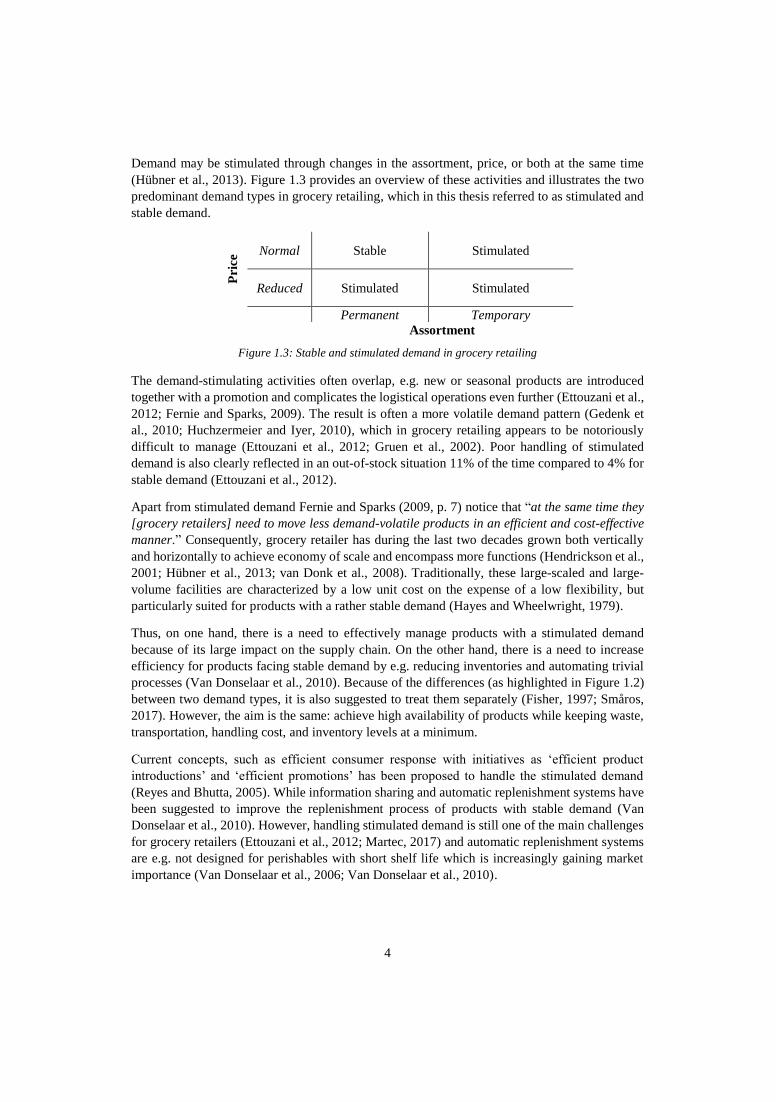
Demand may be stimulated through changes in the assortment, price, or both at the same time
(Hübner et al., 2013). Figure 1.3 provides an overview of these activities and illustrates the two
predominant demand types in grocery retailing, which in this thesis referred to as stimulated and
stable demand.
Pri
ce Normal Stable Stimulated
Reduced Stimulated Stimulated
Permanent Temporary
Assortment
Figure 1.3: Stable and stimulated demand in grocery retailing
The demand-stimulating activities often overlap, e.g. new or seasonal products are introduced
together with a promotion and complicates the logistical operations even further (Ettouzani et al.,
2012; Fernie and Sparks, 2009). The result is often a more volatile demand pattern (Gedenk et
al., 2010; Huchzermeier and Iyer, 2010), which in grocery retailing appears to be notoriously
difficult to manage (Ettouzani et al., 2012; Gruen et al., 2002). Poor handling of stimulated
demand is also clearly reflected in an out-of-stock situation 11% of the time compared to 4% for
stable demand (Ettouzani et al., 2012).
Apart from stimulated demand Fernie and Sparks (2009, p. 7) notice that “at the same time they
[grocery retailers] need to move less demand-volatile products in an efficient and cost-effective
manner.” Consequently, grocery retailer has during the last two decades grown both vertically
and horizontally to achieve economy of scale and encompass more functions (Hendrickson et al.,
2001; Hübner et al., 2013; van Donk et al., 2008). Traditionally, these large-scaled and large-
volume facilities are characterized by a low unit cost on the expense of a low flexibility, but
particularly suited for products with a rather stable demand (Hayes and Wheelwright, 1979).
Thus, on one hand, there is a need to effectively manage products with a stimulated demand
because of its large impact on the supply chain. On the other hand, there is a need to increase
efficiency for products facing stable demand by e.g. reducing inventories and automating trivial
processes (Van Donselaar et al., 2010). Because of the differences (as highlighted in Figure 1.2)
between two demand types, it is also suggested to treat them separately (Fisher, 1997; Småros,
2017). However, the aim is the same: achieve high availability of products while keeping waste,
transportation, handling cost, and inventory levels at a minimum.
Current concepts, such as efficient consumer response with initiatives as ‘efficient product
introductions’ and ‘efficient promotions’ has been proposed to handle the stimulated demand
(Reyes and Bhutta, 2005). While information sharing and automatic replenishment systems have
been suggested to improve the replenishment process of products with stable demand (Van
Donselaar et al., 2010). However, handling stimulated demand is still one of the main challenges
for grocery retailers (Ettouzani et al., 2012; Martec, 2017) and automatic replenishment systems
are e.g. not designed for perishables with short shelf life which is increasingly gaining market
importance (Van Donselaar et al., 2006; Van Donselaar et al., 2010).
5
1.4. Research Objective The objective of this PhD research is to contribute to how grocery retailers can align supply and
demand through improved decision making in their planning processes. Based on the introduction
of the challenges in grocery retailing this objective is further specified into two research
questions. One for each of two demand types from Figure 1.3.
As highlighted by Fernie and Sparks (2009) grocery retailers need to manage stable demand
products in an efficient manner. Information sharing and the use of automatic replenishment
systems have been developed and implemented to support this purpose – this thesis continues this
development. Specifically, information sharing has been shown to be a valuable remedy for
improving availability and has also been proposed to comprehend additional improvements such
as reduce food waste across the supply chain, but the actual size of this improvement remains an
open question (Kaipia et al., 2013; Mena et al., 2011; Mena et al., 2014; Taylor and Fearne, 2009).
Additionally, information sharing is currently mainly used for replenishment decisions and for
products with a long shelf life (Potter and Disney, 2010; Van Donselaar et al., 2010). Thus, to
adequately understand information sharing and evaluate how it can improve decision making,
and its subsequent impact on alignment, a set of questions has been put forward to guide the
research:
Research Question 1:
How does information sharing contribute to align supply and demand in grocery retailing?
a. How is information sharing characterized in grocery retailing?
b. What is the impact of information sharing in grocery retailing?
Secondly, it appears that the demand stimulating activities such as reduced prices, product
introductions, and similar activities from Figure 1.3 are put in place to attract consumers into the
store (Gedenk et al., 2010; Huchzermeier and Iyer, 2010). However, at the same time, the rather
poor realization of these activities with an 11% out-of-stock situation (Ettouzani et al., 2012)
indicates that previous practices are not providing a satisfactory performance. This indicates a
need to examine this topic of stimulated demand activities further. Hence, as a subordinate topic
in this thesis research question 2 was put forward:
Research Question 2:
How do grocery retailers effectively align supply and stimulated demand?
1.5. Scope Even though the research questions help specify the direction of the research the research needs
a further positioning within the existing literature streams and terminologies. The selection and
specifications of research scope were made collectively with the involved case companies (these
will be presented in Chapter 3).
Regarding research question 1; behavioral, technical, and ethical aspects are not considered as
subjects for this study. This include the trust and willingness (Fawcett et al., 2007; Fawcett et al.,
2009) necessary for companies to engage in information sharing activities, as well as the
technology needed to capture data and the rightfulness of sharing personal or near-personal
information for business purposes. Lastly, information quality, even though it relates to
6
information sharing (Myrelid, 2015), it is in this study perceived as a literature stream of its own
(see e.g. (Gustavsson and Wänström, 2009; Lee et al., 2002)) and is thus not explicitly considered
but information is assumed to be of high quality.
For research question 2; demand literature streams with a clear marketing-oriented perspective
(develop promotions, how to develop new products based on consumer preferences, consumer
loyalty, etc.) do not fall within the scope of this study, as the objective of the research is to align
supply and demand.
This study is concerned with research and literature discussing planning within grocery retailing
and particularly for improving the flow of goods and utilization of the reversed information flow.
Examples of such literature streams include (perishable) inventory management, value of
information, and sales and operations planning. Additionally, the conducted studies apply a
process perspective (Slack et al., 2007). I.e., this is the fundamental lens when approaching,
analyzing, and making suggestions to observed gaps in literature and practice.
1.6. Thesis Outline The thesis is based on the research that has been conducted and documented in the seven
appended papers and serves the purpose of synthesizing and presenting these results. The thesis
is intended to be read and understood without reading the appended papers, however when
appropriate a reference to the specific paper is made to clarify details.
The remainder of this thesis is structured around five chapters discussing: (2) the theoretical
background, (3) research design, (4 and 5) findings and discussion, and (6) conclusions. Some
chapters include a section which is dedicated to each research question, and Table 1.1 highlights
the most essential sections and chapters if the thesis is to be read individually according to the
two research questions.
Table 1.1 Essential sections according to the two research questions
Research Question 1 Research Question 2
Theoretical Background Section 2.2 Section 2.3
Research Design Section 3.1.1 Section 3.1.2
Findings and Discussion Chapter 4 Chapter 5
Conclusion Section 6.1 Section 6.1
Appended Papers 1-5 6-7
7
2. Theoretical Background
The relevant literature has been carefully examined either before or in parallel with the initial
phase of each sub-study. This helped ensure theoretical relevance and positioning of the work.
Accordingly, this chapter serves the purpose of outlining the theoretical foundation and is divided
into five major sections. First, there is a general introduction to planning in retailing, which
includes the most relevant industry terms. The second section presents the theoretical background
related to research question 1. Especially, attention is paid to the replenishment and inventory
allocation between a warehouse and stores. These two decisions are selected as a primary focus
point in the thesis because they are expected to have a direct impact on the alignment between
supply and demand. The replenishment decision controls the timing and the quantity of products
delivered to the stores – this timing and quantity should be synchronized to when the demand is
happening to ensure high availability on one hand and low waste on the other. The inventory
allocation controls which store that receive oldest and newest products (from the warehouse) to
reduce this risk of products expiring in the store. Similarly, the inventory allocation also controls
how many products each store should receive, in case of stock-out at the warehouse, to ensure
the highest possible demand is fulfilled. For both the replenishment and the inventory allocation
special devotion is paid to products with a short shelf life, as these are becoming increasingly
important for grocery retailers and are known to have higher waste levels (Kaipia et al., 2013).
The third section presents the theoretical background related to research question 2. Specifically,
it is presented how planning for stimulated demand activities has evolved since the early nineties
and why sales and operations planning (from the manufacturing domain) could be the future step
in this development. Sales and operations planning is a tactical planning process which seeks to
balance supply and demand on a volume level – this purpose is considered to support the overall
objective of aligning supply and demand and resonates why it has been selected as part of this
thesis.
To compare possible scenarios and adequately discuss performance the fourth section outlines
relevant performance measures for grocery retailing. Lastly, the final section summarizes the
presented literature into a research framework and places it in relation to the research questions.
2.1. Planning Frameworks in Grocery Retailing At least three planning frameworks exist for a general introduction to planning in grocery
retailing. They are the Supply Chain Operation Reference (SCOR) model (SCC, 2012), Efficient
Consumer Response (ECR) (Salmon, 1993), and the Retail Demand and Supply Chain Planning
(RDSCP) Framework (Hübner et al., 2013).
The SCOR model provides a generic understanding of supply chains and includes specific
processes for the retail industry (SCC, 2012). Even though it is popular in both industry and
academia, it is a tool developed for diagnostic and benchmarking purposes (as demonstrated in
Paper #4) (Ntabe et al., 2015). Its main strength lays in providing a standardized overview of
material flow and decision processes for the purpose of comparison. However, because a SCOR
flow chart of retailing would be either too detailed or too aggregated it is not considered adequate
at this point.
2
8
ECR consist of four main strategies that all seek to increase collaboration across the supply chain
(Kotzab, 1999). They are (1) efficient store assortment, (2) efficient promotions, (3) efficient
product introductions, and (4) efficient replenishment (Salmon, 1993). Individually, the four
strategies are useful and will be considered in section 2.2 and 2.3, but overall ECR does not
provide a comprehensive overview of the planning tasks found in grocery retailing (Hübner et
al., 2013). ECR has later evolved into collaborative planning forecasting and replenishment
(CPFR) (Barratt and Oliveira, 2001).
The RDSCP framework is useful for a general introduction to planning in grocery retailing. It is
a natural adaptation of the supply chain planning matrix developed to support advanced planning
systems (Fleischmann and Meyr, 2003; Stadtler, 2005). Vertically the decisions are based on the
principles of hierarchical planning ranging from aggregated and long-term down to detailed short-
term decisions. Horizontally, the matrix follows the material flow starting with purchasing and
ending with sales (Stadtler, 2005).
2.1.1. Retail Demand and Supply Chain Planning Framework
Figure 2.1 illustrates the adapted supply chain planning matrix for grocery retailing, namely the
RDSCP framework. It has been solidly verified with interviews and observations across 28
retailers in Europe (Hübner et al., 2013). The main adaptation to this context is horizontally where
the decisions they are grouped according to the functions in retailing. For example, warehousing
has replaced operations from the traditional supply chain planning matrix, and master category
planning has replaced demand planning. The following subsections briefly go through each of
the hierarchical levels of the RDSCP framework and afterward a comparison with ECR.
Long-term configuration planning
The long-term configuration is not only limited to the network design (i.e. the location, size, and
type of warehouse(s) and stores) but also includes the strategies for physical distribution,
technology selection, as well as sourcing and supplier selection (Hübner et al., 2013). The
increasing expansion of the number of retail formats or retail chains and vitality of store locations
emphasizes the complexity and importance of an adequate network design (Gill and Ishaq Bhatti,
2007; Kabadayi et al., 2007). The physical distribution structure entails the decision of direct
delivery to stores from suppliers, cross-docking, through the warehouse, or some other
combination (Akkerman et al., 2010; Kuhn and Sternbeck, 2013). Technology selection is
typically a central element of the warehouse design, e.g. deciding the technology for the pick-
and-pack process of ambient, chilled, and frozen products (De Koster et al., 2007; Gu et al., 2007).
The sourcing strategy specifies the number of suppliers per category, the use of branded or private
labels, while supplier selection and contracting include pricing, delivery terms, yearly volumes
agreements (Hübner et al., 2013).
Mid-term master planning
Mid-term master planning generally covers planning decisions 6-12 months in advance and
constitutes of six major areas as illustrated in Figure 2.1. (1) Product segmentation and allocation
form adequate product groups based on sales patterns, service level, and others logistical factors.
Detailed distribution structure, transportation means, and warehouse allocation(s) are afterward
allocated for these groups. Also, determination of dispatch units and product carries (roll-cages,
returnable boxes, etc.) fall within this area. (2) Inbound planning relates to the calculation of
reorder points, order quantities, and, if the retailer participates in the transportation planning,
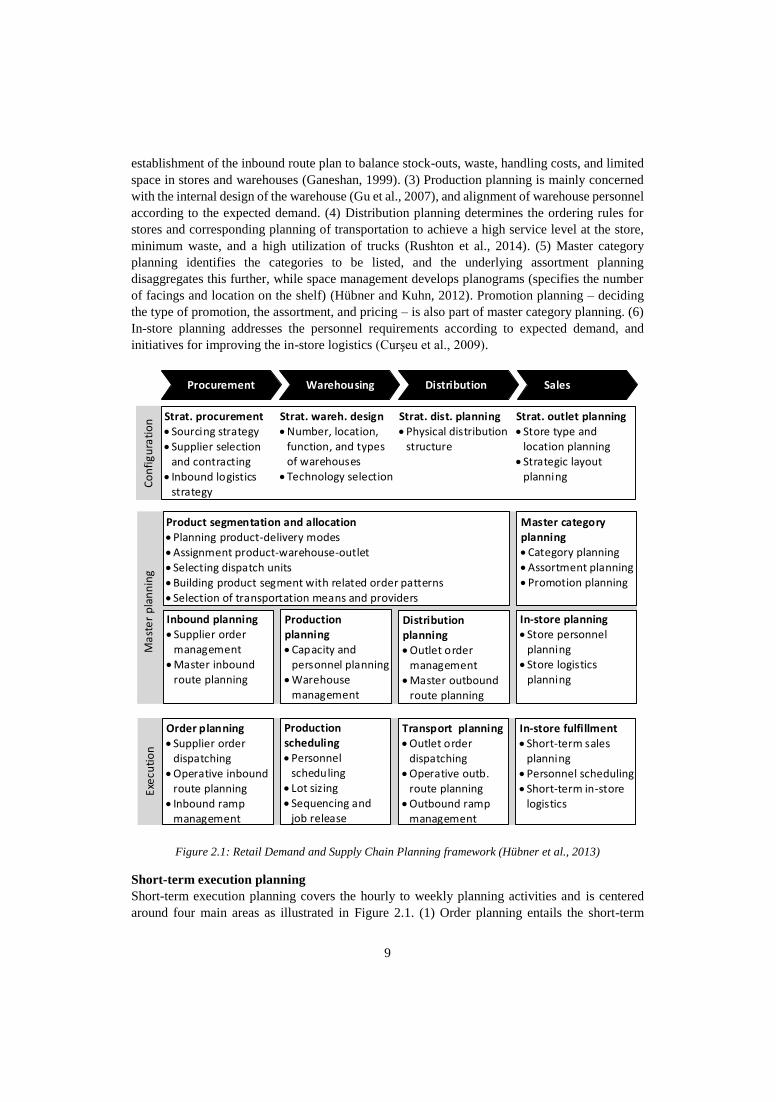
9
establishment of the inbound route plan to balance stock-outs, waste, handling costs, and limited
space in stores and warehouses (Ganeshan, 1999). (3) Production planning is mainly concerned
with the internal design of the warehouse (Gu et al., 2007), and alignment of warehouse personnel
according to the expected demand. (4) Distribution planning determines the ordering rules for
stores and corresponding planning of transportation to achieve a high service level at the store,
minimum waste, and a high utilization of trucks (Rushton et al., 2014). (5) Master category
planning identifies the categories to be listed, and the underlying assortment planning
disaggregates this further, while space management develops planograms (specifies the number
of facings and location on the shelf) (Hübner and Kuhn, 2012). Promotion planning – deciding
the type of promotion, the assortment, and pricing – is also part of master category planning. (6)
In-store planning addresses the personnel requirements according to expected demand, and
initiatives for improving the in-store logistics (Curşeu et al., 2009).
Figure 2.1: Retail Demand and Supply Chain Planning framework (Hübner et al., 2013)
Short-term execution planning
Short-term execution planning covers the hourly to weekly planning activities and is centered
around four main areas as illustrated in Figure 2.1. (1) Order planning entails the short-term
Procurement Warehousing Distribution Sales
Product segmentation and allocation• Planning product-delivery modes• Assignment product-warehouse-outlet• Selecting dispatch units• Building product segment with related order patterns• Selection of transportation means and providers
Strat. procurement• Sourcing strategy• Supplier selection
and contracting• Inbound logistics
strategy
Strat. wareh. design• Number, location,
function, and typesof warehouses
• Technology selection
Strat. dist. planning• Physical distribution
structure
Strat. outlet planning• Store type and
location planning• Strategic layout
planning
Master category planning• Category planning• Assortment planning• Promotion planning
In-store planning• Store personnel
planning• Store logistics
planning
Distribution planning• Outlet order
management• Master outbound
route planning
Inbound planning• Supplier order
management• Master inbound
route planning
Production planning• Capacity and
personnel planning• Warehouse
management
In-store fulfillment• Short-term sales
planning• Personnel scheduling• Short-term in-store
logistics
Transport planning• Outlet order
dispatching• Operative outb.
route planning• Outbound ramp
management
Order planning• Supplier order
dispatching• Operative inbound
route planning• Inbound ramp
management
Production scheduling• Personnel
scheduling• Lot sizing• Sequencing and
job release
Co
nfi
gu
rati
on
Exe
cuti
on
M
ast
er
pla
nn
ing
10
question of when and how much to order, based on the selected inventory policy in the superior
planning level. Also, the allocation of trucks and time-phase deployment for the timing of pick-
ups is part of this planning area. (2) Production scheduling is the short-term adjustment of
warehouse personnel as well as the release of picking orders. (3) Transport planning is the
development of a time-phase route plan for outbound transportation between the warehouse and
stores, as well as the allocation of trucks and drivers for the individual orders. (4) In-store
fulfillment is concerned with forecasting and replenishment of the individual product, restocking
of shelves, mark-down of products with limited remaining shelf life, and short-term adjustment
of store personnel (Kabak et al., 2008; Kotzab and Teller, 2005).
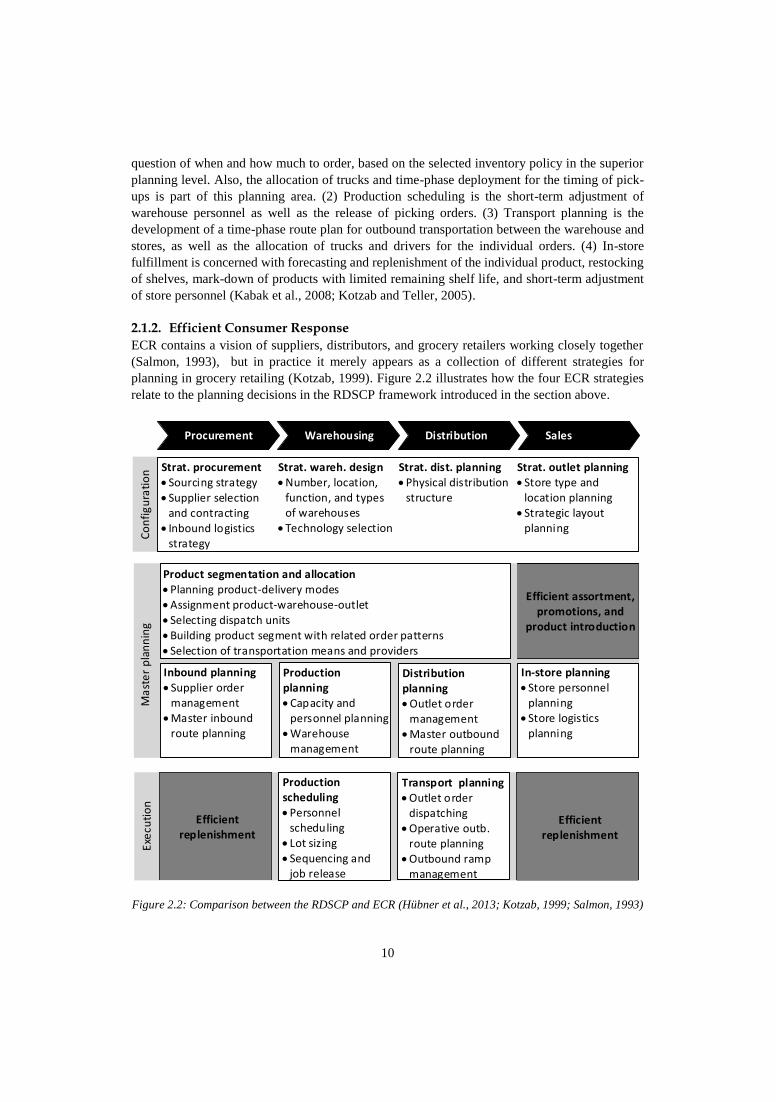
2.1.2. Efficient Consumer Response
ECR contains a vision of suppliers, distributors, and grocery retailers working closely together
(Salmon, 1993), but in practice it merely appears as a collection of different strategies for
planning in grocery retailing (Kotzab, 1999). Figure 2.2 illustrates how the four ECR strategies
relate to the planning decisions in the RDSCP framework introduced in the section above.
Figure 2.2: Comparison between the RDSCP and ECR (Hübner et al., 2013; Kotzab, 1999; Salmon, 1993)
Procurement Warehousing Distribution Sales
Product segmentation and allocation• Planning product-delivery modes• Assignment product-warehouse-outlet• Selecting dispatch units• Building product segment with related order patterns• Selection of transportation means and providers
Strat. procurement• Sourcing strategy• Supplier selection
and contracting• Inbound logistics
strategy
Strat. wareh. design• Number, location,
function, and typesof warehouses
• Technology selection
Strat. dist. planning• Physical distribution
structure
Strat. outlet planning• Store type and
location planning• Strategic layout
planning
Master category planning• Category planning• Assortment planning• Promotion planning
In-store planning• Store personnel
planning• Store logistics
planning
Distribution planning• Outlet order
management• Master outbound
route planning
Inbound planning• Supplier order
management• Master inbound
route planning
Production planning• Capacity and
personnel planning• Warehouse
management
In-store fulfillment• Short-term sales
planning• Personnel scheduling• Short-term in-store
logistics
Transport planning• Outlet order
dispatching• Operative outb.
route planning• Outbound ramp
management
Order planning• Supplier order
dispatching• Operative inbound
route planning• Inbound ramp
management
Production scheduling• Personnel
scheduling• Lot sizing• Sequencing and
job release
Co
nfi
gu
rati
on
Exe
cuti
on
M
ast
er
pla
nn
ing
Efficient replenishment
Efficient assortment, promotions, and
product introduction
Efficient replenishment
11
The efficient replenishment strategy relates to the order planning and in-store fulfillment. The
strategy is based on an increased use of information sharing and thereby connects to the studies
about research question 1. This strategy serves as input to section 2.2.
The strategies, efficient assortment, efficient promotions, and efficient product introductions are
all part of the master category planning. The efficient product introductions and efficient
promotions are highly connected to the second research question of demand-stimulating activities
(see Figure 1.3, page 4). These strategies serve as input in section 2.3.
2.2. Planning with Information Sharing This section revolves around five subsections of how shared information can be utilized for
planning. Firstly, an introduction and overview of planning and information sharing in academic
literature. Secondly, the focus is placed on the replenishment decision in grocery retailing, and
particularly automatic replenishment system, their underlying logic, and use of shared
information. Thirdly, the use of automatic replenishment systems for perishables and why
additional shared information is needed for these type of products. As outlined above the
replenishment decision controls the timing of when and how much products the stores receive,
and is thereby expected to directly support the objective of aligning supply and demand. A similar
reasoning can be made for the fourth subsection which presents inventory allocation policies and
why shared information can contribute to this decision for allocation of perishables. Lastly, a
summary of contextual variables that have been reported to affect the value of sharing and using
information.
2.2.1. An Overview
Information sharing is extensively studied in previous literature – not only for grocery retailing,
but all types of industries and dates back to the identification of the Forrester (bull-whip) effect
(Forrester, 1958; Lee et al., 1997) (for broad review of the literature see Giard and Sali (2013);
Huang et al. (2003); Montoya-Torres and Ortiz-Vargas (2014); Sahin and Robinson (2002)).
Some articulates information sharing as an embedded part of supply chain integration (Flynn et
al., 2010; Frohlich and Westbrook, 2001) and others more generally as a mean to enhance supply
chain coordination (Arshinder et al., 2008) and hence enhance supply chain performance (Baihaqi
and Sohal, 2013; Barratt and Oke, 2007; Myrelid, 2015; Sezen, 2008).
A distinction between information sharing and information utilization is necessary as the same
shared information may be utilized for different planning decisions. Information sharing refers to
the availability of operational, tactical, or strategic insights (Kembro and Näslund, 2014),
whereas information utilization refers to the inclusion of received information, from the supply
chain or surrounding environment, in the internal or collaborative decision processes
(referenced from Paper #4). Thus, it is apparent that information sharing is a prerequisite for
information utilization.
Table 2.1 (from Paper #1) illustrates a summary (non-industry specific) of studies that have been
conducted – showing the type of information that has been considered and the corresponding
planning and control decision of where the information was utilized. The numbers in the table
refer to the number of papers, which has considered a particular combination of shared
information and planning and control decision. The overview consists of 131 papers in total. Thus
many papers have considered more than one type of information or one type of planning decision
at once.
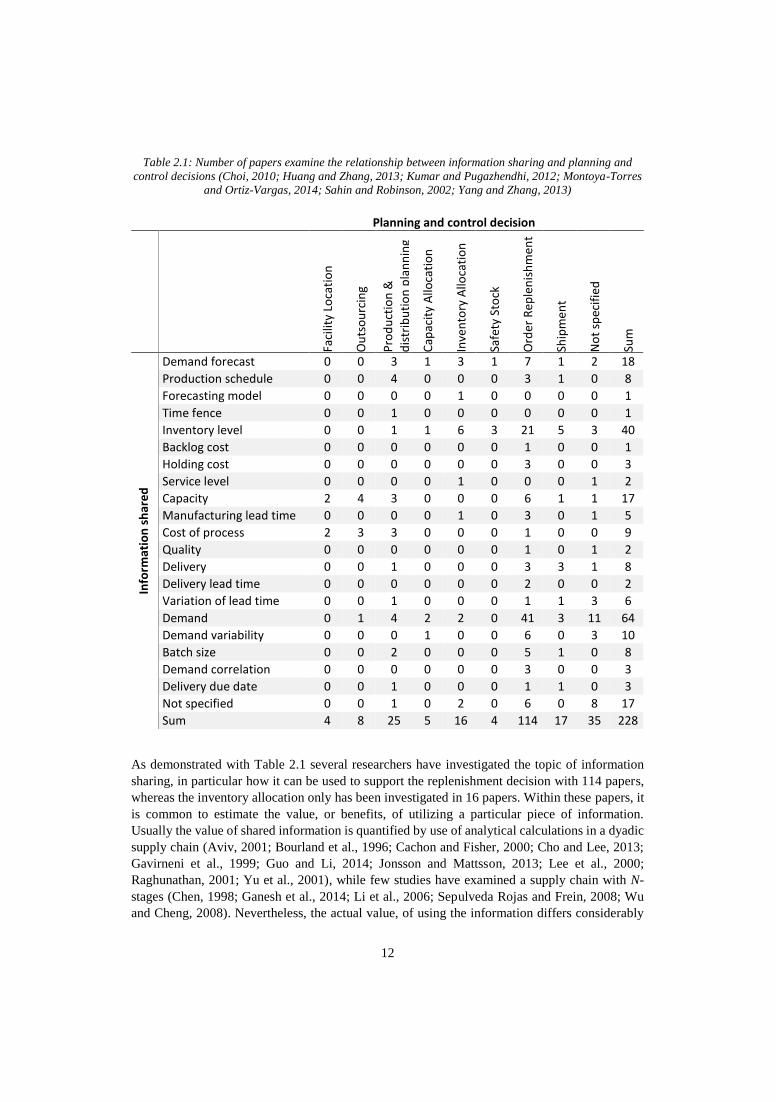
12
Table 2.1: Number of papers examine the relationship between information sharing and planning and
control decisions (Choi, 2010; Huang and Zhang, 2013; Kumar and Pugazhendhi, 2012; Montoya-Torres
and Ortiz-Vargas, 2014; Sahin and Robinson, 2002; Yang and Zhang, 2013)
As demonstrated with Table 2.1 several researchers have investigated the topic of information
sharing, in particular how it can be used to support the replenishment decision with 114 papers,
whereas the inventory allocation only has been investigated in 16 papers. Within these papers, it
is common to estimate the value, or benefits, of utilizing a particular piece of information.
Usually the value of shared information is quantified by use of analytical calculations in a dyadic
supply chain (Aviv, 2001; Bourland et al., 1996; Cachon and Fisher, 2000; Cho and Lee, 2013;
Gavirneni et al., 1999; Guo and Li, 2014; Jonsson and Mattsson, 2013; Lee et al., 2000;
Raghunathan, 2001; Yu et al., 2001), while few studies have examined a supply chain with N-
stages (Chen, 1998; Ganesh et al., 2014; Li et al., 2006; Sepulveda Rojas and Frein, 2008; Wu
and Cheng, 2008). Nevertheless, the actual value, of using the information differs considerably
Planning and control decision
Faci
lity
Loca
tio
n
Ou
tso
urc
ing
Pro
du
ctio
n &
dis
trib
uti
on
pla
nn
ing
Cap
acit
y A
lloca
tio
n
Inve
nto
ry A
lloca
tio
n
Safe
ty S
tock
Ord
er R
eple
nis
hm
ent
Ship
men
t
No
t sp
ecif
ied
Sum
Info
rmat
ion
sh
are
d
Demand forecast 0 0 3 1 3 1 7 1 2 18
Production schedule 0 0 4 0 0 0 3 1 0 8
Forecasting model 0 0 0 0 1 0 0 0 0 1
Time fence 0 0 1 0 0 0 0 0 0 1
Inventory level 0 0 1 1 6 3 21 5 3 40
Backlog cost 0 0 0 0 0 0 1 0 0 1
Holding cost 0 0 0 0 0 0 3 0 0 3
Service level 0 0 0 0 1 0 0 0 1 2
Capacity 2 4 3 0 0 0 6 1 1 17
Manufacturing lead time 0 0 0 0 1 0 3 0 1 5
Cost of process 2 3 3 0 0 0 1 0 0 9
Quality 0 0 0 0 0 0 1 0 1 2
Delivery 0 0 1 0 0 0 3 3 1 8
Delivery lead time 0 0 0 0 0 0 2 0 0 2
Variation of lead time 0 0 1 0 0 0 1 1 3 6
Demand 0 1 4 2 2 0 41 3 11 64
Demand variability 0 0 0 1 0 0 6 0 3 10
Batch size 0 0 2 0 0 0 5 1 0 8
Demand correlation 0 0 0 0 0 0 3 0 0 3
Delivery due date 0 0 1 0 0 0 1 1 0 3
Not specified 0 0 1 0 2 0 6 0 8 17
Sum 4 8 25 5 16 4 114 17 35 228
13
among studies (Jonsson and Mattsson, 2013; Ketzenberg et al., 2007; Rached et al., 2015), and
very little empirical evidence have been provided for information sharing in more than dyadic
relations (Kembro and Näslund, 2014). The focus on dyadic relationships (one seller one buyer)
also explains why the problem of inventory allocations has received little attention as this problem
only exist if there are multiple buyers.
In addition, there is no systematic framework which explains what, when, how, or with whom
information should be shared, and how it differs in various types supply chains (Jonsson et al.,
2016; Jonsson and Mattsson, 2013; Kembro et al., 2014; Lau et al., 2002; Sahin and Robinson,
2002). Or, how the shared information should be linked to the receiving company for supply
chain purposes (Jonsson and Myrelid, 2016; Kaipia, 2009; Kim and Narasimhan, 2002; Myrelid,
2015). In other words: “despite the progress, the research underscored the fact that many SC
managers do not fully understand the nature and role of an information-sharing capability. Thus,
a proven, well-traveled path with well-defined signposts to the development of this important SC
capability has not yet been established” (Fawcett et al., 2009, p. 241). A conceptual framework
provided by Kembro et al. (2014) is a valuable contribution towards establishing this well-
traveled path. However, it is not easily identified from this how the information is incorporated
in the decision processes, which is necessary to benefit from it (Baihaqi and Sohal, 2013;
Moinzadeh, 2002; Zhou and Benton, 2007).
2.2.2. Automatic Replenishment
Information sharing plays an important role in grocery retailing especially for efficient
replenishment also known as automatic replenishment system. This is mainly used for products
with a stable, high demand volume, and generally with a long shelf life (Potter and Disney, 2010;
Van Donselaar et al., 2010), but attempts to use it for perishables is also reported (Broekmeulen
and van Donselaar, 2009; Lowalekar and Ravichandran, 2015; Tekin et al., 2001). From the ECR
domain, automatic replenishment is known as the strategy efficient replenishment (Reyes and
Bhutta, 2005; Yao and Dresner, 2008), and it represents nearly half of the projected savings from
ECR (Salmon, 1993). Efficient replenishment consists of two phases. The driving force of phase
1 is to share POS-information and use as triggers for the next replenishment decision – both for
the inbound and outbound replenishment process at the grocery retailer as illustrated in Figure
2.2 (Salmon, 1993). Phase 2 builds on the foundation from phase 1 and aims to integrate the two
independent replenishment processes into one (Salmon, 1993), which is also known as multi-
echelon inventory systems (see e.g. Clark and Scarf (1960)).
Besides efficient replenishment, a number of sophisticated supply chain initiatives has been
developed during the last decades to increase interfirm coordination of the replenishment as
illustrated in Figure 2.3 (Arshinder et al., 2008; Yao and Dresner, 2008). The common
characteristic is an increased use of shared information, and they can be found under the umbrella
term automatic replenishment programs, automatic replenishment systems, or automatic store
ordering (Ellinger et al., 1999; Sabath et al., 2001; Thomassen, 2013; Van Donselaar et al., 2010;
Yao and Dresner, 2008). Figure 2.3 outlines some of the main methods found in the literature.
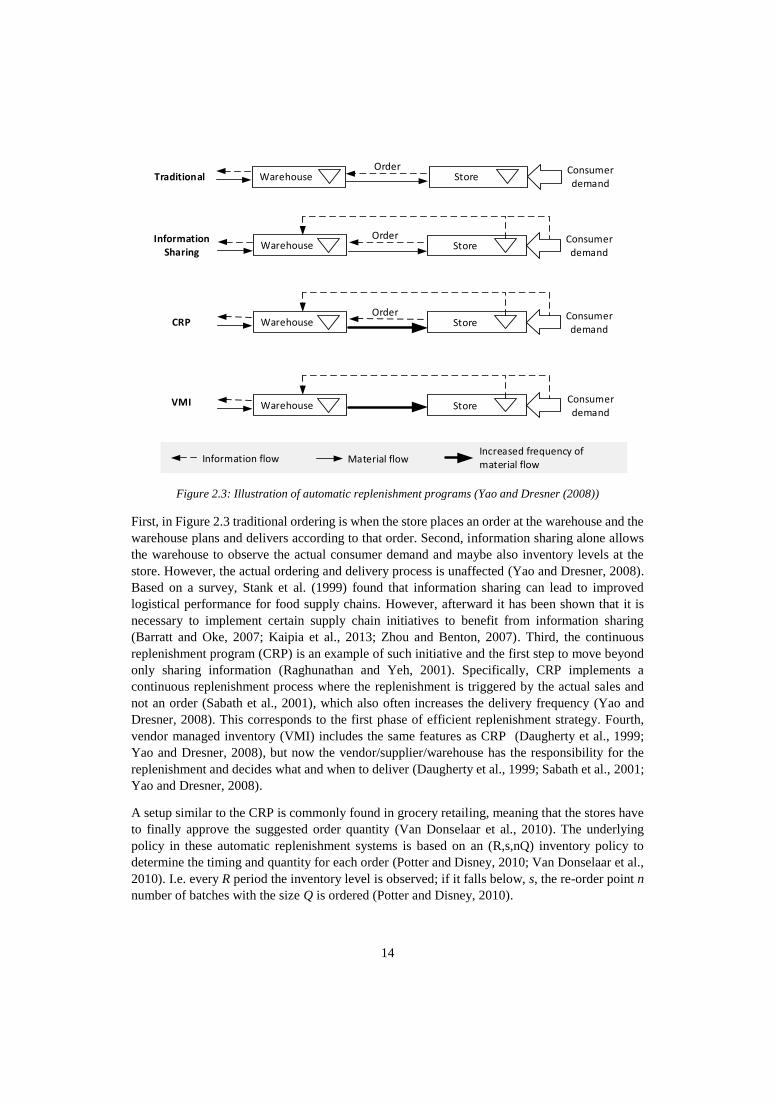
14
Figure 2.3: Illustration of automatic replenishment programs (Yao and Dresner (2008))
First, in Figure 2.3 traditional ordering is when the store places an order at the warehouse and the
warehouse plans and delivers according to that order. Second, information sharing alone allows
the warehouse to observe the actual consumer demand and maybe also inventory levels at the
store. However, the actual ordering and delivery process is unaffected (Yao and Dresner, 2008).
Based on a survey, Stank et al. (1999) found that information sharing can lead to improved
logistical performance for food supply chains. However, afterward it has been shown that it is
necessary to implement certain supply chain initiatives to benefit from information sharing
(Barratt and Oke, 2007; Kaipia et al., 2013; Zhou and Benton, 2007). Third, the continuous
replenishment program (CRP) is an example of such initiative and the first step to move beyond
only sharing information (Raghunathan and Yeh, 2001). Specifically, CRP implements a
continuous replenishment process where the replenishment is triggered by the actual sales and
not an order (Sabath et al., 2001), which also often increases the delivery frequency (Yao and
Dresner, 2008). This corresponds to the first phase of efficient replenishment strategy. Fourth,
vendor managed inventory (VMI) includes the same features as CRP (Daugherty et al., 1999;
Yao and Dresner, 2008), but now the vendor/supplier/warehouse has the responsibility for the
replenishment and decides what and when to deliver (Daugherty et al., 1999; Sabath et al., 2001;
Yao and Dresner, 2008).
A setup similar to the CRP is commonly found in grocery retailing, meaning that the stores have
to finally approve the suggested order quantity (Van Donselaar et al., 2010). The underlying
policy in these automatic replenishment systems is based on an (R,s,nQ) inventory policy to
determine the timing and quantity for each order (Potter and Disney, 2010; Van Donselaar et al.,
2010). I.e. every R period the inventory level is observed; if it falls below, s, the re-order point n
number of batches with the size Q is ordered (Potter and Disney, 2010).
Warehouse StoreOrder Consumer
demand
Warehouse StoreOrder Consumer
demand
Traditional
Information Sharing
Warehouse StoreOrder Consumer
demandCRP
Warehouse StoreConsumer demand
VMI
Information flowIncreased frequency of material flow
Material flow
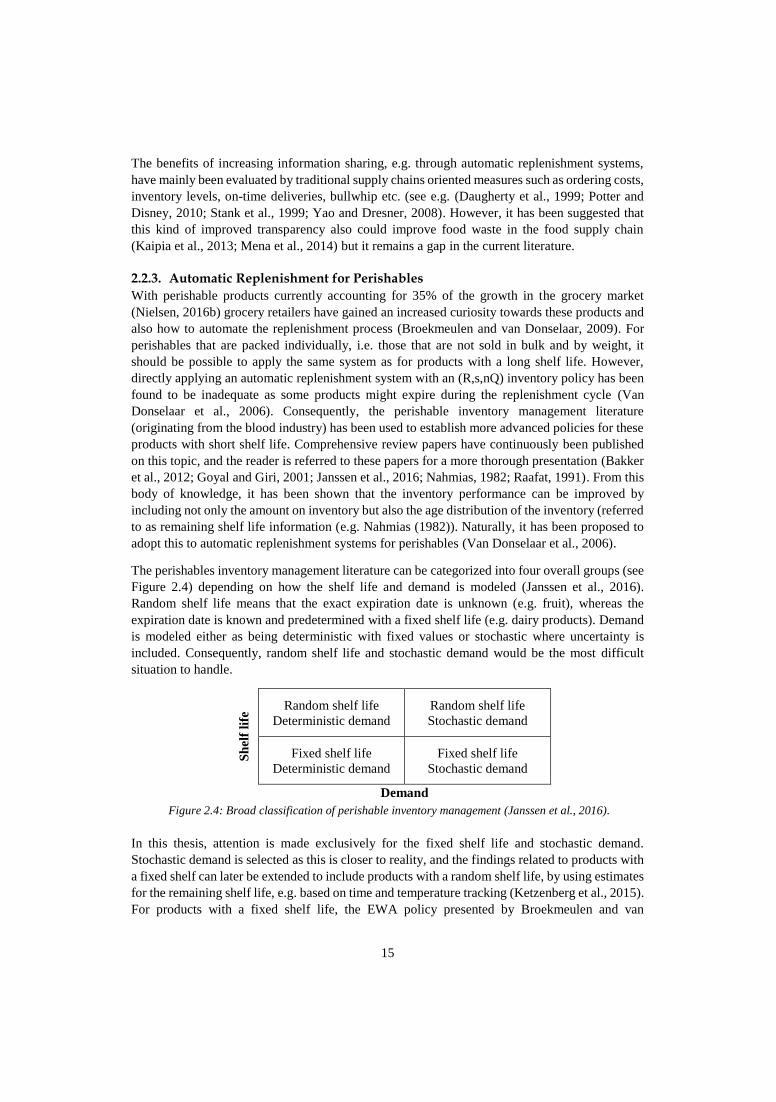
15
The benefits of increasing information sharing, e.g. through automatic replenishment systems,
have mainly been evaluated by traditional supply chains oriented measures such as ordering costs,
inventory levels, on-time deliveries, bullwhip etc. (see e.g. (Daugherty et al., 1999; Potter and
Disney, 2010; Stank et al., 1999; Yao and Dresner, 2008). However, it has been suggested that
this kind of improved transparency also could improve food waste in the food supply chain
(Kaipia et al., 2013; Mena et al., 2014) but it remains a gap in the current literature.
2.2.3. Automatic Replenishment for Perishables
With perishable products currently accounting for 35% of the growth in the grocery market
(Nielsen, 2016b) grocery retailers have gained an increased curiosity towards these products and
also how to automate the replenishment process (Broekmeulen and van Donselaar, 2009). For
perishables that are packed individually, i.e. those that are not sold in bulk and by weight, it
should be possible to apply the same system as for products with a long shelf life. However,
directly applying an automatic replenishment system with an (R,s,nQ) inventory policy has been
found to be inadequate as some products might expire during the replenishment cycle (Van
Donselaar et al., 2006). Consequently, the perishable inventory management literature
(originating from the blood industry) has been used to establish more advanced policies for these
products with short shelf life. Comprehensive review papers have continuously been published
on this topic, and the reader is referred to these papers for a more thorough presentation (Bakker
et al., 2012; Goyal and Giri, 2001; Janssen et al., 2016; Nahmias, 1982; Raafat, 1991). From this
body of knowledge, it has been shown that the inventory performance can be improved by
including not only the amount on inventory but also the age distribution of the inventory (referred
to as remaining shelf life information (e.g. Nahmias (1982)). Naturally, it has been proposed to
adopt this to automatic replenishment systems for perishables (Van Donselaar et al., 2006).
The perishables inventory management literature can be categorized into four overall groups (see
Figure 2.4) depending on how the shelf life and demand is modeled (Janssen et al., 2016).
Random shelf life means that the exact expiration date is unknown (e.g. fruit), whereas the
expiration date is known and predetermined with a fixed shelf life (e.g. dairy products). Demand
is modeled either as being deterministic with fixed values or stochastic where uncertainty is
included. Consequently, random shelf life and stochastic demand would be the most difficult
situation to handle.
Sh
elf
life
Random shelf life
Deterministic demand
Random shelf life
Stochastic demand
Fixed shelf life
Deterministic demand
Fixed shelf life
Stochastic demand
Demand
In this thesis, attention is made exclusively for the fixed shelf life and stochastic demand.
Stochastic demand is selected as this is closer to reality, and the findings related to products with
a fixed shelf can later be extended to include products with a random shelf life, by using estimates
for the remaining shelf life, e.g. based on time and temperature tracking (Ketzenberg et al., 2015).
For products with a fixed shelf life, the EWA policy presented by Broekmeulen and van
Figure 2.4: Broad classification of perishable inventory management (Janssen et al., 2016).
16
Donselaar (2009) is particularly interesting for grocery retailing because it is developed with the
specific purpose of extending automatic replenishment systems to perishables. The EWA policy
assumes fixed shelf life, stochastic demand, and is intuitive to use. However, it also assumes that
the automatic replenishment system has access to remaining shelf life information from the stores,
i.e. stores should then capture and share this information to make such calculations possible. In
simple words, it functions by adjusting the ordering quantity according to the expected amount
of products outdating during the replenishment cycle. Mathematically, the EWA policy can be
expressed as follows:
𝑖𝑓 𝐼𝑡 − ∑ Ô𝑖𝑡+𝑅+𝐿−1𝑖=𝑡+1 < ∑ 𝐸[𝐷]𝑡+𝑅+𝐿
𝑖=𝑡+1 + 𝑆𝑆 then:
𝑄𝑡 = ⌈∑ Ô𝑖
𝑡+𝑅+𝐿−1𝑖=𝑡+1 +∑ 𝐸[𝐷]𝑡+𝑅+𝐿𝑡
𝑖=𝑡+1 +𝑆𝑆−𝐼𝑡
𝐵⌉ (1)
Where:
It: inventory position (inventory on hand plus inventory in transit) at time t.
R: review period (number of days until next review)
L: lead time (from the order is placed to the order is received)
E[D]: expected demand
SS: safety stock, fixed
B: batch size (order multiplier between the store and the warehouse)
Qt: order quantity (number of batches) ordered at time t
Ôi: estimated amount of products outdating
To estimate the amount of products outdating, Ô, the expected demand for each day is subtracted
from either the oldest (in case of first-in-first-out (FIFO) depletion), or the newest products (in
case of last-in-first-out (LIFO) depletion) on hand. Then, any products remaining, with expiration
on that day, will be the estimated amount of products outdating. This procedure is then continued
for L+R-1 number of days. For mathematical notation the of this the reader is referred to
Broekmeulen and van Donselaar (2009).
Some modifications to the EWA policy have also been proposed. Specifically, Duan and Liao
(2013) propose an old inventory ratio (OIR) policy where, compared to the EWA policy, if the
ratio of old products (this is determined subjectively) compared to the overall inventory level is
above a given threshold () a new replenishment order is triggered. E.g., if the old inventory
consists of products with a shelf life less than five days, and in this example, a total volume of 20
products compared to the total inventory level of 50 products will give a ratio of (20/50) 0.4. This
ratio is then compared to the threshold value, , which is optimized through simulation.
Another approach is to use a continuous review policy instead of a periodic review policy. It is
well-known that a continuous review policy requires less safety stock than a periodic review
system because the periodic system has to buffer against uncertainty both during the
replenishment lead time and the review period (Silver et al., 1998). In this domain, the (Q,r,T)
continues review policy is found (Tekin et al., 2001). Here, an order Q is placed either if the
inventory level drops below r or if no order has been placed during the last T time units (e.g. T
numbers of days).
17
A comparison between a traditional order-up-to policy (periodic), traditional re-order point policy
(continuous), EWA, OIR, and an updated version of the (Q,r,T) policy has been made through a
simulation study (Lowalekar and Ravichandran, 2015). The updated (Q,r,T) policy delivers the
best results, while the EWA and OIR share the second place. However, due to the convenience
(in regards to transportation and restocking shelves), periodic review systems are the primary
inventory policies applied in grocery retailing (Van Donselaar et al., 2006), which questions the
applicability of (Q,r,T) policy. Additionally, the use of the subjective threshold value, , in the
OIR policy favorites the EWA policy for automating the replenishment of perishables in grocery
retailing.
Some gaps appear in the literature concerning the estimation of the actual value of applying the
EWA policy. When originally introduced (Broekmeulen and van Donselaar, 2009) it was only
evaluated in a dyadic relation, based on artificial data (the same procedure was followed by
Lowalekar and Ravichandran (2015)), and only with a strictly FIFO or LIFO depletion. This is
of concern, as it has been noted that dyadic relations are too simplistic and do not fully reflect
reality (Huang et al., 2003), and shelf depletion for perishable products is not either FIFO of LIFO
but somewhere in between (Janssen et al., 2016). On a more technical note, the EWA policy
applies fixed safety stock, and this may result in a too high order quantities (and subsequent
inventory levels) if demand is non-stationary (Van Donselaar and Broekmeulen, 2012). Through
somewhat cumbersome estimations (this includes regression of seven independent variables) a
method for setting these safety stock levels has been proposed (Minner and Transchel, 2010; Van
Donselaar and Broekmeulen, 2012). However, for the more pragmatic grocery retailer, no good
solution appears so far to have been found and is open for further research.
2.2.4. Inventory Allocation for Perishables
Inventory allocation concerns the issue of how products are assigned to stores from a common
warehouse. However, it is often neglected and is an understudied planning decision (see Table
2.1, page 12) for perishables (Karaesmen et al., 2011) even though the decision frequently occurs
in grocery retailing. As indicated in Paper #1, previous studies on information sharing have
mainly concerned dyadic relations even though it may not fully represent reality (Huang et al.,
2003). Inventory allocations exemplify why studying only dyadic relations is not enough (as this
problem do not exist in dyadic relations), and as a result, only limited attention has been made to
this area.
Inventory allocation is needed in case of shortage at the warehouse, which is then known as
rationing policies (Diks and De Kok, 1998; Van der Heijden, 1997). However, for perishables,
the problem is further complicated as the warehouse may hold the same products with various
levels of remaining freshness. Thus, even though the warehouse holds a sufficient amount of
products on inventory, the freshness of the products should still be allocated to the stores.
Moreover, in some cases, the problem will extend to assigning both the right volume and the right
level of freshness (here referred to as volume allocation and age allocation) (Federgruen et al.,
1986; Prastacos, 1978). In either case, it would seem intuitive that if the warehouse knew the
remaining shelf life at the stores, they would be able to make better inventory allocation decisions.
Consequently, the use of shared information (sharing remaining shelf life information – just like
the replenishment decisions) becomes a central element to this discussion.
18
For volume allocation (in case of shortage) three common allocation policies for non-perishable
products are (1) fair share allocation, (2) consistent appropriate share allocation, and (3) priority
allocation (De Kok et al., 1994; Van der Heijden et al., 1997). With the fair share allocation the
available inventory is distributed across requesting stores to obtain an equal probability of a stock
out. Whereas, the consistent appropriate share allocates the available inventory based on the
safety stock levels at downstream locations – the higher safety stock, the more allocated products
as uncertainty is higher these locations (Van der Heijden, 1997). To avoid negative allocations
(transshipments) the balanced stock assumption is necessary for these two policies, meaning that
the individual inventory levels (at the downstream locations) do not deviate significantly from
the average inventory level (Van Donselaar, 1990). Lastly, with priority allocation, each
downstream location has a predefined priority, and the available inventory is allocated
accordingly.
For allocation of perishables it has been noted that: “the age of goods supplied/allocated
downstream may be as important as the amount supplied” (Karaesmen et al., 2011, p. 411). The
studies have been greatly simplified to reduced complexity in the problem, e.g. Fujiwara et al.
(1997) assume that the products start to age at the stores and not at the warehouse. This makes
the problem similar to non-perishables as the warehouse does hold the same product with various
levels of freshness. Nevertheless, a general finding is that to minimize shortage (volume
allocation) products should be allocated following the fair share allocation rule. To minimize the
risk of outdating (age allocation) products with a short remaining shelf life should be distributed
evenly (relative to demand) across all stores (Lystad et al., 2006; Prastacos, 1978).
Obviously, there is a need to produce research on this topic without making these types of
simplifying assumptions (Karaesmen et al., 2011). However, the main concern within this body
of literature is a somehow rather distant reflection of reality. If a warehouse has a product with
two different ages, it is not convenient for the pick-and-pack process to allocate products from
both age categories to all requesting stores. The pick-and-pack process would be more likely to
empty the oldest category first and then move on to the next – this would also make traceability
concerns easier to handle. Similar, even if the old products were to be distributed evenly across
the requesting stores it is highly unlikely that each store can get the exact same amount of product
– thus which store should receive more and which should receive less of the old products?
Another concern is that the allocation policies presented above mainly focuses on how to
distribute the products that are close to expiring. However, if a store only receives products twice
a week, it might be important this delivery frequency somehow is reflected in the inventory
allocation to ensure the products stay fresh during the entire replenishment cycle.
2.2.5. Contextual Variables and Information Sharing
For information sharing to be effective managers and decision makers must incorporate the
increased information into their decision processes (as e.g. the replenishment or inventory
allocation decision as discussed above) (Baihaqi and Sohal, 2013; Moinzadeh, 2002; Zhou and
Benton, 2007). However, even if it is incorporated the literature does not fully agree on the
benefits obtained from it – also known as the value of information (Jonsson and Mattsson, 2013;
Ketzenberg et al., 2007; Rached et al., 2015). A plausible explanation for these different results
is that contextual variables moderate the result (Danese, 2011; Jonsson and Mattsson, 2013;
Kembro, 2012). I.e. there is no “one-size-fits-all”, and there is no single best way for information
sharing to be effective, and the benefits will depend on specific contextual variables (Kembro,
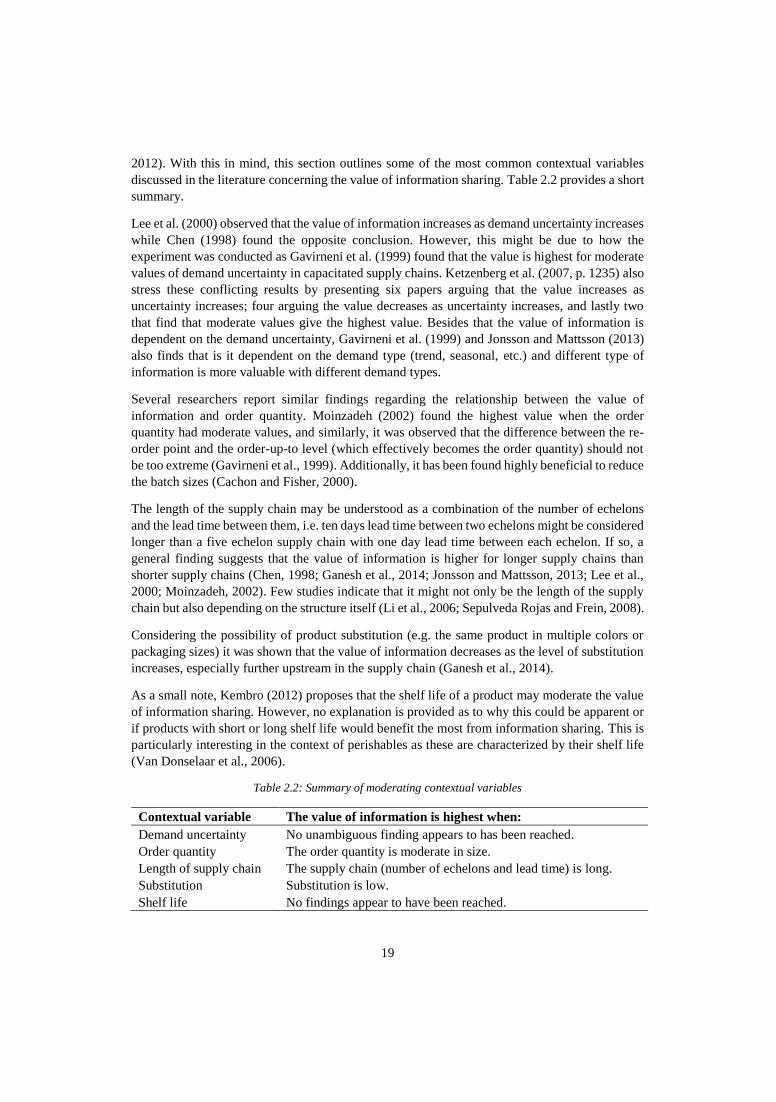
19
2012). With this in mind, this section outlines some of the most common contextual variables
discussed in the literature concerning the value of information sharing. Table 2.2 provides a short
summary.
Lee et al. (2000) observed that the value of information increases as demand uncertainty increases
while Chen (1998) found the opposite conclusion. However, this might be due to how the
experiment was conducted as Gavirneni et al. (1999) found that the value is highest for moderate
values of demand uncertainty in capacitated supply chains. Ketzenberg et al. (2007, p. 1235) also
stress these conflicting results by presenting six papers arguing that the value increases as
uncertainty increases; four arguing the value decreases as uncertainty increases, and lastly two
that find that moderate values give the highest value. Besides that the value of information is
dependent on the demand uncertainty, Gavirneni et al. (1999) and Jonsson and Mattsson (2013)
also finds that is it dependent on the demand type (trend, seasonal, etc.) and different type of
information is more valuable with different demand types.
Several researchers report similar findings regarding the relationship between the value of
information and order quantity. Moinzadeh (2002) found the highest value when the order
quantity had moderate values, and similarly, it was observed that the difference between the re-
order point and the order-up-to level (which effectively becomes the order quantity) should not
be too extreme (Gavirneni et al., 1999). Additionally, it has been found highly beneficial to reduce
the batch sizes (Cachon and Fisher, 2000).
The length of the supply chain may be understood as a combination of the number of echelons
and the lead time between them, i.e. ten days lead time between two echelons might be considered
longer than a five echelon supply chain with one day lead time between each echelon. If so, a
general finding suggests that the value of information is higher for longer supply chains than
shorter supply chains (Chen, 1998; Ganesh et al., 2014; Jonsson and Mattsson, 2013; Lee et al.,
2000; Moinzadeh, 2002). Few studies indicate that it might not only be the length of the supply
chain but also depending on the structure itself (Li et al., 2006; Sepulveda Rojas and Frein, 2008).
Considering the possibility of product substitution (e.g. the same product in multiple colors or
packaging sizes) it was shown that the value of information decreases as the level of substitution
increases, especially further upstream in the supply chain (Ganesh et al., 2014).
As a small note, Kembro (2012) proposes that the shelf life of a product may moderate the value
of information sharing. However, no explanation is provided as to why this could be apparent or
if products with short or long shelf life would benefit the most from information sharing. This is
particularly interesting in the context of perishables as these are characterized by their shelf life
(Van Donselaar et al., 2006).
Table 2.2: Summary of moderating contextual variables
Contextual variable The value of information is highest when:
Demand uncertainty No unambiguous finding appears to has been reached.
Order quantity The order quantity is moderate in size.
Length of supply chain The supply chain (number of echelons and lead time) is long.
Substitution Substitution is low.
Shelf life No findings appear to have been reached.
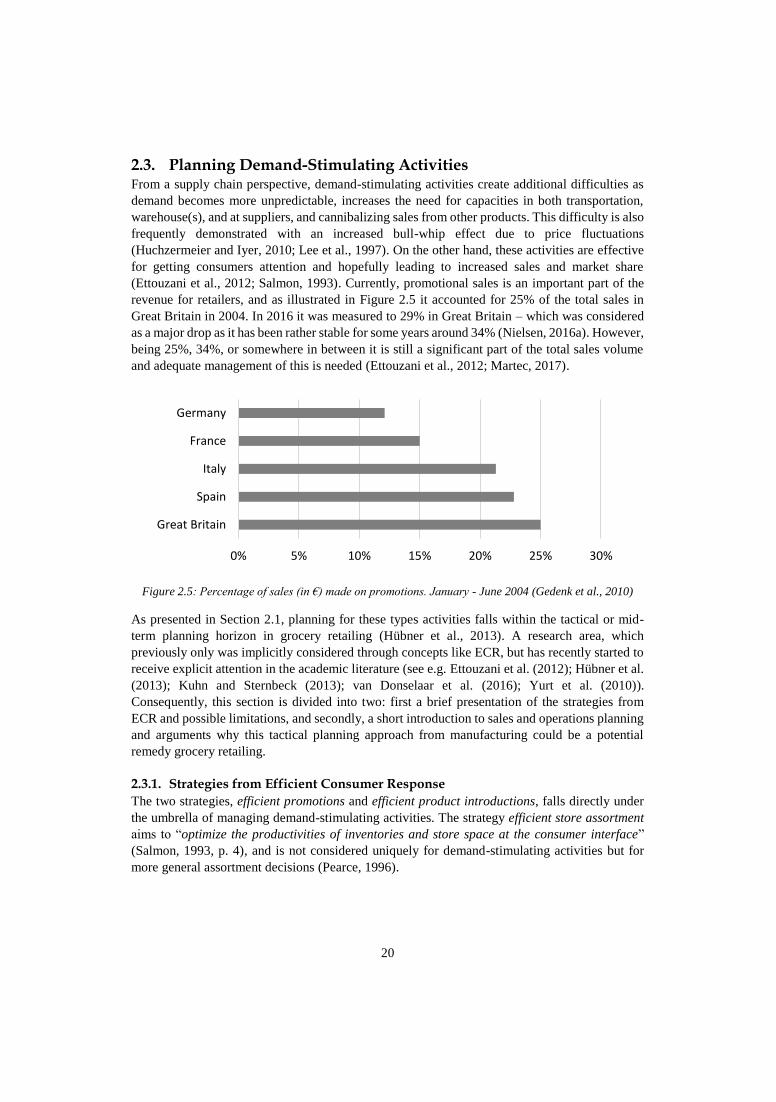
20
2.3. Planning Demand-Stimulating Activities From a supply chain perspective, demand-stimulating activities create additional difficulties as
demand becomes more unpredictable, increases the need for capacities in both transportation,
warehouse(s), and at suppliers, and cannibalizing sales from other products. This difficulty is also
frequently demonstrated with an increased bull-whip effect due to price fluctuations
(Huchzermeier and Iyer, 2010; Lee et al., 1997). On the other hand, these activities are effective
for getting consumers attention and hopefully leading to increased sales and market share
(Ettouzani et al., 2012; Salmon, 1993). Currently, promotional sales is an important part of the
revenue for retailers, and as illustrated in Figure 2.5 it accounted for 25% of the total sales in
Great Britain in 2004. In 2016 it was measured to 29% in Great Britain – which was considered
as a major drop as it has been rather stable for some years around 34% (Nielsen, 2016a). However,
being 25%, 34%, or somewhere in between it is still a significant part of the total sales volume
and adequate management of this is needed (Ettouzani et al., 2012; Martec, 2017).
Figure 2.5: Percentage of sales (in €) made on promotions. January - June 2004 (Gedenk et al., 2010)
As presented in Section 2.1, planning for these types activities falls within the tactical or mid-
term planning horizon in grocery retailing (Hübner et al., 2013). A research area, which
previously only was implicitly considered through concepts like ECR, but has recently started to
receive explicit attention in the academic literature (see e.g. Ettouzani et al. (2012); Hübner et al.
(2013); Kuhn and Sternbeck (2013); van Donselaar et al. (2016); Yurt et al. (2010)).
Consequently, this section is divided into two: first a brief presentation of the strategies from
ECR and possible limitations, and secondly, a short introduction to sales and operations planning
and arguments why this tactical planning approach from manufacturing could be a potential
remedy grocery retailing.
2.3.1. Strategies from Efficient Consumer Response
The two strategies, efficient promotions and efficient product introductions, falls directly under
the umbrella of managing demand-stimulating activities. The strategy efficient store assortment
aims to “optimize the productivities of inventories and store space at the consumer interface”
(Salmon, 1993, p. 4), and is not considered uniquely for demand-stimulating activities but for
more general assortment decisions (Pearce, 1996).
0% 5% 10% 15% 20% 25% 30%
Great Britain
Spain
Italy
France
Germany
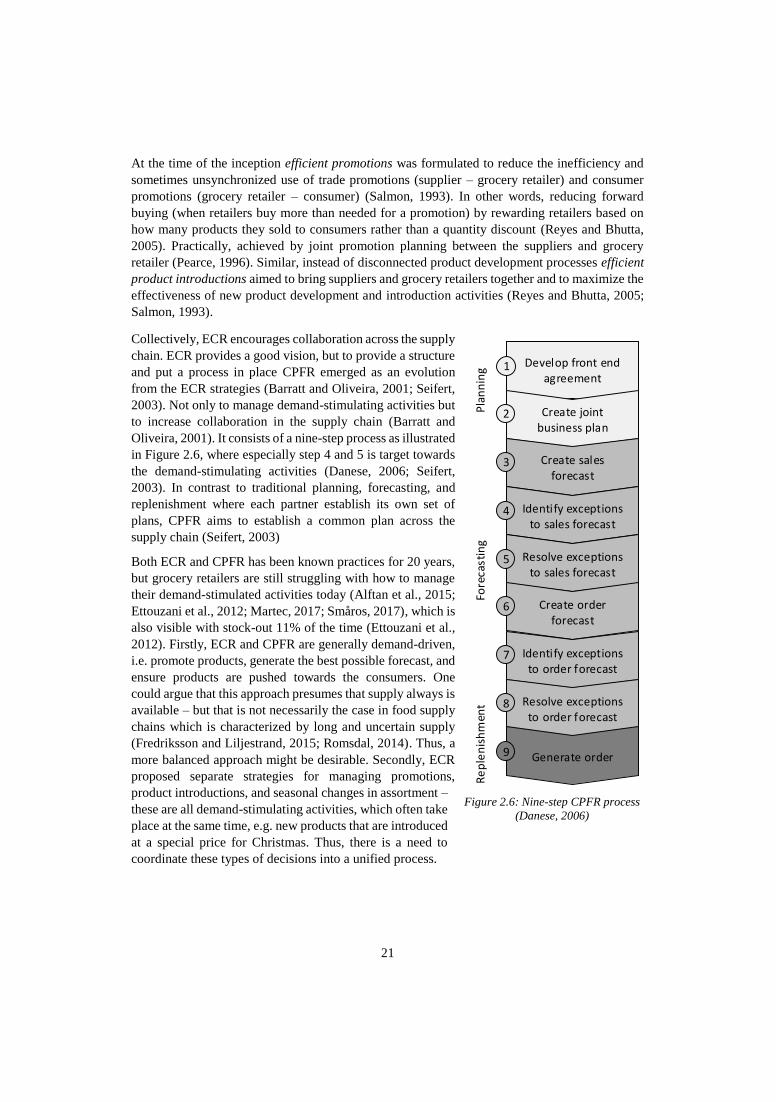
21
At the time of the inception efficient promotions was formulated to reduce the inefficiency and
sometimes unsynchronized use of trade promotions (supplier – grocery retailer) and consumer
promotions (grocery retailer – consumer) (Salmon, 1993). In other words, reducing forward
buying (when retailers buy more than needed for a promotion) by rewarding retailers based on
how many products they sold to consumers rather than a quantity discount (Reyes and Bhutta,
2005). Practically, achieved by joint promotion planning between the suppliers and grocery
retailer (Pearce, 1996). Similar, instead of disconnected product development processes efficient
product introductions aimed to bring suppliers and grocery retailers together and to maximize the
effectiveness of new product development and introduction activities (Reyes and Bhutta, 2005;
Salmon, 1993).
Collectively, ECR encourages collaboration across the supply
chain. ECR provides a good vision, but to provide a structure
and put a process in place CPFR emerged as an evolution
from the ECR strategies (Barratt and Oliveira, 2001; Seifert,
2003). Not only to manage demand-stimulating activities but
to increase collaboration in the supply chain (Barratt and
Oliveira, 2001). It consists of a nine-step process as illustrated
in Figure 2.6, where especially step 4 and 5 is target towards
the demand-stimulating activities (Danese, 2006; Seifert,
2003). In contrast to traditional planning, forecasting, and
replenishment where each partner establish its own set of
plans, CPFR aims to establish a common plan across the
supply chain (Seifert, 2003)
Both ECR and CPFR has been known practices for 20 years,
but grocery retailers are still struggling with how to manage
their demand-stimulated activities today (Alftan et al., 2015;
Ettouzani et al., 2012; Martec, 2017; Småros, 2017), which is
also visible with stock-out 11% of the time (Ettouzani et al.,
2012). Firstly, ECR and CPFR are generally demand-driven,
i.e. promote products, generate the best possible forecast, and
ensure products are pushed towards the consumers. One
could argue that this approach presumes that supply always is
available – but that is not necessarily the case in food supply
chains which is characterized by long and uncertain supply
(Fredriksson and Liljestrand, 2015; Romsdal, 2014). Thus, a
more balanced approach might be desirable. Secondly, ECR
proposed separate strategies for managing promotions,
product introductions, and seasonal changes in assortment –
these are all demand-stimulating activities, which often take
place at the same time, e.g. new products that are introduced
at a special price for Christmas. Thus, there is a need to
coordinate these types of decisions into a unified process.
Create joint business plan
Develop front end agreement
Create sales forecast
Identify exceptions to sales forecast
Resolve exceptions to sales forecast
Create order forecast
Identify exceptions to order forecast
Resolve exceptions to order forecast
Generate order
1
2
3
4
5
6
7
8
9
Pla
nn
ing
Fore
cast
ing
Re
ple
nis
hm
ent
Figure 2.6: Nine-step CPFR process
(Danese, 2006)
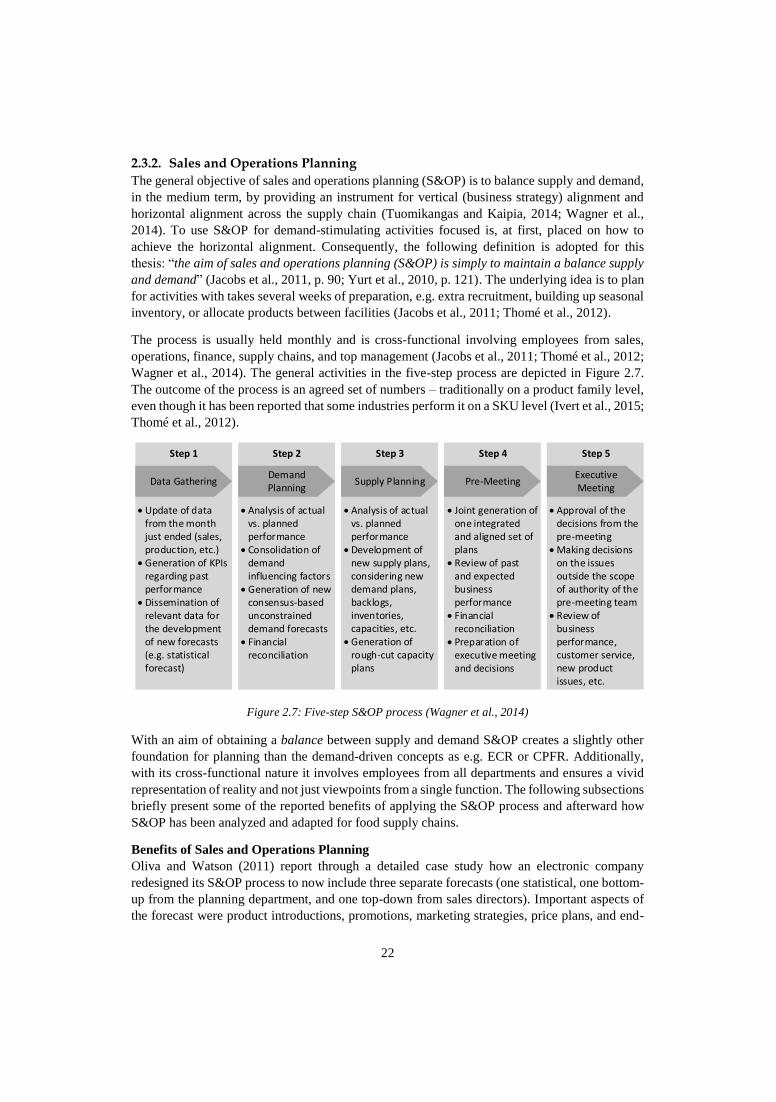
22
2.3.2. Sales and Operations Planning
The general objective of sales and operations planning (S&OP) is to balance supply and demand,
in the medium term, by providing an instrument for vertical (business strategy) alignment and
horizontal alignment across the supply chain (Tuomikangas and Kaipia, 2014; Wagner et al.,
2014). To use S&OP for demand-stimulating activities focused is, at first, placed on how to
achieve the horizontal alignment. Consequently, the following definition is adopted for this
thesis: “the aim of sales and operations planning (S&OP) is simply to maintain a balance supply
and demand” (Jacobs et al., 2011, p. 90; Yurt et al., 2010, p. 121). The underlying idea is to plan
for activities with takes several weeks of preparation, e.g. extra recruitment, building up seasonal
inventory, or allocate products between facilities (Jacobs et al., 2011; Thomé et al., 2012).
The process is usually held monthly and is cross-functional involving employees from sales,
operations, finance, supply chains, and top management (Jacobs et al., 2011; Thomé et al., 2012;
Wagner et al., 2014). The general activities in the five-step process are depicted in Figure 2.7.
The outcome of the process is an agreed set of numbers – traditionally on a product family level,
even though it has been reported that some industries perform it on a SKU level (Ivert et al., 2015;
Thomé et al., 2012).
Figure 2.7: Five-step S&OP process (Wagner et al., 2014)
With an aim of obtaining a balance between supply and demand S&OP creates a slightly other
foundation for planning than the demand-driven concepts as e.g. ECR or CPFR. Additionally,
with its cross-functional nature it involves employees from all departments and ensures a vivid
representation of reality and not just viewpoints from a single function. The following subsections
briefly present some of the reported benefits of applying the S&OP process and afterward how
S&OP has been analyzed and adapted for food supply chains.
Benefits of Sales and Operations Planning
Oliva and Watson (2011) report through a detailed case study how an electronic company
redesigned its S&OP process to now include three separate forecasts (one statistical, one bottom-
up from the planning department, and one top-down from sales directors). Important aspects of
the forecast were product introductions, promotions, marketing strategies, price plans, and end-
Data Gathering
• Update of data from the month just ended (sales, production, etc.)
• Generation of KPIs regarding past performance
• Dissemination of relevant data for the development of new forecasts (e.g. statistical forecast)
• Analysis of actual vs. planned performance
• Consolidation of demand influencing factors
• Generation of new consensus-based unconstrained demand forecasts
• Financial reconciliation
• Analysis of actual vs. planned performance
• Development of new supply plans, considering new demand plans, backlogs, inventories, capacities, etc.
• Generation of rough-cut capacity plans
• Joint generation of one integrated and aligned set of plans
• Review of past and expected business performance
• Financial reconciliation
• Preparation of executive meeting and decisions
• Approval of the decisions from the pre-meeting
• Making decisions on the issues outside the scope of authority of the pre-meeting team
• Review of business performance, customer service, new product issues, etc.
Demand Planning
Supply PlanningExecutive Meeting
Step 1 Step 2 Step 3 Step 4 Step 5
Pre-Meeting
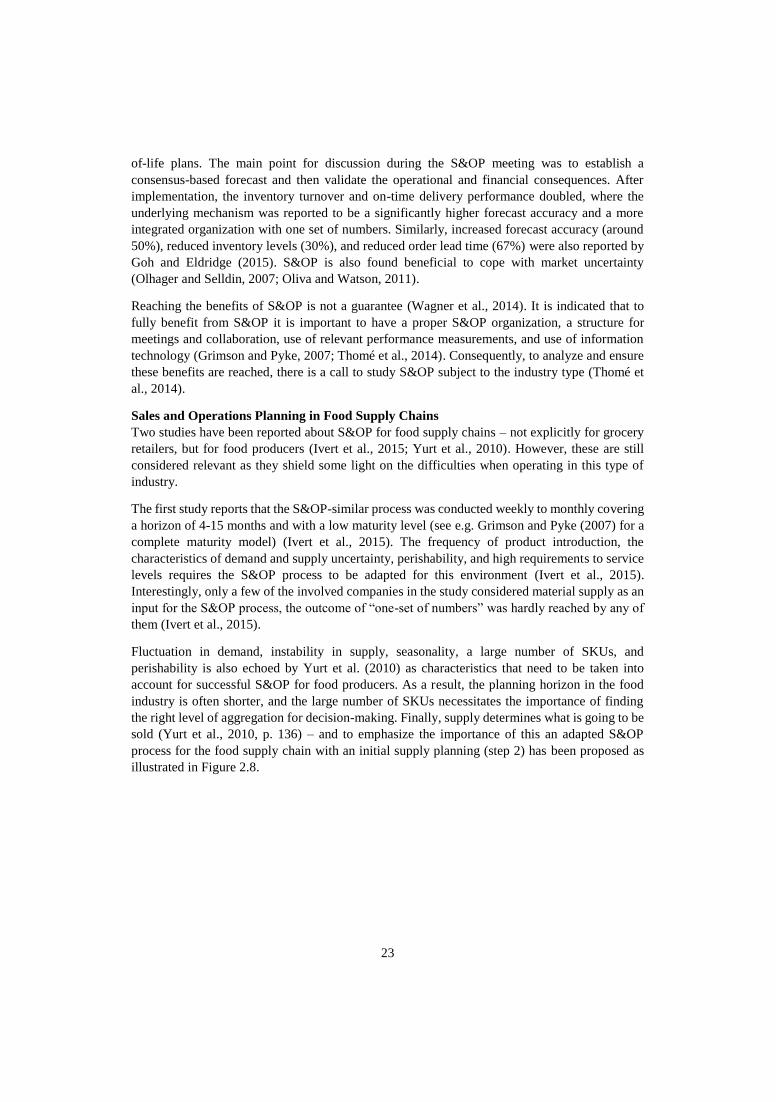
23
of-life plans. The main point for discussion during the S&OP meeting was to establish a
consensus-based forecast and then validate the operational and financial consequences. After
implementation, the inventory turnover and on-time delivery performance doubled, where the
underlying mechanism was reported to be a significantly higher forecast accuracy and a more
integrated organization with one set of numbers. Similarly, increased forecast accuracy (around
50%), reduced inventory levels (30%), and reduced order lead time (67%) were also reported by
Goh and Eldridge (2015). S&OP is also found beneficial to cope with market uncertainty
(Olhager and Selldin, 2007; Oliva and Watson, 2011).
Reaching the benefits of S&OP is not a guarantee (Wagner et al., 2014). It is indicated that to
fully benefit from S&OP it is important to have a proper S&OP organization, a structure for
meetings and collaboration, use of relevant performance measurements, and use of information
technology (Grimson and Pyke, 2007; Thomé et al., 2014). Consequently, to analyze and ensure
these benefits are reached, there is a call to study S&OP subject to the industry type (Thomé et
al., 2014).
Sales and Operations Planning in Food Supply Chains
Two studies have been reported about S&OP for food supply chains – not explicitly for grocery
retailers, but for food producers (Ivert et al., 2015; Yurt et al., 2010). However, these are still
considered relevant as they shield some light on the difficulties when operating in this type of
industry.
The first study reports that the S&OP-similar process was conducted weekly to monthly covering
a horizon of 4-15 months and with a low maturity level (see e.g. Grimson and Pyke (2007) for a
complete maturity model) (Ivert et al., 2015). The frequency of product introduction, the
characteristics of demand and supply uncertainty, perishability, and high requirements to service
levels requires the S&OP process to be adapted for this environment (Ivert et al., 2015).
Interestingly, only a few of the involved companies in the study considered material supply as an
input for the S&OP process, the outcome of “one-set of numbers” was hardly reached by any of
them (Ivert et al., 2015).
Fluctuation in demand, instability in supply, seasonality, a large number of SKUs, and
perishability is also echoed by Yurt et al. (2010) as characteristics that need to be taken into
account for successful S&OP for food producers. As a result, the planning horizon in the food
industry is often shorter, and the large number of SKUs necessitates the importance of finding
the right level of aggregation for decision-making. Finally, supply determines what is going to be
sold (Yurt et al., 2010, p. 136) – and to emphasize the importance of this an adapted S&OP
process for the food supply chain with an initial supply planning (step 2) has been proposed as
illustrated in Figure 2.8.
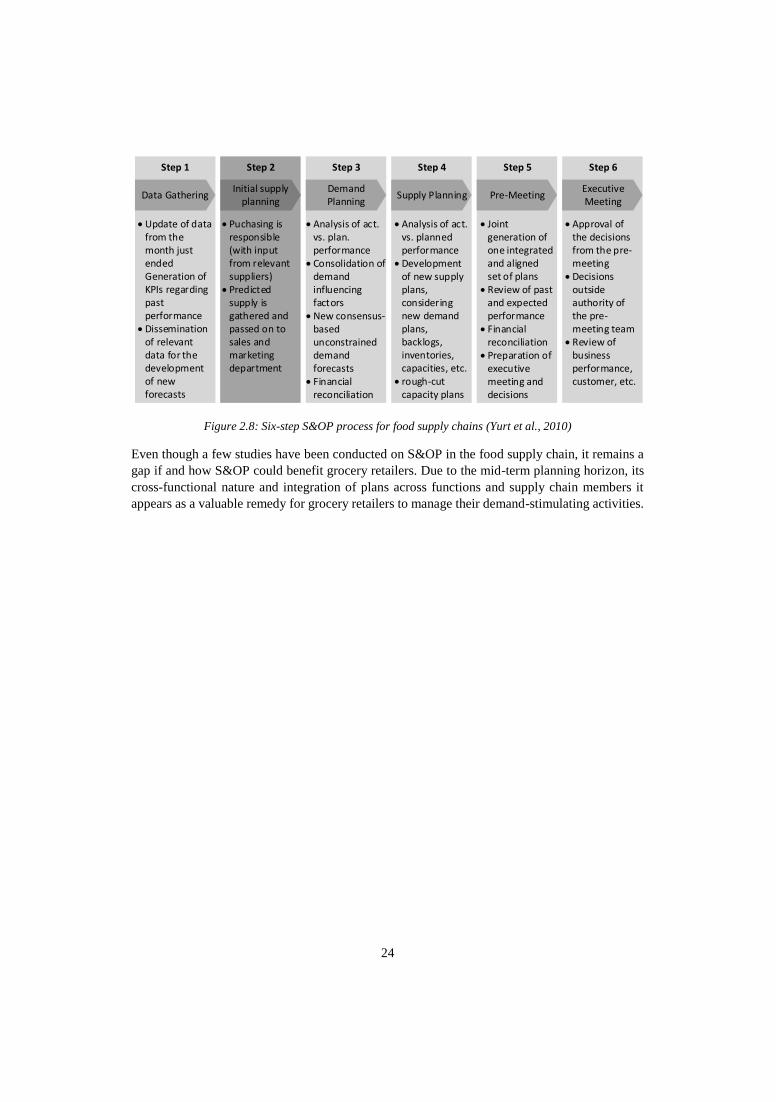
24
Figure 2.8: Six-step S&OP process for food supply chains (Yurt et al., 2010)
Even though a few studies have been conducted on S&OP in the food supply chain, it remains a
gap if and how S&OP could benefit grocery retailers. Due to the mid-term planning horizon, its
cross-functional nature and integration of plans across functions and supply chain members it
appears as a valuable remedy for grocery retailers to manage their demand-stimulating activities.
Data Gathering
• Update of data from the month just ended Generation of KPIs regarding past performance
• Dissemination of relevant data for the development of new forecasts
• Analysis of act. vs. plan. performance
• Consolidation of demand influencing factors
• New consensus-based unconstrained demand forecasts
• Financial reconciliation
• Analysis of act. vs. planned performance
• Development of new supply plans, considering new demand plans, backlogs, inventories, capacities, etc.
• rough-cut capacity plans
• Joint generation of one integrated and aligned set of plans
• Review of past and expected performance
• Financial reconciliation
• Preparation of executive meeting and decisions
• Approval of the decisions from the pre-meeting
• Decisions outside authority of the pre-meeting team
• Review of business performance, customer, etc.
Demand Planning
Supply PlanningExecutive Meeting
Step 1 Step 3 Step 4 Step 5 Step 6
Pre-MeetingInitial supply
planning
Step 2
• Puchasing is responsible (with input from relevant suppliers)
• Predicted supply is gathered and passed on to sales and marketing department
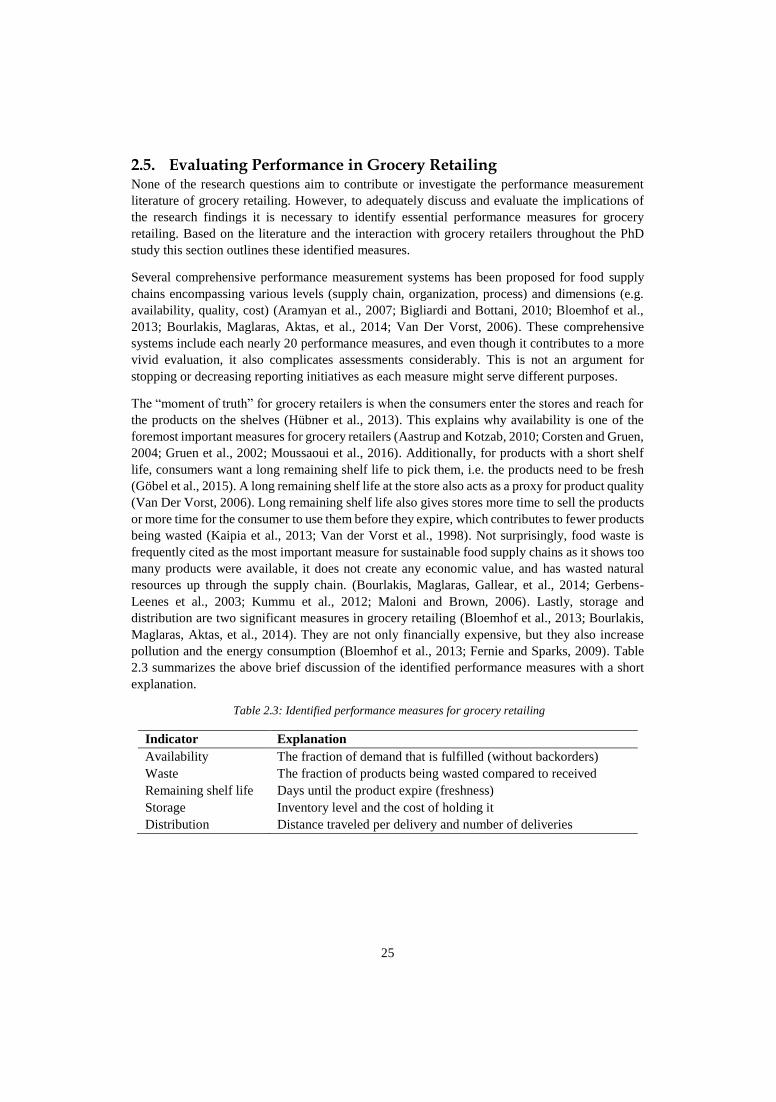
25
2.5. Evaluating Performance in Grocery Retailing None of the research questions aim to contribute or investigate the performance measurement
literature of grocery retailing. However, to adequately discuss and evaluate the implications of
the research findings it is necessary to identify essential performance measures for grocery
retailing. Based on the literature and the interaction with grocery retailers throughout the PhD
study this section outlines these identified measures.
Several comprehensive performance measurement systems has been proposed for food supply
chains encompassing various levels (supply chain, organization, process) and dimensions (e.g.
availability, quality, cost) (Aramyan et al., 2007; Bigliardi and Bottani, 2010; Bloemhof et al.,
2013; Bourlakis, Maglaras, Aktas, et al., 2014; Van Der Vorst, 2006). These comprehensive
systems include each nearly 20 performance measures, and even though it contributes to a more
vivid evaluation, it also complicates assessments considerably. This is not an argument for
stopping or decreasing reporting initiatives as each measure might serve different purposes.
The “moment of truth” for grocery retailers is when the consumers enter the stores and reach for
the products on the shelves (Hübner et al., 2013). This explains why availability is one of the
foremost important measures for grocery retailers (Aastrup and Kotzab, 2010; Corsten and Gruen,
2004; Gruen et al., 2002; Moussaoui et al., 2016). Additionally, for products with a short shelf
life, consumers want a long remaining shelf life to pick them, i.e. the products need to be fresh
(Göbel et al., 2015). A long remaining shelf life at the store also acts as a proxy for product quality
(Van Der Vorst, 2006). Long remaining shelf life also gives stores more time to sell the products
or more time for the consumer to use them before they expire, which contributes to fewer products
being wasted (Kaipia et al., 2013; Van der Vorst et al., 1998). Not surprisingly, food waste is
frequently cited as the most important measure for sustainable food supply chains as it shows too
many products were available, it does not create any economic value, and has wasted natural
resources up through the supply chain. (Bourlakis, Maglaras, Gallear, et al., 2014; Gerbens-
Leenes et al., 2003; Kummu et al., 2012; Maloni and Brown, 2006). Lastly, storage and
distribution are two significant measures in grocery retailing (Bloemhof et al., 2013; Bourlakis,
Maglaras, Aktas, et al., 2014). They are not only financially expensive, but they also increase
pollution and the energy consumption (Bloemhof et al., 2013; Fernie and Sparks, 2009). Table
2.3 summarizes the above brief discussion of the identified performance measures with a short
explanation.
Table 2.3: Identified performance measures for grocery retailing
Indicator Explanation
Availability The fraction of demand that is fulfilled (without backorders)
Waste The fraction of products being wasted compared to received
Remaining shelf life Days until the product expire (freshness)
Storage Inventory level and the cost of holding it
Distribution Distance traveled per delivery and number of deliveries
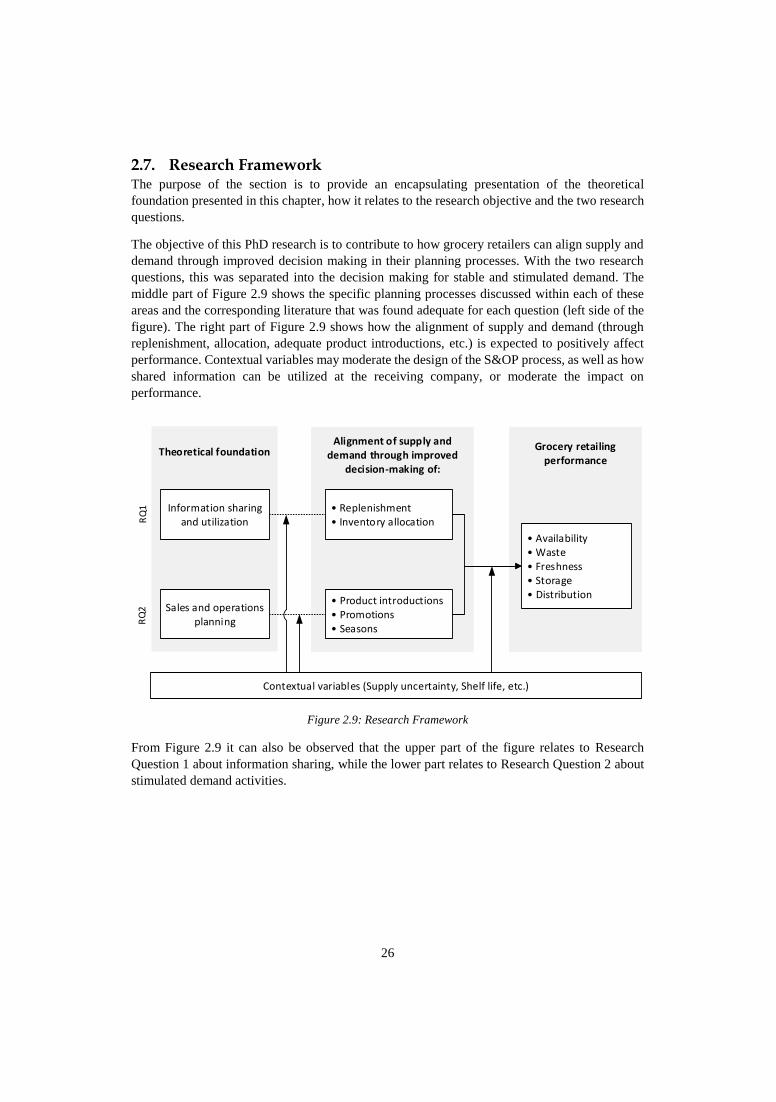
26
2.7. Research Framework The purpose of the section is to provide an encapsulating presentation of the theoretical
foundation presented in this chapter, how it relates to the research objective and the two research
questions.
The objective of this PhD research is to contribute to how grocery retailers can align supply and
demand through improved decision making in their planning processes. With the two research
questions, this was separated into the decision making for stable and stimulated demand. The
middle part of Figure 2.9 shows the specific planning processes discussed within each of these
areas and the corresponding literature that was found adequate for each question (left side of the
figure). The right part of Figure 2.9 shows how the alignment of supply and demand (through
replenishment, allocation, adequate product introductions, etc.) is expected to positively affect
performance. Contextual variables may moderate the design of the S&OP process, as well as how
shared information can be utilized at the receiving company, or moderate the impact on
performance.
Figure 2.9: Research Framework
From Figure 2.9 it can also be observed that the upper part of the figure relates to Research
Question 1 about information sharing, while the lower part relates to Research Question 2 about
stimulated demand activities.
Information sharing and utilization
Sales and operations planning
• Product introductions• Promotions• Seasons
• Replenishment• Inventory allocation
• Availability• Waste• Freshness• Storage• Distribution
Contextual variables (Supply uncertainty, Shelf life, etc.)
Theoretical foundationAlignment of supply and
demand through improved decision-making of:
Grocery retailing performance
RQ
1R
Q2
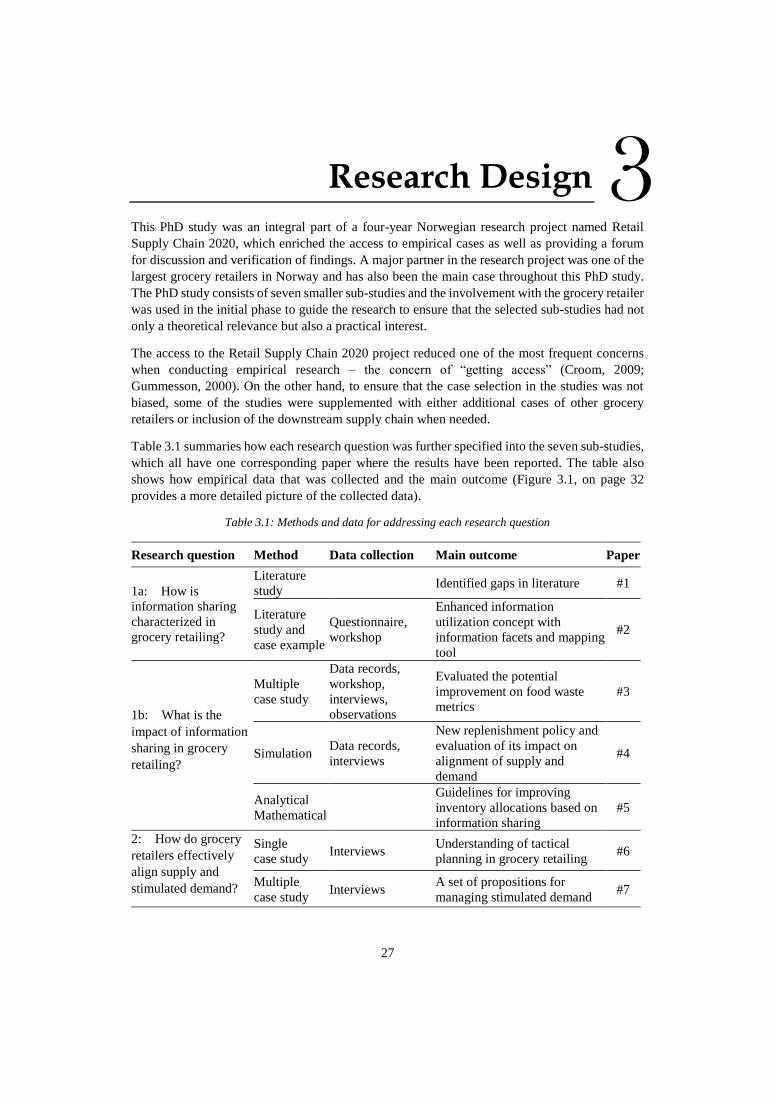
27
3. Research Design
This PhD study was an integral part of a four-year Norwegian research project named Retail
Supply Chain 2020, which enriched the access to empirical cases as well as providing a forum
for discussion and verification of findings. A major partner in the research project was one of the
largest grocery retailers in Norway and has also been the main case throughout this PhD study.
The PhD study consists of seven smaller sub-studies and the involvement with the grocery retailer
was used in the initial phase to guide the research to ensure that the selected sub-studies had not
only a theoretical relevance but also a practical interest.
The access to the Retail Supply Chain 2020 project reduced one of the most frequent concerns
when conducting empirical research – the concern of “getting access” (Croom, 2009;
Gummesson, 2000). On the other hand, to ensure that the case selection in the studies was not
biased, some of the studies were supplemented with either additional cases of other grocery
retailers or inclusion of the downstream supply chain when needed.
Table 3.1 summaries how each research question was further specified into the seven sub-studies,
which all have one corresponding paper where the results have been reported. The table also
shows how empirical data that was collected and the main outcome (Figure 3.1, on page 32
provides a more detailed picture of the collected data).
Table 3.1: Methods and data for addressing each research question
Research question Method Data collection Main outcome Paper
1a: How is
information sharing
characterized in
grocery retailing?
Literature
study Identified gaps in literature #1
Literature
study and
case example
Questionnaire,
workshop
Enhanced information
utilization concept with
information facets and mapping
tool
#2
1b: What is the
impact of information
sharing in grocery
retailing?
Multiple
case study
Data records,
workshop,
interviews,
observations
Evaluated the potential
improvement on food waste
metrics
#3
Simulation Data records,
interviews
New replenishment policy and
evaluation of its impact on
alignment of supply and
demand
#4
Analytical
Mathematical
Guidelines for improving
inventory allocations based on
information sharing
#5
2: How do grocery
retailers effectively
align supply and
stimulated demand?
Single
case study Interviews
Understanding of tactical
planning in grocery retailing #6
Multiple
case study Interviews
A set of propositions for
managing stimulated demand #7
3
28
The research design argues how and why a research problem has been examined in a particular
manner and may be interpreted to consist of (1) data selection, (2) data collection, and (3) data
analysis (Kothari, 2004; Voss et al., 2002; Yin, 2013). As this PhD study was part of the Retail
Supply Chain 2020 project where to collect data (data selection) was clarified, whereas what to
collect and how to collect and analyze it was the primary task when designing the research. The
next section elaborates on these aspects followed by a section that presents how the research
quality was ensured throughout the studies.
3.1. Research Methods A research method refers to the technique of data collection and data analysis (Croom, 2009), i.e.
how and what data that is collected as well as how it is examined. A critical issue when designing
research is to choose the most appropriate research method for the question under investigation
(Croom, 2009; Handfield and Melnyk, 1998). Thus, in the following an elaboration of each
research question and accompanying research method is presented. The reader may use Table 3.1
and Figure 3.1 (at the end of the section) in parallel with reading to alternately switch between
details and overview.
3.1.1. Research Question 1
How does information sharing contribute to align supply and demand in grocery retailing?
It is expected that by synthesizing the answers from the two subquestions (1a and 1b) Research
Question 1 can be answered. Consequently, no independent study was specifically designed for
Research Question 1 but for the subquestions instead.
RQ 1a: How is information sharing characterized in grocery retailing?
The journey of this PhD study started with a single curiosity similar to how Research Question 1
is formulated – but expanded into the research of stimulated demand as well to provide a more
holistic representation of reality. However, because this was the point of departure a preliminary
literature study was initiated to familiarize with the body of knowledge and identify potential
gaps in the literature. It was quickly noticed that several review papers about information sharing
in supply chain management literature had been published within a timeframe of approximately
ten years. As the review papers were published almost within the same period an apparent overlap
between them were evident. Thus, the first research activity during the PhD period was an attempt
to synthesize these review papers into an overview to explain how information sharing was
characterized and utilized. These also served the purpose of identifying gaps for further research.
The findings of this synthesis have been reported in Paper #1 together with a more detailed
description of how the literature study was conducted.
It was identified in Paper #1 that the literature was lacking (or only discussed implicitly) a focus
on how information sharing is linked to various planning decisions. Or, in other words, there is a
need for a more conceptual framework for how to approach information sharing in practice – not
only for grocery retailing but in general. Subsequently, another literature study was conducted to
identify and synthesize facets of information sharing. Keywords like information
“characteristics”, “facets”, “factors”, or similar wording useful to characterize information was
applied during the literature search. Afterwards, it was evaluated how these facets could be
incorporated with existing mapping tools to visualize the link between the information flow
(described by the facets) and decision making. As no existing mapping tool was found adequate
to include all facets a new mapping notation was proposed.
29
To demonstrate the applicability of the mapping notation a questionnaire was sent to two
warehouses, stores, one transport provider, and some suppliers of vegetables (all part of the
Norwegian research project Retail Supply Chain 2020) in August 2015. From the questionnaire,
all facets of the shared information were derived as well as how the information was used at the
receiving company. This was used to exemplify the applicability of the mapping tool, which has
been reported in Paper #2.
The questions in the questionnaire were formulated as closed-ended questions (see Appendix A)
and often with a predefined option to select answers to ensure comparison across the supply chain.
Essentially, the questionnaire could also have been used as an interview guide for structured
interviews. However, because of the geographical dispersion of the companies and to speed up
the collection process, it was decided to distribute the questionnaire electronically. The involved
companies had the option (and made use of it) to call if there were any doubts about the questions.
RQ 1b: What is the impact of information sharing in grocery retailing?
Value of information sharing is a well-established research stream and was also one of the main
findings from Paper #1. However, the main part of the literature investigates non-industry specific
supply chains and mostly develops and applies mathematical methods from operations research
with limited empirical support.
To empirically explore the impact of information sharing in grocery retailing, a multiple case
study with two cases was designed with the replenishment process as the unit of analysis. The
case study method was selected because of its ability to handle multiple types of evidence
(observations, documents, interviews, etc.) and strength in examining contemporary events in its
natural setting (Voss et al., 2002; Yin, 2013). Additionally, a multiple case study was preferable
over a single case as multiple case study enabled a comparison between cases using information
sharing and cases without information sharing (the use of an automatic replenishment program
was used as a proxy for information sharing). The collected data for the comparison took place
between June and September 2015 and consisted of five interviews (see Appendix B for interview
guide), data records from one of Norway’s largest grocery retailer, two workshops, and
observations at two stores for 14 days. The collected data was used to analyze the performance
(from a food waste perspective) of the two different cases. The findings of the study have been
reported in Paper #3.
As elaborated in the introduction, perishables are (and expected to continue) to be of major
importance for future retailers. Paper #3 emphasized the challenge of how to handle these, and
two subsequent studies were designed to examine how information sharing could contribute to
solving this challenge. One study focused on the replenishment decision of perishables, and
another concentrated on inventory allocation. The replenishment decision was selected because
it is the most studied planning and control decision when examining the value of information (see
Paper #1). Inventory allocation of perishables was selected because it is an important decision in
divergent supply chains but has not received the same amount of attention in the literature
(Karaesmen et al., 2011). The Norwegian grocery retailer also expressed an interest in these two
areas which eased the issue of getting access to key personnel and data records.
Several replenishment policies, which use shared information, has been suggested to automate
the replenishment process of perishables. However, these are often only evaluated in simple
30
environments with one store or very few stores and with artificial data. Thus, to evaluate the
impact of such policies in a more realistic context a discrete event simulation model mirroring
thy inventory system of the Norwegian grocery retailer’s downstream supply chain was
established in Enterprise Dynamics® (interviews from Paper #3 was used to design the model).
Discrete event simulation was the preferred simulation type as it enables representation of single
events and has the ability to incorporate uncertainties, whereas e.g. system dynamics has a more
aggregated flow and changes are most commonly made by changing different rates (order arrival
rate, production rate, etc.) (Kleijnen, 2005).
Simulation is typically applied to examine the behavior of a system under a range of conditions
where modeling of inventory systems is a common application (Croom, 2009). A virtual model
of a supply chain offered the ability to evaluate the potential of information sharing across a
number of predefined scenarios. Additionally, one of the scenarios included a newly developed
heuristic for replenishing perishables based on shared information. The model is using point-of-
sales data for more than 200 stores for one year and can change several parameters and thereby
create the different scenarios. Basically, the scenarios could have been implemented in the stores
and then evaluated through a multiple case study similar to Paper #3. However, the simulation
was considered as a more cost-effective and more risk-free solution compared to a multiple case
study. The findings of this simulation study have been reported in Paper #4.
To examine the impact of using shared information for inventory allocation it was found
necessary to develop two new allocation policies due to limited research on this topic. To focus
the research this study was split into two: firstly, development of inventory allocation policies
and secondly the impact of using these policies. The applied method for developing the allocation
policies can be classified as analytical mathematical research as they are built using formal logic
(Wacker, 1998, p. 374). This work has been reported in Paper #5. The impact of using the policies
has been evaluated using the above mentioned simulation model, and the findings are included
later in this thesis in section 4.4.
3.1.2. Research Question 2
How do grocery retailers effectively align supply and stimulated demand?
As introduced in Chapter 1 the demand-stimulating activities include promotions, product
introductions, and seasonal planning. Deciding how to approach and scrutinize these phenomena
further was a result of several reasons – however, the driving one was that these type of activities
have a medium-long planning horizon (1-8 month) and is considered as being part of the tactical
planning level (Hübner et al., 2013). Tactical planning, within the Operations Management field,
is often associated with sales and operations planning (Grimson and Pyke, 2007; Tuomikangas
and Kaipia, 2014). Consequently, it was decided to examine if and how the tactical planning of
demand-stimulating activities in grocery retailing could benefit from the mindset of sales and
operations planning.
An examination of sales and operations planning in grocery retailing would be fairly explorative
as this mindset originates from manufacturing. Following the terminology from Handfield and
Melnyk (1998) the bulk of this type of research could be classified as descriptive (or even
discovery). I.e. to create awareness and trying to explain what is happening. Case studies are
particularly suited when exploring new and complex real-life events (Yin, 2013), where the
31
context and experience are critical for understanding the phenomenon of interest (Barratt et al.,
2011), and when research builds on existing theoretical frameworks (Voss et al., 2002).
Therefore, the case study method was selected for this study.
An initial single case study was conducted at the Norwegian grocery retailer involving personnel
from the purchasing, logistics, and the retail chain departments to provide a preliminary
understanding of the tactical planning process. The findings from this case study have been
reported in Paper #6. To expand the study and increase generalizability a multiple case study was
afterward conducted involving three new additional cases. One premium grocery retailer from
Great Britain, a discount grocery retailer from Norway, and a wholesaler from Finland was
included. The findings from the multiple case study have been reported in Paper #7.
The unit of analysis was, both in the single and the multiple case study, the tactical planning
process, and the primary technique for collecting data was through interviews. A total of ten
interviews were conducted in relation these studies between November 2015 and August 2016.
The interview guide is attached in Appendix C (similar interview guide was used for Paper #6).
For a more thorough explanation of data selection, collection, and data analysis for these studies
the reader is referred to Paper #7.
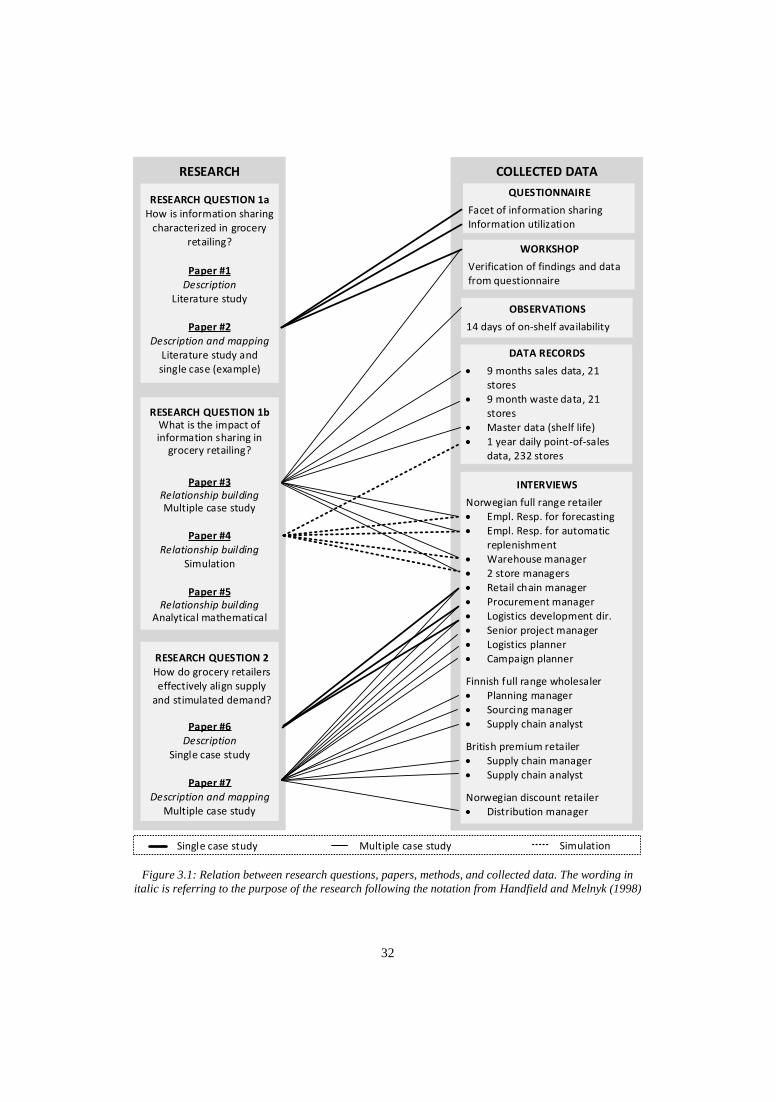
32
INTERVIEWS
Norwegian full range retailer• Empl. Resp. for forecasting• Empl. Resp. for automatic
replenishment• Warehouse manager• 2 store managers• Retail chain manager• Procurement manager• Logistics development dir.• Senior project manager• Logistics planner• Campaign planner
Finnish full range wholesaler• Planning manager• Sourcing manager• Supply chain analyst
British premium retailer• Supply chain manager• Supply chain analyst
Norwegian discount retailer• Distribution manager
OBSERVATIONS
14 days of on-shelf availability
QUESTIONNAIRE
Facet of information sharing Information utilization
WORKSHOP
Verification of findings and data from questionnaire
DATA RECORDS
• 9 months sales data, 21 stores
• 9 month waste data, 21 stores
• Master data (shelf life)• 1 year daily point-of-sales
data, 232 stores
RESEARCH QUESTION 1b What is the impact of information sharing in
grocery retailing?
Paper #6Description
Single case study
Paper #7Description and mapping
Multiple case study
RESEARCH QUESTION 2How do grocery retailers effectively align supply
and stimulated demand?
RESEARCH QUESTION 1aHow is information sharing
characterized in grocery retailing?
Paper #1Description
Literature study
Paper #2Description and mapping
Literature study and single case (example)
Paper #3Relationship buildingMultiple case study
Paper #4Relationship building
Simulation
Paper #5Relationship building
Analytical mathematical
Single case study Multiple case study Simulation
COLLECTED DATARESEARCH
Figure 3.1: Relation between research questions, papers, methods, and collected data. The wording in
italic is referring to the purpose of the research following the notation from Handfield and Melnyk (1998)
33
3.2. Research Quality The traditional way of judging research quality is based on the premise of validity and reliability
(Halldorsson and Aastrup, 2003). This is mainly intended for quantitative research, and as a
corresponding response, the premise of trustworthiness is advocated to judge qualitative research
(Golafshani, 2003; Lincoln and Guba, 1985; Shenton, 2004), and particularity also for qualitative
research within logistics (Halldorsson and Aastrup, 2003). Some overlaps appear between the
two premises (Hoepfl, 1997, Table 1) and even though differences might exist, the fundamental
question (from the premise of trustworthiness): “How can an inquirer persuade his or her
audiences that the findings of an inquiry are worth paying attention to?” (Lincoln and Guba,
1985, p. 290) appear highly relevant regardless of which premise that is used to evaluate quality.
Furthermore, it is recommended and also common practice to evaluate case studies (which are
qualitative) through the premise of validity and reliability (Voss et al., 2002; Yin, 2013). Thus,
as this PhD study is using both qualitative (e.g. case study) and quantitative (e.g. simulation)
methods, the premise of validity and reliability is found adequate to evaluate the research quality.
To elaborate validity sufficiently is it often divided further into three facets: construct validity,
internal validity, and external validity (Yin, 2013). The following subsections present relevant
examples of tactics that have been applied during this PhD study to account for these three facets
of validity and reliability.
3.2.1. Construct Validity
Construct validity is the extent to which correct operational measures have been established for
the concept being studied (Voss et al., 2002, p. 211). To adequately account for construct validity
Yin (2013) proposed two critical aspects: (1) provide clear definitions of what to be investigated,
and (2) show that the operational measures do indeed reflect what is intended to be investigated.
In this PhD study, definitions or explanations have been provided in all appended papers where
some ambiguity might exist for the concepts being studied. The introduction also contains a brief
description of the scope to account for surrounding topics. Also, Paper #2 contributed with a
refined definition of the concept of information utilization.
The use of multiple sources of evidence (interviews, data records, observations), multiple
interviewees, and review of field notes by interviewees were the main tactics used to ensure the
second aspect of construct validity (Yin, 2013). All sources of evidence pointed towards the same
conclusions. Additionally, 2-4 yearly workshops within the Retail Supply Chain 2020 project
with all participating companies were conducted, as well as a review of all papers by the Director
of Logistics Development from the Norwegian grocery retailer before submission. This
contributed significantly to the verification of collected data and the subsequent findings
throughout the whole PhD study.
For the simulation model, verification and validation tactics were used to ensure the model indeed
reflected what was intended. The tactic of “calculating intermediate results” was used for
verification (Kleijnen, 1995). Meaning, intermediate results in the simulation model (e.g.
inventory level after receiving orders and satisfying demand) has first manually been calculated
and then compared with the results from the simulation model. For validation of the model, the
result of the “Baseline” scenario was compared and found similar to other simulation models
from academic literature (see Paper #4).
34
3.2.2. Internal Validity
Internal validity is the extent to which causal relationships are established, whereby certain
conditions are believed to lead to other conditions, as distinguished from spurious relationships
(Yin, 2013, p. 46). In other words, if it is concluded that Y has taken place because of X, but
overlooked that Y really happened because of Z there is a low internal validity. Hereby, it is also
apparent that internal validity is more applicable as evaluation criteria for explanatory and causal
studies and not necessarily in descriptive studies (Croom, 2009; Yin, 2013).
To ensure internal validity the use of ‘pattern matching’ and especially ‘theoretical replication’
has been one of the main tactics in this PhD study (Yin, 2013). In pattern matching, empirically
based patterns are compared with predictions (e.g. from literature) made before collecting the
data, which is a typical deductive approach (Karlsson, 2009). For example, in Paper #3, which
compared two cases (one with and one without information sharing), the expected results were
formulated based on literature before the data collection. Afterwards, the empirical findings were
compared with this prediction. Additionally, in this particular study, the use of theoretical
replication – search for contrasting cases – was used to select cases. Meaning, two different cases
were intentionally selected, and different results were expected.
For the simulation study in Paper #4, the identification of causality is the main curiosity that drove
the whole research. Here, causality is established by adjusting one independent variable at the
time and then evaluating the causal effects on the dependent variables. Thus, not surprisingly
simulation is generally found adequate to investigate causal relationships (Bertrand and Fransoo,
2009; Croom, 2009).
Lastly, Croom (2009) also advocate using method triangulation (e.g. case studies and simulation)
and data triangulation (e.g. interviews and data records) to increase the support of proposed the-
cause-and-effect. Referring to the previously shown Figure 3.1 emphasizes how both strategies
have been used throughout this PhD study.
3.2.3. External Validity
External validity is the extent to which it is possible to generalize from the data and context of
the research study to broader populations and settings (Cook and Campbell, 1979, p. 37). One
could argue that quantitative research is more concerned with this type of generalizability while
qualitative research instead generally seeks illumination (Hoepfl, 1997), however, it is still
essential to define the domain in which the findings are valid (Yin, 2013).
For the case studies (see Figure 3.1), external validity has been accounted for by providing ‘thick
descriptions’ of the context (Bryman and Bell, 2015). Eisenhardt (1989) also explains how
within-analyses in multiple case studies often is (thick) descriptions of a case. These are useful
for gaining insight and establishing the domain in which the findings are valid. Broadening or
adding additional cases is useful to increase external validity further (Meredith, 1998; Voss et al.,
2002), which was a tactic applied in relation to research question 2. Here, the findings and
generalizability were substantially developed by widening the data collection from a single case
study (Paper #6) to a multiple case study (Paper #7).
35
Similarly, the boundaries of the findings from the simulation study (Paper #4) are provided
through the model description and specification of the assumptions. Thus, it is expected that the
findings are valid for another comparable grocery retailer, i.e. with the same supply chain
structure and same assumption as those in the simulation model.
3.2.4. Reliability
Reliability is the extent to which a study’s operations can be repeated with the same results (Voss
et al., 2002, p. 211). The goal of reliability is to minimize bias, so if another researcher with the
same methods conducted the same study s/he would reach the same findings (Bryman and Bell,
2015; Yin, 2013).
Essentially, section 3.1 and the underlying sections describing the methods in each appended
paper is an attempt to document the research process and make it possible for future researchers
to conduct the study and thereby increase reliability (Shenton, 2004; Yin, 2013). More tangible
examples of this are the previously mentioned interview guides and questionnaire in Appendixes.
Additionally, by always having multiple authors involved in the research process contributed to
a more vivid understanding and could be used as an argument for protecting against bias.
The results generated from the simulation model is also subject to reliability concerns due to its
stochastic nature. Some of the values used in the simulation model come from probability
distributions. Therefore, the output might differ slightly from time to time. To account for this,
each scenario is run for one year and then average values were extracted. The length of one year
was found to be sufficient to radically reduce the small variations.

36
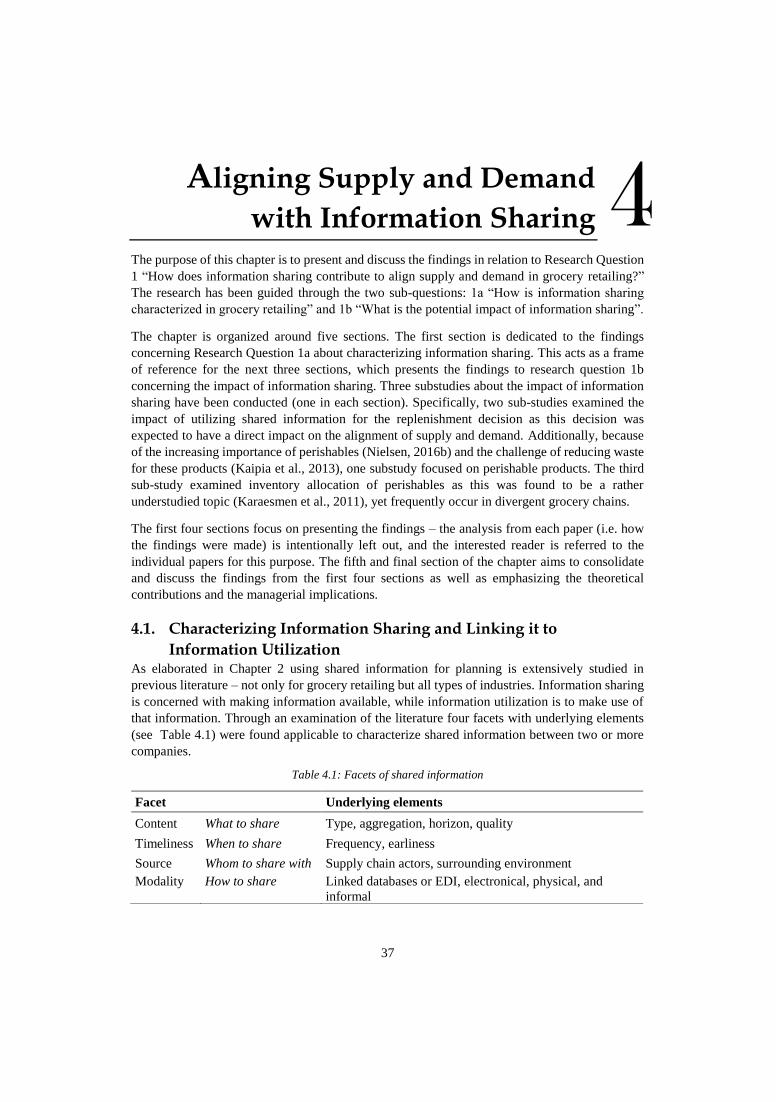
37
4. Aligning Supply and Demand
with Information Sharing
The purpose of this chapter is to present and discuss the findings in relation to Research Question
1 “How does information sharing contribute to align supply and demand in grocery retailing?”
The research has been guided through the two sub-questions: 1a “How is information sharing
characterized in grocery retailing” and 1b “What is the potential impact of information sharing”.
The chapter is organized around five sections. The first section is dedicated to the findings
concerning Research Question 1a about characterizing information sharing. This acts as a frame
of reference for the next three sections, which presents the findings to research question 1b
concerning the impact of information sharing. Three substudies about the impact of information
sharing have been conducted (one in each section). Specifically, two sub-studies examined the
impact of utilizing shared information for the replenishment decision as this decision was
expected to have a direct impact on the alignment of supply and demand. Additionally, because
of the increasing importance of perishables (Nielsen, 2016b) and the challenge of reducing waste
for these products (Kaipia et al., 2013), one substudy focused on perishable products. The third
sub-study examined inventory allocation of perishables as this was found to be a rather
understudied topic (Karaesmen et al., 2011), yet frequently occur in divergent grocery chains.
The first four sections focus on presenting the findings – the analysis from each paper (i.e. how
the findings were made) is intentionally left out, and the interested reader is referred to the
individual papers for this purpose. The fifth and final section of the chapter aims to consolidate
and discuss the findings from the first four sections as well as emphasizing the theoretical
contributions and the managerial implications.
4.1. Characterizing Information Sharing and Linking it to
Information Utilization As elaborated in Chapter 2 using shared information for planning is extensively studied in
previous literature – not only for grocery retailing but all types of industries. Information sharing
is concerned with making information available, while information utilization is to make use of
that information. Through an examination of the literature four facets with underlying elements
(see Table 4.1) were found applicable to characterize shared information between two or more
companies.
Table 4.1: Facets of shared information
Facet Underlying elements
Content What to share Type, aggregation, horizon, quality
Timeliness When to share Frequency, earliness
Source Whom to share with Supply chain actors, surrounding environment
Modality How to share Linked databases or EDI, electronical, physical, and
informal
4
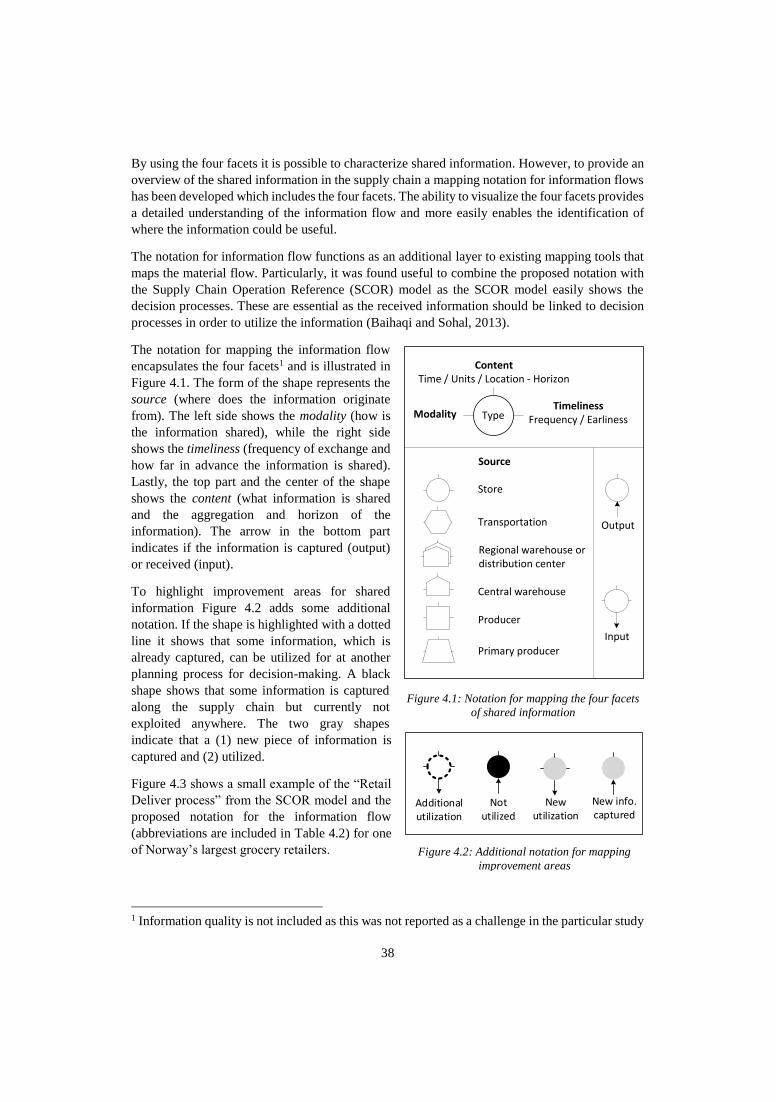
38
By using the four facets it is possible to characterize shared information. However, to provide an
overview of the shared information in the supply chain a mapping notation for information flows
has been developed which includes the four facets. The ability to visualize the four facets provides
a detailed understanding of the information flow and more easily enables the identification of
where the information could be useful.
The notation for information flow functions as an additional layer to existing mapping tools that
maps the material flow. Particularly, it was found useful to combine the proposed notation with
the Supply Chain Operation Reference (SCOR) model as the SCOR model easily shows the
decision processes. These are essential as the received information should be linked to decision
processes in order to utilize the information (Baihaqi and Sohal, 2013).
The notation for mapping the information flow
encapsulates the four facets1 and is illustrated in
Figure 4.1. The form of the shape represents the
source (where does the information originate
from). The left side shows the modality (how is
the information shared), while the right side
shows the timeliness (frequency of exchange and
how far in advance the information is shared).
Lastly, the top part and the center of the shape
shows the content (what information is shared
and the aggregation and horizon of the
information). The arrow in the bottom part
indicates if the information is captured (output)
or received (input).
To highlight improvement areas for shared
information Figure 4.2 adds some additional
notation. If the shape is highlighted with a dotted
line it shows that some information, which is
already captured, can be utilized for at another
planning process for decision-making. A black
shape shows that some information is captured
along the supply chain but currently not
exploited anywhere. The two gray shapes
indicate that a (1) new piece of information is
captured and (2) utilized.
Figure 4.3 shows a small example of the “Retail
Deliver process” from the SCOR model and the
proposed notation for the information flow
(abbreviations are included in Table 4.2) for one
of Norway’s largest grocery retailers.
1 Information quality is not included as this was not reported as a challenge in the particular study
Type
ContentTime / Units / Location - Horizon
TimelinessFrequency / EarlinessModality
Store
Transportation
Regional warehouse or distribution center
Central warehouse
Producer
Primary producer
Output
Input
Source
Figure 4.1: Notation for mapping the four facets
of shared information
New utilization
New info. captured
Additional utilization
Not utilized
Figure 4.2: Additional notation for mapping
improvement areas
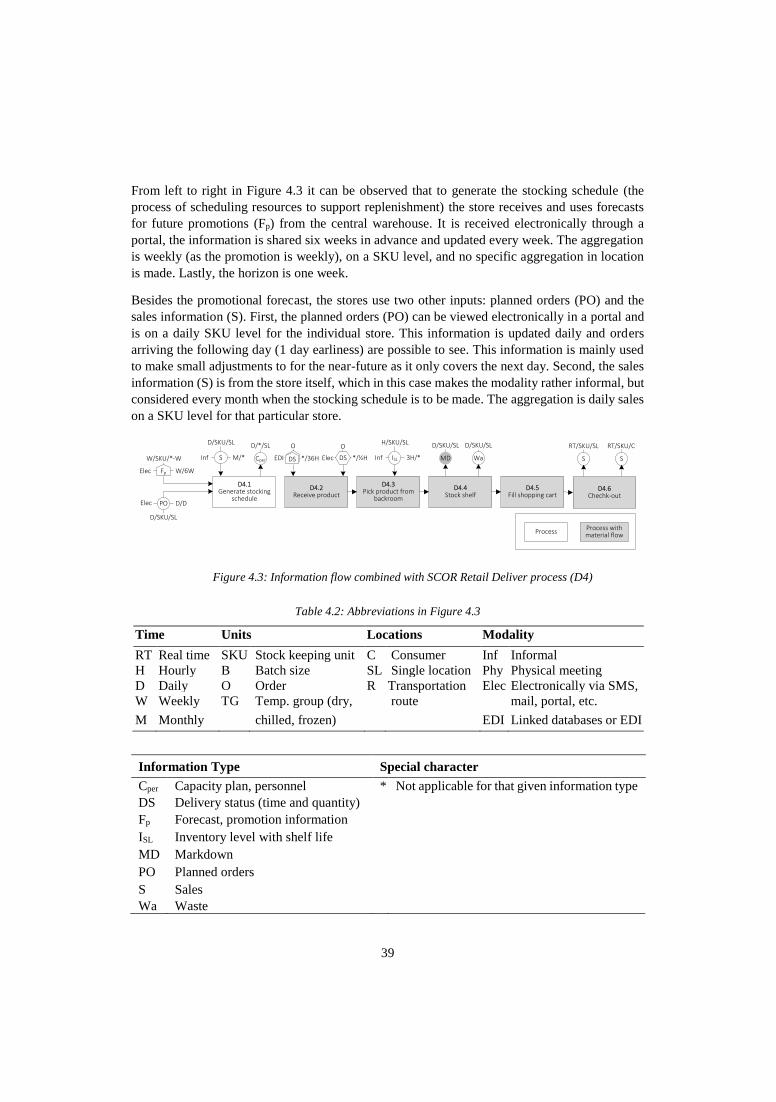
39
From left to right in Figure 4.3 it can be observed that to generate the stocking schedule (the
process of scheduling resources to support replenishment) the store receives and uses forecasts
for future promotions (Fp) from the central warehouse. It is received electronically through a
portal, the information is shared six weeks in advance and updated every week. The aggregation
is weekly (as the promotion is weekly), on a SKU level, and no specific aggregation in location
is made. Lastly, the horizon is one week.
Besides the promotional forecast, the stores use two other inputs: planned orders (PO) and the
sales information (S). First, the planned orders (PO) can be viewed electronically in a portal and
is on a daily SKU level for the individual store. This information is updated daily and orders
arriving the following day (1 day earliness) are possible to see. This information is mainly used
to make small adjustments to for the near-future as it only covers the next day. Second, the sales
information (S) is from the store itself, which in this case makes the modality rather informal, but
considered every month when the stocking schedule is to be made. The aggregation is daily sales
on a SKU level for that particular store.
ProcessProcess with material flow
D4.1Generate stocking
schedule
D4.2Receive product
D4.3Pick product from
backroom
D4.4Stock shelf
D4.5Fill shopping cart
D4.6Chechk-out
RT/SKU/SL
S
D/SKU/SL
Wa
D/*/SL
Cper
D/SKU/SL
MD
0
ISL 3H/*
H/SKU/SL
Inf
0
S M/*
D/SKU/SL
Inf
W/6W
W/SKU/*-W
Elec Fp
*/36H
O
EDI DS */½H
O
Elec DS
RT/SKU/C
S
PO D/D
D/SKU/SL
Elec
Table 4.2: Abbreviations in Figure 4.3
Time Units Locations Modality
RT Real time SKU Stock keeping unit C Consumer Inf Informal
H Hourly B Batch size SL Single location Phy Physical meeting
D Daily O Order R Transportation
route
Elec Electronically via SMS,
W Weekly TG Temp. group (dry, mail, portal, etc.
M Monthly chilled, frozen) EDI Linked databases or EDI
Information Type Special character
Cper Capacity plan, personnel * Not applicable for that given information type
DS Delivery status (time and quantity)
Fp Forecast, promotion information
ISL Inventory level with shelf life
MD Markdown
PO Planned orders
S Sales
Wa Waste
Figure 4.3: Information flow combined with SCOR Retail Deliver process (D4)
40
Figure 4.3 illustrates the material and information flow in order to deliver a retail product. The
additional information layer to the SCOR model shows what type of information that is utilized
at each process to reach a decision, as well as what information that currently is captured or
potentially could be captured at each process. E.g., in the D4.3 process the employee will use
information about the current inventory level when deciding which products to restock. This
information is currently captured informally (left side of the shape), i.e. when the employee sees
an empty shelf. However, if this information was captured electronically, the employee could
access this information in the backroom and easily assess which products (in the whole store) that
required immediate restocking.
Another example in Figure 4.3 is at the D4.4 process where the shelf is physically replenished.
Currently, waste (Wa) is captured on a daily SKU level at each store. However, a potential
information (as indicated with the gray color of the shape) to capture could be to daily record the
SKUs that are marked down (MD) because of short shelf life at each store.
In Paper #2 a full-scale example of a warehouse, transportation provider, and stores are provided.
The proposed notation comprehensively shows the information flow by including all four facets
and the underlying elements. Because the notation splits the information flow into two: (1) where
the information is captured and (2) where it is utilized, it is possible to identify current captured
information which is not utilized. Additionally, because all facets are visually included it is easier
to identify where the information could be used. E.g., information shared on a fine level of
aggregation can be used for day-to-day operational decisions, whereas coarse information which
is only shared infrequently should be used for either tactical or strategic planning decisions.
4.2. Impact of Utilizing Shared Information for Replenishment The facets and proposed mapping tool in Section 4.1 are valuable to identify areas where shared
information could be utilized. This section makes this next step and evaluates the impact of
utilizing shared information - specifically for the replenishment decision. The evaluation is made
by comparing the historical performance of two replenishment methods: one traditional where
orders are placed manually in the stores to the warehouse, and one where the order is placed using
an automatic replenishment system using shared information. For the manual replenishment, the
order is based on a visual examination of the shelf (stock on hand) and the manager’s expectations
of future demand. The automatic replenishment system is managed by the warehouse and uses
the same logic as presented in Section 2.2.2 (p. 13). Table 4.3 shows the shared information (from
the stores to the warehouse) which is embedded in the system.
Table 4.3: Information facets and information utilization for the automatic replenishment system
Facets and elements of shared information Information utilization
Content Type POS, waste • POS, waste information and previous
orders is used to calculate the
inventory level at the stores
• A forecast is calculated based on POS
• An order is placed to raise the
inventory level to the expected
forecast plus safety stock
Aggregation Daily, SKU, store
level
Timeliness Frequency Daily
Source Store
Modality EDI
41
The potential impact of applying automatic replenishment systems has been evaluated through
traditional supply chain oriented measures such as ordering costs, inventory levels, on-time
deliveries, bullwhip etc. (see e.g. (Daugherty et al., 1999; Potter and Disney, 2010; Stank et al.,
1999; Yao and Dresner, 2008). However, it has been suggested that this kind of improved
transparency also could reduce food waste in the food supply chain (Kaipia et al., 2013; Mena et
al., 2014). This section presents a performance comparison of automatic and traditional
replenishment based on food waste metrics in grocery stores. First, the impact on food waste is
presented, and afterward, the impact on remaining shelf life (the freshness of the products) and
availability is presented.
4.2.1. Food Waste
Data records (sales and waste) for a nine-month period was collected from 54 products in 21
stores. Products that were ordered manually in the store (without the use of automatic
replenishment) were grouped as one scenario, and oppositely products that were ordered through
automatic replenishment formed the second scenario. Additionally, to investigate the moderating
effect of shelf life, each scenario was further clustered into different shelf life groups. Table 4.4
shows the number of products and data records (i.e. the number of product-store combinations)
for each shelf life group for the two scenarios.
Table 4.4: Number of products and data records for each shelf life group
Shelf
life
[days]
Number of
products Typical products in this group
Product-store data records
Total Manual Auto. Repl
20-30 4 Eggs 78 29 49
31-50 13 Salmon, trout, cold cuts 225 106 119
51-70 16 Mayonnaise salads, fish cakes 270 111 159
71-90 9 Whole and sliced cheese 147 52 95
91-110 5 Butter, grated cheese 81 28 53
>110 7 Long-lasting bread and butter 133 43 90
Total 54 934 369 565
Figure 4.4 shows how the average food waste percentage is distributed for the two replenishment
methods across the different shelf life groups. A general observation (irrespective of the
replenishment method) is an increase in food waste for products with a medium-long shelf life.
This could be caused by the limited attention to such products in the stores. These are normally
regarded as “dry” products, and the expiration of these products are not perceived to be as
important as for fresh food products.
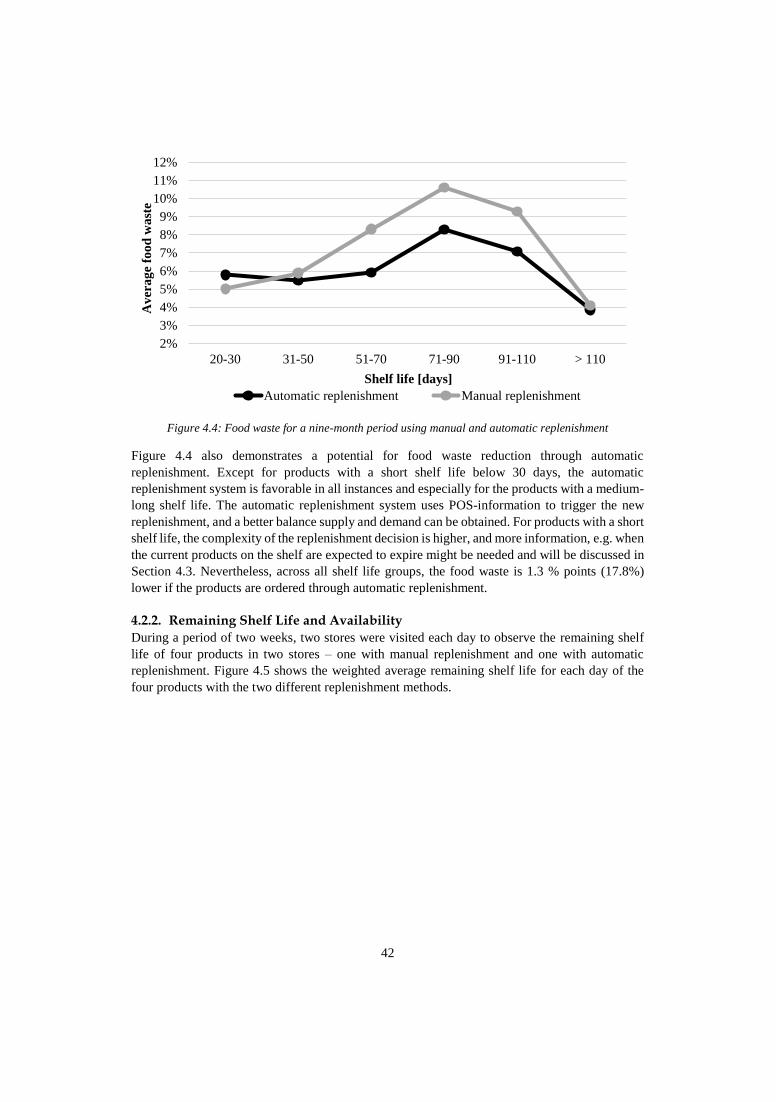
42
Figure 4.4: Food waste for a nine-month period using manual and automatic replenishment
Figure 4.4 also demonstrates a potential for food waste reduction through automatic
replenishment. Except for products with a short shelf life below 30 days, the automatic
replenishment system is favorable in all instances and especially for the products with a medium-
long shelf life. The automatic replenishment system uses POS-information to trigger the new
replenishment, and a better balance supply and demand can be obtained. For products with a short
shelf life, the complexity of the replenishment decision is higher, and more information, e.g. when
the current products on the shelf are expected to expire might be needed and will be discussed in
Section 4.3. Nevertheless, across all shelf life groups, the food waste is 1.3 % points (17.8%)
lower if the products are ordered through automatic replenishment.
4.2.2. Remaining Shelf Life and Availability
During a period of two weeks, two stores were visited each day to observe the remaining shelf
life of four products in two stores – one with manual replenishment and one with automatic
replenishment. Figure 4.5 shows the weighted average remaining shelf life for each day of the
four products with the two different replenishment methods.
2%
3%
4%
5%
6%
7%
8%
9%
10%
11%
12%
20-30 31-50 51-70 71-90 91-110 > 110
Av
era
ge
foo
d w
ast
e
Shelf life [days]
Automatic replenishment Manual replenishment
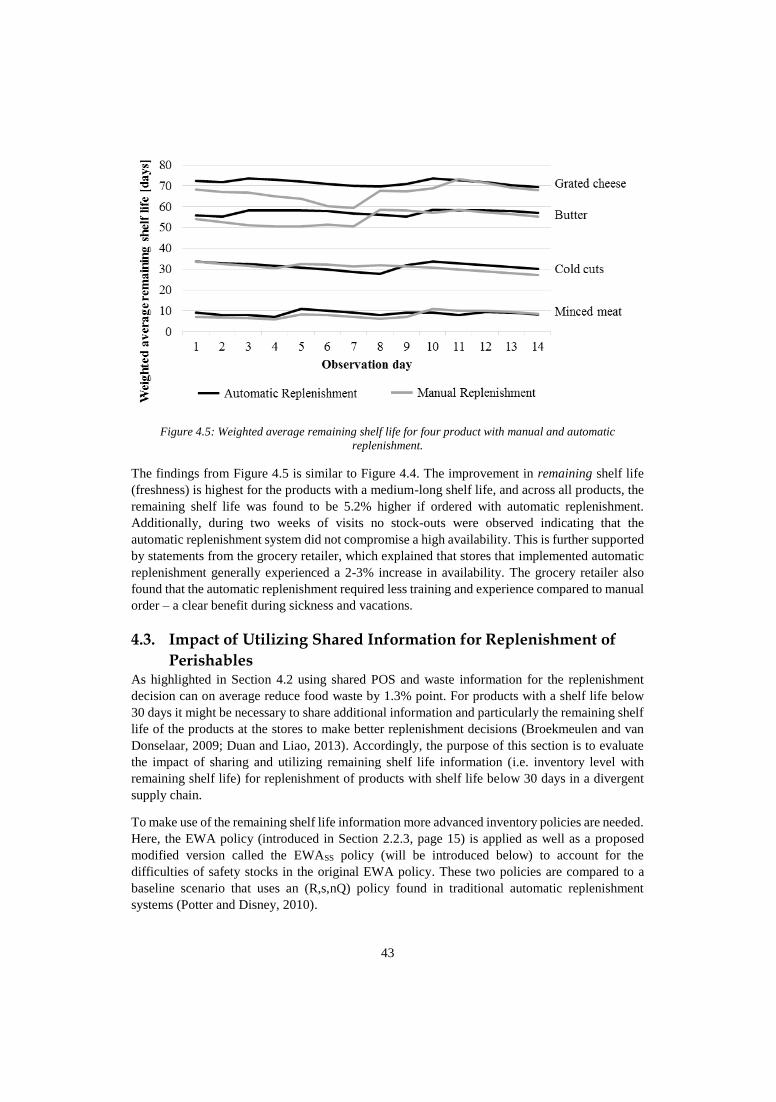
43
Figure 4.5: Weighted average remaining shelf life for four product with manual and automatic
replenishment.
The findings from Figure 4.5 is similar to Figure 4.4. The improvement in remaining shelf life
(freshness) is highest for the products with a medium-long shelf life, and across all products, the
remaining shelf life was found to be 5.2% higher if ordered with automatic replenishment.
Additionally, during two weeks of visits no stock-outs were observed indicating that the
automatic replenishment system did not compromise a high availability. This is further supported
by statements from the grocery retailer, which explained that stores that implemented automatic
replenishment generally experienced a 2-3% increase in availability. The grocery retailer also
found that the automatic replenishment required less training and experience compared to manual
order – a clear benefit during sickness and vacations.
4.3. Impact of Utilizing Shared Information for Replenishment of
Perishables As highlighted in Section 4.2 using shared POS and waste information for the replenishment
decision can on average reduce food waste by 1.3% point. For products with a shelf life below
30 days it might be necessary to share additional information and particularly the remaining shelf
life of the products at the stores to make better replenishment decisions (Broekmeulen and van
Donselaar, 2009; Duan and Liao, 2013). Accordingly, the purpose of this section is to evaluate
the impact of sharing and utilizing remaining shelf life information (i.e. inventory level with
remaining shelf life) for replenishment of products with shelf life below 30 days in a divergent
supply chain.
To make use of the remaining shelf life information more advanced inventory policies are needed.
Here, the EWA policy (introduced in Section 2.2.3, page 15) is applied as well as a proposed
modified version called the EWASS policy (will be introduced below) to account for the
difficulties of safety stocks in the original EWA policy. These two policies are compared to a
baseline scenario that uses an (R,s,nQ) policy found in traditional automatic replenishment
systems (Potter and Disney, 2010).
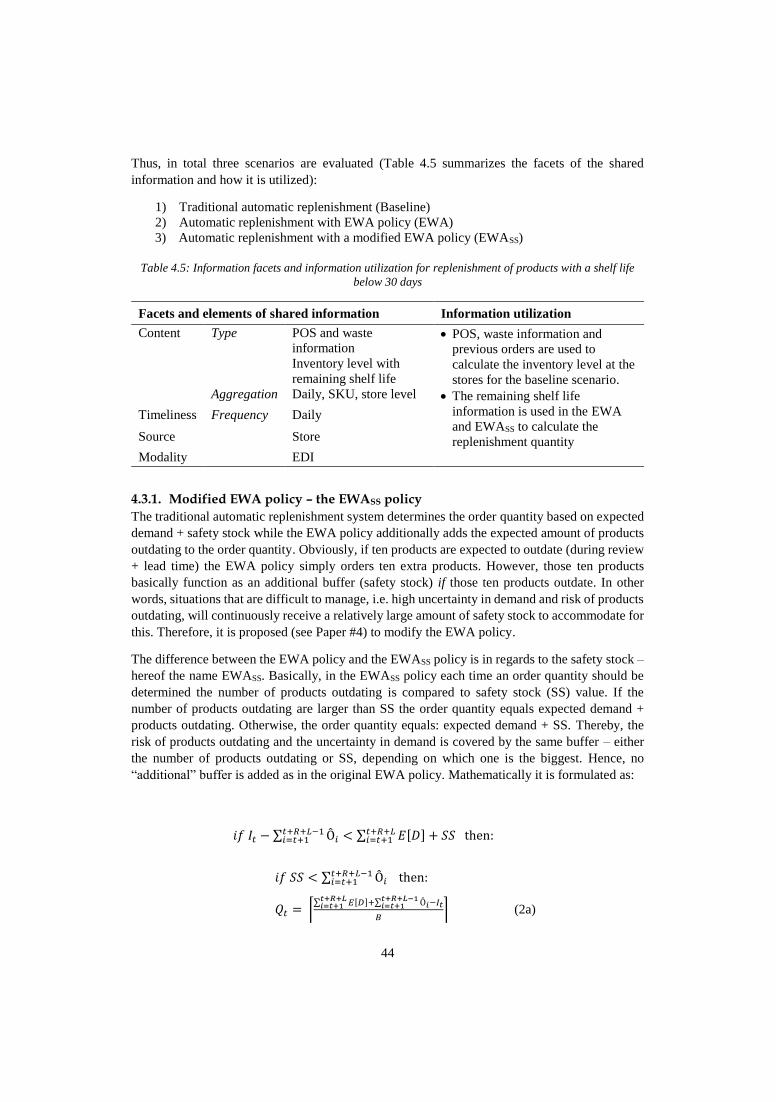
44
Thus, in total three scenarios are evaluated (Table 4.5 summarizes the facets of the shared
information and how it is utilized):
1) Traditional automatic replenishment (Baseline)
2) Automatic replenishment with EWA policy (EWA)
3) Automatic replenishment with a modified EWA policy (EWASS)
Table 4.5: Information facets and information utilization for replenishment of products with a shelf life
below 30 days
Facets and elements of shared information Information utilization
Content Type POS and waste
information
Inventory level with
remaining shelf life
• POS, waste information and
previous orders are used to
calculate the inventory level at the
stores for the baseline scenario.
• The remaining shelf life
information is used in the EWA
and EWASS to calculate the
replenishment quantity
Aggregation Daily, SKU, store level
Timeliness Frequency Daily
Source Store
Modality EDI
4.3.1. Modified EWA policy – the EWASS policy
The traditional automatic replenishment system determines the order quantity based on expected
demand + safety stock while the EWA policy additionally adds the expected amount of products
outdating to the order quantity. Obviously, if ten products are expected to outdate (during review
+ lead time) the EWA policy simply orders ten extra products. However, those ten products
basically function as an additional buffer (safety stock) if those ten products outdate. In other
words, situations that are difficult to manage, i.e. high uncertainty in demand and risk of products
outdating, will continuously receive a relatively large amount of safety stock to accommodate for
this. Therefore, it is proposed (see Paper #4) to modify the EWA policy.
The difference between the EWA policy and the EWASS policy is in regards to the safety stock –
hereof the name EWASS. Basically, in the EWASS policy each time an order quantity should be
determined the number of products outdating is compared to safety stock (SS) value. If the
number of products outdating are larger than SS the order quantity equals expected demand +
products outdating. Otherwise, the order quantity equals: expected demand + SS. Thereby, the
risk of products outdating and the uncertainty in demand is covered by the same buffer – either
the number of products outdating or SS, depending on which one is the biggest. Hence, no
“additional” buffer is added as in the original EWA policy. Mathematically it is formulated as:
𝑖𝑓 𝐼𝑡 − ∑ Ô𝑖𝑡+𝑅+𝐿−1𝑖=𝑡+1 < ∑ 𝐸[𝐷]𝑡+𝑅+𝐿
𝑖=𝑡+1 + 𝑆𝑆 then:
𝑖𝑓 𝑆𝑆 < ∑ Ô𝑖𝑡+𝑅+𝐿−1𝑖=𝑡+1 then:
𝑄𝑡 = ⌈∑ 𝐸[𝐷]+∑ Ô𝑖
𝑡+𝑅+𝐿−1𝑖=𝑡+1
𝑡+𝑅+𝐿𝑖=𝑡+1 −𝐼𝑡
𝐵⌉ (2a)
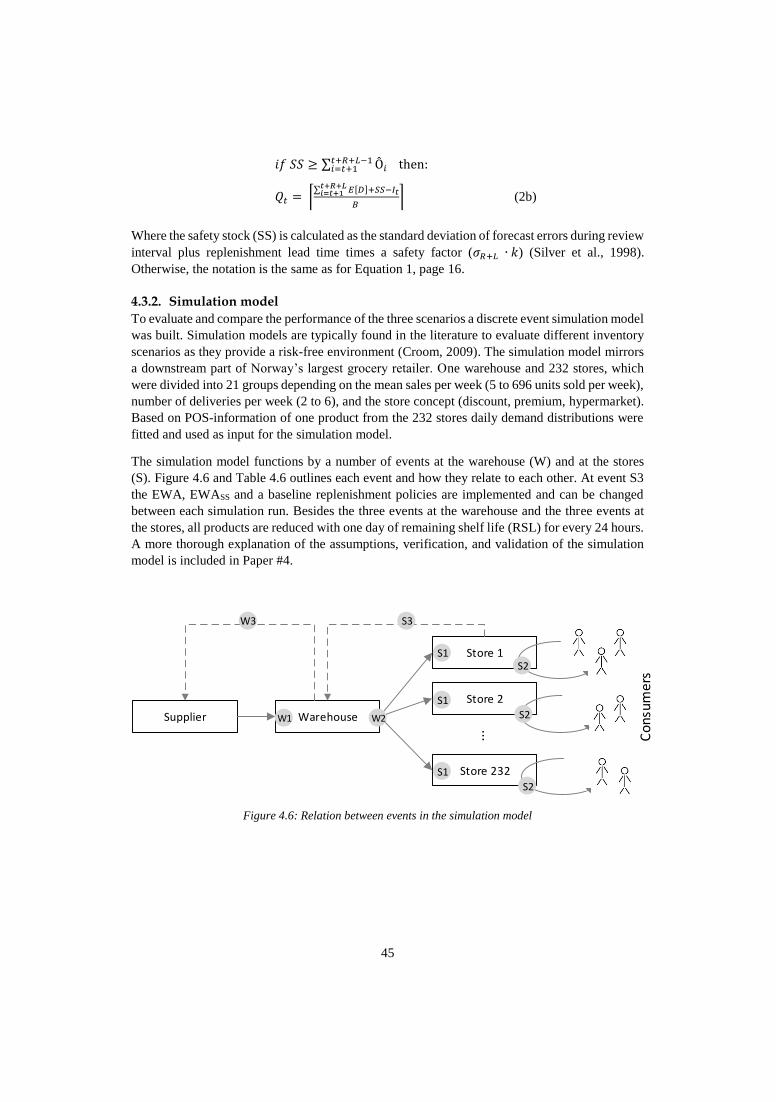
45
𝑖𝑓 𝑆𝑆 ≥ ∑ Ô𝑖𝑡+𝑅+𝐿−1𝑖=𝑡+1 then:
𝑄𝑡 = ⌈∑ 𝐸[𝐷]𝑡+𝑅+𝐿
𝑖=𝑡+1 +𝑆𝑆−𝐼𝑡
𝐵 ⌉ (2b)
Where the safety stock (SS) is calculated as the standard deviation of forecast errors during review
interval plus replenishment lead time times a safety factor (𝜎𝑅+𝐿 ∙ 𝑘) (Silver et al., 1998).
Otherwise, the notation is the same as for Equation 1, page 16.
4.3.2. Simulation model
To evaluate and compare the performance of the three scenarios a discrete event simulation model
was built. Simulation models are typically found in the literature to evaluate different inventory
scenarios as they provide a risk-free environment (Croom, 2009). The simulation model mirrors
a downstream part of Norway’s largest grocery retailer. One warehouse and 232 stores, which
were divided into 21 groups depending on the mean sales per week (5 to 696 units sold per week),
number of deliveries per week (2 to 6), and the store concept (discount, premium, hypermarket).
Based on POS-information of one product from the 232 stores daily demand distributions were
fitted and used as input for the simulation model.
The simulation model functions by a number of events at the warehouse (W) and at the stores
(S). Figure 4.6 and Table 4.6 outlines each event and how they relate to each other. At event S3
the EWA, EWASS and a baseline replenishment policies are implemented and can be changed
between each simulation run. Besides the three events at the warehouse and the three events at
the stores, all products are reduced with one day of remaining shelf life (RSL) for every 24 hours.
A more thorough explanation of the assumptions, verification, and validation of the simulation
model is included in Paper #4.
Supplier Warehouse
Store 1
Store 2
Store 232
...
S2
S2
S2
S3W3
S1
S1
S1
W1 W2
Con
sum
ers
Figure 4.6: Relation between events in the simulation model
46
Table 4.6: Events in the simulation model
Events at the warehouse Events at stores
W1: Goods arrive and are added to inventory
To reflect the processing time and delivery
time from the supplier goods are added to the
inventory 38 hours after they are ordered.
S1: Goods arrive and are added to inventory
To reflect the processing time at the
warehouse and delivery time from the
Norwegian grocery retailer goods are added to
the inventory 38 hours after they are ordered,
e.g. an order placed Monday afternoon is
added to the inventory Wednesday morning
W2: Satisfy demand
Orders from the stores are collected and
shipped to the stores. In case of shortage, a
first-come-first-service principle is followed,
and the FIFO principle is applied for stock
depletion.
S2: Satisfy demand
A random value is picked from the fitted
probability distribution. The α value specifies
how big a proportion of that demand that is
depleted with FIFO (products with the lowest
RSL at the front of the shelf) and the
remaining part is issued with LIFO (products
at the back of the shelf)
W3: Replenishment
If it is an ordering day an exponential
smoothing forecast with weekly seasonality is
generated covering the review and delivery
time. It is assumed that the warehouse always
has access to its own RSL information and the
EWASS policy is always applied.
S3: Replenishment
If it is an ordering day for the particular store
an exponential smoothing forecast with
weekly seasonality is generated covering the
review and delivery time. Depending on the
selected replenishment policy the required
number of batches are calculated, and an order
is placed.
Night: Reduce RSL and record performance
All products with two days RSL are removed
from inventory, and the RSL of all other
products is reduced with one day. Information
about inventory level, average RSL, fill rate,
and amount wasted is recorded.
Night: Reduce RSL and record performance
All products with one day RSL are removed
from inventory, and the RSL of all other
products is reduced with one day. Information
about inventory level, average RSL, fill rate,
and amount waste is recorded.
Each scenario was run for one year, and the shelf life of the product was gradually increased (with
one day) from 4 days of shelf life to 20 days of shelf life. These limits were made because the
total lead time through the supply chain is at least 2 x 38 hours and products with a shelf life less
than four days would have expired before they reached the stores. Additionally, no changes were
observed with a shelf life above 20 days.
To make the simulations closer to reality a batch size of 9 SKUs (between stores and warehouse)
and a mix between FIFO and LIFO depletion was implemented at the stores (Janssen et al., 2016).
Specifically, 90 % of the demand in the stores was depleted following FIFO and the remaining
10 % following LIFO. These numbers are intended to symbolize that 90 % of the consumer will
pick the products in front, while 10 % will search for products at the back of the shelf with a
longer remaining shelf life. Appendix D contains a sensitivity analysis of this parameter with
80% and 100% FIFO. The warehouse always follows a FIFO depletion towards the stores.
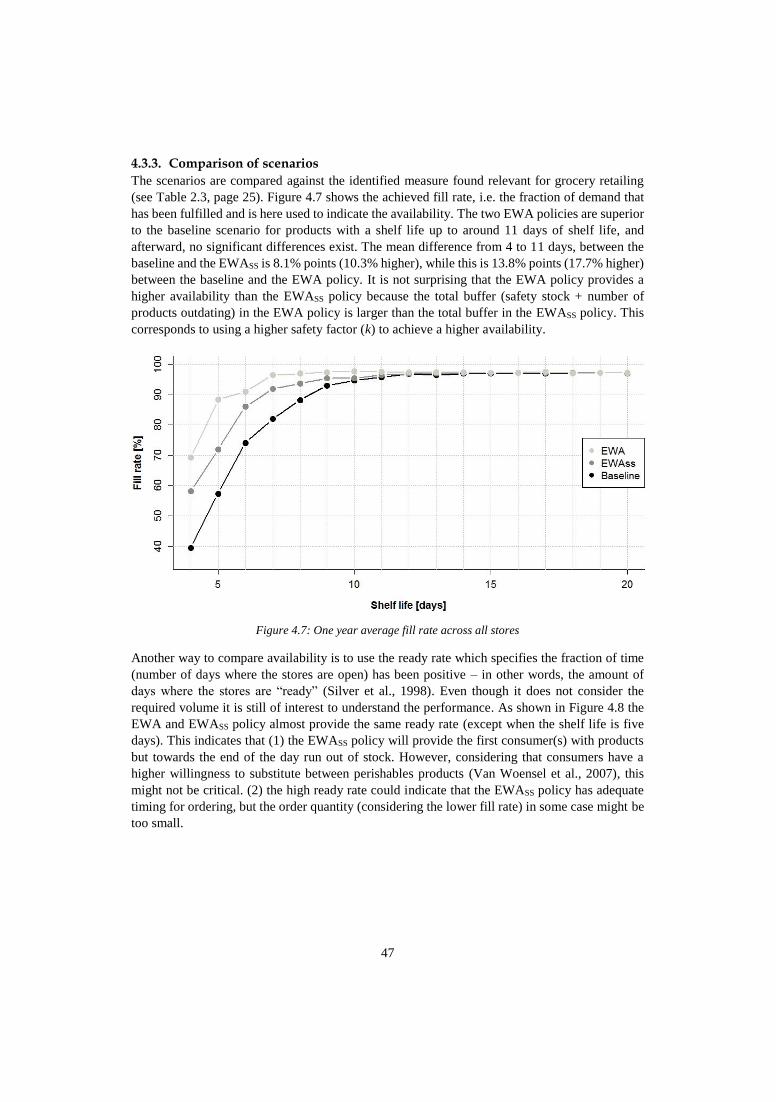
47
4.3.3. Comparison of scenarios
The scenarios are compared against the identified measure found relevant for grocery retailing
(see Table 2.3, page 25). Figure 4.7 shows the achieved fill rate, i.e. the fraction of demand that
has been fulfilled and is here used to indicate the availability. The two EWA policies are superior
to the baseline scenario for products with a shelf life up to around 11 days of shelf life, and
afterward, no significant differences exist. The mean difference from 4 to 11 days, between the
baseline and the EWASS is 8.1% points (10.3% higher), while this is 13.8% points (17.7% higher)
between the baseline and the EWA policy. It is not surprising that the EWA policy provides a
higher availability than the EWASS policy because the total buffer (safety stock + number of
products outdating) in the EWA policy is larger than the total buffer in the EWASS policy. This
corresponds to using a higher safety factor (k) to achieve a higher availability.
Figure 4.7: One year average fill rate across all stores
Another way to compare availability is to use the ready rate which specifies the fraction of time
(number of days where the stores are open) has been positive – in other words, the amount of
days where the stores are “ready” (Silver et al., 1998). Even though it does not consider the
required volume it is still of interest to understand the performance. As shown in Figure 4.8 the
EWA and EWASS policy almost provide the same ready rate (except when the shelf life is five
days). This indicates that (1) the EWASS policy will provide the first consumer(s) with products
but towards the end of the day run out of stock. However, considering that consumers have a
higher willingness to substitute between perishables products (Van Woensel et al., 2007), this
might not be critical. (2) the high ready rate could indicate that the EWASS policy has adequate
timing for ordering, but the order quantity (considering the lower fill rate) in some case might be
too small.
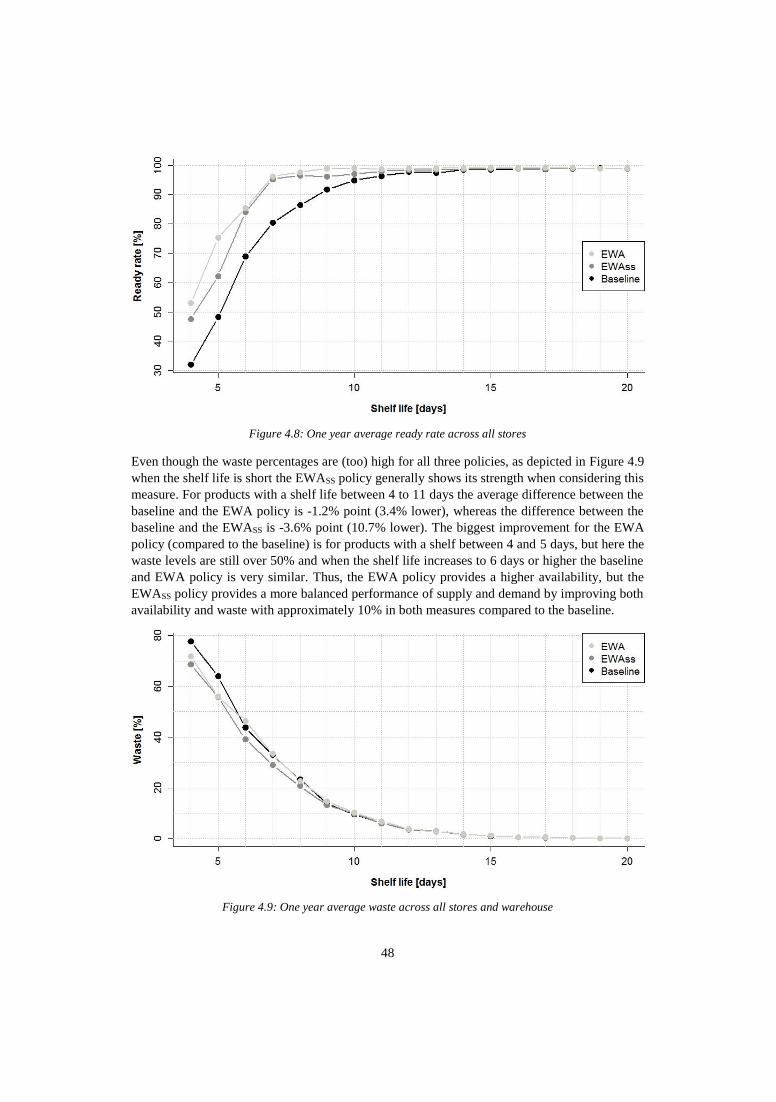
48
Figure 4.8: One year average ready rate across all stores
Even though the waste percentages are (too) high for all three policies, as depicted in Figure 4.9
when the shelf life is short the EWASS policy generally shows its strength when considering this
measure. For products with a shelf life between 4 to 11 days the average difference between the
baseline and the EWA policy is -1.2% point (3.4% lower), whereas the difference between the
baseline and the EWASS is -3.6% point (10.7% lower). The biggest improvement for the EWA
policy (compared to the baseline) is for products with a shelf between 4 and 5 days, but here the
waste levels are still over 50% and when the shelf life increases to 6 days or higher the baseline
and EWA policy is very similar. Thus, the EWA policy provides a higher availability, but the
EWASS policy provides a more balanced performance of supply and demand by improving both
availability and waste with approximately 10% in both measures compared to the baseline.
Figure 4.9: One year average waste across all stores and warehouse
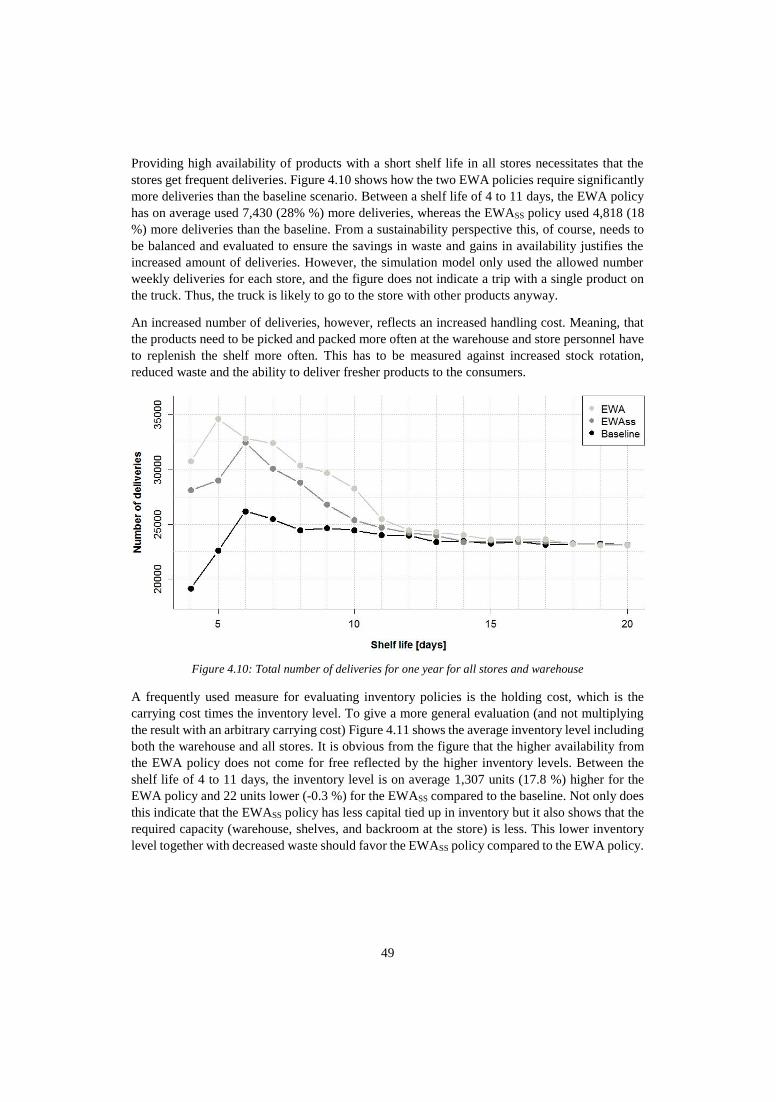
49
Providing high availability of products with a short shelf life in all stores necessitates that the
stores get frequent deliveries. Figure 4.10 shows how the two EWA policies require significantly
more deliveries than the baseline scenario. Between a shelf life of 4 to 11 days, the EWA policy
has on average used 7,430 (28% %) more deliveries, whereas the EWASS policy used 4,818 (18
%) more deliveries than the baseline. From a sustainability perspective this, of course, needs to
be balanced and evaluated to ensure the savings in waste and gains in availability justifies the
increased amount of deliveries. However, the simulation model only used the allowed number
weekly deliveries for each store, and the figure does not indicate a trip with a single product on
the truck. Thus, the truck is likely to go to the store with other products anyway.
An increased number of deliveries, however, reflects an increased handling cost. Meaning, that
the products need to be picked and packed more often at the warehouse and store personnel have
to replenish the shelf more often. This has to be measured against increased stock rotation,
reduced waste and the ability to deliver fresher products to the consumers.
Figure 4.10: Total number of deliveries for one year for all stores and warehouse
A frequently used measure for evaluating inventory policies is the holding cost, which is the
carrying cost times the inventory level. To give a more general evaluation (and not multiplying
the result with an arbitrary carrying cost) Figure 4.11 shows the average inventory level including
both the warehouse and all stores. It is obvious from the figure that the higher availability from
the EWA policy does not come for free reflected by the higher inventory levels. Between the
shelf life of 4 to 11 days, the inventory level is on average 1,307 units (17.8 %) higher for the
EWA policy and 22 units lower (-0.3 %) for the EWASS compared to the baseline. Not only does
this indicate that the EWASS policy has less capital tied up in inventory but it also shows that the
required capacity (warehouse, shelves, and backroom at the store) is less. This lower inventory
level together with decreased waste should favor the EWASS policy compared to the EWA policy.
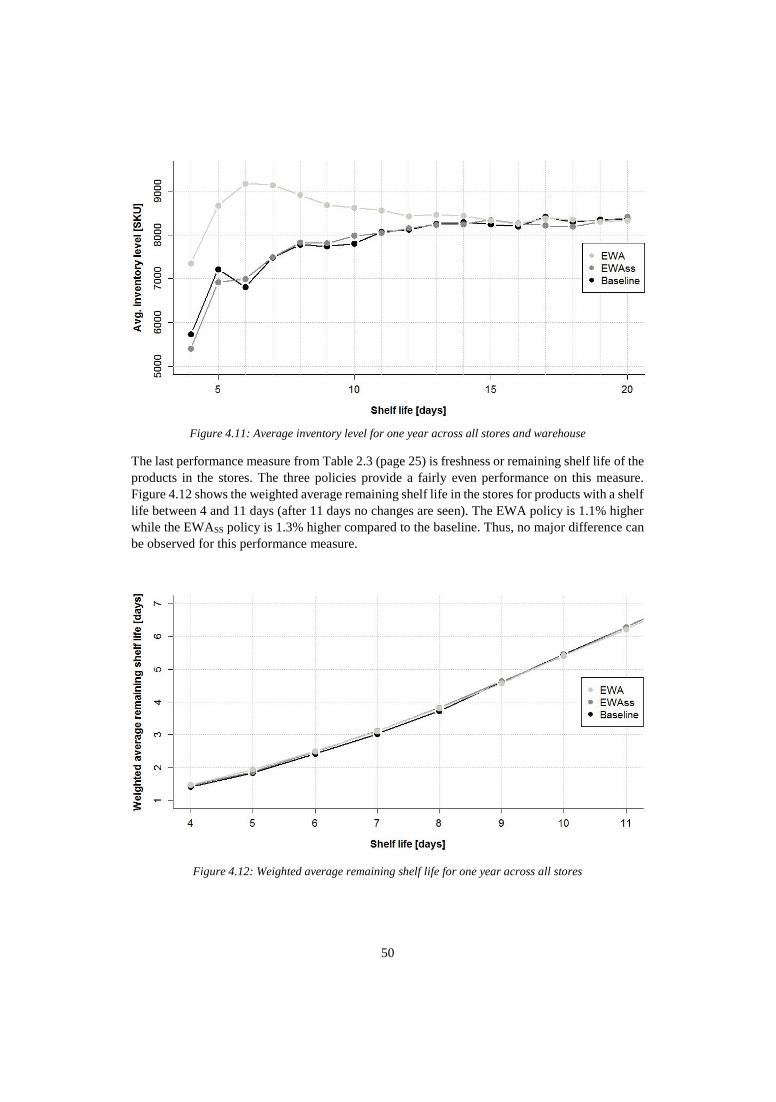
50
Figure 4.11: Average inventory level for one year across all stores and warehouse
The last performance measure from Table 2.3 (page 25) is freshness or remaining shelf life of the
products in the stores. The three policies provide a fairly even performance on this measure.
Figure 4.12 shows the weighted average remaining shelf life in the stores for products with a shelf
life between 4 and 11 days (after 11 days no changes are seen). The EWA policy is 1.1% higher
while the EWASS policy is 1.3% higher compared to the baseline. Thus, no major difference can
be observed for this performance measure.
Figure 4.12: Weighted average remaining shelf life for one year across all stores
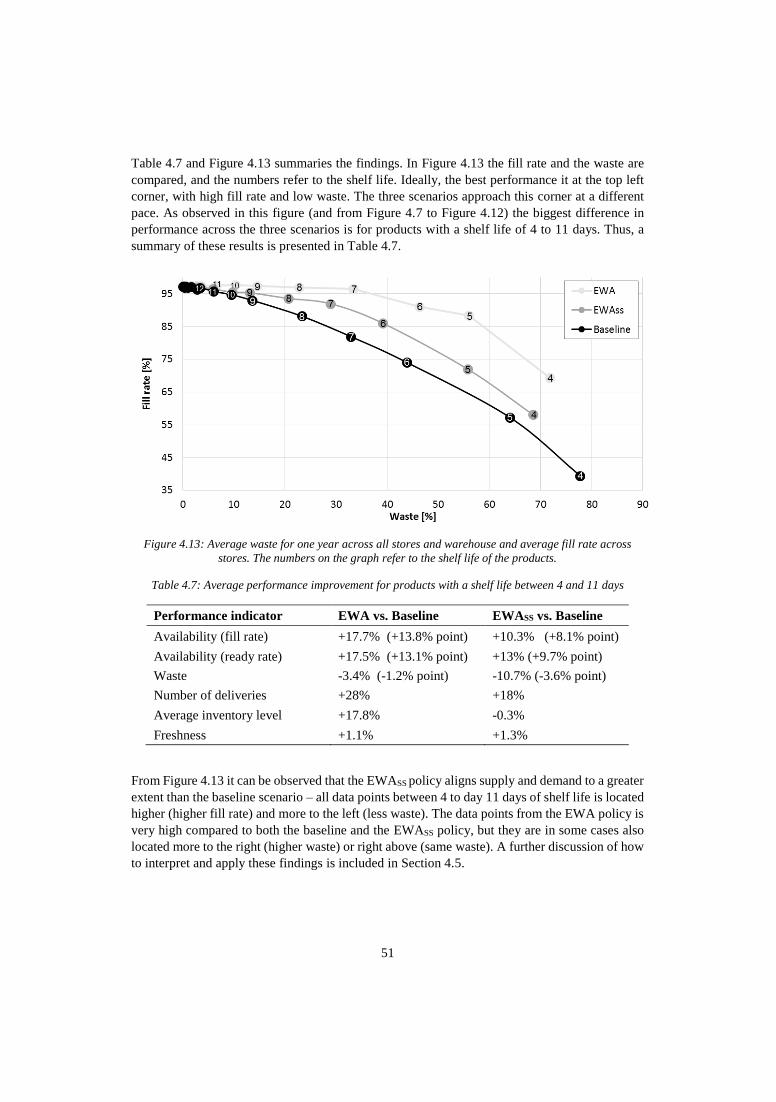
51
Table 4.7 and Figure 4.13 summaries the findings. In Figure 4.13 the fill rate and the waste are
compared, and the numbers refer to the shelf life. Ideally, the best performance it at the top left
corner, with high fill rate and low waste. The three scenarios approach this corner at a different
pace. As observed in this figure (and from Figure 4.7 to Figure 4.12) the biggest difference in
performance across the three scenarios is for products with a shelf life of 4 to 11 days. Thus, a
summary of these results is presented in Table 4.7.
Figure 4.13: Average waste for one year across all stores and warehouse and average fill rate across
stores. The numbers on the graph refer to the shelf life of the products.
Table 4.7: Average performance improvement for products with a shelf life between 4 and 11 days
Performance indicator EWA vs. Baseline EWASS vs. Baseline
Availability (fill rate) +17.7% (+13.8% point) +10.3% (+8.1% point)
Availability (ready rate) +17.5% (+13.1% point) +13% (+9.7% point)
Waste -3.4% (-1.2% point) -10.7% (-3.6% point)
Number of deliveries +28% +18%
Average inventory level +17.8% -0.3%
Freshness +1.1% +1.3%
From Figure 4.13 it can be observed that the EWASS policy aligns supply and demand to a greater
extent than the baseline scenario – all data points between 4 to day 11 days of shelf life is located
higher (higher fill rate) and more to the left (less waste). The data points from the EWA policy is
very high compared to both the baseline and the EWASS policy, but they are in some cases also
located more to the right (higher waste) or right above (same waste). A further discussion of how
to interpret and apply these findings is included in Section 4.5.
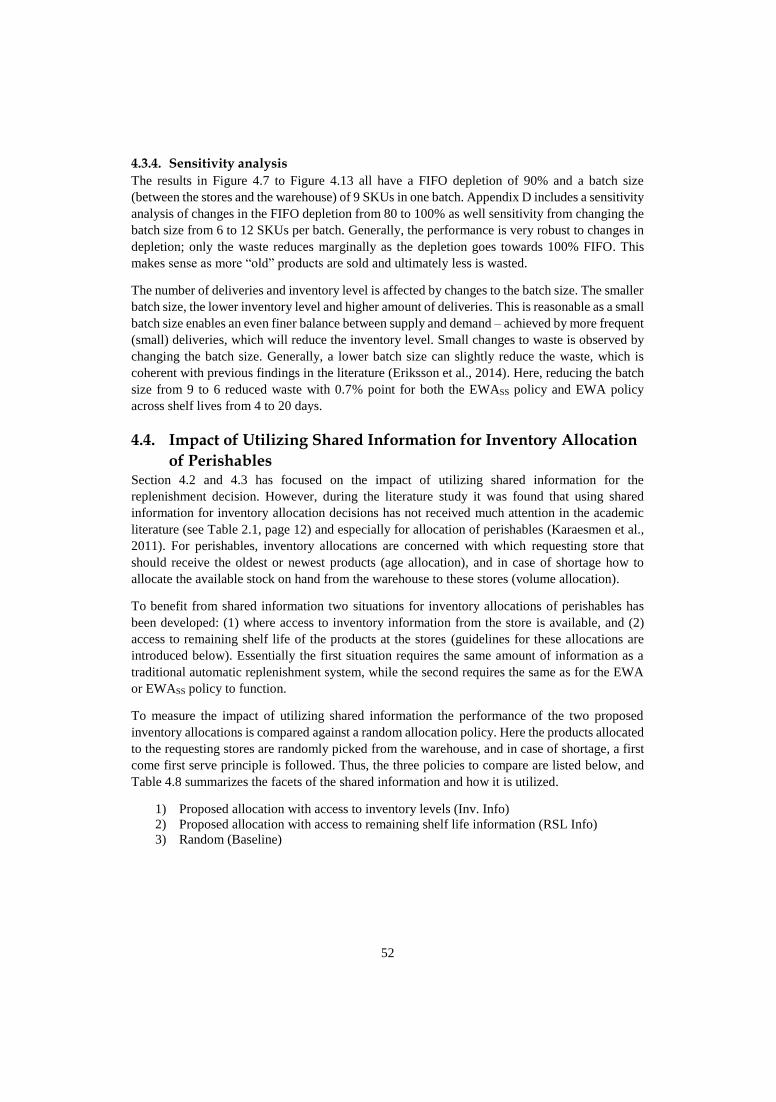
52
4.3.4. Sensitivity analysis
The results in Figure 4.7 to Figure 4.13 all have a FIFO depletion of 90% and a batch size
(between the stores and the warehouse) of 9 SKUs in one batch. Appendix D includes a sensitivity
analysis of changes in the FIFO depletion from 80 to 100% as well sensitivity from changing the
batch size from 6 to 12 SKUs per batch. Generally, the performance is very robust to changes in
depletion; only the waste reduces marginally as the depletion goes towards 100% FIFO. This
makes sense as more “old” products are sold and ultimately less is wasted.
The number of deliveries and inventory level is affected by changes to the batch size. The smaller
batch size, the lower inventory level and higher amount of deliveries. This is reasonable as a small
batch size enables an even finer balance between supply and demand – achieved by more frequent
(small) deliveries, which will reduce the inventory level. Small changes to waste is observed by
changing the batch size. Generally, a lower batch size can slightly reduce the waste, which is
coherent with previous findings in the literature (Eriksson et al., 2014). Here, reducing the batch
size from 9 to 6 reduced waste with 0.7% point for both the EWASS policy and EWA policy
across shelf lives from 4 to 20 days.
4.4. Impact of Utilizing Shared Information for Inventory Allocation
of Perishables Section 4.2 and 4.3 has focused on the impact of utilizing shared information for the
replenishment decision. However, during the literature study it was found that using shared
information for inventory allocation decisions has not received much attention in the academic
literature (see Table 2.1, page 12) and especially for allocation of perishables (Karaesmen et al.,
2011). For perishables, inventory allocations are concerned with which requesting store that
should receive the oldest or newest products (age allocation), and in case of shortage how to
allocate the available stock on hand from the warehouse to these stores (volume allocation).
To benefit from shared information two situations for inventory allocations of perishables has
been developed: (1) where access to inventory information from the store is available, and (2)
access to remaining shelf life of the products at the stores (guidelines for these allocations are
introduced below). Essentially the first situation requires the same amount of information as a
traditional automatic replenishment system, while the second requires the same as for the EWA
or EWASS policy to function.
To measure the impact of utilizing shared information the performance of the two proposed
inventory allocations is compared against a random allocation policy. Here the products allocated
to the requesting stores are randomly picked from the warehouse, and in case of shortage, a first
come first serve principle is followed. Thus, the three policies to compare are listed below, and
Table 4.8 summarizes the facets of the shared information and how it is utilized.
1) Proposed allocation with access to inventory levels (Inv. Info)
2) Proposed allocation with access to remaining shelf life information (RSL Info)
3) Random (Baseline)
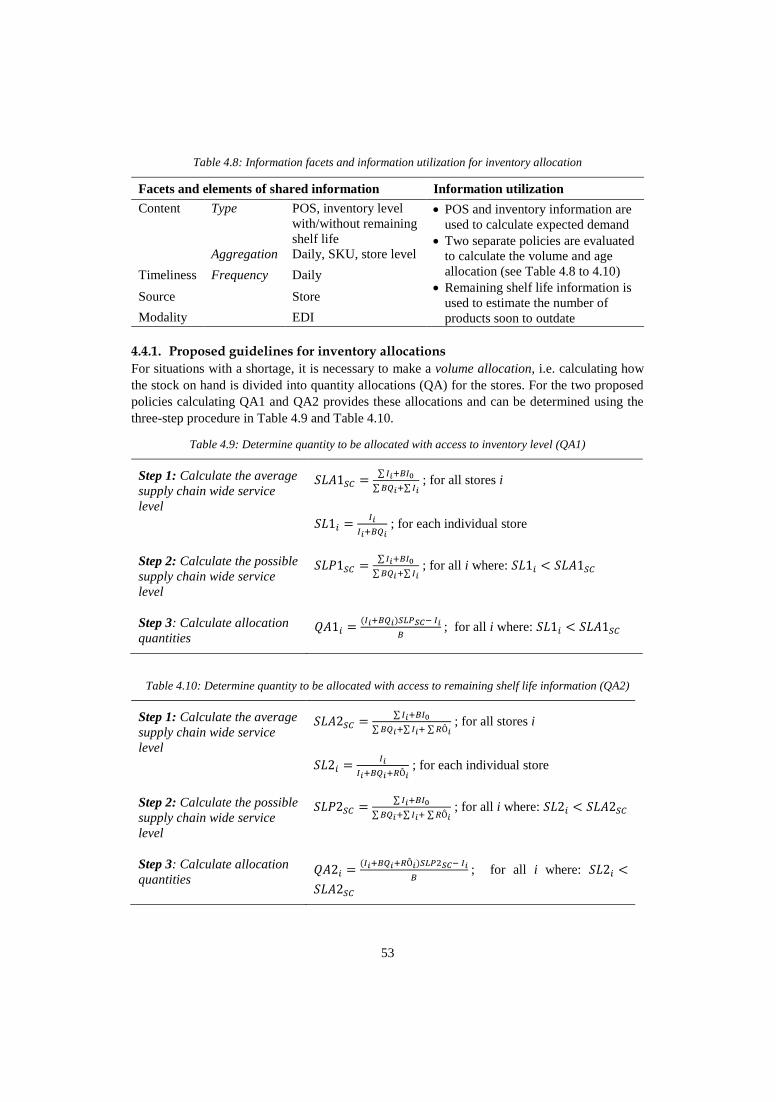
53
Table 4.8: Information facets and information utilization for inventory allocation
Facets and elements of shared information Information utilization
Content Type POS, inventory level
with/without remaining
shelf life
• POS and inventory information are
used to calculate expected demand
• Two separate policies are evaluated
to calculate the volume and age
allocation (see Table 4.8 to 4.10)
• Remaining shelf life information is
used to estimate the number of
products soon to outdate
Aggregation Daily, SKU, store level
Timeliness Frequency Daily
Source Store
Modality EDI
4.4.1. Proposed guidelines for inventory allocations
For situations with a shortage, it is necessary to make a volume allocation, i.e. calculating how
the stock on hand is divided into quantity allocations (QA) for the stores. For the two proposed
policies calculating QA1 and QA2 provides these allocations and can be determined using the
three-step procedure in Table 4.9 and Table 4.10.
Table 4.9: Determine quantity to be allocated with access to inventory level (QA1)
Step 1: Calculate the average
supply chain wide service
level
𝑆𝐿𝐴1𝑆𝐶 =∑ 𝐼𝑖+𝐵𝐼0
∑ 𝐵𝑄𝑖+∑ 𝐼𝑖 ; for all stores i
𝑆𝐿1𝑖 =𝐼𝑖
𝐼𝑖+𝐵𝑄𝑖 ; for each individual store
Step 2: Calculate the possible
supply chain wide service
level
𝑆𝐿𝑃1𝑆𝐶 =∑ 𝐼𝑖+𝐵𝐼0
∑ 𝐵𝑄𝑖+∑ 𝐼𝑖 ; for all i where: 𝑆𝐿1𝑖 < 𝑆𝐿𝐴1𝑆𝐶
Step 3: Calculate allocation
quantities 𝑄𝐴1𝑖 =
(𝐼𝑖+𝐵𝑄𝑖)𝑆𝐿𝑃𝑆𝐶− 𝐼𝑖
𝐵 ; for all i where: 𝑆𝐿1𝑖 < 𝑆𝐿𝐴1𝑆𝐶
Table 4.10: Determine quantity to be allocated with access to remaining shelf life information (QA2)
Step 1: Calculate the average
supply chain wide service
level
𝑆𝐿𝐴2𝑆𝐶 =∑ 𝐼𝑖+𝐵𝐼0
∑ 𝐵𝑄𝑖+∑ 𝐼𝑖+ ∑ 𝑅Ô𝑖 ; for all stores i
𝑆𝐿2𝑖 =𝐼𝑖
𝐼𝑖+𝐵𝑄𝑖+𝑅Ô𝑖 ; for each individual store
Step 2: Calculate the possible
supply chain wide service
level
𝑆𝐿𝑃2𝑆𝐶 =∑ 𝐼𝑖+𝐵𝐼0
∑ 𝐵𝑄𝑖+∑ 𝐼𝑖+ ∑ 𝑅Ô𝑖 ; for all i where: 𝑆𝐿2𝑖 < 𝑆𝐿𝐴2𝑆𝐶
Step 3: Calculate allocation
quantities 𝑄𝐴2𝑖 =
(𝐼𝑖+𝐵𝑄𝑖+𝑅Ô𝑖)𝑆𝐿𝑃2𝑆𝐶− 𝐼𝑖
𝐵 ; for all i where: 𝑆𝐿2𝑖 <
𝑆𝐿𝐴2𝑆𝐶
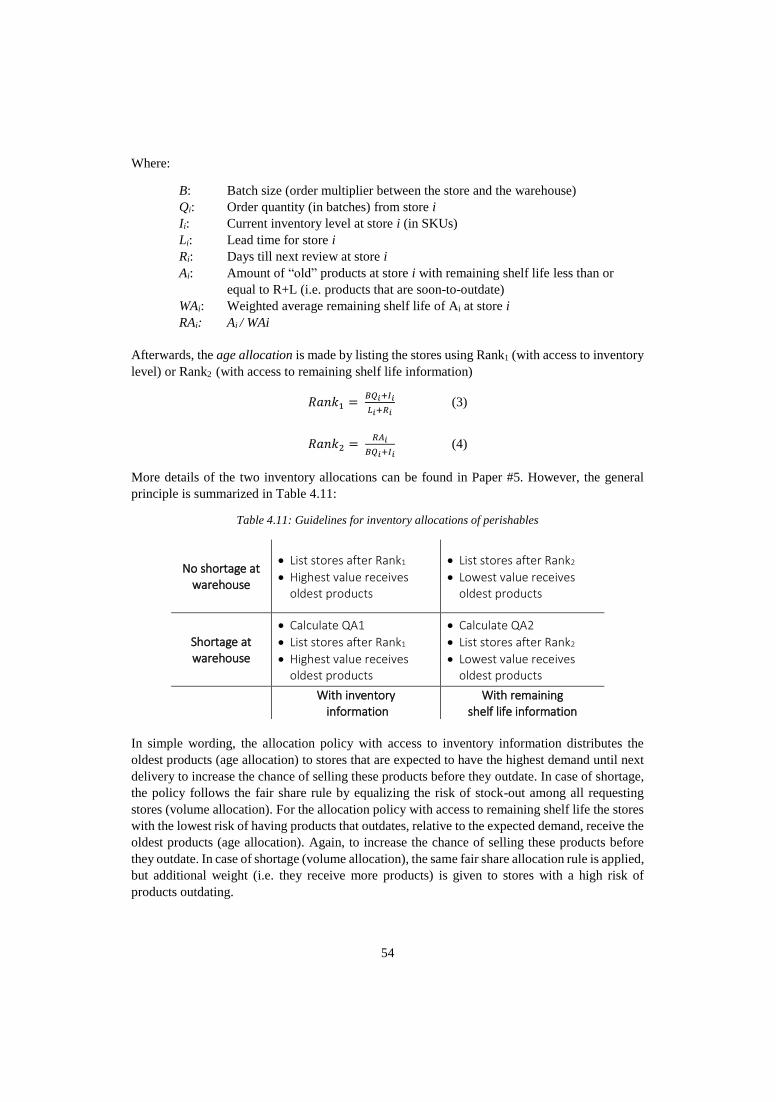
54
Where:
B: Batch size (order multiplier between the store and the warehouse)
Qi: Order quantity (in batches) from store i
Ii: Current inventory level at store i (in SKUs)
Li: Lead time for store i
Ri: Days till next review at store i
Ai: Amount of “old” products at store i with remaining shelf life less than or
equal to R+L (i.e. products that are soon-to-outdate)
WAi: Weighted average remaining shelf life of Ai at store i
RAi: Ai / WAi
Afterwards, the age allocation is made by listing the stores using Rank1 (with access to inventory
level) or Rank2 (with access to remaining shelf life information)
𝑅𝑎𝑛𝑘1 = 𝐵𝑄𝑖+𝐼𝑖
𝐿𝑖+𝑅𝑖 (3)
𝑅𝑎𝑛𝑘2 = 𝑅𝐴𝑖
𝐵𝑄𝑖+𝐼𝑖 (4)
More details of the two inventory allocations can be found in Paper #5. However, the general
principle is summarized in Table 4.11:
Table 4.11: Guidelines for inventory allocations of perishables
No shortage at warehouse
• List stores after Rank1
• Highest value receives oldest products
• List stores after Rank2
• Lowest value receives oldest products
Shortage at warehouse
• Calculate QA1
• List stores after Rank1
• Highest value receives oldest products
• Calculate QA2
• List stores after Rank2
• Lowest value receives oldest products
With inventory
information With remaining
shelf life information
In simple wording, the allocation policy with access to inventory information distributes the
oldest products (age allocation) to stores that are expected to have the highest demand until next
delivery to increase the chance of selling these products before they outdate. In case of shortage,
the policy follows the fair share rule by equalizing the risk of stock-out among all requesting
stores (volume allocation). For the allocation policy with access to remaining shelf life the stores
with the lowest risk of having products that outdates, relative to the expected demand, receive the
oldest products (age allocation). Again, to increase the chance of selling these products before
they outdate. In case of shortage (volume allocation), the same fair share allocation rule is applied,
but additional weight (i.e. they receive more products) is given to stores with a high risk of
products outdating.
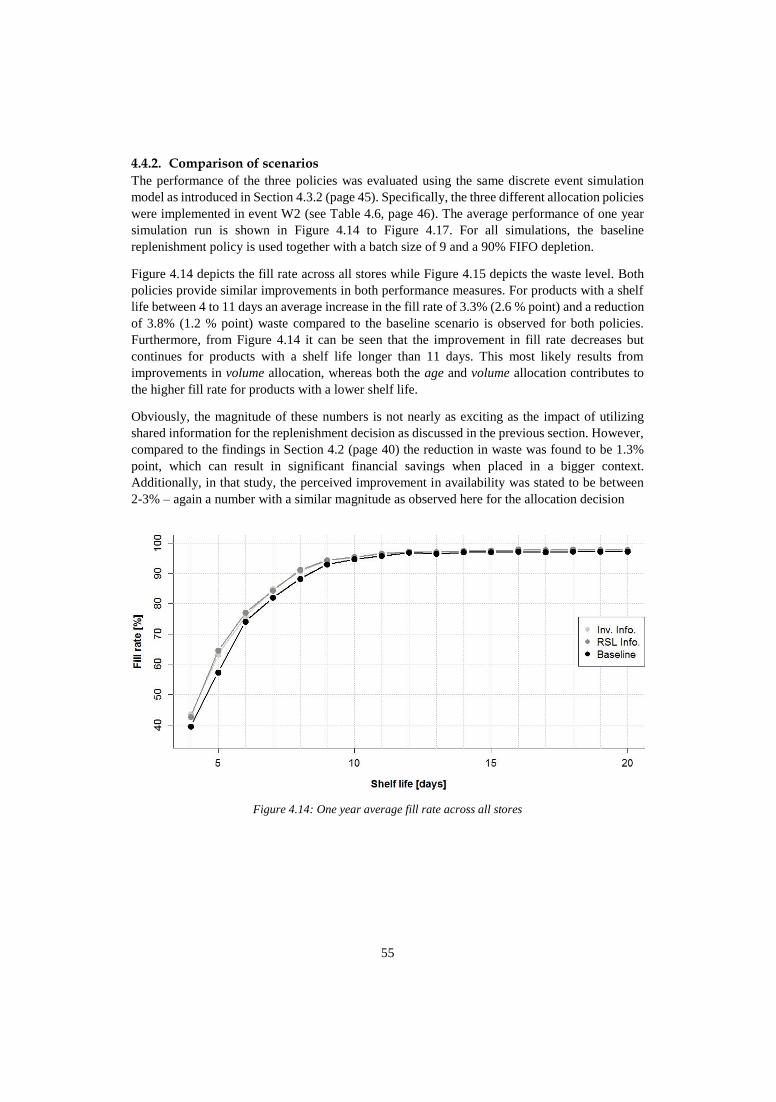
55
4.4.2. Comparison of scenarios
The performance of the three policies was evaluated using the same discrete event simulation
model as introduced in Section 4.3.2 (page 45). Specifically, the three different allocation policies
were implemented in event W2 (see Table 4.6, page 46). The average performance of one year
simulation run is shown in Figure 4.14 to Figure 4.17. For all simulations, the baseline
replenishment policy is used together with a batch size of 9 and a 90% FIFO depletion.
Figure 4.14 depicts the fill rate across all stores while Figure 4.15 depicts the waste level. Both
policies provide similar improvements in both performance measures. For products with a shelf
life between 4 to 11 days an average increase in the fill rate of 3.3% (2.6 % point) and a reduction
of 3.8% (1.2 % point) waste compared to the baseline scenario is observed for both policies.
Furthermore, from Figure 4.14 it can be seen that the improvement in fill rate decreases but
continues for products with a shelf life longer than 11 days. This most likely results from
improvements in volume allocation, whereas both the age and volume allocation contributes to
the higher fill rate for products with a lower shelf life.
Obviously, the magnitude of these numbers is not nearly as exciting as the impact of utilizing
shared information for the replenishment decision as discussed in the previous section. However,
compared to the findings in Section 4.2 (page 40) the reduction in waste was found to be 1.3%
point, which can result in significant financial savings when placed in a bigger context.
Additionally, in that study, the perceived improvement in availability was stated to be between
2-3% – again a number with a similar magnitude as observed here for the allocation decision
Figure 4.14: One year average fill rate across all stores
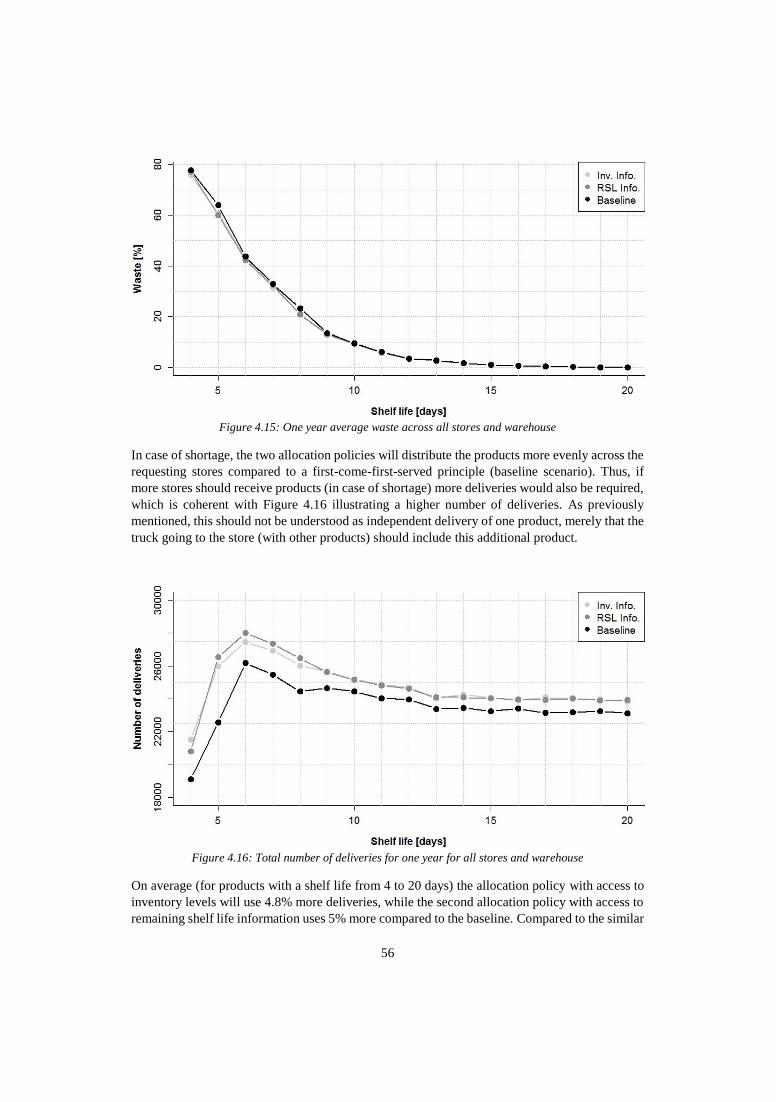
56
Figure 4.15: One year average waste across all stores and warehouse
In case of shortage, the two allocation policies will distribute the products more evenly across the
requesting stores compared to a first-come-first-served principle (baseline scenario). Thus, if
more stores should receive products (in case of shortage) more deliveries would also be required,
which is coherent with Figure 4.16 illustrating a higher number of deliveries. As previously
mentioned, this should not be understood as independent delivery of one product, merely that the
truck going to the store (with other products) should include this additional product.
Figure 4.16: Total number of deliveries for one year for all stores and warehouse
On average (for products with a shelf life from 4 to 20 days) the allocation policy with access to
inventory levels will use 4.8% more deliveries, while the second allocation policy with access to
remaining shelf life information uses 5% more compared to the baseline. Compared to the similar
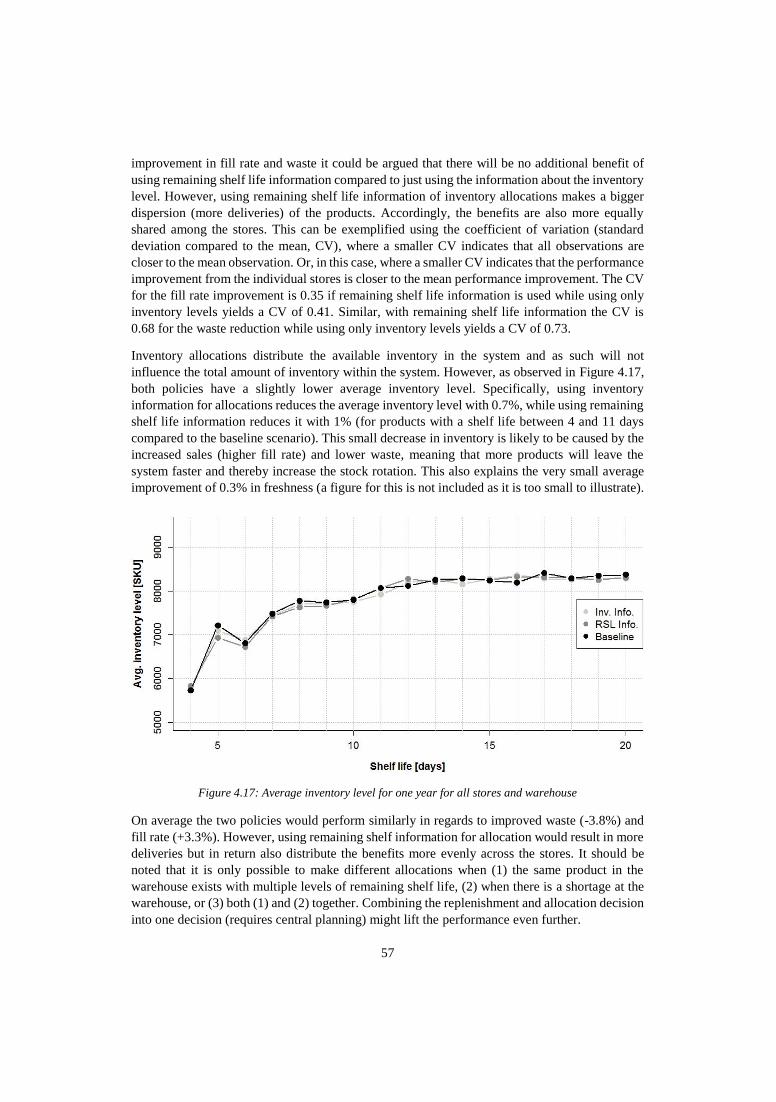
57
improvement in fill rate and waste it could be argued that there will be no additional benefit of
using remaining shelf life information compared to just using the information about the inventory
level. However, using remaining shelf life information of inventory allocations makes a bigger
dispersion (more deliveries) of the products. Accordingly, the benefits are also more equally
shared among the stores. This can be exemplified using the coefficient of variation (standard
deviation compared to the mean, CV), where a smaller CV indicates that all observations are
closer to the mean observation. Or, in this case, where a smaller CV indicates that the performance
improvement from the individual stores is closer to the mean performance improvement. The CV
for the fill rate improvement is 0.35 if remaining shelf life information is used while using only
inventory levels yields a CV of 0.41. Similar, with remaining shelf life information the CV is
0.68 for the waste reduction while using only inventory levels yields a CV of 0.73.
Inventory allocations distribute the available inventory in the system and as such will not
influence the total amount of inventory within the system. However, as observed in Figure 4.17,
both policies have a slightly lower average inventory level. Specifically, using inventory
information for allocations reduces the average inventory level with 0.7%, while using remaining
shelf life information reduces it with 1% (for products with a shelf life between 4 and 11 days
compared to the baseline scenario). This small decrease in inventory is likely to be caused by the
increased sales (higher fill rate) and lower waste, meaning that more products will leave the
system faster and thereby increase the stock rotation. This also explains the very small average
improvement of 0.3% in freshness (a figure for this is not included as it is too small to illustrate).
Figure 4.17: Average inventory level for one year for all stores and warehouse
On average the two policies would perform similarly in regards to improved waste (-3.8%) and
fill rate (+3.3%). However, using remaining shelf information for allocation would result in more
deliveries but in return also distribute the benefits more evenly across the stores. It should be
noted that it is only possible to make different allocations when (1) the same product in the
warehouse exists with multiple levels of remaining shelf life, (2) when there is a shortage at the
warehouse, or (3) both (1) and (2) together. Combining the replenishment and allocation decision
into one decision (requires central planning) might lift the performance even further.
58
4.4.3. Sensitivity analysis
Appendix E contains a sensitivity analysis where the batch size has been changed to 6 and 12
(compared to 9 which is used in Figure 4.14 to Figure 4.17). Similar to the sensitivity of the
replenishment decision it is observed that as the batch size increase the number of deliveries
decreases (more is delivered per trip), which in turn increases the average inventory level
increase. A slight increase is observed in the fill rate as the batch decreases – this enables finer
distribution among stores.
Most interestingly is the reduction in waste where a smaller batch size reduces waste by 3.9%
with allocation based on inventory information and 3.2% with allocation based on remaining shelf
life information. This indicates that the allocation based on remaining shelf life information is
slightly more robust. However, combined these findings suggest that grocery retailers would
benefit from applying one of these allocation policies together with a reduction in batch sizes.
4.5. Discussion The previous section provides a terminology for shared information as well as estimates of the
impact of utilizing shared information for improving decision making and thereby increase the
alignment of supply and demand. The purpose of this section is to discuss these findings and
make them more tangible and consolidating them into one entity. The section is divided into four
subsections. Firstly, the practical implications of information sharing are discussed followed by
a subsection which outlines how to benefit from differentiated information sharing in grocery
retailing. The third subsection briefly comments on how the characteristics of the products
influence the applicability of information sharing. The last subsection is devoted to highlighting
the theoretical contributions that can be derived from the findings.
4.5.1. Implications
All findings indicate that utilizing shared information can improve the alignment of supply and
demand. This is demonstrated by showing a simultaneous improvement in availability (lack of
supply) on hand and reduced food waste (surplus of supply) on the other. However, a reduction
of e.g. 1% point in food waste or 5% point increase in availability might be difficult to interpret
and could sound rather insignificant, which questions the practical relevance of such findings.
Accordingly, this section unfolds the practical relevance and implications of the findings.
Food waste at stores has both environmental and monetary implications. Environmentally, excess
food consumes e.g. unnecessary transportation, energy, water, and cropland up through the supply
chain, while the monetary implications is a direct loss of profit for the store. In 2014 the total
profit of the three largest grocery retailers in Norway was 366 million Euro and a total turnover
of 16,775 million Euro giving an average earning of 2.2%. Now, if 1.3% waste could be
eliminated (this was the reduction identified in Section 4.2) this would potentially increase the
average earnings to 3.5%. In other words, an increase in profit with another 218 million Euro to
a total of 584 million Euro in profit. Thus, using shared information can have a significant
monetary influence on grocery retailers.
The monetary impact of a stock-out (low availability) is not yet quantified in the literature
(Aastrup and Kotzab, 2010). One could argue that a 95% availability would result in 5% of lost
sales. However, consumers may switch to another brand, size, or color of the particular product
and the store still generates its revenue. Similar, if the consumer switches to another store, but
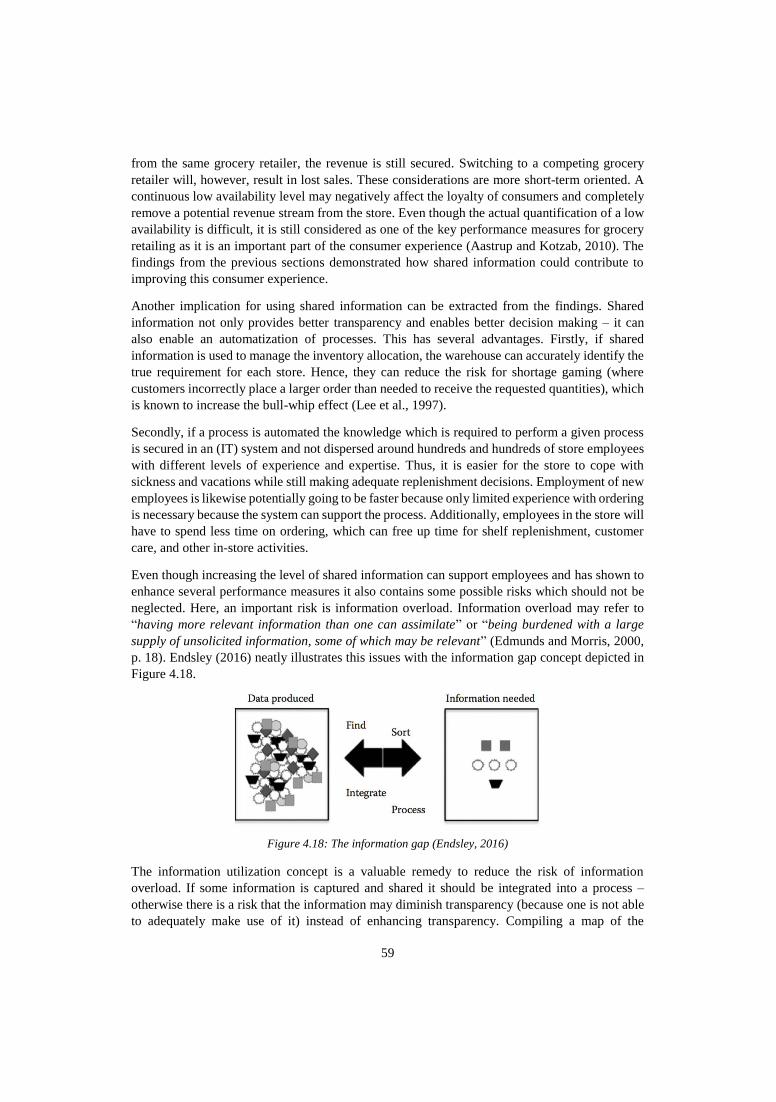
59
from the same grocery retailer, the revenue is still secured. Switching to a competing grocery
retailer will, however, result in lost sales. These considerations are more short-term oriented. A
continuous low availability level may negatively affect the loyalty of consumers and completely
remove a potential revenue stream from the store. Even though the actual quantification of a low
availability is difficult, it is still considered as one of the key performance measures for grocery
retailing as it is an important part of the consumer experience (Aastrup and Kotzab, 2010). The
findings from the previous sections demonstrated how shared information could contribute to
improving this consumer experience.
Another implication for using shared information can be extracted from the findings. Shared
information not only provides better transparency and enables better decision making – it can
also enable an automatization of processes. This has several advantages. Firstly, if shared
information is used to manage the inventory allocation, the warehouse can accurately identify the
true requirement for each store. Hence, they can reduce the risk for shortage gaming (where
customers incorrectly place a larger order than needed to receive the requested quantities), which
is known to increase the bull-whip effect (Lee et al., 1997).
Secondly, if a process is automated the knowledge which is required to perform a given process
is secured in an (IT) system and not dispersed around hundreds and hundreds of store employees
with different levels of experience and expertise. Thus, it is easier for the store to cope with
sickness and vacations while still making adequate replenishment decisions. Employment of new
employees is likewise potentially going to be faster because only limited experience with ordering
is necessary because the system can support the process. Additionally, employees in the store will
have to spend less time on ordering, which can free up time for shelf replenishment, customer
care, and other in-store activities.
Even though increasing the level of shared information can support employees and has shown to
enhance several performance measures it also contains some possible risks which should not be
neglected. Here, an important risk is information overload. Information overload may refer to
“having more relevant information than one can assimilate” or “being burdened with a large
supply of unsolicited information, some of which may be relevant” (Edmunds and Morris, 2000,
p. 18). Endsley (2016) neatly illustrates this issues with the information gap concept depicted in
Figure 4.18.
Figure 4.18: The information gap (Endsley, 2016)
The information utilization concept is a valuable remedy to reduce the risk of information
overload. If some information is captured and shared it should be integrated into a process –
otherwise there is a risk that the information may diminish transparency (because one is not able
to adequately make use of it) instead of enhancing transparency. Compiling a map of the
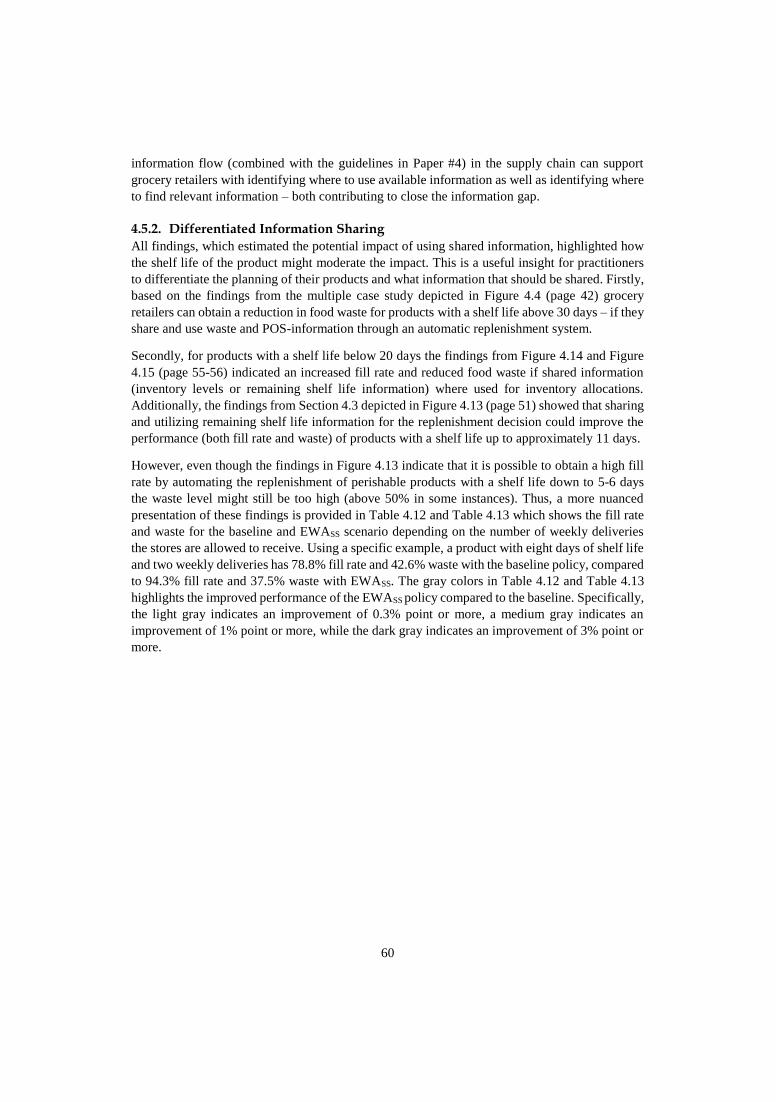
60
information flow (combined with the guidelines in Paper #4) in the supply chain can support
grocery retailers with identifying where to use available information as well as identifying where
to find relevant information – both contributing to close the information gap.
4.5.2. Differentiated Information Sharing
All findings, which estimated the potential impact of using shared information, highlighted how
the shelf life of the product might moderate the impact. This is a useful insight for practitioners
to differentiate the planning of their products and what information that should be shared. Firstly,
based on the findings from the multiple case study depicted in Figure 4.4 (page 42) grocery
retailers can obtain a reduction in food waste for products with a shelf life above 30 days – if they
share and use waste and POS-information through an automatic replenishment system.
Secondly, for products with a shelf life below 20 days the findings from Figure 4.14 and Figure
4.15 (page 55-56) indicated an increased fill rate and reduced food waste if shared information
(inventory levels or remaining shelf life information) where used for inventory allocations.
Additionally, the findings from Section 4.3 depicted in Figure 4.13 (page 51) showed that sharing
and utilizing remaining shelf life information for the replenishment decision could improve the
performance (both fill rate and waste) of products with a shelf life up to approximately 11 days.
However, even though the findings in Figure 4.13 indicate that it is possible to obtain a high fill
rate by automating the replenishment of perishable products with a shelf life down to 5-6 days
the waste level might still be too high (above 50% in some instances). Thus, a more nuanced
presentation of these findings is provided in Table 4.12 and Table 4.13 which shows the fill rate
and waste for the baseline and EWASS scenario depending on the number of weekly deliveries
the stores are allowed to receive. Using a specific example, a product with eight days of shelf life
and two weekly deliveries has 78.8% fill rate and 42.6% waste with the baseline policy, compared
to 94.3% fill rate and 37.5% waste with EWASS. The gray colors in Table 4.12 and Table 4.13
highlights the improved performance of the EWASS policy compared to the baseline. Specifically,
the light gray indicates an improvement of 0.3% point or more, a medium gray indicates an
improvement of 1% point or more, while the dark gray indicates an improvement of 3% point or
more.
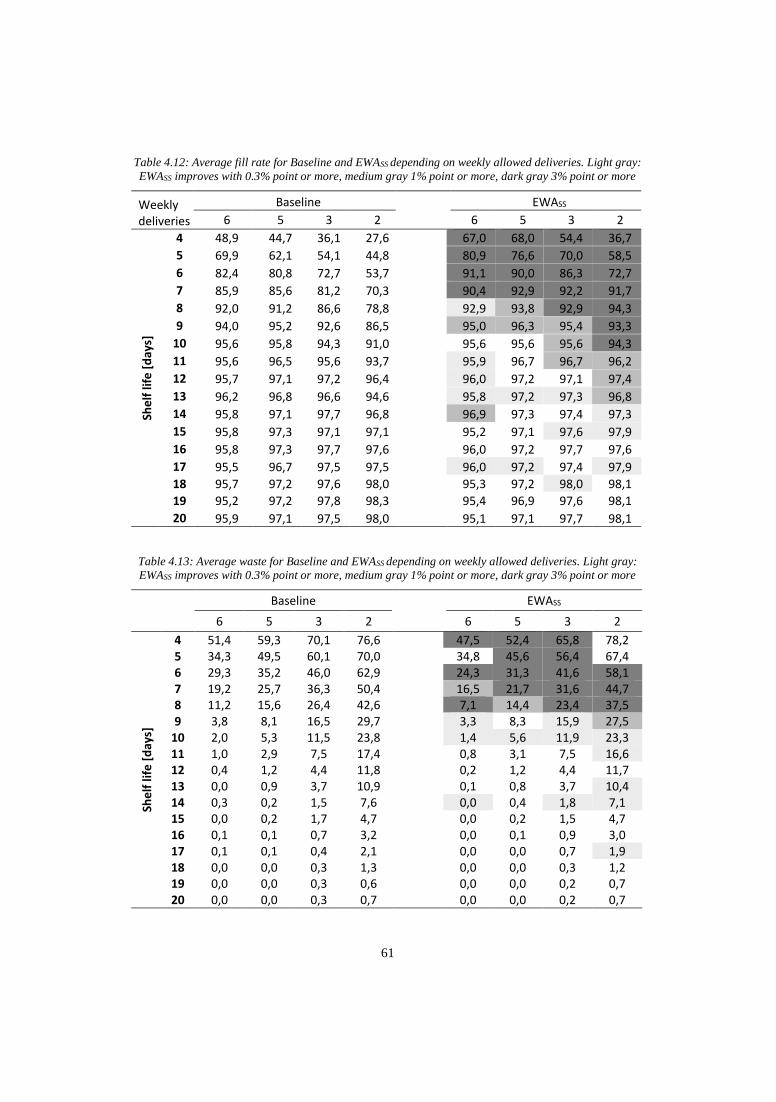
61
Table 4.12: Average fill rate for Baseline and EWASS depending on weekly allowed deliveries. Light gray:
EWASS improves with 0.3% point or more, medium gray 1% point or more, dark gray 3% point or more
Weekly deliveries
Baseline EWASS
6 5 3 2 6 5 3 2
She
lf li
fe [
day
s]
4 48,9 44,7 36,1 27,6 67,0 68,0 54,4 36,7
5 69,9 62,1 54,1 44,8 80,9 76,6 70,0 58,5
6 82,4 80,8 72,7 53,7 91,1 90,0 86,3 72,7
7 85,9 85,6 81,2 70,3 90,4 92,9 92,2 91,7
8 92,0 91,2 86,6 78,8 92,9 93,8 92,9 94,3
9 94,0 95,2 92,6 86,5 95,0 96,3 95,4 93,3
10 95,6 95,8 94,3 91,0 95,6 95,6 95,6 94,3
11 95,6 96,5 95,6 93,7 95,9 96,7 96,7 96,2
12 95,7 97,1 97,2 96,4 96,0 97,2 97,1 97,4
13 96,2 96,8 96,6 94,6 95,8 97,2 97,3 96,8
14 95,8 97,1 97,7 96,8 96,9 97,3 97,4 97,3
15 95,8 97,3 97,1 97,1 95,2 97,1 97,6 97,9
16 95,8 97,3 97,7 97,6 96,0 97,2 97,7 97,6
17 95,5 96,7 97,5 97,5 96,0 97,2 97,4 97,9
18 95,7 97,2 97,6 98,0 95,3 97,2 98,0 98,1
19 95,2 97,2 97,8 98,3 95,4 96,9 97,6 98,1
20 95,9 97,1 97,5 98,0 95,1 97,1 97,7 98,1
Table 4.13: Average waste for Baseline and EWASS depending on weekly allowed deliveries. Light gray:
EWASS improves with 0.3% point or more, medium gray 1% point or more, dark gray 3% point or more
Baseline EWASS
6 5 3 2 6 5 3 2
She
lf li
fe [
day
s]
4 51,4 59,3 70,1 76,6 47,5 52,4 65,8 78,2 5 34,3 49,5 60,1 70,0 34,8 45,6 56,4 67,4 6 29,3 35,2 46,0 62,9 24,3 31,3 41,6 58,1 7 19,2 25,7 36,3 50,4 16,5 21,7 31,6 44,7 8 11,2 15,6 26,4 42,6 7,1 14,4 23,4 37,5 9 3,8 8,1 16,5 29,7 3,3 8,3 15,9 27,5
10 2,0 5,3 11,5 23,8 1,4 5,6 11,9 23,3 11 1,0 2,9 7,5 17,4 0,8 3,1 7,5 16,6 12 0,4 1,2 4,4 11,8 0,2 1,2 4,4 11,7 13 0,0 0,9 3,7 10,9 0,1 0,8 3,7 10,4 14 0,3 0,2 1,5 7,6 0,0 0,4 1,8 7,1 15 0,0 0,2 1,7 4,7 0,0 0,2 1,5 4,7 16 0,1 0,1 0,7 3,2 0,0 0,1 0,9 3,0 17 0,1 0,1 0,4 2,1 0,0 0,0 0,7 1,9 18 0,0 0,0 0,3 1,3 0,0 0,0 0,3 1,2 19 0,0 0,0 0,3 0,6 0,0 0,0 0,2 0,7 20 0,0 0,0 0,3 0,7 0,0 0,0 0,2 0,7
62
From an information sharing and inventory policy perspective, the interesting question is when
the two alternatives overlap and when it is no longer beneficial to share remaining shelf life
information and use the EWASS policy. This overlap is of interest because the EWASS policy
requires additional information to be captured, which may necessitate an investment from the
grocery retailer. An example of this “crossing point” is products with a shelf life of 12 days and
3 weekly deliveries. Here both the baseline and the EWASS policy provides a 4.4% waste and the
fill rate is 97.1% and 97.2%. For products with a lower shelf life, it would be beneficial to use
the EWASS policy, while products with a longer shelf life would get the same results by using the
either the EWASS or baseline (few excepts where the EWASS policy is better).
Based on Table 4.12 and Table 4.13 from above Figure 4.19 aims to illustrate this “crossing
point”. Specifically, Figure 4.19 shows two aspects. Firstly, the two gray areas indicate what
information to share and what policy to apply based on the shelf life and the delivery frequency.
For example, for stores with three weekly deliveries, it would be beneficial to share remaining
shelf life information and use the EWASS policy for products with a shelf life between 7 and 11
days. In both gray areas, the fill rate is 90% or higher, which is considered reasonable for
perishables products (Breokmeulen and van Donselaar, 2009). However, in the dark gray area,
the EWASS policy provides a higher fill rate and/or a lower waste (except products with a shelf
life of 9 days and five weekly deliveries where the baseline has a 0.2% lower waste) compared
to the baseline policy. In the light gray area, the two policies perform (almost) equally compared
to waste and fill rate.
Figure 4.19: General guidelines for what information to share and which inventory policy to apply to
achieve at least a 90% fill rate depending on the delivery frequency and the product’s shelf life
The second aspect that is illustrated in Figure 4.19 is the dotted lines. They depict the approximate
waste levels depending on the delivery frequency and the shelf life. For example, for products
with 11 days of shelf life in stores with 3 weekly deliveries approximately 7% waste would be
4 5 6 7 8 9 10 11 12 13 14 15 16 17 18 19 20
2
Wa
ste
7%
Shelf life
We
ekl
y d
eliv
eri
es
EWAss BaselinePOS and WasteRSL info.
6
5
3
Wa
ste
1
6%
Wa
ste
2
4%
63
expected (specifically 7.5% as seen from Table 4.13). The same 7% waste level would be
expected for products with 8 days of shelf life and 6 weekly deliveries (specifically 7.1% as seen
from Table 4.13).
On the left side of the dark gray area, none of the results from the simulation study indicated a
satisfactory performance in regards to fill rate (too low) and waste (too high), and these products
are likely subject to be handled manually. Based on the sensitivity analysis it might be possible
to use the EWASS in some parts of this area if the batch size is reduced simultaneously.
An interesting observation from Figure 4.19 is that the dark gray area increases (in the shelf life
range) as the weekly number of deliveries decreases. This indicates that sharing remaining shelf
life information and using the EWASS policy has the biggest applicability for smaller stores with
2 to 3 weekly delivers.
For comparison, in the multiple case study (see Figure 4.4, page 42) all products were delivered
three times per week and a product with a shelf life of 20 days was recorded to across the different
stores have a waste level between 0.6% and 20.5% (average of 6%). Based on the simulation
products with 12 days of shelf life and three weekly deliveries has on average 4.4% waste, and
products with 20 days of shelf life have 0.3% waste. Even though it is not completely equal, it is
still considered comparable and adds to the validity of the simulation model. The waste levels are
naturally lower in the simulation model because not all uncertainties can be included. For
example, products that are wasted due to transport damages or consumers which may drop the
products are not part of the simulation model but included in the multiple case study. Likewise,
in the multiple case study consumers may choose not to buy a specific product because of its
appearance (wrinkled apple, grayish meat, etc.) even though it is not expired. This will increase
the waste level in the multiple case study, and this aspect is not included in the simulation model
and adds to the discrepancies between to two studies.
4.5.3. Influence of Product Characteristics on Information Sharing
A part of the information utilization concept was that information needs to be captured before it
can be shared and utilized. Thus, it is important that the characteristics of the product – especially
the packaging – makes such data capturing possible. With this, it is also possible to evaluate
which products that are adequate for either replenishment or inventory allocations based on
shared information. Firstly, the products should be sold individually between the warehouse and
the store to keep an accurate estimate of the inventory level. Meaning, products sold in bulk such
as cases of apples or bananas are not preferable. These types of products are often sold by weight
to the stores (e.g. 20 kg. of bananas) but sold per item to the consumers, which makes it difficult
capture the inventory level at the stores. If the products are sold by weight to the consumers, it
might be possible. However, it should be carefully considered if 20 kg of bananas have the same
weight three days later or if they evaporate and “loses weight”.
A second aspect to consider is mainly in regards to when remaining shelf life information should
be shared. The EWASS (and EWA) policy assumes a predetermined shelf life. Thus, e.g. packed
tomatoes without a predetermined expiration date is not applicable (this might be estimated based
on time and temperature log (Ketzenberg et al., 2015)). Ideal products are dairy, meat, prepacked
cold cuts, special types of cheese, and fruit and vegetables with an expiration date. Among these
products, it should be considered how easily the remaining shelf life information can be captured.
Radio-frequency-identification (RFID) chips per item is a possible but maybe expensive solution.
64
An alternative could be to include the shelf life information in an extended barcode or detect the
expiration date by video cameras placed close to the shelf.
4.5.4. Theoretical Contributions
The findings related to research question 1 adds to the theoretical understanding of information
sharing and particularly for information sharing in grocery retailing. As a starting point, four
facets (content, timeliness, source, and modality) and its underlying elements were identified in
order to characterize information sharing. These facets were used to develop the information
utilization concept proposed by Jonsson and Myrelid (2016). Specifically, it was emphasized how
shared information should be linked to various planning decisions, and a refined definition of
information utilization was proposed to encapsulate this aspect. Opposite to Jonsson and Myrelid
(2016), the definition makes a clear distinction between information sharing and information
utilization, which is necessary as the same shared information can be utilized for different
purposes.
To identify the need and possibility of using shared information a mapping notation for
information flow was developed. The notation includes the four facets (and underlying elements),
illustrates where information is captured, where it is utilized, and highlights areas for
improvement. The notation builds on the ideas from Verdouw et al. (2010) by adding the
information flow as an additional layer to the existing notation from the SCOR model. Hence, a
more comprehensive representation of decision processes as well as material and information
flow can be established.
Having established a terminology to comprehensively represent information sharing, three main
studies were conducted to evaluate the impact of different levels of information sharing and
information utilization. Firstly, the impact of utilizing shared POS and waste information for more
sustainable (less food waste) grocery retailing has been empirically investigated, and it adds to
this limited amount of literature on this topic (Kaipia et al., 2013). The findings showed an
improvement in both reduced food waste and improved freshness at the stores without harming
availability. This supports proposition 1b by Mena et al. (2014) claiming that improved
transparency can reduce supply chain wide food waste.
The second study evaluated the impact of sharing remaining shelf life information because it is
often discussed as a means to automate replenishment of perishables (Van Donselaar et al., 2006).
Through simulation studies, the impact of utilizing this information with the EWA policy in a
more realistic supply chain (200+ stores, actual demand data, combined FIFO and LIFO
depletion) has been evaluated and adds to this body of knowledge (Broekmeulen and van
Donselaar, 2009; Duan and Liao, 2013; Lowalekar and Ravichandran, 2015). Specifically, it was
shown that the EWA policy provides a high availability for perishables but in return suffers from
high inventory level and only slightly reduces waste for products with a shelf life below
approximately 11 days if it is applied in a divergent supply chain.
To offset the high inventory levels obtained with the EWA policy and reduce waste levels further
the EWASS was proposed and evaluated. It builds on the work by Broekmeulen and van Donselaar
(2009) and Van Donselaar and Broekmeulen (2012) and provides a more pragmatic solution to
setting safety stock levels. The EWASS policy uses the same shared information as the EWA
policy. For products with a shelf life less than 11 days the EWA policy outperforms the EWASS
policy in regards to availability while the EWASS policy provides a lower waste level in the same
65
range. However, the EWASS policy provides a more balanced performance of food waste and
availability across all shelf lives compared to EWA and a traditional automatic replenishment
system – which is in line with the objective of this thesis. Additionally, the EWASS policy was
able to obtain these performance gains with a small decrease in the average inventory level.
The third study used the inventory and remaining shelf life information intended for
replenishment for inventory allocation decisions. This exemplifies how the same information can
have another potential utilization for different decision processes (another information
utilization). Two different inventory allocation policies were proposed and evaluated adding to
this limited body of literature (Karaesmen et al., 2011). The findings indicate that even though
the potentials are small in magnitude, it is still possible to allocate products more evenly across
the supply chain to align supply and demand. Also, the findings indicate that a big part of the
potential can be reaped just by using inventory level information (the same information as for
traditional automatic replenishment systems).
Both the empirical study and the simulation studies suggested that the impact of using shared
information is dependent on the shelf life of the product, which is only peripherally mentioned
but not explicitly studied in the literature (Kembro, 2012). It was discussed how the shelf life of
the products (and the delivery frequency) could be used as a guideline for what information to
share and which inventory policy to use. This emphasizes the criticality of the shelf life
characteristic when planning in grocery retailing.
Overall, the findings support previous literature (e.g. Kaipia et al. (2013)) and indicate the impact
of utilizing shared information for planning in grocery retailing. The findings suggest that by
utilizing the increased transparency provided by information sharing is it possible to improve the
alignment of supply and demand. The actual size of the improvement depends (at least) on the
type of shared information, the type of decision, how it is utilized, the shelf life of the product,
the delivery frequency, and the performance measured used. In this PhD study, the impact of
information sharing was empirically quantified to be 17.8% (1.3% point) lower food waste and
5.2% increased freshness across all shelf lives. Through simulation studies of the replenishment
decision, an average of 10-17% increase in fill rate and 3-10% reduction in food waste was
observed (depending on the policy used) for products with a shelf life below 11 days.
Additionally, the simulations of the proposed inventory allocations revealed an additional 3.3%
improvement in fill rate and 3.8% reduction in food waste.

66
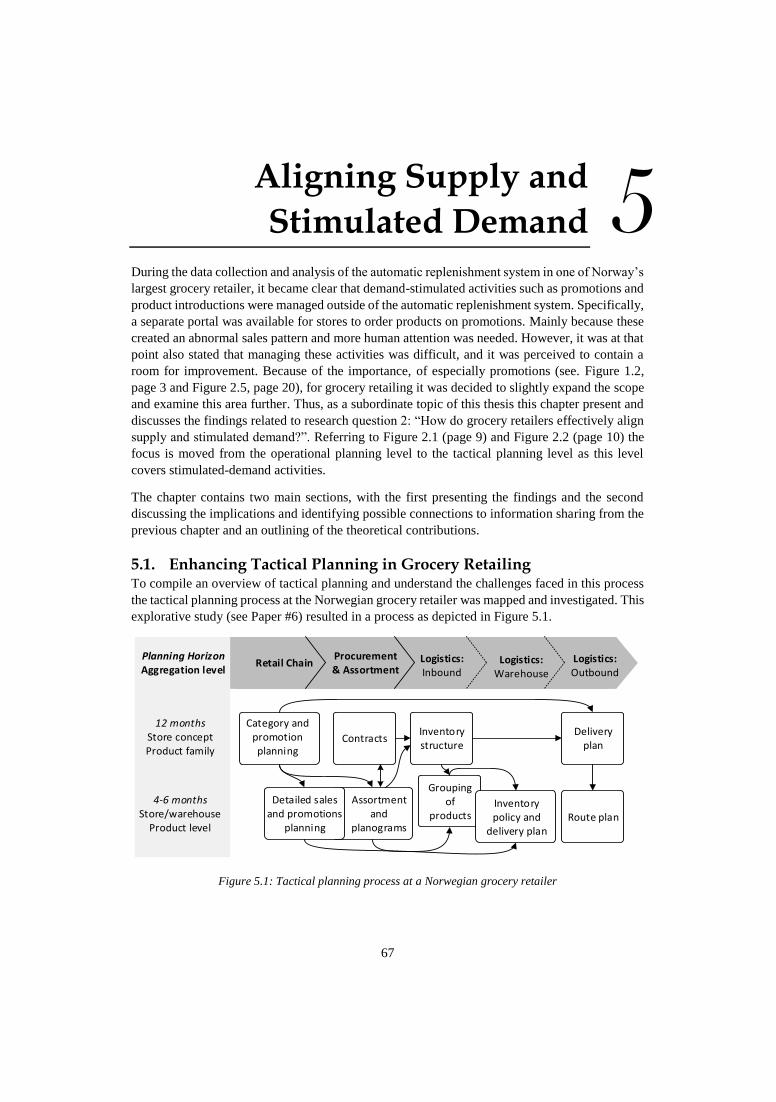
67
5. Aligning Supply and
Stimulated Demand
During the data collection and analysis of the automatic replenishment system in one of Norway’s
largest grocery retailer, it became clear that demand-stimulated activities such as promotions and
product introductions were managed outside of the automatic replenishment system. Specifically,
a separate portal was available for stores to order products on promotions. Mainly because these
created an abnormal sales pattern and more human attention was needed. However, it was at that
point also stated that managing these activities was difficult, and it was perceived to contain a
room for improvement. Because of the importance, of especially promotions (see. Figure 1.2,
page 3 and Figure 2.5, page 20), for grocery retailing it was decided to slightly expand the scope
and examine this area further. Thus, as a subordinate topic of this thesis this chapter present and
discusses the findings related to research question 2: “How do grocery retailers effectively align
supply and stimulated demand?”. Referring to Figure 2.1 (page 9) and Figure 2.2 (page 10) the
focus is moved from the operational planning level to the tactical planning level as this level
covers stimulated-demand activities.
The chapter contains two main sections, with the first presenting the findings and the second
discussing the implications and identifying possible connections to information sharing from the
previous chapter and an outlining of the theoretical contributions.
5.1. Enhancing Tactical Planning in Grocery Retailing To compile an overview of tactical planning and understand the challenges faced in this process
the tactical planning process at the Norwegian grocery retailer was mapped and investigated. This
explorative study (see Paper #6) resulted in a process as depicted in Figure 5.1.
Retail ChainProcurement & Assortment
Logistics: Inbound
12 monthsStore conceptProduct family
4-6 monthsStore/warehouse
Product level
Planning HorizonAggregation level
Category and promotion planning
Detailed sales and promotions
planning
Contracts
Assortment and
planograms
Inventory structure
Grouping of
productsInventory policy and
delivery plan
Delivery plan
Route plan
Logistics: Warehouse
Logistics: Outbound
Figure 5.1: Tactical planning process at a Norwegian grocery retailer
5
68
Figure 5.1 shows the tactical planning for all products (not only those related to stimulated
demand). The process starts in the upper left corner where the ‘retail chain’ decides the main
profile of the chain concept and the product categories and promotions for each concept. This
plan is afterward disaggregated into specific products, volumes and time periods for the
promotions. The ‘procurement and assortment’ function finalizes the master category plan,
adjusts planograms, and matches specific products with suppliers to establish contracts. The
contracts regulate the conditions for the purchase and deliveries (price and discounts, volume,
frequency, promotions, packaging size) for a 12-month period, while the planograms for each
store or store concept are updated every 4 months. Based on the volumes specified in the contracts
and the expected sales in each geographical area, the inventory structure is decided (small
adjustments might be made during the year). Hereafter, all products are divided into different
logistical product groups before the inventory policy and delivery plan is finalized. The inventory
and delivery plan specifies when and how much to collect from each supplier. Lastly, the plan for
outbound deliveries from warehouse to stores is made on two hierarchical levels. Based on the
profile of each concept, the store revenue, and the inventory structure guidelines are provided for
the number of weekly deliveries for three high-level product groups: a) frozen/dry/fresh food, b)
fruits and vegetables and c) products from the central warehouse. Large stores get more frequent
deliveries than smaller stores. Finally, the individual routes from the warehouse to the stores are
calculated by balancing the delivery plan with the utilization of each truck.
Two main findings were made during the explorative study. Firstly, as indicated by Hübner et al.
(2013) tactical planning in retailing occur at two levels with a long (12 months) and medium (4-
6 months) time horizon. The upper tactical planning level determines the overall arrangement of
the category, number of promotions, contract formulation, inventory structure (where should
goods be stored), and an aggregated delivery plan. The lower tactical planning level then makes
more detailed decisions within these boundaries (what products should be included in the
promotion, how should the planograms be adjusted to account for new products, etc.).
Secondly, and more interestingly, the process suffers from limited cross-functional coordination
and feedback. As indicated by the arrows most of the decisions are sequential and top-down
oriented. For demand-stimulated activities, this means that little attention is paid to the
effectiveness of previous demand-stimulated activities, and it may be difficult to adequately
respond to rapid changes in the market because tactical decisions are not jointly coordinated and
implemented among functions. Likewise, there is limited coordination of sub plans. For example,
product introductions may not be entirely coordinated with future promotions and cannibalization
(or amplifying) demand effects might end up being unnoticed.
To support grocery retailers in tactical planning and especially on the lower tactical planning level
where demand-stimulating activities play a major role, a multiple case study involving four case
companies was conducted to gain more insight and eventually increase the generalizability of the
findings. The four case companies were two Norwegian grocery retailers, one British grocery
retailer, and a Finnish wholesaler that serves four grocery retailers. Paper #7 includes an
elaboration for why these companies were selected as well as a detailed analysis of each company.
From the case companies, it became clear that the lower tactical planning level consisted of
promotions planning, product introductions, and seasonal planning. All activities that aim to
stimulate demand. As observed in the first case, even though all three activities were conducted
with (almost) the same planning horizon and by similar functions, the three plans and functions
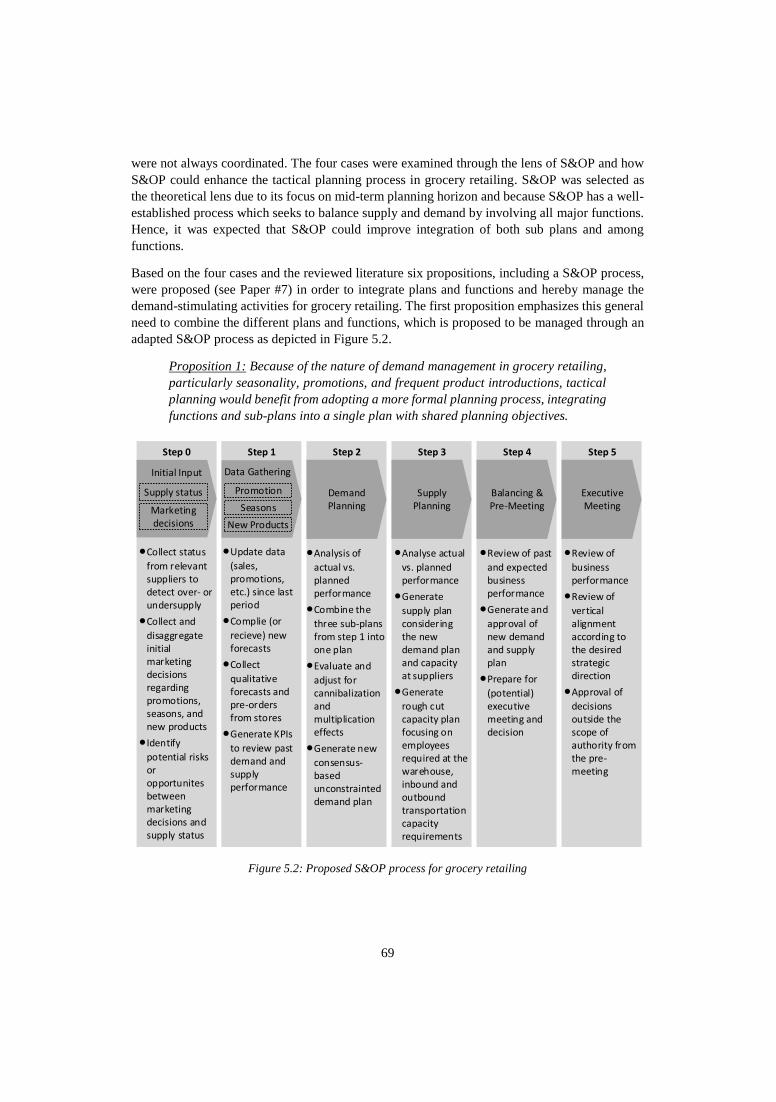
69
were not always coordinated. The four cases were examined through the lens of S&OP and how
S&OP could enhance the tactical planning process in grocery retailing. S&OP was selected as
the theoretical lens due to its focus on mid-term planning horizon and because S&OP has a well-
established process which seeks to balance supply and demand by involving all major functions.
Hence, it was expected that S&OP could improve integration of both sub plans and among
functions.
Based on the four cases and the reviewed literature six propositions, including a S&OP process,
were proposed (see Paper #7) in order to integrate plans and functions and hereby manage the
demand-stimulating activities for grocery retailing. The first proposition emphasizes this general
need to combine the different plans and functions, which is proposed to be managed through an
adapted S&OP process as depicted in Figure 5.2.
Proposition 1: Because of the nature of demand management in grocery retailing,
particularly seasonality, promotions, and frequent product introductions, tactical
planning would benefit from adopting a more formal planning process, integrating
functions and sub-plans into a single plan with shared planning objectives.
Figure 5.2: Proposed S&OP process for grocery retailing
Initial Input
• Collect status
from relevant suppliers to detect over- or undersupply
• Collect and
disaggregate initial marketing decisions regarding promotions, seasons, and new products
• Identify
potential risks or opportunites between marketing decisions and supply status
• Analysis of
actual vs. planned performance
• Combine the
three sub-plans from step 1 into one plan
• Evaluate and
adjust for cannibalization and multiplication effects
• Generate new
consensus-based unconstrainted demand plan
• Analyse actual
vs. planned performance
• Generate
supply plan considering the new demand plan and capacity at suppliers
• Generate
rough cut capacity plan focusing on employees required at the warehouse, inbound and outbound transportation capacity requirements
• Review of past
and expected business performance
• Generate and
approval of new demand and supply plan
• Prepare for
(potential) executive meeting and decision
• Review of
business performance
• Review of
vertical alignment according to the desired strategic direction
• Approval of
decisions outside the scope of authority from the pre-meeting
Demand Planning
Supply Planning
Executive Meeting
Step 0 Step 2 Step 3 Step 4 Step 5
Balancing & Pre-Meeting
Step 1
• Update data
(sales, promotions, etc.) since last period
• Complie (or
recieve) new forecasts
• Collect
qualitative forecasts and pre-orders from stores
• Generate KPIs
to review past demand and supply performance
Supply status
Marketing decisions
Promotion
New Products
Seasons
Data Gathering
70
Opposed to the S&OP process proposed by Yurt et al. (2010) (see Figure 2.8, page 24) it was
observed that “initial supply planning” was the very first activity in all four cases. Also, it did not
only consist of supply planning but also entailed initial input for promotions and seasonal
planning. Thus, in Figure 5.2 it is rephrased to “initial input” and placed as Step 0. Aggregated
market decisions regarding sales, promotion, and similar demand stimulated events are collected
and compared to the status at the suppliers. Step 1 can in principle run as three parallel and
separate processes for promotions, product introductions, and seasonal planning as the idea of
step 2 is to combine the three plans into one consensus-based unconstraint demand plan. Step 3
is the generation of the supply plan, where capacity at suppliers is considered, as well as the
inbound and outbound transportation capacity. At Step 4 the demand and supply plans are
approved together with a review of performance. In case of disagreement or need for radical
decisions, an executive meeting should take place as the last step.
The adapted S&OP process should have a time horizon that covers the next sales season, as this
was generally found to be the longest time horizon compared to product introductions and
promotions. The planning frequency is monthly but should be adjusted if opportunities or risks
arise from the supply side (e.g. due to availability problems) or at the demand side (e.g. due to
competitors actions, new stores, etc.). Since the focus on demand-stimulating activities is so high,
the S&OP process can be conducted on an SKU-level, as also reflected in all four cases and have
been previously reported as the norm in the food and grocery retail industry (Holmström et al.,
2002; Ivert et al., 2015).
The following five propositions aim to support the S&OP process and increase the awareness for
this type of planning in grocery retailing. Particularly, form the cases it was observed that
planning in grocery retailing centers around operational decisions and the limited focus (from
executives and managers) to tactical decisions is mostly to boost sales with vague considerations
to the rest of the supply chain. Thus, to successfully implement a S&OP process grocery retailer
would require more managerial support than currently found. Or, in other words:
Proposition 2: Grocery retailers' planning-related culture and leadership should
facilitate and enhance formal collaborative planning and foster a supply chain
perspective to the planning. This includes support and ownership from top
management, shared objectives for planning, rewards, and empowerment.
It was observed that even at a low level of internal integration (between functions) some case
companies managed to integrate with either suppliers or customers in their tactical planning. E.g.,
the purchasing department in the Finnish wholesaler conducted monthly meetings with their
customers to assess forecast accuracy and jointly approve the forecast for the coming period. Yet,
they did not manage to coordinate transportation or warehouse requirements with the internal
logistics department. Clearly, if grocery retailers want to succeed with a S&OP process internal
integration would be required. This should be facilitated by a proper organizational structure:
Proposition 3: Grocery retailers would benefit from an organizational structure
with dedicated responsibility to integrate functional decisions from category and
assortment, purchasing, and logistics to reach a single consensus-based tactical
supply and demand plan.
71
The inclusion of suppliers and customers was in some of the cases mostly observed by a passive
input of availability confirmation from suppliers or using POS information from stores. External
integration should be pursued simultaneously with internal integration to obtain a supply chain-
wide understanding of constraints and opportunities for stimulated demand activities. This is
important both during the “initial input” in step 0 but also later when balancing supply and
demand. Therefore:
Proposition 4: Grocery retailers would benefit from a supply-chain wide planning
perspective, which actively seeks to involve suppliers and customers into their
tactical planning process to adequately understand demand, create demand, and
ensure availability of products.
It was found that planning for stimulated demand activities is handled on SKU-level in grocery
retailing and not on family-level as traditional S&OP planning. This detailed level is needed to
account for e.g. cannibalization of non-promotional products and ensuring availability at
suppliers of exact products. Consequently, to operate on this level of detail, the planning horizon
was correspondingly observed to be shorter than in traditional S&OP. To support the planning on
a SKU-level it was observed that a single IT system (compared to fragmented) was valuable to
increase the efficiency of the planning process and communicate decisions. However, one of the
Norwegian grocery retailers, which managed to integrate decisions across functions did so with
the use of six different IT systems. This, somehow rather contradictory, observation is reflected
in the fifth proposition:
Proposition 5: A single integrated IT solution may contribute to the efficiency and
communication of the tactical planning process in grocery retailing due to detailed
planning on SKU-level, but does not ensure integration without changes in
planning orientation.
Lastly, as observed in the initial explorative study (Paper #6) nearly all of the cases in the multiple
case study (Paper #7) had no formal feedback loop for the planning of stimulated-demand
activities. Not knowing – and reflecting – on previous performance principally means that the
process starts from scratch each time. However, some tacit knowledge and experiences might
obviously exist for the individual employees. The limited feedback might be caused by the use
of mostly operational measures such as forecast accuracy and inventory levels, which might not
necessarily mirror the performance of the demand-stimulated activities. Grocery retailers should
apply performance measures that reflect how well the demand-stimulated activities was realized
and which will require cross-functional teamwork to succeed. An example is from the British
grocery retailer that evaluated the effectiveness of promotions and shrinkage in other products
groups. Effective promotions would, among others, require proper pricing decisions (marketing
department) as well as an outstanding balance of supply and demand (purchasing and logistics
department). It is proposed that:
Proposition 6: Grocery retailers would benefit from a cross-functional and
process-level planning performance evaluation which should be used as an input
for the next planning round to gradually improve knowledge on demand
stimulating activities.
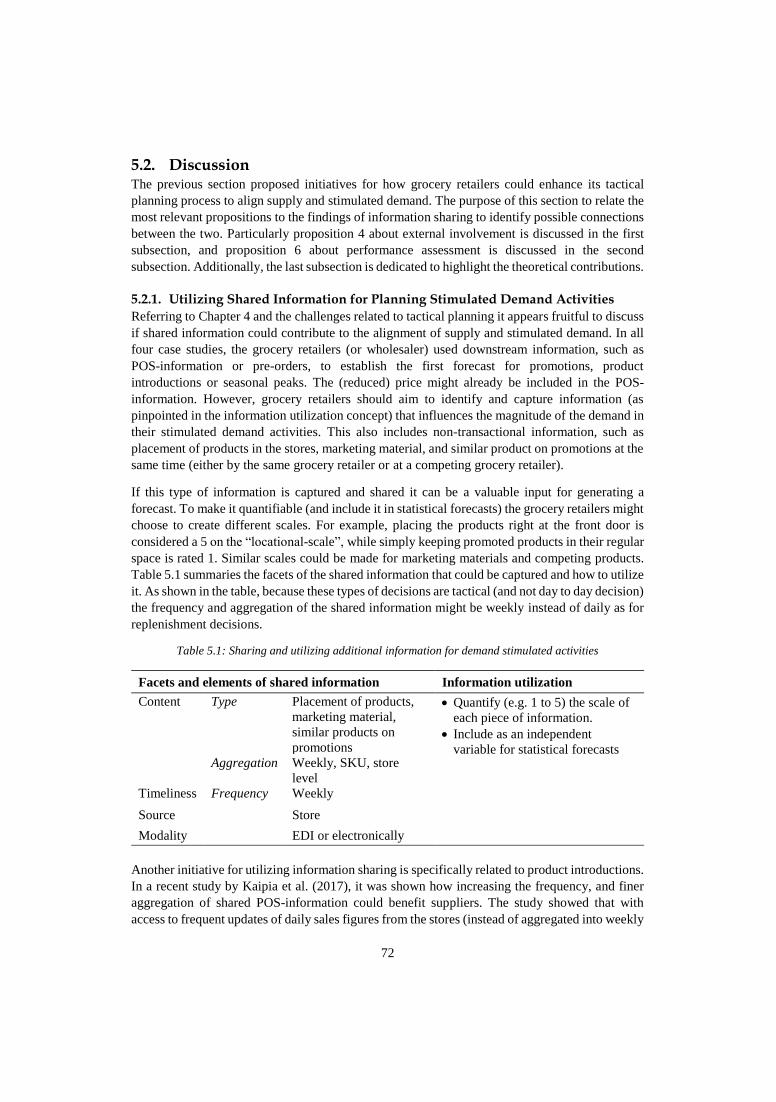
72
5.2. Discussion The previous section proposed initiatives for how grocery retailers could enhance its tactical
planning process to align supply and stimulated demand. The purpose of this section to relate the
most relevant propositions to the findings of information sharing to identify possible connections
between the two. Particularly proposition 4 about external involvement is discussed in the first
subsection, and proposition 6 about performance assessment is discussed in the second
subsection. Additionally, the last subsection is dedicated to highlight the theoretical contributions.
5.2.1. Utilizing Shared Information for Planning Stimulated Demand Activities
Referring to Chapter 4 and the challenges related to tactical planning it appears fruitful to discuss
if shared information could contribute to the alignment of supply and stimulated demand. In all
four case studies, the grocery retailers (or wholesaler) used downstream information, such as
POS-information or pre-orders, to establish the first forecast for promotions, product
introductions or seasonal peaks. The (reduced) price might already be included in the POS-
information. However, grocery retailers should aim to identify and capture information (as
pinpointed in the information utilization concept) that influences the magnitude of the demand in
their stimulated demand activities. This also includes non-transactional information, such as
placement of products in the stores, marketing material, and similar product on promotions at the
same time (either by the same grocery retailer or at a competing grocery retailer).
If this type of information is captured and shared it can be a valuable input for generating a
forecast. To make it quantifiable (and include it in statistical forecasts) the grocery retailers might
choose to create different scales. For example, placing the products right at the front door is
considered a 5 on the “locational-scale”, while simply keeping promoted products in their regular
space is rated 1. Similar scales could be made for marketing materials and competing products.
Table 5.1 summaries the facets of the shared information that could be captured and how to utilize
it. As shown in the table, because these types of decisions are tactical (and not day to day decision)
the frequency and aggregation of the shared information might be weekly instead of daily as for
replenishment decisions.
Table 5.1: Sharing and utilizing additional information for demand stimulated activities
Facets and elements of shared information Information utilization
Content Type Placement of products,
marketing material,
similar products on
promotions
• Quantify (e.g. 1 to 5) the scale of
each piece of information.
• Include as an independent
variable for statistical forecasts Aggregation Weekly, SKU, store
level
Timeliness Frequency Weekly
Source Store
Modality EDI or electronically
Another initiative for utilizing information sharing is specifically related to product introductions.
In a recent study by Kaipia et al. (2017), it was shown how increasing the frequency, and finer
aggregation of shared POS-information could benefit suppliers. The study showed that with
access to frequent updates of daily sales figures from the stores (instead of aggregated into weekly
73
buckets) the supplier was able to make a simple graphical representation of the sales each day.
This enabled the supplier to more precisely observe when new products have reached a steady-
state (stagnation) or if the sales continued to increase above the expected steady-state level. With
this insight, the supplier could adjust production accordingly.
5.2.2. Utilizing Shared Information to Assess Stimulated Demand Activities
As outlined together with proposition 6 grocery retailers should assess the impact of their demand
stimulating activities. The two performance measures from the British grocery retailer, namely,
the effectiveness of promotions and shrinkage (or growth) in product groups, are such assessment
measures and would obviously require the grocery retailer to analyze shared POS-information.
This includes assessing if the product on promotion reached the expected sales level, and how the
promotion affected sales in other product groups. If the performance deviates from the what was
expected additional information might provide insights into the cause. E.g., the supplier was not
able to deliver as intended (and why), the transportation was delayed on the road, the warehouse
had a stock-out, etc. This information is then included in the next planning round to ensure a
continuous improvement.
An important measure of the effectiveness of demand stimulated activities might not only be
increased sales of a particular product but more generally, if it actually stimulates consumers and
increases footfall in the store. As presented in the introduction, a 1.2% year-to-year decrease in
footfall is expected for physical grocery stores (Richardson, 2016), and it should be carefully
considered if the demand stimulated activities indeed improves footfall as intended (Dani, 2015;
Vend, 2016). Capturing the footfall in the stores and sharing it with the grocery retailer’s S&OP
team would be a first step to complete this assessment.
5.2.3. Theoretical Contributions
Paper #6 and #7 is positioned within the limited literature of tactical planning in grocery retailing
(Kuhn and Sternbeck, 2013). The propositions and the proposed S&OP process for grocery
retailing build on the previous work that has identified and systemized planning in grocery retail
(Hübner et al., 2013; Yurt et al., 2010). This contribution further adds to the understanding of
how S&OP planning can be applied in other industries than where it was originally intended
(Thomé et al., 2014). E.g., the proposed S&OP process shows how the characteristics of the
industry, such as supply uncertainty, is incorporated by the additional step 0 of “initial input”.
The findings also support some findings from previous research. Specifically, for food producers,
it was overserved S&OP planning typical is managed on a SKU level with a time horizon covering
4 to 15 months (Ivert et al., 2015; Yurt et al., 2010). This was also observed in the tactical planning
process for grocery retailers, indicating that they obey their mantra – “retail is detail” (Hübner et
al., 2013). It appears that by reducing the time horizon, the grocery retailers can do this detailed
planning which is necessary for their decision-making.

74
75
6. Conclusion
The purpose of this chapter is to condense the work and considerations underlying the previous
chapters. The first section offers an answer to each of the listed research questions identified from
practical challenges and gap in literature. Afterwards, a section is devoted to discuss the
limitations of the studies and proposals for future research.
6.1. Revisiting the Research Questions The objective of this PhD research was to contribute to how grocery retailers can align supply
and demand through improved decision making in their planning processes. This objective has
been examined by (1) considering the use of information sharing, and (2) explorative studies for
stimulated demand. In the following an explicit answer to each research question is provided as
well as a brief outline of the theoretical contributions that were extracted from the findings. The
answer for research question 1 is assembled based on the two sub-questions 1a and 1b.
Research Question 1: How does information sharing contribute to align
supply and demand in grocery retailing?
The findings of this PhD indicate that information sharing can increase the transparency of the
supply chain, i.e. that the receiving entity of the shared information more clearly understands the
previous, current, or future situation at the sending entity. Depending on the facets of the shared
information the receiving entity can utilize the information to make more precise planning
decisions and thereby improve the alignment of supply and demand. In grocery retailing, the
magnitude of the improvement depends (at least) on the type of shared information, the type of
decision, how it is utilized, the shelf life of the product, the delivery frequency, and the
performance measured used.
Research Question 1a: How is information sharing characterized in
grocery retailing?
The conducted research contains the identification of four facets (content, timeliness, source, and
modality) with underlying elements to characterize shared information. These have supported the
development of a mapping notation to comprehensively depict information flows, as well as
contributing to a refined understanding of information utilization. Combined, this can provide
practitioners and academics with a more holistic and encompassing understanding and support
the journey of planning with shared information.
Research Question 1b: What is the impact of information sharing in
grocery retailing?
Shared information should be linked and utilized in planning decisions. As part of this research,
a multiple case study of an automatic replenishment system has been conducted, where the
automatic replenishment system is managed by the warehouse and utilizes shared point-of-sales
and waste information from the stores to calculate the replenishment quantity to each store. The
findings indicated that automatic replenishment, across 54 products, on average reduced food
waste with 17.8%, and with a supporting analysis of 4 products a 5.2% improvement in freshness
was observed.
6
76
The multiple case study also indicated that for products with a shelf life below 30 days additional
information might be necessary to obtain adequate replenishment quantities in automatic
replenishment systems. Subsequently, a new age-based replenishment policy, EWASS, has been
developed which utilized remaining shelf life from stores to calculate replenishment quantities.
For products with a shelf life between 4 to 11 days a discrete event simulation model with 232
stores demonstrated that the EWASS policy was able to, on average, improve availability with
10.3% and reduce waste with 10.7% while slightly decreasing the average inventory level with
0.3%.
In a similar vein, two inventory allocation policies have been developed which utilized inventory
information from stores or remaining shelf life information from stores. This information is
utilized to make age and volume allocation from the warehouse to the stores. Through the same
simulation model a 3.3% increase in availability and 3.8% reduction in waste was identified for
products with a shelf life between 4 and 11 days.
In short, the theoretical contributions of these findings can be summarized:
• Advancement of the information utilization concept (Jonsson and Myrelid, 2016)
• An empirical evaluation of information sharing from a food waste perspective (Mena et
al., 2014; Kaipia et al., 2013)
• A new age-based replenishment policy, EWASS (Broekmulen and Van donselaar 2009)
• Two inventory allocations policies for perishables (Karaesmen et al., 2011)
• An assessment of the policies subject to the shelf life of the product (Kembro, 2012).
To consolidate the findings, general guidelines for when to share more advanced information
(remaining shelf life) and how to utilize it in regards to replenishment policies have been
proposed. The EWASS policy contributes to the alignment of supply and demand and can enable
automatic replenishment systems to function for perishable products with a shelf life down to 6-
8 days depending on the delivery frequency. Specifically, for stores with two weekly deliveries,
it is indicated that it will be beneficial to use the EWASS policy for products with a shelf life
between 8 to 15 days, whereas a store with six weekly deliveries might find it beneficial for
products with a shelf life between 6 to 9 days.
For inventory allocations, the use of remaining shelf life information provides a more even
distribution of the benefits across stores. However, average improvements are possible to achieve
with the information already embedded in a traditional automatic replenishment system, which
means no additional investment in data collection is needed.
Research Question 2: How do grocery retailers effectively align supply and
stimulated demand?
The tactical planning level was found essential for planning of stimulated demand activities based
on a multiple case study of three grocery retailers and one wholesaler. A planning process with a
longer time horizon is necessary as these decisions requires proper coordination in multiple
functions and at supply chain actors weeks and even months in advance, and therefore cannot be
part of the daily replenishment process. Generally, the findings indicated a limited focus on
tactical planning in grocery retailing both in literature and in practice.
77
A main challenge for managing stimulated demand activities was a lack of cross-functional
coordination propelled by the use of sporadic and separate processes and resources. This resulted
in separate plans for different stimulating activities and only a passive involvement of suppliers
and customers. It was further observed that only one of the four case companies vigorously
evaluated the effect of the demand stimulating activities. The remaining three case companies
focused on operational performance measure such as forecast accuracy and inventory levels,
which may not comprehensively reflect the success of e.g. a promotion.
To counteract these challenges it was examined how sales and operations planning, from the
manufacturing domain, could enhance the align of supply and stimulated demand in grocery
retailing. Specifically, an adapted sales and operations planning process for grocery retailing was
proposed along with six propositions for how tactical planning could be encouraged and
supported in grocery retailing. The proposed process is intended to support the handling of
uncertainty in supply and demand by use of an initial step of information gathering, and also
combine the various stimulating demand activities into one consensus-based set of numbers
instead of three separate plans. Additionally, the six propositions covered areas for leadership, IT
usage, performance measures, as well as internal and external integration. This process and
associated propositions are intended to support grocery retailers to align supply and stimulated
demand.
In short, the theoretical contributions of these findings can be summarized:
• An adapted sales and operations planning process for grocery retailing (Yurt et al., 2010)
• A set of propositions for enhancing tactical planning in grocery retailing with S&OP
(Thomé et al., 2014).
Additionally, as a reflection it was discussed how shared information could contribute to more
accurate forecasts for stimulated demand activities and how capturing and sharing footfall
information in stores could be used to evaluate the effectiveness of the activities. This highlights
the versatility of information sharing and further underlines why it is an important capability for
grocery retailing.
6.2. Limitations and Future Research The conducted studies are not without limitations. This section highlights these that are of major
concern and propose paths for future research which can reduce the limitations and build further
on this work.
All studies in Paper #1 to #5 have assumed good quality of the shared information and a high
willingness to share information in the supply chain. Challenges in these aspects are likely to
greatly influence the success of reaping the potentials of information sharing. Nevertheless, the
studies can provide arguments to practitioners on why engaging in (more) information sharing
can benefit the performance of the supply chain. Future studies could, however, examine either
how to improve quality or how to utilize non-perfect information.
Another limitation is related to the generalizability of the findings. Except for the multiple case
study about stimulated demand activities, all collected data originates from the same grocery
retailer. Case studies are generally not intended to generalize findings but merely to empirically
78
shed light on a theoretical concept (Yin, 2013, p. 40). However, to develop theory further, it
should still be encouraged to increase sampling size and ensure the findings are robust.
The proposed process for managing stimulated demand is a proposition, and empirical
verification is indeed encouraged to test its applicability and impact. Likewise, the results from a
simulation only indicate a potential impact in a virtual configuration and do not provide a
guarantee. However, practical implementation and verification might be easier for future research
now with these preliminary results as arguments for implementation. An empirical study on the
value of sharing remaining shelf life information would by nature also take into account more
uncertainties than what is possible in a simulation model. In a similar vein, it could be examined
if the remaining shelf life information could be estimated based on the outflow of products from
the warehouse were the remaining shelf life is known. This should be combined with estimated
depletions rate, point-of-sales, and waste information from the stores. Thereby it might be
possible to estimate the inventory age in the stores without capturing and sharing remaining shelf
life information.
Lastly, future research should also be concerned with inventory allocation of perishables. This
study has proposed some rather simple and intuitive guidelines that easily can be implemented at
grocery retailers. Use of advanced planning models, or combining the replenishment and
inventory allocation into one decision, might improve the alignment between supply and demand
even further.
79
References
Aastrup, J., & Kotzab, H. (2009). Analyzing out-of-stock in independent grocery stores: an
empirical study. International Journal of Retail & Distribution Management, 37(9),
765-789.
Aastrup, J., & Kotzab, H. (2010). Forty years of out-of-stock research–and shelves are still empty.
The International Review of Retail, Distribution and Consumer Research, 20(1), 147-
164.
Ahumada, O., & Villalobos, J. R. (2009). Application of planning models in the agri-food supply
chain: A review. European Journal of Operational Research, 196(1), 1-20.
Akkerman, R., Farahani, P., & Grunow, M. (2010). Quality, safety and sustainability in food
distribution: a review of quantitative operations management approaches and
challenges. Or Spectrum, 32(4), 863-904.
Alftan, A., Kaipia, R., Loikkanen, L., & Spens, K. (2015). Centralised grocery supply chain
planning: improved exception management. International Journal of Physical
Distribution & Logistics Management, 45(3), 237-259.
Aramyan, L. H., Oude Lansink, A. G., Van Der Vorst, J. G., & Van Kooten, O. (2007).
Performance measurement in agri-food supply chains: a case study. Supply Chain
Management: An International Journal, 12(4), 304-315.
Arshinder, Kanda, A., & Deshmukh, S. G. (2008). Supply chain coordination: Perspectives,
empirical studies and research directions. International Journal of Production
Economics, 115(2), 316-335.
Aviv, Y. (2001). The effect of collaborative forecasting on supply chain performance.
Management science, 47(10), 1326-1343.
Baihaqi, I., & Sohal, A. S. (2013). The impact of information sharing in supply chains on
organisational performance: an empirical study. Production Planning & Control, 24(8-
9), 743-758.
Bakker, M., Riezebos, J., & Teunter, R. H. (2012). Review of inventory systems with
deterioration since 2001. European Journal of Operational Research, 221(2), 275-284.
Barratt, M., Choi, T. Y., & Li, M. (2011). Qualitative case studies in operations management:
Trends, research outcomes, and future research implications. Journal of Operations
Management, 29(4), 329-342.
Barratt, M., & Oke, A. (2007). Antecedents of supply chain visibility in retail supply chains: a
resource-based theory perspective. Journal of Operations Management, 25(6), 1217-
1233.
Barratt, M., & Oliveira, A. (2001). Exploring the experiences of collaborative planning initiatives.
International Journal of Physical Distribution & Logistics Management, 31(4), 266-
289.
Beddington, J. (2011). Foresight. The Future of Food and Farming. Retrieved from The
Government Office for Science, London.:
http://www.saiplatform.org/uploads/Library/11-547-future-of-food-and-farming-
summary.pdf
Bertrand, J. W. M., & Fransoo, J. C. (2009). Modelling and Simulation. In C. Karlsson (Ed.),
Researching operations management (pp. 43-83): Routledge.
Bigliardi, B., & Bottani, E. (2010). Performance measurement in the food supply chain: a
balanced scorecard approach. Facilities, 28(5/6), 249-260.
Blackburn, J., & Scudder, G. (2009). Supply chain strategies for perishable products: the case of
fresh produce. Production and Operations Management, 18(2), 129-137.
80
Bloemhof, J. M., van der Vorst, J. G., & Peeters, L. (2013). Review on Performance Indicators
for Sustainable Food Supply Chain Logistics. Retrieved from
Bourlakis, M., Maglaras, G., Aktas, E., Gallear, D., & Fotopoulos, C. (2014). Firm size and
sustainable performance in food supply chains: Insights from Greek SMEs.
International Journal of Production Economics, 152, 112-130.
Bourlakis, M., Maglaras, G., Gallear, D., & Fotopoulos, C. (2014). Examining sustainability
performance in the supply chain: The case of the Greek dairy sector. Industrial
Marketing Management, 43(1), 56-66.
Bourland, K. E., Powell, S. G., & Pyke, D. F. (1996). Exploiting timely demand information to
reduce inventories. European Journal of Operational Research, 92(2), 239-253.
Broekmeulen, R. A., & van Donselaar, K. H. (2009). A heuristic to manage perishable inventory
with batch ordering, positive lead-times, and time-varying demand. Computers &
Operations Research, 36(11), 3013-3018.
Bryman, A., & Bell, E. (2015). Business research methods: Oxford University Press, USA.
Brynild. (2017). Orders between a candy manufacture and grocery retailers from 2012-2014: Data
records, received 30.06.17.
Cachon, G. P., & Fisher, M. (2000). Supply chain inventory management and the value of shared
information. Management science, 46(8), 1032-1048.
Chen, F. (1998). Echelon reorder points, installation reorder points, and the value of centralized
demand information. Management science, 44(12-part-2), S221-S234.
Cho, D. W., & Lee, Y. H. (2013). The value of information sharing in a supply chain with a
seasonal demand process. Computers & Industrial Engineering, 65(1), 97-108.
Choi, H.-c. P. (2010). Information sharing in supply chain management: a literature review on
analytical research. California Journal of Operations Management, 8(1), 110-116.
Clark, A. J., & Scarf, H. (1960). Optimal policies for a multi-echelon inventory problem.
Management science, 6(4), 475-490.
Cook, T. D., & Campbell, D. T. (1979). Quasi-experimentation: Design & analysis issues for
field settings: Houghton Mifflin Boston.
Corsten, D., & Gruen, T. W. (2004). Stock-outs cause walkouts. Harvard Business Review, 82(5),
26-28.
Croom, S. (2009). Introduction to research methodology in operations management. In C.
Karlsson (Ed.), Researching operations management (pp. 43-83): Routledge.
Curşeu, A., Van Woensel, T., Fransoo, J., Van Donselaar, K., & Broekmeulen, R. (2009).
Modelling handling operations in grocery retail stores: an empirical analysis. Journal of
the Operational Research Society, 60(2), 200-214.
Danese, P. (2006). Collaboration forms, information and communication technologies, and
coordination mechanisms in CPFR. International Journal of Production Research,
44(16), 3207-3226.
Danese, P. (2011). Towards a contingency theory of collaborative planning initiatives in supply
networks. International Journal of Production Research, 49(4), 1081-1103.
Dani, S. (2015). Food supply chain management and logistics: Kogan Page.
Daugherty, P. J., Myers, M. B., & Autry, C. W. (1999). Automatic replenishment programs: an
empirical examination. Journal of Business Logistics, 20(2), 63-82.
De Kok, A., Lagodimos, A., & Seidel, H. (1994). Stock allocation in a two-echelon distribution
network under service constraints. (TU Eindhoven. Fac. TBDK, Vakgroep LBS : working
paper series; Vol. 9403).
De Koster, R., Le-Duc, T., & Roodbergen, K. J. (2007). Design and control of warehouse order
picking: A literature review. European Journal of Operational Research, 182(2), 481-
501.
81
Diks, E. B., & De Kok, A. (1998). Optimal control of a divergent multi-echelon inventory system.
European Journal of Operational Research, 111(1), 75-97.
Duan, Q., & Liao, T. W. (2013). A new age-based replenishment policy for supply chain
inventory optimization of highly perishable products. International Journal of
Production Economics, 145(2), 658-671.
ECR. (2003). ECR - Optimal shelf availability. Increasing shopper satisfaction at the moment of
truth. Retrieved from https://www.gs1.ch/docs/default-source/prozesse-dokus/ecr-
europe-osa---optimal-shelf-availability.pdf?sfvrsn=ddc66297_2
Edmunds, A., & Morris, A. (2000). The problem of information overload in business
organisations: a review of the literature. International Journal of Information
Management, 20(1), 17-28.
Eisenhardt, K. M. (1989). Building theories from case study research. Academy of management
review, 14(4), 532-550.
Ellinger, A. E., Taylor, J. C., & Daugherty, P. J. (1999). Automatic replenishment programs and
level of involvement: Performance implications. The International Journal of Logistics
Management, 10(1), 25-36.
Endsley, M. R. (2016). Designing for situation awareness: An approach to user-centered design:
CRC press.
Eriksson, M., Strid, I., & Hansson, P.-A. (2014). Waste of organic and conventional meat and
dairy products—A case study from Swedish retail. Resources, Conservation and
Recycling, 83, 44-52.
Ettouzani, Y., Yates, N., & Mena, C. (2012). Examining retail on shelf availability: promotional
impact and a call for research. International Journal of Physical Distribution & Logistics
Management, 42(3), 213-243.
Fawcett, S. E., Osterhaus, P., Magnan, G. M., Brau, J. C., & McCarter, M. W. (2007). Information
sharing and supply chain performance: the role of connectivity and willingness. Supply
Chain Management: An International Journal, 12(5), 358-368.
Fawcett, S. E., Wallin, C., Allred, C., & Magnan, G. (2009). Supply chain information-sharing:
benchmarking a proven path. Benchmarking: An International Journal, 16(2), 222-246.
Federgruen, A., Prastacos, G., & Zipkin, P. H. (1986). An allocation and distribution model for
perishable products. Operations Research, 34(1), 75-82.
Fernie, J., & Sparks, L. (2009). Logistics and retail management: Emerging issues and new
chanllenges in the retail supply chain (3rd Edition ed.): Kogan page.
Fisher, M. (1997). What is the right supply chain for your product? Harvard Business Review,
March - April, 105-116.
Fleischmann, B., & Meyr, H. (2003). Planning hierarchy, modeling and advanced planning
systems. Handbooks in operations research and management science, 11, 455-523.
Flynn, B. B., Huo, B., & Zhao, X. (2010). The impact of supply chain integration on performance:
a contingency and configuration approach. Journal of Operations Management, 28(1),
58-71.
Forrester, J. W. (1958). Industrial dynamics: a major breakthrough for decision makers. Harvard
Business Review, 36(4), 37-66.
Fredriksson, A., & Liljestrand, K. (2015). Capturing food logistics: a literature review and
research agenda. International Journal of Logistics Research and Applications, 18(1),
16-34.
Frohlich, M. T., & Westbrook, R. (2001). Arcs of integration: an international study of supply
chain strategies. Journal of Operations Management, 19(2), 185-200.
Fujiwara, O., Soewandi, H., & Sedarage, D. (1997). An optimal ordering and issuing policy for
a two-stage inventory system for perishable products. European Journal of Operational
Research, 99(2), 412-424.
82
Ganesh, M., Raghunathan, S., & Rajendran, C. (2014). The value of information sharing in a
multi-product, multi-level supply chain: Impact of product substitution, demand
correlation, and partial information sharing. Decision Support Systems, 58, 79-94.
Ganeshan, R. (1999). Managing supply chain inventories: A multiple retailer, one warehouse,
multiple supplier model. International Journal of Production Economics, 59(1), 341-
354.
Gavirneni, S., Kapuscinski, R., & Tayur, S. (1999). Value of information in capacitated supply
chains. Management science, 45(1), 16-24.
Gedenk, K., Neslin, S. A., & Ailawadi, K. L. (2010). Sales promotion. In M. Kraft & M. K.
Mantrala (Eds.), Retailing in the 21st Century - Current and Future Trends (pp. 345-
359): Berlin Heidelberg: Springer-Verlag.
Gerbens-Leenes, P., Moll, H., & Uiterkamp, A. S. (2003). Design and development of a
measuring method for environmental sustainability in food production systems.
Ecological Economics, 46(2), 231-248.
Giard, V., & Sali, M. (2013). The bullwhip effect in supply chains: a study of contingent and
incomplete literature. International Journal of Production Research, 51(13), 3880-3893.
Gill, A., & Ishaq Bhatti, M. (2007). Optimal model for warehouse location and retailer allocation.
Applied Stochastic Models in Business and Industry, 23(3), 213-221.
Goh, S. H., & Eldridge, S. (2015). New product introduction and supplier integration in sales and
operations planning: Evidence from the Asia Pacific region. International Journal of
Physical Distribution & Logistics Management, 45(9/10), 861-886.
Golafshani, N. (2003). Understanding reliability and validity in qualitative research. The
qualitative report, 8(4), 597-606.
Goworek, H., & McGoldrick, P. (2015). Retail Marketing Management: Principles & Practice
Pearson Education Limited
Goyal, S., & Giri, B. C. (2001). Recent trends in modeling of deteriorating inventory. European
Journal of Operational Research, 134(1), 1-16.
Grimson, J. A., & Pyke, D. F. (2007). Sales and operations planning: an exploratory study and
framework. The International Journal of Logistics Management, 18(3), 322-346.
Gruen, T. W., Corsten, D. S., & Bharadwaj, S. (2002). Retail Out of Stocks: A Worldwide
Examination of Extent, Causes and Consumer Responses. Grocery Manufacturers of
America, Washington, DC.
Gu, J., Goetschalckx, M., & McGinnis, L. F. (2007). Research on warehouse operation: A
comprehensive review. European Journal of Operational Research, 177(1), 1-21.
Gummesson, E. (2000). Qualitative methods in management research: Sage.
Guo, C., & Li, X. (2014). The Impact of Information Sharing in a Two-Level Supply Chain. Paper
presented at the IIE Annual Conference. Proceedings.
Gustavsson, M., & Wänström, C. (2009). Assessing information quality in manufacturing
planning and control processes. International Journal of Quality & Reliability
Management, 26(4), 325-340.
Göbel, C., Langen, N., Blumenthal, A., Teitscheid, P., & Ritter, G. (2015). Cutting Food Waste
through Cooperation along the Food Supply Chain. Sustainability, 7(2), 1429-1445.
Halldorsson, A., & Aastrup, J. (2003). Quality criteria for qualitative inquiries in logistics.
European Journal of Operational Research, 144(2), 321-332.
Handfield, R. B., & Melnyk, S. A. (1998). The scientific theory-building process: a primer using
the case of TQM. Journal of Operations Management, 16(4), 321-339.
Hayes, R. H., & Wheelwright, S. C. (1979). Link manufacturing process and product life cycles.
Harvard Business Review, 57(1), 133-140.
Hendrickson, M., Heffernan, W. D., Howard, P. H., & Heffernan, J. B. (2001). Consolidation in
food retailing and dairy. British Food Journal, 103(10), 715-728.
83
Hoepfl, M. C. (1997). Choosing qualitative research: A primer for technology education
researchers.
Huang, B. F., & Zhang, Y. L. (2013). The study on the value of information sharing with
correlated market demand and cost of information sharing in supply chain. Research
Journal of Applied Sciences, Engineering and Technology, 6(5), 844-848.
Huang, G. Q., Lau, J. S., & Mak, K. (2003). The impacts of sharing production information on
supply chain dynamics: a review of the literature. International Journal of Production
Research, 41(7), 1483-1517.
Huchzermeier, A., & Iyer, A. V. (2010). Supply chain management in a promotional
environment. In M. Kraft & M. K. Mantrala (Eds.), Retailing in the 21st Century -
Current and Future Trends (2nd Edition ed., pp. 373-392): Berlin Heidelberg: Springer-
Verlag.
Hübner, A. H., & Kuhn, H. (2012). Retail category management: State-of-the-art review of
quantitative research and software applications in assortment and shelf space
management. Omega, 40(2), 199-209.
Hübner, A. H., Kuhn, H., & Sternbeck, M. G. (2013). Demand and supply chain planning in
grocery retail: an operations planning framework. International Journal of Retail &
Distribution Management, 41(7), 512-530.
Ivert, L. K., Dukovska-Popovska, I., Kaipia, R., Fredriksson, A., Dreyer, H. C., Johansson, M. I.,
. . . Tuomikangas, N. (2015). Sales and operations planning: responding to the needs of
industrial food producers. Production Planning & Control, 26(4), 280-295.
Jacobs, F. R., Berry, W. L., Whybark, D. C., & E, V. T. (2011). Manufacturing Planning and
Control for Supply Chain Management (6th ed.): McGraw-Hill.
Janssen, L., Claus, T., & Sauer, J. (2016). Literature review of deteriorating inventory models by
key topics from 2012 to 2015. International Journal of Production Economics, 182, 86-
112.
Jonsson, P., Holmström, J., & Ellinger, A. (2016). Future of supply chain planning: closing the
gaps between practice and promise. International Journal of Physical Distribution &
Logistics Management, 46(1).
Jonsson, P., & Mattsson, S.-A. (2013). The value of sharing planning information in supply
chains. International Journal of Physical Distribution & Logistics Management, 43(4),
282-299.
Jonsson, P., & Myrelid, P. (2016). Supply chain information utilization–conceptualization and
antecedents. International Journal of Operations and Production Management, 36(12).
Kabadayi, S., Eyuboglu, N., & Thomas, G. P. (2007). The performance implications of designing
multiple channels to fit with strategy and environment. Journal of marketing, 71(4), 195-
211.
Kabak, Ö., Ülengin, F., Aktaş, E., Önsel, Ş., & Topcu, Y. I. (2008). Efficient shift scheduling in
the retail sector through two-stage optimization. European Journal of Operational
Research, 184(1), 76-90.
Kaipia, R. (2009). Coordinating material and information flows with supply chain planning. The
International Journal of Logistics Management, 20(1), 144-162.
Kaipia, R., Dukovska-Popovska, I., & Loikkanen, L. (2013). Creating sustainable fresh food
supply chains through waste reduction. International Journal of Physical Distribution
& Logistics Management, 43(3), 262-276.
Kaipia, R., Holmström, J., Småros, J., & Rajala, R. (2017). Information sharing for sales and
operations planning: Contextualized solutions and mechanisms. Journal of Operations
Management.
84
Karaesmen, I. Z., Scheller–Wolf, A., & Deniz, B. (2011). Managing perishable and aging
inventories: review and future research directions Planning production and inventories
in the extended enterprise (pp. 393-436): Springer.
Karlsson, C. (2009). Researching operations management: Routledge.
Kembro, J. (2012). Understanding information sharing in supply chains-Identifying contingency
factors that impact benefits of information sharing.
Kembro, J., & Näslund, D. (2014). Information sharing in supply chains, myth or reality? A
critical analysis of empirical literature. International Journal of Physical Distribution &
Logistics Management, 44(3), 179-200.
Kembro, J., Selviaridis, K., & Näslund, D. (2014). Theoretical perspectives on information
sharing in supply chains: a systematic literature review and conceptual framework.
Supply Chain Management: An International Journal, 19(5/6), 609-625.
Ketzenberg, M., Bloemhof, J., & Gaukler, G. (2015). Managing Perishables with Time and
Temperature History. Production and Operations Management, 24(1), 54-70.
Ketzenberg, M. E., Rosenzweig, E. D., Marucheck, A. E., & Metters, R. D. (2007). A framework
for the value of information in inventory replenishment. European Journal of
Operational Research, 182(3), 1230-1250.
Kim, S. W., & Narasimhan, R. (2002). Information system utilization in supply chain integration
efforts. International Journal of Production Research, 40(18), 4585-4609.
Kleijnen, J. P. (1995). Verification and validation of simulation models. European Journal of
Operational Research, 82(1), 145-162.
Kleijnen, J. P. (2005). Supply chain simulation tools and techniques: a survey. International
Journal of Simulation and Process Modelling, 1(1-2), 82-89.
Kothari, C. R. (2004). Research methodology: Methods and techniques: New Age International.
Kotzab, H. (1999). Improving supply chain performance by efficient consumer response? A
critical comparison of existing ECR approaches. Journal of Business & Industrial
Marketing, 14(5/6), 364-377.
Kotzab, H., & Teller, C. (2005). Development and empirical test of a grocery retail instore
logistics model. British Food Journal, 107(8), 594-605.
Kuhn, H., & Sternbeck, M. G. (2013). Integrative retail logistics: an exploratory study.
Operations Management Research, 6(1-2), 2-18.
Kumar, R. S., & Pugazhendhi, S. (2012). Information sharing in supply chains: An overview.
Procedia Engineering, 38, 2147-2154.
Kummu, M., De Moel, H., Porkka, M., Siebert, S., Varis, O., & Ward, P. (2012). Lost food,
wasted resources: Global food supply chain losses and their impacts on freshwater,
cropland, and fertiliser use. Science of the Total Environment, 438, 477-489.
Lau, J. S. K., Huang, G. Q., & Mak, K. L. (2002). Web-based simulation portal for investigating
impacts of sharing production information on supply chain dynamics from the
perspective of inventory allocation. Integrated Manufacturing Systems, 13(5), 345-358.
Lee, H. L., Padmanabhan, V., & Whang, S. (1997). The bullwhip effect in supply chains. Sloan
Management Review, 38(3), 93-102.
Lee, H. L., So, K. C., & Tang, C. S. (2000). The value of information sharing in a two-level
supply chain. Management science, 46(5), 626-643.
Lee, Y. W., Strong, D. M., Kahn, B. K., & Wang, R. Y. (2002). AIMQ: a methodology for
information quality assessment. Information & management, 40(2), 133-146.
Li, J., Sikora, R., Shaw, M. J., & Tan, G. W. (2006). A strategic analysis of inter organizational
information sharing. Decision Support Systems, 42(1), 251-266.
Lincoln, Y. S., & Guba, E. G. (1985). Naturalistic inquiry (Vol. 75): Sage.
85
Lowalekar, H., & Ravichandran, N. (2015). A combined age‐and‐stock‐based policy for ordering
blood units in hospital blood banks. International Transactions in Operational
Research.
Lystad, E., Ferguson, M., & Alexopoulos, C. (2006). Single stage heuristic for perishable
inventory control in two-echelon supply chains. Unpublished (Working paper).
Maloni, M. J., & Brown, M. E. (2006). Corporate social responsibility in the supply chain: an
application in the food industry. Journal of business ethics, 68(1), 35-52.
Martec, I. L. (2015). State of the Retail Supply Chain 2015. Retrieved from
http://hub.relexsolutions.com/state-of-retail-supply-chain-2015
Martec, I. L. (2016). State of the Retail Supply Chain 2016. Retrieved from
http://hub.relexsolutions.com/state-of-retail-supply-chain-2016
Martec, I. L. (2017). State of the Retail Supply Chain 2017. Retrieved from
http://hub.relexsolutions.com/state-of-the-retail-supply-chain-2017-
b?utm_expid=59883418-21.yN309-
UGRXmQenhsSaW_Zw.1&hsCtaTracking=0f606a47-f859-4bf6-8af9-
08060ec04116%7C78891aee-fe3e-4b6b-9c0d-c17a7df38cfd
Mena, C., Adenso-Diaz, B., & Yurt, O. (2011). The causes of food waste in the supplier–retailer
interface: Evidences from the UK and Spain. Resources, Conservation and Recycling,
55(6), 648-658.
Mena, C., Terry, L. A., Williams, A., & Ellram, L. (2014). Causes of waste across multi-tier
supply networks: Cases in the UK food sector. International Journal of Production
Economics, 152, 144-158.
Meredith, J. (1998). Building operations management theory through case and field research.
Journal of Operations Management, 16(4), 441-454.
Minner, S., & Transchel, S. (2010). Periodic review inventory-control for perishable products
under service-level constraints. Or Spectrum, 32(4), 979-996.
Moinzadeh, K. (2002). A multi-echelon inventory system with information exchange.
Management science, 48(3), 414-426.
Montoya-Torres, J. R., & Ortiz-Vargas, D. A. (2014). Collaboration and information sharing in
dyadic supply chains: A literature review over the period 2000–2012. Estudios
Gerenciales, 30(133), 343-354.
Moussaoui, I., Williams, B., Hofer, C., Aloysius, J. A., Waller, M., & Ellinger, A. (2016). Drivers
of retail on-shelf availability: systematic review, critical assessment, and reflections on
the road ahead. International Journal of Physical Distribution & Logistics Management,
46(5).
Myrelid, P. (2015). Utilisation of shared demand-related information for operations planning
and control. Chalmers University of Technology, Gothenburg, Sweden.
Nahmias, S. (1982). Perishable inventory theory: A review. Operations Research, 30(4), 680-
708.
NGA. (2015). Consumer Survey Report. Retrieved from
http://www.nationalgrocers.org/docs/default-source/Surveys-Reports-(2015-
2016)/consumersurveyreport2015.pdf?sfvrsn=2
Nielsen, A. C. (2016a). Supermarket promotions at lowest level for over seven years. Retrieved
from http://www.nielsen.com/eu/en/press-room/2016/supermarket-promotions-at-
lowest-level-for-over-seven-years.html
Nielsen, A. C. (2016b). Western Eurpean FMCG Report Q4 2016. Retrieved from
http://www.nielsen.com/content/dam/nielsenglobal/eu/docs/reports/nielsen-european-
trends-report-Q4-2016.pdf
Ntabe, E. N., LeBel, L., Munson, A. D., & Santa-Eulalia, L.-A. (2015). A systematic literature
review of the supply chain operations reference (SCOR) model application with special
86
attention to environmental issues. International Journal of Production Economics, 169,
310-332.
Olhager, J., & Selldin, E. (2007). Manufacturing planning and control approaches: market
alignment and performance. International Journal of Production Research, 45(6), 1469-
1484.
Oliva, R., & Watson, N. (2011). Cross-functional alignment in supply chain planning: A case
study of sales and operations planning. Journal of Operations Management, 29(5), 434-
448.
Parfitt, J., Barthel, M., & Macnaughton, S. (2010). Food waste within food supply chains:
quantification and potential for change to 2050. Philosophical Transactions of the Royal
Society B: Biological Sciences, 365(1554), 3065-3081.
Pearce, A. (1996). Efficient consumer response: managing the supply chain for “ultimate”
consumer satisfaction. Supply Chain Management: An International Journal, 1(2), 11-
14.
Potter, A., & Disney, S. M. (2010). Removing bullwhip from the Tesco supply chain. Paper
presented at the Production and Operations Management Society Annual Conference.
Prastacos, G. P. (1978). Optimal myopic allocation of a product with fixed lifetime. Journal of
the Operational Research Society, 29(9), 905-913.
Raafat, F. (1991). Survey of literature on continuously deteriorating inventory models. Journal
of the Operational Research Society, 27-37.
Rached, M., Bahroun, Z., & Campagne, J. P. (2015). Assessing the value of information sharing
and its impact on the performance of the various partners in supply chains. Computers
and Industrial Engineering, 88, 237-253.
Raghunathan, S. (2001). Information sharing in a supply chain: A note on its value when demand
is nonstationary. Management science, 47(4), 605-610.
Raghunathan, S., & Yeh, A. B. (2001). Beyond EDI: impact of continuous replenishment
program (CRP) between a manufacturer and its retailers. Information Systems Research,
12(4), 406-419.
Reyes, P. M., & Bhutta, K. (2005). Efficient consumer response: literature review. International
Journal of Integrated Supply Management, 1(4), 346-386.
Richardson, S. (2016). FootFall predictions: how will retail in the UK change in 2016?
Romsdal, A. (2014). Differentiated production planning and control in food supply chains.
(Doctoral Thesis), Norwegian University of Science and Technology.
Rushton, A., Croucher, P., & Baker, P. (2014). The Handbook of Logistics and Distribution
Management - Understanding the Supply Chain (5th Edition ed.): KoganPage.
Sabath, R. E., Autry, C. W., & Daugherty, P. J. (2001). Automatic replenishment programs: The
impact of organizational structure. Journal of Business Logistics, 22(1), 91-105.
Sahin, F., & Robinson, E. P. (2002). Flow coordination and information sharing in supply chains:
review, implications, and directions for future research. Decision sciences, 33(4), 505-
536.
Salmon, K. A. (1993). Efficient Consumer Response: Enhancing Consumer Value in the Grocery
Industry, . Retrieved from The Research Department Food Marketing Institute,
Washington:
Samuel, S. (2017). Online retail sales drive footfall decrease on New Years Day. Retrieved from
http://expertinsights.eversheds-sutherland.com/post/102dwqb/online-retail-sales-drive-
footfall-decrease-on-new-years-day
SCC. (2012). SCOR Supply Chain Operations Reference Model: Revision 11.0: Supply Chain
Council.
Seifert, D. (2003). Collaborative planning, forecasting, and replenishment: How to create a
supply chain advantage: AMACOM Div American Mgmt Assn.
87
Sepulveda Rojas, J., & Frein, Y. (2008). Coordination and demand uncertainty in supply chains.
Production Planning and Control, 19(7), 712-721.
Sezen, B. (2008). Relative effects of design, integration and information sharing on supply chain
performance. Supply Chain Management: An International Journal, 13(3), 233-240.
Shenton, A. K. (2004). Strategies for ensuring trustworthiness in qualitative research projects.
Education for information, 22(2), 63-75.
Silver, E. A., Pyke, D. F., & Peterson, R. (1998). Inventory management and production planning
and scheduling (Vol. 3): Wiley New York.
Singh, R. (2014). Assessing Effectiveness of Coordination in Food Supply Chain: A Framework.
International Journal of Information Systems and Supply Chain Management, 7(3), 104-
177.
Slack, N., S., C., & R, J. (2007). Operations Management (5th ed.): Prentice Hall.
Småros, J. (2017). Better promotion management in 4 steps. Retrieved from
https://www.relexsolutions.com/better-promotion-management-in-4-steps/
Soysal, M., Bloemhof-Ruwaard, J. M., Meuwissen, M. P., & van der Vorst, J. G. (2012). A review
on quantitative models for sustainable food logistics management. International Journal
on Food System Dynamics, 3(2), 136-155.
Stadtler, H. (2005). Supply chain management and advanced planning––basics, overview and
challenges. European Journal of Operational Research, 163(3), 575-588.
Stank, T., Crum, M., & Arango, M. (1999). Benefits of interfirm coordination in food industry
supply chains. Journal of Business Logistics, 20(2), 21.
Sternbeck, M., & Kuhn, H. (2014). Grocery retail operations and automotive logistics: a
functional cross-industry comparison. Benchmarking: An International Journal, 21(5),
814-834.
Taylor, D. H., & Fearne, A. (2009). Demand management in fresh food value chains: a framework
for analysis and improvement. Supply Chain Management: An International Journal,
14(5), 379-392.
Tekin, E., Gürler, Ü., & Berk, E. (2001). Age-based vs. stock level control policies for a
perishable inventory system. European Journal of Operational Research, 134(2), 309-
329.
Thakur, M., Sørensen, C.-F., Bjørnson, F. O., Forås, E., & Hurburgh, C. R. (2011). Managing
food traceability information using EPCIS framework. Journal of Food Engineering,
103(4), 417-433.
Thomassen, M. K. (2013). Exploring Information and Communications Technology in
Collaborative Supply Chain Planning. (Thesis for the degree of Philosophiae Doctor),
Norwegian University of Science and Technology.
Thomé, A. M. T., Scavarda, L. F., Fernandez, N. S., & Scavarda, A. J. (2012). Sales and
operations planning: A research synthesis. International Journal of Production
Economics, 138(1), 1-13.
Thomé, A. M. T., Sousa, R. S., & Scavarda do Carmo, L. F. R. R. (2014). The impact of sales
and operations planning practices on manufacturing operational performance.
International Journal of Production Research, 52(7), 2108-2121.
Trienekens, J., Hvolby, H.-H., & Turner, P. (2017). Challenges and Opportunities in ‘Last
Mile’Logistics for On-Line Food Retail. Paper presented at the IFIP International
Conference on Advances in Production Management Systems.
Trienekens, J., van der Vorst, J., & Verdouw, C. (2014). Global food supply chains Encyclopedia
of Agriculture and Food Systems, 2nd edition (pp. 499-517): Academic Press.
Trienekens, J., Wognum, P., Beulens, A. J., & van der Vorst, J. G. (2012). Transparency in
complex dynamic food supply chains. Advanced Engineering Informatics, 26(1), 55-65.
88
Trienekens, J. H., & van Der Vorst, J. G. A. J. (2006). Traceability in food suppy chains. In P. A.
Luning, F. Devlieghere, & R. Verhé (Eds.), Safety in argi-food chain: Wageningen
Academic Publishers.
Tugby, L. (2016). Footfall suffers sharpest decline in two years but retail parks buck trend.
Retrieved from https://www.retail-week.com/data/footfall-suffers-sharpest-decline-in-
two-years-but-retail-parks-buck-trend/7006672.article
Tuomikangas, N., & Kaipia, R. (2014). A coordination framework for sales and operations
planning (S&OP): Synthesis from the literature. International Journal of Production
Economics, 154, 243-262.
Van der Heijden, M. (1997). Supply rationing in multi-echelon divergent systems. European
Journal of Operational Research, 101(3), 532-549.
Van der Heijden, M., Diks, E., & De Kok, A. (1997). Stock allocation in general multi-echelon
distribution systems with (R, S) order-up-to-policies. International Journal of
Production Economics, 49(2), 157-174.
Van der Vorst, J., Beulens, A., & van Beek, P. (2005). Innovations in logistics and ICT in food
supply chain networks Innovation in Agri-food Systems: Product Quality and Consumer
Acceptance (pp. 245-292): Wageningen Academic Publishers, Wageningen.
Van der Vorst, J., Beulens, A. J., Wit, W. d., & Beek, P. v. (1998). Supply chain management in
food chains: Improving performance by reducing uncertainty. International
Transactions in Operational Research, 5(6), 487-499.
Van Der Vorst, J. G. (2006). Performance measurement in agri-food supply-chain networks. In
C. J. Ondersteijn, J. H. Wijnands, R. B. Huirne, & O. van Kooten (Eds.), Quantifying
the agri-food supply chain (pp. 15-26): Springer.
Van der Vorst, J. G., Tromp, S.-O., & Zee, D.-J. v. d. (2009). Simulation modelling for food
supply chain redesign; integrated decision making on product quality, sustainability and
logistics. International Journal of Production Research, 47(23), 6611-6631.
van Donk, D. P., Akkerman, R., & Van der Vaart, T. (2008). Opportunities and realities of supply
chain integration: the case of food manufacturers. British Food Journal, 110(2), 218-
235.
Van Donselaar, K. (1990). Integral stock norms in divergent systems with lot-sizes. European
Journal of Operational Research, 45(1), 70-84.
van Donselaar, K., Peters, J., de Jong, A., & Broekmeulen, R. (2016). Analysis and forecasting
of demand during promotions for perishable items. International Journal of Production
Economics, 172, 65-75.
Van Donselaar, K., van Woensel, T., Broekmeulen, R., & Fransoo, J. (2006). Inventory control
of perishables in supermarkets. International Journal of Production Economics, 104(2),
462-472.
Van Donselaar, K. H., & Broekmeulen, R. A. (2012). Approximations for the relative outdating
of perishable products by combining stochastic modeling, simulation and regression
modeling. International Journal of Production Economics, 140(2), 660-669.
Van Donselaar, K. H., Gaur, V., Van Woensel, T., Broekmeulen, R. A., & Fransoo, J. C. (2010).
Ordering behavior in retail stores and implications for automated replenishment.
Management science, 56(5), 766-784.
Van Woensel, T., Van Donselaar, K., Broekmeulen, R., & Fransoo, J. (2007). Consumer
responses to shelf out-of-stocks of perishable products. International Journal of
Physical Distribution & Logistics Management, 37(9), 704-718.
Vend. (2016). Retail Trends and Prodictions 2017. Retrieved from
https://www.vendhq.com/uk/university/retail-trends-and-predictions-2017
89
Verdouw, C., Beulens, A., Trienekens, J., & Wolfert, J. (2010). Process modelling in demand-
driven supply chains: A reference model for the fruit industry. Computers and
Electronics in Agriculture, 73(2), 174-187.
Voss, C., Tsikriktsis, N., & Frohlich, M. (2002). Case research in operations management.
International Journal of Operations & Production Management, 22(2), 195-219.
Wacker, J. G. (1998). A definition of theory: research guidelines for different theory-building
research methods in operations management. Journal of Operations Management,
16(4), 361-385.
Wagner, S. M., Ullrich, K. K., & Transchel, S. (2014). The game plan for aligning the
organization. Business Horizons, 57(2), 189-201.
Wognum, P. N., Bremmers, H., Trienekens, J. H., van der Vorst, J. G., & Bloemhof, J. M. (2011).
Systems for sustainability and transparency of food supply chains–Current status and
challenges. Advanced Engineering Informatics, 25(1), 65-76.
Wu, Y., & Cheng, T. E. (2008). The impact of information sharing in a multiple-echelon supply
chain. International Journal of Production Economics, 115(1), 1-11.
Yang, Z., & Zhang, L. (2013). Information Sharing in Supply Chain: A Review. Journal of
Digital Information Management, 11(2), 125.
Yao, Y., & Dresner, M. (2008). The inventory value of information sharing, continuous
replenishment, and vendor-managed inventory. Transportation Research Part E:
Logistics and Transportation Review, 44(3), 361-378.
Yin, R. K. (2013). Case study research: Design and methods (Fifth ed.): Sage publications.
Yu, Z., Yan, H., & Edwin Cheng, T. (2001). Benefits of information sharing with supply chain
partnerships. Industrial Management & Data Systems, 101(3), 114-121.
Yurt, Ö., Mena, C., & Stevens, G. (2010). Sales and operations planning for the food supply
chain: case study. In C. Mena & G. Stevens (Eds.), Delivering Performance in Food
Supply Chains (pp. 119-140): Woodhead Publishing Series in Food Science,
Technology and Nutrition.
Zhou, H., & Benton, W. (2007). Supply chain practice and information sharing. Journal of
Operations Management, 25(6), 1348-1365.

90
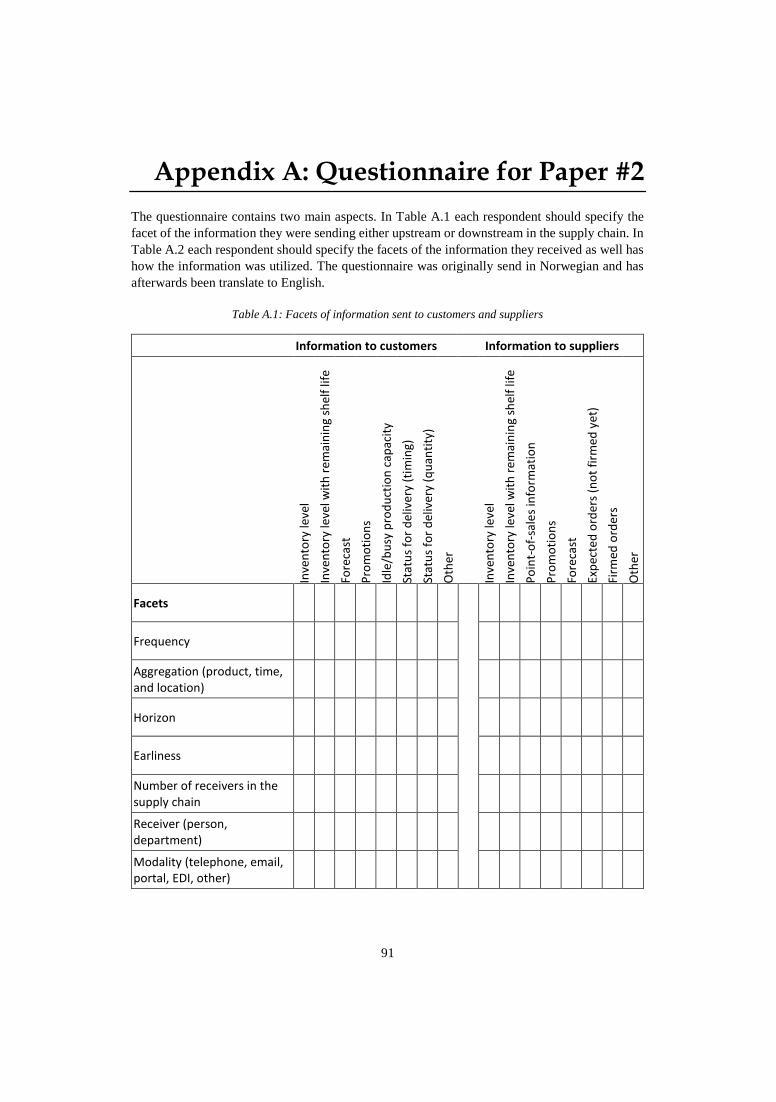
91
Appendix A: Questionnaire for Paper #2
The questionnaire contains two main aspects. In Table A.1 each respondent should specify the
facet of the information they were sending either upstream or downstream in the supply chain. In
Table A.2 each respondent should specify the facets of the information they received as well has
how the information was utilized. The questionnaire was originally send in Norwegian and has
afterwards been translate to English.
Table A.1: Facets of information sent to customers and suppliers
Information to customers Information to suppliers
Inve
nto
ry le
vel
Inve
nto
ry le
vel w
ith
rem
ain
ing
shel
f lif
e
Fore
cast
Pro
mo
tio
ns
Idle
/bu
sy p
rod
uct
ion
cap
acit
y
Stat
us
for
del
iver
y (t
imin
g)
Stat
us
for
del
iver
y (q
uan
tity
)
Oth
er
Inve
nto
ry le
vel
Inve
nto
ry le
vel w
ith
rem
ain
ing
shel
f lif
e
Po
int-
of-
sale
s in
form
atio
n
Pro
mo
tio
ns
Fore
cast
Exp
ecte
d o
rder
s (n
ot
firm
ed y
et)
Firm
ed o
rder
s
Oth
er
Facets
Frequency
Aggregation (product, time, and location)
Horizon
Earliness
Number of receivers in the supply chain
Receiver (person, department)
Modality (telephone, email, portal, EDI, other)
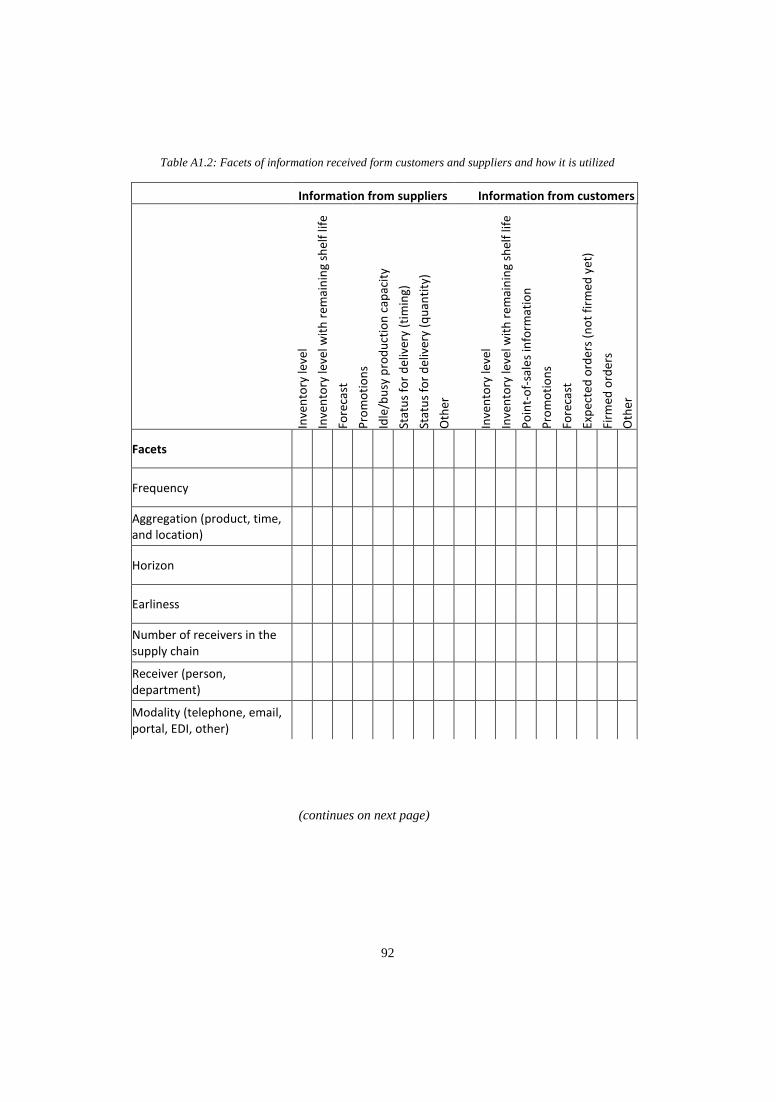
92
Table A1.2: Facets of information received form customers and suppliers and how it is utilized
Information from suppliers Information from customers
Inve
nto
ry le
vel
Inve
nto
ry le
vel w
ith
rem
ain
ing
shel
f lif
e
Fore
cast
Pro
mo
tio
ns
Idle
/bu
sy p
rod
uct
ion
cap
acit
y
Stat
us
for
del
iver
y (t
imin
g)
Stat
us
for
del
iver
y (q
uan
tity
)
Oth
er
Inve
nto
ry le
vel
Inve
nto
ry le
vel w
ith
rem
ain
ing
shel
f lif
e
Po
int-
of-
sale
s in
form
atio
n
Pro
mo
tio
ns
Fore
cast
Exp
ecte
d o
rder
s (n
ot
firm
ed y
et)
Firm
ed o
rder
s
Oth
er
Facets
Frequency
Aggregation (product, time, and location)
Horizon
Earliness
Number of receivers in the supply chain
Receiver (person, department)
Modality (telephone, email, portal, EDI, other)
(continues on next page)
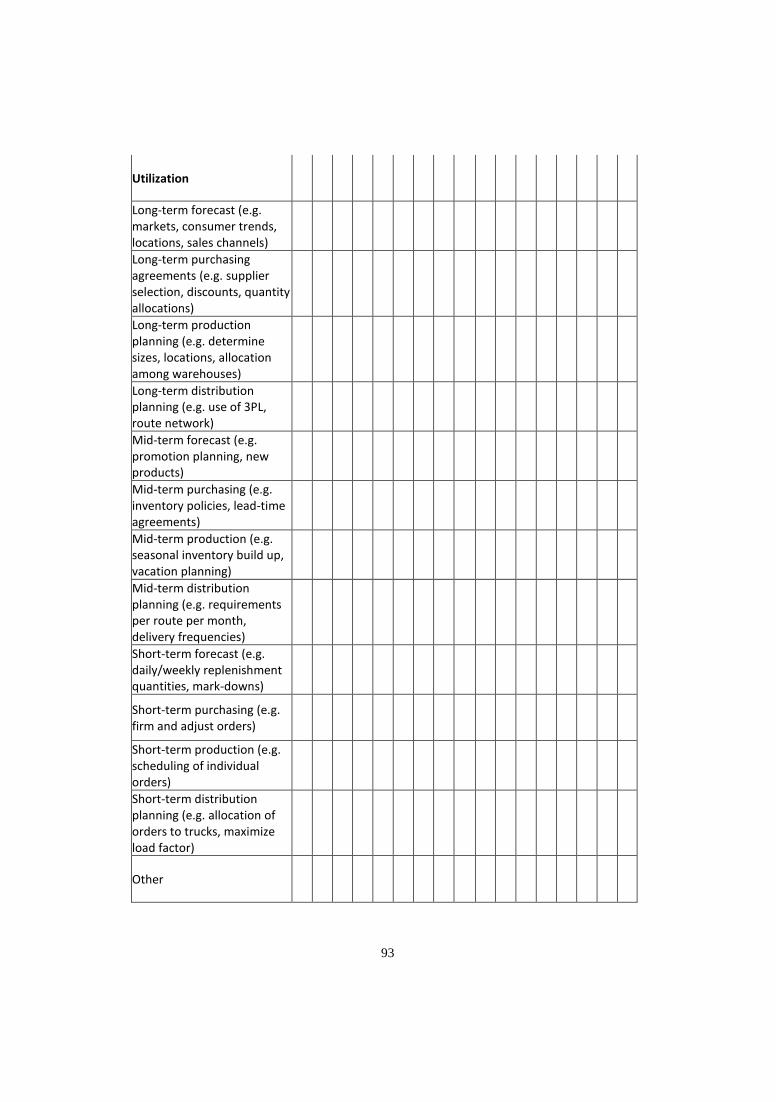
93
Utilization
Long-term forecast (e.g. markets, consumer trends, locations, sales channels) Long-term purchasing agreements (e.g. supplier selection, discounts, quantity allocations) Long-term production planning (e.g. determine sizes, locations, allocation among warehouses) Long-term distribution planning (e.g. use of 3PL, route network) Mid-term forecast (e.g. promotion planning, new products) Mid-term purchasing (e.g. inventory policies, lead-time agreements) Mid-term production (e.g. seasonal inventory build up, vacation planning) Mid-term distribution planning (e.g. requirements per route per month, delivery frequencies) Short-term forecast (e.g. daily/weekly replenishment quantities, mark-downs)
Short-term purchasing (e.g. firm and adjust orders)
Short-term production (e.g. scheduling of individual orders) Short-term distribution planning (e.g. allocation of orders to trucks, maximize load factor)
Other

94
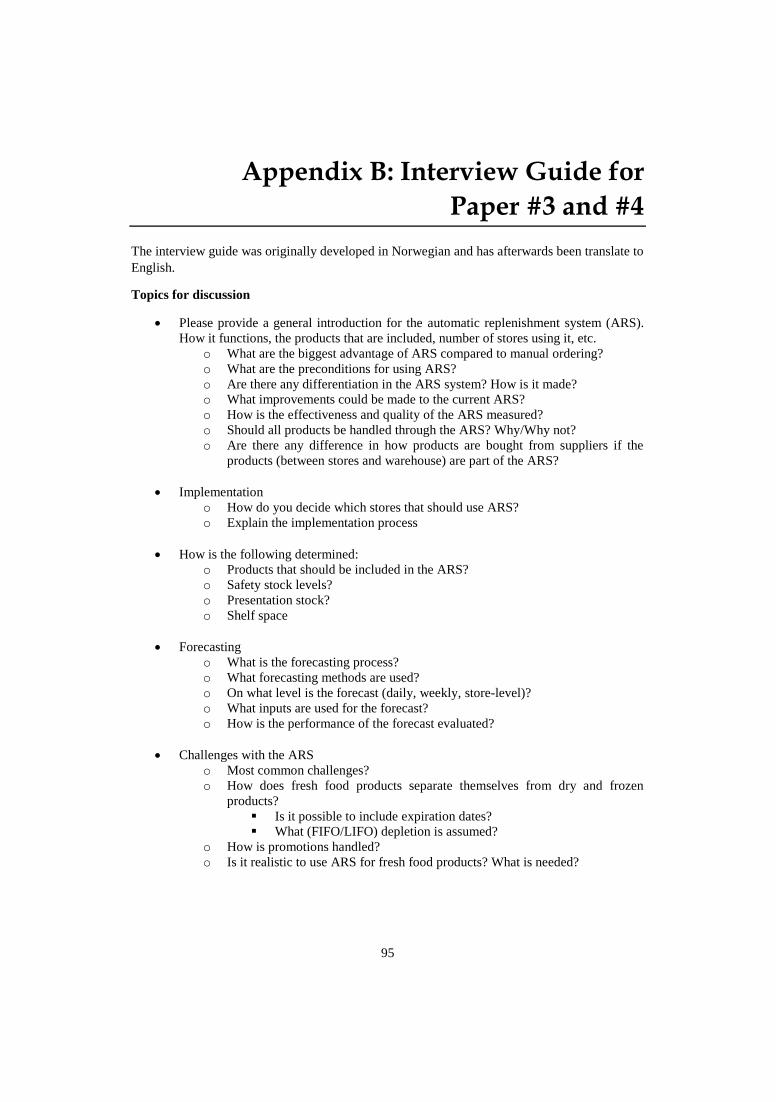
95
Appendix B: Interview Guide for
Paper #3 and #4
The interview guide was originally developed in Norwegian and has afterwards been translate to
English.
Topics for discussion
• Please provide a general introduction for the automatic replenishment system (ARS).
How it functions, the products that are included, number of stores using it, etc.
o What are the biggest advantage of ARS compared to manual ordering?
o What are the preconditions for using ARS?
o Are there any differentiation in the ARS system? How is it made?
o What improvements could be made to the current ARS?
o How is the effectiveness and quality of the ARS measured?
o Should all products be handled through the ARS? Why/Why not?
o Are there any difference in how products are bought from suppliers if the
products (between stores and warehouse) are part of the ARS?
• Implementation
o How do you decide which stores that should use ARS?
o Explain the implementation process
• How is the following determined:
o Products that should be included in the ARS?
o Safety stock levels?
o Presentation stock?
o Shelf space
• Forecasting
o What is the forecasting process?
o What forecasting methods are used?
o On what level is the forecast (daily, weekly, store-level)?
o What inputs are used for the forecast?
o How is the performance of the forecast evaluated?
• Challenges with the ARS
o Most common challenges?
o How does fresh food products separate themselves from dry and frozen
products?
▪ Is it possible to include expiration dates?
▪ What (FIFO/LIFO) depletion is assumed?
o How is promotions handled?
o Is it realistic to use ARS for fresh food products? What is needed?

96
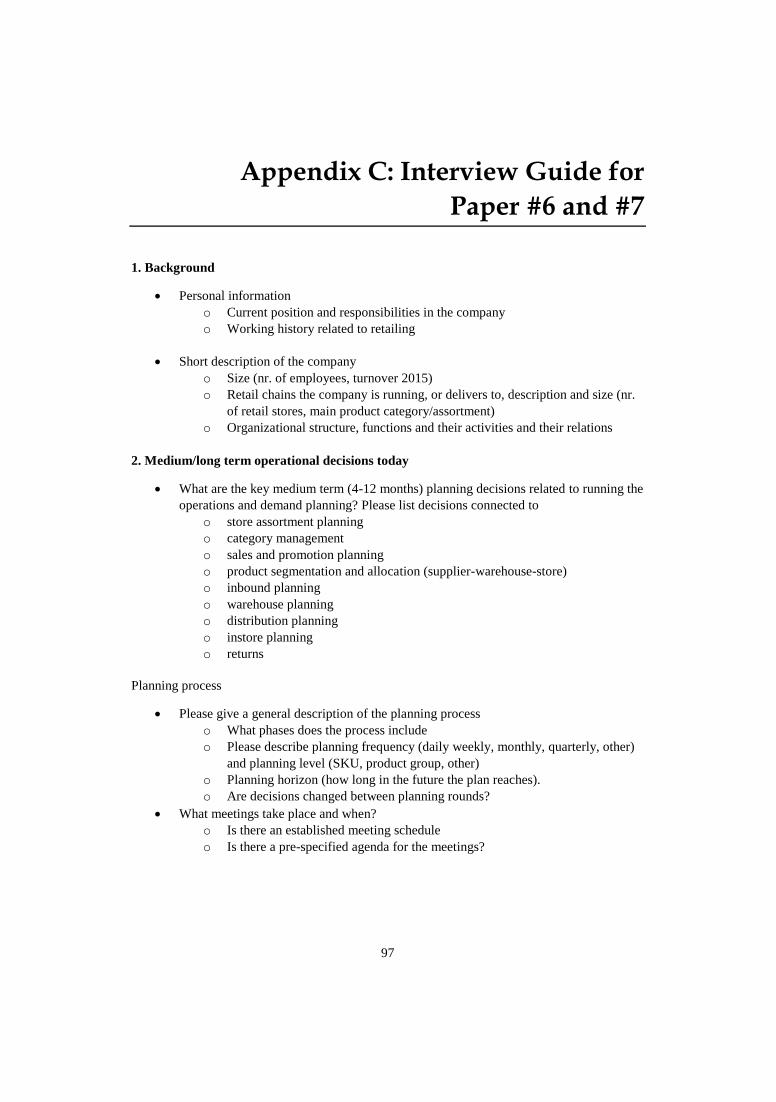
97
Appendix C: Interview Guide for
Paper #6 and #7
1. Background
• Personal information
o Current position and responsibilities in the company
o Working history related to retailing
• Short description of the company
o Size (nr. of employees, turnover 2015)
o Retail chains the company is running, or delivers to, description and size (nr.
of retail stores, main product category/assortment)
o Organizational structure, functions and their activities and their relations
2. Medium/long term operational decisions today
• What are the key medium term (4-12 months) planning decisions related to running the
operations and demand planning? Please list decisions connected to
o store assortment planning
o category management
o sales and promotion planning
o product segmentation and allocation (supplier-warehouse-store)
o inbound planning
o warehouse planning
o distribution planning
o instore planning
o returns
Planning process
• Please give a general description of the planning process
o What phases does the process include
o Please describe planning frequency (daily weekly, monthly, quarterly, other)
and planning level (SKU, product group, other)
o Planning horizon (how long in the future the plan reaches).
o Are decisions changed between planning rounds?
• What meetings take place and when?
o Is there an established meeting schedule
o Is there a pre-specified agenda for the meetings?
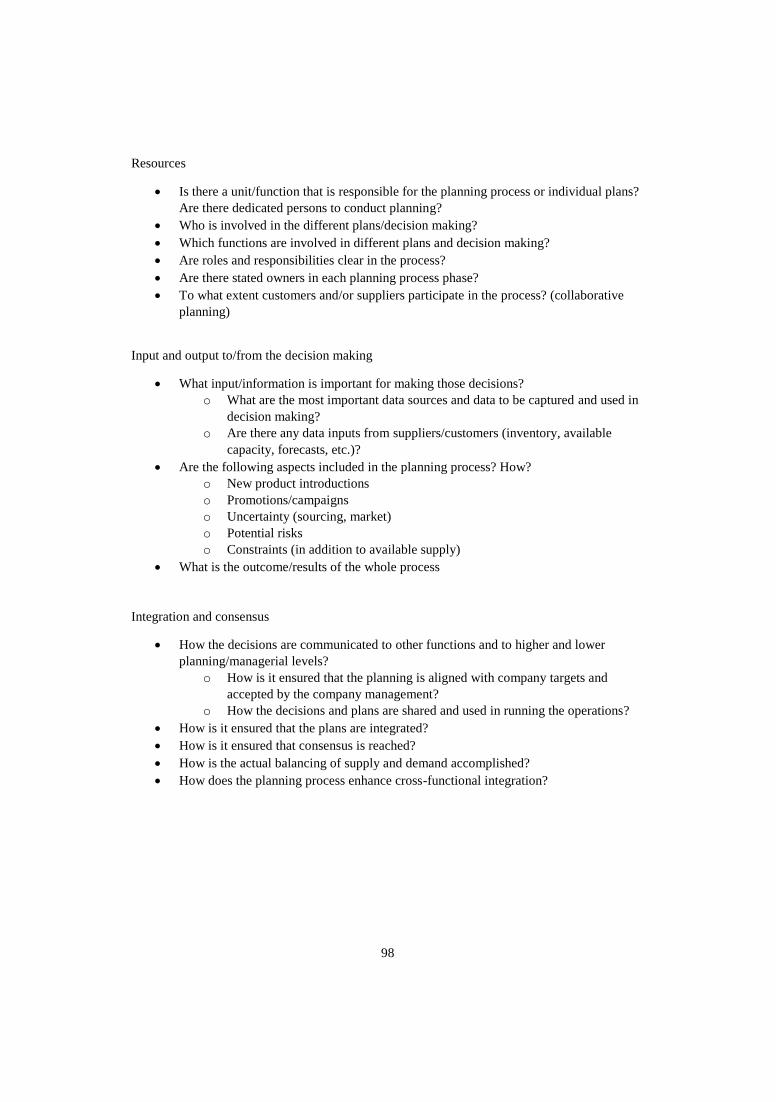
98
Resources
• Is there a unit/function that is responsible for the planning process or individual plans?
Are there dedicated persons to conduct planning?
• Who is involved in the different plans/decision making?
• Which functions are involved in different plans and decision making?
• Are roles and responsibilities clear in the process?
• Are there stated owners in each planning process phase?
• To what extent customers and/or suppliers participate in the process? (collaborative
planning)
Input and output to/from the decision making
• What input/information is important for making those decisions?
o What are the most important data sources and data to be captured and used in
decision making?
o Are there any data inputs from suppliers/customers (inventory, available
capacity, forecasts, etc.)?
• Are the following aspects included in the planning process? How?
o New product introductions
o Promotions/campaigns
o Uncertainty (sourcing, market)
o Potential risks
o Constraints (in addition to available supply)
• What is the outcome/results of the whole process
Integration and consensus
• How the decisions are communicated to other functions and to higher and lower
planning/managerial levels?
o How is it ensured that the planning is aligned with company targets and
accepted by the company management?
o How the decisions and plans are shared and used in running the operations?
• How is it ensured that the plans are integrated?
• How is it ensured that consensus is reached?
• How is the actual balancing of supply and demand accomplished?
• How does the planning process enhance cross-functional integration?
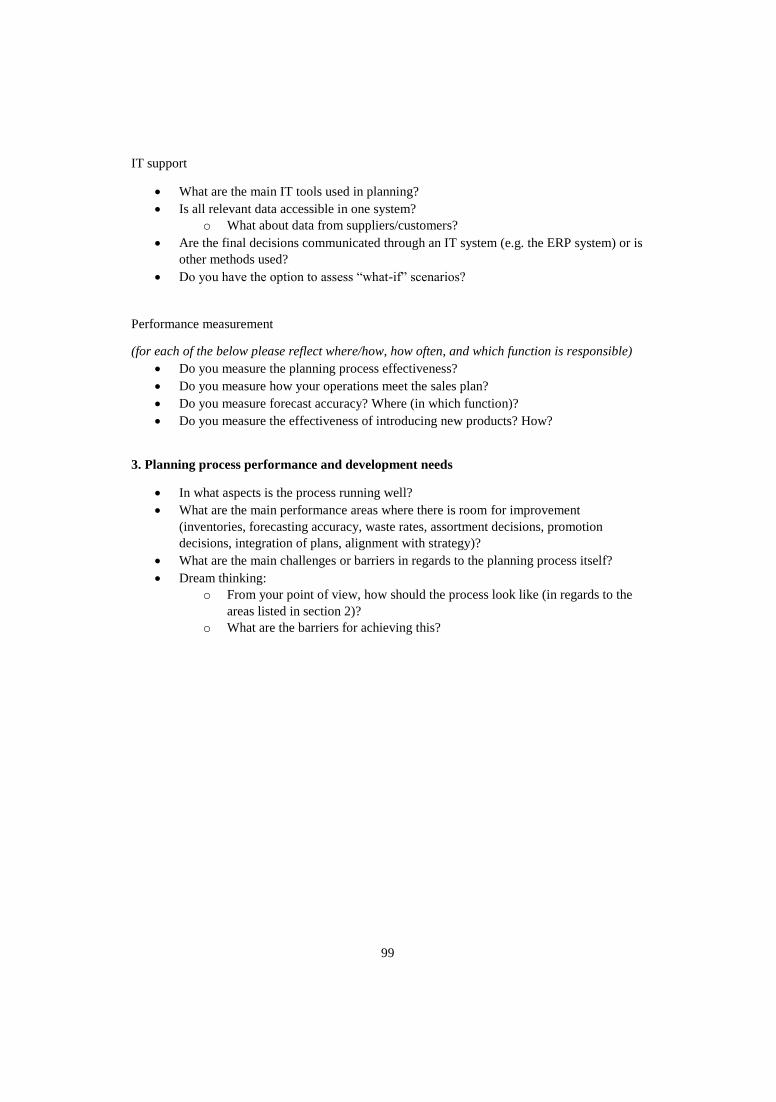
99
IT support
• What are the main IT tools used in planning?
• Is all relevant data accessible in one system?
o What about data from suppliers/customers?
• Are the final decisions communicated through an IT system (e.g. the ERP system) or is
other methods used?
• Do you have the option to assess “what-if” scenarios?
Performance measurement
(for each of the below please reflect where/how, how often, and which function is responsible)
• Do you measure the planning process effectiveness?
• Do you measure how your operations meet the sales plan?
• Do you measure forecast accuracy? Where (in which function)?
• Do you measure the effectiveness of introducing new products? How?
3. Planning process performance and development needs
• In what aspects is the process running well?
• What are the main performance areas where there is room for improvement
(inventories, forecasting accuracy, waste rates, assortment decisions, promotion
decisions, integration of plans, alignment with strategy)?
• What are the main challenges or barriers in regards to the planning process itself?
• Dream thinking:
o From your point of view, how should the process look like (in regards to the
areas listed in section 2)?
o What are the barriers for achieving this?

100
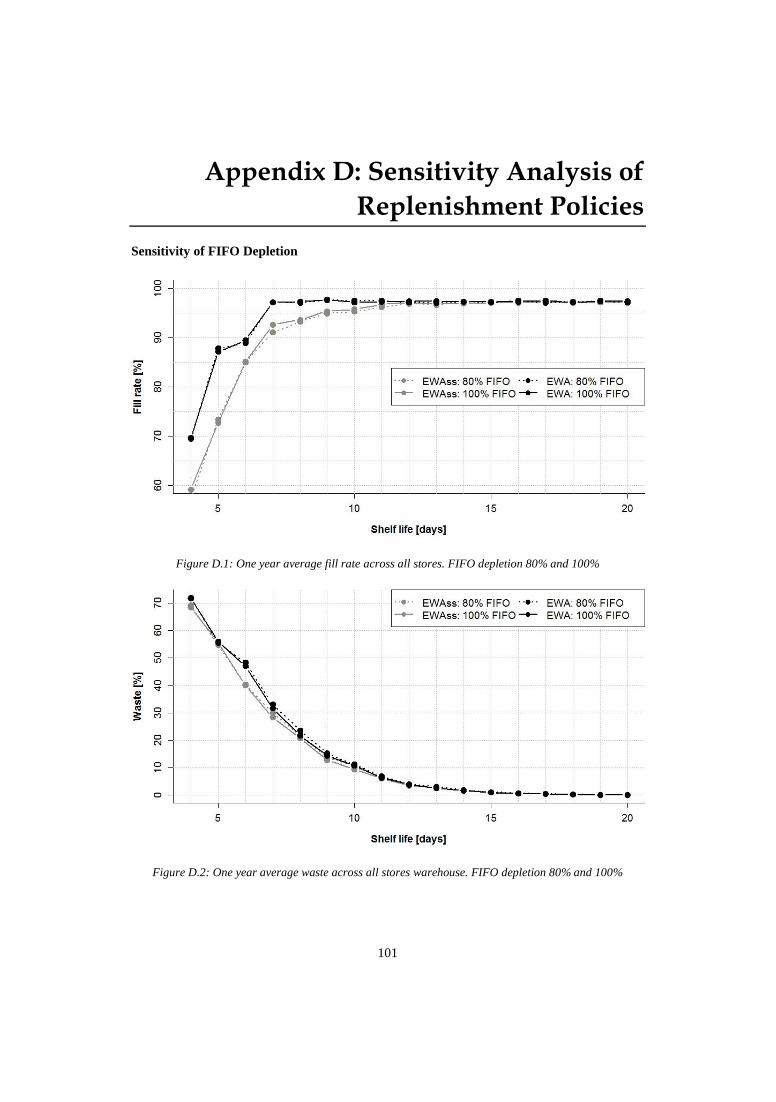
101
Appendix D: Sensitivity Analysis of
Replenishment Policies
Sensitivity of FIFO Depletion
Figure D.1: One year average fill rate across all stores. FIFO depletion 80% and 100%
Figure D.2: One year average waste across all stores warehouse. FIFO depletion 80% and 100%
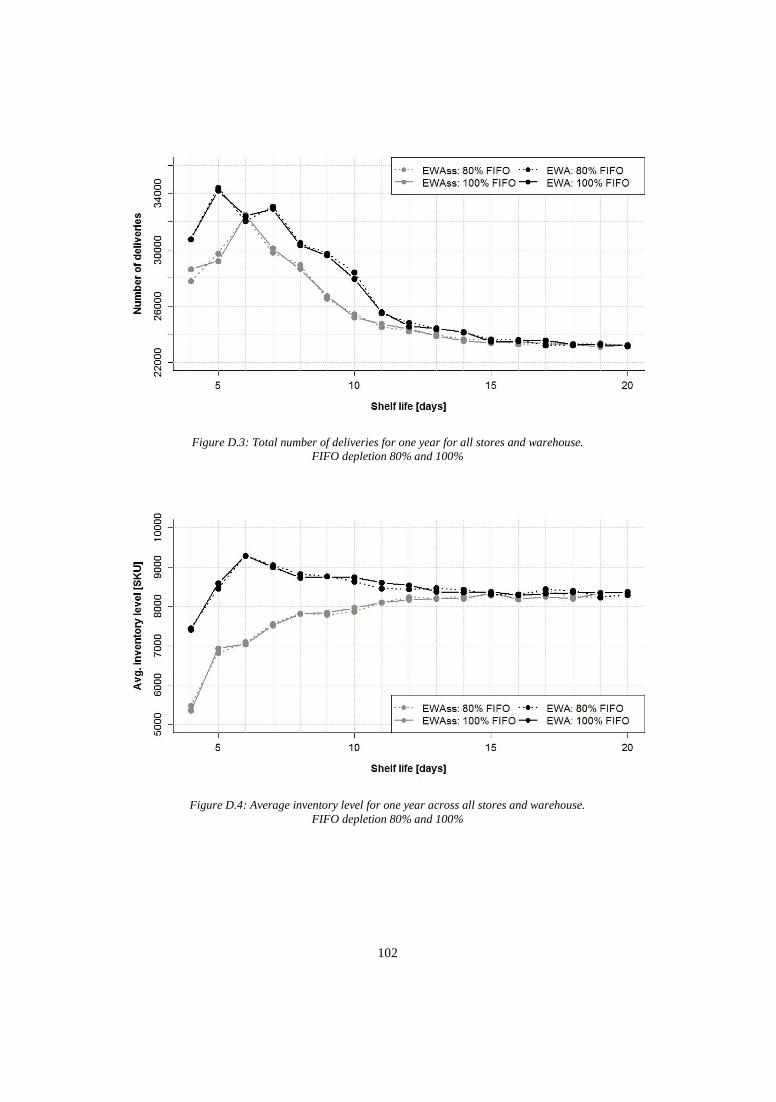
102
Figure D.3: Total number of deliveries for one year for all stores and warehouse.
FIFO depletion 80% and 100%
Figure D.4: Average inventory level for one year across all stores and warehouse.
FIFO depletion 80% and 100%
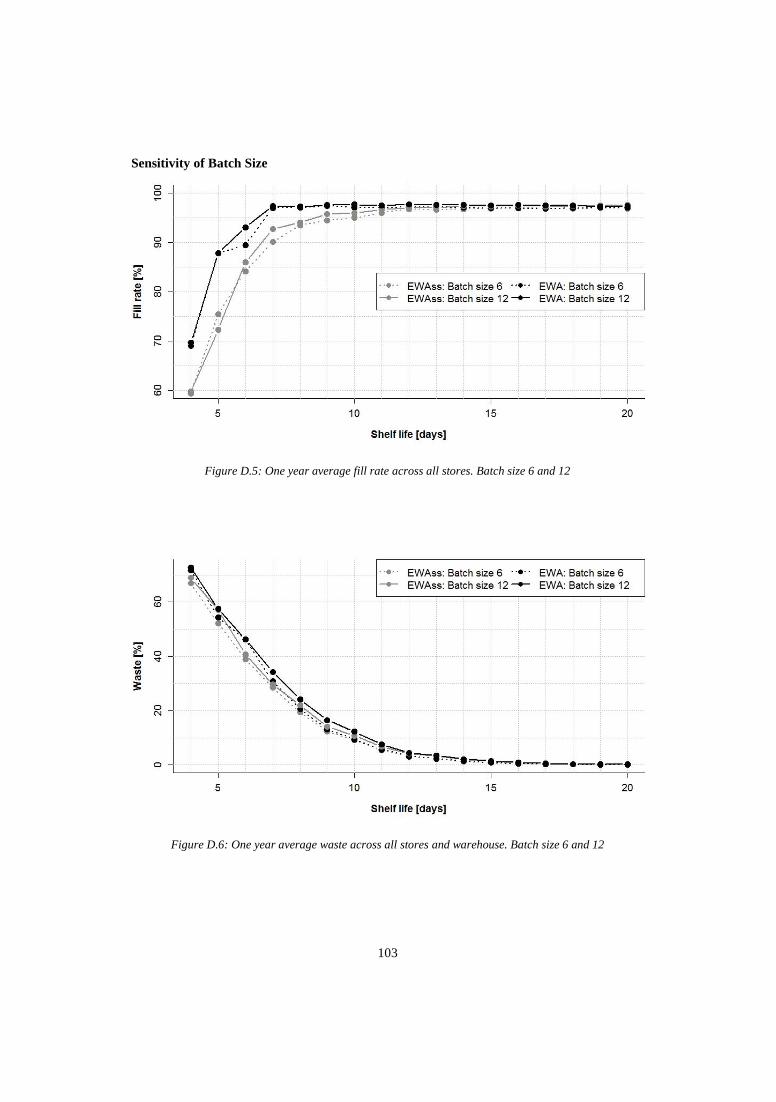
103
Sensitivity of Batch Size
Figure D.5: One year average fill rate across all stores. Batch size 6 and 12
Figure D.6: One year average waste across all stores and warehouse. Batch size 6 and 12
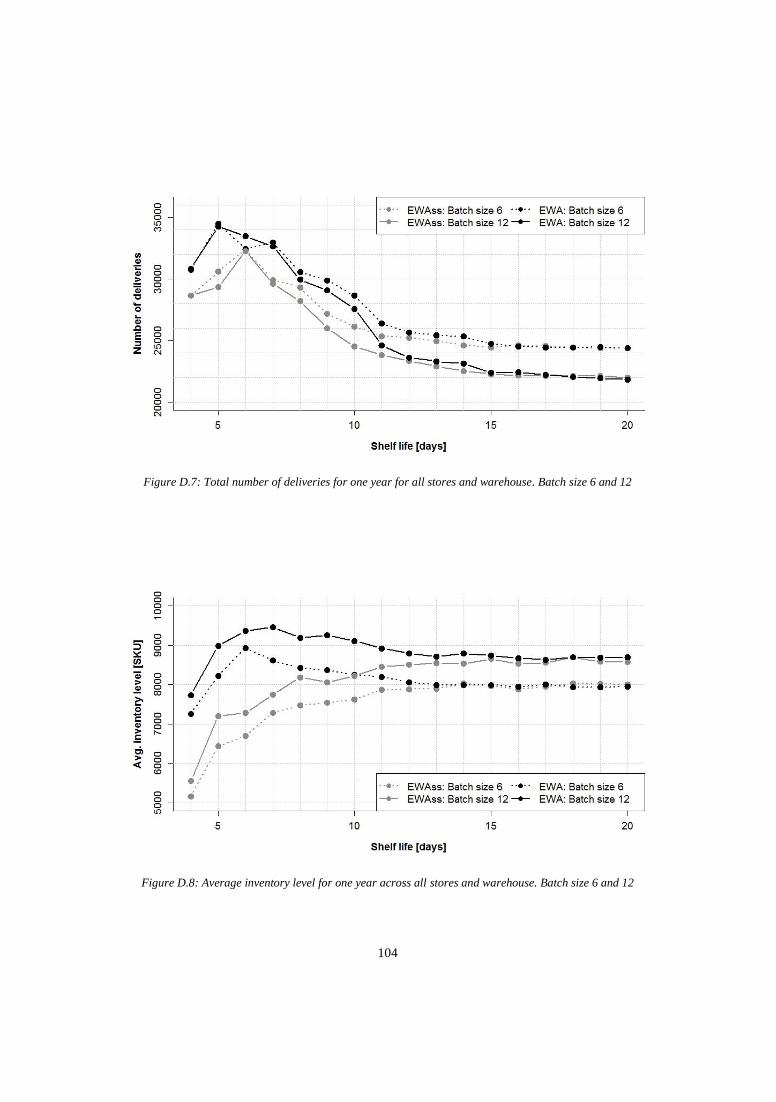
104
Figure D.7: Total number of deliveries for one year for all stores and warehouse. Batch size 6 and 12
Figure D.8: Average inventory level for one year across all stores and warehouse. Batch size 6 and 12
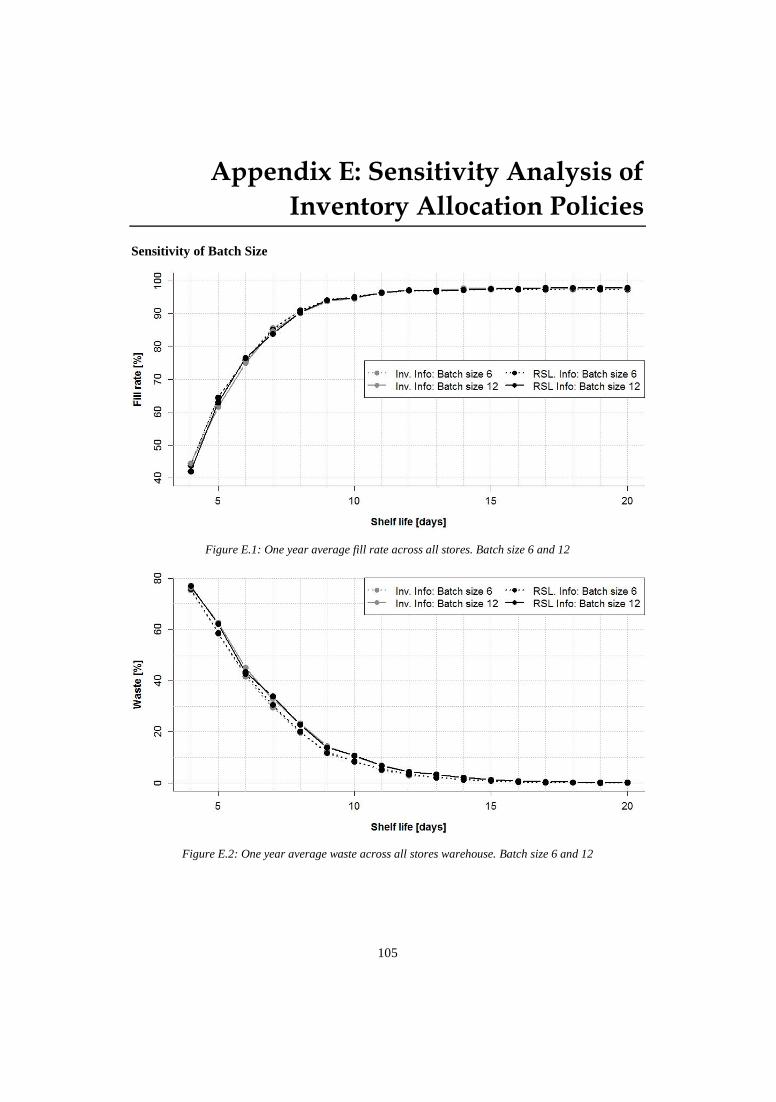
105
Appendix E: Sensitivity Analysis of
Inventory Allocation Policies
Sensitivity of Batch Size
Figure E.1: One year average fill rate across all stores. Batch size 6 and 12
Figure E.2: One year average waste across all stores warehouse. Batch size 6 and 12
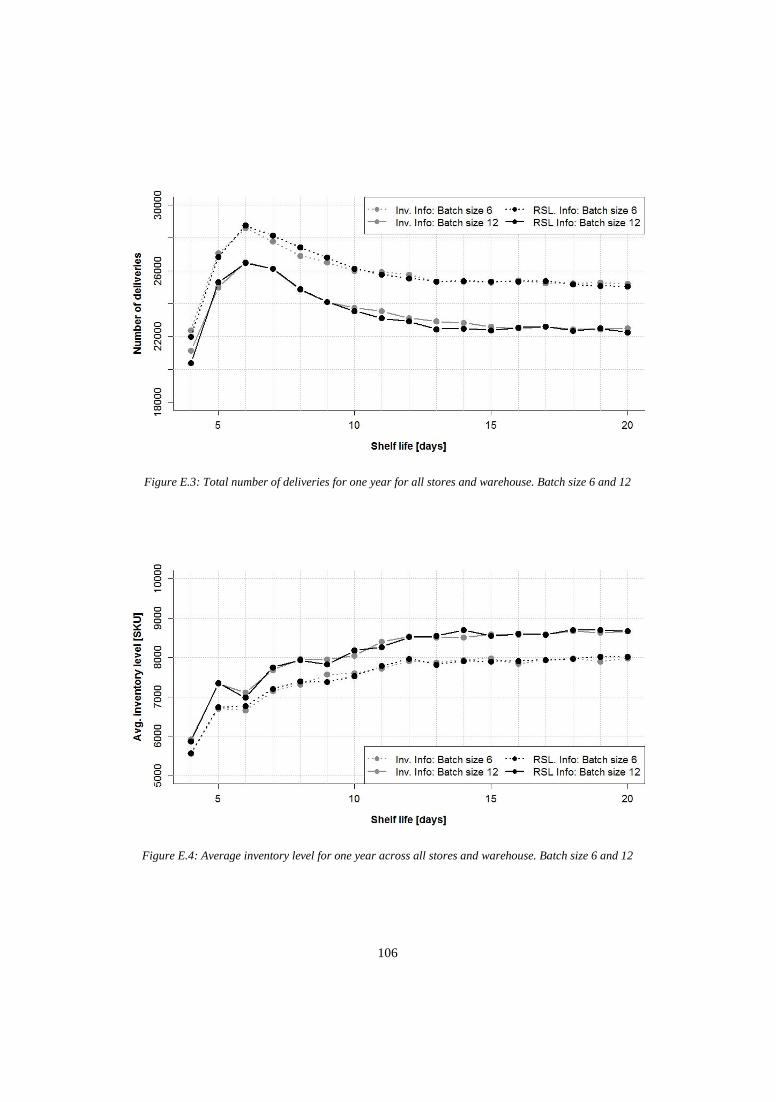
106
Figure E.3: Total number of deliveries for one year for all stores and warehouse. Batch size 6 and 12
Figure E.4: Average inventory level for one year across all stores and warehouse. Batch size 6 and 12
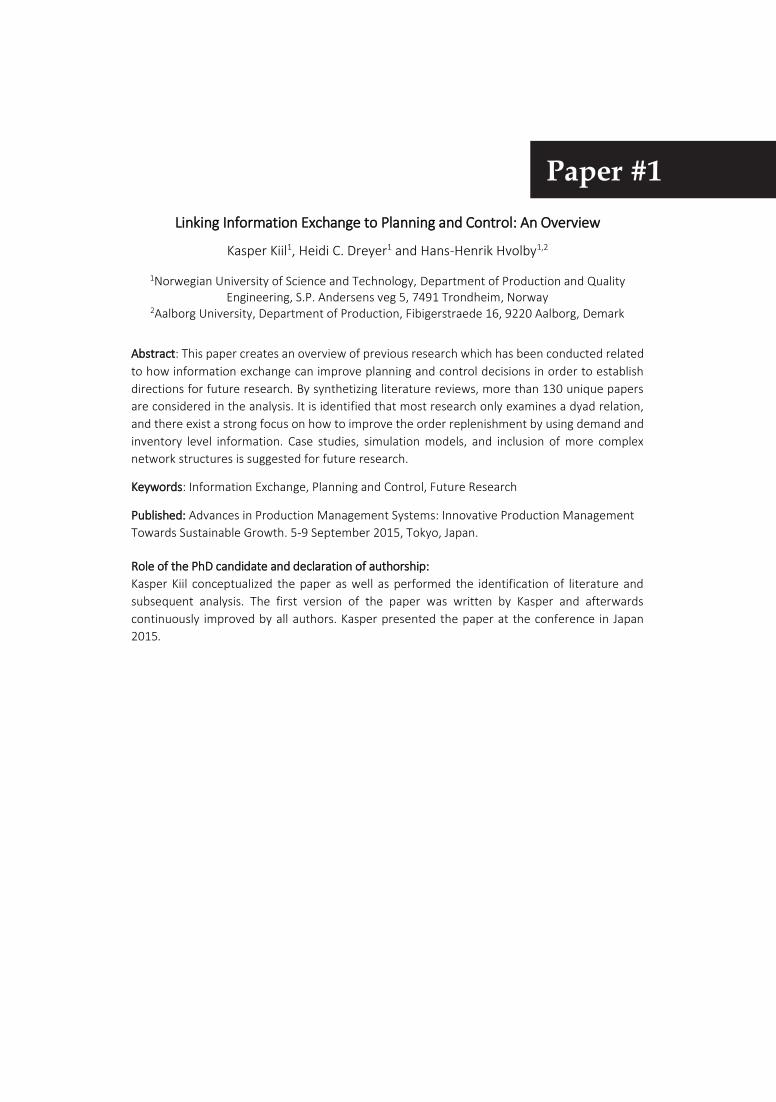
Linking Information Exchange to Planning and Control: An Overview
Kasper Kiil1, Heidi C. Dreyer1 and Hans-Henrik Hvolby1,2
1Norwegian University of Science and Technology, Department of Production and Quality Engineering, S.P. Andersens veg 5, 7491 Trondheim, Norway
2Aalborg University, Department of Production, Fibigerstraede 16, 9220 Aalborg, Demark
Abstract: This paper creates an overview of previous research which has been conducted related
to how information exchange can improve planning and control decisions in order to establish
directions for future research. By synthetizing literature reviews, more than 130 unique papers
are considered in the analysis. It is identified that most research only examines a dyad relation,
and there exist a strong focus on how to improve the order replenishment by using demand and
inventory level information. Case studies, simulation models, and inclusion of more complex
network structures is suggested for future research.
Keywords: Information Exchange, Planning and Control, Future Research
Published: Advances in Production Management Systems: Innovative Production Management
Towards Sustainable Growth. 5-9 September 2015, Tokyo, Japan.
Role of the PhD candidate and declaration of authorship:
Kasper Kiil conceptualized the paper as well as performed the identification of literature and
subsequent analysis. The first version of the paper was written by Kasper and afterwards
continuously improved by all authors. Kasper presented the paper at the conference in Japan
2015.
Paper #1

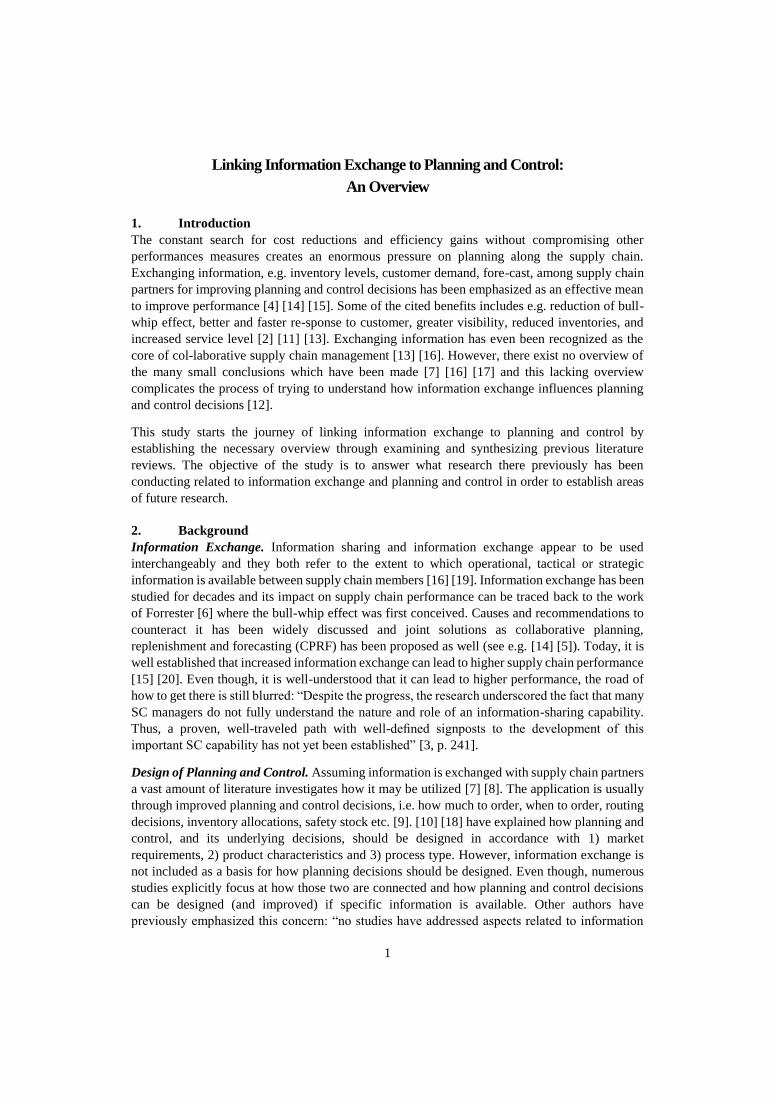
1
Linking Information Exchange to Planning and Control:
An Overview
1. Introduction
The constant search for cost reductions and efficiency gains without compromising other
performances measures creates an enormous pressure on planning along the supply chain.
Exchanging information, e.g. inventory levels, customer demand, fore-cast, among supply chain
partners for improving planning and control decisions has been emphasized as an effective mean
to improve performance [4] [14] [15]. Some of the cited benefits includes e.g. reduction of bull-
whip effect, better and faster re-sponse to customer, greater visibility, reduced inventories, and
increased service level [2] [11] [13]. Exchanging information has even been recognized as the
core of col-laborative supply chain management [13] [16]. However, there exist no overview of
the many small conclusions which have been made [7] [16] [17] and this lacking overview
complicates the process of trying to understand how information exchange influences planning
and control decisions [12].
This study starts the journey of linking information exchange to planning and control by
establishing the necessary overview through examining and synthesizing previous literature
reviews. The objective of the study is to answer what research there previously has been
conducting related to information exchange and planning and control in order to establish areas
of future research.
2. Background
Information Exchange. Information sharing and information exchange appear to be used
interchangeably and they both refer to the extent to which operational, tactical or strategic
information is available between supply chain members [16] [19]. Information exchange has been
studied for decades and its impact on supply chain performance can be traced back to the work
of Forrester [6] where the bull-whip effect was first conceived. Causes and recommendations to
counteract it has been widely discussed and joint solutions as collaborative planning,
replenishment and forecasting (CPRF) has been proposed as well (see e.g. [14] [5]). Today, it is
well established that increased information exchange can lead to higher supply chain performance
[15] [20]. Even though, it is well-understood that it can lead to higher performance, the road of
how to get there is still blurred: “Despite the progress, the research underscored the fact that many
SC managers do not fully understand the nature and role of an information-sharing capability.
Thus, a proven, well-traveled path with well-defined signposts to the development of this
important SC capability has not yet been established” [3, p. 241].
Design of Planning and Control. Assuming information is exchanged with supply chain partners
a vast amount of literature investigates how it may be utilized [7] [8]. The application is usually
through improved planning and control decisions, i.e. how much to order, when to order, routing
decisions, inventory allocations, safety stock etc. [9]. [10] [18] have explained how planning and
control, and its underlying decisions, should be designed in accordance with 1) market
requirements, 2) product characteristics and 3) process type. However, information exchange is
not included as a basis for how planning decisions should be designed. Even though, numerous
studies explicitly focus at how those two are connected and how planning and control decisions
can be designed (and improved) if specific information is available. Other authors have
previously emphasized this concern: “no studies have addressed aspects related to information
2
sharing as a determinant of planning approach.” [12, p. 148]. Essentially, there exist no
encapsulating framework, or well-traveled path [3], to understand how information exchange
influences planning and control decisions, nevertheless the field has still received many valuable
but separate contributions [19].
Linking Information Exchange to Planning and Control. Previously, the type of information
exchanged has been grouped into 20 categories ranging from demand information to what type
of forecasting model or time fence settings the different supply chain partners apply [8]. Planning
and control decisions has been divided into eight categories with facility location as the most
strategic and order replenishment and shipment decision as the most operational [8]. The purpose
of this paper is to connect these two dimensions, and the underlying categories, by generating an
overview of which type of information (exchanged between supply chain partners) there
previously has been examined to improve planning and control decisions. Secondly, it should be
considered how this research has been conducted. The applied method (analytical, simulation,
etc.) and the supply chain structure (dyad, divergent, etc.) condenses the most important parts of
how the research has been conducted, and has also been used in previous review papers [7] [17].
3. Research Design
To grasp the tremendous amount of available literature on information exchange and planning
and control literature reviews can provide valuable information. The initial literature search for
this study discovered several literature reviews, but none of them directly linked information
exchange to planning and control decisions. Therefore, this study assembles previous review
papers to create this link and overview. The research process can be divided into two main steps:
Step 1: Locating Studies. First, only published academic articles and proceedings was chosen to
be included. Second, to not only rely on a single database four databases (Scopus, ScienceDirect,
Google Scholar, and Emerald) were selected. Third, keywords like information exchange,
information sharing and collaboration was combined with supply chain at all four databases.
Fourth, to reduce the number of articles and ensure a relative novel result a 15-year time period
spanning from (including) 2000 to 2014 was selected. 32 papers was identified in this at this
stage, this is predominantly because only review papers, and potential review papers, were
selected for further evaluation.
Step 2: Selection and Evaluation. A comprehensive review [8] presents a conceptual framework
of seven dimensions in order to categorize this type of literature. This framework was later applied
in a simplified version with four dimensions [17]. Those four dimensions correspond to what has
been discussed in the beginning of this paper and are conveyed in this paper. The first two
considers what type of information and which planning and control decisions. The last two is
concerned with how the research was conducted:
1. Type of information exchanged
2. Type of planning decision
3. Applied method
4. Supply chain structure
The 32 review papers from the step 1 were read more in detail and only review papers which had
specified those four dimensions (for the papers they reviewed) was selected for further analysis.
As an example, the review by Giard and Sali (2013) [7] was excluded as they did only specify
3
the planning decision as being either operational, tactical, or strategic which were considered too
coarse. Six review papers from the period between 2000 and 2014 was identified to fulfill the
selection criteria [1] [8] [13] [17] [19] [21]. Within the six review papers, a total of 176 papers
and 131 unique papers had been reviewed.
As the previous review papers provide the main data for the subsequent analysis, their selection
process specifies what papers there ultimately are included. The most common keywords used
within the six selected review papers includes, supply chain information sharing, flow
coordination, supply chain dynamics and collaboration. Some of them have applied a rather broad
search approach in operation manage-ment related journals [19] [8] other focus explicitly on
modeling papers [1], and some solely on two stage supply chain structures [17]. It should be noted
that the chosen method, of only using review papers as the main data source, do not guarantee
that all relevant (unique) papers are identified and included, however the method is still highly
suitable to indicate previous trends.
4. Analysis and Discussion
Haung et al., (2003) [8] present 20 different categories of which type of information to exchange,
and eight categories of different planning and control decisions. The 131 unique papers has been
classified according to those categories and are presented in Table 1.
Table 1 specifies that e.g. seven unique papers has investigated the exchange of demand forecast
in order to make better decisions related to order replenishment. If a paper has investigated how
exchange of demand forecast could be used to improve both inventory allocation and order
replenishment a full point has been assigned to both inventory allocation and order replenishment.
Clearly, the first comment from Table 1 is that sharing demand information (i.e. sharing
downstream demand, especially by the end customer, with upstream facilities), in order to
improve order replenishment (i.e. how a business entity places an order) is the single most
investigated relation between information exchange and planning and control decisions. Out of
the 131 unique papers almost one-third had this particular relation included. The exchange of
inventory levels and demand forecast, to improve decisions related to order replenishment, has
also received a great amount of attention.
Planning and Control Decision. Of the eight different planning decisions, order replenishment
has been considered in almost all papers; remarkably 114 papers includes this decision.
Production and distribution planning is considered in 25 papers while 17 papers investigates
shipments (i.e. shipment within the same tier or emergency shipments where one tier is exclude
[8]). Surprisingly, decisions related to inventory allocation, safety stock, or capacity allocation
has only received very little attention from previous literature. It is surprising as it would be
expected that sharing customers forecast or point-of-sales data could improve the focal
company’s own forecast and hereby obtain lower safety stock levels. Also, if a complete chain is
examined, the total inventory level could might be reduced if it is allocated according to where
the demand is expected.
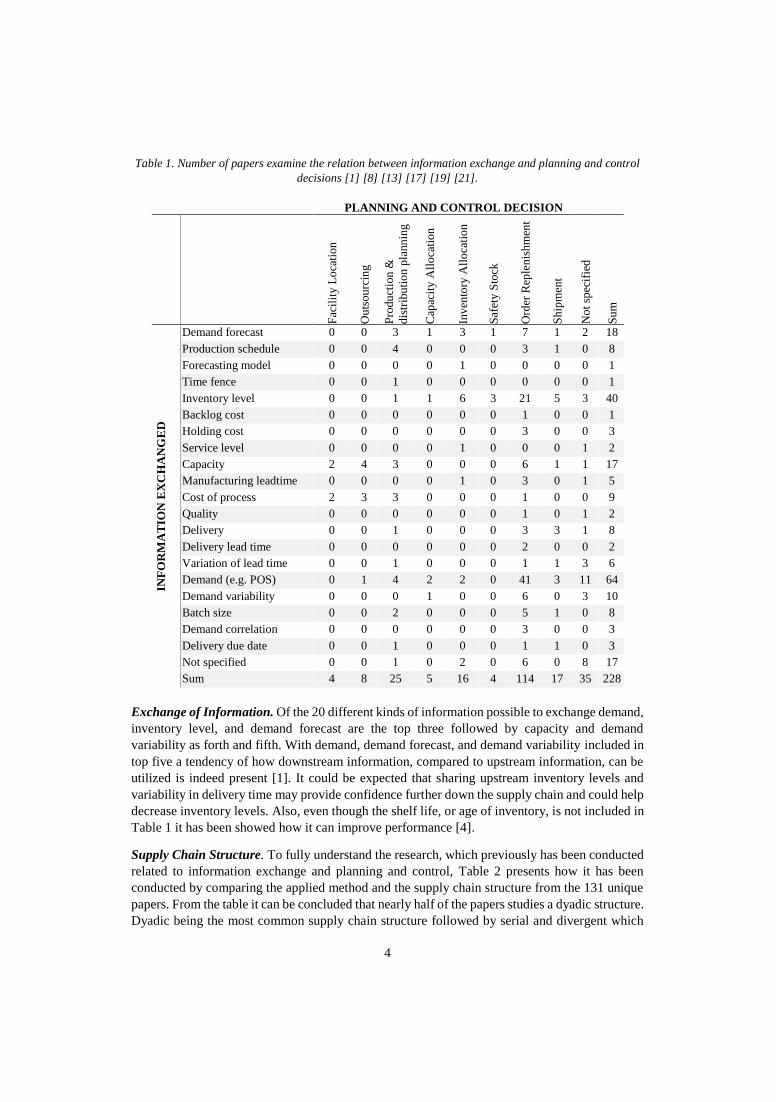
4
Table 1. Number of papers examine the relation between information exchange and planning and control
decisions [1] [8] [13] [17] [19] [21].
PLANNING AND CONTROL DECISION
Fac
ilit
y L
oca
tion
Ou
tso
urc
ing
Pro
du
ctio
n &
dis
trib
uti
on
pla
nn
ing
Cap
acit
y A
llo
cati
on
Inv
ento
ry A
llo
cati
on
Saf
ety
Sto
ck
Ord
er R
eple
nis
hm
ent
Sh
ipm
ent
No
t sp
ecif
ied
Su
m
INF
OR
MA
TIO
N E
XC
HA
NG
ED
Demand forecast 0 0 3 1 3 1 7 1 2 18
Production schedule 0 0 4 0 0 0 3 1 0 8
Forecasting model 0 0 0 0 1 0 0 0 0 1
Time fence 0 0 1 0 0 0 0 0 0 1
Inventory level 0 0 1 1 6 3 21 5 3 40
Backlog cost 0 0 0 0 0 0 1 0 0 1
Holding cost 0 0 0 0 0 0 3 0 0 3
Service level 0 0 0 0 1 0 0 0 1 2
Capacity 2 4 3 0 0 0 6 1 1 17
Manufacturing leadtime 0 0 0 0 1 0 3 0 1 5
Cost of process 2 3 3 0 0 0 1 0 0 9
Quality 0 0 0 0 0 0 1 0 1 2
Delivery 0 0 1 0 0 0 3 3 1 8
Delivery lead time 0 0 0 0 0 0 2 0 0 2
Variation of lead time 0 0 1 0 0 0 1 1 3 6
Demand (e.g. POS) 0 1 4 2 2 0 41 3 11 64
Demand variability 0 0 0 1 0 0 6 0 3 10
Batch size 0 0 2 0 0 0 5 1 0 8
Demand correlation 0 0 0 0 0 0 3 0 0 3
Delivery due date 0 0 1 0 0 0 1 1 0 3
Not specified 0 0 1 0 2 0 6 0 8 17
Sum 4 8 25 5 16 4 114 17 35 228
Exchange of Information. Of the 20 different kinds of information possible to exchange demand,
inventory level, and demand forecast are the top three followed by capacity and demand
variability as forth and fifth. With demand, demand forecast, and demand variability included in
top five a tendency of how downstream information, compared to upstream information, can be
utilized is indeed present [1]. It could be expected that sharing upstream inventory levels and
variability in delivery time may provide confidence further down the supply chain and could help
decrease inventory levels. Also, even though the shelf life, or age of inventory, is not included in
Table 1 it has been showed how it can improve performance [4].
Supply Chain Structure. To fully understand the research, which previously has been conducted
related to information exchange and planning and control, Table 2 presents how it has been
conducted by comparing the applied method and the supply chain structure from the 131 unique
papers. From the table it can be concluded that nearly half of the papers studies a dyadic structure.
Dyadic being the most common supply chain structure followed by serial and divergent which
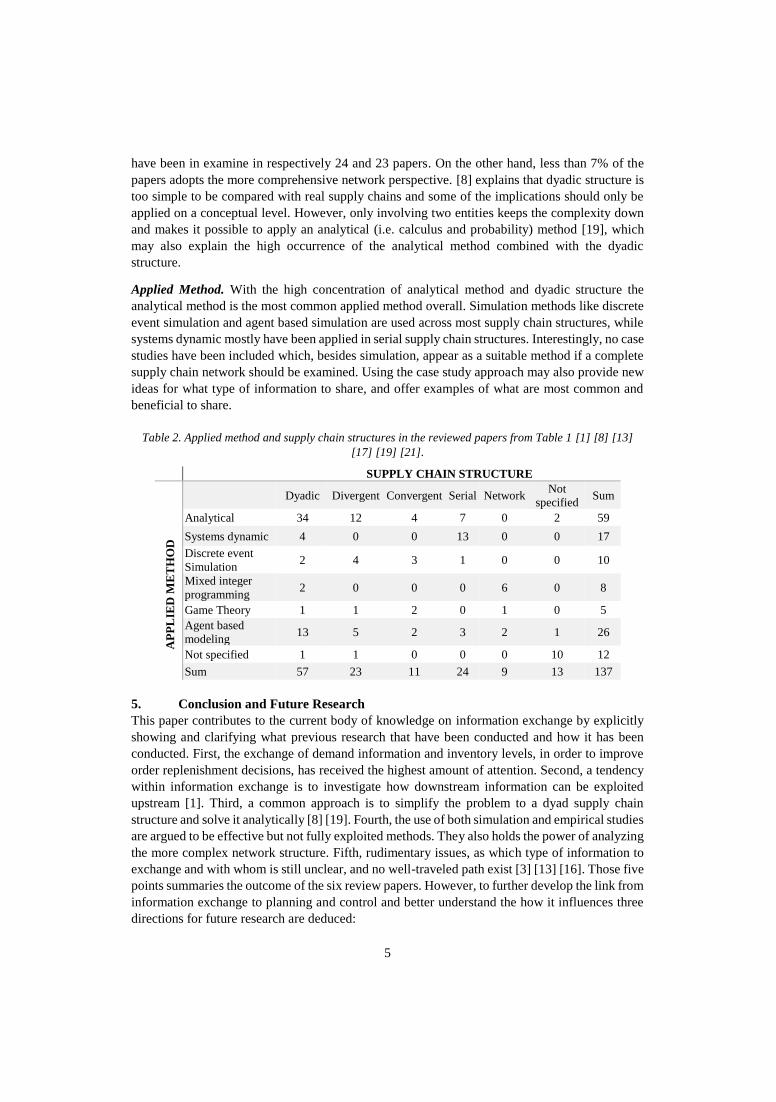
5
have been in examine in respectively 24 and 23 papers. On the other hand, less than 7% of the
papers adopts the more comprehensive network perspective. [8] explains that dyadic structure is
too simple to be compared with real supply chains and some of the implications should only be
applied on a conceptual level. However, only involving two entities keeps the complexity down
and makes it possible to apply an analytical (i.e. calculus and probability) method [19], which
may also explain the high occurrence of the analytical method combined with the dyadic
structure.
Applied Method. With the high concentration of analytical method and dyadic structure the
analytical method is the most common applied method overall. Simulation methods like discrete
event simulation and agent based simulation are used across most supply chain structures, while
systems dynamic mostly have been applied in serial supply chain structures. Interestingly, no case
studies have been included which, besides simulation, appear as a suitable method if a complete
supply chain network should be examined. Using the case study approach may also provide new
ideas for what type of information to share, and offer examples of what are most common and
beneficial to share.
Table 2. Applied method and supply chain structures in the reviewed papers from Table 1 [1] [8] [13]
[17] [19] [21].
SUPPLY CHAIN STRUCTURE
Dyadic Divergent Convergent Serial Network Not
specified Sum
AP
PL
IED
ME
TH
OD
Analytical 34 12 4 7 0 2 59
Systems dynamic 4 0 0 13 0 0 17
Discrete event
Simulation 2 4 3 1 0 0 10
Mixed integer
programming 2 0 0 0 6 0 8
Game Theory 1 1 2 0 1 0 5
Agent based
modeling 13 5 2 3 2 1 26
Not specified 1 1 0 0 0 10 12
Sum 57 23 11 24 9 13 137
5. Conclusion and Future Research
This paper contributes to the current body of knowledge on information exchange by explicitly
showing and clarifying what previous research that have been conducted and how it has been
conducted. First, the exchange of demand information and inventory levels, in order to improve
order replenishment decisions, has received the highest amount of attention. Second, a tendency
within information exchange is to investigate how downstream information can be exploited
upstream [1]. Third, a common approach is to simplify the problem to a dyad supply chain
structure and solve it analytically [8] [19]. Fourth, the use of both simulation and empirical studies
are argued to be effective but not fully exploited methods. They also holds the power of analyzing
the more complex network structure. Fifth, rudimentary issues, as which type of information to
exchange and with whom is still unclear, and no well-traveled path exist [3] [13] [16]. Those five
points summaries the outcome of the six review papers. However, to further develop the link from
information exchange to planning and control and better understand the how it influences three
directions for future research are deduced:
6
Research Design. It was highlighted that especially the network structure has previously been
overlooked. Only studying dyad and simple supply chain structures may not provide the complete
necessary knowledge [19]. It is expected, that this could be accommodated by using simulations
models or using in-depth case studies where before and after situations are evaluated through
essential performance measurements.
Level of Information Exchange. Information exchange can occur at different levels [19] and
from the six reviews at least four dimensions defines the level of information exchange a supply
chain applies. First, frequency and timeliness; this addresses the issue of how often and how far
in advance the information should be exchanged to provide the highest benefit. Second, the
information content specifies what type of information to exchange. Third, information detail
concerns if information should be exchanged at e.g. SKU level or product family level and if it
should be in e.g. monthly, weekly or daily time buckets. Fourth, neighborhood relates to the
number of supply chain partners, which should receive and send the information. For future
research it could be examined how to actually measure this level of information exchange and
provide a generic framework, but also to examine the relationship to different planning and
control levels..
Challenges and Benefits. Future research should be concerned with the impact on the supply
chain performance and the challenges of implementing it. Some of the challenges of sharing data
between individual companies is that it requires a great amount of trust, or willingness, as well
as secure technical solutions for smooth connectivity [3]. How can a company safely share
detailed forecasts with a supplier, if the supplier also supplies the company’s biggest competitors?
On the other hand, future research should also give some attention to how the benefit should be
measured and distributed between various partners.
This paper present the academic perspectives on information exchange and planning and control.
It will be continued with a case study of a network supply chain to examine what type of
information there currently is exchanged, if the type of information identified through the six
review papers include all types of information relevant to consider, and how the information is
linked to the planning and control decisions in the case companies.
6. References
1. Choi, H-c. P. (2010) “Information Sharing in Supply Chain Management: A Literature Review on
Analytical Research”, California Journal of Operations Management, Vol. 8 No. 1, pp. 110-116.
2. Dev, N.K., Caprihan, R., & Swami, S. (2013), “ Strategic positioning of inventory review policies in
alternative supply chain networks: an information-sharing paradigm perspective”, International
Journal of Logistics Research and Applications: A Leading Journal of Supply Chain Management, Vol.
16 No. 1, pp. 14-33.
3. Fawcett, S. E., Wallin, C., Allred, C., & Magnan, G. (2009), “Supply chain information-sharing:
benchmarking a proven path”, Benchmarking: An International Journal, Vol. 16 No. 2, pp. 222-246.
4. Ferguson, M. and Ketzenberg, M. (2006) “Information sharing to improve retail product freshness of
perishables”, Production & Operations Management, Vol 15 No. 1, pp.57-73
5. Fliedner, G. (2003), “CPFR: an emerging supply chain tool”, Industrial Management & data
systems, Vol. 103 No. 1, pp. 14-21.
6. Forrester, J. (1958), "Industrial dynamics: a major breakthrough for decision makers." Harvard
Business Review, Vol. 36 No. 4, pp. 37-66
7. Giard, V., Sali, M. (2013) “The bullwhip effect in supply chains: a study of contingent and incomplete
literature”, International Journal of Production Research, Vol. 51 Nol. 13, pp. 3880-3893.
7
8. Huang, G. Q., Lau, J. S., & Mak, K. L. (2003), “The impacts of sharing production information on
supply chain dynamics: a review of the literature”, International Journal of Production Research, Vol.
41 No. 7, pp. 1483-1517.
9. Jacobs, F. R., Berry, W. L., Whybark, D. C., Vollmann T. E., (2011) Manufacturing Planning and
Control for Supply Chain Management, 6th edition, McGraw-Hill.
10. Jonsson, P. and Mattsson, S.A. (2003). The implications of fit between planning environments and
manufacturing planning and control methods, International Journal of Operations and Production
Management, Vol. 23 No. 8, pp. 872-900.
11. Jonsson, P. and Mattson, S.A. (2013), “The value of sharing planning information in supply chains”,
Journal of Physical Distribution and Logistics Management, Vol. 43 No. 4, pp. 282-299
12. Kaipia, Riikka. "Coordinating material and information flows with supply chain planning, (2009) "The
International Journal of Logistics Management, Vol. 20 No. 1 p. 144-162.
13. Kumar, R. S., & Pugazhendhi, S. (2012), “Information sharing in supply chains: An overview”,
Procedia Engineering, Vol. 38, pp. 2147-2154.
14. Lee, H. L., Padmanabhan, V., & Whang, S. (1997), “The bullwhip effect in supply chains”, Sloan
management review, Vol. 38 No. 3, pp. 93-102.
15. Li, G., Hong, Y., Wang, S. and Xia, Y., (2005) “Comparative analysis on value of information sharing
in supply chains”, Supply Chain Management, Vol. 10 No. 1, pp. 34-46
16. Moberg, C. R., Cutler, B. D., Gross, A., & Speh, T. W. (2002). “Identifying antecedents of information
exchange within supply chains”, International Journal of Physical Distribution & Logistics
Management, Vol. 32 No. 9, pp. 755-770.
17. Montoya-Torres, J. R., & Ortiz-Vargas, D. A. (2014), “Collaboration and information sharing in dyadic
supply chains: A literature review over the period 2000–2012”, Estudios Gerenciales, Vol. 30 No. 133,
pp. 343-354.
18. Olhager, J., and Rudberg, M., (2002) Linking manufacturing strategy decisions on process choice with
manufacturing planning and control systems, International Journal of Production Research, Vol. 40 No.
10, pp. 2335-2351
19. Sahin, F., & Robinson, E. P. (2002), “Flow coordination and information sharing in supply chains:
review, implications, and directions for future research”, Decision sciences, Vol. 33 No. 4, pp. 505-
536.
20. Thatte, A. A., Rao, S. S., & Ragu-Nathan, T. S. (2013), “Impact of SCM practices of a firm on supply
chain responsiveness and competitive advantage of a firm”, Journal of Applied Business Research,
Vol. 29 No. 2, pp. 499-530.
21. Yang, Z., and Zhang L. (2013) “Information Sharing in Supply chain: A Review”, Journal of Digital
Information Management, Vol. 11 No. 2, pp. 125-130
7. Acknowledgements
This paper is part of the Norwegian research project Retail Supply Chain 2020 funded by the
Research Council of Norway and participating industrial companies. The four year project was
initiated in 2014 and this paper especially contributes on one of the four key research areas of
designing new advanced planning and control models through information exchange.

From Information Sharing to Information Utilization in Food Supply Chains
Kasper Kiil1,2, Hans-Henrik Hvolby1,2, Jacques Trienekens3,
Behzad Behdani4, and Jan Ola Strandhagen1
1 Norwegian University of Science and Technology, Department of Mechanical and Industrial Engineering, S.P. Andersens Veg 5, 7194 Trondheim, Norway
2 Aalborg University, Department of Mechanical and Manufacturing Engineering, Centre for Logistics, Fibigerstrede 16, 9220 Aalborg, Denmark
3 Wageningen University, Subdivision of Management Studies, Hollandsweg 1, 6706KN Wageningen, the Netherlands
4 Wageningen University, Subdivision of Operations Research and Logistics, Hollandsweg 1, 6706KN Wageningen, the Netherlands
Purpose: Information sharing has been extensively studied as a key enabler for coordination and
integration in supply chains. However, exactly how the shared information is utilized for decision
making has only received limited scientific attention in the research literature. The aim of this
study is to identify the characteristics of information sharing, and conceptualize how to move
from information sharing to information utilization in food supply chains.
Design/methodology/approach: Using a case study methodology together with review of the
existing literature we describe the main facets of shared information - which influence the
information utilization in a supply chain - and propose a mapping notation for how these facets
can be visualized together with the Supply Chain Operations Reference (SCOR) model.
Findings: Information utilization is especially important because more information sharing does
not necessarily result in a better supply chain performance unless the shared information is
effectively used in the relevant processes in the chain and well-aligned with the requirements for
those processes. The proposed notation provides a systematic structure for mapping the
information flows, their specific facets, and helps clarify what information is available and how
this information can be utilized in different supply chain processes.
Originality/Value: Four facets of information sharing are identified and elaborated for food supply
chains, together with a mapping tool that emphasizes the information flows and the utilization
of information in a supply chains.
Keywords: Information utilization; Information sharing; Mapping tool; Food supply chain; Supply
Chain Operations Reference (SCOR) model
Accepted for publication: International Journal of Information Systems and Supply Chain
Management. Will occur in printed form in August 2018
Role of the PhD candidate and declaration of authorship:
Kasper Kiil conceptualized the paper together with Jacques Trienekens and Behzad Behdani
during a research stay in Wageningen, The Netherlands. Development, distribution, and the
analysis related to the questionnaire was performed by Kasper. The first version of the paper was
written by Kasper and afterwards continuously improved by all authors.
Paper #2

Is not included due to copyright

24
Sustainable food supply chains: The impact of automatic replenishment in grocery stores
Kasper Kiil1,2,*, Heidi C. Dreyer3, and Hans-Henrik Hvolby1,2, Lukas Chabada1
1 Norwegian University of Science and Technology, Department of Mechanical and Industrial Engineering, S.P. Andersens Veg 5, 7491 Trondheim, Norway
2 Aalborg University, Department of Mechanical and Manufacturing Engineering, Centre for Logistics, Fibigerstrede 16, 9220 Aalborg, Denmark
3 Norwegian University of Science and Technology, Department of Industrial Economics and Technology Management, Alfred Getz vei 3, 7491 Trondheim, Norway
Abstract: The aim of this study is to empirically investigate the impact of automatic replenishment on food waste metrics in grocery stores. The work has been designed as a case study focusing on the replenishment process among various stores and a single warehouse. Food waste metrics of products ordered through an automatic replenishment program are compared against products ordered manually. Specifically we contrast food waste, remaining shelf life and availability at the stores for a variety of products with different shelf life. The study suggests that by utilizing an automatic replenishment program the stores can reduce their level of food waste by up to 20% and their products have a longer remaining shelf life without compromising on-shelf availability. The study also indicates that the impact of the automatic replenishment program is dependent on the product’s shelf life. Those products with a shelf life of between 51 and 110 days experience the highest impact, while products with a shelf life below 30 days experience a low or even negative impact. The study extends the current understanding of automatic replenishment programs. The key point for practitioners is to apply appropriate replenishment programs according to the product characteristics and especially the shelf life.
Keywords: Information sharing; food waste; remaining shelf life; automatic replenishment; shelf life
Published: Production Planning and Control (2018), volume 29, issue 2, pp. 106-116
Role of the PhD candidate and declaration of authorship:
Kasper Kiil conceptualized the paper. The data was collected by Lukas Chabada with support from
master students and Kasper for the store visits. Kasper conducted the analysis and wrote the first
version of the paper, which afterwards was continuously improved by all authors.
Paper #3

1
Sustainable food supply chains: The impact of automatic replenishment
in grocery stores
1. Introduction
Sustainability concerns are an essential part of the operations in food supply chains. This paper
focuses on the economic and indirectly the environmental dimensions of sustainability by
investigating food waste metrics. It is estimated that 25%-35% of all food produced ends up as
food waste (Kummu et al. 2012; Parfitt, Barthel, and Macnaughton 2010). Food waste is not only
an indication of economical loss in the phase where it is discarded. It also indicates that natural
resources such as soil and water has been wasted at the farm gate level and unnecessary pollution
has been added to the environment from transportation along the supply chain (Bourlakis et al.
2014; Gerbens-Leenes, Moll, and Uiterkamp 2003; Maloni and Brown 2006).
Ten to twenty percent of all food waste occur at the retailer phase (Kummu et al. 2012; Parfitt,
Barthel, and Macnaughton 2010). This wastage is often explained by the increasing variety and
volume of fresh food products on display, a poor understanding of demand, low transparency,
inadequate replenishment decisions and forecasting difficulties in a push system (Kaipia,
Dukovska-Popovska, and Loikkanen 2013; Mena, Adenso-Diaz, and Yurt 2011). Also, if
products arrive at the stores with a too short remaining shelf life the risk that the products may
expire is higher either in the store or after the consumer takes them to their home (Kaipia,
Dukovska-Popovska, and Loikkanen 2013; Mena, Adenso-Diaz, and Yurt 2011).
The replenishment decision in food supply chains is challenging because the limited shelf life
require the products to move quickly from the primary producer to the end consumer, and limits
the possibility of using buffer inventories (Hübner and Kuhn 2012; Kaipia, Dukovska-Popovska,
and Loikkanen 2013). Also, the increasing product variety (Trienekens et al. 2012) and non-
stationary demand throughout the week (Taylor and Fearne 2009) makes replenishment decisions
difficult to manage. The replenishment is central for the performance of food supply chains as it
balances availability on one side and the risk of food waste on the other. If too few products are
ordered the stores risk a stock out and if too many are ordered the products may end spending too
much time in store reducing remaining shelf life and worst-case end up being wasted.
It is estimated that half of the food losses can be prevented through better supply chain
management (Kummu et al. 2012). In this regards one highly recommended remedy is better
information sharing and improved replenishment decisions (Kaipia, Dukovska-Popovska, and
Loikkanen 2013; Mena, Adenso-Diaz, and Yurt 2011; Taylor and Fearne 2009). Specifically,
Mena et al. (2014) propose that improved transparency of demand information upstream in the
supply chain can help reduce food waste (Proposition 1b, p. 152).
To benefit from information sharing the key element is not only the information shared but also
how the information is utilized by the receiving company (Baihaqi and Sohal 2013; Jonsson and
Mattsson 2013; Barratt and Oke 2007). In food supply chains shared information is often utilized
for replenishment decisions through an automated replenishment program (ARP) (Van Donselaar
et al. 2010). The information is used to gain insight into demand and inventory levels in order to
improve the replenishment decision. Theoretically, it has been demonstrated that this type of
information sharing and replenishment method has a positive impact on supply chain
performance such as reduced uncertainty, reduced bullwhip, reduced inventory levels or
2
increased forecasting accuracy (Lee, So, and Tang 2000; Disney and Towill 2003; Aviv 2001;
Costantino et al. 2015; Titah, Shuraida, and Rekik 2016; Kelepouris, Miliotis, and Pramatari
2008). Average performance improvement of information sharing has been reported to 1.75%
(Chen 1998) and 2.2% (Cachon and Fisher 2000). However no studies have investigated the
impact of these replenishment methods from a sustainability perspective. The reported
performance increase varies substantially between studies and may be explained by different
contingency factors such as different demand patterns, batch sizes and lead times (Jonsson and
Mattsson 2013; Ketzenberg et al. 2007).
Automatic replenishment programs are enabled by an increased amount of shared information
between the supply chain partners. This increased transparency makes it possible to coordinate
replenishment decisions more effectively and synchronize orders to balance availability and food
waste metrics. However, empirical research comparing the impact of ARP on food waste metrics
and other possible contingency factors is very limited in previous research (Kaipia, Dukovska-
Popovska, and Loikkanen 2013) even though it is expected to have a positive impact (Mena et al.
2014).
In this study, we empirically investigate the impact of ARP on food waste metrics in grocery
stores in Norway. Specifically, we compare food waste levels and remaining shelf life at grocery
stores by analyzing two situations: (1) when orders are placed manually and (2) when ordered are
placed through an ARP system. We do this within a case study of a large Norwegian grocery
retailer. The findings add to the research literature within this specific area specifically using a
sustainability perspective.
The remainder of this paper is organized as follows. Section 2 contains a review of relevant
literature for automatic replenishment programs in food supply chains. Section 3 argues for the
selected case study methodology used in this study, provides a description of the cases and
explains how the data has been collected and analyzed. Section 4 presents the analysis and results.
In Section 5 we discuss the findings and conclude where an agenda for further research is also
presented.
2. Automatic replenishment in food supply chains
To increase interfirm coordination and improve the replenishment process a number of
sophisticated supply chain practices known as automatic replenishment programs (ARPs) have
been developed during the last decades (Yao and Dresner 2008; Arshinder, Kanda, and
Deshmukh 2008; Daugherty, Myers, and Autry 1999; Sabath, Autry, and Daugherty 2001).
Automatic replenishment programs include Efficient Consumer Response from the food industry
(Kurt Salamon Associates 1993), Quick Response (Daugherty, Myers, and Autry 1999), the
Continuous Replenishment Program, and Vendor Managed Inventory (Yao and Dresner 2008).
The logic within these ARPs is often implemented directly into the company’s ERP system or as
an add-on to facilitate the replenishment process.
Essentially, the ARP calculates an order proposal for each item for each store based on certain
transactional information from the stores, such as point of sales (POS) data, waste data and master
data such as review periods and batch sizes. The order is a proposal which can be accepted or
overruled by the store management (Van Donselaar et al. 2010). However, in either case it
increases the transparency for the wholesaler and enables the wholesaler to compute an estimate
for future (aggregated) orders.
3
More specifically, the ARP functions by sharing very fine data (high granularity per stock keeping
unit (SKU) level with the wholesaler’s data warehouse. At the wholesaler, the POS data is used
to identify seasonal and other sales patterns and generates a forecast until next delivery (where
the next delivery is determined based on the lead time and the ordering frequency). The sum of
this forecast and the minimum inventory level becomes the order-up-to level for the store for
those particular products. The minimum inventory level is included to create an appealing
shopping experience by having a minimum number of facings of a giving product (Van Donselaar
et al. 2010).
If the current inventory level at the store is below the order-up-to level an order proposal is
generated by computing how many batches the store needs to raise the inventory level up or above
the order-up-to level. The current inventory level at the stores might be an estimate based on
previous amount delivered to the store, amount wasted and the POS data.
The elements for computation of the suggested replenishment quantity to the stores can be
summarized as: i) ordering frequency ii) lead time iii) batch size iv) minimum inventory level v)
POS data (to generate a forecast) and i) current inventory level (Van Donselaar et al. 2010).
Characteristics specific for the food sector such as shelf life and perishability is thus not included
when the automatic replenishment program computes the replenishment quantity (Van Donselaar
et al. 2006; Van Woensel et al. 2007). However, inventory policies which include these aspects
have previously been proposed (Bakker, Riezebos, and Teunter 2012; Broekmeulen and van
Donselaar 2009; Ferguson and Ketzenberg 2006).
2.1. The role of information sharing in automatic replenishment
A key element of ARPs is the use of an increased amount of shared information from the stores
to enable better decision making (Yao and Dresner 2008; Lee, So, and Tang 2000). Information
sharing is often listed as one of the key features for effective coordination and performance
improvements in supply chain management (Arshinder, Kanda, and Deshmukh 2008; Ganesh,
Raghunathan, and Rajendran 2014; Cooper, Lambert, and Pagh 1997; Kembro, Selviaridis, and
Näslund 2014). Several studies have quantified the impact of information sharing by analytical
and numerical calculations in a two level dyadic or divergent supply chain (Aviv 2001; Lee, So,
and Tang 2000; Raghunathan 2001; Yu, Yan, and Edwin Cheng 2001; Cachon and Fisher 2000;
Jonsson and Mattsson 2013; Gavirneni, Kapuscinski, and Tayur 1999) and with multiple echelons
(Wu and Cheng 2008; Chen 1998; Ganesh, Raghunathan, and Rajendran 2014; Rached, Bahroun,
and Campagne 2015).
Some studies indicate a high impact on performance by sharing information while others are more
conservative due to particular contingency factors (Jonsson and Mattsson 2013; Ketzenberg et al.
2007). Borrowed from contingency theory (Donaldson 2006), the underlying idea is that certain
factors influence the impact of information sharing (Kembro and Näslund 2014). Or in other
words, how certain strategies of information sharing fits different circumstances (Vanpoucke,
Boyer, and Vereecke 2009). Table 1 summarizes some of the typical factors found in the literature
that moderates the impact of information sharing. However it should not be considered as an
exhaustive list. Some of the factors still lack empirical evidence and the identification of other
potential contingency factors is still an open research topic (Ketzenberg et al. 2007; Giard and
Sali 2013; Kembro and Näslund 2014). Nevertheless, as ARPs are enabled by information sharing
it is crucial to consider these factors when evaluating how ARP influences the performance of
the company.
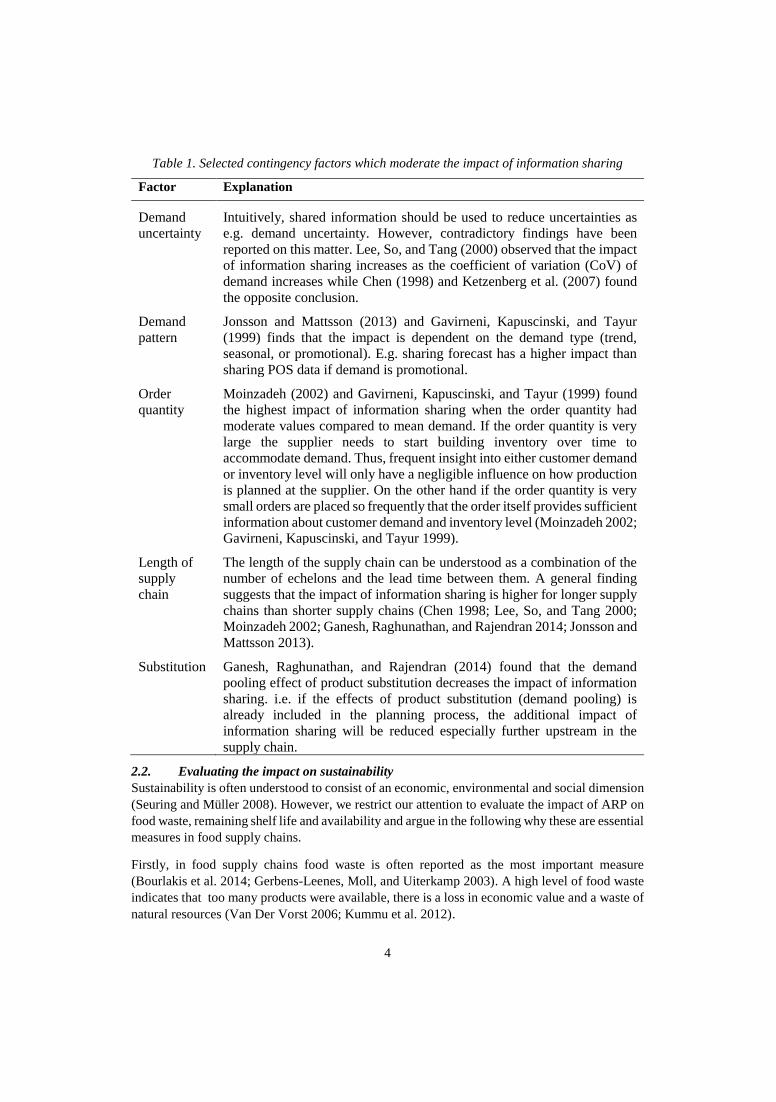
4
Table 1. Selected contingency factors which moderate the impact of information sharing
Factor Explanation
Demand
uncertainty
Intuitively, shared information should be used to reduce uncertainties as
e.g. demand uncertainty. However, contradictory findings have been
reported on this matter. Lee, So, and Tang (2000) observed that the impact
of information sharing increases as the coefficient of variation (CoV) of
demand increases while Chen (1998) and Ketzenberg et al. (2007) found
the opposite conclusion.
Demand
pattern
Jonsson and Mattsson (2013) and Gavirneni, Kapuscinski, and Tayur
(1999) finds that the impact is dependent on the demand type (trend,
seasonal, or promotional). E.g. sharing forecast has a higher impact than
sharing POS data if demand is promotional.
Order
quantity
Moinzadeh (2002) and Gavirneni, Kapuscinski, and Tayur (1999) found
the highest impact of information sharing when the order quantity had
moderate values compared to mean demand. If the order quantity is very
large the supplier needs to start building inventory over time to
accommodate demand. Thus, frequent insight into either customer demand
or inventory level will only have a negligible influence on how production
is planned at the supplier. On the other hand if the order quantity is very
small orders are placed so frequently that the order itself provides sufficient
information about customer demand and inventory level (Moinzadeh 2002;
Gavirneni, Kapuscinski, and Tayur 1999).
Length of
supply
chain
The length of the supply chain can be understood as a combination of the
number of echelons and the lead time between them. A general finding
suggests that the impact of information sharing is higher for longer supply
chains than shorter supply chains (Chen 1998; Lee, So, and Tang 2000;
Moinzadeh 2002; Ganesh, Raghunathan, and Rajendran 2014; Jonsson and
Mattsson 2013).
Substitution Ganesh, Raghunathan, and Rajendran (2014) found that the demand
pooling effect of product substitution decreases the impact of information
sharing. i.e. if the effects of product substitution (demand pooling) is
already included in the planning process, the additional impact of
information sharing will be reduced especially further upstream in the
supply chain.
2.2. Evaluating the impact on sustainability
Sustainability is often understood to consist of an economic, environmental and social dimension
(Seuring and Müller 2008). However, we restrict our attention to evaluate the impact of ARP on
food waste, remaining shelf life and availability and argue in the following why these are essential
measures in food supply chains.
Firstly, in food supply chains food waste is often reported as the most important measure
(Bourlakis et al. 2014; Gerbens-Leenes, Moll, and Uiterkamp 2003). A high level of food waste
indicates that too many products were available, there is a loss in economic value and a waste of
natural resources (Van Der Vorst 2006; Kummu et al. 2012).
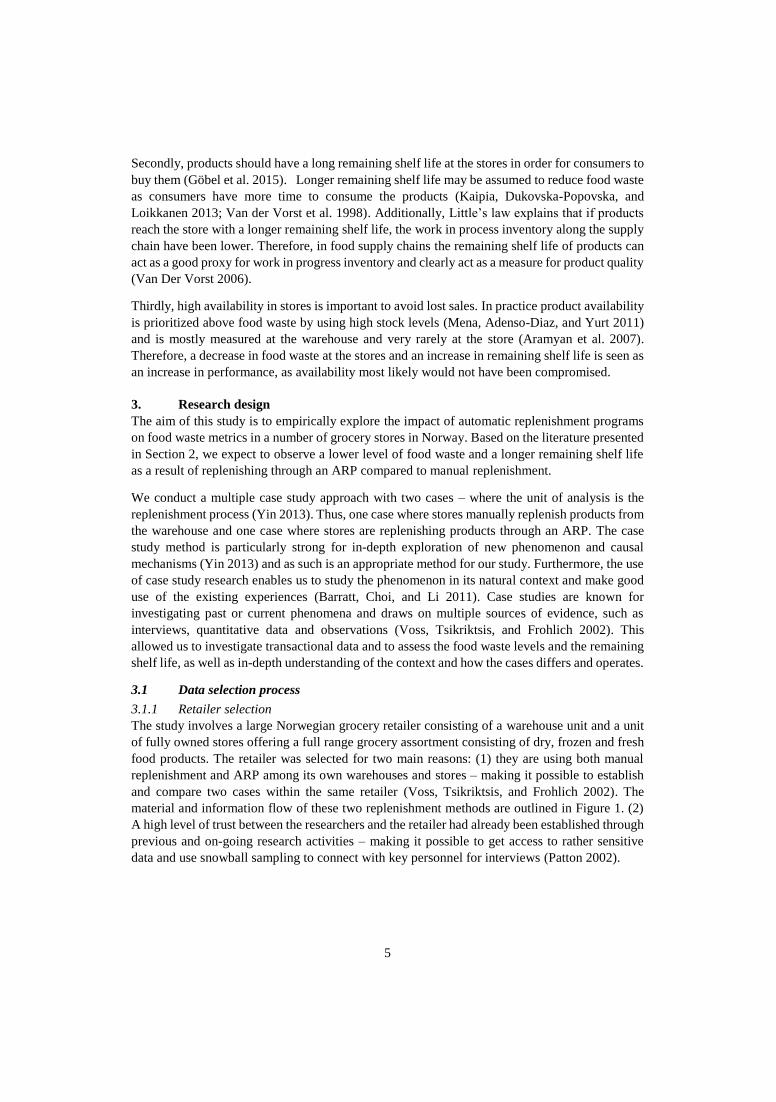
5
Secondly, products should have a long remaining shelf life at the stores in order for consumers to
buy them (Göbel et al. 2015). Longer remaining shelf life may be assumed to reduce food waste
as consumers have more time to consume the products (Kaipia, Dukovska-Popovska, and
Loikkanen 2013; Van der Vorst et al. 1998). Additionally, Little’s law explains that if products
reach the store with a longer remaining shelf life, the work in process inventory along the supply
chain have been lower. Therefore, in food supply chains the remaining shelf life of products can
act as a good proxy for work in progress inventory and clearly act as a measure for product quality
(Van Der Vorst 2006).
Thirdly, high availability in stores is important to avoid lost sales. In practice product availability
is prioritized above food waste by using high stock levels (Mena, Adenso-Diaz, and Yurt 2011)
and is mostly measured at the warehouse and very rarely at the store (Aramyan et al. 2007).
Therefore, a decrease in food waste at the stores and an increase in remaining shelf life is seen as
an increase in performance, as availability most likely would not have been compromised.
3. Research design
The aim of this study is to empirically explore the impact of automatic replenishment programs
on food waste metrics in a number of grocery stores in Norway. Based on the literature presented
in Section 2, we expect to observe a lower level of food waste and a longer remaining shelf life
as a result of replenishing through an ARP compared to manual replenishment.
We conduct a multiple case study approach with two cases – where the unit of analysis is the
replenishment process (Yin 2013). Thus, one case where stores manually replenish products from
the warehouse and one case where stores are replenishing products through an ARP. The case
study method is particularly strong for in-depth exploration of new phenomenon and causal
mechanisms (Yin 2013) and as such is an appropriate method for our study. Furthermore, the use
of case study research enables us to study the phenomenon in its natural context and make good
use of the existing experiences (Barratt, Choi, and Li 2011). Case studies are known for
investigating past or current phenomena and draws on multiple sources of evidence, such as
interviews, quantitative data and observations (Voss, Tsikriktsis, and Frohlich 2002). This
allowed us to investigate transactional data and to assess the food waste levels and the remaining
shelf life, as well as in-depth understanding of the context and how the cases differs and operates.
3.1 Data selection process
3.1.1 Retailer selection
The study involves a large Norwegian grocery retailer consisting of a warehouse unit and a unit
of fully owned stores offering a full range grocery assortment consisting of dry, frozen and fresh
food products. The retailer was selected for two main reasons: (1) they are using both manual
replenishment and ARP among its own warehouses and stores – making it possible to establish
and compare two cases within the same retailer (Voss, Tsikriktsis, and Frohlich 2002). The
material and information flow of these two replenishment methods are outlined in Figure 1. (2)
A high level of trust between the researchers and the retailer had already been established through
previous and on-going research activities – making it possible to get access to rather sensitive
data and use snowball sampling to connect with key personnel for interviews (Patton 2002).
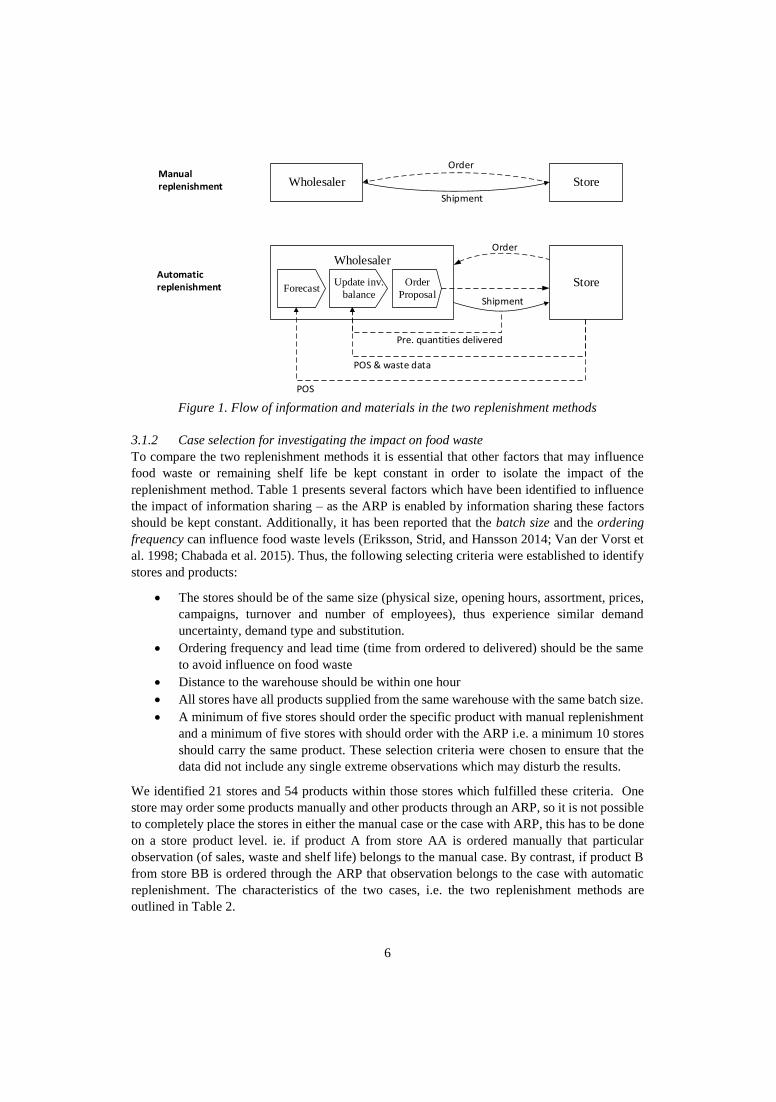
6
Wholesaler Store
Wholesaler
StoreForecast
Update inv.
balance
Order
Proposal
POS
POS & waste data
Pre. quantities delivered
Order
Shipment
Order
Shipment
Manual replenishment
Automatic replenishment
Figure 1. Flow of information and materials in the two replenishment methods
3.1.2 Case selection for investigating the impact on food waste
To compare the two replenishment methods it is essential that other factors that may influence
food waste or remaining shelf life be kept constant in order to isolate the impact of the
replenishment method. Table 1 presents several factors which have been identified to influence
the impact of information sharing – as the ARP is enabled by information sharing these factors
should be kept constant. Additionally, it has been reported that the batch size and the ordering
frequency can influence food waste levels (Eriksson, Strid, and Hansson 2014; Van der Vorst et
al. 1998; Chabada et al. 2015). Thus, the following selecting criteria were established to identify
stores and products:
• The stores should be of the same size (physical size, opening hours, assortment, prices,
campaigns, turnover and number of employees), thus experience similar demand
uncertainty, demand type and substitution.
• Ordering frequency and lead time (time from ordered to delivered) should be the same
to avoid influence on food waste
• Distance to the warehouse should be within one hour
• All stores have all products supplied from the same warehouse with the same batch size.
• A minimum of five stores should order the specific product with manual replenishment
and a minimum of five stores with should order with the ARP i.e. a minimum 10 stores
should carry the same product. These selection criteria were chosen to ensure that the
data did not include any single extreme observations which may disturb the results.
We identified 21 stores and 54 products within those stores which fulfilled these criteria. One
store may order some products manually and other products through an ARP, so it is not possible
to completely place the stores in either the manual case or the case with ARP, this has to be done
on a store product level. ie. if product A from store AA is ordered manually that particular
observation (of sales, waste and shelf life) belongs to the manual case. By contrast, if product B
from store BB is ordered through the ARP that observation belongs to the case with automatic
replenishment. The characteristics of the two cases, i.e. the two replenishment methods are
outlined in Table 2.
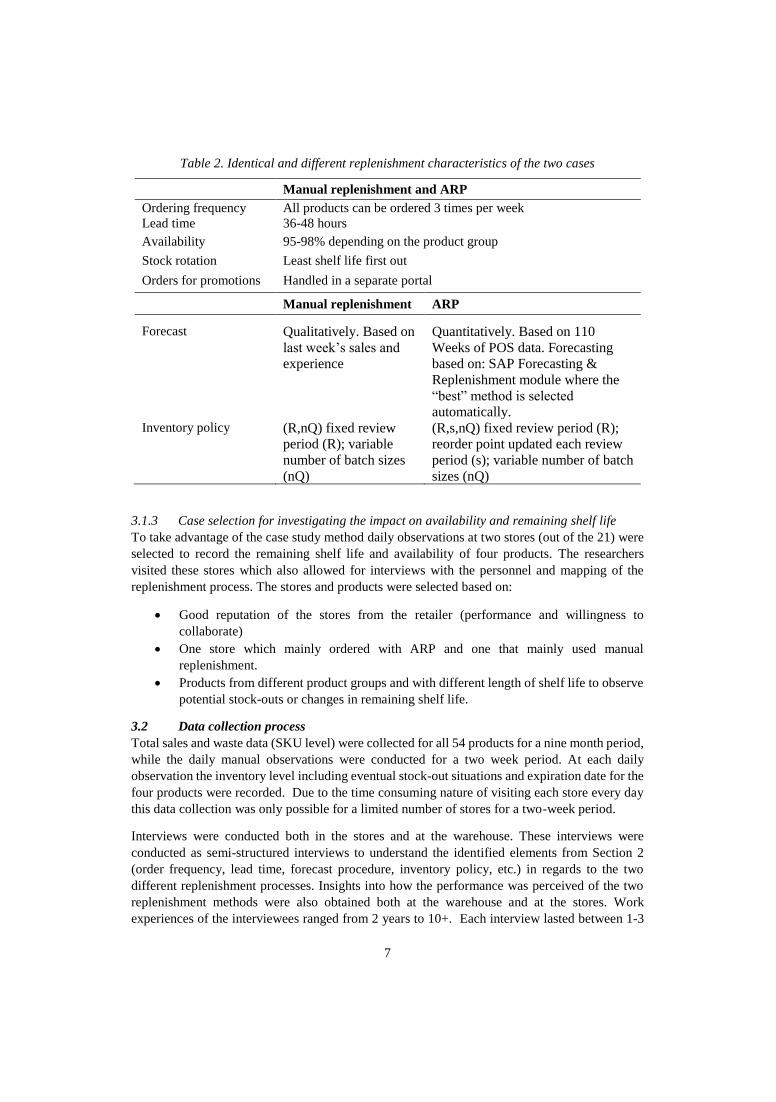
7
Table 2. Identical and different replenishment characteristics of the two cases
Manual replenishment and ARP
Ordering frequency All products can be ordered 3 times per week
Lead time 36-48 hours
Availability 95-98% depending on the product group
Stock rotation Least shelf life first out
Orders for promotions Handled in a separate portal
Manual replenishment ARP
Forecast Qualitatively. Based on
last week’s sales and
experience
Quantitatively. Based on 110
Weeks of POS data. Forecasting
based on: SAP Forecasting &
Replenishment module where the
“best” method is selected
automatically. Inventory policy (R,nQ) fixed review
period (R); variable
number of batch sizes
(nQ)
(R,s,nQ) fixed review period (R);
reorder point updated each review
period (s); variable number of batch
sizes (nQ)
3.1.3 Case selection for investigating the impact on availability and remaining shelf life
To take advantage of the case study method daily observations at two stores (out of the 21) were
selected to record the remaining shelf life and availability of four products. The researchers
visited these stores which also allowed for interviews with the personnel and mapping of the
replenishment process. The stores and products were selected based on:
• Good reputation of the stores from the retailer (performance and willingness to
collaborate)
• One store which mainly ordered with ARP and one that mainly used manual
replenishment.
• Products from different product groups and with different length of shelf life to observe
potential stock-outs or changes in remaining shelf life.
3.2 Data collection process
Total sales and waste data (SKU level) were collected for all 54 products for a nine month period,
while the daily manual observations were conducted for a two week period. At each daily
observation the inventory level including eventual stock-out situations and expiration date for the
four products were recorded. Due to the time consuming nature of visiting each store every day
this data collection was only possible for a limited number of stores for a two-week period.
Interviews were conducted both in the stores and at the warehouse. These interviews were
conducted as semi-structured interviews to understand the identified elements from Section 2
(order frequency, lead time, forecast procedure, inventory policy, etc.) in regards to the two
different replenishment processes. Insights into how the performance was perceived of the two
replenishment methods were also obtained both at the warehouse and at the stores. Work
experiences of the interviewees ranged from 2 years to 10+. Each interview lasted between 1-3
8
hours and was performed by a minimum two of the authors. Directly after the visit, the interview
was documented in field notes and summarised by the researchers. Subsequently, it was sent to
the company for approval and verification as well as discussed in small workshops which served
as a platform for confirming and reconciling the interpretations. Table 3 summaries all collected
data.
Table 3. Collected data
Type Description Coverage Purpose
Data records Sales of 54 products in 21 stores
Waste of 54 products in 21
stores
Shelf life of 54 products (master
data)
Total sales and
waste per product
per store for nine
months
Investigate the
impact on food
waste
Observations Inventory level with remaining
shelf life information of four
products in two stores
Daily observations
for 14 days
Investigate the
impact on
availability and
remaining shelf life
Interviews
(June 2015)
Store managers (2 pers.)
Warehouse manager
Employee responsible for ARP
Employee responsible for
forecasting
Between 1-3
hours per
interview.
Understand the two
replenishment
methods and the
perceived
performance
Workshop
(Sep. 2015)
Warehouse manager
Store managers (2 pers.)
2 workshops, 2
hours each
Validate the
collected data and
discuss preliminary
findings
3.3 Data analysis process
3.3.1 Impact on food waste
The data records of the 54 products (see Table 3) were grouped according to their shelf life as a
higher food waste level was expected for products with short shelf life and less for products with
long shelf life (Mena, Adenso-Diaz, and Yurt 2011). The groups (see Table 4) were formed based
on the criteria of having the same range within each group (in this case ranges of 20 days) while
at the same time not having too big a dispersion of the number of observations and number of
products within each group. However, the first group (20 to 30 days) was used to separate
products which in the literature are known as fresh food products with shelf life below 30 days
(Van Donselaar et al. 2006). Due to confidentiality reasons any individual product cannot be
presented with waste and sales information.
Table 4 specifies the number of data records for each group. The first group (20-30 days) consist
of four products and with data from 21 stores a maximum of 84 data records in total is possible
for this group. However, a total of 78 data records is included as all 21 stores did not carry all
four products. Of the 78 records 29 is from stores with manual replenishment and 49 with an
ARP.
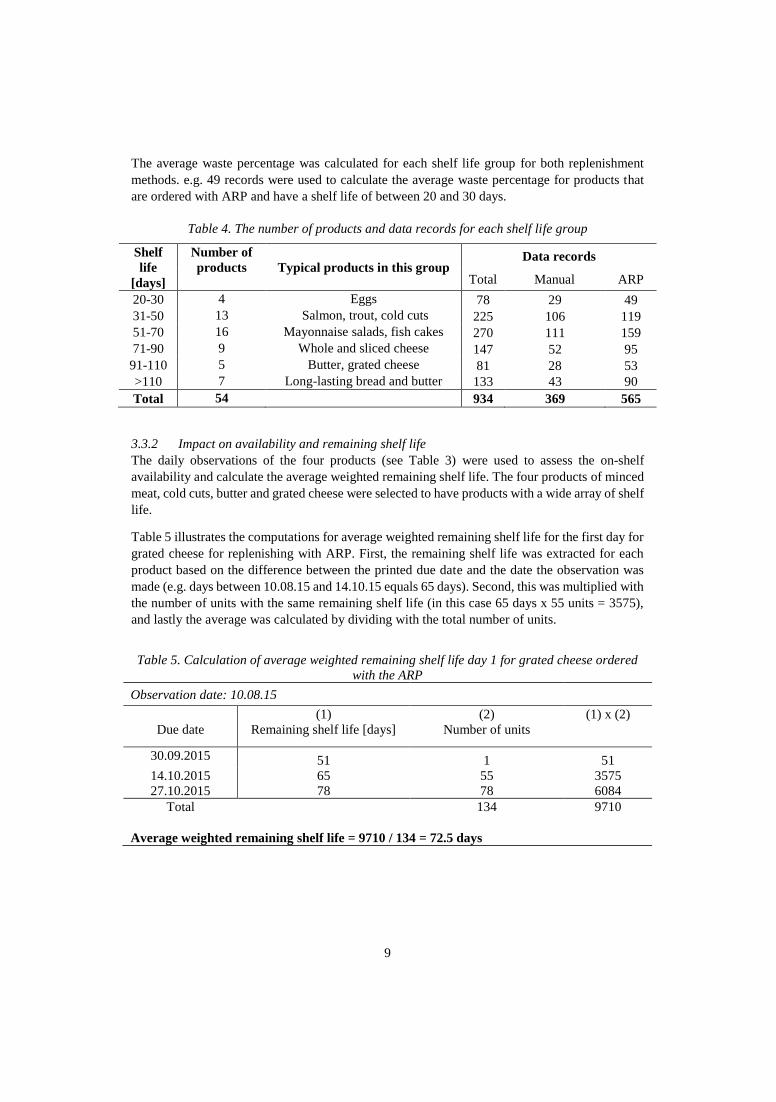
9
The average waste percentage was calculated for each shelf life group for both replenishment
methods. e.g. 49 records were used to calculate the average waste percentage for products that
are ordered with ARP and have a shelf life of between 20 and 30 days.
Table 4. The number of products and data records for each shelf life group
Shelf
life
[days]
Number of
products Typical products in this group Data records
Total Manual ARP
20-30 4 Eggs 78 29 49
31-50 13 Salmon, trout, cold cuts 225 106 119
51-70 16 Mayonnaise salads, fish cakes 270 111 159
71-90 9 Whole and sliced cheese 147 52 95
91-110 5 Butter, grated cheese 81 28 53
>110 7 Long-lasting bread and butter 133 43 90
Total 54 934 369 565
3.3.2 Impact on availability and remaining shelf life
The daily observations of the four products (see Table 3) were used to assess the on-shelf
availability and calculate the average weighted remaining shelf life. The four products of minced
meat, cold cuts, butter and grated cheese were selected to have products with a wide array of shelf
life.
Table 5 illustrates the computations for average weighted remaining shelf life for the first day for
grated cheese for replenishing with ARP. First, the remaining shelf life was extracted for each
product based on the difference between the printed due date and the date the observation was
made (e.g. days between 10.08.15 and 14.10.15 equals 65 days). Second, this was multiplied with
the number of units with the same remaining shelf life (in this case 65 days x 55 units = 3575),
and lastly the average was calculated by dividing with the total number of units.
Table 5. Calculation of average weighted remaining shelf life day 1 for grated cheese ordered
with the ARP
Observation date: 10.08.15
Due date
(1)
Remaining shelf life [days]
(2)
Number of units
(1) x (2)
30.09.2015 51 1 51
14.10.2015 65 55 3575
27.10.2015 78 78 6084
Total 134 9710
Average weighted remaining shelf life = 9710 / 134 = 72.5 days
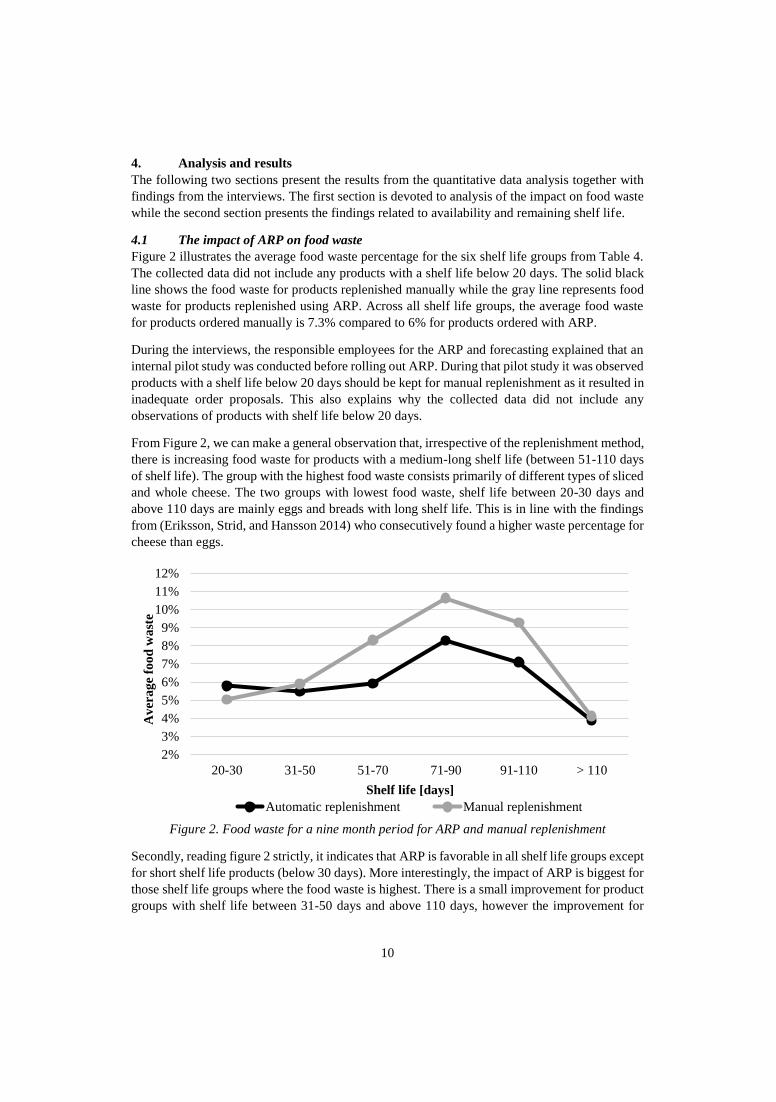
10
4. Analysis and results
The following two sections present the results from the quantitative data analysis together with
findings from the interviews. The first section is devoted to analysis of the impact on food waste
while the second section presents the findings related to availability and remaining shelf life.
4.1 The impact of ARP on food waste
Figure 2 illustrates the average food waste percentage for the six shelf life groups from Table 4.
The collected data did not include any products with a shelf life below 20 days. The solid black
line shows the food waste for products replenished manually while the gray line represents food
waste for products replenished using ARP. Across all shelf life groups, the average food waste
for products ordered manually is 7.3% compared to 6% for products ordered with ARP.
During the interviews, the responsible employees for the ARP and forecasting explained that an
internal pilot study was conducted before rolling out ARP. During that pilot study it was observed
products with a shelf life below 20 days should be kept for manual replenishment as it resulted in
inadequate order proposals. This also explains why the collected data did not include any
observations of products with shelf life below 20 days.
From Figure 2, we can make a general observation that, irrespective of the replenishment method,
there is increasing food waste for products with a medium-long shelf life (between 51-110 days
of shelf life). The group with the highest food waste consists primarily of different types of sliced
and whole cheese. The two groups with lowest food waste, shelf life between 20-30 days and
above 110 days are mainly eggs and breads with long shelf life. This is in line with the findings
from (Eriksson, Strid, and Hansson 2014) who consecutively found a higher waste percentage for
cheese than eggs.
Figure 2. Food waste for a nine month period for ARP and manual replenishment
Secondly, reading figure 2 strictly, it indicates that ARP is favorable in all shelf life groups except
for short shelf life products (below 30 days). More interestingly, the impact of ARP is biggest for
those shelf life groups where the food waste is highest. There is a small improvement for product
groups with shelf life between 31-50 days and above 110 days, however the improvement for
2%
3%
4%
5%
6%
7%
8%
9%
10%
11%
12%
20-30 31-50 51-70 71-90 91-110 > 110
Av
era
ge
foo
d w
ast
e
Shelf life [days]
Automatic replenishment Manual replenishment
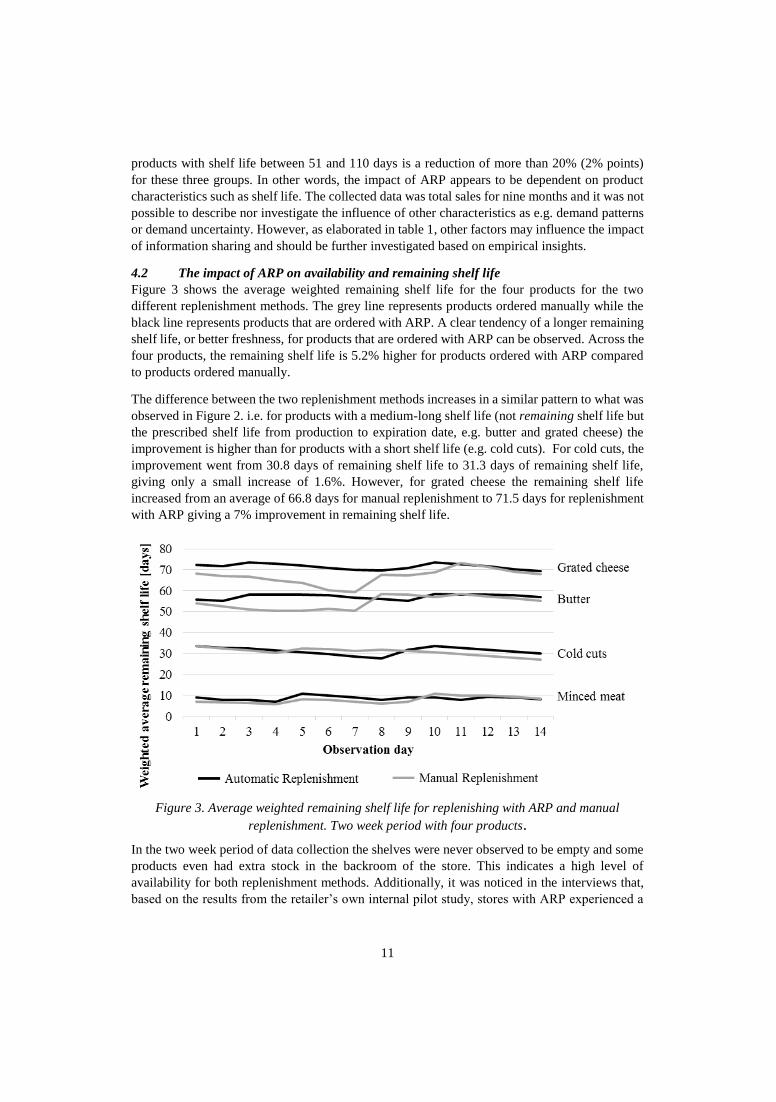
11
products with shelf life between 51 and 110 days is a reduction of more than 20% (2% points)
for these three groups. In other words, the impact of ARP appears to be dependent on product
characteristics such as shelf life. The collected data was total sales for nine months and it was not
possible to describe nor investigate the influence of other characteristics as e.g. demand patterns
or demand uncertainty. However, as elaborated in table 1, other factors may influence the impact
of information sharing and should be further investigated based on empirical insights.
4.2 The impact of ARP on availability and remaining shelf life
Figure 3 shows the average weighted remaining shelf life for the four products for the two
different replenishment methods. The grey line represents products ordered manually while the
black line represents products that are ordered with ARP. A clear tendency of a longer remaining
shelf life, or better freshness, for products that are ordered with ARP can be observed. Across the
four products, the remaining shelf life is 5.2% higher for products ordered with ARP compared
to products ordered manually.
The difference between the two replenishment methods increases in a similar pattern to what was
observed in Figure 2. i.e. for products with a medium-long shelf life (not remaining shelf life but
the prescribed shelf life from production to expiration date, e.g. butter and grated cheese) the
improvement is higher than for products with a short shelf life (e.g. cold cuts). For cold cuts, the
improvement went from 30.8 days of remaining shelf life to 31.3 days of remaining shelf life,
giving only a small increase of 1.6%. However, for grated cheese the remaining shelf life
increased from an average of 66.8 days for manual replenishment to 71.5 days for replenishment
with ARP giving a 7% improvement in remaining shelf life.
Figure 3. Average weighted remaining shelf life for replenishing with ARP and manual
replenishment. Two week period with four products.
In the two week period of data collection the shelves were never observed to be empty and some
products even had extra stock in the backroom of the store. This indicates a high level of
availability for both replenishment methods. Additionally, it was noticed in the interviews that,
based on the results from the retailer’s own internal pilot study, stores with ARP experienced a
12
2-3% increase in availability (assuming that the stores had a yearly turnover of 1.2 million euro
to ensure a satisfactory inventory turnover and stability for using ARP).
Also, from the interviews it was confirmed that for ARP to function it requires high quality data,
e.g. it is important that the number of products on the shelves is aligned with the information in
the system. Poor quality data would result is inadequate order proposals from the ARP. As a
result, store managers have the option to overrule the order proposal from the ARP but this was
mainly applied during the implementation phase until the ARP is fine turned.
Compared to manual replenishment the store managers explained that ARP required less
experience and training and highlighted how this was apparent during sick leave and vacations
where manual replenishment was challenging. The warehouse manager also added that using
ARP makes the replenishment process more standardized. Ideally, this would result in a more
consistent experience (related to availability and remaining shelf life) for the consumers across
stores.
5. Discussion and conclusion
The aim of this study was to empirically explore the impact of automatic replenishment on food
waste and remaining shelf life in a Norwegian grocery store chain. The study contrasted manual
replenishment method with an automated one. The study demonstrated that the use of automatic
replenishment has a positive impact on reducing food waste and increasing remaining shelf life
of some food products. The improvement from automatic replenishment is highest for products
with a shelf life between 51 and 110 days where the food waste reduction exceeds 20% (2%
points) for the products analyzed. Unexpectedly, this group also represents the products with the
highest food waste levels in the study. It was expected that the very fresh product category (shelf
life below 30 days) had the largest waste levels as these products are highly time sensitive and
are commonly known for having high food waste (Mena, Adenso-Diaz, and Yurt 2011; Kaipia,
Dukovska-Popovska, and Loikkanen 2013). The waste level for the products with a long shelf
life were low as expected, but it is somewhat interesting that the utilization of automatic
replenishment did not seem to have a significant impact on food waste for this group.
The discussion of these results is separated into three main subsections. First, we discuss how the
findings can extend the current body of knowledge of automatic replenishment and information
sharing and how it affects sustainability measures. Afterwards we focus on the financial impact
and place the findings in a managerial context to assess its implications. Lastly, we discuss the
limitations of this study and propose important paths for future research.
5.1 Extension of literature
It has been proposed that increased information sharing of demand information upstream in the
supply chain could contribute to decreased food waste in the supply chain (Mena et al. 2014).
Also, empirical research establishing and investigating the relation between information sharing
and performance is scarce (Baihaqi and Sohal 2013; Kembro and Näslund 2014). This study used
an automatic replenishment program as a proxy for information sharing and investigated how it
affects performance of certain sustainability measures.
We empirically investigated the relation between the use of automatic replenishment and food
waste metrics in grocery stores. The findings suggest a positive relationship although modest in
size. The impact may be as high as 20% for certain products, which can be used as an initiative
13
for stores to engage in (more) information sharing activities. The findings add to the limited
amount of literature which investigates how information sharing impacts food waste and the
remaining shelf life. Similar to Kaipia, Dukovska-Popovska, and Loikkanen (2013) the findings
show an improvement in both performance measures and supports proposition 1b by Mena et al.
(2014).
Table 1 highlights how the impact of information sharing has been previously discussed to be
dependent on certain contingency factors. If information is shared and used through an automatic
replenishment program in a food context, Figure 2 and 3 suggests the impact of shared
information depends on the shelf life of the product. The interesting question is why this
dependency appears. A plausible explanation is that the POS and waste data do not provide
sufficient information to support the complexity for replenishing products with a short shelf life.
Here, additional information such as remaining shelf life, quality, appearance or an estimate of
one of these might be necessary to share as well to improve the replenishment decision. This type
of information is available with manual replenishment, thus there is a more complete picture of
how the situation is, and could explain why it performs better for products with a shelf life
between 20-30 days. When the shelf life is medium to medium-long (see Figure 3) it gets less
complicated to make the replenishment decision and here POS data and waste data can be of great
value for making replenishment decisions. For products with a long shelf life the replenishment
decision might have little impact on the level of food waste and improving the replenishment
decision for these products may therefore not show up as less food waste.
The dependency of shelf life for some products adds to the theoretical understanding of
information sharing in supply chains. It has been proposed in numerous studies that the impact
of information sharing is dependent on several factors, such as demand uncertainty, lead times
and order quantities. However, this study proposes a new additional contingency factor by
suggesting that, in a food context, the value of shared information is dependent on the shelf life
of the products.
From a sustainability perspective, the findings indicate that the use of automatic replenishment
contributes to a more sustainable food supply chain with less food waste and provides consumers
with fresher products without harming availability. Obviously, reduced food waste is an
economical gain for the companies involved in the chain, but reducing food waste at stores and
improving remaining shelf life at consumers will, over time, require less food to be produced and
transported from the primary producers to the final consumer. This contributes to a preservation
of natural resources and limits the impact on the environment.
5.2 Managerial and financial implications
From a managerial perspective, the findings highlight that food waste is not only an issue for
products with a shelf life below 30 days but also for products with medium to long shelf life. The
use of an automatic replenishment program is a valuable remedy for decreasing food waste at
stores for products with medium-long shelf life while maintaining the availability of products.
By using an automatic replenishment program the stores were able to obtain a 5.2% improvement
in freshness and 1.3% lower food waste. An average reduction of food waste of 1.3% might not
sound substantial and practitioners may find the impact too small to act upon. However, it should
be taken into account that this is a net loss in profit for the individual store. If put into a broader
context, namely the Norwegian grocery market, it becomes more interesting. The total profit in
14
2014, of the three largest grocery retailers in Norway, was 366 million Euro and a total turnover
of 16,775 million Euro giving an average earning of 2.2%. If the 1.3% waste could be eliminated
this would potentially increase the average earnings to 3,5%. In other words, an increase in profit
with another 218 million Euro to a total of 584 million Euro in profit (some of the savings is of
course already realized as some stores have implemented automatic replenishment). Additionally,
savings for transportation, energy, water and cropland up through the supply chain is possible.
Through better transparency the wholesaler would also be able to improve its own inventory
performance (not just at the stores) an improvement that previously has been reported to be
between 1.75% and 2.2% (Cachon and Fisher 2000; Chen 1998).
Overall, the results indicate that it is beneficial to utilize automatic replenishment for
replenishment decisions in the food industry. However, some differentiating or tailoring of the
replenishment system is needed for products with a short shelf life. Additionally, proper
governance structures should be formulated for the ownership of the shared data, especially if the
retailer and the wholesaler are two independent companies. If multiple retailers use the same
wholesaler a neutral third party company could be introduced to receive the information and
handle the automatic replenishment program. This will reduce the risk of competitors getting
access to sensitive data.
5.3 Limitations and further research
The study has several limitations that should be used to guide further research. The study only
includes a limited number of products for investigating the impact on availability and remaining
shelf life in food stores in Norway. However, the small sample suggests that there is a possible
improvement and for future research this should be scrutinized further with more products and a
longer time period.
It has previously been highlighted how different demand patterns may influence the impact of
information sharing. This could be further investigated for new empirical insights. The collected
data in this study was the total sales for nine months and therefore a further analysis of demand
patterns was not possible. Likewise, the data did not include products with a shelf life below 20
days. It should be investigate if sharing point-of-sales and waste data for these more perishable
products are sufficient or if sharing more detailed information are needed and profitable to
improve the replenishment decision (Huang, Li, and Ho 2015). This additional information may
include inventory levels with remaining shelf life or estimated remaining shelf life based on
temperature log (Ketzenberg, Bloemhof, and Gaukler 2015). This type information could not only
be used for establishing more advanced inventory policies (Cannella, Ciancimino, and Framinan
2011; Cannella 2014; Costantino et al. 2015), but also used to make suggestions for highly
relevant initiatives such as timely markdowns, shop by shop promotions or trans-shipments
between nearby stores on the same delivery route.
Substitution among products may also be an important factor to consider for improving the
replenishment decision further (Ganesh, Raghunathan, and Rajendran 2014). If the products are
ordered manually, the manager may choose to order less of one specific product if he observes a
high stock level of a substituting product with short remaining shelf life (in order to sell this first).
The system that utilizes the shared information does not have this possibility and controls each
product individually and will react more slowly to substitution signals. This is further supported
by Van Woensel et al. (2007) who suggest that automatic replenishment for perishable items with
short shelf life should be separate for non-perishable products and include the substitution effect.
15
6. Acknowledgements
The authors gratefully acknowledge the assistance provided by the Norwegian Research Council
(NRC) for the financial support of Retail Supply Chain 2020. Also, we would like to thank the
participating case company which together with the NRC enabled this study. We would like to
thank Anita Romsdal, Jan Ola Strandhagen and Cecilia Haskins for their helpful comments and
suggestions. Lastly, we would like to thank Chris Martin for assistance in editing this paper.
7. References
Aramyan, Lusine H, Alfons GJM Oude Lansink, Jack GAJ Van Der Vorst, and Olaf Van Kooten. 2007.
"Performance measurement in agri-food supply chains: a case study." Review of. Supply Chain
Management: An International Journal 12 (4):304-15.
Arshinder, Arun Kanda, and S. G. Deshmukh. 2008. "Supply chain coordination: Perspectives, empirical
studies and research directions." Review of. International Journal of Production Economics 115
(2):316-35. doi: 10.1016/j.ijpe.2008.05.011.
Associates, Kurt Salmon. 1993. "Efficient Consumer Response: Enhancing Consumer Value in the Grocery
Industry,." In. The Research Department Food Marketing Institute, Washington.
Aviv, Yossi. 2001. "The effect of collaborative forecasting on supply chain performance." Review of.
Management science 47 (10):1326-43.
Baihaqi, Imam, and Amrik S Sohal. 2013. "The impact of information sharing in supply chains on
organisational performance: an empirical study." Review of. Production Planning & Control 24
(8-9):743-58.
Bakker, Monique, Jan Riezebos, and Ruud H Teunter. 2012. "Review of inventory systems with
deterioration since 2001." Review of. European journal of operational research 221 (2):275-84.
Barratt, Mark, Thomas Y Choi, and Mei Li. 2011. "Qualitative case studies in operations management:
Trends, research outcomes, and future research implications." Review of. Journal of Operations
Management 29 (4):329-42.
Barratt, Mark, and Adegoke Oke. 2007. "Antecedents of supply chain visibility in retail supply chains: a
resource-based theory perspective." Review of. Journal of Operations Management 25 (6):1217-
33.
Bourlakis, Michael, George Maglaras, David Gallear, and Christos Fotopoulos. 2014. "Examining
sustainability performance in the supply chain: The case of the Greek dairy sector." Review of.
Industrial Marketing Management 43 (1):56-66.
Broekmeulen, Rob ACM, and Karel H van Donselaar. 2009. "A heuristic to manage perishable inventory
with batch ordering, positive lead-times, and time-varying demand." Review of. Computers &
Operations Research 36 (11):3013-8.
Cachon, Gérard P, and Marshall Fisher. 2000. "Supply chain inventory management and the value of shared
information." Review of. Management science 46 (8):1032-48.
Cannella, S., E. Ciancimino, and J. M. Framinan. 2011. "Inventory policies and information sharing in multi-
echelon supply chains." Review of. Production Planning & Control 22 (7):649-59. doi:
10.1080/09537287.2010.512276.
Cannella, Salvatore. 2014. "Order-up-to policies in information exchange supply chains." Review of.
Applied Mathematical Modelling 38 (23):5553-61.
Chabada, Lukas, Heidi Carin Dreyer, Hans Henrik Hvolby, and Kasper Kiil. 2015. Linkage Between
Delivery Frequency and Food Waste: Multiple Case Studies of a Norwegian Retail Chain. Paper
presented at the IFIP International Conference on Advances in Production Management Systems.
Chen, Fangruo. 1998. "Echelon reorder points, installation reorder points, and the value of centralized
demand information." Review of. Management science 44 (12-part-2):S221-S34.
Cooper, Martha C, Douglas M Lambert, and Janus D Pagh. 1997. "Supply chain management: more than a
new name for logistics." Review of. The International Journal of Logistics Management 8 (1):1-
14.
Costantino, Francesco, Giulio Di Gravio, Ahmed Shaban, and Massimo Tronci. 2015. "The impact of
information sharing on ordering policies to improve supply chain performances." Review of.
Computers & Industrial Engineering 82:127-42.
16
Daugherty, Patricia J, Matthew B Myers, and Chad W Autry. 1999. "Automatic replenishment programs:
an empirical examination." Review of. Journal of business logistics 20 (2):63-82.
Disney, Stephen M, and Denis R Towill. 2003. "The effect of vendor managed inventory (VMI) dynamics
on the Bullwhip Effect in supply chains." Review of. International Journal of Production
Economics 85 (2):199-215.
Donaldson, Lex. 2006. "The contingency theory of organizational design: challenges and opportunities." In
Organization Design, 19-40. Springer.
Eriksson, Mattias, Ingrid Strid, and Per-Anders Hansson. 2014. "Waste of organic and conventional meat
and dairy products—A case study from Swedish retail." Review of. Resources, Conservation and
Recycling 83:44-52.
Ferguson, M., and M. E. Ketzenberg. 2006. "Information sharing to improve retail product freshness of
perishables." Review of. Production and Operations Management 15 (1):57-73.
Ganesh, M., S. Raghunathan, and C. Rajendran. 2014. "The value of information sharing in a multi-product,
multi-level supply chain: Impact of product substitution, demand correlation, and partial
information sharing." Review of. Decision Support Systems 58:79-94. doi:
10.1016/j.dss.2013.01.012.
Gavirneni, Srinagesh, Roman Kapuscinski, and Sridhar Tayur. 1999. "Value of information in capacitated
supply chains." Review of. Management science 45 (1):16-24.
Gerbens-Leenes, PW, HC Moll, and AJM Schoot Uiterkamp. 2003. "Design and development of a
measuring method for environmental sustainability in food production systems." Review of.
Ecological Economics 46 (2):231-48.
Giard, Vincent, and Mustapha Sali. 2013. "The bullwhip effect in supply chains: a study of contingent and
incomplete literature." Review of. International Journal of Production Research 51 (13):3880-
93.
Göbel, Christine, Nina Langen, Antonia Blumenthal, Petra Teitscheid, and Guido Ritter. 2015. "Cutting
Food Waste through Cooperation along the Food Supply Chain." Review of. Sustainability 7
(2):1429-45.
Huang, Yeu-Shiang, Ming-Chi Li, and Jyh-Wen Ho. 2015. "Determination of the optimal degree of
information sharing in a two-echelon supply chain." Review of. International Journal of
Production Research:1-17.
Hübner, Alexander H, and Heinrich Kuhn. 2012. "Retail category management: State-of-the-art review of
quantitative research and software applications in assortment and shelf space management."
Review of. Omega 40 (2):199-209.
Jonsson, Patrik, and Stig-Arne Mattsson. 2013. "The value of sharing planning information in supply
chains." Review of. International Journal of Physical Distribution & Logistics Management 43
(4):282-99.
Kaipia, Riikka, Iskra Dukovska-Popovska, and Lauri Loikkanen. 2013. "Creating sustainable fresh food
supply chains through waste reduction." Review of. International Journal of Physical Distribution
& Logistics Management 43 (3):262-76.
Kelepouris, T., P. Miliotis, and K. Pramatari. 2008. "The impact of replenishment parameters and
information sharing on the bullwhip effect: A computational study." Review of. Computers and
Operations Research 35 (11):3657-70. doi: 10.1016/j.cor.2007.04.004.
Kembro, Joakim, and Dag Näslund. 2014. "Information sharing in supply chains, myth or reality? A critical
analysis of empirical literature." Review of. International Journal of Physical Distribution &
Logistics Management 44 (3):179-200.
Kembro, Joakim, Kostas Selviaridis, and Dag Näslund. 2014. "Theoretical perspectives on information
sharing in supply chains: a systematic literature review and conceptual framework." Review of.
Supply Chain Management: An International Journal 19 (5/6):609-25.
Ketzenberg, Michael, Jacqueline Bloemhof, and Gary Gaukler. 2015. "Managing Perishables with Time and
Temperature History." Review of. Production and Operations Management 24 (1):54-70.
Ketzenberg, Michael E, Eve D Rosenzweig, Ann E Marucheck, and Richard D Metters. 2007. "A framework
for the value of information in inventory replenishment." Review of. European journal of
operational research 182 (3):1230-50.
Kummu, M, H De Moel, M Porkka, S Siebert, O Varis, and PJ Ward. 2012. "Lost food, wasted resources:
Global food supply chain losses and their impacts on freshwater, cropland, and fertiliser use."
Review of. Science of the Total Environment 438:477-89.
17
Lee, Hau L, Kut C So, and Christopher S Tang. 2000. "The value of information sharing in a two-level
supply chain." Review of. Management science 46 (5):626-43.
Maloni, Michael J, and Michael E Brown. 2006. "Corporate social responsibility in the supply chain: an
application in the food industry." Review of. Journal of business ethics 68 (1):35-52.
Mena, Carlos, B. Adenso-Diaz, and Oznur Yurt. 2011. "The causes of food waste in the supplier–retailer
interface: Evidences from the UK and Spain." Review of. Resources, Conservation and Recycling
55 (6):648-58. doi: 10.1016/j.resconrec.2010.09.006.
Mena, Carlos, Leon A. Terry, Adrian Williams, and Lisa Ellram. 2014. "Causes of waste across multi-tier
supply networks: Cases in the UK food sector." Review of. International Journal of Production
Economics 152:144-58. doi: 10.1016/j.ijpe.2014.03.012.
Moinzadeh, Kamran. 2002. "A multi-echelon inventory system with information exchange." Review of.
Management science 48 (3):414-26.
Parfitt, Julian, Mark Barthel, and Sarah Macnaughton. 2010. "Food waste within food supply chains:
quantification and potential for change to 2050." Review of. Philosophical Transactions of the
Royal Society B: Biological Sciences 365 (1554):3065-81.
Patton, Michael Quinn. 2002. Qualitative Research & Evaluation Methods. Vol. 3rd Edition: SAGE
Publications, Inc.
Rached, M., Z. Bahroun, and J. P. Campagne. 2015. "Assessing the value of information sharing and its
impact on the performance of the various partners in supply chains." Review of. Computers and
Industrial Engineering 88:237-53. doi: 10.1016/j.cie.2015.07.007.
Raghunathan, Srinivasan. 2001. "Information sharing in a supply chain: A note on its value when demand
is nonstationary." Review of. Management science 47 (4):605-10.
Sabath, Robert E, Chad W Autry, and Patricia J Daugherty. 2001. "Automatic replenishment programs: The
impact of organizational structure." Review of. Journal of business logistics 22 (1):91-105.
Seuring, Stefan, and Martin Müller. 2008. "From a literature review to a conceptual framework for
sustainable supply chain management." Review of. Journal of cleaner production 16 (15):1699-
710.
Taylor, David H., and Andrew Fearne. 2009. "Demand management in fresh food value chains: a framework
for analysis and improvement." Review of. Supply Chain Management: An International Journal
14 (5):379-92. doi: 10.1108/13598540910980297.
Titah, Ryad, Shadi Shuraida, and Yacine Rekik. 2016. "Integration Breach: Investigating the Effect of
Internal and External Information Sharing and Coordination on Firm Profit." Review of.
International Journal of Production Economics.
Trienekens, JH, PM Wognum, Adrie JM Beulens, and Jack GAJ van der Vorst. 2012. "Transparency in
complex dynamic food supply chains." Review of. Advanced Engineering Informatics 26 (1):55-
65.
Van Der Vorst, Jack GAJ. 2006. "Performance measurement in agri-food supply-chain networks." In
Quantifying the agri-food supply chain, edited by C.J. Ondersteijn, J.H. Wijnands, R.B. Huirne
and O. van Kooten, 15-26. Springer.
Van der Vorst, JGAJ, Andrie JM Beulens, W de Wit, and P van Beek. 1998. "Supply chain management in
food chains: Improving performance by reducing uncertainty." Review of. International
Transactions in Operational Research 5 (6):487-99.
Van Donselaar, K, Tom van Woensel, RACM Broekmeulen, and J Fransoo. 2006. "Inventory control of
perishables in supermarkets." Review of. International Journal of Production Economics 104
(2):462-72.
Van Donselaar, Karel H, Vishal Gaur, Tom Van Woensel, Rob ACM Broekmeulen, and Jan C Fransoo.
2010. "Ordering behavior in retail stores and implications for automated replenishment." Review
of. Management science 56 (5):766-84.
Van Woensel, Tom, Karel Van Donselaar, Rob Broekmeulen, and Jan Fransoo. 2007. "Consumer responses
to shelf out-of-stocks of perishable products." Review of. International Journal of Physical
Distribution & Logistics Management 37 (9):704-18.
Vanpoucke, Evelyne, Kenneth K. Boyer, and Ann Vereecke. 2009. "Supply chain information flow
strategies: an empirical taxonomy." Review of. International Journal of Operations & Production
Management 29 (12):1213-41. doi: 10.1108/01443570911005974.
Voss, Chris, Nikos Tsikriktsis, and Mark Frohlich. 2002. "Case research in operations management."
Review of. International Journal of Operations & Production Management 22 (2):195-219.

18
Wu, YN, and TC Edwin Cheng. 2008. "The impact of information sharing in a multiple-echelon supply
chain." Review of. International Journal of Production Economics 115 (1):1-11.
Yao, Yuliang, and Martin Dresner. 2008. "The inventory value of information sharing, continuous
replenishment, and vendor-managed inventory." Review of. Transportation Research Part E:
Logistics and Transportation Review 44 (3):361-78.
Yin, Robert K. 2013. Case study research: Design and methods. Fifth ed: Sage publications.
Yu, Zhenxin, Hong Yan, and TC Edwin Cheng. 2001. "Benefits of information sharing with supply chain
partnerships." Review of. Industrial management & Data systems 101 (3):114-21.
Automatic replenishment of perishables in grocery retailing: The value of utilizing
remaining shelf life information
Kasper Kiil1,2, Hans-Henrik Hvolby1,2, Kym Fraser2,3, Heidi C. Dreyer4, and Jan Ola
Strandhagen1
1Norwegian University of Science and Technology, Department of Mechanical and Industrial
Engineering, Trondheim, Norway 2Aalborg University, Celog, Department of Materials and Production, Aalborg, Denmark
3University of South Australia, Barbara Hardy Institute, Adelaide, Australia 4Norwegian University of Science and Technology, Department of Industrial Economics and
Technology Management, Trondheim, Norway
Purpose: To investigate the impact of sharing and utilizing remaining shelf life information from
grocery stores by use of age-based replenishment policies for perishables
Design/methodology/approach: The performance is evaluated through a discrete event
simulation model, which mirrors a part of one of Norway’s largest grocery retailer and uses their
POS-data to reflect a realistic demand pattern of 232 stores for one year
Findings: The findings indicate that a current age-based replenishment policy (EWA policy)
provides a significant improvement of 17.7% increase in availability for perishables with a shelf
life between 4 to 11 days, but suffers from high inventory levels and only reduces waste with
3.4% compared to a base stock policy. A newly proposed policy, EWASS, provides a more balanced
performance with a reduction of 10.7% waste and 10.3% increase in availability by keeping the
same average inventory level.
Implications: Sharing and utilizing remaining shelf life information for replenishment of
perishables with a predetermined shelf life between 6 to 11 days can be beneficial, and could
enable the replenishment processes to be automated. However, as the shelf life increases further
the benefits slowly diminishes.
Originality/Value: The study proposes a new age-based replenishment policy which showed a
more balanced performance improvement, in both waste and availability, compared previous
replenishment policies.
Keywords. Information sharing, Shelf life, Replenishment, Perishables, Simulation
Submitted for first review: British Food Journal. October 2017
Role of the PhD candidate and declaration of authorship:
Kasper Kiil conceptualized the paper. All authors contributed to the design, verification, and
validation of the simulation model. Kasper developed the simulation model, collected data, and
performed the analysis. The paper was written with input from Hans-Henrik Hvolby and Kym
Fraser.
Paper #4

1
Automatic replenishment of perishables in grocery retailing: The value of
utilizing remaining shelf life information
1. Introduction
Perishables are of major importance for grocery retailers and accounts for 25% of the total sales
and more than 35% of the growth in the European grocery market (Nielsen, 2016). Compared to
other food products the main difference is the shorter shelf life (less than 30 days) (Van Donselaar
et al., 2006). Food waste is often reported to be higher for these perishables products (Kaipia et
al., 2013; Mena et al., 2014) and the short shelf life complicates the inventory management
practice (Karaesmen et al., 2011). Non-perishable products are typically managed through an
automatic replenishment system, which generates order proposals to the stores based on point-
of-sales, safety stock levels, batch sizes, and delivering times (Potter and Disney, 2010). These
systems have shown to improve performance of grocery retailer, however, they do not function
satisfactorily in its original form for perishable products (Van Donselaar et al., 2006).
Suggestions for how automatic replenishment systems can handle perishable products has been
introduced by utilizing remaining shelf life (RSL) information (also known as age distribution)
of the products in the stores (Broekmeulen and van Donselaar, 2009; Duan and Liao, 2013;
Lowalekar and Ravichandran, 2015). Mena et al. (2014) adds that increasing transparency (e.g.
by sharing more detailed information about the product’s age) might reduce supply chain wide
food waste. This is also supported by the proposed replenishment models, which yields promising
results with mean performance improvements (calculated as reduced cost) around 8% and up to
25% in some cases. However, several issues are still not addressed in the current solutions.
Currently, the models are only tested with use of artificial generated stationary demand data in a
dyadic relation with one warehouse and one store, or small scaled divergent systems. Likewise,
the models only handle either a complete first-in-first-out (FIFO) depletion or complete last-in-
first-out (LIFO) depletion even though reality lies somewhere in between those two (Janssen et
al., 2016).
Even though the models can bring important insights they do not fully reflect a modern retailer
configuration with hundreds of stores which each differ in sales, delivery frequency, and required
service levels (Aastrup and Kotzab, 2010; Kuhn and Sternbeck, 2013; van Donk et al., 2008). It
is further noticed that studies of information sharing in dyadic supply chains are too simplified
and more realistic supply chain structures are encouraged (Huang et al., 2003).
The purpose of the paper is to investigate the impact of utilizing the remaining shelf life
information from the stores in a setting closer to the reality of today’s grocery retailers.
Specifically, we do this by examining the inventory control of perishables in a divergent food
supply chain based on one of Norway’s largest retailers with more than 200 stores. Through
simulation the study evaluates one of the popular heuristics for replenishment of perishables, the
EWA policy (Broekmeulen and van Donselaar, 2009), and suggests and evaluates a refined
version of this policy. The evaluation of the replenishment policies is made for products with a
shelf life ranging from 4 to 20 days, mixed FIFO and LIFO depletion, various delivery
frequencies, different service level requirements, and evaluated using an range of performance
measures.
2
2. Background
In perishable inventory management demand is modelled either as deterministic or stochastic,
and the shelf life is either considered as fixed or random. A fixed shelf life refers to a known
deterministic life time whereas random shelf life refers to a known or unknown probabilistic life
time (Janssen et al., 2016). In this study, focus is placed on modelling products with a fixed shelf
life under stochastic demand. Within grocery retailing this includes products such as: dairy, meat,
cold cuts, or other perishable products with a predetermined expiration date. Findings of how to
manage these products with a fixed shelf life may later be extended to include products with a
random shelf life.
If the shelf life of the product is fixed to one day the news vendor solution is optimal, and
extensions for two days shelf life has also been provided (Nahmias and Pierskalla, 1973).
However, as shelf life increases further it becomes significantly complicated to mathematically
find the optimal solution and previous contributions has mainly searched for finding good
heuristic replenishment policies rather than the true optimum (Broekmeulen and van Donselaar,
2009; Duan and Liao, 2013). Replenishment policies might be further subdivided intro either
periodic or continuous review policies. Generally, continuous review policies need less safety
stock than periodic review policies, but on the other hand require (hereof the name) a continuous
review of the inventory level and the ability to place orders at all times (Silver et al., 1998). In
grocery retailing periodic review is most common as stores have predefined days where they
place and receive order (Kuhn and Sternbeck, 2013). Consequently, the remaining of this section
is dedicated to present the most relevant periodic replenishment policies for perishables.
A (R,S)-policy with fixed life time is proposed by (Chiu, 1995) where the decision variables are
both the length of the review period (R) and the order-up-to level (S). The flexible review period
is beneficial from an inventory perspective, however, it might be impractical and challenging
from a routing perspective. With only the order quantity as a decision variable Minner and
Transchel (2010) proposed and evaluated a dynamic order policy, which showed a nearly 10%
reduction in waste for products with a very short shelf life (less than 6 days) compared to constant
order policy (i.e. fixed order quantity each time). Minner and Transchel (2010) further observed
that, because of its simplicity, a constant order policy should not be neglected especially if
demand is stationary, demand is somewhat stable (CoV 0.5) and the shelf life is short (2-3
days).
The EWA policy introduced by (Broekmeulen and van Donselaar, 2009) is a direct extension of
the policy found in traditional automatic replenishment systems, and is intended to be used for
automatic replenishment of perishables. Traditional automatic replenishment systems applies a
(R,s,nQ) policy with a fixed review period (R), dynamic reorder-point (s), and order’s a multiplier
(n) of batches with a given batch size (Q) (Potter and Disney, 2010). In contrast, the EWA policy
increases the order quantity based on the expected amount of products outdating. Compared to
the dynamic policy by Minner and Transchel (2010) the EWA policy also takes into account the
batch size constraint between the warehouse and the stores. Mathematically, the EWA policy can
be expressed as follows:
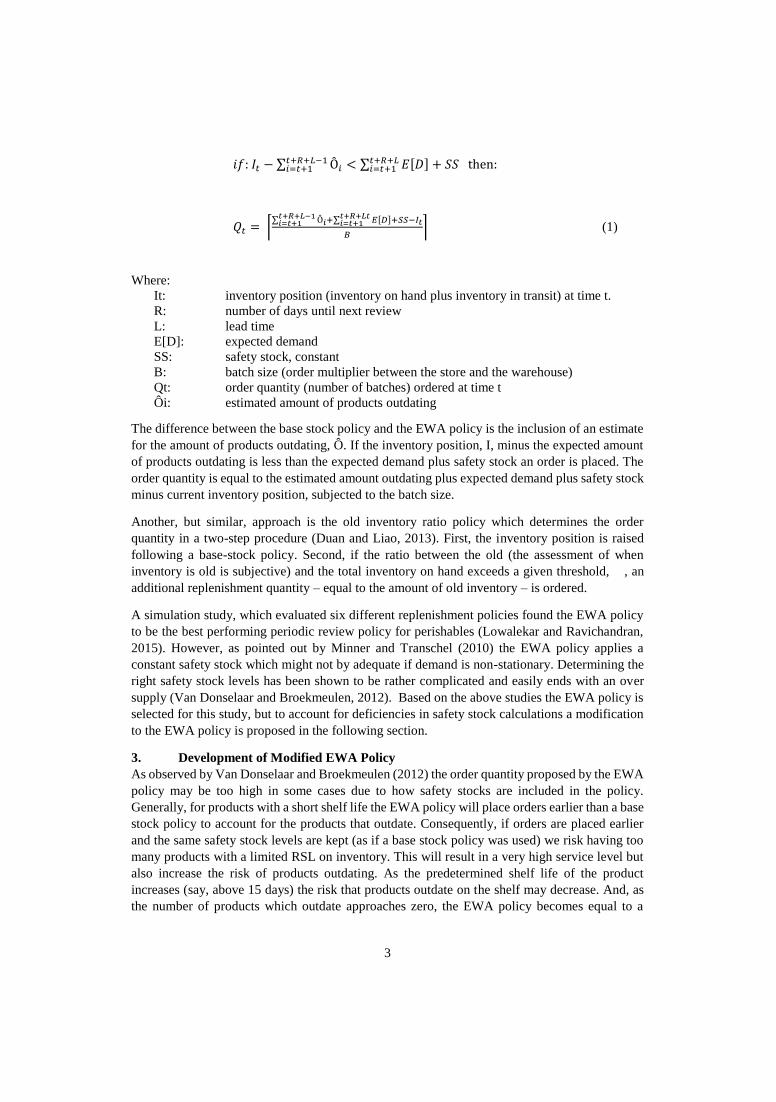
3
𝑖𝑓: 𝐼𝑡 − ∑ Ô𝑖𝑡+𝑅+𝐿−1𝑖=𝑡+1 < ∑ 𝐸[𝐷]𝑡+𝑅+𝐿
𝑖=𝑡+1 + 𝑆𝑆 then:
𝑄𝑡 = ⌈∑ Ô𝑖
𝑡+𝑅+𝐿−1𝑖=𝑡+1 +∑ 𝐸[𝐷]𝑡+𝑅+𝐿𝑡
𝑖=𝑡+1 +𝑆𝑆−𝐼𝑡
𝐵⌉ (1)
Where:
It: inventory position (inventory on hand plus inventory in transit) at time t.
R: number of days until next review
L: lead time
E[D]: expected demand
SS: safety stock, constant
B: batch size (order multiplier between the store and the warehouse)
Qt: order quantity (number of batches) ordered at time t
Ôi: estimated amount of products outdating
The difference between the base stock policy and the EWA policy is the inclusion of an estimate
for the amount of products outdating, Ô. If the inventory position, I, minus the expected amount
of products outdating is less than the expected demand plus safety stock an order is placed. The
order quantity is equal to the estimated amount outdating plus expected demand plus safety stock
minus current inventory position, subjected to the batch size.
Another, but similar, approach is the old inventory ratio policy which determines the order
quantity in a two-step procedure (Duan and Liao, 2013). First, the inventory position is raised
following a base-stock policy. Second, if the ratio between the old (the assessment of when
inventory is old is subjective) and the total inventory on hand exceeds a given threshold, , an
additional replenishment quantity – equal to the amount of old inventory – is ordered.
A simulation study, which evaluated six different replenishment policies found the EWA policy
to be the best performing periodic review policy for perishables (Lowalekar and Ravichandran,
2015). However, as pointed out by Minner and Transchel (2010) the EWA policy applies a
constant safety stock which might not by adequate if demand is non-stationary. Determining the
right safety stock levels has been shown to be rather complicated and easily ends with an over
supply (Van Donselaar and Broekmeulen, 2012). Based on the above studies the EWA policy is
selected for this study, but to account for deficiencies in safety stock calculations a modification
to the EWA policy is proposed in the following section.
3. Development of Modified EWA Policy
As observed by Van Donselaar and Broekmeulen (2012) the order quantity proposed by the EWA
policy may be too high in some cases due to how safety stocks are included in the policy.
Generally, for products with a short shelf life the EWA policy will place orders earlier than a base
stock policy to account for the products that outdate. Consequently, if orders are placed earlier
and the same safety stock levels are kept (as if a base stock policy was used) we risk having too
many products with a limited RSL on inventory. This will result in a very high service level but
also increase the risk of products outdating. As the predetermined shelf life of the product
increases (say, above 15 days) the risk that products outdate on the shelf may decrease. And, as
the number of products which outdate approaches zero, the EWA policy becomes equal to a
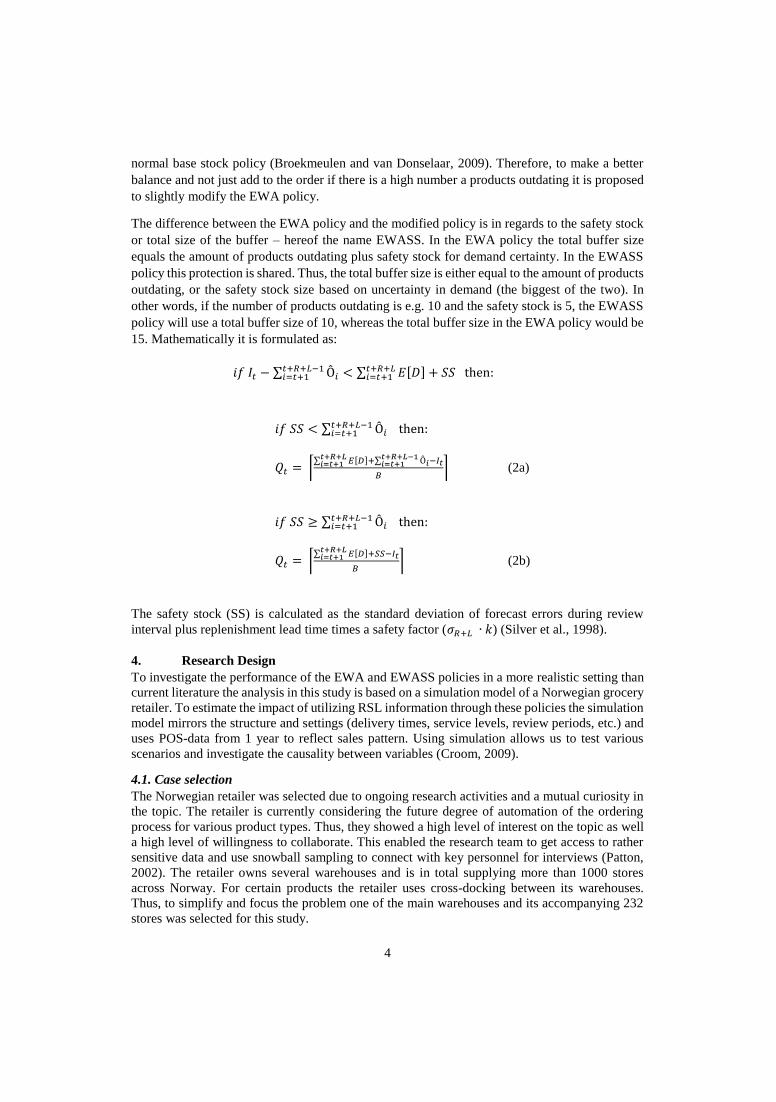
4
normal base stock policy (Broekmeulen and van Donselaar, 2009). Therefore, to make a better
balance and not just add to the order if there is a high number a products outdating it is proposed
to slightly modify the EWA policy.
The difference between the EWA policy and the modified policy is in regards to the safety stock
or total size of the buffer – hereof the name EWASS. In the EWA policy the total buffer size
equals the amount of products outdating plus safety stock for demand certainty. In the EWASS
policy this protection is shared. Thus, the total buffer size is either equal to the amount of products
outdating, or the safety stock size based on uncertainty in demand (the biggest of the two). In
other words, if the number of products outdating is e.g. 10 and the safety stock is 5, the EWASS
policy will use a total buffer size of 10, whereas the total buffer size in the EWA policy would be
15. Mathematically it is formulated as:
𝑖𝑓 𝐼𝑡 − ∑ Ô𝑖𝑡+𝑅+𝐿−1𝑖=𝑡+1 < ∑ 𝐸[𝐷]𝑡+𝑅+𝐿
𝑖=𝑡+1 + 𝑆𝑆 then:
𝑖𝑓 𝑆𝑆 < ∑ Ô𝑖𝑡+𝑅+𝐿−1𝑖=𝑡+1 then:
𝑄𝑡 = ⌈∑ 𝐸[𝐷]+∑ Ô𝑖
𝑡+𝑅+𝐿−1𝑖=𝑡+1
𝑡+𝑅+𝐿𝑖=𝑡+1 −𝐼𝑡
𝐵⌉ (2a)
𝑖𝑓 𝑆𝑆 ≥ ∑ Ô𝑖𝑡+𝑅+𝐿−1𝑖=𝑡+1 then:
𝑄𝑡 = ⌈∑ 𝐸[𝐷]𝑡+𝑅+𝐿
𝑖=𝑡+1 +𝑆𝑆−𝐼𝑡
𝐵 ⌉ (2b)
The safety stock (SS) is calculated as the standard deviation of forecast errors during review
interval plus replenishment lead time times a safety factor (𝜎𝑅+𝐿 ∙ 𝑘) (Silver et al., 1998).
4. Research Design
To investigate the performance of the EWA and EWASS policies in a more realistic setting than
current literature the analysis in this study is based on a simulation model of a Norwegian grocery
retailer. To estimate the impact of utilizing RSL information through these policies the simulation
model mirrors the structure and settings (delivery times, service levels, review periods, etc.) and
uses POS-data from 1 year to reflect sales pattern. Using simulation allows us to test various
scenarios and investigate the causality between variables (Croom, 2009).
4.1. Case selection
The Norwegian retailer was selected due to ongoing research activities and a mutual curiosity in
the topic. The retailer is currently considering the future degree of automation of the ordering
process for various product types. Thus, they showed a high level of interest on the topic as well
a high level of willingness to collaborate. This enabled the research team to get access to rather
sensitive data and use snowball sampling to connect with key personnel for interviews (Patton,
2002). The retailer owns several warehouses and is in total supplying more than 1000 stores
across Norway. For certain products the retailer uses cross-docking between its warehouses.
Thus, to simplify and focus the problem one of the main warehouses and its accompanying 232
stores was selected for this study.
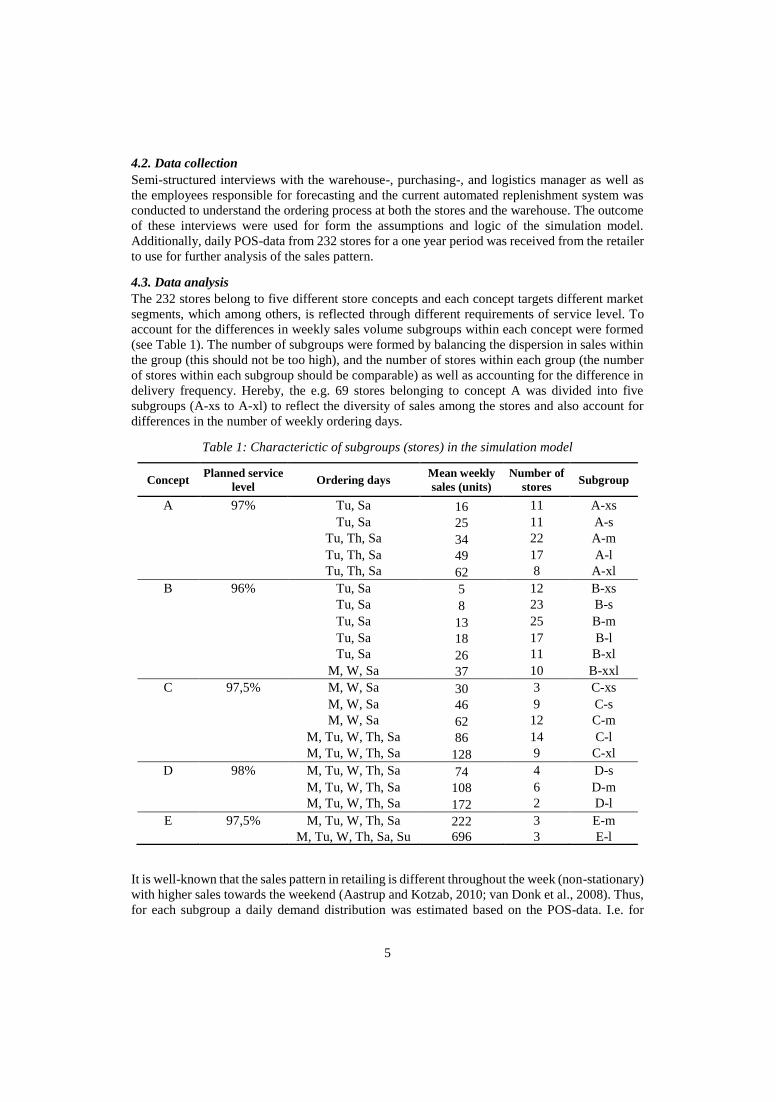
5
4.2. Data collection
Semi-structured interviews with the warehouse-, purchasing-, and logistics manager as well as
the employees responsible for forecasting and the current automated replenishment system was
conducted to understand the ordering process at both the stores and the warehouse. The outcome
of these interviews were used for form the assumptions and logic of the simulation model.
Additionally, daily POS-data from 232 stores for a one year period was received from the retailer
to use for further analysis of the sales pattern.
4.3. Data analysis
The 232 stores belong to five different store concepts and each concept targets different market
segments, which among others, is reflected through different requirements of service level. To
account for the differences in weekly sales volume subgroups within each concept were formed
(see Table 1). The number of subgroups were formed by balancing the dispersion in sales within
the group (this should not be too high), and the number of stores within each group (the number
of stores within each subgroup should be comparable) as well as accounting for the difference in
delivery frequency. Hereby, the e.g. 69 stores belonging to concept A was divided into five
subgroups (A-xs to A-xl) to reflect the diversity of sales among the stores and also account for
differences in the number of weekly ordering days.
Table 1: Characterictic of subgroups (stores) in the simulation model
Concept Planned service
level Ordering days
Mean weekly
sales (units)
Number of
stores Subgroup
A 97% Tu, Sa 16 11 A-xs
Tu, Sa 25 11 A-s
Tu, Th, Sa 34 22 A-m
Tu, Th, Sa 49 17 A-l
Tu, Th, Sa 62 8 A-xl
B 96% Tu, Sa 5 12 B-xs
Tu, Sa 8 23 B-s
Tu, Sa 13 25 B-m
Tu, Sa 18 17 B-l
Tu, Sa 26 11 B-xl
M, W, Sa 37 10 B-xxl
C 97,5% M, W, Sa 30 3 C-xs
M, W, Sa 46 9 C-s
M, W, Sa 62 12 C-m
M, Tu, W, Th, Sa 86 14 C-l
M, Tu, W, Th, Sa 128 9 C-xl
D 98% M, Tu, W, Th, Sa 74 4 D-s
M, Tu, W, Th, Sa 108 6 D-m
M, Tu, W, Th, Sa 172 2 D-l
E 97,5% M, Tu, W, Th, Sa 222 3 E-m
M, Tu, W, Th, Sa, Su 696 3 E-l
It is well-known that the sales pattern in retailing is different throughout the week (non-stationary)
with higher sales towards the weekend (Aastrup and Kotzab, 2010; van Donk et al., 2008). Thus,
for each subgroup a daily demand distribution was estimated based on the POS-data. I.e. for
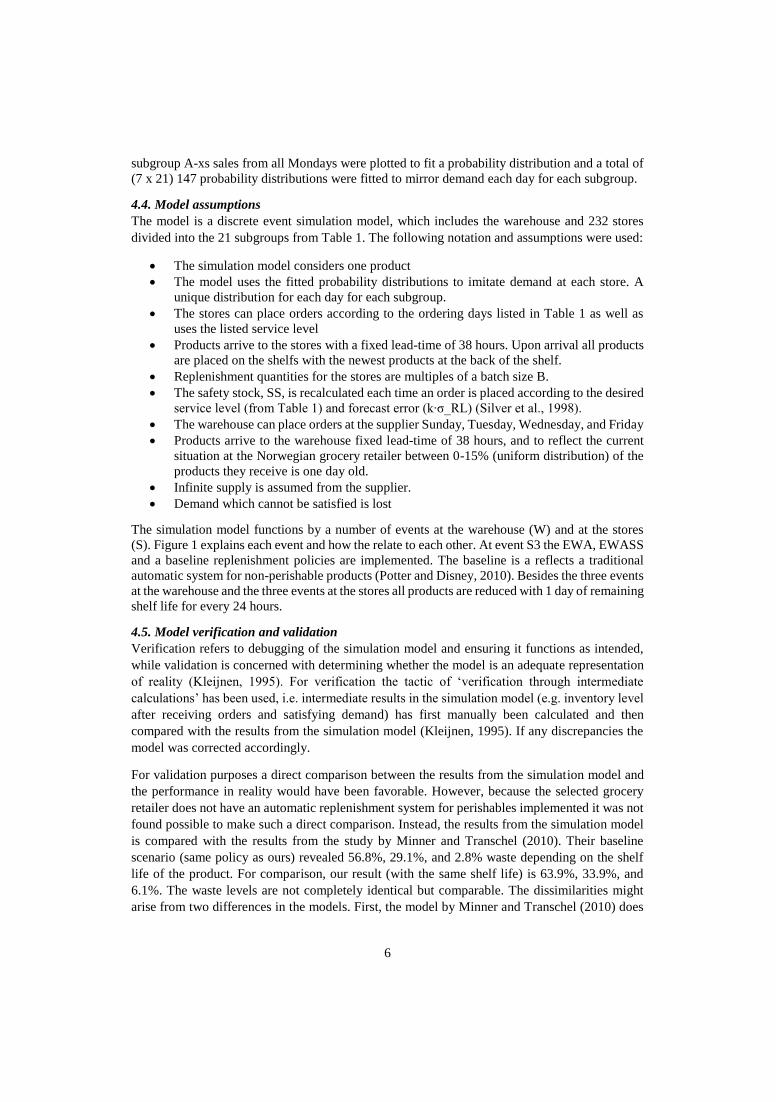
6
subgroup A-xs sales from all Mondays were plotted to fit a probability distribution and a total of
(7 x 21) 147 probability distributions were fitted to mirror demand each day for each subgroup.
4.4. Model assumptions
The model is a discrete event simulation model, which includes the warehouse and 232 stores
divided into the 21 subgroups from Table 1. The following notation and assumptions were used:
• The simulation model considers one product
• The model uses the fitted probability distributions to imitate demand at each store. A
unique distribution for each day for each subgroup.
• The stores can place orders according to the ordering days listed in Table 1 as well as
uses the listed service level
• Products arrive to the stores with a fixed lead-time of 38 hours. Upon arrival all products
are placed on the shelfs with the newest products at the back of the shelf.
• Replenishment quantities for the stores are multiples of a batch size B.
• The safety stock, SS, is recalculated each time an order is placed according to the desired
service level (from Table 1) and forecast error (k∙σ_RL) (Silver et al., 1998).
• The warehouse can place orders at the supplier Sunday, Tuesday, Wednesday, and Friday
• Products arrive to the warehouse fixed lead-time of 38 hours, and to reflect the current
situation at the Norwegian grocery retailer between 0-15% (uniform distribution) of the
products they receive is one day old.
• Infinite supply is assumed from the supplier.
• Demand which cannot be satisfied is lost
The simulation model functions by a number of events at the warehouse (W) and at the stores
(S). Figure 1 explains each event and how the relate to each other. At event S3 the EWA, EWASS
and a baseline replenishment policies are implemented. The baseline is a reflects a traditional
automatic system for non-perishable products (Potter and Disney, 2010). Besides the three events
at the warehouse and the three events at the stores all products are reduced with 1 day of remaining
shelf life for every 24 hours.
4.5. Model verification and validation
Verification refers to debugging of the simulation model and ensuring it functions as intended,
while validation is concerned with determining whether the model is an adequate representation
of reality (Kleijnen, 1995). For verification the tactic of ‘verification through intermediate
calculations’ has been used, i.e. intermediate results in the simulation model (e.g. inventory level
after receiving orders and satisfying demand) has first manually been calculated and then
compared with the results from the simulation model (Kleijnen, 1995). If any discrepancies the
model was corrected accordingly.
For validation purposes a direct comparison between the results from the simulation model and
the performance in reality would have been favorable. However, because the selected grocery
retailer does not have an automatic replenishment system for perishables implemented it was not
found possible to make such a direct comparison. Instead, the results from the simulation model
is compared with the results from the study by Minner and Transchel (2010). Their baseline
scenario (same policy as ours) revealed 56.8%, 29.1%, and 2.8% waste depending on the shelf
life of the product. For comparison, our result (with the same shelf life) is 63.9%, 33.9%, and
6.1%. The waste levels are not completely identical but comparable. The dissimilarities might
arise from two differences in the models. First, the model by Minner and Transchel (2010) does
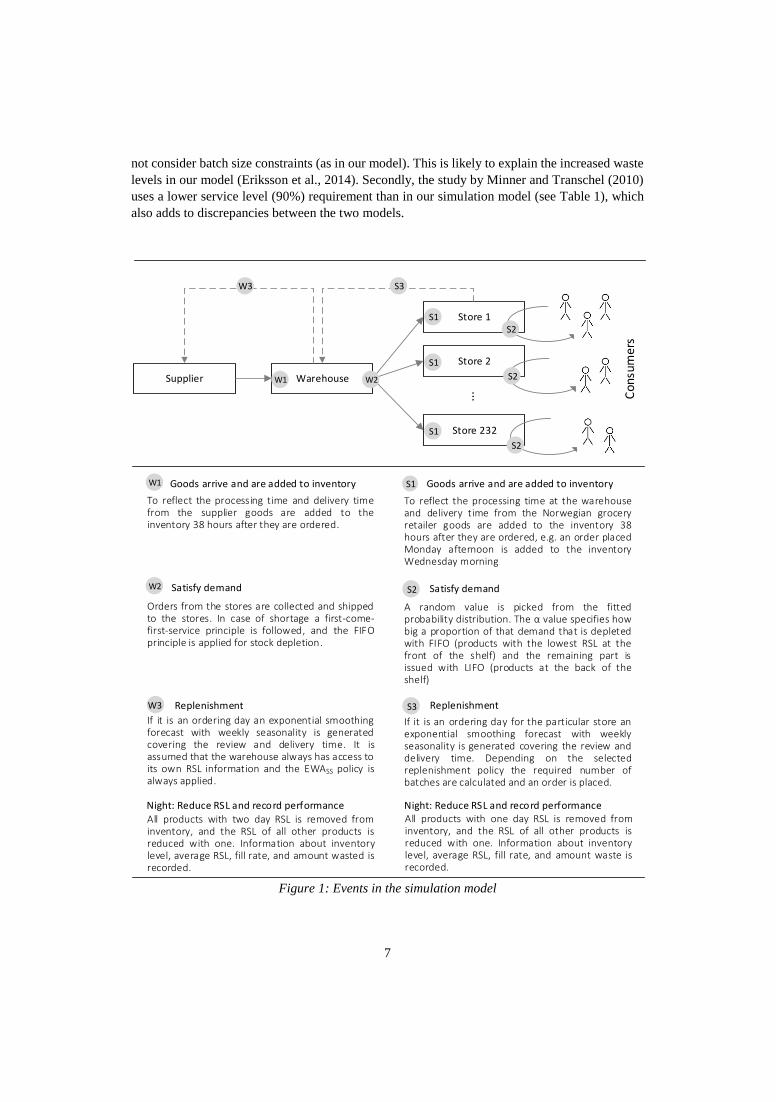
7
not consider batch size constraints (as in our model). This is likely to explain the increased waste
levels in our model (Eriksson et al., 2014). Secondly, the study by Minner and Transchel (2010)
uses a lower service level (90%) requirement than in our simulation model (see Table 1), which
also adds to discrepancies between the two models.
Supplier Warehouse
Store 1
Store 2
Store 232
...
S2
S2
S2
S3W3
S1
S1
S1
W1 W2
Con
sum
ers
To reflect the processing time at the warehouse and delivery time from the Norwegian grocery retailer goods are added to the inventory 38 hours after they are ordered, e.g. an order placed Monday afternoon is added to the inventory Wednesday morning
S1 Goods arrive and are added to inventory
A random value is picked from the fitted probability distribution. The α value specifies how big a proportion of that demand that is depleted with FIFO (products with the lowest RSL at the front of the shelf) and the remaining part is issued with LIFO (products at the back of the shelf)
If it is an ordering day for the particular store an exponential smoothing forecast with weekly seasonality is generated covering the review and delivery time. Depending on the selected replenishment policy the required number of batches are calculated and an order is placed.
All products with one day RSL is removed from inventory, and the RSL of all other products is reduced with one. Information about inventory level, average RSL, fill rate, and amount waste is recorded.
Satisfy demand
Replenishment
Night: Reduce RSL and record performance
To reflect the processing time and delivery time from the supplier goods are added to the inventory 38 hours after they are ordered.
Orders from the stores are collected and shipped to the stores. In case of shortage a first-come-first-service principle is followed, and the FIFO principle is applied for stock depletion.
If it is an ordering day an exponential smoothing forecast with weekly seasonality is generated covering the review and delivery time. It is assumed that the warehouse always has access to its own RSL information and the EWASS policy is always applied.
All products with two day RSL is removed from inventory, and the RSL of all other products is reduced with one. Information about inventory level, average RSL, fill rate, and amount wasted is recorded.
Goods arrive and are added to inventory
Satisfy demand
Replenishment
Night: Reduce RSL and record performance
W1
W2
W3
S2
S3
Figure 1: Events in the simulation model
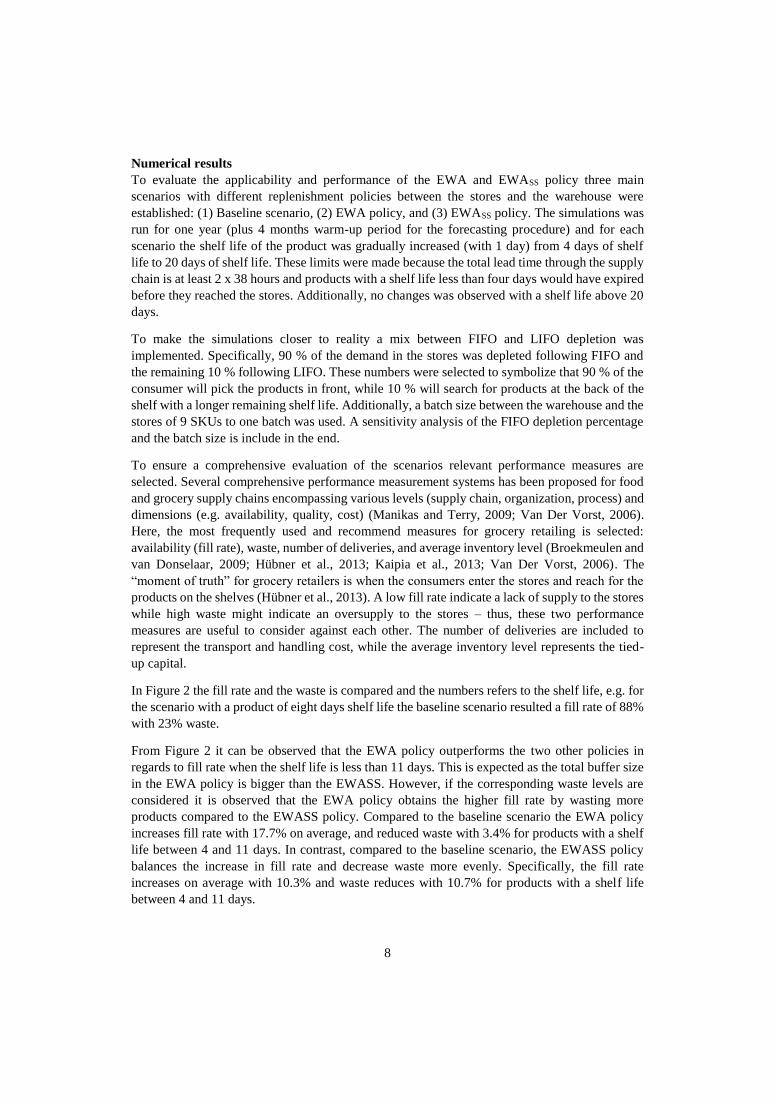
8
Numerical results
To evaluate the applicability and performance of the EWA and EWASS policy three main
scenarios with different replenishment policies between the stores and the warehouse were
established: (1) Baseline scenario, (2) EWA policy, and (3) EWASS policy. The simulations was
run for one year (plus 4 months warm-up period for the forecasting procedure) and for each
scenario the shelf life of the product was gradually increased (with 1 day) from 4 days of shelf
life to 20 days of shelf life. These limits were made because the total lead time through the supply
chain is at least 2 x 38 hours and products with a shelf life less than four days would have expired
before they reached the stores. Additionally, no changes was observed with a shelf life above 20
days.
To make the simulations closer to reality a mix between FIFO and LIFO depletion was
implemented. Specifically, 90 % of the demand in the stores was depleted following FIFO and
the remaining 10 % following LIFO. These numbers were selected to symbolize that 90 % of the
consumer will pick the products in front, while 10 % will search for products at the back of the
shelf with a longer remaining shelf life. Additionally, a batch size between the warehouse and the
stores of 9 SKUs to one batch was used. A sensitivity analysis of the FIFO depletion percentage
and the batch size is include in the end.
To ensure a comprehensive evaluation of the scenarios relevant performance measures are
selected. Several comprehensive performance measurement systems has been proposed for food
and grocery supply chains encompassing various levels (supply chain, organization, process) and
dimensions (e.g. availability, quality, cost) (Manikas and Terry, 2009; Van Der Vorst, 2006).
Here, the most frequently used and recommend measures for grocery retailing is selected:
availability (fill rate), waste, number of deliveries, and average inventory level (Broekmeulen and
van Donselaar, 2009; Hübner et al., 2013; Kaipia et al., 2013; Van Der Vorst, 2006). The
“moment of truth” for grocery retailers is when the consumers enter the stores and reach for the
products on the shelves (Hübner et al., 2013). A low fill rate indicate a lack of supply to the stores
while high waste might indicate an oversupply to the stores – thus, these two performance
measures are useful to consider against each other. The number of deliveries are included to
represent the transport and handling cost, while the average inventory level represents the tied-
up capital.
In Figure 2 the fill rate and the waste is compared and the numbers refers to the shelf life, e.g. for
the scenario with a product of eight days shelf life the baseline scenario resulted a fill rate of 88%
with 23% waste.
From Figure 2 it can be observed that the EWA policy outperforms the two other policies in
regards to fill rate when the shelf life is less than 11 days. This is expected as the total buffer size
in the EWA policy is bigger than the EWASS. However, if the corresponding waste levels are
considered it is observed that the EWA policy obtains the higher fill rate by wasting more
products compared to the EWASS policy. Compared to the baseline scenario the EWA policy
increases fill rate with 17.7% on average, and reduced waste with 3.4% for products with a shelf
life between 4 and 11 days. In contrast, compared to the baseline scenario, the EWASS policy
balances the increase in fill rate and decrease waste more evenly. Specifically, the fill rate
increases on average with 10.3% and waste reduces with 10.7% for products with a shelf life
between 4 and 11 days.
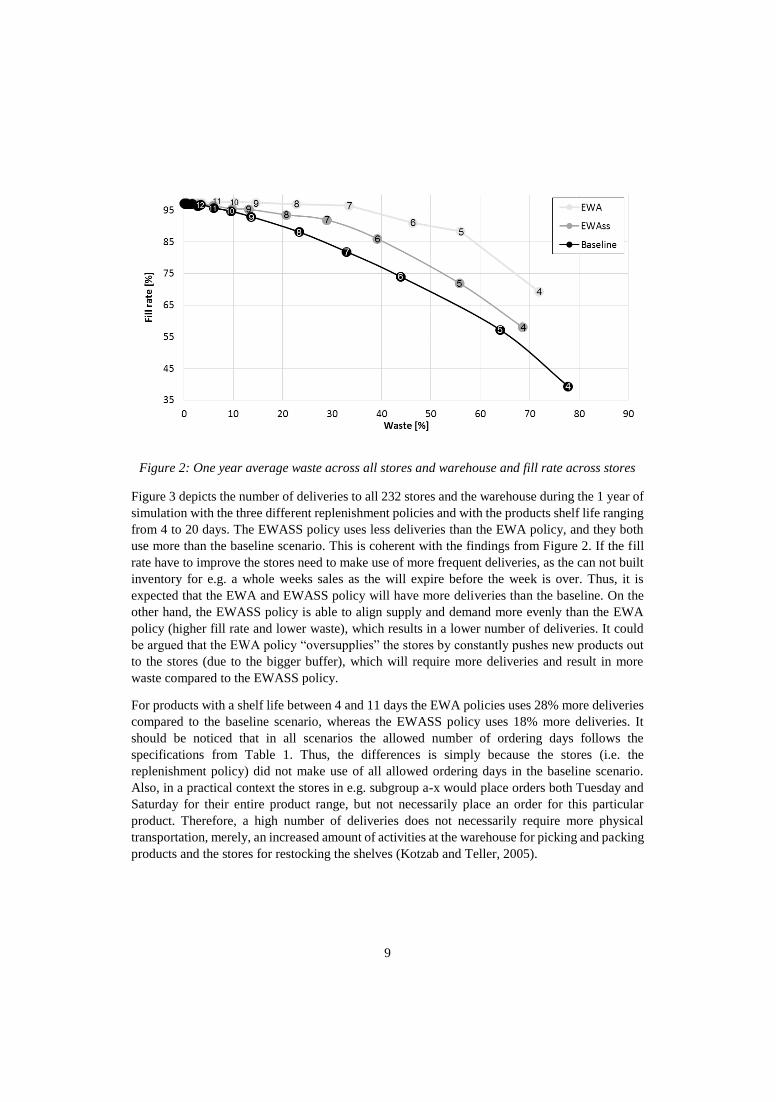
9
Figure 2: One year average waste across all stores and warehouse and fill rate across stores
Figure 3 depicts the number of deliveries to all 232 stores and the warehouse during the 1 year of
simulation with the three different replenishment policies and with the products shelf life ranging
from 4 to 20 days. The EWASS policy uses less deliveries than the EWA policy, and they both
use more than the baseline scenario. This is coherent with the findings from Figure 2. If the fill
rate have to improve the stores need to make use of more frequent deliveries, as the can not built
inventory for e.g. a whole weeks sales as the will expire before the week is over. Thus, it is
expected that the EWA and EWASS policy will have more deliveries than the baseline. On the
other hand, the EWASS policy is able to align supply and demand more evenly than the EWA
policy (higher fill rate and lower waste), which results in a lower number of deliveries. It could
be argued that the EWA policy “oversupplies” the stores by constantly pushes new products out
to the stores (due to the bigger buffer), which will require more deliveries and result in more
waste compared to the EWASS policy.
For products with a shelf life between 4 and 11 days the EWA policies uses 28% more deliveries
compared to the baseline scenario, whereas the EWASS policy uses 18% more deliveries. It
should be noticed that in all scenarios the allowed number of ordering days follows the
specifications from Table 1. Thus, the differences is simply because the stores (i.e. the
replenishment policy) did not make use of all allowed ordering days in the baseline scenario.
Also, in a practical context the stores in e.g. subgroup a-x would place orders both Tuesday and
Saturday for their entire product range, but not necessarily place an order for this particular
product. Therefore, a high number of deliveries does not necessarily require more physical
transportation, merely, an increased amount of activities at the warehouse for picking and packing
products and the stores for restocking the shelves (Kotzab and Teller, 2005).
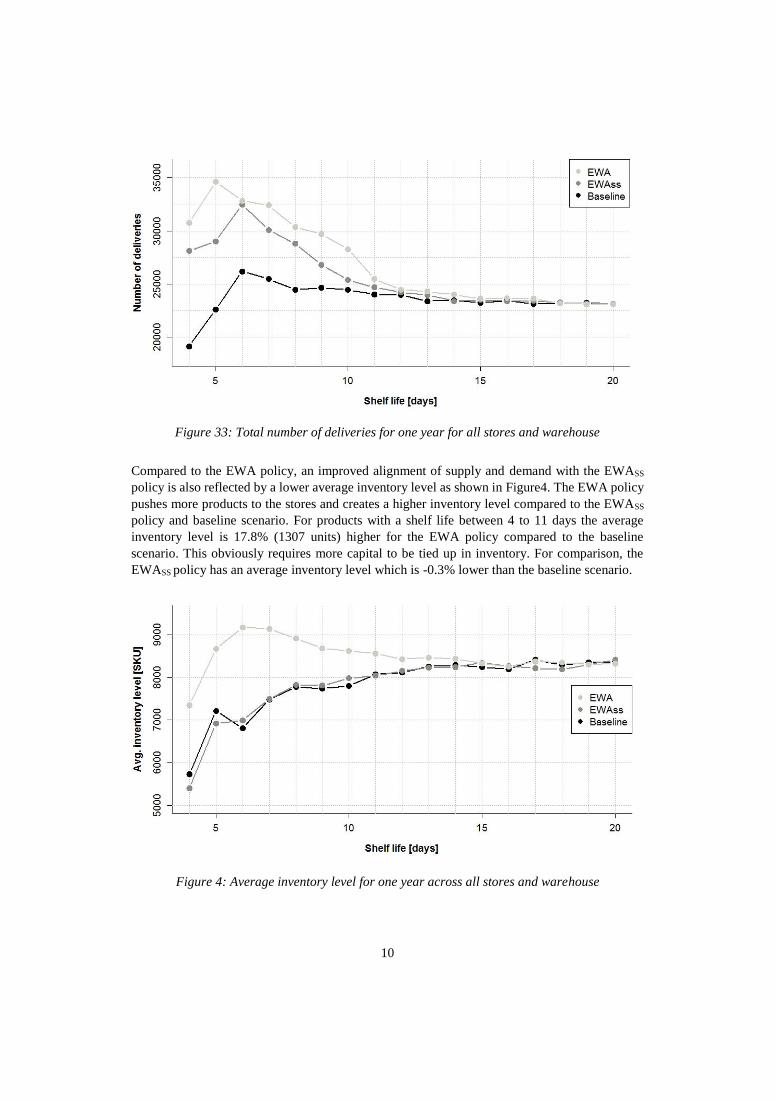
10
Figure 33: Total number of deliveries for one year for all stores and warehouse
Compared to the EWA policy, an improved alignment of supply and demand with the EWASS
policy is also reflected by a lower average inventory level as shown in Figure4. The EWA policy
pushes more products to the stores and creates a higher inventory level compared to the EWASS
policy and baseline scenario. For products with a shelf life between 4 to 11 days the average
inventory level is 17.8% (1307 units) higher for the EWA policy compared to the baseline
scenario. This obviously requires more capital to be tied up in inventory. For comparison, the
EWASS policy has an average inventory level which is -0.3% lower than the baseline scenario.
Figure 4: Average inventory level for one year across all stores and warehouse
11
To evaluate the robustness of the results two sensitivity analyses were made. First, all three
scenarios were run with an 80% and 100% FIFO depletion in the stores. The results showed that
all performance measures were similar, and only a 0.3% point reduction in waste was observed
as the depletion decreased to 80%. In the second sensitivity analysis all three scenarios were run
with a batch size of 6 and 12. Not surprisingly the results indicates that lower batch sizes results
in lower inventory levels and increased deliveries. A smaller batch size also slightly reduces
waste, with approximately 0.7% point for both the EWASS policy and 0.8% EWA policy, which
is coherent with previous findings (Eriksson et al., 2014).
6. Discussion and conclusion
The purpose of this paper was to investigate the impact of utilizing remaining shelf life
information from stores for the replenishment in a setting that was closer to reality than previous
reported in academic literature. Through a discrete event simulation model with one warehouse,
one product, 232 stores, mixed FIFO and LIFO depletion, differentiated service levels and
ordering frequencies, as well as batch size constraint two age-based replenishment policies were
evaluated based on one year POS-data from one of Norway’s largest grocery retailer. If remaining
shelf life information is utilized in the replenishment decision the findings indicate a potential
improvement in availability (up to 15.5% increase) and waste (up 2.3% reduction) for products
with a shelf of 10 days or below. The remaining discussion and conclusion is centered around
three subsections: theoretical contributions, practical implications, and limitation and future
research.
6.1. Contributions to theory
This study makes two primary contributions to theory. Firstly, the EWA policy by Broekmeulen
and van Donselaar (2009) has been evaluated in a divergent supply chain. The results indicate an
average increase of 17.7% in fill rate, for products with a shelf life between 4 to 11 days across
all 232 stores. Even though the fill rate is not reported separately this increase is similar to the
cost improvement reported by Broekmeulen and van Donselaar (2009). However, the findings
also shows that the EWA policy suffers from high inventory and only reduces waste levels
slightly, which could be caused by too high buffers for demand uncertainty and the risk of
expiration (Van Donselaar and Broekmeulen, 2012). Secondly, to off-set the high waste levels
and high inventory levels a modification to the EWA policy, EWASS, is proposed and evaluated.
The EWASS policy demonstrates a more balanced performance of fill rate (+10.3%) and waste (-
10.7%) by improving both parameters without affecting the average inventory level.
6.2. Implications for practitioners
The findings from Figure 2 to Figure 4 clearly demonstrates that the value of sharing and utilizing
information is dependent of the shelf life of the product. Thus, for practitioners the findings
indicate that differentiated information sharing and replenishment policies are useful for
managing a broad range of products. The shelf life is an important characteristic for establishing
this differentiation, and for perishables the remaining shelf life information from the store can be
beneficial to utilize – especially for products with a shelf life around 6 to 11 days based on Figure.
On the other hand, as the shelf life increase, using only POS and waste data (how many product
that are wasted each day) provide a satisfactory performance.
Even though the findings show an improvement in performance grocery retailers and need to
evaluate if they can accept the (still high) waste levels. If so, the findings indicate that it will be
possible to automate the replenishment process for perishable products by utilizing remaining
12
shelf life information. Additional initiatives could also be combined with a sophisticated
replenishment policies and information sharing. E.g. using cross-docking will reduce the time
spent on the warehouse and move products faster to the store, or reducing the batch size to avoid
too many products being wasting at small stores with a low turnover.
6.3. Limitations and future research
The study has several limitations and should be used to guide future research. The study only
included one product and should be extended to (at least) a whole product group. Hereby the
effects of product substitution could be included and incorporated into the replenishment decision
as well (Van Donselaar et al., 2006). The use of simulation provides a risk-free environment to
assess different scenarios and could be particular relevant to evaluate age-based replenishment
polices with substitution. However, empirical research with access to real performance data are
encourages to account for the various uncertainties and particularities that are not included in a
simulation model.
Both the EWA and the EWASS policy assumes that remaining shelf life information is collected
and shared from the grocery stores. Future research could investigate if it would be possible to
estimate this type of information based on (1) the remaining shelf life when the products leave
the warehouse, (2) the amount of products wasted and sold each day in the stores, and (3)
estimates of the FIFO depletion rate in the stores. If reasonable estimates are possible the EWA
and EWASS policy could be implemented without investments for additional data collection.
Acknowledgement
The authors gratefully acknowledge the assistance provided by the Norwegian Research Council
(NRC) for the financial support of Retail Supply Chain 2020. Also, we thank the participating
case company which together with the NRC enabled this study
References
Aastrup, J., & Kotzab, H. (2010). Forty years of out-of-stock research–and shelves are still empty. The
International Review of Retail, Distribution and Consumer Research, 20(1), 147-164.
Broekmeulen, R. A., & van Donselaar, K. H. (2009). A heuristic to manage perishable inventory with batch
ordering, positive lead-times, and time-varying demand. Computers & Operations Research,
36(11), 3013-3018.
Chiu, H. N. (1995). A heuristic (R, T) periodic review perishable inventory model with lead times.
International Journal of Production Economics, 42(1), 1-15.
Croom, S. (2009). Introduction to research methodology in operations management. In C. Karlsson (Ed.),
Researching operations management (pp. 43-83): Routledge.
Duan, Q., & Liao, T. W. (2013). A new age-based replenishment policy for supply chain inventory
optimization of highly perishable products. International Journal of Production Economics,
145(2), 658-671.
Eriksson, M., Strid, I., & Hansson, P.-A. (2014). Waste of organic and conventional meat and dairy
products—A case study from Swedish retail. Resources, Conservation and Recycling, 83, 44-52.
Huang, G. Q., Lau, J. S., & Mak, K. (2003). The impacts of sharing production information on supply chain
dynamics: a review of the literature. International Journal of Production Research, 41(7), 1483-
1517.
Hübner, A. H., Kuhn, H., & Sternbeck, M. G. (2013). Demand and supply chain planning in grocery retail:
an operations planning framework. International Journal of Retail & Distribution Management,
41(7), 512-530.
Janssen, L., Claus, T., & Sauer, J. (2016). Literature review of deteriorating inventory models by key topics
from 2012 to 2015. International Journal of Production Economics, 182, 86-112.
13
Kaipia, R., Dukovska-Popovska, I., & Loikkanen, L. (2013). Creating sustainable fresh food supply chains
through waste reduction. International Journal of Physical Distribution & Logistics Management,
43(3), 262-276.
Karaesmen, I. Z., Scheller–Wolf, A., & Deniz, B. (2011). Managing perishable and aging inventories:
review and future research directions Planning production and inventories in the extended
enterprise (pp. 393-436): Springer.
Kleijnen, J. P. (1995). Verification and validation of simulation models. European Journal of Operational
Research, 82(1), 145-162.
Kotzab, H., & Teller, C. (2005). Development and empirical test of a grocery retail instore logistics model.
British Food Journal, 107(8), 594-605.
Kuhn, H., & Sternbeck, M. G. (2013). Integrative retail logistics: an exploratory study. Operations
Management Research, 6(1-2), 2-18.
Lowalekar, H., & Ravichandran, N. (2015). A combined age‐and‐stock‐based policy for ordering blood
units in hospital blood banks. International Transactions in Operational Research.
Manikas, I., & Terry, L. A. (2009). A case study assessment of the operational performance of a multiple
fresh produce distribution centre in the UK. British Food Journal, 111(5), 421-435.
Mena, C., Terry, L. A., Williams, A., & Ellram, L. (2014). Causes of waste across multi-tier supply
networks: Cases in the UK food sector. International Journal of Production Economics, 152, 144-
158.
Minner, S., & Transchel, S. (2010). Periodic review inventory-control for perishable products under service-
level constraints. Or Spectrum, 32(4), 979-996.
Nahmias, S., & Pierskalla, W. P. (1973). Optimal ordering policies for a product that perishes in two periods
subject to stochastic demand. Naval Research Logistics (NRL), 20(2), 207-229.
Nielsen, A. C. (2016). Western Eurpean FMCG Report Q4 2016. Retrieved from
http://www.nielsen.com/content/dam/nielsenglobal/eu/docs/reports/nielsen-european-trends-
report-Q4-2016.pdf
Patton, M. Q. (2002). Qualitative Research & Evaluation Methods (Vol. 3rd Edition): SAGE Publications,
Inc.
Potter, A., & Disney, S. M. (2010). Removing bullwhip from the Tesco supply chain. Paper presented at the
Production and Operations Management Society Annual Conference.
Silver, E. A., Pyke, D. F., & Peterson, R. (1998). Inventory management and production planning and
scheduling (Vol. 3): Wiley New York.
Van Der Vorst, J. G. (2006). Performance measurement in agri-food supply-chain networks. In C. J.
Ondersteijn, J. H. Wijnands, R. B. Huirne, & O. van Kooten (Eds.), Quantifying the agri-food
supply chain (pp. 15-26): Springer.
van Donk, D. P., Akkerman, R., & Van der Vaart, T. (2008). Opportunities and realities of supply chain
integration: the case of food manufacturers. British Food Journal, 110(2), 218-235.
Van Donselaar, K., van Woensel, T., Broekmeulen, R., & Fransoo, J. (2006). Inventory control of
perishables in supermarkets. International Journal of Production Economics, 104(2), 462-472.
Van Donselaar, K. H., & Broekmeulen, R. A. (2012). Approximations for the relative outdating of perishable
products by combining stochastic modeling, simulation and regression modeling. International
Journal of Production Economics, 140(2), 660-669.

Inventory allocation of perishables: Guidelines
Kasper Kiil1,2, Hans-Henrik Hvolby1,2, Heidi C. Dreyer3 and Jan Ola Strandhagen1
1Norwegian University of Science and Technology, Department of Mechanical and Industrial Engineering, S.P. Andersens veg 5, Trondheim, Norway
2Aalborg University, Celog, Department of Materials and Production, Denmark 3Norwegian University of Science and Technology, Department of Industrial Economics and
Technology Management, Alfred Getz vei 3, Trondheim, Norway
Abstract. The purpose of this study is to investigate and propose guidelines for how to allocate perishables to improve the balance of freshness and availability in retail stores. Specifically, it is investigated how a single warehouse can make the allocation decision to stores with and without access to remaining shelf life information of the products in the stores. Contrary to complex decisions models, this study aim to develop simple guidelines that can be applied manually or easily integrated into existing decision support systems.
Keywords: Inventory allocation, Food supply chain, Perishables, Information sharing, Remaining shelf life
Published: Advances in Production Management Systems: The Path to Intelligent, Collaborative
and Sustainable Manufacturing. 3-7 September 2017, Hamburg, Germany
Role of the PhD candidate and declaration of authorship:
Kasper Kiil conceptualized the paper and the development of the guidelines together with Hans-
Henrik Hvolby. The first version of the paper was written by Kasper and afterwards continuously
improved by all authors. Kasper presented the paper at the conference in Germany 2017.
Paper #55

1
Inventory allocation of perishables: Guidelines
1. Introduction
Food supply chains separates itself from other supply chains and necessitates special logistical
requirements due its characteristics of perishability of products, high demands on quality, and
tractability requirements [1, 2]. Particularly, for products with a shelf life less than 30 days –
known as perishables [3, 4] – where the quality of the products deteriorate over time, questions
the applicability of non-perishable supply chain practices in food supply chains [5, 6].
In retail supply chains, stores in a particular geographical region may be supplied from a central
warehouse or a smaller distribution centre. Inventory allocation policies consider how to
distribute products among the requesting stores from the warehouse in case of shortage – also
known as rationing policies [7, 8]. For perishables, this decision is further complicated as the
products to allocate may have different remaining shelf life. Even if the warehouse has more stock
on hand than what is requested from the stores (no rationing required) the products still needs to
be allocated among the stores to reduce the risk of outdating. Consequently, it has been stated
that for perishables the age of the allocated products may be as important as the amount allocated
[9].
Rationing policies consider how to distribute the amount of products from the warehouse
typically based on information about expected demand, inventory position, or safety stock levels
at the stores [7]. The different age groups of products at the warehouse can be expressed by the
remaining shelf life (RSLW) of those products. To decide which stores that should receive
products with the longest RSLW the remaining shelf life of the products currently at the stores
(RSLS) appear useful and will be investigated. Hereby, a more even distribution of freshness
across the supply chain may be obtained.
The literature on allocation of perishables in distribution systems is limited [10] and is often
presented as comprehensive decision models [11, 12]. It has been noticed that advanced models
and decision support systems faces some barriers of implementation (e.g. the underlying model
is too complex and not understood nor trusted [13]). Subsequently, there is a need to investigate
more real world settings of perishables [14].
In this study, we investigate and propose simple guidelines for how practitioners can allocate the
amount and the age of perishables. As the allocation of the products is made at the warehouse,
we assume access to RSLW at all times. However, depending on the level of shared information
the warehouse might not have access to the RSLS. Thus, we investigate and propose guidelines
for the following scenarios:
(1a) The warehouse has not access to RSLS and no shortage at the warehouse
(1b) The warehouse has not access to RSLS and shortage at the warehouse
(2a) The warehouse has access to RSLS and no shortage at the warehouse
(2b) The warehouse has access to RSLS and shortage at the warehouse.
The remainder of this paper is organized as follows: first, we present the relevant literature about
rationing and inventory allocation of perishables. Afterwards, we restrict our attention to the
development of the guidelines. Section four discusses the implications and applicability of the
guidelines.
2
2. Background
For non-perishables the optimal control of divergent distribution systems follows the order-up-to
policy under the balanced stock assumption [9]. The balanced stock assumption assumes that the
inventory position across all downstream stocking points are balanced or at least negligible
unbalanced, making it possible to consider a divergent system as a serial system [15]. For
divergent systems typical rationing policies includes: Fair Share allocation which strives to
obtain an even probability of stock-out at each downstream stocking point [7]. Priority allocation
which ranks and allocate the amount available based on the importance of each customer.
Consistent Appropriate Share allocation where downstream stocking points with higher safety
stock receives a bigger ratio from the warehouse [7].
No equivalent optimal control mechanism exists for perishables in divergent systems due to the
complexity created by the different ages of the products [9]. Divergent systems are of special
interest as these reflects the common situation of food supply chains. Yet, the contributions for
controlling perishables are limited in these systems [10]. Two main classes of policies can be
identified: (1) rotation policies, where the remaining inventory from downstream stocking points
is returned to the warehouse at the end of each period, and (2) retention policies where the
downstream stocking points keeps all remaining inventory until sold or outdated [16]. As it is
most common to apply the retention policy in food supply chains we restrict our attention to these.
Traditionally, the allocation decisions for perishables have been simplified to reduce complexity
[9]. For instance assuming zero lead time [17] or infinite supply to the stores [10]. Also, in the
policy by Prastacos [16] the only products of interest are products that outdate at the end of the
next period, or in other words, only products with one day left of shelf life. Because it is assumed
that the warehouse has a constant flow of products to the stores, the warehouse will never keep
products with a remaining shelf life of one day. Hereof it follows that what the warehouse
allocates to the stores do not influence outdating in the end of next period (the products that
outdates are already in the stores), and the problem is reduced to minimize the risk of shortage.
To minimize shortage and outdating a common observation appear to have been found in
literature: (1) the number of products soon-to-outdate should be distributed evenly and relatively
to demand (for each location), and (2) the total amount allocated should equalize the probability
of stock-out at each location [10, 16].
3. Development of guidelines
If the RSLS are unbalanced among downstream stocking points it might not be sufficient to just
focus on the soon-to-outdate products at the warehouse, and allocate them relatively to demand
as suggested above. Three practical obstacles highlights this. Firstly, that allocation procedure do
not consider how to allocate products which are not classified as “soon-to-outdate” and how this
affect the freshness at the stores. Secondly, in food supply chain products are often shipped in
multiplies of batch sizes [3], and the allocation sizes might end up being different from the
number of batches – meaning the soon-to-outdate products cannot be evenly distributed. Thirdly,
from the perspective of the pick-and-pack process it is more efficient if e.g. three batches from
the same pallet (same RSLW) is collected to one order instead of three batches from three different
pallets.
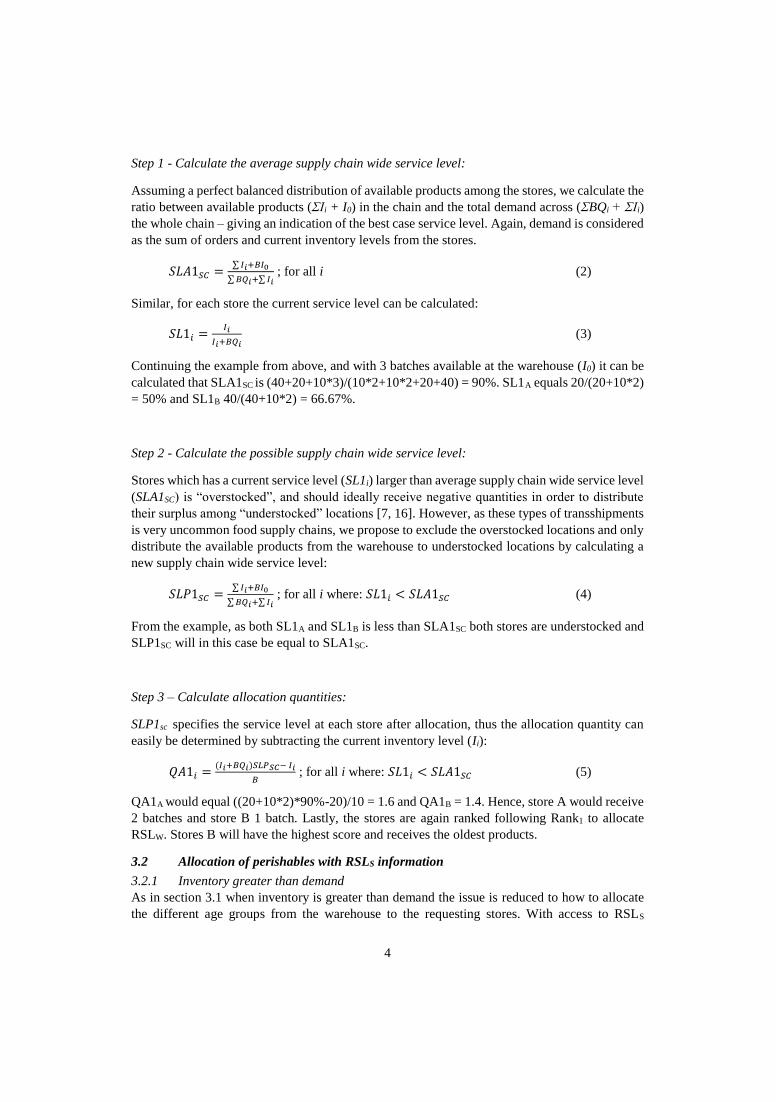
4
Step 1 - Calculate the average supply chain wide service level:
Assuming a perfect balanced distribution of available products among the stores, we calculate the
ratio between available products (ΣIi + I0) in the chain and the total demand across (ΣBQi + ΣIi)
the whole chain – giving an indication of the best case service level. Again, demand is considered
as the sum of orders and current inventory levels from the stores.
𝑆𝐿𝐴1𝑆𝐶 =∑ 𝐼𝑖+𝐵𝐼0
∑ 𝐵𝑄𝑖+∑ 𝐼𝑖 ; for all i (2)
Similar, for each store the current service level can be calculated:
𝑆𝐿1𝑖 =𝐼𝑖
𝐼𝑖+𝐵𝑄𝑖 (3)
Continuing the example from above, and with 3 batches available at the warehouse (I0) it can be
calculated that SLA1SC is (40+20+10*3)/(10*2+10*2+20+40) = 90%. SL1A equals 20/(20+10*2)
= 50% and SL1B 40/(40+10*2) = 66.67%.
Step 2 - Calculate the possible supply chain wide service level:
Stores which has a current service level (SL1i) larger than average supply chain wide service level
(SLA1SC) is “overstocked”, and should ideally receive negative quantities in order to distribute
their surplus among “understocked” locations [7, 16]. However, as these types of transshipments
is very uncommon food supply chains, we propose to exclude the overstocked locations and only
distribute the available products from the warehouse to understocked locations by calculating a
new supply chain wide service level:
𝑆𝐿𝑃1𝑆𝐶 =∑ 𝐼𝑖+𝐵𝐼0
∑ 𝐵𝑄𝑖+∑ 𝐼𝑖 ; for all i where: 𝑆𝐿1𝑖 < 𝑆𝐿𝐴1𝑆𝐶 (4)
From the example, as both SL1A and SL1B is less than SLA1SC both stores are understocked and
SLP1SC will in this case be equal to SLA1SC.
Step 3 – Calculate allocation quantities:
SLP1sc specifies the service level at each store after allocation, thus the allocation quantity can
easily be determined by subtracting the current inventory level (Ii):
𝑄𝐴1𝑖 =(𝐼𝑖+𝐵𝑄𝑖)𝑆𝐿𝑃𝑆𝐶− 𝐼𝑖
𝐵 ; for all i where: 𝑆𝐿1𝑖 < 𝑆𝐿𝐴1𝑆𝐶 (5)
QA1A would equal ((20+10*2)*90%-20)/10 = 1.6 and QA1B = 1.4. Hence, store A would receive
2 batches and store B 1 batch. Lastly, the stores are again ranked following Rank1 to allocate
RSLW. Stores B will have the highest score and receives the oldest products.
3.2 Allocation of perishables with RSLS information
3.2.1 Inventory greater than demand
As in section 3.1 when inventory is greater than demand the issue is reduced to how to allocate
the different age groups from the warehouse to the requesting stores. With access to RSLS
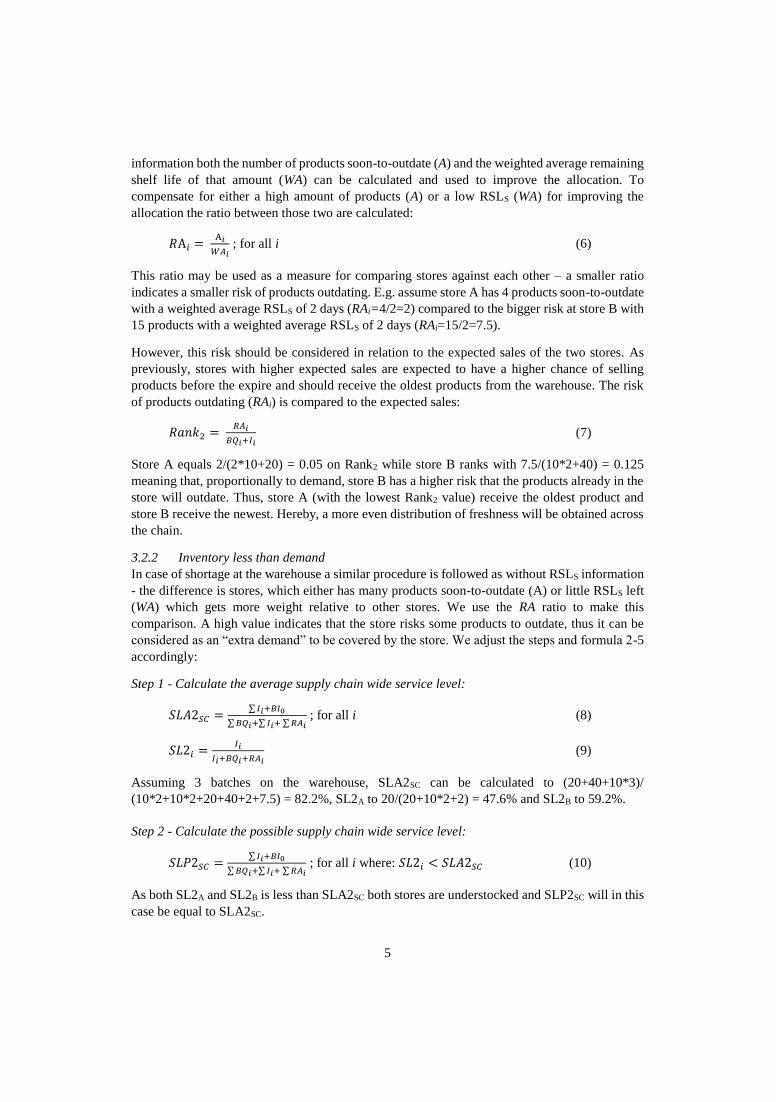
5
information both the number of products soon-to-outdate (A) and the weighted average remaining
shelf life of that amount (WA) can be calculated and used to improve the allocation. To
compensate for either a high amount of products (A) or a low RSLS (WA) for improving the
allocation the ratio between those two are calculated:
𝑅A𝑖 = A𝑖
𝑊𝐴𝑖 ; for all i (6)
This ratio may be used as a measure for comparing stores against each other – a smaller ratio
indicates a smaller risk of products outdating. E.g. assume store A has 4 products soon-to-outdate
with a weighted average RSLS of 2 days (RAi=4/2=2) compared to the bigger risk at store B with
15 products with a weighted average RSLS of 2 days (RAi=15/2=7.5).
However, this risk should be considered in relation to the expected sales of the two stores. As
previously, stores with higher expected sales are expected to have a higher chance of selling
products before the expire and should receive the oldest products from the warehouse. The risk
of products outdating (RAi) is compared to the expected sales:
𝑅𝑎𝑛𝑘2 = 𝑅𝐴𝑖
𝐵𝑄𝑖+𝐼𝑖 (7)
Store A equals 2/(2*10+20) = 0.05 on Rank2 while store B ranks with 7.5/(10*2+40) = 0.125
meaning that, proportionally to demand, store B has a higher risk that the products already in the
store will outdate. Thus, store A (with the lowest Rank2 value) receive the oldest product and
store B receive the newest. Hereby, a more even distribution of freshness will be obtained across
the chain.
3.2.2 Inventory less than demand
In case of shortage at the warehouse a similar procedure is followed as without RSLS information
- the difference is stores, which either has many products soon-to-outdate (A) or little RSLS left
(WA) which gets more weight relative to other stores. We use the RA ratio to make this
comparison. A high value indicates that the store risks some products to outdate, thus it can be
considered as an “extra demand” to be covered by the store. We adjust the steps and formula 2-5
accordingly:
Step 1 - Calculate the average supply chain wide service level:
𝑆𝐿𝐴2𝑆𝐶 =∑ 𝐼𝑖+𝐵𝐼0
∑ 𝐵𝑄𝑖+∑ 𝐼𝑖+ ∑ 𝑅𝐴𝑖 ; for all i (8)
𝑆𝐿2𝑖 =𝐼𝑖
𝐼𝑖+𝐵𝑄𝑖+𝑅𝐴𝑖 (9)
Assuming 3 batches on the warehouse, SLA2SC can be calculated to (20+40+10*3)/
(10*2+10*2+20+40+2+7.5) = 82.2%, SL2A to 20/(20+10*2+2) = 47.6% and SL2B to 59.2%.
Step 2 - Calculate the possible supply chain wide service level:
𝑆𝐿𝑃2𝑆𝐶 =∑ 𝐼𝑖+𝐵𝐼0
∑ 𝐵𝑄𝑖+∑ 𝐼𝑖+ ∑ 𝑅𝐴𝑖 ; for all i where: 𝑆𝐿2𝑖 < 𝑆𝐿𝐴2𝑆𝐶 (10)
As both SL2A and SL2B is less than SLA2SC both stores are understocked and SLP2SC will in this
case be equal to SLA2SC.
3
Similar to literature about simple replenishment policies of perishables (see e.g. [4, 18], we aim
to develop simple allocation policies for perishables which acts as guidelines to ensure its
applicability. These guidelines should consider and accommodate the obstacles highlighted
above.
The following section presents the guidelines if RSLS information from the stores are not
available to the warehouse, and the second section presents the guidelines if we assume RSLS is
available. All guidelines assumes there is access to RSLW at all times. Some general notation is
outlined below:
B : Batch size (order multiplier between the store and the warehouse)
Qi : Order quantity (in batches) from store i
Ii : Current inventory level at store i (in SKUs)
I0 : Current inventory level at warehouse (in batches)
Li : Lead time for store i
Ri : Days till next review at store i
Ai : Amount of “old” products at store i whit a RSLS less than or equal to R+L
WAi: Weighted average RSLS of Ai at store i
3.1 Allocation of perishables without RSLS information
3.1.1 Inventory greater than demand
Rationing among stores are not necessary when the warehouse holds more inventory on hand
than what is totally requested from the stores. This reduces the problem to how to allocate the
different ages groups from the warehouse. To counteract the obstacles of batches and how to
distribute different RSLW to the requesting stores, we propose to rank stores according to expected
sales until next delivery – stores with the highest expected sales receive the oldest products from
the warehouse to increase the chance of selling these products before they outdate. The expected
sales until next delivery (Li + Ri) includes the order (Qi) plus the current inventory level at the
store (Ii), mathematically we formulate this ranking as:
𝑅𝑎𝑛𝑘1 = 𝐵𝑄𝑖+𝐼𝑖
𝐿𝑖+𝑅𝑖 (1)
As an example, assume store A has 20 products currently on inventory (Ii) and ordered (Qi)
additionally 2 batches of 10 products, while store B has 40 products on inventory and also ordered
additionally 2 batches. With both stores having a review and lead time (Li+Ri) of totally 2 days,
store A would obtain a Rank1 score on (2*10+20)/2 = 20 and store B (2*10+40)/2 = 30. In this
case store B should receive the oldest RSLW as a higher sales is expected here compared to store
A.
3.1.2 Inventory less than demand
If the warehouse holds less inventory than what is totally requested from the stores, rationing
among the requesting stores are necessary. Thus, it is necessary to allocate the available amount
and the different age groups from the warehouse. We propose a three-step procedure following
the logic from the fair share allocation rule to calculate the amount to allocate.
6
Step 3 – Calculate allocation quantities:
𝑄𝐴2𝑖 =(𝐼𝑖+𝐵𝑄𝑖+𝑅𝐴𝑖)𝑆𝐿𝑃2𝑆𝐶− 𝐼𝑖
𝐵 ; for all i where: 𝑆𝐿2𝑖 < 𝑆𝐿𝐴2𝑆𝐶 (11)
QA2A would equal ((20+10*2+2)*82.2%-20)/10 = 1.45 and QA2B = 1.55. Hence, store A would
receive 1 batches and store B 2 batches. Lastly, the stores are again ranked according to Rank2.
Stores A will have the lowest score and will receive the oldest products.
4. Conclusions
This study adds to the limited literature about allocation of perishables [10] by proposing
guidelines for how practitioners can allocate perishables to improve the balance of freshness and
availability in stores. Two main areas of concern is discussed in this section. Firstly, what is the
implications2 of applying guidelines like these in practice? Secondly, how widespread is the
applicability and the ease of implementation?
The guidelines strive to balance the risk of shortage and outdating evenly across all downstream
stocking points while accommodating practical obstacles like batch sizing and the efficiency of
pick-and-pack process. Rank1 is applied when there is no access to RSLS information, and strives
to ensure smaller stores with less sales receive products with the highest RSL. Often smaller
stores only have deliveries few times a week, thus it is essential that the products they receive last
as long as possible. On the contrary, bigger stores with higher sales will receive the less fresh
products. The chances of a consumer willing to accept a lower RSL might be higher in these
stores as they generally has more consumers through the store during the day. Rank2 can be
applied when the warehouse has access to the RSLS information. It basically follows the same
reasoning about fresher products to smaller stores. But, here the allocation (amount and RSL) are
dynamically adjusted according to the RSLS. Hereby, larger stores do not necessarily always get
the products with lowest RSL.
Even though the guidelines can be considered applicable to most food supply chains, there is risk
that some stores perceive themselves as having a lower priority if they continuously receive
products with lower RSL than other stores. This should be considered, especially if the stores are
independently owned or franchising of a larger retail concept. The benefits should be distributed
to ensure those stores that may take a big risk of receiving products with low RSL also receive a
corresponding reward. On the other hand, stores that are fully owned by the same retailer may
prefer guidelines as these proposed in this study to improve the balance of freshness and
availability across all its stores.
Lastly, it should be noticed, that using guidelines like these do not guarantee an optimum balance
of freshness and availability and could be considered as a limitation – however, they provide an
easier reasoning for the employees who has to apply them. As future research the guidelines
should be tested either through simulation experiments or case implementation to quantify the
impact on freshness and availability.
2 The guidelines will be tested through discrete event simulation to estimate the impact on freshness, waste,
and available. The results will be presented at the APMS conference in Hamburg 2017 and will be
available upon request, but is omitted in the paper due to space limitation.
7
5. Acknowledgements
We gratefully acknowledge the assistance provided by the Norwegian Research Council for the
financial support of Retail Supply Chain 2020 that enabled this study.
6. References
1. Fredriksson, A. and K. Liljestrand, Capturing food logistics: a literature review and research agenda.
International Journal of Logistics Research and Applications, 2015. 18(1): p. 16-34.
2. Van der Vorst, J.G., S.-O. Tromp, and D.-J.v.d. Zee, Simulation modelling for food supply chain
redesign; integrated decision making on product quality, sustainability and logistics. International
Journal of Production Research, 2009. 47(23): p. 6611-6631.
3. Van Donselaar, K., et al., Inventory control of perishables in supermarkets. International Journal of
Production Economics, 2006. 104(2): p. 462-472.
4. Broekmeulen, R.A. and K.H. van Donselaar, A heuristic to manage perishable inventory with batch
ordering, positive lead-times, and time-varying demand. Computers & Operations Research, 2009.
36(11): p. 3013-3018.
5. Blackburn, J. and G. Scudder, Supply chain strategies for perishable products: the case of fresh produce.
Production and Operations Management, 2009. 18(2): p. 129-137.
6. Soysal, M., et al., A review on quantitative models for sustainable food logistics management.
International Journal on Food System Dynamics, 2012. 3(2): p. 136-155.
7. Van der Heijden, M., Supply rationing in multi-echelon divergent systems. European Journal of
Operational Research, 1997. 101(3): p. 532-549.
8. Diks, E.B. and A. De Kok, Optimal control of a divergent multi-echelon inventory system. European
journal of operational research, 1998. 111(1): p. 75-97.
9. Karaesmen, I.Z., A. Scheller–Wolf, and B. Deniz, Managing perishable and aging inventories: review
and future research directions, in Planning production and inventories in the extended enterprise. 2011,
Springer. p. 393-436.
10. Lystad, E., M. Ferguson, and C. Alexopoulos, Single stage heuristic for perishable inventory control in
two-echelon supply chains. Unpublished (Working paper), 2006.
11. Chew, E.P., C. Lee, and R. Liu, Joint inventory allocation and pricing decisions for perishable products.
International Journal of Production Economics, 2009. 120(1): p. 139-150.
12. Federgruen, A., G. Prastacos, and P.H. Zipkin, An allocation and distribution model for perishable
products. Operations Research, 1986. 34(1): p. 75-82.
13. de Man, J., et al. Automating scheduling tasks; experience of a real case. in Industrial Engineering and
Engineering Management (IEEM), 2015 IEEE International Conference on. 2015. IEEE.
14. Janssen, L., T. Claus, and J. Sauer, Literature review of deteriorating inventory models by key topics
from 2012 to 2015. International Journal of Production Economics, 2016. 182: p. 86-112.
15. Van Donselaar, K., Integral stock norms in divergent systems with lot-sizes. European Journal of
Operational Research, 1990. 45(1): p. 70-84.
16. Prastacos, G.P., Optimal myopic allocation of a product with fixed lifetime. Journal of the operational
Research Society, 1978. 29(9): p. 905-913.
17. Fujiwara, O., H. Soewandi, and D. Sedarage, An optimal ordering and issuing policy for a two-stage
inventory system for perishable products. European Journal of Operational Research, 1997. 99(2): p.
412-424.
18. Duan, Q. and T.W. Liao, A new age-based replenishment policy for supply chain inventory
optimization of highly perishable products. International Journal of Production Economics, 2013.
145(2): p. 658-671.

Retail Tactical Planning: An Aligned Process?
Heidi Dreyer1, Iskra Dukovska-Popovska2, Kasper Kiil1, Riikka Kaipia3
1 Department of Production and Quality Engineering, The Norwegian University of Science and Technology, 7491 Trondheim, Norway [email protected]
2 Department of Mechanical and Manufacturing Engineering, Aalborg University 9220 Aalborg, Denmark
3 Aalto University School of Science, Department of Industrial Engineering and Management, Espoo Finland
Abstract. This paper addresses tactical planning in retailing through a case study approach in one grocery retailing company. Specifically, the issues are how tactical planning is conducted and how the different plans are connected and interact. The case study complements earlier retail planning studies by showing the sequence of planning phases and by studying the fragmented plans as a process. We found that the master category planning phase is important and sets borders for the other planning phases. This practice stabilizes overall planning and is an efficient solution in a complex grocery retailing environment. However, by obeying this practice, the retailer loses responsiveness to demand. Based on the study results, better integration among planning phases is proposed. The company could, if better demand responsiveness is desired, implement formal practices to enable reactions to changes in the environment, particularly demand. These practices could include feedback loops from execution to tactical planning to enable, if needed, plan and planning parameter changes.
Keywords: retailing, grocery, planning processes, tactical planning, demand responsiveness.
Published: Advances in Production Management Systems: Production Management Initiatives
for a Sustainable World. 3-7 September 2016, Iguassu Falls, Brazil.
Role of the PhD candidate and declaration of authorship:
Heidi Carin Dreyer conceptualized the paper. Data collection was jointly performed by Heidi and
Kasper Kiil, while the data analysis was conducted by Heidi, Kasper, and Iskra Dukovska-Popovska.
All authors contributed to writing the paper. Kasper presented the paper at the conference in
Brazil 2016.
Paper #66

1
Retail Tactical Planning: An Aligned Process?
1. Introduction
Efficient supply and demand planning is an appropriate solution to ensure product availability in
stores at lower costs [12, 4]. Retailers fix some important variables, such as store product
segmentation, category management, planograms and delivery patterns and replenishment lead
times, at a tactical level and pass the decisions to the execution level as parameters [12]. How the
different tactical planning issues affect the retail operations (stores, transportation and
distribution) and responds to demand has been treated to a limited extent [12, 4]. Even though the
basic structure of a coordinated planning framework in the grocery retail industry has been
proposed [7], the interdependency of the planning decisions requires a good balance between
individual planning processes and supply and demand management. The need for more
integrative retail logistics and collaborative planning has been identified [7, 12].
This study addresses tactical planning processes in retailing. In particular, the purpose is to
analyse the planning processes and their aim, and to what extent these are integrated to serve the
need for alignment and demand responsiveness. Consequently, the research questions are how is
tactical planning conducted at a retail company and how are the different plans connected and
interact?
2. Literature on retail planning
The main objective of mid-term, aggregated supply chain (SC) planning is to build a plan that
satisfies demand while maximizing profit [2] in a timely manner. Mid-term planning often covers
multiple SC stages [11, 6] is based on aggregate demands for entire product families and covers
a medium-term horizon. Creating such a collaborative plan could be challenging since different
functions may achieve profitability in conflicting ways. Coordination between stages and
functions becomes the core element in SC mid-term planning.
Retail operations and SC management in the retailing context have been largely studied [5]. Most
studies focus on some aspect of planning, like delivery patterns [12], in-store operations [13],
retail store replenishments or reducing waste in fresh food SCs [10]. An overall understanding or
syntheses of retail planning are rarely presented, with an exception being the grocery retail
planning framework by [7]. Mid-term planning comprises several planning phases conducted by
and related to one or more functions. First, mid-term planning deals with category and product-
related aspects that are grouped as product segmentation and allocation (covering issues related
to procurement and logistics) and master category planning, related to sales. Second, mid-term
planning covers plans for managing the product flow (inbound planning, production planning and
distribution planning) and in-store planning, including capacity and personnel planning.
Agrawal and Smith (2009) [1] describe a more process-oriented SC planning framework at a
(furniture) retailer covering the planning steps, their succession and interrelation. Based on
combining the two SC planning overviews, the different planning activities are discussed below.
Following the planning process design [8], we identified, based on theory, design parameters
(planning horizon and aggregation level), inputs, outputs, objectives and functions involved in
each planning phase.
In grocery retail, selection of vendors is more a strategic decision [7]. For products that are carried
over multiple seasons, contracts may allow for modifications in order quantities within certain
2
ranges, depending on the observed demand for the product. In addition, retailers can evaluate
vendors based on past performance and can be involved in the vendors’ production planning more
actively or by sharing forecasts and placing purchase orders [1].
The planning of product logistics deals with coordination of flow of products from suppliers to
warehousing and to retail stores. These decisions are made on different planning objects, product-
specific and product segment-specific decisions. For inbound logistics, the following planning
issues are done at different levels of aggregation: supplier-specific level (related to product
ordering) and supplier-segment level (related to transportation issues). Distribution planning
deals with decisions to fulfill customer service targets at minimum costs as a trade-off between
inventory management policies for each store and delivery policies from the central warehouse.
As in inbound planning, the decisions are done at different aggregation levels, some are store
(concept) related and others focus on delivery regions.
3. Methodology
The aim of the study is to understand the tactical planning processes in grocery retailing. The
methodology we chose is a single exploratory case study since this allowed us to gain the needed
in-depth insight into the planning process and to enable us to study the planning process in its
natural environment [3]. A single case was selected in the grocery sector because of the novel
nature of the retail planning process and the wide product range and the mix of product types
(fresh, frozen and dry food), which make it relevant from a planning perspective.
Data were collected in two steps. First, site visits and workshops focusing on describing processes
and operations, and observations at warehouses and stores were the main means to understand
the planning environment. Second, the data about the tactical planning process were collected in
structured interviews following a case study protocol designed to cover the objective and content
of the tactical planning process, the structure of the planning processes, planning
interconnectedness and performance. [14]. The interviews took place at three levels: retail chain,
procurement and suppliers and logistics and it involved key managers with responsibility for
tactical planning. The field notes from the interviews were converted to a description of the
tactical planning and structured according to the literature in section 2. We asked the key
interviewees to review the case description to ensure its validity [14].
4. Results
4.1. Case description
The case is a Nordic grocery retailer offering a full-range grocery assortment. The organization
is structured into three main functions: retail chain (stores), procurement and assortment, and
logistics. Altogether, the retailer runs hundreds of stores divided in different store concepts
ranging from discount stores and supermarkets to premium stores. Centralised planning tasks
include the development of the different store concepts, their assortments, marketing, sales and
promotions and various purchasing and supplier network decisions. Managing the logistics
consists of the inbound logistics from suppliers to the warehouses, warehouse operations and
outbound logistics to the stores.
4.2. The tactical planning process
Figure 2 illustrates the tactical planning process, while Table 1 includes a more detailed
description of each activity. The tactical planning process takes place at all three functions (Figure
2), but contrary to what is illustrated in the framework presented by [7], the process begins at the
3
retail chain. The tactical planning process can be described as follows: (1) The retail chain decides
the main profile of the chain concept and the product categories (category, profile, depth, price,
etc.) and promotions for each concept. The decisions are made at an aggregated level covering a
time horizon of 12 months, with two main objectives: revenue and profit per chain concept. (2)
This plan is afterwards disaggregated into specific products, volumes and time periods for the
promotions. (3) Additionally, the specifications of each profile act as an input to the procurement
and assortment function, which disaggregates the master category plan into specific products and
suppliers while (4) negotiating and making the final contract with the suppliers. The suppliers’
contracts regulate the terms and conditions for the purchase and deliveries (price and discounts,
volume, frequency, promotions, packaging size) for a 12-month period, while the planograms for
each store or store concept are updated every 4 months. Planograms define where specific
products are placed on shelves and the stock level. (5) Based on the volumes specified in the
contracts and the expected sales in each area (can be derived from the sizes of the shelf in the
planograms), the inventory structure is decided upon. This may be adjusted during the year.
Hereafter, (6) to ease inventory management decisions, all products are divided into different
logistical product groups, which should share the same service level before (7) the final inventory
policy and delivery plan is finalized. By grouping the suppliers into smaller regions, the inventory
and delivery plan specifies when and how much to collect from each supplier. Lastly, the plan for
outbound deliveries from warehouse to stores is made on two hierarchical levels, also with a
varying time horizon. Based on the profile of each concept or the store revenue and the inventory
structure, (8) guidelines are provided for the number of weekly deliveries for three high-level
product groups: a) frozen/dry/fresh food, b) fruits and vegetables and c) products from the central
warehouse. Large stores get more frequent deliveries than smaller stores. Finally, (9) the
individual routes from the warehouse to the stores are calculated by balancing the delivery plan
with the utilization of each truck.
Figure 1 shows that planning is top–down oriented by starting at an aggregated level and letting
the aggregated decisions be the premises for lower level planning. We observed two layers in the
tactical planning: one that focuses on a 12 months horizon and is aggregated (store concept and
product category) and the second that focuses on product family and individual products and has
a 4-month time horizon.
The planning is functional, and the output from one function acts as the input and sets the premises
for the next function. Limited feedback loops and interaction between the planning steps are
apparent. At the tactical level, there is no joint planning team that joins and coordinates the main
planning areas to integrate and align between the functional plans. However, the company does
apply different types of meetings to discuss cross-functional issues between the plans.
For each tactical plan there are objectives that serve the aim of the function. Revenue and profit
are the objectives of the retail chain, and logistics is measured according to the cost and service
level. At this level there do not appear to be any cross-functional objectives that align the SC.
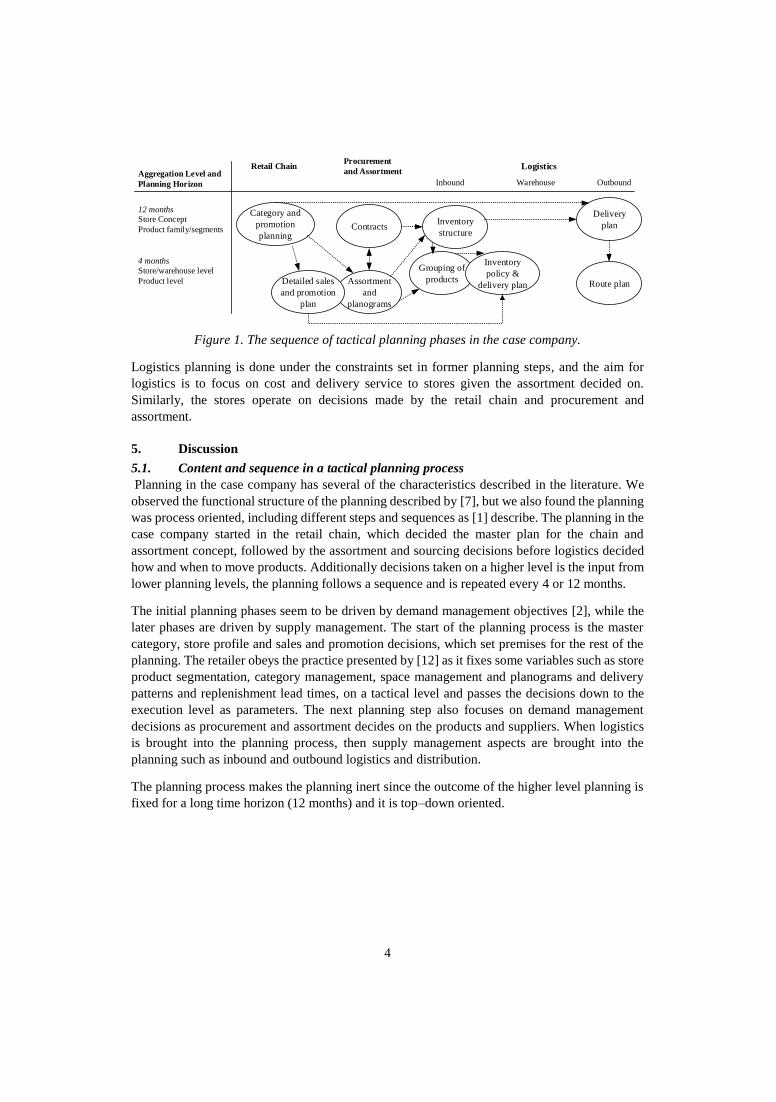
4
Aggregation Level and
Planning Horizon
Store Concept
Product family/segments
Store/warehouse level
Product level
Retail ChainProcurement
and Assortment
Inbound Warehouse Outbound
Logistics
Category and
promotion
planning
12 months
4 months
Contracts
Assortment
and
planograms
Detailed sales
and promotion
plan
Inventory
structure
Grouping of
products
Inventory
policy &
delivery plan Route plan
Delivery
plan
Figure 1. The sequence of tactical planning phases in the case company.
Logistics planning is done under the constraints set in former planning steps, and the aim for
logistics is to focus on cost and delivery service to stores given the assortment decided on.
Similarly, the stores operate on decisions made by the retail chain and procurement and
assortment.
5. Discussion
5.1. Content and sequence in a tactical planning process
Planning in the case company has several of the characteristics described in the literature. We
observed the functional structure of the planning described by [7], but we also found the planning
was process oriented, including different steps and sequences as [1] describe. The planning in the
case company started in the retail chain, which decided the master plan for the chain and
assortment concept, followed by the assortment and sourcing decisions before logistics decided
how and when to move products. Additionally decisions taken on a higher level is the input from
lower planning levels, the planning follows a sequence and is repeated every 4 or 12 months.
The initial planning phases seem to be driven by demand management objectives [2], while the
later phases are driven by supply management. The start of the planning process is the master
category, store profile and sales and promotion decisions, which set premises for the rest of the
planning. The retailer obeys the practice presented by [12] as it fixes some variables such as store
product segmentation, category management, space management and planograms and delivery
patterns and replenishment lead times, on a tactical level and passes the decisions down to the
execution level as parameters. The next planning step also focuses on demand management
decisions as procurement and assortment decides on the products and suppliers. When logistics
is brought into the planning process, then supply management aspects are brought into the
planning such as inbound and outbound logistics and distribution.
The planning process makes the planning inert since the outcome of the higher level planning is
fixed for a long time horizon (12 months) and it is top–down oriented.
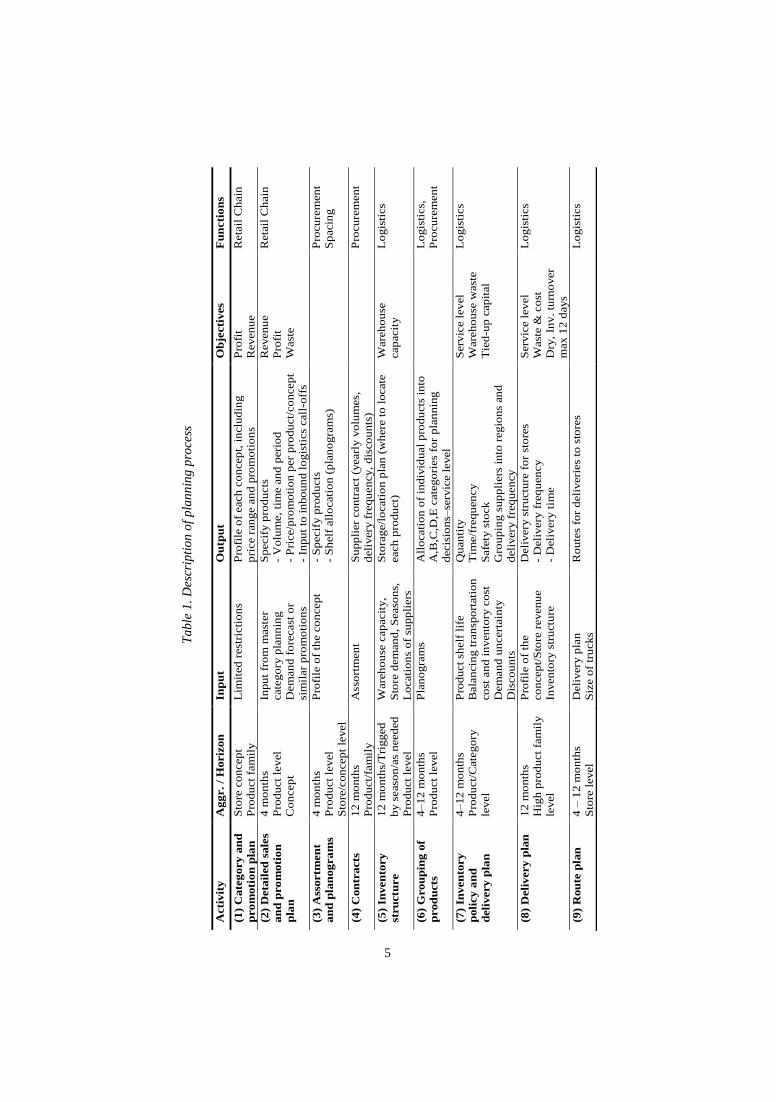
5
Acti
vit
y
Ag
gr.
/ H
oriz
on
In
pu
t O
utp
ut
Ob
jecti
ves
Fu
ncti
on
s
(1)
Cate
gory
an
d
pro
moti
on
pla
n
Sto
re c
on
cep
t
Pro
du
ct
fam
ily
Lim
ited
rest
ricti
on
s P
rofi
le o
f each
co
ncep
t, i
nclu
din
g
pri
ce r
an
ge a
nd
pro
mo
tio
ns
Pro
fit
Reven
ue
Reta
il C
hain
(2)
Deta
iled
sale
s
an
d p
ro
moti
on
pla
n
4 m
on
ths
Pro
du
ct
level
Co
ncep
t
Inpu
t fr
om
mast
er
cate
go
ry p
lan
nin
g
Dem
an
d f
ore
cast
or
sim
ilar
pro
mo
tio
ns
Sp
ecif
y p
rod
ucts
- V
olu
me,
tim
e a
nd
peri
od
- P
rice/p
rom
oti
on
per
pro
du
ct/
co
ncep
t
- In
pu
t to
in
bo
un
d l
ogis
tics
call
-off
s
Reven
ue
Pro
fit
Wast
e
Reta
il C
hain
(3)
Ass
ortm
en
t
an
d p
lan
og
ra
ms
4 m
on
ths
Pro
du
ct
level
Sto
re/c
on
cep
t le
vel
Pro
file
of
the c
on
cep
t -
Sp
ecif
y p
rod
ucts
- S
helf
all
ocati
on (
pla
no
gra
ms)
P
rocu
rem
en
t
Sp
acin
g
(4)
Con
tra
cts
1
2 m
on
ths
Pro
du
ct/
fam
ily
Ass
ort
men
t S
upp
lier
con
tract
(yearl
y v
olu
mes,
deli
very
fre
qu
en
cy,
dis
co
un
ts)
P
rocu
rem
en
t
(5)
Inven
tory
stru
ctu
re
12
mo
nth
s/T
rigged
by s
easo
n/a
s n
eed
ed
Pro
du
ct
level
Ware
ho
use
cap
acit
y,
Sto
re d
em
an
d,
Seaso
ns,
Lo
cati
on
s o
f su
pp
liers
Sto
rage/l
ocati
on p
lan
(w
here
to
locate
each
pro
du
ct)
Ware
ho
use
cap
acit
y
Lo
gis
tics
(6)
Grou
pin
g o
f
prod
ucts
4–
12
mo
nth
s
Pro
du
ct
level
Pla
no
gra
ms
All
ocati
on
of
ind
ivid
ual
pro
du
cts
in
to
A,B
,C,D
,E c
ate
go
ries
for
pla
nnin
g
decis
ion
s–se
rvic
e l
evel
L
ogis
tics,
Pro
cu
rem
en
t
(7)
Inven
tory
poli
cy
an
d
deli
very
pla
n
4–
12
mo
nth
s
Pro
du
ct/
Cate
go
ry
level
Pro
du
ct
shelf
lif
e
Bala
ncin
g t
ran
spo
rtati
on
co
st a
nd
in
ven
tory
co
st
Dem
an
d u
ncert
ain
ty
Dis
co
un
ts
Qu
an
tity
Tim
e/f
req
uen
cy
Safe
ty s
tock
Gro
up
ing s
up
pli
ers
in
to r
egio
ns
an
d
deli
very
fre
qu
en
cy
Serv
ice l
ev
el
Ware
ho
use
wast
e
Tie
d-u
p c
ap
ital
Lo
gis
tics
(8)
Deli
very
pla
n
12
mo
nth
s
Hig
h p
rod
uct
fam
ily
level
Pro
file
of
the
co
ncep
t/S
tore
reven
ue
Inven
tory
str
uctu
re
Deli
very
str
uctu
re f
or
sto
res
- D
eli
very
fre
qu
en
cy
- D
eli
very
tim
e
Serv
ice l
ev
el
Wast
e &
co
st
Dry
, In
v.
turn
over
max 1
2 d
ays
Lo
gis
tics
(9)
Rou
te p
lan
4
– 1
2 m
on
ths
Sto
re l
evel
Deli
very
pla
n
Siz
e o
f tr
ucks
Ro
ute
s fo
r d
eli
veri
es
to s
tore
s
Lo
gis
tics
Ta
ble
1.
Des
crip
tio
n o
f p
lan
nin
g p
roce
ss
6
This makes the planning more predictive and less sensitive to disturbance and market changes
and makes it easier to focus on resource utilization and efficiency. However this makes the
planning less dynamic and adjustable to the actual demand situation. Long-term assortment
planning and promotion planning (12 months) actually stabilize the planning, and other plans are
adjusted.
5.2. Interplay between organizational functions
Constraints are decided by the objectives of the retail chain and procurement and assortment
function, and the main role of logistics is to make a plan that optimizes cost and service level.
The ‘what’ decisions are managed by the retail chain and assortment and procurement, leaving
the ‘when’ and ‘how much’ decisions of warehouse, transport capacity and delivery frequency to
the inbound and outbound logistics planning. The store profile and assortment planning constrains
the following planning phases to an extent that the other plans keep the role of implementing the
plan.
The overall tactical planning process is fragmented as it consists of a set of sequential plans that
are only loosely integrated. First, coordination is done when needed and there is no common
arena for integrating all the functions that are involved in the process in order to have consensus
in the planning. When planning is done in quite separated loops that serve different demands,
they can easily end up in sub-optimising. Second, the planning objectives are different in the main
planning functions; some obey commercial objectives, revenue and profit, and others cost and
service level. The planning is driven by several goals, but it remains unclear how the planning
quality is defined and measured.
Some improvement proposals emerged. First, the different plans can be better coordinated and
integrated in general. Second, there need to be efficient feedback loops from implementing the
plan to tactical planning. This is essential for keeping the plan responsive to demand and
achieving alignment. The company needs to have a practice to update the plan between planning
rounds if needed. Third, the whole process, particularly the operational part, could benefit from
adopting more formal practices. Instead of the reactive way of operating, with ad hoc meetings
and fire fighting, the company could operate in a more proactive manner. Furthermore, we
suggest that differentiated planning [9] can be realised to some extent.
6. Concluding Remarks
The operating environment of retail business increases competitive pressure because of
multichannel operations, global sourcing and increasing number of product variants. To survive
in this competitive environment, retailers need to ensure product availability at stores and at the
same time operate efficiently. Our study examines how a retail company has implemented these
challenges in its planning solution.
The case company uses a solution for defining retail store assortments for a long period of time
and ensuring the supply of products by supplier agreements. This practice stabilises the planning
and sets targets for the operations. The downside of the practice is the low level of demand
responsiveness. In this paper we suggest that the company, if better demand responsiveness is
desired, could realise formal feedback loops from operations to assortment planning. This would
allow adjusting the assortment. This could be applied when planning the next 4-month assortment
but also between the planning rounds. The company could also benefit from more formal planning
practices and integration mechanisms in realising integrated planning.
7
This study reports initial results from an on-going research project concerning one retail
company. The next steps are to collect more data, particularly on outbound logistics and store
planning in order to look deeper into demand responsiveness.
7. Acknowledgements
The authors gratefully acknowledge the BIA program, the Norwegian Research Council for
financial support of the project and the participating case companies.
8. Reference
1. Agrawal, N., Smith, S.A., 2009. Supply chain planning processes for two major retailers. In: Agrawal,
N., Smith, S.A. (Eds.). Retail Supply Chain Management. Springer US, 11-23.
2. Chopra, S., Meindl, P., 2013. Supply Chain Management: Strategy, Planning and Operation. Pearson
Higher Education.
3. Eisenhardt, K.M., 1989. Building theories from case study research. Academy of Management Review,
14 (4), 532-50.
4. Ettouzani, Y., Yates, N., Mena, C., 2012. Examining retail on shelf availability: promotional impact
and a call for research. International Journal of Physical Distribution & Logistics Management, 42 (3),
213-43.
5. Fernie, J., Sparks, L., Alan C. McKinnon, A.C. 2010. Retail logistics in the UK: past, present and
future. International Journal of Retail & Distribution Management, 38 (11/12), 894-914.
6. Fleischmann, B., Meyr, H., Wagner, M., 2008. Advanced planning. In: Stadler, H., Kilger, C. (Eds.).
Supply Chain Management and Advanced Planning. Berling: Springer, 71-95.
7. Hübner, A.H., Kuhn, H., Michael G. Sternbeck, M.G., 2013. Demand and supply chain planning in
grocery retail: an operations planning framework. International Journal of Retail & Distribution
Management, 41 (7), 512-30.
8. Ivert Kjellsdotter, L., Dukovska-Popovska, I., Fredriksson, A., Dreyer, H.C., Kaipia, R., 2015.
Contingency between S&OP design and planning environment. International Journal of Physical
Distribution & Logistics Management, 45 (8), 747-773.
9. Kaipia, R., Holmström, J., 2007. Selecting the right planning approach for a product. Supply Chain
Management – An International Journal, 12 (3), 3-13.
10. Kaipia, R., Dukovska‐Popovska, I., Loikkanen, L. 2013. Creating sustainable fresh food supply chains
through waste reduction. International Journal of Physical Distribution & Logistics Management, 43
(3), 262-76.
11. Kreipl, S., Pinedo M., 1994. Planning and scheduling in supply chains: Overview on issues in practice.
Production and Operations Management, 13 (1), 77-92.
12. Kuhn, H., Sternbeck, M.G., 2013. Integrative retail logistics: an exploratory study. Operations
Management Research, 6 (1), 2-18.
13. van Donselaar, K. H., Gaur, V., van Woensel, T., Broekmeulen, R.A.C.M., Fransoo, J.C., 2010.
Ordering behavior in retail stores and implications for automated replenishment. Management Science,
56 (5), 766-84.
14. Yin, R.K., 2014. Case Study Research: Design and Methods. Thousand Oaks, CA: Sage.

Enhancing tactical planning in grocery retailing with S&OP
Heidi Dreyer1, Kasper Kiil1,2, Iskra Dukovska-Popovska2, Riikka Kaipia3
1 Department of Production and Quality Engineering, The Norwegian University of Science and
Technology, 7491 Trondheim, Norway 2 Dep. of Materials and Production, Aalborg University 9220 Aalborg, Denmark
3 Aalto University School of Science, Dep. of Industrial Eng. and Management, Espoo Finland
Purpose: This paper explores tactical planning in grocery retailing, and propose how the sales and
operations planning (S&OP) concept from manufacturing industries can be applied in grocery
retailing. The study proposes directions for designing tactical planning process in grocery
retailing.
Design/methodology/approach: The work is an explorative case study with four cases in the
grocery retailing in Finland, Norway and the UK.
Findings: The study contributes to the S&OP literature by providing contextualized empirical
insight into tactical planning in grocery retailing. Grocery retailers serve price-sensitive
consumers, and demand is affected by seasons and demand stimulating activities. Planning
resources are directed to managing the market events. Less attention is directed towards aligning
demand and supply, or to providing a single plan to guide company operations.
Research limitations/implications: The study is based on four case studies in grocery retailers.
Comparisons between retail industries could be valuable to understand the contextual planning
characteristics of retailing.
Practical implications: The study provides guidelines for practitioners how S&OP can be adapted
in retailing and presents propositions for how tactical planning could be improved.
Originality/value: The study complements earlier research on retail tactical planning by taking the
planning process and integration aspects. The study suggests that retailers need such a
leadership that enhances a planning-oriented company culture. Retailers would benefit from a
formal and company-wide S&OP process to unify different market-oriented plans to a single set
of numbers, and balance demand and supply, without sacrificing the emphasis on demand
planning.
Keywords: retail planning, grocery, sales and operations planning, tactical planning process,
planning integration.
Submitted for 3rd review: International Journal of Physical Distribution and Logistics
Management
Role of the PhD candidate and declaration of authorship:
Heidi Carin Dreyer conceptualized the paper. Kasper Kiil contributed to data collection from all
four cases together with either Heidi (case 1, 3, and 4) or Riikka Kaipia (case 2). The paper was
jointly written by all authors. Specifically, Kasper composed the interview guide, conducted the
initial within-analyses as well as contributed to the joint development of the propositions. All
authors contributed significantly to refine the whole paper during the review process.
Paper #7

1
Enhancing tactical planning in grocery retailing with S&OP
1. Introdution
Grocery retailers serve a competitive and demanding market with well-informed consumers
expecting excellent product availability, rich assortment, fresh products, and low prices (Hübner
et al., 2013; Kuhn and Sternbeck, 2013). Effective and efficient demand and supply planning is
essential for coordinating thousands of individual and time restricted decisions in the supply chain
(Hübner et al., 2013). However, grocery retailing is characterized by high demand uncertainty
(Taylor and Fearne, 2009; van Donselaar et al., 2010; Ettouzani et al., 2012; Alftan et al., 2015),
large and changing assortment (Hübner et al., 2013; Ketzenberg et al., 2015), and supply
uncertainty, which can reduce the product availability (Hubner et al., 2013; Alftan et al., 2015).
Coping with these features have lead the retailers to require short lead times from suppliers to be
able to respond to the changing demand requirements, but they still need solve the problem of
poor demand forecasting, seasonality in demand and supply, and short product life cycles
(Småros, 2007; Fernie and Grant, 2008; Van Donselaar et al., 2010). Proper tactical planning may
provide stability in this regard, as it sets the premise for further operational decisions.
In retailing, tactical planning determines ground rules of regular operations for the coming 6-12
months, considers seasonal demand patterns as well as yearly business plans when negotiating
with suppliers (Hübner et al., 2013). Tactical planning in retail has been implicitly present in
concepts such as efficient consumer response (ECR), quick response (QR), vendor managed
inventory (VMI) and collaborative planning, forecasting and replenishment (CPFR) (Aastrup et
al., 2008; Holmström et al., 2002), with a focus on collaborative demand and supply
management. Only recently, tactical planning in retail has been explicitly identified and analysed
(Hübner et al. 2013; Kuhn and Sternbeck, 2013). However, these works are limited to the types
of decisions made and only partly their interrelation without examining the process and
integration. This might be highly relevant, as the demand-driven category management and the
supply-oriented operations management aspects are still planned in a quite separated manner
internally in the retail organization (Kuhn and Sternbeck, 2013).
In the manufacturing industries, tactical planning concepts has been well established, clearly
separated from operational and strategic planning (Fleischmann et al., 2008). Particularly, sales
and operations planning (S&OP) is an established a well formulated planning process aiming to
maximize the profitability of a company by aligning and integrating customer demand with
supply (Tuomikangas and Kaipia, 2014; Wagner et al., 2014). In S&OP, integration is enhanced
through a set of mechanisms aligning business strategy and operational planning, as well as
aligning the involved business functions and supply chain partners (Affonso et al., 2008; Wallace,
2011). A growing body of literature has studied S&OP in manufacturing context, however, it has
rarely been discussed in retailing (Harwell, 2006; Olivia and Watson, 2011; Kuhn and Sternbeck,
2013) even though a need for studies in different industries has been identified (Thomé et al.,
2014). These observations indicate a need for exploring the mid-term planning processes in
retailing.
The purpose of this paper is to explore tactical planning in grocery retailing, and propose how the
S&OP concept from manufacturing industries can be applied in grocery retailing. We fulfill this
purpose by examining two research questions:
1. How is tactical planning and planning integration in grocery retailing?
2. How can S&OP be adapted to grocery retailing to enhance the tactical planning process?
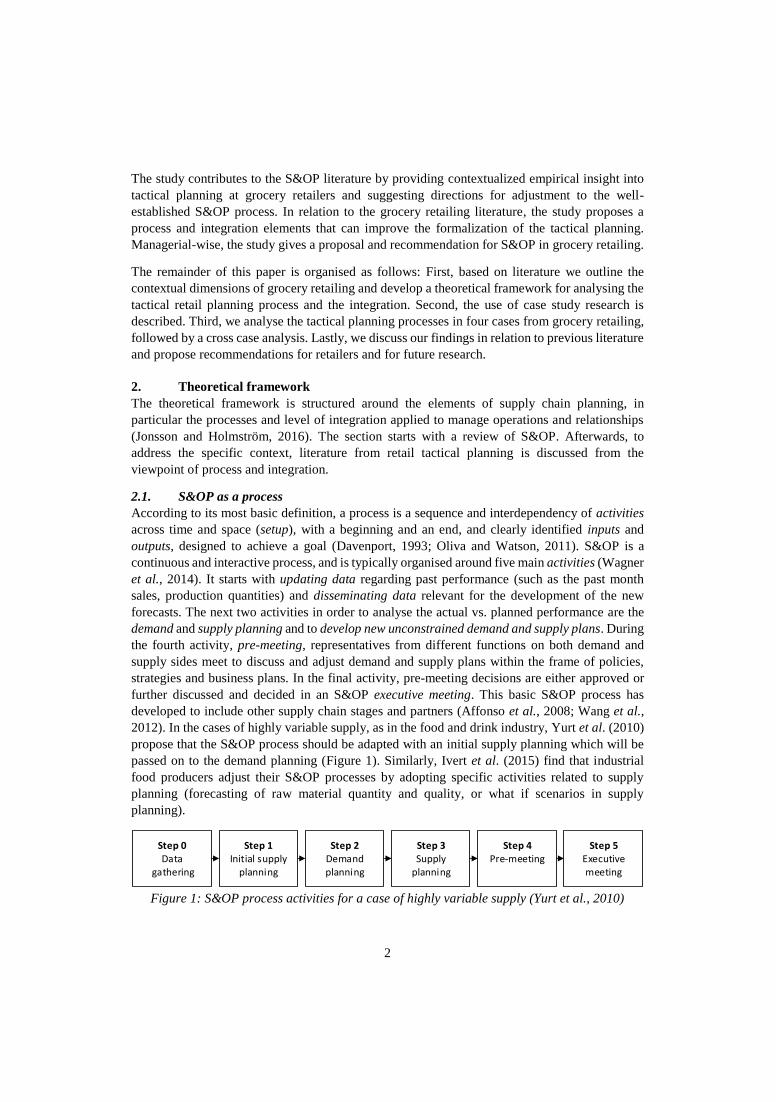
2
The study contributes to the S&OP literature by providing contextualized empirical insight into
tactical planning at grocery retailers and suggesting directions for adjustment to the well-
established S&OP process. In relation to the grocery retailing literature, the study proposes a
process and integration elements that can improve the formalization of the tactical planning.
Managerial-wise, the study gives a proposal and recommendation for S&OP in grocery retailing.
The remainder of this paper is organised as follows: First, based on literature we outline the
contextual dimensions of grocery retailing and develop a theoretical framework for analysing the
tactical retail planning process and the integration. Second, the use of case study research is
described. Third, we analyse the tactical planning processes in four cases from grocery retailing,
followed by a cross case analysis. Lastly, we discuss our findings in relation to previous literature
and propose recommendations for retailers and for future research.
2. Theoretical framework
The theoretical framework is structured around the elements of supply chain planning, in
particular the processes and level of integration applied to manage operations and relationships
(Jonsson and Holmström, 2016). The section starts with a review of S&OP. Afterwards, to
address the specific context, literature from retail tactical planning is discussed from the
viewpoint of process and integration.
2.1. S&OP as a process
According to its most basic definition, a process is a sequence and interdependency of activities
across time and space (setup), with a beginning and an end, and clearly identified inputs and
outputs, designed to achieve a goal (Davenport, 1993; Oliva and Watson, 2011). S&OP is a
continuous and interactive process, and is typically organised around five main activities (Wagner
et al., 2014). It starts with updating data regarding past performance (such as the past month
sales, production quantities) and disseminating data relevant for the development of the new
forecasts. The next two activities in order to analyse the actual vs. planned performance are the
demand and supply planning and to develop new unconstrained demand and supply plans. During
the fourth activity, pre-meeting, representatives from different functions on both demand and
supply sides meet to discuss and adjust demand and supply plans within the frame of policies,
strategies and business plans. In the final activity, pre-meeting decisions are either approved or
further discussed and decided in an S&OP executive meeting. This basic S&OP process has
developed to include other supply chain stages and partners (Affonso et al., 2008; Wang et al.,
2012). In the cases of highly variable supply, as in the food and drink industry, Yurt et al. (2010)
propose that the S&OP process should be adapted with an initial supply planning which will be
passed on to the demand planning (Figure 1). Similarly, Ivert et al. (2015) find that industrial
food producers adjust their S&OP processes by adopting specific activities related to supply
planning (forecasting of raw material quantity and quality, or what if scenarios in supply
planning).
Figure 1: S&OP process activities for a case of highly variable supply (Yurt et al., 2010)
Step 0Data
gathering
Step 1Initial supply
planning
Step 2Demand planning
Step 3Supply
planning
Step 4Pre-meeting
Step 5Executive meeting
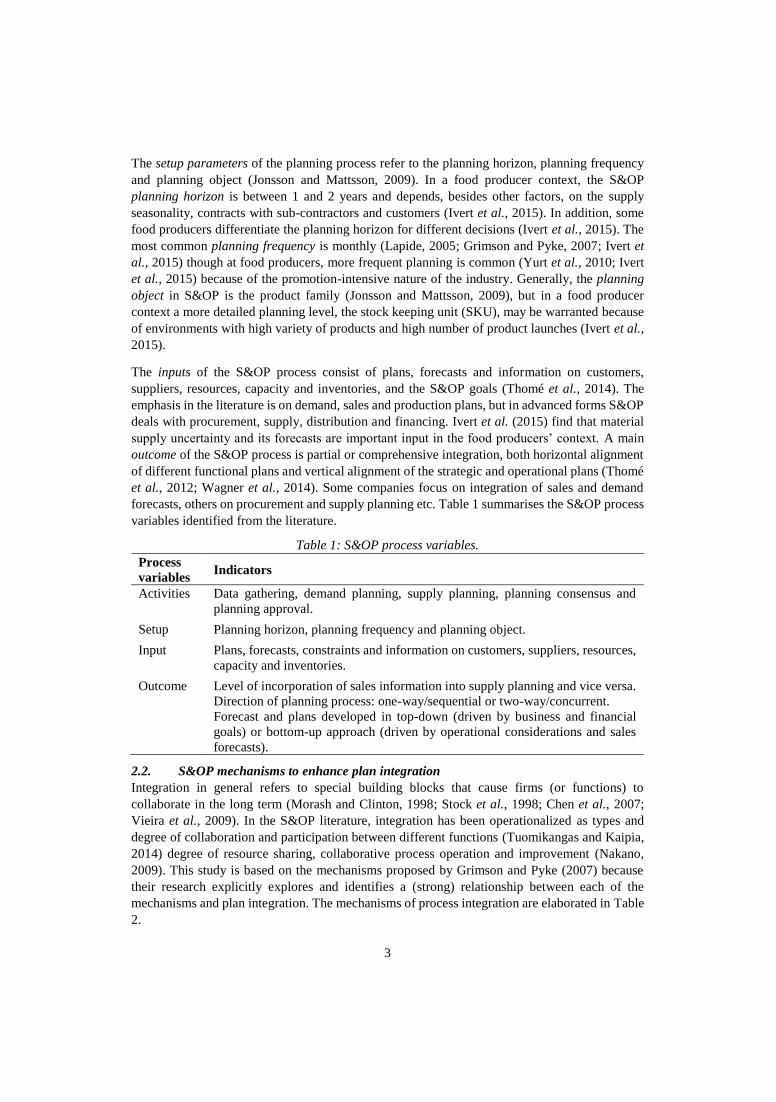
3
The setup parameters of the planning process refer to the planning horizon, planning frequency
and planning object (Jonsson and Mattsson, 2009). In a food producer context, the S&OP
planning horizon is between 1 and 2 years and depends, besides other factors, on the supply
seasonality, contracts with sub-contractors and customers (Ivert et al., 2015). In addition, some
food producers differentiate the planning horizon for different decisions (Ivert et al., 2015). The
most common planning frequency is monthly (Lapide, 2005; Grimson and Pyke, 2007; Ivert et
al., 2015) though at food producers, more frequent planning is common (Yurt et al., 2010; Ivert
et al., 2015) because of the promotion-intensive nature of the industry. Generally, the planning
object in S&OP is the product family (Jonsson and Mattsson, 2009), but in a food producer
context a more detailed planning level, the stock keeping unit (SKU), may be warranted because
of environments with high variety of products and high number of product launches (Ivert et al.,
2015).
The inputs of the S&OP process consist of plans, forecasts and information on customers,
suppliers, resources, capacity and inventories, and the S&OP goals (Thomé et al., 2014). The
emphasis in the literature is on demand, sales and production plans, but in advanced forms S&OP
deals with procurement, supply, distribution and financing. Ivert et al. (2015) find that material
supply uncertainty and its forecasts are important input in the food producers’ context. A main
outcome of the S&OP process is partial or comprehensive integration, both horizontal alignment
of different functional plans and vertical alignment of the strategic and operational plans (Thomé
et al., 2012; Wagner et al., 2014). Some companies focus on integration of sales and demand
forecasts, others on procurement and supply planning etc. Table 1 summarises the S&OP process
variables identified from the literature.
Table 1: S&OP process variables.
Process
variables Indicators
Activities Data gathering, demand planning, supply planning, planning consensus and
planning approval.
Setup Planning horizon, planning frequency and planning object.
Input Plans, forecasts, constraints and information on customers, suppliers, resources,
capacity and inventories.
Outcome Level of incorporation of sales information into supply planning and vice versa.
Direction of planning process: one-way/sequential or two-way/concurrent.
Forecast and plans developed in top-down (driven by business and financial
goals) or bottom-up approach (driven by operational considerations and sales
forecasts).
2.2. S&OP mechanisms to enhance plan integration
Integration in general refers to special building blocks that cause firms (or functions) to
collaborate in the long term (Morash and Clinton, 1998; Stock et al., 1998; Chen et al., 2007;
Vieira et al., 2009). In the S&OP literature, integration has been operationalized as types and
degree of collaboration and participation between different functions (Tuomikangas and Kaipia,
2014) degree of resource sharing, collaborative process operation and improvement (Nakano,
2009). This study is based on the mechanisms proposed by Grimson and Pyke (2007) because
their research explicitly explores and identifies a (strong) relationship between each of the
mechanisms and plan integration. The mechanisms of process integration are elaborated in Table
2.
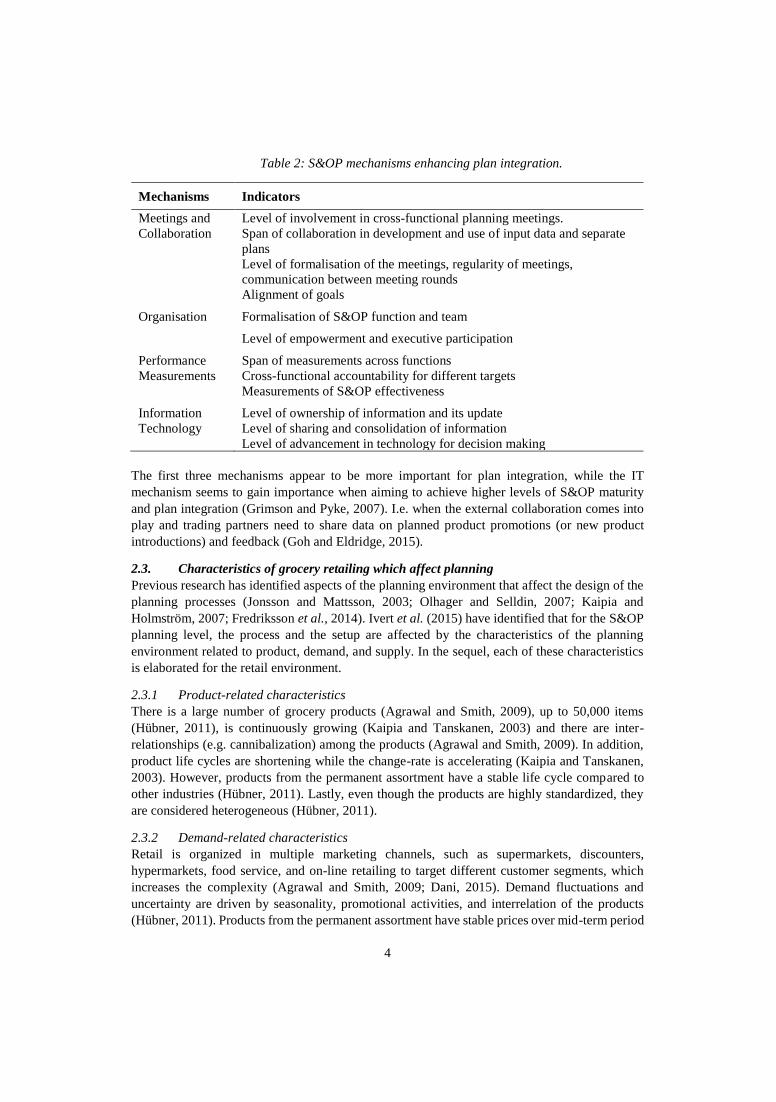
4
Table 2: S&OP mechanisms enhancing plan integration.
Mechanisms Indicators
Meetings and
Collaboration
Level of involvement in cross-functional planning meetings.
Span of collaboration in development and use of input data and separate
plans
Level of formalisation of the meetings, regularity of meetings,
communication between meeting rounds
Alignment of goals
Organisation Formalisation of S&OP function and team
Level of empowerment and executive participation
Performance
Measurements
Span of measurements across functions
Cross-functional accountability for different targets
Measurements of S&OP effectiveness
Information
Technology
Level of ownership of information and its update
Level of sharing and consolidation of information
Level of advancement in technology for decision making
The first three mechanisms appear to be more important for plan integration, while the IT
mechanism seems to gain importance when aiming to achieve higher levels of S&OP maturity
and plan integration (Grimson and Pyke, 2007). I.e. when the external collaboration comes into
play and trading partners need to share data on planned product promotions (or new product
introductions) and feedback (Goh and Eldridge, 2015).
2.3. Characteristics of grocery retailing which affect planning
Previous research has identified aspects of the planning environment that affect the design of the
planning processes (Jonsson and Mattsson, 2003; Olhager and Selldin, 2007; Kaipia and
Holmström, 2007; Fredriksson et al., 2014). Ivert et al. (2015) have identified that for the S&OP
planning level, the process and the setup are affected by the characteristics of the planning
environment related to product, demand, and supply. In the sequel, each of these characteristics
is elaborated for the retail environment.
2.3.1 Product-related characteristics
There is a large number of grocery products (Agrawal and Smith, 2009), up to 50,000 items
(Hübner, 2011), is continuously growing (Kaipia and Tanskanen, 2003) and there are inter-
relationships (e.g. cannibalization) among the products (Agrawal and Smith, 2009). In addition,
product life cycles are shortening while the change-rate is accelerating (Kaipia and Tanskanen,
2003). However, products from the permanent assortment have a stable life cycle compared to
other industries (Hübner, 2011). Lastly, even though the products are highly standardized, they
are considered heterogeneous (Hübner, 2011).
2.3.2 Demand-related characteristics
Retail is organized in multiple marketing channels, such as supermarkets, discounters,
hypermarkets, food service, and on-line retailing to target different customer segments, which
increases the complexity (Agrawal and Smith, 2009; Dani, 2015). Demand fluctuations and
uncertainty are driven by seasonality, promotional activities, and interrelation of the products
(Hübner, 2011). Products from the permanent assortment have stable prices over mid-term period
5
compared to other industries, while the promotional articles have dynamically varying prices
(Hübner, 2011). High availability requirements are propelled by a fierce competition and the
consequent risk of losing sales, and compared to manufacturing, consumers have to be served
immediately. Additionally, grocery retailers need to proactively manage supply and demand
requirements (for example by varying product offers and prices) until the consumer purchase
(Hübner, 2011). Hereof, forecasting and sales planning gain higher importance than other
industries (Hübner, 2011).
2.3.3 Supply-related characteristics
Retailers source products from many suppliers (Hübner, 2011) as well as use multiple brands and
suppliers for the same product type (Agrawal and Smith, 2009). The replenishment cycle needs
to be short and reliable because of the short shelf life of the products and the high service level
requirements (Hübner, 2011). This is in contrast to the long lead times and the seasonality of the
raw materials for the grocery products, as well as their sensitivity to weather and other
environmental conditions. Additionally, different grocery products have dedicated distribution
requirements, e.g. cooled, ambient, fresh (Hübner, 2011; Agrawal and Smith, 2009).
2.4 Tactical planning in retailing
The main grocery retail management initiatives, such as efficient consumer response (ECR), have
attempted to integrate retailers and manufacturers/suppliers to fulfil the consumer needs better,
faster and at less cost (Aastrup et al., 2008). They incorporate logistic driven strategies and
processes constituting efficient replenishment (ER) such as cross docking and continuous
replenishment. Also demand and marketing driven collaborative processes have been developed
for category management (CM), such as efficient store assortment (ESA), efficient promotion
(EP) and efficient product introduction (EPI) (Corsten, 2000). To bridge the gap between demand
and supply side planning, a collaborative planning, forecasting and replenishment concept
(CPFR) emerged (Holmström et al., 2002). However, the process is mainly demand driven and
one-directional, proceeding from sales forecast to logistics forecast (Holmström et al., 2002).
Further developments of this process, such as collaborative buyer-managed forecasting (CBMF)
(Alftan et al., 2015) focus more on how to improve the forecasting in order to better handle
exceptional demand situations when replenishing.
An interesting contribution to retail planning research is provided by Hübner et al. (2013), who
propose a synthesis of retail planning, and designed a demand and supply chain planning
framework, which incorporates the most relevant retail chain planning problems. At the tactical
level, the planning is divided on two levels of aggregation for the decisions. The upper level deals
with master category planning that covers sales aspects, and product segmentation and allocation
that covers issues related to procurement, warehousing and distribution. On the lower level, it
considers plans for managing the product flow (inbound planning, production planning and
distribution planning) and instore planning, including capacity and personnel planning. In
addition, these planning decisions are related to the different functions of the retail supply chain
that are assumed to be taking part in developing the plans, and are distributed across different
hierarchical levels of planning. Even though the framework outlines and structures the main
demand and supply chain planning issues, it does not reflect a planning process or interrelation
between the various decisions towards a common goal. In addition, there is still clear division
between operation related and sales related planning activities.
6
Retail planning has been studied in a large group of articles, but this literature typically focuses
on planning aspects of specific parts of supply chain, such as delivery patterns (Kuhn and
Sternbeck, 2013), instore operations (Kotzab and Teller, 2005; van Donselaar et al., 2010; Reiner
et al., 2013), retail store replenishments (van Donselaar et al., 2010; Alftan et al., 2015) or waste
reduction in fresh food supply chains (Kaipia et al., 2013). Kuhn and Sternbeck (2013) identify
five tactical planning issues related to operations at retail and explore their implications for stores,
transportation and distribution centers.
To summarize, there has been successful attempts to increase collaborative planning in retailing,
and to enhance forecasting and information sharing in planning. Even though for example ECR
has brought suppliers and retailers into the same process, there is still missing a more balanced
view on the tactical supply and demand planning for grocery retailers.
3. Research Design
To serve the purpose of this paper, exploring tactical planning in grocery retailing, and propose
how the S&OP concept from manufacturing industries can be applied in grocery retailing, an
exploratory case study approach was designed. Case study research is particularly suited when
exploring new and complex real-life events (Yin, 2009), where the context and experience are
critical for understanding the phenomenon of interest (Barratt et al., 2011), and when research
builds on existing theoretical frameworks (Voss et al., 2002).
The unit of analysis is the tactical level of planning in grocery retailing with a focus on the process
and the planning integration. We aim to investigate the theory and the retail context in turns by
iterating between the theory and the empirical data which is an approach that can be characterized
as theory elaboration (Ketokivi and Choi, 2014; Narasimhan, 2014). Theory elaboration focuses
on contextualizing a logic from a general theory, or in other words: reconciliation of the general
(in our situation: S&OP) with the particular (the context of grocery retailing derived from case
studies) (Ketokivi and Choi, 2014).
3.1. Case companies
The research involved four cases in the grocery retail sector in Finland, Norway and the UK. The
purpose of case studies are generally not intended to generalize findings, but merely to
empirically shed light and to further elaborate on a theoretical concept (Yin, 2009). Consequently,
we used three main selection criteria. (1) We selected cases based on our preliminary familiarities
of several grocery retailers, which could include planning practices and capabilities at different
maturity levels to broaden the empirical foundation for analysis and subsequent propositions.
Using multiple cases also reduce the risk of misjudging the representativeness of single events
(Voss et al., 2002). (2) Grocery retailing is often characterized by a complex logistical network
and broad product range, thus we wanted to ensure that the selected retailers have a large range
grocery assortment and a large responsibility for wholesaling and logistics operations. (3) The
cases were located in geographical areas with comparable characteristics such as the industry
structure and the retailing business model which made the cases suitable for a cross-case analysis.
The cases are further described in Table 3.
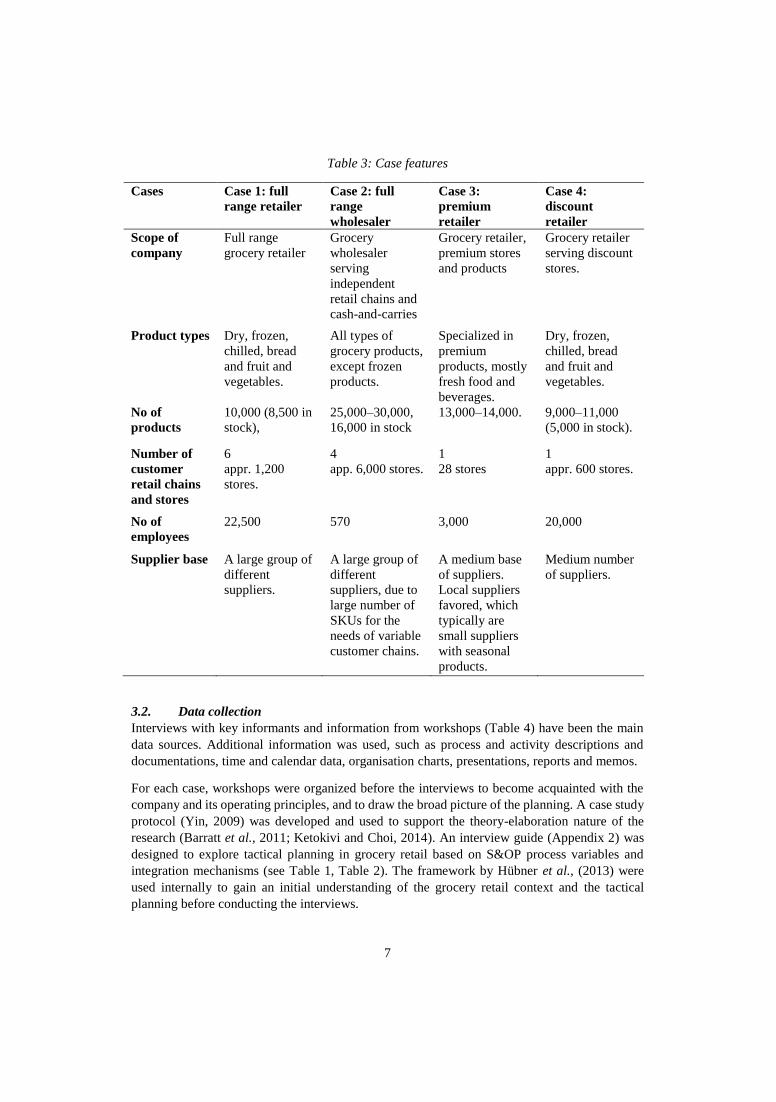
7
Table 3: Case features
Cases Case 1: full
range retailer
Case 2: full
range
wholesaler
Case 3:
premium
retailer
Case 4:
discount
retailer
Scope of
company
Full range
grocery retailer
Grocery
wholesaler
serving
independent
retail chains and
cash-and-carries
Grocery retailer,
premium stores
and products
Grocery retailer
serving discount
stores.
Product types Dry, frozen,
chilled, bread
and fruit and
vegetables.
All types of
grocery products,
except frozen
products.
Specialized in
premium
products, mostly
fresh food and
beverages.
Dry, frozen,
chilled, bread
and fruit and
vegetables.
No of
products
10,000 (8,500 in
stock),
25,000–30,000,
16,000 in stock
13,000–14,000. 9,000–11,000
(5,000 in stock).
Number of
customer
retail chains
and stores
6
appr. 1,200
stores.
4
app. 6,000 stores.
1
28 stores
1
appr. 600 stores.
No of
employees
22,500 570 3,000 20,000
Supplier base A large group of
different
suppliers.
A large group of
different
suppliers, due to
large number of
SKUs for the
needs of variable
customer chains.
A medium base
of suppliers.
Local suppliers
favored, which
typically are
small suppliers
with seasonal
products.
Medium number
of suppliers.
3.2. Data collection
Interviews with key informants and information from workshops (Table 4) have been the main
data sources. Additional information was used, such as process and activity descriptions and
documentations, time and calendar data, organisation charts, presentations, reports and memos.
For each case, workshops were organized before the interviews to become acquainted with the
company and its operating principles, and to draw the broad picture of the planning. A case study
protocol (Yin, 2009) was developed and used to support the theory-elaboration nature of the
research (Barratt et al., 2011; Ketokivi and Choi, 2014). An interview guide (Appendix 2) was
designed to explore tactical planning in grocery retail based on S&OP process variables and
integration mechanisms (see Table 1, Table 2). The framework by Hübner et al., (2013) were
used internally to gain an initial understanding of the grocery retail context and the tactical
planning before conducting the interviews.
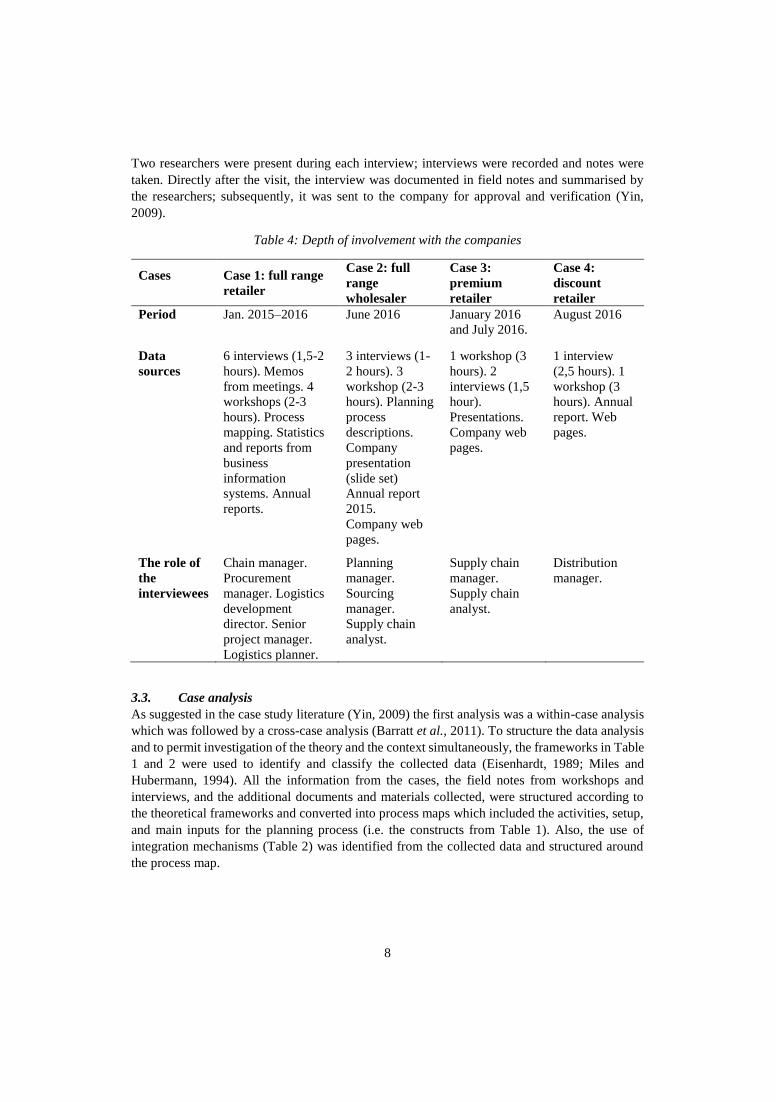
8
Two researchers were present during each interview; interviews were recorded and notes were
taken. Directly after the visit, the interview was documented in field notes and summarised by
the researchers; subsequently, it was sent to the company for approval and verification (Yin,
2009).
Table 4: Depth of involvement with the companies
Cases
Case 1: full range
retailer
Case 2: full
range
wholesaler
Case 3:
premium
retailer
Case 4:
discount
retailer
Period Jan. 2015–2016 June 2016 January 2016
and July 2016.
August 2016
Data
sources
6 interviews (1,5-2
hours). Memos
from meetings. 4
workshops (2-3
hours). Process
mapping. Statistics
and reports from
business
information
systems. Annual
reports.
3 interviews (1-
2 hours). 3
workshop (2-3
hours). Planning
process
descriptions.
Company
presentation
(slide set)
Annual report
2015.
Company web
pages.
1 workshop (3
hours). 2
interviews (1,5
hour).
Presentations.
Company web
pages.
1 interview
(2,5 hours). 1
workshop (3
hours). Annual
report. Web
pages.
The role of
the
interviewees
Chain manager.
Procurement
manager. Logistics
development
director. Senior
project manager.
Logistics planner.
Planning
manager.
Sourcing
manager.
Supply chain
analyst.
Supply chain
manager.
Supply chain
analyst.
Distribution
manager.
3.3. Case analysis
As suggested in the case study literature (Yin, 2009) the first analysis was a within-case analysis
which was followed by a cross-case analysis (Barratt et al., 2011). To structure the data analysis
and to permit investigation of the theory and the context simultaneously, the frameworks in Table
1 and 2 were used to identify and classify the collected data (Eisenhardt, 1989; Miles and
Hubermann, 1994). All the information from the cases, the field notes from workshops and
interviews, and the additional documents and materials collected, were structured according to
the theoretical frameworks and converted into process maps which included the activities, setup,
and main inputs for the planning process (i.e. the constructs from Table 1). Also, the use of
integration mechanisms (Table 2) was identified from the collected data and structured around
the process map.
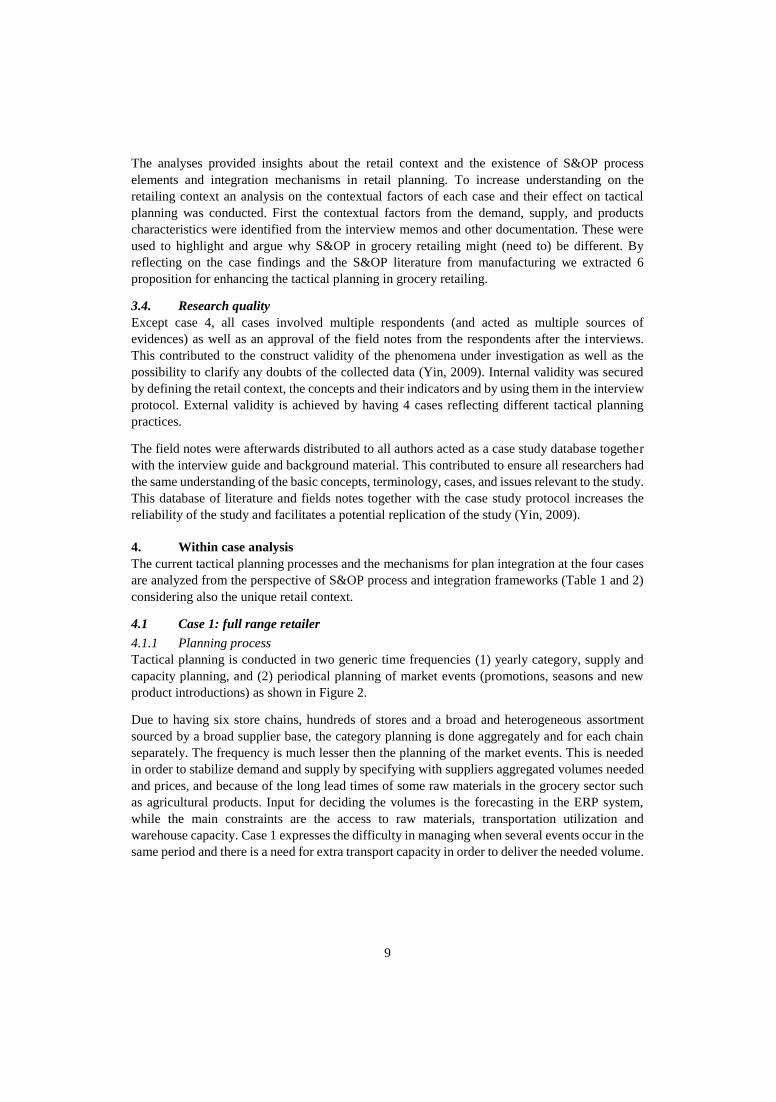
9
The analyses provided insights about the retail context and the existence of S&OP process
elements and integration mechanisms in retail planning. To increase understanding on the
retailing context an analysis on the contextual factors of each case and their effect on tactical
planning was conducted. First the contextual factors from the demand, supply, and products
characteristics were identified from the interview memos and other documentation. These were
used to highlight and argue why S&OP in grocery retailing might (need to) be different. By
reflecting on the case findings and the S&OP literature from manufacturing we extracted 6
proposition for enhancing the tactical planning in grocery retailing.
3.4. Research quality
Except case 4, all cases involved multiple respondents (and acted as multiple sources of
evidences) as well as an approval of the field notes from the respondents after the interviews.
This contributed to the construct validity of the phenomena under investigation as well as the
possibility to clarify any doubts of the collected data (Yin, 2009). Internal validity was secured
by defining the retail context, the concepts and their indicators and by using them in the interview
protocol. External validity is achieved by having 4 cases reflecting different tactical planning
practices.
The field notes were afterwards distributed to all authors acted as a case study database together
with the interview guide and background material. This contributed to ensure all researchers had
the same understanding of the basic concepts, terminology, cases, and issues relevant to the study.
This database of literature and fields notes together with the case study protocol increases the
reliability of the study and facilitates a potential replication of the study (Yin, 2009).
4. Within case analysis
The current tactical planning processes and the mechanisms for plan integration at the four cases
are analyzed from the perspective of S&OP process and integration frameworks (Table 1 and 2)
considering also the unique retail context.
4.1 Case 1: full range retailer
4.1.1 Planning process
Tactical planning is conducted in two generic time frequencies (1) yearly category, supply and
capacity planning, and (2) periodical planning of market events (promotions, seasons and new
product introductions) as shown in Figure 2.
Due to having six store chains, hundreds of stores and a broad and heterogeneous assortment
sourced by a broad supplier base, the category planning is done aggregately and for each chain
separately. The frequency is much lesser then the planning of the market events. This is needed
in order to stabilize demand and supply by specifying with suppliers aggregated volumes needed
and prices, and because of the long lead times of some raw materials in the grocery sector such
as agricultural products. Input for deciding the volumes is the forecasting in the ERP system,
while the main constraints are the access to raw materials, transportation utilization and
warehouse capacity. Case 1 expresses the difficulty in managing when several events occur in the
same period and there is a need for extra transport capacity in order to deliver the needed volume.
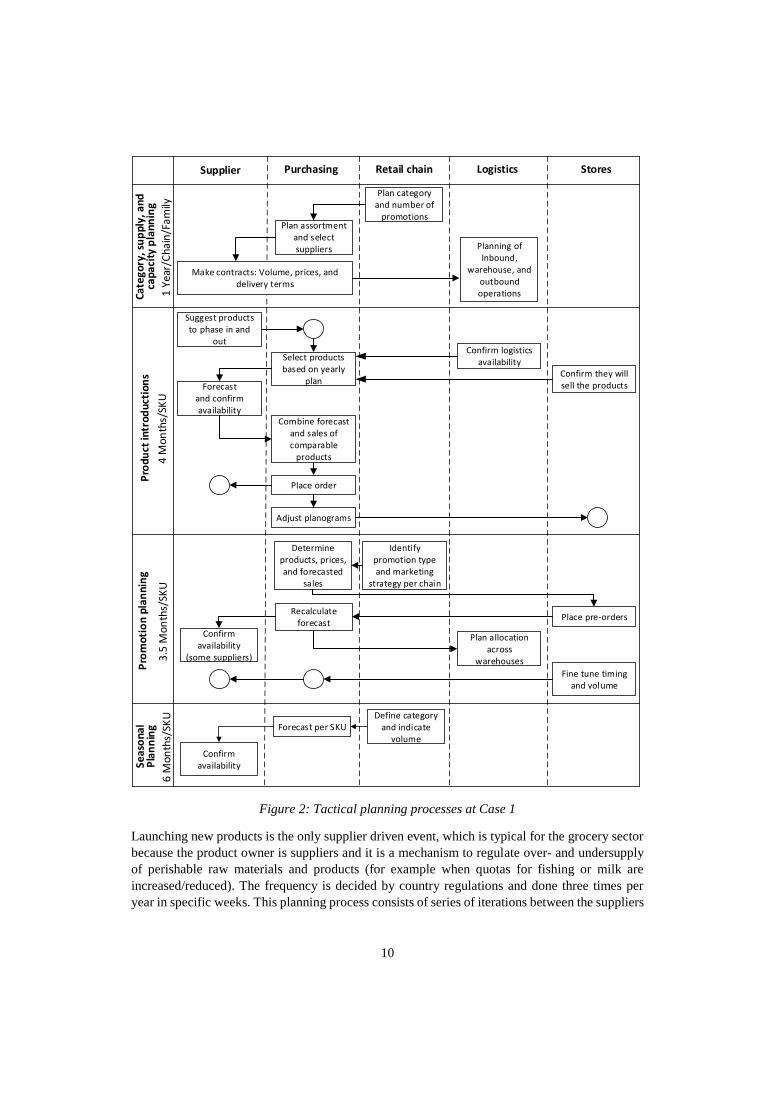
10
Supplier Purchasing Retail chain StoresLogistics
Cate
gory
, su
ppl
y, a
nd
ca
pac
ity
pla
nn
ing
Plan category and number of
promotions
Pro
duct
intr
oduc
tion
sP
rom
oti
on
pla
nn
ing
Seas
ona
l P
lan
nin
g
Plan assortment and select suppliers
Make contracts: Volume, prices, and delivery terms
Planning of Inbound,
warehouse, and outbound operations
Suggest products to phase in and
out
Select products based on yearly
planConfirm they will sell the productsForecast
and confirm availability
Combine forecast and sales of comparable
products
Confirm logistics availability
Place order
Adjust planograms
Identify promotion type and marketing
strategy per chain
Determine products, prices, and forecasted
sales
Place pre-ordersRecalculate
forecast
Plan allocation across
warehouses
Confirm availability
(some suppliers)
Fine tune timing and volume
Define category and indicate
volumeForecast per SKU
Confirm availability
1 Ye
ar/C
hain
/Fam
ily4
Mon
ths/
SKU
3.5
Mon
ths/
SKU
6 M
onth
s/SK
U
Figure 2: Tactical planning processes at Case 1
Launching new products is the only supplier driven event, which is typical for the grocery sector
because the product owner is suppliers and it is a mechanism to regulate over- and undersupply
of perishable raw materials and products (for example when quotas for fishing or milk are
increased/reduced). The frequency is decided by country regulations and done three times per
year in specific weeks. This planning process consists of series of iterations between the suppliers
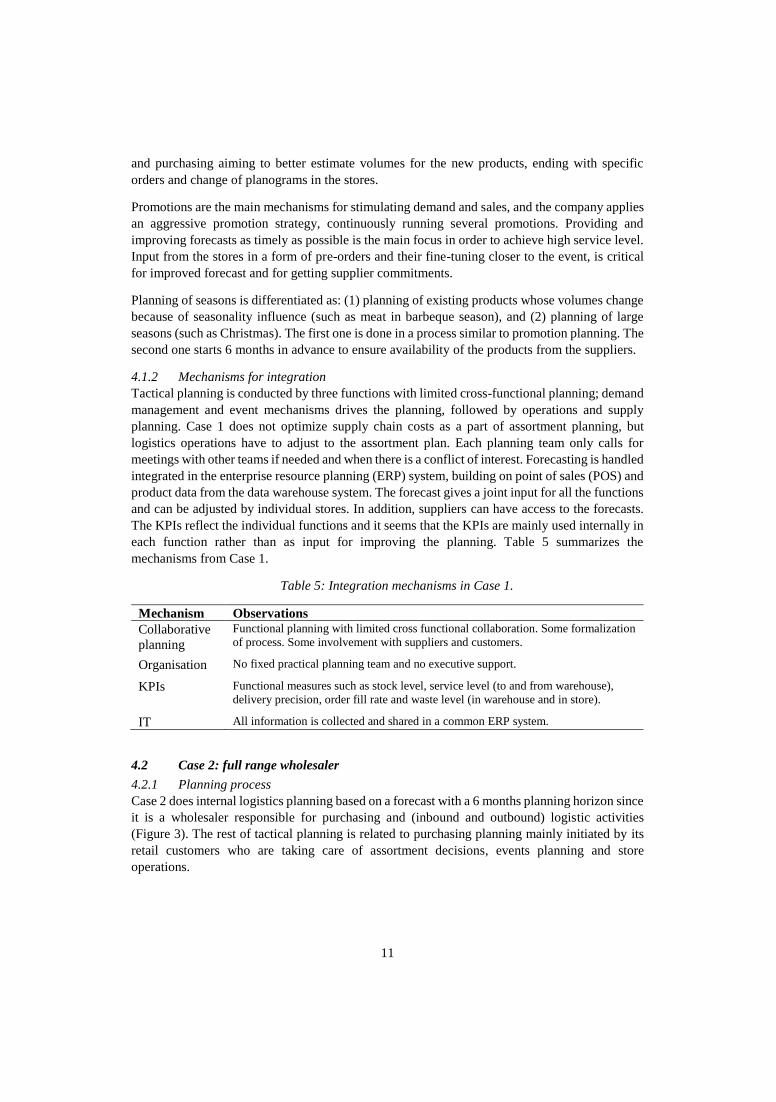
11
and purchasing aiming to better estimate volumes for the new products, ending with specific
orders and change of planograms in the stores.
Promotions are the main mechanisms for stimulating demand and sales, and the company applies
an aggressive promotion strategy, continuously running several promotions. Providing and
improving forecasts as timely as possible is the main focus in order to achieve high service level.
Input from the stores in a form of pre-orders and their fine-tuning closer to the event, is critical
for improved forecast and for getting supplier commitments.
Planning of seasons is differentiated as: (1) planning of existing products whose volumes change
because of seasonality influence (such as meat in barbeque season), and (2) planning of large
seasons (such as Christmas). The first one is done in a process similar to promotion planning. The
second one starts 6 months in advance to ensure availability of the products from the suppliers.
4.1.2 Mechanisms for integration
Tactical planning is conducted by three functions with limited cross-functional planning; demand
management and event mechanisms drives the planning, followed by operations and supply
planning. Case 1 does not optimize supply chain costs as a part of assortment planning, but
logistics operations have to adjust to the assortment plan. Each planning team only calls for
meetings with other teams if needed and when there is a conflict of interest. Forecasting is handled
integrated in the enterprise resource planning (ERP) system, building on point of sales (POS) and
product data from the data warehouse system. The forecast gives a joint input for all the functions
and can be adjusted by individual stores. In addition, suppliers can have access to the forecasts.
The KPIs reflect the individual functions and it seems that the KPIs are mainly used internally in
each function rather than as input for improving the planning. Table 5 summarizes the
mechanisms from Case 1.
Table 5: Integration mechanisms in Case 1.
Mechanism Observations
Collaborative
planning
Functional planning with limited cross functional collaboration. Some formalization
of process. Some involvement with suppliers and customers.
Organisation No fixed practical planning team and no executive support.
KPIs Functional measures such as stock level, service level (to and from warehouse),
delivery precision, order fill rate and waste level (in warehouse and in store).
IT All information is collected and shared in a common ERP system.
4.2 Case 2: full range wholesaler
4.2.1 Planning process
Case 2 does internal logistics planning based on a forecast with a 6 months planning horizon since
it is a wholesaler responsible for purchasing and (inbound and outbound) logistic activities
(Figure 3). The rest of tactical planning is related to purchasing planning mainly initiated by its
retail customers who are taking care of assortment decisions, events planning and store
operations.
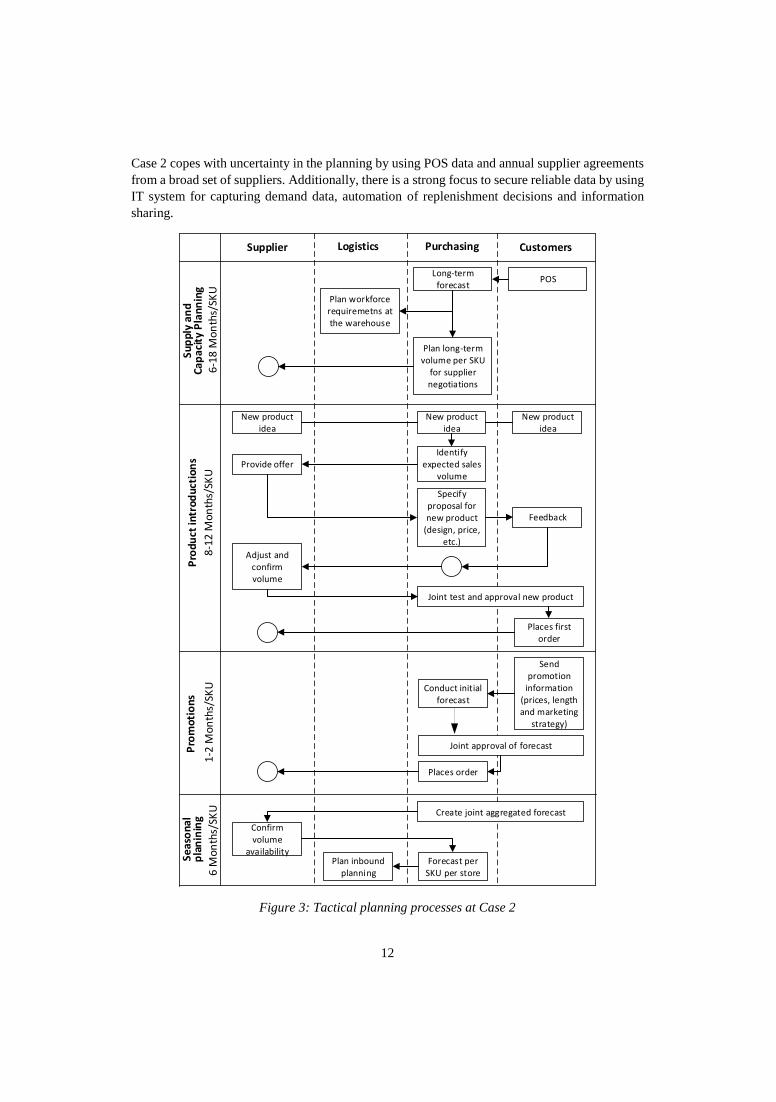
12
Case 2 copes with uncertainty in the planning by using POS data and annual supplier agreements
from a broad set of suppliers. Additionally, there is a strong focus to secure reliable data by using
IT system for capturing demand data, automation of replenishment decisions and information
sharing.
Supplier Logistics Purchasing Customers
Pro
du
ct in
tro
du
ctio
ns
New product idea
New product idea
New product idea
Identify expected sales
volumeProvide offer
Specify proposal for new product
(design, price, etc.)
Feedback
Adjust and confirm volume
Places first order
Send promotion
information (prices, length and marketing
strategy)
Conduct initial forecast
Places order
Pro
mot
ion
sS
ea
son
al
pla
nin
ing
Confirm volume
availability Forecast per
SKU per storePlan inbound
planning
8-1
2 M
on
ths/
SKU
1-2
Mo
nth
s/SK
U6
Mo
nth
s/SK
U
Joint test and approval new product
Joint approval of forecast
Create joint aggregated forecast
6-1
8 M
on
ths/
SKU
Su
pp
ly a
nd
C
ap
aci
ty P
lan
nin
g
Long-term forecast
POS
Plan long-term volume per SKU
for supplier negotiations
Plan workforce requiremetns at the warehouse
Figure 3: Tactical planning processes at Case 2
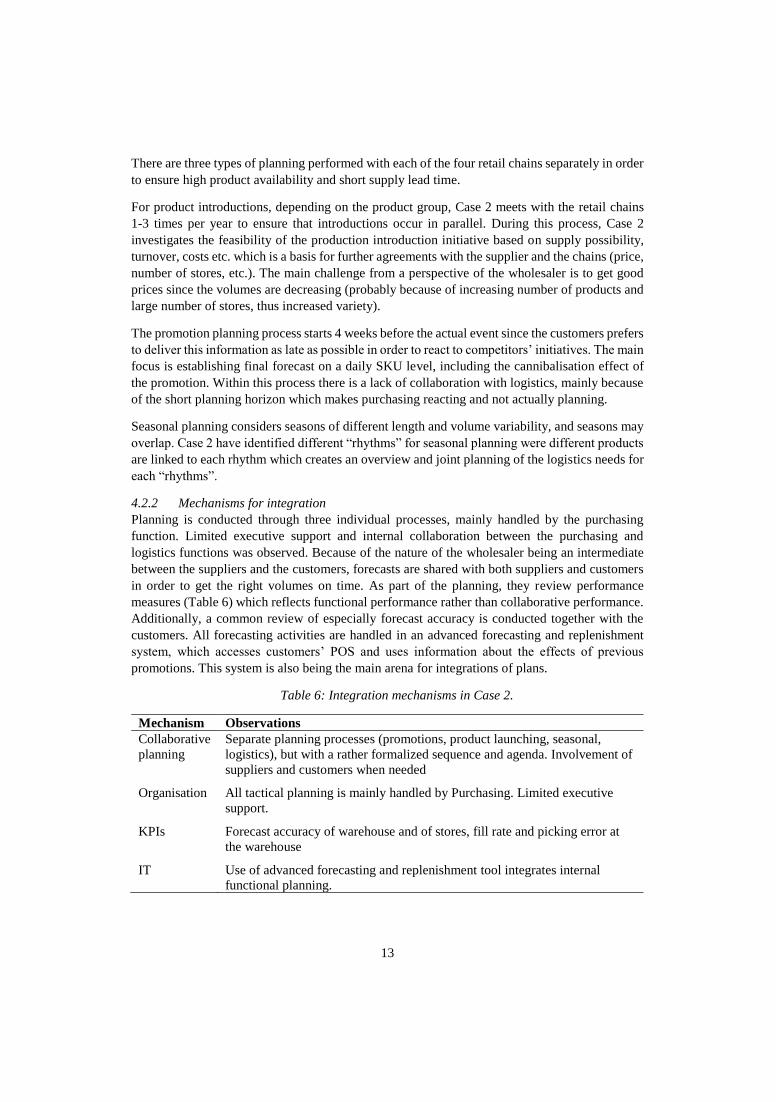
13
There are three types of planning performed with each of the four retail chains separately in order
to ensure high product availability and short supply lead time.
For product introductions, depending on the product group, Case 2 meets with the retail chains
1-3 times per year to ensure that introductions occur in parallel. During this process, Case 2
investigates the feasibility of the production introduction initiative based on supply possibility,
turnover, costs etc. which is a basis for further agreements with the supplier and the chains (price,
number of stores, etc.). The main challenge from a perspective of the wholesaler is to get good
prices since the volumes are decreasing (probably because of increasing number of products and
large number of stores, thus increased variety).
The promotion planning process starts 4 weeks before the actual event since the customers prefers
to deliver this information as late as possible in order to react to competitors’ initiatives. The main
focus is establishing final forecast on a daily SKU level, including the cannibalisation effect of
the promotion. Within this process there is a lack of collaboration with logistics, mainly because
of the short planning horizon which makes purchasing reacting and not actually planning.
Seasonal planning considers seasons of different length and volume variability, and seasons may
overlap. Case 2 have identified different “rhythms” for seasonal planning were different products
are linked to each rhythm which creates an overview and joint planning of the logistics needs for
each “rhythms”.
4.2.2 Mechanisms for integration
Planning is conducted through three individual processes, mainly handled by the purchasing
function. Limited executive support and internal collaboration between the purchasing and
logistics functions was observed. Because of the nature of the wholesaler being an intermediate
between the suppliers and the customers, forecasts are shared with both suppliers and customers
in order to get the right volumes on time. As part of the planning, they review performance
measures (Table 6) which reflects functional performance rather than collaborative performance.
Additionally, a common review of especially forecast accuracy is conducted together with the
customers. All forecasting activities are handled in an advanced forecasting and replenishment
system, which accesses customers’ POS and uses information about the effects of previous
promotions. This system is also being the main arena for integrations of plans.
Table 6: Integration mechanisms in Case 2.
Mechanism Observations
Collaborative
planning
Separate planning processes (promotions, product launching, seasonal,
logistics), but with a rather formalized sequence and agenda. Involvement of
suppliers and customers when needed
Organisation All tactical planning is mainly handled by Purchasing. Limited executive
support.
KPIs Forecast accuracy of warehouse and of stores, fill rate and picking error at
the warehouse
IT Use of advanced forecasting and replenishment tool integrates internal
functional planning.
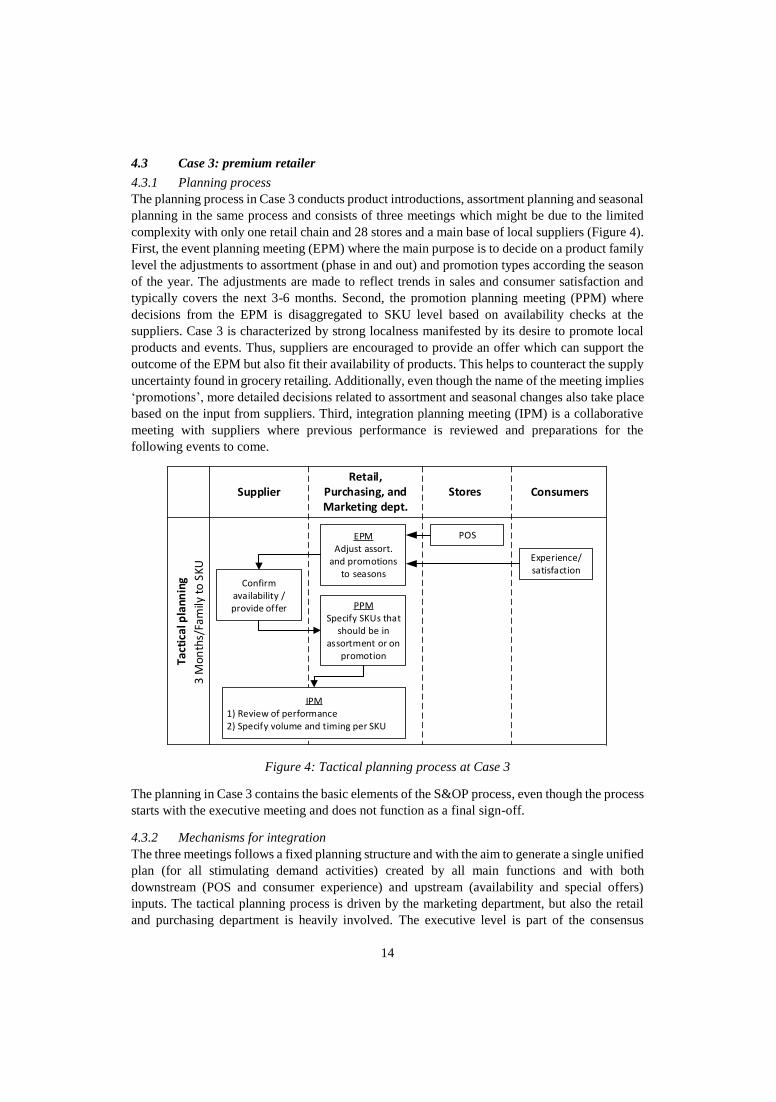
14
4.3 Case 3: premium retailer
4.3.1 Planning process
The planning process in Case 3 conducts product introductions, assortment planning and seasonal
planning in the same process and consists of three meetings which might be due to the limited
complexity with only one retail chain and 28 stores and a main base of local suppliers (Figure 4).
First, the event planning meeting (EPM) where the main purpose is to decide on a product family
level the adjustments to assortment (phase in and out) and promotion types according the season
of the year. The adjustments are made to reflect trends in sales and consumer satisfaction and
typically covers the next 3-6 months. Second, the promotion planning meeting (PPM) where
decisions from the EPM is disaggregated to SKU level based on availability checks at the
suppliers. Case 3 is characterized by strong localness manifested by its desire to promote local
products and events. Thus, suppliers are encouraged to provide an offer which can support the
outcome of the EPM but also fit their availability of products. This helps to counteract the supply
uncertainty found in grocery retailing. Additionally, even though the name of the meeting implies
‘promotions’, more detailed decisions related to assortment and seasonal changes also take place
based on the input from suppliers. Third, integration planning meeting (IPM) is a collaborative
meeting with suppliers where previous performance is reviewed and preparations for the
following events to come.
SupplierRetail,
Purchasing, and Marketing dept.
Stores Consumers
Tact
ical
pla
nnin
g
Experience/ satisfaction
POSEPMAdjust assort.
and promotions to seasons
Confirm availability / provide offer PPM
Specify SKUs that should be in
assortment or on promotion
IPM1) Review of performance2) Specify volume and timing per SKU
3 M
onth
s/Fa
mily
to
SKU
Figure 4: Tactical planning process at Case 3
The planning in Case 3 contains the basic elements of the S&OP process, even though the process
starts with the executive meeting and does not function as a final sign-off.
4.3.2 Mechanisms for integration
The three meetings follows a fixed planning structure and with the aim to generate a single unified
plan (for all stimulating demand activities) created by all main functions and with both
downstream (POS and consumer experience) and upstream (availability and special offers)
inputs. The tactical planning process is driven by the marketing department, but also the retail
and purchasing department is heavily involved. The executive level is part of the consensus
15
process and physical attendance is compulsory for the EPM. An explicit activity in the process is
the review of past performance where key measures are used to evaluate performance specify for
grocery retailing – particularly focus is placed on promotions effectiveness, forecast accuracy,
shrinkage in product categories and inventory levels. Forecasting are handled in an advanced
forecasting and replenishment system, which uses fine granulated sales information from the
stores. Table 5 summarizes the mechanisms from Case 1.
Table 7: Integration mechanisms in Case 3.
Mechanism Observations
Meetings and
collaboration
Highly formalized set of meetings between all functions with fixed agenda and
frequency. Involvement of suppliers and customers.
Organisation Clear cross-functional team handling the tactical planning process with executive
support.
KPIs Use of rather wide KPIs such as promotion effectiveness and product shrinkage.
IT Use of advanced forecasting and replenishment tool.
4.4 Case 4: discount retailer
4.4.1 Tactical planning process
The planning in Case 4 is conducted on two time horizons: yearly planning and mid-term planning
(Figure 5). Decisions about category, assortment and purchasing is taken by the supply chain and
the category/purchasing team, and together with suppliers they establish a yearly agreement for
the assortment on promotions on a volume level acting as input to the aggregated inbound plan.
This enables suppliers to plan for the long production times found in grocery retailing. The yearly
agreement is used to generate planograms and aggregated inbound transportations plans.
The mid-term planning consist of product introductions and a combined process for promotions
and seasonal planning. Product introductions are driven by the suppliers, and the main task for
the grocery retailer is to select which of the proposed products they want to include in the
assortment and to confirm the forecast provided by the supplier. Previously, suppliers struggled
to deliver the required quantities for product introductions. Consequently, the process was
formalized to be more supplier-driven to provide them with a better possibility to cope with
supply uncertainty.
The promotion and seasonal planning is made once a month for the next 2–3 months; exceptions
are long seasons, such as Christmas, where the assortment, initial volume estimation and supplier
involvement begin long time in advance. Afterwards, the stores places pre-orders, and combined
with a forecast from the marketing department, a total estimate per SKU is send for confirmation
to the suppliers. Confirmation from the suppliers are essential to ensure the high availability
requirements in grocery retailing – and consequently, if the suppliers can not confirm the
availability the product is either completely removed from the season or promotion, or a
substituting supplier is found.
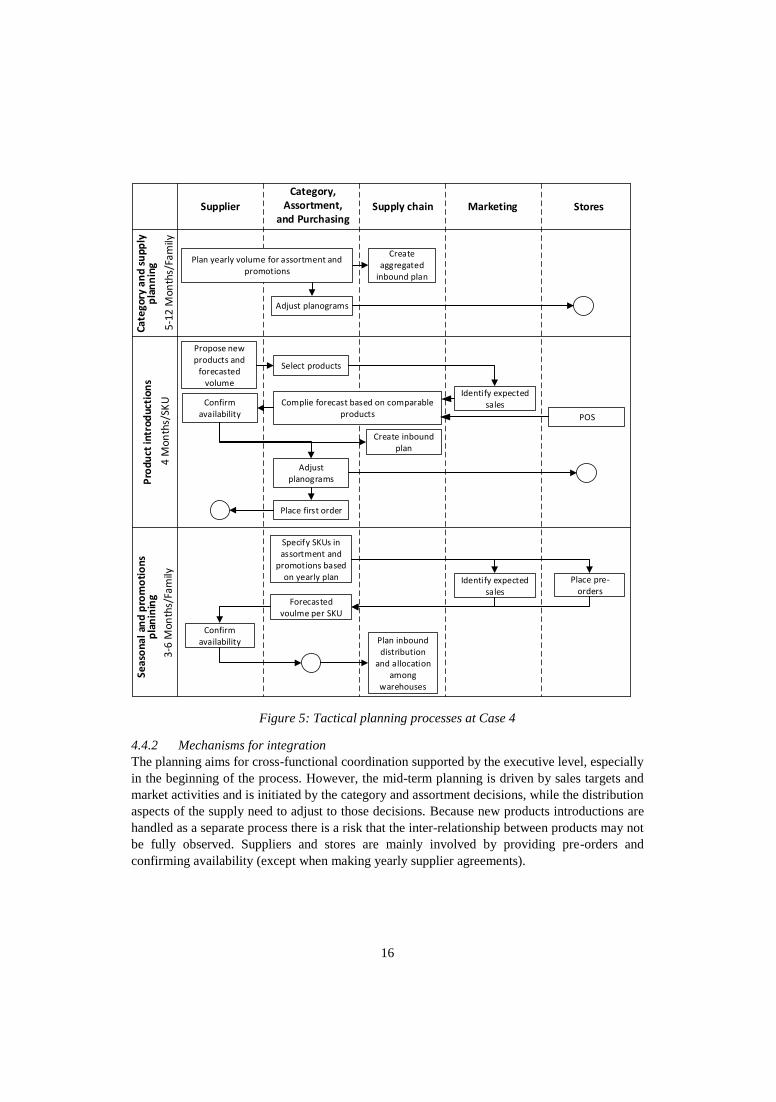
16
Supplier
Category, Assortment,
and PurchasingSupply chain StoresMarketing
Ca
tego
ry a
nd
su
pp
ly
pla
nn
ing
Pro
duct
intr
oduc
tion
sS
eas
on
al a
nd
pro
mo
tio
ns
pla
nin
ing
Create aggregated
inbound plan
Adjust planograms
Specify SKUs in assortment and
promotions based on yearly plan Identify expected
sales
Place pre-orders
Forecasted voulme per SKU
Confirm availability Plan inbound
distribution and allocation
among warehouses
Propose new products and
forecasted volume
Select products
POS
Complie forecast based on comparable products
Confirm availability
Adjust planograms
Place first order
Create inbound plan
Identify expected sales
Plan yearly volume for assortment and promotions
5-1
2 M
onth
s/Fa
mily
4 M
on
ths/
SKU
3-6
Mo
nth
s/Fa
mily
Figure 5: Tactical planning processes at Case 4
4.4.2 Mechanisms for integration
The planning aims for cross-functional coordination supported by the executive level, especially
in the beginning of the process. However, the mid-term planning is driven by sales targets and
market activities and is initiated by the category and assortment decisions, while the distribution
aspects of the supply need to adjust to those decisions. Because new products introductions are
handled as a separate process there is a risk that the inter-relationship between products may not
be fully observed. Suppliers and stores are mainly involved by providing pre-orders and
confirming availability (except when making yearly supplier agreements).
17
Data for all the planning activities are collected and processed in six different IT systems where
the main planning component is made using a spreadsheet-based system. POS data is the main
input for the planning and forecasting. The distributed IT platform makes the process time
consuming, comprehensive and complex. Lastly, a wide set of measures are applied in the yearly
planning in order to review the status, such as forecast accuracy, fill rate, inventory levels and
costs. Table 8 summarizes the integration mechanisms.
Table 8: Integration mechanisms in Case 4
Mechanism Observations
Meetings and
collaboration
Cross-functional involvement. Involvement of suppliers and customers.
Separation between central and decentral planning.
Organisation Executive support in the yearly planning and a rather well defined tactical
planning team.
KPIs A wide set of functional measures applied. No cross functional measures.
IT Data from six different IT systems are collected into one single spreadsheet.
5. Cross case analysis
Here we make observations across cases about how the planning process is designed, and how
integration in tactical planning is realized in retailing context. We follow the variables of S&OP
process and integration mechanisms by Grimson and Pyke (2008). The main contextual factors
dealt with are demand variability, a broad product, supplier and store base, making the whole
industry prone to promotions, seasonal sales activities and frequent product introductions. The
analysis show that the number of SKUs increases in retailing when the customer base consists of
many different retail chains with different store concepts. The cases also indicate that retailers are
not planning supply on a tactical level, but they are relying on supplier capabilities to deliver
agreed on in yearly contracts, supported by retailer preorder practice and supplier forecasts.
5.1 Tactical planning process
First, we address how specific context factors affect process activities and set-up. Tactical
planning on two levels of aggregation is observed in all the cases. Aggregated
category/assortment and promotions planning on a product family level, up to 12 months’ time
horizon, per retail chain (case 1) is observed in three of the cases (1, 3 and 4). In Case 2
(wholesaler) this is done by the retailer customers. Aggregation reduces complexity and
uncertainty, originating from a large number of heterogeneous products, requirements from
multiple retail stores and demand fluctuations, and confirms supply volumes and prices from a
broad supplier base. An aggregated logistics plan is made in Case 1 and 4 to deal with the large
number of stores (1,200 and 600 respectively compared to the 28 stores in Case 3), and in Case
2 to be able to respond timely on capacity variations. The frequency of aggregated planning varies
remarkably across cases. It may be made annually as in Cases 1 and 4. While Case 3 interestingly
conducts aggregated planning bi-weekly in the event planning meeting (EPM), which can be
explained by the limited customer base, higher use of local suppliers and proactive offering of
seasonal and a relatively narrow assortment compared to the other cases.
18
The companies are typically conducting more detailed planning for specific demand situations
(SKU level with varying time horizon, depending on the type of the event). In Cases 1 and 2 there
is separate planning process for product introductions, promotions and seasons respectively,
while Case 4 conducts promotions and seasons planning jointly in one process, and Case 3 has
integrated all events planning into one joint process. Reason for separating planning seems to be
in the nature of the event and the related demand uncertainty leading to different activities and
their timeline respective for each event. Case 4 is a discount retailer with only one type of store
concept so the promotions might not cause so large effect on the demand. Promotions and
seasonal planning follow similar processes initiated by the retailer aiming to increase sales (price,
product and marketing mechanisms) in Cases 1, 3 and 4 or by customers in Case 2. The product
introduction process differs from this in the initiating phase where the driver (in all cases)
basically is the supplier which enables them to affect demand both on the new products and on
existing products.
Demand forecasts made from POS data is the main planning input in all cases, supported by store
preorders and suppliers forecast particularly for product introduction (Case 1 and 4) in order to
improve the relatively low level of forecast accuracy. In case 2 the wholesaler develops the
forecast jointly with the customers. Case 1 and 4 apply yearly supplier contract as input to
stabilize supply (volume, price and delivery terms) since the supplier portfolio is broad and the
lead time and availability requirements are essential. Input related to planning supply operations,
such as capacity at the warehouse, stores, or in a distribution route, mainly act as planning
constrains rather than point for optimization. Other types of downstream input, typical for Case
3, is the consumer and store feedback, and external events, which are probably easier to consider
because of the small number of stores and closer relation to the community/suppliers related to
the stores.
Sales plans are the main outcome in all the cases, but it differs how and if the planning of
promotions, seasonality and product introduction are coupled. In Case 1 and 2, the outcome is
mostly sales plans for the individual events, in Case 3 there is a joint plan, and in Case 4
seasonality and promotions are planned jointly. This might be the result of the combination of
number of products and stores, where Cases 1 and 2 have the largest and Cases 3 and 4 smallest
combination. In Case 1 the sales plans for product introductions lead to adjustments of store
planograms, which require efficient store management because of the size of the assortment and
number of stores. Case 2 does not have influence on the planograms (they are under direction of
the different chains), but uses sales plans for logistics capacity planning. Case 1 and 4 also have
inbound plan and allocation across warehouses as an outcome of season and promotion planning
process, which might be needed because of a larger number of warehouses and a large effect of
these events on the logistics part.
5.2 Planning integration
As a general observation can be stated that integration of tactical planning in retailing seems to
be limited compared to how manufacturers have adopted S&OP. Functional roles seem to be
strong in retailing, and this is supported by measurement system which lacks cross functional
elements. The retailers also protect their position in the supply chain which has included tenses
between actors, which may affect collaboration. The retailers are the important market portal and
distribution channel for suppliers, which increases supplier dependency on retailers. Suppliers
have traditionally served retailers by short delivery times and high delivery reliability, which
19
reduces the retailers need and benefit from planning. Suppliers are however brand-owners in
many cases, and they are actively affecting demand by offering new product, discount and
delivery terms.
Meeting practices and collaborative activities across functions are used in Cases 3 and 4, not with
a purpose to align sales and operations plans (as it is in manufacturing) but to align across
different events and across sales and marketing (Case 3) or to improve the forecast (Case 4).
Because sales and demand boosting seems to be the key profit drivers, and not as in
manufacturing to affect profit by alignment across functions, it seems that cross functional
information sharing is more appropriate than meetings and collaborative plan development.
Collaboration (purchasing function) with suppliers is used in Cases 1 and 4 for the aggregated
sales planning, but also in the more detailed sales planning in Case 3. In Case 3, similarly to
S&OP in manufacturing, there is a team of planners and a formal meeting and collaboration
structure including suppliers. This creates flexibility and capability at Case 3 to adjust and
respond to external events such as festivals and other market requirements.
Customer collaboration (purchasing function) is a practice in all the planning processes of Case
2 in order to jointly create, test and approve the forecast. Case 2 in comparison with the other
cases does not own the retail chains and therefore needs to establish higher collaboration to be
able to identify the demand more accurately. Contrary to the call for internal integration as a
prerequisite for external integration (Grimson and Pyke, 2007; Alftan et al. 2015;), the four retail
cases involve to a certain extent suppliers (forecasting, product availability, pricing agreement)
and customers (pre-orders, consumer feedback) in the planning process, but they do not
necessarily involve all internal functions. Purchasing function has the key coordinator role in
three of the cases (1, 2 and 4).
We observe that under a higher executive support and involvement (Case 3 and partly in Case 4),
the case companies tend to have more formal and integrated planning. Consequently, in case of
limited executive support the cross-functional collaboration decreases and the process becomes
more sequential (Case 1 and 2). Balancing between logistic plans and demand plans does not
happen, and the focus seems to be on developing sales plans, while the logistics plan follows and
responds accordingly.
All case companies have defined performance measures, but only Case 3 established measures
(such as profit, and promotion effectiveness) which drive cross-functional balancing, horizontal
collaboration and improving performance. Case companies 1, 2 and 4 measure individual
functions performance. Case 2 reviewed the forecast accuracy together with the customers; Case
3 and 4 involve suppliers in forecasting and Case 1 receives forecast from suppliers, particularly
valuable for product introductions, indicating external integration. Except from forecast accuracy,
measures as inventory levels, service level, and picking error were also reviewed in most cases.
Sharing spreadsheets or information directly in a common IT system may provide more detailed
information of particular SKUs, being an important integration mechanism compared to meetings
in a context with a wide assortment, supplier and customer base. More advanced IT systems can
support and enable a more mature S&OP process (Lapide, 2005) as observed in Case 3. However,
it does not guarantee planning integration, as seen in Case 1. On the other hand, advanced IT
systems are not necessary for an integration of tactical decisions (Case 4) – even though it would
be more efficient. All case companies’ emphasize the role of IT for external communication and
20
information exchange with suppliers and stores, which can compensate for lack of collaborative
planning activities, plan integration and making consensus. Cases 1 and 2 have invested in
advanced planning software, and are successfully using it for replenishing the stores continuous
assortment but they still have separate planning processes for product introductions, seasons and
promotions. In case 4, there are attempts to integrate different plans, but the company suffers
from a fragmented set of IT systems, which makes integrating the plans complex.
6. Proposals for grocery retailing
Retailers are positioned close to the market and are dealing with a heterogeneous spectrum of
products, making them focus their planning on demand and market events and securing product
availability from suppliers. This observation about consumer orientation in retailing is also
emphasized in the literature (Agrawal and Smith, 2009; Hübner and Kuhn, 2012), but the supplier
and cross-functional integration and how planning is conducted has been less evident in previous
studies.
In contrast to the S&OP process in manufacturing industries (Thomé et al., 2012; Ivert et al.,
2015; Oliva and Watson, 2011), where balancing demand and supply is the aim, the situation in
retailing seems to be that operational supply function (logistics) is an instrument for achieving
demand targets rather than optimizing demand and supply in the same planning process. In
manufacturing, the main objective is to align operations and market requirements to given
constraints in resources and with a satisfactory utilisation of capacity (Goh and Eldridge, 2015).
Retail planning comprises a complex and abundant assortment, supplier and store base with
logistics as the main resource and constraint. The planning objectives in retail are oriented
towards high availability and efficient handling of a broad range of products and high volumes to
reach scale benefits (Cachon and Kök, 2007; Fernie et al., 2010; Hübner and Kuhn, 2012).
However, when there are constrains or pressure on the logistic systems, especially when market
events overlap, managing demand and supply will be challenging if decisions are not coordinated.
Even if capacity is not at major constraint in retailing, challenges related to high inventory, cost
of waste and transportation is evident, which can be dampened in a balanced planning approach.
Consequently, for grocery retailers, the S&OP process should be understood as a balanced and
coordinated decision making process to reach the unified targets of the planning (Tuomikangas
and Kaipia, 2014).
Particularly important and beneficial would be to adopt the aligning of demand and supply and
the formal nature of S&OP, to advance internal and external integration, and to align tactical
planning to strategic and operational planning. Improved alignment of functional plans and event
plans in tactical planning in grocery retailing would have a positive effect by reducing demand
and supply uncertainty and hereby improve availability, reduce inventory and waste, and optimize
the use of the logistics system. Hence we argue:
Proposition 1: Because of the nature of demand management in grocery retailing,
particularly seasonality, promotions, and frequent product introductions, tactical
planning would benefit from adopting a more formal planning process, integrating
functions and sub plans into a single plan with shared planning objectives.
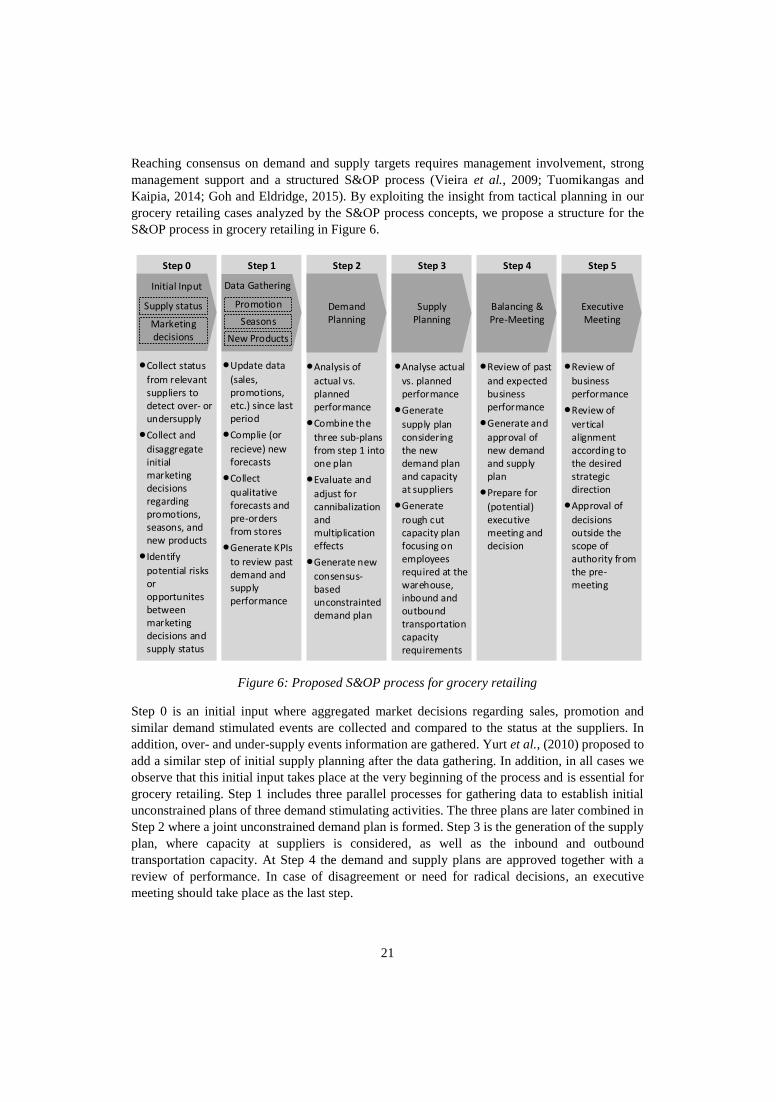
21
Reaching consensus on demand and supply targets requires management involvement, strong
management support and a structured S&OP process (Vieira et al., 2009; Tuomikangas and
Kaipia, 2014; Goh and Eldridge, 2015). By exploiting the insight from tactical planning in our
grocery retailing cases analyzed by the S&OP process concepts, we propose a structure for the
S&OP process in grocery retailing in Figure 6.
Figure 6: Proposed S&OP process for grocery retailing
Step 0 is an initial input where aggregated market decisions regarding sales, promotion and
similar demand stimulated events are collected and compared to the status at the suppliers. In
addition, over- and under-supply events information are gathered. Yurt et al., (2010) proposed to
add a similar step of initial supply planning after the data gathering. In addition, in all cases we
observe that this initial input takes place at the very beginning of the process and is essential for
grocery retailing. Step 1 includes three parallel processes for gathering data to establish initial
unconstrained plans of three demand stimulating activities. The three plans are later combined in
Step 2 where a joint unconstrained demand plan is formed. Step 3 is the generation of the supply
plan, where capacity at suppliers is considered, as well as the inbound and outbound
transportation capacity. At Step 4 the demand and supply plans are approved together with a
review of performance. In case of disagreement or need for radical decisions, an executive
meeting should take place as the last step.
Initial Input
• Collect status
from relevant suppliers to detect over- or undersupply
• Collect and
disaggregate initial marketing decisions regarding promotions, seasons, and new products
• Identify
potential risks or opportunites between marketing decisions and supply status
• Analysis of
actual vs. planned performance
• Combine the
three sub-plans from step 1 into one plan
• Evaluate and
adjust for cannibalization and multiplication effects
• Generate new
consensus-based unconstrainted demand plan
• Analyse actual
vs. planned performance
• Generate
supply plan considering the new demand plan and capacity at suppliers
• Generate
rough cut capacity plan focusing on employees required at the warehouse, inbound and outbound transportation capacity requirements
• Review of past
and expected business performance
• Generate and
approval of new demand and supply plan
• Prepare for
(potential) executive meeting and decision
• Review of
business performance
• Review of
vertical alignment according to the desired strategic direction
• Approval of
decisions outside the scope of authority from the pre-meeting
Demand Planning
Supply Planning
Executive Meeting
Step 0 Step 2 Step 3 Step 4 Step 5
Balancing & Pre-Meeting
Step 1
• Update data
(sales, promotions, etc.) since last period
• Complie (or
recieve) new forecasts
• Collect
qualitative forecasts and pre-orders from stores
• Generate KPIs
to review past demand and supply performance
Supply status
Marketing decisions
Promotion
New Products
Seasons
Data Gathering
22
We envision that the setup of S&OP process in retailing should have a horizon of approximately
6 months, or over the next sales season, as seasonal sales very much characterize grocery retailing.
Some decisions, e.g. promotions, might be at a more gross level as the horizon becomes more
than 3 months out. Important here is to acknowledge that planning horizon is variable, and should
fit to the environment of the individual retailer – if new product introductions have a horizon of
8 months the horizon of the S&OP process should be adjusted accordingly. The planning
frequency is monthly, but should be adjusted if opportunities or risks arise from the supply side
(e.g. due to availability problems) or at the demand side (e.g. due to competitors actions, new
stores, etc.). Since the focus on demand-stimulating activities is so strong, the S&OP process can
be conducted on an SKU-level, as also reflected in all four cases and have been previously
reported as norm in the food and grocery retail industry (Holmström et al., 2002; Ivert et al.,
2015).
6.1 Increasing integration in grocery retailing through S&OP
The S&OP literature suggests that strategic alignment and top management ownership, as well as
shared planning objectives (Thome et al., 2012; Wang et al., 2012; Tuomikangas and Kaipia,
2014) and cross-functional planning is necessary for S&OP to succeed (Grimson and Pyke, 2007;
Tuomikangas and Kaipia, 2014). This may have a positive impact on performance (Thomé et al.,
2014; Goh and Eldridge, 2015) since it will be efficient, coordinated and not conflicting (Agrawal
and Smith, 2009; Olivia and Watson, 2011; Alftan et al., 2015).
In this study, the grocery retailers applied either functional and sequential planning with limited
coordination, or planning in cross-functional teams of managers with the aim to coordinate across
sub-plans and functions and to reach shared planning objectives. The latter is close to the essence
of S&OP planning, and by using this practice flexibility and the ability to respond to varying
volumes can be created. From our cases, we understand that reaching a company-wide planning
process will require changes to how planning is perceived and managed. Tactical planning seems
not to be given strategic importance nor supported widely by management. Executive support
and participation was limited. Therefore, we find that the planning culture is functionally oriented
and that planning leadership is unclear. Consequently, we propose:
Proposition 2: Grocery retailers’s planning-related culture and leadership should
facilitate and enhance formal collaborative planning and foster a supply chain
perspective to the planning. This includes support and ownership from top
management, shared objectives for planning, rewards and empowerment.
This study shows that even at low level of functional integration, suppliers and stores were to
some extent involved in the planning. However, this also shows that the retailers place a conscious
focus on involving external parties, but a weaker awareness on internal integration. We find the
internal integration equally important as the external integration in retailing and it appears that
the current organizational structure does not place a responsibility nor authority to ensure cross-
functional planning. Therefore, we suggest:
Proposition 3: Grocery retailers would benefit from an organizational structure
with dedicated responsibility to integrate functional decisions from category and
assortment, purchasing, and logistics to reach a single consensus-based tactical
supply and demand plan.
23
External and internal collaboration can intensify each other (Stank et al., 2001; Sadler and Hines,
2002), and supplier integration should be pursued simultaneously with deployment of internal
S&OP practices (Thomé et al., 2014). The S&OP literature suggests that suppliers and customers
should be included in the planning process (Affonso et al., 2008; Wang et al., 2012). In our cases,
suppliers were involved in the planning either by taking part in discussions about market targets
and forecasts, or by sharing information about new product development. Involving suppliers was
a mean for the retailers to stabilise supply in terms of availability and especially for new products.
Stores in general seem to be less actively involved in the planning except for placing pre-orders
and giving feedback on market surveys. Therefore, we propose:
Proposition 4: Grocery retailers would benefit from a supply-chain wide planning
perspective, which actively seeks to involve suppliers and customers into their
tactical planning process to adequately understand demand, create demand, and
ensure availability of products.
Information technology as an integration mechanism in manufacturing becomes more important
when moving to a mature process (Ivert and Jonsson, 2010; Oliva and Watson, 2011). However,
at the retailers, it seems that this mechanism is not necessarily related to the maturity of the
planning process but merely to increase the speed and handle the complexity of the process. Case
4, for example, presents one of the highest levels of integration but uses fragmented IT systems
and spreadsheets for planning and coordination. The reason why IT can speed up the process
could be explained by the planning complexity. In grocery retailing the process may include
different planning intervals and planning is handled on SKU-level per store which makes
discussing all details (in physical meetings) inefficient compared to using more advanced IT
solutions. Thus, we propose:
Proposition 5: A single integrated IT solution may contribute to the efficiency and
communication of the tactical planning process in grocery retailing due to detailed
planning on SKU-level, but does not ensure integration without changes in
planning orientation.
Integration is also expected to increase by use of relevant performance measures (Grimson and
Pyke, 2007; Thomé et al., 2012). All cases showed a strong focus on evaluating the forecast
accuracy, which indeed also can be considered as an important and relevant measure for the
S&OP process (Thomé et al., 2012). However, it is not clear how this measure alone stimulates
integration of functions and the different sub-plans in retailing. More formal evaluation of
performance through cross-functional measures appears to be lacking in retailing. This should be
an essential part of the data gathering and pre-meeting (Step 1 and 4 in Figure 1). Harwell (2006)
proposed to evaluate performance through gross profit compared to display space in the store.
Increasing performance here would require an excellent assortment and pricing decisions as well
as outstanding balance of supply and demand. More generally we propose:
Proposition 6: Grocery retailers would benefit from a cross-functional and
process-level planning performance evaluation which should be used as an input
for the next planning round to gradually improve knowledge on demand
stimulating activities.
24
7. Conclusion
In this study, the S&OP process and integration elements are used to investigate how grocery
retailers are conducting tactical planning. In particular, we analysed the planning process and how
it integrates company functions, different sub-plans and external supply chain partners. Our
empirical findings indicate that in grocery retailing, since the retailers are close to the market and
are dealing with a heterogeneous assortment of products, the planning process focuses on
demand-stimulating events and securing product availability from suppliers in order to reach sales
targets. Less attention is directed towards aligning demand and supply, or to providing a single
plan to guide company operations. For the level of process integration, planning was functionally
oriented with limited coordination between functional plans, but included some level of external
integration – mostly for improving forecast accuracy.
The main contribution of the study is the proposal that retailers would benefit from a formal and
company-wide S&OP process. Adopting S&OP principles from manufacturing, retailers would
better unify different market-oriented plans to a single set of numbers, and balance demand and
supply, without sacrificing the high emphasis on demand planning and managing marketing
events important in retailing business. This enhance existing retail planning literature (Olivia and
Watson, 2011; Hübner et al., 2013; Kuhn and Sternbeck, 2013) and enrich the S&OP literature
with a retail specific study (Thomé et al., 2014). Managerial-wise, the study gives a proposal for
a formal S&OP process in retailing, extending the proposal from Yurt et al. (2010). Furthermore,
the study suggests ways to increase integration by top management ownership, shared planning
objectives and reward mechanisms. The organization structure should foster responsibility for
integrating functional plans, and involve suppliers and customers in the planning. Integrated IT
solution may increase planning efficency but does not ensure planning integration, while
evaluating the performance of demand management activities would gradually improve
knowledge about the impact of market events to enhance tactical planning.
Although the research benefits from rich and exploratory data from the grocery retail sector in
Finland, Norway and the UK, it has limitations that require further research. First, the focus of
the study was on the retailer which was the sole provider of the data, leaving out information
from suppliers and customers. A deeper insight would be needed into the integration of supply
chain partners in the planning, in particular in order to explore exact how suppliers and customers
could enrich the planning process and integration. Second, we studied four cases from three
different countries in grocery retailing. Comparisons of different retail industries with larger data
sets would be valuable in helping to understand the planning environment and the contextual
characteristics of retailing. Third, IT and information sharing are important in retail because of
the planning complexity involved and further research should look deeper into decision
complexity and the use of advanced decision support systems to improve information usage,
decision making and analytics. Forth, future studies could include a verification of the process
and propositions.
8. Acknowledgements
The authors gratefully acknowledge the Norwegian Research Council and the BIA programme
for their financial support of the project, as well as the participating case companies, which
together made it possible to carry out this study.
25
9. References
Aastrup, J., Kotzab, H., Grant, D.B., Teller, C. and Bjerre, M. (2008), "A model for
structuring efficient consumer response measures", International Journal of Retail & Distribution
Management, Vol. 36 No. 8, pp. 590-606.
Affonso, R., Marcotte, F. and Grabot, B. (2008), “Sales and operations planning: the supply
pillar”, Production Planning and Control, Vol. 19 No. 2, pp. 132-141.
Agrawal, N. and Smith, S.A. (2009), “Supply chain planning processes for two major retailers”, in Agrawal,
N., Smith, S.A. (Eds.), Retail Supply Chain Management, Springer US, pp. 11-23.
Alftan, A., Kaipia, R., Loikkanen, L. and Spens, K. (2015), “Centralised grocery supply chain
planning: improved exception management”, International Journal of Physical Distribution & Logistics
management, Vol. 45 No. 3, pp. 237-259.
Aramyan, L.H., Lansink, A.G.J.M.O., Van der Vorst, J.G.A.J. and Van Kooten, O.
(2007), “Performance measurement in agri-food supply chains: a case study”, Supply
Chain Management: An International Journal, Vol. 12 No. 4, pp. 304-315.
Barratt, M., Choi, T.Y. and Li, M. (2011), “Qualitative case studies in operations management:
trends, research outcomes and future research implications”, Journal of Operations Management, Vol.
29 No. 4, pp. 329-342.
Cachon, G.P. and Kök, A.G. (2007), “Category management and coordination in retail assortment planning
in the presence of basket shopping consumers management”, Science Vol. 53 No. 6, pp. 934 – 951.
Chen, H., Mattioda, D.D. and Daugherty, P.J. (2007), “Firm-wide integration and form
performance”, International Journal of Logistics Management, Vol. 18 No. 1, pp. 5-21.
Chopra, S. and Meindl, P. (2013), Supply Chain Management: Strategy, Planning and Operation, Essex,
England, Pearson Higher Education.
Corsten, D. (2000), “Standards, processes and capabilities – a new view on co-operation in the
consumer goods system”, in Hines, P. (Ed.), Logistics research network 2001 conference
proceedings in Cardiff, UK, pp. 147-52.
Davenport, T.H. (1993), Process Innovation: Reengineering Work Through Information
Technology, Harvard Business School Press, Boston, Massachusetts.
Dyer, G.W. and Wilkins, A.L. (1991), “Better stories, not better constructs, to generate better theory: A
rejoinder to Eienhardt”, The Academy of Management Review, Vol. 16 No. 3, pp. 613-619.
Eisenhardt, K.M. (1989), “Building theories from case study research”, Academy of Management Review,
Vol. 14 No. 4, pp. 532-50.
Ettouzani, Y., Yates, N., Mena, C. (2012), ” Examining retail on shelf availability: promotional
impact and a call for research”, International Journal of Physical Distribution & Logistics Management,
42 (3), pp. 213-43.
Fernie, J., Sparks, L. and McKinnon, A.C. (2010), “Retail logistics in the UK: past, present and future”,
International Journal of Retail & Distribution Management, Vol. 38 No. 11/12, pp. 894-914.
Fernie, J. and McKinnon, A. (2003), “The grocery supply chain in the UK: improving efficiency in the
logistics network”, The International Review of Retail, Distribution and Consumer Research, Vol. 13
No. 2, pp. 161-74.
Fleischmann, B., Meyr, H. and Wagner, M. (2008), “Advanced planning”, in Stadler, H., Kilger, C. (Eds.),
Supply Chain Management and Advanced Planning, Springer, Berlin, pp. 71-95.
Ganesan, S., George, M., Jap, S., Palmatier, R.W. and Weitz, B. (2009), “Supply chain
management and retailer performance: emerging trends, issues, and implications for research and
practice”, Journal of Retailing, Vol. 85 No. 1, pp. 84-94.
Grimson, J.A. and Pyke, D.F. (2007), “Sales and operations planning: an exploratory study and
framework”, International Journal of Logistics Management, Vol.18 No.3, pp. 322-346.
Goh, S.H. and Eldridge, S. (2015), “New product introduction and supplier integration in sales
and operations planning: Evidence from the Asia Pacific region”, International Journal of Physical
Distribution & Logistics Management, Vol. 45 No. 9/10, pp. 861-886.
Harwell, J. (2006), “Sales & operations planning in the retail industry”, The Journal of Business Forecasting,
Vol. 25 No. 3, pp. 4-10.
26
Holmström, J., Främling, K., Kaipia, R. and Saranen, J. (2002), "Collaborative planning forecasting and
replenishment: new solutions needed for mass collaboration", Supply Chain Management: An
International Journal, Vol. 7 No. 3, pp.136-145.
Hübner, A.H. and Kuhn, H. (2012), “Retail category management: State-of-the-art review of
quantitative research and software applications in assortment and shelf space management”, Omega,
Vol 40 No. 2, pp. 199–209.
Hübner, A.H., Kuhn, H., Michael G. and Sternbeck, M.G. (2013), “Demand and supply chain
planning in grocery retail: an operations planning framework”, International Journal of Retail &
Distribution Management, Vol. 41 No. 7, pp. 512-530.
Ivert Kjellsdotter, L. and Jonsson, P. (2010), “The potential benefits of advanced planning and
scheduling systems in sales and operations planning”, Industrial Management & Data Systems, Vol.
110 No. 5, pp. 659-681.
Ivert Kjellsdotter, L., Dukovska-Popovska, I., Fredriksson, A., Dreyer, H.C. and Kaipia, R.
(2015), ”Contingency between S&OP design and planning environment”, International
Journal of Physical Distribution & Logistics Management, Vol. 45 No. 8, pp. 747-773.
Jonsson, P. and Holmström, J. (2016), “Future of supply chain planning: closing the gaps
between practice and promise”, International Journal of Physical Distribution & Logistics
Management, Vol. 46 No. 1, pp. 62-81.
Jonsson, P. and Mattsson, S.A. (2009), Manufacturing Planning and Control, McGraw-Hill
Education, Berkshire.
Kaipia, R., Dukovska‐Popovska, I. and Loikkanen, L. (2013), ”Creating sustainable fresh food
supply chains through waste reduction”, International Journal of Physical Distribution & Logistics
Management, Vol. 43 No. 3, pp. 262-76.
Ketokivi, M. and Choi, T. (2014), “Renaissance of case research as a scientific method”, Journal of
Operations Management, Vol. 32 No. 5, pp. 232-240.
Ketzenberg, M., Bloemhof, J. and Gaukler, G. (2015), “Managing perishables with time and
temperature history”, Production and Operations Management, Vol. 24 No. 1, pp. 54-70.
Kopalle, P.K. (2010), “Modeling retail phenomena”, Journal of Retailing, Vol. 86 No. 2, pp. 117-124.
Kotzab, H. and Teller, C. (2005), “Development and empirical test of a grocery retail instore
logistics model”, British Food Journal, Vol. 108 No. 8, pp. 594-605.
Kuhn, H. and Sternbeck, M.G. (2013), “Integrative retail logistics: an exploratory study”,
Operations Management Research, Vol. 6 No. 1, pp. 2-18.
Lapide, L. (2005), “Sales and operations planning part III: a diagnostic model”, The Journal of
Business Forecasting, Vol. 24 No. 1, pp. 13-16.
Miles, B.M. and Huberman, A. M. (1994), Data Management and Analysis Methods, Thousand
Oaks, CA: Sage
Morash, E.A. and Clinton, S.R. (1998), “Supply chain integration: customer value through
collaborative closeness versus operational excellence”, Journal of Marketing Theory and Practice, Vol.
6 No. 4, pp. 104-121.
Nakano, M. (2009), “Collaborative forecasting and planning in supply chains: The impact on
performance in Japanese manufacturers”, International Journal of Physical Distribution & Logistics
Management, Vol. 39 No. 2, pp. 84-105.
Narasimhan, R. (2014), “Theory development in operations management: Extending the
frontier of a mature discipline via qualitative research”, Decision Sciences, Vol. 45 No 2, pp. 209-227.
Oliva, R. and Watson, N. (2011), “Cross-functional alignment in supply chain planning: a case study of
sales and operations planning”, Journal of Operations Management, Vol. 29 No. 5, pp. 434-448.
Reiner, G, Teller, C. and Kotzab, H. (2013), ”Analyzing the efficient execution of in-store logistics processes
in grocery retailing – the case of dairy products”, Production and Operations Management, Vol. 22 No.
4, pp. 924-939.
Sadler, I. and Hines, P. (2002), “Strategic operations planning process for manufacturers with a
27
supply chain focus: concepts and a meat processing application”, Supply Chain Management: An
International Journal, Vol. 7 No. 4, pp. 225-241.
Småros, J., (2007). Forecasting collaboration in the European grocery sector: Observations from a case study
Journal of Operations Management, Volume 25, Issue 3, 702-716
Stadtler, H. (2005), “Supply chain management and advanced planning – basics, overview and
challenges”, European Journal of Operational Research, Vol. 163 No. 3, pp. 575-588.
Stank, T.P., Keller, S.B. and Daugherty, P.J. (2001), “Supply chain collaboration and logistics
service performance, Journal of Business Logistics, Vol. 22 No. 1, pp. 29-48.
Stock, G.N., Greis, N.P. and Kasarda, J.D. (1998), “Logistics, strategy and structure: a
conceptual framework”, International Journal of Operations & Production Management, Vol. 18 No.
1/2, pp. 37-52.
Stratton, R., (2012) "Variation and uncertainty buffering: a grocery supply case", Supply Chain
Management: An International Journal, Vol. 17 Issue: 6, pp.655-665
Stuart, I., McCutcheon, D, Handfield, R, McLachin, R. and Samson, D. (2002), “Effective case research in
operations management: a process perspective”, Journal of Operations Management, Vol. 20 No. 5, pp.
419-433.
Taylor, D.H and Fearne, A. (2009) "Demand management in fresh food value chains: a
framework for analysis and improvement", Supply Chain Management: An International
Journal, Vol. 14 Issue: 5, pp. 379-392.
Thomé, A.M.T, Scavarda, L.F, Fernandez, N.S. and Scavarda, A.J. (2012), “Sales and
operations planning: a research synthesis”, International Journal of Production Economics, Vol. 138
No. 1, pp. 1-13.
Thomé, A.M.T, Sousa, R.S. and Scavarda do Carmo, L.F.R.R. (2014), “The impact of sales and operations
planning practices on manufacturing operational performance”, International Journal of Production
Research, Vol. 52 No. 7, pp. 2108-2121.
Tuomikangas, N. and Kaipia, R. (2014), “A coordination framework for sales and operations
planning (S&OP): synthesis from the literature”, International Journal of Production Economics, Vol.
154 No. 8, pp. 243-62.
van Donselaar, K.H., Gaur, V., van Woensel, T., Broekmeulen, R.A.C.M. and Fransoo, J.C. (2010),
“Ordering behavior in retail stores and implications for automated replenishment”, Management
Science, Vol. 56 No. 5, pp. 766-84.
Vieira, J., Yoshizaki, H. and Ho, L. (2009), “Collaboration intensity in the Brazilian supermarket retail
chain”, Supply Chain Management: An International Journal, Vol. 14 No. 1, pp. 11-21.
Voss, C., Tsikriktsis, N. and Frohlich, M. (2002), “Case research in operations management”,
International Journal of Operations & Production Management, Vol. 22 No. 2, pp. 195-219.
Wagner, S.M., Ullrich, K.K.R. and Transchel, S. (2014), “The game plan for aligning the
organization, Business Horizons, Vol. 57 No. 2, pp. 189-201.
Wang, J., Hsieh, S. and Hsu, P. (2012), “Advanced sales and operations planning framework in a company
supply chain”, International Journal of Computer Integrated Manufacturing, Vol. 25 No. 3, pp. 248–
262.
Yin, R.K. (2009), Case Study Research: Design and Methods, Thousand Oaks, CA: Sage.
Yurt, O., Mena, C. and Stevens, G. (2010) “Sales and operations planning for the food supply chain: case
study”, in Mena C. and Stevens G. (Eds.), Delivering Performance in Food Supply Chains, Woodhead
Publishing Limited, UK, pp. 119-140.