Embed Size (px)
Citation preview

RESEARCH ARTICLE Open Access
Alpha-1-acid glycoprotein as potential biomarkerfor alpha-fetoprotein-low hepatocellular carcinomaIndra Bachtiar1*, Valentine Kheng1, Gunawan A Wibowo1, Rino A Gani2, Irsan Hasan2, Andri Sanityoso2,Unggul Budhihusodo2, Syafruddin AR Lelosutan3, Ruswhandi Martamala3, Wenny A Achwan4,Soewignyo Soemoharjo4, Ali Sulaiman5, Laurentius A Lesmana2, Susan Tai1
Abstract
Background: The outcome of patients with hepatocellular carcinoma (HCC) remains poor because of latediagnosis. We determined the performances of a -1-acid glycoprotein (AAG) and des-g-carboxy prothrombin (DCP)for the diagnosis of HCC, especially for a-fetoprotein (AFP)-low HCC.
Methods: Of the 220 patients included in this retrospective study, 124 had HCC, and 61 (49%) of these were AFP-low HCC (AFP ≤ 20 ng/mL). The remaining 96 patients, including 49 with chronic hepatitis B or C and 47 withcirrhosis, were considered as control. Plasma AAG was analyzed using high performance liquid chromatography(HPLC) and confirmed using Western blot technique.
Results: When all patients with HCC were evaluated, the area under receiver operating characteristic (ROC) curvesfor AAG (0.94, 95% CI: 0.91-0.97) and DCP (0.92, 95% CI: 0.88-0.95) were similar (P = 0.40). AAG had better areaunder ROC curve (0.96, 95% CI: 0.94-0.99) than DCP (0.87, 95% CI: 0.81-0.93) for AFP-low HCC (P < 0.05). At thespecificity 95%, the sensitivity of AAG was higher in AFP-low HCC than in AFP-high HCC (82% and 62%,respectively). In contrast, higher sensitivity was obtained from DCP in discriminating HCC patients with low AFPthan that in high AFP (57% and 90%, respectively).
Conclusion: Our cross-sectional study showed that AAG was better performance in diagnosing HCC patients withlow AFP, while DCP did better in those with high AFP.
BackgroundHepatocellular carcinoma (HCC) is one of the mostcommon malignancies in the world [1]. Until recently,AFP has been the most widely used plasma marker fordiagnosis, surveillance, and as a prognostic indicator ofHCC patients’ survival [2]. Several studies indicated thathigh plasma levels of AFP are related to poor prognosis,as well as histologic grade of malignancy [3]. Those withhigh plasma AFP level at the time of HCC diagnosishave more unfavourable outcomes compared to patientswith low AFP level [4]. However, it has been recognizedthat AFP has a low sensitivity in detection of HCC, andthat AFP level often increases in the absence of HCC[5].
To date, several tumor markers have been proposed ascomplement or substitute for AFP in HCC diagnosis.Recently, Lens culinaris agglutinin-reactive fraction ofAFP (AFP-L3) [6] and DCP [7] have been approved bythe Food and Drug Administration as plasma markersfor HCC. AFP-L3 can be detected in the plasma ofpatients with small tumors [8,9]. However, for the diag-nosis of early stage of HCC, AFP-L3 [10] and DCP[10,11] are less sensitive than AFP for the diagnosis ofearly and very early stage HCC. DCP has not been usedin Indonesia and it could be a potential biomarker fordiagnosis of HCC. Therefore a cross-sectional study isrequired to determine the role of DCP in the diagnosisof HCC in the Indonesian population. Another potentialbiomarker for HCC is AAG. AAG is an acute phaseprotein, synthesized predominantly in the liver. Cyto-kines can cause plasma AAG level to increase as part ofan inflammatory response [12]. The plasma level of
* Correspondence: [email protected] Division, Mochtar Riady Institute for Nanotechnology, LippoKarawaci, Tangerang, 15811, IndonesiaFull list of author information is available at the end of the article
Bachtiar et al. BMC Research Notes 2010, 3:319http://www.biomedcentral.com/1756-0500/3/319
© 2010 Bachtiar et al; licensee BioMed Central Ltd. This is an Open Access article distributed under the terms of the Creative CommonsAttribution License (http://creativecommons.org/licenses/by/2.0), which permits unrestricted use, distribution, and reproduction inany medium, provided the original work is properly cited.

AAG has been suggested to be a potential marker fordiagnosing cirrhosis and HCC [13]. Recently we haveshown that combination of AAG and AFP improves theaccuracy of HCC diagnosis [14].Given the rising incidence of HCC in Indonesia and
lack of data on the clinical utility of these two tumormarkers (AAG and DCP) for detecting the presence ofHCC, we selected 220 chronic liver patients, with andwithout HCC. This study is a further step in order toassess the feasibility of AAG to diagnose AFP-low HCC.This study has limitations, and not designed to assessthe treatment and follow-up of the screen-detectedpatients. Our specific aims were to: (i) define the levelof each tumor marker with the best sensitivity, specifi-city, accuracy, positive predictive value (PPV) and nega-tive predictive value (NPV) for diagnosis of HCC; and(ii) to evaluate the clinical utilities of AAG and DCP inHCC patients with low AFP (≤ 20 ng/mL) and highAFP (> 20 ng/mL), especially in attempt to find the bestbiomarker for diagnosing HCC patients with low AFP.
MethodsPatientsA total of 220 plasma samples were collected betweenJanuary 2006 and January 2009 from patients in fourparticipating hospitals, Cipto Mangunkusumo Hospital,Gatot Subroto Army Hospital, Ali Sulaiman Liver ClinicCenter (Jakarta, West Indonesia) and Hepatitis Labora-tory Mataram (West Nusa Tenggara, East Indonesia).Demographic and clinical information of each patientincluding age, gender, and cause of disease wereobtained from chart review. All patients gave informedconsents to participate in the study, and the InstitutionalReview Board of each participating institution approvedthe protocol.The patients were divided into three groups: (i) con-
trol (non-malignant disease), either chronic hepatitispatients with HBV/HCV infection (n = 49) or cirrhoticpatients (n = 47); (ii) AFP-low HCC (n = 61); and (iii)AFP-high HCC (n = 63). Etiology of underlying liverdisease was attributed to HBV based on detection ofHBsAg in plasma via a commercial assay and HCVbased on detection of hepatitis C antibody/hepatitis Cvirus RNA in plasma. The presence of cirrhosis wasdefined by histological measurement or non-histologicalby evidence of portal hypertension in the presence ofchronic liver disease. Diagnosis of HCC relied on thepresence of a malignant liver nodule, as established byimaging techniques. Fine needle aspiration biopsy proce-dure reconfirmed the diagnosis of HCC for sample inwhich the AFP concentration was low. Subjects withHIV co-infection or autoimmune hepatitis wereexcluded in this study. None of the subjects was takingvitamin K at time of the study.
Biomarkers measurementsBlood samples were collected in pyrogen-free tube (BDVacutainer, Plymouth, UK) with ethylene diamine tetra-acetic acid as an anticoagulant. A 10 mL blood samplewas drawn from each subject, and plasma was stored at-80°C until AFP, AAG, and DCP testing.The quantitative measurement of plasma AFP or DCP
was performed using a commercially available enzyme-linked immunosorbent assay (ELISA) kit from AmgenixInternational Inc. (San Jose, CA, USA) or from Diagnos-tica Stago (Asnières-sur-Seine, France), respectively,according to the manufacturers’ instructions. The mini-mum detectable concentration for both AFP and DCPwere 2.0 ng/mL.Measurement of plasma AAG concentration was per-
formed according to our previous report [14]. Briefly,the plasma AAG level was detected via the Agilent 1200HPLC system. A 200 μL of crude plasma was dilutedwith 600 μL of Buffer A (Agilent, Santa Clara, CA). Anamount of 20 μL of the diluted plasma was depleted ona Multiple Affinity Removal Column (Agilent; 4.6 mm ×50 mm) according to the manufacturer’s instructions.The total volume of depleted plasma collected at reten-tion time between 2 and 6 min was approximately 1mL. The depleted plasma was fractionated by columnmRP-C18 (Agilent; 4.6 mm × 50 mm), operated at flowrate 0.75 mL/min and mobile phase comprised of twosolvents: A: water/0.1% trifluoroacetic acid (TFA) and B:Acetonitrile/0.08% TFA. The AAG fraction was detectedbetween retention times at 14.5-16 minute. Quantifica-tion of plasma AAG concentration was performed usingovalbumine as an external standard and for calibrationsample. Measurement of the standard was calculatedbased on peak area integration according to the AgilentChemstation protocol.
Western blotThe result from HPLC analysis was validated using Wes-tern blot. We selected 8 samples randomly from eachgroup, chronic hepatitis, cirrhosis, AFP-low HCC, andAFP-high HCC, respectively. An amount of 25 μL plasmawas depleted using Multiple Affinity Removal Column(Agilent). The low-abundant protein fractions were col-lected and concentrated to 100 μL. Then, 10 μL of theconcentrated fractions were mixed with Laemmli samplebuffer and applied to 12% SDS-PAGE gels. Proteins inthe gels were transferred to 0.45 μm nitrocellulose mem-branes. The membranes were blocked using 5% skimmilk in TBS-T (20 mM Tris-HCl pH 7.5, 500 mMsodium chloride, 0.05% Tween 20) at room temperaturefor one hour. The blots were washed twice using TBS-TT (TBS-T containing 0.2% Triton) and once using TBS(10 mM Tris-HCl pH 7.5, 150 mM sodium chloride).Incubation with primary antibody was done overnight at
Bachtiar et al. BMC Research Notes 2010, 3:319http://www.biomedcentral.com/1756-0500/3/319
Page 2 of 8
4°C in 1:10000 dilution of anti-AAG mouse monoclonal(Sigma, Inc., St. Louise, MO, USA) in blocking buffer.The membranes were washed twice with TBS-TT, oncewith TBS, incubated for two hours with anti-mouse IgGHRP-linked antibody (GE Healthcare, Buckinghamshire,UK) at a 1:5000 dilution in TBS-T, and washed threetimes with TBS-TT. The blots were developed using dia-minobenzidine (DAB) substrate (40 mg/mL DAB, 80 mg/mL nickel chloride, and 30% H2O2 in 0.1 M Tris-HCl pH7.5). The stained membranes were then scanned andquantified using ImageJ software (National Institute ofHealth, Bathesda, MD, USA) by measuring the relativeintensity from each band.
Statistical analysisComparison of clinical characteristics, plasma biomarkerlevels, and Western blot relative intensities among thegroups were analyzed using parametric or non-para-metric analyses based on data distribution. For normaldistributed data, differences between groups were ana-lyzed using Student’s t-test. For non-parametric distribu-ted data and binary variables, Mann Whitney wasperformed to compare groups. The descriptive statisticsfor the markers were compared by scatter plots usingthe GraphPad Prism 5.02 (GraphPad Inc., CA, USA). Todetermine the optimal cut-off values for AFP, AAG, andDCP in the diagnosis of HCC, Receiver Operating Char-acteristic (ROC) curves were constructed using all thepossible cut-offs for each assay. The area under theROC curve (AUC) was calculated and compared. Statis-tical analysis was performed using the SPSS 15.0 (SPSSInc., IL, USA).
ResultsPatient characteristicsA total of 220 patients were included in this study, ofwhich 96 were control and 124 were HCC cases. Of thecases, 61 were AFP-low and 63 were AFP-high. Both theAFP-low and AFP-high HCC patients were older thancontrol (P = 0.01). All groups had more male thanfemale patients. The characteristics of these patientswere shown in Table 1. The majority of control andcases had a viral etiology of their liver diseases, withHBV in 57 patients out of 96 controls and 71 out of 124HCC cases, of which 29 were AFP-low HCC. HCV wasthe underlying etiology of liver disease in 32 patientscontrol and 30 HCC cases of which 12 were AFP-lowHCC. Other HCC patients had a non-viral etiology (nonB, non C) of their liver diseases, with 20 AFP-low and 3AFP-high HCC patients.
Biomarker levelsHPLC chromatogram analysis showed that peak of AAGat retention time 14.5-16 minute revealed high protein
expression in staging of HCC patients with low AFPand high AFP concentration, but this peak was notablysmaller in control (Figure 1A). Furthermore, the resultfrom Western blot showed level of AAG in HCCpatients with low AFP and high AFP were significantlyelevated than those in controls (P < 0.001), which wasconsistent with the result of HPLC (Figure 1B).The AFP, AAG, and DCP values were reported as
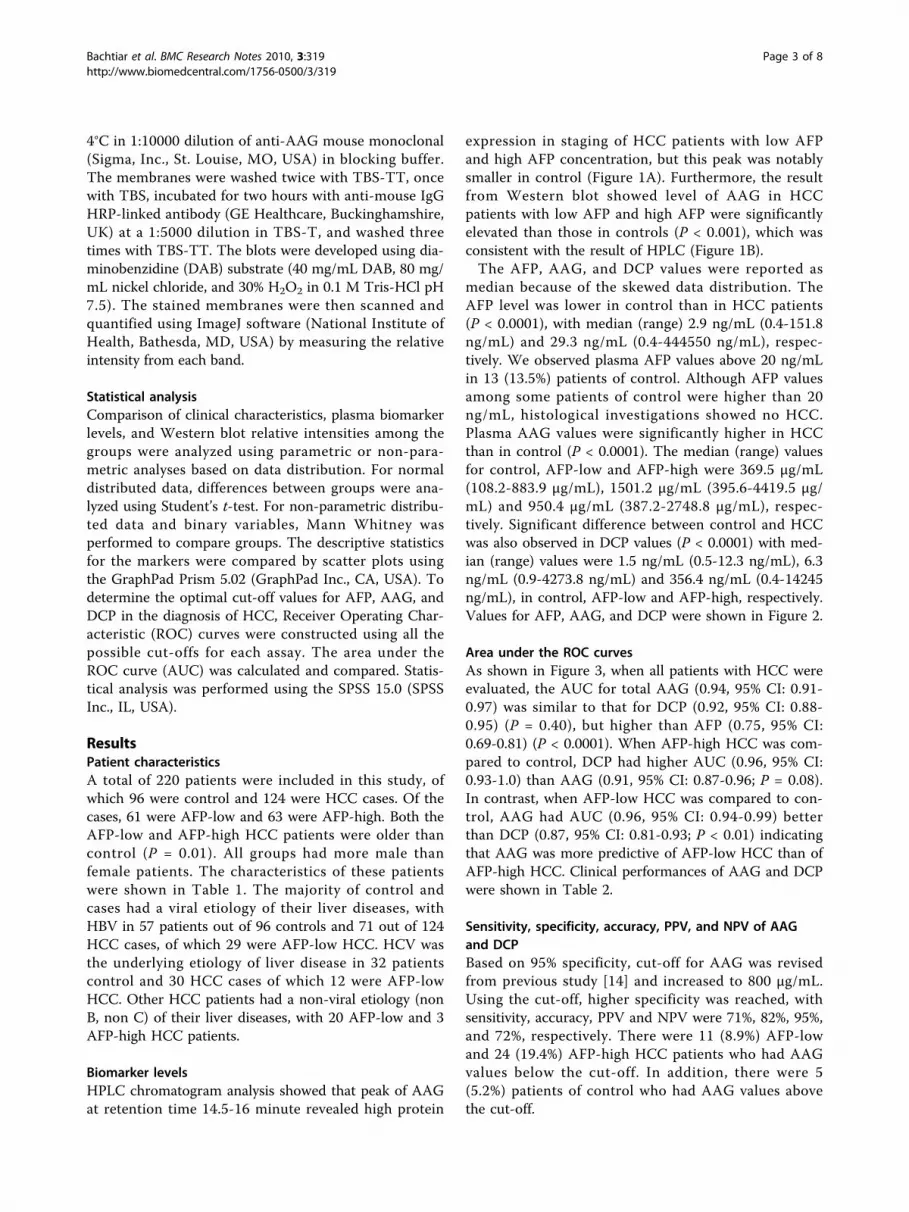
median because of the skewed data distribution. TheAFP level was lower in control than in HCC patients(P < 0.0001), with median (range) 2.9 ng/mL (0.4-151.8ng/mL) and 29.3 ng/mL (0.4-444550 ng/mL), respec-tively. We observed plasma AFP values above 20 ng/mLin 13 (13.5%) patients of control. Although AFP valuesamong some patients of control were higher than 20ng/mL, histological investigations showed no HCC.Plasma AAG values were significantly higher in HCCthan in control (P < 0.0001). The median (range) valuesfor control, AFP-low and AFP-high were 369.5 μg/mL(108.2-883.9 μg/mL), 1501.2 μg/mL (395.6-4419.5 μg/mL) and 950.4 μg/mL (387.2-2748.8 μg/mL), respec-tively. Significant difference between control and HCCwas also observed in DCP values (P < 0.0001) with med-ian (range) values were 1.5 ng/mL (0.5-12.3 ng/mL), 6.3ng/mL (0.9-4273.8 ng/mL) and 356.4 ng/mL (0.4-14245ng/mL), in control, AFP-low and AFP-high, respectively.Values for AFP, AAG, and DCP were shown in Figure 2.
Area under the ROC curvesAs shown in Figure 3, when all patients with HCC wereevaluated, the AUC for total AAG (0.94, 95% CI: 0.91-0.97) was similar to that for DCP (0.92, 95% CI: 0.88-0.95) (P = 0.40), but higher than AFP (0.75, 95% CI:0.69-0.81) (P < 0.0001). When AFP-high HCC was com-pared to control, DCP had higher AUC (0.96, 95% CI:0.93-1.0) than AAG (0.91, 95% CI: 0.87-0.96; P = 0.08).In contrast, when AFP-low HCC was compared to con-trol, AAG had AUC (0.96, 95% CI: 0.94-0.99) betterthan DCP (0.87, 95% CI: 0.81-0.93; P < 0.01) indicatingthat AAG was more predictive of AFP-low HCC than ofAFP-high HCC. Clinical performances of AAG and DCPwere shown in Table 2.
Sensitivity, specificity, accuracy, PPV, and NPV of AAGand DCPBased on 95% specificity, cut-off for AAG was revisedfrom previous study [14] and increased to 800 μg/mL.Using the cut-off, higher specificity was reached, withsensitivity, accuracy, PPV and NPV were 71%, 82%, 95%,and 72%, respectively. There were 11 (8.9%) AFP-lowand 24 (19.4%) AFP-high HCC patients who had AAGvalues below the cut-off. In addition, there were 5(5.2%) patients of control who had AAG values abovethe cut-off.
Bachtiar et al. BMC Research Notes 2010, 3:319http://www.biomedcentral.com/1756-0500/3/319
Page 3 of 8

Cut-off for DCP was taken at 95% specificity on 4.5ng/mL. In clinical studies of patients with liver disease,instead of using cut-off at 7.5 ng/mL [15], a decisioncut-off of 4.5 ng/mL was found to be optimal, givingbetter clinical performances. The sensitivity, accuracy,
PPV, and NPV were 74%, 83%, 95%, and 74%, respec-tively. Based on the cut-off value, we observed 32(25.8%) HCC patients had DCP values below the cut-off,while 5 (5.2%) patients of control had values above thecut-off.
Table 1 Clinical characteristics of patients
Variable Control (n = 96) HCC (n = 124) P-value (vs. control)
Chronic Hepatitis(n = 49)
Cirrhosis(n = 47)
AFP ≤ 20 ng/mL(n = 61)
AFP > 20 ng/mL(n = 63)
AFP-Low HCC AFP-high HCC
Age 42.4 ± 14.9 53.8 ± 9.2 55.8 ± 14.6 53.5 ± 12.9 0.0008 0.0127
Gender (M:F) 25:24 31:16 41:20 51:12 0.2659 0.0030
Etiology (%) 0.0124 0.2458
HBV 69.4 48.9 47.5 66.7
HCV 30.6 36.2 19.7 28.6
Non HBV-non-HCV 0 14.9 32.8 4.8
AST (IU/mL) 32.5 (12-194) 42 (16-110) 91 (5-714) 138 (9-945) 0.0026 < 0.0001
ALT (IU/mL) 32.5 (6-868) 32 (15-63) 46 (8-363) 65 (6-347) < 0.0001 < 0.0001
Data presented as mean ± SD or median (range)
HCC, hepatocellular carcinoma; HBV, hepatitis B virus; HCV, hepatitis C virus; AFP, a-fetoprotein; AST, aspartate aminotransferase; ALT, alanine aminotransferase
Figure 1 HPLC chromatogram profile and western blot analysis. (A) HPLC chromatogram profile of chronic hepatitis, cirrhosis, AFP-low HCC,and AFP-high HCC; (B) Western blot analysis of AAG in chronic hepatitis, cirrhosis, AFP-low HCC, and AFP- high HCC.
Bachtiar et al. BMC Research Notes 2010, 3:319http://www.biomedcentral.com/1756-0500/3/319
Page 4 of 8
In all HCC patients, sensitivity, accuracy, and NPV ofDCP were better than those of AAG. However, whenROC analysis was done in AFP-low HCC patients clini-cal performances of AAG increased over DCP. Sensitiv-ity, accuracy, PPV, and NPV of AAG (82%, 90%, 91%,and 89%, respectively) were better than those of DCP(57%, 80%, 88%, and 78%, respectively). In AFP-highHCC patients, DCP was proven to be better than AAG.The sensitivity, accuracy, PPV, and NPV of DCP were90%, 93%, 92%, and 94%, respectively, while the corre-sponding values for AAG were 62%, 82%, 89%, and 79%.
DiscussionAccording to the World Health Organization (WHO),the incidence of HCC in Indonesia is projected to stea-dily increase until 2030 due to increasing frequency ofcirrhosis in patients with chronic HBV infection [16].Surveillance programs have been done based on abdom-inal ultrasound examination and plasma AFP measure-ment every six months. However, AFP was found to bea poor complement for ultrasound, because of its low
sensitivity and specificity [17], therefore, a search fornew biomarkers for HCC is needed.Several tumor markers have been proposed as comple-
ments or substitutes for AFP in HCC diagnosis. Plasmaconcentration of AAG has been suggested as a potentialmarker for cirrhosis and HCC [13,14]. A study by Kanget al. found that AAG had similar sensitivity value indifferentiating HCC regardless of the tumor size [18].While in our previous study, the diagnostic efficacy ofAAG among the HCC patients with AFP levels below200 ng/mL was similar to the results from total HCCpatients [14]. This previous study clearly demonstratesthat the plasma AAG concentration was increased inpatients with HCC in comparison to patients with non-HCC. In this study, when the ROC of AAG was com-pared among HCC patients, the AAG level was signifi-cantly higher in HCC patients with low AFP value butlower in HCC patients with high AFP values. Theseresults were supported by another study that mentionedthe use of AAG to diagnose HCC patients whose AFPvalues were below 500 ng/mL [18]. Since AFP level was
Figure 2 Scatter plots of plasma AFP, AAG, and DCP. Scatter plots of plasma (A) AFP, (B) AAG, and (C) DCP levels in control, AFP-low HCC,and AFP-high HCC. The black line indicates the median, for which the value is indicated on the bottom of the scatter plot. The dashed lineindicates the cut-off value of each marker, 20 ng/mL for AFP, 800 μg/mL for AAG, and 4.5 ng/mL for DCP. In all markers, P < 0.0001 for controlvs. either AFP-low HCC or AFP-high HCC.
Bachtiar et al. BMC Research Notes 2010, 3:319http://www.biomedcentral.com/1756-0500/3/319
Page 5 of 8

found to be correlated with later stage and poor prog-nosis of HCC [19], therefore it allowed us to proposethat determining AAG levels could be helpful in earlydetection of HCC or AFP-low HCC. The high level ofAAG in HCC patients with low AFP concentrationcould be caused by the inflammation of the liver or theoverproduction of the acute phase protein by hepatomacells [12]. However, further study will be required forclarifying the role of AAG in AFP-low HCC.
Several case-control studies showed sensitivities andspecificities of different biomarkers in the diagnosis ofHCC. A study in Japan of 1377 HCC patients and 355non-HCC controls with chronic hepatitis or cirrhosisshowed that the utility of DCP for the diagnosis of HCCwas lower than that of AFP for small tumors, but higherthan that of AFP for large tumors [11]. Moreover, DCPlevel was reported to be closely correlated with tumorprogression and prognosis, while HCC with high serum
Figure 3 ROC curves of AAG and DCP in HCC patients. ROC curves comparing AAG and DCP in (A) all HCC patients; (B) AFP-low HCCpatients; and (C) AFP-high HCC patients.
Bachtiar et al. BMC Research Notes 2010, 3:319http://www.biomedcentral.com/1756-0500/3/319
Page 6 of 8

levels of DCP and low levels of AFP were an indicationof larger tumor size [20-22]. Similarly, we found thatDCP level increased according to the stepwise progres-sion of liver disease, i.e., from chronic hepatitis to cir-rhosis to HCC. The DCP level was decreased in HCCpatients with low AFP value but significantly increasedin patients with high AFP value. The sensitivity and spe-cificity were 74% and 95%, respectively, for all HCCpatients. These values were similar to the results inChina (77% and 86.4%, respectively) [15] but higherthan the results in USA (74% and 70%, respectively).Recent study demonstrated that AFP was more sensitivethan DCP for the diagnosis of early and very early stageHCC at a new cutoff of 10.9 ng/mL [10]. However,neither AFP alone, DCP alone, nor the combination ofAFP and DCP was sufficiently accurate to be used forHCC surveillance [17]. In light of our recent results andothers, we propose to use AAG as alternative biomarkerto AFP and as a complement for ultrasound in HCCpatients with low AFP.The most important question is whether the cut-off
value of DCP in Indonesian HCC patients was similar tostudies in other countries. We found the optimal cut-offDCP value to be 4.5 ng/mL based on the ROC curve fordistinguishing patients with HCC from those with non-HCC. This DCP cut-off value was lower than the valueused in studies from USA (7.5 ng/mL) [15]. This differ-ence might be due to ethnic differences [23] as otherstudies have also used varying cut-off DCP values forItalian, Japanese and Chinese subjects [19,24]. It is alsopossible that the etiology of liver disease (HBV andHCV) can alter the DCP level. In this study, HBV wasthe underlying etiology in most of our patients withchronic hepatitis/cirrhosis and our patients with HCC.Interestingly, we found that the non-viral etiology (nonB, non C) among HCC patients was also higher, espe-cially for AFP-low HCC. Taken together, our resultssuggest that a lower cut-off of DCP value in our study
may be related to higher HBV-infected and non B-nonC populations among Indonesian subjects. Prospectivestudies on a large number of patients with diverse eth-nic backgrounds and a broad spectrum of underlyingetiologies of liver disease are required in order to con-firm this assumption.
ConclusionOur cross-sectional study showed that AAG was betterperformance in diagnosing HCC patients with low AFP,while DCP did better in those with high AFP. A DCPvalue of > 4.5 ng/mL and AAG value of > 800 μg/mLamong patients with underlying non-malignant liver dis-ease were associated with a high probability of develop-ing HCC. Prospective studies on a large number ofpatients with underlying etiologies of liver disease andtumor staging are required to confirm this study. Datafrom these studies may help to improve the outcome ofpatients with HCC by enabling the diagnosis to be madeat an earlier stage of the disease when curative treat-ment is still possible.
AcknowledgementsThe authors appreciate Prof. David Vaux (La Trobe University, Australia) andDr. Juandy Jo (Uni-Freiburg, Germany) for critical reading. We thank RamaDhenni, Griskalia Christine, and Shinta Soraya for sample collection andpreparation. This work was supported by Mochtar Riady Institute forNanotechnology (MRIN) Funding (Budget no. cc042/2007/08).
Author details1Proteomic Division, Mochtar Riady Institute for Nanotechnology, LippoKarawaci, Tangerang, 15811, Indonesia. 2Hepatology Division, Department ofInternal Medicine, Faculty of Medicine University of Indonesia, Jakarta,Indonesia. 3Gastroentero-Hepatology Division, Department of InternalMedicine, Gatot Soebroto Hospital, Jakarta, Indonesia. 4Department ofInternal Medicine, Mataram General Hospital, Mataram, Indonesia.5Department of Hepatology, Klinik Hati “Prof. Ali Sulaiman”, Jakarta,Indonesia.
Authors’ contributionsIB conceived of, designed, coordinated the study and drafted themanuscript. VK and GAW carried out the AAG and DCP assays and helpedwith the statistical analysis. RAG, IH, AS, UB, SARL, RM, WA, SS, AS, LAS, andST coordinated the study and provided the patients sample.
Competing interestsThe authors declare that they have no competing interests.
Received: 1 September 2010 Accepted: 23 November 2010Published: 23 November 2010
References1. Bosch FX, Ribes J, Diaz M, Cleries R: Primary liver cancer: worldwide
incidence and trends. Gastroenterology 2004, 127:S5-16.2. Taketa K: α-fetoprotein; revolution in hepatology. Hepatology 1990,
12:1420-32.3. Johnson PJ, Melia WM, Palmer MK, Portmann B, Williams R: Relationship
between serum α -fetoprotein, cirrhosis, and survival in hepatocellularcarcinoma. Br J Cancer 1981, 44:502-5.
4. Shirabe K, Takenaka K, Gion T, Shimada M, Fujiwara Y, Sugimachi K:Significance of α-fetoprotein concentrations for detection of earlyrecurrence of hepatocellular carcinoma after hepatic resection. J SurgOncol 1997, 64:143-16.
Table 2 Clinical performance of AAG and DCP atspecificity of 95%
Marker Cut-off Sensitivity Accuracy PPV NPV
All HCC (n = 124)
AAG 800 71 82 95 72
DCP 4.5 74 83 95 74
AFP-low HCC (n = 61)
AAG 800 82 90 91 89
DCP 4.5 57 80 88 78
AFP-high HCC (n = 63)
AAG 800 62 82 89 79
DCP 4.5 90 93 92 94
PPV, positive predictive value; NPV, negative predictive value; HCC,hepatocellular carcinoma; AAG, a-1-acid glycoprotein; DCP, des-g-carboxyprothrombin; AFP, a-fetoprotein
Bachtiar et al. BMC Research Notes 2010, 3:319http://www.biomedcentral.com/1756-0500/3/319
Page 7 of 8

5. Di Bisceglie AM, Sterling RK, Chung RT, Everhart JE, Dienstag JL,Bonkovsky HL, Wright EC, Everson GT, Lindsay KL, Lok AS, Lee WM,Morgan TR, Ghany MG, Gretch DR: Serum α-fetoprotein levels in patientswith advanced hepatitis C: results from the HALT-C Trial. J Hepatol 2005,43:434-441.
6. Oka H, Saito A, Ito K, Kumada T, Satomura S, Kasugai H, Osaki Y, Seki T,Kudo M, Tanaka M: Multicenter prospective analysis of newly diagnosedhepatocellular carcinoma with respect to the percentage of Lensculinaris agglutinin-reactive α-fetoprotein. J Gastroenterol Hepatol 2001,16:1378-83.
7. Okuda H, Obata H, Nakanishi T, Furukawa R, Hashimoto E: Production ofabnormal prothrombin (des-gamma-carboxy prothrombin) byhepatocellular carcinoma: a clinical and experimental study. J Hepatol1987, 4:357-363.
8. Li D, Mallory T, Satomura S: AFP-L3: a new generation of tumor markerfor hepatocellular carcinoma. Clin Chim Acta 2001, 313:15-19.
9. Wang Y, Satomura S, Wise M: AFP-L3% as a biomarker for earlyrecognition of rapidly growing hepatocellular carcinoma. Hepatology2005, 42:390A.
10. Marrero JA, Feng Z, Wang Y, Nguyen MH, Befeler AS, Roberts LR, Reddy KR,Harnois D, Llovet JM, Normolle D, Dalhgren J, Chia D, Lok AS, Wagner PD,Srivastava S, Schwartz M: α-fetoprotein, des-gamma carboxyprothrombin,and lectin-bound α-fetoprotein in early hepatocellular carcinoma.Gastroenterology 2009, 137:110-118.
11. Nakamura S, Nouso K, Sakaguchi K, Ito YM, Ohashi Y, Kobayashi Y,Toshikuni N, Tanaka H, Miyake Y, Matsumoto E, Shiratori Y: Sensitivity andspecificity of des-gamma-carboxy prothrombin for diagnosis of patientswith hepatocellular carcinomas varies according to tumor size. Am JGastroenterol 2006, 101:2038-43.
12. Fournier T, Medjoubi N, Porquet D: α-1-acid glycoprotein. Biochim BiophysActa 2000, 1482:157-171.
13. Paul M, Peter H, Kevin S: The putative use of α-1-acid glycoprotein as anoninvasive marker of fibrosis. Biomed Chromatogr 2006, 20:1351-1358.
14. Bachtiar I, Santoso JM, Atmanegara B, Gani RA, Hasan I, Lesmana LA,Sulaiman A, Gu J, Tai S: Combination of α-1-acid glycoprotein and α-fetoprotein as an improved diagnostic tool for hepatocellular carcinoma.Clin Chim Acta 2009, 399:97-101.
15. Sterling RK, Jeffers L, Gordon F, Venook AP, Reddy KR, Satomura S, Kanke F,Schwartz ME, Sherman M: Utility of Lens culinaris agglutinin-reactivefraction of α-fetoprotein and des-gamma-carboxy prothrombin, alone orin combination, as biomarkers for hepatocellular carcinoma. ClinGastroenterol Hepatol 2009, 7:104.
16. The World Health Organization Index of/Docstore. [http://www.who.int/en/].
17. Lok AS, Sterling RK, Everhart JE, Wright EC, Hoefs JC, Bisceglie AM,Morgan TR, Kim HY: Des-gamma carboxyprothrombin andalphafetoprotein as biomarker for the early detection of hepatocellularcarcinoma. Gastroenterology 2010, 138:493-502.
18. Kang X, Sun L, Guo K, Shu H, Yao J, Qin X, Liu Y: Serum proteinbiomarkers screening in HCC patients with liver cirrhosis by ICAT-LC-MS/MS. J Cancer Res Clin Oncol 2010, 136:1151-1159.
19. Brunello F, Marcarino C, Pasquero P, Gastaldi P, Gonella S, Martini S,Calcamuggi G, Emanuelli G: The des-gamma-carboxyprothrombin for thediagnosis of hepatocellular carcinoma. Ital J Gastroenterol 1993, 25:9-12.
20. Kasahara A, Hayashi N, Fusamoto H, Kawada Y, Imai Y, Yamamoto H,Hayashi E, Ogihara T, Kamada T: Clinical evaluation of plasma des-gamma-carboxy prothrombin as a marker protein of hepatocellularcarcinoma in patients with tumors of various sizes. Dig Dis Sci 1993,38:2170-6.
21. Koike Y, Shiratori Y, Sato S, Obi S, Teratani T, Imamura M, Yoshida H,Shiina S, Omata M: Des-gamma-carboxy prothrombin as a usefulpredisposing factor for the development of portal venous invasion inpatients with hepatocellular carcinoma: a prospective analysis of 227patients. Cancer 2001, 91:561-9.
22. Hamamura K, Shiratori Y, Shiina S, Imamura M, Obi S, Sato S, Yoshida H,Omata M: Unique clinical characteristics of patients with hepatocellularcarcinoma who present with high plasma des-gamma-carboxyprothrombin and low serum alpha-fetoprotein. Cancer 2000,88:1557-1564.
23. Marrero JA, Su GL, Wei W, Emick D, Conjeevaram HS, Fontana RJ, Lok AS:Des-gamma carboxyprothrombin can differentiate hepatocellular
carcinoma from nonmalignant chronic liver disease in americanpatients. Hepatology 2003, 37:1114-1121.
24. Tsai SL, Huang GT, Yang PM, Sheu JC, Sung JL, Chen DS: Plasma des-gamma-carboxyprothrombin in the early stage of hepatocellularcarcinoma. Hepatology 1990, 11:481-488.
doi:10.1186/1756-0500-3-319Cite this article as: Bachtiar et al.: Alpha-1-acid glycoprotein as potentialbiomarker for alpha-fetoprotein-low hepatocellular carcinoma. BMCResearch Notes 2010 3:319.
Submit your next manuscript to BioMed Centraland take full advantage of:
• Convenient online submission
• Thorough peer review
• No space constraints or color figure charges
• Immediate publication on acceptance
• Inclusion in PubMed, CAS, Scopus and Google Scholar
• Research which is freely available for redistribution
Submit your manuscript at www.biomedcentral.com/submit
Bachtiar et al. BMC Research Notes 2010, 3:319http://www.biomedcentral.com/1756-0500/3/319
Page 8 of 8


